
Pneumatic Conveying Design Guide
650
-
Upload
khangminh22 -
Category
Documents
-
view
0 -
download
0
Transcript of Pneumatic Conveying Design Guide


Pneumatic Conveying Design Guide

This page intentionally left blank

Pneumatic Conveying Design Guide
Second Edition
David Mills
AMSTERDAM BOSTON HEIDELBERG LONDON NEW YORK OXFORD PARIS
SAN DIEGO SAN FRANCISCO SINGAPORE SYDNEY TOKYO
Elsevier Butterworth-Heinemann
Linacre House, Jordan Hill, Oxford OX2 8DP
200 Wheeler Road, Burlington, MA 01803
First published 1990
Second edition 2004
© David Mills 2004
This publication contains material from PneumaticConveying Design Guide 1990 which was written by
Dr David Mills under contract with the Department of
Trade and Industry. © Crown copyright 1990. Reproduced
with the permission of the Controller of Her Majesty’s
Stationery Office
Permissions may be sought directly from Elsevier’s
Science and Technology Rights Department in Oxford,
UK: phone: �44-0-1865-843830; fax: �44-0-1865-
853333; e-mail: [email protected]. You may also
complete your request on-line via the Elsevier homepage
(http://www.elsevier.com), by selecting ‘Customer
Support’ and then ‘Obtaining Permissions’
All rights reserved. No part of this publication may be
reproduced in any material form (including photocopying
or storing in any medium by electronic means and whether
or not transiently or incidentally to some other use of this
publication) without the written permission of the
copyright holder except in accordance with the provisions
of the Copyright, Designs and Patents Act 1988 or under
the terms of a licence issued by the Copyright Licensing
Agency Ltd, 90 Tottenham Court Road, London, England
W1T 4LP. Applications for the copyright holder’s written
permission to reproduce any part of this publication should
be addressed to the publisher
British Library Cataloguing in Publication DataA catalogue record for this book is available from the
British Library
Library of Congress Cataloging in Publication DataA catalog record for this book is available from the Library
of Congress
ISBN 0 7506 5471 6
Typeset by Charon Tec Pvt Ltd, Chennai, India
Printed and bound in Great Britain
For information on all Butterworth-Heinemann publications visit our website at www.bh.com
Contents
Preface xi
Part A: Systems and Components
1. Introduction to pneumatic conveying and the guide 031.1 Introduction 03
1.2 Pneumatic conveying 03
1.3 Information provided 13
1.4 Review of chapters 14
1.5 Definitions 20
1.6 Nomenclature 25
References 28
2. Review of pneumatic conveying systems 292.1 Introduction 29
2.2 System types 29
2.3 System requirements 48
2.4 Material property influences 50
References 53
3. Pipeline feeding devices – Part I: Low pressure and vacuum 543.1 Introduction 54
3.2 Rotary valves 58
3.3 Screw feeders 68
3.4 Venturi feeders 69
3.5 Gate lock valves 71
3.6 Suction nozzles 73
3.7 Trickle valves 76
3.8 Blow tanks 77
References 79
4. Pipeline feeding devices – Part II: High pressure 804.1 Introduction 80
4.2 Screw feeders 81
4.3 Rotary valves 82
4.4 Blow tanks 82
4.5 Lock hoppers 101
References 103
5. Pipelines and valves 1045.1 Introduction 104
5.2 Pipelines 104
5.3 Valves 110
5.4 Rubber hose 114
References 116
6. Air movers 1176.1 Introduction 117
6.2 Types of air mover 117
6.3 Air compression effects 130
6.4 Pre-cooling systems 137
6.5 Nomenclature 137
References 138
7. Gas–solid separation devices 1397.1 Introduction 139
7.2 Dust control 140
7.3 Separation devices 141
7.4 System considerations 150
References 151
8. System selection considerations 1528.1 Introduction 152
8.2 Variables involved 153
8.3 Variables investigated 155
8.4 Material compatibility 164
8.5 Design curves 164
8.6 Power requirements 172
8.7 System selection considerations 177
Part B: System Design
9. Air flow rate evaluation 1839.1 Introduction 183
9.2 Volumetric flow rate 186
9.3 The influence of pressure 190
9.4 Stepped pipeline systems 196
9.5 Pipeline purging 202
9.6 The influence of temperature 203
9.7 The influence of altitude 208
9.8 The use of air mass flow rate 209
9.9 Nomenclature 210
10. Air only relationships 21110.1 Introduction 211
10.2 Pipeline pressure drop 211
10.3 Venturi analysis 224
vi CONTENTS
10.4 Air flow rate control 227
10.5 Stepped pipelines 232
10.6 Nomenclature 234
References 235
11. Conveying characteristics 23611.1 Introduction 236
11.2 Single phase flow 237
11.3 Gas–solid flows 239
11.4 The determination of conveying characteristics 243
11.5 Energy considerations 247
11.6 Component pressure drop relationships 252
11.7 Nomenclature 257
References 257
12. Conveying capability 25812.1 Introduction 258
12.2 The influence of materials 258
12.3 System capability 283
References 286
13. Material property influences 28713.1 Introduction 287
13.2 Conveying modes 287
13.3 Conveying capability correlations 294
13.4 Material grade influences 305
13.5 Material degradation effects 311
References 318
14. Pipeline scaling parameters 31914.1 Introduction 319
14.2 Scaling requirements 319
14.3 Conveying distance 320
14.4 Pipeline bore 327
14.5 Pipeline bends 333
14.6 Vertical pipelines 342
14.7 Pipeline material 346
14.8 Stepped pipelines 349
References 353
15. Design procedures 35515.1 Introduction 355
15.2 The use of equations in system design 355
15.3 The use of test data in system design 367
15.4 Typical pipeline and material influences 372
16. Case studies – Part I: Fine material 38416.1 Introduction 384
16.2 Conveying data 385
16.3 Procedure 388
17. Case studies – Part II: Coarse material 39517.1 Introduction 395
17.2 Conveying data 395
17.3 Procedure 398
18. First approximation design methods 40418.1 Introduction 404
18.2 Air only pressure drop method 405
18.3 Universal conveying characteristics method 413
19. Multiple use systems 42319.1 Introduction 423
19.2 Multiple material handling 424
19.3 Multiple delivery points 426
19.4 The use of stepped pipelines 428
References 435
Part C: System Operation
20. Troubleshooting and material flow problems 43920.1 Introduction 439
20.2 Pipeline blockage 439
21. Optimizing and up-rating of existing systems 46121.1 Introduction 461
21.2 System not capable of duty 463
21.3 Optimizing existing systems 464
21.4 Case study 467
21.5 Alternative methods of up-rating 474
22. Operating problems 47822.1 Introduction 478
22.2 Types of system 479
22.3 System components 482
22.4 System related 491
22.5 Material related 494
References 497
23. Erosive wear 49823.1 Introduction 498
23.2 Influence of variables 499
23.3 Industrial solutions and practical issues 512
References 524
viii CONTENTS
24. Particle degradation 52624.1 Introduction 526
24.2 Influence of variables 530
24.3 Recommendations and practical issues 538
24.4 Pneumatic conveying data 540
24.5 Particle melting 544
References 546
25. Moisture and condensation 54725.1 Introduction 547
25.2 Humidity 547
25.3 Air processes 554
25.4 Energy considerations 564
25.5 Nomenclature 569
26. Health and safety 57026.1 Introduction 570
26.2 Dust risks 571
26.3 Conveying systems 578
26.4 System components 580
26.5 Conveying operations 583
26.6 Explosion protection 587
References 594
Appendix 1: Determination of relevant material properties 595A1.1 Introduction 595
A1.2 Particle size and shape 596
A1.3 Particle and bulk density 602
A1.4 Flow properties 605
A1.5 Aeration properties 608
References 616
Appendix 2: Additional conveying data 617A2.1 Introduction 617
A2.2 Materials and pipelines listings 617
A2.3 Material properties listings 620
A2.4 Additional conveying data 622
Index 629
CONTENTS ix

This page intentionally left blank
Preface
For this second edition of the Pneumatic Conveying Design Guide I have followed a
similar format to the first edition, in that it is in three parts plus appendices. There the
similarity ends, however, for the material within these parts has been completely updated,
substantially extended and re-developed to make it more accessible. The figures and
illustrations are incorporated into the text for easy reference and the work is presented
in a single volume.
The first part of the Design Guide is devoted to Systems and Components and general
information on pneumatic conveying. This provides an understanding of dilute and dense
phase conveying modes, solids loading ratio and the influence of pressure and convey-
ing distance, and hence pressure gradient, on flow mechanisms and capabilities. It also
provides a review of major system types, feeding devices, air movers and filtration
devices. A multitude of decisions have to be made with regard to the selection of a
conveying system for a given duty and these chapters will be invaluable in this process.
The new book brings all this information right up to date. Feeding devices are covered
in two chapters and are divided between high and low pressure (including vacuum)
systems, following developments in this area with regard to blow tanks, rotary valves
and the application of lock hoppers. A completely new chapter has been included on
pipelines and valves, which is probably unique, and reinforces the very practical
approach of the book.
The second part of the Design Guide is devoted entirely to System Design and is an
entirely new and updated presentation. In this second edition I have incorporated the main
features of the Abbreviated Design Guide in two case studies. These help to reinforce
the application of the scaling parameters and design procedures that are presented.
Particular emphasis is placed on material types and conveying capability, since this
is where there have been major advancements in the understanding of the technology.
Different grades of exactly the same material can give totally different conveying results
and so this aspect of conveying performance is highlighted. Entire chapters are devoted
to topics such as First Approximation Design Methods and Multiple Use Systems. For
feasibility studies, a quick solution is often required so that system economics can be
assessed and particularly operating costs. There is often a need for a single system to
convey a number of different materials, and possibly to a number of different loca-
tions, and these design issues are addressed.
The third part of the Design Guide is devoted to System Operation and covers a
multitude of very practical operational issues, such as damage to the plant when con-
veying abrasive materials, and damage to the conveyed material by the conveying
plant when handling friable materials. I have re-written the first edition chapters and
have included additional chapters on Moisture and Condensation, and Health and Safety.
This part of the book will be invaluable to any engineer who has to commission a pneu-
matic conveying system or is responsible for the maintenance and operation of such
systems. Pneumatic conveying systems have a reputation for their operational diffi-
culties and so problems of pipeline blockages and systems not capable of meeting the
required duty are considered in detail. The twin problems of erosive wear and particle
degradation are also considered in depth, with numerous means presented on how
these problems can be minimized, if not eliminated.
I have included two Appendices: one is concerned with the determination of mate-
rial properties; and the other contains additional data not incorporated in the text. A
particular feature of the Design Guide is that it provides an understanding of the rela-
tionship between the conveying capability of a given bulk particulate material and
measurable properties of the material. A correlation is included that will give a rea-
sonably reliable indication of whether a material is capable of being conveyed in dense
phase and hence at low velocity. A vast amount of practical data, in the form of con-
veying characteristics, is included and throughout the book this data has been used to
illustrate the derivation of scaling parameters and performance capabilities. This data,
and that included in the second appendix, can be used for design purposes.
The main design and operating parameter required by engineers working with pneu-
matic conveying systems is the value of the minimum conveying air velocity for a
material. I have provide this information for all materials included in the Design Guideand have given guidelines for its assessment for any that are not. Pipeline bends,
stepped pipelines, conveying through flexible hoses, and conveying both vertically up
and down are all issues that tend to cause problems. These pipeline features influence
all aspects of pneumatic conveying and are addressed at appropriate points throughout
the Design Guide.
I have been working in the field of pneumatic conveying for thirty years. In this time
I have written over 170 technical papers for journals and conferences, I have supervised
numerous PhD programmes and have presented many short courses to industry. My
own PhD was on the erosive wear of bends in pneumatic conveying system pipelines. I
was then commissioned by the Department of Trade and Industry to write the original
Pneumatic Conveying Design Guide. In 1988 I was appointed Professor of Bulk Solids
Handling at Glasgow Caledonian University and since 1996 I have worked as an inde-
pendent consultant in pneumatic conveying.
Dr David MillsCanterbury
July 2003
xii PREFACE

Part A
Systems and Components

This page intentionally left blank
1.1 Introduction
The Pneumatic Conveying Design Guide is intended to be of use to both designers and
users of pneumatic conveying systems. It has been written on the basis that the reader
knows little or nothing about pneumatic conveying or pneumatic conveyors, hence
each aspect of the subject is discussed from basic principles and many of the chapters
are of an introductory nature. The Guide, however, also includes detailed data and infor-
mation on the conveying characteristics of a number of materials embracing a wide range
of properties.
The data can be used to design pneumatic conveying systems for the particular mater-
ials, using logic diagrams for design procedures, and scaling parameters for the con-
veying line configuration. Where pneumatic conveyors already exist, the improvement of
their performance is considered, based on strategies for optimizing and up-rating, and
the extending of systems or adapting them for a change of material is also considered.
In this introductory chapter a brief introduction to pneumatic conveying is given to
introduce the common terms and concepts. First among these are dilute and dense phase
conveying and the specific problem of compressibility of air and other gases that might
be used. The capability of pneumatic conveying systems in terms of distance, tonnage
and orientation are addressed, together with a brief history of developments. A very
brief review of the chapters is given, along with some of the basic definitions, and the
nomenclature adopted in the book is presented here for reference.
1.2 Pneumatic conveying
Pneumatic conveying systems are basically quite simple and are eminently suitable for
the transport of powdered and granular materials in factory, site and plant situations.
The system requirements are a source of compressed gas, usually air, a feed device, a
conveying pipeline and a receiver to disengage the conveyed material and carrier gas.
The system is totally enclosed, and if it is required, the system can operate entirely
without moving parts coming into contact with the conveyed material. High, low or
negative pressures can be used to convey materials. For hygroscopic materials dry air
can be used, and for potentially explosive materials an inert gas such as nitrogen can
be employed. A particular advantage is that materials can be fed into reception vessels
maintained at a high pressure if required.
Chapter 1
Introduction to pneumatic conveying and the guide
1.2.1 System flexibility
With a suitable choice and arrangement of equipment, materials can be conveyed from
a hopper or silo in one location to another location some distance away. Considerable
flexibility in both plant layout and operation are possible, such that multiple point feed-
ing can be made into a common line, and a single line can be discharged into a number
of receiving hoppers. With vacuum systems, materials can be picked up from open stor-
age or stockpiles, and they are ideal for clearing dust accumulations and spillages.
Pipelines can run horizontally, as well as vertically up and down, and with bends in
the pipeline any combination of orientations can be accommodated in a single pipeline
run. Conveying materials vertically up or vertically down presents no more of a problem
than conveying horizontally. Material flow rates can be controlled easily and monitored
to continuously check input and output, and most systems can be arranged for completely
automatic operation.
Pneumatic conveying systems are particularly versatile. A very wide range of mater-
ials can be handled and they are totally enclosed by the system and pipeline. This means
that potentially hazardous materials can be conveyed quite safely. There is minimal
risk of dust generation and so these systems generally meet the requirements of any
local Health and Safety Legislation with little or no difficulty.
Pneumatic conveying plants take up little floor space and the pipeline can be easily
routed up walls, across roofs or even underground to avoid existing equipment or
structures. Pipe bends in the conveying line provide this flexibility, but they will add
to the overall resistance of the pipeline. Bends can also add to problems of particle
degradation if the conveyed material is friable, and suffer from erosive wear if the
material is abrasive.
1.2.2 Industries and materials
A wide variety of materials are handled in powdered and granular form, and a large num-
ber of different industries have processes which involve their transfer and storage. Some
of the industries in which bulk materials are conveyed include agriculture, mining,
chemical, pharmaceuticals, paint manufacture, and metal refining and processing.
In agriculture very large tonnages of harvested materials such as grain and rice are
handled, as well as processed materials such as animal feed pellets. Fertilizers represent
a large allied industry with a wide variety of materials. A vast range of food products
from flour to sugar and tea to coffee are conveyed pneumatically in numerous manu-
facturing processes. Confectionery is a particular industry in which many of these mater-
ials are handled.
In the oil industry fine powders such as barytes, cement and bentonite are used for
drilling purposes. In mining and quarrying, lump coal and crushed ores, and minerals
are conveyed. Pulverized coal and ash are both handled in very large quantities in ther-
mal power plants. In the chemical industries materials include soda ash, polyethylene,
PVC and polypropylene in a wide variety of forms from fine powders to pellets.
Sand is used in foundries and glass manufacture, and cement and alumina are other
materials that are conveyed pneumatically in large tonnages in a number of different
industries.
4 PNEUMATIC CONVEYING DESIGN GUIDE
1.2.3 Mode of conveying
Much confusion exists over how materials are conveyed through a pipeline and to the
terminology given to the mode of flow. First it must be recognized that materials can
either be conveyed in batches through a pipeline, or they can be conveyed on a continu-
ous basis, 24 h a day if necessary. In batch conveying the material may be conveyed as
a single plug if the batch size is relatively small.
For continuous conveying, and batch conveying if the batch size is large, two
modes of conveying are recognized. If the material is conveyed in suspension in the air
through the pipeline it is referred to as dilute phase conveying. If the material is con-
veyed at low velocity in a non-suspension mode, through all or part of the pipeline, it
is referred to as dense phase conveying.
1.2.3.1 Dilute phase
Almost any material can be conveyed in dilute phase, suspension flow through a pipe-
line, regardless of the particle size, shape or density. It is often referred to as suspension
flow because the particles are held in suspension in the air as they are blown or sucked
through the pipeline. A relatively high velocity is required and so power requirements
can also be high but there is virtually no limit to the range of materials that can be
conveyed.
There will be contact between the conveyed material and the pipeline, and particu-
larly the bends, and so due consideration must be given to the conveying of both friable
and abrasive materials. With very small particles there will be few impacts but with
large particles gravitational force plays a part and they will tend to ‘skip’ along horizon-
tal pipelines.
Many materials are naturally capable of being conveyed in dense phase flow at low
velocity. These materials can also be conveyed in dilute phase if required. If a high vel-
ocity is used to convey any material such that it is conveyed in suspension in the air,
then it is conveyed in dilute phase.
1.2.3.2 Dense phase
In dense phase conveying two modes of flow are recognized. One is moving bed flow, in
which the material is conveyed in dunes on the bottom of the pipeline, or as a pulsatile
moving bed, when viewed through a sight glass in a horizontal pipeline. The other mode
is slug or plug type flow, in which the material is conveyed as the full bore plugs sep-
arated by air gaps. Dense phase conveying is often referred to as non-suspension flow.
Moving bed flow is only possible in a conventional conveying system if the mater-
ial to be conveyed has good air retention characteristics. This type of flow is typically
limited to very fine powdered materials having a mean particle size in the range of
approximately 40–70 �m, depending upon particle size distribution and particle shape.
Plug type flow is only possible in a conventional conveying system if the material has
good permeability. This type of flow is typically limited to materials that are essentially
mono-sized, since these allow the air to pass readily through the interstices between the
particles. Pelletized materials and seeds are ideal materials for this type of flow.
INTRODUCTION TO PNEUMATIC CONVEYING AND THE GUIDE 5
1.2.3.3 Conveying air velocity
For dilute phase conveying a relatively high conveying air velocity must be main-
tained. This is typically in the region of 12 m/s for a fine powder, to 16 m/s for a fine
granular material, and beyond for larger particles and higher density materials. For
dense phase conveying, air velocities can be down to 3 m/s, and lower in certain cir-
cumstances. This applies to both moving bed and plug type dense phase flows.
These values of air velocity are all conveying line inlet air velocity values. Air is
compressible and so as the material is conveyed along the length of a pipeline the pres-
sure will decrease and the volumetric flow rate will increase.
For air the situation can be modelled by the basic thermodynamic equation:
(1.1)
where p is the air pressure (kN/m2�abs), V., the air flow rate (m3/s), T, the air tempera-
ture (K) and subscripts 1 and 2 relate to different points along the pipeline.
If the temperature can be considered to be constant along the length of the pipeline
this reduces to:
(1.2)
Thus if the pressure is one bar gauge at the material feed point in a positive pressure
conveying system, with discharge to atmospheric pressure, there will be a doubling
of the air flow rate, and hence velocity in a single bore pipeline. If the conveying line
inlet air velocity was 20 m/s at the start of the pipeline it would be approximately
40 m/s at the outlet. The velocity, therefore, in any single bore pipeline will always be
a minimum at the material feed point.
It should be emphasized that absolute values of both pressure and temperature must
always be used in these equations. These velocity values are also superficial values, in
that the presence of the particles is not taken into account in evaluating the velocity,
even for dense phase conveying. This is universally accepted. Most data for these val-
ues, such as that for minimum conveying air velocity are generally determined experi-
mentally or from operating experience. It is just too inconvenient to take the presence
of the particles into account.
1.2.3.4 Particle velocity
In dilute phase conveying, with particles in suspension in the air, the mechanism of con-
veying is one of drag force. The velocity of the particles, therefore, will be lower than that
of the conveying air. It is a difficult and complex process to measure particle velocity,
and apart from research purposes, particle velocity is rarely measured. Once again it is
generally only the velocity of the air that is ever referred to in pneumatic conveying.
In a horizontal pipeline the velocity of the particles will typically be about 80% of
that of the air. This is usually expressed in terms of a slip ratio, defined in terms of the
p V p V1 1 2 2˙ ˙ �
p V
T
p V
T1
˙ ˙1
1
2 2
2
�
6 PNEUMATIC CONVEYING DESIGN GUIDE
velocity of the particles divided by the velocity of the air transporting the particles,
and in this case it would be 0.8. The value depends upon the particle size, shape and
density, and so the value can vary over an extremely wide range. In vertically upward
flow in a pipeline a typical value of the slip ratio will be about 0.7.
These values relate to steady flow conditions in pipelines remote from the point at
which the material is fed into the pipeline, bends in the pipeline and other possible
flow disturbances. At the point at which the material is fed into the pipeline, the mater-
ial will essentially have zero velocity. The material will then be accelerated by the
conveying air to its slip velocity value. This process will require a pipeline length of
several metres and this distance is referred to as the acceleration length. The actual
distance will depend once again on particle size, shape and density.
There is a pressure drop associated with acceleration of the particles in the air
stream and it has to be taken into account by some means. It is not only at the material
feed point that there is an acceleration pressure drop. It is likely to occur at all bends
in the pipeline. In traversing a bend the particles will generally make impact with the
bend wall and so be retarded. The slip velocity at exit from a bend will be lower than
that at inlet and so the particles will have to be re-accelerated back to their steady-state
value. This additional element of the pressure drop is usually incorporated in the overall
loss associated with a bend.
1.2.3.5 Solids loading ratio
Solids loading ratio, or phase density, is a useful parameter in helping to visualize the
flow. It is the ratio of the mass flow rate of the material conveyed divided by the mass
flow rate of the air used to convey the material. It is expressed in a dimensionless form:
(1.3)
where � is the solids loading ratio (dimensionless), mp, the mass flow rate of material
(tonne/h) and ma, the mass flow rate of air (kg/s).
Since the mass flow rate of the conveyed material, or particles, is usually expressed
in tonne/h and the mass flow rate of the air is generally derived by calculation in kg/s,
the constant of 3.6 in Equation (1.3) is required to make the term dimensionless. A par-
ticularly useful feature of this parameter is that its value remains essentially constant
along the length of a pipeline, unlike conveying air velocity and volumetric flow rate,
which are constantly changing.
For dilute phase conveying, maximum values of solids loading ratio that can be
achieved are typically of the order of about 15. This value can be a little higher if the
conveying distance is short, if the conveying line pressure drop is high, or if a low
value of conveying air velocity can be employed. If the air pressure is low or if the
pipeline is very long, then the value of solids loading ratio will be very much lower.
For moving bed flows, solids loading ratios need to be a minimum of about 20
before conveying at a velocity lower than that required for dilute phase can be achieved.
Solids loading ratios, however, of well over 100 are quite common. For much of
�
p
a
�˙
. ˙
m
m3 6
INTRODUCTION TO PNEUMATIC CONVEYING AND THE GUIDE 7
the data presented in this Design Guide on materials such as cement and fine fly ash,
solids loading ratios in excess of 100 are reported, whether for horizontal or vertical
flow.
In conveying barytes vertically up the author has achieved a solids loading ratio of
about 800 with a short pipeline. Conveying at very low velocity is necessary in order
to achieve very high values of solids loading ratio in moving bed flow. This is because
air flow rate is directly proportional to air velocity and air flow rate is on the bottom
line of Equation (1.3).
For plug type flow the use of solids loading ratio is not as appropriate, for the num-
bers do not have the same significance. Since the materials have to be very permeable,
air permeates readily through the plugs. Maximum values of solids loading ratio,
therefore, are only of the order of about 30, even with high values of conveying line
pressure drop. If a material is conveyed at a solids loading ratio of 10, for example, it
could be conveyed in dilute phase or dense phase. It would only be with the value of
the conveying line inlet air velocity that the mode of flow could be determined.
1.2.4 Recent developments
Although pneumatic conveying systems have numerous advantages over alternative
mechanical conveying systems for the transport of materials, they do have drawbacks,
particularly for materials that can only be conveyed in dilute phase. Particle degradation
and erosive wear of pipeline bends are particular examples. Due to the high conveying
air velocity required, energy requirements are also high.
In recent years there have been many developments of pneumatic conveying sys-
tems aimed at increasing their capability for conveying a wider range of materials in
dense phase, and hence at low velocity. This has generally been achieved by condi-
tioning the material at the feed point into the pipeline, or by providing a parallel line
along the length of the pipeline to artificially create either permeability or air retention
in the material.
1.2.4.1 System types
Pneumatic conveying system types can be divided into conventional and innovatory
types. In conventional systems the material to be conveyed is simply fed into the pipe-
line and it is blown or sucked to the discharge point. It must be realized that low vel-
ocity, dense phase, conveying in conventional pneumatic conveying systems is strictly
limited to materials that have the necessary bulk properties of good air retention or
good permeability. The use of high pressure air is not synonymous with dense phase
conveying. It is dictated entirely by the properties of the material to be conveyed in a
conventional conveying system.
Probably the majority of materials that are conveyed have neither of these proper-
ties. There has, therefore, been much research undertaken into pneumatic conveying
with a view to developing systems that are capable of conveying a much wider range
of materials in dense phase and hence at low velocity. Making these systems more
suitable for abrasive and friable materials has provided a particular driving force.
8 PNEUMATIC CONVEYING DESIGN GUIDE
1.2.5 Conveying capability
It has already been mentioned that pneumatic conveying systems are capable of con-
veying almost any material. Distance, however, does impose a practical limit. Although
hydraulic conveying systems are capable of conveying material at a flow rate in excess
of 100 tonne/h, over a distance of 100 km, or more in a single stage, the limit for pneu-
matic conveying is typically about 11⁄2 km for most applications.
With water having a density that is about 800 times greater than that of air, at free
air conditions, the difference in density between the conveyed material and that of the
conveying fluid is widely different. As a consequence conveying air velocities are a
factor of about ten times greater than those required for water in order to convey material
in suspension.
1.2.5.1 High pressure conveying
The biggest problem with high pressure for pneumatic conveying derives from
Equation (1.2). Water can be modelled, as being essentially incompressible and so
there is little change in velocity along the length of the pipeline. Water pressures up to
about 150 bar are therefore used. With air being compressible very few systems, any-
where in the world, operate at a pressure much above 5 bar gauge when delivering
material to a reception point at atmospheric pressure.
In terms of pneumatic conveying, high pressure virtually means anything above
1 bar gauge. This is a typical operating limit with possibly the majority of pneumatic
conveying systems in industry. This corresponds with a doubling in conveying air
velocity, as mentioned above. With any higher air supply pressure it would always be
recommended that the pipeline should be stepped to a larger bore part way along its
length in order to prevent high values of velocity from occurring.
Apart from magnifying problems of erosive wear and particle degradation, velocity
has an adverse effect on pressure drop. The appropriate relationship here is:
(1.4)
where �p is the pressure drop, L, the length of straight pipeline, �, the air density, C,
the conveying air velocity and d, the pipeline bore.
It will be seen from this that velocity is on the top line of the equation and its value
has to be squared. This, therefore, is an extremely important term and anything that
can be done to keep conveying air velocities to as low a value as possible is generally
to be advised. In this respect the stepping of a pipeline is generally an advantage, not
just in minimizing wear and degradation, but generally in terms of achieving an
improvement in conveying performance.
A particular advantage of pneumatic conveying systems is that they can be operated
at high pressure if required. There are many instances in industry where it is necessary
to deliver bulk particulate materials into vessels that operate at high pressure. Again,
by reference to Equation (1.2), it will be seen that this situation does not present a
� �pL C
d
� 2
INTRODUCTION TO PNEUMATIC CONVEYING AND THE GUIDE 9
significant expansion problem. Thus coal, limestone and bed material, for example,
can be delivered to high pressure fluidized bed combustors that operate continuously
at pressures of about 20 bar gauge and above.
1.2.5.2 Long distance conveying
Thermal power stations often employ long distance pneumatic conveying in order to
transfer the pulverized fuel ash to a point on the site boundary for subsequent disposal.
At a power station in Ropar, India, the Punjab State Electricity Board operates a plant
consisting of six 210 MW generating units. Dry ash is conveyed from the electrostatic
precipitators to a group of five storage silos, a distance of about 2 km, where it is avail-
able to cement manufacturers. The transfer is in two stages: The first conveys the ash
from the electrostatic precipitators to two intermediate storage silos over a distance of
400 m. Denseveyor ash vessels are used, the lines are 200 mm bore and 30 tonne/h per
line is achieved.
In the second stage the ash is conveyed over a distance of 1550 m at a rate of
40 tonne/h per line. Twin blow tanks are used (three to each intermediate silo) and the
pipelines are stepped from 200 to 250–300 mm bore. Four compressors are available to
each silo, with two working and two on standby, each delivering 72 m3/min at 4.2 bar
gauge. This plant was commissioned in 1995. Several similar long distance pipelines
have been built at power stations in India, some with much higher conveying capacities.
1.2.5.3 Vertical conveying
Most pneumatic conveying systems have an element of vertical conveying in the pipe-
line run. In the majority of pipelines it is usually conveying vertically up, and at the end
of the pipeline, in order to discharge the material into a hopper or silo. The routing of
the pipeline may include vertically up and vertically down sections to cross roads or
railways, or to avoid obstructions or accommodate existing pipe racking.
Flow vertically up and down presents no undue problems, and is potentially easier,
since the minimum conveying air velocity for flow vertically up is generally lower than
that for horizontal flow. It is not often that advantage can be taken of this since most
pipelines incorporate combinations of both horizontal and vertical pipeline. Since hori-
zontal pipeline usually predominates, conveying air velocities are generally specified
in terms of those required for horizontal conveying. It is probably in mining applications
that significant lengths of vertical pipeline are found.
1.2.5.3.1 Conveying vertically up
In many old collieries, mechanization of coal cutting meant that the existing shaft
winding gear could not cope with the increased output. This was the situation in the
UK in the early 1970s, and so an economical means of increasing capacity had to be
found. Of all the possible hoisting systems examined, the positioning of pipelines in
the corner of existing shafts appeared to offer the best solution. Although the operat-
ing cost for pneumatic conveying systems was recognized as being high, the time and
capital cost elements were very much in their favour.
10 PNEUMATIC CONVEYING DESIGN GUIDE
Onley and Firstbrook [1] reported on tests undertaken at a coal mine having a
200 mm bore pipeline with a 420 m vertical lift; 18.6 tonne/h of �50 mm dolomite
was conveyed with a pressure drop of 1.37 bar. With coal, 42 tonne/h was achieved
with a conveying line pressure drop of 1.72 bar, although with wet �25 mm shale only
23 tonne/h could be achieved with the same air supply pressure.
At another UK colliery the pipeline bore was 300 mm and the vertical lift was 326 m
[1]. In this case there were horizontal runs of 100 m from the feed point and 54 m to
the reception point. 66 tonne/h of �25 mm coal was conveyed with an air supply pres-
sure of 0.75 bar. The blower had a capacity of 1.0 bar, was provided with a 522 kW motor
drive, and could deliver 3.7 m3/s of air. It was subsequently reported that 80 tonne/h
was achieved at this installation [2].
1.2.5.3.2 Conveying vertically down
Pulverized fuel ash, or fly ash, is often available at coal mines, particularly if a power
station is built close to the mine. Disposal of this ash underground for back-filling is
generally considered to be environmentally better than many surface alternatives.
Cement is another material that is commonly used in back-filling operations. Curten
[3] reports that typical applications involve the transport vertically down 700–1000 m
and then directed up to 2000 m into the underground roadways. He reports that the dis-
tances are dependent upon the type of material conveyed and that considerably longer
distances (up to 7000 m) can be achieved if pulverized material is transported compared
with granular support material.
Associated with deep level mining is the problem of providing a tolerable working
environment. For this purpose underground refrigeration plants, evaporative cooling and
the pumping of chilled water from surface refrigeration plants to underground heat
exchangers are some of the methods employed. Sheer et al. [4] reported on the use of ice
in South African gold mines for this purpose. By virtue of latent heat considerations, four
times less water needs to be pumped when using ice in preference to chilled water. Ice
making plant is located at the surface level and the ice produced is pneumatically con-
veyed over distances up to about 5 km, with vertically down distances up to about 2400 m.
1.2.5.4 Flow rate capability
The capability of a pneumatic conveying system, in terms of achieving a given mater-
ial flow rate, depends essentially on the conveying line pressure drop available and the
diameter of the pipeline. As mentioned above, the use of pressure is generally limited
in the majority of applications to about 5 bar and so pipeline bore is increased to
achieve an increase in material flow rate if this is required.
In many cases pressure capability is set by the desire to use a particular type of
compressor or blower. In most cases the duty of conveying a given flow rate of material
can be met by a wide range of combinations of pressure drop and pipeline bore. There
is rarely a single solution to the design of any pneumatic conveying system. Where
there is a choice it is well worthwhile comparing the systems in terms of operating
cost as well as capital cost. Only if a very high material flow rate is required will the
options be limited.
INTRODUCTION TO PNEUMATIC CONVEYING AND THE GUIDE 11
Lithgart [5] reports on a pneumatic system for off-loading cement from bulk car-
riers at 800 tonne/h, and its onward conveying to silos 500 m distant through twin
pipelines. Castle Cement had a need to import up to one million tonne/year of cement
at a terminal 20 km east of London on the River Thames. As the river is tidal (7 m) it
was necessary to build a jetty in the river against which the ships could berth, and
hence the long conveying distance.
A single vacuum nozzle was employed to off-load at 800 tonne/h, but it was decided
to use two pipelines at 400 tonne/h each for the transfer to the silos, as it was con-
sidered that a single bore pipeline would be more expensive to build. It was estimated that
the power required for conveying the cement at 800 tonne/h to the silos was 2400 kW.
1.2.5.4.1 Pressure gradient influence
Conveying distance has a very significant influence on pneumatic conveying system
performance. Assume, for example, that a system is capable of conveying 100 tonne/h
over a distance of 100 m, with a pressure drop of 2 bar. If the distance is doubled, and
there is no change in pressure, the material flow rate will be reduced by at least half,
to a maximum of 50 tonne/h, if there is no change in pipeline bore, and hence air flow
rate, and also power. With a halving of material flow rate and no change in air flow
rate, the solids loading ratio will also be halved.
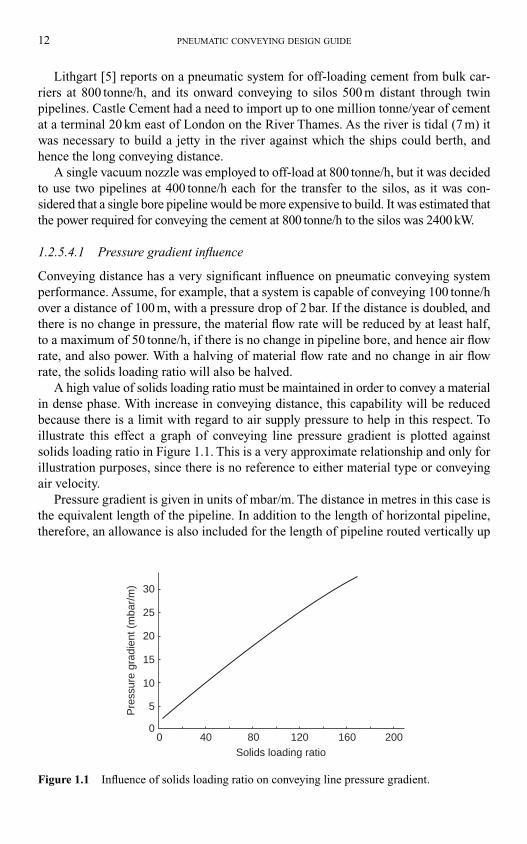
A high value of solids loading ratio must be maintained in order to convey a material
in dense phase. With increase in conveying distance, this capability will be reduced
because there is a limit with regard to air supply pressure to help in this respect. To
illustrate this effect a graph of conveying line pressure gradient is plotted against
solids loading ratio in Figure 1.1. This is a very approximate relationship and only for
illustration purposes, since there is no reference to either material type or conveying
air velocity.
Pressure gradient is given in units of mbar/m. The distance in metres in this case is
the equivalent length of the pipeline. In addition to the length of horizontal pipeline,
therefore, an allowance is also included for the length of pipeline routed vertically up
12 PNEUMATIC CONVEYING DESIGN GUIDE
25
30
20
15
10
5
00 40 80
Solids loading ratio
Pre
ssur
e gr
adie
nt (
mba
r/m
)
120 160 200
Figure 1.1 Influence of solids loading ratio on conveying line pressure gradient.
and the number of bends in the pipeline. It will be seen that to convey at a solids load-
ing ratio of about 100 requires a pressure gradient of about 20 mbar/m.
If only 2 bar is available for conveying, the maximum value of equivalent length
possible will only be 100 m. If the equivalent length of a pipeline is 1000 m and 2 bar
is available for conveying, the pressure gradient will only be about 2 mbar/m and so
the maximum value of solids loading ratio at which the material can be conveyed will
be about 10, which only relates to dilute phase conveying. A much higher pressure
would be needed to maintain a dense phase conveying capability over this distance.
1.2.5.4.2 Material influences
It has already been mentioned that different materials have different conveying cap-
abilities in terms of the minimum value of conveying air velocity required, and hence
air flow rate. Different materials can also achieve very different mass flow rates when
conveyed through the same pipeline under identical conveying conditions. And it is
not just different materials! Different grades of exactly the same material can exhibit
totally different performances. Thus a conveying system designed for one material
may be totally unsuitable for another.
1.3 Information provided
It is for this reason that a considerable amount of conveying data for different materials
is included in this Design Guide and that a lot of consideration is given to this topic
throughout the book.
1.3.1 Availability of design data
Pneumatic conveying system design may be based upon previous experience or upon test
results. Unfortunately commercial interests dictate that manufacturers of pneumatic con-
veyors rarely publish information that could be of value in system design. A single value
of material flow rate, conveying distance, and possibly pipeline bore and air supply pres-
sure, is normally the extent of the information given. Even user companies, many of
whom have had to ‘tune’ their own systems are generally reluctant to divulge detailed
information on the performance of their conveying systems, for commercial reasons.
Different materials are quite likely to have totally different conveying properties
and if a system has to be designed for a material for which no previous experience is
available, it will be necessary to carry out pneumatic conveying trials. These will gen-
erate the data upon which the design can be based.
In this Guide, conveying characteristics for a number of materials are presented
which detail the relationship between the main conveying parameters for a material,
over a wide range of conveying conditions, and the limits of conveying are clearly iden-
tified. With data presented in this form system design is relatively straightforward.
This type of data also allows analysis of existing systems to be carried out. Checks
can be made to determine whether a system is operating under optimum conditions
and, if not, how this can best be achieved. Similar checks will enable an assessment to
be made of the potential for up-rating a system.
INTRODUCTION TO PNEUMATIC CONVEYING AND THE GUIDE 13
1.3.2 Scope of the work
The Guide is intended to be used by both designers and users of pneumatic conveying
systems. For those not familiar with pneumatic conveying it provides information on
the types of system available and the capabilities of pneumatic conveying systems in
terms of material flow rates, conveying distances and power requirements. This should
enable a project engineer both to assess alternative tenders received for a pneumatic
conveying system and to make comparisons with mechanical systems.
For the designer, data on a number of materials is presented which could be used
for the design of systems to handle these materials. Where system design is based on
results obtained from a test facility the actual plant pipeline will have a totally differ-
ent configuration. To overcome this problem scaling parameters are presented for con-
veying distance, pipeline bore, vertical sections and pipeline bends to enable the test
data to be used reliably. For any given conveying duty a range of air supply pressures
and pipeline bores will be capable of meeting the required duty. The design procedures
outlined will allow selection of the combination that will give the lowest power
requirement.
For users of systems the Guide will explain how to check whether an existing system
is operating under optimum conditions. The possibilities of up-rating systems, extend-
ing systems, and changing to a different material are also considered. Operational
problems are featured with separate chapters devoted to an analysis of problems such
as erosive wear, particle degradation, explosions, and moisture and condensation.
The commissioning of systems and troubleshooting are also considered so that the
cause of plant operating problems, such as pipeline blockage, can be determined and
corrected.
1.4 Review of chapters
The layout of this second edition follows the style of the original guide. The work is
divided into three main parts:
• Systems and components
• System design
• System operation
A number of chapters are presented in each part and these are numbered continuously,
as referenced below. Two appendixes are included. One is used to present information
on material characterization, specifically for pneumatic conveying, and additional
conveying data is presented in the second.
1.4.1 Systems and components
This section of the book presents an introduction to all the systems and components
that comprise a pneumatic conveying system. This provides both an introduction to
the subject of pneumatic conveying and background to the selection of systems and
components for a given duty.
14 PNEUMATIC CONVEYING DESIGN GUIDE
1.4.1.2 Review of pneumatic conveying systems
A review is given of all the various types of pneumatic conveying system that are cur-
rently employed and available. This includes:
• Open and closed systems
• Positive pressure and vacuum conveying systems
• Fixed and mobile systems
• Conventional and innovatory systems
• Batch and continuously operating systems
• Pipeline and channel flow systems
Comparisons between the different types of system are given in order to help in the
selection process. The influence of the properties of conveyed materials is incorpor-
ated into this review. Such properties include abrasive, friable, hygroscopic, toxic,
explosive and cohesive. The suitability for multiple product conveying and multiple
distance conveying is also examined.
1.4.1.3 & 4 Pipeline feeding devices
A review is given of all the commercially available devices that are used for feeding mater-
ials into pneumatic conveying system pipelines, and that meet the requirements of all the
different types of conveying system considered in the previous chapter. This includes:
• Rotary valves and the many derivatives
• Screw feeders and the various types available
• Venturi feeders
• Gate lock valve feeders
• Blow tank devices and the multitude of arrangements and configurations
• Vacuum and suction nozzles
• Trickle valves
Chapter 3 concentrates on feeding devices for low pressure and vacuum conveying
systems and Chapter 4 considers high pressure systems. Issues such as feed rate cap-
ability, control, problems of air leakage, and suitability for different types of conveyed
materials are discussed.
1.4.1.5 Pipelines and valves
Both pipeline bends and valves represent major problems in pneumatic conveying and
are probably responsible for the majority of operating problems with regard to pneu-
matic conveying systems, particularly when abrasive materials have to be handled. As
a consequence there have been many developments with regard to both bends and
valves that have resulted specifically from pneumatic conveying.
1.4.1.6 Air movers
The blower, compressor or exhauster is at the heart of the pneumatic conveying sys-
tem. It is essential that the correct type of machine is selected and that it is correctly
INTRODUCTION TO PNEUMATIC CONVEYING AND THE GUIDE 15
specified, particularly in terms of free air delivered. A wide variety of machines are
considered, from fans and blowers to compressors, together with their operating char-
acteristics. Most of the power required for a pneumatic conveying system is that for
the compressor and much of this goes into increasing the temperature of the air. Both
of these features are considered in detail. The possible benefits of cooling air and the
provision of oil free air are also considered.
1.4.1.7 Gas–solids separation devices
This is a particular area of the system in which health and safety issues impact. Dis-
engagement of coarse particles can be achieved by using a gravity-settling chamber.
With finer materials a cyclone may be suitable. For dust and very fine materials a fab-
ric filter is probably most appropriate. The methods and associated equipment are
reviewed and their applications, limitations and control discussed.
1.4.1.8 System selection considerations
The selection of a pneumatic conveying system for a particular application involves
consideration of numerous parameters associated with the conveyed material, the con-
veying conditions and the conveying system. The primary aim is usually for a material
to be conveyed at a specified flow rate over a given distance. For illustration purposes
extremes of material type are considered. The conveying requirements can usually be
met by a wide combination of pipeline bores and conveying line pressure drops. Power
consumption, and hence system-operating costs, are factors that can be used in the
decision-making process but problems of material and system compatibility have to
be taken into account. The inter-relating effects of all these parameters are considered.
1.4.2 System design
This group of chapters is concerned with the design of pneumatic conveying systems.
The first two chapters are devoted to the considerations of air alone, but it is here that
the basic modelling for pneumatic conveying begins. Materials are then added to the
pipeline and the influence of the materials is considered and compared. Scaling param-
eters and design procedures are then introduced and these are reinforced with two case
studies. Some first approximation design methods are presented to allow feasibility
studies and system checks to be undertaken quickly, and the possibilities of multiple-
material and multiple distance conveying are considered.
1.4.2.1 Air flow rate evaluation
Air is compressible with respect to both pressure and temperature, and air movers are
generally specified in terms of ‘free air conditions’. The correct specification of an air
mover in terms of volumetric flow rate is essential in terms of achieving the correct
conveying air velocity. The derivation of all the models necessary is given and the
results are displayed graphically. The equations are presented in terms of both volu-
metric flow rate and conveying air velocity, so that they can be used for the design of
future systems, as well as the checking of existing systems. In addition to the influence
16 PNEUMATIC CONVEYING DESIGN GUIDE
of pressure and temperature, stepped pipelines, pipeline purging and plant elevation
are also considered.
1.4.2.2 Air only relationships
The reference point for any pneumatic conveying system is the performance of the
empty pipeline, and so equations are developed that will allow the air only pressure
drop to be evaluated for any pipeline system. Bends and other pipeline features are
considered for both positive pressure and vacuum conveying systems. Models and
methods for air flow rate control are also included.
1.4.2.3 Conveying characteristics
Conveying characteristics for a material provide a valuable aid to system design. They
provide the design data in terms of air flow rate and air supply pressure for a given
material flow rate and quantify the effect of pipeline bore and conveying distance. In
addition the conveying characteristics identify the minimum conveying conditions
and provide the means to determine power requirements, thus enabling comparisons
to be made for different conveying systems. Conveying characteristics are presented
for representative materials and, in addition to total pipelines, data is also presented
for individual sections of pipeline, as well as bends.
1.4.2.4 Conveying capability
In this chapter the conveying characteristics of a much wider range of materials are
presented to illustrate the full influence that different materials can have on conveying
capability and performance. High and low pressure and dilute and dense phase con-
veying are considered for a broad range of materials.
1.4.2.5 Material property influences
A goal in pneumatic conveying is to make it possible to design a pneumatic convey-
ing system without the need for carrying out full-scale conveying tests with a material.
The results of a study into correlations between material properties obtained from bench
scale tests and material conveying characteristics obtained from full-scale pneumatic
conveying trials are given. Correlations were sought as to whether a material will con-
vey in dense phase and what type of pressure drop/material flow rate characteristic is
to be expected. The work is extended by investigating the influence that conveying
itself might have on the subsequent conveying performance of a material.
1.4.2.6 Pipeline scaling parameters
It is generally not practical to replicate a plant pipeline for the purposes of undertak-
ing tests in order to design a conveying system. Over the years, however, with the
accumulation of practical experience and specific research programmes, scaling
parameters have been developed for the purpose. These will take account of the dif-
ferences between a test facility pipeline and a plant pipeline with respect to lengths of
INTRODUCTION TO PNEUMATIC CONVEYING AND THE GUIDE 17
horizontal and vertical pipeline, number and geometry of bends, and pipeline bore. In
addition to these parameters, pipeline material and pipeline steps are also considered.
1.4.2.7 Design procedures
Logic diagrams are presented for pneumatic conveying system design based on both
mathematical models and test data. They are presented for the purpose of checking the
capability of an existing system, as well as for the design of a new system. Some of
the available equations and bench scale test correlations are evaluated and the more
useful relationships are included to show how they can be used in conjunction with the
logic diagrams.
1.4.2.8 Case studies
Two case studies are presented. One is for a fine material that is capable of dense phase
conveying, in sliding bed flow, in Chapter 16. The other is for a coarse material that is
only capable of dilute phase conveying, in Chapter 17. The scaling process is illus-
trated, by way of example in each case, and for the fine material an investigation into
the unstable region in sliding bed flow is also presented.
1.4.2.9 First approximation design methods
Very often a first approximation solution is all that is required. This may be for system
design purposes, particularly if a feasibility study is being carried out, or to provide a
quick check on the performance of an existing system. An approximate value of power
required is often required so that the operating cost of such a system can be estimated
in terms of pence per tonne. Two such methods are included, one of which can be used
for dense phase conveying systems in addition to dilute phase.
1.4.2.10 Multiple use systems
In many industries more than one material is required to be conveyed by the same sys-
tem. Different materials, however, can have very different conveying characteristics.
Some have very different air requirements as well as different flow rate capabilities.
There are also many systems that require material to be conveyed over a range of dis-
tances. Conveying distance, however, has a marked effect on material flow rate and
can influence air flow rate in certain situations. These various conveying situations are
considered and a variety of solutions are presented.
1.4.3 System operation
This group of chapters is concerned with the operation of pneumatic conveying sys-
tems. Pipeline blockages, do unfortunately occur, but mainly due to poor design and
maintenance and so this topic is given particular consideration. Means of improving
the performance of an existing system are considered, which may be to reduce power
requirements or to increase material flow rate. Many problems relate to the properties
of the conveyed material, and not least of these are abrasive and friable materials and
18 PNEUMATIC CONVEYING DESIGN GUIDE
so one chapter is devoted to erosive wear and another to particle degradation. Moisture
and condensation is similarly considered, as well as the issues relating to health and
safety.
1.4.3.20 Troubleshooting and material flow problems
Due to the complexities of system design, a lack of reliable design data, and a poor
understanding of compressible flow, many pneumatic conveying systems pose numer-
ous problems on commissioning. Pipeline blockage and conveying systems not capable
of achieving the desired material flow rate are common problems. A detailed analysis
of all possible causes is given and a checklist is provided for quick reference.
1.4.3.21 Optimizing and up-rating of existing systems
In some cases, if a system is over designed, it may be possible to optimize the conveying
parameters and either reduce the power requirement for the system or increase the con-
veying capability. Very often an increase in conveying performance is required for an
existing system and so the procedures for reviewing the possibility are explained in detail.
The procedures are given for both positive pressure and vacuum conveying systems.
1.4.3.22 Operating problems
Potential users are often reluctant to install a pneumatic conveying system because they
anticipate operating problems. Pneumatic conveyors can experience problems but the
situation has been improved by the introduction of new types of conveyor and by the
modification of existing systems, based on a better understanding of the mechanisms of
conveying. This often results in a choice of solutions to a particular problem. The most
common problems affecting pneumatic conveyors are examined, such as static electri-
city and material deposition. Some practical solutions to these problems are presented.
1.4.3.23 Erosive wear
Many materials that have to be conveyed are very abrasive, such as silica sand, alu-
mina, cement and fly ash. As a consequence the conveying pipeline, bends and various
components that are exposed to impact by the gas–solids flows have to be specified
such that the problem is minimized to an acceptable level. It is not uncommon for steel
bends installed in a pipeline conveying an abrasive material to fail in a matter of hours.
The mechanics of the erosive wear process is explained, and a review of possible pre-
ventative measures that can be taken, and alternative components or materials that can
be used, is given.
1.4.3.24 Particle degradation
Many materials that have to be conveyed are friable and so particles are liable to be
broken when they impact against retaining surfaces, such as bends in the pipeline.
It is for this reason that pneumatic conveying systems are not generally used for this
type of material. There are numerous means by which the problem can be reduced,
INTRODUCTION TO PNEUMATIC CONVEYING AND THE GUIDE 19
however, relating to conveying conditions, bend geometry and materials of construc-
tion and so a detailed review of these is given.
1.4.3.25 Moisture and condensation
As the temperature of air reduces the capacity for air to support moisture reduces and
condensation is likely to occur. The same situation occurs with an increase in pressure.
Air is the prime mover in pneumatic conveying systems and changes in both tempera-
ture and pressure are very common. The modelling of air with respect to moisture is
presented to illustrate the nature of the problem and to provide guidance on the poten-
tial magnitude of the problem, and for the sizing of air drying plant and equipment
should this be required.
1.4.3.26 Health and safety
Most dusts pose a potential health problem, and many materials that have to be con-
veyed are potentially toxic. Pneumatic conveying is often chosen for hazardous mater-
ials because the system provides a theoretically totally enclosed environment for their
transport. It is also considered that the majority of conveyed materials are potentially
explosive, and this certainly applies to most food products, fuels, chemicals and metal
powders. In this chapter a detailed review of precautions and modifications to plant
and components is given. The nature of the problems is explained and information on
appropriate measurable properties of dust clouds is provided.
1.5 Definitions
To provide a uniform approach to the work, basic definitions of conveying phases, vel-
ocities, operating pressures and conveying conditions are given here for reference. The
most important point is that the dilute and dense are the only conveying phases that are
recognized in this Guide and to which reference is made. This is primarily a function of
material properties. The vast majority of materials are capable of being conveyed in
dilute phase, or suspension flow, but only certain materials are capable of being conveyed
in dense phase, or non-suspension flow, in a conventional pneumatic conveying system.
1.5.1 Solids loading ratio
Solids loading ratio, �, is the ratio of the mass flow rate of the material conveyed to
the mass flow rate of the air used for conveying, as presented in Equation (1.3). It is
used by pneumatic conveying engineers to describe the nature of the gas–solid flow in
a pipeline. Other terms used include phase density, mass ratio and mass flow ratio. It
is a useful dimensionless quantity since its value does not vary with the conveying air
pressure and so its value remains constant throughout the pipeline.
1.5.2 Dilute phase conveying
Dilute phase conveying occurs when a material is conveyed in suspension in the
flowing air.
20 PNEUMATIC CONVEYING DESIGN GUIDE
Note: The dilute phase mode of conveying is sometimes referred to as lean phase
or suspension flow. To keep the material in suspension in the pipeline it is necessary to
maintain a minimum value of conveying line inlet air velocity that, for most materials, is
of the order of 13–15 m/s.
1.5.3 Dense phase conveying
Dense phase conveying occurs when materials are conveyed with air velocities lower
than those required for dilute phase over all or part of the pipeline.
Note: The nature of dense phase flow is very varied, for it depends upon the prop-
erties of the material being conveyed, the solids loading ratio and the conveying air
velocity. Typically it includes flow over a deposited layer, which may itself be moving
slowly, and flow in discrete or separate plugs of material. In terms of solids loading
ratio the appropriate range, for most materials, is normally above about 15, provided
that the conveying line inlet air velocity is below that required for dilute phase con-
veying of the material.
1.5.4 Low pressure and negative pressure (vacuum) conveying
Low pressure conveying systems are those that operate with air pressures below about
1 bar gauge.
Note: These systems cover the normal operating range of positive displacement
blowers and conventional low pressure rotary valve systems. Low pressure is not syn-
onymous with dilute phase conveying. If a material is capable of being conveyed in
dense phase, a low pressure, or vacuum system, could be used to convey the material
in dense phase, since for these materials it is only a function of pressure gradient, as
illustrated in Figure 1.1.
1.5.5 High pressure conveying
High pressure conveying systems are those that operate with air pressures above about
1 bar gauge.
Note: High pressure is not synonymous with dense phase conveying. It is only pos-
sible in conventional conveying systems with materials having appropriate properties,
and then only if the pressure gradient is sufficiently high, since conveying distance can
have an over-riding effect.
1.5.6 Free air conditions
Free air conditions are specified as those at which p � 101.3 kN/m2 absolute (standard
atmospheric pressure) and t �15°C (standard atmospheric temperature).
Note: Free air conditions are generally used as the reference conditions for the
specification of blowers and compressors.
1.5.7 Superficial air velocity
This is the velocity of the air disregarding the presence of the solid particles or porous
media.
INTRODUCTION TO PNEUMATIC CONVEYING AND THE GUIDE 21
Note: In a pipeline it is the air velocity based upon the cross-sectional area and
neglecting the space occupied by the conveyed material. For flow across a membrane
or filter it is the open duct velocity normal to the surface. Air velocity, for a given mass
flow rate, is dependent upon both pressure and temperature. When conveying air veloci-
ties are evaluated at any point in the system, the local values of pressure and temperature
at that point must be used.
1.5.8 Free air velocity
This is the superficial velocity of the air when evaluated at free air conditions.
1.5.9 Minimum conveying air velocity
The minimum conveying air velocity is the lowest superficial air velocity that can be
used to convey a material.
Note: In dilute phase flow this is the lowest air velocity that can be achieved with-
out saltation or choking occurring. The value of the minimum conveying air velocity
in dense phase flow is significantly influenced by the solids loading ratio of the con-
veyed material, in the case of materials having good air retention properties.
1.5.10 Conveying line inlet air velocity
This is the superficial air velocity at the point where the material is fed into the
pipeline.
Note: In a single bore pipeline this will be the lowest air velocity in the conveying
line and so it must be greater than the minimum conveying air velocity required to
ensure successful conveying of a material. This is variously referred to as the pick-up
or entrainment velocity. In a vacuum conveying system it is approximately equal to the
free air velocity.
1.5.11 Conveying line exit air velocity
This is the superficial air velocity at the end of a conveying line where the material is
discharged into the receiving vessel.
Note: In a single bore pipeline this will be the highest air velocity in the conveying
line. In a positive pressure conveying system it is approximately equal to the free air
velocity.
1.5.12 Saltation
Saltation is the process of deposition of solid particles along a horizontal pipeline.
Note: This phenomenon occurs in dilute phase flow when the air velocity falls
below the minimum conveying value. The saltation velocity is the minimum velocity
at which a dilute phase system will operate and is equivalent to the minimum conveying
air velocity.
22 PNEUMATIC CONVEYING DESIGN GUIDE
1.5.13 Choking
Choking occurs in vertically upward flow and is the process that commences when
solid particles near the pipe wall begin to flow downwards. As the process continues
the pipeline eventually becomes blocked or chokes.
Note: Choking in vertical transport is somewhat analogous to saltation in horizontal
transport, for both phenomena represent the onset of saturation conditions in dilute
phase flow.
1.5.14 Acceleration length
This is the length of pipeline required for particles to reach their terminal velocity.
Note: When material is fed into a pipeline the particles are essentially at zero velocity
and so have to be accelerated to their terminal value. A similar situation occurs fol-
lowing bends since a degree of retardation is likely to occur in the flow around a bend.
1.5.15 Null point
The null point in a system is the position where the pressure is equal to the ambient
pressure.
Note: This is generally used in relation to closed loop systems and identifies a
natural point of access to the system for monitoring or conditioning.
1.5.16 Specific humidity
Specific humidity, �, is the ratio of the mass of water vapour to the mass of air in a
given volume of the mixture.
1.5.17 Relative humidity
Relative humidity, �, is the ratio of the partial pressure of the air, at a given tempera-
ture, to the partial pressure of the air when saturated, at the same temperature.
Note: Whereas specific humidity gives an indication of the amount of water vapour
that is actually contained in air, relative humidity gives an indication of how much
more water vapour the air is capable of supporting before it becomes fully saturated.
Its value is usually expressed as a percentage.
1.5.18 Stoichiometric value
The dust cloud concentration at which the quantity of air available exactly matches
that necessary for combustion of a material.
1.5.19 Pulsating flow
Pulsating flow is continuous alternating high and low rates of flow.
Note: Pulsating solids flow in a pipeline can be caused by pulsating material flow
from the feeding device, such as rotary valves, or by pulsating conveying air flow from
INTRODUCTION TO PNEUMATIC CONVEYING AND THE GUIDE 23
an air mover, such as a positive displacement blower. Pulsating air flow is a result of
continuous alternating high and low air compression by the air mover due to the man-
ner in which the machine operates. Pulsating air flow in the conveying line can be
reduced by the use of an air receiver.
1.5.20 Stepped pipeline
A continuous pipeline in which the diameter of the conveying pipe changes, generally
to a larger bore, at points along its length. The purpose is to accommodate the change
in volumetric flow rate of the conveying air as the pressure changes, without the vel-
ocity falling below the minimum value of conveying air velocity at any point. This is
sometimes referred to as a telescoped pipeline.
1.5.21 Air retention
The ability of a bulk material to retain air in the interstitial spaces between particles
for a period of time. Very fine materials such as cement can exhibit this property, and
when first poured into a container the material can behave almost like a liquid.
1.5.22 Permeability
This is a measure of the ease with which air will pass through a bed of bulk particu-
late material when a pressure difference is applied. Pelletized materials generally have
very good permeability for there is little resistance to the flow of air through the inter-
stitial passages. Materials that have a very wide particle size distribution generally
have very poor permeability. If a pipeline blockage occurs with such a material a small
plug of the material is often capable of holding an upstream pressure of 5 bar for a
period of several minutes.
1.5.23 Hardness
Hardness can be defined as the resistance of a material to an applied pressure or force.
1.5.24 Mohs’ scale
The Mohs’ scale of hardness is based on the ability of each material to scratch
ones that come before it on the scale. Each material is allocated a number, 1 for
the least hard material through to 10 for the hardest material. These are talc 1, gypsum
2, calcite 3, fluorite 4, apatite 5, feldspar 6, quartz 7, topaz 8, corundum 9 and
diamond 10.
1.5.25 Brinell hardness
The Brinell hardness number is a number proportional to the load or test force of a
hard steel ball to the calculated curved area of the indentation formed. The ball diameter
is 1, 2.5, 5 or 10 mm.
24 PNEUMATIC CONVEYING DESIGN GUIDE
1.5.26 Vickers hardness
Vickers hardness is a ratio of the load expressed as kilograms force, of a square base
diamond pyramid shaped indenter, to the sloping area of the indentation formed. Very
small indenters are used to measure the harness of small particles.
1.5.27 Transient
A temporary continuous changing rate of flow caused by non-steady state flow condi-
tions, such as starting up and shutting down conveying systems, particularly where
blow tanks are employed.
1.6 Nomenclature
The notation used throughout the book is given here for general reference as it presents the
style adopted and the form of SI units used in one place. Where equations are developed
in the book an abbreviated notation will also be given for reference at the point of use.
1.6.1 Symbols
Symbols Parameter UnitsA Section area � �d2/4 for a circular pipe m2
C Conveying air velocity m/s
Cp Specific heat at constant pressure kJ/kg�KCv Specific heat at constant volume kJ/kg�Kd Pipeline bore m
D Pipe bend diameter m
f Pipeline friction coefficient –
g Gravitational acceleration � 9.81 m/s2 m/s2
h Head loss or gain m
k Bend loss coefficient –
L Pipeline length m
m Mass kg
m· a Air mass flow rate kg/s
m· p Material flow rate tonne/h
M Molecular weight mol
N Number of bends –
p Air pressure – absolute N/m2, kN/m2 and bar
P Power required kW
R Characteristic gas constant � 0.287 kJ/kg�K kJ/kg�Kfor air
R0 Universal gas constant � 8.3143 kJ/kg-mol�K kJ/kg-mol�Ks Specific entropy kJ/kg�Kt Actual temperature °C
T Absolute temperature � t°C � 273 K
v Specific volume of air � 1/� m3/kg
INTRODUCTION TO PNEUMATIC CONVEYING AND THE GUIDE 25
V Volume m3
V.
Volumetric flow rate of air m3/s
z Plant elevation m
1.6.1.1 Greek
Pipe wall roughness m
� Viscosity kg/m�s� Air density � p/RT kg/m3
� Solids loading ratio or phase density � m· p/m· a –
Note: divide this by 3.6 since m· a is in kg/s
and m· p is in tonne/h
� Relative humidity %
Pipeline friction loss constant –
� Specific humidity � mv/ma –
1.6.2 Non-dimensional parameters
Re Reynolds number � � C d/�� Solids loading ratio � m· p/m· a
� Slip ratio � Cp/Ca
1.6.3 Superscripts
n Adiabatic index
� Per unit time or rate e.g. /s
Ratio of specific heats � Cp/Cv
1.6.4 Subscripts
a Conveying air
atm Atmospheric value
b Bends
c Conveying
e Equivalent value
ex Exhauster inlet conditions
f Saturated liquid
fg Change of phase (evaporation) (�g � f)
g Saturated vapour
h Horizontal
i Inlet conditions
min Minimum value
p Conveyed material or particles
pp Plant pipeline
s Suspension of air and particles
sat Saturation value or conditions
26 PNEUMATIC CONVEYING DESIGN GUIDE
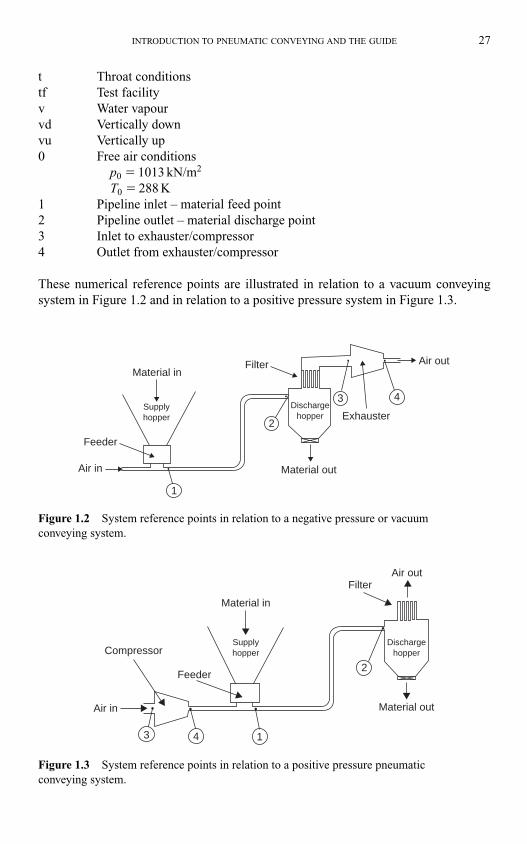
t Throat conditions
tf Test facility
v Water vapour
vd Vertically down
vu Vertically up
0 Free air conditions
p0 � 1013 kN/m2
T0 � 288 K
1 Pipeline inlet – material feed point
2 Pipeline outlet – material discharge point
3 Inlet to exhauster/compressor
4 Outlet from exhauster/compressor
These numerical reference points are illustrated in relation to a vacuum conveying
system in Figure 1.2 and in relation to a positive pressure system in Figure 1.3.
INTRODUCTION TO PNEUMATIC CONVEYING AND THE GUIDE 27
Material in
Supplyhopper
Feeder
Air in
1
2
3
Filter
Material out
Dischargehopper Exhauster
Air out
4
Figure 1.2 System reference points in relation to a negative pressure or vacuum
conveying system.
Filter
Material in
Feeder
Compressor
Air in
Air out
Material out
2
143
Dischargehopper
Supplyhopper
Figure 1.3 System reference points in relation to a positive pressure pneumatic
conveying system.
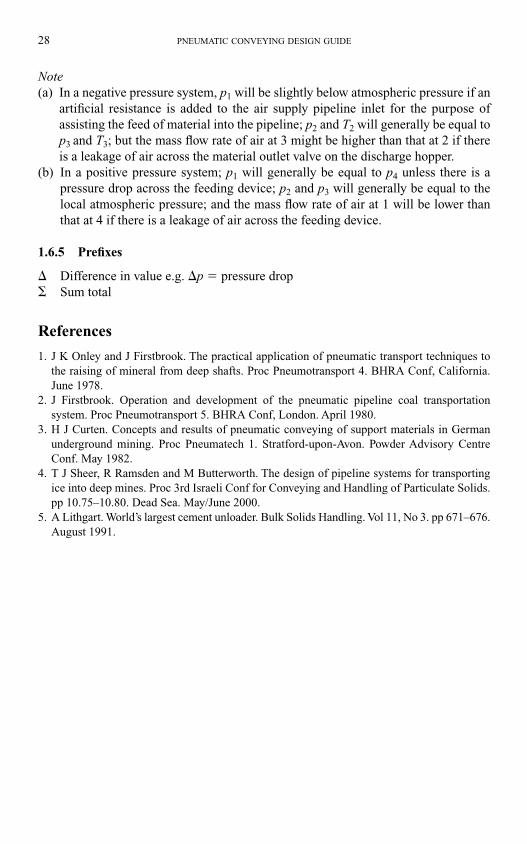
Note(a) In a negative pressure system, p1 will be slightly below atmospheric pressure if an
artificial resistance is added to the air supply pipeline inlet for the purpose of
assisting the feed of material into the pipeline; p2 and T2 will generally be equal to
p3 and T3; but the mass flow rate of air at 3 might be higher than that at 2 if there
is a leakage of air across the material outlet valve on the discharge hopper.
(b) In a positive pressure system; p1 will generally be equal to p4 unless there is a
pressure drop across the feeding device; p2 and p3 will generally be equal to the
local atmospheric pressure; and the mass flow rate of air at 1 will be lower than
that at 4 if there is a leakage of air across the feeding device.
1.6.5 Prefixes
� Difference in value e.g. �p � pressure drop
� Sum total
References
1. J K Onley and J Firstbrook. The practical application of pneumatic transport techniques to
the raising of mineral from deep shafts. Proc Pneumotransport 4. BHRA Conf, California.
June 1978.
2. J Firstbrook. Operation and development of the pneumatic pipeline coal transportation
system. Proc Pneumotransport 5. BHRA Conf, London. April 1980.
3. H J Curten. Concepts and results of pneumatic conveying of support materials in German
underground mining. Proc Pneumatech 1. Stratford-upon-Avon. Powder Advisory Centre
Conf. May 1982.
4. T J Sheer, R Ramsden and M Butterworth. The design of pipeline systems for transporting
ice into deep mines. Proc 3rd Israeli Conf for Conveying and Handling of Particulate Solids.
pp 10.75–10.80. Dead Sea. May/June 2000.
5. A Lithgart. World’s largest cement unloader. Bulk Solids Handling. Vol 11, No 3. pp 671–676.
August 1991.
28 PNEUMATIC CONVEYING DESIGN GUIDE
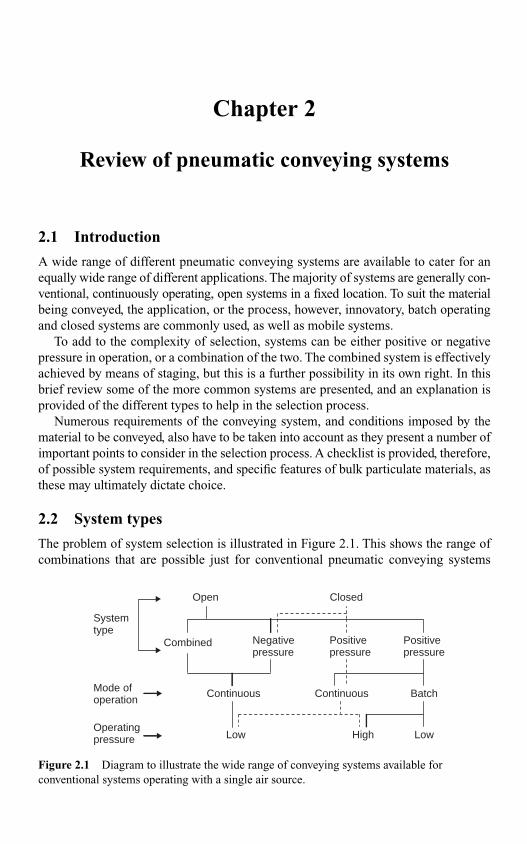
2.1 Introduction
A wide range of different pneumatic conveying systems are available to cater for an
equally wide range of different applications. The majority of systems are generally con-
ventional, continuously operating, open systems in a fixed location. To suit the material
being conveyed, the application, or the process, however, innovatory, batch operating
and closed systems are commonly used, as well as mobile systems.
To add to the complexity of selection, systems can be either positive or negative
pressure in operation, or a combination of the two. The combined system is effectively
achieved by means of staging, but this is a further possibility in its own right. In this
brief review some of the more common systems are presented, and an explanation is
provided of the different types to help in the selection process.
Numerous requirements of the conveying system, and conditions imposed by the
material to be conveyed, also have to be taken into account as they present a number of
important points to consider in the selection process. A checklist is provided, therefore,
of possible system requirements, and specific features of bulk particulate materials, as
these may ultimately dictate choice.
2.2 System types
The problem of system selection is illustrated in Figure 2.1. This shows the range of
combinations that are possible just for conventional pneumatic conveying systems
Chapter 2
Review of pneumatic conveying systems
Open Closed
Systemtype
Mode ofoperation
ContinuousContinuous Batch
Operatingpressure Low LowHigh
Negativepressure
Positivepressure
Positivepressure
Combined
Figure 2.1 Diagram to illustrate the wide range of conveying systems available for
conventional systems operating with a single air source.
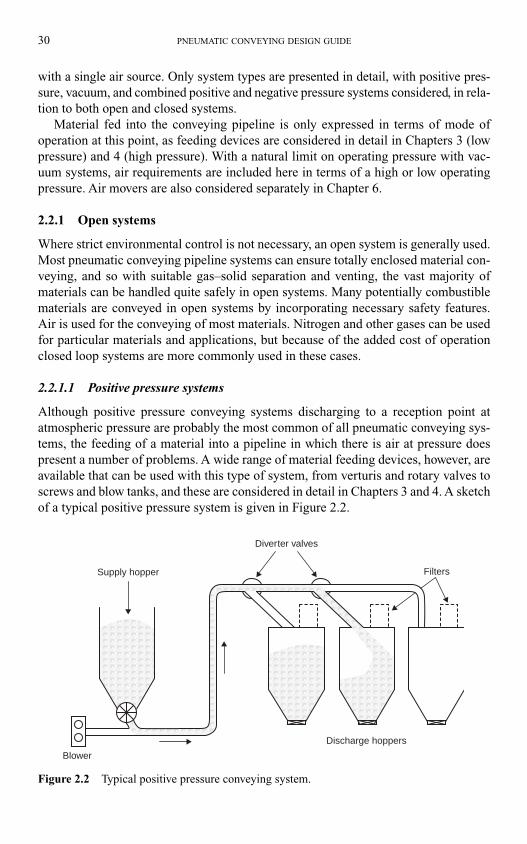
with a single air source. Only system types are presented in detail, with positive pres-
sure, vacuum, and combined positive and negative pressure systems considered, in rela-
tion to both open and closed systems.
Material fed into the conveying pipeline is only expressed in terms of mode of
operation at this point, as feeding devices are considered in detail in Chapters 3 (low
pressure) and 4 (high pressure). With a natural limit on operating pressure with vac-
uum systems, air requirements are included here in terms of a high or low operating
pressure. Air movers are also considered separately in Chapter 6.
2.2.1 Open systems
Where strict environmental control is not necessary, an open system is generally used.
Most pneumatic conveying pipeline systems can ensure totally enclosed material con-
veying, and so with suitable gas–solid separation and venting, the vast majority of
materials can be handled quite safely in open systems. Many potentially combustible
materials are conveyed in open systems by incorporating necessary safety features.
Air is used for the conveying of most materials. Nitrogen and other gases can be used
for particular materials and applications, but because of the added cost of operation
closed loop systems are more commonly used in these cases.
2.2.1.1 Positive pressure systems
Although positive pressure conveying systems discharging to a reception point at
atmospheric pressure are probably the most common of all pneumatic conveying sys-
tems, the feeding of a material into a pipeline in which there is air at pressure does
present a number of problems. A wide range of material feeding devices, however, are
available that can be used with this type of system, from verturis and rotary valves to
screws and blow tanks, and these are considered in detail in Chapters 3 and 4. A sketch
of a typical positive pressure system is given in Figure 2.2.
30 PNEUMATIC CONVEYING DESIGN GUIDE
Diverter valves
Discharge hoppers
Blower
Supply hopper Filters
Figure 2.2 Typical positive pressure conveying system.
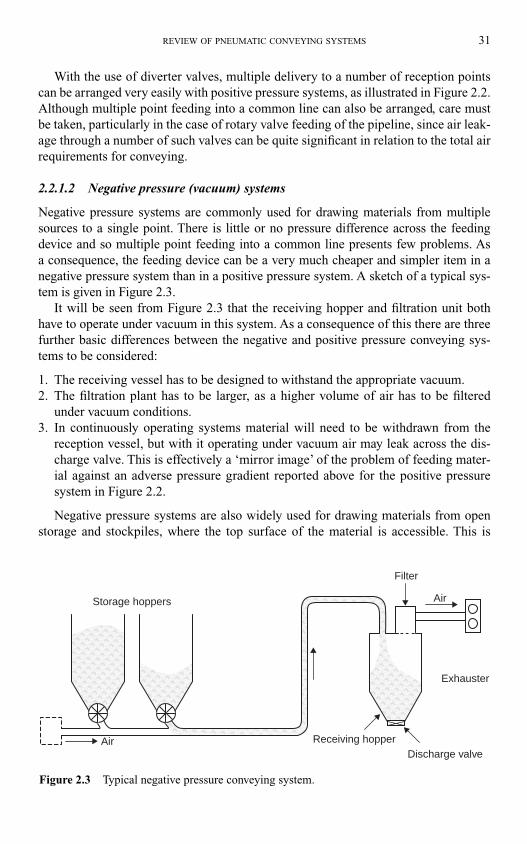
With the use of diverter valves, multiple delivery to a number of reception points
can be arranged very easily with positive pressure systems, as illustrated in Figure 2.2.
Although multiple point feeding into a common line can also be arranged, care must
be taken, particularly in the case of rotary valve feeding of the pipeline, since air leak-
age through a number of such valves can be quite significant in relation to the total air
requirements for conveying.
2.2.1.2 Negative pressure (vacuum) systems
Negative pressure systems are commonly used for drawing materials from multiple
sources to a single point. There is little or no pressure difference across the feeding
device and so multiple point feeding into a common line presents few problems. As
a consequence, the feeding device can be a very much cheaper and simpler item in a
negative pressure system than in a positive pressure system. A sketch of a typical sys-
tem is given in Figure 2.3.
It will be seen from Figure 2.3 that the receiving hopper and filtration unit both
have to operate under vacuum in this system. As a consequence of this there are three
further basic differences between the negative and positive pressure conveying sys-
tems to be considered:
1. The receiving vessel has to be designed to withstand the appropriate vacuum.
2. The filtration plant has to be larger, as a higher volume of air has to be filtered
under vacuum conditions.
3. In continuously operating systems material will need to be withdrawn from the
reception vessel, but with it operating under vacuum air may leak across the dis-
charge valve. This is effectively a ‘mirror image’ of the problem of feeding mater-
ial against an adverse pressure gradient reported above for the positive pressure
system in Figure 2.2.
Negative pressure systems are also widely used for drawing materials from open
storage and stockpiles, where the top surface of the material is accessible. This is
REVIEW OF PNEUMATIC CONVEYING SYSTEMS 31
Discharge valve
Storage hoppers
Receiving hopper
Filter
Air
Air
Exhauster
Figure 2.3 Typical negative pressure conveying system.
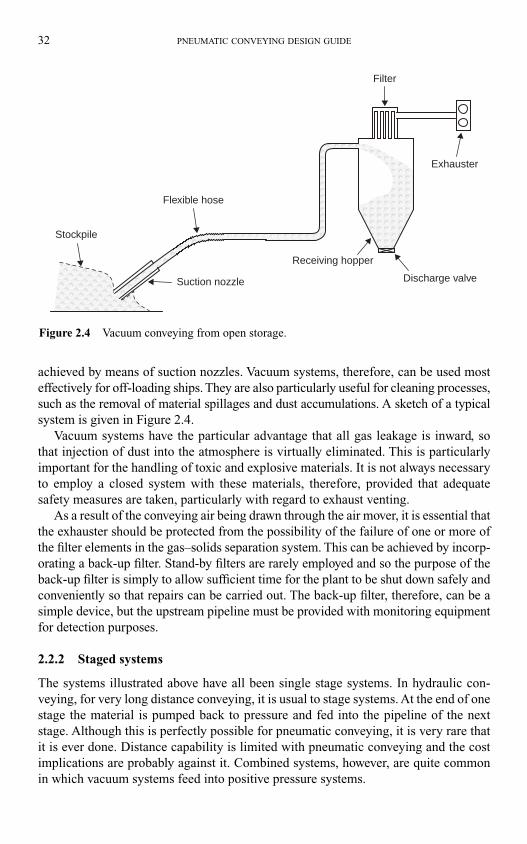
achieved by means of suction nozzles. Vacuum systems, therefore, can be used most
effectively for off-loading ships. They are also particularly useful for cleaning processes,
such as the removal of material spillages and dust accumulations. A sketch of a typical
system is given in Figure 2.4.
Vacuum systems have the particular advantage that all gas leakage is inward, so
that injection of dust into the atmosphere is virtually eliminated. This is particularly
important for the handling of toxic and explosive materials. It is not always necessary
to employ a closed system with these materials, therefore, provided that adequate
safety measures are taken, particularly with regard to exhaust venting.
As a result of the conveying air being drawn through the air mover, it is essential that
the exhauster should be protected from the possibility of the failure of one or more of
the filter elements in the gas–solids separation system. This can be achieved by incorp-
orating a back-up filter. Stand-by filters are rarely employed and so the purpose of the
back-up filter is simply to allow sufficient time for the plant to be shut down safely and
conveniently so that repairs can be carried out. The back-up filter, therefore, can be a
simple device, but the upstream pipeline must be provided with monitoring equipment
for detection purposes.
2.2.2 Staged systems
The systems illustrated above have all been single stage systems. In hydraulic con-
veying, for very long distance conveying, it is usual to stage systems. At the end of one
stage the material is pumped back to pressure and fed into the pipeline of the next
stage. Although this is perfectly possible for pneumatic conveying, it is very rare that
it is ever done. Distance capability is limited with pneumatic conveying and the cost
implications are probably against it. Combined systems, however, are quite common
in which vacuum systems feed into positive pressure systems.
32 PNEUMATIC CONVEYING DESIGN GUIDE
Discharge valve
Receiving hopper
Filter
Exhauster
Flexible hose
Stockpile
Suction nozzle
Figure 2.4 Vacuum conveying from open storage.
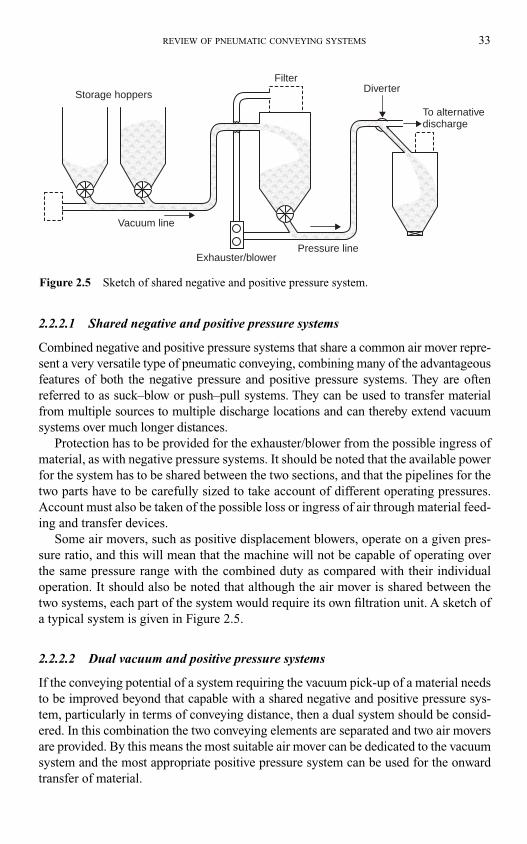
2.2.2.1 Shared negative and positive pressure systems
Combined negative and positive pressure systems that share a common air mover repre-
sent a very versatile type of pneumatic conveying, combining many of the advantageous
features of both the negative pressure and positive pressure systems. They are often
referred to as suck–blow or push–pull systems. They can be used to transfer material
from multiple sources to multiple discharge locations and can thereby extend vacuum
systems over much longer distances.
Protection has to be provided for the exhauster/blower from the possible ingress of
material, as with negative pressure systems. It should be noted that the available power
for the system has to be shared between the two sections, and that the pipelines for the
two parts have to be carefully sized to take account of different operating pressures.
Account must also be taken of the possible loss or ingress of air through material feed-
ing and transfer devices.
Some air movers, such as positive displacement blowers, operate on a given pres-
sure ratio, and this will mean that the machine will not be capable of operating over
the same pressure range with the combined duty as compared with their individual
operation. It should also be noted that although the air mover is shared between the
two systems, each part of the system would require its own filtration unit. A sketch of
a typical system is given in Figure 2.5.
2.2.2.2 Dual vacuum and positive pressure systems
If the conveying potential of a system requiring the vacuum pick-up of a material needs
to be improved beyond that capable with a shared negative and positive pressure sys-
tem, particularly in terms of conveying distance, then a dual system should be consid-
ered. In this combination the two conveying elements are separated and two air movers
are provided. By this means the most suitable air mover can be dedicated to the vacuum
system and the most appropriate positive pressure system can be used for the onward
transfer of material.
REVIEW OF PNEUMATIC CONVEYING SYSTEMS 33
Storage hoppers
Filter
Vacuum line
Exhauster/blowerPressure line
To alternativedischarge
Diverter
Figure 2.5 Sketch of shared negative and positive pressure system.
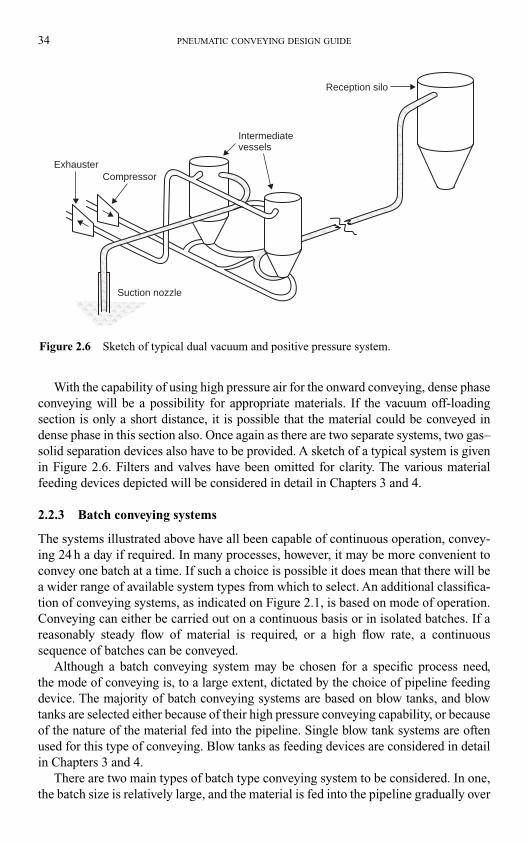
With the capability of using high pressure air for the onward conveying, dense phase
conveying will be a possibility for appropriate materials. If the vacuum off-loading
section is only a short distance, it is possible that the material could be conveyed in
dense phase in this section also. Once again as there are two separate systems, two gas–
solid separation devices also have to be provided. A sketch of a typical system is given
in Figure 2.6. Filters and valves have been omitted for clarity. The various material
feeding devices depicted will be considered in detail in Chapters 3 and 4.
2.2.3 Batch conveying systems
The systems illustrated above have all been capable of continuous operation, convey-
ing 24 h a day if required. In many processes, however, it may be more convenient to
convey one batch at a time. If such a choice is possible it does mean that there will be
a wider range of available system types from which to select. An additional classifica-
tion of conveying systems, as indicated on Figure 2.1, is based on mode of operation.
Conveying can either be carried out on a continuous basis or in isolated batches. If a
reasonably steady flow of material is required, or a high flow rate, a continuous
sequence of batches can be conveyed.
Although a batch conveying system may be chosen for a specific process need,
the mode of conveying is, to a large extent, dictated by the choice of pipeline feeding
device. The majority of batch conveying systems are based on blow tanks, and blow
tanks are selected either because of their high pressure conveying capability, or because
of the nature of the material fed into the pipeline. Single blow tank systems are often
used for this type of conveying. Blow tanks as feeding devices are considered in detail
in Chapters 3 and 4.
There are two main types of batch type conveying system to be considered. In one,
the batch size is relatively large, and the material is fed into the pipeline gradually over
34 PNEUMATIC CONVEYING DESIGN GUIDE
Suction nozzle
ExhausterCompressor
Intermediatevessels
Reception silo
Figure 2.6 Sketch of typical dual vacuum and positive pressure system.
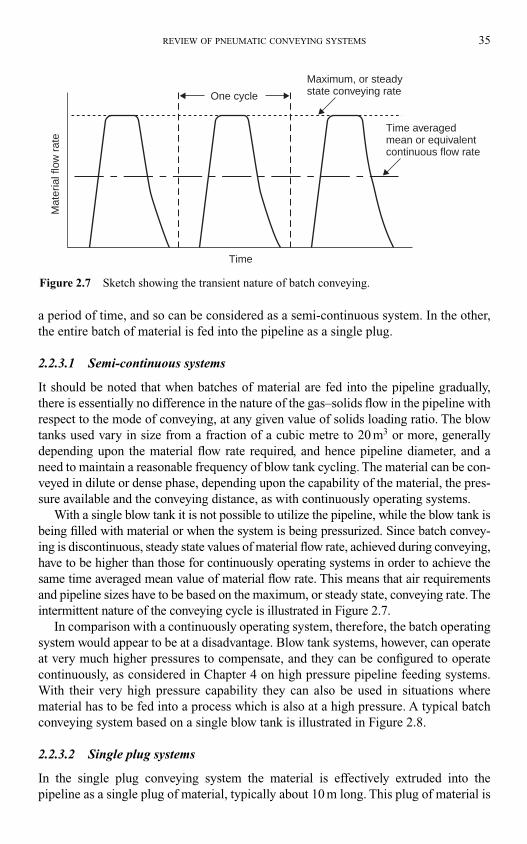
a period of time, and so can be considered as a semi-continuous system. In the other,
the entire batch of material is fed into the pipeline as a single plug.
2.2.3.1 Semi-continuous systems
It should be noted that when batches of material are fed into the pipeline gradually,
there is essentially no difference in the nature of the gas–solids flow in the pipeline with
respect to the mode of conveying, at any given value of solids loading ratio. The blow
tanks used vary in size from a fraction of a cubic metre to 20 m3 or more, generally
depending upon the material flow rate required, and hence pipeline diameter, and a
need to maintain a reasonable frequency of blow tank cycling. The material can be con-
veyed in dilute or dense phase, depending upon the capability of the material, the pres-
sure available and the conveying distance, as with continuously operating systems.
With a single blow tank it is not possible to utilize the pipeline, while the blow tank is
being filled with material or when the system is being pressurized. Since batch convey-
ing is discontinuous, steady state values of material flow rate, achieved during conveying,
have to be higher than those for continuously operating systems in order to achieve the
same time averaged mean value of material flow rate. This means that air requirements
and pipeline sizes have to be based on the maximum, or steady state, conveying rate. The
intermittent nature of the conveying cycle is illustrated in Figure 2.7.
In comparison with a continuously operating system, therefore, the batch operating
system would appear to be at a disadvantage. Blow tank systems, however, can operate
at very much higher pressures to compensate, and they can be configured to operate
continuously, as considered in Chapter 4 on high pressure pipeline feeding systems.
With their very high pressure capability they can also be used in situations where
material has to be fed into a process which is also at a high pressure. A typical batch
conveying system based on a single blow tank is illustrated in Figure 2.8.
2.2.3.2 Single plug systems
In the single plug conveying system the material is effectively extruded into the
pipeline as a single plug of material, typically about 10 m long. This plug of material is
REVIEW OF PNEUMATIC CONVEYING SYSTEMS 35
One cycle
Maximum, or steadystate conveying rate
Time averagedmean or equivalentcontinuous flow rate
Mat
eria
l flo
w r
ate
Time
Figure 2.7 Sketch showing the transient nature of batch conveying.
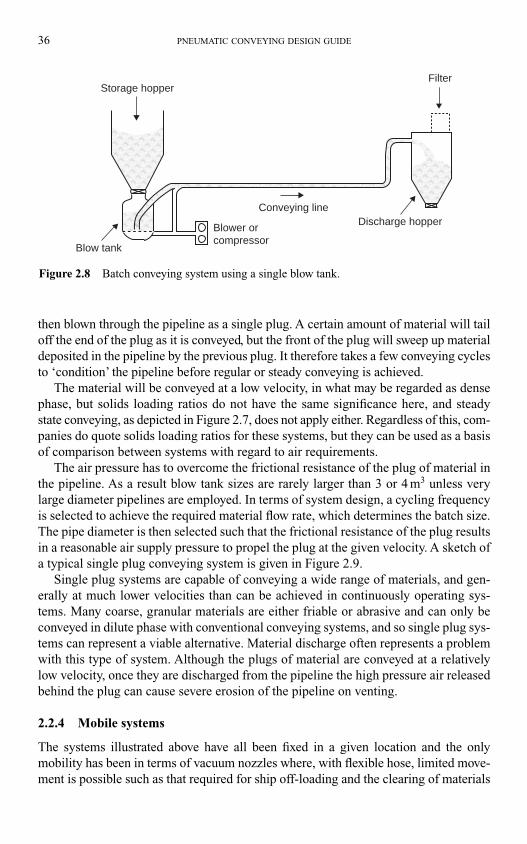
then blown through the pipeline as a single plug. A certain amount of material will tail
off the end of the plug as it is conveyed, but the front of the plug will sweep up material
deposited in the pipeline by the previous plug. It therefore takes a few conveying cycles
to ‘condition’ the pipeline before regular or steady conveying is achieved.
The material will be conveyed at a low velocity, in what may be regarded as dense
phase, but solids loading ratios do not have the same significance here, and steady
state conveying, as depicted in Figure 2.7, does not apply either. Regardless of this, com-
panies do quote solids loading ratios for these systems, but they can be used as a basis
of comparison between systems with regard to air requirements.
The air pressure has to overcome the frictional resistance of the plug of material in
the pipeline. As a result blow tank sizes are rarely larger than 3 or 4 m3 unless very
large diameter pipelines are employed. In terms of system design, a cycling frequency
is selected to achieve the required material flow rate, which determines the batch size.
The pipe diameter is then selected such that the frictional resistance of the plug results
in a reasonable air supply pressure to propel the plug at the given velocity. A sketch of
a typical single plug conveying system is given in Figure 2.9.
Single plug systems are capable of conveying a wide range of materials, and gen-
erally at much lower velocities than can be achieved in continuously operating sys-
tems. Many coarse, granular materials are either friable or abrasive and can only be
conveyed in dilute phase with conventional conveying systems, and so single plug sys-
tems can represent a viable alternative. Material discharge often represents a problem
with this type of system. Although the plugs of material are conveyed at a relatively
low velocity, once they are discharged from the pipeline the high pressure air released
behind the plug can cause severe erosion of the pipeline on venting.
2.2.4 Mobile systems
The systems illustrated above have all been fixed in a given location and the only
mobility has been in terms of vacuum nozzles where, with flexible hose, limited move-
ment is possible such as that required for ship off-loading and the clearing of materials
36 PNEUMATIC CONVEYING DESIGN GUIDE
Blow tank
Storage hopper
Blower orcompressor
Conveying lineDischarge hopper
Filter
Figure 2.8 Batch conveying system using a single blow tank.
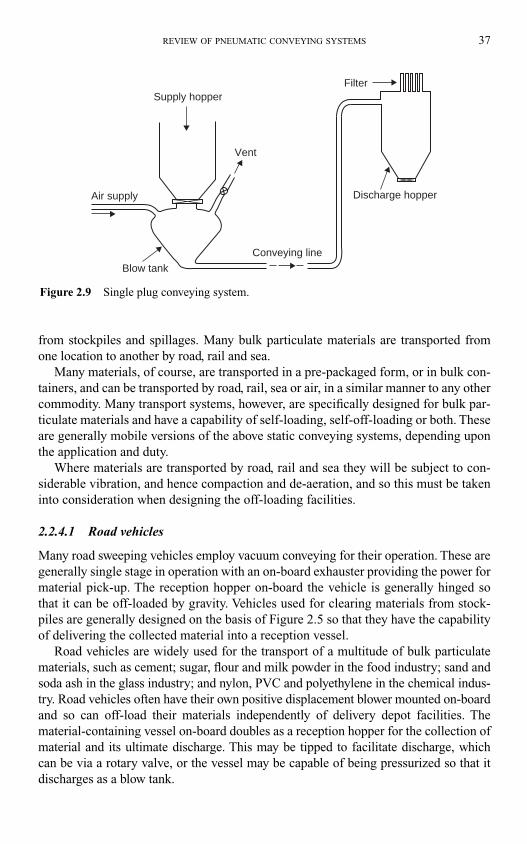
from stockpiles and spillages. Many bulk particulate materials are transported from
one location to another by road, rail and sea.
Many materials, of course, are transported in a pre-packaged form, or in bulk con-
tainers, and can be transported by road, rail, sea or air, in a similar manner to any other
commodity. Many transport systems, however, are specifically designed for bulk par-
ticulate materials and have a capability of self-loading, self-off-loading or both. These
are generally mobile versions of the above static conveying systems, depending upon
the application and duty.
Where materials are transported by road, rail and sea they will be subject to con-
siderable vibration, and hence compaction and de-aeration, and so this must be taken
into consideration when designing the off-loading facilities.
2.2.4.1 Road vehicles
Many road sweeping vehicles employ vacuum conveying for their operation. These are
generally single stage in operation with an on-board exhauster providing the power for
material pick-up. The reception hopper on-board the vehicle is generally hinged so
that it can be off-loaded by gravity. Vehicles used for clearing materials from stock-
piles are generally designed on the basis of Figure 2.5 so that they have the capability
of delivering the collected material into a reception vessel.
Road vehicles are widely used for the transport of a multitude of bulk particulate
materials, such as cement; sugar, flour and milk powder in the food industry; sand and
soda ash in the glass industry; and nylon, PVC and polyethylene in the chemical indus-
try. Road vehicles often have their own positive displacement blower mounted on-board
and so can off-load their materials independently of delivery depot facilities. The
material-containing vessel on-board doubles as a reception hopper for the collection of
material and its ultimate discharge. This may be tipped to facilitate discharge, which
can be via a rotary valve, or the vessel may be capable of being pressurized so that it
discharges as a blow tank.
REVIEW OF PNEUMATIC CONVEYING SYSTEMS 37
Vent
Supply hopper
Blow tank
Discharge hopper
Filter
Air supply
Conveying line
Figure 2.9 Single plug conveying system.
2.2.4.2 Rail vehicles
Railway wagons generally rely on delivery depot facilities for off-loading, because of
their length tilting is not an option and multiple point off-loading is often employed.
They may be off-loaded by rotary valve, or the wagon may be capable of being pres-
surized so that it can be off-loaded as a blow tank.
Whereas road vehicles are typically designed to operate with air at 1 bar gauge for
this purpose, railway wagons are generally designed to 2 bar gauge and a full length
wagon can usually be off-loaded in about 1 h. The base of the wagon is generally sloped
at about 5 degrees in herringbone fashion around each discharge point and fluidized to
facilitate removal of as much of the material as possible.
2.2.4.3 Ships
Large bulk carriers usually rely on port facilities for off-loading and these are generally
similar to that depicted in Figure 2.6. Intermediate bulk carriers, however, often have
on-board facilities for self-off-loading. Such vessels are often used for the transfer of
materials, such as cement, to storage depots at ports for local supply, or to off-shore
drilling rigs.
Materials are typically transferred from storage holds in the ship by a combination
of air-assisted gravity conveyors and vacuum conveying systems, into twin blow tanks
located in the centre of the vessel. High pressure air is supplied by on-board diesel
driven compressors and materials are conveyed to dock-side storage facilities through
flexible rubber hose, which solves the problems of both location and tidal movements.
2.2.5 Closed systems
The systems illustrated above have all been open systems in which air is usually the
conveying gas and this is simply drawn from the atmosphere and returned back to it,
after being filtered. For certain conveying duties, however, it is necessary to convey the
material in a strictly controlled environment. If a dust cloud of the material is poten-
tially explosive, nitrogen or some other gas can be used to convey the material. In an
open system such environmental control can be very expensive, but in a closed system
the gas can be re-circulated and so the operating costs, in terms of inert gas, are signifi-
cantly reduced.
If the material to be handled is toxic or radioactive, it may be possible to use air for
conveying, but very strict control would have to be maintained. A closed system would
be essential in this case, and probably designed to operate entirely under vacuum. Con-
tinuous conveying systems are probably the easiest to arrange in the form of a closed
loop. A sketch of a typical system is given in Figure 2.10.
A null point needs to be established in the system where the pressure is effectively
atmospheric and provision for make-up of conveying gas can be established here. If
this is positioned after the blower the conveying system can operate entirely under
vacuum. If the null point is located before the blower it will operate as a positive
pressure system.
38 PNEUMATIC CONVEYING DESIGN GUIDE
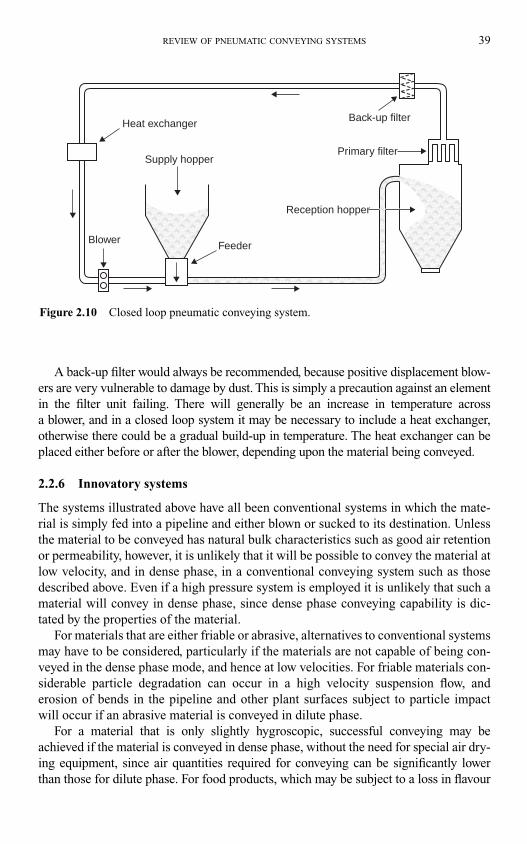
A back-up filter would always be recommended, because positive displacement blow-
ers are very vulnerable to damage by dust. This is simply a precaution against an element
in the filter unit failing. There will generally be an increase in temperature across
a blower, and in a closed loop system it may be necessary to include a heat exchanger,
otherwise there could be a gradual build-up in temperature. The heat exchanger can be
placed either before or after the blower, depending upon the material being conveyed.
2.2.6 Innovatory systems
The systems illustrated above have all been conventional systems in which the mate-
rial is simply fed into a pipeline and either blown or sucked to its destination. Unless
the material to be conveyed has natural bulk characteristics such as good air retention
or permeability, however, it is unlikely that it will be possible to convey the material at
low velocity, and in dense phase, in a conventional conveying system such as those
described above. Even if a high pressure system is employed it is unlikely that such a
material will convey in dense phase, since dense phase conveying capability is dic-
tated by the properties of the material.
For materials that are either friable or abrasive, alternatives to conventional systems
may have to be considered, particularly if the materials are not capable of being con-
veyed in the dense phase mode, and hence at low velocities. For friable materials con-
siderable particle degradation can occur in a high velocity suspension flow, and
erosion of bends in the pipeline and other plant surfaces subject to particle impact
will occur if an abrasive material is conveyed in dilute phase.
For a material that is only slightly hygroscopic, successful conveying may be
achieved if the material is conveyed in dense phase, without the need for special air dry-
ing equipment, since air quantities required for conveying can be significantly lower
than those for dilute phase. For food products, which may be subject to a loss in flavour
REVIEW OF PNEUMATIC CONVEYING SYSTEMS 39
Blower Feeder
Reception hopper
Primary filter
Back-up filterHeat exchanger
Supply hopper
Figure 2.10 Closed loop pneumatic conveying system.
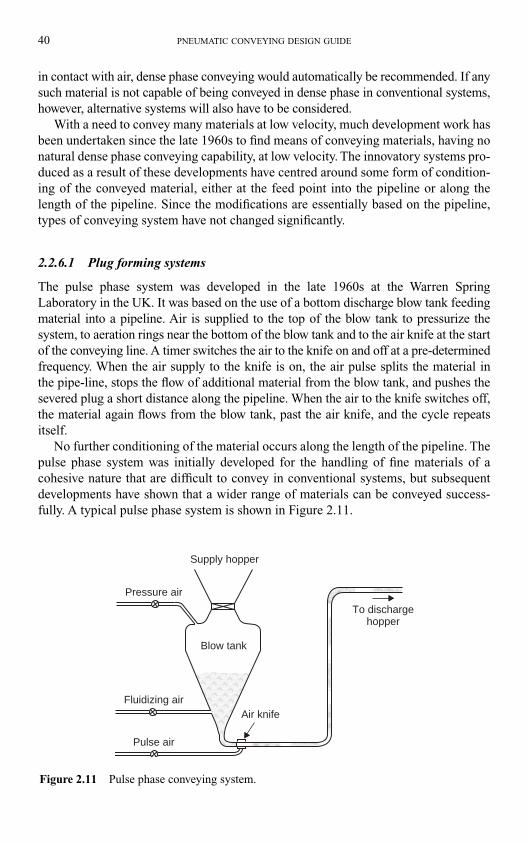
in contact with air, dense phase conveying would automatically be recommended. If any
such material is not capable of being conveyed in dense phase in conventional systems,
however, alternative systems will also have to be considered.
With a need to convey many materials at low velocity, much development work has
been undertaken since the late 1960s to find means of conveying materials, having no
natural dense phase conveying capability, at low velocity. The innovatory systems pro-
duced as a result of these developments have centred around some form of condition-
ing of the conveyed material, either at the feed point into the pipeline or along the
length of the pipeline. Since the modifications are essentially based on the pipeline,
types of conveying system have not changed significantly.
2.2.6.1 Plug forming systems
The pulse phase system was developed in the late 1960s at the Warren Spring
Laboratory in the UK. It was based on the use of a bottom discharge blow tank feeding
material into a pipeline. Air is supplied to the top of the blow tank to pressurize the
system, to aeration rings near the bottom of the blow tank and to the air knife at the start
of the conveying line. A timer switches the air to the knife on and off at a pre-determined
frequency. When the air supply to the knife is on, the air pulse splits the material in
the pipe-line, stops the flow of additional material from the blow tank, and pushes the
severed plug a short distance along the pipeline. When the air to the knife switches off,
the material again flows from the blow tank, past the air knife, and the cycle repeats
itself.
No further conditioning of the material occurs along the length of the pipeline. The
pulse phase system was initially developed for the handling of fine materials of a
cohesive nature that are difficult to convey in conventional systems, but subsequent
developments have shown that a wider range of materials can be conveyed success-
fully. A typical pulse phase system is shown in Figure 2.11.
40 PNEUMATIC CONVEYING DESIGN GUIDE
Supply hopper
Pressure air
Fluidizing air
Pulse air
Air knife
To dischargehopper
Blow tank
Figure 2.11 Pulse phase conveying system.
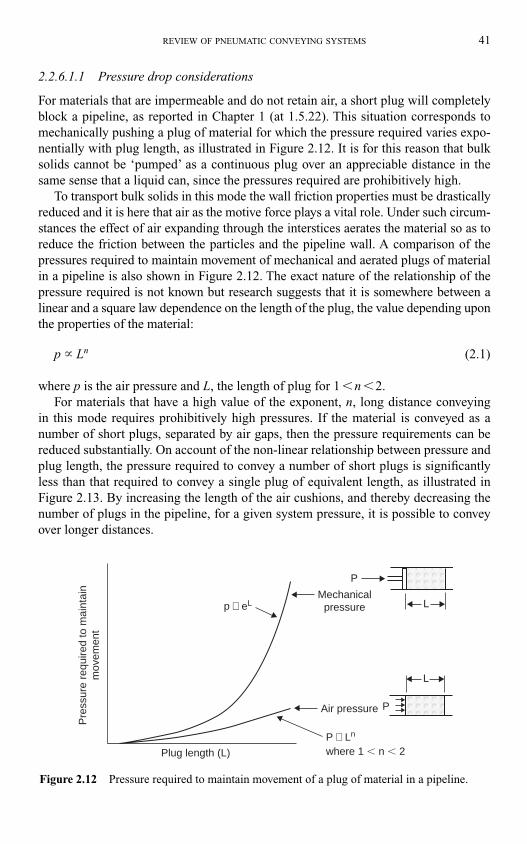
2.2.6.1.1 Pressure drop considerations
For materials that are impermeable and do not retain air, a short plug will completely
block a pipeline, as reported in Chapter 1 (at 1.5.22). This situation corresponds to
mechanically pushing a plug of material for which the pressure required varies expo-
nentially with plug length, as illustrated in Figure 2.12. It is for this reason that bulk
solids cannot be ‘pumped’ as a continuous plug over an appreciable distance in the
same sense that a liquid can, since the pressures required are prohibitively high.
To transport bulk solids in this mode the wall friction properties must be drastically
reduced and it is here that air as the motive force plays a vital role. Under such circum-
stances the effect of air expanding through the interstices aerates the material so as to
reduce the friction between the particles and the pipeline wall. A comparison of the
pressures required to maintain movement of mechanical and aerated plugs of material
in a pipeline is also shown in Figure 2.12. The exact nature of the relationship of the
pressure required is not known but research suggests that it is somewhere between a
linear and a square law dependence on the length of the plug, the value depending upon
the properties of the material:
p � Ln (2.1)
where p is the air pressure and L, the length of plug for 1 �n �2.
For materials that have a high value of the exponent, n, long distance conveying
in this mode requires prohibitively high pressures. If the material is conveyed as a
number of short plugs, separated by air gaps, then the pressure requirements can be
reduced substantially. On account of the non-linear relationship between pressure and
plug length, the pressure required to convey a number of short plugs is significantly
less than that required to convey a single plug of equivalent length, as illustrated in
Figure 2.13. By increasing the length of the air cushions, and thereby decreasing the
number of plugs in the pipeline, for a given system pressure, it is possible to convey
over longer distances.
REVIEW OF PNEUMATIC CONVEYING SYSTEMS 41
Pre
ssur
e re
quire
d to
mai
ntai
nm
ovem
ent
Air pressure
Plug length (L) where 1 � n � 2
Mechanicalpressure
P ∝ Ln
p ∝ eL
P
P
L
L
Figure 2.12 Pressure required to maintain movement of a plug of material in a pipeline.
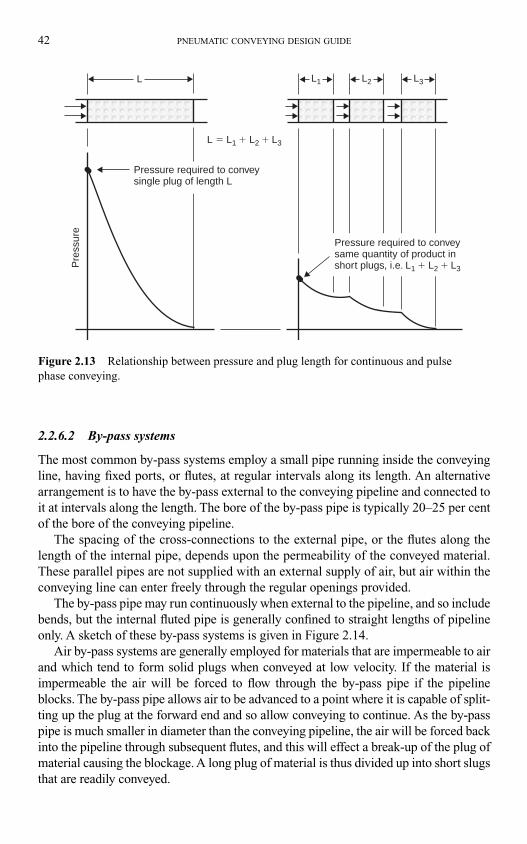
2.2.6.2 By-pass systems
The most common by-pass systems employ a small pipe running inside the conveying
line, having fixed ports, or flutes, at regular intervals along its length. An alternative
arrangement is to have the by-pass external to the conveying pipeline and connected to
it at intervals along the length. The bore of the by-pass pipe is typically 20–25 per cent
of the bore of the conveying pipeline.
The spacing of the cross-connections to the external pipe, or the flutes along the
length of the internal pipe, depends upon the permeability of the conveyed material.
These parallel pipes are not supplied with an external supply of air, but air within the
conveying line can enter freely through the regular openings provided.
The by-pass pipe may run continuously when external to the pipeline, and so include
bends, but the internal fluted pipe is generally confined to straight lengths of pipeline
only. A sketch of these by-pass systems is given in Figure 2.14.
Air by-pass systems are generally employed for materials that are impermeable to air
and which tend to form solid plugs when conveyed at low velocity. If the material is
impermeable the air will be forced to flow through the by-pass pipe if the pipeline
blocks. The by-pass pipe allows air to be advanced to a point where it is capable of split-
ting up the plug at the forward end and so allow conveying to continue. As the by-pass
pipe is much smaller in diameter than the conveying pipeline, the air will be forced back
into the pipeline through subsequent flutes, and this will effect a break-up of the plug of
material causing the blockage. A long plug of material is thus divided up into short slugs
that are readily conveyed.
42 PNEUMATIC CONVEYING DESIGN GUIDE
LP
ress
ure
L1 L2 L3
L � L1 � L2 � L3
Pressure required to conveysingle plug of length L
Pressure required to conveysame quantity of product inshort plugs, i.e. L1 � L2 � L3
Figure 2.13 Relationship between pressure and plug length for continuous and pulse
phase conveying.
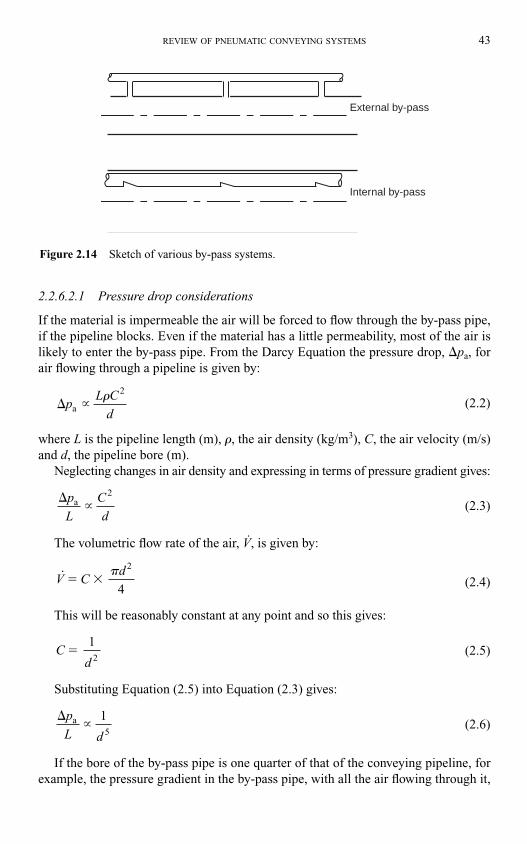
2.2.6.2.1 Pressure drop considerations
If the material is impermeable the air will be forced to flow through the by-pass pipe,
if the pipeline blocks. Even if the material has a little permeability, most of the air is
likely to enter the by-pass pipe. From the Darcy Equation the pressure drop, �pa, for
air flowing through a pipeline is given by:
(2.2)
where L is the pipeline length (m), �, the air density (kg/m3), C, the air velocity (m/s)
and d, the pipeline bore (m).
Neglecting changes in air density and expressing in terms of pressure gradient gives:
(2.3)
The volumetric flow rate of the air, V., is given by:
(2.4)
This will be reasonably constant at any point and so this gives:
(2.5)
Substituting Equation (2.5) into Equation (2.3) gives:
(2.6)
If the bore of the by-pass pipe is one quarter of that of the conveying pipeline, for
example, the pressure gradient in the by-pass pipe, with all the air flowing through it,
��
p
L da 1
5
Cd
�1
2
V Cd
� �� 2
4
��
p
L
C
da
2
� �pL C
da
� 2
REVIEW OF PNEUMATIC CONVEYING SYSTEMS 43
External by-pass
Internal by-pass
Figure 2.14 Sketch of various by-pass systems.
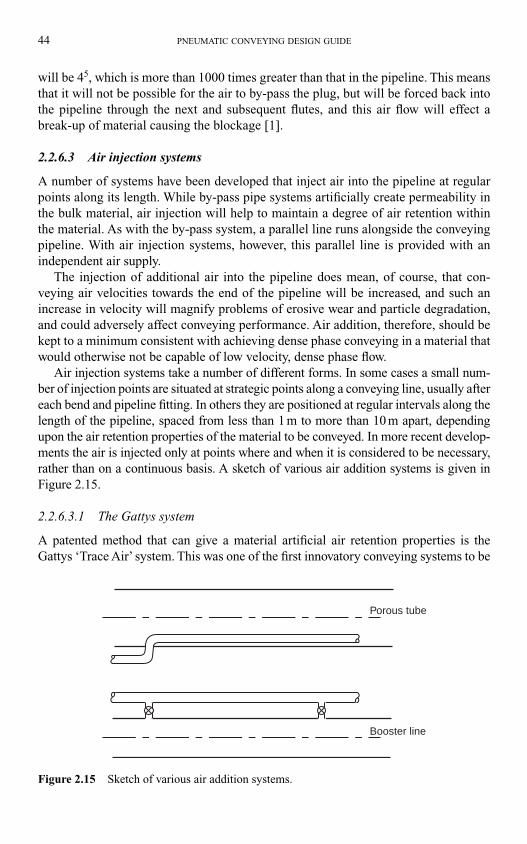
will be 45, which is more than 1000 times greater than that in the pipeline. This means
that it will not be possible for the air to by-pass the plug, but will be forced back into
the pipeline through the next and subsequent flutes, and this air flow will effect a
break-up of material causing the blockage [1].
2.2.6.3 Air injection systems
A number of systems have been developed that inject air into the pipeline at regular
points along its length. While by-pass pipe systems artificially create permeability in
the bulk material, air injection will help to maintain a degree of air retention within
the material. As with the by-pass system, a parallel line runs alongside the conveying
pipeline. With air injection systems, however, this parallel line is provided with an
independent air supply.
The injection of additional air into the pipeline does mean, of course, that con-
veying air velocities towards the end of the pipeline will be increased, and such an
increase in velocity will magnify problems of erosive wear and particle degradation,
and could adversely affect conveying performance. Air addition, therefore, should be
kept to a minimum consistent with achieving dense phase conveying in a material that
would otherwise not be capable of low velocity, dense phase flow.
Air injection systems take a number of different forms. In some cases a small num-
ber of injection points are situated at strategic points along a conveying line, usually after
each bend and pipeline fitting. In others they are positioned at regular intervals along the
length of the pipeline, spaced from less than 1 m to more than 10 m apart, depending
upon the air retention properties of the material to be conveyed. In more recent develop-
ments the air is injected only at points where and when it is considered to be necessary,
rather than on a continuous basis. A sketch of various air addition systems is given in
Figure 2.15.
2.2.6.3.1 The Gattys system
A patented method that can give a material artificial air retention properties is the
Gattys ‘Trace Air’ system. This was one of the first innovatory conveying systems to be
44 PNEUMATIC CONVEYING DESIGN GUIDE
Booster line
Porous tube
Figure 2.15 Sketch of various air addition systems.
commercially available. In this system air at relatively low pressure is supplied continu-
ously to the material in the pipeline through an internal perforated pipe that runs the
whole length of the conveying line. The motive force comes from a pressure drop along
the conveying line created by pumping air in at the upstream end, as in conventional
pneumatic conveying by pipeline, but the pressures are lower and the risk of blockage
is smaller [2].
2.2.6.3.2 Booster systems
In booster systems a separate supply of air is provided to a parallel line. Air is injected
into the conveying pipeline at regular intervals along its length, typically spaced from
3 to 15 m apart, depending upon the material. In some systems sensors are positioned
between the parallel airline and the conveying pipeline so that air is only injected where
required. If a change in pressure difference between the two lines is detected, which
would indicate that a plug is forming in the conveying pipeline, air is injected at that
point to break-up the plug and so facilitate its movement.
2.2.6.4 System selection considerations
Many of the innovatory systems are capable of being stopped and re-started during
operation. With most conventional systems this is not possible, and would result in
considerable inconvenience in clearing pipelines, if this were necessary. In any oper-
ation where this feature would be required, therefore, one of the innovatory systems
would be well worthwhile considering.
An innovatory system may also be chosen for various other reasons. Since they are
capable of conveying materials in dense phase, operating costs for power are likely to
be lower than those for a conventional dilute phase system. Capital costs for the innov-
atory systems are almost certain to be higher, however, and so an economic assess-
ment of the alternative systems would need to be carried out.
2.2.7 Fluidized motion conveying systems
The categorizing of fluidized motion conveying systems always represents a problem.
They are not generally recognized as pneumatic conveying systems because they only
use very low pressure air and the material does not flow through a pipeline. They are,
however, clearly not in the mechanical conveying group of conveyors. Until recent years
their application was relatively limited because the main driving force was gravity, and
so they would only operate on a downward incline, although at a very low angle.
The material is conveyed along a channel which has a continuous porous base. Air
enters the material through the porous base and fluidizes the material. In this condition
the material will behave like a liquid and flow down an inclined channel. The channel
is generally closed to keep the system dust tight. In early systems the channel ran with
the material only partly filling the channel. The fluidizing air escaped into the space
above the flowing material and was ducted to a filtration plant. In a recent development
the channel runs full of material and horizontal conveying is possible.
REVIEW OF PNEUMATIC CONVEYING SYSTEMS 45
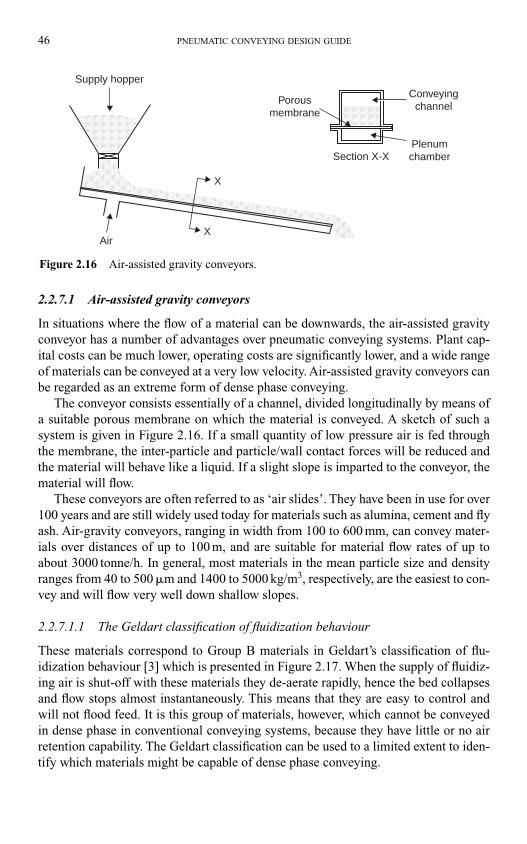
2.2.7.1 Air-assisted gravity conveyors
In situations where the flow of a material can be downwards, the air-assisted gravity
conveyor has a number of advantages over pneumatic conveying systems. Plant cap-
ital costs can be much lower, operating costs are significantly lower, and a wide range
of materials can be conveyed at a very low velocity. Air-assisted gravity conveyors can
be regarded as an extreme form of dense phase conveying.
The conveyor consists essentially of a channel, divided longitudinally by means of
a suitable porous membrane on which the material is conveyed. A sketch of such a
system is given in Figure 2.16. If a small quantity of low pressure air is fed through
the membrane, the inter-particle and particle/wall contact forces will be reduced and
the material will behave like a liquid. If a slight slope is imparted to the conveyor, the
material will flow.
These conveyors are often referred to as ‘air slides’. They have been in use for over
100 years and are still widely used today for materials such as alumina, cement and fly
ash. Air-gravity conveyors, ranging in width from 100 to 600 mm, can convey mater-
ials over distances of up to 100 m, and are suitable for material flow rates of up to
about 3000 tonne/h. In general, most materials in the mean particle size and density
ranges from 40 to 500 �m and 1400 to 5000 kg/m3, respectively, are the easiest to con-
vey and will flow very well down shallow slopes.
2.2.7.1.1 The Geldart classification of fluidization behaviour
These materials correspond to Group B materials in Geldart’s classification of flu-
idization behaviour [3] which is presented in Figure 2.17. When the supply of fluidiz-
ing air is shut-off with these materials they de-aerate rapidly, hence the bed collapses
and flow stops almost instantaneously. This means that they are easy to control and
will not flood feed. It is this group of materials, however, which cannot be conveyed
in dense phase in conventional conveying systems, because they have little or no air
retention capability. The Geldart classification can be used to a limited extent to iden-
tify which materials might be capable of dense phase conveying.
46 PNEUMATIC CONVEYING DESIGN GUIDE
Porousmembrane
Supply hopper
X
XAir
Conveyingchannel
Section X-XPlenumchamber
Figure 2.16 Air-assisted gravity conveyors.
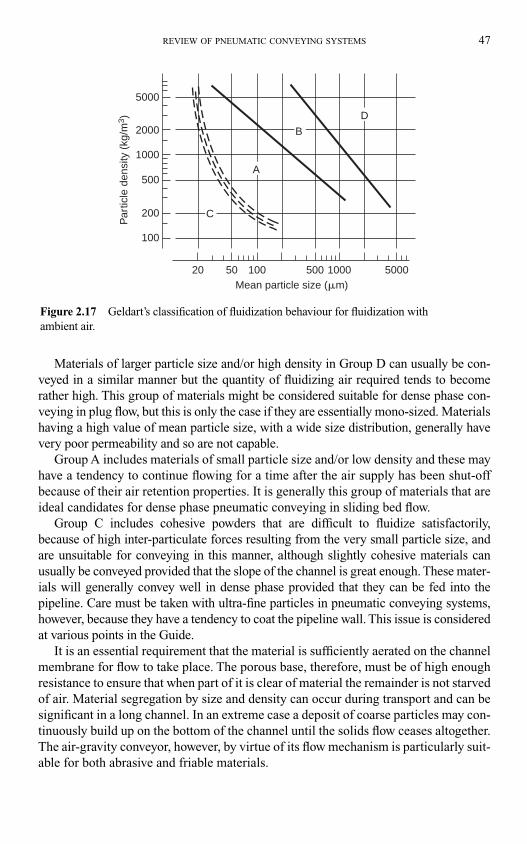
Materials of larger particle size and/or high density in Group D can usually be con-
veyed in a similar manner but the quantity of fluidizing air required tends to become
rather high. This group of materials might be considered suitable for dense phase con-
veying in plug flow, but this is only the case if they are essentially mono-sized. Materials
having a high value of mean particle size, with a wide size distribution, generally have
very poor permeability and so are not capable.
Group A includes materials of small particle size and/or low density and these may
have a tendency to continue flowing for a time after the air supply has been shut-off
because of their air retention properties. It is generally this group of materials that are
ideal candidates for dense phase pneumatic conveying in sliding bed flow.
Group C includes cohesive powders that are difficult to fluidize satisfactorily,
because of high inter-particulate forces resulting from the very small particle size, and
are unsuitable for conveying in this manner, although slightly cohesive materials can
usually be conveyed provided that the slope of the channel is great enough. These mater-
ials will generally convey well in dense phase provided that they can be fed into the
pipeline. Care must be taken with ultra-fine particles in pneumatic conveying systems,
however, because they have a tendency to coat the pipeline wall. This issue is considered
at various points in the Guide.
It is an essential requirement that the material is sufficiently aerated on the channel
membrane for flow to take place. The porous base, therefore, must be of high enough
resistance to ensure that when part of it is clear of material the remainder is not starved
of air. Material segregation by size and density can occur during transport and can be
significant in a long channel. In an extreme case a deposit of coarse particles may con-
tinuously build up on the bottom of the channel until the solids flow ceases altogether.
The air-gravity conveyor, however, by virtue of its flow mechanism is particularly suit-
able for both abrasive and friable materials.
REVIEW OF PNEUMATIC CONVEYING SYSTEMS 47
C
A
D
B
5000
Mean particle size (�m)
Par
ticle
den
sity
(kg
/m3 )
2000
1000
500
200
100
20 50 100 500 1000 5000
Figure 2.17 Geldart’s classification of fluidization behaviour for fluidization with
ambient air.
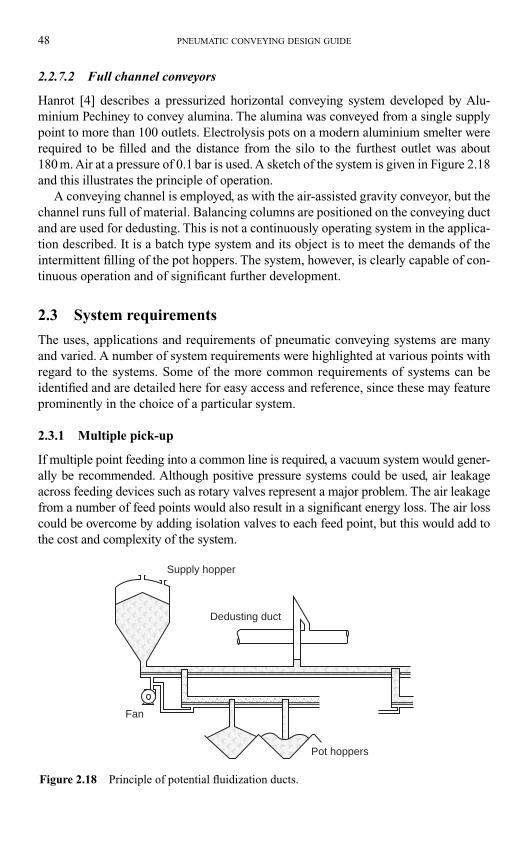
2.2.7.2 Full channel conveyors
Hanrot [4] describes a pressurized horizontal conveying system developed by Alu-
minium Pechiney to convey alumina. The alumina was conveyed from a single supply
point to more than 100 outlets. Electrolysis pots on a modern aluminium smelter were
required to be filled and the distance from the silo to the furthest outlet was about
180 m. Air at a pressure of 0.1 bar is used. A sketch of the system is given in Figure 2.18
and this illustrates the principle of operation.
A conveying channel is employed, as with the air-assisted gravity conveyor, but the
channel runs full of material. Balancing columns are positioned on the conveying duct
and are used for dedusting. This is not a continuously operating system in the applica-
tion described. It is a batch type system and its object is to meet the demands of the
intermittent filling of the pot hoppers. The system, however, is clearly capable of con-
tinuous operation and of significant further development.
2.3 System requirements
The uses, applications and requirements of pneumatic conveying systems are many
and varied. A number of system requirements were highlighted at various points with
regard to the systems. Some of the more common requirements of systems can be
identified and are detailed here for easy access and reference, since these may feature
prominently in the choice of a particular system.
2.3.1 Multiple pick-up
If multiple point feeding into a common line is required, a vacuum system would gener-
ally be recommended. Although positive pressure systems could be used, air leakage
across feeding devices such as rotary valves represent a major problem. The air leakage
from a number of feed points would also result in a significant energy loss. The air loss
could be overcome by adding isolation valves to each feed point, but this would add to
the cost and complexity of the system.
48 PNEUMATIC CONVEYING DESIGN GUIDE
Pot hoppers
Fan
Dedusting duct
Supply hopper
Figure 2.18 Principle of potential fluidization ducts.
2.3.2 Multiple delivery
Multiple delivery to a number of reception point can easily be arranged with positive
pressure systems. Diverter valves can be used most conveniently for this purpose. The
problem with vacuum systems performing this function is equivalent to the problem
of using a positive pressure system for the multiple pick-up of materials.
2.3.3 Multiple pick-up and delivery
The suck–blow, or combined vacuum and positive pressure, system is ideal for situ-
ations where both multiple pick-up and delivery is required. The pressure available for
conveying is rather limited with this type of system and so if it is necessary to convey
over a long distance, a dual system would be more appropriate. In this the vacuum and
positive pressure conveying functions are separated and a high pressure system can be
used to achieve the distant conveying requirement.
2.3.4 Multiple material handling
If it is required to handle two or more materials with the one system, reference must be
made to the conveying characteristics for each material to be conveyed. It is quite likely
that the air requirements for the materials will differ to a large extent. In this case it will
be necessary to base the air requirements, to be specified for the air mover, on the mater-
ial requiring the highest conveying line inlet air velocity. Consideration will then have
to be given to a means of controlling the air flow rate, to lower values, for the other mater-
ials, if this should be required. It is also likely that the flow rate of each material will be
different. The feeding device, therefore, will have to meet the needs of every material, in
terms of flow rate and control. These issues are dealt with at length in the Guide.
2.3.5 Multiple distance conveying
If it is required to convey a material over a range of distances, such as a road tanker sup-
plying a number of different installations, or a pipeline supplying a number of widely
spaced reception points, consideration will again have to be given to differing air
requirements and material flow rates. For a given air supply, the material flow rate will
decrease with increase in conveying distance, and so the material feeding device will
need to be controlled to meet the variation in conveying capability. For materials cap-
able of being conveyed in dense phase there is the added problem that the air flow rate
will also need to be increased for longer distance conveying.
2.3.6 Conveying from stockpiles
If the material is to be conveyed from a stockpile, then a vacuum system using suction
nozzles will be ideal. The type of system required will depend upon the application and
conveying distance. For a short distance a vacuum system will probably meet the
demand on its own. Where access is available to a free surface, as in ship off-loading,
vacuum nozzles can transfer material under vacuum to a surge hopper. If this is not the
final destination for the material it could be the intermediate hopper in a combined
REVIEW OF PNEUMATIC CONVEYING SYSTEMS 49
positive and negative pressure conveying system, or the supply hopper for the second
part of a dual system, from where the material can be blown to a distant reception point.
For clearing dust accumulations and spillages, and surplus material deposited in
stockpiles, mobile units are particularly useful. These are generally suck–blow systems
with a vacuum nozzle. Although they can be small versions of a continuously operating
suck–blow system, they are more usually batch conveying systems with the transfer hop-
per acting also as a blow tank. Material is first drawn into the hopper/blow tank under
vacuum, and when it is full it is pressurized and conveyed on to the reception point.
2.3.7 Start-up with full pipeline
If there is likely to be a need to stop and start the conveying system while it is conveying
material, a system capable of doing this will need to be selected. This is rarely possible
in conventional systems, unless a large air receiver is installed specifically for the pur-
pose, and so consideration will have to be given to innovatory systems. Many of these
systems are capable of starting with a full pipeline, although their capabilities on verti-
cal sections may need to be checked, particularly if the stoppage is for a long period. The
possibility of power cuts, from whatever source, should also be taken into account here.
2.4 Material property influences
The properties of the materials to be conveyed feature prominently in the decisions
that have to be made with regard to the selection of a pneumatic conveying system. As
with ‘System Requirements’, considered above, some of the more common material
properties can be identified and are detailed here for easy access and reference.
2.4.1 Cohesive
Problems may be experienced with cohesive materials in hopper discharge, pipeline
feeding and conveying. If there is any difficulty in discharging a cohesive material
from a rotary valve, a blow-through type should be used. If there is any difficulty in
conveying a cohesive material in a conventional system, then an innovatory system
should be considered. The pulse phase system, for example, was developed for the
handling of such fine cohesive powders.
2.4.2 Combustible
There is a wide range of materials which, in a finely divided state, dispersed in air, will
propagate a flame through the suspension if ignited. These materials include food-
stuffs such as sugar, flour and cocoa, synthetic materials such as plastics, chemical and
pharmaceutical materials, metal powders, and fuels such as wood and coal. If
a closed system is used the oxygen level of the conveying air can be controlled to
an acceptable level, or nitrogen can be used. If an open system is to be used, then
adequate safety devices must be put in place. One possibility is to use a suppressant
system. Another is to employ pressure relief vents and other safety features.
50 PNEUMATIC CONVEYING DESIGN GUIDE
2.4.3 Damp or wet
Materials containing a high level of moisture can generally be conveyed in conventional
systems if they can be fed into the pipeline, and do not contain too many fines. Most
of the handling problems with wet materials occur in trying to discharge them from
hoppers. Fine materials may not discharge satisfactorily from a conventional rotary valve
and so a blow-through type should be used.
Fine materials which are wet will tend to coat the pipeline and bends, and gradually
block the line. Lump coal having a large proportion of fines is a particular problem in
this respect. Single plug blow tank systems and some of the innovatory systems are
capable of handling this type of material. If a conventional system must be used, the
problem can be relieved by heating the conveying air, if the material is not too wet.
2.4.4 Electrostatic
If the build-up of electrostatic charge is a problem when conveying a material, the air
can be humidified. This process can be carried out on-line and does not usually require
a closed system. In dense phase the quantity of air which needs to be conditioned is
much less than in dilute phase systems, and so for materials capable of being conveyed
in dense phase, the operating costs for air quality control will be lower. The entire
system and pipework network should be earthed.
2.4.5 Erosive
If the hardness of the particles to be conveyed is higher than that of the system compon-
ents, such as feeders and pipeline bends, then erosive wear will occur at all surfaces
against which the particles impact. Velocity is one of the major parameters and so the
problem will be significantly reduced in a low velocity system. If a dilute phase system
must be used, feeding devices with moving parts, such as rotary valves and screws,
should be avoided, and all pipeline bends should be protected.
2.4.6 Friable
If degradation of the conveyed material is to be avoided, a system in which the material
can be conveyed at low velocity should be used. The magnitude of particle impacts,
particularly against bends in the pipeline, should be reduced as this is one of the major
causes of the problem. Pipeline feeding devices that can cause particle breakage, such
as screws, should also be avoided.
2.4.7 Granular
Granular materials can be conveyed with few problems in pneumatic conveying systems
provided that they can be fed into the pipeline. Problems with feeding can occur with top
discharge blow tanks and conventional rotary valves. Air will often permeate through
granular materials in top discharge blow tanks and the materials will not convey, particu-
larly if the blow tank does not have a discharge valve. Granular materials containing a
large percentage of fines, and which are not capable of dense phase conveying, may
REVIEW OF PNEUMATIC CONVEYING SYSTEMS 51
block in a top discharge line. In rotary valves, shearing of granular materials should be
avoided, and so a valve with an off-set inlet should be used.
2.4.8 Hygroscopic
If a material is hygroscopic the air used for conveying can be dried to reduce the mois-
ture level to an acceptable level. This process can be carried out on-line and does not
usually require a closed system. For a material which is only slightly hygroscopic, suc-
cessful conveying may be achieved if the material is conveyed in dense phase, without
the need for air drying equipment, since air quantities required for conveying can be
significantly lower than those for dilute phase conveying.
2.4.9 Low melting point
The energy from the impact of particles against bends and pipe walls at high velocity
in dilute phase conveying can result in high particle temperatures being generated. The
effect is localized to the small area around the point of contact on the particle surface,
but can result in that part of the particle melting. The problem is accentuated if the par-
ticles slide on the pipe wall. Plastic pellets such as nylon, polyethylene and polyesters
are prone to melting when conveyed in suspension flow.
Velocity is a major variable and so the problem will be eliminated for most materials
in a low velocity, dense phase system. If such materials have to be conveyed in dilute
phase, a roughened pipeline surface will reduce the problem considerably as this will
prevent the particles from sliding.
2.4.10 Radioactive
Radioactive materials must be conveyed under conditions of absolute safety, and so it
would be essential to employ a closed system so that strict control of the conveying
environment could be obtained. A vacuum system would also be necessary to ensure
that no conveying air could escape from the system, or material in the event of a
bend eroding.
2.4.11 Toxic
If toxic materials are to be handled, strict control of the working environment must be
maintained. A vacuum system, therefore, would be essential to ensure that there could
be no possibility of material leakage. If the conveying air, after filtration, could be
vented safely to the atmosphere, an open system would be satisfactory. If not, a closed
loop system would have to be used.
2.4.12 Very fine
A problem of pipeline coating can occur with very fine powders in the low-micron and
sub-micron range, such as carbon black and titanium dioxide. These materials tend to
adhere to the pipe wall when conveyed in conventional systems. The coating gradually
builds up and can cause a marked reduction in the pipe section area, and hence a
52 PNEUMATIC CONVEYING DESIGN GUIDE
reduction in conveying capacity. Many of the innovatory systems are capable of han-
dling this type of material successfully.
If a conventional system is to be used the material should be conveyed through a
flexible pipeline so that the material build-up can be shaken free on a regular basis. It
is quite likely that the natural pulsations that occur within the system would be suffi-
cient to vibrate the material free to enable it to be re-entrained in the conveying line.
References
1. D Mills. Similarities and differences between conventional and innovatory systems for dense
phase pneumatic conveying. Powder and Bulk Handling. Vol 3. pp 15–23. July–September 1999.
2. C R Woodcock and J S Mason. Bulk Solids Handling – An Introduction to the Practice and
Technology. Leonard Hill: Blackie & Son. 1987.
3. D Geldart. Types of gas fluidization. Powder Technology. Vol 7. pp 185–292. 1973.
4. J-P Hanrot. Multi-point feeding of hoppers, mounted on aluminium smelter pots, by means of
potential fluidization piping. Proc 115th An Mtg, The Metallurgical Soc of AIME. pp 103–109.
New Orleans. March 1986.
REVIEW OF PNEUMATIC CONVEYING SYSTEMS 53
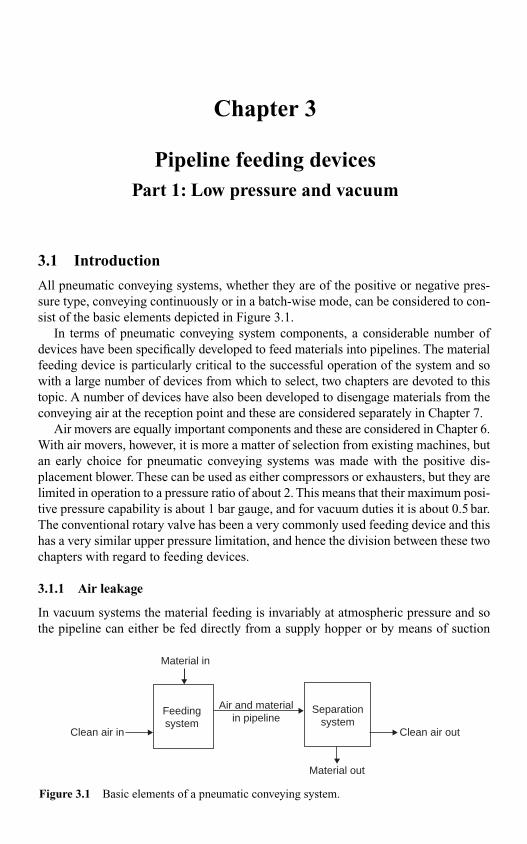
3.1 Introduction
All pneumatic conveying systems, whether they are of the positive or negative pres-
sure type, conveying continuously or in a batch-wise mode, can be considered to con-
sist of the basic elements depicted in Figure 3.1.
In terms of pneumatic conveying system components, a considerable number of
devices have been specifically developed to feed materials into pipelines. The material
feeding device is particularly critical to the successful operation of the system and so
with a large number of devices from which to select, two chapters are devoted to this
topic. A number of devices have also been developed to disengage materials from the
conveying air at the reception point and these are considered separately in Chapter 7.
Air movers are equally important components and these are considered in Chapter 6.
With air movers, however, it is more a matter of selection from existing machines, but
an early choice for pneumatic conveying systems was made with the positive dis-
placement blower. These can be used as either compressors or exhausters, but they are
limited in operation to a pressure ratio of about 2. This means that their maximum posi-
tive pressure capability is about 1 bar gauge, and for vacuum duties it is about 0.5 bar.
The conventional rotary valve has been a very commonly used feeding device and this
has a very similar upper pressure limitation, and hence the division between these two
chapters with regard to feeding devices.
3.1.1 Air leakage
In vacuum systems the material feeding is invariably at atmospheric pressure and so
the pipeline can either be fed directly from a supply hopper or by means of suction
Chapter 3
Pipeline feeding devicesPart 1: Low pressure and vacuum
Clean air in Clean air out
Material out
Feedingsystem
Material in
Air and material Separationsystemin pipeline
Figure 3.1 Basic elements of a pneumatic conveying system.
nozzles from a storage vessel or stockpile. The main point to bear in mind, however, is
that there will be no adverse pressure gradient against which the material has to be fed.
The feeder, therefore, does not have to be designed to additionally withstand a pres-
sure difference. With no adverse pressure drop to feed across it also means that there
will be no leakage of air across the device when feeding material into the pipeline.
Separation systems in these cases, therefore, by necessity, do have to operate under
vacuum conditions.
In positive pressure systems, separation devices invariably operate at atmospheric
pressure. Pipeline feeding in positive pressure systems represents a particular problem,
however, for if the material is contained in a storage hopper at atmospheric pressure,
the material has to be fed against a pressure gradient. As a consequence of this there
may be a loss of conveying air. The feeding device in this case has to be designed to
withstand the pressure difference in addition.
In certain cases this air flow can hinder the downward gravity flow of material into
the feeder and hence interfere with the feeding process. Also, if the loss is significant, the
volumetric air flow rate will have to be increased to compensate, for the correct air flow
rate to the pipeline must be maintained for conveying the material. This loss, therefore,
represents a loss of energy from the system.
3.1.2 Pressure drop
Material flow rate through a pipeline is primarily dependent upon the pressure drop
available across the pipeline. A basic requirement of any feeding device, therefore, is
that the pressure loss across the device should be as low as possible in low pressure
systems, and as small a proportion of the total as possible in high pressure systems.
If the feeder takes an unnecessarily high proportion of the total pressure drop from
the air source, less pressure will be available for conveying the material through the
pipeline, and so the material flow rate will have to be reduced to compensate. Alterna-
tively, if a higher air supply pressure is employed to compensate, more energy will be
required, and hence the operating cost will be greater.
3.1.3 Maintenance
Maintenance of these items is another important factor. If air leakage has to be accepted
with a particular feeding system, the rate of loss must not increase unduly with time,
otherwise insufficient air may ultimately be supplied to a pipeline and a blockage may
occur after a period of time.
3.1.4 Material properties
Material properties are particularly important and have to be taken into account in the
selection of feeding devices. In feeding systems that have moving parts, care has to be
taken with both abrasive and friable materials. Material flow properties need to be taken
into account with feeding devices, and particle size must be considered in all cases,
particularly the two extremes of large lumps and very fine particles.
PIPELINE FEEDING DEVICES 55
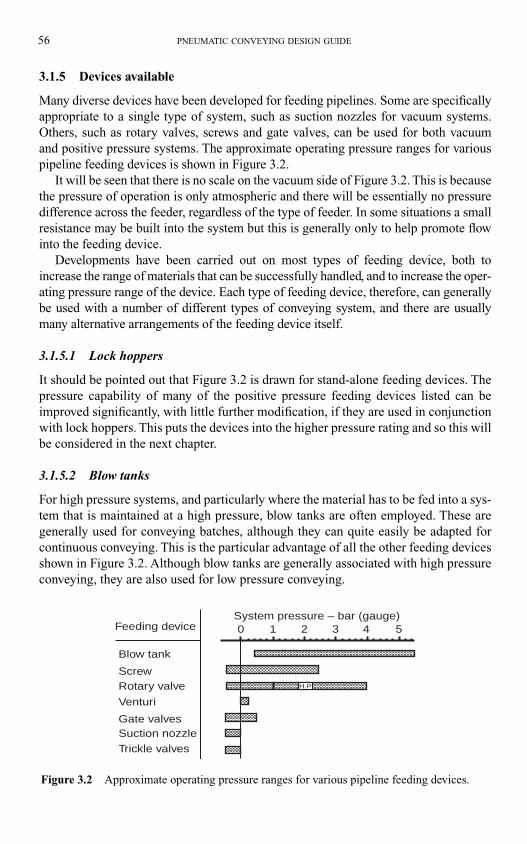
56 PNEUMATIC CONVEYING DESIGN GUIDE
3.1.5 Devices available
Many diverse devices have been developed for feeding pipelines. Some are specifically
appropriate to a single type of system, such as suction nozzles for vacuum systems.
Others, such as rotary valves, screws and gate valves, can be used for both vacuum
and positive pressure systems. The approximate operating pressure ranges for various
pipeline feeding devices is shown in Figure 3.2.
It will be seen that there is no scale on the vacuum side of Figure 3.2. This is because
the pressure of operation is only atmospheric and there will be essentially no pressure
difference across the feeder, regardless of the type of feeder. In some situations a small
resistance may be built into the system but this is generally only to help promote flow
into the feeding device.
Developments have been carried out on most types of feeding device, both to
increase the range of materials that can be successfully handled, and to increase the oper-
ating pressure range of the device. Each type of feeding device, therefore, can generally
be used with a number of different types of conveying system, and there are usually
many alternative arrangements of the feeding device itself.
3.1.5.1 Lock hoppers
It should be pointed out that Figure 3.2 is drawn for stand-alone feeding devices. The
pressure capability of many of the positive pressure feeding devices listed can be
improved significantly, with little further modification, if they are used in conjunction
with lock hoppers. This puts the devices into the higher pressure rating and so this will
be considered in the next chapter.
3.1.5.2 Blow tanks
For high pressure systems, and particularly where the material has to be fed into a sys-
tem that is maintained at a high pressure, blow tanks are often employed. These are
generally used for conveying batches, although they can quite easily be adapted for
continuous conveying. This is the particular advantage of all the other feeding devices
shown in Figure 3.2. Although blow tanks are generally associated with high pressure
conveying, they are also used for low pressure conveying.
Feeding device
Blow tank
ScrewRotary valve
Gate valves
System pressure – bar (gauge)0 1 2 3 4 5
Trickle valvesSuction nozzle
Venturi
H.P
Figure 3.2 Approximate operating pressure ranges for various pipeline feeding devices.
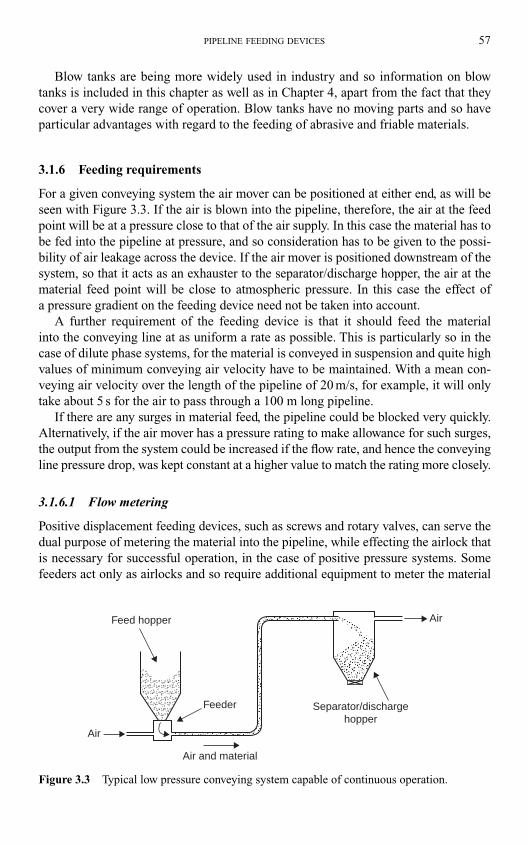
PIPELINE FEEDING DEVICES 57
Blow tanks are being more widely used in industry and so information on blow
tanks is included in this chapter as well as in Chapter 4, apart from the fact that they
cover a very wide range of operation. Blow tanks have no moving parts and so have
particular advantages with regard to the feeding of abrasive and friable materials.
3.1.6 Feeding requirements
For a given conveying system the air mover can be positioned at either end, as will be
seen with Figure 3.3. If the air is blown into the pipeline, therefore, the air at the feed
point will be at a pressure close to that of the air supply. In this case the material has to
be fed into the pipeline at pressure, and so consideration has to be given to the possi-
bility of air leakage across the device. If the air mover is positioned downstream of the
system, so that it acts as an exhauster to the separator/discharge hopper, the air at the
material feed point will be close to atmospheric pressure. In this case the effect of
a pressure gradient on the feeding device need not be taken into account.
A further requirement of the feeding device is that it should feed the material
into the conveying line at as uniform a rate as possible. This is particularly so in the
case of dilute phase systems, for the material is conveyed in suspension and quite high
values of minimum conveying air velocity have to be maintained. With a mean con-
veying air velocity over the length of the pipeline of 20 m/s, for example, it will only
take about 5 s for the air to pass through a 100 m long pipeline.
If there are any surges in material feed, the pipeline could be blocked very quickly.
Alternatively, if the air mover has a pressure rating to make allowance for such surges,
the output from the system could be increased if the flow rate, and hence the conveying
line pressure drop, was kept constant at a higher value to match the rating more closely.
3.1.6.1 Flow metering
Positive displacement feeding devices, such as screws and rotary valves, can serve the
dual purpose of metering the material into the pipeline, while effecting the airlock that
is necessary for successful operation, in the case of positive pressure systems. Some
feeders act only as airlocks and so require additional equipment to meter the material
Feed hopper
Feeder
Air and material
Separator/dischargehopper
Air
Air
Figure 3.3 Typical low pressure conveying system capable of continuous operation.
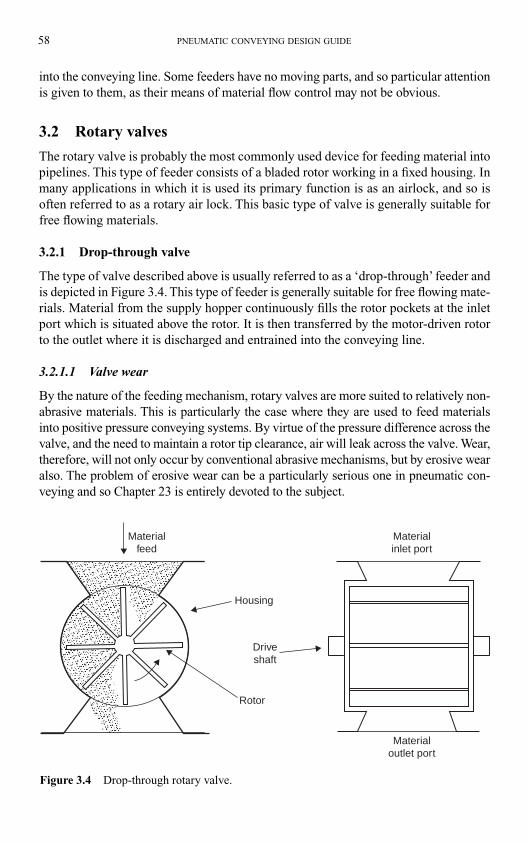
58 PNEUMATIC CONVEYING DESIGN GUIDE
into the conveying line. Some feeders have no moving parts, and so particular attention
is given to them, as their means of material flow control may not be obvious.
3.2 Rotary valves
The rotary valve is probably the most commonly used device for feeding material into
pipelines. This type of feeder consists of a bladed rotor working in a fixed housing. In
many applications in which it is used its primary function is as an airlock, and so is
often referred to as a rotary air lock. This basic type of valve is generally suitable for
free flowing materials.
3.2.1 Drop-through valve
The type of valve described above is usually referred to as a ‘drop-through’ feeder and
is depicted in Figure 3.4. This type of feeder is generally suitable for free flowing mate-
rials. Material from the supply hopper continuously fills the rotor pockets at the inlet
port which is situated above the rotor. It is then transferred by the motor-driven rotor
to the outlet where it is discharged and entrained into the conveying line.
3.2.1.1 Valve wear
By the nature of the feeding mechanism, rotary valves are more suited to relatively non-
abrasive materials. This is particularly the case where they are used to feed materials
into positive pressure conveying systems. By virtue of the pressure difference across the
valve, and the need to maintain a rotor tip clearance, air will leak across the valve. Wear,
therefore, will not only occur by conventional abrasive mechanisms, but by erosive wear
also. The problem of erosive wear can be a particularly serious one in pneumatic con-
veying and so Chapter 23 is entirely devoted to the subject.
Housing
Driveshaft
Rotor
Materialoutlet port
Materialinlet port
Materialfeed
Figure 3.4 Drop-through rotary valve.
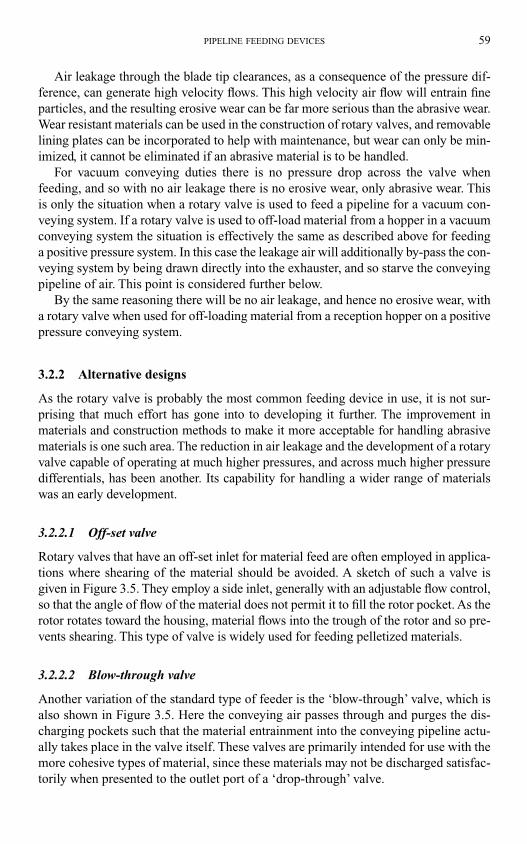
Air leakage through the blade tip clearances, as a consequence of the pressure dif-
ference, can generate high velocity flows. This high velocity air flow will entrain fine
particles, and the resulting erosive wear can be far more serious than the abrasive wear.
Wear resistant materials can be used in the construction of rotary valves, and removable
lining plates can be incorporated to help with maintenance, but wear can only be min-
imized, it cannot be eliminated if an abrasive material is to be handled.
For vacuum conveying duties there is no pressure drop across the valve when
feeding, and so with no air leakage there is no erosive wear, only abrasive wear. This
is only the situation when a rotary valve is used to feed a pipeline for a vacuum con-
veying system. If a rotary valve is used to off-load material from a hopper in a vacuum
conveying system the situation is effectively the same as described above for feeding
a positive pressure system. In this case the leakage air will additionally by-pass the con-
veying system by being drawn directly into the exhauster, and so starve the conveying
pipeline of air. This point is considered further below.
By the same reasoning there will be no air leakage, and hence no erosive wear, with
a rotary valve when used for off-loading material from a reception hopper on a positive
pressure conveying system.
3.2.2 Alternative designs
As the rotary valve is probably the most common feeding device in use, it is not sur-
prising that much effort has gone into to developing it further. The improvement in
materials and construction methods to make it more acceptable for handling abrasive
materials is one such area. The reduction in air leakage and the development of a rotary
valve capable of operating at much higher pressures, and across much higher pressure
differentials, has been another. Its capability for handling a wider range of materials
was an early development.
3.2.2.1 Off-set valve
Rotary valves that have an off-set inlet for material feed are often employed in applica-
tions where shearing of the material should be avoided. A sketch of such a valve is
given in Figure 3.5. They employ a side inlet, generally with an adjustable flow control,
so that the angle of flow of the material does not permit it to fill the rotor pocket. As the
rotor rotates toward the housing, material flows into the trough of the rotor and so pre-
vents shearing. This type of valve is widely used for feeding pelletized materials.
3.2.2.2 Blow-through valve
Another variation of the standard type of feeder is the ‘blow-through’ valve, which is
also shown in Figure 3.5. Here the conveying air passes through and purges the dis-
charging pockets such that the material entrainment into the conveying pipeline actu-
ally takes place in the valve itself. These valves are primarily intended for use with the
more cohesive types of material, since these materials may not be discharged satisfac-
torily when presented to the outlet port of a ‘drop-through’ valve.
PIPELINE FEEDING DEVICES 59
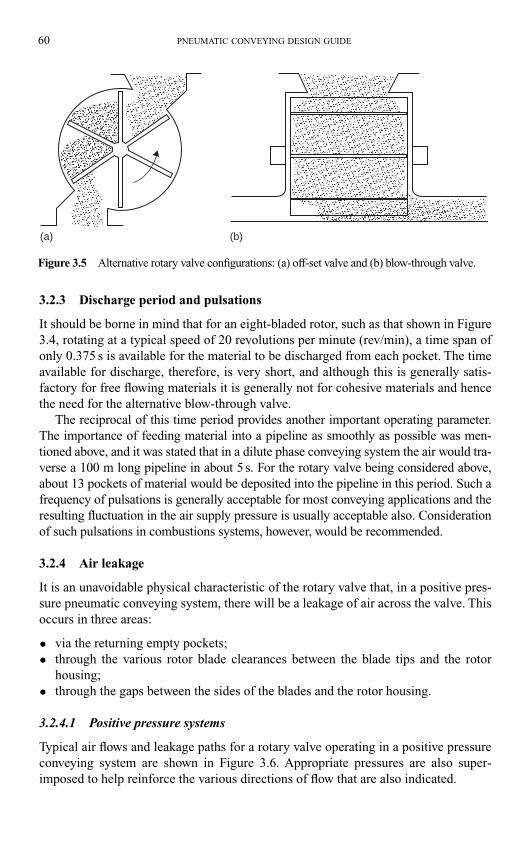
60 PNEUMATIC CONVEYING DESIGN GUIDE
3.2.3 Discharge period and pulsations
It should be borne in mind that for an eight-bladed rotor, such as that shown in Figure
3.4, rotating at a typical speed of 20 revolutions per minute (rev/min), a time span of
only 0.375 s is available for the material to be discharged from each pocket. The time
available for discharge, therefore, is very short, and although this is generally satis-
factory for free flowing materials it is generally not for cohesive materials and hence
the need for the alternative blow-through valve.
The reciprocal of this time period provides another important operating parameter.
The importance of feeding material into a pipeline as smoothly as possible was men-
tioned above, and it was stated that in a dilute phase conveying system the air would tra-
verse a 100 m long pipeline in about 5 s. For the rotary valve being considered above,
about 13 pockets of material would be deposited into the pipeline in this period. Such a
frequency of pulsations is generally acceptable for most conveying applications and the
resulting fluctuation in the air supply pressure is usually acceptable also. Consideration
of such pulsations in combustions systems, however, would be recommended.
3.2.4 Air leakage
It is an unavoidable physical characteristic of the rotary valve that, in a positive pres-
sure pneumatic conveying system, there will be a leakage of air across the valve. This
occurs in three areas:
• via the returning empty pockets;
• through the various rotor blade clearances between the blade tips and the rotor
housing;
• through the gaps between the sides of the blades and the rotor housing.
3.2.4.1 Positive pressure systems
Typical air flows and leakage paths for a rotary valve operating in a positive pressure
conveying system are shown in Figure 3.6. Appropriate pressures are also super-
imposed to help reinforce the various directions of flow that are also indicated.
(a) (b)
Figure 3.5 Alternative rotary valve configurations: (a) off-set valve and (b) blow-through valve.
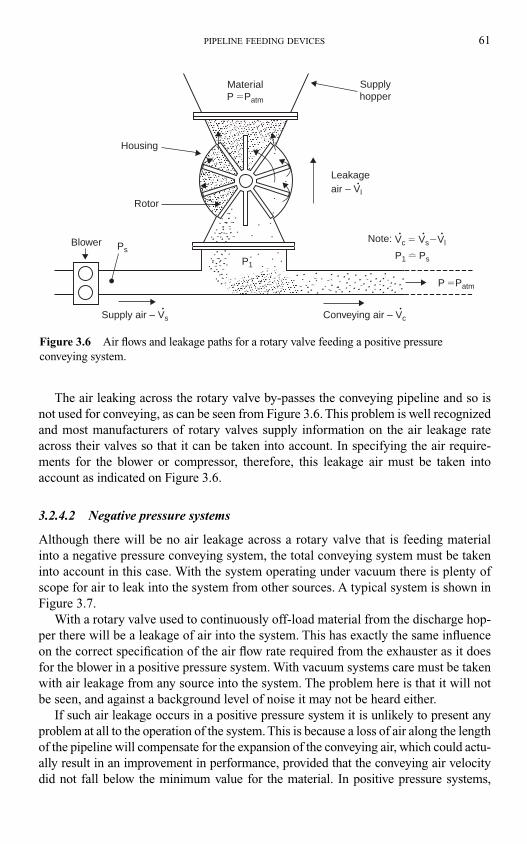
PIPELINE FEEDING DEVICES 61
The air leaking across the rotary valve by-passes the conveying pipeline and so is
not used for conveying, as can be seen from Figure 3.6. This problem is well recognized
and most manufacturers of rotary valves supply information on the air leakage rate
across their valves so that it can be taken into account. In specifying the air require-
ments for the blower or compressor, therefore, this leakage air must be taken into
account as indicated on Figure 3.6.
3.2.4.2 Negative pressure systems
Although there will be no air leakage across a rotary valve that is feeding material
into a negative pressure conveying system, the total conveying system must be taken
into account in this case. With the system operating under vacuum there is plenty of
scope for air to leak into the system from other sources. A typical system is shown in
Figure 3.7.
With a rotary valve used to continuously off-load material from the discharge hop-
per there will be a leakage of air into the system. This has exactly the same influence
on the correct specification of the air flow rate required from the exhauster as it does
for the blower in a positive pressure system. With vacuum systems care must be taken
with air leakage from any source into the system. The problem here is that it will not
be seen, and against a background level of noise it may not be heard either.
If such air leakage occurs in a positive pressure system it is unlikely to present any
problem at all to the operation of the system. This is because a loss of air along the length
of the pipeline will compensate for the expansion of the conveying air, which could actu-
ally result in an improvement in performance, provided that the conveying air velocity
did not fall below the minimum value for the material. In positive pressure systems,
Supplyhopper
MaterialP �Patm
P �Patm
Leakageair – Vl
•
Vc � Vs�Vl• • •
P1 � PsP1
PsNote:
• •
Rotor
Housing
Blower
Supply air – Vs Conveying air – Vc
Figure 3.6 Air flows and leakage paths for a rotary valve feeding a positive pressure
conveying system.
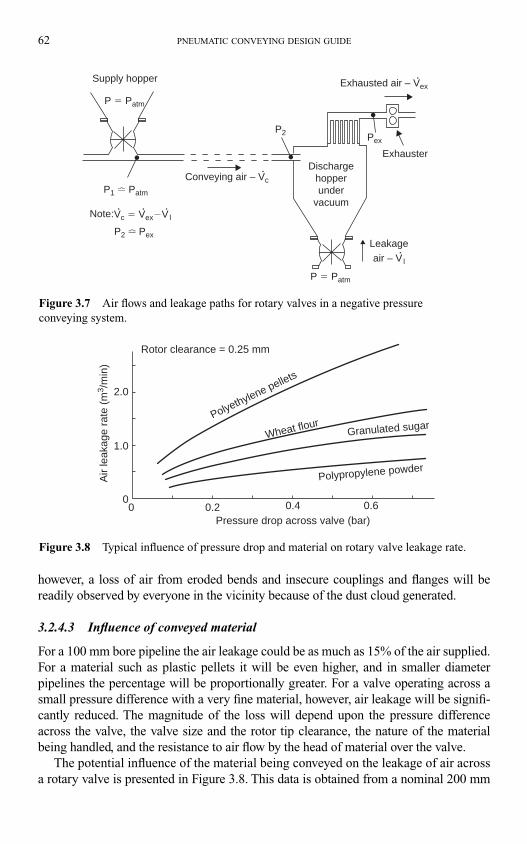
62 PNEUMATIC CONVEYING DESIGN GUIDE
however, a loss of air from eroded bends and insecure couplings and flanges will be
readily observed by everyone in the vicinity because of the dust cloud generated.
3.2.4.3 Influence of conveyed material
For a 100 mm bore pipeline the air leakage could be as much as 15% of the air supplied.
For a material such as plastic pellets it will be even higher, and in smaller diameter
pipelines the percentage will be proportionally greater. For a valve operating across a
small pressure difference with a very fine material, however, air leakage will be signifi-
cantly reduced. The magnitude of the loss will depend upon the pressure difference
across the valve, the valve size and the rotor tip clearance, the nature of the material
being handled, and the resistance to air flow by the head of material over the valve.
The potential influence of the material being conveyed on the leakage of air across
a rotary valve is presented in Figure 3.8. This data is obtained from a nominal 200 mm
Supply hopper
P � Patm
P1 � Patm
P2 � Pex
P � Patm
Note:
ExhausterDischarge
hopperunder
vacuum
P2 Pex
Vc � Vex�V l
Conveying air – Vc
Exhausted air – Vex
Leakage
air – V l
Figure 3.7 Air flows and leakage paths for rotary valves in a negative pressure
conveying system.
2.0
1.0
00 0.2 0.4 0.6
Pressure drop across valve (bar)
Polypropylene powder
Granulated sugarWheat flour
Polyethylene pellets
Rotor clearance = 0.25 mm
Air
leak
age
rate
(m
3 /m
in)
Figure 3.8 Typical influence of pressure drop and material on rotary valve leakage rate.
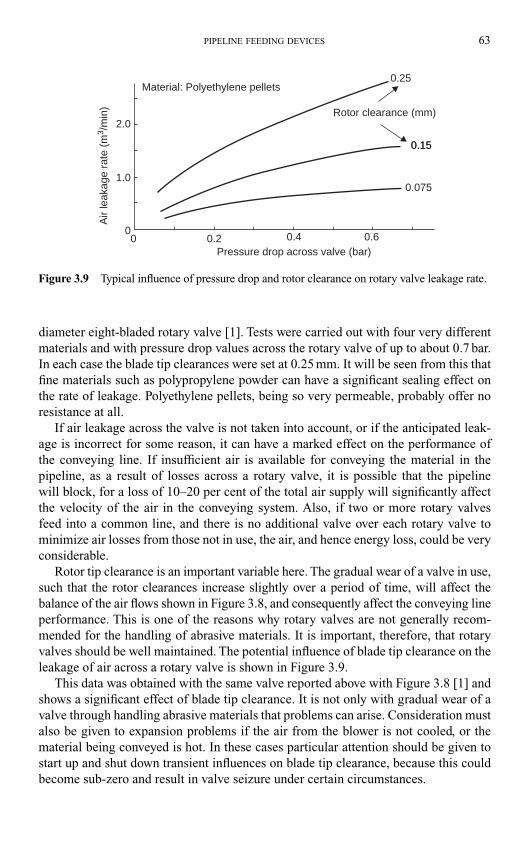
PIPELINE FEEDING DEVICES 63
diameter eight-bladed rotary valve [1]. Tests were carried out with four very different
materials and with pressure drop values across the rotary valve of up to about 0.7 bar.
In each case the blade tip clearances were set at 0.25 mm. It will be seen from this that
fine materials such as polypropylene powder can have a significant sealing effect on
the rate of leakage. Polyethylene pellets, being so very permeable, probably offer no
resistance at all.
If air leakage across the valve is not taken into account, or if the anticipated leak-
age is incorrect for some reason, it can have a marked effect on the performance of
the conveying line. If insufficient air is available for conveying the material in the
pipeline, as a result of losses across a rotary valve, it is possible that the pipeline
will block, for a loss of 10–20 per cent of the total air supply will significantly affect
the velocity of the air in the conveying system. Also, if two or more rotary valves
feed into a common line, and there is no additional valve over each rotary valve to
minimize air losses from those not in use, the air, and hence energy loss, could be very
considerable.
Rotor tip clearance is an important variable here. The gradual wear of a valve in use,
such that the rotor clearances increase slightly over a period of time, will affect the
balance of the air flows shown in Figure 3.8, and consequently affect the conveying line
performance. This is one of the reasons why rotary valves are not generally recom-
mended for the handling of abrasive materials. It is important, therefore, that rotary
valves should be well maintained. The potential influence of blade tip clearance on the
leakage of air across a rotary valve is shown in Figure 3.9.
This data was obtained with the same valve reported above with Figure 3.8 [1] and
shows a significant effect of blade tip clearance. It is not only with gradual wear of a
valve through handling abrasive materials that problems can arise. Consideration must
also be given to expansion problems if the air from the blower is not cooled, or the
material being conveyed is hot. In these cases particular attention should be given to
start up and shut down transient influences on blade tip clearance, because this could
become sub-zero and result in valve seizure under certain circumstances.
2.0
1.0
00 0.2 0.4 0.6
Pressure drop across valve (bar)
Material: Polyethylene pelletsA
ir le
akag
e ra
te (
m3 /
min
)
0.25
0.15
Rotor clearance (mm)
0.15
0.075
Figure 3.9 Typical influence of pressure drop and rotor clearance on rotary valve leakage rate.
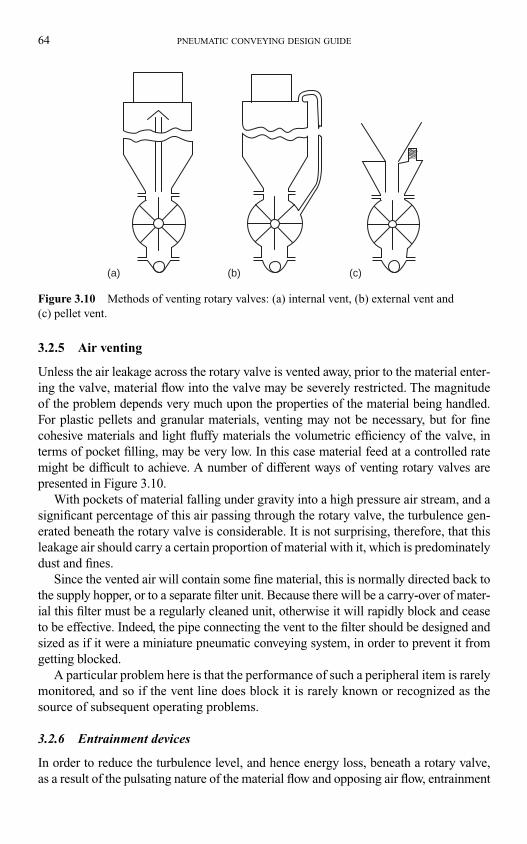
64 PNEUMATIC CONVEYING DESIGN GUIDE
3.2.5 Air venting
Unless the air leakage across the rotary valve is vented away, prior to the material enter-
ing the valve, material flow into the valve may be severely restricted. The magnitude
of the problem depends very much upon the properties of the material being handled.
For plastic pellets and granular materials, venting may not be necessary, but for fine
cohesive materials and light fluffy materials the volumetric efficiency of the valve, in
terms of pocket filling, may be very low. In this case material feed at a controlled rate
might be difficult to achieve. A number of different ways of venting rotary valves are
presented in Figure 3.10.
With pockets of material falling under gravity into a high pressure air stream, and a
significant percentage of this air passing through the rotary valve, the turbulence gen-
erated beneath the rotary valve is considerable. It is not surprising, therefore, that this
leakage air should carry a certain proportion of material with it, which is predominately
dust and fines.
Since the vented air will contain some fine material, this is normally directed back to
the supply hopper, or to a separate filter unit. Because there will be a carry-over of mater-
ial this filter must be a regularly cleaned unit, otherwise it will rapidly block and cease
to be effective. Indeed, the pipe connecting the vent to the filter should be designed and
sized as if it were a miniature pneumatic conveying system, in order to prevent it from
getting blocked.
A particular problem here is that the performance of such a peripheral item is rarely
monitored, and so if the vent line does block it is rarely known or recognized as the
source of subsequent operating problems.
3.2.6 Entrainment devices
In order to reduce the turbulence level, and hence energy loss, beneath a rotary valve,
as a result of the pulsating nature of the material flow and opposing air flow, entrainment
(a) (b) (c)
Figure 3.10 Methods of venting rotary valves: (a) internal vent, (b) external vent and
(c) pellet vent.
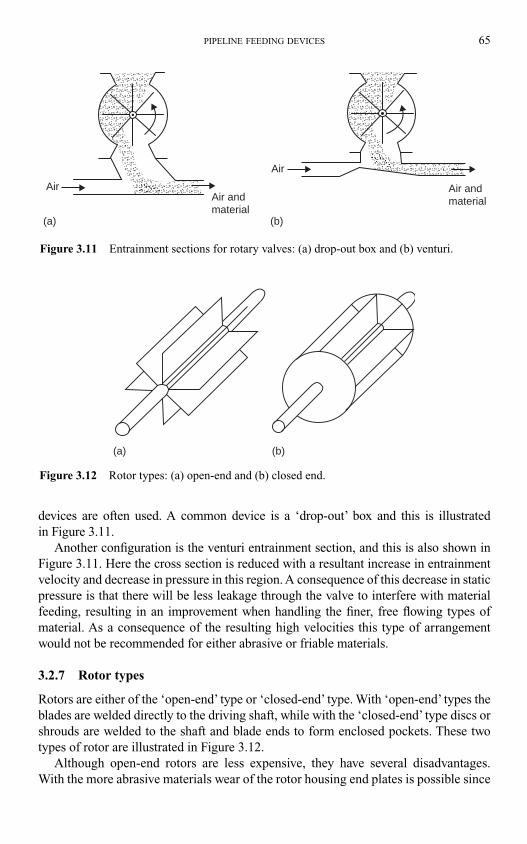
PIPELINE FEEDING DEVICES 65
devices are often used. A common device is a ‘drop-out’ box and this is illustrated
in Figure 3.11.
Another configuration is the venturi entrainment section, and this is also shown in
Figure 3.11. Here the cross section is reduced with a resultant increase in entrainment
velocity and decrease in pressure in this region. A consequence of this decrease in static
pressure is that there will be less leakage through the valve to interfere with material
feeding, resulting in an improvement when handling the finer, free flowing types of
material. As a consequence of the resulting high velocities this type of arrangement
would not be recommended for either abrasive or friable materials.
3.2.7 Rotor types
Rotors are either of the ‘open-end’ type or ‘closed-end’ type. With ‘open-end’ types the
blades are welded directly to the driving shaft, while with the ‘closed-end’ type discs or
shrouds are welded to the shaft and blade ends to form enclosed pockets. These two
types of rotor are illustrated in Figure 3.12.
Although open-end rotors are less expensive, they have several disadvantages.
With the more abrasive materials wear of the rotor housing end plates is possible since
Air
Air
Air andmaterial
Air andmaterial
(a) (b)
Figure 3.11 Entrainment sections for rotary valves: (a) drop-out box and (b) venturi.
(a) (b)
Figure 3.12 Rotor types: (a) open-end and (b) closed end.
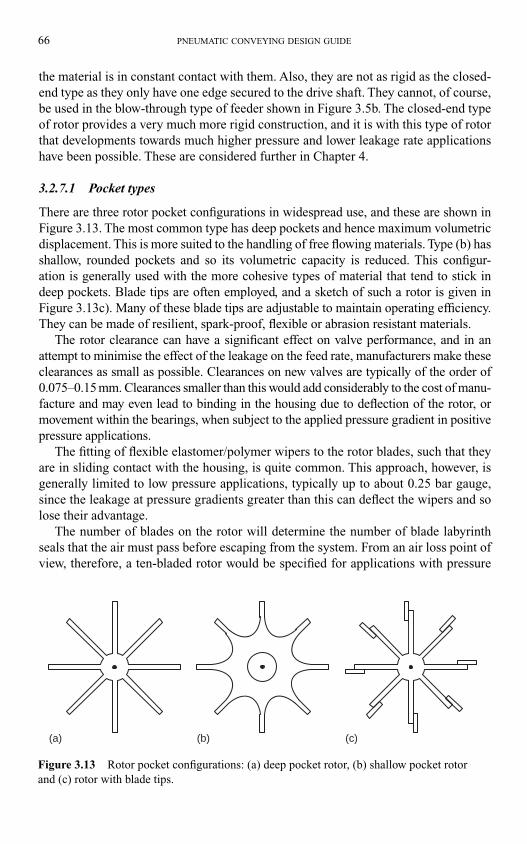
66 PNEUMATIC CONVEYING DESIGN GUIDE
the material is in constant contact with them. Also, they are not as rigid as the closed-
end type as they only have one edge secured to the drive shaft. They cannot, of course,
be used in the blow-through type of feeder shown in Figure 3.5b. The closed-end type
of rotor provides a very much more rigid construction, and it is with this type of rotor
that developments towards much higher pressure and lower leakage rate applications
have been possible. These are considered further in Chapter 4.
3.2.7.1 Pocket types
There are three rotor pocket configurations in widespread use, and these are shown in
Figure 3.13. The most common type has deep pockets and hence maximum volumetric
displacement. This is more suited to the handling of free flowing materials. Type (b) has
shallow, rounded pockets and so its volumetric capacity is reduced. This configur-
ation is generally used with the more cohesive types of material that tend to stick in
deep pockets. Blade tips are often employed, and a sketch of such a rotor is given in
Figure 3.13c). Many of these blade tips are adjustable to maintain operating efficiency.
They can be made of resilient, spark-proof, flexible or abrasion resistant materials.
The rotor clearance can have a significant effect on valve performance, and in an
attempt to minimise the effect of the leakage on the feed rate, manufacturers make these
clearances as small as possible. Clearances on new valves are typically of the order of
0.075–0.15 mm. Clearances smaller than this would add considerably to the cost of manu-
facture and may even lead to binding in the housing due to deflection of the rotor, or
movement within the bearings, when subject to the applied pressure gradient in positive
pressure applications.
The fitting of flexible elastomer/polymer wipers to the rotor blades, such that they
are in sliding contact with the housing, is quite common. This approach, however, is
generally limited to low pressure applications, typically up to about 0.25 bar gauge,
since the leakage at pressure gradients greater than this can deflect the wipers and so
lose their advantage.
The number of blades on the rotor will determine the number of blade labyrinth
seals that the air must pass before escaping from the system. From an air loss point of
view, therefore, a ten-bladed rotor would be specified for applications with pressure
(a) (b) (c)
Figure 3.13 Rotor pocket configurations: (a) deep pocket rotor, (b) shallow pocket rotor
and (c) rotor with blade tips.
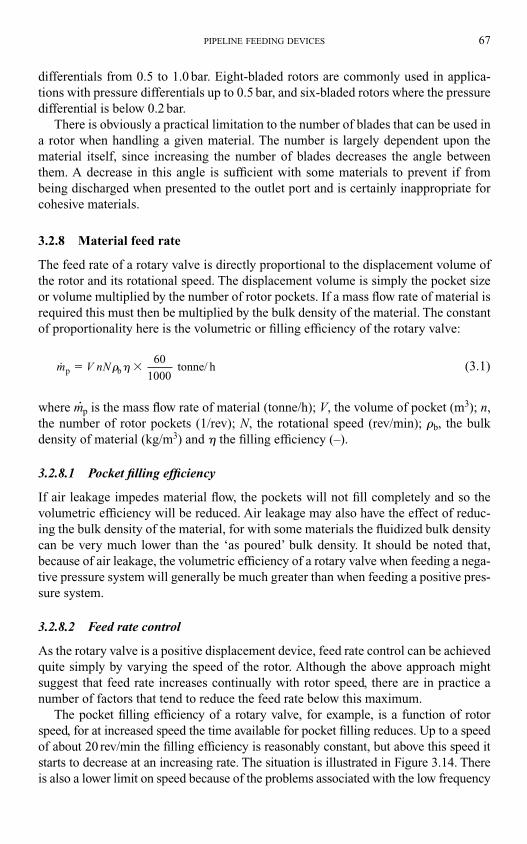
differentials from 0.5 to 1.0 bar. Eight-bladed rotors are commonly used in applica-
tions with pressure differentials up to 0.5 bar, and six-bladed rotors where the pressure
differential is below 0.2 bar.
There is obviously a practical limitation to the number of blades that can be used in
a rotor when handling a given material. The number is largely dependent upon the
material itself, since increasing the number of blades decreases the angle between
them. A decrease in this angle is sufficient with some materials to prevent if from
being discharged when presented to the outlet port and is certainly inappropriate for
cohesive materials.
3.2.8 Material feed rate
The feed rate of a rotary valve is directly proportional to the displacement volume of
the rotor and its rotational speed. The displacement volume is simply the pocket size
or volume multiplied by the number of rotor pockets. If a mass flow rate of material is
required this must then be multiplied by the bulk density of the material. The constant
of proportionality here is the volumetric or filling efficiency of the rotary valve:
(3.1)
where m�p is the mass flow rate of material (tonne/h); V, the volume of pocket (m3); n,
the number of rotor pockets (1/rev); N, the rotational speed (rev/min); �b, the bulk
density of material (kg/m3) and � the filling efficiency (–).
3.2.8.1 Pocket filling efficiency
If air leakage impedes material flow, the pockets will not fill completely and so the
volumetric efficiency will be reduced. Air leakage may also have the effect of reduc-
ing the bulk density of the material, for with some materials the fluidized bulk density
can be very much lower than the ‘as poured’ bulk density. It should be noted that,
because of air leakage, the volumetric efficiency of a rotary valve when feeding a nega-
tive pressure system will generally be much greater than when feeding a positive pres-
sure system.
3.2.8.2 Feed rate control
As the rotary valve is a positive displacement device, feed rate control can be achieved
quite simply by varying the speed of the rotor. Although the above approach might
suggest that feed rate increases continually with rotor speed, there are in practice a
number of factors that tend to reduce the feed rate below this maximum.
The pocket filling efficiency of a rotary valve, for example, is a function of rotor
speed, for at increased speed the time available for pocket filling reduces. Up to a speed
of about 20 rev/min the filling efficiency is reasonably constant, but above this speed it
starts to decrease at an increasing rate. The situation is illustrated in Figure 3.14. There
is also a lower limit on speed because of the problems associated with the low frequency
m V nNp b 60
1000 tonne/ h� �� �
PIPELINE FEEDING DEVICES 67
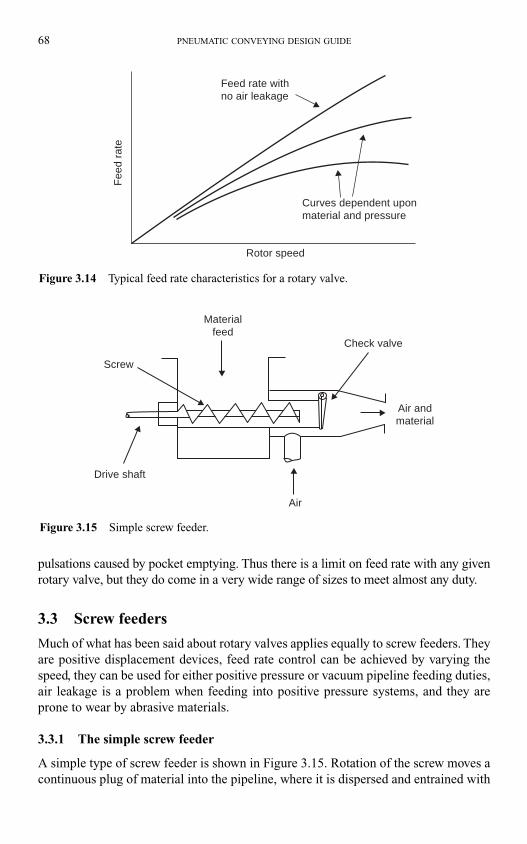
68 PNEUMATIC CONVEYING DESIGN GUIDE
pulsations caused by pocket emptying. Thus there is a limit on feed rate with any given
rotary valve, but they do come in a very wide range of sizes to meet almost any duty.
3.3 Screw feeders
Much of what has been said about rotary valves applies equally to screw feeders. They
are positive displacement devices, feed rate control can be achieved by varying the
speed, they can be used for either positive pressure or vacuum pipeline feeding duties,
air leakage is a problem when feeding into positive pressure systems, and they are
prone to wear by abrasive materials.
3.3.1 The simple screw feeder
A simple type of screw feeder is shown in Figure 3.15. Rotation of the screw moves a
continuous plug of material into the pipeline, where it is dispersed and entrained with
Feed rate withno air leakage
Curves dependent uponmaterial and pressure
Rotor speed
Fee
d ra
te
Figure 3.14 Typical feed rate characteristics for a rotary valve.
Materialfeed
Check valve
Air andmaterial
Screw
Drive shaft
Air
Figure 3.15 Simple screw feeder.
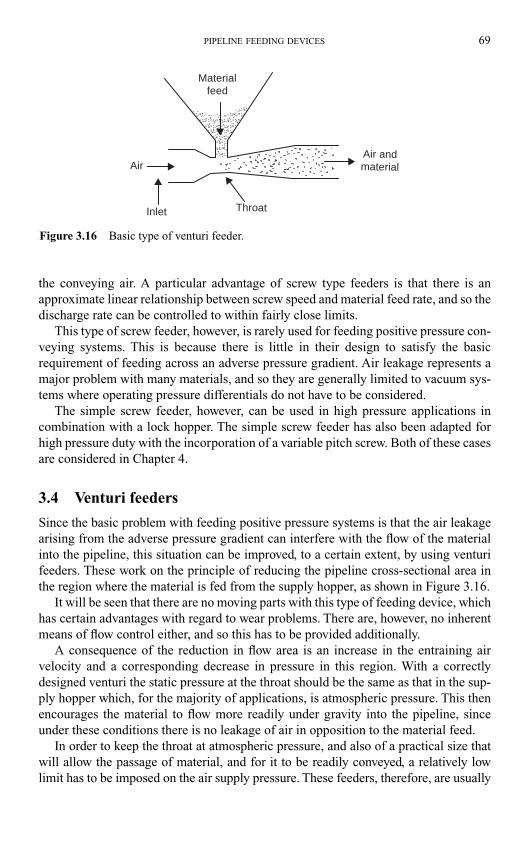
PIPELINE FEEDING DEVICES 69
the conveying air. A particular advantage of screw type feeders is that there is an
approximate linear relationship between screw speed and material feed rate, and so the
discharge rate can be controlled to within fairly close limits.
This type of screw feeder, however, is rarely used for feeding positive pressure con-
veying systems. This is because there is little in their design to satisfy the basic
requirement of feeding across an adverse pressure gradient. Air leakage represents a
major problem with many materials, and so they are generally limited to vacuum sys-
tems where operating pressure differentials do not have to be considered.
The simple screw feeder, however, can be used in high pressure applications in
combination with a lock hopper. The simple screw feeder has also been adapted for
high pressure duty with the incorporation of a variable pitch screw. Both of these cases
are considered in Chapter 4.
3.4 Venturi feeders
Since the basic problem with feeding positive pressure systems is that the air leakage
arising from the adverse pressure gradient can interfere with the flow of the material
into the pipeline, this situation can be improved, to a certain extent, by using venturi
feeders. These work on the principle of reducing the pipeline cross-sectional area in
the region where the material is fed from the supply hopper, as shown in Figure 3.16.
It will be seen that there are no moving parts with this type of feeding device, which
has certain advantages with regard to wear problems. There are, however, no inherent
means of flow control either, and so this has to be provided additionally.
A consequence of the reduction in flow area is an increase in the entraining air
velocity and a corresponding decrease in pressure in this region. With a correctly
designed venturi the static pressure at the throat should be the same as that in the sup-
ply hopper which, for the majority of applications, is atmospheric pressure. This then
encourages the material to flow more readily under gravity into the pipeline, since
under these conditions there is no leakage of air in opposition to the material feed.
In order to keep the throat at atmospheric pressure, and also of a practical size that
will allow the passage of material, and for it to be readily conveyed, a relatively low
limit has to be imposed on the air supply pressure. These feeders, therefore, are usually
Materialfeed
Air
Inlet Throat
Air andmaterial
Figure 3.16 Basic type of venturi feeder.
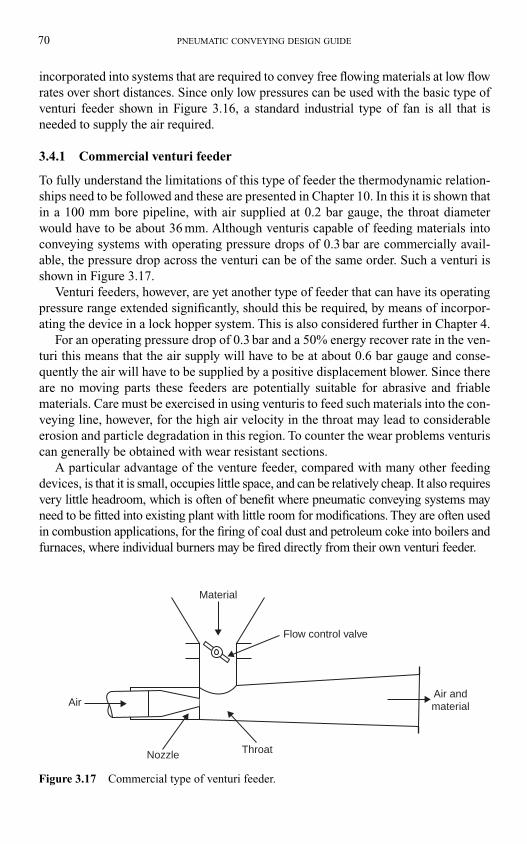
70 PNEUMATIC CONVEYING DESIGN GUIDE
incorporated into systems that are required to convey free flowing materials at low flow
rates over short distances. Since only low pressures can be used with the basic type of
venturi feeder shown in Figure 3.16, a standard industrial type of fan is all that is
needed to supply the air required.
3.4.1 Commercial venturi feeder
To fully understand the limitations of this type of feeder the thermodynamic relation-
ships need to be followed and these are presented in Chapter 10. In this it is shown that
in a 100 mm bore pipeline, with air supplied at 0.2 bar gauge, the throat diameter
would have to be about 36 mm. Although venturis capable of feeding materials into
conveying systems with operating pressure drops of 0.3 bar are commercially avail-
able, the pressure drop across the venturi can be of the same order. Such a venturi is
shown in Figure 3.17.
Venturi feeders, however, are yet another type of feeder that can have its operating
pressure range extended significantly, should this be required, by means of incorpor-
ating the device in a lock hopper system. This is also considered further in Chapter 4.
For an operating pressure drop of 0.3 bar and a 50% energy recover rate in the ven-
turi this means that the air supply will have to be at about 0.6 bar gauge and conse-
quently the air will have to be supplied by a positive displacement blower. Since there
are no moving parts these feeders are potentially suitable for abrasive and friable
materials. Care must be exercised in using venturis to feed such materials into the con-
veying line, however, for the high air velocity in the throat may lead to considerable
erosion and particle degradation in this region. To counter the wear problems venturis
can generally be obtained with wear resistant sections.
A particular advantage of the venture feeder, compared with many other feeding
devices, is that it is small, occupies little space, and can be relatively cheap. It also requires
very little headroom, which is often of benefit where pneumatic conveying systems may
need to be fitted into existing plant with little room for modifications. They are often used
in combustion applications, for the firing of coal dust and petroleum coke into boilers and
furnaces, where individual burners may be fired directly from their own venturi feeder.
Nozzle
Air
Flow control valve
Material
Throat
Air andmaterial
Figure 3.17 Commercial type of venturi feeder.
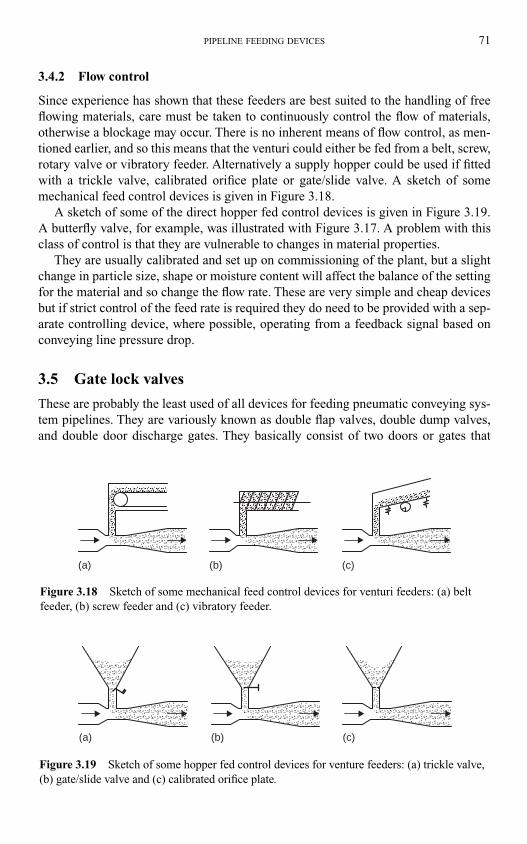
PIPELINE FEEDING DEVICES 71
3.4.2 Flow control
Since experience has shown that these feeders are best suited to the handling of free
flowing materials, care must be taken to continuously control the flow of materials,
otherwise a blockage may occur. There is no inherent means of flow control, as men-
tioned earlier, and so this means that the venturi could either be fed from a belt, screw,
rotary valve or vibratory feeder. Alternatively a supply hopper could be used if fitted
with a trickle valve, calibrated orifice plate or gate/slide valve. A sketch of some
mechanical feed control devices is given in Figure 3.18.
A sketch of some of the direct hopper fed control devices is given in Figure 3.19.
A butterfly valve, for example, was illustrated with Figure 3.17. A problem with this
class of control is that they are vulnerable to changes in material properties.
They are usually calibrated and set up on commissioning of the plant, but a slight
change in particle size, shape or moisture content will affect the balance of the setting
for the material and so change the flow rate. These are very simple and cheap devices
but if strict control of the feed rate is required they do need to be provided with a sep-
arate controlling device, where possible, operating from a feedback signal based on
conveying line pressure drop.
3.5 Gate lock valves
These are probably the least used of all devices for feeding pneumatic conveying sys-
tem pipelines. They are variously known as double flap valves, double dump valves,
and double door discharge gates. They basically consist of two doors or gates that
(a) (b) (c)
Figure 3.18 Sketch of some mechanical feed control devices for venturi feeders: (a) belt
feeder, (b) screw feeder and (c) vibratory feeder.
(a) (b) (c)
Figure 3.19 Sketch of some hopper fed control devices for venture feeders: (a) trickle valve,
(b) gate/slide valve and (c) calibrated orifice plate.
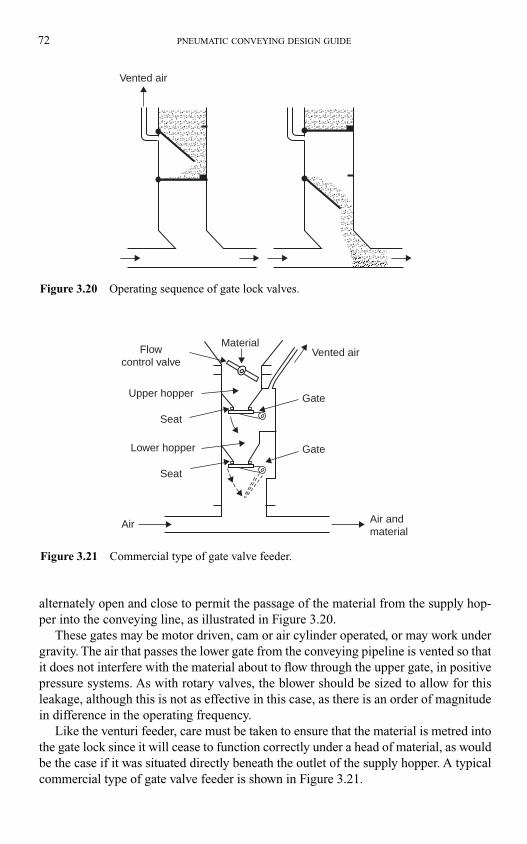
72 PNEUMATIC CONVEYING DESIGN GUIDE
alternately open and close to permit the passage of the material from the supply hop-
per into the conveying line, as illustrated in Figure 3.20.
These gates may be motor driven, cam or air cylinder operated, or may work under
gravity. The air that passes the lower gate from the conveying pipeline is vented so that
it does not interfere with the material about to flow through the upper gate, in positive
pressure systems. As with rotary valves, the blower should be sized to allow for this
leakage, although this is not as effective in this case, as there is an order of magnitude
in difference in the operating frequency.
Like the venturi feeder, care must be taken to ensure that the material is metred into
the gate lock since it will cease to function correctly under a head of material, as would
be the case if it was situated directly beneath the outlet of the supply hopper. A typical
commercial type of gate valve feeder is shown in Figure 3.21.
Vented air
Figure 3.20 Operating sequence of gate lock valves.
Flowcontrol valve
Upper hopper
Lower hopper
Seat
Seat
Air
Gate
Gate
MaterialVented air
Air andmaterial
Figure 3.21 Commercial type of gate valve feeder.
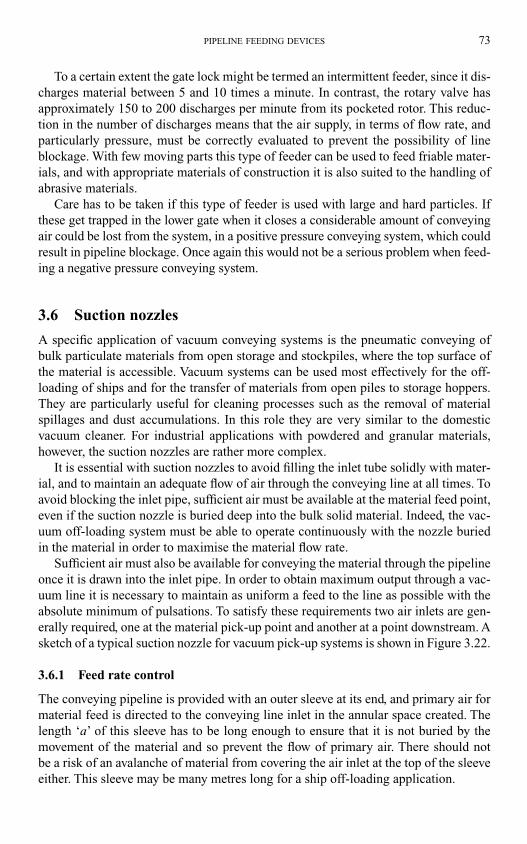
To a certain extent the gate lock might be termed an intermittent feeder, since it dis-
charges material between 5 and 10 times a minute. In contrast, the rotary valve has
approximately 150 to 200 discharges per minute from its pocketed rotor. This reduc-
tion in the number of discharges means that the air supply, in terms of flow rate, and
particularly pressure, must be correctly evaluated to prevent the possibility of line
blockage. With few moving parts this type of feeder can be used to feed friable mater-
ials, and with appropriate materials of construction it is also suited to the handling of
abrasive materials.
Care has to be taken if this type of feeder is used with large and hard particles. If
these get trapped in the lower gate when it closes a considerable amount of conveying
air could be lost from the system, in a positive pressure conveying system, which could
result in pipeline blockage. Once again this would not be a serious problem when feed-
ing a negative pressure conveying system.
3.6 Suction nozzles
A specific application of vacuum conveying systems is the pneumatic conveying of
bulk particulate materials from open storage and stockpiles, where the top surface of
the material is accessible. Vacuum systems can be used most effectively for the off-
loading of ships and for the transfer of materials from open piles to storage hoppers.
They are particularly useful for cleaning processes such as the removal of material
spillages and dust accumulations. In this role they are very similar to the domestic
vacuum cleaner. For industrial applications with powdered and granular materials,
however, the suction nozzles are rather more complex.
It is essential with suction nozzles to avoid filling the inlet tube solidly with mater-
ial, and to maintain an adequate flow of air through the conveying line at all times. To
avoid blocking the inlet pipe, sufficient air must be available at the material feed point,
even if the suction nozzle is buried deep into the bulk solid material. Indeed, the vac-
uum off-loading system must be able to operate continuously with the nozzle buried
in the material in order to maximise the material flow rate.
Sufficient air must also be available for conveying the material through the pipeline
once it is drawn into the inlet pipe. In order to obtain maximum output through a vac-
uum line it is necessary to maintain as uniform a feed to the line as possible with the
absolute minimum of pulsations. To satisfy these requirements two air inlets are gen-
erally required, one at the material pick-up point and another at a point downstream. A
sketch of a typical suction nozzle for vacuum pick-up systems is shown in Figure 3.22.
3.6.1 Feed rate control
The conveying pipeline is provided with an outer sleeve at its end, and primary air for
material feed is directed to the conveying line inlet in the annular space created. The
length ‘a’ of this sleeve has to be long enough to ensure that it is not buried by the
movement of the material and so prevent the flow of primary air. There should not
be a risk of an avalanche of material from covering the air inlet at the top of the sleeve
either. This sleeve may be many metres long for a ship off-loading application.
PIPELINE FEEDING DEVICES 73
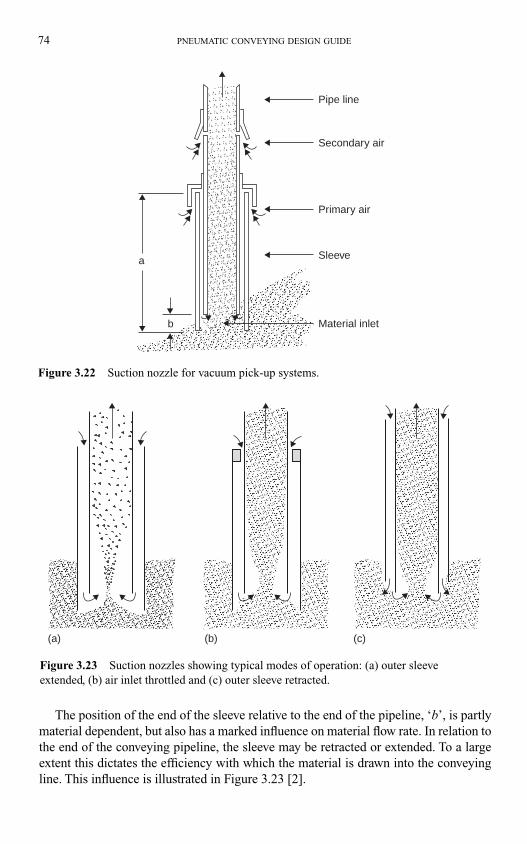
74 PNEUMATIC CONVEYING DESIGN GUIDE
The position of the end of the sleeve relative to the end of the pipeline, ‘b’, is partly
material dependent, but also has a marked influence on material flow rate. In relation to
the end of the conveying pipeline, the sleeve may be retracted or extended. To a large
extent this dictates the efficiency with which the material is drawn into the conveying
line. This influence is illustrated in Figure 3.23 [2].
Sleeve
Material inlet
Primary air
Secondary air
Pipe line
a
b
Figure 3.22 Suction nozzle for vacuum pick-up systems.
(a) (b) (c)
Figure 3.23 Suction nozzles showing typical modes of operation: (a) outer sleeve
extended, (b) air inlet throttled and (c) outer sleeve retracted.
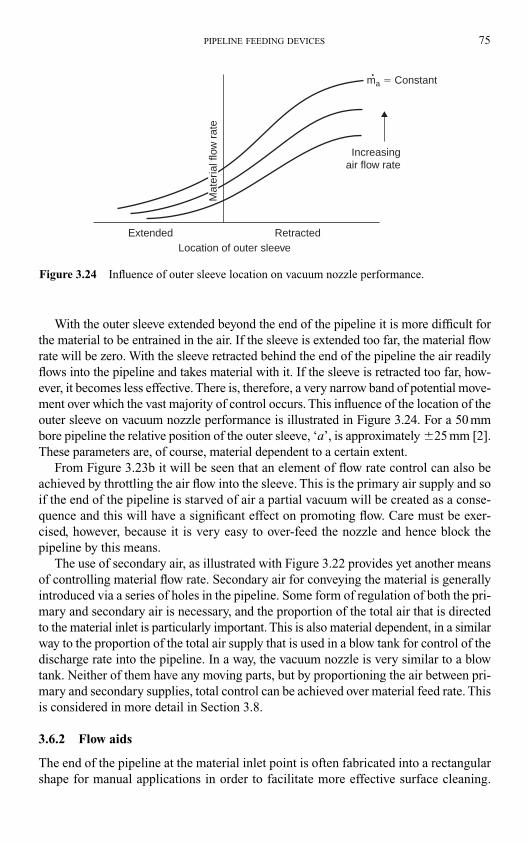
PIPELINE FEEDING DEVICES 75
With the outer sleeve extended beyond the end of the pipeline it is more difficult for
the material to be entrained in the air. If the sleeve is extended too far, the material flow
rate will be zero. With the sleeve retracted behind the end of the pipeline the air readily
flows into the pipeline and takes material with it. If the sleeve is retracted too far, how-
ever, it becomes less effective. There is, therefore, a very narrow band of potential move-
ment over which the vast majority of control occurs. This influence of the location of the
outer sleeve on vacuum nozzle performance is illustrated in Figure 3.24. For a 50 mm
bore pipeline the relative position of the outer sleeve, ‘a’, is approximately �25 mm [2].
These parameters are, of course, material dependent to a certain extent.
From Figure 3.23b it will be seen that an element of flow rate control can also be
achieved by throttling the air flow into the sleeve. This is the primary air supply and so
if the end of the pipeline is starved of air a partial vacuum will be created as a conse-
quence and this will have a significant effect on promoting flow. Care must be exer-
cised, however, because it is very easy to over-feed the nozzle and hence block the
pipeline by this means.
The use of secondary air, as illustrated with Figure 3.22 provides yet another means
of controlling material flow rate. Secondary air for conveying the material is generally
introduced via a series of holes in the pipeline. Some form of regulation of both the pri-
mary and secondary air is necessary, and the proportion of the total air that is directed
to the material inlet is particularly important. This is also material dependent, in a similar
way to the proportion of the total air supply that is used in a blow tank for control of the
discharge rate into the pipeline. In a way, the vacuum nozzle is very similar to a blow
tank. Neither of them have any moving parts, but by proportioning the air between pri-
mary and secondary supplies, total control can be achieved over material feed rate. This
is considered in more detail in Section 3.8.
3.6.2 Flow aids
The end of the pipeline at the material inlet point is often fabricated into a rectangular
shape for manual applications in order to facilitate more effective surface cleaning.
Extended Retracted
Increasingair flow rate
Location of outer sleeve
Mat
eria
l flo
w r
ate
ma � Constant•
Figure 3.24 Influence of outer sleeve location on vacuum nozzle performance.
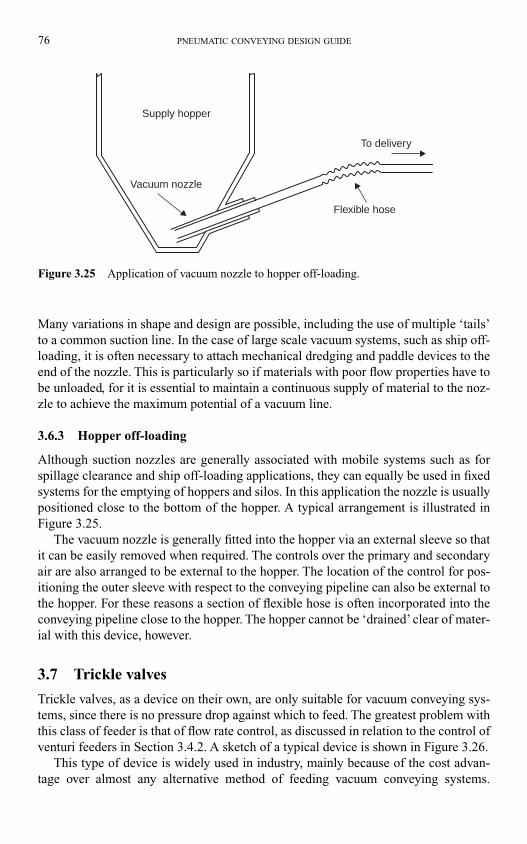
76 PNEUMATIC CONVEYING DESIGN GUIDE
Many variations in shape and design are possible, including the use of multiple ‘tails’
to a common suction line. In the case of large scale vacuum systems, such as ship off-
loading, it is often necessary to attach mechanical dredging and paddle devices to the
end of the nozzle. This is particularly so if materials with poor flow properties have to
be unloaded, for it is essential to maintain a continuous supply of material to the noz-
zle to achieve the maximum potential of a vacuum line.
3.6.3 Hopper off-loading
Although suction nozzles are generally associated with mobile systems such as for
spillage clearance and ship off-loading applications, they can equally be used in fixed
systems for the emptying of hoppers and silos. In this application the nozzle is usually
positioned close to the bottom of the hopper. A typical arrangement is illustrated in
Figure 3.25.
The vacuum nozzle is generally fitted into the hopper via an external sleeve so that
it can be easily removed when required. The controls over the primary and secondary
air are also arranged to be external to the hopper. The location of the control for pos-
itioning the outer sleeve with respect to the conveying pipeline can also be external to
the hopper. For these reasons a section of flexible hose is often incorporated into the
conveying pipeline close to the hopper. The hopper cannot be ‘drained’ clear of mater-
ial with this device, however.
3.7 Trickle valves
Trickle valves, as a device on their own, are only suitable for vacuum conveying sys-
tems, since there is no pressure drop against which to feed. The greatest problem with
this class of feeder is that of flow rate control, as discussed in relation to the control of
venturi feeders in Section 3.4.2. A sketch of a typical device is shown in Figure 3.26.
This type of device is widely used in industry, mainly because of the cost advan-
tage over almost any alternative method of feeding vacuum conveying systems.
To delivery
Flexible hose
Vacuum nozzle
Supply hopper
Figure 3.25 Application of vacuum nozzle to hopper off-loading.
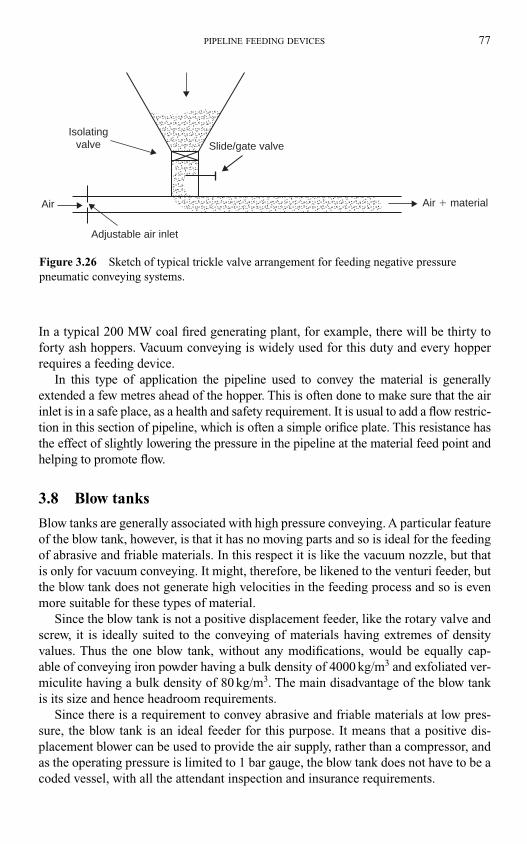
PIPELINE FEEDING DEVICES 77
In a typical 200 MW coal fired generating plant, for example, there will be thirty to
forty ash hoppers. Vacuum conveying is widely used for this duty and every hopper
requires a feeding device.
In this type of application the pipeline used to convey the material is generally
extended a few metres ahead of the hopper. This is often done to make sure that the air
inlet is in a safe place, as a health and safety requirement. It is usual to add a flow restric-
tion in this section of pipeline, which is often a simple orifice plate. This resistance has
the effect of slightly lowering the pressure in the pipeline at the material feed point and
helping to promote flow.
3.8 Blow tanks
Blow tanks are generally associated with high pressure conveying. A particular feature
of the blow tank, however, is that it has no moving parts and so is ideal for the feeding
of abrasive and friable materials. In this respect it is like the vacuum nozzle, but that
is only for vacuum conveying. It might, therefore, be likened to the venturi feeder, but
the blow tank does not generate high velocities in the feeding process and so is even
more suitable for these types of material.
Since the blow tank is not a positive displacement feeder, like the rotary valve and
screw, it is ideally suited to the conveying of materials having extremes of density
values. Thus the one blow tank, without any modifications, would be equally cap-
able of conveying iron powder having a bulk density of 4000 kg/m3 and exfoliated ver-
miculite having a bulk density of 80 kg/m3. The main disadvantage of the blow tank
is its size and hence headroom requirements.
Since there is a requirement to convey abrasive and friable materials at low pres-
sure, the blow tank is an ideal feeder for this purpose. It means that a positive dis-
placement blower can be used to provide the air supply, rather than a compressor, and
as the operating pressure is limited to 1 bar gauge, the blow tank does not have to be a
coded vessel, with all the attendant inspection and insurance requirements.
Slide/gate valve
Air � material
Adjustable air inlet
Air
Isolatingvalve
Figure 3.26 Sketch of typical trickle valve arrangement for feeding negative pressure
pneumatic conveying systems.
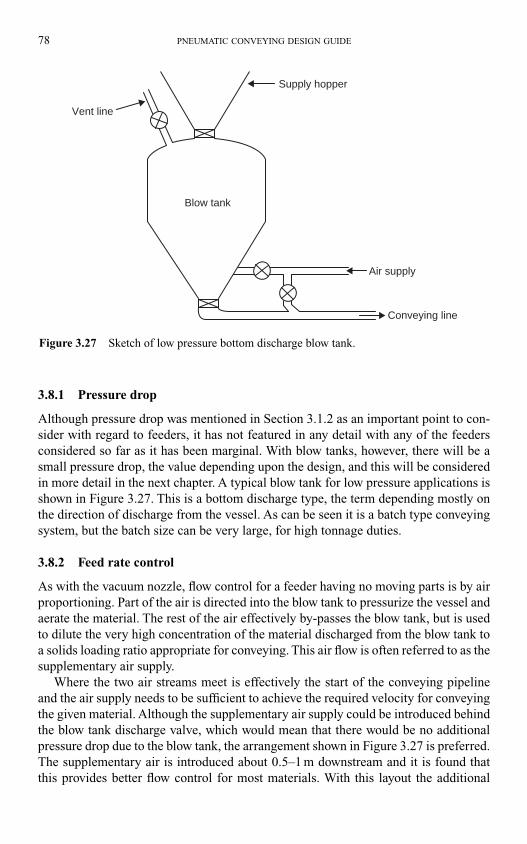
78 PNEUMATIC CONVEYING DESIGN GUIDE
3.8.1 Pressure drop
Although pressure drop was mentioned in Section 3.1.2 as an important point to con-
sider with regard to feeders, it has not featured in any detail with any of the feeders
considered so far as it has been marginal. With blow tanks, however, there will be a
small pressure drop, the value depending upon the design, and this will be considered
in more detail in the next chapter. A typical blow tank for low pressure applications is
shown in Figure 3.27. This is a bottom discharge type, the term depending mostly on
the direction of discharge from the vessel. As can be seen it is a batch type conveying
system, but the batch size can be very large, for high tonnage duties.
3.8.2 Feed rate control
As with the vacuum nozzle, flow control for a feeder having no moving parts is by air
proportioning. Part of the air is directed into the blow tank to pressurize the vessel and
aerate the material. The rest of the air effectively by-passes the blow tank, but is used
to dilute the very high concentration of the material discharged from the blow tank to
a solids loading ratio appropriate for conveying. This air flow is often referred to as the
supplementary air supply.
Where the two air streams meet is effectively the start of the conveying pipeline
and the air supply needs to be sufficient to achieve the required velocity for conveying
the given material. Although the supplementary air supply could be introduced behind
the blow tank discharge valve, which would mean that there would be no additional
pressure drop due to the blow tank, the arrangement shown in Figure 3.27 is preferred.
The supplementary air is introduced about 0.5–1 m downstream and it is found that
this provides better flow control for most materials. With this layout the additional
Vent line
Supply hopper
Blow tank
Air supply
Conveying line
Figure 3.27 Sketch of low pressure bottom discharge blow tank.
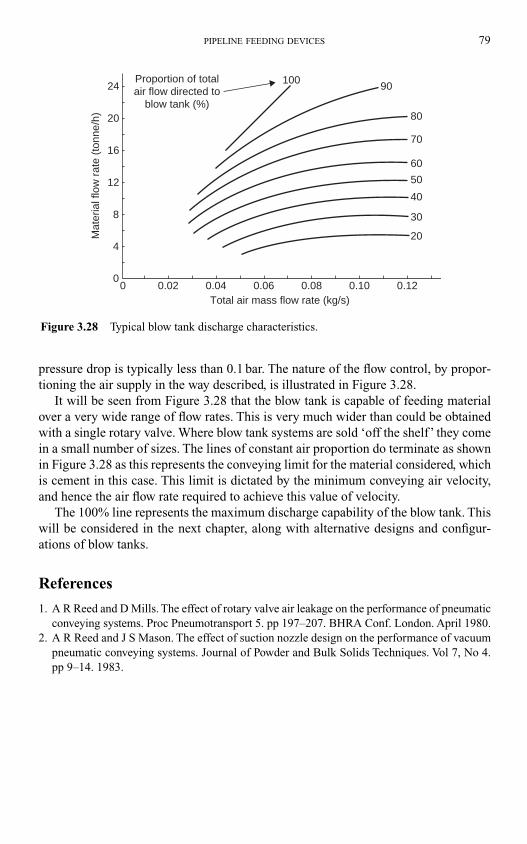
PIPELINE FEEDING DEVICES 79
pressure drop is typically less than 0.1 bar. The nature of the flow control, by propor-
tioning the air supply in the way described, is illustrated in Figure 3.28.
It will be seen from Figure 3.28 that the blow tank is capable of feeding material
over a very wide range of flow rates. This is very much wider than could be obtained
with a single rotary valve. Where blow tank systems are sold ‘off the shelf’ they come
in a small number of sizes. The lines of constant air proportion do terminate as shown
in Figure 3.28 as this represents the conveying limit for the material considered, which
is cement in this case. This limit is dictated by the minimum conveying air velocity,
and hence the air flow rate required to achieve this value of velocity.
The 100% line represents the maximum discharge capability of the blow tank. This
will be considered in the next chapter, along with alternative designs and configur-
ations of blow tanks.
References
1. A R Reed and D Mills. The effect of rotary valve air leakage on the performance of pneumatic
conveying systems. Proc Pneumotransport 5. pp 197–207. BHRA Conf. London. April 1980.
2. A R Reed and J S Mason. The effect of suction nozzle design on the performance of vacuum
pneumatic conveying systems. Journal of Powder and Bulk Solids Techniques. Vol 7, No 4.
pp 9–14. 1983.
24
20
16
12
8
4
0 0.02 0.04 0.06 0.08 0.10 0.120
10090
80
70
60
50
40
30
20
Total air mass flow rate (kg/s)
Mat
eria
l flo
w r
ate
(ton
ne/h
)Proportion of totalair flow directed to
blow tank (%)
Figure 3.28 Typical blow tank discharge characteristics.
4.1 Introduction
The use of high pressure systems in pneumatic conveying has been a long and slow
development. Part of this was probably due to a misunderstanding of the relationship
between high pressure and dense phase conveying. There was very little published
information on the subject and few universities, on a worldwide basis, were undertak-
ing research in the area. This was one of the main reasons for the Department of Trade
and Industry in the UK commissioning research work in the early 1980s for the prepar-
ation of the first edition of this Design Guide.
There was probably also a reluctance to venture into an unknown area, when the
rotary valve and positive displacement blower were so dominant. The blow tank was
being used, and at high pressure, but it was still very much a batch conveying system
with limited demand. With an increasing need for high tonnage flows and long distance
conveying, particularly in the cement and coal fired power generation industries, the
screw conveyor was developed and became dominant in this market for many years.
Then in the mid-1980s with the start of globalization, and increasing competition
in industry, manufacturing companies made advances with both rotary valves and
blow tanks. Two manufacturers in Europe developed a rotary valve that would operate
with air supply pressures greater than two bar gauge, and the use of lock hoppers was
introduced with blow tanks so that they could operate continuously at high pressure.
Today, most companies manufacturing rotary valves offer high pressure rotary
valves for a very wide range of materials, although they will be found most widely in
use in the chemicals industry. The initial impetus for the continuously operating blow
tank was to try to take over the market for high pressure screw feeders and this was
successful to a large extent. Demand for the screw feeder has fallen significantly and
that for the continuously operating blow tank has been well established.
4.1.1 Lock hoppers
Although the concept of lock hoppers has been known for a very long time, and has
been utilized in many other areas of industry, it has been slow in being adopted in pneu-
matic conveying. It is not only blow tanks that can benefit from their use, however. As
the lock hopper enables the feeder to operate without a pressure drop existing across
it, conventional rotary valves and conventional screw feeders can also be used for the
Chapter 4
Pipeline feeding devices Part 2: High pressure
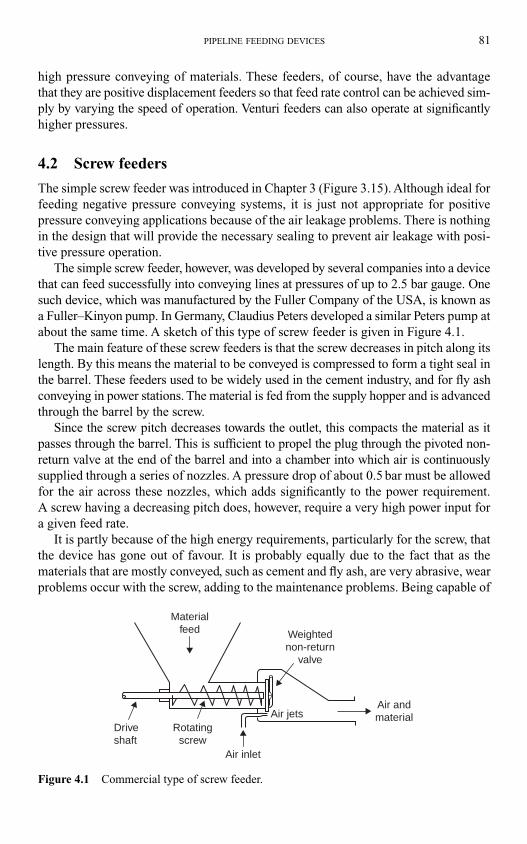
PIPELINE FEEDING DEVICES 81
high pressure conveying of materials. These feeders, of course, have the advantage
that they are positive displacement feeders so that feed rate control can be achieved sim-
ply by varying the speed of operation. Venturi feeders can also operate at significantly
higher pressures.
4.2 Screw feeders
The simple screw feeder was introduced in Chapter 3 (Figure 3.15). Although ideal for
feeding negative pressure conveying systems, it is just not appropriate for positive
pressure conveying applications because of the air leakage problems. There is nothing
in the design that will provide the necessary sealing to prevent air leakage with posi-
tive pressure operation.
The simple screw feeder, however, was developed by several companies into a device
that can feed successfully into conveying lines at pressures of up to 2.5 bar gauge. One
such device, which was manufactured by the Fuller Company of the USA, is known as
a Fuller–Kinyon pump. In Germany, Claudius Peters developed a similar Peters pump at
about the same time. A sketch of this type of screw feeder is given in Figure 4.1.
The main feature of these screw feeders is that the screw decreases in pitch along its
length. By this means the material to be conveyed is compressed to form a tight seal in
the barrel. These feeders used to be widely used in the cement industry, and for fly ash
conveying in power stations. The material is fed from the supply hopper and is advanced
through the barrel by the screw.
Since the screw pitch decreases towards the outlet, this compacts the material as it
passes through the barrel. This is sufficient to propel the plug through the pivoted non-
return valve at the end of the barrel and into a chamber into which air is continuously
supplied through a series of nozzles. A pressure drop of about 0.5 bar must be allowed
for the air across these nozzles, which adds significantly to the power requirement.
A screw having a decreasing pitch does, however, require a very high power input for
a given feed rate.
It is partly because of the high energy requirements, particularly for the screw, that
the device has gone out of favour. It is probably equally due to the fact that as the
materials that are mostly conveyed, such as cement and fly ash, are very abrasive, wear
problems occur with the screw, adding to the maintenance problems. Being capable of
Air inlet
Driveshaft
Rotatingscrew
Materialfeed
Air jetsAir andmaterial
Weightednon-return
valve
Figure 4.1 Commercial type of screw feeder.
continuous operation and having a high pressure capability means that it is often used
in closed loop conveying systems, when a high operating pressure is required.
For high pressure operation the device is only suitable for materials that can be com-
pressed, which generally restricts their use to materials that have very good air retention
properties, such as cement and fly ash. These are Group A materials in Geldart’s classi-
fication shown in Figure 2.17. Due to their very good air retention capability, their
bulk density can be increased by up to 50 per cent simply by means of vibration. With
Group B materials, however, the increase in bulk density achieved is typically about one-
third of this, which is insufficient. The seal against the high pressure conveying air is
effected in the reducing pitch screw. The required degree of compression cannot be
obtained with granular materials (Group B) and so air will leak through the feeder at
high operating pressure.
4.3 Rotary valves
The conventional rotary valve has been developed, as mentioned above, to have a
capability of feeding material into positive pressure pneumatic conveying systems at
pressures of up to 3–4 bar gauge. This is as a stand-alone feeder without the use of a
lock hopper. With a lock hopper there is no pressure drop across the rotary valve and
so a conventional rotary valve can operate at significantly higher pressures. This point
should be understood because it does tend to cause a lot of confusion.
The closed end type of rotor, illustrated in Figure 3.12b, provides a significantly
more rigid construction, and it is with this type of rotor that developments with much
higher pressure and lower leakage rate applications have been possible. This new gen-
eration of rotary valves are often used in low pressure systems, instead of the conven-
tional valve, simply because of the reduced air leakage.
With an end plate it is possible to provide a seal to significantly reduce the quantity
of air that leaks across the valve by this route, and a more rigid construction allows rotor
tip clearances to be reduced. Air leakage via the returning empty pockets remains a
problem, but by these various improvements the operating pressure differential has been
improved to about 3–4 bar gauge, compared with about 1 bar gauge for the conventional
rotary valve, as indicated on Figure 3.2.
4.4 Blow tanks
Blow tanks are often employed in pneumatic conveying systems because of their
capability of using high pressure air. A high pressure air supply is necessary if it is
required to convey over long distances in dilute phase, or to convey at high mass flow
rates over short distances through small bore pipelines. As an example of the latter,
cement was conveyed at 25 tonne/h over a distance of 100 m through a 2 in. (53 mm
actual) bore pipeline containing 17 bends, by the author, using a high pressure blow
tank, to provide data for the first edition of this Pneumatic Conveying Design Guide.
Blow tanks are neither restricted to dense phase conveying nor to high pressure use.
Low pressure blow tanks are often used as an alternative to screw feeders and rotary
valves for feeding pipelines, particularly if abrasive materials have to be conveyed, as
82 PNEUMATIC CONVEYING DESIGN GUIDE
was considered in the previous chapter on ‘low pressure feeding devices’. Materials
not capable of being conveyed in dense phase can be conveyed equally well in dilute
phase suspension flow from a blow tank. Depending upon their pressure rating, blow
tanks have to be designed and manufactured to an appropriate pressure vessel code, and
are subject to insurance and inspection. They can, therefore, be more expensive than
alternative feeding systems.
The blow tank has no moving parts and so both wear of the feeder and degradation
of the material are significantly reduced. Another advantage of these systems is that
the blow tank also serves as the feeder, and so the problems associated with feeding
against an adverse pressure gradient, such as air leakage, do not arise. There will, how-
ever, be a small pressure drop across the blow tank in order to achieve material feed,
and so this must be taken into account when evaluating air requirements.
In most blow tank systems the air supply to the blow tank is split into two streams.
One air stream pressurizes the blow tank and may also fluidize or aerate the material
in the blow tank. This air stream serves to discharge the material from the blow tank.
The other air stream is fed directly into the discharge line just downstream of the blow
tank. This is generally referred to as supplementary air and it provides the necessary
control over the material flow in the conveying line.
4.4.1 Basic blow tank types
There are numerous different types of blow tank, and for each type alternative config-
urations are possible. The basic features of different blow tanks are essentially similar,
but different arrangements can result in very different conveying capabilities and con-
trol characteristics.
There are also a variety of blow tank configurations that are widely used. Apart
from single blow tanks there are twin blow tank arrangements, with both parallel and
series arrangements. Blow tanks operating in parallel basically consist of two identi-
cal blow tanks, generally placed alongside each other, and while one is being filled the
other is being discharged, generally as a means of improving cycling efficiency.
Twin blow tanks that operate in series is another term for a single blow tank oper-
ating with a lock hopper and this is considered as a separate topic within this chapter.
The top vessel is not a blow tank, but is the lock hopper, and this allows conveying on
a continuous basis from the blow tank beneath. Due to headroom problems a further
development here is to position the lock hopper alongside the blow tank.
4.4.1.1 Top and bottom discharge
The blow tank shown in Figure 4.2 is a top discharge type. It is shown with a discharge
valve so that it can be isolated from the conveying line. It also has a vent line and
valve so that it can be de-pressurized independently of the conveying line. Discharge
is arranged through an off-take pipe which is positioned above the fluidizing mem-
brane. The material is discharged vertically up and the discharge pipe exits the blow
tank through the top of the vessel, and hence the term ‘top discharge’ in this case.
With this type of blow tank, however, it is not possible to completely discharge the
contents, although with a conical membrane very little material will remain. Where a
PIPELINE FEEDING DEVICES 83
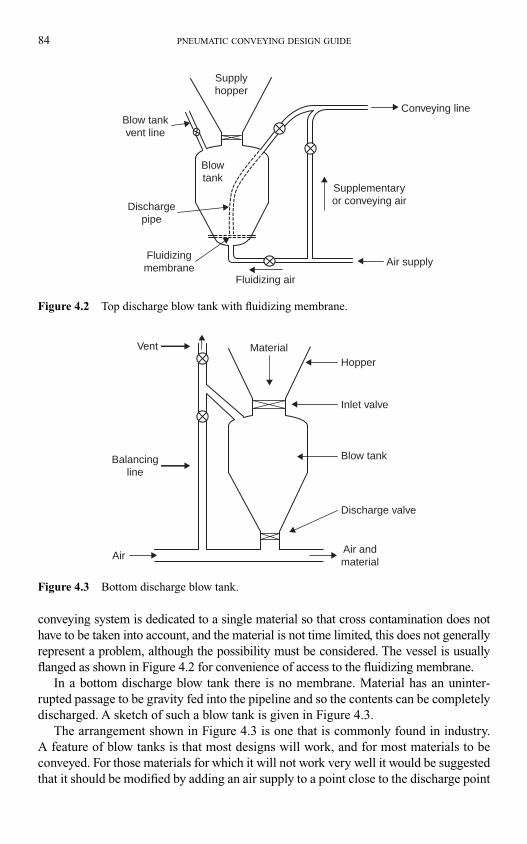
84 PNEUMATIC CONVEYING DESIGN GUIDE
conveying system is dedicated to a single material so that cross contamination does not
have to be taken into account, and the material is not time limited, this does not generally
represent a problem, although the possibility must be considered. The vessel is usually
flanged as shown in Figure 4.2 for convenience of access to the fluidizing membrane.
In a bottom discharge blow tank there is no membrane. Material has an uninter-
rupted passage to be gravity fed into the pipeline and so the contents can be completely
discharged. A sketch of such a blow tank is given in Figure 4.3.
The arrangement shown in Figure 4.3 is one that is commonly found in industry.
A feature of blow tanks is that most designs will work, and for most materials to be
conveyed. For those materials for which it will not work very well it would be suggested
that it should be modified by adding an air supply to a point close to the discharge point
Dischargepipe
Fluidizingmembrane
Fluidizing air
Air supply
Supplementaryor conveying air
Conveying line
Supplyhopper
Blowtank
Blow tankvent line
Figure 4.2 Top discharge blow tank with fluidizing membrane.
Balancingline
AirAir andmaterial
Discharge valve
Blow tank
Inlet valve
HopperMaterialVent
Figure 4.3 Bottom discharge blow tank.
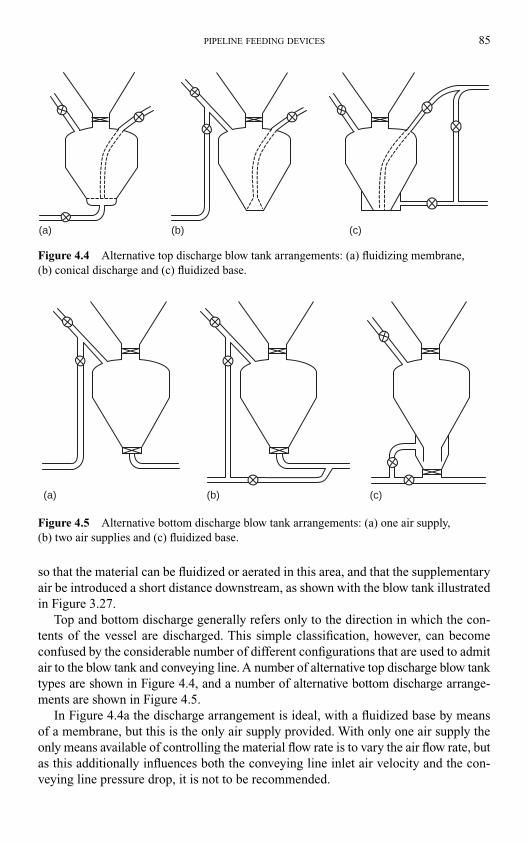
PIPELINE FEEDING DEVICES 85
so that the material can be fluidized or aerated in this area, and that the supplementary
air be introduced a short distance downstream, as shown with the blow tank illustrated
in Figure 3.27.
Top and bottom discharge generally refers only to the direction in which the con-
tents of the vessel are discharged. This simple classification, however, can become
confused by the considerable number of different configurations that are used to admit
air to the blow tank and conveying line. A number of alternative top discharge blow tank
types are shown in Figure 4.4, and a number of alternative bottom discharge arrange-
ments are shown in Figure 4.5.
In Figure 4.4a the discharge arrangement is ideal, with a fluidized base by means
of a membrane, but this is the only air supply provided. With only one air supply the
only means available of controlling the material flow rate is to vary the air flow rate, but
as this additionally influences both the conveying line inlet air velocity and the con-
veying line pressure drop, it is not to be recommended.
(a) (b) (c)
Figure 4.4 Alternative top discharge blow tank arrangements: (a) fluidizing membrane,
(b) conical discharge and (c) fluidized base.
(a) (b) (c)
Figure 4.5 Alternative bottom discharge blow tank arrangements: (a) one air supply,
(b) two air supplies and (c) fluidized base.
The situation with regard to blow tank control is illustrated with Figure 3.28. The
100 per cent line represents the situation here and illustrates that there is little scope
for control. If the conveying line to be fed is long, the pipeline is likely to block if the
air supply pressure is not high enough, since the maximum material flow rate will
be delivered. Only with supplementary air can the material flow rate be controlled to
a lower value to match the pressure capability of the air supply.
Figure 4.4b presents a similar situation in that there is only one air supply. The situ-
ation here is potentially worse, for the air has to permeate through the material to get
to the point of discharge. For materials that have a wide particle size distribution, and
that de-aerate rapidly, the system is unlikely to work.
The blow tank illustrated in Figure 4.4c is ideal. Although it only has one air sup-
ply into the blow tank, that is used to fluidize the material, and a supplementary air
supply is also available to dilute the material discharged to the required solids loading
ratio for conveying through the pipeline. In this design the air enters a plenum chamber
at the base of the blow tank and enters the blow tank in the area where the material is
discharged. There is a gap of about 1 mm between the bottom of the conical wall of the
blow tank and the flat base, and it is through here that the air passes to both aerate the
material and pressurize the blow tank.
An air supply to the top of the blow tank is not essential, although it will increase the
rate of pressurization. The use of the air through the base of the blow tank is particu-
larly useful in transport applications and in situations where material is left for a period
of time in a blow tank before being discharged. In both of these situations the material
will tend to compact, de-aerate and consolidate and will be difficult to discharge. With
fluidizing air entering at the base, also being used to pressurize the blow tank, it has the
effect of stirring up the material and aerating the entire batch prior to being discharged.
It will be seen that this is a top discharge blow tank and has no membrane. A porous
membrane is more effective at fluidizing material than an annular slot and so in some
cases an additional air supply is taken directly to the entrance of the off-take pipe to pro-
vide further fluidization in this region. This is sometimes necessary for materials with
very poor air retention, for they could block the discharge pipe if only a small percent-
age of the total air supply is directed to the blow tank for aerating the material and
pressurizing the blow tank. At the end of the conveying cycle a small residue of mater-
ial is likely to remain in the bottom of the blow tank.
The blow tank shown in Figure 4.5a has a similar deficiency to that of Figure 4.4b,
with a single air supply into the top, although the bottom discharge blow tank has the
advantage of gravity discharge. In this case it is quite likely to discharge material but
with very little control, as discussed earlier. The application of these configurations of
blow tank, therefore, is strictly limited unless air is introduced into the pipeline down-
stream of the blow tank via trace lines or boosters.
The blow tank shown in Figure 4.5b will also be limited in terms of the type of
material that can be conveyed, and probably in terms of the discharge rate that can be
achieved. There are two air supplies, which are necessary for full control, but for many
materials air needs to be introduced near the discharge point to help promote flow.
The blow tank in Figure 4.5c has an aeration device similar to that shown in Figure
4.4c. The air enters into a plenum chamber and fluidizes or aerates the material in the
86 PNEUMATIC CONVEYING DESIGN GUIDE
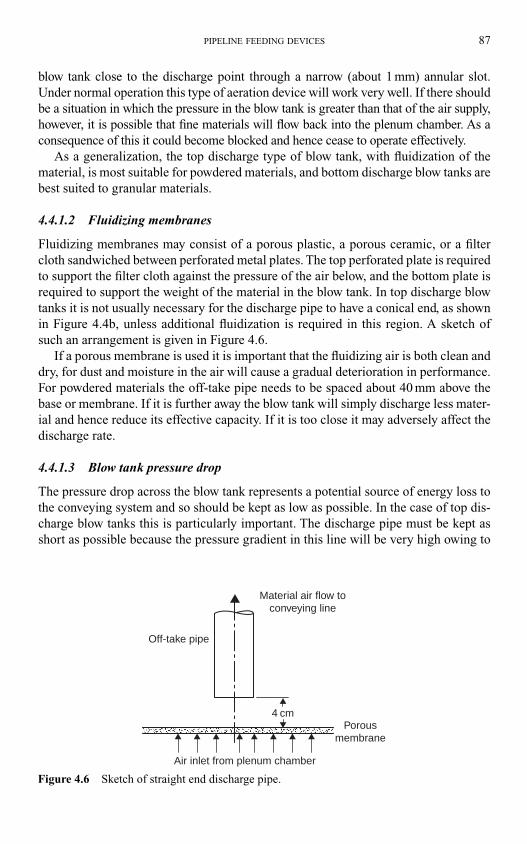
blow tank close to the discharge point through a narrow (about 1 mm) annular slot.
Under normal operation this type of aeration device will work very well. If there should
be a situation in which the pressure in the blow tank is greater than that of the air supply,
however, it is possible that fine materials will flow back into the plenum chamber. As a
consequence of this it could become blocked and hence cease to operate effectively.
As a generalization, the top discharge type of blow tank, with fluidization of the
material, is most suitable for powdered materials, and bottom discharge blow tanks are
best suited to granular materials.
4.4.1.2 Fluidizing membranes
Fluidizing membranes may consist of a porous plastic, a porous ceramic, or a filter
cloth sandwiched between perforated metal plates. The top perforated plate is required
to support the filter cloth against the pressure of the air below, and the bottom plate is
required to support the weight of the material in the blow tank. In top discharge blow
tanks it is not usually necessary for the discharge pipe to have a conical end, as shown
in Figure 4.4b, unless additional fluidization is required in this region. A sketch of
such an arrangement is given in Figure 4.6.
If a porous membrane is used it is important that the fluidizing air is both clean and
dry, for dust and moisture in the air will cause a gradual deterioration in performance.
For powdered materials the off-take pipe needs to be spaced about 40 mm above the
base or membrane. If it is further away the blow tank will simply discharge less mater-
ial and hence reduce its effective capacity. If it is too close it may adversely affect the
discharge rate.
4.4.1.3 Blow tank pressure drop
The pressure drop across the blow tank represents a potential source of energy loss to
the conveying system and so should be kept as low as possible. In the case of top dis-
charge blow tanks this is particularly important. The discharge pipe must be kept as
short as possible because the pressure gradient in this line will be very high owing to
PIPELINE FEEDING DEVICES 87
Off-take pipe
Air inlet from plenum chamber
4 cmPorous
membrane
Material air flow toconveying line
Figure 4.6 Sketch of straight end discharge pipe.
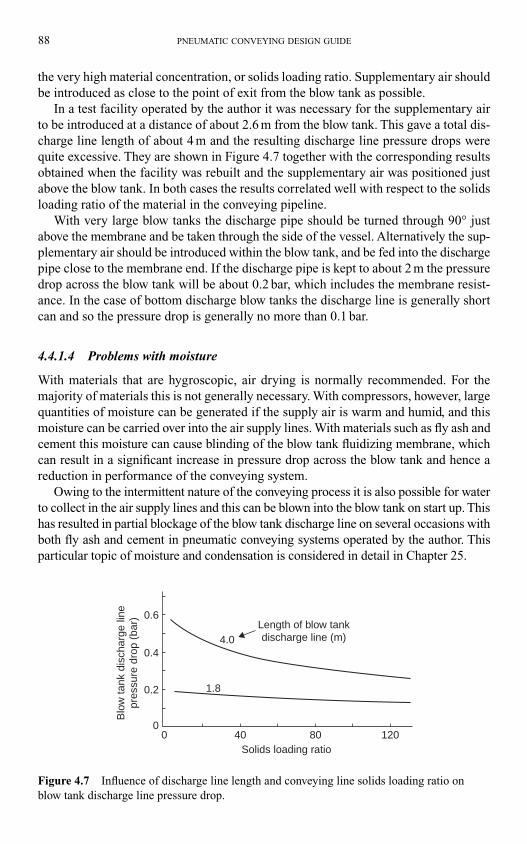
88 PNEUMATIC CONVEYING DESIGN GUIDE
the very high material concentration, or solids loading ratio. Supplementary air should
be introduced as close to the point of exit from the blow tank as possible.
In a test facility operated by the author it was necessary for the supplementary air
to be introduced at a distance of about 2.6 m from the blow tank. This gave a total dis-
charge line length of about 4 m and the resulting discharge line pressure drops were
quite excessive. They are shown in Figure 4.7 together with the corresponding results
obtained when the facility was rebuilt and the supplementary air was positioned just
above the blow tank. In both cases the results correlated well with respect to the solids
loading ratio of the material in the conveying pipeline.
With very large blow tanks the discharge pipe should be turned through 90° just
above the membrane and be taken through the side of the vessel. Alternatively the sup-
plementary air should be introduced within the blow tank, and be fed into the discharge
pipe close to the membrane end. If the discharge pipe is kept to about 2 m the pressure
drop across the blow tank will be about 0.2 bar, which includes the membrane resist-
ance. In the case of bottom discharge blow tanks the discharge line is generally short
can and so the pressure drop is generally no more than 0.1 bar.
4.4.1.4 Problems with moisture
With materials that are hygroscopic, air drying is normally recommended. For the
majority of materials this is not generally necessary. With compressors, however, large
quantities of moisture can be generated if the supply air is warm and humid, and this
moisture can be carried over into the air supply lines. With materials such as fly ash and
cement this moisture can cause blinding of the blow tank fluidizing membrane, which
can result in a significant increase in pressure drop across the blow tank and hence a
reduction in performance of the conveying system.
Owing to the intermittent nature of the conveying process it is also possible for water
to collect in the air supply lines and this can be blown into the blow tank on start up. This
has resulted in partial blockage of the blow tank discharge line on several occasions with
both fly ash and cement in pneumatic conveying systems operated by the author. This
particular topic of moisture and condensation is considered in detail in Chapter 25.
0 40 80 120Solids loading ratio
1.8
4.0Length of blow tankdischarge line (m)
Blo
w ta
nk d
isch
arge
line
pres
sure
dro
p (b
ar) 0.6
0.4
0.2
0
Figure 4.7 Influence of discharge line length and conveying line solids loading ratio on
blow tank discharge line pressure drop.
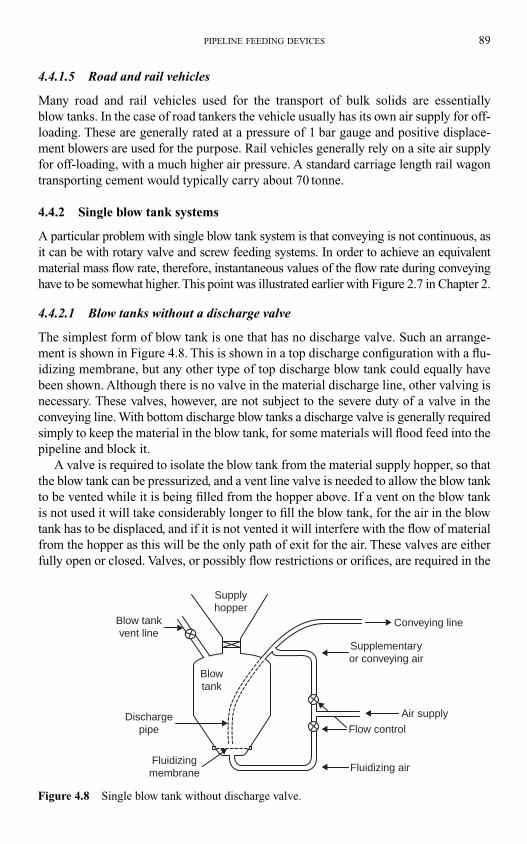
4.4.1.5 Road and rail vehicles
Many road and rail vehicles used for the transport of bulk solids are essentially
blow tanks. In the case of road tankers the vehicle usually has its own air supply for off-
loading. These are generally rated at a pressure of 1 bar gauge and positive displace-
ment blowers are used for the purpose. Rail vehicles generally rely on a site air supply
for off-loading, with a much higher air pressure. A standard carriage length rail wagon
transporting cement would typically carry about 70 tonne.
4.4.2 Single blow tank systems
A particular problem with single blow tank system is that conveying is not continuous, as
it can be with rotary valve and screw feeding systems. In order to achieve an equivalent
material mass flow rate, therefore, instantaneous values of the flow rate during conveying
have to be somewhat higher. This point was illustrated earlier with Figure 2.7 in Chapter 2.
4.4.2.1 Blow tanks without a discharge valve
The simplest form of blow tank is one that has no discharge valve. Such an arrange-
ment is shown in Figure 4.8. This is shown in a top discharge configuration with a flu-
idizing membrane, but any other type of top discharge blow tank could equally have
been shown. Although there is no valve in the material discharge line, other valving is
necessary. These valves, however, are not subject to the severe duty of a valve in the
conveying line. With bottom discharge blow tanks a discharge valve is generally required
simply to keep the material in the blow tank, for some materials will flood feed into the
pipeline and block it.
A valve is required to isolate the blow tank from the material supply hopper, so that
the blow tank can be pressurized, and a vent line valve is needed to allow the blow tank
to be vented while it is being filled from the hopper above. If a vent on the blow tank
is not used it will take considerably longer to fill the blow tank, for the air in the blow
tank has to be displaced, and if it is not vented it will interfere with the flow of material
from the hopper as this will be the only path of exit for the air. These valves are either
fully open or closed. Valves, or possibly flow restrictions or orifices, are required in the
PIPELINE FEEDING DEVICES 89
Fluidizing air
Air supply
Flow control
Fluidizingmembrane
Dischargepipe
Blow tankvent line
Supplyhopper
Blowtank
Conveying line
Supplementaryor conveying air
Figure 4.8 Single blow tank without discharge valve.
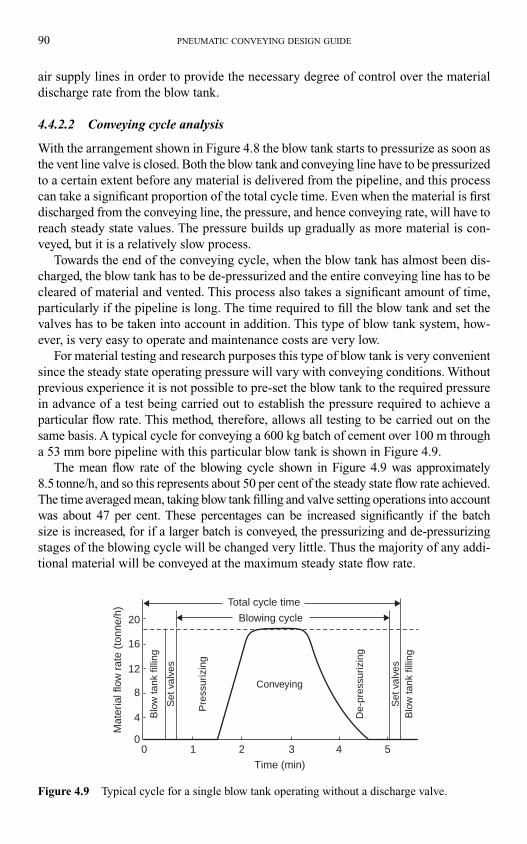
air supply lines in order to provide the necessary degree of control over the material
discharge rate from the blow tank.
4.4.2.2 Conveying cycle analysis
With the arrangement shown in Figure 4.8 the blow tank starts to pressurize as soon as
the vent line valve is closed. Both the blow tank and conveying line have to be pressurized
to a certain extent before any material is delivered from the pipeline, and this process
can take a significant proportion of the total cycle time. Even when the material is first
discharged from the conveying line, the pressure, and hence conveying rate, will have to
reach steady state values. The pressure builds up gradually as more material is con-
veyed, but it is a relatively slow process.
Towards the end of the conveying cycle, when the blow tank has almost been dis-
charged, the blow tank has to be de-pressurized and the entire conveying line has to be
cleared of material and vented. This process also takes a significant amount of time,
particularly if the pipeline is long. The time required to fill the blow tank and set the
valves has to be taken into account in addition. This type of blow tank system, how-
ever, is very easy to operate and maintenance costs are very low.
For material testing and research purposes this type of blow tank is very convenient
since the steady state operating pressure will vary with conveying conditions. Without
previous experience it is not possible to pre-set the blow tank to the required pressure
in advance of a test being carried out to establish the pressure required to achieve a
particular flow rate. This method, therefore, allows all testing to be carried out on the
same basis. A typical cycle for conveying a 600 kg batch of cement over 100 m through
a 53 mm bore pipeline with this particular blow tank is shown in Figure 4.9.
The mean flow rate of the blowing cycle shown in Figure 4.9 was approximately
8.5 tonne/h, and so this represents about 50 per cent of the steady state flow rate achieved.
The time averaged mean, taking blow tank filling and valve setting operations into account
was about 47 per cent. These percentages can be increased significantly if the batch
size is increased, for if a larger batch is conveyed, the pressurizing and de-pressurizing
stages of the blowing cycle will be changed very little. Thus the majority of any addi-
tional material will be conveyed at the maximum steady state flow rate.
90 PNEUMATIC CONVEYING DESIGN GUIDE
0 1 2 3 4 5
Time (min)
Conveying
Total cycle time
Set
val
ves
Blo
w ta
nk fi
lling
Pre
ssur
izin
g
Set
val
ves
Blo
w ta
nk fi
lling
De-
pres
suriz
ing
Mat
eria
l flo
w r
ate
(ton
ne/h
)
Blowing cycle20
16
12
8
4
0
Figure 4.9 Typical cycle for a single blow tank operating without a discharge valve.
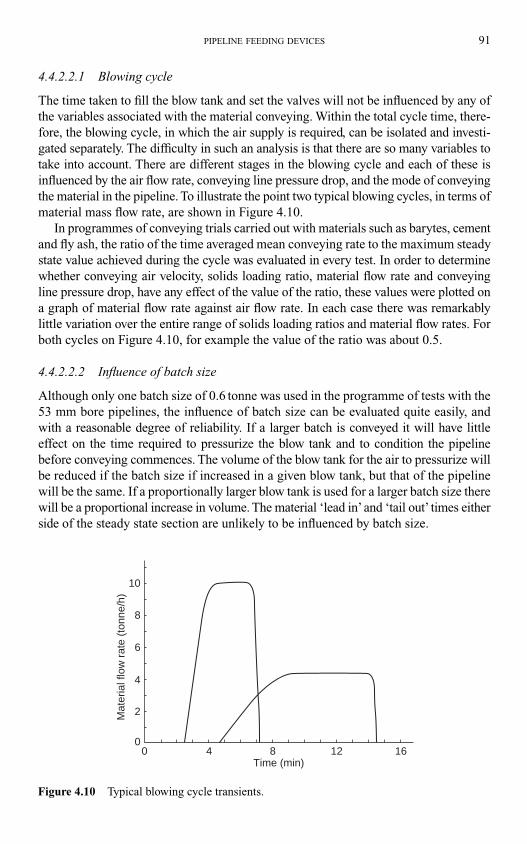
4.4.2.2.1 Blowing cycle
The time taken to fill the blow tank and set the valves will not be influenced by any of
the variables associated with the material conveying. Within the total cycle time, there-
fore, the blowing cycle, in which the air supply is required, can be isolated and investi-
gated separately. The difficulty in such an analysis is that there are so many variables to
take into account. There are different stages in the blowing cycle and each of these is
influenced by the air flow rate, conveying line pressure drop, and the mode of conveying
the material in the pipeline. To illustrate the point two typical blowing cycles, in terms of
material mass flow rate, are shown in Figure 4.10.
In programmes of conveying trials carried out with materials such as barytes, cement
and fly ash, the ratio of the time averaged mean conveying rate to the maximum steady
state value achieved during the cycle was evaluated in every test. In order to determine
whether conveying air velocity, solids loading ratio, material flow rate and conveying
line pressure drop, have any effect of the value of the ratio, these values were plotted on
a graph of material flow rate against air flow rate. In each case there was remarkably
little variation over the entire range of solids loading ratios and material flow rates. For
both cycles on Figure 4.10, for example the value of the ratio was about 0.5.
4.4.2.2.2 Influence of batch size
Although only one batch size of 0.6 tonne was used in the programme of tests with the
53 mm bore pipelines, the influence of batch size can be evaluated quite easily, and
with a reasonable degree of reliability. If a larger batch is conveyed it will have little
effect on the time required to pressurize the blow tank and to condition the pipeline
before conveying commences. The volume of the blow tank for the air to pressurize will
be reduced if the batch size if increased in a given blow tank, but that of the pipeline
will be the same. If a proportionally larger blow tank is used for a larger batch size there
will be a proportional increase in volume. The material ‘lead in’and ‘tail out’ times either
side of the steady state section are unlikely to be influenced by batch size.
PIPELINE FEEDING DEVICES 91
10
8
6
4
2
00 4 8 12 16
Time (min)
Mat
eria
l flo
w r
ate
(ton
ne/h
)
Figure 4.10 Typical blowing cycle transients.
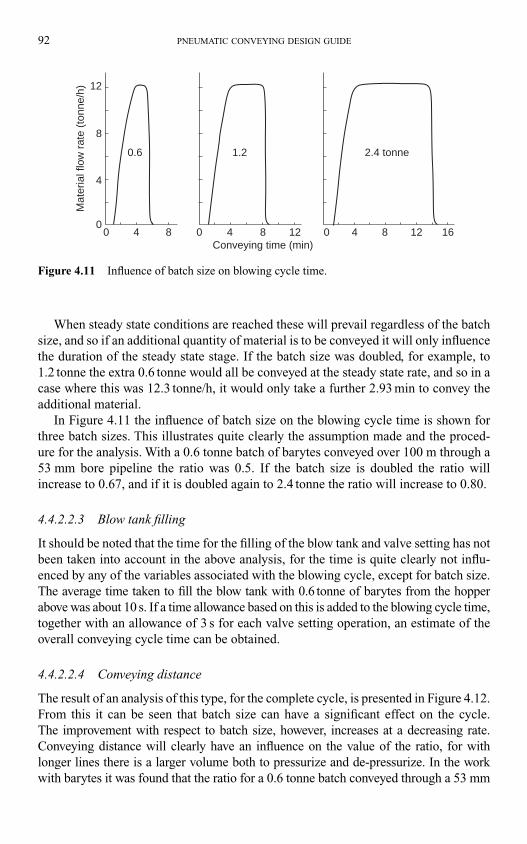
92 PNEUMATIC CONVEYING DESIGN GUIDE
When steady state conditions are reached these will prevail regardless of the batch
size, and so if an additional quantity of material is to be conveyed it will only influence
the duration of the steady state stage. If the batch size was doubled, for example, to
1.2 tonne the extra 0.6 tonne would all be conveyed at the steady state rate, and so in a
case where this was 12.3 tonne/h, it would only take a further 2.93 min to convey the
additional material.
In Figure 4.11 the influence of batch size on the blowing cycle time is shown for
three batch sizes. This illustrates quite clearly the assumption made and the proced-
ure for the analysis. With a 0.6 tonne batch of barytes conveyed over 100 m through a
53 mm bore pipeline the ratio was 0.5. If the batch size is doubled the ratio will
increase to 0.67, and if it is doubled again to 2.4 tonne the ratio will increase to 0.80.
4.4.2.2.3 Blow tank filling
It should be noted that the time for the filling of the blow tank and valve setting has not
been taken into account in the above analysis, for the time is quite clearly not influ-
enced by any of the variables associated with the blowing cycle, except for batch size.
The average time taken to fill the blow tank with 0.6 tonne of barytes from the hopper
above was about 10 s. If a time allowance based on this is added to the blowing cycle time,
together with an allowance of 3 s for each valve setting operation, an estimate of the
overall conveying cycle time can be obtained.
4.4.2.2.4 Conveying distance
The result of an analysis of this type, for the complete cycle, is presented in Figure 4.12.
From this it can be seen that batch size can have a significant effect on the cycle.
The improvement with respect to batch size, however, increases at a decreasing rate.
Conveying distance will clearly have an influence on the value of the ratio, for with
longer lines there is a larger volume both to pressurize and de-pressurize. In the work
with barytes it was found that the ratio for a 0.6 tonne batch conveyed through a 53 mm
12
8
0.6 1.2 2.4 tonne
Conveying time (min)
Mat
eria
l flo
w r
ate
(ton
ne/h
)
4
00 4 8 0 4 8 12 0 4 8 12 16
Figure 4.11 Influence of batch size on blowing cycle time.
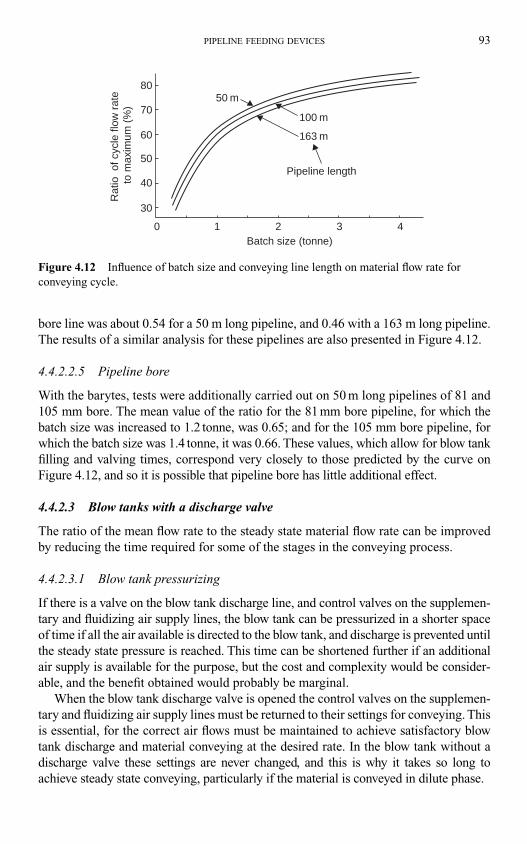
PIPELINE FEEDING DEVICES 93
bore line was about 0.54 for a 50 m long pipeline, and 0.46 with a 163 m long pipeline.
The results of a similar analysis for these pipelines are also presented in Figure 4.12.
4.4.2.2.5 Pipeline bore
With the barytes, tests were additionally carried out on 50 m long pipelines of 81 and
105 mm bore. The mean value of the ratio for the 81 mm bore pipeline, for which the
batch size was increased to 1.2 tonne, was 0.65; and for the 105 mm bore pipeline, for
which the batch size was 1.4 tonne, it was 0.66. These values, which allow for blow tank
filling and valving times, correspond very closely to those predicted by the curve on
Figure 4.12, and so it is possible that pipeline bore has little additional effect.
4.4.2.3 Blow tanks with a discharge valve
The ratio of the mean flow rate to the steady state material flow rate can be improved
by reducing the time required for some of the stages in the conveying process.
4.4.2.3.1 Blow tank pressurizing
If there is a valve on the blow tank discharge line, and control valves on the supplemen-
tary and fluidizing air supply lines, the blow tank can be pressurized in a shorter space
of time if all the air available is directed to the blow tank, and discharge is prevented until
the steady state pressure is reached. This time can be shortened further if an additional
air supply is available for the purpose, but the cost and complexity would be consider-
able, and the benefit obtained would probably be marginal.
When the blow tank discharge valve is opened the control valves on the supplemen-
tary and fluidizing air supply lines must be returned to their settings for conveying. This
is essential, for the correct air flows must be maintained to achieve satisfactory blow
tank discharge and material conveying at the desired rate. In the blow tank without a
discharge valve these settings are never changed, and this is why it takes so long to
achieve steady state conveying, particularly if the material is conveyed in dilute phase.
0
80
70
60
50
40
30
50 m
100 m
163 m
Pipeline length
Rat
io o
f cyc
le fl
ow r
ate
to m
axim
um (
%)
1 2 3 4Batch size (tonne)
Figure 4.12 Influence of batch size and conveying line length on material flow rate for
conveying cycle.
94 PNEUMATIC CONVEYING DESIGN GUIDE
4.4.2.3.2 Blow tank venting
If there is a vent line between the blow tank and the supply hopper it will also be possible
to reduce the time required for de-pressurizing the system. As soon as the blow tank is
empty, the discharge valve should be shut and the vent line opened. It will also be neces-
sary to shut the blow tank fluidizing air supply valve and fully open the supplementary air
supply valve. By this means the blow tank can be isolated from both the air supply and the
conveying line, and the processes associated with each can be carried out simultaneously.
By this means the blow tank can be de-pressurized very quickly in isolation from
the conveying line. The total air supply will still be available to the pipeline so that this
can be purged separately, and at the same time. This will also prevent the large volume of
air in the blow tank from expanding rapidly through the conveying line, thereby causing
very high air velocities and possible severe pipeline erosion during the venting process if
the conveyed material is abrasive.
Isolation of the blow tank will also reduce the loading on the filtration unit at this
time in the conveying cycle. It is important that this surge of air at the end of the cycle
is taken into account when sizing the filters for the plant, regardless of the mode of blow
tank operation, but particularly if the blow tank is not vented in isolation. If the blow tank
is vented to the supply hopper it is equally essential that the filter on the supply hop-
per is also correctly sized for the anticipated volumetric flow rate.
4.4.3 Single blow tank control
With rotary valves and screw feeders, material flow rate can be controlled, over a
limited range, simply by varying the drive speed. Blow tanks, as already mentioned in
Chapter 3, have no moving parts, and yet turn-down ratios of 10:1 can be achieved
quite successfully.
4.4.3.1 Air proportioning
Control of a blow tank is achieved by proportioning the total air supply between that
which is directed to the blow tank and that which goes directly to the start of the con-
veying line. The total air supply is used to convey the material through the pipeline.
4.4.3.1.1 Blow tank air
The air directed to the blow tank is used to pressurize the blow tank. This air supply
may also aerate or fluidize the material, depending upon the bulk characteristics of the
material. The blow tank air discharges the material from the blow tank into the convey-
ing line. The solids loading ratio of the material in the blow tank discharge line can be
extremely high, and hence there is a pressure drop associated with this feeding. This is
why supplementary air is necessary, unless the conveying line is very short and high
pressure air is available.
4.4.3.1.2 Supplementary air
The supplementary air passes directly to the start of the conveying line at the blow
tank discharge point. The supplementary air effectively dilutes the flow of material for
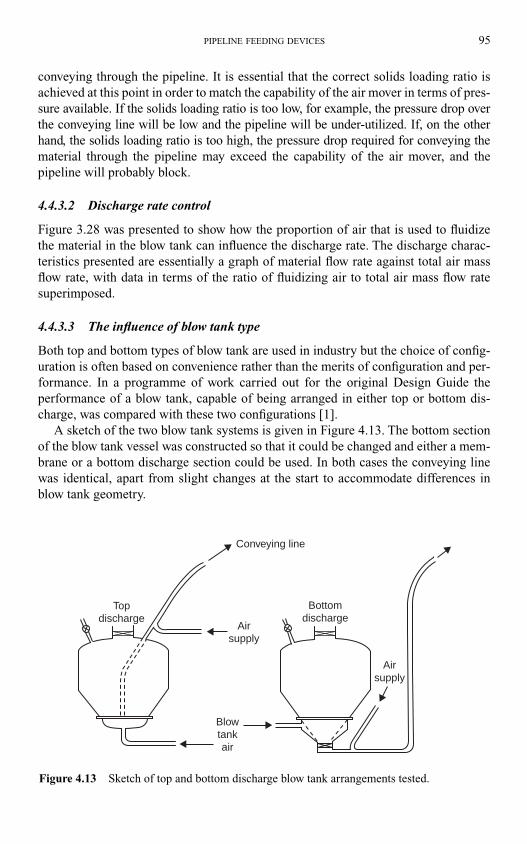
PIPELINE FEEDING DEVICES 95
conveying through the pipeline. It is essential that the correct solids loading ratio is
achieved at this point in order to match the capability of the air mover in terms of pres-
sure available. If the solids loading ratio is too low, for example, the pressure drop over
the conveying line will be low and the pipeline will be under-utilized. If, on the other
hand, the solids loading ratio is too high, the pressure drop required for conveying the
material through the pipeline may exceed the capability of the air mover, and the
pipeline will probably block.
4.4.3.2 Discharge rate control
Figure 3.28 was presented to show how the proportion of air that is used to fluidize
the material in the blow tank can influence the discharge rate. The discharge charac-
teristics presented are essentially a graph of material flow rate against total air mass
flow rate, with data in terms of the ratio of fluidizing air to total air mass flow rate
superimposed.
4.4.3.3 The influence of blow tank type
Both top and bottom types of blow tank are used in industry but the choice of config-
uration is often based on convenience rather than the merits of configuration and per-
formance. In a programme of work carried out for the original Design Guide the
performance of a blow tank, capable of being arranged in either top or bottom dis-
charge, was compared with these two configurations [1].
A sketch of the two blow tank systems is given in Figure 4.13. The bottom section
of the blow tank vessel was constructed so that it could be changed and either a mem-
brane or a bottom discharge section could be used. In both cases the conveying line
was identical, apart from slight changes at the start to accommodate differences in
blow tank geometry.
Topdischarge
Conveying line
Blowtankair
Bottomdischarge
Airsupply
Airsupply
Figure 4.13 Sketch of top and bottom discharge blow tank arrangements tested.
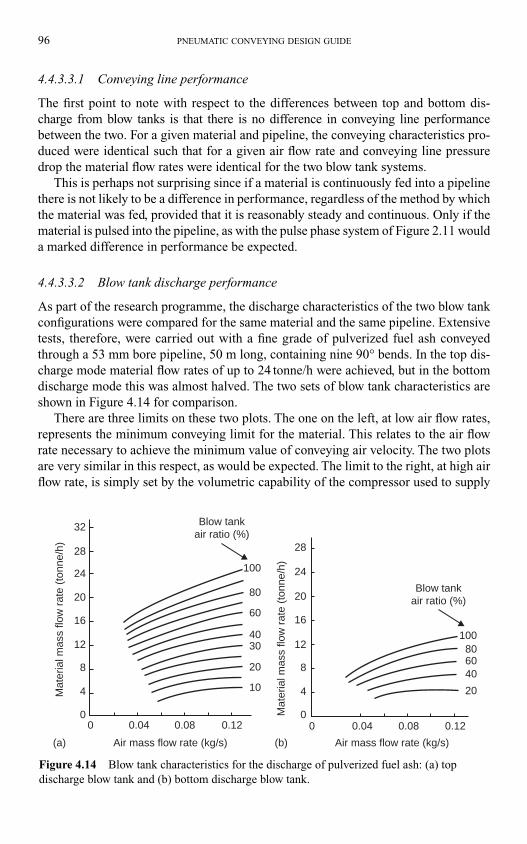
96 PNEUMATIC CONVEYING DESIGN GUIDE
4.4.3.3.1 Conveying line performance
The first point to note with respect to the differences between top and bottom dis-
charge from blow tanks is that there is no difference in conveying line performance
between the two. For a given material and pipeline, the conveying characteristics pro-
duced were identical such that for a given air flow rate and conveying line pressure
drop the material flow rates were identical for the two blow tank systems.
This is perhaps not surprising since if a material is continuously fed into a pipeline
there is not likely to be a difference in performance, regardless of the method by which
the material was fed, provided that it is reasonably steady and continuous. Only if the
material is pulsed into the pipeline, as with the pulse phase system of Figure 2.11 would
a marked difference in performance be expected.
4.4.3.3.2 Blow tank discharge performance
As part of the research programme, the discharge characteristics of the two blow tank
configurations were compared for the same material and the same pipeline. Extensive
tests, therefore, were carried out with a fine grade of pulverized fuel ash conveyed
through a 53 mm bore pipeline, 50 m long, containing nine 90° bends. In the top dis-
charge mode material flow rates of up to 24 tonne/h were achieved, but in the bottom
discharge mode this was almost halved. The two sets of blow tank characteristics are
shown in Figure 4.14 for comparison.
There are three limits on these two plots. The one on the left, at low air flow rates,
represents the minimum conveying limit for the material. This relates to the air flow
rate necessary to achieve the minimum value of conveying air velocity. The two plots
are very similar in this respect, as would be expected. The limit to the right, at high air
flow rate, is simply set by the volumetric capability of the compressor used to supply
Blow tankair ratio (%)
Blow tankair ratio (%)
Air mass flow rate (kg/s)
100806040
20
0.120.080.040
Air mass flow rate (kg/s)
Mat
eria
l mas
s flo
w r
ate
(ton
ne/h
)
Mat
eria
l mas
s flo
w r
ate
(ton
ne/h
)
0.120.080.0400
4
8
12
16
20
24100
80
60
4030
20
10
28
0
4
8
12
16
20
24
28
32
(a) (b)
Figure 4.14 Blow tank characteristics for the discharge of pulverized fuel ash: (a) top
discharge blow tank and (b) bottom discharge blow tank.
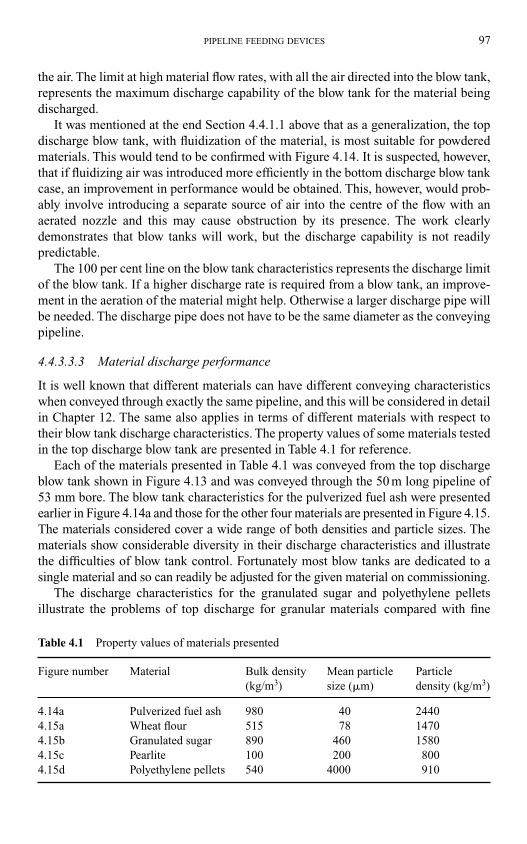
PIPELINE FEEDING DEVICES 97
the air. The limit at high material flow rates, with all the air directed into the blow tank,
represents the maximum discharge capability of the blow tank for the material being
discharged.
It was mentioned at the end Section 4.4.1.1 above that as a generalization, the top
discharge blow tank, with fluidization of the material, is most suitable for powdered
materials. This would tend to be confirmed with Figure 4.14. It is suspected, however,
that if fluidizing air was introduced more efficiently in the bottom discharge blow tank
case, an improvement in performance would be obtained. This, however, would prob-
ably involve introducing a separate source of air into the centre of the flow with an
aerated nozzle and this may cause obstruction by its presence. The work clearly
demonstrates that blow tanks will work, but the discharge capability is not readily
predictable.
The 100 per cent line on the blow tank characteristics represents the discharge limit
of the blow tank. If a higher discharge rate is required from a blow tank, an improve-
ment in the aeration of the material might help. Otherwise a larger discharge pipe will
be needed. The discharge pipe does not have to be the same diameter as the conveying
pipeline.
4.4.3.3.3 Material discharge performance
It is well known that different materials can have different conveying characteristics
when conveyed through exactly the same pipeline, and this will be considered in detail
in Chapter 12. The same also applies in terms of different materials with respect to
their blow tank discharge characteristics. The property values of some materials tested
in the top discharge blow tank are presented in Table 4.1 for reference.
Each of the materials presented in Table 4.1 was conveyed from the top discharge
blow tank shown in Figure 4.13 and was conveyed through the 50 m long pipeline of
53 mm bore. The blow tank characteristics for the pulverized fuel ash were presented
earlier in Figure 4.14a and those for the other four materials are presented in Figure 4.15.
The materials considered cover a wide range of both densities and particle sizes. The
materials show considerable diversity in their discharge characteristics and illustrate
the difficulties of blow tank control. Fortunately most blow tanks are dedicated to a
single material and so can readily be adjusted for the given material on commissioning.
The discharge characteristics for the granulated sugar and polyethylene pellets
illustrate the problems of top discharge for granular materials compared with fine
Table 4.1 Property values of materials presented
Figure number Material Bulk density Mean particle Particle
(kg/m3) size (�m) density (kg/m3)
4.14a Pulverized fuel ash 980 40 2440
4.15a Wheat flour 515 78 1470
4.15b Granulated sugar 890 460 1580
4.15c Pearlite 100 200 800
4.15d Polyethylene pellets 540 4000 910
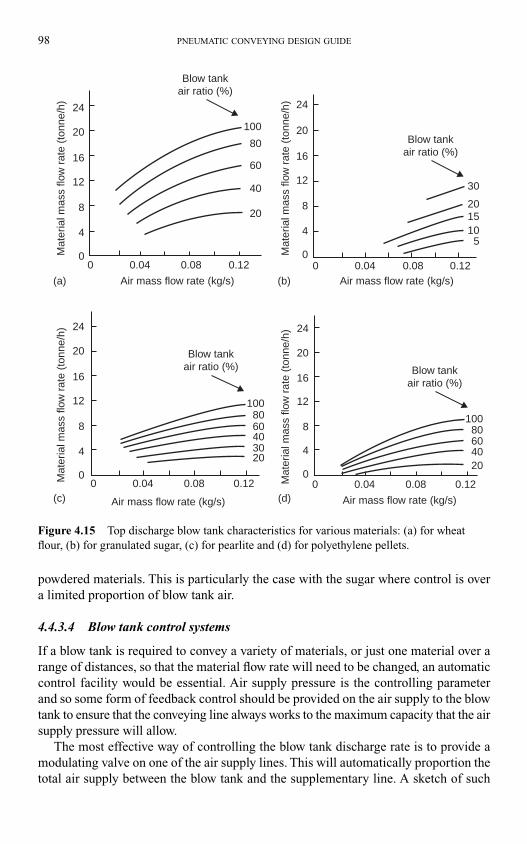
powdered materials. This is particularly the case with the sugar where control is over
a limited proportion of blow tank air.
4.4.3.4 Blow tank control systems
If a blow tank is required to convey a variety of materials, or just one material over a
range of distances, so that the material flow rate will need to be changed, an automatic
control facility would be essential. Air supply pressure is the controlling parameter
and so some form of feedback control should be provided on the air supply to the blow
tank to ensure that the conveying line always works to the maximum capacity that the air
supply pressure will allow.
The most effective way of controlling the blow tank discharge rate is to provide a
modulating valve on one of the air supply lines. This will automatically proportion the
total air supply between the blow tank and the supplementary line. A sketch of such
98 PNEUMATIC CONVEYING DESIGN GUIDE
Air mass flow rate (kg/s)
0.120.080.040
Air mass flow rate (kg/s)
0.120.080.040
Air mass flow rate (kg/s)
0.120.080.040
Air mass flow rate (kg/s) 0.120.080.040
Mat
eria
l mas
s flo
w r
ate
(ton
ne/h
)
0
4
8
12
16
20
24
Mat
eria
l mas
s flo
w r
ate
(ton
ne/h
)
0
4
8
12
16
20
24
Mat
eria
l mas
s flo
w r
ate
(ton
ne/h
)
0
4
8
12
16
20
24
Mat
eria
l mas
s flo
w r
ate
(ton
ne/h
)
0
4
8
12
16
20
24
100
100
10080604020
8060403020
80
60
40
20
30
2015105
Blow tankair ratio (%)
Blow tankair ratio (%)
Blow tankair ratio (%)
Blow tankair ratio (%)
(a) (b)
(d)(c)
Figure 4.15 Top discharge blow tank characteristics for various materials: (a) for wheat
flour, (b) for granulated sugar, (c) for pearlite and (d) for polyethylene pellets.
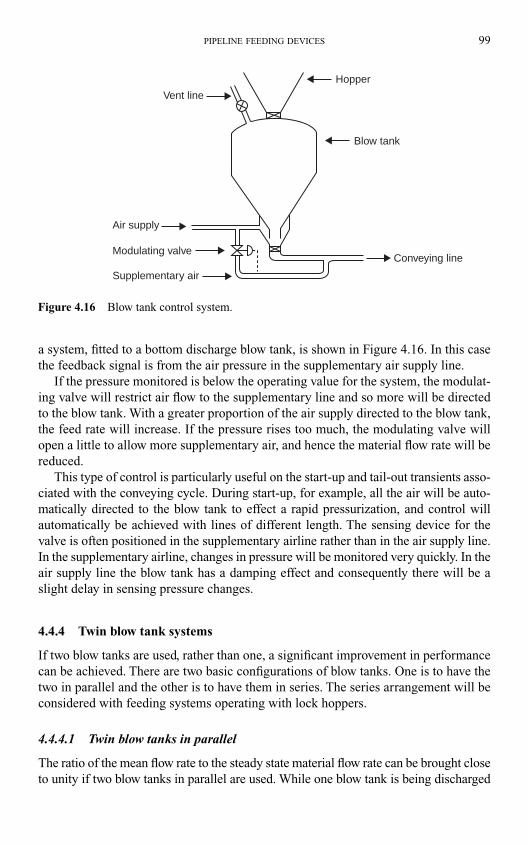
a system, fitted to a bottom discharge blow tank, is shown in Figure 4.16. In this case
the feedback signal is from the air pressure in the supplementary air supply line.
If the pressure monitored is below the operating value for the system, the modulat-
ing valve will restrict air flow to the supplementary line and so more will be directed
to the blow tank. With a greater proportion of the air supply directed to the blow tank,
the feed rate will increase. If the pressure rises too much, the modulating valve will
open a little to allow more supplementary air, and hence the material flow rate will be
reduced.
This type of control is particularly useful on the start-up and tail-out transients asso-
ciated with the conveying cycle. During start-up, for example, all the air will be auto-
matically directed to the blow tank to effect a rapid pressurization, and control will
automatically be achieved with lines of different length. The sensing device for the
valve is often positioned in the supplementary airline rather than in the air supply line.
In the supplementary airline, changes in pressure will be monitored very quickly. In the
air supply line the blow tank has a damping effect and consequently there will be a
slight delay in sensing pressure changes.
4.4.4 Twin blow tank systems
If two blow tanks are used, rather than one, a significant improvement in performance
can be achieved. There are two basic configurations of blow tanks. One is to have the
two in parallel and the other is to have them in series. The series arrangement will be
considered with feeding systems operating with lock hoppers.
4.4.4.1 Twin blow tanks in parallel
The ratio of the mean flow rate to the steady state material flow rate can be brought close
to unity if two blow tanks in parallel are used. While one blow tank is being discharged
PIPELINE FEEDING DEVICES 99
Air supply
Modulating valve
Supplementary air
Conveying line
Blow tank
Hopper
Vent line
Figure 4.16 Blow tank control system.

100 PNEUMATIC CONVEYING DESIGN GUIDE
into the conveying pipeline, the other can be de-pressurized, filled, and pressurized,
ready for discharging when the other one is empty. By this means almost continuous
conveying can be achieved through a common pipeline. This arrangement, however,
requires a full set of discharge, vent and isolating valves, and level switches for each
blow tank, and an automatic control system to achieve the correct timing. A sketch of a
typical parallel arrangement of twin blow tanks is given in Figure 4.17.
The sequence of events would be as follows:
From this it can be seen that the blow tank pressurizing process in one blow tank
has to be carried out while the material is being discharged from the other. This would
require additional air and it would probably not be economically viable for the
marginal improvement obtained. To achieve a high tonnage with a single blow tank, a
fairly large blow tank would be needed, but with twin blow tanks the tank size can be
smaller. The size can be based on a reasonably short blow tank cycle, provided that the
two sets of sequences can be fitted into the time allowed.
Blow Tank A Blow Tank B
fill dischargepressurize
Change →Over vent
discharge fillpressurize
Change →Over vent
fill discharge
Conveying line
Air supply
Figure 4.17 Typical parallel arrangement of twin blow tanks.
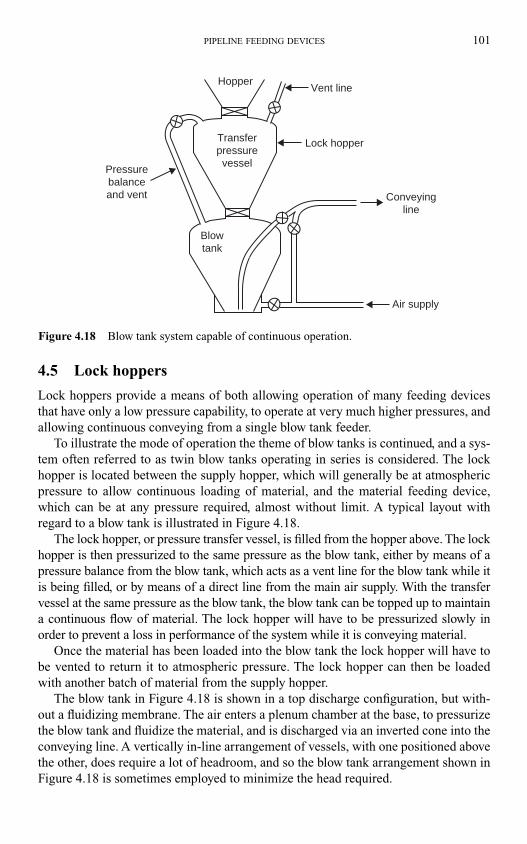
PIPELINE FEEDING DEVICES 101
4.5 Lock hoppers
Lock hoppers provide a means of both allowing operation of many feeding devices
that have only a low pressure capability, to operate at very much higher pressures, and
allowing continuous conveying from a single blow tank feeder.
To illustrate the mode of operation the theme of blow tanks is continued, and a sys-
tem often referred to as twin blow tanks operating in series is considered. The lock
hopper is located between the supply hopper, which will generally be at atmospheric
pressure to allow continuous loading of material, and the material feeding device,
which can be at any pressure required, almost without limit. A typical layout with
regard to a blow tank is illustrated in Figure 4.18.
The lock hopper, or pressure transfer vessel, is filled from the hopper above. The lock
hopper is then pressurized to the same pressure as the blow tank, either by means of a
pressure balance from the blow tank, which acts as a vent line for the blow tank while it
is being filled, or by means of a direct line from the main air supply. With the transfer
vessel at the same pressure as the blow tank, the blow tank can be topped up to maintain
a continuous flow of material. The lock hopper will have to be pressurized slowly in
order to prevent a loss in performance of the system while it is conveying material.
Once the material has been loaded into the blow tank the lock hopper will have to
be vented to return it to atmospheric pressure. The lock hopper can then be loaded
with another batch of material from the supply hopper.
The blow tank in Figure 4.18 is shown in a top discharge configuration, but with-
out a fluidizing membrane. The air enters a plenum chamber at the base, to pressurize
the blow tank and fluidize the material, and is discharged via an inverted cone into the
conveying line. A vertically in-line arrangement of vessels, with one positioned above
the other, does require a lot of headroom, and so the blow tank arrangement shown in
Figure 4.18 is sometimes employed to minimize the head required.
Air supply
Conveyingline
Lock hopper
Vent lineHopper
Transferpressurevessel
Pressurebalanceand vent
Blowtank
Figure 4.18 Blow tank system capable of continuous operation.
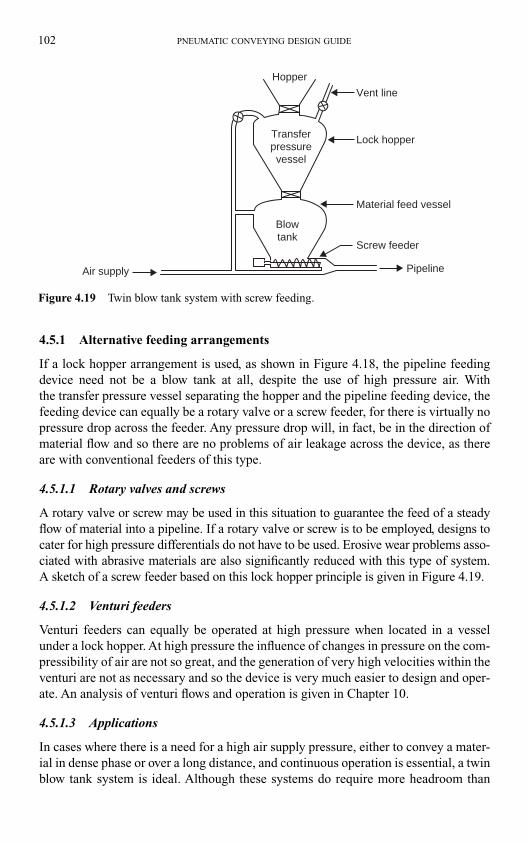
102 PNEUMATIC CONVEYING DESIGN GUIDE
4.5.1 Alternative feeding arrangements
If a lock hopper arrangement is used, as shown in Figure 4.18, the pipeline feeding
device need not be a blow tank at all, despite the use of high pressure air. With
the transfer pressure vessel separating the hopper and the pipeline feeding device, the
feeding device can equally be a rotary valve or a screw feeder, for there is virtually no
pressure drop across the feeder. Any pressure drop will, in fact, be in the direction of
material flow and so there are no problems of air leakage across the device, as there
are with conventional feeders of this type.
4.5.1.1 Rotary valves and screws
A rotary valve or screw may be used in this situation to guarantee the feed of a steady
flow of material into a pipeline. If a rotary valve or screw is to be employed, designs to
cater for high pressure differentials do not have to be used. Erosive wear problems asso-
ciated with abrasive materials are also significantly reduced with this type of system.
A sketch of a screw feeder based on this lock hopper principle is given in Figure 4.19.
4.5.1.2 Venturi feeders
Venturi feeders can equally be operated at high pressure when located in a vessel
under a lock hopper. At high pressure the influence of changes in pressure on the com-
pressibility of air are not so great, and the generation of very high velocities within the
venturi are not as necessary and so the device is very much easier to design and oper-
ate. An analysis of venturi flows and operation is given in Chapter 10.
4.5.1.3 Applications
In cases where there is a need for a high air supply pressure, either to convey a mater-
ial in dense phase or over a long distance, and continuous operation is essential, a twin
blow tank system is ideal. Although these systems do require more headroom than
Screw feeder
Lock hopper
Hopper
Blowtank
Transferpressurevessel
Air supply
Material feed vessel
Pipeline
Vent line
Figure 4.19 Twin blow tank system with screw feeding.
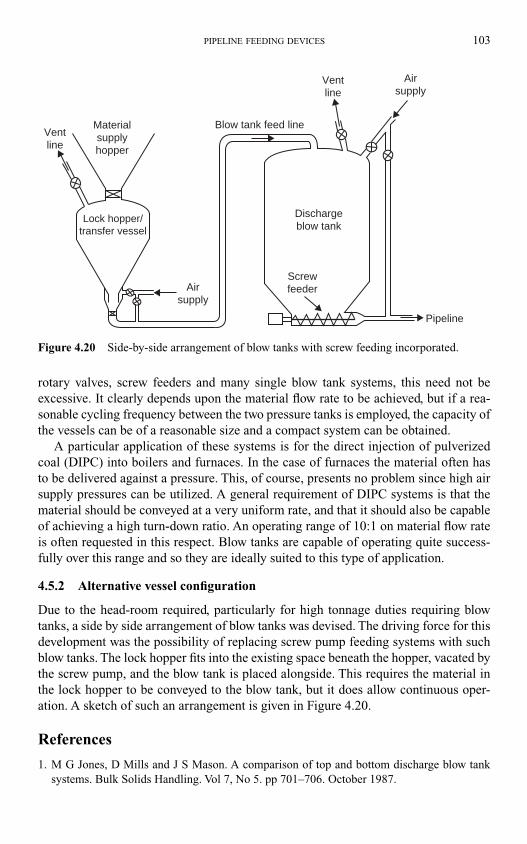
PIPELINE FEEDING DEVICES 103
rotary valves, screw feeders and many single blow tank systems, this need not be
excessive. It clearly depends upon the material flow rate to be achieved, but if a rea-
sonable cycling frequency between the two pressure tanks is employed, the capacity of
the vessels can be of a reasonable size and a compact system can be obtained.
A particular application of these systems is for the direct injection of pulverized
coal (DIPC) into boilers and furnaces. In the case of furnaces the material often has
to be delivered against a pressure. This, of course, presents no problem since high air
supply pressures can be utilized. A general requirement of DIPC systems is that the
material should be conveyed at a very uniform rate, and that it should also be capable
of achieving a high turn-down ratio. An operating range of 10:1 on material flow rate
is often requested in this respect. Blow tanks are capable of operating quite success-
fully over this range and so they are ideally suited to this type of application.
4.5.2 Alternative vessel configuration
Due to the head-room required, particularly for high tonnage duties requiring blow
tanks, a side by side arrangement of blow tanks was devised. The driving force for this
development was the possibility of replacing screw pump feeding systems with such
blow tanks. The lock hopper fits into the existing space beneath the hopper, vacated by
the screw pump, and the blow tank is placed alongside. This requires the material in
the lock hopper to be conveyed to the blow tank, but it does allow continuous oper-
ation. A sketch of such an arrangement is given in Figure 4.20.
References
1. M G Jones, D Mills and J S Mason. A comparison of top and bottom discharge blow tank
systems. Bulk Solids Handling. Vol 7, No 5. pp 701–706. October 1987.
Materialsupplyhopper
Lock hopper/transfer vessel
Airsupply
Dischargeblow tank
Screwfeeder
Blow tank feed line
Ventline
Airsupply
Pipeline
Ventline
Figure 4.20 Side-by-side arrangement of blow tanks with screw feeding incorporated.
5.1 Introduction
Decisions with regard to the specification of components for pneumatic conveying
systems do not end with the feeder, air mover and filtration system. There are likely to
be numerous valves on the plant, and the pipeline is just as important. This importance
is significantly magnified if the material to be conveyed is abrasive.
5.2 Pipelines
Decisions do have to be made with regard to the pipeline. Material, wall thickness, sur-
face finish, steps and bends to be used, all have to be given due consideration. One of
the most critical parameters with regard to the successful operation of a pneumatic con-
veying system is maintaining a minimum value of conveying air velocity for the mate-
rial to be handled. For the dilute phase conveying of granulated sugar, for example, this
is about 16 m/s. If the velocity drops to 15 m/s the pipeline is likely to block.
5.2.1 Wall thickness
The volumetric flow rate of the air required is obtained by multiplying the conveying
air velocity by the cross-sectional area of the pipeline, and making due note of both
the pressure and temperature of the air. The diameter of a 4 in. nominal bore pipeline,
however, is rarely 4 in. If a conveying air velocity is based on a diameter of 4 in., for
example, and it is a schedule 10 pipeline, the actual bore will be 4.026 in. (106.1 mm)
and not 4.000 in. (101.6 mm). This difference will mean that the conveying air velocity
will be about 9 per cent lower. If 16 m/s is the velocity in a 101.6 mm bore pipeline, it
will only be 14.6 m/s in a 106.1 mm bore line, and the pipeline is likely to block.
If an abrasive material is to be conveyed, wear of the pipeline must be expected. To
give the pipeline a longer life, pipe having a greater wall thickness should be used.
Schedule numbers are often used to specify wall thickness. Typical dimensions for
4 in. nominal bore pipeline are given in Table 5.1.
If the material to be conveyed is not abrasive at all, a thin walled pipeline should be
suitable for the duty. Pipeline weight in kg/m could be added to Table 5.1 and this
would show a marked difference. Lighter pipe sections will certainly make construc-
tion of the pipeline easier, particularly if there are vertical sections to erect.
Chapter 5
Pipelines and valves
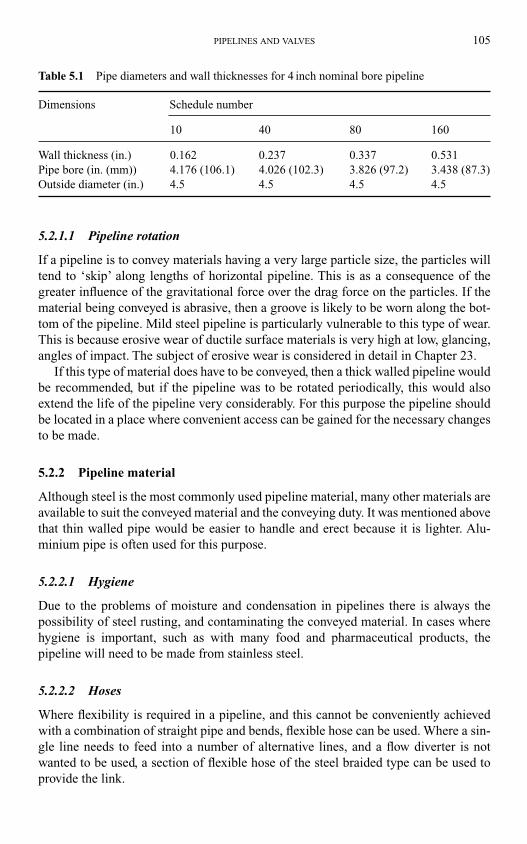
PIPELINES AND VALVES 105
5.2.1.1 Pipeline rotation
If a pipeline is to convey materials having a very large particle size, the particles will
tend to ‘skip’ along lengths of horizontal pipeline. This is as a consequence of the
greater influence of the gravitational force over the drag force on the particles. If the
material being conveyed is abrasive, then a groove is likely to be worn along the bot-
tom of the pipeline. Mild steel pipeline is particularly vulnerable to this type of wear.
This is because erosive wear of ductile surface materials is very high at low, glancing,
angles of impact. The subject of erosive wear is considered in detail in Chapter 23.
If this type of material does have to be conveyed, then a thick walled pipeline would
be recommended, but if the pipeline was to be rotated periodically, this would also
extend the life of the pipeline very considerably. For this purpose the pipeline should
be located in a place where convenient access can be gained for the necessary changes
to be made.
5.2.2 Pipeline material
Although steel is the most commonly used pipeline material, many other materials are
available to suit the conveyed material and the conveying duty. It was mentioned above
that thin walled pipe would be easier to handle and erect because it is lighter. Alu-
minium pipe is often used for this purpose.
5.2.2.1 Hygiene
Due to the problems of moisture and condensation in pipelines there is always the
possibility of steel rusting, and contaminating the conveyed material. In cases where
hygiene is important, such as with many food and pharmaceutical products, the
pipeline will need to be made from stainless steel.
5.2.2.2 Hoses
Where flexibility is required in a pipeline, and this cannot be conveniently achieved
with a combination of straight pipe and bends, flexible hose can be used. Where a sin-
gle line needs to feed into a number of alternative lines, and a flow diverter is not
wanted to be used, a section of flexible hose of the steel braided type can be used to
provide the link.
Table 5.1 Pipe diameters and wall thicknesses for 4 inch nominal bore pipeline
Dimensions Schedule number
10 40 80 160
Wall thickness (in.) 0.162 0.237 0.337 0.531
Pipe bore (in. (mm)) 4.176 (106.1) 4.026 (102.3) 3.826 (97.2) 3.438 (87.3)
Outside diameter (in.) 4.5 4.5 4.5 4.5
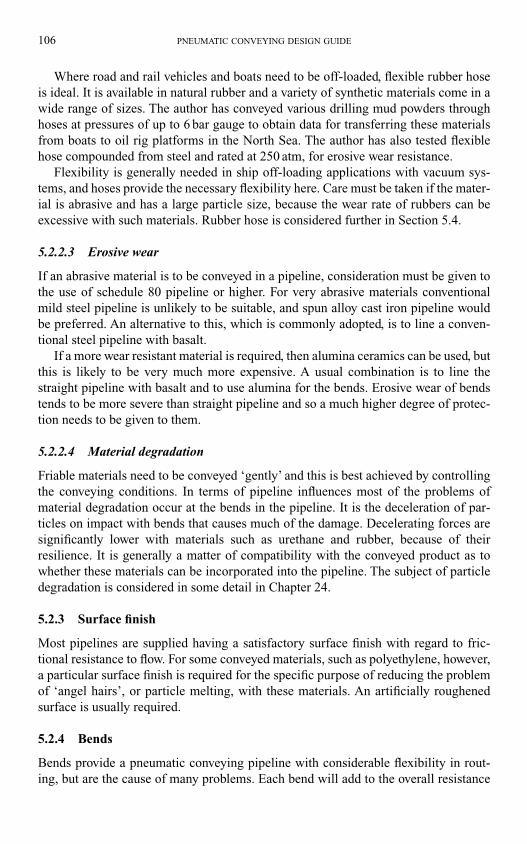
Where road and rail vehicles and boats need to be off-loaded, flexible rubber hose
is ideal. It is available in natural rubber and a variety of synthetic materials come in a
wide range of sizes. The author has conveyed various drilling mud powders through
hoses at pressures of up to 6 bar gauge to obtain data for transferring these materials
from boats to oil rig platforms in the North Sea. The author has also tested flexible
hose compounded from steel and rated at 250 atm, for erosive wear resistance.
Flexibility is generally needed in ship off-loading applications with vacuum sys-
tems, and hoses provide the necessary flexibility here. Care must be taken if the mater-
ial is abrasive and has a large particle size, because the wear rate of rubbers can be
excessive with such materials. Rubber hose is considered further in Section 5.4.
5.2.2.3 Erosive wear
If an abrasive material is to be conveyed in a pipeline, consideration must be given to
the use of schedule 80 pipeline or higher. For very abrasive materials conventional
mild steel pipeline is unlikely to be suitable, and spun alloy cast iron pipeline would
be preferred. An alternative to this, which is commonly adopted, is to line a conven-
tional steel pipeline with basalt.
If a more wear resistant material is required, then alumina ceramics can be used, but
this is likely to be very much more expensive. A usual combination is to line the
straight pipeline with basalt and to use alumina for the bends. Erosive wear of bends
tends to be more severe than straight pipeline and so a much higher degree of protec-
tion needs to be given to them.
5.2.2.4 Material degradation
Friable materials need to be conveyed ‘gently’ and this is best achieved by controlling
the conveying conditions. In terms of pipeline influences most of the problems of
material degradation occur at the bends in the pipeline. It is the deceleration of par-
ticles on impact with bends that causes much of the damage. Decelerating forces are
significantly lower with materials such as urethane and rubber, because of their
resilience. It is generally a matter of compatibility with the conveyed product as to
whether these materials can be incorporated into the pipeline. The subject of particle
degradation is considered in some detail in Chapter 24.
5.2.3 Surface finish
Most pipelines are supplied having a satisfactory surface finish with regard to fric-
tional resistance to flow. For some conveyed materials, such as polyethylene, however,
a particular surface finish is required for the specific purpose of reducing the problem
of ‘angel hairs’, or particle melting, with these materials. An artificially roughened
surface is usually required.
5.2.4 Bends
Bends provide a pneumatic conveying pipeline with considerable flexibility in rout-
ing, but are the cause of many problems. Each bend will add to the overall resistance
106 PNEUMATIC CONVEYING DESIGN GUIDE
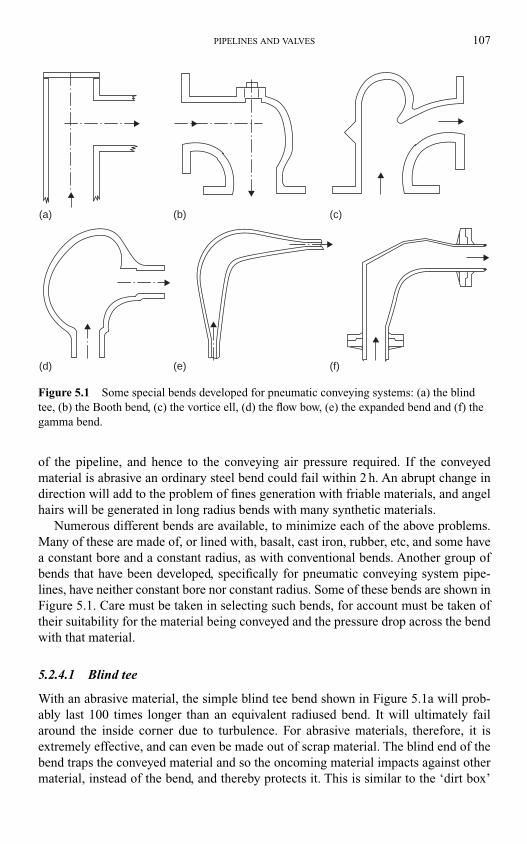
PIPELINES AND VALVES 107
of the pipeline, and hence to the conveying air pressure required. If the conveyed
material is abrasive an ordinary steel bend could fail within 2 h. An abrupt change in
direction will add to the problem of fines generation with friable materials, and angel
hairs will be generated in long radius bends with many synthetic materials.
Numerous different bends are available, to minimize each of the above problems.
Many of these are made of, or lined with, basalt, cast iron, rubber, etc, and some have
a constant bore and a constant radius, as with conventional bends. Another group of
bends that have been developed, specifically for pneumatic conveying system pipe-
lines, have neither constant bore nor constant radius. Some of these bends are shown in
Figure 5.1. Care must be taken in selecting such bends, for account must be taken of
their suitability for the material being conveyed and the pressure drop across the bend
with that material.
5.2.4.1 Blind tee
With an abrasive material, the simple blind tee bend shown in Figure 5.1a will prob-
ably last 100 times longer than an equivalent radiused bend. It will ultimately fail
around the inside corner due to turbulence. For abrasive materials, therefore, it is
extremely effective, and can even be made out of scrap material. The blind end of the
bend traps the conveyed material and so the oncoming material impacts against other
material, instead of the bend, and thereby protects it. This is similar to the ‘dirt box’
(a) (b) (c)
(d) (e) (f)
Figure 5.1 Some special bends developed for pneumatic conveying systems: (a) the blind
tee, (b) the Booth bend, (c) the vortice ell, (d) the flow bow, (e) the expanded bend and (f) the
gamma bend.
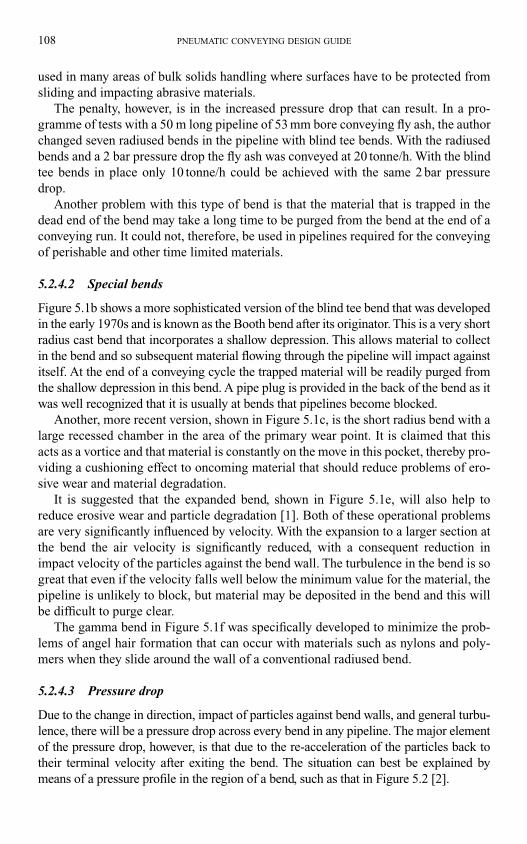
108 PNEUMATIC CONVEYING DESIGN GUIDE
used in many areas of bulk solids handling where surfaces have to be protected from
sliding and impacting abrasive materials.
The penalty, however, is in the increased pressure drop that can result. In a pro-
gramme of tests with a 50 m long pipeline of 53 mm bore conveying fly ash, the author
changed seven radiused bends in the pipeline with blind tee bends. With the radiused
bends and a 2 bar pressure drop the fly ash was conveyed at 20 tonne/h. With the blind
tee bends in place only 10 tonne/h could be achieved with the same 2 bar pressure
drop.
Another problem with this type of bend is that the material that is trapped in the
dead end of the bend may take a long time to be purged from the bend at the end of a
conveying run. It could not, therefore, be used in pipelines required for the conveying
of perishable and other time limited materials.
5.2.4.2 Special bends
Figure 5.1b shows a more sophisticated version of the blind tee bend that was developed
in the early 1970s and is known as the Booth bend after its originator. This is a very short
radius cast bend that incorporates a shallow depression. This allows material to collect
in the bend and so subsequent material flowing through the pipeline will impact against
itself. At the end of a conveying cycle the trapped material will be readily purged from
the shallow depression in this bend. A pipe plug is provided in the back of the bend as it
was well recognized that it is usually at bends that pipelines become blocked.
Another, more recent version, shown in Figure 5.1c, is the short radius bend with a
large recessed chamber in the area of the primary wear point. It is claimed that this
acts as a vortice and that material is constantly on the move in this pocket, thereby pro-
viding a cushioning effect to oncoming material that should reduce problems of ero-
sive wear and material degradation.
It is suggested that the expanded bend, shown in Figure 5.1e, will also help to
reduce erosive wear and particle degradation [1]. Both of these operational problems
are very significantly influenced by velocity. With the expansion to a larger section at
the bend the air velocity is significantly reduced, with a consequent reduction in
impact velocity of the particles against the bend wall. The turbulence in the bend is so
great that even if the velocity falls well below the minimum value for the material, the
pipeline is unlikely to block, but material may be deposited in the bend and this will
be difficult to purge clear.
The gamma bend in Figure 5.1f was specifically developed to minimize the prob-
lems of angel hair formation that can occur with materials such as nylons and poly-
mers when they slide around the wall of a conventional radiused bend.
5.2.4.3 Pressure drop
Due to the change in direction, impact of particles against bend walls, and general turbu-
lence, there will be a pressure drop across every bend in any pipeline. The major element
of the pressure drop, however, is that due to the re-acceleration of the particles back to
their terminal velocity after exiting the bend. The situation can best be explained by
means of a pressure profile in the region of a bend, such as that in Figure 5.2 [2].
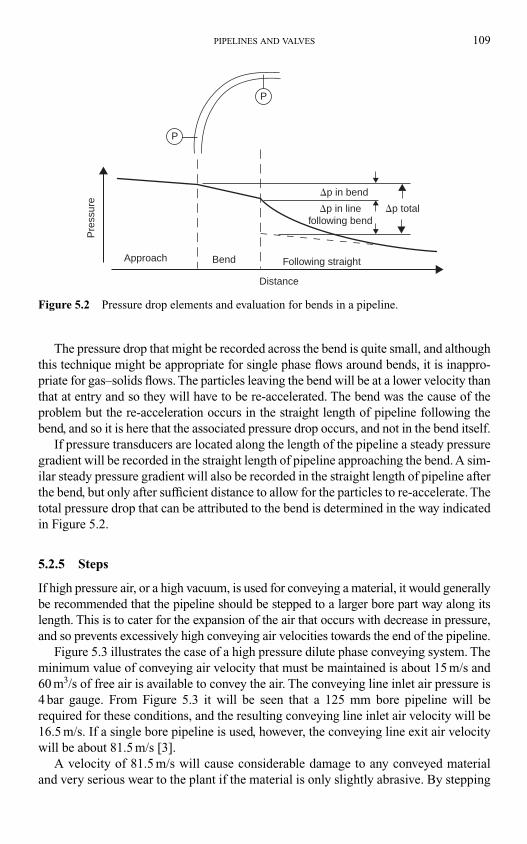
PIPELINES AND VALVES 109
The pressure drop that might be recorded across the bend is quite small, and although
this technique might be appropriate for single phase flows around bends, it is inappro-
priate for gas–solids flows. The particles leaving the bend will be at a lower velocity than
that at entry and so they will have to be re-accelerated. The bend was the cause of the
problem but the re-acceleration occurs in the straight length of pipeline following the
bend, and so it is here that the associated pressure drop occurs, and not in the bend itself.
If pressure transducers are located along the length of the pipeline a steady pressure
gradient will be recorded in the straight length of pipeline approaching the bend. A sim-
ilar steady pressure gradient will also be recorded in the straight length of pipeline after
the bend, but only after sufficient distance to allow for the particles to re-accelerate. The
total pressure drop that can be attributed to the bend is determined in the way indicated
in Figure 5.2.
5.2.5 Steps
If high pressure air, or a high vacuum, is used for conveying a material, it would generally
be recommended that the pipeline should be stepped to a larger bore part way along its
length. This is to cater for the expansion of the air that occurs with decrease in pressure,
and so prevents excessively high conveying air velocities towards the end of the pipeline.
Figure 5.3 illustrates the case of a high pressure dilute phase conveying system. The
minimum value of conveying air velocity that must be maintained is about 15 m/s and
60 m3/s of free air is available to convey the air. The conveying line inlet air pressure is
4 bar gauge. From Figure 5.3 it will be seen that a 125 mm bore pipeline will be
required for these conditions, and the resulting conveying line inlet air velocity will be
16.5 m/s. If a single bore pipeline is used, however, the conveying line exit air velocity
will be about 81.5 m/s [3].
A velocity of 81.5 m/s will cause considerable damage to any conveyed material
and very serious wear to the plant if the material is only slightly abrasive. By stepping
P
PP
ress
ure
Approach Bend Following straight
Distance
�p in bend
�p in linefollowing bend
�p total
Figure 5.2 Pressure drop elements and evaluation for bends in a pipeline.
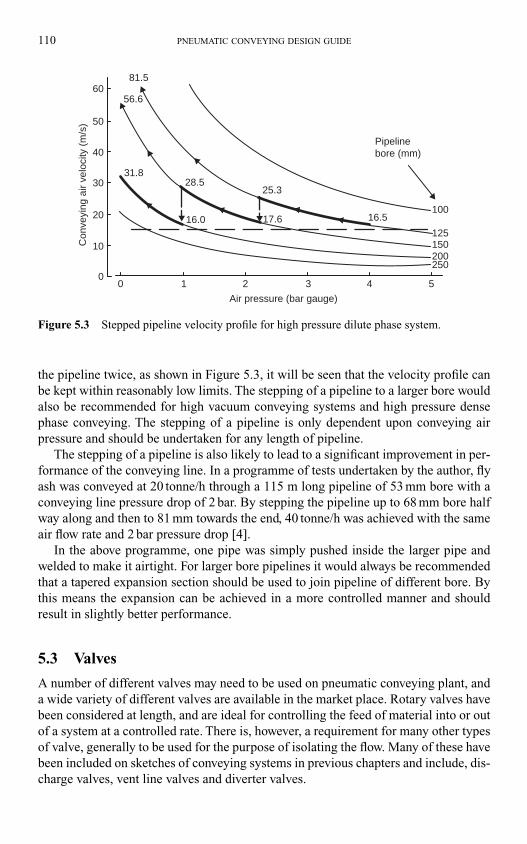
110 PNEUMATIC CONVEYING DESIGN GUIDE
the pipeline twice, as shown in Figure 5.3, it will be seen that the velocity profile can
be kept within reasonably low limits. The stepping of a pipeline to a larger bore would
also be recommended for high vacuum conveying systems and high pressure dense
phase conveying. The stepping of a pipeline is only dependent upon conveying air
pressure and should be undertaken for any length of pipeline.
The stepping of a pipeline is also likely to lead to a significant improvement in per-
formance of the conveying line. In a programme of tests undertaken by the author, fly
ash was conveyed at 20 tonne/h through a 115 m long pipeline of 53 mm bore with a
conveying line pressure drop of 2 bar. By stepping the pipeline up to 68 mm bore half
way along and then to 81 mm towards the end, 40 tonne/h was achieved with the same
air flow rate and 2 bar pressure drop [4].
In the above programme, one pipe was simply pushed inside the larger pipe and
welded to make it airtight. For larger bore pipelines it would always be recommended
that a tapered expansion section should be used to join pipeline of different bore. By
this means the expansion can be achieved in a more controlled manner and should
result in slightly better performance.
5.3 Valves
A number of different valves may need to be used on pneumatic conveying plant, and
a wide variety of different valves are available in the market place. Rotary valves have
been considered at length, and are ideal for controlling the feed of material into or out
of a system at a controlled rate. There is, however, a requirement for many other types
of valve, generally to be used for the purpose of isolating the flow. Many of these have
been included on sketches of conveying systems in previous chapters and include, dis-
charge valves, vent line valves and diverter valves.
00
10
20
30
40
50
60
1 2 3 4 5
81.5
56.6
31.828.5
25.3
17.6 16.5
Pipelinebore (mm)
100
125150200250
16.0
Air pressure (bar gauge)
Con
veyi
ng a
ir ve
loci
ty (
m/s
)
Figure 5.3 Stepped pipeline velocity profile for high pressure dilute phase system.
PIPELINES AND VALVES 111
5.3.1 Discharge valves
A valve in a conveying line that is required to stop and start the flow is an onerous
duty. Although the valve is only used in either the open or closed position, and is not
used for flow control purposes, particulate material must be able to pass freely through
when it is open. If the control surfaces of the valve remain in the flow path, as they will
with pinch valves and ball valves, they must provide a perfectly smooth passage for
the flow of material through the valve when open.
Any small protuberances or surface irregularities that could promote turbulence in
the area would result in a rapid deterioration in performance. This is particularly the
case when the material to be conveyed is abrasive. This type of valve is also very vul-
nerable during the opening and closing sequences, and so these operations should be
completed as quickly as possible.
5.3.1.1 Ball valves
The author has tested numerous ball valves in a 100 mm bore pipeline conveying sil-
ica sand in dilute phase at 2 bar pressure. They did not perform very well in such a
harsh environment. As they have moving parts the very fine abrasive dust in the con-
veyed material wrecked havoc. The valves soon lost their airtightness, and the torque
required to operate the valves gradually increased and soon exceeded that available by
the automatic control facilities provided with the valves.
5.3.1.2 Pinch valves
Pinch valves are a much better proposition, as there is no relative movement between
surfaces in which fine abrasive dust can lodge. These can also be opened and closed
rapidly. Rubbers and urethanes also have very reasonable erosive wear resistance, and
so are well worth considering for this kind of duty. They will not last forever, and so
periodic maintenance is essential, and will be required. These valves must be located
in an accessible position, and spares must be available.
5.3.1.3 Dome valves
The dome valve is a more recent addition to the list of valves available, but it has been
specifically designed for this type of duty, and is now being widely used in the indus-
try. The valve has moving parts, but these move completely out of the path of the con-
veyed material when the valve is open. On closing, the valve first cuts through the
material and then becomes airtight by means of an inflatable seal. The valve can be
water cooled and so it is capable of handling hot materials.
5.3.2 Isolating valves
There are many instances where material has to be transferred, usually under gravity,
in batches. The valve is either open or closed and often has to provide an airtight seal.
In the gate lock feeder, for example, a pair of valves is required to operate in sequence
to feed small batches of material into a pipeline.
112 PNEUMATIC CONVEYING DESIGN GUIDE
Where batches of material have to be fed into blow tanks, the valve has to be cap-
able of withstanding the pressure subsequently applied to the blow tank. Of the valves
considered above only the dome valve would be appropriate for this type of duty. It
finds wide use in this application, particularly with the more difficult granular and
abrasive materials.
5.3.2.1 Butterfly valves
If the material to be handled is not abrasive, the butterfly valve is ideal. They are rea-
sonably priced, require very little headroom, are not too heavy, and are reasonably air-
tight. They are widely used in the food and related industries, and in gate lock feeders.
They are, however, much too vulnerable for use with abrasive materials, since the
valve remains in the flow when it is open.
5.3.2.2 Disc valves
Disc valves, like butterfly valves, require very little headroom, but like dome valves,
they swing completely out of the way of the flow of material. They cut though the
material on closing, but generally rely on the subsequent pressure in the vessel below
to provide the necessary seal. Their suitability for use will depend very much upon the
material to be handled and the application.
5.3.2.3 Slide valves
Slide valves are the oldest valves in the business, and although they have been
improved over the years, the disc valve is a specific development from it. They take up
little space and are cheap. A particular application is in terms of back-up. If any of the
other more expensive and sophisticated valves fail, and need to be replaced, this can
be a very difficult and time consuming task if the valve is holding several hundred
tonnes of material in a hopper, and this must be drained out before the valve can be
removed for repair or replacement.
5.3.3 Vent line valves
This is a deceptively easy duty, but if it is on a high pressure blow tank handling a mate-
rial such as fly ash or cement, the valve will have to operate in a very harsh environment.
With the venting of high pressure air the air velocity will be very high, albeit for a very
short period of time. As a consequence of the turbulence in the blow tank, however, a
considerable amount of abrasive dust is likely to be carried with the air. If the material is
abrasive then the choice is between a pinch valve and a dome valve. If the material is
non-abrasive, a diaphragm valve could be used.
5.3.4 Flow diversion
Flow diverting is a very common requirement with pneumatic conveying systems and
can be achieved very easily. Many companies manufacture specific flow diverting
valves for the purpose. Alternatively flow diversion can be achieved by using a set of
isolating valves. The most common requirement is to divert the flow to one of two
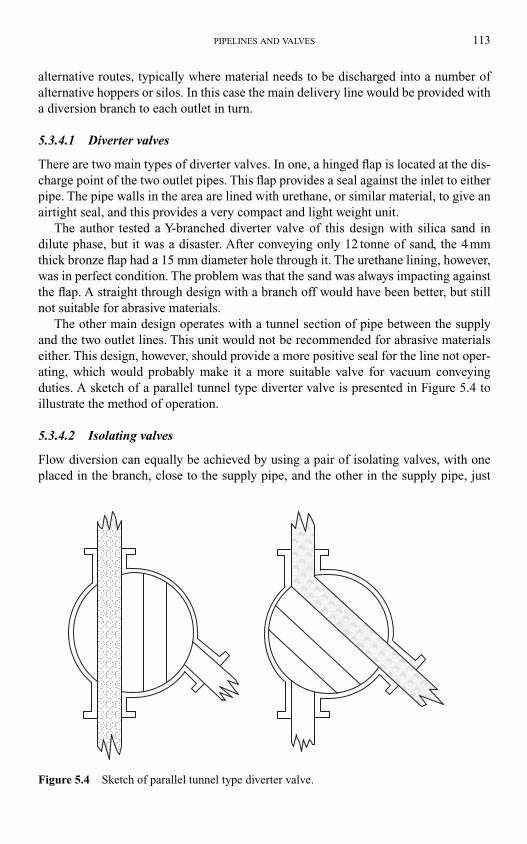
PIPELINES AND VALVES 113
alternative routes, typically where material needs to be discharged into a number of
alternative hoppers or silos. In this case the main delivery line would be provided with
a diversion branch to each outlet in turn.
5.3.4.1 Diverter valves
There are two main types of diverter valves. In one, a hinged flap is located at the dis-
charge point of the two outlet pipes. This flap provides a seal against the inlet to either
pipe. The pipe walls in the area are lined with urethane, or similar material, to give an
airtight seal, and this provides a very compact and light weight unit.
The author tested a Y-branched diverter valve of this design with silica sand in
dilute phase, but it was a disaster. After conveying only 12 tonne of sand, the 4 mm
thick bronze flap had a 15 mm diameter hole through it. The urethane lining, however,
was in perfect condition. The problem was that the sand was always impacting against
the flap. A straight through design with a branch off would have been better, but still
not suitable for abrasive materials.
The other main design operates with a tunnel section of pipe between the supply
and the two outlet lines. This unit would not be recommended for abrasive materials
either. This design, however, should provide a more positive seal for the line not oper-
ating, which would probably make it a more suitable valve for vacuum conveying
duties. A sketch of a parallel tunnel type diverter valve is presented in Figure 5.4 to
illustrate the method of operation.
5.3.4.2 Isolating valves
Flow diversion can equally be achieved by using a pair of isolating valves, with one
placed in the branch, close to the supply pipe, and the other in the supply pipe, just
Figure 5.4 Sketch of parallel tunnel type diverter valve.
downstream of the branch. This can be repeated at any number of points along the
pipeline. The main disadvantage with this arrangement is that a plug of material will
be trapped in the short section of pipeline not in use, which will have to be blown
through when the flow direction changes.
If the conveyed material is abrasive, this method of flow diversion would be rec-
ommended. Either pinch valves or dome valves would need to be employed for the
purpose. With two separate valves, instead of one to operate, care would have to be
exercised with the sequencing when changing flow direction.
5.3.5 Flow splitting
Multiple flow splitting is not a common requirement and so there are few devices avail-
able. They are often required on boiler plant, where coal dust might need to be sent to
the four corners of a boiler, and on blast furnaces, where coal or limestone powder
might need injecting at a dozen or more different points around its circumference.
The main requirement here is generally that all of the outlets should be supplied
with material, and at a uniform rate to each, despite the fact that the distance to each
point will be different. The splitting is best achieved in the vertical plane, with the line
sizes very carefully evaluated to provide a uniform balance for each.
5.4 Rubber hose
Rubber hose is widely used in conveying systems for both pipeline and bends, and in
systems where a degree of natural flexibility is required. Its particular properties also
make it ideal for use in systems where the material being conveyed may be friable,
abrasive or cohesive. Its natural flexibility makes it ideal for use in vacuum off-loading
applications, mobile conveying systems and for joining pipeline sections in situations
where standard pipeline bends will not match the geometry required [5].
5.4.1 Erosive wear and particle degradation
Rubber hose has the capability of withstanding erosive wear better than steel pipeline
in certain situations. Although the hardness of the surface material is generally much
lower than that of alternative metal surfaces, and of the particles impacting against
the surface, it derives its erosive wear resistance from the fact that it is able to absorb
much of the energy of impact by virtue of its resilience. By the same mechanism, the
energy of impact of friable materials is also absorbed and so particle degradation can
also be reduced appreciably.
5.4.2 Pressure drop
Problems of erosive wear and particle degradation are particularly severe in high
velocity dilute phase conveying. Unfortunately the pressure drop for gas–solid flows
through rubber hose also increases with increase in velocity, and more so than for steel
pipeline. In a programme of tests with cement the author tested both steel and rubber
hose and found that for low velocity, dense phase conveying, there was little difference
114 PNEUMATIC CONVEYING DESIGN GUIDE
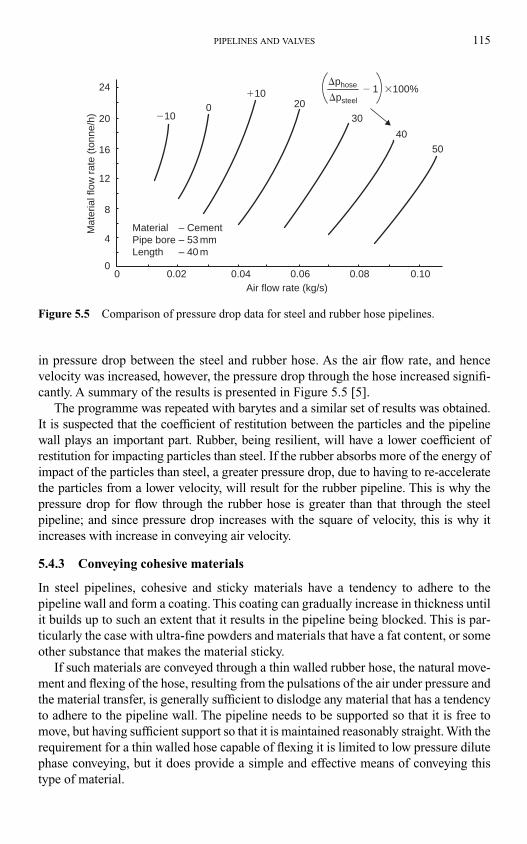
PIPELINES AND VALVES 115
in pressure drop between the steel and rubber hose. As the air flow rate, and hence
velocity was increased, however, the pressure drop through the hose increased signifi-
cantly. A summary of the results is presented in Figure 5.5 [5].
The programme was repeated with barytes and a similar set of results was obtained.
It is suspected that the coefficient of restitution between the particles and the pipeline
wall plays an important part. Rubber, being resilient, will have a lower coefficient of
restitution for impacting particles than steel. If the rubber absorbs more of the energy of
impact of the particles than steel, a greater pressure drop, due to having to re-accelerate
the particles from a lower velocity, will result for the rubber pipeline. This is why the
pressure drop for flow through the rubber hose is greater than that through the steel
pipeline; and since pressure drop increases with the square of velocity, this is why it
increases with increase in conveying air velocity.
5.4.3 Conveying cohesive materials
In steel pipelines, cohesive and sticky materials have a tendency to adhere to the
pipeline wall and form a coating. This coating can gradually increase in thickness until
it builds up to such an extent that it results in the pipeline being blocked. This is par-
ticularly the case with ultra-fine powders and materials that have a fat content, or some
other substance that makes the material sticky.
If such materials are conveyed through a thin walled rubber hose, the natural move-
ment and flexing of the hose, resulting from the pulsations of the air under pressure and
the material transfer, is generally sufficient to dislodge any material that has a tendency
to adhere to the pipeline wall. The pipeline needs to be supported so that it is free to
move, but having sufficient support so that it is maintained reasonably straight. With the
requirement for a thin walled hose capable of flexing it is limited to low pressure dilute
phase conveying, but it does provide a simple and effective means of conveying this
type of material.
24
20
16
12
8
4
00
Mat
eria
l flo
w r
ate
(ton
ne/h
)
0.02 0.04 0.06 0.08 0.10
�10
�100 20
30
40
50
Material – CementPipe bore – 53 mmLength – 40 m
Air flow rate (kg/s)
� 1 �100%�phose
�psteel
Figure 5.5 Comparison of pressure drop data for steel and rubber hose pipelines.

116 PNEUMATIC CONVEYING DESIGN GUIDE
References
1. V K Agarwal, N Kulkarni and D Mills. Influence of expanded bends on wear and particle
degradation in pneumatic conveying system pipelines. Proc IMechE Conf on Powder and
Bulk Solids Handling. pp 307–317. London. June 2000.
2. D Mills. The value and use of measurements in pneumatic conveying. Part 1 – conveying air
pressure. Material and Product Handling. Vol 2, pp 7–13. January–March 2002.
3. D Mills. Application of stepped pipelines in pneumatic conveying systems. Proc 15th Int
Conf on Hydrotransport. pp 401–416. Banff, Canada. June 2002.
4. D Mills and J S Mason. An analysis of stepped pipelines for pneumatic conveying systems.
Proc 12th Powder and Bulk Solids Conf. pp 696–704. Chicago. May 1987.
5. D Mills. Using rubber hose to enhance your pneumatic conveying process. Powder and Bulk
Engineering. pp 79–87. March 2000.
6.1 Introduction
The air mover is at the heart of the pneumatic conveying system, and the success of the
entire system rests on correctly specifying the duty of the air mover. The specification
is in terms of the volumetric flow rate of free air required, and the pressure at which it
must be delivered. The values of these two parameters are primarily dependent upon the
material to be conveyed, its flow rate and the conveying distance, and this is considered
in Chapter 9. The choice of an air mover to supply the air at the desired flow rate and
pressure is equally important, and there is a wide range of machines that are potentially
capable of meeting the duty.
Not all air movers are ideally suited to pneumatic conveying, however, and so the
operating characteristics must be understood and interpreted. Plant air may be avail-
able, but it may not be economical to use it for pneumatic conveying. Some air movers
have limitations, and some are more suited as exhausters than compressors, and so the
correct choice must be made for vacuum and positive pressure duties.
There are also many peripheral issues associated with the supply of air for pneumatic
conveying systems that need to be considered, in addition to the basic hardware. Power
requirements for pneumatic conveying can be very high, particularly if it is required to
convey a material at a high flow rate over a long distance, and so a first order approxi-
mation is presented to allow reasonably reliable estimates to be made early in the selec-
tion process.
With most compressors the air is delivered at a high temperature, but this may have
to be cooled if high temperature air is not suitable for conveying the material. When
compressed air is cooled to ambient temperature, however, it often becomes saturated
with water, and this may cause problems. In addition, many compressors do not deliver
oil free air.
6.2 Types of air mover
Air movers available for pneumatic conveying applications range from fans and blow-
ers, producing high volumetric flow rates at relatively low pressures, to positive dis-
placement compressors, usually reciprocating or rotary screw machines, capable of
producing the higher pressures required for long distance or dense phase conveying
systems. The main features of some air movers typically employed for pneumatic con-
veying duties are outlined, in particular the operating characteristics.
Chapter 6
Air movers
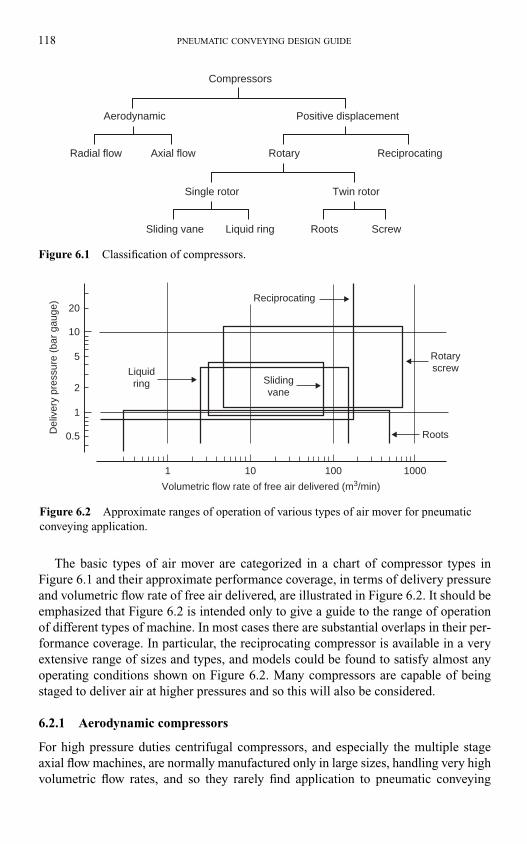
118 PNEUMATIC CONVEYING DESIGN GUIDE
The basic types of air mover are categorized in a chart of compressor types in
Figure 6.1 and their approximate performance coverage, in terms of delivery pressure
and volumetric flow rate of free air delivered, are illustrated in Figure 6.2. It should be
emphasized that Figure 6.2 is intended only to give a guide to the range of operation
of different types of machine. In most cases there are substantial overlaps in their per-
formance coverage. In particular, the reciprocating compressor is available in a very
extensive range of sizes and types, and models could be found to satisfy almost any
operating conditions shown on Figure 6.2. Many compressors are capable of being
staged to deliver air at higher pressures and so this will also be considered.
6.2.1 Aerodynamic compressors
For high pressure duties centrifugal compressors, and especially the multiple stage
axial flow machines, are normally manufactured only in large sizes, handling very high
volumetric flow rates, and so they rarely find application to pneumatic conveying
Compressors
Radial flow Axial flow
Single rotor Twin rotor
Sliding vane Liquid ring Roots Screw
ReciprocatingRotary
Aerodynamic Positive displacement
Figure 6.1 Classification of compressors.
Rotaryscrew
Reciprocating
Liquidring Sliding
vane
Roots
Volumetric flow rate of free air delivered (m3/min)
Del
iver
y pr
essu
re (
bar
gaug
e)
1
0.5
1
2
5
10
20
10 100 1000
Figure 6.2 Approximate ranges of operation of various types of air mover for pneumatic
conveying application.
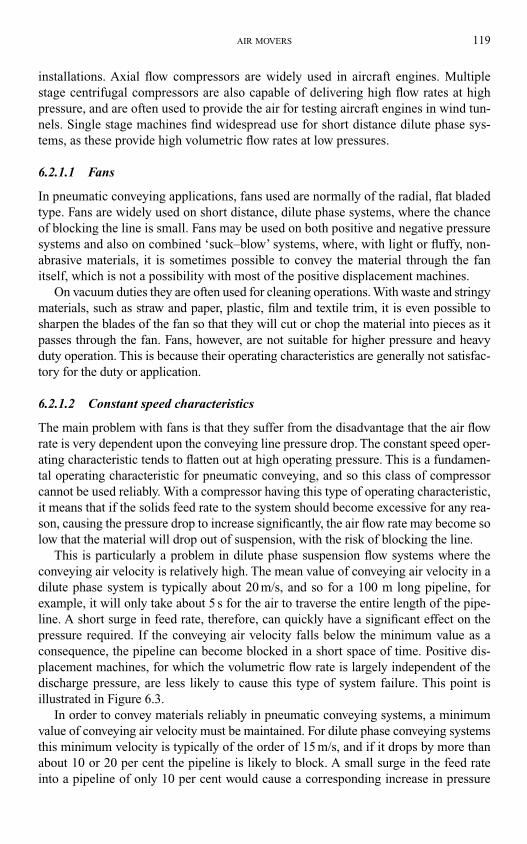
installations. Axial flow compressors are widely used in aircraft engines. Multiple
stage centrifugal compressors are also capable of delivering high flow rates at high
pressure, and are often used to provide the air for testing aircraft engines in wind tun-
nels. Single stage machines find widespread use for short distance dilute phase sys-
tems, as these provide high volumetric flow rates at low pressures.
6.2.1.1 Fans
In pneumatic conveying applications, fans used are normally of the radial, flat bladed
type. Fans are widely used on short distance, dilute phase systems, where the chance
of blocking the line is small. Fans may be used on both positive and negative pressure
systems and also on combined ‘suck–blow’ systems, where, with light or fluffy, non-
abrasive materials, it is sometimes possible to convey the material through the fan
itself, which is not a possibility with most of the positive displacement machines.
On vacuum duties they are often used for cleaning operations. With waste and stringy
materials, such as straw and paper, plastic, film and textile trim, it is even possible to
sharpen the blades of the fan so that they will cut or chop the material into pieces as it
passes through the fan. Fans, however, are not suitable for higher pressure and heavy
duty operation. This is because their operating characteristics are generally not satisfac-
tory for the duty or application.
6.2.1.2 Constant speed characteristics
The main problem with fans is that they suffer from the disadvantage that the air flow
rate is very dependent upon the conveying line pressure drop. The constant speed oper-
ating characteristic tends to flatten out at high operating pressure. This is a fundamen-
tal operating characteristic for pneumatic conveying, and so this class of compressor
cannot be used reliably. With a compressor having this type of operating characteristic,
it means that if the solids feed rate to the system should become excessive for any rea-
son, causing the pressure drop to increase significantly, the air flow rate may become so
low that the material will drop out of suspension, with the risk of blocking the line.
This is particularly a problem in dilute phase suspension flow systems where the
conveying air velocity is relatively high. The mean value of conveying air velocity in a
dilute phase system is typically about 20 m/s, and so for a 100 m long pipeline, for
example, it will only take about 5 s for the air to traverse the entire length of the pipe-
line. A short surge in feed rate, therefore, can quickly have a significant effect on the
pressure required. If the conveying air velocity falls below the minimum value as a
consequence, the pipeline can become blocked in a short space of time. Positive dis-
placement machines, for which the volumetric flow rate is largely independent of the
discharge pressure, are less likely to cause this type of system failure. This point is
illustrated in Figure 6.3.
In order to convey materials reliably in pneumatic conveying systems, a minimum
value of conveying air velocity must be maintained. For dilute phase conveying systems
this minimum velocity is typically of the order of 15 m/s, and if it drops by more than
about 10 or 20 per cent the pipeline is likely to block. A small surge in the feed rate
into a pipeline of only 10 per cent would cause a corresponding increase in pressure
AIR MOVERS 119
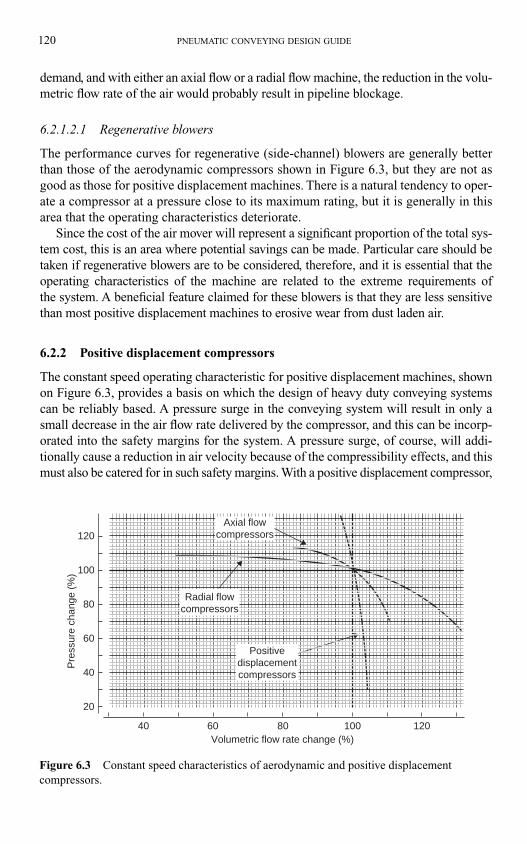
120 PNEUMATIC CONVEYING DESIGN GUIDE
demand, and with either an axial flow or a radial flow machine, the reduction in the volu-
metric flow rate of the air would probably result in pipeline blockage.
6.2.1.2.1 Regenerative blowers
The performance curves for regenerative (side-channel) blowers are generally better
than those of the aerodynamic compressors shown in Figure 6.3, but they are not as
good as those for positive displacement machines. There is a natural tendency to oper-
ate a compressor at a pressure close to its maximum rating, but it is generally in this
area that the operating characteristics deteriorate.
Since the cost of the air mover will represent a significant proportion of the total sys-
tem cost, this is an area where potential savings can be made. Particular care should be
taken if regenerative blowers are to be considered, therefore, and it is essential that the
operating characteristics of the machine are related to the extreme requirements of
the system. A beneficial feature claimed for these blowers is that they are less sensitive
than most positive displacement machines to erosive wear from dust laden air.
6.2.2 Positive displacement compressors
The constant speed operating characteristic for positive displacement machines, shown
on Figure 6.3, provides a basis on which the design of heavy duty conveying systems
can be reliably based. A pressure surge in the conveying system will result in only a
small decrease in the air flow rate delivered by the compressor, and this can be incorp-
orated into the safety margins for the system. A pressure surge, of course, will addi-
tionally cause a reduction in air velocity because of the compressibility effects, and this
must also be catered for in such safety margins. With a positive displacement compressor,
Volumetric flow rate change (%)
Pre
ssur
e ch
ange
(%
)
20
40
60
80
100
120
40 60 80 100 120
Radial flowcompressors
Axial flowcompressors
Positivedisplacementcompressors
Figure 6.3 Constant speed characteristics of aerodynamic and positive displacement
compressors.
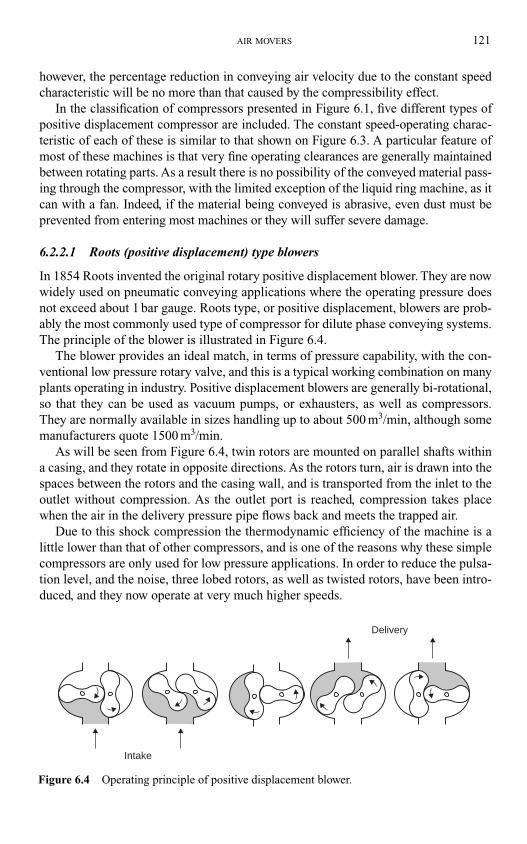
AIR MOVERS 121
however, the percentage reduction in conveying air velocity due to the constant speed
characteristic will be no more than that caused by the compressibility effect.
In the classification of compressors presented in Figure 6.1, five different types of
positive displacement compressor are included. The constant speed-operating charac-
teristic of each of these is similar to that shown on Figure 6.3. A particular feature of
most of these machines is that very fine operating clearances are generally maintained
between rotating parts. As a result there is no possibility of the conveyed material pass-
ing through the compressor, with the limited exception of the liquid ring machine, as it
can with a fan. Indeed, if the material being conveyed is abrasive, even dust must be
prevented from entering most machines or they will suffer severe damage.
6.2.2.1 Roots (positive displacement) type blowers
In 1854 Roots invented the original rotary positive displacement blower. They are now
widely used on pneumatic conveying applications where the operating pressure does
not exceed about 1 bar gauge. Roots type, or positive displacement, blowers are prob-
ably the most commonly used type of compressor for dilute phase conveying systems.
The principle of the blower is illustrated in Figure 6.4.
The blower provides an ideal match, in terms of pressure capability, with the con-
ventional low pressure rotary valve, and this is a typical working combination on many
plants operating in industry. Positive displacement blowers are generally bi-rotational,
so that they can be used as vacuum pumps, or exhausters, as well as compressors.
They are normally available in sizes handling up to about 500 m3/min, although some
manufacturers quote 1500 m3/min.
As will be seen from Figure 6.4, twin rotors are mounted on parallel shafts within
a casing, and they rotate in opposite directions. As the rotors turn, air is drawn into the
spaces between the rotors and the casing wall, and is transported from the inlet to the
outlet without compression. As the outlet port is reached, compression takes place
when the air in the delivery pressure pipe flows back and meets the trapped air.
Due to this shock compression the thermodynamic efficiency of the machine is a
little lower than that of other compressors, and is one of the reasons why these simple
compressors are only used for low pressure applications. In order to reduce the pulsa-
tion level, and the noise, three lobed rotors, as well as twisted rotors, have been intro-
duced, and they now operate at very much higher speeds.
Intake
Delivery
Figure 6.4 Operating principle of positive displacement blower.
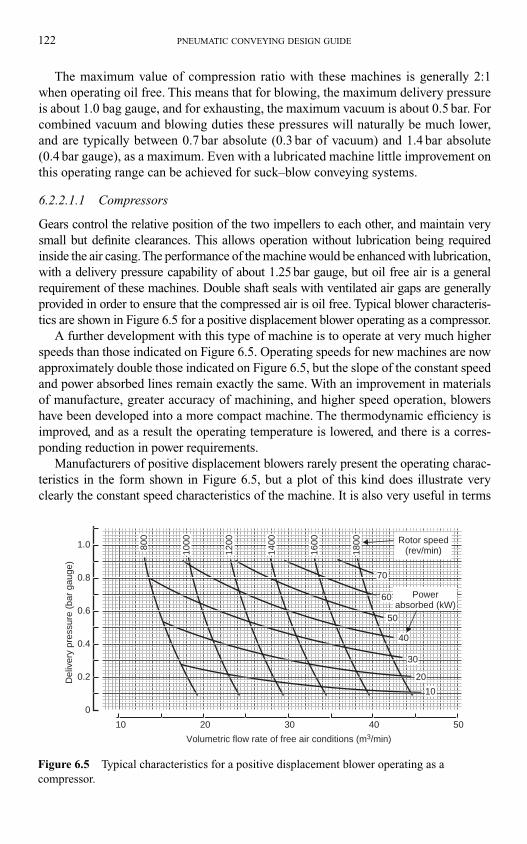
122 PNEUMATIC CONVEYING DESIGN GUIDE
The maximum value of compression ratio with these machines is generally 2:1
when operating oil free. This means that for blowing, the maximum delivery pressure
is about 1.0 bag gauge, and for exhausting, the maximum vacuum is about 0.5 bar. For
combined vacuum and blowing duties these pressures will naturally be much lower,
and are typically between 0.7 bar absolute (0.3 bar of vacuum) and 1.4 bar absolute
(0.4 bar gauge), as a maximum. Even with a lubricated machine little improvement on
this operating range can be achieved for suck–blow conveying systems.
6.2.2.1.1 Compressors
Gears control the relative position of the two impellers to each other, and maintain very
small but definite clearances. This allows operation without lubrication being required
inside the air casing. The performance of the machine would be enhanced with lubrication,
with a delivery pressure capability of about 1.25 bar gauge, but oil free air is a general
requirement of these machines. Double shaft seals with ventilated air gaps are generally
provided in order to ensure that the compressed air is oil free. Typical blower characteris-
tics are shown in Figure 6.5 for a positive displacement blower operating as a compressor.
A further development with this type of machine is to operate at very much higher
speeds than those indicated on Figure 6.5. Operating speeds for new machines are now
approximately double those indicated on Figure 6.5, but the slope of the constant speed
and power absorbed lines remain exactly the same. With an improvement in materials
of manufacture, greater accuracy of machining, and higher speed operation, blowers
have been developed into a more compact machine. The thermodynamic efficiency is
improved, and as a result the operating temperature is lowered, and there is a corres-
ponding reduction in power requirements.
Manufacturers of positive displacement blowers rarely present the operating charac-
teristics in the form shown in Figure 6.5, but a plot of this kind does illustrate very
clearly the constant speed characteristics of the machine. It is also very useful in terms
1.0
0.8
0.6
0.4
0.2
0
10 20 30 40 50
Del
iver
y pr
essu
re (
bar
gaug
e)
Volumetric flow rate of free air conditions (m3/min)
1000
1200
1400
1600
1800800
10
20
30
40
50
60
70
Powerabsorbed (kW)
Rotor speed(rev/min)
Figure 6.5 Typical characteristics for a positive displacement blower operating as a
compressor.
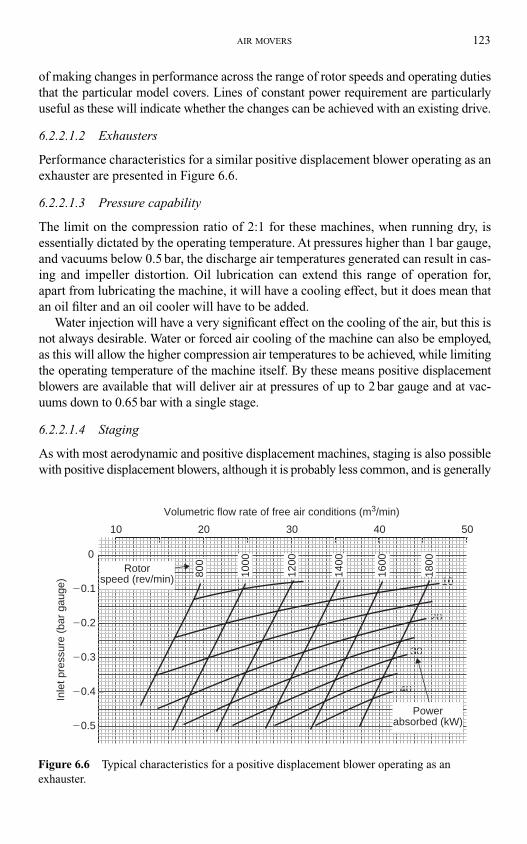
AIR MOVERS 123
of making changes in performance across the range of rotor speeds and operating duties
that the particular model covers. Lines of constant power requirement are particularly
useful as these will indicate whether the changes can be achieved with an existing drive.
6.2.2.1.2 Exhausters
Performance characteristics for a similar positive displacement blower operating as an
exhauster are presented in Figure 6.6.
6.2.2.1.3 Pressure capability
The limit on the compression ratio of 2:1 for these machines, when running dry, is
essentially dictated by the operating temperature. At pressures higher than 1 bar gauge,
and vacuums below 0.5 bar, the discharge air temperatures generated can result in cas-
ing and impeller distortion. Oil lubrication can extend this range of operation for,
apart from lubricating the machine, it will have a cooling effect, but it does mean that
an oil filter and an oil cooler will have to be added.
Water injection will have a very significant effect on the cooling of the air, but this is
not always desirable. Water or forced air cooling of the machine can also be employed,
as this will allow the higher compression air temperatures to be achieved, while limiting
the operating temperature of the machine itself. By these means positive displacement
blowers are available that will deliver air at pressures of up to 2 bar gauge and at vac-
uums down to 0.65 bar with a single stage.
6.2.2.1.4 Staging
As with most aerodynamic and positive displacement machines, staging is also possible
with positive displacement blowers, although it is probably less common, and is generally
0
�0.1
�0.2
�0.3
�0.4
�0.5
10
20
30
40
Inle
t pre
ssur
e (b
ar g
auge
)
10 20 30 40 50
Volumetric flow rate of free air conditions (m3/min)
Powerabsorbed (kW)
Rotorspeed (rev/min) 80
0
1000
1200
1400
1600
1800
Figure 6.6 Typical characteristics for a positive displacement blower operating as an
exhauster.
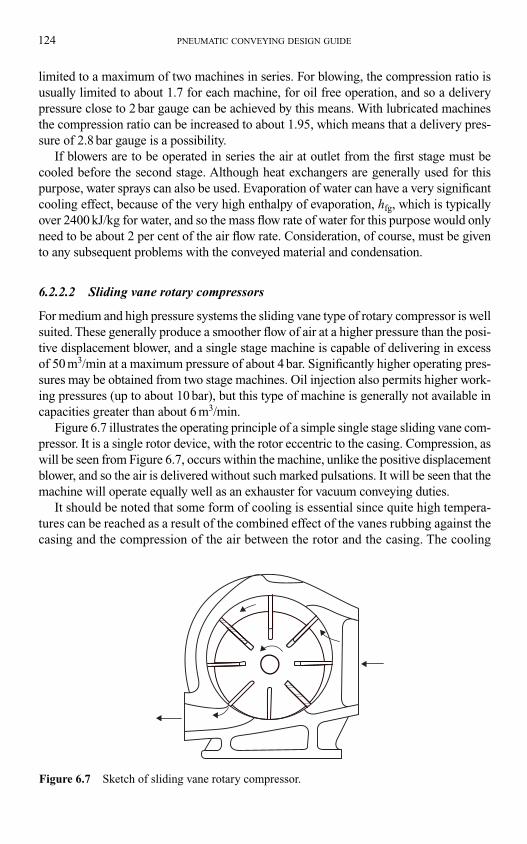
124 PNEUMATIC CONVEYING DESIGN GUIDE
limited to a maximum of two machines in series. For blowing, the compression ratio is
usually limited to about 1.7 for each machine, for oil free operation, and so a delivery
pressure close to 2 bar gauge can be achieved by this means. With lubricated machines
the compression ratio can be increased to about 1.95, which means that a delivery pres-
sure of 2.8 bar gauge is a possibility.
If blowers are to be operated in series the air at outlet from the first stage must be
cooled before the second stage. Although heat exchangers are generally used for this
purpose, water sprays can also be used. Evaporation of water can have a very significant
cooling effect, because of the very high enthalpy of evaporation, hfg, which is typically
over 2400 kJ/kg for water, and so the mass flow rate of water for this purpose would only
need to be about 2 per cent of the air flow rate. Consideration, of course, must be given
to any subsequent problems with the conveyed material and condensation.
6.2.2.2 Sliding vane rotary compressors
For medium and high pressure systems the sliding vane type of rotary compressor is well
suited. These generally produce a smoother flow of air at a higher pressure than the posi-
tive displacement blower, and a single stage machine is capable of delivering in excess
of 50 m3/min at a maximum pressure of about 4 bar. Significantly higher operating pres-
sures may be obtained from two stage machines. Oil injection also permits higher work-
ing pressures (up to about 10 bar), but this type of machine is generally not available in
capacities greater than about 6 m3/min.
Figure 6.7 illustrates the operating principle of a simple single stage sliding vane com-
pressor. It is a single rotor device, with the rotor eccentric to the casing. Compression, as
will be seen from Figure 6.7, occurs within the machine, unlike the positive displacement
blower, and so the air is delivered without such marked pulsations. It will be seen that the
machine will operate equally well as an exhauster for vacuum conveying duties.
It should be noted that some form of cooling is essential since quite high tempera-
tures can be reached as a result of the combined effect of the vanes rubbing against the
casing and the compression of the air between the rotor and the casing. The cooling
Figure 6.7 Sketch of sliding vane rotary compressor.
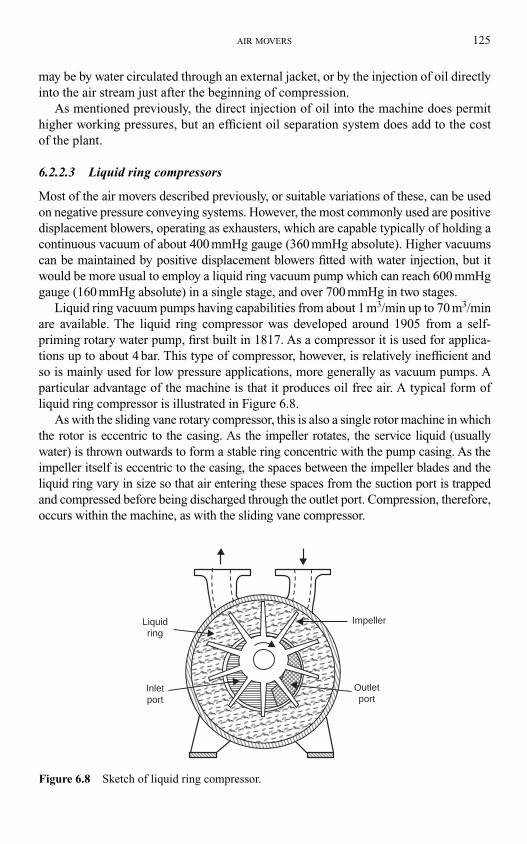
AIR MOVERS 125
may be by water circulated through an external jacket, or by the injection of oil directly
into the air stream just after the beginning of compression.
As mentioned previously, the direct injection of oil into the machine does permit
higher working pressures, but an efficient oil separation system does add to the cost
of the plant.
6.2.2.3 Liquid ring compressors
Most of the air movers described previously, or suitable variations of these, can be used
on negative pressure conveying systems. However, the most commonly used are positive
displacement blowers, operating as exhausters, which are capable typically of holding a
continuous vacuum of about 400 mmHg gauge (360 mmHg absolute). Higher vacuums
can be maintained by positive displacement blowers fitted with water injection, but it
would be more usual to employ a liquid ring vacuum pump which can reach 600 mmHg
gauge (160 mmHg absolute) in a single stage, and over 700 mmHg in two stages.
Liquid ring vacuum pumps having capabilities from about 1 m3/min up to 70 m3/min
are available. The liquid ring compressor was developed around 1905 from a self-
priming rotary water pump, first built in 1817. As a compressor it is used for applica-
tions up to about 4 bar. This type of compressor, however, is relatively inefficient and
so is mainly used for low pressure applications, more generally as vacuum pumps. A
particular advantage of the machine is that it produces oil free air. A typical form of
liquid ring compressor is illustrated in Figure 6.8.
As with the sliding vane rotary compressor, this is also a single rotor machine in which
the rotor is eccentric to the casing. As the impeller rotates, the service liquid (usually
water) is thrown outwards to form a stable ring concentric with the pump casing. As the
impeller itself is eccentric to the casing, the spaces between the impeller blades and the
liquid ring vary in size so that air entering these spaces from the suction port is trapped
and compressed before being discharged through the outlet port. Compression, therefore,
occurs within the machine, as with the sliding vane compressor.
Impeller
Outletport
Inletport
Liquidring
Figure 6.8 Sketch of liquid ring compressor.
The liquid ring also performs the useful functions of cooling the compressed air
and washing out small quantities of entrained dust. The tolerance of the machine to
dust is a particular advantage in vacuum conveying systems and is, therefore, widely
used in this application.
6.2.2.4 Rotary screw compressors
A relatively recent innovation for medium to high pressure operation is the helical
lobe rotary, or Lysholm, screw compressor. The rotary screw compressor was patented
in 1878, but in a form similar to the Roots blower, that is, without internal compres-
sion. The mathematical laws for obtaining compression were developed by the
Swedish engineer, A. Lysholm in the 1930s.
In 1958 rotor profiles giving a high efficiency were developed but these require oil
injection into the compression chamber to reduce internal air leakage. The oil helps to
cool the air during compression but, as with oil injected sliding vane machines, it is
generally necessary to remove the oil from the compressed air. With large compres-
sors the injection, separation and filtration equipment can represent a substantial pro-
portion of the plant cost. In 1967 a much improved rotor profile was developed which
allowed rolling motion between the rotor flanks with reduced air leakage, without the
need for oil injection.
The machine consists essentially of male and female intermeshing rotors mounted
on parallel shafts. Inlet and outlet ports are at opposite ends of the compressor. Air
entering one of the cavities in the female rotor becomes trapped by a male lobe, and as
the rotors turn, this trapped air is compressed and moved towards the discharge end.
Continuing rotation of the lobes causes the discharge opening to be uncovered so that
the trapped air, now at minimum volume, is released into the discharge line.
Screw compressors are manufactured with capacities ranging from 4 to 700 m3/min.
With oil injection they can develop maximum pressures of about 9 bar. Dry machines
can reach 11 bar with two stages, and about 4 bar with a single stage. As these machines
are generally free from pressure pulsations it is not usually necessary to operate with an
air receiver, and they do not require special foundations for mounting.
6.2.2.5 Reciprocating compressors
The familiar reciprocating compressor, until recent years, was probably the most
widely used machine for providing high pressure air for pneumatic conveying sys-
tems, but the screw compressor has been a serious competitor where large flow
rates are required. Reciprocating compressors are available as single cylinder machines,
or with multiple cylinders arranged to give one or more stages of compression.
Reciprocating compressors probably have the best thermodynamic efficiency of any
air mover.
Where it is essential that there should be no material contamination with oil, recip-
rocating compressors can be provided with carbon filled polytetrafluoroethylene (ptfe)
rings, which eliminate the need for oil in cylinder lubrication, and hence additional
separation equipment. A compressor of this type could thus be found to suit almost any
126 PNEUMATIC CONVEYING DESIGN GUIDE
AIR MOVERS 127
pneumatic conveying application in the medium to high pressure range. Even the
disadvantage of a pulsating air flow, usually associated with reciprocating machines,
can be overcome by selecting one of the modern, small mobile cylinder compressors,
such as that in which seven pairs of radially disposed opposing pistons are made to
reciprocate by the motion of a centrally placed wobble plate.
6.2.3 Staging
Arranging two or more compressors in series, in order to achieve higher delivery pres-
sures, is possible with most types of compressor, as mentioned earlier with respect to
the staging of positive displacement blowers. To improve the efficiency of compres-
sion it is usual to cool the air between the stages. Due to the high delivery temperature
of air from compressors, which is considered in detail in Section of 6.3.1, this cooling
is essential.
The lower volumetric flow rate of the air, as a result of the increase in pressure, and
the reduction in temperature, will mean that the size of the next compression stage can
be reduced, apart from improving conditions with regard to lubrication as a result of
the lower air temperature. Inter-cooling by means of an air blast, or a water-based heat
exchanger, are the normal means of cooling the air between stages.
With regard to the staging of positive displacement blowers, considered above, it
was mentioned that water sprays could also be used. Some compressors, however, are
susceptible to damage by water drops and so it is generally recommended that the air
between stages should not be cooled to a temperature below that of the prevailing dew
point. This aspect of air requirements is considered in some detail in Chapter 25 on
‘Moisture and condensation’. The elimination of water between stages will also min-
imize the problems caused by the possible rusting of materials in this area.
6.2.4 Specification of air movers
The operating performance of compressors and exhausters, for a particular model, is
generally in terms of the volumetric flow rate of the air and the delivery pressure, or
vacuum, for a range of rotational speeds, similar to those presented in Figures 6.5 and
6.6. Different models will cover a different range of duties, and there is likely to be an
overlap in volumetric flow rate capability between different models.
As air is compressible, with respect to both pressure and temperature, it is necessary
to specify reference conditions for air movers, that are internationally recognized. It is
essential, therefore, that it should be realized that the volumetric flow rate to be speci-
fied for the air mover will not be same as the volumetric flow rate required to convey a
material at the start of a pipeline.
It will be necessary to convert the volumetric flow rate required for the system to
the volumetric flow rate to be specified for the air mover. The air mass flow rate will
be exactly the same for the two, but this is not how air movers are specified. It would
provide a useful check, however, if the air mass flow rate was to be evaluated for the
two cases. All the models required for this type of analysis are presented in Chapter 9
on Air Flow Rate Evaluation.
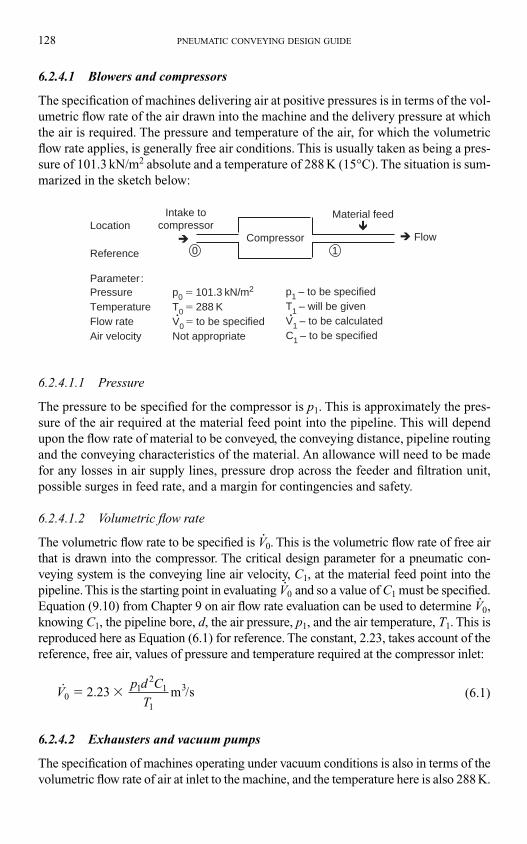
128 PNEUMATIC CONVEYING DESIGN GUIDE
6.2.4.1 Blowers and compressors
The specification of machines delivering air at positive pressures is in terms of the vol-
umetric flow rate of the air drawn into the machine and the delivery pressure at which
the air is required. The pressure and temperature of the air, for which the volumetric
flow rate applies, is generally free air conditions. This is usually taken as being a pres-
sure of 101.3 kN/m2 absolute and a temperature of 288 K (15°C). The situation is sum-
marized in the sketch below:
6.2.4.1.1 Pressure
The pressure to be specified for the compressor is p1. This is approximately the pres-
sure of the air required at the material feed point into the pipeline. This will depend
upon the flow rate of material to be conveyed, the conveying distance, pipeline routing
and the conveying characteristics of the material. An allowance will need to be made
for any losses in air supply lines, pressure drop across the feeder and filtration unit,
possible surges in feed rate, and a margin for contingencies and safety.
6.2.4.1.2 Volumetric flow rate
The volumetric flow rate to be specified is V�0. This is the volumetric flow rate of free air
that is drawn into the compressor. The critical design parameter for a pneumatic con-
veying system is the conveying line air velocity, C1, at the material feed point into the
pipeline. This is the starting point in evaluating V�0 and so a value of C1 must be specified.
Equation (9.10) from Chapter 9 on air flow rate evaluation can be used to determine V�0,
knowing C1, the pipeline bore, d, the air pressure, p1, and the air temperature, T1. This is
reproduced here as Equation (6.1) for reference. The constant, 2.23, takes account of the
reference, free air, values of pressure and temperature required at the compressor inlet:
(6.1)
6.2.4.2 Exhausters and vacuum pumps
The specification of machines operating under vacuum conditions is also in terms of the
volumetric flow rate of air at inlet to the machine, and the temperature here is also 288 K.
˙ /Vp d C
T01
21
1
2.23 m s3� �
LocationIntake to
compressor
Reference
Parameter:Pressure TemperatureFlow rateAir velocity
Compressor
Material feed�
Flow��10
p1 – to be specifiedT1 – will be givenV1 – to be calculatedC1 – to be specified
p0 � 101.3 kN/m2
T0 � 288 KV0� to be specifiedNot appropriate
• •
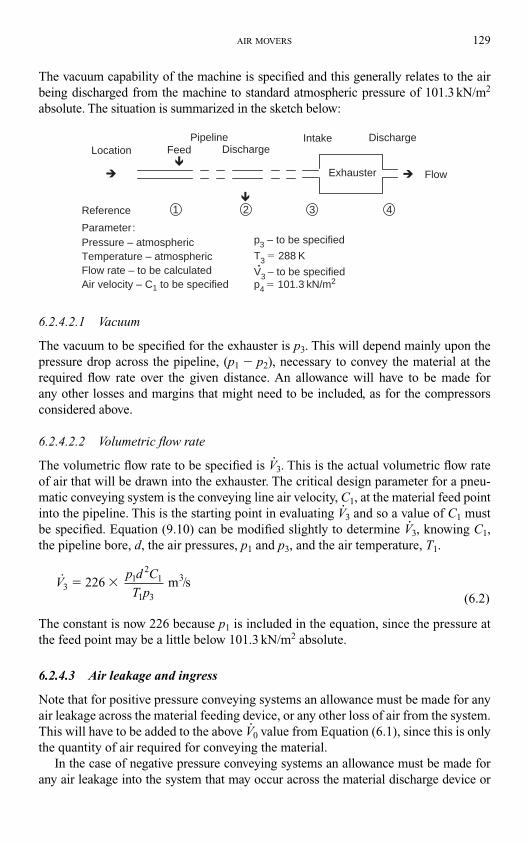
AIR MOVERS 129
The vacuum capability of the machine is specified and this generally relates to the air
being discharged from the machine to standard atmospheric pressure of 101.3 kN/m2
absolute. The situation is summarized in the sketch below:
6.2.4.2.1 Vacuum
The vacuum to be specified for the exhauster is p3. This will depend mainly upon the
pressure drop across the pipeline, (p1 � p2), necessary to convey the material at the
required flow rate over the given distance. An allowance will have to be made for
any other losses and margins that might need to be included, as for the compressors
considered above.
6.2.4.2.2 Volumetric flow rate
The volumetric flow rate to be specified is V�3. This is the actual volumetric flow rate
of air that will be drawn into the exhauster. The critical design parameter for a pneu-
matic conveying system is the conveying line air velocity, C1, at the material feed point
into the pipeline. This is the starting point in evaluating V�3 and so a value of C1 must
be specified. Equation (9.10) can be modified slightly to determine V�3, knowing C1,
the pipeline bore, d, the air pressures, p1 and p3, and the air temperature, T1.
(6.2)
The constant is now 226 because p1 is included in the equation, since the pressure at
the feed point may be a little below 101.3 kN/m2 absolute.
6.2.4.3 Air leakage and ingress
Note that for positive pressure conveying systems an allowance must be made for any
air leakage across the material feeding device, or any other loss of air from the system.
This will have to be added to the above V�0 value from Equation (6.1), since this is only
the quantity of air required for conveying the material.
In the case of negative pressure conveying systems an allowance must be made for
any air leakage into the system that may occur across the material discharge device or
Vp d C
T p31
21
1 3
226 m /s3� �
PipelineFeed
�� �
�
DischargeIntake Discharge
Flow
Location
Exhauster
Reference
Parameter:Pressure – atmosphericTemperature – atmosphericFlow rate – to be calculatedAir velocity – C1 to be specified
1 2 3 4
p3 – to be specified
T3 � 288 K
V3 – to be specifiedp4 � 101.3 kN/m2
•
any other gain of air into the system. This will have to be added to the above V�3 value from
Equation (6.2), as this is also the quantity of air required for conveying the material only.
6.3 Air compression effects
When compressed air is delivered into a pipeline for use, the air will almost certainly
be very hot, and it may contain quantities of water and oil. Air delivery temperature and
the problem of oil are considered in some detail at this point, but the specific subjects
of moisture and condensation, and air drying, although introduced here, are considered
generally and in more detail in Chapter 25. The power required to provide the com-
pressed air, and hence the operating cost, can be very high, and this topic is also con-
sidered in some detail at this point.
6.3.1 Delivery temperature
Much of the work energy that goes into compressing air manifests itself in increas-
ing the temperature of the air. For air compression to pressures greater than about
2 bar gauge air cooling is generally employed. The most efficient form of compression
is to carry out the process isothermally, and so cylinders of reciprocating machines
are often water cooled, and if staging is employed for achieving high pressures,
inter-cooling is generally incorporated as well. For most high pressure machines
that have some form of air cooling, therefore, the influence of air temperature can be
neglected.
In the majority of dilute phase conveying systems, where a large volume of air is
required at a relatively low pressure, positive displacement blowers are generally used.
For this type of application they are not usually cooled and so the air, after compres-
sion, can be at a fairly high temperature. Thermodynamic equations are available that
will allow this temperature to be evaluated. Compression can be based on an isen-
tropic model for which the relationship between the absolute pressure and the absolute
temperature is given by:
(6.3)
where � is the ratio of specific heats, Cp/Cv � 1.4 for air and subscripts 1 and 2 refer
to inlet and outlet conditions.
This is the ideal case. In practice the air will be delivered at a higher temperature
than this due to thermodynamic irreversibilities. The compression process is adiabatic,
partly because of the speed of the process, but it is far from being a reversible process.
As a result, the temperature of the air leaving a compressor can be very high.
If, for example, air at a temperature of 20°C is compressed to 1 bar gauge in a posi-
tive displacement blower, the minimum temperature after compression, for a reversible
process, would be about 84°C, and with an isentropic efficiency of 80 per cent it would
be 100°C. Irreversibility is taken into account by means of an isentropic efficiency,
T
T
p
p2
1
2
1
1)/
�
�
(� �
130 PNEUMATIC CONVEYING DESIGN GUIDE
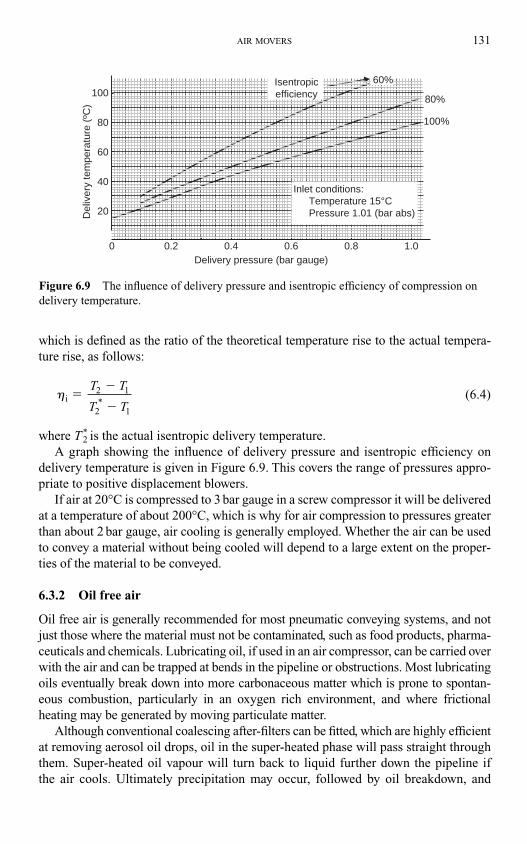
AIR MOVERS 131
which is defined as the ratio of the theoretical temperature rise to the actual tempera-
ture rise, as follows:
(6.4)
where T*2 is the actual isentropic delivery temperature.
A graph showing the influence of delivery pressure and isentropic efficiency on
delivery temperature is given in Figure 6.9. This covers the range of pressures appro-
priate to positive displacement blowers.
If air at 20°C is compressed to 3 bar gauge in a screw compressor it will be delivered
at a temperature of about 200°C, which is why for air compression to pressures greater
than about 2 bar gauge, air cooling is generally employed. Whether the air can be used
to convey a material without being cooled will depend to a large extent on the proper-
ties of the material to be conveyed.
6.3.2 Oil free air
Oil free air is generally recommended for most pneumatic conveying systems, and not
just those where the material must not be contaminated, such as food products, pharma-
ceuticals and chemicals. Lubricating oil, if used in an air compressor, can be carried over
with the air and can be trapped at bends in the pipeline or obstructions. Most lubricating
oils eventually break down into more carbonaceous matter which is prone to spontan-
eous combustion, particularly in an oxygen rich environment, and where frictional
heating may be generated by moving particulate matter.
Although conventional coalescing after-filters can be fitted, which are highly efficient
at removing aerosol oil drops, oil in the super-heated phase will pass straight through
them. Super-heated oil vapour will turn back to liquid further down the pipeline if
the air cools. Ultimately precipitation may occur, followed by oil breakdown, and
�i
1
�
�
�
T T
T T2 1
2*
80
100
60
40
20
0 0.2 0.4 0.6 0.8 1.0Delivery pressure (bar gauge)
Del
iver
y te
mpe
ratu
re (
ºC) 80%
100%
Isentropicefficiency
Inlet conditions: Temperature 15°C Pressure 1.01 (bar abs)
60%
Figure 6.9 The influence of delivery pressure and isentropic efficiency of compression on
delivery temperature.
eventually a compressed air fire. The only safe solution, where oil injected compres-
sors are used, is to employ chemical after-filters such as the carbon absorber type that
are capable of removing oil in both liquid droplet and super-heated phases. The solu-
tion, however, is expensive and requires continuous maintenance and replacement of
carbon filter cells.
6.3.3 Water removal
As the pressure of air is increased, its capability for holding moisture in suspension
decreases. As the temperature of air increases, however, it is able to absorb much more
moisture. If saturated air is compressed isothermally, therefore, the specific humidity
will automatically be reduced. If the air is not initially saturated, isothermal compression
will reduce the relative humidity of the air and it may well reach the saturation point
during the compression process. Where air is compressed isothermally, therefore, quite
large quantities of water vapour can be condensed, and in many cases the air leaving the
compressor will be saturated. In adiabatic compression the temperature of the air will
rise, and because of the marked ability of warmer air to support moisture, it is unlikely
that any condensation will take place during the compression process.
6.3.3.1 Air line filters
As compression occurs very rapidly, it is quite possible that when condensation does
occur, droplets of water will be carried through pipelines with the compressed air. Also,
if additional cooling of saturated air occurs in the outlet line, further condensation will
occur. The removal of droplets of water in suspension is a relatively simple process.
Normal air line filters work on a similar principle to a spin drier. Air flowing through
the filter is made to swirl by passing it through a series of louvers. This causes the water
droplets to be thrown outwards and drain to a bowl where it can be drained off. It is
important, therefore, that such filters, and compressor and air receiver drains, should be
carefully maintained, and be protected from frost.
6.3.4 Air drying
If dry air is required for conveying a material a reduction in specific humidity can be
obtained by cooling the air at constant pressure. This may be prior to compression or
after. When air is cooled its relative humidity will increase, and when it reaches 100 per
cent further cooling will cause condensation. Beyond this point the specific humidity
will decrease. If the condensate is drained away and the air is then heated, its specific
humidity will remain constant, but the relative humidity will decrease. This process is
adopted in most refrigerant types of air dryer. Alternatively a desiccant dehumidifier
can be used for the purpose. If the material to be conveyed is hygroscopic, some form
of air drying is usually incorporated.
6.3.4.1 Refrigerants
Refrigeration drying is particularly effective when the air is warm and the humidity is
high. Under these circumstances a cooling system can remove two to four times as
132 PNEUMATIC CONVEYING DESIGN GUIDE
much energy (temperature and moisture) from an air stream as the machine consumes
in electrical power to accomplish this removal [1]. The air may be dried under atmos-
pheric conditions, prior to being compressed or otherwise used, or it may be dried at
pressure after it has been compressed. In the latter case refrigeration units are used for
the dual purpose of both drying and cooling the air.
Refrigerant dryers usually have two stages of heat exchange. In the first the warm
inlet air is pre-cooled by the cold, dry, outgoing air. It then passes to a refrigerant heat
exchanger where it is cooled to the required dew point. This is usually about 2°C. Drying
down to this level of moisture avoids problems of ice formation and freezing in the unit.
If any further drying is required, much lower temperatures would have to be achieved,
and this would make a refrigerant unit very expensive.
Such units, however, are now available and these have the capability of cooling the air
down to �60°C. The process is generally staged, with three units arranged in series and
parallel. The first is a conventional, continuously operating unit, which reduces the tem-
perature to 2°C, as above. In series with this are two refrigeration units with the capabil-
ity of cooling the air down to �60°C. As ice will form on these units they are arranged
in parallel, with one operating, to dry the air, while the other is being de-frosted.
6.3.4.2 Desiccants
Desiccant dehumidifiers are particularly well suited to the removal of moisture from
air at low temperature and low humidity. The driest possible air is obtained from a des-
iccant dryer. These are capable of reducing the moisture level to an equivalent dew
point temperature of �70°C if necessary. They should not, however, be used for dry-
ing warm, humid air unless absolutely necessary, for they are costly to operate. A
refrigeration system will generally add 10 per cent to the operating costs, but this may
be as high as 30 per cent with a chemical type of dryer.
Typically 15 per cent of the compressed air being dried is lost to the system as it is
required for purging the saturated desiccant in regenerative types. An additional prob-
lem with this type of system is that dust can be carried over into the conveying line.
Water droplets often result in the bursting of the desiccant granules and so it is neces-
sary to provide a filter for these fragments.
There are two main types of desiccant dryer. In one, desiccant tablets are charged,
and when these decay they need to be topped up. In the other, a regenerative system is
employed. For drying compressed air, two units operating in parallel are generally
used. While the process air is passed through one unit for drying, the desiccant in the
other unit is being dried by heated reactivation air ready for re-use. For the drying of
atmospheric air a slowly rotating (typically at about six revolutions per hour) device
is generally used in which the process and recirculation air streams are kept separate
by means of seals.
It should be noted that this is entirely a chemical process, and although extremely low
values of dew point can be achieved, there is no physical reduction in temperature of
the air. The air temperature will rise in proportion to the amount of water removed [1].
For positive pressure conveying systems these are generally used to dry the air after it
has been compressed and cooled.
AIR MOVERS 133
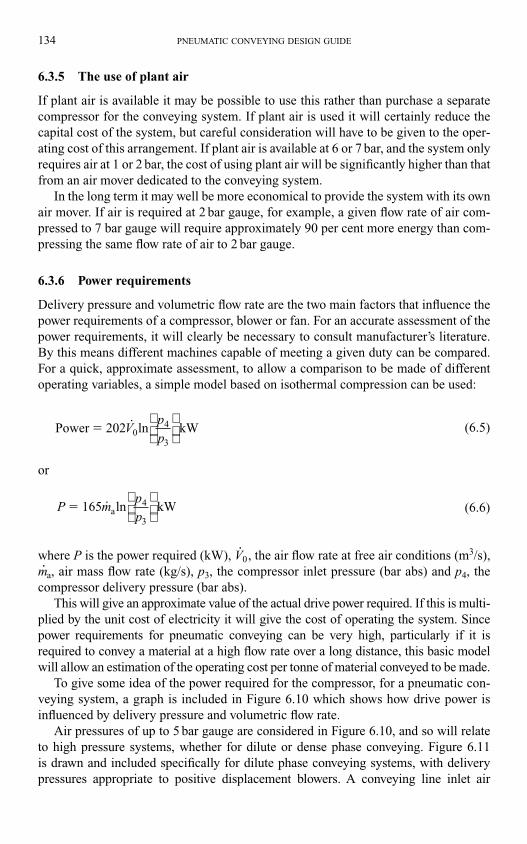
6.3.5 The use of plant air
If plant air is available it may be possible to use this rather than purchase a separate
compressor for the conveying system. If plant air is used it will certainly reduce the
capital cost of the system, but careful consideration will have to be given to the oper-
ating cost of this arrangement. If plant air is available at 6 or 7 bar, and the system only
requires air at 1 or 2 bar, the cost of using plant air will be significantly higher than that
from an air mover dedicated to the conveying system.
In the long term it may well be more economical to provide the system with its own
air mover. If air is required at 2 bar gauge, for example, a given flow rate of air com-
pressed to 7 bar gauge will require approximately 90 per cent more energy than com-
pressing the same flow rate of air to 2 bar gauge.
6.3.6 Power requirements
Delivery pressure and volumetric flow rate are the two main factors that influence the
power requirements of a compressor, blower or fan. For an accurate assessment of the
power requirements, it will clearly be necessary to consult manufacturer’s literature.
By this means different machines capable of meeting a given duty can be compared.
For a quick, approximate assessment, to allow a comparison to be made of different
operating variables, a simple model based on isothermal compression can be used:
(6.5)
or
(6.6)
where P is the power required (kW), V�0, the air flow rate at free air conditions (m3/s),
m�a, air mass flow rate (kg/s), p3, the compressor inlet pressure (bar abs) and p4, the
compressor delivery pressure (bar abs).
This will give an approximate value of the actual drive power required. If this is multi-
plied by the unit cost of electricity it will give the cost of operating the system. Since
power requirements for pneumatic conveying can be very high, particularly if it is
required to convey a material at a high flow rate over a long distance, this basic model
will allow an estimation of the operating cost per tonne of material conveyed to be made.
To give some idea of the power required for the compressor, for a pneumatic con-
veying system, a graph is included in Figure 6.10 which shows how drive power is
influenced by delivery pressure and volumetric flow rate.
Air pressures of up to 5 bar gauge are considered in Figure 6.10, and so will relate
to high pressure systems, whether for dilute or dense phase conveying. Figure 6.11
is drawn and included specifically for dilute phase conveying systems, with delivery
pressures appropriate to positive displacement blowers. A conveying line inlet air
P mp
p 165 ln kWa� ˙ 4
3
Power 202 ln kW� Vp
p04
3
134 PNEUMATIC CONVEYING DESIGN GUIDE
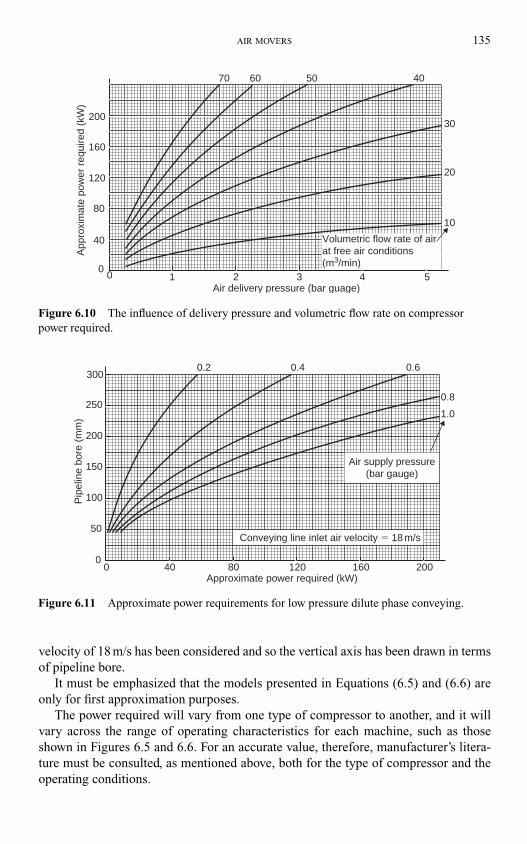
AIR MOVERS 135
velocity of 18 m/s has been considered and so the vertical axis has been drawn in terms
of pipeline bore.
It must be emphasized that the models presented in Equations (6.5) and (6.6) are
only for first approximation purposes.
The power required will vary from one type of compressor to another, and it will
vary across the range of operating characteristics for each machine, such as those
shown in Figures 6.5 and 6.6. For an accurate value, therefore, manufacturer’s litera-
ture must be consulted, as mentioned above, both for the type of compressor and the
operating conditions.
200
160
120
80
40
00 1
10
2
20
3
30
4
40
5
506070
Air delivery pressure (bar guage)
App
roxi
mat
e po
wer
req
uire
d (k
W)
Volumetric flow rate of airat free air conditions(m3/min)
Figure 6.10 The influence of delivery pressure and volumetric flow rate on compressor
power required.
250
300
200
150
100
50
00 40 80 120
1.0
160
0.8
200
0.60.40.2
Pip
elin
e bo
re (
mm
)
Approximate power required (kW)
Conveying line inlet air velocity � 18 m/s
Air supply pressure(bar gauge)
Figure 6.11 Approximate power requirements for low pressure dilute phase conveying.
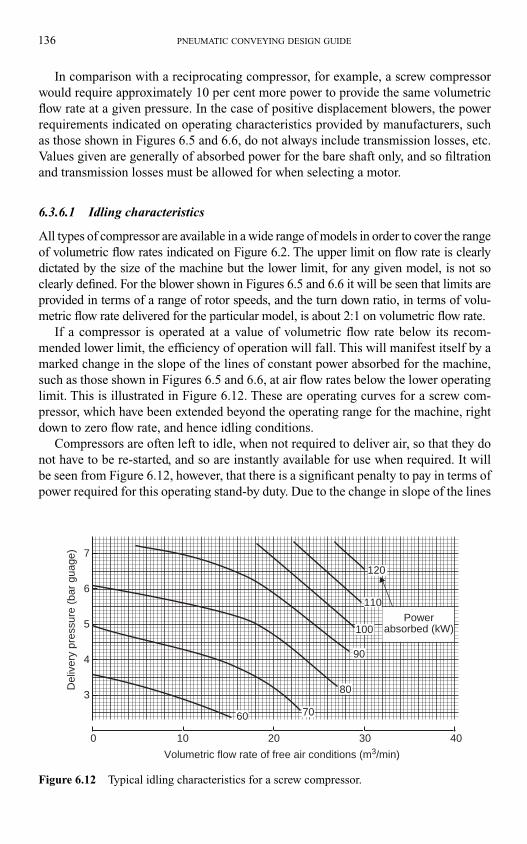
136 PNEUMATIC CONVEYING DESIGN GUIDE
In comparison with a reciprocating compressor, for example, a screw compressor
would require approximately 10 per cent more power to provide the same volumetric
flow rate at a given pressure. In the case of positive displacement blowers, the power
requirements indicated on operating characteristics provided by manufacturers, such
as those shown in Figures 6.5 and 6.6, do not always include transmission losses, etc.
Values given are generally of absorbed power for the bare shaft only, and so filtration
and transmission losses must be allowed for when selecting a motor.
6.3.6.1 Idling characteristics
All types of compressor are available in a wide range of models in order to cover the range
of volumetric flow rates indicated on Figure 6.2. The upper limit on flow rate is clearly
dictated by the size of the machine but the lower limit, for any given model, is not so
clearly defined. For the blower shown in Figures 6.5 and 6.6 it will be seen that limits are
provided in terms of a range of rotor speeds, and the turn down ratio, in terms of volu-
metric flow rate delivered for the particular model, is about 2:1 on volumetric flow rate.
If a compressor is operated at a value of volumetric flow rate below its recom-
mended lower limit, the efficiency of operation will fall. This will manifest itself by a
marked change in the slope of the lines of constant power absorbed for the machine,
such as those shown in Figures 6.5 and 6.6, at air flow rates below the lower operating
limit. This is illustrated in Figure 6.12. These are operating curves for a screw com-
pressor, which have been extended beyond the operating range for the machine, right
down to zero flow rate, and hence idling conditions.
Compressors are often left to idle, when not required to deliver air, so that they do
not have to be re-started, and so are instantly available for use when required. It will
be seen from Figure 6.12, however, that there is a significant penalty to pay in terms of
power required for this operating stand-by duty. Due to the change in slope of the lines
7
6
5
4
3
0 10 20 30 40
Del
iver
y pr
essu
re (
bar
guag
e)
Volumetric flow rate of free air conditions (m3/min)
Powerabsorbed (kW)
60 70
80
90
100
110
120
Figure 6.12 Typical idling characteristics for a screw compressor.
AIR MOVERS 137
of constant power absorbed, below the recommended range of operating, the power
absorbed when idling, and delivering no air, is almost 70 per cent of that required for
full load operation. Thus when idling, at a given delivery pressure, there is a saving in
power of only some 30 per cent.
6.4 Pre-cooling systems
In recent years, with increasing emphasis on power consumption, more consideration
is being given to ways of reducing power. A European Union study has shown that
15 per cent of the world-wide energy consumption is used to produce compressed
air. One proposal, with regard to reducing the power requirement for compressed air,
is that the air should be cooled to �60°C before being compressed.
It was mentioned earlier, in relation to refrigeration drying of air, that units were
available that were capable of cooling air to a temperature of �60°C. Such units form
the basis of commercially available pre-cooling systems for compressors.
The idea is that all of the air to be compressed should be physically cooled
to �60°C first. By this means the air will be extremely dry, so that there will be no
need for a further dryer on the pressure side, and there will be no possibility of con-
densation occurring anywhere in the subsequent system. This will also eliminate the
presence of water–oil emulsions that can occur in lubricated compressors.
For air at standard atmospheric pressure the density is 1.225 kg/m3 at a temperature
of 15°C but at �60°C it is 1.657 kg/m3, which represents a 35 per cent increase. In
terms of the volumetric flow rate it means that this is reduced to 74 per cent of the free
air flow rate that would have to be compressed, and so a much smaller compressor can
be used. Manufacturers of this type of system claim that up to a 30 per cent reduction
in power consumption of compressors can be made by this means, and that plant
maintenance is significantly reduced.
If atmospheric air at a temperature of 15°C is compressed to 2 bar gauge, the deliv-
ery temperature, assuming adiabatic compression and an isentropic efficiency of 70
per cent, will be about 165°C. For air at �60°C, similarly compressed, the delivery
temperature will be about 50°C. In the first case the air would, for most applications,
have to be cooled, and if it was not dried, condensation could well occur. With the pre-
cooling system the air would probably not need to be cooled after being compressed,
and being dry, there would be no possibility of condensation occurring.
6.5 Nomenclature
C Conveying air velocity m/s
Cp Specific heat at constant pressure kJ/kg�KCv Specific heat at constant volume kJ/kg�Kd Pipe bore m
hfg Enthalpy of evaporation kJ/kg
m. Mass flow rate kg/s
p Air pressure kN/m2 (bar)
Note: 1 bar �100 kN/m2
P Power required kW
t Actual temperature °C
T Absolute temperature � K
t°C � 273
V.
Volumetric flow rate m3s
6.5.1 Greek
� Ratio of specific heats � Cp/Cv –
� Efficiency %
6.5.2 Subscripts
a Conveying air
i Isentropic value
0 Free air or reference conditions:
p0 �101.3 kN/m2, T0 � 288 K
1 Pipeline inlet conditions
2 Pipeline outlet conditions
3 Compressor/exhauster inlet conditions
4 Compressor/exhauster outlet conditions
6.5.3 Superscripts
* Actual isentropic value –
� Per unit time or rate 1/s
References
1. K Speltz. Dehumidification in manufacturing – methods and applications. Proc 23rd Powder
and Bulk Solids Conf. pp 83–93. Chicago. May 1998.
138 PNEUMATIC CONVEYING DESIGN GUIDE
7.1 Introduction
Gas–solid separation devices associated with pneumatic conveying systems have two
functions. The first is to recover as much as possible of the conveyed material for the
next stage of the handling or treatment process. The second is to minimize pollution of
the working environment by the material. A number of devices are available that meet
these requirements. Particle size is the main parameter to be considered here in terms
of system selection and air flow rate in terms of system sizing.
7.1.1 Separation requirements
The first of these functions is principally a matter of economics, in that the more valu-
able the material, the more trouble should be taken to ensure total recovery. However,
the avoidance of environmental pollution is potentially more important, particularly
since the introduction of more stringent Health and Safety at Work Legislation. Where
the material is known to be potentially dangerous, of course, extreme measures must
be taken to prevent its escape into the atmosphere from the handling plant. This is par-
ticularly the case with toxic and explosive materials.
The choice of gas–solid disengaging system to be used on any given application will
be influenced by a number of factors, notably the amount of bulk particulate material
involved, the particle size range of the material, the collecting efficiency required, and
the capital and running costs. In general, the finer the particles that have to be collected,
the higher will be the cost of a suitable separation system.
7.1.2 Separation mechanisms
Where a bulk material consists of relatively large and heavy particles, with no fine dust,
it may be sufficient to collect the material in a simple bin, the solid material falling under
gravity to the bottom of the bin, while the gas is taken off through a suitable vent.
However, with a bulk solid of slightly smaller particle size it may be advisable to
enhance the gravitational effect, and the most common method of achieving this is to
impart spin to the gas–solid stream so that the solid particles are thrown outwards while
the gas is drawn off from the centre of the vortex. This is basically the principle on which
the cyclone separator operates.
Where fine particles are involved, especially if they are also of low density, separ-
ation in a cyclone may not be fully effective, and in this case the gas–solid stream may
Chapter 7
Gas–solid separation devices
be vented through a fabric filter. Many different types of fabric filter are in use and
selection depends mainly upon the nature of the solid particles being collected and the
proportion of solids in the gas stream.
For materials containing extremely fine particles or dust, further refinement in the
filtration technique may be necessary, using wet washers or scrubbers, or electrostatic
precipitators, for example. While this last group of gas–solid separation devices are
used in industry, they are generally used in association with a process plant, and are
very rarely used in conjunction with a pneumatic conveying system, and so no further
reference will be made to any of these devices.
7.1.3 Pressure drop considerations
The separation device should not present a high pressure drop to the system if maximum
material flow rate is to be achieved for a given overall pressure drop. This is particularly
the case in low pressure fan systems, where the pressure drop across the separation unit
could be a significant percentage of the total pressure drop available. Regular mainten-
ance of separation equipment is important. The pressure drop across fabric filters will
increase rapidly if they are not cleaned regularly, or if the fabric is not replaced when
cleaning is no longer effective. If cyclones are used for separation, wear will reduce the
separation efficiency.
7.2 Dust control
In addition to the economic reasons for efficiently removing solid material from a con-
veying gas stream, there are important considerations of product quality control, and
health and safety. In this respect it is generally very fine particles or dust that pose the
problem.
7.2.1 Particle degradation
In some manufacturing processes, a bulk solid is actually required in the form of ultra-
fine particles. In many cases, however, the presence of dust in the product is undesir-
able for practical and commercial reasons. Much of the dust results from particle
degradation in the conveying process and, for a given material, this is a function of the
conveying conditions, in terms of material concentration and conveying air velocity,
and the pipeline geometry.
Plant operating difficulties can result if degradation causes a large percentage of
fines to be produced, particularly if the filtration equipment provided is not capable of
handling the fines satisfactorily. Filter cloths and screens will rapidly block if they
have to cope with unexpectedly high flow rates of fine material. The net result is that
there is usually an increase in pressure drop across the filter.
This means that the pressure drop available for conveying the material will be
reduced, which in turn means that the mass flow rate of the material will probably have
to drop to compensate. Alternatively, if the filtration plant is correctly specified, with par-
ticle degradation taken into account, it is likely to cost more as a result. This, therefore,
140 PNEUMATIC CONVEYING DESIGN GUIDE
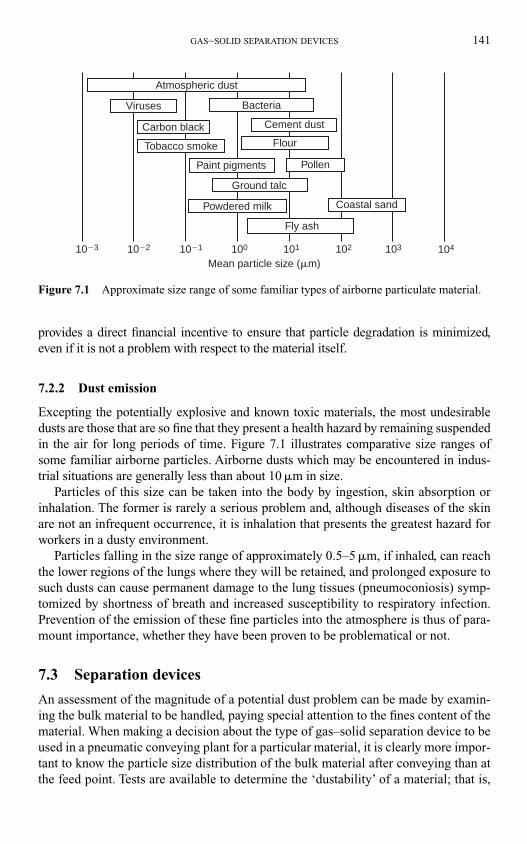
provides a direct financial incentive to ensure that particle degradation is minimized,
even if it is not a problem with respect to the material itself.
7.2.2 Dust emission
Excepting the potentially explosive and known toxic materials, the most undesirable
dusts are those that are so fine that they present a health hazard by remaining suspended
in the air for long periods of time. Figure 7.1 illustrates comparative size ranges of
some familiar airborne particles. Airborne dusts which may be encountered in indus-
trial situations are generally less than about 10 �m in size.
Particles of this size can be taken into the body by ingestion, skin absorption or
inhalation. The former is rarely a serious problem and, although diseases of the skin
are not an infrequent occurrence, it is inhalation that presents the greatest hazard for
workers in a dusty environment.
Particles falling in the size range of approximately 0.5–5 �m, if inhaled, can reach
the lower regions of the lungs where they will be retained, and prolonged exposure to
such dusts can cause permanent damage to the lung tissues (pneumoconiosis) symp-
tomized by shortness of breath and increased susceptibility to respiratory infection.
Prevention of the emission of these fine particles into the atmosphere is thus of para-
mount importance, whether they have been proven to be problematical or not.
7.3 Separation devices
An assessment of the magnitude of a potential dust problem can be made by examin-
ing the bulk material to be handled, paying special attention to the fines content of the
material. When making a decision about the type of gas–solid separation device to be
used in a pneumatic conveying plant for a particular material, it is clearly more impor-
tant to know the particle size distribution of the bulk material after conveying than at
the feed point. Tests are available to determine the ‘dustability’ of a material; that is,
GAS–SOLID SEPARATION DEVICES 141
10�3 10�2 10�1 100
Fly ash
Paint pigments
Ground talc
101 102 103 104
Mean particle size (�m)
Coastal sand
Pollen
Powdered milk
Flour
Cement dust
Bacteria
Atmospheric dust
Viruses
Carbon black
Tobacco smoke
Figure 7.1 Approximate size range of some familiar types of airborne particulate material.
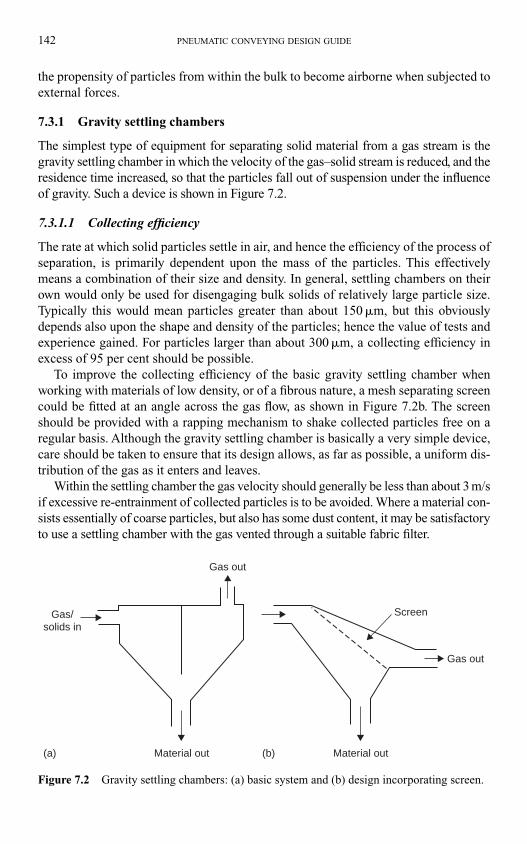
the propensity of particles from within the bulk to become airborne when subjected to
external forces.
7.3.1 Gravity settling chambers
The simplest type of equipment for separating solid material from a gas stream is the
gravity settling chamber in which the velocity of the gas–solid stream is reduced, and the
residence time increased, so that the particles fall out of suspension under the influence
of gravity. Such a device is shown in Figure 7.2.
7.3.1.1 Collecting efficiency
The rate at which solid particles settle in air, and hence the efficiency of the process of
separation, is primarily dependent upon the mass of the particles. This effectively
means a combination of their size and density. In general, settling chambers on their
own would only be used for disengaging bulk solids of relatively large particle size.
Typically this would mean particles greater than about 150 �m, but this obviously
depends also upon the shape and density of the particles; hence the value of tests and
experience gained. For particles larger than about 300 �m, a collecting efficiency in
excess of 95 per cent should be possible.
To improve the collecting efficiency of the basic gravity settling chamber when
working with materials of low density, or of a fibrous nature, a mesh separating screen
could be fitted at an angle across the gas flow, as shown in Figure 7.2b. The screen
should be provided with a rapping mechanism to shake collected particles free on a
regular basis. Although the gravity settling chamber is basically a very simple device,
care should be taken to ensure that its design allows, as far as possible, a uniform dis-
tribution of the gas as it enters and leaves.
Within the settling chamber the gas velocity should generally be less than about 3 m/s
if excessive re-entrainment of collected particles is to be avoided. Where a material con-
sists essentially of coarse particles, but also has some dust content, it may be satisfactory
to use a settling chamber with the gas vented through a suitable fabric filter.
142 PNEUMATIC CONVEYING DESIGN GUIDE
Gas/solids in
Gas out
Material out Material out
Screen
Gas out
(a) (b)
Figure 7.2 Gravity settling chambers: (a) basic system and (b) design incorporating screen.
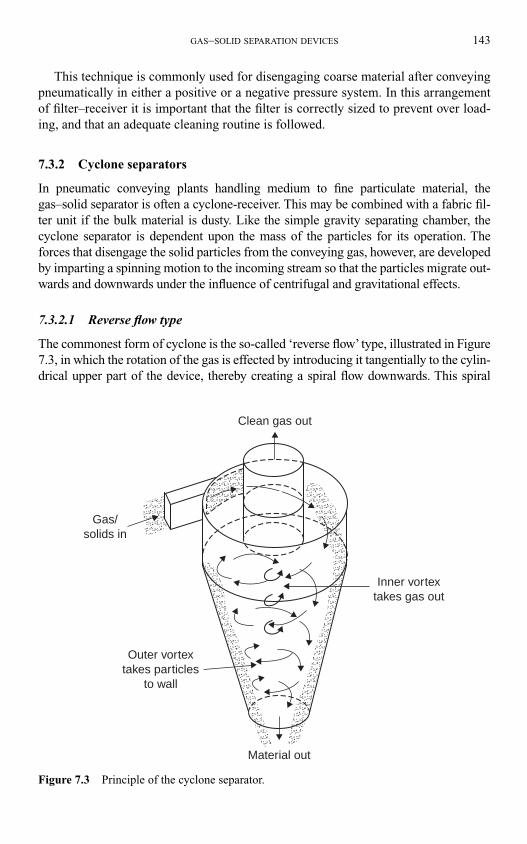
This technique is commonly used for disengaging coarse material after conveying
pneumatically in either a positive or a negative pressure system. In this arrangement
of filter–receiver it is important that the filter is correctly sized to prevent over load-
ing, and that an adequate cleaning routine is followed.
7.3.2 Cyclone separators
In pneumatic conveying plants handling medium to fine particulate material, the
gas–solid separator is often a cyclone-receiver. This may be combined with a fabric fil-
ter unit if the bulk material is dusty. Like the simple gravity separating chamber, the
cyclone separator is dependent upon the mass of the particles for its operation. The
forces that disengage the solid particles from the conveying gas, however, are developed
by imparting a spinning motion to the incoming stream so that the particles migrate out-
wards and downwards under the influence of centrifugal and gravitational effects.
7.3.2.1 Reverse flow type
The commonest form of cyclone is the so-called ‘reverse flow’ type, illustrated in Figure
7.3, in which the rotation of the gas is effected by introducing it tangentially to the cylin-
drical upper part of the device, thereby creating a spiral flow downwards. This spiral
GAS–SOLID SEPARATION DEVICES 143
Outer vortextakes particles
to wall
Material out
Inner vortextakes gas out
Clean gas out
Gas/solids in
Figure 7.3 Principle of the cyclone separator.
continues down the outside of the unit until it reaches a point, near to the base of the
cone, where it reverses its direction of flow. The solid particles are then collected from
the outlet at the base of the conical lower part while the cleaned gas flows in the oppos-
ite direction through the top outlet.
Alternative designs of cyclone separator that have been proposed include the
‘straight-through’ type, in which the rotation of the gas–solids stream is imparted by
fixed vanes mounted in a circular duct. The cleaned gas leaves through a concentric
inner duct while the solid particles are extracted through an annular space between the
inner and outer ducts.
7.3.2.2 Collecting efficiency
The size of particles that can be separated in a cyclone, and the collecting efficiency,
depend principally upon the difference in density of the solid particles and the convey-
ing gas, the solids concentration, the inlet gas velocity and the dimensions (notably the
diameter) of the cyclone itself. Increasing the entry velocity or decreasing the cylinder
diameter should normally result in an increase in the collecting efficiency of finer par-
ticles, but the practical lower limit on particle size is likely to be around 10 �m.
It should be noted that decreasing the cylinder diameter will reduce the gas–solids
throughput, and consequently more cyclones will be needed for a given application,
and at greater cost. Also, operating at a higher inlet gas velocity (up to a maximum
of about 30 m/s) may cause difficulties when the conveyed particles are abrasive or fri-
able. In contrast, operation at higher solids concentrations may be advantageous, as
finer particles tend to be trapped and swept out by larger particles, resulting in an
improved collecting efficiency.
7.3.2.3 Typical dimensions
The dimensions of a cyclone designed for optimum performance will therefore
depend on its actual application, that is, on the nature of the solid material to be separ-
ated and the separation efficiency required. Typically the proportions would be as
shown in Figure 7.4. It is general practice to avoid extremely large diameter cyclones
and provide extra capacity by means of smaller units connected in parallel. Most com-
mercial units, therefore, are typically less than 3 m in diameter.
For high collecting efficiency the shape of the cyclone would be modified by
decreasing the cross-sectional area of the gas–solid inlet and the gas outlet, and redu-
cing the depth to which the gas outlet duct extends into the cyclone cylinder. Also, for
high efficiency, a cyclone of smaller diameter would be selected. Thus, while it would
be usual to select a single cyclone of suitable capacity for a given application, mul-
tiple parallel units would give better collecting efficiency for fine particles. Two of
more units in series might be preferable, where the material to be collected has a wide
particle size range.
Many attempts have been made to develop theoretical expressions for the prediction
of collecting efficiency, based on the dimensions of the cyclone and on the properties
of the gas and solid material to be separated. None has really proved to be satisfactory
and reliance must be placed on experimental data for cyclone performance.
144 PNEUMATIC CONVEYING DESIGN GUIDE
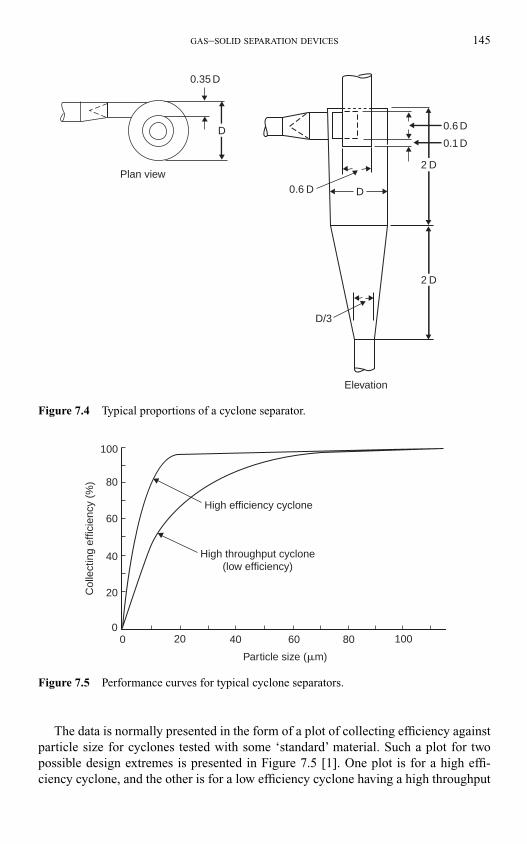
The data is normally presented in the form of a plot of collecting efficiency against
particle size for cyclones tested with some ‘standard’ material. Such a plot for two
possible design extremes is presented in Figure 7.5 [1]. One plot is for a high effi-
ciency cyclone, and the other is for a low efficiency cyclone having a high throughput
GAS–SOLID SEPARATION DEVICES 145
Plan view
D
D
0.35 D
0.6 D
0.6 D
0.1 D
2 D
D/3
2 D
Elevation
Figure 7.4 Typical proportions of a cyclone separator.
Col
lect
ing
effic
ienc
y (%
)
Particle size (�m)
High throughput cyclone(low efficiency)
High efficiency cyclone
00
20
20
40
40
60
60
80
80
100
100
Figure 7.5 Performance curves for typical cyclone separators.
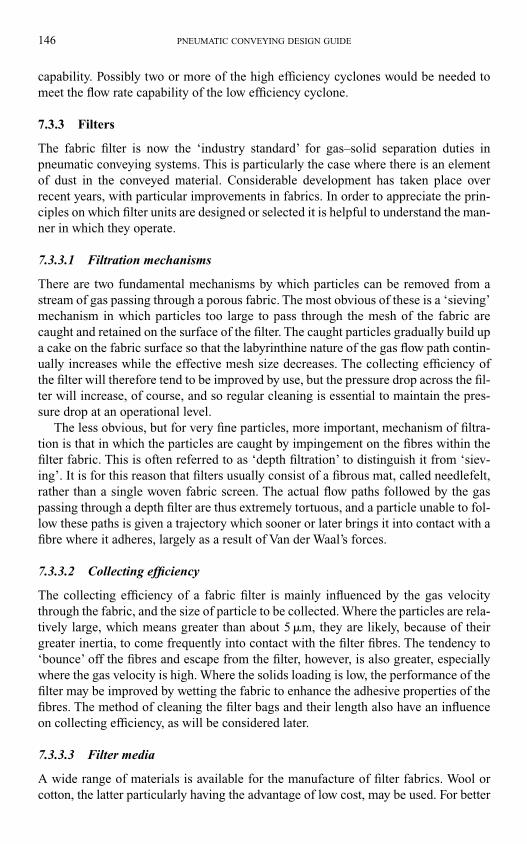
capability. Possibly two or more of the high efficiency cyclones would be needed to
meet the flow rate capability of the low efficiency cyclone.
7.3.3 Filters
The fabric filter is now the ‘industry standard’ for gas–solid separation duties in
pneumatic conveying systems. This is particularly the case where there is an element
of dust in the conveyed material. Considerable development has taken place over
recent years, with particular improvements in fabrics. In order to appreciate the prin-
ciples on which filter units are designed or selected it is helpful to understand the man-
ner in which they operate.
7.3.3.1 Filtration mechanisms
There are two fundamental mechanisms by which particles can be removed from a
stream of gas passing through a porous fabric. The most obvious of these is a ‘sieving’
mechanism in which particles too large to pass through the mesh of the fabric are
caught and retained on the surface of the filter. The caught particles gradually build up
a cake on the fabric surface so that the labyrinthine nature of the gas flow path contin-
ually increases while the effective mesh size decreases. The collecting efficiency of
the filter will therefore tend to be improved by use, but the pressure drop across the fil-
ter will increase, of course, and so regular cleaning is essential to maintain the pres-
sure drop at an operational level.
The less obvious, but for very fine particles, more important, mechanism of filtra-
tion is that in which the particles are caught by impingement on the fibres within the
filter fabric. This is often referred to as ‘depth filtration’ to distinguish it from ‘siev-
ing’. It is for this reason that filters usually consist of a fibrous mat, called needlefelt,
rather than a single woven fabric screen. The actual flow paths followed by the gas
passing through a depth filter are thus extremely tortuous, and a particle unable to fol-
low these paths is given a trajectory which sooner or later brings it into contact with a
fibre where it adheres, largely as a result of Van der Waal’s forces.
7.3.3.2 Collecting efficiency
The collecting efficiency of a fabric filter is mainly influenced by the gas velocity
through the fabric, and the size of particle to be collected. Where the particles are rela-
tively large, which means greater than about 5 �m, they are likely, because of their
greater inertia, to come frequently into contact with the filter fibres. The tendency to
‘bounce’ off the fibres and escape from the filter, however, is also greater, especially
where the gas velocity is high. Where the solids loading is low, the performance of the
filter may be improved by wetting the fabric to enhance the adhesive properties of the
fibres. The method of cleaning the filter bags and their length also have an influence
on collecting efficiency, as will be considered later.
7.3.3.3 Filter media
A wide range of materials is available for the manufacture of filter fabrics. Wool or
cotton, the latter particularly having the advantage of low cost, may be used. For better
146 PNEUMATIC CONVEYING DESIGN GUIDE
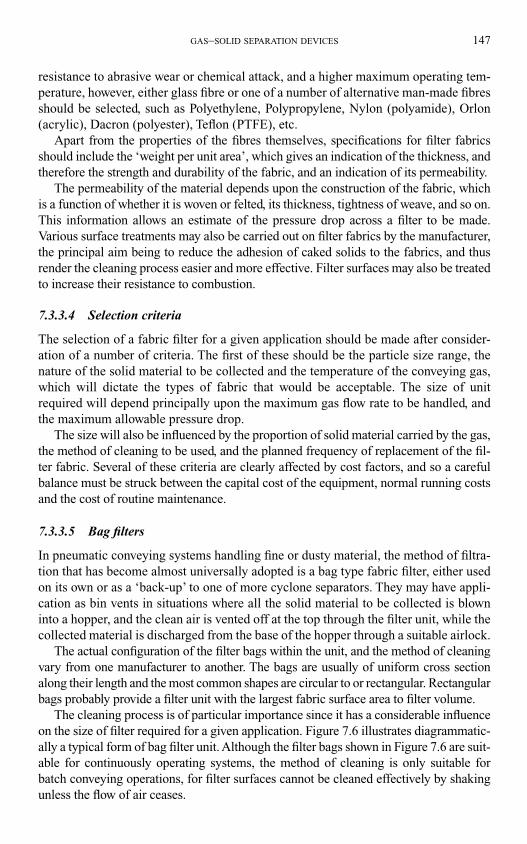
resistance to abrasive wear or chemical attack, and a higher maximum operating tem-
perature, however, either glass fibre or one of a number of alternative man-made fibres
should be selected, such as Polyethylene, Polypropylene, Nylon (polyamide), Orlon
(acrylic), Dacron (polyester), Teflon (PTFE), etc.
Apart from the properties of the fibres themselves, specifications for filter fabrics
should include the ‘weight per unit area’, which gives an indication of the thickness, and
therefore the strength and durability of the fabric, and an indication of its permeability.
The permeability of the material depends upon the construction of the fabric, which
is a function of whether it is woven or felted, its thickness, tightness of weave, and so on.
This information allows an estimate of the pressure drop across a filter to be made.
Various surface treatments may also be carried out on filter fabrics by the manufacturer,
the principal aim being to reduce the adhesion of caked solids to the fabrics, and thus
render the cleaning process easier and more effective. Filter surfaces may also be treated
to increase their resistance to combustion.
7.3.3.4 Selection criteria
The selection of a fabric filter for a given application should be made after consider-
ation of a number of criteria. The first of these should be the particle size range, the
nature of the solid material to be collected and the temperature of the conveying gas,
which will dictate the types of fabric that would be acceptable. The size of unit
required will depend principally upon the maximum gas flow rate to be handled, and
the maximum allowable pressure drop.
The size will also be influenced by the proportion of solid material carried by the gas,
the method of cleaning to be used, and the planned frequency of replacement of the fil-
ter fabric. Several of these criteria are clearly affected by cost factors, and so a careful
balance must be struck between the capital cost of the equipment, normal running costs
and the cost of routine maintenance.
7.3.3.5 Bag filters
In pneumatic conveying systems handling fine or dusty material, the method of filtra-
tion that has become almost universally adopted is a bag type fabric filter, either used
on its own or as a ‘back-up’ to one of more cyclone separators. They may have appli-
cation as bin vents in situations where all the solid material to be collected is blown
into a hopper, and the clean air is vented off at the top through the filter unit, while the
collected material is discharged from the base of the hopper through a suitable airlock.
The actual configuration of the filter bags within the unit, and the method of cleaning
vary from one manufacturer to another. The bags are usually of uniform cross section
along their length and the most common shapes are circular to or rectangular. Rectangular
bags probably provide a filter unit with the largest fabric surface area to filter volume.
The cleaning process is of particular importance since it has a considerable influence
on the size of filter required for a given application. Figure 7.6 illustrates diagrammatic-
ally a typical form of bag filter unit. Although the filter bags shown in Figure 7.6 are suit-
able for continuously operating systems, the method of cleaning is only suitable for
batch conveying operations, for filter surfaces cannot be cleaned effectively by shaking
unless the flow of air ceases.
GAS–SOLID SEPARATION DEVICES 147
The gas–solid stream enters the device from beneath the fabric bags so that larger
particles are separated by gravity settling, often aided by a cyclone action, although
this is not necessary, provided that direct impingement of particles on the bags from
the conveying line is prevented. Fine particles are then caught on the insides of the
fabric bags as the gas flows upwards through the unit.
These filters are available in a very wide range of sizes, lengths, shapes and config-
urations. The shaking mechanism represented in Figure 7.6 is one of several methods
of bag cleaning that may be employed.
7.3.3.6 Filter size
The basic measure of filter size is the effective surface area of fabric through which the
gas has to pass. It is usual, in the case of pneumatic conveying systems, to specify the
size of filter required on the basis of an assumed value of the so-called ‘air to fabric
ratio’, which is defined as the ratio of the volumetric air flow rate divided by the effec-
tive area of the filter fabric. It should be noted that this parameter is not, in fact, a ratio
but has the dimensions of velocity. It is perhaps best regarded as a superficial velocity
of the air through the filter fabric.
The actual value of the air to fabric ratio to be used depends upon several factors,
as indicated previously and, although there have been attempts to develop theoretical
expressions for the prediction of this parameter in various situations, none is really
satisfactory, and reliance must be placed on experience. The manufacturers of filter
units should normally be able to advise on suitable air to fabric ratios for the bulk par-
ticulate material being handled.
Typical values for felted fabrics are in the region of about 0.025 m/s for fine partic-
ulate materials and up to about 0.050 m/s when handling coarser or granular materials.
148 PNEUMATIC CONVEYING DESIGN GUIDE
Gas/solidsin
Clean gasout
Shaking mechanism
Filter bag
Support cage
Receivinghopper
Figure 7.6 Typical shaken bag filter unit.
For woven fabrics, however, these figures should be halved, since the free area actually
available for gas flow is much less.
7.3.3.7 Filter cleaning
The design of present-day fabric filter units, with their multiple bags or envelopes and
their complex cleaning mechanisms, has gradually evolved with increasing awareness
of the need to conserve energy and to avoid atmospheric pollution. The use of mul-
tiple bags was simply a means of getting a larger area of fabric into a small space, but
a more important aspect of filter design, concerned the method of minimizing the pro-
portion of fabric area out of action at any one time for cleaning.
This consideration led to the introduction of filter units having two or more sep-
arate compartments, each containing a number of bags. By this means one compart-
ment could be shut off for cleaning while the others remained in service, handling the
full gas–solid flow. Modern filter units using pulsed air jets for fabric cleaning do not
require the unit to be compartmentalized, but are still designed to ensure that only a
small number of bags are out of service at the same time.
There are two basic types of cleaning action that can be employed. These are mechan-
ical shaking and air pulsing. The former system, illustrated in Figure 7.6, tends to be
cheaper, but its application is restricted to batch operations. The cleaning will not func-
tion properly when on load, and so the filter can only be shaken effectively at the end of
a conveying cycle in the absence of air and material flow. It is also restricted to installa-
tions handling materials which readily form a caked layer on the surface of the filter fab-
ric. Shaking the framework on which the bags are mounted causes a flexing or rippling
movement of the fabric which results in the material being dislodged and falling into the
collecting hopper.
7.3.3.8 Reverse air jet cleaning
An alternative method of causing the filter fabric to flex and so dislodge caked mater-
ial is to arrange for a periodic reversal of the direction of gas flow through the fabric.
This may be achieved either by diverting the total flow of cleaned gas back through one
section of the filter, or by a system of high pressure jets, operating in sequence, which
inject cleaned air downwards through the bag walls in the reverse direction to the nor-
mal air flow. Such a device is shown in Figure 7.7 and this is very much the industry
standard at the present time.
The pulsed reverse air jets last for only a very short period of time, typically less
than a second, and so continuous operation of the filter is possible, and maximum
utilization of the fabric area can be achieved. The air is generally pulsed through a ven-
turi positioned at the inlet to the bag, and the bags are usually supported by a wire cage.
The high pressure air pulsed through the venturi creates a shock wave and it is this, in
combination with the reverse flow of air, that results in the cleaning of the filter bag.
There is clearly a limit to the length of filter bag that can be effectively cleaned by
this means, and a reduction in cleaning efficiency must be expected if very long bags
are used. Neither the pulse of air in the reverse direction, nor the shock wave will be
GAS–SOLID SEPARATION DEVICES 149
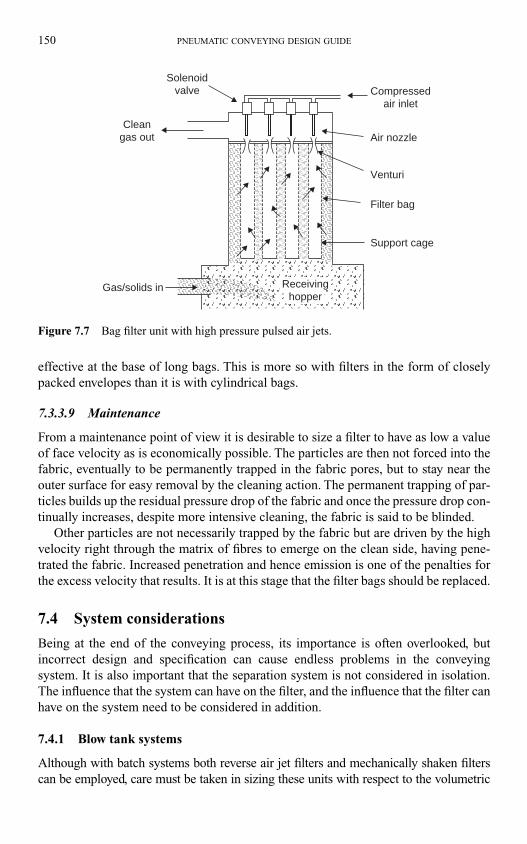
effective at the base of long bags. This is more so with filters in the form of closely
packed envelopes than it is with cylindrical bags.
7.3.3.9 Maintenance
From a maintenance point of view it is desirable to size a filter to have as low a value
of face velocity as is economically possible. The particles are then not forced into the
fabric, eventually to be permanently trapped in the fabric pores, but to stay near the
outer surface for easy removal by the cleaning action. The permanent trapping of par-
ticles builds up the residual pressure drop of the fabric and once the pressure drop con-
tinually increases, despite more intensive cleaning, the fabric is said to be blinded.
Other particles are not necessarily trapped by the fabric but are driven by the high
velocity right through the matrix of fibres to emerge on the clean side, having pene-
trated the fabric. Increased penetration and hence emission is one of the penalties for
the excess velocity that results. It is at this stage that the filter bags should be replaced.
7.4 System considerations
Being at the end of the conveying process, its importance is often overlooked, but
incorrect design and specification can cause endless problems in the conveying
system. It is also important that the separation system is not considered in isolation.
The influence that the system can have on the filter, and the influence that the filter can
have on the system need to be considered in addition.
7.4.1 Blow tank systems
Although with batch systems both reverse air jet filters and mechanically shaken filters
can be employed, care must be taken in sizing these units with respect to the volumetric
150 PNEUMATIC CONVEYING DESIGN GUIDE
Solenoidvalve Compressed
air inlet
Air nozzle
Venturi
Support cage
Gas/solids in
Cleangas out
Filter bag
Receivinghopper
Figure 7.7 Bag filter unit with high pressure pulsed air jets.
flow rate of air. If, at the end of a conveying cycle the pipeline and blow tank have to be
vented through the filter unit, the air flow rate will be considerably greater than the steady
air flow rating of the air mover. This is particularly the case if the blow tank operates at a
high pressure, for the transient nature of the air flow through the conveying cycle is sig-
nificantly magnified.
This will result in a considerable increase in the air velocity through the filter, pos-
sibly resulting in blinded filters, giving higher filter resistance and subsequent diffi-
culty with cleaning. This is particularly so in the case of mechanically shaken filters.
It is essential in these circumstances to reduce the air supply at the end of the convey-
ing cycle in order to keep the total air flow rate to as low a value as possible. To cater
for these surges simply by increasing the filter size may be a more expensive solution.
7.4.2 Vacuum conveying systems
In vacuum conveying systems the clean air at outlet from the filter is drawn through an
exhauster. Should a filter bag split, or otherwise fail, material will be carried over to
the exhauster. Although a turbo blower can tolerate a certain amount of dusty air, pro-
vided that it is not abrasive, positive displacement blowers cannot, and so some form
of protection must be provided. A cyclone is often used for this purpose, and although
its efficiency with respect to fine particles is rather low, it will allow time for the sys-
tem to be shut down before serious damage occurs to the blower.
The design parameter for sizing fabric filters is related to the superficial air velocity
across the filter fabric. In a positive pressure conveying system the air flow rate that
can be used in this evaluation is simply the volumetric rating of the air mover, unless
the material conveyed is at a high temperature. In a negative pressure system the filter
is under vacuum and this will have to be taken into account.
In comparison with a positive pressure system, employing the same ‘free air’ flow
rate, a vacuum system operating under 0.5 bar of vacuum, for example, will need to
have a filter approximately twice the size of one required for a positive pressure sys-
tem. This is not a fair comparison, of course, since the pipeline bore for the vacuum
system will be larger, but it does highlight the need to take account of both pressure
and temperature in sizing. The modelling for this is considered in Chapter 9.
References
1. C R Woodcock and J S Mason. Bulk Solids Handling: An Introduction to the Practice and
Technology. Glasgow: Blackie & Son Ltd. 1987.
GAS–SOLID SEPARATION DEVICES 151
8.1 Introduction
The selection of a pneumatic conveying system for a particular application involves the
consideration of numerous parameters associated with the conveyed material, the con-
veying conditions and the system itself. The basic specification is usually that a material
should be conveyed at a specified flow rate over a given distance. Unfortunately the con-
veying potential of a pneumatic conveying system is not easily defined or evaluated.
The influence that conveying distance has on material flow, for example, is particu-
larly complex. For any given situation, however, a wide combination of pipeline bores
and conveying line pressure drop values are usually available that will adequately meet
the requirements. There is rarely a problem of not being able to achieve a given duty,
therefore, but getting it right first time is a common problem.
Power consumption, and hence system operating costs are an obvious factor in the
decision-making process. This, however, is not straightforward either, for problems of
material and system compatibility also have to be taken into account. The inter-relating
effects of all of these parameters are considered, both to provide information on the
potential capability of pneumatic conveying systems, and as an introduction to the next
section of the book, Part B, on System Design.
8.1.1 System economics
Generally the most economic system is required that will convey a material satisfactorily,
with as few operational problems as possible. System economics are based on a com-
bination of plant capital cost and operating costs. The operating costs take into account
costs of power for operation, maintenance and staffing. Maintenance and staffing costs
are partly dictated by the capital cost for the plant. Choice of components, such as feed-
ers, filters and pipeline, and automatic controls and instrumentation will dictate to a cer-
tain extent the potential level of plant maintenance and manpower that will be required.
Capital costs of plant are generally provided as part of a tender, and so comparison
can be made between competing pneumatic conveying systems, and possibly with
alternative mechanical conveying systems, for a given duty. Operating costs, in terms
of power requirements, however, are relatively easy to evaluate. These costs can often
play a dominant role, particularly with pneumatic conveying systems, and so as it is
such an important parameter, power requirements are also considered.
Chapter 8
System selection considerations
8.1.2 Material considerations
With so many different systems, requirements and possible variables to take into account
it will only be possible to consider a relatively narrow range in this review. In order to
illustrate the potential influence of as many of the main parameters as possible, several
series of graphs are included. They are all concerned with continuously operating con-
ventional systems, but they will provide a basis for comparison with other systems. The
main emphasis is on conveyed material influences in both dilute and dense phase flow.
For dense phase flow only sliding bed flow is considered in detail but reference to plug
flow is made for comparison. In dilute phase flow the upper and lower extremes of con-
veying capability are considered which will cover almost any material.
8.2 Variables involved
When selecting a pneumatic conveying system for a particular application it is generally
the conveying potential of the system that is of primary importance. The number of fac-
tors that have a potential influence on material flow rate, however, is quite considerable.
They can be grouped into three broad categories: those associated with the conveyed
material, the conveying conditions and the pipeline geometry.
8.2.1 The conveyed material
Properties of the conveyed material that can influence the conveying capability and
potential flow rate that can be achieved include mean particle size, particle size distri-
bution, particle shape, particle and bulk densities, air retention and permeability. The
influence of material properties are dealt with in Chapter 12, with test methods for the
determination of material properties relevant to pneumatic conveying being detailed
in Appendix 1.
For the purpose of this introductory chapter, two representative materials are con-
sidered. These are materials that, in the experience of the author, cover the extremes of
conveyability of powdered and granular materials. One is typical of powdered mater-
ials, such as bentonite and fly ash that have very good air retention properties. These
materials are capable of being conveyed in dense phase and with low air velocities in
conventional conveying systems, and are presented here in terms of material type A. The
other material is typical of coarse granular materials having poor air retention properties,
such as sand and granulated sugar. These materials are only capable of being conveyed
in dilute phase suspension flow in conventional conveying systems, and are presented
here in terms of material type B.
8.2.2 Conveying conditions
Material conveying conditions that have a direct influence on material conveying
potential include solids loading ratio, conveying line pressure drop, and air flow rate
or conveying air velocity. Of these conveying line pressure drop is the only fully inde-
pendent variable since both solids loading ratio and conveying air velocity are add-
itionally material dependent.
SYSTEM SELECTION CONSIDERATIONS 153
8.2.2.1 Conveying line pressure drop
Conveying line pressure drop is a primary variable. It is one of the main variables asso-
ciated with the energy imparted to the conveying air by the air mover for the system. In
order to show the influence of conveying line pressure drop on the flow rate that can be
achieved for a given material in a given pipeline, values of conveying line pressure drop
up to 3 bar are considered. This adequately covers the operating range of the majority
of pneumatic conveying systems, and is sufficiently wide to illustrate the potential
influence that higher values of pressure drop can have.
8.2.2.2 System influences
All the data presented here are based on continuously operating systems, since the main
objects are to show the potential of pneumatic conveying systems and the relative effect
that changes in system parameters can have on operating performance. If a choice is
ultimately to be made between a system capable of continuous operation and one based
on the intermittent conveying of batches, however, the relationship between the steady
state flow rate achieved during batch conveying and the time averaged mean will have
to be taken into account (see Figures 2.7 and 4.9).
8.2.2.3 Material influences
The solids loading ratio at which the material can be conveyed and the minimum con-
veying air velocity that can be employed are both dependent upon the properties of the
material being conveyed. The influence of material properties features prominently and
so the effect of solids loading ratio and minimum conveying air velocity are also con-
sidered in detail. Both conveying line pressure drop and conveying distance have an
inter-relating effect on these parameters and so these influences are also incorporated.
8.2.3 Pipeline geometry
Pipeline geometry can be varied principally in terms of the length of the pipeline, the
bore of the pipe and the number of bends in the pipeline. The influence of pipeline
geometry is dealt with specifically in Chapter 14. For the purposes of this introductory
chapter a basic pipeline geometry has been selected, and all pipelines considered are
geometrically similar so that the influence of changes can be clearly seen.
8.2.3.1 Pipeline length
Pipeline length has to be considered in terms of its orientation, and account must be
taken of the individual lengths of horizontal, vertically up and vertically down sections.
For this introductory chapter all conveying distances are essentially for horizontal
pipeline. Bends are automatically taken into account as discussed below. Any elements
of vertical lift in a pipeline can be approximated by taking double the vertical rise and
adding this to the total length of horizontal pipeline. Conveying distances that have
been considered, on this basis, in general range from about 50 to 500 m, in order to
cover as wide a range of applications as possible, and to show the potentials and limi-
tations of pneumatic conveying for long distance conveying.
154 PNEUMATIC CONVEYING DESIGN GUIDE
8.2.3.2 Pipeline bore
All pipelines considered here are single bore lines. When high air supply pressures are
used for conveying a material the pipeline bore is often increased to a larger size part
way along its length. This is particularly the case where high conveying air pressures
are employed, when several such changes may be made. Stepped pipelines are con-
sidered in Chapters 9 and 14. The range of pipeline diameters considered here is from
50 to 250 mm.
8.2.3.3 Pipeline bends
Pipeline bends can have a significant influence on the performance of a pneumatic
conveying system pipeline. The number of bends in a pipeline, therefore, is particu-
larly important. In the data presented here the proportion of bends to pipeline length
considered is approximately in the ratio of one bend to every 15 m of pipeline.
Bend geometry is another important factor and this is considered in detail in
Chapter 14. This is usually considered in terms of the ratio of the bend diameter, D, to the
pipe bore, d. Bends can range from those having a very large radius, to elbows and blind
tees. In the data presented here the bends in the pipeline have a D/d ratio of about 8:1.
8.3 Variables investigated
Since the conveying capacity of a pneumatic conveying system is of primary concern,
major consideration has been given to material flow rate. Material properties and the
effects that they have on both conveying conditions and material flow rate are particu-
larly important. Conveying distance is clearly of fundamental importance, and pipe bore
and conveying line pressure drop are both major variables that must be considered.
With this small group alone there are five independent variables, and so universal
relationships are quite impossible to represent in either tabular or graphical form.
Mathematical models do not exist that will adequately cover even this small group of
variables or the ranges that need to be considered. In order to demonstrate the capabil-
ities of pneumatic conveying systems, and to illustrate the influence of the major vari-
ables, therefore, several sets of curves are presented and the relationships are developed
individually.
8.3.1 The influence of material type
The vast differences that can exist between materials with respect to their conveying
potential are illustrated in Figures 8.1 and 8.2.
For just these two plots a third material type has been added to complete the picture
with regard to material types. This is material type C which covers materials that have
very good permeability. To have such properties the material has to have a mean par-
ticle size above about 1 mm and for the particle size to be almost zero, so that it is
effectively mono-sized. This group includes materials such as nylon and polyethylene
pellets, and seeds and grains, such as peanuts. In terms of numbers of materials, this
group is in a minority, compared with the other two, and so as not to confuse the issue
SYSTEM SELECTION CONSIDERATIONS 155
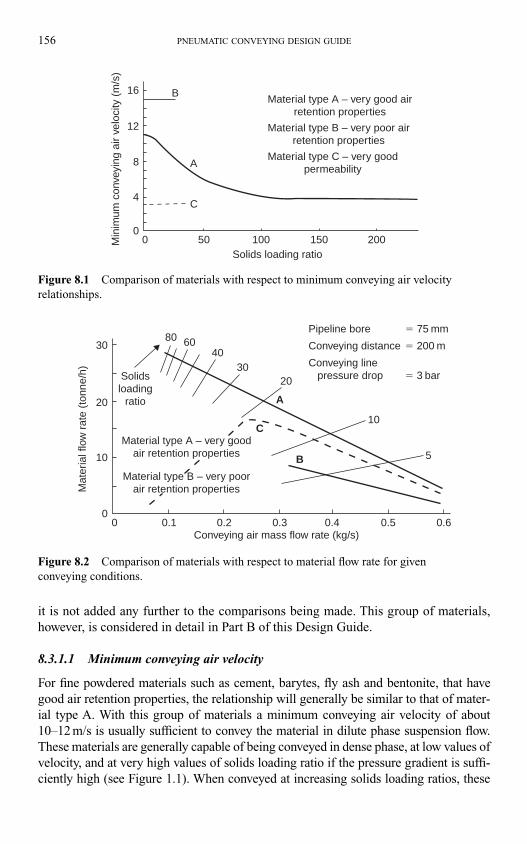
156 PNEUMATIC CONVEYING DESIGN GUIDE
it is not added any further to the comparisons being made. This group of materials,
however, is considered in detail in Part B of this Design Guide.
8.3.1.1 Minimum conveying air velocity
For fine powdered materials such as cement, barytes, fly ash and bentonite, that have
good air retention properties, the relationship will generally be similar to that of mater-
ial type A. With this group of materials a minimum conveying air velocity of about
10–12 m/s is usually sufficient to convey the material in dilute phase suspension flow.
These materials are generally capable of being conveyed in dense phase, at low values of
velocity, and at very high values of solids loading ratio if the pressure gradient is suffi-
ciently high (see Figure 1.1). When conveyed at increasing solids loading ratios, these
00
4
8
12
16 B
A
C
Solids loading ratio
Min
imum
con
veyi
ng a
ir ve
loci
ty (
m/s
)
Material type C – very goodpermeability
Material type A – very good airretention properties
Material type B – very poor airretention properties
50 100 150 200
Figure 8.1 Comparison of materials with respect to minimum conveying air velocity
relationships.
Material type A – very goodair retention properties
Material type B – very poorair retention properties
Conveying air mass flow rate (kg/s)
Solidsloading
ratio
Mat
eria
l flo
w r
ate
(ton
ne/h
)
Pipeline bore � 75 mm
Conveying distance � 200 m
Conveying line pressure drop � 3 bar
00
C
B
A
10
20
3080 60
4030
20
10
5
0.1 0.2 0.3 0.4 0.5 0.6
Figure 8.2 Comparison of materials with respect to material flow rate for given
conveying conditions.
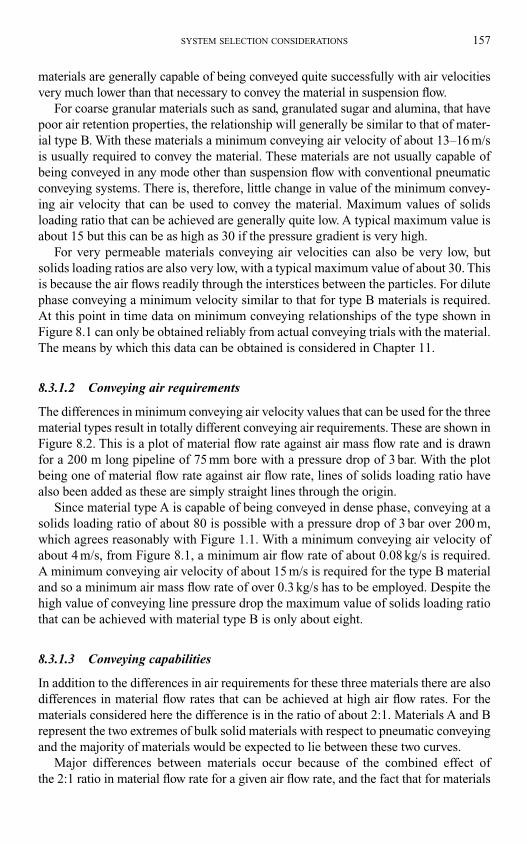
materials are generally capable of being conveyed quite successfully with air velocities
very much lower than that necessary to convey the material in suspension flow.
For coarse granular materials such as sand, granulated sugar and alumina, that have
poor air retention properties, the relationship will generally be similar to that of mater-
ial type B. With these materials a minimum conveying air velocity of about 13–16 m/s
is usually required to convey the material. These materials are not usually capable of
being conveyed in any mode other than suspension flow with conventional pneumatic
conveying systems. There is, therefore, little change in value of the minimum convey-
ing air velocity that can be used to convey the material. Maximum values of solids
loading ratio that can be achieved are generally quite low. A typical maximum value is
about 15 but this can be as high as 30 if the pressure gradient is very high.
For very permeable materials conveying air velocities can also be very low, but
solids loading ratios are also very low, with a typical maximum value of about 30. This
is because the air flows readily through the interstices between the particles. For dilute
phase conveying a minimum velocity similar to that for type B materials is required.
At this point in time data on minimum conveying relationships of the type shown in
Figure 8.1 can only be obtained reliably from actual conveying trials with the material.
The means by which this data can be obtained is considered in Chapter 11.
8.3.1.2 Conveying air requirements
The differences in minimum conveying air velocity values that can be used for the three
material types result in totally different conveying air requirements. These are shown in
Figure 8.2. This is a plot of material flow rate against air mass flow rate and is drawn
for a 200 m long pipeline of 75 mm bore with a pressure drop of 3 bar. With the plot
being one of material flow rate against air flow rate, lines of solids loading ratio have
also been added as these are simply straight lines through the origin.
Since material type A is capable of being conveyed in dense phase, conveying at a
solids loading ratio of about 80 is possible with a pressure drop of 3 bar over 200 m,
which agrees reasonably with Figure 1.1. With a minimum conveying air velocity of
about 4 m/s, from Figure 8.1, a minimum air flow rate of about 0.08 kg/s is required.
A minimum conveying air velocity of about 15 m/s is required for the type B material
and so a minimum air mass flow rate of over 0.3 kg/s has to be employed. Despite the
high value of conveying line pressure drop the maximum value of solids loading ratio
that can be achieved with material type B is only about eight.
8.3.1.3 Conveying capabilities
In addition to the differences in air requirements for these three materials there are also
differences in material flow rates that can be achieved at high air flow rates. For the
materials considered here the difference is in the ratio of about 2:1. Materials A and B
represent the two extremes of bulk solid materials with respect to pneumatic conveying
and the majority of materials would be expected to lie between these two curves.
Major differences between materials occur because of the combined effect of
the 2:1 ratio in material flow rate for a given air flow rate, and the fact that for materials
SYSTEM SELECTION CONSIDERATIONS 157
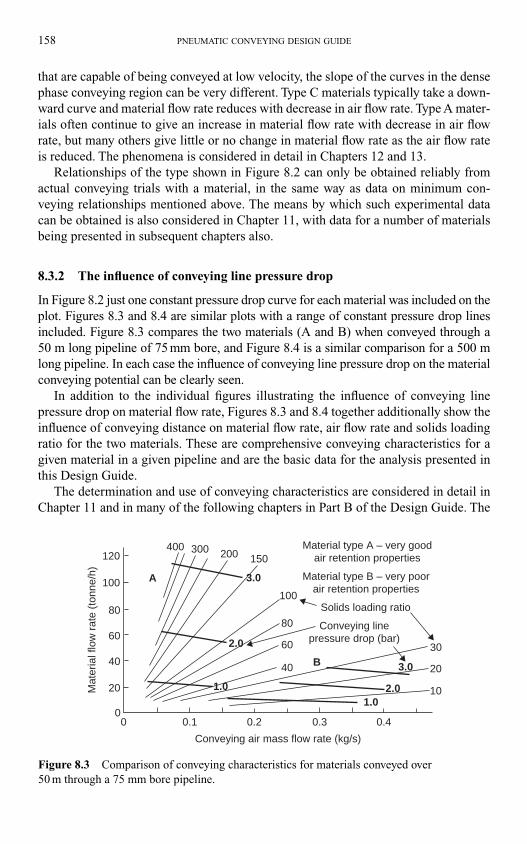
158 PNEUMATIC CONVEYING DESIGN GUIDE
that are capable of being conveyed at low velocity, the slope of the curves in the dense
phase conveying region can be very different. Type C materials typically take a down-
ward curve and material flow rate reduces with decrease in air flow rate. Type A mater-
ials often continue to give an increase in material flow rate with decrease in air flow
rate, but many others give little or no change in material flow rate as the air flow rate
is reduced. The phenomena is considered in detail in Chapters 12 and 13.
Relationships of the type shown in Figure 8.2 can only be obtained reliably from
actual conveying trials with a material, in the same way as data on minimum con-
veying relationships mentioned above. The means by which such experimental data
can be obtained is also considered in Chapter 11, with data for a number of materials
being presented in subsequent chapters also.
8.3.2 The influence of conveying line pressure drop
In Figure 8.2 just one constant pressure drop curve for each material was included on the
plot. Figures 8.3 and 8.4 are similar plots with a range of constant pressure drop lines
included. Figure 8.3 compares the two materials (A and B) when conveyed through a
50 m long pipeline of 75 mm bore, and Figure 8.4 is a similar comparison for a 500 m
long pipeline. In each case the influence of conveying line pressure drop on the material
conveying potential can be clearly seen.
In addition to the individual figures illustrating the influence of conveying line
pressure drop on material flow rate, Figures 8.3 and 8.4 together additionally show the
influence of conveying distance on material flow rate, air flow rate and solids loading
ratio for the two materials. These are comprehensive conveying characteristics for a
given material in a given pipeline and are the basic data for the analysis presented in
this Design Guide.
The determination and use of conveying characteristics are considered in detail in
Chapter 11 and in many of the following chapters in Part B of the Design Guide. The
Conveying air mass flow rate (kg/s)
Material type A – very goodair retention properties
Solids loading ratio
Conveying linepressure drop (bar)
100100
120 200 150
8080
6060
4040
30
20
20
00 0.1 0.2 0.3 0.4
1.02.0
3.0
1.0
2.0
3.0
10
300400
A
B
Mat
eria
l flo
w r
ate
(ton
ne/h
)
Material type B – very poorair retention properties
Figure 8.3 Comparison of conveying characteristics for materials conveyed over
50 m through a 75 mm bore pipeline.
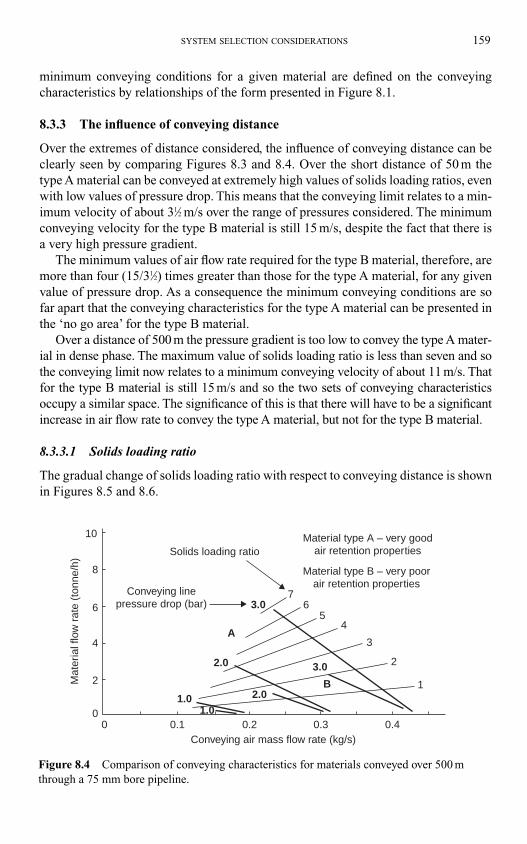
SYSTEM SELECTION CONSIDERATIONS 159
minimum conveying conditions for a given material are defined on the conveying
characteristics by relationships of the form presented in Figure 8.1.
8.3.3 The influence of conveying distance
Over the extremes of distance considered, the influence of conveying distance can be
clearly seen by comparing Figures 8.3 and 8.4. Over the short distance of 50 m the
type A material can be conveyed at extremely high values of solids loading ratios, even
with low values of pressure drop. This means that the conveying limit relates to a min-
imum velocity of about 31⁄2 m/s over the range of pressures considered. The minimum
conveying velocity for the type B material is still 15 m/s, despite the fact that there is
a very high pressure gradient.
The minimum values of air flow rate required for the type B material, therefore, are
more than four (15/31⁄2) times greater than those for the type A material, for any given
value of pressure drop. As a consequence the minimum conveying conditions are so
far apart that the conveying characteristics for the type A material can be presented in
the ‘no go area’ for the type B material.
Over a distance of 500 m the pressure gradient is too low to convey the type A mater-
ial in dense phase. The maximum value of solids loading ratio is less than seven and so
the conveying limit now relates to a minimum conveying velocity of about 11 m/s. That
for the type B material is still 15 m/s and so the two sets of conveying characteristics
occupy a similar space. The significance of this is that there will have to be a significant
increase in air flow rate to convey the type A material, but not for the type B material.
8.3.3.1 Solids loading ratio
The gradual change of solids loading ratio with respect to conveying distance is shown
in Figures 8.5 and 8.6.
Material type A – very goodair retention properties
Material type B – very poorair retention properties
Conveying air mass flow rate (kg/s)0
0
2
2
3
45
67
1
4
6
8
10
0.1 0.2 0.3
3.0
A
B
3.02.0
1.01.0
2.0
0.4
Solids loading ratio
Conveying linepressure drop (bar)
Mat
eria
l flo
w r
ate
(ton
ne/h
)
Figure 8.4 Comparison of conveying characteristics for materials conveyed over 500 m
through a 75 mm bore pipeline.
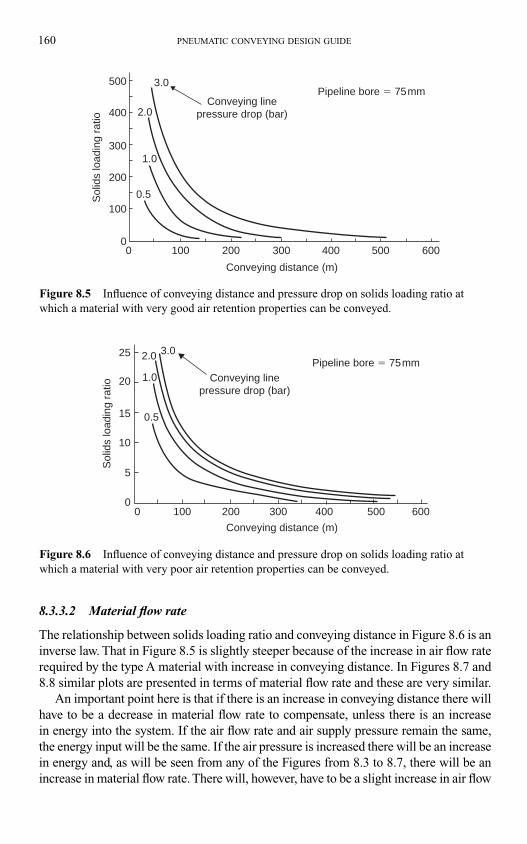
160 PNEUMATIC CONVEYING DESIGN GUIDE
8.3.3.2 Material flow rate
The relationship between solids loading ratio and conveying distance in Figure 8.6 is an
inverse law. That in Figure 8.5 is slightly steeper because of the increase in air flow rate
required by the type A material with increase in conveying distance. In Figures 8.7 and
8.8 similar plots are presented in terms of material flow rate and these are very similar.
An important point here is that if there is an increase in conveying distance there will
have to be a decrease in material flow rate to compensate, unless there is an increase
in energy into the system. If the air flow rate and air supply pressure remain the same,
the energy input will be the same. If the air pressure is increased there will be an increase
in energy and, as will be seen from any of the Figures from 8.3 to 8.7, there will be an
increase in material flow rate. There will, however, have to be a slight increase in air flow
Conveying distance (m)
100
100
200
200
300
300
400
400
500
500 3.0
2.0
1.0
0.5
00 600
Conveying linepressure drop (bar)
Pipeline bore � 75mmS
olid
s lo
adin
g ra
tio
Figure 8.5 Influence of conveying distance and pressure drop on solids loading ratio at
which a material with very good air retention properties can be conveyed.
Conveying distance (m)
Conveying linepressure drop (bar)
10000
10
15
5
20
25 3.02.0
1.0
0.5
200 300 400 500 600
Pipeline bore � 75mm
Sol
ids
load
ing
ratio
Figure 8.6 Influence of conveying distance and pressure drop on solids loading ratio at
which a material with very poor air retention properties can be conveyed.
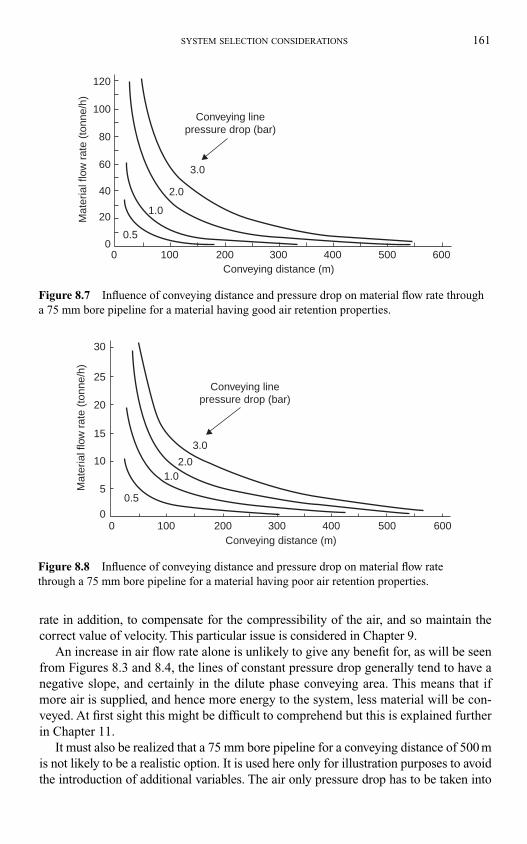
SYSTEM SELECTION CONSIDERATIONS 161
rate in addition, to compensate for the compressibility of the air, and so maintain the
correct value of velocity. This particular issue is considered in Chapter 9.
An increase in air flow rate alone is unlikely to give any benefit for, as will be seen
from Figures 8.3 and 8.4, the lines of constant pressure drop generally tend to have a
negative slope, and certainly in the dilute phase conveying area. This means that if
more air is supplied, and hence more energy to the system, less material will be con-
veyed. At first sight this might be difficult to comprehend but this is explained further
in Chapter 11.
It must also be realized that a 75 mm bore pipeline for a conveying distance of 500 m
is not likely to be a realistic option. It is used here only for illustration purposes to avoid
the introduction of additional variables. The air only pressure drop has to be taken into
3.0
2.0
1.0
0.5
00
20
40
60
80
100
120
100 200 300 400 500 600
Conveying linepressure drop (bar)
Conveying distance (m)
Mat
eria
l flo
w r
ate
(ton
ne/h
)
Figure 8.7 Influence of conveying distance and pressure drop on material flow rate through
a 75 mm bore pipeline for a material having good air retention properties.
00
5
10
15
20
25
30
100 200 300 400 500 600Conveying distance (m)
Conveying linepressure drop (bar)
3.0
2.01.0
0.5
Mat
eria
l flo
w r
ate
(ton
ne/h
)
Figure 8.8 Influence of conveying distance and pressure drop on material flow rate
through a 75 mm bore pipeline for a material having poor air retention properties.
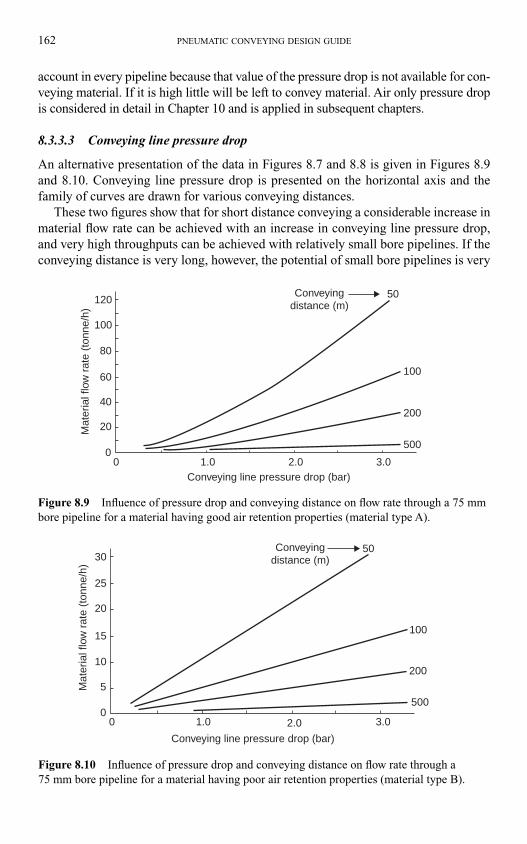
162 PNEUMATIC CONVEYING DESIGN GUIDE
account in every pipeline because that value of the pressure drop is not available for con-
veying material. If it is high little will be left to convey material. Air only pressure drop
is considered in detail in Chapter 10 and is applied in subsequent chapters.
8.3.3.3 Conveying line pressure drop
An alternative presentation of the data in Figures 8.7 and 8.8 is given in Figures 8.9
and 8.10. Conveying line pressure drop is presented on the horizontal axis and the
family of curves are drawn for various conveying distances.
These two figures show that for short distance conveying a considerable increase in
material flow rate can be achieved with an increase in conveying line pressure drop,
and very high throughputs can be achieved with relatively small bore pipelines. If the
conveying distance is very long, however, the potential of small bore pipelines is very
Conveying line pressure drop (bar)
Mat
eria
l flo
w r
ate
(ton
ne/h
)
0 1.0 2.0 3.0
50
100
200
5000
20
40
60
80
100
120Conveying
distance (m)
Figure 8.9 Influence of pressure drop and conveying distance on flow rate through a 75 mm
bore pipeline for a material having good air retention properties (material type A).
50
100
200
500
Conveying line pressure drop (bar)
00
5
10
15
20
25
30
1.0 2.0 3.0
Mat
eria
l flo
w r
ate
(ton
ne/h
)
Conveyingdistance (m)
Figure 8.10 Influence of pressure drop and conveying distance on flow rate through a
75 mm bore pipeline for a material having poor air retention properties (material type B).
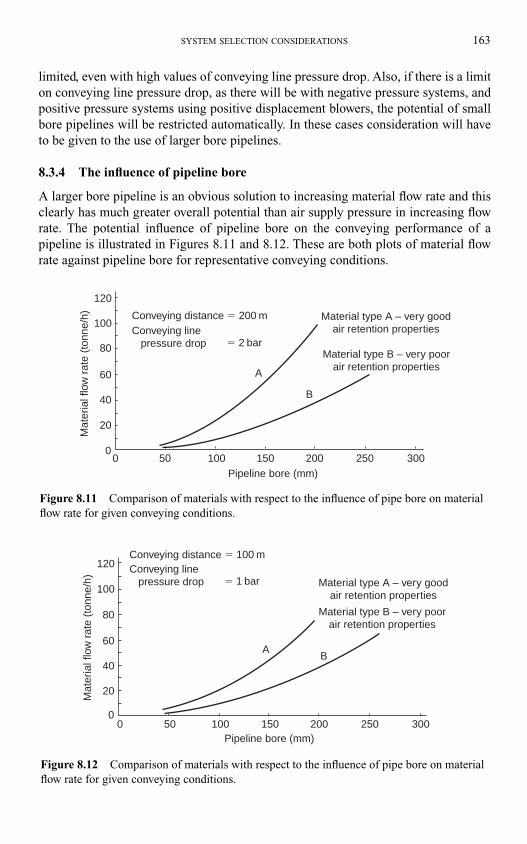
SYSTEM SELECTION CONSIDERATIONS 163
limited, even with high values of conveying line pressure drop. Also, if there is a limit
on conveying line pressure drop, as there will be with negative pressure systems, and
positive pressure systems using positive displacement blowers, the potential of small
bore pipelines will be restricted automatically. In these cases consideration will have
to be given to the use of larger bore pipelines.
8.3.4 The influence of pipeline bore
A larger bore pipeline is an obvious solution to increasing material flow rate and this
clearly has much greater overall potential than air supply pressure in increasing flow
rate. The potential influence of pipeline bore on the conveying performance of a
pipeline is illustrated in Figures 8.11 and 8.12. These are both plots of material flow
rate against pipeline bore for representative conveying conditions.
Mat
eria
l flo
w r
ate
(ton
ne/h
)
00 50 100 150
Pipeline bore (mm)
A
B
200 250 300
20
40
60
80
100
120
Conveying distance � 200 m Material type A – very goodair retention properties
Material type B – very poorair retention properties
Conveying line pressure drop � 2 bar
Figure 8.11 Comparison of materials with respect to the influence of pipe bore on material
flow rate for given conveying conditions.
Mat
eria
l flo
w r
ate
(ton
ne/h
)
0
20
40
60
80
100
120 Conveying line pressure drop
Conveying distance � 100 m
Material type A – very goodair retention properties
� 1 bar
0 50 100 150Pipeline bore (mm)
200 250 300
AB
Material type B – very poorair retention properties
Figure 8.12 Comparison of materials with respect to the influence of pipe bore on material
flow rate for given conveying conditions.
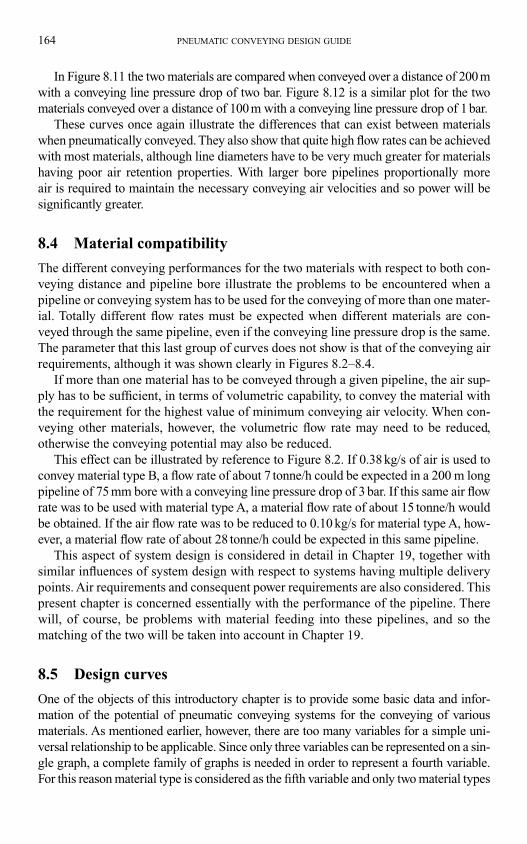
In Figure 8.11 the two materials are compared when conveyed over a distance of 200 m
with a conveying line pressure drop of two bar. Figure 8.12 is a similar plot for the two
materials conveyed over a distance of 100 m with a conveying line pressure drop of 1 bar.
These curves once again illustrate the differences that can exist between materials
when pneumatically conveyed. They also show that quite high flow rates can be achieved
with most materials, although line diameters have to be very much greater for materials
having poor air retention properties. With larger bore pipelines proportionally more
air is required to maintain the necessary conveying air velocities and so power will be
significantly greater.
8.4 Material compatibility
The different conveying performances for the two materials with respect to both con-
veying distance and pipeline bore illustrate the problems to be encountered when a
pipeline or conveying system has to be used for the conveying of more than one mater-
ial. Totally different flow rates must be expected when different materials are con-
veyed through the same pipeline, even if the conveying line pressure drop is the same.
The parameter that this last group of curves does not show is that of the conveying air
requirements, although it was shown clearly in Figures 8.2–8.4.
If more than one material has to be conveyed through a given pipeline, the air sup-
ply has to be sufficient, in terms of volumetric capability, to convey the material with
the requirement for the highest value of minimum conveying air velocity. When con-
veying other materials, however, the volumetric flow rate may need to be reduced,
otherwise the conveying potential may also be reduced.
This effect can be illustrated by reference to Figure 8.2. If 0.38 kg/s of air is used to
convey material type B, a flow rate of about 7 tonne/h could be expected in a 200 m long
pipeline of 75 mm bore with a conveying line pressure drop of 3 bar. If this same air flow
rate was to be used with material type A, a material flow rate of about 15 tonne/h would
be obtained. If the air flow rate was to be reduced to 0.10 kg/s for material type A, how-
ever, a material flow rate of about 28 tonne/h could be expected in this same pipeline.
This aspect of system design is considered in detail in Chapter 19, together with
similar influences of system design with respect to systems having multiple delivery
points. Air requirements and consequent power requirements are also considered. This
present chapter is concerned essentially with the performance of the pipeline. There
will, of course, be problems with material feeding into these pipelines, and so the
matching of the two will be taken into account in Chapter 19.
8.5 Design curves
One of the objects of this introductory chapter is to provide some basic data and infor-
mation of the potential of pneumatic conveying systems for the conveying of various
materials. As mentioned earlier, however, there are too many variables for a simple uni-
versal relationship to be applicable. Since only three variables can be represented on a sin-
gle graph, a complete family of graphs is needed in order to represent a fourth variable.
For this reason material type is considered as the fifth variable and only two material types
164 PNEUMATIC CONVEYING DESIGN GUIDE
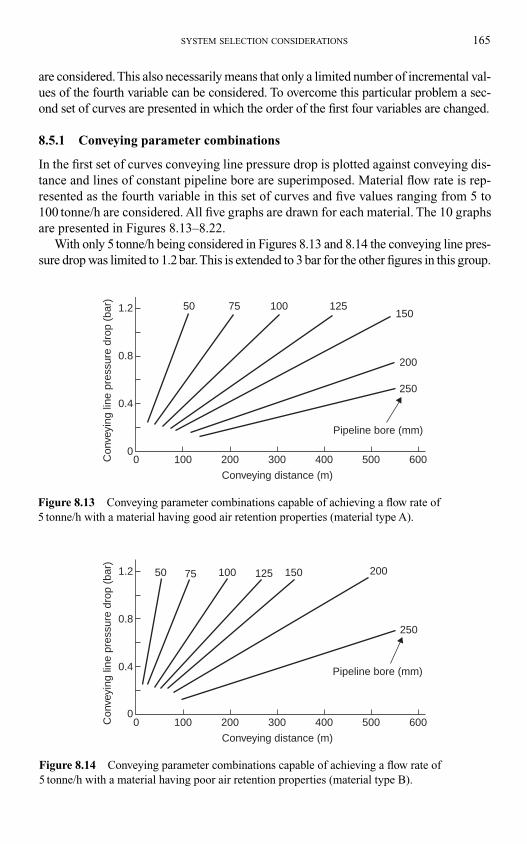
SYSTEM SELECTION CONSIDERATIONS 165
are considered. This also necessarily means that only a limited number of incremental val-
ues of the fourth variable can be considered. To overcome this particular problem a sec-
ond set of curves are presented in which the order of the first four variables are changed.
8.5.1 Conveying parameter combinations
In the first set of curves conveying line pressure drop is plotted against conveying dis-
tance and lines of constant pipeline bore are superimposed. Material flow rate is rep-
resented as the fourth variable in this set of curves and five values ranging from 5 to
100 tonne/h are considered. All five graphs are drawn for each material. The 10 graphs
are presented in Figures 8.13–8.22.
With only 5 tonne/h being considered in Figures 8.13 and 8.14 the conveying line pres-
sure drop was limited to 1.2 bar. This is extended to 3 bar for the other figures in this group.
00
0.4
0.8
1.2
100 200 300 400 500 600
Conveying distance (m)
Con
veyi
ng li
ne p
ress
ure
drop
(ba
r) 50 75 100 125150
200
250
Pipeline bore (mm)
Figure 8.13 Conveying parameter combinations capable of achieving a flow rate of
5 tonne/h with a material having good air retention properties (material type A).
00
0.4
0.8
1.2
100 200 300 400 500 600
Conveying distance (m)
Con
veyi
ng li
ne p
ress
ure
drop
(ba
r)
50 75 100 125 150 200
250
Pipeline bore (mm)
Figure 8.14 Conveying parameter combinations capable of achieving a flow rate of
5 tonne/h with a material having poor air retention properties (material type B).
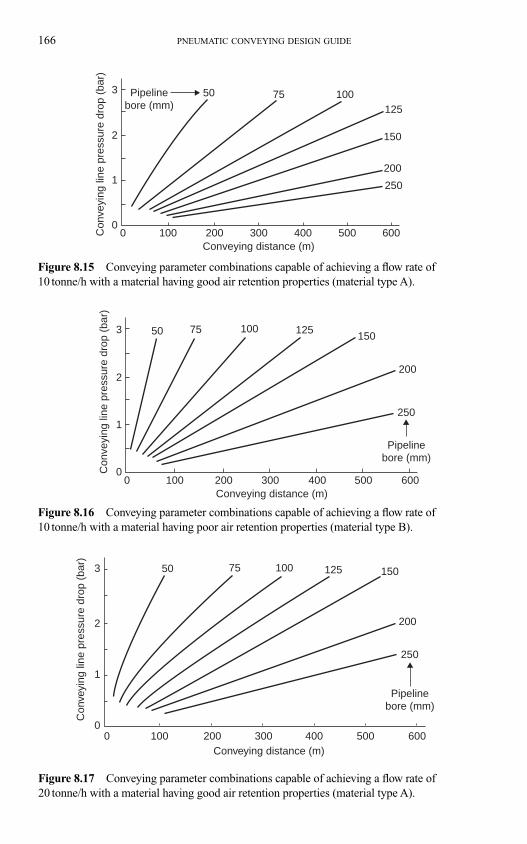
166 PNEUMATIC CONVEYING DESIGN GUIDE
Conveying distance (m)
Pipelinebore (mm)
50 75 100125
150
200
250
60050040030020010000
1
2
3C
onve
ying
line
pre
ssur
e dr
op (
bar)
Figure 8.15 Conveying parameter combinations capable of achieving a flow rate of
10 tonne/h with a material having good air retention properties (material type A).
Conveying distance (m)
Pipelinebore (mm)
50 75 100 125150
200
250
60050040030020010000
1
2
3
Con
veyi
ng li
ne p
ress
ure
drop
(ba
r)
Figure 8.16 Conveying parameter combinations capable of achieving a flow rate of
10 tonne/h with a material having poor air retention properties (material type B).
00
1
2
3 50 75 100 125 150
200
250
100 200 300 400 500 600Conveying distance (m)
Con
veyi
ng li
ne p
ress
ure
drop
(ba
r)
Pipelinebore (mm)
Figure 8.17 Conveying parameter combinations capable of achieving a flow rate of
20 tonne/h with a material having good air retention properties (material type A).
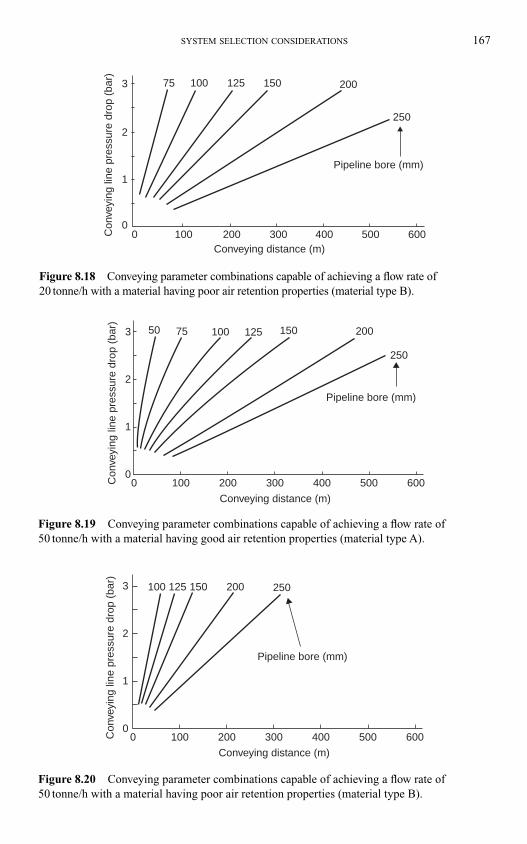
SYSTEM SELECTION CONSIDERATIONS 167
0 100 200 300 400 500 600Conveying distance (m)
0
1
2
3
Con
veyi
ng li
ne p
ress
ure
drop
(ba
r) 75 100 125 150 200
250
Pipeline bore (mm)
Figure 8.18 Conveying parameter combinations capable of achieving a flow rate of
20 tonne/h with a material having poor air retention properties (material type B).
00
1
2
3
100 200 300 400 500 600
Conveying distance (m)
Con
veyi
ng li
ne p
ress
ure
drop
(ba
r) 50 75 100 125 150 200
250
Pipeline bore (mm)
Figure 8.19 Conveying parameter combinations capable of achieving a flow rate of
50 tonne/h with a material having good air retention properties (material type A).
00
1
2
3
100 200 300 400 500 600
Conveying distance (m)
Con
veyi
ng li
ne p
ress
ure
drop
(ba
r)
100 125 150 200 250
Pipeline bore (mm)
Figure 8.20 Conveying parameter combinations capable of achieving a flow rate of
50 tonne/h with a material having poor air retention properties (material type B).
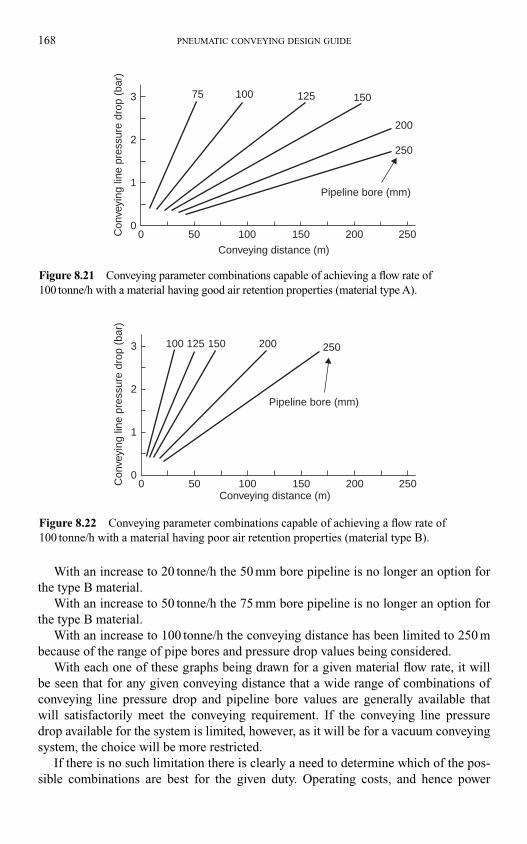
00
1
2
3
50 100 150 200 250Conveying distance (m)
Con
veyi
ng li
ne p
ress
ure
drop
(ba
r)
100 125 150 200 250
Pipeline bore (mm)
Figure 8.22 Conveying parameter combinations capable of achieving a flow rate of
100 tonne/h with a material having poor air retention properties (material type B).
168 PNEUMATIC CONVEYING DESIGN GUIDE
With an increase to 20 tonne/h the 50 mm bore pipeline is no longer an option for
the type B material.
With an increase to 50 tonne/h the 75 mm bore pipeline is no longer an option for
the type B material.
With an increase to 100 tonne/h the conveying distance has been limited to 250 m
because of the range of pipe bores and pressure drop values being considered.
With each one of these graphs being drawn for a given material flow rate, it will
be seen that for any given conveying distance that a wide range of combinations of
conveying line pressure drop and pipeline bore values are generally available that
will satisfactorily meet the conveying requirement. If the conveying line pressure
drop available for the system is limited, however, as it will be for a vacuum conveying
system, the choice will be more restricted.
If there is no such limitation there is clearly a need to determine which of the pos-
sible combinations are best for the given duty. Operating costs, and hence power
00
1
2
3
50 100 150 200 250
Conveying distance (m)
Con
veyi
ng li
ne p
ress
ure
drop
(ba
r)
10075 125 150
200
250
Pipeline bore (mm)
Figure 8.21 Conveying parameter combinations capable of achieving a flow rate of
100 tonne/h with a material having good air retention properties (material type A).
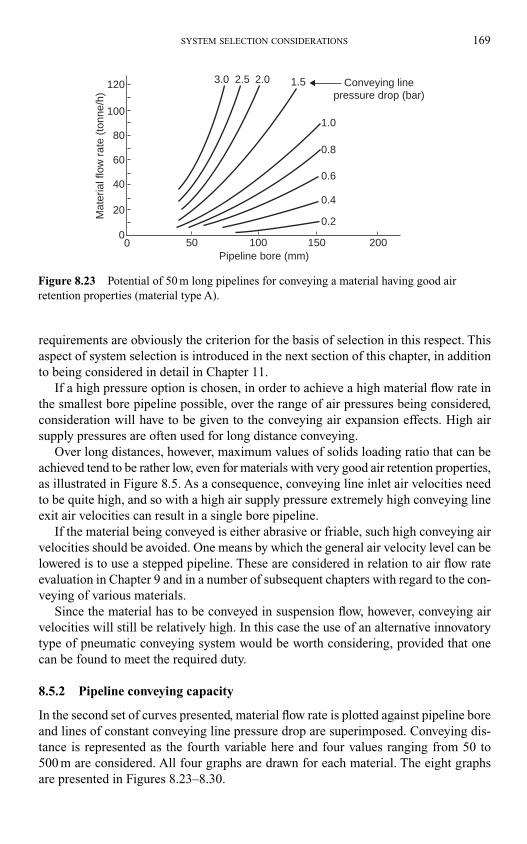
SYSTEM SELECTION CONSIDERATIONS 169
requirements are obviously the criterion for the basis of selection in this respect. This
aspect of system selection is introduced in the next section of this chapter, in addition
to being considered in detail in Chapter 11.
If a high pressure option is chosen, in order to achieve a high material flow rate in
the smallest bore pipeline possible, over the range of air pressures being considered,
consideration will have to be given to the conveying air expansion effects. High air
supply pressures are often used for long distance conveying.
Over long distances, however, maximum values of solids loading ratio that can be
achieved tend to be rather low, even for materials with very good air retention properties,
as illustrated in Figure 8.5. As a consequence, conveying line inlet air velocities need
to be quite high, and so with a high air supply pressure extremely high conveying line
exit air velocities can result in a single bore pipeline.
If the material being conveyed is either abrasive or friable, such high conveying air
velocities should be avoided. One means by which the general air velocity level can be
lowered is to use a stepped pipeline. These are considered in relation to air flow rate
evaluation in Chapter 9 and in a number of subsequent chapters with regard to the con-
veying of various materials.
Since the material has to be conveyed in suspension flow, however, conveying air
velocities will still be relatively high. In this case the use of an alternative innovatory
type of pneumatic conveying system would be worth considering, provided that one
can be found to meet the required duty.
8.5.2 Pipeline conveying capacity
In the second set of curves presented, material flow rate is plotted against pipeline bore
and lines of constant conveying line pressure drop are superimposed. Conveying dis-
tance is represented as the fourth variable here and four values ranging from 50 to
500 m are considered. All four graphs are drawn for each material. The eight graphs
are presented in Figures 8.23–8.30.
Pipeline bore (mm)
120
100
100 150 200
80
60
50
40
20
00
Conveying linepressure drop (bar)
3.0 2.5 2.0 1.5
1.0
0.8
0.6
0.4
0.2Mat
eria
l flo
w r
ate
(ton
ne/h
)
Figure 8.23 Potential of 50 m long pipelines for conveying a material having good air
retention properties (material type A).
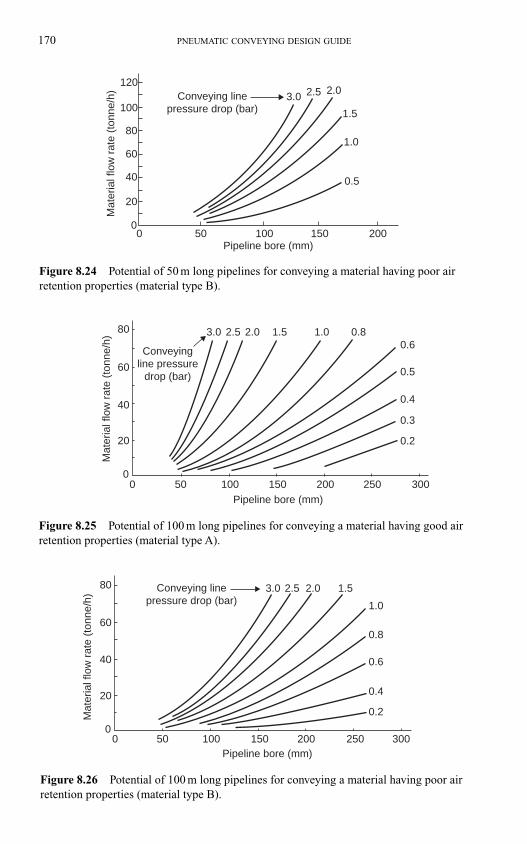
170 PNEUMATIC CONVEYING DESIGN GUIDE
Pipeline bore (mm)
120
100
100 150 200
80
60
50
40
20
00
Conveying linepressure drop (bar)
3.0 2.5 2.0
1.5
1.0
0.5
Mat
eria
l flo
w r
ate
(ton
ne/h
)
Figure 8.24 Potential of 50 m long pipelines for conveying a material having poor air
retention properties (material type B).
Conveyingline pressure
drop (bar)
Mat
eria
l flo
w r
ate
(ton
ne/h
)
Pipeline bore (mm)0 50 100
3.0 2.02.5 1.5 1.0 0.80.6
0.5
0.4
0.3
0.2
150 200 250 3000
20
40
60
80
Figure 8.25 Potential of 100 m long pipelines for conveying a material having good air
retention properties (material type A).
Mat
eria
l flo
w r
ate
(ton
ne/h
)
0
20
40
60
80
Pipeline bore (mm)0 50 100 150 200 250 300
Conveying linepressure drop (bar)
3.0 2.02.5 1.5
1.0
0.8
0.6
0.4
0.2
Figure 8.26 Potential of 100 m long pipelines for conveying a material having poor air
retention properties (material type B).
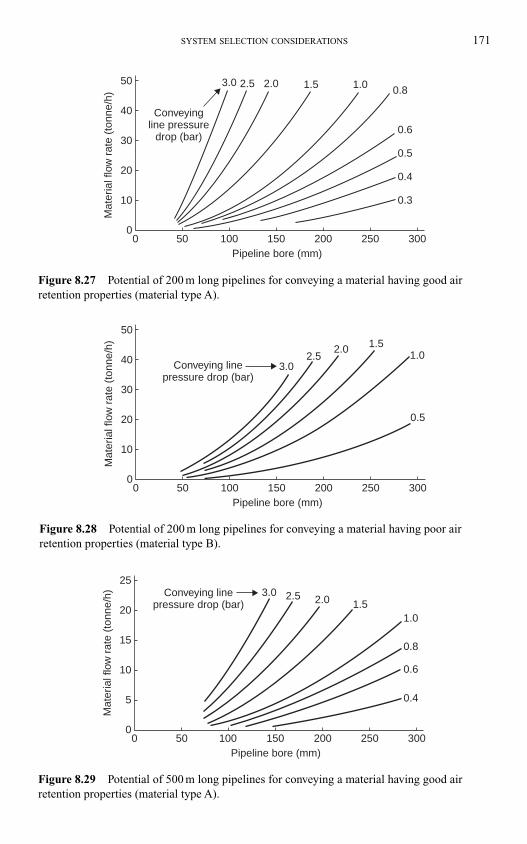
SYSTEM SELECTION CONSIDERATIONS 171
00
30
20
10
40
50
50 100 150 200 250 300
Mat
eria
l flo
w r
ate
(ton
ne/h
)Conveying
line pressuredrop (bar)
0.3
0.4
0.5
0.6
0.81.01.52.02.53.0
Pipeline bore (mm)
Figure 8.27 Potential of 200 m long pipelines for conveying a material having good air
retention properties (material type A).
00
30
20
10
40
50
50 100 150 200 250 300
Mat
eria
l flo
w r
ate
(ton
ne/h
)
Conveying linepressure drop (bar)
0.5
1.01.5
2.52.0
3.0
Pipeline bore (mm)
Figure 8.28 Potential of 200 m long pipelines for conveying a material having poor air
retention properties (material type B).
00
15
10
5
20
25
50 100 150 200 250 300
Mat
eria
l flo
w r
ate
(ton
ne/h
) Conveying linepressure drop (bar)
0.8
0.6
0.4
1.01.5
2.5 2.03.0
Pipeline bore (mm)
Figure 8.29 Potential of 500 m long pipelines for conveying a material having good air
retention properties (material type A).
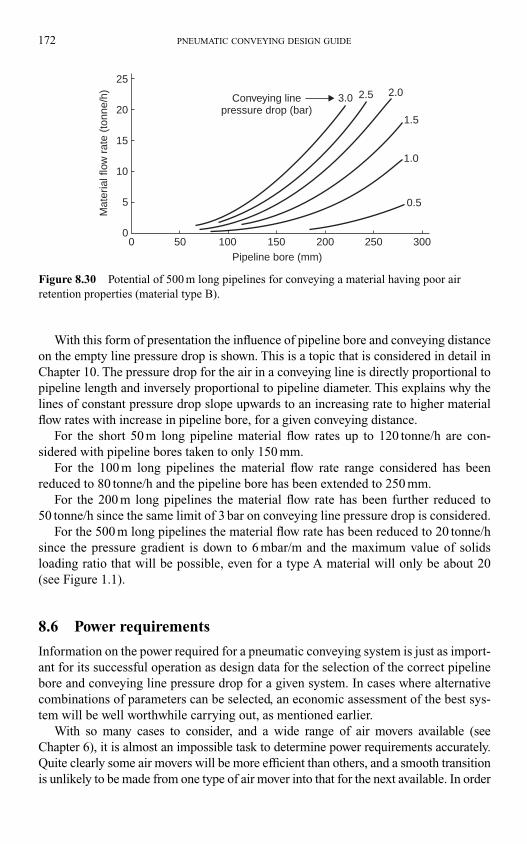
00
15
10
5
20
25
50 100 150 200 250 300
Mat
eria
l flo
w r
ate
(ton
ne/h
)Conveying line
pressure drop (bar)1.5
1.0
0.5
2.02.53.0
Pipeline bore (mm)
Figure 8.30 Potential of 500 m long pipelines for conveying a material having poor air
retention properties (material type B).
172 PNEUMATIC CONVEYING DESIGN GUIDE
With this form of presentation the influence of pipeline bore and conveying distance
on the empty line pressure drop is shown. This is a topic that is considered in detail in
Chapter 10. The pressure drop for the air in a conveying line is directly proportional to
pipeline length and inversely proportional to pipeline diameter. This explains why the
lines of constant pressure drop slope upwards to an increasing rate to higher material
flow rates with increase in pipeline bore, for a given conveying distance.
For the short 50 m long pipeline material flow rates up to 120 tonne/h are con-
sidered with pipeline bores taken to only 150 mm.
For the 100 m long pipelines the material flow rate range considered has been
reduced to 80 tonne/h and the pipeline bore has been extended to 250 mm.
For the 200 m long pipelines the material flow rate has been further reduced to
50 tonne/h since the same limit of 3 bar on conveying line pressure drop is considered.
For the 500 m long pipelines the material flow rate has been reduced to 20 tonne/h
since the pressure gradient is down to 6 mbar/m and the maximum value of solids
loading ratio that will be possible, even for a type A material will only be about 20
(see Figure 1.1).
8.6 Power requirements
Information on the power required for a pneumatic conveying system is just as import-
ant for its successful operation as design data for the selection of the correct pipeline
bore and conveying line pressure drop for a given system. In cases where alternative
combinations of parameters can be selected, an economic assessment of the best sys-
tem will be well worthwhile carrying out, as mentioned earlier.
With so many cases to consider, and a wide range of air movers available (see
Chapter 6), it is almost an impossible task to determine power requirements accurately.
Quite clearly some air movers will be more efficient than others, and a smooth transition
is unlikely to be made from one type of air mover into that for the next available. In order
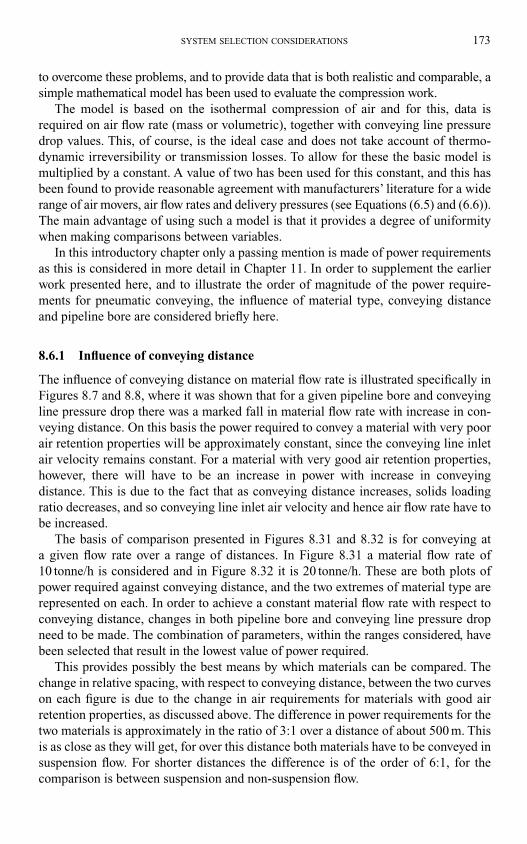
SYSTEM SELECTION CONSIDERATIONS 173
to overcome these problems, and to provide data that is both realistic and comparable, a
simple mathematical model has been used to evaluate the compression work.
The model is based on the isothermal compression of air and for this, data is
required on air flow rate (mass or volumetric), together with conveying line pressure
drop values. This, of course, is the ideal case and does not take account of thermo-
dynamic irreversibility or transmission losses. To allow for these the basic model is
multiplied by a constant. A value of two has been used for this constant, and this has
been found to provide reasonable agreement with manufacturers’ literature for a wide
range of air movers, air flow rates and delivery pressures (see Equations (6.5) and (6.6)).
The main advantage of using such a model is that it provides a degree of uniformity
when making comparisons between variables.
In this introductory chapter only a passing mention is made of power requirements
as this is considered in more detail in Chapter 11. In order to supplement the earlier
work presented here, and to illustrate the order of magnitude of the power require-
ments for pneumatic conveying, the influence of material type, conveying distance
and pipeline bore are considered briefly here.
8.6.1 Influence of conveying distance
The influence of conveying distance on material flow rate is illustrated specifically in
Figures 8.7 and 8.8, where it was shown that for a given pipeline bore and conveying
line pressure drop there was a marked fall in material flow rate with increase in con-
veying distance. On this basis the power required to convey a material with very poor
air retention properties will be approximately constant, since the conveying line inlet
air velocity remains constant. For a material with very good air retention properties,
however, there will have to be an increase in power with increase in conveying
distance. This is due to the fact that as conveying distance increases, solids loading
ratio decreases, and so conveying line inlet air velocity and hence air flow rate have to
be increased.
The basis of comparison presented in Figures 8.31 and 8.32 is for conveying at
a given flow rate over a range of distances. In Figure 8.31 a material flow rate of
10 tonne/h is considered and in Figure 8.32 it is 20 tonne/h. These are both plots of
power required against conveying distance, and the two extremes of material type are
represented on each. In order to achieve a constant material flow rate with respect to
conveying distance, changes in both pipeline bore and conveying line pressure drop
need to be made. The combination of parameters, within the ranges considered, have
been selected that result in the lowest value of power required.
This provides possibly the best means by which materials can be compared. The
change in relative spacing, with respect to conveying distance, between the two curves
on each figure is due to the change in air requirements for materials with good air
retention properties, as discussed above. The difference in power requirements for the
two materials is approximately in the ratio of 3:1 over a distance of about 500 m. This
is as close as they will get, for over this distance both materials have to be conveyed in
suspension flow. For shorter distances the difference is of the order of 6:1, for the
comparison is between suspension and non-suspension flow.
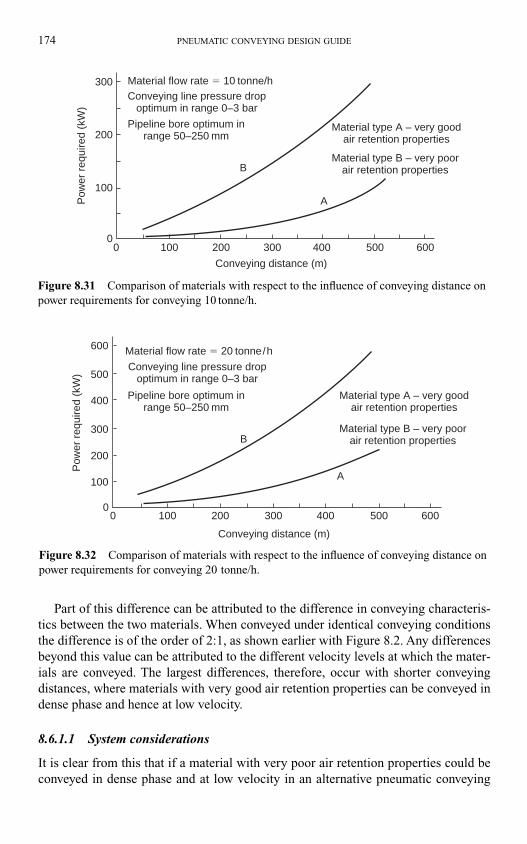
174 PNEUMATIC CONVEYING DESIGN GUIDE
Part of this difference can be attributed to the difference in conveying characteris-
tics between the two materials. When conveyed under identical conveying conditions
the difference is of the order of 2:1, as shown earlier with Figure 8.2. Any differences
beyond this value can be attributed to the different velocity levels at which the mater-
ials are conveyed. The largest differences, therefore, occur with shorter conveying
distances, where materials with very good air retention properties can be conveyed in
dense phase and hence at low velocity.
8.6.1.1 System considerations
It is clear from this that if a material with very poor air retention properties could be
conveyed in dense phase and at low velocity in an alternative pneumatic conveying
Material flow rate � 10 tonne/h
Conveying distance (m)
300
200
100
00 100 200 300
B
A
400 500 600
Pow
er r
equi
red
(kW
)
Material type A – very goodair retention properties
Material type B – very poorair retention properties
Conveying line pressure dropoptimum in range 0–3 bar
Pipeline bore optimum inrange 50–250 mm
Figure 8.31 Comparison of materials with respect to the influence of conveying distance on
power requirements for conveying 10 tonne/h.
Material flow rate � 20 tonne/h
200
300
400
500
100
00 100 200 300
B
A
400 500 600
Pow
er r
equi
red
(kW
)
Material type A – very goodair retention properties
600
Conveying distance (m)
Material type B – very poorair retention properties
Conveying line pressure dropoptimum in range 0–3 bar
Pipeline bore optimum inrange 50–250 mm
Figure 8.32 Comparison of materials with respect to the influence of conveying distance on
power requirements for conveying 20 tonne/h.
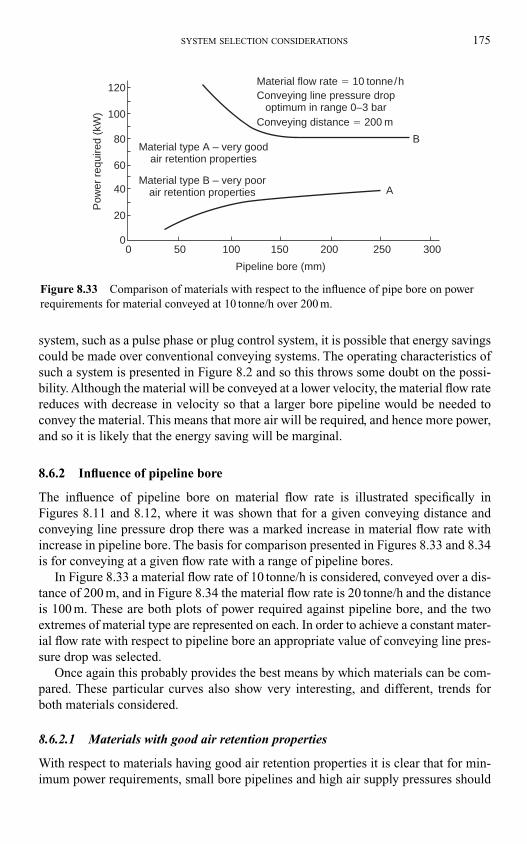
SYSTEM SELECTION CONSIDERATIONS 175
system, such as a pulse phase or plug control system, it is possible that energy savings
could be made over conventional conveying systems. The operating characteristics of
such a system is presented in Figure 8.2 and so this throws some doubt on the possi-
bility. Although the material will be conveyed at a lower velocity, the material flow rate
reduces with decrease in velocity so that a larger bore pipeline would be needed to
convey the material. This means that more air will be required, and hence more power,
and so it is likely that the energy saving will be marginal.
8.6.2 Influence of pipeline bore
The influence of pipeline bore on material flow rate is illustrated specifically in
Figures 8.11 and 8.12, where it was shown that for a given conveying distance and
conveying line pressure drop there was a marked increase in material flow rate with
increase in pipeline bore. The basis for comparison presented in Figures 8.33 and 8.34
is for conveying at a given flow rate with a range of pipeline bores.
In Figure 8.33 a material flow rate of 10 tonne/h is considered, conveyed over a dis-
tance of 200 m, and in Figure 8.34 the material flow rate is 20 tonne/h and the distance
is 100 m. These are both plots of power required against pipeline bore, and the two
extremes of material type are represented on each. In order to achieve a constant mater-
ial flow rate with respect to pipeline bore an appropriate value of conveying line pres-
sure drop was selected.
Once again this probably provides the best means by which materials can be com-
pared. These particular curves also show very interesting, and different, trends for
both materials considered.
8.6.2.1 Materials with good air retention properties
With respect to materials having good air retention properties it is clear that for min-
imum power requirements, small bore pipelines and high air supply pressures should
Material type A – very goodair retention properties
Pipeline bore (mm)
100500
20
0
40
60
80
100
120
150 200 250
A
B
300
Pow
er r
equi
red
(kW
)Material flow rate � 10 tonne/h
Material type B – very poorair retention properties
Conveying line pressure dropoptimum in range 0–3 bar
Conveying distance � 200 m
Figure 8.33 Comparison of materials with respect to the influence of pipe bore on power
requirements for material conveyed at 10 tonne/h over 200 m.
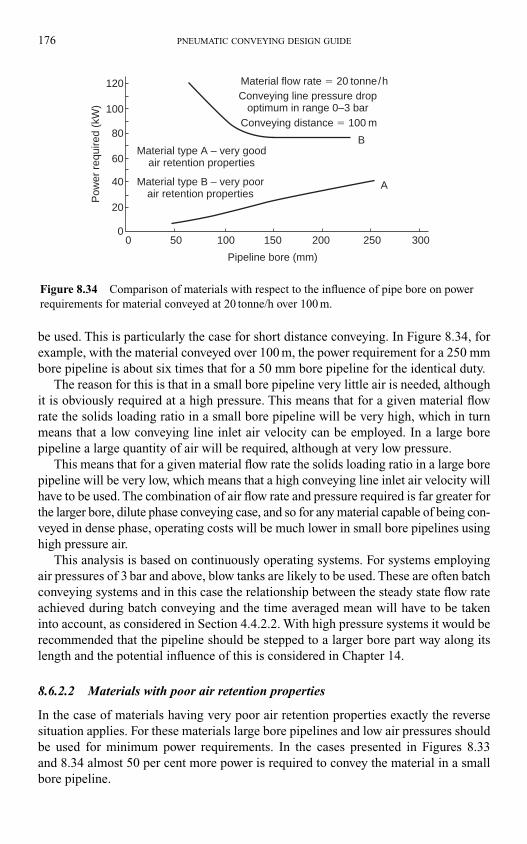
176 PNEUMATIC CONVEYING DESIGN GUIDE
be used. This is particularly the case for short distance conveying. In Figure 8.34, for
example, with the material conveyed over 100 m, the power requirement for a 250 mm
bore pipeline is about six times that for a 50 mm bore pipeline for the identical duty.
The reason for this is that in a small bore pipeline very little air is needed, although
it is obviously required at a high pressure. This means that for a given material flow
rate the solids loading ratio in a small bore pipeline will be very high, which in turn
means that a low conveying line inlet air velocity can be employed. In a large bore
pipeline a large quantity of air will be required, although at very low pressure.
This means that for a given material flow rate the solids loading ratio in a large bore
pipeline will be very low, which means that a high conveying line inlet air velocity will
have to be used. The combination of air flow rate and pressure required is far greater for
the larger bore, dilute phase conveying case, and so for any material capable of being con-
veyed in dense phase, operating costs will be much lower in small bore pipelines using
high pressure air.
This analysis is based on continuously operating systems. For systems employing
air pressures of 3 bar and above, blow tanks are likely to be used. These are often batch
conveying systems and in this case the relationship between the steady state flow rate
achieved during batch conveying and the time averaged mean will have to be taken
into account, as considered in Section 4.4.2.2. With high pressure systems it would be
recommended that the pipeline should be stepped to a larger bore part way along its
length and the potential influence of this is considered in Chapter 14.
8.6.2.2 Materials with poor air retention properties
In the case of materials having very poor air retention properties exactly the reverse
situation applies. For these materials large bore pipelines and low air pressures should
be used for minimum power requirements. In the cases presented in Figures 8.33
and 8.34 almost 50 per cent more power is required to convey the material in a small
bore pipeline.
Pipeline bore (mm)
100500
20
0
40
60
80
100
120
150 200 250
A
B
300
Pow
er r
equi
red
(kW
)Material flow rate � 20 tonne/h
Material type A – very goodair retention properties
Material type B – very poorair retention properties
Conveying line pressure dropoptimum in range 0–3 bar
Conveying distance � 100 m
Figure 8.34 Comparison of materials with respect to the influence of pipe bore on power
requirements for material conveyed at 20 tonne/h over 100 m.
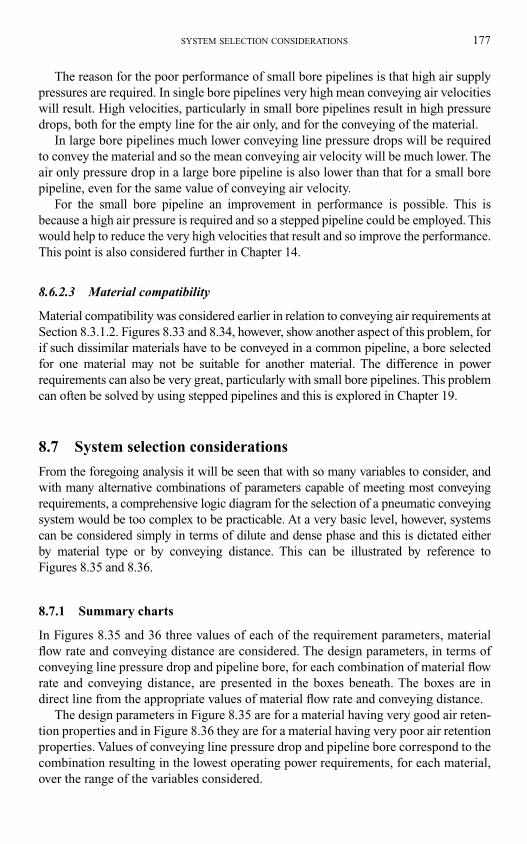
SYSTEM SELECTION CONSIDERATIONS 177
The reason for the poor performance of small bore pipelines is that high air supply
pressures are required. In single bore pipelines very high mean conveying air velocities
will result. High velocities, particularly in small bore pipelines result in high pressure
drops, both for the empty line for the air only, and for the conveying of the material.
In large bore pipelines much lower conveying line pressure drops will be required
to convey the material and so the mean conveying air velocity will be much lower. The
air only pressure drop in a large bore pipeline is also lower than that for a small bore
pipeline, even for the same value of conveying air velocity.
For the small bore pipeline an improvement in performance is possible. This is
because a high air pressure is required and so a stepped pipeline could be employed. This
would help to reduce the very high velocities that result and so improve the performance.
This point is also considered further in Chapter 14.
8.6.2.3 Material compatibility
Material compatibility was considered earlier in relation to conveying air requirements at
Section 8.3.1.2. Figures 8.33 and 8.34, however, show another aspect of this problem, for
if such dissimilar materials have to be conveyed in a common pipeline, a bore selected
for one material may not be suitable for another material. The difference in power
requirements can also be very great, particularly with small bore pipelines. This problem
can often be solved by using stepped pipelines and this is explored in Chapter 19.
8.7 System selection considerations
From the foregoing analysis it will be seen that with so many variables to consider, and
with many alternative combinations of parameters capable of meeting most conveying
requirements, a comprehensive logic diagram for the selection of a pneumatic conveying
system would be too complex to be practicable. At a very basic level, however, systems
can be considered simply in terms of dilute and dense phase and this is dictated either
by material type or by conveying distance. This can be illustrated by reference to
Figures 8.35 and 8.36.
8.7.1 Summary charts
In Figures 8.35 and 36 three values of each of the requirement parameters, material
flow rate and conveying distance are considered. The design parameters, in terms of
conveying line pressure drop and pipeline bore, for each combination of material flow
rate and conveying distance, are presented in the boxes beneath. The boxes are in
direct line from the appropriate values of material flow rate and conveying distance.
The design parameters in Figure 8.35 are for a material having very good air reten-
tion properties and in Figure 8.36 they are for a material having very poor air retention
properties. Values of conveying line pressure drop and pipeline bore correspond to the
combination resulting in the lowest operating power requirements, for each material,
over the range of the variables considered.
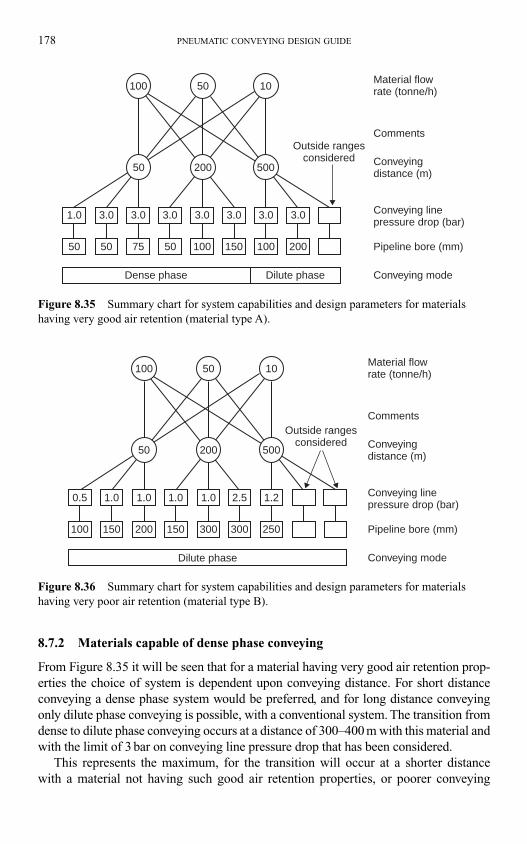
178 PNEUMATIC CONVEYING DESIGN GUIDE
8.7.2 Materials capable of dense phase conveying
From Figure 8.35 it will be seen that for a material having very good air retention prop-
erties the choice of system is dependent upon conveying distance. For short distance
conveying a dense phase system would be preferred, and for long distance conveying
only dilute phase conveying is possible, with a conventional system. The transition from
dense to dilute phase conveying occurs at a distance of 300–400 m with this material and
with the limit of 3 bar on conveying line pressure drop that has been considered.
This represents the maximum, for the transition will occur at a shorter distance
with a material not having such good air retention properties, or poorer conveying
100 50 10
50020050
1.0 3.0 3.0 3.0 3.0 3.0 3.0 3.0
50 50 75 50 100 150 100 200
Outside rangesconsidered
Dense phase Dilute phase
Material flowrate (tonne/h)
Comments
Conveyingdistance (m)
Conveying linepressure drop (bar)
Pipeline bore (mm)
Conveying mode
Figure 8.35 Summary chart for system capabilities and design parameters for materials
having very good air retention (material type A).
100 50 10
50020050
0.5 1.0 1.0 1.0 1.0 2.5 1.2
100 150 200 150 300 300 250
Outside rangesconsidered
Dilute phase
Material flowrate (tonne/h)
Comments
Conveyingdistance (m)
Conveying linepressure drop (bar)
Pipeline bore (mm)
Conveying mode
Figure 8.36 Summary chart for system capabilities and design parameters for materials
having very poor air retention (material type B).
characteristics. For the material with very poor air retention properties in Figure 8.36 only
dilute phase conveying is available over the range of conveying distances considered.
Although dense phase conveying is recommended when this is possible for a mater-
ial, personal factors may dictate the selection of a dilute phase system. The decision
presented here is simply based on operating costs. Plant capital costs, or a desire to use
low pressure air movers or certain feeding devices, may result in a dilute phase system
being preferred. As demonstrated in this chapter, a wide range of conveying parameter
combinations are generally available for a material capable of being conveyed in dense
phase, and so the material could be conveyed quite successfully in either dilute or dense
phase in many cases.
8.7.3 Alternatives to dilute phase conveying
When the choice of conventional conveying system is restricted to dilute phase, either
because of the distance conveyed or the properties of the material, the use of an alter-
native innovatory system, such as pulse phase, plug control or air addition system,
may be well worth considering. If the material is capable of being conveyed in such a
system over the distance required, and this is clearly the first point to establish, such a
system should enable the material to be conveyed at much lower velocities, which will
help with respect of plant erosion and particle degradation.
The next point to establish is whether the operating costs are lower, for the plant cap-
ital costs will almost certainly be higher. Operating costs will depend upon the convey-
ing characteristics for the material. If these are similar to those of material A in Figure
8.2 then the operating costs will be significantly lower, but if they are similar to those of
material C in Figure 8.2 any such benefit is likely to be marginal. The ultimate decision,
therefore, needs to be made in relation to these various points.
SYSTEM SELECTION CONSIDERATIONS 179

This page intentionally left blank

Part B
System Design

This page intentionally left blank
9.1 Introduction
The selection of a fan, blower or compressor is probably one of the most important
decisions to be made in the design of a pneumatic conveying system. It is often the
largest single item of capital expenditure and the potential conveying capacity of the
plant is dependent upon the correct choice being made. The rating of the fan, blower or
compressor is expressed in terms of the supply pressure required and the volumetric
flow to be delivered. Any error in this specification will result in a system that is either
over-rated, is not capable of achieving the desired material flow rate, or will cause a
pipeline blockage and convey nothing.
For an existing system it is often necessary to check the performance, particularly
if operating problems are encountered, or changes in material or conveying distance
need to be considered. Here it is the conveying line inlet air velocity that is important.
Since the determination of conveying line inlet air velocity and the specification of air
requirements is so important for the successful operation of pneumatic conveying sys-
tems, all the appropriate models are derived and presented for reference purposes.
Although it is air that is generally referred to, materials can be conveyed with any
suitable gas. Constants are included in the equations that will correctly account for the
type of gas used when evaluating the volumetric flow rate required. Air mass flow rate is
also considered, as it is a useful working parameter with regard to solids loading ratio,
and as its value remains constant it is particularly useful in equations of continuity.
9.1.1 Supply pressure
The delivery pressure, or vacuum, required depends essentially upon the working
pressure drop needed over the length of the conveying pipeline. The pressure drop
across the gas–solids separation device can usually be neglected, but if a blow tank is
used for feeding the material into the pipeline then an allowance for the pressure drop
across the feeding device will have to be made. Consideration will also have to be
given to the pressure drop in any air supply and extraction lines, and to the need for a
margin on the value of conveying line pressure drop required to convey the material
through the pipeline at the specified rate.
The magnitude of the conveying line pressure drop, whether for a positive or a neg-
ative pressure system, depends to a large extent on the conveying distance and on the
Chapter 9
Air flow rate evaluation
solids loading ratio at which the material is to be conveyed. For short distance dilute
phase conveying a fan or blower would be satisfactory, but for dense phase conveying
or long distance dilute phase conveying, a reciprocating or screw compressor would
be required. The pressure drop is also dependent upon the conveying gas velocity and
a multitude of properties associated with the conveyed material.
9.1.2 Volumetric flow rate
The volumetric flow rate required from the fan, blower or compressor depends upon a
combination of the velocity required to convey the material and the diameter of the
pipeline to be used. Pipes and fittings are generally available in a range of standard
sizes, but velocity is not so clearly defined.
For convenience the velocity at the end of the pipeline could be specified, for in the
majority of cases compressors are rated in terms of ‘free air delivered’, and the pressure
at the end of a pipeline in positive pressure systems, in most applications, will be suffi-
ciently close to atmospheric for this purpose. It is, however, the velocity at the start of
the line that needs to be ascertained for design purposes.
The problem is that air, and any other gas that is used for the conveying of mater-
ials, is compressible and so its density, and hence volumetric flow rate, is influenced
by both pressure and temperature. If the plant is not located at sea level, the influence
of elevation may also have to be taken into account. As a result of the compressibility
with respect to pressure, stepped bore pipelines are often employed and so these are
given due consideration.
In negative pressure systems the air at the start of the conveying line is approxi-
mately at atmospheric pressure, and it decreases along the length of the conveying line
to the exhauster. For this type of conveying system, therefore, the minimum velocity
that needs to be specified occurs at the free air conditions. Exhausters, however, are
generally specified in terms of the volumetric flow rate of the air that is drawn into the
air mover, and not free air conditions, and so it is essentially the same problem in evalu-
ating air flow rates as with positive pressure conveying systems.
9.1.3 The influence of velocity
A conveying plant is usually designed to achieve a specified flow rate. Material flow rate
can be equated to the solids loading ratio and the air mass flow rate. The air flow rate, in
turn, is proportional to air velocity and pipe bore. Since these three parameters also have
an effect on the compressor rating, it is extremely important that the correct air mover
specification is made. The relationship between the various parameters that link the
compressor rating and material flow rate is demonstrated with the path analysis shown
in Figure 9.1.
Figure 9.1 also illustrates the importance of conveying air velocity in this relation-
ship, as it influences both the supply pressure and the volumetric flow rate of the com-
pressor. This helps to explain why conveying air is one of the most important variables
in pneumatic conveying, and why it needs to be controlled fairly precisely.
If, in a dilute phase conveying system, the velocity is too low, it is possible that the
material being conveyed will drop out of suspension and block the pipeline. If, on the
184 PNEUMATIC CONVEYING DESIGN GUIDE
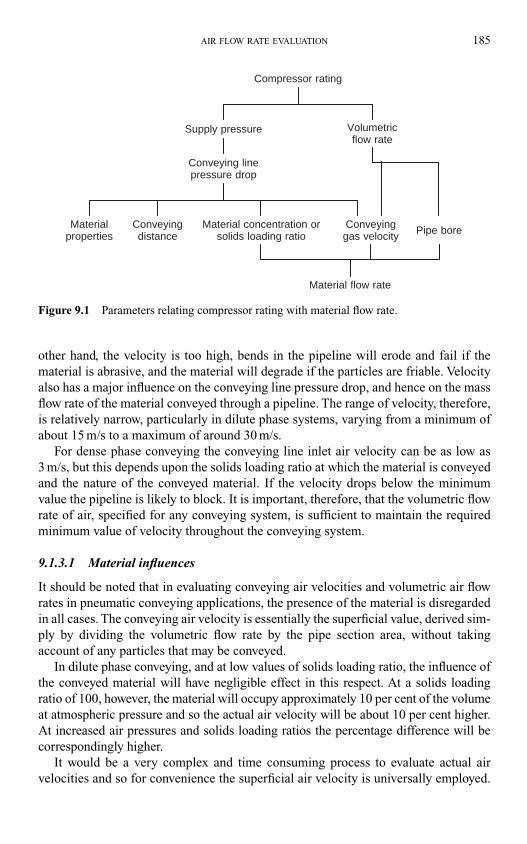
other hand, the velocity is too high, bends in the pipeline will erode and fail if the
material is abrasive, and the material will degrade if the particles are friable. Velocity
also has a major influence on the conveying line pressure drop, and hence on the mass
flow rate of the material conveyed through a pipeline. The range of velocity, therefore,
is relatively narrow, particularly in dilute phase systems, varying from a minimum of
about 15 m/s to a maximum of around 30 m/s.
For dense phase conveying the conveying line inlet air velocity can be as low as
3 m/s, but this depends upon the solids loading ratio at which the material is conveyed
and the nature of the conveyed material. If the velocity drops below the minimum
value the pipeline is likely to block. It is important, therefore, that the volumetric flow
rate of air, specified for any conveying system, is sufficient to maintain the required
minimum value of velocity throughout the conveying system.
9.1.3.1 Material influences
It should be noted that in evaluating conveying air velocities and volumetric air flow
rates in pneumatic conveying applications, the presence of the material is disregarded
in all cases. The conveying air velocity is essentially the superficial value, derived sim-
ply by dividing the volumetric flow rate by the pipe section area, without taking
account of any particles that may be conveyed.
In dilute phase conveying, and at low values of solids loading ratio, the influence of
the conveyed material will have negligible effect in this respect. At a solids loading
ratio of 100, however, the material will occupy approximately 10 per cent of the volume
at atmospheric pressure and so the actual air velocity will be about 10 per cent higher.
At increased air pressures and solids loading ratios the percentage difference will be
correspondingly higher.
It would be a very complex and time consuming process to evaluate actual air
velocities and so for convenience the superficial air velocity is universally employed.
AIR FLOW RATE EVALUATION 185
Compressor rating
Supply pressure
Conveying linepressure drop
Material flow rate
Volumetricflow rate
Materialproperties
Conveyingdistance
Material concentration orsolids loading ratio
Conveyinggas velocity Pipe bore
Figure 9.1 Parameters relating compressor rating with material flow rate.
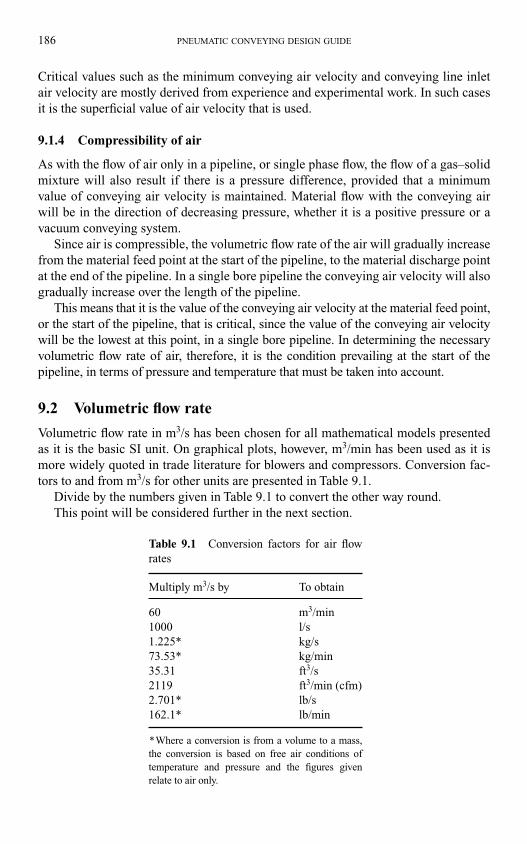
Critical values such as the minimum conveying air velocity and conveying line inlet
air velocity are mostly derived from experience and experimental work. In such cases
it is the superficial value of air velocity that is used.
9.1.4 Compressibility of air
As with the flow of air only in a pipeline, or single phase flow, the flow of a gas–solid
mixture will also result if there is a pressure difference, provided that a minimum
value of conveying air velocity is maintained. Material flow with the conveying air
will be in the direction of decreasing pressure, whether it is a positive pressure or a
vacuum conveying system.
Since air is compressible, the volumetric flow rate of the air will gradually increase
from the material feed point at the start of the pipeline, to the material discharge point
at the end of the pipeline. In a single bore pipeline the conveying air velocity will also
gradually increase over the length of the pipeline.
This means that it is the value of the conveying air velocity at the material feed point,
or the start of the pipeline, that is critical, since the value of the conveying air velocity
will be the lowest at this point, in a single bore pipeline. In determining the necessary
volumetric flow rate of air, therefore, it is the condition prevailing at the start of the
pipeline, in terms of pressure and temperature that must be taken into account.
9.2 Volumetric flow rate
Volumetric flow rate in m3/s has been chosen for all mathematical models presented
as it is the basic SI unit. On graphical plots, however, m3/min has been used as it is
more widely quoted in trade literature for blowers and compressors. Conversion fac-
tors to and from m3/s for other units are presented in Table 9.1.
Divide by the numbers given in Table 9.1 to convert the other way round.
This point will be considered further in the next section.
186 PNEUMATIC CONVEYING DESIGN GUIDE
Table 9.1 Conversion factors for air flow
rates
Multiply m3/s by To obtain
60 m3/min
1000 l/s
1.225* kg/s
73.53* kg/min
35.31 ft3/s
2119 ft3/min (cfm)
2.701* lb/s
162.1* lb/min
* Where a conversion is from a volume to a mass,
the conversion is based on free air conditions of
temperature and pressure and the figures given
relate to air only.
9.2.1 Presentation of equations
The majority of the equations that follow are presented in terms of both volumetric
flow rate and conveying air velocity. The reason for this is the need to provide models
that can be used for both the design of future systems and for checking the operation
of existing systems.
In the design of a system a specific value of conveying air velocity will generally
be recommended, together with a pipe bore, and it is the value of volumetric flow rate
that is required for specification of the blower or compressor. In order to check an
existing system it is usually necessary to determine the conveying air velocity for the
particular conditions.
In addition to providing the appropriate models for the evaluation of air require-
ments and conveying air velocities, graphical representation of these models is also
presented. With programmable calculators and computers, models such as these can
be handled quite easily and quickly. Graphs, however, do have the advantage of show-
ing visually the relative effects of the various parameters, and in some cases can be
used very effectively to illustrate particular processes.
9.2.2 The influence of pipe bore
The diameter of a pipeline probably has the most significant effect of any single
parameter on volumetric flow rate. The volumetric flow rate through a pipeline
depends upon the mean velocity of flow at a given point in the pipeline and the pipe
section area. The relationship is:
(9.1)
where V� is the volumetric flow rate (m3/s), C is the conveying air velocity (m/s) and Ais the pipe section area (m2) � �d2/4 for a circular pipe, where d is the pipe bore (m)
so that
(9.2)
or
(9.3)
A graphical representation of the above models is presented in Figure 9.2. This is a
plot of volumetric air flow rate against conveying air velocity, with a series of lines
representing the relationship for different sizes of pipe. Conveying air velocities from
about 2 to 40 m/s have been considered in order to cover the two extremes of minimum
velocity in dense phase conveying and maximum velocity in dilute phase conveying.
With pipeline bore as the family of curves this is a linear relationship.
CV
d m/s�
4
2
˙
�
˙ /Vd C
m s3�
� 2
4
V C A � �
AIR FLOW RATE EVALUATION 187
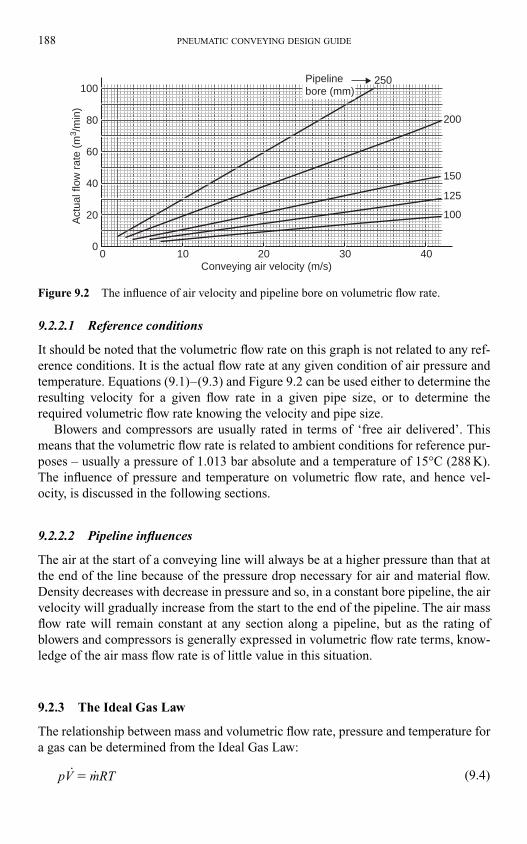
9.2.2.1 Reference conditions
It should be noted that the volumetric flow rate on this graph is not related to any ref-
erence conditions. It is the actual flow rate at any given condition of air pressure and
temperature. Equations (9.1)–(9.3) and Figure 9.2 can be used either to determine the
resulting velocity for a given flow rate in a given pipe size, or to determine the
required volumetric flow rate knowing the velocity and pipe size.
Blowers and compressors are usually rated in terms of ‘free air delivered’. This
means that the volumetric flow rate is related to ambient conditions for reference pur-
poses – usually a pressure of 1.013 bar absolute and a temperature of 15°C (288 K).
The influence of pressure and temperature on volumetric flow rate, and hence vel-
ocity, is discussed in the following sections.
9.2.2.2 Pipeline influences
The air at the start of a conveying line will always be at a higher pressure than that at
the end of the line because of the pressure drop necessary for air and material flow.
Density decreases with decrease in pressure and so, in a constant bore pipeline, the air
velocity will gradually increase from the start to the end of the pipeline. The air mass
flow rate will remain constant at any section along a pipeline, but as the rating of
blowers and compressors is generally expressed in volumetric flow rate terms, know-
ledge of the air mass flow rate is of little value in this situation.
9.2.3 The Ideal Gas Law
The relationship between mass and volumetric flow rate, pressure and temperature for
a gas can be determined from the Ideal Gas Law:
(9.4)pV mRT˙ ˙ �
188 PNEUMATIC CONVEYING DESIGN GUIDE
100
80
60
40
20
00 10 20 30 40
Conveying air velocity (m/s)
Act
ual f
low
rat
e (m
3 /m
in)
100
125
150
200
250Pipelinebore (mm)
Figure 9.2 The influence of air velocity and pipeline bore on volumetric flow rate.
where p is the absolute pressure of gas (kN/m2), V� is the actual volumetric flow rate of
the gas at the pressure p (m3/s), m� is the mass flow rate of gas (kg/s), R is the character-
istic gas constant (kJ/kg . K) and T is the absolute temperature of gas (K) � t°C � 273.
Rearranging this gives:
For a given gas and constant mass flow rate:
so that
(9.5)
where subscripts 1 and 2 can relate to any two points anywhere along the conveying
pipeline or in terms of ‘free air conditions’
(9.6)
where subscript 0 refers to reference conditions usually p0 � 101.3 kN/m2 absolute,
T0 � 288 K and V�0 � free air delivered, and subscript 1 refers to actual conditions
anywhere along the conveying pipeline.
9.2.3.1 Working relationships
Substituting reference values into Equation (9.6) and rearranging gives:
(9.7)
or alternatively
(9.8)
9.2.3.2 Gas constants
The constant, R, in Equation (9.4) has a specific value for every gas and is obtained from:
(9.9)RR
M kJ/kg K� �0
˙˙
/VTV
p11 0
1
0.352 m s3� �
˙
.
˙˙
/Vp
TV
p V
T01
1
11 1
1101 3
288
2.843 m s
3��
�� � �
p V
T
p V
T0 0
0
1 1
1
˙ ˙ �
p V
T
p V
T1 1
1
2 2
2
˙ ˙ �
pV
Tconstant
˙�
pV
TmR
˙˙�
AIR FLOW RATE EVALUATION 189
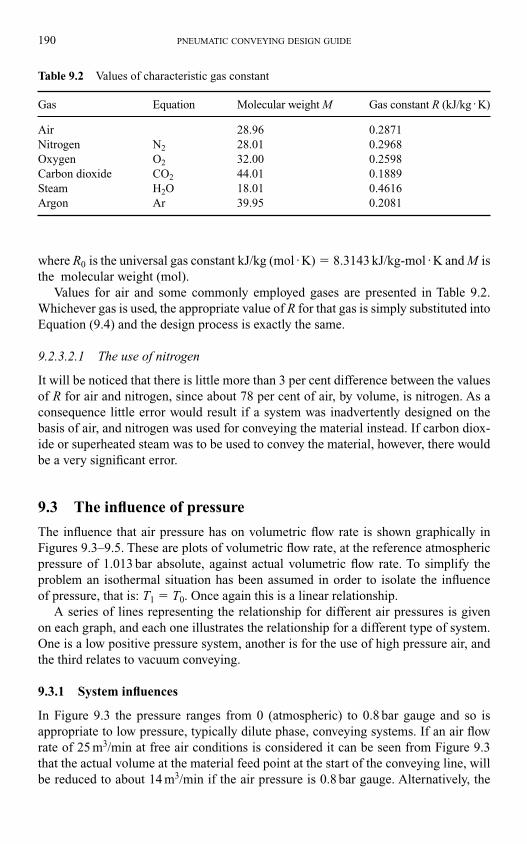
where R0 is the universal gas constant kJ/kg (mol . K) � 8.3143 kJ/kg-mol . K and M is
the molecular weight (mol).
Values for air and some commonly employed gases are presented in Table 9.2.
Whichever gas is used, the appropriate value of R for that gas is simply substituted into
Equation (9.4) and the design process is exactly the same.
9.2.3.2.1 The use of nitrogen
It will be noticed that there is little more than 3 per cent difference between the values
of R for air and nitrogen, since about 78 per cent of air, by volume, is nitrogen. As a
consequence little error would result if a system was inadvertently designed on the
basis of air, and nitrogen was used for conveying the material instead. If carbon diox-
ide or superheated steam was to be used to convey the material, however, there would
be a very significant error.
9.3 The influence of pressure
The influence that air pressure has on volumetric flow rate is shown graphically in
Figures 9.3–9.5. These are plots of volumetric flow rate, at the reference atmospheric
pressure of 1.013 bar absolute, against actual volumetric flow rate. To simplify the
problem an isothermal situation has been assumed in order to isolate the influence
of pressure, that is: T1 � T0. Once again this is a linear relationship.
A series of lines representing the relationship for different air pressures is given
on each graph, and each one illustrates the relationship for a different type of system.
One is a low positive pressure system, another is for the use of high pressure air, and
the third relates to vacuum conveying.
9.3.1 System influences
In Figure 9.3 the pressure ranges from 0 (atmospheric) to 0.8 bar gauge and so is
appropriate to low pressure, typically dilute phase, conveying systems. If an air flow
rate of 25 m3/min at free air conditions is considered it can be seen from Figure 9.3
that the actual volume at the material feed point at the start of the conveying line, will
be reduced to about 14 m3/min if the air pressure is 0.8 bar gauge. Alternatively, the
190 PNEUMATIC CONVEYING DESIGN GUIDE
Table 9.2 Values of characteristic gas constant
Gas Equation Molecular weight M Gas constant R (kJ/kg . K)
Air 28.96 0.2871
Nitrogen N2 28.01 0.2968
Oxygen O2 32.00 0.2598
Carbon dioxide CO2 44.01 0.1889
Steam H2O 18.01 0.4616
Argon Ar 39.95 0.2081
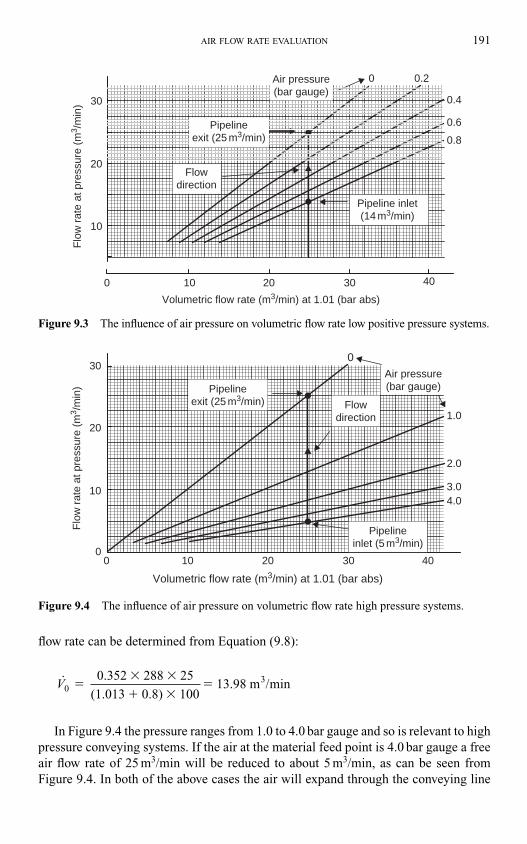
flow rate can be determined from Equation (9.8):
In Figure 9.4 the pressure ranges from 1.0 to 4.0 bar gauge and so is relevant to high
pressure conveying systems. If the air at the material feed point is 4.0 bar gauge a free
air flow rate of 25 m3/min will be reduced to about 5 m3/min, as can be seen from
Figure 9.4. In both of the above cases the air will expand through the conveying line
˙ /V0 0.352 288 25
(1.013 0.8) 100 13.98 m min
3�� �
� ��
AIR FLOW RATE EVALUATION 191
30
20
10
0 10
Volumetric flow rate (m3/min) at 1.01 (bar abs)
20
0.20
0.4
0.6
0.8
30 40
Flo
w r
ate
at p
ress
ure
(m3 /
min
)
Flowdirection
Pipeline inlet(14 m3/min)
Pipelineexit (25 m3/min)
Air pressure(bar gauge)
Figure 9.3 The influence of air pressure on volumetric flow rate low positive pressure systems.
00
10
20
30
10 20
Volumetric flow rate (m3/min) at 1.01 (bar abs)
Flo
w r
ate
at p
ress
ure
(m3 /
min
)
40
2.0
1.0
3.04.0
30
Pipelineexit (25 m3/min) Flow
direction
Pipelineinlet (5 m3/min)
Air pressure(bar gauge)
0
Figure 9.4 The influence of air pressure on volumetric flow rate high pressure systems.
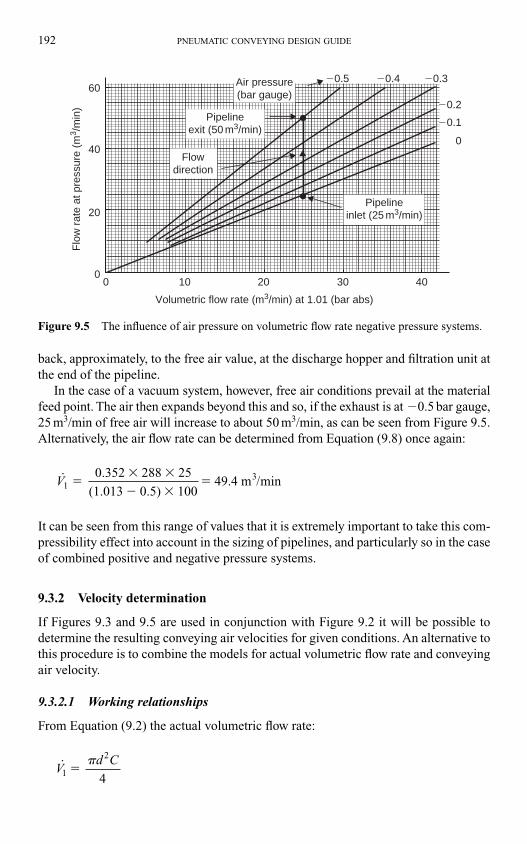
back, approximately, to the free air value, at the discharge hopper and filtration unit at
the end of the pipeline.
In the case of a vacuum system, however, free air conditions prevail at the material
feed point. The air then expands beyond this and so, if the exhaust is at �0.5 bar gauge,
25 m3/min of free air will increase to about 50 m3/min, as can be seen from Figure 9.5.
Alternatively, the air flow rate can be determined from Equation (9.8) once again:
It can be seen from this range of values that it is extremely important to take this com-
pressibility effect into account in the sizing of pipelines, and particularly so in the case
of combined positive and negative pressure systems.
9.3.2 Velocity determination
If Figures 9.3 and 9.5 are used in conjunction with Figure 9.2 it will be possible to
determine the resulting conveying air velocities for given conditions. An alternative to
this procedure is to combine the models for actual volumetric flow rate and conveying
air velocity.
9.3.2.1 Working relationships
From Equation (9.2) the actual volumetric flow rate:
Vd C
1
2
4 �
�
˙ /V1 0.352 288 25
(1.013 0.5) 100 49.4 m min
3�� �
� ��
192 PNEUMATIC CONVEYING DESIGN GUIDE
�0.5 �0.4 �0.3
�0.2
�0.1
0
00
20
40
60
10 20 30 40
Volumetric flow rate (m3/min) at 1.01 (bar abs)
Flo
w r
ate
at p
ress
ure
(m3 /
min
)Air pressure(bar gauge)
Pipelineexit (50 m3/min)
Flowdirection
Pipelineinlet (25 m3/min)
Figure 9.5 The influence of air pressure on volumetric flow rate negative pressure systems.
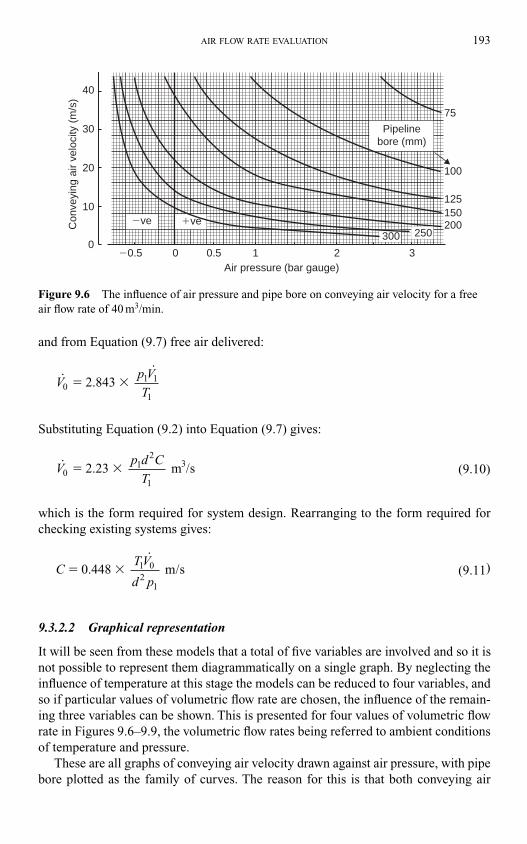
and from Equation (9.7) free air delivered:
Substituting Equation (9.2) into Equation (9.7) gives:
(9.10)
which is the form required for system design. Rearranging to the form required for
checking existing systems gives:
(9.11)
9.3.2.2 Graphical representation
It will be seen from these models that a total of five variables are involved and so it is
not possible to represent them diagrammatically on a single graph. By neglecting the
influence of temperature at this stage the models can be reduced to four variables, and
so if particular values of volumetric flow rate are chosen, the influence of the remain-
ing three variables can be shown. This is presented for four values of volumetric flow
rate in Figures 9.6–9.9, the volumetric flow rates being referred to ambient conditions
of temperature and pressure.
These are all graphs of conveying air velocity drawn against air pressure, with pipe
bore plotted as the family of curves. The reason for this is that both conveying air
CTV
d p 0.448 m/s� � 1 0
21
˙
˙ /Vp d C
T01
2
1
2.23 m s3� �
˙˙
Vp V
T01 1
1
2.843 � �
AIR FLOW RATE EVALUATION 193
�0.5 0.5
Con
veyi
ng a
ir ve
loci
ty (
m/s
)
Air pressure (bar gauge)
200150125
100
75
0 1 2 3
40
30
20
10
0
Pipelinebore (mm)
250300�ve�ve
Figure 9.6 The influence of air pressure and pipe bore on conveying air velocity for a free
air flow rate of 40 m3/min.
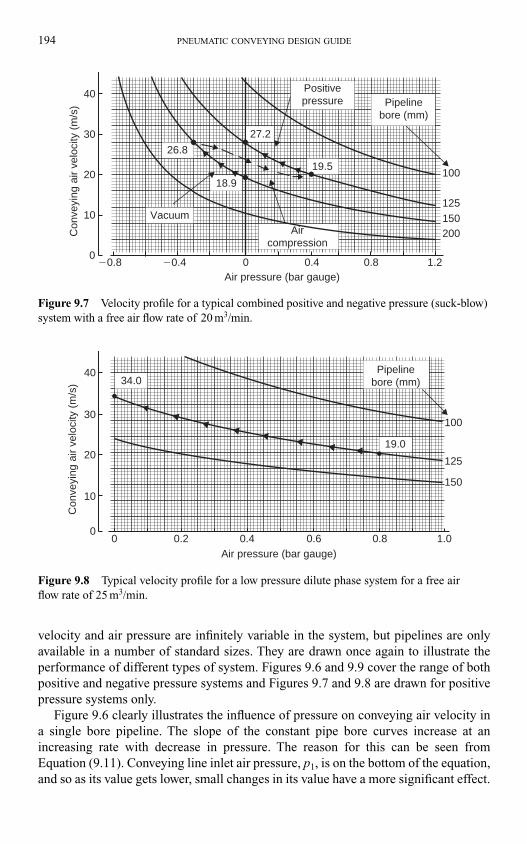
velocity and air pressure are infinitely variable in the system, but pipelines are only
available in a number of standard sizes. They are drawn once again to illustrate the
performance of different types of system. Figures 9.6 and 9.9 cover the range of both
positive and negative pressure systems and Figures 9.7 and 9.8 are drawn for positive
pressure systems only.
Figure 9.6 clearly illustrates the influence of pressure on conveying air velocity in
a single bore pipeline. The slope of the constant pipe bore curves increase at an
increasing rate with decrease in pressure. The reason for this can be seen from
Equation (9.11). Conveying line inlet air pressure, p1, is on the bottom of the equation,
and so as its value gets lower, small changes in its value have a more significant effect.
194 PNEUMATIC CONVEYING DESIGN GUIDE
19.5
0
10
20
30
40
�0.8 �0.4 0.4 0.8 1.20Air pressure (bar gauge)
Positivepressure Pipeline
bore (mm)
Vacuum
Con
veyi
ng a
ir ve
loci
ty (
m/s
)
26.8
27.2
18.9100
125150200Air
compression
Figure 9.7 Velocity profile for a typical combined positive and negative pressure (suck-blow)
system with a free air flow rate of 20 m3/min.
Air pressure (bar gauge)
00 0.2 0.4 0.6 0.8 1.0
100
125
150
19.0
34.0Pipeline
bore (mm)
Con
veyi
ng a
ir ve
loci
ty (
m/s
)
40
30
20
10
Figure 9.8 Typical velocity profile for a low pressure dilute phase system for a free air
flow rate of 25 m3/min.
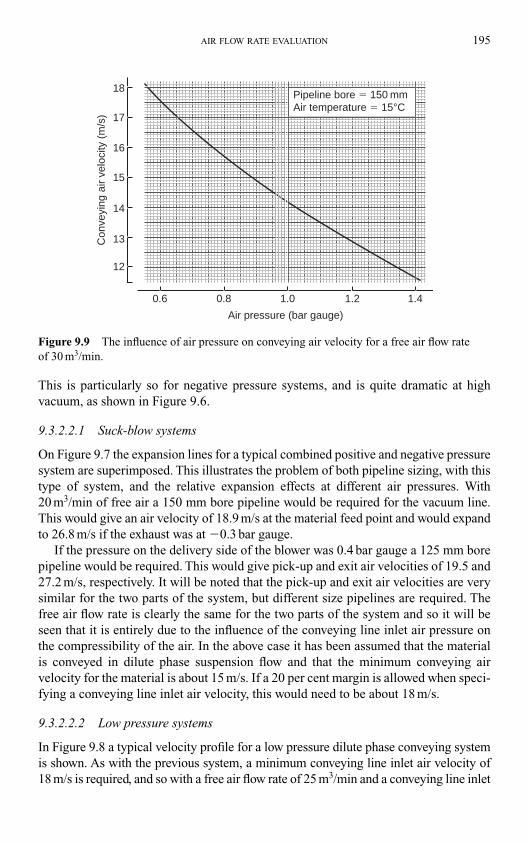
This is particularly so for negative pressure systems, and is quite dramatic at high
vacuum, as shown in Figure 9.6.
9.3.2.2.1 Suck-blow systems
On Figure 9.7 the expansion lines for a typical combined positive and negative pressure
system are superimposed. This illustrates the problem of both pipeline sizing, with this
type of system, and the relative expansion effects at different air pressures. With
20 m3/min of free air a 150 mm bore pipeline would be required for the vacuum line.
This would give an air velocity of 18.9 m/s at the material feed point and would expand
to 26.8 m/s if the exhaust was at �0.3 bar gauge.
If the pressure on the delivery side of the blower was 0.4 bar gauge a 125 mm bore
pipeline would be required. This would give pick-up and exit air velocities of 19.5 and
27.2 m/s, respectively. It will be noted that the pick-up and exit air velocities are very
similar for the two parts of the system, but different size pipelines are required. The
free air flow rate is clearly the same for the two parts of the system and so it will be
seen that it is entirely due to the influence of the conveying line inlet air pressure on
the compressibility of the air. In the above case it has been assumed that the material
is conveyed in dilute phase suspension flow and that the minimum conveying air
velocity for the material is about 15 m/s. If a 20 per cent margin is allowed when speci-
fying a conveying line inlet air velocity, this would need to be about 18 m/s.
9.3.2.2.2 Low pressure systems
In Figure 9.8 a typical velocity profile for a low pressure dilute phase conveying system
is shown. As with the previous system, a minimum conveying line inlet air velocity of
18 m/s is required, and so with a free air flow rate of 25 m3/min and a conveying line inlet
AIR FLOW RATE EVALUATION 195
17
18
16
15
14
13
12
0.6 0.8 1.0 1.2 1.4
Air pressure (bar gauge)
Pipeline bore � 150 mmAir temperature � 15°C
Con
veyi
ng a
ir ve
loci
ty (
m/s
)
Figure 9.9 The influence of air pressure on conveying air velocity for a free air flow rate
of 30 m3/min.
air pressure of 0.8 bar gauge, a 125 mm bore pipeline would be required. The resulting
conveying line inlet air velocity is about 19 m/s, and it will be seen that the air velocity
gradually increases along the length of the pipeline as the air pressure decreases. At the
end of the pipeline the conveying line exit air velocity will be about 34 m/s.
The above is simply an example to illustrate the variation in conveying air velocity
from feed point to material discharge in a pipeline. For the design of a conveying
system Equation (9.10) would be used to evaluate the free air requirements.
For a 125 mm bore pipeline, and with a conveying line inlet air pressure of 0.8 bar
gauge (181.3 kN/m2 absolute) and a conveying line inlet air velocity of 18 m/s, this
would come to 0.395 m3/s or 23.7 m3/min. If the influence of pressure was not taken
into account, and the volumetric flow rate was evaluated on the basis of an air velocity
of 18 m/s, effectively at the end of the pipeline, the conveying line inlet air velocity that
would result at a pressure of 0.8 bar gauge would be about 10 m/s, and the pipeline
would almost certainly block.
The influence of air pressure on conveying air velocity is illustrated further with
Figure 9.9. This is a graph of conveying air velocity plotted against air pressure, and
is drawn for a free air flow rate of 30 m3/min in a 150 mm bore pipeline. During the
operation of a pneumatic conveying system the conveying line inlet air pressure may
vary slightly, particularly if there are variations in the feed rate of the material into the
pipeline. If the feed rate increases for a short period by 10 per cent, the conveying line
inlet air pressure will also have to increase by about 10 per cent in order to meet
the increase in demand.
If the minimum conveying air velocity for the material was 15 m/s and it was being
conveyed with a conveying line inlet air pressure of 0.8 bar gauge, an increase in pres-
sure to only 1.0 bar gauge would probably be sufficient to result in a pipeline blockage.
At low air pressures conveying air velocity is very sensitive to changes in air pressure
and so due consideration must be given to this when deciding upon a safety margin for
conveying line inlet air velocity, and hence the volumetric flow rate of free air, to be
specified for the system.
9.4 Stepped pipeline systems
Figures 9.6–9.8 show quite clearly the nature of the problem of single bore pipeline
conveying, with respect to air expansion and hence conveying air velocities, particu-
larly where high pressures or vacuums are employed. For both long distance, and
dense phase conveying, it is generally necessary to have a fairly high air pressure at
the start of the conveying line. As the pressure of the conveying air decreases along the
length of the line, its density decreases, with a corresponding increase in velocity, as
illustrated above. A simple means of limiting the very high velocities that can occur
towards the end of a pipeline is to step the pipeline to a larger bore once or twice along
its length. By this means it will be possible to keep the conveying air velocity within
reasonable limits.
The ultimate solution, of course, is to use a tapered pipeline, for in this the convey-
ing air velocity could remain constant along the entire length of the pipeline. This,
however, is neither practical nor possible, but it does provide the basis for a model of
196 PNEUMATIC CONVEYING DESIGN GUIDE
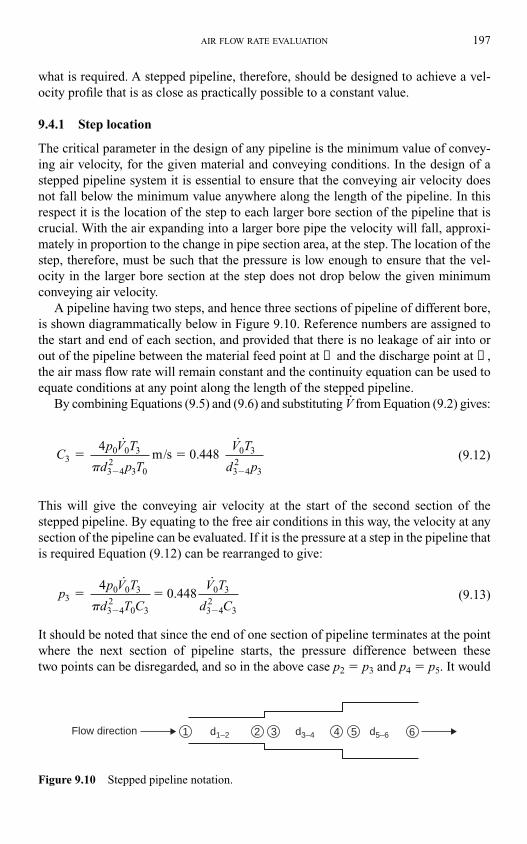
what is required. A stepped pipeline, therefore, should be designed to achieve a vel-
ocity profile that is as close as practically possible to a constant value.
9.4.1 Step location
The critical parameter in the design of any pipeline is the minimum value of convey-
ing air velocity, for the given material and conveying conditions. In the design of a
stepped pipeline system it is essential to ensure that the conveying air velocity does
not fall below the minimum value anywhere along the length of the pipeline. In this
respect it is the location of the step to each larger bore section of the pipeline that is
crucial. With the air expanding into a larger bore pipe the velocity will fall, approxi-
mately in proportion to the change in pipe section area, at the step. The location of the
step, therefore, must be such that the pressure is low enough to ensure that the vel-
ocity in the larger bore section at the step does not drop below the given minimum
conveying air velocity.
A pipeline having two steps, and hence three sections of pipeline of different bore,
is shown diagrammatically below in Figure 9.10. Reference numbers are assigned to
the start and end of each section, and provided that there is no leakage of air into or
out of the pipeline between the material feed point at ① and the discharge point at ➅,the air mass flow rate will remain constant and the continuity equation can be used to
equate conditions at any point along the length of the stepped pipeline.
By combining Equations (9.5) and (9.6) and substituting V� from Equation (9.2) gives:
(9.12)
This will give the conveying air velocity at the start of the second section of the
stepped pipeline. By equating to the free air conditions in this way, the velocity at any
section of the pipeline can be evaluated. If it is the pressure at a step in the pipeline that
is required Equation (9.12) can be rearranged to give:
(9.13)
It should be noted that since the end of one section of pipeline terminates at the point
where the next section of pipeline starts, the pressure difference between these
two points can be disregarded, and so in the above case p2 � p3 and p4 � p5. It would
pp V T
d T C
V T
d C3
0 3
32
0 3
0 3
32
3
4
0.4480
4 4
� �� �
˙ ˙
�
Cp V T
d p T
V T
d p3
0 0 3
32
3
0
3
4
m/s 0.448
4 0
3
3 42
� �� �
˙ ˙
�
AIR FLOW RATE EVALUATION 197
Flow direction 1 d1–2 d3–4 d5–62 3 4 5 6
Figure 9.10 Stepped pipeline notation.
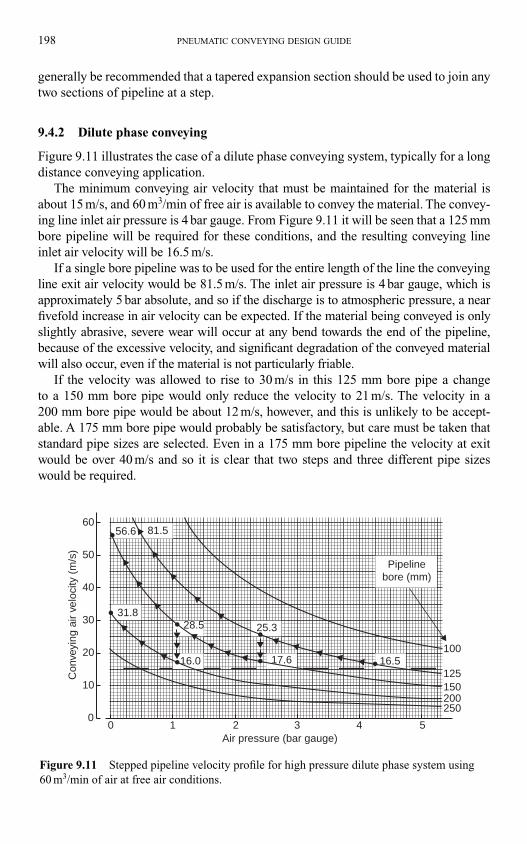
generally be recommended that a tapered expansion section should be used to join any
two sections of pipeline at a step.
9.4.2 Dilute phase conveying
Figure 9.11 illustrates the case of a dilute phase conveying system, typically for a long
distance conveying application.
The minimum conveying air velocity that must be maintained for the material is
about 15 m/s, and 60 m3/min of free air is available to convey the material. The convey-
ing line inlet air pressure is 4 bar gauge. From Figure 9.11 it will be seen that a 125 mm
bore pipeline will be required for these conditions, and the resulting conveying line
inlet air velocity will be 16.5 m/s.
If a single bore pipeline was to be used for the entire length of the line the conveying
line exit air velocity would be 81.5 m/s. The inlet air pressure is 4 bar gauge, which is
approximately 5 bar absolute, and so if the discharge is to atmospheric pressure, a near
fivefold increase in air velocity can be expected. If the material being conveyed is only
slightly abrasive, severe wear will occur at any bend towards the end of the pipeline,
because of the excessive velocity, and significant degradation of the conveyed material
will also occur, even if the material is not particularly friable.
If the velocity was allowed to rise to 30 m/s in this 125 mm bore pipe a change
to a 150 mm bore pipe would only reduce the velocity to 21 m/s. The velocity in a
200 mm bore pipe would be about 12 m/s, however, and this is unlikely to be accept-
able. A 175 mm bore pipe would probably be satisfactory, but care must be taken that
standard pipe sizes are selected. Even in a 175 mm bore pipeline the velocity at exit
would be over 40 m/s and so it is clear that two steps and three different pipe sizes
would be required.
198 PNEUMATIC CONVEYING DESIGN GUIDE
60
50
40
30
20
10
00 1 2 3 4 5
100
125150200250
Air pressure (bar gauge)
Con
veyi
ng a
ir ve
loci
ty (
m/s
)
31.828.5 25.3
17.6 16.516.0
56.6 81.5
Pipelinebore (mm)
Figure 9.11 Stepped pipeline velocity profile for high pressure dilute phase system using
60 m3/min of air at free air conditions.
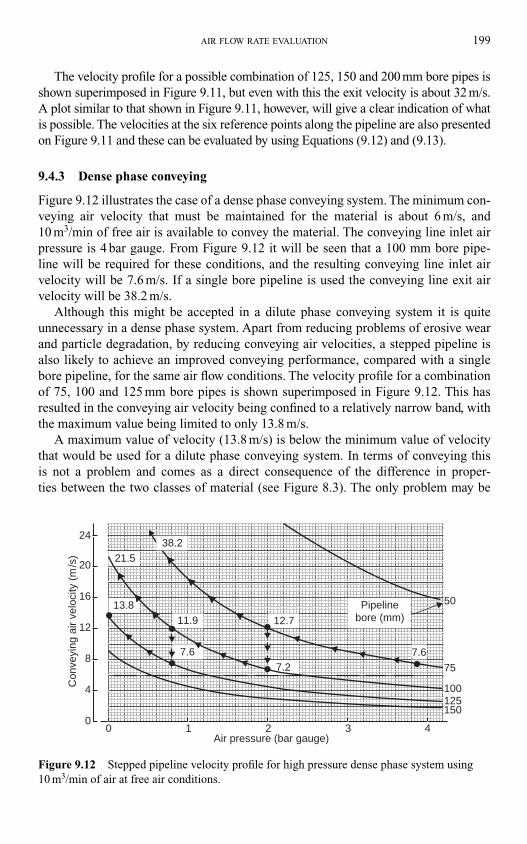
The velocity profile for a possible combination of 125, 150 and 200 mm bore pipes is
shown superimposed in Figure 9.11, but even with this the exit velocity is about 32 m/s.
A plot similar to that shown in Figure 9.11, however, will give a clear indication of what
is possible. The velocities at the six reference points along the pipeline are also presented
on Figure 9.11 and these can be evaluated by using Equations (9.12) and (9.13).
9.4.3 Dense phase conveying
Figure 9.12 illustrates the case of a dense phase conveying system. The minimum con-
veying air velocity that must be maintained for the material is about 6 m/s, and
10 m3/min of free air is available to convey the material. The conveying line inlet air
pressure is 4 bar gauge. From Figure 9.12 it will be seen that a 100 mm bore pipe-
line will be required for these conditions, and the resulting conveying line inlet air
velocity will be 7.6 m/s. If a single bore pipeline is used the conveying line exit air
velocity will be 38.2 m/s.
Although this might be accepted in a dilute phase conveying system it is quite
unnecessary in a dense phase system. Apart from reducing problems of erosive wear
and particle degradation, by reducing conveying air velocities, a stepped pipeline is
also likely to achieve an improved conveying performance, compared with a single
bore pipeline, for the same air flow conditions. The velocity profile for a combination
of 75, 100 and 125 mm bore pipes is shown superimposed in Figure 9.12. This has
resulted in the conveying air velocity being confined to a relatively narrow band, with
the maximum value being limited to only 13.8 m/s.
A maximum value of velocity (13.8 m/s) is below the minimum value of velocity
that would be used for a dilute phase conveying system. In terms of conveying this
is not a problem and comes as a direct consequence of the difference in proper-
ties between the two classes of material (see Figure 8.3). The only problem may be
AIR FLOW RATE EVALUATION 199
20
24
21.538.2
13.811.9
7.27.6
75
50
100125150
7.6
16
12
8
4
00 1 2 3 4
Air pressure (bar gauge)
Con
veyi
ng a
ir ve
loci
ty (
m/s
)
Pipelinebore (mm)12.7
Figure 9.12 Stepped pipeline velocity profile for high pressure dense phase system using
10 m3/min of air at free air conditions.
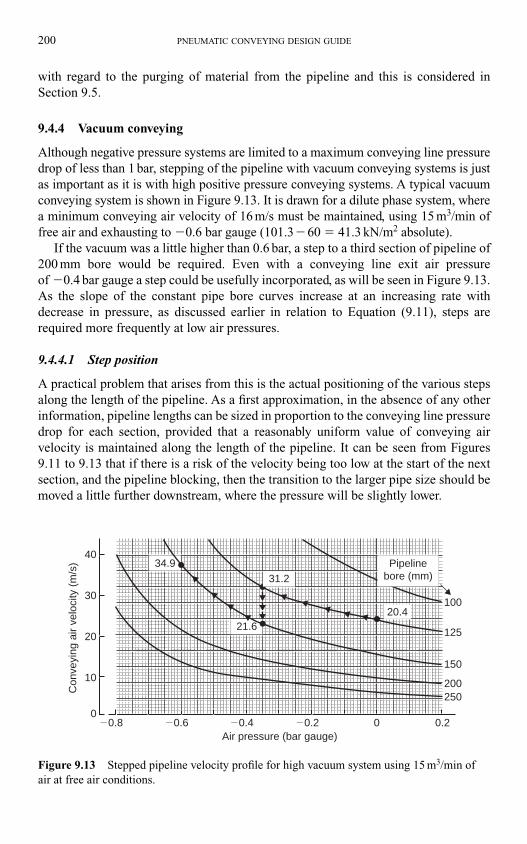
with regard to the purging of material from the pipeline and this is considered in
Section 9.5.
9.4.4 Vacuum conveying
Although negative pressure systems are limited to a maximum conveying line pressure
drop of less than 1 bar, stepping of the pipeline with vacuum conveying systems is just
as important as it is with high positive pressure conveying systems. A typical vacuum
conveying system is shown in Figure 9.13. It is drawn for a dilute phase system, where
a minimum conveying air velocity of 16 m/s must be maintained, using 15 m3/min of
free air and exhausting to �0.6 bar gauge (101.3�60 � 41.3 kN/m2 absolute).
If the vacuum was a little higher than 0.6 bar, a step to a third section of pipeline of
200 mm bore would be required. Even with a conveying line exit air pressure
of �0.4 bar gauge a step could be usefully incorporated, as will be seen in Figure 9.13.
As the slope of the constant pipe bore curves increase at an increasing rate with
decrease in pressure, as discussed earlier in relation to Equation (9.11), steps are
required more frequently at low air pressures.
9.4.4.1 Step position
A practical problem that arises from this is the actual positioning of the various steps
along the length of the pipeline. As a first approximation, in the absence of any other
information, pipeline lengths can be sized in proportion to the conveying line pressure
drop for each section, provided that a reasonably uniform value of conveying air
velocity is maintained along the length of the pipeline. It can be seen from Figures
9.11 to 9.13 that if there is a risk of the velocity being too low at the start of the next
section, and the pipeline blocking, then the transition to the larger pipe size should be
moved a little further downstream, where the pressure will be slightly lower.
200 PNEUMATIC CONVEYING DESIGN GUIDE
Con
veyi
ng a
ir ve
loci
ty (
m/s
)
Air pressure (bar gauge)
40
30
20
10
00.20�0.8 �0.6 �0.4 �0.2
100
125
150
200250
Pipelinebore (mm)31.2
21.6
34.9
20.4
Figure 9.13 Stepped pipeline velocity profile for high vacuum system using 15 m3/min of
air at free air conditions.
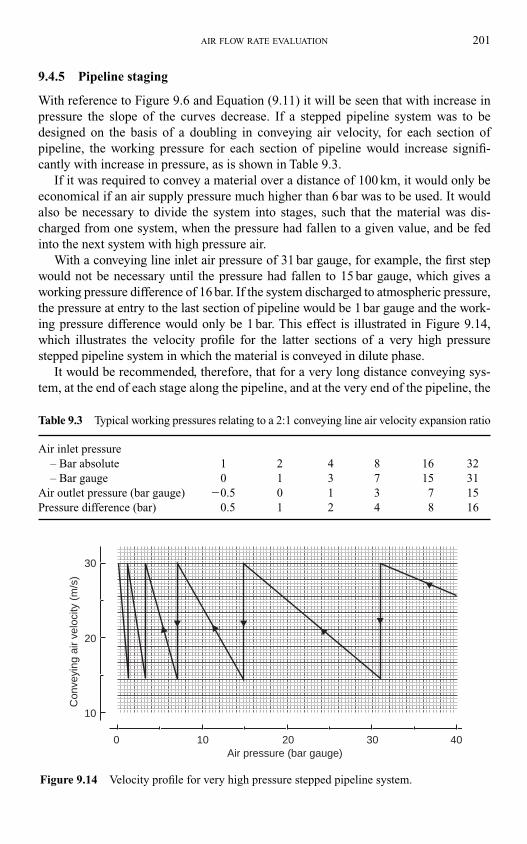
9.4.5 Pipeline staging
With reference to Figure 9.6 and Equation (9.11) it will be seen that with increase in
pressure the slope of the curves decrease. If a stepped pipeline system was to be
designed on the basis of a doubling in conveying air velocity, for each section of
pipeline, the working pressure for each section of pipeline would increase signifi-
cantly with increase in pressure, as is shown in Table 9.3.
If it was required to convey a material over a distance of 100 km, it would only be
economical if an air supply pressure much higher than 6 bar was to be used. It would
also be necessary to divide the system into stages, such that the material was dis-
charged from one system, when the pressure had fallen to a given value, and be fed
into the next system with high pressure air.
With a conveying line inlet air pressure of 31 bar gauge, for example, the first step
would not be necessary until the pressure had fallen to 15 bar gauge, which gives a
working pressure difference of 16 bar. If the system discharged to atmospheric pressure,
the pressure at entry to the last section of pipeline would be 1 bar gauge and the work-
ing pressure difference would only be 1 bar. This effect is illustrated in Figure 9.14,
which illustrates the velocity profile for the latter sections of a very high pressure
stepped pipeline system in which the material is conveyed in dilute phase.
It would be recommended, therefore, that for a very long distance conveying sys-
tem, at the end of each stage along the pipeline, and at the very end of the pipeline, the
AIR FLOW RATE EVALUATION 201
Table 9.3 Typical working pressures relating to a 2:1 conveying line air velocity expansion ratio
Air inlet pressure
– Bar absolute 1 2 4 8 16 32
– Bar gauge 0 1 3 7 15 31
Air outlet pressure (bar gauge) �0.5 0 1 3 7 15
Pressure difference (bar) 0.5 1 2 4 8 16
Air pressure (bar gauge)
30
30 40
20
20
10
100
Con
veyi
ng a
ir ve
loci
ty (
m/s
)
Figure 9.14 Velocity profile for very high pressure stepped pipeline system.
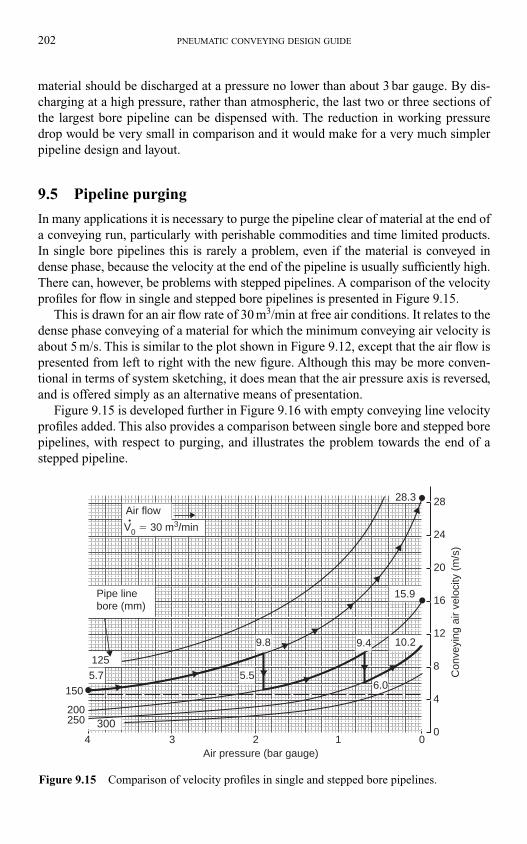
material should be discharged at a pressure no lower than about 3 bar gauge. By dis-
charging at a high pressure, rather than atmospheric, the last two or three sections of
the largest bore pipeline can be dispensed with. The reduction in working pressure
drop would be very small in comparison and it would make for a very much simpler
pipeline design and layout.
9.5 Pipeline purging
In many applications it is necessary to purge the pipeline clear of material at the end of
a conveying run, particularly with perishable commodities and time limited products.
In single bore pipelines this is rarely a problem, even if the material is conveyed in
dense phase, because the velocity at the end of the pipeline is usually sufficiently high.
There can, however, be problems with stepped pipelines. A comparison of the velocity
profiles for flow in single and stepped bore pipelines is presented in Figure 9.15.
This is drawn for an air flow rate of 30 m3/min at free air conditions. It relates to the
dense phase conveying of a material for which the minimum conveying air velocity is
about 5 m/s. This is similar to the plot shown in Figure 9.12, except that the air flow is
presented from left to right with the new figure. Although this may be more conven-
tional in terms of system sketching, it does mean that the air pressure axis is reversed,
and is offered simply as an alternative means of presentation.
Figure 9.15 is developed further in Figure 9.16 with empty conveying line velocity
profiles added. This also provides a comparison between single bore and stepped bore
pipelines, with respect to purging, and illustrates the problem towards the end of a
stepped pipeline.
202 PNEUMATIC CONVEYING DESIGN GUIDE
00
4
8
12
16
20
24
28
123
200
150
250
Air pressure (bar gauge)4
Con
veyi
ng a
ir ve
loci
ty (
m/s
)
300
28.3
15.9
10.2
6.0
9.49.8
5.55.7
125
Pipe linebore (mm)
Air flow
V0 � 30 m3/min
Figure 9.15 Comparison of velocity profiles in single and stepped bore pipelines.
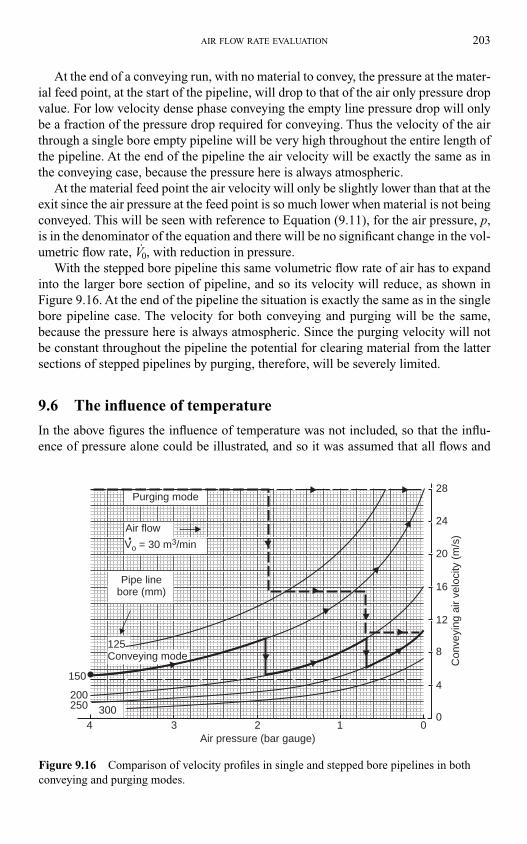
At the end of a conveying run, with no material to convey, the pressure at the mater-
ial feed point, at the start of the pipeline, will drop to that of the air only pressure drop
value. For low velocity dense phase conveying the empty line pressure drop will only
be a fraction of the pressure drop required for conveying. Thus the velocity of the air
through a single bore empty pipeline will be very high throughout the entire length of
the pipeline. At the end of the pipeline the air velocity will be exactly the same as in
the conveying case, because the pressure here is always atmospheric.
At the material feed point the air velocity will only be slightly lower than that at the
exit since the air pressure at the feed point is so much lower when material is not being
conveyed. This will be seen with reference to Equation (9.11), for the air pressure, p,
is in the denominator of the equation and there will be no significant change in the vol-
umetric flow rate, V.0, with reduction in pressure.
With the stepped bore pipeline this same volumetric flow rate of air has to expand
into the larger bore section of pipeline, and so its velocity will reduce, as shown in
Figure 9.16. At the end of the pipeline the situation is exactly the same as in the single
bore pipeline case. The velocity for both conveying and purging will be the same,
because the pressure here is always atmospheric. Since the purging velocity will not
be constant throughout the pipeline the potential for clearing material from the latter
sections of stepped pipelines by purging, therefore, will be severely limited.
9.6 The influence of temperature
In the above figures the influence of temperature was not included, so that the influ-
ence of pressure alone could be illustrated, and so it was assumed that all flows and
AIR FLOW RATE EVALUATION 203
00
4
8
12
16
20
24
28
123
200
150
250
Air pressure (bar gauge)4
Con
veyi
ng a
ir ve
loci
ty (
m/s
)
300
Pipe linebore (mm)
Air flow
Purging mode
Vo = 30 m3/min
125Conveying mode
Figure 9.16 Comparison of velocity profiles in single and stepped bore pipelines in both
conveying and purging modes.
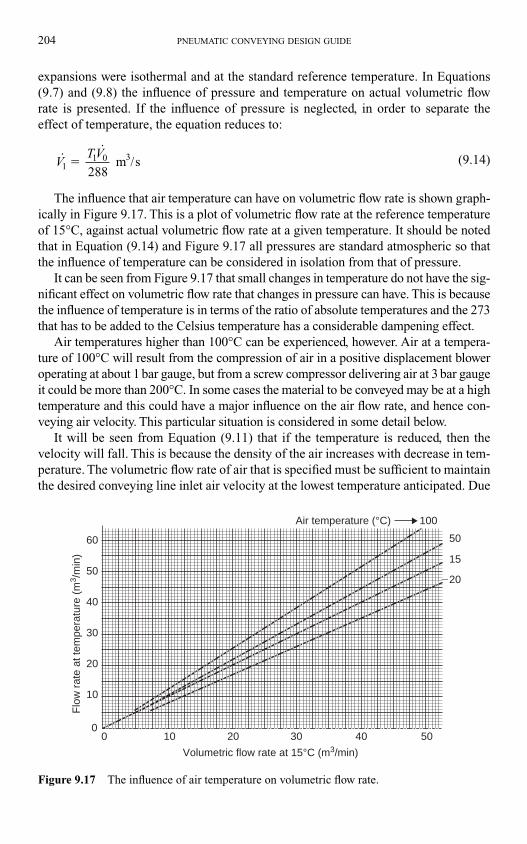
expansions were isothermal and at the standard reference temperature. In Equations
(9.7) and (9.8) the influence of pressure and temperature on actual volumetric flow
rate is presented. If the influence of pressure is neglected, in order to separate the
effect of temperature, the equation reduces to:
(9.14)
The influence that air temperature can have on volumetric flow rate is shown graph-
ically in Figure 9.17. This is a plot of volumetric flow rate at the reference temperature
of 15°C, against actual volumetric flow rate at a given temperature. It should be noted
that in Equation (9.14) and Figure 9.17 all pressures are standard atmospheric so that
the influence of temperature can be considered in isolation from that of pressure.
It can be seen from Figure 9.17 that small changes in temperature do not have the sig-
nificant effect on volumetric flow rate that changes in pressure can have. This is because
the influence of temperature is in terms of the ratio of absolute temperatures and the 273
that has to be added to the Celsius temperature has a considerable dampening effect.
Air temperatures higher than 100°C can be experienced, however. Air at a tempera-
ture of 100°C will result from the compression of air in a positive displacement blower
operating at about 1 bar gauge, but from a screw compressor delivering air at 3 bar gauge
it could be more than 200°C. In some cases the material to be conveyed may be at a high
temperature and this could have a major influence on the air flow rate, and hence con-
veying air velocity. This particular situation is considered in some detail below.
It will be seen from Equation (9.11) that if the temperature is reduced, then the
velocity will fall. This is because the density of the air increases with decrease in tem-
perature. The volumetric flow rate of air that is specified must be sufficient to maintain
the desired conveying line inlet air velocity at the lowest temperature anticipated. Due
˙˙
/VTV
11 0
288 m s
3�
204 PNEUMATIC CONVEYING DESIGN GUIDE
60
50
40
30
20
10
00 10 20 30
Volumetric flow rate at 15°C (m3/min)
Flo
w r
ate
at te
mpe
ratu
re (
m3 /
min
)
40 50
50
15
�20
Air temperature (°C) 100
Figure 9.17 The influence of air temperature on volumetric flow rate.
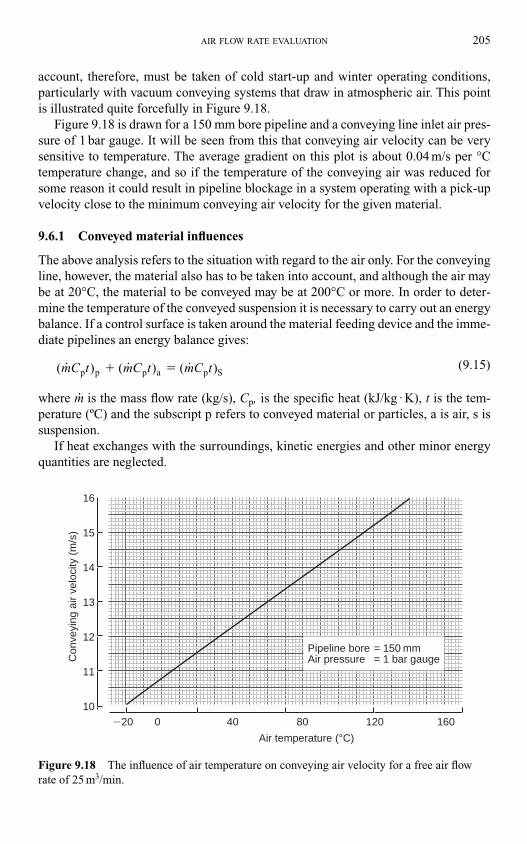
account, therefore, must be taken of cold start-up and winter operating conditions,
particularly with vacuum conveying systems that draw in atmospheric air. This point
is illustrated quite forcefully in Figure 9.18.
Figure 9.18 is drawn for a 150 mm bore pipeline and a conveying line inlet air pres-
sure of 1 bar gauge. It will be seen from this that conveying air velocity can be very
sensitive to temperature. The average gradient on this plot is about 0.04 m/s per °C
temperature change, and so if the temperature of the conveying air was reduced for
some reason it could result in pipeline blockage in a system operating with a pick-up
velocity close to the minimum conveying air velocity for the given material.
9.6.1 Conveyed material influences
The above analysis refers to the situation with regard to the air only. For the conveying
line, however, the material also has to be taken into account, and although the air may
be at 20°C, the material to be conveyed may be at 200°C or more. In order to deter-
mine the temperature of the conveyed suspension it is necessary to carry out an energy
balance. If a control surface is taken around the material feeding device and the imme-
diate pipelines an energy balance gives:
(9.15)
where m� is the mass flow rate (kg/s), Cp, is the specific heat (kJ/kg . K), t is the tem-
perature (ºC) and the subscript p refers to conveyed material or particles, a is air, s is
suspension.
If heat exchanges with the surroundings, kinetic energies and other minor energy
quantities are neglected.
( ˙ ) ˙ ) ˙ )mC t mC t mC tp p p a p S ( (� �
AIR FLOW RATE EVALUATION 205
14
15
16
13
12
11
10�20 400 80 120 160
Con
veyi
ng a
ir ve
loci
ty (
m/s
)
Air temperature (°C)
Pipeline bore = 150 mmAir pressure = 1 bar gauge
Figure 9.18 The influence of air temperature on conveying air velocity for a free air flow
rate of 25 m3/min.
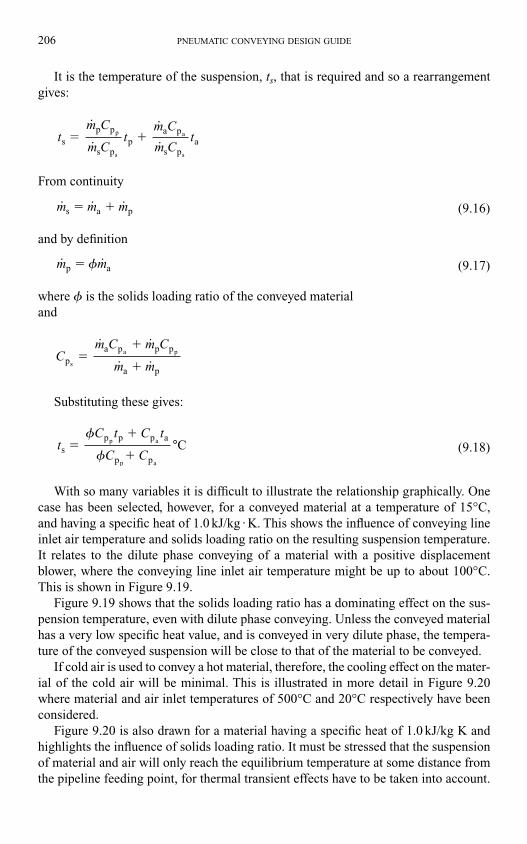
It is the temperature of the suspension, ts, that is required and so a rearrangement
gives:
From continuity
(9.16)
and by definition
(9.17)
where � is the solids loading ratio of the conveyed material
and
Substituting these gives:
(9.18)
With so many variables it is difficult to illustrate the relationship graphically. One
case has been selected, however, for a conveyed material at a temperature of 15°C,
and having a specific heat of 1.0 kJ/kg . K. This shows the influence of conveying line
inlet air temperature and solids loading ratio on the resulting suspension temperature.
It relates to the dilute phase conveying of a material with a positive displacement
blower, where the conveying line inlet air temperature might be up to about 100°C.
This is shown in Figure 9.19.
Figure 9.19 shows that the solids loading ratio has a dominating effect on the sus-
pension temperature, even with dilute phase conveying. Unless the conveyed material
has a very low specific heat value, and is conveyed in very dilute phase, the tempera-
ture of the conveyed suspension will be close to that of the material to be conveyed.
If cold air is used to convey a hot material, therefore, the cooling effect on the mater-
ial of the cold air will be minimal. This is illustrated in more detail in Figure 9.20
where material and air inlet temperatures of 500°C and 20°C respectively have been
considered.
Figure 9.20 is also drawn for a material having a specific heat of 1.0 kJ/kg K and
highlights the influence of solids loading ratio. It must be stressed that the suspension
of material and air will only reach the equilibrium temperature at some distance from
the pipeline feeding point, for thermal transient effects have to be taken into account.
tC t C t
C Cs
p p p a
p p
C
p a
p a
��
�
�
�°
Cm C m C
m mp
a p p p
a ps
a p
�
�
�
˙ ˙
˙ ˙
˙ ˙m mp a � �
˙ ˙ ˙m m ms a p � �
tm C
m Ct
m C
m Cts
p p
s p
p
a p
s p
a p
s
a
s
� �˙
˙
˙
˙
206 PNEUMATIC CONVEYING DESIGN GUIDE
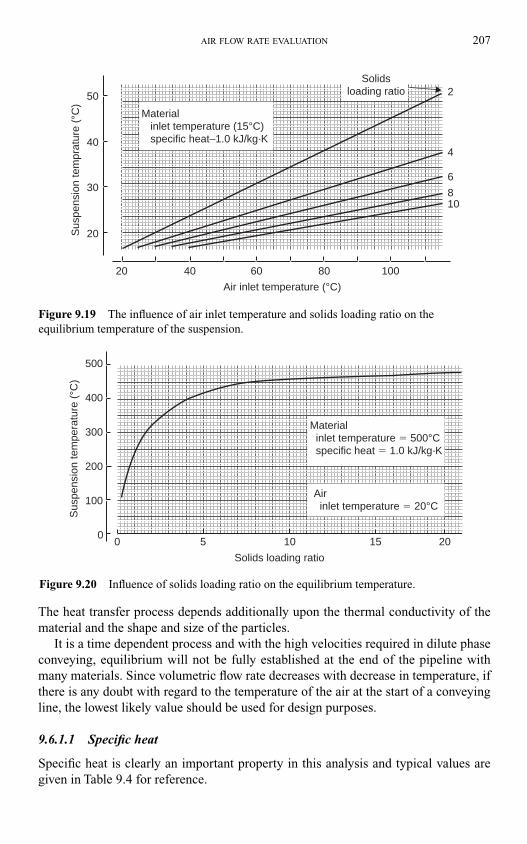
The heat transfer process depends additionally upon the thermal conductivity of the
material and the shape and size of the particles.
It is a time dependent process and with the high velocities required in dilute phase
conveying, equilibrium will not be fully established at the end of the pipeline with
many materials. Since volumetric flow rate decreases with decrease in temperature, if
there is any doubt with regard to the temperature of the air at the start of a conveying
line, the lowest likely value should be used for design purposes.
9.6.1.1 Specific heat
Specific heat is clearly an important property in this analysis and typical values are
given in Table 9.4 for reference.
AIR FLOW RATE EVALUATION 207
Air inlet temperature (°C)
Sus
pens
ion
tem
prat
ure
(°C
)
30
40
50
60 80 100
108
6
4
2
20
20 40
Material inlet temperature (15°C) specific heat–1.0 kJ/kg·K
Solidsloading ratio
Figure 9.19 The influence of air inlet temperature and solids loading ratio on the
equilibrium temperature of the suspension.
00
100
200
300
400
500
5
Solids loading ratio
Sus
pens
ion
tem
pera
ture
(°C
)
10 15 20
Material inlet temperature � 500°C specific heat � 1.0 kJ/kg·K
Air inlet temperature � 20°C
Figure 9.20 Influence of solids loading ratio on the equilibrium temperature.
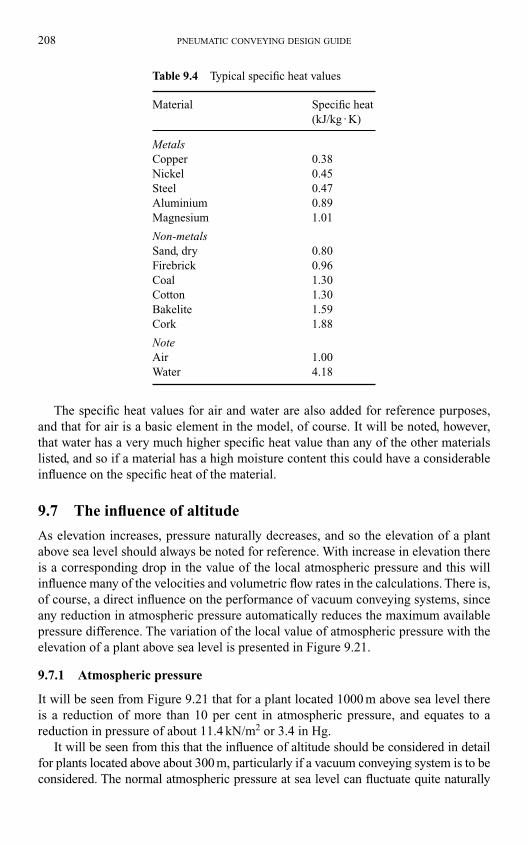
The specific heat values for air and water are also added for reference purposes,
and that for air is a basic element in the model, of course. It will be noted, however,
that water has a very much higher specific heat value than any of the other materials
listed, and so if a material has a high moisture content this could have a considerable
influence on the specific heat of the material.
9.7 The influence of altitude
As elevation increases, pressure naturally decreases, and so the elevation of a plant
above sea level should always be noted for reference. With increase in elevation there
is a corresponding drop in the value of the local atmospheric pressure and this will
influence many of the velocities and volumetric flow rates in the calculations. There is,
of course, a direct influence on the performance of vacuum conveying systems, since
any reduction in atmospheric pressure automatically reduces the maximum available
pressure difference. The variation of the local value of atmospheric pressure with the
elevation of a plant above sea level is presented in Figure 9.21.
9.7.1 Atmospheric pressure
It will be seen from Figure 9.21 that for a plant located 1000 m above sea level there
is a reduction of more than 10 per cent in atmospheric pressure, and equates to a
reduction in pressure of about 11.4 kN/m2 or 3.4 in Hg.
It will be seen from this that the influence of altitude should be considered in detail
for plants located above about 300 m, particularly if a vacuum conveying system is to be
considered. The normal atmospheric pressure at sea level can fluctuate quite naturally
208 PNEUMATIC CONVEYING DESIGN GUIDE
Table 9.4 Typical specific heat values
Material Specific heat
(kJ/kg . K)
MetalsCopper 0.38
Nickel 0.45
Steel 0.47
Aluminium 0.89
Magnesium 1.01
Non-metalsSand, dry 0.80
Firebrick 0.96
Coal 1.30
Cotton 1.30
Bakelite 1.59
Cork 1.88
NoteAir 1.00
Water 4.18
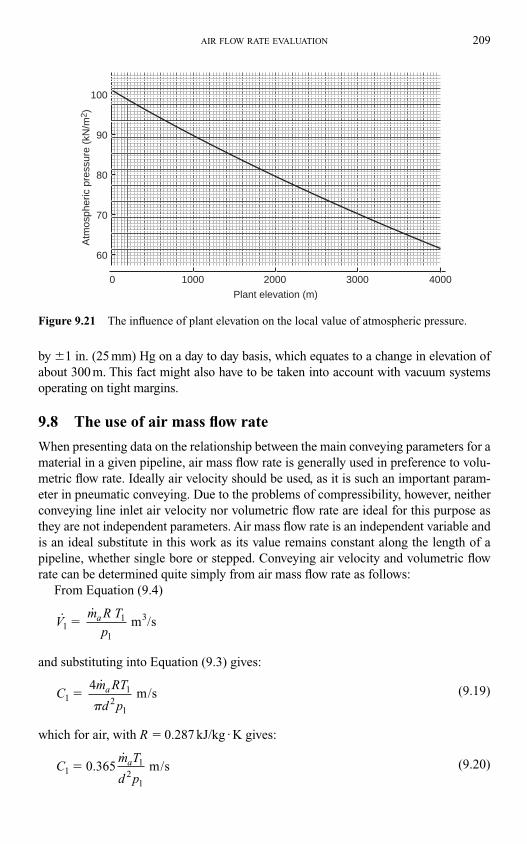
by �1 in. (25 mm) Hg on a day to day basis, which equates to a change in elevation of
about 300 m. This fact might also have to be taken into account with vacuum systems
operating on tight margins.
9.8 The use of air mass flow rate
When presenting data on the relationship between the main conveying parameters for a
material in a given pipeline, air mass flow rate is generally used in preference to volu-
metric flow rate. Ideally air velocity should be used, as it is such an important param-
eter in pneumatic conveying. Due to the problems of compressibility, however, neither
conveying line inlet air velocity nor volumetric flow rate are ideal for this purpose as
they are not independent parameters. Air mass flow rate is an independent variable and
is an ideal substitute in this work as its value remains constant along the length of a
pipeline, whether single bore or stepped. Conveying air velocity and volumetric flow
rate can be determined quite simply from air mass flow rate as follows:
From Equation (9.4)
and substituting into Equation (9.3) gives:
(9.19)
which for air, with R � 0.287 kJ/kg . K gives:
(9.20)Cm T
d pa
11
21
0.365 m/s�˙
Cm RT
d pa
11
21
4
m/s�˙
�
˙ ˙/V
m R T
pa
11
1
m s3�
AIR FLOW RATE EVALUATION 209
100
90
80
70
60
0 1000 2000 3000 4000
Atm
osph
eric
pre
ssur
e (k
N/m
2 )
Plant elevation (m)
Figure 9.21 The influence of plant elevation on the local value of atmospheric pressure.
9.9 Nomenclature
A Pipe section area (m2)
C Velocity (m/s)
Cp Specific heat at constant pressure (kJ/kg.K)
Cv Specific heat at constant volume (kJ/kg.K)
d Pipe bore (m)
m. Mass flow rate (kg/s and tonne/h)
M Molecular weight (–)
p Pressure (N/m2, kN/m2, bar). Note: 1 bar � 100 kN/m2 � 105 N/m2
R Characteristic gas constant (kJ/kg.K)
R0 Universal gas constant (kJ/kg-mol.K) � 8.3143 kJ/kg mol.K
t Actual temperature (°C)
T Absolute temperature � t � 273 (K)
V.
Volumetric flow rate (m3/s and m3/min)
9.9.1 Greek
� Solids loading ratio � m.p/m.a
9.9.2 Subscripts
a Air
p Conveyed material or particles
s Suspension
0 Reference conditions (free air)
p �101.3 kN/m2
t �15°C
1, 2 Actual conditions, usually pipeline inlet and outlet.
210 PNEUMATIC CONVEYING DESIGN GUIDE
10.1 Introduction
Although few reliable or universal models currently exist for predicting the pressure
drop for gas–solid flows in pipelines, models for the single phase flow of a gas are well
established. Although discussion will generally be in terms of air, the models presented
will work equally well with the appropriate value of the specific gas constant for the
particular gas being considered. Gas constants for a range of gases were presented in
Section 9.2.3.2 with Table 9.2.
Empty conveying pipeline pressure drop values, for air only, will provide a useful
datum for both the potential capability of a system for conveying material and the con-
dition of the pipeline (considered in Chapter 20). Air only pressure drop values for the
conveying pipeline also provide a basis for some first approximation design methods
for the pneumatic conveying of materials (see Chapter 18).
Air supply and exhaust or venting pipelines can be of a considerable length with
some systems, whether for positive pressure or vacuum systems, particularly if the air
mover or the filtration plant is remote from the conveying system. In these cases it is
important that the air only pressure drop values in these pipeline sections are evaluated,
rather than just being ignored, for they could represent a large proportion of the avail-
able pressure drop if they are not sized correctly. Air flow control is also important,
particularly if plant air is used for a conveying system, or if the air supply to a system
needs to be proportioned between that delivered to a blow tank and that directed to the
pipeline, for example.
10.2 Pipeline pressure drop
The pressure drop in the empty pipeline is a major consideration in the design of a pneu-
matic conveying system. If a positive displacement blower is used in combination with a
long distance, small bore pipeline, for the suspension flow of a material, for example, it
is quite possible that the entire pressure drop would be utilized in blowing the air through
the pipeline and that no material would be conveyed. The pressure drop for air only in a
pipeline is significantly influenced by the air velocity that is required for the conveying
of the material. Bends and other pipeline features also need to be taken into account.
The value of the empty line pressure drop for any pipeline will provide a useful indi-
cator of the condition of the pipeline. If a pressure gauge is situated in the air supply
Chapter 10
Air only relationships
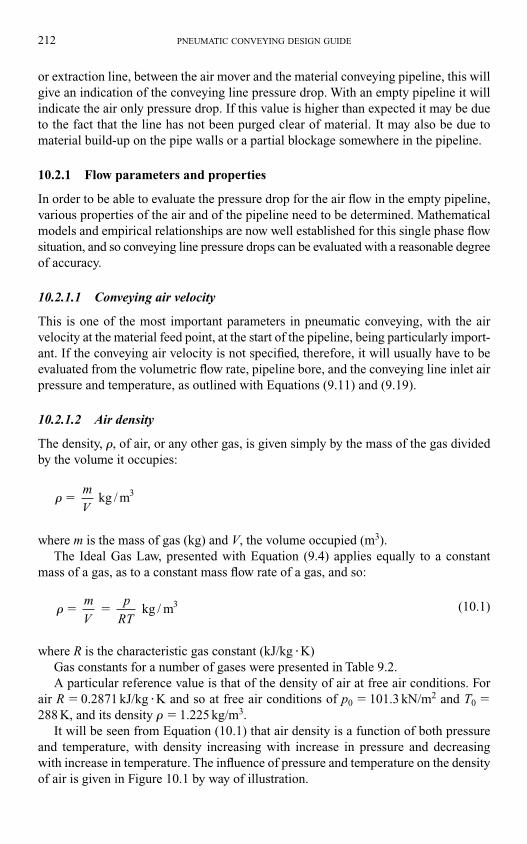
or extraction line, between the air mover and the material conveying pipeline, this will
give an indication of the conveying line pressure drop. With an empty pipeline it will
indicate the air only pressure drop. If this value is higher than expected it may be due
to the fact that the line has not been purged clear of material. It may also be due to
material build-up on the pipe walls or a partial blockage somewhere in the pipeline.
10.2.1 Flow parameters and properties
In order to be able to evaluate the pressure drop for the air flow in the empty pipeline,
various properties of the air and of the pipeline need to be determined. Mathematical
models and empirical relationships are now well established for this single phase flow
situation, and so conveying line pressure drops can be evaluated with a reasonable degree
of accuracy.
10.2.1.1 Conveying air velocity
This is one of the most important parameters in pneumatic conveying, with the air
velocity at the material feed point, at the start of the pipeline, being particularly import-
ant. If the conveying air velocity is not specified, therefore, it will usually have to be
evaluated from the volumetric flow rate, pipeline bore, and the conveying line inlet air
pressure and temperature, as outlined with Equations (9.11) and (9.19).
10.2.1.2 Air density
The density, �, of air, or any other gas, is given simply by the mass of the gas divided
by the volume it occupies:
where m is the mass of gas (kg) and V, the volume occupied (m3).
The Ideal Gas Law, presented with Equation (9.4) applies equally to a constant
mass of a gas, as to a constant mass flow rate of a gas, and so:
(10.1)
where R is the characteristic gas constant (kJ/kg �K)
Gas constants for a number of gases were presented in Table 9.2.
A particular reference value is that of the density of air at free air conditions. For
air R � 0.2871 kJ/kg �K and so at free air conditions of p0 � 101.3 kN/m2 and T0 �288 K, and its density � � 1.225 kg/m3.
It will be seen from Equation (10.1) that air density is a function of both pressure
and temperature, with density increasing with increase in pressure and decreasing
with increase in temperature. The influence of pressure and temperature on the density
of air is given in Figure 10.1 by way of illustration.
� kg / m3� �
m
V
p
RT
� kg / m3�
m
V
212 PNEUMATIC CONVEYING DESIGN GUIDE
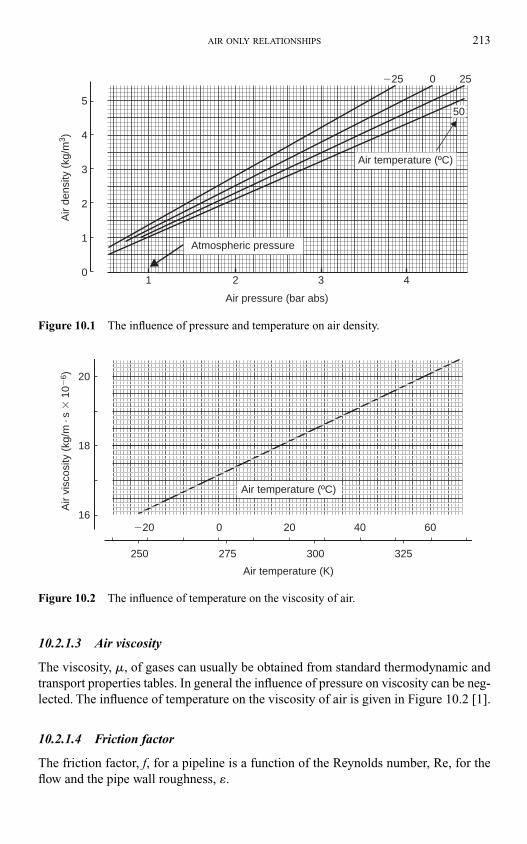
10.2.1.3 Air viscosity
The viscosity, �, of gases can usually be obtained from standard thermodynamic and
transport properties tables. In general the influence of pressure on viscosity can be neg-
lected. The influence of temperature on the viscosity of air is given in Figure 10.2 [1].
10.2.1.4 Friction factor
The friction factor, f, for a pipeline is a function of the Reynolds number, Re, for the
flow and the pipe wall roughness, �.
AIR ONLY RELATIONSHIPS 213
5
4
3
2
2
1
10
3 4
Air pressure (bar abs)
Air
dens
ity (
kg/m
3 )
250�25
Atmospheric pressure
Air temperature (ºC)
50
Figure 10.1 The influence of pressure and temperature on air density.
Air temperature (K)
Air
visc
osity
(kg
/m·s
� 1
0�6 ) 20
18
16
250 275 300 325
6040200�20
Air temperature (ºC)
Figure 10.2 The influence of temperature on the viscosity of air.
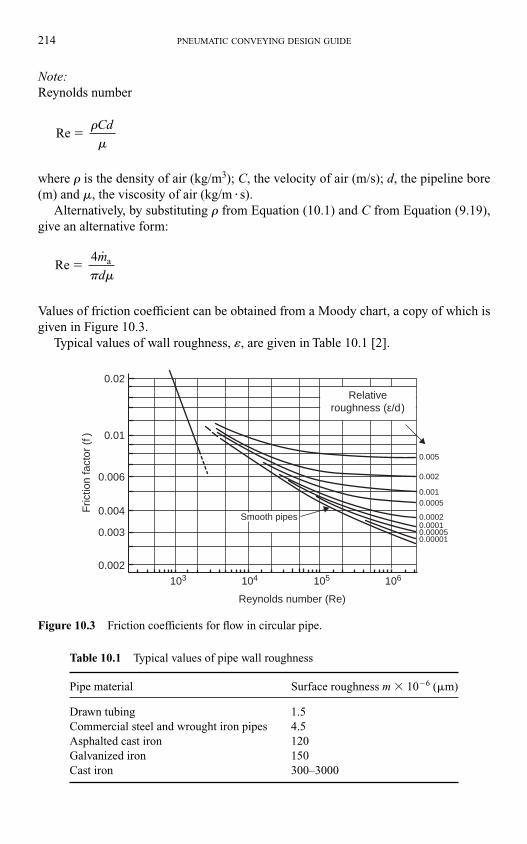
Note:Reynolds number
where � is the density of air (kg/m3); C, the velocity of air (m/s); d, the pipeline bore
(m) and �, the viscosity of air (kg/m �s).
Alternatively, by substituting � from Equation (10.1) and C from Equation (9.19),
give an alternative form:
Values of friction coefficient can be obtained from a Moody chart, a copy of which is
given in Figure 10.3.
Typical values of wall roughness, �, are given in Table 10.1 [2].
Re 4 a�
m
d� �
Re ��
�
Cd
214 PNEUMATIC CONVEYING DESIGN GUIDE
0.02
0.01
0.006
0.004
0.003
0.002
Fric
tion
fact
or (
f)
0.005
0.002
0.0010.0005
0.00020.00010.000050.00001
Smooth pipes
103 104 105
Reynolds number (Re)
106
Relativeroughness (ε/d)
Figure 10.3 Friction coefficients for flow in circular pipe.
Table 10.1 Typical values of pipe wall roughness
Pipe material Surface roughness m � 10�6 (�m)
Drawn tubing 1.5
Commercial steel and wrought iron pipes 4.5
Asphalted cast iron 120
Galvanized iron 150
Cast iron 300–3000
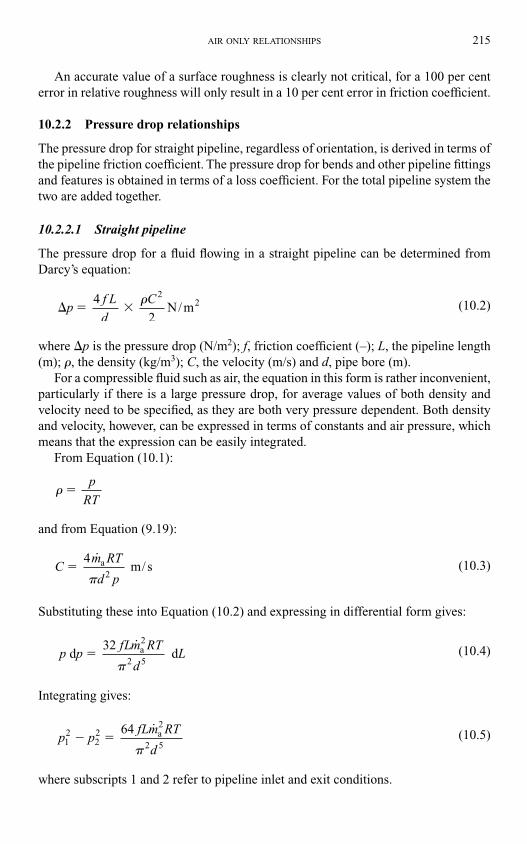
An accurate value of a surface roughness is clearly not critical, for a 100 per cent
error in relative roughness will only result in a 10 per cent error in friction coefficient.
10.2.2 Pressure drop relationships
The pressure drop for straight pipeline, regardless of orientation, is derived in terms of
the pipeline friction coefficient. The pressure drop for bends and other pipeline fittings
and features is obtained in terms of a loss coefficient. For the total pipeline system the
two are added together.
10.2.2.1 Straight pipeline
The pressure drop for a fluid flowing in a straight pipeline can be determined from
Darcy’s equation:
(10.2)
where �p is the pressure drop (N/m2); f, friction coefficient (–); L, the pipeline length
(m); �, the density (kg/m3); C, the velocity (m/s) and d, pipe bore (m).
For a compressible fluid such as air, the equation in this form is rather inconvenient,
particularly if there is a large pressure drop, for average values of both density and
velocity need to be specified, as they are both very pressure dependent. Both density
and velocity, however, can be expressed in terms of constants and air pressure, which
means that the expression can be easily integrated.
From Equation (10.1):
and from Equation (9.19):
(10.3)
Substituting these into Equation (10.2) and expressing in differential form gives:
(10.4)
Integrating gives:
(10.5)
where subscripts 1 and 2 refer to pipeline inlet and exit conditions.
p pfLm RT
d12
22
2
2 5
64
a� �˙
�
p pfLm RT
dL d
32
da�
˙ 2
2 5�
Cm RT
d p
4 m/ sa�
˙
� 2
� �p
RT
� � �pf L
d
C
N/m
24
2
2�
AIR ONLY RELATIONSHIPS 215
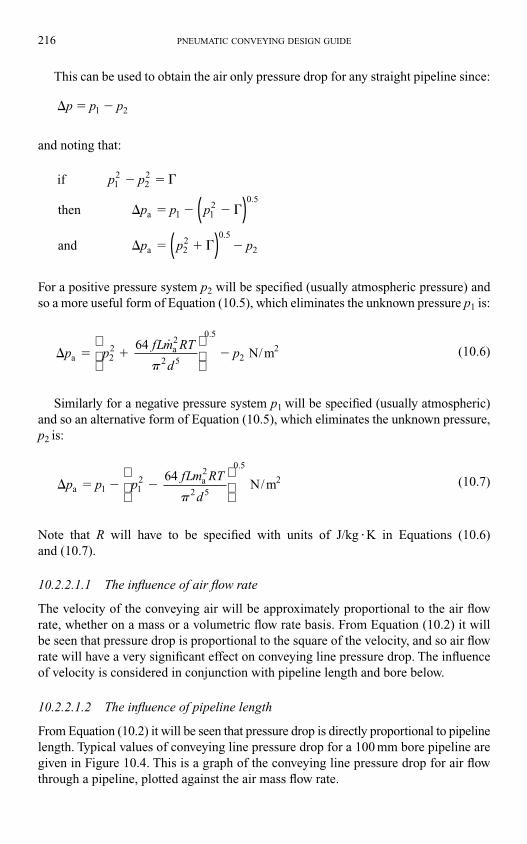
This can be used to obtain the air only pressure drop for any straight pipeline since:
and noting that:
For a positive pressure system p2 will be specified (usually atmospheric pressure) and
so a more useful form of Equation (10.5), which eliminates the unknown pressure p1 is:
(10.6)
Similarly for a negative pressure system p1 will be specified (usually atmospheric)
and so an alternative form of Equation (10.5), which eliminates the unknown pressure,
p2 is:
(10.7)
Note that R will have to be specified with units of J/kg �K in Equations (10.6)
and (10.7).
10.2.2.1.1 The influence of air flow rate
The velocity of the conveying air will be approximately proportional to the air flow
rate, whether on a mass or a volumetric flow rate basis. From Equation (10.2) it will
be seen that pressure drop is proportional to the square of the velocity, and so air flow
rate will have a very significant effect on conveying line pressure drop. The influence
of velocity is considered in conjunction with pipeline length and bore below.
10.2.2.1.2 The influence of pipeline length
From Equation (10.2) it will be seen that pressure drop is directly proportional to pipeline
length. Typical values of conveying line pressure drop for a 100 mm bore pipeline are
given in Figure 10.4. This is a graph of the conveying line pressure drop for air flow
through a pipeline, plotted against the air mass flow rate.
� � � �p p pfLm RT
da
a 2 N/m1 1
22
2 5
0 5
64
�
.
� � �p pfLm RT
dpa
a 2
64 N/m2
22
2 5
0 5
2
˙.
�
if
then
and
a
a2
p p
p p p
p p p
12
22
1 12
0 5
2
0 5
2
� �
� � � �
� � �
( )( )
.
.
� � �p p p 1 2
216 PNEUMATIC CONVEYING DESIGN GUIDE
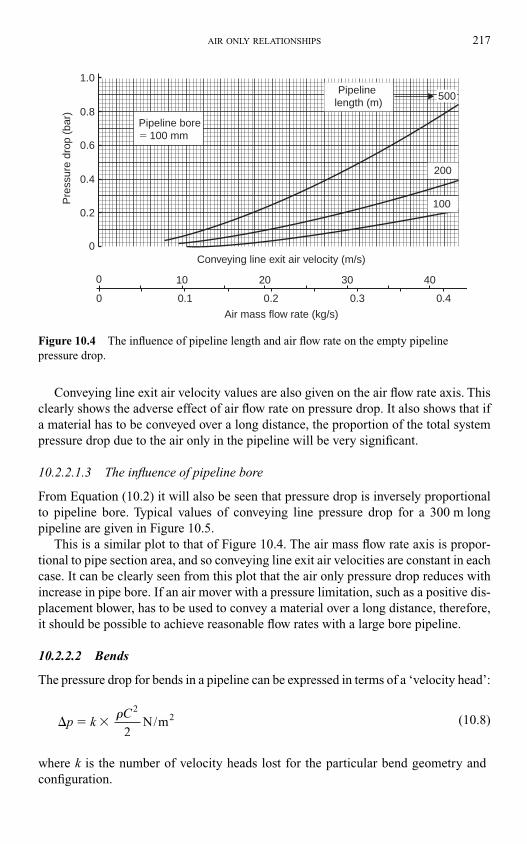
Conveying line exit air velocity values are also given on the air flow rate axis. This
clearly shows the adverse effect of air flow rate on pressure drop. It also shows that if
a material has to be conveyed over a long distance, the proportion of the total system
pressure drop due to the air only in the pipeline will be very significant.
10.2.2.1.3 The influence of pipeline bore
From Equation (10.2) it will also be seen that pressure drop is inversely proportional
to pipeline bore. Typical values of conveying line pressure drop for a 300 m long
pipeline are given in Figure 10.5.
This is a similar plot to that of Figure 10.4. The air mass flow rate axis is propor-
tional to pipe section area, and so conveying line exit air velocities are constant in each
case. It can be clearly seen from this plot that the air only pressure drop reduces with
increase in pipe bore. If an air mover with a pressure limitation, such as a positive dis-
placement blower, has to be used to convey a material over a long distance, therefore,
it should be possible to achieve reasonable flow rates with a large bore pipeline.
10.2.2.2 Bends
The pressure drop for bends in a pipeline can be expressed in terms of a ‘velocity head’:
(10.8)
where k is the number of velocity heads lost for the particular bend geometry and
configuration.
� � �p kC
N/m2� 2
2
AIR ONLY RELATIONSHIPS 217
1.0
0.8
0.6
0.4
0.2
10 20 30 40
0.40.30.20.1
0
0
0
Air mass flow rate (kg/s)
Conveying line exit air velocity (m/s)
Pre
ssur
e dr
op (
bar)
Pipeline bore� 100 mm
Pipeline length (m)
500
200
100
Figure 10.4 The influence of pipeline length and air flow rate on the empty pipeline
pressure drop.
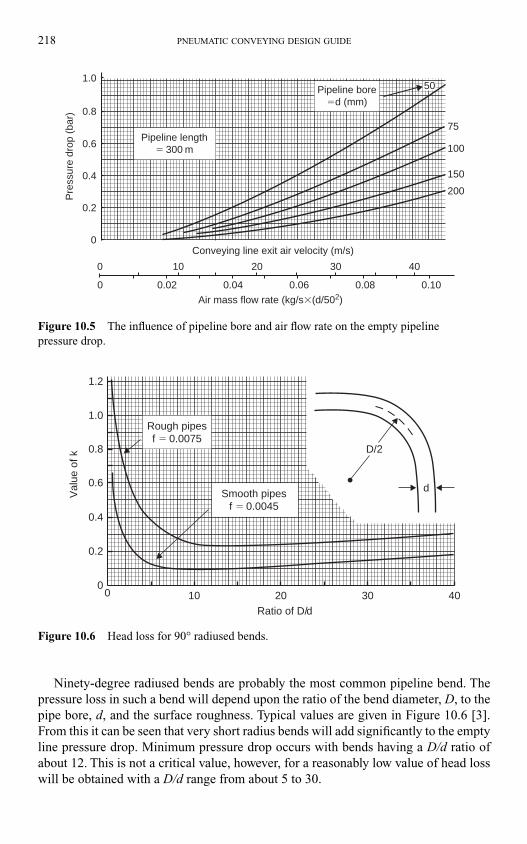
Ninety-degree radiused bends are probably the most common pipeline bend. The
pressure loss in such a bend will depend upon the ratio of the bend diameter, D, to the
pipe bore, d, and the surface roughness. Typical values are given in Figure 10.6 [3].
From this it can be seen that very short radius bends will add significantly to the empty
line pressure drop. Minimum pressure drop occurs with bends having a D/d ratio of
about 12. This is not a critical value, however, for a reasonably low value of head loss
will be obtained with a D/d range from about 5 to 30.
218 PNEUMATIC CONVEYING DESIGN GUIDE
Conveying line exit air velocity (m/s)
Air mass flow rate (kg/s�(d/502)
Pre
ssur
e dr
op (
bar)
0
0
10 20 30 40
0.100.080.060.040.02
1.0
0.8
0.6
0.4
0.2
0
75
100
150
200
Pipeline length� 300 m
Pipeline bore�d (mm)
50
Figure 10.5 The influence of pipeline bore and air flow rate on the empty pipeline
pressure drop.
00
0.2
0.4
0.6
0.8
1.0
1.2
10 20 30 40
D/2
d
Ratio of D/d
Val
ue o
f k
Rough pipesf � 0.0075
Smooth pipesf � 0.0045
Figure 10.6 Head loss for 90° radiused bends.
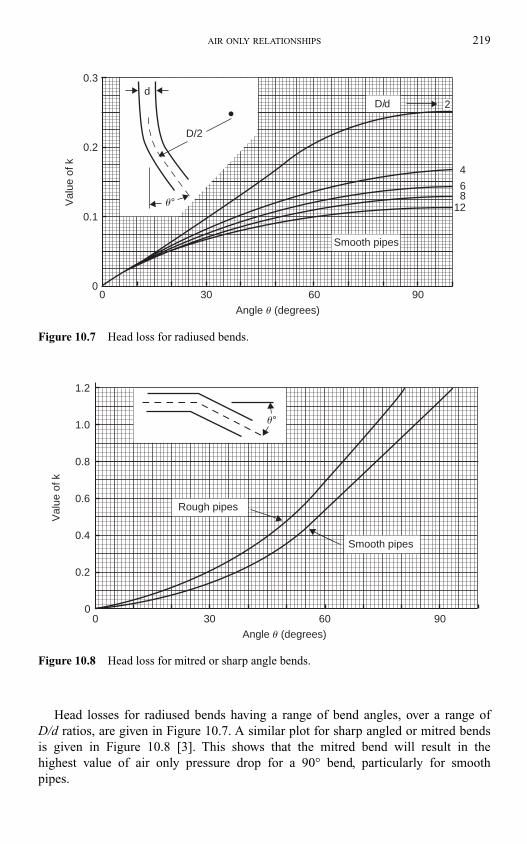
Head losses for radiused bends having a range of bend angles, over a range of
D/d ratios, are given in Figure 10.7. A similar plot for sharp angled or mitred bends
is given in Figure 10.8 [3]. This shows that the mitred bend will result in the
highest value of air only pressure drop for a 90° bend, particularly for smooth
pipes.
AIR ONLY RELATIONSHIPS 219
00
0.1
0.3
0.2
30 60 90
Angle u (degrees)
Val
ue o
f k 4
68
12
D/d 2
Smooth pipes
u°
D/2
d
Figure 10.7 Head loss for radiused bends.
00
0.2
0.4
0.6
0.8
1.0
1.2
30 60 90
Angle u (degrees)
Val
ue o
f k
u°
Smooth pipes
Rough pipes
Figure 10.8 Head loss for mitred or sharp angle bends.
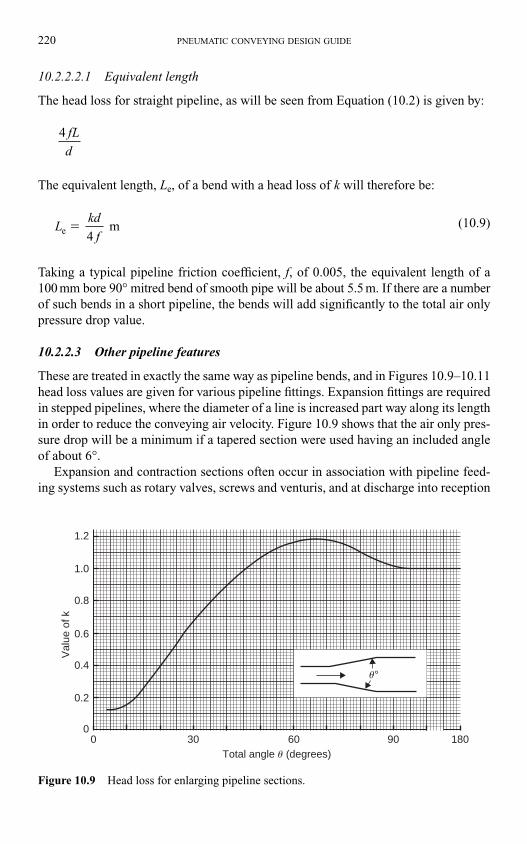
10.2.2.2.1 Equivalent length
The head loss for straight pipeline, as will be seen from Equation (10.2) is given by:
The equivalent length, Le, of a bend with a head loss of k will therefore be:
(10.9)
Taking a typical pipeline friction coefficient, f, of 0.005, the equivalent length of a
100 mm bore 90° mitred bend of smooth pipe will be about 5.5 m. If there are a number
of such bends in a short pipeline, the bends will add significantly to the total air only
pressure drop value.
10.2.2.3 Other pipeline features
These are treated in exactly the same way as pipeline bends, and in Figures 10.9–10.11
head loss values are given for various pipeline fittings. Expansion fittings are required
in stepped pipelines, where the diameter of a line is increased part way along its length
in order to reduce the conveying air velocity. Figure 10.9 shows that the air only pres-
sure drop will be a minimum if a tapered section were used having an included angle
of about 6°.
Expansion and contraction sections often occur in association with pipeline feed-
ing systems such as rotary valves, screws and venturis, and at discharge into reception
Lkd
fe m�4
4 fL
d
220 PNEUMATIC CONVEYING DESIGN GUIDE
Total angle u (degrees)
Val
ue o
f k
00
0.2
0.4
0.6
0.8
1.0
1.2
30 60 90 180
u°
Figure 10.9 Head loss for enlarging pipeline sections.
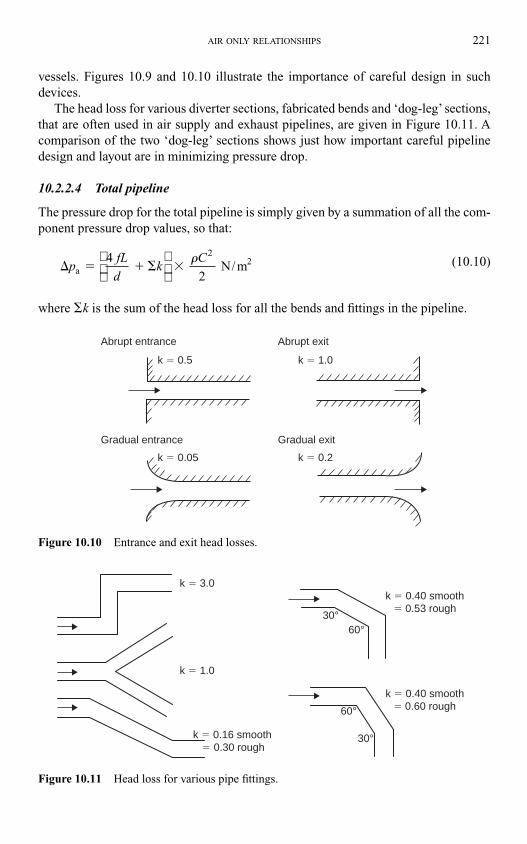
vessels. Figures 10.9 and 10.10 illustrate the importance of careful design in such
devices.
The head loss for various diverter sections, fabricated bends and ‘dog-leg’ sections,
that are often used in air supply and exhaust pipelines, are given in Figure 10.11. A
comparison of the two ‘dog-leg’ sections shows just how important careful pipeline
design and layout are in minimizing pressure drop.
10.2.2.4 Total pipeline
The pressure drop for the total pipeline is simply given by a summation of all the com-
ponent pressure drop values, so that:
(10.10)
where �k is the sum of the head loss for all the bends and fittings in the pipeline.
� � � �pfL
dk
Ca
2
4 N/m
� 2
2
AIR ONLY RELATIONSHIPS 221
Gradual entrance
Abrupt entrance
k � 0.5
k � 0.05 k � 0.2
k � 1.0
Abrupt exit
Gradual exit
Figure 10.10 Entrance and exit head losses.
k � 3.0
k � 1.0
30°60°
30°
60°
k � 0.16 smooth � 0.30 rough
k � 0.40 smooth � 0.53 rough
k � 0.40 smooth � 0.60 rough
Figure 10.11 Head loss for various pipe fittings.
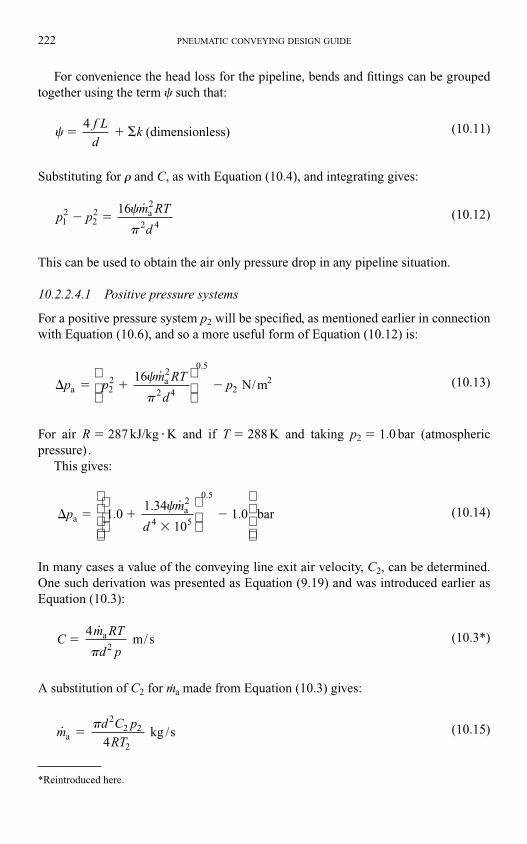
For convenience the head loss for the pipeline, bends and fittings can be grouped
together using the term � such that:
(10.11)
Substituting for � and C, as with Equation (10.4), and integrating gives:
(10.12)
This can be used to obtain the air only pressure drop in any pipeline situation.
10.2.2.4.1 Positive pressure systems
For a positive pressure system p2 will be specified, as mentioned earlier in connection
with Equation (10.6), and so a more useful form of Equation (10.12) is:
(10.13)
For air R � 287 kJ/kg � K and if T � 288 K and taking p2 � 1.0 bar (atmospheric
pressure) .
This gives:
(10.14)
In many cases a value of the conveying line exit air velocity, C2, can be determined.
One such derivation was presented as Equation (9.19) and was introduced earlier as
Equation (10.3):
(10.3*)
A substitution of C2 for m.a made from Equation (10.3) gives:
(10.15)md C p
RTa kg /s�� 2
2 2
24
Cm RT
d p
4 m/ sa�
˙
� 2
� � �
�pm
da
a
5 1.0
1.34
10 1.0 bar
� ˙.
2
4
0 5
� � �p pm RT
dpa
2 a
2
2
16 N/m2
2
4
0 5
2
�
�
˙.
p pm RT
d12
22
2
2 4
16 a� ��
�
˙
� 4
(dimensionless)� �f L
dk
222 PNEUMATIC CONVEYING DESIGN GUIDE
*Reintroduced here.
Substituting this into Equation (10.12) gives:
(10.16)
From which:
(10.17)
Thus in a situation where the downstream pressure, p2, is known (commonly this
would be atmospheric pressure in a positive pressure system) and the conveying line
exit air velocity can be determined, this expression allows the pressure drop for the air
alone to be estimated quite easily.
Alternatively, if the conveying line inlet air velocity, C1, is known, this can be used
instead. A substitution of C1 for m.a, from Equation (10.3), into Equation (10.12) gives:
(10.18)
From which:
(10.19)
Note:
The velocity, C1, in Equations (10.18) and (10.19), is not the conveying line inlet air
velocity which is specified for gas–solid flows in pneumatic conveying. It is the con-
veying line inlet air velocity that will result when no material is conveyed. C2 in
Equations (10.16) and (10.17), of course, is the same whether material is conveyed or
not, since the pressure will always be the same at the end of the pipeline.
10.2.2.4.2 Negative pressure systems
For a negative pressure system, p1, will be specified (usually atmospheric). A
re-arrangement of Equation (10.18) gives:
(10.20)� � � �p pC
RTa2
1 N/m112
1
0 5
1�
.
� ��
�p pRT
RT Ca
2
1 N/m2
1
1 12
0 5
�
.
p pC p
RT12
22 1
212
1
� ��
� � �p pC
RT 1 1 N/m
22
22
2
0 5
�
.
p pC p
RT12
22 2
222
2
� ��
AIR ONLY RELATIONSHIPS 223
Note:
In this case the conveying line inlet air velocity, C1, will be the same whether the material
is conveyed or not, since the pressure, p1, will be atmospheric in both cases. This is
similar to Equations (10.16) and (10.17) for positive pressure systems.
10.2.3 Air only pressure drop datum
The empty pipeline pressure drop relationships for a pipeline, such as those shown in
Figures 10.4 and 10.5, provide a datum for material conveying characteristics and cap-
ability. At a given value of air flow rate the pressure drop available must be greater than
the air only pressure drop value, otherwise it will not be possible to convey material.
At any value of conveying line pressure drop there will be a corresponding value of
air flow rate at which the air only pressure drop will equal the conveying line pressure
drop. This value can be determined from Equation (10.13) by making m.a the subject
of the equation. Such a re-arrangement gives:
(10.21)
This is quite a useful relationship, for it allows an estimate to be made of where the
various lines of constant conveying line pressure drop on material conveying charac-
teristics will reach the horizontal axis.
For air R � 287 J/kg �K and if T � 288 K,
(10.22)
where all pressures are in bar.
10.3 Venturi analysis
Particular advantages of using venturi feeders for positive pressure conveying lines are
that minimum headroom is required, there are no moving parts and, if the device is cor-
rectly designed, there need be no air leakage from the feeder, as there is with nearly all
other types of feeder. A venturi basically consists of a controlled reduction in pipeline
cross section in the region where the material is fed from the supply hopper, as shown in
Figure 10.12.
A consequence of this reduction in flow area is an increase in the entraining air
velocity, and a corresponding decrease in pressure, in this region. With a correctly
designed venturi the pressure at the throat should be just a little lower, or about the
same, as that in the supply hopper which, for the majority of applications, is atmos-
pheric pressure. This then encourages the material to flow readily under gravity into the
pipeline, and under these conditions there will be no leakage of air from the feeder in
opposition to the material feed.
˙( )
.
md p p p
aa 273
kg/s�
� 41 2
0 5
�
˙( )
.
md p p p
RTaa
kg/s�
��
�
2 41 2
0 5
16
224 PNEUMATIC CONVEYING DESIGN GUIDE
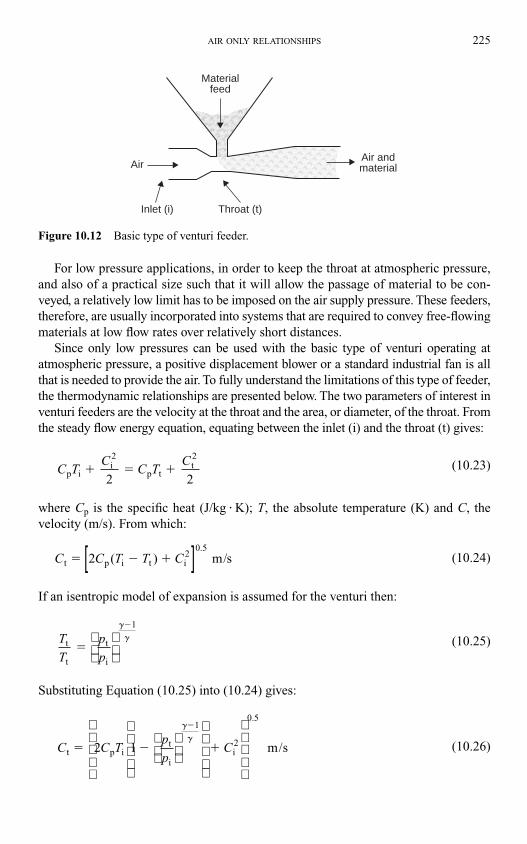
For low pressure applications, in order to keep the throat at atmospheric pressure,
and also of a practical size such that it will allow the passage of material to be con-
veyed, a relatively low limit has to be imposed on the air supply pressure. These feeders,
therefore, are usually incorporated into systems that are required to convey free-flowing
materials at low flow rates over relatively short distances.
Since only low pressures can be used with the basic type of venturi operating at
atmospheric pressure, a positive displacement blower or a standard industrial fan is all
that is needed to provide the air. To fully understand the limitations of this type of feeder,
the thermodynamic relationships are presented below. The two parameters of interest in
venturi feeders are the velocity at the throat and the area, or diameter, of the throat. From
the steady flow energy equation, equating between the inlet (i) and the throat (t) gives:
(10.23)
where Cp is the specific heat (J/kg � K); T, the absolute temperature (K) and C, the
velocity (m/s). From which:
(10.24)
If an isentropic model of expansion is assumed for the venturi then:
(10.25)
Substituting Equation (10.25) into (10.24) gives:
(10.26)C C Tp
pCt p i
t
i
i 2 m/s� �
�
1
1
2
0 5
�
�
.
T
T
p
pt
t
t
i
�
�
�
�
1
C C T T Ct p i t i 2 ( m/s� � ).
20 5[ ]
C TC
C TC
p ii
p tt �
2 2
2 2
AIR ONLY RELATIONSHIPS 225
Throat (t)Inlet (i)
Air
Materialfeed
Air andmaterial
Figure 10.12 Basic type of venturi feeder.
From the continuity equation:
(10.27)
where A is the section area � �d2/4 (m2) and �, the density of gas (kg/m3)
(10.28)
Substituting Equation (10.28) into (10.27) gives:
(10.29)
Substituting Equation (10.25) into (10.29) gives:
(10.30)
If, for example,
Ci � 20 m/s
di � 100 mm
Ti � 293 K
pt � 101.3 kN/m2 abs
pi � 0.2 bar gauge � 121.3 kN/m2 abs
Note that for air Cp � 1000 J/kg and � � 1.4. Substituting into Equation (10.26) gives:
and substituting into Equation (10.30) gives:
d t 20
173
101.3
121.3 100
36.3 mm
� � �
�
�
0 7140 5
..
Ct2
2000 293 1 101.3
121.3 20
173 m/s
� � �
�
0 2860 5
..
dC
C
p
pdt
i
t
t
i
i m� � �
�
10 5
�
.
dC
C
p
p
T
Tdt
i
t
i
t
t
i
i m� � � �
0 5.
p
RT
m AC A Ca i i i t t t kg/s� �� �
226 PNEUMATIC CONVEYING DESIGN GUIDE
10.3.1 Atmospheric pressure applications
Although venturis capable of feeding materials into conveying pipelines with operat-
ing pressure drops of 0.4 bar are commercially available, the additional pressure drop
across the venturi can be of the same order. This means that the air supply pressure
will have to be at about 0.8 bar gauge and consequently, for this type of duty, it would
be recommended that the air should be supplied by a positive displacement blower.
10.3.2 High pressure applications
It was mentioned in Chapters 3 and 4, dealing with feeding devices for pneumatic con-
veying systems that with the use of lock hoppers (see Section 4.5) venturis could also
be used in high pressure systems. Although the above analysis was used to illustrate the
atmospheric pressure application, the same models can be used to analyse high pressure
applications simply with an alternative value of the pressure at the throat, pt.
10.4 Air flow rate control
If the air to be used for conveying, is taken from a plant air supply, or some central
source, it will probably be necessary to put a flow restriction into the pipeline. This will
be needed in order to limit the quantity of air drawn to that of the volumetric flow rate
actually required. If this is not done an uncontrolled expansion will occur and very much
more air than necessary will be used. It will only be limited by the volumetric cap-
ability of the supply, or by the increased frictional resistance of the flow in the pipe-
line. The increased air flow rate will almost certainly result in a decrease in the material
flow rate through the pipeline. It will also add significantly to problems of erosive
wear and particle degradation.
Flow restrictors may also be required in situations where the air supply needs to be
divided, as in blow tank systems. For the control of many types of blow tank it is neces-
sary to proportion the air supply between the blow tank and the conveying line. If the
total air supply is set, a flow restrictor can be placed in one or both of the divided lines.
This, however, can only be done if the blow tank is dedicated to a single material con-
veyed over a fixed distance. For systems handling more than one material, or conveying
to a number of hoppers over varying distances, a variable flow control would be needed.
In these cases special control valves would be required rather than fixed restrictors.
Nozzles and orifice plates are most commonly used for restricting the air flow in a
pipeline. Under certain flow conditions they can also be used to meter and control the
air flow.
10.4.1 Nozzles
For the single phase flow of fluids through nozzles the theory is well established, and
for a gas such as air it is based on the use of many of the equations already presented.
Nozzles are either of the convergent–divergent type, as shown in Figure 10.13a, or are
convergent only, as shown in Figure 10.13b. Both types restrict the flow by means of a
short throat section at a reduced diameter.
AIR ONLY RELATIONSHIPS 227
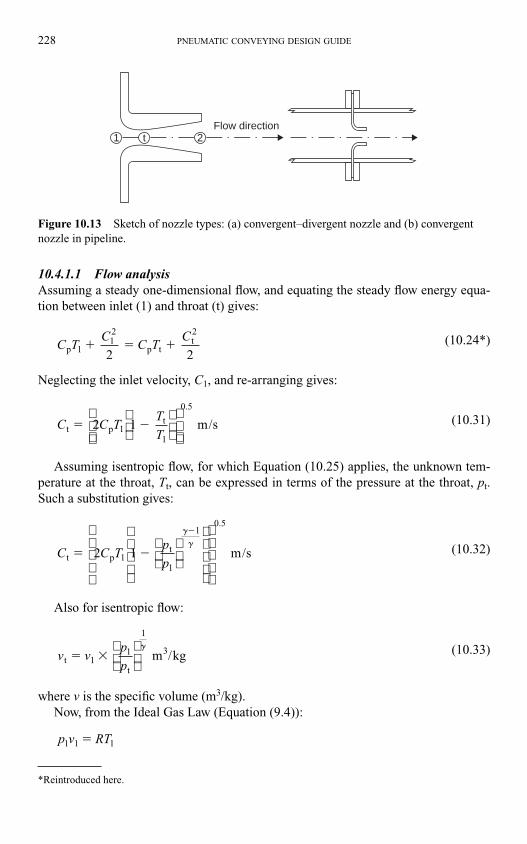
10.4.1.1 Flow analysisAssuming a steady one-dimensional flow, and equating the steady flow energy equa-
tion between inlet (1) and throat (t) gives:
(10.24*)
Neglecting the inlet velocity, C1, and re-arranging gives:
(10.31)
Assuming isentropic flow, for which Equation (10.25) applies, the unknown tem-
perature at the throat, Tt, can be expressed in terms of the pressure at the throat, pt.
Such a substitution gives:
(10.32)
Also for isentropic flow:
(10.33)
where v is the specific volume (m3/kg).
Now, from the Ideal Gas Law (Equation (9.4)):
p v RT1 1 1 �
v vp
pt
t
3 m /kg� �1
1
1
�
C C Tp
pt pt
1
2 1 m/s� �
�
1
1
0 5
�
�
.
C C TT
Tt pt 2 1 m/s� �1
1
0 5
.
C TC
C TC
p p tt 1
12 2
2 2 �
228 PNEUMATIC CONVEYING DESIGN GUIDE
Flow direction2t1
Figure 10.13 Sketch of nozzle types: (a) convergent–divergent nozzle and (b) convergent
nozzle in pipeline.
*Reintroduced here.
and substituting this into Equation (10.33) gives:
(10.34)
From the continuity equation (Equation (10.27)):
Substituting Ct from Equation (10.32) and �t from Equation (10.34) into this gives:
(10.35)
Re-arranging this gives:
(10.36)
where dt is the nozzle throat diameter (m).
10.4.1.2 Critical pressure
A peculiarity of the expansion of the flow of a fluid through a nozzle is that as
the downstream pressure, p2, reduces, for a given upstream pressure, p1, the pressure
at the throat, pt, will not reduce constantly with downstream pressure. The pressure at
the throat will reduce to a fixed proportion of the inlet pressure, and any further reduc-
tion of the downstream pressure will not result in a lowering of the pressure at the
throat.
Under these conditions the nozzle is said to be ‘choked’. When critical flow condi-
tions exist, the velocity at the throat will be equal to the local sonic velocity. The air
mass flow rate through a nozzle is a maximum under choked flow conditions and no
reduction of the downstream pressure, below the critical throat pressure, will result in
any change of the air mass flow rate.
˙
.
md p
R
C
T
p
p
p
pat p t t
1
kg/s� � �
� �
�
�21
1 1
2
1
0 5
4
2
˙
.
m
A C Tpp
RTp
ppt
a
t pt
1
kg/s�
�
�
�
2 11
1
0 5
1
1
1
1
�
�
�
mA C
v
A C
vat t
t
kg/s� �1 1
1
vRT
p
p
pt
t
3 m kg� �1
1
1
1
�/
AIR ONLY RELATIONSHIPS 229
It can be shown (e.g. [4]) that the ratio between the throat pressure and the supply
or inlet pressure is given by:
(10.37)
For air � � 1.4, R � 287 J/kg . K and Cp � 1000 J/kg �K and so
10.4.1.3 Nozzle size and capability
Substituting the above data for air into Equation (10.36) gives:
(10.38)
where p1 is the inlet or supply pressure (N/m2 abs).
For the air flow rate in volumetric terms, the Ideal Gas Law gives:
For the volumetric flow rate at free air conditions, substitution of this into Equation
(10.38) gives:
(10.39)
and substituting for R and free air conditions gives:
(10.40)
Alternatively, for a given air flow rate:
(10.41)dm T
pta 5.62 m�
˙ ..
10 5
1
0 5
˙ /.
Vp d
T0
12
10 5
0.0259 m st 3�
˙.
Vp d
T
RT
p01
2
10 5
0
0
0.0317 m /st 3� �
˙ ˙/V
m RT
p m sa 3�
˙.
mp d
Ta
t 0.0317 kg/s� 12
10 5
p
pt 0.5281
�
p
pt
1
2
11
�
�
�
�
�
230 PNEUMATIC CONVEYING DESIGN GUIDE
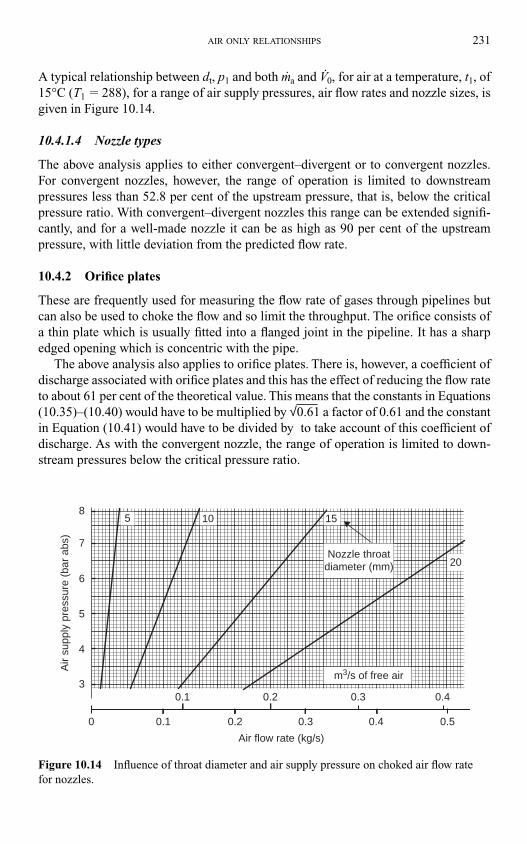
A typical relationship between dt, p1 and both m.a and V
.0, for air at a temperature, t1, of
15°C (T1 � 288), for a range of air supply pressures, air flow rates and nozzle sizes, is
given in Figure 10.14.
10.4.1.4 Nozzle types
The above analysis applies to either convergent–divergent or to convergent nozzles.
For convergent nozzles, however, the range of operation is limited to downstream
pressures less than 52.8 per cent of the upstream pressure, that is, below the critical
pressure ratio. With convergent–divergent nozzles this range can be extended signifi-
cantly, and for a well-made nozzle it can be as high as 90 per cent of the upstream
pressure, with little deviation from the predicted flow rate.
10.4.2 Orifice plates
These are frequently used for measuring the flow rate of gases through pipelines but
can also be used to choke the flow and so limit the throughput. The orifice consists of
a thin plate which is usually fitted into a flanged joint in the pipeline. It has a sharp
edged opening which is concentric with the pipe.
The above analysis also applies to orifice plates. There is, however, a coefficient of
discharge associated with orifice plates and this has the effect of reducing the flow rate
to about 61 per cent of the theoretical value. This means that the constants in Equations
(10.35)–(10.40) would have to be multiplied by √0.61 a factor of 0.61 and the constant
in Equation (10.41) would have to be divided by to take account of this coefficient of
discharge. As with the convergent nozzle, the range of operation is limited to down-
stream pressures below the critical pressure ratio.
AIR ONLY RELATIONSHIPS 231
Air flow rate (kg/s)
Air
supp
ly p
ress
ure
(bar
abs
)
0
3
4
5
6
7
8
0.1
0.1 0.2
0.2 0.3
0.3 0.4
0.4 0.5
Nozzle throatdiameter (mm) 20
15105
m3/s of free air
Figure 10.14 Influence of throat diameter and air supply pressure on choked air flow rate
for nozzles.
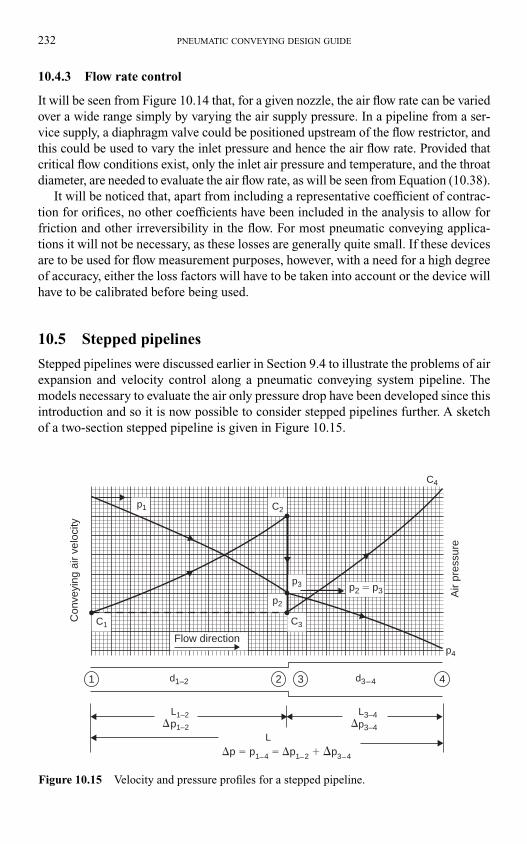
10.4.3 Flow rate control
It will be seen from Figure 10.14 that, for a given nozzle, the air flow rate can be varied
over a wide range simply by varying the air supply pressure. In a pipeline from a ser-
vice supply, a diaphragm valve could be positioned upstream of the flow restrictor, and
this could be used to vary the inlet pressure and hence the air flow rate. Provided that
critical flow conditions exist, only the inlet air pressure and temperature, and the throat
diameter, are needed to evaluate the air flow rate, as will be seen from Equation (10.38).
It will be noticed that, apart from including a representative coefficient of contrac-
tion for orifices, no other coefficients have been included in the analysis to allow for
friction and other irreversibility in the flow. For most pneumatic conveying applica-
tions it will not be necessary, as these losses are generally quite small. If these devices
are to be used for flow measurement purposes, however, with a need for a high degree
of accuracy, either the loss factors will have to be taken into account or the device will
have to be calibrated before being used.
10.5 Stepped pipelines
Stepped pipelines were discussed earlier in Section 9.4 to illustrate the problems of air
expansion and velocity control along a pneumatic conveying system pipeline. The
models necessary to evaluate the air only pressure drop have been developed since this
introduction and so it is now possible to consider stepped pipelines further. A sketch
of a two-section stepped pipeline is given in Figure 10.15.
232 PNEUMATIC CONVEYING DESIGN GUIDE
21 3 4
L
d3–4d1–2
L1–2p1–2�
L3–4p3–4�
�p � p1–4 � �p1–2 � �p3–4
Air
pres
sure
Con
veyi
ng a
ir ve
loci
ty
p4
C4
C1
C2
Flow direction
p1
p3 p2 � p3p2
C3
Figure 10.15 Velocity and pressure profiles for a stepped pipeline.
10.5.1 Air only pressure drop
From Equation (10.12), for a single bore pipeline, the following expression was
developed:
(10.42)
which gives either
(10.43)
which is an expression in terms of the inlet pressure, p1 or
(10.44)
which is an expression in terms of the outlet pressure, p2.
For a stepped pipeline the total pressure drop will be equal to the sum of the indi-
vidual pressure drops for each section. For a two-section pipeline the unknown pres-
sure at the step can be eliminated by using both of the above expressions, noting that
p2 � p3.
For the first section:
and for the second section:
adding these two expressions gives:
which reduces to:
(10.45)p p12
22
1 2 N/m3 42� � � �
p p p p p p1 4 1 4 12
2
0 5
42
0 5
1 3 4� � � � � � �( ) ( ). .
� � �� �p p p3 4 42
3 4
0 5
4 ( ) .
� � � � � �p p p1 1 12
1
0 5
2 2 ( ) .
� � � � � �� �p p p p pa 2 4 1 4 1 3
� � �p p pa2
N/m22
0 5
2( ) .
� � � � p p pa2
N/m1 12
0 5( ) .
p pm RT
d12
22
2
2 4
16N/m a 2� � �
�
�
˙
AIR ONLY RELATIONSHIPS 233
This equation is of the same form as Equation (10.42) and so the solution can either
be in terms of the inlet pressure, p1, as in Equation (10.43), or in terms of the exit pres-
sure, p4, as in Equation (10.44). The choice will depend upon which value is known,
and whether the stepped pipeline is for a positive pressure or a vacuum system.
It should be noted that if the pipeline comprises more than one step, additional
equations will be needed to solve the additional unknown pressures at the steps.
10.5.2 Position of steps
The position of the transition to a larger bore line must be such that the conveying air
velocity does not drop below that of the conveying line inlet air velocity employed at
the start of the pipeline. As the pressure drops along the length of the pipeline the
velocity will increase, but a change in pipeline bore will significantly alter the situ-
ation, as illustrated in Figure 10.15, and with the examples shown in Figures 9.11 to
9.16 in Chapter 9 on Air flow rate evaluation.
It was also mentioned, in Section 9.4.4.1, that as a first approximation, pipeline
lengths could be sized in proportion to the conveying line pressure drop for each sec-
tion of pipeline, provided that a reasonably uniform value of conveying air velocity is
maintained along the length of the pipeline. With reference to Figure 10.15, the length
of the first section of pipeline, L1–2, would be:
(10.46)
The pressure at the step can be evaluated from Equation (9.13), developed in
Section 9.4.1, from which the velocity at the end of each section along the length of
the pipeline can be determined from either Equation (9.11), in terms of volumetric
flow rates or Equation (9.20), in terms of air mass flow rate, to check on the uniformity
of the velocity profile.
10.5.3 Transition sections
A tapered transition from one section to another would be recommended, in order to
recover as much of the energy as possible in the preceding high velocity flow. The
included angle of the transition would need to be about 5–10°, as shown in Figure 10.9.
10.6 Nomenclature
A Pipe section area m2
C Conveying air velocity m/s
Cp Specific heat at constant pressure kJ/kg.K
Cv Specific heat at constant volume kJ/kg.K
d Pipe bore m
f Friction coefficient –
k Bend loss coefficient –
L Pipeline length m
Lp p
p pL1
1 2
1 4
� ��
��2
m
234 PNEUMATIC CONVEYING DESIGN GUIDE
m Mass kg
m.
Mass flow rate kg/s
p Air pressure kN/m2 N/m2
Note: 1 bar �100 kN/m2
R Characteristic gas constant kJ/kg �K
t Actual temperature °C
T Absolute temperature K
� t 273
V.
Volume m3
Volumetric flow rate m3/s
10.6.1 Greek
� Ratio of specific heats Cp/Cv
� Pipe wall roughness m
� Viscosity kg/m�s� Specific volume m3/kg � 1/�� Density kg/m3
� Total pipeline head loss coefficient –
10.6.2 Subscripts
a Conveying air
e Equivalent value, usually length
i Inlet conditions
t Throat conditions
0 Reference conditions, free air values
P0 � 101.3 kN/m2
T0 � 288 K
1, 2 Actual conditions, usually at inlet and outlet
3, 4, Actual conditions, usually at steps along pipeline or air mover inlet and
etc. outlet
10.6.3 Prefixes
� Difference in value
∑ Sum total
References
1. Y R Mayhew and G F C Rogers. Thermodynamic and Transport Properties of Fluids. Basil:
Blackwell. 1968.
2. J M Gasiorek and W G Carter. Mechanics of Fluids for Mechanical Engineers. Blackie and
Son. 1967.
3. J R D Francis. Fluid Mechanics for Engineering Students – 4th Ed. Edward Arnold. 1975.
4. V M Faires. Applied Thermodynamics – 3rd Ed. MacMillan. 1957.
AIR ONLY RELATIONSHIPS 235
11.1 Introduction
The capability or a pneumatic conveying system for conveying bulk particulate materials
depends mainly upon five parameters. These are pipe bore, conveying distance, pressure
available, conveying air velocity and material properties. The influence of many of these
variables is reasonably predictable but that of the conveyed material is not, at present.
For this reason the conveying characteristics of many different materials are presented
and featured in order to illustrate the importance and significance of material properties.
11.1.1 Conveying characteristics
If a pneumatic conveying system is to be designed to ensure satisfactory operation,
and to achieve maximum efficiency, it is necessary to know the conveying character-
istics of the material to be handled. The conveying characteristics will tell a designer
what the minimum conveying velocity is for the material, whether there is an optimum
velocity at which the material can be conveyed, and what pipeline diameter and air
mover rating will be required for a given material flow rate and conveying distance.
Alternatively, for an existing pneumatic conveying plant, the appropriate conveying
characteristics will tell a designer what flow rate to expect if it is necessary to convey a
different material, and whether the air flow rate is satisfactory. Conveying characteristics
can also be used to check and optimize an existing plant if it is not operating satisfac-
torily. This aspect is considered in Chapter 21.
In order to be able to specify a pipe size and compressor rating for a required duty it
is necessary to have information on the conveying characteristics of the material. If suf-
ficient previous experience with a material is available, such that the conveying charac-
teristics for the material are already established, it should be possible to base a design
on the known information.
If previous experience with a material is not available, or is not sufficient for a full
investigation, it will be necessary to carry out pneumatic conveying trials with the
material. These should be planned such that they will provide data on the relationships
between material flow rate, air flow rate and conveying line pressure drop over as wide
a range of conveying conditions as can be achieved with the material.
The trials should also provide information on the minimum conveying air velocity
for the material and how this is influenced by conveying conditions. This is particularly
Chapter 11
Conveying characteristics
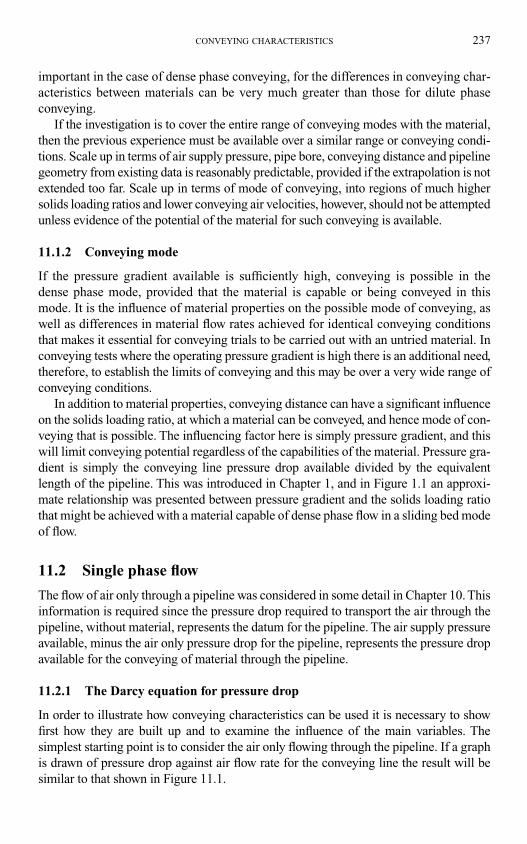
CONVEYING CHARACTERISTICS 237
important in the case of dense phase conveying, for the differences in conveying char-
acteristics between materials can be very much greater than those for dilute phase
conveying.
If the investigation is to cover the entire range of conveying modes with the material,
then the previous experience must be available over a similar range or conveying condi-
tions. Scale up in terms of air supply pressure, pipe bore, conveying distance and pipeline
geometry from existing data is reasonably predictable, provided if the extrapolation is not
extended too far. Scale up in terms of mode of conveying, into regions of much higher
solids loading ratios and lower conveying air velocities, however, should not be attempted
unless evidence of the potential of the material for such conveying is available.
11.1.2 Conveying mode
If the pressure gradient available is sufficiently high, conveying is possible in the
dense phase mode, provided that the material is capable or being conveyed in this
mode. It is the influence of material properties on the possible mode of conveying, as
well as differences in material flow rates achieved for identical conveying conditions
that makes it essential for conveying trials to be carried out with an untried material. In
conveying tests where the operating pressure gradient is high there is an additional need,
therefore, to establish the limits of conveying and this may be over a very wide range of
conveying conditions.
In addition to material properties, conveying distance can have a significant influence
on the solids loading ratio, at which a material can be conveyed, and hence mode of con-
veying that is possible. The influencing factor here is simply pressure gradient, and this
will limit conveying potential regardless of the capabilities of the material. Pressure gra-
dient is simply the conveying line pressure drop available divided by the equivalent
length of the pipeline. This was introduced in Chapter 1, and in Figure 1.1 an approxi-
mate relationship was presented between pressure gradient and the solids loading ratio
that might be achieved with a material capable of dense phase flow in a sliding bed mode
of flow.
11.2 Single phase flow
The flow of air only through a pipeline was considered in some detail in Chapter 10. This
information is required since the pressure drop required to transport the air through the
pipeline, without material, represents the datum for the pipeline. The air supply pressure
available, minus the air only pressure drop for the pipeline, represents the pressure drop
available for the conveying of material through the pipeline.
11.2.1 The Darcy equation for pressure drop
In order to illustrate how conveying characteristics can be used it is necessary to show
first how they are built up and to examine the influence of the main variables. The
simplest starting point is to consider the air only flowing through the pipeline. If a graph
is drawn of pressure drop against air flow rate for the conveying line the result will be
similar to that shown in Figure 11.1.
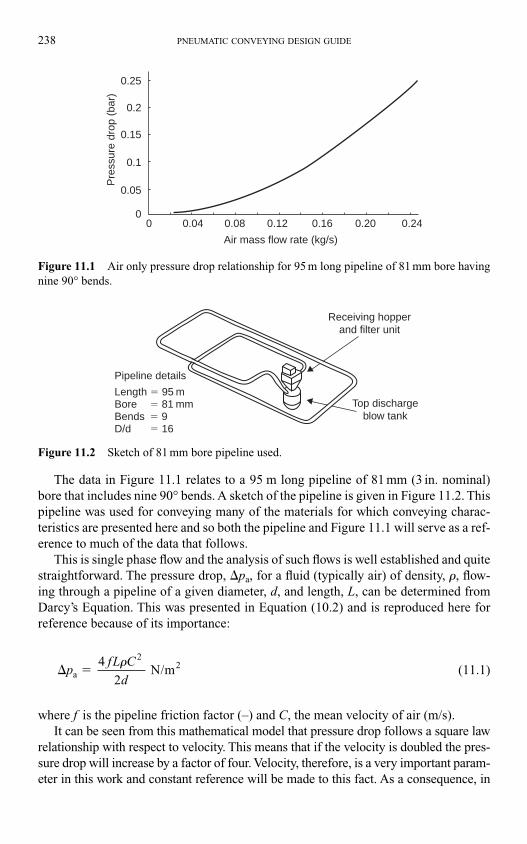
238 PNEUMATIC CONVEYING DESIGN GUIDE
The data in Figure 11.1 relates to a 95 m long pipeline of 81 mm (3 in. nominal)
bore that includes nine 90° bends. A sketch of the pipeline is given in Figure 11.2. This
pipeline was used for conveying many of the materials for which conveying charac-
teristics are presented here and so both the pipeline and Figure 11.1 will serve as a ref-
erence to much of the data that follows.
This is single phase flow and the analysis of such flows is well established and quite
straightforward. The pressure drop, �pa, for a fluid (typically air) of density, �, flow-
ing through a pipeline of a given diameter, d, and length, L, can be determined from
Darcy’s Equation. This was presented in Equation (10.2) and is reproduced here for
reference because of its importance:
(11.1)
where f is the pipeline friction factor (–) and C, the mean velocity of air (m/s).
It can be seen from this mathematical model that pressure drop follows a square law
relationship with respect to velocity. This means that if the velocity is doubled the pres-
sure drop will increase by a factor of four. Velocity, therefore, is a very important param-
eter in this work and constant reference will be made to this fact. As a consequence, in
� �pfL C
da2
4
N/m� 2
2
00
0.05
0.1
0.15
0.2
0.25
0.04 0.08 0.12
Air mass flow rate (kg/s)
Pre
ssur
e dr
op (
bar)
0.16 0.20 0.24
Figure 11.1 Air only pressure drop relationship for 95 m long pipeline of 81 mm bore having
nine 90° bends.
Receiving hopperand filter unit
Top dischargeblow tank
Pipeline details
Length � 95 mBore � 81 mmBends � 9D/d � 16
Figure 11.2 Sketch of 81 mm bore pipeline used.
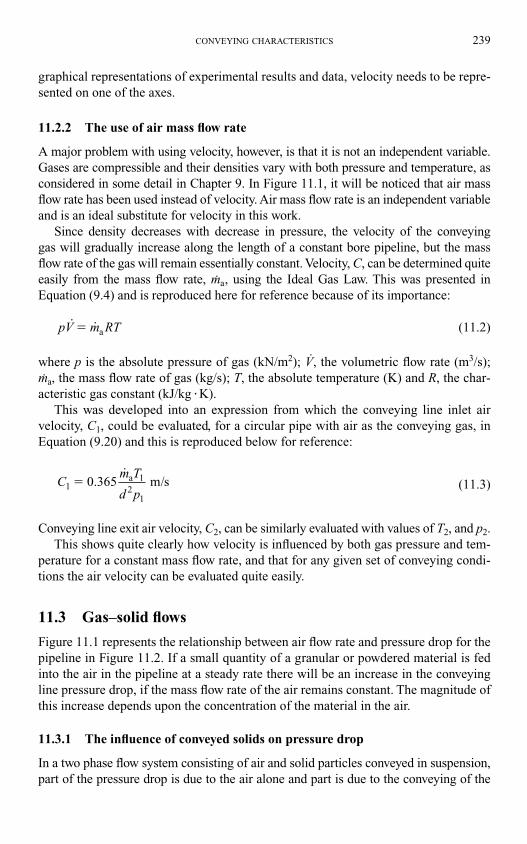
CONVEYING CHARACTERISTICS 239
graphical representations of experimental results and data, velocity needs to be repre-
sented on one of the axes.
11.2.2 The use of air mass flow rate
A major problem with using velocity, however, is that it is not an independent variable.
Gases are compressible and their densities vary with both pressure and temperature, as
considered in some detail in Chapter 9. In Figure 11.1, it will be noticed that air mass
flow rate has been used instead of velocity. Air mass flow rate is an independent variable
and is an ideal substitute for velocity in this work.
Since density decreases with decrease in pressure, the velocity of the conveying
gas will gradually increase along the length of a constant bore pipeline, but the mass
flow rate of the gas will remain essentially constant. Velocity, C, can be determined quite
easily from the mass flow rate, m.a, using the Ideal Gas Law. This was presented in
Equation (9.4) and is reproduced here for reference because of its importance:
(11.2)
where p is the absolute pressure of gas (kN/m2); V., the volumetric flow rate (m3/s);
m.a, the mass flow rate of gas (kg/s); T, the absolute temperature (K) and R, the char-
acteristic gas constant (kJ/kg �K).
This was developed into an expression from which the conveying line inlet air
velocity, C1, could be evaluated, for a circular pipe with air as the conveying gas, in
Equation (9.20) and this is reproduced below for reference:
(11.3)
Conveying line exit air velocity, C2, can be similarly evaluated with values of T2, and p2.
This shows quite clearly how velocity is influenced by both gas pressure and tem-
perature for a constant mass flow rate, and that for any given set of conveying condi-
tions the air velocity can be evaluated quite easily.
11.3 Gas–solid flows
Figure 11.1 represents the relationship between air flow rate and pressure drop for the
pipeline in Figure 11.2. If a small quantity of a granular or powdered material is fed
into the air in the pipeline at a steady rate there will be an increase in the conveying
line pressure drop, if the mass flow rate of the air remains constant. The magnitude of
this increase depends upon the concentration of the material in the air.
11.3.1 The influence of conveyed solids on pressure drop
In a two phase flow system consisting of air and solid particles conveyed in suspension,
part of the pressure drop is due to the air alone and part is due to the conveying of the
Cm T
d p1
1
21
0.365 m/sa�˙
pV m RT˙ ˙ a�
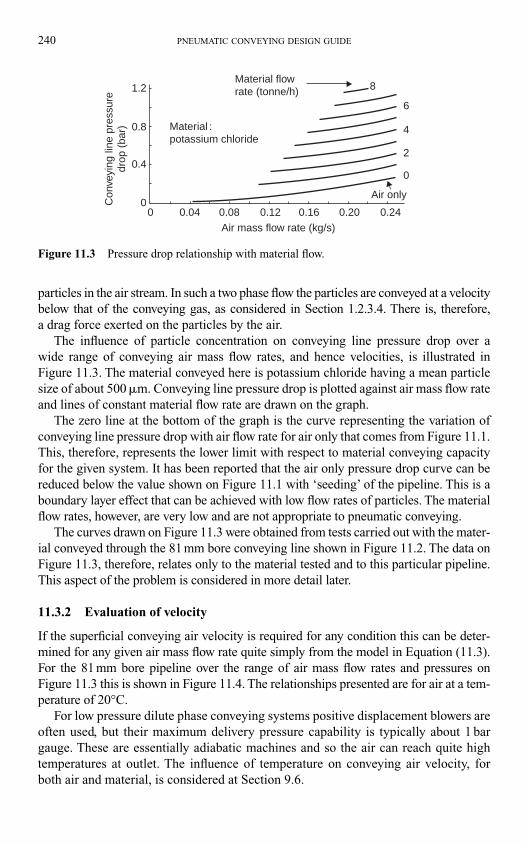
240 PNEUMATIC CONVEYING DESIGN GUIDE
particles in the air stream. In such a two phase flow the particles are conveyed at a velocity
below that of the conveying gas, as considered in Section 1.2.3.4. There is, therefore,
a drag force exerted on the particles by the air.
The influence of particle concentration on conveying line pressure drop over a
wide range of conveying air mass flow rates, and hence velocities, is illustrated in
Figure 11.3. The material conveyed here is potassium chloride having a mean particle
size of about 500 �m. Conveying line pressure drop is plotted against air mass flow rate
and lines of constant material flow rate are drawn on the graph.
The zero line at the bottom of the graph is the curve representing the variation of
conveying line pressure drop with air flow rate for air only that comes from Figure 11.1.
This, therefore, represents the lower limit with respect to material conveying capacity
for the given system. It has been reported that the air only pressure drop curve can be
reduced below the value shown on Figure 11.1 with ‘seeding’ of the pipeline. This is a
boundary layer effect that can be achieved with low flow rates of particles. The material
flow rates, however, are very low and are not appropriate to pneumatic conveying.
The curves drawn on Figure 11.3 were obtained from tests carried out with the mater-
ial conveyed through the 81 mm bore conveying line shown in Figure 11.2. The data on
Figure 11.3, therefore, relates only to the material tested and to this particular pipeline.
This aspect of the problem is considered in more detail later.
11.3.2 Evaluation of velocity
If the superficial conveying air velocity is required for any condition this can be deter-
mined for any given air mass flow rate quite simply from the model in Equation (11.3).
For the 81 mm bore pipeline over the range of air mass flow rates and pressures on
Figure 11.3 this is shown in Figure 11.4. The relationships presented are for air at a tem-
perature of 20°C.
For low pressure dilute phase conveying systems positive displacement blowers are
often used, but their maximum delivery pressure capability is typically about 1 bar
gauge. These are essentially adiabatic machines and so the air can reach quite high
temperatures at outlet. The influence of temperature on conveying air velocity, for
both air and material, is considered at Section 9.6.
00
0.4
0.8
1.2
0.04 0.08 0.12
Air mass flow rate (kg/s)
Air only
Material :potassium chloride
Material flowrate (tonne/h) 8
6
4
2
0
Con
veyi
ng li
ne p
ress
ure
drop
(ba
r)
0.16 0.20 0.24
Figure 11.3 Pressure drop relationship with material flow.
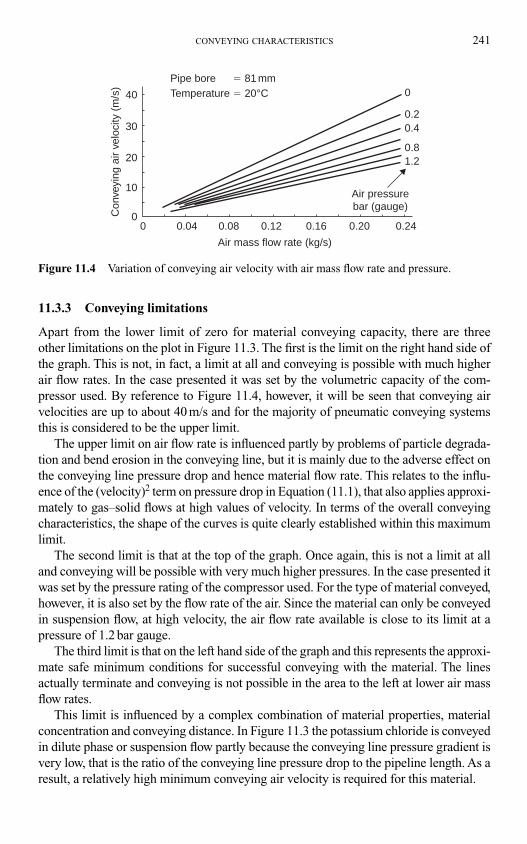
CONVEYING CHARACTERISTICS 241
11.3.3 Conveying limitations
Apart from the lower limit of zero for material conveying capacity, there are three
other limitations on the plot in Figure 11.3. The first is the limit on the right hand side of
the graph. This is not, in fact, a limit at all and conveying is possible with much higher
air flow rates. In the case presented it was set by the volumetric capacity of the com-
pressor used. By reference to Figure 11.4, however, it will be seen that conveying air
velocities are up to about 40 m/s and for the majority of pneumatic conveying systems
this is considered to be the upper limit.
The upper limit on air flow rate is influenced partly by problems of particle degrada-
tion and bend erosion in the conveying line, but it is mainly due to the adverse effect on
the conveying line pressure drop and hence material flow rate. This relates to the influ-
ence of the (velocity)2 term on pressure drop in Equation (11.1), that also applies approxi-
mately to gas–solid flows at high values of velocity. In terms of the overall conveying
characteristics, the shape of the curves is quite clearly established within this maximum
limit.
The second limit is that at the top of the graph. Once again, this is not a limit at all
and conveying will be possible with very much higher pressures. In the case presented it
was set by the pressure rating of the compressor used. For the type of material conveyed,
however, it is also set by the flow rate of the air. Since the material can only be conveyed
in suspension flow, at high velocity, the air flow rate available is close to its limit at a
pressure of 1.2 bar gauge.
The third limit is that on the left hand side of the graph and this represents the approxi-
mate safe minimum conditions for successful conveying with the material. The lines
actually terminate and conveying is not possible in the area to the left at lower air mass
flow rates.
This limit is influenced by a complex combination of material properties, material
concentration and conveying distance. In Figure 11.3 the potassium chloride is conveyed
in dilute phase or suspension flow partly because the conveying line pressure gradient is
very low, that is the ratio of the conveying line pressure drop to the pipeline length. As a
result, a relatively high minimum conveying air velocity is required for this material.
00
10
20
30
40
Pipe bore � 81 mmTemperature � 20°C
Air pressurebar (gauge)
0
0.20.4
0.81.2
0.04 0.08 0.12
Air mass flow rate (kg/s)
Con
veyi
ng a
ir ve
loci
ty (
m/s
)
0.16 0.20 0.24
Figure 11.4 Variation of conveying air velocity with air mass flow rate and pressure.
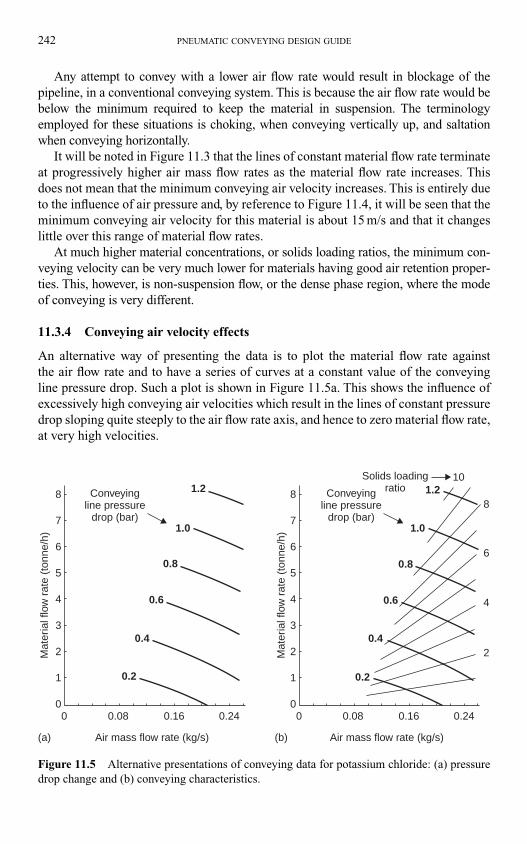
242 PNEUMATIC CONVEYING DESIGN GUIDE
Any attempt to convey with a lower air flow rate would result in blockage of the
pipeline, in a conventional conveying system. This is because the air flow rate would be
below the minimum required to keep the material in suspension. The terminology
employed for these situations is choking, when conveying vertically up, and saltation
when conveying horizontally.
It will be noted in Figure 11.3 that the lines of constant material flow rate terminate
at progressively higher air mass flow rates as the material flow rate increases. This
does not mean that the minimum conveying air velocity increases. This is entirely due
to the influence of air pressure and, by reference to Figure 11.4, it will be seen that the
minimum conveying air velocity for this material is about 15 m/s and that it changes
little over this range of material flow rates.
At much higher material concentrations, or solids loading ratios, the minimum con-
veying velocity can be very much lower for materials having good air retention proper-
ties. This, however, is non-suspension flow, or the dense phase region, where the mode
of conveying is very different.
11.3.4 Conveying air velocity effects
An alternative way of presenting the data is to plot the material flow rate against
the air flow rate and to have a series of curves at a constant value of the conveying
line pressure drop. Such a plot is shown in Figure 11.5a. This shows the influence of
excessively high conveying air velocities which result in the lines of constant pressure
drop sloping quite steeply to the air flow rate axis, and hence to zero material flow rate,
at very high velocities.
8
7
6
5
4
3
2
1
00
0.2
0.4
0.6
0.8
1.0
1.2Conveyingline pressure
drop (bar)
Conveyingline pressure
drop (bar)
0.08
Air mass flow rate (kg/s)(a) (b)
Mat
eria
l flo
w r
ate
(ton
ne/h
)
Mat
eria
l flo
w r
ate
(ton
ne/h
)
0.16 0.24
8
7
6
5
4
3
2
1
00
0.2
0.4
0.6
0.8
1.0
1.210
8
6
4
2
Solids loadingratio
0.08
Air mass flow rate (kg/s)
0.16 0.24
Figure 11.5 Alternative presentations of conveying data for potassium chloride: (a) pressure
drop change and (b) conveying characteristics.
CONVEYING CHARACTERISTICS 243
This is because of the square law relationship of pressure drop with respect to vel-
ocity, as mentioned above. If the conveying system has a compressor or blower with a
maximum rating in terms of delivery pressure, a considerable amount of this available
pressure will be taken up by moving the air through the line if the air flow rate, and hence
velocity, is too high.
Part of the pressure drop is due to the material being conveyed and the greater the
concentration of the material in the air, the greater the pressure drop. If the conveying air
velocity is too high, therefore, the concentration of the material in the air will have to be
reduced in order to match the available pressure drop, and so the resulting material flow
rate will be much lower.
11.3.5 Solids loading ratio
Solids loading ratio is the term generally used by pneumatic conveying engineers
to describe the conveyed gas–solids flow. Solids loading ratio is the ratio of the mass
flow rate of the solids conveyed to the mass flow rate of the air used (see Equation (1.3)).
The particular advantages over particle concentration are that it is a dimensionless quan-
tity and its value does not vary with the conveying gas pressure. With the graphs in
Figure 11.5 being plots of material flow rate against air flow rate, lines of constant solids
loading ratio can be superimposed quite easily as they are straight lines through the
origin. Such a plot is shown in Figure 11.5b.
11.4 The determination of conveying characteristics
Although the analysis of single phase flow is well established, that for the two phase flow
of solid particles in a gas is not. Mathematical and empirical models have been derived
to predict the influence of the many variables, but their use is generally very limited.
Where models are available they are likely to be restricted to a narrow range of operat-
ing conditions, and nothing is currently available that will cover the entire range of the
conveying characteristics shown in Figure 11.5b. It is necessary, therefore, to carry out
tests with the actual material in a pneumatic conveying test facility.
The necessity for carrying out tests with the actual material for which the data is
required is essential, for conveying characteristics can vary significantly from one mater-
ial to another, and even between different grades of the same material. Carrying out tests
in a similar pipeline, however, is not as critical as it is possible to use scaling parameters
to scale the conveying characteristics from a test line to an actual plant pipeline. This
aspect of system design is considered in Chapter 14.
11.4.1 Instrumentation and control
In order to determine the conveying characteristics for a material it is necessary to have
a conveying plant that has sufficient controls and instrumentation to enable conveying
trials to be carried out over as wide a range of conditions as possible. Air flow rate,
material flow rate and conveying line pressure drop are the main parameters that have to
be measured, and air flow rate and material flow rate need to be varied over as wide range
as possible, within the limits imposed by the conveying air supply.
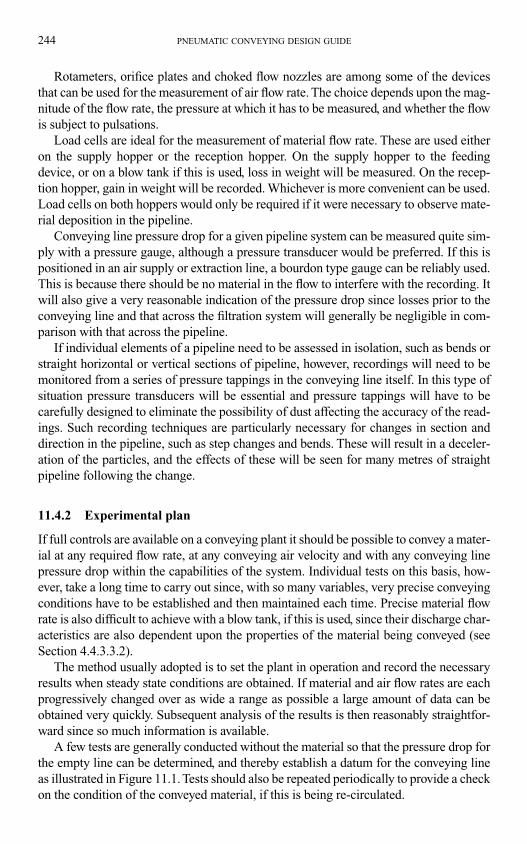
244 PNEUMATIC CONVEYING DESIGN GUIDE
Rotameters, orifice plates and choked flow nozzles are among some of the devices
that can be used for the measurement of air flow rate. The choice depends upon the mag-
nitude of the flow rate, the pressure at which it has to be measured, and whether the flow
is subject to pulsations.
Load cells are ideal for the measurement of material flow rate. These are used either
on the supply hopper or the reception hopper. On the supply hopper to the feeding
device, or on a blow tank if this is used, loss in weight will be measured. On the recep-
tion hopper, gain in weight will be recorded. Whichever is more convenient can be used.
Load cells on both hoppers would only be required if it were necessary to observe mate-
rial deposition in the pipeline.
Conveying line pressure drop for a given pipeline system can be measured quite sim-
ply with a pressure gauge, although a pressure transducer would be preferred. If this is
positioned in an air supply or extraction line, a bourdon type gauge can be reliably used.
This is because there should be no material in the flow to interfere with the recording. It
will also give a very reasonable indication of the pressure drop since losses prior to the
conveying line and that across the filtration system will generally be negligible in com-
parison with that across the pipeline.
If individual elements of a pipeline need to be assessed in isolation, such as bends or
straight horizontal or vertical sections of pipeline, however, recordings will need to be
monitored from a series of pressure tappings in the conveying line itself. In this type of
situation pressure transducers will be essential and pressure tappings will have to be
carefully designed to eliminate the possibility of dust affecting the accuracy of the read-
ings. Such recording techniques are particularly necessary for changes in section and
direction in the pipeline, such as step changes and bends. These will result in a deceler-
ation of the particles, and the effects of these will be seen for many metres of straight
pipeline following the change.
11.4.2 Experimental plan
If full controls are available on a conveying plant it should be possible to convey a mater-
ial at any required flow rate, at any conveying air velocity and with any conveying line
pressure drop within the capabilities of the system. Individual tests on this basis, how-
ever, take a long time to carry out since, with so many variables, very precise conveying
conditions have to be established and then maintained each time. Precise material flow
rate is also difficult to achieve with a blow tank, if this is used, since their discharge char-
acteristics are also dependent upon the properties of the material being conveyed (see
Section 4.4.3.3.2).
The method usually adopted is to set the plant in operation and record the necessary
results when steady state conditions are obtained. If material and air flow rates are each
progressively changed over as wide a range as possible a large amount of data can be
obtained very quickly. Subsequent analysis of the results is then reasonably straightfor-
ward since so much information is available.
A few tests are generally conducted without the material so that the pressure drop for
the empty line can be determined, and thereby establish a datum for the conveying line
as illustrated in Figure 11.1. Tests should also be repeated periodically to provide a check
on the condition of the conveyed material, if this is being re-circulated.
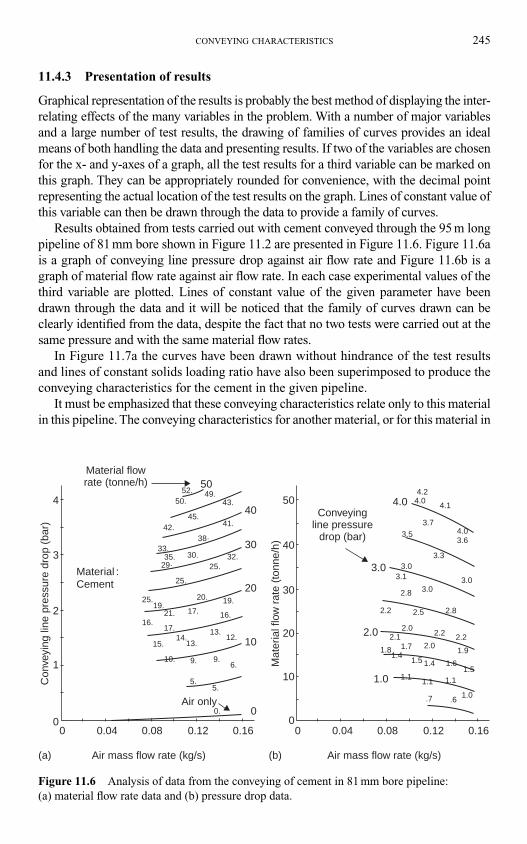
CONVEYING CHARACTERISTICS 245
11.4.3 Presentation of results
Graphical representation of the results is probably the best method of displaying the inter-
relating effects of the many variables in the problem. With a number of major variables
and a large number of test results, the drawing of families of curves provides an ideal
means of both handling the data and presenting results. If two of the variables are chosen
for the x- and y-axes of a graph, all the test results for a third variable can be marked on
this graph. They can be appropriately rounded for convenience, with the decimal point
representing the actual location of the test results on the graph. Lines of constant value of
this variable can then be drawn through the data to provide a family of curves.
Results obtained from tests carried out with cement conveyed through the 95 m long
pipeline of 81 mm bore shown in Figure 11.2 are presented in Figure 11.6. Figure 11.6a
is a graph of conveying line pressure drop against air flow rate and Figure 11.6b is a
graph of material flow rate against air flow rate. In each case experimental values of the
third variable are plotted. Lines of constant value of the given parameter have been
drawn through the data and it will be noticed that the family of curves drawn can be
clearly identified from the data, despite the fact that no two tests were carried out at the
same pressure and with the same material flow rates.
In Figure 11.7a the curves have been drawn without hindrance of the test results
and lines of constant solids loading ratio have also been superimposed to produce the
conveying characteristics for the cement in the given pipeline.
It must be emphasized that these conveying characteristics relate only to this material
in this pipeline. The conveying characteristics for another material, or for this material in
4
Material flowrate (tonne/h)
Material :
Air only0
10
20
30
40
5052.
50.
42.45.
49.43.
4.24.0
4.1
3.73.5
3.6
3.3
3.0
3.03.1
2.8
2.82.52.2
2.02.2 2.22.1
1.8 1.71.4
1.51.5
1.11.1 1.1
1.0.7 .6
1.4 1.6
2.01.9
3.0
4.0
33.35. 30.
29· 25.
25.
25. 20. 19.
16.19.
16.21.
17.
15.14.
13.13.
12.
10. 9. 9.6.
5.5.
0.
17.
32.
38·
41.
3
2
1
00 0.04 0.08 0.12 0.16
Air mass flow rate (kg/s)(a) (b)
Con
veyi
ng li
ne p
ress
ure
drop
(ba
r)
50 4.0
3.0
2.0
1.0
Conveyingline pressure
drop (bar)40
30
20
10
00 0.04 0.08 0.12 0.16
Air mass flow rate (kg/s)
Mat
eria
l flo
w r
ate
(ton
ne/h
)
Cement
Figure 11.6 Analysis of data from the conveying of cement in 81 mm bore pipeline:
(a) material flow rate data and (b) pressure drop data.
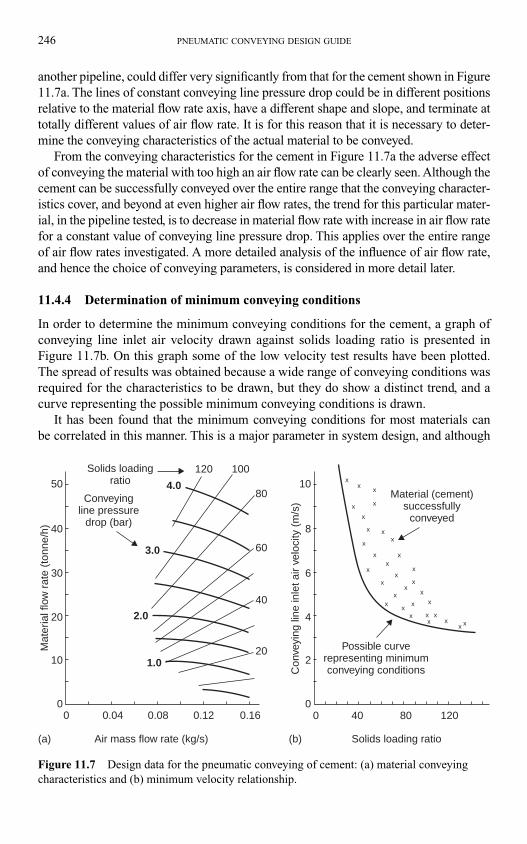
246 PNEUMATIC CONVEYING DESIGN GUIDE
another pipeline, could differ very significantly from that for the cement shown in Figure
11.7a. The lines of constant conveying line pressure drop could be in different positions
relative to the material flow rate axis, have a different shape and slope, and terminate at
totally different values of air flow rate. It is for this reason that it is necessary to deter-
mine the conveying characteristics of the actual material to be conveyed.
From the conveying characteristics for the cement in Figure 11.7a the adverse effect
of conveying the material with too high an air flow rate can be clearly seen. Although the
cement can be successfully conveyed over the entire range that the conveying character-
istics cover, and beyond at even higher air flow rates, the trend for this particular mater-
ial, in the pipeline tested, is to decrease in material flow rate with increase in air flow rate
for a constant value of conveying line pressure drop. This applies over the entire range
of air flow rates investigated. A more detailed analysis of the influence of air flow rate,
and hence the choice of conveying parameters, is considered in more detail later.
11.4.4 Determination of minimum conveying conditions
In order to determine the minimum conveying conditions for the cement, a graph of
conveying line inlet air velocity drawn against solids loading ratio is presented in
Figure 11.7b. On this graph some of the low velocity test results have been plotted.
The spread of results was obtained because a wide range of conveying conditions was
required for the characteristics to be drawn, but they do show a distinct trend, and a
curve representing the possible minimum conveying conditions is drawn.
It has been found that the minimum conveying conditions for most materials can
be correlated in this manner. This is a major parameter in system design, and although
50
40
30
20
10
0
10
8
6
4
2
00 40 80
Solids loading ratio
Possible curverepresenting minimumconveying conditionsC
onve
ying
line
inle
t air
velo
city
(m
/s)
Material (cement)successfully
conveyed
1200 0.04 0.08
1.0
2.0
3.0
4.0
120 100
80Conveyingline pressure
drop (bar)
Mat
eria
l flo
w r
ate
(ton
ne/h
)
Solids loadingratio
60
40
20
0.12 0.16
Air mass flow rate (kg/s)(a) (b)
xxxx
xx
x
x
x
x
xx
xx
x
xx
x
xx
x
x
xx
x
x
x
x x
xx
x
Figure 11.7 Design data for the pneumatic conveying of cement: (a) material conveying
characteristics and (b) minimum velocity relationship.
CONVEYING CHARACTERISTICS 247
the data can be obtained from Figure 11.7a, it is a much more complex relationship in
this form because of the additional influence of pressure on conveying air velocity. Plots
such as those in Figure 11.7b, therefore, provide a very useful means of identifying
minimum conveying conditions for materials. The exact position of the curve on
Figure 11.7b, which represents the minimum conveying conditions, is rather difficult to
locate. If the pipeline is blocked no experimental results are obtained for the test,
although in some cases it might be possible to estimate the approximate location on the
graph from tests which preceded it.
As this is the design parameter that dictates the air requirements in terms of volu-
metric flow rate for a conveying system it would obviously be expedient to specify an air
mover having a capacity with a reasonable margin, in order to allow for any differences
in this relationship that might occur if a material with a slightly different specification
has to be conveyed. Although an optimum design would normally be based on the sys-
tem operating as close as possible to the minimum conveying conditions, a margin in air
flow rate would be advisable in case the solids loading ratio specified in the design was,
for some reason, on the low side.
11.4.5 The use of conveying characteristics
With conveying line pressure drop, solids loading ratio and both material and air flow
rates all represented on the one graph, all the data necessary for the design of a pneumatic
conveying system is available. If a system has to be designed to achieve a given flow rate,
a point on the conveying characteristics must be chosen just above the minimum convey-
ing conditions to ensure that the pipeline will not block. This point gives the compressor
rating required, in terms of delivery pressure and volumetric flow rate (evaluated from the
air mass flow rate), and the solids loading ratio of the conveyed material.
Alternatively, if a compressor or conveying system is already available with a given
air supply pressure, the conveying characteristics can be used to determine the volumet-
ric flow rate required to achieve optimum conveying conditions. They will also give the
expected material flow rate and solids loading ratio. A particularly advantageous feature
of presenting design information in this form is that it can be scaled quite easily. Con-
veying characteristics for a given material in one pipeline can be scaled to that of another
pipeline of a different length, bore and configuration. The conveying characteristics
themselves are scaled and so design data is obtained directly for the new pipeline. This
process is considered in Chapter14.
11.5 Energy considerations
Apart from showing the relationship between the main design parameters for the con-
veying of a material through a pipeline, the conveying characteristics can be further
developed to provide data on power requirements so that energy considerations can
also be taken into account at the design stage of a system.
Two further materials, conveyed through the pipeline presented in Figure 11.2, are
used to illustrate these points. One is cryolite, a coarse granular material with a very
wide particle size distribution. The other is a dicalcium phosphate, a fine powdered
material with good air retention properties.
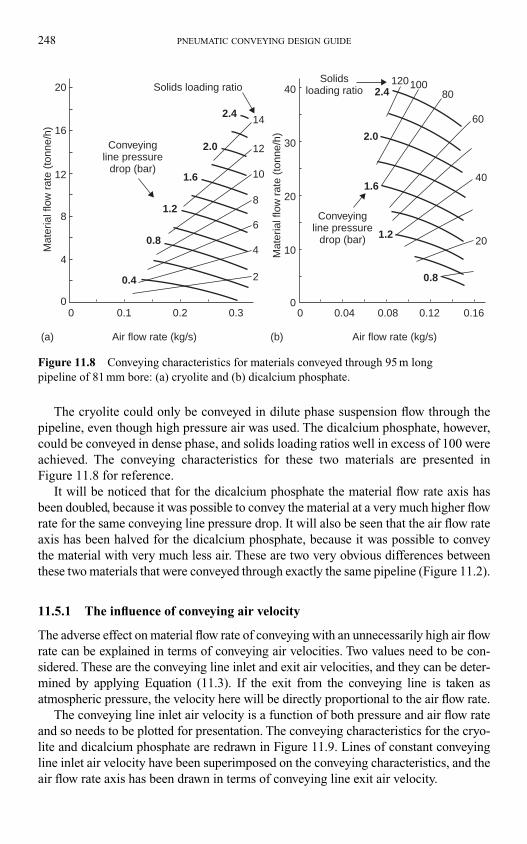
248 PNEUMATIC CONVEYING DESIGN GUIDE
The cryolite could only be conveyed in dilute phase suspension flow through the
pipeline, even though high pressure air was used. The dicalcium phosphate, however,
could be conveyed in dense phase, and solids loading ratios well in excess of 100 were
achieved. The conveying characteristics for these two materials are presented in
Figure 11.8 for reference.
It will be noticed that for the dicalcium phosphate the material flow rate axis has
been doubled, because it was possible to convey the material at a very much higher flow
rate for the same conveying line pressure drop. It will also be seen that the air flow rate
axis has been halved for the dicalcium phosphate, because it was possible to convey
the material with very much less air. These are two very obvious differences between
these two materials that were conveyed through exactly the same pipeline (Figure 11.2).
11.5.1 The influence of conveying air velocity
The adverse effect on material flow rate of conveying with an unnecessarily high air flow
rate can be explained in terms of conveying air velocities. Two values need to be con-
sidered. These are the conveying line inlet and exit air velocities, and they can be deter-
mined by applying Equation (11.3). If the exit from the conveying line is taken as
atmospheric pressure, the velocity here will be directly proportional to the air flow rate.
The conveying line inlet air velocity is a function of both pressure and air flow rate
and so needs to be plotted for presentation. The conveying characteristics for the cryo-
lite and dicalcium phosphate are redrawn in Figure 11.9. Lines of constant conveying
line inlet air velocity have been superimposed on the conveying characteristics, and the
air flow rate axis has been drawn in terms of conveying line exit air velocity.
Solids loading ratio
Conveyingline pressure
drop (bar)
Conveyingline pressure
drop (bar)
Solidsloading ratio20 40 2.4
2.0
1.6
1.2
0.80.4
0.8
1.2
1.6
2.0
2.414
12
10
8
6
4
2
20
40
60
80100120
30
20
10
00 0.04 0.08 0.12 0.16
16
12
8
4
00 0.1 0.2 0.3
Air flow rate (kg/s)(a) (b) Air flow rate (kg/s)
Mat
eria
l flo
w r
ate
(ton
ne/h
)
Mat
eria
l flo
w r
ate
(ton
ne/h
)
Figure 11.8 Conveying characteristics for materials conveyed through 95 m long
pipeline of 81 mm bore: (a) cryolite and (b) dicalcium phosphate.
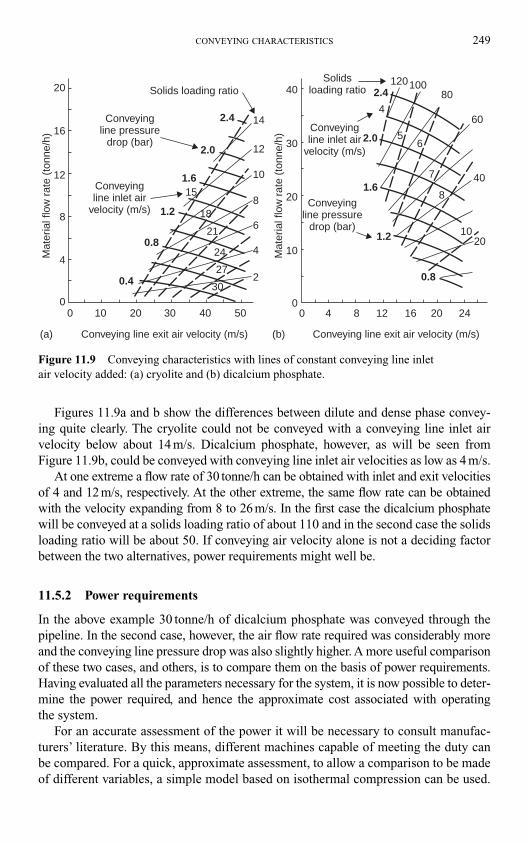
CONVEYING CHARACTERISTICS 249
Figures 11.9a and b show the differences between dilute and dense phase convey-
ing quite clearly. The cryolite could not be conveyed with a conveying line inlet air
velocity below about 14 m/s. Dicalcium phosphate, however, as will be seen from
Figure 11.9b, could be conveyed with conveying line inlet air velocities as low as 4 m/s.
At one extreme a flow rate of 30 tonne/h can be obtained with inlet and exit velocities
of 4 and 12 m/s, respectively. At the other extreme, the same flow rate can be obtained
with the velocity expanding from 8 to 26 m/s. In the first case the dicalcium phosphate
will be conveyed at a solids loading ratio of about 110 and in the second case the solids
loading ratio will be about 50. If conveying air velocity alone is not a deciding factor
between the two alternatives, power requirements might well be.
11.5.2 Power requirements
In the above example 30 tonne/h of dicalcium phosphate was conveyed through the
pipeline. In the second case, however, the air flow rate required was considerably more
and the conveying line pressure drop was also slightly higher. A more useful comparison
of these two cases, and others, is to compare them on the basis of power requirements.
Having evaluated all the parameters necessary for the system, it is now possible to deter-
mine the power required, and hence the approximate cost associated with operating
the system.
For an accurate assessment of the power it will be necessary to consult manufac-
turers’ literature. By this means, different machines capable of meeting the duty can
be compared. For a quick, approximate assessment, to allow a comparison to be made
of different variables, a simple model based on isothermal compression can be used.
Solids loading ratio
Conveyingline pressure
drop (bar)
Conveyingline inlet air
velocity (m/s)
Conveyingline inlet air
velocity (m/s)
Conveyingline pressure
drop (bar)
Solidsloading ratio20 40 2.4
2.0
4
56
7
8
10
1.6
1.2
0.80.4
0.8
1.2
1.6
2.0
2.4 14
12
10
8
6
424
21
18
15
27
302
20
40
60
80100120
30
20
10
00 4 8 12 16 20 24
16
12
8
4
00 10 20 30 40 50
Conveying line exit air velocity (m/s) Conveying line exit air velocity (m/s)(a) (b)
Mat
eria
l flo
w r
ate
(ton
ne/h
)
Mat
eria
l flo
w r
ate
(ton
ne/h
)
Figure 11.9 Conveying characteristics with lines of constant conveying line inlet
air velocity added: (a) cryolite and (b) dicalcium phosphate.
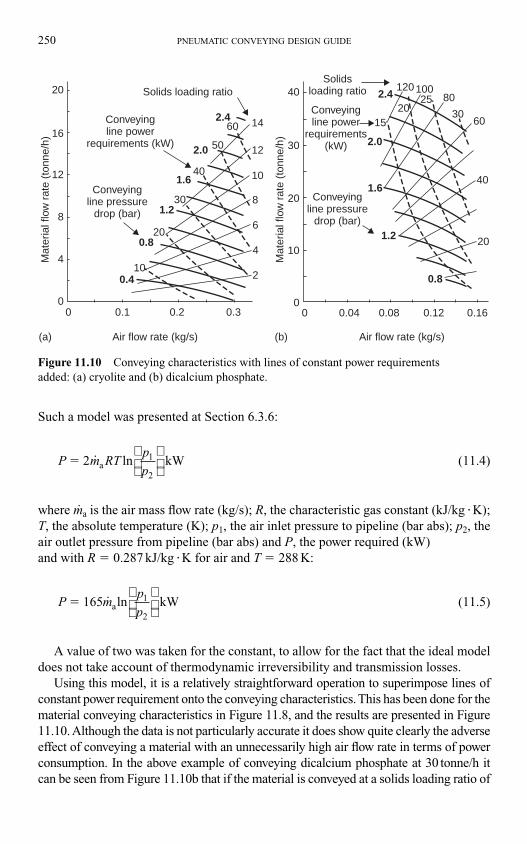
250 PNEUMATIC CONVEYING DESIGN GUIDE
Such a model was presented at Section 6.3.6:
(11.4)
where m.a is the air mass flow rate (kg/s); R, the characteristic gas constant (kJ/kg �K);
T, the absolute temperature (K); p1, the air inlet pressure to pipeline (bar abs); p2, the
air outlet pressure from pipeline (bar abs) and P, the power required (kW)
and with R � 0.287 kJ/kg �K for air and T � 288 K:
(11.5)
A value of two was taken for the constant, to allow for the fact that the ideal model
does not take account of thermodynamic irreversibility and transmission losses.
Using this model, it is a relatively straightforward operation to superimpose lines of
constant power requirement onto the conveying characteristics. This has been done for the
material conveying characteristics in Figure 11.8, and the results are presented in Figure
11.10. Although the data is not particularly accurate it does show quite clearly the adverse
effect of conveying a material with an unnecessarily high air flow rate in terms of power
consumption. In the above example of conveying dicalcium phosphate at 30 tonne/h it
can be seen from Figure 11.10b that if the material is conveyed at a solids loading ratio of
P mp
p 165 ln kWa� ˙ 1
2
P m RTp
p 2 ln kWa� ˙ 1
2
Air flow rate (kg/s)(a) (b) Air flow rate (kg/s)
Solids loading ratio
Conveyingline pressure
drop (bar)
Conveyingline pressure
drop (bar)
Conveyingline power
requirements (kW)
Conveyingline power
requirements(kW)
Solidsloading ratio20 40 80
3060
40
20
0.8
15
25
2.0
1.6
1.2
202.4 100120
30
20
10
00 0.04 0.08 0.12 0.16
16
12
8
4
00 0.1 0.2
0.410
20
30
40
50
60
0.8
1.2
1.6
2.0
2.4 14
12
10
8
6
4
2
0.3
Mat
eria
l flo
w r
ate
(ton
ne/h
)
Mat
eria
l flo
w r
ate
(ton
ne/h
)
Figure 11.10 Conveying characteristics with lines of constant power requirements
added: (a) cryolite and (b) dicalcium phosphate.
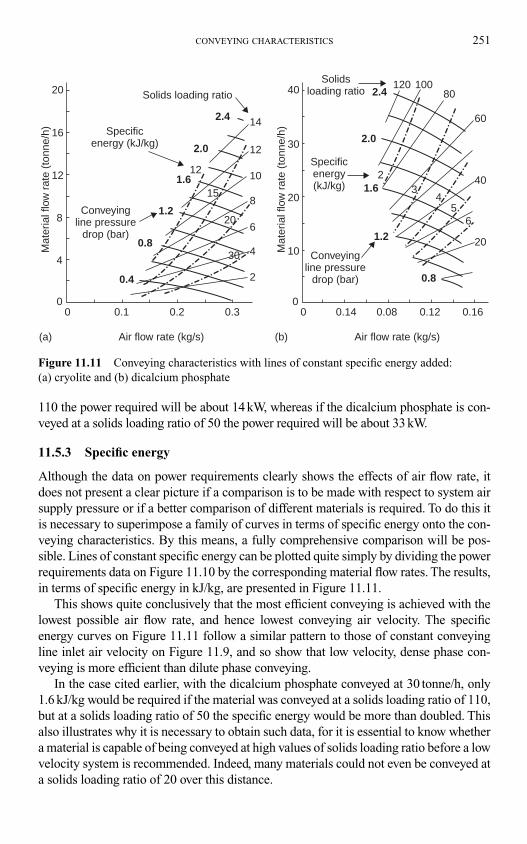
CONVEYING CHARACTERISTICS 251
110 the power required will be about 14 kW, whereas if the dicalcium phosphate is con-
veyed at a solids loading ratio of 50 the power required will be about 33 kW.
11.5.3 Specific energy
Although the data on power requirements clearly shows the effects of air flow rate, it
does not present a clear picture if a comparison is to be made with respect to system air
supply pressure or if a better comparison of different materials is required. To do this it
is necessary to superimpose a family of curves in terms of specific energy onto the con-
veying characteristics. By this means, a fully comprehensive comparison will be pos-
sible. Lines of constant specific energy can be plotted quite simply by dividing the power
requirements data on Figure 11.10 by the corresponding material flow rates. The results,
in terms of specific energy in kJ/kg, are presented in Figure 11.11.
This shows quite conclusively that the most efficient conveying is achieved with the
lowest possible air flow rate, and hence lowest conveying air velocity. The specific
energy curves on Figure 11.11 follow a similar pattern to those of constant conveying
line inlet air velocity on Figure 11.9, and so show that low velocity, dense phase con-
veying is more efficient than dilute phase conveying.
In the case cited earlier, with the dicalcium phosphate conveyed at 30 tonne/h, only
1.6 kJ/kg would be required if the material was conveyed at a solids loading ratio of 110,
but at a solids loading ratio of 50 the specific energy would be more than doubled. This
also illustrates why it is necessary to obtain such data, for it is essential to know whether
a material is capable of being conveyed at high values of solids loading ratio before a low
velocity system is recommended. Indeed, many materials could not even be conveyed at
a solids loading ratio of 20 over this distance.
20 Solids loading ratio
Solidsloading ratio
2.4
2.0
2
4
6
8
10
15
20
30
12
14
1.2
0.8
0.4
121.6
Specificenergy (kJ/kg)
Specificenergy(kJ/kg)
Conveyingline pressure
drop (bar)
Conveyingline pressure
drop (bar)
16
12
8
4
00 0.1 0.2
Air flow rate (kg/s)(a) (b)
Mat
eria
l flo
w r
ate
(ton
ne/h
)
0.3
40
2.0
120 10080
60
40
20
65
43
21.6
1.2
0.8
2.4
30
20
10
00 0.14 0.08 0.12 0.16
Air flow rate (kg/s)
Mat
eria
l flo
w r
ate
(ton
ne/h
)
Figure 11.11 Conveying characteristics with lines of constant specific energy added:
(a) cryolite and (b) dicalcium phosphate
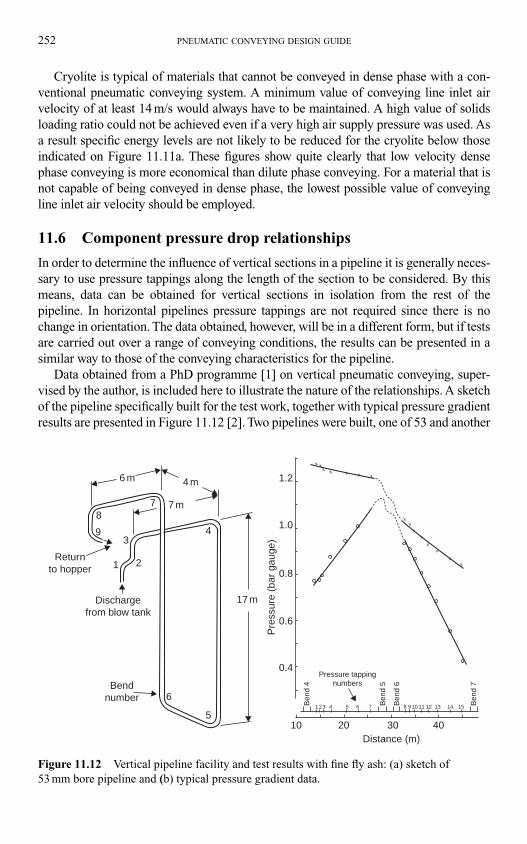
252 PNEUMATIC CONVEYING DESIGN GUIDE
Cryolite is typical of materials that cannot be conveyed in dense phase with a con-
ventional pneumatic conveying system. A minimum value of conveying line inlet air
velocity of at least 14 m/s would always have to be maintained. A high value of solids
loading ratio could not be achieved even if a very high air supply pressure was used. As
a result specific energy levels are not likely to be reduced for the cryolite below those
indicated on Figure 11.11a. These figures show quite clearly that low velocity dense
phase conveying is more economical than dilute phase conveying. For a material that is
not capable of being conveyed in dense phase, the lowest possible value of conveying
line inlet air velocity should be employed.
11.6 Component pressure drop relationships
In order to determine the influence of vertical sections in a pipeline it is generally neces-
sary to use pressure tappings along the length of the section to be considered. By this
means, data can be obtained for vertical sections in isolation from the rest of the
pipeline. In horizontal pipelines pressure tappings are not required since there is no
change in orientation. The data obtained, however, will be in a different form, but if tests
are carried out over a range of conveying conditions, the results can be presented in a
similar way to those of the conveying characteristics for the pipeline.
Data obtained from a PhD programme [1] on vertical pneumatic conveying, super-
vised by the author, is included here to illustrate the nature of the relationships. A sketch
of the pipeline specifically built for the test work, together with typical pressure gradient
results are presented in Figure 11.12 [2]. Two pipelines were built, one of 53 and another
xx
xx
xx
xx
xxxxxxx
6 m 4 m
17 m
7 m
1.2
1.0
0.8
0.6
Pre
ssur
e (b
ar g
auge
)
0.4
10 20 30 40Distance (m)
Pressure tappingnumbers
1 23 4 5 6 7 8 910 11 12 13 14 15Ben
d 4
Ben
d 5
Ben
d 6
Ben
d 7
Returnto hopper
Dischargefrom blow tank
Bendnumber 6
5
4
21
39
87
Figure 11.12 Vertical pipeline facility and test results with fine fly ash: (a) sketch of
53 mm bore pipeline and (b) typical pressure gradient data.
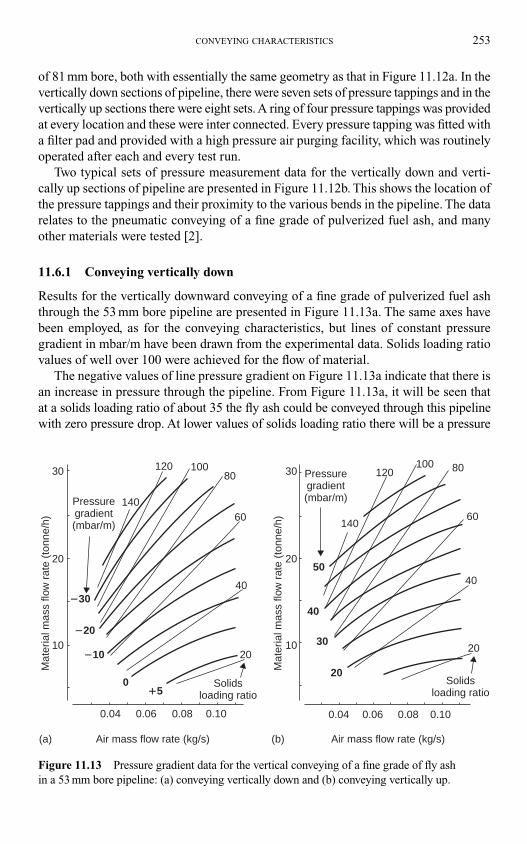
CONVEYING CHARACTERISTICS 253
of 81 mm bore, both with essentially the same geometry as that in Figure 11.12a. In the
vertically down sections of pipeline, there were seven sets of pressure tappings and in the
vertically up sections there were eight sets. A ring of four pressure tappings was provided
at every location and these were inter connected. Every pressure tapping was fitted with
a filter pad and provided with a high pressure air purging facility, which was routinely
operated after each and every test run.
Two typical sets of pressure measurement data for the vertically down and verti-
cally up sections of pipeline are presented in Figure 11.12b. This shows the location of
the pressure tappings and their proximity to the various bends in the pipeline. The data
relates to the pneumatic conveying of a fine grade of pulverized fuel ash, and many
other materials were tested [2].
11.6.1 Conveying vertically down
Results for the vertically downward conveying of a fine grade of pulverized fuel ash
through the 53 mm bore pipeline are presented in Figure 11.13a. The same axes have
been employed, as for the conveying characteristics, but lines of constant pressure
gradient in mbar/m have been drawn from the experimental data. Solids loading ratio
values of well over 100 were achieved for the flow of material.
The negative values of line pressure gradient on Figure 11.13a indicate that there is
an increase in pressure through the pipeline. From Figure 11.13a, it will be seen that
at a solids loading ratio of about 35 the fly ash could be conveyed through this pipeline
with zero pressure drop. At lower values of solids loading ratio there will be a pressure
0
0.04 0.06
Air mass flow rate (kg/s)(a) (b) Air mass flow rate (kg/s)
Mat
eria
l mas
s flo
w r
ate
(ton
ne/h
)
Mat
eria
l mas
s flo
w r
ate
(ton
ne/h
)
0.08 0.10
Solidsloading ratio
20
40
60
80100120
140
30
20
10
30
20
10
20
0.04 0.06 0.08 0.10
30
40
50
140
120100 80
60
40
20
Solidsloading ratio
�10
�5
�20
�30
Pressuregradient(mbar/m)
Pressuregradient(mbar/m)
Figure 11.13 Pressure gradient data for the vertical conveying of a fine grade of fly ash
in a 53 mm bore pipeline: (a) conveying vertically down and (b) conveying vertically up.
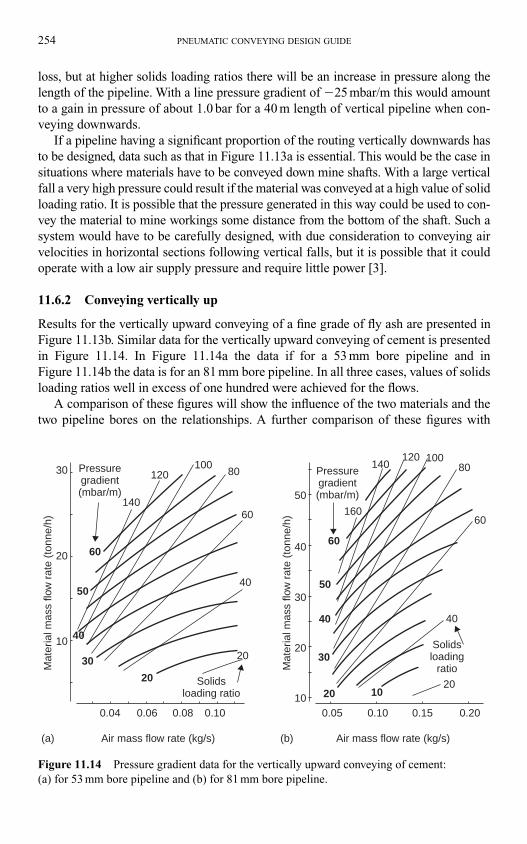
254 PNEUMATIC CONVEYING DESIGN GUIDE
loss, but at higher solids loading ratios there will be an increase in pressure along the
length of the pipeline. With a line pressure gradient of �25 mbar/m this would amount
to a gain in pressure of about 1.0 bar for a 40 m length of vertical pipeline when con-
veying downwards.
If a pipeline having a significant proportion of the routing vertically downwards has
to be designed, data such as that in Figure 11.13a is essential. This would be the case in
situations where materials have to be conveyed down mine shafts. With a large vertical
fall a very high pressure could result if the material was conveyed at a high value of solid
loading ratio. It is possible that the pressure generated in this way could be used to con-
vey the material to mine workings some distance from the bottom of the shaft. Such a
system would have to be carefully designed, with due consideration to conveying air
velocities in horizontal sections following vertical falls, but it is possible that it could
operate with a low air supply pressure and require little power [3].
11.6.2 Conveying vertically up
Results for the vertically upward conveying of a fine grade of fly ash are presented in
Figure 11.13b. Similar data for the vertically upward conveying of cement is presented
in Figure 11.14. In Figure 11.14a the data if for a 53 mm bore pipeline and in
Figure 11.14b the data is for an 81 mm bore pipeline. In all three cases, values of solids
loading ratios well in excess of one hundred were achieved for the flows.
A comparison of these figures will show the influence of the two materials and the
two pipeline bores on the relationships. A further comparison of these figures with
10080
60
120
140
60
30
20
10
50
10
20
20
30
40
50
60
160
140Pressuregradient(mbar/m)
120 10080
60
1020
40
Solidsloading
ratio
30
40
Mat
eria
l mas
s flo
w r
ate
(ton
ne/h
)
Mat
eria
l mas
s flo
w r
ate
(ton
ne/h
)
50
40
30
20
0.04 0.06
Air mass flow rate (kg/s)(a) (b)
0.08 0.10 0.05 0.10
Air mass flow rate (kg/s)
0.15 0.20
Solidsloading ratio
Pressuregradient(mbar/m)
20
40
Figure 11.14 Pressure gradient data for the vertically upward conveying of cement:
(a) for 53 mm bore pipeline and (b) for 81 mm bore pipeline.
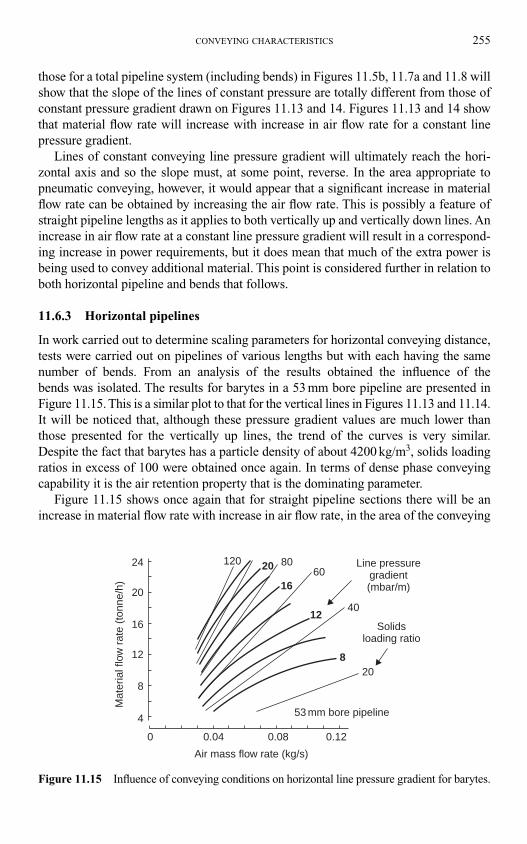
CONVEYING CHARACTERISTICS 255
those for a total pipeline system (including bends) in Figures 11.5b, 11.7a and 11.8 will
show that the slope of the lines of constant pressure are totally different from those of
constant pressure gradient drawn on Figures 11.13 and 14. Figures 11.13 and 14 show
that material flow rate will increase with increase in air flow rate for a constant line
pressure gradient.
Lines of constant conveying line pressure gradient will ultimately reach the hori-
zontal axis and so the slope must, at some point, reverse. In the area appropriate to
pneumatic conveying, however, it would appear that a significant increase in material
flow rate can be obtained by increasing the air flow rate. This is possibly a feature of
straight pipeline lengths as it applies to both vertically up and vertically down lines. An
increase in air flow rate at a constant line pressure gradient will result in a correspond-
ing increase in power requirements, but it does mean that much of the extra power is
being used to convey additional material. This point is considered further in relation to
both horizontal pipeline and bends that follows.
11.6.3 Horizontal pipelines
In work carried out to determine scaling parameters for horizontal conveying distance,
tests were carried out on pipelines of various lengths but with each having the same
number of bends. From an analysis of the results obtained the influence of the
bends was isolated. The results for barytes in a 53 mm bore pipeline are presented in
Figure 11.15. This is a similar plot to that for the vertical lines in Figures 11.13 and 11.14.
It will be noticed that, although these pressure gradient values are much lower than
those presented for the vertically up lines, the trend of the curves is very similar.
Despite the fact that barytes has a particle density of about 4200 kg/m3, solids loading
ratios in excess of 100 were obtained once again. In terms of dense phase conveying
capability it is the air retention property that is the dominating parameter.
Figure 11.15 shows once again that for straight pipeline sections there will be an
increase in material flow rate with increase in air flow rate, in the area of the conveying
120 20 80
1660
1240
820
Solidsloading ratio
53 mm bore pipeline4
0 0.04 0.08 0.12
Air mass flow rate (kg/s)
Mat
eria
l flo
w r
ate
(ton
ne/h
)
8
12
16
20
24 Line pressuregradient(mbar/m)
Figure 11.15 Influence of conveying conditions on horizontal line pressure gradient for barytes.
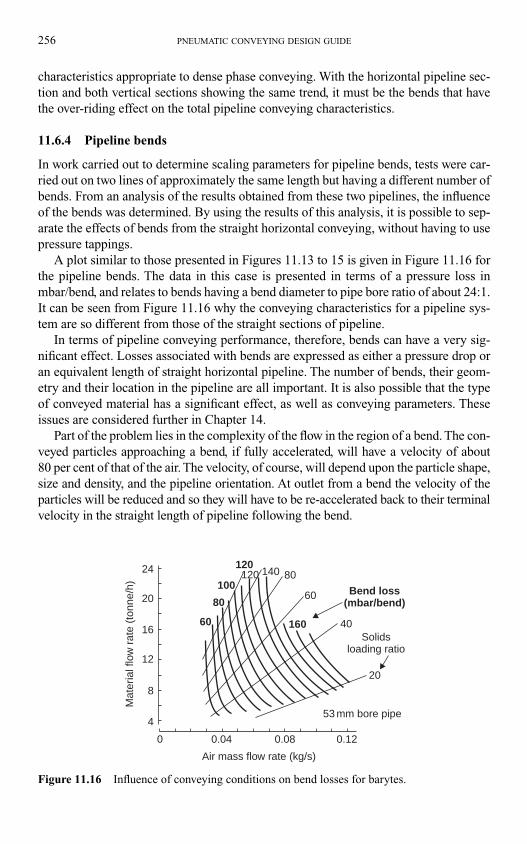
256 PNEUMATIC CONVEYING DESIGN GUIDE
characteristics appropriate to dense phase conveying. With the horizontal pipeline sec-
tion and both vertical sections showing the same trend, it must be the bends that have
the over-riding effect on the total pipeline conveying characteristics.
11.6.4 Pipeline bends
In work carried out to determine scaling parameters for pipeline bends, tests were car-
ried out on two lines of approximately the same length but having a different number of
bends. From an analysis of the results obtained from these two pipelines, the influence
of the bends was determined. By using the results of this analysis, it is possible to sep-
arate the effects of bends from the straight horizontal conveying, without having to use
pressure tappings.
A plot similar to those presented in Figures 11.13 to 15 is given in Figure 11.16 for
the pipeline bends. The data in this case is presented in terms of a pressure loss in
mbar/bend, and relates to bends having a bend diameter to pipe bore ratio of about 24:1.
It can be seen from Figure 11.16 why the conveying characteristics for a pipeline sys-
tem are so different from those of the straight sections of pipeline.
In terms of pipeline conveying performance, therefore, bends can have a very sig-
nificant effect. Losses associated with bends are expressed as either a pressure drop or
an equivalent length of straight horizontal pipeline. The number of bends, their geom-
etry and their location in the pipeline are all important. It is also possible that the type
of conveyed material has a significant effect, as well as conveying parameters. These
issues are considered further in Chapter 14.
Part of the problem lies in the complexity of the flow in the region of a bend. The con-
veyed particles approaching a bend, if fully accelerated, will have a velocity of about
80 per cent of that of the air. The velocity, of course, will depend upon the particle shape,
size and density, and the pipeline orientation. At outlet from a bend the velocity of the
particles will be reduced and so they will have to be re-accelerated back to their terminal
velocity in the straight length of pipeline following the bend.
4
0 0.04 0.08 0.12
Air mass flow rate (kg/s)
Mat
eria
l flo
w r
ate
(ton
ne/h
)
8
12
16
20
24 120120
100
80
60
60
80140
160 40
20
Bend loss(mbar/bend)
Solidsloading ratio
53 mm bore pipe
Figure 11.16 Influence of conveying conditions on bend losses for barytes.
11.7 Nomenclature
A pipe section area m2
C conveying air velocity m/s
d pipeline bore m
f pipeline friction factor –
L pipeline length m
m.
mass flow rate kg/s for air
tonne/h for material
P power kW
p air pressure kN/m2
R characteristic gas constant kJ/kg�KT air temperature (absolute) K
V.
volumetric flow rate m3/s
11.7.1 Greek
� air density kg/m3
� solids loading ratio –
11.7.2 Subscripts
a air
p conveyed material or particles
1 inlet conditions and reference
2 exit conditions and reference
11.7.3 Prefixes
� difference in value
References
1. P Marjanovic. An investigation of the behaviour of gas–solids mixture flow properties for
vertical conveying in pipelines. PhD Thesis. CNAA. Thames Polytechnic (now the University
of Greenwich), London, UK. 1984.
2. D Mills. A review of the research work of Professor Predrag Marjanovic. Proc 4th Int Conf
for Conveying and handling of particulate solids. Budapest. May 2003.
3. D Mills. Application of stepped pipelines in pneumatic conveying systems. Proc 15th Int
Conf on Hydrotransport Incorporating the 11th Int Symp on Freight Pipelines. Banff,
Canada. pp. 401–416. June 2002.
� a
˙
. ˙
m
mp
3 6
CONVEYING CHARACTERISTICS 257
12.1 Introduction
In Chapter 11 a limited number of materials were considered in order to illustrate the
global differences between dilute phase and dense phase conveying. For dense phase
conveying only powdered materials having good air retention properties were considered.
Within this framework the influence of air flow rate and conveying air velocity were
considered, particularly in terms of power requirements and energy considerations.
Conveying with high pressure air was employed in most cases to show the influence
on the conveying capability of the different materials being considered. Low pressure
conveying data is therefore automatically included in all of the conveying characteristics
presented in Chapter 11, but it does tend to get lost and overlooked in the overall scale.
Similarly the low pressure, and hence dilute phase conveying, of the materials having
good air retention, also tends to disappear into the bottom right hand corner of the
overall conveying characteristics of these materials when conveyed with high pressure air.
In this chapter a much wider range of materials is considered and low pressure con-
veying data is specifically included so that the performance of all types of material can
be examined at low values of solids loading ratio. Both sliding bed and plug flow modes
of dense phase conveying are considered in the range of materials included.
12.2 The influence of materials
The conveying characteristics for different materials can vary significantly. This is
particularly so for materials capable of being conveyed in dense phase. At low values
of air flow rate the lines of constant conveying line pressure drop can have a wide var-
iety of slopes. There is also the added complexity of different materials having differ-
ent minimum conveying limits. Thus for a given air flow rate and conveying line
pressure drop, material flow rates for different materials can vary considerably, and the
air flow rate necessary to convey different materials can also vary considerably.
Some of these differences were illustrated in the previous chapter with the mater-
ials used to show how conveying characteristics are determined and to compare power
and energy requirements. These differences, however, are not just a feature of convey-
ing with high pressure air but will be found in low pressure systems also.
12.2.1 Low pressure conveying – Part I
If only low pressure air is available for conveying a material through a pipeline, such as
that from a positive displacement blower or a vacuum system, and below about 1 bar
Chapter 12
Conveying capability
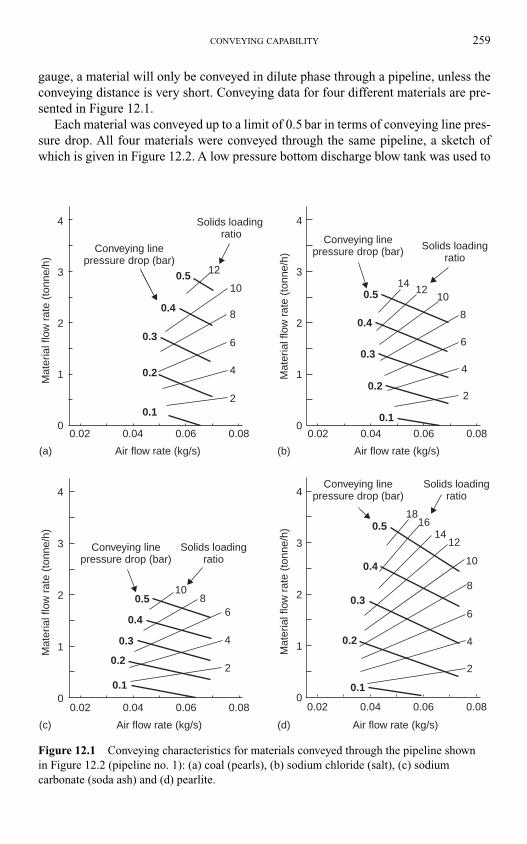
CONVEYING CAPABILITY 259
gauge, a material will only be conveyed in dilute phase through a pipeline, unless the
conveying distance is very short. Conveying data for four different materials are pre-
sented in Figure 12.1.
Each material was conveyed up to a limit of 0.5 bar in terms of conveying line pres-
sure drop. All four materials were conveyed through the same pipeline, a sketch of
which is given in Figure 12.2. A low pressure bottom discharge blow tank was used to
Conveying linepressure drop (bar)
Solids loading ratio
Air flow rate (kg/s)
4
3
2
1
00.02 0.04 0.06 0.08
0.1
0.2
0.3
0.4
0.5 12
10
8
6
4
2
Mat
eria
l flo
w r
ate
(ton
ne/h
)
Conveying linepressure drop (bar)
Solids loadingratio
Air flow rate (kg/s)
4
3
2
1
00.02 0.04 0.06 0.08
0.1
0.2
0.3
0.4
0.510
86
4
2
Mat
eria
l flo
w r
ate
(ton
ne/h
)
Conveying linepressure drop (bar) Solids loading
ratio
Air flow rate (kg/s)
4
3
2
1
00.02 0.04 0.06 0.08
0.1
0.2
0.3
0.4
0.5 1012
14
8
6
4
2
Mat
eria
l flo
w r
ate
(ton
ne/h
)
Conveying linepressure drop (bar)
Solids loadingratio
Air flow rate (kg/s)
4
3
2
1
00.02 0.04 0.06 0.08
0.1
0.2
0.3
0.4
0.518
1614
12
10
8
6
4
2
Mat
eria
l flo
w r
ate
(ton
ne/h
)
(a)
(c) (d)
(b)
Figure 12.1 Conveying characteristics for materials conveyed through the pipeline shown
in Figure 12.2 (pipeline no. 1): (a) coal (pearls), (b) sodium chloride (salt), (c) sodium
carbonate (soda ash) and (d) pearlite.
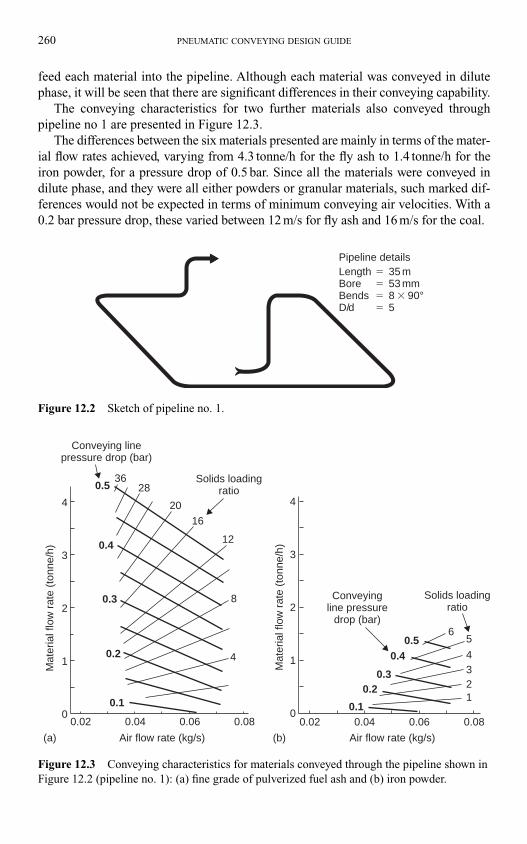
260 PNEUMATIC CONVEYING DESIGN GUIDE
feed each material into the pipeline. Although each material was conveyed in dilute
phase, it will be seen that there are significant differences in their conveying capability.
The conveying characteristics for two further materials also conveyed through
pipeline no 1 are presented in Figure 12.3.
The differences between the six materials presented are mainly in terms of the mater-
ial flow rates achieved, varying from 4.3 tonne/h for the fly ash to 1.4 tonne/h for the
iron powder, for a pressure drop of 0.5 bar. Since all the materials were conveyed in
dilute phase, and they were all either powders or granular materials, such marked dif-
ferences would not be expected in terms of minimum conveying air velocities. With a
0.2 bar pressure drop, these varied between 12 m/s for fly ash and 16 m/s for the coal.
Length � 35 mBore � 53 mmBends � 8 � 90°D/d � 5
Pipeline details
Figure 12.2 Sketch of pipeline no. 1.
4
3
2
1
0
4
8
12
16
20
Solids loadingratio
Solids loadingratio
2836
0.5
0.4
0.3
0.20.5 5
4321
6
0.4
0.30.2
0.10
1
2
3
4
0.02 0.04 0.06 0.08
0.1
0.02 0.04 0.06 0.08
Conveying linepressure drop (bar)
Conveyingline pressure
drop (bar)
Air flow rate (kg/s) Air flow rate (kg/s)
Mat
eria
l flo
w r
ate
(ton
ne/h
)
Mat
eria
l flo
w r
ate
(ton
ne/h
)
(a) (b)
Figure 12.3 Conveying characteristics for materials conveyed through the pipeline shown in
Figure 12.2 (pipeline no. 1): (a) fine grade of pulverized fuel ash and (b) iron powder.
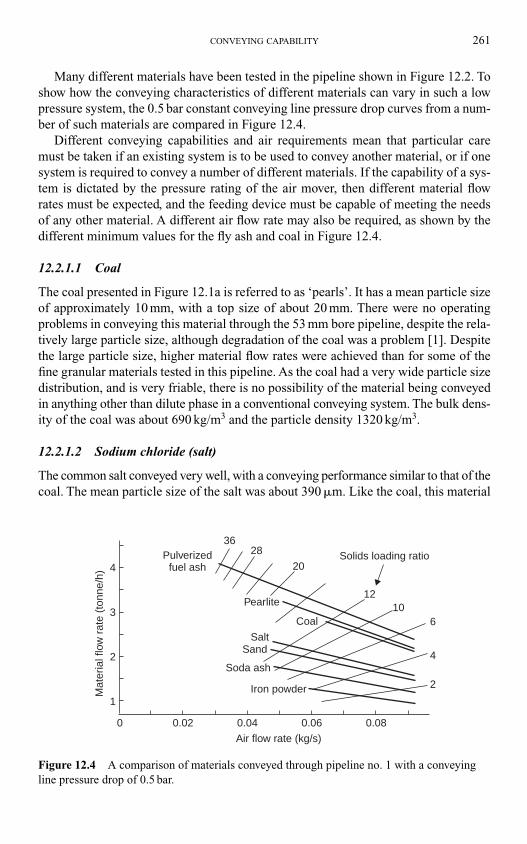
CONVEYING CAPABILITY 261
Many different materials have been tested in the pipeline shown in Figure 12.2. To
show how the conveying characteristics of different materials can vary in such a low
pressure system, the 0.5 bar constant conveying line pressure drop curves from a num-
ber of such materials are compared in Figure 12.4.
Different conveying capabilities and air requirements mean that particular care
must be taken if an existing system is to be used to convey another material, or if one
system is required to convey a number of different materials. If the capability of a sys-
tem is dictated by the pressure rating of the air mover, then different material flow
rates must be expected, and the feeding device must be capable of meeting the needs
of any other material. A different air flow rate may also be required, as shown by the
different minimum values for the fly ash and coal in Figure 12.4.
12.2.1.1 Coal
The coal presented in Figure 12.1a is referred to as ‘pearls’. It has a mean particle size
of approximately 10 mm, with a top size of about 20 mm. There were no operating
problems in conveying this material through the 53 mm bore pipeline, despite the rela-
tively large particle size, although degradation of the coal was a problem [1]. Despite
the large particle size, higher material flow rates were achieved than for some of the
fine granular materials tested in this pipeline. As the coal had a very wide particle size
distribution, and is very friable, there is no possibility of the material being conveyed
in anything other than dilute phase in a conventional conveying system. The bulk dens-
ity of the coal was about 690 kg/m3 and the particle density 1320 kg/m3.
12.2.1.2 Sodium chloride (salt)
The common salt conveyed very well, with a conveying performance similar to that of the
coal. The mean particle size of the salt was about 390 �m. Like the coal, this material
4
3
2
1
0 0.02 0.04 0.06 0.08
3628
20
1210
6
4
2
Pulverizedfuel ash
Pearlite
Coal
SaltSand
Soda ash
Iron powder
Solids loading ratio
Air flow rate (kg/s)
Mat
eria
l flo
w r
ate
(ton
ne/h
)
Figure 12.4 A comparison of materials conveyed through pipeline no. 1 with a conveying
line pressure drop of 0.5 bar.
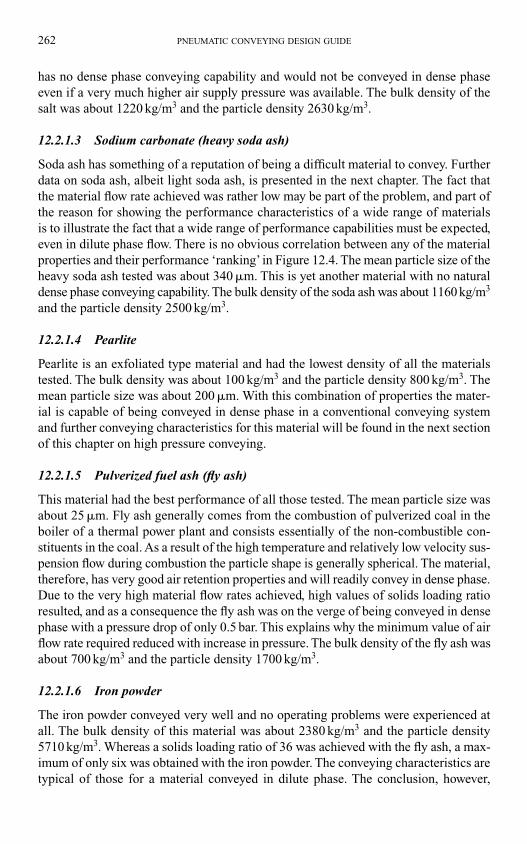
has no dense phase conveying capability and would not be conveyed in dense phase
even if a very much higher air supply pressure was available. The bulk density of the
salt was about 1220 kg/m3 and the particle density 2630 kg/m3.
12.2.1.3 Sodium carbonate (heavy soda ash)
Soda ash has something of a reputation of being a difficult material to convey. Further
data on soda ash, albeit light soda ash, is presented in the next chapter. The fact that
the material flow rate achieved was rather low may be part of the problem, and part of
the reason for showing the performance characteristics of a wide range of materials
is to illustrate the fact that a wide range of performance capabilities must be expected,
even in dilute phase flow. There is no obvious correlation between any of the material
properties and their performance ‘ranking’ in Figure 12.4. The mean particle size of the
heavy soda ash tested was about 340 �m. This is yet another material with no natural
dense phase conveying capability. The bulk density of the soda ash was about 1160 kg/m3
and the particle density 2500 kg/m3.
12.2.1.4 Pearlite
Pearlite is an exfoliated type material and had the lowest density of all the materials
tested. The bulk density was about 100 kg/m3 and the particle density 800 kg/m3. The
mean particle size was about 200 �m. With this combination of properties the mater-
ial is capable of being conveyed in dense phase in a conventional conveying system
and further conveying characteristics for this material will be found in the next section
of this chapter on high pressure conveying.
12.2.1.5 Pulverized fuel ash (fly ash)
This material had the best performance of all those tested. The mean particle size was
about 25 �m. Fly ash generally comes from the combustion of pulverized coal in the
boiler of a thermal power plant and consists essentially of the non-combustible con-
stituents in the coal. As a result of the high temperature and relatively low velocity sus-
pension flow during combustion the particle shape is generally spherical. The material,
therefore, has very good air retention properties and will readily convey in dense phase.
Due to the very high material flow rates achieved, high values of solids loading ratio
resulted, and as a consequence the fly ash was on the verge of being conveyed in dense
phase with a pressure drop of only 0.5 bar. This explains why the minimum value of air
flow rate required reduced with increase in pressure. The bulk density of the fly ash was
about 700 kg/m3 and the particle density 1700 kg/m3.
12.2.1.6 Iron powder
The iron powder conveyed very well and no operating problems were experienced at
all. The bulk density of this material was about 2380 kg/m3 and the particle density
5710 kg/m3. Whereas a solids loading ratio of 36 was achieved with the fly ash, a max-
imum of only six was obtained with the iron powder. The conveying characteristics are
typical of those for a material conveyed in dilute phase. The conclusion, however,
262 PNEUMATIC CONVEYING DESIGN GUIDE
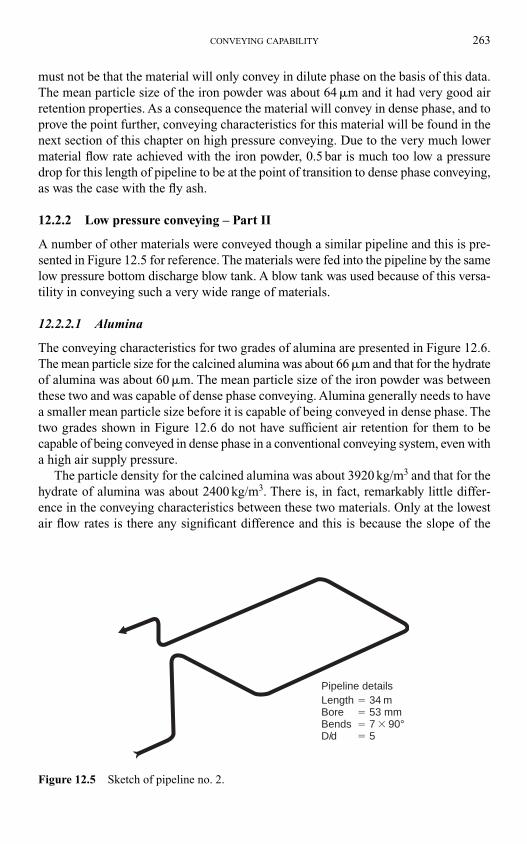
CONVEYING CAPABILITY 263
must not be that the material will only convey in dilute phase on the basis of this data.
The mean particle size of the iron powder was about 64 �m and it had very good air
retention properties. As a consequence the material will convey in dense phase, and to
prove the point further, conveying characteristics for this material will be found in the
next section of this chapter on high pressure conveying. Due to the very much lower
material flow rate achieved with the iron powder, 0.5 bar is much too low a pressure
drop for this length of pipeline to be at the point of transition to dense phase conveying,
as was the case with the fly ash.
12.2.2 Low pressure conveying – Part II
A number of other materials were conveyed though a similar pipeline and this is pre-
sented in Figure 12.5 for reference. The materials were fed into the pipeline by the same
low pressure bottom discharge blow tank. A blow tank was used because of this versa-
tility in conveying such a very wide range of materials.
12.2.2.1 Alumina
The conveying characteristics for two grades of alumina are presented in Figure 12.6.
The mean particle size for the calcined alumina was about 66 �m and that for the hydrate
of alumina was about 60 �m. The mean particle size of the iron powder was between
these two and was capable of dense phase conveying. Alumina generally needs to have
a smaller mean particle size before it is capable of being conveyed in dense phase. The
two grades shown in Figure 12.6 do not have sufficient air retention for them to be
capable of being conveyed in dense phase in a conventional conveying system, even with
a high air supply pressure.
The particle density for the calcined alumina was about 3920 kg/m3 and that for the
hydrate of alumina was about 2400 kg/m3. There is, in fact, remarkably little differ-
ence in the conveying characteristics between these two materials. Only at the lowest
air flow rates is there any significant difference and this is because the slope of the
Pipeline detailsLength � 34 mBore � 53 mmBends � 7 � 90°D/d � 5
Figure 12.5 Sketch of pipeline no. 2.
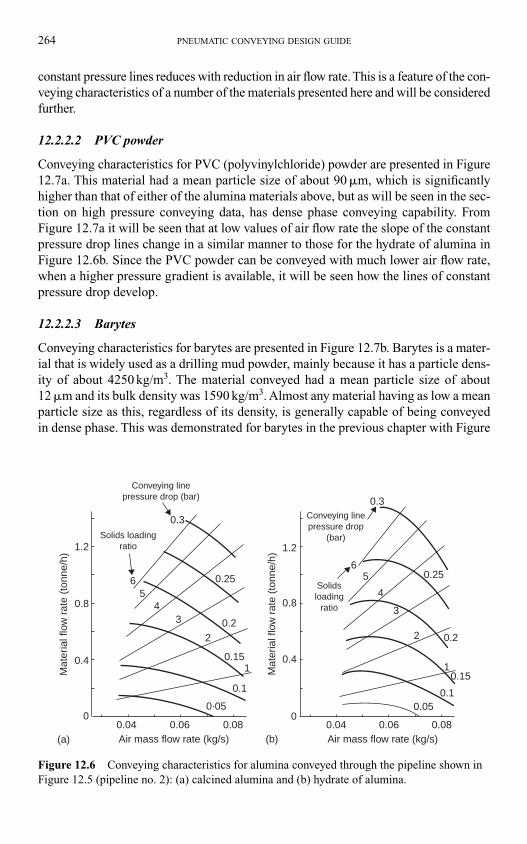
264 PNEUMATIC CONVEYING DESIGN GUIDE
constant pressure lines reduces with reduction in air flow rate. This is a feature of the con-
veying characteristics of a number of the materials presented here and will be considered
further.
12.2.2.2 PVC powder
Conveying characteristics for PVC (polyvinylchloride) powder are presented in Figure
12.7a. This material had a mean particle size of about 90 �m, which is significantly
higher than that of either of the alumina materials above, but as will be seen in the sec-
tion on high pressure conveying data, has dense phase conveying capability. From
Figure 12.7a it will be seen that at low values of air flow rate the slope of the constant
pressure drop lines change in a similar manner to those for the hydrate of alumina in
Figure 12.6b. Since the PVC powder can be conveyed with much lower air flow rate,
when a higher pressure gradient is available, it will be seen how the lines of constant
pressure drop develop.
12.2.2.3 Barytes
Conveying characteristics for barytes are presented in Figure 12.7b. Barytes is a mater-
ial that is widely used as a drilling mud powder, mainly because it has a particle dens-
ity of about 4250 kg/m3. The material conveyed had a mean particle size of about
12 �m and its bulk density was 1590 kg/m3. Almost any material having as low a mean
particle size as this, regardless of its density, is generally capable of being conveyed
in dense phase. This was demonstrated for barytes in the previous chapter with Figure
Conveying linepressure drop (bar)
Solids loadingratio
Air mass flow rate (kg/s)
Mat
eria
l flo
w r
ate
(ton
ne/h
)
1.2
0.8
0.4
00.04 0.06 0.08
0·05
0.1
0.15
0.2
0.25
0.3
65
43
2
1
Conveying linepressure drop
(bar)
Solidsloading
ratio
Air mass flow rate (kg/s)
Mat
eria
l flo
w r
ate
(ton
ne/h
) 1.2
0.8
0.4
00.04 0.06 0.08
0.050.1
0.15
0.2
0.25
0.3
65
4
3
2
1
(a) (b)
Figure 12.6 Conveying characteristics for alumina conveyed through the pipeline shown in
Figure 12.5 (pipeline no. 2): (a) calcined alumina and (b) hydrate of alumina.
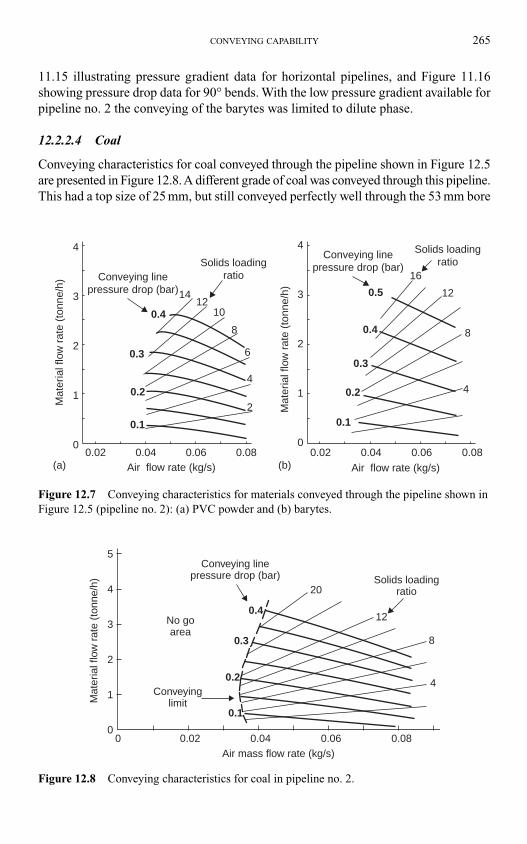
CONVEYING CAPABILITY 265
11.15 illustrating pressure gradient data for horizontal pipelines, and Figure 11.16
showing pressure drop data for 90° bends. With the low pressure gradient available for
pipeline no. 2 the conveying of the barytes was limited to dilute phase.
12.2.2.4 Coal
Conveying characteristics for coal conveyed through the pipeline shown in Figure 12.5
are presented in Figure 12.8. A different grade of coal was conveyed through this pipeline.
This had a top size of 25 mm, but still conveyed perfectly well through the 53 mm bore
Conveying linepressure drop (bar)
Solids loadingratio
Air flow rate (kg/s)
Mat
eria
l flo
w r
ate
(ton
ne/h
)
4
3
2
1
00.02 0.04
0.1
0.2
0.3
0.4
1412
10
8
6
4
2
0.06 0.08
Conveying linepressure drop (bar)
Solids loadingratio
Air flow rate (kg/s)
Mat
eria
l flo
w r
ate
(ton
ne/h
)
4
3
2
1
00.02 0.04
0.1
0.2
0.3
0.4
0.5
16
12
8
4
0.06 0.08(a) (b)
Figure 12.7 Conveying characteristics for materials conveyed through the pipeline shown in
Figure 12.5 (pipeline no. 2): (a) PVC powder and (b) barytes.
5
4
3
2
1
00 0.02
0.4
0.3
20
12
8
40.2
0.1
0.04 0.06 0.08
Conveying linepressure drop (bar)
No goarea
Conveyinglimit
Solids loadingratio
Air mass flow rate (kg/s)
Mat
eria
l flo
w r
ate
(ton
ne/h
)
Figure 12.8 Conveying characteristics for coal in pipeline no. 2.
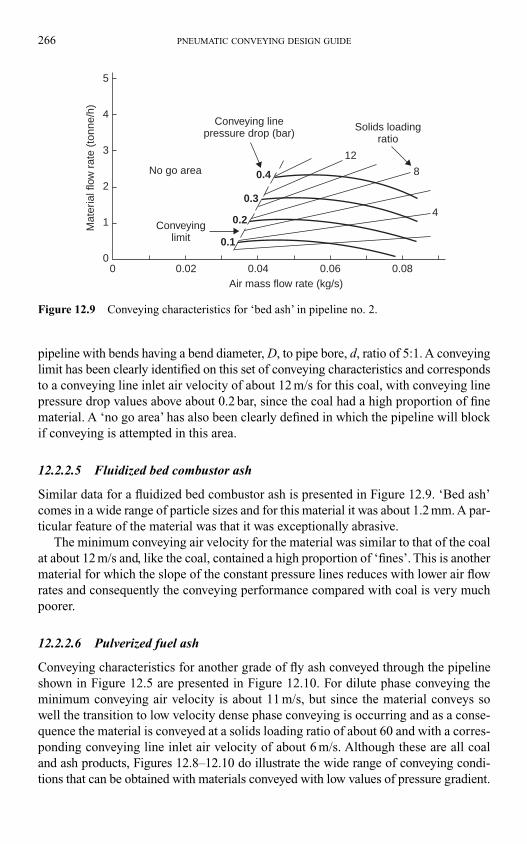
266 PNEUMATIC CONVEYING DESIGN GUIDE
pipeline with bends having a bend diameter, D, to pipe bore, d, ratio of 5:1. A conveying
limit has been clearly identified on this set of conveying characteristics and corresponds
to a conveying line inlet air velocity of about 12 m/s for this coal, with conveying line
pressure drop values above about 0.2 bar, since the coal had a high proportion of fine
material. A ‘no go area’ has also been clearly defined in which the pipeline will block
if conveying is attempted in this area.
12.2.2.5 Fluidized bed combustor ash
Similar data for a fluidized bed combustor ash is presented in Figure 12.9. ‘Bed ash’
comes in a wide range of particle sizes and for this material it was about 1.2 mm. A par-
ticular feature of the material was that it was exceptionally abrasive.
The minimum conveying air velocity for the material was similar to that of the coal
at about 12 m/s and, like the coal, contained a high proportion of ‘fines’. This is another
material for which the slope of the constant pressure lines reduces with lower air flow
rates and consequently the conveying performance compared with coal is very much
poorer.
12.2.2.6 Pulverized fuel ash
Conveying characteristics for another grade of fly ash conveyed through the pipeline
shown in Figure 12.5 are presented in Figure 12.10. For dilute phase conveying the
minimum conveying air velocity is about 11 m/s, but since the material conveys so
well the transition to low velocity dense phase conveying is occurring and as a conse-
quence the material is conveyed at a solids loading ratio of about 60 and with a corres-
ponding conveying line inlet air velocity of about 6 m/s. Although these are all coal
and ash products, Figures 12.8–12.10 do illustrate the wide range of conveying condi-
tions that can be obtained with materials conveyed with low values of pressure gradient.
5
4
3
2
1
00 0.02
0.4
0.3
12
8
40.2
0.1
0.04 0.06 0.08
Conveying linepressure drop (bar)
No go area
Conveyinglimit
Solids loadingratio
Air mass flow rate (kg/s)
Mat
eria
l flo
w r
ate
(ton
ne/h
)
Figure 12.9 Conveying characteristics for ‘bed ash’ in pipeline no. 2.
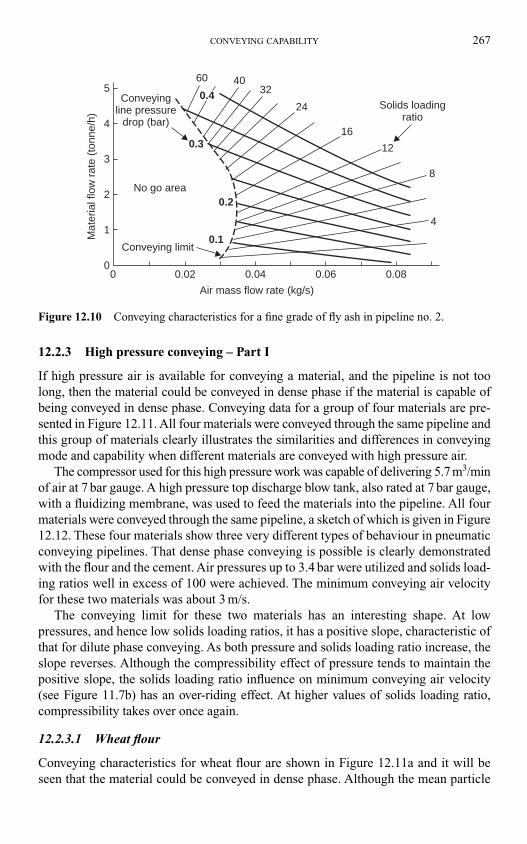
CONVEYING CAPABILITY 267
12.2.3 High pressure conveying – Part I
If high pressure air is available for conveying a material, and the pipeline is not too
long, then the material could be conveyed in dense phase if the material is capable of
being conveyed in dense phase. Conveying data for a group of four materials are pre-
sented in Figure 12.11. All four materials were conveyed through the same pipeline and
this group of materials clearly illustrates the similarities and differences in conveying
mode and capability when different materials are conveyed with high pressure air.
The compressor used for this high pressure work was capable of delivering 5.7 m3/min
of air at 7 bar gauge. A high pressure top discharge blow tank, also rated at 7 bar gauge,
with a fluidizing membrane, was used to feed the materials into the pipeline. All four
materials were conveyed through the same pipeline, a sketch of which is given in Figure
12.12. These four materials show three very different types of behaviour in pneumatic
conveying pipelines. That dense phase conveying is possible is clearly demonstrated
with the flour and the cement. Air pressures up to 3.4 bar were utilized and solids load-
ing ratios well in excess of 100 were achieved. The minimum conveying air velocity
for these two materials was about 3 m/s.
The conveying limit for these two materials has an interesting shape. At low
pressures, and hence low solids loading ratios, it has a positive slope, characteristic of
that for dilute phase conveying. As both pressure and solids loading ratio increase, the
slope reverses. Although the compressibility effect of pressure tends to maintain the
positive slope, the solids loading ratio influence on minimum conveying air velocity
(see Figure 11.7b) has an over-riding effect. At higher values of solids loading ratio,
compressibility takes over once again.
12.2.3.1 Wheat flour
Conveying characteristics for wheat flour are shown in Figure 12.11a and it will be
seen that the material could be conveyed in dense phase. Although the mean particle
00
1
2
3
4
5
0.02 0.04 0.06 0.08
Conveyingline pressure
drop (bar)
Conveying limit
60 4032
24
16
12
8
4
Solids loadingratio
Air mass flow rate (kg/s)
Mat
eria
l flo
w r
ate
(ton
ne/h
)
0.1
0.2
0.3
0.4
No go area
Figure 12.10 Conveying characteristics for a fine grade of fly ash in pipeline no. 2.
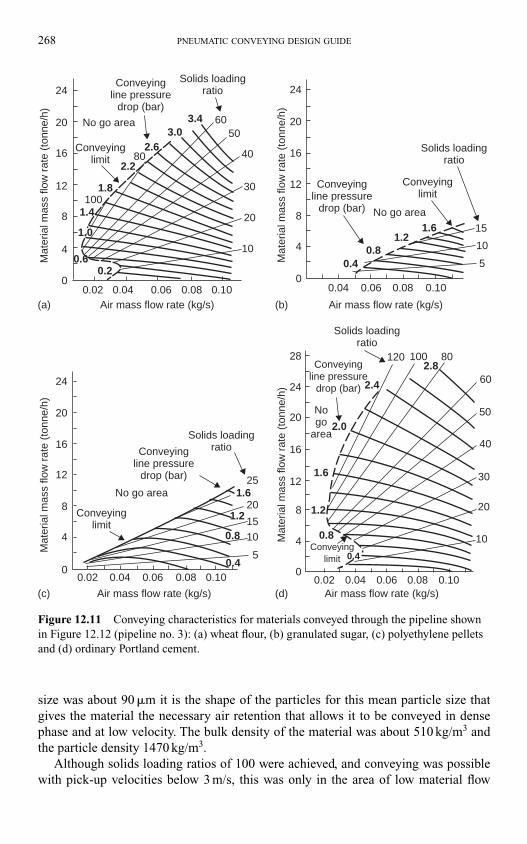
268 PNEUMATIC CONVEYING DESIGN GUIDE
size was about 90 �m it is the shape of the particles for this mean particle size that
gives the material the necessary air retention that allows it to be conveyed in dense
phase and at low velocity. The bulk density of the material was about 510 kg/m3 and
the particle density 1470 kg/m3.
Although solids loading ratios of 100 were achieved, and conveying was possible
with pick-up velocities below 3 m/s, this was only in the area of low material flow
Air mass flow rate (kg/s) Air mass flow rate (kg/s)
Solids loadingratio
Conveyingline pressure
drop (bar)
Conveyingline pressure
drop (bar)
Conveyinglimit
Conveyinglimit
0.020
4
8
12
16
20
24
0
4
8
12
16
20
24
0.60.2
1.0
1.4
1.8
2.2
2.63.0
3.4 60
80
100
50
40
30
20
10
0.04 0.06 0.08 0.10 0.04
0.40.8
1.21.6 15
10
5
0.06 0.08 0.10
Solids loadingratio
Mat
eria
l mas
s flo
w r
ate
(ton
ne/h
)M
ater
ial m
ass
flow
rat
e (t
onne
/h)
Mat
eria
l mas
s flo
w r
ate
(ton
ne/h
)M
ater
ial m
ass
flow
rat
e (t
onne
/h)
Conveyingline pressure
drop (bar)
Conveyinglimit
Solids loadingratio
Air mass flow rate (kg/s)
0.020
4
8
12
16
20
24
0.04 0.06 0.08 0.100.4
5
10
15
20
25
0.8
1.2
1.6No go area
Conveyingline pressure
drop (bar)
Conveyinglimit
Solids loadingratio
Air mass flow rate (kg/s)0.02
0
4
8
12
16
20
24
28
0.04 0.06 0.08
0.4
0.8
1.2
1.6
2.0
2.4
2.8
0.10
10
20
30
40
50
60
80100120
Nogo
area
(a) (b)
(c) (d)
No go area
No go area
Figure 12.11 Conveying characteristics for materials conveyed through the pipeline shown
in Figure 12.12 (pipeline no. 3): (a) wheat flour, (b) granulated sugar, (c) polyethylene pellets
and (d) ordinary Portland cement.
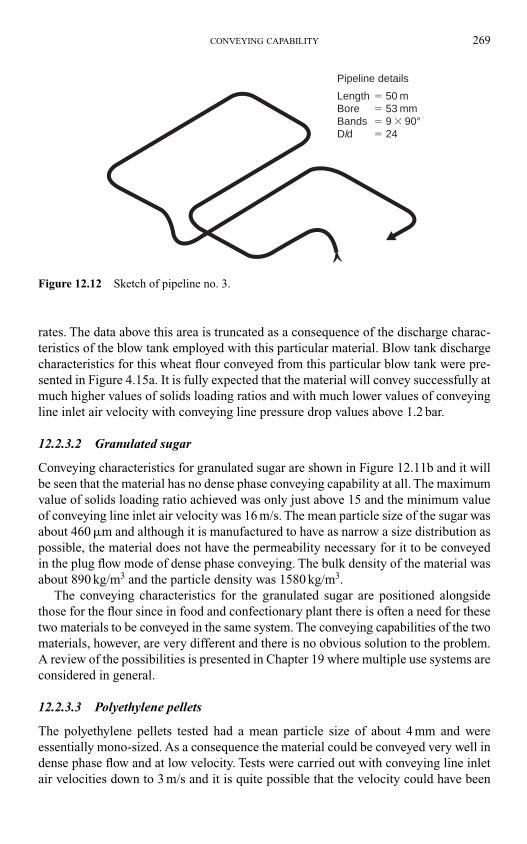
CONVEYING CAPABILITY 269
rates. The data above this area is truncated as a consequence of the discharge charac-
teristics of the blow tank employed with this particular material. Blow tank discharge
characteristics for this wheat flour conveyed from this particular blow tank were pre-
sented in Figure 4.15a. It is fully expected that the material will convey successfully at
much higher values of solids loading ratios and with much lower values of conveying
line inlet air velocity with conveying line pressure drop values above 1.2 bar.
12.2.3.2 Granulated sugar
Conveying characteristics for granulated sugar are shown in Figure 12.11b and it will
be seen that the material has no dense phase conveying capability at all. The maximum
value of solids loading ratio achieved was only just above 15 and the minimum value
of conveying line inlet air velocity was 16 m/s. The mean particle size of the sugar was
about 460 �m and although it is manufactured to have as narrow a size distribution as
possible, the material does not have the permeability necessary for it to be conveyed
in the plug flow mode of dense phase conveying. The bulk density of the material was
about 890 kg/m3 and the particle density was 1580 kg/m3.
The conveying characteristics for the granulated sugar are positioned alongside
those for the flour since in food and confectionary plant there is often a need for these
two materials to be conveyed in the same system. The conveying capabilities of the two
materials, however, are very different and there is no obvious solution to the problem.
A review of the possibilities is presented in Chapter 19 where multiple use systems are
considered in general.
12.2.3.3 Polyethylene pellets
The polyethylene pellets tested had a mean particle size of about 4 mm and were
essentially mono-sized. As a consequence the material could be conveyed very well in
dense phase flow and at low velocity. Tests were carried out with conveying line inlet
air velocities down to 3 m/s and it is quite possible that the velocity could have been
Pipeline details
Length � 50 m Bore � 53 mmBands � 9 � 90°D/d � 24
Figure 12.12 Sketch of pipeline no. 3.
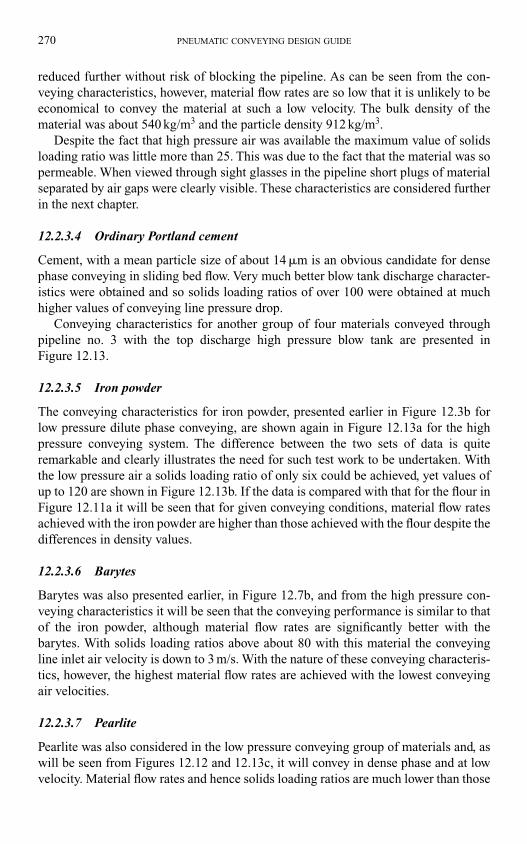
270 PNEUMATIC CONVEYING DESIGN GUIDE
reduced further without risk of blocking the pipeline. As can be seen from the con-
veying characteristics, however, material flow rates are so low that it is unlikely to be
economical to convey the material at such a low velocity. The bulk density of the
material was about 540 kg/m3 and the particle density 912 kg/m3.
Despite the fact that high pressure air was available the maximum value of solids
loading ratio was little more than 25. This was due to the fact that the material was so
permeable. When viewed through sight glasses in the pipeline short plugs of material
separated by air gaps were clearly visible. These characteristics are considered further
in the next chapter.
12.2.3.4 Ordinary Portland cement
Cement, with a mean particle size of about 14 �m is an obvious candidate for dense
phase conveying in sliding bed flow. Very much better blow tank discharge character-
istics were obtained and so solids loading ratios of over 100 were obtained at much
higher values of conveying line pressure drop.
Conveying characteristics for another group of four materials conveyed through
pipeline no. 3 with the top discharge high pressure blow tank are presented in
Figure 12.13.
12.2.3.5 Iron powder
The conveying characteristics for iron powder, presented earlier in Figure 12.3b for
low pressure dilute phase conveying, are shown again in Figure 12.13a for the high
pressure conveying system. The difference between the two sets of data is quite
remarkable and clearly illustrates the need for such test work to be undertaken. With
the low pressure air a solids loading ratio of only six could be achieved, yet values of
up to 120 are shown in Figure 12.13b. If the data is compared with that for the flour in
Figure 12.11a it will be seen that for given conveying conditions, material flow rates
achieved with the iron powder are higher than those achieved with the flour despite the
differences in density values.
12.2.3.6 Barytes
Barytes was also presented earlier, in Figure 12.7b, and from the high pressure con-
veying characteristics it will be seen that the conveying performance is similar to that
of the iron powder, although material flow rates are significantly better with the
barytes. With solids loading ratios above about 80 with this material the conveying
line inlet air velocity is down to 3 m/s. With the nature of these conveying characteris-
tics, however, the highest material flow rates are achieved with the lowest conveying
air velocities.
12.2.3.7 Pearlite
Pearlite was also considered in the low pressure conveying group of materials and, as
will be seen from Figures 12.12 and 12.13c, it will convey in dense phase and at low
velocity. Material flow rates and hence solids loading ratios are much lower than those
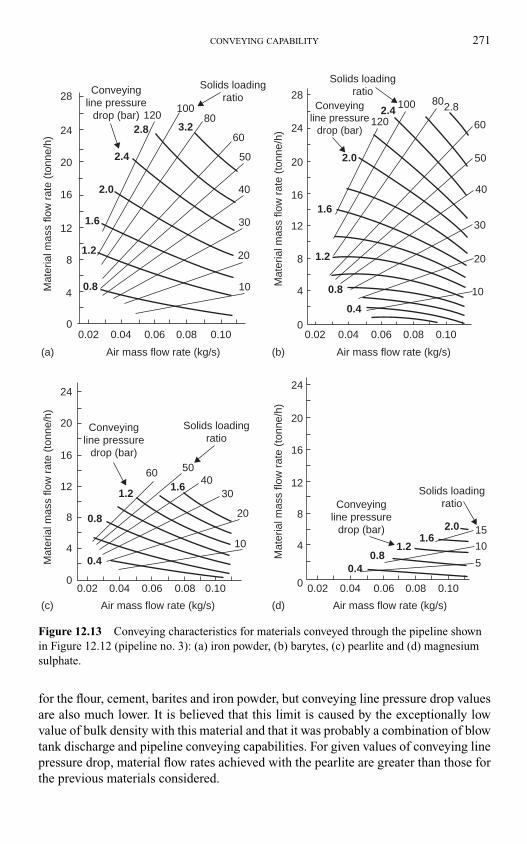
CONVEYING CAPABILITY 271
for the flour, cement, barites and iron powder, but conveying line pressure drop values
are also much lower. It is believed that this limit is caused by the exceptionally low
value of bulk density with this material and that it was probably a combination of blow
tank discharge and pipeline conveying capabilities. For given values of conveying line
pressure drop, material flow rates achieved with the pearlite are greater than those for
the previous materials considered.
Mat
eria
l mas
s flo
w r
ate
(ton
ne/h
)
(a) (b)
(c) (d)
Mat
eria
l mas
s flo
w r
ate
(ton
ne/h
)
Air mass flow rate (kg/s)
50
40
30
20
28
24
16
12
8
410
00.040.02 0.06 0.08
2.0
2.4
2.8 3.2
1.6
1.2
0.8
120
Solids loadingratio
Conveyingline pressure
drop (bar)100
80
60
20
0.10
Mat
eria
l mas
s flo
w r
ate
(ton
ne/h
)
Mat
eria
l mas
s flo
w r
ate
(ton
ne/h
)
5040
30
10
Solids loadingratio
Conveyingline pressure
drop (bar)
60
1.21.6
0.8
0.4
Air mass flow rate (kg/s)
20
20
24
16
12
8
4
00.040.02 0.06 0.08 0.10
Solids loadingratioConveying
line pressuredrop (bar)
Air mass flow rate (kg/s)
20
24
16
12
8
4
0 0.040.02
0.40.8
1.21.6
2.0
5
10
15
0.06 0.08 0.10
Air mass flow rate (kg/s)
50
30
24
4 10
20
28
16
12
8
0
2.0
2.4 2.8
1.6
1.2
0.8
0.4
120
Solids loadingratio
Conveyingline pressure
drop (bar)
100 80
60
40
20
0.040.02 0.06 0.08 0.10
Figure 12.13 Conveying characteristics for materials conveyed through the pipeline shown
in Figure 12.12 (pipeline no. 3): (a) iron powder, (b) barytes, (c) pearlite and (d) magnesium
sulphate.
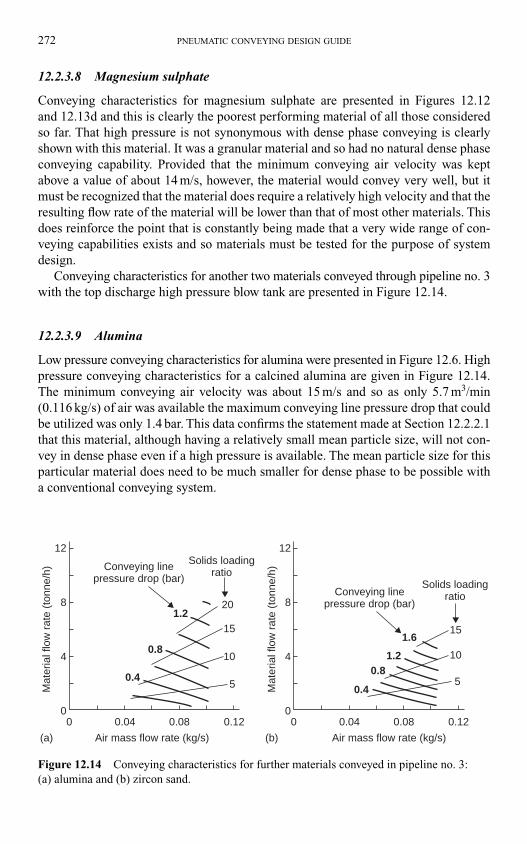
272 PNEUMATIC CONVEYING DESIGN GUIDE
12.2.3.8 Magnesium sulphate
Conveying characteristics for magnesium sulphate are presented in Figures 12.12
and 12.13d and this is clearly the poorest performing material of all those considered
so far. That high pressure is not synonymous with dense phase conveying is clearly
shown with this material. It was a granular material and so had no natural dense phase
conveying capability. Provided that the minimum conveying air velocity was kept
above a value of about 14 m/s, however, the material would convey very well, but it
must be recognized that the material does require a relatively high velocity and that the
resulting flow rate of the material will be lower than that of most other materials. This
does reinforce the point that is constantly being made that a very wide range of con-
veying capabilities exists and so materials must be tested for the purpose of system
design.
Conveying characteristics for another two materials conveyed through pipeline no. 3
with the top discharge high pressure blow tank are presented in Figure 12.14.
12.2.3.9 Alumina
Low pressure conveying characteristics for alumina were presented in Figure 12.6. High
pressure conveying characteristics for a calcined alumina are given in Figure 12.14.
The minimum conveying air velocity was about 15 m/s and so as only 5.7 m3/min
(0.116 kg/s) of air was available the maximum conveying line pressure drop that could
be utilized was only 1.4 bar. This data confirms the statement made at Section 12.2.2.1
that this material, although having a relatively small mean particle size, will not con-
vey in dense phase even if a high pressure is available. The mean particle size for this
particular material does need to be much smaller for dense phase to be possible with
a conventional conveying system.
12
8
4
00 0.04 0.08 0.12
Mat
eria
l flo
w r
ate
(ton
ne/h
) Conveying linepressure drop (bar)
0.4
0.8
1.2
5
10
15
20
Solids loadingratio
Air mass flow rate (kg/s)(a)
12
8
4
00 0.04 0.08 0.12
Mat
eria
l flo
w r
ate
(ton
ne/h
)
Conveying linepressure drop (bar)
0.4
0.81.2
1.6
5
10
15
Solids loadingratio
Air mass flow rate (kg/s)(b)
Figure 12.14 Conveying characteristics for further materials conveyed in pipeline no. 3:
(a) alumina and (b) zircon sand.
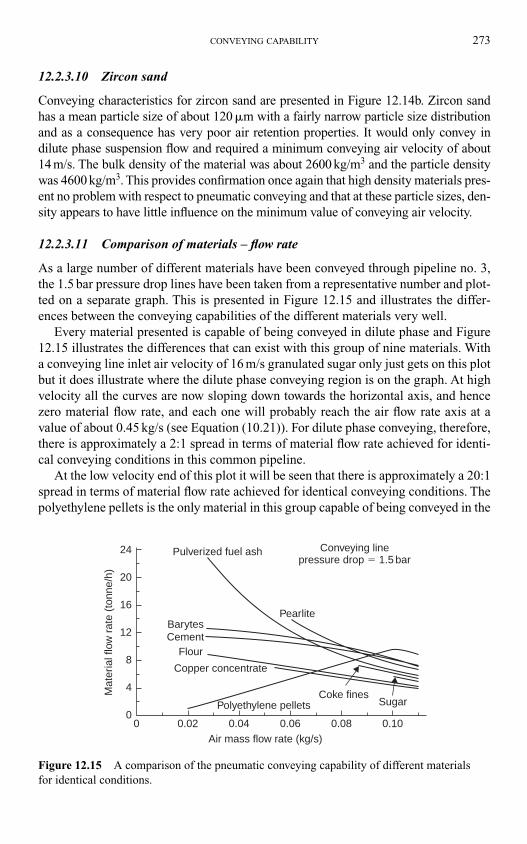
CONVEYING CAPABILITY 273
12.2.3.10 Zircon sand
Conveying characteristics for zircon sand are presented in Figure 12.14b. Zircon sand
has a mean particle size of about 120 �m with a fairly narrow particle size distribution
and as a consequence has very poor air retention properties. It would only convey in
dilute phase suspension flow and required a minimum conveying air velocity of about
14 m/s. The bulk density of the material was about 2600 kg/m3 and the particle density
was 4600 kg/m3. This provides confirmation once again that high density materials pres-
ent no problem with respect to pneumatic conveying and that at these particle sizes, den-
sity appears to have little influence on the minimum value of conveying air velocity.
12.2.3.11 Comparison of materials – flow rate
As a large number of different materials have been conveyed through pipeline no. 3,
the 1.5 bar pressure drop lines have been taken from a representative number and plot-
ted on a separate graph. This is presented in Figure 12.15 and illustrates the differ-
ences between the conveying capabilities of the different materials very well.
Every material presented is capable of being conveyed in dilute phase and Figure
12.15 illustrates the differences that can exist with this group of nine materials. With
a conveying line inlet air velocity of 16 m/s granulated sugar only just gets on this plot
but it does illustrate where the dilute phase conveying region is on the graph. At high
velocity all the curves are now sloping down towards the horizontal axis, and hence
zero material flow rate, and each one will probably reach the air flow rate axis at a
value of about 0.45 kg/s (see Equation (10.21)). For dilute phase conveying, therefore,
there is approximately a 2:1 spread in terms of material flow rate achieved for identi-
cal conveying conditions in this common pipeline.
At the low velocity end of this plot it will be seen that there is approximately a 20:1
spread in terms of material flow rate achieved for identical conveying conditions. The
polyethylene pellets is the only material in this group capable of being conveyed in the
00
4
8
12
16
20
24
0.02 0.04 0.06 0.08 0.10Air mass flow rate (kg/s)
Mat
eria
l flo
w r
ate
(ton
ne/h
)
PearliteBarytesCement
Flour
Pulverized fuel ash Conveying linepressure drop � 1.5 bar
SugarCoke fines
Polyethylene pellets
Copper concentrate
Figure 12.15 A comparison of the pneumatic conveying capability of different materials
for identical conditions.
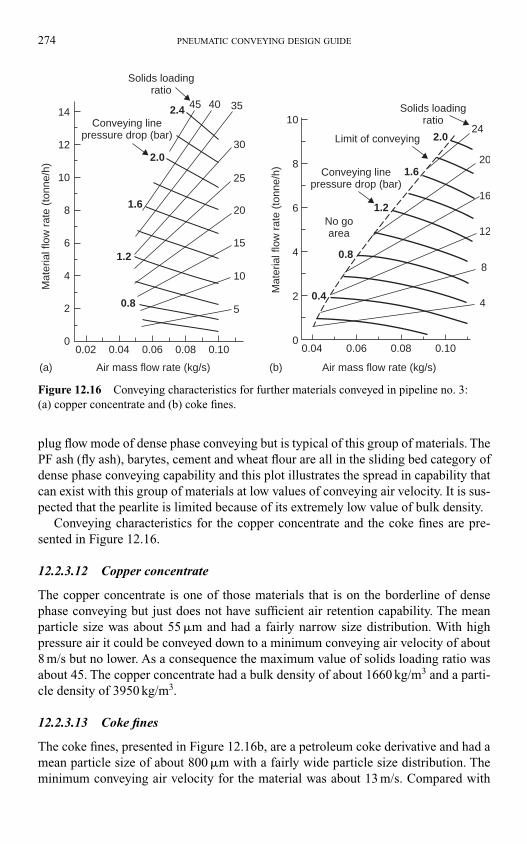
274 PNEUMATIC CONVEYING DESIGN GUIDE
plug flow mode of dense phase conveying but is typical of this group of materials. The
PF ash (fly ash), barytes, cement and wheat flour are all in the sliding bed category of
dense phase conveying capability and this plot illustrates the spread in capability that
can exist with this group of materials at low values of conveying air velocity. It is sus-
pected that the pearlite is limited because of its extremely low value of bulk density.
Conveying characteristics for the copper concentrate and the coke fines are pre-
sented in Figure 12.16.
12.2.3.12 Copper concentrate
The copper concentrate is one of those materials that is on the borderline of dense
phase conveying but just does not have sufficient air retention capability. The mean
particle size was about 55 �m and had a fairly narrow size distribution. With high
pressure air it could be conveyed down to a minimum conveying air velocity of about
8 m/s but no lower. As a consequence the maximum value of solids loading ratio was
about 45. The copper concentrate had a bulk density of about 1660 kg/m3 and a parti-
cle density of 3950 kg/m3.
12.2.3.13 Coke fines
The coke fines, presented in Figure 12.16b, are a petroleum coke derivative and had a
mean particle size of about 800 �m with a fairly wide particle size distribution. The
minimum conveying air velocity for the material was about 13 m/s. Compared with
Conveying linepressure drop (bar)
Solids loadingratio
Air mass flow rate (kg/s)
0.02
0.8
1.2
1.6
2.0
2.0
2.4
0
2
4
6
8
10
12
14
0.04 0.06 0.08 0.10
Mat
eria
l flo
w r
ate
(ton
ne/h
)
20
25
30
35
15
10
5
4045
Conveying linepressure drop (bar)
Solids loadingratio
Air mass flow rate (kg/s)
0.4
0.8
1.2
12
16
20
24
1.6
0
2
4
4
6
8
8
10
0.04 0.06 0.08 0.10
Mat
eria
l flo
w r
ate
(ton
ne/h
)
(a) (b)
Limit of conveying
No goarea
Figure 12.16 Conveying characteristics for further materials conveyed in pipeline no. 3:
(a) copper concentrate and (b) coke fines.
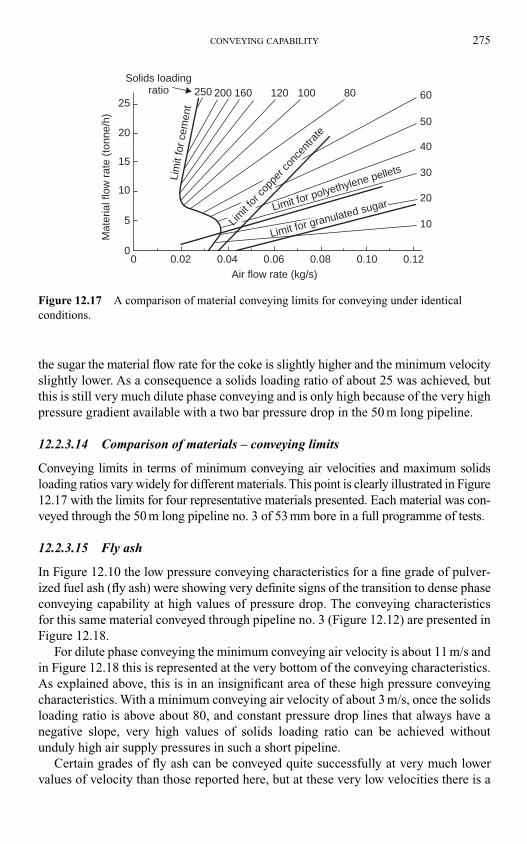
CONVEYING CAPABILITY 275
the sugar the material flow rate for the coke is slightly higher and the minimum velocity
slightly lower. As a consequence a solids loading ratio of about 25 was achieved, but
this is still very much dilute phase conveying and is only high because of the very high
pressure gradient available with a two bar pressure drop in the 50 m long pipeline.
12.2.3.14 Comparison of materials – conveying limits
Conveying limits in terms of minimum conveying air velocities and maximum solids
loading ratios vary widely for different materials. This point is clearly illustrated in Figure
12.17 with the limits for four representative materials presented. Each material was con-
veyed through the 50 m long pipeline no. 3 of 53 mm bore in a full programme of tests.
12.2.3.15 Fly ash
In Figure 12.10 the low pressure conveying characteristics for a fine grade of pulver-
ized fuel ash (fly ash) were showing very definite signs of the transition to dense phase
conveying capability at high values of pressure drop. The conveying characteristics
for this same material conveyed through pipeline no. 3 (Figure 12.12) are presented in
Figure 12.18.
For dilute phase conveying the minimum conveying air velocity is about 11 m/s and
in Figure 12.18 this is represented at the very bottom of the conveying characteristics.
As explained above, this is in an insignificant area of these high pressure conveying
characteristics. With a minimum conveying air velocity of about 3 m/s, once the solids
loading ratio is above about 80, and constant pressure drop lines that always have a
negative slope, very high values of solids loading ratio can be achieved without
unduly high air supply pressures in such a short pipeline.
Certain grades of fly ash can be conveyed quite successfully at very much lower
values of velocity than those reported here, but at these very low velocities there is a
Lim
it fo
r ce
men
t
Air flow rate (kg/s)
Mat
eria
l flo
w r
ate
(ton
ne/h
)
Solids loadingratio
25
20
15
10
5
160200250 120 100 80 60
50
40
30
20
10
00 0.02 0.04 0.06 0.08 0.10 0.12
Limit f
or co
pper
conc
entra
te
Limit for polyethylene pellets
Limit for granulated sugar
Figure 12.17 A comparison of material conveying limits for conveying under identical
conditions.
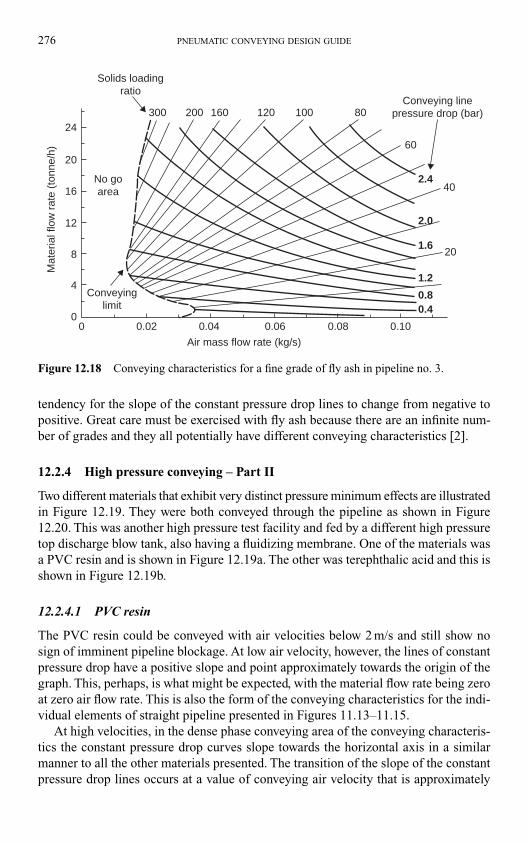
276 PNEUMATIC CONVEYING DESIGN GUIDE
tendency for the slope of the constant pressure drop lines to change from negative to
positive. Great care must be exercised with fly ash because there are an infinite num-
ber of grades and they all potentially have different conveying characteristics [2].
12.2.4 High pressure conveying – Part II
Two different materials that exhibit very distinct pressure minimum effects are illustrated
in Figure 12.19. They were both conveyed through the pipeline as shown in Figure
12.20. This was another high pressure test facility and fed by a different high pressure
top discharge blow tank, also having a fluidizing membrane. One of the materials was
a PVC resin and is shown in Figure 12.19a. The other was terephthalic acid and this is
shown in Figure 12.19b.
12.2.4.1 PVC resin
The PVC resin could be conveyed with air velocities below 2 m/s and still show no
sign of imminent pipeline blockage. At low air velocity, however, the lines of constant
pressure drop have a positive slope and point approximately towards the origin of the
graph. This, perhaps, is what might be expected, with the material flow rate being zero
at zero air flow rate. This is also the form of the conveying characteristics for the indi-
vidual elements of straight pipeline presented in Figures 11.13–11.15.
At high velocities, in the dense phase conveying area of the conveying characteris-
tics the constant pressure drop curves slope towards the horizontal axis in a similar
manner to all the other materials presented. The transition of the slope of the constant
pressure drop lines occurs at a value of conveying air velocity that is approximately
Conveying linepressure drop (bar)
Solids loadingratio
Conveyinglimit
Air mass flow rate (kg/s)
Mat
eria
l flo
w r
ate
(ton
ne/h
)
No goarea
300 200 160 120 80100
60
40
20
24
20
16
12
8
4
0 0.02 0.04 0.06 0.08 0.10
2.4
2.0
1.6
0.8
1.2
0.40
Figure 12.18 Conveying characteristics for a fine grade of fly ash in pipeline no. 3.
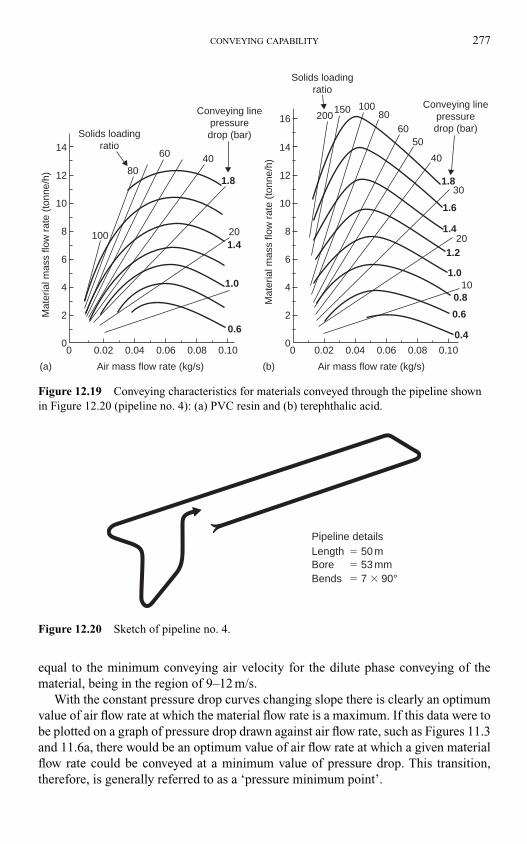
CONVEYING CAPABILITY 277
equal to the minimum conveying air velocity for the dilute phase conveying of the
material, being in the region of 9–12 m/s.
With the constant pressure drop curves changing slope there is clearly an optimum
value of air flow rate at which the material flow rate is a maximum. If this data were to
be plotted on a graph of pressure drop drawn against air flow rate, such as Figures 11.3
and 11.6a, there would be an optimum value of air flow rate at which a given material
flow rate could be conveyed at a minimum value of pressure drop. This transition,
therefore, is generally referred to as a ‘pressure minimum point’.
Conveying linepressuredrop (bar)
Conveying linepressuredrop (bar)Solids loading
ratio
Air mass flow rate (kg/s)
0.02
0.6
1.0
1.4
1.8
00
2
4
6
8
10
12
14
0.04 0.06 0.08 0.10
Mat
eria
l mas
s flo
w r
ate
(ton
ne/h
)
20
4060
80
100
Solids loadingratio
Air mass flow rate (kg/s)
0.02
0.4
0.6
0.8
1.0
1.2
1.4
1.6
1.8
00
2
4
6
8
10
12
14
16
0.04 0.06 0.08 0.10
Mat
eria
l mas
s flo
w r
ate
(ton
ne/h
)
20
10
40
30
6050
80100150
200
(a) (b)
Figure 12.19 Conveying characteristics for materials conveyed through the pipeline shown
in Figure 12.20 (pipeline no. 4): (a) PVC resin and (b) terephthalic acid.
Figure 12.20 Sketch of pipeline no. 4.
Pipeline detailsLength � 50 mBore � 53 mmBends � 7 � 90°
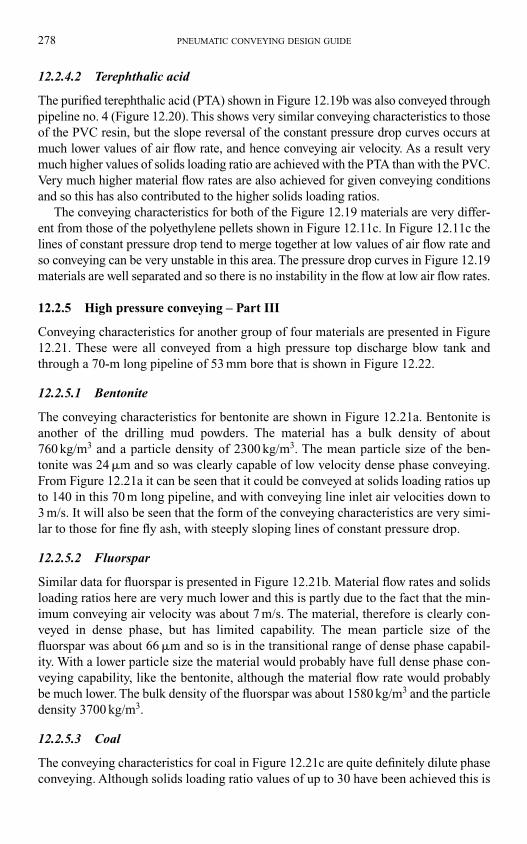
278 PNEUMATIC CONVEYING DESIGN GUIDE
12.2.4.2 Terephthalic acid
The purified terephthalic acid (PTA) shown in Figure 12.19b was also conveyed through
pipeline no. 4 (Figure 12.20). This shows very similar conveying characteristics to those
of the PVC resin, but the slope reversal of the constant pressure drop curves occurs at
much lower values of air flow rate, and hence conveying air velocity. As a result very
much higher values of solids loading ratio are achieved with the PTA than with the PVC.
Very much higher material flow rates are also achieved for given conveying conditions
and so this has also contributed to the higher solids loading ratios.
The conveying characteristics for both of the Figure 12.19 materials are very differ-
ent from those of the polyethylene pellets shown in Figure 12.11c. In Figure 12.11c the
lines of constant pressure drop tend to merge together at low values of air flow rate and
so conveying can be very unstable in this area. The pressure drop curves in Figure 12.19
materials are well separated and so there is no instability in the flow at low air flow rates.
12.2.5 High pressure conveying – Part III
Conveying characteristics for another group of four materials are presented in Figure
12.21. These were all conveyed from a high pressure top discharge blow tank and
through a 70-m long pipeline of 53 mm bore that is shown in Figure 12.22.
12.2.5.1 Bentonite
The conveying characteristics for bentonite are shown in Figure 12.21a. Bentonite is
another of the drilling mud powders. The material has a bulk density of about
760 kg/m3 and a particle density of 2300 kg/m3. The mean particle size of the ben-
tonite was 24 �m and so was clearly capable of low velocity dense phase conveying.
From Figure 12.21a it can be seen that it could be conveyed at solids loading ratios up
to 140 in this 70 m long pipeline, and with conveying line inlet air velocities down to
3 m/s. It will also be seen that the form of the conveying characteristics are very simi-
lar to those for fine fly ash, with steeply sloping lines of constant pressure drop.
12.2.5.2 Fluorspar
Similar data for fluorspar is presented in Figure 12.21b. Material flow rates and solids
loading ratios here are very much lower and this is partly due to the fact that the min-
imum conveying air velocity was about 7 m/s. The material, therefore is clearly con-
veyed in dense phase, but has limited capability. The mean particle size of the
fluorspar was about 66 �m and so is in the transitional range of dense phase capabil-
ity. With a lower particle size the material would probably have full dense phase con-
veying capability, like the bentonite, although the material flow rate would probably
be much lower. The bulk density of the fluorspar was about 1580 kg/m3 and the particle
density 3700 kg/m3.
12.2.5.3 Coal
The conveying characteristics for coal in Figure 12.21c are quite definitely dilute phase
conveying. Although solids loading ratio values of up to 30 have been achieved this is
CONVEYING CAPABILITY 279
only because high pressure air has been used and the coal contained a high proportion
of fine material. The fines have helped to lower the minimum conveying air velocity
for the material to about 12 m/s, and as material flow rates for coal are quite high in
relation to other materials, as will be seen from Figure 12.4, this has resulted in a high
value of solids loading ratio for dilute phase conveying.
Conveying linepressure drop (bar)
Conveyingline pressure
drop (bar)
Conveyingline pressure
drop (bar)
Conveyingline pressure
drop (bar)
Solids loadingratio
Solids loadingratio
Solids loadingratio
Solids loadingratio
Limit ofconveying
No goarea
Air mass flow rate (kg/s)
Air mass flow rate (kg/s) Air mass flow rate (kg/s)
Air mass flow rate (kg/s)
0.02
0.8
0.4
1.21.6 2.0
60
6050
30
70
40
40
20
20
1010
0.8
1.2
1.6
2.010
0140
00
2
4
6
8
10
12
14
0
2
4
6
5
8
10
10
15
20
2530
12
14
0
2
4
6
8
10
12
14
0
2
4
6
8
10
12
14
0.04 0.06 0.08 0.10
0.02
0.40.4
0.6
0.8 0.8
1.0
1.2
1.2
1.41.6
1.6
2.0
2.4 25
20
15
10
5
1.8
0 0.04 0.06 0.08 0.10 0.04 0.06 0.08 0.10
0.020 0.04 0.06 0.08 0.10
Mat
eria
l mas
s flo
w r
ate
(ton
ne/h
)M
ater
ial m
ass
flow
rat
e (t
onne
/h)
Mat
eria
l mas
s flo
w r
ate
(ton
ne/h
)M
ater
ial m
ass
flow
rat
e (t
onne
/h)
(a) (b)
(c) (d)
Figure 12.21 Conveying characteristics for materials conveyed through the pipeline
shown in Figure 12.22 (pipeline no. 5): (a) bentonite, (b) fluorspar, (c) coal
and (d) silica sand.
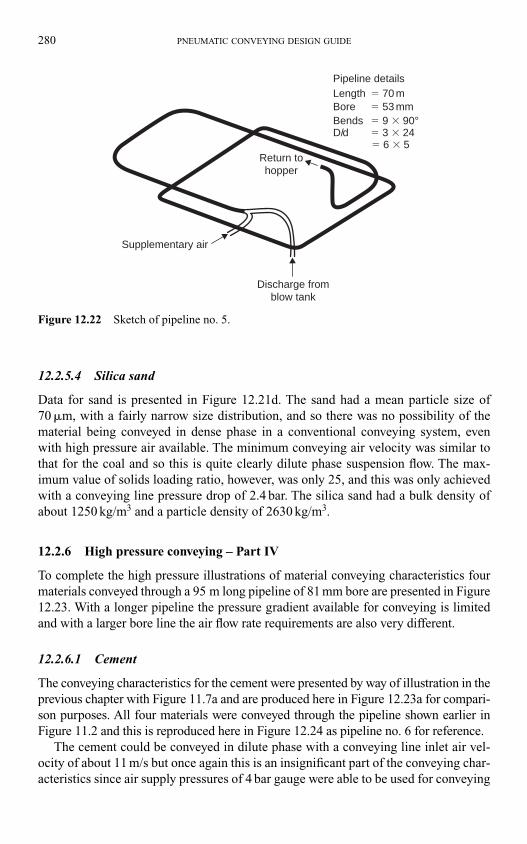
280 PNEUMATIC CONVEYING DESIGN GUIDE
12.2.5.4 Silica sand
Data for sand is presented in Figure 12.21d. The sand had a mean particle size of
70 �m, with a fairly narrow size distribution, and so there was no possibility of the
material being conveyed in dense phase in a conventional conveying system, even
with high pressure air available. The minimum conveying air velocity was similar to
that for the coal and so this is quite clearly dilute phase suspension flow. The max-
imum value of solids loading ratio, however, was only 25, and this was only achieved
with a conveying line pressure drop of 2.4 bar. The silica sand had a bulk density of
about 1250 kg/m3 and a particle density of 2630 kg/m3.
12.2.6 High pressure conveying – Part IV
To complete the high pressure illustrations of material conveying characteristics four
materials conveyed through a 95 m long pipeline of 81 mm bore are presented in Figure
12.23. With a longer pipeline the pressure gradient available for conveying is limited
and with a larger bore line the air flow rate requirements are also very different.
12.2.6.1 Cement
The conveying characteristics for the cement were presented by way of illustration in the
previous chapter with Figure 11.7a and are produced here in Figure 12.23a for compari-
son purposes. All four materials were conveyed through the pipeline shown earlier in
Figure 11.2 and this is reproduced here in Figure 12.24 as pipeline no. 6 for reference.
The cement could be conveyed in dilute phase with a conveying line inlet air vel-
ocity of about 11 m/s but once again this is an insignificant part of the conveying char-
acteristics since air supply pressures of 4 bar gauge were able to be used for conveying
Return tohopper
Supplementary air
Discharge fromblow tank
Pipeline detailsLength � 70 mBore � 53 mmBends � 9 � 90°D/d � 3 � 24 � 6 � 5
Figure 12.22 Sketch of pipeline no. 5.
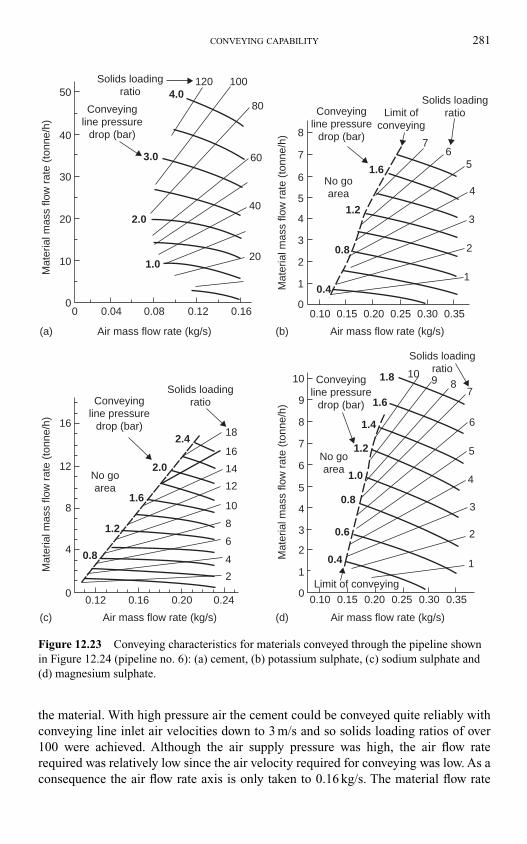
CONVEYING CAPABILITY 281
the material. With high pressure air the cement could be conveyed quite reliably with
conveying line inlet air velocities down to 3 m/s and so solids loading ratios of over
100 were achieved. Although the air supply pressure was high, the air flow rate
required was relatively low since the air velocity required for conveying was low. As a
consequence the air flow rate axis is only taken to 0.16 kg/s. The material flow rate
Air mass flow rate (kg/s)
50
40
30
20
10
00 0.04 0.08
1.0
2.0
3.0
4.0120Solids loading
ratio
Conveyingline pressure
drop (bar)
100
80
60
40
20
0.12 0.16
Mat
eria
l mas
s flo
w r
ate
(ton
ne/h
)
Air mass flow rate (kg/s)
Solids loadingratioLimit of
conveying
7
1.6
1.2
0.8
0.40
1
2
3
4
5
6
7
8
0.10 0.15 0.20 0.25 0.30 0.35
65
4
3
2
1
Conveyingline pressure
drop (bar)
Mat
eria
l mas
s flo
w r
ate
(ton
ne/h
)
Air mass flow rate (kg/s)
Solids loadingratioConveying
line pressuredrop (bar)
2.4
2.0
1.6
1.2
0.8
0.12 0.16 0.20 0.240
4
8
12
1618
16
14
12
10
8
6
4
2
Mat
eria
l mas
s flo
w r
ate
(ton
ne/h
)
Air mass flow rate (kg/s)
Solids loadingratio
Limit of conveying
Conveyingline pressure
drop (bar)
1.8 109 8
7
6
5
4
3
2
1
1.6
1.4
1.2
1.0
0.8
0.6
0.4
0.100
1
2
3
4
5
6
7
8
9
10
0.15 0.20 0.25 0.30 0.35
Mat
eria
l mas
s flo
w r
ate
(ton
ne/h
)
(a) (b)
(c) (d)
No goarea
No goarea
No goarea
Figure 12.23 Conveying characteristics for materials conveyed through the pipeline shown
in Figure 12.24 (pipeline no. 6): (a) cement, (b) potassium sulphate, (c) sodium sulphate and
(d) magnesium sulphate.
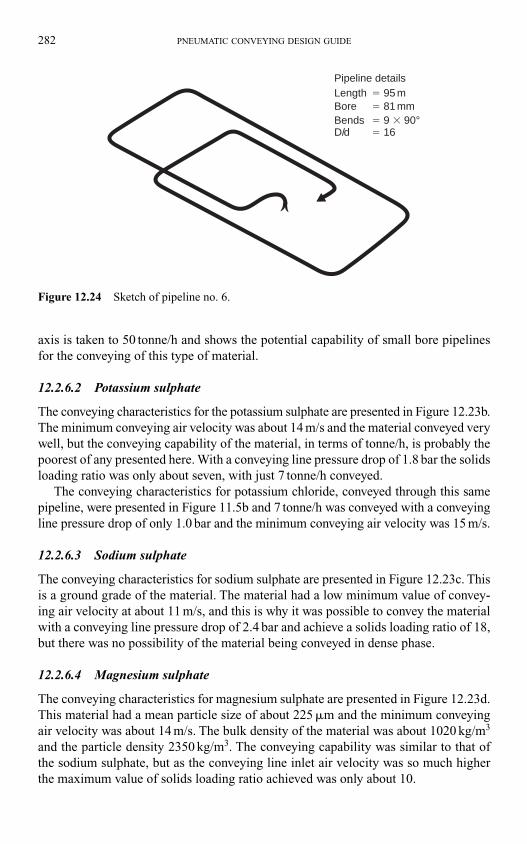
282 PNEUMATIC CONVEYING DESIGN GUIDE
axis is taken to 50 tonne/h and shows the potential capability of small bore pipelines
for the conveying of this type of material.
12.2.6.2 Potassium sulphate
The conveying characteristics for the potassium sulphate are presented in Figure 12.23b.
The minimum conveying air velocity was about 14 m/s and the material conveyed very
well, but the conveying capability of the material, in terms of tonne/h, is probably the
poorest of any presented here. With a conveying line pressure drop of 1.8 bar the solids
loading ratio was only about seven, with just 7 tonne/h conveyed.
The conveying characteristics for potassium chloride, conveyed through this same
pipeline, were presented in Figure 11.5b and 7 tonne/h was conveyed with a conveying
line pressure drop of only 1.0 bar and the minimum conveying air velocity was 15 m/s.
12.2.6.3 Sodium sulphate
The conveying characteristics for sodium sulphate are presented in Figure 12.23c. This
is a ground grade of the material. The material had a low minimum value of convey-
ing air velocity at about 11 m/s, and this is why it was possible to convey the material
with a conveying line pressure drop of 2.4 bar and achieve a solids loading ratio of 18,
but there was no possibility of the material being conveyed in dense phase.
12.2.6.4 Magnesium sulphate
The conveying characteristics for magnesium sulphate are presented in Figure 12.23d.
This material had a mean particle size of about 225 �m and the minimum conveying
air velocity was about 14 m/s. The bulk density of the material was about 1020 kg/m3
and the particle density 2350 kg/m3. The conveying capability was similar to that of
the sodium sulphate, but as the conveying line inlet air velocity was so much higher
the maximum value of solids loading ratio achieved was only about 10.
Pipeline detailsLength � 95 mBore � 81 mmBends � 9 � 90°D/d � 16
Figure 12.24 Sketch of pipeline no. 6.
CONVEYING CAPABILITY 283
12.3 System capability
For a given material a particular problem with pneumatic conveying systems is the
evaluation of their conveying potential; and even for a first approximation value. The
capability of a pneumatic conveying system, in terms of achieving a given material
mass flow rate, depends primarily on the following three parameters:
1. the diameter of the pipeline
2. the distance to be conveyed, and
3. the conveying line pressure drop available.
Air flow rate is a secondary function, being primarily dependent upon the pipeline
bore and air pressure. It is, however, important with respect to achieving optimum con-
veying conditions in a given pipeline. The properties of the material to be conveyed are
also of paramount importance. Their main influence, however, in terms of material
mass flow rate, is in placing an upper limit on the solids loading ratio at which the mate-
rial can be conveyed under particular conditions, as shown in Figure 12.17.
12.3.1 Solids loading ratio – �
The solids loading ratio of a conveyed material is the dimensionless ratio of the mass
flow rate of the material being conveyed, m�p, to the mass flow rate of the air used for
conveying, m�a:
(12.1)
The constant of 3.6 is required to render the parameter dimensionless since material
flow rate is in tonne/h and air flow rate is in kg/s.
Since air is a compressible fluid its density changes with pressure and so the volu-
metric flow rate of the conveying air can increase quite significantly along the length
of a pipeline. Solids loading ratio, therefore, is a particularly useful parameter for
describing the concentration of the material in the air in pneumatic conveying system
pipelines, for it is a dimensionless quantity and its value remains essentially constant.
12.3.2 The influence of pipe bore
The mass flow rate of a material, m�p, can be expressed in terms of the solids loading
ratio, �, at which the material is conveyed, by:
(12.2)
where m�a is the air mass flow rate (kg/s).
Now
(12.3)˙ ˙m Va a�
˙ ˙m mp a tonne/h� �
�
p
a
�˙
. ˙
m
m3 6
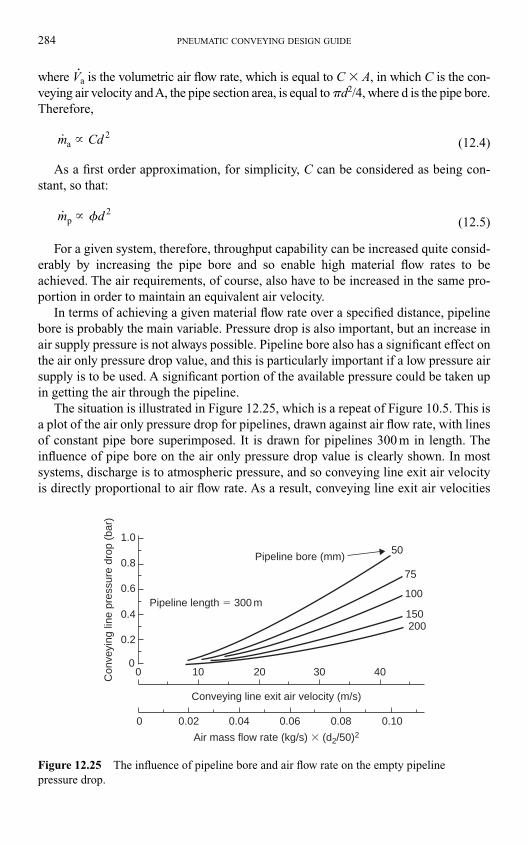
284 PNEUMATIC CONVEYING DESIGN GUIDE
where V�a is the volumetric air flow rate, which is equal to C � A, in which C is the con-
veying air velocity and A, the pipe section area, is equal to �d2/4, where d is the pipe bore.
Therefore,
(12.4)
As a first order approximation, for simplicity, C can be considered as being con-
stant, so that:
(12.5)
For a given system, therefore, throughput capability can be increased quite consid-
erably by increasing the pipe bore and so enable high material flow rates to be
achieved. The air requirements, of course, also have to be increased in the same pro-
portion in order to maintain an equivalent air velocity.
In terms of achieving a given material flow rate over a specified distance, pipeline
bore is probably the main variable. Pressure drop is also important, but an increase in
air supply pressure is not always possible. Pipeline bore also has a significant effect on
the air only pressure drop value, and this is particularly important if a low pressure air
supply is to be used. A significant portion of the available pressure could be taken up
in getting the air through the pipeline.
The situation is illustrated in Figure 12.25, which is a repeat of Figure 10.5. This is
a plot of the air only pressure drop for pipelines, drawn against air flow rate, with lines
of constant pipe bore superimposed. It is drawn for pipelines 300 m in length. The
influence of pipe bore on the air only pressure drop value is clearly shown. In most
systems, discharge is to atmospheric pressure, and so conveying line exit air velocity
is directly proportional to air flow rate. As a result, conveying line exit air velocities
m dp � � 2
m Cda � 2
Pipeline length � 300 m
Pipeline bore (mm)50
75
100
150200
0.8
0.6
0.4
0.2
0
1.0
Con
veyi
ng li
ne p
ress
ure
drop
(ba
r)
Air mass flow rate (kg/s) � (d2/50)2
0.020 0.04 0.06 0.08 0.10
Conveying line exit air velocity (m/s)
0 10 20 30 40
Figure 12.25 The influence of pipeline bore and air flow rate on the empty pipeline
pressure drop.
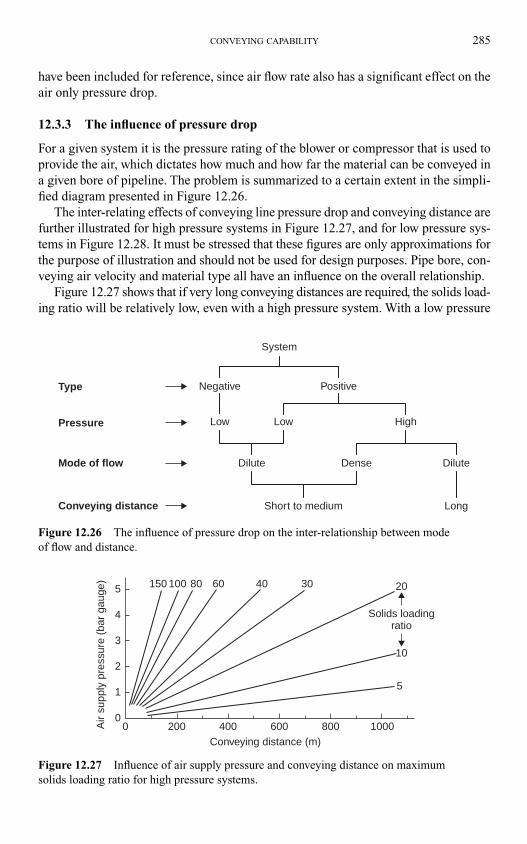
CONVEYING CAPABILITY 285
have been included for reference, since air flow rate also has a significant effect on the
air only pressure drop.
12.3.3 The influence of pressure drop
For a given system it is the pressure rating of the blower or compressor that is used to
provide the air, which dictates how much and how far the material can be conveyed in
a given bore of pipeline. The problem is summarized to a certain extent in the simpli-
fied diagram presented in Figure 12.26.
The inter-relating effects of conveying line pressure drop and conveying distance are
further illustrated for high pressure systems in Figure 12.27, and for low pressure sys-
tems in Figure 12.28. It must be stressed that these figures are only approximations for
the purpose of illustration and should not be used for design purposes. Pipe bore, con-
veying air velocity and material type all have an influence on the overall relationship.
Figure 12.27 shows that if very long conveying distances are required, the solids load-
ing ratio will be relatively low, even with a high pressure system. With a low pressure
System
Negative Positive
Low Low High
Dilute DiluteDense
Short to medium Long
Type
Pressure
Mode of flow
Conveying distance
Figure 12.26 The influence of pressure drop on the inter-relationship between mode
of flow and distance.
00
1
2
3
4
5
200 400 600 800 1000Conveying distance (m)
Air
supp
ly p
ress
ure
(bar
gau
ge) 150 100 80 60 40 30 20
10
5
Solids loadingratio
Figure 12.27 Influence of air supply pressure and conveying distance on maximum
solids loading ratio for high pressure systems.
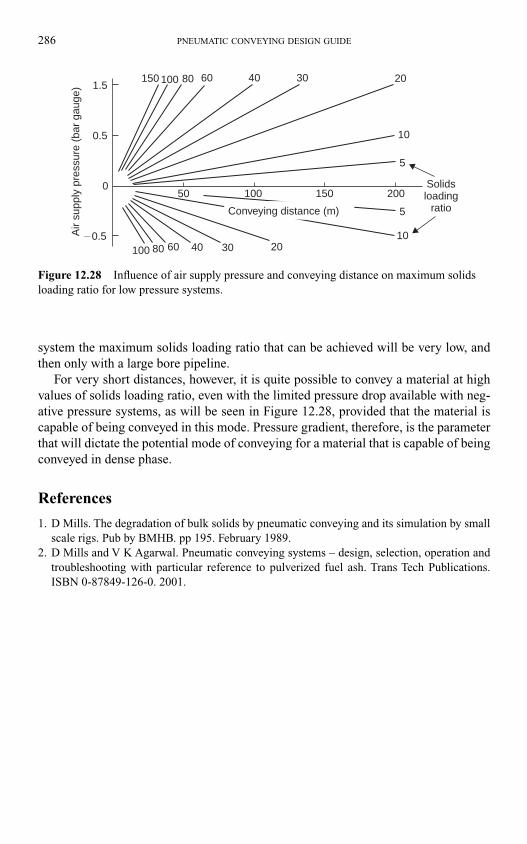
286 PNEUMATIC CONVEYING DESIGN GUIDE
system the maximum solids loading ratio that can be achieved will be very low, and
then only with a large bore pipeline.
For very short distances, however, it is quite possible to convey a material at high
values of solids loading ratio, even with the limited pressure drop available with neg-
ative pressure systems, as will be seen in Figure 12.28, provided that the material is
capable of being conveyed in this mode. Pressure gradient, therefore, is the parameter
that will dictate the potential mode of conveying for a material that is capable of being
conveyed in dense phase.
References
1. D Mills. The degradation of bulk solids by pneumatic conveying and its simulation by small
scale rigs. Pub by BMHB. pp 195. February 1989.
2. D Mills and V K Agarwal. Pneumatic conveying systems – design, selection, operation and
troubleshooting with particular reference to pulverized fuel ash. Trans Tech Publications.
ISBN 0-87849-126-0. 2001.
�0.5
0
0.5
1.5
50 100 150 200
Air
supp
ly p
ress
ure
(bar
gau
ge)
150 100
100
80
80
60
60
40
40
30 20
10
5
Solidsloading
ratio
30 2010
5Conveying distance (m)
Figure 12.28 Influence of air supply pressure and conveying distance on maximum solids
loading ratio for low pressure systems.
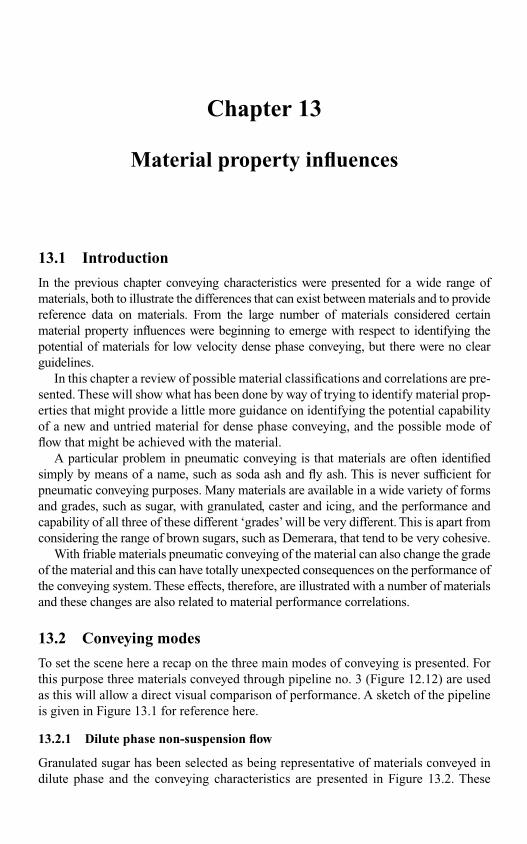
13.1 Introduction
In the previous chapter conveying characteristics were presented for a wide range of
materials, both to illustrate the differences that can exist between materials and to provide
reference data on materials. From the large number of materials considered certain
material property influences were beginning to emerge with respect to identifying the
potential of materials for low velocity dense phase conveying, but there were no clear
guidelines.
In this chapter a review of possible material classifications and correlations are pre-
sented. These will show what has been done by way of trying to identify material prop-
erties that might provide a little more guidance on identifying the potential capability
of a new and untried material for dense phase conveying, and the possible mode of
flow that might be achieved with the material.
A particular problem in pneumatic conveying is that materials are often identified
simply by means of a name, such as soda ash and fly ash. This is never sufficient for
pneumatic conveying purposes. Many materials are available in a wide variety of forms
and grades, such as sugar, with granulated, caster and icing, and the performance and
capability of all three of these different ‘grades’ will be very different. This is apart from
considering the range of brown sugars, such as Demerara, that tend to be very cohesive.
With friable materials pneumatic conveying of the material can also change the grade
of the material and this can have totally unexpected consequences on the performance of
the conveying system. These effects, therefore, are illustrated with a number of materials
and these changes are also related to material performance correlations.
13.2 Conveying modes
To set the scene here a recap on the three main modes of conveying is presented. For
this purpose three materials conveyed through pipeline no. 3 (Figure 12.12) are used
as this will allow a direct visual comparison of performance. A sketch of the pipeline
is given in Figure 13.1 for reference here.
13.2.1 Dilute phase non-suspension flow
Granulated sugar has been selected as being representative of materials conveyed in
dilute phase and the conveying characteristics are presented in Figure 13.2. These
Chapter 13
Material property influences
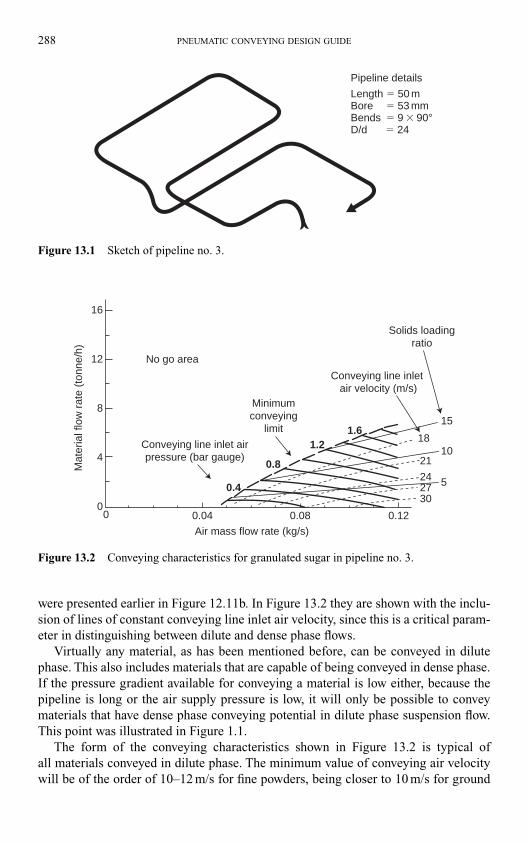
were presented earlier in Figure 12.11b. In Figure 13.2 they are shown with the inclu-
sion of lines of constant conveying line inlet air velocity, since this is a critical param-
eter in distinguishing between dilute and dense phase flows.
Virtually any material, as has been mentioned before, can be conveyed in dilute
phase. This also includes materials that are capable of being conveyed in dense phase.
If the pressure gradient available for conveying a material is low either, because the
pipeline is long or the air supply pressure is low, it will only be possible to convey
materials that have dense phase conveying potential in dilute phase suspension flow.
This point was illustrated in Figure 1.1.
The form of the conveying characteristics shown in Figure 13.2 is typical of
all materials conveyed in dilute phase. The minimum value of conveying air velocity
will be of the order of 10–12 m/s for fine powders, being closer to 10 m/s for ground
288 PNEUMATIC CONVEYING DESIGN GUIDE
Length � 50 mBore � 53 mmBends � 9 � 90°D/d � 24
Pipeline details
Figure 13.1 Sketch of pipeline no. 3.
Conveying line inlet airpressure (bar gauge)
Conveying line inlet air velocity (m/s)
Minimumconveying
limit
Air mass flow rate (kg/s)
Mat
eria
l flo
w r
ate
(ton
ne/h
)
Solids loadingratio
No go area
16
12
8
4
00 0.04
0.4
0.8
1.21.6
0.08 0.12
15
10
5
18
21
242730
Figure 13.2 Conveying characteristics for granulated sugar in pipeline no. 3.
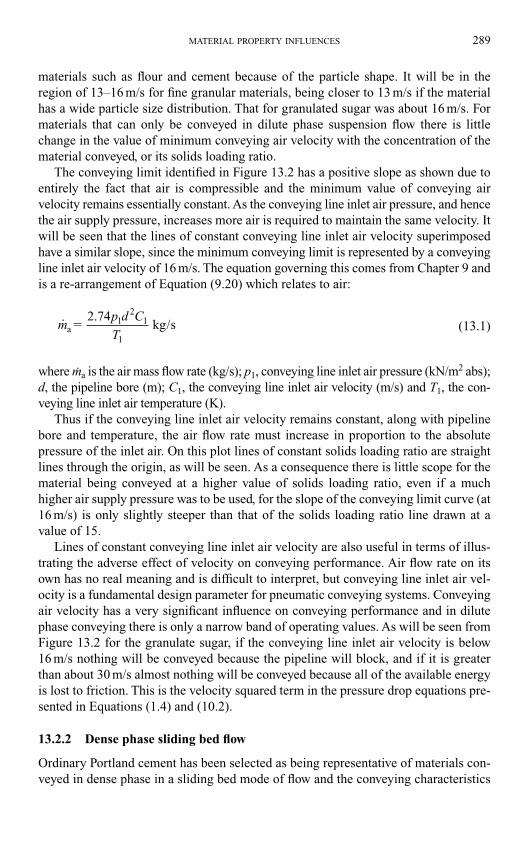
materials such as flour and cement because of the particle shape. It will be in the
region of 13–16 m/s for fine granular materials, being closer to 13 m/s if the material
has a wide particle size distribution. That for granulated sugar was about 16 m/s. For
materials that can only be conveyed in dilute phase suspension flow there is little
change in the value of minimum conveying air velocity with the concentration of the
material conveyed, or its solids loading ratio.
The conveying limit identified in Figure 13.2 has a positive slope as shown due to
entirely the fact that air is compressible and the minimum value of conveying air
velocity remains essentially constant. As the conveying line inlet air pressure, and hence
the air supply pressure, increases more air is required to maintain the same velocity. It
will be seen that the lines of constant conveying line inlet air velocity superimposed
have a similar slope, since the minimum conveying limit is represented by a conveying
line inlet air velocity of 16 m/s. The equation governing this comes from Chapter 9 and
is a re-arrangement of Equation (9.20) which relates to air:
(13.1)
where m.a is the air mass flow rate (kg/s); p1, conveying line inlet air pressure (kN/m2 abs);
d, the pipeline bore (m); C1, the conveying line inlet air velocity (m/s) and T1, the con-
veying line inlet air temperature (K).
Thus if the conveying line inlet air velocity remains constant, along with pipeline
bore and temperature, the air flow rate must increase in proportion to the absolute
pressure of the inlet air. On this plot lines of constant solids loading ratio are straight
lines through the origin, as will be seen. As a consequence there is little scope for the
material being conveyed at a higher value of solids loading ratio, even if a much
higher air supply pressure was to be used, for the slope of the conveying limit curve (at
16 m/s) is only slightly steeper than that of the solids loading ratio line drawn at a
value of 15.
Lines of constant conveying line inlet air velocity are also useful in terms of illus-
trating the adverse effect of velocity on conveying performance. Air flow rate on its
own has no real meaning and is difficult to interpret, but conveying line inlet air vel-
ocity is a fundamental design parameter for pneumatic conveying systems. Conveying
air velocity has a very significant influence on conveying performance and in dilute
phase conveying there is only a narrow band of operating values. As will be seen from
Figure 13.2 for the granulate sugar, if the conveying line inlet air velocity is below
16 m/s nothing will be conveyed because the pipeline will block, and if it is greater
than about 30 m/s almost nothing will be conveyed because all of the available energy
is lost to friction. This is the velocity squared term in the pressure drop equations pre-
sented in Equations (1.4) and (10.2).
13.2.2 Dense phase sliding bed flow
Ordinary Portland cement has been selected as being representative of materials con-
veyed in dense phase in a sliding bed mode of flow and the conveying characteristics
mp d C
Ta
2.74kg/s� 1
21
1
MATERIAL PROPERTY INFLUENCES 289
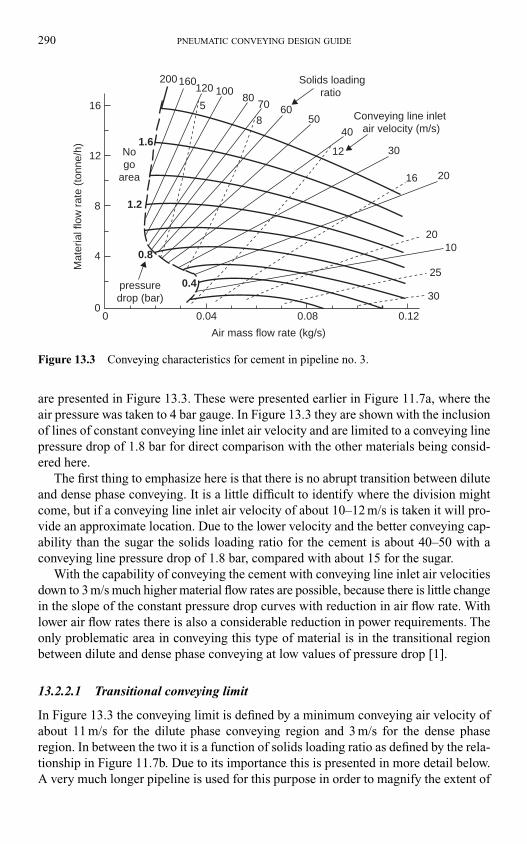
are presented in Figure 13.3. These were presented earlier in Figure 11.7a, where the
air pressure was taken to 4 bar gauge. In Figure 13.3 they are shown with the inclusion
of lines of constant conveying line inlet air velocity and are limited to a conveying line
pressure drop of 1.8 bar for direct comparison with the other materials being consid-
ered here.
The first thing to emphasize here is that there is no abrupt transition between dilute
and dense phase conveying. It is a little difficult to identify where the division might
come, but if a conveying line inlet air velocity of about 10–12 m/s is taken it will pro-
vide an approximate location. Due to the lower velocity and the better conveying cap-
ability than the sugar the solids loading ratio for the cement is about 40–50 with a
conveying line pressure drop of 1.8 bar, compared with about 15 for the sugar.
With the capability of conveying the cement with conveying line inlet air velocities
down to 3 m/s much higher material flow rates are possible, because there is little change
in the slope of the constant pressure drop curves with reduction in air flow rate. With
lower air flow rates there is also a considerable reduction in power requirements. The
only problematic area in conveying this type of material is in the transitional region
between dilute and dense phase conveying at low values of pressure drop [1].
13.2.2.1 Transitional conveying limit
In Figure 13.3 the conveying limit is defined by a minimum conveying air velocity of
about 11 m/s for the dilute phase conveying region and 3 m/s for the dense phase
region. In between the two it is a function of solids loading ratio as defined by the rela-
tionship in Figure 11.7b. Due to its importance this is presented in more detail below.
A very much longer pipeline is used for this purpose in order to magnify the extent of
290 PNEUMATIC CONVEYING DESIGN GUIDE
200
1.6
1.2
0.8
0.4
160120 100
8070 60
505
8
12
40
30
2016
2010
25
30
16
12
8
4
0
Conveying line inlet air velocity (m/s)
Air mass flow rate (kg/s)
Mat
eria
l flo
w r
ate
(ton
ne/h
)Solids loading
ratio
0 0.04 0.08 0.12
pressuredrop (bar)
Nogo
area
Figure 13.3 Conveying characteristics for cement in pipeline no. 3.
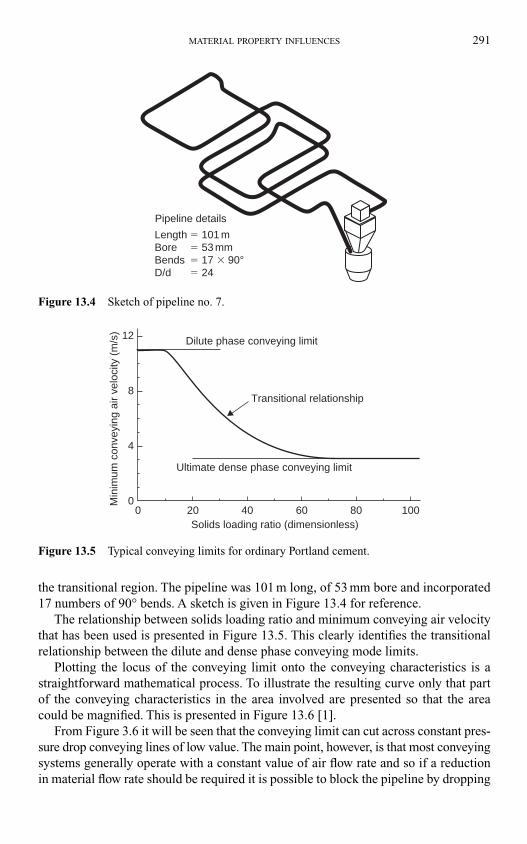
the transitional region. The pipeline was 101 m long, of 53 mm bore and incorporated
17 numbers of 90° bends. A sketch is given in Figure 13.4 for reference.
The relationship between solids loading ratio and minimum conveying air velocity
that has been used is presented in Figure 13.5. This clearly identifies the transitional
relationship between the dilute and dense phase conveying mode limits.
Plotting the locus of the conveying limit onto the conveying characteristics is a
straightforward mathematical process. To illustrate the resulting curve only that part
of the conveying characteristics in the area involved are presented so that the area
could be magnified. This is presented in Figure 13.6 [1].
From Figure 3.6 it will be seen that the conveying limit can cut across constant pres-
sure drop conveying lines of low value. The main point, however, is that most conveying
systems generally operate with a constant value of air flow rate and so if a reduction
in material flow rate should be required it is possible to block the pipeline by dropping
MATERIAL PROPERTY INFLUENCES 291
Pipeline details
Length � 101 mBore � 53 mmBends � 17 � 90°D/d � 24
Figure 13.4 Sketch of pipeline no. 7.
Dilute phase conveying limit
Transitional relationship
Ultimate dense phase conveying limit
Solids loading ratio (dimensionless)0
020 40 60 80 100
Min
imum
con
veyi
ng a
ir ve
loci
ty (
m/s
) 12
8
4
Figure 13.5 Typical conveying limits for ordinary Portland cement.
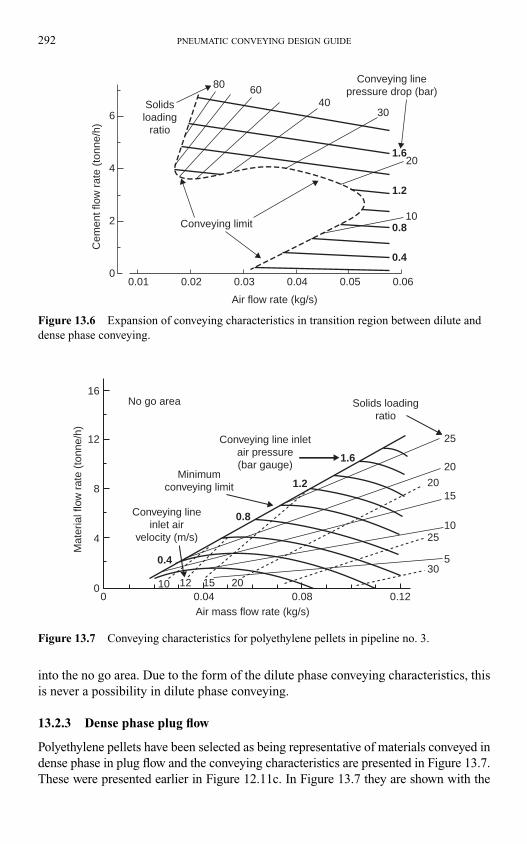
into the no go area. Due to the form of the dilute phase conveying characteristics, this
is never a possibility in dilute phase conveying.
13.2.3 Dense phase plug flow
Polyethylene pellets have been selected as being representative of materials conveyed in
dense phase in plug flow and the conveying characteristics are presented in Figure 13.7.
These were presented earlier in Figure 12.11c. In Figure 13.7 they are shown with the
292 PNEUMATIC CONVEYING DESIGN GUIDE
6
4
2
00.01 0.02 0.03 0.04
0.4
0.8
1.2
1.6
0.05 0.06
Conveying limit
Air flow rate (kg/s)
Cem
ent f
low
rat
e (t
onne
/h)
80 6040
30
20
10
Conveying linepressure drop (bar)
Solidsloading
ratio
Figure 13.6 Expansion of conveying characteristics in transition region between dilute and
dense phase conveying.
Air mass flow rate (kg/s)
Conveying lineinlet air
velocity (m/s)
Conveying line inletair pressure(bar gauge)
25
20
15
10
30
25
20
5
12
8
4
00 0.04
0.8
1.2
1.6
0.4
0.08 0.12
16
Mat
eria
l flo
w r
ate
(ton
ne/h
)
10 12 15 20
Minimumconveying limit
No go area Solids loadingratio
Figure 13.7 Conveying characteristics for polyethylene pellets in pipeline no. 3.
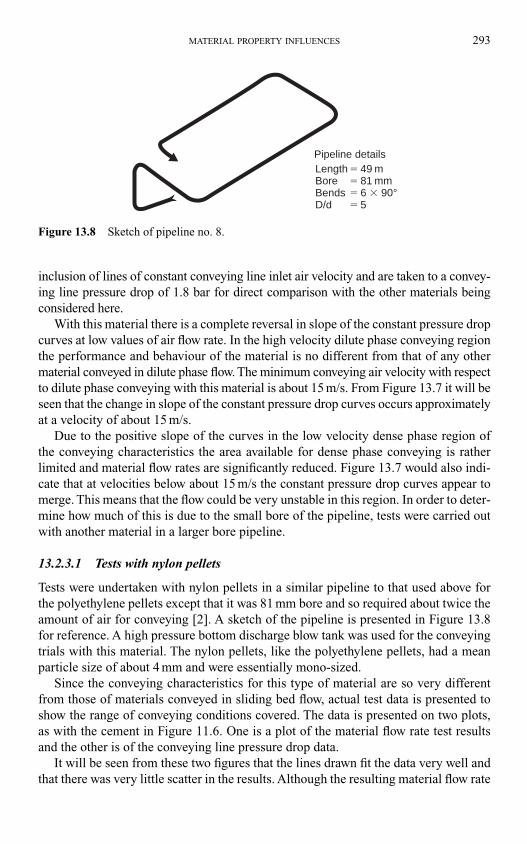
inclusion of lines of constant conveying line inlet air velocity and are taken to a convey-
ing line pressure drop of 1.8 bar for direct comparison with the other materials being
considered here.
With this material there is a complete reversal in slope of the constant pressure drop
curves at low values of air flow rate. In the high velocity dilute phase conveying region
the performance and behaviour of the material is no different from that of any other
material conveyed in dilute phase flow. The minimum conveying air velocity with respect
to dilute phase conveying with this material is about 15 m/s. From Figure 13.7 it will be
seen that the change in slope of the constant pressure drop curves occurs approximately
at a velocity of about 15 m/s.
Due to the positive slope of the curves in the low velocity dense phase region of
the conveying characteristics the area available for dense phase conveying is rather
limited and material flow rates are significantly reduced. Figure 13.7 would also indi-
cate that at velocities below about 15 m/s the constant pressure drop curves appear to
merge. This means that the flow could be very unstable in this region. In order to deter-
mine how much of this is due to the small bore of the pipeline, tests were carried out
with another material in a larger bore pipeline.
13.2.3.1 Tests with nylon pellets
Tests were undertaken with nylon pellets in a similar pipeline to that used above for
the polyethylene pellets except that it was 81 mm bore and so required about twice the
amount of air for conveying [2]. A sketch of the pipeline is presented in Figure 13.8
for reference. A high pressure bottom discharge blow tank was used for the conveying
trials with this material. The nylon pellets, like the polyethylene pellets, had a mean
particle size of about 4 mm and were essentially mono-sized.
Since the conveying characteristics for this type of material are so very different
from those of materials conveyed in sliding bed flow, actual test data is presented to
show the range of conveying conditions covered. The data is presented on two plots,
as with the cement in Figure 11.6. One is a plot of the material flow rate test results
and the other is of the conveying line pressure drop data.
It will be seen from these two figures that the lines drawn fit the data very well and
that there was very little scatter in the results. Although the resulting material flow rate
MATERIAL PROPERTY INFLUENCES 293
Length � 49 mBore � 81 mmBends � 6 � 90°D/d � 5
Pipeline details
Figure 13.8 Sketch of pipeline no. 8.
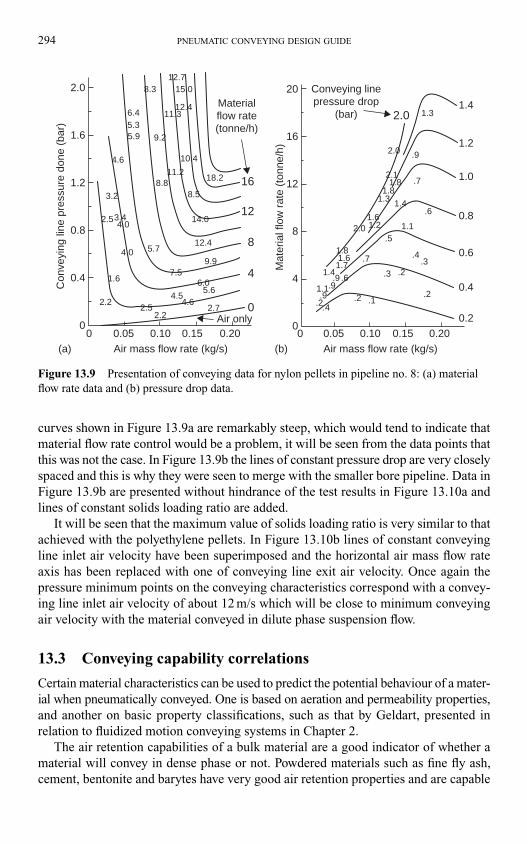
curves shown in Figure 13.9a are remarkably steep, which would tend to indicate that
material flow rate control would be a problem, it will be seen from the data points that
this was not the case. In Figure 13.9b the lines of constant pressure drop are very closely
spaced and this is why they were seen to merge with the smaller bore pipeline. Data in
Figure 13.9b are presented without hindrance of the test results in Figure 13.10a and
lines of constant solids loading ratio are added.
It will be seen that the maximum value of solids loading ratio is very similar to that
achieved with the polyethylene pellets. In Figure 13.10b lines of constant conveying
line inlet air velocity have been superimposed and the horizontal air mass flow rate
axis has been replaced with one of conveying line exit air velocity. Once again the
pressure minimum points on the conveying characteristics correspond with a convey-
ing line inlet air velocity of about 12 m/s which will be close to minimum conveying
air velocity with the material conveyed in dilute phase suspension flow.
13.3 Conveying capability correlations
Certain material characteristics can be used to predict the potential behaviour of a mater-
ial when pneumatically conveyed. One is based on aeration and permeability properties,
and another on basic property classifications, such as that by Geldart, presented in
relation to fluidized motion conveying systems in Chapter 2.
The air retention capabilities of a bulk material are a good indicator of whether a
material will convey in dense phase or not. Powdered materials such as fine fly ash,
cement, bentonite and barytes have very good air retention properties and are capable
294 PNEUMATIC CONVEYING DESIGN GUIDE
1.42.0
2.0
2.11.8
1.3
1.61.22.0
1.81.61.7
1.4.9 .6
.7
.91.1.9
.2
1.8
1.3
.9
.7
.6
1.1
1.4
.5
.4.3
.2.3
.2.1.2
.4
20
Mat
eria
l flo
w r
ate
(ton
ne/h
)
16
12
8
4
0
1.2
1.0
0.8
0.6
0.4
0.20 0.05 0.10 0.15
Air mass flow rate (kg/s)0.20
Conveying linepressure drop
(bar)
12.715.08.3
6.4
5.9 9.2
10.4
16
12
8
4
0
11.28.8
18.2
8.5
14.0
12.4
9.97.5
5.6
2.74.5
4.6
2.2
1.6
2.2
5.7
4.0
4.0
2.53.4
3.2
4.6
2.5
6.0
5.311.3
12.4
Con
veyi
ng li
ne p
ress
ure
done
(ba
r)
0(a) (b)
0
0.4
0.8
1.2
1.6
2.0
0.05 0.10 0.15 0.20Air mass flow rate (kg/s)
Materialflow rate(tonne/h)
Air only
Figure 13.9 Presentation of conveying data for nylon pellets in pipeline no. 8: (a) material
flow rate data and (b) pressure drop data.
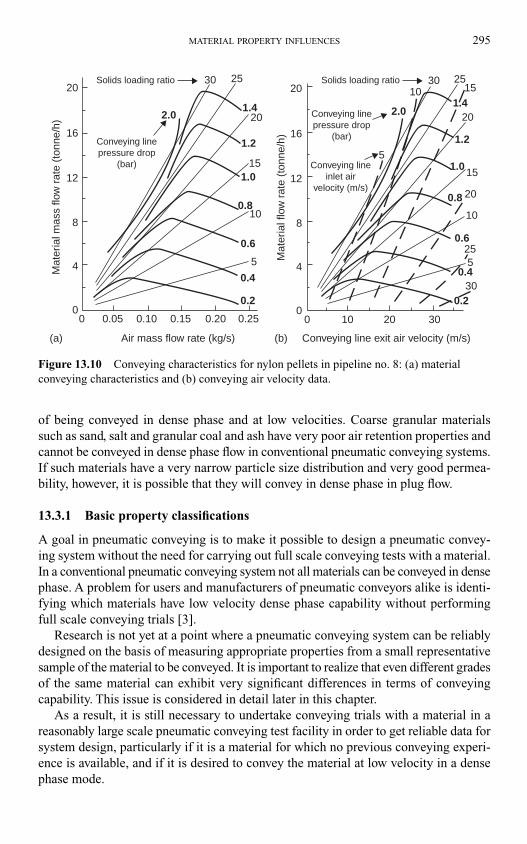
of being conveyed in dense phase and at low velocities. Coarse granular materials
such as sand, salt and granular coal and ash have very poor air retention properties and
cannot be conveyed in dense phase flow in conventional pneumatic conveying systems.
If such materials have a very narrow particle size distribution and very good permea-
bility, however, it is possible that they will convey in dense phase in plug flow.
13.3.1 Basic property classifications
A goal in pneumatic conveying is to make it possible to design a pneumatic convey-
ing system without the need for carrying out full scale conveying tests with a material.
In a conventional pneumatic conveying system not all materials can be conveyed in dense
phase. A problem for users and manufacturers of pneumatic conveyors alike is identi-
fying which materials have low velocity dense phase capability without performing
full scale conveying trials [3].
Research is not yet at a point where a pneumatic conveying system can be reliably
designed on the basis of measuring appropriate properties from a small representative
sample of the material to be conveyed. It is important to realize that even different grades
of the same material can exhibit very significant differences in terms of conveying
capability. This issue is considered in detail later in this chapter.
As a result, it is still necessary to undertake conveying trials with a material in a
reasonably large scale pneumatic conveying test facility in order to get reliable data for
system design, particularly if it is a material for which no previous conveying experi-
ence is available, and if it is desired to convey the material at low velocity in a dense
phase mode.
MATERIAL PROPERTY INFLUENCES 295
00
4
8
12
16
20
00 0.05 0.10 0.15 0.20 0.25
4
8
12
16
20
10 20 30
30
55
5
25
1010
20
2020
2525 3030
2.0
Solids loading ratio
Conveying linepressure drop
(bar)Conveying linepressure drop
(bar) Conveying lineinlet air
velocity (m/s)
Conveying line exit air velocity (m/s)Air mass flow rate (kg/s)
Mat
eria
l mas
s flo
w r
ate
(ton
ne/h
)
Mat
eria
l flo
w r
ate
(ton
ne/h
)
10
1515
15
0.20.2
0.4 0.4
0.60.6
0.80.8
1.01.0
1.21.2
2.01.41.4
(a) (b)
Solids loading ratio
Figure 13.10 Conveying characteristics for nylon pellets in pipeline no. 8: (a) material
conveying characteristics and (b) conveying air velocity data.
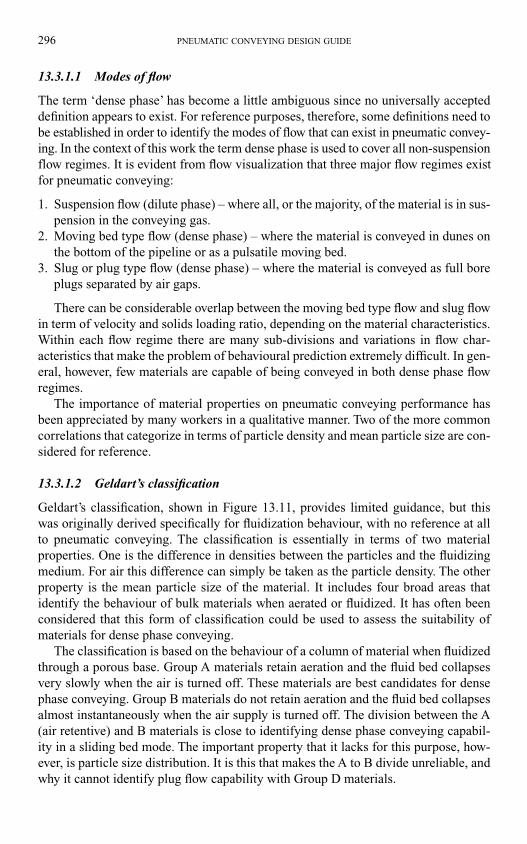
13.3.1.1 Modes of flow
The term ‘dense phase’ has become a little ambiguous since no universally accepted
definition appears to exist. For reference purposes, therefore, some definitions need to
be established in order to identify the modes of flow that can exist in pneumatic convey-
ing. In the context of this work the term dense phase is used to cover all non-suspension
flow regimes. It is evident from flow visualization that three major flow regimes exist
for pneumatic conveying:
1. Suspension flow (dilute phase) – where all, or the majority, of the material is in sus-
pension in the conveying gas.
2. Moving bed type flow (dense phase) – where the material is conveyed in dunes on
the bottom of the pipeline or as a pulsatile moving bed.
3. Slug or plug type flow (dense phase) – where the material is conveyed as full bore
plugs separated by air gaps.
There can be considerable overlap between the moving bed type flow and slug flow
in term of velocity and solids loading ratio, depending on the material characteristics.
Within each flow regime there are many sub-divisions and variations in flow char-
acteristics that make the problem of behavioural prediction extremely difficult. In gen-
eral, however, few materials are capable of being conveyed in both dense phase flow
regimes.
The importance of material properties on pneumatic conveying performance has
been appreciated by many workers in a qualitative manner. Two of the more common
correlations that categorize in terms of particle density and mean particle size are con-
sidered for reference.
13.3.1.2 Geldart’s classification
Geldart’s classification, shown in Figure 13.11, provides limited guidance, but this
was originally derived specifically for fluidization behaviour, with no reference at all
to pneumatic conveying. The classification is essentially in terms of two material
properties. One is the difference in densities between the particles and the fluidizing
medium. For air this difference can simply be taken as the particle density. The other
property is the mean particle size of the material. It includes four broad areas that
identify the behaviour of bulk materials when aerated or fluidized. It has often been
considered that this form of classification could be used to assess the suitability of
materials for dense phase conveying.
The classification is based on the behaviour of a column of material when fluidized
through a porous base. Group A materials retain aeration and the fluid bed collapses
very slowly when the air is turned off. These materials are best candidates for dense
phase conveying. Group B materials do not retain aeration and the fluid bed collapses
almost instantaneously when the air supply is turned off. The division between the A
(air retentive) and B materials is close to identifying dense phase conveying capabil-
ity in a sliding bed mode. The important property that it lacks for this purpose, how-
ever, is particle size distribution. It is this that makes the A to B divide unreliable, and
why it cannot identify plug flow capability with Group D materials.
296 PNEUMATIC CONVEYING DESIGN GUIDE
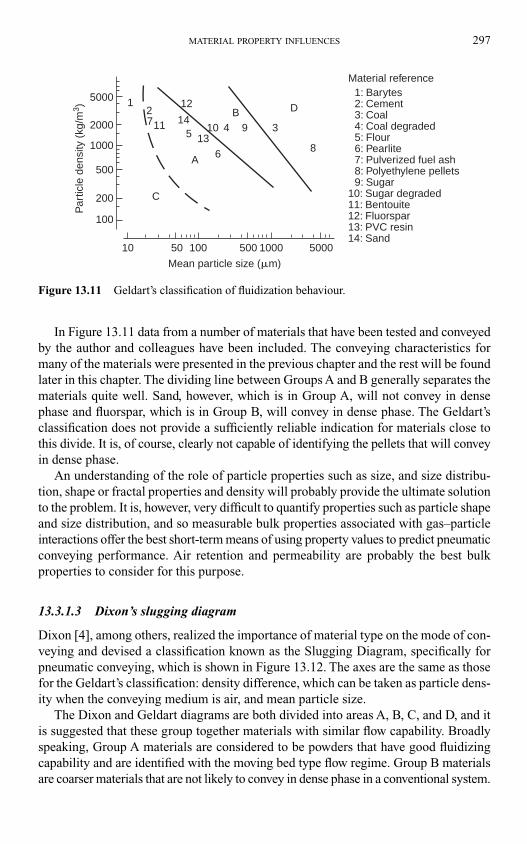
In Figure 13.11 data from a number of materials that have been tested and conveyed
by the author and colleagues have been included. The conveying characteristics for
many of the materials were presented in the previous chapter and the rest will be found
later in this chapter. The dividing line between Groups A and B generally separates the
materials quite well. Sand, however, which is in Group A, will not convey in dense
phase and fluorspar, which is in Group B, will convey in dense phase. The Geldart’s
classification does not provide a sufficiently reliable indication for materials close to
this divide. It is, of course, clearly not capable of identifying the pellets that will convey
in dense phase.
An understanding of the role of particle properties such as size, and size distribu-
tion, shape or fractal properties and density will probably provide the ultimate solution
to the problem. It is, however, very difficult to quantify properties such as particle shape
and size distribution, and so measurable bulk properties associated with gas–particle
interactions offer the best short-term means of using property values to predict pneumatic
conveying performance. Air retention and permeability are probably the best bulk
properties to consider for this purpose.
13.3.1.3 Dixon’s slugging diagram
Dixon [4], among others, realized the importance of material type on the mode of con-
veying and devised a classification known as the Slugging Diagram, specifically for
pneumatic conveying, which is shown in Figure 13.12. The axes are the same as those
for the Geldart’s classification: density difference, which can be taken as particle dens-
ity when the conveying medium is air, and mean particle size.
The Dixon and Geldart diagrams are both divided into areas A, B, C, and D, and it
is suggested that these group together materials with similar flow capability. Broadly
speaking, Group A materials are considered to be powders that have good fluidizing
capability and are identified with the moving bed type flow regime. Group B materials
are coarser materials that are not likely to convey in dense phase in a conventional system.
MATERIAL PROPERTY INFLUENCES 297
10
C
Mean particle size (�m)
Par
ticle
den
sity
(kg
/m3 )
Material reference
4: Coal degraded
14: Sand13: PVC resin12: Fluorspar11: Bentouite10: Sugar degraded
9: Sugar8: Polyethylene pellets7: Pulverized fuel ash6: Pearlite5: Flour
3: Coal2: Cement1: Barytes
A
12
8
39
6
4511 14
12
1013
7B D
50 100
100
200
500
500 1000
1000
2000
5000
5000
Figure 13.11 Geldart’s classification of fluidization behaviour.
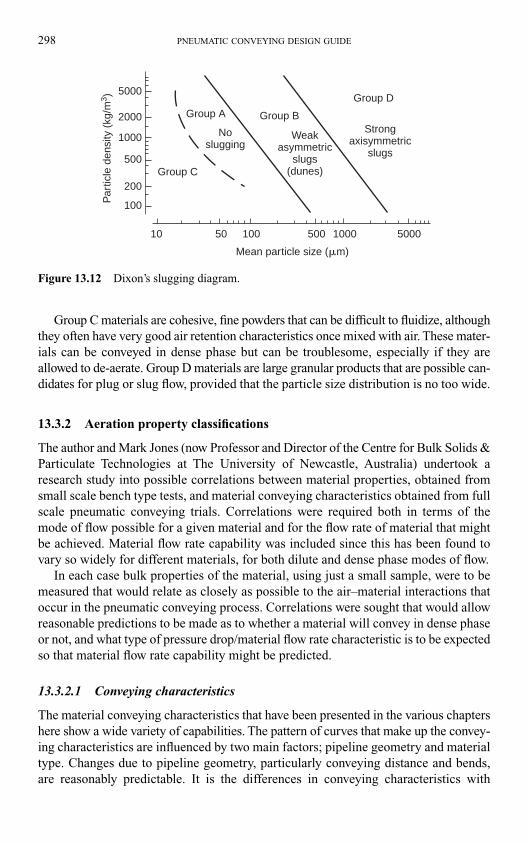
Group C materials are cohesive, fine powders that can be difficult to fluidize, although
they often have very good air retention characteristics once mixed with air. These mater-
ials can be conveyed in dense phase but can be troublesome, especially if they are
allowed to de-aerate. Group D materials are large granular products that are possible can-
didates for plug or slug flow, provided that the particle size distribution is no too wide.
13.3.2 Aeration property classifications
The author and Mark Jones (now Professor and Director of the Centre for Bulk Solids &
Particulate Technologies at The University of Newcastle, Australia) undertook a
research study into possible correlations between material properties, obtained from
small scale bench type tests, and material conveying characteristics obtained from full
scale pneumatic conveying trials. Correlations were required both in terms of the
mode of flow possible for a given material and for the flow rate of material that might
be achieved. Material flow rate capability was included since this has been found to
vary so widely for different materials, for both dilute and dense phase modes of flow.
In each case bulk properties of the material, using just a small sample, were to be
measured that would relate as closely as possible to the air–material interactions that
occur in the pneumatic conveying process. Correlations were sought that would allow
reasonable predictions to be made as to whether a material will convey in dense phase
or not, and what type of pressure drop/material flow rate characteristic is to be expected
so that material flow rate capability might be predicted.
13.3.2.1 Conveying characteristics
The material conveying characteristics that have been presented in the various chapters
here show a wide variety of capabilities. The pattern of curves that make up the convey-
ing characteristics are influenced by two main factors; pipeline geometry and material
type. Changes due to pipeline geometry, particularly conveying distance and bends,
are reasonably predictable. It is the differences in conveying characteristics with
298 PNEUMATIC CONVEYING DESIGN GUIDE
Par
ticle
den
sity
(kg
/m3 )
100
200
500
1000
2000
5000
Strongaxisymmetric
slugs
Weakasymmetric
slugs(dunes)
Noslugging
Group D
Group C
Group BGroup A
10
Mean particle size (�m)
50 100 500 1000 5000
Figure 13.12 Dixon’s slugging diagram.
respect to material type that present most difficulties, and so it is this issue that was
addressed.
The conveying characteristics are built up from the lines of constant conveying line
pressure drop and solids loading ratio, plotted as material flow rate against air flow rate,
over the range of conveyability of interest for any given material. It is the lines of constant
conveying line pressure drop that are important. For a given pipeline the shape, spacing
and limits of the pressure drop lines can vary significantly from one material to another.
The differences and changes with respect to material type are not entirely predictable,
and this is why it is necessary to carry out tests if there is no previous, or only limited,
conveying experience with a material. Once data is available it can be scaled to the
required pipeline geometry with a reasonable degree of accuracy. The scaling, however,
must not extend beyond the limits for which the data is available and the conveying
capability proven.
13.3.2.2 Material testing
A number of different materials were tested extensively for the benefit of the research.
Two of the materials, granulated sugar and coal, degraded to such an extent during the
conveying trials that their conveying characteristics changed. In each case it was pos-
sible to obtain conveying characteristics for these materials, in both the as received
and degraded conditions, and property values were also determined.
With both conveying data and property values available for a wide range of materials,
there was the possibility of deriving correlations between the two. Since pneumatic
conveying is the transport of particulate solids in air, it was possible that the most
likely correlations between conveying characteristics and material properties would
be found from bench tests in which material–air interactions take place. For this reason
a number of properties associated with aeration were determined. These included per-
meability factor, minimum fluidizing velocity, de-aeration rate and specific surface.
For similar reasons various density measurements were taken. Particle density and
bulk density in both the ‘as poured’ and ‘vibrated’ conditions were measured. Voidage
and degree of compaction were then derived from these values. Particle size is clearly
important and so both the mean value and size distributions were determined. Particle
shape and moisture content were also recorded, although these were included more for
material reference purposes. Much of this data is logged in Appendix 1 for reference.
13.3.2.3 Conveying mode correlations
For a conveying mode correlation, air retention and permeability were the main bulk
properties that were considered and it is these terms that have been used widely in terms
of discussing material conveying capability and performance to this point in the Design
Guide.
13.3.2.3.1 Permeability factor
To determine whether or not permeability factor can distinguish between materials
that will convey in dense phase and those that will not, minimum conveying air velocity
MATERIAL PROPERTY INFLUENCES 299
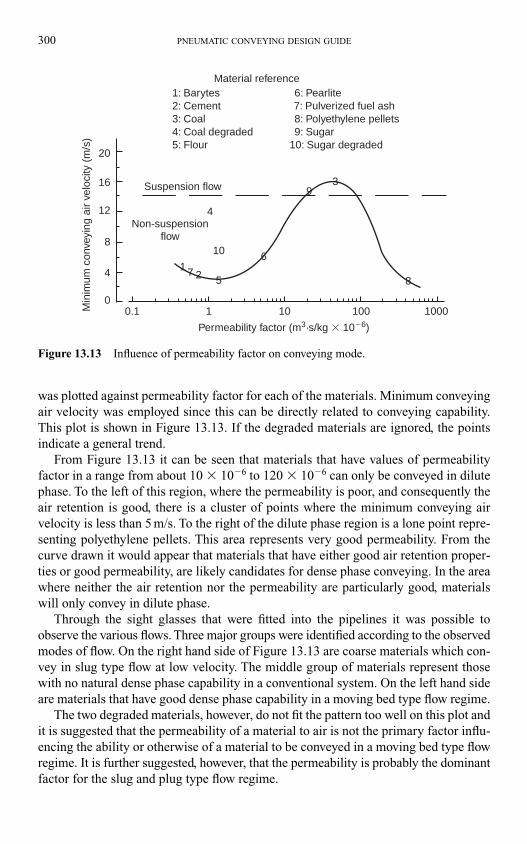
was plotted against permeability factor for each of the materials. Minimum conveying
air velocity was employed since this can be directly related to conveying capability.
This plot is shown in Figure 13.13. If the degraded materials are ignored, the points
indicate a general trend.
From Figure 13.13 it can be seen that materials that have values of permeability
factor in a range from about 10 � 10�6 to 120 � 10�6 can only be conveyed in dilute
phase. To the left of this region, where the permeability is poor, and consequently the
air retention is good, there is a cluster of points where the minimum conveying air
velocity is less than 5 m/s. To the right of the dilute phase region is a lone point repre-
senting polyethylene pellets. This area represents very good permeability. From the
curve drawn it would appear that materials that have either good air retention proper-
ties or good permeability, are likely candidates for dense phase conveying. In the area
where neither the air retention nor the permeability are particularly good, materials
will only convey in dilute phase.
Through the sight glasses that were fitted into the pipelines it was possible to
observe the various flows. Three major groups were identified according to the observed
modes of flow. On the right hand side of Figure 13.13 are coarse materials which con-
vey in slug type flow at low velocity. The middle group of materials represent those
with no natural dense phase capability in a conventional system. On the left hand side
are materials that have good dense phase capability in a moving bed type flow regime.
The two degraded materials, however, do not fit the pattern too well on this plot and
it is suggested that the permeability of a material to air is not the primary factor influ-
encing the ability or otherwise of a material to be conveyed in a moving bed type flow
regime. It is further suggested, however, that the permeability is probably the dominant
factor for the slug and plug type flow regime.
300 PNEUMATIC CONVEYING DESIGN GUIDE
Permeability factor (m3·s/kg � 10�6)
Min
imum
con
veyi
ng a
ir ve
loci
ty (
m/s
)
0.1 10
4
4
8
39
6
51
2
108
12
16
20
10 100 1000
Material reference
Non-suspensionflow
Suspension flow
4: Coal degraded10: Sugar degraded9: Sugar8: Polyethylene pellets7: Pulverized fuel ash6: Pearlite
5: Flour
3: Coal2: Cement1: Barytes
7
Figure 13.13 Influence of permeability factor on conveying mode.
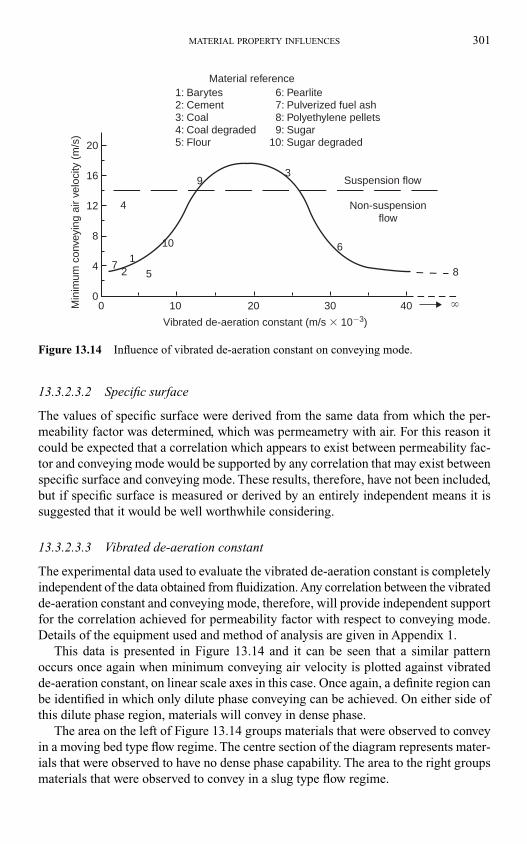
13.3.2.3.2 Specific surface
The values of specific surface were derived from the same data from which the per-
meability factor was determined, which was permeametry with air. For this reason it
could be expected that a correlation which appears to exist between permeability fac-
tor and conveying mode would be supported by any correlation that may exist between
specific surface and conveying mode. These results, therefore, have not been included,
but if specific surface is measured or derived by an entirely independent means it is
suggested that it would be well worthwhile considering.
13.3.2.3.3 Vibrated de-aeration constant
The experimental data used to evaluate the vibrated de-aeration constant is completely
independent of the data obtained from fluidization. Any correlation between the vibrated
de-aeration constant and conveying mode, therefore, will provide independent support
for the correlation achieved for permeability factor with respect to conveying mode.
Details of the equipment used and method of analysis are given in Appendix 1.
This data is presented in Figure 13.14 and it can be seen that a similar pattern
occurs once again when minimum conveying air velocity is plotted against vibrated
de-aeration constant, on linear scale axes in this case. Once again, a definite region can
be identified in which only dilute phase conveying can be achieved. On either side of
this dilute phase region, materials will convey in dense phase.
The area on the left of Figure 13.14 groups materials that were observed to convey
in a moving bed type flow regime. The centre section of the diagram represents mater-
ials that were observed to have no dense phase capability. The area to the right groups
materials that were observed to convey in a slug type flow regime.
MATERIAL PROPERTY INFLUENCES 301
Material reference
4: Coal degraded10: Sugar degraded
9: Sugar8: Polyethylene pellets7: Pulverized fuel ash6: Pearlite
5: Flour
3: Coal2: Cement1: Barytes
Min
imum
con
veyi
ng a
ir ve
loci
ty (
m/s
)
8
6
39
10
4
12
75
00
10 20 30 40
4
8
12
16
20
Non-suspensionflow
Vibrated de-aeration constant (m/s � 10�3)
Suspension flow
�
Figure 13.14 Influence of vibrated de-aeration constant on conveying mode.
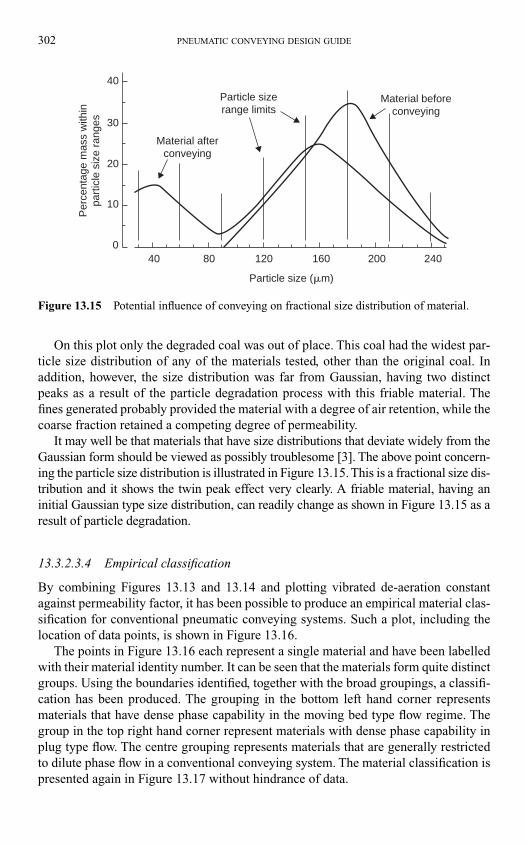
On this plot only the degraded coal was out of place. This coal had the widest par-
ticle size distribution of any of the materials tested, other than the original coal. In
addition, however, the size distribution was far from Gaussian, having two distinct
peaks as a result of the particle degradation process with this friable material. The
fines generated probably provided the material with a degree of air retention, while the
coarse fraction retained a competing degree of permeability.
It may well be that materials that have size distributions that deviate widely from the
Gaussian form should be viewed as possibly troublesome [3]. The above point concern-
ing the particle size distribution is illustrated in Figure 13.15. This is a fractional size dis-
tribution and it shows the twin peak effect very clearly. A friable material, having an
initial Gaussian type size distribution, can readily change as shown in Figure 13.15 as a
result of particle degradation.
13.3.2.3.4 Empirical classification
By combining Figures 13.13 and 13.14 and plotting vibrated de-aeration constant
against permeability factor, it has been possible to produce an empirical material clas-
sification for conventional pneumatic conveying systems. Such a plot, including the
location of data points, is shown in Figure 13.16.
The points in Figure 13.16 each represent a single material and have been labelled
with their material identity number. It can be seen that the materials form quite distinct
groups. Using the boundaries identified, together with the broad groupings, a classifi-
cation has been produced. The grouping in the bottom left hand corner represents
materials that have dense phase capability in the moving bed type flow regime. The
group in the top right hand corner represent materials with dense phase capability in
plug type flow. The centre grouping represents materials that are generally restricted
to dilute phase flow in a conventional conveying system. The material classification is
presented again in Figure 13.17 without hindrance of data.
302 PNEUMATIC CONVEYING DESIGN GUIDE
40
30
20
040 80 120 160 200 240
Particle size (�m)
Material afterconveying
Material beforeconveying
Per
cent
age
mas
s w
ithin
part
icle
siz
e ra
nges
Particle sizerange limits
10
Figure 13.15 Potential influence of conveying on fractional size distribution of material.
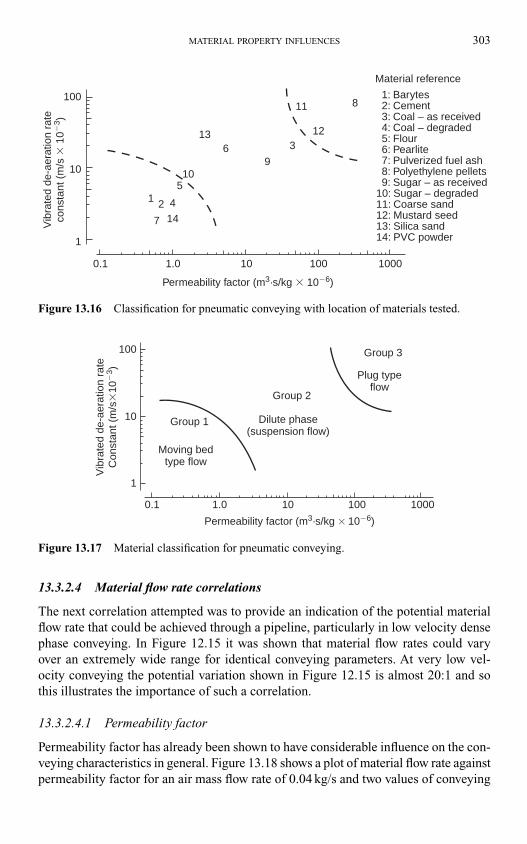
13.3.2.4 Material flow rate correlations
The next correlation attempted was to provide an indication of the potential material
flow rate that could be achieved through a pipeline, particularly in low velocity dense
phase conveying. In Figure 12.15 it was shown that material flow rates could vary
over an extremely wide range for identical conveying parameters. At very low vel-
ocity conveying the potential variation shown in Figure 12.15 is almost 20:1 and so
this illustrates the importance of such a correlation.
13.3.2.4.1 Permeability factor
Permeability factor has already been shown to have considerable influence on the con-
veying characteristics in general. Figure 13.18 shows a plot of material flow rate against
permeability factor for an air mass flow rate of 0.04 kg/s and two values of conveying
MATERIAL PROPERTY INFLUENCES 303
0.1
1
1
11 8
123
96
13
105
14
42
7
10
100
1.0 10 100 1000
Permeability factor (m3·s/kg � 10�6)
4: Coal – degraded
6: Pearlite5: Flour
3: Coal – as received2: Cement1: Barytes
Material reference
10: Sugar – degraded
14: PVC powder
12: Mustard seed11: Coarse sand
13: Silica sand
9: Sugar – as received8: Polyethylene pellets7: Pulverized fuel ash
Vib
rate
d de
-aer
atio
n ra
teco
nsta
nt (
m/s
� 1
0�3 )
Figure 13.16 Classification for pneumatic conveying with location of materials tested.
0.1 1.0 10 100 1000
1
10
100
Group 2
Group 1
Group 3
Plug typeflow
Dilute phase(suspension flow)
Moving bedtype flow
Permeability factor (m3·s/kg � 10�6)
Vib
rate
d de
-aer
atio
n ra
teC
onst
ant (
m/s
�10
�3 )
Figure 13.17 Material classification for pneumatic conveying.
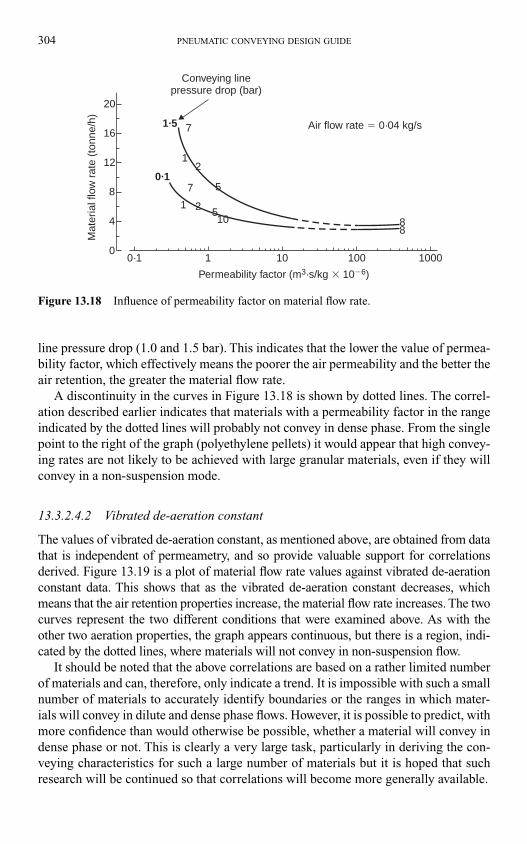
line pressure drop (1.0 and 1.5 bar). This indicates that the lower the value of permea-
bility factor, which effectively means the poorer the air permeability and the better the
air retention, the greater the material flow rate.
A discontinuity in the curves in Figure 13.18 is shown by dotted lines. The correl-
ation described earlier indicates that materials with a permeability factor in the range
indicated by the dotted lines will probably not convey in dense phase. From the single
point to the right of the graph (polyethylene pellets) it would appear that high convey-
ing rates are not likely to be achieved with large granular materials, even if they will
convey in a non-suspension mode.
13.3.2.4.2 Vibrated de-aeration constant
The values of vibrated de-aeration constant, as mentioned above, are obtained from data
that is independent of permeametry, and so provide valuable support for correlations
derived. Figure 13.19 is a plot of material flow rate values against vibrated de-aeration
constant data. This shows that as the vibrated de-aeration constant decreases, which
means that the air retention properties increase, the material flow rate increases. The two
curves represent the two different conditions that were examined above. As with the
other two aeration properties, the graph appears continuous, but there is a region, indi-
cated by the dotted lines, where materials will not convey in non-suspension flow.
It should be noted that the above correlations are based on a rather limited number
of materials and can, therefore, only indicate a trend. It is impossible with such a small
number of materials to accurately identify boundaries or the ranges in which mater-
ials will convey in dilute and dense phase flows. However, it is possible to predict, with
more confidence than would otherwise be possible, whether a material will convey in
dense phase or not. This is clearly a very large task, particularly in deriving the con-
veying characteristics for such a large number of materials but it is hoped that such
research will be continued so that correlations will become more generally available.
304 PNEUMATIC CONVEYING DESIGN GUIDE
Permeability factor (m3·s/kg � 10�6)
Mat
eria
l flo
w r
ate
(ton
ne/h
)Conveying line
pressure drop (bar)
Air flow rate � 0·04 kg/s
20
16
12
8
4
00·1
0·1
1·5
101
1
7
2
5
521
7
10
100 1000
88
Figure 13.18 Influence of permeability factor on material flow rate.
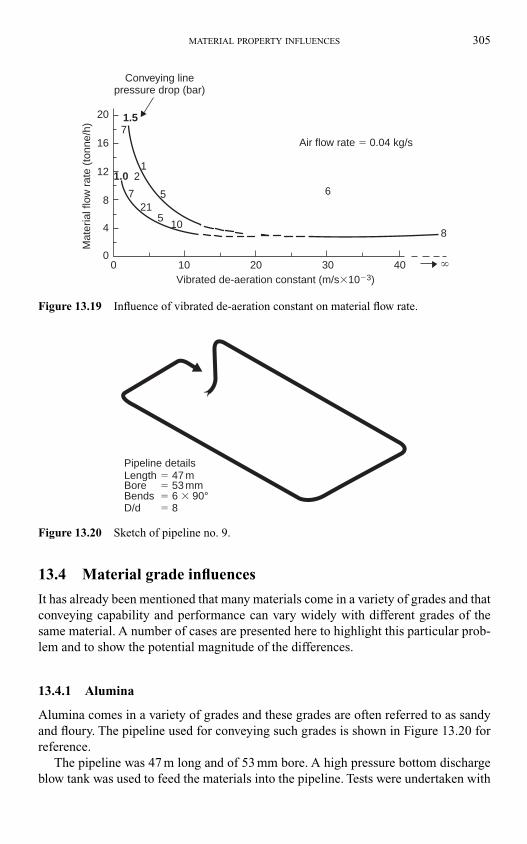
13.4 Material grade influences
It has already been mentioned that many materials come in a variety of grades and that
conveying capability and performance can vary widely with different grades of the
same material. A number of cases are presented here to highlight this particular prob-
lem and to show the potential magnitude of the differences.
13.4.1 Alumina
Alumina comes in a variety of grades and these grades are often referred to as sandy
and floury. The pipeline used for conveying such grades is shown in Figure 13.20 for
reference.
The pipeline was 47 m long and of 53 mm bore. A high pressure bottom discharge
blow tank was used to feed the materials into the pipeline. Tests were undertaken with
MATERIAL PROPERTY INFLUENCES 305
Mat
eria
l flo
w r
ate
(ton
ne/h
)
20
16
12
8
4
00 10 20
6
8
30 40
1.5
1.0 2
721
10
5
1
7
5
Conveying linepressure drop (bar)
Air flow rate � 0.04 kg/s
Vibrated de-aeration constant (m/s�10�3)�
Figure 13.19 Influence of vibrated de-aeration constant on material flow rate.
Pipeline detailsLength � 47 mBore � 53 mmBends � 6 � 90°D/d � 8
Figure 13.20 Sketch of pipeline no. 9.
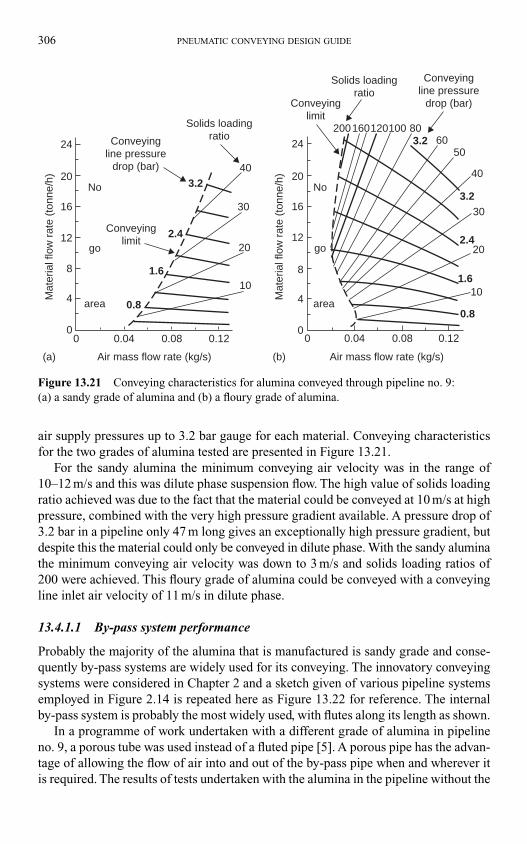
air supply pressures up to 3.2 bar gauge for each material. Conveying characteristics
for the two grades of alumina tested are presented in Figure 13.21.
For the sandy alumina the minimum conveying air velocity was in the range of
10–12 m/s and this was dilute phase suspension flow. The high value of solids loading
ratio achieved was due to the fact that the material could be conveyed at 10 m/s at high
pressure, combined with the very high pressure gradient available. A pressure drop of
3.2 bar in a pipeline only 47 m long gives an exceptionally high pressure gradient, but
despite this the material could only be conveyed in dilute phase. With the sandy alumina
the minimum conveying air velocity was down to 3 m/s and solids loading ratios of
200 were achieved. This floury grade of alumina could be conveyed with a conveying
line inlet air velocity of 11 m/s in dilute phase.
13.4.1.1 By-pass system performance
Probably the majority of the alumina that is manufactured is sandy grade and conse-
quently by-pass systems are widely used for its conveying. The innovatory conveying
systems were considered in Chapter 2 and a sketch given of various pipeline systems
employed in Figure 2.14 is repeated here as Figure 13.22 for reference. The internal
by-pass system is probably the most widely used, with flutes along its length as shown.
In a programme of work undertaken with a different grade of alumina in pipeline
no. 9, a porous tube was used instead of a fluted pipe [5]. A porous pipe has the advan-
tage of allowing the flow of air into and out of the by-pass pipe when and wherever it
is required. The results of tests undertaken with the alumina in the pipeline without the
306 PNEUMATIC CONVEYING DESIGN GUIDE
Air mass flow rate (kg/s) Air mass flow rate (kg/s)
50
40
30 30
20
24
16
12
8
4
20
24
16
12
8
4
20
1010
000
00.040.04 0.080.08
1.6
0.8
2.4
3.2
120
Solids loadingratio
Solids loadingratio
Conveyinglimit
Conveyinglimit
No
go
area
No
go
area
Conveyingline pressure
drop (bar)
Conveyingline pressure
drop (bar)
100200160 80603.2
3.2
2.4
1.6
0.8
40
20
0.120.12
Mat
eria
l flo
w r
ate
(ton
ne/h
)
Mat
eria
l flo
w r
ate
(ton
ne/h
)
(a) (b)
Figure 13.21 Conveying characteristics for alumina conveyed through pipeline no. 9:
(a) a sandy grade of alumina and (b) a floury grade of alumina.
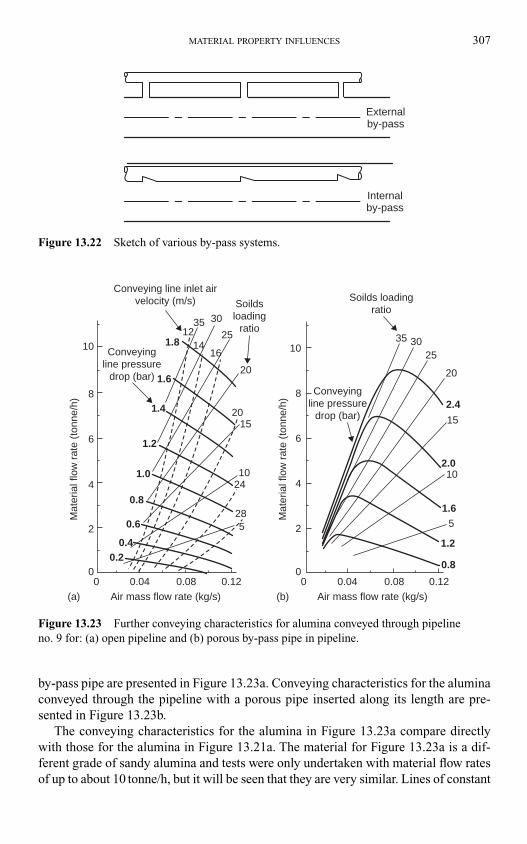
by-pass pipe are presented in Figure 13.23a. Conveying characteristics for the alumina
conveyed through the pipeline with a porous pipe inserted along its length are pre-
sented in Figure 13.23b.
The conveying characteristics for the alumina in Figure 13.23a compare directly
with those for the alumina in Figure 13.21a. The material for Figure 13.23a is a dif-
ferent grade of sandy alumina and tests were only undertaken with material flow rates
of up to about 10 tonne/h, but it will be seen that they are very similar. Lines of constant
MATERIAL PROPERTY INFLUENCES 307
Externalby-pass
Internalby-pass
Figure 13.22 Sketch of various by-pass systems.
10 1.8
1.6
1.4
1.2
1.0
0.6
0.8
0.40.2
28
2410
1520
20 20
251214
16
3035
8
6
4
2
0
10
8
6
4
2
00 0.04 0.08 0.12 0 0.04 0.08 0.12
0.8
1.2
55
1.6
102.0
2.4
15
253035
Soilds loadingratio
Conveyingline pressure
drop (bar)
Conveyingline pressure
drop (bar)
Soildsloading
ratio
Conveying line inlet airvelocity (m/s)
Mat
eria
l flo
w r
ate
(ton
ne/h
)
Mat
eria
l flo
w r
ate
(ton
ne/h
)
Air mass flow rate (kg/s) Air mass flow rate (kg/s)(a) (b)
Figure 13.23 Further conveying characteristics for alumina conveyed through pipeline
no. 9 for: (a) open pipeline and (b) porous by-pass pipe in pipeline.
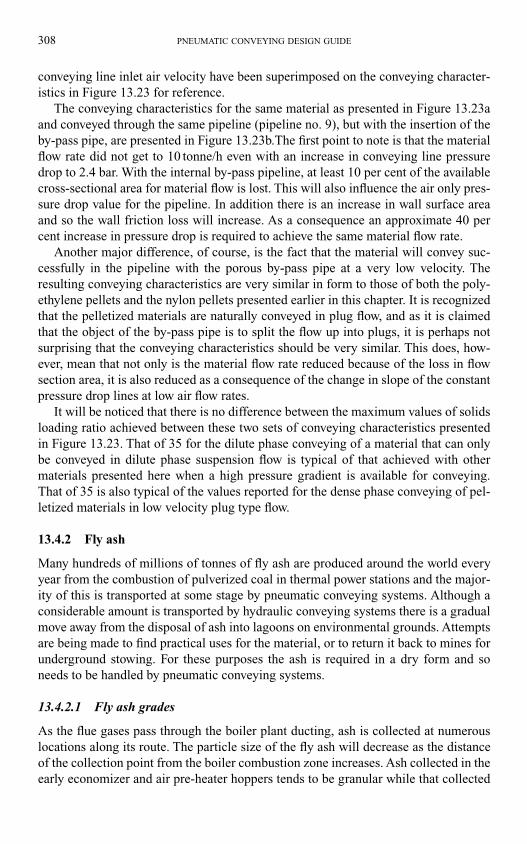
conveying line inlet air velocity have been superimposed on the conveying character-
istics in Figure 13.23 for reference.
The conveying characteristics for the same material as presented in Figure 13.23a
and conveyed through the same pipeline (pipeline no. 9), but with the insertion of the
by-pass pipe, are presented in Figure 13.23b.The first point to note is that the material
flow rate did not get to 10 tonne/h even with an increase in conveying line pressure
drop to 2.4 bar. With the internal by-pass pipeline, at least 10 per cent of the available
cross-sectional area for material flow is lost. This will also influence the air only pres-
sure drop value for the pipeline. In addition there is an increase in wall surface area
and so the wall friction loss will increase. As a consequence an approximate 40 per
cent increase in pressure drop is required to achieve the same material flow rate.
Another major difference, of course, is the fact that the material will convey suc-
cessfully in the pipeline with the porous by-pass pipe at a very low velocity. The
resulting conveying characteristics are very similar in form to those of both the poly-
ethylene pellets and the nylon pellets presented earlier in this chapter. It is recognized
that the pelletized materials are naturally conveyed in plug flow, and as it is claimed
that the object of the by-pass pipe is to split the flow up into plugs, it is perhaps not
surprising that the conveying characteristics should be very similar. This does, how-
ever, mean that not only is the material flow rate reduced because of the loss in flow
section area, it is also reduced as a consequence of the change in slope of the constant
pressure drop lines at low air flow rates.
It will be noticed that there is no difference between the maximum values of solids
loading ratio achieved between these two sets of conveying characteristics presented
in Figure 13.23. That of 35 for the dilute phase conveying of a material that can only
be conveyed in dilute phase suspension flow is typical of that achieved with other
materials presented here when a high pressure gradient is available for conveying.
That of 35 is also typical of the values reported for the dense phase conveying of pel-
letized materials in low velocity plug type flow.
13.4.2 Fly ash
Many hundreds of millions of tonnes of fly ash are produced around the world every
year from the combustion of pulverized coal in thermal power stations and the major-
ity of this is transported at some stage by pneumatic conveying systems. Although a
considerable amount is transported by hydraulic conveying systems there is a gradual
move away from the disposal of ash into lagoons on environmental grounds. Attempts
are being made to find practical uses for the material, or to return it back to mines for
underground stowing. For these purposes the ash is required in a dry form and so
needs to be handled by pneumatic conveying systems.
13.4.2.1 Fly ash grades
As the flue gases pass through the boiler plant ducting, ash is collected at numerous
locations along its route. The particle size of the fly ash will decrease as the distance
of the collection point from the boiler combustion zone increases. Ash collected in the
early economizer and air pre-heater hoppers tends to be granular while that collected
308 PNEUMATIC CONVEYING DESIGN GUIDE
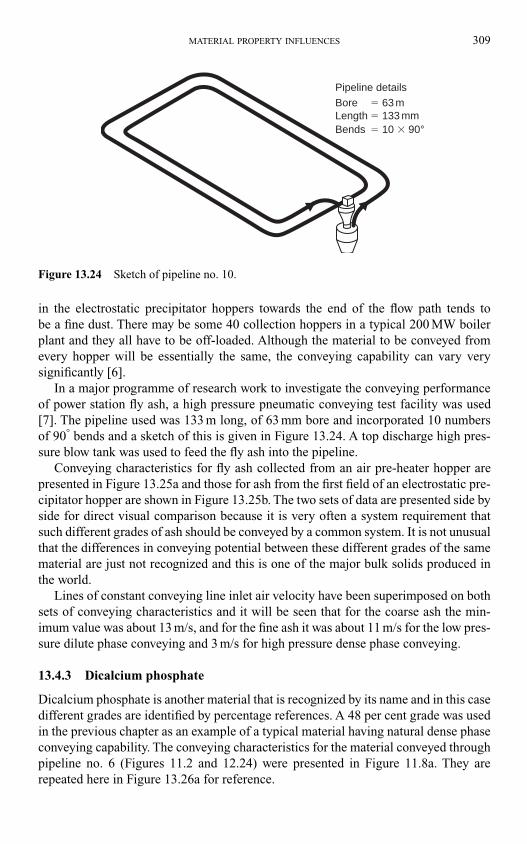
in the electrostatic precipitator hoppers towards the end of the flow path tends to
be a fine dust. There may be some 40 collection hoppers in a typical 200 MW boiler
plant and they all have to be off-loaded. Although the material to be conveyed from
every hopper will be essentially the same, the conveying capability can vary very
significantly [6].
In a major programme of research work to investigate the conveying performance
of power station fly ash, a high pressure pneumatic conveying test facility was used
[7]. The pipeline used was 133 m long, of 63 mm bore and incorporated 10 numbers
of 90° bends and a sketch of this is given in Figure 13.24. A top discharge high pres-
sure blow tank was used to feed the fly ash into the pipeline.
Conveying characteristics for fly ash collected from an air pre-heater hopper are
presented in Figure 13.25a and those for ash from the first field of an electrostatic pre-
cipitator hopper are shown in Figure 13.25b. The two sets of data are presented side by
side for direct visual comparison because it is very often a system requirement that
such different grades of ash should be conveyed by a common system. It is not unusual
that the differences in conveying potential between these different grades of the same
material are just not recognized and this is one of the major bulk solids produced in
the world.
Lines of constant conveying line inlet air velocity have been superimposed on both
sets of conveying characteristics and it will be seen that for the coarse ash the min-
imum value was about 13 m/s, and for the fine ash it was about 11 m/s for the low pres-
sure dilute phase conveying and 3 m/s for high pressure dense phase conveying.
13.4.3 Dicalcium phosphate
Dicalcium phosphate is another material that is recognized by its name and in this case
different grades are identified by percentage references. A 48 per cent grade was used
in the previous chapter as an example of a typical material having natural dense phase
conveying capability. The conveying characteristics for the material conveyed through
pipeline no. 6 (Figures 11.2 and 12.24) were presented in Figure 11.8a. They are
repeated here in Figure 13.26a for reference.
MATERIAL PROPERTY INFLUENCES 309
Pipeline detailsBore � 63 mLength � 133 mmBends � 10 � 90°
Figure 13.24 Sketch of pipeline no. 10.
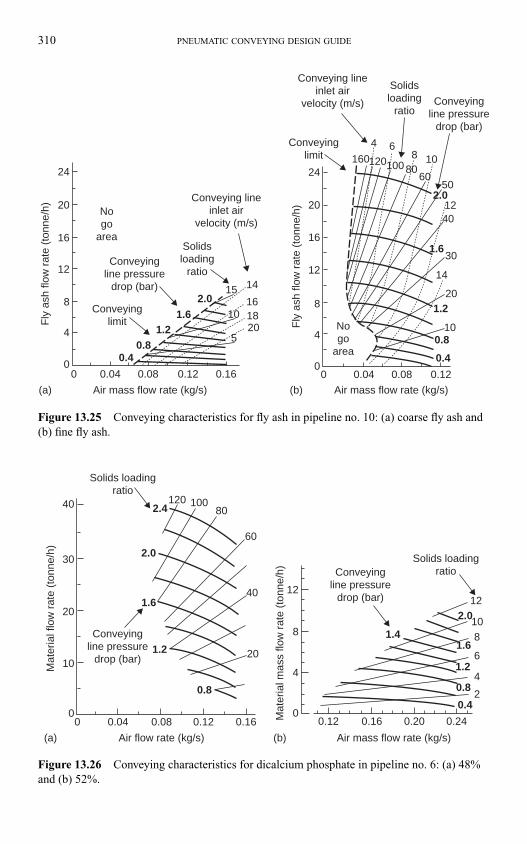
310 PNEUMATIC CONVEYING DESIGN GUIDE
Air mass flow rate (kg/s) Air mass flow rate (kg/s)
30
20
24
16
15 1414
12
4 68 10
50
1618
12
8
4 1010
5
0
20
24
16
12
20
8
4
000 0.04 0.08
2.0
120160
Solidsloading
ratio
Solidsloading
ratio
Conveying lineinlet air
velocity (m/s)
Conveying lineinlet air
velocity (m/s) Conveyingline pressure
drop (bar)
Conveyingline pressure
drop (bar)
100 8060
40
20
0.12
0.8 0.8
0.4 0.4
1.2
1.21.6
1.6
2.0
0.04 0.08 0.120.16
Fly
ash
flow
rat
e (t
onne
/h)
Fly
ash
flow
rat
e (t
onne
/h)
Conveyinglimit
Conveyinglimit No
goarea
Nogo
area
(a) (b)
Figure 13.25 Conveying characteristics for fly ash in pipeline no. 10: (a) coarse fly ash and
(b) fine fly ash.
Air mass flow rate (kg/s)Air flow rate (kg/s)
40
30
20
10
10
1212
00
00.04 0.08
1.2
1.6
0.8
2.0
2.4120
Solids loadingratioConveying
line pressuredrop (bar)
Conveyingline pressure
drop (bar)
10080
60
40
20
0.12 0.16 0.12 0.16 0.20 0.24
0.4
0.8
1.2
1.41.6
2.0
Mat
eria
l flo
w r
ate
(ton
ne/h
)
Mat
eria
l mas
s flo
w r
ate
(ton
ne/h
)
2
4 4
8 8
6
(a) (b)
Solids loadingratio
Figure 13.26 Conveying characteristics for dicalcium phosphate in pipeline no. 6: (a) 48%
and (b) 52%.
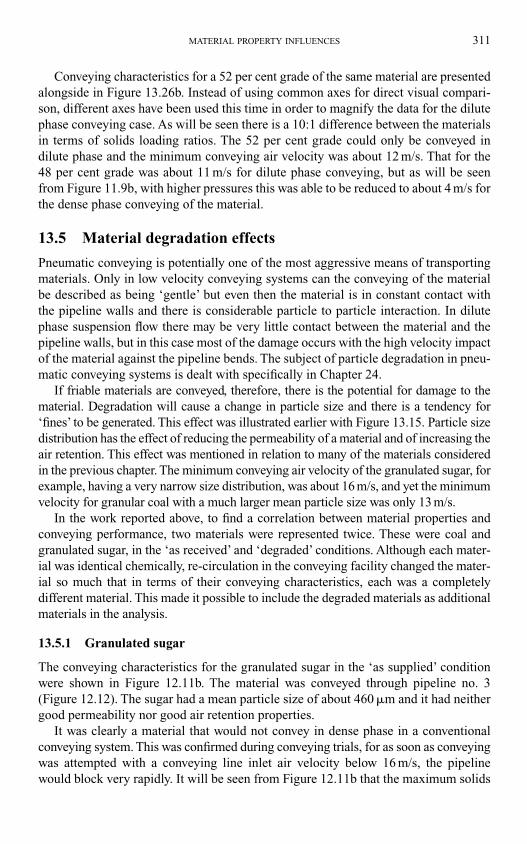
Conveying characteristics for a 52 per cent grade of the same material are presented
alongside in Figure 13.26b. Instead of using common axes for direct visual compari-
son, different axes have been used this time in order to magnify the data for the dilute
phase conveying case. As will be seen there is a 10:1 difference between the materials
in terms of solids loading ratios. The 52 per cent grade could only be conveyed in
dilute phase and the minimum conveying air velocity was about 12 m/s. That for the
48 per cent grade was about 11 m/s for dilute phase conveying, but as will be seen
from Figure 11.9b, with higher pressures this was able to be reduced to about 4 m/s for
the dense phase conveying of the material.
13.5 Material degradation effects
Pneumatic conveying is potentially one of the most aggressive means of transporting
materials. Only in low velocity conveying systems can the conveying of the material
be described as being ‘gentle’ but even then the material is in constant contact with
the pipeline walls and there is considerable particle to particle interaction. In dilute
phase suspension flow there may be very little contact between the material and the
pipeline walls, but in this case most of the damage occurs with the high velocity impact
of the material against the pipeline bends. The subject of particle degradation in pneu-
matic conveying systems is dealt with specifically in Chapter 24.
If friable materials are conveyed, therefore, there is the potential for damage to the
material. Degradation will cause a change in particle size and there is a tendency for
‘fines’ to be generated. This effect was illustrated earlier with Figure 13.15. Particle size
distribution has the effect of reducing the permeability of a material and of increasing the
air retention. This effect was mentioned in relation to many of the materials considered
in the previous chapter. The minimum conveying air velocity of the granulated sugar, for
example, having a very narrow size distribution, was about 16 m/s, and yet the minimum
velocity for granular coal with a much larger mean particle size was only 13 m/s.
In the work reported above, to find a correlation between material properties and
conveying performance, two materials were represented twice. These were coal and
granulated sugar, in the ‘as received’ and ‘degraded’ conditions. Although each mater-
ial was identical chemically, re-circulation in the conveying facility changed the mater-
ial so much that in terms of their conveying characteristics, each was a completely
different material. This made it possible to include the degraded materials as additional
materials in the analysis.
13.5.1 Granulated sugar
The conveying characteristics for the granulated sugar in the ‘as supplied’ condition
were shown in Figure 12.11b. The material was conveyed through pipeline no. 3
(Figure 12.12). The sugar had a mean particle size of about 460 �m and it had neither
good permeability nor good air retention properties.
It was clearly a material that would not convey in dense phase in a conventional
conveying system. This was confirmed during conveying trials, for as soon as conveying
was attempted with a conveying line inlet air velocity below 16 m/s, the pipeline
would block very rapidly. It will be seen from Figure 12.11b that the maximum solids
MATERIAL PROPERTY INFLUENCES 311
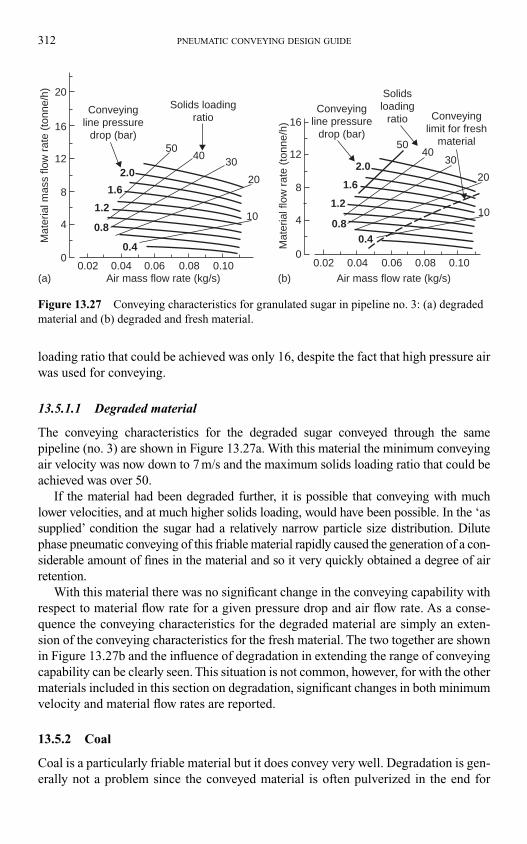
loading ratio that could be achieved was only 16, despite the fact that high pressure air
was used for conveying.
13.5.1.1 Degraded material
The conveying characteristics for the degraded sugar conveyed through the same
pipeline (no. 3) are shown in Figure 13.27a. With this material the minimum conveying
air velocity was now down to 7 m/s and the maximum solids loading ratio that could be
achieved was over 50.
If the material had been degraded further, it is possible that conveying with much
lower velocities, and at much higher solids loading, would have been possible. In the ‘as
supplied’ condition the sugar had a relatively narrow particle size distribution. Dilute
phase pneumatic conveying of this friable material rapidly caused the generation of a con-
siderable amount of fines in the material and so it very quickly obtained a degree of air
retention.
With this material there was no significant change in the conveying capability with
respect to material flow rate for a given pressure drop and air flow rate. As a conse-
quence the conveying characteristics for the degraded material are simply an exten-
sion of the conveying characteristics for the fresh material. The two together are shown
in Figure 13.27b and the influence of degradation in extending the range of conveying
capability can be clearly seen. This situation is not common, however, for with the other
materials included in this section on degradation, significant changes in both minimum
velocity and material flow rates are reported.
13.5.2 Coal
Coal is a particularly friable material but it does convey very well. Degradation is gen-
erally not a problem since the conveyed material is often pulverized in the end for
312 PNEUMATIC CONVEYING DESIGN GUIDE
50 5040 40
30 30
20 20
10 10
00.04 0.06
Air mass flow rate (kg/s) Air mass flow rate (kg/s)0.02 0.100.08 0.04 0.060.02 0.100.08
2.02.0
1.6 1.6
1.2 1.2
0.8 0.8
0.40.4
Solids loadingratio
Conveyingline pressure
drop (bar)
20
1616
1212
88
44
0
Mat
eria
l flo
w r
ate
(ton
ne/h
)
Solidsloading
ratioConveying
line pressuredrop (bar)
Conveyinglimit for fresh
material
Mat
eria
l mas
s flo
w r
ate
(ton
ne/h
)
(a) (b)
Figure 13.27 Conveying characteristics for granulated sugar in pipeline no. 3: (a) degraded
material and (b) degraded and fresh material.
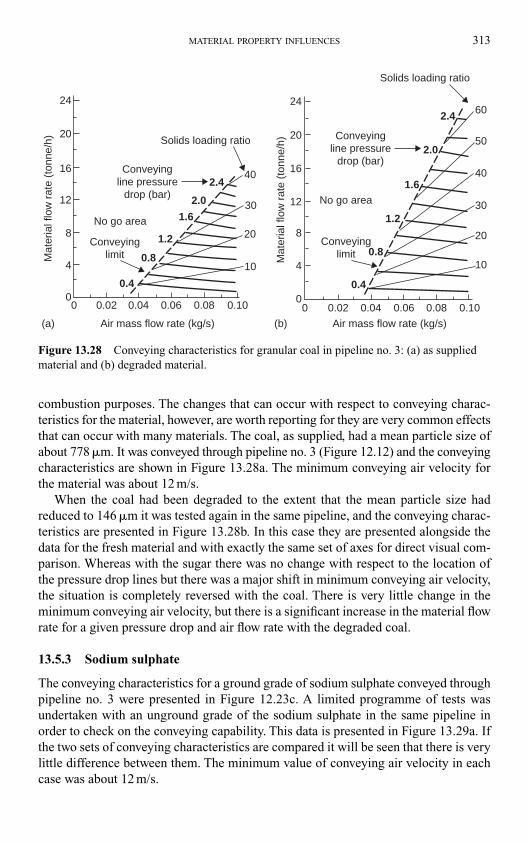
combustion purposes. The changes that can occur with respect to conveying charac-
teristics for the material, however, are worth reporting for they are very common effects
that can occur with many materials. The coal, as supplied, had a mean particle size of
about 778 �m. It was conveyed through pipeline no. 3 (Figure 12.12) and the conveying
characteristics are shown in Figure 13.28a. The minimum conveying air velocity for
the material was about 12 m/s.
When the coal had been degraded to the extent that the mean particle size had
reduced to 146 �m it was tested again in the same pipeline, and the conveying charac-
teristics are presented in Figure 13.28b. In this case they are presented alongside the
data for the fresh material and with exactly the same set of axes for direct visual com-
parison. Whereas with the sugar there was no change with respect to the location of
the pressure drop lines but there was a major shift in minimum conveying air velocity,
the situation is completely reversed with the coal. There is very little change in the
minimum conveying air velocity, but there is a significant increase in the material flow
rate for a given pressure drop and air flow rate with the degraded coal.
13.5.3 Sodium sulphate
The conveying characteristics for a ground grade of sodium sulphate conveyed through
pipeline no. 3 were presented in Figure 12.23c. A limited programme of tests was
undertaken with an unground grade of the sodium sulphate in the same pipeline in
order to check on the conveying capability. This data is presented in Figure 13.29a. If
the two sets of conveying characteristics are compared it will be seen that there is very
little difference between them. The minimum value of conveying air velocity in each
case was about 12 m/s.
MATERIAL PROPERTY INFLUENCES 313
50
60
4040
3030
2020
1010
00 0.04 0.06
Air mass flow rate (kg/s) Air mass flow rate (kg/s)
0.02 0.100.0800 0.04 0.060.02 0.100.08
2.0
2.0
2.4
2.4
1.6
1.6 1.2
1.20.80.8
0.40.4
Solids loading ratio
Solids loading ratio Conveyingline pressure
drop (bar)Conveying
line pressuredrop (bar)
24
20
24
20
1616
1212
88
44
Mat
eria
l flo
w r
ate
(ton
ne/h
)
Mat
eria
l flo
w r
ate
(ton
ne/h
)
Conveyinglimit
No go area
No go area
Conveyinglimit
(a) (b)
Figure 13.28 Conveying characteristics for granular coal in pipeline no. 3: (a) as supplied
material and (b) degraded material.
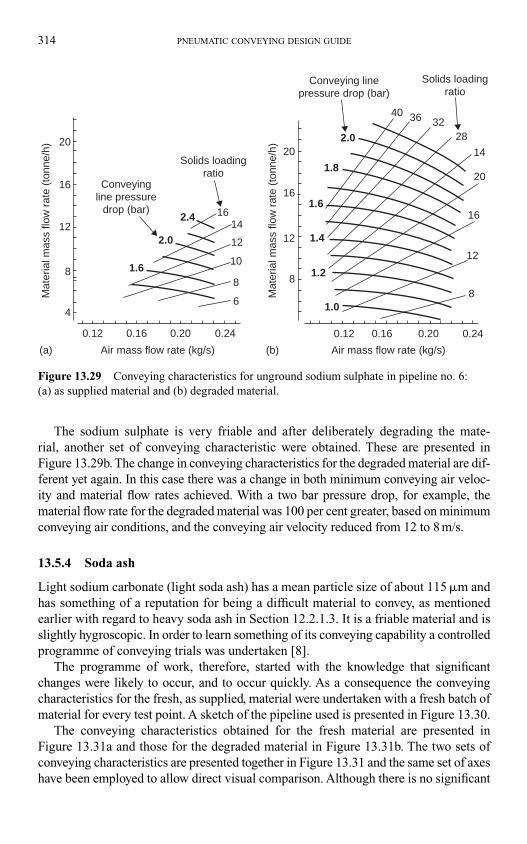
The sodium sulphate is very friable and after deliberately degrading the mate-
rial, another set of conveying characteristic were obtained. These are presented in
Figure 13.29b. The change in conveying characteristics for the degraded material are dif-
ferent yet again. In this case there was a change in both minimum conveying air veloc-
ity and material flow rates achieved. With a two bar pressure drop, for example, the
material flow rate for the degraded material was 100 per cent greater, based on minimum
conveying air conditions, and the conveying air velocity reduced from 12 to 8 m/s.
13.5.4 Soda ash
Light sodium carbonate (light soda ash) has a mean particle size of about 115 �m and
has something of a reputation for being a difficult material to convey, as mentioned
earlier with regard to heavy soda ash in Section 12.2.1.3. It is a friable material and is
slightly hygroscopic. In order to learn something of its conveying capability a controlled
programme of conveying trials was undertaken [8].
The programme of work, therefore, started with the knowledge that significant
changes were likely to occur, and to occur quickly. As a consequence the conveying
characteristics for the fresh, as supplied, material were undertaken with a fresh batch of
material for every test point. A sketch of the pipeline used is presented in Figure 13.30.
The conveying characteristics obtained for the fresh material are presented in
Figure 13.31a and those for the degraded material in Figure 13.31b. The two sets of
conveying characteristics are presented together in Figure 13.31 and the same set of axes
have been employed to allow direct visual comparison. Although there is no significant
314 PNEUMATIC CONVEYING DESIGN GUIDE
Air mass flow rate (kg/s) Air mass flow rate (kg/s)
2.0
2.0
2.4
12
14
14
1616
10
8
6
1.6
0.12 0.16 0.20 0.24 0.12 0.16 0.20 0.24
1.6
1.8
1.2
1.4
1.0
Solids loadingratio
Solids loadingratio
Conveyingline pressure
drop (bar)
Conveying linepressure drop (bar)
20
20
28323640
16
12
12
88
20
16
12
8
4
Mat
eria
l mas
s flo
w r
ate
(ton
ne/h
)
Mat
eria
l mas
s flo
w r
ate
(ton
ne/h
)
(a) (b)
Figure 13.29 Conveying characteristics for unground sodium sulphate in pipeline no. 6:
(a) as supplied material and (b) degraded material.
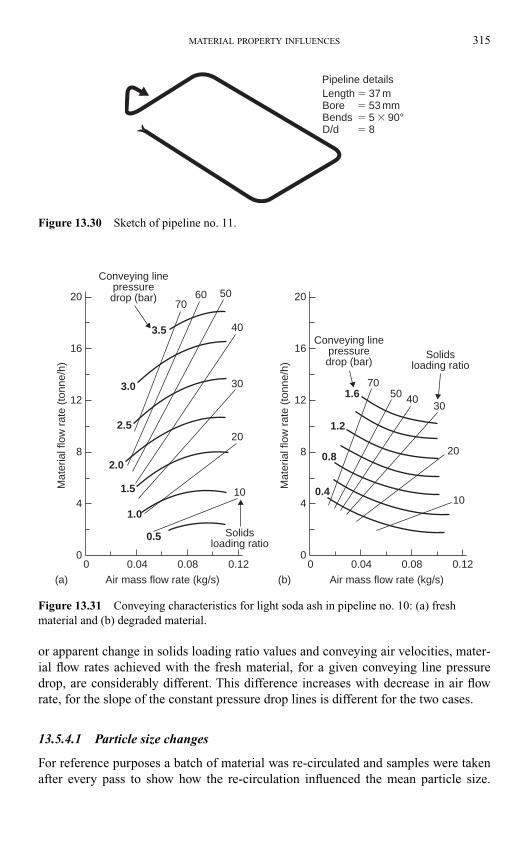
or apparent change in solids loading ratio values and conveying air velocities, mater-
ial flow rates achieved with the fresh material, for a given conveying line pressure
drop, are considerably different. This difference increases with decrease in air flow
rate, for the slope of the constant pressure drop lines is different for the two cases.
13.5.4.1 Particle size changes
For reference purposes a batch of material was re-circulated and samples were taken
after every pass to show how the re-circulation influenced the mean particle size.
MATERIAL PROPERTY INFLUENCES 315
Length � 37 m Bore � 53 mm Bends � 5 � 90° D/d � 8
Pipeline details
Figure 13.30 Sketch of pipeline no. 11.
Conveying linepressuredrop (bar)
Solidsloading ratio
Air mass flow rate (kg/s)
00
4
8
12
16
20
0.04 0.08 0.12
Mat
eria
l flo
w r
ate
(ton
ne/h
)
(a)
7060 50
40
30
20
10
0.5
1.0
1.5
2.0
3.0
3.5
2.5
Conveying linepressuredrop (bar)
Solidsloading ratio
Air mass flow rate (kg/s)
00
4
8
12
16
20
0.04 0.08 0.12
Mat
eria
l flo
w r
ate
(ton
ne/h
)
(b)
7050 40
30
20
10
1.2
1.6
0.8
0.4
Figure 13.31 Conveying characteristics for light soda ash in pipeline no. 10: (a) fresh
material and (b) degraded material.
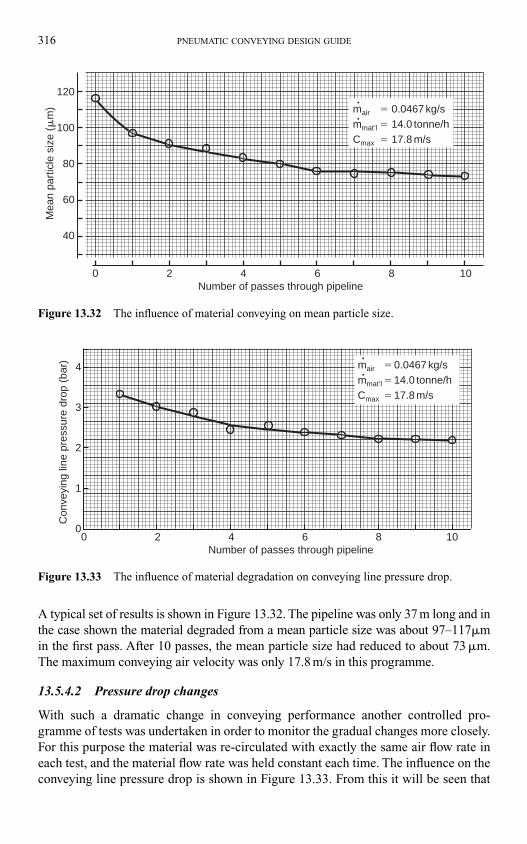
A typical set of results is shown in Figure 13.32. The pipeline was only 37 m long and in
the case shown the material degraded from a mean particle size was about 97–117�m
in the first pass. After 10 passes, the mean particle size had reduced to about 73 �m.
The maximum conveying air velocity was only 17.8 m/s in this programme.
13.5.4.2 Pressure drop changes
With such a dramatic change in conveying performance another controlled pro-
gramme of tests was undertaken in order to monitor the gradual changes more closely.
For this purpose the material was re-circulated with exactly the same air flow rate in
each test, and the material flow rate was held constant each time. The influence on the
conveying line pressure drop is shown in Figure 13.33. From this it will be seen that
316 PNEUMATIC CONVEYING DESIGN GUIDE
120
100
80
60
40
0 2 4 6 8 10
Mea
n pa
rtic
le s
ize
(�m
)
Number of passes through pipeline
mair � 0.0467 kg/smmat’l � 14.0 tonne/hCmax � 17.8 m/s
•
•
Figure 13.32 The influence of material conveying on mean particle size.
4
3
2
1
00 2 4 6 8 10
Con
veyi
ng li
ne p
ress
ure
drop
(ba
r)
Number of passes through pipeline
mair � 0.0467 kg/smmat’l � 14.0 tonne/hCmax � 17.8 m/s
•
•
Figure 13.33 The influence of material degradation on conveying line pressure drop.
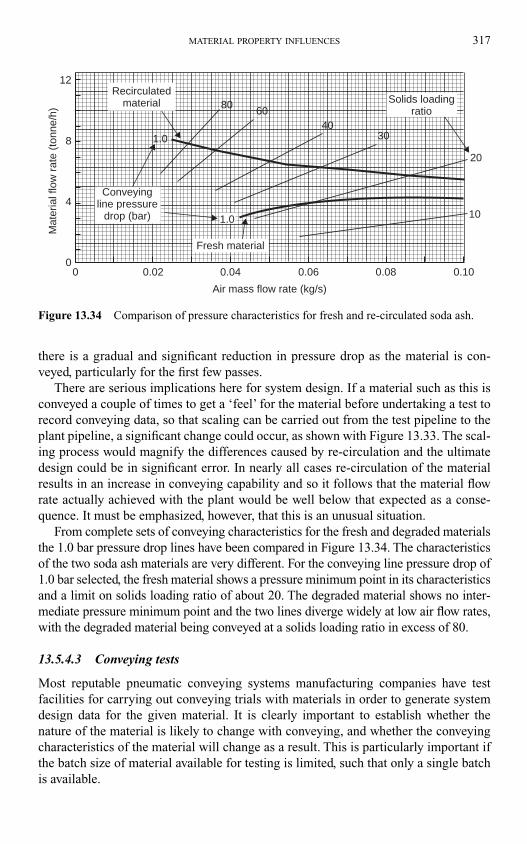
there is a gradual and significant reduction in pressure drop as the material is con-
veyed, particularly for the first few passes.
There are serious implications here for system design. If a material such as this is
conveyed a couple of times to get a ‘feel’ for the material before undertaking a test to
record conveying data, so that scaling can be carried out from the test pipeline to the
plant pipeline, a significant change could occur, as shown with Figure 13.33. The scal-
ing process would magnify the differences caused by re-circulation and the ultimate
design could be in significant error. In nearly all cases re-circulation of the material
results in an increase in conveying capability and so it follows that the material flow
rate actually achieved with the plant would be well below that expected as a conse-
quence. It must be emphasized, however, that this is an unusual situation.
From complete sets of conveying characteristics for the fresh and degraded materials
the 1.0 bar pressure drop lines have been compared in Figure 13.34. The characteristics
of the two soda ash materials are very different. For the conveying line pressure drop of
1.0 bar selected, the fresh material shows a pressure minimum point in its characteristics
and a limit on solids loading ratio of about 20. The degraded material shows no inter-
mediate pressure minimum point and the two lines diverge widely at low air flow rates,
with the degraded material being conveyed at a solids loading ratio in excess of 80.
13.5.4.3 Conveying tests
Most reputable pneumatic conveying systems manufacturing companies have test
facilities for carrying out conveying trials with materials in order to generate system
design data for the given material. It is clearly important to establish whether the
nature of the material is likely to change with conveying, and whether the conveying
characteristics of the material will change as a result. This is particularly important if
the batch size of material available for testing is limited, such that only a single batch
is available.
MATERIAL PROPERTY INFLUENCES 317
00
4
8
12
0.02 0.04 0.06 0.08 0.10
4060
80
30
20
10
Solids loadingratio
Air mass flow rate (kg/s)
Mat
eria
l flo
w r
ate
(ton
ne/h
)
1.0
Recirculatedmaterial
Fresh material
Conveyingline pressure
drop (bar) 1.0
Figure 13.34 Comparison of pressure characteristics for fresh and re-circulated soda ash.
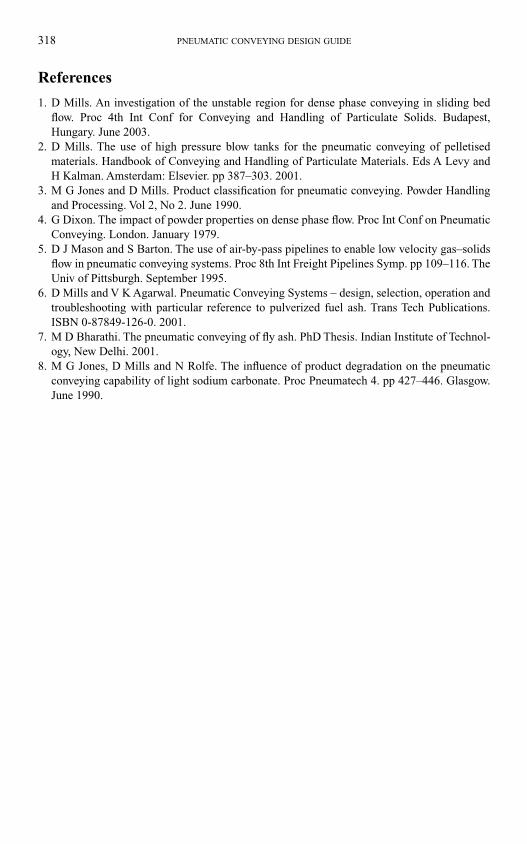
References
1. D Mills. An investigation of the unstable region for dense phase conveying in sliding bed
flow. Proc 4th Int Conf for Conveying and Handling of Particulate Solids. Budapest,
Hungary. June 2003.
2. D Mills. The use of high pressure blow tanks for the pneumatic conveying of pelletised
materials. Handbook of Conveying and Handling of Particulate Materials. Eds A Levy and
H Kalman. Amsterdam: Elsevier. pp 387–303. 2001.
3. M G Jones and D Mills. Product classification for pneumatic conveying. Powder Handling
and Processing. Vol 2, No 2. June 1990.
4. G Dixon. The impact of powder properties on dense phase flow. Proc Int Conf on Pneumatic
Conveying. London. January 1979.
5. D J Mason and S Barton. The use of air-by-pass pipelines to enable low velocity gas–solids
flow in pneumatic conveying systems. Proc 8th Int Freight Pipelines Symp. pp 109–116. The
Univ of Pittsburgh. September 1995.
6. D Mills and V K Agarwal. Pneumatic Conveying Systems – design, selection, operation and
troubleshooting with particular reference to pulverized fuel ash. Trans Tech Publications.
ISBN 0-87849-126-0. 2001.
7. M D Bharathi. The pneumatic conveying of fly ash. PhD Thesis. Indian Institute of Technol-
ogy, New Delhi. 2001.
8. M G Jones, D Mills and N Rolfe. The influence of product degradation on the pneumatic
conveying capability of light sodium carbonate. Proc Pneumatech 4. pp 427–446. Glasgow.
June 1990.
318 PNEUMATIC CONVEYING DESIGN GUIDE
14.1 Introduction
Although reliable models are now well established for single phase flow, no such rela-
tionships are available for gas–solid flows. The use of mathematical models is very
limited, both in terms of the range of conveying conditions over which they can be applied
and the range of materials for which they are applicable. Test data, therefore, is probably
more widely used for system design and, if a system has to be designed for a material for
which no previous experience exists, it is usual to carry out tests with the material in order
to obtain the necessary data. Most companies in the business of manufacturing and sell-
ing pneumatic conveying systems have test facilities for this very purpose.
As it is rarely practicable to convey a material through a test pipeline of the exact
geometry as the one to be built, it is usually necessary to scale the conveying charac-
teristics obtained from a test pipeline to that required. If a number of design alterna-
tives are to be considered, additional scaling will be necessary, for the conveying of a
material through a range of pipelines of different bore will be very expensive and time
consuming. Scaling in terms of pipeline geometry needs to be carried out with respect
to conveying distance, pipeline bore, pipeline orientation, and the number of bends in
the pipeline. Pipeline material, bend geometry, and stepped pipelines are other impor-
tant parameters that also need to be considered.
The design of the pipeline is probably one of the first tasks to be undertaken in pneu-
matic conveying system design. The conveying distance and material flow rate for the
plant are usually specified, and so it is necessary to determine the pipeline bore and the
air supply pressure required. The starting point in this process is generally test data or
some previous experience with the particular material to be conveyed. If the conveying
characteristics are available for a material in a known pipeline they can be scaled, for
the same material, to another pipeline, with a reasonable degree of accuracy.
14.2 Scaling requirements
The main requirements of scaling are that dynamic similarity should be maintained
and that the scaling should remain within established flow regimes.
14.2.1 Conveying air velocity
If, for a given material, conveying data relating to one pipeline is to be scaled to that
for another pipeline, it is essential that conveying conditions, in terms of air velocities,
Chapter 14
Pipeline scaling parameters
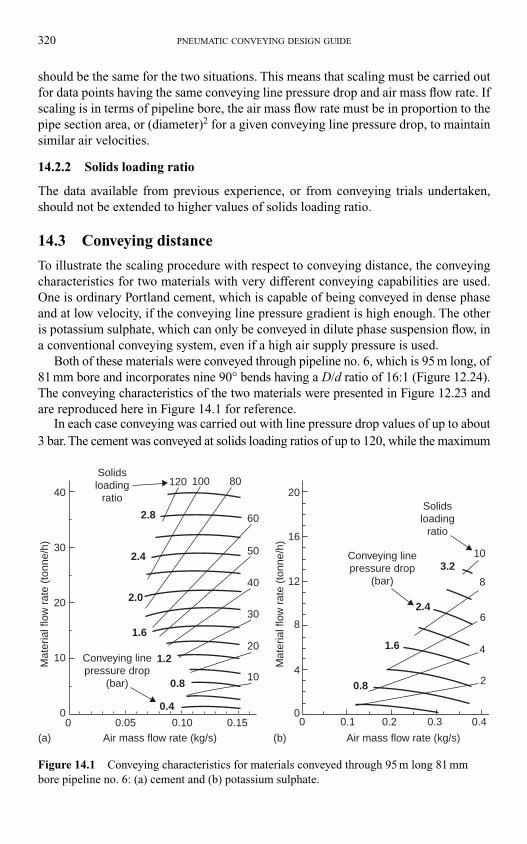
should be the same for the two situations. This means that scaling must be carried out
for data points having the same conveying line pressure drop and air mass flow rate. If
scaling is in terms of pipeline bore, the air mass flow rate must be in proportion to the
pipe section area, or (diameter)2 for a given conveying line pressure drop, to maintain
similar air velocities.
14.2.2 Solids loading ratio
The data available from previous experience, or from conveying trials undertaken,
should not be extended to higher values of solids loading ratio.
14.3 Conveying distance
To illustrate the scaling procedure with respect to conveying distance, the conveying
characteristics for two materials with very different conveying capabilities are used.
One is ordinary Portland cement, which is capable of being conveyed in dense phase
and at low velocity, if the conveying line pressure gradient is high enough. The other
is potassium sulphate, which can only be conveyed in dilute phase suspension flow, in
a conventional conveying system, even if a high air supply pressure is used.
Both of these materials were conveyed through pipeline no. 6, which is 95 m long, of
81 mm bore and incorporates nine 90° bends having a D/d ratio of 16:1 (Figure 12.24).
The conveying characteristics of the two materials were presented in Figure 12.23 and
are reproduced here in Figure 14.1 for reference.
In each case conveying was carried out with line pressure drop values of up to about
3 bar. The cement was conveyed at solids loading ratios of up to 120, while the maximum
320 PNEUMATIC CONVEYING DESIGN GUIDE
0.05 0.10Air mass flow rate (kg/s)(a) (b) Air mass flow rate (kg/s)
Mat
eria
l flo
w r
ate
(ton
ne/h
)
Mat
eria
l flo
w r
ate
(ton
ne/h
)
0.4
0.8
1.2Conveying linepressure drop
(bar)
20
30
40
50
60
80100120
2.8
Solidsloading
ratio40 20
16
12
8
4
00 0.1 0.2
1.6
2.4
3.2Conveying linepressure drop
(bar)
Solidsloading
ratio
10
8
6
4
20.8
0.3 0.4
30
20
10
0
2.4
2.0
1.6
10
0.150
Figure 14.1 Conveying characteristics for materials conveyed through 95 m long 81 mm
bore pipeline no. 6: (a) cement and (b) potassium sulphate.
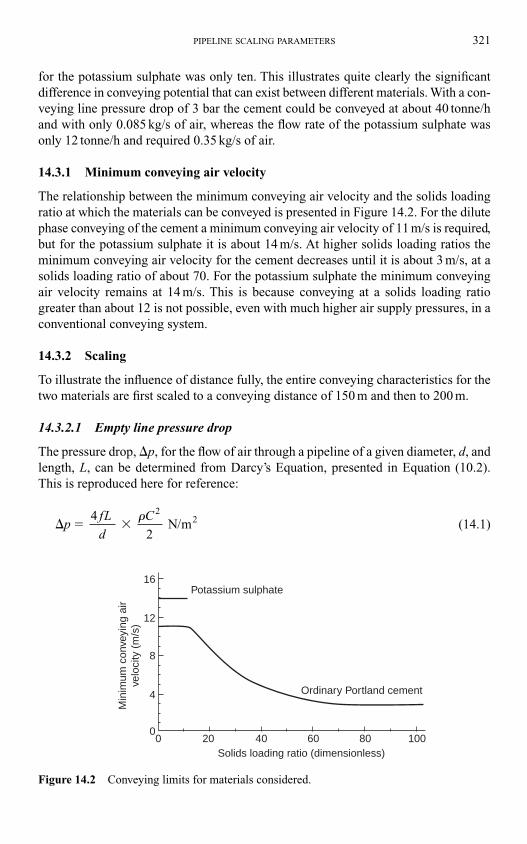
for the potassium sulphate was only ten. This illustrates quite clearly the significant
difference in conveying potential that can exist between different materials. With a con-
veying line pressure drop of 3 bar the cement could be conveyed at about 40 tonne/h
and with only 0.085 kg/s of air, whereas the flow rate of the potassium sulphate was
only 12 tonne/h and required 0.35 kg/s of air.
14.3.1 Minimum conveying air velocity
The relationship between the minimum conveying air velocity and the solids loading
ratio at which the materials can be conveyed is presented in Figure 14.2. For the dilute
phase conveying of the cement a minimum conveying air velocity of 11 m/s is required,
but for the potassium sulphate it is about 14 m/s. At higher solids loading ratios the
minimum conveying air velocity for the cement decreases until it is about 3 m/s, at a
solids loading ratio of about 70. For the potassium sulphate the minimum conveying
air velocity remains at 14 m/s. This is because conveying at a solids loading ratio
greater than about 12 is not possible, even with much higher air supply pressures, in a
conventional conveying system.
14.3.2 Scaling
To illustrate the influence of distance fully, the entire conveying characteristics for the
two materials are first scaled to a conveying distance of 150 m and then to 200 m.
14.3.2.1 Empty line pressure drop
The pressure drop, �p, for the flow of air through a pipeline of a given diameter, d, and
length, L, can be determined from Darcy’s Equation, presented in Equation (10.2).
This is reproduced here for reference:
(14.1)� � �pfL
d
C
4 N/m
2� 2
2
PIPELINE SCALING PARAMETERS 321
Potassium sulphate16
12
8
4
00 20 40 60 80 100
Solids loading ratio (dimensionless)
Min
imum
con
veyi
ng a
irve
loci
ty (
m/s
)
Ordinary Portland cement
Figure 14.2 Conveying limits for materials considered.
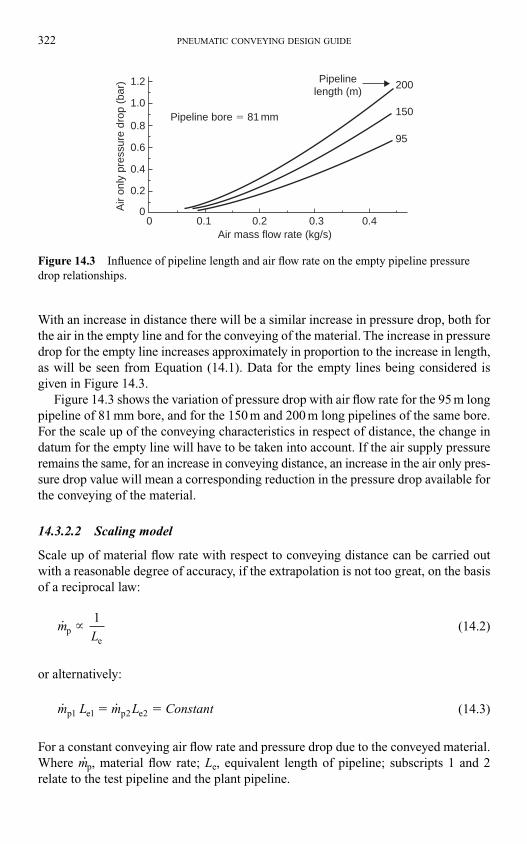
With an increase in distance there will be a similar increase in pressure drop, both for
the air in the empty line and for the conveying of the material. The increase in pressure
drop for the empty line increases approximately in proportion to the increase in length,
as will be seen from Equation (14.1). Data for the empty lines being considered is
given in Figure 14.3.
Figure 14.3 shows the variation of pressure drop with air flow rate for the 95 m long
pipeline of 81 mm bore, and for the 150 m and 200 m long pipelines of the same bore.
For the scale up of the conveying characteristics in respect of distance, the change in
datum for the empty line will have to be taken into account. If the air supply pressure
remains the same, for an increase in conveying distance, an increase in the air only pres-
sure drop value will mean a corresponding reduction in the pressure drop available for
the conveying of the material.
14.3.2.2 Scaling model
Scale up of material flow rate with respect to conveying distance can be carried out
with a reasonable degree of accuracy, if the extrapolation is not too great, on the basis
of a reciprocal law:
(14.2)
or alternatively:
(14.3)
For a constant conveying air flow rate and pressure drop due to the conveyed material.
Where m�p, material flow rate; Le, equivalent length of pipeline; subscripts 1 and 2
relate to the test pipeline and the plant pipeline.
˙ ˙m L m L Constantp e p e 1 1 2 2� �
mLp
e
1
�
322 PNEUMATIC CONVEYING DESIGN GUIDE
Pipeline bore � 81 mm
1.2
1.0
0.8
0.6
0.4
0.2
00
0.1 0.2Air mass flow rate (kg/s)
Air
only
pre
ssur
e dr
op (
bar)
0.3 0.4
Pipelinelength (m)
200
150
95
Figure 14.3 Influence of pipeline length and air flow rate on the empty pipeline pressure
drop relationships.
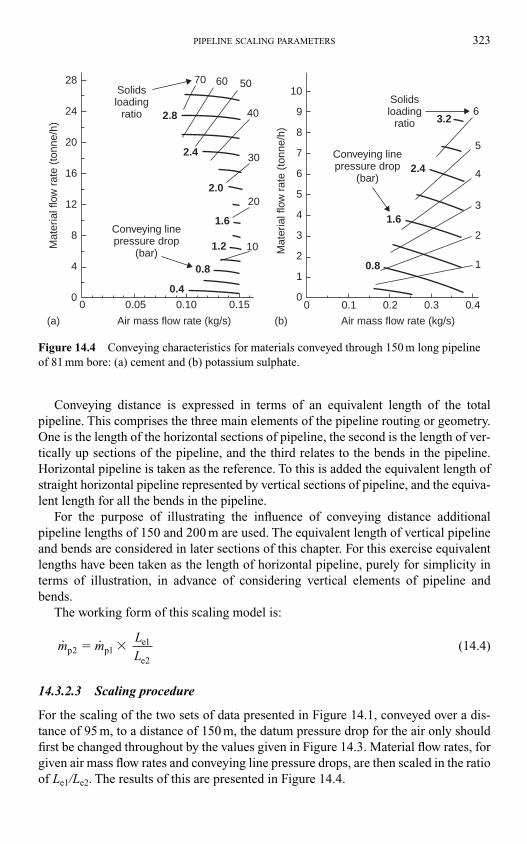
Conveying distance is expressed in terms of an equivalent length of the total
pipeline. This comprises the three main elements of the pipeline routing or geometry.
One is the length of the horizontal sections of pipeline, the second is the length of ver-
tically up sections of the pipeline, and the third relates to the bends in the pipeline.
Horizontal pipeline is taken as the reference. To this is added the equivalent length of
straight horizontal pipeline represented by vertical sections of pipeline, and the equiva-
lent length for all the bends in the pipeline.
For the purpose of illustrating the influence of conveying distance additional
pipeline lengths of 150 and 200 m are used. The equivalent length of vertical pipeline
and bends are considered in later sections of this chapter. For this exercise equivalent
lengths have been taken as the length of horizontal pipeline, purely for simplicity in
terms of illustration, in advance of considering vertical elements of pipeline and
bends.
The working form of this scaling model is:
(14.4)
14.3.2.3 Scaling procedure
For the scaling of the two sets of data presented in Figure 14.1, conveyed over a dis-
tance of 95 m, to a distance of 150 m, the datum pressure drop for the air only should
first be changed throughout by the values given in Figure 14.3. Material flow rates, for
given air mass flow rates and conveying line pressure drops, are then scaled in the ratio
of Le1/Le2. The results of this are presented in Figure 14.4.
˙ ˙m mL
Lp pe
e
2 11
2
� �
PIPELINE SCALING PARAMETERS 323
Air mass flow rate (kg/s) Air mass flow rate (kg/s)
Mat
eria
l flo
w r
ate
(ton
ne/h
)
Mat
eria
l flo
w r
ate
(ton
ne/h
)
0
(a) (b)
0.05
0.4
0.8
Conveying linepressure drop
(bar)1.2
1.6
2.0
2.4
2.8
Solidsloading
ratio
2810
9
8
7
6
5
4
3
2
1
00 0.1 0.2 0.3 0.4
0.8
1.6
2.4Conveying linepressure drop
(bar)
Solidsloading
ratio 3.26
5
4
3
2
1
24
20
16
12
8
4
0
70 60 50
40
30
20
10
0.10 0.15
Figure 14.4 Conveying characteristics for materials conveyed through 150 m long pipeline
of 81 mm bore: (a) cement and (b) potassium sulphate.
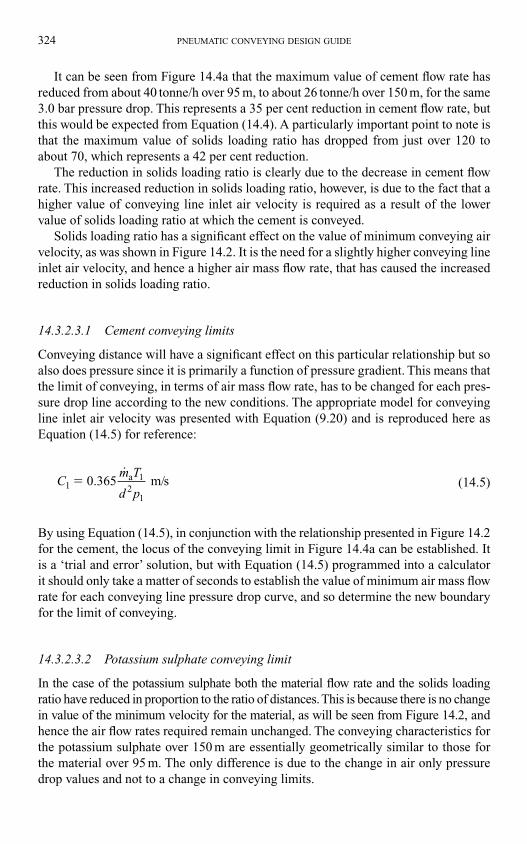
It can be seen from Figure 14.4a that the maximum value of cement flow rate has
reduced from about 40 tonne/h over 95 m, to about 26 tonne/h over 150 m, for the same
3.0 bar pressure drop. This represents a 35 per cent reduction in cement flow rate, but
this would be expected from Equation (14.4). A particularly important point to note is
that the maximum value of solids loading ratio has dropped from just over 120 to
about 70, which represents a 42 per cent reduction.
The reduction in solids loading ratio is clearly due to the decrease in cement flow
rate. This increased reduction in solids loading ratio, however, is due to the fact that a
higher value of conveying line inlet air velocity is required as a result of the lower
value of solids loading ratio at which the cement is conveyed.
Solids loading ratio has a significant effect on the value of minimum conveying air
velocity, as was shown in Figure 14.2. It is the need for a slightly higher conveying line
inlet air velocity, and hence a higher air mass flow rate, that has caused the increased
reduction in solids loading ratio.
14.3.2.3.1 Cement conveying limits
Conveying distance will have a significant effect on this particular relationship but so
also does pressure since it is primarily a function of pressure gradient. This means that
the limit of conveying, in terms of air mass flow rate, has to be changed for each pres-
sure drop line according to the new conditions. The appropriate model for conveying
line inlet air velocity was presented with Equation (9.20) and is reproduced here as
Equation (14.5) for reference:
(14.5)
By using Equation (14.5), in conjunction with the relationship presented in Figure 14.2
for the cement, the locus of the conveying limit in Figure 14.4a can be established. It
is a ‘trial and error’ solution, but with Equation (14.5) programmed into a calculator
it should only take a matter of seconds to establish the value of minimum air mass flow
rate for each conveying line pressure drop curve, and so determine the new boundary
for the limit of conveying.
14.3.2.3.2 Potassium sulphate conveying limit
In the case of the potassium sulphate both the material flow rate and the solids loading
ratio have reduced in proportion to the ratio of distances. This is because there is no change
in value of the minimum velocity for the material, as will be seen from Figure 14.2, and
hence the air flow rates required remain unchanged. The conveying characteristics for
the potassium sulphate over 150 m are essentially geometrically similar to those for
the material over 95 m. The only difference is due to the change in air only pressure
drop values and not to a change in conveying limits.
Cm T
d p1
1
21
0.365 m/sa�˙
324 PNEUMATIC CONVEYING DESIGN GUIDE
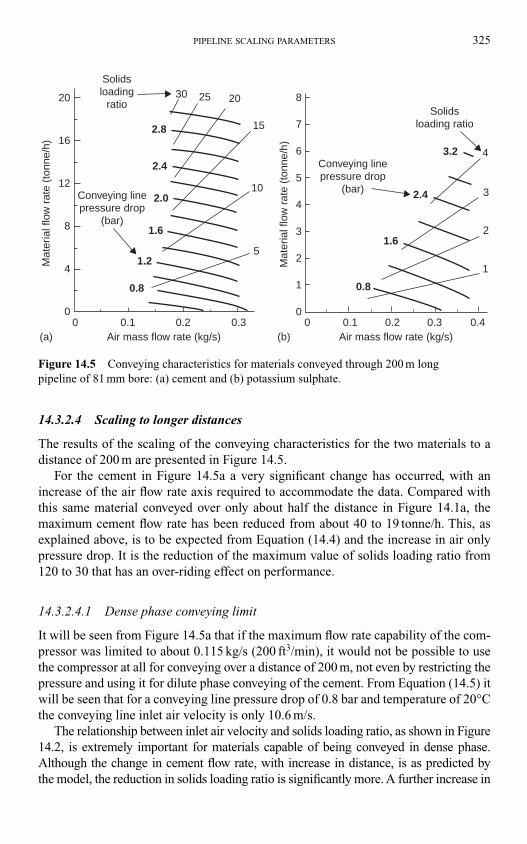
14.3.2.4 Scaling to longer distances
The results of the scaling of the conveying characteristics for the two materials to a
distance of 200 m are presented in Figure 14.5.
For the cement in Figure 14.5a a very significant change has occurred, with an
increase of the air flow rate axis required to accommodate the data. Compared with
this same material conveyed over only about half the distance in Figure 14.1a, the
maximum cement flow rate has been reduced from about 40 to 19 tonne/h. This, as
explained above, is to be expected from Equation (14.4) and the increase in air only
pressure drop. It is the reduction of the maximum value of solids loading ratio from
120 to 30 that has an over-riding effect on performance.
14.3.2.4.1 Dense phase conveying limit
It will be seen from Figure 14.5a that if the maximum flow rate capability of the com-
pressor was limited to about 0.115 kg/s (200 ft3/min), it would not be possible to use
the compressor at all for conveying over a distance of 200 m, not even by restricting the
pressure and using it for dilute phase conveying of the cement. From Equation (14.5) it
will be seen that for a conveying line pressure drop of 0.8 bar and temperature of 20°C
the conveying line inlet air velocity is only 10.6 m/s.
The relationship between inlet air velocity and solids loading ratio, as shown in Figure
14.2, is extremely important for materials capable of being conveyed in dense phase.
Although the change in cement flow rate, with increase in distance, is as predicted by
the model, the reduction in solids loading ratio is significantly more. A further increase in
PIPELINE SCALING PARAMETERS 325
20
16
12
8
4
00 0.1
0.8 0.8
1.2
1.61.6
2.0
2.4
2.4
3.2
2.8
30 20
15
10
5
1
1
0
2
23
34
4
5
6
7
825
0.2 0.3 0 0.1 0.2 0.3 0.4
Conveying linepressure drop
(bar)
Conveying linepressure drop
(bar)
Mat
eria
l flo
w r
ate
(ton
ne/h
)
Mat
eria
l flo
w r
ate
(ton
ne/h
)
Air mass flow rate (kg/s) Air mass flow rate (kg/s)
Solidsloading
ratioSolids
loading ratio
(a) (b)
Figure 14.5 Conveying characteristics for materials conveyed through 200 m long
pipeline of 81 mm bore: (a) cement and (b) potassium sulphate.
distance would result in this reducing to a point at which the cement could only be con-
veyed in dilute phase.
With a further increase in distance the boundary limit to conveying would be little
different from those for the potassium sulphate, although the flow rate would remain
at a slightly higher value. Dense phase conveying requires a high pressure gradient
which is typically about 20 mbar/m for horizontal conveying at a solids loading ratio
of about 100 (see Figure 1.1). Pressure gradient is simply the available pressure divided
by conveying distance. Dense phase conveying, therefore, is possible, even with neg-
ative pressure systems, provided that the distance is short. For conveying over longer
distances, higher pressures will be required, but there is a limit.
14.3.2.5 Iterative process
In scaling the conveying characteristics for the cement to longer distances, the upper
part of the conveying characteristics become unavailable for scaling, since this is the
area of maximum solids loading ratio and lowest velocity. A reduction in cement flow
rate will automatically reduce the solids loading ratio by the same amount, for a given
air flow rate and pressure drop, and this reduction in solids loading ratio will necessi-
tate a correspondingly higher value of inlet air velocity. This means that a higher air
flow rate will be required, which in turn means a further lowering of the solids loading
ratio, as discussed above.
Over an even longer distance, therefore, it is clear that the cement will be restricted to
dilute phase conveying, and if a conveying line pressure drop of 3.0 bar should need to be
utilized, an air flow rate much higher than 0.115 kg/s would be required. In this case it is
likely that the conveying line exit air velocity would be in excess of 50 m/s for a single
bore pipeline. Great care must be taken, therefore, if a change in distance is needed for a
material which is capable of being conveyed in dense phase. Air requirements for con-
veying a material must be based on the longest distance, and a reduction in air flow rate
should ideally be made to achieve optimum conveying conditions over shorter distances.
For the potassium sulphate in Figure 14.5b the conveying characteristics have
reduced almost geometrically, with a halving of both material flow rate and solids load-
ing ratio, and no change in air requirements. In this case an iterative process of deter-
mining the minimum conveying limits is not necessary because there is no change in
minimum conveying air velocity with respect to solids loading ratio for this material.
14.3.2.5.1 Note
It should be pointed out that the influence of bends in the pipeline has been taken into
account in these examples. The number of bends has been scaled in proportion and so
the conveying characteristics for the cement conveyed over 200 m includes approxi-
mately 19 bends. The number of bends in a pipeline can have a major influence on the
conveying characteristics, as will be shown later, and the large number in this case has
had a significant effect on the rapid transition from dense phase conveying, over 95 m,
to almost dilute phase conveying, over 200 m, for the cement. The transition does not
generally happen as quickly as this, since the example is a little artificial, but it is never-
theless illustrative of the process which is the main point of the exercise.
326 PNEUMATIC CONVEYING DESIGN GUIDE
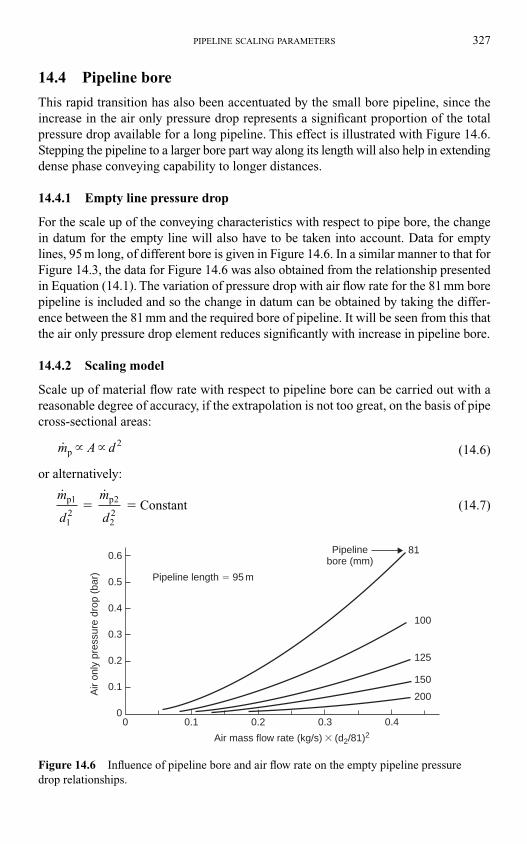
14.4 Pipeline bore
This rapid transition has also been accentuated by the small bore pipeline, since the
increase in the air only pressure drop represents a significant proportion of the total
pressure drop available for a long pipeline. This effect is illustrated with Figure 14.6.
Stepping the pipeline to a larger bore part way along its length will also help in extending
dense phase conveying capability to longer distances.
14.4.1 Empty line pressure drop
For the scale up of the conveying characteristics with respect to pipe bore, the change
in datum for the empty line will also have to be taken into account. Data for empty
lines, 95 m long, of different bore is given in Figure 14.6. In a similar manner to that for
Figure 14.3, the data for Figure 14.6 was also obtained from the relationship presented
in Equation (14.1). The variation of pressure drop with air flow rate for the 81 mm bore
pipeline is included and so the change in datum can be obtained by taking the differ-
ence between the 81 mm and the required bore of pipeline. It will be seen from this that
the air only pressure drop element reduces significantly with increase in pipeline bore.
14.4.2 Scaling model
Scale up of material flow rate with respect to pipeline bore can be carried out with a
reasonable degree of accuracy, if the extrapolation is not too great, on the basis of pipe
cross-sectional areas:
(14.6)
or alternatively:
(14.7)˙ ˙m
d
m
d
p
1
p Constant
1
2
2
22
� �
m A dp � � 2
PIPELINE SCALING PARAMETERS 327
0.6
0.5
0.4
0.3
0.2
0.1
00.10 0.2 0.3 0.4
Pipeline length � 95 m
Pipelinebore (mm)
Air
only
pre
ssur
e dr
op (
bar)
Air mass flow rate (kg/s) � (d2/81)2
81
100
125
150
200
Figure 14.6 Influence of pipeline bore and air flow rate on the empty pipeline pressure
drop relationships.
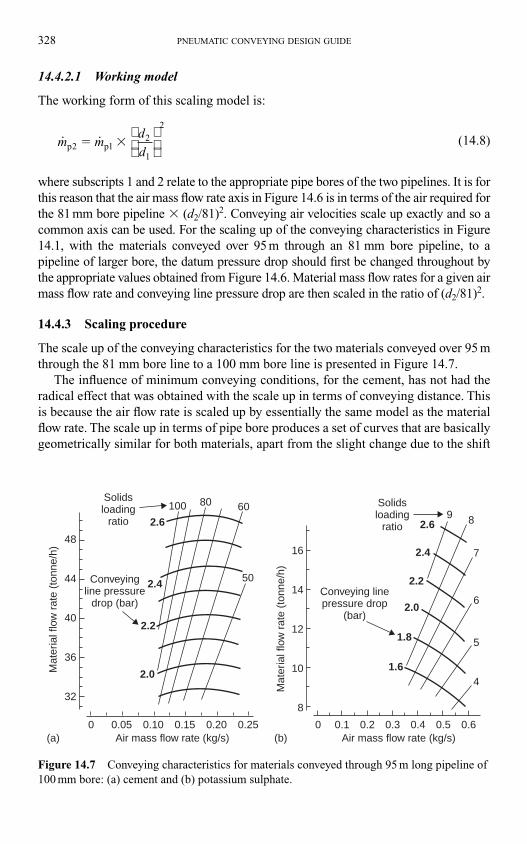
14.4.2.1 Working model
The working form of this scaling model is:
(14.8)
where subscripts 1 and 2 relate to the appropriate pipe bores of the two pipelines. It is for
this reason that the air mass flow rate axis in Figure 14.6 is in terms of the air required for
the 81 mm bore pipeline � (d2/81)2. Conveying air velocities scale up exactly and so a
common axis can be used. For the scaling up of the conveying characteristics in Figure
14.1, with the materials conveyed over 95 m through an 81 mm bore pipeline, to a
pipeline of larger bore, the datum pressure drop should first be changed throughout by
the appropriate values obtained from Figure 14.6. Material mass flow rates for a given air
mass flow rate and conveying line pressure drop are then scaled in the ratio of (d2/81)2.
14.4.3 Scaling procedure
The scale up of the conveying characteristics for the two materials conveyed over 95 m
through the 81 mm bore line to a 100 mm bore line is presented in Figure 14.7.
The influence of minimum conveying conditions, for the cement, has not had the
radical effect that was obtained with the scale up in terms of conveying distance. This
is because the air flow rate is scaled up by essentially the same model as the material
flow rate. The scale up in terms of pipe bore produces a set of curves that are basically
geometrically similar for both materials, apart from the slight change due to the shift
˙ ˙m md
dp p 2 12
1
2
� �
328 PNEUMATIC CONVEYING DESIGN GUIDE
48
44
40
36
32
2.0
0.050
8
0
10
12
14
16
0.10 0.15 0.20 0.25 0.1 0.2 0.3 0.4 0.5 0.6
2.2
2.4
2.6
2.0
1.8
1.64
5
6
7
89
2.2
2.4
2.6
Air mass flow rate (kg/s) Air mass flow rate (kg/s)
Mat
eria
l flo
w r
ate
(ton
ne/h
)
Mat
eria
l flo
w r
ate
(ton
ne/h
)
Conveyingline pressure
drop (bar)Conveying linepressure drop
(bar)
Solidsloading
ratio
Solidsloading
ratio
100 80 60
50
(a) (b)
Figure 14.7 Conveying characteristics for materials conveyed through 95 m long pipeline of
100 mm bore: (a) cement and (b) potassium sulphate.
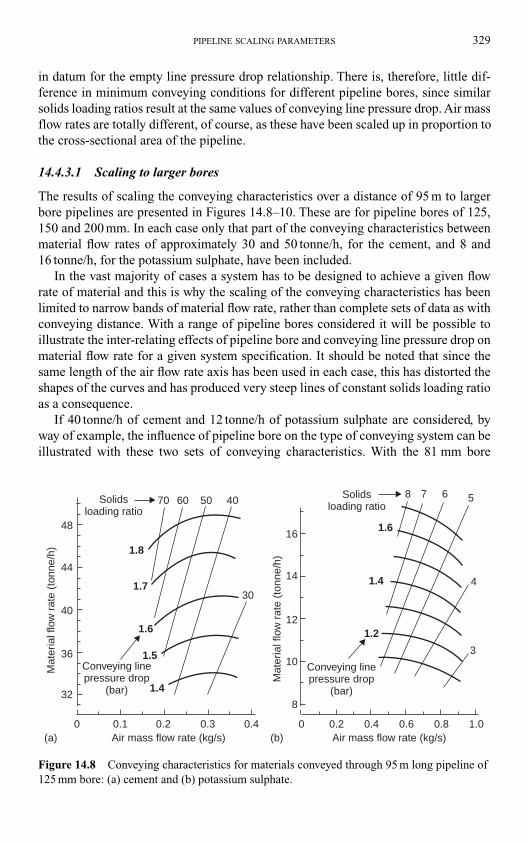
in datum for the empty line pressure drop relationship. There is, therefore, little dif-
ference in minimum conveying conditions for different pipeline bores, since similar
solids loading ratios result at the same values of conveying line pressure drop. Air mass
flow rates are totally different, of course, as these have been scaled up in proportion to
the cross-sectional area of the pipeline.
14.4.3.1 Scaling to larger bores
The results of scaling the conveying characteristics over a distance of 95 m to larger
bore pipelines are presented in Figures 14.8–10. These are for pipeline bores of 125,
150 and 200 mm. In each case only that part of the conveying characteristics between
material flow rates of approximately 30 and 50 tonne/h, for the cement, and 8 and
16 tonne/h, for the potassium sulphate, have been included.
In the vast majority of cases a system has to be designed to achieve a given flow
rate of material and this is why the scaling of the conveying characteristics has been
limited to narrow bands of material flow rate, rather than complete sets of data as with
conveying distance. With a range of pipeline bores considered it will be possible to
illustrate the inter-relating effects of pipeline bore and conveying line pressure drop on
material flow rate for a given system specification. It should be noted that since the
same length of the air flow rate axis has been used in each case, this has distorted the
shapes of the curves and has produced very steep lines of constant solids loading ratio
as a consequence.
If 40 tonne/h of cement and 12 tonne/h of potassium sulphate are considered, by
way of example, the influence of pipeline bore on the type of conveying system can be
illustrated with these two sets of conveying characteristics. With the 81 mm bore
PIPELINE SCALING PARAMETERS 329
4816
70 60 50 40
30
14
12
10
8
8 7 6 5
3
444
40
36
32
0
Mat
eria
l flo
w r
ate
(ton
ne/h
)
Mat
eria
l flo
w r
ate
(ton
ne/h
)
0.1 0.2 0.3 0.4 0 0.2 0.4 0.6 0.8 1.0
1.8
1.7
1.6
1.6
1.5
1.4
1.4
1.2
Air mass flow rate (kg/s) Air mass flow rate (kg/s)(a) (b)
Conveying linepressure drop
(bar)
Conveying linepressure drop
(bar)
Solidsloading ratio
Solidsloading ratio
Figure 14.8 Conveying characteristics for materials conveyed through 95 m long pipeline of
125 mm bore: (a) cement and (b) potassium sulphate.
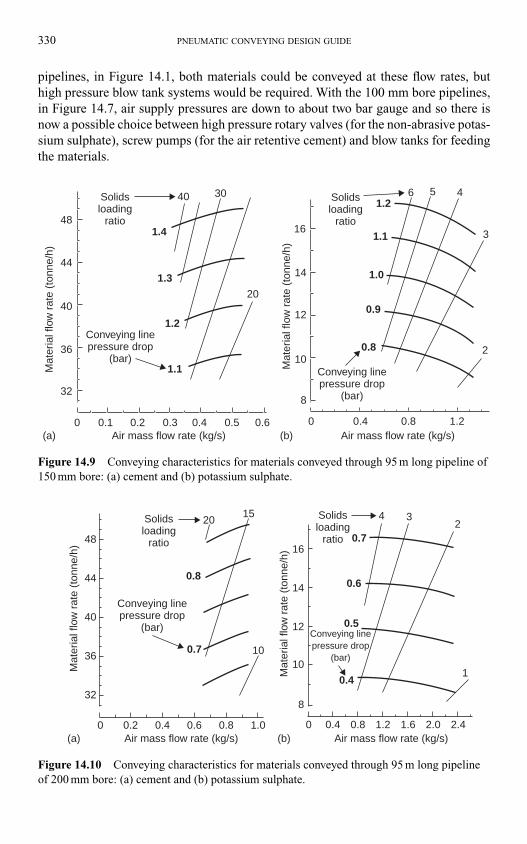
330 PNEUMATIC CONVEYING DESIGN GUIDE
48
44
40
36
32
Mat
eria
l flo
w r
ate
(ton
ne/h
)
Conveying linepressure drop
(bar)Conveying linepressure drop
(bar)
Solidsloading
ratio
Solidsloading
ratio
0 0.1 0.2 0.3 0.4 0.5 0.6 0 0.4 0.8
0.8
0.9
Air mass flow rate (kg/s) Air mass flow rate (kg/s)(a) (b)
16
14
12
10
8
6 5 4
3
2
Mat
eria
l flo
w r
ate
(ton
ne/h
)
1.1
1.1
1.0
40 30
20
1.3
1.4
1.2
1.2
1.2
Figure 14.9 Conveying characteristics for materials conveyed through 95 m long pipeline of
150 mm bore: (a) cement and (b) potassium sulphate.
32
0 0.2 0.4
0.7
0.8
0.6 0.8 1.0 0
8
10
12
14
16
0.4
0.4
0.5
0.6
4 32
1
0.7
0.8 1.2 1.6 2.0 2.4
36
40
44
48
Solidsloading
ratio
Solidsloading
ratio
Conveying linepressure drop
(bar)Conveying linepressure drop
(bar)
2015
10
Air mass flow rate (kg/s) Air mass flow rate (kg/s)
Mat
eria
l flo
w r
ate
(ton
ne/h
)
Mat
eria
l flo
w r
ate
(ton
ne/h
)
(a) (b)
Figure 14.10 Conveying characteristics for materials conveyed through 95 m long pipeline
of 200 mm bore: (a) cement and (b) potassium sulphate.
pipelines, in Figure 14.1, both materials could be conveyed at these flow rates, but
high pressure blow tank systems would be required. With the 100 mm bore pipelines,
in Figure 14.7, air supply pressures are down to about two bar gauge and so there is
now a possible choice between high pressure rotary valves (for the non-abrasive potas-
sium sulphate), screw pumps (for the air retentive cement) and blow tanks for feeding
the materials.
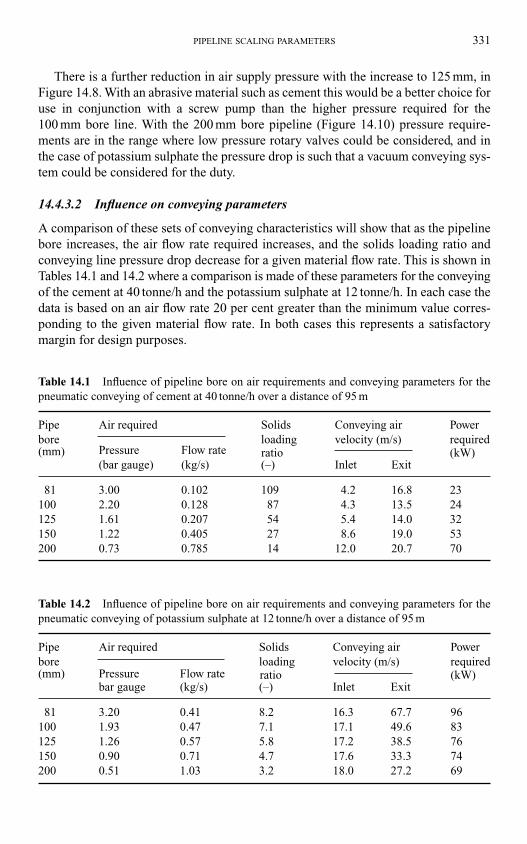
There is a further reduction in air supply pressure with the increase to 125 mm, in
Figure 14.8. With an abrasive material such as cement this would be a better choice for
use in conjunction with a screw pump than the higher pressure required for the
100 mm bore line. With the 200 mm bore pipeline (Figure 14.10) pressure require-
ments are in the range where low pressure rotary valves could be considered, and in
the case of potassium sulphate the pressure drop is such that a vacuum conveying sys-
tem could be considered for the duty.
14.4.3.2 Influence on conveying parameters
A comparison of these sets of conveying characteristics will show that as the pipeline
bore increases, the air flow rate required increases, and the solids loading ratio and
conveying line pressure drop decrease for a given material flow rate. This is shown in
Tables 14.1 and 14.2 where a comparison is made of these parameters for the conveying
of the cement at 40 tonne/h and the potassium sulphate at 12 tonne/h. In each case the
data is based on an air flow rate 20 per cent greater than the minimum value corres-
ponding to the given material flow rate. In both cases this represents a satisfactory
margin for design purposes.
PIPELINE SCALING PARAMETERS 331
Table 14.1 Influence of pipeline bore on air requirements and conveying parameters for the
pneumatic conveying of cement at 40 tonne/h over a distance of 95 m
Pipe Air required Solids Conveying air Power
borePressure Flow rate
loading velocity (m/s) required(mm)
(bar gauge) (kg/s) (–)ratio
Inlet Exit(kW)
81 3.00 0.102 109 4.2 16.8 23
100 2.20 0.128 87 4.3 13.5 24
125 1.61 0.207 54 5.4 14.0 32
150 1.22 0.405 27 8.6 19.0 53
200 0.73 0.785 14 12.0 20.7 70
Table 14.2 Influence of pipeline bore on air requirements and conveying parameters for the
pneumatic conveying of potassium sulphate at 12 tonne/h over a distance of 95 m
Pipe Air required Solids Conveying air Power
borePressure Flow rate
loading velocity (m/s) required(mm)
bar gauge (kg/s) (–)ratio
Inlet Exit(kW)
81 3.20 0.41 8.2 16.3 67.7 96
100 1.93 0.47 7.1 17.1 49.6 83
125 1.26 0.57 5.8 17.2 38.5 76
150 0.90 0.71 4.7 17.6 33.3 74
200 0.51 1.03 3.2 18.0 27.2 69
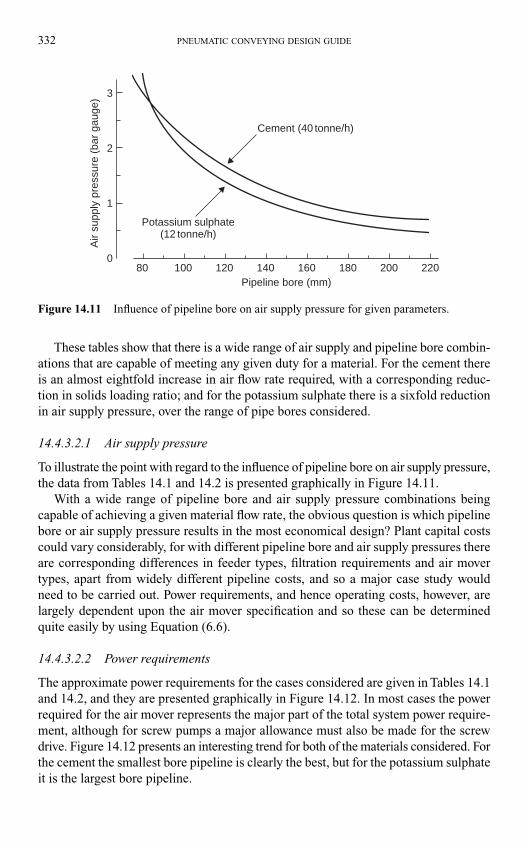
These tables show that there is a wide range of air supply and pipeline bore combin-
ations that are capable of meeting any given duty for a material. For the cement there
is an almost eightfold increase in air flow rate required, with a corresponding reduc-
tion in solids loading ratio; and for the potassium sulphate there is a sixfold reduction
in air supply pressure, over the range of pipe bores considered.
14.4.3.2.1 Air supply pressure
To illustrate the point with regard to the influence of pipeline bore on air supply pressure,
the data from Tables 14.1 and 14.2 is presented graphically in Figure 14.11.
With a wide range of pipeline bore and air supply pressure combinations being
capable of achieving a given material flow rate, the obvious question is which pipeline
bore or air supply pressure results in the most economical design? Plant capital costs
could vary considerably, for with different pipeline bore and air supply pressures there
are corresponding differences in feeder types, filtration requirements and air mover
types, apart from widely different pipeline costs, and so a major case study would
need to be carried out. Power requirements, and hence operating costs, however, are
largely dependent upon the air mover specification and so these can be determined
quite easily by using Equation (6.6).
14.4.3.2.2 Power requirements
The approximate power requirements for the cases considered are given in Tables 14.1
and 14.2, and they are presented graphically in Figure 14.12. In most cases the power
required for the air mover represents the major part of the total system power require-
ment, although for screw pumps a major allowance must also be made for the screw
drive. Figure 14.12 presents an interesting trend for both of the materials considered. For
the cement the smallest bore pipeline is clearly the best, but for the potassium sulphate
it is the largest bore pipeline.
332 PNEUMATIC CONVEYING DESIGN GUIDE
80 100 120 140 160 180 200 220Pipeline bore (mm)
Air
supp
ly p
ress
ure
(bar
gau
ge) 3
2
1
0
Potassium sulphate(12 tonne/h)
Cement (40 tonne/h)
Figure 14.11 Influence of pipeline bore on air supply pressure for given parameters.
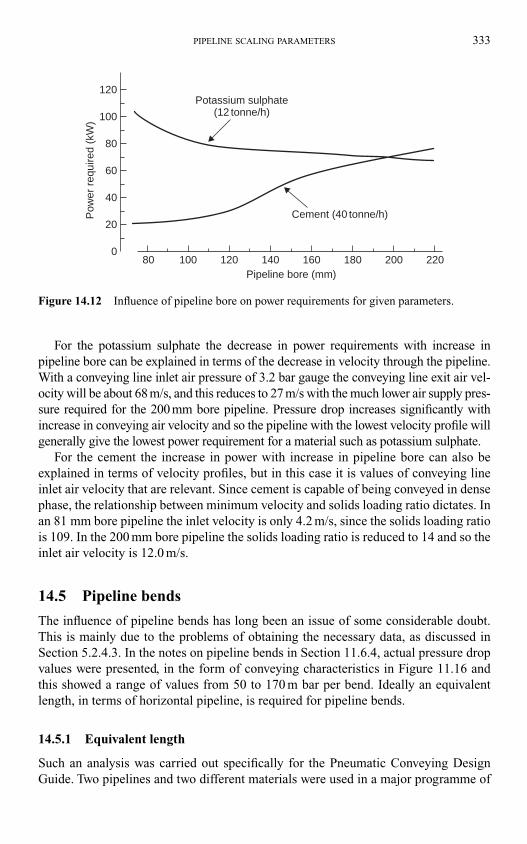
For the potassium sulphate the decrease in power requirements with increase in
pipeline bore can be explained in terms of the decrease in velocity through the pipeline.
With a conveying line inlet air pressure of 3.2 bar gauge the conveying line exit air vel-
ocity will be about 68 m/s, and this reduces to 27 m/s with the much lower air supply pres-
sure required for the 200 mm bore pipeline. Pressure drop increases significantly with
increase in conveying air velocity and so the pipeline with the lowest velocity profile will
generally give the lowest power requirement for a material such as potassium sulphate.
For the cement the increase in power with increase in pipeline bore can also be
explained in terms of velocity profiles, but in this case it is values of conveying line
inlet air velocity that are relevant. Since cement is capable of being conveyed in dense
phase, the relationship between minimum velocity and solids loading ratio dictates. In
an 81 mm bore pipeline the inlet velocity is only 4.2 m/s, since the solids loading ratio
is 109. In the 200 mm bore pipeline the solids loading ratio is reduced to 14 and so the
inlet air velocity is 12.0 m/s.
14.5 Pipeline bends
The influence of pipeline bends has long been an issue of some considerable doubt.
This is mainly due to the problems of obtaining the necessary data, as discussed in
Section 5.2.4.3. In the notes on pipeline bends in Section 11.6.4, actual pressure drop
values were presented, in the form of conveying characteristics in Figure 11.16 and
this showed a range of values from 50 to 170 m bar per bend. Ideally an equivalent
length, in terms of horizontal pipeline, is required for pipeline bends.
14.5.1 Equivalent length
Such an analysis was carried out specifically for the Pneumatic Conveying Design
Guide. Two pipelines and two different materials were used in a major programme of
PIPELINE SCALING PARAMETERS 333
80
80
60
40
20
100
100
120 140 160 180 200 220Pipeline bore (mm)
Pow
er r
equi
red
(kW
)120
0
Potassium sulphate(12 tonne/h)
Cement (40 tonne/h)
Figure 14.12 Influence of pipeline bore on power requirements for given parameters.
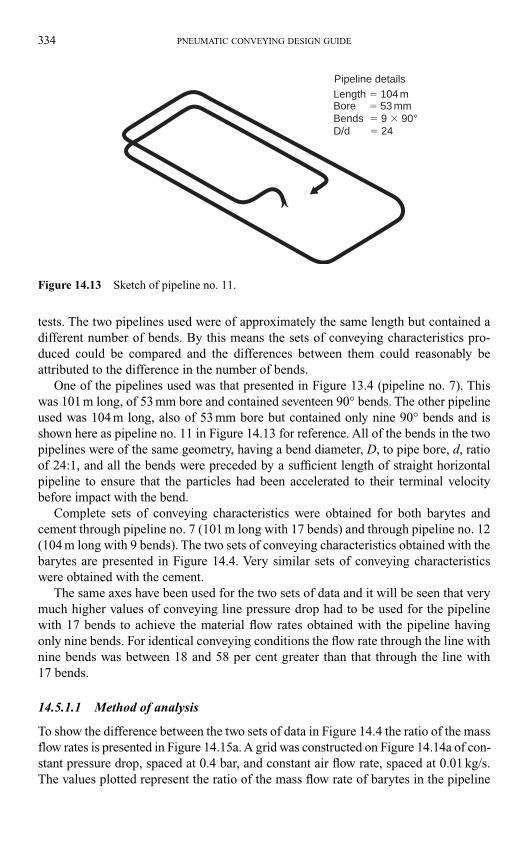
tests. The two pipelines used were of approximately the same length but contained a
different number of bends. By this means the sets of conveying characteristics pro-
duced could be compared and the differences between them could reasonably be
attributed to the difference in the number of bends.
One of the pipelines used was that presented in Figure 13.4 (pipeline no. 7). This
was 101 m long, of 53 mm bore and contained seventeen 90° bends. The other pipeline
used was 104 m long, also of 53 mm bore but contained only nine 90° bends and is
shown here as pipeline no. 11 in Figure 14.13 for reference. All of the bends in the two
pipelines were of the same geometry, having a bend diameter, D, to pipe bore, d, ratio
of 24:1, and all the bends were preceded by a sufficient length of straight horizontal
pipeline to ensure that the particles had been accelerated to their terminal velocity
before impact with the bend.
Complete sets of conveying characteristics were obtained for both barytes and
cement through pipeline no. 7 (101 m long with 17 bends) and through pipeline no. 12
(104 m long with 9 bends). The two sets of conveying characteristics obtained with the
barytes are presented in Figure 14.4. Very similar sets of conveying characteristics
were obtained with the cement.
The same axes have been used for the two sets of data and it will be seen that very
much higher values of conveying line pressure drop had to be used for the pipeline
with 17 bends to achieve the material flow rates obtained with the pipeline having
only nine bends. For identical conveying conditions the flow rate through the line with
nine bends was between 18 and 58 per cent greater than that through the line with
17 bends.
14.5.1.1 Method of analysis
To show the difference between the two sets of data in Figure 14.4 the ratio of the mass
flow rates is presented in Figure 14.15a. A grid was constructed on Figure 14.14a of con-
stant pressure drop, spaced at 0.4 bar, and constant air flow rate, spaced at 0.01 kg/s.
The values plotted represent the ratio of the mass flow rate of barytes in the pipeline
334 PNEUMATIC CONVEYING DESIGN GUIDE
Pipeline detailsLength � 104 m
D/d � 24
Bore � 53 mmBends � 9 � 90°
Figure 14.13 Sketch of pipeline no. 11.
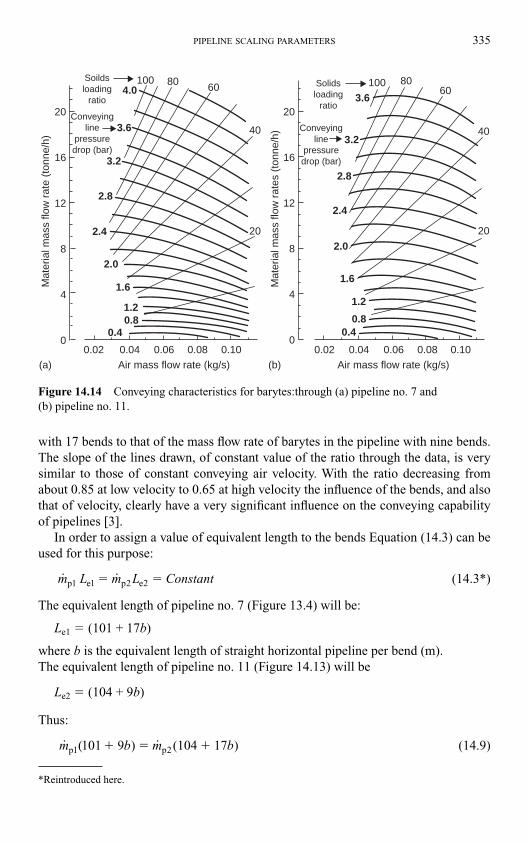
with 17 bends to that of the mass flow rate of barytes in the pipeline with nine bends.
The slope of the lines drawn, of constant value of the ratio through the data, is very
similar to those of constant conveying air velocity. With the ratio decreasing from
about 0.85 at low velocity to 0.65 at high velocity the influence of the bends, and also
that of velocity, clearly have a very significant influence on the conveying capability
of pipelines [3].
In order to assign a value of equivalent length to the bends Equation (14.3) can be
used for this purpose:
(14.3*)
The equivalent length of pipeline no. 7 (Figure 13.4) will be:
Le1 � (101 + 17b)
where b is the equivalent length of straight horizontal pipeline per bend (m).
The equivalent length of pipeline no. 11 (Figure 14.13) will be
Le2 � (104 + 9b)
Thus:
(14.9)˙ ( ) ˙ )m b m bp p 9 (104 171 2101 � � �
˙ ˙m L m L Constantp e p e 1 1 2 2� �
PIPELINE SCALING PARAMETERS 335
20
16
12
8
4
0
20
16
12
8
4
00.02 0.04 0.06
Air mass flow rate (kg/s)
0.08 0.10
Mat
eria
l mas
s flo
w r
ate
(ton
ne/h
)
Soildsloading
ratio
100 80 60
40
20
0.40.81.2
1.6
2.0
2.4
2.8
3.2
3.6
4.0Solidsloading
ratioConveying
linepressuredrop (bar)
Conveyingline
pressuredrop (bar)
0.8
20
Mat
eria
l mas
s flo
w r
ates
(to
nne/
h) 40
6080100
3.6
3.2
2.8
2.4
2.0
1.6
1.2
0.4
0.02 0.04 0.06 0.08 0.10
Air mass flow rate (kg/s)(a) (b)
Figure 14.14 Conveying characteristics for barytes:through (a) pipeline no. 7 and
(b) pipeline no. 11.
*Reintroduced here.
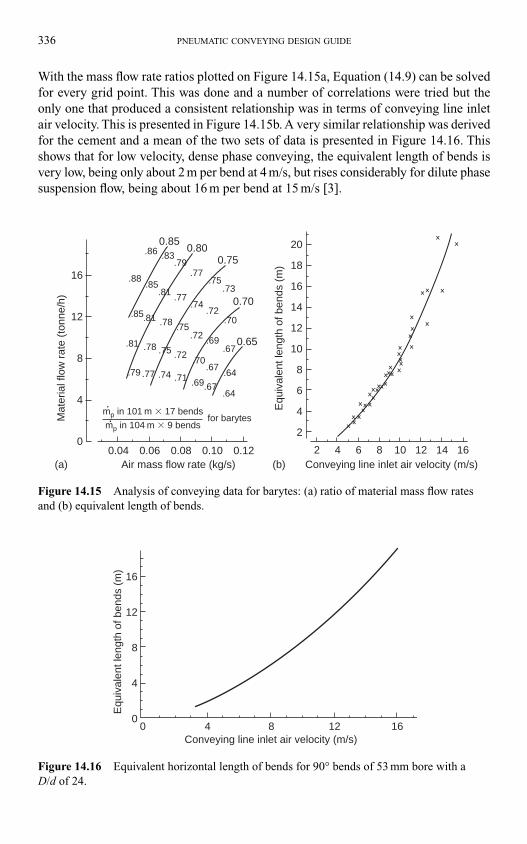
With the mass flow rate ratios plotted on Figure 14.15a, Equation (14.9) can be solved
for every grid point. This was done and a number of correlations were tried but the
only one that produced a consistent relationship was in terms of conveying line inlet
air velocity. This is presented in Figure 14.15b. A very similar relationship was derived
for the cement and a mean of the two sets of data is presented in Figure 14.16. This
shows that for low velocity, dense phase conveying, the equivalent length of bends is
very low, being only about 2 m per bend at 4 m/s, but rises considerably for dilute phase
suspension flow, being about 16 m per bend at 15 m/s [3].
336 PNEUMATIC CONVEYING DESIGN GUIDE
16
8
12
4
2
4
6
8
10
12
14
16
18
20
00.04 0.06 0.08 0.10 0.12 42 6 8 10 12 14 16
Conveying line inlet air velocity (m/s)Air mass flow rate (kg/s)
Mat
eria
l flo
w r
ate
(ton
ne/h
)
0.85.86
.88
.85
.85
.83.79
.81
.81
.81 .78
.78
.77
.77.75
.74
.75
.75
.77 .74 .71
.72
.72
.73
.72.70
.69
.70
.69
.67
.67
.64
.64.67
.79
0.800.75
0.65
0.70
Equ
ival
ent l
engt
h of
ben
ds (
m)
mp in 101 m � 17 bends
mp in 104 m � 9 bendsfor barytes
(a) (b)
..
Figure 14.15 Analysis of conveying data for barytes: (a) ratio of material mass flow rates
and (b) equivalent length of bends.
4
00 4 8 12 16
Conveying line inlet air velocity (m/s)
Equ
ival
ent l
engt
h of
ben
ds (
m)
8
12
16
Figure 14.16 Equivalent horizontal length of bends for 90° bends of 53 mm bore with a
D/d of 24.
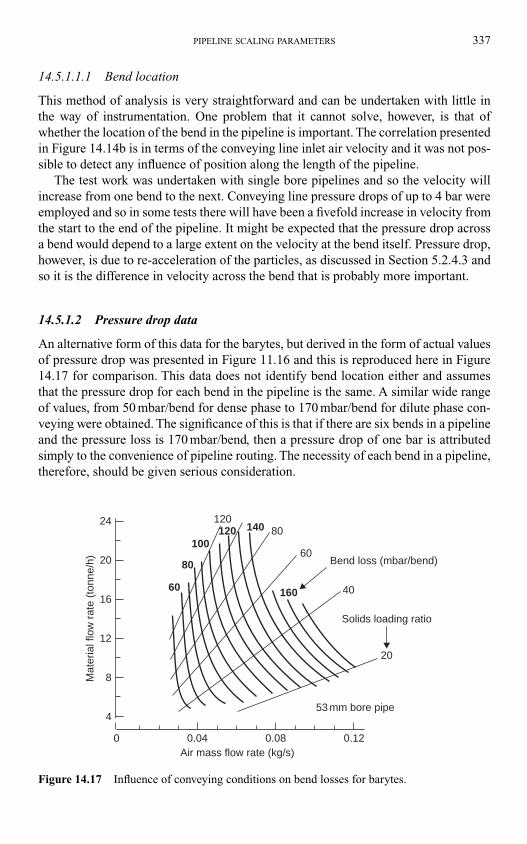
14.5.1.1.1 Bend location
This method of analysis is very straightforward and can be undertaken with little in
the way of instrumentation. One problem that it cannot solve, however, is that of
whether the location of the bend in the pipeline is important. The correlation presented
in Figure 14.14b is in terms of the conveying line inlet air velocity and it was not pos-
sible to detect any influence of position along the length of the pipeline.
The test work was undertaken with single bore pipelines and so the velocity will
increase from one bend to the next. Conveying line pressure drops of up to 4 bar were
employed and so in some tests there will have been a fivefold increase in velocity from
the start to the end of the pipeline. It might be expected that the pressure drop across
a bend would depend to a large extent on the velocity at the bend itself. Pressure drop,
however, is due to re-acceleration of the particles, as discussed in Section 5.2.4.3 and
so it is the difference in velocity across the bend that is probably more important.
14.5.1.2 Pressure drop data
An alternative form of this data for the barytes, but derived in the form of actual values
of pressure drop was presented in Figure 11.16 and this is reproduced here in Figure
14.17 for comparison. This data does not identify bend location either and assumes
that the pressure drop for each bend in the pipeline is the same. A similar wide range
of values, from 50 mbar/bend for dense phase to 170 mbar/bend for dilute phase con-
veying were obtained. The significance of this is that if there are six bends in a pipeline
and the pressure loss is 170 mbar/bend, then a pressure drop of one bar is attributed
simply to the convenience of pipeline routing. The necessity of each bend in a pipeline,
therefore, should be given serious consideration.
PIPELINE SCALING PARAMETERS 337
0.04 0.08 0.12
16
12
8
4
20
Air mass flow rate (kg/s)
Mat
eria
l flo
w r
ate
(ton
ne/h
)
24
0
60
60
40
20
80
80100
120120
160
140
Bend loss (mbar/bend)
Solids loading ratio
53 mm bore pipe
Figure 14.17 Influence of conveying conditions on bend losses for barytes.
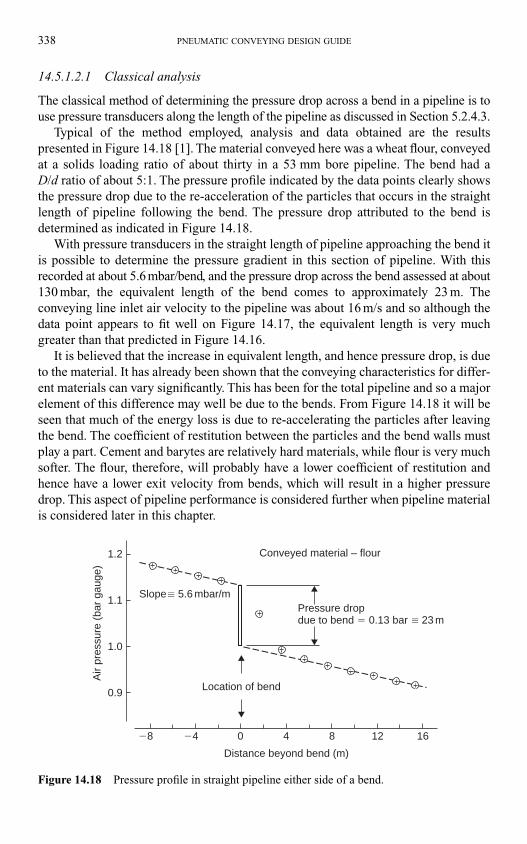
14.5.1.2.1 Classical analysis
The classical method of determining the pressure drop across a bend in a pipeline is to
use pressure transducers along the length of the pipeline as discussed in Section 5.2.4.3.
Typical of the method employed, analysis and data obtained are the results
presented in Figure 14.18 [1]. The material conveyed here was a wheat flour, conveyed
at a solids loading ratio of about thirty in a 53 mm bore pipeline. The bend had a
D/d ratio of about 5:1. The pressure profile indicated by the data points clearly shows
the pressure drop due to the re-acceleration of the particles that occurs in the straight
length of pipeline following the bend. The pressure drop attributed to the bend is
determined as indicated in Figure 14.18.
With pressure transducers in the straight length of pipeline approaching the bend it
is possible to determine the pressure gradient in this section of pipeline. With this
recorded at about 5.6 mbar/bend, and the pressure drop across the bend assessed at about
130 mbar, the equivalent length of the bend comes to approximately 23 m. The
conveying line inlet air velocity to the pipeline was about 16 m/s and so although the
data point appears to fit well on Figure 14.17, the equivalent length is very much
greater than that predicted in Figure 14.16.
It is believed that the increase in equivalent length, and hence pressure drop, is due
to the material. It has already been shown that the conveying characteristics for differ-
ent materials can vary significantly. This has been for the total pipeline and so a major
element of this difference may well be due to the bends. From Figure 14.18 it will be
seen that much of the energy loss is due to re-accelerating the particles after leaving
the bend. The coefficient of restitution between the particles and the bend walls must
play a part. Cement and barytes are relatively hard materials, while flour is very much
softer. The flour, therefore, will probably have a lower coefficient of restitution and
hence have a lower exit velocity from bends, which will result in a higher pressure
drop. This aspect of pipeline performance is considered further when pipeline material
is considered later in this chapter.
338 PNEUMATIC CONVEYING DESIGN GUIDE
4�4�8 8 12 16
1.0
0.9
1.1
Distance beyond bend (m)
Air
pres
sure
(ba
r ga
uge)
1.2
0
Location of bend
Slope 5.6 mbar/mPressure dropdue to bend � 0.13 bar 23 m
Conveyed material – flour
Figure 14.18 Pressure profile in straight pipeline either side of a bend.
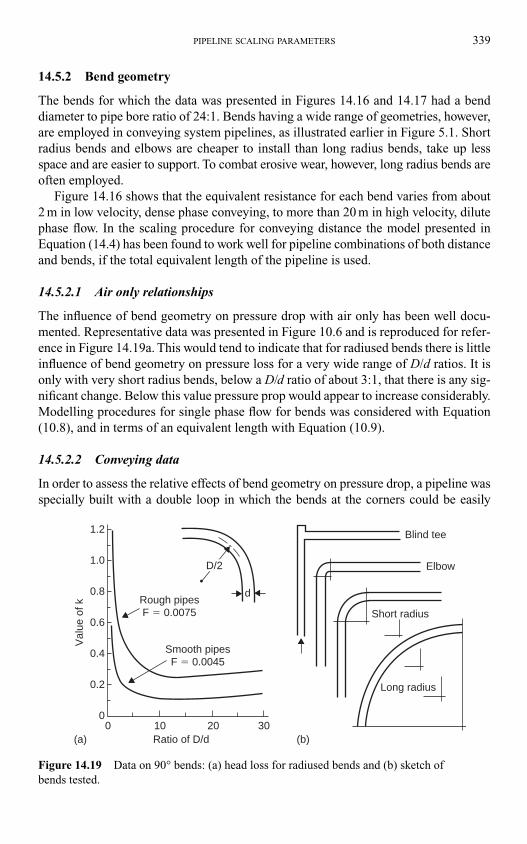
14.5.2 Bend geometry
The bends for which the data was presented in Figures 14.16 and 14.17 had a bend
diameter to pipe bore ratio of 24:1. Bends having a wide range of geometries, however,
are employed in conveying system pipelines, as illustrated earlier in Figure 5.1. Short
radius bends and elbows are cheaper to install than long radius bends, take up less
space and are easier to support. To combat erosive wear, however, long radius bends are
often employed.
Figure 14.16 shows that the equivalent resistance for each bend varies from about
2 m in low velocity, dense phase conveying, to more than 20 m in high velocity, dilute
phase flow. In the scaling procedure for conveying distance the model presented in
Equation (14.4) has been found to work well for pipeline combinations of both distance
and bends, if the total equivalent length of the pipeline is used.
14.5.2.1 Air only relationships
The influence of bend geometry on pressure drop with air only has been well docu-
mented. Representative data was presented in Figure 10.6 and is reproduced for refer-
ence in Figure 14.19a. This would tend to indicate that for radiused bends there is little
influence of bend geometry on pressure loss for a very wide range of D/d ratios. It is
only with very short radius bends, below a D/d ratio of about 3:1, that there is any sig-
nificant change. Below this value pressure prop would appear to increase considerably.
Modelling procedures for single phase flow for bends was considered with Equation
(10.8), and in terms of an equivalent length with Equation (10.9).
14.5.2.2 Conveying data
In order to assess the relative effects of bend geometry on pressure drop, a pipeline was
specially built with a double loop in which the bends at the corners could be easily
PIPELINE SCALING PARAMETERS 339
Rough pipesF � 0.0075
Smooth pipesF � 0.0045
Ratio of D/d
Val
ue o
f k
Long radius
Short radius
Elbow
Blind tee
d
1.2
1.0
0.8
0.6
0.4
0.2
10 20 300
0(a) (b)
D/2
Figure 14.19 Data on 90° bends: (a) head loss for radiused bends and (b) sketch of
bends tested.
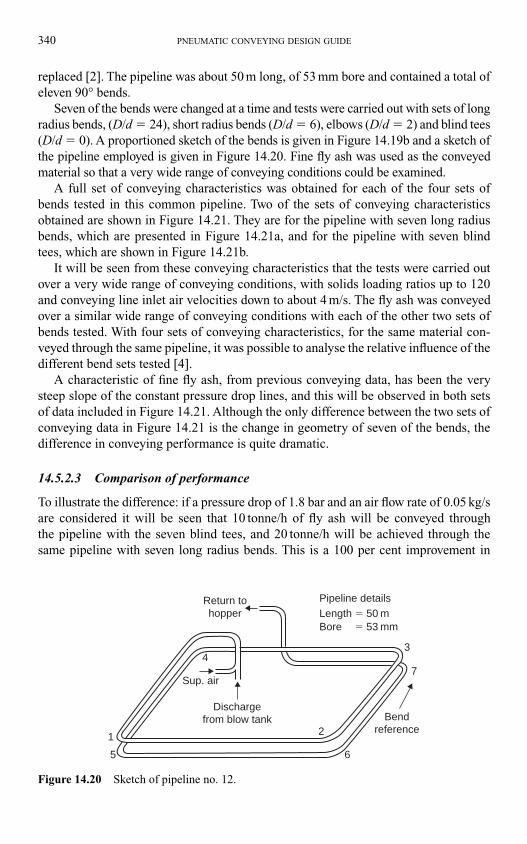
replaced [2]. The pipeline was about 50 m long, of 53 mm bore and contained a total of
eleven 90° bends.
Seven of the bends were changed at a time and tests were carried out with sets of long
radius bends, (D/d � 24), short radius bends (D/d � 6), elbows (D/d � 2) and blind tees
(D/d � 0). A proportioned sketch of the bends is given in Figure 14.19b and a sketch of
the pipeline employed is given in Figure 14.20. Fine fly ash was used as the conveyed
material so that a very wide range of conveying conditions could be examined.
A full set of conveying characteristics was obtained for each of the four sets of
bends tested in this common pipeline. Two of the sets of conveying characteristics
obtained are shown in Figure 14.21. They are for the pipeline with seven long radius
bends, which are presented in Figure 14.21a, and for the pipeline with seven blind
tees, which are shown in Figure 14.21b.
It will be seen from these conveying characteristics that the tests were carried out
over a very wide range of conveying conditions, with solids loading ratios up to 120
and conveying line inlet air velocities down to about 4 m/s. The fly ash was conveyed
over a similar wide range of conveying conditions with each of the other two sets of
bends tested. With four sets of conveying characteristics, for the same material con-
veyed through the same pipeline, it was possible to analyse the relative influence of the
different bend sets tested [4].
A characteristic of fine fly ash, from previous conveying data, has been the very
steep slope of the constant pressure drop lines, and this will be observed in both sets
of data included in Figure 14.21. Although the only difference between the two sets of
conveying data in Figure 14.21 is the change in geometry of seven of the bends, the
difference in conveying performance is quite dramatic.
14.5.2.3 Comparison of performance
To illustrate the difference: if a pressure drop of 1.8 bar and an air flow rate of 0.05 kg/s
are considered it will be seen that 10 tonne/h of fly ash will be conveyed through
the pipeline with the seven blind tees, and 20 tonne/h will be achieved through the
same pipeline with seven long radius bends. This is a 100 per cent improvement in
340 PNEUMATIC CONVEYING DESIGN GUIDE
Pipeline details
1
5
3
2
6
Bendreference
4
Sup. air
Dischargefrom blow tank
Return tohopper Length � 50 m
Bore � 53 mm
7
Figure 14.20 Sketch of pipeline no. 12.
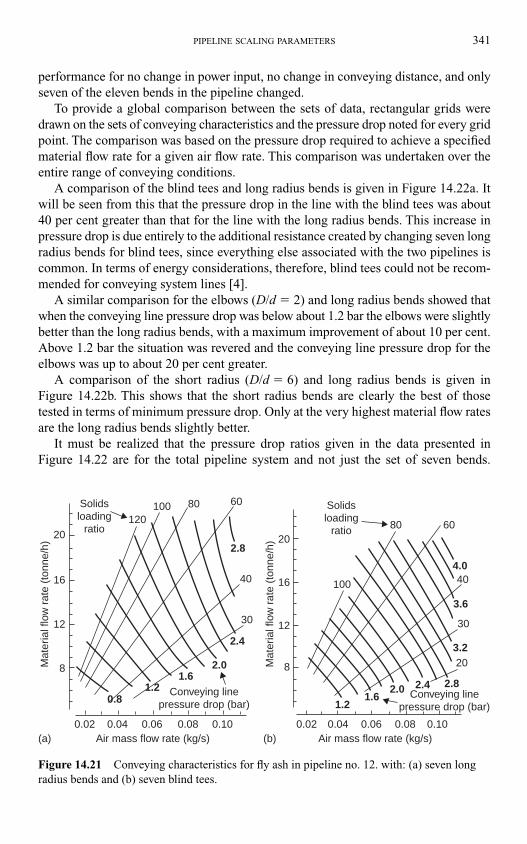
performance for no change in power input, no change in conveying distance, and only
seven of the eleven bends in the pipeline changed.
To provide a global comparison between the sets of data, rectangular grids were
drawn on the sets of conveying characteristics and the pressure drop noted for every grid
point. The comparison was based on the pressure drop required to achieve a specified
material flow rate for a given air flow rate. This comparison was undertaken over the
entire range of conveying conditions.
A comparison of the blind tees and long radius bends is given in Figure 14.22a. It
will be seen from this that the pressure drop in the line with the blind tees was about
40 per cent greater than that for the line with the long radius bends. This increase in
pressure drop is due entirely to the additional resistance created by changing seven long
radius bends for blind tees, since everything else associated with the two pipelines is
common. In terms of energy considerations, therefore, blind tees could not be recom-
mended for conveying system lines [4].
A similar comparison for the elbows (D/d � 2) and long radius bends showed that
when the conveying line pressure drop was below about 1.2 bar the elbows were slightly
better than the long radius bends, with a maximum improvement of about 10 per cent.
Above 1.2 bar the situation was revered and the conveying line pressure drop for the
elbows was up to about 20 per cent greater.
A comparison of the short radius (D/d � 6) and long radius bends is given in
Figure 14.22b. This shows that the short radius bends are clearly the best of those
tested in terms of minimum pressure drop. Only at the very highest material flow rates
are the long radius bends slightly better.
It must be realized that the pressure drop ratios given in the data presented in
Figure 14.22 are for the total pipeline system and not just the set of seven bends.
PIPELINE SCALING PARAMETERS 341
Conveying linepressure drop (bar)
Conveying linepressure drop (bar)
Solidsloading
ratio
Solidsloading
ratio
Mat
eria
l flo
w r
ate
(ton
ne/h
)
8
12
16
20
Mat
eria
l flo
w r
ate
(ton
ne/h
)
8
12
16
20
3.6
1.6
1.6
1.2
1.2 2.8
2.8
2.4
2.4
2.0
2.0
3.2
4.04040
3030
20
60
60
80
80
0.8
100
100120
Air mass flow rate (kg/s)0.040.02 0.06 0.08 0.10
Air mass flow rate (kg/s)(a) (b)0.040.02 0.06 0.08 0.10
Figure 14.21 Conveying characteristics for fly ash in pipeline no. 12. with: (a) seven long
radius bends and (b) seven blind tees.
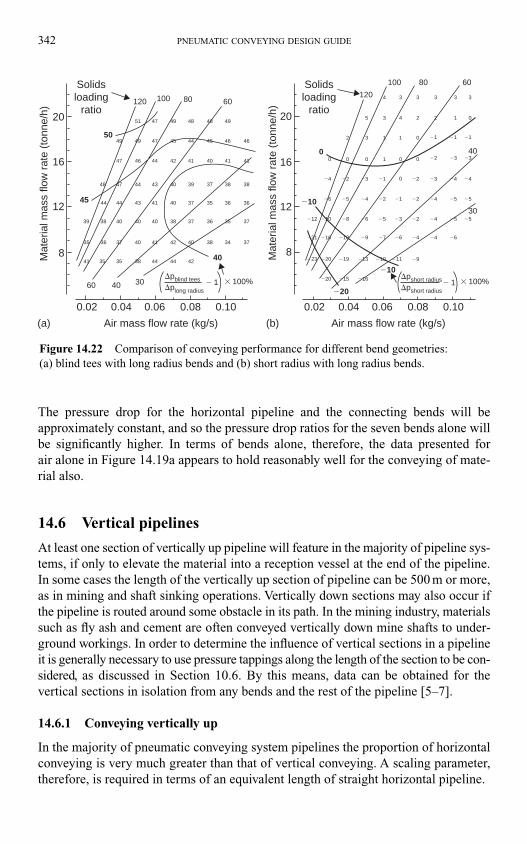
The pressure drop for the horizontal pipeline and the connecting bends will be
approximately constant, and so the pressure drop ratios for the seven bends alone will
be significantly higher. In terms of bends alone, therefore, the data presented for
air alone in Figure 14.19a appears to hold reasonably well for the conveying of mate-
rial also.
14.6 Vertical pipelines
At least one section of vertically up pipeline will feature in the majority of pipeline sys-
tems, if only to elevate the material into a reception vessel at the end of the pipeline.
In some cases the length of the vertically up section of pipeline can be 500 m or more,
as in mining and shaft sinking operations. Vertically down sections may also occur if
the pipeline is routed around some obstacle in its path. In the mining industry, materials
such as fly ash and cement are often conveyed vertically down mine shafts to under-
ground workings. In order to determine the influence of vertical sections in a pipeline
it is generally necessary to use pressure tappings along the length of the section to be con-
sidered, as discussed in Section 10.6. By this means, data can be obtained for the
vertical sections in isolation from any bends and the rest of the pipeline [5–7].
14.6.1 Conveying vertically up
In the majority of pneumatic conveying system pipelines the proportion of horizontal
conveying is very much greater than that of vertical conveying. A scaling parameter,
therefore, is required in terms of an equivalent length of straight horizontal pipeline.
342 PNEUMATIC CONVEYING DESIGN GUIDE
0.02
20
Solidsloading
ratio
Solidsloading
ratio120
120
100 80 60
40
30
�20
�10
�10
0
50
45
60 40 30
40
51 47
49
47 46 44 42 41 40 41 41
383837394043444748
44
39 38 40 40 40 38 37 36 35 37
37343840424140373635
41 35 35 38 44 44 42
44 43 41 40 37 35 36 36
49 47 45 44 45 46 46
49 48 48 49
4
5
2 1 0
0
�4 �2 �3 �1
�1 �1 �1
�2
�2 �3 �3
�3 �4 �4
�5�5�4�2�1�2�4�5�6
�12 �10 �8 �6 �5 �3 �2 �4 �5 �5
�6�4�4�6�7�9�10�16�21
�23 �20
�20 �15 �16
�19 �13 �10 �11 �9
0 0 0
0
01
3 1
3 4 2 2 1 0
3 3 3 3 3100 80 60
16
12
8
0.04 0.06 0.08 0.10
� 100%
Air mass flow rate (kg/s)(a) (b)
�pblind tees � 1�plong radius
Mat
eria
l mas
s flo
w r
ate
(ton
ne/h
)
0.02
20
16
12
8
0.04 0.06 0.08 0.10
Air mass flow rate (kg/s)
Mat
eria
l mas
s flo
w r
ate
(ton
ne/h
)� 100%
�pshort radius� 1�pshort radius
Figure 14.22 Comparison of conveying performance for different bend geometries:
(a) blind tees with long radius bends and (b) short radius with long radius bends.
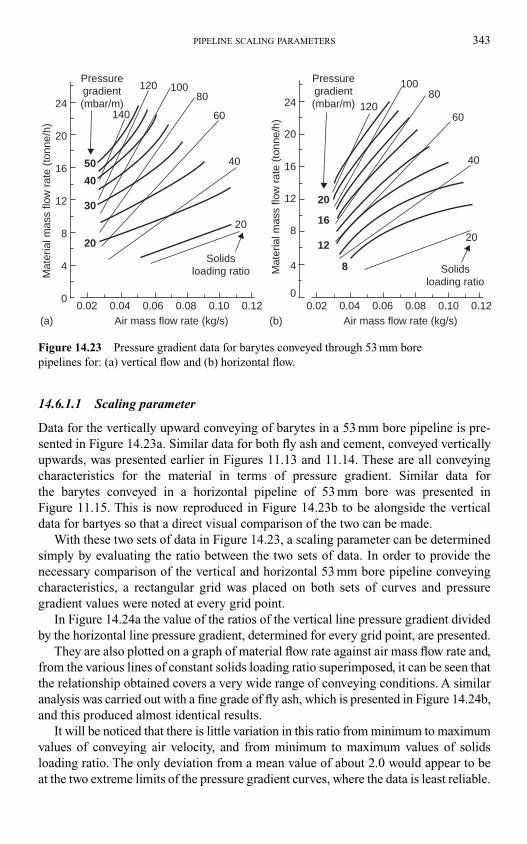
14.6.1.1 Scaling parameter
Data for the vertically upward conveying of barytes in a 53 mm bore pipeline is pre-
sented in Figure 14.23a. Similar data for both fly ash and cement, conveyed vertically
upwards, was presented earlier in Figures 11.13 and 11.14. These are all conveying
characteristics for the material in terms of pressure gradient. Similar data for
the barytes conveyed in a horizontal pipeline of 53 mm bore was presented in
Figure 11.15. This is now reproduced in Figure 14.23b to be alongside the vertical
data for bartyes so that a direct visual comparison of the two can be made.
With these two sets of data in Figure 14.23, a scaling parameter can be determined
simply by evaluating the ratio between the two sets of data. In order to provide the
necessary comparison of the vertical and horizontal 53 mm bore pipeline conveying
characteristics, a rectangular grid was placed on both sets of curves and pressure
gradient values were noted at every grid point.
In Figure 14.24a the value of the ratios of the vertical line pressure gradient divided
by the horizontal line pressure gradient, determined for every grid point, are presented.
They are also plotted on a graph of material flow rate against air mass flow rate and,
from the various lines of constant solids loading ratio superimposed, it can be seen that
the relationship obtained covers a very wide range of conveying conditions. A similar
analysis was carried out with a fine grade of fly ash, which is presented in Figure 14.24b,
and this produced almost identical results.
It will be noticed that there is little variation in this ratio from minimum to maximum
values of conveying air velocity, and from minimum to maximum values of solids
loading ratio. The only deviation from a mean value of about 2.0 would appear to be
at the two extreme limits of the pressure gradient curves, where the data is least reliable.
PIPELINE SCALING PARAMETERS 343
24
20
20
20
2020
30
40
40 4050
60 60
80 80100 100120
120140
16
12
12
0
8
4
Mat
eria
l mas
s flo
w r
ate
(ton
ne/h
)
Mat
eria
l mas
s flo
w r
ate
(ton
ne/h
)
24
20
16
16
12
0
8
84Solids
loading ratio Solidsloading ratio
0.120.100.02 0.04 0.080.06Air mass flow rate (kg/s)(a) (b)
0.120.100.02 0.04 0.080.06Air mass flow rate (kg/s)
Pressuregradient(mbar/m)
Pressuregradient(mbar/m)
Figure 14.23 Pressure gradient data for barytes conveyed through 53 mm bore
pipelines for: (a) vertical flow and (b) horizontal flow.
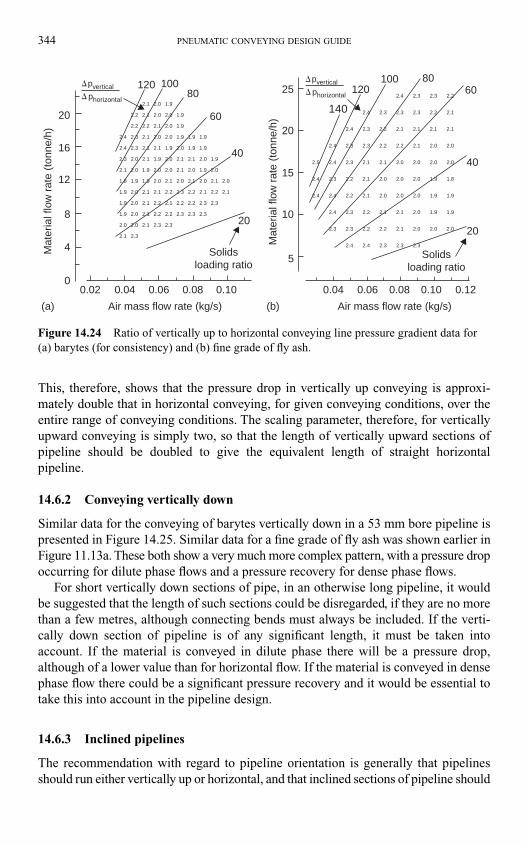
This, therefore, shows that the pressure drop in vertically up conveying is approxi-
mately double that in horizontal conveying, for given conveying conditions, over the
entire range of conveying conditions. The scaling parameter, therefore, for vertically
upward conveying is simply two, so that the length of vertically upward sections of
pipeline should be doubled to give the equivalent length of straight horizontal
pipeline.
14.6.2 Conveying vertically down
Similar data for the conveying of barytes vertically down in a 53 mm bore pipeline is
presented in Figure 14.25. Similar data for a fine grade of fly ash was shown earlier in
Figure 11.13a. These both show a very much more complex pattern, with a pressure drop
occurring for dilute phase flows and a pressure recovery for dense phase flows.
For short vertically down sections of pipe, in an otherwise long pipeline, it would
be suggested that the length of such sections could be disregarded, if they are no more
than a few metres, although connecting bends must always be included. If the verti-
cally down section of pipeline is of any significant length, it must be taken into
account. If the material is conveyed in dilute phase there will be a pressure drop,
although of a lower value than for horizontal flow. If the material is conveyed in dense
phase flow there could be a significant pressure recovery and it would be essential to
take this into account in the pipeline design.
14.6.3 Inclined pipelines
The recommendation with regard to pipeline orientation is generally that pipelines
should run either vertically up or horizontal, and that inclined sections of pipeline should
344 PNEUMATIC CONVEYING DESIGN GUIDE
20
20
10
5
25
15
16
12
0
8
4Mat
eria
l flo
w r
ate
(ton
ne/h
)
Mat
eria
l flo
w r
ate
(ton
ne/h
)
0.100.02 0.04 0.080.06
Air mass flow rate (kg/s)
0.10 0.120.04 0.080.06
Air mass flow rate (kg/s)(a) (b)
Solidsloading ratio
Solidsloading ratio
2020
4040
60
6080
80
2.5
2.4
2.4
2.3
2.4
2.4
2.4
2.4
2.3
2.4
2.3
2.3
2.3
2.4
2.2
2.3
2.2
2.4
2.4
2.2
2.1
2.3
2.3
2.1
2.2
2.1
2.3
2.3
2.3
2.0
2.0
2.1
2.1
2.0
2.0
2.0
2.3
2.4
2.3
2.1
2.0
2.2
2.1
2.0
2.1
2.0
2.3
2.3
2.2
2.1
2.2
2.2
2.0
2.1
2.0
2.3
2.2
2.0
2.0
2.0
2.1
1.9
1.9
1.9
2.2
2.1
2.0
2.0
2.0
2.1
1.9
1.9
1.8
1.9
1.9
2.1
2.0
2.2
2.2
2.3
2.1
1.9
2.0
2.2
2.3
2.1
1.9
2.0
2.0
2.0
1.9
2.0
2.0
2.2
2.1
2.3
2.2
2.1
2.0
2.0
2.1
2.0
2.1
1.9
2.0
2.1
2.2
2.3
2.2
2.0
1.9
1.9
1.9
2.0
2.1
2.1
2.3
2.2
2.3
2.0
1.9
1.9
2.0
1.9
2.1
2.3
2.3
2.0
2.1
2.0
2.2
2.2
2.3
2.3
2.0
2.0
2.0
2.0
2.0
2.3
2.0
1.9
2.1
2.1
2.2
2.1
2.1
2.1
1.9
2.1
2.1
2.1
2.1
1.9
2.4
2.4
2.3
2.1
1.9
1.9
2.0
2.1
1.9
1.8
100 100120 120
140phorizontal
pvertical
�
�phorizontal
pvertical
�
�
Figure 14.24 Ratio of vertically up to horizontal conveying line pressure gradient data for
(a) barytes (for consistency) and (b) fine grade of fly ash.
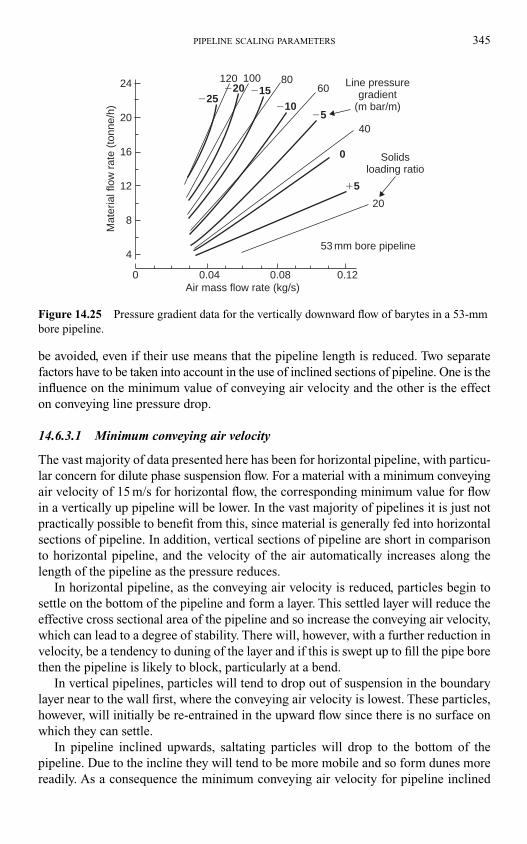
be avoided, even if their use means that the pipeline length is reduced. Two separate
factors have to be taken into account in the use of inclined sections of pipeline. One is the
influence on the minimum value of conveying air velocity and the other is the effect
on conveying line pressure drop.
14.6.3.1 Minimum conveying air velocity
The vast majority of data presented here has been for horizontal pipeline, with particu-
lar concern for dilute phase suspension flow. For a material with a minimum conveying
air velocity of 15 m/s for horizontal flow, the corresponding minimum value for flow
in a vertically up pipeline will be lower. In the vast majority of pipelines it is just not
practically possible to benefit from this, since material is generally fed into horizontal
sections of pipeline. In addition, vertical sections of pipeline are short in comparison
to horizontal pipeline, and the velocity of the air automatically increases along the
length of the pipeline as the pressure reduces.
In horizontal pipeline, as the conveying air velocity is reduced, particles begin to
settle on the bottom of the pipeline and form a layer. This settled layer will reduce the
effective cross sectional area of the pipeline and so increase the conveying air velocity,
which can lead to a degree of stability. There will, however, with a further reduction in
velocity, be a tendency to duning of the layer and if this is swept up to fill the pipe bore
then the pipeline is likely to block, particularly at a bend.
In vertical pipelines, particles will tend to drop out of suspension in the boundary
layer near to the wall first, where the conveying air velocity is lowest. These particles,
however, will initially be re-entrained in the upward flow since there is no surface on
which they can settle.
In pipeline inclined upwards, saltating particles will drop to the bottom of the
pipeline. Due to the incline they will tend to be more mobile and so form dunes more
readily. As a consequence the minimum conveying air velocity for pipeline inclined
PIPELINE SCALING PARAMETERS 345
Air mass flow rate (kg/s)
Mat
eria
l flo
w r
ate
(ton
ne/h
)
0
4
8
12
16
20
24�25
�20 �15�10
�5
�5
0.04 0.08
20
40
6080100120
0
0.12
53 mm bore pipeline
Solidsloading ratio
Line pressuregradient
(m bar/m)
Figure 14.25 Pressure gradient data for the vertically downward flow of barytes in a 53-mm
bore pipeline.
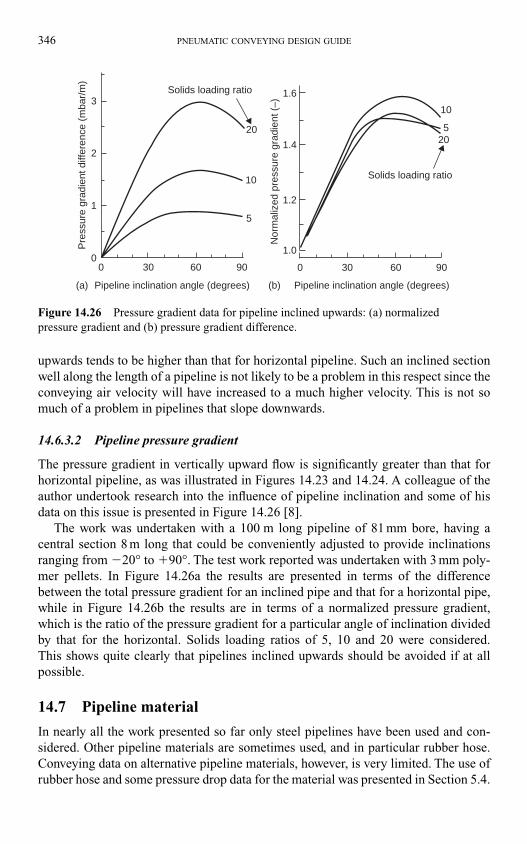
upwards tends to be higher than that for horizontal pipeline. Such an inclined section
well along the length of a pipeline is not likely to be a problem in this respect since the
conveying air velocity will have increased to a much higher velocity. This is not so
much of a problem in pipelines that slope downwards.
14.6.3.2 Pipeline pressure gradient
The pressure gradient in vertically upward flow is significantly greater than that for
horizontal pipeline, as was illustrated in Figures 14.23 and 14.24. A colleague of the
author undertook research into the influence of pipeline inclination and some of his
data on this issue is presented in Figure 14.26 [8].
The work was undertaken with a 100 m long pipeline of 81 mm bore, having a
central section 8 m long that could be conveniently adjusted to provide inclinations
ranging from �20° to �90°. The test work reported was undertaken with 3 mm poly-
mer pellets. In Figure 14.26a the results are presented in terms of the difference
between the total pressure gradient for an inclined pipe and that for a horizontal pipe,
while in Figure 14.26b the results are in terms of a normalized pressure gradient,
which is the ratio of the pressure gradient for a particular angle of inclination divided
by that for the horizontal. Solids loading ratios of 5, 10 and 20 were considered.
This shows quite clearly that pipelines inclined upwards should be avoided if at all
possible.
14.7 Pipeline material
In nearly all the work presented so far only steel pipelines have been used and con-
sidered. Other pipeline materials are sometimes used, and in particular rubber hose.
Conveying data on alternative pipeline materials, however, is very limited. The use of
rubber hose and some pressure drop data for the material was presented in Section 5.4.
346 PNEUMATIC CONVEYING DESIGN GUIDE
Solids loading ratio
Pipeline inclination angle (degrees) Pipeline inclination angle (degrees)N
orm
aliz
ed p
ress
ure
grad
ient
(–)
Solids loading ratio
20
10
5
3
2
1
00 30 60 90 0
1.0
1.2
1.4
1.6
30
20
10
5
60 90
Pre
ssur
e gr
adie
nt d
iffer
ence
(m
bar/
m)
(a) (b)
Figure 14.26 Pressure gradient data for pipeline inclined upwards: (a) normalized
pressure gradient and (b) pressure gradient difference.
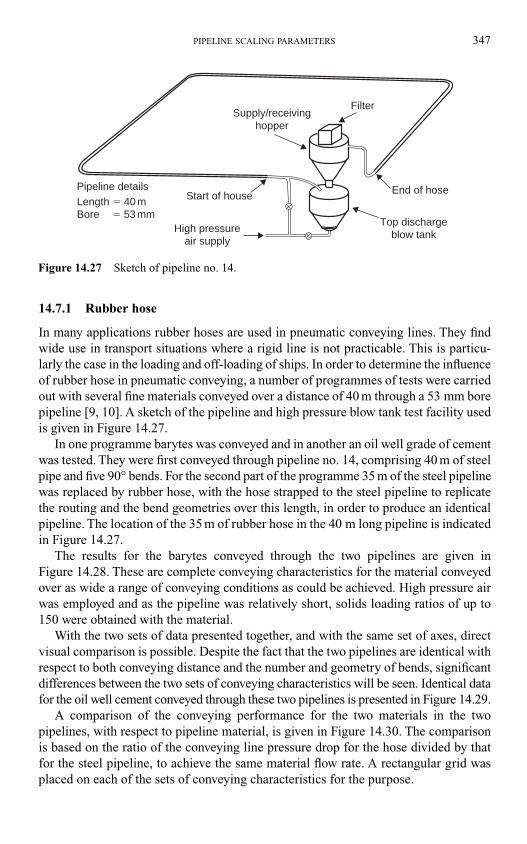
14.7.1 Rubber hose
In many applications rubber hoses are used in pneumatic conveying lines. They find
wide use in transport situations where a rigid line is not practicable. This is particu-
larly the case in the loading and off-loading of ships. In order to determine the influence
of rubber hose in pneumatic conveying, a number of programmes of tests were carried
out with several fine materials conveyed over a distance of 40 m through a 53 mm bore
pipeline [9, 10]. A sketch of the pipeline and high pressure blow tank test facility used
is given in Figure 14.27.
In one programme barytes was conveyed and in another an oil well grade of cement
was tested. They were first conveyed through pipeline no. 14, comprising 40 m of steel
pipe and five 90° bends. For the second part of the programme 35 m of the steel pipeline
was replaced by rubber hose, with the hose strapped to the steel pipeline to replicate
the routing and the bend geometries over this length, in order to produce an identical
pipeline. The location of the 35 m of rubber hose in the 40 m long pipeline is indicated
in Figure 14.27.
The results for the barytes conveyed through the two pipelines are given in
Figure 14.28. These are complete conveying characteristics for the material conveyed
over as wide a range of conveying conditions as could be achieved. High pressure air
was employed and as the pipeline was relatively short, solids loading ratios of up to
150 were obtained with the material.
With the two sets of data presented together, and with the same set of axes, direct
visual comparison is possible. Despite the fact that the two pipelines are identical with
respect to both conveying distance and the number and geometry of bends, significant
differences between the two sets of conveying characteristics will be seen. Identical data
for the oil well cement conveyed through these two pipelines is presented in Figure 14.29.
A comparison of the conveying performance for the two materials in the two
pipelines, with respect to pipeline material, is given in Figure 14.30. The comparison
is based on the ratio of the conveying line pressure drop for the hose divided by that
for the steel pipeline, to achieve the same material flow rate. A rectangular grid was
placed on each of the sets of conveying characteristics for the purpose.
PIPELINE SCALING PARAMETERS 347
Supply/receivinghopper
Filter
End of hose
Top dischargeblow tank
Start of house
High pressureair supply
Pipeline detailsLength � 40 mBore � 53 mm
Figure 14.27 Sketch of pipeline no. 14.
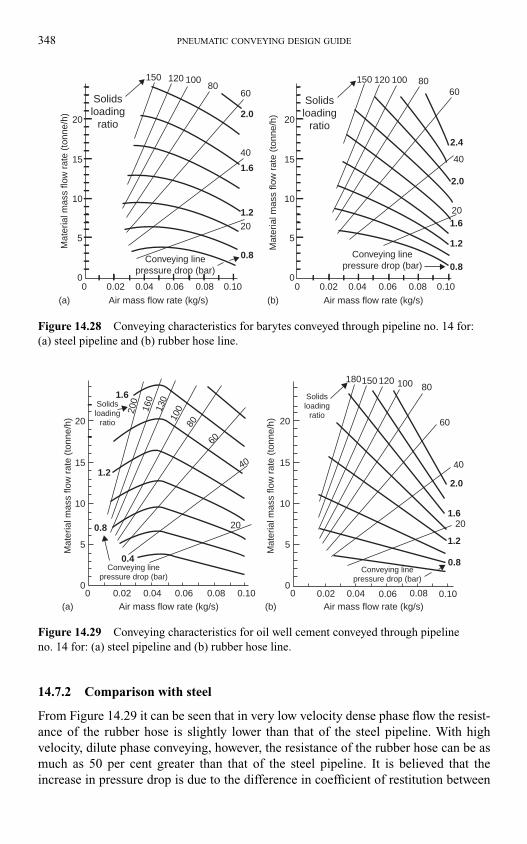
14.7.2 Comparison with steel
From Figure 14.29 it can be seen that in very low velocity dense phase flow the resist-
ance of the rubber hose is slightly lower than that of the steel pipeline. With high
velocity, dilute phase conveying, however, the resistance of the rubber hose can be as
much as 50 per cent greater than that of the steel pipeline. It is believed that the
increase in pressure drop is due to the difference in coefficient of restitution between
348 PNEUMATIC CONVEYING DESIGN GUIDE
(a)
Mat
eria
l mas
s flo
w r
ate
(ton
ne/h
)
(b)
Mat
eria
l mas
s flo
w r
ate
(ton
ne/h
)Conveying line
pressure drop (bar)
Conveying linepressure drop (bar)
Solidsloading
ratio
Air mass flow rate (kg/s)
00 0.02 0.04 0.06 0.08 0.10
Air mass flow rate (kg/s)
0 0.02 0.04 0.06 0.08 0.10
0.80.8
1.2
1.62.0
2.0
2.4
1.6
1.25
10
15
20
0
5
10
15
20
20
4040
20
150 150120 120100 10080 80
60 60Solidsloading
ratio
Figure 14.28 Conveying characteristics for barytes conveyed through pipeline no. 14 for:
(a) steel pipeline and (b) rubber hose line.
(a) (b)
Mat
eria
l mas
s flo
w r
ate
(ton
ne/h
)
Mat
eria
l mas
s flo
w r
ate
(ton
ne/h
)
Air mass flow rate (kg/s) Air mass flow rate (kg/s)
Conveying linepressure drop (bar)
Conveying linepressure drop (bar)
Solidsloading
ratio
Solidsloading
ratio
00 0.02 0.04 0.06 0.08 0.10 0 0.02 0.04 0.06 0.08
0.8
1.2
1.6
2.0
0.100
5 5
10 10
15 15
20
20 20
60
80100120150180
40 40
60
80
10013
0
160
200
1.6
1.2
0.8
0.4
20
Figure 14.29 Conveying characteristics for oil well cement conveyed through pipeline
no. 14 for: (a) steel pipeline and (b) rubber hose line.
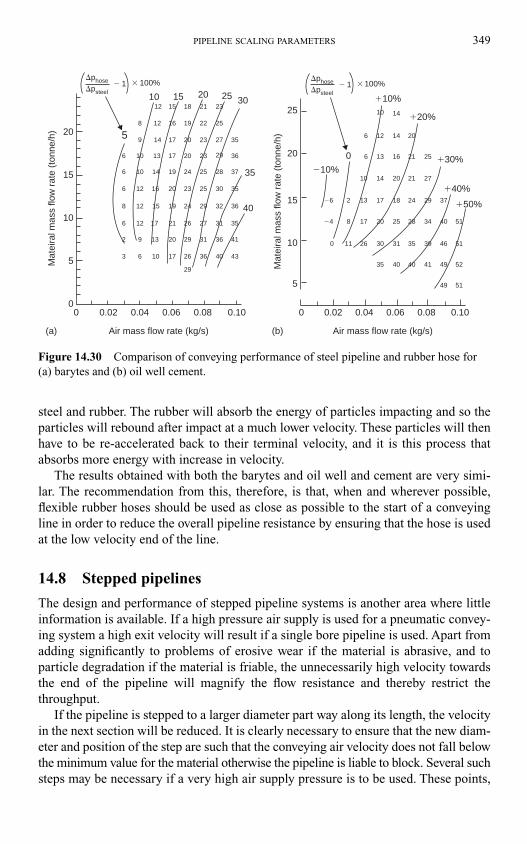
steel and rubber. The rubber will absorb the energy of particles impacting and so the
particles will rebound after impact at a much lower velocity. These particles will then
have to be re-accelerated back to their terminal velocity, and it is this process that
absorbs more energy with increase in velocity.
The results obtained with both the barytes and oil well and cement are very simi-
lar. The recommendation from this, therefore, is that, when and wherever possible,
flexible rubber hoses should be used as close as possible to the start of a conveying
line in order to reduce the overall pipeline resistance by ensuring that the hose is used
at the low velocity end of the line.
14.8 Stepped pipelines
The design and performance of stepped pipeline systems is another area where little
information is available. If a high pressure air supply is used for a pneumatic convey-
ing system a high exit velocity will result if a single bore pipeline is used. Apart from
adding significantly to problems of erosive wear if the material is abrasive, and to
particle degradation if the material is friable, the unnecessarily high velocity towards
the end of the pipeline will magnify the flow resistance and thereby restrict the
throughput.
If the pipeline is stepped to a larger diameter part way along its length, the velocity
in the next section will be reduced. It is clearly necessary to ensure that the new diam-
eter and position of the step are such that the conveying air velocity does not fall below
the minimum value for the material otherwise the pipeline is liable to block. Several such
steps may be necessary if a very high air supply pressure is to be used. These points,
PIPELINE SCALING PARAMETERS 349
20
20
15
15
10
5
0
20
25
25 30
35
4015
10
10
5
5
0 0.02 0.04 0.06
Air mass flow rate (kg/s) Air mass flow rate (kg/s)
Mat
eira
l mas
s flo
w r
ate
(ton
ne/h
)
Mat
eira
l mas
s flo
w r
ate
(ton
ne/h
)
0.08 0.10 0 0.02 0.04 0.06 0.08 0.10
40
3026
20
18
16
17
17
11
8
2
0
�4
�6
0 6
6
�10%
�20%
�10%
�30%
�40%
�50%
1410
13
13
12 14
1410
25
24
21
21
20
20
40
46
40
41 49
49
3935
25
31
28
29
27
35
34
37
52
51
51
51
6
6
6
63
8
8
9
9
10
10
12
12
12
14
14
16
16
15
15
17
17
17
17
13
10
13
12
126
2 20
20
20
20
24
29
29
29
28
29
24
25
25
25
23
23
23
22
21
26 27
26 36
31
30
32
31
37
36
36
36
35
35
35
40 43
41
23
21
27
19
19
19
18
(a) (b)
� 100%�phose � 1�psteel
� 100%�phose � 1�psteel
Figure 14.30 Comparison of conveying performance of steel pipeline and rubber hose for
(a) barytes and (b) oil well cement.
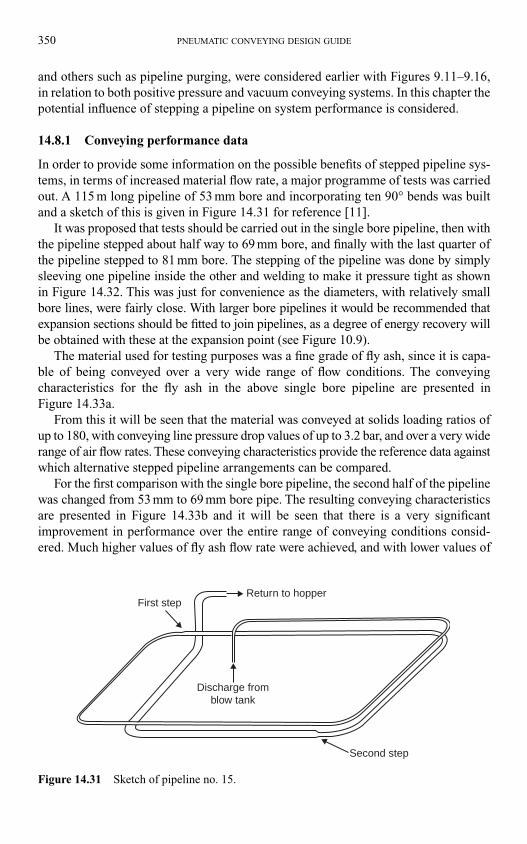
and others such as pipeline purging, were considered earlier with Figures 9.11–9.16,
in relation to both positive pressure and vacuum conveying systems. In this chapter the
potential influence of stepping a pipeline on system performance is considered.
14.8.1 Conveying performance data
In order to provide some information on the possible benefits of stepped pipeline sys-
tems, in terms of increased material flow rate, a major programme of tests was carried
out. A 115 m long pipeline of 53 mm bore and incorporating ten 90° bends was built
and a sketch of this is given in Figure 14.31 for reference [11].
It was proposed that tests should be carried out in the single bore pipeline, then with
the pipeline stepped about half way to 69 mm bore, and finally with the last quarter of
the pipeline stepped to 81 mm bore. The stepping of the pipeline was done by simply
sleeving one pipeline inside the other and welding to make it pressure tight as shown
in Figure 14.32. This was just for convenience as the diameters, with relatively small
bore lines, were fairly close. With larger bore pipelines it would be recommended that
expansion sections should be fitted to join pipelines, as a degree of energy recovery will
be obtained with these at the expansion point (see Figure 10.9).
The material used for testing purposes was a fine grade of fly ash, since it is capa-
ble of being conveyed over a very wide range of flow conditions. The conveying
characteristics for the fly ash in the above single bore pipeline are presented in
Figure 14.33a.
From this it will be seen that the material was conveyed at solids loading ratios of
up to 180, with conveying line pressure drop values of up to 3.2 bar, and over a very wide
range of air flow rates. These conveying characteristics provide the reference data against
which alternative stepped pipeline arrangements can be compared.
For the first comparison with the single bore pipeline, the second half of the pipeline
was changed from 53 mm to 69 mm bore pipe. The resulting conveying characteristics
are presented in Figure 14.33b and it will be seen that there is a very significant
improvement in performance over the entire range of conveying conditions consid-
ered. Much higher values of fly ash flow rate were achieved, and with lower values of
350 PNEUMATIC CONVEYING DESIGN GUIDE
Discharge fromblow tank
Return to hopperFirst step
Second step
Figure 14.31 Sketch of pipeline no. 15.
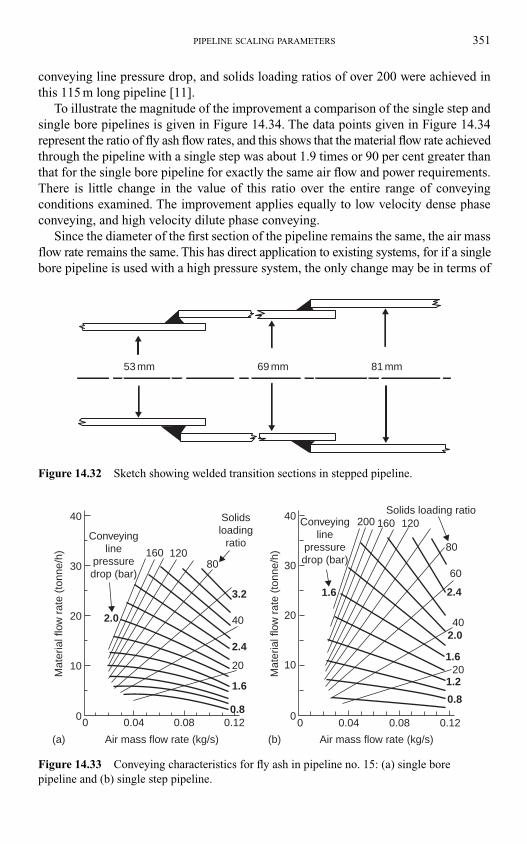
conveying line pressure drop, and solids loading ratios of over 200 were achieved in
this 115 m long pipeline [11].
To illustrate the magnitude of the improvement a comparison of the single step and
single bore pipelines is given in Figure 14.34. The data points given in Figure 14.34
represent the ratio of fly ash flow rates, and this shows that the material flow rate achieved
through the pipeline with a single step was about 1.9 times or 90 per cent greater than
that for the single bore pipeline for exactly the same air flow and power requirements.
There is little change in the value of this ratio over the entire range of conveying
conditions examined. The improvement applies equally to low velocity dense phase
conveying, and high velocity dilute phase conveying.
Since the diameter of the first section of the pipeline remains the same, the air mass
flow rate remains the same. This has direct application to existing systems, for if a single
bore pipeline is used with a high pressure system, the only change may be in terms of
PIPELINE SCALING PARAMETERS 351
53 mm 69 mm 81 mm
Figure 14.32 Sketch showing welded transition sections in stepped pipeline.
40
30
20
10
00 0.04
2.0
0.08 0.120.8
1.6
2.4
3.2
20
40
80120160
Conveyingline
pressuredrop (bar)
Solidsloading
ratio
Air mass flow rate (kg/s)
Mat
eria
l flo
w r
ate
(ton
ne/h
)
40
30
20
10
00 0.04 0.08 0.12
0.8
1.6
1.220
2.0
2.41.6
60
40
80
120160200Conveyingline
pressuredrop (bar)
Solids loading ratio
Air mass flow rate (kg/s)
Mat
eria
l flo
w r
ate
(ton
ne/h
)
(a) (b)
Figure 14.33 Conveying characteristics for fly ash in pipeline no. 15: (a) single bore
pipeline and (b) single step pipeline.
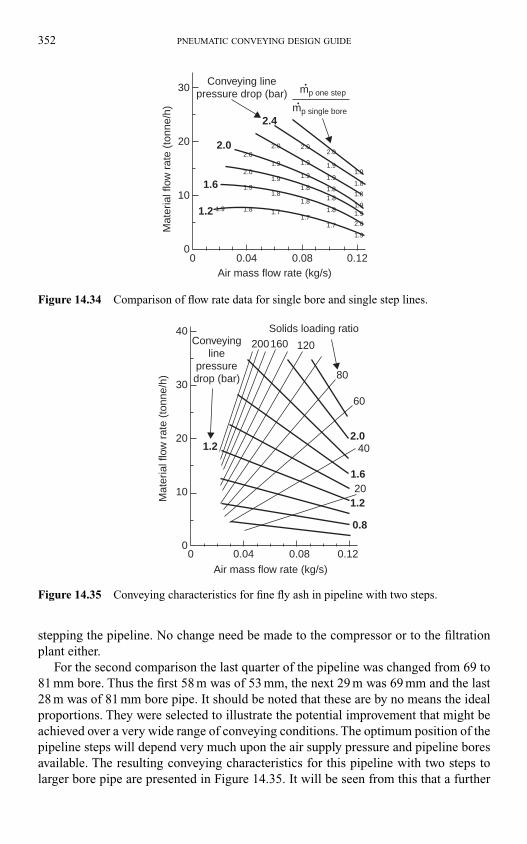
stepping the pipeline. No change need be made to the compressor or to the filtration
plant either.
For the second comparison the last quarter of the pipeline was changed from 69 to
81 mm bore. Thus the first 58 m was of 53 mm, the next 29 m was 69 mm and the last
28 m was of 81 mm bore pipe. It should be noted that these are by no means the ideal
proportions. They were selected to illustrate the potential improvement that might be
achieved over a very wide range of conveying conditions. The optimum position of the
pipeline steps will depend very much upon the air supply pressure and pipeline bores
available. The resulting conveying characteristics for this pipeline with two steps to
larger bore pipe are presented in Figure 14.35. It will be seen from this that a further
352 PNEUMATIC CONVEYING DESIGN GUIDE
00
0.04 0.08 0.12Air mass flow rate (kg/s)
30
20 2.0
1.2
1.6
2.0
2.0
1.9
1.81.9
2.0
1.9
1.9
1.7
1.8
2.0
1.9
1.9
1.7
1.8
1.8
2.0
1.9
1.91.9
1.9
1.8
1.8
2.0
1.9
1.9
1.7
1.81.8
1.8
2.4
10
Mat
eria
l flo
w r
ate
(ton
ne/h
)
Conveying linepressure drop (bar) mp one step
mp single bore•
•
Figure 14.34 Comparison of flow rate data for single bore and single step lines.
0
30
40
20
10
Mat
eria
l flo
w r
ate
(ton
ne/h
)
Conveyingline
pressuredrop (bar)
0 0.04 0.08 0.12
Air mass flow rate (kg/s)
1.2
0.8
200
Solids loading ratio
160 120
80
60
20
402.0
1.2
1.6
Figure 14.35 Conveying characteristics for fine fly ash in pipeline with two steps.
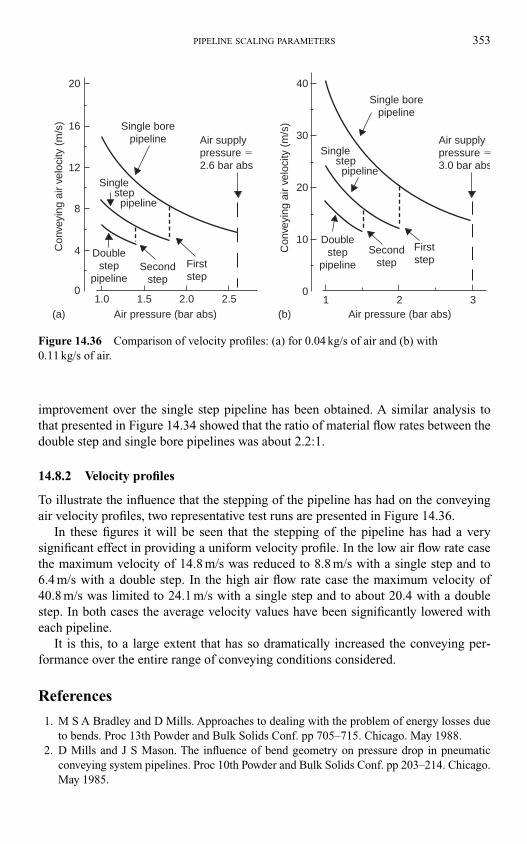
improvement over the single step pipeline has been obtained. A similar analysis to
that presented in Figure 14.34 showed that the ratio of material flow rates between the
double step and single bore pipelines was about 2.2:1.
14.8.2 Velocity profiles
To illustrate the influence that the stepping of the pipeline has had on the conveying
air velocity profiles, two representative test runs are presented in Figure 14.36.
In these figures it will be seen that the stepping of the pipeline has had a very
significant effect in providing a uniform velocity profile. In the low air flow rate case
the maximum velocity of 14.8 m/s was reduced to 8.8 m/s with a single step and to
6.4 m/s with a double step. In the high air flow rate case the maximum velocity of
40.8 m/s was limited to 24.1 m/s with a single step and to about 20.4 with a double
step. In both cases the average velocity values have been significantly lowered with
each pipeline.
It is this, to a large extent that has so dramatically increased the conveying per-
formance over the entire range of conveying conditions considered.
References
1. M S A Bradley and D Mills. Approaches to dealing with the problem of energy losses due
to bends. Proc 13th Powder and Bulk Solids Conf. pp 705–715. Chicago. May 1988.
2. D Mills and J S Mason. The influence of bend geometry on pressure drop in pneumatic
conveying system pipelines. Proc 10th Powder and Bulk Solids Conf. pp 203–214. Chicago.
May 1985.
PIPELINE SCALING PARAMETERS 353
Single borepipeline
Single borepipeline
Single
20 40
30
20
10
01 2 3
16
12
8
4
01.0 2.01.5 2.5
Air pressure (bar abs)(a) (b) Air pressure (bar abs)
Air supplypressure � 2.6 bar abs
Air supplypressure �3.0 bar abs
Con
veyi
ng a
ir ve
loci
ty (
m/s
)
Con
veyi
ng a
ir ve
loci
ty (
m/s
)
Doublestep
pipeline
Doublestep
pipelineFirststep
Firststep
Secondstep
Secondstep
steppipeline
Singlesteppipeline
Figure 14.36 Comparison of velocity profiles: (a) for 0.04 kg/s of air and (b) with
0.11 kg/s of air.
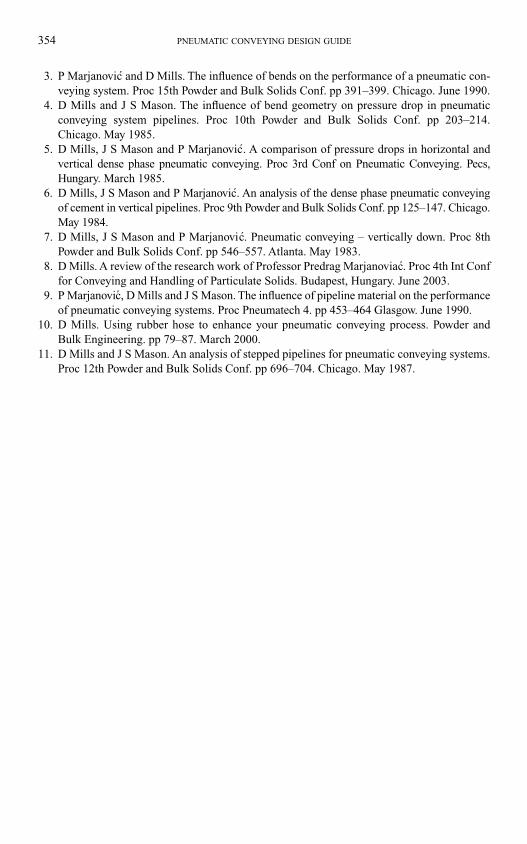
3. P Marjanovic and D Mills. The influence of bends on the performance of a pneumatic con-
veying system. Proc 15th Powder and Bulk Solids Conf. pp 391–399. Chicago. June 1990.
4. D Mills and J S Mason. The influence of bend geometry on pressure drop in pneumatic
conveying system pipelines. Proc 10th Powder and Bulk Solids Conf. pp 203–214.
Chicago. May 1985.
5. D Mills, J S Mason and P Marjanovic. A comparison of pressure drops in horizontal and
vertical dense phase pneumatic conveying. Proc 3rd Conf on Pneumatic Conveying. Pecs,
Hungary. March 1985.
6. D Mills, J S Mason and P Marjanovic. An analysis of the dense phase pneumatic conveying
of cement in vertical pipelines. Proc 9th Powder and Bulk Solids Conf. pp 125–147. Chicago.
May 1984.
7. D Mills, J S Mason and P Marjanovic. Pneumatic conveying – vertically down. Proc 8th
Powder and Bulk Solids Conf. pp 546–557. Atlanta. May 1983.
8. D Mills. A review of the research work of Professor Predrag Marjanoviac. Proc 4th Int Conf
for Conveying and Handling of Particulate Solids. Budapest, Hungary. June 2003.
9. P Marjanovic, D Mills and J S Mason. The influence of pipeline material on the performance
of pneumatic conveying systems. Proc Pneumatech 4. pp 453–464 Glasgow. June 1990.
10. D Mills. Using rubber hose to enhance your pneumatic conveying process. Powder and
Bulk Engineering. pp 79–87. March 2000.
11. D Mills and J S Mason. An analysis of stepped pipelines for pneumatic conveying systems.
Proc 12th Powder and Bulk Solids Conf. pp 696–704. Chicago. May 1987.
354 PNEUMATIC CONVEYING DESIGN GUIDE
15.1 Introduction
A pneumatic conveying system may be designed using mathematical models, available
test data or a combination of the two. If mathematical models are to be used, some
degree of confidence needs to be established as to their suitability for a particular appli-
cation, such as conveying a particular material under closely defined conditions, before
they are employed. Test data is used extensively in system design. This data may have
been obtained from a test facility or from conveying experience on an actual plant.
It is essential however that the available data relates to the same grade of material
for which the new plant design is required. It is also essential that the data is available to
slightly higher values of solids loading ratio and to slightly lower values of conveying
line inlet air velocity, than are contemplated for the new design. Existing data should
never be scaled beyond known conveying boundaries. In cases where no previous
experience of the material or the range of conveying conditions required is available,
then conveying trials are usually carried out in order to obtain the necessary test data for
system design purposes.
A set of logic diagrams are presented and these can be used for the purpose of both
designing a new conveying system and for checking the capability of an existing system,
using both mathematical models and test data.
15.2 The use of equations in system design
The design of pneumatic conveying systems using mathematical models is generally
the preferred method. There are, however, a limited number of reliable equations avail-
able at present.
15.2.1 Logic diagram for system design
A logic diagram for the design of a pneumatic conveying system based on the use of
mathematical models is presented in Figure 15.1. The procedure starts with the specifi-
cation of the fixed parameters, goes through the necessary selection and calculation of
conveying and system parameters to the final specification of the most suitable pipeline
bore and air requirements. The numbers of the boxes in Figure 15.1 corresponds to the
number of the sections in which the relevant calculation is discussed.
Chapter 15
Design procedures
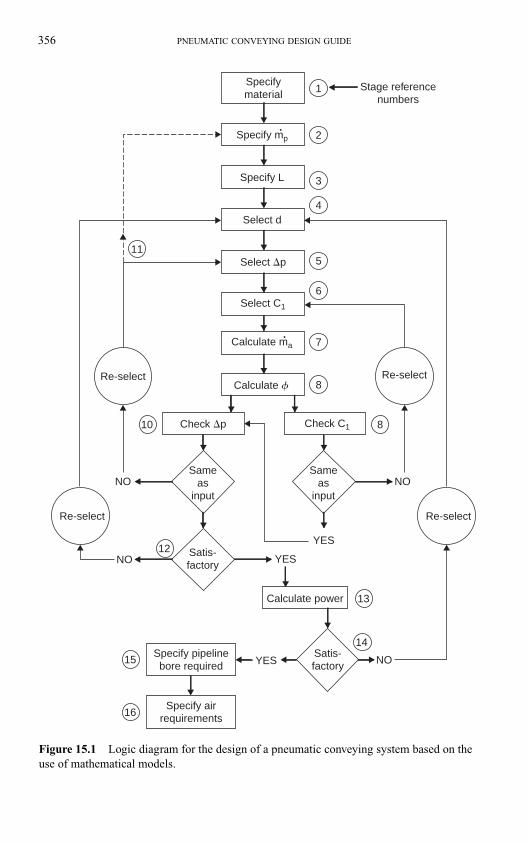
356 PNEUMATIC CONVEYING DESIGN GUIDE
Specifymaterial
Specify mp
Sameas
input
Satis-factory
Calculate power
NO
YES
YES
YES NO
NO
NO
Select d
Check �p
Select �p
Select C1
Calculate ma
Calculate f
Specify pipelinebore required
Specify airrequirements
Check C1
1
2
4
5
6
7
8
10
11
12
15
13
14
16
8
3Specify L
Stage referencenumbers
•
•
Sameas
input
Satis-factory
Re-selectRe-select
Re-select Re-select
Figure 15.1 Logic diagram for the design of a pneumatic conveying system based on the
use of mathematical models.
15.2.1.1 Specify material
A bulk particulate material will be specified through a knowledge of some of all of the
following parameters:
• Material name
• Bulk properties:
1. density,
2. particle size distribution,
3. free moisture,
4. permeability,
5. air retention.
• Particle properties:
1. density,
2. shape,
3. hardness,
4. friability.
Bulk densities, for example, are needed for the sizing of system components, such
as rotary valves and blow tanks. Properties associated with drag, friction and shearing
forces are desirable as these have an influence on the conveying potential for specified
conveying conditions. Information on air retention and permeability would be useful
as this relates to the potential mode of conveying and to the minimum conveying air
velocity that can be employed. Particle hardness is important in terms of potential wear
problems, and these are considered in detail in Chapter 23. Particle friability is simi-
larly important in terms of material degradation and this is considered in Chapter 24.
For contractual reasons it would always be recommended that all parties involved
should make a note of as many of the material properties as possible, for reference
and identification purposes. These, of course, are the properties of the material upon
which the design is based. Material property influences on conveying performance
were considered at length in Chapter 13, where it was shown that a slight change in
grade of a material can, with some materials, have a significant effect on the convey-
ing capability of the material.
15.2.1.2 Specify mass flow rate of material required
This will generally be specified as a steady hourly rate, or a time averaged mean value.
For continuously operating systems this value is the flow rate that needs to be specified.
For batch operating systems the system will have to be designed to a higher value than
this to take account of the fact that continuous conveying cannot be achieved, as discussed
in relation to Figure 2.7. The ratio between the value to be specified for design purposes
and the time averaged mean will depend upon the type of batch system to be used.
If the type of system required is known from the outset, then the appropriate value
of material flow rate can be specified. If the investigation or survey is to cover a wide
variety of pipeline bores, then a wide range of conveying line pressure drop values will
result. The value of conveying line pressure drop may, to a certain extent, dictate the
choice of system. The provisional feed-back loop to material flow rate specification,
DESIGN PROCEDURES 357
therefore, is to take account of a change from continuous to batch operating systems
which could occur within such an investigation.
The system design procedure outlined here relates essentially to the pipeline and
specification of the air requirements to ensure that the material is conveyed at the spe-
cified flow rate. Due consideration will have to be given to the device used to feed the
material into the conveying line, for this must also be capable of meeting the flow rate
requirements. Feeder design and specification, however, can generally be considered in
isolation from that of the pipeline system, and so is not included here. The same situ-
ation applies with regard to the design of systems for discharging the conveying line.
15.2.1.3 Specify conveying distance required
It will be required to specify the conveying distance, together with the routing and
details of the pipeline. It is the actual distance that is of primary importance, but the ori-
entation of the pipeline and the number of bends and their geometry are also important.
Pipeline length has to be considered in terms of the individual lengths of horizontal,
vertically up and vertically down sections. Bend geometry is considered in terms of
the bend angle and the ratio of the bend diameter, D, to the pipe bore, d. The influence
of pipeline length, orientation and bends were considered in detail in Chapter 14. Pipe-
line bore is an entirely separate variable and is not considered at this stage.
15.2.1.4 Select pipeline bore
The diameter of the pipeline is one of the primary variables in terms of achieving a
specified material flow rate through a pipeline. In combination with the conveying line
pressure drop a wide range of pipeline bores will often meet the conveying require-
ments, as illustrated with Figure 14.11. It is, therefore, necessary to select a value of
pipeline bore, and in the first instance this may well be and estimated value or guess.
If this proves to be unacceptable for some reason it will be necessary to re-select. This
will be requested automatically by means of the various loops incorporated into
the logic diagram. Subsequent values of pipeline bore, however, will be selected with
the benefit of the initial estimate.
At this stage no provision is made for stepped pipelines. Should an increase in
pipeline bore be required part way along its length, however, it could be designed
in isolation. Such a design could be based on the required single pipeline bore, and steps
could be evaluated as indicated in Section 9.4. A comparison of single and stepped
bore pipelines was presented in Section 14.8 and it would be suggested that the math-
ematical model being employed could be tested against that data, for the benefits
achieved by stepping the pipeline are very material dependent.
15.2.1.5 Select conveying line pressure drop
In a similar manner to pipeline bore, it will be necessary to select a value of convey-
ing line pressure drop. This may also be an estimated value or guess. If the selection is
to be restricted to negative pressure or low pressure systems, however, the range will
be limited automatically. Once again, if the value chosen proves to be unacceptable for
358 PNEUMATIC CONVEYING DESIGN GUIDE
some reason it will be necessary to re-select, and the necessary loop is incorporated
for this purpose.
15.2.1.6 Select conveying line inlet air velocity
At the end of the design process two parameters will emerge. One is pipeline bore and
the other is the air requirements, in terms of volumetric flow rate and pressure cap-
ability. There is, therefore, a necessity for a conveying air velocity to be evaluated.
Although the air velocity at free air conditions is the most convenient for this purpose,
a major design parameter is that of the conveying air velocity at the material feed point
into the pipeline. This is the conveying line inlet air velocity, C1.
The conveying line inlet air velocity is not a parameter whose value is estimated,
and certainly not guessed. It must be selected and specified precisely. This is why, in
Chapter 12, a multitude of values were given for the various materials considered so
that a ‘feel’ for this critical design parameter would be obtained in terms of the differ-
ent properties of the materials. That the value is dependent upon the type of material
was illustrated with the compilation plots in Figures 12.4 and 12.15.
For dilute phase conveying the value of the minimum conveying air velocity,
Cmin, will almost certainly be above 10 m/s. For cement it is about 10–11 m/s, fine fly
ash 11–12 m/s, granular alumina 13–14 m/s and about 16 m/s for granulated sugar,
the value depending mainly upon mean particle size, particle shape and particle size
distribution. For dense phase conveying the minimum conveying air velocity can be as
low as 3 m/s with many materials, such as cement, fly ash, barytes and bentonite. For
design purposes a value of conveying line inlet air velocity, C1, would be taken as the
minimum conveying air velocity plus a 20 per cent margin:
(15.1)
It is clearly not advisable to use the minimum value of conveying air velocity for
design purposes. The margin is to allow for surges in material flow rate and a safety fac-
tor. A surge in material flow rate will cause an increase in pressure, and this will result
in a slight reduction in conveying air velocity from two separate sources. One is due
to the problems of compressibility of air (see Equation (9.11) and Figure 9.9) and the
other is due to the operating characteristics of the compressor (see Figures 6.3 and 6.5).
An additional problem with dense phase conveying, in sliding bed flow for pow-
dered materials, is that the minimum value of conveying air velocity is dependent
upon the solid loading ratio and so in this case an initial estimate will have to be made.
This relationship has already been illustrated three times, because of its importance,
and so it is not reproduced again here for reference. In Figure 8.1 the relationship for
all three modes of conveying was included for comparison purposes, in Figure 13.5
the transitional relationship between dilute and dense phase conveying was high-
lighted for cement, and then in Figure 14.2 specific data for cement and potassium sul-
phate was presented. The maximum value of solids loading ratio that can be achieved
with a material, conveyed in dense phase sliding bed flow, is dependent upon the pres-
sure gradient available and this was illustrated in Figure 1.1.
C C1 1.2 m/smin� �
DESIGN PROCEDURES 359
For most materials the value of conveying line inlet air velocity that is used is that
given by Equation (15.1). An unnecessarily high margin is not recommended because of
the adverse effect of velocity on conveying performance, as has been adequately illus-
trated with the multitude of conveying characteristics presented. For a few materials,
however, this is not necessarily the case. These are materials that can be conveyed at low
velocity and show pressure minimum points in their conveying characteristics. These
include polyethylene pellets in Figure 12.11c, PVC and PTA in Figure 12.19, and nylon
pellets in Figure 13.10. With these materials the optimum point may be chosen, or a
lower velocity, particularly if there is a concern about degradation of the material.
To cater for the variation of minimum conveying air velocity with solids loading
ratio, for materials capable of being conveyed in dense phase in sliding bed flow, a
check and feedback loop are incorporated into the logic diagram. It is unlikely that
a correct estimate of the value to be taken for conveying line inlet air velocity would
be made in the first instance. Also, if a review of alternative conveying parameters is
being undertaken, different air supply pressures will result, and these will give differ-
ent pressure gradients. Solids loading ratio, in turn, is dependent upon pressure gradi-
ent, and minimum conveying air velocity is dependent upon solids loading ratio.
15.2.1.7 Calculate air mass flow rate
The determination of the air mass flow rate is the first stage in evaluating the solids
loading ratio and providing a check on the value of the conveying line inlet air velocity.
Air mass flow rate can be evaluated from the Ideal Gas Law and this was presented in
Equation (9.4). This was developed into an expression in terms of the conveying line
inlet air velocity with Equation (9.19) and this is reproduced here as Equation (15.2):
(15.2)
where C1 is the conveying line inlet air velocity (m/s); m�a, air mass flow rate (kg/s); R,
characteristic gas constant (kJ/kg . K); T1, conveying line inlet temperature (K); d,
pipeline bore (m) and p1, conveying line inlet air pressure (kN/m2).
Re-arranging this equation in terms of the air mass flow rate and substituting
R � 0.287 kJ/kg . K for air gives:
(15.3)
where d is the the pipeline bore selected at stage 4; C1, the conveying line inlet air
velocity selected at stage 6; p1, for a negative pressure system will be equal to the
atmospheric pressure, patm, of 101.3 kN/m2 abs or the appropriate local value if at ele-
vation and for a positive pressure system will be equal to patm � 100 �p, where �p is
the conveying line pressure drop (in bar) selected at stage 5.
mp C d
Ta 2.74
kg/s� 1 12
1
Cm RT
d p1
1
21
4
m/sa�˙
�
360 PNEUMATIC CONVEYING DESIGN GUIDE
15.2.1.8 Calculate solids loading ratio
Solids loading ratio, �, is the ratio of the material flow rate, m. p, specified at stage 2 to
the air mass flow rate, m. a, calculated at stage 7. For consistency in units:
(15.4)
15.2.1.9 Check conveying line inlet air velocity
This is the first of the loops in this logic diagram used to provide a check on the input
data for which an initial estimate was necessary. This particular check is for conveying
line inlet air velocity and so only applies to materials that are capable of being conveyed
in dense phase, as discussed at stage 6. For such materials the value of minimum con-
veying air velocity, and hence conveying line inlet air velocity, is dependent upon the
value of solids loading ratio.
Having evaluated solids loading ratio at stage 8, the value obtained can be used to
determine the corresponding value of conveying line inlet air velocity. This can either
be by means of a relationship such as that shown in Figure 13.5 for the material, or
some equation of the form:
(15.5)
An approximate model that would fit the transitional relationship for the cement in
Figure 13.5, for example, and so allow the checking process to be undertaken mathe-
matically would be:
(15.6)
where C1 is the conveying line inlet air velocity and �, the solids loading ratio.
If the value of conveying line inlet air velocity, corresponding to the solids loading
ratio for the material, differs from that of the initial estimate, it will be necessary to
return to stage 6. The new value can be used as a guide for the next value to be selected,
and then the process from stage 6 can be repeated. This is an iterative process that does
not converge quickly, and so the next value of conveying line inlet air velocity to be
selected must be judged on the basis of previous results, and not simply be a transfer of
the result obtained from the check carried out.
If the material has no dense phase conveying potential, or the pressure gradient is such
that the material can only be conveyed in dilute phase suspension flow, this particular
operation is not necessary. The value chosen will not change to any significant degree
over the range of solids loading ratio values that will be possible with the material.
15.2.1.10 Check conveying line pressure drop
At this point a value for all the main parameters will be available and so a check can
be made of the value of conveying line pressure drop selected. Mathematical models
for system design are generally in terms of evaluating the conveying line pressure
drop for a given set of conditions. The model used, therefore, can be applied to the
C10 3
36 7 m/s� ��� .
C1 constant m/sn� � ��
�
(dimensionless)p
a
�˙
. ˙
m
m3 6
DESIGN PROCEDURES 361
system and the resulting value of conveying line pressure drop can be checked against
that selected at stage 5.
If the value determined by means of the model used differs from that selected it will
be necessary to return to stage 5. This is the second of the loops in the logic diagram
used to provide a check on the input data from which an initial estimate was necessary.
The process is similar to that described above for conveying line inlet air velocity.
15.2.1.11 Re-specify material mass flow rate
If the check on conveying line pressure drop is close to the original estimate, it will
only be necessary to return to stage 5 and select a new value. If the check shows a con-
siderable discrepancy, however, it may be necessary to think in terms of a totally dif-
ferent system, for which a change in material flow rate may be required, in addition to
a change in conveying line pressure drop, for the current bore of pipeline.
If, for example, an original estimate for conveying line pressure drop was 0.8 bar,
and the check revealed that for the specified conditions it would actually be two or three
times greater than this, then a change in system could be considered. At 0.8 bar a con-
tinuously operating system with a low pressure rotary valve and positive displacement
blower would be appropriate. With a very much higher operating pressure, a system
based on blow tanks, or a high pressure screw or rotary valve would need to be con-
sidered, along with a screw compressor. In the case of a high pressure blow tank the
material mass flow rate would need to be modified, as discussed earlier at stage 2.
15.2.1.12 Re-select pipeline bore
If the value of conveying line pressure drop that results from the analysis at stage 10
is not satisfactory, then it will be necessary to select another pipeline bore if the alter-
natives at stage 11 are not acceptable. If, for example, the design is to be restricted to
a low pressure continuously operating system, then a larger pipeline bore will have
to be selected at stage 4 and the analysis from there will have to be repeated.
15.2.1.13 Calculate power required
Having evaluated all the parameters necessary for the system, it is now possible to deter-
mine the power required, and hence the approximate cost associated with operating the
system. For an accurate assessment of the power it will be necessary to consult manufac-
turers’ literature. By this means different machines capable of meeting the duty could be
compared. For a quick, approximate assessment, to allow a comparison to be made of dif-
ferent variables in the design, a simple model based on isothermal compression could be
used. Such a model was presented in Equation (6.6) and is reproduced here for reference:
(15.7)
where m�a is the air mass flow rate (kg/s); p3, compressor inlet pressure (kN/m2 abs) and
p4, compressor delivery pressure (kN/m2 abs).
Power 165 ln kWa� mp
p4
3
362 PNEUMATIC CONVEYING DESIGN GUIDE
The air mass flow rate in kg/s was evaluated at stage 7, but an allowance should be
made for any air leakage across rotary valves, etc. The pressure difference across
the compressor, p4 – p3, equates to the conveying line pressure drop at stage 5, but an
allowance should be made for any pressure drop across the feeder, filter and any air
supply and extraction lines. One of these values is usually atmospheric pressure.
15.2.1.14 System re-assessment
It was shown with Figure 14.11 that a wide range of combinations of pipeline bore and
conveying line pressure drop values could be obtained that would meet a required duty.
It was further shown with Figure 14.12 that the power required would probably vary
from one set of design parameters to another, and that material type has a very signifi-
cant influence on the relationship. This loop is added here to allow a full survey to be
made, so that the most suitable combination of parameters will ultimately be selected.
The starting point in carrying out a further analysis is to select a different pipeline
bore. This will result in a different conveying line pressure drop and so allow a full
picture to emerge for the system. It should be noted that pipeline bore is positioned
before conveying line pressure drop in this logic diagram since pipes are only avail-
able in incremental sizes, whereas conveying line pressure drop is infinitely variable.
15.2.1.15 Specify pipeline bore required
The final requirement in the design process is to specify the pipeline bore required and
the necessary rating of the air mover. If the full analysis has been carried out, as speci-
fied in this logic diagram, then the most suitable pipeline size should result. If the
pipeline is required to handle more than one material, however, a compromise may
well have to be made on both pipeline bore and air requirements, Problems associated
with multiple material handling are considered in Chapter 19.
15.2.1.16 Specify air requirements
Air requirements are specified in terms of volumetric flow rate and delivery or exhaust
pressure. The air mass flow rate was evaluated at stage 7 and the relationship between
mass and volumetric flow rates is given by:
(15.8)
where m�a is the air mass flow rate (kg/s); �, density of air (kg/m3) and V�, volumetric
flow rate of air (m3/s).
It is the volumetric flow rate at free air conditions, V�0, that is required and so the
corresponding density of air at free air conditions is needed. This was evaluated at
Section 10.2.1.2 as 1.225 kg/m3. Note that the reciprocal of this is referred to as spe-
cific volume and is 0.818 m3/kg at free air conditions.
In systems where there is likely to be an air leakage, at the material feed point in
the case of positive pressure systems, and at the material discharge point in vacuum
systems, an allowance for this must be made in the specification of the volumetric air
flow rate required. The delivery or exhaust pressure required is equal to the conveying
˙ ˙m Va kg/s� ��
DESIGN PROCEDURES 363
line pressure drop, plus an allowance for air filtration, the feeding device, air supply
and exhaust lines and safety margin. Having determined the necessary air requirements
the most appropriate choice of air mover can be made. The capabilities and perform-
ance of a number of different types of air mover were considered in Chapter 6.
15.2.2 Logic diagram for system capability
A logic diagram, based on the use of mathematical models, for determining the cap-
ability of an existing pneumatic conveying system is presented in Figure 15.2. This
type of analysis is generally required in situations where a change in use or layout of
a pneumatic conveying system is involved. If a given system is required to convey a
different material, or if a shortening or extension of the conveying line is made, it
would be well worthwhile carrying out such an analysis in order to provide a check on
the air requirements, in addition to determining the new flow rate of the material.
15.2.2.1 Specify material to be conveyed
This specification is the same as that for stage 1 in the previous logic diagram.
15.2.2.2 Specify conveying distance
This specification is the same as that for stage 3 in the previous logic diagram.
15.2.2.3 Specify pipeline bore
For an existing system the pipeline bore will not be a variable. If the resulting flow rate
with the new material in the existing system is insufficient, however, it may be necessary
to consider installing a pipeline with a larger bore. In this case the design procedure
outlines previously in Figure 15.1 for basic system design will be more appropriate,
although reference to Chapter 21 on the ‘Optimising and Up-Rating of Existing Sys-
tems’ would probably be the best starting point since a change of pipeline bore would
also influence the air mover specification, as well as that of the filtration plant.
15.2.2.4 Specify maximum value of conveying line pressure drop
For an existing system an air mover will be available. It is suggested that, as a starting
point in the analysis, the maximum pressure rating of the air mover should be used.
The corresponding maximum value of conveying line pressure drop can be obtained by
subtracting appropriate pressure drop allowances for pipeline feeding, air separation,
transmission losses and operating safety margin, as discussed in relation to power require-
ments at stage 13 in connection with system design for the previous logic diagram. As this
represents the upper limit available any necessary changes will be to a lower value.
15.2.2.5 Select conveying line inlet air velocity
Once again the same basic philosophy of matching conveying line inlet air velocity
with solids loading ratio, as expounded at stage 6 in the previous logic diagram applies.
This, of course, is only the case for materials that have dense phase conveying potential.
364 PNEUMATIC CONVEYING DESIGN GUIDE
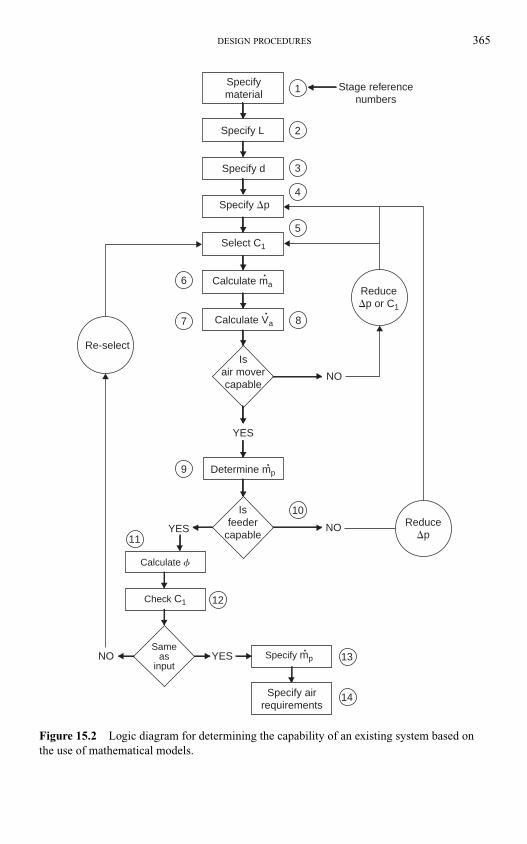
DESIGN PROCEDURES 365
Sameas
inputSpecify mp
Specifymaterial
Isair movercapable
NO
NOYES
YES
Specify d
Specify �p
Select C1
Calculate ma
Calculate Va
Calculate f
Check C1
Specify airrequirements
1
2
4
5
6
7
9
13
14
8
10
11
12
3
Stage referencenumbers
Specify L
•
•
Isfeeder
capable
YESNO
Reduce�p or C1
Re-select
Determine mp•
•
Reduce�p
Figure 15.2 Logic diagram for determining the capability of an existing system based on
the use of mathematical models.
With an existing system the capabilities of the air mover have to be considered.
As a starting point in the analysis, therefore, it is suggested that the maximum velocity
available should be used, or the maximum velocity necessary for the material if this
is lower. As this represents the highest value available, or necessary, any subsequent
changes will only be to lower values.
15.2.2.6 Calculate air mass flow rate
The air mass flow rate, m�a, can be evaluated using Equation (15.3) presented above.
15.2.2.7 Calculate volumetric air flow rate
The volumetric flow rate of the air, V�
a, at free air conditions, V�
0, can be determined
from the air mass flow rate evaluated in the previous stage, using a re-arrangement of
Equation (15.8):
(15.9)
The constant of 0.816 is the value of the specific volume of the air at free air conditions
and has the units of m3/kg.
15.2.2.8 Is the air mover capable?
At stage 4 the conveying line pressure drop was specified, and hence the supply or
exhaust pressure can be obtained, and the volumetric flow rate was determined at
stage 7. With an existing system it is necessary to check that the requirements are within
the capabilities of the air mover, and the above parameters are those necessary for such
a check to be made.
In the first instance the conveying line pressure drop and conveying line inlet air
velocity are chosen to ensure that this is the case. If at a subsequent stage, the rela-
tionship between conveying line inlet air velocity and solids loading ratio is not satis-
fied and it is necessary to make changes, then a further check is advisable. If it is found
that the air mover is not capable, a reduction will have to be made in either the con-
veying line pressure drop or the conveying line inlet air velocity.
The possibility of a reduction in conveying line inlet air velocity will depend upon
the value of the solids loading ratio to be evaluated at stage 11. If a reduction in con-
veying line inlet air velocity cannot be made, then a reduction in conveying line pres-
sure drop will have to be made. In addition to satisfying the conveying requirements,
the characteristics of the air mover will also have to be consulted in order to check on
the possibility of making such changes.
15.2.2.9 Determine material flow rate
At this point a value of all the main parameters is available, with the exception of the
solids loading ratio, but since m�p � � � m�a by definition, a simple relationship exists
that should present no difficulty in incorporating. It should be possible, therefore, with
the appropriate model, to evaluate the material flow rate for the given set of conditions.
˙ ˙V m0 0.816 m /sa3�
366 PNEUMATIC CONVEYING DESIGN GUIDE
15.2.2.10 Is the material feeding device capable?
If an existing system is required to handle another material, it is quite possible that the
material flow rate with the new material could be significantly different from that of
the original material. If the new flow rate is lower, or higher, the possibility of using
the feeding device satisfactorily must be investigated. If it is established that the feed-
ing device has a maximum capability that is less than that of the pipeline system with
the new material, then a reduction in conveying line pressure drop should be made in
order to reduce the capability of the pipeline to match that of the feeder. If this is done
it should result in a saving in operating power. In the case of positive displacement
feeders the bulk density of the new material must also be taken into account.
15.2.2.11 Calculate solids loading ratio
This is evaluated in the same way as described at stage 8 in the previous logic diagram
with Equation (15.4).
15.2.2.12 Check conveying line inlet air velocity
Having determined the material flow rate at stage 9, and then the solids loading ratio
at stage 11, it is now possible to check the value of conveying line inlet air velocity at
stage 5. This process is the same as that outlined at stage 9 for the previous logic diagram.
15.2.2.13 Specify material flow rate
When a check at stage 12 is obtained between solids loading ratio and conveying line inlet
air velocity, the process will be complete. The final value of material flow rate determined
at stage 9 can be specified as the actual rating of the system with the given material.
15.2.2.14 Specify air requirements
A loop is built into the logic diagram to ensure that the air mover is capable of meet-
ing the required demand. It is quite possible, however, that some changes may have to
be made, such as restricting delivery pressure, restricting flow rate, changing drive
speed, etc, and so this will need to be clearly specified.
15.3 The use of test data in system design
The application and use of test data is probably the most common method of designing
a pneumatic conveying system. This is used extensively in cases where test data or pre-
vious experience with a material is available. Where no previous experience with a par-
ticular material is available, it is usual to obtain test data specifically for the purpose of
system design, since the use of mathematical models is particularly unreliable in these
situations. As for the section on the use of equations in system design, two logic dia-
grams are also presented here, one for the original design of a system, and another for
evaluating the capability of an existing system.
DESIGN PROCEDURES 367
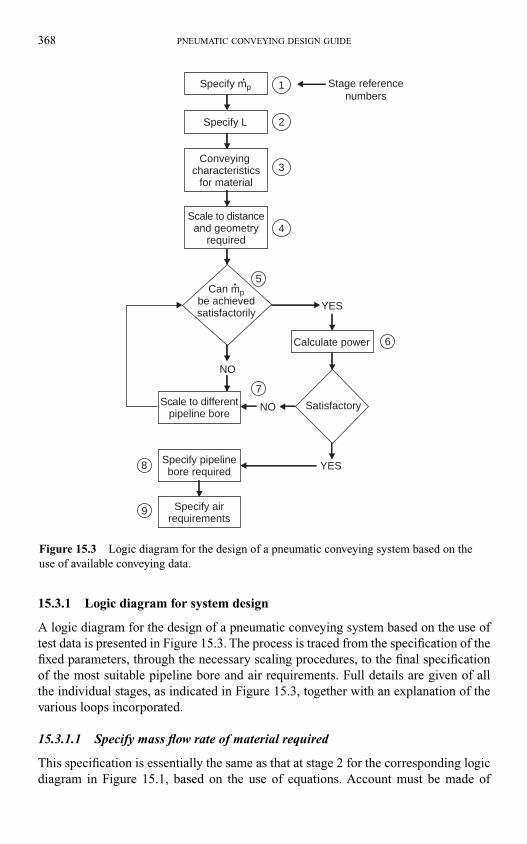
15.3.1 Logic diagram for system design
A logic diagram for the design of a pneumatic conveying system based on the use of
test data is presented in Figure 15.3. The process is traced from the specification of the
fixed parameters, through the necessary scaling procedures, to the final specification
of the most suitable pipeline bore and air requirements. Full details are given of all
the individual stages, as indicated in Figure 15.3, together with an explanation of the
various loops incorporated.
15.3.1.1 Specify mass flow rate of material required
This specification is essentially the same as that at stage 2 for the corresponding logic
diagram in Figure 15.1, based on the use of equations. Account must be made of
368 PNEUMATIC CONVEYING DESIGN GUIDE
9
8
6
5
7
Can mpbe achievedsatisfactorily
YES
YES
NO
NO Satisfactory
1
2
3
4
Stage referencenumbers
Specify pipelinebore required
Scale to differentpipeline bore
Specify airrequirements
Specify mp
Calculate power
Conveying characteristics
for material
Scale to distanceand geometry
required
Specify L
•
•
Figure 15.3 Logic diagram for the design of a pneumatic conveying system based on the
use of available conveying data.
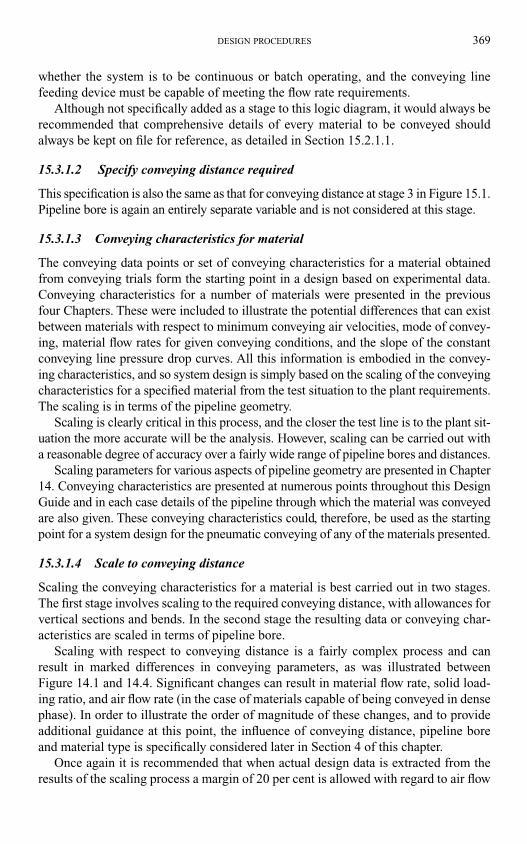
whether the system is to be continuous or batch operating, and the conveying line
feeding device must be capable of meeting the flow rate requirements.
Although not specifically added as a stage to this logic diagram, it would always be
recommended that comprehensive details of every material to be conveyed should
always be kept on file for reference, as detailed in Section 15.2.1.1.
15.3.1.2 Specify conveying distance required
This specification is also the same as that for conveying distance at stage 3 in Figure 15.1.
Pipeline bore is again an entirely separate variable and is not considered at this stage.
15.3.1.3 Conveying characteristics for material
The conveying data points or set of conveying characteristics for a material obtained
from conveying trials form the starting point in a design based on experimental data.
Conveying characteristics for a number of materials were presented in the previous
four Chapters. These were included to illustrate the potential differences that can exist
between materials with respect to minimum conveying air velocities, mode of convey-
ing, material flow rates for given conveying conditions, and the slope of the constant
conveying line pressure drop curves. All this information is embodied in the convey-
ing characteristics, and so system design is simply based on the scaling of the conveying
characteristics for a specified material from the test situation to the plant requirements.
The scaling is in terms of the pipeline geometry.
Scaling is clearly critical in this process, and the closer the test line is to the plant sit-
uation the more accurate will be the analysis. However, scaling can be carried out with
a reasonable degree of accuracy over a fairly wide range of pipeline bores and distances.
Scaling parameters for various aspects of pipeline geometry are presented in Chapter
14. Conveying characteristics are presented at numerous points throughout this Design
Guide and in each case details of the pipeline through which the material was conveyed
are also given. These conveying characteristics could, therefore, be used as the starting
point for a system design for the pneumatic conveying of any of the materials presented.
15.3.1.4 Scale to conveying distance
Scaling the conveying characteristics for a material is best carried out in two stages.
The first stage involves scaling to the required conveying distance, with allowances for
vertical sections and bends. In the second stage the resulting data or conveying char-
acteristics are scaled in terms of pipeline bore.
Scaling with respect to conveying distance is a fairly complex process and can
result in marked differences in conveying parameters, as was illustrated between
Figure 14.1 and 14.4. Significant changes can result in material flow rate, solid load-
ing ratio, and air flow rate (in the case of materials capable of being conveyed in dense
phase). In order to illustrate the order of magnitude of these changes, and to provide
additional guidance at this point, the influence of conveying distance, pipeline bore
and material type is specifically considered later in Section 4 of this chapter.
Once again it is recommended that when actual design data is extracted from the
results of the scaling process a margin of 20 per cent is allowed with regard to air flow
DESIGN PROCEDURES 369
rate for the design point taken in relation to the minimum conveying conditions. This
is summarized with Equation (15.1).
15.3.1.5 Can material flow rate be achieved?
This stage is essentially one of checking whether, for the given pipeline bore the material
flow rate can be achieved. If the conveying characteristics for the material were deter-
mined for a wide range of conveying line pressure drop values, it is probable that the
required material flow rate would be achieved if a wide range of pipeline bores are con-
sidered. The decision here is essentially the same as that outlined at stage 14 for Figure
15.1. If a preference exists for a low pressure system or a particular pipeline bore, then
the choice will be automatically restricted. If there are no restraints then a full survey
could be carried out in order to determine the most economic combination of parameters.
15.3.1.6 Calculate power required
If, for a specified pipeline bore, the material flow rate can be achieved, then the power
required can be determined. A model that can conveniently be used to determine the
approximate power required was presented with Equation (15.7). The air mass flow
rate is required for this model but it can be obtained directly from the conveying char-
acteristics for the material.
15.3.1.7 Scale to different pipeline bore
If the required material flow rate cannot be achieved with a given pipeline bore, or if
the power requirement for a certain pipeline bore is not satisfactory, the conveying
characteristics should be scaled to another size of pipeline and the process repeated.
The influence of pipeline bore on conveying parameters is also considered in Section 4
of this chapter.
15.3.1.8 Specify pipeline bore required
This specification is the same as that for pipeline bore at stage 15 in connection with
Figure 15.1.
15.3.1.9 Specify air requirements
This specification is the same as that for air requirements at stage 16 in Figure 15.1,
where an appropriate model for volumetric air flow rate was presented (see also
Equation (15.9)). Allowances will also have to be made for air leakage and other com-
ponent pressure drops as discussed at stage 16 for the corresponding logic diagram
based on the use of equations.
15.3.2 Logic diagram for system capability
A logic diagram, based on the use of test data, for determining the capability of an
existing pneumatic conveying system is presented in Figure 15.4.
370 PNEUMATIC CONVEYING DESIGN GUIDE
15.3.2.1 Specify bounding conditions
With an existing system, the pipeline will form part of the established system, and so
length, geometry and bore will all be fixed. An air supply will also be available, but it
may be possible to alter the balance of flow rate and pressure should this be necessary.
15.3.2.2 Material conveying characteristics
Conveying characteristics for the material form the starting point in this process, as
they did for the original system design considered earlier.
15.3.2.3 Scale conveying characteristics
With a clearly defined pipeline length, bore and geometry, the available conveying
data for the material can be scaled directly to that of the plant pipeline.
15.3.2.4 Specify air requirements
All the information relating to the conveying of the material will be found within the
scaled conveying characteristics. Air requirements will need to be established first as
these have a direct influence on the material flow rate. With an existing system the pres-
sure capability will be known and so if allowances are made for pressure drops associated
with material feeding, air separation, etc, as discussed in relation to other design proced-
ures, a value for the conveying line pressure drop can be obtained. With a 20 per cent
allowance on minimum conveying air velocity, the value of air flow rate necessary can be
obtained from the conveying characteristics. If the corresponding air flow rate does not
match the capability of the air mover, the characteristics of the air mover will have to be
consulted in order to check on the possibility of making any necessary changes.
DESIGN PROCEDURES 371
1
2
3
4
Stage referencenumbers
Specifybounding
parameters
Conveyingcharacteristics
for material
Scale to lengthand borerequired
Specify airrequirements
Specify mp•
Figure 15.4 Logic diagram for determining the capability of an existing system based on
the use of available conveying data.
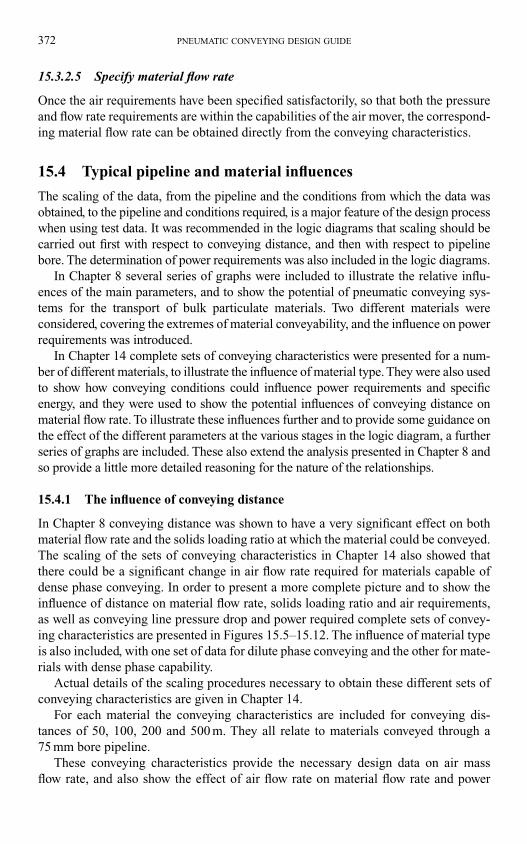
15.3.2.5 Specify material flow rate
Once the air requirements have been specified satisfactorily, so that both the pressure
and flow rate requirements are within the capabilities of the air mover, the correspond-
ing material flow rate can be obtained directly from the conveying characteristics.
15.4 Typical pipeline and material influences
The scaling of the data, from the pipeline and the conditions from which the data was
obtained, to the pipeline and conditions required, is a major feature of the design process
when using test data. It was recommended in the logic diagrams that scaling should be
carried out first with respect to conveying distance, and then with respect to pipeline
bore. The determination of power requirements was also included in the logic diagrams.
In Chapter 8 several series of graphs were included to illustrate the relative influ-
ences of the main parameters, and to show the potential of pneumatic conveying sys-
tems for the transport of bulk particulate materials. Two different materials were
considered, covering the extremes of material conveyability, and the influence on power
requirements was introduced.
In Chapter 14 complete sets of conveying characteristics were presented for a num-
ber of different materials, to illustrate the influence of material type. They were also used
to show how conveying conditions could influence power requirements and specific
energy, and they were used to show the potential influences of conveying distance on
material flow rate. To illustrate these influences further and to provide some guidance on
the effect of the different parameters at the various stages in the logic diagram, a further
series of graphs are included. These also extend the analysis presented in Chapter 8 and
so provide a little more detailed reasoning for the nature of the relationships.
15.4.1 The influence of conveying distance
In Chapter 8 conveying distance was shown to have a very significant effect on both
material flow rate and the solids loading ratio at which the material could be conveyed.
The scaling of the sets of conveying characteristics in Chapter 14 also showed that
there could be a significant change in air flow rate required for materials capable of
dense phase conveying. In order to present a more complete picture and to show the
influence of distance on material flow rate, solids loading ratio and air requirements,
as well as conveying line pressure drop and power required complete sets of convey-
ing characteristics are presented in Figures 15.5–15.12. The influence of material type
is also included, with one set of data for dilute phase conveying and the other for mate-
rials with dense phase capability.
Actual details of the scaling procedures necessary to obtain these different sets of
conveying characteristics are given in Chapter 14.
For each material the conveying characteristics are included for conveying dis-
tances of 50, 100, 200 and 500 m. They all relate to materials conveyed through a
75 mm bore pipeline.
These conveying characteristics provide the necessary design data on air mass
flow rate, and also show the effect of air flow rate on material flow rate and power
372 PNEUMATIC CONVEYING DESIGN GUIDE
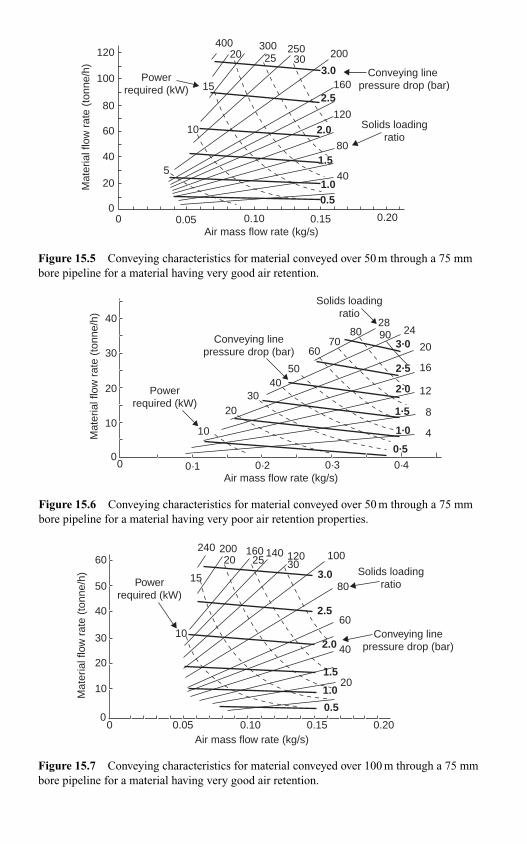
Powerrequired (kW)
Conveying line pressure drop (bar)
400 300 250 200
160
120
80
40
0.51.0
2.0
3.0
2.5
1.5
Solids loadingratio
Air mass flow rate (kg/s)
Mat
eria
l flo
w r
ate
(ton
ne/h
)
0.0500
205
10
15
20 25 30
40
60
80
100
120
0.10 0.15 0.20
Figure 15.5 Conveying characteristics for material conveyed over 50 m through a 75 mm
bore pipeline for a material having very good air retention.
Mat
eria
l flo
w r
ate
(ton
ne/h
) 40
30
10
00 0·1 0·2 0·3 0·4
20
Air mass flow rate (kg/s)
Solids loadingratio
Conveying linepressure drop (bar)
Powerrequired (kW)
10
2030
4050
6070
8028
24
20
16
12
4
8
903·0
2·5
2·0
1·5
1·0
0·5
Figure 15.6 Conveying characteristics for material conveyed over 50 m through a 75 mm
bore pipeline for a material having very poor air retention properties.
Air mass flow rate (kg/s)0 0.05 0.10 0.15 0.20
Solids loadingratio
Conveying linepressure drop (bar)
Mat
eria
l flo
w r
ate
(ton
ne/h
)
60
30
20
10
0
40
50 Powerrequired (kW)
240 200 160 140 120 10020 25 303.0
2.5
80
60
40
20
2.0
1.5
1.0
0.5
15
10
Figure 15.7 Conveying characteristics for material conveyed over 100 m through a 75 mm
bore pipeline for a material having very good air retention.
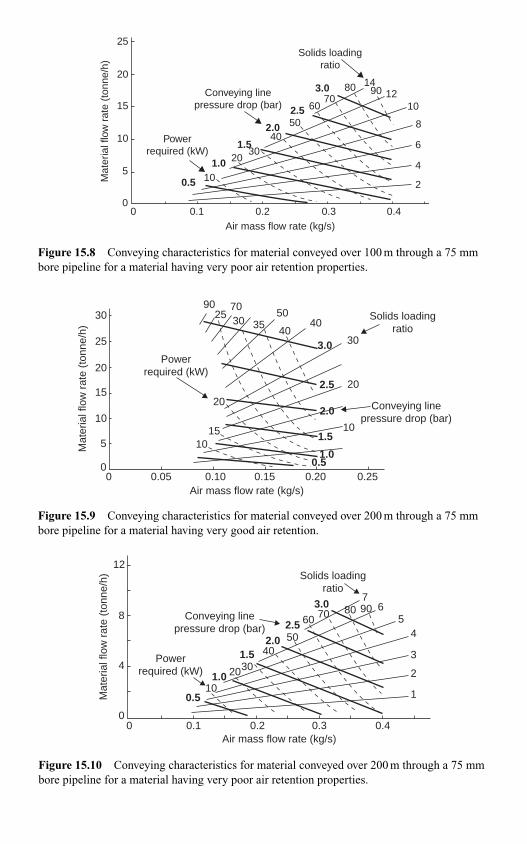
Mat
eria
l flo
w r
ate
(ton
ne/h
)
Air mass flow rate (kg/s)
Solids loadingratio
00
5
10
10
1412
10
8
6
4
2
20
4050
908070
60
30
15
20
25
0.1
0.5
1.5
2.5
1.0
2.0
3.0
0.2 0.3 0.4
Conveying linepressure drop (bar)
Powerrequired (kW)
Figure 15.8 Conveying characteristics for material conveyed over 100 m through a 75 mm
bore pipeline for a material having very poor air retention properties.
Mat
eria
l flo
w r
ate
(ton
ne/h
)
Air mass flow rate (kg/s)0 0.05 0.10 0.15 0.20 0.25
Solids loadingratio
Conveying linepressure drop (bar)
Powerrequired (kW)
0.5
1.5
2.5
1.0
2.0
3.0
10
10
20
3040
15
2535
20
4050
90 70
30
0
5
10
15
20
30
25
Figure 15.9 Conveying characteristics for material conveyed over 200 m through a 75 mm
bore pipeline for a material having very good air retention.
Mat
eria
l flo
w r
ate
(ton
ne/h
)
0
4
8
12
10
50
90807060
40
3020
Air mass flow rate (kg/s)0 0.1 0.2 0.3 0.4
4
3
2
1
56
7
0.5
2.5
1.5
1.0
3.0
2.0
Solids loadingratio
Conveying linepressure drop (bar)
Powerrequired (kW)
Figure 15.10 Conveying characteristics for material conveyed over 200 m through a 75 mm
bore pipeline for a material having very poor air retention properties.
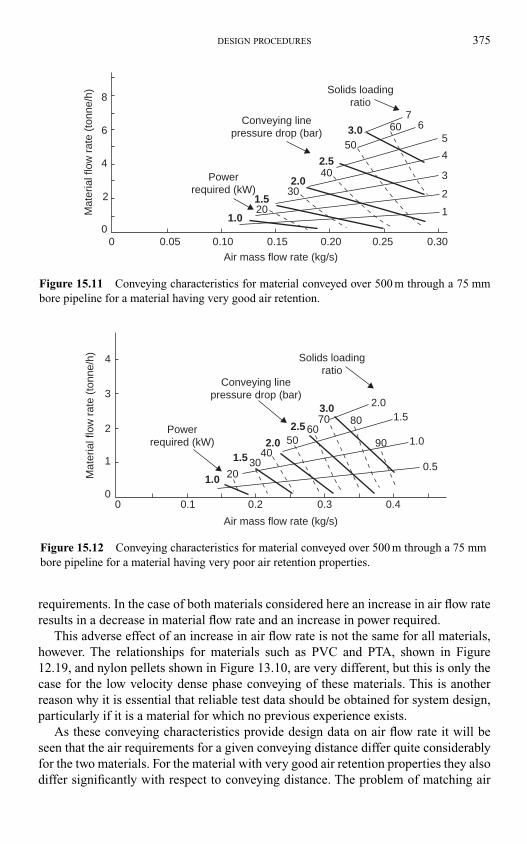
requirements. In the case of both materials considered here an increase in air flow rate
results in a decrease in material flow rate and an increase in power required.
This adverse effect of an increase in air flow rate is not the same for all materials,
however. The relationships for materials such as PVC and PTA, shown in Figure
12.19, and nylon pellets shown in Figure 13.10, are very different, but this is only the
case for the low velocity dense phase conveying of these materials. This is another
reason why it is essential that reliable test data should be obtained for system design,
particularly if it is a material for which no previous experience exists.
As these conveying characteristics provide design data on air flow rate it will be
seen that the air requirements for a given conveying distance differ quite considerably
for the two materials. For the material with very good air retention properties they also
differ significantly with respect to conveying distance. The problem of matching air
DESIGN PROCEDURES 375
Mat
eria
l flo
w r
ate
(ton
ne/h
)
00
2
4
8
6
Solids loadingratio
Conveying linepressure drop (bar)
Powerrequired (kW)
50
60
40
30
20
4
3
2
1
56
7
2.5
1.5
1.0
3.0
2.0
Air mass flow rate (kg/s)
0.05 0.10 0.15 0.20 0.300.25
Figure 15.11 Conveying characteristics for material conveyed over 500 m through a 75 mm
bore pipeline for a material having very good air retention.
Conveying linepressure drop (bar)
Powerrequired (kW)
Solids loadingratio
Air mass flow rate (kg/s)
Mat
eria
l flo
w r
ate
(ton
ne/h
)
1.5
1.0
0.5
2.03.0
2.5
2.01.5
1.0
0.100
1
2
3
4
2030
4050
6070 80
90
0.2 0.3 0.4
Figure 15.12 Conveying characteristics for material conveyed over 500 m through a 75 mm
bore pipeline for a material having very poor air retention properties.
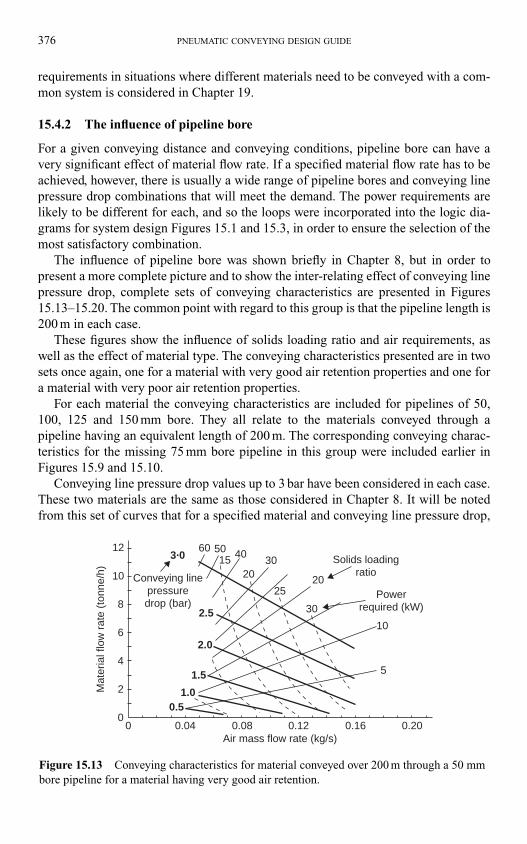
requirements in situations where different materials need to be conveyed with a com-
mon system is considered in Chapter 19.
15.4.2 The influence of pipeline bore
For a given conveying distance and conveying conditions, pipeline bore can have a
very significant effect of material flow rate. If a specified material flow rate has to be
achieved, however, there is usually a wide range of pipeline bores and conveying line
pressure drop combinations that will meet the demand. The power requirements are
likely to be different for each, and so the loops were incorporated into the logic dia-
grams for system design Figures 15.1 and 15.3, in order to ensure the selection of the
most satisfactory combination.
The influence of pipeline bore was shown briefly in Chapter 8, but in order to
present a more complete picture and to show the inter-relating effect of conveying line
pressure drop, complete sets of conveying characteristics are presented in Figures
15.13–15.20. The common point with regard to this group is that the pipeline length is
200 m in each case.
These figures show the influence of solids loading ratio and air requirements, as
well as the effect of material type. The conveying characteristics presented are in two
sets once again, one for a material with very good air retention properties and one for
a material with very poor air retention properties.
For each material the conveying characteristics are included for pipelines of 50,
100, 125 and 150 mm bore. They all relate to the materials conveyed through a
pipeline having an equivalent length of 200 m. The corresponding conveying charac-
teristics for the missing 75 mm bore pipeline in this group were included earlier in
Figures 15.9 and 15.10.
Conveying line pressure drop values up to 3 bar have been considered in each case.
These two materials are the same as those considered in Chapter 8. It will be noted
from this set of curves that for a specified material and conveying line pressure drop,
376 PNEUMATIC CONVEYING DESIGN GUIDE
0.04
0.5
1.5
2.0
2.5
3·060 50 40
30
20
30
10
5
25
2015
1.0
0.08 0.12 0.16 0.20Air mass flow rate (kg/s)
Mat
eria
l flo
w r
ate
(ton
ne/h
)
00
2
4
8
6
10
12Solids loading
ratioConveying linepressuredrop (bar)
Powerrequired (kW)
Figure 15.13 Conveying characteristics for material conveyed over 200 m through a 50 mm
bore pipeline for a material having very good air retention.
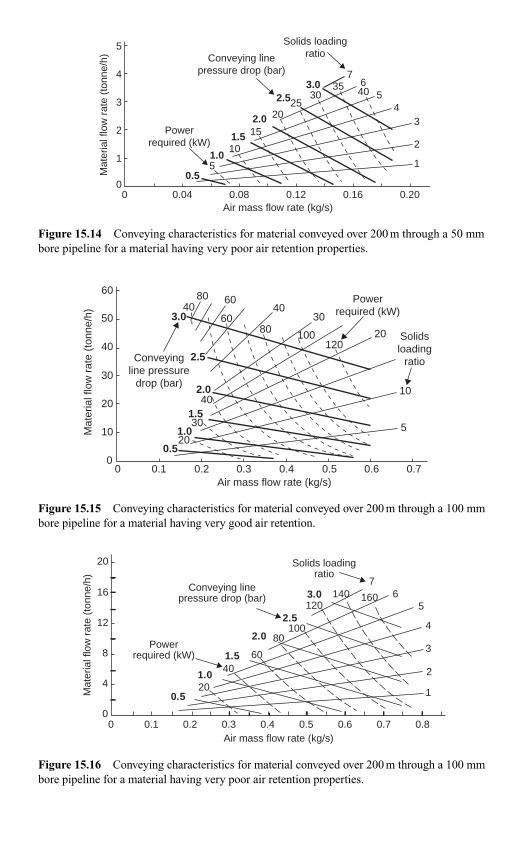
Air mass flow rate (kg/s)
Mat
eria
l flo
w r
ate
(ton
ne/h
)
Solids loadingratioConveying line
pressure drop (bar)
Powerrequired (kW)
5
4
3
2
1
00
5
10
15
2025
3035 40
76
54
3
2
1
0.04
0.5
1.0
1.5
2.0
2.53.0
0.08 0.12 0.16 0.20
Figure 15.14 Conveying characteristics for material conveyed over 200 m through a 50 mm
bore pipeline for a material having very poor air retention properties.
0
10
20
30
3.0
2.5
1.5
0.5
1.0
2.0
40
40
20
30
4030
20
10
5
80
80 100120
60
60
40
50
60
0 0.1 0.2 0.3 0.4 0.5 0.6 0.7
Mat
eria
l flo
w r
ate
(ton
ne/h
)
Conveyingline pressure
drop (bar)
Powerrequired (kW)
Solidsloading
ratio
Air mass flow rate (kg/s)
Figure 15.15 Conveying characteristics for material conveyed over 200 m through a 100 mm
bore pipeline for a material having very good air retention.
Air mass flow rate (kg/s)
Mat
eria
l flo
w r
ate
(ton
ne/h
)
Solids loadingratio
20
20
4060
80100
120140 16016
12
8
4
00
0.5
1.0
2.0
3.0
1.5
2.5
0.50.40.30.20.1 0.6 0.7 0.8
76
5
4
3
2
1
Conveying linepressure drop (bar)
Powerrequired (kW)
Figure 15.16 Conveying characteristics for material conveyed over 200 m through a 100 mm
bore pipeline for a material having very poor air retention properties.
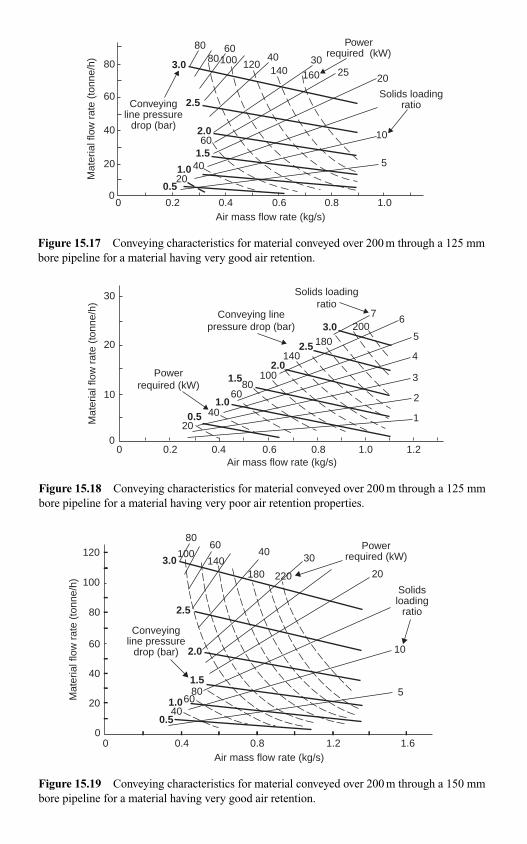
Powerrequired (kW)
Conveyingline pressure
drop (bar)
160
80 60
60
80 40
40
0.5
1.0
1.00.2 0.4 0.6 0.8
2.0
3.0
2.5
1.5
Solids loadingratio
Air mass flow rate (kg/s)
Mat
eria
l flo
w r
ate
(ton
ne/h
)
00
20 5
10
20
20
2530
40
60
80 100 120140
Figure 15.17 Conveying characteristics for material conveyed over 200 m through a 125 mm
bore pipeline for a material having very good air retention.
Powerrequired (kW)
Conveying linepressure drop (bar) 200
180
80
140
0.51.0
2.0
3.0
2.5
1.5
1
2
3
4
5
67
Solids loadingratio
Air mass flow rate (kg/s)
Mat
eria
l flo
w r
ate
(ton
ne/h
)
0.400
20
0.2 0.6 0.8 1.0 1.2
10
20
30
40
60
100
Figure 15.18 Conveying characteristics for material conveyed over 200 m through a 125 mm
bore pipeline for a material having very poor air retention properties.
Air mass flow rate (kg/s)
Mat
eria
l flo
w r
ate
(ton
ne/h
)
Powerrequired (kW)
Solidsloading
ratio
Conveyingline pressure
drop (bar)
00
20
40
60
80
80
80
3.0
1.5
0.5
2.5
2.0
1.0
60
60
40
40
220180140 30
20
10
5
100
120
0.4 0.8 1.2 1.6
100
Figure 15.19 Conveying characteristics for material conveyed over 200 m through a 150 mm
bore pipeline for a material having very good air retention.
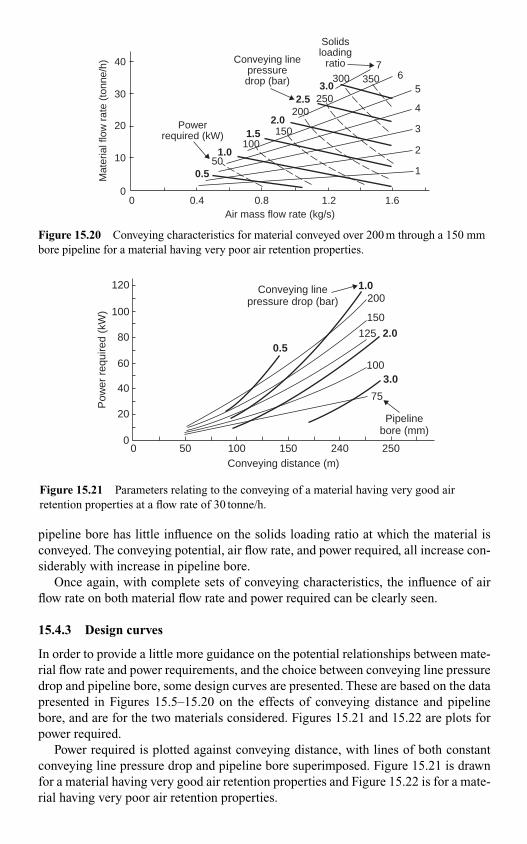
00
50
100
200
300
150
250
350
20
10
30
40
0.4 0.8 1.2
0.5
1.0
2.0
3.0
76
5
4
3
2
1
1.5
2.5
1.6Air mass flow rate (kg/s)
Mat
eria
l flo
w r
ate
(ton
ne/h
)
Solidsloading
ratioConveying linepressuredrop (bar)
Powerrequired (kW)
Figure 15.20 Conveying characteristics for material conveyed over 200 m through a 150 mm
bore pipeline for a material having very poor air retention properties.
Conveying linepressure drop (bar)
120
0
20
40
Pow
er r
equi
red
(kW
)
60
80
100
250240150
2.0
1.0
0.5
3.0
75
100500Conveying distance (m)
Pipelinebore (mm)
100
200
125
150
Figure 15.21 Parameters relating to the conveying of a material having very good air
retention properties at a flow rate of 30 tonne/h.
pipeline bore has little influence on the solids loading ratio at which the material is
conveyed. The conveying potential, air flow rate, and power required, all increase con-
siderably with increase in pipeline bore.
Once again, with complete sets of conveying characteristics, the influence of air
flow rate on both material flow rate and power required can be clearly seen.
15.4.3 Design curves
In order to provide a little more guidance on the potential relationships between mate-
rial flow rate and power requirements, and the choice between conveying line pressure
drop and pipeline bore, some design curves are presented. These are based on the data
presented in Figures 15.5–15.20 on the effects of conveying distance and pipeline
bore, and are for the two materials considered. Figures 15.21 and 15.22 are plots for
power required.
Power required is plotted against conveying distance, with lines of both constant
conveying line pressure drop and pipeline bore superimposed. Figure 15.21 is drawn
for a material having very good air retention properties and Figure 15.22 is for a mate-
rial having very poor air retention properties.
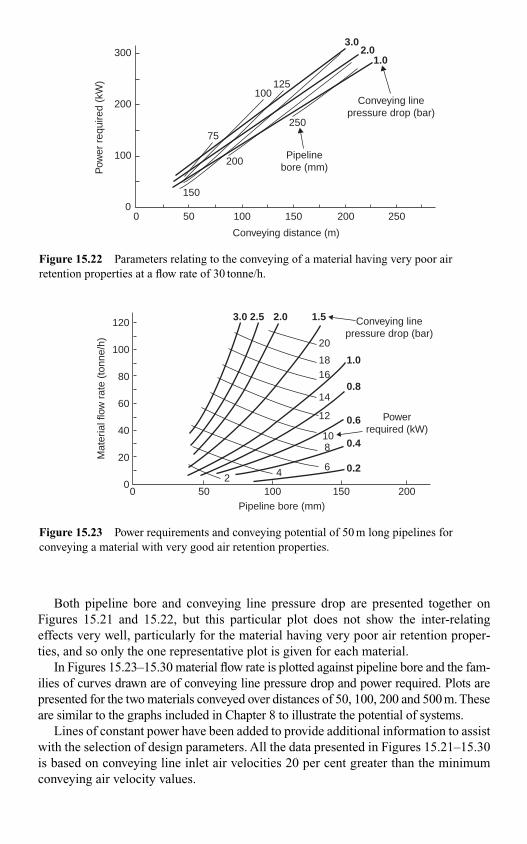
2502001501005000
100
100200
200
3.0
1.0
Conveying linepressure drop (bar)
Conveying distance (m)
Pow
er r
equi
red
(kW
)
Pipelinebore (mm)
2.0
125
150
25075
300
Figure 15.22 Parameters relating to the conveying of a material having very poor air
retention properties at a flow rate of 30 tonne/h.
Powerrequired (kW)
Pipeline bore (mm)
Conveying linepressure drop (bar)
150 200
Mat
eria
l flo
w r
ate
(ton
ne/h
)
00
20
10
20
40
50
60
1816
14
12
8
0.2
0.4
0.6
0.8
1.0
2.03.0 1.52.5
4 62
80
100
100
120
Figure 15.23 Power requirements and conveying potential of 50 m long pipelines for
conveying a material with very good air retention properties.
Both pipeline bore and conveying line pressure drop are presented together on
Figures 15.21 and 15.22, but this particular plot does not show the inter-relating
effects very well, particularly for the material having very poor air retention proper-
ties, and so only the one representative plot is given for each material.
In Figures 15.23–15.30 material flow rate is plotted against pipeline bore and the fam-
ilies of curves drawn are of conveying line pressure drop and power required. Plots are
presented for the two materials conveyed over distances of 50, 100, 200 and 500 m. These
are similar to the graphs included in Chapter 8 to illustrate the potential of systems.
Lines of constant power have been added to provide additional information to assist
with the selection of design parameters. All the data presented in Figures 15.21–15.30
is based on conveying line inlet air velocities 20 per cent greater than the minimum
conveying air velocity values.
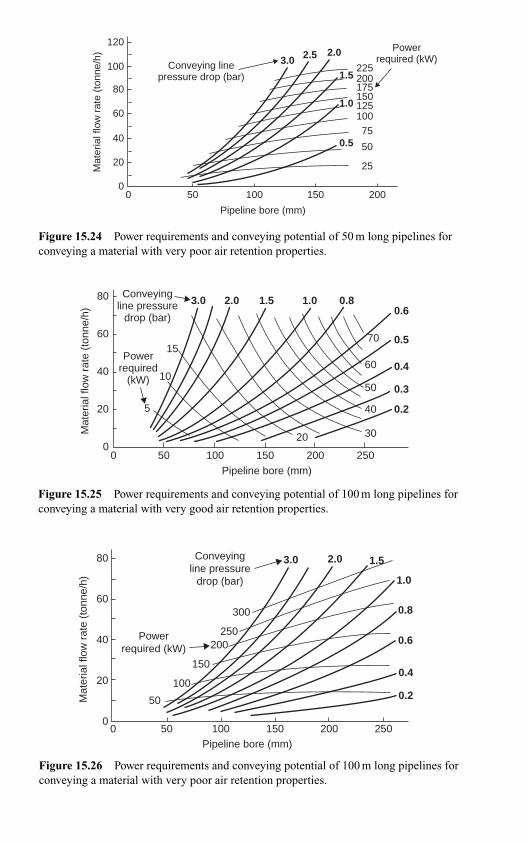
Conveying linepressure drop (bar)
Pipeline bore (mm)
Mat
eria
l flo
w r
ate
(ton
ne/h
) Powerrequired (kW)
125
120
80
60
100
100
100
40
20
00
50
50
150
150
3.0 2.5 2.0
1.5
1.0
0.5
200
200
75
25
175
225
Figure 15.24 Power requirements and conveying potential of 50 m long pipelines for
conveying a material with very poor air retention properties.
80
60
40
20
00 50 100 150 200
Pipeline bore (mm)250
Mat
eria
l flo
w r
ate
(ton
ne/h
)
Conveyingline pressure
drop (bar)
Powerrequired
(kW)
3.0
15
10
5
2.0 1.5 1.0 0.80.6
0.5
0.4
0.3
0.2
3020
40
50
60
70
Figure 15.25 Power requirements and conveying potential of 100 m long pipelines for
conveying a material with very good air retention properties.
00
20
40
60
80
Mat
eria
l flo
w r
ate
(ton
ne/h
)
50 100 150 200 250Pipeline bore (mm)
Conveyingline pressure
drop (bar)
Powerrequired (kW)
300
250200
150
0.2
0.4
0.6
0.8
1.0
1.52.03.0
100
50
Figure 15.26 Power requirements and conveying potential of 100 m long pipelines for
conveying a material with very poor air retention properties.
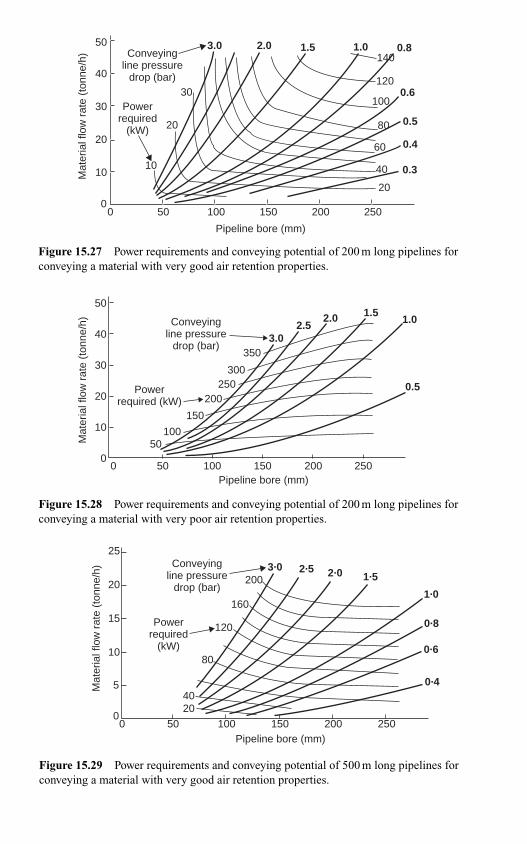
Mat
eria
l flo
w r
ate
(ton
ne/h
)
Pipeline bore (mm)
Conveyingline pressure
drop (bar)
Powerrequired (kW)
00
50
50
10
20
30
40
50
100
100
150
150
200
200
300
3.0
2.0 1.02.51.5
0.5
250
250
350
Figure 15.28 Power requirements and conveying potential of 200 m long pipelines for
conveying a material with very poor air retention properties.
Mat
eria
l flo
w r
ate
(ton
ne/h
)
50
25
20
15
10
5
00
40
80
120
160
200
20
100 150 200 250
0·4
0·6
0·8
1·0
1·52·02·53·0
Pipeline bore (mm)
Conveyingline pressure
drop (bar)
Powerrequired
(kW)
Figure 15.29 Power requirements and conveying potential of 500 m long pipelines for
conveying a material with very good air retention properties.
3.0
3030
40
50
120
50 100 150 200 250
2020
20
1010
00
2.0 1.5 1.0 0.8
0.6
0.5
0.4
0.3
Pipeline bore (mm)
Mat
eria
l flo
w r
ate
(ton
ne/h
) Conveyingline pressure
drop (bar)
Powerrequired
(kW)
40
60
80
100
140
Figure 15.27 Power requirements and conveying potential of 200 m long pipelines for
conveying a material with very good air retention properties.
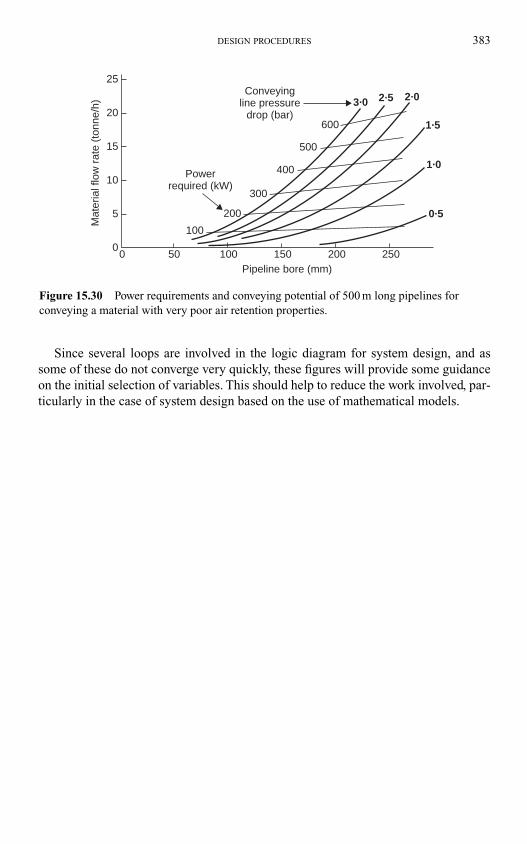
DESIGN PROCEDURES 383
Mat
eria
l flo
w r
ate
(ton
ne/h
)
50
25
20
15
10
5
00
200
300
400
500
600
100
100 150 200 250
0·5
1·0
1·5
2·02·53·0
Pipeline bore (mm)
Conveyingline pressure
drop (bar)
Powerrequired (kW)
Figure 15.30 Power requirements and conveying potential of 500 m long pipelines for
conveying a material with very poor air retention properties.
Since several loops are involved in the logic diagram for system design, and as
some of these do not converge very quickly, these figures will provide some guidance
on the initial selection of variables. This should help to reduce the work involved, par-
ticularly in the case of system design based on the use of mathematical models.
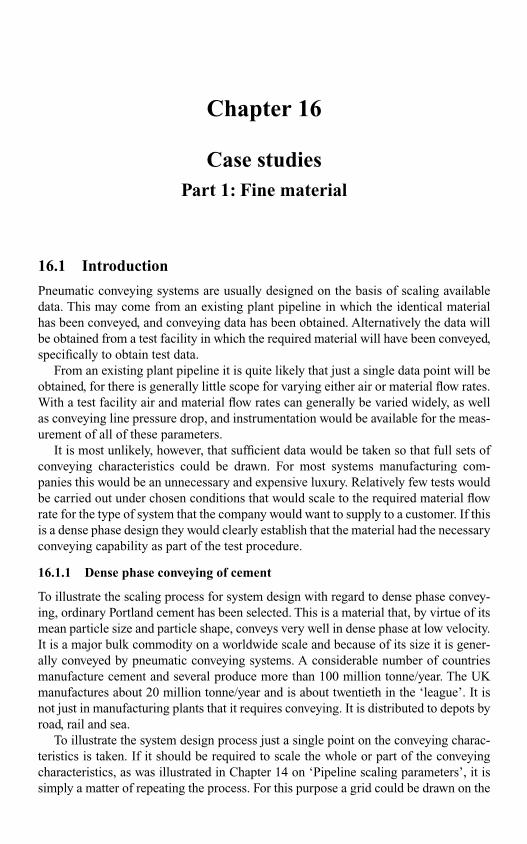
16.1 Introduction
Pneumatic conveying systems are usually designed on the basis of scaling available
data. This may come from an existing plant pipeline in which the identical material
has been conveyed, and conveying data has been obtained. Alternatively the data will
be obtained from a test facility in which the required material will have been conveyed,
specifically to obtain test data.
From an existing plant pipeline it is quite likely that just a single data point will be
obtained, for there is generally little scope for varying either air or material flow rates.
With a test facility air and material flow rates can generally be varied widely, as well
as conveying line pressure drop, and instrumentation would be available for the meas-
urement of all of these parameters.
It is most unlikely, however, that sufficient data would be taken so that full sets of
conveying characteristics could be drawn. For most systems manufacturing com-
panies this would be an unnecessary and expensive luxury. Relatively few tests would
be carried out under chosen conditions that would scale to the required material flow
rate for the type of system that the company would want to supply to a customer. If this
is a dense phase design they would clearly establish that the material had the necessary
conveying capability as part of the test procedure.
16.1.1 Dense phase conveying of cement
To illustrate the scaling process for system design with regard to dense phase convey-
ing, ordinary Portland cement has been selected. This is a material that, by virtue of its
mean particle size and particle shape, conveys very well in dense phase at low velocity.
It is a major bulk commodity on a worldwide scale and because of its size it is gener-
ally conveyed by pneumatic conveying systems. A considerable number of countries
manufacture cement and several produce more than 100 million tonne/year. The UK
manufactures about 20 million tonne/year and is about twentieth in the ‘league’. It is
not just in manufacturing plants that it requires conveying. It is distributed to depots by
road, rail and sea.
To illustrate the system design process just a single point on the conveying charac-
teristics is taken. If it should be required to scale the whole or part of the conveying
characteristics, as was illustrated in Chapter 14 on ‘Pipeline scaling parameters’, it is
simply a matter of repeating the process. For this purpose a grid could be drawn on the
Chapter 16
Case studies Part 1: Fine material
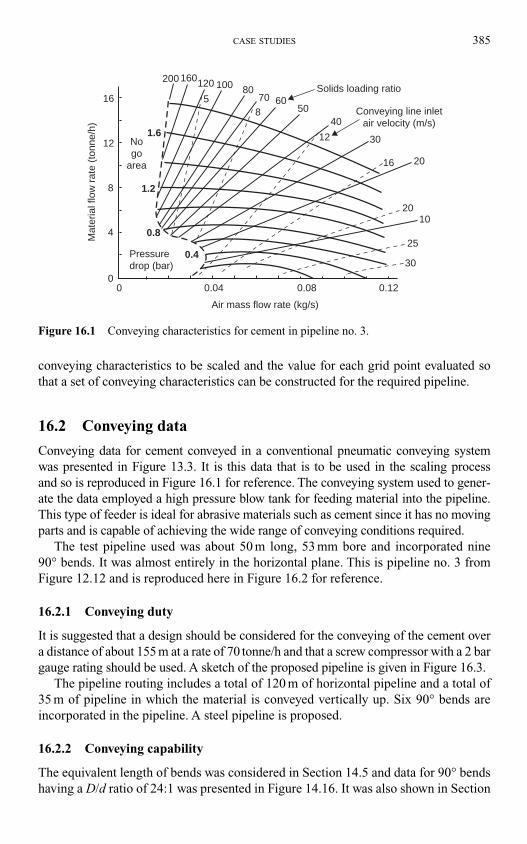
CASE STUDIES 385
conveying characteristics to be scaled and the value for each grid point evaluated so
that a set of conveying characteristics can be constructed for the required pipeline.
16.2 Conveying data
Conveying data for cement conveyed in a conventional pneumatic conveying system
was presented in Figure 13.3. It is this data that is to be used in the scaling process
and so is reproduced in Figure 16.1 for reference. The conveying system used to gener-
ate the data employed a high pressure blow tank for feeding material into the pipeline.
This type of feeder is ideal for abrasive materials such as cement since it has no moving
parts and is capable of achieving the wide range of conveying conditions required.
The test pipeline used was about 50 m long, 53 mm bore and incorporated nine
90° bends. It was almost entirely in the horizontal plane. This is pipeline no. 3 from
Figure 12.12 and is reproduced here in Figure 16.2 for reference.
16.2.1 Conveying duty
It is suggested that a design should be considered for the conveying of the cement over
a distance of about 155 m at a rate of 70 tonne/h and that a screw compressor with a 2 bar
gauge rating should be used. A sketch of the proposed pipeline is given in Figure 16.3.
The pipeline routing includes a total of 120 m of horizontal pipeline and a total of
35 m of pipeline in which the material is conveyed vertically up. Six 90° bends are
incorporated in the pipeline. A steel pipeline is proposed.
16.2.2 Conveying capability
The equivalent length of bends was considered in Section 14.5 and data for 90° bends
having a D/d ratio of 24:1 was presented in Figure 14.16. It was also shown in Section
200 12080
60
40
12 30
16 20
2010
25
30
0.120.080.040
5070
100160
Air mass flow rate (kg/s)
Mat
eria
l flo
w r
ate
(ton
ne/h
)16
12
8
4
0
Nogo
area
1.2
0.8
0.4
1.6
Pressuredrop (bar)
Solids loading ratio
Conveying line inletair velocity (m/s)
58
Figure 16.1 Conveying characteristics for cement in pipeline no. 3.
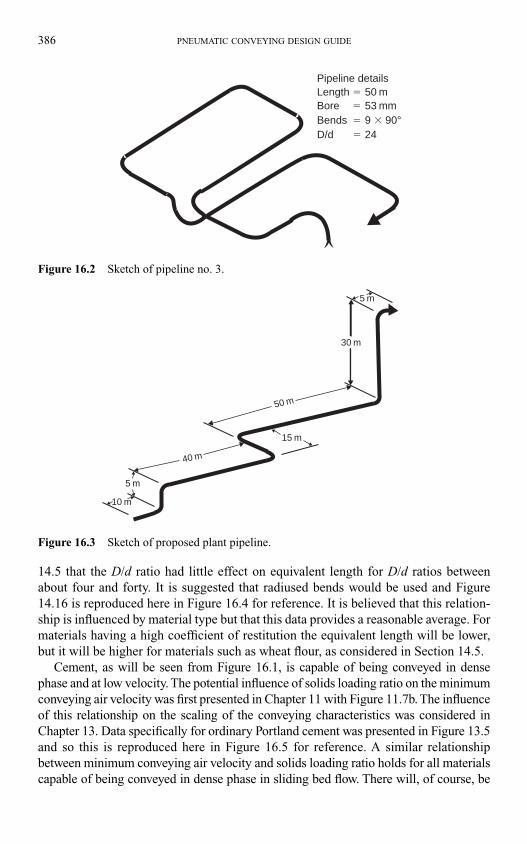
386 PNEUMATIC CONVEYING DESIGN GUIDE
14.5 that the D/d ratio had little effect on equivalent length for D/d ratios between
about four and forty. It is suggested that radiused bends would be used and Figure
14.16 is reproduced here in Figure 16.4 for reference. It is believed that this relation-
ship is influenced by material type but that this data provides a reasonable average. For
materials having a high coefficient of restitution the equivalent length will be lower,
but it will be higher for materials such as wheat flour, as considered in Section 14.5.
Cement, as will be seen from Figure 16.1, is capable of being conveyed in dense
phase and at low velocity. The potential influence of solids loading ratio on the minimum
conveying air velocity was first presented in Chapter 11 with Figure 11.7b. The influence
of this relationship on the scaling of the conveying characteristics was considered in
Chapter 13. Data specifically for ordinary Portland cement was presented in Figure 13.5
and so this is reproduced here in Figure 16.5 for reference. A similar relationship
between minimum conveying air velocity and solids loading ratio holds for all materials
capable of being conveyed in dense phase in sliding bed flow. There will, of course, be
Pipeline detailsLength � 50 mBore � 53 mmBends � 9 � 90°D/d � 24
Figure 16.2 Sketch of pipeline no. 3.
10 m
15 m
50 m
30 m
5 m
40 m
5 m
Figure 16.3 Sketch of proposed plant pipeline.
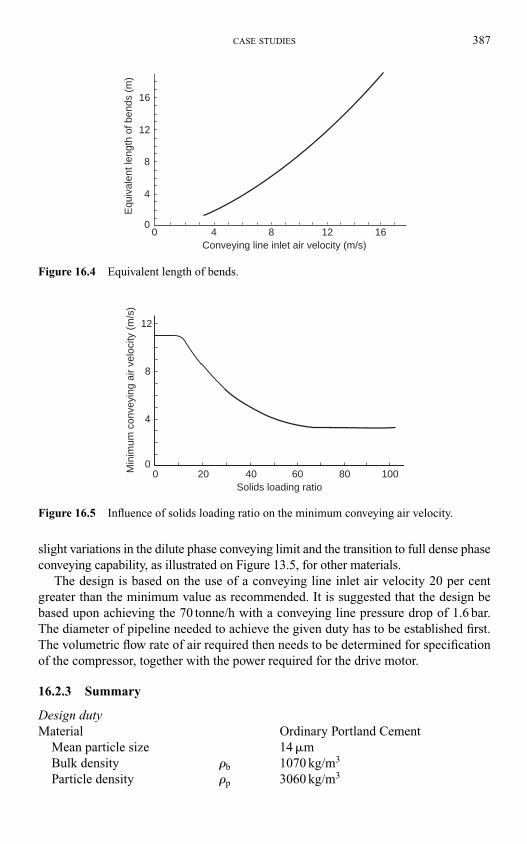
CASE STUDIES 387
slight variations in the dilute phase conveying limit and the transition to full dense phase
conveying capability, as illustrated on Figure 13.5, for other materials.
The design is based on the use of a conveying line inlet air velocity 20 per cent
greater than the minimum value as recommended. It is suggested that the design be
based upon achieving the 70 tonne/h with a conveying line pressure drop of 1.6 bar.
The diameter of pipeline needed to achieve the given duty has to be established first.
The volumetric flow rate of air required then needs to be determined for specification
of the compressor, together with the power required for the drive motor.
16.2.3 Summary
Design dutyMaterial Ordinary Portland Cement
Mean particle size 14 �m
Bulk density �b 1070 kg/m3
Particle density �p 3060 kg/m3
0 4 8 12 16Conveying line inlet air velocity (m/s)
Equ
ival
ent l
engt
h of
ben
ds (
m)
16
12
8
4
0
Figure 16.4 Equivalent length of bends.
0 20 40 60 80 100Solids loading ratio
12
8
4
0Min
imum
con
veyi
ng a
ir ve
loci
ty (
m/s
)
Figure 16.5 Influence of solids loading ratio on the minimum conveying air velocity.
388 PNEUMATIC CONVEYING DESIGN GUIDE
Pipeline Figure 16.3
Horizontal h 120 m
Vertical v 35 m
Bends b 6 � 90°
Capability
Material flow rate m.p 70 tonne/h
Air supply Screw compressor
Delivery pressure p 2.0 bar gauge
Pipeline inlet pressure p1 1.6 bar gauge
Pipeline pressure drop �p 1.6 bar
Pipeline inlet velocity C1 1.2 � Cmin
Determine
Pipeline bore dFree air delivered V
.0
Power required P
16.3 Procedure
The location of the equivalent operating point on the conveying characteristics for the
test pipeline needs to be established first, taking account of the pressure and air flow
rate requirements. Scaling is conveniently carried out in two stages. In the first stage
scaling is with respect to conveying distance, and this includes both pipeline orienta-
tion and bends. In the second stage the scaling is with respect to pipeline bore.
Air only pressure drop values need to be established and so this procedure is also
included. In this case, as the pipeline is longer and will be of a larger bore the two
effects are likely to cancel each other. If there is likely to be a noticeable difference
between the two it would always be recommended that this should be taken into
account. Appropriate equations, derived earlier in the Design Guide, are reproduced
where required for convenient reference.
16.3.1 Operating point
The operating point on the conveying characteristics for the test pipeline on Figure
16.1 must first be identified. At 1.6 bar the minimum air flow rate is about 0.021 kg/s
and so the operating point will correspond with an air flow rate 20 per cent higher at
0.025 kg/s. The corresponding material flow rate is approximately 12.8 tonne/h. This
is shown on Figure 16.6 and is identified as point (a) as a first estimate.
16.3.1.1 Conveying line inlet air velocity
The minimum conveying air velocity, Cmin, corresponding to the conveying limit for a
pressure drop of 1.6 bar can be determined by using Equation (9.20), reproduced here
as Equation (16.1).
(16.1)Cm T
d p1
1
21
0.365 m/sa�˙
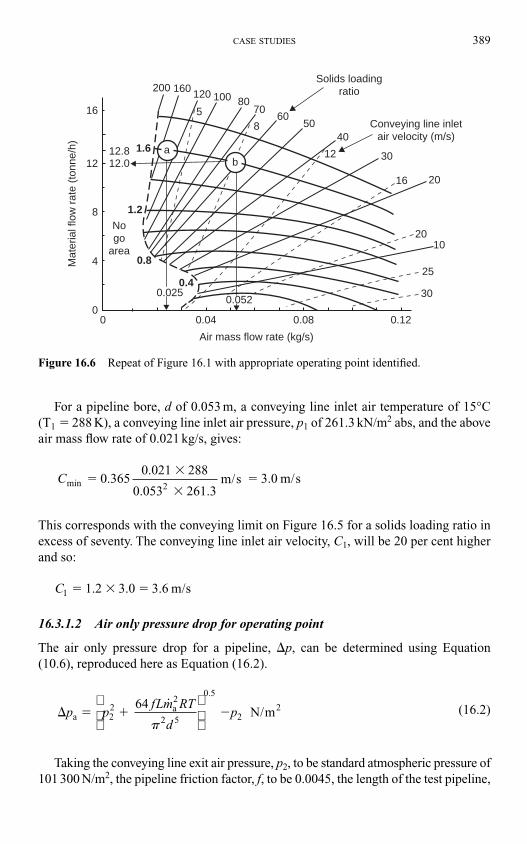
CASE STUDIES 389
For a pipeline bore, d of 0.053 m, a conveying line inlet air temperature of 15°C
(T1 � 288 K), a conveying line inlet air pressure, p1 of 261.3 kN/m2 abs, and the above
air mass flow rate of 0.021 kg/s, gives:
This corresponds with the conveying limit on Figure 16.5 for a solids loading ratio in
excess of seventy. The conveying line inlet air velocity, C1, will be 20 per cent higher
and so:
16.3.1.2 Air only pressure drop for operating point
The air only pressure drop for a pipeline, �p, can be determined using Equation
(10.6), reproduced here as Equation (16.2).
(16.2)
Taking the conveying line exit air pressure, p2, to be standard atmospheric pressure of
101 300 N/m2, the pipeline friction factor, f, to be 0.0045, the length of the test pipeline,
� � � �p pfLm RT
dpa
a 2
64 N/m2
22
2 5
0 5
2
˙.
�
C1 1.2 3.0 3.6 m/s� � �
Cmin 2 0.365
0.021 288
0.053 261.3m/s 3.0 m/s�
�
��
200120
8060
40
12 30
16 20
2010
25
30
0.120.080.040
5070
100160
Air mass flow rate (kg/s)
Mat
eria
l flo
w r
ate
(ton
ne/h
)
16
12
8
4
0
Nogo
area
1.2
0.8
0.4
1.6
Solids loadingratio
Conveying line inletair velocity (m/s)
58
ab
0.0520.025
12.812.0
Figure 16.6 Repeat of Figure 16.1 with appropriate operating point identified.
390 PNEUMATIC CONVEYING DESIGN GUIDE
L, as 50 m, the air flow rate as determined above at 0.025 kg/s, R for air � 287 J/kg �K,
the air temperature T � 288 K and the test pipeline bore, d of 0.053 m, gives:
As will be seen this is negligible and not really worthwhile taking into account.
This is because it is for very low velocity conveying in a relatively short pipeline. For
high velocity dilute phase conveying in a long pipeline it would be essential that this
should be taken into account.
NoteFor greater accuracy with this air only pressure drop value, if it is be required, an
allowance for the bends in the pipeline should also be included. If Equation (10.9)
is used for the purpose and a value for k for the bends of 0.2 is taken from Figure
10.6 it will be seen that the equivalent length for all nine bends will come to about
5.4 m. This value should be added to the actual pipeline length of 50 m and used in
Equation (16.2).
16.3.2 Equivalent lengths
The equivalent length of a pipeline for the conveying of material takes the length of
horizontal pipeline as the reference value. To this is added an equivalent length of
straight horizontal pipeline, both for the vertically up sections of pipeline and for the
bends in the pipeline. These two elements were considered in Chapter 14 on ‘Pipeline
scaling parameters’.
For vertically up elements of pipeline in Section 14.6 it was shown that the scaling
parameter was two, so that the length of the vertically up sections of pipeline is sim-
ply doubled. No significant influence of conveying conditions were found and so it is
applied universally to dilute and dense phase conveying. For pipeline bends in Section
14.5 it was shown that the equivalent length of the bends could be related to the con-
veying line inlet air velocity and the analysis reported provides the basis of the rela-
tionship presented in Figure 16.4. It was found that the equivalent length of pipe bends
varied little with bend geometry, being reasonably consistent over a D/d range from
about four to forty. For very short radius bends, and blind tee bends in particular, how-
ever, the equivalent length would be very much greater.
The equivalent length of a pipeline, Le, therefore, can be expressed as:
Le � h � 2v � Nb m (16.3)
where h is the total length of horizontal sections of pipeline; v, the total length of ver-
tically up sections of pipeline; N, the total number of bends in pipeline and b, the
equivalent length of each bend.
� � �� � � � �
��
� � �
pa
2
2 2
64 0.0045 50 0.025 287 288
0.053101300
886N/m 0.89kN/m bar
101300
0 009
2
2 5
0 5
�
.
.
CASE STUDIES 391
16.3.2.1 Test pipeline
A sketch of the test pipeline is given in Figure 16.2 and from this it will be seen that
the equivalent length of the test pipeline, Le1, is:
There is no significant vertical lift and there are nine bends in the test pipeline.
With a conveying line inlet air velocity of 3.6 m/s the equivalent length of the bends,
from Figure 16.4, is about 11⁄2 m each.
16.3.2.2 Plant pipeline
A sketch of the plant pipeline is given in Figure 16.3 and from this it will be seen that
the equivalent length of the plant pipeline, Le2, is:
The actual length of the plant pipeline is 155 m and it is this length that needs to be
used to evaluate the air only pressure drop for the plant pipeline having the same bore
as the test pipeline. Neglecting the effect of the bends once again and substituting the
length of 155 m in place of 50 m into Equation (16.2) (this is the only parameter to
change in this equation), gives:
Although this is three times greater than that for the test pipeline, as would be
expected, it is still insignificant in terms of the 1.6 bar conveying line pressure drop
value. The increase in the air only pressure drop from 0.009 bar to 0.027 bar means
that 0.018 bar less pressure is available for conveying material.
This loss in pressure of 0.018 bar should be deducted from the 1.6 bar, which gives
1.582 bar, and it is this value that should be used on Figure 16.6 in order to determine
the material flow rate to be used for scaling purposes. Once again, for low velocity
high pressure conveying, these pressure drop terms are insignificant, but for long dis-
tance, high velocity, low pressure conveying these terms will be significant and will
have to be taken into account. This will be illustrated in the next case study in the next
chapter.
16.3.3 Scaling for length
The scaling model for pipeline length is given in Equation (14.4) and is reproduced
here in Equation (16.4):
(16.4)˙ ˙ .m mL
Lp pe
e
64
199 4.12 tonne/ h2 1
1
2
12 8� � � �
� � � �pa2 2
2721 N/m 2.72 kN/m 0.027 bar
Le1
2 120 (2 35) (6 1 199 m2 � � � � � �)
Le1
2 50 (2 0) (9 1 64 m1 � � � � � �)
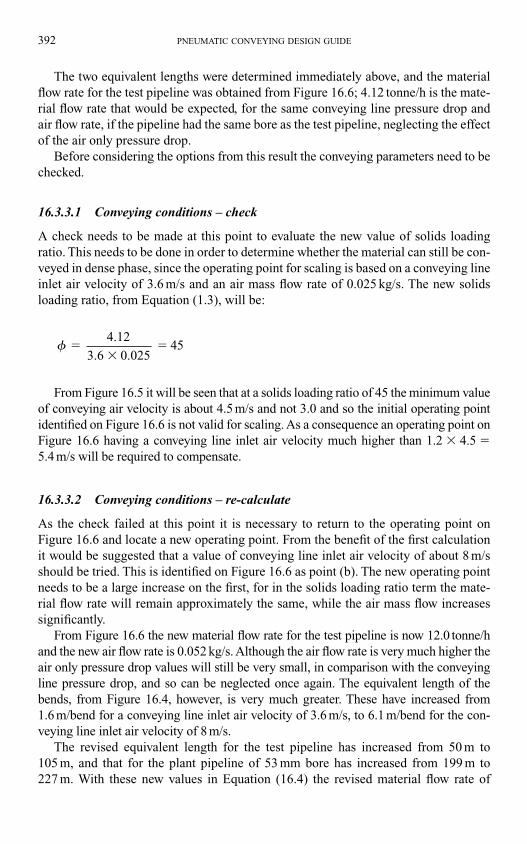
392 PNEUMATIC CONVEYING DESIGN GUIDE
The two equivalent lengths were determined immediately above, and the material
flow rate for the test pipeline was obtained from Figure 16.6; 4.12 tonne/h is the mate-
rial flow rate that would be expected, for the same conveying line pressure drop and
air flow rate, if the pipeline had the same bore as the test pipeline, neglecting the effect
of the air only pressure drop.
Before considering the options from this result the conveying parameters need to be
checked.
16.3.3.1 Conveying conditions – check
A check needs to be made at this point to evaluate the new value of solids loading
ratio. This needs to be done in order to determine whether the material can still be con-
veyed in dense phase, since the operating point for scaling is based on a conveying line
inlet air velocity of 3.6 m/s and an air mass flow rate of 0.025 kg/s. The new solids
loading ratio, from Equation (1.3), will be:
From Figure 16.5 it will be seen that at a solids loading ratio of 45 the minimum value
of conveying air velocity is about 4.5 m/s and not 3.0 and so the initial operating point
identified on Figure 16.6 is not valid for scaling. As a consequence an operating point on
Figure 16.6 having a conveying line inlet air velocity much higher than 1.2 � 4.5 �5.4 m/s will be required to compensate.
16.3.3.2 Conveying conditions – re-calculate
As the check failed at this point it is necessary to return to the operating point on
Figure 16.6 and locate a new operating point. From the benefit of the first calculation
it would be suggested that a value of conveying line inlet air velocity of about 8 m/s
should be tried. This is identified on Figure 16.6 as point (b). The new operating point
needs to be a large increase on the first, for in the solids loading ratio term the mate-
rial flow rate will remain approximately the same, while the air mass flow increases
significantly.
From Figure 16.6 the new material flow rate for the test pipeline is now 12.0 tonne/h
and the new air flow rate is 0.052 kg/s. Although the air flow rate is very much higher the
air only pressure drop values will still be very small, in comparison with the conveying
line pressure drop, and so can be neglected once again. The equivalent length of the
bends, from Figure 16.4, however, is very much greater. These have increased from
1.6 m/bend for a conveying line inlet air velocity of 3.6 m/s, to 6.1 m/bend for the con-
veying line inlet air velocity of 8 m/s.
The revised equivalent length for the test pipeline has increased from 50 m to
105 m, and that for the plant pipeline of 53 mm bore has increased from 199 m to
227 m. With these new values in Equation (16.4) the revised material flow rate of
� 4.12
3.6 0.025 45�
��
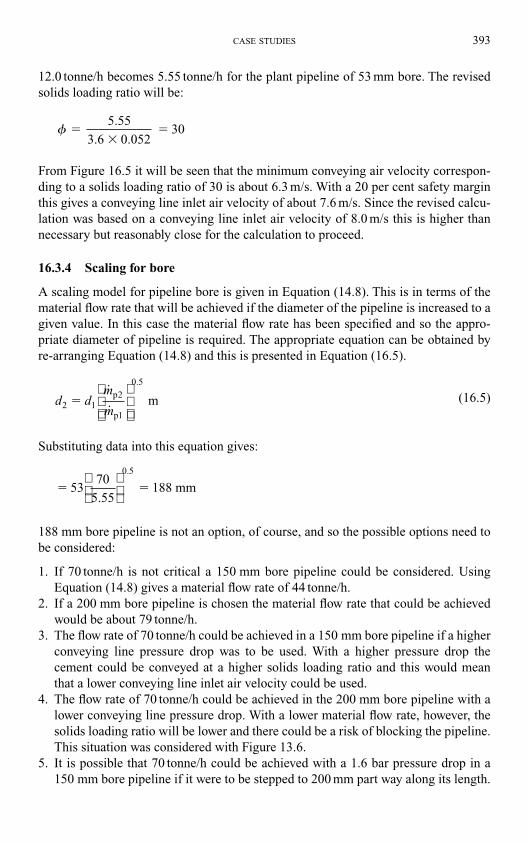
CASE STUDIES 393
12.0 tonne/h becomes 5.55 tonne/h for the plant pipeline of 53 mm bore. The revised
solids loading ratio will be:
From Figure 16.5 it will be seen that the minimum conveying air velocity correspon-
ding to a solids loading ratio of 30 is about 6.3 m/s. With a 20 per cent safety margin
this gives a conveying line inlet air velocity of about 7.6 m/s. Since the revised calcu-
lation was based on a conveying line inlet air velocity of 8.0 m/s this is higher than
necessary but reasonably close for the calculation to proceed.
16.3.4 Scaling for bore
A scaling model for pipeline bore is given in Equation (14.8). This is in terms of the
material flow rate that will be achieved if the diameter of the pipeline is increased to a
given value. In this case the material flow rate has been specified and so the appro-
priate diameter of pipeline is required. The appropriate equation can be obtained by
re-arranging Equation (14.8) and this is presented in Equation (16.5).
(16.5)
Substituting data into this equation gives:
188 mm bore pipeline is not an option, of course, and so the possible options need to
be considered:
1. If 70 tonne/h is not critical a 150 mm bore pipeline could be considered. Using
Equation (14.8) gives a material flow rate of 44 tonne/h.
2. If a 200 mm bore pipeline is chosen the material flow rate that could be achieved
would be about 79 tonne/h.
3. The flow rate of 70 tonne/h could be achieved in a 150 mm bore pipeline if a higher
conveying line pressure drop was to be used. With a higher pressure drop the
cement could be conveyed at a higher solids loading ratio and this would mean
that a lower conveying line inlet air velocity could be used.
4. The flow rate of 70 tonne/h could be achieved in the 200 mm bore pipeline with a
lower conveying line pressure drop. With a lower material flow rate, however, the
solids loading ratio will be lower and there could be a risk of blocking the pipeline.
This situation was considered with Figure 13.6.
5. It is possible that 70 tonne/h could be achieved with a 1.6 bar pressure drop in a
150 mm bore pipeline if it were to be stepped to 200 mm part way along its length.
� � 5370
5.55 188 mm
0 5.
d dm
m2 1
2
1
0 5
mp
p
�˙
˙
.
� 5.55
3.6 0.052 30�
��

394 PNEUMATIC CONVEYING DESIGN GUIDE
In assessing tender proposals for such a system, where a design might come on the
border-line of pipeline bores, or pressure rating for different components, it is essential
that the design options be interrogated in order to determine what margins have been
incorporated.
16.3.5 Air requirements
An air supply pressure of 2 bar gauge was selected at the outset, along with a convey-
ing line pressure drop of 1.6 bar, and so the free air flow and an approximate value for
the power supply are now required.
16.3.5.1 Air flow rate
The air flow rate will be evaluated for the 200 mm bore pipeline, assuming that the air
supply pressure will be about 1.6 bar gauge. The equations for evaluating air flow rate
were developed in Chapter 9. The design here is based on a conveying line inlet air veloc-
ity of 8.0 m/s and Equation (9.10), reproduced here as Equation (16.6) is appropriate:
(16.6)
This is the volumetric flow rate of the air at free air conditions, which are the
reference conditions required for the specification of a compressor.
16.3.5.2 Power required
An approximate value for the compressor drive power required was presented in
Equation (6.5) and this is reproduced here as Equation (16.7):
(16.7)P 203 ln kW 203 0.647 ln 3
101 3 125 kW� � �
�
��V
p
p04
3
261
˙ /Vd p C
T0
21 1
1
2.23 m s 2.23 0.200 261.3 8.0
288 0.647 m /s
32
3� � �� �
�
17.1 Introduction
For this case study a material has been chosen that has no natural dense phase convey-
ing capability and so can only be conveyed in dilute phase suspension flow in a conven-
tional pneumatic conveying system. The magnesium sulphate had a mean particle size of
about 225 �m and so de-aerated very rapidly. The bulk density of the material was about
1010 kg/m3 and the particle density 2350 kg/m3. As with dense phase conveying, the min-
imum conveying air velocity for a material is a critical design parameter, but unlike dense
phase conveying there is no significant change in its value with solids loading ratio.
Data on the pneumatic conveying of magnesium sulphate was presented in Chapter 12.
The material was conveyed through pipeline no. 6 (Figure 12.24) and the conveying
characteristics were presented in Figure 12.23d. It was reported (Section 12.2.6.4) that
the minimum conveying air velocity for the material was about 14 m/s. Tests were car-
ried out with conveying line pressure drop values up to 1.8 bar and the maximum value
of solids loading ratio that could be achieved was about 10.
17.1.1 Dilute phase conveying of magnesium sulphate
To illustrate the scaling process for system design with regard to dilute phase conveying,
the magnesium sulphate is used. Once again just a single point is selected for scaling
but the entire conveying characteristics can be scaled if required.
17.2 Conveying data
A sketch of the test pipeline used for this case study is given in Figure 17.1. It is almost
identical to pipeline no. 6 reported above but the bore of the pipeline was 105 mm
instead of 81 mm.
The pipeline was 95 m long and almost entirely in the horizontal plane. The pipeline
incorporated nine 90° bends and they all had a D/d ratio of 12:1. The pipeline was fed by
a high pressure top discharge blow tank. Conveying characteristics for the magnesium
sulphate conveyed through this pipeline are presented in Figure 17.2.
Chapter 17
Case studiesPart II: Coarse material
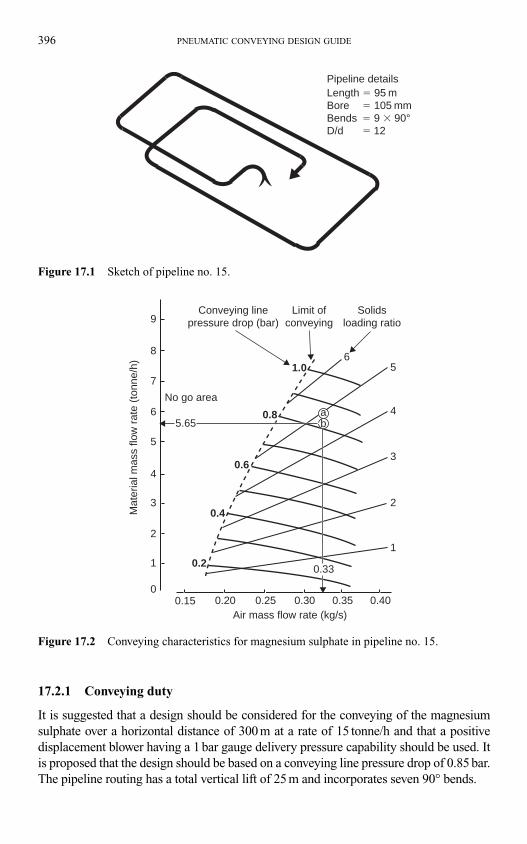
17.2.1 Conveying duty
It is suggested that a design should be considered for the conveying of the magnesium
sulphate over a horizontal distance of 300 m at a rate of 15 tonne/h and that a positive
displacement blower having a 1 bar gauge delivery pressure capability should be used. It
is proposed that the design should be based on a conveying line pressure drop of 0.85 bar.
The pipeline routing has a total vertical lift of 25 m and incorporates seven 90° bends.
396 PNEUMATIC CONVEYING DESIGN GUIDE
b
0.33
1
2
3
4
56
Conveying linepressure drop (bar)
Limit ofconveying
Solidsloading ratio
No go area
5.65
9
8
7
6
5
1
00.15 0.20 0.25 0.30 0.35 0.40
2
3
4
Air mass flow rate (kg/s)
Mat
eria
l mas
s flo
w r
ate
(ton
ne/h
)
1.0
0.8
0.4
0.2
0.6
a
Figure 17.2 Conveying characteristics for magnesium sulphate in pipeline no. 15.
Pipeline detailsLength � 95 mBore � 105 mmBends � 9 � 90°D/d � 12
Figure 17.1 Sketch of pipeline no. 15.
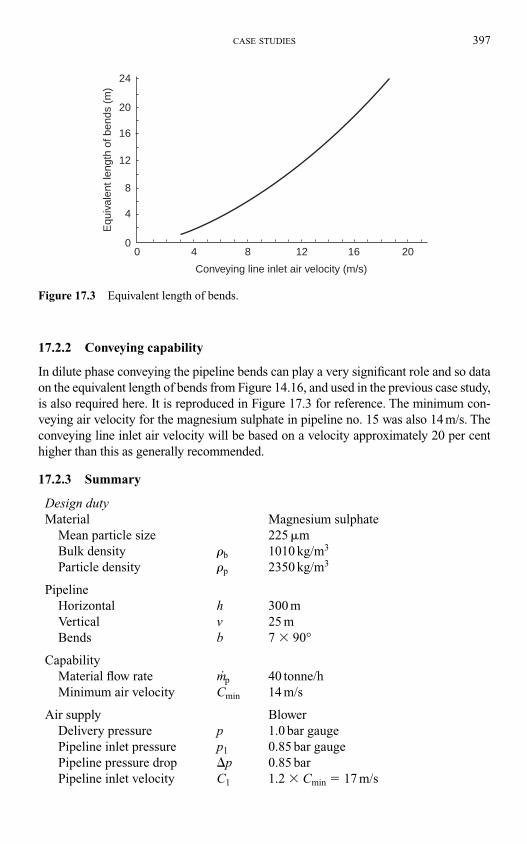
17.2.2 Conveying capability
In dilute phase conveying the pipeline bends can play a very significant role and so data
on the equivalent length of bends from Figure 14.16, and used in the previous case study,
is also required here. It is reproduced in Figure 17.3 for reference. The minimum con-
veying air velocity for the magnesium sulphate in pipeline no. 15 was also 14 m/s. The
conveying line inlet air velocity will be based on a velocity approximately 20 per cent
higher than this as generally recommended.
17.2.3 Summary
Design dutyMaterial Magnesium sulphate
Mean particle size 225 �m
Bulk density �b 1010 kg/m3
Particle density �p 2350 kg/m3
Pipeline
Horizontal h 300 m
Vertical v 25 m
Bends b 7 � 90°
Capability
Material flow rate m.p 40 tonne/h
Minimum air velocity Cmin 14 m/s
Air supply Blower
Delivery pressure p 1.0 bar gauge
Pipeline inlet pressure p1 0.85 bar gauge
Pipeline pressure drop �p 0.85 bar
Pipeline inlet velocity C1 1.2 � Cmin � 17 m/s
CASE STUDIES 397
0 4 8 12 16
Conveying line inlet air velocity (m/s)
20
Equ
ival
ent l
engt
h of
ben
ds (
m)
20
16
12
4
0
24
8
Figure 17.3 Equivalent length of bends.
Determine
Pipeline bore dFree air delivered V
.0
Power required P
17.3 Procedure
The location of the equivalent operating point on the conveying characteristics for the
test pipeline needs to be established first, taking account of the pressure and air flow
rate requirements. Scaling is conveniently carried out in two stages. In the first stage
scaling is with respect to conveying distance, and this includes both pipeline orientation
and bends. In the second stage the scaling is with respect to pipeline bore. Air only
pressure drop values need to be established and so this procedure is also included.
17.3.1 Operating point
The operating point on the conveying characteristics for the test pipeline on Figure
17.2 must first be identified. Since the pressure drop line has been chosen as 0.85 bar
and the conveying line inlet air velocity has been determined as 17 m/s, the appropri-
ate air mass flow rate can be calculated. This can be determined from Equation (13.1),
reproduced here as Equation (17.1) for reference and use:
(17.1)
where m.a is the air mass flow rate (kg/s); p1, the conveying line inlet air pressure
(185 kN/m2 abs); d, the pipeline bore (0.105 m); C1, the conveying line inlet air velocity
(17 m/s) and T1, the conveying line inlet air temperature (288 K (15°C)).
Substituting these values in Equation (17.1) gives
m.a � 0.330 kg/s
This operating point is located on Figure 17.2 as point (a) and it will be seen that it is
approximately 20 per cent in-board from the conveying limit.
17.3.2 Air only pressure drop values
The air only pressure drop for a pipeline, �pa, can be determined using Equation
(10.14), reproduced here as Equation (17.2).
(17.2)
where � � (4fL)/d �∑k from Equation (10.11).
� � ��
�pm
da
a
5
1.34
10 1.0 bar1 0
2
4
0 5
.˙
.
�
mp d C
Ta 2.74
kg/s� 12
1
1
398 PNEUMATIC CONVEYING DESIGN GUIDE
17.3.2.1 Test pipeline
Taking the pipeline friction factor, f, to be 0.0045, the length of the test pipeline, L, as
95 m, the pipeline bore, d, as 0.105 m, and the bend loss coefficient as 0.2 (Figure
10.6) for each of nine bends, gives:
Substituting this value, the air flow rate of 0.330 kg/s and the pipeline bore of 0.105 m
into Equation (17.2) gives:
From this it will be seen that the air only pressure drop is quite significant for dilute
phase flow. This value of pressure drop is automatically included in the conveying
characteristics in Figure 17.2. A constant pressure drop line of 0.103 bar, if included
on the plot, would strike the horizontal axis at an air flow rate of 0.330 kg/s. It also
means that at the operating point only 0.850�0.103 � 0.747 bar is used for conveying
material. This value will decrease with increase in pipeline length.
17.3.2.2 Plant pipeline of 105 mm bore
The actual length of the plant pipeline is 325 m and it is this length that needs to be
used to evaluate the air only pressure drop for the plant pipeline having the same bore
as the test pipeline. Taking the pipeline friction factor, f, to be 0.0045, the length of the
plant pipeline, L, as 325 m, the pipeline bore, d, as 0.105 m and the bend loss coeffi-
cient as 0.2 (Figure 10.6) for each of seven bends, gives:
Substituting this value, the air flow rate of 0.330 kg/s and the pipeline bore of 0.105 m
into Equation (17.2) gives:
This represents an increase in air only pressure drop of 0.298 � 0.103 � 0.195 bar. This
means that instead of having 0.747 bar for conveying material, it is now reduced to
0.747 � 0.195 � 0.552 bar. This represents a 26 per cent reduction in available pressure
drop and so this will have a very significant effect on the material flow rate that can be
achieved. This is in addition to the reduction as a consequence of scaling to a longer
pipeline.
To achieve the 15 tonne/h in the plant pipeline, however, a much larger bore pipeline
will be required and this will improve the situation considerably. When the conveying
characteristics are scaled in total these features can be seen, as with Figures 14.1, 14.4
� �pa 0.298 bar
� 4 0.0045 325
0.105 (7 0.2) 57.1�
� �� � �
� �pa 0.103 bar
� 4 0.0045 95
0.105 (9 0.2) 18.1�
� �� � �
CASE STUDIES 399
and 14.5. When only a single point is used the intermediate stage of the data scaled to
the plant pipeline, of the test pipeline bore, is not available. This means that a value for
the plant pipeline bore needs to be selected at this point. If the value chosen does not
meet the required duty the calculation will have to return to this point with an updated
value. For 15 tonne/h a bore of 250 mm will be selected.
17.3.2.3 Plant pipeline of 250 mm bore
Taking the pipeline friction factor, f, to be 0.0045, the length of the plant pipeline, L, as
325 m, the pipeline bore, d, as 0.250 m and the bend loss coefficient as 0.2 (Figure 10.6)
for each of seven bends, gives:
For the larger bore of pipeline a new air flow rate will be required. This can either be
determined by using Equation (17.1), as for the test pipeline, or scaling the 0.330 kg/s
for the test pipeline in proportion to the larger pipe section area. Either way the new air
flow rate will come to 1.87 kg/s.
Substituting the new value for �, the new air flow rate of 1.87 kg/s and the pipeline
bore of 0.250 m into Equation (17.2) gives:
The original operating point on the material conveying characteristics on Figure 17.2
was set at a pressure drop of 0.85 bar (point a). For the plant pipeline the air only pres-
sure drop is 0.139 bar whereas for the test pipeline it is 0.103 bar, which represents an
increase of 0.036 bar. The operating point on Figure 17.2 therefore needs to be reduced
by this amount for scaling purposes, to take account of the difference in air only pressure
drop values. The new operating point (b) is therefore at a pressure drop of 0.814 bar.
17.3.3 Equivalent lengths
The equivalent length of a pipeline for the conveying of material takes the length of hori-
zontal pipeline as the reference value. To this is added an equivalent length of straight
horizontal pipeline, both for the vertically up sections of pipeline and for the bends in the
pipeline. These two elements were considered in Chapter 14 on ‘Pipeline scaling param-
eters’. This procedure was considered at this point in the previous case study and an
expression for the equivalent length, Le, of a pipeline was given with Equation (16.3).
This is reproduced here as Equation (17.3) for use in this case study:
(17.3)
where h is the total length of horizontal sections of pipeline; v, the total length of verti-
cally up sections of pipeline; N, the total number of bends in pipeline and b, the equiva-
lent length of each bend.
L h v Nbe 2 m� � �
� �pa 0.139 bar
� 4 0.0045 325
(7 0.2) 24.8�� �
� � �0 25.
400 PNEUMATIC CONVEYING DESIGN GUIDE
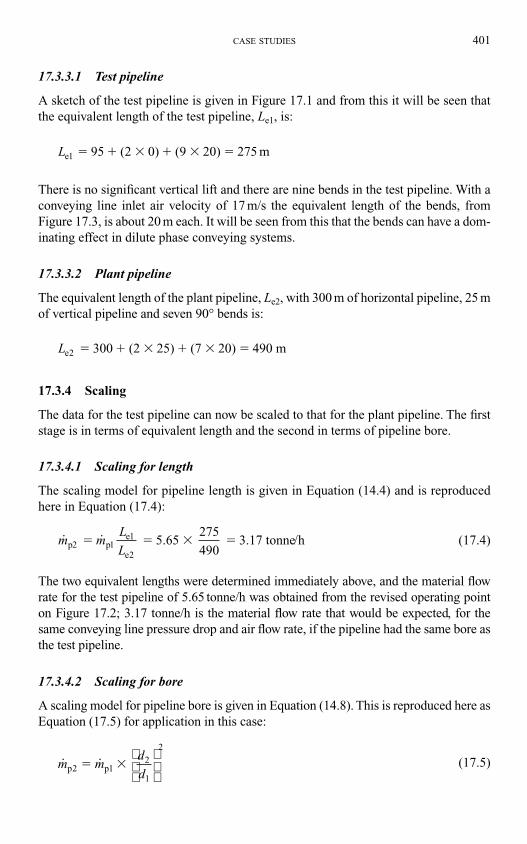
17.3.3.1 Test pipeline
A sketch of the test pipeline is given in Figure 17.1 and from this it will be seen that
the equivalent length of the test pipeline, Le1, is:
There is no significant vertical lift and there are nine bends in the test pipeline. With a
conveying line inlet air velocity of 17 m/s the equivalent length of the bends, from
Figure 17.3, is about 20 m each. It will be seen from this that the bends can have a dom-
inating effect in dilute phase conveying systems.
17.3.3.2 Plant pipeline
The equivalent length of the plant pipeline, Le2, with 300 m of horizontal pipeline, 25 m
of vertical pipeline and seven 90° bends is:
17.3.4 Scaling
The data for the test pipeline can now be scaled to that for the plant pipeline. The first
stage is in terms of equivalent length and the second in terms of pipeline bore.
17.3.4.1 Scaling for length
The scaling model for pipeline length is given in Equation (14.4) and is reproduced
here in Equation (17.4):
(17.4)
The two equivalent lengths were determined immediately above, and the material flow
rate for the test pipeline of 5.65 tonne/h was obtained from the revised operating point
on Figure 17.2; 3.17 tonne/h is the material flow rate that would be expected, for the
same conveying line pressure drop and air flow rate, if the pipeline had the same bore as
the test pipeline.
17.3.4.2 Scaling for bore
A scaling model for pipeline bore is given in Equation (14.8). This is reproduced here as
Equation (17.5) for application in this case:
(17.5)˙ ˙m md
dp p 2 12
1
2
� �
˙ ˙m mL
Lp pe
e
5.65 275
490 3.17 tonne/h2 1
1
2
� � � �
Le 300 (2 25) (7 20) 490 m2 � � � � � �
Le 95 (2 0) (9 20) 275 m1 � � � � � �
CASE STUDIES 401
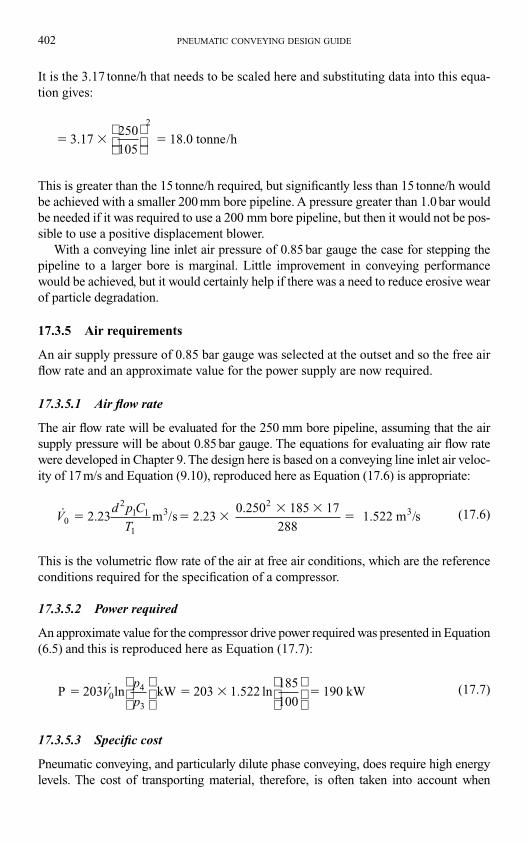
It is the 3.17 tonne/h that needs to be scaled here and substituting data into this equa-
tion gives:
This is greater than the 15 tonne/h required, but significantly less than 15 tonne/h would
be achieved with a smaller 200 mm bore pipeline. A pressure greater than 1.0 bar would
be needed if it was required to use a 200 mm bore pipeline, but then it would not be pos-
sible to use a positive displacement blower.
With a conveying line inlet air pressure of 0.85 bar gauge the case for stepping the
pipeline to a larger bore is marginal. Little improvement in conveying performance
would be achieved, but it would certainly help if there was a need to reduce erosive wear
of particle degradation.
17.3.5 Air requirements
An air supply pressure of 0.85 bar gauge was selected at the outset and so the free air
flow rate and an approximate value for the power supply are now required.
17.3.5.1 Air flow rate
The air flow rate will be evaluated for the 250 mm bore pipeline, assuming that the air
supply pressure will be about 0.85 bar gauge. The equations for evaluating air flow rate
were developed in Chapter 9. The design here is based on a conveying line inlet air veloc-
ity of 17 m/s and Equation (9.10), reproduced here as Equation (17.6) is appropriate:
(17.6)
This is the volumetric flow rate of the air at free air conditions, which are the reference
conditions required for the specification of a compressor.
17.3.5.2 Power required
An approximate value for the compressor drive power required was presented in Equation
(6.5) and this is reproduced here as Equation (17.7):
(17.7)
17.3.5.3 Specific cost
Pneumatic conveying, and particularly dilute phase conveying, does require high energy
levels. The cost of transporting material, therefore, is often taken into account when
P 203 ln kW 203 1.522 ln185
100 190 kW� � � �V
p
p04
3
˙ / /Vd p C
T0
21 1
1
2.23 m s 2.23 0.250 185 17
288 1.522 m s
32
3� � �� �
�
� � � 3.17 250
105 18.0 tonne/h
2
402 PNEUMATIC CONVEYING DESIGN GUIDE

selecting a conveying system. With an estimated value for power required it is possible to
evaluate conveying costs.
If the unit cost of electricity is taken as €0.10/kW �h the specific cost can be
evaluated as follows:
17.3.5.4 Solids loading ratio
The solids loading ratio, �, does not feature at all in these calculations. It is often
quoted for reference and so its value will be:
As can be seen this is very dilute phase conveying, as expected, but is typical of low
pressure long distance conveying systems handling this type of material.
� 18
3.6 1.87 2.7�
��
Specific cost 190 kW h
tonne
10c
kW h 1.06 per tonne conveyed� � � �
18 .€
CASE STUDIES 403
18.1 Introduction
Pneumatic conveying system design is generally carried out either by using published
mathematical models, or by using reliable conveying data that may be available.
Mathematical models are often used when some confidence has been established in
their suitability for a particular application, such as the conveying of a specified mater-
ial over a given range of conveying conditions. They are, however, generally restricted
to dilute phase suspension flow.
Conveying data is used extensively in situations where previous experience is avail-
able, or from the results of tests specifically carried out for the purpose of system
design. In cases where no previous experience of the material, or the range of convey-
ing conditions required is available, then conveying trials are usually carried out in
order to obtain the necessary data for system design. This is particularly so if dense
phase conveying is required.
In many cases a quick approximate answer is all that is required initially, rather
than a full design study, particularly if it is a feasibility study that is being carried out.
A quick check on the expected throughput of a given system is often wanted, or the
diameter of pipeline necessary for a given material flow rate may be needed. Very often
the air requirements, in terms of supply pressure and volumetric flow rate, are wanted
so that the approximate power required, and hence operating cost of the system can be
evaluated, as illustrated at the end of the last chapter.
Two first approximation methods for pneumatic conveying system design are pre-
sented that will provide a quick solution. One is applicable to both the dilute and dense
phase conveying of materials while the other is only for dilute phase suspension flow.
It must be emphasized that these are only first approximation solutions, as the title
states, and that they should not be used for design purposes. They will, however, provide
a reasonable guide to system parameters and can be applied very easily. A particular
advantage of one method is that it can be applied to dense phase conveying as well as
dilute phase.
18.1.1 Methods presented
One method is based on the value of the air only pressure drop for the pipeline, which
is a relatively straightforward parameter to evaluate. All the models and data likely to
be required for such an evaluation are presented in Chapter 10, and several applica-
tions of the equations are included in the case studies presented in the previous two
Chapter 18
First approximation design methods
FIRST APPROXIMATION DESIGN METHODS 405
chapters. It would be recommended that the use of this method should be restricted to
dilute phase suspension flow since the accuracy reduces at velocities below about
10 m/s and at solids loading ratios above 20.
The second method is based on the use of a universal set of conveying characteris-
tics, comprising two sets of data. One relates to straight pipeline and the other to the bends
in the pipeline. The data covers both dilute and dense phase conveying, but the dense
phase conveying is only applicable to sliding bed flow and hence fine powdered mater-
ials. It must be emphasized once again that these are strictly quick check methods and
will provide only a first approximation solution. This is primarily because there is no
reference anywhere in these procedures to the conveyed material.
18.2 Air only pressure drop method
Many of the basic models that are used in pneumatic conveying are mathematically
correct, or very closely so. This is the case in evaluating conveying air velocities, for
in most pneumatic conveying situations the volume occupied by the conveyed mater-
ial will be negligible in comparison with that of the air.
18.2.1 Basic equations
The Ideal Gas Law relates the volumetric flow rate of the air to the pressure and tem-
perature of the air. The volumetric flow rate of the air can also be expressed in terms
of the conveying air velocity and the pipeline bore. These models, therefore, can be
used quite reliably in gas–solid flow situations. Material mass flow rate can be intro-
duced in terms of the solids loading ratio of the conveyed material. The solids load-
ing ratio is a parameter that is often known approximately, and in these cases quite
simple equations can be derived equating the variables.
18.2.1.1 Solids loading ratio
Solids loading ratio, �, is defined as the ratio of the mass flow rate of the material con-
veyed, to the mass flow rate of the air used to convey the material and was presented
in the introductory chapter with Equation (1.3). This is a dimensionless ratio and is
a particularly useful parameter since its value remains constant along the length of a
pipeline, regardless of the air pressure and temperature, and conveying air velocity. It
is presented here as Equation (18.1):
(18.1)
where � is the solids loading ratio (dimensionless), m� p, the mass flow rate of material
(tonne/h) and m� a, the mass flow rate of air (kg/s).
18.2.1.2 The Ideal Gas Law
Air mass flow rate is not always a convenient parameter in this work and air flow
rate is often better expressed in volumetric terms. The Ideal Gas Law, for a steady flow
� p
a
�˙
. ˙
m
m3 6
406 PNEUMATIC CONVEYING DESIGN GUIDE
situation, however, presented in Equation (9.4), can be expressed in terms of air
flow rate:
(18.2)
18.2.1.3 Volumetric flow rate
An alternative, and more direct, expression for volumetric flow rate is derived from
the flow situation:
and for a circular pipe:
(18.3)
This is the actual volumetric flow rate. Since air and other gases are compressible,
volumetric flow rate will change with both pressure and temperature. It also means that
the conveying air velocity will vary along the length of a pipeline. A full explanation
and analysis of this was included in Chapter 9.
18.2.2 Derived relationships
The three equations presented above can be considered as being exact equations, and
so any combination of these equations will similarly produce precise relationships.
Although these equations include all the basic parameters in pneumatic conveying,
they will not produce design relationships. This is because they do not include the
necessary fundamental relationships between material flow rate, pressure drop and
conveying air velocity. Combinations of these three equations, however, produce equa-
tions that can be usefully used to check system designs. They will also provide a good
basis for the inclusion of design relationships.
18.2.2.1 Material flow rate
By substituting Equation (18.3) into (18.2) and then into Equation (18.1) and
re-arranging gives:
By putting R � 0.287 kJ/kg � K for air gives:
(18.4)mpCd
Tp 9.85 tonne/h� �2
md pC
RTp 3.6 tonne/h� � ��� 2
4
˙ /V Cd
m s3� �
� 2
4
V Velocity Flow Area� �
˙˙
mpV
RTa kg/s�
FIRST APPROXIMATION DESIGN METHODS 407
18.2.2.2 Pipeline bore
For a given material flow rate and conveying conditions, the diameter of the pipeline
is generally required. An alternative arrangement of Equation (18.4) gives:
(18.5)
18.2.2.3 Conveying line pressure drop
An alternative arrangement, in terms of the pressure required to convey the material
gives:
(18.6)
18.2.2.4 Reference conditions
The variables in these equations can be taken at any point along the pipeline. In the case
of air pressure and velocity, however, these are generally only known, with any degree
of accuracy, at the very start and end of a pipeline. Since the conveying line inlet air
velocity is probably the most critical parameter in system design it is generally conditions
at the material feed point, at the start of the pipeline, that are used for this purpose.
18.2.3 Empirical relationships
It will be seen from Equations (18.4) to (18.6) that, for a given material and pipeline,
there are only a limited number of variables relating the main conveying parameters.
Of these the conveying air temperature will be known and either the material flow rate
required, pipeline bore to be used, or conveying line pressure drop available will be
specified. This means that there are only four variables in these equations.
It will be possible to provide solutions to Equations (18.4)–(18.6), therefore, if two
further relationships can be provided. These will, by necessity, be empirical, and so the
accuracy of any expressions developed will depend upon the accuracy of the empirical
relationships used.
18.2.3.1 Conveying line inlet air velocity
The conveying line inlet air velocity, C1, to be employed is a value that should be known
with a high degree of certainty. The value depends very much upon the material to be
conveyed, although for dilute phase conveying it will be in a fairly narrow range of val-
ues, and is generally expressed in terms of the minimum value of conveying air velocity
for the material.
For dilute phase conveying the minimum value of conveying air velocity, Cmin, will
almost certainly be above 10 m/s. For cement and similar materials it is about 10–11 m/s,
and for fine fly ash and similar materials it is about 11–12 m/s. For granular alumina it
pm T
Cd 0.1015 kN/m abs
p 2�˙
2�
dm T
pC 0.319 m
p�
˙.
�
0 5
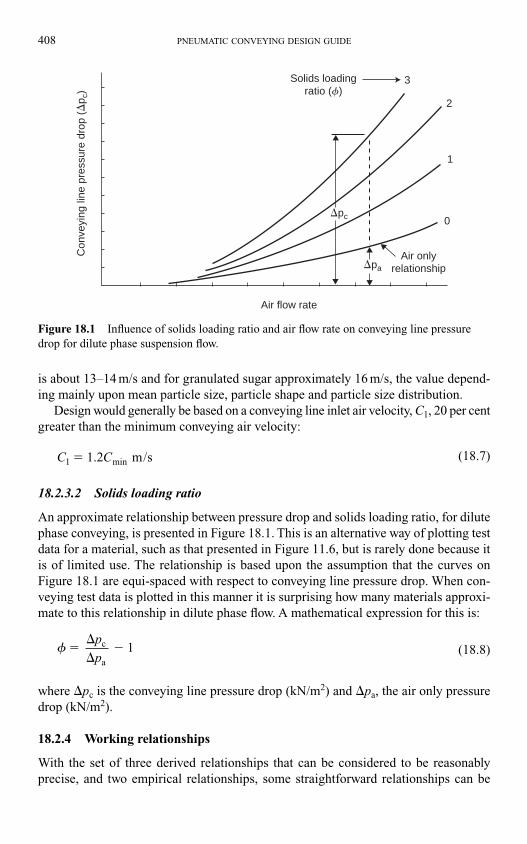
408 PNEUMATIC CONVEYING DESIGN GUIDE
is about 13–14 m/s and for granulated sugar approximately 16 m/s, the value depend-
ing mainly upon mean particle size, particle shape and particle size distribution.
Design would generally be based on a conveying line inlet air velocity, C1, 20 per cent
greater than the minimum conveying air velocity:
(18.7)
18.2.3.2 Solids loading ratio
An approximate relationship between pressure drop and solids loading ratio, for dilute
phase conveying, is presented in Figure 18.1. This is an alternative way of plotting test
data for a material, such as that presented in Figure 11.6, but is rarely done because it
is of limited use. The relationship is based upon the assumption that the curves on
Figure 18.1 are equi-spaced with respect to conveying line pressure drop. When con-
veying test data is plotted in this manner it is surprising how many materials approxi-
mate to this relationship in dilute phase flow. A mathematical expression for this is:
(18.8)
where �pc is the conveying line pressure drop (kN/m2) and �pa, the air only pressure
drop (kN/m2).
18.2.4 Working relationships
With the set of three derived relationships that can be considered to be reasonably
precise, and two empirical relationships, some straightforward relationships can be
� 1c
a
��
��
p
p
C C1 1.2 m/smin�
3
2
1
0
Air onlyrelationship
Solids loadingratio (f)
�pc
�pa
Air flow rate
Con
veyi
ng li
ne p
ress
ure
drop
(�
p c)
Figure 18.1 Influence of solids loading ratio and air flow rate on conveying line pressure
drop for dilute phase suspension flow.
FIRST APPROXIMATION DESIGN METHODS 409
obtained that can be used for providing a quick check on a system design or on the
operation of an existing system.
18.2.4.1 Material flow rate
By directly equating Equations (18.1) and (18.8) and re-arranging, an expression for
material flow rate is derived:
(18.9)
If air mass flow rate, m. a, is not a convenient parameter, it can be expressed in terms
of conveying air velocity by substituting Equation (15.3) to give:
(18.10)
Pipeline inlet conditions are the most convenient to use here.
18.2.4.1.1 Negative pressure systems
For vacuum systems the pressure, p, will be atmospheric.
18.2.4.1.2 Positive pressure systems
For positive pressure systems the pressure, p, in Equation (18.10) will be equal to the
conveying line pressure drop, �pc, plus atmospheric pressure. This is:
where �pc is the conveying line pressure drop (kN/m2) and patm, atmospheric pressure
(kN/m2)
18.2.4.2 Pipeline bore
By substituting the solids loading ratio, �, from Equation (18.8) into (18.5), the
expression can be in terms of the pipeline bore required:
(18.11)
The situation for both positive and negative pressure systems is the same as
above.
dm T p
pC p p 0.319
m
p a
c a
��
� � �
˙
( )
p p p c atm� � �
mpCd
T
p
ppc
a
9.85 tonne/h� ��
��
2
1
˙ ˙m mp
pp ac
a
3.6 tonne/h��
��1
410 PNEUMATIC CONVEYING DESIGN GUIDE
18.2.4.3 Air supply pressure
Alternatively, the expression can be in terms of the pressure required to convey the
material. Substituting the solids loading ratio, �, from Equation (18.8) into (18.6)
gives:
(18.12)
Pipeline inlet conditions are again the most convenient to use.
18.2.4.3.1 Negative pressure systems
For negative pressure systems the pressure, p, will be atmospheric and hence �pc can
be determined, which is the value required in this case. Re-arranging Equation (18.12)
and expressing in terms of pipeline inlet conditions gives:
(18.13)
18.2.4.3.2 Positive pressure systems
For a positive pressure system:
Substituting this into Equation (18.12) and expressing in terms of pipeline inlet con-
ditions gives:
This is a quadratic equation, the solution to which is:
(18.14)
Note: This will give the correct root.
18.2.4.4 Air only pressure drop
Since the air only pressure drop, �pa, features prominently in these models, a conven-
ient expression for this pressure drop is required. An expression that will give the air
only pressure drop in terms of conveying line inlet, or exit, air velocity is needed.
p p p p pm T p
C d
1
2 (
atm a atm a
p a� � � � � � �
�)
˙
.
2 1
12
2 46
12
p p p pm T p
C d1 1
1
12
( )˙
0.1015 atm a
p a� � � � �
�
� � �p p pc atm
� � � �p pm T
C d pc a
p
atm
2 0.1015 1 kN/m
˙1
12
pm T
Cd
p
p p 0.1015
kN/m abs
p a
c a
2� � ��
� � �
˙
( )2
FIRST APPROXIMATION DESIGN METHODS 411
18.2.4.4.1 Negative pressure systems
For negative pressure systems the expression also needs to be in terms of the inlet air
pressure, p1, since this is generally known (usually atmospheric). Such an equation
was developed in Chapter 10 (Equation (10.20)) and is:
(18.15)
Note: The value of R for air will have to be 287 J/kg � K to make the group in the
brackets dimensionless, and then the units of �pa will be same as those used for p1.
18.2.4.4.2 Positive pressure systems
For positive pressure systems the expression needs to be in terms of the exit pressure,
p2, since this is generally known (usually atmospheric). Such an equation, also devel-
oped in Chapter 10 (Equation (10.17)) is:
(18.16)
Note that R must have units of J/kg � K as in Equation (18.15) above.
18.2.4.5 Vertical conveying
The models presented so far relate essentially to horizontal pipelines. Most pneumatic
conveying systems, however, will include a vertical lift and so this needs to be taken
into account. The pressure drop in vertical conveying over a very wide range of solids
loading ratio values, is approximately double that for horizontal conveying, as consid-
ered in Chapter 14. Sections of vertical conveying in a pipeline, therefore, can most
conveniently be accounted for by working in terms of an equivalent length and allow-
ing double for vertical lifts. This equivalent length replaces the actual pipeline length
in Equation (10.2) and subsequent equations.
18.2.5 Procedure
To illustrate the process it is proposed to investigate the possibility of conveying a coarse
material at a flow rate, m� p1, of 30 tonne/h using a positive displacement blower and a
positive pressure conveying system. The pipeline is 135 m long, with 110 m horizon-
tal and 25 m vertical lift, giving an equivalent length, Le, of 160 m, plus five 90° bends.
It is assumed that the temperature of the air and material at the conveying line inlet,
T1, are 300 K (27°C).
In the first instance the possibility of conveying the material in a 200 mm bore
pipeline, d1, is to be investigated. Since the material can only be conveyed in dilute phase
suspension flow a conveying line inlet air velocity, C1, of 17 m/s is taken.
� � � �p pC
RTa 222
2
0 5
1 1�
.
� � � �p pC
RTa 112
1
0 5
1 1�
.
18.2.5.1 Air only pressure drop
The starting point in the process is to evaluate the air only pressure drop, �pa, for
the pipeline and potential conveying parameters. Details of the pipeline are specified
but those for the conveying parameters will not be known until the calculation is com-
pleted, and so assumptions will need to be made in order to get the process started.
If, at the end of the calculation the assumptions made are too far removed from the
values calculated, the process will have to be repeated, and hence it is an iterative
solution.
Possibly the best equation for the air only pressure drop for the given situation is
Equation (18.16) presented above. The conveying line outlet air velocity, C2, is the only
unknown here and so a value has to be estimated. If it is estimated that the conveying
line pressure drop will be about 0.75 bar, then C2 will approximately equal 1.75 � C1,
and as C1 is 17 m/s, as specified earlier, then C2 will be approximately 30 m/s.
The pipeline friction loss coefficient was presented in Chapter 10:
(18.17)
This was Equation (10.11). Taking a bend loss coefficient of 0.2 (Figure 10.6) for each
of the five bends, and a pipeline exit loss coefficient of 1.0 (Figure 10.10), gives a
value of �k � 2. Substituting a pipeline friction coefficient f � 0.0045, the equivalent
length of 160 m and the pipeline bore of 0.2 m gives:
Substituting these values for C2 and � into Equation (18.16), along with the known
parameters, gives:
18.2.5.2 Air supply pressure
Since the pipeline bore and material flow rate have been specified, it is the conveying
line pressure drop that needs to be determined. Equation (18.14), developed and pre-
sented above, is appropriate for the given situation and the substitution of the param-
eters into this equation gives:
p 1
2 8.34 (101.3 8.34)
30 300 8.34
17 0.2
174.1 kN/m abs
2
2
2
� � � � �� �
� �
�
101 32 46
12
..
� � ��
�� �pa
22
101.3 16.4 30
287 300 8.34 kN/m1 1
0 5
.
� 16.4�
� 4
� � �fL
dk
412 PNEUMATIC CONVEYING DESIGN GUIDE
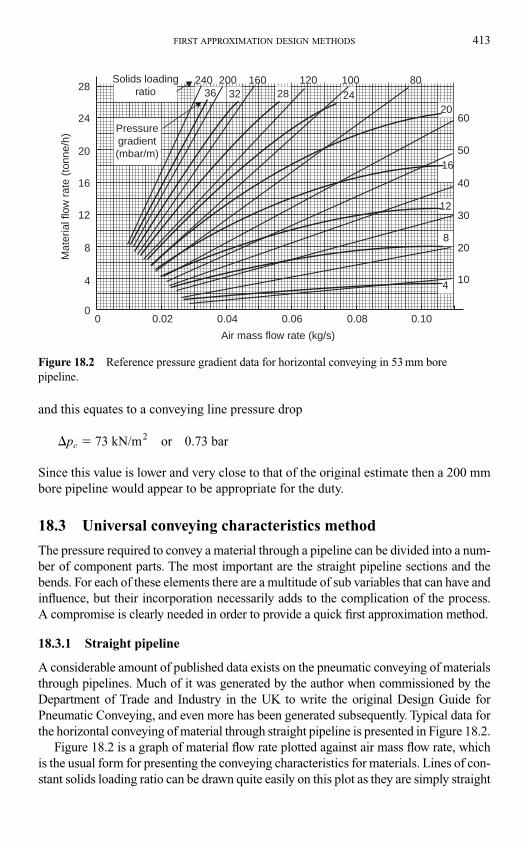
FIRST APPROXIMATION DESIGN METHODS 413
and this equates to a conveying line pressure drop
Since this value is lower and very close to that of the original estimate then a 200 mm
bore pipeline would appear to be appropriate for the duty.
18.3 Universal conveying characteristics method
The pressure required to convey a material through a pipeline can be divided into a num-
ber of component parts. The most important are the straight pipeline sections and the
bends. For each of these elements there are a multitude of sub variables that can have and
influence, but their incorporation necessarily adds to the complication of the process.
A compromise is clearly needed in order to provide a quick first approximation method.
18.3.1 Straight pipeline
A considerable amount of published data exists on the pneumatic conveying of materials
through pipelines. Much of it was generated by the author when commissioned by the
Department of Trade and Industry in the UK to write the original Design Guide for
Pneumatic Conveying, and even more has been generated subsequently. Typical data for
the horizontal conveying of material through straight pipeline is presented in Figure 18.2.
Figure 18.2 is a graph of material flow rate plotted against air mass flow rate, which
is the usual form for presenting the conveying characteristics for materials. Lines of con-
stant solids loading ratio can be drawn quite easily on this plot as they are simply straight
� �pc2
73 kN/m or 0.73 bar
Mat
eria
l flo
w r
ate
(ton
ne/h
)
Air mass flow rate (kg/s)
0
4
8
12
16
20
24
28
0 0.02 0.06 0.10
10
20
36 32 28 24
16
12
820
30
40
50
60
80100120160200240
0.080.04
Solids loadingratio
Pressuregradient(mbar/m)
4
Figure 18.2 Reference pressure gradient data for horizontal conveying in 53 mm bore
pipeline.
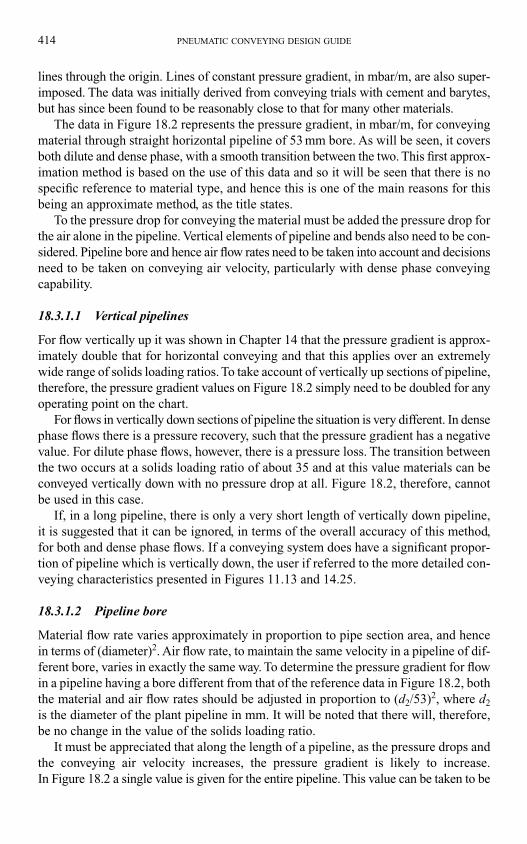
lines through the origin. Lines of constant pressure gradient, in mbar/m, are also super-
imposed. The data was initially derived from conveying trials with cement and barytes,
but has since been found to be reasonably close to that for many other materials.
The data in Figure 18.2 represents the pressure gradient, in mbar/m, for conveying
material through straight horizontal pipeline of 53 mm bore. As will be seen, it covers
both dilute and dense phase, with a smooth transition between the two. This first approx-
imation method is based on the use of this data and so it will be seen that there is no
specific reference to material type, and hence this is one of the main reasons for this
being an approximate method, as the title states.
To the pressure drop for conveying the material must be added the pressure drop for
the air alone in the pipeline. Vertical elements of pipeline and bends also need to be con-
sidered. Pipeline bore and hence air flow rates need to be taken into account and decisions
need to be taken on conveying air velocity, particularly with dense phase conveying
capability.
18.3.1.1 Vertical pipelines
For flow vertically up it was shown in Chapter 14 that the pressure gradient is approx-
imately double that for horizontal conveying and that this applies over an extremely
wide range of solids loading ratios. To take account of vertically up sections of pipeline,
therefore, the pressure gradient values on Figure 18.2 simply need to be doubled for any
operating point on the chart.
For flows in vertically down sections of pipeline the situation is very different. In dense
phase flows there is a pressure recovery, such that the pressure gradient has a negative
value. For dilute phase flows, however, there is a pressure loss. The transition between
the two occurs at a solids loading ratio of about 35 and at this value materials can be
conveyed vertically down with no pressure drop at all. Figure 18.2, therefore, cannot
be used in this case.
If, in a long pipeline, there is only a very short length of vertically down pipeline,
it is suggested that it can be ignored, in terms of the overall accuracy of this method,
for both and dense phase flows. If a conveying system does have a significant propor-
tion of pipeline which is vertically down, the user if referred to the more detailed con-
veying characteristics presented in Figures 11.13 and 14.25.
18.3.1.2 Pipeline bore
Material flow rate varies approximately in proportion to pipe section area, and hence
in terms of (diameter)2. Air flow rate, to maintain the same velocity in a pipeline of dif-
ferent bore, varies in exactly the same way. To determine the pressure gradient for flow
in a pipeline having a bore different from that of the reference data in Figure 18.2, both
the material and air flow rates should be adjusted in proportion to (d2/53)2, where d2
is the diameter of the plant pipeline in mm. It will be noted that there will, therefore,
be no change in the value of the solids loading ratio.
It must be appreciated that along the length of a pipeline, as the pressure drops and
the conveying air velocity increases, the pressure gradient is likely to increase.
In Figure 18.2 a single value is given for the entire pipeline. This value can be taken to be
414 PNEUMATIC CONVEYING DESIGN GUIDE
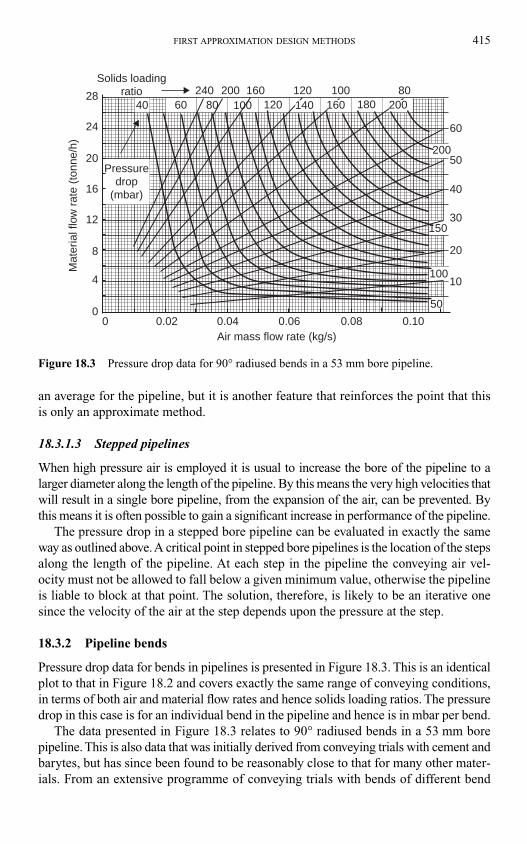
FIRST APPROXIMATION DESIGN METHODS 415
an average for the pipeline, but it is another feature that reinforces the point that this
is only an approximate method.
18.3.1.3 Stepped pipelines
When high pressure air is employed it is usual to increase the bore of the pipeline to a
larger diameter along the length of the pipeline. By this means the very high velocities that
will result in a single bore pipeline, from the expansion of the air, can be prevented. By
this means it is often possible to gain a significant increase in performance of the pipeline.
The pressure drop in a stepped bore pipeline can be evaluated in exactly the same
way as outlined above. A critical point in stepped bore pipelines is the location of the steps
along the length of the pipeline. At each step in the pipeline the conveying air vel-
ocity must not be allowed to fall below a given minimum value, otherwise the pipeline
is liable to block at that point. The solution, therefore, is likely to be an iterative one
since the velocity of the air at the step depends upon the pressure at the step.
18.3.2 Pipeline bends
Pressure drop data for bends in pipelines is presented in Figure 18.3. This is an identical
plot to that in Figure 18.2 and covers exactly the same range of conveying conditions,
in terms of both air and material flow rates and hence solids loading ratios. The pressure
drop in this case is for an individual bend in the pipeline and hence is in mbar per bend.
The data presented in Figure 18.3 relates to 90° radiused bends in a 53 mm bore
pipeline. This is also data that was initially derived from conveying trials with cement and
barytes, but has since been found to be reasonably close to that for many other mater-
ials. From an extensive programme of conveying trials with bends of different bend
Air mass flow rate (kg/s)0 0.02 0.06 0.100.080.04
Mat
eria
l flo
w r
ate
(ton
ne/h
)
0
4
8
12
16
20
24
28 808060
100120160200240Solids loading
ratio
Pressuredrop
(mbar)
10
20
200
150
50
30
40
50
60
40 100 120 160 180 200140
100
Figure 18.3 Pressure drop data for 90° radiused bends in a 53 mm bore pipeline.
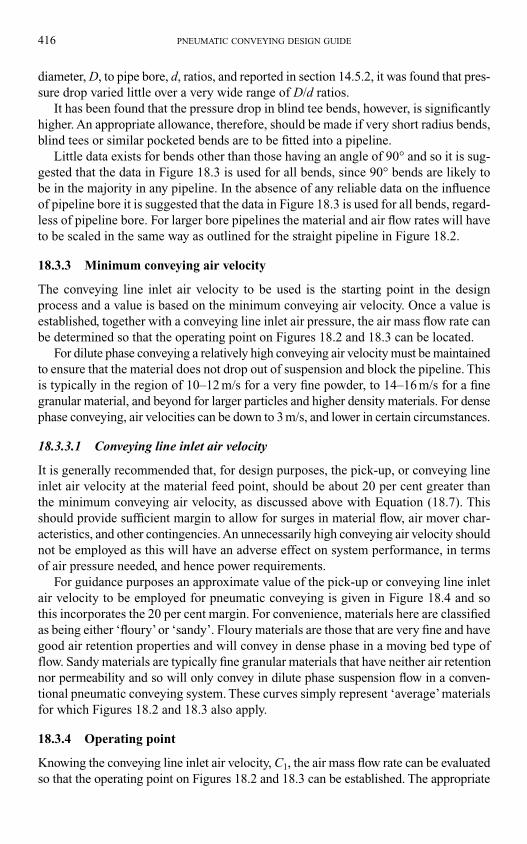
416 PNEUMATIC CONVEYING DESIGN GUIDE
diameter, D, to pipe bore, d, ratios, and reported in section 14.5.2, it was found that pres-
sure drop varied little over a very wide range of D/d ratios.
It has been found that the pressure drop in blind tee bends, however, is significantly
higher. An appropriate allowance, therefore, should be made if very short radius bends,
blind tees or similar pocketed bends are to be fitted into a pipeline.
Little data exists for bends other than those having an angle of 90° and so it is sug-
gested that the data in Figure 18.3 is used for all bends, since 90° bends are likely to
be in the majority in any pipeline. In the absence of any reliable data on the influence
of pipeline bore it is suggested that the data in Figure 18.3 is used for all bends, regard-
less of pipeline bore. For larger bore pipelines the material and air flow rates will have
to be scaled in the same way as outlined for the straight pipeline in Figure 18.2.
18.3.3 Minimum conveying air velocity
The conveying line inlet air velocity to be used is the starting point in the design
process and a value is based on the minimum conveying air velocity. Once a value is
established, together with a conveying line inlet air pressure, the air mass flow rate can
be determined so that the operating point on Figures 18.2 and 18.3 can be located.
For dilute phase conveying a relatively high conveying air velocity must be maintained
to ensure that the material does not drop out of suspension and block the pipeline. This
is typically in the region of 10–12 m/s for a very fine powder, to 14–16 m/s for a fine
granular material, and beyond for larger particles and higher density materials. For dense
phase conveying, air velocities can be down to 3 m/s, and lower in certain circumstances.
18.3.3.1 Conveying line inlet air velocity
It is generally recommended that, for design purposes, the pick-up, or conveying line
inlet air velocity at the material feed point, should be about 20 per cent greater than
the minimum conveying air velocity, as discussed above with Equation (18.7). This
should provide sufficient margin to allow for surges in material flow, air mover char-
acteristics, and other contingencies. An unnecessarily high conveying air velocity should
not be employed as this will have an adverse effect on system performance, in terms
of air pressure needed, and hence power requirements.
For guidance purposes an approximate value of the pick-up or conveying line inlet
air velocity to be employed for pneumatic conveying is given in Figure 18.4 and so
this incorporates the 20 per cent margin. For convenience, materials here are classified
as being either ‘floury’or ‘sandy’. Floury materials are those that are very fine and have
good air retention properties and will convey in dense phase in a moving bed type of
flow. Sandy materials are typically fine granular materials that have neither air retention
nor permeability and so will only convey in dilute phase suspension flow in a conven-
tional pneumatic conveying system. These curves simply represent ‘average’ materials
for which Figures 18.2 and 18.3 also apply.
18.3.4 Operating point
Knowing the conveying line inlet air velocity, C1, the air mass flow rate can be evaluated
so that the operating point on Figures 18.2 and 18.3 can be established. The appropriate
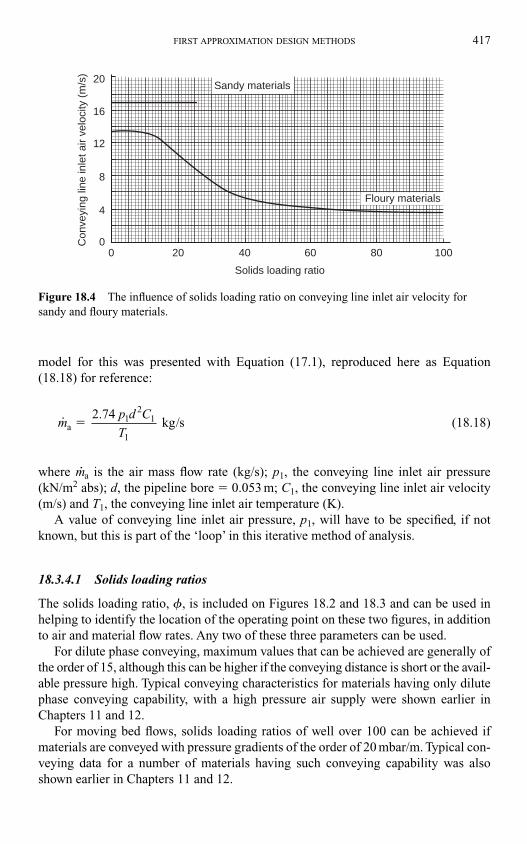
FIRST APPROXIMATION DESIGN METHODS 417
model for this was presented with Equation (17.1), reproduced here as Equation
(18.18) for reference:
(18.18)
where m�a is the air mass flow rate (kg/s); p1, the conveying line inlet air pressure
(kN/m2 abs); d, the pipeline bore � 0.053 m; C1, the conveying line inlet air velocity
(m/s) and T1, the conveying line inlet air temperature (K).
A value of conveying line inlet air pressure, p1, will have to be specified, if not
known, but this is part of the ‘loop’ in this iterative method of analysis.
18.3.4.1 Solids loading ratios
The solids loading ratio, �, is included on Figures 18.2 and 18.3 and can be used in
helping to identify the location of the operating point on these two figures, in addition
to air and material flow rates. Any two of these three parameters can be used.
For dilute phase conveying, maximum values that can be achieved are generally of
the order of 15, although this can be higher if the conveying distance is short or the avail-
able pressure high. Typical conveying characteristics for materials having only dilute
phase conveying capability, with a high pressure air supply were shown earlier in
Chapters 11 and 12.
For moving bed flows, solids loading ratios of well over 100 can be achieved if
materials are conveyed with pressure gradients of the order of 20 mbar/m. Typical con-
veying data for a number of materials having such conveying capability was also
shown earlier in Chapters 11 and 12.
mp d C
Ta 2.74
kg/s� 12
1
1
00
4
8
12
16
20C
onve
ying
line
inle
t air
velo
city
(m
/s)
20 40 60 80 100
Solids loading ratio
Sandy materials
Floury materials
Figure 18.4 The influence of solids loading ratio on conveying line inlet air velocity for
sandy and floury materials.
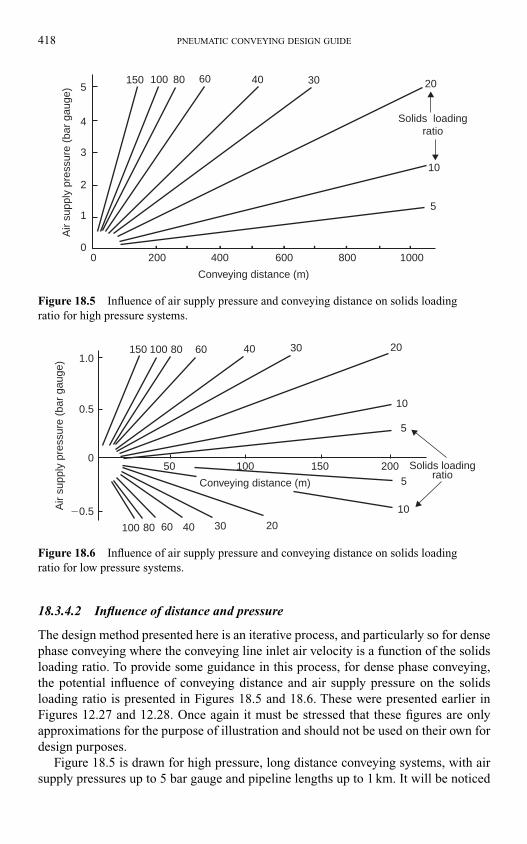
418 PNEUMATIC CONVEYING DESIGN GUIDE
18.3.4.2 Influence of distance and pressure
The design method presented here is an iterative process, and particularly so for dense
phase conveying where the conveying line inlet air velocity is a function of the solids
loading ratio. To provide some guidance in this process, for dense phase conveying,
the potential influence of conveying distance and air supply pressure on the solids
loading ratio is presented in Figures 18.5 and 18.6. These were presented earlier in
Figures 12.27 and 12.28. Once again it must be stressed that these figures are only
approximations for the purpose of illustration and should not be used on their own for
design purposes.
Figure 18.5 is drawn for high pressure, long distance conveying systems, with air
supply pressures up to 5 bar gauge and pipeline lengths up to 1 km. It will be noticed
5
4
3
2
1
00 200 400 600 800 1000
Air
supp
ly p
ress
ure
(bar
gau
ge)
Conveying distance (m)
150 100 80 60 40 30 20
10
5
Solids loadingratio
Figure 18.5 Influence of air supply pressure and conveying distance on solids loading
ratio for high pressure systems.
100 80 60 40 30 20
10
5200150
5
10050
10
20304060801001501.0
0.5
0
�0.5
Conveying distance (m)
Solids loadingratio
Air
supp
ly p
ress
ure
(bar
gau
ge)
Figure 18.6 Influence of air supply pressure and conveying distance on solids loading
ratio for low pressure systems.
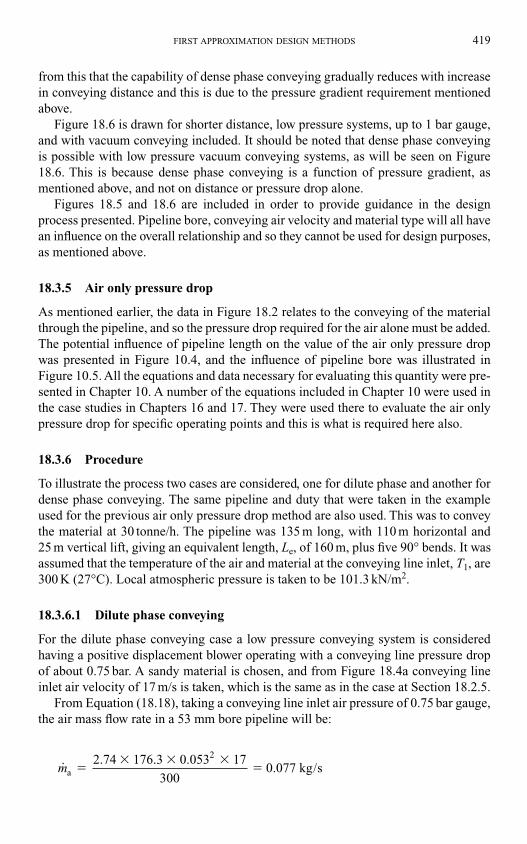
FIRST APPROXIMATION DESIGN METHODS 419
from this that the capability of dense phase conveying gradually reduces with increase
in conveying distance and this is due to the pressure gradient requirement mentioned
above.
Figure 18.6 is drawn for shorter distance, low pressure systems, up to 1 bar gauge,
and with vacuum conveying included. It should be noted that dense phase conveying
is possible with low pressure vacuum conveying systems, as will be seen on Figure
18.6. This is because dense phase conveying is a function of pressure gradient, as
mentioned above, and not on distance or pressure drop alone.
Figures 18.5 and 18.6 are included in order to provide guidance in the design
process presented. Pipeline bore, conveying air velocity and material type will all have
an influence on the overall relationship and so they cannot be used for design purposes,
as mentioned above.
18.3.5 Air only pressure drop
As mentioned earlier, the data in Figure 18.2 relates to the conveying of the material
through the pipeline, and so the pressure drop required for the air alone must be added.
The potential influence of pipeline length on the value of the air only pressure drop
was presented in Figure 10.4, and the influence of pipeline bore was illustrated in
Figure 10.5. All the equations and data necessary for evaluating this quantity were pre-
sented in Chapter 10. A number of the equations included in Chapter 10 were used in
the case studies in Chapters 16 and 17. They were used there to evaluate the air only
pressure drop for specific operating points and this is what is required here also.
18.3.6 Procedure
To illustrate the process two cases are considered, one for dilute phase and another for
dense phase conveying. The same pipeline and duty that were taken in the example
used for the previous air only pressure drop method are also used. This was to convey
the material at 30 tonne/h. The pipeline was 135 m long, with 110 m horizontal and
25 m vertical lift, giving an equivalent length, Le, of 160 m, plus five 90° bends. It was
assumed that the temperature of the air and material at the conveying line inlet, T1, are
300 K (27°C). Local atmospheric pressure is taken to be 101.3 kN/m2.
18.3.6.1 Dilute phase conveying
For the dilute phase conveying case a low pressure conveying system is considered
having a positive displacement blower operating with a conveying line pressure drop
of about 0.75 bar. A sandy material is chosen, and from Figure 18.4a conveying line
inlet air velocity of 17 m/s is taken, which is the same as in the case at Section 18.2.5.
From Equation (18.18), taking a conveying line inlet air pressure of 0.75 bar gauge,
the air mass flow rate in a 53 mm bore pipeline will be:
ma
2
2.74 176.3 0.053 17
300 0.077 kg/s�
� � ��
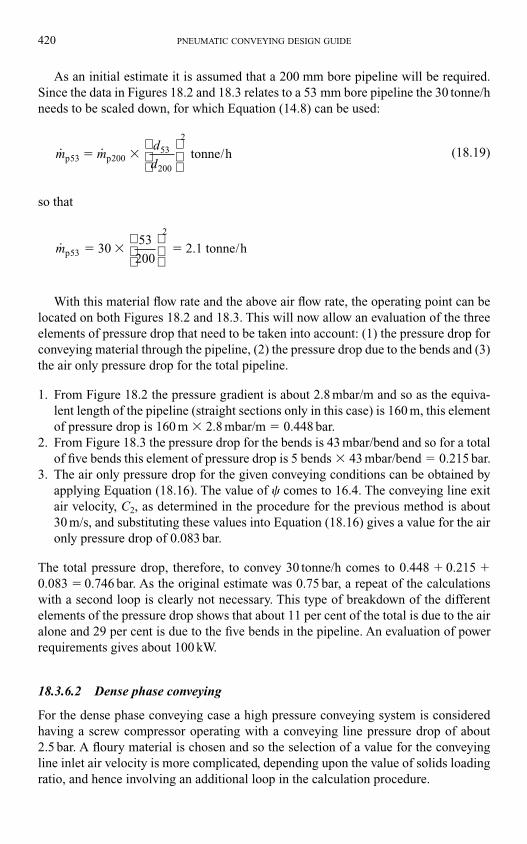
As an initial estimate it is assumed that a 200 mm bore pipeline will be required.
Since the data in Figures 18.2 and 18.3 relates to a 53 mm bore pipeline the 30 tonne/h
needs to be scaled down, for which Equation (14.8) can be used:
(18.19)
so that
With this material flow rate and the above air flow rate, the operating point can be
located on both Figures 18.2 and 18.3. This will now allow an evaluation of the three
elements of pressure drop that need to be taken into account: (1) the pressure drop for
conveying material through the pipeline, (2) the pressure drop due to the bends and (3)
the air only pressure drop for the total pipeline.
1. From Figure 18.2 the pressure gradient is about 2.8 mbar/m and so as the equiva-
lent length of the pipeline (straight sections only in this case) is 160 m, this element
of pressure drop is 160 m � 2.8 mbar/m � 0.448 bar.
2. From Figure 18.3 the pressure drop for the bends is 43 mbar/bend and so for a total
of five bends this element of pressure drop is 5 bends � 43 mbar/bend � 0.215 bar.
3. The air only pressure drop for the given conveying conditions can be obtained by
applying Equation (18.16). The value of � comes to 16.4. The conveying line exit
air velocity, C2, as determined in the procedure for the previous method is about
30 m/s, and substituting these values into Equation (18.16) gives a value for the air
only pressure drop of 0.083 bar.
The total pressure drop, therefore, to convey 30 tonne/h comes to 0.448 � 0.215 �0.083 � 0.746 bar. As the original estimate was 0.75 bar, a repeat of the calculations
with a second loop is clearly not necessary. This type of breakdown of the different
elements of the pressure drop shows that about 11 per cent of the total is due to the air
alone and 29 per cent is due to the five bends in the pipeline. An evaluation of power
requirements gives about 100 kW.
18.3.6.2 Dense phase conveying
For the dense phase conveying case a high pressure conveying system is considered
having a screw compressor operating with a conveying line pressure drop of about
2.5 bar. A floury material is chosen and so the selection of a value for the conveying
line inlet air velocity is more complicated, depending upon the value of solids loading
ratio, and hence involving an additional loop in the calculation procedure.
mp 30 53
200 2.1 tonne/h53
2
� � �
˙ ˙m md
dp p tonne/h53 20053
200
2
� �
420 PNEUMATIC CONVEYING DESIGN GUIDE
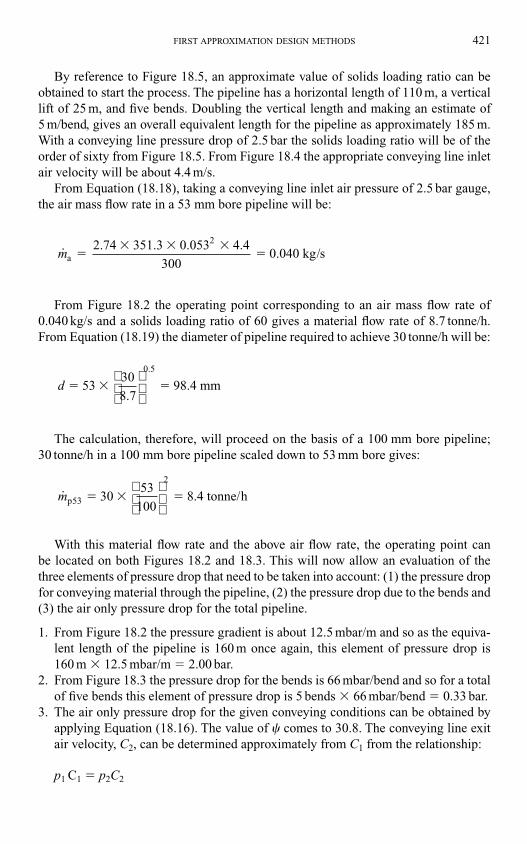
FIRST APPROXIMATION DESIGN METHODS 421
By reference to Figure 18.5, an approximate value of solids loading ratio can be
obtained to start the process. The pipeline has a horizontal length of 110 m, a vertical
lift of 25 m, and five bends. Doubling the vertical length and making an estimate of
5 m/bend, gives an overall equivalent length for the pipeline as approximately 185 m.
With a conveying line pressure drop of 2.5 bar the solids loading ratio will be of the
order of sixty from Figure 18.5. From Figure 18.4 the appropriate conveying line inlet
air velocity will be about 4.4 m/s.
From Equation (18.18), taking a conveying line inlet air pressure of 2.5 bar gauge,
the air mass flow rate in a 53 mm bore pipeline will be:
From Figure 18.2 the operating point corresponding to an air mass flow rate of
0.040 kg/s and a solids loading ratio of 60 gives a material flow rate of 8.7 tonne/h.
From Equation (18.19) the diameter of pipeline required to achieve 30 tonne/h will be:
The calculation, therefore, will proceed on the basis of a 100 mm bore pipeline;
30 tonne/h in a 100 mm bore pipeline scaled down to 53 mm bore gives:
With this material flow rate and the above air flow rate, the operating point can
be located on both Figures 18.2 and 18.3. This will now allow an evaluation of the
three elements of pressure drop that need to be taken into account: (1) the pressure drop
for conveying material through the pipeline, (2) the pressure drop due to the bends and
(3) the air only pressure drop for the total pipeline.
1. From Figure 18.2 the pressure gradient is about 12.5 mbar/m and so as the equiva-
lent length of the pipeline is 160 m once again, this element of pressure drop is
160 m � 12.5 mbar/m � 2.00 bar.
2. From Figure 18.3 the pressure drop for the bends is 66 mbar/bend and so for a total
of five bends this element of pressure drop is 5 bends � 66 mbar/bend � 0.33 bar.
3. The air only pressure drop for the given conveying conditions can be obtained by
applying Equation (18.16). The value of � comes to 30.8. The conveying line exit
air velocity, C2, can be determined approximately from C1 from the relationship:
p1 C1 � p2C2
mp 30 53
100 8.4 tonne/h53
2
� � �
d 53 30
8.7 98.4 mm� � �
0 5.
ma
2
2.74 351.3 0.053 4.4
0.040 kg/s�� � �
�300
since there is no change in pipeline bore or temperature and so
from which
C2 �15.3 m/s
and substituting the values for � and C2 into Equation (18.16) gives a value for the air
only pressure drop of 0.042 bar.
The total pressure drop, therefore, to convey 30 tonne/h comes to 2.00 � 0.33 �0.04 � 2.37 bar.
Checks now need to be made. For the solids loading ratio the air mass flow rate is
required and so from Equation (18.18):
This relates to the 100 mm bore pipeline through which 30 tonne/h is to be con-
veyed and so the solids loading ratio, from Equation (18.1), is:
This is close enough to the original estimate of 60 and the pressure drop of 2.37 bar
is sufficiently close to the 2.5 bar selected for repeat calculations not to be necessary,
particularly as the solids loading ratio is higher than estimated and the pressure drop
is lower than estimated.
A breakdown of the different elements of pressure drop for this case shows that
about 2 per cent of the total is due to the air alone and 14 per cent is due to the five
bends in the pipeline. The power requirements for this case are approximately 30 kW.
These numbers are very different from those for the dilute phase conveying of the
material at the same flow rate and through the same pipeline.
� 30
3.6 0.136 61�
��
ma
2
2.74 338.3 0.100 4.4
0.136 kg/s�� � �
�300
351 3 2. 4.4 101.3 � � � C
422 PNEUMATIC CONVEYING DESIGN GUIDE
19.1 Introduction
Not all pneumatic conveying systems are dedicated to the conveying of a single mater-
ial over just one distance. In many cases several materials have to be conveyed to a
number of different reception points. In a manufacturing process a single pipeline may
be used to convey a diverse range of materials from a number of supply hoppers to a sin-
gle delivery point for blending. In many industries, such as glass and food, a wide var-
iety of materials have to be conveyed by a common system, since there is a requirement
to deliver a given ‘menu’ for a particular process.
In ship off-loading a single line may be used to unload several different materials
and to convey them to separate locations. Road and rail vehicles, and ships with their
own off-loading facilities, are often required to discharge their materials into reception
silos through pipelines of varying distances and geometry. In all of these cases it is
essential that each material should be conveyed successfully, but each material may
have different conveying characteristics and as a consequence the air requirements
for the conveying of different materials, and the material flow rates achieved, can vary
significantly. Conveying distance can also have a significant influence on conveying
performance [1].
Some of the materials to be transported may be capable of being conveyed in dense
phase, and hence at low velocity, while others may have no dense phase capability and
will have to be conveyed in dilute phase with a high conveying air velocity. The convey-
ing performance of different grades of the same material can also differ widely. Alumina
and fly ash are two common materials that can come in a number of different grades.
It is often necessary for different grades of either of these materials to be conveyed by
a common system.
The design of these systems, therefore, requires very careful consideration. Fly ash,
for example, collected in air pre-heater and economizer hoppers is usually coarse, and in
general can only be conveyed in dilute phase, while the ash collected in the precipitator
hoppers is usually fine and can normally be conveyed very easily in dense phase. By
employing stepped pipelines, different materials such as these can be conveyed quite
easily by a common pneumatic conveying system.
Chapter 19
Multiple use systems
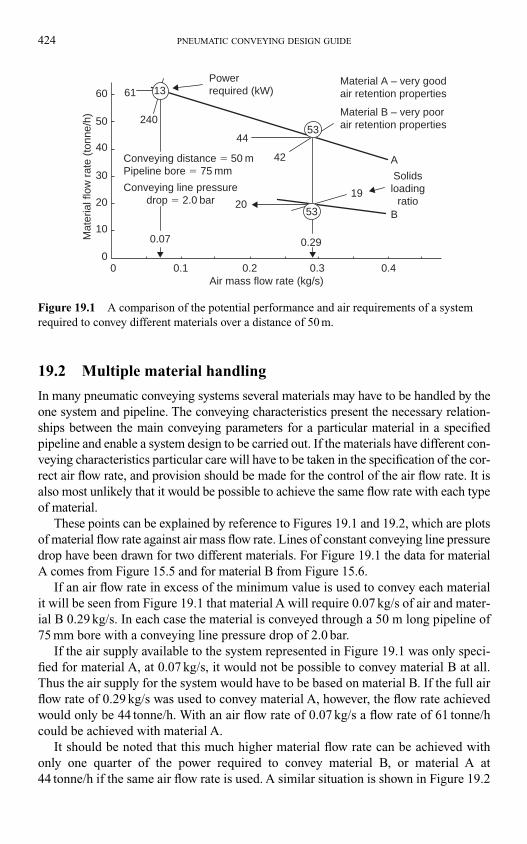
19.2 Multiple material handling
In many pneumatic conveying systems several materials may have to be handled by the
one system and pipeline. The conveying characteristics present the necessary relation-
ships between the main conveying parameters for a particular material in a specified
pipeline and enable a system design to be carried out. If the materials have different con-
veying characteristics particular care will have to be taken in the specification of the cor-
rect air flow rate, and provision should be made for the control of the air flow rate. It is
also most unlikely that it would be possible to achieve the same flow rate with each type
of material.
These points can be explained by reference to Figures 19.1 and 19.2, which are plots
of material flow rate against air mass flow rate. Lines of constant conveying line pressure
drop have been drawn for two different materials. For Figure 19.1 the data for material
A comes from Figure 15.5 and for material B from Figure 15.6.
If an air flow rate in excess of the minimum value is used to convey each material
it will be seen from Figure 19.1 that material A will require 0.07 kg/s of air and mater-
ial B 0.29 kg/s. In each case the material is conveyed through a 50 m long pipeline of
75 mm bore with a conveying line pressure drop of 2.0 bar.
If the air supply available to the system represented in Figure 19.1 was only speci-
fied for material A, at 0.07 kg/s, it would not be possible to convey material B at all.
Thus the air supply for the system would have to be based on material B. If the full air
flow rate of 0.29 kg/s was used to convey material A, however, the flow rate achieved
would only be 44 tonne/h. With an air flow rate of 0.07 kg/s a flow rate of 61 tonne/h
could be achieved with material A.
It should be noted that this much higher material flow rate can be achieved with
only one quarter of the power required to convey material B, or material A at
44 tonne/h if the same air flow rate is used. A similar situation is shown in Figure 19.2
424 PNEUMATIC CONVEYING DESIGN GUIDE
0
10
20
30
40
50
60
240
44
42
20
0.10 0.2 0.3 0.4Air mass flow rate (kg/s)
0.07
19
0.29
Material A – very goodair retention properties
Material B – very poorair retention properties
A
B
Solidsloading
ratio
Powerrequired (kW)61
Conveying distance � 50 mPipeline bore � 75 mm
Conveying line pressuredrop � 2.0 bar
Mat
eria
l flo
w r
ate
(ton
ne/h
)
53
53
13
Figure 19.1 A comparison of the potential performance and air requirements of a system
required to convey different materials over a distance of 50 m.
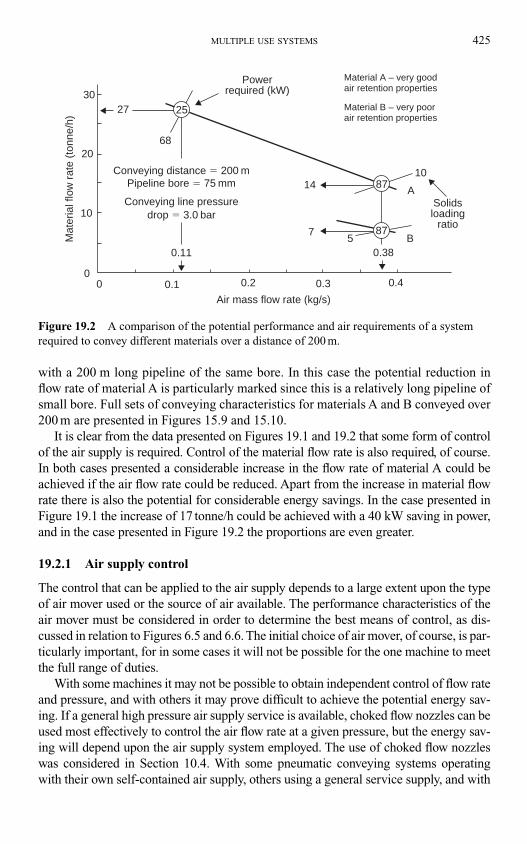
with a 200 m long pipeline of the same bore. In this case the potential reduction in
flow rate of material A is particularly marked since this is a relatively long pipeline of
small bore. Full sets of conveying characteristics for materials A and B conveyed over
200 m are presented in Figures 15.9 and 15.10.
It is clear from the data presented on Figures 19.1 and 19.2 that some form of control
of the air supply is required. Control of the material flow rate is also required, of course.
In both cases presented a considerable increase in the flow rate of material A could be
achieved if the air flow rate could be reduced. Apart from the increase in material flow
rate there is also the potential for considerable energy savings. In the case presented in
Figure 19.1 the increase of 17 tonne/h could be achieved with a 40 kW saving in power,
and in the case presented in Figure 19.2 the proportions are even greater.
19.2.1 Air supply control
The control that can be applied to the air supply depends to a large extent upon the type
of air mover used or the source of air available. The performance characteristics of the
air mover must be considered in order to determine the best means of control, as dis-
cussed in relation to Figures 6.5 and 6.6. The initial choice of air mover, of course, is par-
ticularly important, for in some cases it will not be possible for the one machine to meet
the full range of duties.
With some machines it may not be possible to obtain independent control of flow rate
and pressure, and with others it may prove difficult to achieve the potential energy sav-
ing. If a general high pressure air supply service is available, choked flow nozzles can be
used most effectively to control the air flow rate at a given pressure, but the energy sav-
ing will depend upon the air supply system employed. The use of choked flow nozzles
was considered in Section 10.4. With some pneumatic conveying systems operating
with their own self-contained air supply, others using a general service supply, and with
MULTIPLE USE SYSTEMS 425
2527
68
1410
75
87
87
A
B0.11
0.3 0.40.20.100
10
20
30
0.38
Mat
eria
l flo
w r
ate
(ton
ne/h
)
Air mass flow rate (kg/s)
Solidsloading
ratio
Material A – very goodair retention properties
Material B – very poorair retention properties
Powerrequired (kW)
Conveying distance � 200 mPipeline bore � 75 mm
Conveying line pressuredrop � 3.0 bar
Figure 19.2 A comparison of the potential performance and air requirements of a system
required to convey different materials over a distance of 200 m.
such a wide range of air movers available, each with it own operating characteristics, it
is quite impossible to offer general recommendations on system control in this respect.
High, low and negative pressure systems all require separate treatment, with control
of the air mover being necessary in some cases, and control by means of the air supply
line being possible in other cases. The important points to bear in mind are that different
materials are quite likely to have different volumetric air flow and power requirements,
and that the air supply should be capable of meeting both the maximum demand and
being conveniently controlled to lower demand levels.
19.2.2 Material flow control
Since different materials have different flow rate capabilities in a given conveying line,
due consideration should be given to the material feeding device. Changes in material
feed rate must clearly be made, for if a design was based on the conveying of material B
only, for example, the pipeline would be considerably under-utilized for the conveying of
material A. Alternatively, if the design was based on material A, the pipeline would almost
certainly block when conveying material B, even if the air flow rate was correct.
The feeding device, therefore, should be capable of operating satisfactorily and con-
veniently over the range to be encountered. With volumetric feeders, such as rotary valves
and screws, differences in material bulk densities should also be taken into account as well
as differences in flow rate.
19.3 Multiple delivery points
Many pneumatic conveying systems are required to deliver a material to a number of dif-
ferent locations. For example, by means of diverter valves in a pipeline several hoppers or
silos can be loaded from a given supply point. If the delivery points are at varying distances
from the supply point, however, it is unlikely that it would be possible to achieve the same
material flow rate to each point. With different material flow rates, and hence solids load-
ing ratios, it is possible that air flow rates would also have to be adjusted for a material
capable of being conveyed in dense phase.
These points can be explained with reference to Figures 19.3 and 19.4. These are
plots of material flow rate against air mass flow rate, and lines of constant conveying line
pressure drop have been drawn for conveying distances of 100 and 200 m.
Figure 19.3 shows the situation for a material having very good air retention proper-
ties and Figure 19.4 is for a material with very poor air retention properties. An air flow
rate 20 per cent in excess of the minimum value required to convey each material is used
for illustration purposes. Full sets of conveying characteristics for materials A and B in
Figures 19.3 and 19.4 were presented in Figures 15.7–15.10.
19.3.1 Material influences
For materials capable of being conveyed in dense phase, an increase in conveying dis-
tance for a constant conveying line pressure drop will result in a reduction in material
flow rate, and so the material will have to be conveyed at a lower solids loading ratio. At
a lower value of solids loading ratio a higher minimum conveying air velocity will be
426 PNEUMATIC CONVEYING DESIGN GUIDE
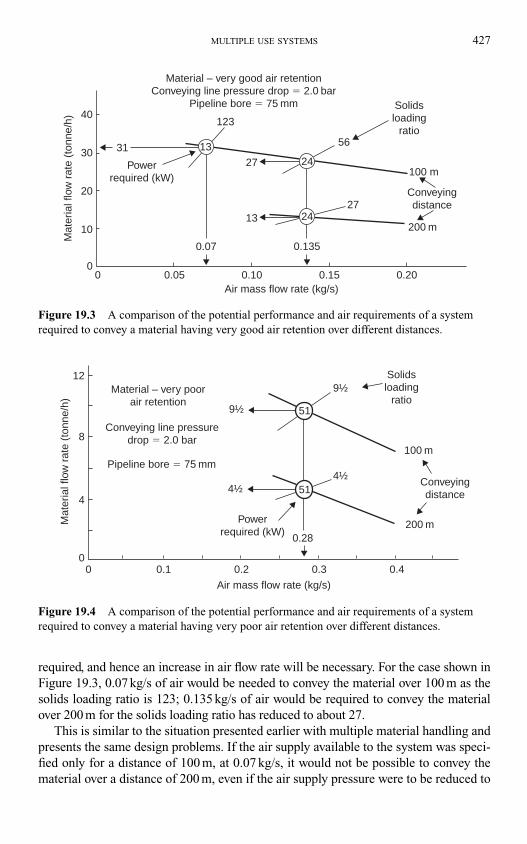
required, and hence an increase in air flow rate will be necessary. For the case shown in
Figure 19.3, 0.07 kg/s of air would be needed to convey the material over 100 m as the
solids loading ratio is 123; 0.135 kg/s of air would be required to convey the material
over 200 m for the solids loading ratio has reduced to about 27.
This is similar to the situation presented earlier with multiple material handling and
presents the same design problems. If the air supply available to the system was speci-
fied only for a distance of 100 m, at 0.07 kg/s, it would not be possible to convey the
material over a distance of 200 m, even if the air supply pressure were to be reduced to
MULTIPLE USE SYSTEMS 427
24
24
Material – very good air retentionConveying line pressure drop � 2.0 bar
Pipeline bore � 75 mm Solidsloading
ratio
Air mass flow rate (kg/s)
Mat
eria
l flo
w r
ate
(ton
ne/h
)
Conveyingdistance
Powerrequired (kW)
40
30
1327
200 m
100 m27
56
123
31
20
10
00 0.05 0.10 0.15
0.07 0.135
0.20
1324
24
Figure 19.3 A comparison of the potential performance and air requirements of a system
required to convey a material having very good air retention over different distances.
Material – very poorair retention
51
51
Solidsloading
ratio
Air mass flow rate (kg/s)
12
8
4
00 0.1 0.2 0.3
0.28
0.4
200 m
100 m
4½4½
9½
9½
Mat
eria
l flo
w r
ate
(ton
ne/h
)
Conveyingdistance
Powerrequired (kW)
Conveying line pressuredrop � 2.0 bar
Pipeline bore � 75 mm
Figure 19.4 A comparison of the potential performance and air requirements of a system
required to convey a material having very poor air retention over different distances.
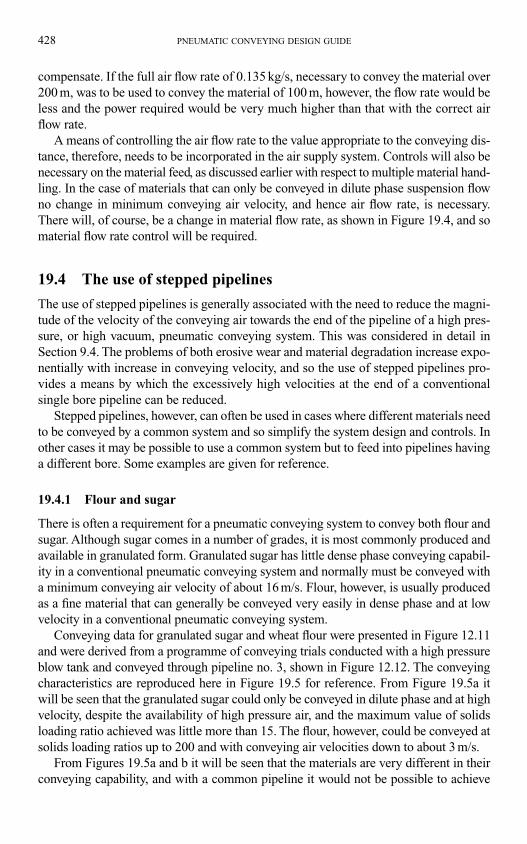
compensate. If the full air flow rate of 0.135 kg/s, necessary to convey the material over
200 m, was to be used to convey the material of 100 m, however, the flow rate would be
less and the power required would be very much higher than that with the correct air
flow rate.
A means of controlling the air flow rate to the value appropriate to the conveying dis-
tance, therefore, needs to be incorporated in the air supply system. Controls will also be
necessary on the material feed, as discussed earlier with respect to multiple material hand-
ling. In the case of materials that can only be conveyed in dilute phase suspension flow
no change in minimum conveying air velocity, and hence air flow rate, is necessary.
There will, of course, be a change in material flow rate, as shown in Figure 19.4, and so
material flow rate control will be required.
19.4 The use of stepped pipelines
The use of stepped pipelines is generally associated with the need to reduce the magni-
tude of the velocity of the conveying air towards the end of the pipeline of a high pres-
sure, or high vacuum, pneumatic conveying system. This was considered in detail in
Section 9.4. The problems of both erosive wear and material degradation increase expo-
nentially with increase in conveying velocity, and so the use of stepped pipelines pro-
vides a means by which the excessively high velocities at the end of a conventional
single bore pipeline can be reduced.
Stepped pipelines, however, can often be used in cases where different materials need
to be conveyed by a common system and so simplify the system design and controls. In
other cases it may be possible to use a common system but to feed into pipelines having
a different bore. Some examples are given for reference.
19.4.1 Flour and sugar
There is often a requirement for a pneumatic conveying system to convey both flour and
sugar. Although sugar comes in a number of grades, it is most commonly produced and
available in granulated form. Granulated sugar has little dense phase conveying capabil-
ity in a conventional pneumatic conveying system and normally must be conveyed with
a minimum conveying air velocity of about 16 m/s. Flour, however, is usually produced
as a fine material that can generally be conveyed very easily in dense phase and at low
velocity in a conventional pneumatic conveying system.
Conveying data for granulated sugar and wheat flour were presented in Figure 12.11
and were derived from a programme of conveying trials conducted with a high pressure
blow tank and conveyed through pipeline no. 3, shown in Figure 12.12. The conveying
characteristics are reproduced here in Figure 19.5 for reference. From Figure 19.5a it
will be seen that the granulated sugar could only be conveyed in dilute phase and at high
velocity, despite the availability of high pressure air, and the maximum value of solids
loading ratio achieved was little more than 15. The flour, however, could be conveyed at
solids loading ratios up to 200 and with conveying air velocities down to about 3 m/s.
From Figures 19.5a and b it will be seen that the materials are very different in their
conveying capability, and with a common pipeline it would not be possible to achieve
428 PNEUMATIC CONVEYING DESIGN GUIDE
optimum conveying conditions for both materials. A compromise would have to be
made, but because of the very much higher air requirements of the sugar, it would be the
sugar that would dictate the design for the combined system. To illustrate the nature of
the problem a design based on the use of an air supply pressure of 2 bar gauge and a con-
veying line inlet air velocity 20 per cent greater than the minimum conveying air vel-
ocity is assumed. The data for this situation is presented in Table 19.1 [2, 3].
MULTIPLE USE SYSTEMS 429
Conveying linepressure drop (bar)
Conveying linepressure drop (bar)
Air mass flow rate (kg/s)
0.04
0.40.8
1.21.6
2.0 15
10
5
00
4
8
12
16
20
24
0
4
8
12
16
20
24
0.08 0.12 0.04
200160120100 8060
40
4.0
4.0
3.2
2.4
1.6
0.8
30
50
20
10
0 0.08 0.12
Air mass flow rate (kg/s)
Conveying limit
Conveyinglimit
Solidsloading
ratio
Solidsloading
ratio
Mat
eria
l flo
w r
ate
(ton
ne/h
)
Mat
eria
l flo
w r
ate
(ton
ne/h
)
(a) (b)
Nogoarea
Nogoarea
Figure 19.5 Conveying characteristics for materials conveyed through Pipeline no. 3: (a)
granulated sugar and (b) wheat flour.
Table 19.1 Comparison of conveying parameters for granulated sugar and wheat flour conveyed
through pipeline no. 3 with a conveying line pressure drop of 2.0 bar
Conveying parameters Units Material conveyed
Sugar Flour
Minimum* Minimum* As sugar
Inlet air pressure bar gauge 2.0 2.0 2.0
Inlet air velocity m/s 19.2 3.6 19.2
Air mass flow rate kg/s 0.154 0.029 0.154
Material flow rate tonne/h 7 15 6
Solids loading ratio – 12.6 144 10.8
Power required kW 28 5.2 28
Specific energy kJ/kg 14.4 1.25 16.8
* Conveying conditions
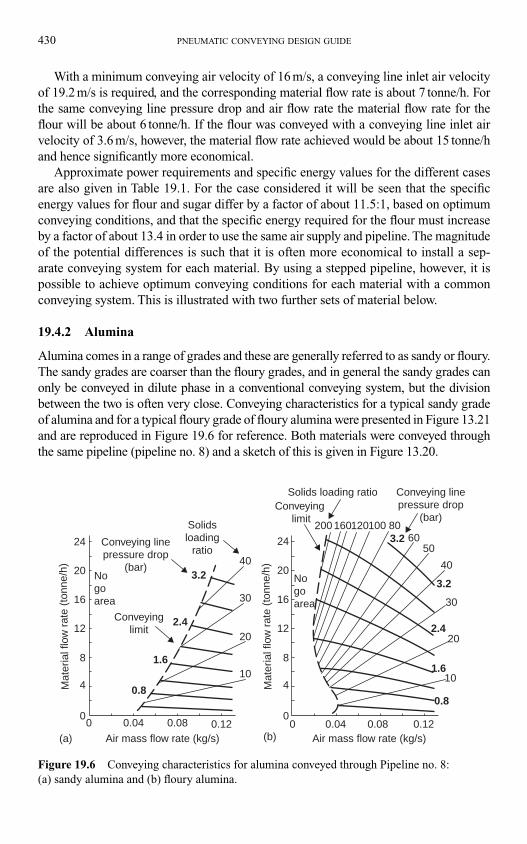
With a minimum conveying air velocity of 16 m/s, a conveying line inlet air velocity
of 19.2 m/s is required, and the corresponding material flow rate is about 7 tonne/h. For
the same conveying line pressure drop and air flow rate the material flow rate for the
flour will be about 6 tonne/h. If the flour was conveyed with a conveying line inlet air
velocity of 3.6 m/s, however, the material flow rate achieved would be about 15 tonne/h
and hence significantly more economical.
Approximate power requirements and specific energy values for the different cases
are also given in Table 19.1. For the case considered it will be seen that the specific
energy values for flour and sugar differ by a factor of about 11.5:1, based on optimum
conveying conditions, and that the specific energy required for the flour must increase
by a factor of about 13.4 in order to use the same air supply and pipeline. The magnitude
of the potential differences is such that it is often more economical to install a sep-
arate conveying system for each material. By using a stepped pipeline, however, it is
possible to achieve optimum conveying conditions for each material with a common
conveying system. This is illustrated with two further sets of material below.
19.4.2 Alumina
Alumina comes in a range of grades and these are generally referred to as sandy or floury.
The sandy grades are coarser than the floury grades, and in general the sandy grades can
only be conveyed in dilute phase in a conventional conveying system, but the division
between the two is often very close. Conveying characteristics for a typical sandy grade
of alumina and for a typical floury grade of floury alumina were presented in Figure 13.21
and are reproduced in Figure 19.6 for reference. Both materials were conveyed through
the same pipeline (pipeline no. 8) and a sketch of this is given in Figure 13.20.
430 PNEUMATIC CONVEYING DESIGN GUIDE
Air mass flow rate (kg/s)
Conveyinglimit
Conveying linepressure drop
(bar)
Solidsloading
ratio
Mat
eria
l flo
w r
ate
(ton
ne/h
)
Nogoarea
Nogoarea
00 0.04
0.8
1.6
2.4
3.240
30
20
10
0.08 0.12
4
8
12
16
20
24
Air mass flow rate (kg/s)
Conveying limit
Conveying linepressure drop
(bar)
Solids loading ratio
Mat
eria
l flo
w r
ate
(ton
ne/h
)
00 0.04
0.8
1.6
2.4
3.2
3.2
40
5060
80100120160200
30
20
10
0.08 0.12
4
8
12
16
20
24
(a) (b)
Figure 19.6 Conveying characteristics for alumina conveyed through Pipeline no. 8:
(a) sandy alumina and (b) floury alumina.
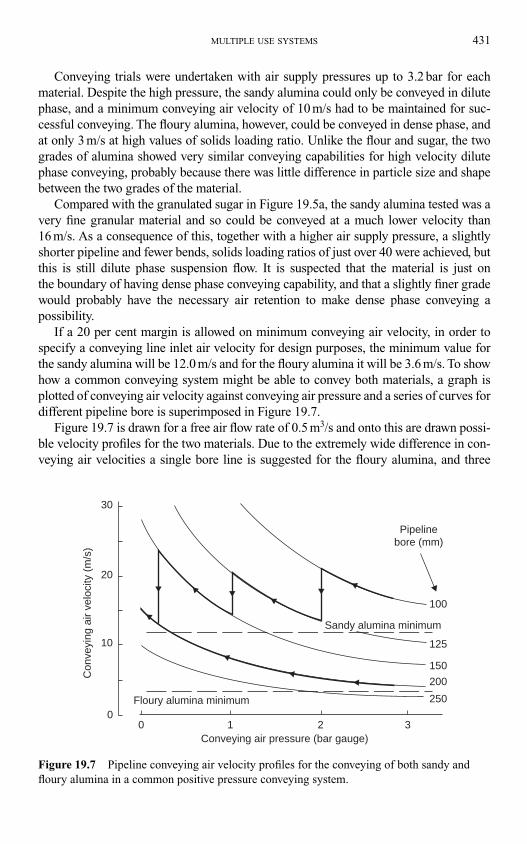
Conveying trials were undertaken with air supply pressures up to 3.2 bar for each
material. Despite the high pressure, the sandy alumina could only be conveyed in dilute
phase, and a minimum conveying air velocity of 10 m/s had to be maintained for suc-
cessful conveying. The floury alumina, however, could be conveyed in dense phase, and
at only 3 m/s at high values of solids loading ratio. Unlike the flour and sugar, the two
grades of alumina showed very similar conveying capabilities for high velocity dilute
phase conveying, probably because there was little difference in particle size and shape
between the two grades of the material.
Compared with the granulated sugar in Figure 19.5a, the sandy alumina tested was a
very fine granular material and so could be conveyed at a much lower velocity than
16 m/s. As a consequence of this, together with a higher air supply pressure, a slightly
shorter pipeline and fewer bends, solids loading ratios of just over 40 were achieved, but
this is still dilute phase suspension flow. It is suspected that the material is just on
the boundary of having dense phase conveying capability, and that a slightly finer grade
would probably have the necessary air retention to make dense phase conveying a
possibility.
If a 20 per cent margin is allowed on minimum conveying air velocity, in order to
specify a conveying line inlet air velocity for design purposes, the minimum value for
the sandy alumina will be 12.0 m/s and for the floury alumina it will be 3.6 m/s. To show
how a common conveying system might be able to convey both materials, a graph is
plotted of conveying air velocity against conveying air pressure and a series of curves for
different pipeline bore is superimposed in Figure 19.7.
Figure 19.7 is drawn for a free air flow rate of 0.5 m3/s and onto this are drawn possi-
ble velocity profiles for the two materials. Due to the extremely wide difference in con-
veying air velocities a single bore line is suggested for the floury alumina, and three
MULTIPLE USE SYSTEMS 431
00 1 2 3
10
20
30
250
150
125
Sandy alumina minimum
100
200
Pipelinebore (mm)
Floury alumina minimum
Conveying air pressure (bar gauge)
Con
veyi
ng a
ir ve
loci
ty (
m/s
)
Figure 19.7 Pipeline conveying air velocity profiles for the conveying of both sandy and
floury alumina in a common positive pressure conveying system.
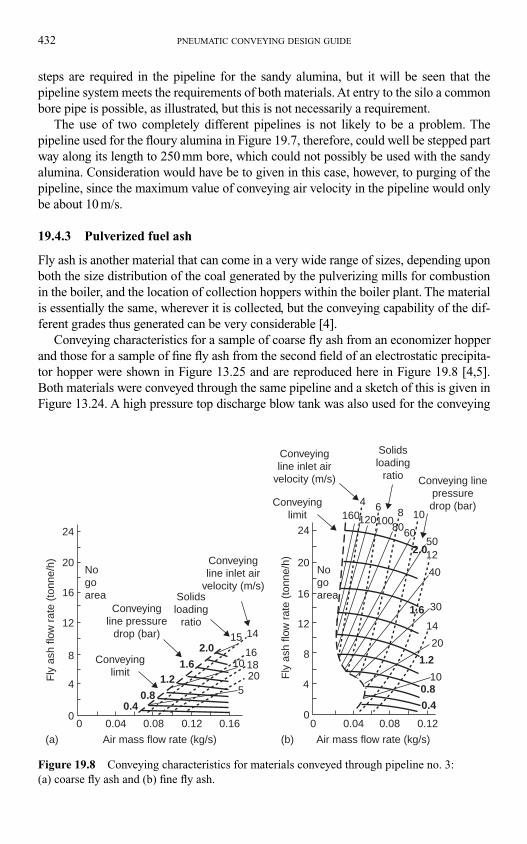
steps are required in the pipeline for the sandy alumina, but it will be seen that the
pipeline system meets the requirements of both materials. At entry to the silo a common
bore pipe is possible, as illustrated, but this is not necessarily a requirement.
The use of two completely different pipelines is not likely to be a problem. The
pipeline used for the floury alumina in Figure 19.7, therefore, could well be stepped part
way along its length to 250 mm bore, which could not possibly be used with the sandy
alumina. Consideration would have be to given in this case, however, to purging of the
pipeline, since the maximum value of conveying air velocity in the pipeline would only
be about 10 m/s.
19.4.3 Pulverized fuel ash
Fly ash is another material that can come in a very wide range of sizes, depending upon
both the size distribution of the coal generated by the pulverizing mills for combustion
in the boiler, and the location of collection hoppers within the boiler plant. The material
is essentially the same, wherever it is collected, but the conveying capability of the dif-
ferent grades thus generated can be very considerable [4].
Conveying characteristics for a sample of coarse fly ash from an economizer hopper
and those for a sample of fine fly ash from the second field of an electrostatic precipita-
tor hopper were shown in Figure 13.25 and are reproduced here in Figure 19.8 [4,5].
Both materials were conveyed through the same pipeline and a sketch of this is given in
Figure 13.24. A high pressure top discharge blow tank was also used for the conveying
432 PNEUMATIC CONVEYING DESIGN GUIDE
Conveyingline pressure
drop (bar)
Conveying linepressuredrop (bar)
Conveyingline inlet air
velocity (m/s)
Conveyingline inlet air
velocity (m/s)
Air mass flow rate (kg/s)
Fly
ash
flow
rat
e (t
onne
/h)
Fly
ash
flow
rat
e (t
onne
/h)
Air mass flow rate (kg/s)
0.40.40.8
1.21.6
2.014
14
12
4 6 8 10
1.2
1.6
2.0
15161820
10
5
0
4
8
12
16
20
24
0
4
8
12
16
20
24
0.040 0.08 0.12 0.16 0.040 0.08 0.12
1601201008060
40
0.8
30
50
20
10
Conveyinglimit
Conveyinglimit
Solidsloading
ratio
Solidsloading
ratio
Nogoarea
Nogoarea
(a) (b)
Figure 19.8 Conveying characteristics for materials conveyed through pipeline no. 3:
(a) coarse fly ash and (b) fine fly ash.
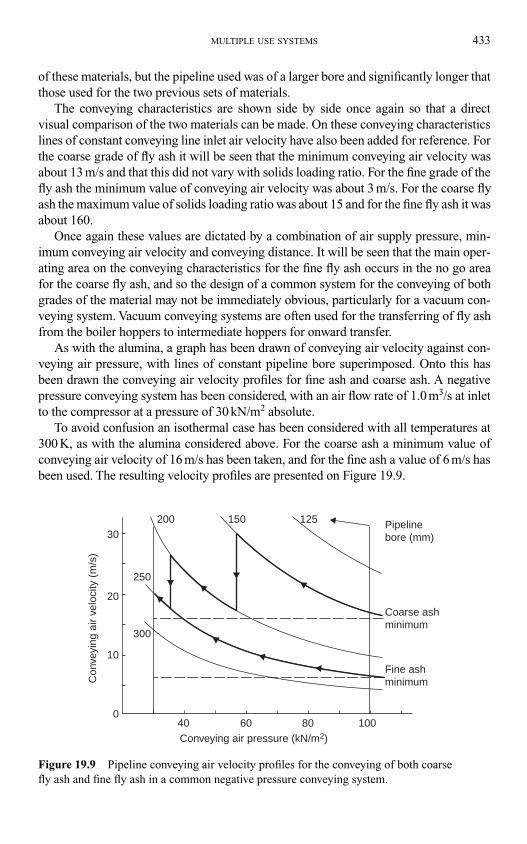
of these materials, but the pipeline used was of a larger bore and significantly longer that
those used for the two previous sets of materials.
The conveying characteristics are shown side by side once again so that a direct
visual comparison of the two materials can be made. On these conveying characteristics
lines of constant conveying line inlet air velocity have also been added for reference. For
the coarse grade of fly ash it will be seen that the minimum conveying air velocity was
about 13 m/s and that this did not vary with solids loading ratio. For the fine grade of the
fly ash the minimum value of conveying air velocity was about 3 m/s. For the coarse fly
ash the maximum value of solids loading ratio was about 15 and for the fine fly ash it was
about 160.
Once again these values are dictated by a combination of air supply pressure, min-
imum conveying air velocity and conveying distance. It will be seen that the main oper-
ating area on the conveying characteristics for the fine fly ash occurs in the no go area
for the coarse fly ash, and so the design of a common system for the conveying of both
grades of the material may not be immediately obvious, particularly for a vacuum con-
veying system. Vacuum conveying systems are often used for the transferring of fly ash
from the boiler hoppers to intermediate hoppers for onward transfer.
As with the alumina, a graph has been drawn of conveying air velocity against con-
veying air pressure, with lines of constant pipeline bore superimposed. Onto this has
been drawn the conveying air velocity profiles for fine ash and coarse ash. A negative
pressure conveying system has been considered, with an air flow rate of 1.0 m3/s at inlet
to the compressor at a pressure of 30 kN/m2 absolute.
To avoid confusion an isothermal case has been considered with all temperatures at
300 K, as with the alumina considered above. For the coarse ash a minimum value of
conveying air velocity of 16 m/s has been taken, and for the fine ash a value of 6 m/s has
been used. The resulting velocity profiles are presented on Figure 19.9.
MULTIPLE USE SYSTEMS 433
200 150 125 Pipelinebore (mm)
Coarse ashminimum
Fine ashminimum
1008060400
10
20
30
250
300
Con
veyi
ng a
ir ve
loci
ty (
m/s
)
Conveying air pressure (kN/m2)
Figure 19.9 Pipeline conveying air velocity profiles for the conveying of both coarse
fly ash and fine fly ash in a common negative pressure conveying system.
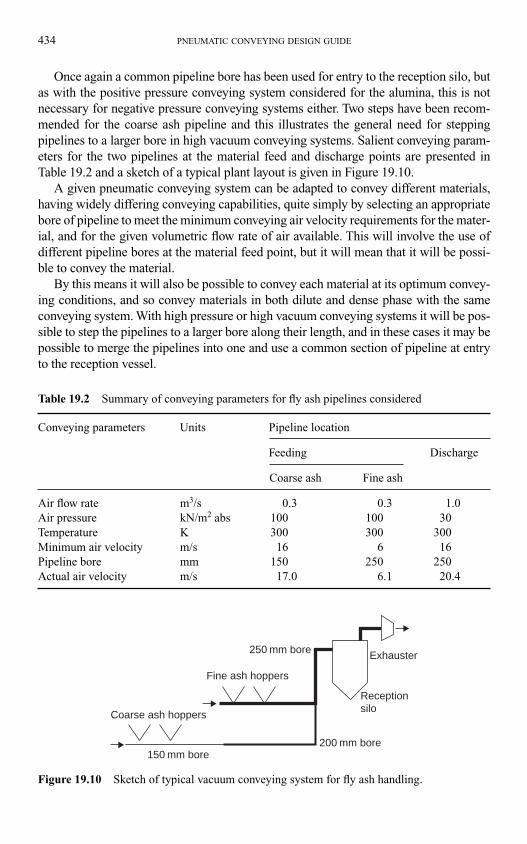
Once again a common pipeline bore has been used for entry to the reception silo, but
as with the positive pressure conveying system considered for the alumina, this is not
necessary for negative pressure conveying systems either. Two steps have been recom-
mended for the coarse ash pipeline and this illustrates the general need for stepping
pipelines to a larger bore in high vacuum conveying systems. Salient conveying param-
eters for the two pipelines at the material feed and discharge points are presented in
Table 19.2 and a sketch of a typical plant layout is given in Figure 19.10.
A given pneumatic conveying system can be adapted to convey different materials,
having widely differing conveying capabilities, quite simply by selecting an appropriate
bore of pipeline to meet the minimum conveying air velocity requirements for the mater-
ial, and for the given volumetric flow rate of air available. This will involve the use of
different pipeline bores at the material feed point, but it will mean that it will be possi-
ble to convey the material.
By this means it will also be possible to convey each material at its optimum convey-
ing conditions, and so convey materials in both dilute and dense phase with the same
conveying system. With high pressure or high vacuum conveying systems it will be pos-
sible to step the pipelines to a larger bore along their length, and in these cases it may be
possible to merge the pipelines into one and use a common section of pipeline at entry
to the reception vessel.
434 PNEUMATIC CONVEYING DESIGN GUIDE
Fine ash hoppers
250 mm bore Exhauster
Receptionsilo
200 mm bore150 mm bore
Coarse ash hoppers
Figure 19.10 Sketch of typical vacuum conveying system for fly ash handling.
Table 19.2 Summary of conveying parameters for fly ash pipelines considered
Conveying parameters Units Pipeline location
Feeding Discharge
Coarse ash Fine ash
Air flow rate m3/s 0.3 0.3 1.0
Air pressure kN/m2 abs 100 100 30
Temperature K 300 300 300
Minimum air velocity m/s 16 6 16
Pipeline bore mm 150 250 250
Actual air velocity m/s 17.0 6.1 20.4
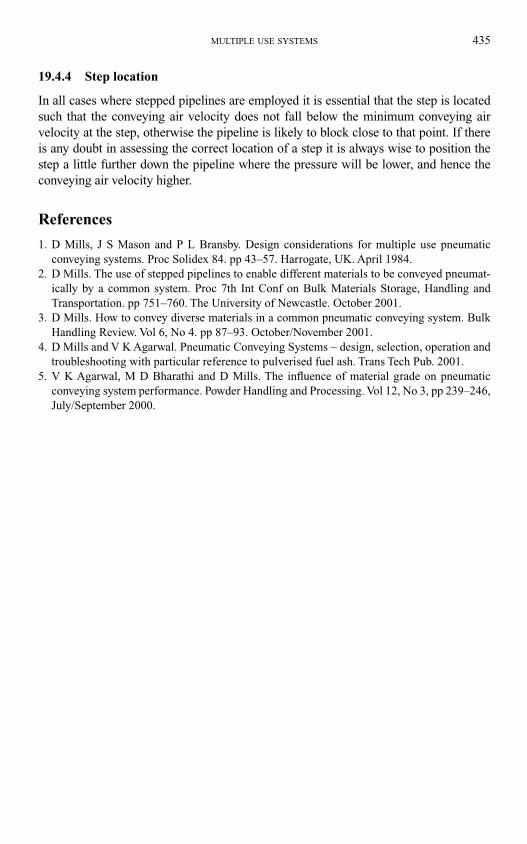
19.4.4 Step location
In all cases where stepped pipelines are employed it is essential that the step is located
such that the conveying air velocity does not fall below the minimum conveying air
velocity at the step, otherwise the pipeline is likely to block close to that point. If there
is any doubt in assessing the correct location of a step it is always wise to position the
step a little further down the pipeline where the pressure will be lower, and hence the
conveying air velocity higher.
References
1. D Mills, J S Mason and P L Bransby. Design considerations for multiple use pneumatic
conveying systems. Proc Solidex 84. pp 43–57. Harrogate, UK. April 1984.
2. D Mills. The use of stepped pipelines to enable different materials to be conveyed pneumat-
ically by a common system. Proc 7th Int Conf on Bulk Materials Storage, Handling and
Transportation. pp 751–760. The University of Newcastle. October 2001.
3. D Mills. How to convey diverse materials in a common pneumatic conveying system. Bulk
Handling Review. Vol 6, No 4. pp 87–93. October/November 2001.
4. D Mills and V K Agarwal. Pneumatic Conveying Systems – design, selection, operation and
troubleshooting with particular reference to pulverised fuel ash. Trans Tech Pub. 2001.
5. V K Agarwal, M D Bharathi and D Mills. The influence of material grade on pneumatic
conveying system performance. Powder Handling and Processing. Vol 12, No 3, pp 239–246,
July/September 2000.
MULTIPLE USE SYSTEMS 435

This page intentionally left blank

Part C
System Operation

This page intentionally left blank
20.1 Introduction
Despite being simple in concept, pneumatic conveying systems present significant
design problems, not least because of the fact that the conveying medium is compres-
sible. Any changes in pipeline geometry, whether horizontal runs, vertical lift or even
bends can have a marked effect on performance. The properties of the material to be
conveyed can have a significant influence on both the design and specification of com-
ponents, and can also have a major influence on conveying performance.
One of the major difficulties with pneumatic conveying systems is that it is not always
obvious what effect a change in operating conditions will have on system perform-
ance. A change of material or conveying distance, in particular, may require changes
in both material feed rate and air flow rate. Unfortunately the cause of a particular
problem in a pneumatic conveying system is not always obvious either. Particular note
of changes in performance that might occur with respect to time should be made, for
these should not occur with a pneumatic conveying system, and could well lead to failure
over a period of time.
20.2 Pipeline blockage
One of the most frustrating problems encountered in system operation is that of
pipeline blockage. This is by no means uncommon and there are a multitude of differ-
ent circumstances and possible causes.
20.2.1 General
In any pipeline blockage situation the first thing to do is to check all the obvious sys-
tem features:
• Is the reception point clear?
• Are the diverter valves operating satisfactorily?
• Is the full conveying air supply available?
• Was the pipeline clear on start up?
• Has a pipeline bend failed?
The problem may relate to system components, such as the feeding device or filtra-
tion plant. It may be a material related problem, such as particle size or moisture. The
Chapter 20
Troubleshooting and material flow problems
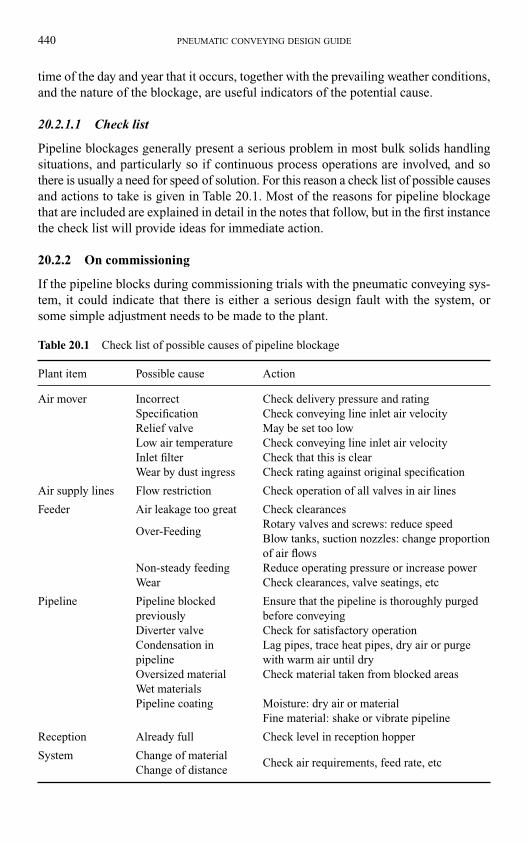
time of the day and year that it occurs, together with the prevailing weather conditions,
and the nature of the blockage, are useful indicators of the potential cause.
20.2.1.1 Check list
Pipeline blockages generally present a serious problem in most bulk solids handling
situations, and particularly so if continuous process operations are involved, and so
there is usually a need for speed of solution. For this reason a check list of possible causes
and actions to take is given in Table 20.1. Most of the reasons for pipeline blockage
that are included are explained in detail in the notes that follow, but in the first instance
the check list will provide ideas for immediate action.
20.2.2 On commissioning
If the pipeline blocks during commissioning trials with the pneumatic conveying sys-
tem, it could indicate that there is either a serious design fault with the system, or
some simple adjustment needs to be made to the plant.
440 PNEUMATIC CONVEYING DESIGN GUIDE
Table 20.1 Check list of possible causes of pipeline blockage
Plant item Possible cause Action
Air mover Incorrect Check delivery pressure and rating
Specification Check conveying line inlet air velocity
Relief valve May be set too low
Low air temperature Check conveying line inlet air velocity
Inlet filter Check that this is clear
Wear by dust ingress Check rating against original specification
Air supply lines Flow restriction Check operation of all valves in air lines
Feeder Air leakage too great Check clearances
Rotary valves and screws: reduce speedOver-Feeding
Blow tanks, suction nozzles: change proportion
of air flows
Non-steady feeding Reduce operating pressure or increase power
Wear Check clearances, valve seatings, etc
Pipeline Pipeline blocked Ensure that the pipeline is thoroughly purged
previously before conveying
Diverter valve Check for satisfactory operation
Condensation in Lag pipes, trace heat pipes, dry air or purge
pipeline with warm air until dry
Oversized material Check material taken from blocked areas
Wet materials
Pipeline coating Moisture: dry air or material
Fine material: shake or vibrate pipeline
Reception Already full Check level in reception hopper
System Change of materialCheck air requirements, feed rate, etc
Change of distance
20.2.2.1 Incorrect air mover specification
If it is the former, the most likely reason is that the air mover is incorrectly sized for
the duty. There are two possible reasons why the air mover may be incorrectly sized:
1. If the volumetric flow rate of air available for conveying the material in the pipeline
is insufficient, it is unlikely that it will be possible to convey the material. A certain
minimum value of conveying air velocity must be maintained at the material pick-
up point at the start of the conveying line. The value depends upon the material being
conveyed and, for materials that are capable of being conveyed in dense phase, in mov-
ing bed flow, varies with the solids loading ratio at which the material is conveyed.
2. The other possibility is that the incorrect conveying line inlet air pressure has been
used in evaluating the volumetric flow rate required by the compressor. Since air is
compressible it is extremely important that the pressure of the air at the material
pick-up point, in absolute terms, is taken into account in evaluating the free air
requirements for the air mover specification.
20.2.2.1.1 Conveying air velocity
One of two parameters is required here. These are the free air flow rate delivered, V�0,
and the conveying line inlet air velocity, C1. For the design of a system C1 must be
specified and V�0 is calculated on the basis of the value used. As air is compressible,
with respect to both temperature and pressure, the starting point in the determination of
any relationship for the determination of conveying air flow rate is the Ideal Gas Law. An
expression for the volumetric flow rate of free air required was developed in Chapter 9
with Equation (9.10) and this is reproduced here in Equation (20.1) for reference:
(20.1)
where V�0 is the free air flow rate (m3/s); p1, the conveying line inlet air pressure �101.3 � gauge pressure (kN/m2 abs); d, the pipeline bore (m); C1, the conveying line
inlet air velocity (m/s) and T1, the conveying line inlet air temperature (K). Equation
(20.1) can be used to check the specification of an air mover, given the conveying line
inlet air velocity and other parameters.
Re-arranging Equation (20.1) in terms of conveying line inlet air velocity gives:
(20.2)
Equation (20.2) can be used to provide a check on the conveying line inlet air
velocity, given the free air flow rate of the air mover being used on the plant and other
parameters.
Pipeline bore influencePipeline bores quoted are ‘nominal’ sizes only since it is generally the outer diameter
that is standardized because of the needs of flanging and threading. The diameter of a
CT V
d p1
1 0
21
0.448 m/s� �˙
˙ /Vp d C
T01
21
1
2.233 m s3� �
TROUBLESHOOTING AND MATERIAL FLOW PROBLEMS 441
4 in. nominal bore pipeline, however, is rarely 4 in. If a conveying air velocity is based
on a diameter of 4 in., for example, and it is a schedule 10 pipeline, the actual bore will
be 106.1 mm and not 101.6 mm. This difference will mean that the conveying air
velocity will be about 9 per cent lower. If 16 m/s is the velocity in a 101.6 mm bore
pipeline, it will only be 14.6 m/s in a 106.1 mm bore line and the pipeline is likely to
block if the minimum conveying air velocity for the material is 15 m/s.
Conveying gas influencesAlthough air is used for the vast majority of pneumatic conveying systems, other
gases such as carbon dioxide and superheated steam can be used for specific applica-
tions. Nitrogen is often used if the material is potentially explosive. The above equations,
in terms of velocities and volumetric flow rates will apply to any gas, but because the
characteristic gas constant, R, for each is different, then the density of each gas will be
different. If densities or mass flow rates have to be used in any calculation, therefore,
Equations (20.1) and (20.2) will have to be modified. This was considered in Chapter 9
with Equation (9.9) and Table 9.2.
20.2.2.1.2 Influence of solids loading ratio
It is the velocity at the material feed point, at the start of the conveying line that
is important. If this velocity is too low the pipeline is likely to block. For materials
conveyed in dilute phase, or suspension flow, it is necessary to maintain a minimum
velocity, Cmin, of about 11–16 m/s, depending upon conveyed material, as mentioned
in Section 15.2.1.6. Typical values and data for Cmin were presented in Figure 14.2. A
20 per cent margin on this value is generally recommended in terms of specifying a
value for the actual conveying line inlet air velocity, C1 to be employed. Typical values
of C1 were presented in Figure 18.4.
For fine powders, such as cement, flour and fly ash, that are capable of dense phase
conveying in moving bed type flow, the value of minimum velocity is dependent upon the
solids loading ratio at which the material is conveyed. Only at high values of solids load-
ing ratio can the conveying air velocity be as low as 3 m/s. If the material is conveyed in
dilute phase, at a low value of solids loading ratio, velocities appropriate to the dilute
phase conveying of a fine material must be used. There is, therefore, a gradual transition
between dilute and dense phase, with respect to minimum conveying air velocity. To
ensure successful conveying, therefore, the conveying line inlet air velocity must be
above these minimum values, whether the material is conveyed in dilute or dense phase.
20.2.2.1.3 Air mover change
If pipeline blockages occur and it is found that the conveying line inlet air velocity is
too low, then an air mover with a higher volumetric flow rate will have to be used. If it
is replaced with one having a higher delivery pressure, as well as a higher volumetric
flow rate, Equation (20.2) must be checked again, because air supply pressure also has
a significant influence on conveying line inlet air velocity.
It is equally important that any replacement is not over-rated. It is not gener-
ally necessary for the conveying line inlet air velocity to be any higher than about
442 PNEUMATIC CONVEYING DESIGN GUIDE
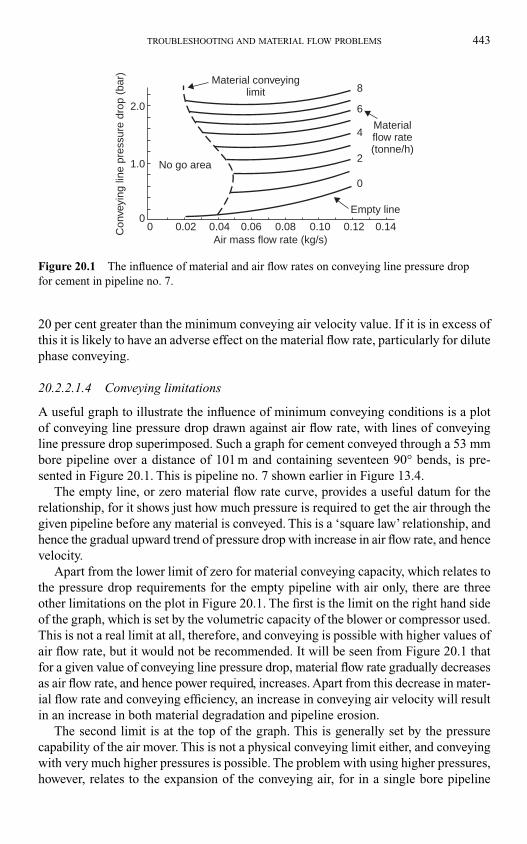
20 per cent greater than the minimum conveying air velocity value. If it is in excess of
this it is likely to have an adverse effect on the material flow rate, particularly for dilute
phase conveying.
20.2.2.1.4 Conveying limitations
A useful graph to illustrate the influence of minimum conveying conditions is a plot
of conveying line pressure drop drawn against air flow rate, with lines of conveying
line pressure drop superimposed. Such a graph for cement conveyed through a 53 mm
bore pipeline over a distance of 101 m and containing seventeen 90° bends, is pre-
sented in Figure 20.1. This is pipeline no. 7 shown earlier in Figure 13.4.
The empty line, or zero material flow rate curve, provides a useful datum for the
relationship, for it shows just how much pressure is required to get the air through the
given pipeline before any material is conveyed. This is a ‘square law’ relationship, and
hence the gradual upward trend of pressure drop with increase in air flow rate, and hence
velocity.
Apart from the lower limit of zero for material conveying capacity, which relates to
the pressure drop requirements for the empty pipeline with air only, there are three
other limitations on the plot in Figure 20.1. The first is the limit on the right hand side
of the graph, which is set by the volumetric capacity of the blower or compressor used.
This is not a real limit at all, therefore, and conveying is possible with higher values of
air flow rate, but it would not be recommended. It will be seen from Figure 20.1 that
for a given value of conveying line pressure drop, material flow rate gradually decreases
as air flow rate, and hence power required, increases. Apart from this decrease in mater-
ial flow rate and conveying efficiency, an increase in conveying air velocity will result
in an increase in both material degradation and pipeline erosion.
The second limit is at the top of the graph. This is generally set by the pressure
capability of the air mover. This is not a physical conveying limit either, and conveying
with very much higher pressures is possible. The problem with using higher pressures,
however, relates to the expansion of the conveying air, for in a single bore pipeline
TROUBLESHOOTING AND MATERIAL FLOW PROBLEMS 443
Materialflow rate(tonne/h)
Empty line
00
1.0
2.0
0.02 0.04 0.06 0.08 0.10 0.12 0.14Air mass flow rate (kg/s)
Con
veyi
ng li
ne p
ress
ure
drop
(ba
r)
0
2
4
6
8Material conveying
limit
No go area
Figure 20.1 The influence of material and air flow rates on conveying line pressure drop
for cement in pipeline no. 7.
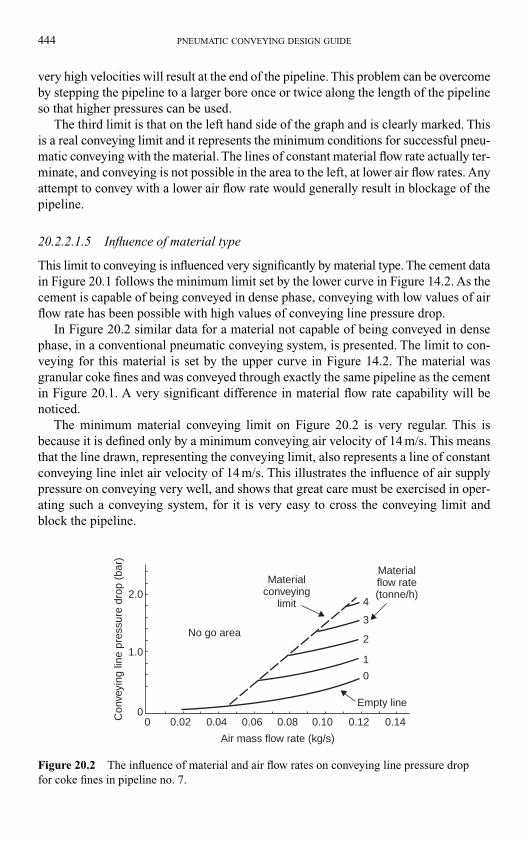
very high velocities will result at the end of the pipeline. This problem can be overcome
by stepping the pipeline to a larger bore once or twice along the length of the pipeline
so that higher pressures can be used.
The third limit is that on the left hand side of the graph and is clearly marked. This
is a real conveying limit and it represents the minimum conditions for successful pneu-
matic conveying with the material. The lines of constant material flow rate actually ter-
minate, and conveying is not possible in the area to the left, at lower air flow rates. Any
attempt to convey with a lower air flow rate would generally result in blockage of the
pipeline.
20.2.2.1.5 Influence of material type
This limit to conveying is influenced very significantly by material type. The cement data
in Figure 20.1 follows the minimum limit set by the lower curve in Figure 14.2. As the
cement is capable of being conveyed in dense phase, conveying with low values of air
flow rate has been possible with high values of conveying line pressure drop.
In Figure 20.2 similar data for a material not capable of being conveyed in dense
phase, in a conventional pneumatic conveying system, is presented. The limit to con-
veying for this material is set by the upper curve in Figure 14.2. The material was
granular coke fines and was conveyed through exactly the same pipeline as the cement
in Figure 20.1. A very significant difference in material flow rate capability will be
noticed.
The minimum material conveying limit on Figure 20.2 is very regular. This is
because it is defined only by a minimum conveying air velocity of 14 m/s. This means
that the line drawn, representing the conveying limit, also represents a line of constant
conveying line inlet air velocity of 14 m/s. This illustrates the influence of air supply
pressure on conveying very well, and shows that great care must be exercised in oper-
ating such a conveying system, for it is very easy to cross the conveying limit and
block the pipeline.
444 PNEUMATIC CONVEYING DESIGN GUIDE
Materialflow rate(tonne/h)
00
1.0
2.0
0.02 0.04 0.06 0.08 0.10 0.12 0.14
Air mass flow rate (kg/s)
Con
veyi
ng li
ne p
ress
ure
drop
(ba
r)
0
1
2
3
4
Materialconveying
limit
No go area
Empty line
Figure 20.2 The influence of material and air flow rates on conveying line pressure drop
for coke fines in pipeline no. 7.
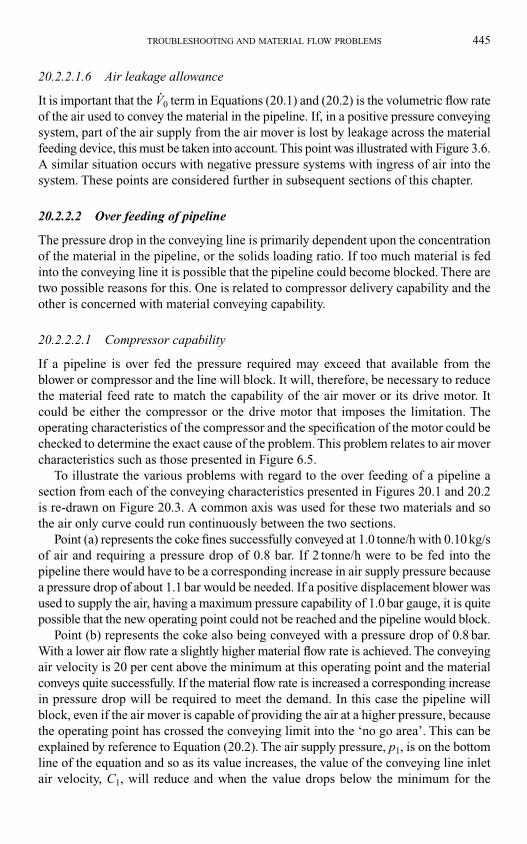
20.2.2.1.6 Air leakage allowance
It is important that the V�0 term in Equations (20.1) and (20.2) is the volumetric flow rate
of the air used to convey the material in the pipeline. If, in a positive pressure conveying
system, part of the air supply from the air mover is lost by leakage across the material
feeding device, this must be taken into account. This point was illustrated with Figure 3.6.
A similar situation occurs with negative pressure systems with ingress of air into the
system. These points are considered further in subsequent sections of this chapter.
20.2.2.2 Over feeding of pipeline
The pressure drop in the conveying line is primarily dependent upon the concentration
of the material in the pipeline, or the solids loading ratio. If too much material is fed
into the conveying line it is possible that the pipeline could become blocked. There are
two possible reasons for this. One is related to compressor delivery capability and the
other is concerned with material conveying capability.
20.2.2.2.1 Compressor capability
If a pipeline is over fed the pressure required may exceed that available from the
blower or compressor and the line will block. It will, therefore, be necessary to reduce
the material feed rate to match the capability of the air mover or its drive motor. It
could be either the compressor or the drive motor that imposes the limitation. The
operating characteristics of the compressor and the specification of the motor could be
checked to determine the exact cause of the problem. This problem relates to air mover
characteristics such as those presented in Figure 6.5.
To illustrate the various problems with regard to the over feeding of a pipeline a
section from each of the conveying characteristics presented in Figures 20.1 and 20.2
is re-drawn on Figure 20.3. A common axis was used for these two materials and so
the air only curve could run continuously between the two sections.
Point (a) represents the coke fines successfully conveyed at 1.0 tonne/h with 0.10 kg/s
of air and requiring a pressure drop of 0.8 bar. If 2 tonne/h were to be fed into the
pipeline there would have to be a corresponding increase in air supply pressure because
a pressure drop of about 1.1 bar would be needed. If a positive displacement blower was
used to supply the air, having a maximum pressure capability of 1.0 bar gauge, it is quite
possible that the new operating point could not be reached and the pipeline would block.
Point (b) represents the coke also being conveyed with a pressure drop of 0.8 bar.
With a lower air flow rate a slightly higher material flow rate is achieved. The conveying
air velocity is 20 per cent above the minimum at this operating point and the material
conveys quite successfully. If the material flow rate is increased a corresponding increase
in pressure drop will be required to meet the demand. In this case the pipeline will
block, even if the air mover is capable of providing the air at a higher pressure, because
the operating point has crossed the conveying limit into the ‘no go area’. This can be
explained by reference to Equation (20.2). The air supply pressure, p1, is on the bottom
line of the equation and so as its value increases, the value of the conveying line inlet
air velocity, C1, will reduce and when the value drops below the minimum for the
TROUBLESHOOTING AND MATERIAL FLOW PROBLEMS 445
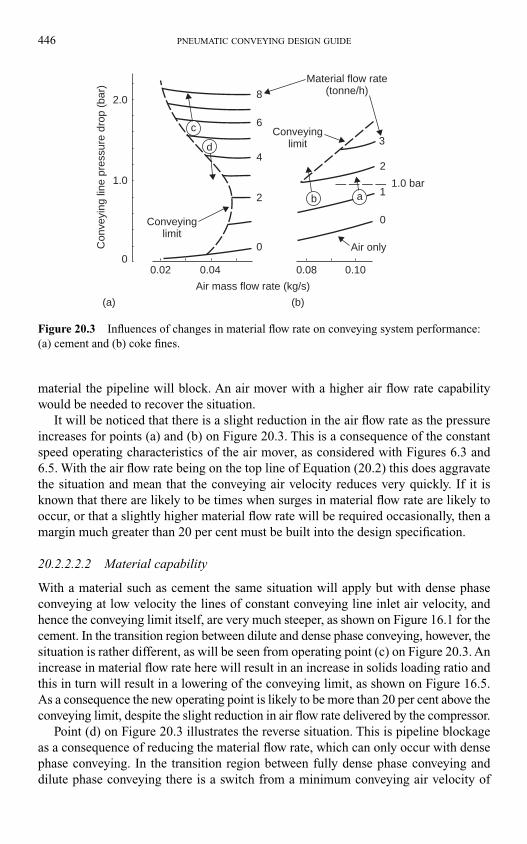
material the pipeline will block. An air mover with a higher air flow rate capability
would be needed to recover the situation.
It will be noticed that there is a slight reduction in the air flow rate as the pressure
increases for points (a) and (b) on Figure 20.3. This is a consequence of the constant
speed operating characteristics of the air mover, as considered with Figures 6.3 and
6.5. With the air flow rate being on the top line of Equation (20.2) this does aggravate
the situation and mean that the conveying air velocity reduces very quickly. If it is
known that there are likely to be times when surges in material flow rate are likely to
occur, or that a slightly higher material flow rate will be required occasionally, then a
margin much greater than 20 per cent must be built into the design specification.
20.2.2.2.2 Material capability
With a material such as cement the same situation will apply but with dense phase
conveying at low velocity the lines of constant conveying line inlet air velocity, and
hence the conveying limit itself, are very much steeper, as shown on Figure 16.1 for the
cement. In the transition region between dilute and dense phase conveying, however, the
situation is rather different, as will be seen from operating point (c) on Figure 20.3. An
increase in material flow rate here will result in an increase in solids loading ratio and
this in turn will result in a lowering of the conveying limit, as shown on Figure 16.5.
As a consequence the new operating point is likely to be more than 20 per cent above the
conveying limit, despite the slight reduction in air flow rate delivered by the compressor.
Point (d) on Figure 20.3 illustrates the reverse situation. This is pipeline blockage
as a consequence of reducing the material flow rate, which can only occur with dense
phase conveying. In the transition region between fully dense phase conveying and
dilute phase conveying there is a switch from a minimum conveying air velocity of
446 PNEUMATIC CONVEYING DESIGN GUIDE
Material flow rate(tonne/h)
0
1.0
2.0
0.02 0.04 0.08 0.10
Air mass flow rate (kg/s)
(a) (b)
Con
veyi
ng li
ne p
ress
ure
drop
(ba
r)
0
0
1.0 bar1
2
3
2
4
6
8
Conveyinglimit
Conveyinglimit
Air only
c
d
b a
Figure 20.3 Influences of changes in material flow rate on conveying system performance:
(a) cement and (b) coke fines.
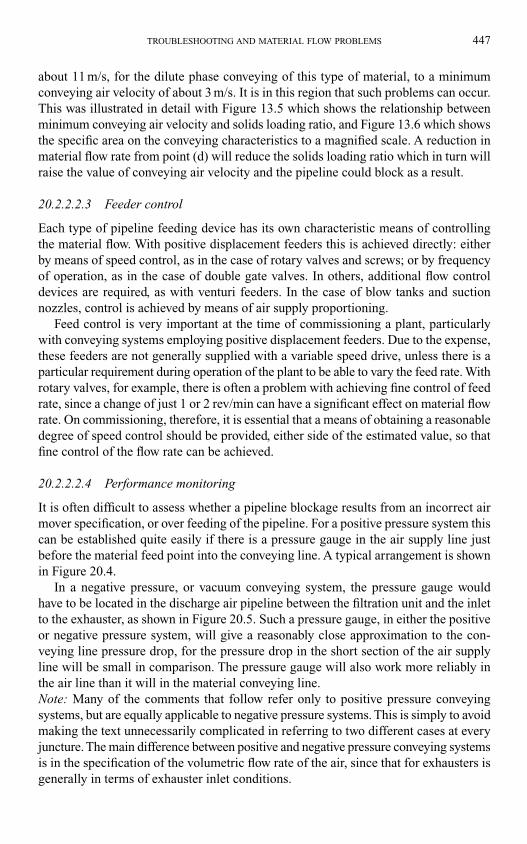
about 11 m/s, for the dilute phase conveying of this type of material, to a minimum
conveying air velocity of about 3 m/s. It is in this region that such problems can occur.
This was illustrated in detail with Figure 13.5 which shows the relationship between
minimum conveying air velocity and solids loading ratio, and Figure 13.6 which shows
the specific area on the conveying characteristics to a magnified scale. A reduction in
material flow rate from point (d) will reduce the solids loading ratio which in turn will
raise the value of conveying air velocity and the pipeline could block as a result.
20.2.2.2.3 Feeder control
Each type of pipeline feeding device has its own characteristic means of controlling
the material flow. With positive displacement feeders this is achieved directly: either
by means of speed control, as in the case of rotary valves and screws; or by frequency
of operation, as in the case of double gate valves. In others, additional flow control
devices are required, as with venturi feeders. In the case of blow tanks and suction
nozzles, control is achieved by means of air supply proportioning.
Feed control is very important at the time of commissioning a plant, particularly
with conveying systems employing positive displacement feeders. Due to the expense,
these feeders are not generally supplied with a variable speed drive, unless there is a
particular requirement during operation of the plant to be able to vary the feed rate. With
rotary valves, for example, there is often a problem with achieving fine control of feed
rate, since a change of just 1 or 2 rev/min can have a significant effect on material flow
rate. On commissioning, therefore, it is essential that a means of obtaining a reasonable
degree of speed control should be provided, either side of the estimated value, so that
fine control of the flow rate can be achieved.
20.2.2.2.4 Performance monitoring
It is often difficult to assess whether a pipeline blockage results from an incorrect air
mover specification, or over feeding of the pipeline. For a positive pressure system this
can be established quite easily if there is a pressure gauge in the air supply line just
before the material feed point into the conveying line. A typical arrangement is shown
in Figure 20.4.
In a negative pressure, or vacuum conveying system, the pressure gauge would
have to be located in the discharge air pipeline between the filtration unit and the inlet
to the exhauster, as shown in Figure 20.5. Such a pressure gauge, in either the positive
or negative pressure system, will give a reasonably close approximation to the con-
veying line pressure drop, for the pressure drop in the short section of the air supply
line will be small in comparison. The pressure gauge will also work more reliably in
the air line than it will in the material conveying line.
Note: Many of the comments that follow refer only to positive pressure conveying
systems, but are equally applicable to negative pressure systems. This is simply to avoid
making the text unnecessarily complicated in referring to two different cases at every
juncture. The main difference between positive and negative pressure conveying systems
is in the specification of the volumetric flow rate of the air, since that for exhausters is
generally in terms of exhauster inlet conditions.
TROUBLESHOOTING AND MATERIAL FLOW PROBLEMS 447
If the reading on the pressure gauge is above the design value it would indicate that
the pipeline is being over fed, and so the feed rate should be reduced. If the pressure is
at the design value or below, and the pipeline blocks, it would indicate that the volumet-
ric flow rate is insufficient. Pipeline blockage can occur very rapidly, particularly with
high velocity dilute phase conveying. In a 100 m long pipeline, for example, with a mean
conveying air velocity of 20 m/s the air will traverse the pipeline in 5 s. The particles
are conveyed at a slightly lower velocity but they will only take a few seconds longer.
A pressure gauge in the air line is particularly useful for monitoring the performance
of a system. If the pressure reading is below the design value, for example, it would
indicate that the performance of the system has been under estimated and that it would
be possible to feed more material into the pipeline. Care must be exercised here, how-
ever, and the air velocities should be checked as mentioned above, for an increase in air
supply pressure will result in a lowering of the conveying line inlet air velocity.
448 PNEUMATIC CONVEYING DESIGN GUIDE
Product feeddevice
Fan orblower
Storage siloor hopper
Air
Air
Air–solid flow Dischargehopper
P
Figure 20.4 Performance monitoring of a positive pressure conveying system.
P
Dischargehopper
Storage hoppers
Exhauster
Filter
Air
Air
Figure 20.5 Performance monitoring of a vacuum or negative pressure conveying system.
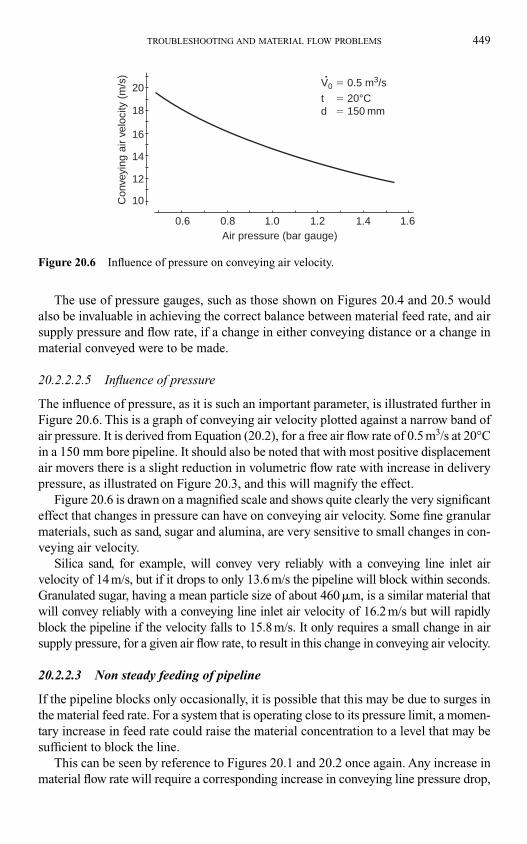
The use of pressure gauges, such as those shown on Figures 20.4 and 20.5 would
also be invaluable in achieving the correct balance between material feed rate, and air
supply pressure and flow rate, if a change in either conveying distance or a change in
material conveyed were to be made.
20.2.2.2.5 Influence of pressure
The influence of pressure, as it is such an important parameter, is illustrated further in
Figure 20.6. This is a graph of conveying air velocity plotted against a narrow band of
air pressure. It is derived from Equation (20.2), for a free air flow rate of 0.5 m3/s at 20°C
in a 150 mm bore pipeline. It should also be noted that with most positive displacement
air movers there is a slight reduction in volumetric flow rate with increase in delivery
pressure, as illustrated on Figure 20.3, and this will magnify the effect.
Figure 20.6 is drawn on a magnified scale and shows quite clearly the very significant
effect that changes in pressure can have on conveying air velocity. Some fine granular
materials, such as sand, sugar and alumina, are very sensitive to small changes in con-
veying air velocity.
Silica sand, for example, will convey very reliably with a conveying line inlet air
velocity of 14 m/s, but if it drops to only 13.6 m/s the pipeline will block within seconds.
Granulated sugar, having a mean particle size of about 460 �m, is a similar material that
will convey reliably with a conveying line inlet air velocity of 16.2 m/s but will rapidly
block the pipeline if the velocity falls to 15.8 m/s. It only requires a small change in air
supply pressure, for a given air flow rate, to result in this change in conveying air velocity.
20.2.2.3 Non steady feeding of pipeline
If the pipeline blocks only occasionally, it is possible that this may be due to surges in
the material feed rate. For a system that is operating close to its pressure limit, a momen-
tary increase in feed rate could raise the material concentration to a level that may be
sufficient to block the line.
This can be seen by reference to Figures 20.1 and 20.2 once again. Any increase in
material flow rate will require a corresponding increase in conveying line pressure drop,
TROUBLESHOOTING AND MATERIAL FLOW PROBLEMS 449
0.6
20
18
16
14
12
10
0.8 1.0 1.2 1.4 1.6Air pressure (bar gauge)
V0 � 0.5 m3/s
t � 20°Cd � 150 mm
Con
veyi
ng a
ir ve
loci
ty (
m/s
) •
Figure 20.6 Influence of pressure on conveying air velocity.
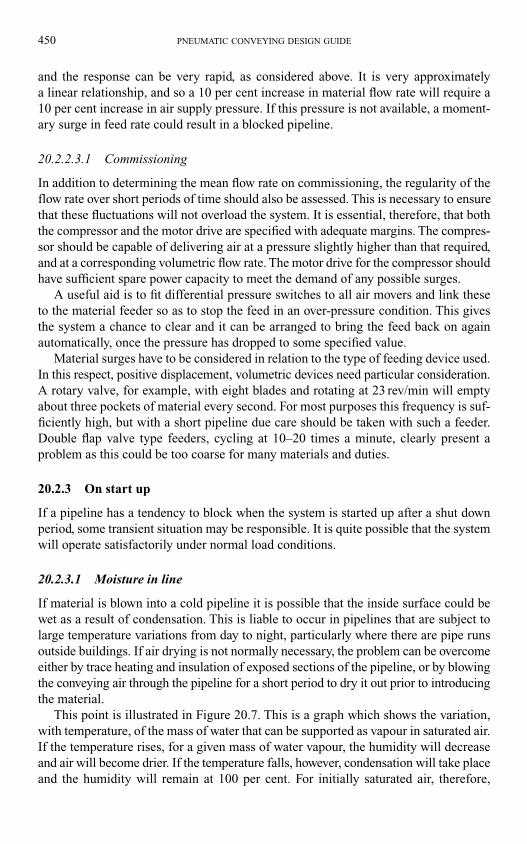
and the response can be very rapid, as considered above. It is very approximately
a linear relationship, and so a 10 per cent increase in material flow rate will require a
10 per cent increase in air supply pressure. If this pressure is not available, a moment-
ary surge in feed rate could result in a blocked pipeline.
20.2.2.3.1 Commissioning
In addition to determining the mean flow rate on commissioning, the regularity of the
flow rate over short periods of time should also be assessed. This is necessary to ensure
that these fluctuations will not overload the system. It is essential, therefore, that both
the compressor and the motor drive are specified with adequate margins. The compres-
sor should be capable of delivering air at a pressure slightly higher than that required,
and at a corresponding volumetric flow rate. The motor drive for the compressor should
have sufficient spare power capacity to meet the demand of any possible surges.
A useful aid is to fit differential pressure switches to all air movers and link these
to the material feeder so as to stop the feed in an over-pressure condition. This gives
the system a chance to clear and it can be arranged to bring the feed back on again
automatically, once the pressure has dropped to some specified value.
Material surges have to be considered in relation to the type of feeding device used.
In this respect, positive displacement, volumetric devices need particular consideration.
A rotary valve, for example, with eight blades and rotating at 23 rev/min will empty
about three pockets of material every second. For most purposes this frequency is suf-
ficiently high, but with a short pipeline due care should be taken with such a feeder.
Double flap valve type feeders, cycling at 10–20 times a minute, clearly present a
problem as this could be too coarse for many materials and duties.
20.2.3 On start up
If a pipeline has a tendency to block when the system is started up after a shut down
period, some transient situation may be responsible. It is quite possible that the system
will operate satisfactorily under normal load conditions.
20.2.3.1 Moisture in line
If material is blown into a cold pipeline it is possible that the inside surface could be
wet as a result of condensation. This is liable to occur in pipelines that are subject to
large temperature variations from day to night, particularly where there are pipe runs
outside buildings. If air drying is not normally necessary, the problem can be overcome
either by trace heating and insulation of exposed sections of the pipeline, or by blowing
the conveying air through the pipeline for a short period to dry it out prior to introducing
the material.
This point is illustrated in Figure 20.7. This is a graph which shows the variation,
with temperature, of the mass of water that can be supported as vapour in saturated air.
If the temperature rises, for a given mass of water vapour, the humidity will decrease
and air will become drier. If the temperature falls, however, condensation will take place
and the humidity will remain at 100 per cent. For initially saturated air, therefore,
450 PNEUMATIC CONVEYING DESIGN GUIDE
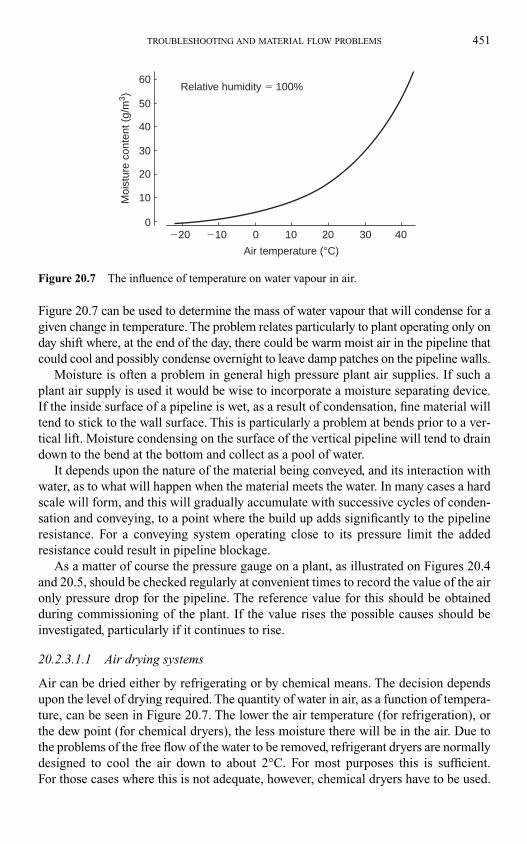
Figure 20.7 can be used to determine the mass of water vapour that will condense for a
given change in temperature. The problem relates particularly to plant operating only on
day shift where, at the end of the day, there could be warm moist air in the pipeline that
could cool and possibly condense overnight to leave damp patches on the pipeline walls.
Moisture is often a problem in general high pressure plant air supplies. If such a
plant air supply is used it would be wise to incorporate a moisture separating device.
If the inside surface of a pipeline is wet, as a result of condensation, fine material will
tend to stick to the wall surface. This is particularly a problem at bends prior to a ver-
tical lift. Moisture condensing on the surface of the vertical pipeline will tend to drain
down to the bend at the bottom and collect as a pool of water.
It depends upon the nature of the material being conveyed, and its interaction with
water, as to what will happen when the material meets the water. In many cases a hard
scale will form, and this will gradually accumulate with successive cycles of conden-
sation and conveying, to a point where the build up adds significantly to the pipeline
resistance. For a conveying system operating close to its pressure limit the added
resistance could result in pipeline blockage.
As a matter of course the pressure gauge on a plant, as illustrated on Figures 20.4
and 20.5, should be checked regularly at convenient times to record the value of the air
only pressure drop for the pipeline. The reference value for this should be obtained
during commissioning of the plant. If the value rises the possible causes should be
investigated, particularly if it continues to rise.
20.2.3.1.1 Air drying systems
Air can be dried either by refrigerating or by chemical means. The decision depends
upon the level of drying required. The quantity of water in air, as a function of tempera-
ture, can be seen in Figure 20.7. The lower the air temperature (for refrigeration), or
the dew point (for chemical dryers), the less moisture there will be in the air. Due to
the problems of the free flow of the water to be removed, refrigerant dryers are normally
designed to cool the air down to about 2°C. For most purposes this is sufficient.
For those cases where this is not adequate, however, chemical dryers have to be used.
TROUBLESHOOTING AND MATERIAL FLOW PROBLEMS 451
60Relative humidity � 100%
50
40
30
20
10
0�20 �10 0 10 20 30 40
Air temperature (°C)
Moi
stur
e co
nten
t (g/
m3 )
Figure 20.7 The influence of temperature on water vapour in air.
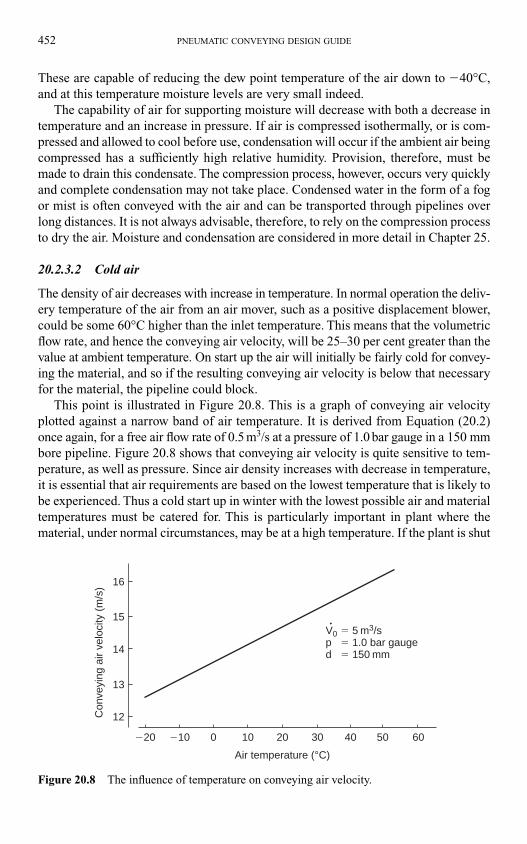
These are capable of reducing the dew point temperature of the air down to �40°C,
and at this temperature moisture levels are very small indeed.
The capability of air for supporting moisture will decrease with both a decrease in
temperature and an increase in pressure. If air is compressed isothermally, or is com-
pressed and allowed to cool before use, condensation will occur if the ambient air being
compressed has a sufficiently high relative humidity. Provision, therefore, must be
made to drain this condensate. The compression process, however, occurs very quickly
and complete condensation may not take place. Condensed water in the form of a fog
or mist is often conveyed with the air and can be transported through pipelines over
long distances. It is not always advisable, therefore, to rely on the compression process
to dry the air. Moisture and condensation are considered in more detail in Chapter 25.
20.2.3.2 Cold air
The density of air decreases with increase in temperature. In normal operation the deliv-
ery temperature of the air from an air mover, such as a positive displacement blower,
could be some 60°C higher than the inlet temperature. This means that the volumetric
flow rate, and hence the conveying air velocity, will be 25–30 per cent greater than the
value at ambient temperature. On start up the air will initially be fairly cold for convey-
ing the material, and so if the resulting conveying air velocity is below that necessary
for the material, the pipeline could block.
This point is illustrated in Figure 20.8. This is a graph of conveying air velocity
plotted against a narrow band of air temperature. It is derived from Equation (20.2)
once again, for a free air flow rate of 0.5 m3/s at a pressure of 1.0 bar gauge in a 150 mm
bore pipeline. Figure 20.8 shows that conveying air velocity is quite sensitive to tem-
perature, as well as pressure. Since air density increases with decrease in temperature,
it is essential that air requirements are based on the lowest temperature that is likely to
be experienced. Thus a cold start up in winter with the lowest possible air and material
temperatures must be catered for. This is particularly important in plant where the
material, under normal circumstances, may be at a high temperature. If the plant is shut
452 PNEUMATIC CONVEYING DESIGN GUIDE
Con
veyi
ng a
ir ve
loci
ty (
m/s
)
Air temperature (°C)
�20 �10 10
12
13
14
15
16
20 30 40 50 600
V0 � 5 m3/sp � 1.0 bar gauged � 150 mm
•
Figure 20.8 The influence of temperature on conveying air velocity.
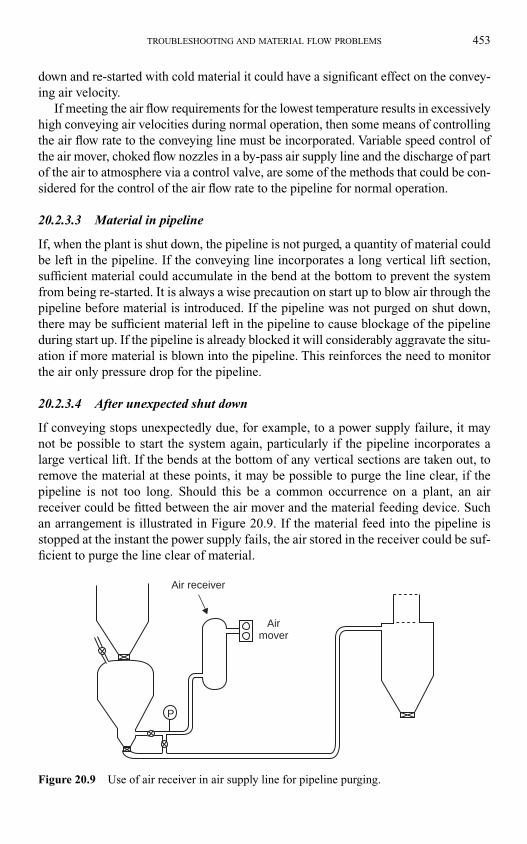
down and re-started with cold material it could have a significant effect on the convey-
ing air velocity.
If meeting the air flow requirements for the lowest temperature results in excessively
high conveying air velocities during normal operation, then some means of controlling
the air flow rate to the conveying line must be incorporated. Variable speed control of
the air mover, choked flow nozzles in a by-pass air supply line and the discharge of part
of the air to atmosphere via a control valve, are some of the methods that could be con-
sidered for the control of the air flow rate to the pipeline for normal operation.
20.2.3.3 Material in pipeline
If, when the plant is shut down, the pipeline is not purged, a quantity of material could
be left in the pipeline. If the conveying line incorporates a long vertical lift section,
sufficient material could accumulate in the bend at the bottom to prevent the system
from being re-started. It is always a wise precaution on start up to blow air through the
pipeline before material is introduced. If the pipeline was not purged on shut down,
there may be sufficient material left in the pipeline to cause blockage of the pipeline
during start up. If the pipeline is already blocked it will considerably aggravate the situ-
ation if more material is blown into the pipeline. This reinforces the need to monitor
the air only pressure drop for the pipeline.
20.2.3.4 After unexpected shut down
If conveying stops unexpectedly due, for example, to a power supply failure, it may
not be possible to start the system again, particularly if the pipeline incorporates a
large vertical lift. If the bends at the bottom of any vertical sections are taken out, to
remove the material at these points, it may be possible to purge the line clear, if the
pipeline is not too long. Should this be a common occurrence on a plant, an air
receiver could be fitted between the air mover and the material feeding device. Such
an arrangement is illustrated in Figure 20.9. If the material feed into the pipeline is
stopped at the instant the power supply fails, the air stored in the receiver could be suf-
ficient to purge the line clear of material.
TROUBLESHOOTING AND MATERIAL FLOW PROBLEMS 453
Air receiver
Airmover
P
Figure 20.9 Use of air receiver in air supply line for pipeline purging.
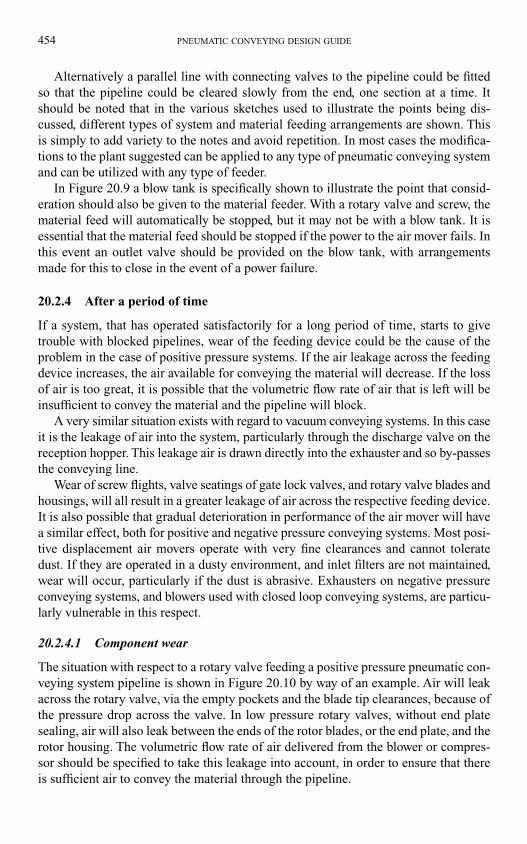
Alternatively a parallel line with connecting valves to the pipeline could be fitted
so that the pipeline could be cleared slowly from the end, one section at a time. It
should be noted that in the various sketches used to illustrate the points being dis-
cussed, different types of system and material feeding arrangements are shown. This
is simply to add variety to the notes and avoid repetition. In most cases the modifica-
tions to the plant suggested can be applied to any type of pneumatic conveying system
and can be utilized with any type of feeder.
In Figure 20.9 a blow tank is specifically shown to illustrate the point that consid-
eration should also be given to the material feeder. With a rotary valve and screw, the
material feed will automatically be stopped, but it may not be with a blow tank. It is
essential that the material feed should be stopped if the power to the air mover fails. In
this event an outlet valve should be provided on the blow tank, with arrangements
made for this to close in the event of a power failure.
20.2.4 After a period of time
If a system, that has operated satisfactorily for a long period of time, starts to give
trouble with blocked pipelines, wear of the feeding device could be the cause of the
problem in the case of positive pressure systems. If the air leakage across the feeding
device increases, the air available for conveying the material will decrease. If the loss
of air is too great, it is possible that the volumetric flow rate of air that is left will be
insufficient to convey the material and the pipeline will block.
A very similar situation exists with regard to vacuum conveying systems. In this case
it is the leakage of air into the system, particularly through the discharge valve on the
reception hopper. This leakage air is drawn directly into the exhauster and so by-passes
the conveying line.
Wear of screw flights, valve seatings of gate lock valves, and rotary valve blades and
housings, will all result in a greater leakage of air across the respective feeding device.
It is also possible that gradual deterioration in performance of the air mover will have
a similar effect, both for positive and negative pressure conveying systems. Most posi-
tive displacement air movers operate with very fine clearances and cannot tolerate
dust. If they are operated in a dusty environment, and inlet filters are not maintained,
wear will occur, particularly if the dust is abrasive. Exhausters on negative pressure
conveying systems, and blowers used with closed loop conveying systems, are particu-
larly vulnerable in this respect.
20.2.4.1 Component wear
The situation with respect to a rotary valve feeding a positive pressure pneumatic con-
veying system pipeline is shown in Figure 20.10 by way of an example. Air will leak
across the rotary valve, via the empty pockets and the blade tip clearances, because of
the pressure drop across the valve. In low pressure rotary valves, without end plate
sealing, air will also leak between the ends of the rotor blades, or the end plate, and the
rotor housing. The volumetric flow rate of air delivered from the blower or compres-
sor should be specified to take this leakage into account, in order to ensure that there
is sufficient air to convey the material through the pipeline.
454 PNEUMATIC CONVEYING DESIGN GUIDE
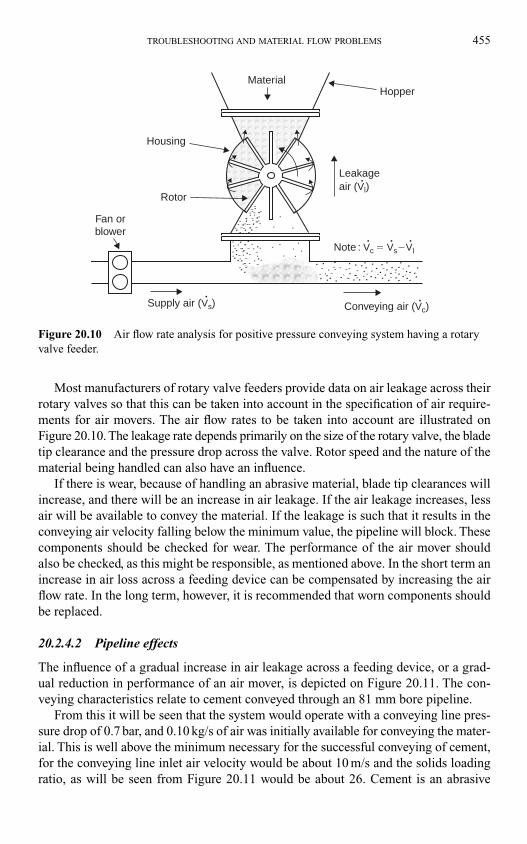
Most manufacturers of rotary valve feeders provide data on air leakage across their
rotary valves so that this can be taken into account in the specification of air require-
ments for air movers. The air flow rates to be taken into account are illustrated on
Figure 20.10. The leakage rate depends primarily on the size of the rotary valve, the blade
tip clearance and the pressure drop across the valve. Rotor speed and the nature of the
material being handled can also have an influence.
If there is wear, because of handling an abrasive material, blade tip clearances will
increase, and there will be an increase in air leakage. If the air leakage increases, less
air will be available to convey the material. If the leakage is such that it results in the
conveying air velocity falling below the minimum value, the pipeline will block. These
components should be checked for wear. The performance of the air mover should
also be checked, as this might be responsible, as mentioned above. In the short term an
increase in air loss across a feeding device can be compensated by increasing the air
flow rate. In the long term, however, it is recommended that worn components should
be replaced.
20.2.4.2 Pipeline effects
The influence of a gradual increase in air leakage across a feeding device, or a grad-
ual reduction in performance of an air mover, is depicted on Figure 20.11. The con-
veying characteristics relate to cement conveyed through an 81 mm bore pipeline.
From this it will be seen that the system would operate with a conveying line pres-
sure drop of 0.7 bar, and 0.10 kg/s of air was initially available for conveying the mater-
ial. This is well above the minimum necessary for the successful conveying of cement,
for the conveying line inlet air velocity would be about 10 m/s and the solids loading
ratio, as will be seen from Figure 20.11 would be about 26. Cement is an abrasive
TROUBLESHOOTING AND MATERIAL FLOW PROBLEMS 455
Fan orblower
Rotor
Housing
MaterialHopper
Supply air (Vs) Conveying air (Vc)
Note : Vc � Vs�Vl
Leakageair (Vl)
•
•
•
•
•
•
Figure 20.10 Air flow rate analysis for positive pressure conveying system having a rotary
valve feeder.
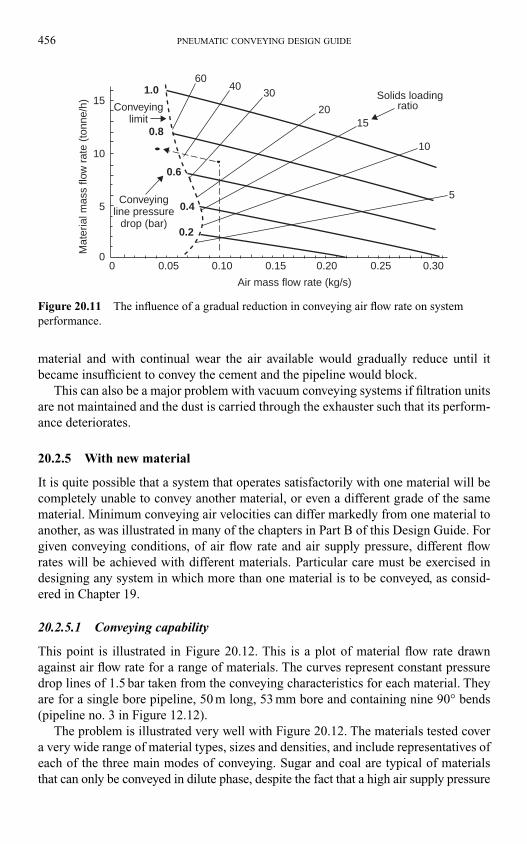
material and with continual wear the air available would gradually reduce until it
became insufficient to convey the cement and the pipeline would block.
This can also be a major problem with vacuum conveying systems if filtration units
are not maintained and the dust is carried through the exhauster such that its perform-
ance deteriorates.
20.2.5 With new material
It is quite possible that a system that operates satisfactorily with one material will be
completely unable to convey another material, or even a different grade of the same
material. Minimum conveying air velocities can differ markedly from one material to
another, as was illustrated in many of the chapters in Part B of this Design Guide. For
given conveying conditions, of air flow rate and air supply pressure, different flow
rates will be achieved with different materials. Particular care must be exercised in
designing any system in which more than one material is to be conveyed, as consid-
ered in Chapter 19.
20.2.5.1 Conveying capability
This point is illustrated in Figure 20.12. This is a plot of material flow rate drawn
against air flow rate for a range of materials. The curves represent constant pressure
drop lines of 1.5 bar taken from the conveying characteristics for each material. They
are for a single bore pipeline, 50 m long, 53 mm bore and containing nine 90° bends
(pipeline no. 3 in Figure 12.12).
The problem is illustrated very well with Figure 20.12. The materials tested cover
a very wide range of material types, sizes and densities, and include representatives of
each of the three main modes of conveying. Sugar and coal are typical of materials
that can only be conveyed in dilute phase, despite the fact that a high air supply pressure
456 PNEUMATIC CONVEYING DESIGN GUIDE
Mat
eria
l mas
s flo
w r
ate
(ton
ne/h
)
Conveyinglimit
Air mass flow rate (kg/s)
5
10
20
3040
601.0
0.8
0.6
0.4
0.2
15
Conveyingline pressure
drop (bar)
10
5
00 0.05 0.10 0.15 0.20 0.25 0.30
15 Solids loadingratio
Figure 20.11 The influence of a gradual reduction in conveying air flow rate on system
performance.
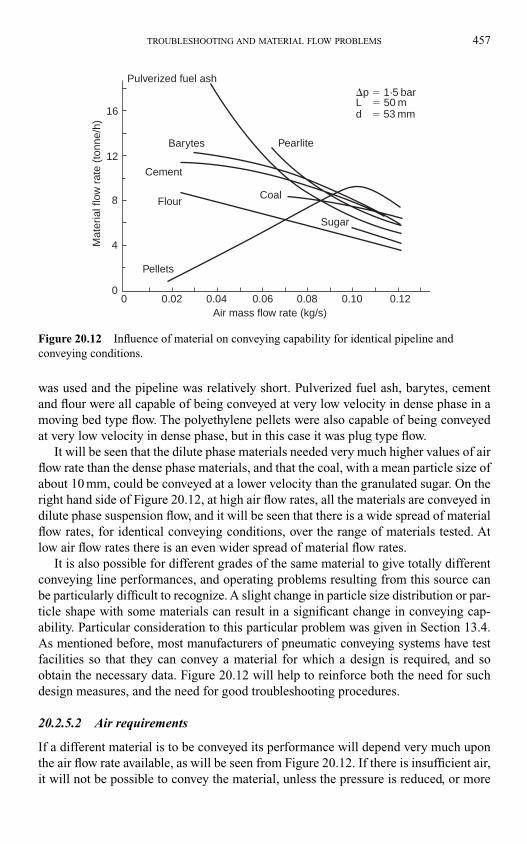
was used and the pipeline was relatively short. Pulverized fuel ash, barytes, cement
and flour were all capable of being conveyed at very low velocity in dense phase in a
moving bed type flow. The polyethylene pellets were also capable of being conveyed
at very low velocity in dense phase, but in this case it was plug type flow.
It will be seen that the dilute phase materials needed very much higher values of air
flow rate than the dense phase materials, and that the coal, with a mean particle size of
about 10 mm, could be conveyed at a lower velocity than the granulated sugar. On the
right hand side of Figure 20.12, at high air flow rates, all the materials are conveyed in
dilute phase suspension flow, and it will be seen that there is a wide spread of material
flow rates, for identical conveying conditions, over the range of materials tested. At
low air flow rates there is an even wider spread of material flow rates.
It is also possible for different grades of the same material to give totally different
conveying line performances, and operating problems resulting from this source can
be particularly difficult to recognize. A slight change in particle size distribution or par-
ticle shape with some materials can result in a significant change in conveying cap-
ability. Particular consideration to this particular problem was given in Section 13.4.
As mentioned before, most manufacturers of pneumatic conveying systems have test
facilities so that they can convey a material for which a design is required, and so
obtain the necessary data. Figure 20.12 will help to reinforce both the need for such
design measures, and the need for good troubleshooting procedures.
20.2.5.2 Air requirements
If a different material is to be conveyed its performance will depend very much upon
the air flow rate available, as will be seen from Figure 20.12. If there is insufficient air,
it will not be possible to convey the material, unless the pressure is reduced, or more
TROUBLESHOOTING AND MATERIAL FLOW PROBLEMS 457
�p � 1·5 barL � 50 md � 53 mm
Pearlite
CoalFlour
Cement
Barytes
Pellets
Pulverized fuel ashM
ater
ial f
low
rat
e (t
onne
/h)
16
12
8
4
00
0.02 0.04 0.06 0.08 0.10 0.12Air mass flow rate (kg/s)
Sugar
Figure 20.12 Influence of material on conveying capability for identical pipeline and
conveying conditions.
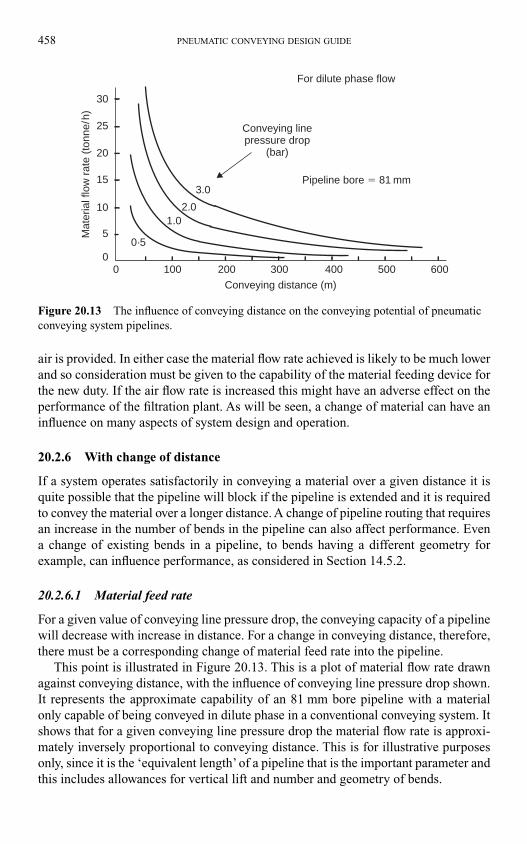
air is provided. In either case the material flow rate achieved is likely to be much lower
and so consideration must be given to the capability of the material feeding device for
the new duty. If the air flow rate is increased this might have an adverse effect on the
performance of the filtration plant. As will be seen, a change of material can have an
influence on many aspects of system design and operation.
20.2.6 With change of distance
If a system operates satisfactorily in conveying a material over a given distance it is
quite possible that the pipeline will block if the pipeline is extended and it is required
to convey the material over a longer distance. A change of pipeline routing that requires
an increase in the number of bends in the pipeline can also affect performance. Even
a change of existing bends in a pipeline, to bends having a different geometry for
example, can influence performance, as considered in Section 14.5.2.
20.2.6.1 Material feed rate
For a given value of conveying line pressure drop, the conveying capacity of a pipeline
will decrease with increase in distance. For a change in conveying distance, therefore,
there must be a corresponding change of material feed rate into the pipeline.
This point is illustrated in Figure 20.13. This is a plot of material flow rate drawn
against conveying distance, with the influence of conveying line pressure drop shown.
It represents the approximate capability of an 81 mm bore pipeline with a material
only capable of being conveyed in dilute phase in a conventional conveying system. It
shows that for a given conveying line pressure drop the material flow rate is approxi-
mately inversely proportional to conveying distance. This is for illustrative purposes
only, since it is the ‘equivalent length’ of a pipeline that is the important parameter and
this includes allowances for vertical lift and number and geometry of bends.
458 PNEUMATIC CONVEYING DESIGN GUIDE
For dilute phase flow
Conveying linepressure drop
(bar)
Pipeline bore � 81 mm
Conveying distance (m)
Mat
eria
l flo
w r
ate
(ton
ne/h
)
30
25
20
00 100 200 300 400 500 600
5
10
153.0
2.01.0
0·5
Figure 20.13 The influence of conveying distance on the conveying potential of pneumatic
conveying system pipelines.
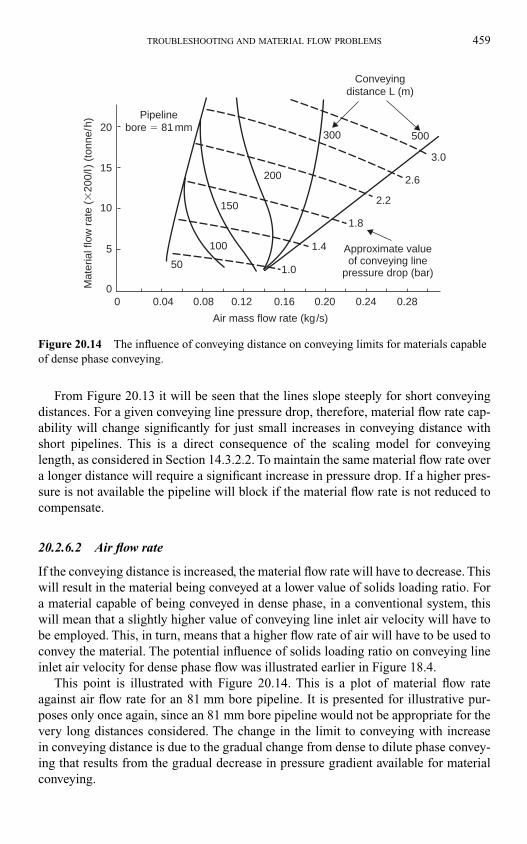
From Figure 20.13 it will be seen that the lines slope steeply for short conveying
distances. For a given conveying line pressure drop, therefore, material flow rate cap-
ability will change significantly for just small increases in conveying distance with
short pipelines. This is a direct consequence of the scaling model for conveying
length, as considered in Section 14.3.2.2. To maintain the same material flow rate over
a longer distance will require a significant increase in pressure drop. If a higher pres-
sure is not available the pipeline will block if the material flow rate is not reduced to
compensate.
20.2.6.2 Air flow rate
If the conveying distance is increased, the material flow rate will have to decrease. This
will result in the material being conveyed at a lower value of solids loading ratio. For
a material capable of being conveyed in dense phase, in a conventional system, this
will mean that a slightly higher value of conveying line inlet air velocity will have to
be employed. This, in turn, means that a higher flow rate of air will have to be used to
convey the material. The potential influence of solids loading ratio on conveying line
inlet air velocity for dense phase flow was illustrated earlier in Figure 18.4.
This point is illustrated with Figure 20.14. This is a plot of material flow rate
against air flow rate for an 81 mm bore pipeline. It is presented for illustrative pur-
poses only once again, since an 81 mm bore pipeline would not be appropriate for the
very long distances considered. The change in the limit to conveying with increase
in conveying distance is due to the gradual change from dense to dilute phase convey-
ing that results from the gradual decrease in pressure gradient available for material
conveying.
TROUBLESHOOTING AND MATERIAL FLOW PROBLEMS 459
50
100
150
200
300 500
3.0
2.6
2.2
1.8
1.4
1.0
20
15
10
5
00 0.080.04 0.12 0.16 0.20 0.24 0.28
Air mass flow rate (kg/s)
Mat
eria
l flo
w r
ate
(�20
0/l)
(to
nne/
h)
Pipelinebore � 81 mm
Approximate valueof conveying line
pressure drop (bar)
Conveyingdistance L (m)
Figure 20.14 The influence of conveying distance on conveying limits for materials capable
of dense phase conveying.
20.2.6.3 Conveying potential
In terms of conveying potential it is conveying line pressure gradient and material
properties that are the important parameters. To convey in dense phase requires a high
pressure gradient, because of the high concentration of the material in the air. Due to
the compressibility problems with air, and expansion effects in particular, air supply
pressures greater than about 5 bar gauge are rarely employed. If it is required to convey
over a long distance, therefore, the pressure gradient must be reduced if it is not pos-
sible to utilise a higher air supply pressure to compensate. If the pressure gradient has
to be reduced it will not be possible to convey in dense phase.
Thus even if a material is capable of being conveyed in dense phase and at low
velocity, the material will have to be conveyed in dilute phase, and at a much higher
velocity, if it is required to convey the material over a long distance. A larger bore
pipeline will have to be used, as an alternative to a higher air supply pressure, in order
to achieve the material flow rate required.
If the properties of the material are such that it can only be conveyed in dilute
phase, suspension flow, the use of high pressure air for conveying will have no effect
at all in changing this to dense phase, unless a totally different conveying system is
employed. The transition that occurs with dense phase materials that is depicted on
Figure 20.14 is only appropriate for dense phase conveying. For materials that are only
capable of dilute phase conveying the conveying limit will not vary with respect to
conveying distance.
460 PNEUMATIC CONVEYING DESIGN GUIDE
21.1 Introduction
There is often a need in industry for an existing plant to be up-rated to meet a demand
for increased output or production. If part of a process plant includes pneumatic con-
veying facilities it is not always obvious as to how this might be achieved. It may be
possible to increase capacity simply be optimizing the existing system. Alternatively
it might be necessary to add or replace some of the plant.
All too often, when it is required to increase the capacity of an existing pneumatic
conveying system, an attempt is made at improving output by increasing the amount of
air used for conveying the material in a pipeline. This is usually done by adding another
blower in parallel, by changing the existing blower for one with a much higher volu-
metric flow rate, or by changing the drive such that the rotor speed of the blower is
increased. In nearly all cases, however, the net result of these simple modifications is
that the material flow rate through the pipeline does not increase at all, but decreases,
and often by a considerable amount.
There are many different solutions to the problem and consideration is given to some
of the alternatives that are available. An explanation is also given as to how an existing
system could be tested in order to check whether it is operating under optimum con-
ditions. Various methods are compared, in terms of potential material flow rates, and the
effect that the changing of one plant item can have on the rest of the system are con-
sidered. Although low pressure continuously operating systems using positive displace-
ment blowers are generally used for reference purposes in this chapter, the underlying
principles and points considered will generally apply equally to any other type of system.
21.1.1 Optimizing conveying conditions
Engineers asked to undertake the design of a pneumatic conveying system are usually
aware of the situation with respect to air flow rate, but are often not certain of the rela-
tionship between conveying air flow rate, or velocity, and material flow rate, air supply
pressure and pipeline layout. The problem, of course, is that different materials can have
totally different conveying characteristics and that conveying distance can also influence
these characteristics, as illustrated at many points in Part B of this ‘Design guide’.
Unless conveying trials are carried out with a material, or previous experience with
the material is available, it is unlikely that the plant could be built to achieve the
Chapter 21
Optimizing and up-rating of existing systems
required output without over-design in certain areas. They will know that a dilute
phase conveying system will not operate if the velocity is below the saltation or chok-
ing velocity. They are equally aware, however, that the system will operate reasonably
well, although inefficiently, if the velocity is on the high side.
The tendency, therefore, is to ‘play safe’ and either install a pipeline with a larger
bore than necessary, or to install a blower having a capacity much greater than is actu-
ally necessary. If, on commissioning the plant, the design flow rates are not achieved,
the situation can usually be rectified by changing the V-belt drive gear ratio to achieve
a lower volume output. It is quite likely, therefore, that the output of an existing con-
veying plant could be increased quite simply by adjusting the air flow rate and opti-
mizing the conveying of the material in the existing pipeline.
21.1.2 Modifying plant components
If the conveying line is already operating under optimum conditions, or if optimization
does not achieve the desired increase in material flow rate, it is possible that a modifi-
cation to one or two of the plant components will result in an increase in capacity. For
a given system, the material flow rate is dependent to a large extent upon the conveying
line pressure drop available. It is necessary, therefore, to either provide the system with
more pressure or to minimize the pressure drop associated with some of the plant com-
ponents and thereby make more available for the conveying of the material.
The total pressure drop for the conveying system is made up of that due to the feed-
ing device, that due to the conveying line and that due to the filtration plant at the end
of the line. If the pressure drop associated with the material feeding and filtration units
can be reduced, a greater pressure drop will be available for conveying the material in
the pipeline, which will enable more material to be conveyed. Air supply and extrac-
tion lines, particularly if they are long, should also be included in this review.
Increasing the pipeline to a larger bore will almost certainly achieve an improve-
ment in performance. An increase to the next standard size, however, may achieve a
material flow rate higher than necessary. If the conveying line pressure drop is greater
than about 0.8 bar for a positive pressure system, or more than about 0.4 bar for a vac-
uum system, the possibility of stepping the pipeline to a larger bore part way along its
length would be well worthwhile exploring.
This is certainly the case for virtually all materials conveyed in dilute phase and for
most materials conveyed in dense phase in sliding bed flow. It is only where materials
exhibit a pressure minimum point in their conveying characteristics that the benefits
would need to be reviewed carefully. Stepping of the pipeline will reduce the high val-
ues of conveying air velocity that can result towards the end of single bore pipelines.
Since pressure drop is dependent upon both pipe bore and velocity the stepping of the
pipeline to a larger bore will generally help on both accounts. The stepping of pipeline
systems was considered in Section 9.4 in relation to conveying air velocities, and in
Section 14.8 in relation to conveying performance.
21.1.3 Replacing plant components
If optimizing the conveying conditions and modifying plant items does not result in the
desired increase in performance it will probably be necessary to replace one or more of
462 PNEUMATIC CONVEYING DESIGN GUIDE
the plant items. One of the easiest items to replace is probably the blower or compres-
sor. It is important to realise, however, that if no other changes are made to the plant the
output of the new air mover will only need to be increased in terms of delivery pressure.
Only a relatively small increase in volumetric flow rate will be required in order to com-
pensate for the increase in delivery pressure to maintain the necessary conveying line
inlet air velocity. If a rotary valve is used in such a system it may also be necessary to
take into account the corresponding increase in air leakage that is likely to result.
There are, of course, limits as to what can be achieved by replacing the blower or
compressor. For negative pressure, or vacuum systems, the increase in available pres-
sure drop may only be marginal. With positive pressure systems the material feeding
device may impose a limit on the maximum supply pressure, particularly with low pres-
sure rotary valves and venturi feeders. An increase in conveying line pressure drop can
result in an increase in material flow rate as has been shown with the various material
conveying characteristics presented but there is clearly a limit on the improvement that
can be achieved.
If a significant improvement in performance is required then an increase in pipeline
bore will be required. It is quite likely, however, that a new blower or compressor will be
required as well, unless the original one installed was grossly over-rated. The possibility
of increasing the speed of an existing machine to deliver a higher air flow rate could be
explored, along with the capability of the existing drive motor. The capability of the
existing filtration plant would also have to be examined for the higher air flow rate.
21.2 System not capable of duty
As with the problem of pipeline blockage, considered in the previous chapter, the inabil-
ity of a system to achieve the rated duty could result from an error in the system design.
Alternatively, it is possible that the problem could be rectified by some simple adjust-
ment to the plant. It is particularly important to determine whether the limitation on
material flow rate is due to the material feeding device or to the pipeline and air supply.
21.2.1 Material feeding
The first check to be made is on the conveying line pressure drop. If this is below the
capability of the air mover it is probable that insufficient material is being fed into
the pipeline. This may be rectified by adjusting the controls on the feeding device. If
the maximum output of the feeder does not meet the conveying capability of the pipe-
line, however, it will probably be necessary to fit a larger feeder.
In the case of feeders delivering material into positive pressure conveying systems,
there will be a leakage of air across the device. It should be checked that the feeder is
operating satisfactorily with the material before recommending a larger size. In the
case of rotary valves, for example, leakage air can restrict the flow of material into the
valve. The leakage air might also aerate the material to such an extent that there is a
significant reduction in bulk density. The effectiveness of air vents and the clearances
on all moving parts should also be checked.
If the conveying line pressure drop is at the design value, however, it would indi-
cate that it is the pipeline or the air supply that is the main cause of the system not
being able to achieve the required material flow rate.
OPTIMIZING AND UP-RATING OF EXISTING SYSTEMS 463
21.2.2 Air filtration
Another check to be made should be on the filtration unit. If this is incorrectly sized for
the duty it is possible that the pressure drop across the filter will be unnecessarily high.
Filter cloth surface areas are sized primarily on volumetric air flow rate. If it is incor-
rectly sized an additional unit could be installed, if there is sufficient space. If there is not
sufficient room, then the filter unit will probably have to be replaced with a larger unit.
Before going to this length, however, a check should be made that cleaning cycles
are satisfactory, cleaning is effective, and that the filter cloths do not need replacing.
The pressure drop across a filtration unit should be low and so this element of pressure
drop is only likely to be significant on low pressure conveying systems.
21.2.3 Reduce air flow rate
An improvement in system performance will often be obtained by reducing the quan-
tity of air that is used for conveying the material, particularly if the system is over-
rated in terms of the volumetric flow rate of air that is supplied. This, however, must
be carefully considered before being undertaken. It is essentially a programme of opti-
mization that is required and it must be carefully planned.
21.3 Optimizing existing systems
In the majority of cases optimization of an existing system will be achieved by reducing
the amount of air used for conveying the material. The problem with existing plants,
however, is the potential disruption of production, particularly if a change in conditions
results in a pipeline blockage. A large degree of control, therefore, is required so that
changes can be made gradually and their effects can be carefully monitored.
21.3.1 Control and instrumentation
Although reducing the speed of the blower can produce the additional benefit of a slight
increase in delivery pressure, it is not very convenient in terms of control and gradual
adjustment. An off-take to atmosphere in the air supply line between the blower and the
point at which the material is fed into the pipeline provides much more flexibility.
This can easily be arranged by fitting a Tee-piece into the line, with a control valve
on the off-take. If there is not already a pressure gauge on the air supply line one could
be fitted at the same time, as this will be needed to record the air supply pressure, or
conveying line pressure drop.
If a rotameter, or some other form of air flow rate measuring device, is also fitted
so that the air is discharged through it to atmosphere, a measure of the air flow rate dis-
charged will be obtained as well. As many valves have non-linear characteristics, a
rotameter would be particularly useful in ensuring that the desired proportion of air
was discharged. By this means it will be possible to exercise full control over the air
flow rate and quite accurately determine the amount actually used for conveying. Once
this off-take is installed, tests can be carried out on the plant with little disruption to
production.
464 PNEUMATIC CONVEYING DESIGN GUIDE
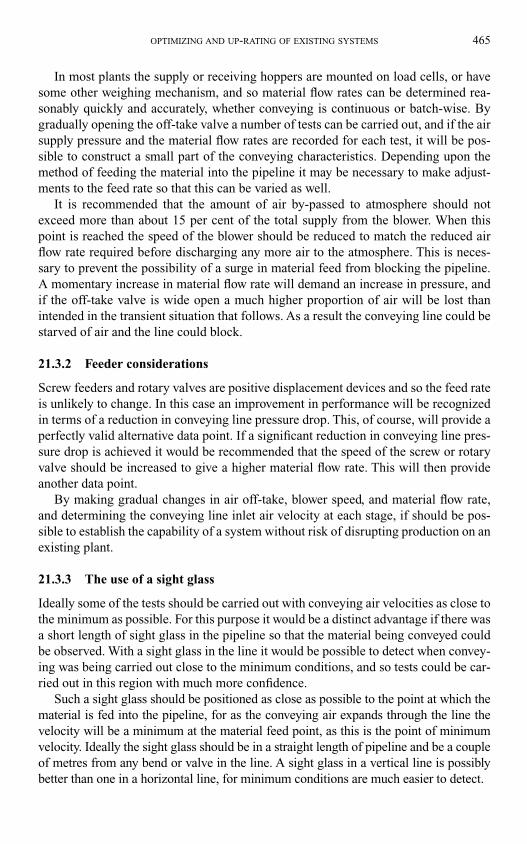
In most plants the supply or receiving hoppers are mounted on load cells, or have
some other weighing mechanism, and so material flow rates can be determined rea-
sonably quickly and accurately, whether conveying is continuous or batch-wise. By
gradually opening the off-take valve a number of tests can be carried out, and if the air
supply pressure and the material flow rates are recorded for each test, it will be pos-
sible to construct a small part of the conveying characteristics. Depending upon the
method of feeding the material into the pipeline it may be necessary to make adjust-
ments to the feed rate so that this can be varied as well.
It is recommended that the amount of air by-passed to atmosphere should not
exceed more than about 15 per cent of the total supply from the blower. When this
point is reached the speed of the blower should be reduced to match the reduced air
flow rate required before discharging any more air to the atmosphere. This is neces-
sary to prevent the possibility of a surge in material feed from blocking the pipeline.
A momentary increase in material flow rate will demand an increase in pressure, and
if the off-take valve is wide open a much higher proportion of air will be lost than
intended in the transient situation that follows. As a result the conveying line could be
starved of air and the line could block.
21.3.2 Feeder considerations
Screw feeders and rotary valves are positive displacement devices and so the feed rate
is unlikely to change. In this case an improvement in performance will be recognized
in terms of a reduction in conveying line pressure drop. This, of course, will provide a
perfectly valid alternative data point. If a significant reduction in conveying line pres-
sure drop is achieved it would be recommended that the speed of the screw or rotary
valve should be increased to give a higher material flow rate. This will then provide
another data point.
By making gradual changes in air off-take, blower speed, and material flow rate,
and determining the conveying line inlet air velocity at each stage, if should be pos-
sible to establish the capability of a system without risk of disrupting production on an
existing plant.
21.3.3 The use of a sight glass
Ideally some of the tests should be carried out with conveying air velocities as close to
the minimum as possible. For this purpose it would be a distinct advantage if there was
a short length of sight glass in the pipeline so that the material being conveyed could
be observed. With a sight glass in the line it would be possible to detect when convey-
ing was being carried out close to the minimum conditions, and so tests could be car-
ried out in this region with much more confidence.
Such a sight glass should be positioned as close as possible to the point at which the
material is fed into the pipeline, for as the conveying air expands through the line the
velocity will be a minimum at the material feed point, as this is the point of minimum
velocity. Ideally the sight glass should be in a straight length of pipeline and be a couple
of metres from any bend or valve in the line. A sight glass in a vertical line is possibly
better than one in a horizontal line, for minimum conditions are much easier to detect.
OPTIMIZING AND UP-RATING OF EXISTING SYSTEMS 465
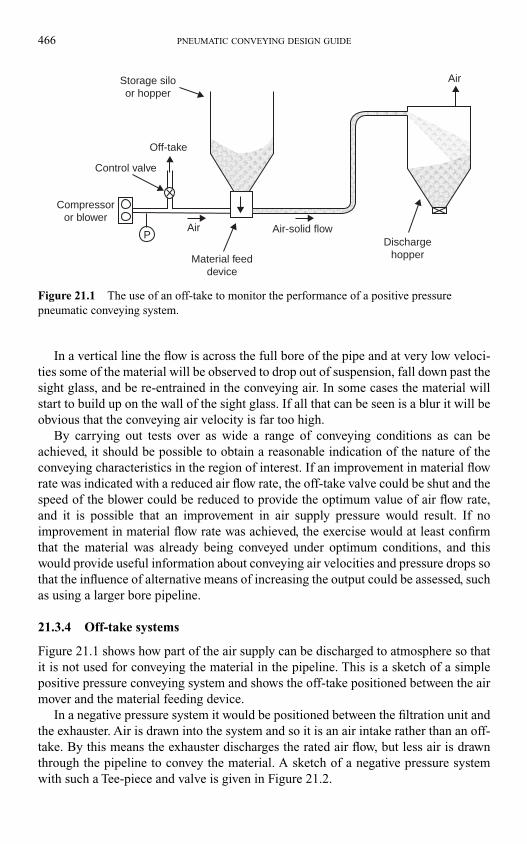
In a vertical line the flow is across the full bore of the pipe and at very low veloci-
ties some of the material will be observed to drop out of suspension, fall down past the
sight glass, and be re-entrained in the conveying air. In some cases the material will
start to build up on the wall of the sight glass. If all that can be seen is a blur it will be
obvious that the conveying air velocity is far too high.
By carrying out tests over as wide a range of conveying conditions as can be
achieved, it should be possible to obtain a reasonable indication of the nature of the
conveying characteristics in the region of interest. If an improvement in material flow
rate was indicated with a reduced air flow rate, the off-take valve could be shut and the
speed of the blower could be reduced to provide the optimum value of air flow rate,
and it is possible that an improvement in air supply pressure would result. If no
improvement in material flow rate was achieved, the exercise would at least confirm
that the material was already being conveyed under optimum conditions, and this
would provide useful information about conveying air velocities and pressure drops so
that the influence of alternative means of increasing the output could be assessed, such
as using a larger bore pipeline.
21.3.4 Off-take systems
Figure 21.1 shows how part of the air supply can be discharged to atmosphere so that
it is not used for conveying the material in the pipeline. This is a sketch of a simple
positive pressure conveying system and shows the off-take positioned between the air
mover and the material feeding device.
In a negative pressure system it would be positioned between the filtration unit and
the exhauster. Air is drawn into the system and so it is an air intake rather than an off-
take. By this means the exhauster discharges the rated air flow, but less air is drawn
through the pipeline to convey the material. A sketch of a negative pressure system
with such a Tee-piece and valve is given in Figure 21.2.
466 PNEUMATIC CONVEYING DESIGN GUIDE
Material feeddevice
Air-solid flowDischarge
hopper
Air
Air
Compressoror blower
Control valve
Off-take
Storage siloor hopper
P
Figure 21.1 The use of an off-take to monitor the performance of a positive pressure
pneumatic conveying system.
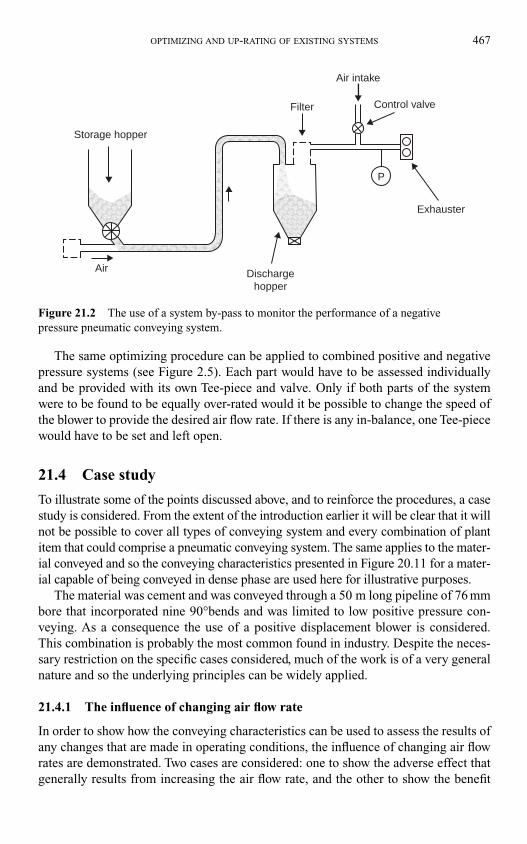
The same optimizing procedure can be applied to combined positive and negative
pressure systems (see Figure 2.5). Each part would have to be assessed individually
and be provided with its own Tee-piece and valve. Only if both parts of the system
were to be found to be equally over-rated would it be possible to change the speed of
the blower to provide the desired air flow rate. If there is any in-balance, one Tee-piece
would have to be set and left open.
21.4 Case study
To illustrate some of the points discussed above, and to reinforce the procedures, a case
study is considered. From the extent of the introduction earlier it will be clear that it will
not be possible to cover all types of conveying system and every combination of plant
item that could comprise a pneumatic conveying system. The same applies to the mater-
ial conveyed and so the conveying characteristics presented in Figure 20.11 for a mater-
ial capable of being conveyed in dense phase are used here for illustrative purposes.
The material was cement and was conveyed through a 50 m long pipeline of 76 mm
bore that incorporated nine 90°bends and was limited to low positive pressure con-
veying. As a consequence the use of a positive displacement blower is considered.
This combination is probably the most common found in industry. Despite the neces-
sary restriction on the specific cases considered, much of the work is of a very general
nature and so the underlying principles can be widely applied.
21.4.1 The influence of changing air flow rate
In order to show how the conveying characteristics can be used to assess the results of
any changes that are made in operating conditions, the influence of changing air flow
rates are demonstrated. Two cases are considered: one to show the adverse effect that
generally results from increasing the air flow rate, and the other to show the benefit
OPTIMIZING AND UP-RATING OF EXISTING SYSTEMS 467
Dischargehopper
Air
Control valve
Storage hopper
Exhauster
Filter
Air intake
P
Figure 21.2 The use of a system by-pass to monitor the performance of a negative
pressure pneumatic conveying system.
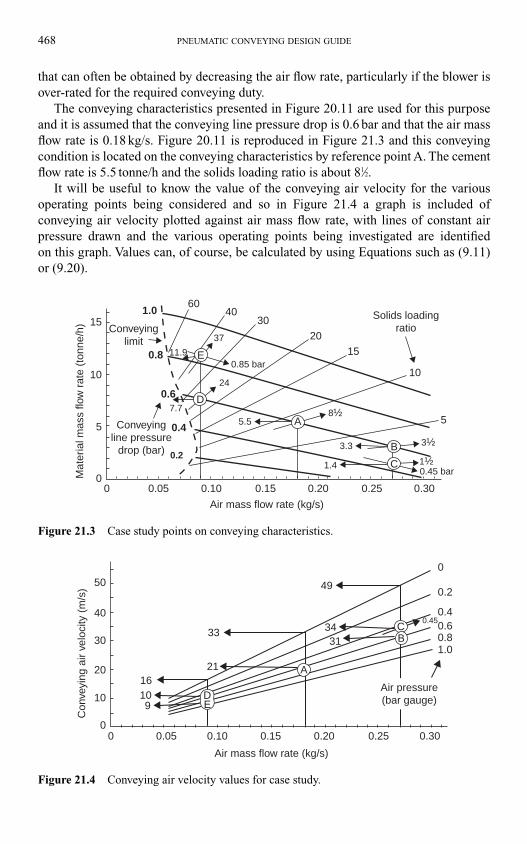
that can often be obtained by decreasing the air flow rate, particularly if the blower is
over-rated for the required conveying duty.
The conveying characteristics presented in Figure 20.11 are used for this purpose
and it is assumed that the conveying line pressure drop is 0.6 bar and that the air mass
flow rate is 0.18 kg/s. Figure 20.11 is reproduced in Figure 21.3 and this conveying
condition is located on the conveying characteristics by reference point A. The cement
flow rate is 5.5 tonne/h and the solids loading ratio is about 81⁄2.
It will be useful to know the value of the conveying air velocity for the various
operating points being considered and so in Figure 21.4 a graph is included of
conveying air velocity plotted against air mass flow rate, with lines of constant air
pressure drawn and the various operating points being investigated are identified
on this graph. Values can, of course, be calculated by using Equations such as (9.11)
or (9.20).
468 PNEUMATIC CONVEYING DESIGN GUIDE
Mat
eria
l mas
s flo
w r
ate
(ton
ne/h
)
0
4060
5
0.2
0.4
0.6
0.8
8½
3½
1½
0.85 bar
0.45 bar
5
10
1.0
10
1520
15
30
37
5.5
3.3
1.4
7.7
11.9
24
Air mass flow rate (kg/s)
Solids loadingratio
Conveyingline pressure
drop (bar)
Conveyinglimit
0 0.05 0.250.20 0.300.150.10
E
A
B
D
C
Figure 21.3 Case study points on conveying characteristics.
Air mass flow rate (kg/s)
00
10
20
30
40
50
33
49
3431
16109
21
0.05 0.25
0.2
0.40.60.81.0
0
0.45
0.20 0.300.150.10
Air pressure(bar gauge)
A
CB
DE
Con
veyi
ng a
ir ve
loci
ty (
m/s
)
Figure 21.4 Conveying air velocity values for case study.
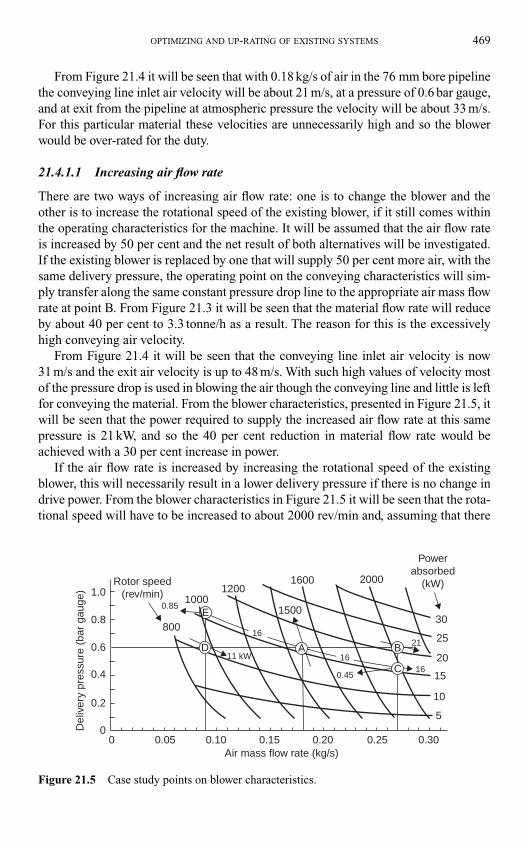
From Figure 21.4 it will be seen that with 0.18 kg/s of air in the 76 mm bore pipeline
the conveying line inlet air velocity will be about 21 m/s, at a pressure of 0.6 bar gauge,
and at exit from the pipeline at atmospheric pressure the velocity will be about 33 m/s.
For this particular material these velocities are unnecessarily high and so the blower
would be over-rated for the duty.
21.4.1.1 Increasing air flow rate
There are two ways of increasing air flow rate: one is to change the blower and the
other is to increase the rotational speed of the existing blower, if it still comes within
the operating characteristics for the machine. It will be assumed that the air flow rate
is increased by 50 per cent and the net result of both alternatives will be investigated.
If the existing blower is replaced by one that will supply 50 per cent more air, with the
same delivery pressure, the operating point on the conveying characteristics will sim-
ply transfer along the same constant pressure drop line to the appropriate air mass flow
rate at point B. From Figure 21.3 it will be seen that the material flow rate will reduce
by about 40 per cent to 3.3 tonne/h as a result. The reason for this is the excessively
high conveying air velocity.
From Figure 21.4 it will be seen that the conveying line inlet air velocity is now
31 m/s and the exit air velocity is up to 48 m/s. With such high values of velocity most
of the pressure drop is used in blowing the air though the conveying line and little is left
for conveying the material. From the blower characteristics, presented in Figure 21.5, it
will be seen that the power required to supply the increased air flow rate at this same
pressure is 21 kW, and so the 40 per cent reduction in material flow rate would be
achieved with a 30 per cent increase in power.
If the air flow rate is increased by increasing the rotational speed of the existing
blower, this will necessarily result in a lower delivery pressure if there is no change in
drive power. From the blower characteristics in Figure 21.5 it will be seen that the rota-
tional speed will have to be increased to about 2000 rev/min and, assuming that there
OPTIMIZING AND UP-RATING OF EXISTING SYSTEMS 469
Air mass flow rate (kg/s)0
00.05
0.2
0.4
0.6
0.8
1.0
0.250.20 0.300.150.10
Del
iver
y pr
essu
re (
bar
gaug
e)
5
10
20
25
15
30
1200
800
1000
1600
1500
2000
Powerabsorbed
(kW)Rotor speed(rev/min)
16
1616
21
C
BAD
E
11 kW
0.85
0.45
Figure 21.5 Case study points on blower characteristics.
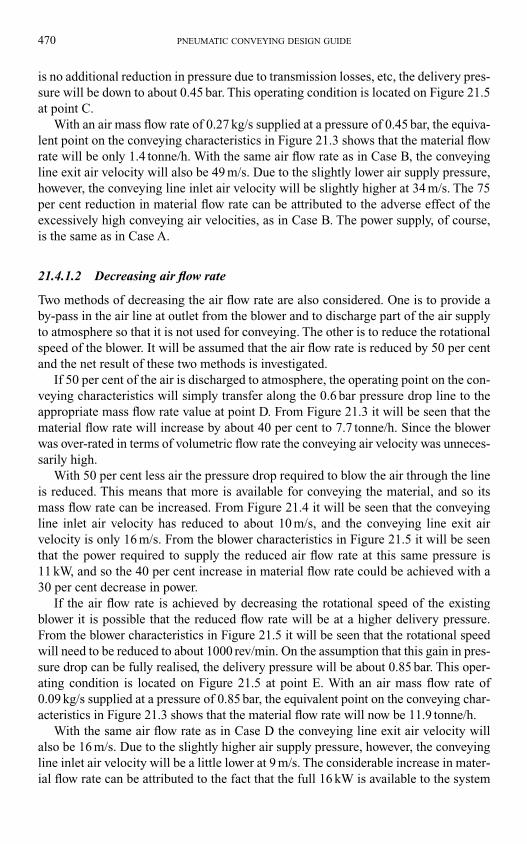
is no additional reduction in pressure due to transmission losses, etc, the delivery pres-
sure will be down to about 0.45 bar. This operating condition is located on Figure 21.5
at point C.
With an air mass flow rate of 0.27 kg/s supplied at a pressure of 0.45 bar, the equiva-
lent point on the conveying characteristics in Figure 21.3 shows that the material flow
rate will be only 1.4 tonne/h. With the same air flow rate as in Case B, the conveying
line exit air velocity will also be 49 m/s. Due to the slightly lower air supply pressure,
however, the conveying line inlet air velocity will be slightly higher at 34 m/s. The 75
per cent reduction in material flow rate can be attributed to the adverse effect of the
excessively high conveying air velocities, as in Case B. The power supply, of course,
is the same as in Case A.
21.4.1.2 Decreasing air flow rate
Two methods of decreasing the air flow rate are also considered. One is to provide a
by-pass in the air line at outlet from the blower and to discharge part of the air supply
to atmosphere so that it is not used for conveying. The other is to reduce the rotational
speed of the blower. It will be assumed that the air flow rate is reduced by 50 per cent
and the net result of these two methods is investigated.
If 50 per cent of the air is discharged to atmosphere, the operating point on the con-
veying characteristics will simply transfer along the 0.6 bar pressure drop line to the
appropriate mass flow rate value at point D. From Figure 21.3 it will be seen that the
material flow rate will increase by about 40 per cent to 7.7 tonne/h. Since the blower
was over-rated in terms of volumetric flow rate the conveying air velocity was unneces-
sarily high.
With 50 per cent less air the pressure drop required to blow the air through the line
is reduced. This means that more is available for conveying the material, and so its
mass flow rate can be increased. From Figure 21.4 it will be seen that the conveying
line inlet air velocity has reduced to about 10 m/s, and the conveying line exit air
velocity is only 16 m/s. From the blower characteristics in Figure 21.5 it will be seen
that the power required to supply the reduced air flow rate at this same pressure is
11 kW, and so the 40 per cent increase in material flow rate could be achieved with a
30 per cent decrease in power.
If the air flow rate is achieved by decreasing the rotational speed of the existing
blower it is possible that the reduced flow rate will be at a higher delivery pressure.
From the blower characteristics in Figure 21.5 it will be seen that the rotational speed
will need to be reduced to about 1000 rev/min. On the assumption that this gain in pres-
sure drop can be fully realised, the delivery pressure will be about 0.85 bar. This oper-
ating condition is located on Figure 21.5 at point E. With an air mass flow rate of
0.09 kg/s supplied at a pressure of 0.85 bar, the equivalent point on the conveying char-
acteristics in Figure 21.3 shows that the material flow rate will now be 11.9 tonne/h.
With the same air flow rate as in Case D the conveying line exit air velocity will
also be 16 m/s. Due to the slightly higher air supply pressure, however, the conveying
line inlet air velocity will be a little lower at 9 m/s. The considerable increase in mater-
ial flow rate can be attributed to the fact that the full 16 kW is available to the system
470 PNEUMATIC CONVEYING DESIGN GUIDE
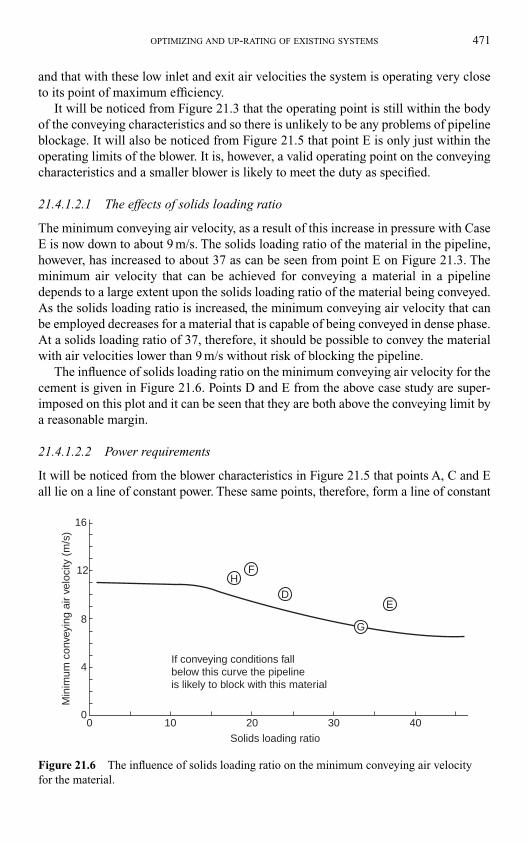
and that with these low inlet and exit air velocities the system is operating very close
to its point of maximum efficiency.
It will be noticed from Figure 21.3 that the operating point is still within the body
of the conveying characteristics and so there is unlikely to be any problems of pipeline
blockage. It will also be noticed from Figure 21.5 that point E is only just within the
operating limits of the blower. It is, however, a valid operating point on the conveying
characteristics and a smaller blower is likely to meet the duty as specified.
21.4.1.2.1 The effects of solids loading ratio
The minimum conveying air velocity, as a result of this increase in pressure with Case
E is now down to about 9 m/s. The solids loading ratio of the material in the pipeline,
however, has increased to about 37 as can be seen from point E on Figure 21.3. The
minimum air velocity that can be achieved for conveying a material in a pipeline
depends to a large extent upon the solids loading ratio of the material being conveyed.
As the solids loading ratio is increased, the minimum conveying air velocity that can
be employed decreases for a material that is capable of being conveyed in dense phase.
At a solids loading ratio of 37, therefore, it should be possible to convey the material
with air velocities lower than 9 m/s without risk of blocking the pipeline.
The influence of solids loading ratio on the minimum conveying air velocity for the
cement is given in Figure 21.6. Points D and E from the above case study are super-
imposed on this plot and it can be seen that they are both above the conveying limit by
a reasonable margin.
21.4.1.2.2 Power requirements
It will be noticed from the blower characteristics in Figure 21.5 that points A, C and E
all lie on a line of constant power. These same points, therefore, form a line of constant
OPTIMIZING AND UP-RATING OF EXISTING SYSTEMS 471
16
12
8
4
00 10 20 30 40
If conveying conditions fallbelow this curve the pipelineis likely to block with this material
Solids loading ratio
Min
imum
con
veyi
ng a
ir ve
loci
ty (
m/s
)
HF
DE
G
Figure 21.6 The influence of solids loading ratio on the minimum conveying air velocity
for the material.
power on the conveying characteristics in Figure 21.3. Lines of constant power can be
superimposed on the conveying characteristics quite easily, as illustrated in Section
11.5.2, and so to illustrate this point the conveying characteristics in Figure 21.3 are
reproduced with lines of constant power requirements in Figure 21.7. It can be seen from
Figure 21.7 that, for a material that has conveying characteristics of this type, that a
reduction in air flow rate, for a constant value of conveying line pressure drop leads to a
significant reduction in power requirements as well as an increase in material flow rate.
21.4.2 The influence of changing pipeline diameter
If the required increase in material flow rate is greater than that which can reasonably
be obtained by optimizing the existing system, it will probably be necessary to
increase the size of the pipeline. If it can be established that the blower is over-rated
for the existing plant, in terms of volumetric flow rate, it is possible that the same
blower could be used with a larger bore line. In order to investigate this possibility,
conveying characteristics for different sizes of pipe are necessary. For the purposes of
demonstrating the potential influence of pipe bore the conveying characteristics for
the cement in the 76 mm bore line in Figure 21.3 have been scaled in proportion to
pipe section area.
In Figure 21.8 the conveying characteristics for the material conveyed through a
100 mm bore pipe are presented. If the reference condition used in Figure 21.3, to
show the influence of air mass flow rate, is taken again, both the possibility of using
the same blower with a larger size pipe and the influence of pipe bore can be investi-
gated. In the earlier case a blower capable of delivering 0.18 kg/s of air at 0.6 bar gauge
was considered. For the 76 mm bore line in Figure 21.3 it was shown that the material
flow rate would be 5.5 tonne/h. This, however, could be increased to 7.7 tonne/h by
472 PNEUMATIC CONVEYING DESIGN GUIDE
Conveyingline pressure
drop (bar)
Solids loadingratio
Powerrequirements
(kW)
Air mass flow rate (kg/s)
0.05 0.10 0.15 0.20 0.300.25
5
5
5
10
15
15
15
Mat
eria
l mas
s flo
w r
ate
(ton
ne/h
)
20
20
2530
30
6040
10
10
0.2
0.4
0.6
0.8
1.0
00
Figure 21.7 Influence of conveying parameters on power requirements.
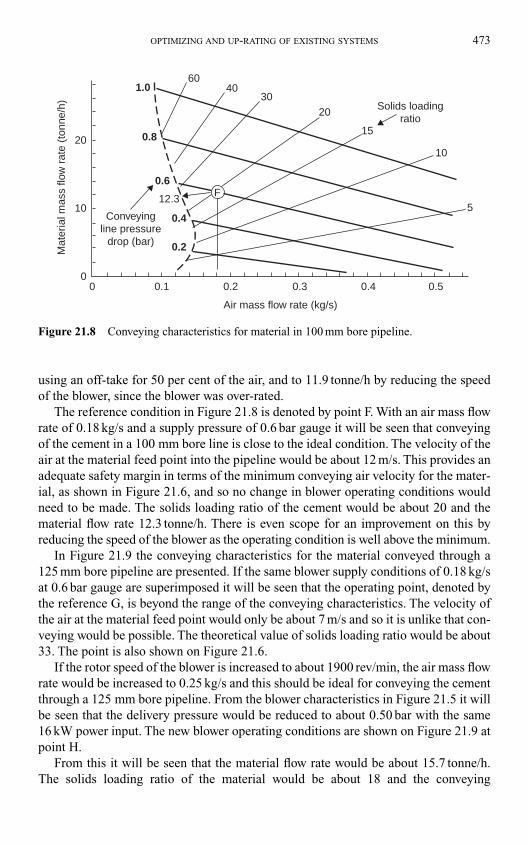
using an off-take for 50 per cent of the air, and to 11.9 tonne/h by reducing the speed
of the blower, since the blower was over-rated.
The reference condition in Figure 21.8 is denoted by point F. With an air mass flow
rate of 0.18 kg/s and a supply pressure of 0.6 bar gauge it will be seen that conveying
of the cement in a 100 mm bore line is close to the ideal condition. The velocity of the
air at the material feed point into the pipeline would be about 12 m/s. This provides an
adequate safety margin in terms of the minimum conveying air velocity for the mater-
ial, as shown in Figure 21.6, and so no change in blower operating conditions would
need to be made. The solids loading ratio of the cement would be about 20 and the
material flow rate 12.3 tonne/h. There is even scope for an improvement on this by
reducing the speed of the blower as the operating condition is well above the minimum.
In Figure 21.9 the conveying characteristics for the material conveyed through a
125 mm bore pipeline are presented. If the same blower supply conditions of 0.18 kg/s
at 0.6 bar gauge are superimposed it will be seen that the operating point, denoted by
the reference G, is beyond the range of the conveying characteristics. The velocity of
the air at the material feed point would only be about 7 m/s and so it is unlike that con-
veying would be possible. The theoretical value of solids loading ratio would be about
33. The point is also shown on Figure 21.6.
If the rotor speed of the blower is increased to about 1900 rev/min, the air mass flow
rate would be increased to 0.25 kg/s and this should be ideal for conveying the cement
through a 125 mm bore pipeline. From the blower characteristics in Figure 21.5 it will
be seen that the delivery pressure would be reduced to about 0.50 bar with the same
16 kW power input. The new blower operating conditions are shown on Figure 21.9 at
point H.
From this it will be seen that the material flow rate would be about 15.7 tonne/h.
The solids loading ratio of the material would be about 18 and the conveying
OPTIMIZING AND UP-RATING OF EXISTING SYSTEMS 473
Conveyingline pressure
drop (bar)
Solids loadingratio
Air mass flow rate (kg/s)
0.1 0.2 0.3 0.4 0.5
510
15
Mat
eria
l mas
s flo
w r
ate
(ton
ne/h
)
20
2030
6040
10
0.2
0.4
12.3
0.6
0.8
1.0
00
F
Figure 21.8 Conveying characteristics for material in 100 mm bore pipeline.
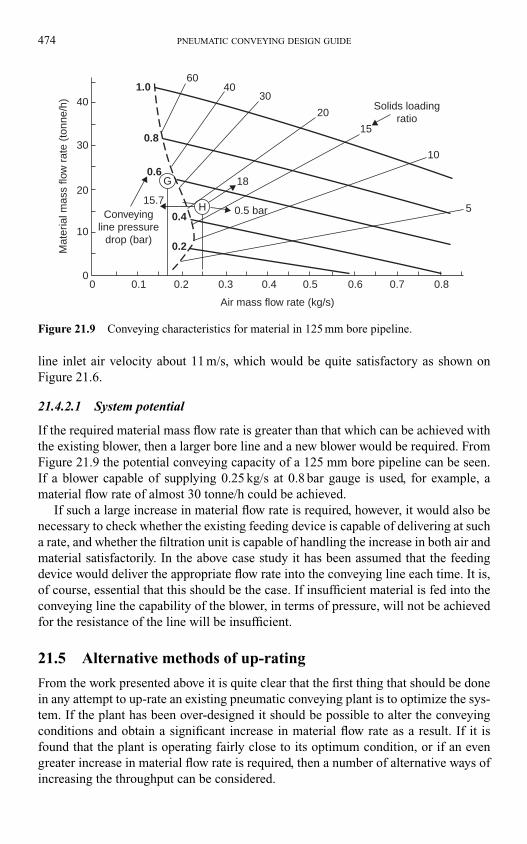
line inlet air velocity about 11 m/s, which would be quite satisfactory as shown on
Figure 21.6.
21.4.2.1 System potential
If the required material mass flow rate is greater than that which can be achieved with
the existing blower, then a larger bore line and a new blower would be required. From
Figure 21.9 the potential conveying capacity of a 125 mm bore pipeline can be seen.
If a blower capable of supplying 0.25 kg/s at 0.8 bar gauge is used, for example, a
material flow rate of almost 30 tonne/h could be achieved.
If such a large increase in material flow rate is required, however, it would also be
necessary to check whether the existing feeding device is capable of delivering at such
a rate, and whether the filtration unit is capable of handling the increase in both air and
material satisfactorily. In the above case study it has been assumed that the feeding
device would deliver the appropriate flow rate into the conveying line each time. It is,
of course, essential that this should be the case. If insufficient material is fed into the
conveying line the capability of the blower, in terms of pressure, will not be achieved
for the resistance of the line will be insufficient.
21.5 Alternative methods of up-rating
From the work presented above it is quite clear that the first thing that should be done
in any attempt to up-rate an existing pneumatic conveying plant is to optimize the sys-
tem. If the plant has been over-designed it should be possible to alter the conveying
conditions and obtain a significant increase in material flow rate as a result. If it is
found that the plant is operating fairly close to its optimum condition, or if an even
greater increase in material flow rate is required, then a number of alternative ways of
increasing the throughput can be considered.
474 PNEUMATIC CONVEYING DESIGN GUIDE
Conveyingline pressure
drop (bar)
Solids loadingratio
Air mass flow rate (kg/s)
5
15
Mat
eria
l mas
s flo
w r
ate
(ton
ne/h
)
20
20
30
30
60
4040
10
10
0.2
0.2 0.3 0.4 0.5 0.6 0.7 0.80.1
0.4
0.6
0.8
1.0
00
G
H
18
0.5 bar15.7
Figure 21.9 Conveying characteristics for material in 125 mm bore pipeline.
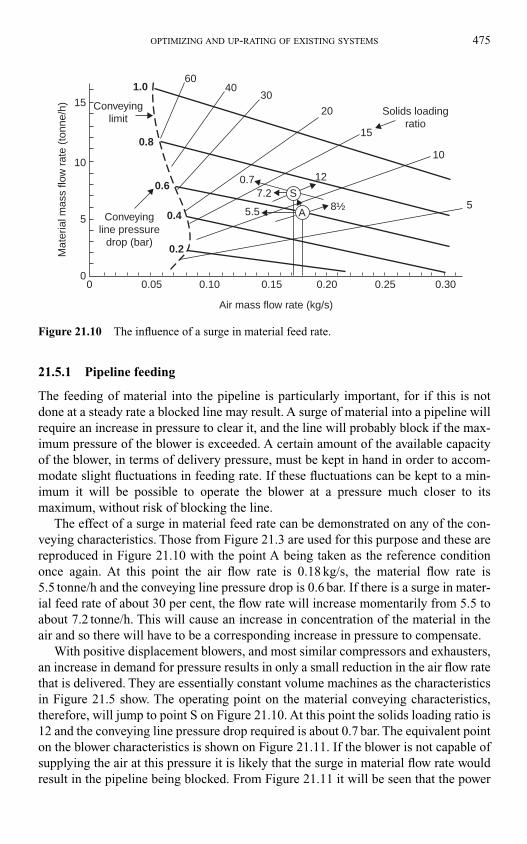
21.5.1 Pipeline feeding
The feeding of material into the pipeline is particularly important, for if this is not
done at a steady rate a blocked line may result. A surge of material into a pipeline will
require an increase in pressure to clear it, and the line will probably block if the max-
imum pressure of the blower is exceeded. A certain amount of the available capacity
of the blower, in terms of delivery pressure, must be kept in hand in order to accom-
modate slight fluctuations in feeding rate. If these fluctuations can be kept to a min-
imum it will be possible to operate the blower at a pressure much closer to its
maximum, without risk of blocking the line.
The effect of a surge in material feed rate can be demonstrated on any of the con-
veying characteristics. Those from Figure 21.3 are used for this purpose and these are
reproduced in Figure 21.10 with the point A being taken as the reference condition
once again. At this point the air flow rate is 0.18 kg/s, the material flow rate is
5.5 tonne/h and the conveying line pressure drop is 0.6 bar. If there is a surge in mater-
ial feed rate of about 30 per cent, the flow rate will increase momentarily from 5.5 to
about 7.2 tonne/h. This will cause an increase in concentration of the material in the
air and so there will have to be a corresponding increase in pressure to compensate.
With positive displacement blowers, and most similar compressors and exhausters,
an increase in demand for pressure results in only a small reduction in the air flow rate
that is delivered. They are essentially constant volume machines as the characteristics
in Figure 21.5 show. The operating point on the material conveying characteristics,
therefore, will jump to point S on Figure 21.10. At this point the solids loading ratio is
12 and the conveying line pressure drop required is about 0.7 bar. The equivalent point
on the blower characteristics is shown on Figure 21.11. If the blower is not capable of
supplying the air at this pressure it is likely that the surge in material flow rate would
result in the pipeline being blocked. From Figure 21.11 it will be seen that the power
OPTIMIZING AND UP-RATING OF EXISTING SYSTEMS 475
Conveyingline pressure
drop (bar)
Solids loadingratio
Conveyinglimit
Air mass flow rate (kg/s)
0.05 0.10
0.7 12
7.2
5.5 8½
0.15 0.20 0.300.25
55
10
15
15
Mat
eria
l mas
s flo
w r
ate
(ton
ne/h
)
20
30
6040
10
0.2
0.4
0.6
0.8
1.0
00
S
A
Figure 21.10 The influence of a surge in material feed rate.
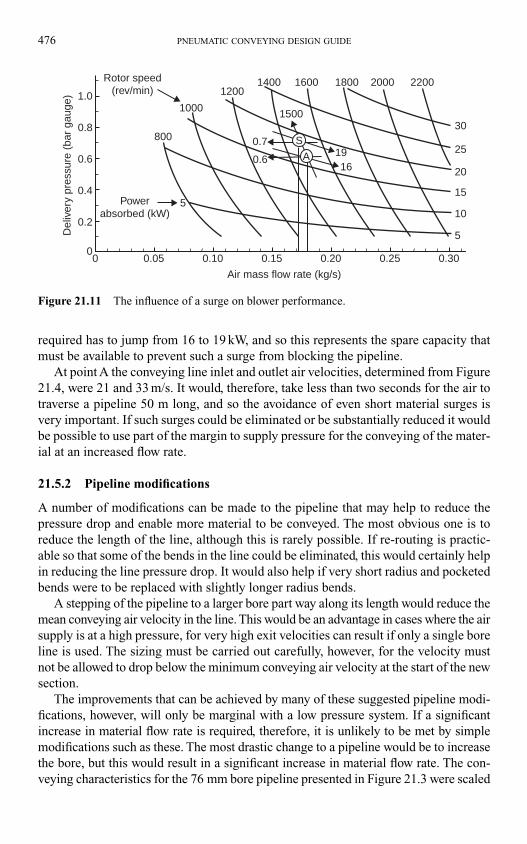
required has to jump from 16 to 19 kW, and so this represents the spare capacity that
must be available to prevent such a surge from blocking the pipeline.
At point A the conveying line inlet and outlet air velocities, determined from Figure
21.4, were 21 and 33 m/s. It would, therefore, take less than two seconds for the air to
traverse a pipeline 50 m long, and so the avoidance of even short material surges is
very important. If such surges could be eliminated or be substantially reduced it would
be possible to use part of the margin to supply pressure for the conveying of the mater-
ial at an increased flow rate.
21.5.2 Pipeline modifications
A number of modifications can be made to the pipeline that may help to reduce the
pressure drop and enable more material to be conveyed. The most obvious one is to
reduce the length of the line, although this is rarely possible. If re-routing is practic-
able so that some of the bends in the line could be eliminated, this would certainly help
in reducing the line pressure drop. It would also help if very short radius and pocketed
bends were to be replaced with slightly longer radius bends.
A stepping of the pipeline to a larger bore part way along its length would reduce the
mean conveying air velocity in the line. This would be an advantage in cases where the air
supply is at a high pressure, for very high exit velocities can result if only a single bore
line is used. The sizing must be carried out carefully, however, for the velocity must
not be allowed to drop below the minimum conveying air velocity at the start of the new
section.
The improvements that can be achieved by many of these suggested pipeline modi-
fications, however, will only be marginal with a low pressure system. If a significant
increase in material flow rate is required, therefore, it is unlikely to be met by simple
modifications such as these. The most drastic change to a pipeline would be to increase
the bore, but this would result in a significant increase in material flow rate. The con-
veying characteristics for the 76 mm bore pipeline presented in Figure 21.3 were scaled
476 PNEUMATIC CONVEYING DESIGN GUIDE
1.0
0.8
0.6
0.4
0.2
00 0.05 0.10 0.15
0.6
0.71916
0.20 0.25 0.30
800
1000
12001400 1600 1800 2000 2200
30
25
20
15
10
5
5
Rotor speed(rev/min)
Air mass flow rate (kg/s)
Powerabsorbed (kW)
Del
iver
y pr
essu
re (
bar
gaug
e)
1500
S
A
Figure 21.11 The influence of a surge on blower performance.
up to 100 mm bore in Figure 21.8 and to a 125 mm bore line in Figure 21.9. These show
quite clearly the potential of pipe bore, but as mentioned earlier, the subsidiary influ-
ences of material feeding and filtration must be given due consideration.
21.5.3 Air supply pressure
The influence of air supply pressure has already been mentioned in relation to pipeline
feeding. In the example given above it was stated that a 30 per cent increase in mater-
ial flow rate would require an increase in the conveying line pressure drop from 0.6 to
0.7 bar. The increase in pressure required for a given increase in material flow rate,
therefore, can be determined very easily from the conveying characteristics.
If the blower is replaced with another, the output of the replacement will only need
to be increased in terms of delivery pressure. There may need to be a small increase in
volumetric flow rate in order to compensate for the increase in delivery pressure and
so maintain the same conveying line inlet air velocity. If a rotary valve is used to feed
the material into the conveying line it may also be necessary to allow for a small
increase in air leakage across the valve. The increase in blower rating, therefore, is
essentially in terms of delivery pressure only if no other changes are made to the plant.
OPTIMIZING AND UP-RATING OF EXISTING SYSTEMS 477
22.1 Introduction
Since the cause of any operating problem is not always obvious, this chapter has been
subdivided into four major areas to help in the identification and solving processes.
In the first section problems related to particular types of system are considered. The
second section is devoted to problems that can be associated with system components,
including air movers, feeders and filtration systems. The next deals with system-related
problems and includes effects that the material can have on the system. The last con-
cerns material-related problems and includes effects that the system can have on the
conveyed material.
Although the specific problem of pipeline blockage was considered in detail in
Chapter 20, and that of systems not capable of achieving the rated duty in Chapter 21,
many of the items considered may also have an influence on material flow rate. A num-
ber of the problems that are considered to be are either very common in the industry, or
need more detailed treatment, have an entire chapter devoted to them later in this part
of the Design Guide.
In trying to identify any particular problem it is suggested that each section
should be consulted since cross-referencing and repetition have been kept to a min-
imum. Those items that relate to the particular problems experienced, type of plant
and components used, and material conveyed, should all be referred to in order to
obtain a clear picture of the problem in relation to the entire system and the material
handled.
22.1.1 Existing plant
This section of the Guide is directed essentially at identifying operating problems that
occur with an established plant, or one that has just been installed. It is not intended to
support system design by way of problem anticipation so that counter measures or
appropriate equipment selection are dealt with before the plant is built. If a new system
is designed correctly, and potential problem areas are recognized at the design stage,
there should be no need to refer to this section at all. This part of the Guide can, of
course, be used as a checklist to ensure that all possible sources of problems have been
considered at the design stage, and should prove to be invaluable when commissioning
a plant.
Chapter 22
Operating problems
22.2 Types of system
In this section, problems that relate specifically to a particular type of pneumatic con-
veying system are considered. System types were considered mainly in Chapter 2 and
reference will be made to particular figures included there.
22.2.1 Positive pressure systems
The most common problems associated with pneumatic conveying systems relate to
the fact that the material to be conveyed has to be fed into a pipeline in which the con-
veying air is maintained at pressure. Air requirements have to be specified, taking
account of both the compressibility of the air, and air leakage from or into the system.
22.2.1.1 Multi point feeding
Multi point feeding of a positive pressure pneumatic conveying system is not gener-
ally recommended unless particular attention has been paid to the problem of air leak-
age. For feeders subject to air leakage, air loss from a single feeder can be a significant
proportion of that required for conveying the material. The air loss from a number of
feeders, therefore, would be seriously detrimental to the performance of the system.
The air loss from multiple feeding points would be difficult to accurately estimate
and so the air flow rate available for conveying could not be guaranteed. Apart from
the problem of having too little or too much air for conveying the material, the loss of
a large quantity of air from multiple feeding points would represent a very significant
energy loss from the system.
22.2.2 Negative pressure systems
A common fault with negative pressure, or vacuum conveying systems, is the loss of
vacuum, particularly with batch and intermittently operating systems. The cause of the
problem is often that the discharge flap fails to seat at the base of the receiver vessel.
Another common problem is similar to that experienced with positive pressure sys-
tems, in that the compressibility of the air is not taken into account correctly. In vacuum
systems, however, this can affect the specification of the filter, as well as the conveying
line inlet air velocity and the specification of the air mover.
22.2.2.1 Air filtration
With negative pressure systems, the entire discharge system operates under vacuum,
and this includes the filtration plant. Filters are generally sized in terms of the surface
area of filter cloth, and the surface area required is evaluated in terms of a given air
velocity across the fabric surface. Under vacuum, therefore, the volumetric flow rate
of air to be handled is very much higher than it is for a positive pressure conveying
system discharging to atmospheric pressure.
The size of filter required for a vacuum conveying system will depend upon the
exhauster pressure, and for a vacuum of 0.5 bar, for example, it will need to be about
twice the size of that required for an equivalent positive pressure system. If the filtration
OPERATING PROBLEMS 479
plant is not sized, taking this into account, it will be too small for the duty and system
performance and operating problems can be expected as a result.
22.2.2.1.1 Back-up filters
It is generally recommended that a secondary filter, often referred to as a policeman
filter, should be fitted to negative pressure conveying systems. This is a particular
requirement if a positive displacement blower, screw compressor or a sliding vane
rotary compressor is used as an exhauster. These exhausters operate with very fine
clearances between the moving parts and cannot tolerate dust, particularly if it is
abrasive.
A back-up filter is required in case an element in the main filter unit should fail. If
an abrasive material such as silica sand, cement, alumina or fly ash, is being conveyed,
and the main filter unit fails, considerable damage will be caused to any of the above
exhausters in a very short space of time. A back-up filter will allow time for the con-
veying system to be shut down safely so that repairs can be carried out. A similar situ-
ation occurs with combined ‘suck-blow’ systems and with closed loop conveying
systems.
22.2.2.2 Multi point discharge
Vacuum conveying systems are not generally recommended if multi point discharging
of materials is required, since a complex arrangement of pipe-work and isolating
valves is necessary. The problem is essentially the reverse of that associated with mul-
tiple point feeding of positive pressure conveying systems considered above. They are
sometimes used in low pressure systems, where ductwork is used. Valves in the duct-
work, however, have to seal effectively, otherwise the air leakage into the system will
have an adverse effect on the conveying of the material.
22.2.2.3 Air ingress
If air leaks into a vacuum or negative pressure system it will alter the balance of con-
veying air velocities along the length of the pipeline. The problems that occur here can
generally be considered to be a mirror image of those that exist on similar positive
pressure systems.
22.2.2.3.1 Into reception hopper
If air leaks into the reception hopper, and thereby bypasses the conveying pipeline, air
velocities in the conveying line will fall and the pipeline could block if the ingress of
air is not allowed for in the specification of the air mover. This can occur if the mater-
ial in the reception hopper is discharged by means of a rotary valve, for example. The
rotary valve will typically discharge the material into a vessel at atmospheric pressure,
and so there will be a pressure difference across the valve. As with rotary valves feed-
ing positive pressure pneumatic conveying systems, there will be a leakage of air
across the valve because of the pressure difference. In a vacuum system this air will
leak into the system, and so it must be taken into account (see Figure 3.7).
480 PNEUMATIC CONVEYING DESIGN GUIDE
22.2.2.3.2 Into pipeline
Air ingress is likely to occur along a pipeline at flexible sections, such as those used in
ship off-loading systems, particularly if the conveyed material is erosive and the flex-
ible joint has to be made from hard metal or ceramic materials. If air leaks into a
pipeline part way along its length in this way, it will result in a lowering of the con-
veying air velocity at the material feed point into the pipeline. This is the critical point
in a pipeline and so could result in pipeline blockage.
If a bend in a pipeline fails, or if pipeline joints are not securely tightened in a pos-
itive pressure conveying system, clouds of dust will result and the situation is likely to
be dealt with very quickly. In terms of conveying performance it is unlikely to present
a problem, for downstream of the feed point the velocity increases and such air loss
could be a benefit to the system. In a vacuum system dust is not likely to be released
in this situation, as air is drawn into the system, and so the problem may not be recog-
nized. Air drawn into the system, however, will starve the pipeline inlet of air and the
pipeline could block as a consequence.
22.2.2.4 Stepped pipelines
With a vacuum of only 0.5 bar there will be a doubling in conveying air velocity through
the pipeline. Stepped pipelines, therefore, are well worth considering for vacuum sys-
tems, particularly if high vacuum is employed (see Figure 9.13). Reduced erosive wear,
particle degradation and improved conveying performance are all possible benefits.
22.2.2.5 Air mover specification
Care must be exercised in specifying exhausters. The rating of an exhauster is not usu-
ally in terms of free air conditions, as with positive pressure systems, but in terms of
the volumetric flow rate of air at inlet to the exhauster. This, however, is not signifi-
cantly different from the means by which positive pressure air movers are specified,
for they are both in terms of the displacement volume of the air mover at inlet condi-
tions. The value, of course, will vary with the vacuum drawn and so the conveying line
inlet air velocity will have to be carefully evaluated and the influence of the vacuum
determined. This, however, is very similar to the analysis that must be made for posi-
tive pressure systems and considered in Chapter 9.
22.2.3 Combined systems
It must be appreciated that the available power for a combined positive and negative
pressure conveying system has to be shared between the two parts of the system (see
Figure 2.5). If a positive displacement blower/exhauster is used, the pressure capability
on both the vacuum and blowing sides will be lower than that which can be achieved
with an equivalent machine used for the single duty. With a blower, for example, a pres-
sure ratio of 2:1 is generally considered to be the upper operating limit, regardless of
the application.
This means that for a positive pressure system the maximum delivery pressure
is about 1 bar gauge (2 bar abs/1 bar abs � 2). For a negative pressure system the
OPERATING PROBLEMS 481
maximum exhaust pressure is about �0.5 bar gauge (1 bar abs/0.5 bar abs � 2). For a
combined system the limit on pressures is approximately 0.4 bar gauge on blowing
and �0.3 bar gauge on vacuum (1.4 bar abs/0.7 bar abs � 2).
A sketch of a typical system is given in Figure 2.5 and velocity profiles through such
a system were presented in Figure 9.7. Even though a common air mover is used for
both parts of the system, the diameter of pipeline employed for the vacuum side of the
system is generally larger than that for the positive pressure side. If an improvement in
performance is required or there is an imbalance in conveying distances between the
two sections, two separate systems and a dedicated air mover for each would be better.
By this means the pressure rating and air flow rate can be chosen to match the require-
ments of each section more closely.
22.2.4 Fan systems
As a result of the performance characteristics of fans, conveying air velocities will
be high at low material flow rates, and low at high material flow rates. A comparison of
the operating characteristics of fans and positive displacement machines is shown in
Figure 6.3. If a fan system is overfed, the pressure demand on the fan will increase. This
will cause a decrease in volumetric flow rate and it is possible that the pipeline will block.
The ideal characteristics for an air mover, for a pneumatic conveying system, are
those that result in no change in volumetric flow rate with increase in pressure. Positive
displacement machines come close to this, as shown in Figure 6.5, and hence this type
of air mover is widely used for pneumatic conveying systems. They are almost exclu-
sively used for high material flow rate and long distance conveying duties.
22.2.5 Single plug blow tank systems
With some materials the plug of material that is conveyed will be accelerated along the
length of the system pipeline. If there is no check on the volumetric flow rate of air
supplied, additional air and hence energy will be expended unnecessarily on the mater-
ial. If the volumetric flow rate of air needs to be controlled a choked flow nozzle or
orifice plate can be used in the air supply line.
When a plug of material is discharged from a pipeline at a high pressure, a large vol-
ume of pressurized air is released, particularly if it is a long pipeline. A certain amount
of material is almost certain to be left in the pipeline. This will tail off the end of the
plug being conveyed, to be swept up by the front of the next plug. The high pressure air
in the pipeline will suddenly be vented from the end of the pipeline when the plug is
discharged. The venting air, which can reach an exceptionally high velocity, will pick
up deposited material and cause severe erosion problems if the material is abrasive.
22.3 System components
Many of the problems encountered in pneumatic conveying systems are associated with
the various components that go to comprise the system itself. The problems generally
result from either incorrect specification, or a failure to take account of the properties
of the material to be conveyed. Not all types of system components are mentioned
individually. Most of the problems associated with screw feeders, for example, are
common to rotary valves, and so simple representative components are considered.
482 PNEUMATIC CONVEYING DESIGN GUIDE
22.3.1 Blowers
The rotary lobes in blowers are machined to close tolerances, as are moving parts in
many other air compressors. Any ingress of dust or material into the machine will have
a serious effect on the performance of the blower. Downstream of the blower, or any
other air mover, non-return valves should be fitted into the air supply lines to prevent
the possibility of backflushing of materials. This is always a possibility if the pipeline
blocks.
Some materials that have very poor permeability are capable of holding back air
pressures of 6 bar gauge with just a short plug of material in the pipeline. If the
pipeline blocks and the air mover is switched off while the pipeline is being cleared,
the material in the pipeline could easily be backflushed to the compressor if it was not
protected with non-return valves.
22.3.1.1 Air filters
If a blower, or any other positive displacement air mover, is operating in a dusty envir-
onment a filter should be fitted to the air inlet. This filter should be cleaned or changed
periodically, for if it becomes choked with dust, the added resistance will have an
adverse effect on the blower performance. A source of air away from the plant or out-
side the building is generally recommended in these circumstances.
In negative pressure, closed loop and combined systems, blowers have to operate
with air that has been used for conveying material. In these cases it is essential that the
air is effectively filtered. Unless the filtration unit is 100 per cent reliable, it is generally
advisable to add a back-up filter in order to provide a measure of protection for the
blower in the event of a rupture of one of the filter elements. If a gradual change in per-
formance of a conveying system is observed over a period of time, it could be due to
wear of the blower. Ingress of dusty air into the blower will cause a gradual change in
its operating characteristics.
22.3.2 Blow tanks
Of all systems components, the operation and control of blow tanks is probably least
understood. The transient nature of their operation must be taken into account in speci-
fying material flow rate (see Figure 2.7) and air requirements. A variety of blow tank
designs and configurations exist and these were considered in both Chapters 3 and 4.
A particular advantage of blow tanks is that they have no moving parts, which makes
them ideal for the feeding of abrasive materials, but the means by which material feed
rate is controlled is by no means obvious.
22.3.2.1 Control
The discharge rate of a blow tank is controlled by means of proportioning the air sup-
ply between the fluidizing and supplementary air lines as considered with Figure 3.28.
A control system fitted to a blow tank was presented in Figure 4.16. For complete
system control the blow tank characteristics need to be considered in conjunction with
the pipeline conveying characteristics and Figure 22.1 is included to illustrate the
interaction between the two.
OPERATING PROBLEMS 483
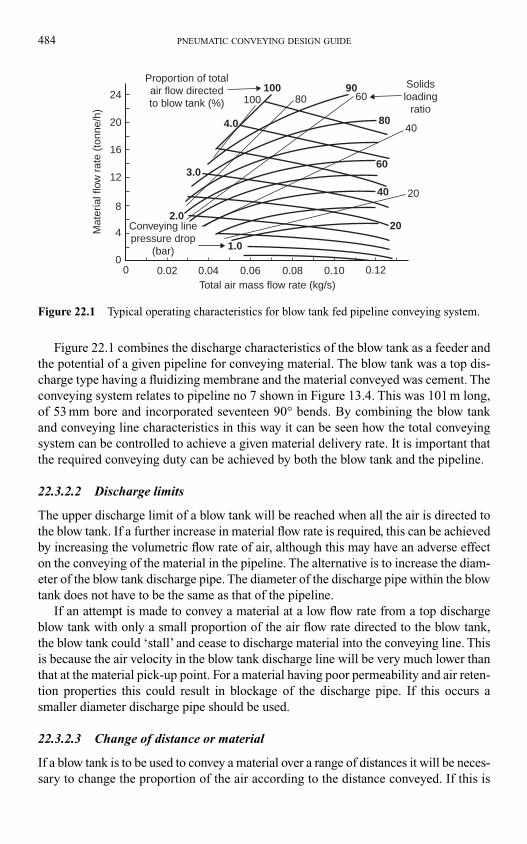
484 PNEUMATIC CONVEYING DESIGN GUIDE
Figure 22.1 combines the discharge characteristics of the blow tank as a feeder and
the potential of a given pipeline for conveying material. The blow tank was a top dis-
charge type having a fluidizing membrane and the material conveyed was cement. The
conveying system relates to pipeline no 7 shown in Figure 13.4. This was 101 m long,
of 53 mm bore and incorporated seventeen 90° bends. By combining the blow tank
and conveying line characteristics in this way it can be seen how the total conveying
system can be controlled to achieve a given material delivery rate. It is important that
the required conveying duty can be achieved by both the blow tank and the pipeline.
22.3.2.2 Discharge limits
The upper discharge limit of a blow tank will be reached when all the air is directed to
the blow tank. If a further increase in material flow rate is required, this can be achieved
by increasing the volumetric flow rate of air, although this may have an adverse effect
on the conveying of the material in the pipeline. The alternative is to increase the diam-
eter of the blow tank discharge pipe. The diameter of the discharge pipe within the blow
tank does not have to be the same as that of the pipeline.
If an attempt is made to convey a material at a low flow rate from a top discharge
blow tank with only a small proportion of the air flow rate directed to the blow tank,
the blow tank could ‘stall’ and cease to discharge material into the conveying line. This
is because the air velocity in the blow tank discharge line will be very much lower than
that at the material pick-up point. For a material having poor permeability and air reten-
tion properties this could result in blockage of the discharge pipe. If this occurs a
smaller diameter discharge pipe should be used.
22.3.2.3 Change of distance or material
If a blow tank is to be used to convey a material over a range of distances it will be neces-
sary to change the proportion of the air according to the distance conveyed. If this is
Total air mass flow rate (kg/s)
Mat
eria
l flo
w r
ate
(ton
ne/h
)
00
0.02 0.06 0.120.100.080.04
4
8
12
16
20
20
20
40
40
60
60
80
8090100
100
4.0
1.0
2.0
3.0
24
Conveying linepressure drop
(bar)
Proportion of totalair flow directedto blow tank (%)
Solidsloading
ratio
Figure 22.1 Typical operating characteristics for blow tank fed pipeline conveying system.
not done the pipeline will be under-utilized for shorter distances, and may block on
longer distances. Feeder control, with respect to a change of distance, is an issue that
must be considered with regard to any type of feeder. The same applies to a change of
material but is particularly critical with regard to blow tanks as illustrated with Figure
4.15. An automatic control system, as mentioned above, would be recommended in
both of these cases.
22.3.2.4 Discharge valve
If the conveyed material is abrasive, any valve in the conveying line will be subject to
wear. With top discharge blow tanks, discharge valves are not necessary. They will,
however, enable a blow tank to be pressurized quickly and so give an overall increase
in the conveying efficiency and material flow rate (see Section 4.4.2). In bottom dis-
charge blow tanks the discharge valve may be necessary to prevent flooding of free
flowing materials into the conveying line, and hence overload the conveying system on
start-up.
22.3.2.5 Moisture in air
When air is compressed, its capacity for supporting water vapour decreases. Even
relatively dry air may reach its saturation point and condensation may occur as the pres-
sure is increased. With moist air the quantity of water precipitated can be very high,
particularly with respect to a change in temperature (see Chapter 25). Unless positive
measures are taken to remove this water, drops of water will be transported through the
air supply lines with the conveying air. If a fluidizing membrane is used in a blow tank,
this water can cause blinding of the membrane with certain materials and this can
affect system performance.
Since most blow tanks are used for batch conveying, it is possible for water to accu-
mulate in the supply lines as a result of the intermittent operation. On start up with the
next batch, a small pool of water could be blown into the blow tank. With materials
such as cement and fly ash this could cause the material to set in the discharge area and
cause a major restriction to the flow. Most problems associated with moisture can be
overcome by drying the air. If the material is hygroscopic it will probably be necessary
to incorporate a desiccant type dryer. If moisture and condensation are to be avoided,
then a refrigerant dryer should be satisfactory for most applications.
22.3.2.6 Pressure drop
Both the blinding of a fluidizing membrane and a restriction in the discharge pipe will
add to the pressure drop across a blow tank. If the pressure drop across the material feeder
increases, the pressure drop available for the material in the pipeline will decrease, and
result in a decrease in conveying capacity, if it is taken into account, and pipeline
blockage if not.
Part of the blow tank pressure drop occurs in discharging the material from the blow
tank. This is particularly a problem in top discharge blow tanks where a long length of
discharge pipe may be required. The conveying air should be introduced as close to the
OPERATING PROBLEMS 485
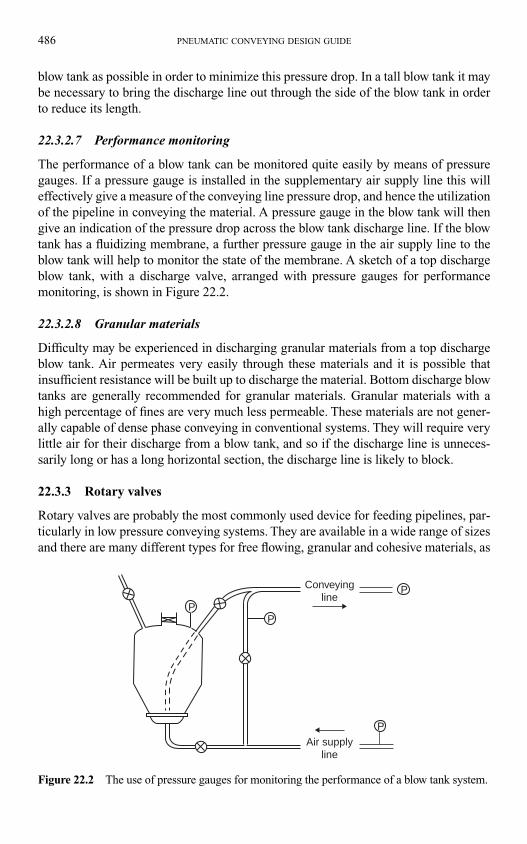
486 PNEUMATIC CONVEYING DESIGN GUIDE
blow tank as possible in order to minimize this pressure drop. In a tall blow tank it may
be necessary to bring the discharge line out through the side of the blow tank in order
to reduce its length.
22.3.2.7 Performance monitoring
The performance of a blow tank can be monitored quite easily by means of pressure
gauges. If a pressure gauge is installed in the supplementary air supply line this will
effectively give a measure of the conveying line pressure drop, and hence the utilization
of the pipeline in conveying the material. A pressure gauge in the blow tank will then
give an indication of the pressure drop across the blow tank discharge line. If the blow
tank has a fluidizing membrane, a further pressure gauge in the air supply line to the
blow tank will help to monitor the state of the membrane. A sketch of a top discharge
blow tank, with a discharge valve, arranged with pressure gauges for performance
monitoring, is shown in Figure 22.2.
22.3.2.8 Granular materials
Difficulty may be experienced in discharging granular materials from a top discharge
blow tank. Air permeates very easily through these materials and it is possible that
insufficient resistance will be built up to discharge the material. Bottom discharge blow
tanks are generally recommended for granular materials. Granular materials with a
high percentage of fines are very much less permeable. These materials are not gener-
ally capable of dense phase conveying in conventional systems. They will require very
little air for their discharge from a blow tank, and so if the discharge line is unneces-
sarily long or has a long horizontal section, the discharge line is likely to block.
22.3.3 Rotary valves
Rotary valves are probably the most commonly used device for feeding pipelines, par-
ticularly in low pressure conveying systems. They are available in a wide range of sizes
and there are many different types for free flowing, granular and cohesive materials, as
PP
P
P
Air supplyline
Conveyingline
Figure 22.2 The use of pressure gauges for monitoring the performance of a blow tank system.
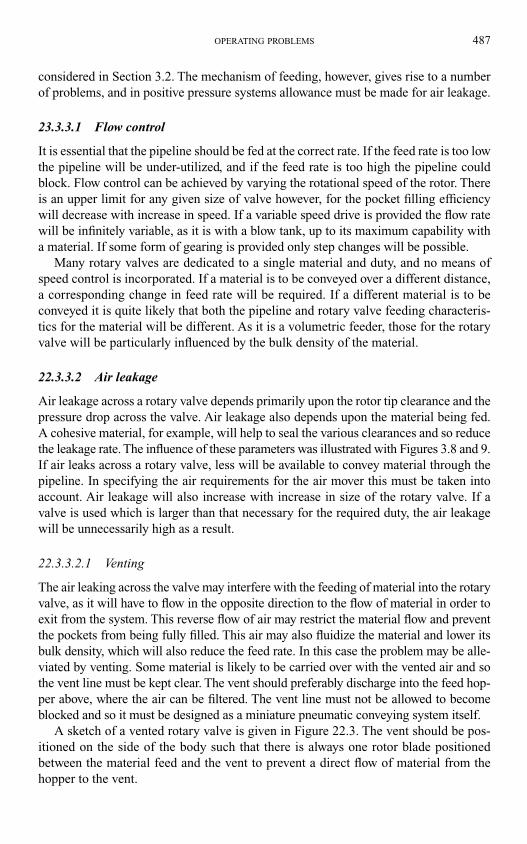
considered in Section 3.2. The mechanism of feeding, however, gives rise to a number
of problems, and in positive pressure systems allowance must be made for air leakage.
23.3.3.1 Flow control
It is essential that the pipeline should be fed at the correct rate. If the feed rate is too low
the pipeline will be under-utilized, and if the feed rate is too high the pipeline could
block. Flow control can be achieved by varying the rotational speed of the rotor. There
is an upper limit for any given size of valve however, for the pocket filling efficiency
will decrease with increase in speed. If a variable speed drive is provided the flow rate
will be infinitely variable, as it is with a blow tank, up to its maximum capability with
a material. If some form of gearing is provided only step changes will be possible.
Many rotary valves are dedicated to a single material and duty, and no means of
speed control is incorporated. If a material is to be conveyed over a different distance,
a corresponding change in feed rate will be required. If a different material is to be
conveyed it is quite likely that both the pipeline and rotary valve feeding characteris-
tics for the material will be different. As it is a volumetric feeder, those for the rotary
valve will be particularly influenced by the bulk density of the material.
22.3.3.2 Air leakage
Air leakage across a rotary valve depends primarily upon the rotor tip clearance and the
pressure drop across the valve. Air leakage also depends upon the material being fed.
A cohesive material, for example, will help to seal the various clearances and so reduce
the leakage rate. The influence of these parameters was illustrated with Figures 3.8 and 9.
If air leaks across a rotary valve, less will be available to convey material through the
pipeline. In specifying the air requirements for the air mover this must be taken into
account. Air leakage will also increase with increase in size of the rotary valve. If a
valve is used which is larger than that necessary for the required duty, the air leakage
will be unnecessarily high as a result.
22.3.3.2.1 Venting
The air leaking across the valve may interfere with the feeding of material into the rotary
valve, as it will have to flow in the opposite direction to the flow of material in order to
exit from the system. This reverse flow of air may restrict the material flow and prevent
the pockets from being fully filled. This air may also fluidize the material and lower its
bulk density, which will also reduce the feed rate. In this case the problem may be alle-
viated by venting. Some material is likely to be carried over with the vented air and so
the vent line must be kept clear. The vent should preferably discharge into the feed hop-
per above, where the air can be filtered. The vent line must not be allowed to become
blocked and so it must be designed as a miniature pneumatic conveying system itself.
A sketch of a vented rotary valve is given in Figure 22.3. The vent should be pos-
itioned on the side of the body such that there is always one rotor blade positioned
between the material feed and the vent to prevent a direct flow of material from the
hopper to the vent.
OPERATING PROBLEMS 487
488 PNEUMATIC CONVEYING DESIGN GUIDE
22.3.3.3 Valve seizure
Valve seizure could be caused by the trapping of granular materials or by some foreign
body in the material. If hot material is conveyed seizure could be caused by differential
expansion problems. Particular care should be taken on start up with a cold valve.
Insulation and trace heating may be necessary to maintain blade tip clearances, for if
clearances become too great in such transient situations the pipeline could block because
of a loss of too much air. If bearings are not protected and maintained, dust ingress could
cause serious problems. If a bearing ran hot before seizure it could provide the necessary
source of ignition for an explosion in a dusty environment (see Chapter 26).
22.3.3.4 Valve wear
Rotary valves are not generally recommended for handling abrasive materials, although
they can be manufactured with wear resistant materials. Apart from abrasive wear of the
sliding surfaces, erosive wear will be severe as a result of the very high velocities
achieved by the air leaking through the valve. Wear will result in an increase in rotor tip
clearances and hence an increase in air leakage. This, in turn, will cause a loss of air to
the conveying line, which could ultimately result in pipeline blockage. This point was
discussed in Section 20.2.4 and with Figure 20.11.
22.3.4 Filters
Most problems that occur with filters generally result from incorrect specification,
either in terms of the air flow rate or the particle size distribution to be expected.
22.3.4.1 Material degradation
Filter cloths and screens will rapidly block if they have to cope with unexpectedly high
flow rates of fine powder. The net result is that there is usually an increase in pressure
Blower
Rotor
Housing
MaterialHopper
Leakageair (Vl)
Vent
Conveying air (Vc)Supply air (Vs)
Note : Vc � Vs �Vl
•
••
••
•
Figure 22.3 Sketch of vented rotary valve.
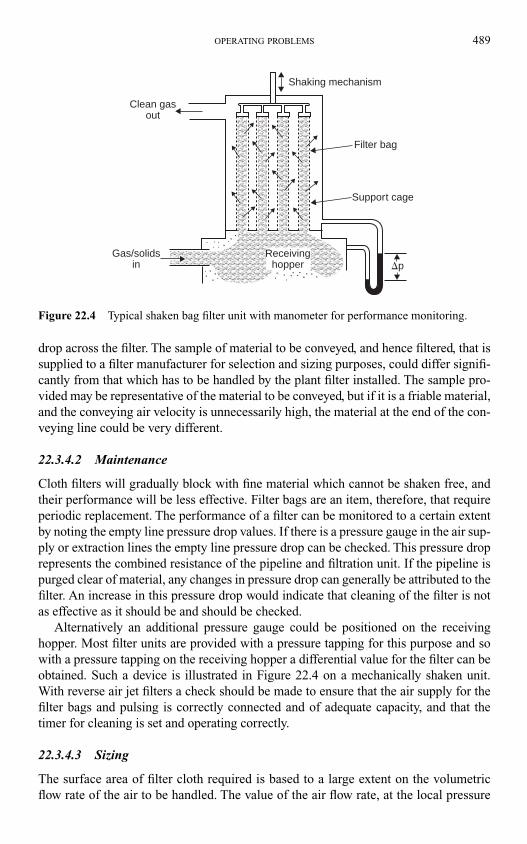
drop across the filter. The sample of material to be conveyed, and hence filtered, that is
supplied to a filter manufacturer for selection and sizing purposes, could differ signifi-
cantly from that which has to be handled by the plant filter installed. The sample pro-
vided may be representative of the material to be conveyed, but if it is a friable material,
and the conveying air velocity is unnecessarily high, the material at the end of the con-
veying line could be very different.
22.3.4.2 Maintenance
Cloth filters will gradually block with fine material which cannot be shaken free, and
their performance will be less effective. Filter bags are an item, therefore, that require
periodic replacement. The performance of a filter can be monitored to a certain extent
by noting the empty line pressure drop values. If there is a pressure gauge in the air sup-
ply or extraction lines the empty line pressure drop can be checked. This pressure drop
represents the combined resistance of the pipeline and filtration unit. If the pipeline is
purged clear of material, any changes in pressure drop can generally be attributed to the
filter. An increase in this pressure drop would indicate that cleaning of the filter is not
as effective as it should be and should be checked.
Alternatively an additional pressure gauge could be positioned on the receiving
hopper. Most filter units are provided with a pressure tapping for this purpose and so
with a pressure tapping on the receiving hopper a differential value for the filter can be
obtained. Such a device is illustrated in Figure 22.4 on a mechanically shaken unit.
With reverse air jet filters a check should be made to ensure that the air supply for the
filter bags and pulsing is correctly connected and of adequate capacity, and that the
timer for cleaning is set and operating correctly.
22.3.4.3 Sizing
The surface area of filter cloth required is based to a large extent on the volumetric
flow rate of the air to be handled. The value of the air flow rate, at the local pressure
OPERATING PROBLEMS 489
Shaking mechanism
Clean gasout
Gas/solidsin
Support cage
Filter bag
�pReceiving
hopper
Figure 22.4 Typical shaken bag filter unit with manometer for performance monitoring.
490 PNEUMATIC CONVEYING DESIGN GUIDE
and temperature conditions, divided by the cloth area gives an approximate face
velocity. Typical values for felted fabrics are in the region of about 0.025 m/s for
fine particulate materials and up to about 0.050 m/s when handling coarser or granu-
lar materials.
It must be remembered that if the filter is used in a negative pressure system, the volu-
metric flow rate to be handled will be significantly higher, because of the very low
pressure, and so the cloth area will have to be much greater than that in an equivalent
positive pressure system exhausting to atmospheric pressure, in order to maintain
the same face velocity. The same considerations will have to be given to the filters in a
system that operates at a high altitude, and to any system in which high temperature
material has to be handled.
22.3.4.4 Batch cycles
In batch conveying cycles, such as those associated with blow tanks, the air flow rate is
not uniform with respect to time. At the end of the cycle, when the blow tank is just
empty, a very large volume of air is stored under pressure in the blow tank and pipeline.
The venting of this air, together with the regular compressor output for conveying, will
result in a significantly higher filter duty at this time. This high air flow rate should be
taken into account in the specification of the conveying line filter.
The resulting surge can be reduced by isolating the blow tank from the conveying
line when it is empty, and venting the blow tank separately. If this is done, however, the
filter on the material feed hopper above the blow tank will have to be appropriately
sized for this intermittent high flow rate duty. Alternatively the supply from the air
mover can be isolated when the blow tank is empty and the pressurized air in the blow
tank can be used to purge the conveying line.
22.3.5 Vacuum nozzles
Vacuum nozzles are widely used for feeding negative pressure, or vacuum systems,
since they enable material to be transported from open storage, such as from stock-
piles and from the holds of ships. They can equally be used in hoppers as an alterna-
tive to rotary valves and screw feeders as illustrated in Figure 3.25.
22.3.5.1 Flow control
Vacuum nozzles, unlike rotary valves and screws, are not positive displacement feeders.
Their control, therefore, is based on proportioning of the air, in a similar manner to
that of a blow tank. The main requirement is that primary air should be provided at the
pick-up point and that this should be sleeved to provide a free passage of air directly
from the atmosphere, as shown in Figure 3.22. For continuous operation the nozzle
needs to be plunged into the material. Air may permeate through the material but it is
unlikely to be sufficient for conveying alone.
The primary air, together with any that might permeate through the material, will
pick the material up and transfer it into the conveying line. If the concentration of mater-
ial is too great, the secondary air can be used to provide the necessary dilution. This
OPERATING PROBLEMS 491
proportioning of the air is essential if the pipeline is to operate at the maximum mater-
ial flow rate with the available pressure drop generated by the exhauster. The location
of the outer sleeve in relation to the pipeline (see Figure 3.23) is also important in terms
of feed rate control as illustrated in Figure 3.24.
22.4 System related
In this section problems relating to the system are considered, other than throughput
problems which were considered in Chapters 20 and 21. One part is concerned essen-
tially with environmental factors such as altitude, temperature variations and condensa-
tion. Another part deals with physical problems that can happen to the system such as an
explosion, bends eroding and electrostatic discharges. Many of these problems are
caused directly by the material being conveyed. They are considered in this section since
the problem may not initially be recognized in terms of the material being conveyed.
22.4.1 Altitude
The operation of a pneumatic conveying system at altitude should present no problems
at all, provided that due account has been taken of the local air pressure, and hence
density of the air. This will influence the specification of the air mover since the
volumetric flow rate is generally quoted in terms of free air (see Equation (9.10) and
Figure 9.21). It will also influence the size of the filter required, as discussed above in
the section on component related problems.
For a plant located at an elevation of 1000 m above sea level, for example, there is a
reduction in ambient pressure of about 11.4 kN/m2 or 85 mmHg, which is more than
10 per cent of the standard atmospheric pressure at sea level. The normal atmospheric
pressure at sea level can fluctuate quite naturally by �25 mmHg on a day to day basis,
which equates to a change in elevation of about 300 m.
22.4.2 Condensation
Condensation is liable to occur in pipelines that are subject to large temperature vari-
ations, particularly where there are pipe runs outside buildings, and air drying is not
employed. This problem is considered in detail in Chapter 25.
22.4.3 Electrostatics
Pneumatic conveying systems are known to be prolific generators of static electricity.
In a large number of cases the amount of charge generated is too small to have any
noticeable effect, but sometimes appreciable generation can occur. Very often, this is
just a nuisance, but occasionally it can present a hazard. The electrostatic problem can
be reduced by earthing the pipeline and ensuring that electrical continuity is main-
tained across all flanged joints. The humidity of the conveying air can also be used as
a means of controlling static build-up. The use of humidity for charge control, how-
ever, is clearly not suitable if the material being conveyed is hygroscopic, or where
condensation might be a problem.
22.4.4 Erosive wear
If the hardness of the particles to be conveyed is higher than that of the system compo-
nents, such as feeders and pipeline bends, then erosive wear will occur at all surfaces
against which the particles impact. Erosion is wear caused by the impact of particles
against surfaces, and the angle of impact is a major variable in the wear process.
Abrasive wear is caused by the sliding of particles against surfaces. Abrasive wear can
be a problem with hoppers, chutes and cyclones, but in pneumatic conveying systems
erosive wear can be an order of magnitude more serious. As a consequence Chapter 23
is devoted entirely to the subject of Erosive Wear.
22.4.5 Explosions
There is a wide range of material which, in a finely divided state, dispersed in air, will
propagate a flame through the suspension if ignited. These materials include foodstuffs
such as flour, sugar and cocoa, synthetic materials such as plastics, chemical and phar-
maceutical materials, metal powders and fuels such as coal and wood. Research has
shown that the particle size must be below about 200 µm for a hazard to exist.
It is virtually impossible to avoid dust cloud formations in pneumatic conveying.
Even when the material being conveyed consists of particles larger than 200 µm, con-
sideration must be given to the production of fines during conveying which may result
in an explosion hazard being created in the receiving vessel. This is another topic that
clearly requires serious consideration and so the problem is reviewed and a range of
solutions are presented in Chapter 26.
22.4.6 Pipeline purging
With foodstuffs and perishable commodities there is generally a need to purge the
pipeline clear of material. With dilute phase conveying this is rarely a problem, for
although the conveying line inlet air velocity may only be 12 m/s while conveying, dur-
ing purging of the pipeline the conveying line pressure drop will be little more than the
air only pressure drop value. As a consequence the air velocity for purging will be close
to the conveying line exit air velocity and this is generally sufficient to ensure a pipeline
will be purged clear in a matter of minutes.
Difficulties can be experienced with low velocity dense phase conveying, however,
since conveying line inlet air velocities can be very much lower. In a programme of
tests carried out with a 1260 kg batch of cement a note of the mass of cement that could
not be conveyed to the reception hopper was made, as part of the recorded information
taken in determining the conveying characteristics for the material in the test pipeline.
The results are presented in Figure 22.5 [1].
A sketch of the 95 m long pipeline of 105 mm bore is given in Figure 22.6. It will
be seen that in addition to the usual lines of constant conveying line pressure drop and
solids loading ratio, lines of constant conveying line inlet air velocity have been
added. The horizontal axis has been doubled to provide conveying line exit air vel-
ocity values and lines of constant percentage of batch conveyed have also been superim-
posed. The purging of the pipeline was limited to about 1 min in all cases.
492 PNEUMATIC CONVEYING DESIGN GUIDE
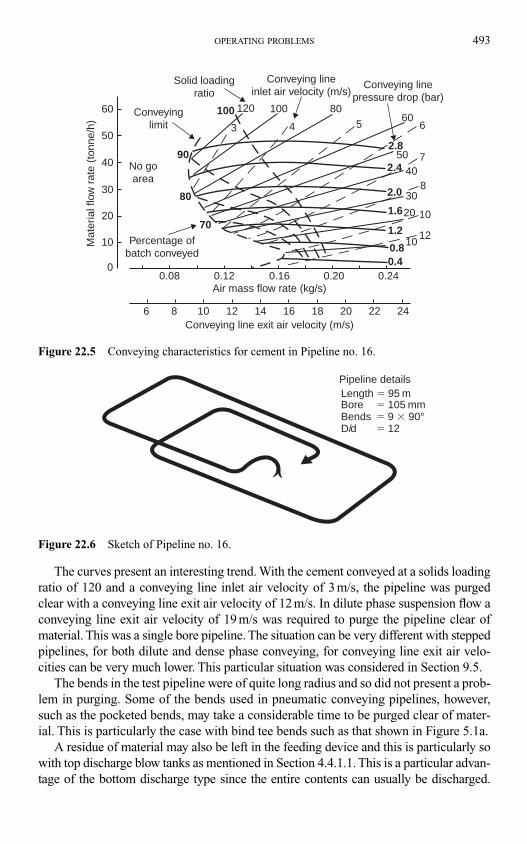
OPERATING PROBLEMS 493
The curves present an interesting trend. With the cement conveyed at a solids loading
ratio of 120 and a conveying line inlet air velocity of 3 m/s, the pipeline was purged
clear with a conveying line exit air velocity of 12 m/s. In dilute phase suspension flow a
conveying line exit air velocity of 19 m/s was required to purge the pipeline clear of
material. This was a single bore pipeline. The situation can be very different with stepped
pipelines, for both dilute and dense phase conveying, for conveying line exit air velo-
cities can be very much lower. This particular situation was considered in Section 9.5.
The bends in the test pipeline were of quite long radius and so did not present a prob-
lem in purging. Some of the bends used in pneumatic conveying pipelines, however,
such as the pocketed bends, may take a considerable time to be purged clear of mater-
ial. This is particularly the case with bind tee bends such as that shown in Figure 5.1a.
A residue of material may also be left in the feeding device and this is particularly so
with top discharge blow tanks as mentioned in Section 4.4.1.1. This is a particular advan-
tage of the bottom discharge type since the entire contents can usually be discharged.
Mat
eria
l flo
w r
ate
(ton
ne/h
)Solid loading
ratio
10 10
10
2.8
0.40.8
0.08
1.2
1.6
8
7
6543
12
0
20 20
3030
4040
50
50
6060
90
10 12
0.12
14 16
0.16
18 20
0.240.20
22 2486
120100 100
70
80
80
Conveying linepressure drop (bar)
Conveying lineinlet air velocity (m/s)
Conveying line exit air velocity (m/s)
Conveyinglimit
Percentage ofbatch conveyed
No goarea
Air mass flow rate (kg/s)
2.4
2.0
Figure 22.5 Conveying characteristics for cement in Pipeline no. 16.
Pipeline details
Bends � 9 � 90°D/d � 12
Bore � 105 mmLength � 95 m
Figure 22.6 Sketch of Pipeline no. 16.
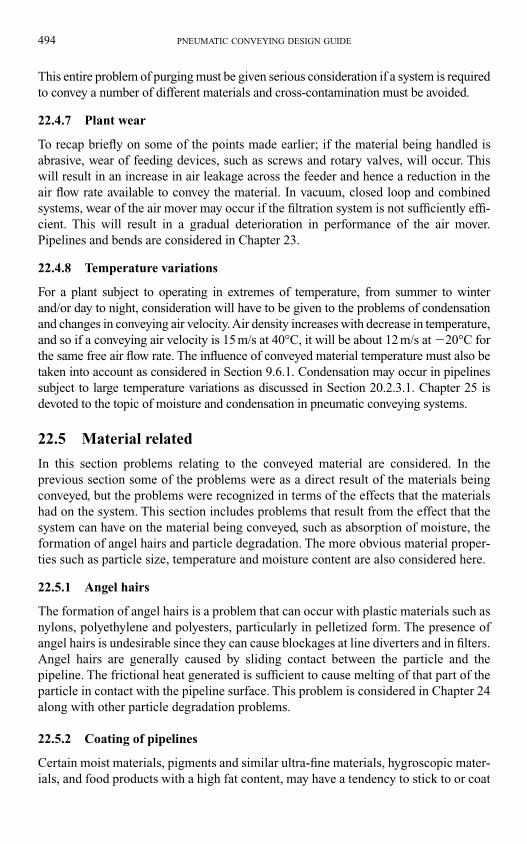
494 PNEUMATIC CONVEYING DESIGN GUIDE
This entire problem of purging must be given serious consideration if a system is required
to convey a number of different materials and cross-contamination must be avoided.
22.4.7 Plant wear
To recap briefly on some of the points made earlier; if the material being handled is
abrasive, wear of feeding devices, such as screws and rotary valves, will occur. This
will result in an increase in air leakage across the feeder and hence a reduction in the
air flow rate available to convey the material. In vacuum, closed loop and combined
systems, wear of the air mover may occur if the filtration system is not sufficiently effi-
cient. This will result in a gradual deterioration in performance of the air mover.
Pipelines and bends are considered in Chapter 23.
22.4.8 Temperature variations
For a plant subject to operating in extremes of temperature, from summer to winter
and/or day to night, consideration will have to be given to the problems of condensation
and changes in conveying air velocity. Air density increases with decrease in temperature,
and so if a conveying air velocity is 15 m/s at 40°C, it will be about 12 m/s at �20°C for
the same free air flow rate. The influence of conveyed material temperature must also be
taken into account as considered in Section 9.6.1. Condensation may occur in pipelines
subject to large temperature variations as discussed in Section 20.2.3.1. Chapter 25 is
devoted to the topic of moisture and condensation in pneumatic conveying systems.
22.5 Material related
In this section problems relating to the conveyed material are considered. In the
previous section some of the problems were as a direct result of the materials being
conveyed, but the problems were recognized in terms of the effects that the materials
had on the system. This section includes problems that result from the effect that the
system can have on the material being conveyed, such as absorption of moisture, the
formation of angel hairs and particle degradation. The more obvious material proper-
ties such as particle size, temperature and moisture content are also considered here.
22.5.1 Angel hairs
The formation of angel hairs is a problem that can occur with plastic materials such as
nylons, polyethylene and polyesters, particularly in pelletized form. The presence of
angel hairs is undesirable since they can cause blockages at line diverters and in filters.
Angel hairs are generally caused by sliding contact between the particle and the
pipeline. The frictional heat generated is sufficient to cause melting of that part of the
particle in contact with the pipeline surface. This problem is considered in Chapter 24
along with other particle degradation problems.
22.5.2 Coating of pipelines
Certain moist materials, pigments and similar ultra-fine materials, hygroscopic mater-
ials, and food products with a high fat content, may have a tendency to stick to or coat
OPERATING PROBLEMS 495
the walls of a pipeline. If the coating builds up it will gradually reduce the section area
of the pipeline and generally results in blockage. Conveying with a very much higher
air velocity is often successful with some materials. One method that often works is to
convey the material through a rubber hose capable of withstanding the conveying air
pressure. The natural flexing of the hose with the conveying of the material and pres-
surizing and de-pressurizing is often sufficient to dislodge any build-up of material.
22.5.3 Cohesive materials
With cohesive materials the problems often relate to the difficulty of feeding the material
into the pipeline. If difficulties are encountered in achieving flow rates with a system, and
the conveying line pressure drop is below the expected value, the problem could well
relate to the discharge of the material from the supply hopper, rather than the capability
of the feeding device or the pipeline. In this case, the use of a suitable bin discharge aid
should be considered. In the case of rotary valves, a blow through type should be used if
there is any difficulty in discharging a cohesive material into a conveying line.
22.5.4 Consolidation of materials
Many bulk materials increase in strength with time. This is a particular problem with
the storage of bulk solids in hoppers and silos. A material stored for 1 day may well
flow freely from a hopper but refuse to flow at all after being stored for two days. Bulk
density can also increase with time, and significantly so with some materials. If a
material has consolidated in a hopper and is fed into a positive displacement feeder,
the pipeline could block due to being overfed.
This can occur with rotary valve fed systems on start-up. The bulk density of mater-
ials such as barytes, cement and fly ash can increase by 30 to 40 per cent with com-
paction. The discharge rate of a rotary valve was given in Equation (3.1) and it will be
seen that it is directly proportional to the bulk density of the material. Once the mater-
ial in the hopper has been disturbed by flowing down into the rotary valve, and with
aeration from a proportion of the air leaking across the rotary valve, operation could be
back to normal once the blockage has been cleared and the system re-started.
Aeration of the material before being conveyed would always be recommended in
road and rail vehicle transport systems. By the time such a vehicle arrives at a depot for
off-loading a considerable degree of compaction will have resulted. This is one of the
advantages of pressurizing bottom discharge blow tanks from the bottom, as shown in
Figure 4.16. The air required to pressurize the vessel must pass through the material
and this will aerate the material very effectively.
22.5.5 Degradation of materials
The fracture and breakage of pneumatically conveyed materials is a problem with all
friable materials. Even if the presence of fines in the material is not a problem with
respect to product quality, the fines produced will add unnecessarily to the duty on the
filtration unit. The problem is influenced to a large extent by conveying air velocity.
Since this is a major problem in the industry Chapter 24 is devoted to the subject.
496 PNEUMATIC CONVEYING DESIGN GUIDE
22.5.6 Granular materials
If a granular material has to be conveyed, difficulties may be experienced in dischar-
ging the material into the conveying line. Rotary valves and blow tanks may cause prob-
lems here, and so reference should be made to the appropriate items in Chapters 3 and 4.
Once the granular material is fed into the pipeline there should be no problem with its
conveying, although it is almost certain that it will have to be conveyed in dilute phase
suspension flow, unless the material has a very narrow particle size distribution and
good permeability.
22.5.7 Hygroscopic materials
If a hygroscopic material is pneumatically conveyed it may absorb moisture from the
air used to convey the material and become very cohesive, and have poor flowability
as a result. Although the specific humidity of the air will reduce if it is compressed
isothermally beyond the saturation point, its relative humidity will increase and is
likely to be 100 per cent after compression. The added moisture will not only affect
material quality but could cause subsequent handling problems.
Problems of moisture in conveying air are not so serious in negative pressure
systems. Although the specific humidity will remain constant, the relative humidity of
the air will constantly reduce along the pipeline as the conveying air pressure reduces.
The problem can be overcome altogether by drying the air that is used for conveying
the material, either by refrigeration or desiccant devices. The subject of moisture in air
with respect to pneumatic conveying systems is considered in detail in Chapter 25.
22.5.8 Large particles
Large particles can be conveyed quite successfully in pneumatic conveying systems
but a general recommendation is that the diameter of the pipeline should be about
three times that of the larger particles. This is simply an expedient measure to ensure
that the pipeline will not block by the wedging action of two ‘rigid’ particles. There are
exceptions to this rule, of course, and with very ‘pliable’ materials such as fish, it is
possible to convey ‘particles’ that are slightly larger than that of the pipeline bore.
With ‘rigid’ particles, shape may present a problem if a mean particle value is used in
sizing, and the particles have an irregular shape.
Care must be exercised with the feeding of these materials in all cases. With mater-
ials such as coal, clinker and iron ore, gate valves are often used because they are very
rugged, and heavy duty closing devices are employed. The trapping of these particles
must be avoided for they may damage the seals. Trapped particles and damaged seals
will both allow air to leak through the feeder and so affect the performance of the con-
veying system.
22.5.9 Material grade
If a system is dedicated to a single duty with a single material, and the system has been
optimized to the lowest specific energy, operating difficulties may be experienced if
there is a change in material grade or quality. If a material is produced with a slightly
OPERATING PROBLEMS 497
different shape or size it could be sufficient to cause the pipeline to be blocked. It must
be appreciated that different grades of the same material can have very different con-
veying characteristics, and even the pneumatic conveying of a material can change its
conveying characteristics. This was illustrated in Chapter 13 with light soda ash and a
number of other materials.
22.5.10 Temperature
High temperature materials can be conveyed quite successfully and conveying gas at
any temperature can be used. Compatibility with system components is the determin-
ing factor. Conveying air velocities also have to be guaranteed if there are significant
temperature changes. It is the evaluation of gas and conveyed material temperature
that presents the difficulty, as discussed in Section 9.6.1.
At the feeding point, for example, cold air may be used to convey a high tempera-
ture material. Along the conveying line there will be a move towards thermal equilib-
rium between the air and the material, and there will be heat transfer from the pipeline
to the surroundings. Since conveying times are very short it is unlikely that equilib-
rium will be established. It is quite possible, therefore, for the surface of the particles
to be ‘cold’ and the inner core to be ‘hot’. Due to this it is often possible to use filter
cloths in these high temperature situations. By the same reasoning the material in the
reception hopper could be very hot once equilibrium has been established there.
The maintenance of conveying air velocities is particularly important in these situ-
ations but their evaluation can be difficult. Particle temperature transients represent a
complex convection, radiation and three-dimensional conduction heat transfer prob-
lem. Since air density increases with decrease in temperature, however, the mainten-
ance of air velocities is only likely to be a problem in situations where a very high
temperature gas is used to convey a cold material. In this case the temperature gradi-
ent effect could over-ride the pressure gradient influence on air density.
22.5.11 Wet materials
Fine materials that are wet will tend to coat the pipeline and gradually block the
pipeline. The problem can be relieved by heating the conveying air if the material is not
too wet. Greater difficulty may be experienced in discharging a material from a hopper
if it is wet. When wet granular materials are fed into a pipeline bends present a particu-
lar difficulty since these can become wet with moisture centrifuged off particles on
impact, and fine material will adhere and gradually block the line at the bend. Single
plug blow tanks, as illustrated in Figure 2.9, often work well with wet materials since the
retarding force is wall friction, and the higher the moisture content the lower the wall
friction.
Reference
1. D Mills, V K Agarwal and M D Bharathi. The pneumatic conveying of fly ash and cement at
low velocity. Proc 24th Powder and Bulk Solids Conf. pp 147–163. Chicago. May 1999.
23.1 Introduction
Erosive wear results from the impact of particles against surfaces. Typical erosive wear
situations in bulk solids handling plant are in the loading and off-loading of materials,
and with free fall onto surfaces. The blowing of materials into cyclones, their loading
into hoppers and onto chutes, off-loading from hoppers, conveyor belts and bucket ele-
vators, are common examples. These are all cases where particles impact against sur-
faces and cause erosive wear, rather than slide against a retaining surface and cause
abrasive wear.
Erosion represents a major problem, not only in bulk solids handling plant, but
in many other areas. In thermal power plant pulverized fuel causes erosive wear of
supply lines and nozzles, and the resulting fly ash is a problem with respect to boiler
tubes. Both pneumatic and hydraulic conveying of particulate materials in pipelines
can result in severe erosion problems, and aircraft, rockets and missiles are eroded by
rain drops and ice particles. The area that has probably received most attention, how-
ever, is aircraft engines, and in particular helicopters, for dust ingestion can cause con-
siderable damage, and has resulted in several catastrophic failures in service.
It is a major feature in the wear of pneumatic and hydraulic pipeline transport sys-
tems. In pneumatic conveying, in particular, it can be a severe problem because of the
high velocities required for conveying bulk particulate materials. The erosion of sur-
faces by solid particles in a fluid stream is probably the main reason why industry is
often reluctant to install pneumatic conveying systems, particularly when abrasive
materials have to be handled. In several other areas, however, erosion has many prac-
tical uses and advantages, such as in erosive cleaning of surfaces and erosive drilling
and cutting.
23.1.1 Data sources
Information on erosive wear comes from a very wide range of sources, therefore.
Until recent years little was known of the fundamental mechanisms of the erosion
process or of the variables that influence the problem. There are, in fact, so many vari-
ables that influence the problem that advances have only been made by the develop-
ment and use of specially designed erosive wear testing rigs. In these a wide range of
powdered and granular materials have been impacted against a wide range of surface
Chapter 23
Erosive wear
materials over carefully controlled conditions of velocity, particle concentration, tem-
perature, impact angle, etc.
Many studies have been of a general nature with a view to getting a better under-
standing of the basic mechanisms of the process, and for this purpose numerous
single particle impact investigations have been undertaken. Other studies have been
conducted for specific purposes, and so the range of variables investigated can be
extremely wide. For particle impact velocity, for example, tests have been carried out
at about 1–3 m/s for hydraulic transport, from 15 to 35 m/s for pneumatic conveying,
from 100 to 500 m/s for aircraft applications and up to 8000 m/s for rockets.
23.1.2 Issues considered
The information presented on erosive wear, therefore, is in two sections. In the first the
influence of the major variables in the problem of erosive wear is presented, and the data
for this has been obtained from a very wide range of sources. This provides general
information on the basic mechanisms of the erosive wear process and influence of the
variables involved, and will provide a useful background and basis for subsequent deci-
sions in relation to the wear of pneumatic conveying system pipelines and components.
In the second part a review of industrial solutions to the problem of pipeline wear
is presented, with particular reference to bend wear. Bends in pneumatic conveying
system pipelines are probably the most vulnerable of all components to wear. If silica
sand is conveyed through a pipeline with a conveying air velocity of about 25 m/s, for
example, an ordinary mild steel bend could fail well within 2 h. This review, therefore,
covers issues such as bend geometry and the use of wear resistant materials.
23.2 Influence of variables
There are many parameters associated with both the impacting particles and the sur-
face material that will have an effect on erosive wear. In some cases the variables are
inter-related and so need to be considered in groups in these situations.
23.2.1 Impact angle and surface material
A curve presented by Tilly [1] and shown in Figure 23.1 illustrates the variation of ero-
sion with impact angle for two different surface materials and is typical of the early
work carried out to investigate the influence of these variables.
Both materials showed very significant differences in both erosion rate and the
effect of impact angle. These materials do, in fact, exhibit characteristic types of
behaviour that are now well recognized. The aluminium alloy is typical of ductile
materials: it suffers maximum erosion at an impact angle of about 20° and offers good
erosion resistance to normal impact. The glass is typical of brittle materials: it suffers
severe erosion under normal impact but offers good erosion resistance to low angle,
glancing impact. These particular tests were carried out with sand particles sieved to
between 60 and 125 �m and impacted at about 100 m/s. That brittle and ductile mater-
ials respond to erosion in very different ways can be clearly seen from Figure 23.1,
and it is obvious that different mechanisms of material removal must be involved.
EROSIVE WEAR 499
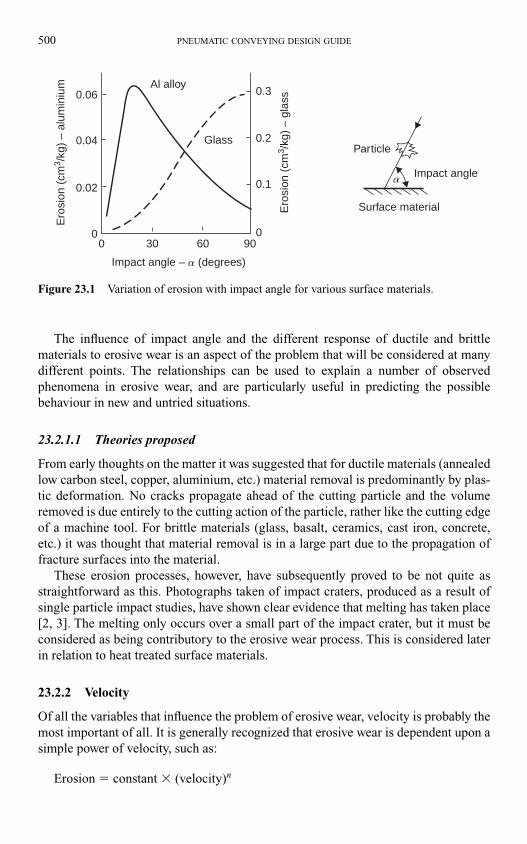
500 PNEUMATIC CONVEYING DESIGN GUIDE
The influence of impact angle and the different response of ductile and brittle
materials to erosive wear is an aspect of the problem that will be considered at many
different points. The relationships can be used to explain a number of observed
phenomena in erosive wear, and are particularly useful in predicting the possible
behaviour in new and untried situations.
23.2.1.1 Theories proposed
From early thoughts on the matter it was suggested that for ductile materials (annealed
low carbon steel, copper, aluminium, etc.) material removal is predominantly by plas-
tic deformation. No cracks propagate ahead of the cutting particle and the volume
removed is due entirely to the cutting action of the particle, rather like the cutting edge
of a machine tool. For brittle materials (glass, basalt, ceramics, cast iron, concrete,
etc.) it was thought that material removal is in a large part due to the propagation of
fracture surfaces into the material.
These erosion processes, however, have subsequently proved to be not quite as
straightforward as this. Photographs taken of impact craters, produced as a result of
single particle impact studies, have shown clear evidence that melting has taken place
[2, 3]. The melting only occurs over a small part of the impact crater, but it must be
considered as being contributory to the erosive wear process. This is considered later
in relation to heat treated surface materials.
23.2.2 Velocity
Of all the variables that influence the problem of erosive wear, velocity is probably the
most important of all. It is generally recognized that erosive wear is dependent upon a
simple power of velocity, such as:
Erosion � constant � (velocity)n
Impact angle – a (degrees)
90
0.1
603000
0.02
0.04
0.06Al alloy
Glass
Ero
sion
(cm
3 /kg
) –
alum
iniu
m
0
0.2
0.3
Ero
sion
(cm
3 /kg
) –
glas
s
Particle
Impact angle
Surface material
a
Figure 23.1 Variation of erosion with impact angle for various surface materials.
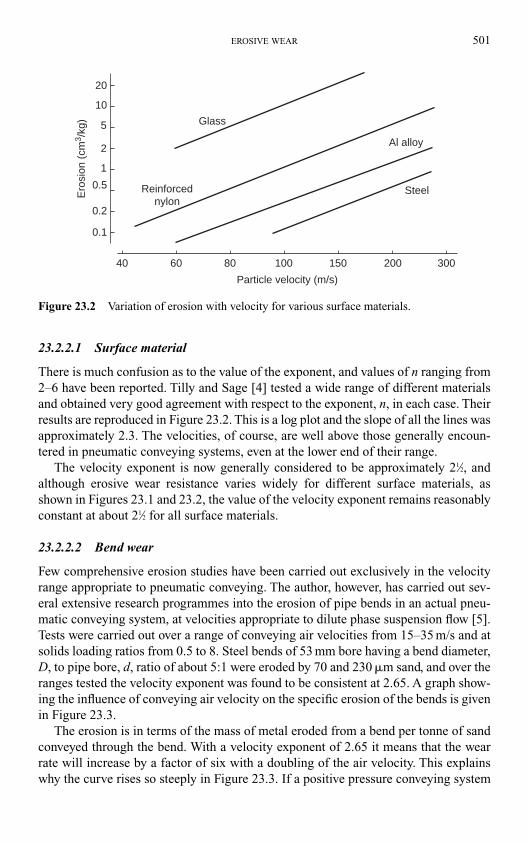
EROSIVE WEAR 501
23.2.2.1 Surface material
There is much confusion as to the value of the exponent, and values of n ranging from
2–6 have been reported. Tilly and Sage [4] tested a wide range of different materials
and obtained very good agreement with respect to the exponent, n, in each case. Their
results are reproduced in Figure 23.2. This is a log plot and the slope of all the lines was
approximately 2.3. The velocities, of course, are well above those generally encoun-
tered in pneumatic conveying systems, even at the lower end of their range.
The velocity exponent is now generally considered to be approximately 21⁄2, and
although erosive wear resistance varies widely for different surface materials, as
shown in Figures 23.1 and 23.2, the value of the velocity exponent remains reasonably
constant at about 21⁄2 for all surface materials.
23.2.2.2 Bend wear
Few comprehensive erosion studies have been carried out exclusively in the velocity
range appropriate to pneumatic conveying. The author, however, has carried out sev-
eral extensive research programmes into the erosion of pipe bends in an actual pneu-
matic conveying system, at velocities appropriate to dilute phase suspension flow [5].
Tests were carried out over a range of conveying air velocities from 15–35 m/s and at
solids loading ratios from 0.5 to 8. Steel bends of 53 mm bore having a bend diameter,
D, to pipe bore, d, ratio of about 5:1 were eroded by 70 and 230 �m sand, and over the
ranges tested the velocity exponent was found to be consistent at 2.65. A graph show-
ing the influence of conveying air velocity on the specific erosion of the bends is given
in Figure 23.3.
The erosion is in terms of the mass of metal eroded from a bend per tonne of sand
conveyed through the bend. With a velocity exponent of 2.65 it means that the wear
rate will increase by a factor of six with a doubling of the air velocity. This explains
why the curve rises so steeply in Figure 23.3. If a positive pressure conveying system
Glass
Reinforcednylon
Particle velocity (m/s)
Ero
sion
(cm
3 /kg
)
Al alloy
Steel
300200100 150806040
0.1
0.2
0.5
1
2
5
10
20
Figure 23.2 Variation of erosion with velocity for various surface materials.
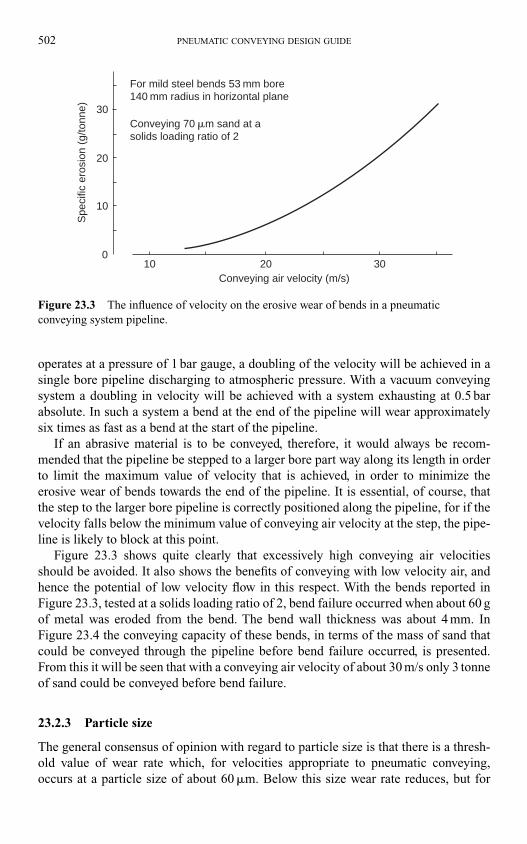
502 PNEUMATIC CONVEYING DESIGN GUIDE
operates at a pressure of 1 bar gauge, a doubling of the velocity will be achieved in a
single bore pipeline discharging to atmospheric pressure. With a vacuum conveying
system a doubling in velocity will be achieved with a system exhausting at 0.5 bar
absolute. In such a system a bend at the end of the pipeline will wear approximately
six times as fast as a bend at the start of the pipeline.
If an abrasive material is to be conveyed, therefore, it would always be recom-
mended that the pipeline be stepped to a larger bore part way along its length in order
to limit the maximum value of velocity that is achieved, in order to minimize the
erosive wear of bends towards the end of the pipeline. It is essential, of course, that
the step to the larger bore pipeline is correctly positioned along the pipeline, for if the
velocity falls below the minimum value of conveying air velocity at the step, the pipe-
line is likely to block at this point.
Figure 23.3 shows quite clearly that excessively high conveying air velocities
should be avoided. It also shows the benefits of conveying with low velocity air, and
hence the potential of low velocity flow in this respect. With the bends reported in
Figure 23.3, tested at a solids loading ratio of 2, bend failure occurred when about 60 g
of metal was eroded from the bend. The bend wall thickness was about 4 mm. In
Figure 23.4 the conveying capacity of these bends, in terms of the mass of sand that
could be conveyed through the pipeline before bend failure occurred, is presented.
From this it will be seen that with a conveying air velocity of about 30 m/s only 3 tonne
of sand could be conveyed before bend failure.
23.2.3 Particle size
The general consensus of opinion with regard to particle size is that there is a thresh-
old value of wear rate which, for velocities appropriate to pneumatic conveying,
occurs at a particle size of about 60 �m. Below this size wear rate reduces, but for
Conveying air velocity (m/s)
Spe
cific
ero
sion
(g/
tonn
e)
30
30
20
20
10
010
For mild steel bends 53 mm bore140 mm radius in horizontal plane
Conveying 70 �m sand at asolids loading ratio of 2
Figure 23.3 The influence of velocity on the erosive wear of bends in a pneumatic
conveying system pipeline.
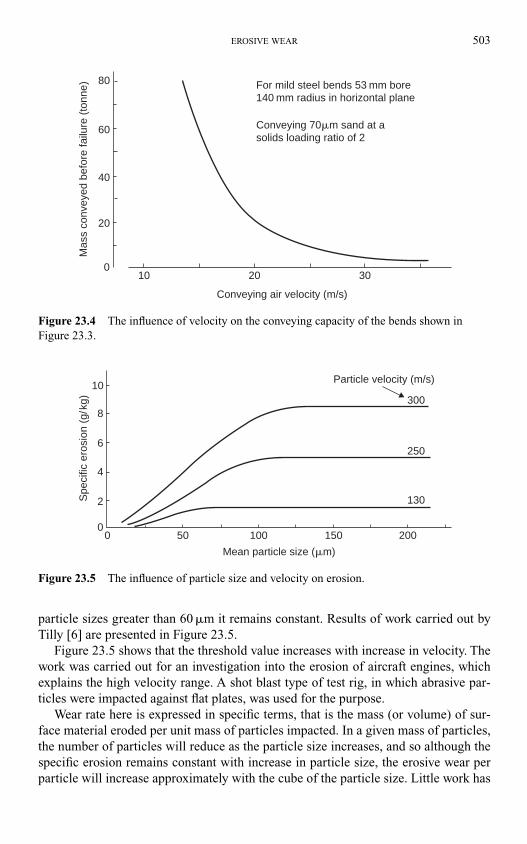
EROSIVE WEAR 503
particle sizes greater than 60 �m it remains constant. Results of work carried out by
Tilly [6] are presented in Figure 23.5.
Figure 23.5 shows that the threshold value increases with increase in velocity. The
work was carried out for an investigation into the erosion of aircraft engines, which
explains the high velocity range. A shot blast type of test rig, in which abrasive par-
ticles were impacted against flat plates, was used for the purpose.
Wear rate here is expressed in specific terms, that is the mass (or volume) of sur-
face material eroded per unit mass of particles impacted. In a given mass of particles,
the number of particles will reduce as the particle size increases, and so although the
specific erosion remains constant with increase in particle size, the erosive wear per
particle will increase approximately with the cube of the particle size. Little work has
Conveying air velocity (m/s)
10 20
20
300
60
40
80 For mild steel bends 53 mm bore140 mm radius in horizontal plane
Conveying 70�m sand at asolids loading ratio of 2
Mas
s co
nvey
ed b
efor
e fa
ilure
(to
nne)
Figure 23.4 The influence of velocity on the conveying capacity of the bends shown in
Figure 23.3.
Mean particle size (�m)
Spe
cific
ero
sion
(g/
kg)
10
8
6
4
2
00
50 100 150 200
130
250
300
Particle velocity (m/s)
Figure 23.5 The influence of particle size and velocity on erosion.
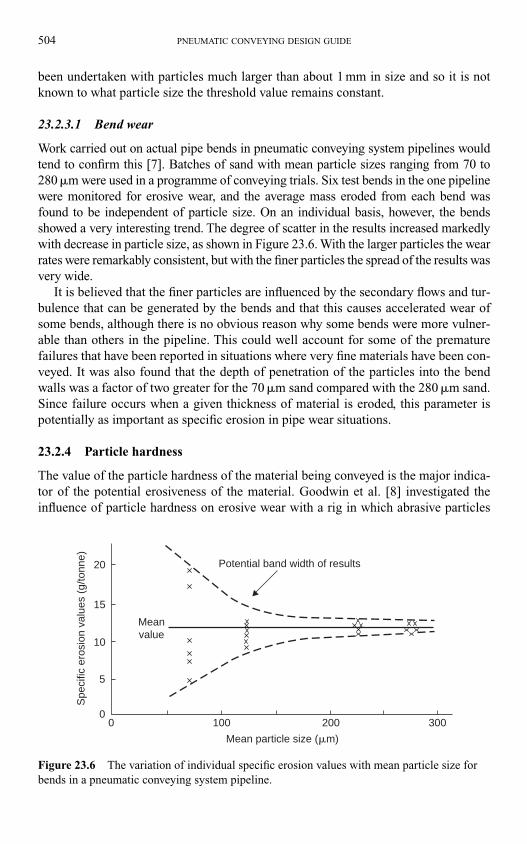
504 PNEUMATIC CONVEYING DESIGN GUIDE
been undertaken with particles much larger than about 1 mm in size and so it is not
known to what particle size the threshold value remains constant.
23.2.3.1 Bend wear
Work carried out on actual pipe bends in pneumatic conveying system pipelines would
tend to confirm this [7]. Batches of sand with mean particle sizes ranging from 70 to
280 �m were used in a programme of conveying trials. Six test bends in the one pipeline
were monitored for erosive wear, and the average mass eroded from each bend was
found to be independent of particle size. On an individual basis, however, the bends
showed a very interesting trend. The degree of scatter in the results increased markedly
with decrease in particle size, as shown in Figure 23.6. With the larger particles the wear
rates were remarkably consistent, but with the finer particles the spread of the results was
very wide.
It is believed that the finer particles are influenced by the secondary flows and tur-
bulence that can be generated by the bends and that this causes accelerated wear of
some bends, although there is no obvious reason why some bends were more vulner-
able than others in the pipeline. This could well account for some of the premature
failures that have been reported in situations where very fine materials have been con-
veyed. It was also found that the depth of penetration of the particles into the bend
walls was a factor of two greater for the 70 �m sand compared with the 280 �m sand.
Since failure occurs when a given thickness of material is eroded, this parameter is
potentially as important as specific erosion in pipe wear situations.
23.2.4 Particle hardness
The value of the particle hardness of the material being conveyed is the major indica-
tor of the potential erosiveness of the material. Goodwin et al. [8] investigated the
influence of particle hardness on erosive wear with a rig in which abrasive particles
Mean particle size (�m)
100
Spe
cific
ero
sion
val
ues
(g/to
nne)
200 30000
5
10
15
20
Meanvalue
Potential band width of results
Figure 23.6 The variation of individual specific erosion values with mean particle size for
bends in a pneumatic conveying system pipeline.
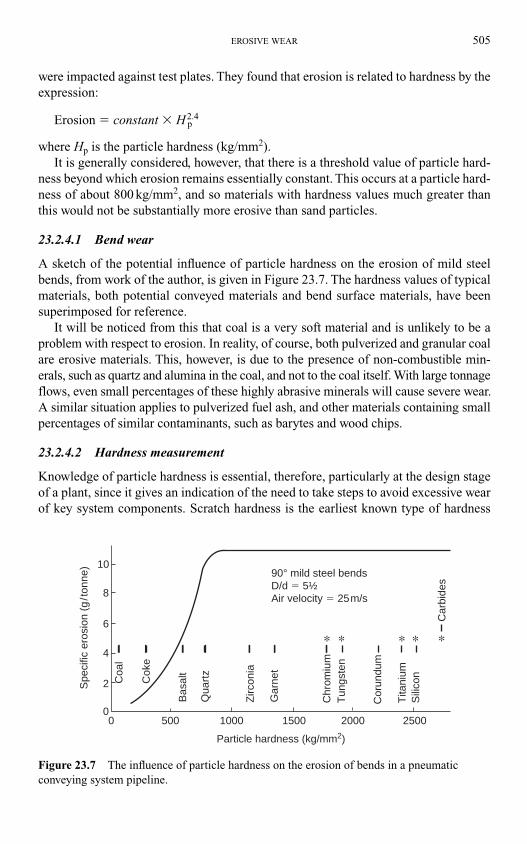
EROSIVE WEAR 505
were impacted against test plates. They found that erosion is related to hardness by the
expression:
Erosion � constant � H2.4p
where Hp is the particle hardness (kg/mm2).
It is generally considered, however, that there is a threshold value of particle hard-
ness beyond which erosion remains essentially constant. This occurs at a particle hard-
ness of about 800 kg/mm2, and so materials with hardness values much greater than
this would not be substantially more erosive than sand particles.
23.2.4.1 Bend wear
A sketch of the potential influence of particle hardness on the erosion of mild steel
bends, from work of the author, is given in Figure 23.7. The hardness values of typical
materials, both potential conveyed materials and bend surface materials, have been
superimposed for reference.
It will be noticed from this that coal is a very soft material and is unlikely to be a
problem with respect to erosion. In reality, of course, both pulverized and granular coal
are erosive materials. This, however, is due to the presence of non-combustible min-
erals, such as quartz and alumina in the coal, and not to the coal itself. With large tonnage
flows, even small percentages of these highly abrasive minerals will cause severe wear.
A similar situation applies to pulverized fuel ash, and other materials containing small
percentages of similar contaminants, such as barytes and wood chips.
23.2.4.2 Hardness measurement
Knowledge of particle hardness is essential, therefore, particularly at the design stage
of a plant, since it gives an indication of the need to take steps to avoid excessive wear
of key system components. Scratch hardness is the earliest known type of hardness
10
8
6
4
2
00 500 1000 20001500 2500
Car
bide
s
Spe
cific
ero
sion
(g
/ton
ne)
Particle hardness (kg/mm2)
90° mild steel bendsD/d � 5½Air velocity � 25m/s
Cor
undu
m
Chr
omiu
m
Gar
net
Zirc
onia
Qua
rtz
Bas
alt
Cok
e
Coa
l
Tun
gste
n
Tita
nium
Sili
con
Figure 23.7 The influence of particle hardness on the erosion of bends in a pneumatic
conveying system pipeline.
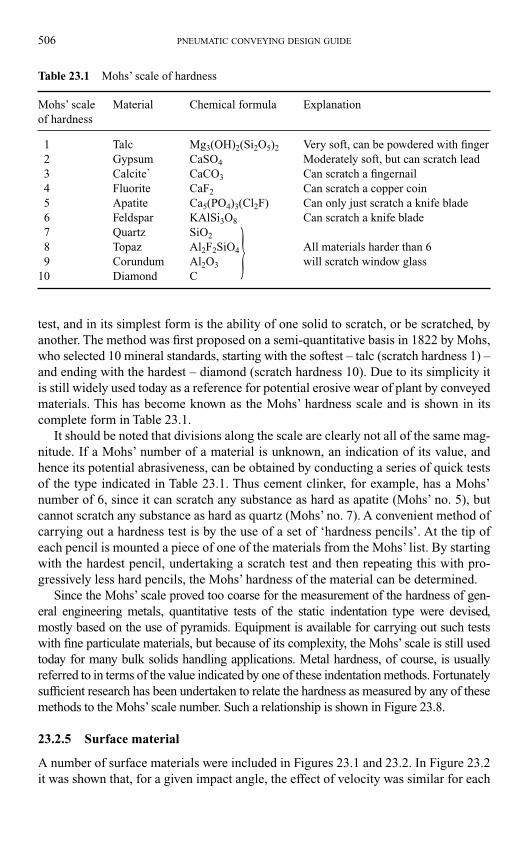
506 PNEUMATIC CONVEYING DESIGN GUIDE
test, and in its simplest form is the ability of one solid to scratch, or be scratched, by
another. The method was first proposed on a semi-quantitative basis in 1822 by Mohs,
who selected 10 mineral standards, starting with the softest – talc (scratch hardness 1) –
and ending with the hardest – diamond (scratch hardness 10). Due to its simplicity it
is still widely used today as a reference for potential erosive wear of plant by conveyed
materials. This has become known as the Mohs’ hardness scale and is shown in its
complete form in Table 23.1.
It should be noted that divisions along the scale are clearly not all of the same mag-
nitude. If a Mohs’ number of a material is unknown, an indication of its value, and
hence its potential abrasiveness, can be obtained by conducting a series of quick tests
of the type indicated in Table 23.1. Thus cement clinker, for example, has a Mohs’
number of 6, since it can scratch any substance as hard as apatite (Mohs’ no. 5), but
cannot scratch any substance as hard as quartz (Mohs’ no. 7). A convenient method of
carrying out a hardness test is by the use of a set of ‘hardness pencils’. At the tip of
each pencil is mounted a piece of one of the materials from the Mohs’ list. By starting
with the hardest pencil, undertaking a scratch test and then repeating this with pro-
gressively less hard pencils, the Mohs’ hardness of the material can be determined.
Since the Mohs’ scale proved too coarse for the measurement of the hardness of gen-
eral engineering metals, quantitative tests of the static indentation type were devised,
mostly based on the use of pyramids. Equipment is available for carrying out such tests
with fine particulate materials, but because of its complexity, the Mohs’ scale is still used
today for many bulk solids handling applications. Metal hardness, of course, is usually
referred to in terms of the value indicated by one of these indentation methods. Fortunately
sufficient research has been undertaken to relate the hardness as measured by any of these
methods to the Mohs’ scale number. Such a relationship is shown in Figure 23.8.
23.2.5 Surface material
A number of surface materials were included in Figures 23.1 and 23.2. In Figure 23.2
it was shown that, for a given impact angle, the effect of velocity was similar for each
Table 23.1 Mohs’ scale of hardness
Mohs’ scale Material Chemical formula Explanation
of hardness
1 Talc Mg3(OH)2(Si2O5)2 Very soft, can be powdered with finger
2 Gypsum CaSO4 Moderately soft, but can scratch lead
3 Calcite` CaCO3 Can scratch a fingernail
4 Fluorite CaF2 Can scratch a copper coin
5 Apatite Ca5(PO4)3(Cl2F) Can only just scratch a knife blade
6 Feldspar KAlSi3O8 Can scratch a knife blade
7 Quartz SiO2
8 Topaz Al2F2SiO4} All materials harder than 6
9 Corundum Al2O3 will scratch window glass
10 Diamond C
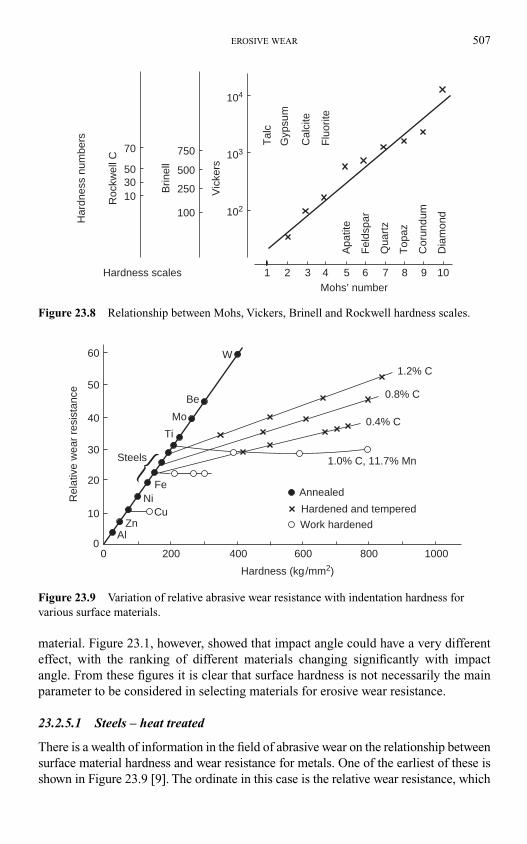
EROSIVE WEAR 507
material. Figure 23.1, however, showed that impact angle could have a very different
effect, with the ranking of different materials changing significantly with impact
angle. From these figures it is clear that surface hardness is not necessarily the main
parameter to be considered in selecting materials for erosive wear resistance.
23.2.5.1 Steels – heat treated
There is a wealth of information in the field of abrasive wear on the relationship between
surface material hardness and wear resistance for metals. One of the earliest of these is
shown in Figure 23.9 [9]. The ordinate in this case is the relative wear resistance, which
Mohs’ number1Hardness scales
Har
dnes
s nu
mbe
rs
Apa
tite
Fel
dspa
r
Qua
rtz
Top
az
Cor
undu
m
Dia
mon
d
Roc
kwel
l C
Brin
ell
Tal
c
Gyp
sum
Cal
cite
Flu
orite
Vic
kers
102
103
104
70
50
750
500
250
100
3010
2 3 4 5 6 7 8 9 10
Figure 23.8 Relationship between Mohs, Vickers, Brinell and Rockwell hardness scales.
Rel
ativ
e w
ear
resi
stan
ce
Annealed
Work hardened
Hardened and tempered
2000
0 400 600 800 1000
10
20
30
40
50
60
Steels
Be
Mo
Ti
FeNi
CuZn
Al
1.0% C, 11.7% Mn
0.4% C
0.8% C
1.2% C
W
Hardness (kg/mm2)
Figure 23.9 Variation of relative abrasive wear resistance with indentation hardness for
various surface materials.
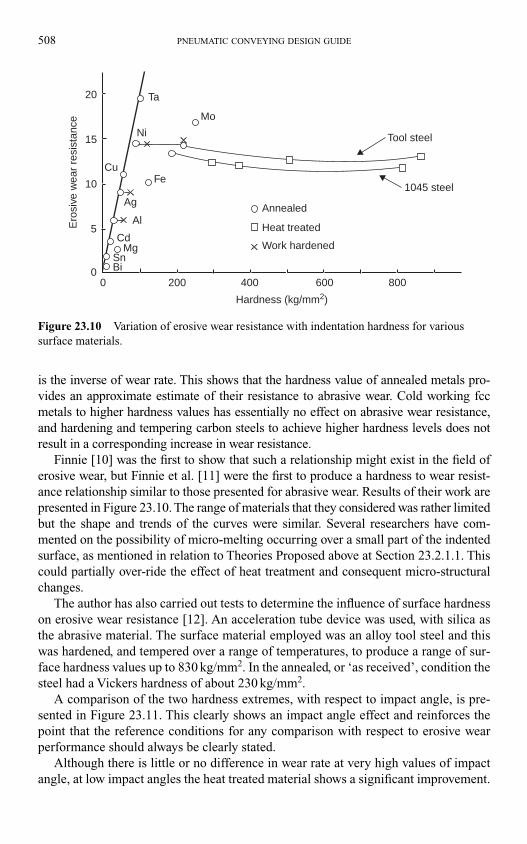
508 PNEUMATIC CONVEYING DESIGN GUIDE
is the inverse of wear rate. This shows that the hardness value of annealed metals pro-
vides an approximate estimate of their resistance to abrasive wear. Cold working fcc
metals to higher hardness values has essentially no effect on abrasive wear resistance,
and hardening and tempering carbon steels to achieve higher hardness levels does not
result in a corresponding increase in wear resistance.
Finnie [10] was the first to show that such a relationship might exist in the field of
erosive wear, but Finnie et al. [11] were the first to produce a hardness to wear resist-
ance relationship similar to those presented for abrasive wear. Results of their work are
presented in Figure 23.10. The range of materials that they considered was rather limited
but the shape and trends of the curves were similar. Several researchers have com-
mented on the possibility of micro-melting occurring over a small part of the indented
surface, as mentioned in relation to Theories Proposed above at Section 23.2.1.1. This
could partially over-ride the effect of heat treatment and consequent micro-structural
changes.
The author has also carried out tests to determine the influence of surface hardness
on erosive wear resistance [12]. An acceleration tube device was used, with silica as
the abrasive material. The surface material employed was an alloy tool steel and this
was hardened, and tempered over a range of temperatures, to produce a range of sur-
face hardness values up to 830 kg/mm2. In the annealed, or ‘as received’, condition the
steel had a Vickers hardness of about 230 kg/mm2.
A comparison of the two hardness extremes, with respect to impact angle, is pre-
sented in Figure 23.11. This clearly shows an impact angle effect and reinforces the
point that the reference conditions for any comparison with respect to erosive wear
performance should always be clearly stated.
Although there is little or no difference in wear rate at very high values of impact
angle, at low impact angles the heat treated material shows a significant improvement.
Ero
sive
wea
r re
sist
ance
Annealed
Heat treated
Work hardened
0 200 400 600 800
Hardness (kg/mm2)
Ta
Ni
Fe
Ag
Al
CdMg
SnBi0
5
10
15
20
Tool steel
1045 steel
Mo
Cu
Figure 23.10 Variation of erosive wear resistance with indentation hardness for various
surface materials.
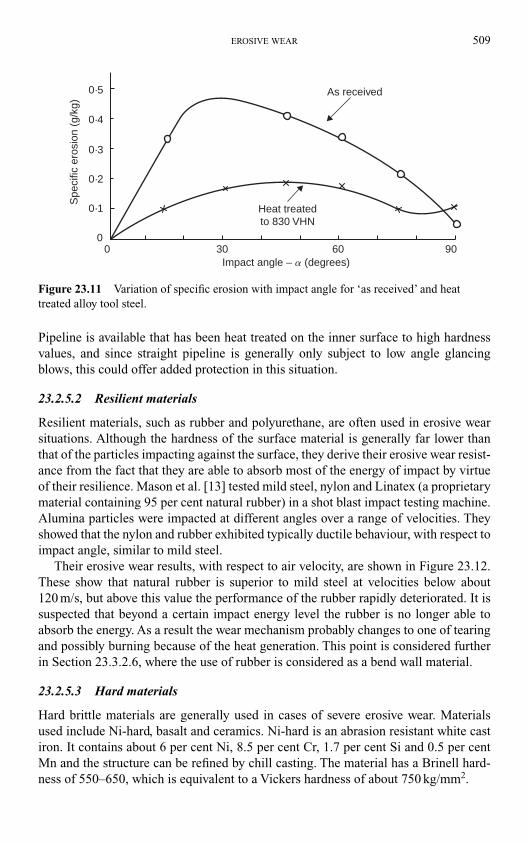
EROSIVE WEAR 509
Pipeline is available that has been heat treated on the inner surface to high hardness
values, and since straight pipeline is generally only subject to low angle glancing
blows, this could offer added protection in this situation.
23.2.5.2 Resilient materials
Resilient materials, such as rubber and polyurethane, are often used in erosive wear
situations. Although the hardness of the surface material is generally far lower than
that of the particles impacting against the surface, they derive their erosive wear resist-
ance from the fact that they are able to absorb most of the energy of impact by virtue
of their resilience. Mason et al. [13] tested mild steel, nylon and Linatex (a proprietary
material containing 95 per cent natural rubber) in a shot blast impact testing machine.
Alumina particles were impacted at different angles over a range of velocities. They
showed that the nylon and rubber exhibited typically ductile behaviour, with respect to
impact angle, similar to mild steel.
Their erosive wear results, with respect to air velocity, are shown in Figure 23.12.
These show that natural rubber is superior to mild steel at velocities below about
120 m/s, but above this value the performance of the rubber rapidly deteriorated. It is
suspected that beyond a certain impact energy level the rubber is no longer able to
absorb the energy. As a result the wear mechanism probably changes to one of tearing
and possibly burning because of the heat generation. This point is considered further
in Section 23.3.2.6, where the use of rubber is considered as a bend wall material.
23.2.5.3 Hard materials
Hard brittle materials are generally used in cases of severe erosive wear. Materials
used include Ni-hard, basalt and ceramics. Ni-hard is an abrasion resistant white cast
iron. It contains about 6 per cent Ni, 8.5 per cent Cr, 1.7 per cent Si and 0.5 per cent
Mn and the structure can be refined by chill casting. The material has a Brinell hard-
ness of 550–650, which is equivalent to a Vickers hardness of about 750 kg/mm2.
As received
Heat treatedto 830 VHN
Impact angle – a (degrees)0 30 60 90
0·5
0·4
0·3
0·2
0·1
0
Spe
cific
ero
sion
(g/
kg)
Figure 23.11 Variation of specific erosion with impact angle for ‘as received’ and heat
treated alloy tool steel.
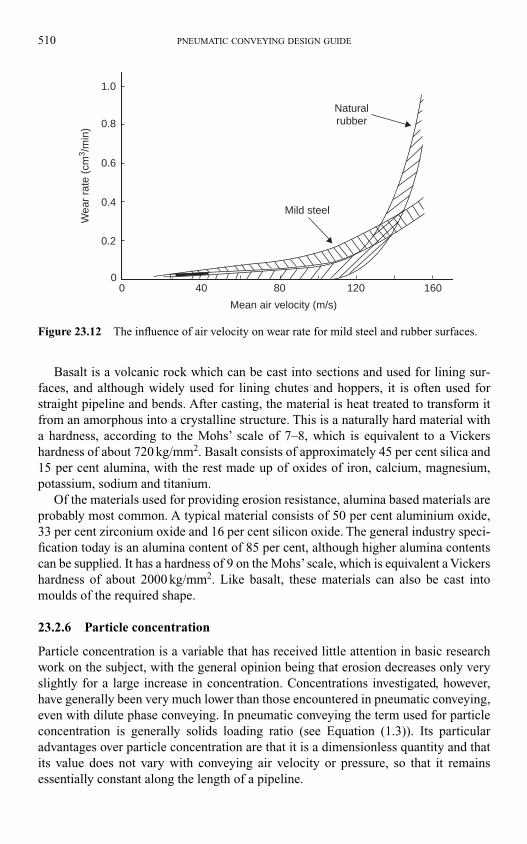
510 PNEUMATIC CONVEYING DESIGN GUIDE
Basalt is a volcanic rock which can be cast into sections and used for lining sur-
faces, and although widely used for lining chutes and hoppers, it is often used for
straight pipeline and bends. After casting, the material is heat treated to transform it
from an amorphous into a crystalline structure. This is a naturally hard material with
a hardness, according to the Mohs’ scale of 7–8, which is equivalent to a Vickers
hardness of about 720 kg/mm2. Basalt consists of approximately 45 per cent silica and
15 per cent alumina, with the rest made up of oxides of iron, calcium, magnesium,
potassium, sodium and titanium.
Of the materials used for providing erosion resistance, alumina based materials are
probably most common. A typical material consists of 50 per cent aluminium oxide,
33 per cent zirconium oxide and 16 per cent silicon oxide. The general industry speci-
fication today is an alumina content of 85 per cent, although higher alumina contents
can be supplied. It has a hardness of 9 on the Mohs’ scale, which is equivalent a Vickers
hardness of about 2000 kg/mm2. Like basalt, these materials can also be cast into
moulds of the required shape.
23.2.6 Particle concentration
Particle concentration is a variable that has received little attention in basic research
work on the subject, with the general opinion being that erosion decreases only very
slightly for a large increase in concentration. Concentrations investigated, however,
have generally been very much lower than those encountered in pneumatic conveying,
even with dilute phase conveying. In pneumatic conveying the term used for particle
concentration is generally solids loading ratio (see Equation (1.3)). Its particular
advantages over particle concentration are that it is a dimensionless quantity and that
its value does not vary with conveying air velocity or pressure, so that it remains
essentially constant along the length of a pipeline.
Naturalrubber
Mild steel
00
0.2
0.4
0.6
0.8
1.0
40 80 120 160
Mean air velocity (m/s)
Wea
r ra
te (
cm3 /
min
)
Figure 23.12 The influence of air velocity on wear rate for mild steel and rubber surfaces.
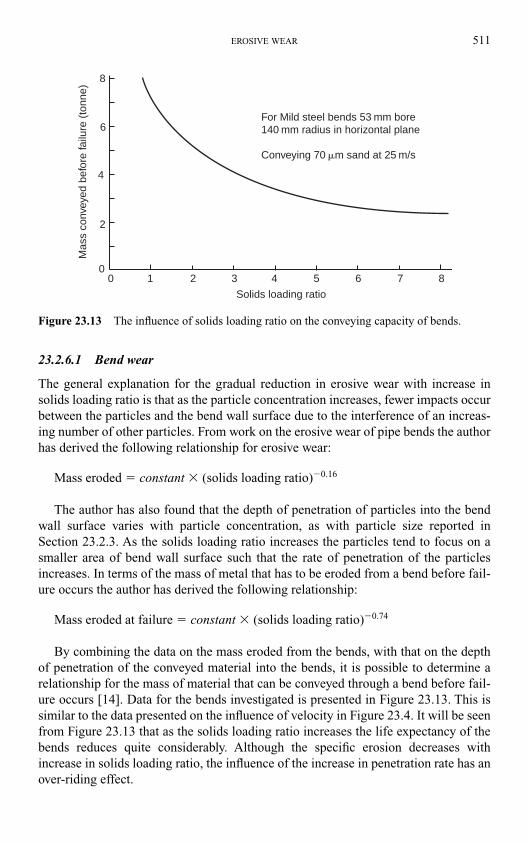
EROSIVE WEAR 511
23.2.6.1 Bend wear
The general explanation for the gradual reduction in erosive wear with increase in
solids loading ratio is that as the particle concentration increases, fewer impacts occur
between the particles and the bend wall surface due to the interference of an increas-
ing number of other particles. From work on the erosive wear of pipe bends the author
has derived the following relationship for erosive wear:
Mass eroded � constant � (solids loading ratio)�0.16
The author has also found that the depth of penetration of particles into the bend
wall surface varies with particle concentration, as with particle size reported in
Section 23.2.3. As the solids loading ratio increases the particles tend to focus on a
smaller area of bend wall surface such that the rate of penetration of the particles
increases. In terms of the mass of metal that has to be eroded from a bend before fail-
ure occurs the author has derived the following relationship:
Mass eroded at failure � constant � (solids loading ratio)�0.74
By combining the data on the mass eroded from the bends, with that on the depth
of penetration of the conveyed material into the bends, it is possible to determine a
relationship for the mass of material that can be conveyed through a bend before fail-
ure occurs [14]. Data for the bends investigated is presented in Figure 23.13. This is
similar to the data presented on the influence of velocity in Figure 23.4. It will be seen
from Figure 23.13 that as the solids loading ratio increases the life expectancy of the
bends reduces quite considerably. Although the specific erosion decreases with
increase in solids loading ratio, the influence of the increase in penetration rate has an
over-riding effect.
For Mild steel bends 53 mm bore140 mm radius in horizontal plane
Conveying 70 �m sand at 25 m/s
Mas
s co
nvey
ed b
efor
e fa
ilure
(to
nne)
8
6
4
2
00 1 2 3 4 7 85 6
Solids loading ratio
Figure 23.13 The influence of solids loading ratio on the conveying capacity of bends.
It was reported earlier, with respect to particle size, and Figure 23.6, that the degree
of scatter of the results increased considerably with decrease in particle size. A simi-
lar phenomenon was observed with regard to solids loading ratio, with the degree of
scatter increasing considerably with increase in solids loading ratio. In terms of com-
ponent life, therefore, both particle penetration rate and possible scatter in the results
are potentially as important as mass eroded. Once again there was no obvious expla-
nation for the occurrence, but it is possible that eddies produced and turbulence gen-
erated increase with increase in concentration.
23.2.7 Particle shape
The influence of particle shape on mass eroded has been reported by many
researchers. The result is much as one might expect, for smooth and rounded particles
do not cause as much erosion as sharp angular particles, under similar conditions of
impact velocity and surface and particle hardnesses. For test work on the erosive wear
of pipe bends in pneumatic conveying system pipelines there is generally a need to
re-circulate the conveyed material. As a result of re-circulating the material, it degrades
and the sharp angular corners and edges of the fresh material are gradually worn away,
and they become more rounded and hence significantly less erosive [15]. This is a
major problem when test facilities are used to assess component life.
23.2.8 Surface finish
It is generally thought that a highly polished surface will reduce the rate of erosive
wear, but it must be emphasized that this is effectively just an incubation period. It will
generally only have the effect of reducing the wear rate initially. Once the material sur-
face starts to wear it will have little further influence on the steady state erosion rate.
Brittle materials that have porous surfaces are particularly vulnerable to erosive wear.
This can result in the casting process of these materials if gas bubbles are allowed to
form. If a gas bubble results in particles impacting at an angle close to 90° extremely
rapid wear will result in that area [16].
23.3 Industrial solutions and practical issues
To a certain extent the problem of bend wear in pneumatic conveying system pipelines
is a problem with which industry has learnt to live. There are a number of ways by
which the severity of the problem can be reduced, but a number of factors relating to
the material conveyed and the system itself have to be taken into account. Expense is
obviously a consideration, some methods may lead to a reduction in the conveying
capability of the plant, and if the material being conveyed is friable then a solution that
minimizes the effect of degradation must be sought.
23.3.1 Pipeline considerations
The volumetric flow rate of air specified and the pipeline bore chosen are of major
importance, for the two have to be selected so that the resulting conveying air velocity is
512 PNEUMATIC CONVEYING DESIGN GUIDE
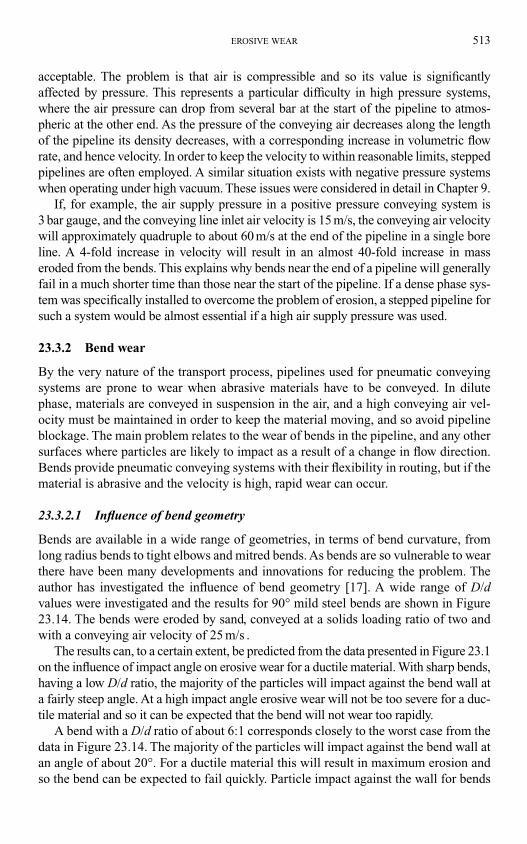
acceptable. The problem is that air is compressible and so its value is significantly
affected by pressure. This represents a particular difficulty in high pressure systems,
where the air pressure can drop from several bar at the start of the pipeline to atmos-
pheric at the other end. As the pressure of the conveying air decreases along the length
of the pipeline its density decreases, with a corresponding increase in volumetric flow
rate, and hence velocity. In order to keep the velocity to within reasonable limits, stepped
pipelines are often employed. A similar situation exists with negative pressure systems
when operating under high vacuum. These issues were considered in detail in Chapter 9.
If, for example, the air supply pressure in a positive pressure conveying system is
3 bar gauge, and the conveying line inlet air velocity is 15 m/s, the conveying air velocity
will approximately quadruple to about 60 m/s at the end of the pipeline in a single bore
line. A 4-fold increase in velocity will result in an almost 40-fold increase in mass
eroded from the bends. This explains why bends near the end of a pipeline will generally
fail in a much shorter time than those near the start of the pipeline. If a dense phase sys-
tem was specifically installed to overcome the problem of erosion, a stepped pipeline for
such a system would be almost essential if a high air supply pressure was used.
23.3.2 Bend wear
By the very nature of the transport process, pipelines used for pneumatic conveying
systems are prone to wear when abrasive materials have to be conveyed. In dilute
phase, materials are conveyed in suspension in the air, and a high conveying air vel-
ocity must be maintained in order to keep the material moving, and so avoid pipeline
blockage. The main problem relates to the wear of bends in the pipeline, and any other
surfaces where particles are likely to impact as a result of a change in flow direction.
Bends provide pneumatic conveying systems with their flexibility in routing, but if the
material is abrasive and the velocity is high, rapid wear can occur.
23.3.2.1 Influence of bend geometry
Bends are available in a wide range of geometries, in terms of bend curvature, from
long radius bends to tight elbows and mitred bends. As bends are so vulnerable to wear
there have been many developments and innovations for reducing the problem. The
author has investigated the influence of bend geometry [17]. A wide range of D/dvalues were investigated and the results for 90° mild steel bends are shown in Figure
23.14. The bends were eroded by sand, conveyed at a solids loading ratio of two and
with a conveying air velocity of 25 m/s .
The results can, to a certain extent, be predicted from the data presented in Figure 23.1
on the influence of impact angle on erosive wear for a ductile material. With sharp bends,
having a low D/d ratio, the majority of the particles will impact against the bend wall at
a fairly steep angle. At a high impact angle erosive wear will not be too severe for a duc-
tile material and so it can be expected that the bend will not wear too rapidly.
A bend with a D/d ratio of about 6:1 corresponds closely to the worst case from the
data in Figure 23.14. The majority of the particles will impact against the bend wall at
an angle of about 20°. For a ductile material this will result in maximum erosion and
so the bend can be expected to fail quickly. Particle impact against the wall for bends
EROSIVE WEAR 513
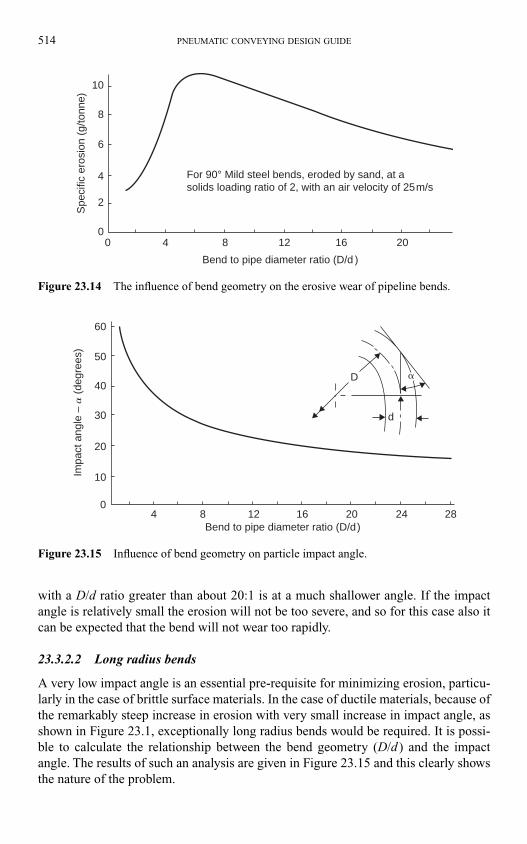
514 PNEUMATIC CONVEYING DESIGN GUIDE
with a D/d ratio greater than about 20:1 is at a much shallower angle. If the impact
angle is relatively small the erosion will not be too severe, and so for this case also it
can be expected that the bend will not wear too rapidly.
23.3.2.2 Long radius bends
A very low impact angle is an essential pre-requisite for minimizing erosion, particu-
larly in the case of brittle surface materials. In the case of ductile materials, because of
the remarkably steep increase in erosion with very small increase in impact angle, as
shown in Figure 23.1, exceptionally long radius bends would be required. It is possi-
ble to calculate the relationship between the bend geometry (D/d ) and the impact
angle. The results of such an analysis are given in Figure 23.15 and this clearly shows
the nature of the problem.
For 90° Mild steel bends, eroded by sand, at asolids loading ratio of 2, with an air velocity of 25m/s
Bend to pipe diameter ratio (D/d )
Spe
cific
ero
sion
(g/
tonn
e)
00
4
8
12 16 20
4
6
8
10
2
Figure 23.14 The influence of bend geometry on the erosive wear of pipeline bends.
Bend to pipe diameter ratio (D/d )
10
20
04 8 12 16 20 24 28
30
40
50
60
Impa
ct a
ngle
– a
(de
gree
s)
d
D �
Figure 23.15 Influence of bend geometry on particle impact angle.
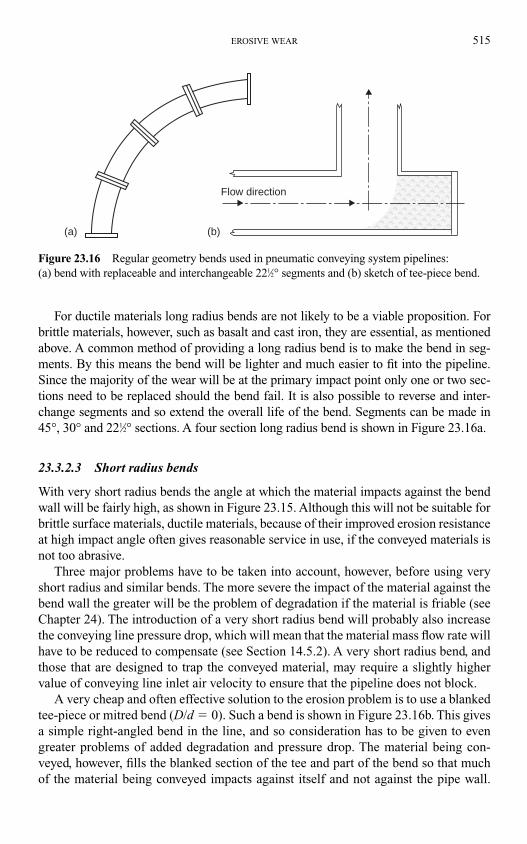
EROSIVE WEAR 515
For ductile materials long radius bends are not likely to be a viable proposition. For
brittle materials, however, such as basalt and cast iron, they are essential, as mentioned
above. A common method of providing a long radius bend is to make the bend in seg-
ments. By this means the bend will be lighter and much easier to fit into the pipeline.
Since the majority of the wear will be at the primary impact point only one or two sec-
tions need to be replaced should the bend fail. It is also possible to reverse and inter-
change segments and so extend the overall life of the bend. Segments can be made in
45°, 30° and 221⁄2° sections. A four section long radius bend is shown in Figure 23.16a.
23.3.2.3 Short radius bends
With very short radius bends the angle at which the material impacts against the bend
wall will be fairly high, as shown in Figure 23.15. Although this will not be suitable for
brittle surface materials, ductile materials, because of their improved erosion resistance
at high impact angle often gives reasonable service in use, if the conveyed materials is
not too abrasive.
Three major problems have to be taken into account, however, before using very
short radius and similar bends. The more severe the impact of the material against the
bend wall the greater will be the problem of degradation if the material is friable (see
Chapter 24). The introduction of a very short radius bend will probably also increase
the conveying line pressure drop, which will mean that the material mass flow rate will
have to be reduced to compensate (see Section 14.5.2). A very short radius bend, and
those that are designed to trap the conveyed material, may require a slightly higher
value of conveying line inlet air velocity to ensure that the pipeline does not block.
A very cheap and often effective solution to the erosion problem is to use a blanked
tee-piece or mitred bend (D/d � 0). Such a bend is shown in Figure 23.16b. This gives
a simple right-angled bend in the line, and so consideration has to be given to even
greater problems of added degradation and pressure drop. The material being con-
veyed, however, fills the blanked section of the tee and part of the bend so that much
of the material being conveyed impacts against itself and not against the pipe wall.
Flow direction
(a) (b)
Figure 23.16 Regular geometry bends used in pneumatic conveying system pipelines:
(a) bend with replaceable and interchangeable 221⁄2° segments and (b) sketch of tee-piece bend.
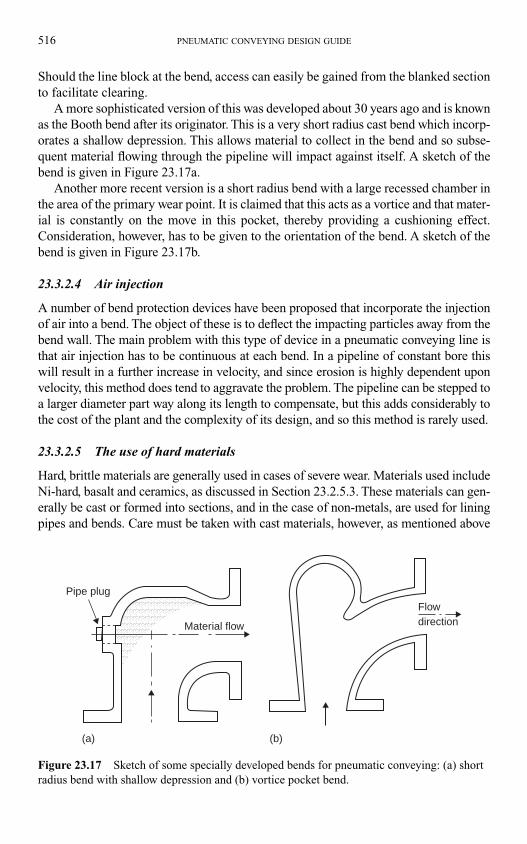
516 PNEUMATIC CONVEYING DESIGN GUIDE
Should the line block at the bend, access can easily be gained from the blanked section
to facilitate clearing.
A more sophisticated version of this was developed about 30 years ago and is known
as the Booth bend after its originator. This is a very short radius cast bend which incorp-
orates a shallow depression. This allows material to collect in the bend and so subse-
quent material flowing through the pipeline will impact against itself. A sketch of the
bend is given in Figure 23.17a.
Another more recent version is a short radius bend with a large recessed chamber in
the area of the primary wear point. It is claimed that this acts as a vortice and that mater-
ial is constantly on the move in this pocket, thereby providing a cushioning effect.
Consideration, however, has to be given to the orientation of the bend. A sketch of the
bend is given in Figure 23.17b.
23.3.2.4 Air injection
A number of bend protection devices have been proposed that incorporate the injection
of air into a bend. The object of these is to deflect the impacting particles away from the
bend wall. The main problem with this type of device in a pneumatic conveying line is
that air injection has to be continuous at each bend. In a pipeline of constant bore this
will result in a further increase in velocity, and since erosion is highly dependent upon
velocity, this method does tend to aggravate the problem. The pipeline can be stepped to
a larger diameter part way along its length to compensate, but this adds considerably to
the cost of the plant and the complexity of its design, and so this method is rarely used.
23.3.2.5 The use of hard materials
Hard, brittle materials are generally used in cases of severe wear. Materials used include
Ni-hard, basalt and ceramics, as discussed in Section 23.2.5.3. These materials can gen-
erally be cast or formed into sections, and in the case of non-metals, are used for lining
pipes and bends. Care must be taken with cast materials, however, as mentioned above
Pipe plug
Material flow
Flowdirection
(a) (b)
Figure 23.17 Sketch of some specially developed bends for pneumatic conveying: (a) short
radius bend with shallow depression and (b) vortice pocket bend.
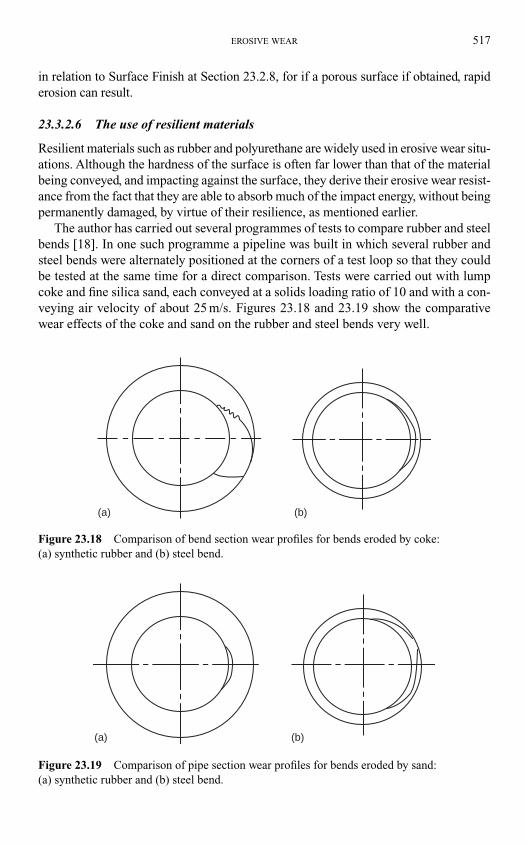
EROSIVE WEAR 517
in relation to Surface Finish at Section 23.2.8, for if a porous surface if obtained, rapid
erosion can result.
23.3.2.6 The use of resilient materials
Resilient materials such as rubber and polyurethane are widely used in erosive wear situ-
ations. Although the hardness of the surface is often far lower than that of the material
being conveyed, and impacting against the surface, they derive their erosive wear resist-
ance from the fact that they are able to absorb much of the impact energy, without being
permanently damaged, by virtue of their resilience, as mentioned earlier.
The author has carried out several programmes of tests to compare rubber and steel
bends [18]. In one such programme a pipeline was built in which several rubber and
steel bends were alternately positioned at the corners of a test loop so that they could
be tested at the same time for a direct comparison. Tests were carried out with lump
coke and fine silica sand, each conveyed at a solids loading ratio of 10 and with a con-
veying air velocity of about 25 m/s. Figures 23.18 and 23.19 show the comparative
wear effects of the coke and sand on the rubber and steel bends very well.
(a) (b)
Figure 23.18 Comparison of bend section wear profiles for bends eroded by coke:
(a) synthetic rubber and (b) steel bend.
(a) (b)
Figure 23.19 Comparison of pipe section wear profiles for bends eroded by sand:
(a) synthetic rubber and (b) steel bend.
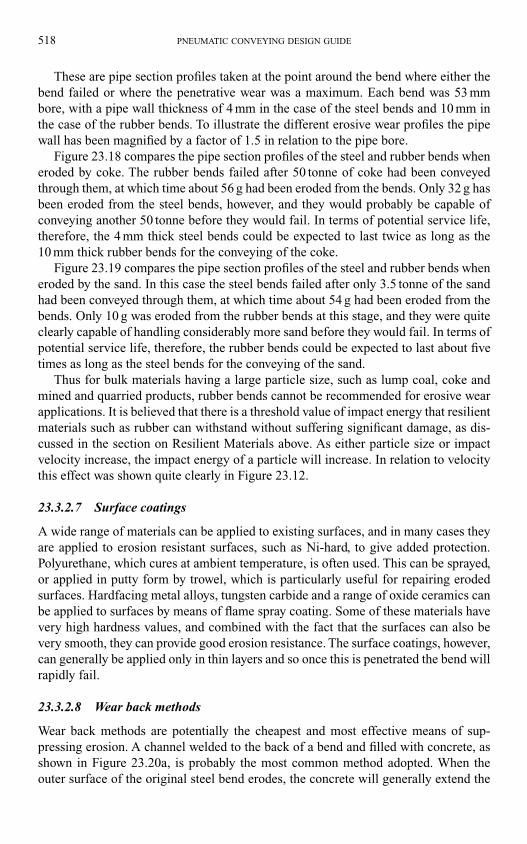
These are pipe section profiles taken at the point around the bend where either the
bend failed or where the penetrative wear was a maximum. Each bend was 53 mm
bore, with a pipe wall thickness of 4 mm in the case of the steel bends and 10 mm in
the case of the rubber bends. To illustrate the different erosive wear profiles the pipe
wall has been magnified by a factor of 1.5 in relation to the pipe bore.
Figure 23.18 compares the pipe section profiles of the steel and rubber bends when
eroded by coke. The rubber bends failed after 50 tonne of coke had been conveyed
through them, at which time about 56 g had been eroded from the bends. Only 32 g has
been eroded from the steel bends, however, and they would probably be capable of
conveying another 50 tonne before they would fail. In terms of potential service life,
therefore, the 4 mm thick steel bends could be expected to last twice as long as the
10 mm thick rubber bends for the conveying of the coke.
Figure 23.19 compares the pipe section profiles of the steel and rubber bends when
eroded by the sand. In this case the steel bends failed after only 3.5 tonne of the sand
had been conveyed through them, at which time about 54 g had been eroded from the
bends. Only 10 g was eroded from the rubber bends at this stage, and they were quite
clearly capable of handling considerably more sand before they would fail. In terms of
potential service life, therefore, the rubber bends could be expected to last about five
times as long as the steel bends for the conveying of the sand.
Thus for bulk materials having a large particle size, such as lump coal, coke and
mined and quarried products, rubber bends cannot be recommended for erosive wear
applications. It is believed that there is a threshold value of impact energy that resilient
materials such as rubber can withstand without suffering significant damage, as dis-
cussed in the section on Resilient Materials above. As either particle size or impact
velocity increase, the impact energy of a particle will increase. In relation to velocity
this effect was shown quite clearly in Figure 23.12.
23.3.2.7 Surface coatings
A wide range of materials can be applied to existing surfaces, and in many cases they
are applied to erosion resistant surfaces, such as Ni-hard, to give added protection.
Polyurethane, which cures at ambient temperature, is often used. This can be sprayed,
or applied in putty form by trowel, which is particularly useful for repairing eroded
surfaces. Hardfacing metal alloys, tungsten carbide and a range of oxide ceramics can
be applied to surfaces by means of flame spray coating. Some of these materials have
very high hardness values, and combined with the fact that the surfaces can also be
very smooth, they can provide good erosion resistance. The surface coatings, however,
can generally be applied only in thin layers and so once this is penetrated the bend will
rapidly fail.
23.3.2.8 Wear back methods
Wear back methods are potentially the cheapest and most effective means of sup-
pressing erosion. A channel welded to the back of a bend and filled with concrete, as
shown in Figure 23.20a, is probably the most common method adopted. When the
outer surface of the original steel bend erodes, the concrete will generally extend the
518 PNEUMATIC CONVEYING DESIGN GUIDE
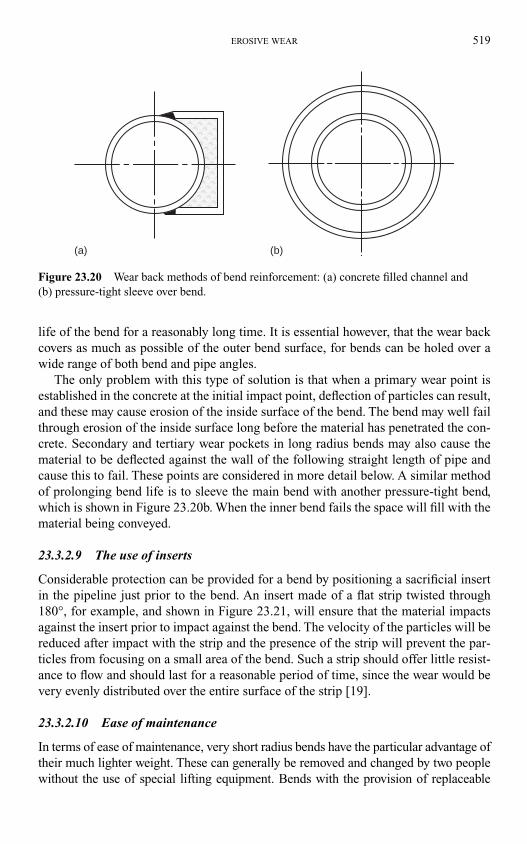
EROSIVE WEAR 519
life of the bend for a reasonably long time. It is essential however, that the wear back
covers as much as possible of the outer bend surface, for bends can be holed over a
wide range of both bend and pipe angles.
The only problem with this type of solution is that when a primary wear point is
established in the concrete at the initial impact point, deflection of particles can result,
and these may cause erosion of the inside surface of the bend. The bend may well fail
through erosion of the inside surface long before the material has penetrated the con-
crete. Secondary and tertiary wear pockets in long radius bends may also cause the
material to be deflected against the wall of the following straight length of pipe and
cause this to fail. These points are considered in more detail below. A similar method
of prolonging bend life is to sleeve the main bend with another pressure-tight bend,
which is shown in Figure 23.20b. When the inner bend fails the space will fill with the
material being conveyed.
23.3.2.9 The use of inserts
Considerable protection can be provided for a bend by positioning a sacrificial insert
in the pipeline just prior to the bend. An insert made of a flat strip twisted through
180°, for example, and shown in Figure 23.21, will ensure that the material impacts
against the insert prior to impact against the bend. The velocity of the particles will be
reduced after impact with the strip and the presence of the strip will prevent the par-
ticles from focusing on a small area of the bend. Such a strip should offer little resist-
ance to flow and should last for a reasonable period of time, since the wear would be
very evenly distributed over the entire surface of the strip [19].
23.3.2.10 Ease of maintenance
In terms of ease of maintenance, very short radius bends have the particular advantage of
their much lighter weight. These can generally be removed and changed by two people
without the use of special lifting equipment. Bends with the provision of replaceable
(a) (b)
Figure 23.20 Wear back methods of bend reinforcement: (a) concrete filled channel and
(b) pressure-tight sleeve over bend.
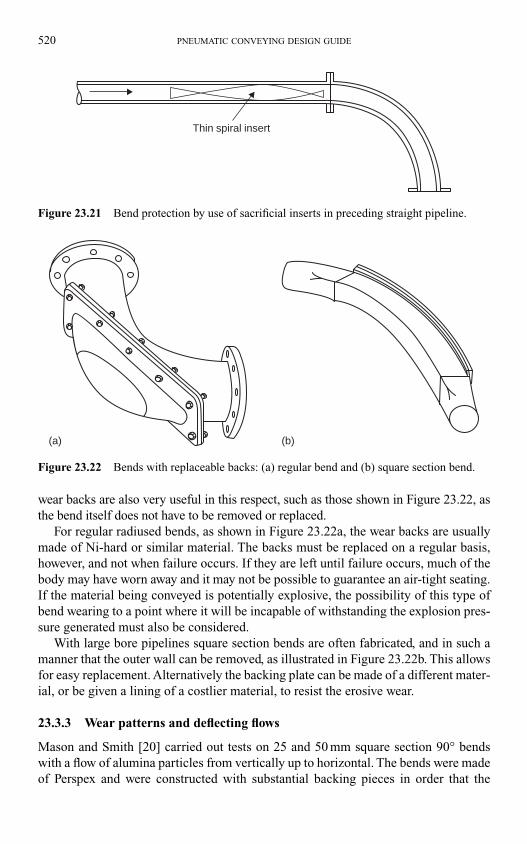
520 PNEUMATIC CONVEYING DESIGN GUIDE
wear backs are also very useful in this respect, such as those shown in Figure 23.22, as
the bend itself does not have to be removed or replaced.
For regular radiused bends, as shown in Figure 23.22a, the wear backs are usually
made of Ni-hard or similar material. The backs must be replaced on a regular basis,
however, and not when failure occurs. If they are left until failure occurs, much of the
body may have worn away and it may not be possible to guarantee an air-tight seating.
If the material being conveyed is potentially explosive, the possibility of this type of
bend wearing to a point where it will be incapable of withstanding the explosion pres-
sure generated must also be considered.
With large bore pipelines square section bends are often fabricated, and in such a
manner that the outer wall can be removed, as illustrated in Figure 23.22b. This allows
for easy replacement. Alternatively the backing plate can be made of a different mater-
ial, or be given a lining of a costlier material, to resist the erosive wear.
23.3.3 Wear patterns and deflecting flows
Mason and Smith [20] carried out tests on 25 and 50 mm square section 90° bends
with a flow of alumina particles from vertically up to horizontal. The bends were made
of Perspex and were constructed with substantial backing pieces in order that the
Thin spiral insert
Figure 23.21 Bend protection by use of sacrificial inserts in preceding straight pipeline.
(a) (b)
Figure 23.22 Bends with replaceable backs: (a) regular bend and (b) square section bend.
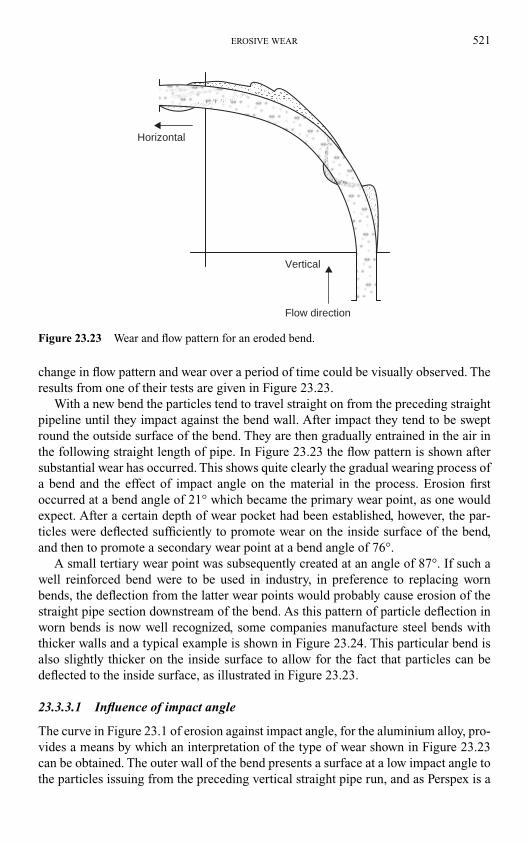
EROSIVE WEAR 521
change in flow pattern and wear over a period of time could be visually observed. The
results from one of their tests are given in Figure 23.23.
With a new bend the particles tend to travel straight on from the preceding straight
pipeline until they impact against the bend wall. After impact they tend to be swept
round the outside surface of the bend. They are then gradually entrained in the air in
the following straight length of pipe. In Figure 23.23 the flow pattern is shown after
substantial wear has occurred. This shows quite clearly the gradual wearing process of
a bend and the effect of impact angle on the material in the process. Erosion first
occurred at a bend angle of 21° which became the primary wear point, as one would
expect. After a certain depth of wear pocket had been established, however, the par-
ticles were deflected sufficiently to promote wear on the inside surface of the bend,
and then to promote a secondary wear point at a bend angle of 76°.
A small tertiary wear point was subsequently created at an angle of 87°. If such a
well reinforced bend were to be used in industry, in preference to replacing worn
bends, the deflection from the latter wear points would probably cause erosion of the
straight pipe section downstream of the bend. As this pattern of particle deflection in
worn bends is now well recognized, some companies manufacture steel bends with
thicker walls and a typical example is shown in Figure 23.24. This particular bend is
also slightly thicker on the inside surface to allow for the fact that particles can be
deflected to the inside surface, as illustrated in Figure 23.23.
23.3.3.1 Influence of impact angle
The curve in Figure 23.1 of erosion against impact angle, for the aluminium alloy, pro-
vides a means by which an interpretation of the type of wear shown in Figure 23.23
can be obtained. The outer wall of the bend presents a surface at a low impact angle to
the particles issuing from the preceding vertical straight pipe run, and as Perspex is a
Vertical
Flow direction
Horizontal
Figure 23.23 Wear and flow pattern for an eroded bend.
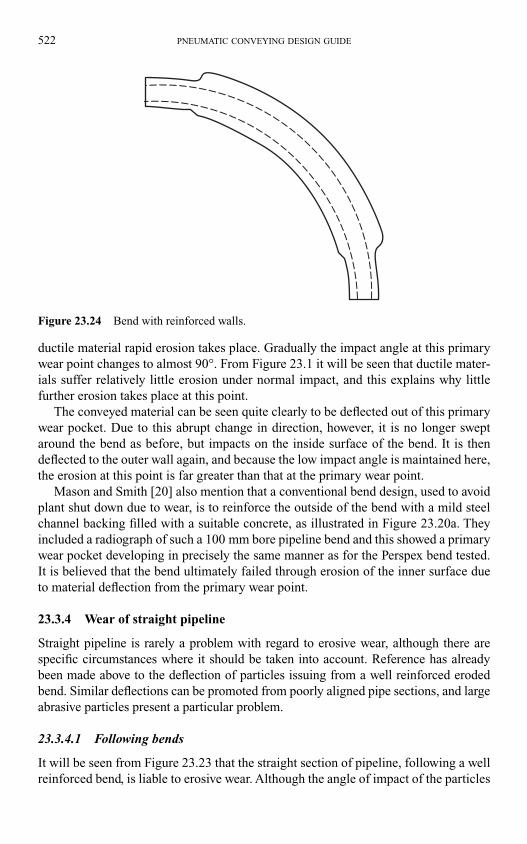
522 PNEUMATIC CONVEYING DESIGN GUIDE
ductile material rapid erosion takes place. Gradually the impact angle at this primary
wear point changes to almost 90°. From Figure 23.1 it will be seen that ductile mater-
ials suffer relatively little erosion under normal impact, and this explains why little
further erosion takes place at this point.
The conveyed material can be seen quite clearly to be deflected out of this primary
wear pocket. Due to this abrupt change in direction, however, it is no longer swept
around the bend as before, but impacts on the inside surface of the bend. It is then
deflected to the outer wall again, and because the low impact angle is maintained here,
the erosion at this point is far greater than that at the primary wear point.
Mason and Smith [20] also mention that a conventional bend design, used to avoid
plant shut down due to wear, is to reinforce the outside of the bend with a mild steel
channel backing filled with a suitable concrete, as illustrated in Figure 23.20a. They
included a radiograph of such a 100 mm bore pipeline bend and this showed a primary
wear pocket developing in precisely the same manner as for the Perspex bend tested.
It is believed that the bend ultimately failed through erosion of the inner surface due
to material deflection from the primary wear point.
23.3.4 Wear of straight pipeline
Straight pipeline is rarely a problem with regard to erosive wear, although there are
specific circumstances where it should be taken into account. Reference has already
been made above to the deflection of particles issuing from a well reinforced eroded
bend. Similar deflections can be promoted from poorly aligned pipe sections, and large
abrasive particles present a particular problem.
23.3.4.1 Following bends
It will be seen from Figure 23.23 that the straight section of pipeline, following a well
reinforced bend, is liable to erosive wear. Although the angle of impact of the particles
Figure 23.24 Bend with reinforced walls.
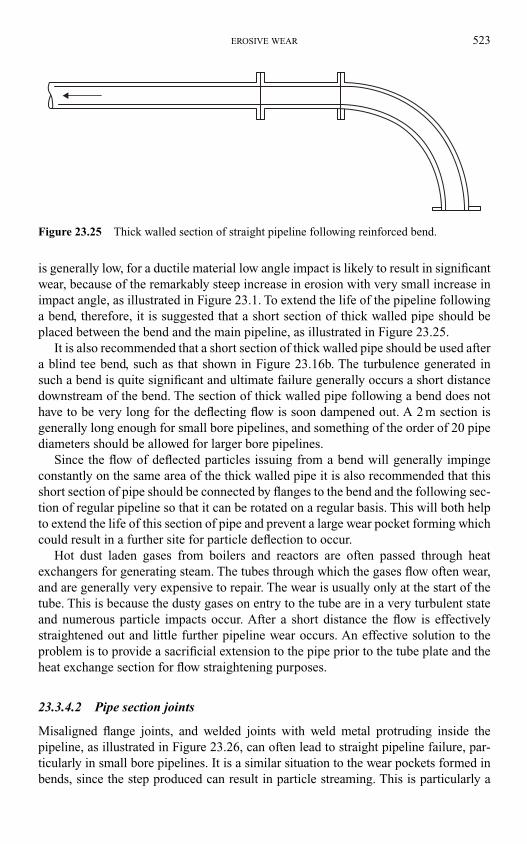
EROSIVE WEAR 523
is generally low, for a ductile material low angle impact is likely to result in significant
wear, because of the remarkably steep increase in erosion with very small increase in
impact angle, as illustrated in Figure 23.1. To extend the life of the pipeline following
a bend, therefore, it is suggested that a short section of thick walled pipe should be
placed between the bend and the main pipeline, as illustrated in Figure 23.25.
It is also recommended that a short section of thick walled pipe should be used after
a blind tee bend, such as that shown in Figure 23.16b. The turbulence generated in
such a bend is quite significant and ultimate failure generally occurs a short distance
downstream of the bend. The section of thick walled pipe following a bend does not
have to be very long for the deflecting flow is soon dampened out. A 2 m section is
generally long enough for small bore pipelines, and something of the order of 20 pipe
diameters should be allowed for larger bore pipelines.
Since the flow of deflected particles issuing from a bend will generally impinge
constantly on the same area of the thick walled pipe it is also recommended that this
short section of pipe should be connected by flanges to the bend and the following sec-
tion of regular pipeline so that it can be rotated on a regular basis. This will both help
to extend the life of this section of pipe and prevent a large wear pocket forming which
could result in a further site for particle deflection to occur.
Hot dust laden gases from boilers and reactors are often passed through heat
exchangers for generating steam. The tubes through which the gases flow often wear,
and are generally very expensive to repair. The wear is usually only at the start of the
tube. This is because the dusty gases on entry to the tube are in a very turbulent state
and numerous particle impacts occur. After a short distance the flow is effectively
straightened out and little further pipeline wear occurs. An effective solution to the
problem is to provide a sacrificial extension to the pipe prior to the tube plate and the
heat exchange section for flow straightening purposes.
23.3.4.2 Pipe section joints
Misaligned flange joints, and welded joints with weld metal protruding inside the
pipeline, as illustrated in Figure 23.26, can often lead to straight pipeline failure, par-
ticularly in small bore pipelines. It is a similar situation to the wear pockets formed in
bends, since the step produced can result in particle streaming. This is particularly a
Figure 23.25 Thick walled section of straight pipeline following reinforced bend.
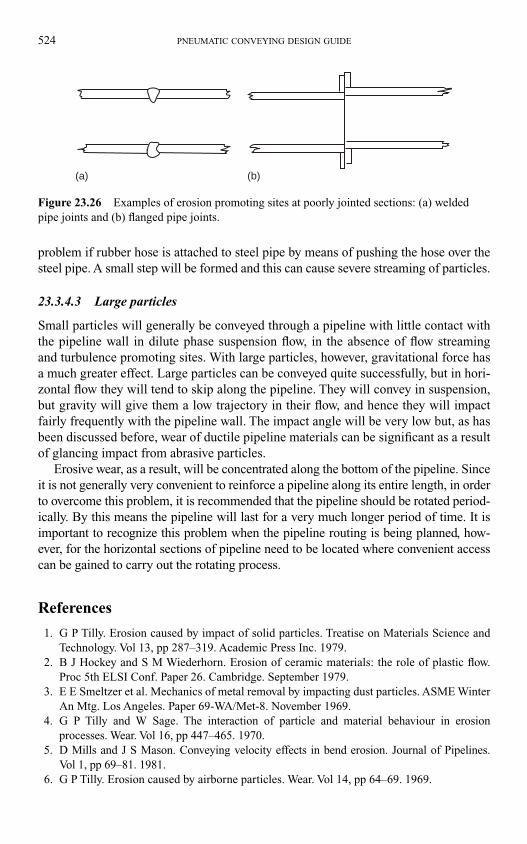
524 PNEUMATIC CONVEYING DESIGN GUIDE
problem if rubber hose is attached to steel pipe by means of pushing the hose over the
steel pipe. A small step will be formed and this can cause severe streaming of particles.
23.3.4.3 Large particles
Small particles will generally be conveyed through a pipeline with little contact with
the pipeline wall in dilute phase suspension flow, in the absence of flow streaming
and turbulence promoting sites. With large particles, however, gravitational force has
a much greater effect. Large particles can be conveyed quite successfully, but in hori-
zontal flow they will tend to skip along the pipeline. They will convey in suspension,
but gravity will give them a low trajectory in their flow, and hence they will impact
fairly frequently with the pipeline wall. The impact angle will be very low but, as has
been discussed before, wear of ductile pipeline materials can be significant as a result
of glancing impact from abrasive particles.
Erosive wear, as a result, will be concentrated along the bottom of the pipeline. Since
it is not generally very convenient to reinforce a pipeline along its entire length, in order
to overcome this problem, it is recommended that the pipeline should be rotated period-
ically. By this means the pipeline will last for a very much longer period of time. It is
important to recognize this problem when the pipeline routing is being planned, how-
ever, for the horizontal sections of pipeline need to be located where convenient access
can be gained to carry out the rotating process.
References
1. G P Tilly. Erosion caused by impact of solid particles. Treatise on Materials Science and
Technology. Vol 13, pp 287–319. Academic Press Inc. 1979.
2. B J Hockey and S M Wiederhorn. Erosion of ceramic materials: the role of plastic flow.
Proc 5th ELSI Conf. Paper 26. Cambridge. September 1979.
3. E E Smeltzer et al. Mechanics of metal removal by impacting dust particles. ASME Winter
An Mtg. Los Angeles. Paper 69-WA/Met-8. November 1969.
4. G P Tilly and W Sage. The interaction of particle and material behaviour in erosion
processes. Wear. Vol 16, pp 447–465. 1970.
5. D Mills and J S Mason. Conveying velocity effects in bend erosion. Journal of Pipelines.
Vol 1, pp 69–81. 1981.
6. G P Tilly. Erosion caused by airborne particles. Wear. Vol 14, pp 64–69. 1969.
(a) (b)
Figure 23.26 Examples of erosion promoting sites at poorly jointed sections: (a) welded
pipe joints and (b) flanged pipe joints.
7. D Mills and J S Mason. The effect of particle size on erosion of pipe bends in pneumatic
conveying systems. Proc Powtech ’79. NEC Birmingham. March 1979.
8. J E Goodwin, W Sage and G P Tilly. Study of erosion by solid particles. Proc IMechE,
Vol 183, No 15, pp 279–292. 1969–70.
9. M M Khruschof. Resistance of metals to wear by abrasion, as related to hardness. Proc
IMechE Conf on Lub and Wear. pp 655–659. 1959.
10. I Finnie. Erosion by solid particles in a fluid stream. Spec Tech Pub No 307 of Am Soc for
Testing Materials. pp 70–82. June 1961.
11. I Finnie, J Wolak and T Kabil. Erosion of metals by solid particles. ASTM Journal of
Materials. Vol 2, pp 682–700. September 1967.
12. D Mills and J S Mason. The erosive wear of hardened and tempered steels in pneumatic
conveying system pipelines. Proc 7th ELSI Conf. Paper 81. Cambridge. September 1987.
13. J S Mason et al. The rapid erosion of various pipe wall materials by a stream of abrasive
alumina particles. Proc Pneumotransport 2. Paper E1. Guildford. 1973.
14. D Mills and J S Mason. Evaluating the conveying capacity and service life of pipe bends in
pneumatic conveying systems. Journal of Powder and Bulk Solids Technology. Vol 3, No 2,
pp 13–20. 1979.
15. D Mills and J S Mason. Particle size effects in bend erosion. Wear. Vol 44, pp 311–328. 1977.
16. E Raask. Impact erosion wear caused by pulverised coal and ash. Proc 5th ELSI Conf.
Paper 41. Cambridge. September 1979.
17. K N Tong, D Mills and J S Mason. The influence of bend radius on the erosion of pipe
bends in pneumatic conveying systems. Proc 5th Powder and Bulk Solids Conf. Chicago.
May 1980.
18. V K Agarwal, D Mills and J S Mason. A comparison of the erosive wear of steel and
rubber bends in pneumatic conveying system pipelines. Proc 6th ELSI Conf. Paper 60.
Cambridge. September 1983.
19. V K Agarwal and D Mills. The use of inserts for reducing bend wear in pneumatic convey-
ing system pipelines. Proc 14th Powder and Bulk Solids Conf. Chicago. May 1989.
20. J S Mason and B V Smith. The erosion of bends by pneumatically conveyed suspensions
of abrasive particles. Powder Technol, Vol 6, pp 323–335. 1973.
EROSIVE WEAR 525
24.1 Introduction
In some bulk solids handling processes intentional breakdown of the material is
required, as in crushing, grinding and comminution. In many handling and storage situ-
ations, however, unintentional breakage occurs. This is usually termed degradation or
attrition, depending on the mechanism of particle breakage. Bulk materials, when
pneumatically conveyed, will impact against bends in the pipeline, and there may be a
significant amount of particle to particle interaction. There may also be frequent
impacts against the pipeline walls, and particles sliding along the pipeline walls in low
velocity dense phase flows. These collisions and interactions will produce forces on
the particles that may lead to their breakage.
24.1.1 Particle breakage
If particle breakdown occurs easily the bulk solid is said to be friable. Tendency to par-
ticle breakdown covers three main situations. The first is a tendency to shatter or
degrade when the bulk solid is subject to impact or compressive loading. The second
is the tendency for fines and small pieces to be worn away by attrition when bulk solids
either rub against each other or against some surface, such as a pipeline wall or bend.
The third is the tendency for materials such as nylons and polymers to form angel
hairs when conveyed, as a result of micro-melting occurring, due to the frictional heat
of particles sliding against pipeline walls.
Of all conveying systems, dilute phase probably results in more material degrad-
ation and attrition than any other. This is because particle velocity is a major variable in
the problem and, in dilute phase conveying, high velocities have to be maintained. The
potential influence of a pneumatic conveying system on a material is demonstrated in
Figures 24.1 and 24.2. This is a consequence of conveying a friable material at an
excessively high velocity in dilute phase suspension flow in a conveying system with
a large number of small radius bends.
Figure 24.1 shows the influence on the cumulative particle size distribution for the
material before and after conveying. The mean particle size, based on the 50 per cent
value, has changed from about 177–152 µm. The really significant effect, however, is
shown in the fractional size distribution plot in Figure 24.2. In this magnified plot the
effect of degradation on the material can be clearly seen. A considerable number of
Chapter 24
Particle degradation
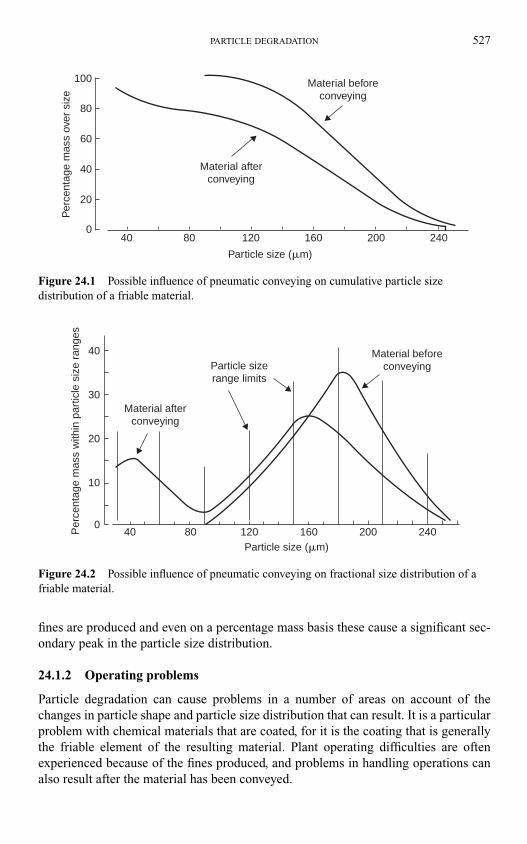
PARTICLE DEGRADATION 527
fines are produced and even on a percentage mass basis these cause a significant sec-
ondary peak in the particle size distribution.
24.1.2 Operating problems
Particle degradation can cause problems in a number of areas on account of the
changes in particle shape and particle size distribution that can result. It is a particular
problem with chemical materials that are coated, for it is the coating that is generally
the friable element of the resulting material. Plant operating difficulties are often
experienced because of the fines produced, and problems in handling operations can
also result after the material has been conveyed.
40
Per
cent
age
mas
s ov
er s
ize
0
20
40
60
80
100
80 120 160 200 240
Particle size (�m)
Material afterconveying
Material beforeconveying
Figure 24.1 Possible influence of pneumatic conveying on cumulative particle size
distribution of a friable material.
Per
cent
age
mas
s w
ithin
par
ticle
siz
e ra
nges
0
20
40 80 120 160 200 240
40
30
10
Particle size (�m)
Material afterconveying
Material beforeconveyingParticle size
range limits
Figure 24.2 Possible influence of pneumatic conveying on fractional size distribution of a
friable material.
Apart from the obvious problems of quality control with friable materials, changes
in particle shape can also lead to subsequent process difficulties with certain mater-
ials. The appearance of the material may also change so that it is not so readily sold.
Changes in particle size distribution can affect flow characteristics, which in the
extreme can change a free-flowing material into one which will only handle with great
difficulty, and with materials for subsequent sale this can lead to customer problems.
24.1.2.1 Filtration problems
In pneumatic conveying systems plant operating difficulties can result if degradation
causes a large percentage of fines to be produced, particularly if the filtration equipment
is not capable of handling the fines satisfactorily. Filter cloths and screens will rapidly
block if they have to cope with unexpectedly high flow rates of fine powder. The net
result is that there is usually an increase in pressure drop across the filter, and this could
be a significant proportion of the total pressure available in a low pressure system.
This means that the pressure drop available for conveying the material will be
reduced, which in turn means that the mass flow rate of the material will probably have
to be reduced in order to compensate. If this is not done there will be the risk of block-
ing the pipeline. Alternatively, if the filtration plant is correctly specified, with material
degradation taken into account, it is likely to cost very much more as a result. This,
therefore, provides a direct financial incentive to ensure that particle degradation is
minimized, even if it does not represent a problem with respect to the material itself [1].
24.1.2.2 Flow problems
In many systems there is a need to store the conveyed material in a hopper or silo.
Flow functions can be determined for bulk particulate materials, from which hopper
wall angles and opening sizes can be evaluated, to ensure that the material flows reli-
ably at the rate required. A change in particle size distribution of a material, as a result
of conveying operations, however, can result in a significant change in flow properties.
Thus a hopper designed for a material in the ‘as received’ condition may be totally
unsuitable for the material after it has been conveyed. As a result it may be necessary
to fit an expensive flow aid to the hopper to recover the situation.
24.1.2.3 Potential explosion problems
Many materials, in a dust cloud, can ignite and cause an explosion. Dust clouds are
clearly quite impossible to avoid somewhere in a pneumatic conveying system, and so
this poses a problem with regard to the safe operation of such systems. Of those mater-
ials that are potentially explosive, research has shown that it is only the fraction with
a particle size less than about 200 µm that poses the problem. Degradation and attri-
tion caused by pneumatic conveying, however, can result in the generation of a con-
siderable number of fines, particularly if the material is friable. Even if the material
did not represent a problem with respect to explosions in the ‘as received’ condition,
the situation could be very different after the material has been conveyed.
528 PNEUMATIC CONVEYING DESIGN GUIDE
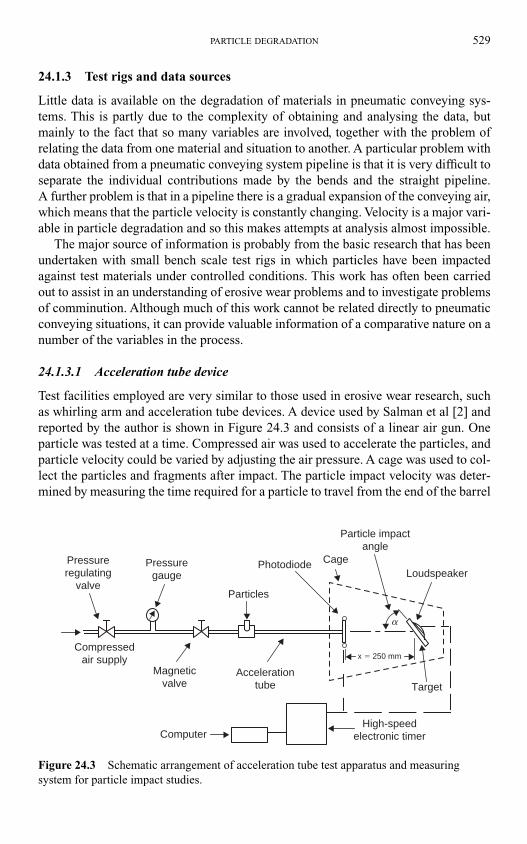
PARTICLE DEGRADATION 529
24.1.3 Test rigs and data sources
Little data is available on the degradation of materials in pneumatic conveying sys-
tems. This is partly due to the complexity of obtaining and analysing the data, but
mainly to the fact that so many variables are involved, together with the problem of
relating the data from one material and situation to another. A particular problem with
data obtained from a pneumatic conveying system pipeline is that it is very difficult to
separate the individual contributions made by the bends and the straight pipeline.
A further problem is that in a pipeline there is a gradual expansion of the conveying air,
which means that the particle velocity is constantly changing. Velocity is a major vari-
able in particle degradation and so this makes attempts at analysis almost impossible.
The major source of information is probably from the basic research that has been
undertaken with small bench scale test rigs in which particles have been impacted
against test materials under controlled conditions. This work has often been carried
out to assist in an understanding of erosive wear problems and to investigate problems
of comminution. Although much of this work cannot be related directly to pneumatic
conveying situations, it can provide valuable information of a comparative nature on a
number of the variables in the process.
24.1.3.1 Acceleration tube device
Test facilities employed are very similar to those used in erosive wear research, such
as whirling arm and acceleration tube devices. A device used by Salman et al [2] and
reported by the author is shown in Figure 24.3 and consists of a linear air gun. One
particle was tested at a time. Compressed air was used to accelerate the particles, and
particle velocity could be varied by adjusting the air pressure. A cage was used to col-
lect the particles and fragments after impact. The particle impact velocity was deter-
mined by measuring the time required for a particle to travel from the end of the barrel
Pressureregulating
valve
Pressuregauge
Compressedair supply
Magneticvalve
Accelerationtube
Particles
Photodiode
ComputerHigh-speed
electronic timer
Target
Cage
Particle impactangle
Loudspeaker
x � 250 mm
a
Figure 24.3 Schematic arrangement of acceleration tube test apparatus and measuring
system for particle impact studies.
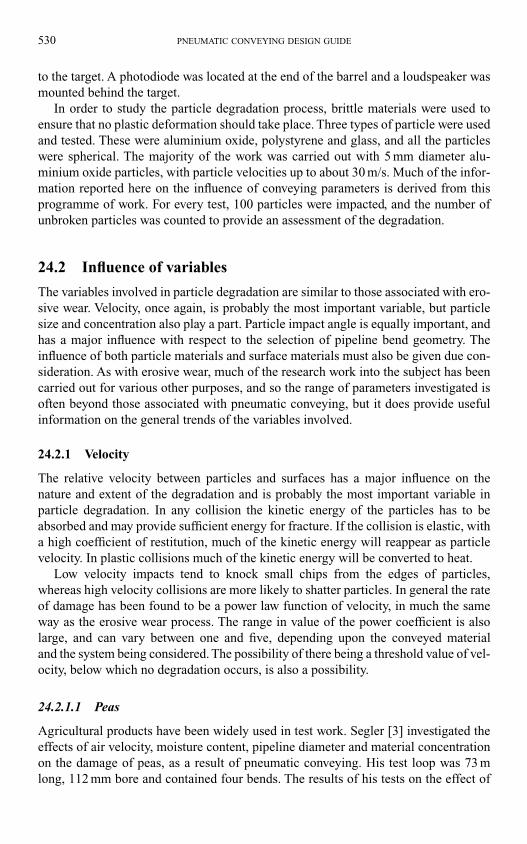
to the target. A photodiode was located at the end of the barrel and a loudspeaker was
mounted behind the target.
In order to study the particle degradation process, brittle materials were used to
ensure that no plastic deformation should take place. Three types of particle were used
and tested. These were aluminium oxide, polystyrene and glass, and all the particles
were spherical. The majority of the work was carried out with 5 mm diameter alu-
minium oxide particles, with particle velocities up to about 30 m/s. Much of the infor-
mation reported here on the influence of conveying parameters is derived from this
programme of work. For every test, 100 particles were impacted, and the number of
unbroken particles was counted to provide an assessment of the degradation.
24.2 Influence of variables
The variables involved in particle degradation are similar to those associated with ero-
sive wear. Velocity, once again, is probably the most important variable, but particle
size and concentration also play a part. Particle impact angle is equally important, and
has a major influence with respect to the selection of pipeline bend geometry. The
influence of both particle materials and surface materials must also be given due con-
sideration. As with erosive wear, much of the research work into the subject has been
carried out for various other purposes, and so the range of parameters investigated is
often beyond those associated with pneumatic conveying, but it does provide useful
information on the general trends of the variables involved.
24.2.1 Velocity
The relative velocity between particles and surfaces has a major influence on the
nature and extent of the degradation and is probably the most important variable in
particle degradation. In any collision the kinetic energy of the particles has to be
absorbed and may provide sufficient energy for fracture. If the collision is elastic, with
a high coefficient of restitution, much of the kinetic energy will reappear as particle
velocity. In plastic collisions much of the kinetic energy will be converted to heat.
Low velocity impacts tend to knock small chips from the edges of particles,
whereas high velocity collisions are more likely to shatter particles. In general the rate
of damage has been found to be a power law function of velocity, in much the same
way as the erosive wear process. The range in value of the power coefficient is also
large, and can vary between one and five, depending upon the conveyed material
and the system being considered. The possibility of there being a threshold value of vel-
ocity, below which no degradation occurs, is also a possibility.
24.2.1.1 Peas
Agricultural products have been widely used in test work. Segler [3] investigated the
effects of air velocity, moisture content, pipeline diameter and material concentration
on the damage of peas, as a result of pneumatic conveying. His test loop was 73 m
long, 112 mm bore and contained four bends. The results of his tests on the effect of
530 PNEUMATIC CONVEYING DESIGN GUIDE
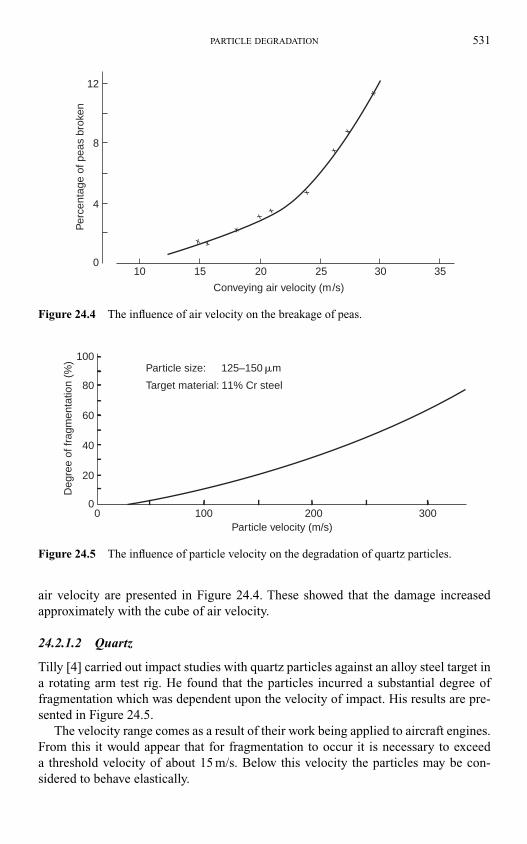
PARTICLE DEGRADATION 531
air velocity are presented in Figure 24.4. These showed that the damage increased
approximately with the cube of air velocity.
24.2.1.2 Quartz
Tilly [4] carried out impact studies with quartz particles against an alloy steel target in
a rotating arm test rig. He found that the particles incurred a substantial degree of
fragmentation which was dependent upon the velocity of impact. His results are pre-
sented in Figure 24.5.
The velocity range comes as a result of their work being applied to aircraft engines.
From this it would appear that for fragmentation to occur it is necessary to exceed
a threshold velocity of about 15 m/s. Below this velocity the particles may be con-
sidered to behave elastically.
010 15 20 25 30 35
12
8
4
Conveying air velocity (m/s)
Per
cent
age
of p
eas
brok
en
Figure 24.4 The influence of air velocity on the breakage of peas.
100
80
60
40
20
00 100 200 300
Particle size: 125–150 �m
Target material: 11% Cr steel
Particle velocity (m/s)
Deg
ree
of fr
agm
enta
tion
(%)
Figure 24.5 The influence of particle velocity on the degradation of quartz particles.
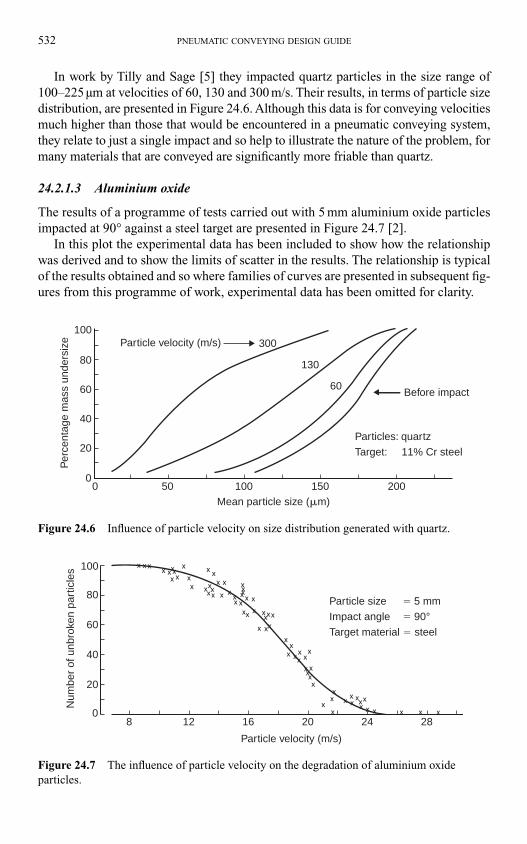
532 PNEUMATIC CONVEYING DESIGN GUIDE
In work by Tilly and Sage [5] they impacted quartz particles in the size range of
100–225 µm at velocities of 60, 130 and 300 m/s. Their results, in terms of particle size
distribution, are presented in Figure 24.6. Although this data is for conveying velocities
much higher than those that would be encountered in a pneumatic conveying system,
they relate to just a single impact and so help to illustrate the nature of the problem, for
many materials that are conveyed are significantly more friable than quartz.
24.2.1.3 Aluminium oxide
The results of a programme of tests carried out with 5 mm aluminium oxide particles
impacted at 90° against a steel target are presented in Figure 24.7 [2].
In this plot the experimental data has been included to show how the relationship
was derived and to show the limits of scatter in the results. The relationship is typical
of the results obtained and so where families of curves are presented in subsequent fig-
ures from this programme of work, experimental data has been omitted for clarity.
100
80
Per
cent
age
mas
s un
ders
ize
60
40
20
50 100 150 2000
0Mean particle size (�m)
Particle velocity (m/s)
Particles: quartz
Target: 11% Cr steel
Before impact
300
130
60
Figure 24.6 Influence of particle velocity on size distribution generated with quartz.
100
80
60
40
20
08 12 16 20 24 28
Particle velocity (m/s)
Num
ber
of u
nbro
ken
part
icle
s
Particle size � 5 mm
Impact angle � 90°Target material � steel
Figure 24.7 The influence of particle velocity on the degradation of aluminium oxide
particles.
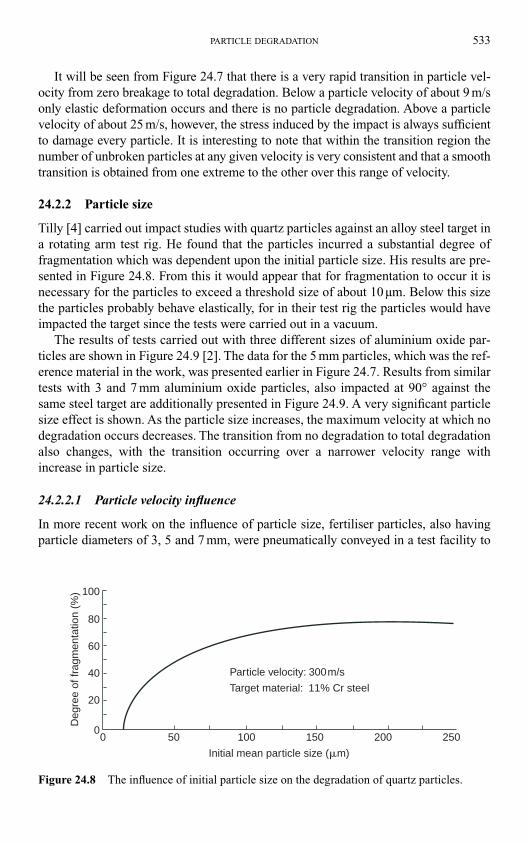
PARTICLE DEGRADATION 533
It will be seen from Figure 24.7 that there is a very rapid transition in particle vel-
ocity from zero breakage to total degradation. Below a particle velocity of about 9 m/s
only elastic deformation occurs and there is no particle degradation. Above a particle
velocity of about 25 m/s, however, the stress induced by the impact is always sufficient
to damage every particle. It is interesting to note that within the transition region the
number of unbroken particles at any given velocity is very consistent and that a smooth
transition is obtained from one extreme to the other over this range of velocity.
24.2.2 Particle size
Tilly [4] carried out impact studies with quartz particles against an alloy steel target in
a rotating arm test rig. He found that the particles incurred a substantial degree of
fragmentation which was dependent upon the initial particle size. His results are pre-
sented in Figure 24.8. From this it would appear that for fragmentation to occur it is
necessary for the particles to exceed a threshold size of about 10 µm. Below this size
the particles probably behave elastically, for in their test rig the particles would have
impacted the target since the tests were carried out in a vacuum.
The results of tests carried out with three different sizes of aluminium oxide par-
ticles are shown in Figure 24.9 [2]. The data for the 5 mm particles, which was the ref-
erence material in the work, was presented earlier in Figure 24.7. Results from similar
tests with 3 and 7 mm aluminium oxide particles, also impacted at 90° against the
same steel target are additionally presented in Figure 24.9. A very significant particle
size effect is shown. As the particle size increases, the maximum velocity at which no
degradation occurs decreases. The transition from no degradation to total degradation
also changes, with the transition occurring over a narrower velocity range with
increase in particle size.
24.2.2.1 Particle velocity influence
In more recent work on the influence of particle size, fertiliser particles, also having
particle diameters of 3, 5 and 7 mm, were pneumatically conveyed in a test facility to
100
80
60
40
20
00 50 100 150 250200
Deg
ree
of fr
agm
enta
tion
(%)
Initial mean particle size (�m)
Particle velocity: 300m/s
Target material: 11% Cr steel
Figure 24.8 The influence of initial particle size on the degradation of quartz particles.
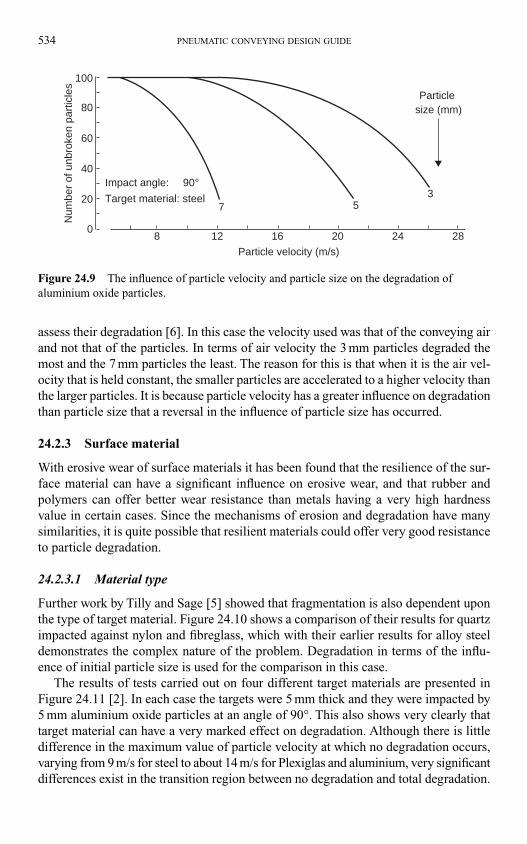
534 PNEUMATIC CONVEYING DESIGN GUIDE
assess their degradation [6]. In this case the velocity used was that of the conveying air
and not that of the particles. In terms of air velocity the 3 mm particles degraded the
most and the 7 mm particles the least. The reason for this is that when it is the air vel-
ocity that is held constant, the smaller particles are accelerated to a higher velocity than
the larger particles. It is because particle velocity has a greater influence on degradation
than particle size that a reversal in the influence of particle size has occurred.
24.2.3 Surface material
With erosive wear of surface materials it has been found that the resilience of the sur-
face material can have a significant influence on erosive wear, and that rubber and
polymers can offer better wear resistance than metals having a very high hardness
value in certain cases. Since the mechanisms of erosion and degradation have many
similarities, it is quite possible that resilient materials could offer very good resistance
to particle degradation.
24.2.3.1 Material type
Further work by Tilly and Sage [5] showed that fragmentation is also dependent upon
the type of target material. Figure 24.10 shows a comparison of their results for quartz
impacted against nylon and fibreglass, which with their earlier results for alloy steel
demonstrates the complex nature of the problem. Degradation in terms of the influ-
ence of initial particle size is used for the comparison in this case.
The results of tests carried out on four different target materials are presented in
Figure 24.11 [2]. In each case the targets were 5 mm thick and they were impacted by
5 mm aluminium oxide particles at an angle of 90°. This also shows very clearly that
target material can have a very marked effect on degradation. Although there is little
difference in the maximum value of particle velocity at which no degradation occurs,
varying from 9 m/s for steel to about 14 m/s for Plexiglas and aluminium, very significant
differences exist in the transition region between no degradation and total degradation.
100
80
60
40
20
08 12 16 20 24 28
7 53
Impact angle: 90°Target material: steel
Particle size (mm)
Num
ber
of u
nbro
ken
part
icle
s
Particle velocity (m/s)
Figure 24.9 The influence of particle velocity and particle size on the degradation of
aluminium oxide particles.
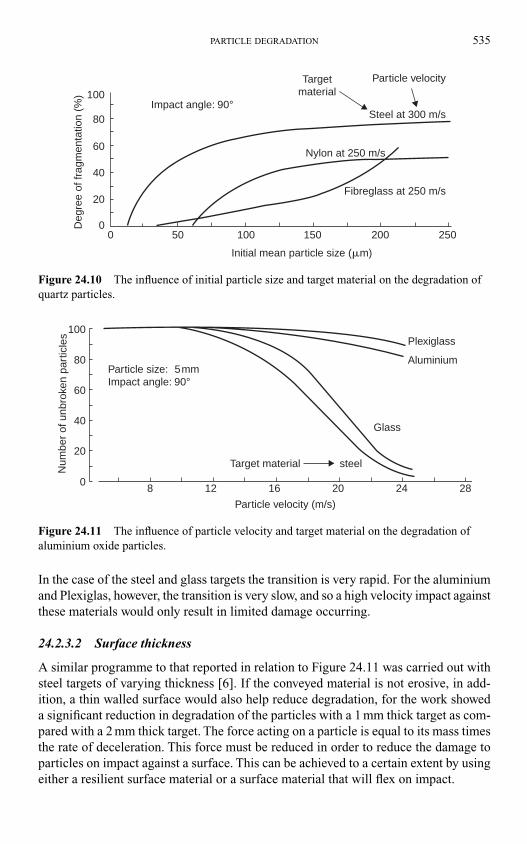
PARTICLE DEGRADATION 535
In the case of the steel and glass targets the transition is very rapid. For the aluminium
and Plexiglas, however, the transition is very slow, and so a high velocity impact against
these materials would only result in limited damage occurring.
24.2.3.2 Surface thickness
A similar programme to that reported in relation to Figure 24.11 was carried out with
steel targets of varying thickness [6]. If the conveyed material is not erosive, in add-
ition, a thin walled surface would also help reduce degradation, for the work showed
a significant reduction in degradation of the particles with a 1 mm thick target as com-
pared with a 2 mm thick target. The force acting on a particle is equal to its mass times
the rate of deceleration. This force must be reduced in order to reduce the damage to
particles on impact against a surface. This can be achieved to a certain extent by using
either a resilient surface material or a surface material that will flex on impact.
100
80
60
40
20
00 50 100 150 200 250
Impact angle: 90°
Targetmaterial
Particle velocity
Steel at 300 m/s
Nylon at 250 m/s
Fibreglass at 250 m/s
Deg
ree
of fr
agm
enta
tion
(%)
Initial mean particle size (�m)
Figure 24.10 The influence of initial particle size and target material on the degradation of
quartz particles.
100
80
60
40
20
08 12 16 20 24 28
Particle size: 5mmImpact angle: 90°
Target material steel
Glass
Aluminium
Plexiglass
Num
ber
of u
nbro
ken
part
icle
s
Particle velocity (m/s)
Figure 24.11 The influence of particle velocity and target material on the degradation of
aluminium oxide particles.
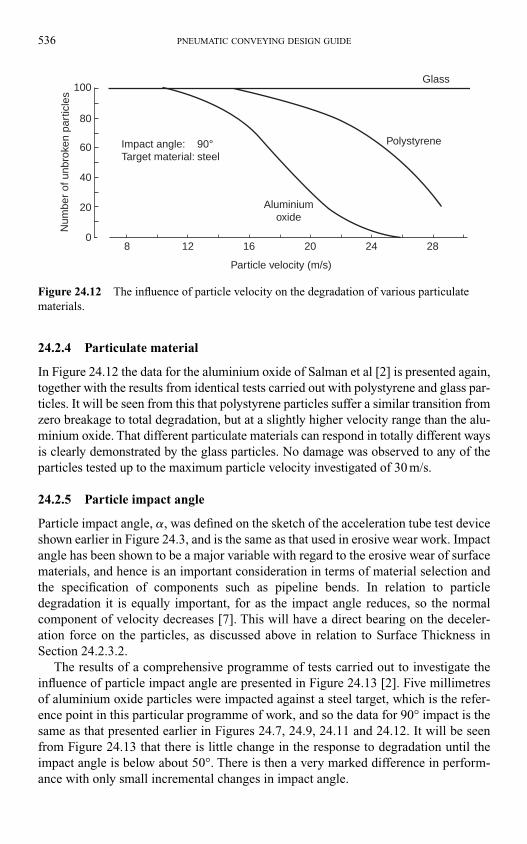
536 PNEUMATIC CONVEYING DESIGN GUIDE
24.2.4 Particulate material
In Figure 24.12 the data for the aluminium oxide of Salman et al [2] is presented again,
together with the results from identical tests carried out with polystyrene and glass par-
ticles. It will be seen from this that polystyrene particles suffer a similar transition from
zero breakage to total degradation, but at a slightly higher velocity range than the alu-
minium oxide. That different particulate materials can respond in totally different ways
is clearly demonstrated by the glass particles. No damage was observed to any of the
particles tested up to the maximum particle velocity investigated of 30 m/s.
24.2.5 Particle impact angle
Particle impact angle, �, was defined on the sketch of the acceleration tube test device
shown earlier in Figure 24.3, and is the same as that used in erosive wear work. Impact
angle has been shown to be a major variable with regard to the erosive wear of surface
materials, and hence is an important consideration in terms of material selection and
the specification of components such as pipeline bends. In relation to particle
degradation it is equally important, for as the impact angle reduces, so the normal
component of velocity decreases [7]. This will have a direct bearing on the deceler-
ation force on the particles, as discussed above in relation to Surface Thickness in
Section 24.2.3.2.
The results of a comprehensive programme of tests carried out to investigate the
influence of particle impact angle are presented in Figure 24.13 [2]. Five millimetres
of aluminium oxide particles were impacted against a steel target, which is the refer-
ence point in this particular programme of work, and so the data for 90° impact is the
same as that presented earlier in Figures 24.7, 24.9, 24.11 and 24.12. It will be seen
from Figure 24.13 that there is little change in the response to degradation until the
impact angle is below about 50°. There is then a very marked difference in perform-
ance with only small incremental changes in impact angle.
100
80
60
40
20
08 12 16 20 24 28
Glass
Polystyrene
Aluminiumoxide
Num
ber
of u
nbro
ken
part
icle
s
Particle velocity (m/s)
Impact angle: 90°Target material: steel
Figure 24.12 The influence of particle velocity on the degradation of various particulate
materials.
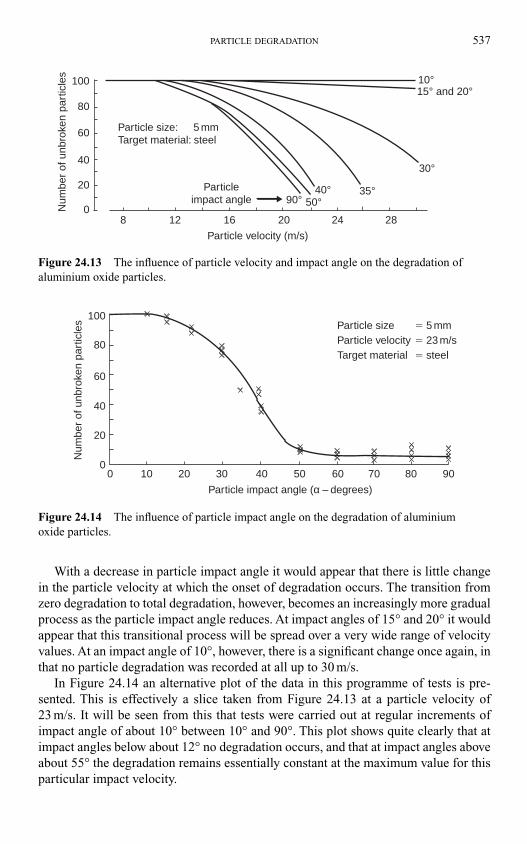
PARTICLE DEGRADATION 537
With a decrease in particle impact angle it would appear that there is little change
in the particle velocity at which the onset of degradation occurs. The transition from
zero degradation to total degradation, however, becomes an increasingly more gradual
process as the particle impact angle reduces. At impact angles of 15° and 20° it would
appear that this transitional process will be spread over a very wide range of velocity
values. At an impact angle of 10°, however, there is a significant change once again, in
that no particle degradation was recorded at all up to 30 m/s.
In Figure 24.14 an alternative plot of the data in this programme of tests is pre-
sented. This is effectively a slice taken from Figure 24.13 at a particle velocity of
23 m/s. It will be seen from this that tests were carried out at regular increments of
impact angle of about 10° between 10° and 90°. This plot shows quite clearly that at
impact angles below about 12° no degradation occurs, and that at impact angles above
about 55° the degradation remains essentially constant at the maximum value for this
particular impact velocity.
100
80
60
40
20
08 12 16 20 24 28
90° 50°40° 35°
30°
10°15° and 20°
Particleimpact angle
Particle velocity (m/s)
Num
ber
of u
nbro
ken
part
icle
s
Particle size: 5 mmTarget material: steel
Figure 24.13 The influence of particle velocity and impact angle on the degradation of
aluminium oxide particles.
0 10 20 30 40 50 60 70 80 90
100
80
60
40
20
0
Particle impact angle (α – degrees)
Particle size � 5 mmParticle velocity � 23 m/sTarget material � steel
Num
ber
of u
nbro
ken
part
icle
s
Figure 24.14 The influence of particle impact angle on the degradation of aluminium
oxide particles.
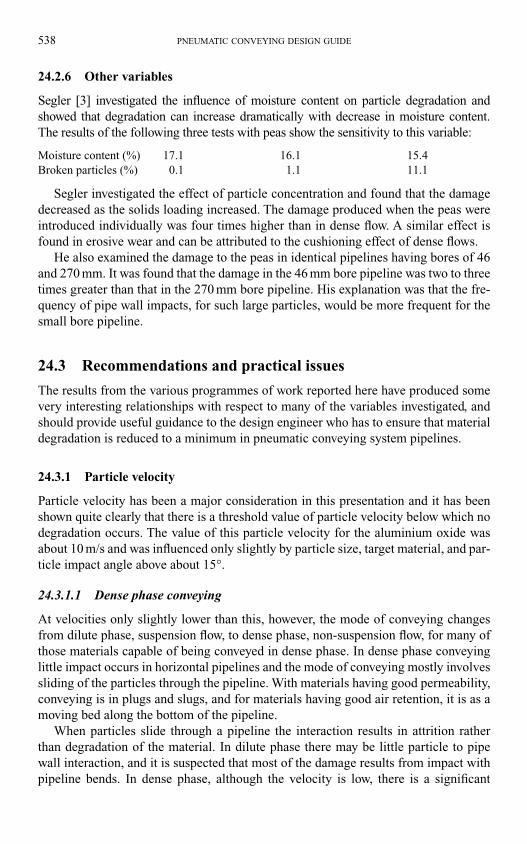
24.2.6 Other variables
Segler [3] investigated the influence of moisture content on particle degradation and
showed that degradation can increase dramatically with decrease in moisture content.
The results of the following three tests with peas show the sensitivity to this variable:
Moisture content (%) 17.1 16.1 15.4
Broken particles (%) 0.1 1.1 11.1
Segler investigated the effect of particle concentration and found that the damage
decreased as the solids loading increased. The damage produced when the peas were
introduced individually was four times higher than in dense flow. A similar effect is
found in erosive wear and can be attributed to the cushioning effect of dense flows.
He also examined the damage to the peas in identical pipelines having bores of 46
and 270 mm. It was found that the damage in the 46 mm bore pipeline was two to three
times greater than that in the 270 mm bore pipeline. His explanation was that the fre-
quency of pipe wall impacts, for such large particles, would be more frequent for the
small bore pipeline.
24.3 Recommendations and practical issues
The results from the various programmes of work reported here have produced some
very interesting relationships with respect to many of the variables investigated, and
should provide useful guidance to the design engineer who has to ensure that material
degradation is reduced to a minimum in pneumatic conveying system pipelines.
24.3.1 Particle velocity
Particle velocity has been a major consideration in this presentation and it has been
shown quite clearly that there is a threshold value of particle velocity below which no
degradation occurs. The value of this particle velocity for the aluminium oxide was
about 10 m/s and was influenced only slightly by particle size, target material, and par-
ticle impact angle above about 15°.
24.3.1.1 Dense phase conveying
At velocities only slightly lower than this, however, the mode of conveying changes
from dilute phase, suspension flow, to dense phase, non-suspension flow, for many of
those materials capable of being conveyed in dense phase. In dense phase conveying
little impact occurs in horizontal pipelines and the mode of conveying mostly involves
sliding of the particles through the pipeline. With materials having good permeability,
conveying is in plugs and slugs, and for materials having good air retention, it is as a
moving bed along the bottom of the pipeline.
When particles slide through a pipeline the interaction results in attrition rather
than degradation of the material. In dilute phase there may be little particle to pipe
wall interaction, and it is suspected that most of the damage results from impact with
pipeline bends. In dense phase, although the velocity is low, there is a significant
538 PNEUMATIC CONVEYING DESIGN GUIDE
amount of particle to pipe wall interaction and this is likely to cause more damage to
the particles than the bends. As a consequence it is possible for some materials to suf-
fer a greater amount of damage in low velocity dense phase flow than they would in
higher velocity dilute phase flow. It is important, therefore, to examine the relative
effects of degradation and attrition on the conveyed material before deciding upon the
type of pneumatic conveying system to be employed.
24.3.1.2 Dilute phase conveying
For many materials dense phase conveying is not an option, for the majority of materials
cannot be conveyed at low velocity in a conventional conveying system. For these
materials conveying has to be in suspension flow and so if the material is friable,
degradation must be limited. To this end the material should be conveyed at as low a
velocity as possible, consistent with reliable conveying, and the pipeline should be
stepped to a larger bore part way along its length to reduce the high conveying air
velocities that result at the end of the pipeline.
With a 1 bar pressure drop in a positive pressure system, discharging to atmos-
pheric pressure, the conveying air velocity will approximately double from the mater-
ial feed point to discharge. For the situation presented in Figure 24.7 it will be seen
that at 10 m/s no damage occurs, but at 20 m/s 80 per cent of the particles are broken.
As the air expands through the pipeline, therefore, it is the bends at the end of the
pipeline, in a single bore line, that are likely to cause the majority of the damage. By
stepping the pipeline the maximum velocity in the pipeline could possibly be limited
to 15 or 16 m/s, at which the degradation would be limited to only 30 per cent.
24.3.2 Particle impact angle
For given conveying conditions, particle impact angle is probably the most important
variable with respect to pneumatic conveying system pipelines. Particle impact angles
against pipeline walls will generally be very low since particles will only suffer a
glancing impact. From the data presented here it would appear that little degradation
will occur in straight pipeline, even for long pipelines and repeated impacts.
It is clearly major changes in flow direction, and in particular bends, that are likely
to result in the majority of degradation occurring. In this respect, particle impact angle
can be related approximately to the radius of curvature of a bend. In a short radius bend
the particles will impact at a high value of angle, but in a long radius bend the impact
angle will be much lower, as illustrated in Figure 23.15. Since degradation reduces sig-
nificantly with reduction in impact angle, the use of long radius bends would be rec-
ommended in any system where particle degradation needs to be minimized.
24.3.3 Bend material
The choice of material for the pipeline, and in particular the bends, provides another
means by which particle degradation can be minimized. Although there is little change
in the value of the lower threshold velocity, below which no degradation occurs, with
respect to target material, there is a very significant effect on the upper threshold
PARTICLE DEGRADATION 539
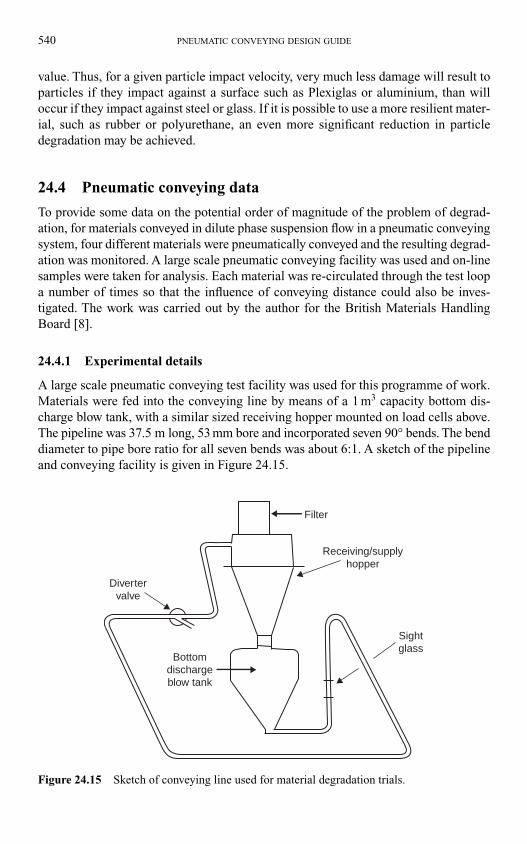
540 PNEUMATIC CONVEYING DESIGN GUIDE
value. Thus, for a given particle impact velocity, very much less damage will result to
particles if they impact against a surface such as Plexiglas or aluminium, than will
occur if they impact against steel or glass. If it is possible to use a more resilient mater-
ial, such as rubber or polyurethane, an even more significant reduction in particle
degradation may be achieved.
24.4 Pneumatic conveying data
To provide some data on the potential order of magnitude of the problem of degrad-
ation, for materials conveyed in dilute phase suspension flow in a pneumatic conveying
system, four different materials were pneumatically conveyed and the resulting degrad-
ation was monitored. A large scale pneumatic conveying facility was used and on-line
samples were taken for analysis. Each material was re-circulated through the test loop
a number of times so that the influence of conveying distance could also be inves-
tigated. The work was carried out by the author for the British Materials Handling
Board [8].
24.4.1 Experimental details
A large scale pneumatic conveying test facility was used for this programme of work.
Materials were fed into the conveying line by means of a 1 m3 capacity bottom dis-
charge blow tank, with a similar sized receiving hopper mounted on load cells above.
The pipeline was 37.5 m long, 53 mm bore and incorporated seven 90° bends. The bend
diameter to pipe bore ratio for all seven bends was about 6:1. A sketch of the pipeline
and conveying facility is given in Figure 24.15.
Divertervalve
Filter
Receiving/supplyhopper
Sightglass
Bottomdischargeblow tank
Figure 24.15 Sketch of conveying line used for material degradation trials.
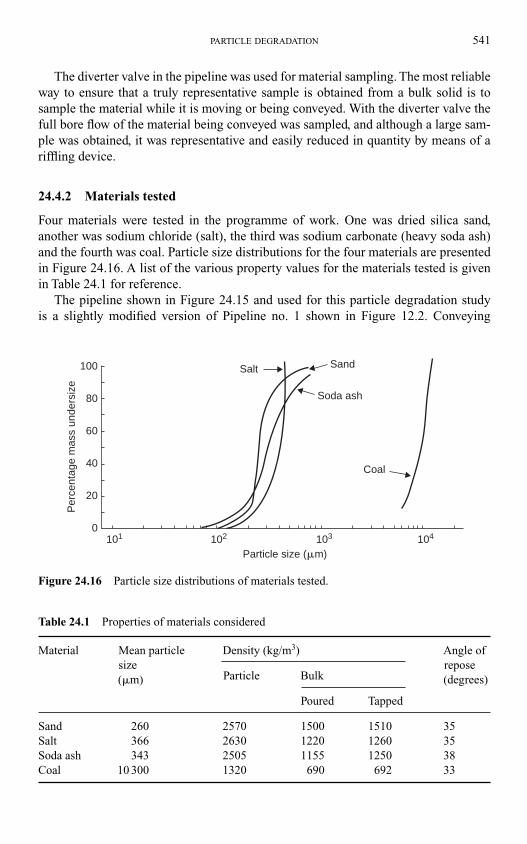
PARTICLE DEGRADATION 541
The diverter valve in the pipeline was used for material sampling. The most reliable
way to ensure that a truly representative sample is obtained from a bulk solid is to
sample the material while it is moving or being conveyed. With the diverter valve the
full bore flow of the material being conveyed was sampled, and although a large sam-
ple was obtained, it was representative and easily reduced in quantity by means of a
riffling device.
24.4.2 Materials tested
Four materials were tested in the programme of work. One was dried silica sand,
another was sodium chloride (salt), the third was sodium carbonate (heavy soda ash)
and the fourth was coal. Particle size distributions for the four materials are presented
in Figure 24.16. A list of the various property values for the materials tested is given
in Table 24.1 for reference.
The pipeline shown in Figure 24.15 and used for this particle degradation study
is a slightly modified version of Pipeline no. 1 shown in Figure 12.2. Conveying
Coal
Soda ash
SandSalt
104101 102 103
Particle size (�m)
100
80
60
40
20
0
Per
cent
age
mas
s un
ders
ize
Figure 24.16 Particle size distributions of materials tested.
Table 24.1 Properties of materials considered
Material Mean particle Density (kg/m3) Angle of
sizeParticle Bulk
repose
(�m)
Poured Tapped
(degrees)
Sand 260 2570 1500 1510 35
Salt 366 2630 1220 1260 35
Soda ash 343 2505 1155 1250 38
Coal 10 300 1320 690 692 33
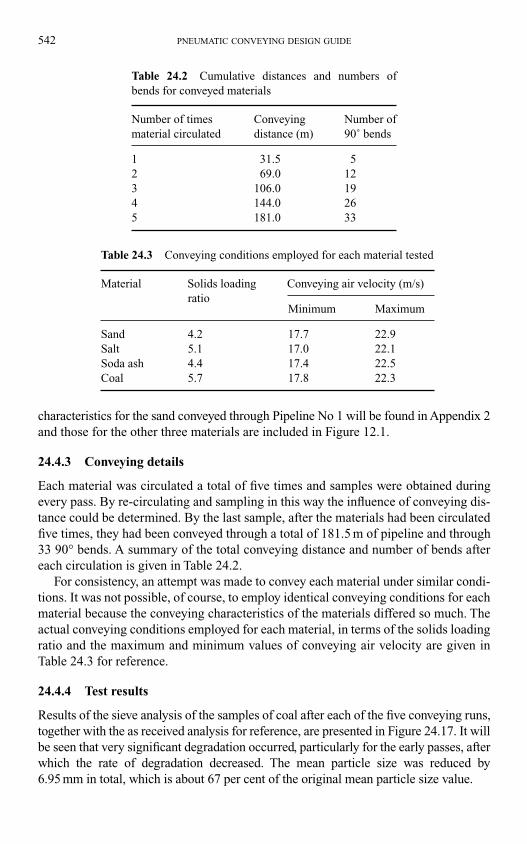
542 PNEUMATIC CONVEYING DESIGN GUIDE
characteristics for the sand conveyed through Pipeline No 1 will be found in Appendix 2
and those for the other three materials are included in Figure 12.1.
24.4.3 Conveying details
Each material was circulated a total of five times and samples were obtained during
every pass. By re-circulating and sampling in this way the influence of conveying dis-
tance could be determined. By the last sample, after the materials had been circulated
five times, they had been conveyed through a total of 181.5 m of pipeline and through
33 90° bends. A summary of the total conveying distance and number of bends after
each circulation is given in Table 24.2.
For consistency, an attempt was made to convey each material under similar condi-
tions. It was not possible, of course, to employ identical conveying conditions for each
material because the conveying characteristics of the materials differed so much. The
actual conveying conditions employed for each material, in terms of the solids loading
ratio and the maximum and minimum values of conveying air velocity are given in
Table 24.3 for reference.
24.4.4 Test results
Results of the sieve analysis of the samples of coal after each of the five conveying runs,
together with the as received analysis for reference, are presented in Figure 24.17. It will
be seen that very significant degradation occurred, particularly for the early passes, after
which the rate of degradation decreased. The mean particle size was reduced by
6.95 mm in total, which is about 67 per cent of the original mean particle size value.
Table 24.2 Cumulative distances and numbers of
bends for conveyed materials
Number of times Conveying Number of
material circulated distance (m) 90˚ bends
1 31.5 5
2 69.0 12
3 106.0 19
4 144.0 26
5 181.0 33
Table 24.3 Conveying conditions employed for each material tested
Material Solids loading Conveying air velocity (m/s)
ratio Minimum Maximum
Sand 4.2 17.7 22.9
Salt 5.1 17.0 22.1
Soda ash 4.4 17.4 22.5
Coal 5.7 17.8 22.3
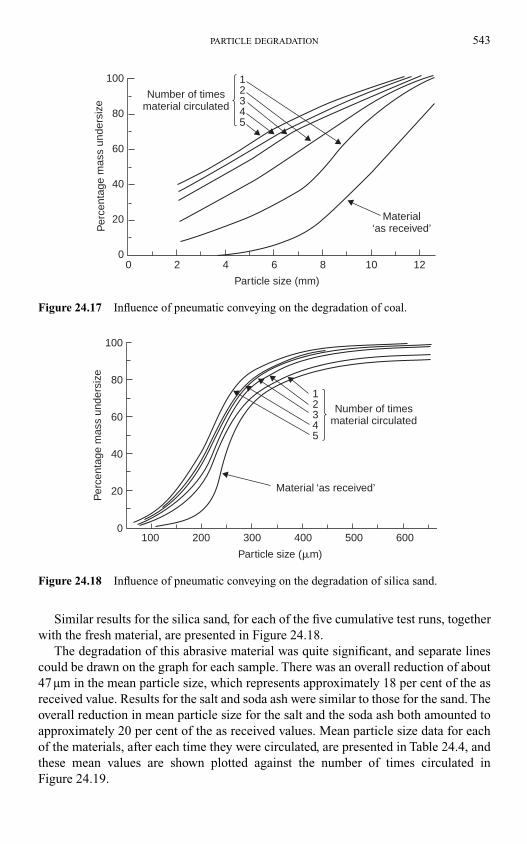
PARTICLE DEGRADATION 543
Similar results for the silica sand, for each of the five cumulative test runs, together
with the fresh material, are presented in Figure 24.18.
The degradation of this abrasive material was quite significant, and separate lines
could be drawn on the graph for each sample. There was an overall reduction of about
47 µm in the mean particle size, which represents approximately 18 per cent of the as
received value. Results for the salt and soda ash were similar to those for the sand. The
overall reduction in mean particle size for the salt and the soda ash both amounted to
approximately 20 per cent of the as received values. Mean particle size data for each
of the materials, after each time they were circulated, are presented in Table 24.4, and
these mean values are shown plotted against the number of times circulated in
Figure 24.19.
Number of timesmaterial circulated
100
80
60
40
20
00 2 4 6 8 10 12
Material‘as received’
Particle size (mm)
Per
cent
age
mas
s un
ders
ize
12345
Figure 24.17 Influence of pneumatic conveying on the degradation of coal.
Material ‘as received’
100
80
60
40
20
0100 200 300 400 500 600
Particle size (�m)
Per
cent
age
mas
s un
ders
ize
12345
Number of timesmaterial circulated
Figure 24.18 Influence of pneumatic conveying on the degradation of silica sand.
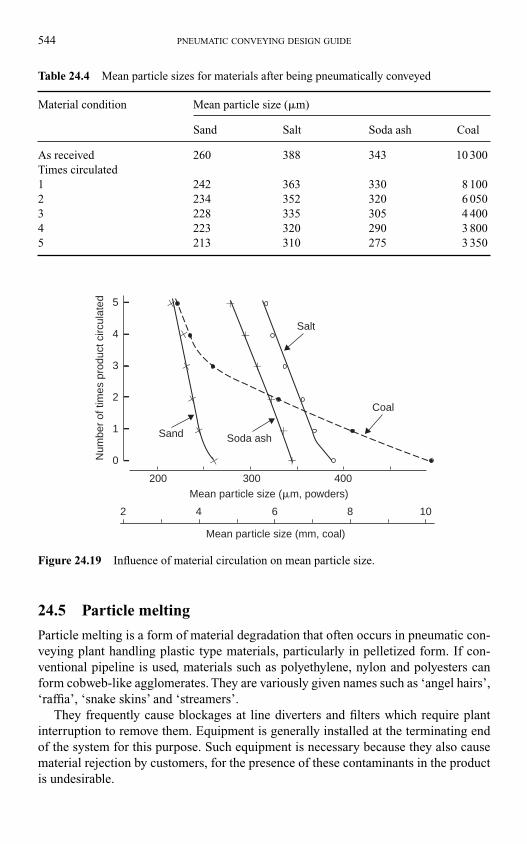
544 PNEUMATIC CONVEYING DESIGN GUIDE
24.5 Particle melting
Particle melting is a form of material degradation that often occurs in pneumatic con-
veying plant handling plastic type materials, particularly in pelletized form. If con-
ventional pipeline is used, materials such as polyethylene, nylon and polyesters can
form cobweb-like agglomerates. They are variously given names such as ‘angel hairs’,
‘raffia’, ‘snake skins’ and ‘streamers’.
They frequently cause blockages at line diverters and filters which require plant
interruption to remove them. Equipment is generally installed at the terminating end
of the system for this purpose. Such equipment is necessary because they also cause
material rejection by customers, for the presence of these contaminants in the product
is undesirable.
Table 24.4 Mean particle sizes for materials after being pneumatically conveyed
Material condition Mean particle size (�m)
Sand Salt Soda ash Coal
As received 260 388 343 10 300
Times circulated
1 242 363 330 8 100
2 234 352 320 6 050
3 228 335 305 4 400
4 223 320 290 3 800
5 213 310 275 3 350
5
4
3
2
1
0
200 300 400
Sand
Salt
Soda ash
Coal
Mean particle size (�m, powders)
2 4 6 8 10
Mean particle size (mm, coal)
Num
ber
of ti
mes
pro
duct
circ
ulat
ed
Figure 24.19 Influence of material circulation on mean particle size.
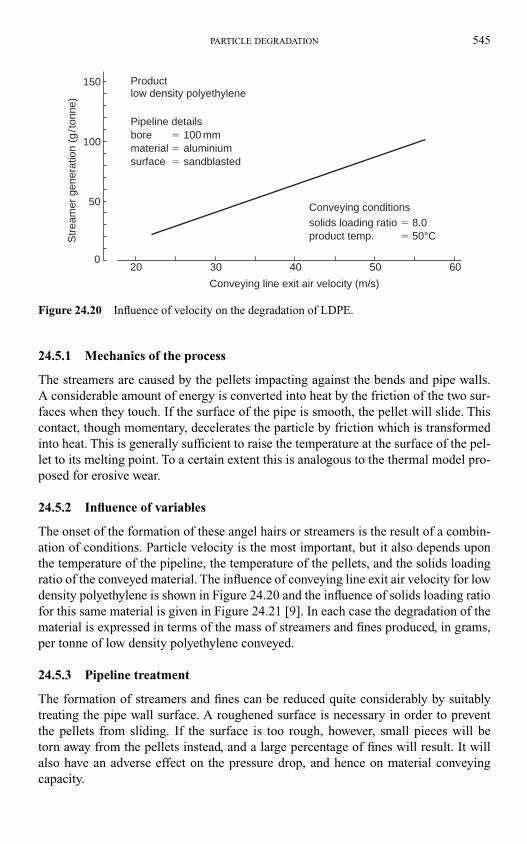
PARTICLE DEGRADATION 545
24.5.1 Mechanics of the process
The streamers are caused by the pellets impacting against the bends and pipe walls.
A considerable amount of energy is converted into heat by the friction of the two sur-
faces when they touch. If the surface of the pipe is smooth, the pellet will slide. This
contact, though momentary, decelerates the particle by friction which is transformed
into heat. This is generally sufficient to raise the temperature at the surface of the pel-
let to its melting point. To a certain extent this is analogous to the thermal model pro-
posed for erosive wear.
24.5.2 Influence of variables
The onset of the formation of these angel hairs or streamers is the result of a combin-
ation of conditions. Particle velocity is the most important, but it also depends upon
the temperature of the pipeline, the temperature of the pellets, and the solids loading
ratio of the conveyed material. The influence of conveying line exit air velocity for low
density polyethylene is shown in Figure 24.20 and the influence of solids loading ratio
for this same material is given in Figure 24.21 [9]. In each case the degradation of the
material is expressed in terms of the mass of streamers and fines produced, in grams,
per tonne of low density polyethylene conveyed.
24.5.3 Pipeline treatment
The formation of streamers and fines can be reduced quite considerably by suitably
treating the pipe wall surface. A roughened surface is necessary in order to prevent
the pellets from sliding. If the surface is too rough, however, small pieces will be
torn away from the pellets instead, and a large percentage of fines will result. It will
also have an adverse effect on the pressure drop, and hence on material conveying
capacity.
40 50 6030200
50
100
150 Product
Conveying line exit air velocity (m/s)
solids loading ratio � 8.0product temp. � 50°C
low density polyethylene
Pipeline detailsbore � 100 mmmaterial � aluminiumsurface � sandblasted
Str
eam
er g
ener
atio
n (g
/ton
ne)
Conveying conditions
Figure 24.20 Influence of velocity on the degradation of LDPE.
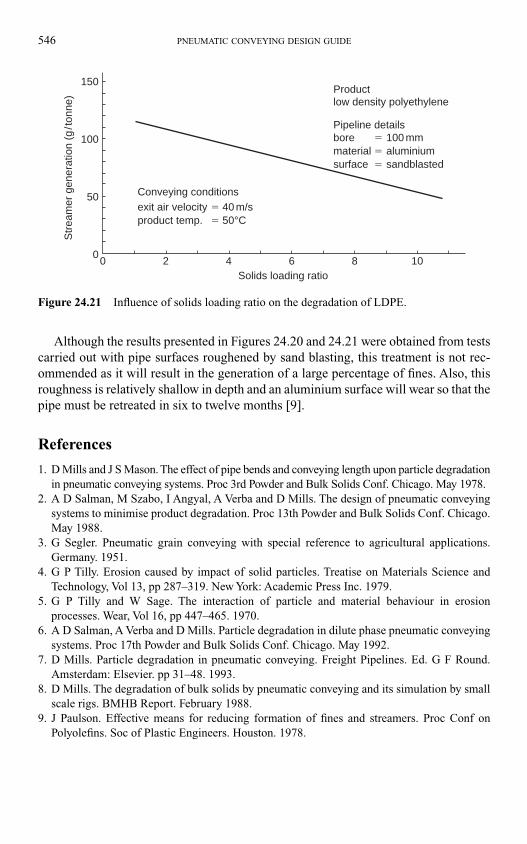
546 PNEUMATIC CONVEYING DESIGN GUIDE
Although the results presented in Figures 24.20 and 24.21 were obtained from tests
carried out with pipe surfaces roughened by sand blasting, this treatment is not rec-
ommended as it will result in the generation of a large percentage of fines. Also, this
roughness is relatively shallow in depth and an aluminium surface will wear so that the
pipe must be retreated in six to twelve months [9].
References
1. D Mills and J S Mason. The effect of pipe bends and conveying length upon particle degradation
in pneumatic conveying systems. Proc 3rd Powder and Bulk Solids Conf. Chicago. May 1978.
2. A D Salman, M Szabo, I Angyal, A Verba and D Mills. The design of pneumatic conveying
systems to minimise product degradation. Proc 13th Powder and Bulk Solids Conf. Chicago.
May 1988.
3. G Segler. Pneumatic grain conveying with special reference to agricultural applications.
Germany. 1951.
4. G P Tilly. Erosion caused by impact of solid particles. Treatise on Materials Science and
Technology, Vol 13, pp 287–319. New York: Academic Press Inc. 1979.
5. G P Tilly and W Sage. The interaction of particle and material behaviour in erosion
processes. Wear, Vol 16, pp 447–465. 1970.
6. A D Salman, A Verba and D Mills. Particle degradation in dilute phase pneumatic conveying
systems. Proc 17th Powder and Bulk Solids Conf. Chicago. May 1992.
7. D Mills. Particle degradation in pneumatic conveying. Freight Pipelines. Ed. G F Round.
Amsterdam: Elsevier. pp 31–48. 1993.
8. D Mills. The degradation of bulk solids by pneumatic conveying and its simulation by small
scale rigs. BMHB Report. February 1988.
9. J Paulson. Effective means for reducing formation of fines and streamers. Proc Conf on
Polyolefins. Soc of Plastic Engineers. Houston. 1978.
0
50
100
150
exit air velocity � 40 m/sproduct temp. � 50°C
Str
eam
er g
ener
atio
n (g
/ton
ne)
0 2 4 6 8 10Solids loading ratio
Conveying conditions
Productlow density polyethylene
Pipeline detailsbore � 100 mmmaterial � aluminiumsurface � sandblasted
Figure 24.21 Influence of solids loading ratio on the degradation of LDPE.
25.1 Introduction
Atmospheric air naturally contains a certain amount of water vapour. The amount of
water vapour that air can contain depends upon both temperature and pressure. A
decrease in temperature or an increase in pressure can result in condensation occur-
ring when the air passes through the saturation point. The problem with condensation,
however, is that it can sometimes be very difficult to predict. The presence of moisture
may even be unknown if it cannot be seen, although its effects will certainly be evident.
The addition of water to a bulk solid can have a significant effect on its flowability.
Condensation usually occurs on the walls of containing vessels and surfaces such as
hoppers, silos and pipelines. Although the effect might be localized, the material/
surface interface is critical to the smooth operation of most bulk solids handling plants.
Some materials are hygroscopic and will naturally absorb moisture from the air with-
out condensation occurring. For these materials it is generally necessary to dry the air
that comes into contact with the material, to a value of relative humidity below that at
which the material is capable of absorbing atmospheric moisture.
25.2 Humidity
The amount of water vapour that air can support is not constant but varies with both
temperature and pressure. Once air is saturated, a change in either temperature or
pressure can result in condensation occurring. The terms used here are relative humid-
ity and specific humidity, and the Ideal Gas Law, commonly used for air, provides the
basis for modelling moist air.
Specific humidity is the ratio of the mass of water vapour to the mass of dry air in
any given volume, or volumetric flow rate, of the mixture. It is usually expressed in
terms of grams of water per kg of dry air, and so it is strictly not a dimensionless quan-
tity. Relative humidity is the ratio of the partial pressure of the vapour actually present
to the partial pressure of the vapour when the air is saturated at the same temperature.
It is usually expressed as a percentage, with 100 per cent representing saturated air.
Thus, specific humidity is a measure of the moisture content of the air, and relative
humidity is a measure of the ease with which the atmosphere will take up moisture.
Relative humidity is usually obtained by means of wet- and dry-bulb thermometers or
some other form of hygrometer and specific humidity can be calculated.
Chapter 25
Moisture and condensation
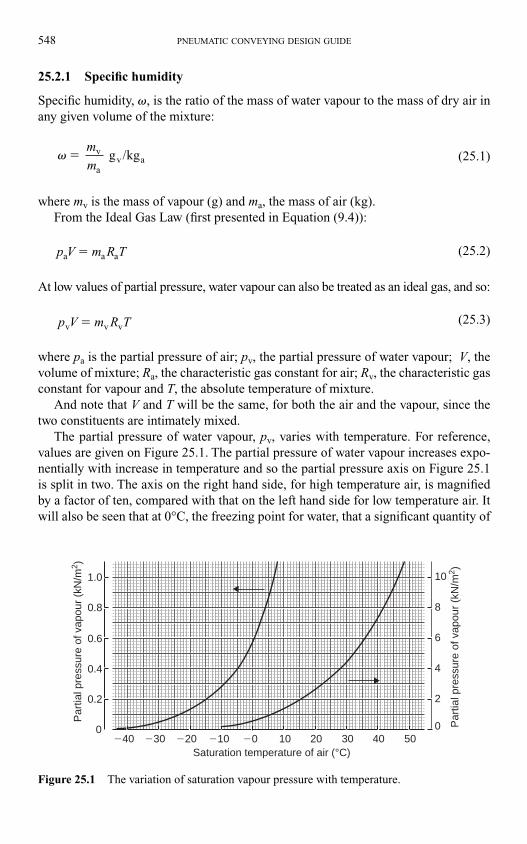
25.2.1 Specific humidity
Specific humidity, �, is the ratio of the mass of water vapour to the mass of dry air in
any given volume of the mixture:
(25.1)
where mv is the mass of vapour (g) and ma, the mass of air (kg).
From the Ideal Gas Law (first presented in Equation (9.4)):
(25.2)
At low values of partial pressure, water vapour can also be treated as an ideal gas, and so:
(25.3)
where pa is the partial pressure of air; pv, the partial pressure of water vapour; V, the
volume of mixture; Ra, the characteristic gas constant for air; Rv, the characteristic gas
constant for vapour and T, the absolute temperature of mixture.
And note that V and T will be the same, for both the air and the vapour, since the
two constituents are intimately mixed.
The partial pressure of water vapour, pv, varies with temperature. For reference,
values are given on Figure 25.1. The partial pressure of water vapour increases expo-
nentially with increase in temperature and so the partial pressure axis on Figure 25.1
is split in two. The axis on the right hand side, for high temperature air, is magnified
by a factor of ten, compared with that on the left hand side for low temperature air. It
will also be seen that at 0°C, the freezing point for water, that a significant quantity of
p V m R Tv v v �
p V m R Ta a a �
� g kgv
a
v a�m
m/
548 PNEUMATIC CONVEYING DESIGN GUIDE
Saturation temperature of air (°C)�40
0
0.2
0.4
0.6
0.8
1.0
�30 �20 �10 �0 10 20 30 40 500
2
4
Par
tial p
ress
ure
of v
apou
r (k
N/m
2 )
Par
tial p
ress
ure
of v
apou
r (k
N/m
2 )
6
8
10
Figure 25.1 The variation of saturation vapour pressure with temperature.
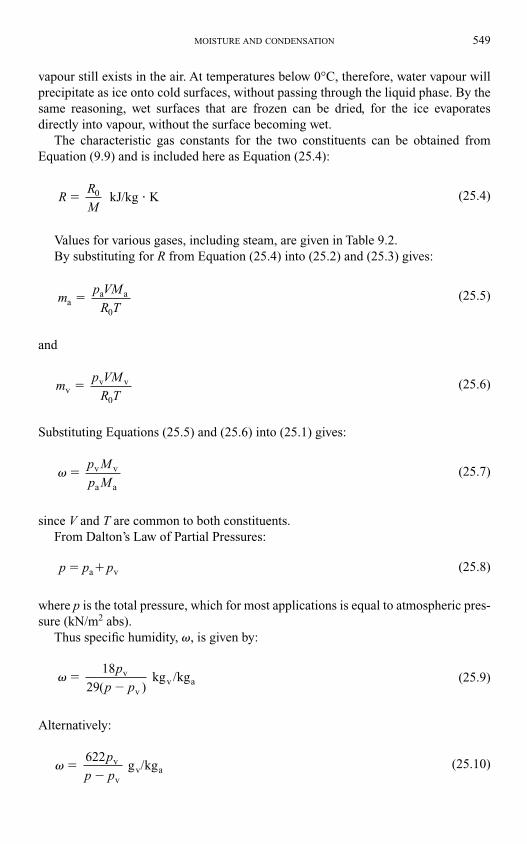
vapour still exists in the air. At temperatures below 0°C, therefore, water vapour will
precipitate as ice onto cold surfaces, without passing through the liquid phase. By the
same reasoning, wet surfaces that are frozen can be dried, for the ice evaporates
directly into vapour, without the surface becoming wet.
The characteristic gas constants for the two constituents can be obtained from
Equation (9.9) and is included here as Equation (25.4):
(25.4)
Values for various gases, including steam, are given in Table 9.2.
By substituting for R from Equation (25.4) into (25.2) and (25.3) gives:
(25.5)
and
(25.6)
Substituting Equations (25.5) and (25.6) into (25.1) gives:
(25.7)
since V and T are common to both constituents.
From Dalton’s Law of Partial Pressures:
(25.8)
where p is the total pressure, which for most applications is equal to atmospheric pres-
sure (kN/m2 abs).
Thus specific humidity, �, is given by:
(25.9)
Alternatively:
(25.10)� 622
g kgv
v
v a��
p
p p/
� 18
( kg kgv
v
v a��
p
p p29 )/
p p p a v� �
� v v
a a
�p M
p M
mp VM
R Tvv v �
0
mp VM
R Taa a �
0
RR
M kJ/kg K� �0
MOISTURE AND CONDENSATION 549
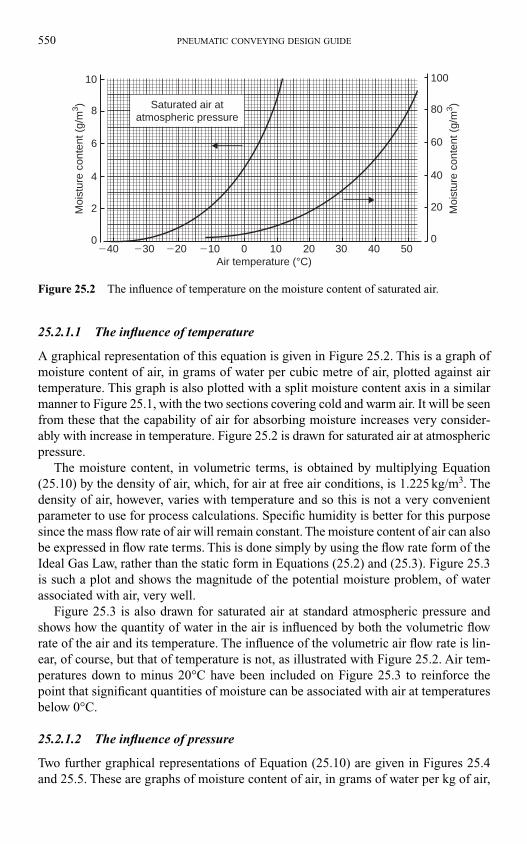
25.2.1.1 The influence of temperature
A graphical representation of this equation is given in Figure 25.2. This is a graph of
moisture content of air, in grams of water per cubic metre of air, plotted against air
temperature. This graph is also plotted with a split moisture content axis in a similar
manner to Figure 25.1, with the two sections covering cold and warm air. It will be seen
from these that the capability of air for absorbing moisture increases very consider-
ably with increase in temperature. Figure 25.2 is drawn for saturated air at atmospheric
pressure.
The moisture content, in volumetric terms, is obtained by multiplying Equation
(25.10) by the density of air, which, for air at free air conditions, is 1.225 kg/m3. The
density of air, however, varies with temperature and so this is not a very convenient
parameter to use for process calculations. Specific humidity is better for this purpose
since the mass flow rate of air will remain constant. The moisture content of air can also
be expressed in flow rate terms. This is done simply by using the flow rate form of the
Ideal Gas Law, rather than the static form in Equations (25.2) and (25.3). Figure 25.3
is such a plot and shows the magnitude of the potential moisture problem, of water
associated with air, very well.
Figure 25.3 is also drawn for saturated air at standard atmospheric pressure and
shows how the quantity of water in the air is influenced by both the volumetric flow
rate of the air and its temperature. The influence of the volumetric air flow rate is lin-
ear, of course, but that of temperature is not, as illustrated with Figure 25.2. Air tem-
peratures down to minus 20°C have been included on Figure 25.3 to reinforce the
point that significant quantities of moisture can be associated with air at temperatures
below 0°C.
25.2.1.2 The influence of pressure
Two further graphical representations of Equation (25.10) are given in Figures 25.4
and 25.5. These are graphs of moisture content of air, in grams of water per kg of air,
550 PNEUMATIC CONVEYING DESIGN GUIDE
�400
2
4
6
8
10
0
20
40
60
80
100
�30 �20 �10 10 20 30 40 500
Moi
stur
e co
nten
t (g/
m3 )
Moi
stur
e co
nten
t (g/
m3 )
Air temperature (°C)
Saturated air atatmospheric pressure
Figure 25.2 The influence of temperature on the moisture content of saturated air.
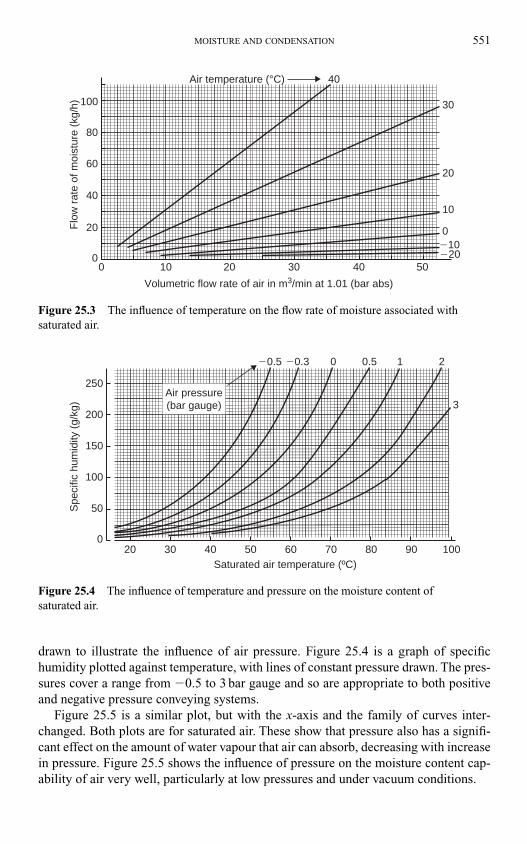
drawn to illustrate the influence of air pressure. Figure 25.4 is a graph of specific
humidity plotted against temperature, with lines of constant pressure drawn. The pres-
sures cover a range from �0.5 to 3 bar gauge and so are appropriate to both positive
and negative pressure conveying systems.
Figure 25.5 is a similar plot, but with the x-axis and the family of curves inter-
changed. Both plots are for saturated air. These show that pressure also has a signifi-
cant effect on the amount of water vapour that air can absorb, decreasing with increase
in pressure. Figure 25.5 shows the influence of pressure on the moisture content cap-
ability of air very well, particularly at low pressures and under vacuum conditions.
MOISTURE AND CONDENSATION 551
10 20
Volumetric flow rate of air in m3/min at 1.01 (bar abs)
Air temperature (°C)F
low
rat
e of
moi
stur
e (k
g/h)
30
30
40
20
10
�10�20
0
40 500
0
20
40
60
80
100
Figure 25.3 The influence of temperature on the flow rate of moisture associated with
saturated air.
Spe
cific
hum
idity
(g/
kg)
Saturated air temperature (ºC)
250
200
150
100
50
020 30 40 50 60 70 80 90 100
�0.5 �0.3 0.50 1 2
3Air pressure(bar gauge)
Figure 25.4 The influence of temperature and pressure on the moisture content of
saturated air.
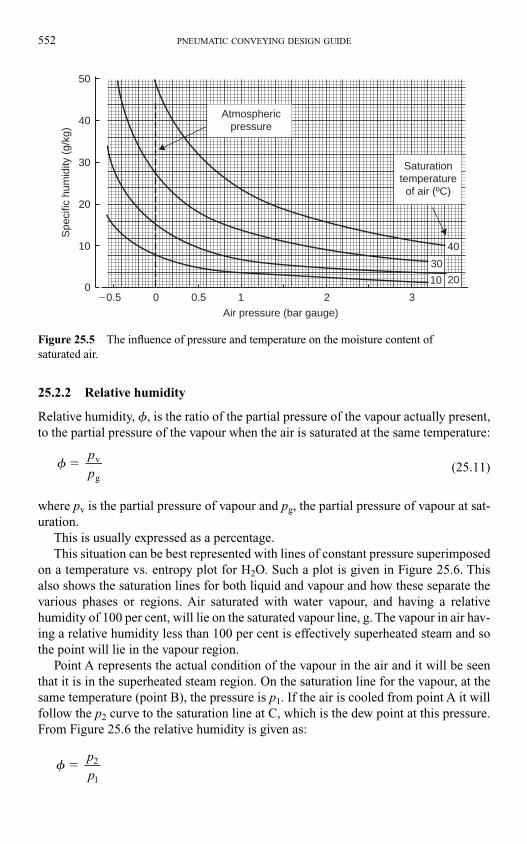
25.2.2 Relative humidity
Relative humidity, �, is the ratio of the partial pressure of the vapour actually present,
to the partial pressure of the vapour when the air is saturated at the same temperature:
(25.11)
where pv is the partial pressure of vapour and pg, the partial pressure of vapour at sat-
uration.
This is usually expressed as a percentage.
This situation can be best represented with lines of constant pressure superimposed
on a temperature vs. entropy plot for H2O. Such a plot is given in Figure 25.6. This
also shows the saturation lines for both liquid and vapour and how these separate the
various phases or regions. Air saturated with water vapour, and having a relative
humidity of 100 per cent, will lie on the saturated vapour line, g. The vapour in air hav-
ing a relative humidity less than 100 per cent is effectively superheated steam and so
the point will lie in the vapour region.
Point A represents the actual condition of the vapour in the air and it will be seen
that it is in the superheated steam region. On the saturation line for the vapour, at the
same temperature (point B), the pressure is p1. If the air is cooled from point A it will
follow the p2 curve to the saturation line at C, which is the dew point at this pressure.
From Figure 25.6 the relative humidity is given as:
� �p
p2
1
� v
g
�p
p
552 PNEUMATIC CONVEYING DESIGN GUIDE
Air pressure (bar gauge)
Spe
cific
hum
idity
(g/
kg)
�0.5 0.500
10
20
30
40
50
1 2 3
40
30
2010
Atmosphericpressure
Saturationtemperature
of air (ºC)
Figure 25.5 The influence of pressure and temperature on the moisture content of
saturated air.
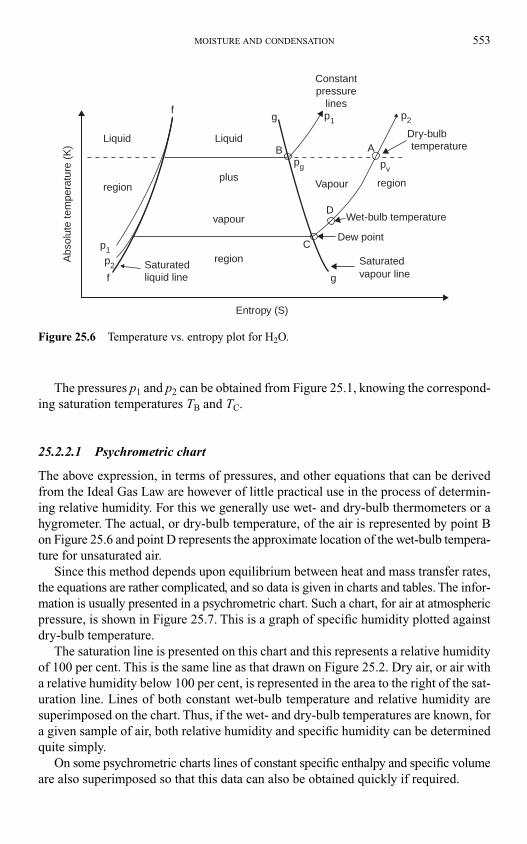
The pressures p1 and p2 can be obtained from Figure 25.1, knowing the correspond-
ing saturation temperatures TB and TC.
25.2.2.1 Psychrometric chart
The above expression, in terms of pressures, and other equations that can be derived
from the Ideal Gas Law are however of little practical use in the process of determin-
ing relative humidity. For this we generally use wet- and dry-bulb thermometers or a
hygrometer. The actual, or dry-bulb temperature, of the air is represented by point B
on Figure 25.6 and point D represents the approximate location of the wet-bulb tempera-
ture for unsaturated air.
Since this method depends upon equilibrium between heat and mass transfer rates,
the equations are rather complicated, and so data is given in charts and tables. The infor-
mation is usually presented in a psychrometric chart. Such a chart, for air at atmospheric
pressure, is shown in Figure 25.7. This is a graph of specific humidity plotted against
dry-bulb temperature.
The saturation line is presented on this chart and this represents a relative humidity
of 100 per cent. This is the same line as that drawn on Figure 25.2. Dry air, or air with
a relative humidity below 100 per cent, is represented in the area to the right of the sat-
uration line. Lines of both constant wet-bulb temperature and relative humidity are
superimposed on the chart. Thus, if the wet- and dry-bulb temperatures are known, for
a given sample of air, both relative humidity and specific humidity can be determined
quite simply.
On some psychrometric charts lines of constant specific enthalpy and specific volume
are also superimposed so that this data can also be obtained quickly if required.
MOISTURE AND CONDENSATION 553
Liquid Liquid
Constantpressure
lines
Dry-bulb
Wet-bulb temperature
temperature
region
Dew point
Saturatedvapour line
Vapour
vapour
region
region
Saturatedliquid line
Abs
olut
e te
mpe
ratu
re (
K)
f
f
p1
p1
pg
p2
pv
p2
Entropy (S)
plus
A
D
C
g
g
B
Figure 25.6 Temperature vs. entropy plot for H2O.
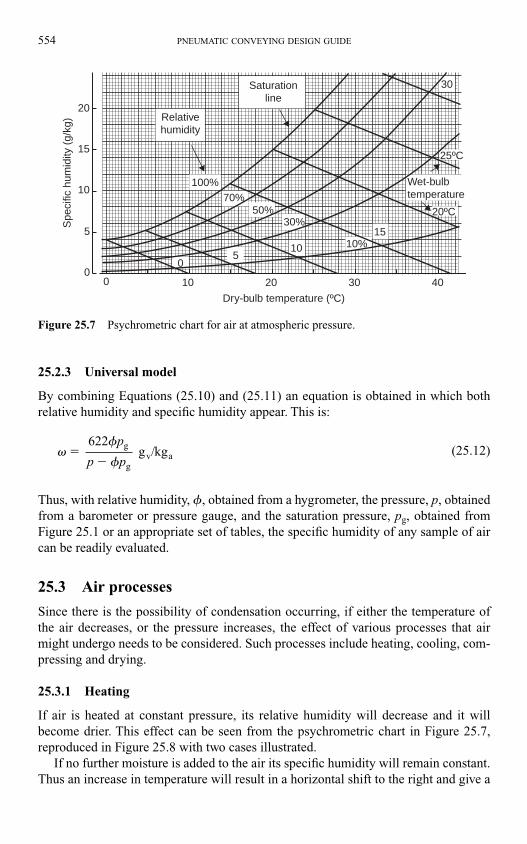
25.2.3 Universal model
By combining Equations (25.10) and (25.11) an equation is obtained in which both
relative humidity and specific humidity appear. This is:
(25.12)
Thus, with relative humidity, �, obtained from a hygrometer, the pressure, p, obtained
from a barometer or pressure gauge, and the saturation pressure, pg, obtained from
Figure 25.1 or an appropriate set of tables, the specific humidity of any sample of air
can be readily evaluated.
25.3 Air processes
Since there is the possibility of condensation occurring, if either the temperature of
the air decreases, or the pressure increases, the effect of various processes that air
might undergo needs to be considered. Such processes include heating, cooling, com-
pressing and drying.
25.3.1 Heating
If air is heated at constant pressure, its relative humidity will decrease and it will
become drier. This effect can be seen from the psychrometric chart in Figure 25.7,
reproduced in Figure 25.8 with two cases illustrated.
If no further moisture is added to the air its specific humidity will remain constant.
Thus an increase in temperature will result in a horizontal shift to the right and give a
��
�
622
g kg
g
g
v a��
p
p p/
554 PNEUMATIC CONVEYING DESIGN GUIDE
20
15
10
5
00 10 20 30 40
Dry-bulb temperature (ºC)
Spe
cific
hum
idity
(g/
kg) Relative
humidity
Saturationline
Wet-bulbtemperature
100%70%
50%30%
10 10%15
20ºC
30
25ºC
05
Figure 25.7 Psychrometric chart for air at atmospheric pressure.
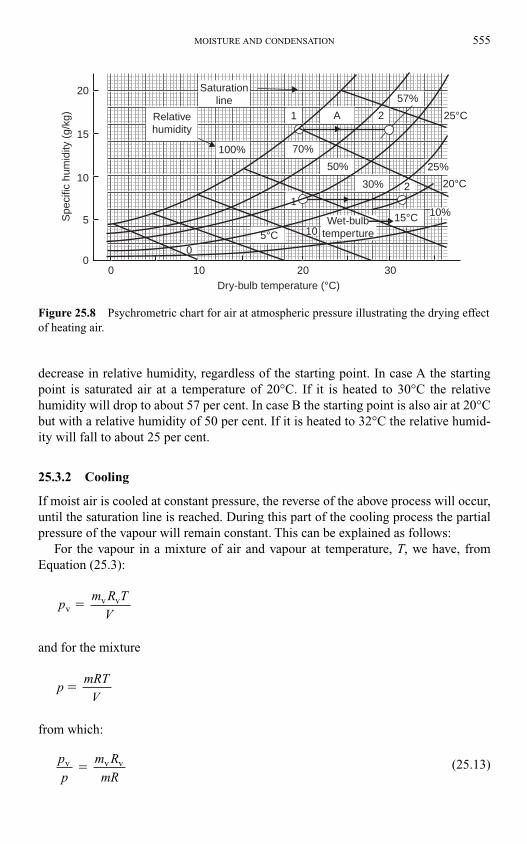
decrease in relative humidity, regardless of the starting point. In case A the starting
point is saturated air at a temperature of 20°C. If it is heated to 30°C the relative
humidity will drop to about 57 per cent. In case B the starting point is also air at 20°C
but with a relative humidity of 50 per cent. If it is heated to 32°C the relative humid-
ity will fall to about 25 per cent.
25.3.2 Cooling
If moist air is cooled at constant pressure, the reverse of the above process will occur,
until the saturation line is reached. During this part of the cooling process the partial
pressure of the vapour will remain constant. This can be explained as follows:
For the vapour in a mixture of air and vapour at temperature, T, we have, from
Equation (25.3):
and for the mixture
from which:
(25.13)p
p
m R
mRv v v �
pmRT
V �
pm R T
Vvv v �
MOISTURE AND CONDENSATION 555
0 10
1
1 A
2
20 30
5
10
15
20
Dry-bulb temperature (°C)
Spe
cific
hum
idity
(g/
kg)
100% 70%
25%
10%
30%
57%
15°C
20°C
0
5°C
25°C
Wet-bulbtemperture
Relativehumidity
Saturationline
50%
10
0
2
Figure 25.8 Psychrometric chart for air at atmospheric pressure illustrating the drying effect
of heating air.
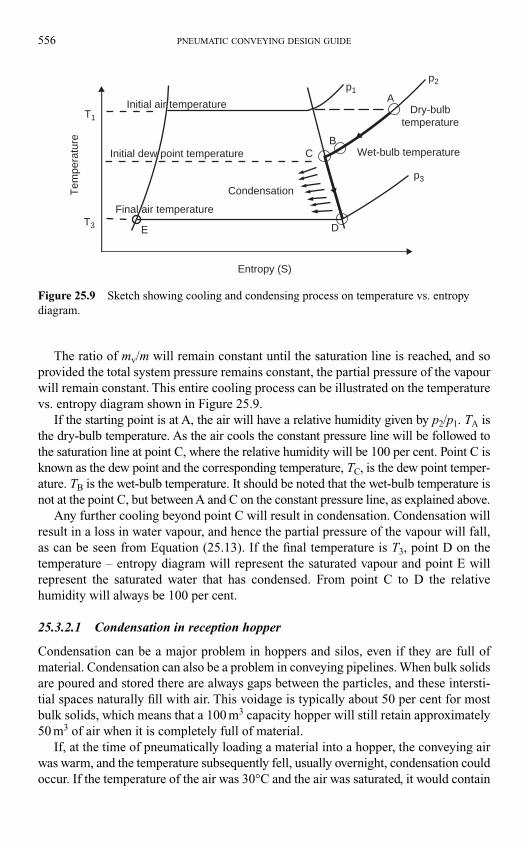
The ratio of mv/m will remain constant until the saturation line is reached, and so
provided the total system pressure remains constant, the partial pressure of the vapour
will remain constant. This entire cooling process can be illustrated on the temperature
vs. entropy diagram shown in Figure 25.9.
If the starting point is at A, the air will have a relative humidity given by p2/p1. TA is
the dry-bulb temperature. As the air cools the constant pressure line will be followed to
the saturation line at point C, where the relative humidity will be 100 per cent. Point C is
known as the dew point and the corresponding temperature, TC, is the dew point temper-
ature. TB is the wet-bulb temperature. It should be noted that the wet-bulb temperature is
not at the point C, but between A and C on the constant pressure line, as explained above.
Any further cooling beyond point C will result in condensation. Condensation will
result in a loss in water vapour, and hence the partial pressure of the vapour will fall,
as can be seen from Equation (25.13). If the final temperature is T3, point D on the
temperature – entropy diagram will represent the saturated vapour and point E will
represent the saturated water that has condensed. From point C to D the relative
humidity will always be 100 per cent.
25.3.2.1 Condensation in reception hopper
Condensation can be a major problem in hoppers and silos, even if they are full of
material. Condensation can also be a problem in conveying pipelines. When bulk solids
are poured and stored there are always gaps between the particles, and these intersti-
tial spaces naturally fill with air. This voidage is typically about 50 per cent for most
bulk solids, which means that a 100 m3 capacity hopper will still retain approximately
50 m3 of air when it is completely full of material.
If, at the time of pneumatically loading a material into a hopper, the conveying air
was warm, and the temperature subsequently fell, usually overnight, condensation could
occur. If the temperature of the air was 30°C and the air was saturated, it would contain
556 PNEUMATIC CONVEYING DESIGN GUIDE
T1
T3
p1
p2
p3
A
BC
DE
Tem
pera
ture
Initial air temperature Dry-bulbtemperature
Wet-bulb temperature
Final air temperature
Initial dew point temperature
Condensation
Entropy (S)
Figure 25.9 Sketch showing cooling and condensing process on temperature vs. entropy
diagram.
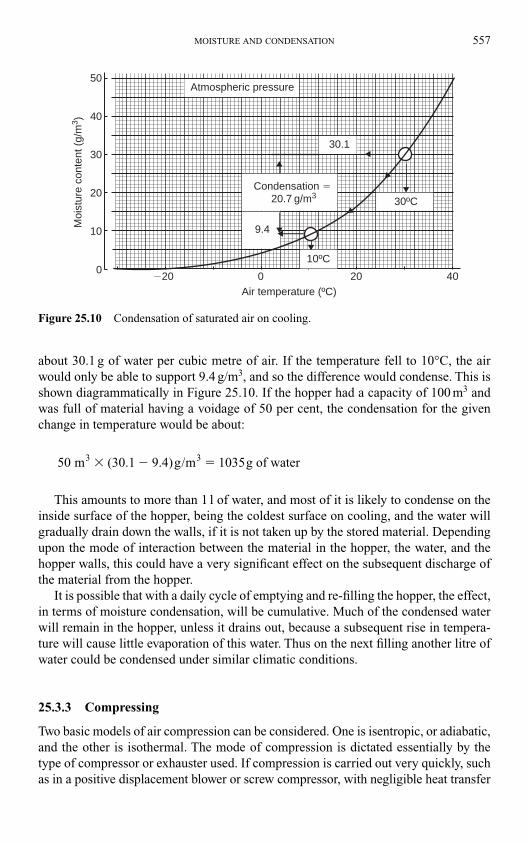
about 30.1 g of water per cubic metre of air. If the temperature fell to 10°C, the air
would only be able to support 9.4 g/m3, and so the difference would condense. This is
shown diagrammatically in Figure 25.10. If the hopper had a capacity of 100 m3 and
was full of material having a voidage of 50 per cent, the condensation for the given
change in temperature would be about:
This amounts to more than 1 l of water, and most of it is likely to condense on the
inside surface of the hopper, being the coldest surface on cooling, and the water will
gradually drain down the walls, if it is not taken up by the stored material. Depending
upon the mode of interaction between the material in the hopper, the water, and the
hopper walls, this could have a very significant effect on the subsequent discharge of
the material from the hopper.
It is possible that with a daily cycle of emptying and re-filling the hopper, the effect,
in terms of moisture condensation, will be cumulative. Much of the condensed water
will remain in the hopper, unless it drains out, because a subsequent rise in tempera-
ture will cause little evaporation of this water. Thus on the next filling another litre of
water could be condensed under similar climatic conditions.
25.3.3 Compressing
Two basic models of air compression can be considered. One is isentropic, or adiabatic,
and the other is isothermal. The mode of compression is dictated essentially by the
type of compressor or exhauster used. If compression is carried out very quickly, such
as in a positive displacement blower or screw compressor, with negligible heat transfer
50 m (30.1 9.4)g/m 1035g of water3 3� � �
MOISTURE AND CONDENSATION 557
Air temperature (ºC)
Moi
stur
e co
nten
t (g/
m3 )
�200
10
20
30
40
50
20 400
Atmospheric pressure
Condensation � 20.7 g/m3
30.1
30ºC
10ºC
9.4
Figure 25.10 Condensation of saturated air on cooling.
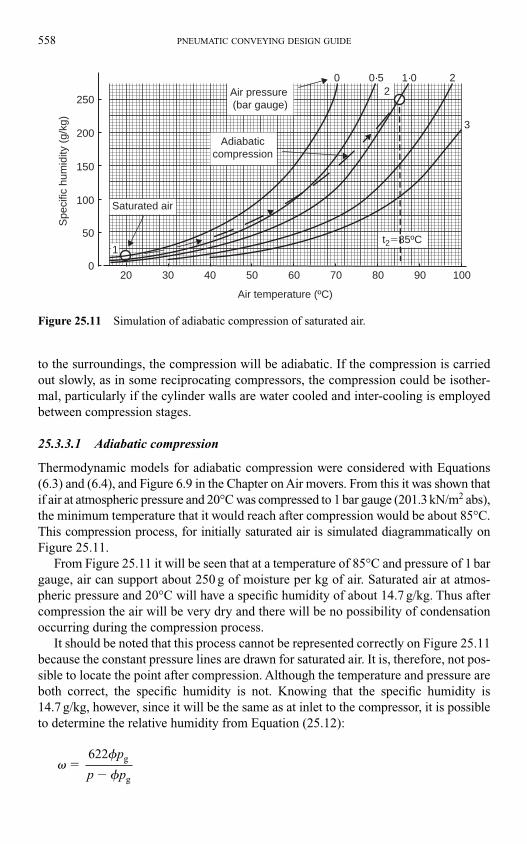
to the surroundings, the compression will be adiabatic. If the compression is carried
out slowly, as in some reciprocating compressors, the compression could be isother-
mal, particularly if the cylinder walls are water cooled and inter-cooling is employed
between compression stages.
25.3.3.1 Adiabatic compression
Thermodynamic models for adiabatic compression were considered with Equations
(6.3) and (6.4), and Figure 6.9 in the Chapter on Air movers. From this it was shown that
if air at atmospheric pressure and 20°C was compressed to 1 bar gauge (201.3 kN/m2 abs),
the minimum temperature that it would reach after compression would be about 85°C.
This compression process, for initially saturated air is simulated diagrammatically on
Figure 25.11.
From Figure 25.11 it will be seen that at a temperature of 85°C and pressure of 1 bar
gauge, air can support about 250 g of moisture per kg of air. Saturated air at atmos-
pheric pressure and 20°C will have a specific humidity of about 14.7 g/kg. Thus after
compression the air will be very dry and there will be no possibility of condensation
occurring during the compression process.
It should be noted that this process cannot be represented correctly on Figure 25.11
because the constant pressure lines are drawn for saturated air. It is, therefore, not pos-
sible to locate the point after compression. Although the temperature and pressure are
both correct, the specific humidity is not. Knowing that the specific humidity is
14.7 g/kg, however, since it will be the same as at inlet to the compressor, it is possible
to determine the relative humidity from Equation (25.12):
��
�
622
g
g
��
p
p p
558 PNEUMATIC CONVEYING DESIGN GUIDE
Spe
cific
hum
idity
(g/
kg)
Air temperature (ºC)
0 0·5 1·0 2
3
20 30 40 50 60 70 80 90 1000
50
100
150
200
250
t2�85ºC
Adiabaticcompression
Air pressure (bar gauge)
Saturated air
2
1
Figure 25.11 Simulation of adiabatic compression of saturated air.
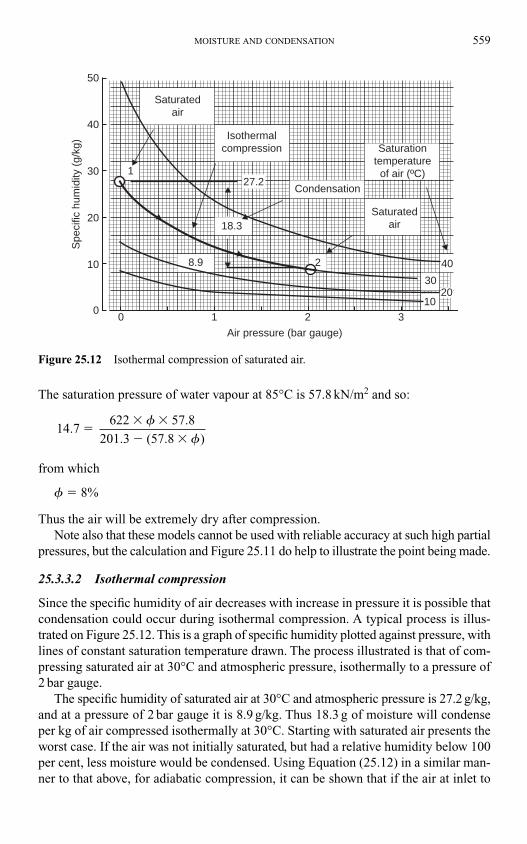
The saturation pressure of water vapour at 85°C is 57.8 kN/m2 and so:
from which
� � 8%
Thus the air will be extremely dry after compression.
Note also that these models cannot be used with reliable accuracy at such high partial
pressures, but the calculation and Figure 25.11 do help to illustrate the point being made.
25.3.3.2 Isothermal compression
Since the specific humidity of air decreases with increase in pressure it is possible that
condensation could occur during isothermal compression. A typical process is illus-
trated on Figure 25.12. This is a graph of specific humidity plotted against pressure, with
lines of constant saturation temperature drawn. The process illustrated is that of com-
pressing saturated air at 30°C and atmospheric pressure, isothermally to a pressure of
2 bar gauge.
The specific humidity of saturated air at 30°C and atmospheric pressure is 27.2 g/kg,
and at a pressure of 2 bar gauge it is 8.9 g/kg. Thus 18.3 g of moisture will condense
per kg of air compressed isothermally at 30°C. Starting with saturated air presents the
worst case. If the air was not initially saturated, but had a relative humidity below 100
per cent, less moisture would be condensed. Using Equation (25.12) in a similar man-
ner to that above, for adiabatic compression, it can be shown that if the air at inlet to
14 7201 3
.. )
622 57.8
(57.8 �
� �
� �
�
�
MOISTURE AND CONDENSATION 559
Air pressure (bar gauge)
50
40
30
20
10
00 1 2 3
Spe
cific
hum
idity
(g/
kg)
Saturatedair
Isothermalcompression
27.2Condensation
Saturatedair18.3
8.9 2
Saturationtemperature
of air (ºC)
40
3020
10
1
Figure 25.12 Isothermal compression of saturated air.
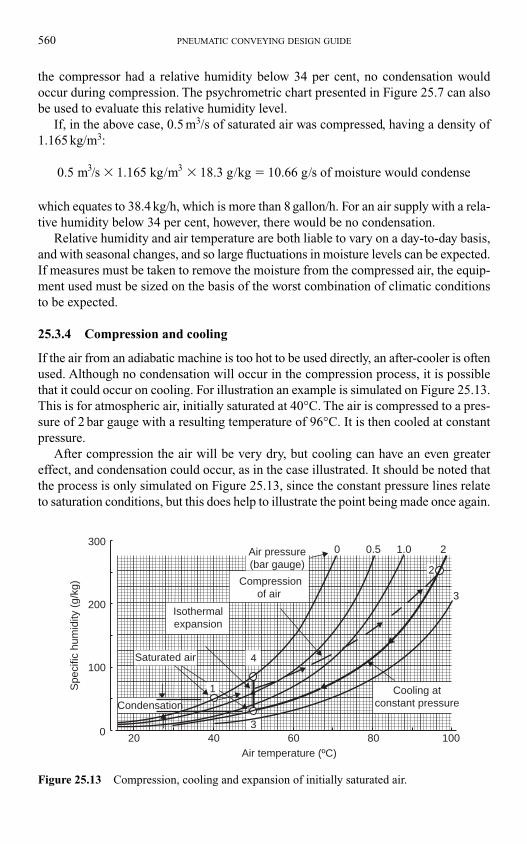
the compressor had a relative humidity below 34 per cent, no condensation would
occur during compression. The psychrometric chart presented in Figure 25.7 can also
be used to evaluate this relative humidity level.
If, in the above case, 0.5 m3/s of saturated air was compressed, having a density of
1.165 kg/m3:
which equates to 38.4 kg/h, which is more than 8 gallon/h. For an air supply with a rela-
tive humidity below 34 per cent, however, there would be no condensation.
Relative humidity and air temperature are both liable to vary on a day-to-day basis,
and with seasonal changes, and so large fluctuations in moisture levels can be expected.
If measures must be taken to remove the moisture from the compressed air, the equip-
ment used must be sized on the basis of the worst combination of climatic conditions
to be expected.
25.3.4 Compression and cooling
If the air from an adiabatic machine is too hot to be used directly, an after-cooler is often
used. Although no condensation will occur in the compression process, it is possible
that it could occur on cooling. For illustration an example is simulated on Figure 25.13.
This is for atmospheric air, initially saturated at 40°C. The air is compressed to a pres-
sure of 2 bar gauge with a resulting temperature of 96°C. It is then cooled at constant
pressure.
After compression the air will be very dry, but cooling can have an even greater
effect, and condensation could occur, as in the case illustrated. It should be noted that
the process is only simulated on Figure 25.13, since the constant pressure lines relate
to saturation conditions, but this does help to illustrate the point being made once again.
0 5. / m s 1.165 kg/m 18.3 g/kg 10.66 g/s of moisture would condense3 3� � �
560 PNEUMATIC CONVEYING DESIGN GUIDE
Air temperature (ºC)
Spe
cific
hum
idity
(g/
kg)
0 0.5 1.0 2
3
300
200
100
020 40 60 80 100
Air pressure(bar gauge)
Compressionof air
Isothermalexpansion
Saturated air
CondensationCooling at
constant pressure1
4
3
2
Figure 25.13 Compression, cooling and expansion of initially saturated air.
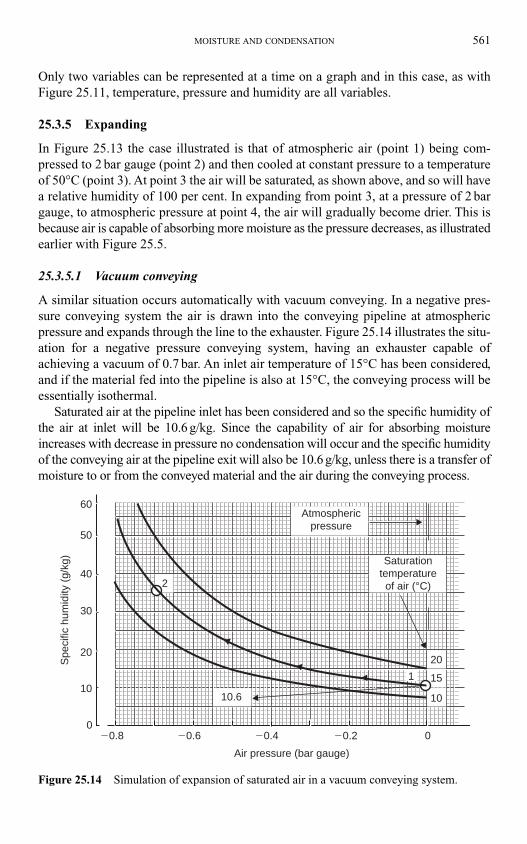
Only two variables can be represented at a time on a graph and in this case, as with
Figure 25.11, temperature, pressure and humidity are all variables.
25.3.5 Expanding
In Figure 25.13 the case illustrated is that of atmospheric air (point 1) being com-
pressed to 2 bar gauge (point 2) and then cooled at constant pressure to a temperature
of 50°C (point 3). At point 3 the air will be saturated, as shown above, and so will have
a relative humidity of 100 per cent. In expanding from point 3, at a pressure of 2 bar
gauge, to atmospheric pressure at point 4, the air will gradually become drier. This is
because air is capable of absorbing more moisture as the pressure decreases, as illustrated
earlier with Figure 25.5.
25.3.5.1 Vacuum conveying
A similar situation occurs automatically with vacuum conveying. In a negative pres-
sure conveying system the air is drawn into the conveying pipeline at atmospheric
pressure and expands through the line to the exhauster. Figure 25.14 illustrates the situ-
ation for a negative pressure conveying system, having an exhauster capable of
achieving a vacuum of 0.7 bar. An inlet air temperature of 15°C has been considered,
and if the material fed into the pipeline is also at 15°C, the conveying process will be
essentially isothermal.
Saturated air at the pipeline inlet has been considered and so the specific humidity of
the air at inlet will be 10.6 g/kg. Since the capability of air for absorbing moisture
increases with decrease in pressure no condensation will occur and the specific humidity
of the conveying air at the pipeline exit will also be 10.6 g/kg, unless there is a transfer of
moisture to or from the conveyed material and the air during the conveying process.
MOISTURE AND CONDENSATION 561
1010
2020
30
40
50
60
10.6
2
Saturationtemperatureof air (°C)
Atmosphericpressure
�0.8 �0.6 �0.4 �0.2 00
Air pressure (bar gauge)
Spe
cific
hum
idity
(g/
kg)
1 15
Figure 25.14 Simulation of expansion of saturated air in a vacuum conveying system.
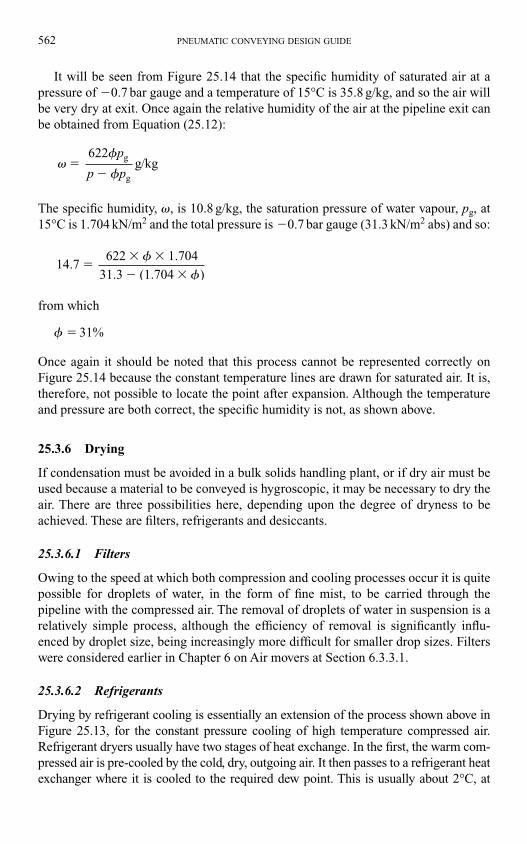
It will be seen from Figure 25.14 that the specific humidity of saturated air at a
pressure of �0.7 bar gauge and a temperature of 15°C is 35.8 g/kg, and so the air will
be very dry at exit. Once again the relative humidity of the air at the pipeline exit can
be obtained from Equation (25.12):
The specific humidity, �, is 10.8 g/kg, the saturation pressure of water vapour, pg, at
15°C is 1.704 kN/m2 and the total pressure is �0.7 bar gauge (31.3 kN/m2 abs) and so:
from which
� � 31%
Once again it should be noted that this process cannot be represented correctly on
Figure 25.14 because the constant temperature lines are drawn for saturated air. It is,
therefore, not possible to locate the point after expansion. Although the temperature
and pressure are both correct, the specific humidity is not, as shown above.
25.3.6 Drying
If condensation must be avoided in a bulk solids handling plant, or if dry air must be
used because a material to be conveyed is hygroscopic, it may be necessary to dry the
air. There are three possibilities here, depending upon the degree of dryness to be
achieved. These are filters, refrigerants and desiccants.
25.3.6.1 Filters
Owing to the speed at which both compression and cooling processes occur it is quite
possible for droplets of water, in the form of fine mist, to be carried through the
pipeline with the compressed air. The removal of droplets of water in suspension is a
relatively simple process, although the efficiency of removal is significantly influ-
enced by droplet size, being increasingly more difficult for smaller drop sizes. Filters
were considered earlier in Chapter 6 on Air movers at Section 6.3.3.1.
25.3.6.2 Refrigerants
Drying by refrigerant cooling is essentially an extension of the process shown above in
Figure 25.13, for the constant pressure cooling of high temperature compressed air.
Refrigerant dryers usually have two stages of heat exchange. In the first, the warm com-
pressed air is pre-cooled by the cold, dry, outgoing air. It then passes to a refrigerant heat
exchanger where it is cooled to the required dew point. This is usually about 2°C, at
14 731 3
.. )
622 1.704
(1.704 �
� �
� �
�
�
��
�
622
g/kg
g
g
��
p
p p
562 PNEUMATIC CONVEYING DESIGN GUIDE
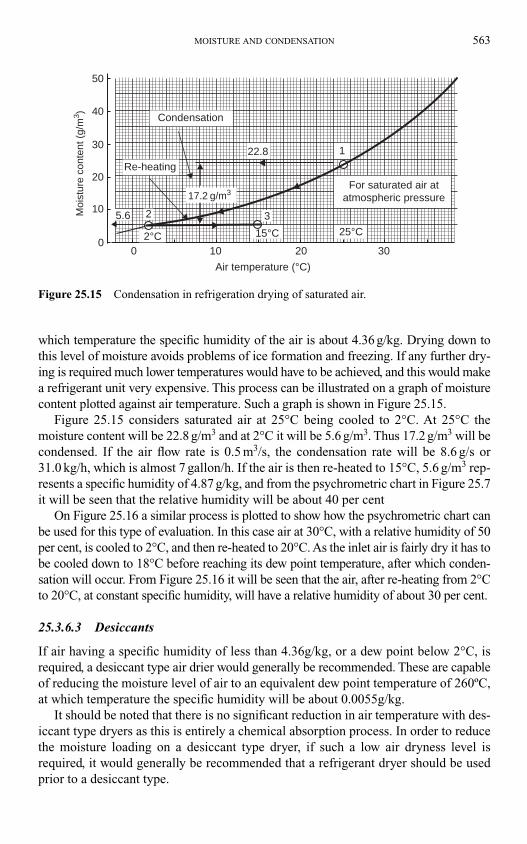
which temperature the specific humidity of the air is about 4.36 g/kg. Drying down to
this level of moisture avoids problems of ice formation and freezing. If any further dry-
ing is required much lower temperatures would have to be achieved, and this would make
a refrigerant unit very expensive. This process can be illustrated on a graph of moisture
content plotted against air temperature. Such a graph is shown in Figure 25.15.
Figure 25.15 considers saturated air at 25°C being cooled to 2°C. At 25°C the
moisture content will be 22.8 g/m3 and at 2°C it will be 5.6 g/m3. Thus 17.2 g/m3 will be
condensed. If the air flow rate is 0.5 m3/s, the condensation rate will be 8.6 g/s or
31.0 kg/h, which is almost 7 gallon/h. If the air is then re-heated to 15°C, 5.6 g/m3 rep-
resents a specific humidity of 4.87 g/kg, and from the psychrometric chart in Figure 25.7
it will be seen that the relative humidity will be about 40 per cent
On Figure 25.16 a similar process is plotted to show how the psychrometric chart can
be used for this type of evaluation. In this case air at 30°C, with a relative humidity of 50
per cent, is cooled to 2°C, and then re-heated to 20°C. As the inlet air is fairly dry it has to
be cooled down to 18°C before reaching its dew point temperature, after which conden-
sation will occur. From Figure 25.16 it will be seen that the air, after re-heating from 2°C
to 20°C, at constant specific humidity, will have a relative humidity of about 30 per cent.
25.3.6.3 Desiccants
If air having a specific humidity of less than 4.36g/kg, or a dew point below 2°C, is
required, a desiccant type air drier would generally be recommended. These are capable
of reducing the moisture level of air to an equivalent dew point temperature of 260ºC,
at which temperature the specific humidity will be about 0.0055g/kg.
It should be noted that there is no significant reduction in air temperature with des-
iccant type dryers as this is entirely a chemical absorption process. In order to reduce
the moisture loading on a desiccant type dryer, if such a low air dryness level is
required, it would generally be recommended that a refrigerant dryer should be used
prior to a desiccant type.
MOISTURE AND CONDENSATION 563
Air temperature (°C)
00
Moi
stur
e co
nten
t (g/
m3 )
10
10
20
20
30
30
40
50
Condensation
Re-heating
For saturated air atatmospheric pressure
22.8
17.2 g/m3
1
325.6
2°C 15°C 25°C
Figure 25.15 Condensation in refrigeration drying of saturated air.
25.4 Energy considerations
In Chapter 6 on Air movers, the use of pre-cooling systems for compressors was intro-
duced and it was mentioned that significant energy savings could be made. In order to
be able to assess the energy requirements for this type of system the energy model is
presented here. From the above consideration of moisture and condensation it will be
seen that the analysis will have to include elements for air, water and steam.
25.4.1 Steady Flow Energy Equation
The Steady Flow Energy Equation in its full form is as follows:
(25.14)
where Q.
is the heat transfer (kW); W., the work transfer (kW); m
., the mass flow rate (kg/s);
h, the specific enthalpy (kJ/kg); C, the velocity (m/s); g, the gravitational acceleration
(m/s2); z, the elevation (m) and subscripts 1 and 2 relate to inlet and outlet conditions.
Some of these energy quantities may be zero, such as heat and work transfers, and
many will be negligibly small, such as changes in kinetic and potential energy. The
mass flow rate, m., terms will apply to each constituent; air, water and steam.
Note that:
h � u � pv kJ/kg (25.15)
� Cpt kJ/kg (25.16)
where
(25.17)u C t (specific internal energy) kJ/kgv� ( )
˙ ˙ ˙ ( )˙ ˙
Q W m h hm
C Cmg
z z 1� � � � � � �2 22
12
2 12000 1000
( ) ( )
564 PNEUMATIC CONVEYING DESIGN GUIDE
0 10Dry-bulb temperature (°C)
20 30 40
10%
30%
0
Spe
cific
hum
idity
(g/
kg)
10
20
5
15
70% 50%
25
20
15
Wet-bulbtemperature
Relativehumidity
Re-heating
Cooling
Saturationline
100%
2
05
3
10
1
Figure 25.16 Cooling, condensing and re-heating atmospheric air.
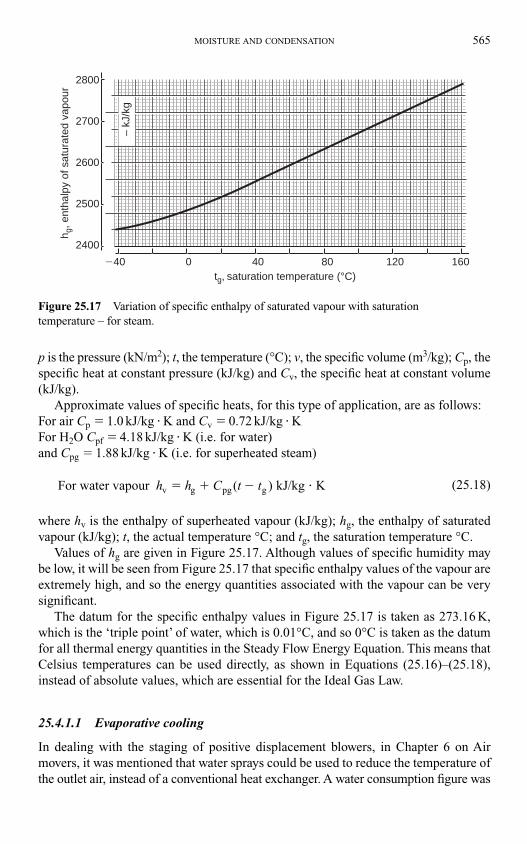
p is the pressure (kN/m2); t, the temperature (°C); v, the specific volume (m3/kg); Cp, the
specific heat at constant pressure (kJ/kg) and Cv, the specific heat at constant volume
(kJ/kg).
Approximate values of specific heats, for this type of application, are as follows:
For air Cp � 1.0 kJ/kg � K and Cv � 0.72 kJ/kg � K
For H2O Cpf � 4.18 kJ/kg � K (i.e. for water)
and Cpg � 1.88 kJ/kg � K (i.e. for superheated steam)
(25.18)
where hv is the enthalpy of superheated vapour (kJ/kg); hg, the enthalpy of saturated
vapour (kJ/kg); t, the actual temperature °C; and tg, the saturation temperature °C.
Values of hg are given in Figure 25.17. Although values of specific humidity may
be low, it will be seen from Figure 25.17 that specific enthalpy values of the vapour are
extremely high, and so the energy quantities associated with the vapour can be very
significant.
The datum for the specific enthalpy values in Figure 25.17 is taken as 273.16 K,
which is the ‘triple point’ of water, which is 0.01°C, and so 0°C is taken as the datum
for all thermal energy quantities in the Steady Flow Energy Equation. This means that
Celsius temperatures can be used directly, as shown in Equations (25.16)–(25.18),
instead of absolute values, which are essential for the Ideal Gas Law.
25.4.1.1 Evaporative cooling
In dealing with the staging of positive displacement blowers, in Chapter 6 on Air
movers, it was mentioned that water sprays could be used to reduce the temperature of
the outlet air, instead of a conventional heat exchanger. A water consumption figure was
For water vapour kJ/kg Kv g pg gh h C t t� � � �( )
MOISTURE AND CONDENSATION 565
�40
2400
2500
2600
2700
2800
– kJ
/kg
0 40 80 160120tg, saturation temperature (°C)
h g, e
ntha
lpy
of s
atur
ated
vap
our
Figure 25.17 Variation of specific enthalpy of saturated vapour with saturation
temperature – for steam.
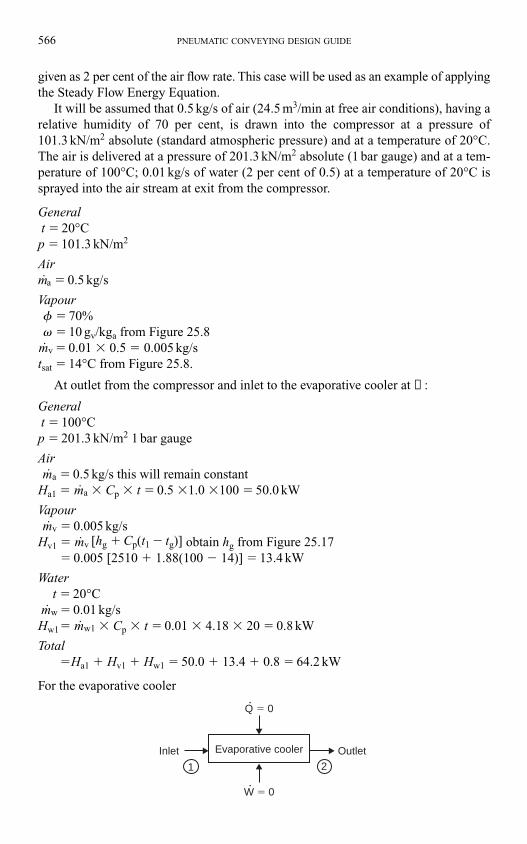
given as 2 per cent of the air flow rate. This case will be used as an example of applying
the Steady Flow Energy Equation.
It will be assumed that 0.5 kg/s of air (24.5 m3/min at free air conditions), having a
relative humidity of 70 per cent, is drawn into the compressor at a pressure of
101.3 kN/m2 absolute (standard atmospheric pressure) and at a temperature of 20°C.
The air is delivered at a pressure of 201.3 kN/m2 absolute (1 bar gauge) and at a tem-
perature of 100°C; 0.01 kg/s of water (2 per cent of 0.5) at a temperature of 20°C is
sprayed into the air stream at exit from the compressor.
Generalt � 20°C
p � 101.3 kN/m2
Airm.a � 0.5 kg/s
Vapour� � 70%
� � 10 gv/kga from Figure 25.8
m.
v � 0.01 � 0.5 � 0.005 kg/s
tsat � 14°C from Figure 25.8.
At outlet from the compressor and inlet to the evaporative cooler at ➀ :
Generalt � 100°C
p � 201.3 kN/m2 1 bar gauge
Airm.
a � 0.5 kg/s this will remain constant
Ha1 � m.a � Cp � t � 0.5 �1.0 �100 � 50.0 kW
Vapourm.
v � 0.005 kg/s
Hv1 � m.v [hg � Cp(t1 � tg)] obtain hg from Figure 25.17
� 0.005 [2510 � 1.88(100 � 14)] � 13.4 kW
Watert � 20°C
m.w � 0.01 kg/s
Hw1� m.w1 � Cp � t � 0.01 � 4.18 � 20 � 0.8 kW
Total�Ha1 � Hv1 � Hw1 � 50.0 � 13.4 � 0.8 � 64.2 kW
For the evaporative cooler
Evaporative coolerInlet Outlet
Q � 0•
W � 0•
1 2
566 PNEUMATIC CONVEYING DESIGN GUIDE
For the evaporative cooler it can be assumed that there will be no work done, and heat
exchange with the surroundings can be neglected. It can also be assumed that all
kinetic and potential energies can be disregarded. Thus the only energy into the sys-
tem is that of the enthalpies of the air, water and vapour, as evaluated above at 64.2 kW.
At outlet it will be assumed that all the water is evaporated and so only the enthalpies
of the air and vapour need be taken into account.
At outlet from the evaporative cooler at ②:
Generalt � t2 this is unknown and has to be evaluated
p � 201.3 kN/m2
Airm.
a � 0.5 kg/s
Ha2 � m.a � Cp � t2 � 0.5 �1.0 � t2 � 0.5t2kW
Waterm.w � 0 assume all evaporated
Vapourm.
v � 0.005 � 0.01 � 0.015 kg/s
Hv2 � m.v2[hg � Cp(t2 � tg)]
This will be a ‘trial and error’ solution since hg is a function of t2.If, for a first approximation, it is assumed that the vapour leaving the evaporative
cooler is saturated, and that t2 will be approximately 50°C, hg can be taken as
2590 kJ/kg (from Figure 25.17) and a balance gives:
64.2 � 0.5t2 � (0.015 � 2590)
from which
t2 � 50.7°C
To provide a check on this temperature, and the fact that the water has all evaporated,
Equation (25.12) can be used to evaluate the relative humidity.
The specific humidity of the air leaving the evaporative cooler, if all the water has
evaporated, will be, from Equation (25.1):
Substituting this into Equation (25.12) gives:
From which the relative humidity is 75 per cent, and so all the water will have evapo-
rated, residence time permitting. From this it will be seen that the cooling effect of water,
because of the very high enthalpy of evaporation, hfg, can be very effective, and that the
enthalpy term for vapour should always be included in any energy analysis of a system.
30201 3
622 12.33
12.33�
�
�
�
�.
� 0.015
0.5 1000 30 g kgv
a
v a� � � �˙
˙/
m
m
MOISTURE AND CONDENSATION 567
25.4.1.2 Flash drying
A flash dryer is essentially a pneumatic conveying system. It consists mainly of a ver-
tically upward section of duct. Wet material is fed in at the bottom and is conveyed up
by hot air or gas. The dried material is removed either by cyclone separator or bag fil-
ter. The vertically upward flow allows intimate mixing, and a reasonable residence time
for the necessary mass transfer process to take place. The evaporation of the moisture
from the wet material rapidly cools the hot air, and so the method of drying is gener-
ally suitable for most powdered and granular materials, including many heat sensitive
products.
The Steady Flow Energy Equation can be used to model this type of system also,
knowing the moisture content and flow rate of the feed material. As with the evapora-
tive cooling case considered above, there will be no work transfer, heat transfer to the
surroundings can be neglected, and changes in kinetic and potential energy can gener-
ally be neglected. In addition to allowing for flows of water, air and vapour, however,
account also has to be taken of the conveyed material. Specific heat values of a number
of materials were given in Table 9.4.
25.4.1.3 Vacuum drying
In the heating of a material the driving force is temperature difference, and the greater
the temperature difference the faster the material will be heated, or cooled. For the
flow of a fluid the driving force is pressure difference. In the case of the drying of wet
bulk particulate materials the driving force is the difference in vapour pressure, and
this can reasonably be related to relative humidity difference. When the material is
wet, or frozen, the air in intimate contact with the material, in the boundary layer, will
be saturated and have a relative humidity of 100 per cent. The lower the relative
humidity of the body of drying air in contact with the material, the greater the drying
effect will be.
In the flash dryer, considered above, the drying air is given an extremely low value
of relative humidity by means of heating to a high temperature. Saturated air at 20°C,
when heated to 100°C, for example, will have a relative humidity of about 2 per cent.
Relative humidity, however, can be lowered in a similar manner by reducing pressure,
and this effect was shown earlier in Figure 25.5. Saturated air, at 20°C and atmospheric
pressure, will have a relative humidity of about 20 per cent when the pressure is
reduced to �0.8 bar of vacuum (21.3 kN/m2 absolute). A difference in temperature,
therefore, is not a necessary requirement for drying. Dehumidified air, dried with a
desiccant type dryer, can also be used to dry wet materials at atmospheric temperature.
Combinations of any of these three methods of reducing the relative humidity of the
drying air can be used to speed the process.
Vacuum drying of materials at very low pressures is usually a batch operation, and
as extremely low values of relative humidity can be achieved, the drying process is
reasonably quick. With no requirement for heat it is ideal for heat sensitive materials.
With the potential for achieving very low values of relative humidity, particularly when
the atmospheric air is fairly dry, consideration must be given to the drying of materials
when pneumatically conveyed in vacuum conveying systems.
568 PNEUMATIC CONVEYING DESIGN GUIDE
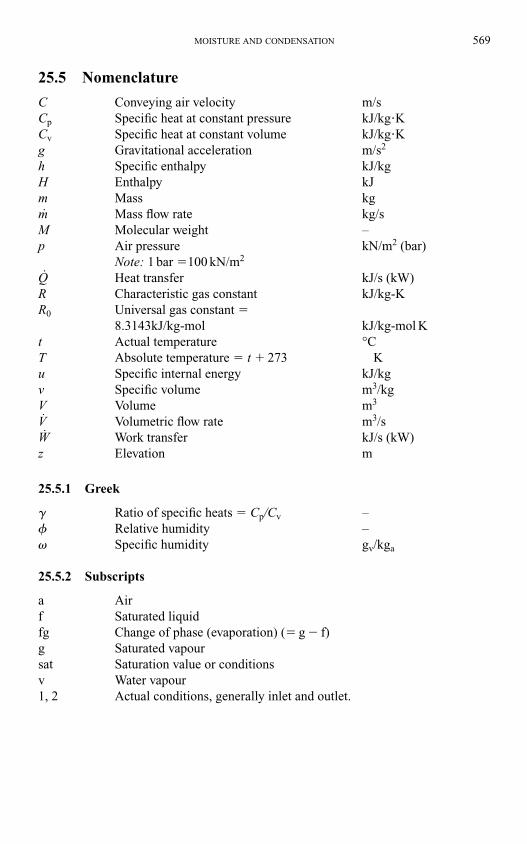
25.5 Nomenclature
C Conveying air velocity m/s
Cp Specific heat at constant pressure kJ/kg�KCv Specific heat at constant volume kJ/kg�Kg Gravitational acceleration m/s2
h Specific enthalpy kJ/kg
H Enthalpy kJ
m Mass kg
m.
Mass flow rate kg/s
M Molecular weight –
p Air pressure kN/m2 (bar)
Note: 1 bar �100 kN/m2
Q.
Heat transfer kJ/s (kW)
R Characteristic gas constant kJ/kg-K
R0 Universal gas constant �8.3143kJ/kg-mol kJ/kg-mol K
t Actual temperature °C
T Absolute temperature � t � 273 K
u Specific internal energy kJ/kg
v Specific volume m3/kg
V Volume m3
V.
Volumetric flow rate m3/s
W.
Work transfer kJ/s (kW)
z Elevation m
25.5.1 Greek
� Ratio of specific heats � Cp/Cv –
� Relative humidity –
� Specific humidity gv/kga
25.5.2 Subscripts
a Air
f Saturated liquid
fg Change of phase (evaporation) (� g � f)
g Saturated vapour
sat Saturation value or conditions
v Water vapour
1, 2 Actual conditions, generally inlet and outlet.
MOISTURE AND CONDENSATION 569
26.1 Introduction
Pneumatic conveying systems are basically quite simple and are eminently suitable for
the safe transport of powdered and granular materials in factory, site and plant situ-
ations. The system requirements are a source of compressed gas, usually air, a feed
device, a conveying pipeline, and a receiver to disengage the conveyed material and
carrier gas. The system is totally enclosed, and if it is required, the system can operate
entirely without moving parts coming into contact with the conveyed material. High,
low or negative pressure air can be used to convey materials. For explosible materials,
an inert gas such as nitrogen can be employed instead of air.
26.1.1 System flexibility
With a suitable choice and arrangement of equipment, materials can be conveyed from
a hopper or silo in one location, to another location some distance away. Considerable
flexibility in both plant layout and operation are possible, such that multiple point feed-
ing can be made into a common line, and a single line can be discharged into a number
of receiving hoppers. With vacuum systems, materials can be picked up from open stor-
age or stockpiles, and they are ideal for clearing dust accumulations and spillages.
Pneumatic conveying systems are particularly versatile. A very wide range of mate-
rials can be handled, and they are totally enclosed by the system and pipeline. This
means that potentially hazardous materials can be conveyed quite safely, with the cor-
rect choice of system and components. There is minimal risk of dust generation, and
so these systems generally meet the requirements of any local Health and Safety leg-
islation with little or no difficulty.
26.1.2 Industries and materials
A wide variety of materials are handled in powdered and granular form, and a large
number of different industries have processes that involve their transfer and storage.
Some of the industries in which bulk materials are conveyed include agriculture, min-
ing, chemicals, pharmaceuticals, paint, rubber and metal refining and processing. In
agriculture very large tonnages of harvested materials such as grain and rice are han-
dled, as well as processed materials such as animal feed. Fertilizers represent a large
allied industry with a wide variety of materials. A vast range of food products, from
Chapter 26
Health and safety
flour to sugar and tea to coffee and milk powder, are conveyed pneumatically in
numerous manufacturing processes. Confectionery is an industry in which many of
these materials are also handled.
26.1.3 Mode of conveying
Much confusion exists over how materials are conveyed through a pipeline and to the
terminology given to the mode of flow. First it must be recognized that materials can
either be conveyed in batches through a pipeline, or they can be conveyed on a con-
tinuous basis, 24 h a day if necessary. In batch conveying the material may be con-
veyed as a single plug if the batch size is relatively small. For continuous conveying,
and batch conveying if the batch size is large, two modes of conveying are recognized.
These are dilute and dense phase flow and are considered in detail in Section 1.2.3.
26.1.4 System integration
Dust, mess and spillage that are often found surrounding bulk solids handling plant
are not generally caused by pneumatic conveying systems. Feeders for pneumatic con-
veying systems, for example, usually fit under hoppers, and these in turn are fed from
above by other systems, such as belts, bucket elevators and chain and flight (en-masse)
conveyors. Dust and mess in the area often comes from poor integration of the
mechanical conveyor with the hopper, and not with the pneumatic conveyor. In terms
of plant safety, therefore, due consideration must be given to the interfacing of differ-
ent systems, particularly if they are operating in series.
Pneumatic conveying systems provide a totally enclosed environment throughout
for the transport of materials, and along the conveying route there are no moving parts
at all, unless diverter valves are employed for multiple point off-loading. Some feed-
ing devices, such as blow tanks, venturis and vacuum nozzles have no moving parts,
apart from valves opening and closing at the start and end of the process. Although
pneumatic conveying systems are capable of releasing dust into the atmosphere, it
generally occurs only as a result of a fault situation, and is not an endemic problem
with the conveying system.
26.2 Dust risks
Many dusts represent a very significant health hazard. If these materials are to be con-
veyed it is essential that any dust associated with the material should remain within the
conveying system while being transported. If any material is deemed to be toxic to any
degree there should be no possibility of any dust being released into the atmosphere.
There is also a wide range of materials, which, in a finely divided state, dispersed in
air, will propagate a flame through the suspension if ignited.
These materials include foodstuffs such as sugar, flour and cocoa, synthetic mater-
ials such as plastics, chemical and pharmaceutical products, metal powders, and fuels
such as coal, coke and sawdust. If conveyed with air there is the possibility of a dust
explosion within the system. If the dust is released from the system there is the possi-
bility of a dust explosion external to the conveying system.
HEALTH AND SAFETY 571
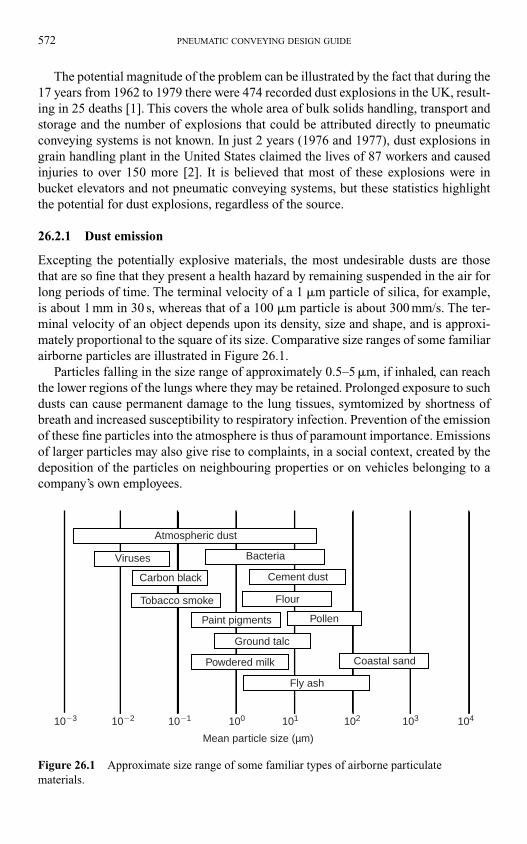
The potential magnitude of the problem can be illustrated by the fact that during the
17 years from 1962 to 1979 there were 474 recorded dust explosions in the UK, result-
ing in 25 deaths [1]. This covers the whole area of bulk solids handling, transport and
storage and the number of explosions that could be attributed directly to pneumatic
conveying systems is not known. In just 2 years (1976 and 1977), dust explosions in
grain handling plant in the United States claimed the lives of 87 workers and caused
injuries to over 150 more [2]. It is believed that most of these explosions were in
bucket elevators and not pneumatic conveying systems, but these statistics highlight
the potential for dust explosions, regardless of the source.
26.2.1 Dust emission
Excepting the potentially explosive materials, the most undesirable dusts are those
that are so fine that they present a health hazard by remaining suspended in the air for
long periods of time. The terminal velocity of a 1 �m particle of silica, for example,
is about 1 mm in 30 s, whereas that of a 100 �m particle is about 300 mm/s. The ter-
minal velocity of an object depends upon its density, size and shape, and is approxi-
mately proportional to the square of its size. Comparative size ranges of some familiar
airborne particles are illustrated in Figure 26.1.
Particles falling in the size range of approximately 0.5–5 �m, if inhaled, can reach
the lower regions of the lungs where they may be retained. Prolonged exposure to such
dusts can cause permanent damage to the lung tissues, symtomized by shortness of
breath and increased susceptibility to respiratory infection. Prevention of the emission
of these fine particles into the atmosphere is thus of paramount importance. Emissions
of larger particles may also give rise to complaints, in a social context, created by the
deposition of the particles on neighbouring properties or on vehicles belonging to a
company’s own employees.
572 PNEUMATIC CONVEYING DESIGN GUIDE
Atmospheric dust
Viruses Bacteria
Carbon black Cement dust
Tobacco smoke Flour
Paint pigments Pollen
Ground talc
Powdered milk
Fly ash
Coastal sand
10�3 10�2 10�1 100 101 102 103 104
Mean particle size (µm)
Figure 26.1 Approximate size range of some familiar types of airborne particulate
materials.
26.2.1.1 Dust as a health hazard
When suspended in air the smallest particle visible to the naked eye is about 50–100 �m
in diameter, but it is the particles of 0.2–5 �m diameter that are most dangerous for the
lungs, as mentioned above. Thus the existence of visible dust gives only indirect evi-
dence of danger, as finer invisible particles will almost certainly be present as well. The
fact that no dust can be seen is no reliable indication that dangerous dust may not be
present in the air. The large visible particles in a dust cloud will quickly fall to the floor,
but it will take many hours for the fine dangerous particles to reach the ground.
Airborne dusts that may be encountered in industrial situations are generally less
than about 10 �m in size and can be taken into the body by ingestion, skin absorption
or inhalation. The former is rarely a serious problem, but diseases of the skin are of not
infrequent occurrence. Allergic reactions are known to be caused by powders contain-
ing, for example, metals such as chrome, nickel and cobalt. It is, however, inhalation
that presents the greatest hazards for workers in a dusty environment.
Relatively large particles of dust that have been inhaled and become deposited in the
respiratory system will usually be carried back to the mouth by cilliary action and be
subsequently swallowed or expectorated. At the other extreme, ultra-fine particles (less
than about 0.2 �m) that become deposited are likely to pass relatively quickly, generally
into solution in the extra-cellular fluids of the lung tissues. Much of this is excreted by
the kidneys, either unchanged or after detoxication by the liver. This is the fate of many
systemic poisons, for example lead, which gain entry to the body via the lungs [3].
Inhaled particles with the approximate size range of 0.2–5 �m can reach the lower
regions of the lungs where they will probably be retained. Prolonged exposure to such
dusts can cause various diseases, most of them potentially serious, and often resulting
in permanent damage to the lung tissues. The best known are probably the diseases
collectively designated ‘pneumoconiosis’ and characterized by chronic fibrosis of the
lungs as a result of continuous inhalation of mineral dusts such as silica, asbestos and
coal. Generally the symptoms are a chronic shortage of breath and increased suscep-
tibility to respiratory infection. Other dust-related diseases include pneumonitis (an
acute inflammation of the lung tissue or bronchioles) and lung cancer.
The relative dangers of some common dusts are compared in Table 26.1 in which
the minerals are conveniently classified in Groups I–IV [3].
26.2.1.2 Dust concentration limits
One of the criteria used in monitoring the compliance of companies with the 1974
Health and Safety at Work Act, and other relevant statutory provisions, is the concen-
tration of airborne dust. The measured concentration is compared with variously
defined ‘threshold limit values’ (TLVs) which are also functions of the duration of
exposure of personnel to the dust. The most commonly used definitions of threshold
limit value are [4]:
• TLV-TWA: time-weighted average concentration for a normal 8 h working day or
40 h week, to which most workers can be repeatedly exposed day after day, without
adverse effect.
HEALTH AND SAFETY 573
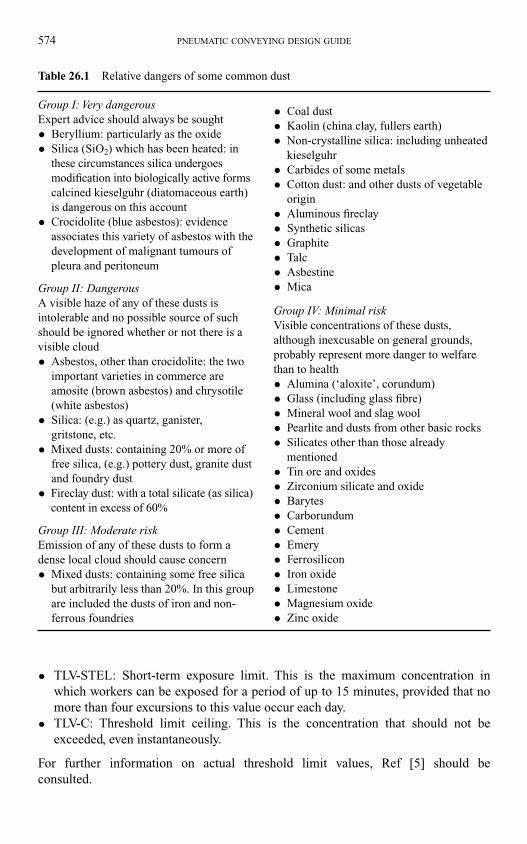
574 PNEUMATIC CONVEYING DESIGN GUIDE
• TLV-STEL: Short-term exposure limit. This is the maximum concentration in
which workers can be exposed for a period of up to 15 minutes, provided that no
more than four excursions to this value occur each day.
• TLV-C: Threshold limit ceiling. This is the concentration that should not be
exceeded, even instantaneously.
For further information on actual threshold limit values, Ref [5] should be
consulted.
Table 26.1 Relative dangers of some common dust
Group I: Very dangerousExpert advice should always be sought
• Beryllium: particularly as the oxide
• Silica (SiO2) which has been heated: in
these circumstances silica undergoes
modification into biologically active forms
calcined kieselguhr (diatomaceous earth)
is dangerous on this account
• Crocidolite (blue asbestos): evidence
associates this variety of asbestos with the
development of malignant tumours of
pleura and peritoneum
Group II: DangerousA visible haze of any of these dusts is
intolerable and no possible source of such
should be ignored whether or not there is a
visible cloud
• Asbestos, other than crocidolite: the two
important varieties in commerce are
amosite (brown asbestos) and chrysotile
(white asbestos)
• Silica: (e.g.) as quartz, ganister,
gritstone, etc.
• Mixed dusts: containing 20% or more of
free silica, (e.g.) pottery dust, granite dust
and foundry dust
• Fireclay dust: with a total silicate (as silica)
content in excess of 60%
Group III: Moderate riskEmission of any of these dusts to form a
dense local cloud should cause concern
• Mixed dusts: containing some free silica
but arbitrarily less than 20%. In this group
are included the dusts of iron and non-
ferrous foundries
• Coal dust
• Kaolin (china clay, fullers earth)
• Non-crystalline silica: including unheated
kieselguhr
• Carbides of some metals
• Cotton dust: and other dusts of vegetable
origin
• Aluminous fireclay
• Synthetic silicas
• Graphite
• Talc
• Asbestine
• Mica
Group IV: Minimal riskVisible concentrations of these dusts,
although inexcusable on general grounds,
probably represent more danger to welfare
than to health
• Alumina (‘aloxite’, corundum)
• Glass (including glass fibre)
• Mineral wool and slag wool
• Pearlite and dusts from other basic rocks
• Silicates other than those already
mentioned
• Tin ore and oxides
• Zirconium silicate and oxide
• Barytes
• Carborundum
• Cement
• Emery
• Ferrosilicon
• Iron oxide
• Limestone
• Magnesium oxide
• Zinc oxide
26.2.1.2 Dust suppression
Where a test for dustiness, or previous experience with a material, indicates that the
generation of dust is likely to present a problem, serious consideration should be given
to methods of reducing the material’s dustability. It may be appropriate to re-examine
the manufacturing process to see if the proportion of fines could be lessened. Agglo-
meration of the particles, for example by pelletizing, should have a significant effect.
If dust is generated during transport, it may be possible to change routing or conveying
parameters.
Total enclosure of the processing and handling plant is probably the most desirable
approach but, in addition to the high cost, there are obvious problems over accessibil-
ity. A generally more satisfactory arrangement is to use some kind of partial enclosure
or hood in conjunction with an exhaust system which will draw off the dusty air and
so minimize the dispersion of solid particles into the atmosphere. Dusty air collected
from a booth, hood or other type of partial or total enclosure must then be filtered, or
otherwise cleaned, before it can be released into the atmosphere.
26.2.2 Explosion risks
Apart from choking lungs, irritating eyes and blocking pores, some seemingly innocu-
ous dusts can ignite to cause fires. Many materials, in a dust cloud, can ignite and
cause an explosion which could be capable of demolishing a factory. A corn starch
powder explosion at General Foods, Banbury did just this in 1981. The company
pneumatically conveyed corn starch, used in custard powder production, from a trans-
fer hopper to feed bins, via a diverter valve.
An accumulation of corn starch on the operating cylinder caused a malfunction of
this diverter valve. When one hopper was full, the flow should have been diverted to
the next one. An already full hopper, therefore, was over-filled causing powder to be
dispersed into the surrounding atmosphere. The actual explosion therefore occurred,
external to the processing plant where the dust cloud was ignited by electrical arcing
from nearby electrical switchgear, burning nine men and blowing out brickwork and
windows on all four walls [6].
When an explosible dust cloud is ignited in the open air there is a flash fire but
little hazardous pressure develops. If the dust cloud is in a confined situation, however,
such as a conveyor or storage vessel, then ignition of the cloud will lead to a build-up
of pressure. The magnitude of this pressure depends upon the volume of the suspen-
sion, the nature of the material, and the rate of relief to atmosphere. Research has
shown that the particle size must be below about 200 �m for a hazard to exist.
At some point in a pneumatic conveying system, or time in the conveying cycle,
whether dilute or dense phase, positive or negative pressure, the material will be dis-
persed as a suspension. A typical point is at discharge into a receiving vessel and a
common time is during a transient operation such as start-up or shut-down. Consid-
eration, therefore, must be given to the possibility of an explosion and its effects on
the plant should a source of ignition be present.
Due to legal and Health and Safety Executive requirements it is advisable for spe-
cialist advice to be sought on dust explosion risks. Authoritative literature on the
HEALTH AND SAFETY 575
subject is widely available and there are many tests that can be carried out to determine
the seriousness of the problem. It is strongly recommended that a specialist in this field
is consulted if there is any doubt about the potential explosion risk connected with
pneumatically conveying any material.
26.2.2.1 Ignition sources
For an explosion to occur two conditions must be satisfied. Firstly, a sufficiently ener-
getic source of ignition must be provided and secondly the concentration of the mater-
ial in the air must be favourable. Two sources of ignition frequently met in industrial
plant are a hot surface and a spark. Consequently, the minimum ignition temperature
and the minimum ignition energy are the ignition characteristics commonly measured
in routine testing for explosibility.
Ignition temperature, however, is not constant for a given dust cloud, for it depends
upon the size and shape of the apparatus used to measure it. Minimum ignition tem-
peratures, therefore, are determined in a standardized form of apparatus, which
enables meaningful comparisons between materials to be made. Typical values of
minimum ignition temperature for sugar, coffee and cocoa are 350, 410 and 420°C,
respectively [8].
The minimum energy relates to ignition by sparks, whether produced be electricity,
friction or hot cutting. A characteristic of any form of spark is that a small particle or a
small volume of gas at high temperature is produced for a short period of time. Since it
is much easier for experimental purposes to measure the energy delivered by an elec-
tric spark than by friction or thermal processes, the routine test for determining this
characteristic uses an electric spark ignition source. Typical values of minimum igni-
tion energy for titanium, polystyrene and coal are 10, 15 and 60 mJ, respectively [7].
26.2.2.2 Explosibility limits
For a flame to propagate through a dust cloud the concentration of the material in air
must fall within a range which is defined by the lower and upper explosibility limits.
The lower explosibility limit, or minimum explosible concentration, may be defined as
the minimum concentration of material in a cloud or suspension necessary for sus-
tained flame propagation. This is a fairly well defined quantity and can be determined
reliably in small scale tests. Values are usually expressed in terms of the mass of mater-
ial per unit volume of air. Typical values for wood flour and grain dust are 40 and
55 g/m3, respectively [7].
As the concentration of the material is increased above the lower explosibility limit
the vigour of the explosion increases. When the dust concentration is increased
beyond the stoichiometric value, the dust has a quenching effect. Eventually a con-
centration is reached at which flame propagation no longer occurs. This concentration
is the upper explosion limit. This limit is not as easy to determine because of the dif-
ficulty of achieving a uniform dispersion of the material. From values that have been
determined it would appear that for most common materials the upper limit is prob-
ably in the range of 2–10 kg/m3. This is equivalent to solids loading ratios of about
1.5–8, which covers the major part of the dilute phase conveying range.
576 PNEUMATIC CONVEYING DESIGN GUIDE
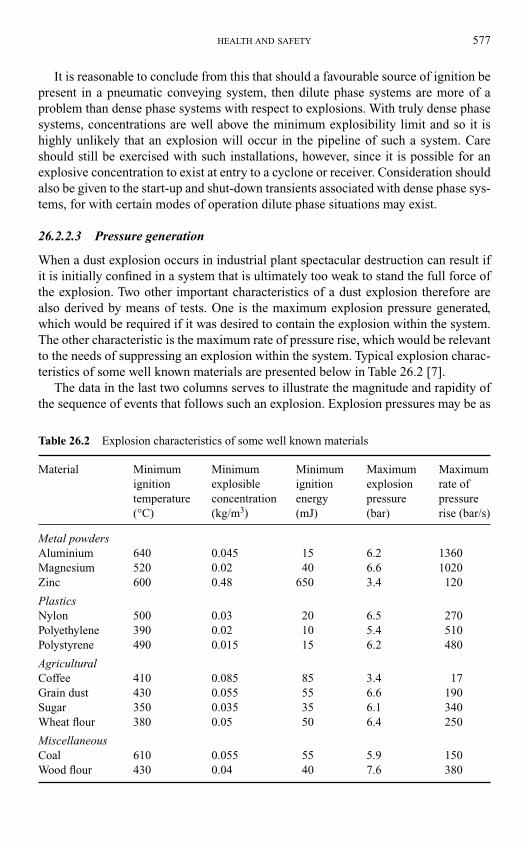
HEALTH AND SAFETY 577
It is reasonable to conclude from this that should a favourable source of ignition be
present in a pneumatic conveying system, then dilute phase systems are more of a
problem than dense phase systems with respect to explosions. With truly dense phase
systems, concentrations are well above the minimum explosibility limit and so it is
highly unlikely that an explosion will occur in the pipeline of such a system. Care
should still be exercised with such installations, however, since it is possible for an
explosive concentration to exist at entry to a cyclone or receiver. Consideration should
also be given to the start-up and shut-down transients associated with dense phase sys-
tems, for with certain modes of operation dilute phase situations may exist.
26.2.2.3 Pressure generation
When a dust explosion occurs in industrial plant spectacular destruction can result if
it is initially confined in a system that is ultimately too weak to stand the full force of
the explosion. Two other important characteristics of a dust explosion therefore are
also derived by means of tests. One is the maximum explosion pressure generated,
which would be required if it was desired to contain the explosion within the system.
The other characteristic is the maximum rate of pressure rise, which would be relevant
to the needs of suppressing an explosion within the system. Typical explosion charac-
teristics of some well known materials are presented below in Table 26.2 [7].
The data in the last two columns serves to illustrate the magnitude and rapidity of
the sequence of events that follows such an explosion. Explosion pressures may be as
Table 26.2 Explosion characteristics of some well known materials
Material Minimum Minimum Minimum Maximum Maximum
ignition explosible ignition explosion rate of
temperature concentration energy pressure pressure
(°C) (kg/m3) (mJ) (bar) rise (bar/s)
Metal powdersAluminium 640 0.045 15 6.2 1360
Magnesium 520 0.02 40 6.6 1020
Zinc 600 0.48 650 3.4 120
PlasticsNylon 500 0.03 20 6.5 270
Polyethylene 390 0.02 10 5.4 510
Polystyrene 490 0.015 15 6.2 480
AgriculturalCoffee 410 0.085 85 3.4 17
Grain dust 430 0.055 55 6.6 190
Sugar 350 0.035 35 6.1 340
Wheat flour 380 0.05 50 6.4 250
MiscellaneousCoal 610 0.055 55 5.9 150
Wood flour 430 0.04 40 7.6 380
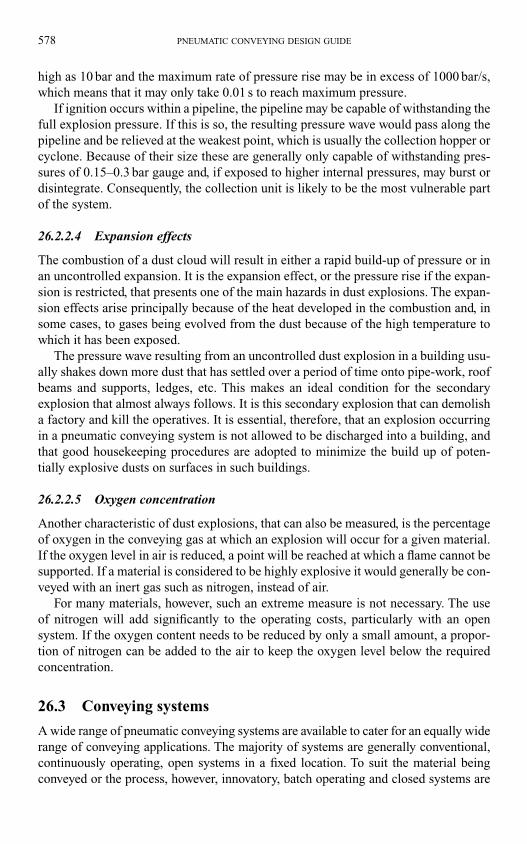
high as 10 bar and the maximum rate of pressure rise may be in excess of 1000 bar/s,
which means that it may only take 0.01 s to reach maximum pressure.
If ignition occurs within a pipeline, the pipeline may be capable of withstanding the
full explosion pressure. If this is so, the resulting pressure wave would pass along the
pipeline and be relieved at the weakest point, which is usually the collection hopper or
cyclone. Because of their size these are generally only capable of withstanding pres-
sures of 0.15–0.3 bar gauge and, if exposed to higher internal pressures, may burst or
disintegrate. Consequently, the collection unit is likely to be the most vulnerable part
of the system.
26.2.2.4 Expansion effects
The combustion of a dust cloud will result in either a rapid build-up of pressure or in
an uncontrolled expansion. It is the expansion effect, or the pressure rise if the expan-
sion is restricted, that presents one of the main hazards in dust explosions. The expan-
sion effects arise principally because of the heat developed in the combustion and, in
some cases, to gases being evolved from the dust because of the high temperature to
which it has been exposed.
The pressure wave resulting from an uncontrolled dust explosion in a building usu-
ally shakes down more dust that has settled over a period of time onto pipe-work, roof
beams and supports, ledges, etc. This makes an ideal condition for the secondary
explosion that almost always follows. It is this secondary explosion that can demolish
a factory and kill the operatives. It is essential, therefore, that an explosion occurring
in a pneumatic conveying system is not allowed to be discharged into a building, and
that good housekeeping procedures are adopted to minimize the build up of poten-
tially explosive dusts on surfaces in such buildings.
26.2.2.5 Oxygen concentration
Another characteristic of dust explosions, that can also be measured, is the percentage
of oxygen in the conveying gas at which an explosion will occur for a given material.
If the oxygen level in air is reduced, a point will be reached at which a flame cannot be
supported. If a material is considered to be highly explosive it would generally be con-
veyed with an inert gas such as nitrogen, instead of air.
For many materials, however, such an extreme measure is not necessary. The use
of nitrogen will add significantly to the operating costs, particularly with an open
system. If the oxygen content needs to be reduced by only a small amount, a propor-
tion of nitrogen can be added to the air to keep the oxygen level below the required
concentration.
26.3 Conveying systems
A wide range of pneumatic conveying systems are available to cater for an equally wide
range of conveying applications. The majority of systems are generally conventional,
continuously operating, open systems in a fixed location. To suit the material being
conveyed or the process, however, innovatory, batch operating and closed systems are
578 PNEUMATIC CONVEYING DESIGN GUIDE
HEALTH AND SAFETY 579
commonly used, as well as mobile systems. To add to the complexity of selection,
systems can be either positive or negative pressure in operation, or a combination of
the two.
26.3.1 Closed systems
For the conveying of toxic or radioactive materials, where the air coming into contact
with the material must not be released into the atmosphere, or must be very closely
regulated, a closed system would be essential. A sketch of a typical system was given
in Figure 2.10 and is reproduced here as Figure 26.2 for reference. A closed system
may also be chosen to convey a potentially explosive material, typically with an inert
gas. In a closed system the gas can be re-circulated and so the operating costs, in terms
of inert gas, are significantly reduced.
A null point needs to be established in the gas only part of the system, where the
pressure is effectively atmospheric, and provision for make up or control of the con-
veying gas can be established here. If this null point is positioned after the blower the
conveying system can operate entirely under vacuum. If the null point is located
before the blower it will operate as a positive pressure system.
26.3.2 Open systems
Where strict environmental control is not necessary an open system is generally pre-
ferred, since the capital cost of the plant will be less, the operational complexity will
be reduced, and a much wider range of systems will be available. Most pneumatic con-
veying pipeline and channel systems can ensure totally enclosed material conveying,
and so with suitable gas–solid separation and venting, the vast majority of materials
can be handled quite safely in an open system. Many potentially combustible mater-
ials are conveyed in open systems by incorporating necessary safety features.
Heat exchanger
Supplyhopper
Back-up filter
Primary filter
Receptionhopper
Feeder
Blower
Figure 26.2 Closed loop pneumatic conveying system.
26.3.2.1 Positive pressure systems
Although positive pressure conveying systems discharging to a reception point at
atmospheric pressure are probably the most common of all pneumatic conveying sys-
tems, the feeding of a material into a pipeline in which there is air at a high pressure
does present a number of problems. A wide range of feeding devices is available that
can be used, as considered in Chapters 3 and 4. With each type of feeder, however,
there is the potential of air leaking from the system, and carrying dust with it, as a
result of the adverse pressure gradient.
With the use of diverter valves, multiple delivery to a number of reception points
can be arranged very easily with positive pressure systems. Although multiple point
feeding into a common line can also be arranged, care must be taken with regard to the
potential for air leaking across a number of feeding points when not in use, as a result
of the high pressure air in the pipeline.
26.3.2.2 Negative pressure (vacuum) systems
Negative pressure systems are commonly used for drawing materials from multiple
sources to a single point. There is no adverse pressure difference across the feeding
device in a negative pressure system and so multiple point feeding into a common line
presents few problems. In comparison with a positive pressure system, however, the
filtration plant has to be much larger, as a higher volume of air has to be filtered under
vacuum conditions.
A particular advantage of negative pressure systems, whether open or closed, in
terms of potentially hazardous materials, is that should a pipeline coupling be inad-
vertently left un-tightened, or a bend in the pipeline fail, air will be drawn into a sys-
tem maintained under vacuum. With a positive pressure system a considerable amount
of dust could be released into the atmosphere before the plant could be shut down
safely. The author has personal experience here, for while conveying cement at
50 tonne/h a flexible hose connecting the blow tank with the pipeline came adrift when
the pressure in the line was three bar gauge. It can happen. If it had been a food prod-
uct, chemical or metal powder, that was being conveyed, the consequences could have
been very serious.
Vacuum systems are also widely used for clearing dust released into the atmos-
phere from many other bulk solids handling operations. This is generally achieved by
the use of ventilated hoods. This may be at a material transfer point in a mechanical
conveying system, or at a gravity loading station for sack filling from storage hoppers.
Mobile conveying systems such as road and rail vehicles require similar ventilation
systems when being loaded with bulk particulate materials.
26.4 System components
The selection of components for a pneumatic conveying system is as important as the
selection of the type of conveying system for a given duty. Air movers, pipeline feed-
ing devices and gas–solid separation systems, all have to be carefully considered and
there are multiple choices for each.
580 PNEUMATIC CONVEYING DESIGN GUIDE
HEALTH AND SAFETY 581
26.4.1 Blowers and compressors
With air movers a positive displacement machine is generally required. If a blower or
compressor is incorrectly specified, in terms of either pressure or volumetric flow rate,
the pipeline is likely to block, and with a toxic material this will create its own hazards
since the pipeline will have to be unblocked by some means. A minimum gas velocity
must be maintained throughout the pipeline system to ensure satisfactory conveying,
and it must be remembered that all gases are compressible with respect to both pres-
sure and temperature when it comes to evaluating flow rates from specified velocities.
The compression process in most air movers is adiabatic and it is far from being
reversible. As a result, the temperature of the air leaving a compressor can be very
high. If, for example, air at 20°C is compressed to l bar gauge in a positive displace-
ment blower, the minimum temperature after compression, for a reversible process,
would be about 84°C, and with an isentropic efficiency of 80 per cent it would be
100°C. If the same air is compressed to 3 bar gauge in a screw compressor it will be
delivered at a temperature of about 200°C.
26.4.1.1 Oil free air
Oil free air is generally recommended for most pneumatic conveying systems and not
just those where the material must not be contaminated, such as food products, pharma-
ceuticals and chemicals. Lubricating oil, if used in an air compressor, can be carried
over with the air and can be trapped at bends in the pipeline or obstructions. Most
lubricating oils eventually break down into more carbonaceous matter which is prone
to spontaneous combustion, particularly in an oxygen rich environment, and where
frictional heating may be generated by moving particulate matter.
Although conventional coalescing after-filters can be fitted, which are highly effi-
cient at removing aerosol oil drops, oil in the super-heated phase will pass straight
through them. Super-heated oil vapour will turn back to liquid further down the pipe-
line if the air cools. Ultimately precipitation may occur, followed by oil breakdown,
and eventually a compressed air fire. The only safe solution, where oil injected com-
pressors are used, is to use chemical after-filters such as the carbon absorber type which
are capable of removing oil in both liquid droplet and super-heated phases. The solution,
however, is expensive and requires continuous maintenance, and replacement of carbon
filter cells.
26.4.2 Pipeline feeding
There have been numerous developments in pipeline feeders to meet the demands of
different material characteristics, and ever increasing pressure capabilities for long
distance and dense phase conveying. Although the majority of systems probably oper-
ate with positive displacement blowers at a pressure below one bar gauge, discharging
to atmospheric pressure, there is an increasing demand for conveying systems to feed
materials into chemical reactors and combustion systems which operate at a pressure
of 20 bar or more.
With positive pressure systems the main problem is feeding the material into a
pipeline which contains air at pressure. Due to adverse pressure it is almost impossible
to prevent air from leaking across the feeding device. This air will almost certainly carry
dust with it, and so if this air or dust must be controlled, some means of containment
must be incorporated into the conveying system.
26.4.2.1 Rotary valves
The rotary valve is probably the most commonly used device for feeding conveying
pipelines. By virtue of the moving parts and a need to maintain clearances between the
rotor blades and the casing, air will leak across the feeder when there is a pressure dif-
ference. Rotary valves are ideally suited to both positive pressure and vacuum con-
veying. The rotary valve is a positive displacement device and so feed rate can be
controlled fairly precisely by varying the speed of rotation. The situation with regard
to screw feeders is very similar, as these are also positive displacement devices. In
positive pressure systems air leakage can be minimized by reducing blade tip clear-
ances, increasing the number of rotor blades, and providing seals on the rotor end
plates, but it cannot be eliminated.
Air at pressure will always return with the empty pockets, apart from leaking past
blade tip clearances. The air leaking across a rotary valve will often restrict the flow of
material into a rotary valve from the supply hopper above. To minimize this influence
it is usual to vent a rotary valve in some way. A common device is to provide a vent on
the return side of the valve as shown earlier in Figure 22.3. Since the vented air will
contain some fine material, this is either directed back to the supply hopper, ducted to
a separate filter unit, or re-introduced back into the conveying pipeline.
As there will be a carry-over of material any filter used must be regularly cleaned,
otherwise it will rapidly block and cease to be effective. If the air is vented into the
supply hopper above, or to a separate filter, the pipe connecting the vent to the filter
unit must be designed and sized as if it were a miniature pneumatic conveying system,
in order to prevent it from getting blocked. With low pressure conveying systems a
venturi can be used to feed the dusty gas from the vent directly back into the pipeline.
If the material to be conveyed is potentially explosive, the use of rotary valves will
have to be questioned. With metal blades and a metal housing, a shower of sparks
would result if the two were to meet, and a single spark would provide an adequate
source of ignition for many materials. With positive pressure conveying systems
rotary valve blade tip clearances need to be very small and so differential expansion,
resulting from the handling of hot material, or bearing wear, could cause the two to
meet. Bearing failure on a rotary valve could well result in a surface at a sufficiently
high temperature to provide a necessary ignition source, both within and external to
the conveying system. In a fault situation dust can leak from a pressurized conveying
system and so bearings external to the system are vulnerable.
26.4.2.2 Blow tanks
The use of blow tanks has increased considerably in recent years and there have been
many developments with regard to type and configuration. A particular advantage
with these systems is that the blow tank also serves as the feeding device, and so many
of the problems associated with pressure differentials across the feeder are largely
582 PNEUMATIC CONVEYING DESIGN GUIDE
HEALTH AND SAFETY 583
eliminated. Blow tanks vary in size from a few cubic litres to 30 m3 or more, generally
depending upon the material flow rate required and the need to maintain a reasonable
rate of blow tank cycling.
With single blow tanks, conveying is by way of batches, but with a large blow tank
it may take many minutes to convey the batch, and so the material is likely to be con-
veyed on a semi-continuous basis. Although continuous air leakage does not occur
with blow tanks, as it does with rotary valves, consideration does have to be given to
the venting of the blow tank at the end of the conveying cycle, as well as on filling. A
similar situation exists with regard to gate valve feeders. Blow tanks generally form
the basis of mobile conveying systems, such as road and rail vehicles, and so special
provision must be made for venting these during filling operations.
If a discharge valve is not employed on a blow tank there will be a considerable
surge at the end of the conveying cycle as the pressurized air in the empty blow tank
has to be vented through the pipeline. This will represent a considerable loading on the
filtration plant and so it must be sized to take this transient situation into account. With
a discharge valve the blow tank can be isolated, once the blow tank is empty, and as a
consequence the cycling frequency can be increased quite considerably. In this case,
however, the pressurized air in the blow tank will have to be vented before the blow
tank can be re-filled and this will create a similar surge loading on the filter through
which this air passes.
26.5 Conveying operations
Consideration must be given to some conveying operations and the conveying of cer-
tain materials with regard to safety provisions. Mention has already been made of
start-up and shut-down transients, for example. In most dense phase conveying situ-
ations, the concentration of the material will be well above the value at which an explo-
sion would be possible. During transient operation, however, and plant shut-down in
particular, the concentration of the material in the air cannot be guaranteed to be above
the required value while the system is being purged. Regardless of the conveying sys-
tem and the mode of conveying, however, the material will generally be discharged
into a receiving vessel, where there is every possibility of the material being dispersed
in a low concentration cloud.
Pneumatic conveying is an extremely aggressive means of conveying materials,
and particularly so in dilute phase conveying where high gas velocities are required.
As a result abrasive particles can cause severe wear of the conveying plant and friable
particles can suffer considerable degradation. The consequences of these influences
must be given every consideration.
26.5.1 Tramp materials
High conveying air velocities also mean that tramp materials can be conveyed through
the pipeline with the material being conveyed. It is possible for nuts, bolts and washers
to find their way into the conveyed material, somewhere in the system, and these will
be conveyed quite successfully through the pipeline, with the potential of generating
showers of sparks, as they will inevitably make numerous contacts with the bends and
pipeline walls in their passage through the pipeline.
26.5.2 Static electricity
Whenever two dissimilar materials come into contact, a charge is transferred between
them. The amount of charge transfer depends upon the type of contact made, as well
as on the nature of the materials. Almost all bulk solids acquire an electrostatic charge
in conveying and handling operations. In a large number of cases the amount of charge
generated is too small to have any noticeable effect, but in many cases appreciable
charge generation can occur, resulting in high electric fields. Very often these are just
a nuisance, but occasionally they can attain hazardous levels. In all cases where dust
clouds are present the build-up of an electrostatic charge should be prevented.
Pneumatic conveying systems are prolific generators of static electricity. Frictional
charging of the particles moving along the walls of a pipeline can lead to a carry-over
of net charge into the receiving hopper. In the case of non-conducting materials a
build-up of charge might occur in the receiving vessel, because of the difficulties of
leakage through an insulating medium. In the case of conducting solids, electrostatic
problems can still arise when the particles are suspended in air. In such a case the air
prevents the electric charge on each individual particle from leaking away.
It is possible, therefore, for high electric fields to exist in receiving hoppers. In
many cases the charge may reach the breakdown level for air and produce a spark.
Such a spark may have sufficient energy to provide the necessary source of ignition
for the dust cloud in the vessel, and hence cause an explosion. A ‘rule of thumb’ value
of 25 mJ is often taken, and materials with ignition energies less than this may be
regarded as being particularly prone to ignition by static electricity (see Table 26.2). In
these cases special precautions should be taken.
26.5.2.1 Earthing
From an electrostatic point of view, pneumatic conveying lines should be constructed of
metal and be securely bonded to earth. All flanged joints in the pipe-work should main-
tain electrical continuity across them, to reduce the chance of arc-over within the pipe.
Particular attention should be given to areas where rubber or plastic is inserted for anti-
vibration purposes, and where sight glasses are positioned in pipelines. Regular routine
checks of the integrity of the earthing of all metal parts of the system should be carried
out. The use of well grounded facilities can help to reduce these potential hazards.
Although certainly safer than systems that have plastic sections, where charge can
build up, earthed metal systems will not ensure that the system is safe. Metal pipes pro-
vide a very effective source of charge for particles conveyed through them. The charge
created on the pipe will flow instantly to earth, but that on the particles may remain for
long periods. The storage potential is particularly important with regard to operations
subsequent to conveying, for it is quite possible for such a charge on a material to be
transferred to operatives.
If this occurred in the presence of an appropriate concentration of the material, the
spark could provide the necessary ignition energy to cause an explosion. In this case
584 PNEUMATIC CONVEYING DESIGN GUIDE
special precautions should be taken, including the use of anti-static clothing and con-
ducting footwear by all people in direct contact with a dust cloud. These, however,
would be quite useless if they were to be used on a highly insulated floor, such as is
often found in modern buildings. The operatives should stand on an earthed metal grid
or plate at the point of operation.
26.5.2.2 Humidity control
Static generation on a material increases as the relative humidity of the surrounding
air decreases and since it is more difficult to generate and store charges under more
humid conditions, increasing the relative humidity of the conveying air to 60–75 per
cent may also be used as a means of controlling the problem. The use of humidity for
charge control is obviously not suitable for hygroscopic materials, and must be con-
sidered in relation to the possibility of condensation and freezing in any application.
26.5.3 Particle attrition
Of those materials that are explosible, research has shown that it is only the fraction
with a particle size less than about 200 �m that poses the problem. If a size analysis of
a material to be conveyed shows that there is no significant amount of material below
this size, the possibility of an explosion occurring during its conveying should not be
dismissed. Degradation caused by pneumatic conveying can result in the generation of
a considerable number of fines, particularly if the material is friable. This point was
illustrated earlier in Figure 24.2 which shows the possible fractional size distribution
of a material both before and after conveying.
Initially the material had a mean particle size of about 350 �m, with a typically
Gaussian distribution, and contained essentially no material below 200 �m in size.
After conveying the mean particle size of the material was about 280 �m. The really
significant effect, however, is shown in the fractional size plot in Figure 24.2. A con-
siderable number of fines can be produced and even on a percentage mass basis these
can cause a significant secondary peak in the particle size distribution. This is likely to
occur with a very friable material, such as granulated sugar, when conveyed at high
velocity over a long distance in a pipeline with a large number of bends. In terms of
explosion risks the material after conveying could be a serious contender.
26.5.4 Erosive wear
Many materials that require conveying are abrasive. These include some of the larger
bulk commodities such as cement, alumina, fly ash and silica sand. With a conveying
air velocity of only 20 m/s silica sand is capable of wearing a hole in a conventional
steel bend in a pipeline in less than 2 h. Erosive wear can be reduced with wear resist-
ant materials and special bends, but it cannot be eliminated. Even straight pipeline is
prone to wear under some circumstances.
If an abrasive material has to be conveyed, therefore, consideration must be given
to the possibility of a bend or some other component in the system failing, with the
consequent release of dust, particularly with a positive pressure conveying system.
HEALTH AND SAFETY 585
Bends are available that have detectors embedded into them so that notice can be given
in advance of an impending failure.
26.5.5 Material deposition
In long straight horizontal pipe runs, and large diameter pipelines, there is the possi-
bility of material coming out of suspension in dilute phase conveying and depositing
on the bottom of the pipeline. Accumulations of material such as pulverized coal in
a pipeline could result in a fire, through spontaneous combustion, and possibly an
explosion. An increase in conveying air velocity will generally help to reduce the
problem but this is not an ideal solution. A disturbance to the flow with a turbulence
generator usually cures the problem.
Food products, of course, will deteriorate if left in pipelines, and contamination of
subsequent product could result. Since it is unlikely to be known whether such depos-
ition occurs or not, it is necessary to physically clean all lines periodically. For food
and pharmaceutical products, pipelines and all valves and components that could pos-
sibly come into contact with the material being conveyed are likely to be made of
stainless steel. A particular problem with carbon steel is that it is liable to rust, as a
result of condensation in the pipeline, and so contaminate the material.
26.5.5.1 Pipeline purging
If a pipeline is to be purged with the conveying air, in order to clear it of material,
radiused bends should be used rather than blind tees. Blind tees are used in pipelines
because they will trap the conveyed material and so provide protection to a bend from
abrasive particles, since the particles will impact against each other rather than the
bend wall. Material will require a much longer purging time to be completely cleared
from blind tees. If additional air is available for purging, the process will be more
effective. Air stored in a receiver will help here, particularly if it is at pressure, but care
must be taken not to overload the filtration plant during this operation.
In dense phase conveying, air velocities employed are very much lower than those
required for dilute phase conveying. Pipeline purging can be a major problem if add-
itional air is not available. If high pressure air is used for conveying a material it is
common for the pipeline to be stepped to a larger bore along its length once or twice
in order to allow the air to expand and so prevent excessive velocities from occurring
towards the end of the pipeline. This does, however, create problems if such a pipeline
needs to be purged clear, for the purging velocity will decrease at each step to a larger
bore and so considerably more air would be needed for the purpose (see Figure 9.16).
26.5.6 Power failure
The consequences of a power failure on system operation need to be considered at the
design stage so that back-up systems and preventative measures can be incorporated
at the time of installation. With a pneumatic conveying system the plant will generally
shut itself down safely on loss of power, but whether it can be started up again will
depend upon the type of conveying system, pipeline routing, mode of conveying and
material properties.
586 PNEUMATIC CONVEYING DESIGN GUIDE
In many cases the pipeline will block and the only method of restarting the system
will be to physically remove the material from where the pipeline is blocked, usually
at the bottom of a vertical lift. If this is not an option then a stand-by power system
must be available to take over. Alternatively an air receiver can be built into the air
supply system, and this will provide air to purge the lines sufficiently clear of material
so that the system can be restarted when power is reinstated (see Figure 20.9).
If the possibility of the pipeline becoming blocked from any eventuality must be
avoided, consideration should be given to the use of an innovatory system. In ‘con-
ventional systems’ the material is simply blown or sucked through the pipeline. In
‘innovatory systems’ the material is either conditioned as it is fed into the pipeline, or
along the length of the pipeline. There is no difference in any of the basic system com-
ponents employed.
Air pulsing or trace air lines are generally employed. Parallel lines are used either
to inject air into the pipeline, to give the material artificial air retention, or to allow the
air within the pipeline to by-pass short sections of material, to give the material artifi-
cial permeability. Depending upon the properties of the material to be conveyed, one
or other of these innovatory systems will generally guarantee that the pipeline can be
restarted on full load.
26.6 Explosion protection
Despite the fact that the potential for an explosion in a pneumatic conveying system is
high, the demand for such systems also remains high. This is partly due to the fact that
the system totally encloses the material, such that dust generation external to the sys-
tem is virtually eliminated, and with a pipeline total flexibility in the conveying route
is possible without material transfer or staging. There are also a number of different
means by which a pneumatic conveying system can quite easily be protected.
Since the dispersion of powdered and granular materials in air is fundamental to
pneumatic conveying, it is evident that if a material is known or shown to be explosi-
ble, then consideration should be given to the hazard that this presents at the design
stage of a system, or when re-commissioning an existing system to convey a different
material. While it is equally obvious that the generation of sources of ignition should be
minimized, unforeseen mechanical, electrical or human failures mean that the complete
elimination of ignition sources cannot be relied upon, particularly where powered
machinery is involved.
To avoid the potentially catastrophic effects of an explosion, therefore, reliance is
normally placed on the adequate functioning of a means of protection for the system.
Such protection is normally based on one or more of the following approaches:
1. Minimizing sources of ignition and prevention of ignition.
2. Allowing the explosion to take its full course but ensuring that it does so safely by
either containment or explosion relief venting.
3. Detection and suppression.
The method of protection selected will depend upon a number of factors. These include
the design of any associated plant or process, the running costs, the economics of
HEALTH AND SAFETY 587
alternative protection methods, the explosibility of the material, and the extent to
which an explosion and its consequences can be foreseen, together with the require-
ments of any local regulatory authorities concerned.
26.6.1 Minimizing sources and prevention of ignition
The first step in any explosion protection programme is to minimize or eliminate, as far
as possible, all potential sources of ignition. The minimum ignition temperature is rele-
vant to ignition by hot surfaces. Rotary valve bearings have already been mentioned in
this context, as an example, and welding operations on any part of the system should
be prohibited while the system is operating. The possibility of sparks must also be
reviewed, with due consideration given to valve operations, friction with conveyed
materials, and electrostatic generation.
26.6.1.1 Inerting
Prevention of ignition can be guaranteed by using an inert gas such as nitrogen for
conveying the material. Alternatively, nitrogen can be added to the air in order to
reduce the percentage of oxygen present in the conveying air to a level at which a
flame cannot be supported. The maximum oxygen concentration is one of the many
standard tests that can be carried out with a material, as mentioned earlier. Since inert
gases are rather expensive, these methods are generally used with closed loop systems
(see Figure 26.2).
26.6.2 Containment
The combustion of a dust cloud will result in either a rapid build up of pressure or in
an uncontrolled expansion. It is the expansion effect, or the pressure rise if the expan-
sion is restricted, that presents one of the main hazards in dust explosions. The expan-
sion effects arise principally because of the heat generated in the combustion and, in
some cases, to gases being evolved from the dust because of the high temperature to
which it has been exposed.
If the presence of evolved gases is neglected, the situation can be modelled very
approximately with the thermodynamic relationship (see Section 9.2.3):
If the explosion is confined, V1 will equal V2 and so the resulting pressure, p2, will be
given by:
Flame temperatures are typically a couple of thousand degrees and so it can be seen
that explosion pressures can reach 7 or 8 bar. The critical information from Table 26.2,
however, is that this pressure can be reached in milliseconds.
p pT
T2 12
1
� �
p V
T
p V
T1 1
1
2 2
2
�
588 PNEUMATIC CONVEYING DESIGN GUIDE
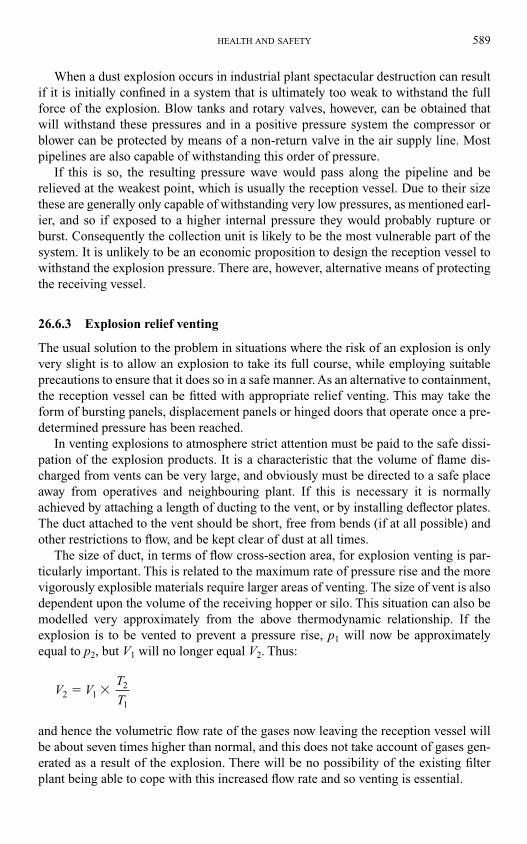
When a dust explosion occurs in industrial plant spectacular destruction can result
if it is initially confined in a system that is ultimately too weak to withstand the full
force of the explosion. Blow tanks and rotary valves, however, can be obtained that
will withstand these pressures and in a positive pressure system the compressor or
blower can be protected by means of a non-return valve in the air supply line. Most
pipelines are also capable of withstanding this order of pressure.
If this is so, the resulting pressure wave would pass along the pipeline and be
relieved at the weakest point, which is usually the reception vessel. Due to their size
these are generally only capable of withstanding very low pressures, as mentioned earl-
ier, and so if exposed to a higher internal pressure they would probably rupture or
burst. Consequently the collection unit is likely to be the most vulnerable part of the
system. It is unlikely to be an economic proposition to design the reception vessel to
withstand the explosion pressure. There are, however, alternative means of protecting
the receiving vessel.
26.6.3 Explosion relief venting
The usual solution to the problem in situations where the risk of an explosion is only
very slight is to allow an explosion to take its full course, while employing suitable
precautions to ensure that it does so in a safe manner. As an alternative to containment,
the reception vessel can be fitted with appropriate relief venting. This may take the
form of bursting panels, displacement panels or hinged doors that operate once a pre-
determined pressure has been reached.
In venting explosions to atmosphere strict attention must be paid to the safe dissi-
pation of the explosion products. It is a characteristic that the volume of flame dis-
charged from vents can be very large, and obviously must be directed to a safe place
away from operatives and neighbouring plant. If this is necessary it is normally
achieved by attaching a length of ducting to the vent, or by installing deflector plates.
The duct attached to the vent should be short, free from bends (if at all possible) and
other restrictions to flow, and be kept clear of dust at all times.
The size of duct, in terms of flow cross-section area, for explosion venting is par-
ticularly important. This is related to the maximum rate of pressure rise and the more
vigorously explosible materials require larger areas of venting. The size of vent is also
dependent upon the volume of the receiving hopper or silo. This situation can also be
modelled very approximately from the above thermodynamic relationship. If the
explosion is to be vented to prevent a pressure rise, p1 will now be approximately
equal to p2, but V1 will no longer equal V2. Thus:
and hence the volumetric flow rate of the gases now leaving the reception vessel will
be about seven times higher than normal, and this does not take account of gases gen-
erated as a result of the explosion. There will be no possibility of the existing filter
plant being able to cope with this increased flow rate and so venting is essential.
V VT
T2 12
1
� �
HEALTH AND SAFETY 589
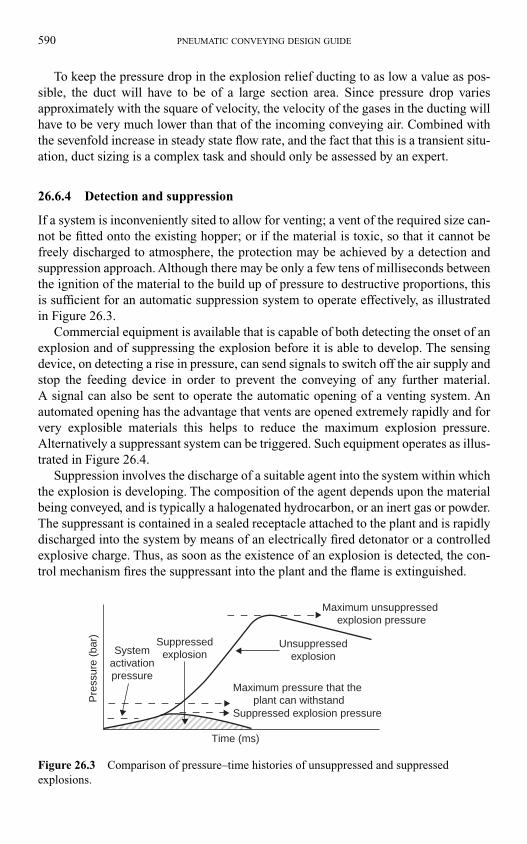
590 PNEUMATIC CONVEYING DESIGN GUIDE
To keep the pressure drop in the explosion relief ducting to as low a value as pos-
sible, the duct will have to be of a large section area. Since pressure drop varies
approximately with the square of velocity, the velocity of the gases in the ducting will
have to be very much lower than that of the incoming conveying air. Combined with
the sevenfold increase in steady state flow rate, and the fact that this is a transient situ-
ation, duct sizing is a complex task and should only be assessed by an expert.
26.6.4 Detection and suppression
If a system is inconveniently sited to allow for venting; a vent of the required size can-
not be fitted onto the existing hopper; or if the material is toxic, so that it cannot be
freely discharged to atmosphere, the protection may be achieved by a detection and
suppression approach. Although there may be only a few tens of milliseconds between
the ignition of the material to the build up of pressure to destructive proportions, this
is sufficient for an automatic suppression system to operate effectively, as illustrated
in Figure 26.3.
Commercial equipment is available that is capable of both detecting the onset of an
explosion and of suppressing the explosion before it is able to develop. The sensing
device, on detecting a rise in pressure, can send signals to switch off the air supply and
stop the feeding device in order to prevent the conveying of any further material.
A signal can also be sent to operate the automatic opening of a venting system. An
automated opening has the advantage that vents are opened extremely rapidly and for
very explosible materials this helps to reduce the maximum explosion pressure.
Alternatively a suppressant system can be triggered. Such equipment operates as illus-
trated in Figure 26.4.
Suppression involves the discharge of a suitable agent into the system within which
the explosion is developing. The composition of the agent depends upon the material
being conveyed, and is typically a halogenated hydrocarbon, or an inert gas or powder.
The suppressant is contained in a sealed receptacle attached to the plant and is rapidly
discharged into the system by means of an electrically fired detonator or a controlled
explosive charge. Thus, as soon as the existence of an explosion is detected, the con-
trol mechanism fires the suppressant into the plant and the flame is extinguished.
Maximum unsuppressed explosion pressure
Unsuppressedexplosion
Maximum pressure that the plant can withstand
Suppressedexplosion
Pre
ssur
e (b
ar)
Systemactivationpressure
Time (ms)
Suppressed explosion pressure
Figure 26.3 Comparison of pressure–time histories of unsuppressed and suppressed
explosions.
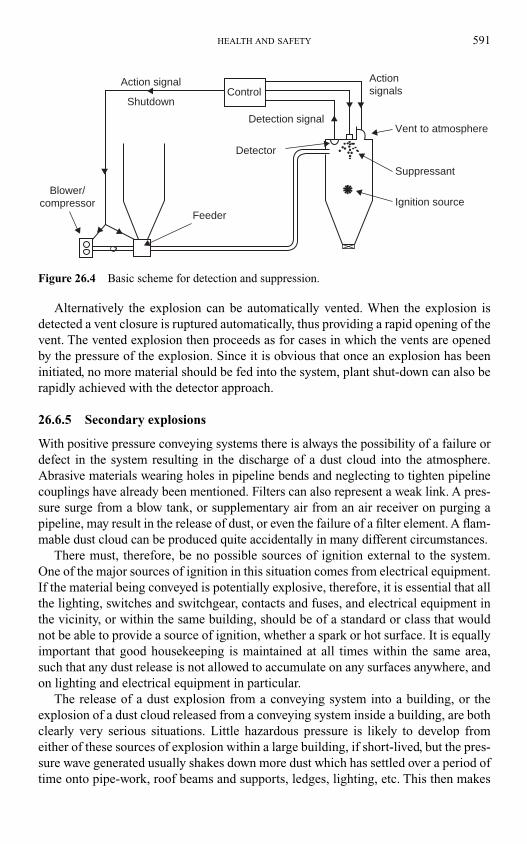
HEALTH AND SAFETY 591
Alternatively the explosion can be automatically vented. When the explosion is
detected a vent closure is ruptured automatically, thus providing a rapid opening of the
vent. The vented explosion then proceeds as for cases in which the vents are opened
by the pressure of the explosion. Since it is obvious that once an explosion has been
initiated, no more material should be fed into the system, plant shut-down can also be
rapidly achieved with the detector approach.
26.6.5 Secondary explosions
With positive pressure conveying systems there is always the possibility of a failure or
defect in the system resulting in the discharge of a dust cloud into the atmosphere.
Abrasive materials wearing holes in pipeline bends and neglecting to tighten pipeline
couplings have already been mentioned. Filters can also represent a weak link. A pres-
sure surge from a blow tank, or supplementary air from an air receiver on purging a
pipeline, may result in the release of dust, or even the failure of a filter element. A flam-
mable dust cloud can be produced quite accidentally in many different circumstances.
There must, therefore, be no possible sources of ignition external to the system.
One of the major sources of ignition in this situation comes from electrical equipment.
If the material being conveyed is potentially explosive, therefore, it is essential that all
the lighting, switches and switchgear, contacts and fuses, and electrical equipment in
the vicinity, or within the same building, should be of a standard or class that would
not be able to provide a source of ignition, whether a spark or hot surface. It is equally
important that good housekeeping is maintained at all times within the same area,
such that any dust release is not allowed to accumulate on any surfaces anywhere, and
on lighting and electrical equipment in particular.
The release of a dust explosion from a conveying system into a building, or the
explosion of a dust cloud released from a conveying system inside a building, are both
clearly very serious situations. Little hazardous pressure is likely to develop from
either of these sources of explosion within a large building, if short-lived, but the pres-
sure wave generated usually shakes down more dust which has settled over a period of
time onto pipe-work, roof beams and supports, ledges, lighting, etc. This then makes
Blower/compressor
Action signal Actionsignals
Detector
Detection signal
Feeder
Vent to atmosphere
Suppressant
Ignition source
ShutdownControl
Figure 26.4 Basic scheme for detection and suppression.
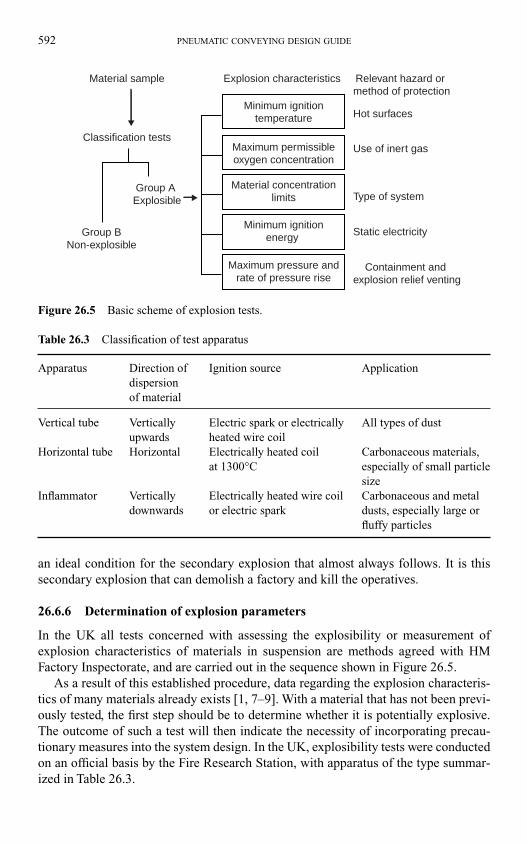
592 PNEUMATIC CONVEYING DESIGN GUIDE
an ideal condition for the secondary explosion that almost always follows. It is this
secondary explosion that can demolish a factory and kill the operatives.
26.6.6 Determination of explosion parameters
In the UK all tests concerned with assessing the explosibility or measurement of
explosion characteristics of materials in suspension are methods agreed with HM
Factory Inspectorate, and are carried out in the sequence shown in Figure 26.5.
As a result of this established procedure, data regarding the explosion characteris-
tics of many materials already exists [1, 7–9]. With a material that has not been previ-
ously tested, the first step should be to determine whether it is potentially explosive.
The outcome of such a test will then indicate the necessity of incorporating precau-
tionary measures into the system design. In the UK, explosibility tests were conducted
on an official basis by the Fire Research Station, with apparatus of the type summar-
ized in Table 26.3.
Material sample Explosion characteristics Relevant hazard or method of protection
Hot surfaces
Use of inert gas
Type of system
Static electricity
Containment and explosion relief venting
Classification tests
Group A Explosible
Group BNon-explosible
Minimum ignitiontemperature
Maximum permissibleoxygen concentration
Material concentrationlimits
Minimum ignitionenergy
Maximum pressure andrate of pressure rise
Figure 26.5 Basic scheme of explosion tests.
Table 26.3 Classification of test apparatus
Apparatus Direction of Ignition source Application
dispersion
of material
Vertical tube Vertically Electric spark or electrically All types of dust
upwards heated wire coil
Horizontal tube Horizontal Electrically heated coil Carbonaceous materials,
at 1300°C especially of small particle
size
Inflammator Vertically Electrically heated wire coil Carbonaceous and metal
downwards or electric spark dusts, especially large or
fluffy particles
26.6.6.1 Test apparatus
In the vertical tube apparatus the dust is placed in a cup and dispersed upwards over
the ignition source by a controlled air blast. Observation of the flame propagation can
then be made. A modification of the electrodes will allow this device to be used for the
determination of minimum ignition energy. The Hartmann bomb is a more substantial
version of this apparatus that can also be used for the measurement of explosion pres-
sure and rate of pressure rise [10].
The horizontal tube apparatus also involves the dispersion by air of a dust sample
over an ignition source. Since the residence time of a dust near the coil is short, any
material that is observed to propagate a flame must be regarded as presenting a ser-
ious explosion hazard. The inflammator is essentially a vertically mounted glass tube.
A sample of dust, held in a horizontal tube, is blown by air and is directed downwards
by a deflector plate.
Although convenient for the testing of explosion characteristics, the Hartmann
bomb has been criticized on the grounds that test results do not reliably scale up to
correspond to industrial plant. This has led to the development of the so-called 20-l
sphere apparatus. This consists of a spherical stainless steel vessel fitted with a water
jacket. A dust cloud is formed in the vessel as the dust enters from a pressurized cham-
ber through a perforated dispersion ring. Sixty milliseconds after the dust is released
into the sphere the detonator is fired and the resulting pressure rise is monitored [10].
26.6.6.2 Material classification
Depending on the outcome of such tests the material is simply classified with respect
to explosibility as follows:
• Group A – materials which ignited and propagated a flame in the test apparatus.
• Group B – materials which did not propagate a flame in the test apparatus.
Group A materials clearly represent a direct explosion risk and, as such, it would be a
wise precaution, or even a legal requirement, to incorporate protection measures into
the system. The range of materials that fall into this group is wide, as indicated earlier.
Sand, alumina and certain paint pigments are examples of Group B materials. Some
Group B materials, although not explosible, may nevertheless present a fire risk.
Further details regarding materials that have been categorized with respect to this A
and B classification may be obtained from [11].
If a material is shown to be of the Group A type, further information on the extent
of the explosion hazard may be required when considering suitable precautions for its
safe handling. The following parameters can be determined by use of the test methods
described above:
1. minimum ignition temperature,
2. maximum permissible oxygen concentration to prevent ignition,
3. minimum explosible concentration,
4. minimum ignition energy,
5. maximum explosion pressure and rate of pressure rise.
HEALTH AND SAFETY 593
594 PNEUMATIC CONVEYING DESIGN GUIDE
Since the explosion characteristics, in terms of these parameters, of many materials are
well documented elsewhere [7–9], it is not appropriate to include this information here.
In order to illustrate the magnitude of the quantities involved, however, details regarding
a few well known materials are given in Table 26.2 [7]. A summary of the applications
of the results of these various tests to practical conditions is included in Figure 26.5.
References
1. P Field. Dust Explosions. Handbook of Powder Technology. Vol 4. Elsevier. 1982.
2. J Cross and D Farrer. Dust Explosions. Plenum Press. 1982.
3. HM (UK) Factory Inspectorate Technical Data Note 14. Health: Dust in Industry. London:
HMSO. 1970.
4. C Schofield. Dust: The problems and approaches to solutions. Proc Solidex ’82 Conf.
Harrogate. March/April 1982.
5. Health and Safety Executive. Guidance Note EH 15/80. Threshold Limit Values. London:
HMSO. 1980.
6. Corn Starch Dust Explosion at General Foods Ltd, Banbury, 18 November 1981. Health and
Safety Executive Report. London: HMSO. 1983.
7. HM (UK) Factory Inspectorate. Dust Explosions in Factories. Health and Safety at Work
Booklet No 22. London: HMSO. 1976.
8. M N Raferty. Explosibility tests for industrial dusts. Fire Research Technical Paper No 21.
Ministry of Technology and Fire Offices Committee. London: HMSO. 1962.
9. C R Woodcock and J S Mason. Bulk Solids Handling: An Introduction to the Practice and
Technology. Chapman and Hall. 1987.
10. K N Palmer. Dust Explosions and Fires. Chapman and Hall. London. 1973.
11. Dust Explosions in Factories. Classified list of dusts that have been tested for explosibility in
the form of a dust cloud. Department of Employment. HM Factory Inspectorate SHW 830.
London: HMSO. 1974.
A1.1 Introduction
For the purpose of characterizing and defining materials, for which conveying data has
been obtained, it would always be recommended that various bench scale tests should be
carried out on each material to obtain a number of measurable properties for reference.
Such properties will allow comparison between the conveying capability of different
materials to be made, and can enable correlations between material properties and pneu-
matic conveying characteristics to be determined, as illustrated in Section 13.3.2.
Details of a number of such tests that can be carried out to provide bulk and par-
ticle properties are presented in this appendix. Some property values are required for
material identification purposes, such as mean particle size, size distribution and bulk
and particle density. Some material properties will be required in system design, such
as particle hardness, friability, moisture content and particle shape. Some of the bulk
properties in which air and material interact are particularly useful in identifying con-
veying capability, such as air retention and permeability.
Such data was recorded for many of the materials tested in the various pneumatic
conveying programmes that are reported in this Design Guide. Data obtained is pre-
sented in Appendix 2, along with additional conveying characteristics for a variety of
materials and pipelines.
A1.1.1 The need for characterization
For the efficient transport and storage of bulk solids, descriptive parameters are
required in a similar way to those used for single phase fluids such as liquids and
gases. For these, property values such as density, viscosity and specific heat are used,
and the influence of temperature and pressure can be readily taken into account. For
bulk solids, however, few of these properties are appropriate and very few of the rela-
tionships that apply to single phase fluids and flow can be applied. By virtue of the
nature of bulk solids it is found that very many more property values are required. The
problem is even more complex than conventional two phase flow in which liquid and
vapour exist together, for example, such as boiling and condensation, for they are both
fluids and the different phases are of the same fluid.
A1.1.2 Particle and bulk properties
By virtue of the nature of bulk solids it is clear that some properties will relate specifi-
cally to the individual particles, and some to the material in its bulk form. The ambient
Appendix 1
Determination of relevant material properties
fluid will also have to be taken into account. Two of the most common properties are
density and size. Neither of these, however, is as straightforward as might at first appear.
For density there are bulk and particle values, but for the bulk, in air, this can vary sig-
nificantly with the degree of compaction of the material. Size, of course, relates only to
the particles, but a bulk solid will generally contain a vast number of individual particles
and in most cases the particles encompass a wide size range.
There is, therefore, a particular need for property values that specifically relate to
bulk solids in the design of systems required to handle, store and transport bulk solid
products. It is also important that any descriptive terms or parameters that are used for
bulk solids are convenient, consistent and easily understood.
A1.2 Particle size and shape
Particle size is a property that can relate to both individual particles and to the bulk.
Shape is principally a particle property. Most bulk solids consist of many particles of
different sizes, randomly grouped together to form a bulk. For some purposes a single
linear dimension, as a representative value of particle size, may be all that is required
to specify a material. In other cases some form of distribution may also be necessary
in order to give some indication of the size range of the particles constituting the bulk
material.
A1.2.1 Particle size
A spherical particle is clearly defined by its diameter and this is a meaningful parameter.
The general definition of particle size, however, is neither straightforward nor unique.
Irregular particles may have a diameter defined in terms of a three-dimensional equiva-
lence, such as:
• the diameter of a sphere having the same surface area,
• the diameter of a sphere having the same volume or mass,
• the size of a hole (circular or square) through which the particle will just pass.
Alternatively the equivalent diameter could be defined in terms of a two-dimensional
equivalence, such as:
• the diameter of an inscribed circle,
• the diameter of a circumscribed circle,
• the diameter of a circle with the same perimeter.
There are also statistical diameters, such as:
• Feret’s diameter, which is the distance between the tangents to extremities of the
particle, measured in a fixed direction;
• Martin’s diameter, which is the length of the line, in a fixed direction, that divides
the particle seen in three dimensions into two equal areas.
The measurement of the sizes of individual particles is mainly of value in research
work. In industry the use of size distributions is generally of greater value.
596 PNEUMATIC CONVEYING DESIGN GUIDE
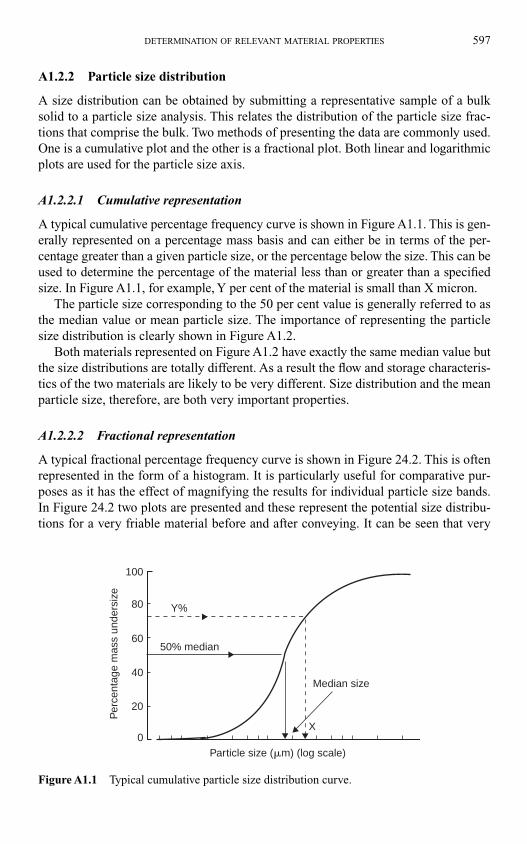
A1.2.2 Particle size distribution
A size distribution can be obtained by submitting a representative sample of a bulk
solid to a particle size analysis. This relates the distribution of the particle size frac-
tions that comprise the bulk. Two methods of presenting the data are commonly used.
One is a cumulative plot and the other is a fractional plot. Both linear and logarithmic
plots are used for the particle size axis.
A1.2.2.1 Cumulative representation
A typical cumulative percentage frequency curve is shown in Figure A1.1. This is gen-
erally represented on a percentage mass basis and can either be in terms of the per-
centage greater than a given particle size, or the percentage below the size. This can be
used to determine the percentage of the material less than or greater than a specified
size. In Figure A1.1, for example, Y per cent of the material is small than X micron.
The particle size corresponding to the 50 per cent value is generally referred to as
the median value or mean particle size. The importance of representing the particle
size distribution is clearly shown in Figure A1.2.
Both materials represented on Figure A1.2 have exactly the same median value but
the size distributions are totally different. As a result the flow and storage characteris-
tics of the two materials are likely to be very different. Size distribution and the mean
particle size, therefore, are both very important properties.
A1.2.2.2 Fractional representation
A typical fractional percentage frequency curve is shown in Figure 24.2. This is often
represented in the form of a histogram. It is particularly useful for comparative pur-
poses as it has the effect of magnifying the results for individual particle size bands.
In Figure 24.2 two plots are presented and these represent the potential size distribu-
tions for a very friable material before and after conveying. It can be seen that very
DETERMINATION OF RELEVANT MATERIAL PROPERTIES 597
100
80
60
40
20
0
Median size
50% median
X
Y%
Per
cent
age
mas
s un
ders
ize
Particle size (�m) (log scale)
Figure A1.1 Typical cumulative particle size distribution curve.
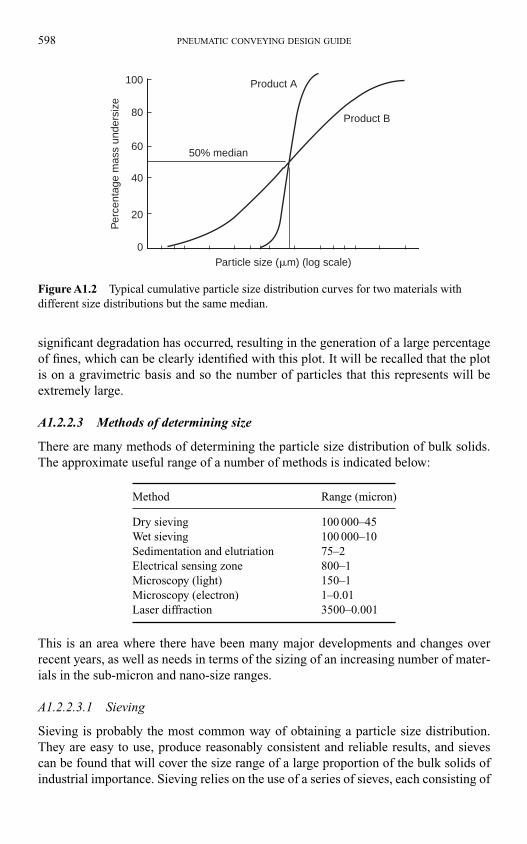
significant degradation has occurred, resulting in the generation of a large percentage
of fines, which can be clearly identified with this plot. It will be recalled that the plot
is on a gravimetric basis and so the number of particles that this represents will be
extremely large.
A1.2.2.3 Methods of determining size
There are many methods of determining the particle size distribution of bulk solids.
The approximate useful range of a number of methods is indicated below:
Method Range (micron)
Dry sieving 100 000–45
Wet sieving 100 000–10
Sedimentation and elutriation 75–2
Electrical sensing zone 800–1
Microscopy (light) 150–1
Microscopy (electron) 1–0.01
Laser diffraction 3500–0.001
This is an area where there have been many major developments and changes over
recent years, as well as needs in terms of the sizing of an increasing number of mater-
ials in the sub-micron and nano-size ranges.
A1.2.2.3.1 Sieving
Sieving is probably the most common way of obtaining a particle size distribution.
They are easy to use, produce reasonably consistent and reliable results, and sieves
can be found that will cover the size range of a large proportion of the bulk solids of
industrial importance. Sieving relies on the use of a series of sieves, each consisting of
598 PNEUMATIC CONVEYING DESIGN GUIDE
100
80
60
40
20
0
Product A
Product B
50% median
Particle size (�m) (log scale)
Per
cent
age
mas
s un
ders
ize
Figure A1.2 Typical cumulative particle size distribution curves for two materials with
different size distributions but the same median.
a woven wire mesh or perforated plate rigidly mounted in a shallow frame. Such sieves
are specially manufactured so that the apertures in the wire mesh or perforated plate
are of a certain size.
The measuring technique involves placing a pre-determined mass of the material to
be sized on the top surface of a series of sieves stacked together. The stack is then agi-
tated, generally by a mechanical shaker for a given time. The sieves are graduated
from the largest at the top to the smallest at the bottom, with a similar pan beneath to
collect the ‘fines’. The range of sizes is selected to suit the material being examined.
Collecting and weighing the material retained on each sieve and in the pan then allows
the size distribution to be analysed.
Sieving may be carried out either wet or dry. In wet sieving the bulk solid is washed
with water, usually by means of a water spray, during the sieving operation. Wet siev-
ing is used where there are problems of fine particles adhering to coarser particles.
This is particularly a problem with materials subject to the influence of electrostatic
charge. It is also possible to sieve to a smaller particle size with wet sieving.
A1.2.2.3.2 Sedimentation
The sedimentation method is based on the rate of settling of particles. This process is
carried out by dispersing the sample in a liquid. If the bulk solid dissolves in water a
suitable non-reactive liquid has to be used. With this method it is the ‘Stokes’ diameter
that is determined. This is the diameter of a sphere that has the same density and free-
falling velocity as the irregular particles under test.
A1.2.2.3.3 Elutriation
The elutriation method is based on the vertical lift of particles from a porous surface
by an upward flow of air at a known velocity. It is the ‘Stokes’ diameter that is deter-
mined by this method, as with the sedimentation method described above. The pro-
portion of the sample that is removed at a given air velocity is measured. The air
velocity is then increased and the process is repeated. It is clearly a slow process as
only one size can be measured at a time, but it is ideal for materials that are very fri-
able and susceptible to damage on sieves and forced flow through laser diffraction
devices.
A1.2.2.3.4 Electrical sensing zone
The electrical sensing method (the Coulter principle) enables both size and number of
particles to be determined. The material sample is mixed in an electrically conductive
liquid and the suspension is made to flow through a small orifice. On either side of the
orifice is an electrode. Any particle that passes through the orifice increases the resist-
ance between the electrodes.
This generates a voltage pulse, the magnitude of which is a function of the volume
of the particle. The results, therefore, are given in terms of the diameter of a sphere of
equivalent volume. These pulses are electronically scaled and counted and from the
DETERMINATION OF RELEVANT MATERIAL PROPERTIES 599
resulting data the size distribution of the sample can be determined, either in gravi-
metric of particle number terms.
A1.2.2.3.5 Microscopy
With the optical microscope method a sample of material is dispersed on a glass slide
and the individual particles are observed and measured. Areas of the magnified
images are compared with areas of reference circles of known sizes on a graticule.
From this the diameter of the particles corresponding to their equivalent projected
area are deduced. By using a transmission electron microscope, particles finer than
one micron can be sized by similar means.
The principle disadvantage of sizing by microscopy is that it can be both tedious
and time consuming. With the use of sophisticated electronic image analysing and
counting techniques, however, the time element can be reduced considerably. A par-
ticular advantage of viewing the material through a microscope, however, is that,
unlike all other sizing techniques, it also gives the opportunity to learn something of
the shape and structure of the particles. These are also important characteristics,
which relate to the nature of the bulk solid and how it may handle. It influences the
packing arrangement of the particles and their interaction with fluids, and hence
affects the flowability and conveyability of the bulk.
A1.2.2.3.6 Laser diffraction
During the early 1970s techniques were developed for determining the size distribu-
tion of a sample of fine particulate material by measuring the diffraction that occurs as
a beam of light passes through a suspension of the sample. Within a few years the
technique was improved to a point where a reliable size analysis could be made by a
semi-skilled operative in just a few minutes. In recent years laser diffraction devices
have taken most of the market share of both electrical sensing zone and sedimentation
devices. The range of particle sizes has also increased, to both larger and smaller par-
ticles, with continuing development.
A1.2.3 Particle shape
The term particle shape is clearly self explanatory. The most established approach is
to describe shape by quantitative terms that give an indication as to the shape of the
particles as observed with the naked eye or through a microscope. In some cases it
might be necessary to ascribe a numerical value to particle shape. For this purpose a
sphere is generally taken as the reference shape.
A1.2.3.1 Descriptive terms
Shape is clearly difficult to define with one meaningful parameter, the significance of
which can be understood universally. For this reason quantitative terms are used to
give some indication of the general nature of shape, and standards exist that attempt to
define the terms. A British Standard [1] defines the terminology of particle shape for
600 PNEUMATIC CONVEYING DESIGN GUIDE
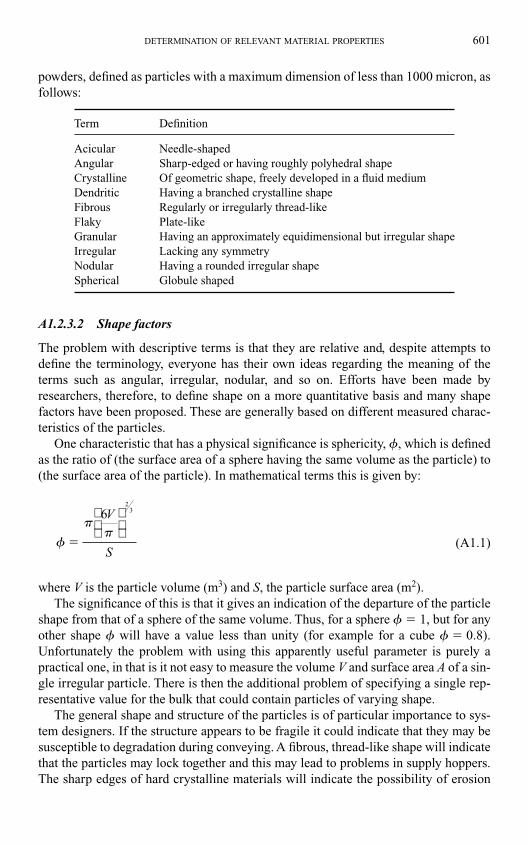
powders, defined as particles with a maximum dimension of less than 1000 micron, as
follows:
Term Definition
Acicular Needle-shaped
Angular Sharp-edged or having roughly polyhedral shape
Crystalline Of geometric shape, freely developed in a fluid medium
Dendritic Having a branched crystalline shape
Fibrous Regularly or irregularly thread-like
Flaky Plate-like
Granular Having an approximately equidimensional but irregular shape
Irregular Lacking any symmetry
Nodular Having a rounded irregular shape
Spherical Globule shaped
A1.2.3.2 Shape factors
The problem with descriptive terms is that they are relative and, despite attempts to
define the terminology, everyone has their own ideas regarding the meaning of the
terms such as angular, irregular, nodular, and so on. Efforts have been made by
researchers, therefore, to define shape on a more quantitative basis and many shape
factors have been proposed. These are generally based on different measured charac-
teristics of the particles.
One characteristic that has a physical significance is sphericity, �, which is defined
as the ratio of (the surface area of a sphere having the same volume as the particle) to
(the surface area of the particle). In mathematical terms this is given by:
(A1.1)
where V is the particle volume (m3) and S, the particle surface area (m2).
The significance of this is that it gives an indication of the departure of the particle
shape from that of a sphere of the same volume. Thus, for a sphere � � 1, but for any
other shape � will have a value less than unity (for example for a cube � � 0.8).
Unfortunately the problem with using this apparently useful parameter is purely a
practical one, in that is it not easy to measure the volume V and surface area A of a sin-
gle irregular particle. There is then the additional problem of specifying a single rep-
resentative value for the bulk that could contain particles of varying shape.
The general shape and structure of the particles is of particular importance to sys-
tem designers. If the structure appears to be fragile it could indicate that they may be
susceptible to degradation during conveying. A fibrous, thread-like shape will indicate
that the particles may lock together and this may lead to problems in supply hoppers.
The sharp edges of hard crystalline materials will indicate the possibility of erosion
�
��
�
6V
S
23
DETERMINATION OF RELEVANT MATERIAL PROPERTIES 601
and abrasion of system components. Such information, therefore, enables the system
to be selected and designed to minimize the risk of operational problems.
A1.2.3.3 Specific surface
Specific surface area is an important material property, especially when the material is
used as a catalyst or an absorber, or is an active agent in a pharmaceutical product.
Most particles are irregular and even with a single size range an accurate total surface
for all the particles cannot usually be determined from a mean particle diameter. In
some circumstances, however, the surface area can be calculated from particle size
data [2]. The specific surface may also be calculated by air permeability and nitrogen
adsorption (BET) methods. This is considered further in Section A1.5.6 on Aeration
Properties A1.
A1.3 Particle and bulk density
Particle density relates, as the name implies, to the individual particles in a bulk solid.
Only if the material is a mixture or blend of different materials, or if it is significantly
influenced by contaminants, will there be any problem here. Bulk density is clearly a
bulk property and material composition need not be considered. The condition or state
of the bulk, however, is important, for different values will be obtained with aeration
and compaction. The dimensions used for both particle and bulk density are kg/m3.
A1.3.1 Particle density
Particle density is the mass of an individual particle of a bulk solid, divided by the
volume of the particle.
A1.3.1.1 Reference values
The volume may be measured inclusive or exclusive of any open and closed pores that
may exist. Closed pores are defined as being cavities not communicating with the sur-
face of the particle. As a result, particle density can be expressed in a number of dif-
ferent ways:
• True particle density: This is the mass of the particle divided by the volume of the
particle, excluding open and closed pores.
• Apparent particle density: This is the mass of the particle divided by the volume of
the particle, excluding open pores but including closed pores.
• Effective particle density: This is the mass of the particle divided by the volume of
the particle, including both open and closed pores.
A.1.3.1.2 Methods of determination
One of two devices is generally used for determining particle density. In both methods
the displacement volume of a given mass of a small sample of material is measured.
602 PNEUMATIC CONVEYING DESIGN GUIDE
A1.3.1.2.1 Relative density method
The classical method of determining the particle density of a material is to use a rela-
tive density technique. Relative density in this case is the ratio of the density of the
particles tested to that of the known density of the comparing liquid used. The particle
density, �p, is then given by:
(A1.2)
A more convenient device, however, is the air comparison pycnometer.
A1.3.1.2.2 Air comparison pycnometer
The air comparison pycnometer is particularly suitable for fine powders and for mater-
ials that are soluble or friable. The device consists of two small identical cylinders
with pistons, one for measuring and one for reference. The cylinders are connected
through a valve and a differential pressure indicator. The measuring piston is also con-
nected to a scale, reading volume in cubic centimeters.
A1.3.2 Bulk density
This is the mass of material divided by the volume occupied by the material. If it is
required to quote the bulk density exclusive of moisture, the term dry bulk density
should be used. The normal procedure is to fill a container of known size and deter-
mine the volume occupied by the measured mass of the sample used. The container
should be of regular geometric shape with smooth inner surfaces. As a general guide-
line the smallest dimension of the container should be at least 10 times the maximum
particle size of the sample.
A1.3.2.1 Reference values
Bulk density values are difficult to determine with any degree of precision, and are
very dependent on the sample and the method of filling the container. It is often more
appropriate to quote a range of bulk densities rather than one specific value. In any
bulk density measurement the test conditions should simulate or represent the actual
conditions under which the bulk density needs to be known as closely as possible. In
practice the value will vary depending on circumstances. Three main conditions are
generally recognized for which bulk density values are specified.
A1.3.2.1.1 As poured bulk density
This is the bulk density that results from pouring the material into a heap or container
in the absence of any applied compacting force. The bulk density, �b, is then:
(A1.3)�b3mass of particles
enclosed volume kg/m�
�p relative density of particles density of comparing liquid� �
DETERMINATION OF RELEVANT MATERIAL PROPERTIES 603
A1.3.2.1.2 Compacted (tapped) bulk density
This is the bulk density created by the application of compacting forces, for example
by tapping, impact or vibration. Compaction of the bulk solid can be accomplished by
tamping the material, layer by layer, with some form of rod, according to a prescribed
procedure. In the case of powders the container can be relatively small, and a glass
measuring cylinder is generally used. Compaction of the powder can be achieved by
bumping the cylinder against a flat surface according to a prescribed procedure.
A1.3.2.1.3 Aerated bulk density
This is the bulk density created when the material is fluidized and the particles are separ-
ated from each other by an air film. This only applies to fine, dry powders, for with large
particles the air will simply pass through the interstices and not separate the particles, and
wet and cohesive materials will not aerate/fluidize. The aerated bulk density can be meas-
ured very simply by inverting a glass measuring cylinder, partly filled with a known mass
of the material, and reading off the inverted level as quickly as possible. For a more pre-
cise value a special apparatus should be used in which a column of powder is expanded
by air via a porous base. Aeration should be according to a prescribed procedure.
A1.3.2.2 Application
A knowledge of the bulk density is essential for the determination of several import-
ant factors in the design of a conveying system. These include:
• The approximate mass of material discharged per unit time by a feeder of known
volumetric capacity.
• The approximate mass of material in a hopper or receiver of known volume, and
• The approximate volume of a hopper or receiver that is required to store a specified
mass of material.
Unfortunately, unlike particle density that has a unique value, bulk density depends
upon the condition of the material. If, for example, a material has just been pneumat-
ically conveyed to a receiving vessel, the aeration can have the effect of ‘fluffing up’
the material such that it will have a low bulk density. After a period of time, however,
a combination of this air percolating out of the bulk, together with a reorientation of
the particles due to extraneous vibrations that occur in almost every plant, the volume
occupied by a given mass will gradually reduce and therefore increase its bulk density.
Obviously, the bulk density used to size a specific item of equipment should approxi-
mate, as closely as possible, to the condition of the material at that point in the system
at any given time. This is difficult to determine, however, and experience has shown that
a knowledge of the ‘as poured’ and ‘tapped’ values enables the designer to estimate,
with a reasonable degree of accuracy, the volume or mass of material in or delivered by
the component in question.
A1.3.3 Voidage
There will clearly be a difference between the particle and bulk density values for
any given bulk solid. In general the particle density will be about double that of the
604 PNEUMATIC CONVEYING DESIGN GUIDE
‘as poured’ value. Obviously, this bulk density value depends upon the particle density,
particle shape and how the constituent particles are packed or positioned with respect
to each other. The normal method of relating these factors is by the expression:
(A1.4)
where �b is the bulk density (kg/m3); �p, the particle density (kg/m3) and �, the voidage.
The voidage, therefore, represents the proportion of space not occupied by the particles
within the bulk.
A1.4 Flow properties
Bulk solids range from very free flowing to very cohesive. The position of a particular
material relative to these two extremes provides an indication of its ‘flowability’. It is
essential that a designer has an indication of this at an early stage, since it influences the
type of system and components that are required to handle the material. Flowability is
significantly influenced by the inter-particulate forces that exist within a bulk solid.
With free-flowing materials the forces of attraction between the constituent par-
ticles are negligible, so that the bulk can be very easily induced to flow under the action
of gravity, even if it has been subject to prior consolidation. When such materials flow
they do so as individual, discrete particles; dry sand and granulated sugar are examples.
With cohesive materials the inter-particulate forces are high enough to prevent this from
occurring and when such materials flow they do so in a ‘lumpy’ or ‘batch-wise’ manner.
Starch and cocoa powder are typical examples.
In general free-flowing materials present few problems with respect to the design
of a system. However, great care must be exercised with systems to handle cohesive
materials since their reluctance to flow can lead to numerous difficulties. Unfortunately
the transition from free flowing to cohesive behaviour is ill defined, and there are many
materials which, by a slight change in operating conditions, can effectively change
their flow characteristics. It is clearly important, therefore, to have a thorough under-
standing of the nature of the material at the design stage of a system.
A1.4.1 Factors influencing flowability
The principal factors influencing the flowability of bulk solids are particle size, par-
ticle shape, electrostatic charge and moisture. It is quite possible that a combination of
these, rather than any single factor, would be responsible for the poor flow character-
istics of a material.
A1.4.1.1 Particle size
With respect to particle size, there is a natural force of attraction between particles that
increases with decreasing size. This factor alone is sufficient to render a material that
is identical in every other respect, less free flowing over a finer size range. From experi-
ence it would appear that 50–100 �m is the approximate range where dry, regularly
� �b p3
) kg/m� � �(1
DETERMINATION OF RELEVANT MATERIAL PROPERTIES 605
shaped materials exhibit a noticeable change in flow characteristics. A knowledge of
particle size distribution is therefore clearly essential.
A1.4.1.2 Particle shape
The influence of particle shape is easier to understand. Regular shaped particles can-
not pack together to form a mechanical bond and so cannot impede the free movement
of a particle with respect to its neighbours. Highly irregular shaped and fibrous par-
ticles, however, can interlock and thereby render the bulk less free flowing than a more
regular shaped material.
A1.4.1.3 Electrostatic charge
As a result of handling the material it is possible for the particles to acquire an elec-
trostatic charge. Experience has shown that such a charge can change even the most
free-flowing material into one that exhibits cohesive characteristics. Certain polymers,
such as PVC resins, are particularly susceptible to flow problems of this kind.
A1.4.1.4 Moisture
Moisture can affect flowability in several ways. Deliquescent materials such as sugar
may form a hydrate of the surface of the particles. These may cause them to bind
together to form a cake and prevent them from flowing. With materials such as sand,
where the particles are impervious, any moisture will adhere to the surface of the par-
ticles. This moisture can be sufficient to form water bonds, thereby causing the par-
ticles to cohere. Moisture in this form is referred to as ‘free moisture’. The general trend
is for added moisture to increase the cohesiveness of a bulk solid until a peak is reached,
after which further moisture addition has the opposite effect until ultimately the bulk
solid will behave like a slurry.
With materials that have particles that are pervious to water, any moisture will be pref-
erentially absorbed into the particles until a point is reached where they become saturated.
Unless the material is also deliquescent, moisture in this form does not contribute to its
cohesion. It is the excess water that contributes to cohesion since this then manifests itself
as surface moisture. With some pervious materials there may be a certain amount of water
that, under normal atmospheric conditions, always remains within the particles, such as
with ‘wheat flour’. This is commonly referred to as ‘inherent moisture’.
A1.4.2 Tests for flowability
Tests for characterizing the flowability of bulk solids range from very simple tests to
highly sophisticated techniques. A very simple approach is to take a handful of the
material and to see if it can be consolidated into a ball by squeezing it. Alternatively a
shear tester can be used to quantify this characteristic, but a high level of expertise is
required to use the equipment. The approach that is commonly adopted is to undertake
a quick comparative test and to place the outcome in context with experience from
handling and testing similar types of material. To this end the angle of repose is a use-
ful indicator of a material’s flowability.
606 PNEUMATIC CONVEYING DESIGN GUIDE
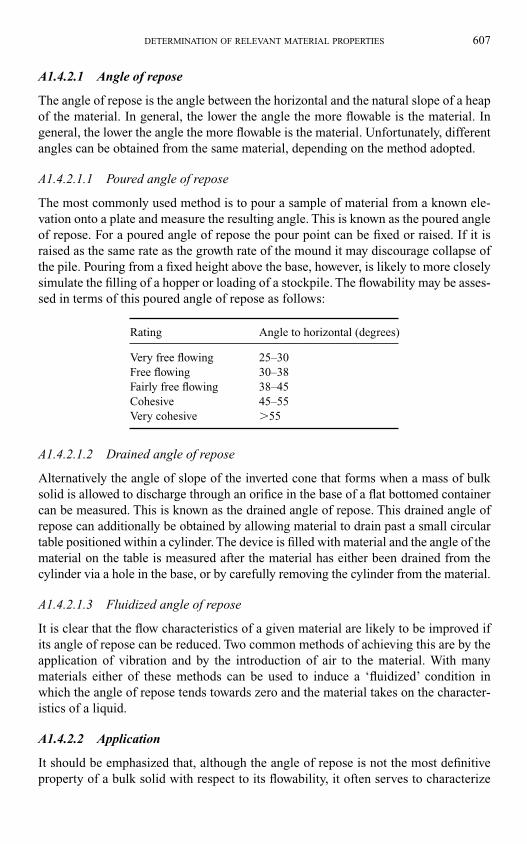
A1.4.2.1 Angle of repose
The angle of repose is the angle between the horizontal and the natural slope of a heap
of the material. In general, the lower the angle the more flowable is the material. In
general, the lower the angle the more flowable is the material. Unfortunately, different
angles can be obtained from the same material, depending on the method adopted.
A1.4.2.1.1 Poured angle of repose
The most commonly used method is to pour a sample of material from a known ele-
vation onto a plate and measure the resulting angle. This is known as the poured angle
of repose. For a poured angle of repose the pour point can be fixed or raised. If it is
raised as the same rate as the growth rate of the mound it may discourage collapse of
the pile. Pouring from a fixed height above the base, however, is likely to more closely
simulate the filling of a hopper or loading of a stockpile. The flowability may be asses-
sed in terms of this poured angle of repose as follows:
Rating Angle to horizontal (degrees)
Very free flowing 25–30
Free flowing 30–38
Fairly free flowing 38–45
Cohesive 45–55
Very cohesive �55
A1.4.2.1.2 Drained angle of repose
Alternatively the angle of slope of the inverted cone that forms when a mass of bulk
solid is allowed to discharge through an orifice in the base of a flat bottomed container
can be measured. This is known as the drained angle of repose. This drained angle of
repose can additionally be obtained by allowing material to drain past a small circular
table positioned within a cylinder. The device is filled with material and the angle of the
material on the table is measured after the material has either been drained from the
cylinder via a hole in the base, or by carefully removing the cylinder from the material.
A1.4.2.1.3 Fluidized angle of repose
It is clear that the flow characteristics of a given material are likely to be improved if
its angle of repose can be reduced. Two common methods of achieving this are by the
application of vibration and by the introduction of air to the material. With many
materials either of these methods can be used to induce a ‘fluidized’ condition in
which the angle of repose tends towards zero and the material takes on the character-
istics of a liquid.
A1.4.2.2 Application
It should be emphasized that, although the angle of repose is not the most definitive
property of a bulk solid with respect to its flowability, it often serves to characterize
DETERMINATION OF RELEVANT MATERIAL PROPERTIES 607
the material in this respect to a level that is sufficient for system design. The angle of
repose, of course, is particularly useful for calculating the volume of a stored mass of
bulk solid, such as that in a stockpile or silo.
A1.5 Aeration properties
Aeration is a rather loose term to describe the condition that exists when, through
some form of agitation, the constituent particles of a bulk solid are separated from one
another by an air film. In practice the term is only relevant to powders and fine granu-
lar materials, but bulk solids consisting of coarse particles can be aerated if the par-
ticle density is low enough. A simple visual test that can be used to assess the aeration
potential of a bulk solid is to place a sample of it in a glass jar. If it is shaken and
inverted for a short period, the resulting volume increase in the space occupied by the
material is an indication of the degree of aeration.
A1.5.1 Fluidization
A special case of aeration is fluidization. This occurs when the aeration is sufficient to
cause the material to assume liquid-like properties. The onset of fluidization roughly
coincides with the situation when the air flow percolating through a column of mater-
ial is just sufficient to support the column in a fluidized state. Increasing the air flow
still further can result in considerable expansion of the material with bubbling of the
air as it breaks through the surface.
A particulate material in this fluidized state exhibits a number of fluid-like charac-
teristics. It will, for example, flow through a hole in a vessel in which the material is
fluidized, light objects will ‘float’ on its surface, and in a large vessel the surface will
remain effectively horizontal if the vessel is tilted. A development of this characteris-
tic is the continuous aeration of a bulk solid in an inclined channel which allows the
material to flow steadily along the channel even when its slope is as little as two or
three degrees.
A1.5.1.1 Fluidized angle of repose
Most free-flowing materials display a natural angle of repose of around 30–38°. In
order to get such a material to flow continuously, under gravity alone, or on an inclined
surface it would normally be necessary for the slope of the surface to be greater than
this angle of repose. Materials exhibiting some degree of cohesiveness have much
larger angles of repose and often will not flow, even on steeply inclined surfaces, with-
out some form of assistance.
The introduction of air to a bulk solid, by supporting the material on a plate made
of a suitable porous substance, for example, and allowing the air to flow upwards
through it into the material, can significantly reduce the angle of repose. The material
will then flow continuously from the plate when it is inclined at a very shallow angle.
This needs only to be greater than the fluidized angle of repose of the material. For
most free-flowing materials this is about 2–6°.
608 PNEUMATIC CONVEYING DESIGN GUIDE
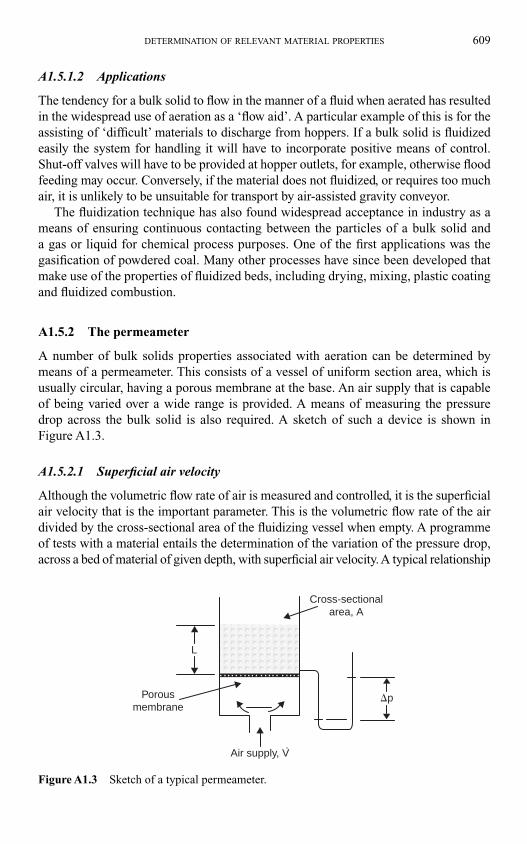
A1.5.1.2 Applications
The tendency for a bulk solid to flow in the manner of a fluid when aerated has resulted
in the widespread use of aeration as a ‘flow aid’. A particular example of this is for the
assisting of ‘difficult’ materials to discharge from hoppers. If a bulk solid is fluidized
easily the system for handling it will have to incorporate positive means of control.
Shut-off valves will have to be provided at hopper outlets, for example, otherwise flood
feeding may occur. Conversely, if the material does not fluidized, or requires too much
air, it is unlikely to be unsuitable for transport by air-assisted gravity conveyor.
The fluidization technique has also found widespread acceptance in industry as a
means of ensuring continuous contacting between the particles of a bulk solid and
a gas or liquid for chemical process purposes. One of the first applications was the
gasification of powdered coal. Many other processes have since been developed that
make use of the properties of fluidized beds, including drying, mixing, plastic coating
and fluidized combustion.
A1.5.2 The permeameter
A number of bulk solids properties associated with aeration can be determined by
means of a permeameter. This consists of a vessel of uniform section area, which is
usually circular, having a porous membrane at the base. An air supply that is capable
of being varied over a wide range is provided. A means of measuring the pressure
drop across the bulk solid is also required. A sketch of such a device is shown in
Figure A1.3.
A1.5.2.1 Superficial air velocity
Although the volumetric flow rate of air is measured and controlled, it is the superficial
air velocity that is the important parameter. This is the volumetric flow rate of the air
divided by the cross-sectional area of the fluidizing vessel when empty. A programme
of tests with a material entails the determination of the variation of the pressure drop,
across a bed of material of given depth, with superficial air velocity. A typical relationship
DETERMINATION OF RELEVANT MATERIAL PROPERTIES 609
Cross-sectionalarea, A
L
Porousmembrane
Air supply, V
�p
Figure A1.3 Sketch of a typical permeameter.
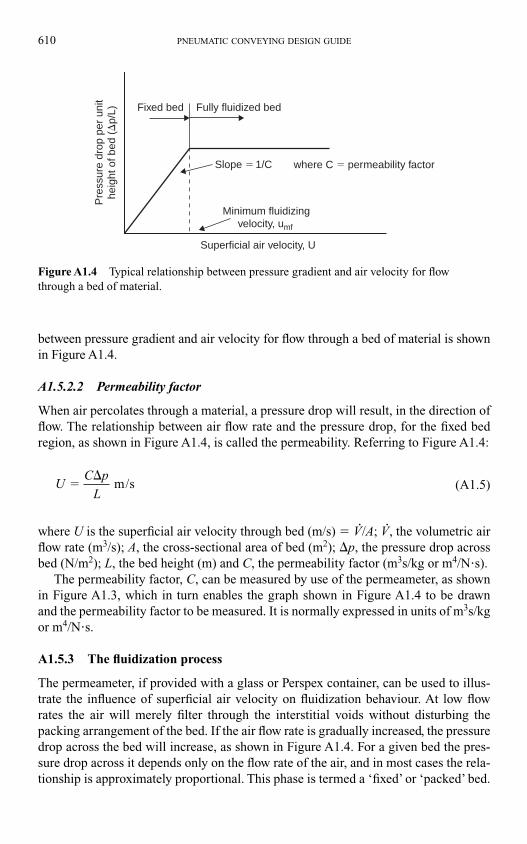
between pressure gradient and air velocity for flow through a bed of material is shown
in Figure A1.4.
A1.5.2.2 Permeability factor
When air percolates through a material, a pressure drop will result, in the direction of
flow. The relationship between air flow rate and the pressure drop, for the fixed bed
region, as shown in Figure A1.4, is called the permeability. Referring to Figure A1.4:
(A1.5)
where U is the superficial air velocity through bed (m/s) � V�/A; V�, the volumetric air
flow rate (m3/s); A, the cross-sectional area of bed (m2); p, the pressure drop across
bed (N/m2); L, the bed height (m) and C, the permeability factor (m3s/kg or m4/N�s).
The permeability factor, C, can be measured by use of the permeameter, as shown
in Figure A1.3, which in turn enables the graph shown in Figure A1.4 to be drawn
and the permeability factor to be measured. It is normally expressed in units of m3s/kg
or m4/N�s.
A1.5.3 The fluidization process
The permeameter, if provided with a glass or Perspex container, can be used to illus-
trate the influence of superficial air velocity on fluidization behaviour. At low flow
rates the air will merely filter through the interstitial voids without disturbing the
packing arrangement of the bed. If the air flow rate is gradually increased, the pressure
drop across the bed will increase, as shown in Figure A1.4. For a given bed the pres-
sure drop across it depends only on the flow rate of the air, and in most cases the rela-
tionship is approximately proportional. This phase is termed a ‘fixed’ or ‘packed’ bed.
UC p
L�
m/s
610 PNEUMATIC CONVEYING DESIGN GUIDE
Fixed bed Fully fluidized bed
Slope � 1/C where C � permeability factor
Minimum fluidizingvelocity, umf
Superficial air velocity, U
Pre
ssur
e dr
op p
er u
nit
heig
ht o
f bed
(�
p/L)
Figure A1.4 Typical relationship between pressure gradient and air velocity for flow
through a bed of material.
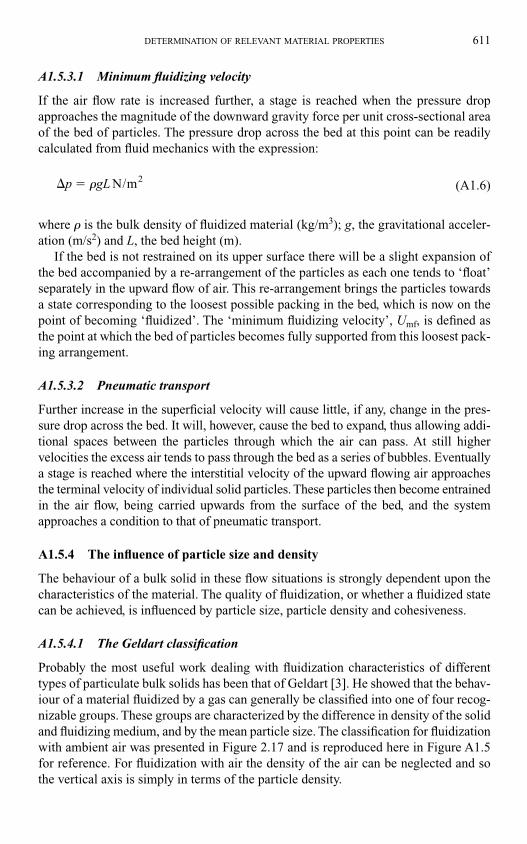
A1.5.3.1 Minimum fluidizing velocity
If the air flow rate is increased further, a stage is reached when the pressure drop
approaches the magnitude of the downward gravity force per unit cross-sectional area
of the bed of particles. The pressure drop across the bed at this point can be readily
calculated from fluid mechanics with the expression:
(A1.6)
where � is the bulk density of fluidized material (kg/m3); g, the gravitational acceler-
ation (m/s2) and L, the bed height (m).
If the bed is not restrained on its upper surface there will be a slight expansion of
the bed accompanied by a re-arrangement of the particles as each one tends to ‘float’
separately in the upward flow of air. This re-arrangement brings the particles towards
a state corresponding to the loosest possible packing in the bed, which is now on the
point of becoming ‘fluidized’. The ‘minimum fluidizing velocity’, Umf, is defined as
the point at which the bed of particles becomes fully supported from this loosest pack-
ing arrangement.
A1.5.3.2 Pneumatic transport
Further increase in the superficial velocity will cause little, if any, change in the pres-
sure drop across the bed. It will, however, cause the bed to expand, thus allowing addi-
tional spaces between the particles through which the air can pass. At still higher
velocities the excess air tends to pass through the bed as a series of bubbles. Eventually
a stage is reached where the interstitial velocity of the upward flowing air approaches
the terminal velocity of individual solid particles. These particles then become entrained
in the air flow, being carried upwards from the surface of the bed, and the system
approaches a condition to that of pneumatic transport.
A1.5.4 The influence of particle size and density
The behaviour of a bulk solid in these flow situations is strongly dependent upon the
characteristics of the material. The quality of fluidization, or whether a fluidized state
can be achieved, is influenced by particle size, particle density and cohesiveness.
A1.5.4.1 The Geldart classification
Probably the most useful work dealing with fluidization characteristics of different
types of particulate bulk solids has been that of Geldart [3]. He showed that the behav-
iour of a material fluidized by a gas can generally be classified into one of four recog-
nizable groups. These groups are characterized by the difference in density of the solid
and fluidizing medium, and by the mean particle size. The classification for fluidization
with ambient air was presented in Figure 2.17 and is reproduced here in Figure A1.5
for reference. For fluidization with air the density of the air can be neglected and so
the vertical axis is simply in terms of the particle density.
�p gL� N/m2
DETERMINATION OF RELEVANT MATERIAL PROPERTIES 611
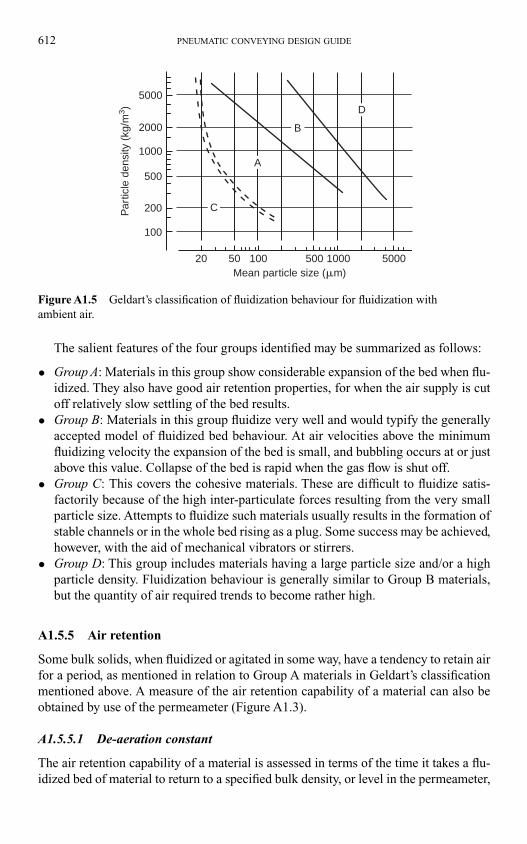
The salient features of the four groups identified may be summarized as follows:
• Group A: Materials in this group show considerable expansion of the bed when flu-
idized. They also have good air retention properties, for when the air supply is cut
off relatively slow settling of the bed results.
• Group B: Materials in this group fluidize very well and would typify the generally
accepted model of fluidized bed behaviour. At air velocities above the minimum
fluidizing velocity the expansion of the bed is small, and bubbling occurs at or just
above this value. Collapse of the bed is rapid when the gas flow is shut off.
• Group C: This covers the cohesive materials. These are difficult to fluidize satis-
factorily because of the high inter-particulate forces resulting from the very small
particle size. Attempts to fluidize such materials usually results in the formation of
stable channels or in the whole bed rising as a plug. Some success may be achieved,
however, with the aid of mechanical vibrators or stirrers.
• Group D: This group includes materials having a large particle size and/or a high
particle density. Fluidization behaviour is generally similar to Group B materials,
but the quantity of air required trends to become rather high.
A1.5.5 Air retention
Some bulk solids, when fluidized or agitated in some way, have a tendency to retain air
for a period, as mentioned in relation to Group A materials in Geldart’s classification
mentioned above. A measure of the air retention capability of a material can also be
obtained by use of the permeameter (Figure A1.3).
A1.5.5.1 De-aeration constant
The air retention capability of a material is assessed in terms of the time it takes a flu-
idized bed of material to return to a specified bulk density, or level in the permeameter,
612 PNEUMATIC CONVEYING DESIGN GUIDE
5000
2000
1000
500
200
100
20 50 100 500 1000 5000Mean particle size (�m)
Par
ticle
den
sity
(kg
/m3 ) D
A
B
C
Figure A1.5 Geldart’s classification of fluidization behaviour for fluidization with
ambient air.
after quickly shutting off the air supply. The starting, or reference, point for such a
determination, is that the fluidizing should be at the point that provides a maximum
volume increase of the material without severe bubbling at the material surface.
For convenience a scale should be provided on the permeameter. With some bulk
solids the level of the material falls very rapidly, particularly in the early stages, and
so this is not a constant that can conveniently be recorded manually at the time it is
carried out.
A1.5.5.1.1 Analysis
One method of obtaining the necessary data is to use high speed photography. Another
method is to use a video tape recording of the fall. Sutton and Richmond [4] analysed
this transient fall by extending Fick’s Law of Diffusion to the situation. They obtained:
(A1.7)
where � is the material bulk density (kg/m3); , the time (s); k�, the de-aeration constant
(m/s); p, the pressure drop across bed (N/m2) and L, the bed height (m).
Integration of this expression between suitable experimentally derived limits will
yield the de-aeration constant. High values of this constant indicate a high settling rate
and, therefore, poor air retention capability.
A further method of monitoring rapid transients is to use an electronic differential
pressure transducer. If this is connected across the pressure tappings on the column of
material on the permeameter, it will provide a suitable trace of the pressure decay fol-
lowing the shut off of the air, for evaluation of the constant.
The value of the de-aeration constant obtained will give some indication of the
capability of a material for dense phase pneumatic conveying, without the need for air
addition along the length of the pipeline. It will also give an indication of the effect
that aeration might have on the material, for aiding its discharge from hoppers.
A1.5.5.1.2 Vibrated de-aeration constant
If the bed of material in the de-aerated condition is vibrated, the height will fall in a
similar manner to that described above, in which the fluidized bed height falls when
the air supply is cut off. A comparison of the two de-aeration plots of bed height ver-
sus time is illustrated in Figure A1.6 [5].
It is possible, therefore, that this vibration test could generally be of more value
than the permeameter method. For materials that exhibit poor air retention character-
istics, and hence de-aerate rapidly, the rate of change can be slow enough to observe
visually. On the other hand, for some very air retentive powders, the settling time can
run into hours and even days and vibration can speed up the process considerably.
It is also very much easier to apply to cohesive and other materials that are difficult
to aerate. Vibration is applied in the vertical plane, but only a narrow band of fre-
quencies have a settling effect on materials. If the frequency is too low it has little
d
d
�
�� �
k
p
L
DETERMINATION OF RELEVANT MATERIAL PROPERTIES 613
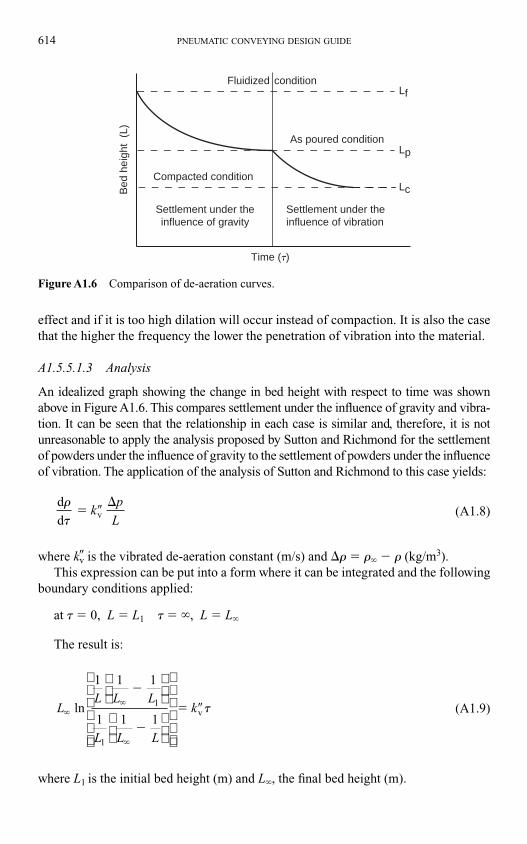
effect and if it is too high dilation will occur instead of compaction. It is also the case
that the higher the frequency the lower the penetration of vibration into the material.
A1.5.5.1.3 Analysis
An idealized graph showing the change in bed height with respect to time was shown
above in Figure A1.6. This compares settlement under the influence of gravity and vibra-
tion. It can be seen that the relationship in each case is similar and, therefore, it is not
unreasonable to apply the analysis proposed by Sutton and Richmond for the settlement
of powders under the influence of gravity to the settlement of powders under the influence
of vibration. The application of the analysis of Sutton and Richmond to this case yields:
(A1.8)
where k�v is the vibrated de-aeration constant (m/s) and � � �� � � (kg/m3).
This expression can be put into a form where it can be integrated and the following
boundary conditions applied:
at � � 0, L � L1 � � �, L � L�
The result is:
(A1.9)
where L1 is the initial bed height (m) and L�, the final bed height (m).
LL L L
L L L
k��
�
�
�
� � ln
1
1 v
1 1
1 1
1
1
�
d
d v
�
�� �
k
p
L
614 PNEUMATIC CONVEYING DESIGN GUIDE
Time (t)
Settlement under theinfluence of gravity
Bed
hei
ght
(L)
Settlement under the influence of vibration
Lc
Lp
Lf
Compacted condition
As poured condition
conditionFluidized
Figure A1.6 Comparison of de-aeration curves.
This equation can be written in the form of a straight line graph, the slope of which
is the vibrated de-aeration constant.
Thus
(A1.10)
where
(A1.11)
A detailed test procedure is given in Ref. [5]. These tests are relatively easy to under-
take and take little time to carry out. A small sample of the material is all that is
required and the equipment needed to carry out the tests manually is relatively simple
and inexpensive.
A1.5.6 Specific surface
The specific surface of a material is expressed in terms of the total surface area per
unit mass, m2/kg, or per unit volume, m2/m3, of the material. Specific surface is often
used as a measure of the ‘fineness’ of a material. Several different methods for deter-
mining a value of specific surface have been developed.
A1.5.6.1 British Standard procedure
A British Standard [2] sets out a procedure and provides a theory and equations from
which an estimated value of specific surface can be obtained by using an air perme-
ameter. The theory is based on an equation derived by Carmen and Arnell. This relies
on the fact that the rate of flow of a moving fluid, under the influence of a constant
pressure difference through a compacted bed of uniform cross-sectional area, is a
function of the surface area that the walls of the channels through the bed present to
the moving fluid. As there is normally a great variation in, and a lack of precise know-
ledge of, the shape and dimensions of such channels, rigorous mathematical treatment
is impracticable. By making a number of assumptions, however, the specific surface of
many powders can be estimated from air permeability data.
A1.5.6.2 Lea and Nurse method
A permeability cell, similar to the permeameter, is used, except that the air flow is in
the opposite direction. It consists of two metal cylinders, 25.40 mm diameter, con-
nected by flanges with a recess for a perforated plate [6]. Filter paper is placed on the
perforated plate and a given mass of material is introduced. A plunger is provided to
H LL L L
L L L
ln
1
1�
�
�
��
�
1 1
1 1
1
1
H k v� � �
DETERMINATION OF RELEVANT MATERIAL PROPERTIES 615
form the sample into a cylindrical bed 10.00 mm deep. The sample, in the case of
cement, must have a porosity of 0.475. The cell is connected to a bed manometer and
a flow meter manometer. Specific surface, for a specified air flow rate, is determined
from the manometer reading and the density of the material.
A1.5.6.3 The Blaine method
The cell of this permeability apparatus is 12.70 mm diameter with a perforated plate at
the base. A plunger is provided to form a bed of material 15 mm high. This method is
usually associated with cement, for which the porosity must be 0.500. Air is evacuated
until the manometer liquid reaches the top mark. The valve is shut tight and a clock is
started when the liquid reaches the second marked level. The time is recorded for the
liquid to drop to the third level. Prior calibration of the instrument to a set procedure is
necessary, and Ref. [7] provides equations for the evaluation of specific surface.
References
1. BS 2955. Glossary of terms relating to powders. 1958.
2. BS 4359. Methods for determination of specific surface of powders. Part 2: Air permeability
method. 1971.
3. D Geldart. Types of gas fluidisation. Powder Technology. Vol 7, pp 285–292. 1973.
4. H M Sutton and R A Richmond. Improving the storage conditions of fine powders by aer-
ation. Transactions of the Institution of Chemical Engineers. Vol 51. 1973.
5. M G Jones and D Mills. Product classification for pneumatic conveying. Powder Handling
and Processing. Vol 2. No 2. pp 117–122. June 1990.
6. BS 4550. Part 3, Section 3.3. Methods of testing cement. 1978.
7. ASTM Standard test method for fineness of Portland cement by air permeability apparatus.
C204. pp 211–218. 1984.
616 PNEUMATIC CONVEYING DESIGN GUIDE
A2.1 Introduction
Conveying data on a wide variety of materials has been used to illustrate the influence
of material properties on conveying capability and performance. The importance of
material grade has been highlighted, as well as the potential influence of material
degradation as a result of pneumatic conveying. Conveying data has also been used to
show how scaling parameters for pipeline bends, pipeline orientation and pipeline
material can be evaluated.
The main point with regard to conveying data, however, is its importance in system
design. Since different materials, conveyed under identical conditions of air flow rate
and pressure drop, can exhibit widely varying material flow rates, conveying data and
scaling is widely used for system design. The determination and specification of the
minimum conveying air velocity is equally important.
To this end actual conveying data in the form of complete performance maps has been
used throughout. For most applications just one or two data points will be required,
but this will allow a wide range of pressure drop options to be considered and a choice
between dilute and dense phase conveying, where this is a possibility. Full details of
each pipeline used are also provided.
A2.2 Materials and pipelines listings
The different materials for which conveying characteristics are presented in this
Design Guide are listed in Table A2.1. The figure number for the appropriate data is
given, together with the pipeline reference number. Pipeline information can be
obtained from Table A2.1.
Details of the pipelines used for conveying the various materials are presented in
Table A2.2. The number of the figure in the text is given for each so that a sketch can
be viewed, and basic details are listed in Table A2.2.
From the sketches of the pipelines it will be seen that many of the routings follow
a prescribed pattern. This was to a design of the author for the benefit of the original
Design Guide and for the specific purpose of generating a wide range of conveying
data. A dimensioned plan view of the laboratory in which they were installed is given
in Figure A2.1.
Appendix 2
Additional conveying data
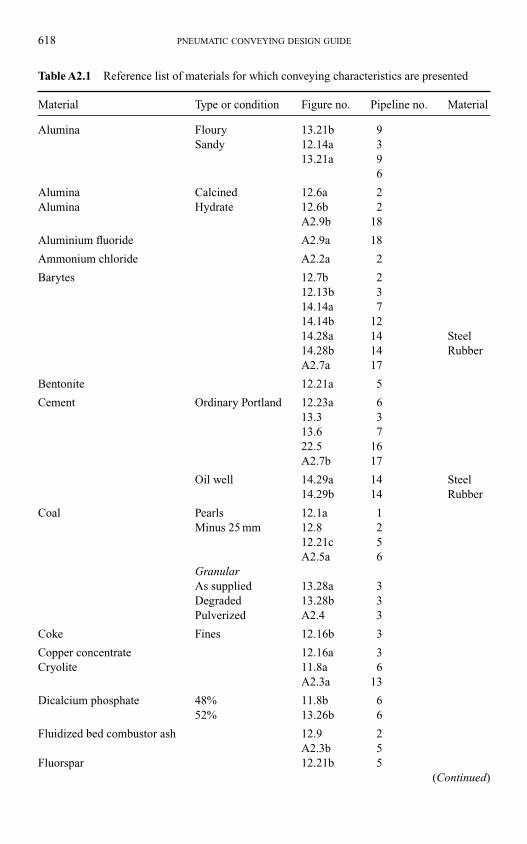
618 PNEUMATIC CONVEYING DESIGN GUIDE
Table A2.1 Reference list of materials for which conveying characteristics are presented
Material Type or condition Figure no. Pipeline no. Material
Alumina Floury 13.21b 9
Sandy 12.14a 3
13.21a 9
6
Alumina Calcined 12.6a 2
Alumina Hydrate 12.6b 2
A2.9b 18
Aluminium fluoride A2.9a 18
Ammonium chloride A2.2a 2
Barytes 12.7b 2
12.13b 3
14.14a 7
14.14b 12
14.28a 14 Steel
14.28b 14 Rubber
A2.7a 17
Bentonite 12.21a 5
Cement Ordinary Portland 12.23a 6
13.3 3
13.6 7
22.5 16
A2.7b 17
Oil well 14.29a 14 Steel
14.29b 14 Rubber
Coal Pearls 12.1a 1
Minus 25 mm 12.8 2
12.21c 5
A2.5a 6
GranularAs supplied 13.28a 3
Degraded 13.28b 3
Pulverized A2.4 3
Coke Fines 12.16b 3
Copper concentrate 12.16a 3
Cryolite 11.8a 6
A2.3a 13
Dicalcium phosphate 48% 11.8b 6
52% 13.26b 6
Fluidized bed combustor ash 12.9 2
A2.3b 5
Fluorspar 12.21b 5
(Continued)
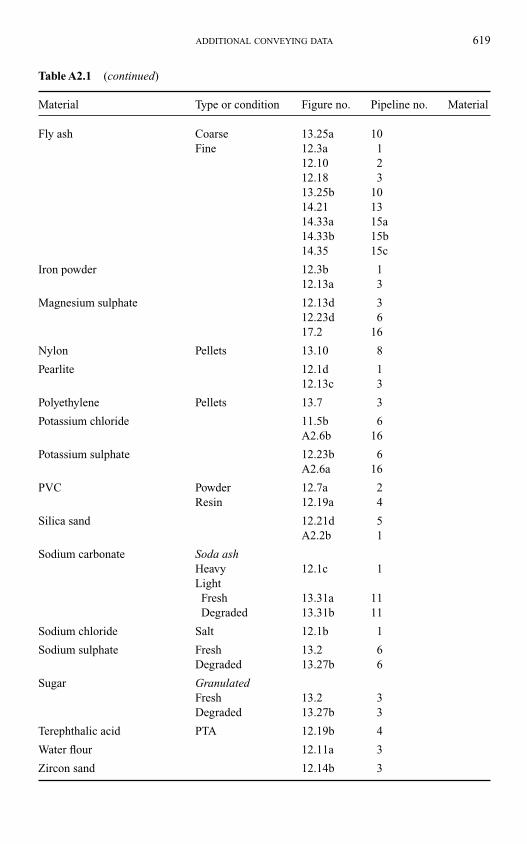
ADDITIONAL CONVEYING DATA 619
Table A2.1 (continued)
Material Type or condition Figure no. Pipeline no. Material
Fly ash Coarse 13.25a 10
Fine 12.3a 1
12.10 2
12.18 3
13.25b 10
14.21 13
14.33a 15a
14.33b 15b
14.35 15c
Iron powder 12.3b 1
12.13a 3
Magnesium sulphate 12.13d 3
12.23d 6
17.2 16
Nylon Pellets 13.10 8
Pearlite 12.1d 1
12.13c 3
Polyethylene Pellets 13.7 3
Potassium chloride 11.5b 6
A2.6b 16
Potassium sulphate 12.23b 6
A2.6a 16
PVC Powder 12.7a 2
Resin 12.19a 4
Silica sand 12.21d 5
A2.2b 1
Sodium carbonate Soda ashHeavy 12.1c 1
Light
Fresh 13.31a 11
Degraded 13.31b 11
Sodium chloride Salt 12.1b 1
Sodium sulphate Fresh 13.2 6
Degraded 13.27b 6
Sugar GranulatedFresh 13.2 3
Degraded 13.27b 3
Terephthalic acid PTA 12.19b 4
Water flour 12.11a 3
Zircon sand 12.14b 3
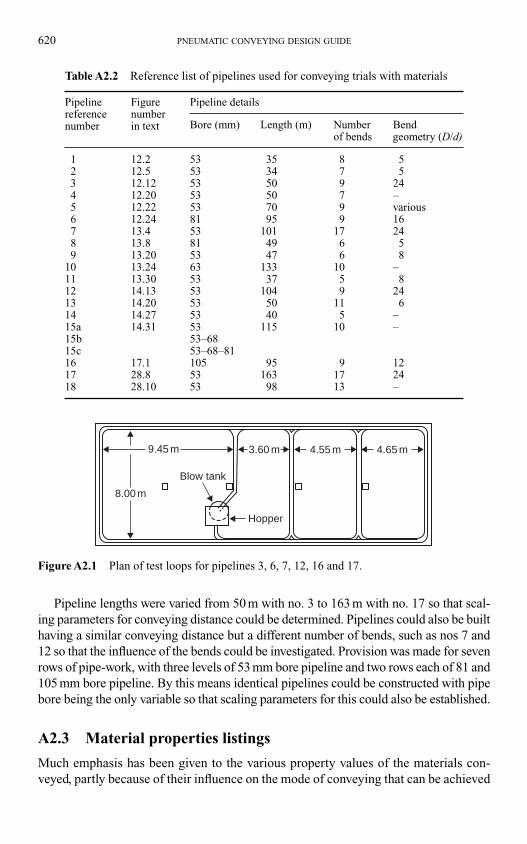
620 PNEUMATIC CONVEYING DESIGN GUIDE
Table A2.2 Reference list of pipelines used for conveying trials with materials
Pipeline Figure Pipeline details
reference number Bore (mm) Length (m) Number Bend number in text
of bends geometry (D/d)
1 12.2 53 35 8 5
2 12.5 53 34 7 5
3 12.12 53 50 9 24
4 12.20 53 50 7 –
5 12.22 53 70 9 various
6 12.24 81 95 9 16
7 13.4 53 101 17 24
8 13.8 81 49 6 5
9 13.20 53 47 6 8
10 13.24 63 133 10 –
11 13.30 53 37 5 8
12 14.13 53 104 9 24
13 14.20 53 50 11 6
14 14.27 53 40 5 –
15a 14.31 53 115 10 –
15b 53–68
15c 53–68–81
16 17.1 105 95 9 12
17 28.8 53 163 17 24
18 28.10 53 98 13 –
Hopper
4.55 m3.60 m9.45 m 4.65 m
Blow tank
8.00 m
Figure A2.1 Plan of test loops for pipelines 3, 6, 7, 12, 16 and 17.
Pipeline lengths were varied from 50 m with no. 3 to 163 m with no. 17 so that scal-
ing parameters for conveying distance could be determined. Pipelines could also be built
having a similar conveying distance but a different number of bends, such as nos 7 and
12 so that the influence of the bends could be investigated. Provision was made for seven
rows of pipe-work, with three levels of 53 mm bore pipeline and two rows each of 81 and
105 mm bore pipeline. By this means identical pipelines could be constructed with pipe
bore being the only variable so that scaling parameters for this could also be established.
A2.3 Material properties listings
Much emphasis has been given to the various property values of the materials con-
veyed, partly because of their influence on the mode of conveying that can be achieved
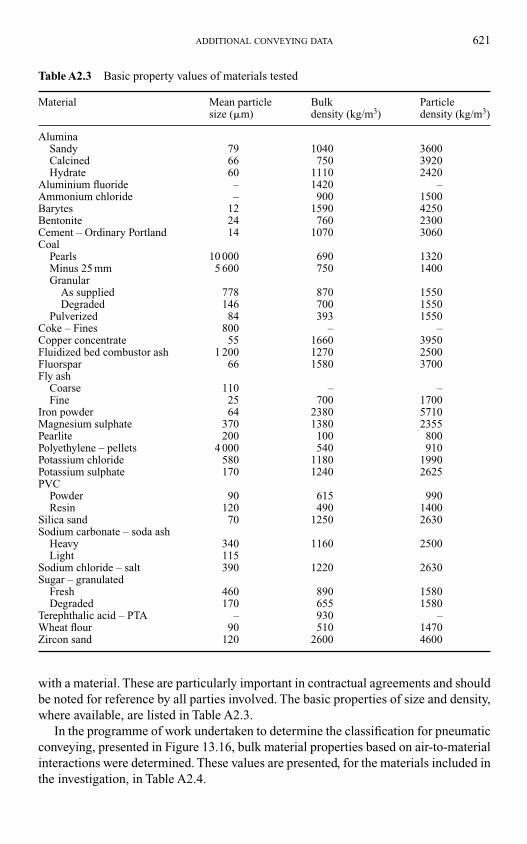
ADDITIONAL CONVEYING DATA 621
Table A2.3 Basic property values of materials tested
Material Mean particle Bulk Particle
size (�m) density (kg/m3) density (kg/m3)
Alumina
Sandy 79 1040 3600
Calcined 66 750 3920
Hydrate 60 1110 2420
Aluminium fluoride – 1420 –
Ammonium chloride – 900 1500
Barytes 12 1590 4250
Bentonite 24 760 2300
Cement – Ordinary Portland 14 1070 3060
Coal
Pearls 10 000 690 1320
Minus 25 mm 5 600 750 1400
Granular
As supplied 778 870 1550
Degraded 146 700 1550
Pulverized 84 393 1550
Coke – Fines 800 – –
Copper concentrate 55 1660 3950
Fluidized bed combustor ash 1 200 1270 2500
Fluorspar 66 1580 3700
Fly ash
Coarse 110 – –
Fine 25 700 1700
Iron powder 64 2380 5710
Magnesium sulphate 370 1380 2355
Pearlite 200 100 800
Polyethylene – pellets 4 000 540 910
Potassium chloride 580 1180 1990
Potassium sulphate 170 1240 2625
PVC
Powder 90 615 990
Resin 120 490 1400
Silica sand 70 1250 2630
Sodium carbonate – soda ash
Heavy 340 1160 2500
Light 115
Sodium chloride – salt 390 1220 2630
Sugar – granulated
Fresh 460 890 1580
Degraded 170 655 1580
Terephthalic acid – PTA – 930 –
Wheat flour 90 510 1470
Zircon sand 120 2600 4600
with a material. These are particularly important in contractual agreements and should
be noted for reference by all parties involved. The basic properties of size and density,
where available, are listed in Table A2.3.
In the programme of work undertaken to determine the classification for pneumatic
conveying, presented in Figure 13.16, bulk material properties based on air-to-material
interactions were determined. These values are presented, for the materials included in
the investigation, in Table A2.4.
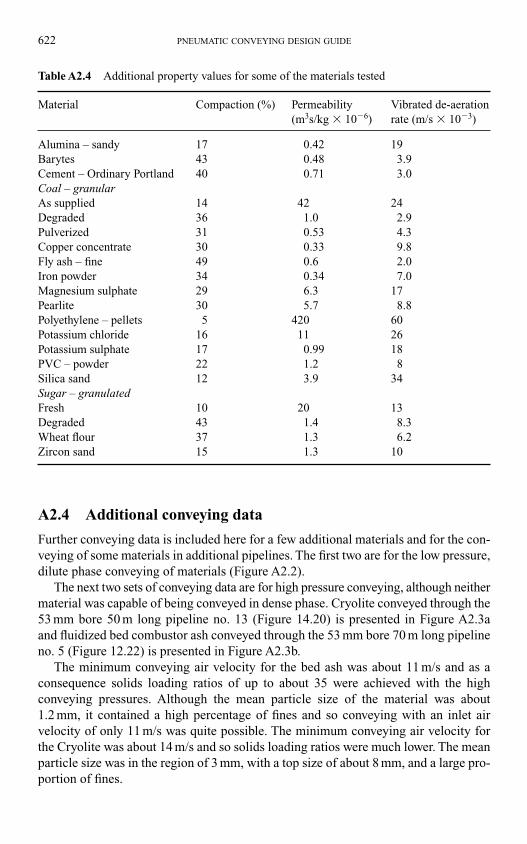
A2.4 Additional conveying data
Further conveying data is included here for a few additional materials and for the con-
veying of some materials in additional pipelines. The first two are for the low pressure,
dilute phase conveying of materials (Figure A2.2).
The next two sets of conveying data are for high pressure conveying, although neither
material was capable of being conveyed in dense phase. Cryolite conveyed through the
53 mm bore 50 m long pipeline no. 13 (Figure 14.20) is presented in Figure A2.3a
and fluidized bed combustor ash conveyed through the 53 mm bore 70 m long pipeline
no. 5 (Figure 12.22) is presented in Figure A2.3b.
The minimum conveying air velocity for the bed ash was about 11 m/s and as a
consequence solids loading ratios of up to about 35 were achieved with the high
conveying pressures. Although the mean particle size of the material was about
1.2 mm, it contained a high percentage of fines and so conveying with an inlet air
velocity of only 11 m/s was quite possible. The minimum conveying air velocity for
the Cryolite was about 14 m/s and so solids loading ratios were much lower. The mean
particle size was in the region of 3 mm, with a top size of about 8 mm, and a large pro-
portion of fines.
622 PNEUMATIC CONVEYING DESIGN GUIDE
Table A2.4 Additional property values for some of the materials tested
Material Compaction (%) Permeability Vibrated de-aeration
(m3s/kg � 10�6) rate (m/s � 10�3)
Alumina – sandy 17 0.42 19
Barytes 43 0.48 3.9
Cement – Ordinary Portland 40 0.71 3.0
Coal – granularAs supplied 14 42 24
Degraded 36 1.0 2.9
Pulverized 31 0.53 4.3
Copper concentrate 30 0.33 9.8
Fly ash – fine 49 0.6 2.0
Iron powder 34 0.34 7.0
Magnesium sulphate 29 6.3 17
Pearlite 30 5.7 8.8
Polyethylene – pellets 5 420 60
Potassium chloride 16 11 26
Potassium sulphate 17 0.99 18
PVC – powder 22 1.2 8
Silica sand 12 3.9 34
Sugar – granulatedFresh 10 20 13
Degraded 43 1.4 8.3
Wheat flour 37 1.3 6.2
Zircon sand 15 1.3 10
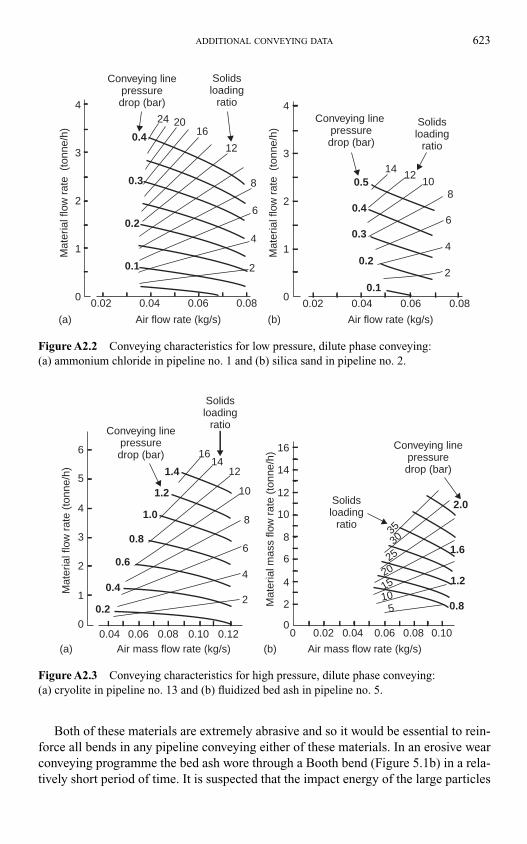
ADDITIONAL CONVEYING DATA 623
0.4
0.3
0.2
0.1
0.4
0.514
1210
8
6
4
2
0.3
0.2
0.1
24 2016
12
8
6
4
2
0.02 0.04 0.06 0.08 0.02 0.04 0.06 0.08
Conveying linepressuredrop (bar)
Conveying line pressuredrop (bar)
Solidsloading
ratio
Solidsloading
ratio
4
3
2
1
0
4
3
2
1
0
Air flow rate (kg/s) Air flow rate (kg/s)(a) (b)
Mat
eria
l flo
w r
ate
(to
nne/
h)
Mat
eria
l flo
w r
ate
(to
nne/
h)
Figure A2.2 Conveying characteristics for low pressure, dilute phase conveying:
(a) ammonium chloride in pipeline no. 1 and (b) silica sand in pipeline no. 2.
Solidsloading
ratio
Conveying linepressuredrop (bar)
3530
25
20
1510
5
2.0
1.6
1.2
0.80.2
0.4
0.6
0.8
1.0
1.2
1.4
1614
12
10
8
6
6 16
14
12
10
8
6
4
2
00 0.020.04 0.06 0.08 0.10 0.12 0.04 0.06 0.08 0.10
5
4
3
2
1
0
4
2
Conveying linepressuredrop (bar)
Solidsloading
ratio
Air mass flow rate (kg/s) Air mass flow rate (kg/s)(a) (b)
Mat
eria
l flo
w r
ate
(ton
ne/h
)
Mat
eria
l mas
s flo
w r
ate
(ton
ne/h
)
Figure A2.3 Conveying characteristics for high pressure, dilute phase conveying:
(a) cryolite in pipeline no. 13 and (b) fluidized bed ash in pipeline no. 5.
Both of these materials are extremely abrasive and so it would be essential to rein-
force all bends in any pipeline conveying either of these materials. In an erosive wear
conveying programme the bed ash wore through a Booth bend (Figure 5.1b) in a rela-
tively short period of time. It is suspected that the impact energy of the large particles
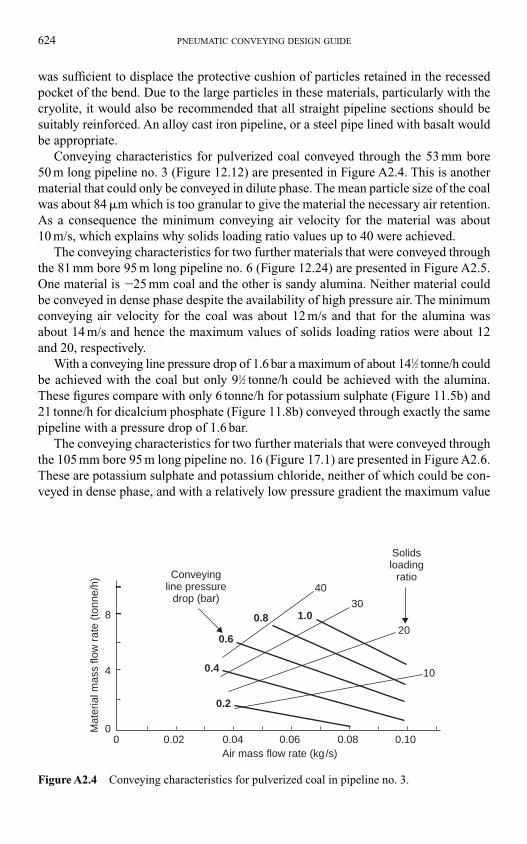
was sufficient to displace the protective cushion of particles retained in the recessed
pocket of the bend. Due to the large particles in these materials, particularly with the
cryolite, it would also be recommended that all straight pipeline sections should be
suitably reinforced. An alloy cast iron pipeline, or a steel pipe lined with basalt would
be appropriate.
Conveying characteristics for pulverized coal conveyed through the 53 mm bore
50 m long pipeline no. 3 (Figure 12.12) are presented in Figure A2.4. This is another
material that could only be conveyed in dilute phase. The mean particle size of the coal
was about 84 �m which is too granular to give the material the necessary air retention.
As a consequence the minimum conveying air velocity for the material was about
10 m/s, which explains why solids loading ratio values up to 40 were achieved.
The conveying characteristics for two further materials that were conveyed through
the 81 mm bore 95 m long pipeline no. 6 (Figure 12.24) are presented in Figure A2.5.
One material is �25 mm coal and the other is sandy alumina. Neither material could
be conveyed in dense phase despite the availability of high pressure air. The minimum
conveying air velocity for the coal was about 12 m/s and that for the alumina was
about 14 m/s and hence the maximum values of solids loading ratios were about 12
and 20, respectively.
With a conveying line pressure drop of 1.6 bar a maximum of about 141⁄2 tonne/h could
be achieved with the coal but only 91⁄2 tonne/h could be achieved with the alumina.
These figures compare with only 6 tonne/h for potassium sulphate (Figure 11.5b) and
21 tonne/h for dicalcium phosphate (Figure 11.8b) conveyed through exactly the same
pipeline with a pressure drop of 1.6 bar.
The conveying characteristics for two further materials that were conveyed through
the 105 mm bore 95 m long pipeline no. 16 (Figure 17.1) are presented in Figure A2.6.
These are potassium sulphate and potassium chloride, neither of which could be con-
veyed in dense phase, and with a relatively low pressure gradient the maximum value
624 PNEUMATIC CONVEYING DESIGN GUIDE
Conveyingline pressure
drop (bar)
8
4
00 0.02 0.04 0.06 0.08 0.10
0.2
0.4
0.6
0.8
40
1.030
20
10
Solidsloading
ratio
Air mass flow rate (kg/s)
Mat
eria
l mas
s flo
w r
ate
(ton
ne/h
)
Figure A2.4 Conveying characteristics for pulverized coal in pipeline no. 3.
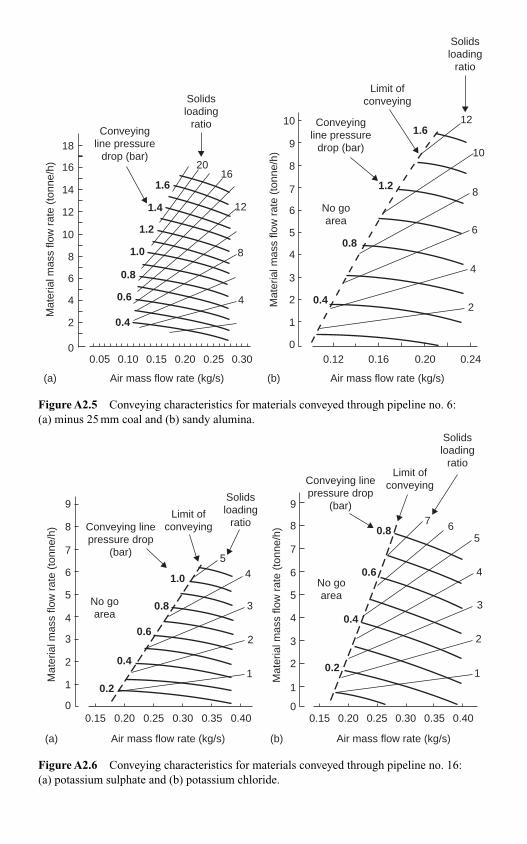
20
1.6
1.4
1.2
1.2
1.6
1.0
0.8
0.8
0.6
0.4
0.44
8
12
16
18
16
14
12
10
8
6
4
2
00.05 0.10 0.15 0.20 0.25 0.30
Air mass flow rate (kg/s) Air mass flow rate (kg/s)(a)
Solidsloading
ratioConveying
line pressuredrop (bar)
Mat
eria
l mas
s flo
w r
ate
(ton
ne/h
)
Mat
eria
l mas
s flo
w r
ate
(ton
ne/h
)
Solidsloading
ratio
Limit ofconveying
Conveyingline pressure
drop (bar)
No goarea
10
9
8
7
6
5
4
3
2
1
00.12 0.16 0.20 0.24
2
4
6
8
10
12
(b)
Figure A2.5 Conveying characteristics for materials conveyed through pipeline no. 6:
(a) minus 25 mm coal and (b) sandy alumina.
9
8
7
6
5
4
3
2
1
00.15 0.20 0.25 0.30 0.35 0.40
0.2
0.4
0.6
0.8
1.0
5
4
3
2
1
Conveying linepressure drop
(bar)
Conveying linepressure drop
(bar)Limit of
conveying
Limit ofconveying
Solidsloading
ratio
No goareaNo go
area
Air mass flow rate (kg/s) Air mass flow rate (kg/s)(a)
Mat
eria
l mas
s flo
w r
ate
(ton
ne/h
)
Mat
eria
l mas
s flo
w r
ate
(ton
ne/h
)
9
8
7
6
5
4
3
2
1
0
Solidsloading
ratio
5
4
3
2
1
67
0.2
0.4
0.6
0.8
0.15 0.20 0.25 0.30 0.35 0.40
(b)
Figure A2.6 Conveying characteristics for materials conveyed through pipeline no. 16:
(a) potassium sulphate and (b) potassium chloride.
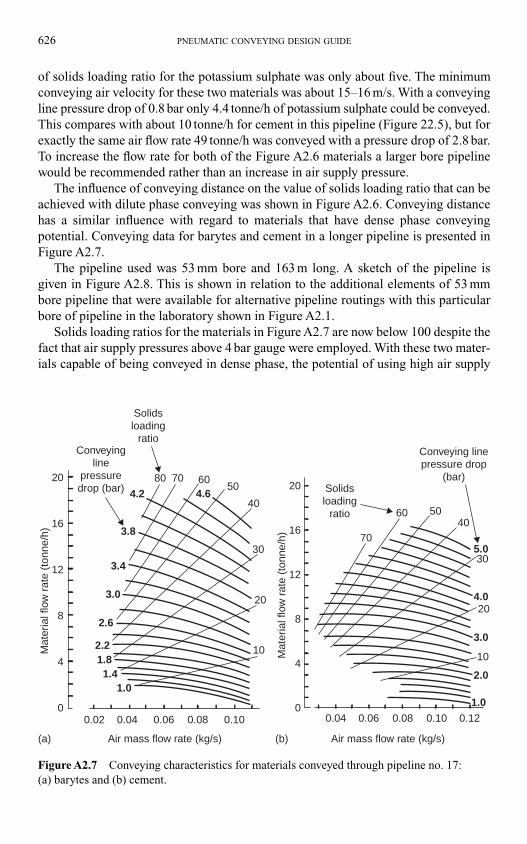
626 PNEUMATIC CONVEYING DESIGN GUIDE
Solidsloading
ratio
Solidsloading
ratio
Conveying linepressure drop
(bar)
Conveyingline
pressuredrop (bar)
Air mass flow rate (kg/s) Air mass flow rate (kg/s)(a) (b)
Mat
eria
l flo
w r
ate
(ton
ne/h
)
Mat
eria
l flo
w r
ate
(ton
ne/h
)
0.04
20
16
12
8
4
0
20 80 70 60
60
70
5040
5.030
4.0
3.0
10
2.0
1.0
20
50
40
30
20
10
1.01.4
1.82.2
2.6
3.0
3.4
3.8
4.2 4.6
16
12
8
4
00.06 0.08 0.10 0.120.02 0.04 0.06 0.08 0.10
Figure A2.7 Conveying characteristics for materials conveyed through pipeline no. 17:
(a) barytes and (b) cement.
of solids loading ratio for the potassium sulphate was only about five. The minimum
conveying air velocity for these two materials was about 15–16 m/s. With a conveying
line pressure drop of 0.8 bar only 4.4 tonne/h of potassium sulphate could be conveyed.
This compares with about 10 tonne/h for cement in this pipeline (Figure 22.5), but for
exactly the same air flow rate 49 tonne/h was conveyed with a pressure drop of 2.8 bar.
To increase the flow rate for both of the Figure A2.6 materials a larger bore pipeline
would be recommended rather than an increase in air supply pressure.
The influence of conveying distance on the value of solids loading ratio that can be
achieved with dilute phase conveying was shown in Figure A2.6. Conveying distance
has a similar influence with regard to materials that have dense phase conveying
potential. Conveying data for barytes and cement in a longer pipeline is presented in
Figure A2.7.
The pipeline used was 53 mm bore and 163 m long. A sketch of the pipeline is
given in Figure A2.8. This is shown in relation to the additional elements of 53 mm
bore pipeline that were available for alternative pipeline routings with this particular
bore of pipeline in the laboratory shown in Figure A2.1.
Solids loading ratios for the materials in Figure A2.7 are now below 100 despite the
fact that air supply pressures above 4 bar gauge were employed. With these two mater-
ials capable of being conveyed in dense phase, the potential of using high air supply
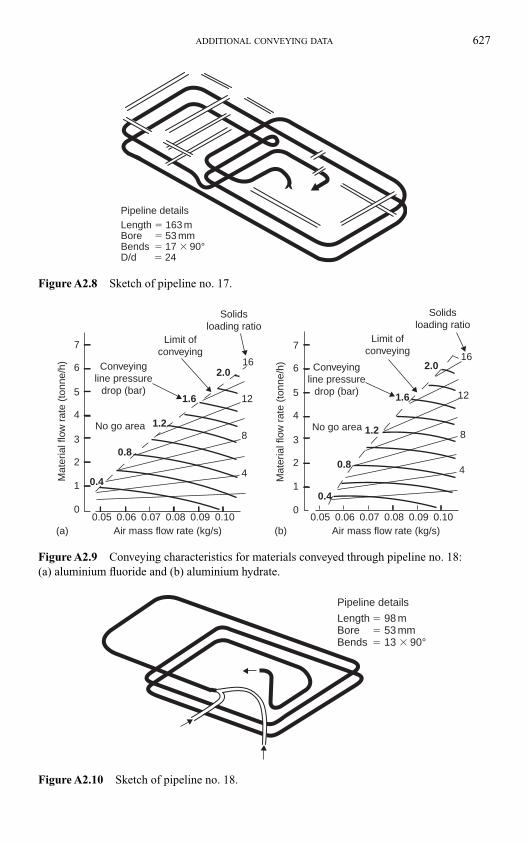
ADDITIONAL CONVEYING DATA 627
Pipeline detailsLength � 163 mBore � 53 mmBends � 17 � 90°D/d � 24
Figure A2.8 Sketch of pipeline no. 17.
Conveyingline pressure
drop (bar)
Limit ofconveying
Solidsloading ratio
Solidsloading ratio
No go area No go area
0.4
0.8
1.2
1.6
2.016
12
8
4
0.4
0.8
1.2
1.6
2.016
12
8
4
7
6
5
4
3
2
1
00.05 0.06 0.07 0.08 0.09 0.10
Air mass flow rate (kg/s) Air mass flow rate (kg/s)
7
6
5
4
3
2
1
00.05 0.06 0.07 0.08 0.09 0.10
Mat
eria
l flo
w r
ate
(ton
ne/h
)
Mat
eria
l flo
w r
ate
(ton
ne/h
) Conveyingline pressure
drop (bar)
Limit ofconveying
(a) (b)
Figure A2.9 Conveying characteristics for materials conveyed through pipeline no. 18:
(a) aluminium fluoride and (b) aluminium hydrate.
Pipeline details
Length � 98 m Bore � 53 mm Bends � 13 � 90°
Figure A2.10 Sketch of pipeline no. 18.

pressures can be clearly seen. Compared with the materials conveyed through the larger
bore and shorter length pipeline presented in Figure A2.6, material flow rates are very
much higher and air flow rates required are much lower.
Conveying characteristics for two further fine granular materials with no natural
dense phase conveying capability are shown in Figure A2.9. A sketch of the pipeline
used for conveying these materials is shown in Figure A2.10. The minimum convey-
ing air velocity for the aluminium fluoride was about 14 m/s and that for the alu-
minium hydrate was about 13 m/s.
628 PNEUMATIC CONVEYING DESIGN GUIDE
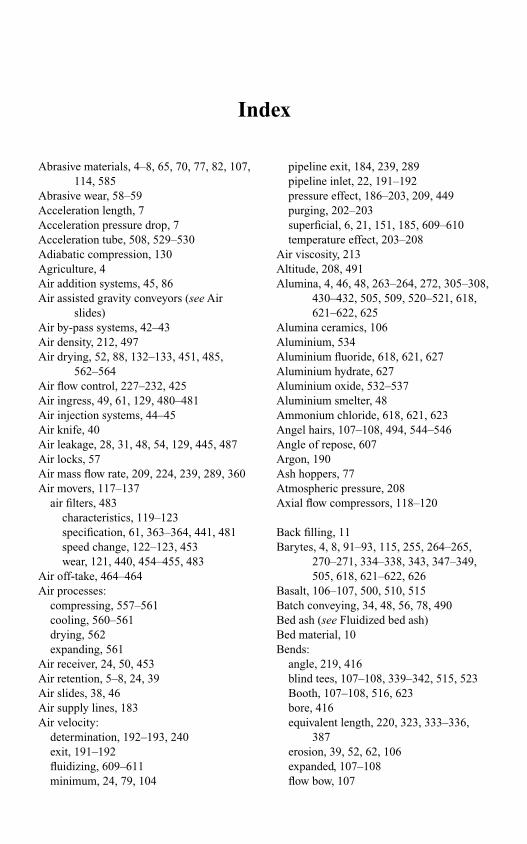
Index
Abrasive materials, 4–8, 65, 70, 77, 82, 107,
114, 585
Abrasive wear, 58–59
Acceleration length, 7
Acceleration pressure drop, 7
Acceleration tube, 508, 529–530
Adiabatic compression, 130
Agriculture, 4
Air addition systems, 45, 86
Air assisted gravity conveyors (see Air
slides)
Air by-pass systems, 42–43
Air density, 212, 497
Air drying, 52, 88, 132–133, 451, 485,
562–564
Air flow control, 227–232, 425
Air ingress, 49, 61, 129, 480–481
Air injection systems, 44–45
Air knife, 40
Air leakage, 28, 31, 48, 54, 129, 445, 487
Air locks, 57
Air mass flow rate, 209, 224, 239, 289, 360
Air movers, 117–137
air filters, 483
characteristics, 119–123
specification, 61, 363–364, 441, 481
speed change, 122–123, 453
wear, 121, 440, 454–455, 483
Air off-take, 464–464
Air processes:
compressing, 557–561
cooling, 560–561
drying, 562
expanding, 561
Air receiver, 24, 50, 453
Air retention, 5–8, 24, 39
Air slides, 38, 46
Air supply lines, 183
Air velocity:
determination, 192–193, 240
exit, 191–192
fluidizing, 609–611
minimum, 24, 79, 104
pipeline exit, 184, 239, 289
pipeline inlet, 22, 191–192
pressure effect, 186–203, 209, 449
purging, 202–203
superficial, 6, 21, 151, 185, 609–610
temperature effect, 203–208
Air viscosity, 213
Altitude, 208, 491
Alumina, 4, 46, 48, 263–264, 272, 305–308,
430–432, 505, 509, 520–521, 618,
621–622, 625
Alumina ceramics, 106
Aluminium, 534
Aluminium fluoride, 618, 621, 627
Aluminium hydrate, 627
Aluminium oxide, 532–537
Aluminium smelter, 48
Ammonium chloride, 618, 621, 623
Angel hairs, 107–108, 494, 544–546
Angle of repose, 607
Argon, 190
Ash hoppers, 77
Atmospheric pressure, 208
Axial flow compressors, 118–120
Back filling, 11
Barytes, 4, 8, 91–93, 115, 255, 264–265,
270–271, 334–338, 343, 347–349,
505, 618, 621–622, 626
Basalt, 106–107, 500, 510, 515
Batch conveying, 34, 48, 56, 78, 490
Bed ash (see Fluidized bed ash)
Bed material, 10
Bends:
angle, 219, 416
blind tees, 107–108, 339–342, 515, 523
Booth, 107–108, 516, 623
bore, 416
equivalent length, 220, 323, 333–336,
387
erosion, 39, 52, 62, 106
expanded, 107–108
flow bow, 107
Bends (contd)
gamma, 107
geometry, 218, 339–342, 458, 513–514
location, 337
long radius, 514–515, 519
material, 106, 539–540
mitred, 219, 515
pocketed, 107, 476
pressure drop, 106–109, 217–220, 256,
337–338, 415
pressure profile, 109, 338
radiused, 107
types, 107
vortice, 107–108, 516
wear, 106, 501–505, 511–513
Bentonite, 4, 278–279, 618, 621
Blaine number, 616
Blast furnaces, 114
Blind tees (see Bends)
Blowers, 11, 21, 24, 37, 54, 77, 121–123,
475–476, 483, 581
compressors, 122–123, 469, 581
exhausters, 123, 125
Blow tanks, 25, 30, 34, 37–38, 56–57,
77–79, 82–103, 483, 496, 582–583
air requirements, 79
continuously operating, 80
control systems, 98–99, 483–484
cycle analysis, 90–91
discharge limit, 79, 97, 484
discharge type, 95
bottom, 40, 78, 84–87
top, 51, 83–87, 101, 484
discharge valve, 89, 93, 485, 583
filling, 91
flow control, 78–79, 85–86, 94–95
fluidizing membrane, 83–87, 89, 485
low pressure, 77, 83
in parallel, 99–100
pressure capability, 56
pressure drop, 78, 83, 87–88, 183
in series, 83, 101–103
single batch, 35–36
single plug, 35, 37, 482
size, 35–36, 90–92
transients, 35
twin, 10, 38, 83, 99–103
types, 83–87, 95
venting, 37, 89, 94, 583
Boiler plant, 114, 309
Boosters, 45, 86
Booth bend, 107–108, 516, 623
Brinell hardness, 24, 507
By–pass systems, 42–44, 306–308
Carbon black, 52
Carbon dioxide, 190
Cast iron, 106–107, 500, 515
Cement, 4, 11, 12, 24, 46, 81, 88, 90,
245–246, 289, 338, 384–394, 446,
455–456, 467, 492–493
ordinary portland, 268–270, 280–282,
290–292, 320–326, 387, 484, 618,
621–622, 626
oil well, 348–349, 618
Ceramics, 500
Channel flow systems, 45–48
Choking, 22–23, 28, 56, 75, 77, 462
Closed loop systems, 30, 38, 52, 82, 579
Coal, 10–11, 50, 505, 618, 621–622
degradation, 543–544
dust, 70, 114
granular, 278–279, 312–313
injection, 114
lump, 259–261, 265, 457, 625
pulverized, 103, 624
Cocoa, 50
Coefficient of restitution, 115, 338, 348–349
Coffee, 4
Cohesive (see Material properties)
Coke, 517–518, 618, 621
Coke fines, 273–275, 444, 446
Cold air, 452–453
Combined systems, 33
Combustible materials (see Material
properties)
Commissioning, 71, 97, 440, 450
Compressors, 38
air temperature, 39, 130
axial flow, 118–120
capability, 118, 445–446
centrifugal, 118–120
characteristics, 119–123
damage, 32, 39
delivery temperature, 130–131
idling, 136–137
liquid ring, 125–126
power required, 134–136
630 INDEX
pre-cooling systems, 137
reciprocating, 126
screw, 126, 136
sliding vane, 124–125
specification, 127–130
staging, 118, 123, 127
wear, 454–455
Condensation, 124, 132, 137, 440, 491, 547,
556–561
Confectionery, 4
Continuity equation, 226
Conveying air velocity, 63, 212, 248,
319–320, 441
dilute phase, 6
dense phase, 6
evaluation, 192–193, 240
minimum, 6, 22, 96, 109, 119, 156, 236,
321, 345–346, 359
pipeline exit, 22, 109
pipeline inlet, 6, 324, 359–361, 364, 388,
407, 416
Conveying capability, 9–11, 157–158,
258–286, 456–457
Conveying capacity, 169–172
Conveying characteristics, 236–256,
298–299, 369
determination, 243–246
Conveying correlations, 294–305
Conveying distance, 9, 12, 35, 92, 159–168,
358, 372–376, 418–419, 458–459
Conveying limitations, 96, 241–242, 321,
325, 443
Conveying modes, 237, 287, 296
Conveying trials, 13, 295, 317
Copper concentrate, 273–274, 618, 621–622
Critical pressure, 229–230
Cryolite, 248–252, 618, 623
Cyclones, 143–146
collecting efficiency, 144–145
cyclone separators, 139, 143
Dalton’s law, 549
Darcy equation, 215, 237, 321
De-aeration, 46, 299, 612–615
Deflecting flows, 520–521, 523
Degraded material, 140
Dense phase, 5–12, 21, 34, 39, 52, 199,
289–294, 384–394, 404, 420–422,
538–539
capability, 46
vacuum conveying, 34
Denseveyor, 10
Density:
bulk, 67, 82, 541, 603
fluidized, 67
particle, 541
Desiccant dryers, 133, 451–452, 485, 563
Dew point, 133, 552–554
Dicalcium phosphate, 248–251, 309–311,
618
Dilute phase, 5–12, 20, 39, 51, 52, 119, 179,
198, 287–289, 351,
395–404,419–420, 460, 526, 539
Diverter valves, 31, 49, 105, 112–113,
439–440
Dixon’s slugging diagram, 297–298
Dolomite, 11
Drag force, 6
Drilling mud powders, 106
Drilling rigs, 28
Drop-out box, 65
Dust concentration, 573–574, 576
Dust emission, 572
Dust risks, 571–572
Dust suppression, 575
Earthing, 51, 584
Economizer hoppers, 308
Electrolysis pots, 48
Electrostatic precipitators, 10, 140, 309
Electrostatics (see Material properties)
Entrainment devices, 64–65
Entrainment velocity, 22, 65, 69
Entropy, 552–556
Equivalent length, 12, 390, 400, 458
Erosion:
erosive wear, 9, 44, 58, 106, 498–524,
585
impact angle, 105, 499–500, 521
Evaporative cooling, 127, 565–567
Exhausters, 33, 37, 54, 122, 128–129
Explosion, 492, 528, 571–572
containment, 588–589
detection, 590–591
parameters, 577
determination, 592
expansion effects, 578
explosibility limits, 576–577
INDEX 631
Explosion (contd)
ignition sources, 576
inerting, 588
oxygen concentration, 578
pressure generation, 577–578
protection, 587
relief venting, 587, 589–590
risks, 575–576
secondary, 575, 591–592
suppression, 587, 590–591
Explosive materials, 3, 141, 577
Fans, 70, 119
Fan systems, 119, 140, 482
Feeders, 56, 102, 367, 465, 581
air leakage, 57, 83
control, 57, 447
maintenance, 55
material surges, 57, 440
pressure drop, 55, 78, 83
venting, 487–488
wear, 83, 454–455
Feeding requirements, 57
Fertilizers, 4
Fick’s Law, 613
Filters, 30–31, 146–151, 464, 488, 528, 562
back up, 32, 39, 480, 483
batch operation, 34, 94, 147, 150
cleaning, 149
fabric, 140, 142
failure, 32
filter media, 146–147
maintenance, 150, 489
negative pressure systems, 151,
479–480
pressure drop, 140, 183, 489
reverse air jet cleaning, 149–150
selection, 147
shaken units, 147–148, 489
sizing, 94, 148–149, 489–490
Fish, 496
Flanges, 62
Flash drying, 568
Flexible hose, 36, 53, 76, 106, 114–115,
346–349
Flood feeding, 46, 89
Flour, 4, 50, 62, 97–98, 267–268, 274, 289,
338, 387, 428–430, 577, 619,
621–622
Flow diversion, 112–113
Flow splitting, 114
Fluidization, 38, 608–611
Fluidized bed ash, 266, 618, 621, 623
Fluidized bed combustion, 10
Fluidized motion, 45–48, 294
Fluidizing membrane, 485–486
Fluorspar, 278–279, 297, 618, 621
Fly ash, 4–11, 46, 81, 88, 96–98, 252–253,
260–262, 266–267, 275–276,
308–310, 341–344, 350–353,
432–435, 619, 621–622
Foundries, 4
Fractal properties, 297
Free air conditions, 21, 184, 188–189,
193
Free air velocity, 22
Friable materials, 4–8, 65, 70, 77, 114
Friction factor, 213
Full channel conveyors, 48
Fuller-Kinyon, 81, 103
Gas constants:
characteristic, 189–190, 442
universal, 190
Gas-solid separation (see Filters)
Gate lock valves, 71–73
feed control, 71
feeding, 56, 111, 496
vacuum operation, 73
Gattys system, 44
Geldart classification, 46–47, 82, 296–297,
611–612
Glass manufacture, 4, 37
Grain, 4
Granulated sugar (see Sugar)
Gravity settling chambers, 142
Hardness, 24
Health and safety, 4
Heat exchanger, 11, 39, 124, 523
Heat treatment, 500, 507
High pressure conveying, 9, 21, 77, 80, 82,
191, 267–282
High pressure delivery, 35, 56, 80
High vacuum conveying, 110
Horizontal conveying, 255, 413
Hoses, 105, 114–115
Hot material, 111
632 INDEX
Humidity:
control, 585
relative, 23, 547, 552
specific, 23, 547–549, 554
Hydraulic conveying, 9, 32, 498
Hygiene, 105
Hygroscopic materials, 3, 88
Ice, 11
Ideal gas law, 188, 212, 228, 239, 405, 548
Inclined pipelines, 344–346
Inert gas, 3, 38
Innovatory systems, 8, 29, 40–45, 50, 53,
306–308
Instrumentation, 152, 384
Insulation, 488
Iron powder, 77, 260–263, 270–271, 619, 621
Limestone, 10, 114
Liquid ring vacuum pump, 125–126
Load cells, 242, 465
Lock hoppers, 56, 69, 70, 80, 83, 101–103
Logic diagrams, 355–371
system capability, 364–367
system design, 355–364, 368–370
Long distance conveying, 10
Low pressure conveying, 21, 56, 82, 191,
195, 258–267
Lysholm, 126
Magnesium sulphate, 271–272, 281–282,
395–403, 619, 621–622
Material capability, 446
Material characterization, 595
Material consolidation, 86, 495
Material degradation, 51, 106, 140,
311–317, 488, 495, 540–545
Material deposition, 439, 453, 586
Material entrainment, 59, 64–65
Material feeding, 30–31, 458, 463
Material flow control, 426
Material grade, 12, 295, 305–317, 423,
496–497
Material influences, 12, 258, 303
Material properties, 154, 357, 595–596
abrasive, 36
aeration, 608–609
air retention, 39–44, 86, 156, 175–177,
297, 312, 612
angle of repose, 607
cohesive, 40, 50, 59, 115, 495
combustible, 30, 50
density, 487, 495, 602–604
electrostatic, 51, 491, 606
erosive, 51
explosive, 32
flow, 605–607
friable, 36, 51
granular, 51, 156–157, 486, 496
hygroscopic, 39, 52, 314, 496, 585
low melting point, 52
permeability, 39, 42–44, 156, 297–304,
610
radioactive, 38, 52
shape, 297
size, 47, 297, 496
size distribution, 24, 297–298, 457, 527
specific heat, 208
specific surface, 301
toxic, 32, 38, 52, 141
very fine, 47
vibrated de-aeration constant, 301–305
wet, 51, 440, 497
Material segregation, 47
Material surges, 475
Material temperature, 63, 205–208
Material testing, 299
Mechanical feeders, 71, 76
Metal powders, 50
Milk powder, 37
Minimum velocity, 10, 22, 345–346, 416
Mining, 4–11, 518
Mobile systems, 36, 50, 76
Mohs’ scale, 24, 506
Moisture, 51, 87–88, 450–451, 485,
550–551, 606
Moody diagram, 214
Moving bed flow, 5
Multi point delivery, 31, 49, 426–428
Multi point feeding, 4, 31–33, 48, 426–435,
479
Multiple delivery, 31–33, 49, 480
Multiple material conveying, 49, 424–435
Multiple systems, 33, 49, 119, 195,
423–435, 481–482
Ni-hard, 509, 520
Nitrogen, 3, 30, 38, 190, 442
INDEX 633
Negative pressure conveying, 21
Negative pressure systems, 31, 61–62,
410–411, 434, 445, 448, 466–467,
479–480, 496, 580
Non-return valves, 483
Non steady feeding, 440, 449–450
Nozzles:
air flow, 227, 425
flow analysis, 228–231
vacuum (see Vacuum nozzles)
Null point, 23, 38
Nylon, 37, 52, 293–295, 619
Oil free air, 122, 131–132, 591
Open systems, 30, 579–580
Orifice plates, 231
Over feeding, 440, 445
Oxygen, 190
Paint manufacture, 4
Partial pressure, 23, 548
Particle:
attrition, 526, 585
deflection, 520–523
degradation, 4, 9, 44, 114, 140, 302,
526–546
density, 7, 602–603
hardness, 24, 504–505
impact angle, 105, 499–500, 521,
536–537, 539
material, 536
melting, 52, 106, 544–546
shape, 5, 512, 596, 600–602
size, 5, 502, 524, 533, 596
size distribution, 5, 86, 541, 597–600
velocity, 6, 529, 533–534, 538
Pearlite, 97–98, 259–262, 270–271, 619,
621–622
Peas, 530–531, 538
Pelletized materials, 5, 24, 59, 297, 308
Performance monitoring, 447–449, 486
Permeability, 5–8, 24, 39, 610
Permeameter, 609–610
Perspex, 520–522
Peters pump, 81
Petroleum coke, 70
Pharmaceuticals, 4, 50
Phase density (see Solids loading ratio)
Pick-up velocity, 22
Pipeline:
bends, 106, 155, 217–220, 256, 333–342,
415–416, 497
blockage, 41, 57, 63, 73, 75, 86, 95,
104, 108, 115, 119, 184, 439–460,
465, 497
bore, 11, 155, 163–172, 175–176,
187–188, 217, 283–285, 358, 363,
376–383, 409, 441, 472–474
coating, 47, 52, 115, 440, 494–495
condensation, 440, 450
couplings, 62
diameter, 35
drying, 450
equivalent length, 390–391, 400–401
erosion, 36, 94
expansion, 110, 220
feeding, 51, 475–476, 487, 591
fittings, 220
flanges, 62
flexible (see Flexible hose)
friction factor, 213
geometry, 154
horizontal, 413–414
inclined, 344–346
joints, 523–523
lagging, 450
length, 154
material, 105, 346–349,
orientation, 344–346
pressure drop, 114–115, 162–163,
211–217, 358–359, 407
purging, 108, 202–203, 453–454,
492–493, 586
rotation, 105
schedule number, 104–105
staging, 201–202
stepped, 9, 24, 109–110, 196–203, 232,
349–353, 428–435, 476, 481
treatment, 52, 545–546
velocity profile, 110, 193–203
venting, 482
wall roughness, 52, 106, 214
wall thickness, 104–105
wear, 104
Plant air, 117, 134
Plant elevation, 208, 491
Plexiglass, 534–535
Plug conveying, 292–294
634 INDEX
Plug flow, 5–8, 47, 292–294
Plug forming systems, 40
Polyester, 52
Polyethylene, 4, 37, 52, 62–63, 97–98,
268–270, 292–293, 457, 619,
621–622
Polypropylene, 4, 62
Polystyrene, 536
Porous membrane, 46–47
Porous pipe, 306–308
Positive pressure systems, 30, 60–61, 222,
410, 448, 479, 580
Potassium chloride, 240, 242, 619,
621–622, 625
Potassium sulphate, 281–282, 320–326,
619, 621–622, 625
Potential fluidization, 48
Pot hoppers, 48
Power failure, 50, 453–454, 586–587
Power required, 5, 117, 134–136,
152,172–176,362–363
Power requirements, 249–250, 471–472
Pre-cooling systems, 137
Pressure:
critical, 229–230
delivery, 183
gradient, 12, 21, 55, 109, 237, 252–255,
286, 343–346, 459
influence, 418–419
minimum point, 317, 360
relief, 50
tappings, 253
Psychrometric chart, 553–554
PTA (see Terephthalic acid)
Pulsating flow, 23
Pulsations, 53, 68
Pulse phase, 40, 50
Pulverized coal, 4
Pulverized fuel ash (see Fly ash)
Purging pipelines, 202–203
Push-pull (see Multiple systems)
PVC, 4, 37, 264–265, 276–277, 619, 621–622
Quarrying, 4, 518
Quartz particles, 531–533
Radial flow compressors, 118–120
Radioactive (see Material properties)
Rail vehicles, 38, 89, 423
Reciprocating compressors, 126–127
Refrigerant dryers, 132–133, 485, 562–563
Regenerative blowers, 120
Relative humidity (see Humidity)
Resilient materials, 106, 115, 509,
517–518
Reverse air jet cleaning, 149–150
Reynolds number, 213–214
Rice, 4
Road vehicles, 37, 89, 423
Rockwell hardness, 507
Roots, 121–123, 126
Rotameters, 244, 464
Rotary valves, 21, 23, 30–31, 37–38, 54,
58–68, 486–487, 496, 582
air leakage, 60–63, 82, 477, 582
blade tip clearance, 58, 63, 488
blade tips, 66
in blow tank, 102
blow through, 50, 51, 59–60, 66
drop through, 58
entrainment devices, 64–65
feed control, 67–68
feeding, 51
filling efficiency, 67
high pressure, 59, 66, 80, 82
material consolidation, 495
negative pressure, 59
off-set, 52, 59
pressure capability, 56
pocket types, 66–67
rotor types, 65–66
seizure, 63, 488
venting, 64, 487–488
wear, 51, 58, 454–455, 488
Rubber bends, 509, 517–518
Rubber hose, 347–348
Rubber surfaces, 509–510
Sacrificial inserts, 519–520
Salt, 259–261, 543–544, 619, 621
Saltation, 22–23, 462
Sand, 4, 37, 261, 297
Scaling parameters, 14, 319–353
bends, 333–342
distance, 320–326
pipe bore, 327–333, 393
vertical flow, 342–346
Screw compressors (see Compressors)
INDEX 635
Screw feeders, 30, 68–69, 80–82
air leakage, 69, 81
in blow tank, 102
feed control, 57, 69
high pressure, 80–81
pressure capability, 56
pressure drop, 81
variable pitch, 69
wear, 51, 81, 454–455
Screw pump (see Fuller-Kinyon)
Seeds, 5
Self loading, 37
Separation devices, 141
Shale, 11
Ship off-loading, 12, 32, 36, 49, 73, 106,
347, 423
Ships, 38
Sight glasses, 5, 300, 465–466, 584
Silica sand, 279–280, 449, 508, 543–544,
619, 621–622, 623
Single phase flow, 237
Single plug systems, 35, 51, 482, 497
Size distribution (see Material properties)
Sliding bed flow, 47, 289–292
Sliding vane compressors, 124–125
Slip ratio, 6
Slip velocity, 7
Slug flow (see Plug flow)
Soda ash, 4, 37, 259–262, 314–317,
543–544, 619, 621
Solids loading ratio, 7, 20, 36, 78, 86, 95,
159, 243, 283–286, 291, 320, 361,
405, 408, 417–418, 441, 471, 511,
576
Sodium carbonate (see Soda ash)
Sodium chloride (see Salt)
Sodium sulphate, 281–282, 313–314, 619
Spillages, 4, 37, 50, 76
Specific cost, 403
Specific energy, 251–252
Specific erosion, 502–509
Specific heat, 205–208
Specific humidity (see Humidity)
Specific surface, 602, 615–616
Staged systems, 32
Staging, 29, 201
Static electricity, 584
Steam, 190
Steel, 348–349, 507
Step location, 200, 232–234, 435
Stepped pipelines (see Pipelines)
Stoichiometric, 23
Stockpiles, 4, 31, 37, 49, 55, 73
Suck-blow (see Multiple systems)
Suction nozzles (see Vacuum nozzles)
Sugar, 4, 50, 62, 97–98, 104, 268–269,
287–289, 311–312, 428–430, 619,
621–622
Superficial velocity, 6, 21, 185
Suppressant systems, 50
Surface coatings, 518
Surface finish, 106, 512
Surface thickness, 535
Surges, 57, 94, 119–121, 475–476
Suspension temperature, see Temperature
System capability, 283–286, 370–372, 474
System economics, 152
System selection, 45, 177
Tea, 4
Temperature:
material, 205, 497
suspension, 205–208
variations, 494
wet and dry bulb, 547, 553–554
Terephthalic acid, 277–278, 619, 621
Test facilities, 14
Thermal power plant, 4, 10
Tidal movement, 12, 38
Titanium dioxide, 52
Toxic (see Material properties)
Trace air lines, 44–45, 86
Trace heating, 488
Tramp material, 583
Transient, 25, 582
Trickle valves, 76–77
Turbulence, 64, 111
Vacuum conveying, 21, 190, 192, 200,
561–562
Vacuum conveying systems, 31–32, 52, 580
Vacuum drying, 568
Vacuum nozzles, 36, 73–76, 490
applications, 12, 49, 73, 76
feeding, 32
flow aids, 75–76
flow control, 73–75, 490–491
Vacuum pumps, 125–126
636 INDEX

Valves, 110
ball, 111
butterfly, 112
disc, 112
discharge, 31, 100, 111
diverter, 31, 49
dome, 111–114
isolating, 100, 111–113
modulating, 98
non-return, 81, 483
pinch, 111–114
slide, 112
Venting, 30
Vent line valves, 112
Venturi entrainment, 65
Venturi feeders, 30, 69–71
analysis, 224–227
flow control, 69, 71
high pressure, 80, 102
pressure capability, 56, 70
Vermiculite, 77
Vertical conveying, 10, 411
Vertical pipelines, 10, 252, 342
flow down, 11, 253, 344
flow up, 7–10, 50, 253–254, 342–344,
414
Vickers hardness, 25, 507–508
Volumetric flow rate, 184–192, 366, 406,
441
Voidage, 604–605
Vortice bend, 107–108, 516
Wear back, 518–519
Wear resistance, 59, 70, 111, 507–508
Wet materials, 497
Wheat flour (see Flour)
Wood, 50, 505
Zircon sand, 272–273, 619, 621–622
INDEX 637