Plio-Pleistocene history of West African Sudanian savanna and the phylogeography of the Praomys...
17
Plio-Pleistocene history of West African Sudanian savanna and the phylogeography of the Praomys daltoni complex (Rodentia): the environment ⁄ geography ⁄ genetic interplay J. BRYJA,* L. GRANJON,† 1 G. DOBIGNY,† 2 H. PATZENHAUEROVA ´ ,* A. KONEC ˇ NY ´ ,*† J. M. DUPLANTIER,† P. GAUTHIER,† M. COLYN,‡ L. DURNEZ,§ A. LALIS – and V. NICOLAS – *Institute of Vertebrate Biology, Academy of Sciences of the Czech Republic, Kve ˇtna ´ 8, 603 65 Brno, Czech Republic, †IRD, CBGP (UMR IRD ⁄ INRA ⁄ CIRAD ⁄ MontpellierSupAgro), Campus International de Baillarguet, CS 30016, 34988 Montferrier-sur-Lez Cedex, France, ‡UMR CNRS 6553 Ecobio, Universite ´ de Rennes 1, Station Biologique, 35380 Paimpont, France, §Evolutionary Ecology Group, Department of Biology, University of Antwerp, Groenenborgerlaan 171, B-2020 Antwerp, Belgium & Mycobacteriology Unit, Department of Microbiology, Institute of Tropical Medicine, Nationalestraat 155, B-2000 Antwerp, Belgium, –Muse ´um National d’Histoire Naturelle, De ´partement de Syste ´matique et Evolution, UMR CNRS 7205, Laboratoire Mammife `res et Oiseaux, 47 rue Cuvier, CP 51, 75005 Paris, France Abstract Rodents of the Praomys daltoni complex are typical inhabitants of the Sudanian savanna ecosystem in western Africa and represent a suitable model for testing the effects of Quaternary climatic oscillations on extant genetic variation patterns. Phylogeographical analyses of mitochondrial DNA sequences (cytochrome b) across the distribution range of the complex revealed several well-defined clades that do not support the division of the clade into the two species currently recognized on the basis of morphology, i.e. P. daltoni (Thomas, 1892) and Praomys derooi (Van der Straeten & Verheyen 1978). The observed genetic structure fits the refuge hypothesis, suggesting that only a small number of populations repeatedly survived in distinct forest-savanna mosaic blocks during the arid phases of the Pleistocene, and then expanded again during moister periods. West African rivers may also have contributed to genetic differentiation, especially by forming barriers after secondary contact of expanding populations. The combination of three types of genetic markers (mtDNA sequences, microsatellite loci, cytogenetic data) provides evidence for the presence of up to three lineages, which most probably represent distinct biological species. Furthermore, incongruence between nuclear and mtDNA markers in some individuals unambiguously points towards a past introgression event. Our results highlight the importance of combining different molecular markers for an accurate interpretation of genetic data. Keywords: cytochrome b, microsatellites, mtDNA introgression, Quaternary, rodents Received 13 November 2009; revision received 16 August 2010; accepted 22 August 2010 Introduction Recent technical advances in molecular genetics provide powerful tools for uncovering cryptic animal diversity, for tracing the evolutionary history of particular species and for formulating hypotheses about the possible influence of past environmental processes on extant genetic structure. Thus, it has become possible to recon- struct an organism’s evolutionary history at various Correspondence: Josef Bryja, Department of Population Biol- ogy, Institute of Vertebrate Biology, Academy of Sciences of the Czech Republic, 675 02 Studenec 122, Czech Republic. Fax: +420-568422387; E-mail: [email protected] 1 Present address: IRD, CBGP (UMR IRD ⁄ INRA ⁄ CIRAD ⁄ MontpellierSupAgro), Campus de Bel-Air, BP 1386, Dakar, CP 18524, Senegal. 2 Present address: Centre Re ´gional Agrhymet, Rive Droite, BP11011, Niamey, Niger. ȑ 2010 Blackwell Publishing Ltd Molecular Ecology (2010) 19, 4783–4799 doi: 10.1111/j.1365-294X.2010.04847.x
-
Upload
independent -
Category
Documents
-
view
3 -
download
0
Transcript of Plio-Pleistocene history of West African Sudanian savanna and the phylogeography of the Praomys...

Molecular Ecology (2010) 19, 4783–4799 doi: 10.1111/j.1365-294X.2010.04847.x
Plio-Pleistocene history of West African Sudaniansavanna and the phylogeography of the Praomys daltonicomplex (Rodentia): the environment ⁄geography ⁄geneticinterplay
J . BRYJA,* L . GRANJON,†1 G. DOBIGNY,†2 H. PATZENHAUEROVA,* A. KONECNY , *†
J . M. DUPLANTIER,† P. GAUTHIER,† M. COLYN,‡ L. DURNEZ,§ A. LALIS– and V. NICOLAS–
*Institute of Vertebrate Biology, Academy of Sciences of the Czech Republic, Kvetna 8, 603 65 Brno, Czech Republic, †IRD,
CBGP (UMR IRD ⁄ INRA ⁄ CIRAD ⁄ MontpellierSupAgro), Campus International de Baillarguet, CS 30016, 34988
Montferrier-sur-Lez Cedex, France, ‡UMR CNRS 6553 Ecobio, Universite de Rennes 1, Station Biologique, 35380 Paimpont,
France, §Evolutionary Ecology Group, Department of Biology, University of Antwerp, Groenenborgerlaan 171, B-2020 Antwerp,
Belgium & Mycobacteriology Unit, Department of Microbiology, Institute of Tropical Medicine, Nationalestraat 155, B-2000
Antwerp, Belgium, –Museum National d’Histoire Naturelle, Departement de Systematique et Evolution, UMR CNRS 7205,
Laboratoire Mammiferes et Oiseaux, 47 rue Cuvier, CP 51, 75005 Paris, France
Corresponde
ogy, Institute
the Czech Re
Fax: +420-5681Present add
MontpellierS
18524, Seneg2Present add
BP11011, Nia
� 2010 Black
Abstract
Rodents of the Praomys daltoni complex are typical inhabitants of the Sudanian savanna
ecosystem in western Africa and represent a suitable model for testing the effects of
Quaternary climatic oscillations on extant genetic variation patterns. Phylogeographical
analyses of mitochondrial DNA sequences (cytochrome b) across the distribution range
of the complex revealed several well-defined clades that do not support the division of
the clade into the two species currently recognized on the basis of morphology, i.e.
P. daltoni (Thomas, 1892) and Praomys derooi (Van der Straeten & Verheyen 1978). The
observed genetic structure fits the refuge hypothesis, suggesting that only a small
number of populations repeatedly survived in distinct forest-savanna mosaic blocks
during the arid phases of the Pleistocene, and then expanded again during moister
periods. West African rivers may also have contributed to genetic differentiation,
especially by forming barriers after secondary contact of expanding populations. The
combination of three types of genetic markers (mtDNA sequences, microsatellite loci,
cytogenetic data) provides evidence for the presence of up to three lineages, which most
probably represent distinct biological species. Furthermore, incongruence between
nuclear and mtDNA markers in some individuals unambiguously points towards a past
introgression event. Our results highlight the importance of combining different
molecular markers for an accurate interpretation of genetic data.
Keywords: cytochrome b, microsatellites, mtDNA introgression, Quaternary, rodents
Received 13 November 2009; revision received 16 August 2010; accepted 22 August 2010
nce: Josef Bryja, Department of Population Biol-
of Vertebrate Biology, Academy of Sciences of
public, 675 02 Studenec 122, Czech Republic.
422387; E-mail: [email protected]
ress: IRD, CBGP (UMR IRD ⁄ INRA ⁄ CIRAD ⁄upAgro), Campus de Bel-Air, BP 1386, Dakar, CP
al.
ress: Centre Regional Agrhymet, Rive Droite,
mey, Niger.
well Publishing Ltd
Introduction
Recent technical advances in molecular genetics provide
powerful tools for uncovering cryptic animal diversity,
for tracing the evolutionary history of particular species
and for formulating hypotheses about the possible
influence of past environmental processes on extant
genetic structure. Thus, it has become possible to recon-
struct an organism’s evolutionary history at various

4784 J . BRYJA ET AL.
taxonomic levels, e.g. by documenting colonization
routes, discontinuities in genetic structure and factors
determining lineage distribution. Nevertheless, intellec-
tual maturation of the field will eventually depend not
only on these recent developments but also on synthe-
ses based on comparative information gained across dif-
ferent regions of the globe and ⁄ or across taxa (Avise
2000). In this respect, while a relatively large number of
studies have already been conducted in the Palaearctic
and Nearctic regions, empirical phylogeographical sur-
veys in regions of the southern hemisphere are still
needed (Beheregaray 2008), and especially in tropical
Africa, a region that constitutes a major source of biodi-
versity (Hewitt 2001).
Analyses of terrigenous dust flux from marine sedi-
ments and lake records suggest significant fluctuations
of Plio-Pleistocene environments in Sub-Saharan Africa
(deMenocal 2004; Trauth et al. 2009). Climatic shifts
within the last two million years ago (Mya) in Africa
resulted in oscillations between dry and humid condi-
tions causing the expansion and contraction of particu-
lar habitats. These environmental changes may have
had evolutionary consequences for animal taxa relating
to genetic divergence, local adaptations and speciation.
In relation to forest habitat, the refuge theory (Mayr &
O’Hara 1986; Haffer 1997; Maley 2001) has often been
invoked to explain how forest taxa may have been
trapped in remaining suitable habitats during aridity
peaks in tropical environments, and then differentiated
in isolation before spreading when conditions become
favourable again. To confirm the presumed role of cli-
mate fluctuations on genetic structure, it is necessary to
perform surveys at the scale of the whole distribution
of a species, or a supra-specific taxon. However, such
large-scale genetic studies of African model taxa are
particularly scarce. In mammals, most such studies
have been carried out on such large-sized species as
primates (e.g. Anthony et al. 2007), ungulates (e.g. Arct-
ander et al. 1999; Okello et al. 2005; Lorenzen et al.
2008) or carnivores (e.g. Dubach et al. 2005). Genetic
differentiation in these species has been usually
reported as being surprisingly low (but see Moodley &
Bruford 2007), which could be a result of high historical
and ⁄ or ongoing gene flow linked with their ecological
characteristics (ability to live in a wide range of habitats
and ⁄ or important individual mobility). Conversely,
rodents may represent more suitable candidates for
reconstructing environmental effects on the history of
biota owing to their short generation time, rapid
mtDNA substitution rate, relatively limited dispersal
ability and strong associations with particular habitats
(Fedorov et al. 2008).
In western Africa, recent fine-scale phylogeographical
studies of rodents have provided important insights
into the evolution of extant biota (Mouline et al. 2008;
Nicolas et al. 2008a,b, 2009; Brouat et al. 2009). All these
studies rely on mtDNA, and usually on cytochrome b
sequences. This marker has well-known disadvantages
(e.g. Ballard & Whitlock 2004; Triant & Dewoody 2007),
however; therefore, it is recommended to complement
such mtDNA data with a set of nuclear markers (e.g.
microsatellites or nuclear gene sequences) to obtain
more reliable information (Avise 2000). Besides, chro-
mosomal characteristics of African rodents has also
shown to be potentially useful for phylogeographical
inferences, as this group (and especially the Muridae
family) often displays species-specific or intraspecific
variability indicating polytypic or phylogeographical
structuring (e.g. Volobouev et al. 2002; Dobigny et al.
2010).
In this paper, we use a combination of mitochondrial,
cytogenetic and microsatellite data to analyse historical
evolution and contemporary gene flow in the Praomys
daltoni complex. The so-called Praomys group (Praomy-
ini in Lecompte et al. 2008) is one of the most diverse
and abundant groups of African murid rodents (Leco-
mpte et al. 2002, 2008). Several species within this
group have recently served as useful models for
addressing questions about the consequences of past cli-
matic changes on the genetic structure of contemporary
fauna in various environments, such as tropical forests
(Nicolas et al. 2008a), Sahelian humid habitats (Mouline
et al. 2008) or savannas (Brouat et al. 2009). Based on
mtDNA and nuclear sequences, it has been hypothe-
sized that a wave of species diversification occurred in
the genus Praomys around 6.5–5 Mya, i.e. during the
end of the glacial episode associated with the Messinian
crisis (Lecompte et al. 2005). At that time, forest blocks
in western Africa were of limited extension, acting as
refugia for forest-dwelling Praomys species. Very soon
after these events, the lineage leading to the tree
savanna-dwelling P. daltoni group emerged. This group
is currently considered to be composed of two species,
P. daltoni (Thomas, 1892) and P. derooi (Van der Strae-
ten & Verheyen 1978), which were once considered to
belong to the genus Myomys (Lecompte et al. 2005;
Musser & Carleton 2005).
As exceptions in the humid forest-dwelling genus,
both P. daltoni and P. derooi are primarily adapted to
open tree savannas, avoid continuous tropical forest
and can also be found in human settlements. They are
very similar in pelage coloration and texture (except
that the belly of most P. derooi individuals is grey,
whereas most P. daltoni have a white belly), as well as
in external, cranial, and dental morphology (Van der
Straeten 1979; Lecompte et al. 2005), karyotype (Granjon
et al. 2005), and genetic variability based on mtDNA
(Lecompte et al. 2002) and nuclear sequences (Lecompte
� 2010 Blackwell Publishing Ltd

PHYLOGEOGRAPHY OF RODENTS IN SUDANIAN SAVANNA 4785
et al. 2005). These resemblances are such that it was
suspected that P. derooi simply represents local popula-
tions of P. daltoni (Musser & Carleton 2005). However,
both taxa apparently live in sympatry in some parts of
their distribution, e.g. in Ghana, Togo and Benin, differ-
ing here mainly in their level of association with human
settlements (Van der Straeten & Verheyen 1978; Granjon
et al. 2005). Therefore, the status of these two ‘species’
remains controversial.
Here, we use a large dataset of mtDNA sequences
and karyotypes to analyse the phylogeographical struc-
ture of the P. daltoni complex and to identify the main
geographical barriers to historical and current gene
flow. This is one of the first studies testing the effects of
Quaternary climatic oscillations in the Sudanian
savanna belt of western Africa. Species of the P. daltoni
complex are widespread in forest-savanna mosaic or in
riparian habitats in savanna, where they are partly
arboreal. As such, their phylogeographical structure
may have been affected by the Plio-Pleistocene oscilla-
tions of forests (which shrank in dry periods; Nicolas
et al. 2008a) or savannas (which expanded in dry peri-
ods; Brouat et al. 2009). Using a combination of mtDNA
and nuclear markers, we also wanted to test the pres-
ence of reproductive barriers between ‘daltoni-like’ and
‘derooi-like’ individuals that differ in coloration and
habitat preferences, but live in the same areas.
Although previous analyses have attempted (and failed)
to identify significant morphometric (but see Van der
Straeten & Verheyen 1978), karyotypic or genetic differ-
ences between these two groups, more extensive sam-
ples of both of them, originating from the same
geographical areas, were compared here for the first
time.
Material and methods
Sample collection and mitochondrial DNA sequencing
The material for phylogenetic analysis consisted of
137 individuals of the P. daltoni group collected from
91 localities across most of its distribution from wes-
tern Senegal to northern Cameroon (Fig. 1, Table 1).
Sequences from three of these individuals were
retrieved from GenBank (accession no. AF518348,
AF518350 and AF518351; see Table S1, Supporting
information). In most cases, DNA was extracted using
DNeasy Blood & Tissue kit (Qiagen) and a large pro-
portion of the cytochrome b gene was amplified by
polymerase chain reaction (PCR) using primers
L14723 and H15915 (Lecompte et al. 2002). Sequencing
of PCR products was conducted from both ends
using BigDye� terminator chemistry (Applied Biosys-
tems).
� 2010 Blackwell Publishing Ltd
Phylogenetic analysis
The sequences of cytochrome b were edited and aligned
in SeqScape v2.5 (Applied Biosystems), producing a final
alignment of 987 bp. The haplotypes were identified
using DnaSP v. 5 (Librado & Rozas 2009). A web imple-
mentation of the MODELTEST script (Posada & Crandall
1998) called Findmodel (http://www.hiv.lanl.gov/con-
tent/sequence/findmodel/findmodel.html) was used to
identify the most appropriate substitution model. The
Akaike information criterion compared between 28 mod-
els revealed that the model best fitting the data is the gen-
eral time reversible model with a gamma-distributed rate
variation across sites (GTR + G).
The GTR + G model was used to analyse the evolu-
tionary relationships of all nonidentical haplotypes
using the Bayesian Markov chain Monte Carlo (MCMC)
method. MCMC analysis was performed with MrBayes
v. 3.1 using the default priors (Ronquist & Huelsenbeck
2003). Four heated and one cold chains were employed
in all analyses, and runs were initiated from random
trees. Two independent runs were conducted with
4 million generations per run; trees and parameters
were sampled every 1000 generations. Stationarity was
assessed by examining the average standard deviation
of split frequencies and the potential scale reduction
factor (Ronquist et al. 2005). For each run, the first 30%
of sampled trees were discarded as burn-in. Bayesian
posterior probabilities were used to assess branch sup-
port of the MCMC tree. Maximum likelihood (ML)
analyses were performed on the PhyML 3.0 online web
server (Guindon et al. 2005), where the BIONJ distance-
based tree was used as the starting tree. A neighbour-
joining (NJ) tree was constructed on the basis of GTR
distances in PAUP 4b10 (Swofford 2000), and clade sup-
port was tested using 1000 bootstraps. Relationships
between haplotypes were also investigated by con-
structing networks using the median-joining method
available in Network v. 4.510 (Bandlet et al. 1999). The
net average K2-P distances between clades were calcu-
lated in MEGA 4.0 (Tamura et al. 2007).
According to previous phylogenetic analysis of the
Praomys complex, it is still not clear which species is the
closest relative of the P. daltoni group (Lecompte et al.
2005) Therefore, representatives of both the Praomys
jacksoni group (Praomys degraaffi, GenBank accession no.
AF518358) and the Praomys tullbergi group (Praomys
rostratus, EU740761) were included as outgroups in
phylogenetic analyses.
Genetic diversity and historical demography
Diversity estimates for the main clades recovered in our
phylogenetic analyses, i.e. number of sequences (N),

Fig. 1 Map of sampling points showing the distribution of principal phylogenetic clades identified on the basis of mtDNA analyses.
Different symbols represent populations belonging to different clades: clade A (dark blue triangles), clade B (dark purple circle), clade
C1 (green triangles), clade C2 (yellow squares) and clade D (red circles). Numbers indicate collection sites. See Table 1 for description of
haplotypes occurring at different localities. Rivers mentioned in the text are shown in blue. The presumed distribution of mtDNA
clades is marked by dashed lines of particular colours.
4786 J . BRYJA ET AL.
number of polymorphic sites (Np), number of haplo-
types (Nh), haplotype diversity (Hd), nucleotide diver-
sity (Pi, expressed as percentages, i.e. 0.001 = 0.1%) and
average number of nucleotide differences (k), were cal-
culated in DnaSP software.
We evaluated the hypothesis of recent population
growth by calculating the mismatch distribution of pair-
wise differences (Rogers & Harpending 1992) between
all haplotypes within each clade in ARLEQUIN 3.11
(Excoffier et al. 2005). The fit of our datasets to the
expectations of the (sudden) demographic expansion
model or the spatial expansion (infinite-island) model
was tested using the sum of squared deviations
between the observed and expected mismatch from
1000 parametric bootstrap replicates.
Bayesian skyline plots (Drummond et al. 2005) were
used to estimate past population dynamics through
time. This method is independent of a priori defined
demographic models and tree reconstructions; thus, it is
suitable for taxa with complicated population history
and ⁄ or shallow phylogenetic structure. Analyses were
run in BEAST 1.4.8. (Drummond & Rambaut 2007)
using the GTR + G model and a strict molecular clock.
The MCMC simulations were run with 20 million itera-
tions two times for each lineage. Genealogies and
model parameters were sampled every 1000 iterations.
One million iterations of each run were discarded as
burn-in, while the remaining results were combined in
LOGCOMBINER and summarized as BSPs after analy-
sis of convergence in TRACER v1.4 (Rambaut & Drum-
mond 2007). For approximate timing of population
events, the number of substitution per site per Mya was
set to 0.02311 (derived from the divergence time esti-
mates in BEAST).
The plausibility of an isolation-by-distance scenario
was explicitly tested by performing Mantel’s tests using
ARLEQUIN to analyse the relationships between genetic
(mean number of pairwise nucleotide differences) and
geographical distances between sampling localities.
Divergence time estimates
Using clades identified in the phylogenetic analyses, a
Bayesian MCMC approach was employed to calculate
� 2010 Blackwell Publishing Ltd

Table 1 Checklist of localities sampled for phylogenetic analysis and detailed information on number of individuals and their cyto-
chrome b haplotypes (987 bp)
Country Locality
Locality
no.
Sample
size Haplotypes GPS Haplogroup
Guinea Altou Foukola 1 2 hi, h2 12�22¢N, 13�27¢W Clade D
Guinea Koba 2 2 h3, h4 11�10¢N, 13�17¢W Clade D
Guinea Kogon-Lengue 3 1 h3 11�08¢N, 13�45¢W Clade D
Guinea Molota 4 1 h5 09�54¢N, 12�51¢W Clade D
Guinea Saourou 5 2 h6, h7 11�31¢N, 09�01¢W Clade D
Guinea Tamba-Sako 6 1 h8 11�12¢N, 13�29¢W Clade D
Mali Argueta 7 1 h9 14�57¢N, 11�02¢W Clade D
Mali Bakoye 8 1 h10 12�43¢N, 09�28¢W Clade D
Mali Bawere 9 1 h11 14�36¢N, 05�52¢W Clade D
Mali Benkorokawere 10 1 h12 14�13¢N, 06�07¢W Clade D
Mali Bindougou 11 1 h13 12�15¢N, 10�19¢W Clade D
Mali Boulou 12 1 h14 15�10¢N, 09�31¢W Clade D
Mali Dilly 13 1 h15 15�01¢N, 07�40¢W Clade D
Mali Djoliba 14 1 h16 12�19¢N, 08�08¢W Clade D
Mali Emnal’here 15 2 h17, h61 14�28¢N, 04�05¢W Clade C1 + Clade D
Mali Golo 16 1 h18 12�21¢N, 08�48¢W Clade D
Mali Hassilbarke-Maure 17 1 h19 14�58¢N, 09�24¢W Clade D
Mali Kabara 18 1 h20 16�42¢N, 02�59¢W Clade D
Mali Katibougou 19 1 h21 12�56¢N, 07�32¢W Clade D
Mali Kolonina 20 1 h22 14�29¢N, 08�01¢W Clade D
Mali Koulikoro 21 2 h23 12�52¢N, 07�34¢W Clade D
Mali Makana 22 1 h14 15�08¢N, 09�26¢W Clade D
Mali Maniale 23 1 h24 14�13¢N, 06�05¢W Clade D
Mali Massakoroma 24 1 h25 12�18¢N, 08�46¢W Clade D
Mali Monzou Bougou 25 1 h14 14�59¢N, 10�01¢W Clade D
Mali Nafadji 26 2 h18, h26 12�23¢N, 08�49¢W Clade D
Mali Niamou 27 1 h26 14�01¢N, 08�03¢W Clade D
Mali Sambe 28 1 h15 15�07¢N, 07�59¢W Clade D
Mali Sandiguila 29 1 h27 12�57¢N, 10�28¢W Clade D
Mali Sanfinian 30 1 h28 12�31¢N, 09�55¢W Clade D
Mali Siby 31 1 h29 12�28¢N, 08�22¢W Clade D
Mali Sikawere-Moussa 32 2 h24, h30 14�33¢N, 05�55¢W Clade D
Mali Soukoutali 33 2 h13, h31 12�28¢N, 10�15¢W Clade D
Mali Tabakoto-Fitini 34 1 h27 13�03¢N, 11�01¢W Clade D
Mali Tambale 35 1 h26 12�30¢N, 08�52¢W Clade D
Mali Tombane 36 1 h18 12�16¢N, 08�46¢W Clade D
Mali Topokone 37 1 h32 15�02¢N, 10�35¢W Clade D
Mali Toumania 38 1 h27 13�01¢N, 10�26¢W Clade D
Senegal Bundu-Kundi 39 1 h33 12�31¢N, 12�20¢W Clade D
Senegal Diala Koto 40 1 h34 13�18¢N, 13�16¢W Clade D
Senegal Diboli Foulbe 41 3 h35, h36 14�28¢N, 12�12¢W Clade D
Senegal Dindefelo 42 2 h8 12�23¢N, 12�19¢W Clade D
Senegal Dingnessou 43 2 h37, h38 12�34¢N, 12�12¢W Clade D
Senegal Gue de Samabailo 44 1 h39 12�39¢N, 13�20¢W Clade D
Senegal Kedougou 45 1 h40 12�33¢N, 12�11¢W Clade D
Senegal Lingue Kountou 46 3 h41, h42, h43 13�02¢N, 13�05¢W Clade D
Senegal Mako 47 1 h44 12�51¢N, 12�21¢W Clade D
Senegal Mereto 48 1 h45 13�42¢N, 14�26¢W Clade D
Senegal Oubadji 49 2 h46,h47 12�41¢N, 13�03¢W Clade D
Senegal Simenti 50 1 h48 13�02¢N, 13�18¢W Clade D
Senegal Tata 51 2 h49, h50 14�06¢N, 13�25¢W Clade D
Senegal Bandia 52 2 h51, h52 14�33¢N, 17�01¢W Clade D
Burkina Faso Bougouriba 53 1 h53 10�33¢N, 03�05¢W Clade C1
Burkina Faso Dedougou 54 1 h54 12�24¢N, 03�33¢W Clade C1
Burkina Faso Kourouma 55 2 h55 11�39¢N, 04�45¢W Clade C1
PHYLOGEOGRAPHY OF RODENTS IN SUDANIAN SAVANNA 4787
� 2010 Blackwell Publishing Ltd

Table 1 (Continued)
Country Locality
Locality
no.
Sample
size Haplotypes GPS Haplogroup
Burkina Faso Ouaga 2000 56 1 h56 12�18¢N, 01�31¢W Clade C1
Burkina Faso Pissy 57 2 h57, h58 12�20¢N, 01�35¢W Clade C1
Mali Dabi 58 1 h59 15�54¢N, 04�08¢W Clade C1
Mali Djenne 59 1 h60 13�54¢N, 04�33¢W Clade C1
Mali Ende 60 2 h62, h63 14�10¢N, 03�32¢W Clade C1
Mali Farako 61 1 h55 11�14¢N, 05�26¢W Clade C1
Mali Gao 62 1 h64 16�16¢N, 00�03¢W Clade C1
Mali Gono 63 1 h65 15�03¢N, 02�47¢W Clade C1
Mali Hombori 64 1 h66 15�17¢N, 01�42¢W Clade C1
Mali Kidal 65 1 h67 18�26¢N, 01�24¢E Clade C1
Mali Korioume 66 1 h68 16�39¢N, 03�01¢W Clade C1
Mali Madina Diassa 67 1 h69 10�45¢N, 07�42¢W Clade C1
Mali Mamouroubougou 68 1 h55 11�13¢N, 05�26¢W Clade C1
Mali Samaya 69 1 h70 12�20¢N, 08�10¢W Clade C1
Mali Tombouctou 70 1 h64 16�45¢N, 03�00¢W Clade C1
Mali Woroni 71 1 h71 10�47¢N, 05�34¢W Clade C1
Ghana Yendi 72 1 h72 09�25¢N, 00�01¢W Clade C2
Benin Igbere 73 8 h73, h74, h93,h94 08�59¢N, 01�58¢E Clade A + Clade C2
Benin Koto 74 4 h75, h76, h77, h78 06�58¢N, 02�07¢E Clade C2
Benin Partago 75 1 h79 09�31¢N, 01�55¢E Clade C2
Benin Tianwassaka 76 1 h80 10�43¢N, 01�22¢E Clade C2
Benin Wannou 77 3 h81, h100, h101 09�01¢N, 02�03¢E Clade A + Clade C2
Benin Doyi’ssa 78 1 h82 07�59¢N, 01�59¢E Clade C2
Ghana Buoyem 79 3 h83, h84 07�40¢N, 01�57¢W Clade C2
Ghana Afegame (Wli Waterfall) 80 1 h85 07�06¢N, 00�35¢E Clade A
Niger La Tapoa 81 1 h86 12�28¢N, 02�26¢E Clade A
Niger Perelougou 82 1 h87 12�09¢N, 02�19¢E Clade A
Niger Point Triple 83 2 h86, h88 11�54¢N, 02�24¢E Clade A
Benin Agbassa 84 2 h89, h90 08�48¢N, 02�15¢E Clade A
Benin Gotcha 85 1 h91 08�16¢N, 01�43¢E Clade A
Benin Goutere 86 1 h92 10�53¢N, 02�14¢E Clade A
Benin Tanguieta 87 1 h95 10�38¢N, 01�15¢E Clade A
Benin Terou 88 6 h94, h96, h97, h98, h99 09�05¢N, 02�05¢E Clade A
Benin Adjassagon 89 5 h102 06�59¢N, 01�57¢E Clade A
Benin Tandji 90 2 h103 06�57¢N, 01�58¢E Clade A
Cameroon Gamnaga 91 1 h104 10�57¢N, 14�03¢E Clade B
4788 J . BRYJA ET AL.
the time to the most recent common ancestor (TMRCA).
As TMRCA estimates when genes last shared a com-
mon ancestor, it can be used as a proxy for ancestral
population age. Clades were dated using the pro-
gramme BEAST as described in Nicolas et al. (2008a).
As Praomys has a poor fossil record, calibration of a
molecular clock within the genus was not feasible. As a
consequence, four external calibration points derived
from rodent palaeontological data were used for infer-
ring divergence times from cytochrome b sequences: the
Mus ⁄ Rattus lineage split estimated at 11–12.3 Mya (Ben-
ton & Donoghue 2007), the appearance of Otomys esti-
mated at 6 Mya (Jansa et al. 2006), the divergence
between the ‘large’ Apodemus mystacinus and all the
‘small’ Sylvaemus estimated at 7 Mya and the diver-
gence between Apodemus sylvaticus and A. flavicollis esti-
mated at 4 Mya (Michaux et al. 2005).
Cytogenetic analysis
In total, 10 Praomys specimens from all the main identi-
fied haplogroups (see Table S1, Supporting information,
Fig. 2) were karyotyped using the air-drying method
(see Dobigny et al. 2008). Slides were conventionally
stained using 4% phosphate-buffered Giemsa for identi-
fying diploid numbers (2n), as well as chromosomes
morphology (autosomal fundamental number, NFa; X
and Y morphology). At least five well-spread metapha-
ses were analysed per specimen.
Microsatellite analysis
Analyses of cytochrome b sequences (see Results)
showed that two very distinct mtDNA haplogroups co-
occur in Benin. Therefore, we decided to test whether a
� 2010 Blackwell Publishing Ltd

DM4199 (h27) = 2n = 36 – NFa = 34 – X large sMM4424 (h18) = 2n = 36 – NFa = 34 – X large sM
–/95/–
98/99/1.00
82/90/1.00
C2M6072 (h80) = 2n = 36 – NFa = 34 –X large sM
100/99/–
71/–/0.83
98/97/1.00C1
M5640 (h54) = 2n = 36 – NFa = 34 – X large sMM4880 (h55) = 2n = 36, NFa = 34, X large sM, Y medium-sized sMADI91 (h67) = 2n = 36, NFa = 34 (see Dobigny et al. 2001)
58/99/1.00
54/79/0.97
A
B C319 (h104) = 2n = 30 – NFa = 34 –X large sT, Y medium-sized sT
PNW1 (h86) = 2n = 36 – NFa = 34 – X large sM, Y medium-sized sMPNW4 (h88) = 2n = 36 – NFa = 34 – X large sMPNW5 (h86) = 2n = 36 – NFa = 34 – X large sM, Y medium-sized sMPNW6 (h87) = 2n = 36 – NFa = 34 – X large sM, Y medium-sized sM
Fig. 2 Phylogenetic relationships between haplotypes recovered by maximum likelihood (ML) analysis (GTR + G substitution
model). Main clades are identified on the right-hand border; broad lines separate presumed species. The numbers above branches
represent ML and neighbour-joining (NJ) bootstrap support and Bayesian posterior probability, respectively. See text and Table 1 for
more details on localities and haplotypes. Karyotypic results for individuals that belong to the different clades are reported on the
right of the tree.
PHYLOGEOGRAPHY OF RODENTS IN SUDANIAN SAVANNA 4789
barrier to gene flow exists between them by analysing
129 individuals from Benin for both mtDNA and micro-
satellite markers (Table S1, Supporting information).
We first identified the clade membership of each indi-
vidual by comparing ca 700 bp of the cytochrome b
gene with the dataset used previously for phylogeo-
graphical analysis. The same 129 individuals were
genotyped at seven microsatellite loci, i.e. MH3, MH30,
MH60, MH74, MH80, MH133 and MH141, following
Loiseau et al. (2007).
Genetic differences among individuals were displayed
by factorial correspondence analysis (FCA) using GE-
NETIX version 4.05.2 (Belkhir et al. 1996-2004; http://
www.genetix.univ-montp2.fr/genetix/info.htm). The
differences between the two haplogroups co-occurring in
Benin were quantified by FST, and their significance was
tested by 1000 permutations in GENETIX. In addition, a
Bayesian clustering procedure, implemented in STRUC-
TURE 2.2 (Falush et al. 2007), was used to infer the num-
� 2010 Blackwell Publishing Ltd
ber of distinct genetic populations represented in the
sample and the assignments of individuals to these
genetic clusters. The programme was run with three
independent simulations of 1 000 000 iterations each, for
values of K ranging from 1 to 5, following a burn-in of
100 000 iterations. In all simulations, the admixture
ancestry model and correlated allele frequency models
were used. The likelihood of K, i.e. Ln Pr(X|K), was used
to infer the number of real populations in the datasets.
The model with the highest Ln Pr(X|K) for a specific
value of K was subsequently used to analyse the propor-
tion of individuals in each estimated cluster.
Results
Phylogenetic analysis of cytochrome b sequences
Among the 137 ingroup sequences (987 bp), 104 different
haplotypes were identified (GenBank accession no.
4790 J . BRYJA ET AL.
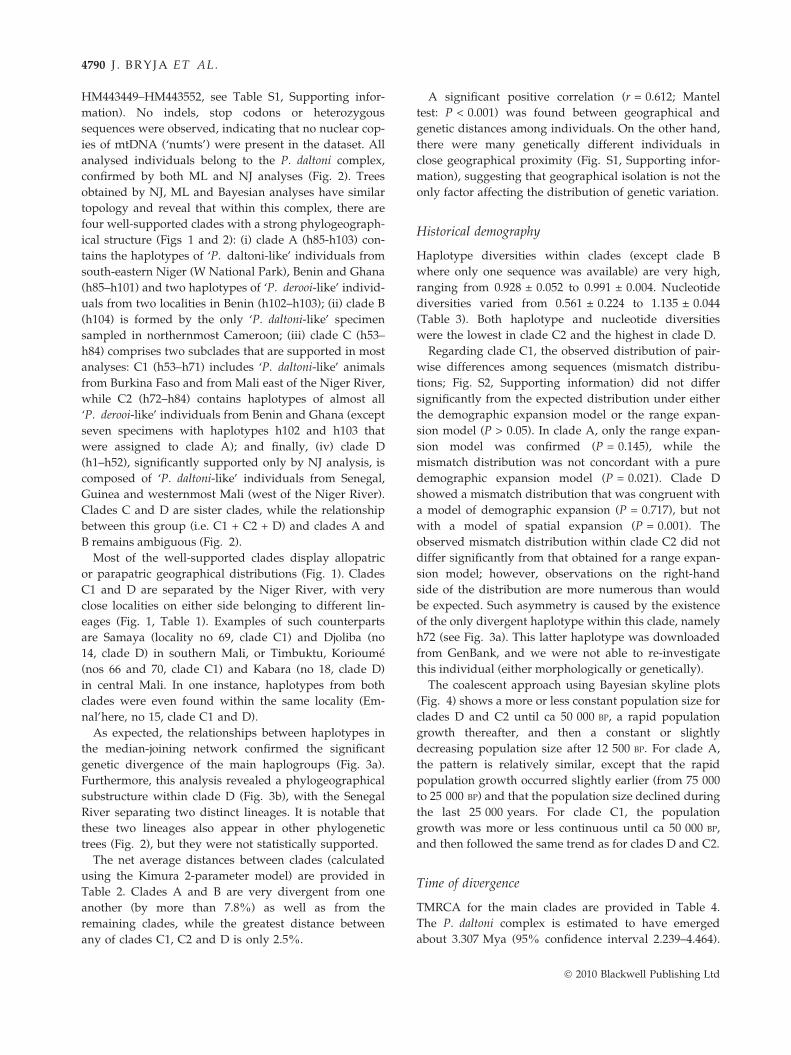
HM443449–HM443552, see Table S1, Supporting infor-
mation). No indels, stop codons or heterozygous
sequences were observed, indicating that no nuclear cop-
ies of mtDNA (‘numts’) were present in the dataset. All
analysed individuals belong to the P. daltoni complex,
confirmed by both ML and NJ analyses (Fig. 2). Trees
obtained by NJ, ML and Bayesian analyses have similar
topology and reveal that within this complex, there are
four well-supported clades with a strong phylogeograph-
ical structure (Figs 1 and 2): (i) clade A (h85-h103) con-
tains the haplotypes of ‘P. daltoni-like’ individuals from
south-eastern Niger (W National Park), Benin and Ghana
(h85–h101) and two haplotypes of ‘P. derooi-like’ individ-
uals from two localities in Benin (h102–h103); (ii) clade B
(h104) is formed by the only ‘P. daltoni-like’ specimen
sampled in northernmost Cameroon; (iii) clade C (h53–
h84) comprises two subclades that are supported in most
analyses: C1 (h53–h71) includes ‘P. daltoni-like’ animals
from Burkina Faso and from Mali east of the Niger River,
while C2 (h72–h84) contains haplotypes of almost all
‘P. derooi-like’ individuals from Benin and Ghana (except
seven specimens with haplotypes h102 and h103 that
were assigned to clade A); and finally, (iv) clade D
(h1–h52), significantly supported only by NJ analysis, is
composed of ‘P. daltoni-like’ individuals from Senegal,
Guinea and westernmost Mali (west of the Niger River).
Clades C and D are sister clades, while the relationship
between this group (i.e. C1 + C2 + D) and clades A and
B remains ambiguous (Fig. 2).
Most of the well-supported clades display allopatric
or parapatric geographical distributions (Fig. 1). Clades
C1 and D are separated by the Niger River, with very
close localities on either side belonging to different lin-
eages (Fig. 1, Table 1). Examples of such counterparts
are Samaya (locality no 69, clade C1) and Djoliba (no
14, clade D) in southern Mali, or Timbuktu, Korioume
(nos 66 and 70, clade C1) and Kabara (no 18, clade D)
in central Mali. In one instance, haplotypes from both
clades were even found within the same locality (Em-
nal’here, no 15, clade C1 and D).
As expected, the relationships between haplotypes in
the median-joining network confirmed the significant
genetic divergence of the main haplogroups (Fig. 3a).
Furthermore, this analysis revealed a phylogeographical
substructure within clade D (Fig. 3b), with the Senegal
River separating two distinct lineages. It is notable that
these two lineages also appear in other phylogenetic
trees (Fig. 2), but they were not statistically supported.
The net average distances between clades (calculated
using the Kimura 2-parameter model) are provided in
Table 2. Clades A and B are very divergent from one
another (by more than 7.8%) as well as from the
remaining clades, while the greatest distance between
any of clades C1, C2 and D is only 2.5%.
A significant positive correlation (r = 0.612; Mantel
test: P < 0.001) was found between geographical and
genetic distances among individuals. On the other hand,
there were many genetically different individuals in
close geographical proximity (Fig. S1, Supporting infor-
mation), suggesting that geographical isolation is not the
only factor affecting the distribution of genetic variation.
Historical demography
Haplotype diversities within clades (except clade B
where only one sequence was available) are very high,
ranging from 0.928 ± 0.052 to 0.991 ± 0.004. Nucleotide
diversities varied from 0.561 ± 0.224 to 1.135 ± 0.044
(Table 3). Both haplotype and nucleotide diversities
were the lowest in clade C2 and the highest in clade D.
Regarding clade C1, the observed distribution of pair-
wise differences among sequences (mismatch distribu-
tions; Fig. S2, Supporting information) did not differ
significantly from the expected distribution under either
the demographic expansion model or the range expan-
sion model (P > 0.05). In clade A, only the range expan-
sion model was confirmed (P = 0.145), while the
mismatch distribution was not concordant with a pure
demographic expansion model (P = 0.021). Clade D
showed a mismatch distribution that was congruent with
a model of demographic expansion (P = 0.717), but not
with a model of spatial expansion (P = 0.001). The
observed mismatch distribution within clade C2 did not
differ significantly from that obtained for a range expan-
sion model; however, observations on the right-hand
side of the distribution are more numerous than would
be expected. Such asymmetry is caused by the existence
of the only divergent haplotype within this clade, namely
h72 (see Fig. 3a). This latter haplotype was downloaded
from GenBank, and we were not able to re-investigate
this individual (either morphologically or genetically).
The coalescent approach using Bayesian skyline plots
(Fig. 4) shows a more or less constant population size for
clades D and C2 until ca 50 000 BP, a rapid population
growth thereafter, and then a constant or slightly
decreasing population size after 12 500 BP. For clade A,
the pattern is relatively similar, except that the rapid
population growth occurred slightly earlier (from 75 000
to 25 000 BP) and that the population size declined during
the last 25 000 years. For clade C1, the population
growth was more or less continuous until ca 50 000 BP,
and then followed the same trend as for clades D and C2.
Time of divergence
TMRCA for the main clades are provided in Table 4.
The P. daltoni complex is estimated to have emerged
about 3.307 Mya (95% confidence interval 2.239–4.464).
� 2010 Blackwell Publishing Ltd

Clade C2
Clade AClade C1
Clade D
Clade B
h8h4
h46h37h39
h38
h52
h51
h48
h3h45
h5h33
h36
h40
h47
h27h2
h50
h17
h12
h13h18
h31h9h15
h22 h16
h23h26
h25
h30 h11
h20 h24
h7 h29
h47
h44
h1h41
h10h15
h14 h32
h28h19
h6
h21
h41
h49
h43
h42h34
h35
(a)
(b)
Fig. 3 (a) Median-joining network of Praomys daltoni mtDNA haplotypes. The number of mutations between haplotypes is related to
the length of branches, and circle sizes are proportional to the number of the same haplotypes in the data set. (b) Detail of the haplo-
type network from clade D. Black circles correspond to haplotypes found west of the Senegal River, while those found east of it are
marked by white circles. See Table 1 for haplotype designations.
Table 2 Net average distances (K2-P) between haplogroups
identified by phylogenetic analysis
Clade A Clade B Clade C1 Clade C2
Clade A –
Clade B 0.096 –
Clade C1 0.085 0.094 –
Clade C2 0.087 0.094 0.010 –
Clade D 0.078 0.083 0.023 0.025
PHYLOGEOGRAPHY OF RODENTS IN SUDANIAN SAVANNA 4791
Estimated TMRCA for clades B + C1 + C2 + D is about
3.2 Mya. TMRCA for clades C1 + C2 + D is dated about
1 Mya, while these individual lineages coalesce between
0.39 and 0.49 Mya (Table 4).
Cytogenetic analysis
Karyotypes (Fig. 5a) of the specimens from Mali
(M4199, M4424, M4880; see Table S1, Supporting infor-
� 2010 Blackwell Publishing Ltd
mation for details), Benin (M6072), Burkina Faso
(M5640) and Niger (PNW1, 4, 5 and 6) were all similar
with 2n = 36 chromosomes. Autosomes were acrocentric
(NFa = 34), the X and Y, respectively, being very large
and medium-sized elements. This karyotype is the same
as that described for P. daltoni from Burkina Faso, Mali
(Dobigny et al. 2001; Granjon et al. 2005) and Senegal
(Viegas-Pequignot et al. 1983; Granjon et al. 1992), as
well as for ‘typical’ P. derooi from Benin (Granjon et al.
2005). Such karyotypic uniformity in specimens from
molecular clades A, C and D was further supported by
a comparison of G-banded preparations (data not
shown).
Interestingly, the only divergent karyotype belongs to
a male specimen (C319) from Cameroon. It was charac-
terized by 2n = 30 chromosomes, with the three largest
pairs submeta- or metacentric (NFa = 34). Another dif-
ference was noted in the sex chromosome morphology,
the X and Y being large and medium-sized subtelocen-

Table 3 Diversity estimates for the main clades identified by the phylogenetic analyses. Diversity values were calculated in DnaSP
software and are expressed as number of sequences (N), number of polymorphic sites (Np), number of haplotypes (Nh), haplotype
diversity (Hd), nucleotide diversity (Pi, expressed as percentages, i.e. 0.001 = 0.1%) and average number of nucleotide differences (k).
The estimates are not given for clade B because of low sample size (N = 1)
Clades N Np Nh Hd Pi k
Clade A 27 47 19 0.960 ± 0.025 0.657 ± 0.126 6.484
Clade B 1 – 1 – – –
Clade C1 23 43 19 0.972 ± 0.026 0.686 ± 0.104 6.767
Clade C2 18 39 13 0.928 ± 0.052 0.561 ± 0.224 5.536
Clade C2 without h72 17 17 12 0.919 ± 0.057 0.310 ± 0.058 3.059
Clade D 68 91 52 0.991 ± 0.004 1.135 ± 0.044 11.198
Total 137 217 104 0.994 ± 0.002 4.115 ± 0.249 40.617
Clade C2 Clade D
Clade A Clade C1
1.0E1
1.0E0
1.0E-1
1.0E-20.0 0.05 0.1 0.15
Time0.2 0.25 0.3 0.0 0.05 0.1 0.15
Time0.2 0.25
0.0 0.05 0.1 0.15Time
0.2 0.25 0.3 0.35 0.0 0.05 0.1 0.15Time
0.2 0.25
1.0E1
1.0E0
1.0E-1
1.0E-2
1.0E1
1.0E0
1.0E-1
1.0E-2
1.0E1
1.0E0
1.0E-1
1.0E-2
Fig. 4 Bayesian skyline plots for main lineages of the complex, showing changes of effective population size (Nem) in time (mea-
sured in Mya). The thick solid line depicts median estimate, grey margins represent 95% highest posterior density intervals.
4792 J . BRYJA ET AL.
tric (almost acrocentric) elements, respectively (Fig. 5b).
Unfortunately, although we strongly suspect this dip-
loid number difference (2n = 30 vs. 2n = 36 in the other
specimens) to be caused by the accumulation of three
centric fusions in the original 2n = 36 karyotype,
G-bands were of too poor quality to confirm this unam-
biguously.
As most karyotyped specimens were also analysed
genetically, cytogenetic results can be mapped onto the
mtDNA topology (Fig. 2). In essence, chromosomal
data suggest karyotypic conservation within the whole
P. daltoni complex, with the only exception being that
of the Cameroon lineage (clade B).
Comparison of mtDNA and microsatellite data inBenin
Two clades (A and C2) largely overlap in Benin
(Fig. 1), and individuals of both clades were occasion-
ally captured in the same locality (no 73, Igbere; no 77,
Wannou). All individuals from this area clustered very
clearly either within mtDNA clade A or clade C2 in the
NJ analysis (bootstrap >95, with 1000 replicates; not
shown). The seven microsatellite loci were highly poly-
morphic in 139 individuals from Benin and confirm the
presence of two genetically differentiated groups. Using
FCA, all but seven samples clustered into two distinct
groups that correspond to mtDNA clades A and C2
(Fig. 6a). These seven individuals were placed in the
C2 ‘group’ (corresponding to ‘P. derooi-like’ individu-
als), although they possessed mtDNA haplotypes of
clade A (see Table S1, Supporting information). They
were captured in the localities Tandji and Adjassagon,
where only typical P. derooi occurred (i.e. dark belly,
living in houses; see Table S1, Supporting information).
After exclusion of these seven specimens from subse-
quent analyses, differences on nuclear microsatellites
between the two mtDNA clades were highly significant
� 2010 Blackwell Publishing Ltd

Table 4 Time to most recent common ancestor (in millions
years ago) for the main clades identified in phylogenetic analy-
sis. Estimates were carried out by Bayesian MCMC analysis in
BEAST software. The mean and range (95% confidence inter-
vals derived from the Bayesian probability distribution) over
two runs are given. TMRCA was not estimated for clade D,
because it was not monophyletic in BI analysis
Clades Haplotypes Mean Range
Clade A h85–h103 0.492 0.269–0.740
Clade C1 h53–h71 0.389 0.236–0.566
Clade C2 h72–h84 0.437 0.245–0.631
Clades C1–C2 h53–h84 0.587 0.380–0.823
Clades C1, C2, D h1–h84 1.04 0.671–1.430
Clades B, C1, C2, D h1–h84 and h104 3.157 2.008–4.374
All h1–h104 3.307 2.239–4.464
PHYLOGEOGRAPHY OF RODENTS IN SUDANIAN SAVANNA 4793
(FST = 0.139, P < 0.001). Similarly, the best models in
STRUCTURE were those for two populations (K = 2;
Fig. 6b), which assigned very consistently all but the
same seven individuals to the expected mtDNA clades
(Fig. 6c). Note that what might be termed ‘inaccurate’
clustering of seven individuals was not a result of labo-
ratory error, as DNA extractions, fragment analyses and
mtDNA sequencing were performed independently and
repeatedly up to three times (and always with consis-
tent results).
Discussion
The P. daltoni complex is really ‘complex’
The phylogenetic analysis of cytochrome b revealed four
well-defined clades within the so-called ‘P. daltoni’
1 2 3 4 5
6 7 8 9 10
11 12 13 14 1511 12 13 14 15
16 17 X Y
(a) (b)
Fig. 5 The two conventionally stained karyotypes found within the
tern Niger (PNW6, with 2n = 36, NFa = 34, and corresponding to mtD
with 2n = 30, NFa = 34, and corresponding to h104, clade b). Note th
sess similar karyotypes to PNW6.
� 2010 Blackwell Publishing Ltd
complex. Such a pattern only partly supports the divi-
sion of this group into the two currently recognized
species, P. daltoni and P. derooi. Instead, the combina-
tion of one mtDNA marker, seven nuclear microsatel-
lites and karyotypic evidence suggests the presence of
at least three lineages, which could represent three dis-
tinct biological species. We nevertheless suggest that
more detailed taxonomic work is necessary to confirm
these results.
Praomys daltoni was described from south-eastern
Senegal (Grubb et al. 1998); hence, clade D presumably
represents typical individuals of this species, as
sequences from this clade were found in individuals
from Sudanian savanna in the westernmost part of
Africa, including Senegal, Guinea and western Mali
(west of the Niger River). The sister clade C is differ-
ent by only 2.3–2.5% (K2P distance), and it appears to
be subdivided into two subgroups showing allopatric
distributions, associated with strong phenotypical dif-
ferences in coloration and ecology. Subclade C1 is dis-
tributed in Mali, east of the Niger River (plus at the
isolated locality of Kidal in north-eastern Mali) and in
Burkina Faso, and it comprises individuals belonging
to typical P. daltoni (e.g. Dobigny et al. 2001; Granjon
et al. 2005). Clade C1 has a parapatric distribution
with clade D, with the Niger River representing an
apparently important barrier to gene flow. Very sur-
prisingly, all individuals in subclade C2 (which is
well-supported in most analyses, but is only about 1%
divergent from C1) were identified in the field as
P. derooi based on their grey belly coloration and their
occurrence in human settlements (see Table S1, Sup-
porting information). This species was described from
Togo by Van der Straeten & Verheyen (1978), mainly
1 2 3 4 5
6 7 8 9 10
11 12 13 1411 12 13 14
X Y
Praomys daltoni complex: male individuals from (a) south-wes-
NA haplotype h87, clade a) and (b) northern Cameroon (C319,
at all karyotyped individuals from clades A, C1, C2 and D pos-

0%
20%
40%
60%
80%
100%
Clade C2 Clade A
–5000
–4900
–4800
–4700
–4600
–4500
–4400
–4300
–4200
0 1 2 3 4 5 6
Ln
(p
rob
of
dat
a)
Number of populations (K) –4
–3
–2
–1
0
1
2
3(a)
(c)
(b)
–1.5 –1 –0.5 0 0.5 1 1.5 2
Fact
ori
al a
xis
2
Factorial axis 1
Fig. 6 Results of microsatellite analysis of individuals from Benin. (a) Factorial correspondence analysis in Genetix; squares—individ-
uals with mtDNA from clade A, triangles—from clade C2. Note the seven individuals with mtDNA from clade A, but clustered
within individuals with mtDNA from clade C2 (marked by black squares). (b) Likelihood of models in STRUCTURE for increasing
number of populations (K); the highest likelihood is observed for K = 2. (c) Assignment of individuals to particular populations using
the best model (i.e. K = 2; the run with the highest likelihood) in STRUCTURE.
4794 J . BRYJA ET AL.
on the basis of coloration and craniometric data; it is
not clear from their publication, however, from
whence their analysed individuals of ‘P. cf. daltoni’
originated. If they originated from the same area as
P. derooi, i.e. Benin, Togo, Ghana and Nigeria, they
could belong to clade A, which is the most divergent
group of haplotypes in the P. daltoni complex (mean
K2P distance to other clades 7.8–9.6%). In this study,
the mtDNA sequences from clade A were found in
Benin, south-western Niger and western Ghana
(Fig. 1), which suggests that they most probably are
present also in Togo, eastern Burkina Faso and wes-
tern Nigeria, where ‘P. daltoni-like’ individuals have
been found (e.g. Robins & Van der Straeten 1996).
Most of these individuals were found outside human
settlements in Sudanian savanna habitats and, at first
sight, are phenotypically similar to P. daltoni from
westernmost Africa (i.e. clades C1 and D). The remain-
ing clade B (K2P distance from other clades is
8.3–9.4%) consists of the only individual captured in a
village of northern Cameroon.
Using mtDNA genetic distances only to infer the spe-
cific status of specific taxa may be misleading (e.g.
Bradley & Baker 2001), but the comparison with pub-
lished studies suggests that up to three species could be
identified on the basis of our data. The interspecific
cytochrome b sequence variation detected in various
rodent genera reaches 7–18% [e.g. almost 10% in Pero-
myscus (Harris et al. 2000) and Sigmodon (Peppers &
Bradley 2000); 4.2–18% in Microtus (Jaarola et al. 2004)],
which is comparable with values between the three
main lineages identified in the present study, i.e. clades
A, B and C+D. Finally, although additional sampling
would be required to reject a simple intraspecific Rob-
ertsonian polymorphism, our karyotypic data might
indicate a species-specific status for clade B.
Association of the P. daltoni complex evolution withPlio-Pleistocene climate history
Specimens from a given clade often originate from
adjacent geographical localities. The observed pattern
� 2010 Blackwell Publishing Ltd

PHYLOGEOGRAPHY OF RODENTS IN SUDANIAN SAVANNA 4795
cannot, however, be owing only to isolation by dis-
tance (as expected in such a small rodent species, with
presumably low dispersal abilities), because several
neighbouring localities were characterized by very dif-
ferent haplotypes (Fig. S1, Supporting information). A
presence of well-defined haplogroups separated by rel-
atively large mutational distances is often explained as
a result of the presence of long-term extrinsic barriers
for genetic exchange between populations (Avise 2000).
The refuge theory argues that environmental (essen-
tially climate-driven) changes are responsible for the
fragmentation of a species range (Mayr & O’Hara 1986;
Haffer 1997; Maley 2001; Plana 2004). For populations
that long have remained isolated, climate-driven vicari-
ance events may be sufficient for reproductive isolation
to evolve by drift alone (mutation-driven speciation).
Nevertheless, adaptation to local ecological conditions
in different refuges may also accelerate divergence and
finally lead to ecological speciation (reviewed in Schlut-
er 2001). The confidence intervals of our estimated time
of divergence are large, and they should be interpreted
cautiously; nevertheless, our results clearly suggest that
the initial split of the three main lineages occurred at
the end of the Pliocene. The first splits between wes-
tern (clades C1 + C2 + D), central (A) and eastern (B)
lineages were estimated at about 3.2–3.3 Mya, which is
a period of intense speciation within genera of Praomy-
ini. For example, TMRCA of four Mastomys species
was estimated between 2.82 and 3 Mya (Lecompte
et al. 2002; Brouat et al. 2009), the P. jacksoni group
diverged by 3.5 Mya (Lecompte et al. 2002) and
Hylomyscus stella and Hylomyscus parvus by 3.1 Mya
(Lecompte et al. 2005).
Probably around 1.0 Mya, a second split occurred
within the western clade thus isolating clades C and
D. This period is characterized by strong aridity in
West Africa coinciding with the onset and intensifica-
tion of high-latitude glacial cycles (deMenocal 2004)
and eccentricity maxima with insolation-driven mon-
soons in Africa (Trauth et al. 2009). It was an impor-
tant period for extinction ⁄ speciation events, being well
documented e.g. in hominids (extinction of the genus
Paranthropus or the species Homo ergaster; deMenocal
2004). In West African rodents, this period often coin-
cides with the deepest within-species divergences [e.g.
0.93 Mya for Mastomys huberti (Mouline et al. 2008),
0.985 Mya for P. rostratus (Nicolas et al. 2008a) or
1.16 Mya for Mastomys erythroleucus (Brouat et al.
2009)].
Coalescence events within all major clades (0.389–
0.492; Table 4) also seem related to the Pleistocene
oscillations between humid and arid periods, with
associated expansion and contraction of forest habitats
(Maley 2001; deMenocal 2004). After 1 Mya, the peri-
� 2010 Blackwell Publishing Ltd
odicity of glacial cycles switched from 41 000 to
100 000 years, resulting in prolonged periods of aridity
in Africa (deMenocal 2004). One may postulate that
during the more arid periods of the Pleistocene, tree
savanna and dry forest habitats around forest block
refuges (i.e. the preferred habitat of members of the
P. daltoni complex) were reduced to patches separated
from each other by a drier and inhospitable Sahelian
environment. In such a scenario, the current pattern of
parapatric distribution of most clades would result
from secondary contacts following population expan-
sions from such refugia during more favourable peri-
ods. In support of this hypothesis, a phenomenon of
rapid population size expansion was detected in all
clades from ca 75, 000–50, 000 years ago to ca 25 000–
12 500 BP.
Rivers as important barriers to gene flow in westernAfrica
In general, secondary contact zones between clades are
often broadly coincident with major geographical barri-
ers (Emerson & Hewitt 2005). Within the distribution
range of the P. daltoni complex, these barriers mainly
consist of wide rivers, which may have constrained or
limited past population expansions, as hypothesized in
the case of other West African rodent taxa (genus
Taterillus: Dobigny et al. 2005; M. erythroleucus: Brouat
et al. 2009). During prolonged wet climatic phases of
the last million years, some of the West African rivers
may have been wide enough to completely prevent
mammal dispersal (Robbins 1978). Whatever their roles
in the past, these large rivers today probably contribute
to the maintenance of the genetic differentiation
observed between the clades of the P. daltoni complex.
For instance, clades C1 and D are almost completely
separated by the Niger River. The two genetic groups
identified by network analysis within clade D are also
clearly separated by the Senegal River, and even the
origin of clade C2 could possibly be also explained by
the presence of the Volta River.
The local coexistence of individuals from two differ-
ent clades in some localities (e.g. in the inner delta of
Niger River in Mali) may have been favoured by trans-
port by humans in recent times. Indeed, the synanthro-
py shown by P. daltoni in the northern part of its
distribution, especially in Mali and Senegal (L. Granjon
& J.M. Duplantier, unpublished data), may represent
a potential factor of homogenization that would coun-
terbalance genetic differentiation associated with
geographical barriers. Similarly, the occurrence of clade
C2 (i.e. synanthropic ‘P. derooi-like’) on the right bank
of the Volta River (locality no 79) could be explained by
recent human-mediated movements.

4796 J . BRYJA ET AL.
Asymmetric introgression of mtDNA in Benin
The wide geographical overlap between deeply diver-
gent clades A and C2 in Benin and neighbouring areas
indicates that this secondary contact is much older than
those between clades C1 and D, or within clade D. As a
consequence, it is reasonable to suggest the existence of
a reproductive barrier between these two sympatric
haplogroups. Although no karyotypic differences were
apparent between individuals of clades A and C2,
mtDNA haplotypes of these clades are well differenti-
ated. In addition, the analysis of nuclear microsatellites
also revealed the presence of two well-supported
groups that coincide with differences in pelage colour
(white vs. grey belly) and preferred habitat type (com-
mensal vs. savanna) (see Table S1, Supporting informa-
tion). These results strongly suggest the presence of two
sympatric (but not syntopic) biological species that are
reproductively isolated (‘P. daltoni-like’ and ‘P. derooi-
like’). Surprisingly, seven individuals from two
localities clustered in different clades for mtDNA and
microsatellite analyses, possessing clade A-like mtDNA,
but a pelage colour, preferred habitat type, and nuclear
DNA genotypes typical of individuals with clade C2
mtDNA haplotypes. This pattern most probably corre-
sponds to mtDNA introgression as a result of past
hybridization followed by back-crosses with paternal
lineages and highlights the potential risk of interpreting
a gene tree as an organismal tree when relying on a sin-
gle molecular marker (Ruedi et al. 1997).
Mitochondrial DNA introgression is not rare in nature
(e.g. Abramson et al. 2009; Good et al. 2003; Ruedi et al.
1997 for rodents; Currat et al. 2008 for examples, in other
groups). Such a process is usually asymmetric and often
occurs in invasive species, so that the mtDNA of a native
species introgresses into the organelle genome of an inva-
sive species (Currat et al. 2008). If this is the case in the
P. daltoni complex, then this data could be used to distin-
guish between alternative phylogeographical scenarios.
We postulate that because we have found no introgres-
sion of mtDNA from clade C2 into clade A, population
‘A’ may have been present in Benin earlier than ‘C2’. The
newly arriving group ‘C2’ (in ca 0.6 Mya, or even more
recently) was not completely isolated reproductively
from the local ‘A’ population and, therefore, on second-
ary contact, was ‘infected’ by A-type mtDNA. However,
these two incipient species rapidly achieved isolation that
led to a complete segregation of nuclear DNA.
Conclusions
By using a combination of mtDNA sequences, nuclear
microsatellite loci and karyotypic data, we found a very
high and pronounced diversity in murine rodents of the
Praomys daltoni complex. The results are among the first
from the West African Sudanian savanna, showing that
the genetic architecture of a complex was significantly
shaped by Plio-Pleistocene climatic changes and their
environmental consequences. Although follow-on
research is greatly needed (including to examine mor-
phology ⁄ morphometry, compare with type specimens,
conduct ecological studies), the combined genetic
approach suggests the presence of up to three well-
defined species. These species are not consistent with
the current taxonomy and would be unrecognized if
only one genetic marker were used.
Acknowledgements
JB, LG, AK, JMD and VN conceived the study, all authors
collected the material, HP and AK conducted most of the
DNA analyses, LG, GD and PG prepared the karyotypes, JB
and VN analysed the mtDNA and microsatellite data and JB,
LG, GD, VN wrote the paper. The work was supported by (i)
The Grant Agency of the Academy of Sciences of the Czech
Republic, project no. IAA6093404 and the Czech Science
Foundation, project no. P506 ⁄ 10 ⁄ 0983; (ii) Projet d’Amenage-
ment des Massifs Forestiers d’Agoua, des Monts Kouffe et de
Wari-Maro (Benin), the Societe des Amis de Museum (Paris,
France); (iii) the Programme Pluridisciplinaire de Formation
Evolution et Structure des Ecosystemes (MNHN, Paris,
France); (iv) Project no. 01KI0701 of Bundesministerium fur
Bildung und Forschung in Ghana; (v) Project ‘Forets de failles
et forets galeries au sud du Mali: deux voies pour la peren-
nite des refuges guineens en zone soudanienne’, Programme
‘Ecosystemes Tropicaux’, Convention de Recherche 0000337
MEDD-IRD; (vi) the European Union (project INCOCT-2005-
051476-BURULICO); (vii) Project no ANR-05-JC05-48631 ‘Poly-
morphisme par inversions chez les Mastomys’. Work permit in
the W National Park area was kindly provided by Mr
Soumeıla Sahailou (coord. ECOPAS programme). We are
grateful for help in the field and for the provision of samples
to I. Ag Aboumahamad, S. Ag Atteynine, K. Ba, J. Cerveny,
A. Dalecky, J. Decher, C. Denys, C. Diop, A. Doukary, K.
Hima, P. Koubek, A.D. Ndiaye, Y. Papillon, B. Sicard, C.
Tatard, and P. Vallo.
References
Abramson NI, Rodchenkova EN, Kostygov AY (2009) Genetic
variation and phylogeography of the bank vole (Clethrionomys
glareolus, Arvicolinae, Rodentia) in Russia with special
reference to the introgression of the mtDNA of a closely related
species, red-backed vole (Cl. rutilus). Russian Journal of Genetics,
45, 533–545.
Anthony NM, Johnson-Bawe M, Jeffery K et al. (2007) The role
of Pleistocene refugia and rivers in shaping gorilla genetic
diversity in central Africa. Proceedings of the National Academy
of Sciences of the United States of America, 104, 20432–20436.
Arctander P, Johansen C, Coutellec-Vreto MA (1999)
Phylogeography of three closely related African bovids (tribe
Alcelaphini). Molecular Biology and Evolution, 16, 1724–1739.
� 2010 Blackwell Publishing Ltd

PHYLOGEOGRAPHY OF RODENTS IN SUDANIAN SAVANNA 4797
Avise JC (2000) Phylogeography. The history and formation of
species. Harvard University Press, Cambridge, MA.
Ballard JW, Whitlock MC (2004) The incomplete natural
history of mitochondria. Molecular Ecology, 13, 729–744.
Bandlet HJ, Forster P, Rohl A (1999) Median-joining networks
for inferring intrapsecific phylogenies. Molecular Biology and
Evolution, 16, 37–48.
Beheregaray LB (2008) Twenty years of phylogeography: the
state of the field and the challenges for the Southern
Hemisphere. Molecular Ecology, 17, 3754–3774.
Belkhir K, Borsa P, Chikhi L, Raufaste N, Bonhomme F (1996-
2004) GENETIX 4.05, logiciel sous Windows TM pour la
genetique des populations. Laboratoire Genome, Populations,
Interactions, CNRS UMR 5000, Universite de Montpellier II,
Montpellier (France).
Benton MJ, Donoghue PCJ (2007) Paleontological evidence to
date the tree of life. Molecular Biology and Evolution, 24, 26–
53.
Bradley RD, Baker A (2001) A test of the genetic species
concept: cytochrome-b sequences and mammals. Journal of
Mammalogy, 82, 960–973.
Brouat C, Tatard C, Ba K et al. (2009) Phylogeography of the
Guinea multimammate mouse (Mastomys erythroleucus): a
case study for Sahelian species in West Africa. Journal of
Biogeography, 36, 2237–2250.
Currat M, Ruedi M, Petit RJ, Excoffier L (2008) The hidden
side of invasions: massive introgression by local genes.
Evolution, 62, 1908–1920.
Dobigny G, Moulin S, Cornette R, Gautun JC (2001) Rodents
from Adrar des Iforas, Mali: chromosomal data. Mammalia,
65, 215–220.
Dobigny G, Aniskin V, Granjon L, Cornette R, Volobouev V
(2005) Recent radiation in West African Taterillus (Rodentia,
Gerbillinae): the concerted role of climatic and chromosome
changes. Heredity, 95, 358–368.
Dobigny G, Lecompte E, Tatard C et al. (2008) An update on
the taxonomy and geographic distribution of the cryptic
species Mastomys kollmannspergeri (Muridae, Murinae) using
combined cytogenetic and molecular data. Journal of Zoology,
276, 368–374.
Dobigny G, Catalan J, Gauthier P et al. (2010) Geographic
patterns of inversion polymorphisms in a wild African
rodent, Mastomys erythroleucus. Heredity, 104, 378–386.
Drummond AJ, Rambaut A (2007) BEAST: Bayesian
evolutionary analysis by sampling trees. BMC Evolutionary
Biology, 7, 214.
Drummond AJ, Rambaut A, Shapiro B, Pybus OG (2005)
Bayesian coalescent inference of past population dynamics
from molecular sequences. Molecular Biology and Evolution, 5,
1185–1192.
Dubach J, Patterson BD, Briggs MB et al. (2005) Molecular
genetic variation across the southern and eastern geographic
ranges of the African lion, Panthera leo. Conservation Genetics,
6, 15–24.
Emerson BC, Hewitt GM (2005) Phylogeography. Current
Biology, 15, R367–R371.
Excoffier L, Laval G, Schneider S (2005) Arlequin ver. 3.0: an
integrated software package for population genetics data
analysis. Evolutionary Bioinformatics Online, 1, 47–50.
Falush D, Stephens M, Pritchard JK (2007) Inference of
population structure using multilocus genotype data:
� 2010 Blackwell Publishing Ltd
dominant markers and null alleles. Molecular Ecology Notes,
7, 574–578.
Fedorov VB, Goropashnaya AV, Boeskorov GG, Cook JA
(2008) Comparative phylogeography and demography
history of the wood lemming (Myopus schisticolor):
implications for late Quaternary history of the taiga species
in Eurasia. Molecular Ecology, 17, 598–610.
Good JM, Demboski JR, Nagorsen DW, Sullivan J (2003)
Phylogeography and introgressive hybridization: Chipmunks
(genus Tamias) in the northern Rocky Mountains. Evolution,
57, 1900–1916.
Granjon L, Duplantier JM, Catalan J, Britton-Davidian J (1992)
Karyotypic data on rodents from Senegal. Israel Journal of
Zoology, 38, 263–276.
Granjon L, Ba K, Daouda IH, Duplantier JM (2005) New data
on chromosomes from murid rodents of Benin—The
karyotype of Myomys derooi. Mammalia, 69, 421–426.
Grubb P, Jones TS, Davies AG et al. (1998) Mammals of Ghana,
Sierra Leone and The Gambia. The Trendrine Press, Cornwall.
Guindon S, Lethiec F, Duroux P, Gascuel O (2005) PHYML
Online—a web server for fast maximum likelihood-based
phylogenetic inference. Nucleic Acids Research, 33 (Web
Server issue), W557–W559.
Haffer J (1997) Alternative models of vertebrate speciation in
Amazonia: an overview. Biodiversity and Conservation, 6, 451–
476.
Harris D, Rogers DS, Sullivan J (2000) Phylogeography of
Peromyscus furvus (Rodentia: Muridae) based on cytochrome
b sequence data. Molecular Ecology, 9, 2129–2135.
Hewitt GM (2001) Speciation, hybrid zones and
phylogeography: seeing genes in space and time. Molecular
Ecology, 10, 537–549.
Jaarola M, Martınkova N, Gunduz I et al. (2004) Molecular
phylogeny of the speciose vole genus Microtus (Arvicolinae,
Rodentia) inferred from mitochondrial DNA sequences.
Molecular Phylogenetics and Evolution, 33, 647–663.
Jansa SA, Barker FK, Heaney LR (2006) The pattern and timing
of diversification of Philippine endemic rodents: evidence
from mitochondrial and nuclear gene sequences. Systematic
Biology, 55, 73–88.
Lecompte E, Granjon L, KerbisPeterhans JC, Denys C (2002)
Cytochrome b-based phylogeny of the Praomys group
(Rodentia, Murinae): a new African radiation? Comptes
Rendus Biologies, 325, 1–14.
Lecompte E, Denys C, Granjon L (2005) Confrontation of
morphological and molecular data: the Praomys group
(Rodentia, Murinae) as a case of adaptive convergences and
morphological stasis. Molecular Phylogenetics and Evolution,
37, 899–919.
Lecompte E, Aplin K, Denys C et al. (2008) Phylogeny and
biogeography of African Murinae based on mitochondrial
and nuclear gene sequences, with a new tribal classification
of the subfamily. BMC Evolutionary Biology, 8, 199.
Librado P, Rozas J (2009) DnaSP v5: a software for comprehen-
sive analysis of DNA polymorphism data. Bioinformatics, 25,
1451–1452.
Loiseau A, Konecny A, Galan M et al. (2007) New
polymorphic microsatellite loci for rodents of the genus
Mastomys using PCR multiplexing, and cross-species
amplification in Myomys and Praomys. Molecular Ecology
Notes, 7, 684–687.

4798 J . BRYJA ET AL.
Lorenzen ED, Arctander P, Siegismund HR (2008) High variation
and very low differentiation in wide ranging plains zebra
(Equus quagga) insights from mtDNA and microsatellites.
Molecular Ecology, 17, 2812–2824.
Maley J (2001) The impact of arid phases on the African rain
forest through geological history. In:African rain forest ecology
and conservation (eds Weber W, White L, Vedder A,
Naughton-Treves L). pp. 68–87, Yale University Press, New
Haven, Connecticut.
Mayr E, O’Hara EJ (1986) The biogeographic evidence
supporting the Pleistocene forest refuge hypothesis.
Evolution, 40, 55–67.
deMenocal PB (2004) African climate change and faunal
evolution during the Pliocene-Pleistocene. Earth and Planetary
Science Letters, 220, 3–24.
Michaux JR, Libois R, Filippucci MG (2005) So close and so
different: comparative phylogeography of two small
mammal species, the yellow-necked fieldmouse (Apodemus
flavicollis) and the woodmouse (Apodemus sylvaticus) in the
Western Palearctic region. Heredity, 94, 52–63.
Moodley Y, Bruford MW (2007) Molecular biogeography:
towards an integrated framework for conserving pan-African
biodiversity. PLoS ONE, 2, e454.
Mouline K, Granjon L, Galan M et al. (2008) Phylogeography
of a Sahelian rodent species Mastomys huberti: a Plio-
Pleistocene story of emergence and colonisation of humid
habitats. Molecular Ecology, 17, 1036–1053.
Musser GG, Carleton MD (2005) Superfamily Muroidea.
In:Mammal species of the world: a taxonomic and geographic
reference (ed Wilson DE, Reeder DM). pp. 894–1531, The
Johns Hopkins University Press, Baltimore.
Nicolas V, Bryja J, Akpatou B et al. (2008a) Comparative
phylogeography of two sibling species of forest-dwelling
rodent (Praomys rostratus and P. tullbergi) in West Africa:
different reactions to past forest fragmentation. Molecular
Ecology, 17, 5118–5134.
Nicolas V, Mboumba JF, Verheyen E et al. (2008b) Phylo-
geographic structure and regional history of Lemniscomys
striatus (Rodentia: Muridae) in tropical Africa. Journal of
Biogeography, 35, 2074–2089.
Nicolas V, Granjon L, Duplantier JM, Cruaud C, Dobigny G
(2009) Phylogeography of spiny mice (genus Acomys,
Rodentia: Muridae), from the south-western margin of the
Sahara with taxonomic implications. Biological Journal of the
Linnean Society, 98, 29–46.
Okello JBA, Nyakaana S, Masembe C, Siegismund HR,
Arctander P (2005) Mitochondrial DNA variation of the
common hippopotamus: evidence for a recent population
expansion. Heredity, 95, 206–215.
Peppers LL, Bradley RD (2000) Cryptic species in Sigmodon
hispidus: evidence from DNA sequences. Journal of
Mammalogy, 81, 332–343.
Plana V (2004) Mechanisms and tempo of evolution in the
African Guineo-Congolian rainforest. Philosophical Transactions
of the Royal Society of London. Series B, Biological Sciences, 359,
1585–1594.
Posada D, Crandall KA (1998) Modeltest: testing the model of
DNA substitution. Bioinformatics, 14, 817–818.
Rambaut A, Drummond AJ (2007) TRACER v1.4. Available
from http://tree.bio.ed.ac.uk/software/tracer
Robbins CB (1978) The Dahomey Gap: a reevaluation of its
significance as a faunal barrier to West African high forest
mammals. Bulletin of the Carnegie Museum of Natural History,
6, 168–174.
Robins CB, Van der Straeten E (1996) Small mammals of Togo
and Benin. II. Rodentia. Mammalia, 60, 231–242.
Rogers AR, Harpending H (1992) Population growth makes
waves in the distribution of pairwise genetic differences.
Molecular Biology and Evolution, 9, 552–569.
Ronquist F, Huelsenbeck JP (2003) MRBAYES 3: Bayesian
phylogenetic inference under mixed models. Bioinformatics,
19, 1572–1574.
Ronquist F, Huelsenbeck JP, Van der Mark P (2005) MrBayes
3.1 Manual. http://mrbayes.csit.fsu.edu/ (May 2007).
Ruedi M, Smith MF, Patton JL (1997) Phylogenetic evidence of
mitochondrial DNA introgression among pocket gophers in
New Mexico (family Geomyidae). Molecular Ecology, 6, 453–
462.
Schluter D (2001) Ecology and the origin of species. Trends in
Ecology and Evolution, 16, 372–380.
Swofford DL (2000) PAUP*: phylogenetic analysis using
parsimony (*and other methods), version 4.0. Sinauer Associates,
Sunderland, MA.
Tamura K, Dudley J, Nei M, Kumar S (2007) MEGA4:
Molecular Evolutionary Genetics Analysis (MEGA)
software version 4.0. Molecular Biology and Evolution, 24,
1596–1599.
Trauth MH, Larrasoana JC, Mudelsee M (2009) Trends,
rhythms and events in Plio-Pleistocene African climate.
Quaternary Science Reviews, 28, 399–411.
Triant DA, Dewoody JA (2007) The occurrence, detection, and
avoidance of mitochondrial DNA translocations in
mammalian systematics and phylogeography. Journal of
Mammalogy, 88, 908–920.
Van der Straeten E (1979) Biometrical relationships between
Praomys-Myomys-Mastomys and Myomyscus (= Praomys
complex) (Mammalia, Muridae). African Small Mammals
Newsletter, 3, 27–30.
Van der Straeten E, Verheyen WN (1978) Taxonomical notes
on the West African Myomys with the description of Myomys
derooi (Mammalia—Muridae). Zeitschrift fur Saugetierkunde,
43, 31–41.
Viegas-Pequignot E, Dutrillaux B, Prod¢Homme M, Petter F
(1983) Chromosomal phylogeny of Muridae: a study of 10
genera. Cytogenetics and Cell Genetics, 35, 269–278.
Volobouev VT, Aniskin VM, Lecompte E, Ducroz JF (2002)
Patterns of karyotype evolution in complexes of sibling
species within three genera of African murid rodents
inferred from the comparison of cytogenetic and molecular
data. Cytogenetic and Genome Research, 96, 261–275.
This research is part of an ongoing series of collaborative stu-
dies on the phylogeograpy of African rodents. Josef Bryja is a
research scientist at the IVB AS CR, where he is interested in
many aspects of molecular ecology, including the population
genetics of rodents in Africa. Violaine Nicolas is mainly inter-
ested in the phylogeography and ecology of African mammals.
Laurent Granjon, Gauthier Dobigny, Jean-Marc Duplantier, and
Philippe Gauthier are population biologists whose main
� 2010 Blackwell Publishing Ltd

PHYLOGEOGRAPHY OF RODENTS IN SUDANIAN SAVANNA 4799
research models are West African rodents. Adam Konecny,
Aude Lalis, and Liez Durnez are now postdocs that have
worked on the systematics, ecology and ⁄ or population biology
of African rodents during their PhD studies. Hana Patzen-
hauerova is a PhD student working under the supervision of
JB on population genetics of mole-rats. Marc Colyn is a specia-
list of the African mammal biogeography.
Supporting information
Additional supporting information may be found in the online
version of this article.
� 2010 Blackwell Publishing Ltd
Fig. S1 Scatter plot of geographic (in km) and genetic distances
(mean number of nucleotide differences) between individuals.
Fig. S2 Observed and expected mismatch distribution under
models of pure demographic (squares, dotted line) and spatial
(triangles, dashed line) expansion. See text for more details.
Table S1 List of specimens used in the study with the collec-
tion in which they are stored, haplotype number and GenBank
Accession codes
Please note: Wiley-Blackwell are not responsible for the content
or functionality of any supporting information supplied by the
authors. Any queries (other than missing material) should be
directed to the corresponding author for the article.