PLEASE TYPE THE UNIVERSITY OF NEW SOUTH WALES
342
Creating Stable and Versatile Monolayer Systems on Carbon Substrates for Sensors and other Applications by Guozhen Liu B.Sc., M.Sc. A thesis presented in fulfilment of the requirements for the degree of Doctor of Philosophy School of Chemistry The University of New South Wales Sydney 2052, Australia August 2006 i
-
Upload
khangminh22 -
Category
Documents
-
view
0 -
download
0
Transcript of PLEASE TYPE THE UNIVERSITY OF NEW SOUTH WALES
Creating Stable and Versatile Monolayer Systems on Carbon Substrates for Sensors and other
Applications
by
Guozhen Liu
B.Sc., M.Sc.
A thesis presented in fulfilment
of the requirements for the degree of
Doctor of Philosophy
School of Chemistry
The University of New South Wales
Sydney 2052, Australia
August 2006
i
PLEASE TYPE THE UNIVERSITY OF NEW SOUTH WALES Thesis/Dissertation Sheet
Surname or Family name: Liu
First name: Guozhen Other names:
Abbreviation for degree as given in the University Calendar: PhD
School: Chemistry Faculty: Science
Title: Creating Stable and Versatile Monolayer Systems on Carbon Substrates for Sensors and other Applications
Abstract 350 words maximum: (PLEASE TYPE)
The aim of this project is to develop strategies for fabrication of carbon electrode surfaces with a view to creating stable and versatile monolayer
systems for sensing and other applications. Glassy carbon (GC) electrodes have been successfully modified with versatile monolayers via the
electrochemical reduction of aryl diazonium salts. The surfaces modified with diazonium salt monolayers were properly characterised by
electrochemistry, AFM and XPS. The rates of heterogeneous electron transfer through organic monolayers on GC, Pyrolysed Photoresist Films
(PPF) and gold surfaces have been studied using ferrocene as the redox probe.
The diazonium salt monolayers created on GC surfaces demonstrated very stable ability and can serve as a good alternative to alkanethiol self-
assembled monolayers on gold electrodes for sensing purposes. Tripeptide Gly-Gly-His modified GC electrodes have been successfully used as
the electrochemical copper sensors and were found to be extremely stable. PPF has proved to be a good alternative to the GC electrode for the
commercialisation of the fabricated electrochemical sensors.
The most important and difficult task of this project is to fabricate glucose biosensors and immunosensors on carbon electrodes. The rigid and
conjugated molecular wires (MW) as the efficient conduit for electron transfer, and a molecule with poly(ethylene glycol) chains (PEG) as an
insulator for reducing the non-specific protein adsorption were successfully synthesised and introduced in the sensing systems. MW modified on
GC electrodes can be used to explore the deeply buried active site of glucose oxidase to achieve direct electron transfer of GOx from the active
centre FAD through the MW to the underlying GC electrode, and to fabricate third generation biosensors.
The interface comprising mixed monolayers of MW and PEG has the ability to facilitate efficient electron transfer. A label-free immunosensor
system has been successfully developed for electrochemical detection of biomolecular pairs such as biotin/antibiotin with low detection limitation
based on mixed monolayers of MW and PEG modified GC electrode surfaces. In addition, a displacement assay has shown that the free biotin
can compete with the attached biotin for binding antibiotin. SWNTs can be used as an alternative to MW to fabricate another label-free
immunosensor system due to the high efficiency of electron transfer that SWNTs have demonstrated.
Declaration relating to disposition of project thesis/dissertation
I hereby grant to the University of New South Wales or its agents the right to archive and to make available my thesis or dissertation in whole or in part in the University libraries in all forms of media, now or here after known, subject to the provisions of the Copyright Act 1968. I retain all property rights, such as patent rights. I also retain the right to use in future work (such as articles or books) all or part of this thesis or dissertation.
I also authorise University Microfilms to use the 350 word abstract of my thesis in Dissertation Abstracts International (this is applicable to doctoral these only).
Signature: Witness: Date: .
The University recognises that there may be exceptional circumstances requiring restrictions on copying or conditions on use. Requests for restriction for a period of up to 2 years must be made in writing to the Registrar. Requests for a longer period of restriction may be considered in exceptional circumstances if accompanied by a letter of support from the Supervisor or Head of School. Such requests must be submitted with the thesis/dissertation.
FOR OFFICE USE ONLY Date of Completion of Requirements for the Award:
Registrar and Deputy Principal
THIS SHEET IS TO BE GLUED TO THE SIDE FRONT COVER OF THE THESIS
Certificate of Originality
‘I hereby declare that this submission is my own work and that, to the best of my
knowledge, it contains no material preciously published or written by another person, or
substantial proportions of material which have been accepted for the award of any other
degree or diploma at the University of New South Wales or any other educational
institution, except where due acknowledgement is made in the thesis. Any contribution
made to the research by others, with whom I have worked at the University of New
South Wales or elsewhere, is explicitly acknowledged in the thesis. I also declare that
the intellectual content of this thesis is the product of my own work, except to the extent
that assistance from others in the project’s design and conception or in style,
presentation and linguistic expression is acknowledged.’
Signed:………………………………….
Guozhen Liu
August 2006
ii
Copyright and DAI Statement
‘I hereby grant the University of New South Wales or its agents the right to archive and
to make available my thesis or dissertation in whole or part in the University libraries in
all forms of media, now or here after known, subject to the provisions of the Copyright
Act 1968. I retain all proprietary rights, such as patent rights. I also retain the right to
use in future works (such as articles or books) all or part of this thesis or dissertation.
I authorise University Microfilms to use the 350 words abstract of my thesis in
Dissertation Abstracts International.
I have either used no substantial portions of copyright material in my thesis or I have
obtained permission to use copy material; where permission has not been granted I have
applied/will apply for a partial restriction of the digital copy of my thesis or
dissertation.’
Signed:………………………………….
Guozhen Liu
August 2006
iii
Acknowledgements
It would have been definitely impossible to complete my PhD project and thesis work
without the help, support and encouragement from other people including friends and
families.
First of all, I sincerely thank my supervisor Assoc/Prof. J. Justin Gooding for his
consistent guidance, patience, and support throughout the past three years. I was always
impressed by his down-to-earth personality and earnest attitude towards scientific
research, and more importantly his enthusiastic approach and erudite knowledge have
enlightened me in many aspects in my research. He has also made an excellent model of
being a good person in the society for me. I feel very grateful to have known him and
worked with him, and I believe what I have learn from him will greatly benefit to my
future career and even my whole life.
Thanks to Prof. D. Brynn Hibbert for lots of inspiring advices during this project.
Thanks to Dr. Alison Downard at University of Canterbury, New Zealand for help with
making Pyrolysed Photoresist Films (PPF) and her kind hospitality during my visiting
her lab.
Thanks to Dr. Jingquan Liu for help with the organic synthesis and invaluable
comments and support throughout this project.
Thanks also to Assoc/Prof. Barbara Messerle, Dr. Jason Harper, Dr. Jim Hook, Dr.
Michael Jones, and Paul Eggers for discuss with organic synthesis.
Thanks to Dr. Till Böcking for help with the XPS data and all the suggestions.
I’d like to thank Dr. Edith Chow, Dr. Jingquan Liu, and Dr. Till Böcking for their
careful proof reading of this thesis.
iv
Thanks all the group members Alison Chou, Callie Reynolds Massey-Reed, Eillen Peh,
Kate Odenthal, Kris Kilian, Paul Eggers, Rongmei Liu, Dr. Till Böcking, Dr. Wenrong
Yang and former group members Dr. Edith Chow, Dr. Freya Mearns, Dr. Florian
Bender, Dr. Elicia Wong, Dr. Jingquan Liu, Dr. Jianfeng Li and Dr. Min Zhao for their
help and kindness.
Thanks to all of the friends I have met in both countries, Australia and China. I will
refrain from mentioning any names, for fear of leaving someone out. Nevertheless, you
are all greatly cherished and I am indebted to each one of you.
Thanks to the Endeavour International Postgraduate Research Scholarship (EIPRS) and
Australia Research Council (ARC) for financial support to undertake this project.
Finally I would like to thank my dear husband Kaiji Wang for his deep love, constant
support and patience. Without his accompany with me in Sydney, I could not have
carried out my PhD study. And I would like to thank my parents and all my families for
their constant love, support and encouragement in China.
v
Abstract
The aim of this project is to develop strategies for fabrication of carbon electrode
surfaces with a view to creating stable and versatile monolayer systems for sensing and
other applications. Glassy carbon (GC) electrodes have been successfully modified with
versatile monolayers via the electrochemical reduction of aryl diazonium salts. The
surfaces modified with diazonium salt monolayers were properly characterised by
electrochemistry, AFM and XPS. The rates of heterogeneous electron transfer through
organic monolayers on GC, Pyrolysed Photoresist Films (PPF) and gold surfaces have
been studied using ferrocene as the redox probe.
The diazonium salt monolayers created on GC surfaces demonstrated very stable ability
and can serve as a good alternative to alkanethiol self-assembled monolayers on gold
electrodes for sensing purposes. Tripeptide Gly-Gly-His modified GC electrodes have
been successfully used as the electrochemical copper sensors and were found to be
extremely stable. PPF has proved to be a good alternative to the GC electrode for the
commercialisation of the fabricated electrochemical sensors.
The most important and difficult task of this project is to fabricate glucose biosensors
and immunosensors on carbon electrodes. The rigid and conjugated molecular wires
(MW) as the efficient conduit for electron transfer, and a molecule with poly(ethylene
glycol) chains (PEG) as an insulator for reducing the non-specific protein adsorption
were successfully synthesised and introduced in the sensing systems. MW modified on
GC electrodes can be used to explore the deeply buried active site of glucose oxidase to
vi
achieve direct electron transfer of GOx from the active centre FAD through the MW to
the underlying GC electrode, and to fabricate third generation biosensors.
The interface comprising mixed monolayers of MW and PEG has the ability to facilitate
efficient electron transfer. A label-free immunosensor system has been successfully
developed for electrochemical detection of biomolecular pairs such as biotin and
antibiotin with low detection limitation based on mixed monolayers of MW and PEG
modified GC electrode surfaces. In addition, a displacement assay has shown that the
free biotin can compete with the attached biotin for binding antibiotin. SWNTs can be
used as an alternative to MW to fabricate another label-free immunosensor system due
to the high efficiency of electron transfer that SWNTs have demonstrated.
vii
Publications (during PhD)
1. The Modification of Glassy Carbon and Gold Electrodes with Aryl Diazonium Salt:
The Impact of the Electrode Materials on the Rate of Heterogeneous Electron
Transfer, Guozhen Liu, Jingquan Liu, Till Böcking, Paul. K. Eggers and J. Justin
Gooding, Chemical Physics, 2005, 319, 136-146.
2. Study of Factors Affecting the Performance of Voltammetric Copper Sensors based
on Gly-Gly-His Modified Glassy Carbon and Gold Electrodes, Guozhen Liu,
Quynh Thu Nguyen, Edith Chow, Till Böcking, D. Brynn Hibbert and J. Justin
Gooding, Electroanalysis, 2006, 18(12), 1141-1151.
3. An Electrochemical Interface Comprising Molecular Wires and Poly(ethylene
glycol) Spacer Units Self-Assembled on Carbon Electrodes for Studies of Protein
Electrochemistry, Guozhen Liu and J. Justin Gooding, Langmuir, 2006, 22(17),
7421-7430.
4. Diazonium salts: Stable Monolayers on Gold Electrodes for Sensing Applications,
Guozhen Liu, Till Böcking, and J. Justin Gooding, accepted by Journal of
Electroanalytical Chemistry.
5. Exploration of Deeply Buried Active Sites of Glucose Oxidase Using Molecular
Wires Immobilized on Carbon Electrodes, Guozhen Liu and J. Justin Gooding, to
be submitted to Chemical Communications.
6. Electrochemical Transduction of Biomolecular Recognition on Molecular Wire
Modified Carbon Surfaces, Guozhen Liu and J. Justin Gooding, in preparation.
7. A Label-Free Immunosensor on GC Electrodes, Guozhen Liu and J. Justin
Gooding, submitted for the patent.
viii
Table of Contents
Title Page……………………………………………………………………….……...(i)
Certificate of Originality..…………………………………………………….…….....(ii)
Copyright and DAI Statement………………………………………………….…..…(iii)
Acknowledgements……………………………………………….…..……………….(iv)
Abstract..……………………………………………………………………….…..…(vi)
Publications………………………………………………………………….…...….(viii)
Table of Contents………………………………………………………………...……(ix)
List of Abbreviations..……………………………………………………….…..…..(xxi)
Chapter One Introduction………………………………………………...1
1.1 Introduction.........................................................................................................2
1.2 Biosensors ............................................................................................................4
1.2.1 The General Principle of Biosensors…………………………………….4
1.2.2 Transducers………………………………………………………………5
1.2.3 Immobilisation…………………………………………………………...6
1.3 Classification of Biosensors ................................................................................7
1.3.1 Catalytic Biosensors……………………………………………………..7
1.3.1.1 The Principle of Catalytic Biosensors…………………………...7
1.3.1.2 Efforts towards Improving Electrical Communication between
the Enzyme and the Electrode………………………………………………….9
1.3.1.3 Issues with the Current Catalytic Biosensors…………………..10
1.3.2 Affinity Biosensors……………………………………………………..11
ix
1.3.2.1 Immunosensors…………………………………………………12
1.3.2.2 Antibody Structures…………………………………………….12
1.3.2.3 The Principle of Immuno-Interaction…………………………..13
1.3.2.4 Issues with Current Immunosensors……………………………14
1.4 Solutions for Existing Problems with Current Biosensors............................16
1.5 Creating More Stable Self-Assembled Monolayers on Electrode Surfaces
for the Construction of Sensors ...................................................................................16
1.5.1 Self-Assembled Monolayers on Gold Electrodes………………………17
1.5.2 Self-Assembled Monolayers on Glassy Carbon Surfaces……………...19
1.5.2.1 Glassy Carbon Surfaces………………………………………...19
1.5.2.2 Modification of Glassy Carbon Electrodes with Stable Self-
Assembled Monolayers……………………………………………………….20
1.6 Creating the Sensing Interfaces with the Ability to Resist Non-Specific
Adsorption .....................................................................................................................24
1.7 Using Molecular Wires to Establish Efficient Electron Transfer on Sensing
Interfaces........................................................................................................................26
1.7.1 Using Oligo(phenyl ethynylene) Bridges to Facilitate Electron Transfer
between Biomolecules and Sensing Interfaces……………………………………..27
1.7.2 Using Single-Walled Carbon Nanotubes to Facilitate Electron Transfer
between Biomolecules and Sensing Interfaces……………………………………..28
1.8 Aims of the Thesis .............................................................................................30
1.9 Overview of Chapters .......................................................................................31
1.10 References ..........................................................................................................33
x
Chapter Two Experimental Procedures and Instrumentation.……….….47
2.1 Chemicals, Reagents and Solutions .................................................................48
2.2 Synthesis.............................................................................................................53
2.2.1 Synthesis of 4-Carboxyphenyl Diazonium Tetrafluoroborate and 4-
Nitrophenyl Diazonium Tetrafluoroborate…………………………………………53
2.2.2 Synthesis of Benzenediazonium Tetrafluoroborate…………………….54
2.2.3 Synthesis of Ferrocenemethylamine……………………………………54
2.2.4 Synthesis of 1,1`-Ferrocenedimethylamine…………………………….55
2.2.5 Synthesis of Molecular Wires………………………………………….56
2.2.5.1 Synthesis of 1-Bromo-3-nitro-4-(4-aminophenylethynyl)benzene
(1)……………………………………………………………………………...57
2.2.5.2 Synthesis of Methyl 4-(trimethylsilylethynyl)benzoate (2a)…...58
2.2.5.3 Synthesis of Methyl 4-ethynylbenzoate (2)…………………….58
2.2.5.4 Synthesis of Methyl 2`-nitro-4, 4`-diphenylethynyl-4``-
aminobenzoate (3)…………………………………………………………….59
2.2.5.5 Synthesis of Methyl 2`-nitro-4, 4`-diphenylethynyl-4``-amino
Benzoic Acid (4)………………………………………………………………59
2.2.5.6 Synthesis of Methyl 2`-nitro-4, 4`-diphenylethynyl-4``-benzoic
acid Benzenediazonium Tetrafluoroborate (5)………………………………..60
2.2.6 Synthesis of 4-(2-(2-(2-Methoxyethoxy)ethyl)benzenediazonium
Tetrafluoroborate…………………………………………………………………...61
2.2.6.1 Synthesis of 2-(2-(2-Methoxyethoxy)ethoxy)ethyl p-
Toluenesulfonate (a).………………………………………………………….62
2.2.6.2 Synthesis of 4-(2-(2-(2-
Methoxyethoxy)ethoxy)ethyl)nitrobenzene (b)……………………………….62
xi
2.2.6.3 Synthesis of 4-(2-(2-(2-Methoxyethoxy)ethoxy)ethyl)aniline
(c)……………………………………………………………………………...63
2.2.6.4 Synthesis of 4-(2-(2-(2-
Methoxyethoxy)ethoxy)ethyl)benzenediazonium Tetrafluoroborate (d)……..63
2.3 Instrumentation.................................................................................................64
2.3.1 Electrochemical System………………………………………………..64
2.3.2 Nuclear Magnetic Resonance (NMR) Spectrometer…………………...66
2.3.3 X-ray Photoelectron Spectroscopy (XPS)……………………………...66
2.3.4 Atomic Force Microscopy (AFM)……………………………………...67
2.3.5 Fourier Transfer Ion Cyclotron Mass Spectrometry (FT-ICR MS)……67
2.3.6 LEO-Scanning Electron Microscope (LEO-SEM)……………………..67
2.4 Procedures .........................................................................................................67
2.4.1 Preparation of Glassy Carbon Electrodes and Calculation of the
Electrochemical Surface Area……………………………………………………...67
2.4.2 Derivatisation of Glassy Carbon Electrodes with Diazonium Salts……70
2.4.3 Preparation of Pyrolysed Photoresist Films…………………………….71
2.4.4 Preparation of Gold Electrodes and Calculation of the Electrochemical
Surface Area………………………………………………………………………..72
2.4.5 Preparation of Homogeneous Pure and Mixed Alkanethiol Self-
Assembled Monolayers on Gold Surfaces………………………………………….73
2.4.6 Covalent Attachment of Ferrocene Redox Probes onto Glassy Carbon
Electrodes Modified with Diazonium Salt Monolayers……………………………75
2.4.7 Determination of the Surface Coverage of Redox Species…………….76
2.4.8 Calculation of the Rate Constant of Heterogeneous Electron Transfer
using Laviron Theory...…………………………………………………………….76
xii
2.5 References ..........................................................................................................79
Chapter Three Covalent Modification of Electrode Surfaces by
Electrochemical Reduction of Aryl Diazonium Salts…………….………82
3.1 Introduction.......................................................................................................83
3.2 Experimental Section........................................................................................84
3.3 Results and Discussion......................................................................................84
3.3.1 Influence of Scan Rates on the Capacitance of Bare Glassy Carbon
Electrodes in Aqueous and Nonaqueous Electrolytes……………………………...84
3.3.2 Modification of Glassy Carbon Electrodes with Aryl Diazonium Salts by
Electrochemical Reductive Adsorption…………………………………………….87
3.3.3 Electrochemistry of a Glassy Carbon Electrode Modified with 4-
Carboxyphenyl Diazonium Tetrafluoroborate……………………………………...90
3.3.4 Effect of Solution pH on the Blocking Property of the 4-Carboxyphenyl
Groups Modified on Glassy Carbon Electrodes……………………………………94
3.3.5 Characterisation of 4-Carboxyphenyl Modified Glassy Carbon Surfaces
Using X-ray Photoelectron Spectroscopy………………………………………….95
3.3.6 Stability of Carboxyphenyl Monolayers Modified on Glassy Carbon
Electrodes…………………………………………………………………………..96
3.3.7 Electrochemistry of a Glassy Carbon Electrode Modified with Phenyl
Diazonium Tetrafluoroborate………………………………………………………99
3.3.8 Modification of Gold Electrodes with Aryl Diazonium Salts………...102
3.3.8.1 Electrochemistry of 4-Carboxyphenyl Modified Gold
Electrodes……………………………………………………………………102
xiii
3.3.8.2 Characterisation of 4-Carboxyphenyl Modified Gold Surfaces
Using XPS…………………………………………………………………...104
3.3.8.3 Robustness of Monolayers Modified on Gold Surfaces………105
3.3.8.4 Reductive Desorption of Diazonium Salt Monolayers………..109
3.4 Conclusions ......................................................................................................112
3.5 References ........................................................................................................112
Chapter Four Heterogeneous Electron Transfer Through Organic
Monolayers on Carbon and Gold Electrodes……….…………………...116
4.1 Introduction.....................................................................................................117
4.2 Experimental Section......................................................................................118
4.3 Results and Discussion....................................................................................119
4.3.1 Heterogeneous Electron Transfer Through Diazonium Salt Monolayers
Modified on Glassy Carbon Electrodes Using Ferrocene as the Redox Probe…...119
4.3.2 Heterogeneous Electron Transfer Through Diazonium Salt Monolayers
Modified on Gold Electrodes Using Ferrocene as the Redox Probe……………...124
4.3.3 Heterogeneous Electron Transfer Through Diazonium Salt Monolayers
Modified on Pyrolysed Photoresist Films………………………………………...126
4.3.3.1 Pyrolysed Photoresist Films (PPF)……………………………126
4.3.3.2 Heterogeneous Electron Transfer on PPF Surfaces…………...127
4.3.4 Heterogeneous Electron Transfer Through Alkanethiol Monolayers
Modified on Gold Electrodes……………………………………………………..131
4.3.5 Kinetics of Heterogeneous Electron Transfer Through Organic
Monolayers on Carbon and Gold Electrodes……………………………………...132
4.4 Conclusions ......................................................................................................140
xiv
4.5 References ........................................................................................................141
Chapter Five Fabrication of Electrochemical Copper Sensors Based on
Gly-Gly-His Modified Carbon Electrodes………………………………145
5.1 Introduction.....................................................................................................146
5.2 Experimental Section......................................................................................148
5.3 Results and Discussion....................................................................................150
5.3.1 Electrochemistry of Cu2+ Complexed Gly-Gly-His on Glassy Carbon
Electrodes…………………………………………………………………………150
5.3.2 Characterisation of Gly-Gly-His Modified Glassy Carbon Surfaces Using
XPS………………………………………………………………………………..156
5.3.3 Calibration Curve of Gly-Gly-His Modified Glassy Carbon Electrodes
for the Detection of Cu2+………………………………………………………….162
5.3.4 Attachment of Gly-Gly-His onto Mixed Aryl Diazonium Salts Modified
Glassy Carbon Electrodes for the Detection of Cu2+……………………………...164
5.3.5 Electrochemistry of Cu2+ Complexed with Gly-Gly-His Modified on
Pyrolysed Photoresist Films………………………………………………………168
5.3.6 Stability of Gly-Gly-His Modified Glassy Carbon Electrodes for the
Detection of Cu2+……………………………………………………………….…172
5.4 Conclusions ......................................................................................................174
5.5 References ........................................................................................................175
xv
Chapter Six An Interface Comprising Molecular Wires and Poly(ethylene
glycol) Spacer Units Self-Assembled on Carbon Electrodes for Studies of
Protein Electrochemistry...………………………………………………180
6.1 Introduction.....................................................................................................181
6.2 Experimental Section......................................................................................184
6.2.1 Chemicals and Procedures…………………………………………….184
6.2.2 Bovine Serum Albumin Labelled Au Nanoparticles………………….185
6.3 Result and Discussion .....................................................................................185
6.3.1 Electrochemistry of PEG Modified Glassy Carbon Electrodes……….185
6.3.2 Non-Specific Protein Adsorption on PEG Modified Glassy Carbon
Surfaces…………………………………………………………………………...187
6.3.3 Electrochemistry of Glassy Carbon Electrodes Modified with Mixed
Monolayers of MW and PEG at the Molar Ratio of 1:20 ………………………...191
6.3.4 Electron Transfer Through Monolayers of MW on Glassy Carbon
Surfaces…………………………………………………………………………...194
6.3.5 Direct Electron Transfer between HRP and MW on Glassy Carbon
Surfaces…………………………………………………………………………...199
6.4 Conclusions ......................................................................................................204
6.5 References ........................................................................................................204
Chapter Seven Exploration of Deeply Buried Active Sites of Glucose
Oxidase Using Molecular Wires Self-Assembled on Carbon Electrodes.212
7.1 Introduction.....................................................................................................213
7.2 Experimental Section......................................................................................220
xvi
7.2.1 Chemicals and Procedures…………………………………………….220
7.2.2 Direct Attachment of GOx to Glassy Carbon Electrodes Modified with
Mixed Monolayers of 4-Carboxyphenyl and MW………………………………..220
7.3 Results and Discussion....................................................................................221
7.3.1 Electrochemistry of MW Modified Glassy Carbon Surfaces…………221
7.3.2 Exploration of Active Centres of GOx Using MW Modified on Glassy
Carbon Electrodes…………………………………………………………………222
7.3.2.1 Electrochemistry of GOx Coupled on Glassy Carbon
Electrodes……………………………………………………………………222
7.3.2.2 Effect of Mixed Monolayers on the Redox Response of GOx..226
7.3.2.3 Surface Coverage of GOx on MW Modified Glassy Carbon
Electrodes……………………………………………………………………229
7.3.2.4 The Rate Constant of Electron Transfer between FAD and Glassy
Carbon Electrodes……………………………………………………………230
7.3.2.5 Measurement of Biocatalytical Activity of GOx……………...231
7.4 Conclusions ......................................................................................................237
7.5 References ........................................................................................................237
Chapter Eight Development of a Label-Free Immunosensor on Molecular
Wire Modified Glassy Carbon Surfaces…………………….…………...241
8.1 Introduction.....................................................................................................242
8.2 Experimental Section......................................................................................247
8.2.1 Chemicals and Procedures…………………………………………….247
8.2.2 Covalent Coupling of Ferrocenedimethylamine to Mixed Monolayers of
MW and PEG Modified Glassy Carbon Electrodes………………………………248
xvii
8.2.3 Immobilisation of Biotin and Anti-biotin on Ferrocenedimethylamine
Modified Glassy Carbon Electrode Surfaces……………………………………...248
8.3 Results and Discussion....................................................................................248
8.3.1 Electrochemistry of Glassy Carbon Electrodes Modified with Mixed
Monolayers of MW and PEG at a Molar Ratio of 1:20…………………………...248
8.3.2 Electrochemistry of Ferrocenedimethylamine on Glassy Carbon
Electrodes Modified with Mixed Monolayers of MW and PEG at a Molar Ratio of
1:20………………………………………………………………………………..249
8.3.3 Heterogeneous Electron Transfer Through Mixed Monolayers of MW
and PEG Modified Glassy Carbon Electrodes Using Ferrocene as the Redox
Probe………………………………………………………………………………253
8.3.4 Electrochemistry of Ferrocene Modified Glassy Carbon Electrode
Surfaces after Immobilisation of Biotin and Antibiotin…………………………..254
8.3.5 Calibration Curve for the Detection of Antibiotin…………………….260
8.3.6 Displacement Immunoassay…………………………………………..262
8.3.7 Electrochemical Stimulation of Antibiotin Dissociation from the
Immunosensor Interface…………………………………………………………..266
8.4 Conclusions ......................................................................................................269
8.5 References ........................................................................................................270
Chapter Nine Towards the Fabrication of Immunosensors Using SWNTs
as the Conduit for Electron Transfer.…………….……………………...275
9.1 Introduction.....................................................................................................276
9.2 Experimental Section......................................................................................279
9.2.1 Chemicals and Procedures…………………………………………….279
xviii
9.2.2 Preparation of the Cut SWNTs……..…………………………………279
9.2.3 Fabrication of the Cut SWNTs on the 4-Aminophenyl Modified Glassy
Carbon Electrodes…………………………………………………………………280
9.3 Results and Discussion....................................................................................280
9.3.1 Modification of the Glassy Carbon Electrodes with 4-Nitrophenyl
Diazonium Tetrafluoroborate……………………………………………………..280
9.3.2 Conversion of the 4-Nitrophenyl Groups on Glassy Carbon Electrode
Surfaces into 4-Aminophenyl Groups…………………………………………….284
9.3.3 Attachment of Ferrocenecarboxylic Acids on 4-Aminophenyl Modified
Glassy Carbon Electrodes…………………………………………………………286
9.3.4 Characterisation of the SWNT Modified Glassy Carbon Surfaces by
AFM……………………………………………………………………………….289
9.3.5 Covalent Attachment of Ferrocenemethylamine to SWNT Modified
Glassy Carbon Electrodes…………………………………………………………290
9.3.6 Fabrication of a Label-Free Immunosensor on SWNTs Modified Glassy
Carbon Substrates…………………………………………………………………294
9.4 Conclusions ......................................................................................................298
9.5 References ........................................................................................................299
Chapter Ten Conclusions and Future Directions……………………...304
10.1 Introduction.....................................................................................................305
10.2 Brief Summary ................................................................................................306
10.3 Future Directions ............................................................................................308
10.3.1 Further Investigation of Heterogeneous Electron Transfer within and
between the Enzymes……………………………………………………………..308
xix
10.3.2 Optimisation of the Fabricated Immunosensors………………………308
10.3.3 Development of the Immunosensor Arrays…………………………...309
10.3.4 Diagnosis and Treatment of Pathogenic Cells Using the Nanoparticle-
Antibody Conjugate……………………………………………………………….313
10.4 References ........................................................................................................316
xx
List of Abbreviations
AFM Atomic force microscope
BSA Bovine Serum Albumin
CV Cyclic voltammetry
DCC 1,3-dicyclohexylcarbodiimide
DMF Dimethyl formamide
DMSO Dimethyl sulphoxide
E Electrode potential
Eo` Formal potential
EDC 1-ethyl-3-(3-dimethylamino)propyl) carbodiimide
ET Electron transfer
EtOAc Ethyl acetate
F Farady constant
FCA Ferrocenecarboxylic acid
GCE Glassy carbon electrode
Gly-Gly-His Glycine-Glycine-Histidine
h Hour
HEPES N-(2-hydroxyethyl)piperazine-N-(2-ethanesulfonic acid)
kET Electron transfer rate constant
L Litre
LP Light petroleum
m Minute
MES 2-(N-morpholino)ethanesulfonic acid
xxi
mol Mole
MP-11 Horseradish peroxidase
NHS N-hydroxysuccinimide
NMR Nuclear magnetic resonance
OSWV Osteryoung Square Wave Voltammetry
PPF Pyrolysed Photoresist Film
Q Charge per unit area
R Gas constant
R Radius
R Resistance
s Second
SAMs Self-assembled monolayers
SEM Scanning electron microscopy
STM Scanning tunnelling microscopy
SWNT Single-walled carbon nanotube
T Absolute temperature
TEM Transmission electron microscopy
THF Tetrahydrofuran
UV Ultraviolet
xxii

Chapter 1-General Introduction
Chapter One
General Introduction
1
Chapter 1-General Introduction
1.1 Introduction
A biosensor is a compact analytical device that is capable of detecting a target analyte
using a biological recognition element (biochemical receptor) immobilised directly onto
a physical or physicochemical transducer.1 Examples of biochemical receptors are
enzymes, antibodies or fragments of antibodies, membrane receptors, whole cells,
nucleic acids and DNA fragments, which are used to recognise and interact specifically
with the analyte in question. The response is sensed by the transducer, which has the
ability to translate a biological interaction into a usable electrical signal. The most
frequently used transducers are based on electrochemistry, fluorescence, interferometry,
resonance and reflectometry.2 Biosensors are usually classified into various basic
groups according either to the method of signal transduction or to the biorecognition
principle. Accordingly, biosensors can be categorised as electrochemical, optical,
piezoelectric and thermal sensors on the basis of the transducing element, and as
immuno-chemical, enzymatic, non-enzymatic receptor, whole-cell and DNA biosensors
on the basis of the biorecognition principle.
Biosensors have many potential advantages in comparison to many conventional
analytical approaches in terms of simplicity, low limits of detection and sensitivity. A
biosensor should be clearly distinguished from a bioanalytical system, which requires
additional steps, such as reagent addition. Biosensor technology offers the possibility of
identifying and quantifying specific compounds directly in liquid media or in very dirty
environments, although in some cases previous sample preparation is also needed.
Biosensors are widely used for quality assurance in agriculture, food and
pharmaceutical industries, monitoring environmental pollutants and biological agents,
2
Chapter 1-General Introduction
medical diagnostics and biological assays. There are many biosensors under
development and also extensive literature on this area.1-8 Commercialisation is the best
indicator of the success of a biosensor.8-10 However, only a small number of all
biosensors developed are commercially available. Additionally, most commercial
biosensors are focused on medical applications, such as glucose-detecting biosensors.
Food, agriculture, military, veterinary and the environment are potential markets which
still need to be established. An essential requirement for the commercialisation of these
devices is a clear application need. Also, the technology must offer advantages over
established technologies. Issues such as market size, development costs, and ease of
manufacture should be addressed before the sensor reaches the development stage.
The biosensors market is growing significantly, from $113.5 million in 1997 to $197.6
million by 2004, as predicted for sales in Europe.11 Taking advantages of the steady new
developments in biochemistry, biotechnology, genetics, electronics, physics, and
microfabrication, research in biosensors has produced a huge amount of new ideas, and
devices in recent decades. As a result of the potential development, biosensors have
been obtaining wide applications for clinical diagnostics, analytical chemistry,
pharmaceutical development, the food industry and environmental monitoring.
This chapter will introduce the concept of biosensors, the problems existing with the
current biosensors, how to form more stable monolayer systems for the fabrication of
biosensors, and how to achieve direct electron transfer between biomolecules and the
electrodes via the efficient electron transfer linker to develop third generation
biosensors and label-free immunosensors.
3
Chapter 1-General Introduction
1.2 Biosensors
1.2.1 The General Principle of Biosensors
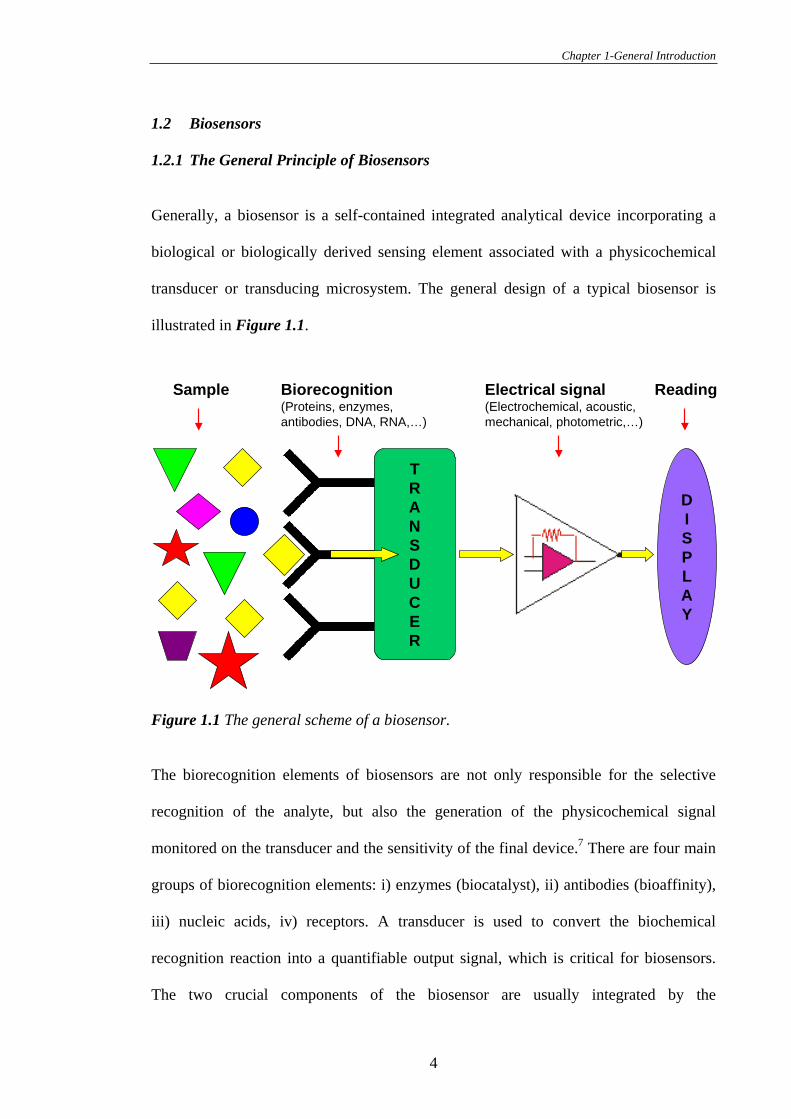
Generally, a biosensor is a self-contained integrated analytical device incorporating a
biological or biologically derived sensing element associated with a physicochemical
transducer or transducing microsystem. The general design of a typical biosensor is
illustrated in Figure 1.1.
TRANSDUCER
Biorecognition(Proteins, enzymes,antibodies, DNA, RNA,…)
Sample Electrical signal(Electrochemical, acoustic,mechanical, photometric,…)
Reading
DISPLAY
Figure 1.1 The general scheme of a biosensor.
The biorecognition elements of biosensors are not only responsible for the selective
recognition of the analyte, but also the generation of the physicochemical signal
monitored on the transducer and the sensitivity of the final device.7 There are four main
groups of biorecognition elements: i) enzymes (biocatalyst), ii) antibodies (bioaffinity),
iii) nucleic acids, iv) receptors. A transducer is used to convert the biochemical
recognition reaction into a quantifiable output signal, which is critical for biosensors.
The two crucial components of the biosensor are usually integrated by the
4
Chapter 1-General Introduction
immobilisation of the biorecognition components onto the surface of the transducer. The
following two sections will introduce the transducer and the immobilisation method in
more detail.
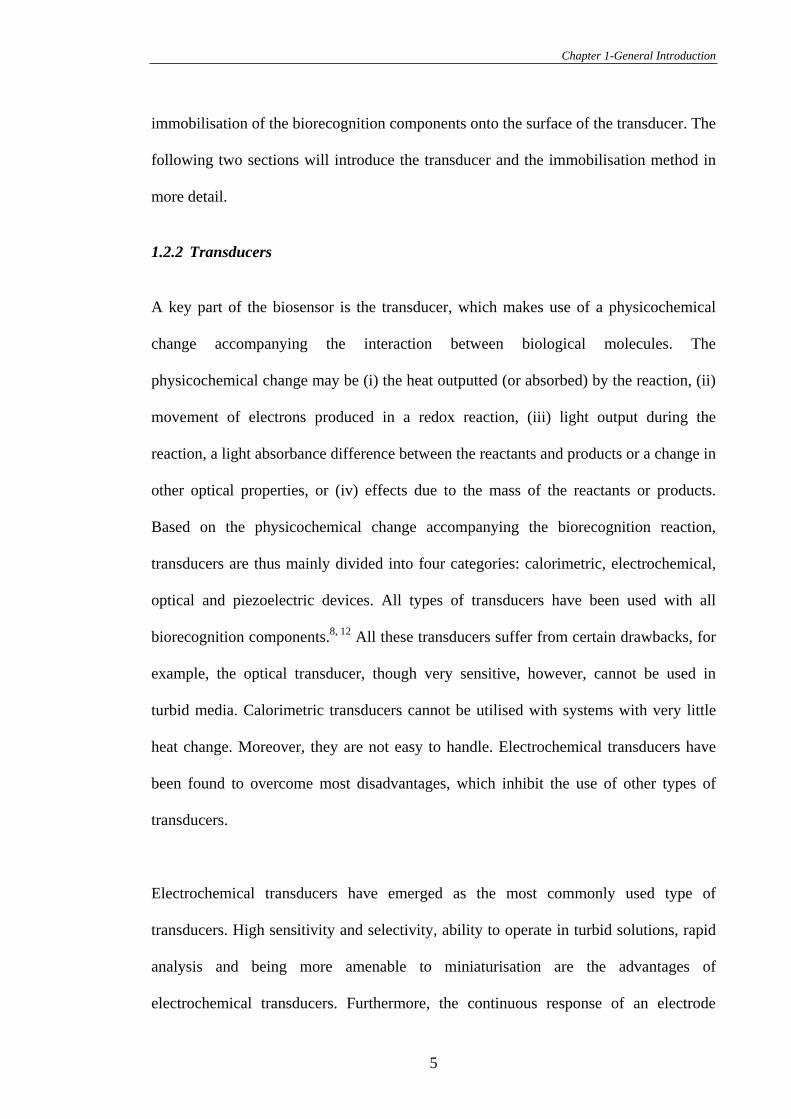
1.2.2 Transducers
A key part of the biosensor is the transducer, which makes use of a physicochemical
change accompanying the interaction between biological molecules. The
physicochemical change may be (i) the heat outputted (or absorbed) by the reaction, (ii)
movement of electrons produced in a redox reaction, (iii) light output during the
reaction, a light absorbance difference between the reactants and products or a change in
other optical properties, or (iv) effects due to the mass of the reactants or products.
Based on the physicochemical change accompanying the biorecognition reaction,
transducers are thus mainly divided into four categories: calorimetric, electrochemical,
optical and piezoelectric devices. All types of transducers have been used with all
biorecognition components.8, 12 All these transducers suffer from certain drawbacks, for
example, the optical transducer, though very sensitive, however, cannot be used in
turbid media. Calorimetric transducers cannot be utilised with systems with very little
heat change. Moreover, they are not easy to handle. Electrochemical transducers have
been found to overcome most disadvantages, which inhibit the use of other types of
transducers.
Electrochemical transducers have emerged as the most commonly used type of
transducers. High sensitivity and selectivity, ability to operate in turbid solutions, rapid
analysis and being more amenable to miniaturisation are the advantages of
electrochemical transducers. Furthermore, the continuous response of an electrode
5

Chapter 1-General Introduction
system allows for on-line control, and the equipment required for electrochemical
transducers is simple and cheap compared to most other analytical devices. Thus this
thesis will exclusively investigate the electrochemical transducers.
1.2.3 Immobilisation
Immobilisation of biological elements as well as their orientation (i.e., accessibility of
the ligand binding site to the analyte) are important considerations in the design and
construction of biosensors. This is primarily due to the stoichiometric relationship
between biological elements and the finite surface area of the signal transducer. The
immobilisation method is determined by the nature of the biocomponent to be
immobilised. The type of transducing element used and the physical properties of the
analyte are also important factors that assist in selecting a method.13 In general, the
immobilisation procedure must maintain the biorecognition molecule close to the
transducer surface, while retaining its biological activity, in a reproducible manner.
Furthermore, it is desirable that the immobilisation layer gives the biological molecule
enhanced stability, is robust, is applicable to many different biomolecules, is chemically
resistant to the reactants and products of the biochemical reaction and gives control over
the distribution and orientation of the immobilised species.14
A wide variety of immobilisation methods, which have the dominant effect on the
performance of the biosensors, have been developed on various substrates.15-17 General
strategies for immobilising biological elements on the transducer surface include
adsorption,18-20 microencapsulation, entrapment,21, 22 cross linking, covalent bonding,23-
25 and the use of biological binding proteins such as protein A or protein G26, 27 or use of
the avidin/biotin system. Although all these immobilisation approaches are highly
6
Chapter 1-General Introduction
versatile, the common drawback with these methods is the poor control over the
location and density of biorecognition molecules. Modification of surfaces with a self-
assembled monolayer can be achieved with molecule level control over the interface,
and hence the position of the recognition molecules in space can also be controlled with
molecular level precision.28 Thus, the self-assembly provides a potential strategy for
integrating biorecognition components with transducers. This thesis will use self-
assembly chemistry to immobilise the sensing interface in fabrication of biosensors.
1.3 Classification of Biosensors
Based on the biorecognition components used, biosensors can be classified as two
categories: catalytic biosensors and affinity biosensors.
1.3.1 Catalytic Biosensors
Catalytic biosensors are based on the recognition and binding of an analyte followed by
a catalysed chemical conversion of the analyte from a nondetectable form to a
detectable form, which are detected and recorded by a transducer. In the catalytic
biosensors, biocatalysts, such as enzymes and microbiological cells, are used to
recognise, bind, and chemically convert a molecule. To extend the range of detectable
analytes a second or third enzyme can be used that converts the nondetectable primary
product to a secondary detectable one.29
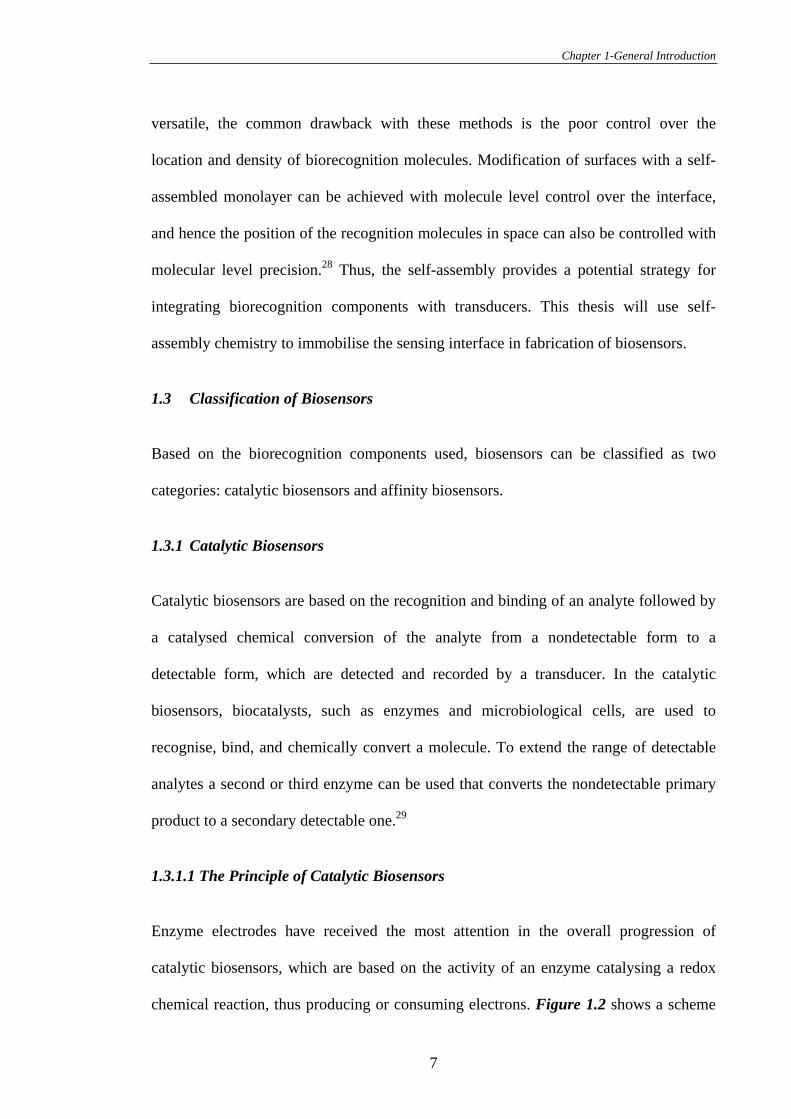
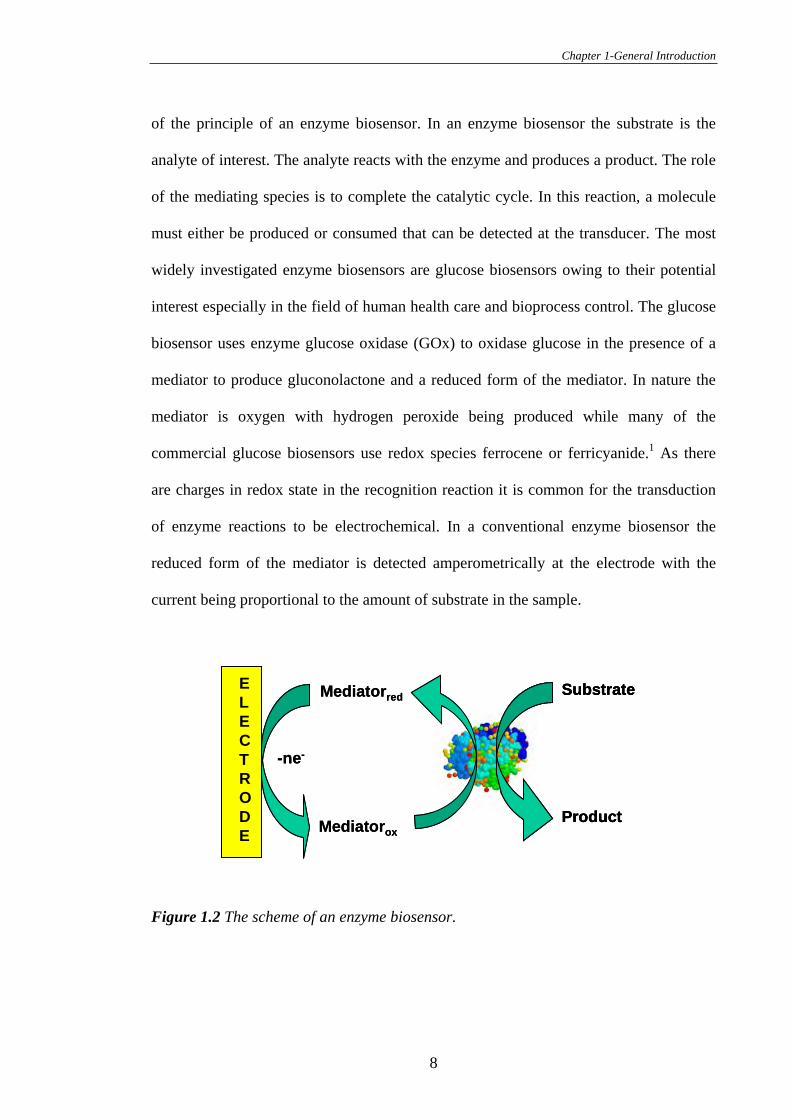
1.3.1.1 The Principle of Catalytic Biosensors
Enzyme electrodes have received the most attention in the overall progression of
catalytic biosensors, which are based on the activity of an enzyme catalysing a redox
chemical reaction, thus producing or consuming electrons. Figure 1.2 shows a scheme
7
Chapter 1-General Introduction
of the principle of an enzyme biosensor. In an enzyme biosensor the substrate is the
analyte of interest. The analyte reacts with the enzyme and produces a product. The role
of the mediating species is to complete the catalytic cycle. In this reaction, a molecule
must either be produced or consumed that can be detected at the transducer. The most
widely investigated enzyme biosensors are glucose biosensors owing to their potential
interest especially in the field of human health care and bioprocess control. The glucose
biosensor uses enzyme glucose oxidase (GOx) to oxidase glucose in the presence of a
mediator to produce gluconolactone and a reduced form of the mediator. In nature the
mediator is oxygen with hydrogen peroxide being produced while many of the
commercial glucose biosensors use redox species ferrocene or ferricyanide.1 As there
are charges in redox state in the recognition reaction it is common for the transduction
of enzyme reactions to be electrochemical. In a conventional enzyme biosensor the
reduced form of the mediator is detected amperometrically at the electrode with the
current being proportional to the amount of substrate in the sample.
-ne-
Substrate
Product
Mediatorred
Mediatorox
ELECTRODE
-ne-
Substrate
Product
Substrate
Product
Mediatorred
Mediatorox
ELECTRODE
ELECTRODE
Figure 1.2 The scheme of an enzyme biosensor.
8
Chapter 1-General Introduction
1.3.1.2 Efforts towards Improving Electrical Communication between the Enzyme
and the Electrode
As the enzyme reaction involves a change in oxidation state, the ultimate goal of
enzyme electrode research is to obviate the need for a mediator by oxidising and
reducing the enzyme directly at the electrode. Achieving direct electron transfer
between the active centre of the enzyme and an electrode is crucial for development of
novel enzyme biosensors or bioelectronics.30 Direct electron transfer was observed on
small redox proteins such as cytochrome c,31-36 microperoxidase37, 38 and azurin35 with
redox active sites being located close to the enzyme surface. With most oxidoreductase
enzymes however, the redox active centres are located at a sufficient distance from the
surface of the glycoprotein to prevent direct electron transfer. For example, in the case
of GOx, the closest approach of the redox active centre, flavin adenine dinucleotide
(FAD), to the enzyme surface is 13 Å.39 Therefore, it is far more difficult to incorporate
these proteins into a biosensor system due to the weak electrical communication to their
surrounding environment.
Various strategies have been employed, such as promoters,40 redox mediators,41 direct
covalent linkage of the protein or enzyme to the electrode,42 and protein adsorption,43 to
achieve direct and reversible electron transfer between the active centre of GOx and the
underlying electrodes by bringing the flavoenzyme close to the electrode surfaces.
Degani and Heller44, 45 have successfully established direct electrical communication
between the redox centres of the enzymes and electrodes through bonding electron
transfer relays. Later, based on the idea of entrapping GOx in a redox polymer which
shuttled the electrons by Heller and coworkers.46-48 Willner and coworkers49, 50
9
Chapter 1-General Introduction
incorporated an electron transfer relay (PPQ) between the active centre of the enzyme
and the electrode and illustrated some important development. Firstly, the
communication between enzyme and electrodes was improved by coupling mediating
molecules to the redox active centre. Secondly, the active GOx could be reconstituted
around a surface immobilised FAD to give an immobilised enzyme with a defined
orientation on the surface. Willner’s final glucose biosensors had demonstrated
excellent performance, however the electron transfer still relied on the presence of a
mediating relay. Thus, the elegant wired enzyme electrode of Willner and coworkers
still represents a second generation biosensor.
1.3.1.3 Issues with the Current Catalytic Biosensors
By introducing the mediator to turn over the enzyme and carry electrons between
enzyme and the transducer, second generation biosensors have overcome the drawback
of first generation biosensors where the normal product of the reaction diffuses to the
transducer and causes the electrical response.51-54 However, new problems are faced
when the mediator is introduced into a biosensor system. Firstly, oxygen competition
with the mediator exists because oxygen is a very active native mediator. Secondly, the
concentration of the mediator is changing all the time, hence the measured response on
the transducer is variable. Thirdly, the working efficiency is limited by the diffusion
process of the mediator. For these reasons it is desirable to develop third generation
biosensors based on direct electron transfer.
With third generation biosensors, the absence of mediators is the main advantage,
providing them with superior selectivity and the lack of another reagent in the reaction
sequence. Another attractive feature of the system based on direct electron transfer is
10
Chapter 1-General Introduction
the possibility of modulating the desired properties of an analytical device using protein
modification with genetic or chemical engineering techniques on one hand, and novel
interfacial technologies on the other hand. A few groups have been trying to fabricate
third generation biosensors based on direct electron transfer.42, 55-57 Gooding and
coworkers have extended the principle to achieve electron tunnelling directly to the
electrode from the FAD by introducing a norbornylogous bridge as the electron transfer
linker.58 When the apo-GOx was refolded on the FAD modified electrode incorporated
with the norbornylogous bridge, the enzyme was found to be biocatalytically active.
However, no biocatalytic event was observed under anaerobic conditions, indicating
that the direct electron transfer to the enzyme was very insignificant due to poor
electrical coupling between the redox active centre FAD and the electrode. Thus, how to
achieve significant direct electron transfer to GOx for fabrication third generation
biosensors still remains the challenge to researchers.
1.3.2 Affinity Biosensors
Another class of biosensors is the affinity bisensors, which are devices in which
receptor molecules bind analyte molecules, causing a physicochemical change that is
detected by a transducer. In the affinity biosensors, receptor molecules such as
antibodies, nucleic acids, receptor proteins, biomimetic materials and DNA are used to
bind molecules non-catalytically. The main advantages of these kinds of biosensors are
the wide range of affinities available, thus expanding the number of analytes that can be
selectively detected. Bioaffinity biosensors primarily depend on the use of antibodies
due to the availability of monoclonal and polyclonal antibodies toward a wide range of
analytes as well as their relative affinity and selectivity of these proteins for a specific
11
Chapter 1-General Introduction
compound or a closely related group of compounds.7 So the following section will
concentrate on affinity biosensors based on immunoreactions on the sensing interface.
1.3.2.1 Immunosensors
Immunosensors are immunoreaction-based affinity biosensors, which use immuno-
compounds as biological receptors and are usually the result of the integration in one
device of an immunoassay and a directly associated transducer. Generally, immobilised
antibodies or antigens on a transducer form the biorecognition elements of an
immunosensor. So understanding the antibody structure is very important for the
development of an immunosensor.
1.3.2.2 Antibody Structures
Antibodies (Ab) are immunosystem related proteins synthesised by plasma cells, i.e.,
mature B-lymphocyte, in animals in response to the presence of a foreign substance,
called an antigen (Ag) with a molecular weight higher than 1.5 kDa. Antibodies are
divided into five major classes, IgG, IgA, IgM, IgD, and IgE, based on their constant
region structure and immune function. IgG, also known as –globulin, has a mass of
150 kDa and is the principal antibody in serum.
Antibodies are structurally very similar. The structure of an antibody can be generally
represented by the structure of an IgG molecule (Figure 1.3). An IgG consists of two
heavy and two light chains, which are interconnected by disulfide bonds to form a “Y”
shaped molecule. Each chain is composed of a variable and a constant region. Each
variable region includes three hypervariable segments that vary from one antibody to
another, conferring on antibodies a large range of antigen specificity. This antigen
12
Chapter 1-General Introduction
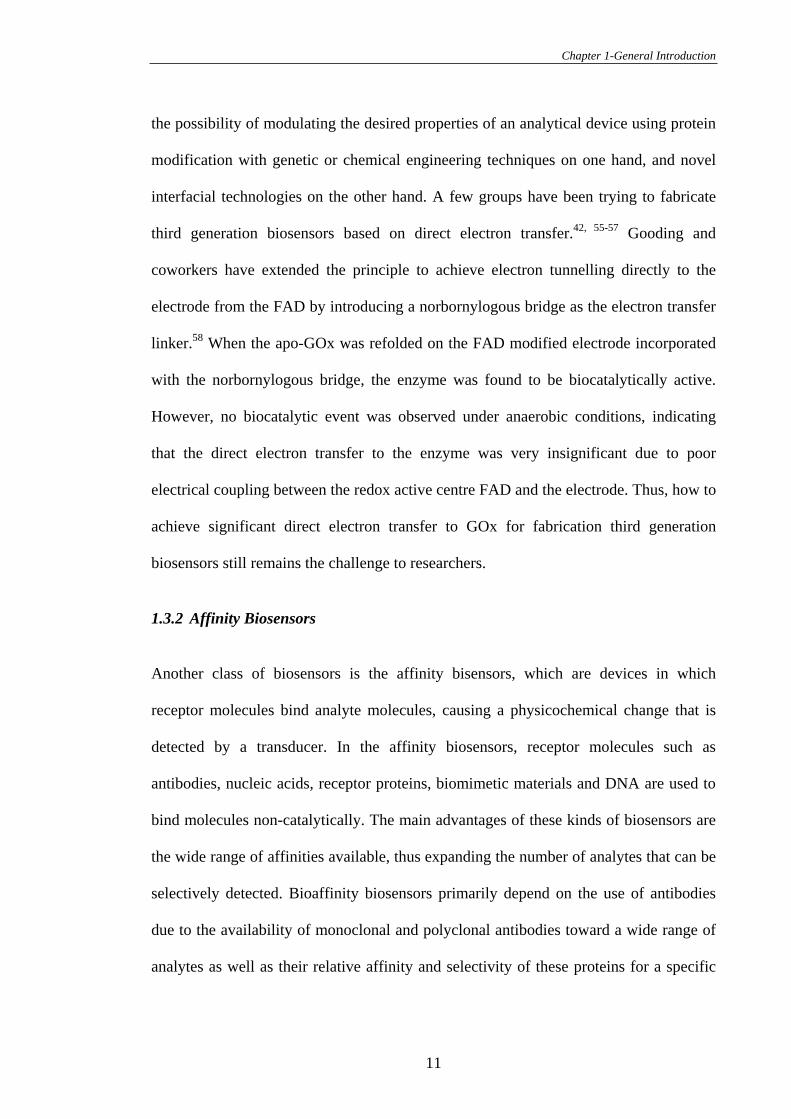
specificity of an antibody is conferred by the variable regions of both the light and
heavy chains which contain the complementarity-determining regions that determine
much of the specificity of the molecule. Thus, an IgG molecule has two identical
binding locations for the antigen.59
Figure 1.3 Basic structure of an IgG molecule.
1.3.2.3 The Principle of Immuno-Interaction
The interaction of an antibody with an antigen forms the basis of all immuno-chemical
techniques. The molecular forces responsible for the Ab-Ag binding are based on non-
covalent interactions including: non-polar hydrophobic interactions, Coulomb
interaction, Van der Waals interaction, London dispersion attractive forces and steric
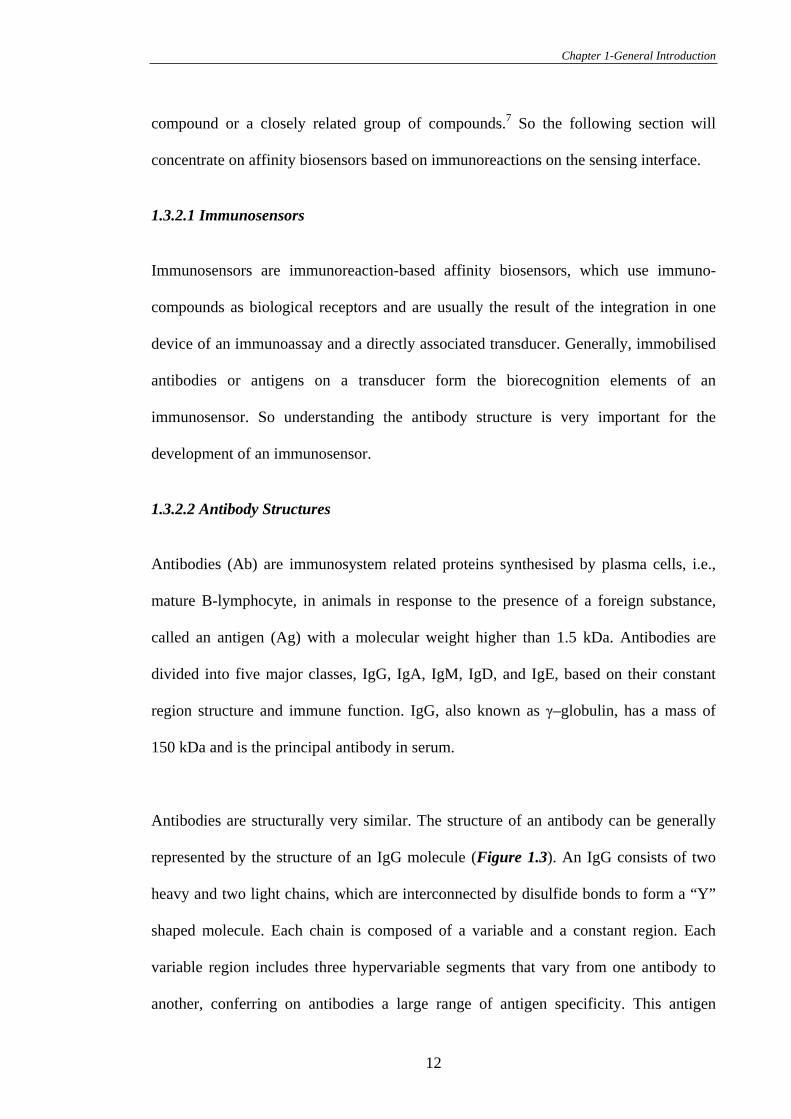
repulsion forces. The interaction is characterised with an association and a dissociation
reaction rate constant, ka and kd respectively.
Ab Ab-AgAg+ka
kd
13
Chapter 1-General Introduction
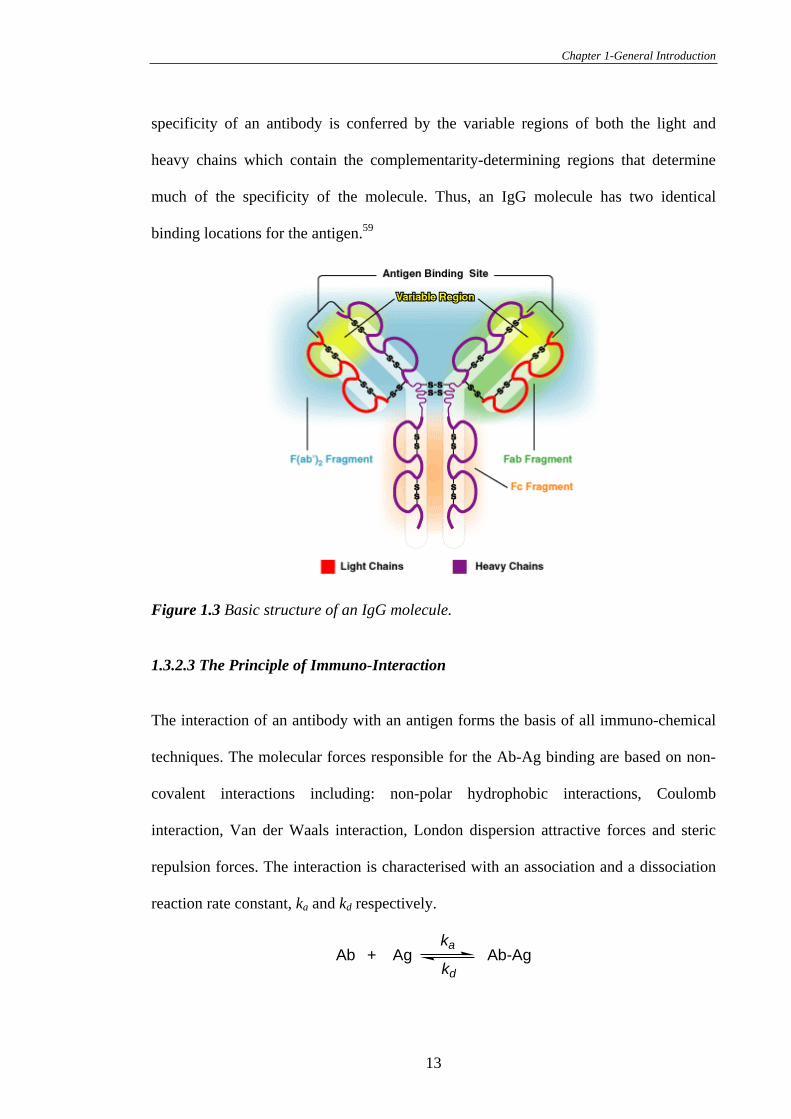
The affinity constant Ka, which varies in strength from 104 to 1015 M-1 (typically of the
order of 108 to 1012 M-1)60 depending on the nature of antigens and the binding affinity
of the corresponding antibodies, can be described by:
]][[][
AgAbAgAb
kk
d
aAK
Where [Ab], [Ag] and [Ab-Ag] are the molar concentrations of the antibody, antigen
and antibody-antigen complex in solution, respectively.61 The antibody-antigen
interaction defines both the specificity and the detection limit of an immonosensor. The
ultimate detection limit of an immunoassay is determined by the antibody-antigen
binding constant. The greater the binding constant of the antibody, the lower detection
limit can be achieved.62
1.3.2.4 Issues with Current Immunosensors
With an immunosensor, once the antibody-antigen binding reaction has occurred, there
is still the need to transduce the biorecognition event. Unlike catalytic biosensors where
the biorecognition event produces a molecule which can be detected, in affinity sensors
the analyte simply binds. To transduce such biorecognition events either requires labels,
so familiar in the myriad of immunoassay formats, or a transduction method which can
detect the change that occurs at the sensing interface. Most immunosensor devices
reported to date perform indirect measurements by using competitive immunoassay
configurations and/or labels such as enzymes (e.g., alkaline phosphate,63 horseradish
peroxidase64), and chemiluminescent probes,65, 66 that convert an enzyme substrate into
a measurable product.67-69 In these configurations, the analyte and the enzyme-labelled
analyte compete for a limited number of binding sites on the immobilised antibodies.
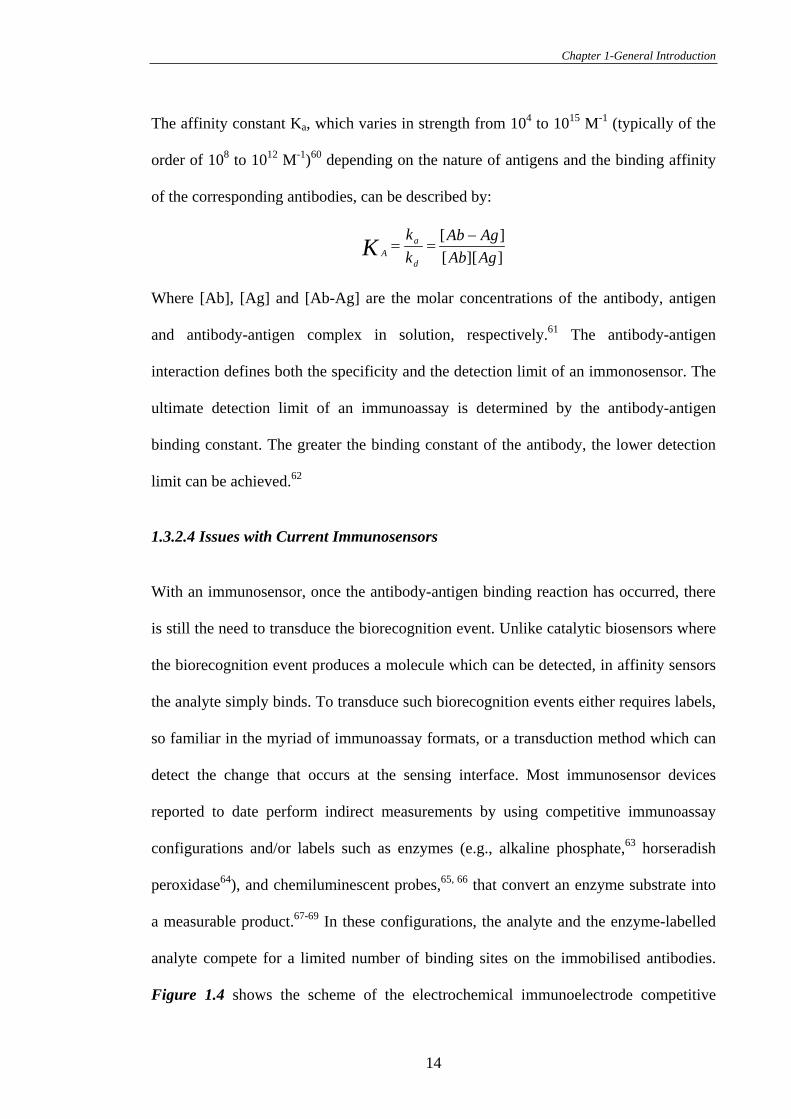
Figure 1.4 shows the scheme of the electrochemical immunoelectrode competitive
14
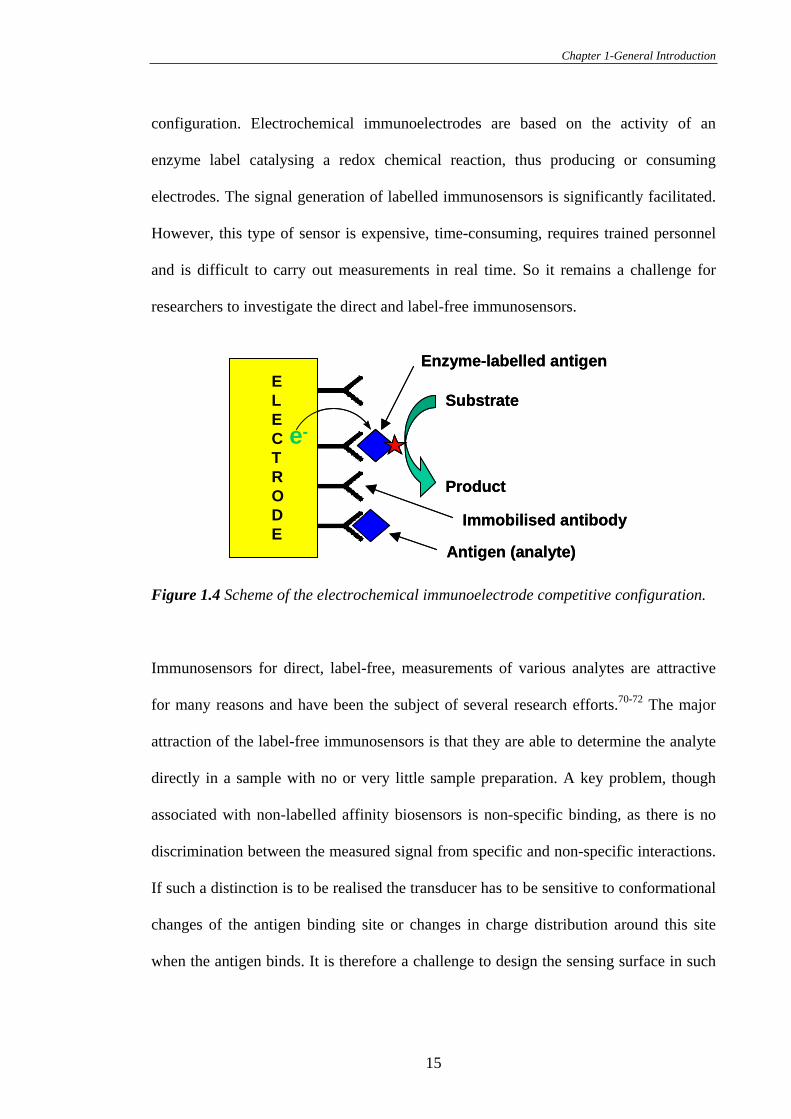
Chapter 1-General Introduction
configuration. Electrochemical immunoelectrodes are based on the activity of an
enzyme label catalysing a redox chemical reaction, thus producing or consuming
electrodes. The signal generation of labelled immunosensors is significantly facilitated.
However, this type of sensor is expensive, time-consuming, requires trained personnel
and is difficult to carry out measurements in real time. So it remains a challenge for
researchers to investigate the direct and label-free immunosensors.
Substrate
Product
ELECTRODE
Enzyme-labelled antigen
Antigen (analyte)
Immobilised antibody
e-
Substrate
Product
ELECTRODE
Enzyme-labelled antigen
Antigen (analyte)
Immobilised antibody
e-
Figure 1.4 Scheme of the electrochemical immunoelectrode competitive configuration.
Immunosensors for direct, label-free, measurements of various analytes are attractive
for many reasons and have been the subject of several research efforts.70-72 The major
attraction of the label-free immunosensors is that they are able to determine the analyte
directly in a sample with no or very little sample preparation. A key problem, though
associated with non-labelled affinity biosensors is non-specific binding, as there is no
discrimination between the measured signal from specific and non-specific interactions.
If such a distinction is to be realised the transducer has to be sensitive to conformational
changes of the antigen binding site or changes in charge distribution around this site
when the antigen binds. It is therefore a challenge to design the sensing surface in such
15
Chapter 1-General Introduction
a way that ensures higher specific rather than non-specific binding in the fabrication of
label-free immunosensors.
1.4 Solutions for Existing Problems with Current Biosensors
The concept of biosensors (i.e, catalytic biosensors and affinity biosensors) and the
existing problems with current biosensor have been introduced in above sections. It is
necessary to find solutions for the existing problem with current biosensors. Based on
the principle of a biosensor, the integration of biorecognition components with
transducers through immobilisation is the interfacial reaction. Thus it is possible to
solve the existing problems with current catalytic biosensors and immunosensors if an
optimised sensing interface was constructed, which is critical for development of both
catalytic biosensors and affinity biosensors. For biosensing applications, the optimised
sensing interface should meet three requirements: i) the sensing interface should be very
stable, ii) the sensing interface has the ability to bind the specific analyte of interest but
resist the non-specific binding which affects the selectivity and sensitivity of a
biosensor, iii) efficient electrical communications can be established between the
biorecognition component and the transducer. The following sections will introduce
how to design this optimised sensing interface with these unique characteristics to solve
the existing problems with current biosensors.
1.5 Creating More Stable Self-Assembled Monolayers on Electrode Surfaces for the
Construction of Sensors
As introduced in section 1.2.3, self-assembling provides a potential strategy for
integrating biorecognition components with transducers to form the sensing interface.
Formation of monolayers by self-assembly makes it possible to control the sensing
16
Chapter 1-General Introduction
interface with desirable properties. Self-assembled monolayers (SAMs) are ordered
monomolecular films which are spontaneously formed upon immersing a solid substrate
into a solution containing amphifunctional molecules. The amphifunctional molecule
has a head group, which usually has a high affinity for the solid surface, a tail, typically
an alkyl chain, and a terminal group which can be used to control the surface properties
of the resultant monolayer. So SAMs have two key features of self-assembly in
biological systems, namely that molecules have high affinity for each other and
predictable structures are formed when the molecular units associate. These unique
characteristics make SAMs an excellent model system for sensing construction.
1.5.1 Self-Assembled Monolayers on Gold Electrodes
The most studied and the best characterised self-assembled monolayers (SAMs) for
sensing applications are those formed by alkanethiols chemisorbed from solution onto
gold surfaces.73-75 The exact nature of the bond that forms between the gold and the
sulfur is still not clear but in the case of alkanethiols it can be considered as a oxidative
addition of the S-H bond to the gold surface followed by a reductive elimination of
hydrogen.76
200
21 HAuAuSRAuHSR nn
Evidence for hydrogen elimination has been hard to come by but the presence of a
thiolate has been confirmed by many groups.77-79 The formed Au-S bond strength is
about 40 kcal mol-1 78 and the free energy change for the adsorption of alkanethiols on
gold is approximately –5.5 kcal mol-1.80 The equivalent Au-S bond is also formed with a
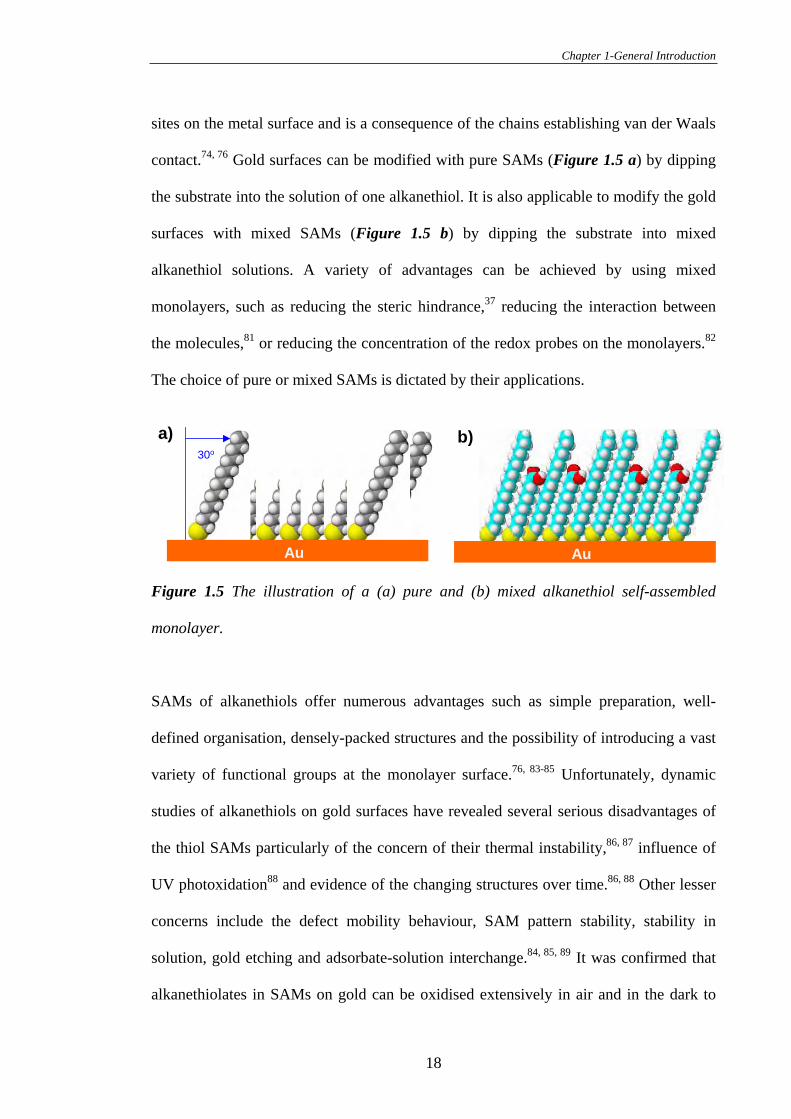
disulphide.76 The alkanethiol chains typically tilt between 20-30 degrees from normal to
the Au(111) surface as shown in Figure 1.5 a. The tilt angle is dictated by the spacing
17
Chapter 1-General Introduction
sites on the metal surface and is a consequence of the chains establishing van der Waals
contact.74, 76 Gold surfaces can be modified with pure SAMs (Figure 1.5 a) by dipping
the substrate into the solution of one alkanethiol. It is also applicable to modify the gold
surfaces with mixed SAMs (Figure 1.5 b) by dipping the substrate into mixed
alkanethiol solutions. A variety of advantages can be achieved by using mixed
monolayers, such as reducing the steric hindrance,37 reducing the interaction between
the molecules,81 or reducing the concentration of the redox probes on the monolayers.82
The choice of pure or mixed SAMs is dictated by their applications.
a)30o
b)
Au AuAu
Figure 1.5 The illustration of a (a) pure and (b) mixed alkanethiol self-assembled
monolayer.
SAMs of alkanethiols offer numerous advantages such as simple preparation, well-
defined organisation, densely-packed structures and the possibility of introducing a vast
variety of functional groups at the monolayer surface.76, 83-85 Unfortunately, dynamic
studies of alkanethiols on gold surfaces have revealed several serious disadvantages of
the thiol SAMs particularly of the concern of their thermal instability,86, 87 influence of
UV photoxidation88 and evidence of the changing structures over time.86, 88 Other lesser
concerns include the defect mobility behaviour, SAM pattern stability, stability in
solution, gold etching and adsorbate-solution interchange.84, 85, 89 It was confirmed that
alkanethiolates in SAMs on gold can be oxidised extensively in air and in the dark to
18
Chapter 1-General Introduction
form sulfates and sulfonates.85, 88 All these critical issues have greatly limited the
possible commercial applications involving SAMs on gold surfaces. It would therefore
be desirable to develop an alternative substrate which is more stable and more
compatible with self-assembled monolayers, and then hopefully some attractive
applications of gold–thiol chemistry can be transferred to this substrate.
1.5.2 Self-Assembled Monolayers on Glassy Carbon Surfaces
Many researchers have proved that modification of glassy carbon (GC) surface is an
important objective in material science and electrochemistry due to the key advantages
with carbon materials,90 such as low cost, rich surface chemistry, wide potential range,
and compatibility with a variety of electrolytes. Thus modification of GC electrodes
with self-assembled monolayers of diazonium salts by electrochemically reductive
adsorption might be an alternative system to SAMs of alkanethiols on gold surfaces for
sensing construction. Before investigating this possibility, it is important to understand
the constitution of the GC surfaces.
1.5.2.1 Glassy Carbon Surfaces
Glassy or vitreous carbon is an attractive addition to the growing list of solid carbon
electrodes that are now available to electrochemists.91 Glassy carbon firstly named by
Yamada and Sato in 1962,92 is typically a hard, solid carbon material and is produced by
thermal degradation of selected organic polymers, such as resins of furfuryl alcohol,
phenol formaldehyde, acetone-furfural, or furfural alcohol-phenol copolymer in an inert
atmosphere.93 The formation of final structure of glassy carbon has been extensively
studied by Jenkins and Kawamura by means of X-ray diffraction, infrared spectroscopy,
and the determination of the hardness.94 They concluded from their studies that glassy
19
Chapter 1-General Introduction
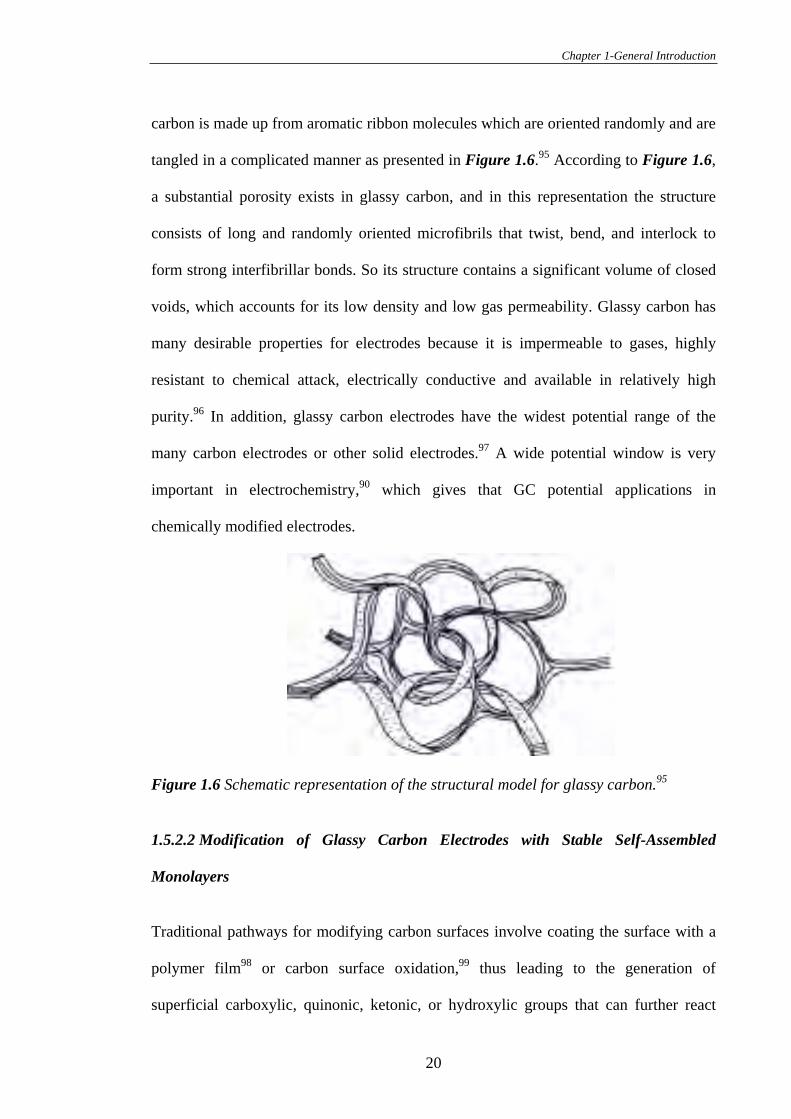
carbon is made up from aromatic ribbon molecules which are oriented randomly and are
tangled in a complicated manner as presented in Figure 1.6.95 According to Figure 1.6,
a substantial porosity exists in glassy carbon, and in this representation the structure
consists of long and randomly oriented microfibrils that twist, bend, and interlock to
form strong interfibrillar bonds. So its structure contains a significant volume of closed
voids, which accounts for its low density and low gas permeability. Glassy carbon has
many desirable properties for electrodes because it is impermeable to gases, highly
resistant to chemical attack, electrically conductive and available in relatively high
purity.96 In addition, glassy carbon electrodes have the widest potential range of the
many carbon electrodes or other solid electrodes.97 A wide potential window is very
important in electrochemistry,90 which gives that GC potential applications in
chemically modified electrodes.
Figure 1.6 Schematic representation of the structural model for glassy carbon.95
1.5.2.2 Modification of Glassy Carbon Electrodes with Stable Self-Assembled
Monolayers
Traditional pathways for modifying carbon surfaces involve coating the surface with a
polymer film98 or carbon surface oxidation,99 thus leading to the generation of
superficial carboxylic, quinonic, ketonic, or hydroxylic groups that can further react
20
Chapter 1-General Introduction
with the substance to be attached.100, 101 The exact nature and number of oxygenated
functional groups thus formed are difficult to ascertain and control, and corrosion of the
carbon surface is often observed leading to undesirable large background currents in
electrochemical applications. Fortunately, electrochemically assisted covalent
modification of GC surfaces has been introduced to bind moieties directly to the carbon
lattice in past decade with many advantadges.102 Covalent modification of carbon
electrodes via electrochemically reductive adsorption of aryl diazonioum salts has been
explored by a few groups,102-120 which has proved to be the more simple, flexible and
promising surface modification strategy. The acceptance and application of this method
by a number of researchers is primarily due to the ease with which diazonium salts
bearing a wide range of functional groups can be synthesised, as well as the structure
and stability of the resulting layer.107 The attractiveness of aryl diazonium salts are
enhanced further by recent studies showing they can also be grafted to a variety of
metal121-128 and semiconductor129-133 surfaces as well as organic materials.134, 135 This
feature raises the exciting possibility of one monolayer forming system being suitable
for a large range of electrode materials for a diverse range of applications.
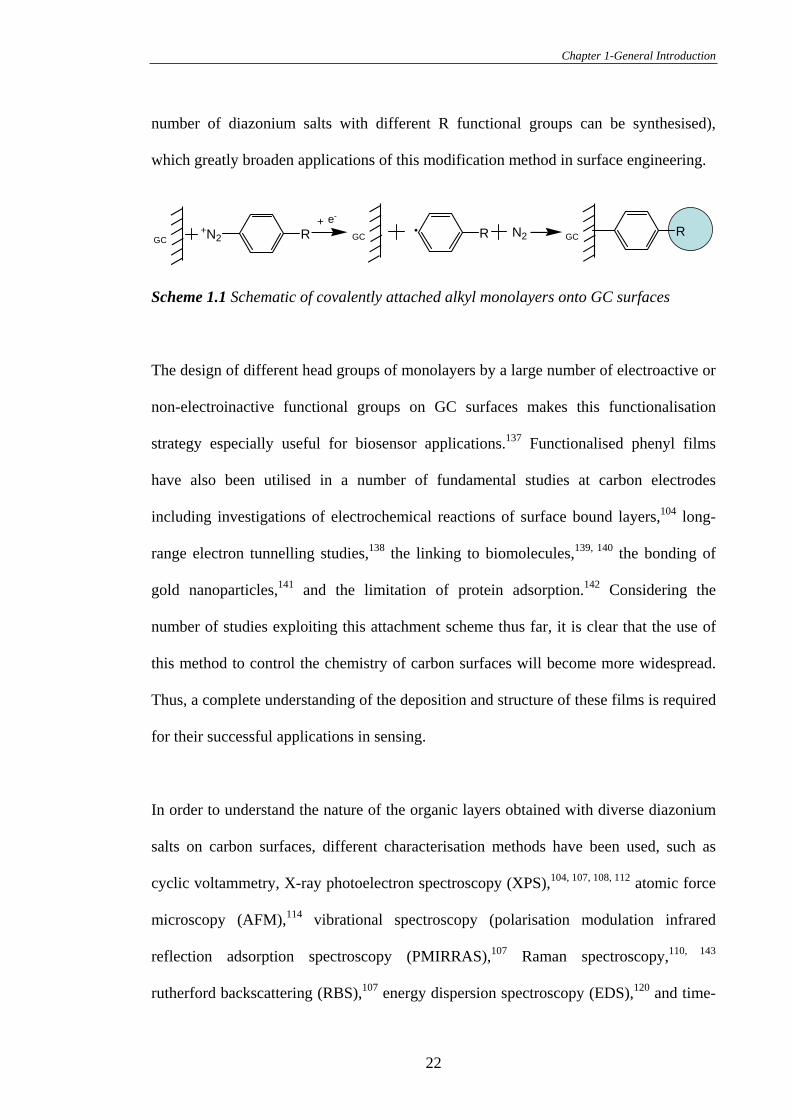
The mechanism of the electrografting of diazonium salts has been extensively reported
in the literature.125, 136 The binding of aryl groups to carbon electrodes is believed to be a
two-step process as shown in Scheme 1.1 which involves i) the electrochemical
reduction of the diazonium function with the formation of a phenyl radical, and ii) the
chemical grafting of the radical at the surface of the electrode with the formation of a
covalent carbon-carbon bond between a surface of the substrate and the phenyl group. It
is worth mentioning that the terminal functional R group can be versatile (i.e., a large
21
Chapter 1-General Introduction
number of diazonium salts with different R functional groups can be synthesised),
which greatly broaden applications of this modification method in surface engineering.
+N2 R N2 RGC.e-
GCGC R+
Scheme 1.1 Schematic of covalently attached alkyl monolayers onto GC surfaces
The design of different head groups of monolayers by a large number of electroactive or
non-electroinactive functional groups on GC surfaces makes this functionalisation
strategy especially useful for biosensor applications.137 Functionalised phenyl films
have also been utilised in a number of fundamental studies at carbon electrodes
including investigations of electrochemical reactions of surface bound layers,104 long-
range electron tunnelling studies,138 the linking to biomolecules,139, 140 the bonding of
gold nanoparticles,141 and the limitation of protein adsorption.142 Considering the
number of studies exploiting this attachment scheme thus far, it is clear that the use of
this method to control the chemistry of carbon surfaces will become more widespread.
Thus, a complete understanding of the deposition and structure of these films is required
for their successful applications in sensing.
In order to understand the nature of the organic layers obtained with diverse diazonium
salts on carbon surfaces, different characterisation methods have been used, such as
cyclic voltammetry, X-ray photoelectron spectroscopy (XPS),104, 107, 108, 112 atomic force
microscopy (AFM),114 vibrational spectroscopy (polarisation modulation infrared
reflection adsorption spectroscopy (PMIRRAS),107 Raman spectroscopy,110, 143
rutherford backscattering (RBS),107 energy dispersion spectroscopy (EDS),120 and time-
22
Chapter 1-General Introduction
of-flight secondary ion mass spectroscopy (ToF-SIMS).119 The results of these different
techniques leave little doubt about the presence on solid–state substrates of the aryl-R
groups bearing the R-substituents of the starting phenyldiazonium salt. In addition,
clarifying the character of the bond between the organic layer and substrate has attracted
much attention. The first indication is the strength of this bond on carbon which resists
ultrasonic cleaning in a variety of solvents and is stable for a month in ambient
conditions.107 The XPS observation,107 ToF-SIMS data119 and electrochemistry results
obtained by McCreery’s group144-147 clearly support the existence of a covalent bond
excluding a mere physisorption between carbon and the organic group.
Although the presence of an organic layer on the carbon surface and the existence of the
strong covalent bonding produced by electrical reduction of aryl diazonium salts have
been thoroughly characterised, there still exist divergent results on the modification
layer thickness. Some groups estimated the surface coverages of modified organic
layers by integration of cyclic voltammograms, Raman and RBS signals,110, 112 and
reported monolayers had been achieved. Monolayers also have been observed using
AFM by McCreery on pyrolyzed photoresist at certain conditions.115 However
multilayers have been observed using scanning probe microscopy in the reduction of
diethylaminophenyldiazonium ion by Kariuki and McDermott.103, 114 Downard obtained
four layers of 4-nitrophenyl groups on pyrolysed photoresist films by AFM.148 The
theoretical surface coverage of nitrophenyl groups was calculated to be 12 × 10-10 mol
cm-2 for ideal monolayer close-packing.110 Thus, it is difficult to make precise
comparisons between the above results since the conditions and carbon substrates vary
from one research to another. However, an agreement that it is possible to control the
thickness of the layers by controlling the charge passed during the electrochemical
23
Chapter 1-General Introduction
modification has been reached.126 Thus it is clear that derivatisation conditions, such as
electrolysis time, grafting potential, the type of carbon substrate, and the nature of the
diazonium salt and its concentration, are critical to producing a monolayer without
progressing to multilayer films. The low concentrations ( 1 mM) and relatively short
electrolysis times are generally suitable for the monolayer formation on GC.115 In
general, it is applicable to form self-assembled monolayers of diazonium salts on carbon
substrates.
Based on above introduction, it can be realised that modification of GC surfaces with
SAMs of diazonium salts can serve as an excellent alternative to SAMs of alkanethiols
on gold substrates. Thus covalent modification of GC surfaces by electrically reductive
adsorption of aryl diazonium salts to form stable SAMs provides the desirable strategy
for construction of sensing interface. This strategy will be used throughout this thesis
for fabrication of stable sensing interface.
1.6 Creating the Sensing Interfaces with the Ability to Resist Non-Specific
Adsorption
Non-specific binding is a general problem though associated with biosensors as there is
no discrimination between the measured signal from specific and non-specific
interactions. Non-specific adsorption is an interfacial process and appears to correlate
with the hydrophobicity of the surface. SAMs are therefore important in understanding
and controlling proteins adsorption because they are model systems where the surface
properties are well defined and can be easily altered in a known way. For biosensing
applications, the chemical properties of the SAM surface must be tailored such that the
24
Chapter 1-General Introduction
surface presents functional groups that will specifically bind to proteins of interest while
rejecting all other proteins.
Considerable effort has been expended in efforts to create surfaces that minimise the
non-specific adsorption of proteins by masking the surfaces with blocking agents such
as bovine serum albumin149 or by tailoring the end groups on the sensing interface.150
The most widely used and successful strategy is to form SAMs tailed with hydrophilic
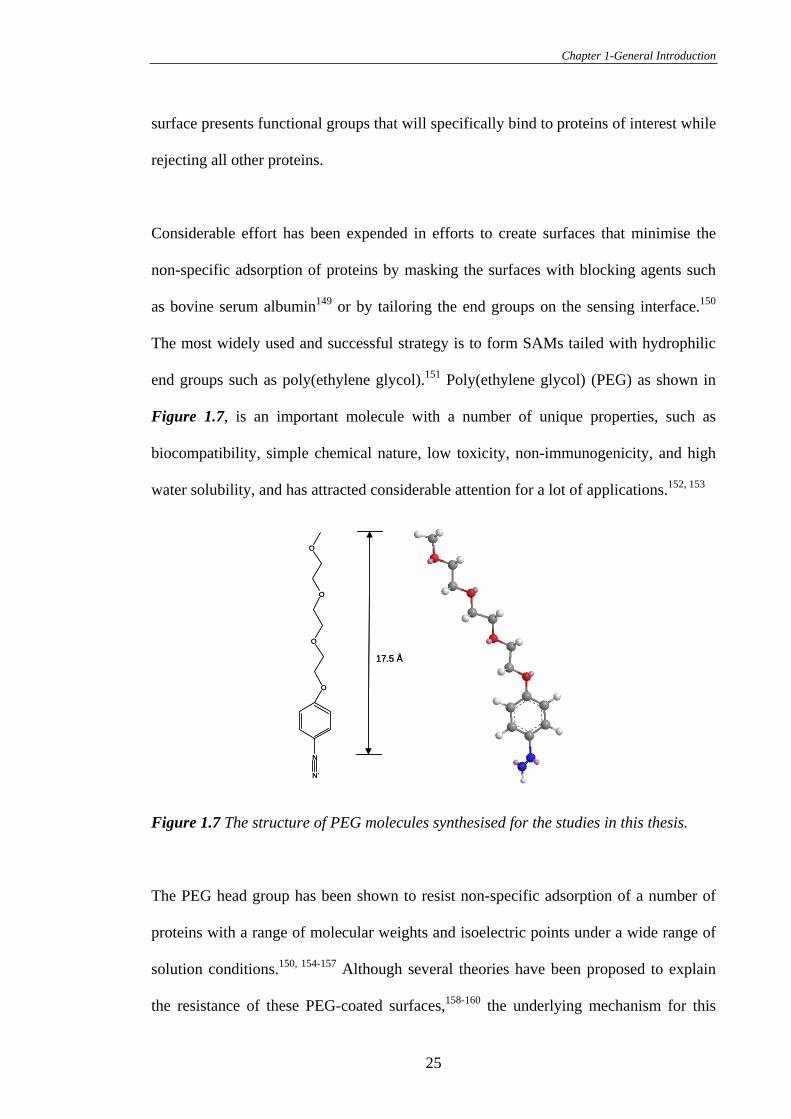
end groups such as poly(ethylene glycol).151 Poly(ethylene glycol) (PEG) as shown in
Figure 1.7, is an important molecule with a number of unique properties, such as
biocompatibility, simple chemical nature, low toxicity, non-immunogenicity, and high
water solubility, and has attracted considerable attention for a lot of applications.152, 153
N
N-
O
O
O
O
17.5 Å
N
N-
O
O
O
O
17.5 Å
Figure 1.7 The structure of PEG molecules synthesised for the studies in this thesis.
The PEG head group has been shown to resist non-specific adsorption of a number of
proteins with a range of molecular weights and isoelectric points under a wide range of
solution conditions.150, 154-157 Although several theories have been proposed to explain
the resistance of these PEG-coated surfaces,158-160 the underlying mechanism for this
25
Chapter 1-General Introduction
anti-nonspecific binding problem remains unclear. With the widely accepted agreement
that PEG has the ability to resist protein adsorption, it is hence applicable to introduce
PEG molecules to sensing interface for solving the non-specific binding problem with
biosensors.
1.7 Using Molecular Wires to Establish Efficient Electron Transfer on Sensing
Interfaces
For sensing applications, it is critical to establish the efficient electrical communication
between biorecognition components and the surrounding environments through a linker,
which should be concluded on the self-assembled monolayers, the platform for sensing.
Most importantly, the linker should have high efficiency for electron transfer in order to
provide efficient response time in sensing. Basically, this linker should be rigid allowing
it to stand free in space above a surface, and be sufficiently long to prevent close
proximity between the electrode surface and redox-active centre, thereby minimising
undesirable interactions between the two sites. This linker, however, should not be too
long because long chain molecules provide substantial barrier properties to electron
transfer and are strongly resistant to ion penetration.161 Thus in order to establish the
efficient electron transfer between biomolecules and the surrounding environment, it is
critical to design a rigid linker molecule with easily tailored lengths and high efficient
electron transfer.
Molecule wires consisting of a molecular chain with extended electronic conjugation
that would promote strong coupling between the two groups (molecules, electrodes, or
other entities) attached to the chain ends, such as oligo(phenyl enevinylene) bridges,162
norbornylogous163, 164 bridges and oligo(phenyl ethynylene)137, 165-167 bridges have the
26
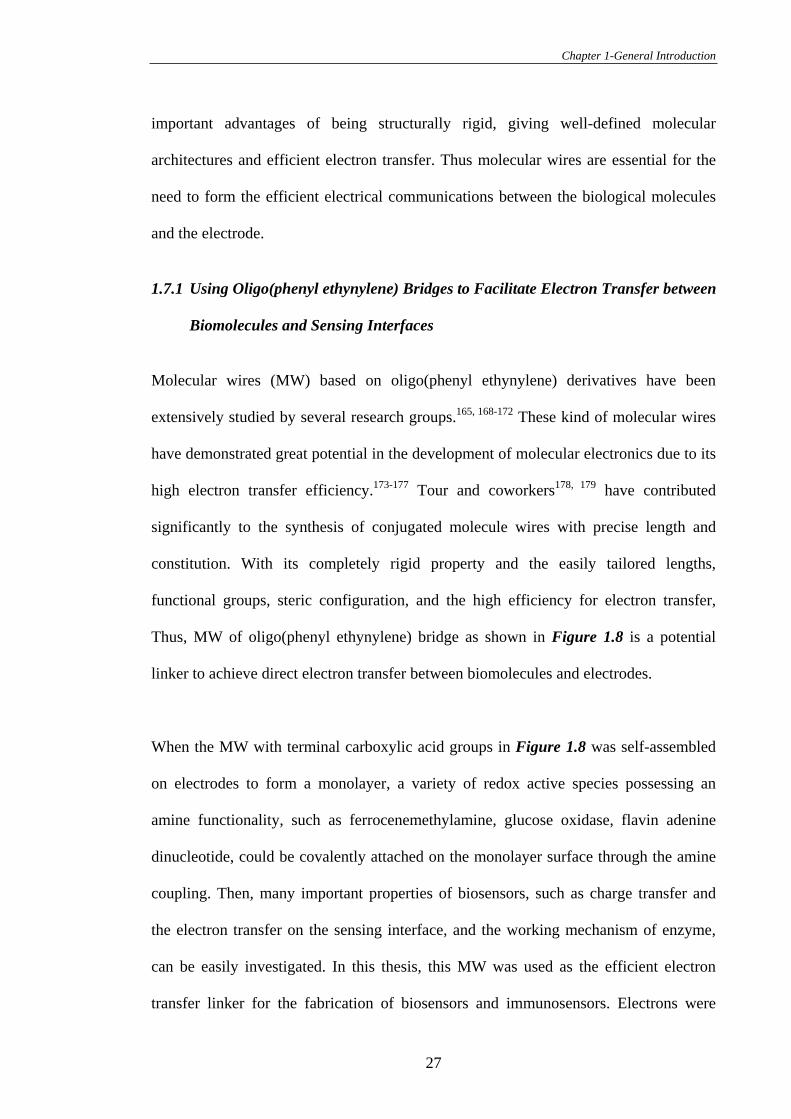
Chapter 1-General Introduction
important advantages of being structurally rigid, giving well-defined molecular
architectures and efficient electron transfer. Thus molecular wires are essential for the
need to form the efficient electrical communications between the biological molecules
and the electrode.
1.7.1 Using Oligo(phenyl ethynylene) Bridges to Facilitate Electron Transfer between
Biomolecules and Sensing Interfaces
Molecular wires (MW) based on oligo(phenyl ethynylene) derivatives have been
extensively studied by several research groups.165, 168-172 These kind of molecular wires
have demonstrated great potential in the development of molecular electronics due to its
high electron transfer efficiency.173-177 Tour and coworkers178, 179 have contributed
significantly to the synthesis of conjugated molecule wires with precise length and
constitution. With its completely rigid property and the easily tailored lengths,
functional groups, steric configuration, and the high efficiency for electron transfer,
Thus, MW of oligo(phenyl ethynylene) bridge as shown in Figure 1.8 is a potential
linker to achieve direct electron transfer between biomolecules and electrodes.
When the MW with terminal carboxylic acid groups in Figure 1.8 was self-assembled
on electrodes to form a monolayer, a variety of redox active species possessing an
amine functionality, such as ferrocenemethylamine, glucose oxidase, flavin adenine
dinucleotide, could be covalently attached on the monolayer surface through the amine
coupling. Then, many important properties of biosensors, such as charge transfer and
the electron transfer on the sensing interface, and the working mechanism of enzyme,
can be easily investigated. In this thesis, this MW was used as the efficient electron
transfer linker for the fabrication of biosensors and immunosensors. Electrons were
27
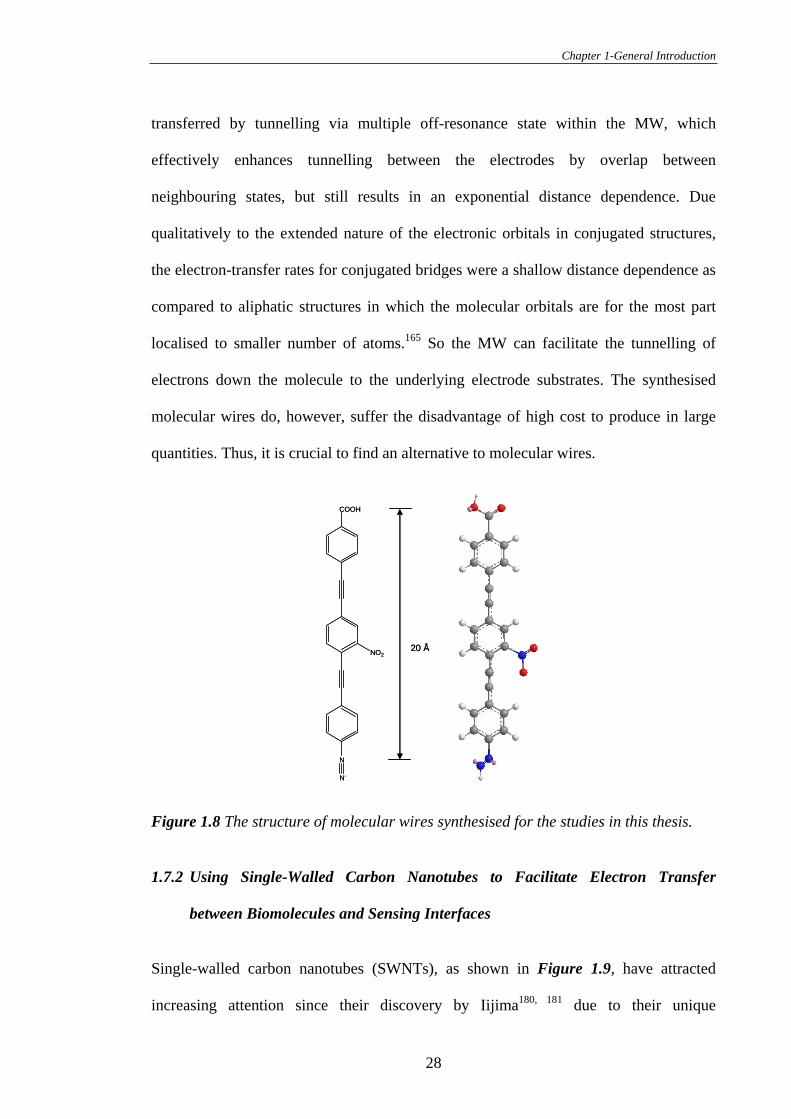
Chapter 1-General Introduction
transferred by tunnelling via multiple off-resonance state within the MW, which
effectively enhances tunnelling between the electrodes by overlap between
neighbouring states, but still results in an exponential distance dependence. Due
qualitatively to the extended nature of the electronic orbitals in conjugated structures,
the electron-transfer rates for conjugated bridges were a shallow distance dependence as
compared to aliphatic structures in which the molecular orbitals are for the most part
localised to smaller number of atoms.165 So the MW can facilitate the tunnelling of
electrons down the molecule to the underlying electrode substrates. The synthesised
molecular wires do, however, suffer the disadvantage of high cost to produce in large
quantities. Thus, it is crucial to find an alternative to molecular wires.
N
N-
NO2
COOH
20 Å
N
N-
NO2
COOH
20 Å
Figure 1.8 The structure of molecular wires synthesised for the studies in this thesis.
1.7.2 Using Single-Walled Carbon Nanotubes to Facilitate Electron Transfer
between Biomolecules and Sensing Interfaces
Single-walled carbon nanotubes (SWNTs), as shown in Figure 1.9, have attracted
increasing attention since their discovery by Iijima180, 181 due to their unique
28
Chapter 1-General Introduction
structural,182 mechanical183 and electric184 properties. Carbon nanotubes being small,
rigid and simple to produce in large quantities, and having functional groups at both
ends of the tube after being cut, can be metallic185-187 or semi-conducting. Their small
size and conductivity means they can be regarded as the smallest possible electrodes
with diameters less than one nanometer.188 Basic electrochemistry of SWNTs has been
studied by a few groups.189-192 Electrodes modified with carbon nanotubes have been
shown to have outstanding electrochemical properties193-195 and show fast electron
transfer properties.196 So SWNTs have demonstrated all properties owned by molecular
wires such as being rigid, easily tailored length by cutting, having terminal functional
groups and high efficiency for electron transfer, and can be recognised as another kind
of molecular wire. To be produced in large quantities is an important advantage of
SWNTs over MW. Thus carbon nanotubes are good materials for the development of
biosensors and can serve as a good alternative to the synthesised molecular wires.
a) b)
Figure 1.9 The general structure of single-walled carbon nanotubes in (a) side view, (b)
top view.
SWNTs are known to have a number of carboxylic acid groups at each end of the tubes
after being cut in a 3:1 mixture of concentrated H2SO4/HNO3, which are responsible for
29
Chapter 1-General Introduction
the good electrochemical properties.197-199 A longer cutting time produces shorter
tubes198 and more oxygenated species formed at the ends of tubes.200 The presence of
terminal carboxylic acid groups at each end of the nanotubes makes it compatible with
SAMs. If a substrate is modified with a monolayer with amine terminated groups, the
cut SWNTs with terminal carboxylate groups can be covalently attached by the amide
bond coupling. After the attachment of SWNTs, a lot of other molecules with functional
groups can be further introduced to SAMs. Thus, it is applicable to replace MWs with
SWNTs for sensing construction.
1.8 Aims of the Thesis
The purpose of this thesis is to fabricate GC electrodes, as an alternative to gold
substrates, by covalent attachment of a variety of aryl diazonium salts with different
functional groups for creating stable and versatile monolayer systems for the
development of biosensors. Another very interesting aspect in this thesis is to introduce
the PEG molecules as an insulator and molecular wires as the electron transfer linker to
the sensing interface for sensing construction. The PEG insulator has the ability to
reduce the non-specific protein adsorption and the MW is a good conduit with high
efficiency of electron transfer. This thesis will attempt to achieve direct electron transfer
to GOx by using molecular wires to build the connection to the redox centre via the
substrate channel such that a close approach can be achieved between the isoalloxazin
ring of FAD and the conduit for electron transfer. This thesis will also attempt to
construct a sensing interface consisting molecular wire and PEG for fabrication a label-
free immunosensor which can overcome the problem of non-specific adsorption with
current immunosensors. Inspired by the unique properties possessed by SWNTs,
30
Chapter 1-General Introduction
another similar label-free immunosensor will also be investigated by replacing MWs
with SWNTs.
1.9 Overview of Chapters
The general organisation of the thesis is as follows:
Chapter 2–Experimental Procedures and Instrumentations
This chapter gives a general description of the experimental techniques,
instrumentations, chemicals, reagents and synthesis of a few compounds.
Chapter 3–Covalent Modification of Electrode Surfaces by Electrochemical
Reduction of Aryl Diazonium Salts
The strategy of covalent modification of electrode surfaces by electrochemical reduction
of aryl diazonium salts with different functional groups to form stable monolayers has
been studied. The step-by-step modifications were characterised by electrochemistry
and XPS.
Chapter 4–Heterogeneous Electron Transfer Through Organic Monolayers on
Carbon and Gold Electrodes
The monolayer modified electrode surfaces with the terminal carboxylic acid groups
can be covalently attached with the redox probe ferrocenemethylamine by the amine
binding. The rates of the heterogeneous electron transfer for ferrocene through organic
monolayers on glassy carbon electrodes, pyrolised photoresist films and gold surfaces
were studied and discussed.
31
Chapter 1-General Introduction
Chapter 5–Fabrication of Electrochemical Copper Sensors Based on Gly-Gly-His
Modified Carbon Electrodes
The stable monolayers formed by reductive adsorption of aryl diazonium salts on GC
electrodes were further tested by covalent modification of tripeptide Gly-Gly-His to 4-
carboxyphenyl modified carbon surfaces for the sensitive detection of a metal ion, Cu2+.
The detection limits of copper for the fabricated systems are presented and discussed in
this chapter. The fabricated Gly-Gly-His copper sensor was found to be very stable.
Chapter 6–An Interface Comprising Molecular Wires and Poly(ethylene glycol)
Spacer Units Self-Assembled on Carbon Electrodes for Studies of Protein
Electrochemistry
In this chapter, a generic interface composed of a mixed monolayer of
oligophenylethynylene MW and PEG is deposited on GC electrodes by reductive
adsorption of the respective aryl diazonium salts. PEG with the ability to reduce the
non-specific protein adsorption was demonstrated. The ability of the MW to facilitate
efficient electron transfer through the PEG layer to the underlying electrode was also
investigated by covalently attaching ferrocene methylamine to the end of the MW.
Direct electron transfer between HRP and underlying GC electrodes through MW has
been studied.
Chapter 7–Exploration of Deeply Buried Active Sites of Glucose Oxidase Using
Molecular Wire Self-Assembled on Carbon Electrodes
The efficient electron transfer of MW is further demonstrated by fabrication of a third
generation glucose biosensor using the synthesised MW as the electron transfer linker.
The electron transfer between the active centre FAD of GOx and the underlying GC
32
Chapter 1-General Introduction
electrode through MW has been discussed. The biocatalytical activity for the fabricated
biosensors was also investigated.
Chapter 8–Development of a Label-Free Immunosensors on Molecular Wire
Modified Glassy Carbon Surfaces
A novel innunosensor system is developed on the MW and PEG modified GC interface.
The so-formed system can be used to detect anti-biotin based on the biotin-antibody
biorecognition to a low detection limit. In addition, the displacement assay has shown
the free biotin can compete with the attached biotin for binding antibiotin. Thus the so-
fabricated novel immunosensor system can be used for detection of biological analytes.
Chapter 9–Towards the Fabrication of Immunosensors Using SWNTs as the
Conductor
In this chapter the chemical modification of SWNTs is described together with their
attachment onto a GC electrode as an alternative to MW acting as the electron transfer
linker. The rate of electron transfer through the attached SWNTs was discussed. An
immunosensor incorporated with SWNTs has also been fabricated.
Chapter 10– Conclusions and Future Directions
In this chapter general conclusions are made and future directions are also discussed.
1.10 References
(1) Earp, R.L., Dessy, R.E., Commercial Biosensors. John Wiley and Sons, Inc.:
New York, 1998; Vol. 148, p 99.
33
Chapter 1-General Introduction
(2) Turns, A.P.F., Karube, I., Wilson, G.S., Biosensors: Fundamentals and
Applications. Oxford Science Publications: Oxford, 1987; p v-vii.
(3) Wang, J., Electroanalysis 2001, 13, 983-988.
(4) Berggren, C., Bjarnason, B., Johansson, G., Electroanalysis 2001, 13, 173-180.
(5) Gorton, L., Jonsson-Pettersson, G., Csoregi, E., Johansson, K., Dominguez, E.,
Marko-Varga, G., Analyst 1992, 117, 1235-1241.
(6) Bunde, R.L., Jarvi, E.J., Rosentreter, J.J., Talanta 1998, 46, 1223-1236.
(7) Mehrvar, M., Bis, C., Schuarer, J.M., Moo-Young, M., Luong, J.H., Anal. Sci.
2000, 16, 677-692.
(8) Nakamura, H., Karube, I., Anal. Bioanal. Chem. 2003, 377, 446-468.
(9) Souza, D., Biosens. Bioelectron. 2001, 16, 337-353.
(10) O`Connell, P.J., Guilbault, G.G., Anal. Lett. 2001, 34, 1063-1078.
(11) European Immunodiagnostic Markets; USA: Frost & Sullivan: New York, NY,
1998; pp 3270-3253.
(12) Willner, I., Willner, B., Trends Biotechnol. 2001, 19, 222-230.
(13) Tapuhi, E., Annette, V.E., South African J. Chem. 1996, 49, 8-15.
(14) Gooding, J.J., Hibbert, D.B., Trac-Trends Anal. Chem. 1999, 18, 525-533.
(15) Scouten, W.H., Luong, J.H.T., Brown, R.S., Trends Biotechnol. 1995, 13, 178-
185.
(16) Rao, S.V., Anderson, K.W., Bachas, L.G., Mikrochim. Acta 1998, 128, 127-143.
(17) Taylor, R.F., Marenchic, I.G., Spencer, R.H., Anal. Chim. Acta 1991, 249, 67-
70.
(18) Karyakiu, A.A., Presnova, G.V., Rubtsova, M.Y., Egorov, A.M., Anal. Chem.
2000, 72, 3805-3809.
(19) O`Brien, J.C., Jones, V.W., Porter, M.D., Anal. Chem. 2000, 72, 703-711.
34
Chapter 1-General Introduction
(20) Wu, Z.Y., Yan, Y.H., Shen, G.L., Yu, R.Q., Anal. Chim. Acta 2000, 412, 29-34.
(21) Sadik, O.A., Van Emon, J.M., Biosens. Bioelectron. 1996, 11, i-x.
(22) Wang, J., Pamidi, P.V., Anal. Chem. 1998, 70, 1171-1175.
(23) Eggins, B.R., Biosensors: An Introduction. John Wiley and Sons Inc: New York,
1996; p 1-117.
(24) Niwi, O., Xu, Y., Kalsall, H.B., Heineman, W.R., Anal. Chem. 1993, 65, 1559-
1563.
(25) Shriver-Lake, L.C., Donner, B., Eldestein, R., Breslin, K., Bathia, S.K., Ligler,
F.S., Biosens. Bioelectron. 1997, 12, 1101-1106.
(26) Kramer, P.M., Kast, R., Bilitewski, U., Bannierink, S., Bruss, U., ACS Symp.
Ser. 1997, 657, 133-139.
(27) Valat, C., Limoges, B., Huet, D., Romette, J.L., Anal. Chim. Acta 2000, 404,
187-192.
(28) Gooding, J.J., In Encyclopedia of Nanoscience and Nanotechnology, Nalwa,
H.S., Ed. American Scientific Publishing: California, 2004; Vol. 1, pp 17-49.
(29) Wollenberger, U., Schubert, F., D., P., Scheller, F.W., TIBECH 1993, 11, 255-
259.
(30) Willner, I., Science 2002, 298, 2407-2408.
(31) Wei, J.J., Liu, H.Y., Khoshtariya, D.E., Yamamoto, H., Dick, A., Waldeck,
D.H., Angew. Chem. Int. Edit. 2002, 41, 4700-4703.
(32) Wei, J.J., Liu, H.Y., Dick, A.R., Yamamoto, H., He, Y.F., Waldeck, D.H., J.
Am. Chem. Soc. 2002, 124, 9591-9599.
(33) Di Gleria, K., Hill, H.A.O., Lowe, V.J., Page, D.J., J. Electroanal. Chem. 1986,
213, 333-8.
35
Chapter 1-General Introduction
(34) Arnold, S., Feng, Z.Q., Kakiuchi, T., Knoll, W., Niki, K., J. Electroanal. Chem.
1997, 438, 91-97.
(35) Ruzgas, T., Wong, L., Gaigalas, A.K., Vilker, V.L., Langmuir 1998, 14, 7298-
7305.
(36) Liu, H., Yamamoto, H., Wei, J.J., Waldeck, D.H., Langmuir 2003, 19, 2378-
2387.
(37) Gorton, L., Lindgren, A., Larsson, T., Munteanu, F.D., Ruzgas, T., Gazaryan, I.,
Anal. Chim. Acta 1999, 400, 91-108.
(38) Yao, T., Harada, I., Nakahara, T., Bunseki Kagaku 1995, 44, 927-932.
(39) Hecht, H.J., Schomburg, D., Kalisz, H., Schmid, R.D., Biosens. Bioelectron.
1993, 8, 197-203.
(40) Armstrong, F.A., Lannon, A.M., J. Am. Chem. Soc. 1987, 109, 7211.
(41) Katz, E., Helegshabtai, V., Willner, B., Willner, I., Buckmann, A.F.,
Bioelectrochem. Bioenerg. 1997, 42, 95-104.
(42) Jiang, L., McNeil, C.J., Cooper, J.M., Chem. Commun. 1995, 1293-1295.
(43) Guo, Y.Q., Guadalupe, A.R., Chem. Commun. 1997, 1437-1439.
(44) Degani, Y., Heller, A., J. Phys. Chem. 1987, 91, 1285-1289.
(45) Degani, Y., Heller, A., J. Am. Chem. Soc. 1988, 110, 2615-2620.
(46) Heller, A., J. Phys. Chem. 1992, 96, 3579-3587.
(47) Ohara, T.J., Rajagopalan, R., Heller, A., Anal. Chem. 1994, 66, 2451-2457.
(48) Rajagopalan, R., Ohara, T.J., Heller, A., Diagnos. Biosens. Poly. 1994, 556,
307-317.
(49) Riklin, A., Katz, E., Willner, I., Stocker, A., Buckmann, A.F., Nature 1995, 376,
672-675.
36
Chapter 1-General Introduction
(50) Willner, I., Blonder, R., Katz, E., Stocker, A., Buckmann, A.F., J. Am. Chem.
Soc. 1996, 118, 5310-5311.
(51) Zhang, Z., Haiying, L., Deng, J., Anal. Chem. 1996, 68, 1632-1638.
(52) Gooding, J.J., Praig, V., Hall, E.A.H., Anal. Chem. 1998, 70, 2396-2402.
(53) Rodriguez, M.C., Rivas, G.A., Electroanalysis 2001, 13, 1179-1184.
(54) Situmorang, M., Gooding, J.J., Hibbert, D.B., Anal. Chim. Acta 1999, 394, 211-
223.
(55) Wen, Z., Ye, B., Zhou, X., Electroanalysis 1997, 9, 641-645.
(56) Godet, C., Boujtita, M., El Murr, N., New J. Chem. 1999, 23, 795-797.
(57) Chi, Q., Zhang, J., Dong, S.J., Electrochim. Acta 1994, 39, 2431-2438.
(58) Liu, J.Q., Gooding, J.J., Paddon-Row, M.N., Chem. Phys. 2006, in press.
(59) Stryer, L., Biochemistry. 3rd ed.; W.H. Freeman and Company: New York, 1988.
(60) Green, N.M., Anfinsin, C.B., Edsall, J.T., Richards, F., Advances in Protein
Chemistry. Academic Press:San Diego: CA, 1975; Vol. 29, p 85-133.
(61) Butler, J.E.F., Immunochemistry of Solid Phase Immunoassay. CRC Press: Boca
Raton, FL, USA, 1991.
(62) Ekins, R.P., Immunoassay Design and Optimization. Stockton Press: New York,
1991; p 96-153.
(63) Diaz-Gonzalez, M., Hernandez-Santos, D., Gonzalez-Garcia, M.B., Costa-
Garcia, A., Talanta 2005, 65, 565-573.
(64) Ruan, C., Zeng, K., Varghese, O.K., Grimes, C.A., Biosens. Bioelectron. 2004,
20, 585-591.
(65) Sparreboom, A., Rongen, H.A., Van Bennekom, W.P., Anal. Chim. Acta 1994,
295, 1-26.
37
Chapter 1-General Introduction
(66) Rongen, H.A.H., Hoetelmans, R.M.W., Bult, A., Van Bennekom, W.P., J.
Pharm. Biomed. Appl. 1994, 12, 433-462.
(67) Gosling, J.P., Enzyme Immunoassay: With and Without Separation, in Principle
and Practice of Immunoassay. 2nd ed.; Stockton Press: London, 1997; p 349,
351-388.
(68) Porstmann, T., Kiessig, S.T., J. Immunol. Methods 1992, 150, 5-21.
(69) Tijssen, P., Methods Immunol. Anal. 1993, 1, 283-297.
(70) Berggren, C., Johansson, G., Anal. Chem. 1997, 69, 3651-3657.
(71) Willner, I., Katz, E., Angew. Chem. Int. Edit. 2000, 39, 1181-1218.
(72) Yan, J., Tender, L.M., Hampton, P.D., Lopez, G.P., J. Phys. Chem. B 2001, 105,
8905-8910.
(73) Nuzzo, R.G., Allara, D.L., J. Am. Chem. Soc. 1983, 105, 4481-4483.
(74) Ulman, A., An Introduction to Ultrathin Organic Films From Langmuir-
Blodgett to Self-Assembly. Academic Press: London, 1991.
(75) Dubois, L.H., Nuzzo, R.G., Ann. Rev. Phys. Chem. 1992, 43, 437-63.
(76) Ulman, A., Chem. Rev. 1996, 96, 1533-1554.
(77) Walczak, M.M., Chung, C., Stole, S.M., Widrig, C.A., Porter, M.D., J. Am.
Chem. Soc. 1991, 113, 2370-2372.
(78) Nuzzo, R.G., Dubois, L.H., Allara, D.L., J. Am. Chem. Soc. 1990, 112, 3145-
3147.
(79) Li, Y., Huang, J., McIver Jr, R.T., Hemminger, J.C., J. Am. Chem. Soc. 1992,
114, 2428-2431.
(80) Schlenoff, J.B., Li, M., Ly, H., J. Am. Chem. Soc. 1995, 117, 12528-12530.
(81) Hong, H.G., Mallouk, T.E., Langmuir 1991, 7, 2362-2369.
38
Chapter 1-General Introduction
(82) Liu, J.Q., Paddon-Row, M.N., Gooding, J.J., J. Phys. Chem. B 2004, 108, 8460-
8466.
(83) Rogers, J.A., Jackman, R.J., Whitesides, G.M., J. Microelectromech. Sys. 1997,
6, 184-192.
(84) Wilbur, J.L., Whitesides, G.M., Chapter 8, Self-assembly and Self-assembled
Monolayers in Micro and Nanofabrication Nanotechnology. Springler-Verlag:
New York, 1999.
(85) Finklea, H.O., Electroanal. Chem. 1996, 19, 109-115.
(86) Delamarche, E., Michel, B., Kang, H., Gerber, C., Langmuir 1994, 10, 4103-
4108.
(87) Horn, A.B., Russell, D.A., Shorthouse, L.J., Simpson, T.R.E., J. Chem. Soc.
Faraday Trans. 1996, 92, 4759-4762.
(88) Schoenfisch, M.H., Pemberton, J.E., J. Am. Chem. Soc. 1998, 120, 4502-4513.
(89) Zamborini, F.P., Crooks, R.M., Langmuir 1998, 14, 3279-3286.
(90) McCreery, R.L., In Electroanalytical Chemistry, Bard, A.J., Ed. Dekker: New
York, 1991; Vol. 17, p 221.
(91) Van Der Linden, W.E., Dieker, J.W., Anal. Chim. Acta 1980, 119, 1-24.
(92) Yamada, S., Sato, H., Nature 1962, 193, 261-263.
(93) Bokros, J.C., Carbon 1976, 14, 291-293.
(94) Jenkins, G., Kawamura, K., Nature 1971, 231, 175-177.
(95) Jenkins, G., Kawamura, K., Polymeric Carbons-Carbon Fibre, Glassy and
Char. Cambridge University Press: Cambridge, England, 1976.
(96) Kinoshita, K., Carbon: Electrochemical and Physiochemical Properties. Willey:
New York, 1988.
(97) Monien, H., Specker, H., Zinke, K., Anal. Chem. 1967, 225, 342-345.
39
Chapter 1-General Introduction
(98) Nowak, R., Schultz, F.A., Umana, M., Abruna, H.D., Murry, R.W., J.
Electroanal. Chem. 1978, 94, 219-225.
(99) Lopez-Garzon, F.J., Domingo-Garcia, M., Perez-Mendoza, M., Alvarez, P.M.,
Gomez-Serrano, V., Langmuir 2003, 19, 2838-2844.
(100) Armstrong, F.A., Brown, K.J., J. Electroanal. Chem 1987, 219, 319-325.
(101) Anne, A., Blanc, B., Moiroux, J., Saveant, J.M., Langmuir 1998, 14, 2368-2371.
(102) Downard, A.J., Electroanalysis 2000, 12, 1085-1096.
(103) Kariuki, J.K., McDermott, M.T., Langmuir 1999, 15, 6534-6540.
(104) Saby, C., Ortiz, B., Champagne, G.Y., Belanger, D., Langmuir 1997, 13, 6805-
6813.
(105) Liu, S., Tang, Z., Shi, Z., Niu, L., Wang, E., Dong, S., Langmuir 1999, 15,
7268-7275.
(106) Bahr, J.L., Yang, J., Kosynkin, D.V., Bronikowski, M.J., Smalley, R.E., Tour,
J.M., J. Am. Chem. Soc. 2001, 123, 6536-6542.
(107) Allongue, P., Delamar, M., Desbat, B., Fagebaume, O., Hitmi, R., Pinson, J.,
Saveant, J.-M., J. Am. Chem. Soc. 1997, 119, 201-207.
(108) Delamar, M., Desarmot, G., Fagebaume, O., Hitmi, R., Pinson, J., Saveant, J.M.,
Carbon 1997, 35, 801-807.
(109) Ortiz, B., Saby, C., Champagne, G.Y., Belanger, D., J. Electroanal. Chem.
1998, 455, 75-81.
(110) Liu, Y.-C., McCreery, R.L., J. Am. Chem. Soc. 1995, 117, 11254-11259.
(111) Downard, A.J., Prince, M.J., Langmuir 2001, 17, 5581-5586.
(112) Delamar, M., Hitmi, R., Pinson, J., Saveant, J.M., J. Am. Chem. Soc. 1992, 114,
5883-5884.
40
Chapter 1-General Introduction
(113) Kuo, T.-C., McCreery, R.L., Swain, G.M., Electrochem. Solid-State Lett. 1999,
2, 288-290.
(114) Kariuki, J.K., McDermott, M.T., Langmuir 2001, 17, 5947-5951.
(115) Anariba, F., Duvall, S.H., McCreery, R.L., Anal. Chem. 2003, 75, 3837-3844.
(116) Solak, A.O., Eichorst, L.R., Clark, W.J., McCreery, R.L., Anal. Chem. 2003, 75,
296-305.
(117) Marwan, J., Addou, T., Belanger, D., Chem. Mater. 2005, 17, 2395-2403.
(118) D'Amours, M., Belanger, D., J. Phys. Chem. B 2003, 107, 4811-4817.
(119) Combellas, C., Kanoufi, F., Pinson, J., Podvorica, F.I., Langmuir 2005, 21, 280-
286.
(120) Coulon, E., Pinson, J., Bourzat, J.D., Commercon, A., Pulicani, J.P., J. Org.
Chem. 2002, 67, 8513-8518.
(121) Ahlberg, E., Helgee, B., Parker, V.D., Acta Chem. Scand. B 1980, 34, 181-186.
(122) Adenier, A., Bernard, M.-C., Chehimi, M.M., Cabet-Deliry, E., Desbat, B.,
Fagebaume, O., Pinson, J., Podvorica, F., J. Am. Chem. Soc. 2001, 123, 4541-
4549.
(123) Bernard, M.-C., Chausse, A., Cabet-Deliry, E., Chehimi, M.M., Pinson, J.,
Podvorica, F., Vautrin-U1, C., Chem. Mater. 2003, 15, 3450-3462.
(124) Hurley, B.L., McCreery, R.L., J. Electrochem. Soc. 2004, 151, B252-B259.
(125) Boukerma, K., Chehimi, M.M., Pinson, J., Blomfield, C., Langmuir 2003, 19,
6333-6335.
(126) Pinson, J., Podvorica, F., Chem. Soc. Rev. 2005, 34, 429-439.
(127) Chausse, A., Chehimi, M.M., Karsi, N., Pinson, J., Podvorica, F., Vautrin-Ul,
C., Chem. Mater. 2002, 14, 392-400.
41
Chapter 1-General Introduction
(128) Adenier, A., Cabet-Deliry, E., Lalot, T., Pinson, J., Podvorica, F., Chem. Mater.
2002, 14, 4576-4585.
(129) Hartig, P., Dittrich, T., Rappich, J., J. Electroanal. Chem. 2002, 524, 120-126.
(130) Stewart, M.P., Maya, F., Kosynkin, D.V., Dirk, S.M., Stapleton, J.J., Mcguiness,
C.L., Allara, D.L., Tour, J.M., J. Am. Chem. Soc. 2004, 126, 370-378.
(131) Allongue, P., De Villeneuve, C.H., Cherouvrier, G., Cortes, R., Bernard, M.C.,
J. Electroanal. Chem. 2003, 550, 161-174.
(132) Henry De Villeneuve, C., Pinson, J., Bernard, M.C., Allongue, P., J. Phys.
Chem. B 1997, 101, 2415-2420.
(133) Allongue, P., De Villeneuve, C.H., Pinson, J., Ozanam, F., Chazalviel, J.N.,
Wallart, X., Electrochim. Acta 1998, 43, 2791-2798.
(134) Combellas, C., Kanoufi, F., Mazouzi, D., Thiebault, A., Bertrand, P., Medard,
N., Polymer 2003, 44, 19-24.
(135) Liu, G., Freund, M.S., Chem. Mater. 1996, 8, 1164-1166.
(136) Andrieux, C.P., Pinson, J., J. Am. Chem. Soc. 2003, 125, 14801-14806.
(137) Umek, R.M., Lin, S.W., Vielmetter, J., Terbrueggen, R.H., Irvine, B., Yu, C.J.,
Kayyem, J.F., Yowanto, H., Blackburn, G.F., Farkas, D.H., Chen, Y.-P., J. Mol.
Diagnostics 2001, 3, 74-84.
(138) Yang, H.-H., McCreery, R.L., Anal. Chem. 1999, 71, 4081-4087.
(139) Bourdillon, C., Delamar, M., Demaille, C., Hitmi, R., Moiroux, J., Pinson, J., J.
Electroanal. Chem. 1992, 336, 113-23.
(140) Dequaire, M., Degrand, C., Limoges, B., J. Am. Chem. Soc. 1999, 121, 6946-
6947.
(141) Harnisch, J.A., Pris, A.D., Porter, M.D., J. Am. Chem. Soc. 2001, 123, 5829-
5830.
42
Chapter 1-General Introduction
(142) Downard, A.J., Roddick, A.D., Electroanalysis 1995, 7, 376-8.
(143) Chen, P., McCreery, R.L., Anal. Chem. 1996, 68, 3958-3965.
(144) Solak, A.O., Ranganathan, S., Itoh, T., McCreery, R.L., Electrochem. Solid State
Lett. 2002, 5, E43-E46.
(145) Itoh, T., McCreery, R.L., J. Am. Chem. Soc. 2002, 124, 10894-10902.
(146) Liu, Y.-C., McCreery, R.L., Anal. Chem. 1997, 69, 2091-2097.
(147) Nowak, A.M., McCreery, R.L., Anal. Chem. 2004, 76, 1089-1097.
(148) Brooksby, P.A., Downard, A.J., Langmuir 2004, 20, 5038-5045.
(149) Taitt, C.R., Goldston, H.M., Feldstein, M.J., Cras, J.J., Hoffman, K.E., Liger,
F.S., Biosens. Bioelectron. 2000, 14, 785-794.
(150) Prime, K.L., Whitesides, G.M., J. Am. Chem. Soc. 1993, 115, 10714-10721.
(151) Lahiri, J., Isaacs, L., Grzybowski, B., Carbeck, J.D., Whitesides, G.M.,
Langmuir 1999, 15, 7186-7198.
(152) Hui, S.W., Kuhl, T.L., Guo, Y.Q., Israelachvili, J., Colloid. Surface. B 1999, 14,
213-222.
(153) Harris, J.M., Poly(ethylene glycol) Chemistry: Biotechnical and Biomedical
Applications. Plenum Press: New York, 1992.
(154) Prime, K.L., Whitesides, G.M., Science 1991, 252, 1164-1167.
(155) Mougin, K., Lawrence, M.B., Fernandez, E.J., Hillier, A.C., Langmuir 2004, 20,
4302-4305.
(156) Zheng, M., Li, Z., Huang, X., Langmuir 2004, 20, 4226-4235.
(157) Herrwerth, S., Rosendahl, T., Feng, C., Fick, J., Eck, W., Himmelhaus, M.,
Dahint, R., Grunze, M., Langmuir 2003, 19, 1880-1887.
(158) Lee, J.H., Kopeckova, P., Kopecek, J., Andrade, J.D., Biomaterials 1990, 11,
455-464.
43
Chapter 1-General Introduction
(159) Kane, R.S., Deschatelets, P., Whitesides, G.M., Langmuir 2003, 19, 2388-2391.
(160) Fick, J., Steitz, R., Leiner, V., Tokumitsu, S., Himmelhaus, M., Grunze, M.,
Langmuir 2004, 20, 3048-3053.
(161) Porter, M.D., Bright, T.B., Allara, D.L., Chidsey, C.E.D., J. Am. Chem. Soc.
1987, 109, 3559-68.
(162) Sikes, H.D., Smalley, J.F., Dudek, S.P., Cook, A.R., Newton, M.D., Chidsey,
C.E.D., Feldberg, S.W., Science 2001, 291, 1519-1523.
(163) Paddon-Row, M.N., Aust. J. Chem. 2003, 56, 729-748.
(164) Paddon-Row, M.N., Acc. Chem. Res. 1994, 27, 18-25.
(165) Creager, S., Yu, C.J., Bamdad, C., O'Connor, S., MacLean, T., Lam, E., Chong,
Y., Olsen, G.T., Luo, J., Gozin, M., Kayyem, J.F., J. Am. Chem. Soc. 1999, 121,
1059-1064.
(166) Hess, C.R., Juda, G.A., Dooley, D.M., Amii, R.N., Hill, M.G., Winkler, J.R.,
Gray, H.B., J. Am. Chem. Soc. 2003, 125, 7156-7157.
(167) Fan, F.R.F., Yang, J.P., Cai, L.T., Price, D.W., Dirk, S.M., Kosynkin, D.V.,
Yao, Y.X., Rawlett, A.M., Tour, J.M., Bard, A.J., J. Am. Chem. Soc. 2002, 124,
5550-5560.
(168) Tour, J.M., Rawlett, A.M., Kozaki, M., Yao, Y.X., Jagessar, R.C., Dirk, S.M.,
Price, D.W., Reed, M.A., Zhou, C., Chen, J., Wang, W., Campbell, I., Chem.
Eur. J. 2001, 7, 5118-5134.
(169) Sachs, S.B., Dudek, S.P., Hsung, R.P., Sita, L.R., Smalley, J.F., Newton, M.D.,
Feldberg, S.W., Chidsey, C.E.D., J. Am. Chem. Soc. 1997, 119, 10563-10564.
(170) Zehner, R.W., Sita, L.R., Langmuir 1997, 13, 2973-2979.
(171) Hoger, S., Enkelmann, V., Angew. Chem. Int. Edit. 1995, 34, 2713-2716.
(172) Hsung, R.P., Chidsey, C.E.D., Sita, L.R., Organometallics 1995, 14, 4808-4815.
44

Chapter 1-General Introduction
(173) Fan, F.-R.F., Yang, J., Dirk, S.M., Price, D.W., Kosynkin, D., Tour, J.M., Bard,
A.J., J. Am. Chem. Soc. 2001, 123, 2454-2455.
(174) Fan, F.-R.F., Yao, Y., Cai, L.T., Cheng, H., Tour, J.M., Bard, A.J., J. Am. Chem.
Soc. 2004, 126, 4035-4042.
(175) Chen, J., Reed, M.A., Rawlett, A.M., Tour, J.M., Science 1999, 286, 1550-1552.
(176) Collier, C.P., Wong, E.W., Belohradsky, M., Raymo, F.M., Stoddart, J.F.,
Kuekes, P.J., Williams, R.S., Heath, J.R., Science 1999, 285, 391-394.
(177) Chen, Y., Jung, G.Y., Ohlberg, D.A.A., Li, X.M., Stewart, D.R., Jeppesen, J.O.,
Nielsen, K.A., Stoddart, J.F., Williams, R.S., Nanotechnology 2003, 14, 462-
468.
(178) Tour, J.M., Chem. Rev. 1996, 96, 537-553.
(179) Tour, J.M., Acc. Chem. Res. 2000, 33, 791-804.
(180) Iijima, S., Ichihashi, T., Nature 1993, 363, 603-605.
(181) Iijima, S., Nature 1991, 354, 56-58.
(182) Ajayan, P.M., Chem. Rev. 1999, 99, 1787-1793.
(183) Salvetat-Delmotte, J.P., Rubio, A., Carbon 2002, 40, 1729-1731.
(184) Colbert, D.T., Smalley, R.E., Trends Biotechnol. 1999, 17, 46-48.
(185) Tang, Z.K., Zhang, L.Y., Wang, N., Zhang, X.X., Wen, G.H., Li, G.D., Wang,
J.N., Chan, C.T., Sheng, P., Science 2001, 292, 2462-2465.
(186) Ouyang, M., Huang, J.L., Cheung, C.L., Lieber, C.M., Science 2001, 292, 702-
705.
(187) Tans, S.J., Devoret, M.H., Dai, H.J., Thess, A., Smalley, R.E., Geerligs, L.J.,
Dekker, C., Nature 1997, 386, 474-477.
(188) Zhao, Q., Gan, Z.H., Zhuang, Q.K., Electroanalysis 2002, 14, 1609-1613.
45
Chapter 1-General Introduction
(189) Luo, H.X., Shi, Z.J., Li, N.Q., Gu, Z.N., Zhuang, Q.K., Anal. Chem. 2001, 73,
915-920.
(190) Diao, P., Liu, Z.F., Wu, B., Nan, X.L., Zhang, J., Wei, Z., Chemphyschem 2002,
3, 898-901.
(191) Wang, J.X., Li, M.X., Shi, Z.J., Li, N.Q., Gu, Z.N., Anal. Chem. 2002, 74, 1993-
1997.
(192) Barisci, J.N., Wallace, G.G., Baughman, R.H., J. Electrochem. Soc. 2000, 147,
4580-4583.
(193) Wang, J., Musameh, M., Lin, Y.H., J. Am. Chem. Soc. 2003, 125, 2408-2409.
(194) Gao, M., Dai, L.M., Wallace, G.G., Electroanalysis 2003, 15, 1089-1094.
(195) Valentini, F., Amine, A., Orlanducci, S., Terranova, M.L., Palleschi, G., Anal.
Chem. 2003, 75, 5413-5421.
(196) Nugent, J.M., Santhanam, K.S.V., Rubio, A., Ajayan, P.M., Nano Lett. 2001, 1,
87-91.
(197) Banks, C.E., Moore, R.R., Davies, T.J., Compton, R.G., Chem. Commun. 2004,
1804-1805.
(198) Gooding, J.J., Wibowo, R., Liu, J., Yang, W., Losic, D., Orbons, S., Mearns,
F.J., Shapter, J.G., Hibbert, D.B., J. Am. Chem. Soc. 2003, 125, 9006-9007.
(199) Liu, J.Q., Chou, A., Rahmat, W., Paddon-Row, M.N., Gooding, J.J.,
Electroanalysis 2005, 17, 38-46.
(200) Chou, A., Böcking, T., Singh, N.K., Gooding, J.J., Chem. Commun. 2005, 842-
844.
46
Chapter 2-Experimental Procedures and Instrumentations
Chapter Two
Experimental Procedures and Instrumentation
47
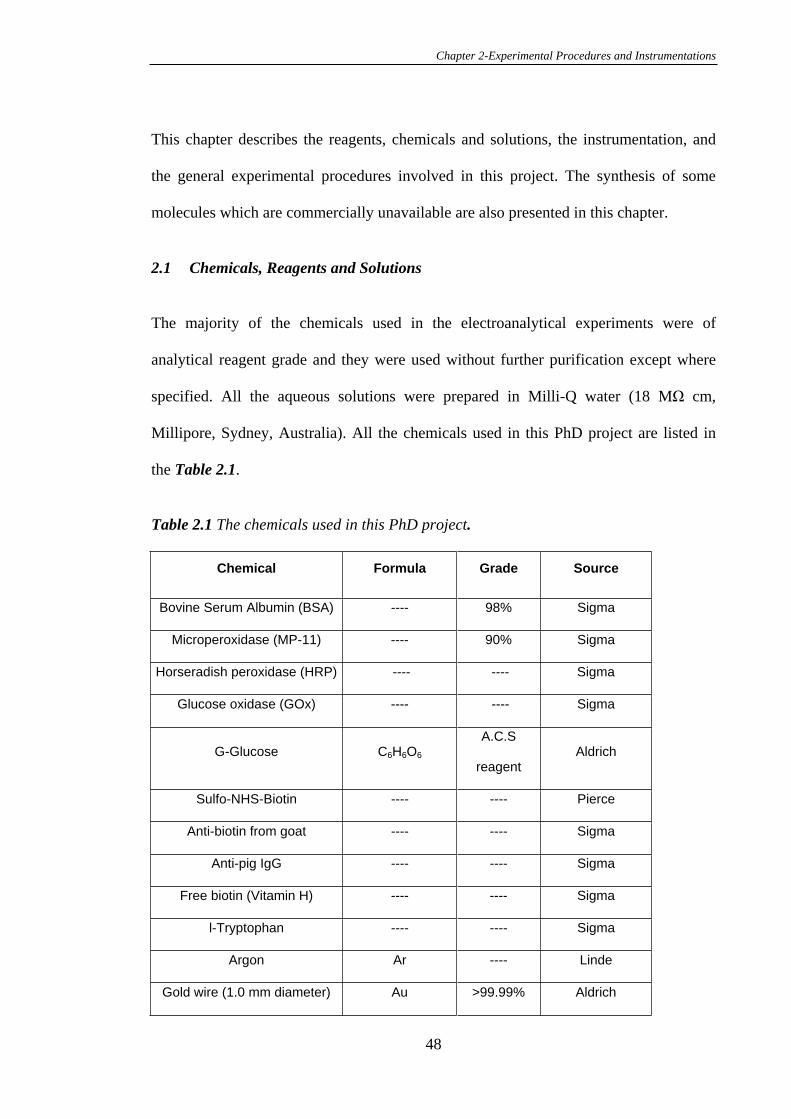
Chapter 2-Experimental Procedures and Instrumentations
This chapter describes the reagents, chemicals and solutions, the instrumentation, and
the general experimental procedures involved in this project. The synthesis of some
molecules which are commercially unavailable are also presented in this chapter.
2.1 Chemicals, Reagents and Solutions
The majority of the chemicals used in the electroanalytical experiments were of
analytical reagent grade and they were used without further purification except where
specified. All the aqueous solutions were prepared in Milli-Q water (18 M cm,
Millipore, Sydney, Australia). All the chemicals used in this PhD project are listed in
the Table 2.1.
Table 2.1 The chemicals used in this PhD project.
Chemical Formula Grade Source
Bovine Serum Albumin (BSA) ---- 98% Sigma
Microperoxidase (MP-11) ---- 90% Sigma
Horseradish peroxidase (HRP) ---- ---- Sigma
Glucose oxidase (GOx) ---- ---- Sigma
G-Glucose C6H6O6
A.C.S
reagentAldrich
Sulfo-NHS-Biotin ---- ---- Pierce
Anti-biotin from goat ---- ---- Sigma
Anti-pig IgG ---- ---- Sigma
Free biotin (Vitamin H) ---- ---- Sigma
l-Tryptophan ---- ---- Sigma
Argon Ar ---- Linde
Gold wire (1.0 mm diameter) Au >99.99% Aldrich
48
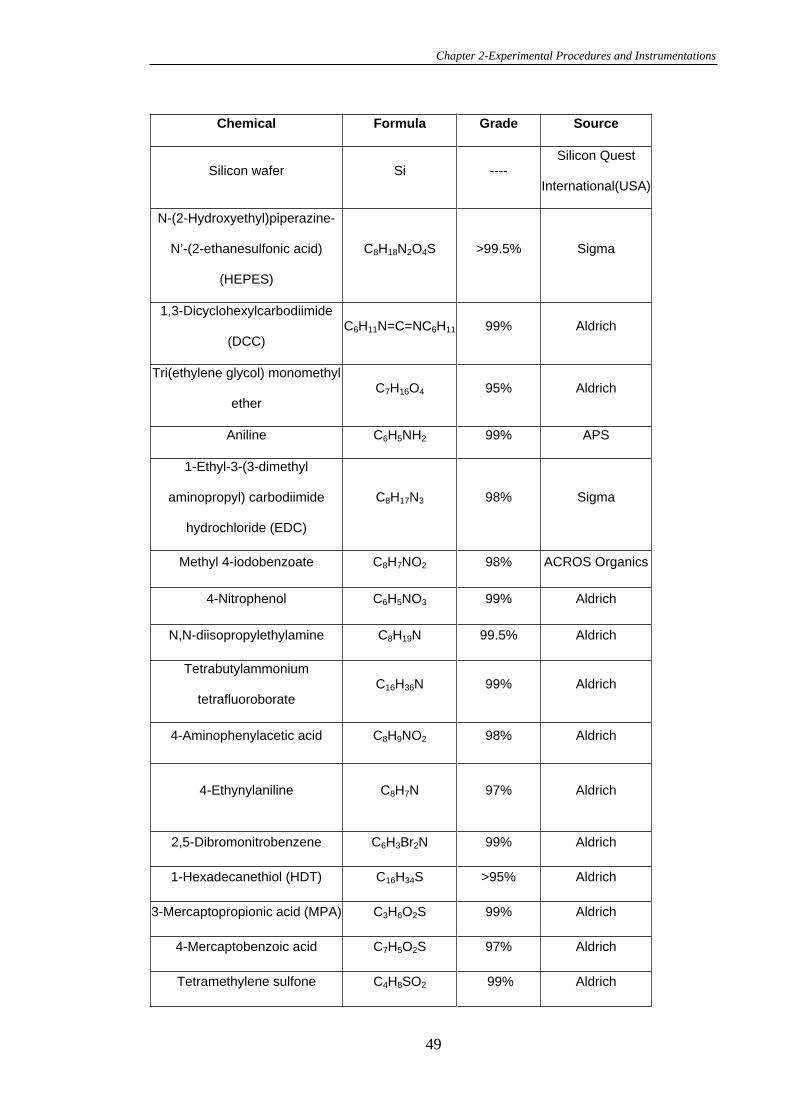
Chapter 2-Experimental Procedures and Instrumentations
Chemical Formula Grade Source
Silicon wafer Si ----Silicon Quest
International(USA)
N-(2-Hydroxyethyl)piperazine-
N’-(2-ethanesulfonic acid)
(HEPES)
C8H18N2O4S >99.5% Sigma
1,3-Dicyclohexylcarbodiimide
(DCC)C6H11N=C=NC6H11 99% Aldrich
Tri(ethylene glycol) monomethyl
etherC7H16O4 95% Aldrich
Aniline C6H5NH2 99% APS
1-Ethyl-3-(3-dimethyl
aminopropyl) carbodiimide
hydrochloride (EDC)
C8H17N3 98% Sigma
Methyl 4-iodobenzoate C8H7NO2 98% ACROS Organics
4-Nitrophenol C6H5NO3 99% Aldrich
N,N-diisopropylethylamine C8H19N 99.5% Aldrich
Tetrabutylammonium
tetrafluoroborateC16H36N 99% Aldrich
4-Aminophenylacetic acid C8H9NO2 98% Aldrich
4-Ethynylaniline C8H7N 97% Aldrich
2,5-Dibromonitrobenzene C6H3Br2N 99% Aldrich
1-Hexadecanethiol (HDT) C16H34S >95% Aldrich
3-Mercaptopropionic acid (MPA) C3H6O2S 99% Aldrich
4-Mercaptobenzoic acid C7H5O2S 97% Aldrich
Tetramethylene sulfone C4H8SO2 99% Aldrich
49
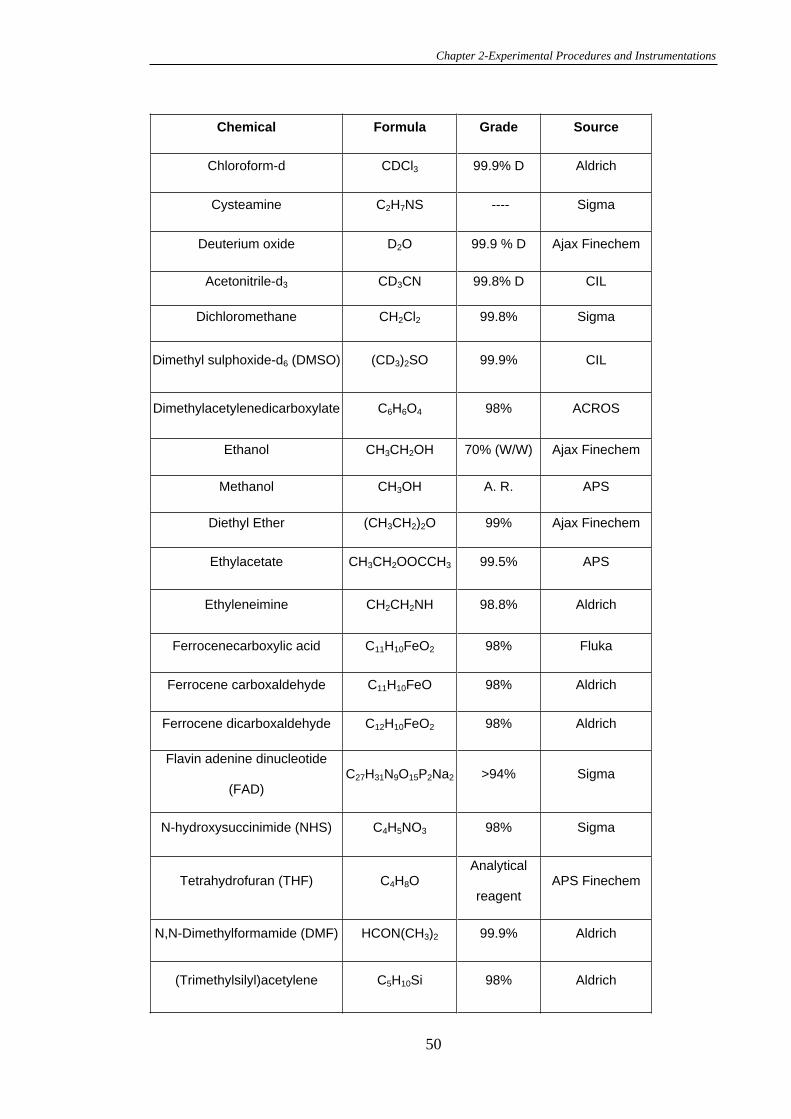
Chapter 2-Experimental Procedures and Instrumentations
Chemical Formula Grade Source
Chloroform-d CDCl3 99.9% D Aldrich
Cysteamine C2H7NS ---- Sigma
Deuterium oxide D2O 99.9 % D Ajax Finechem
Acetonitrile-d3 CD3CN 99.8% D CIL
Dichloromethane CH2Cl2 99.8% Sigma
Dimethyl sulphoxide-d6 (DMSO) (CD3)2SO 99.9% CIL
Dimethylacetylenedicarboxylate C6H6O4 98% ACROS
Ethanol CH3CH2OH 70% (W/W) Ajax Finechem
Methanol CH3OH A. R. APS
Diethyl Ether (CH3CH2)2O 99% Ajax Finechem
Ethylacetate CH3CH2OOCCH3 99.5% APS
Ethyleneimine CH2CH2NH 98.8% Aldrich
Ferrocenecarboxylic acid C11H10FeO2 98% Fluka
Ferrocene carboxaldehyde C11H10FeO 98% Aldrich
Ferrocene dicarboxaldehyde C12H10FeO2 98% Aldrich
Flavin adenine dinucleotide
(FAD)C27H31N9O15P2Na2 >94% Sigma
N-hydroxysuccinimide (NHS) C4H5NO3 98% Sigma
Tetrahydrofuran (THF) C4H8OAnalytical
reagentAPS Finechem
N,N-Dimethylformamide (DMF) HCON(CH3)2 99.9% Aldrich
(Trimethylsilyl)acetylene C5H10Si 98% Aldrich
50
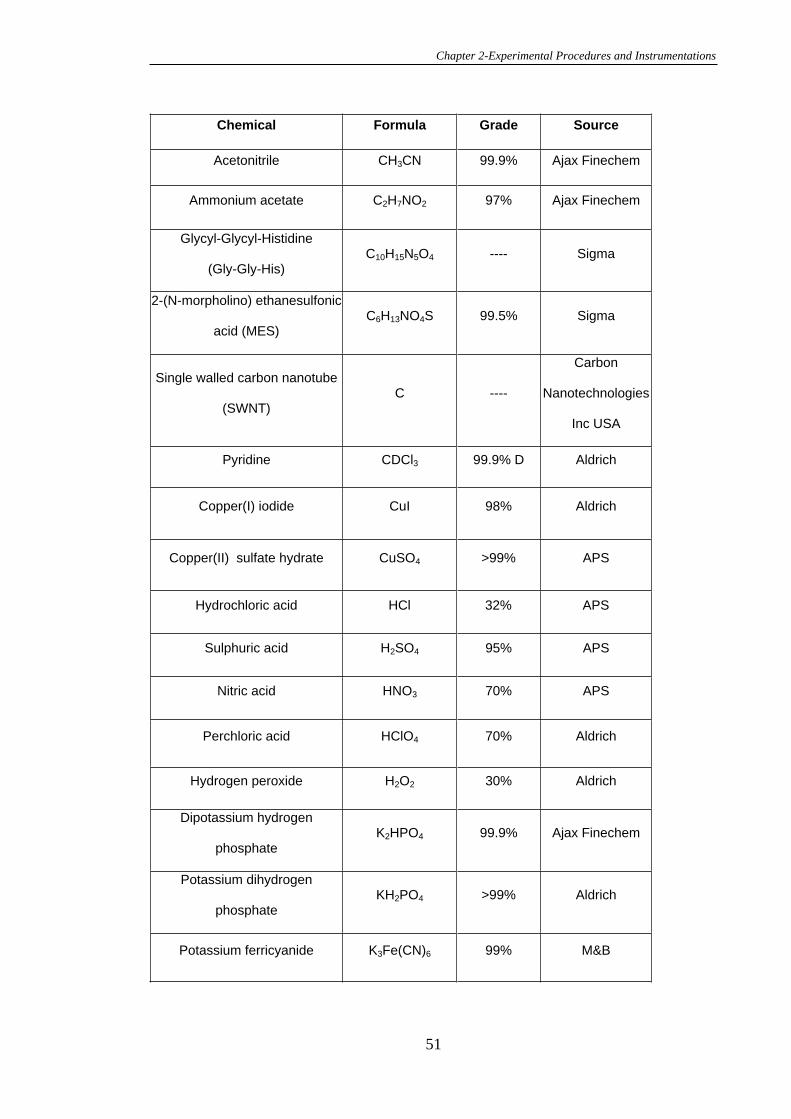
Chapter 2-Experimental Procedures and Instrumentations
Chemical Formula Grade Source
Acetonitrile CH3CN 99.9% Ajax Finechem
Ammonium acetate C2H7NO2 97% Ajax Finechem
Glycyl-Glycyl-Histidine
(Gly-Gly-His)C10H15N5O4 ---- Sigma
2-(N-morpholino) ethanesulfonic
acid (MES) C6H13NO4S 99.5% Sigma
Single walled carbon nanotube
(SWNT)C ----
Carbon
Nanotechnologies
Inc USA
Pyridine CDCl3 99.9% D Aldrich
Copper(I) iodide CuI 98% Aldrich
Copper(II) sulfate hydrate CuSO4 >99% APS
Hydrochloric acid HCl 32% APS
Sulphuric acid H2SO4 95% APS
Nitric acid HNO3 70% APS
Perchloric acid HClO4 70% Aldrich
Hydrogen peroxide H2O2 30% Aldrich
Dipotassium hydrogen
phosphateK2HPO4 99.9% Ajax Finechem
Potassium dihydrogen
phosphateKH2PO4 >99% Aldrich
Potassium ferricyanide K3Fe(CN)6 99% M&B
51
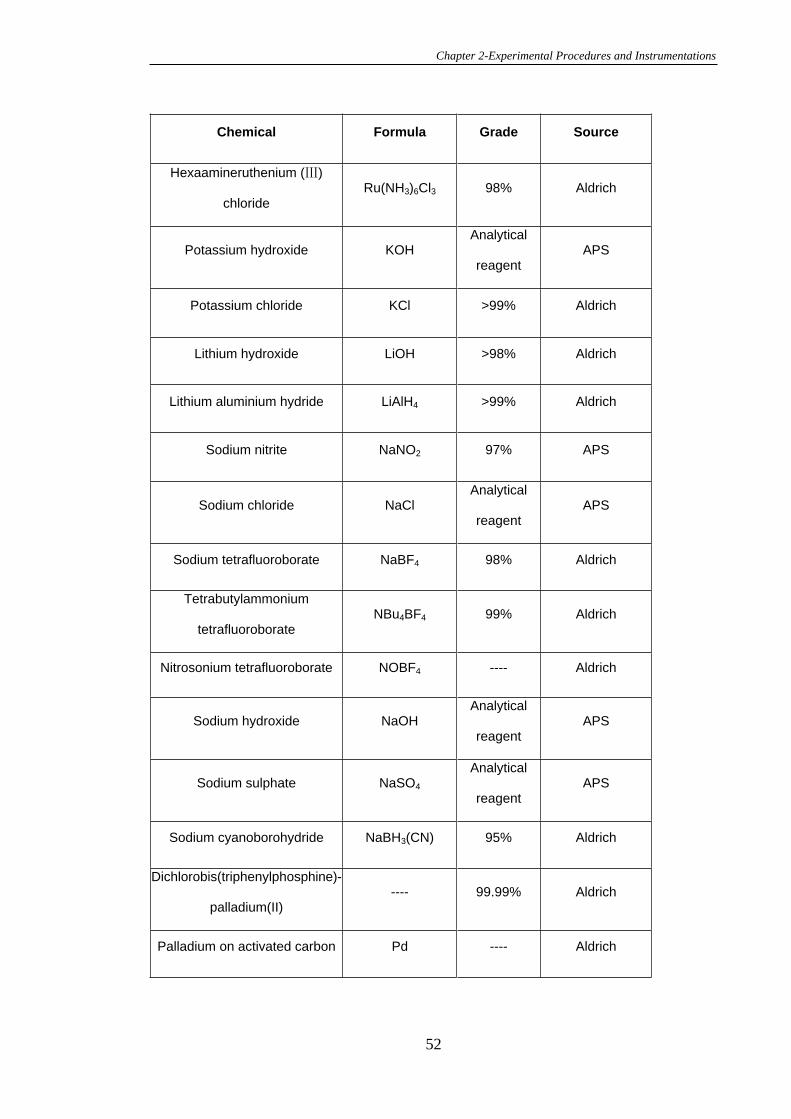
Chapter 2-Experimental Procedures and Instrumentations
Chemical Formula Grade Source
Hexaamineruthenium ( )
chlorideRu(NH3)6Cl3 98% Aldrich
Potassium hydroxide KOHAnalytical
reagentAPS
Potassium chloride KCl >99% Aldrich
Lithium hydroxide LiOH >98% Aldrich
Lithium aluminium hydride LiAlH4 >99% Aldrich
Sodium nitrite NaNO2 97% APS
Sodium chloride NaClAnalytical
reagentAPS
Sodium tetrafluoroborate NaBF4 98% Aldrich
Tetrabutylammonium
tetrafluoroborateNBu4BF4 99% Aldrich
Nitrosonium tetrafluoroborate NOBF4 ---- Aldrich
Sodium hydroxide NaOHAnalytical
reagentAPS
Sodium sulphate NaSO4
Analytical
reagentAPS
Sodium cyanoborohydride NaBH3(CN) 95% Aldrich
Dichlorobis(triphenylphosphine)-
palladium(II)---- 99.99% Aldrich
Palladium on activated carbon Pd ---- Aldrich
52
Chapter 2-Experimental Procedures and Instrumentations
2.2 Synthesis
Some molecules used in this project were synthesised because they are not
commercially available.
2.2.1 Synthesis of 4-Carboxyphenyl Diazonium Tetrafluoroborate and 4-Nitrophenyl
Diazonium Tetrafluoroborate
The synthesis of 4-nitrophenyl diazonium tetrafluoroborate and 4-carboxyphenyl
diazonium tetrafluoroborate were carried out following the method developed by
Saby et al.1 The corresponding aniline (0.01 mol) was dissolved by warming into 3 mL
of concentrated hydrochloric acid (10 M) and 12 mL of water. A precipitate was
obtained by cooling down to 0 oC in an ice/acetone bath. This precipitate disappeared
after slow addition of a solution containing 0.752 g of sodium nitrite (0.011 mol) in
2 mL of water with vigorous stirring. The solution was filtered, and 1.48 g (0.013 mol)
of sodium tetrafluoroborate was added with stirring. The thick slurry was cooled below
0 oC in an ice/acetone bath, filtered by suction, and washed with a cooled 5% NaBF4
solution to remove traces of acid and then washed with cold ether. The powder was
dried in vacuum. Recrystallisation was carried out with a mixture of acetonitrile and
cold ether to give the expected product. The diazonium salt was kept in a desiccator, at
4 oC over phosphorus pentaoxide. 1H NMR (300 MHz, CD3CN) for 4-carboxyphenyl
diazonium tetrafluoroborate: 8.42 (d, J 9.1 Hz, 2H), 8.58 (d, J 9.1 Hz, 2H). 1H NMR
(300 MHz, CD3CN) for (4-nitrophenyl) diazonium tetrafluoroborate: 8.62 (d, J 4.7 Hz,
2H), 8.75(d, J 9.4 Hz, 2H). The diazonium function was detected by IR spectroscopy at
about 2300 cm-1.
53
Chapter 2-Experimental Procedures and Instrumentations
2.2.2 Synthesis of Benzenediazonium Tetrafluoroborate
The benzenediazonium tetrafluoroborate was synthesised by following the procedures
described by Downard et al.2 Aniline (0.49 mL, 5 mmol) was added to 2.5 mL of 35%
fluoroboric acid prediluted with 1.5 mL of water, and the solution was then cooled in
the 0 oC ice/acetone bath. A solution of 0.346 g (5 mmol) of sodium nitrite in 0.7 mL
water was added slowly to the stirred solution maintaining the temperature at around
10 oC. The mixture was then cooled to below 0 oC in an ice/acetone bath. The cream
precipitate was collected on a sintered glass filter which had been cooled with ice water
and washed with cold 5% fluoroboric acid (1 mL) followed by cold ether. The product
was dried in vacuo and stored in a fridge in the dark in a vacuumed desiccator. 1H NMR
(300 MHz, CD3CN): 7.94 (d, J 1.1 Hz, 2H), 8.26 (s, 1H), 8.46 (d, J 1.1 Hz, 2H).
2.2.3 Synthesis of Ferrocenemethylamine
Synthesis of ferrocenemethylamine was carried out by following the procedure
described by Kraatz.3 To a cooled solution (0 oC) of ferrocenecarboxaldehyde (2.14 g,
10 mmol) in MeOH (50 mL) in an ice bath (0 oC) was added ammonium acetate (7.7 g,
0.1 mol), and the mixture was stirred for 2 h. NaBH3(CN) (0.46 g, 7.3 mmol) was then
added to the cold solution. After stirring for 12 h, the volume of the solution was
reduced to about 20 mL and water (10 mL) was added. The pH of the solution was
adjusted to pH 2.0 with 1 M HCl, after which the pH was adjusted to 8.0 by adding
solid KOH (about 2 g). The resulting dark-brown solution was extracted with CH2Cl2
(4×50 mL). The organic phases were collected and washed with H2O (3×50 mL), dried
over anhydrous Na2SO4 and then pumped to dryness to yield a brown oily solid (2.0 g).
The resultant material was redissolved in MeOH (10 mL), and 1 M HCl (5 mL) was
54
Chapter 2-Experimental Procedures and Instrumentations
added and then pumped to dryness again. The crude product was dissolved in a
minimum amount of MeOH and transferred onto an alumina plug (ca. 5 cm long). The
impurity was removed with CH2Cl2 as eluent, and the product was eluted with MeOH.
After evaporation of the solvent, a yellow solid (1.8 g, 72%) was obtained. 1H NMR
(300 MHz, CDCl3): 2.1 (s, 3H), 3.88 (s, 2H), 4.17 (t, 5H), 4.22 (d, J 4.3 Hz, 2H), 4.28
(d, J 8.6 Hz, 2H).
2.2.4 Synthesis of 1,1’-Ferrocenedimethylamine
Synthesis of 1,1’-ferrocenedimethylamine was carried out by following the procedure
by Ossola.4 1,1’-ferrocenedicarboxyaldehyde (0.4 g, 1.65 mmol) was dissolved in EtOH
(8 mL) and the resulting solution was heated at 50 oC. An aqueous solution of
hydroxylamine hydrochloride (0.8 g, 6.76 mmol) and an aqueous solution of sodium
acetate (0.9 g, 11.2 mmol) were added. The resulting mixture was stirred at 50 oC for
4 h and evaporated. The residue was dissolved in diethyl ether, and the resulting
solution was filtered and evaporated to dryness. The reddish solid residue (0.8 g,
2.94 mmol) was dissolved in dry THF (25 mL). A 1 M diethyl ether solution of LiAlH4
(9 mL) was added dropwise to the resulting solution and the mixture was stirred
overnight. Benzene was added (90 mL) and the mixture stirred for 15 min. Ethyl acetate
was added and the mixture stirred for 15 min. Ten drops of 5 M NaOH solution were
added, the mixture stirred for 15 min and filtered. The solution was evaporated, the
residue dissolved in CH2Cl2, the solution filtered and evaporated. The residue was
purified by column chromatography (silica gel, 95% MeOH and 5% NH4OH as eluent)
to give the desired product as a light yellow microcrystalline solid. 1H NMR (300 MHz,
CDCl3): 1.99-1.96 (brs, 6H), 3.58 (s, 2H), 3.82 (s, 2H), 4.08 (s, 8H),
55
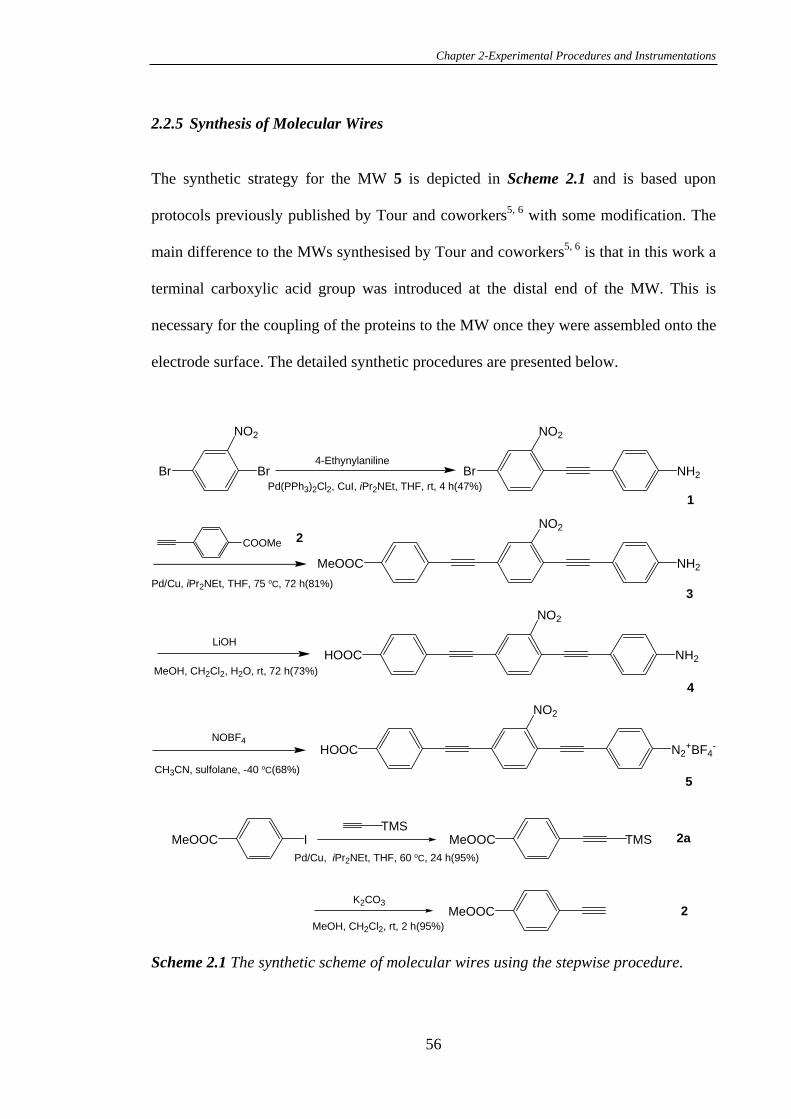
Chapter 2-Experimental Procedures and Instrumentations
2.2.5 Synthesis of Molecular Wires
The synthetic strategy for the MW 5 is depicted in Scheme 2.1 and is based upon
protocols previously published by Tour and coworkers5, 6 with some modification. The
main difference to the MWs synthesised by Tour and coworkers5, 6 is that in this work a
terminal carboxylic acid group was introduced at the distal end of the MW. This is
necessary for the coupling of the proteins to the MW once they were assembled onto the
electrode surface. The detailed synthetic procedures are presented below.
4-Ethynylaniline
Pd(PPh3)2Cl2, CuI, iPr2NEt, THF, rt, 4 h(47%)
Pd/Cu, iPr2NEt, THF, 75 oC, 72 h(81%)
LiOH
MeOH, CH2Cl2, H2O, rt, 72 h(73%)
CH3CN, sulfolane, -40 oC(68%)
1
3
4
2
TMS
K2CO3
MeOH, CH2Cl2, rt, 2 h(95%)
Pd/Cu, iPr2NEt, THF, 60 oC, 24 h(95%)
2
2a
NH2Br
NO2
BrBr
NO2
NH2
NO2
COOMe
MeOOC
NH2
NO2
HOOC
5
N2+BF4
-
NO2
HOOC
IMeOOC TMSMeOOC
MeOOC
NOBF4
Scheme 2.1 The synthetic scheme of molecular wires using the stepwise procedure.
56
Chapter 2-Experimental Procedures and Instrumentations
2.2.5.1 Synthesis of 1-Bromo-3-nitro-4-(4-aminophenylethynyl)benzene (1)
Compound 1 was synthesised using the method of Kosynkin et al.5 by following the
general procedure for the Pd/Cu-catalysed coupling reaction,7-9 but with substitution of
triethylamine for diisopropylethylamine as the only modification. 1,4-Dibromo-2-
nitrobenzene (2.81 g, 10.0 mmol), bis(triphenylphosphine) palladium(II) dichloride
(0.07 g, 0.10 mmol), copper(I) iodide (0.019 g, 0.10 mmol) were added to an oven-dried
round bottom flask equipped with a magnetic stirrer bar. The vessel was then sealed
with a rubber septum, evacuated and backfilled with nitrogen. Dry THF (5 mL) was
added and followed by diisopropylethylamine (5 mL). After 5 min at room temperature,
4-ethynylaniline (0.590 g, 5.0 mmol) was added and the reaction mixture was stirred at
room temperature for 4 h or until complete reaction was noted by TLC analysis. The
reaction was quenched with water (20 mL). The organic layer was diluted with
dichloromethane (10 mL) and washed with a saturated solution of NaHCO3 (3×50 mL)
and then brine (3×50 mL) until the blue colour of copper complexes could not be seen
in the aqueous phase. The combined aqueous phases were extracted with
dichloromethane (3×100 mL). The combined organic extracts were dried over
anhydrous NaSO4, filtered and the solvent removed in vacuo. The crude red product
was then purified by column chromatography (silica gel, 70% dichloromethane and
30% light petroleum as eluent) to give the desired product 1 as a red solid.
Recrystallization of the major fraction from dichloromethane/light petroleum afforded
the title compound 1 as bright red fine needles (0.75 g, 47%). m.p. 156-158 oC (lit.5
m.p. 147-149 oC). 1H NMR (300MHz, CDCl3): 3.88 (brs, 2H), 6.64 (d, J 8.3 Hz, 2H),
7.40 (d, J 8.7 Hz, 2H), 7.53 (d, J 8.4 Hz, 1H), 7.68 (d, J 1.9 Hz, 1H), 8.21 (d, J 1.9 Hz,
57
Chapter 2-Experimental Procedures and Instrumentations
1H). 13C NMR (300MHz, CDCl3): 82.8, 100.2, 111.1, 114.3, 114.6, 118.5, 120.6,
127.7, 133.7, 135.1, 135.8, 147.8, 149.2.
2.2.5.2 Synthesis of Methyl 4-(trimethylsilylethynyl)benzoate (2a)
Compound 2a was synthesised previously by Tour et al.6 Methyl 4-iodobenzoate
(5.240 g, 20 mmol), bis(triphenylphosphine)palladium(II) dichloride (0.702 g, 1 mmol),
copper(I) iodide (0.038 g, 2 mmol), trimethylsilylacetylene (4 mL, 26 mmol),
diisopropylethylamine (14 mL, 80 mmol) and dry THF (50 mL) were treated by the
general procedure for the Pd/Cu-catalysed coupling reaction7-9 at 60 C for 24 h to
afford an orange solid. Column chromatography (silica gel, 50 dichloromethane and
50 light petroleum as eluent) afforded the desired product 2a (4.40 g, 95 ) as orange
needles. 1H NMR (300MHz, CDCl3): 0.26 (s, 9H) 3.91 (s, 3H), 7.51 (d, J 8.7 Hz, 2H),
7.96 (d, J 8.3 Hz, 2H). 13C NMR (300MHz, CDCl3): 0.0, 52.1, 97.6, 104.0, 127.7,
129.3, 129.6, 131.8, 166.4.
2.2.5.3 Synthesis of Methyl 4-ethynylbenzoate (2)
Compound 2 was synthesised by following the general procedure of Tour et al. for the
deprotection of trimethylsilyl-protected alkynes.6 The silylated alkyne compound 2a
(0.81 g, 3.5 mmol) was dissolved in MeOH (50 mL) and the cosolvent dichloromethane
(50 mL), and then potassium carbonate (2.42 g, 17.5 mmol) was added. The mixture
was stirred at room temperature for 2 h then added to water (50 mL) to quench the
reaction. The mixture was extracted with diethyl ether (2×50 mL) and then the
combined organic extracts were washed with brine (3×50 mL). The combined organic
extracts were then dried over anhydrous NaSO4, filtered and the solvent was evaporated
58
Chapter 2-Experimental Procedures and Instrumentations
in vacuo to afford the desired product 2 (0.53 g, 95 ) as brown crystal that was
immediately reacted in the next step without further purification.
2.2.5.4 Synthesis of Methyl 2'-nitro-4, 4 -diphenylethynyl-4 -aminobenzoate (3)
Compound 3 was synthesised in an adaptation of the general procedure for the Pd/Cu-
catalyzed coupling reaction.7-9 Bromide 1 (0.174 g, 0.55 mmol), alkyne 2 (0.12 g, 0.72
mmol), copper(I) iodide (0.002 g, 0.011 mmol), bis(triphenylphosphine)palladium(II)
dichloride (0.016 g, 0.022 mmol), diisopropylethylamine (0.36 mL, 2.08 mmol) and dry
THF (15 mL) were heated at 75 C for 3 days. The crude product was purified by
column chromatography (silica gel, dichloromethane as eluent) to give the product 3 as
red solid (0.176 g, 81 ). 1H NMR (300MHz, DMSO): 3.86 (s, 3H) 6.68 (d, J 8.3 Hz,
2H), 7.24 (d, J 8.7 Hz, 2H), 7.85 (dd, J 8.6, 3.0 Hz, 4H), 8.00 (d, J 8.3 Hz, 2H), 8.28 (s,
1H). 13C NMR (300MHz, DMSO): 54.4, 85.1, 92.0, 93.6, 104.2, 108.7, 115.7, 120.7,
123.1, 128.2, 129.5, 131.5, 131.9, 133.9, 135.5, 136.0, 137.7, 150.6, 152.9, 167.6.
2.2.5.5 Synthesis of Methyl 2 -nitro-4, 4 -diphenylethynyl-4 -amino Benzoic Acid (4)
Carboxylic acid 4 was synthesised by an adaptation of the procedure from Corey et al.10
Ester 3 (0.058 g, 0.15 mmol) was added to a 250 mL round bottom flask equipped with
a magnetic stirring bar along with lithium hydroxide (0.02 g, 0.75 mmol), MeOH
(9 mL), dichloromethane (5 mL) and water (3 mL). The reaction mixture was allowed to
stir at room temperature for 3 days. The reaction was quenched with water (20 mL) and
extracted with dichloromethane (2×20 mL). The combined organic phases were
extracted with water (2×20 mL). The red aqueous extracts were combined and acidified
to pH 3.0 whereupon a red solid precipitated. The solid material was collected on a
fritted funnel, and the filtrate was evaporated in vacuo to afford the desired product 4 as
59
Chapter 2-Experimental Procedures and Instrumentations
red prisms (0.042 g, 73 ). m.p 300 oC. 1H NMR (300MHz, DMSO): 4.04 (brs, 2H),
6.58 (d, J 8.3 Hz, 2H), 7.24 (d, J 8.3 Hz, 2H), 7.76 (dd, J 8.6, 3.0 Hz, 4H), 7.98 (d, J 8.3
Hz, 2H), 8.28 (s, 1H), 13.16 (brs, 1H). 13C NMR (300MHz, DMSO): 83.1, 90.0, 92.2,
102.5, 107.0, 114.1, 119.8, 122.1, 126.1, 127.8, 130.0, 132.2, 133.8, 134.4, 135.6,
136.1, 149.0, 151.2, 167.0. FTICR HRMS found m/z 405.0858, C23H14 N2O4Na+
requires 405.0846.
2.2.5.6 Synthesis of Methyl 2 -nitro-4, 4 -diphenylethynyl-4 -benzoic acid
Benzenediazonium Tetrafluoroborate (5)
Diazonium salt 5 was synthesised by following the general diazotization procedure of
Tour et al.5 NOBF4 (0.022 g, 0.172 mmol) was weighed out in a glovebox and placed in
a round bottom flask equipped with a magnetic stirring bar and sealed with a septum.
Acetonitrile (1 mL)/sulfolane (0.2 mL) were injected and the resulting suspension was
cooled in a dry ice/acetonitrile bath to -40 C. The solution of the aniline compound 4
(0.060 g, 0.156 mmol) was prepared by adding warm sulfolane (1 mL, 45-50 C) to the
amine under a blanket of nitrogen, sonication for 1 min and subsequent addition of
acetonitrile (0.2 mL). The aniline solution was then added to the nitrosonium salt
suspension over a period of 10 min. The reaction mixture was kept at -40 C for 30 min
and was then allowed to warm to the room temperature. Then the product 5 was
precipitated with diethyl ether (12 mL) and collected by filtration, washed with diethyl
ether and dried over anhydrous NaSO4. Additional purification of the salt 5 was
accomplished by reprecipitation from DMSO (0.5 mL) by dichloromethane (10 mL) to
afford the desired product 5 as a red solid (0.050 g, 68 ). 1H NMR (300MHz, DMSO):
6.56 (d, J 8.3 Hz, 2H), 7.23 (d, J 8.3 Hz, 2H), 7.74 (dd, J 8.6, 3.0 Hz, 4H), 7.96 (d, J
8.3 Hz, 2H), 8.26 (s, 1H). 13C NMR (300MHz, DMSO): 83.1, 90.0, 92.2, 102.5, 107.0,
60
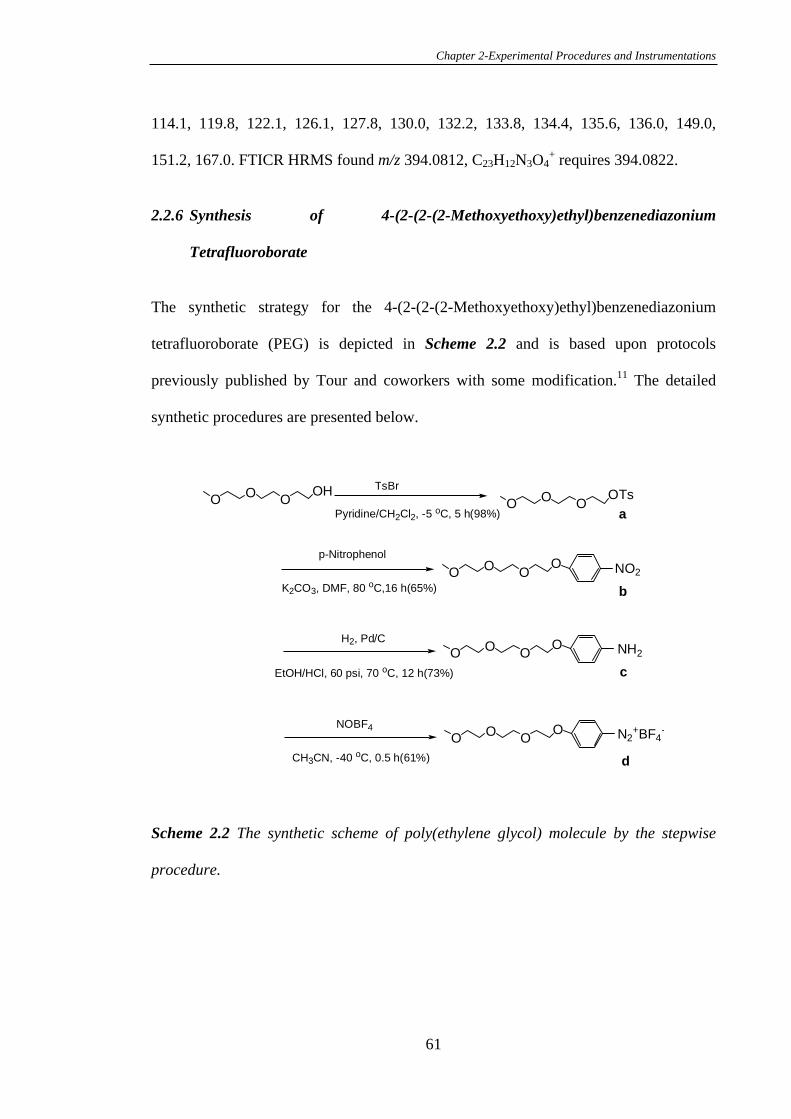
Chapter 2-Experimental Procedures and Instrumentations
114.1, 119.8, 122.1, 126.1, 127.8, 130.0, 132.2, 133.8, 134.4, 135.6, 136.0, 149.0,
151.2, 167.0. FTICR HRMS found m/z 394.0812, C23H12N3O4+ requires 394.0822.
2.2.6 Synthesis of 4-(2-(2-(2-Methoxyethoxy)ethyl)benzenediazonium
Tetrafluoroborate
The synthetic strategy for the 4-(2-(2-(2-Methoxyethoxy)ethyl)benzenediazonium
tetrafluoroborate (PEG) is depicted in Scheme 2.2 and is based upon protocols
previously published by Tour and coworkers with some modification.11 The detailed
synthetic procedures are presented below.
OO
OOTs
OO
OO NO2
OO
OO NH2
OO
OO N2
+BF4-
OO
OOH TsBr
Pyridine/CH2Cl2, -5 oC, 5 h(98%)
p-Nitrophenol
K2CO3, DMF, 80 oC,16 h(65%)
H2, Pd/C
EtOH/HCl, 60 psi, 70 oC, 12 h(73%)
CH3CN, -40 oC, 0.5 h(61%)
NOBF4
a
b
c
d
Scheme 2.2 The synthetic scheme of poly(ethylene glycol) molecule by the stepwise
procedure.
61
Chapter 2-Experimental Procedures and Instrumentations
2.2.6.1 Synthesis of 2-(2-(2-Methoxyethoxy)ethoxy)ethyl p-Toluenesulfonate (a)
This step is slightly different from that reported in the literature.11 Tri(ethylene glycol)
monomethyl ether (1.0 g, 6.1 mmol) was added to a mixture of dry pyridine (5 mL) and
dichloromethane (10 mL), which was cooled beforehand to -5 oC. The mixture was then
cooled in an ice bath. A solution of p-toluenesulfonyl bromide (2.04 g, 9.1 mmol) in
dichloromethane (5 mL) was added slowly. The resulting mixture was maintained at –
5 oC with stirring for 5 h, and then moved into a freezer and left there overnight. The
reaction was then quenched with water (60 mL) and extracted with dichloromethane
(4×50 mL). The combined organic extracts were washed successively with 2 M HCl
(2×70 mL), saturated aqueous NaHCO3 (50 mL) and brine (50 mL), before being dried
with Na2SO4. After filtration, the solvent was evaporated in vacuo to afford the desired
pure product a as a colourless liquid (1.52 g, 98 ). 1H NMR (300 MHz, CDCl3): 2.43
(s, 3H), 3.35 (s, 2H), 3.51-3.52 (m, 2H), 3.57-3.59 (m, 6H), 3.65-3.68 (t, J 4.6 Hz, 2H),
4.13-4.16 (t, J 4.8 Hz, 2H), 7.32 (d, J 8.3 Hz, 2H), 7.78 (d, J 8.3 Hz, 2H). 13C NMR
(300 MHz, CDCl3): 21.5, 58.9, 68.2, 68.6, 69.1, 70.5, 70.6, 71.8, 127.9, 129.7, 133.0,
144.7.
2.2.6.2 Synthesis of 4-(2-(2-(2-Methoxyethoxy)ethoxy)ethyl)nitrobenzene (b)
Compound a (0.9 g, 3.53 mmol) was dissolved in dimethylformamide (50 mL).
Potassium carbonate (1.18 g, 8.5 mmol) and 4- nitrophenol (0.38 g, 2.75 mmol) were
added. The solution was stirred at 80 oC for 24 h. After cooling to room temperature, the
solution was poured into water (30 mL) with stirring for 5 min and extracted with
dichloromethane (3×30 mL). The combined organic phases were washed with water
(5×50 mL) and then brine (2×50 mL), dried over Na2SO4, and filtered, and the solvent
62
Chapter 2-Experimental Procedures and Instrumentations
was removed by distillation at reduced pressure to afford the desired product b as a light
brown liquid (0.65 g, 65 ). 1H NMR (300 MHz, CDCl3): 3.36 (s, 3H), 3.53-3.55 (m,
2H), 3.62-3.68 (m, 4H), 3.71-3.74 (m, 2H), 3.89 (t, J 4.6 Hz, 2H), 4.22 (t, J 4.8 Hz, 2H),
6.97 (d, J 9.4 Hz, 2H), 8.17 (d, J 6.2 Hz, 2H). 13C NMR (300 MHz, CDCl3): 58.9,
68.1, 69.3, 70.5, 70.6, 70.8, 71.8, 114.5, 125.7, 141.6, 163.8.
2.2.6.3 Synthesis of 4-(2-(2-(2-Methoxyethoxy)ethoxy)ethyl)aniline (c)
Compound c (2.0 g, 7.0 mmol) was dissolved in a mixture of hydrochloric acid (2 mL)
and absolute ethanol (18 mL), and the catalyst 10 palladium on carbon (0.4 g,
0.35 mmol) was added. The mixture was hydrogenated on a Parr apparatus (60 psi,
70 oC) for 12 h with stirring. The mixture was then filtered over Celite and washed with
ethanol (30 mL). Solid sodium bicarbonate (4 g, 48 mmol) was added, and the mixture
was stirred for 2 h and then anhydrous Na2SO4 was added. After filtration, the solvent
was removed by evaporation at reduced pressure. The resulting brown oil was purified
by column chromatography (silica gel, 20 dichloromethane and 80 ethyl acetate as
eluent) to afford the pure compound c (1.3g, 73 ). 1H NMR (300MHz, CDCl3): 3.13
(brs, 2H), 3.37 (s, 3H), 3.55 (t, J 4.8 Hz, 3H), 3.63-3.68 (m, 4H), 3.70-3.71 (m, 2H),
3.81 (t, J 5.9 Hz, 2H), 4.04 (t, J 7.5 Hz, 2H), 6.63 (d, J 8.7 Hz, 2H), 6.75 (d, J 8.7 Hz,
2H). 13C NMR (300MHz, CDCl3): 58.9, 68.1, 69.8, 70.5, 70.6, 70.7, 71.9, 115.8,
116.5, 139.6, 152,1.
2.2.6.4 Synthesis of 4-(2-(2-(2-Methoxyethoxy)ethoxy)ethyl)benzenediazonium
Tetrafluoroborate (d)
Nitrosonium tetrafluoroborate (0.64 g, 4.7 mmol) was weighed out in a glovebox and
sealed with septum. After removal from the glovebox, acetonitrile (3 mL mmol-1 of
63
Chapter 2-Experimental Procedures and Instrumentations
aniline, 12 mL) was added and the solution was cooled to –40 oC with dry
ice/acetonitrile. A solution of c (1.0 g, 3.92 mmol) in acetonitrile (ca. 1 mL mmol-1,
4 mL) was added dropwise for 30 min while stirring in dry ice/acetonitrile bath. After
complete addition, stirring was continued for 30 min, at which time the cold bath was
removed. After stirring for a total of 1 h, the solution was diluted with ether (50 mL)
and stirred to obtain a dark red, sticky residue. The residue was mixed three times with
cold ether, decanting the solvent and dried in vacuo to afford the desired product d
(1.02 g, 61 ) as a dark red, sticky material which was sufficiently pure by 1H NMR. 1H
NMR (300MHz, CDCl3): 3.29 (s, 2H), 3.46 (t, J 5.4 Hz, 2H), 3.58-3.61 (m, 4H), 3.62-
3.66 (m, 2H), 3.87 (t, J 8.7 Hz, 2H), 4.31 (t, J 8.7 Hz, 2H), 7.19 (d, J 9.5 Hz, 2H), 8.42
(d, J 9.5 Hz, 2H). FTICR MS found m/z 267.1344, C13H19O4N2 requires 267.1340.
2.3 Instrumentation
2.3.1 Electrochemical System
The instrument used in this project is mainly an electrochemical device, a potentiostat,
which was used for characterisation and mechanistic studies of redox reactions at
electrodes. Cyclic voltammetry (CV), chronoamperometry (CA), and Osteryoung
Square Wave Voltammetry (OSWV) were performed using a BAS 100B
Electrochemical Analyser (Bioanalytical System Inc., Lafayette, Inc., USA) potentiostat
interfaced with a Bootstrap Dimension Penta 12 computer system. The electrochemical
cell consisted of a three electrode system using a glassy carbon (GC) electrode or gold
electrode as the working electrode, platinum foil as the auxiliary electrode and
Ag/AgCl/3.0 M NaCl electrode as the reference electrode (from Bioanalytical Systems
Inc., USA).
64
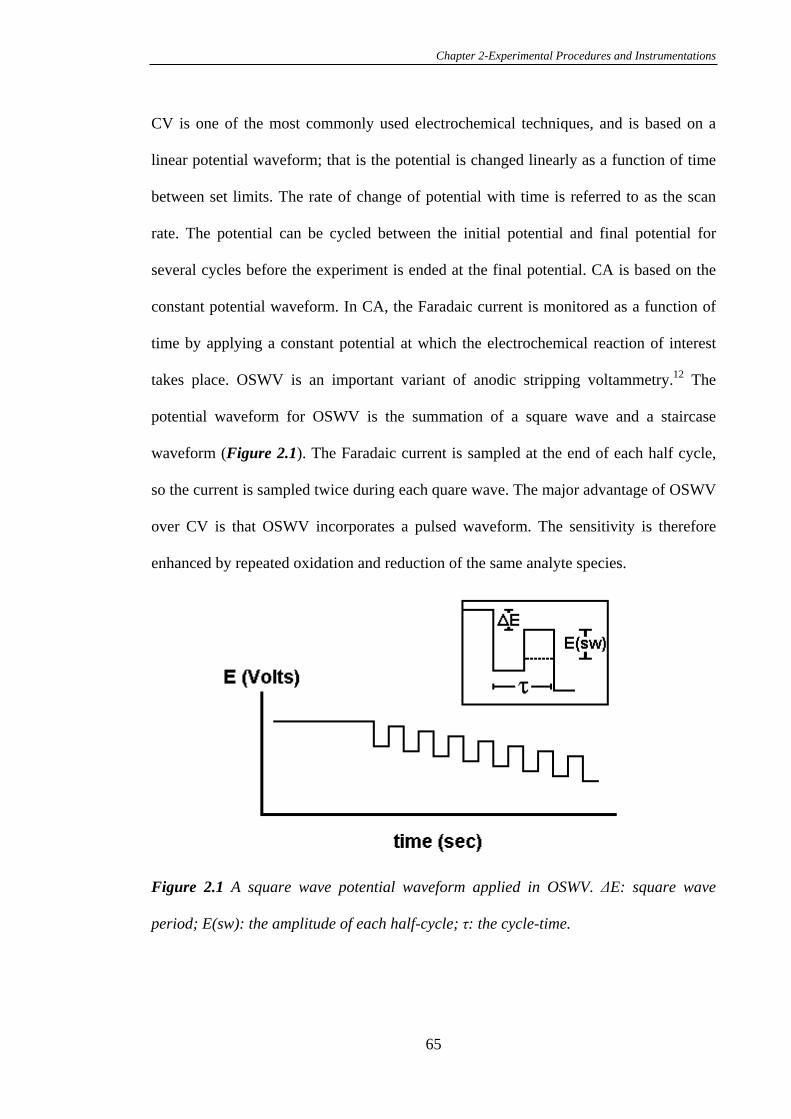
Chapter 2-Experimental Procedures and Instrumentations
CV is one of the most commonly used electrochemical techniques, and is based on a
linear potential waveform; that is the potential is changed linearly as a function of time
between set limits. The rate of change of potential with time is referred to as the scan
rate. The potential can be cycled between the initial potential and final potential for
several cycles before the experiment is ended at the final potential. CA is based on the
constant potential waveform. In CA, the Faradaic current is monitored as a function of
time by applying a constant potential at which the electrochemical reaction of interest
takes place. OSWV is an important variant of anodic stripping voltammetry.12 The
potential waveform for OSWV is the summation of a square wave and a staircase
waveform (Figure 2.1). The Faradaic current is sampled at the end of each half cycle,
so the current is sampled twice during each quare wave. The major advantage of OSWV
over CV is that OSWV incorporates a pulsed waveform. The sensitivity is therefore
enhanced by repeated oxidation and reduction of the same analyte species.
Figure 2.1 A square wave potential waveform applied in OSWV. E: square wave
period; E(sw): the amplitude of each half-cycle; : the cycle-time.
65
Chapter 2-Experimental Procedures and Instrumentations
2.3.2 Nuclear Magnetic Resonance (NMR) Spectrometer
1H NMR spectra were obtained using a Bruker AC300F (300 MHz) spectrometer or a
Bruker DPX300 (300 MHz) spectrometer. Data were reported as follows: chemical shift
( ) measured in parts per million (ppm) downfield from TMS; multiplicity; proton
count. Multiplicities were reported as singlet (s), broad singlet (brs), doublet (d), triplet
(t), quartet (q), and multiplet (m). 13C spectra were obtained on Bruker AC300F
(300 MHz) spectrometer or a Bruker DPX300 (300 MHz) spectrometer. 13C chemical
shifts ( ) were reported in parts per million (ppm) downfield from TMS and identifiable
signals were given.
2.3.3 X-ray Photoelectron Spectroscopy (XPS)
X-ray photoelectron spectra were collected from glassy carbon plates (Carbon vitreous
foil version 6, Goodfellow Cambridge-Limited England) or gold foil ( 99.99 gold,
Goodfellow, Cambridge, UK) on a VG EscaLab 220-IXL spectrometer with a
monochromated Al K source (1486.6 eV), hemispherical analyzer and multichannel
detector. The spectra were accumulated at a take-off angle of 90 with a 0.79 mm2 spot
size at a pressure of less than 10-8 mbar. The pass energy for the survey scan is 100 eV
and for the narrow scan 20 eV. The step size for the survey scan is 1.0 eV and for the
narrow scan 0.1 eV. Survey spectra (0-1100 eV) were obtained, followed by high
resolution spectra of C1s, O1s, N1s regions. The spectra were generally calibrated on
the C1s Peak (285.0eV) or on the Au4f7/2 peak (84.0 eV). Atomic sensitivity factors
are C1s 1.0, O1s 2.93, S2p 1.68, N1s 1.8, Au4f7/2 9.58. Spectra were analysed using
XPSPEAK41 software. Percentage coverages for the different elements and sub-groups
were estimated from the corresponding fitted areas.
66
Chapter 2-Experimental Procedures and Instrumentations
2.3.4 Atomic Force Microscopy (AFM)
Atomic force microscopy images were taken using a Digital Instruments Dimension
3100 scanning probe microscope. All images were acquired in tapping mode using
commercial Si cantilevers/tips (Olympus) used at their fundamental resonance
frequencies, which typically varied between 275-320 kHz. AFM images were
performed on GC plates and PPF substrates.
2.3.5 Fourier Transfer Ion Cyclotron Mass Spectrometry (FT-ICR MS)
FT-ICR mass spectra were obtained on a commercial Bruker BioAPEK 70e (Billerica,
MA) Fourier transfer mass spectrometer. This instrument is equipped with a 7 T passive
shielded superconducting magnet, a vacuum system, ion optics voltage supplies, the
external ion sources, a silicon graphics (Unix) workstation and an Infinity Cell.
2.3.6 LEO-Scanning Electron Microscope (LEO-SEM)
All the scanning electron microscope images reported here were taken on a LEO-SEM
(Supra 55VP, Zeiss) using an InLens detector. The images presented were obtained with
an accelerating voltage of 10 KV.
2.4 Procedures
2.4.1 Preparation of Glassy Carbon Electrodes and Calculation of the
Electrochemical Surface Area
Adsorbed impurities on the GC electrode surface may hinder electrochemical processes
and the formation of monolayers. So cleaning electrodes immediately prior to use is
vital. The working GC electrodes (Bioanalytical Systems Inc., USA) were 3 mm
67
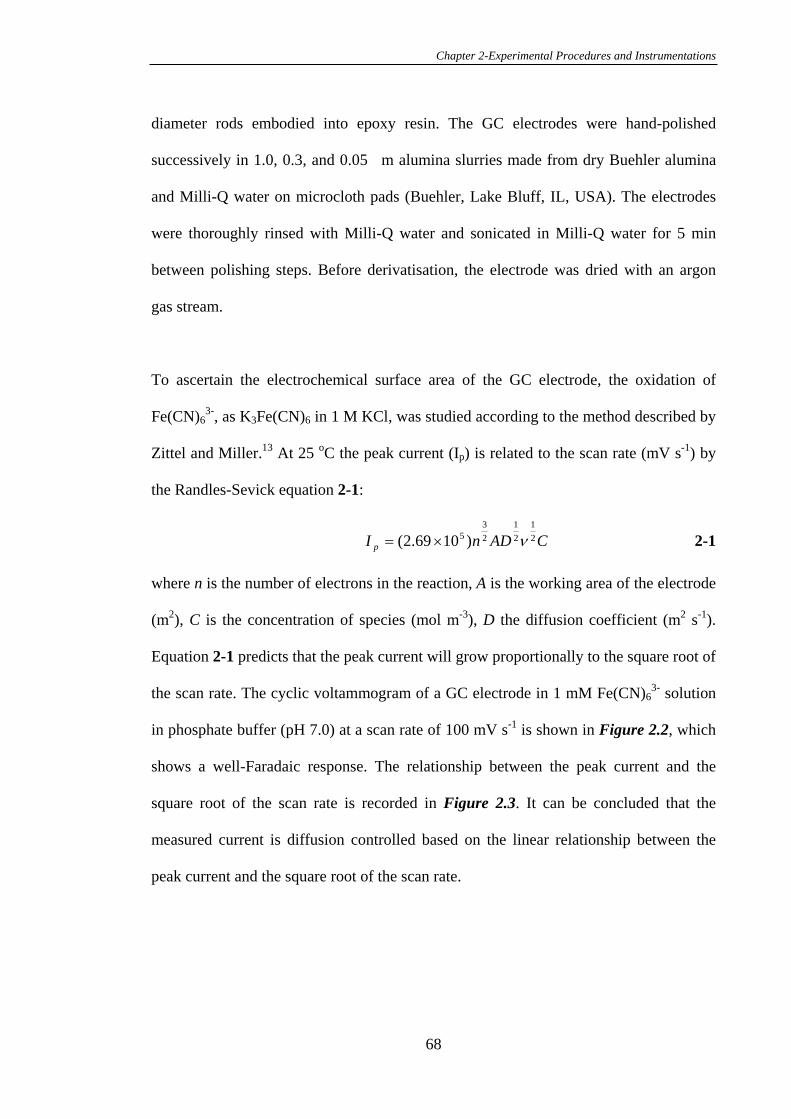
Chapter 2-Experimental Procedures and Instrumentations
diameter rods embodied into epoxy resin. The GC electrodes were hand-polished
successively in 1.0, 0.3, and 0.05 m alumina slurries made from dry Buehler alumina
and Milli-Q water on microcloth pads (Buehler, Lake Bluff, IL, USA). The electrodes
were thoroughly rinsed with Milli-Q water and sonicated in Milli-Q water for 5 min
between polishing steps. Before derivatisation, the electrode was dried with an argon
gas stream.
To ascertain the electrochemical surface area of the GC electrode, the oxidation of
Fe(CN)63-, as K3Fe(CN)6 in 1 M KCl, was studied according to the method described by
Zittel and Miller.13 At 25 oC the peak current (Ip) is related to the scan rate (mV s-1) by
the Randles-Sevick equation 2-1:
CADnI p21
21
23
5 )1069.2( 2-1
where n is the number of electrons in the reaction, A is the working area of the electrode
(m2), C is the concentration of species (mol m-3), D the diffusion coefficient (m2 s-1).
Equation 2-1 predicts that the peak current will grow proportionally to the square root of
the scan rate. The cyclic voltammogram of a GC electrode in 1 mM Fe(CN)63- solution
in phosphate buffer (pH 7.0) at a scan rate of 100 mV s-1 is shown in Figure 2.2, which
shows a well-Faradaic response. The relationship between the peak current and the
square root of the scan rate is recorded in Figure 2.3. It can be concluded that the
measured current is diffusion controlled based on the linear relationship between the
peak current and the square root of the scan rate.
68
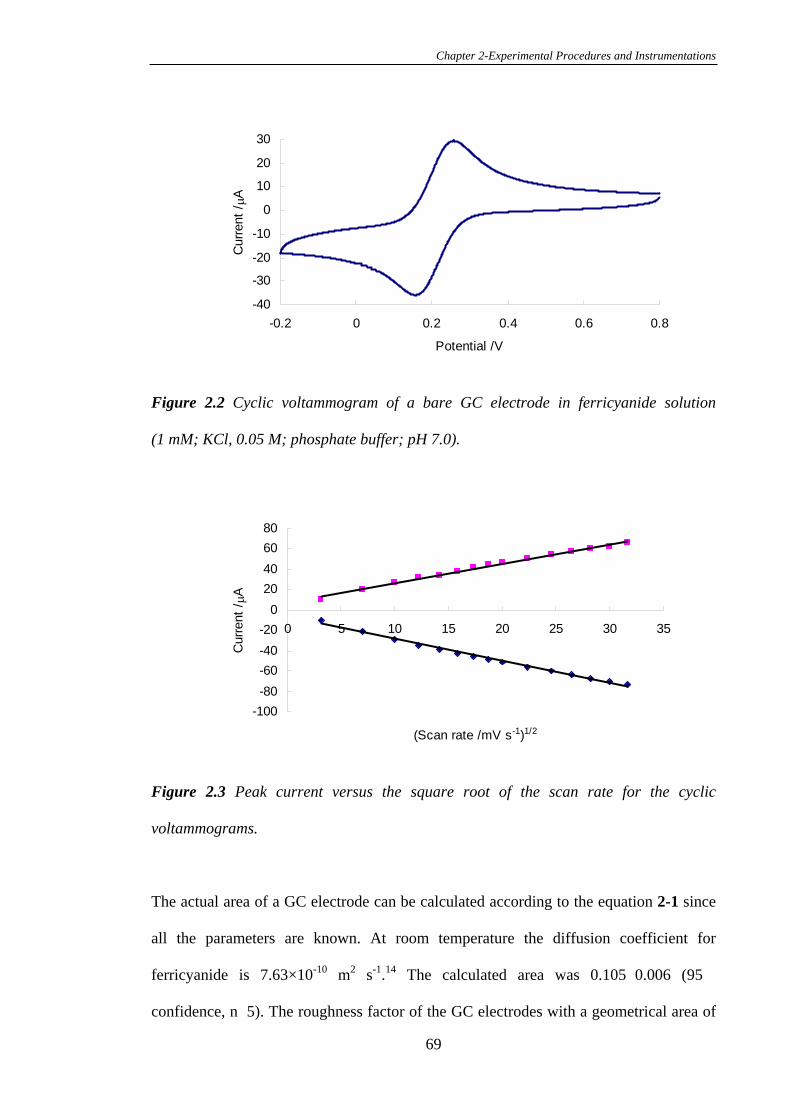
Chapter 2-Experimental Procedures and Instrumentations
-40
-30
-20
-10
0
10
20
30
-0.2 0 0.2 0.4 0.6 0.8
Potential /V
Curr
ent
/A
Figure 2.2 Cyclic voltammogram of a bare GC electrode in ferricyanide solution
(1 mM; KCl, 0.05 M; phosphate buffer; pH 7.0).
-100
-80
-60
-40
-20
0
20
40
60
80
0 5 10 15 20 25 30 35
(Scan rate /mV s-1)1/2
Curr
ent
/A
Figure 2.3 Peak current versus the square root of the scan rate for the cyclic
voltammograms.
The actual area of a GC electrode can be calculated according to the equation 2-1 since
all the parameters are known. At room temperature the diffusion coefficient for
ferricyanide is 7.63×10⁻¹⁰ m2 s-1.14 The calculated area was 0.105 0.006 (95
confidence, n 5). The roughness factor of the GC electrodes with a geometrical area of
69
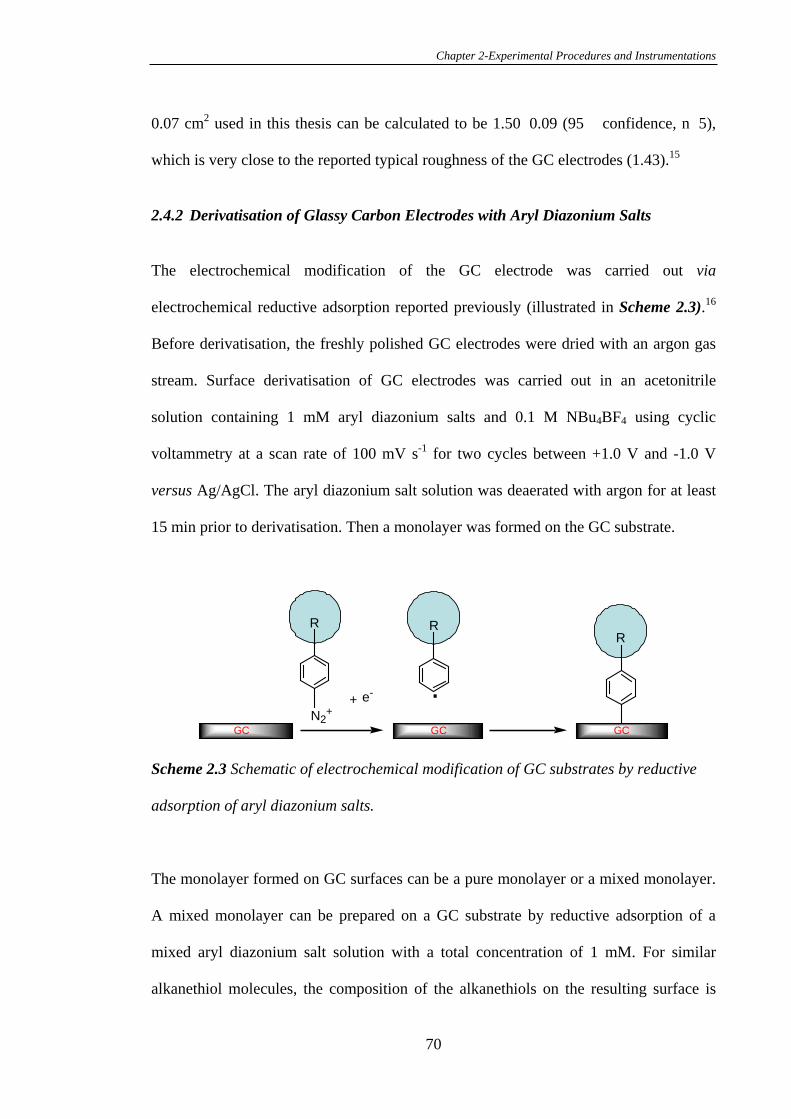
Chapter 2-Experimental Procedures and Instrumentations
0.07 cm2 used in this thesis can be calculated to be 1.50 0.09 (95 confidence, n 5),
which is very close to the reported typical roughness of the GC electrodes (1.43).15
2.4.2 Derivatisation of Glassy Carbon Electrodes with Aryl Diazonium Salts
The electrochemical modification of the GC electrode was carried out via
electrochemical reductive adsorption reported previously (illustrated in Scheme 2.3).16
Before derivatisation, the freshly polished GC electrodes were dried with an argon gas
stream. Surface derivatisation of GC electrodes was carried out in an acetonitrile
solution containing 1 mM aryl diazonium salts and 0.1 M NBu4BF4 using cyclic
voltammetry at a scan rate of 100 mV s-1 for two cycles between +1.0 V and -1.0 V
versus Ag/AgCl. The aryl diazonium salt solution was deaerated with argon for at least
15 min prior to derivatisation. Then a monolayer was formed on the GC substrate.
R
GC
R
GC GC
e-+
.
R
N2+
Scheme 2.3 Schematic of electrochemical modification of GC substrates by reductive
adsorption of aryl diazonium salts.
The monolayer formed on GC surfaces can be a pure monolayer or a mixed monolayer.
A mixed monolayer can be prepared on a GC substrate by reductive adsorption of a
mixed aryl diazonium salt solution with a total concentration of 1 mM. For similar
alkanethiol molecules, the composition of the alkanethiols on the resulting surface is
70
Chapter 2-Experimental Procedures and Instrumentations
usually quite similar to that of alkanethiols in solution used for the attachment of self-
assembled monolayers.17 It can be assumed that the composition of the diazonium salts
on the resulting surface is also similar to that of diazonium salts in solution used for
attachment of monolayers. Therefore, the composition of mixed monolayers on GC
electrodes can be adjusted by adjusting the composition of the aryl diazonium salt
mixture in solution.
2.4.3 Preparation of Pyrolysed Photoresist Films
An alternative GC electrode surface referred to as pyrolysed photoresist films (PPF) was
prepared as described previously.18 The whole preparation process is shown in Scheme
2.4. A Si (100) wafer with a protective surface film was precut into 1.4×1.4 cm2
sections, ultrasonically cleaned in successive baths of acetone, methanol, and isopropyl
alcohol to remove the protective film, and dried with nitrogen gas. A small amount of
photoresist (2-3 drops) of AZ4620 (Clariant) was spin-coated onto the wafer with a fast
acceleration rate for 30 s at 6000 rpm. The photoresist-covered wafer was soft-baked at
95 oC for 20 min and cooled to room temperature prior to application of a second layer
of photoresist, giving a final film thickness of 8.2 0.8 µm (95 confidence, n 5) by
AFM.19
The photoresist-coated wafers were placed in a furnace within a silicon glass tube, and a
forming gas atmosphere (95 nitrogen + 5 hydrogen) was flowed through the tube
during the heating and cooling phases of pyrolysis (flow rate 6 L min-1). The furnace
required several hours (ca. 10 h) to reach the maxima temperature of 1100 oC where it
was maintained ( 50 oC for 1 h. After cooling to room temperature, which typically
takes overnight, the samples were removed from the furnace and briefly sonicated (3 s)
71
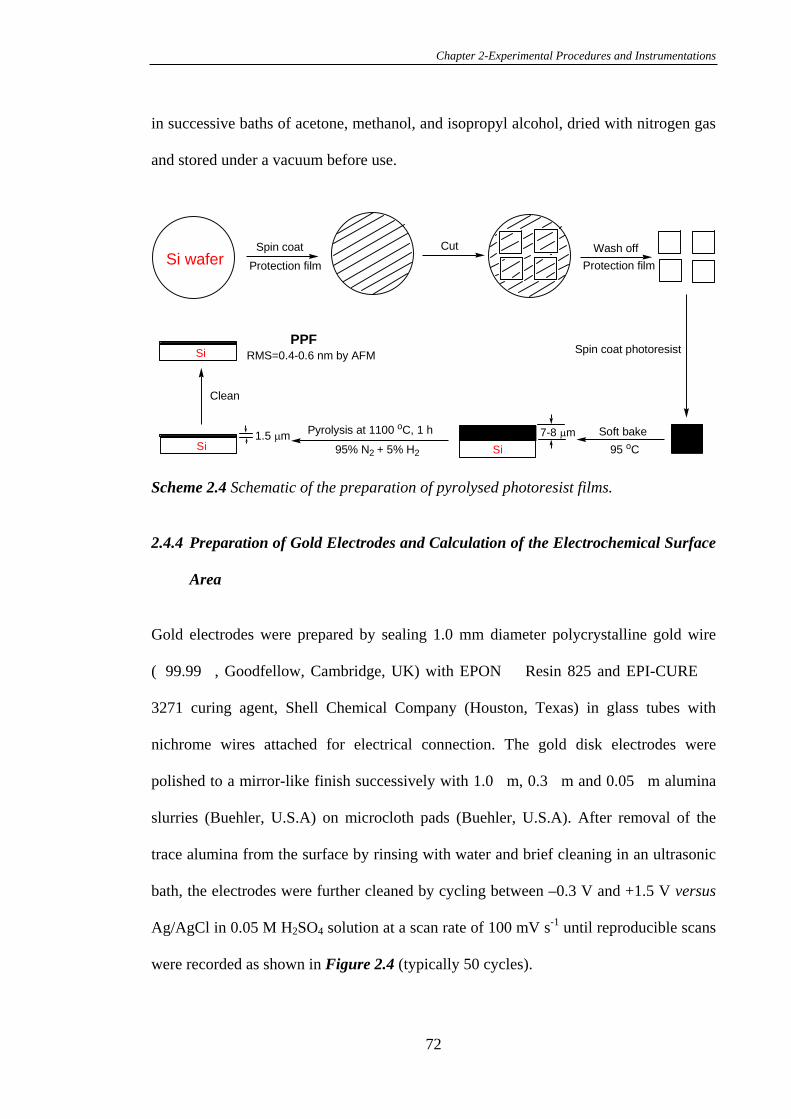
Chapter 2-Experimental Procedures and Instrumentations
in successive baths of acetone, methanol, and isopropyl alcohol, dried with nitrogen gas
and stored under a vacuum before use.
Spin coat
Protection film
Cut Wash off
Protection film
Spin coat photoresist
Soft bakePyrolysis at 1100 oC, 1 h
95% N2 + 5% H2
Si wafer
Si
Si
95 oC
7-8 m1.5 m
PPFRMS=0.4-0.6 nm by AFM
Clean
Si
Scheme 2.4 Schematic of the preparation of pyrolysed photoresist films.
2.4.4 Preparation of Gold Electrodes and Calculation of the Electrochemical Surface
Area
Gold electrodes were prepared by sealing 1.0 mm diameter polycrystalline gold wire
( 99.99 , Goodfellow, Cambridge, UK) with EPON Resin 825 and EPI-CURE
3271 curing agent, Shell Chemical Company (Houston, Texas) in glass tubes with
nichrome wires attached for electrical connection. The gold disk electrodes were
polished to a mirror-like finish successively with 1.0 m, 0.3 m and 0.05 m alumina
slurries (Buehler, U.S.A) on microcloth pads (Buehler, U.S.A). After removal of the
trace alumina from the surface by rinsing with water and brief cleaning in an ultrasonic
bath, the electrodes were further cleaned by cycling between –0.3 V and +1.5 V versus
Ag/AgCl in 0.05 M H2SO4 solution at a scan rate of 100 mV s-1 until reproducible scans
were recorded as shown in Figure 2.4 (typically 50 cycles).
72
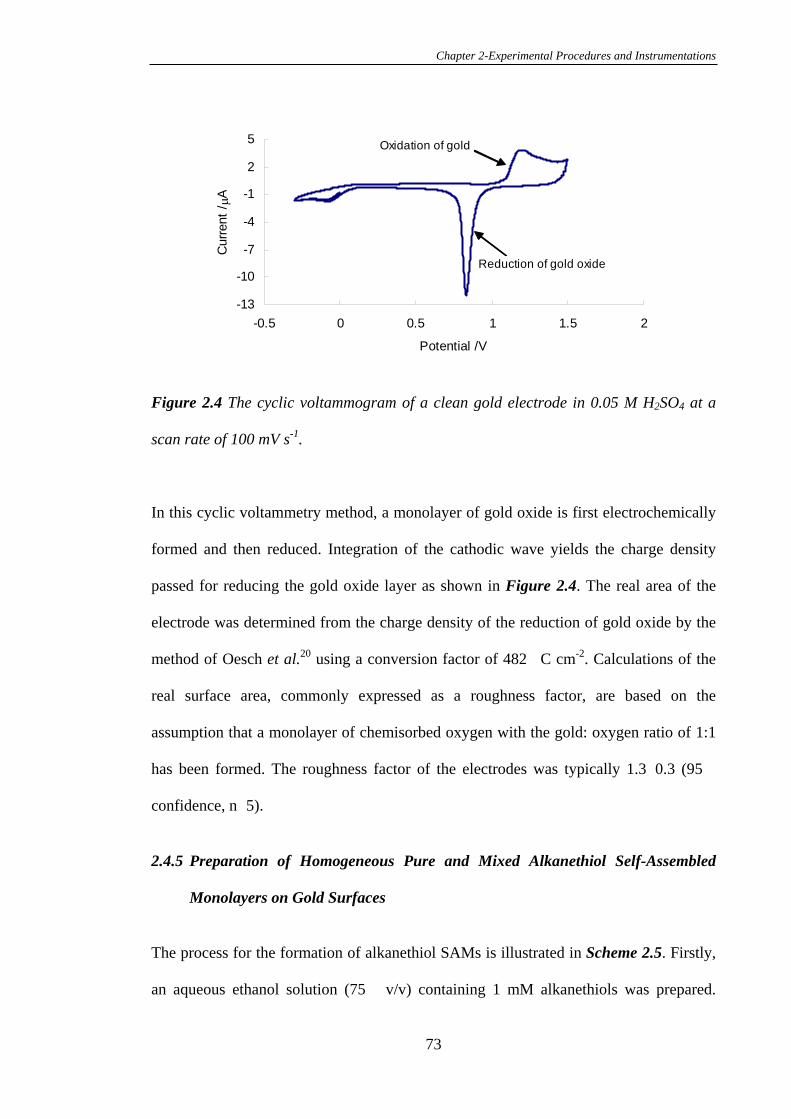
Chapter 2-Experimental Procedures and Instrumentations
-13
-10
-7
-4
-1
2
5
-0.5 0 0.5 1 1.5 2
Potential /V
Curr
ent
/A
Oxidation of gold
Reduction of gold oxide
Figure 2.4 The cyclic voltammogram of a clean gold electrode in 0.05 M H2SO4 at a
scan rate of 100 mV s-1.
In this cyclic voltammetry method, a monolayer of gold oxide is first electrochemically
formed and then reduced. Integration of the cathodic wave yields the charge density
passed for reducing the gold oxide layer as shown in Figure 2.4. The real area of the
electrode was determined from the charge density of the reduction of gold oxide by the
method of Oesch et al.20 using a conversion factor of 482 C cm-2. Calculations of the
real surface area, commonly expressed as a roughness factor, are based on the
assumption that a monolayer of chemisorbed oxygen with the gold: oxygen ratio of 1:1
has been formed. The roughness factor of the electrodes was typically 1.3 0.3 (95
confidence, n 5).
2.4.5 Preparation of Homogeneous Pure and Mixed Alkanethiol Self-Assembled
Monolayers on Gold Surfaces
The process for the formation of alkanethiol SAMs is illustrated in Scheme 2.5. Firstly,
an aqueous ethanol solution (75 v/v) containing 1 mM alkanethiols was prepared.
73
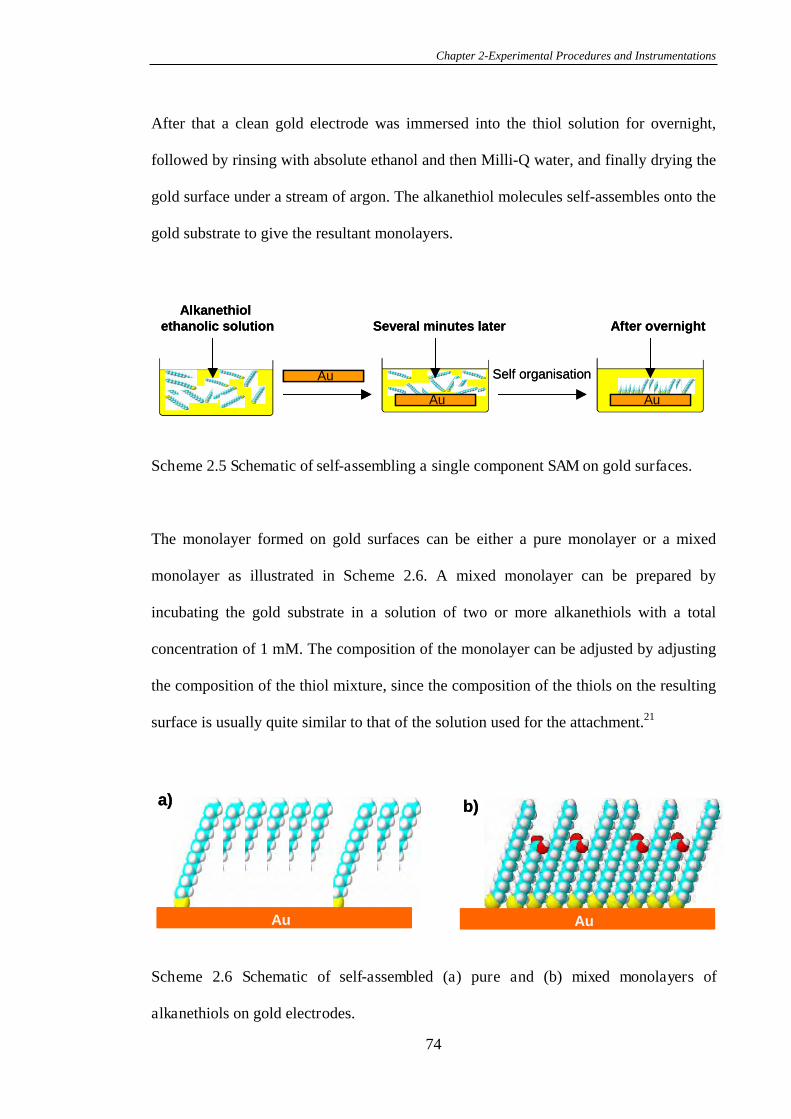
Chapter 2-Experimental Procedures and Instrumentations
After that a clean gold electrode was immersed into the thiol solution for overnight,
followed by rinsing with absolute ethanol and then Milli-Q water, and finally drying the
gold surface under a stream of argon. The alkanethiol molecules self-assembles onto the
gold substrate to give the resultant monolayers.
AuAu
Au Self organisation
Alkanethiolethanolic solution Several minutes later After overnight
AuAuAuAuAu
AuAu Self organisation
Alkanethiolethanolic solution Several minutes later After overnight
Scheme 2.5 Schematic of self-assembling a single component SAM on gold surfaces.
The monolayer formed on gold surfaces can be either a pure monolayer or a mixed
monolayer as illustrated in Scheme 2.6. A mixed monolayer can be prepared by
incubating the gold substrate in a solution of two or more alkanethiols with a total
concentration of 1 mM. The composition of the monolayer can be adjusted by adjusting
the composition of the thiol mixture, since the composition of the thiols on the resulting
surface is usually quite similar to that of the solution used for the attachment.21
Au
a) b)
AuAuAu
a) b)
AuAu
Scheme 2.6 Schematic of self-assembled (a) pure and (b) mixed monolayers of
alkanethiols on gold electrodes.
74
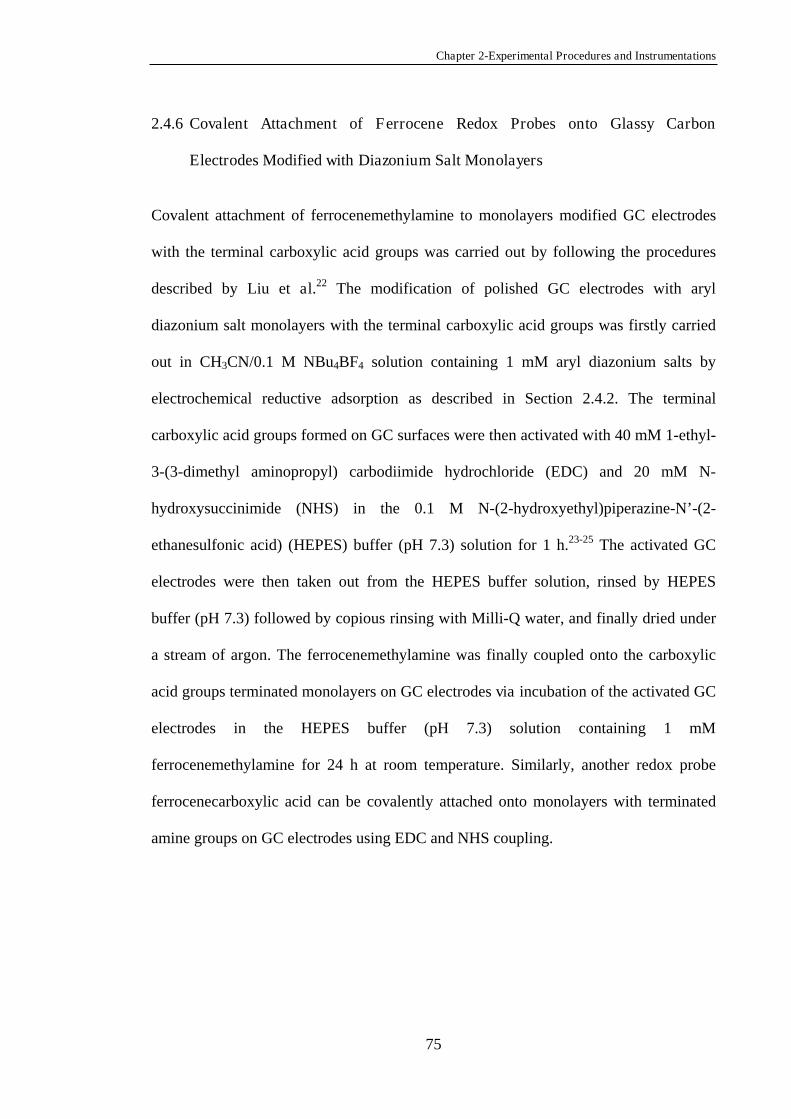
Chapter 2-Experimental Procedures and Instrumentations
2.4.6 Covalent Attachment of Ferrocene Redox Probes onto Glassy Carbon
Electrodes Modified with Diazonium Salt Monolayers
Covalent attachment of ferrocenemethylamine to monolayers modified GC electrodes
with the terminal carboxylic acid groups was carried out by following the procedures
described by Liu et al.22 The modification of polished GC electrodes with aryl
diazonium salt monolayers with the terminal carboxylic acid groups was firstly carried
out in CH3CN/0.1 M NBu4BF4 solution containing 1 mM aryl diazonium salts by
electrochemical reductive adsorption as described in Section 2.4.2. The terminal
carboxylic acid groups formed on GC surfaces were then activated with 40 mM 1-ethyl-
3-(3-dimethyl aminopropyl) carbodiimide hydrochloride (EDC) and 20 mM N-
hydroxysuccinimide (NHS) in the 0.1 M N-(2-hydroxyethyl)piperazine-N’-(2-
ethanesulfonic acid) (HEPES) buffer (pH 7.3) solution for 1 h.23-25 The activated GC
electrodes were then taken out from the HEPES buffer solution, rinsed by HEPES
buffer (pH 7.3) followed by copious rinsing with Milli-Q water, and finally dried under
a stream of argon. The ferrocenemethylamine was finally coupled onto the carboxylic
acid groups terminated monolayers on GC electrodes via incubation of the activated GC
electrodes in the HEPES buffer (pH 7.3) solution containing 1 mM
ferrocenemethylamine for 24 h at room temperature. Similarly, another redox probe
ferrocenecarboxylic acid can be covalently attached onto monolayers with terminated
amine groups on GC electrodes using EDC and NHS coupling.
75
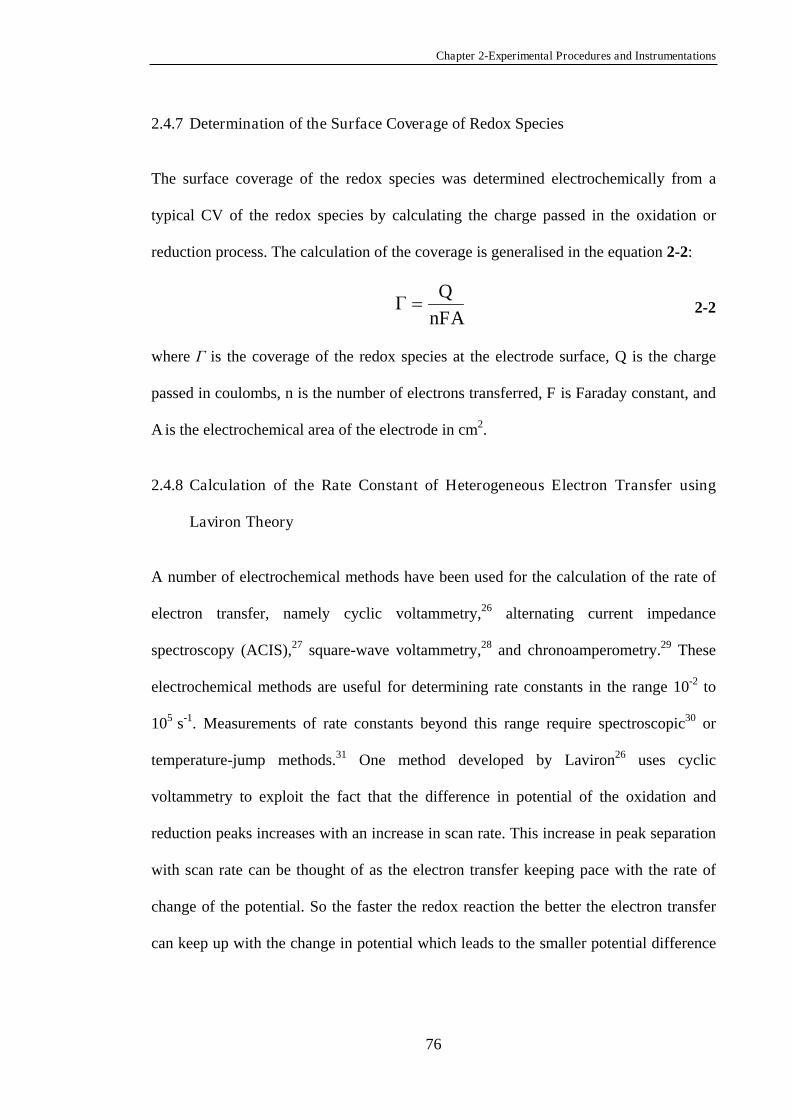
Chapter 2-Experimental Procedures and Instrumentations
2.4.7 Determination of the Surface Coverage of Redox Species
The surface coverage of the redox species was determined electrochemically from a
typical CV of the redox species by calculating the charge passed in the oxidation or
reduction process. The calculation of the coverage is generalised in the equation 2-2:
nFAQ
2-2
where is the coverage of the redox species at the electrode surface, Q is the charge
passed in coulombs, n is the number of electrons transferred, F is Faraday constant, and
A is the electrochemical area of the electrode in cm2.
2.4.8 Calculation of the Rate Constant of Heterogeneous Electron Transfer using
Laviron Theory
A number of electrochemical methods have been used for the calculation of the rate of
electron transfer, namely cyclic voltammetry,26 alternating current impedance
spectroscopy (ACIS),27 square-wave voltammetry,28 and chronoamperometry.29 These
electrochemical methods are useful for determining rate constants in the range 10-2 to
105 s-1. Measurements of rate constants beyond this range require spectroscopic30 or
temperature-jump methods.31 One method developed by Laviron26 uses cyclic
voltammetry to exploit the fact that the difference in potential of the oxidation and
reduction peaks increases with an increase in scan rate. This increase in peak separation
with scan rate can be thought of as the electron transfer keeping pace with the rate of
change of the potential. So the faster the redox reaction the better the electron transfer
can keep up with the change in potential which leads to the smaller potential difference
76
Chapter 2-Experimental Procedures and Instrumentations
between the peaks. Using this trend, the transfer coefficient and the electron transfer
rate constant can be calculated. The details of the calculation are illustrated below.
Based on Laviron theory, for a redox reaction the electron efficiency can be described
by equation 2-3:
)nv/k)(F/RT(m s 2-3
Where ks is the electron transfer rate constant, is the scan rate, n is the number of
electrons involved in the redox reaction, m is the electron efficiency, F is the Faradic
constant, T is the absolute temperature and R is the gas constant. Equation 2-3 can be
easily rewritten as equation 2-4.
)m/)(n/k)(F/RT(v s 1 2-4
Table 2.2 gives some values of n Ep as a function of 1/m for =0.5 ( is the electron
transfer coefficient; Ep is the difference in potential at current maxima between the
peak for oxidation and that for reduction). Based on Table 2.2, the relationship between
n Ep and 1/m can be illustrated in Figure 2.5. Therefore, the rate constant (ks) of
electron transfer is calculated differently at different conditions. When n Ep<200 mV,
1/m can be obtained from the function in Figure 2.5. Then according to equation 2-4, a
linear relationship is expected between 1/m and scan rate ( ), and ks can be deduced
from the slope of this linear curve.
77
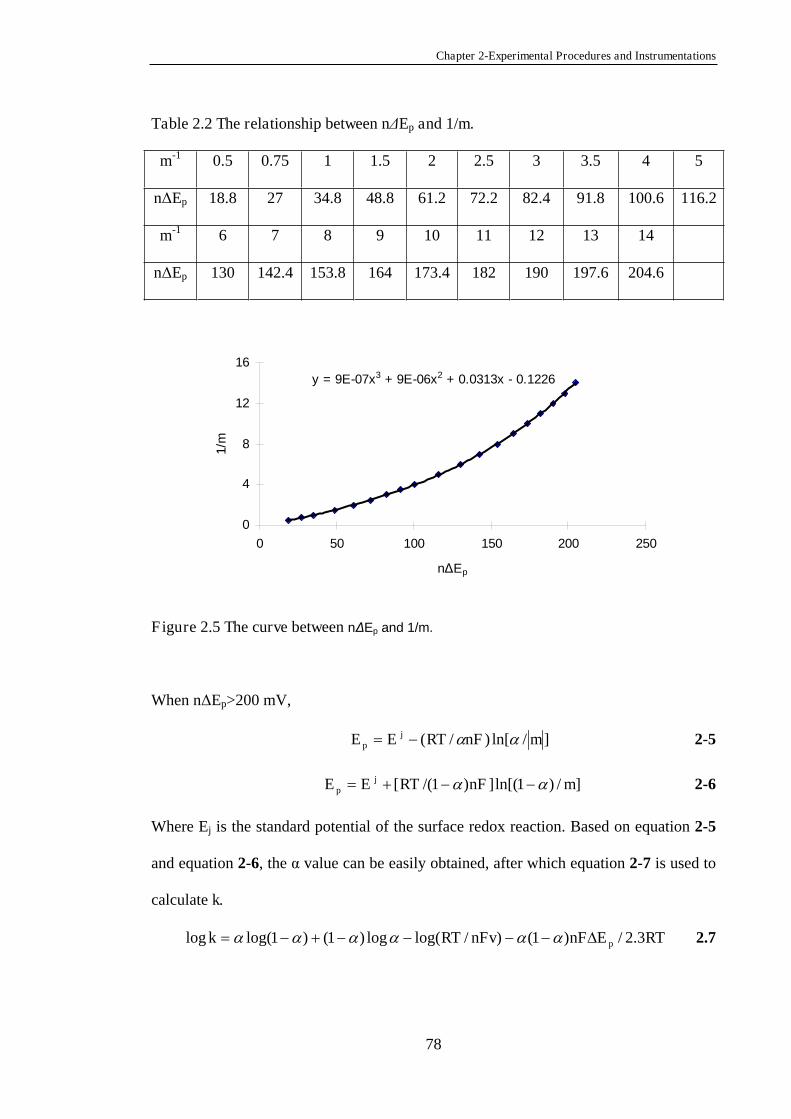
Chapter 2-Experimental Procedures and Instrumentations
Table 2.2 The relationship between n Ep and 1/m.
m-1 0.5 0.75 1 1.5 2 2.5 3 3.5 4 5
n Ep 18.8 27 34.8 48.8 61.2 72.2 82.4 91.8 100.6 116.2
m-1 6 7 8 9 10 11 12 13 14
n Ep 130 142.4 153.8 164 173.4 182 190 197.6 204.6
y = 9E-07x3 + 9E-06x2 + 0.0313x - 0.1226
0
4
8
12
16
0 50 100 150 200 250
n Ep
1/m
Figure 2.5 The curve between n Ep and 1/m.
When n Ep>200 mV,
]/ln[)/( mnFRTEE jp 2-5
]/)1ln[(])1/([ mnFRTEE jp 2-6
Where Ej is the standard potential of the surface redox reaction. Based on equation 2-5
and equation 2-6, the value can be easily obtained, after which equation 2-7 is used to
calculate k.
RTEnFnFvRTk p 3.2/)1()/log(log)1()1log(log 2.7
78
Chapter 2-Experimental Procedures and Instrumentations
It is important however to appreciate the limitations of the Laviron method. The Laviron
method assumes the Butler-Volmer theory applies. This is certainly the case with high
reorganisation energy (>2.0 eV). For reorganisation energies below about 2.0 eV,
voltammograms are predicted to be broader and peak potentials are in most cases
predicted to shift further from the formal potential. In this case, the rate constant of
electron transfer can be calculated by the Marcus theory.32 All rates of electron transfer
in this project were calculated by the Laviron method.
2.5 References
(1) Saby, C., Ortiz, B., Champagne, G.Y., Belanger, D., Langmuir 1997, 13, 6805-
6813.
(2) Downard, A.J., Prince, M.J., Langmuir 2001, 17, 5581-5586.
(3) Kraatz, H.B., J. Organomet. Chem. 1999, 579, 222-226.
(4) Ossola, F., Tomasin, P., Benetollo, F., Foresti, E., Vigato, P.A., Inorg. Chim.
Acta 2003, 353, 292-300.
(5) Kosynkin, D.V., Tour, J.M., Org. Lett. 2001, 3, 993-995.
(6) Tour, J.M., Rawlett, A.M., Kozaki, M., Yao, Y.X., Jagessar, R.C., Dirk, S.M.,
Price, D.W., Reed, M.A., Zhou, C., Chen, J., Wang, W., Campbell, I., Chem.
Eur. J. 2001, 7, 5118-5134.
(7) Tohji, K., Goto, T., Takahashi, H., Shinoda, Y., Shimizu, N., Jeyadevan, B.,
Matsuoka, I., Saito, Y., Kasuya, A., Ohsuna, T., Hiraga, H., Nishina, Y., Nature
1996, 383, 679-679.
(8) Suffert, J., Ziessel, R., Tetrahedron Lett. 1991, 32, 757-760.
(9) Stephens, R.D., Castro, C.E., J. Org. Chem. 1963, 28, 3313-3315.
(10) Corey, E.J., Szekely, I., Shiner, C.S., Tetrahedron Lett. 1977, 18, 3529-3533.
79
Chapter 2-Experimental Procedures and Instrumentations
(11) Bahr, J.L., Yang, J., Kosynkin, D.V., Bronikowski, M.J., Smalley, R.E., Tour,
J.M., J. Am. Chem. Soc. 2001, 123, 6536-6542.
(12) O'Dea, J.J., Osteryoung, J., Osteryoung, R.A., Anal. Chem. 1981, 53, 695-701.
(13) Zittel, H.E., Miller, F.J., Anal. Chem. 1965, 37, 200-203.
(14) Sawyer, D.T., Sobkowiak, A., Roberts, J.L., Experimental Electrochemistry for
Chemists. Wiley: New York, 1995; p 74-75.
(15) Pontikos, N.M., McCreery, R.L., J. Electroanal. Chem. 1992, 324, 229-242.
(16) Bourdillon, C., Delamar, M., Demaille, C., Hitmi, R., Moiroux, J., Pinson, J., J.
Electroanal. Chem. 1992, 336, 113-23.
(17) Gooding, J.J., Mearns, F., Yang, W.R., Liu, J.Q., Electroanalysis 2003, 15, 81-
96.
(18) Ranganathan, S., McCreery, R.L., Anal. Chem. 2001, 73, 893-900.
(19) Brooksby, P.A., Downard, A.J., Langmuir 2004, 20, 5038-5045.
(20) Oesch, U., Janata, J., Electrochim. Acta 1983, 28, 1237-1246.
(21) Gooding, J.J., In Encyclopedia of Nanoscience and Nanotechnology, Nalwa,
H.S., Ed. American Scientific Publishing: California, 2004; Vol. 1, pp 17-49.
(22) Liu, J.Q., Paddon-Row, M.N., Gooding, J.J., J. Phys. Chem. B 2004, 108, 8460-
8466.
(23) Yang, W., Jaramillo, D., Gooding, J.J., Hibbert, D.B., Zhang, R., Willett, G.D.,
Fisher, K.J., Chem. Commun. 2001, 1982-1983.
(24) Staros, J.V., Wright, R.W., Swingle, D.M., Anal. Biochem. 1986, 156, 220-2.
(25) Yang, W.R., Gooding, J.J., Hibbert, D.B., Analyst 2001, 126, 1573-1577.
(26) Laviron, E., J. Electroanal. Chem. 1979, 101, 19-28.
(27) Laviron, E., J. Electroanal Chem. 1975, 97, 135-149.
(28) Reeves, J.H., Song, S., Bowden, E.F., Anal. Chem. 1993, 65, 683-689.
80
Chapter 2-Experimental Procedures and Instrumentations
(29) Chidsey, C.E.D., Science 1991, 251, 919-922.
(30) Ye, S., Yashiro, A., Sato, Y., Uosaki, K., J. Chem. Soc. Faraday Trans. 1996,
92, 3813-1821.
(31) Smalley, J.F., Feldberg, S.W., Chidsey, C.E.D., Linford, M.R., Newton, M.D.,
Liu, Y.P., J. Phys.Chem. 1995, 99, 13141-13149.
(32) Weber, K., Creager, S.E., Anal. Chem. 1994, 66, 3164-3172.
81
Chapter3-Covalent Modification of Electrode Surfaces by Electrochemical Reduction of Aryl Diazonium Salts
Chapter Three
Covalent Modification of Electrode Surfaces by Electrochemical
Reduction of Aryl Diazonium Salts
82
Chapter -Covalent Modification of Electrode Surfaces by Electrochemical Reduction of Aryl Diazonium Salts
3.1 Introduction
In light of the introduction in Chapter One on the advantages of monolayer modification
in electron transfer,1, 2 molecular electronics,3, 4 bioelectronics5, 6 and sensors,7 and the
disadvantages of the commonly used alkanethiol chemistry on gold surfaces, an
alternative monolayer system to gold-thiol chemistry is desirable. This alternative
should overcome some of the disadvantages without severely compromising the
advantages of gold/thiol chemistry. The electrochemical reduction of aryl diazonium
salts is one possible alternative which has been used as a method for the covalent
derivatisation of carbon surfaces.8-10 The reduction reaction results in the loss of N2 and
the formation of a carbon-carbon covalent bond between the adsorbed molecules and
carbon substrates which is strong, stable over both time and temperature, nonpolar and
conjugated.11 The attractiveness of aryl diazonium salts is enhanced further by recent
studies showing that they can also be grafted onto a variety of metal12, 13 and
semiconductor14 surfaces as well as carbon nanotubes.15 This feature raises the exciting
possibility of one monolayer forming system being suitable for a large range of
electrode materials for a diverse range of applications.
The purpose of this chapter is to investigate the strategy for covalent modification of
glassy carbon (GC) and gold substrates with monolayers of aryl diazonium salts by
electrochemical reduction to study the possibility of GC electrodes serving as an
alternative to gold electrodes. The stability of monolayers of aryl diazonium salts on GC
and gold electrode surfaces has been studied. For comparison the stability of self-
83
Chapter -Covalent Modification of Electrode Surfaces by Electrochemical Reduction of Aryl Diazonium Salts
assembled monolayers (SAMs) of alkanethiols on gold surfaces has been also
investigated.
3.2 Experimental Section
All reagents and materials are listed in Table 2.1 in Chapter Two or prepared according
to the procedures described in Chapter Two. GC and gold electrodes were prepared
according to the method described in Section 2.4. All solutions of monolayers were
prepared as described in Section 2.4.2. All electrochemical measurements were
performed with a BAS-l00B electrochemical analyser. All potentials were quoted
relative to an Ag/AgCl reference at room temperature. All cyclic voltammetry
measurements were performed in phosphate buffer (0.05 M, 0.05 M KCl, pH 7.0).
3.3 Results and Discussion
3.3.1 Influence of Scan Rates on the Capacitance of Bare Glassy Carbon Electrodes
in Aqueous and Nonaqueous Electrolytes
The capacitive current, which is attributed to the charging and the discharging of the
interfacial electrical double layer, provides information regarding the accessibility of the
electrode to ions.16 In the case of monolayer modified electrodes the thickness of the
monolayer and the level of defects will influence the accessibility of ions. Therefore,
measurement of the electrochemical capacitance provides a means of investigating the
surface properties of electrodes.17-19 Double layer capacitances (Cdl) were determined
using cyclic voltammetry20 by scanning the electrode between a potential window in a
supporting electrolyte where the charging current was independent of the applied
voltage (i.e. no Faradaic process occurring). The following equation 3-1 is applied:
84
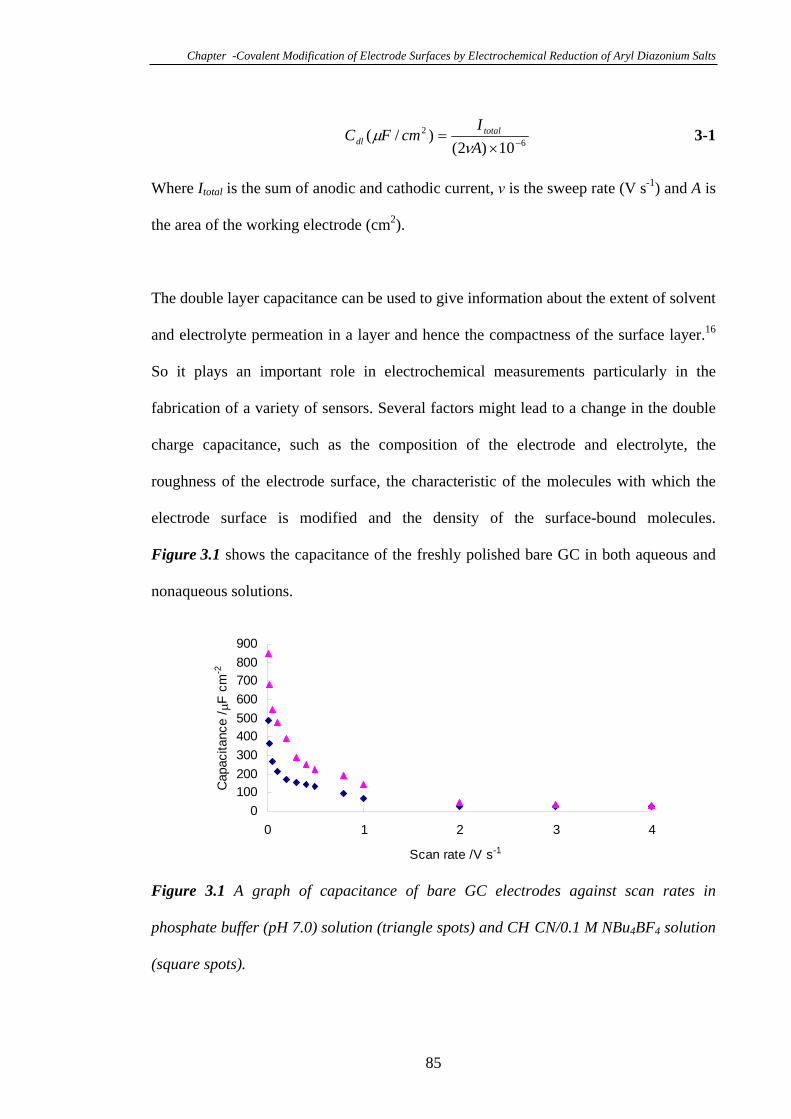
Chapter -Covalent Modification of Electrode Surfaces by Electrochemical Reduction of Aryl Diazonium Salts
62
10)2()/(
AIcmFC total
dl 3-1
Where Itotal is the sum of anodic and cathodic current, is the sweep rate (V s-1) and A is
the area of the working electrode (cm2).
The double layer capacitance can be used to give information about the extent of solvent
and electrolyte permeation in a layer and hence the compactness of the surface layer.16
So it plays an important role in electrochemical measurements particularly in the
fabrication of a variety of sensors. Several factors might lead to a change in the double
charge capacitance, such as the composition of the electrode and electrolyte, the
roughness of the electrode surface, the characteristic of the molecules with which the
electrode surface is modified and the density of the surface-bound molecules.
Figure 3.1 shows the capacitance of the freshly polished bare GC in both aqueous and
nonaqueous solutions.
0
100
200
300
400
500
600
700
800
900
0 1 2 3
Scan rate /V s-1
Capacitance /
F c
m-2
4
Figure 3.1 A graph of capacitance of bare GC electrodes against scan rates in
phosphate buffer (pH 7.0) solution (triangle spots) and CH CN/0.1 M NBu4BF4 solution
(square spots).
85
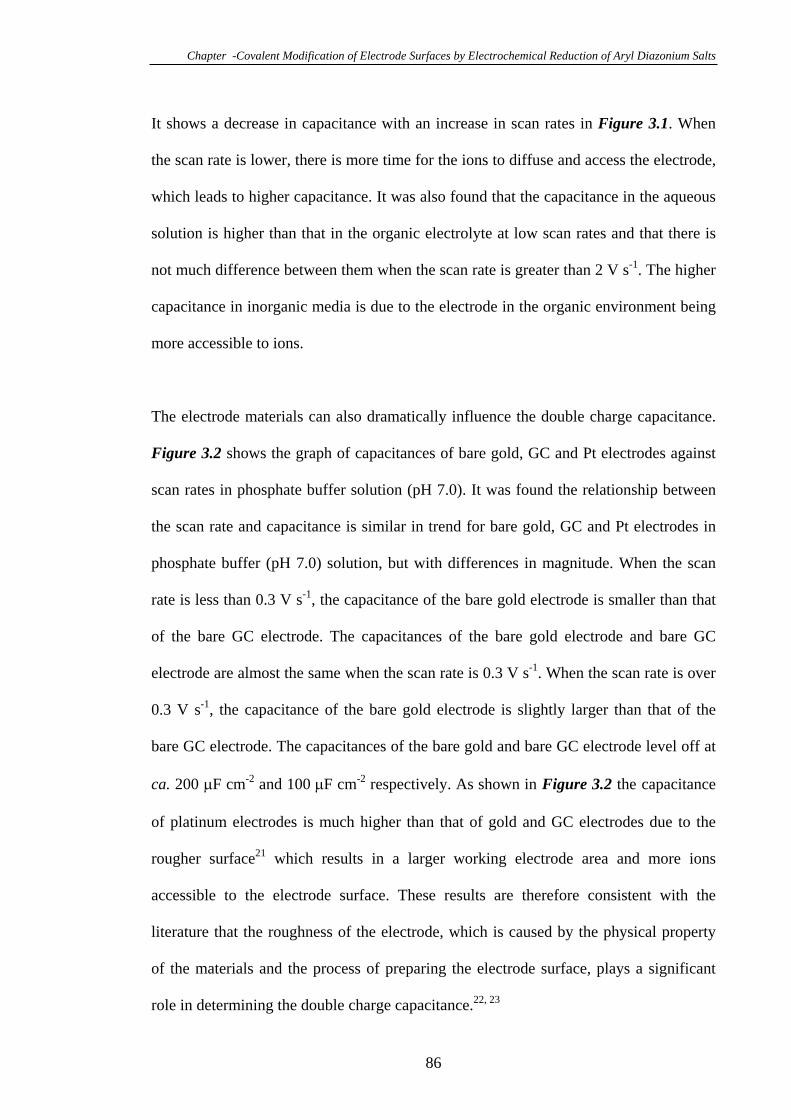
Chapter -Covalent Modification of Electrode Surfaces by Electrochemical Reduction of Aryl Diazonium Salts
It shows a decrease in capacitance with an increase in scan rates in Figure 3.1. When
the scan rate is lower, there is more time for the ions to diffuse and access the electrode,
which leads to higher capacitance. It was also found that the capacitance in the aqueous
solution is higher than that in the organic electrolyte at low scan rates and that there is
not much difference between them when the scan rate is greater than 2 V s-1. The higher
capacitance in inorganic media is due to the electrode in the organic environment being
more accessible to ions.
The electrode materials can also dramatically influence the double charge capacitance.
Figure 3.2 shows the graph of capacitances of bare gold, GC and Pt electrodes against
scan rates in phosphate buffer solution (pH 7.0). It was found the relationship between
the scan rate and capacitance is similar in trend for bare gold, GC and Pt electrodes in
phosphate buffer (pH 7.0) solution, but with differences in magnitude. When the scan
rate is less than 0.3 V s-1, the capacitance of the bare gold electrode is smaller than that
of the bare GC electrode. The capacitances of the bare gold electrode and bare GC
electrode are almost the same when the scan rate is 0.3 V s-1. When the scan rate is over
0.3 V s-1, the capacitance of the bare gold electrode is slightly larger than that of the
bare GC electrode. The capacitances of the bare gold and bare GC electrode level off at
ca. 200 F cm-2 and 100 F cm-2 respectively. As shown in Figure 3.2 the capacitance
of platinum electrodes is much higher than that of gold and GC electrodes due to the
rougher surface21 which results in a larger working electrode area and more ions
accessible to the electrode surface. These results are therefore consistent with the
literature that the roughness of the electrode, which is caused by the physical property
of the materials and the process of preparing the electrode surface, plays a significant
role in determining the double charge capacitance.22, 23
86
Chapter -Covalent Modification of Electrode Surfaces by Electrochemical Reduction of Aryl Diazonium Salts
0
500
1000
1500
2000
2500
3000
3500
0 0.2 0.4 0.6 0.8
Scan rate /V s-1
Capacitance /
F c
m-2
Au
GC
Pt
Figure 3.2 The graph of capacitances of bare gold, GC and Pt electrodes against scan
rates in the phosphate buffer solution (pH 7.0).
3.3.2 Modification of Glassy Carbon Electrodes with Aryl Diazonium Salts by
Electrochemical Reductive Adsorption
The electrochemically assisted covalent modification of carbon electrodes has been
explored by a few groups.10, 24-27 The most frequently used methods for the modification
of GC surfaces is the reductive adsorption of aryl diazonium salts. Scheme 3.1 shows
the schematic of modification of 4-carboxyphenyl diazonium salts (CP) on GC
electrodes. In order to achieve this kind of modification, two methods can be used. One
is by poising the electrode at a reducing potential and the other is by repeated cycling.
Downard and Prince28 have reported the surface coverage and the blocking properties of
diazonium–derived surface layers depending on the potential used for film formation. It
is worth investigating the influence of the modification method on the quality of the
monolayers. The commonly used ferricyanide was selected as the redox probe to
achieve this purpose because the blocking properties of monolyers can be tested easily
in ferricyanide. The interfacial capacitance can be used to evaluate the compactness or
87
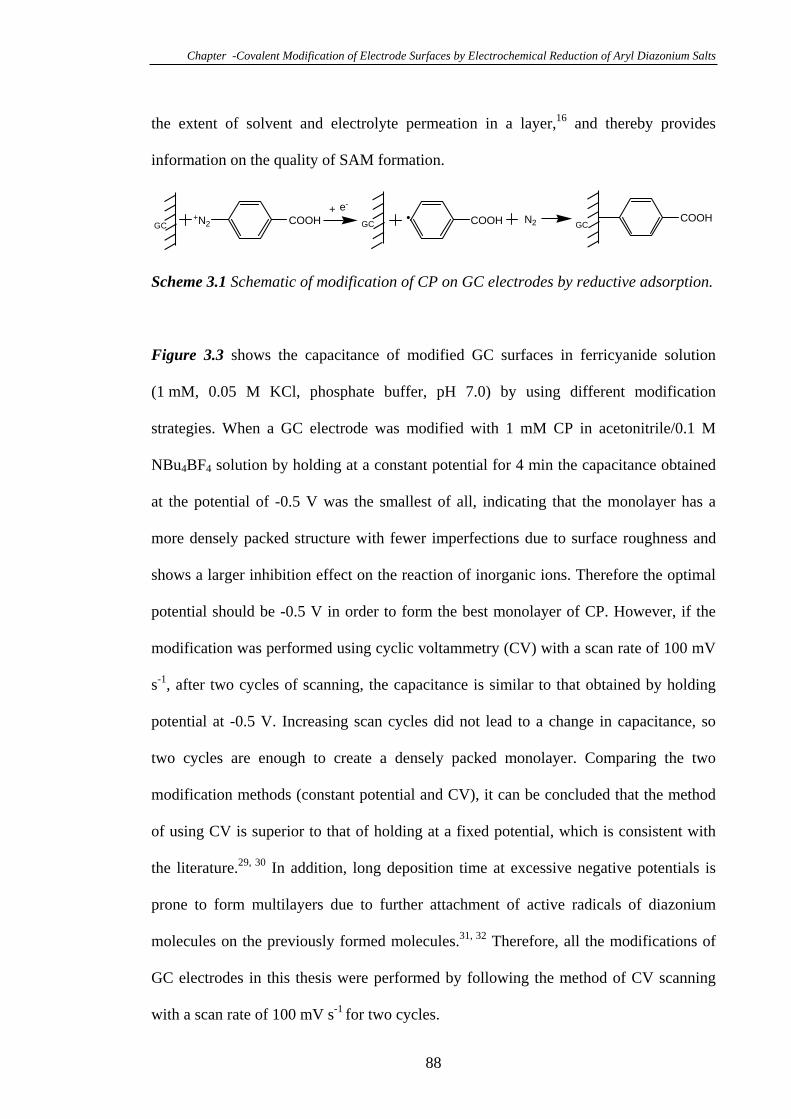
Chapter -Covalent Modification of Electrode Surfaces by Electrochemical Reduction of Aryl Diazonium Salts
the extent of solvent and electrolyte permeation in a layer,16 and thereby provides
information on the quality of SAM formation.
+N2 COOH N2COOH
GC.e-
GCGCCOOH
+
Scheme 3.1 Schematic of modification of CP on GC electrodes by reductive adsorption.
Figure 3.3 shows the capacitance of modified GC surfaces in ferricyanide solution
(1 mM, 0.05 M KCl, phosphate buffer, pH 7.0) by using different modification
strategies. When a GC electrode was modified with 1 mM CP in acetonitrile/0.1 M
NBu4BF4 solution by holding at a constant potential for 4 min the capacitance obtained
at the potential of -0.5 V was the smallest of all, indicating that the monolayer has a
more densely packed structure with fewer imperfections due to surface roughness and
shows a larger inhibition effect on the reaction of inorganic ions. Therefore the optimal
potential should be -0.5 V in order to form the best monolayer of CP. However, if the
modification was performed using cyclic voltammetry (CV) with a scan rate of 100 mV
s-1, after two cycles of scanning, the capacitance is similar to that obtained by holding
potential at -0.5 V. Increasing scan cycles did not lead to a change in capacitance, so
two cycles are enough to create a densely packed monolayer. Comparing the two
modification methods (constant potential and CV), it can be concluded that the method
of using CV is superior to that of holding at a fixed potential, which is consistent with
the literature.29, 30 In addition, long deposition time at excessive negative potentials is
prone to form multilayers due to further attachment of active radicals of diazonium
molecules on the previously formed molecules.31, 32 Therefore, all the modifications of
GC electrodes in this thesis were performed by following the method of CV scanning
with a scan rate of 100 mV s-1 for two cycles.
88
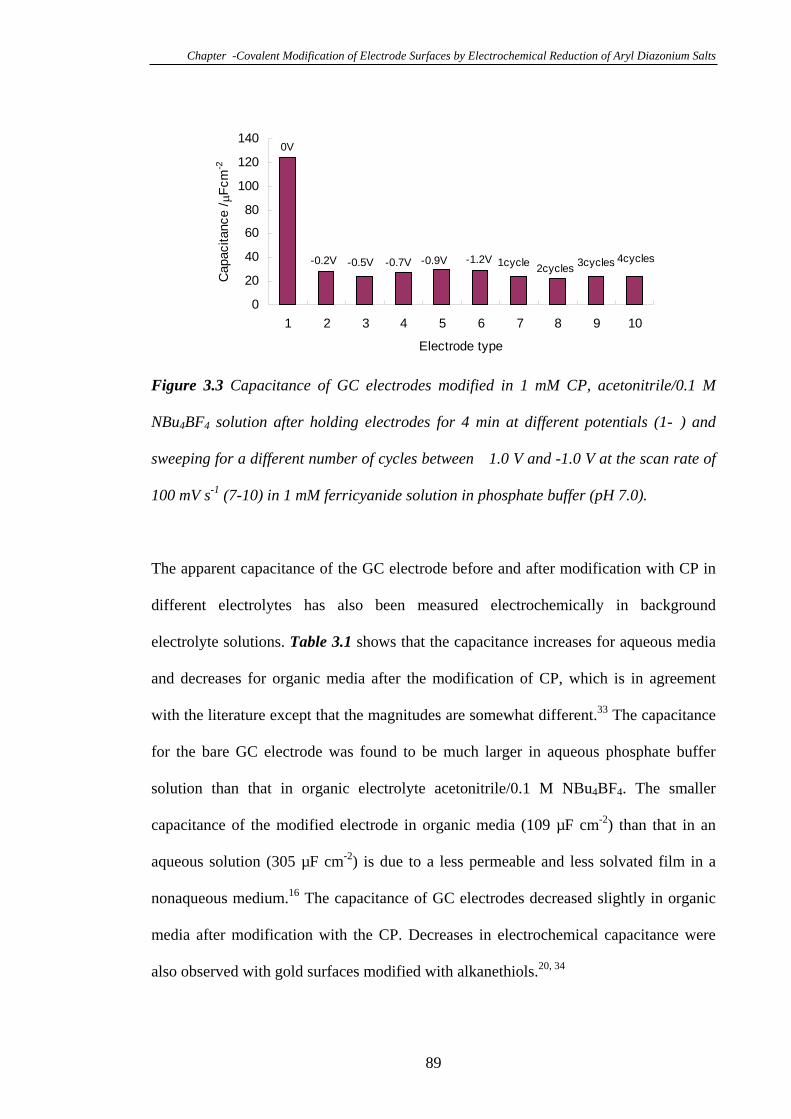
Chapter -Covalent Modification of Electrode Surfaces by Electrochemical Reduction of Aryl Diazonium Salts
0
20
40
60
80
100
120
140
1 2 3 4 5 6 7 8 9 10
Electrode type
Capacitance /
Fcm
-2
0V
-0.2V -0.5V -0.7V -0.9V -1.2V 1cycle2cycles
3cycles 4cycles
Figure 3.3 Capacitance of GC electrodes modified in 1 mM CP, acetonitrile/0.1 M
NBu4BF4 solution after holding electrodes for 4 min at different potentials (1- ) and
sweeping for a different number of cycles between 1.0 V and -1.0 V at the scan rate of
100 mV s-1 (7-10) in 1 mM ferricyanide solution in phosphate buffer (pH 7.0).
The apparent capacitance of the GC electrode before and after modification with CP in
different electrolytes has also been measured electrochemically in background
electrolyte solutions. Table 3.1 shows that the capacitance increases for aqueous media
and decreases for organic media after the modification of CP, which is in agreement
with the literature except that the magnitudes are somewhat different.33 The capacitance
for the bare GC electrode was found to be much larger in aqueous phosphate buffer
solution than that in organic electrolyte acetonitrile/0.1 M NBu4BF4. The smaller
capacitance of the modified electrode in organic media (109 µF cm-2) than that in an
aqueous solution (305 µF cm-2) is due to a less permeable and less solvated film in a
nonaqueous medium.16 The capacitance of GC electrodes decreased slightly in organic
media after modification with the CP. Decreases in electrochemical capacitance were
also observed with gold surfaces modified with alkanethiols.20, 34
89
Chapter -Covalent Modification of Electrode Surfaces by Electrochemical Reduction of Aryl Diazonium Salts
Table 3.1 The double layer charging capacitance of GC electrodes in phosphate buffer
(pH 7.0) and acetonitrile before and after modification of CP.
Capacitance (µF cm-2) at 100 mV s-1GC electrode
Phosphate buffer solution Acetonitrile solution
Bare
CP Modified
250
305
131
109
3.3.3 Electrochemistry of a Glassy Carbon Electrode Modified with 4-Carboxyphenyl
Diazonium Tetrafluoroborate
Cyclic voltammetry was carried out with a freshly polished GC electrode in a 1 mM CP
and 0.1 M NBu4BF4 solution in acetonitrile (Figure 3.4 a). The first sweep gave the
irreversible reduction wave at ca. -0.16 V versus Ag/AgCl, which was attributed to the
formation of the 4-carboxyphenyl radical from the diazonium derivative due to one
electron transfer redox reaction.9, 26, 33 The peak due to the Faradaic process disappeared
completely after the first cycle which implies that the electrode surface has been
occupied by the aryl diazonium salt molecules and the free molecules in the solution can
not access the electrode anymore.9, 26, 33 The surface coverage of the modified layer
could be estimated through integration of the redox peaks of CP in acetonitrile/0.1 M
NBu4BF4 solution. It appears that the surface coverage can be controlled through
controlling the concentration of the aryl diazonium salts, but the surface coverage of CP
reached saturation when the concentration of the aryl diazonium salts was greater than
5 mM (Figure 3.4 b). Based on the area of the reduction peak in Figure 3.4 a, the
coverage of the CP was calculated to be 7.4×10⁻¹⁰ mol cm-2 when the modification was
carried out in a 1 mM CP solution. The reported surface coverage on GC substrates
varies in the range of 4-30×10-10 mol cm-2.35 The theoretical surface coverage of
90
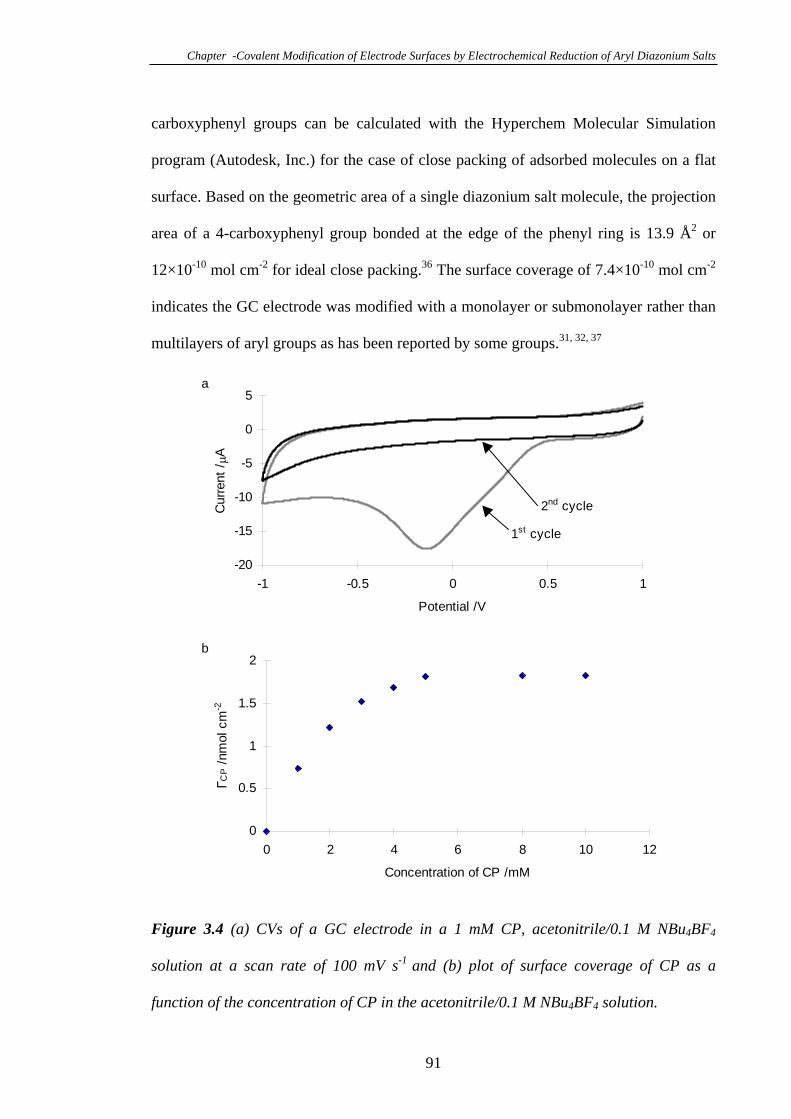
Chapter -Covalent Modification of Electrode Surfaces by Electrochemical Reduction of Aryl Diazonium Salts
carboxyphenyl groups can be calculated with the Hyperchem Molecular Simulation
program (Autodesk, Inc.) for the case of close packing of adsorbed molecules on a flat
surface. Based on the geometric area of a single diazonium salt molecule, the projection
area of a 4-carboxyphenyl group bonded at the edge of the phenyl ring is 13.9 Å2 or
12×10-10 mol cm-2 for ideal close packing.36 The surface coverage of 7.4×10⁻¹⁰ mol cm-2
indicates the GC electrode was modified with a monolayer or submonolayer rather than
multilayers of aryl groups as has been reported by some groups.31, 32, 37
0
0.5
1
1.5
2
0 2 4 6 8 10 1
Concentration of CP /mM
CP /
nm
ol cm
-2
b
2
-20
-15
-10
-5
0
5
-1 -0.5 0 0.5 1
Potential /V
Curr
ent
/A
1st cycle
2nd cycle
a
Figure 3.4 (a) CVs of a GC electrode in a 1 mM CP, acetonitrile/0.1 M NBu4BF4
solution at a scan rate of 100 mV s-1 and (b) plot of surface coverage of CP as a
function of the concentration of CP in the acetonitrile/0.1 M NBu4BF4 solution.
91
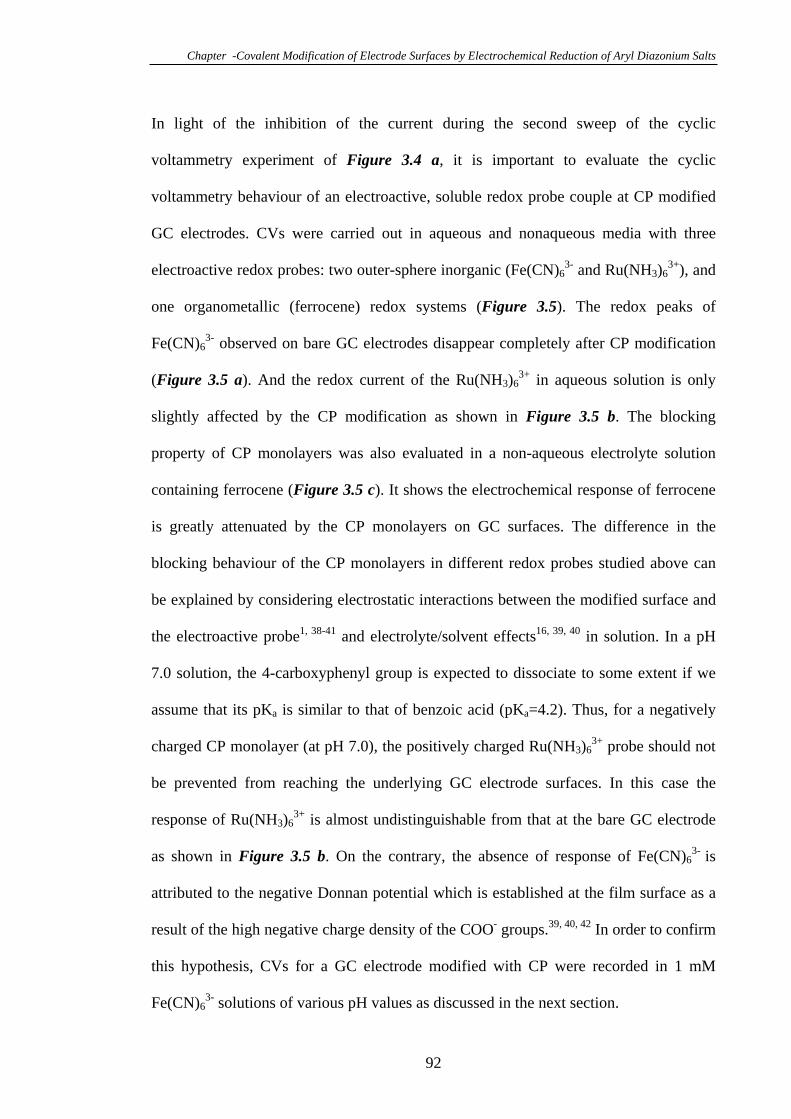
Chapter -Covalent Modification of Electrode Surfaces by Electrochemical Reduction of Aryl Diazonium Salts
In light of the inhibition of the current during the second sweep of the cyclic
voltammetry experiment of Figure 3.4 a, it is important to evaluate the cyclic
voltammetry behaviour of an electroactive, soluble redox probe couple at CP modified
GC electrodes. CVs were carried out in aqueous and nonaqueous media with three
electroactive redox probes: two outer-sphere inorganic (Fe(CN)63- and Ru(NH3)6
3+), and
one organometallic (ferrocene) redox systems (Figure 3.5). The redox peaks of
Fe(CN)63- observed on bare GC electrodes disappear completely after CP modification
(Figure 3.5 a). And the redox current of the Ru(NH3)63+ in aqueous solution is only
slightly affected by the CP modification as shown in Figure 3.5 b. The blocking
property of CP monolayers was also evaluated in a non-aqueous electrolyte solution
containing ferrocene (Figure 3.5 c). It shows the electrochemical response of ferrocene
is greatly attenuated by the CP monolayers on GC surfaces. The difference in the
blocking behaviour of the CP monolayers in different redox probes studied above can
be explained by considering electrostatic interactions between the modified surface and
the electroactive probe1, 38-41 and electrolyte/solvent effects16, 39, 40 in solution. In a pH
7.0 solution, the 4-carboxyphenyl group is expected to dissociate to some extent if we
assume that its pKa is similar to that of benzoic acid (pKa=4.2). Thus, for a negatively
charged CP monolayer (at pH 7.0), the positively charged Ru(NH3)63+ probe should not
be prevented from reaching the underlying GC electrode surfaces. In this case the
response of Ru(NH3)63+ is almost undistinguishable from that at the bare GC electrode
as shown in Figure 3.5 b. On the contrary, the absence of response of Fe(CN)63- is
attributed to the negative Donnan potential which is established at the film surface as a
result of the high negative charge density of the COO- groups.39, 40, 42 In order to confirm
this hypothesis, CVs for a GC electrode modified with CP were recorded in 1 mM
Fe(CN)63- solutions of various pH values as discussed in the next section.
92
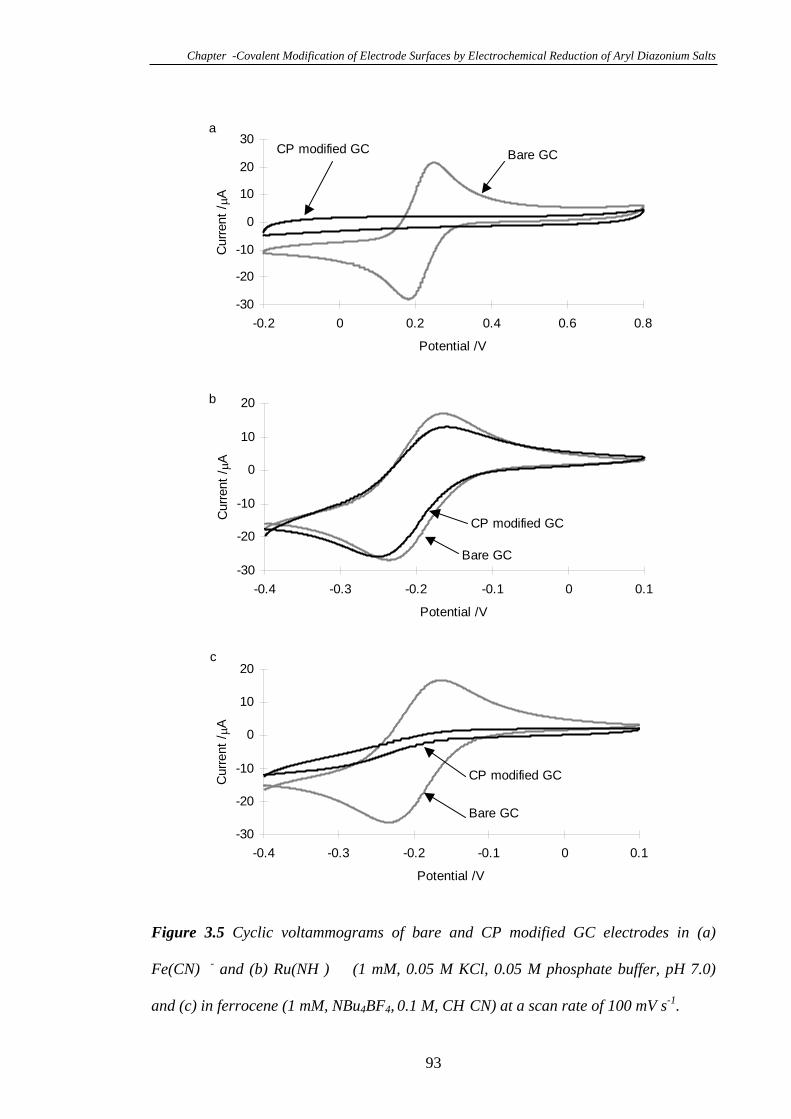
Chapter -Covalent Modification of Electrode Surfaces by Electrochemical Reduction of Aryl Diazonium Salts
-30
-20
-10
0
10
20
30
-0.2 0 0.2 0.4 0.6 0.8
Potential /V
Curr
ent
/A
CP modified GC
a
Bare GC
-30
-20
-10
0
10
20
-0.4 -0.3 -0.2 -0.1 0 0.1
Potential /V
Curr
ent
/A
CP modified GC
b
Bare GC
-30
-20
-10
0
10
20
-0.4 -0.3 -0.2 -0.1 0 0.1
Potential /V
Curr
ent
/A
CP modified GC
c
Bare GC
Figure 3.5 Cyclic voltammograms of bare and CP modified GC electrodes in (a)
Fe(CN) - and (b) Ru(NH ) (1 mM, 0.05 M KCl, 0.05 M phosphate buffer, pH 7.0)
and (c) in ferrocene (1 mM, NBu4BF4, 0.1 M, CH CN) at a scan rate of 100 mV s-1.
93
Chapter -Covalent Modification of Electrode Surfaces by Electrochemical Reduction of Aryl Diazonium Salts
3.3.4 Effect of Solution pH on the Blocking Property of the 4-Carboxyphenyl Groups
Modified on Glassy Carbon Electrodes
To confirm the electrostatic interaction between the modified surface and electroactive
probe, Fe(CN)63- was used as a redox probe to test the effect of pH of the electrolyte on
its electrochemical response. Figure 3.6 shows that the anodic peak current of CVs
decreases with an increase in pH. As the pH increases, the terminal carboxylic acid
groups on the monolayer surface deprotonated to form a negatively charged interface
which then prevents the access of the negatively charged Fe(CN)63- redox species from
reaching the underlying GC electrode surface. At low pH values, the carboxylic acid
groups will remain in the neutral form and the negatively charged Fe(CN)63- can more
easily penetrate the neutral monolayer surface. These experiments show the carboxylic
acid groups modified on GC surfaces appear either as -COOH or as -COO- depending
on the pH of the solution in which the electrode has been exposed. Similar pH-
modulated electrochemical responses for Fe(CN)63- have been reported in the literature
for alkanethiols with COOH and NH2 terminal groups.1, 39, 40 According to the
literature43, the surface pKa of monolayer can be determined from the current parameter
of CVs in phosphate buffer with different pH. The surface pKa of the CP monolayer on
GC surfaces estimated from the Ipa–pH curve of Figure 3.6 is 2.41. This value is
smaller than that expected for benzoic acid in bulk solution (pKa 4.2).44 It should be
noted that the surfaces’ pKa values are frequently different from that in bulk solution
due to the formation of stable intermolecular hydrogen bonding.43, 45 Hydrogen bond
formation between the atoms of terminal carboxyl causes the protons of carboxyl to be
held more tightly on the monolayer surface. Thus, the deprotonation of the carboxylic
acid groups becomes more difficult, leading to the decrease in the surface pKa.
94
Chapter -Covalent Modification of Electrode Surfaces by Electrochemical Reduction of Aryl Diazonium Salts
0
2
4
6
8
10
12
14
0 2 4 6 8
pH
Curr
ent
/A
10
Figure 3.6 Plot of the anodic peak current from cyclic voltammograms as a function of
solution pH. CVs were recorded at a CP modified GC electrode in 0.05 M phosphate
buffer solutions with different pH values containing 1 mM Fe(CN) - at a scan rate of
100 mV s-1.
3.3.5 Characterisation of 4-Carboxyphenyl Modified Glassy Carbon Surfaces Using
X-ray Photoelectron Spectroscopy
X-ray Photoelectron Spectroscopy (XPS) measurements were carried out to further
characterise the modified species after modification of the GC surface. The XP survey
spectrum of the bare GC electrode (Figure 3.7 a) showed the peaks expected with small
carbon 1s and oxygen 1s peaks at ~285 and ~532 eV respectively indicating the
presence of organic contaminants such as adventitious hydrocarbons and water.
Importantly, almost no nitrogen 1s peak was observed on the bare GC plate. After the
GC surfaces were modified with parabenzoic acid, the XP survey spectrum showed a
significant increase in the 1s peaks of carbon and oxygen at ~285 and ~532 eV
respectively, but no significant evidence of a nitrogen 1s peak (Figure 3.7 b) indicating
the nitrogens of the diazonium salt are lost in the immobilisation on the GC surface. It
can be seen in Figure 3.7 a (inset) the C1s scan of the bare GC plate is dominated by
95
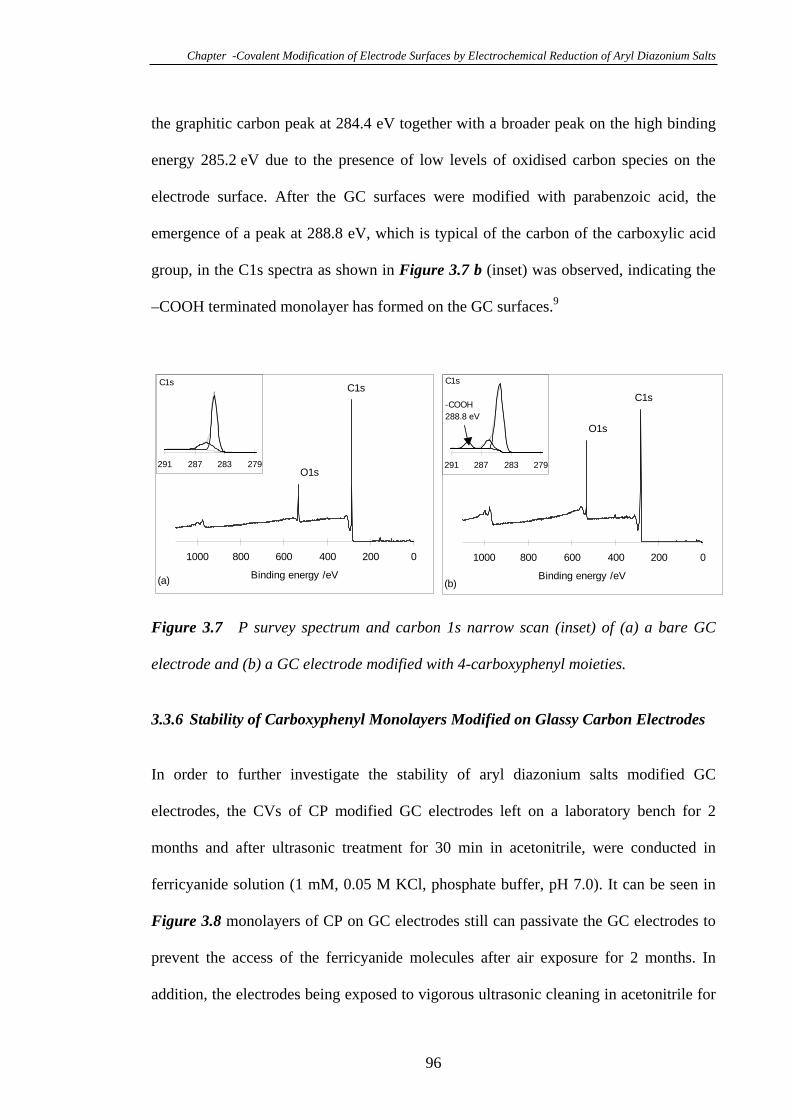
Chapter -Covalent Modification of Electrode Surfaces by Electrochemical Reduction of Aryl Diazonium Salts
the graphitic carbon peak at 284.4 eV together with a broader peak on the high binding
energy 285.2 eV due to the presence of low levels of oxidised carbon species on the
electrode surface. After the GC surfaces were modified with parabenzoic acid, the
emergence of a peak at 288.8 eV, which is typical of the carbon of the carboxylic acid
group, in the C1s spectra as shown in Figure 3.7 b (inset) was observed, indicating the
–COOH terminated monolayer has formed on the GC surfaces.9
02004006008001000
Binding energy /eV(b)
O1s
C1s
02004006008001000
Binding energy /eV
O1s
C1s
(a)
279283287291
C1s
279283287291
-COOH
288.8 eV
C1s
Figure 3.7 P survey spectrum and carbon 1s narrow scan (inset) of (a) a bare GC
electrode and (b) a GC electrode modified with 4-carboxyphenyl moieties.
3.3.6 Stability of Carboxyphenyl Monolayers Modified on Glassy Carbon Electrodes
In order to further investigate the stability of aryl diazonium salts modified GC
electrodes, the CVs of CP modified GC electrodes left on a laboratory bench for 2
months and after ultrasonic treatment for 30 min in acetonitrile, were conducted in
ferricyanide solution (1 mM, 0.05 M KCl, phosphate buffer, pH 7.0). It can be seen in
Figure 3.8 monolayers of CP on GC electrodes still can passivate the GC electrodes to
prevent the access of the ferricyanide molecules after air exposure for 2 months. In
addition, the electrodes being exposed to vigorous ultrasonic cleaning in acetonitrile for
96
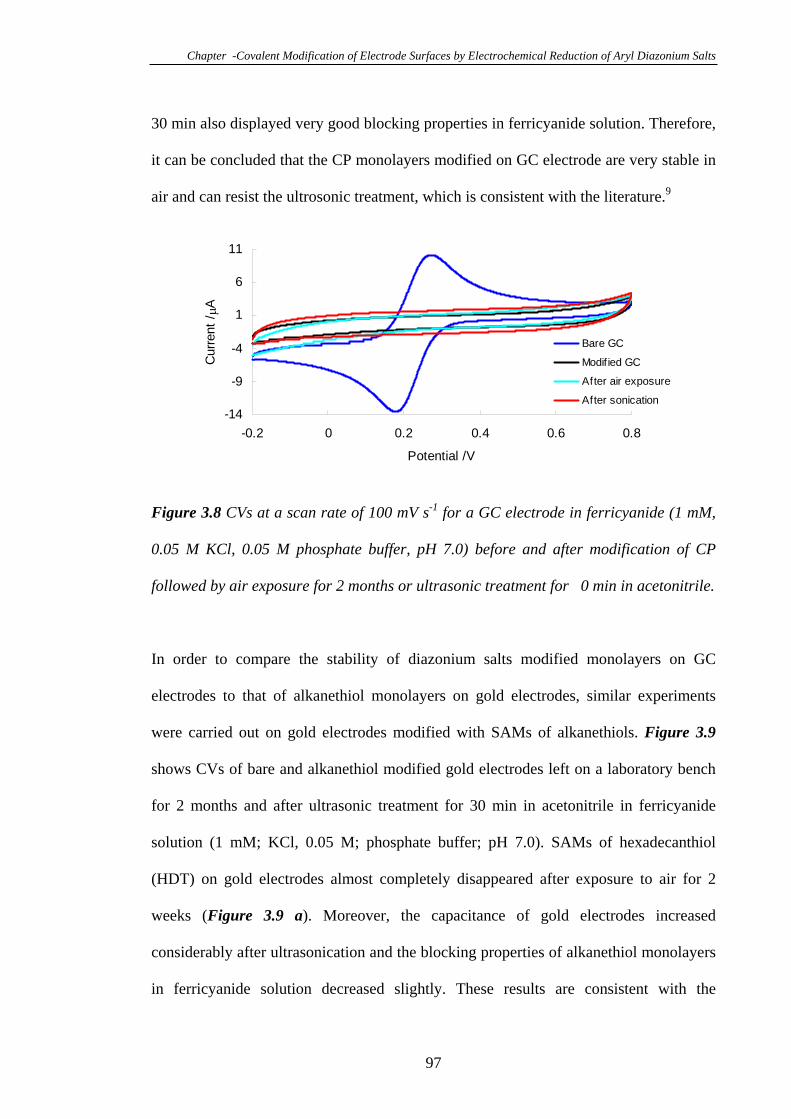
Chapter -Covalent Modification of Electrode Surfaces by Electrochemical Reduction of Aryl Diazonium Salts
30 min also displayed very good blocking properties in ferricyanide solution. Therefore,
it can be concluded that the CP monolayers modified on GC electrode are very stable in
air and can resist the ultrosonic treatment, which is consistent with the literature.9
-14
-9
-4
1
6
11
-0.2 0 0.2 0.4 0.6 0.8
Potential /V
Curr
ent
/A
Bare GC
Modif ied GC
After air exposure
After sonication
Figure 3.8 CVs at a scan rate of 100 mV s-1 for a GC electrode in ferricyanide (1 mM,
0.05 M KCl, 0.05 M phosphate buffer, pH 7.0) before and after modification of CP
followed by air exposure for 2 months or ultrasonic treatment for 0 min in acetonitrile.
In order to compare the stability of diazonium salts modified monolayers on GC
electrodes to that of alkanethiol monolayers on gold electrodes, similar experiments
were carried out on gold electrodes modified with SAMs of alkanethiols. Figure 3.9
shows CVs of bare and alkanethiol modified gold electrodes left on a laboratory bench
for 2 months and after ultrasonic treatment for 30 min in acetonitrile in ferricyanide
solution (1 mM; KCl, 0.05 M; phosphate buffer; pH 7.0). SAMs of hexadecanthiol
(HDT) on gold electrodes almost completely disappeared after exposure to air for 2
weeks (Figure 3.9 a). Moreover, the capacitance of gold electrodes increased
considerably after ultrasonication and the blocking properties of alkanethiol monolayers
in ferricyanide solution decreased slightly. These results are consistent with the
97
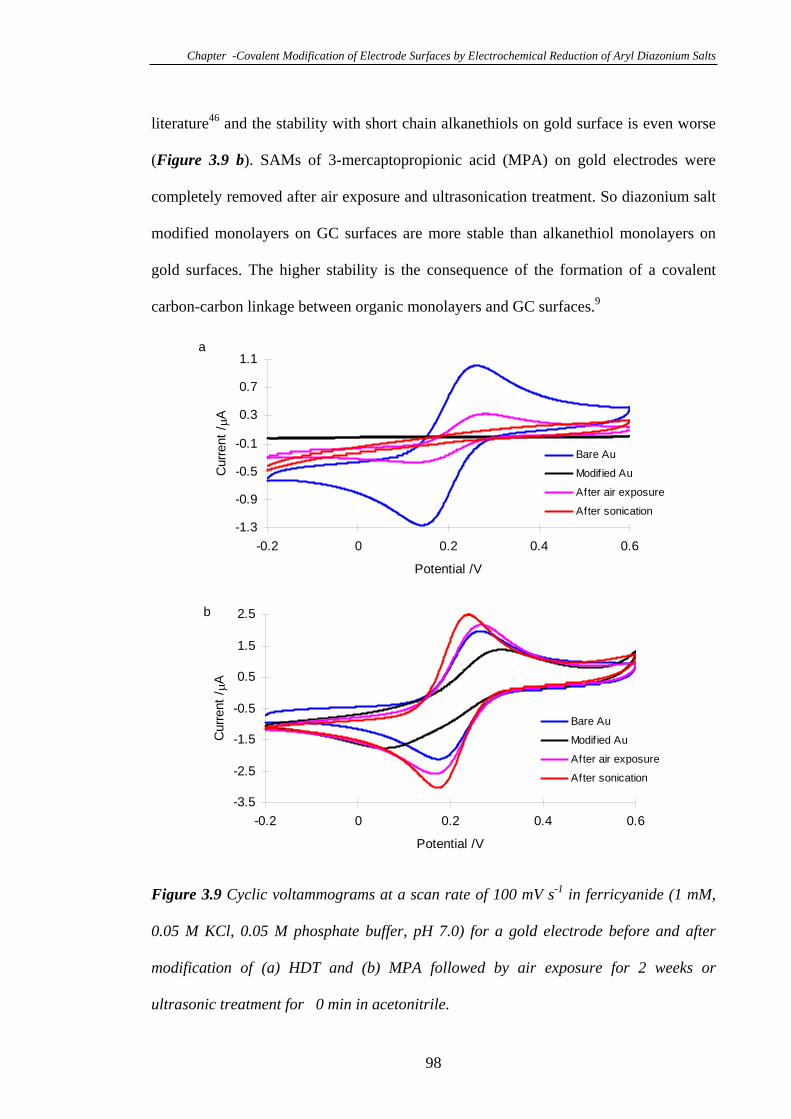
Chapter -Covalent Modification of Electrode Surfaces by Electrochemical Reduction of Aryl Diazonium Salts
literature46 and the stability with short chain alkanethiols on gold surface is even worse
(Figure 3.9 b). SAMs of 3-mercaptopropionic acid (MPA) on gold electrodes were
completely removed after air exposure and ultrasonication treatment. So diazonium salt
modified monolayers on GC surfaces are more stable than alkanethiol monolayers on
gold surfaces. The higher stability is the consequence of the formation of a covalent
carbon-carbon linkage between organic monolayers and GC surfaces.9
-3.5
-2.5
-1.5
-0.5
0.5
1.5
2.5
-0.2 0 0.2 0.4 0.6
Potential /V
Curr
ent
/A
Bare Au
Modif ied Au
After air exposure
After sonication
b
-1.3
-0.9
-0.5
-0.1
0.3
0.7
1.1
-0.2 0 0.2 0.4 0.6
Potential /V
Curr
ent
/A
Bare Au
Modif ied Au
After air exposure
After sonication
a
Figure 3.9 Cyclic voltammograms at a scan rate of 100 mV s-1 in ferricyanide (1 mM,
0.05 M KCl, 0.05 M phosphate buffer, pH 7.0) for a gold electrode before and after
modification of (a) HDT and (b) MPA followed by air exposure for 2 weeks or
ultrasonic treatment for 0 min in acetonitrile.
98
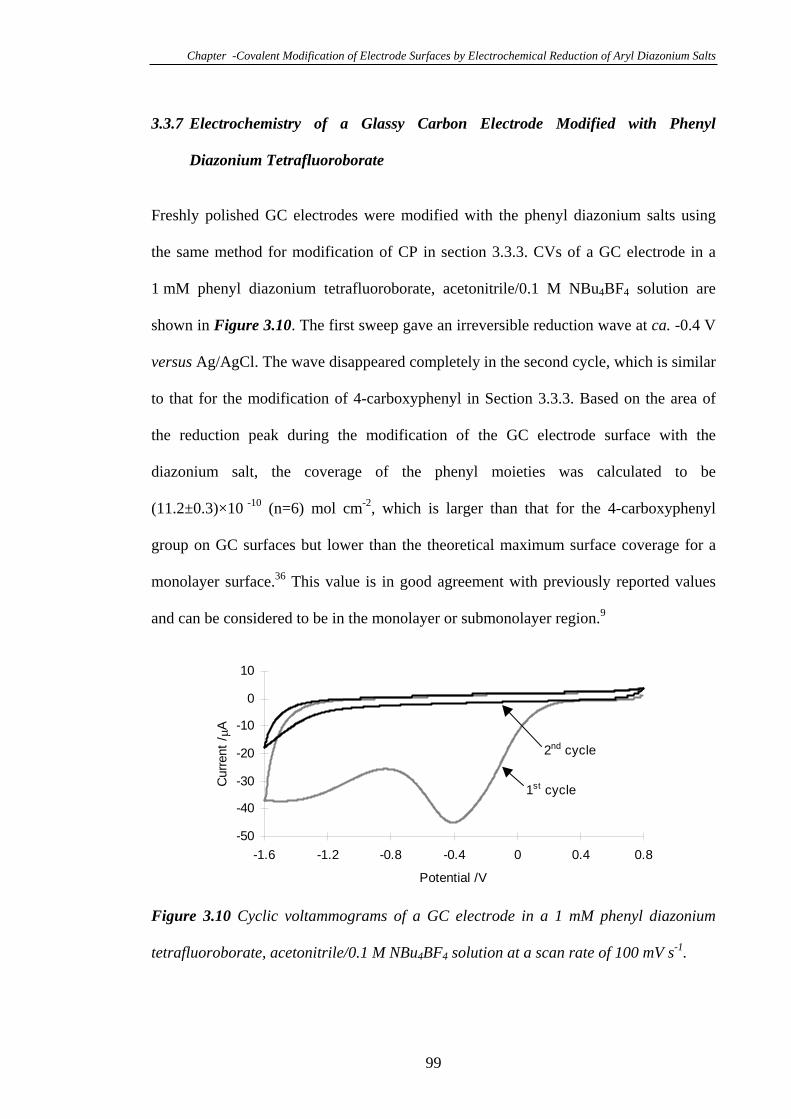
Chapter -Covalent Modification of Electrode Surfaces by Electrochemical Reduction of Aryl Diazonium Salts
3.3.7 Electrochemistry of a Glassy Carbon Electrode Modified with Phenyl
Diazonium Tetrafluoroborate
Freshly polished GC electrodes were modified with the phenyl diazonium salts using
the same method for modification of CP in section 3.3.3. CVs of a GC electrode in a
1 mM phenyl diazonium tetrafluoroborate, acetonitrile/0.1 M NBu4BF4 solution are
shown in Figure 3.10. The first sweep gave an irreversible reduction wave at ca. -0.4 V
versus Ag/AgCl. The wave disappeared completely in the second cycle, which is similar
to that for the modification of 4-carboxyphenyl in Section 3.3.3. Based on the area of
the reduction peak during the modification of the GC electrode surface with the
diazonium salt, the coverage of the phenyl moieties was calculated to be
(11.2±0.3)×10 -10 (n=6) mol cm-2, which is larger than that for the 4-carboxyphenyl
group on GC surfaces but lower than the theoretical maximum surface coverage for a
monolayer surface.36 This value is in good agreement with previously reported values
and can be considered to be in the monolayer or submonolayer region.9
-50
-40
-30
-20
-10
0
10
-1.6 -1.2 -0.8 -0.4 0 0.4 0.8
Potential /V
Curr
ent
/A
1st cycle
2nd cycle
Figure 3.10 Cyclic voltammograms of a GC electrode in a 1 mM phenyl diazonium
tetrafluoroborate, acetonitrile/0.1 M NBu4BF4 solution at a scan rate of 100 mV s-1.
99
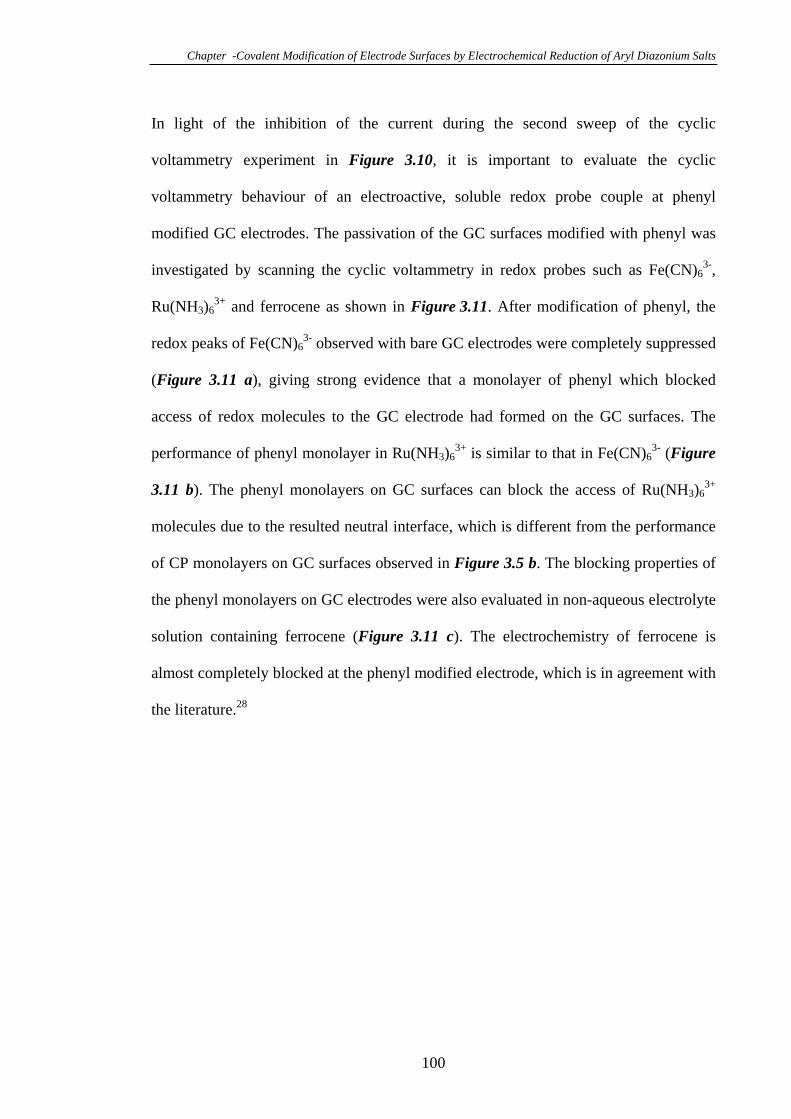
Chapter -Covalent Modification of Electrode Surfaces by Electrochemical Reduction of Aryl Diazonium Salts
In light of the inhibition of the current during the second sweep of the cyclic
voltammetry experiment in Figure 3.10, it is important to evaluate the cyclic
voltammetry behaviour of an electroactive, soluble redox probe couple at phenyl
modified GC electrodes. The passivation of the GC surfaces modified with phenyl was
investigated by scanning the cyclic voltammetry in redox probes such as Fe(CN)63-,
Ru(NH3)63+ and ferrocene as shown in Figure 3.11. After modification of phenyl, the
redox peaks of Fe(CN)63- observed with bare GC electrodes were completely suppressed
(Figure 3.11 a), giving strong evidence that a monolayer of phenyl which blocked
access of redox molecules to the GC electrode had formed on the GC surfaces. The
performance of phenyl monolayer in Ru(NH3)63+ is similar to that in Fe(CN)6
3- (Figure
3.11 b). The phenyl monolayers on GC surfaces can block the access of Ru(NH3)63+
molecules due to the resulted neutral interface, which is different from the performance
of CP monolayers on GC surfaces observed in Figure 3.5 b. The blocking properties of
the phenyl monolayers on GC electrodes were also evaluated in non-aqueous electrolyte
solution containing ferrocene (Figure 3.11 c). The electrochemistry of ferrocene is
almost completely blocked at the phenyl modified electrode, which is in agreement with
the literature.28
100
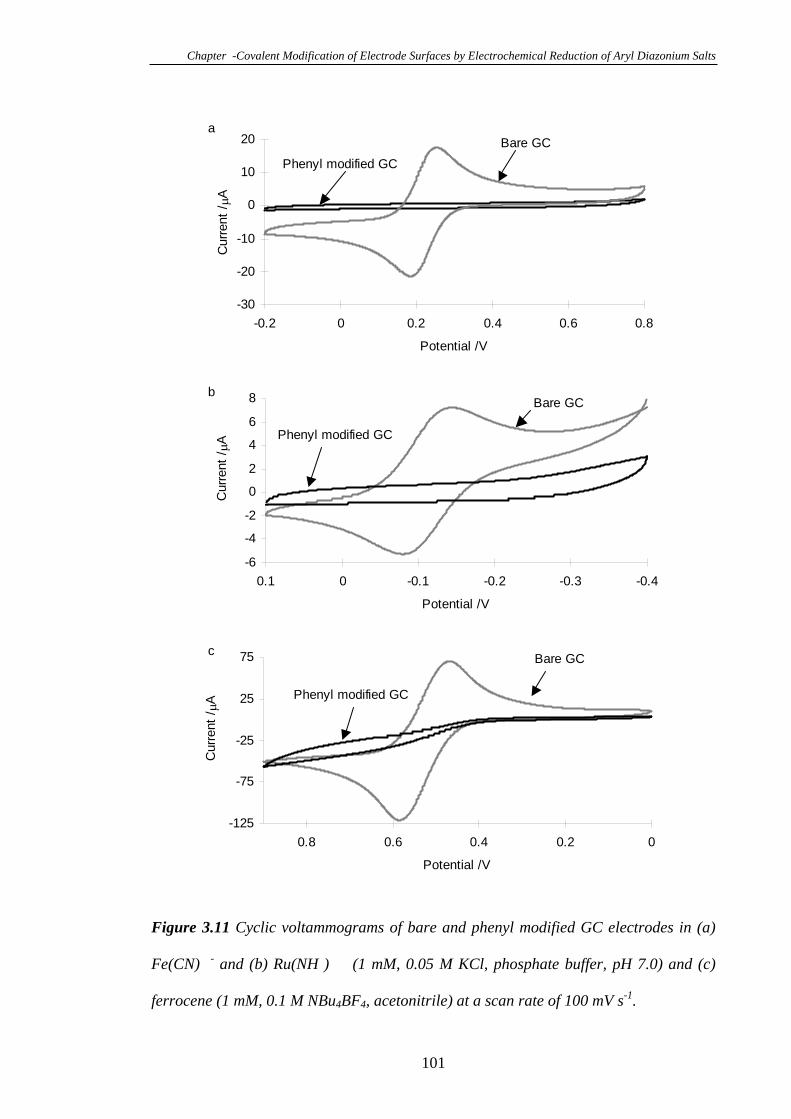
Chapter -Covalent Modification of Electrode Surfaces by Electrochemical Reduction of Aryl Diazonium Salts
-30
-20
-10
0
10
20
-0.2 0 0.2 0.4 0.6 0.8
Potential /V
Curr
ent
/A
Phenyl modified GC
aBare GC
-6
-4
-2
0
2
4
6
8
-0.4-0.3-0.2-0.100.1
Potential /V
Curr
ent
/A Phenyl modified GC
bBare GC
-125
-75
-25
25
75
00.20.40.60.8
Potential /V
Curr
ent
/A Phenyl modified GC
Bare GCc
Figure 3.11 Cyclic voltammograms of bare and phenyl modified GC electrodes in (a)
Fe(CN) - and (b) Ru(NH ) (1 mM, 0.05 M KCl, phosphate buffer, pH 7.0) and (c)
ferrocene (1 mM, 0.1 M NBu4BF4, acetonitrile) at a scan rate of 100 mV s-1.
101
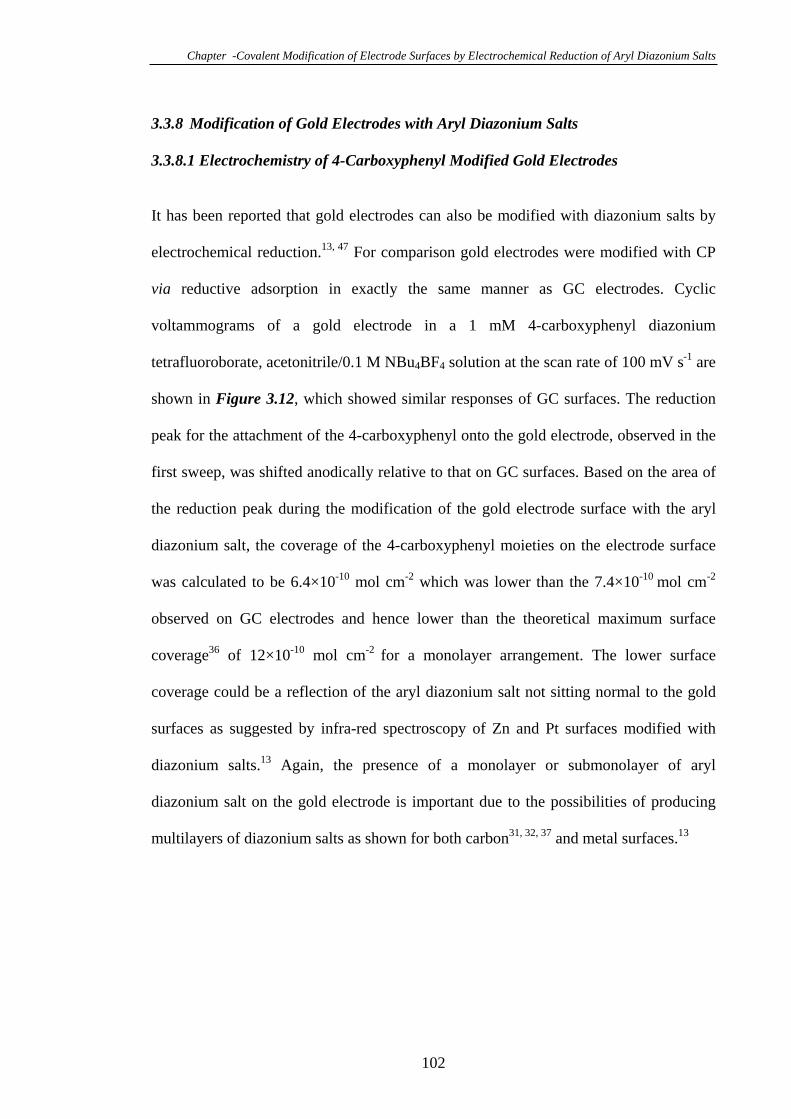
Chapter -Covalent Modification of Electrode Surfaces by Electrochemical Reduction of Aryl Diazonium Salts
3.3.8 Modification of Gold Electrodes with Aryl Diazonium Salts
3.3.8.1 Electrochemistry of 4-Carboxyphenyl Modified Gold Electrodes
It has been reported that gold electrodes can also be modified with diazonium salts by
electrochemical reduction.13, 47 For comparison gold electrodes were modified with CP
via reductive adsorption in exactly the same manner as GC electrodes. Cyclic
voltammograms of a gold electrode in a 1 mM 4-carboxyphenyl diazonium
tetrafluoroborate, acetonitrile/0.1 M NBu4BF4 solution at the scan rate of 100 mV s-1 are
shown in Figure 3.12, which showed similar responses of GC surfaces. The reduction
peak for the attachment of the 4-carboxyphenyl onto the gold electrode, observed in the
first sweep, was shifted anodically relative to that on GC surfaces. Based on the area of
the reduction peak during the modification of the gold electrode surface with the aryl
diazonium salt, the coverage of the 4-carboxyphenyl moieties on the electrode surface
was calculated to be 6.4×10⁻¹⁰ mol cm-2 which was lower than the 7.4×10⁻¹⁰ mol cm-2
observed on GC electrodes and hence lower than the theoretical maximum surface
coverage36 of 12×10-10 mol cm-2 for a monolayer arrangement. The lower surface
coverage could be a reflection of the aryl diazonium salt not sitting normal to the gold
surfaces as suggested by infra-red spectroscopy of Zn and Pt surfaces modified with
diazonium salts.13 Again, the presence of a monolayer or submonolayer of aryl
diazonium salt on the gold electrode is important due to the possibilities of producing
multilayers of diazonium salts as shown for both carbon31, 32, 37 and metal surfaces.13
102
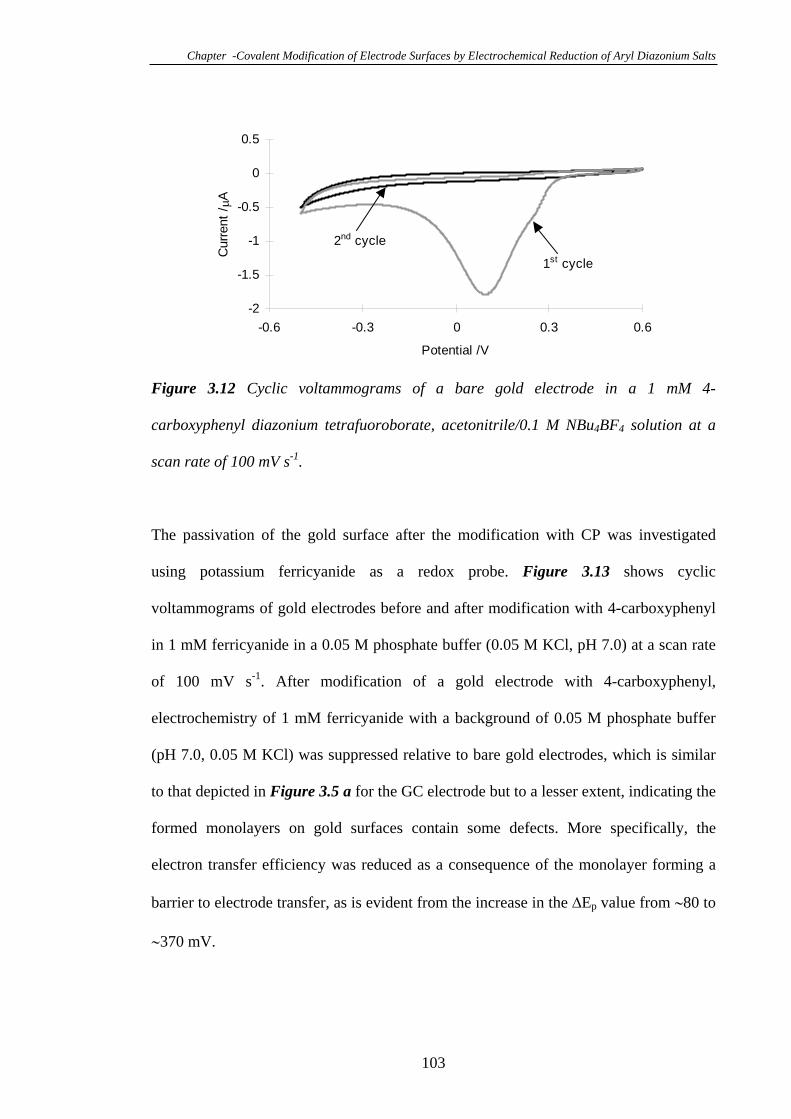
Chapter -Covalent Modification of Electrode Surfaces by Electrochemical Reduction of Aryl Diazonium Salts
-2
-1.5
-1
-0.5
0
0.5
-0.6 -0.3 0 0.3 0.6
Potential /V
Curr
ent
/A
2nd cycle
1st cycle
Figure 3.12 Cyclic voltammograms of a bare gold electrode in a 1 mM 4-
carboxyphenyl diazonium tetrafuoroborate, acetonitrile/0.1 M NBu4BF4 solution at a
scan rate of 100 mV s-1.
The passivation of the gold surface after the modification with CP was investigated
using potassium ferricyanide as a redox probe. Figure 3.13 shows cyclic
voltammograms of gold electrodes before and after modification with 4-carboxyphenyl
in 1 mM ferricyanide in a 0.05 M phosphate buffer (0.05 M KCl, pH 7.0) at a scan rate
of 100 mV s-1. After modification of a gold electrode with 4-carboxyphenyl,
electrochemistry of 1 mM ferricyanide with a background of 0.05 M phosphate buffer
(pH 7.0, 0.05 M KCl) was suppressed relative to bare gold electrodes, which is similar
to that depicted in Figure 3.5 a for the GC electrode but to a lesser extent, indicating the
formed monolayers on gold surfaces contain some defects. More specifically, the
electron transfer efficiency was reduced as a consequence of the monolayer forming a
barrier to electrode transfer, as is evident from the increase in the Ep value from 80 to
370 mV.
103
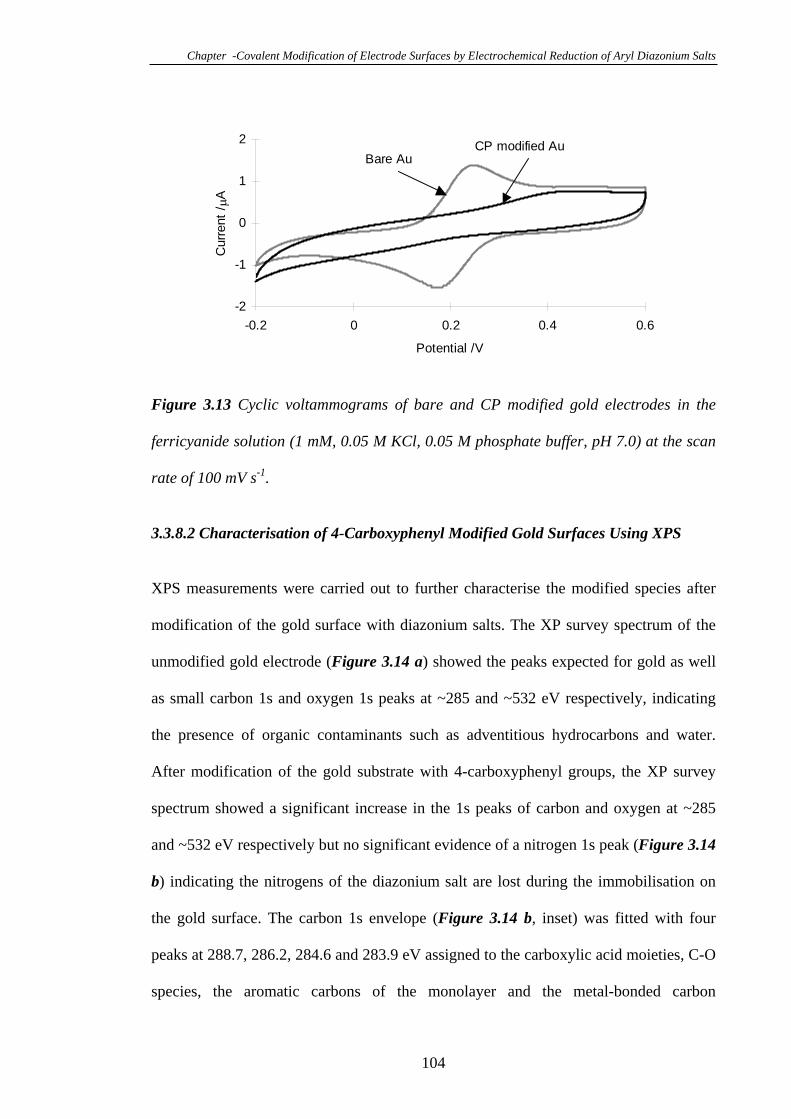
Chapter -Covalent Modification of Electrode Surfaces by Electrochemical Reduction of Aryl Diazonium Salts
-2
-1
0
1
2
-0.2 0 0.2 0.4 0.6
Potential /V
Curr
ent
/A
Bare AuCP modified Au
Figure 3.13 Cyclic voltammograms of bare and CP modified gold electrodes in the
ferricyanide solution (1 mM, 0.05 M KCl, 0.05 M phosphate buffer, pH 7.0) at the scan
rate of 100 mV s-1.
3.3.8.2 Characterisation of 4-Carboxyphenyl Modified Gold Surfaces Using XPS
XPS measurements were carried out to further characterise the modified species after
modification of the gold surface with diazonium salts. The XP survey spectrum of the
unmodified gold electrode (Figure 3.14 a) showed the peaks expected for gold as well
as small carbon 1s and oxygen 1s peaks at ~285 and ~532 eV respectively, indicating
the presence of organic contaminants such as adventitious hydrocarbons and water.
After modification of the gold substrate with 4-carboxyphenyl groups, the XP survey
spectrum showed a significant increase in the 1s peaks of carbon and oxygen at ~285
and ~532 eV respectively but no significant evidence of a nitrogen 1s peak (Figure 3.14
b) indicating the nitrogens of the diazonium salt are lost during the immobilisation on
the gold surface. The carbon 1s envelope (Figure 3.14 b, inset) was fitted with four
peaks at 288.7, 286.2, 284.6 and 283.9 eV assigned to the carboxylic acid moieties, C-O
species, the aromatic carbons of the monolayer and the metal-bonded carbon
104
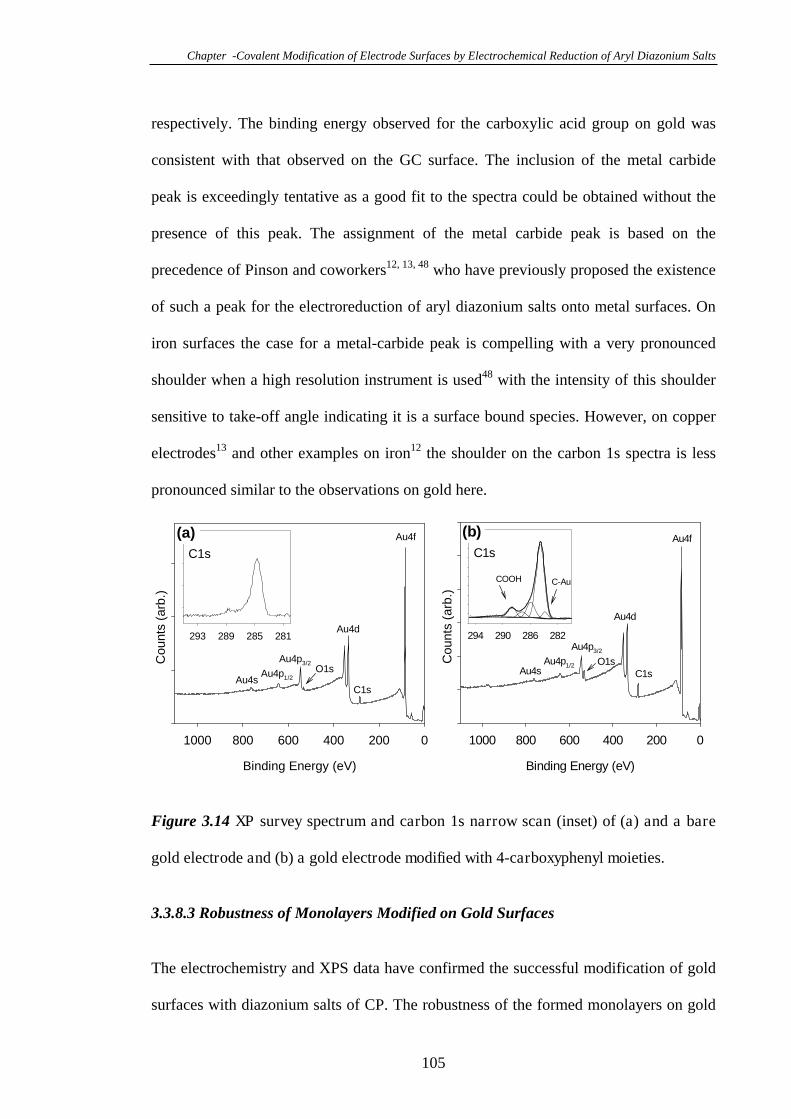
Chapter -Covalent Modification of Electrode Surfaces by Electrochemical Reduction of Aryl Diazonium Salts
respectively. The binding energy observed for the carboxylic acid group on gold was
consistent with that observed on the GC surface. The inclusion of the metal carbide
peak is exceedingly tentative as a good fit to the spectra could be obtained without the
presence of this peak. The assignment of the metal carbide peak is based on the
precedence of Pinson and coworkers12, 13, 48 who have previously proposed the existence
of such a peak for the electroreduction of aryl diazonium salts onto metal surfaces. On
iron surfaces the case for a metal-carbide peak is compelling with a very pronounced
shoulder when a high resolution instrument is used48 with the intensity of this shoulder
sensitive to take-off angle indicating it is a surface bound species. However, on copper
electrodes13 and other examples on iron12 the shoulder on the carbon 1s spectra is less
pronounced similar to the observations on gold here.
Binding Energy (eV)
02004006008001000
Counts
(arb
.)
O1s
Au4f
C1s
Au4d
Au4p3/2
281285289293
C1s
Au4p1/2Au4s
(a)
Binding Energy (eV)
02004006008001000
Counts
(arb
.)
O1s
Au4f
Au4p3/2
Au4d
Au4p1/2
Au4s
282286290294
C1s
COOH C-Au
(b)
C1s
Figure 3.14 XP survey spectrum and carbon 1s narrow scan (inset) of (a) and a bare
gold electrode and (b) a gold electrode modified with 4-carboxyphenyl moieties.
3.3.8.3 Robustness of Monolayers Modified on Gold Surfaces
The electrochemistry and XPS data have confirmed the successful modification of gold
surfaces with diazonium salts of CP. The robustness of the formed monolayers on gold
105
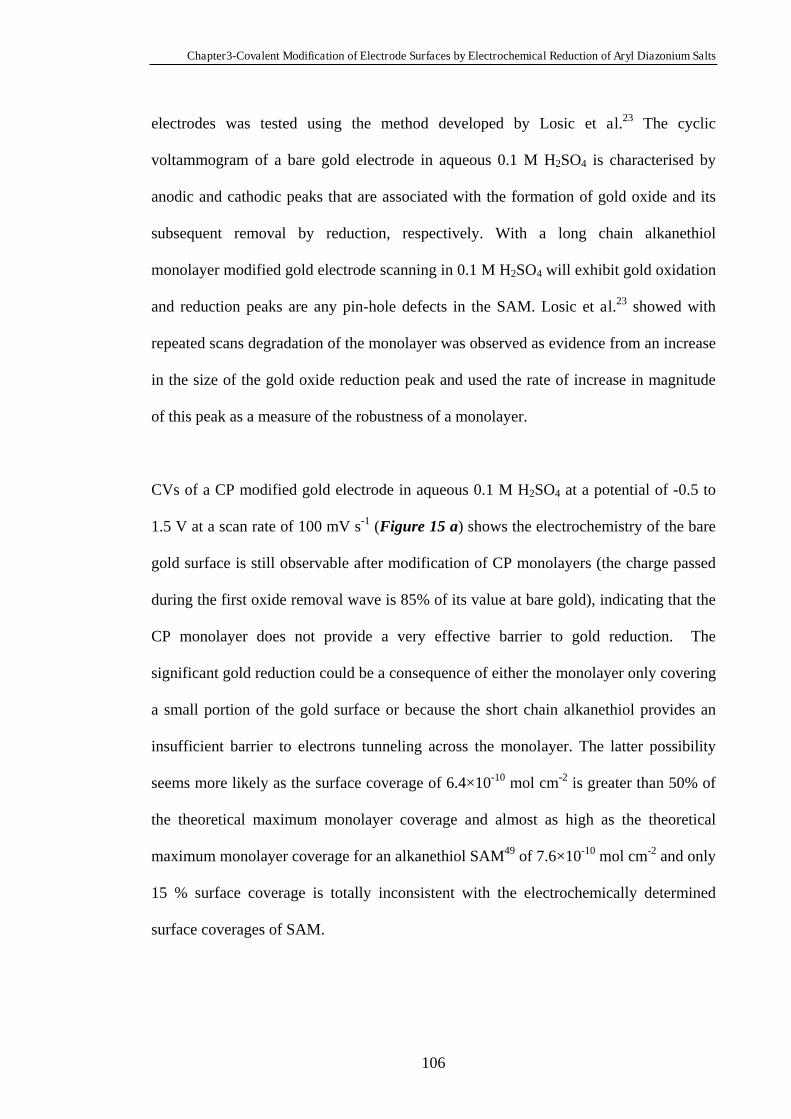
Chapter3-Covalent Modification of Electrode Surfaces by Electrochemical Reduction of Aryl Diazonium Salts
electrodes was tested using the method developed by Losic et al.23 The cyclic
voltammogram of a bare gold electrode in aqueous 0.1 M H2SO4 is characterised by
anodic and cathodic peaks that are associated with the formation of gold oxide and its
subsequent removal by reduction, respectively. With a long chain alkanethiol
monolayer modified gold electrode scanning in 0.1 M H2SO4 will exhibit gold oxidation
and reduction peaks are any pin-hole defects in the SAM. Losic et al.23 showed with
repeated scans degradation of the monolayer was observed as evidence from an increase
in the size of the gold oxide reduction peak and used the rate of increase in magnitude
of this peak as a measure of the robustness of a monolayer.
CVs of a CP modified gold electrode in aqueous 0.1 M H2SO4 at a potential of -0.5 to
1.5 V at a scan rate of 100 mV s-1 (Figure 15 a) shows the electrochemistry of the bare
gold surface is still observable after modification of CP monolayers (the charge passed
during the first oxide removal wave is 85% of its value at bare gold), indicating that the
CP monolayer does not provide a very effective barrier to gold reduction. The
significant gold reduction could be a consequence of either the monolayer only covering
a small portion of the gold surface or because the short chain alkanethiol provides an
insufficient barrier to electrons tunneling across the monolayer. The latter possibility
seems more likely as the surface coverage of 6.4×10⁻¹⁰ mol cm-2 is greater than 50% of
the theoretical maximum monolayer coverage and almost as high as the theoretical
maximum monolayer coverage for an alkanethiol SAM49 of 7.6×10⁻¹⁰ mol cm-2 and only
15 % surface coverage is totally inconsistent with the electrochemically determined
surface coverages of SAM.
106
Chapter3-Covalent Modification of Electrode Surfaces by Electrochemical Reduction of Aryl Diazonium Salts
-16
-12
-8
-4
0
4
8
-0.3 0.2 0.7 1.2 1.7
Potential /V
Curr
ent
/A
Bare Au
CP modif ied Au
HDT modif ied Au
a
0
0.2
0.4
0.6
0.8
1
1.2
1 3 5 7 9 11 13
Number of cycles
1-(
I ba
re-I
sca
n,n
)/(I
ba
re-I
sca
n,1
)
15
CP modif ied Au
HDT modif ied Au
MBA modif ied Au
MPA modif ied Au
b
Figure 3.15 (a) Cyclic voltammograms in 0.1 M H2SO4 at the scan rate of 100 mV s-1
for a bare gold electrode, a CP modified gold electrode and an HDT modified gold
electrode during the first cycle, and (b) relative current change from the first cycle for
the CP, HDT, MBA, MPA modified gold electrodes versus number of cycles in 0.1 M
H2SO4 at a scan rate of 100 mV s-1. Ibare, Iscan,1 and Iscan,n refer to the current of bare
gold, current of modified gold in the first scan and current of modified gold in the n
scan (n is the scan number), respectively.
For comparison cyclic voltammetry for different alkanethiols modified gold electrodes
was also carried out in aqueous 0.1 M H2SO4. SAMs of 4-mercaptobenzoic acid (MBA)
107
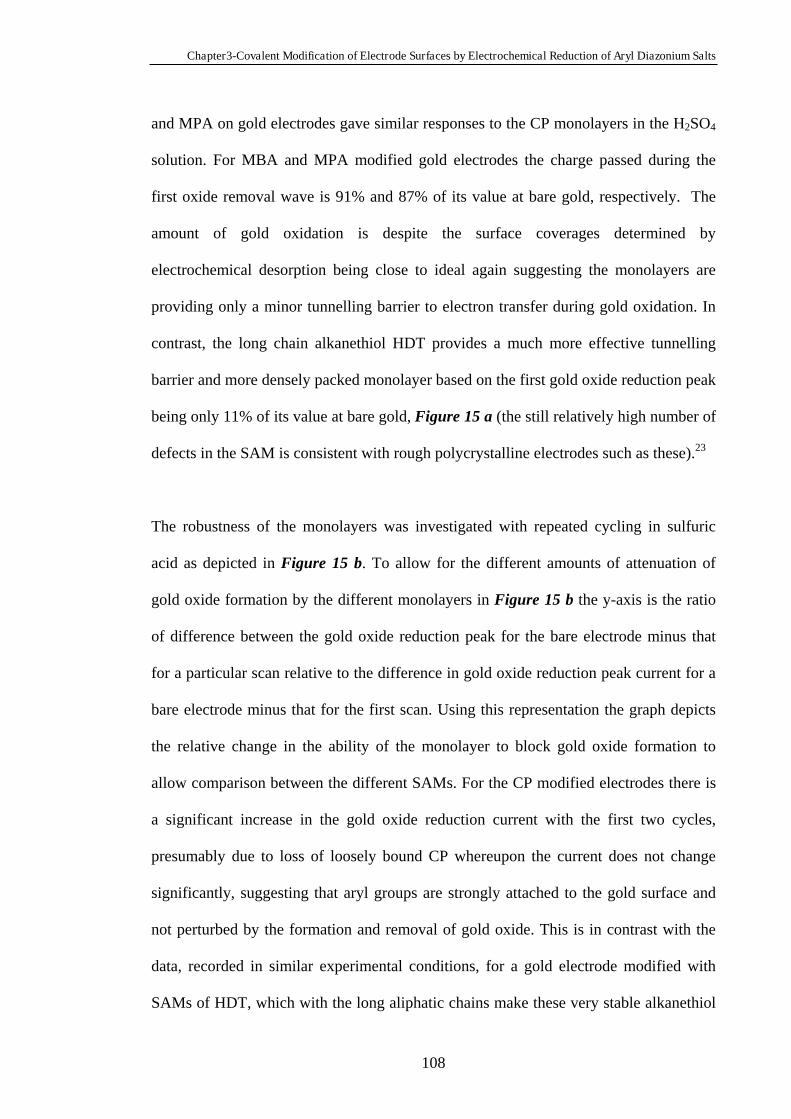
Chapter3-Covalent Modification of Electrode Surfaces by Electrochemical Reduction of Aryl Diazonium Salts
and MPA on gold electrodes gave similar responses to the CP monolayers in the H2SO4
solution. For MBA and MPA modified gold electrodes the charge passed during the
first oxide removal wave is 91% and 87% of its value at bare gold, respectively. The
amount of gold oxidation is despite the surface coverages determined by
electrochemical desorption being close to ideal again suggesting the monolayers are
providing only a minor tunnelling barrier to electron transfer during gold oxidation. In
contrast, the long chain alkanethiol HDT provides a much more effective tunnelling
barrier and more densely packed monolayer based on the first gold oxide reduction peak
being only 11% of its value at bare gold, Figure 15 a (the still relatively high number of
defects in the SAM is consistent with rough polycrystalline electrodes such as these).23
The robustness of the monolayers was investigated with repeated cycling in sulfuric
acid as depicted in Figure 15 b. To allow for the different amounts of attenuation of
gold oxide formation by the different monolayers in Figure 15 b the y-axis is the ratio
of difference between the gold oxide reduction peak for the bare electrode minus that
for a particular scan relative to the difference in gold oxide reduction peak current for a
bare electrode minus that for the first scan. Using this representation the graph depicts
the relative change in the ability of the monolayer to block gold oxide formation to
allow comparison between the different SAMs. For the CP modified electrodes there is
a significant increase in the gold oxide reduction current with the first two cycles,
presumably due to loss of loosely bound CP whereupon the current does not change
significantly, suggesting that aryl groups are strongly attached to the gold surface and
not perturbed by the formation and removal of gold oxide. This is in contrast with the
data, recorded in similar experimental conditions, for a gold electrode modified with
SAMs of HDT, which with the long aliphatic chains make these very stable alkanethiol
108
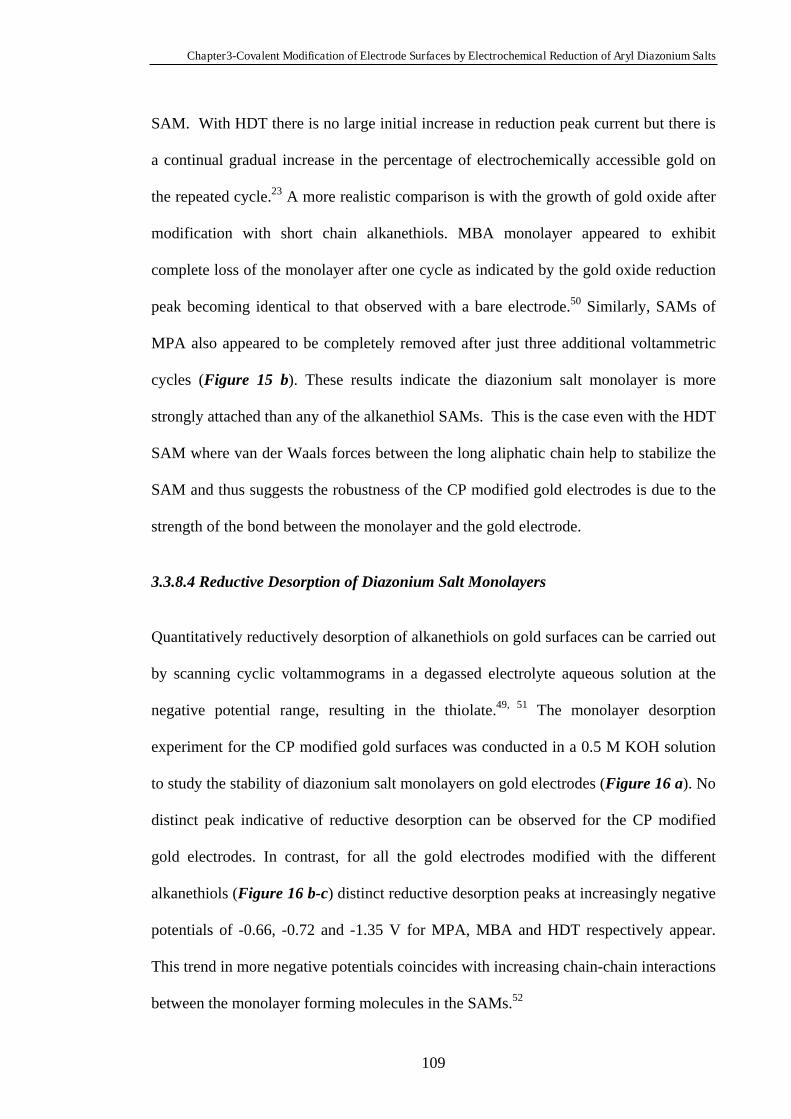
Chapter3-Covalent Modification of Electrode Surfaces by Electrochemical Reduction of Aryl Diazonium Salts
SAM. With HDT there is no large initial increase in reduction peak current but there is
a continual gradual increase in the percentage of electrochemically accessible gold on
the repeated cycle.23 A more realistic comparison is with the growth of gold oxide after
modification with short chain alkanethiols. MBA monolayer appeared to exhibit
complete loss of the monolayer after one cycle as indicated by the gold oxide reduction
peak becoming identical to that observed with a bare electrode.50 Similarly, SAMs of
MPA also appeared to be completely removed after just three additional voltammetric
cycles (Figure 15 b). These results indicate the diazonium salt monolayer is more
strongly attached than any of the alkanethiol SAMs. This is the case even with the HDT
SAM where van der Waals forces between the long aliphatic chain help to stabilize the
SAM and thus suggests the robustness of the CP modified gold electrodes is due to the
strength of the bond between the monolayer and the gold electrode.
3.3.8.4 Reductive Desorption of Diazonium Salt Monolayers
Quantitatively reductively desorption of alkanethiols on gold surfaces can be carried out
by scanning cyclic voltammograms in a degassed electrolyte aqueous solution at the
negative potential range, resulting in the thiolate.49, 51 The monolayer desorption
experiment for the CP modified gold surfaces was conducted in a 0.5 M KOH solution
to study the stability of diazonium salt monolayers on gold electrodes (Figure 16 a). No
distinct peak indicative of reductive desorption can be observed for the CP modified
gold electrodes. In contrast, for all the gold electrodes modified with the different
alkanethiols (Figure 16 b-c) distinct reductive desorption peaks at increasingly negative
potentials of -0.66, -0.72 and -1.35 V for MPA, MBA and HDT respectively appear.
This trend in more negative potentials coincides with increasing chain-chain interactions
between the monolayer forming molecules in the SAMs.52
109
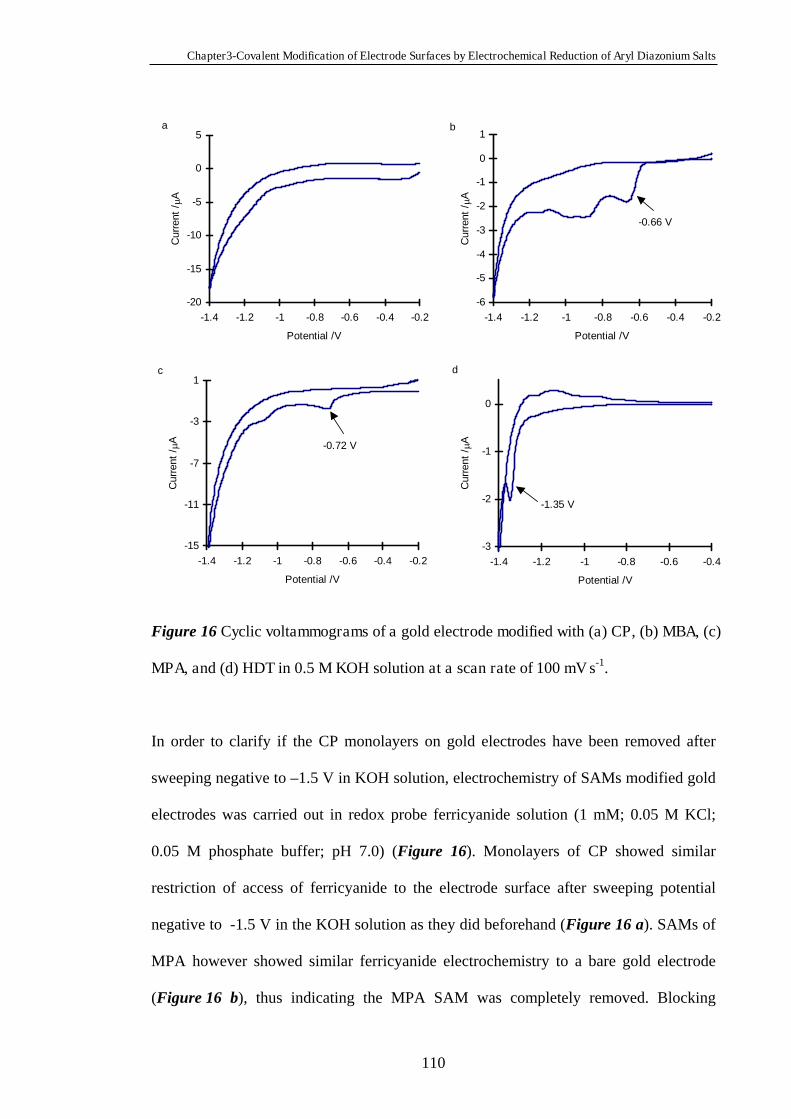
Chapter3-Covalent Modification of Electrode Surfaces by Electrochemical Reduction of Aryl Diazonium Salts
-3
-2
-1
0
-1.4 -1.2 -1 -0.8 -0.6 -0.4
Potential /V
Curr
ent
/A
-1.35 V
d
-20
-15
-10
-5
0
5
-1.4 -1.2 -1 -0.8 -0.6 -0.4 -0.2
Potential /V
Curr
ent
/A
a
-6
-5
-4
-3
-2
-1
0
1
-1.4 -1.2 -1 -0.8 -0.6 -0.4 -0.2
Potential /V
Curr
ent
/A
-0.66 V
b
-15
-11
-7
-3
1
-1.4 -1.2 -1 -0.8 -0.6 -0.4 -0.2
Potential /V
Curr
ent
/A
-0.72 V
c
Figure 16 Cyclic voltammograms of a gold electrode modified with (a) CP, (b) MBA, (c)
MPA, and (d) HDT in 0.5 M KOH solution at a scan rate of 100 mV s-1.
In order to clarify if the CP monolayers on gold electrodes have been removed after
sweeping negative to –1.5 V in KOH solution, electrochemistry of SAMs modified gold
electrodes was carried out in redox probe ferricyanide solution (1 mM; 0.05 M KCl;
0.05 M phosphate buffer; pH 7.0) (Figure 16). Monolayers of CP showed similar
restriction of access of ferricyanide to the electrode surface after sweeping potential
negative to -1.5 V in the KOH solution as they did beforehand (Figure 16 a). SAMs of
MPA however showed similar ferricyanide electrochemistry to a bare gold electrode
(Figure 16 b), thus indicating the MPA SAM was completely removed. Blocking
110
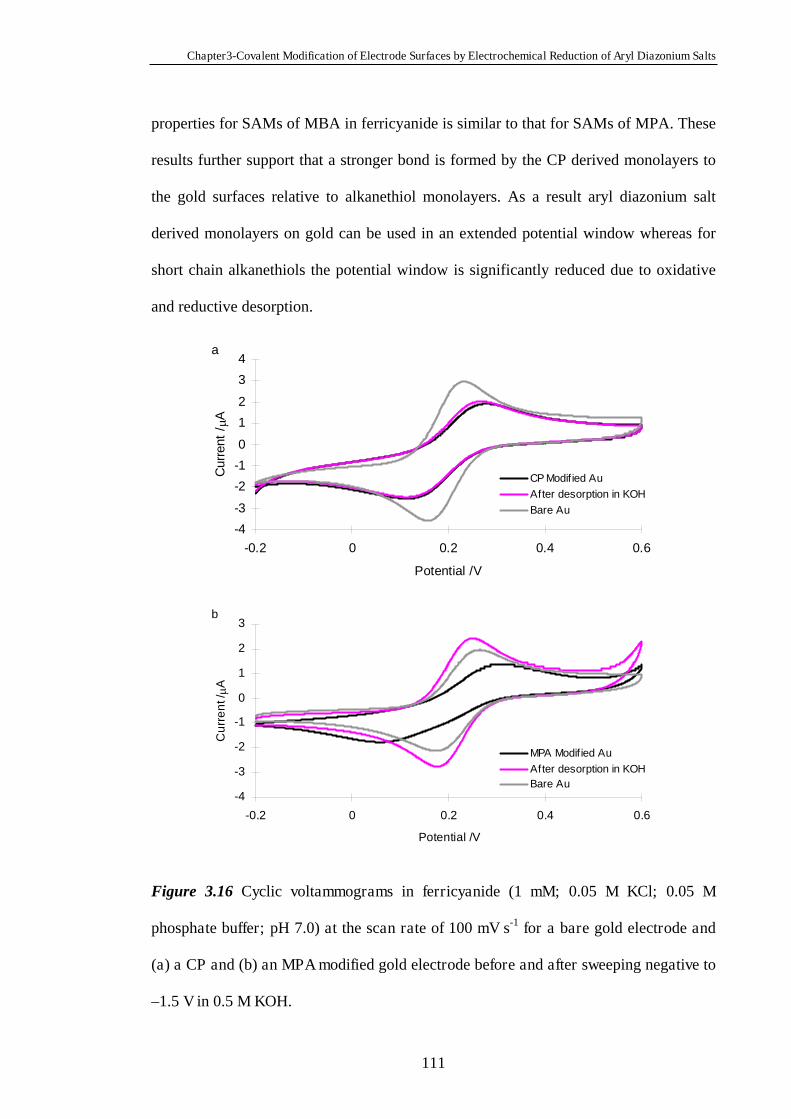
Chapter3-Covalent Modification of Electrode Surfaces by Electrochemical Reduction of Aryl Diazonium Salts
properties for SAMs of MBA in ferricyanide is similar to that for SAMs of MPA. These
results further support that a stronger bond is formed by the CP derived monolayers to
the gold surfaces relative to alkanethiol monolayers. As a result aryl diazonium salt
derived monolayers on gold can be used in an extended potential window whereas for
short chain alkanethiols the potential window is significantly reduced due to oxidative
and reductive desorption.
-4
-3
-2
-1
0
1
2
3
-0.2 0 0.2 0.4 0.6
Potential /V
Cu
rre
nt /
A
MPA Modif ied Au
After desorption in KOH
Bare Au
b
-4
-3
-2
-1
0
1
2
3
4
-0.2 0 0.2 0.4 0.6
Potential /V
Curr
ent
/A
CP Modif ied Au
After desorption in KOH
Bare Au
a
Figure 3.16 Cyclic voltammograms in ferricyanide (1 mM; 0.05 M KCl; 0.05 M
phosphate buffer; pH 7.0) at the scan rate of 100 mV s-1 for a bare gold electrode and
(a) a CP and (b) an MPA modified gold electrode before and after sweeping negative to
–1.5 V in 0.5 M KOH.
111
Chapter3-Covalent Modification of Electrode Surfaces by Electrochemical Reduction of Aryl Diazonium Salts
3.4 Conclusions
Glassy carbon and gold electrodes have been successfully modified with aryl diazonium
salt molecules using the two-cycle cyclic voltammetry method to form novel and stable
monolayers. XPS technique has been successfully used to monitor the step-by-step
attachment. The nitrogen groups were found to be lost during the modification of aryl
diazonium salts by reductive adsorption. Monolayers of aryl diazonium salts on GC and
gold electrodes are more stable than the self-assembled monolayers of alkanethiols on
gold electrodes. So the higher stability of diazoniam salt monolayers created on GC
surfaces provides a great potential for GC electrodes to be used as a good alternative to
gold for sensing and other applications.
3.5 References
(1) Finklea, H.O., Electroanal. Chem. 1996, 19, 109-115.
(2) Adams, D.M., Brus, L., Chidsey, C.E.D., Creager, S., Creutz, C., Kagan, C.R.,
Kamat, P.V., Lieberman, M., Lindsay, S., Marcus, R.A., Metzger, R.M., Michel-
Beyerle, M.E., Miller, J.R., Newton, M.D., Rolison, D.R., Sankey, O., Schanze,
K.S., Yardley, J., Zhu, X.Y., J. Phys. Chem. B 2003, 107, 6668-6697.
(3) Cahen, D., Hodes, G., Adv. Mater. 2002, 14, 789-798.
(4) Salomon, A., Cahen, D., Lindsay, S., Tomfohr, J., Engelkes, V.B., Frisbie, C.D.,
Adv. Mater. 2003, 15, 1881-1890.
(5) Willner, I., Katz, E., Angew. Chem. Int. Edit. 2000, 39, 1181-1218.
(6) Willner, I., Science 2002, 298, 2407-2408.
(7) Gooding, J.J., Mearns, F., Yang, W.R., Liu, J.Q., Electroanalysis 2003, 15, 81-96.
112
Chapter3-Covalent Modification of Electrode Surfaces by Electrochemical Reduction of Aryl Diazonium Salts
(8) Bourdillon, C., Delamar, M., Demaille, C., Hitmi, R., Moiroux, J., Pinson, J., J.
Electroanal. Chem. 1992, 336, 113-23.
(9) Allongue, P., Delamar, M., Desbat, B., Fagebaume, O., Hitmi, R., Pinson, J.,
Saveant, J.-M., J. Am. Chem. Soc. 1997, 119, 201-207.
(10) Downard, A.J., Electroanalysis 2000, 12, 1085-1096.
(11) Ranganathan, S., Steidel, I., Anariba, F., McCreery, R.L., Nano Letters 2001, 1,
491-494.
(12) Adenier, A., Bernard, M.-C., Chehimi, M.M., Cabet-Deliry, E., Desbat, B.,
Fagebaume, O., Pinson, J., Podvorica, F., J. Am. Chem. Soc. 2001, 123, 4541-4549.
(13) Bernard, M.-C., Chausse, A., Cabet-Deliry, E., Chehimi, M.M., Pinson, J.,
Podvorica, F., Vautrin-U1, C., Chem. Mater. 2003, 15, 3450-3462.
(14) Stewart, M.P., Maya, F., Kosynkin, D.V., Dirk, S.M., Stapleton, J.J., Mcguiness,
C.L., Allara, D.L., Tour, J.M., J. Am. Chem. Soc. 2004, 126, 370-378.
(15) Bahr, J.L., Yang, J., Kosynkin, D.V., Bronikowski, M.J., Smalley, R.E., Tour, J.M.,
J. Am. Chem. Soc. 2001, 123, 6536-6542.
(16) Anderson, M.R., Evaniak, M.N., Zhang, M., Langmuir 1996, 12, 2327-2331.
(17) Friggeri, A., Van Veggel, F.C.J.M., Reinhoudt, D.N., Chem. Eur. J. 1999, 5, 3595-
3602.
(18) Peng, Z.Q., Dong, S.J., Langmuir 2001, 17, 4904-4909.
(19) Li, J.H., Ding, L., Wang, E.K., Dong, S.J., J. Electroanal. Chem. 1997, 431, 227-
230.
(20) Leopold, M.C., Black, J.A., Bowden, E.F., Langmuir 2002, 18, 978-980.
(21) Http://Chem.Ch.Huji.Ac.Il/~Eugeniik/Surfacearea0.Htm,
(22) Creager, S.E., Hockett, L.A., Rowe, G.K., Langmuir 1992, 8, 854-861.
(23) Losic, D., Shapter, J.G., Gooding, J.J., Langmuir 2001, 17, 3307-3316.
113
Chapter3-Covalent Modification of Electrode Surfaces by Electrochemical Reduction of Aryl Diazonium Salts
(24) Maeda, H., Yamauchi, Y., Hosoe, M., Li, T.X., Yamaguchi, E., Kasamatsu, M.,
Ohmori, H., Chem. Pharm. Bull. 1994, 42, 1870-1873.
(25) Barbier, B., Pinson, J., Desarmot, G., Sanchez, M., J. Electrochem. Soc. 1990, 137,
1757-1764.
(26) Delamar, M., Hitmi, R., Pinson, J., Saveant, J.M., J. Am. Chem. Soc. 1992, 114,
5883-5884.
(27) Andrieux, C.P., Gonzalez, F., Saveant, J.-M., J. Am. Chem. Soc. 1997, 119, 4292-
4300.
(28) Downard, A.J., Langmuir 2000, 16, 9680-9682.
(29) Zhang, Z., Haiying, L., Deng, J., Anal. Chem. 1996, 68, 1632-1638.
(30) Situmorang, M., Gooding, J.J., Hibbert, D.B., Barnett, D., Biosens. Bioelectron.
1998, 13, 953-962.
(31) Anariba, F., Duvall, S.H., McCreery, R.L., Anal. Chem. 2003, 75, 3837-3844.
(32) Kariuki, J.K., McDermott, M.T., Langmuir 2001, 17, 5947-5951.
(33) Saby, C., Ortiz, B., Champagne, G.Y., Belanger, D., Langmuir 1997, 13, 6805-
6813.
(34) Bandyopapadhyay, K., Vijayamohanan, K., Langmuir 1998, 14, 625-629.
(35) Brooksby, P.A., Downard, A.J., Langmuir 2004, 20, 5038-5045.
(36) Liu, Y.-C., McCreery, R.L., J. Am. Chem. Soc. 1995, 117, 11254-11259.
(37) Kariuki, J.K., McDermott, M.T., Langmuir 1999, 15, 6534-6540.
(38) Finklea, H.O., Avery, S., Lynch, M., Furtsch, T., Langmuir 1987, 3, 409-413.
(39) Cheng, Q., Bratjter-Toth, A., Anal. Chem. 1995, 67, 2767-2775.
(40) Cheng, Q., Brajter-Toth, A., Anal. Chem. 1996, 68, 4180-4185.
(41) Madoz, J., Kuznetzov, B.A., Medrano, F.J., Garcia, J.L., Fernandez, V.M., J. Am.
Chem. Soc. 1997, 119, 1043-1051.
114
Chapter3-Covalent Modification of Electrode Surfaces by Electrochemical Reduction of Aryl Diazonium Salts
(42) Downard, A.J., Roddick, A.D., Bond, A.M., Anal. Chim. Acta 1995, 317, 303-310.
(43) Zhao, J.W., Luo, L.Q., Yang, X.R., Wang, E.K., Dong, S.J., Electroanalysis 1999,
11, 1108-1111.
(44) Petrov, J.G., Mobius, D., Langmuir 1996, 12, 3650-3656.
(45) Crooks, R.M., Sun, L., Xu, C., Hill, S.L., Ricco, A., J. Spectrosc. 1993, 8, 28-31.
(46) Schoenfisch, M.H., Pemberton, J.E., J. Am. Chem. Soc. 1998, 120, 4502-4513.
(47) Laforgue, A., Addou, T., Belanger, D., Langmuir 2005, 21, 6855-6865.
(48) Boukerma, K., Chehimi, M.M., Pinson, J., Blomfield, C., Langmuir 2003, 19,
6333-6335.
(49) Walczak, M.M., Popenoe, D.D., Deinhammer, R.S., Lamp, B.D., Chung, C., Porter,
M.D., Langmuir 1991, 7, 2687-2693.
(50) Sabatani, E., Cohen-Boulakia, J., Bruening, M., Rubinstein, I., Langmuir 1993, 9,
2974-2961.
(51) Zhong, C.J., Woods, N.T., Dawson, G.B., Porter, M.D., Electrochem. Commun.
1999, 1, 17-21.
(52) Widrig, C.A., Chung, C., Porter, M.D., J. Electroanal. Chem. 1991, 310, 335-359.
115
Chapter 4-Heterogeneous Electron Transfer Through Organic Monolayers on Carbon and Gold Electrodes
Chapter Four
Heterogeneous Electron Transfer through Organic Monolayers
on Carbon and Gold Electrodes
116
Chapter 4-Heterogeneous Electron Transfer Through Organic Monolayers on Carbon and Gold Electrodes
4.1 Introduction
Electron transfer through organic films of nanometer thickness is of fundamental and
practical importance to the area of sensor technologies, anti-corrosion films and
electronic devices. There are phenomenological factors affecting electron transfer at
interfaces, for examples the solvent reorganisation energy,1, 2 the density of electronic
states in the electrode surfaces,3-6 and electronic coupling between the electrode and the
redox couple.7, 8 The development of self-assembled methods for the construction of
monolayer films on electrode surfaces provides a means to control and manipulate the
interfacial characteristics.9 This technology has been exploited to investigate
fundamental issues of electron transfer between an electrode and a redox couple.10
The results in Chapter Three have demonstrated the glassy carbon (GC) electrodes can
be covalently modified with more stable monolayers of aryl diazonium salts by
electrochemical reduction relative to gold. The reduction reaction results in the loss of
N2 and the formation of a carbon-carbon covalent bond between the adsorbed molecules
and carbon substrates. Thus the conjugated carbon network in the glassy carbon (GC)
electrode can be thought of as continuing into the monolayer system rather than the
abrupt change from electrons being in a metallic environment to an organic
environment.11 The continuity of the electrode material into the monolayer has resulted
in the suggestion that GC electrodes modified by aryl diazonium salts have the potential
to reduce the barrier towards electron transfer from the carbon electrode into the
monolayer which is important for all molecular scale devices where communication
with the macroscopic world is achieved through electron transport. However, a rather
117
Chapter 4-Heterogeneous Electron Transfer Through Organic Monolayers on Carbon and Gold Electrodes
large tunneling barrier (~2 eV) can be created by the gold/thiol junction based on the
self-assembled monolayers (SAMs) of alkanethiols on gold surfaces.11 McCreery and
coworkers12-15 have extensively studied the effects of surface structure on the
heterogeneous electron transfer kinetics on GC surfaces by examining different redox
probe solutions on polished and modified GC electrodes. It was concluded carbon
surface variables affect sensitively the kinetics of a given system of interest. However,
the heterogeneous electron transfer between redox active molecules and GC electrodes
through aryl diazonium salt derived monolayers has yet to be investigated. Nor has the
notion that the carbon-carbon bond will allow the efficient electron transfer.
The purpose of this chapter is to demonstrate the modification of GC and gold
substrates using mixtures of aryl diazonium salt molecules (introducing phenyl and 4-
carboxyphenyl groups onto the surface) and to compare the kinetics of electron transfer
to GC, pyrolysed photoresist films (PPF) and gold surfaces from the same ferrocene-
based monolayer system. The electron transfer of a similar ferrocene-based system
prepared by using mixed self-assembled monolayers of 4-mercaptobenzoic acid (MBA)
and 1-propanethiol (PT) on gold surfaces has also been studied for further comparison.
4.2 Experimental Section
All reagents and materials are listed in Table 2.1 and prepared according to the
procedures in Chapter Two. GC, PPF and gold electrodes were prepared according to
the method described in Section 2.4. Mixed monolayers were prepared as described in
Section 2.4.2 and ferrocenemethylamine was covalently attached to monolayers
according to the procedures in Section 2.2.6. All electrochemical measurements were
performed with a BAS-l00B electrochemical analyser. All potentials were quoted
118
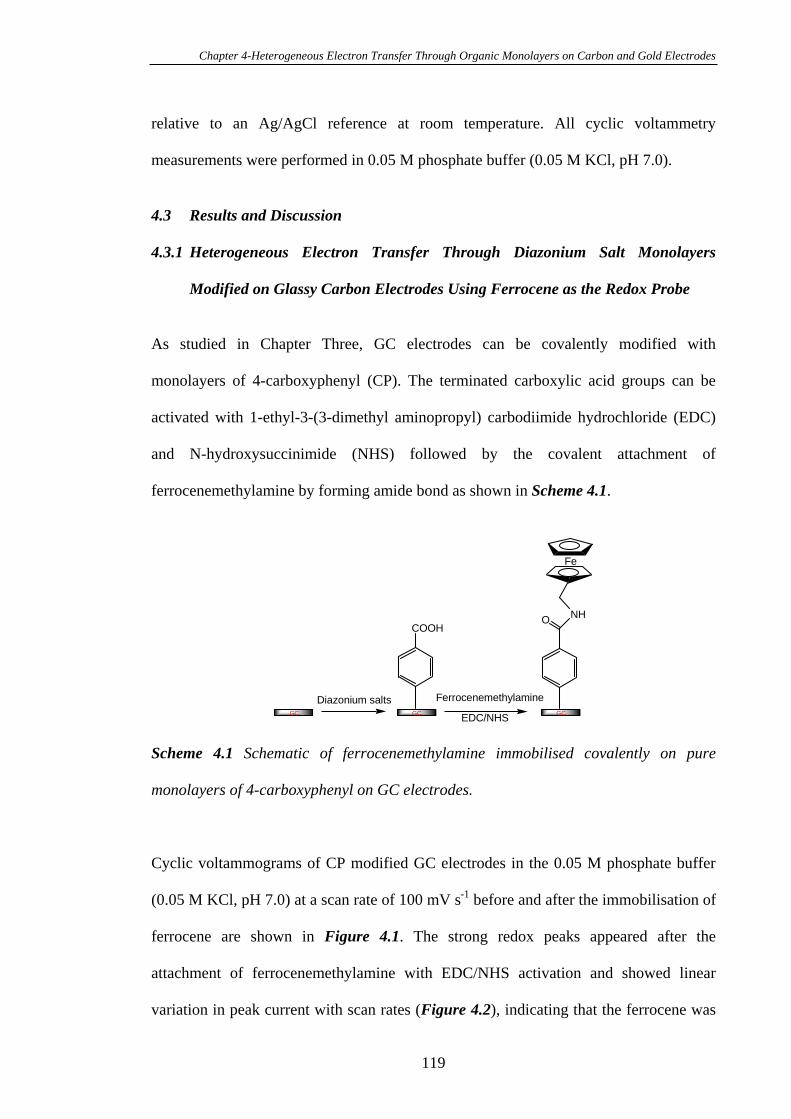
Chapter 4-Heterogeneous Electron Transfer Through Organic Monolayers on Carbon and Gold Electrodes
relative to an Ag/AgCl reference at room temperature. All cyclic voltammetry
measurements were performed in 0.05 M phosphate buffer (0.05 M KCl, pH 7.0).
4.3 Results and Discussion
4.3.1 Heterogeneous Electron Transfer Through Diazonium Salt Monolayers
Modified on Glassy Carbon Electrodes Using Ferrocene as the Redox Probe
As studied in Chapter Three, GC electrodes can be covalently modified with
monolayers of 4-carboxyphenyl (CP). The terminated carboxylic acid groups can be
activated with 1-ethyl-3-(3-dimethyl aminopropyl) carbodiimide hydrochloride (EDC)
and N-hydroxysuccinimide (NHS) followed by the covalent attachment of
ferrocenemethylamine by forming amide bond as shown in Scheme 4.1.
Diazonium salts
EDC/NHS
FerrocenemethylamineGC GC GC
NHO
Fe
COOH
Scheme 4.1 Schematic of ferrocenemethylamine immobilised covalently on pure
monolayers of 4-carboxyphenyl on GC electrodes.
Cyclic voltammograms of CP modified GC electrodes in the 0.05 M phosphate buffer
(0.05 M KCl, pH 7.0) at a scan rate of 100 mV s-1 before and after the immobilisation of
ferrocene are shown in Figure 4.1. The strong redox peaks appeared after the
attachment of ferrocenemethylamine with EDC/NHS activation and showed linear
variation in peak current with scan rates (Figure 4.2), indicating that the ferrocene was
119
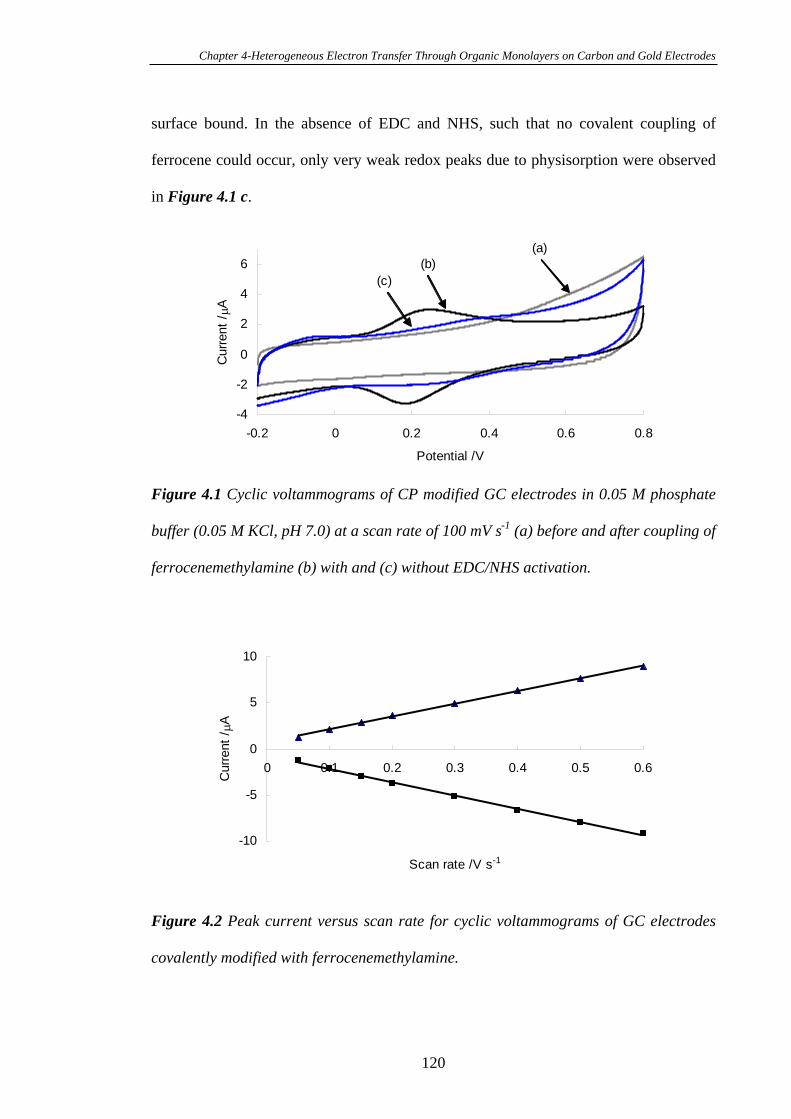
Chapter 4-Heterogeneous Electron Transfer Through Organic Monolayers on Carbon and Gold Electrodes
surface bound. In the absence of EDC and NHS, such that no covalent coupling of
ferrocene could occur, only very weak redox peaks due to physisorption were observed
in Figure 4.1 c.
-4
-2
0
2
4
6
-0.2 0 0.2 0.4 0.6 0.8
Potential /V
Cur
rent
/A
(c)
(a)(b)
Figure 4.1 Cyclic voltammograms of CP modified GC electrodes in 0.05 M phosphate
buffer (0.05 M KCl, pH 7.0) at a scan rate of 100 mV s-1 (a) before and after coupling of
ferrocenemethylamine (b) with and (c) without EDC/NHS activation.
-10
-5
0
5
10
0 0.1 0.2 0.3 0.4 0.5 0.6
Scan rate /V s-1
Cur
rent
/A
Figure 4.2 Peak current versus scan rate for cyclic voltammograms of GC electrodes
covalently modified with ferrocenemethylamine.
120
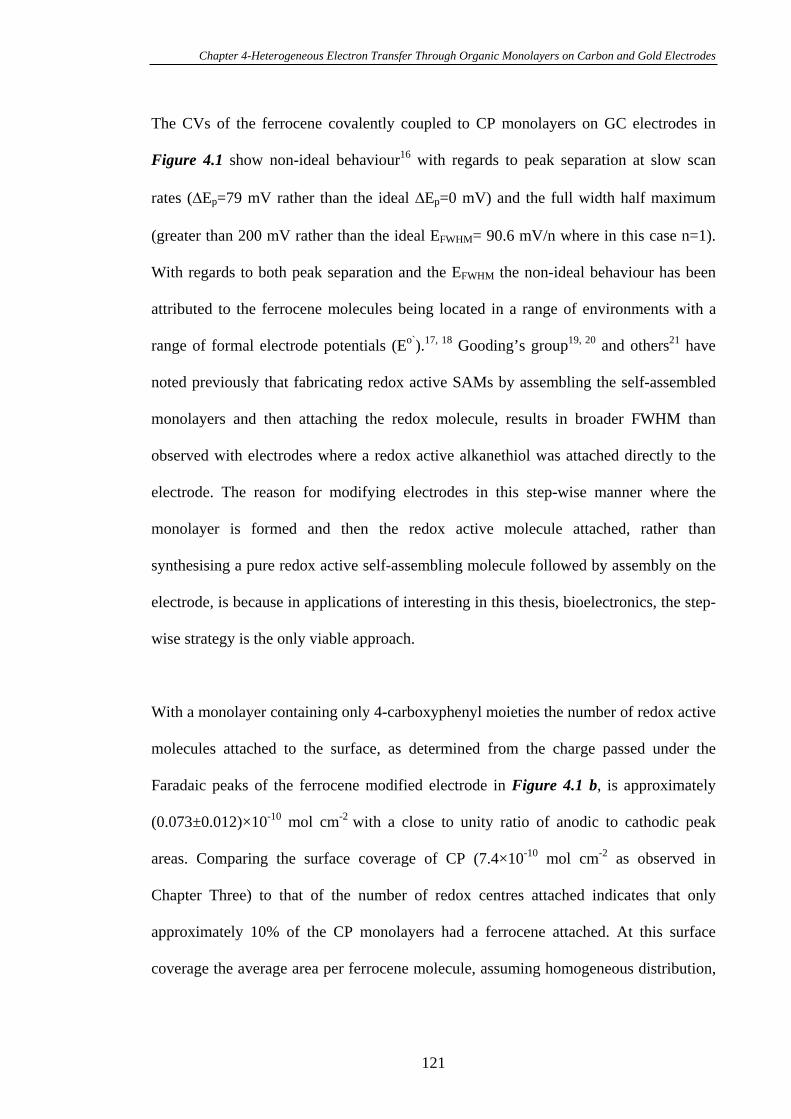
Chapter 4-Heterogeneous Electron Transfer Through Organic Monolayers on Carbon and Gold Electrodes
The CVs of the ferrocene covalently coupled to CP monolayers on GC electrodes in
Figure 4.1 show non-ideal behaviour16 with regards to peak separation at slow scan
rates ( Ep=79 mV rather than the ideal Ep=0 mV) and the full width half maximum
(greater than 200 mV rather than the ideal EFWHM= 90.6 mV/n where in this case n=1).
With regards to both peak separation and the EFWHM the non-ideal behaviour has been
attributed to the ferrocene molecules being located in a range of environments with a
range of formal electrode potentials (Eo`).17, 18 Gooding’s group19, 20 and others21 have
noted previously that fabricating redox active SAMs by assembling the self-assembled
monolayers and then attaching the redox molecule, results in broader FWHM than
observed with electrodes where a redox active alkanethiol was attached directly to the
electrode. The reason for modifying electrodes in this step-wise manner where the
monolayer is formed and then the redox active molecule attached, rather than
synthesising a pure redox active self-assembling molecule followed by assembly on the
electrode, is because in applications of interesting in this thesis, bioelectronics, the step-
wise strategy is the only viable approach.
With a monolayer containing only 4-carboxyphenyl moieties the number of redox active
molecules attached to the surface, as determined from the charge passed under the
Faradaic peaks of the ferrocene modified electrode in Figure 4.1 b, is approximately
(0.073±0.012)×10-10 mol cm-2 with a close to unity ratio of anodic to cathodic peak
areas. Comparing the surface coverage of CP (7.4×10⁻¹⁰ mol cm-2 as observed in
Chapter Three) to that of the number of redox centres attached indicates that only
approximately 10% of the CP monolayers had a ferrocene attached. At this surface
coverage the average area per ferrocene molecule, assuming homogeneous distribution,
121
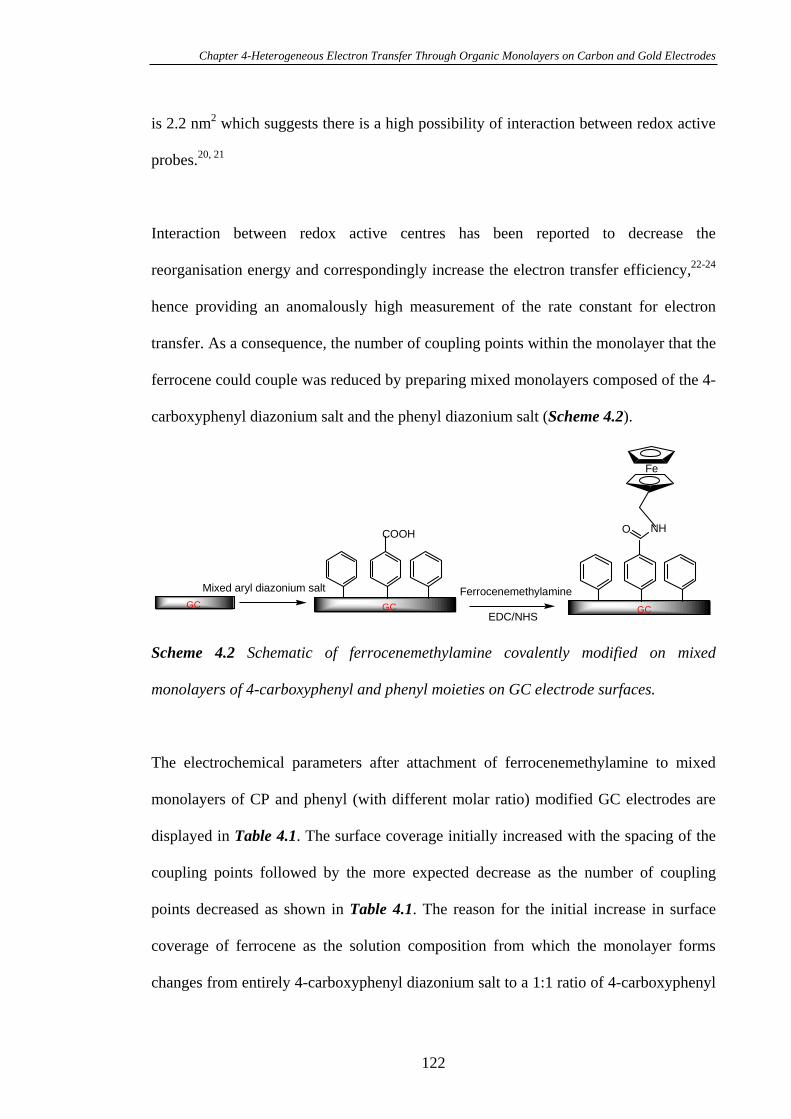
Chapter 4-Heterogeneous Electron Transfer Through Organic Monolayers on Carbon and Gold Electrodes
is 2.2 nm2 which suggests there is a high possibility of interaction between redox active
probes.20, 21
Interaction between redox active centres has been reported to decrease the
reorganisation energy and correspondingly increase the electron transfer efficiency,22-24
hence providing an anomalously high measurement of the rate constant for electron
transfer. As a consequence, the number of coupling points within the monolayer that the
ferrocene could couple was reduced by preparing mixed monolayers composed of the 4-
carboxyphenyl diazonium salt and the phenyl diazonium salt (Scheme 4.2).
Mixed aryl diazonium salt
EDC/NHS
Ferrocenemethylamine
COOH NHO
Fe
GC GC GC
Scheme 4.2 Schematic of ferrocenemethylamine covalently modified on mixed
monolayers of 4-carboxyphenyl and phenyl moieties on GC electrode surfaces.
The electrochemical parameters after attachment of ferrocenemethylamine to mixed
monolayers of CP and phenyl (with different molar ratio) modified GC electrodes are
displayed in Table 4.1. The surface coverage initially increased with the spacing of the
coupling points followed by the more expected decrease as the number of coupling
points decreased as shown in Table 4.1. The reason for the initial increase in surface
coverage of ferrocene as the solution composition from which the monolayer forms
changes from entirely 4-carboxyphenyl diazonium salt to a 1:1 ratio of 4-carboxyphenyl
122
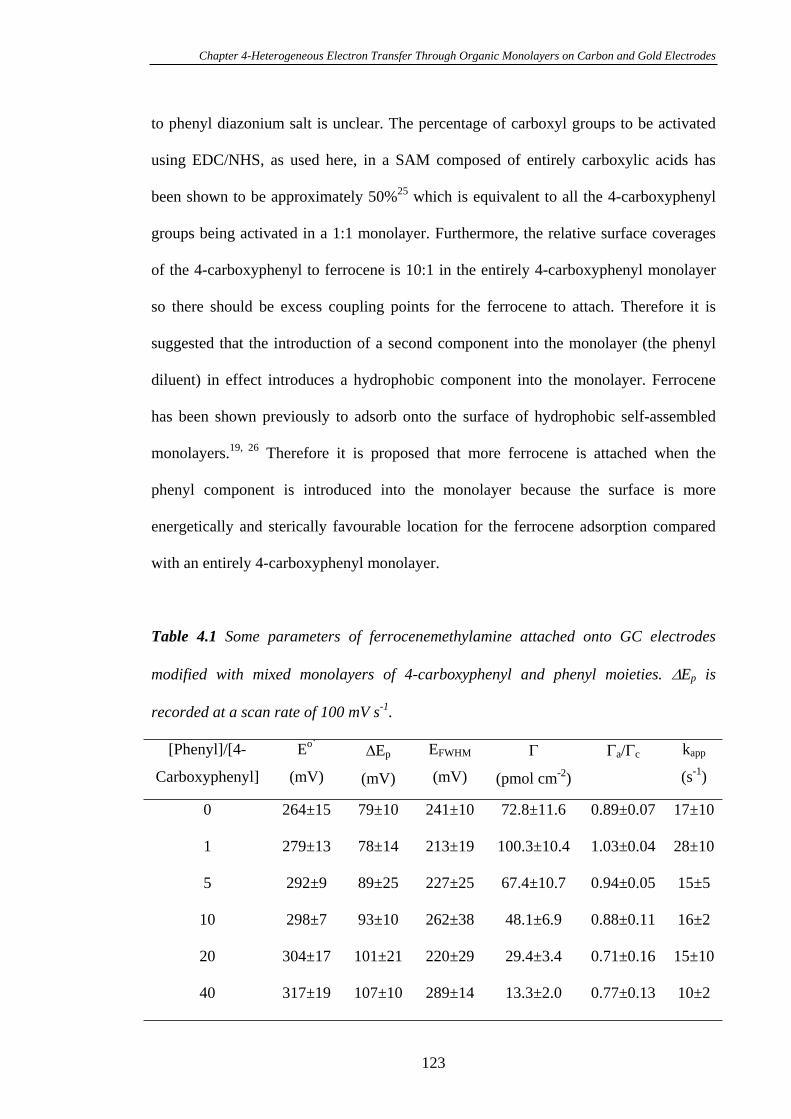
Chapter 4-Heterogeneous Electron Transfer Through Organic Monolayers on Carbon and Gold Electrodes
to phenyl diazonium salt is unclear. The percentage of carboxyl groups to be activated
using EDC/NHS, as used here, in a SAM composed of entirely carboxylic acids has
been shown to be approximately 50%25 which is equivalent to all the 4-carboxyphenyl
groups being activated in a 1:1 monolayer. Furthermore, the relative surface coverages
of the 4-carboxyphenyl to ferrocene is 10:1 in the entirely 4-carboxyphenyl monolayer
so there should be excess coupling points for the ferrocene to attach. Therefore it is
suggested that the introduction of a second component into the monolayer (the phenyl
diluent) in effect introduces a hydrophobic component into the monolayer. Ferrocene
has been shown previously to adsorb onto the surface of hydrophobic self-assembled
monolayers.19, 26 Therefore it is proposed that more ferrocene is attached when the
phenyl component is introduced into the monolayer because the surface is more
energetically and sterically favourable location for the ferrocene adsorption compared
with an entirely 4-carboxyphenyl monolayer.
Table 4.1 Some parameters of ferrocenemethylamine attached onto GC electrodes
modified with mixed monolayers of 4-carboxyphenyl and phenyl moieties. Ep is
recorded at a scan rate of 100 mV s-1.
[Phenyl]/[4-
Carboxyphenyl]
Eo`
(mV)
Ep
(mV)
EFWHM
(mV) (pmol cm-2)a/ c kapp
(s-1)
0
1
5
10
20
40
264±15
279±13
292±9
298±7
304±17
317±19
79±10
78±14
89±25
93±10
101±21
107±10
241±10
213±19
227±25
262±38
220±29
289±14
72.8±11.6
100.3±10.4
67.4±10.7
48.1±6.9
29.4±3.4
13.3±2.0
0.89±0.07
1.03±0.04
0.94±0.05
0.88±0.11
0.71±0.16
0.77±0.13
17±10
28±10
15±5
16±2
15±10
10±2
123
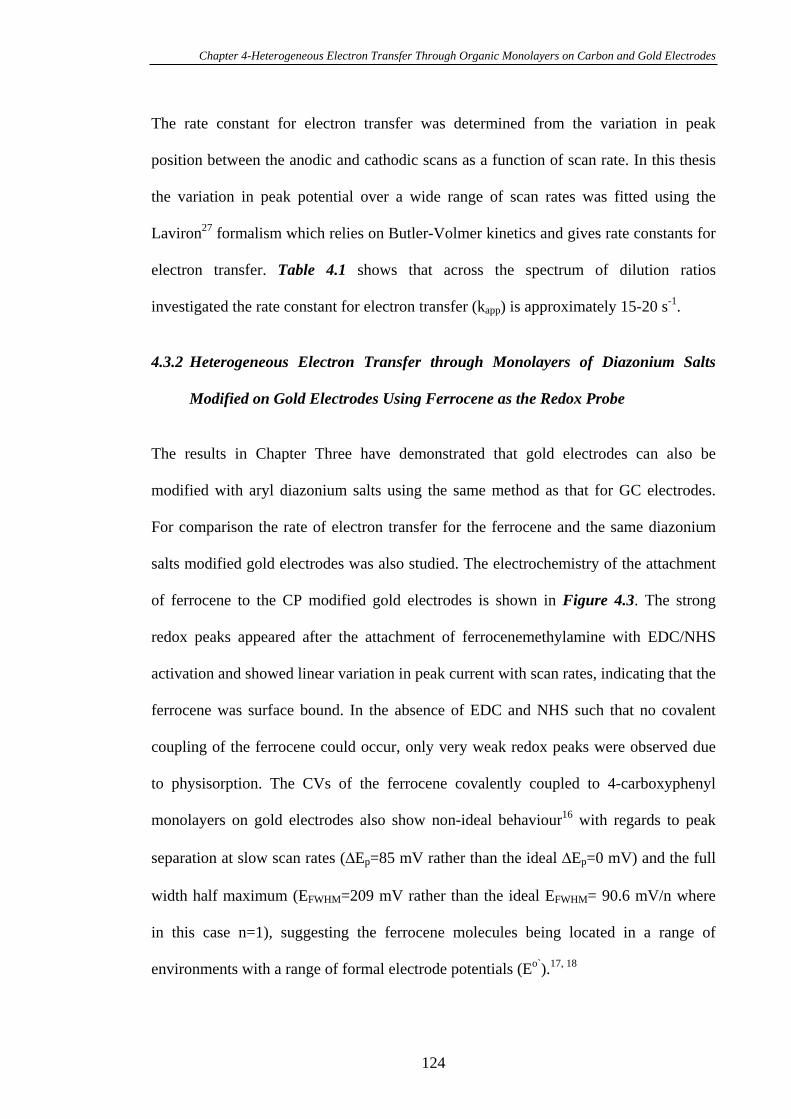
Chapter 4-Heterogeneous Electron Transfer Through Organic Monolayers on Carbon and Gold Electrodes
The rate constant for electron transfer was determined from the variation in peak
position between the anodic and cathodic scans as a function of scan rate. In this thesis
the variation in peak potential over a wide range of scan rates was fitted using the
Laviron27 formalism which relies on Butler-Volmer kinetics and gives rate constants for
electron transfer. Table 4.1 shows that across the spectrum of dilution ratios
investigated the rate constant for electron transfer (kapp) is approximately 15-20 s-1.
4.3.2 Heterogeneous Electron Transfer through Monolayers of Diazonium Salts
Modified on Gold Electrodes Using Ferrocene as the Redox Probe
The results in Chapter Three have demonstrated that gold electrodes can also be
modified with aryl diazonium salts using the same method as that for GC electrodes.
For comparison the rate of electron transfer for the ferrocene and the same diazonium
salts modified gold electrodes was also studied. The electrochemistry of the attachment
of ferrocene to the CP modified gold electrodes is shown in Figure 4.3. The strong
redox peaks appeared after the attachment of ferrocenemethylamine with EDC/NHS
activation and showed linear variation in peak current with scan rates, indicating that the
ferrocene was surface bound. In the absence of EDC and NHS such that no covalent
coupling of the ferrocene could occur, only very weak redox peaks were observed due
to physisorption. The CVs of the ferrocene covalently coupled to 4-carboxyphenyl
monolayers on gold electrodes also show non-ideal behaviour16 with regards to peak
separation at slow scan rates ( Ep=85 mV rather than the ideal Ep=0 mV) and the full
width half maximum (EFWHM=209 mV rather than the ideal EFWHM= 90.6 mV/n where
in this case n=1), suggesting the ferrocene molecules being located in a range of
environments with a range of formal electrode potentials (Eo`).17, 18
124
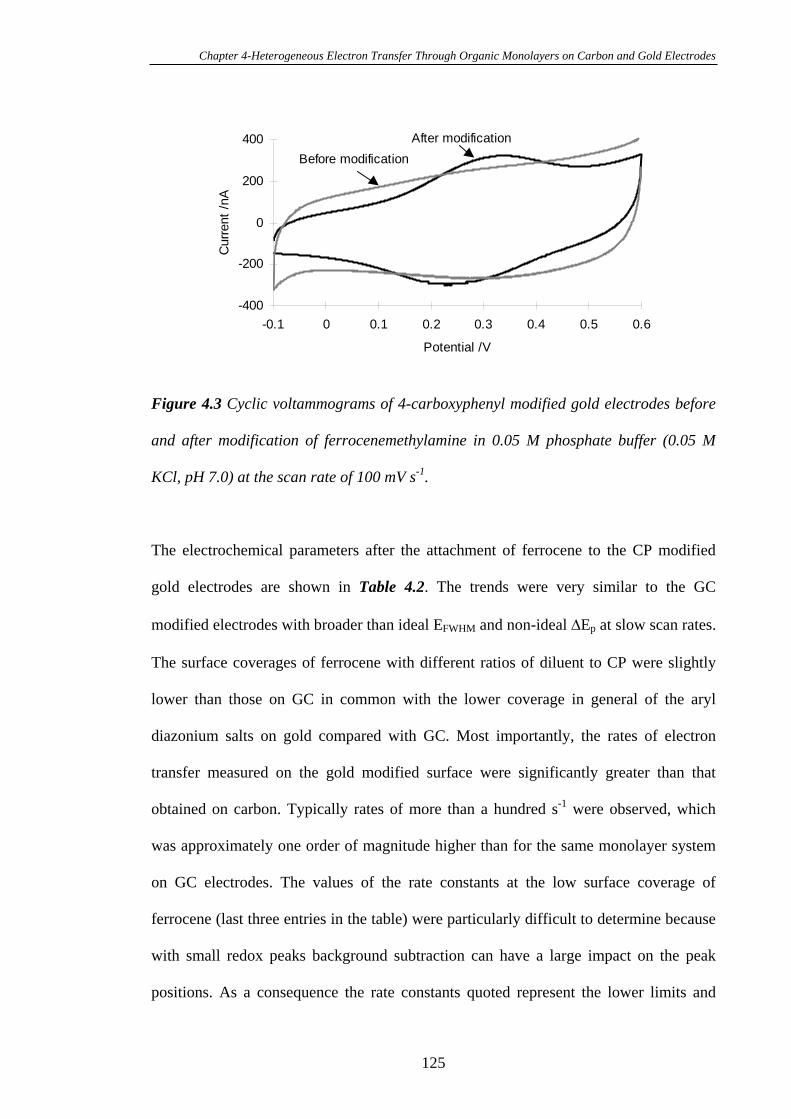
Chapter 4-Heterogeneous Electron Transfer Through Organic Monolayers on Carbon and Gold Electrodes
-400
-200
0
200
400
-0.1 0 0.1 0.2 0.3 0.4 0.5 0.6
Potential /V
Cur
rent
/nA
After modificationBefore modification
Figure 4.3 Cyclic voltammograms of 4-carboxyphenyl modified gold electrodes before
and after modification of ferrocenemethylamine in 0.05 M phosphate buffer (0.05 M
KCl, pH 7.0) at the scan rate of 100 mV s-1.
The electrochemical parameters after the attachment of ferrocene to the CP modified
gold electrodes are shown in Table 4.2. The trends were very similar to the GC
modified electrodes with broader than ideal EFWHM and non-ideal Ep at slow scan rates.
The surface coverages of ferrocene with different ratios of diluent to CP were slightly
lower than those on GC in common with the lower coverage in general of the aryl
diazonium salts on gold compared with GC. Most importantly, the rates of electron
transfer measured on the gold modified surface were significantly greater than that
obtained on carbon. Typically rates of more than a hundred s-1 were observed, which
was approximately one order of magnitude higher than for the same monolayer system
on GC electrodes. The values of the rate constants at the low surface coverage of
ferrocene (last three entries in the table) were particularly difficult to determine because
with small redox peaks background subtraction can have a large impact on the peak
positions. As a consequence the rate constants quoted represent the lower limits and
125
Chapter 4-Heterogeneous Electron Transfer Through Organic Monolayers on Carbon and Gold Electrodes
therefore we expect the true rate constant is closer to that observed at the 1:5
monolayers.
Table 4.2 Some parameters of ferrocenemethylamine attached onto gold electrodes
modified with mixed monolayers of 4-carboxyphenyl and phenyl moieties. Ep is
recorded at a scan rate of 100 mV s-1.
[Phenyl]/[4-
Carboxyphenyl]
Eo`
(mV)
Ep
(mV)
EFWHM
(mV) (pmol cm-2)a/ c kapp
(s-1)
0
1
5
10
20
40
268±12
277±25
280±18
282±14
292±19
317±21
81±14
85±9
75±10
92±12
89±8
81±16
209±11
191±17
227±8
260±15
272±14
308±10
49.3±7.6
80.6±5.9
53.7±5.4
25.8±4.0
13.3±2.4
7.1±1.0
0.87±0.13
0.86±0.09
0.72±0.14
0.92±0.07
0.76±0.03
0.93±0.02
257±41
530±42
211±23
83±50
69±50
68±50
4.3.3 Heterogeneous Electron Transfer Through Diazonium Salt Monolayers
Modified on Pyrolysed Photoresist Films
4.3.3.1 Pyrolysed Photoresist Films (PPF)
As described in Chapter Two, PPF, which is produced by deposing positive and
negative photoresists on silicon wafers by spin coating and then pyrolysed at
temperature of 600-1100 oC in an inert environment, has attracted particular attention by
electrochemists.28-30 PPF is exceptionally smooth (<0.5 nm rms) comparing to other
carbon electrode surfaces, such as polished GC and vacuum heat-treated GC disks,
whose root-mean-square surface roughness was found by STM to be 4.1 and 4.5 nm,
respectively.29, 31, 32 Ultraflat solid surfaces will be extremely important for future
126
Chapter 4-Heterogeneous Electron Transfer Through Organic Monolayers on Carbon and Gold Electrodes
advancements of molecular electronic devices.11 Additionally, curing in a reducing
atmosphere minimises carbon oxidation, leading to low oxygen/carbon atomic (O/C)
ratio that is relatively stable toward air oxidation. The smoothness and low O/C ratio
results in a surface with a low capacitance, contributing to the low background levels
observed. PPF with properties similar to a very smooth version of GC, has a very low
background current and oxygen/carbon atomic ratio compared to conventional GC,31
and can also be chemically modified via aryl diazonium ion reduction to yield a
covalently attached monolayer.29 The low oxygen/carbon atomic ratio, smoother surface
and the relative stability of PPF indicate that PPF surfaces may be a good alternative to
GC substrate for sensing applications. It is worthy studying electron transfer through
ferrocene system modified on PPF to investigate if the roughness of substrate has some
influence to the heterogeneous electron transfer.
4.3.3.2 Heterogeneous Electron Transfer on PPF Surfaces
As studied above, there is huge difference between the rates of electron transfer for the
same ferrocene systems on different electrode materials GC and gold electrodes.
Another carbon substrate PPF with a smoother surface was used for fabrication of the
similar ferrocene system to study the rate of electron transfer. Firstly, the PPF electrodes
were modified with CP by the reductive reduction of aryl diazonium salts. Cyclic
voltammograms of a PPF electrode in the acetonitrile/0.1 M NBu4BF4 solution
containing 1 mM CP at the scan rate of 100 mV s-1 are shown in Figure 4.4, which is
similar to that on the GC surfaces. The first sweep gave the irreversible reduction wave
at ca. -0.16 V versus Ag/AgCl, which is attributed to the formation of the 4-
carboxyphenyl radical from the diazonium derivative. The waves disappeared
completely in the second cycle. The surface coverage of the modified layer was
127
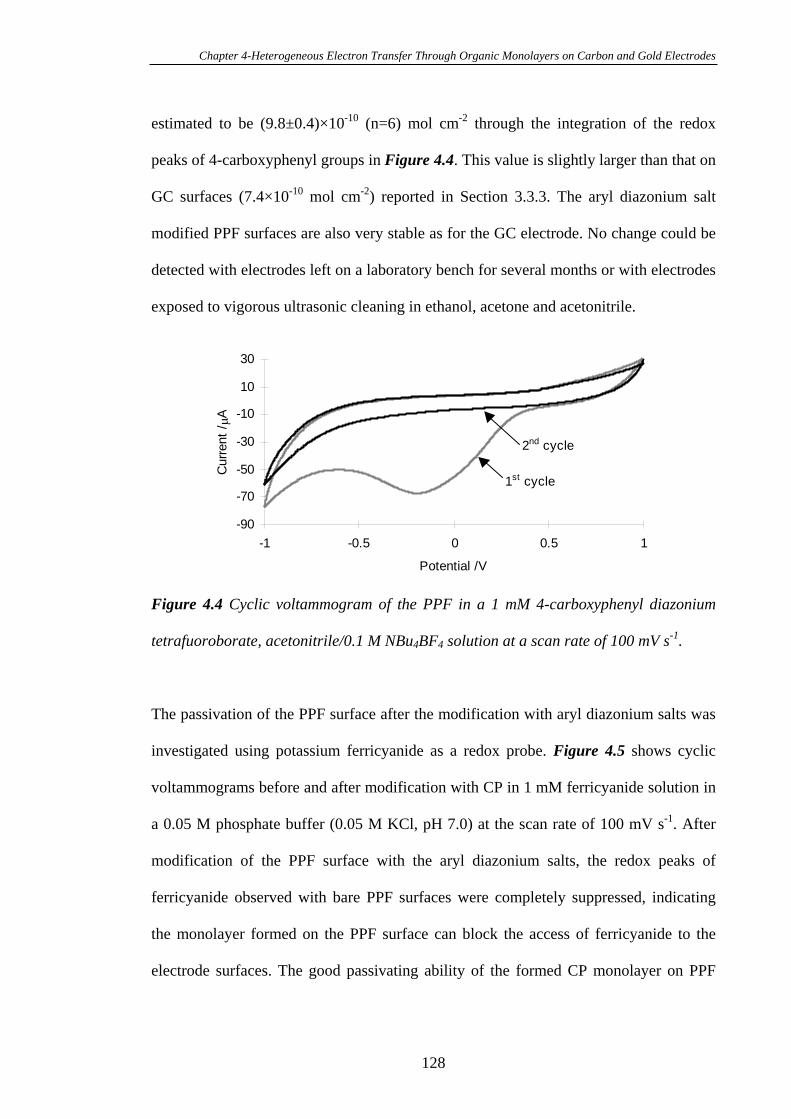
Chapter 4-Heterogeneous Electron Transfer Through Organic Monolayers on Carbon and Gold Electrodes
estimated to be (9.8±0.4)×10-10 (n=6) mol cm-2 through the integration of the redox
peaks of 4-carboxyphenyl groups in Figure 4.4. This value is slightly larger than that on
GC surfaces (7.4×10⁻¹⁰ mol cm-2) reported in Section 3.3.3. The aryl diazonium salt
modified PPF surfaces are also very stable as for the GC electrode. No change could be
detected with electrodes left on a laboratory bench for several months or with electrodes
exposed to vigorous ultrasonic cleaning in ethanol, acetone and acetonitrile.
-90
-70
-50
-30
-10
10
30
-1 -0.5 0 0.5 1
Potential /V
Cur
rent
/A
1st cycle
2nd cycle
Figure 4.4 Cyclic voltammogram of the PPF in a 1 mM 4-carboxyphenyl diazonium
tetrafuoroborate, acetonitrile/0.1 M NBu4BF4 solution at a scan rate of 100 mV s-1.
The passivation of the PPF surface after the modification with aryl diazonium salts was
investigated using potassium ferricyanide as a redox probe. Figure 4.5 shows cyclic
voltammograms before and after modification with CP in 1 mM ferricyanide solution in
a 0.05 M phosphate buffer (0.05 M KCl, pH 7.0) at the scan rate of 100 mV s-1. After
modification of the PPF surface with the aryl diazonium salts, the redox peaks of
ferricyanide observed with bare PPF surfaces were completely suppressed, indicating
the monolayer formed on the PPF surface can block the access of ferricyanide to the
electrode surfaces. The good passivating ability of the formed CP monolayer on PPF
128
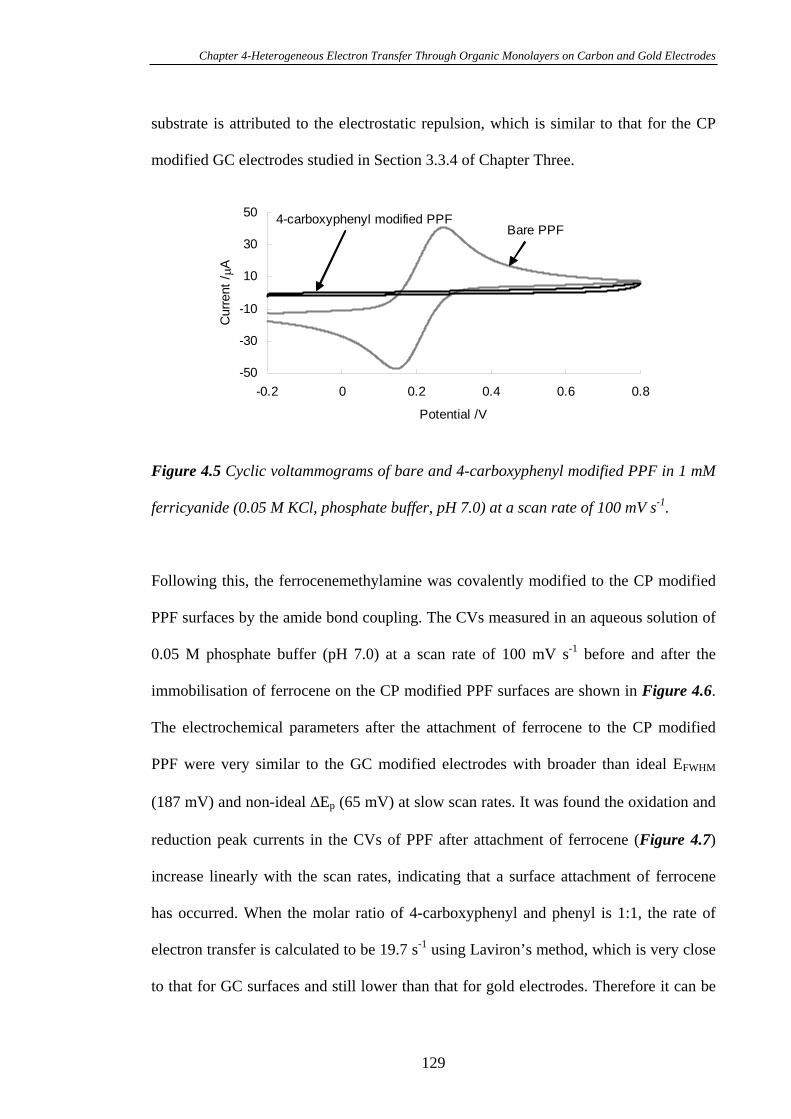
Chapter 4-Heterogeneous Electron Transfer Through Organic Monolayers on Carbon and Gold Electrodes
substrate is attributed to the electrostatic repulsion, which is similar to that for the CP
modified GC electrodes studied in Section 3.3.4 of Chapter Three.
-50
-30
-10
10
30
50
-0.2 0 0.2 0.4 0.6 0.8
Potential /V
Cur
rent
/A
4-carboxyphenyl modified PPFBare PPF
Figure 4.5 Cyclic voltammograms of bare and 4-carboxyphenyl modified PPF in 1 mM
ferricyanide (0.05 M KCl, phosphate buffer, pH 7.0) at a scan rate of 100 mV s-1.
Following this, the ferrocenemethylamine was covalently modified to the CP modified
PPF surfaces by the amide bond coupling. The CVs measured in an aqueous solution of
0.05 M phosphate buffer (pH 7.0) at a scan rate of 100 mV s-1 before and after the
immobilisation of ferrocene on the CP modified PPF surfaces are shown in Figure 4.6.
The electrochemical parameters after the attachment of ferrocene to the CP modified
PPF were very similar to the GC modified electrodes with broader than ideal EFWHM
(187 mV) and non-ideal Ep (65 mV) at slow scan rates. It was found the oxidation and
reduction peak currents in the CVs of PPF after attachment of ferrocene (Figure 4.7)
increase linearly with the scan rates, indicating that a surface attachment of ferrocene
has occurred. When the molar ratio of 4-carboxyphenyl and phenyl is 1:1, the rate of
electron transfer is calculated to be 19.7 s-1 using Laviron’s method, which is very close
to that for GC surfaces and still lower than that for gold electrodes. Therefore it can be
129
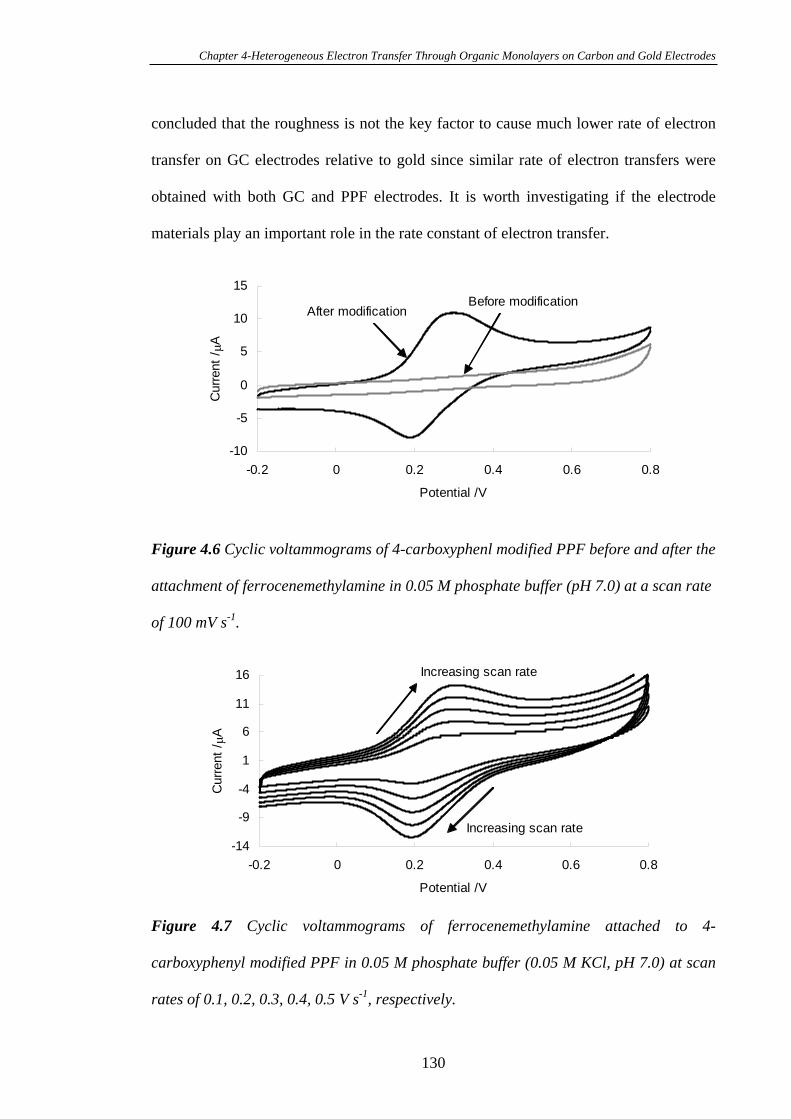
Chapter 4-Heterogeneous Electron Transfer Through Organic Monolayers on Carbon and Gold Electrodes
concluded that the roughness is not the key factor to cause much lower rate of electron
transfer on GC electrodes relative to gold since similar rate of electron transfers were
obtained with both GC and PPF electrodes. It is worth investigating if the electrode
materials play an important role in the rate constant of electron transfer.
-10
-5
0
5
10
15
-0.2 0 0.2 0.4 0.6 0.8
Potential /V
Cur
rent
/A
After modificationBefore modification
Figure 4.6 Cyclic voltammograms of 4-carboxyphenl modified PPF before and after the
attachment of ferrocenemethylamine in 0.05 M phosphate buffer (pH 7.0) at a scan rate
of 100 mV s-1.
-14
-9
-4
1
6
11
16
-0.2 0 0.2 0.4 0.6 0.8
Potential /V
Cur
rent
/A
Increasing scan rate
Increasing scan rate
Figure 4.7 Cyclic voltammograms of ferrocenemethylamine attached to 4-
carboxyphenyl modified PPF in 0.05 M phosphate buffer (0.05 M KCl, pH 7.0) at scan
rates of 0.1, 0.2, 0.3, 0.4, 0.5 V s-1, respectively.
130
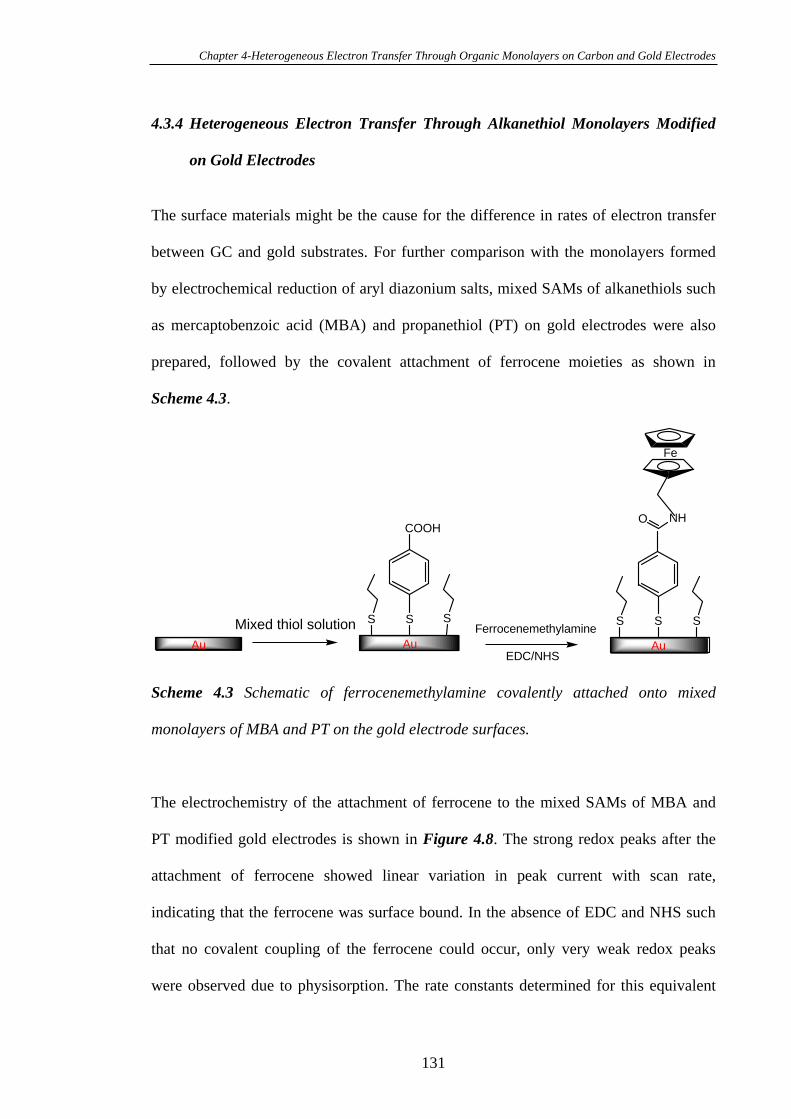
Chapter 4-Heterogeneous Electron Transfer Through Organic Monolayers on Carbon and Gold Electrodes
4.3.4 Heterogeneous Electron Transfer Through Alkanethiol Monolayers Modified
on Gold Electrodes
The surface materials might be the cause for the difference in rates of electron transfer
between GC and gold substrates. For further comparison with the monolayers formed
by electrochemical reduction of aryl diazonium salts, mixed SAMs of alkanethiols such
as mercaptobenzoic acid (MBA) and propanethiol (PT) on gold electrodes were also
prepared, followed by the covalent attachment of ferrocene moieties as shown in
Scheme 4.3.
Mixed thiol solution S S
COOH
EDC/NHS
Ferrocenemethylamine S
NHO
Fe
Au Au Au
S S S
Scheme 4.3 Schematic of ferrocenemethylamine covalently attached onto mixed
monolayers of MBA and PT on the gold electrode surfaces.
The electrochemistry of the attachment of ferrocene to the mixed SAMs of MBA and
PT modified gold electrodes is shown in Figure 4.8. The strong redox peaks after the
attachment of ferrocene showed linear variation in peak current with scan rate,
indicating that the ferrocene was surface bound. In the absence of EDC and NHS such
that no covalent coupling of the ferrocene could occur, only very weak redox peaks
were observed due to physisorption. The rate constants determined for this equivalent
131
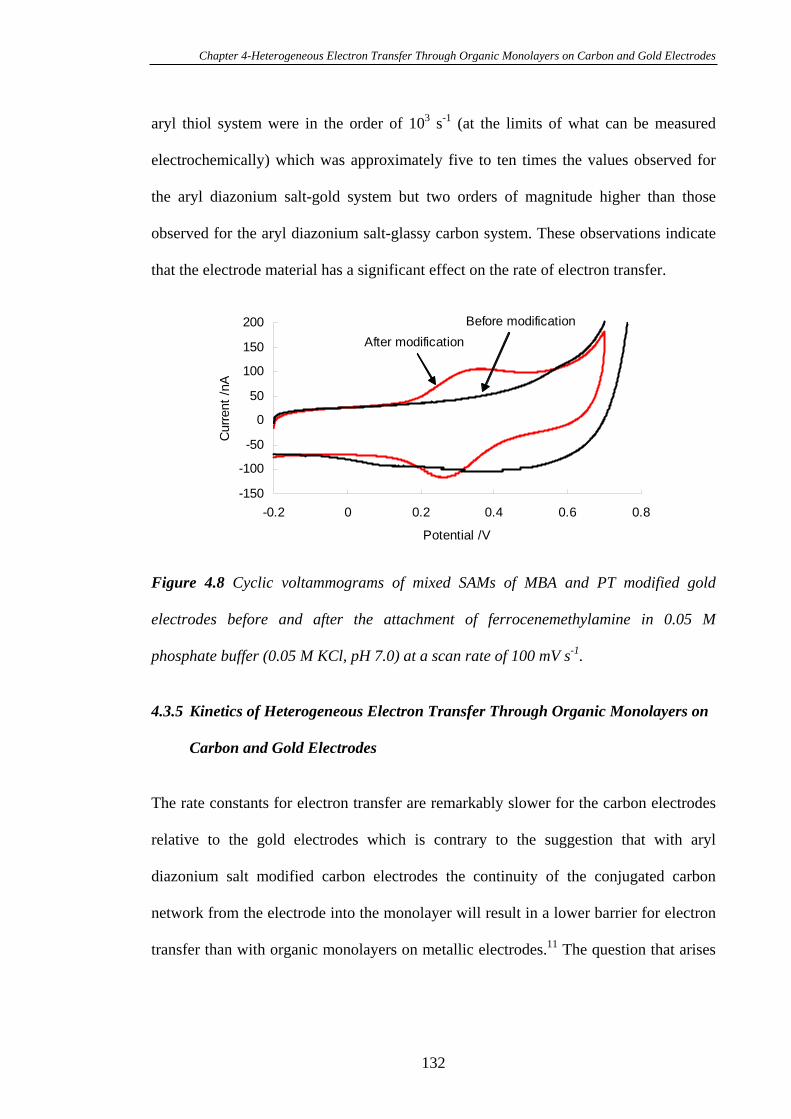
Chapter 4-Heterogeneous Electron Transfer Through Organic Monolayers on Carbon and Gold Electrodes
aryl thiol system were in the order of 103 s-1 (at the limits of what can be measured
electrochemically) which was approximately five to ten times the values observed for
the aryl diazonium salt-gold system but two orders of magnitude higher than those
observed for the aryl diazonium salt-glassy carbon system. These observations indicate
that the electrode material has a significant effect on the rate of electron transfer.
-150
-100
-50
0
50
100
150
200
-0.2 0 0.2 0.4 0.6 0.8
Potential /V
Cur
rent
/nA
After modificationBefore modification
Figure 4.8 Cyclic voltammograms of mixed SAMs of MBA and PT modified gold
electrodes before and after the attachment of ferrocenemethylamine in 0.05 M
phosphate buffer (0.05 M KCl, pH 7.0) at a scan rate of 100 mV s-1.
4.3.5 Kinetics of Heterogeneous Electron Transfer Through Organic Monolayers on
Carbon and Gold Electrodes
The rate constants for electron transfer are remarkably slower for the carbon electrodes
relative to the gold electrodes which is contrary to the suggestion that with aryl
diazonium salt modified carbon electrodes the continuity of the conjugated carbon
network from the electrode into the monolayer will result in a lower barrier for electron
transfer than with organic monolayers on metallic electrodes.11 The question that arises
132
Chapter 4-Heterogeneous Electron Transfer Through Organic Monolayers on Carbon and Gold Electrodes
is why is there a difference in rate constant of around one order of magnitude for the
same redox active molecule connected to electrodes by the same bridge molecule?
The Marcus-Hush expression for electron transfer between a donor and acceptor
through an organic bridge in solution includes terms for electronic coupling between the
donor and acceptor, the Gibbs free energy for electron transfer (the driving force, GET)
and the nuclear reorganisation energy ( ) of the redox molecule as a consequence of its
change in oxidation state.33 For a given donor and acceptor pair, the rate of electron
transfer decays exponentially with distance according to a proportionality constant, the
value, sometimes called a damping factor. When the organic bridge is anchored to an
electrode such that it can act as the donor and/or acceptor the situation is complicated
somewhat as the electronic properties of the electrode can also play a role in the rate of
electron transfer.34 Equations describing the rate constant for electron transfer now
incorporate terms related to the Fermi levels of the electrode and the effective density of
electronics states near the Fermi level. In this study the only changes between the
monolayer systems studied relate to the electrode material and the bond to the electrode.
Hence the reorganisation energy and the driving force will remain unchanged. The
electronic coupling may be influenced by the electrode material as changes in electrodes
may alter the extent of wave function mixing between the organic molecules and the
substrates, especially when conjugated molecules are involved as in this case. A detailed
discussion of the theory of electron transfer and how different electrode materials will
influence the electron transfer is clearly not within the scope of my expertise. However
some comments on the large difference in the rate of electron transfer within the limited
knowledge of the experimental systems investigated is worthwhile.
133
Chapter 4-Heterogeneous Electron Transfer Through Organic Monolayers on Carbon and Gold Electrodes
The first possibility is that there are multilayers on the carbon electrode rather than
monolayers of the bridge molecule as the rate of electron transfer decays exponentially
with distance. However, the surface coverage of the reduced aryl diazonium salts on the
electrode, as determined from the charge passed, was below the maximum theoretical
coverage for a monolayer of reduced aryl diazonium salts, suggesting a monolayer or
submonolayer modification of the carbon electrode. Hence any significant multilayering
can be ruled out and the difference in electron transfer rate must, in someway, be related
to the different electrode surfaces.
The different electrode surfaces could influence the rate of electron transfer due to the
different electronic properties of the surfaces or the nature of the linkage made to each
electrode or both.5 The results support both of these possibilities playing a role. This
conclusion is drawn from the differences in rate constant calculated on the gold surface
for the aryl diazonium salt relative to aryl thiol monolayers and the large difference the
aryl diazonium salt derived monolayers on gold versus the carbon electrodes. The
investigation of the aryl thiol monolayer systems on gold was necessary to draw this
conclusion because of the uncertainty in the nature of the bond formed between the
monolayer and the gold surface during the electroreduction of the aryl diazonium salt.
On carbon electrodes a carbon-carbon covalent bond with little charge transfer is well
established but the existence of a metal-carbon bond much less so. As indicated in the
results section 3.3.8.2, the fitting of the C 1s spectrum with a metal carbide bond is
tentative, as a good fit could also be achieved without including this bond. The
suggestion of a metal-carbon bond is based on the precedence of Pinson and coworkers
35-37 who have provided good evidence for a metal carbon bond on iron and copper
surfaces with very limited charge transfer.36 That is a similar bond to that formed on a
134
Chapter 4-Heterogeneous Electron Transfer Through Organic Monolayers on Carbon and Gold Electrodes
carbon electrode. The gold-thiol bond however, although also the subject of some
controversy, is generally accepted as being a pseudocovalent bond with significant ionic
character.38 In my hands the rate constant for the gold-thiol system is at least five that
for the aryl diazonium derived monolayer on gold, despite the extra bond between the
phenyl ring and the electrode, which is the reason for the assertion that the bond to the
electrode is playing some role.
If the bond between the organic monolayer and the electrode is only of minor
importance when considering the large difference in rate constants between the gold and
carbon electrodes, what is it about the electrode materials which cause such a large
difference? For saturated bridge molecules in metal-molecule-metal junctions fabricated
by assembling a monolayer on an electrode surface and contacting the top with a
conducting probe atomic force microscope, Beebe et al.39 have shown that the contact
resistance is increased with increasing work function of the metals in the junction.
Although glassy carbon is a heterogeneous material, the work function for carbon is
approximately 5.0 eV whilst for polycrystalline gold it is 5.1 eV.40 The similarity in the
work functions suggests this is not a dominant factor in the large difference in the rate
constant for electron transfer. As a consequence, it is proposed that the difference in rate
constant is a due to a difference in the electronic coupling between the electrode and the
redox molecule, perhaps as a consequence of the wave function mixing between the
molecule and the electrode.41 Stokbro et al.42 have calculated for dithiol benzene
assembled on a gold molecular break junction that when a gold-thiolate bond is formed
the energies of the HOMO (Highest Occupied Molecular Orbital) and LUMO (Lowest
Unoccupied Molecular Orbital) of the dithiol benzene fall below the Fermi level of the
organic molecule. Therefore, the electron density of the metal spills over into the
135
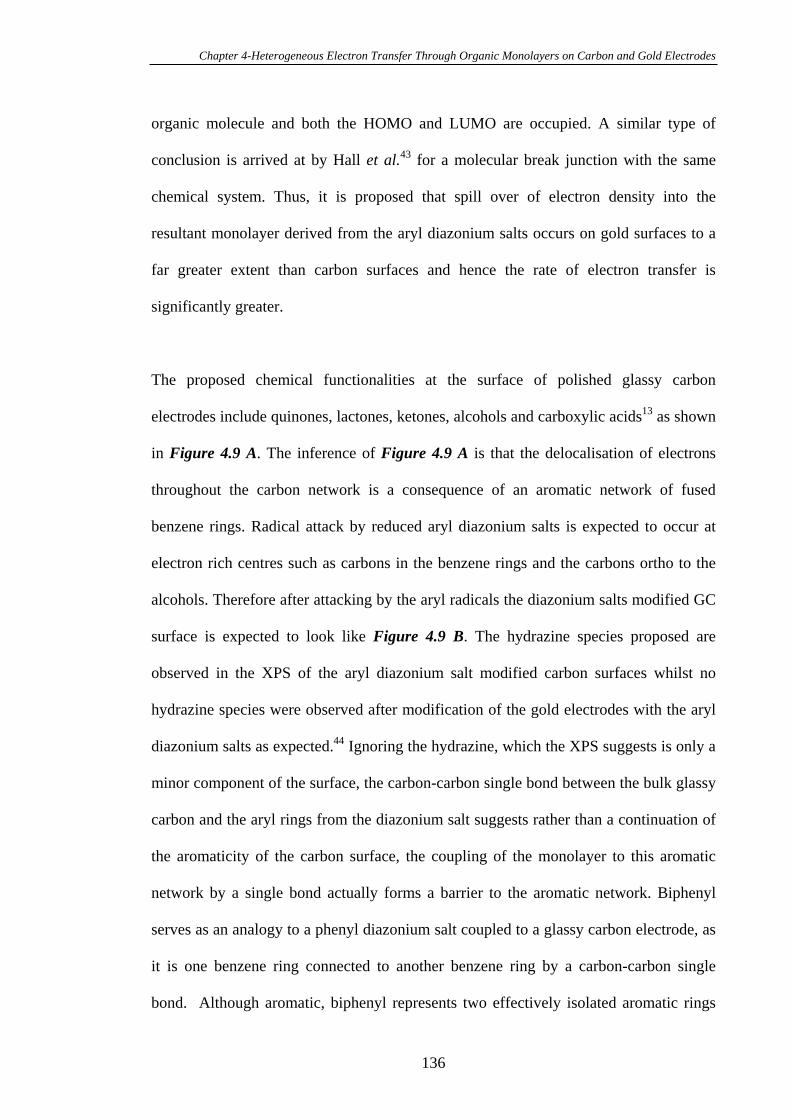
Chapter 4-Heterogeneous Electron Transfer Through Organic Monolayers on Carbon and Gold Electrodes
organic molecule and both the HOMO and LUMO are occupied. A similar type of
conclusion is arrived at by Hall et al.43 for a molecular break junction with the same
chemical system. Thus, it is proposed that spill over of electron density into the
resultant monolayer derived from the aryl diazonium salts occurs on gold surfaces to a
far greater extent than carbon surfaces and hence the rate of electron transfer is
significantly greater.
The proposed chemical functionalities at the surface of polished glassy carbon
electrodes include quinones, lactones, ketones, alcohols and carboxylic acids13 as shown
in Figure 4.9 A. The inference of Figure 4.9 A is that the delocalisation of electrons
throughout the carbon network is a consequence of an aromatic network of fused
benzene rings. Radical attack by reduced aryl diazonium salts is expected to occur at
electron rich centres such as carbons in the benzene rings and the carbons ortho to the
alcohols. Therefore after attacking by the aryl radicals the diazonium salts modified GC
surface is expected to look like Figure 4.9 B. The hydrazine species proposed are
observed in the XPS of the aryl diazonium salt modified carbon surfaces whilst no
hydrazine species were observed after modification of the gold electrodes with the aryl
diazonium salts as expected.44 Ignoring the hydrazine, which the XPS suggests is only a
minor component of the surface, the carbon-carbon single bond between the bulk glassy
carbon and the aryl rings from the diazonium salt suggests rather than a continuation of
the aromaticity of the carbon surface, the coupling of the monolayer to this aromatic
network by a single bond actually forms a barrier to the aromatic network. Biphenyl
serves as an analogy to a phenyl diazonium salt coupled to a glassy carbon electrode, as
it is one benzene ring connected to another benzene ring by a carbon-carbon single
bond. Although aromatic, biphenyl represents two effectively isolated aromatic rings
136
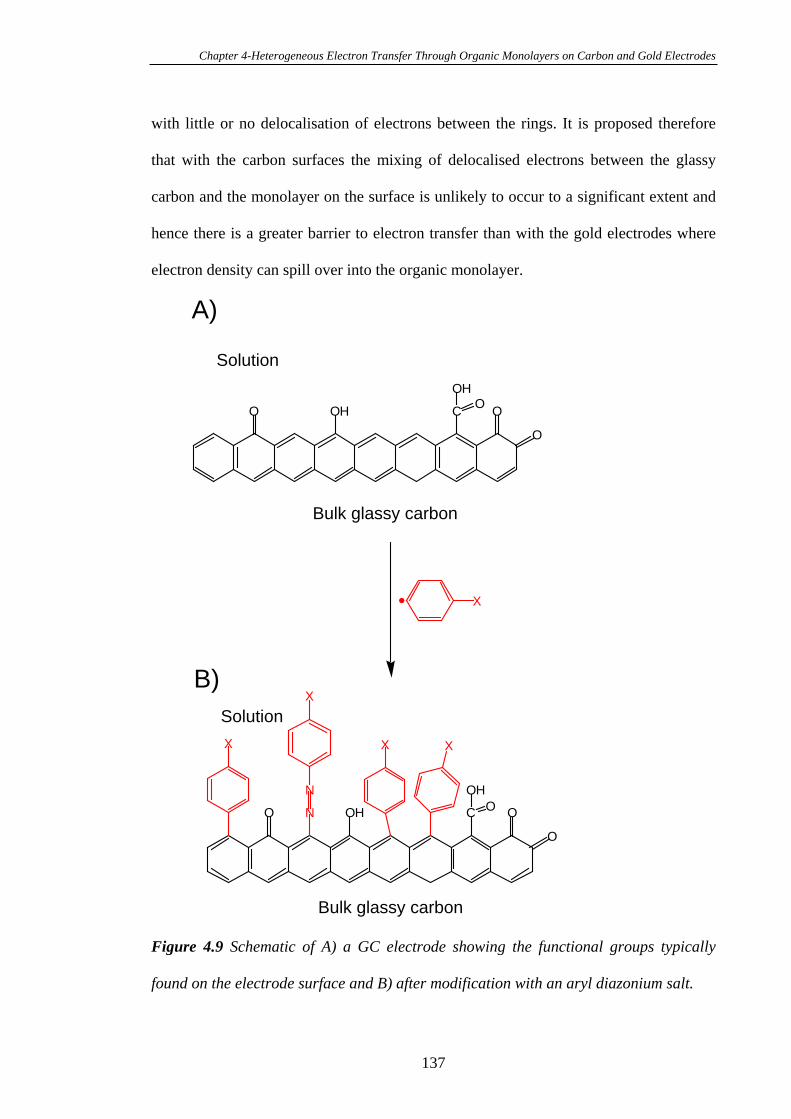
Chapter 4-Heterogeneous Electron Transfer Through Organic Monolayers on Carbon and Gold Electrodes
with little or no delocalisation of electrons between the rings. It is proposed therefore
that with the carbon surfaces the mixing of delocalised electrons between the glassy
carbon and the monolayer on the surface is unlikely to occur to a significant extent and
hence there is a greater barrier to electron transfer than with the gold electrodes where
electron density can spill over into the organic monolayer.
O
O
OC O
Bulk glassy carbon
Solution
X
N
N
X
X
X X
OH
O
O
OC OOH
OH
OH
A)
B)Solution
Bulk glassy carbon
Figure 4.9 Schematic of A) a GC electrode showing the functional groups typically
found on the electrode surface and B) after modification with an aryl diazonium salt.
137
Chapter 4-Heterogeneous Electron Transfer Through Organic Monolayers on Carbon and Gold Electrodes
Evidence to support the notion that there is little mixing of delocalised electrons
between a glass carbon electrode and an aryl diazonium salt derived monolayer comes
from Solak et al.45 Solak et al.45 showed that a biphenyl diazonium salt modified GC
electrode was effectively passivating to outer sphere redox active molecules in
solutions, a similar observation to that in Chapter Three. However, upon poising the
electrode at –0.2 V, in which an electron is injected into the biphenyl ring, the organic
layer deposited onto the GC electrode became conducting. Further layers of diazonium
salts could be deposited and good electron transfer could occur to redox species in
solution. Thus, the situation changed from the monolayer being a layer over the
electrode to part of the electrode. It was proposed that the injection of an electron
resulted in a change in the organization of -bonds with a double bond connecting the
glassy carbon electrode to the monolayer. Thus, the injection of the electron caused a
significant decrease in the HOMO-LUMO gap, a reduction in the barrier to electron
transfer and a higher electronic conductance. Thus, with the data presented in this
chapter, if on gold there is mixing of delocalised electrons between the gold electrode
and the organic monolayer but little or no mixing of delocalised electrons on the GC
electrodes there should be a difference in the amount of electron transfer that can be
achieved with a redox active molecule in solution rather than attached to the monolayer.
The electrochemistry of the monolayer modified GC and gold electrodes with redox
active molecule in solution are shown in Figure 4.10. In both cases the electrode is
modified with a 1:1 molar ratio of the 4-carboxyphenyl and phenyl. The two redox
active molecules are ferricyanide in aqueous solution and ferrocene recorded in
acetonitrile. These were chosen as they are both redox molecules which undergo outer
sphere electron transfer rather than adsorbing onto an electrode surface prior to electron
138
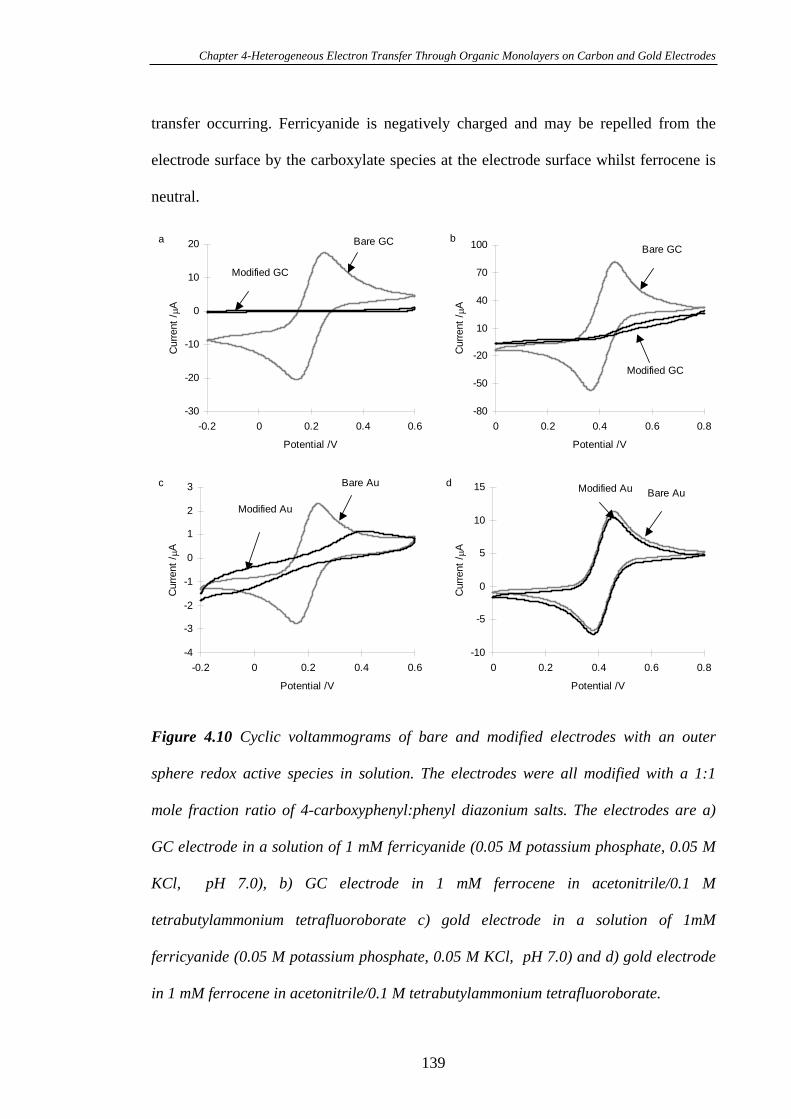
Chapter 4-Heterogeneous Electron Transfer Through Organic Monolayers on Carbon and Gold Electrodes
transfer occurring. Ferricyanide is negatively charged and may be repelled from the
electrode surface by the carboxylate species at the electrode surface whilst ferrocene is
neutral.
-30
-20
-10
0
10
20
-0.2 0 0.2 0.4 0.6
Potential /V
Cur
rent
/A
Bare GC
Modified GC
a
-4
-3
-2
-1
0
1
2
3
-0.2 0 0.2 0.4 0.6
Potential /V
Cur
rent
/A
Bare Au
Modified Au
c
-80
-50
-20
10
40
70
100
0 0.2 0.4 0.6 0.8
Potential /VC
urre
nt /
A
Bare GC
Modified GC
b
-10
-5
0
5
10
15
0 0.2 0.4 0.6 0.8
Potential /V
Cur
rent
/A
Bare AuModified Aud
Figure 4.10 Cyclic voltammograms of bare and modified electrodes with an outer
sphere redox active species in solution. The electrodes were all modified with a 1:1
mole fraction ratio of 4-carboxyphenyl:phenyl diazonium salts. The electrodes are a)
GC electrode in a solution of 1 mM ferricyanide (0.05 M potassium phosphate, 0.05 M
KCl, pH 7.0), b) GC electrode in 1 mM ferrocene in acetonitrile/0.1 M
tetrabutylammonium tetrafluoroborate c) gold electrode in a solution of 1mM
ferricyanide (0.05 M potassium phosphate, 0.05 M KCl, pH 7.0) and d) gold electrode
in 1 mM ferrocene in acetonitrile/0.1 M tetrabutylammonium tetrafluoroborate.
139
Chapter 4-Heterogeneous Electron Transfer Through Organic Monolayers on Carbon and Gold Electrodes
Figure 4.10 clearly shows diffusion controlled CVs where there is significantly more
electron transfer through the monolayer on gold as distinct from carbon. This is
particularly dramatic with the ferrocene redox couple where on gold the redox
chemistry is identical to when the monolayer is absent. It is important to emphasise the
ferricyanide electrochemistry was performed after the ferrocene measurements,
verifying the monolayer is present. Thus, assuming the packing of the diazonium salt
derived monolayers is not dramatically different, and the similarity in surface coverage
during deposition suggests the coverage of monolayers is similar on each electrode
material, these results provide good evidence that the order of magnitude difference in
electron transfer ability between aryl diazonium salt derived monolayers on gold and the
same monolayers on GC electrodes is due to better mixing of delocalised electrons on
the gold surface.
4.4 Conclusions
Electrochemical reductive adsorption of mixtures of 4-carboxyphenyl and phenyl
diazonium salts on GC, PPF and gold surfaces has yielded stable mixed monolayers to
which ferrocenemethylamine could be covalently attached via activation of the surface
bound 4-carboxyphenyl moieties. The rates of the heterogeneous electron transfer for
immobilised ferrocene through the mixed monolayers were an order of magnitude
higher for the gold electrodes in comparison to the carbon electrodes. Furthermore
mixed aryl diazonium salt derived monolayers on GC and PPF surfaces showed
stronger blocking of electron transfer from redox-couples in solution than the equivalent
monolayers on gold surfaces. These results suggest that the mixing of delocalised
electrons between the electrode material and the monolayer occurs to a greater extent
for gold than for GC allowing more rapid electron transfer for the system on gold than
140
Chapter 4-Heterogeneous Electron Transfer Through Organic Monolayers on Carbon and Gold Electrodes
on GC. However, the higher stability of monolayer created on GC and PPF surfaces,
which is very critical for sensing applications, will make GC or PPF surfaces a good
alternative to gold surfaces for the development of electrochemical sensors.
4.5 References
(1) Liu, Y.P., Newton, M.D., J. Phys. Chem. 1994, 98, 7162-7169.
(2) Newton, M.D., J. Electroanal. Chem. 1997, 438, 3-10.
(3) Gosavi, S., Marcus, R.A., J. Phys. Chem. B 2000, 104, 2067-2072.
(4) Forster, R.J., Loughman, P., Keyes, T.E., J. Am. Chem. Soc. 2000, 122, 11948-
11955.
(5) Finklea, H.O., Yoon, K., Chamberlain, E., Allen, J., Haddox, R., J. Phys. Chem. B
2001, 105, 3088-3092.
(6) Liu, G., Liu, J., Böcking, T., Eggers, P., Gooding, J.J., Chem. Phys. 2005, 319, 136-
146.
(7) Marcus, R.A., Ksu, C.P., J. Chem. Phys. 1997, 106, 584-598.
(8) Hsu, C.P., J. Electroanal. Chem. 1997, 438, 27-35.
(9) Ulman, A., An Introduction to Ultrathin Organic Films From Langmuir-Blodgett to
Self-Assembly. Academic Press: London, 1991.
(10) Napper, A.M., Liu, H.Y., Waldeck, D.H., J. Phys. Chem. B 2001, 105, 7699-7707.
(11) Ranganathan, S., Steidel, I., Anariba, F., McCreery, R.L., Nano Letters 2001, 1,
491-494.
(12) McCreery, R.L., Carbon Electrodes: Structural Effects on Electron-Transfer
Kinetics. Marcel Dekker: New York, 1991; Vol. 17.
(13) Chen, P., McCreery, R.L., Anal. Chem. 1996, 68, 3958-3965.
(14) Kuo, T.-C., McCreery, R.L., Anal. Chem. 1999, 71, 1553-1560.
141
Chapter 4-Heterogeneous Electron Transfer Through Organic Monolayers on Carbon and Gold Electrodes
(15) Yang, H.-H., McCreery, R.L., Anal. Chem. 1999, 71, 4081-4087.
(16) Finklea, H.O., Electroanal. Chem. 1996, 19, 109-115.
(17) Rowe, G.K., Carter, M.T., Richardson, J.N., Murray, R.W., Langmuir 1995, 11,
1797-1806.
(18) Honeychurch, M.J., Langmuir 1998, 14, 6291-6296.
(19) Liu, J.Q., Paddon-Row, M.N., Gooding, J.J., J. Phys. Chem. B 2004, 108, 8460-
8466.
(20) Liu, J.Q., Gooding, J.J., Paddon-Row, M.N., Chem. Commun. 2005, 631-633.
(21) Seo, K., Jeon, I.C., Yoo, D.J., Langmuir 2004, 20, 4147-4154.
(22) Finklea, H.O., Hanshew, D.D., J. Am. Chem. Soc. 1992, 114, 3173-81.
(23) Wei, J.J., Liu, H.Y., Khoshtariya, D.E., Yamamoto, H., Dick, A., Waldeck, D.H.,
Angew. Chem. Int. Edit. 2002, 41, 4700-4703.
(24) Salomon, A., Cahen, D., Lindsay, S., Tomfohr, J., Engelkes, V.B., Frisbie, C.D.,
Adv. Mater. 2003, 15, 1881-1890.
(25) Jiang, L., Glidle, A., Griffith, A., McNeil, C.J., Cooper, J.M., Bioelectrochem.
Bioenerg. 1997, 42, 15-23.
(26) Creager, S.E., Rowe, G.K., J. Electroanal. Chem. 1997, 420, 291-299.
(27) Laviron, E., J. Electroanal. Chem. 1979, 101, 19-28.
(28) Kostecki, R., Schnyder, B., Alliata, D., Song, X., Kinoshita, K., Kotz, R., Thin
Solid Films 2001, 396, 36-43.
(29) Ranganathan, S., McCreery, R.L., Anal. Chem. 2001, 73, 893-900.
(30) Hebert, N.E., Snyder, B., McCreery, R.L., Kuhr, W.G., Brazill, S.A., Anal. Chem.
2003, 75, 4265-4271.
(31) McDermott, M.T., McCreery, R.L., Langmuir 1994, 10, 4307-4314.
(32) Ranganathan, S., McCreery, R.L., J. Electrochem. Soc. 2000, 147, 277-282.
142
Chapter 4-Heterogeneous Electron Transfer Through Organic Monolayers on Carbon and Gold Electrodes
(33) Paddon-Row, M.N., In Electron Transfer in Chemistry, Balzani, V., Ed. Wiley-
VCH: Weinheim, 2001; Vol. 3, Part 2, Ch. 1, p 179.
(34) Adams, D.M., Brus, L., Chidsey, C.E.D., Creager, S., Creutz, C., Kagan, C.R.,
Kamat, P.V., Lieberman, M., Lindsay, S., Marcus, R.A., Metzger, R.M., Michel-
Beyerle, M.E., Miller, J.R., Newton, M.D., Rolison, D.R., Sankey, O., Schanze,
K.S., Yardley, J., Zhu, X.Y., J. Phys. Chem. B 2003, 107, 6668-6697.
(35) Adenier, A., Bernard, M.-C., Chehimi, M.M., Cabet-Deliry, E., Desbat, B.,
Fagebaume, O., Pinson, J., Podvorica, F., J. Am. Chem. Soc. 2001, 123, 4541-4549.
(36) Bernard, M.-C., Chausse, A., Cabet-Deliry, E., Chehimi, M.M., Pinson, J.,
Podvorica, F., Vautrin-U1, C., Chem. Mater. 2003, 15, 3450-3462.
(37) Boukerma, K., Chehimi, M.M., Pinson, J., Blomfield, C., Langmuir 2003, 19,
6333-6335.
(38) Ulman, A., Chem. Rev. 1996, 96, 1533-1554.
(39) Beebe, J.M., Engelkes, V.B., Miller, L.L., Frisbie, C.D., J. Am. Chem. Soc. 2002,
124, 11268-11269.
(40) CRC Handbook of Chemistry and Physics. 67 ed.; CRC Press: Boca Raton, Florida,
1986.
(41) Vondrak, T., Wang, H., Winget, P., Cramer, C.J., Zhu, X.-Y., J. Am. Chem. Soc.
2000, 122, 4700-4707.
(42) Stokbro, K., Taylor, J., Brandbyge, M., Mozos, J.L., Ordejon, P., Comp. Mater. Sci.
2003, 27, 151-160.
(43) Hall, L.E., Reimers, J.R., Hush, N.S., Silverbrook, K., J. Chem. Phys. 2000, 112,
1510-1521.
(44) Nguyen, Q.T. Honours Thesis, School of Chemistry, The University of New South
Wales, Sydney, 2004.
143
Chapter 4-Heterogeneous Electron Transfer Through Organic Monolayers on Carbon and Gold Electrodes
(45) Solak, A.O., Eichorst, L.R., Clark, W.J., McCreery, R.L., Anal. Chem. 2003, 75,
296-305.
144
Chapter 5-Fabrication of Electrochemical Copper Sensors Based on Gly-Gly-His Modified Carbon Electrodes
Chapter Five
Fabrication of Electrochemical Copper Sensors Based on
Gly-Gly-His Modified Carbon Electrodes
145
Chapter 5-Fabrication of Electrochemical Copper Sensors Based on Gly-Gly-His Modified Carbon Electrodes
5.1 Introduction
The development of practical sensors for the detection and quantification of metal ions
in environmental samples is the subject of considerable research owing to the growing
public concern of their toxic effects.1 The majority of this research is based on the
development of electrochemical metal sensors using amino acid and peptides as
recognition elements. There are a number of attractive features of using peptides in the
development of electrochemical metal ion sensors.2-4 The variety of amino acid building
blocks provides a myriad of peptide ligands that will have a broad spectrum of affinities
for different metal ions. The simple, generic chemistry involved in synthesising
different ligands renders peptide ligands a highly attractive and under-exploited class of
ligands for the development of solid-state metal ion sensors.
Self-assembly of alkanethiol monolayers on noble metal surfaces for the fabrication of a
sensing interfaces has received considerable interest owing to the ability to control the
sensing element at the molecular level.5 One of the earlier examples of a self-assembled
monolayer that selectively binds redox metal ions was described by Rubinstein and
coworkers.6 Turyan and Mandler have developed the metal sensors for the detection of
Cd (II) and Cd (VI) in aqueous solution for gold electrodes.7, 8 Flink et al. have extended
the ion recognition to electrochemically inactive cations using impedance
spectroscopy.9 Immobilisation of peptides on self-assembled monolayers (SAMs) of
alkanethiol modified gold surfaces for metal ion sensing has received considerable
recent interest.1 Apart from the selectivity imparted from using different peptide
ligands, an additional level of selectivity can be achieved by exploiting different redox
146
Chapter 5-Fabrication of Electrochemical Copper Sensors Based on Gly-Gly-His Modified Carbon Electrodes
potentials of different metals. Making good use of the diversity of peptides and their
selectivity for different metals, Gooding and coworkers have successfully developed
several highly sensitive and selective metal sensors using amino acids,10, 11
oligopeptides12, 13 and polypeptides14 as the selective recognition elements based on
self-assembled monolayers of alkanethiols on gold surfaces.12, 15-17 However, studies
have revealed that these monolayers are not very stable and that they can be oxidatively
or reductively desorbed.18-20 The problem of instability is worse with the short chain
alkanethiols which are used to bring the peptide closer to the gold electrode surfaces
such that appreciable electrochemistry of the metal or metal ions can be achieved. It is
therefore desirable to develop an alternative sensing interface for metal ion detection,
which is more stable and could overcome the disadvantages of gold-alkanethiol
chemistry without compromising the advantages of the self-assembly system for the
fabrication of chemical sensors.
As introduced in Chapter Three, GC surfaces can be electrochemically modified with
aryl diazonium salts by reductive adsorption to form a stable carbon-carbon covalent
bond on the electrode surface.21 These aryl groups can possess a variety of functional
groups for further modification. So a good candidate methodology to produce more
stable monolayer systems is the modification of GC electrodes with aryl diazonium
salts. GC electrodes are inexpensive and chemically inert, and have a wide potential
window.22 Despite the lower electron transfer kinetics on GC surfaces relative to gold
surfaces, as described in Chapter Four, GC electrodes have better potential for the
fabrication of chemical sensors as the stability of the recognition interface is more
important for sensing than the electron transfer efficiency.
147
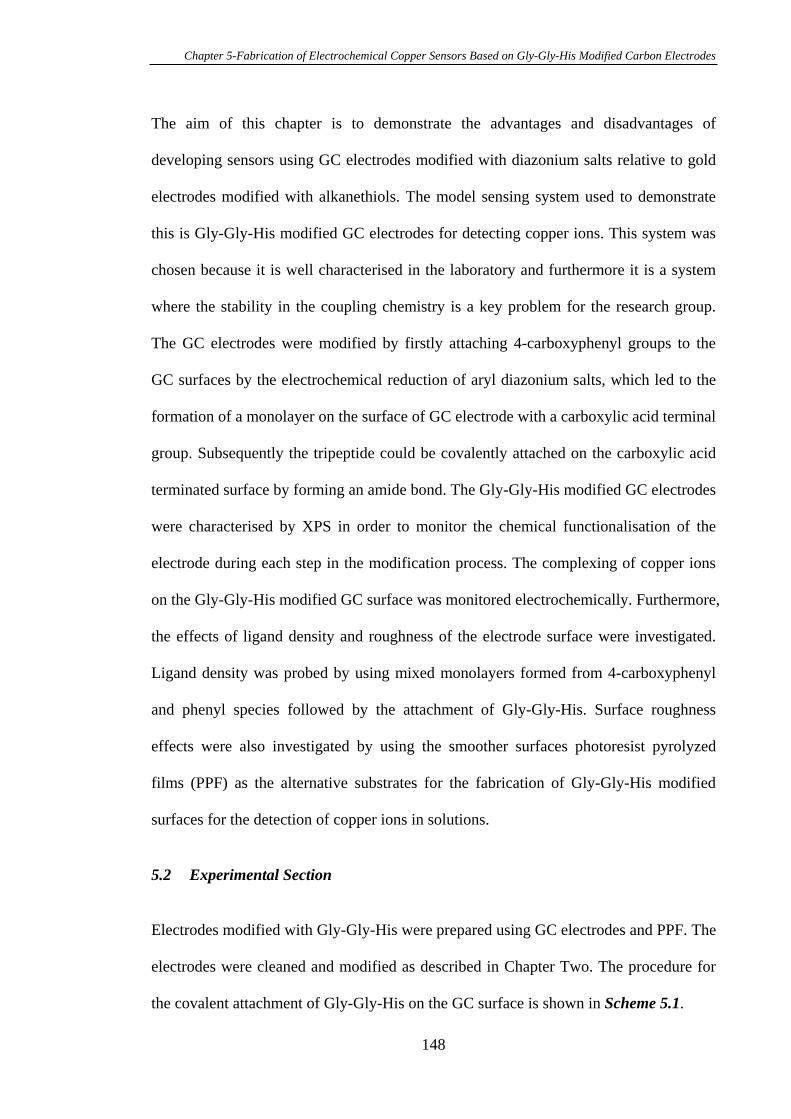
Chapter 5-Fabrication of Electrochemical Copper Sensors Based on Gly-Gly-His Modified Carbon Electrodes
The aim of this chapter is to demonstrate the advantages and disadvantages of
developing sensors using GC electrodes modified with diazonium salts relative to gold
electrodes modified with alkanethiols. The model sensing system used to demonstrate
this is Gly-Gly-His modified GC electrodes for detecting copper ions. This system was
chosen because it is well characterised in the laboratory and furthermore it is a system
where the stability in the coupling chemistry is a key problem for the research group.
The GC electrodes were modified by firstly attaching 4-carboxyphenyl groups to the
GC surfaces by the electrochemical reduction of aryl diazonium salts, which led to the
formation of a monolayer on the surface of GC electrode with a carboxylic acid terminal
group. Subsequently the tripeptide could be covalently attached on the carboxylic acid
terminated surface by forming an amide bond. The Gly-Gly-His modified GC electrodes
were characterised by XPS in order to monitor the chemical functionalisation of the
electrode during each step in the modification process. The complexing of copper ions
on the Gly-Gly-His modified GC surface was monitored electrochemically. Furthermore,
the effects of ligand density and roughness of the electrode surface were investigated.
Ligand density was probed by using mixed monolayers formed from 4-carboxyphenyl
and phenyl species followed by the attachment of Gly-Gly-His. Surface roughness
effects were also investigated by using the smoother surfaces photoresist pyrolyzed
films (PPF) as the alternative substrates for the fabrication of Gly-Gly-His modified
surfaces for the detection of copper ions in solutions.
5.2 Experimental Section
Electrodes modified with Gly-Gly-His were prepared using GC electrodes and PPF. The
electrodes were cleaned and modified as described in Chapter Two. The procedure for
the covalent attachment of Gly-Gly-His on the GC surface is shown in Scheme 5.1.
148
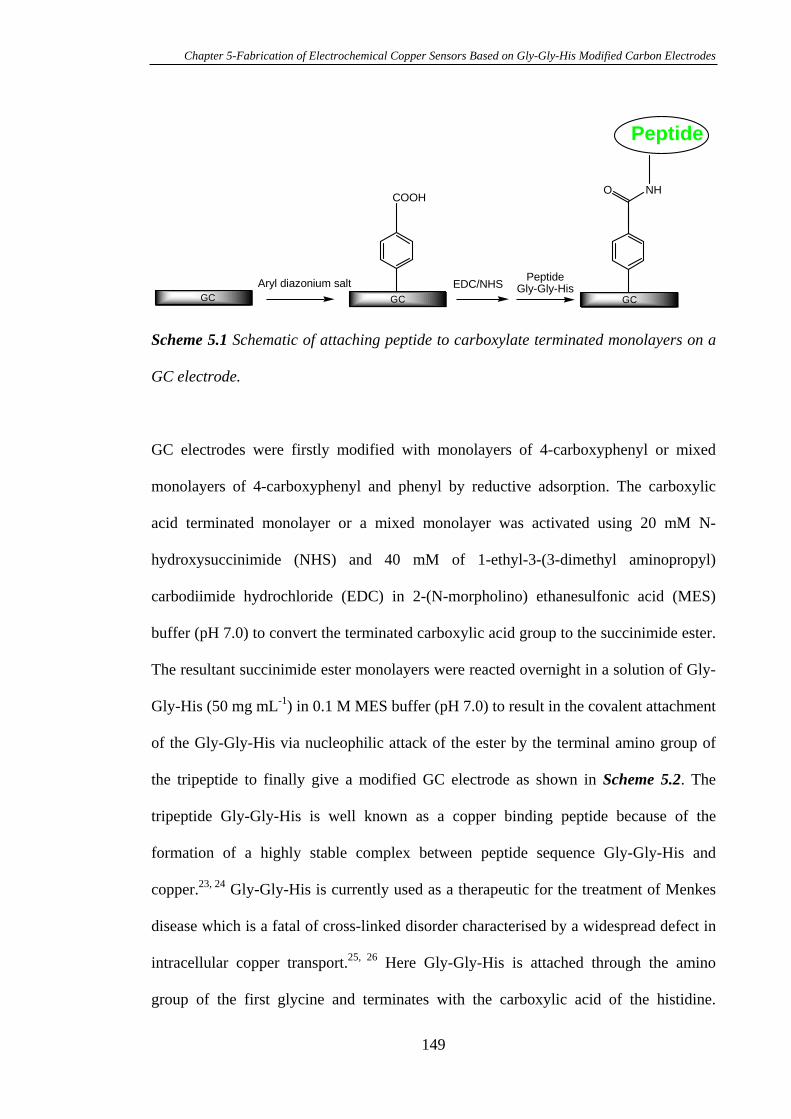
Chapter 5-Fabrication of Electrochemical Copper Sensors Based on Gly-Gly-His Modified Carbon Electrodes
COOHNHO
GC GC GC
Peptide
Aryl diazonium salt EDC/NHS PeptideGly-Gly-His
Scheme 5.1 Schematic of attaching peptide to carboxylate terminated monolayers on a
GC electrode.
GC electrodes were firstly modified with monolayers of 4-carboxyphenyl or mixed
monolayers of 4-carboxyphenyl and phenyl by reductive adsorption. The carboxylic
acid terminated monolayer or a mixed monolayer was activated using 20 mM N-
hydroxysuccinimide (NHS) and 40 mM of 1-ethyl-3-(3-dimethyl aminopropyl)
carbodiimide hydrochloride (EDC) in 2-(N-morpholino) ethanesulfonic acid (MES)
buffer (pH 7.0) to convert the terminated carboxylic acid group to the succinimide ester.
The resultant succinimide ester monolayers were reacted overnight in a solution of Gly-
Gly-His (50 mg mL-1) in 0.1 M MES buffer (pH 7.0) to result in the covalent attachment
of the Gly-Gly-His via nucleophilic attack of the ester by the terminal amino group of
the tripeptide to finally give a modified GC electrode as shown in Scheme 5.2. The
tripeptide Gly-Gly-His is well known as a copper binding peptide because of the
formation of a highly stable complex between peptide sequence Gly-Gly-His and
copper.23, 24 Gly-Gly-His is currently used as a therapeutic for the treatment of Menkes
disease which is a fatal of cross-linked disorder characterised by a widespread defect in
intracellular copper transport.25, 26 Here Gly-Gly-His is attached through the amino
group of the first glycine and terminates with the carboxylic acid of the histidine.
149
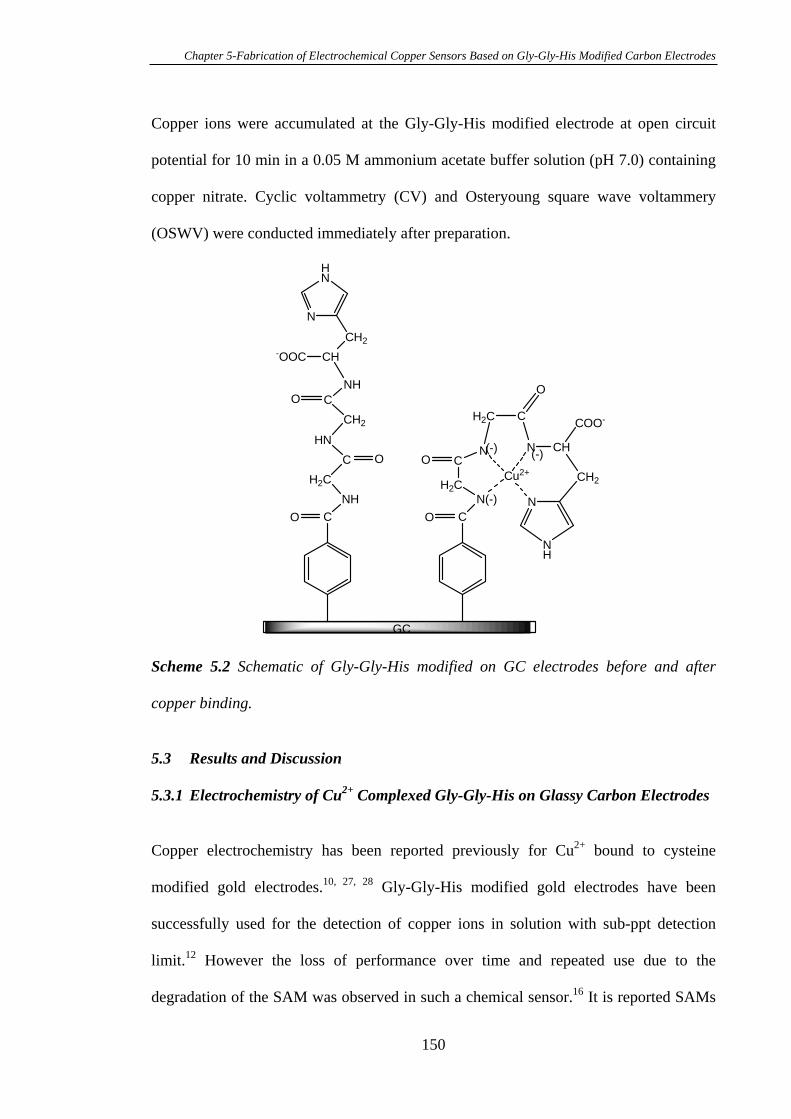
Chapter 5-Fabrication of Electrochemical Copper Sensors Based on Gly-Gly-His Modified Carbon Electrodes
Copper ions were accumulated at the Gly-Gly-His modified electrode at open circuit
potential for 10 min in a 0.05 M ammonium acetate buffer solution (pH 7.0) containing
copper nitrate. Cyclic voltammetry (CV) and Osteryoung square wave voltammery
(OSWV) were conducted immediately after preparation.
GC
CO
O
NHH2C
C
O
OHN
CH2
CNH
CH-OOCCH2
N
HN
CON(-)
H2C
CN
Cu2+
N
N
CH
NH
CH2
COO-H2C C
O
(-)(-)
Scheme 5.2 Schematic of Gly-Gly-His modified on GC electrodes before and after
copper binding.
5.3 Results and Discussion
5.3.1 Electrochemistry of Cu2+ Complexed Gly-Gly-His on Glassy Carbon Electrodes
Copper electrochemistry has been reported previously for Cu2+ bound to cysteine
modified gold electrodes.10, 27, 28 Gly-Gly-His modified gold electrodes have been
successfully used for the detection of copper ions in solution with sub-ppt detection
limit.12 However the loss of performance over time and repeated use due to the
degradation of the SAM was observed in such a chemical sensor.16 It is reported SAMs
150
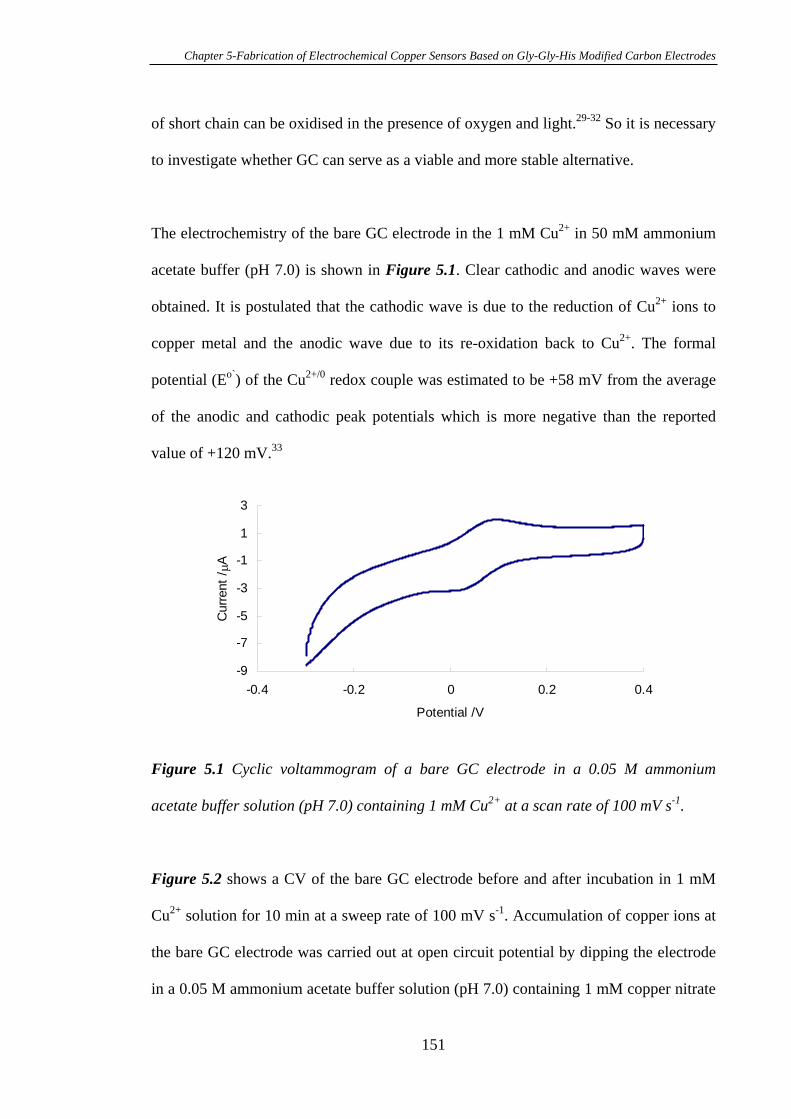
Chapter 5-Fabrication of Electrochemical Copper Sensors Based on Gly-Gly-His Modified Carbon Electrodes
of short chain can be oxidised in the presence of oxygen and light.29-32 So it is necessary
to investigate whether GC can serve as a viable and more stable alternative.
The electrochemistry of the bare GC electrode in the 1 mM Cu2+ in 50 mM ammonium
acetate buffer (pH 7.0) is shown in Figure 5.1. Clear cathodic and anodic waves were
obtained. It is postulated that the cathodic wave is due to the reduction of Cu2+ ions to
copper metal and the anodic wave due to its re-oxidation back to Cu2+. The formal
potential (Eo`) of the Cu2+/0 redox couple was estimated to be +58 mV from the average
of the anodic and cathodic peak potentials which is more negative than the reported
value of +120 mV.33
-9
-7
-5
-3
-1
1
3
-0.4 -0.2 0 0.2 0.4
Potential /V
Cur
rent
/A
Figure 5.1 Cyclic voltammogram of a bare GC electrode in a 0.05 M ammonium
acetate buffer solution (pH 7.0) containing 1 mM Cu2+ at a scan rate of 100 mV s-1.
Figure 5.2 shows a CV of the bare GC electrode before and after incubation in 1 mM
Cu2+ solution for 10 min at a sweep rate of 100 mV s-1. Accumulation of copper ions at
the bare GC electrode was carried out at open circuit potential by dipping the electrode
in a 0.05 M ammonium acetate buffer solution (pH 7.0) containing 1 mM copper nitrate
151
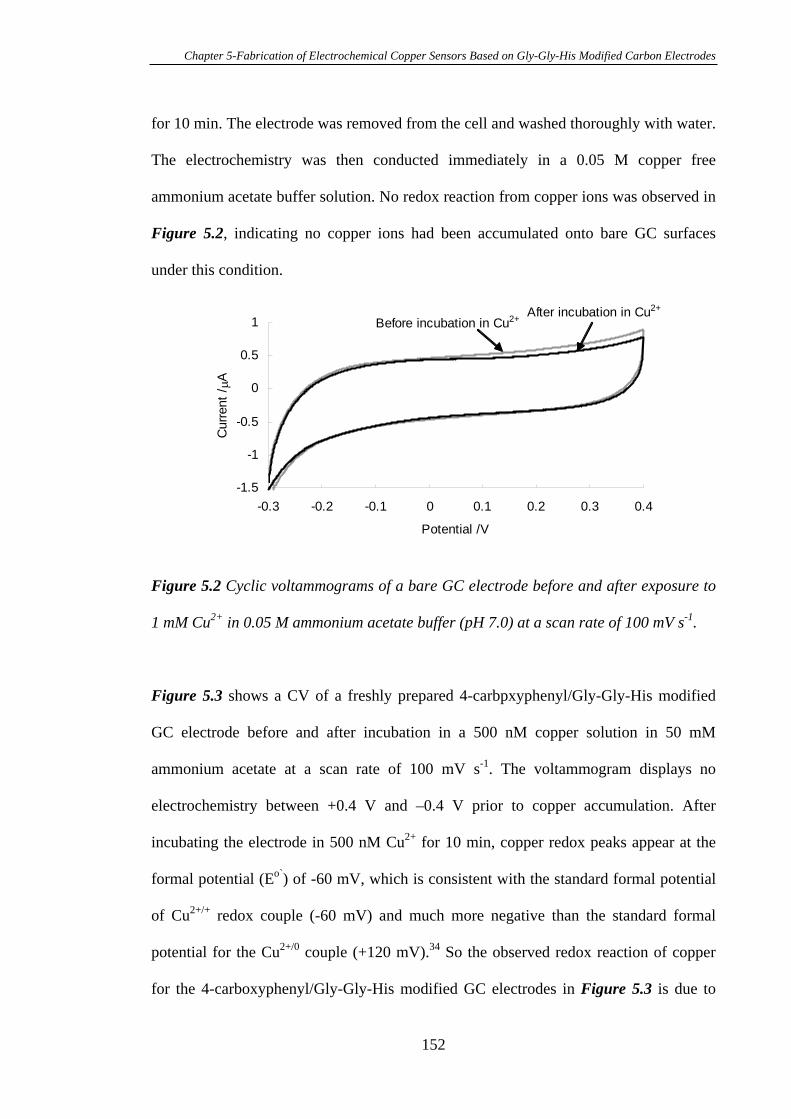
Chapter 5-Fabrication of Electrochemical Copper Sensors Based on Gly-Gly-His Modified Carbon Electrodes
for 10 min. The electrode was removed from the cell and washed thoroughly with water.
The electrochemistry was then conducted immediately in a 0.05 M copper free
ammonium acetate buffer solution. No redox reaction from copper ions was observed in
Figure 5.2, indicating no copper ions had been accumulated onto bare GC surfaces
under this condition.
-1.5
-1
-0.5
0
0.5
1
-0.3 -0.2 -0.1 0 0.1 0.2 0.3 0.4
Potential /V
Cur
rent
/A
After incubation in Cu2+
Before incubation in Cu2+
Figure 5.2 Cyclic voltammograms of a bare GC electrode before and after exposure to
1 mM Cu2+ in 0.05 M ammonium acetate buffer (pH 7.0) at a scan rate of 100 mV s-1.
Figure 5.3 shows a CV of a freshly prepared 4-carbpxyphenyl/Gly-Gly-His modified
GC electrode before and after incubation in a 500 nM copper solution in 50 mM
ammonium acetate at a scan rate of 100 mV s-1. The voltammogram displays no
electrochemistry between +0.4 V and –0.4 V prior to copper accumulation. After
incubating the electrode in 500 nM Cu2+ for 10 min, copper redox peaks appear at the
formal potential (Eo`) of -60 mV, which is consistent with the standard formal potential
of Cu2+/+ redox couple (-60 mV) and much more negative than the standard formal
potential for the Cu2+/0 couple (+120 mV).34 So the observed redox reaction of copper
for the 4-carboxyphenyl/Gly-Gly-His modified GC electrodes in Figure 5.3 is due to
152
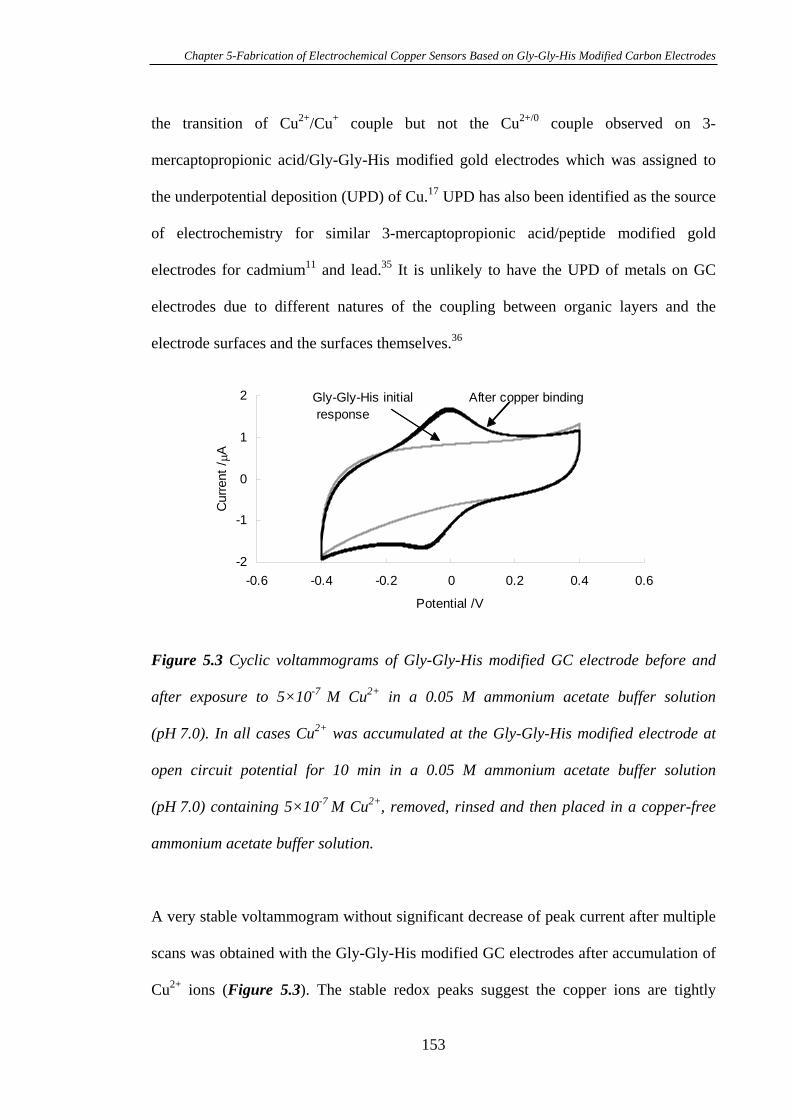
Chapter 5-Fabrication of Electrochemical Copper Sensors Based on Gly-Gly-His Modified Carbon Electrodes
the transition of Cu2+/Cu+ couple but not the Cu2+/0 couple observed on 3-
mercaptopropionic acid/Gly-Gly-His modified gold electrodes which was assigned to
the underpotential deposition (UPD) of Cu.17 UPD has also been identified as the source
of electrochemistry for similar 3-mercaptopropionic acid/peptide modified gold
electrodes for cadmium11 and lead.35 It is unlikely to have the UPD of metals on GC
electrodes due to different natures of the coupling between organic layers and the
electrode surfaces and the surfaces themselves.36
-2
-1
0
1
2
-0.6 -0.4 -0.2 0 0.2 0.4 0.6
Potential /V
Cur
rent
/A
After copper bindingGly-Gly-His initial response
Figure 5.3 Cyclic voltammograms of Gly-Gly-His modified GC electrode before and
after exposure to 5×10⁻⁷ M Cu2+ in a 0.05 M ammonium acetate buffer solution
(pH 7.0). In all cases Cu2+ was accumulated at the Gly-Gly-His modified electrode at
open circuit potential for 10 min in a 0.05 M ammonium acetate buffer solution
(pH 7.0) containing 5×10⁻⁷ M Cu2+, removed, rinsed and then placed in a copper-free
ammonium acetate buffer solution.
A very stable voltammogram without significant decrease of peak current after multiple
scans was obtained with the Gly-Gly-His modified GC electrodes after accumulation of
Cu2+ ions (Figure 5.3). The stable redox peaks suggest the copper ions are tightly
153
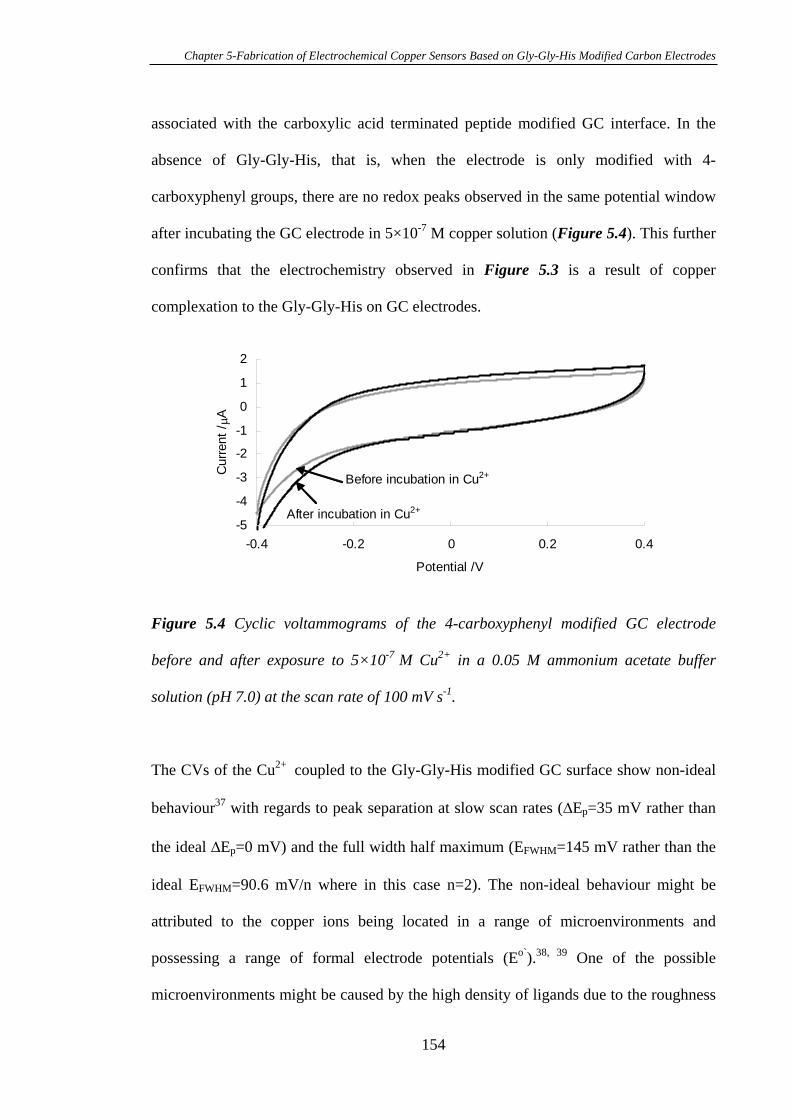
Chapter 5-Fabrication of Electrochemical Copper Sensors Based on Gly-Gly-His Modified Carbon Electrodes
associated with the carboxylic acid terminated peptide modified GC interface. In the
absence of Gly-Gly-His, that is, when the electrode is only modified with 4-
carboxyphenyl groups, there are no redox peaks observed in the same potential window
after incubating the GC electrode in 5×10⁻⁷ M copper solution (Figure 5.4). This further
confirms that the electrochemistry observed in Figure 5.3 is a result of copper
complexation to the Gly-Gly-His on GC electrodes.
-5
-4
-3
-2
-1
0
1
2
-0.4 -0.2 0 0.2 0.4
Potential /V
Cur
rent
/A
After incubation in Cu2+
Before incubation in Cu2+
Figure 5.4 Cyclic voltammograms of the 4-carboxyphenyl modified GC electrode
before and after exposure to 5×10⁻⁷ M Cu2+ in a 0.05 M ammonium acetate buffer
solution (pH 7.0) at the scan rate of 100 mV s-1.
The CVs of the Cu2+ coupled to the Gly-Gly-His modified GC surface show non-ideal
behaviour37 with regards to peak separation at slow scan rates ( Ep=35 mV rather than
the ideal Ep=0 mV) and the full width half maximum (EFWHM=145 mV rather than the
ideal EFWHM=90.6 mV/n where in this case n=2). The non-ideal behaviour might be
attributed to the copper ions being located in a range of microenvironments and
possessing a range of formal electrode potentials (Eo`).38, 39 One of the possible
microenvironments might be caused by the high density of ligands due to the roughness
154
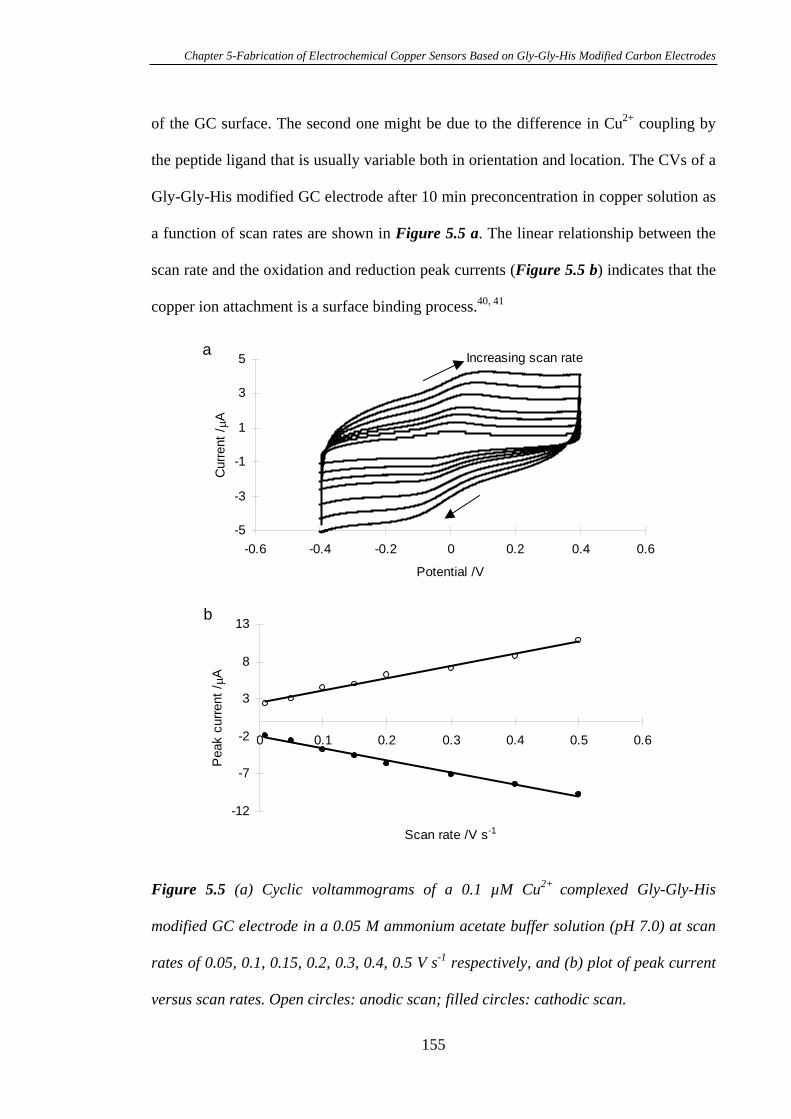
Chapter 5-Fabrication of Electrochemical Copper Sensors Based on Gly-Gly-His Modified Carbon Electrodes
of the GC surface. The second one might be due to the difference in Cu2+ coupling by
the peptide ligand that is usually variable both in orientation and location. The CVs of a
Gly-Gly-His modified GC electrode after 10 min preconcentration in copper solution as
a function of scan rates are shown in Figure 5.5 a. The linear relationship between the
scan rate and the oxidation and reduction peak currents (Figure 5.5 b) indicates that the
copper ion attachment is a surface binding process.40, 41
-12
-7
-2
3
8
13
0 0.1 0.2 0.3 0.4 0.5 0.6
Scan rate /V s-1
Pea
k cu
rrent
/A
b
-5
-3
-1
1
3
5
-0.6 -0.4 -0.2 0 0.2 0.4 0.6
Potential /V
Cur
rent
/A
Increasing scan ratea
Figure 5.5 (a) Cyclic voltammograms of a 0.1 µM Cu2+ complexed Gly-Gly-His
modified GC electrode in a 0.05 M ammonium acetate buffer solution (pH 7.0) at scan
rates of 0.05, 0.1, 0.15, 0.2, 0.3, 0.4, 0.5 V s-1 respectively, and (b) plot of peak current
versus scan rates. Open circles: anodic scan; filled circles: cathodic scan.
155
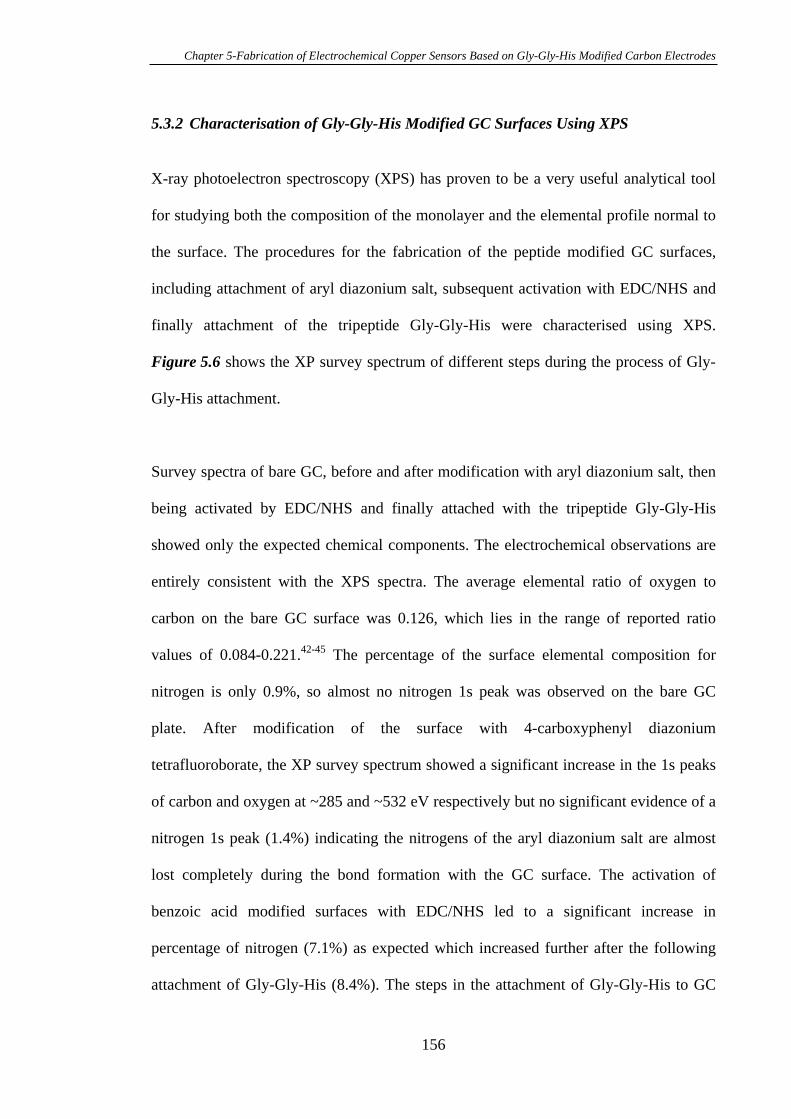
Chapter 5-Fabrication of Electrochemical Copper Sensors Based on Gly-Gly-His Modified Carbon Electrodes
5.3.2 Characterisation of Gly-Gly-His Modified GC Surfaces Using XPS
X-ray photoelectron spectroscopy (XPS) has proven to be a very useful analytical tool
for studying both the composition of the monolayer and the elemental profile normal to
the surface. The procedures for the fabrication of the peptide modified GC surfaces,
including attachment of aryl diazonium salt, subsequent activation with EDC/NHS and
finally attachment of the tripeptide Gly-Gly-His were characterised using XPS.
Figure 5.6 shows the XP survey spectrum of different steps during the process of Gly-
Gly-His attachment.
Survey spectra of bare GC, before and after modification with aryl diazonium salt, then
being activated by EDC/NHS and finally attached with the tripeptide Gly-Gly-His
showed only the expected chemical components. The electrochemical observations are
entirely consistent with the XPS spectra. The average elemental ratio of oxygen to
carbon on the bare GC surface was 0.126, which lies in the range of reported ratio
values of 0.084-0.221.42-45 The percentage of the surface elemental composition for
nitrogen is only 0.9%, so almost no nitrogen 1s peak was observed on the bare GC
plate. After modification of the surface with 4-carboxyphenyl diazonium
tetrafluoroborate, the XP survey spectrum showed a significant increase in the 1s peaks
of carbon and oxygen at ~285 and ~532 eV respectively but no significant evidence of a
nitrogen 1s peak (1.4%) indicating the nitrogens of the aryl diazonium salt are almost
lost completely during the bond formation with the GC surface. The activation of
benzoic acid modified surfaces with EDC/NHS led to a significant increase in
percentage of nitrogen (7.1%) as expected which increased further after the following
attachment of Gly-Gly-His (8.4%). The steps in the attachment of Gly-Gly-His to GC
156
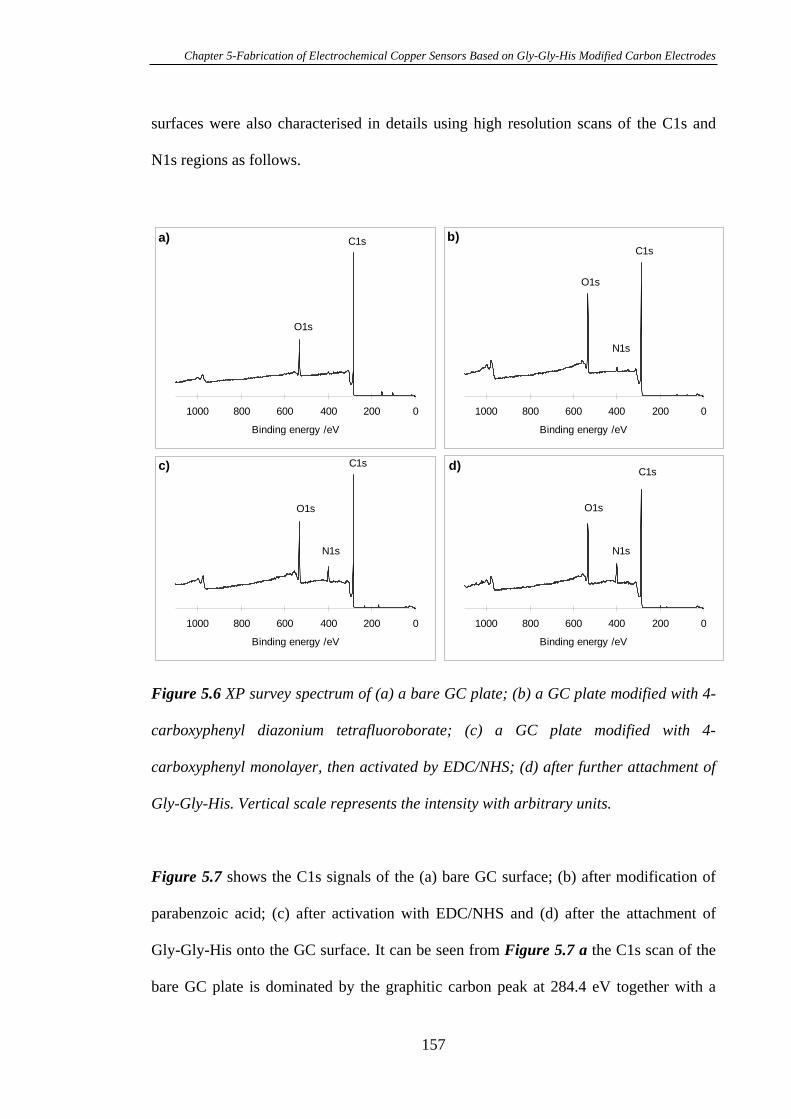
Chapter 5-Fabrication of Electrochemical Copper Sensors Based on Gly-Gly-His Modified Carbon Electrodes
surfaces were also characterised in details using high resolution scans of the C1s and
N1s regions as follows.
02004006008001000
Binding energy /eV
O1s
N1s
C1sc)
02004006008001000
Binding energy /eV
C1s
N1s
O1s
d)
02004006008001000
Binding energy /eV
b)
O1s
N1s
C1s
02004006008001000
Binding energy /eV
O1s
C1sa)
Figure 5.6 XP survey spectrum of (a) a bare GC plate; (b) a GC plate modified with 4-
carboxyphenyl diazonium tetrafluoroborate; (c) a GC plate modified with 4-
carboxyphenyl monolayer, then activated by EDC/NHS; (d) after further attachment of
Gly-Gly-His. Vertical scale represents the intensity with arbitrary units.
Figure 5.7 shows the C1s signals of the (a) bare GC surface; (b) after modification of
parabenzoic acid; (c) after activation with EDC/NHS and (d) after the attachment of
Gly-Gly-His onto the GC surface. It can be seen from Figure 5.7 a the C1s scan of the
bare GC plate is dominated by the graphitic carbon peak at 284.4 eV together with a
157
Chapter 5-Fabrication of Electrochemical Copper Sensors Based on Gly-Gly-His Modified Carbon Electrodes
broader peak on the high binding energy 285.2 eV due to the presence of low levels of
oxidised carbon species on the electrode surface. After the GC surfaces were modified
with parabenzoic acid, a peak at 288.8 eV, which is typical of the carbon of the
carboxylic acid group, in the C1s spectra as shown in Figure 5.7 b was observed,
indicating the –COOH terminated monolayers have formed on the GC surfaces. This
binding energy is less than that of carboxylate functional groups in polymers
(289.2 eV)46 but is in good agreement with that reported by Allongue and coworkers47.
In addition, the C1s signal at 286.3 eV may be attributed to the organic contaminates
physisorbed on the –COOH terminated monolayer surface, which has been previously
reported by Sieval et al.48
As can be seen from Figure 5.7 c, activation of the carboxylic acid group on the
monolayer with EDC/NHS led to an increase in oxidised carbon species as evidenced
by fitted peaks in the approximate range of 286-289 eV. The emergence of a peak at
287.6 eV can be reasonably assigned to the carbon formed in the NHS ester. This
negative shift in binding energy due to deprotonation of the carboxylic acid group was
also observed on SAMs of 11-mercaptoundecanoic acid (11-MUA) system on gold
electrode49. The corresponding peak area ratio of the newly developed ester carbon peak
and the carboxylic acid group indicates an activation efficiency of 53%. After the
attachment of Gly-Gly-His, no new peak was observed in the C1s spectra as shown in
Figure 5.7 d, and hence this is not useful for providing valuable information for the
attachment of Gly-Gly-His.
158
Chapter 5-Fabrication of Electrochemical Copper Sensors Based on Gly-Gly-His Modified Carbon Electrodes
279281283285287289291
Binding energy /eV
d)
-COOHcarbon288.8 eV
284.8 eV286.3 eV
287.7 eV
279281283285287289291
Binding energy /eV
a)
284.4 eV
285.2 eV
C1s
279281283285287289291
Binding energy /eV
b)
284.4 eV286.3 eV
-COOHcarbon288.8 eV
C1s
279281283285287289291
Binding energy /eV
c)
-COOHcarbon288.9 eV
287.7 eV
286.3 eV284.9 eV
Figure 5.7 C1s core level spectra collected at a take-off angle of 90o of (a) a bare GC
plate; (b) a GC plate modified with 4-carboxyphenyl moieties; (c) a GC plate modified
with 4-carboxyphenyl monolayer, then activated by EDC/NHS; (d) after further
attachment of Gly-Gly-His. Vertical scale represents the intensity with arbitrary units.
Comparing with the C1s, the N1s spectra for the attachment of Gly-Gly-His are more
informative for characterisation. The proposed chemical reactions occurring at the GC
surface were further supported by changes in the N1s spectra. The N1s signal at
399.5 eV as shown in Figure 5.8 a, b was observed for both the bare and the 4-
carboxyphenyl modified GC surface, which was possibly due to contaminants absorbed
from the atmosphere onto the GC surface during the preparation process. In Figure 5.8
159
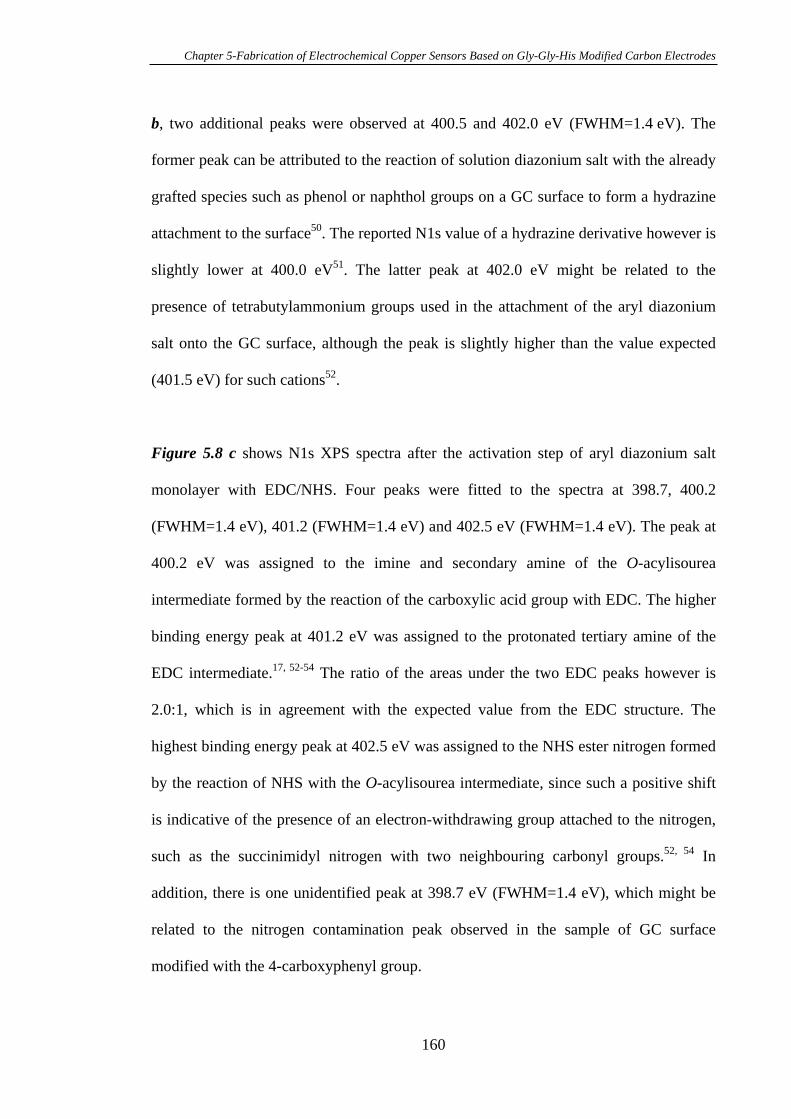
Chapter 5-Fabrication of Electrochemical Copper Sensors Based on Gly-Gly-His Modified Carbon Electrodes
b, two additional peaks were observed at 400.5 and 402.0 eV (FWHM=1.4 eV). The
former peak can be attributed to the reaction of solution diazonium salt with the already
grafted species such as phenol or naphthol groups on a GC surface to form a hydrazine
attachment to the surface50. The reported N1s value of a hydrazine derivative however is
slightly lower at 400.0 eV51. The latter peak at 402.0 eV might be related to the
presence of tetrabutylammonium groups used in the attachment of the aryl diazonium
salt onto the GC surface, although the peak is slightly higher than the value expected
(401.5 eV) for such cations52.
Figure 5.8 c shows N1s XPS spectra after the activation step of aryl diazonium salt
monolayer with EDC/NHS. Four peaks were fitted to the spectra at 398.7, 400.2
(FWHM=1.4 eV), 401.2 (FWHM=1.4 eV) and 402.5 eV (FWHM=1.4 eV). The peak at
400.2 eV was assigned to the imine and secondary amine of the O-acylisourea
intermediate formed by the reaction of the carboxylic acid group with EDC. The higher
binding energy peak at 401.2 eV was assigned to the protonated tertiary amine of the
EDC intermediate.17, 52-54 The ratio of the areas under the two EDC peaks however is
2.0:1, which is in agreement with the expected value from the EDC structure. The
highest binding energy peak at 402.5 eV was assigned to the NHS ester nitrogen formed
by the reaction of NHS with the O-acylisourea intermediate, since such a positive shift
is indicative of the presence of an electron-withdrawing group attached to the nitrogen,
such as the succinimidyl nitrogen with two neighbouring carbonyl groups.52, 54 In
addition, there is one unidentified peak at 398.7 eV (FWHM=1.4 eV), which might be
related to the nitrogen contamination peak observed in the sample of GC surface
modified with the 4-carboxyphenyl group.
160
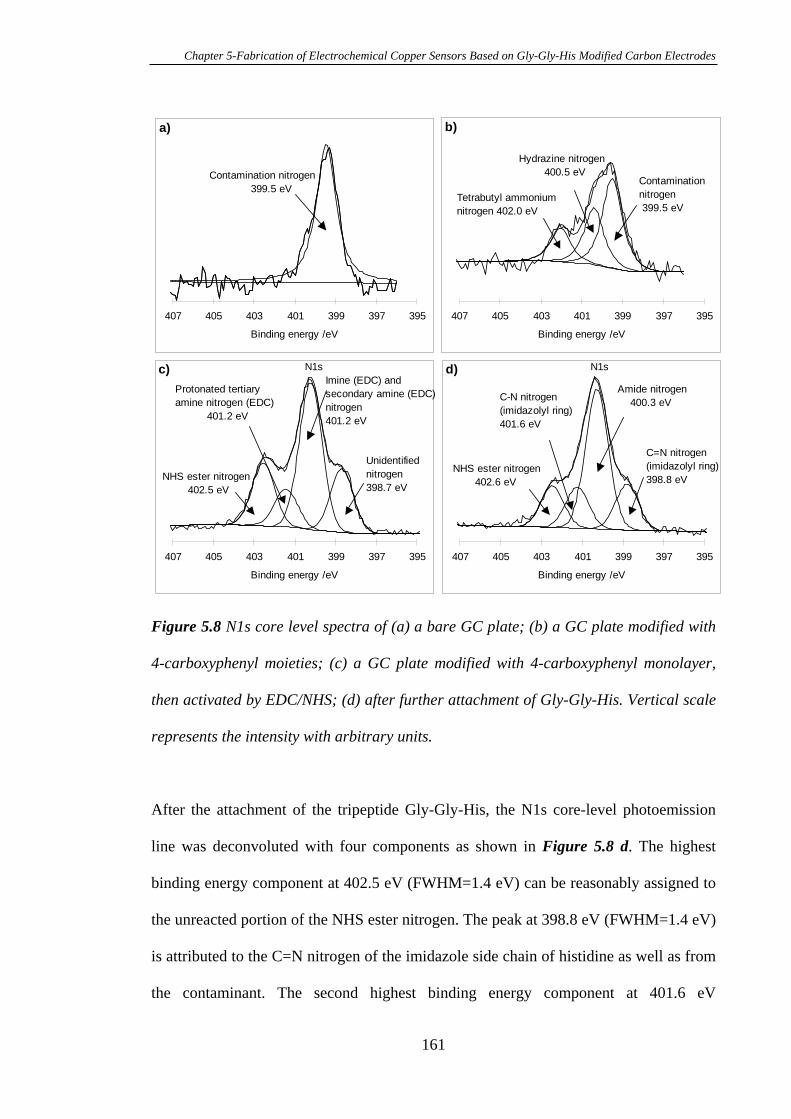
Chapter 5-Fabrication of Electrochemical Copper Sensors Based on Gly-Gly-His Modified Carbon Electrodes
395397399401403405407
Binding energy /eV
a)
Contamination nitrogen 399.5 eV
395397399401403405407
Binding energy /eV
c)
NHS ester nitrogen402.5 eV
Protonated tertiaryamine nitrogen (EDC)
401.2 eV
Imine (EDC) and secondary amine (EDC)nitrogen401.2 eV
Unidentifiednitrogen398.7 eV
N1s
395397399401403405407
Binding energy /eV
d)
NHS ester nitrogen402.6 eV
C-N nitrogen(imidazolyl ring)401.6 eV
Amide nitrogen 400.3 eV
C=N nitrogen(imidazolyl ring)398.8 eV
N1s
395397399401403405407
Binding energy /eV
b)
Tetrabutyl ammoniumnitrogen 402.0 eV
Hydrazine nitrogen 400.5 eV
Contaminationnitrogen 399.5 eV
Figure 5.8 N1s core level spectra of (a) a bare GC plate; (b) a GC plate modified with
4-carboxyphenyl moieties; (c) a GC plate modified with 4-carboxyphenyl monolayer,
then activated by EDC/NHS; (d) after further attachment of Gly-Gly-His. Vertical scale
represents the intensity with arbitrary units.
After the attachment of the tripeptide Gly-Gly-His, the N1s core-level photoemission
line was deconvoluted with four components as shown in Figure 5.8 d. The highest
binding energy component at 402.5 eV (FWHM=1.4 eV) can be reasonably assigned to
the unreacted portion of the NHS ester nitrogen. The peak at 398.8 eV (FWHM=1.4 eV)
is attributed to the C=N nitrogen of the imidazole side chain of histidine as well as from
the contaminant. The second highest binding energy component at 401.6 eV
161

Chapter 5-Fabrication of Electrochemical Copper Sensors Based on Gly-Gly-His Modified Carbon Electrodes
(FWHM=1.3 eV) originates from the C-N nitrogen of the imidazolyl ring.55 The peak at
400.3 eV (FWHM=1.3 eV) was assigned to the amide nitrogens of the peptide bonds.17
The peak area ratio of approximately is 1:3:1 for these three components is in good
agreement with the predicted structure of the monolayer of aryl diazonium salt modified
with Gly-Gly-His via the formation of an amide bond. This roughly equals the areas
under the two newly formed imidazolyl nitrogen peaks and that of the unreacted NHS
ester nitrogen, suggesting about 50 % reaction efficiency.
5.3.3 Calibration Curve of Gly-Gly-His Modified Glassy Carbon Electrodes for the
Detection of Cu2+
The attachment of Gly-Gly-His to the 4-carboxyphenyl modified GC surfaces for the
detection of Cu2+ was characterised by electrochemistry and XPS. Subsequently Gly-
Gly-His fabricated GC surfaces were used for the detection of copper ions with different
concentrations. As a more sensitive electroanalytical method than cyclic voltametry,
Osteryoung Square Wave Voltammetry was employed with a Gly-Gly-His modified GC
electrode for the detection of low levels of copper ions. Figure 5.9 shows OSWV peaks
of a Gly-Gly-His modified GC electrode in 0.05 M ammonium acetate buffer solution
(pH 7.0) for a series of copper standards adsorbed for 10 min from copper solution. A
graph of the average peak current density from the OSWV measurements against the
concentration of copper solution is shown in Figure 5.10 for four different electrodes.
The lowest concentration that was detected with this electrode was 0.13 ppb (2 nM).
This lowest detected concentration of Cu2+ is significantly lower than that reported
previously for copper adsorbed on an electrochemically oxidised GC surface (2.5
mM),56 but higher than that for the Gly-Gly-His modified gold electrodes (0.3 nM).57
162

Chapter 5-Fabrication of Electrochemical Copper Sensors Based on Gly-Gly-His Modified Carbon Electrodes
0
0.1
0.2
0.3
0.4
0.5
0.6
0.7
-0.4 -0.2 0 0.2
Potential /V
Cur
rent
/A
Figure 5.9 OSW voltammograms of a Gly-Gly-His modified GC electrode complexed
with Cu2+ after an accumulation time of 10 min in 0.05 M ammonium acetate buffer (pH
7.0) solutions containing different concentrations of Cu2+. Voltammograms illustrate an
increasing peak height with concentration ([Cu2+]/ppb): 0, 0.32, 3.2, 6.4, 9.8 and 12.8.
0
5
10
15
20
25
30
35
0 30 60 90 120
[Cu2+] /ppb
Cur
rent
den
sity
/A
cm
-2
150
Figure 5.10 Plot of Ioswv versus concentration of copper in the accumulation solution for
four electrodes. In all cases Cu2+ was accumulated at the Gly-Gly-His modified
electrode at open circuit potential for 10 min in a 0.05 M ammonium acetate buffer
solution (pH 7.0) containing copper ions, removed, rinsed and then placed in a copper-
free ammonium acetate buffer solution for electrochemical measurement. Inset is the
linear calibration range.
163
Chapter 5-Fabrication of Electrochemical Copper Sensors Based on Gly-Gly-His Modified Carbon Electrodes
The surprisingly higher detection limit for copper could imply a perturbation in the
thermodynamics of binding. This means inferior accessibility of Cu2+ to the attached
Gly-Gly-His on the GC surfaces relative to gold surfaces. It is hypothesised that two
possible causes of poor accessibility are: 1) the attached Gly-Gly-His ligands are too
close together to allow for efficient binding of Cu2+. This problem can be addressed by
spacing the ligands further apart with mixed monolayers of 4-carboxyphenyl and phenyl
groups; 2) the GC surface may be too rough, such that some of the Gly-Gly-His ligands
are less available to the copper ions. These possibilities are consistent with the fact of
non-ideal Ep and EFWHM due to the coupled Cu2+ being located in different
microenvironments as mentioned in Section 5.3.1. As introduced in Chapter One, PPF
with smoother surfaces might be a good alternative to GC for the fabrication of similar
chemical sensors. The following sections investigate the influence of these two options
(mixed monolayers and PPF) on the detection limit of copper ions.
5.3.4 Attachment of Gly-Gly-His onto Mixed Aryl Diazonium Salts Modified Glassy
Carbon Electrodes for the Detection of Cu2+
Mixed monolayers on gold surfaces have been widely studied, and provide a useful
methodology for incorporating into a monolayer molecular species whose own physical
dimensions would preclude a direct, well-organised assembly.58 A mixed SAM on gold
surfaces formed from two alkanethiols in solution has been regarded as being a
reasonably homogeneous mixture of the alkanethiols59 rather than phase segregation
into “islands” as has been observed in Langmuir-Blodgett films60. However, some phase
segregation has also been reported to occur when the two components are quite different
chemically.61 In fact, whether phase segregation occurs or not depends on the surface
upon which assembly forms, the alkanethiol used and the measurement technique.62 The
164
Chapter 5-Fabrication of Electrochemical Copper Sensors Based on Gly-Gly-His Modified Carbon Electrodes
homogeneity of mixed SAMs with alkanethiols on gold surfaces is attributed to strong
sulfur-substrate interactions. Considering the head group-substrate bond is stronger for
aryl diazonium salts and the two components are very similar, the monolayers with
diazonium salts on GC surfaces are expected to be homogeneous.
Mixed monolayers comprising 4-carboxylphenyl and phenyl moieties were prepared by
immersing the GC electrodes in solutions of mixtures of the corresponding diazonium
salts at a given molar fraction for the electrochemically reductive adsorption. The
tripeptide Gly-Gly-His could be attached to the mixed monolayers modified surfaces as
described previously. After that, the prepared system could be used as a chemical sensor
to detect copper ions in solution. Accumulation of copper ions at this Gly-Gly-His
modified GC electrode was carried out at open circuit potential by dipping the electrode
in a 0.05 M ammonium acetate buffer solution (pH 7.0) containing 0.2 µM copper
nitrate for 10 min. The electrode was removed from the cell and washed thoroughly
with water. The electrochemistry was then conducted immediately in a 0.05 M copper
free ammonium acetate buffer solution. A plot of Cu2+ surface coverage against the
mole ratio of phenyl to 4-carboxyphenyl was obtained as shown in Figure 5.11. It
shows the surface coverage of complexed copper ion decreased with an increasing mole
ratio of phenyl to 4-carboxyphenyl groups as expected. When the Gly-Gly-His was
immobilised on pure 4-carboxyphenyl modified GC surfaces followed by the
complexation of Cu2+, the maximum copper coverage of 7.2×10⁻¹¹ mol cm-2 was
obtained by integration of the cyclic voltammogram. GC surfaces were modified with
less 4-carboxyphenyl groups when the phenyl diazonium salts were used to dilute the
modification solution of 4-carboxyphenyl diazonium salts, indicating a decrease in
available benzoic acid sites for Gly-Gly-His attachment and the amount of copper ions
165
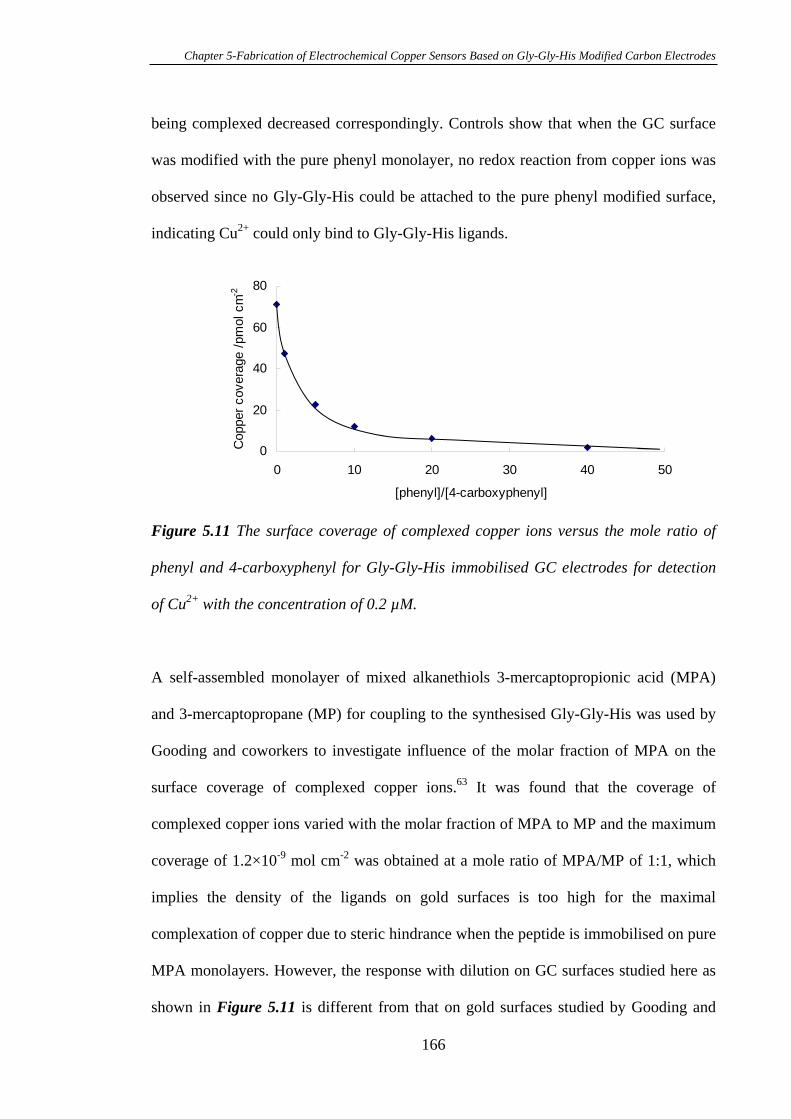
Chapter 5-Fabrication of Electrochemical Copper Sensors Based on Gly-Gly-His Modified Carbon Electrodes
being complexed decreased correspondingly. Controls show that when the GC surface
was modified with the pure phenyl monolayer, no redox reaction from copper ions was
observed since no Gly-Gly-His could be attached to the pure phenyl modified surface,
indicating Cu2+ could only bind to Gly-Gly-His ligands.
0
20
40
60
80
0 10 20 30 40 5
[phenyl]/[4-carboxyphenyl]
Cop
per c
over
age
/pm
ol c
m-2
0
Figure 5.11 The surface coverage of complexed copper ions versus the mole ratio of
phenyl and 4-carboxyphenyl for Gly-Gly-His immobilised GC electrodes for detection
of Cu2+ with the concentration of 0.2 µM.
A self-assembled monolayer of mixed alkanethiols 3-mercaptopropionic acid (MPA)
and 3-mercaptopropane (MP) for coupling to the synthesised Gly-Gly-His was used by
Gooding and coworkers to investigate influence of the molar fraction of MPA on the
surface coverage of complexed copper ions.63 It was found that the coverage of
complexed copper ions varied with the molar fraction of MPA to MP and the maximum
coverage of 1.2×10⁻⁹ mol cm-2 was obtained at a mole ratio of MPA/MP of 1:1, which
implies the density of the ligands on gold surfaces is too high for the maximal
complexation of copper due to steric hindrance when the peptide is immobilised on pure
MPA monolayers. However, the response with dilution on GC surfaces studied here as
shown in Figure 5.11 is different from that on gold surfaces studied by Gooding and
166
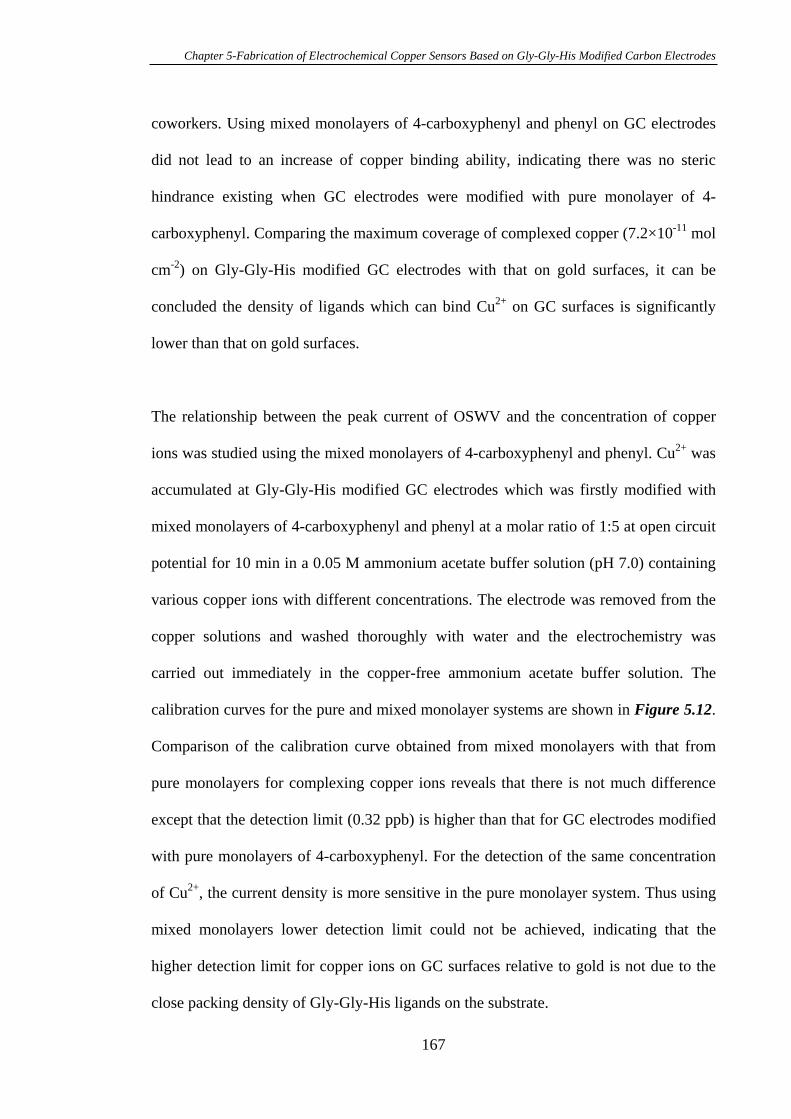
Chapter 5-Fabrication of Electrochemical Copper Sensors Based on Gly-Gly-His Modified Carbon Electrodes
coworkers. Using mixed monolayers of 4-carboxyphenyl and phenyl on GC electrodes
did not lead to an increase of copper binding ability, indicating there was no steric
hindrance existing when GC electrodes were modified with pure monolayer of 4-
carboxyphenyl. Comparing the maximum coverage of complexed copper (7.2×10⁻¹¹ mol
cm-2) on Gly-Gly-His modified GC electrodes with that on gold surfaces, it can be
concluded the density of ligands which can bind Cu2+ on GC surfaces is significantly
lower than that on gold surfaces.
The relationship between the peak current of OSWV and the concentration of copper
ions was studied using the mixed monolayers of 4-carboxyphenyl and phenyl. Cu2+ was
accumulated at Gly-Gly-His modified GC electrodes which was firstly modified with
mixed monolayers of 4-carboxyphenyl and phenyl at a molar ratio of 1:5 at open circuit
potential for 10 min in a 0.05 M ammonium acetate buffer solution (pH 7.0) containing
various copper ions with different concentrations. The electrode was removed from the
copper solutions and washed thoroughly with water and the electrochemistry was
carried out immediately in the copper-free ammonium acetate buffer solution. The
calibration curves for the pure and mixed monolayer systems are shown in Figure 5.12.
Comparison of the calibration curve obtained from mixed monolayers with that from
pure monolayers for complexing copper ions reveals that there is not much difference
except that the detection limit (0.32 ppb) is higher than that for GC electrodes modified
with pure monolayers of 4-carboxyphenyl. For the detection of the same concentration
of Cu2+, the current density is more sensitive in the pure monolayer system. Thus using
mixed monolayers lower detection limit could not be achieved, indicating that the
higher detection limit for copper ions on GC surfaces relative to gold is not due to the
close packing density of Gly-Gly-His ligands on the substrate.
167
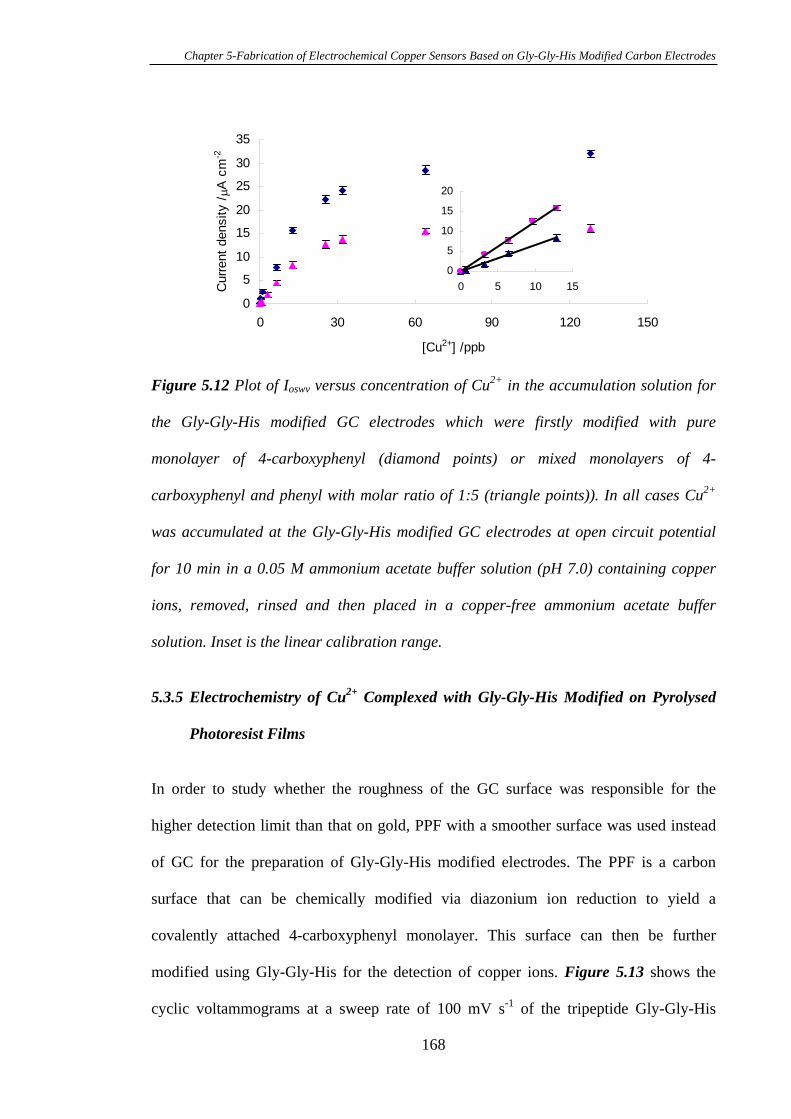
Chapter 5-Fabrication of Electrochemical Copper Sensors Based on Gly-Gly-His Modified Carbon Electrodes
0
5
10
15
20
25
30
35
0 30 60 90 120 1
[Cu2+] /ppb
Cur
rent
den
sity
/A
cm
-2
50
0
5
10
15
20
0 5 10 15
Figure 5.12 Plot of Ioswv versus concentration of Cu2+ in the accumulation solution for
the Gly-Gly-His modified GC electrodes which were firstly modified with pure
monolayer of 4-carboxyphenyl (diamond points) or mixed monolayers of 4-
carboxyphenyl and phenyl with molar ratio of 1:5 (triangle points)). In all cases Cu2+
was accumulated at the Gly-Gly-His modified GC electrodes at open circuit potential
for 10 min in a 0.05 M ammonium acetate buffer solution (pH 7.0) containing copper
ions, removed, rinsed and then placed in a copper-free ammonium acetate buffer
solution. Inset is the linear calibration range.
5.3.5 Electrochemistry of Cu2+ Complexed with Gly-Gly-His Modified on Pyrolysed
Photoresist Films
In order to study whether the roughness of the GC surface was responsible for the
higher detection limit than that on gold, PPF with a smoother surface was used instead
of GC for the preparation of Gly-Gly-His modified electrodes. The PPF is a carbon
surface that can be chemically modified via diazonium ion reduction to yield a
covalently attached 4-carboxyphenyl monolayer. This surface can then be further
modified using Gly-Gly-His for the detection of copper ions. Figure 5.13 shows the
cyclic voltammograms at a sweep rate of 100 mV s-1 of the tripeptide Gly-Gly-His
168
Chapter 5-Fabrication of Electrochemical Copper Sensors Based on Gly-Gly-His Modified Carbon Electrodes
modified PPF before and after incubation in a 5×10⁻⁷ M Cu2+ solution. The appearance
of redox peaks with formal potential Eo` of -70 mV due to the reduction of Cu2+ to Cu+
and the oxidation back to Cu2+ suggests the successful complexation of the peptide to
the carboxylic acid terminated PPF interface. The control shows that if the Gly-Gly-His
is absent, such that the electrode is only modified with 4-carboxylphenyl, there is no
redox response in the CV at this copper concentration. The linear relationship between
the scan rates and the oxidation and reduction peak currents gives evidence of a surface
binding process (Figure 5.14).
-14
-11
-8
-5
-2
1
4
7
-0.4 -0.2 0 0.2 0.4
Potential /V
Cur
rent
/A
After copper binding
Gly-Gly-His initial response
After copper removal
Figure 5.13 Cyclic voltammograms of Gly-Gly-His modified PPF before and after
exposure to copper ions in 0.05 M ammonium acetate buffer solution (pH 7.0). In all
cases Cu2+ was accumulated at the Gly-Gly-His modified PPF electrode at open circuit
potential for 10 min in a 0.05 M ammonium acetate buffer solution (pH 7.0) containing
5×10⁻⁷ M copper, removed, rinsed and then placed in a copper-free ammonium acetate
buffer solution. Also shown is the cyclic voltammogram of Gly-Gly-His modified PPF
binding with Cu2+ after regeneration of the PPF surface to Cu2+ free by holding the
working electrode at +0.5 V for 30 s in 0.1 M HClO4. Sweep rate: 100 mV s-1.
169
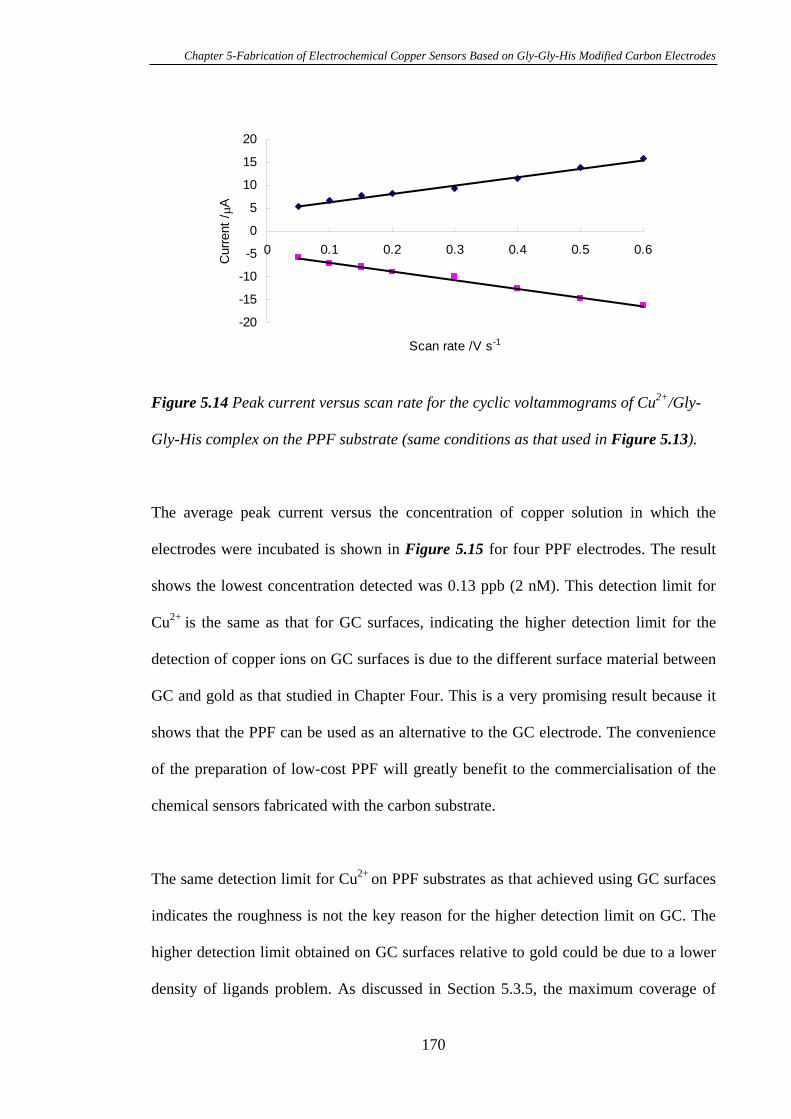
Chapter 5-Fabrication of Electrochemical Copper Sensors Based on Gly-Gly-His Modified Carbon Electrodes
-20
-15
-10
-5
0
5
10
15
20
0 0.1 0.2 0.3 0.4 0.5 0.6
Scan rate /V s-1
Cur
rent
/A
Figure 5.14 Peak current versus scan rate for the cyclic voltammograms of Cu2+/Gly-
Gly-His complex on the PPF substrate (same conditions as that used in Figure 5.13).
The average peak current versus the concentration of copper solution in which the
electrodes were incubated is shown in Figure 5.15 for four PPF electrodes. The result
shows the lowest concentration detected was 0.13 ppb (2 nM). This detection limit for
Cu2+ is the same as that for GC surfaces, indicating the higher detection limit for the
detection of copper ions on GC surfaces is due to the different surface material between
GC and gold as that studied in Chapter Four. This is a very promising result because it
shows that the PPF can be used as an alternative to the GC electrode. The convenience
of the preparation of low-cost PPF will greatly benefit to the commercialisation of the
chemical sensors fabricated with the carbon substrate.
The same detection limit for Cu2+ on PPF substrates as that achieved using GC surfaces
indicates the roughness is not the key reason for the higher detection limit on GC. The
higher detection limit obtained on GC surfaces relative to gold could be due to a lower
density of ligands problem. As discussed in Section 5.3.5, the maximum coverage of
170
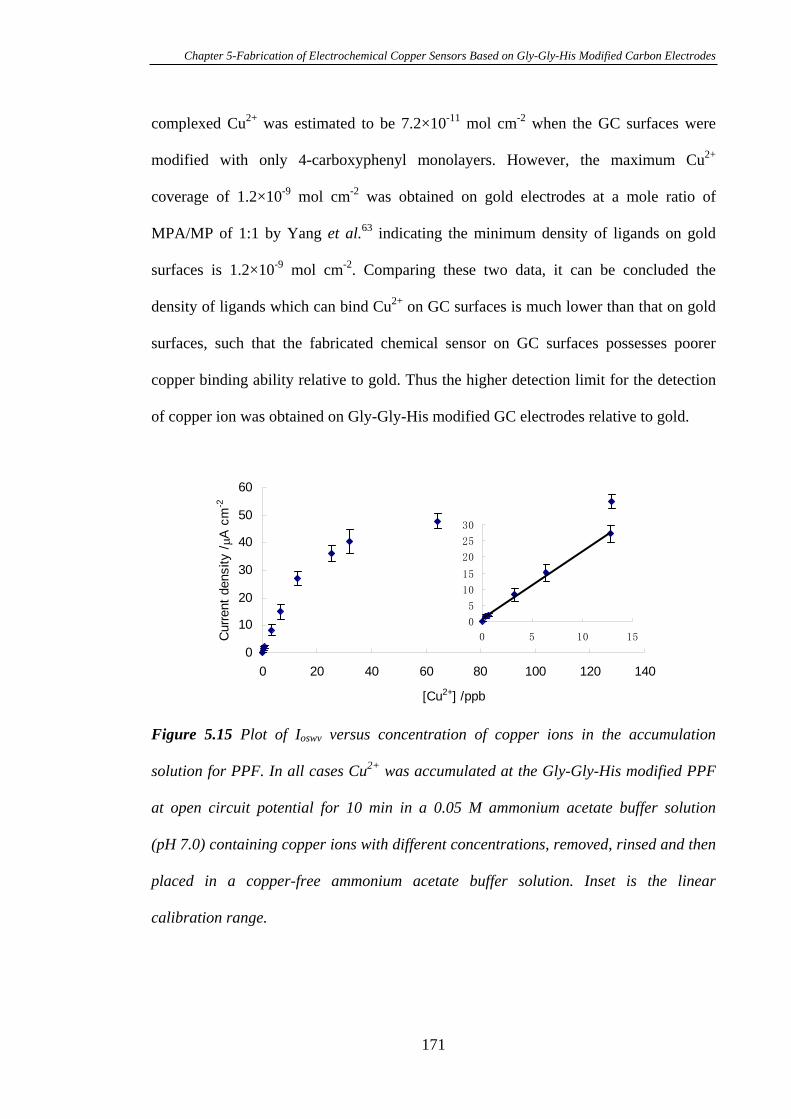
Chapter 5-Fabrication of Electrochemical Copper Sensors Based on Gly-Gly-His Modified Carbon Electrodes
complexed Cu2+ was estimated to be 7.2×10⁻¹¹ mol cm-2 when the GC surfaces were
modified with only 4-carboxyphenyl monolayers. However, the maximum Cu2+
coverage of 1.2×10⁻⁹ mol cm-2 was obtained on gold electrodes at a mole ratio of
MPA/MP of 1:1 by Yang et al.63 indicating the minimum density of ligands on gold
surfaces is 1.2×10⁻⁹ mol cm-2. Comparing these two data, it can be concluded the
density of ligands which can bind Cu2+ on GC surfaces is much lower than that on gold
surfaces, such that the fabricated chemical sensor on GC surfaces possesses poorer
copper binding ability relative to gold. Thus the higher detection limit for the detection
of copper ion was obtained on Gly-Gly-His modified GC electrodes relative to gold.
0
10
20
30
40
50
60
0 20 40 60 80 100 120 140
[Cu2+] /ppb
Cur
rent
den
sity
/A
cm
-2
Figure 5.15 Plot of Ioswv versus concentration of copper ions in the accumulation
solution for PPF. In all cases Cu2+ was accumulated at the Gly-Gly-His modified PPF
at open circuit potential for 10 min in a 0.05 M ammonium acetate buffer solution
(pH 7.0) containing copper ions with different concentrations, removed, rinsed and then
placed in a copper-free ammonium acetate buffer solution. Inset is the linear
calibration range.
171
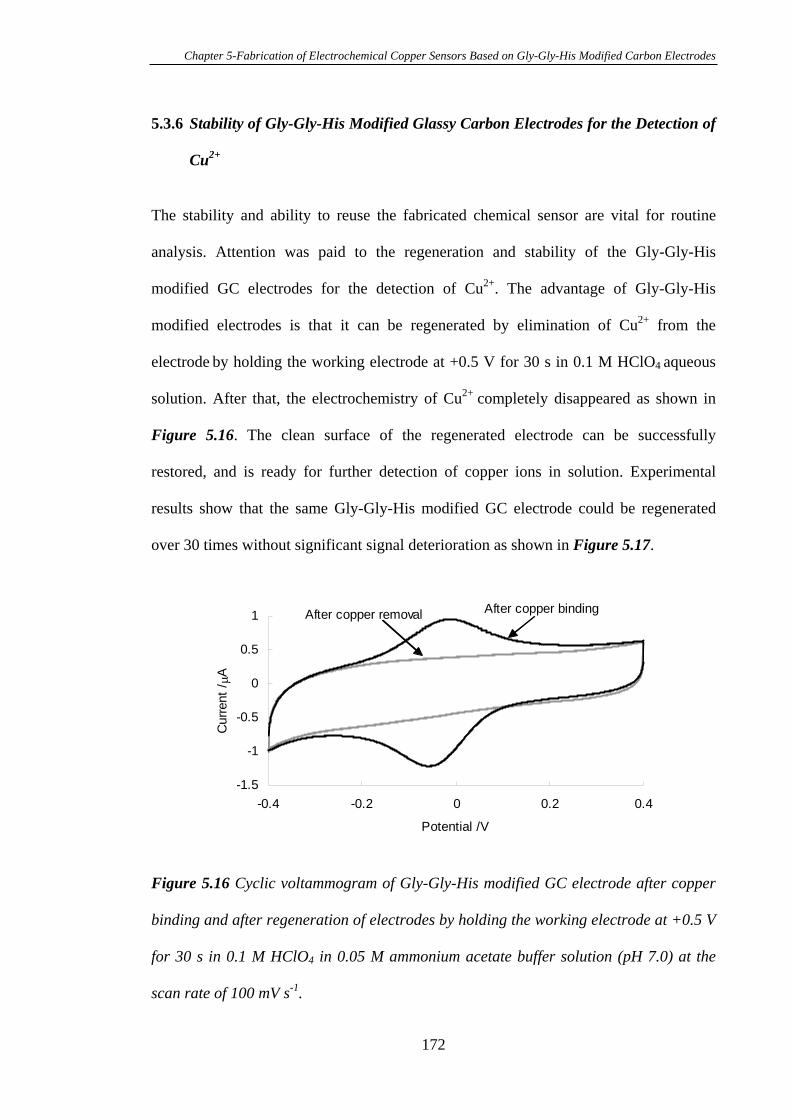
Chapter 5-Fabrication of Electrochemical Copper Sensors Based on Gly-Gly-His Modified Carbon Electrodes
5.3.6 Stability of Gly-Gly-His Modified Glassy Carbon Electrodes for the Detection of
Cu2+
The stability and ability to reuse the fabricated chemical sensor are vital for routine
analysis. Attention was paid to the regeneration and stability of the Gly-Gly-His
modified GC electrodes for the detection of Cu2+. The advantage of Gly-Gly-His
modified electrodes is that it can be regenerated by elimination of Cu2+ from the
electrode by holding the working electrode at +0.5 V for 30 s in 0.1 M HClO4 aqueous
solution. After that, the electrochemistry of Cu2+ completely disappeared as shown in
Figure 5.16. The clean surface of the regenerated electrode can be successfully
restored, and is ready for further detection of copper ions in solution. Experimental
results show that the same Gly-Gly-His modified GC electrode could be regenerated
over 30 times without significant signal deterioration as shown in Figure 5.17.
-1.5
-1
-0.5
0
0.5
1
-0.4 -0.2 0 0.2 0.4
Potential /V
Cur
rent
/A
After copper bindingAfter copper removal
Figure 5.16 Cyclic voltammogram of Gly-Gly-His modified GC electrode after copper
binding and after regeneration of electrodes by holding the working electrode at +0.5 V
for 30 s in 0.1 M HClO4 in 0.05 M ammonium acetate buffer solution (pH 7.0) at the
scan rate of 100 mV s-1.
172
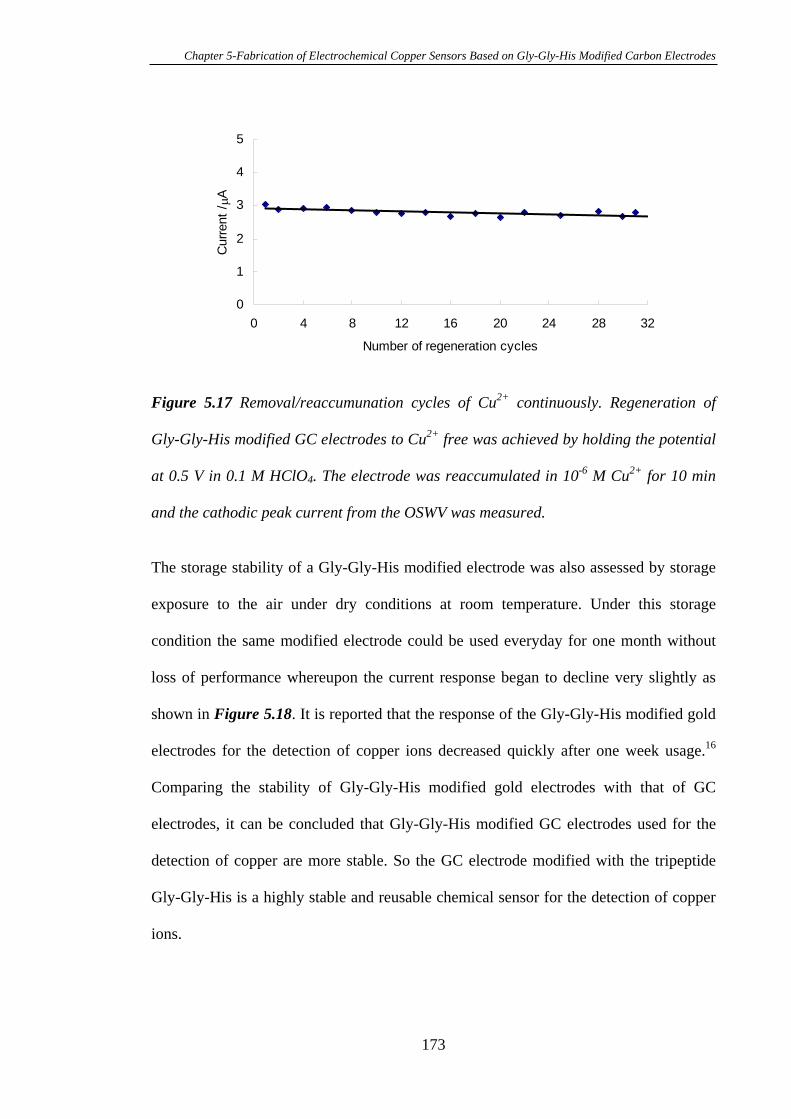
Chapter 5-Fabrication of Electrochemical Copper Sensors Based on Gly-Gly-His Modified Carbon Electrodes
0
1
2
3
4
5
0 4 8 12 16 20 24 28 32
Number of regeneration cycles
Cur
rent
/A
Figure 5.17 Removal/reaccumunation cycles of Cu2+ continuously. Regeneration of
Gly-Gly-His modified GC electrodes to Cu2+ free was achieved by holding the potential
at 0.5 V in 0.1 M HClO4. The electrode was reaccumulated in 10-6 M Cu2+ for 10 min
and the cathodic peak current from the OSWV was measured.
The storage stability of a Gly-Gly-His modified electrode was also assessed by storage
exposure to the air under dry conditions at room temperature. Under this storage
condition the same modified electrode could be used everyday for one month without
loss of performance whereupon the current response began to decline very slightly as
shown in Figure 5.18. It is reported that the response of the Gly-Gly-His modified gold
electrodes for the detection of copper ions decreased quickly after one week usage.16
Comparing the stability of Gly-Gly-His modified gold electrodes with that of GC
electrodes, it can be concluded that Gly-Gly-His modified GC electrodes used for the
detection of copper are more stable. So the GC electrode modified with the tripeptide
Gly-Gly-His is a highly stable and reusable chemical sensor for the detection of copper
ions.
173
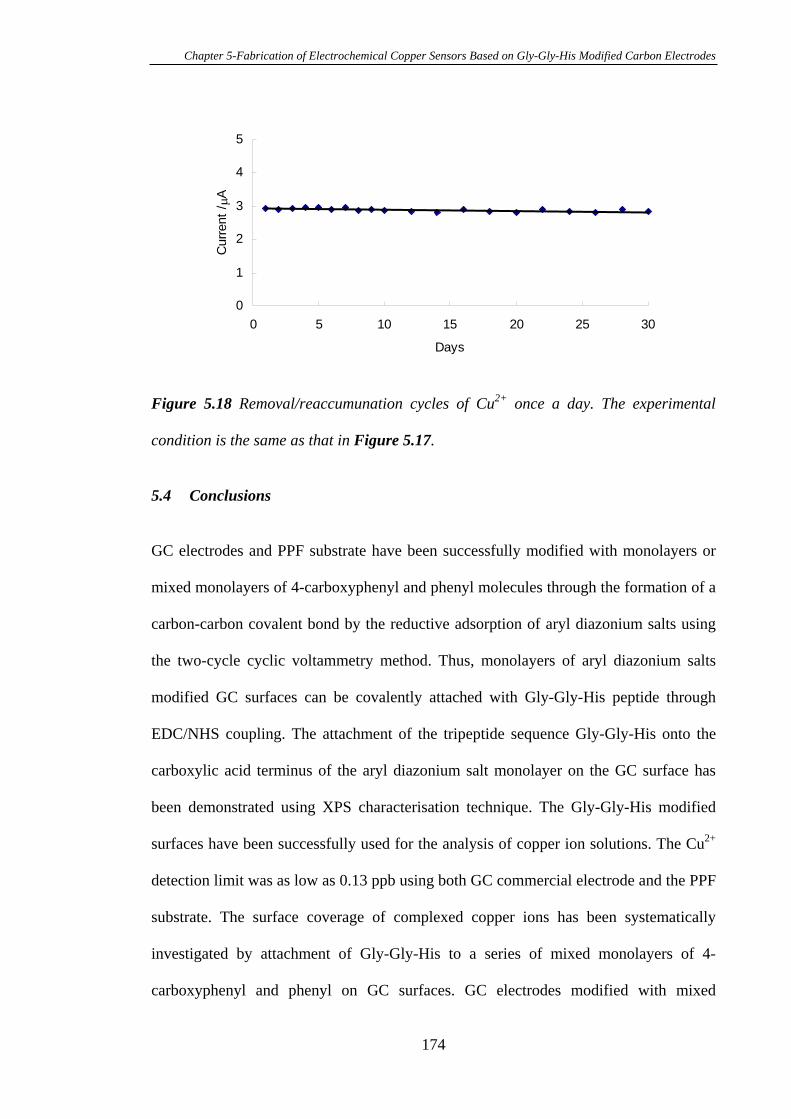
Chapter 5-Fabrication of Electrochemical Copper Sensors Based on Gly-Gly-His Modified Carbon Electrodes
0
1
2
3
4
5
0 5 10 15 20 25 30
Days
Cur
rent
/A
Figure 5.18 Removal/reaccumunation cycles of Cu2+ once a day. The experimental
condition is the same as that in Figure 5.17.
5.4 Conclusions
GC electrodes and PPF substrate have been successfully modified with monolayers or
mixed monolayers of 4-carboxyphenyl and phenyl molecules through the formation of a
carbon-carbon covalent bond by the reductive adsorption of aryl diazonium salts using
the two-cycle cyclic voltammetry method. Thus, monolayers of aryl diazonium salts
modified GC surfaces can be covalently attached with Gly-Gly-His peptide through
EDC/NHS coupling. The attachment of the tripeptide sequence Gly-Gly-His onto the
carboxylic acid terminus of the aryl diazonium salt monolayer on the GC surface has
been demonstrated using XPS characterisation technique. The Gly-Gly-His modified
surfaces have been successfully used for the analysis of copper ion solutions. The Cu2+
detection limit was as low as 0.13 ppb using both GC commercial electrode and the PPF
substrate. The surface coverage of complexed copper ions has been systematically
investigated by attachment of Gly-Gly-His to a series of mixed monolayers of 4-
carboxyphenyl and phenyl on GC surfaces. GC electrodes modified with mixed
174
Chapter 5-Fabrication of Electrochemical Copper Sensors Based on Gly-Gly-His Modified Carbon Electrodes
monolayers have a higher detection limit of copper ions than that for GC electrodes
modified with the pure monolayer of 4-carboxyphenyl. The Gly-Gly-His peptide
modified GC electrode for the detection of copper was found to be very stable. After
one month storage and frequent usage, the measured sensitivity did not show much
decay within that period of time. PPF has proved to be a good alternative for the GC
electrode for the fabrication of chemical sensors. The so-fabricated electrode will be a
good example for the fabrication of other chemical sensors built with other polypeptides
for the analysis of other metal ions and also supplies an effective tool for medical
diagnosis.
5.5 References
(1) Gooding, J.J., Chow, E., Finlayson, R., Aust. J. Chem. 2003, 56, 159-162.
(2) Kozlowski, H., W., B., Byba, M., Kowalik-Jankowska, T., Coord. Chem. Rev. 1999,
184, 319-346.
(3) Sigel, H., Martin, R.B., Chem. Rev. 1982, 82, 385-426.
(4) Gooding, J.J., Hibbert, D.B., Yang, W., Sensors 2001, 1, 75-90.
(5) Hsueh, C.C., Lee, M.T., Freund, M.S., Ferguson, G.S., Angew. Chem. Int. Edit.
2000, 39, 1228-1232.
(6) Rubinstein, I., Steinberg, S., Tor, Y., Shanzer, A., Sagiv, J., Nature 1988, 332, 426-
427.
(7) Turyan, I., Mandler, D., Anal. Chem. 1994, 66, 58-63.
(8) Turyan, I., Mandler, D., Anal. Chem. 1997, 69, 894-899.
(9) Flink, S., Boukamp, B.A., Van Der Berg, A., Van Veggel, F.C.J.M., Reinhoudt,
D.N., J. Am. Chem. Soc. 1998, 120, 4652-4657.
(10) Yang, W., Gooding, J.J., Hibbert, D.B., J. Electroanal. Chem. 2001, 516, 10-16.
175
Chapter 5-Fabrication of Electrochemical Copper Sensors Based on Gly-Gly-His Modified Carbon Electrodes
(11) Chow, E., Hibbert, D.B., Gooding, J.J., Analyst 2005, 130, 831-837.
(12) Yang, W., Jaramillo, D., Gooding, J.J., Hibbert, D.B., Zhang, R., Willett, G.D.,
Fisher, K.J., Chem. Commun. 2001, 1982-1983.
(13) Chow, E., Hibbert, D.B., Gooding, J.J., Electrochem. Commun. 2005, 7, 101-106.
(14) Yang, W., Gooding, J.J., Hibbert, D.B., Analyst 2001, 126, 1573-1577.
(15) Chow, E., Aust. J. Chem. 2005, 58, 306.
(16) Yang, W.R., Chow, E., Willett, G.D., Hibbert, D.B., Gooding, J.J., Analyst 2003,
128, 712-718.
(17) Chow, E., Wong, E.L.S., Böcking, T., Nguyen, Q.T., Hibbert, D.B., Gooding, J.J.,
Sens. Actuators B 2005, 111-112, 540-548.
(18) Gregory, E.P., Chem. Rev. 1997, 97, 1117-1127.
(19) Delamarche, E., Michel, B., Kang, H., Gerber, C., Langmuir 1994, 10, 4103-4108.
(20) Flynn, N.T., Tran, T.N.T., Cima, M.J., Langer, R., Langmuir 2003, 19, 10909-
10915.
(21) Delamar, M., Hitmi, R., Pinson, J., Saveant, J.M., J. Am. Chem. Soc. 1992, 114,
5883-5884.
(22) McCreery, R.L., In Electroanalytical Chemistry, Bard, A.J., Ed. Dekker: New York,
1991; Vol. 17, p 221.
(23) Lau, S.J., Kruck, T.P.A., Sarkar, B., J. Biol. Chem. 1974, 249, 5878-5884.
(24) Masuoka, J., Hegenauer, J., Vandyke, B.R., Saltman, P., J. Biol. Chem. 1993, 268,
21533-21537.
(25) Menkes, J.H., Alter, M., Steigleder, G.K., Weakley, D.R., Sung, J.H., Pediatrics
1962, 29, 764-769.
(26) Sarkar, B., Chem. Rev. 1999, 99, 2535-2544.
176
Chapter 5-Fabrication of Electrochemical Copper Sensors Based on Gly-Gly-His Modified Carbon Electrodes
(27) Liu, A.C., Chen, D.C., Lin, C.C., Chou, H.H., Chen, C.H., Anal.Chem. 1999, 71,
1549-1552.
(28) Arrigan, D.W.M., Le Bihan, L., Analyst 1999, 124, 1645-1649.
(29) Cao, Y.H., Li, Y.S., Tseng, J.L., Desiderio, D.M., Spectrochimica Acta 2001, 57,
27-34.
(30) Cooper, E., Leggett, G.J., Langmuir 1998, 14, 4795-4801.
(31) Garrell, R.L., Chadwick, J.E., Severance, D.L., Mcdonald, N.A., Myles, D.C., J. Am.
Chem. Soc. 1995, 117, 11563-11571.
(32) Hutt, D.A., Leggett, G.J., J. Phys. Chem. 1996, 100, 6657-6662.
(33) Bard, A.J., Faulkner, L.R., Electrochemical Methods,. Wiley, New York, 2001; p
808.
(34) Aylward, G.H., Findlay, T.J.V., SI Chemical Data. Wiley: Sydney, 1974.
(35) Chow, E., Hibbert, D.B., Gooding, J.J., Anal. Chim. Acta 2005, 543, 167-176.
(36) Liu, G., Bocking, T., Gooding, J.J., J. Electroanal. Chem. 2006, submitted.
(37) Finklea, H.O., Electroanal. Chem. 1996, 19, 109-115.
(38) Honeychurch, M.J., Langmuir 1998, 14, 6291-6296.
(39) Rowe, G.K., Carter, M.T., Richardson, J.N., Murray, R.W., Langmuir 1995, 11,
1797-1806.
(40) Laviron, E., J. Electroanal. Chem. 1979, 101, 19-28.
(41) Bard, A.J., Faulkner, L.R., Electrochemical Methods: Fundamentals and
Applications. Wiley: New York: 1980.
(42) Hu, I.F., Karweik, D.H., Kuwana, T., J. Electroanal. Chem. 1985, 188, 59-72.
(43) Engstrom, R.C., Strasser, V.A., Anal. Chem. 1984, 56, 136-141.
(44) Evans, J.F., Kuwana, T., Anal. Chem. 1979, 51, 358-365.
(45) Miller, C.W., Karweik, D.H., Kuwana, T., Anal. Chem. 1981, 53, 2319-2325.
177
Chapter 5-Fabrication of Electrochemical Copper Sensors Based on Gly-Gly-His Modified Carbon Electrodes
(46) Beamson, G., Briggs, D., High Resolution XPS of Organic Polymers. Wiley:
Chichester, 1992.
(47) Allongue, P., Delamar, M., Desbat, B., Fagebaume, O., Hitmi, R., Pinson, J.,
Saveant, J.-M., J. Am. Chem. Soc. 1997, 119, 201-207.
(48) Sieval, A.B., Demirel, A.L., Nissink, J.W.M., Linford, M.R., Van Der Maas, J.H.,
De Jeu, W.H., Zuilhof, H., Sudhoelter, E.J.R., Langmuir 1998, 14, 1759-1768.
(49) Cecchet, F., Pilling, M., Hevesi, L., Schergna, S., Wong, J.K.Y., Clarkson, G.J.,
Leigh, D.A., Rudolf, P., J. Phys. Chem. B 2003, 107, 10863-10872.
(50) Saby, C., Ortiz, B., Champagne, G.Y., Belanger, D., Langmuir 1997, 13, 6805-6813.
(51) Elliott, C.M., Murray, R.W., Anal. Chem. 1976, 48, 1247-1254.
(52) Delamarche, E., Sundarababu, G., Biebuyck, H., Michel, B., Gerber, C., Sigrist, H.,
Wolf, H., Ringsdorf, H., Xanthopoulos, N., Mathieu, H.J., Langmuir 1996, 12,
1997-2003.
(53) Jiang, L., Glidle, A., Griffith, A., McNeil, C.J., Cooper, J.M., Bioelectrochem.
Bioenerg. 1997, 42, 15-23.
(54) Böcking, T., James, M., Coster, H.G.L., Chilcott, T.C., Barrow, K.D., Langmuir
2004, 20, 9227-9235.
(55) Abe, T., Watanabe, A., Soil Sci. 2004, 169, 35-43.
(56) Shin, H., Park, M., Kim, A.R., Kang, C., J. Electroanal. Chem. 2003, 547, 143-149.
(57) Nguyen, Q.T. Honours Thesis, School of Chemistry, The University of New South
Wales, Sydney, 2004.
(58) Love, J.C., Estroff, L.A., Kriebel, J.K., Nuzzo, R.G., Whitesides, G.M., Chem. Rev.
2005, 105, 1103-1169.
(59) Bain, C.D., Whitesides, G.M., J. Am. Chem. Soc. 1988, 110, 6560-6561.
178
Chapter 5-Fabrication of Electrochemical Copper Sensors Based on Gly-Gly-His Modified Carbon Electrodes
(60) Ulman, A., An Introduction to Ultrathin Organic Films From Langmuir-Blodgett to
Self-Assembly. Academic Press: London, 1991.
(61) Atre, S.V., Liedberg, B., Allara, D.L., Langmuir 1995, 11, 3882-3893.
(62) Gooding, J.J., In Encyclopedia of Nanoscience and Nanotechnology, Nalwa, H.S.,
Ed. American Scientific Publishing: California, 2004; Vol. 1, pp 17-49.
(63) Yang, W.R., Hibbert, D.B., Zhang, R., Willett, G.D., Gooding, J.J., Langmuir 2005,
21, 260-265.
179
Chapter 6-An Interface Comprising Molecular Wires and Poly(ethylene glycol) Spacer Units Self-Assembled on Carbon Electrodes for Studies of Protein Electrochemistry
Chapter Six
An Interface Comprising Molecular Wires and Poly(ethylene
glycol) Spacer Units Self-Assembled on Carbon Electrodes for
Studies of Protein Electrochemistry
180
Chapter 6-An Interface Comprising Molecular Wires and Poly(ethylene glycol) Spacer Units Self-Assembled on Carbon Electrodes for Studies of Protein Electrochemistry
6.1 Introduction
Understanding and manipulating electronic transfer through molecular-scale “wires” is
beginning to attract tremendous attention in the developing fields of biosensors1-3 and
bioelectronics4, 5 as well as molecular electronics.6-9 The attraction of molecular wires
(MWs) in bioelectronics is that good electronic coupling exists between the electron
donor at one end and the acceptor at the other over long distances.10 For biological
systems, there is general agreement that the electronic coupling between electron donors
and acceptors, and hence as a consequence the distance, plays a critical role in
controlling long-range electron transfer (ET) process.11, 12 Numerous studies have
investigated long range ET between redox-active probes and an electrode through self-
assembled monolayers (SAMs) formed on a gold substrate with alkanethiols,13-16
conjugated molecules,2, 3, 17, 18 and DNA1, 19-22 to redox molecules such as ferrocene,15, 16,
23 and ruthenium complex,14, 24-26 and to redox proteins such as cytochrome c,27-30
azurin,31, 32 horseradish peroxidase,33, 34 or laccase.35, 36 Self-assembled monolayers
formed on electrodes are attractive for ET studies in general, and protein
electrochemistry in particular, as surfaces can be designed with a high degree of control
over the molecular architecture.37-39 Such a control allows the preparation of platforms
to immobilise proteins which are compatible with the protein where the spacing
between the protein and the electrode can be precisely manipulated along with the
dielectric constant of the protein environment and the orientation and density of proteins
on the surface; all of which may strongly influence the efficiency of direct ET.27
Both the Waldeck’s group29, 30 and Gray’s group40 have taken the concept of using
181
Chapter 6-An Interface Comprising Molecular Wires and Poly(ethylene glycol) Spacer Units Self-Assembled on Carbon Electrodes for Studies of Protein Electrochemistry
SAMs for protein electrochemistry a step further than simply being a platform upon
which the protein is immobilised. Both groups incorporated molecular components in
the SAMs which interact with specific sites on the protein and facilitate ET. For
example, recently Gray and coworkers40 have achieved direct ET between the deeply
buried active site of amine oxidase and underlying electrode using a molecular wire.
This study allowed for the first time the interrogation of the electrochemistry of the
active site of the enzyme in its native state. The study also presents the idea of using an
electrode interface with MWs which can penetrate into the protein to facilitate ET. This
same idea of obtaining a more intimate interaction between the protein and the electrode
has also been demonstrated with carbon nanotubes,41-44 nanoparticles45 and other rigid
organic molecules.46 However, in all cases there is little control over whether the redox
proteins adsorb to the ends of the MWs or to other surface sites.
An important issue for electrode constructs where a “molecular wire” penetrates into the
biology is to ensure that the biological molecules interact specifically with the MWs,
rather than the rest of the electrode surface.16 However, the non-specific adsorption of
proteins is a problem that exists with most surfaces when exposed to biological
samples.47 Thus, to achieve a generic surface which ensures specific interactions
between a protein and an electrode requires two important things: 1) MWs that can
interact directly with the protein and have high efficiency of electron transfer and 2)
spacer molecules that are able to resist nonspecific adsorption of proteins. In this
chapter molecular wires derived from oligo(phenyl ethynylene) derivatives were used as
others have shown this class of molecule allows electron transport with high
efficiency.2, 48-56 Similarly, the spacer molecules to be used will be poly(ethylene glycol)
(PEG) derivatives, an important class of molecules with a number of unique properties
182
Chapter 6-An Interface Comprising Molecular Wires and Poly(ethylene glycol) Spacer Units Self-Assembled on Carbon Electrodes for Studies of Protein Electrochemistry
as introduced in Chapter One, which show considerable promise with regards to
producing surfaces which resist non-specific protein adsorption.47, 57-65
In Chapter Three and Chapter Four, it was demonstrated that the electrochemical
reduction of aryl diazonium salts on glassy carbon (GC) surfaces to form covalent
bonds is a promising alternative monolayer system to the gold-thiol chemistry.66-68 As
introduced in Chapter One, functionalised phenyl films by reductive adsorption of
diazonium salts have been utilised in a number of fundamental studies at carbon
electrodes.6, 49, 66, 69-72 Thus, the modification of carbon electrodes with diazonium salts
promises to be a good system for investigation of protein electrochemistry both from the
perspective of the stability of the monolayer on the GC surface and the rich array of
organic modifying molecules. Hence modified electrodes with tailored molecular
designs can be produced.49, 67
The purpose of this chapter is to demonstrate the modification and utilisation of GC
electrodes with a generic interface compatible with investigating specific protein
electrochemistry. Horseradish peroxidase (HRP) is used as a model protein here to
illustrate the utility of the interface before investigating the electrochemistry of proteins
with redox centres embedded deep within the glycoprotein. The interface consists of a
20 Å long rigid MW as shown in Scheme 6.1, and a PEG molecule with three ethylene
glycol units. The ability of the interface to facilitate efficient electron transfer is
demonstrated using ferrocenemethylamine attached to the end of the MWs whilst the
protein resistance of the interface is studied using protein modified gold nanoparticles
which could be quantified by scanning electron microscopy, changes in electrode
capacitance when exposed to solutions of bovine serum albumin (BSA) and the
183
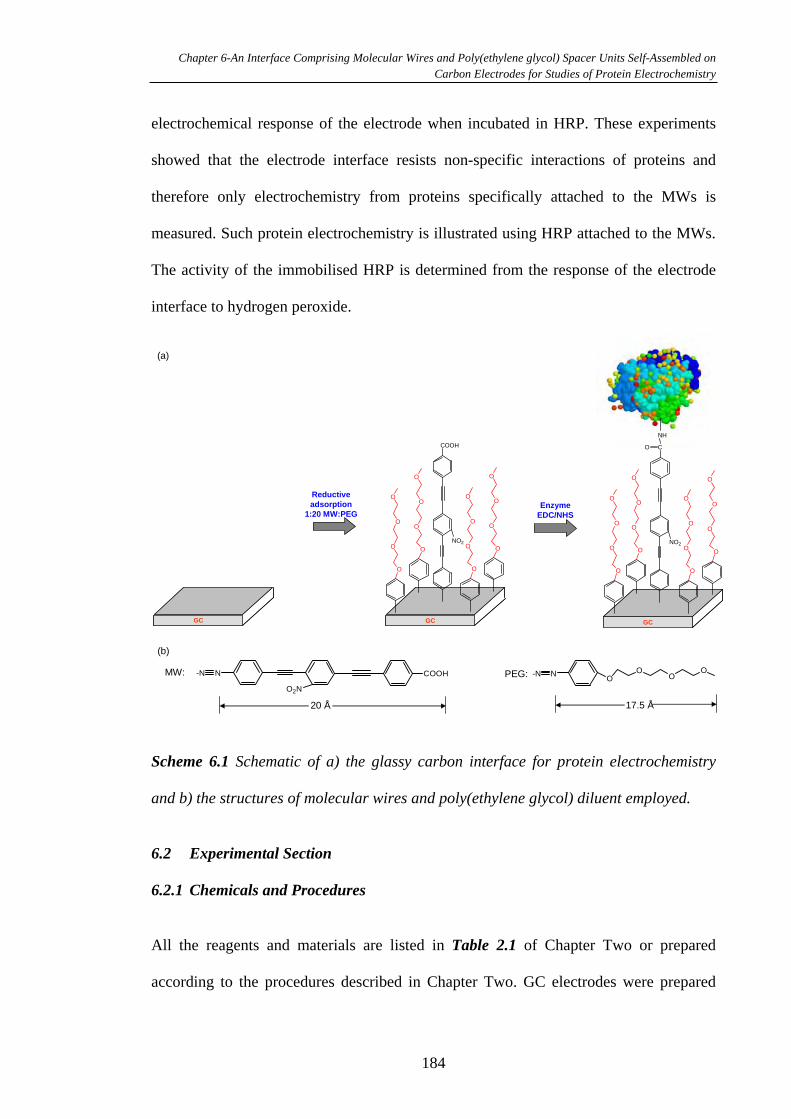
Chapter 6-An Interface Comprising Molecular Wires and Poly(ethylene glycol) Spacer Units Self-Assembled on Carbon Electrodes for Studies of Protein Electrochemistry
electrochemical response of the electrode when incubated in HRP. These experiments
showed that the electrode interface resists non-specific interactions of proteins and
therefore only electrochemistry from proteins specifically attached to the MWs is
measured. Such protein electrochemistry is illustrated using HRP attached to the MWs.
The activity of the immobilised HRP is determined from the response of the electrode
interface to hydrogen peroxide.
EnzymeEDC/NHS
GCGC
NO2
COOH
GCGC
NO2
CO
NH
O
O
O
O
O
O
O
O
O
O
O
O
O
O
O
O
O
O
O
O
O
O
O
O
O
O
O
O
O
O
O
O
Reductiveadsorption
1:20 MW:PEG
GCGC
(a)
N
O2N
COOH-N OO
OO
N-N
(b)
MW: PEG:
20 Å 17.5 Å
Scheme 6.1 Schematic of a) the glassy carbon interface for protein electrochemistry
and b) the structures of molecular wires and poly(ethylene glycol) diluent employed.
6.2 Experimental Section
6.2.1 Chemicals and Procedures
All the reagents and materials are listed in Table 2.1 of Chapter Two or prepared
according to the procedures described in Chapter Two. GC electrodes were prepared
184
Chapter 6-An Interface Comprising Molecular Wires and Poly(ethylene glycol) Spacer Units Self-Assembled on Carbon Electrodes for Studies of Protein Electrochemistry
according to the method described in Section 2.4. Ferrocenemethylamine, PEG and MW
were synthesised according to the procedures described in Chapter Two. All pure and
mixed monolayers were prepared as described in Section 2.4.2 and ferrocene was
covalently attached on the monolayers according to Section 2.2.6. All electrochemical
measurements were performed with a BAS-l00B electrochemical analyser. All the
scanning electron microscope (SEM) images reported here were taken in a LEO-SEM
(Supra 55VP, Zeiss) using an InLenes detector. All potentials were quoted relative to an
Ag/AgCl reference at room temperature. All CV measurements were carried out in the
0.05 M phosphate buffer (0.05 M KCl, pH 7.0). All surface coverage measurements are
based on the actual surface area of the GC electrode rather than geometric area.
6.2.2 Bovine Serum Albumin Labelled Au Nanoparticles
Gold nanoparticles (15 nm in diameter) were synthesised according to the literature
method.73 BSA labeled Au nanoparticles were prepared according to the protocols from
the literature.73 To 25 mL of colloidal gold nanoparticles (15 nm) were added 1 mL of
BSA (10 mg mL-1 in Milli-Q water). The BSA-Au conjugates were observed to
sediment after 24 h. Then the fresh polished GC plates were dipped into the prepared
BSA-Au conjugates for 1 h. Before the SEM measurement, the surface was rinsed with
copious amount of water and dried with an argon stream.
6.3 Result and Discussion
6.3.1 Electrochemistry of PEG Modified Glassy Carbon Electrodes
The modification of GC electrodes with the PEG molecule as depicted in Scheme 6.1
was carried out by performing cyclic voltammetry with a GC electrode in a 1 mM PEG
diazonium tetrafluoroborate, acetonitrile/0.1 M NBu4BF4 solution from +1.0 to -1.5 V
185
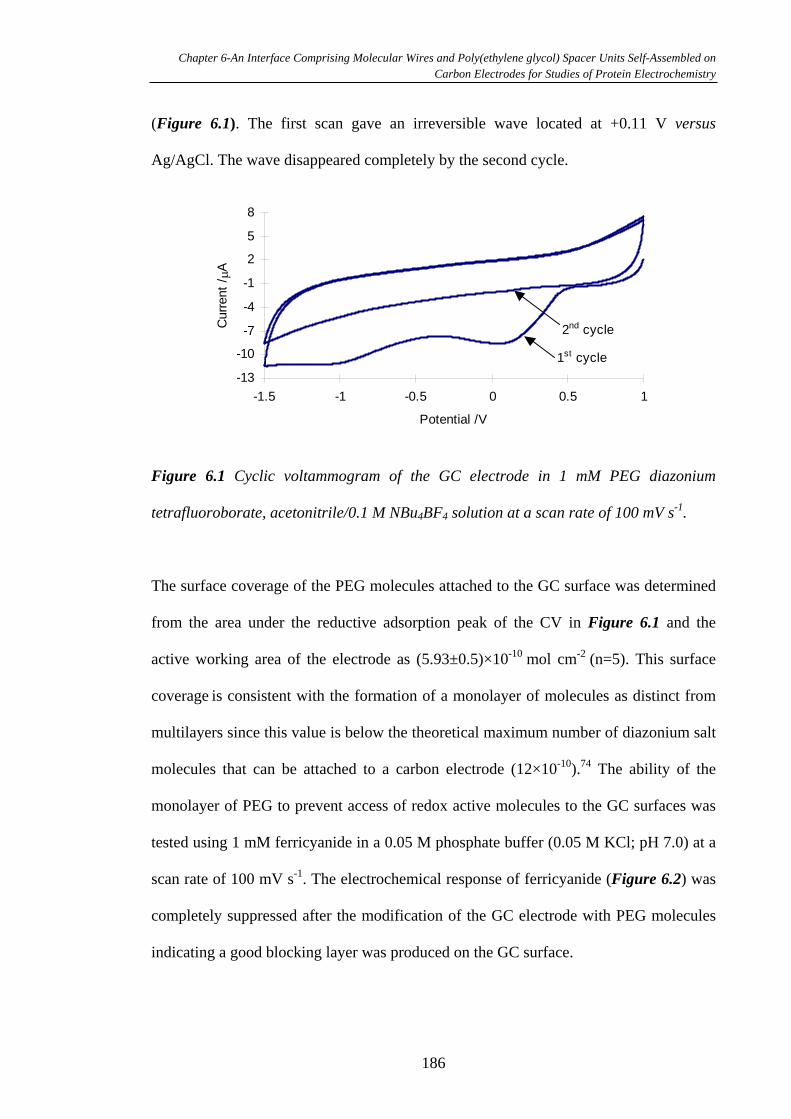
Chapter 6-An Interface Comprising Molecular Wires and Poly(ethylene glycol) Spacer Units Self-Assembled on Carbon Electrodes for Studies of Protein Electrochemistry
(Figure 6.1). The first scan gave an irreversible wave located at +0.11 V versus
Ag/AgCl. The wave disappeared completely by the second cycle.
-13
-10
-7
-4
-1
2
5
8
-1.5 -1 -0.5 0 0.5 1
Potential /V
Curr
ent
/A
1st cycle
2nd cycle
Figure 6.1 Cyclic voltammogram of the GC electrode in 1 mM PEG diazonium
tetrafluoroborate, acetonitrile/0.1 M NBu4BF4 solution at a scan rate of 100 mV s-1.
The surface coverage of the PEG molecules attached to the GC surface was determined
from the area under the reductive adsorption peak of the CV in Figure 6.1 and the
active working area of the electrode as (5.93±0.5)×10-10 mol cm-2 (n=5). This surface
coverage is consistent with the formation of a monolayer of molecules as distinct from
multilayers since this value is below the theoretical maximum number of diazonium salt
molecules that can be attached to a carbon electrode (12×10-10).74 The ability of the
monolayer of PEG to prevent access of redox active molecules to the GC surfaces was
tested using 1 mM ferricyanide in a 0.05 M phosphate buffer (0.05 M KCl; pH 7.0) at a
scan rate of 100 mV s-1. The electrochemical response of ferricyanide (Figure 6.2) was
completely suppressed after the modification of the GC electrode with PEG molecules
indicating a good blocking layer was produced on the GC surface.
186
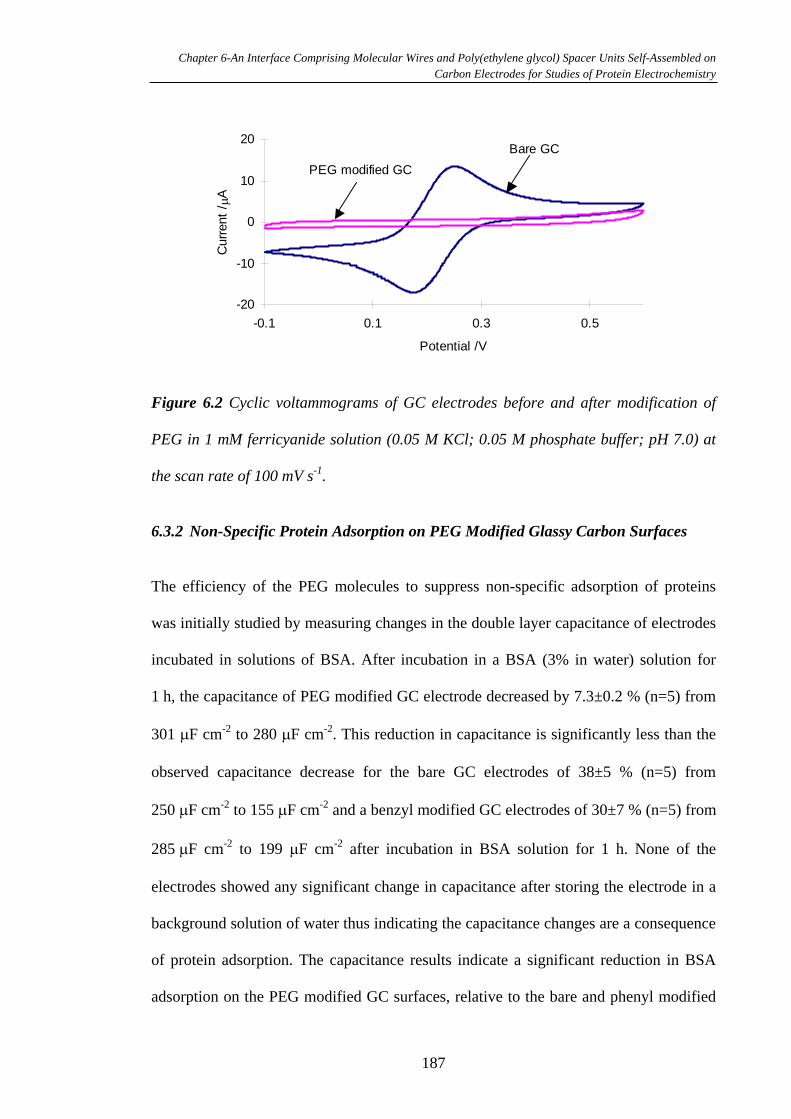
Chapter 6-An Interface Comprising Molecular Wires and Poly(ethylene glycol) Spacer Units Self-Assembled on Carbon Electrodes for Studies of Protein Electrochemistry
-20
-10
0
10
20
-0.1 0.1 0.3 0.5
Potential /V
Curr
ent
/A
PEG modified GC
Bare GC
Figure 6.2 Cyclic voltammograms of GC electrodes before and after modification of
PEG in 1 mM ferricyanide solution (0.05 M KCl; 0.05 M phosphate buffer; pH 7.0) at
the scan rate of 100 mV s-1.
6.3.2 Non-Specific Protein Adsorption on PEG Modified Glassy Carbon Surfaces
The efficiency of the PEG molecules to suppress non-specific adsorption of proteins
was initially studied by measuring changes in the double layer capacitance of electrodes
incubated in solutions of BSA. After incubation in a BSA (3% in water) solution for
1 h, the capacitance of PEG modified GC electrode decreased by 7.3±0.2 % (n=5) from
301 F cm-2 to 280 F cm-2. This reduction in capacitance is significantly less than the
observed capacitance decrease for the bare GC electrodes of 38±5 % (n=5) from
250 F cm-2 to 155 F cm-2 and a benzyl modified GC electrodes of 30±7 % (n=5) from
285 F cm-2 to 199 F cm-2 after incubation in BSA solution for 1 h. None of the
electrodes showed any significant change in capacitance after storing the electrode in a
background solution of water thus indicating the capacitance changes are a consequence
of protein adsorption. The capacitance results indicate a significant reduction in BSA
adsorption on the PEG modified GC surfaces, relative to the bare and phenyl modified
187
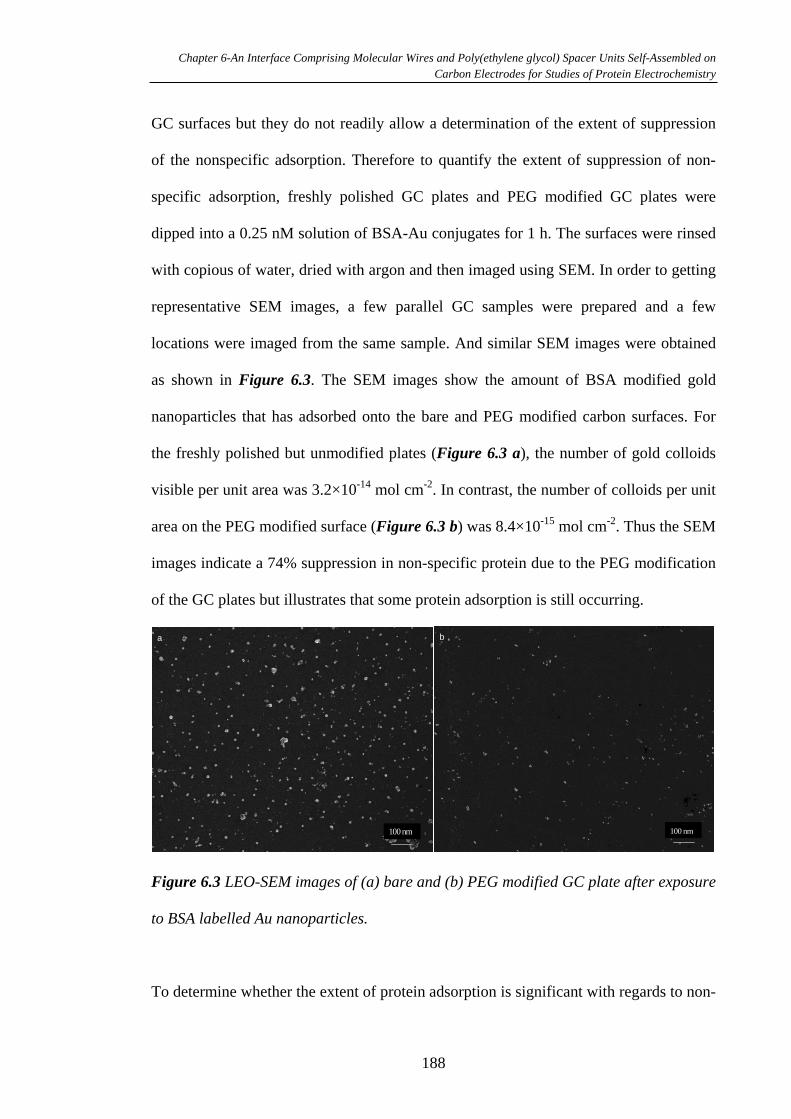
Chapter 6-An Interface Comprising Molecular Wires and Poly(ethylene glycol) Spacer Units Self-Assembled on Carbon Electrodes for Studies of Protein Electrochemistry
GC surfaces but they do not readily allow a determination of the extent of suppression
of the nonspecific adsorption. Therefore to quantify the extent of suppression of non-
specific adsorption, freshly polished GC plates and PEG modified GC plates were
dipped into a 0.25 nM solution of BSA-Au conjugates for 1 h. The surfaces were rinsed
with copious of water, dried with argon and then imaged using SEM. In order to getting
representative SEM images, a few parallel GC samples were prepared and a few
locations were imaged from the same sample. And similar SEM images were obtained
as shown in Figure 6.3. The SEM images show the amount of BSA modified gold
nanoparticles that has adsorbed onto the bare and PEG modified carbon surfaces. For
the freshly polished but unmodified plates (Figure 6.3 a), the number of gold colloids
visible per unit area was 3.2×10⁻¹⁴ mol cm-2. In contrast, the number of colloids per unit
area on the PEG modified surface (Figure 6.3 b) was 8.4×10⁻¹⁵ mol cm-2. Thus the SEM
images indicate a 74% suppression in non-specific protein due to the PEG modification
of the GC plates but illustrates that some protein adsorption is still occurring.
100 nm
a
100 nm
b
Figure 6.3 LEO-SEM images of (a) bare and (b) PEG modified GC plate after exposure
to BSA labelled Au nanoparticles.
To determine whether the extent of protein adsorption is significant with regards to non-
188
Chapter 6-An Interface Comprising Molecular Wires and Poly(ethylene glycol) Spacer Units Self-Assembled on Carbon Electrodes for Studies of Protein Electrochemistry
specific protein electrochemistry, the non-specific adsorption of HRP was studied on
bare GC electrodes, phenyl modified GC electrodes and PEG modified GC electrodes.
Figure 6.4 shows the cyclic voltammograms in 0.05 M phosphate buffer (0.05 M KCl,
pH 7.0) at the scan rate of 100 mV s-1 for bare GC electrodes, phenyl modified GC
electrodes and PEG modified GC electrodes before and after incubation in 1 mg mL-1
HRP in DMSO solution for 1 h. After incubation of the bare GC electrode in 1 mg mL-1
HRP-phosphate buffer solution, a pair of obvious redox peaks at -0.35 V appeared as
shown in Figure 6.4 a, which is consistent with the result of Guo et al.75 where HRP
adsorbed from DMSO onto GC electrodes had a formal potential in phosphate buffer
(pH 7.0) of -0.365 V. The CVs of phenyl modified GC electrodes after incubation in 1
mg mL-1 HRP solution also gave redox peaks at the same potential position as shown in
Figure 6.4 b. The appearance of redox peaks in both cases indicates that considerable
amount of HRP had adsorbed onto bare and phenyl modified GC electrodes. By
integration of the peak area under the CVs after background subtraction, the amount of
HRP adsorbed on bare and phenyl modified GC surfaces was found to be 2.82×10⁻¹¹
mol cm-2 and 3.78×10⁻¹² mol cm-2, respectively. So the protein adsorption on bare GC
surfaces is more significant than that on phenyl modified GC surfaces. Importantly,
after incubation of PEG modified GC electrodes in HRP solution under the same
conditions, the CV in Figure 6.4 c does not show any electrochemistry due to adsorbed
HRP. Controls where the bare and PEG modified GC electrodes were soaked in
background solvent DMSO for 1 h showed no redox peaks. It can therefore be
concluded that PEG modified GC surfaces provides sufficient resistance to non-specific
adsorption of protein to confidently allow any electrochemistry observed from an
electrode interface modified with a 1:20 ratio of the MW to PEG molecules to be
unambiguously assigned to protein attached to the end of the MW.
189

Chapter 6-An Interface Comprising Molecular Wires and Poly(ethylene glycol) Spacer Units Self-Assembled on Carbon Electrodes for Studies of Protein Electrochemistry
-2
-1
0
1
2
-0.6 -0.5 -0.4 -0.3 -0.2 -0.1 0
Potential /V
Curr
ent
/A
After incubation in HRP
a Before incubation in HRP
-2
-1
0
1
-0.6 -0.5 -0.4 -0.3 -0.2 -0.1 0
Potential /V
Curr
ent
/A
b
After incubation in HRP
Before incubation in HRP
-3
-2
-1
0
1
2
3
-0.6 -0.5 -0.4 -0.3 -0.2 -0.1 0
Potential /V
Curr
ent
/A
After incubation in HRP
c
Before incubation in HRP
Figure 6.4 Cyclic voltammograms of (a) bare, (b) phenyl modified and (c) PEG
modified GC electrodes before and after incubation in HRP-DMSO solution for 1 h in
0.05 M phosphate buffer (0.05 M KCl, pH 7.0) at the scan rate of 100 mV s-1.
190
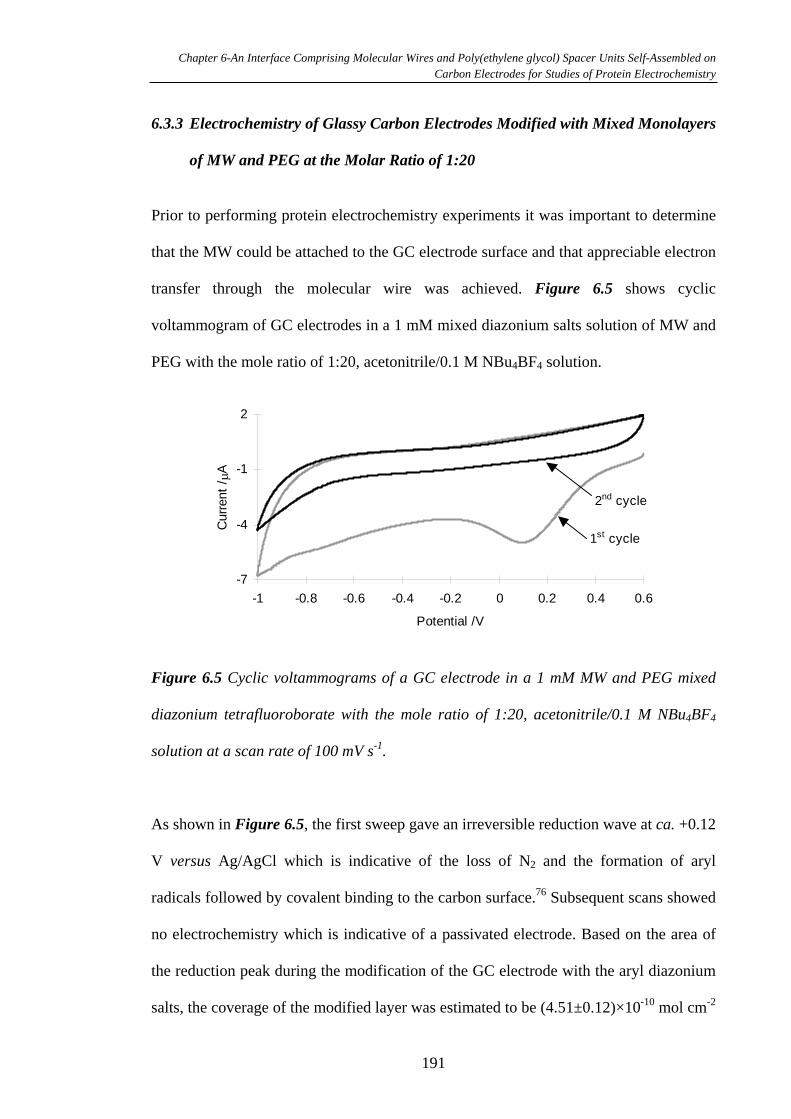
Chapter 6-An Interface Comprising Molecular Wires and Poly(ethylene glycol) Spacer Units Self-Assembled on Carbon Electrodes for Studies of Protein Electrochemistry
6.3.3 Electrochemistry of Glassy Carbon Electrodes Modified with Mixed Monolayers
of MW and PEG at the Molar Ratio of 1:20
Prior to performing protein electrochemistry experiments it was important to determine
that the MW could be attached to the GC electrode surface and that appreciable electron
transfer through the molecular wire was achieved. Figure 6.5 shows cyclic
voltammogram of GC electrodes in a 1 mM mixed diazonium salts solution of MW and
PEG with the mole ratio of 1:20, acetonitrile/0.1 M NBu4BF4 solution.
-7
-4
-1
2
-1 -0.8 -0.6 -0.4 -0.2 0 0.2 0.4 0.6
Potential /V
Curr
ent
/A
1st cycle
2nd cycle
Figure 6.5 Cyclic voltammograms of a GC electrode in a 1 mM MW and PEG mixed
diazonium tetrafluoroborate with the mole ratio of 1:20, acetonitrile/0.1 M NBu4BF4
solution at a scan rate of 100 mV s-1.
As shown in Figure 6.5, the first sweep gave an irreversible reduction wave at ca. +0.12
V versus Ag/AgCl which is indicative of the loss of N2 and the formation of aryl
radicals followed by covalent binding to the carbon surface.76 Subsequent scans showed
no electrochemistry which is indicative of a passivated electrode. Based on the area of
the reduction peak during the modification of the GC electrode with the aryl diazonium
salts, the coverage of the modified layer was estimated to be (4.51±0.12)×10-10 mol cm-2
191
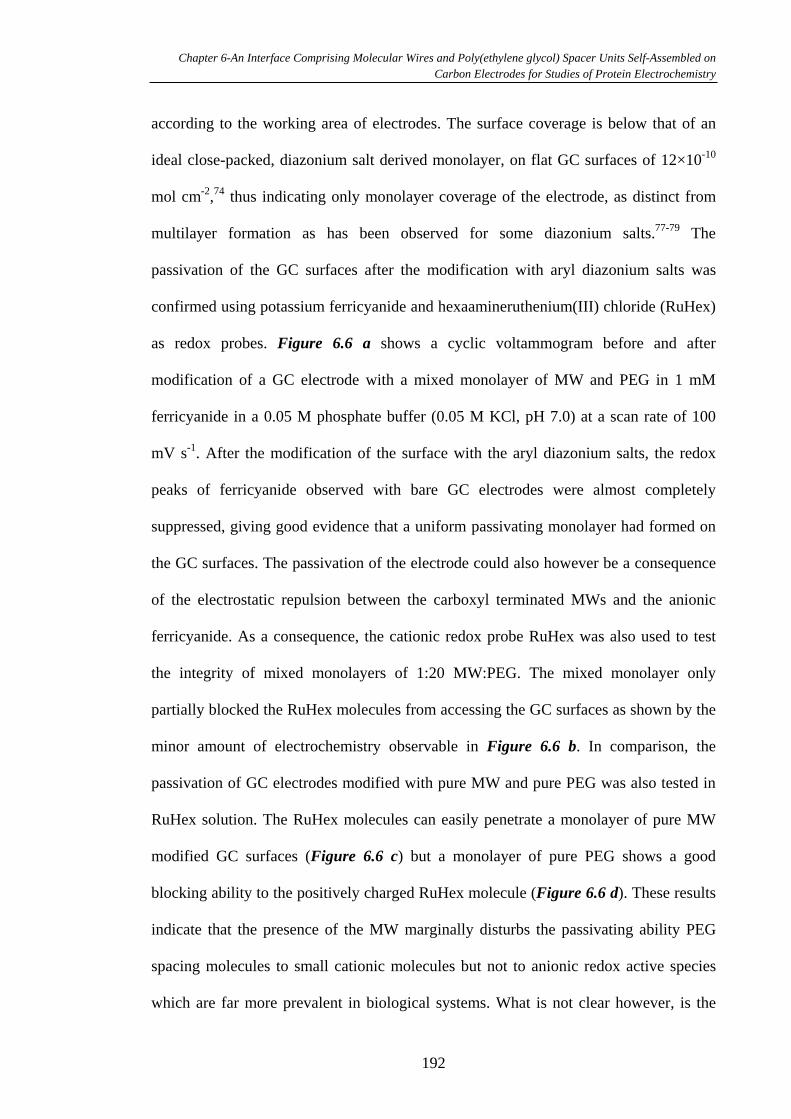
Chapter 6-An Interface Comprising Molecular Wires and Poly(ethylene glycol) Spacer Units Self-Assembled on Carbon Electrodes for Studies of Protein Electrochemistry
according to the working area of electrodes. The surface coverage is below that of an
ideal close-packed, diazonium salt derived monolayer, on flat GC surfaces of 12×10-10
mol cm-2,74 thus indicating only monolayer coverage of the electrode, as distinct from
multilayer formation as has been observed for some diazonium salts.77-79 The
passivation of the GC surfaces after the modification with aryl diazonium salts was
confirmed using potassium ferricyanide and hexaamineruthenium(III) chloride (RuHex)
as redox probes. Figure 6.6 a shows a cyclic voltammogram before and after
modification of a GC electrode with a mixed monolayer of MW and PEG in 1 mM
ferricyanide in a 0.05 M phosphate buffer (0.05 M KCl, pH 7.0) at a scan rate of 100
mV s-1. After the modification of the surface with the aryl diazonium salts, the redox
peaks of ferricyanide observed with bare GC electrodes were almost completely
suppressed, giving good evidence that a uniform passivating monolayer had formed on
the GC surfaces. The passivation of the electrode could also however be a consequence
of the electrostatic repulsion between the carboxyl terminated MWs and the anionic
ferricyanide. As a consequence, the cationic redox probe RuHex was also used to test
the integrity of mixed monolayers of 1:20 MW:PEG. The mixed monolayer only
partially blocked the RuHex molecules from accessing the GC surfaces as shown by the
minor amount of electrochemistry observable in Figure 6.6 b. In comparison, the
passivation of GC electrodes modified with pure MW and pure PEG was also tested in
RuHex solution. The RuHex molecules can easily penetrate a monolayer of pure MW
modified GC surfaces (Figure 6.6 c) but a monolayer of pure PEG shows a good
blocking ability to the positively charged RuHex molecule (Figure 6.6 d). These results
indicate that the presence of the MW marginally disturbs the passivating ability PEG
spacing molecules to small cationic molecules but not to anionic redox active species
which are far more prevalent in biological systems. What is not clear however, is the
192
Chapter 6-An Interface Comprising Molecular Wires and Poly(ethylene glycol) Spacer Units Self-Assembled on Carbon Electrodes for Studies of Protein Electrochemistry
distribution of the MW within the PEG monolayer. Attempts to perform STM
measurements to elucidate whether the MW was homogeneously distributed or
clustered in islands on the surface were unsuccessful as the monolayer was too
passivating across the entire surface. The fact that the entire surface was passivating
however suggests that the MW were at least not aggregating into large conducting
clusters but does not preclude the possibility of a small aggregates of MW being present
on the surface.
-20
-10
0
10
20
-0.1 0.1 0.3 0.5
Potential /V
Curr
ent
/A
Bare GC
in Fe(CN)63-a
MW/PEG modified GC
-30
-20
-10
0
10
20
30
-0.4 -0.3 -0.2 -0.1 0 0.1
Potential /V
Curr
ent
/A
MW/PEG modified GC
in Ru3+b
Bare GC
-30
-20
-10
0
10
20
-0.4 -0.3 -0.2 -0.1 0 0.1
Potential /V
Curr
ent
/A
MW modified GC
in Ru3+c
Bare GC
-30
-20
-10
0
10
20
-0.4 -0.3 -0.2 -0.1 0 0.1
Potential /V
Curr
ent
/A
PEG modified GC
in Ru3+d
Bare GC
Figure 6.6 Cyclic voltammograms of GC electrodes before and after (a) modification
with mixed monolayers of MW and PEG in 1 mM ferricyanide solution (0.05 M KCl;
0.05 M phosphate buffer; pH 7.0), (b) modification with mixed monolayers of MW and
PEG (c) modification with MW and (d) modification with PEG in 1 mM Ru3+ solution
(0.05 M KCl; 0.05 M phosphate buffer; pH 7.0) at the scan rate of 100 mV s-1.
193
Chapter 6-An Interface Comprising Molecular Wires and Poly(ethylene glycol) Spacer Units Self-Assembled on Carbon Electrodes for Studies of Protein Electrochemistry
6.3.4 Electron Transfer Through Monolayers of MW on Glassy Carbon Surfaces
After modification of the GC electrodes with the MW/PEG mixed monolayers the next
step was the attachment of ferrocene to investigate the electron transfer ability of the
modified electrodes. CVs measured in a solution of 0.05 M phosphate buffer (0.05 M
KCl, pH 7.0) at a scan rate of 100 mV s-1 before and after the immobilisation of
ferrocene on the 1:20 MW:PEG modified GC electrodes are shown in Figure 6.7. The
formal potential (Eo`) was 308±17 mV (95% confidence, n=5) and the ratio of the area
of the anodic to cathodic peaks was 0.96±0.07 (95% confidence, n=5). A linear
variation in peak current with scan rate was observed indicating that the ferrocene was
surface bound. The full width half maximum (EFWHM) of the redox peaks was 213 mV,
which is significantly higher than the ideal value (90.6 mV/n in this case n=1). Broader
than ideal EFWHM have previously been observed for electrode interfaces where the
redox active molecule was attached to a preformed SAM.3, 80, 81 The broader than ideal
EFWHM is consistent with some non-specific adsorption of the ferrocene to the electrode
surface, as observed when no EDC/NHS coupling reagents were used, as broader than
ideal EFWHM are indicative of the redox active molecule being located in a range of
environments with a range of formal electrode potentials.82, 83 The surface coverage of
ferrocene molecules was (1.68±0.23)×10-11 mol cm-2 (n =5), suggesting nearly every
MW in the monolayer has a ferrocene attached. This conclusion is based on the
assumption that the CV for the deposition indicated a surface coverage of molecule in
the monolayer of 4.51×10⁻¹⁰ mol cm-2. One twentieth of this coverage is 2.26×10⁻¹¹
mol cm-2 at number close to the number of ferrocene molecules interrogated
electrochemically. At this surface coverage the area per ferrocene molecule is
approximately 0.99 nm2, assuming a uniform distribution, which is significantly greater
194
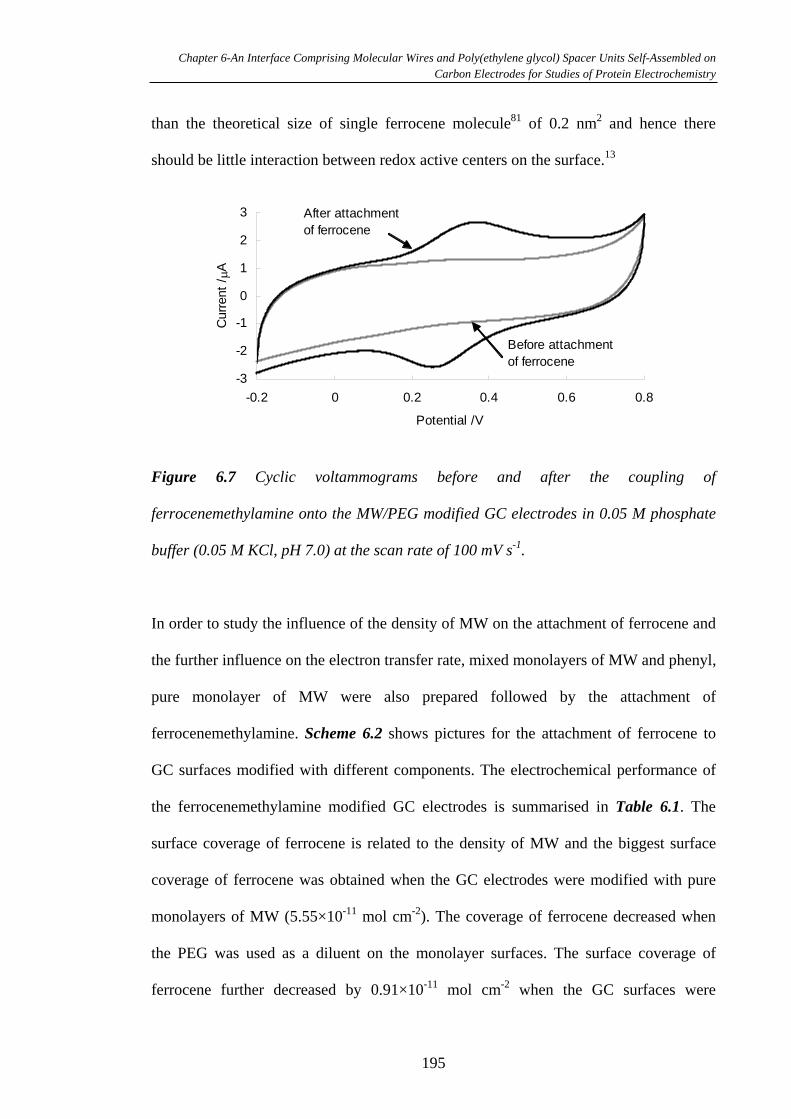
Chapter 6-An Interface Comprising Molecular Wires and Poly(ethylene glycol) Spacer Units Self-Assembled on Carbon Electrodes for Studies of Protein Electrochemistry
than the theoretical size of single ferrocene molecule81 of 0.2 nm2 and hence there
should be little interaction between redox active centers on the surface.13
-3
-2
-1
0
1
2
3
-0.2 0 0.2 0.4 0.6 0.8
Potential /V
Curr
ent
/A
After attachment
of ferrocene
Before attachment
of ferrocene
Figure 6.7 Cyclic voltammograms before and after the coupling of
ferrocenemethylamine onto the MW/PEG modified GC electrodes in 0.05 M phosphate
buffer (0.05 M KCl, pH 7.0) at the scan rate of 100 mV s-1.
In order to study the influence of the density of MW on the attachment of ferrocene and
the further influence on the electron transfer rate, mixed monolayers of MW and phenyl,
pure monolayer of MW were also prepared followed by the attachment of
ferrocenemethylamine. Scheme 6.2 shows pictures for the attachment of ferrocene to
GC surfaces modified with different components. The electrochemical performance of
the ferrocenemethylamine modified GC electrodes is summarised in Table 6.1. The
surface coverage of ferrocene is related to the density of MW and the biggest surface
coverage of ferrocene was obtained when the GC electrodes were modified with pure
monolayers of MW (5.55×10⁻¹¹ mol cm-2). The coverage of ferrocene decreased when
the PEG was used as a diluent on the monolayer surfaces. The surface coverage of
ferrocene further decreased by 0.91×10⁻¹¹ mol cm-2 when the GC surfaces were
195
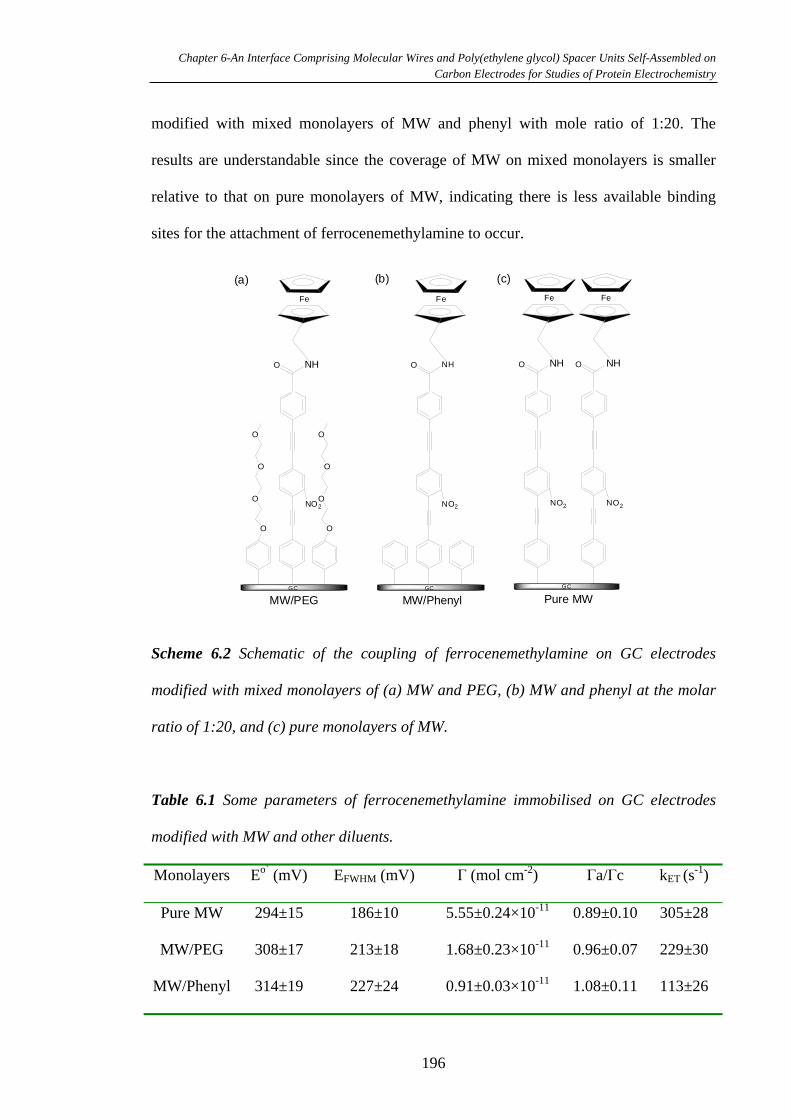
Chapter 6-An Interface Comprising Molecular Wires and Poly(ethylene glycol) Spacer Units Self-Assembled on Carbon Electrodes for Studies of Protein Electrochemistry
modified with mixed monolayers of MW and phenyl with mole ratio of 1:20. The
results are understandable since the coverage of MW on mixed monolayers is smaller
relative to that on pure monolayers of MW, indicating there is less available binding
sites for the attachment of ferrocenemethylamine to occur.
GC
O
O
O
O
O
O
O
O
NO2
NHO
Fe
NO2
NHO
Fe
NO2
NHO
Fe
NO2
NHO
Fe
GC GC
Pure MWMW/PhenylMW/PEG
(a) (b) (c)
Scheme 6.2 Schematic of the coupling of ferrocenemethylamine on GC electrodes
modified with mixed monolayers of (a) MW and PEG, (b) MW and phenyl at the molar
ratio of 1:20, and (c) pure monolayers of MW.
Table 6.1 Some parameters of ferrocenemethylamine immobilised on GC electrodes
modified with MW and other diluents.
Monolayers Eo` (mV) EFWHM (mV) (mol cm-2) a/ c kET (s-1)
Pure MW
MW/PEG
MW/Phenyl
294±15
308±17
314±19
186±10
213±18
227±24
5.55±0.24×10⁻¹¹
1.68±0.23×10⁻¹¹
0.91±0.03×10⁻¹¹
0.89±0.10
0.96±0.07
1.08±0.11
305±28
229±30
113±26
196
Chapter 6-An Interface Comprising Molecular Wires and Poly(ethylene glycol) Spacer Units Self-Assembled on Carbon Electrodes for Studies of Protein Electrochemistry
The ET rate was calculated using the Laviron’s method, which assumes Butler-Volmer
kinetics and a Langmuir adsorption isotherm.84 The rate of ET was determined by the
relationship between the peak separation and the scan rate as shown in Figure 6.8. The
rate constant was found to be 305±28 s-1 (n=4) when the ferrocene was attached to GC
electrodes modified with pure MW monolayers, which is much smaller than that
through norbornylogous bridge with similar length on gold electrodes (>1000 s-1).85, 86
The rate constant reported by Creager and coworkers was only 6.6 s-1 for ferrocene
attached on the alkanethiol monolayers.87 However rate constants were found to be
extremely high (from ~104 to ~106 s-1) when the ferrocene modified MW with three
phenyleneethynylene units was attached on gold surfaces.2, 3, 53 The huge difference of
electron transfer on similar electron transfer system may be due to two differences
between the system studied here and systems used by Creager’s group and Smalley’s
group. Firstly, electrode materials play an important role in the ET mechanism.88 The
MW used here was modified on GC surfaces, which has been shown to have lower
electron transfer efficiency than gold.89 Secondly, Creager’s group and Smalley’s group
synthesised ferrocene-terminated oligo(phenyleneethynyl)arene-thiol molecule followed
by modification of this target molecule to the gold surface for exploring conductivity of
the oligo(phenyleneethynyl)arene molecular wire that bridges ferrocene complexes and
electrodes. The synthesised whole bridge structures were -conjugated, which can
promote electronic coupling between ferrocene and the underlying electrode, thereby
promote rapid electron transfer over long distances.2 However, this study used step-wise
method to attach ferrocene to MW modified GC surfaces and the resultant MW system
has an aliphatic “tail” of a few bonds length. The electron transfer through this “tail ” is
though - coupling, which can greatly compromise the rate of electron transfer
between ferrocene and GC electrodes.
197
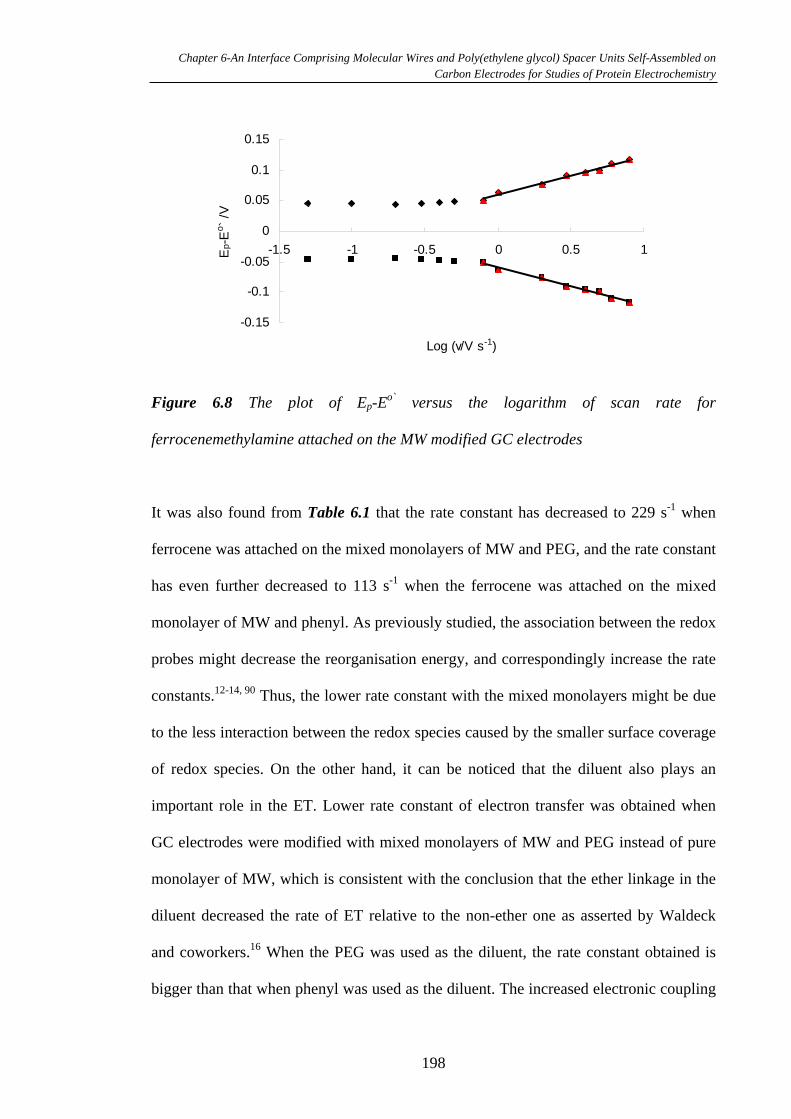
Chapter 6-An Interface Comprising Molecular Wires and Poly(ethylene glycol) Spacer Units Self-Assembled on Carbon Electrodes for Studies of Protein Electrochemistry
-0.15
-0.1
-0.05
0
0.05
0.1
0.15
-1.5 -1 -0.5 0 0.5 1
Log ( /V s-1)
Ep-E
o`
/V
Figure 6.8 The plot of Ep-Eo` versus the logarithm of scan rate for
ferrocenemethylamine attached on the MW modified GC electrodes
It was also found from Table 6.1 that the rate constant has decreased to 229 s-1 when
ferrocene was attached on the mixed monolayers of MW and PEG, and the rate constant
has even further decreased to 113 s-1 when the ferrocene was attached on the mixed
monolayer of MW and phenyl. As previously studied, the association between the redox
probes might decrease the reorganisation energy, and correspondingly increase the rate
constants.12-14, 90 Thus, the lower rate constant with the mixed monolayers might be due
to the less interaction between the redox species caused by the smaller surface coverage
of redox species. On the other hand, it can be noticed that the diluent also plays an
important role in the ET. Lower rate constant of electron transfer was obtained when
GC electrodes were modified with mixed monolayers of MW and PEG instead of pure
monolayer of MW, which is consistent with the conclusion that the ether linkage in the
diluent decreased the rate of ET relative to the non-ether one as asserted by Waldeck
and coworkers.16 When the PEG was used as the diluent, the rate constant obtained is
bigger than that when phenyl was used as the diluent. The increased electronic coupling
198
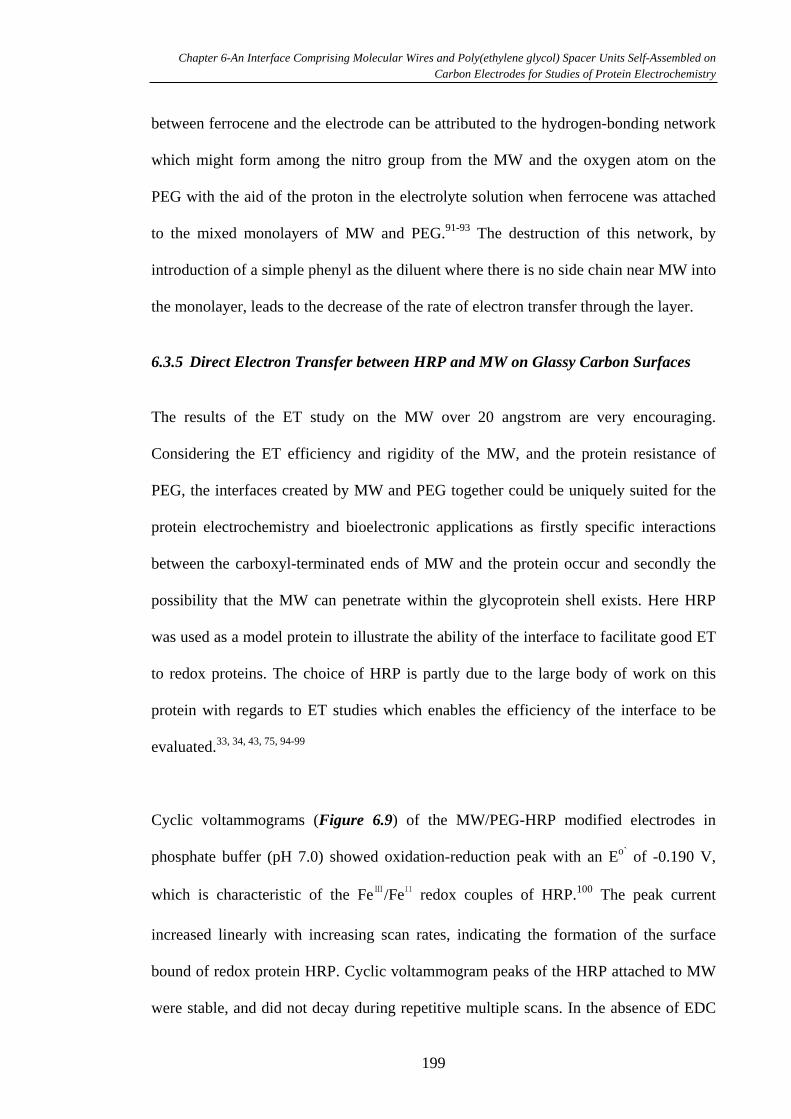
Chapter 6-An Interface Comprising Molecular Wires and Poly(ethylene glycol) Spacer Units Self-Assembled on Carbon Electrodes for Studies of Protein Electrochemistry
between ferrocene and the electrode can be attributed to the hydrogen-bonding network
which might form among the nitro group from the MW and the oxygen atom on the
PEG with the aid of the proton in the electrolyte solution when ferrocene was attached
to the mixed monolayers of MW and PEG.91-93 The destruction of this network, by
introduction of a simple phenyl as the diluent where there is no side chain near MW into
the monolayer, leads to the decrease of the rate of electron transfer through the layer.
6.3.5 Direct Electron Transfer between HRP and MW on Glassy Carbon Surfaces
The results of the ET study on the MW over 20 angstrom are very encouraging.
Considering the ET efficiency and rigidity of the MW, and the protein resistance of
PEG, the interfaces created by MW and PEG together could be uniquely suited for the
protein electrochemistry and bioelectronic applications as firstly specific interactions
between the carboxyl-terminated ends of MW and the protein occur and secondly the
possibility that the MW can penetrate within the glycoprotein shell exists. Here HRP
was used as a model protein to illustrate the ability of the interface to facilitate good ET
to redox proteins. The choice of HRP is partly due to the large body of work on this
protein with regards to ET studies which enables the efficiency of the interface to be
evaluated.33, 34, 43, 75, 94-99
Cyclic voltammograms (Figure 6.9) of the MW/PEG-HRP modified electrodes in
phosphate buffer (pH 7.0) showed oxidation-reduction peak with an Eo` of -0.190 V,
which is characteristic of the Fe /Fe redox couples of HRP.100 The peak current
increased linearly with increasing scan rates, indicating the formation of the surface
bound of redox protein HRP. Cyclic voltammogram peaks of the HRP attached to MW
were stable, and did not decay during repetitive multiple scans. In the absence of EDC
199
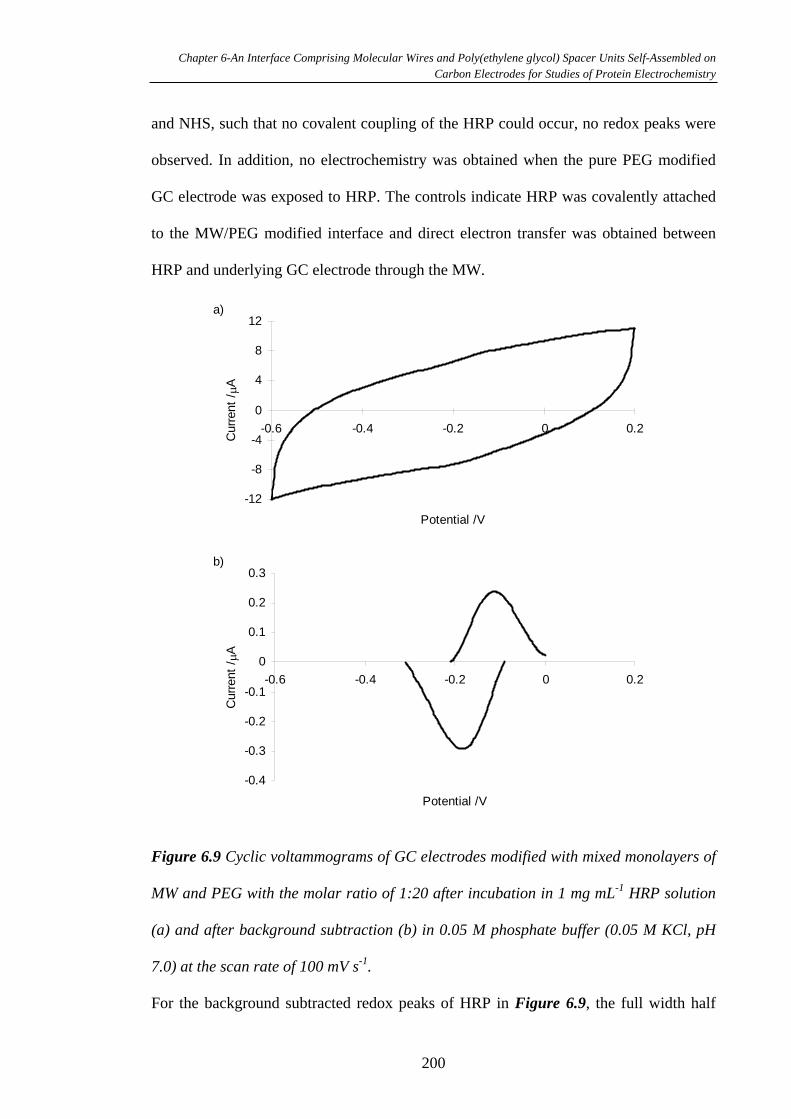
Chapter 6-An Interface Comprising Molecular Wires and Poly(ethylene glycol) Spacer Units Self-Assembled on Carbon Electrodes for Studies of Protein Electrochemistry
and NHS, such that no covalent coupling of the HRP could occur, no redox peaks were
observed. In addition, no electrochemistry was obtained when the pure PEG modified
GC electrode was exposed to HRP. The controls indicate HRP was covalently attached
to the MW/PEG modified interface and direct electron transfer was obtained between
HRP and underlying GC electrode through the MW.
-0.4
-0.3
-0.2
-0.1
0
0.1
0.2
0.3
-0.6 -0.4 -0.2 0 0.2
Potential /V
Curr
ent
/A
b)
-12
-8
-4
0
4
8
12
-0.6 -0.4 -0.2 0 0.2
Potential /V
Curr
ent
/A
a)
Figure 6.9 Cyclic voltammograms of GC electrodes modified with mixed monolayers of
MW and PEG with the molar ratio of 1:20 after incubation in 1 mg mL-1 HRP solution
(a) and after background subtraction (b) in 0.05 M phosphate buffer (0.05 M KCl, pH
7.0) at the scan rate of 100 mV s-1.
For the background subtracted redox peaks of HRP in Figure 6.9, the full width half
200
Chapter 6-An Interface Comprising Molecular Wires and Poly(ethylene glycol) Spacer Units Self-Assembled on Carbon Electrodes for Studies of Protein Electrochemistry
maximum of the oxidation wave was 106 mV which is very close to the ideal of 91 mV
and consistent with values for cytochrome c determined by Waldeck and coworkers29
and Gray and workers40 where SAM modified electrodes which interact specifically
with the redox centre of proteins are employed. This almost ideal value of the EFWHM
implies that the HRP molecules that are being electrochemically interrogated are in
close to a uniform environment. The surface concentration of HRP was estimated to be
(6.16±1.29)×10-12 mol cm-2 which corresponds to 27 nm2 per HRP, which is consistent
with the size of a single HRP molecule revealed by X-ray crystallography of 5 nm×4
nm×3 nm101, 102 and is close to the theoretical surfaces coverage for a compact
monolayer (8.5×10⁻¹² mol cm-2) of HRP assuming a projected area of ~20 nm2 per
molecule.103 The calculated coverage of HRP is much lower than the estimate of the
minimum number of MW in the interface determined from the coverage of
ferrocenemethylamine on the GC surfaces (2.41×10⁻¹¹ mol cm-2). Thus it seems likely
that more than one MW is coupled to each HRP.
The rate constant of electron transfer was calculated to be 13.4±2.3 s-1 (95% confidence,
n=3). The rate constant, despite the HRP being at least 20 Å from the electrode, is faster
than any rate constants reported in the literature using native HRP where the activity of
the enzyme has been demonstrated. For example at an MPA/HRP modified gold
surfaces 0.287 s-1 was reported,34 at nanotube modified electrodes Yu et al.43 measured
a rate of 2.5 s-1 while the rate constant is similar to that reported by Lötzbeyer for
microperoxidase MP-11 covalently attached to a short chain alkanethiol modified gold
electrodes (12 s-1).104 The larger rate constant of electron transfer obtained in this study
suggests either there is some denaturing of the HRP or the MW could be penetrating the
glycoprotein and reducing the distance between the redox centre and the MW. As
201
Chapter 6-An Interface Comprising Molecular Wires and Poly(ethylene glycol) Spacer Units Self-Assembled on Carbon Electrodes for Studies of Protein Electrochemistry
denaturing of the enzyme will result in loss of catalytic activity, to determine which of
these options is the more likely the activity of the MW/PEG-HRP was investigated.
The MW/PEG-HRP modified GC electrodes were used to detect the H2O2 with the
turning over of the enzyme being achieved by direct electron transfer. The relationship
between the amount of H2O2 consumed by the enzyme and the electrochemical signal at
a MW-HRP modified electrode can be depicted by the following kinetic scheme:95
HRP (Fe3+) + H2O2 Compound I (Fe4+=O) + H2O
Compound I (Fe4+=O) + e- +H+ Compound II
Compound II + e- +H+ HRP (Fe2+)
where Compound I and Compound II are oxygen complexes of HRP. They are reduced
by accepting two electrons from the solvent yielding an enhanced reduction current.
The amperometric responses of the HRP-MW/PEG modified GC electrode to H2O2 are
shown in Figure 6.10 a. After successively adding H2O2 in the stirred phosphate buffer
solution, the current of the HRP-MW/PEG modified GC electrode measured at –0.25 V
increases significantly. Moreover, the catalytic reduction current increases linearly with
increasing H2O2 concentration from 5 to 50 µM as shown in Figure 6.10 b. However,
no increasing of cathodic peak corresponding to the reduction of H2O2 can be observed
at the MW/PEG modified GC electrode or the GOx-MW/PEG modified GC electrode
(Figure 6.10), which was fabricated using the same method as that used for the HRP-
MW/PEG modified GC electrode except replacing HRP with GOx, under the same
conditions. The sensitivity to the change in the concentration of H2O2 was 15 nA/µM,
which is similar to that for H2O2 sensor based on SWNT/HRP system (21 nA/µM).43
202
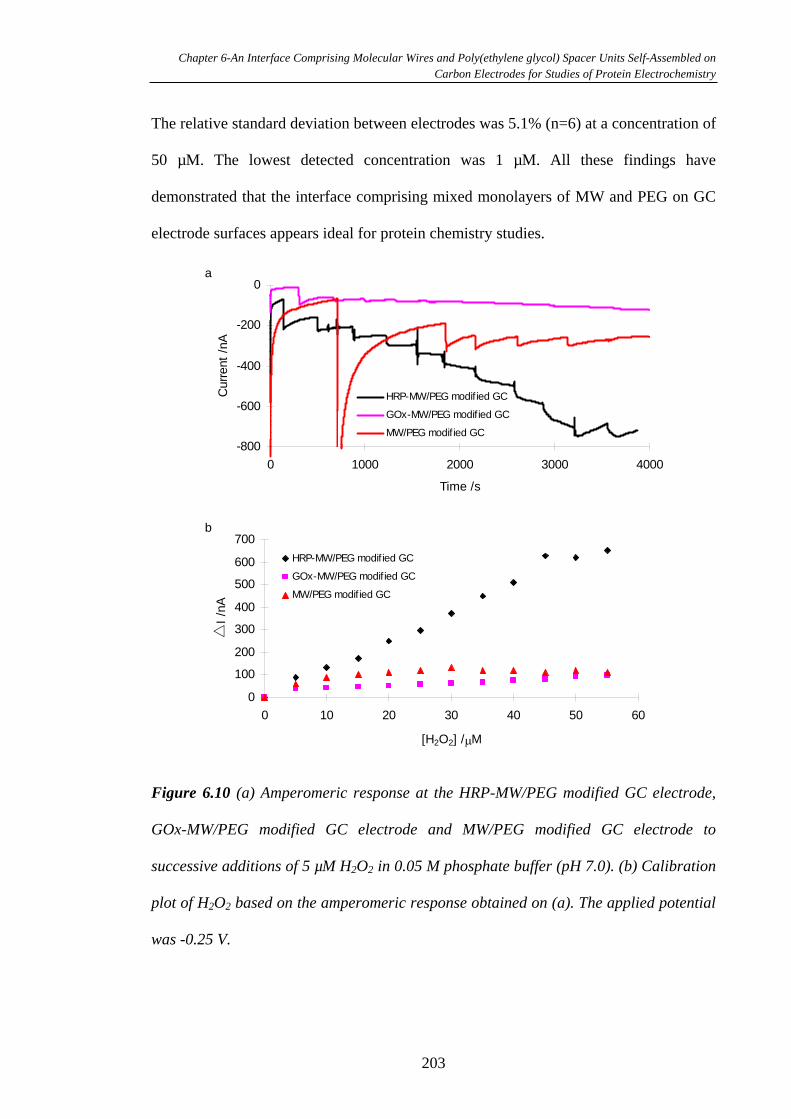
Chapter 6-An Interface Comprising Molecular Wires and Poly(ethylene glycol) Spacer Units Self-Assembled on Carbon Electrodes for Studies of Protein Electrochemistry
The relative standard deviation between electrodes was 5.1% (n=6) at a concentration of
50 µM. The lowest detected concentration was 1 µM. All these findings have
demonstrated that the interface comprising mixed monolayers of MW and PEG on GC
electrode surfaces appears ideal for protein chemistry studies.
-800
-600
-400
-200
0
0 1000 2000 3000 4000
Time /s
Curr
ent
/nA
HRP-MW/PEG modif ied GC
GOx-MW/PEG modif ied GC
MW/PEG modif ied GC
a
0
100
200
300
400
500
600
700
0 10 20 30 40 50 60
[H2O2] / M
I /n
A
HRP-MW/PEG modif ied GC
GOx-MW/PEG modif ied GC
MW/PEG modif ied GC
b
Figure 6.10 (a) Amperomeric response at the HRP-MW/PEG modified GC electrode,
GOx-MW/PEG modified GC electrode and MW/PEG modified GC electrode to
successive additions of 5 µM H2O2 in 0.05 M phosphate buffer (pH 7.0). (b) Calibration
plot of H2O2 based on the amperomeric response obtained on (a). The applied potential
was -0.25 V.
203
Chapter 6-An Interface Comprising Molecular Wires and Poly(ethylene glycol) Spacer Units Self-Assembled on Carbon Electrodes for Studies of Protein Electrochemistry
6.4 Conclusions
The electron transfer through the pure and mixed monolayers of MW to GC electrodes
has been studied. The rate constant of electron transfer of MW on GC electrodes was
found to be much smaller than that through the bridge monolayer on gold electrode, and
also decreased further more when the bridge monolayer was diluted with different
diluents. The PEG modified interface was found to reduce the adsorption of protein
molecules to some degree. With its completely rigid property, easily tailored lengths
and versatile functional groups, the rigid MW could be quite appropriate material for the
fabrication of molecular electronics or nanodevices. Also the interface comprising
mixed monolayers of MW and PEG appears to be a very useful model system in the
biorecognition, biosensors, immunoassays, and enzyme inhibition assays. So the next
chapter is to use this MW to explore flavin adenine dinucleotide (FAD), the deeply
buried active centre of glucose oxidase to achieve direct ET between the enzyme and
the electrode for the purpose of the fabrication of third generation glucose biosensors.
6.5 References
(1) Umek, R.M., Lin, S.W., Vielmetter, J., Terbrueggen, R.H., Irvine, B., Yu, C.J.,
Kayyem, J.F., Yowanto, H., Blackburn, G.F., Farkas, D.H., Chen, Y.-P., J. Mol.
Diagnostics 2001, 3, 74-84.
(2) Creager, S., Yu, C.J., Bamdad, C., O'Connor, S., MacLean, T., Lam, E., Chong,
Y., Olsen, G.T., Luo, J., Gozin, M., Kayyem, J.F., J. Am. Chem. Soc. 1999, 121,
1059-1064.
(3) Sikes, H.D., Smalley, J.F., Dudek, S.P., Cook, A.R., Newton, M.D., Chidsey,
C.E.D., Feldberg, S.W., Science 2001, 291, 1519-1523.
204

Chapter 6-An Interface Comprising Molecular Wires and Poly(ethylene glycol) Spacer Units Self-Assembled on Carbon Electrodes for Studies of Protein Electrochemistry
(4) Willner, I., Science 2002, 298, 2407-2408.
(5) Pardo-Yissar, V., Katz, E., Willner, I., Kotlyar, A.B., Sanders, C., Lill, H.,
Faraday Discuss. 2000, 119-134.
(6) Ranganathan, S., Steidel, I., Anariba, F., McCreery, R.L., Nano Letters 2001, 1,
491-494.
(7) Chen, J., Reed, M.A., Rawlett, A.M., Tour, J.M., Science 1999, 286, 1550-1552.
(8) Chen, Y., Jung, G.Y., Ohlberg, D.A.A., Li, X.M., Stewart, D.R., Jeppesen, J.O.,
Nielsen, K.A., Stoddart, J.F., Williams, R.S., Nanotechnology 2003, 14, 462-
468.
(9) Collier, C.P., Wong, E.W., Belohradsky, M., Raymo, F.M., Stoddart, J.F.,
Kuekes, P.J., Williams, R.S., Heath, J.R., Science 1999, 285, 391-394.
(10) Adams, D.M., Brus, L., Chidsey, C.E.D., Creager, S., Creutz, C., Kagan, C.R.,
Kamat, P.V., Lieberman, M., Lindsay, S., Marcus, R.A., Metzger, R.M., Michel-
Beyerle, M.E., Miller, J.R., Newton, M.D., Rolison, D.R., Sankey, O., Schanze,
K.S., Yardley, J., Zhu, X.Y., J. Phys. Chem. B 2003, 107, 6668-6697.
(11) Gray, H.B., Winkler, J.R., Annu. Rev. Biochem. 1996, 65, 537-561.
(12) Wei, J.J., Liu, H.Y., Khoshtariya, D.E., Yamamoto, H., Dick, A., Waldeck,
D.H., Angew. Chem. Int. Edit. 2002, 41, 4700-4703.
(13) Chidsey, C.E.D., Bertozzi, C.R., Putvinski, T.M., Mujsce, A.M., J. Am. Chem.
Soc. 1990, 112, 4301-4306.
(14) Finklea, H.O., Hanshew, D.D., J. Am. Chem. Soc. 1992, 114, 3173-81.
(15) Weber, K., Hockett, L., Creager, S., J. Phys. Chem. B 1997, 101, 8286-8291.
(16) Napper, A.M., Liu, H.Y., Waldeck, D.H., J. Phys. Chem. B 2001, 105, 7699-
7707.
(17) Tour, J.M., Kozaki, M., Seminario, J.M., J. Am. Chem. Soc. 1998, 120, 8486-
205
Chapter 6-An Interface Comprising Molecular Wires and Poly(ethylene glycol) Spacer Units Self-Assembled on Carbon Electrodes for Studies of Protein Electrochemistry
8493.
(18) Cai, L.T., Yao, Y.X., Yang, J.P., Price, D.W., Tour, J.M., Chem. Mater. 2002,
14, 2905-2909.
(19) Hall, D.B., Holmlin, R.E., Barton, J.K., Nature 1996, 382, 731-735.
(20) Arkin, M.R., Stemp, E.D.A., Holmlin, R.E., Barton, J.K., Hormann, A., Olson,
E.J.C., Barbara, P.F., Science 1996, 273, 475-480.
(21) Harriman, A., Angew. Chem. Int. Edit. 1999, 38, 945-949.
(22) Wong, E.L.S., Gooding, J.J., Anal. Chem. 2003, 75, 3845-3852.
(23) Liu, J.Q., Paddon-Row, M.N., Gooding, J.J., J. Phys. Chem. B 2004, 108, 8460-
8466.
(24) Ravenscroft, M.S., Finklea, H.O., J. Phys. Chem. 1994, 98, 3843-50.
(25) Smalley, J.F., Finklea, H.O., Chidsey, C.E.D., J. Am. Chem. Soc. 2003, 125,
2004.
(26) Hortholary, C., Minc, F., Coudret, C., Bonvoisin, J., Launay, J.-P., Chem.
Commun. 2002, 1932-1933.
(27) Song, S., Clark, R.A., Bowden, E.F., Tarlov, M.J., J. Phys. Chem. 1993, 97,
6564-72.
(28) Murgida, D.H., Hildebrandt, P., J. Mol. Struct. 2001, 565, 97-100.
(29) Wei, J.J., Liu, H.Y., Dick, A.R., Yamamoto, H., He, Y.F., Waldeck, D.H., J.
Am. Chem. Soc. 2002, 124, 9591-9599.
(30) Wei, J.J., Liu, H.Y., Niki, K., Margoliash, E., Waldeck, D.H., J. Phys. Chem. B
2004, 108, 16912-16917.
(31) Fristrup, P., Grubb, M., Zhang, J., Christensen, H.E.M., Hansen, A.M., Ulstrup,
J., J. Electroanal. Chem. 2001, 511, 128-133.
(32) Zhang, J.D.K., A. M.; Ulstrup, J., J. Electroanal. Chem. 2003, 541, 133.
206
Chapter 6-An Interface Comprising Molecular Wires and Poly(ethylene glycol) Spacer Units Self-Assembled on Carbon Electrodes for Studies of Protein Electrochemistry
(33) Gorton, L., Lindgren, A., Larsson, T., Munteanu, F.D., Ruzgas, T., Gazaryan, I.,
Anal. Chim. Acta 1999, 400, 91-108.
(34) Gooding, J.J., Erokhin, P., Losic, D., Yang, W.R., Policarpio, V., Liu, J.Q., Ho,
F.M., Situmorang, M., Hibbert, D.B., Shapter, J.G., Anal. Sci. 2001, 17, 3-9.
(35) Lindgren, A., Larsson, T., Ruzgas, T., Gorton, L., J. Electroanal. Chem. 2000,
494, 105-113.
(36) Johnson, D.L., Thompson, J.L., Brinkmann, S.M., Schuller, K.A., Martin, L.L.,
Biochemistry 2003, 42, 10229-10237.
(37) Gooding, J.J., Hibbert, D.B., Trac-Trends Anal. Chem. 1999, 18, 525-533.
(38) Gooding, J.J., Mearns, F., Yang, W.R., Liu, J.Q., Electroanalysis 2003, 15, 81-
96.
(39) Cooper, E., Leggett, G.J., Langmuir 1998, 14, 4795-4801.
(40) Hess, C.R., Juda, G.A., Dooley, D.M., Amii, R.N., Hill, M.G., Winkler, J.R.,
Gray, H.B., J. Am. Chem. Soc. 2003, 125, 7156-7157.
(41) Gooding, J.J., Wibowo, R., Liu, J., Yang, W., Losic, D., Orbons, S., Mearns,
F.J., Shapter, J.G., Hibbert, D.B., J. Am. Chem. Soc. 2003, 125, 9006-9007.
(42) Liu, J.Q., Chou, A., Rahmat, W., Paddon-Row, M.N., Gooding, J.J.,
Electroanalysis 2005, 17, 38-46.
(43) Yu, X., Chattopadhyay, D., Galeska, I., Papadimitrakopoulos, F., Rusling, J.F.,
Electrochem. Commun. 2003, 5, 408-411.
(44) Patolsky, F., Weizmann, Y., Willner, I., Angew. Chem. Int. Edit. 2004, 43, 2113-
2117.
(45) Xiao, Y., Patolsky, F., Katz, E., Hainfeld, J.F., Willner, I., Science 2003, 299,
1877-1881.
(46) Liu, J.Q., Paddon-Row, M.N., Gooding, J.J., Chem. Phys. 2006, 324, 226-235.
207
Chapter 6-An Interface Comprising Molecular Wires and Poly(ethylene glycol) Spacer Units Self-Assembled on Carbon Electrodes for Studies of Protein Electrochemistry
(47) Prime, K.L., Whitesides, G.M., Science 1991, 252, 1164-1167.
(48) Tour, J.M., Chem. Rev. 1996, 96, 537-553.
(49) Tour, J.M., Acc. Chem. Res. 2000, 33, 791-804.
(50) Hsung, R.P., Chidsey, C.E.D., Sita, L.R., Organometallics 1995, 14, 4808-4815.
(51) Hoger, S., Enkelmann, V., Angew. Chem. Int. Edit. 1995, 34, 2713-2716.
(52) Zehner, R.W., Sita, L.R., Langmuir 1997, 13, 2973-2979.
(53) Sachs, S.B., Dudek, S.P., Hsung, R.P., Sita, L.R., Smalley, J.F., Newton, M.D.,
Feldberg, S.W., Chidsey, C.E.D., J. Am. Chem. Soc. 1997, 119, 10563-10564.
(54) Tour, J.M., Rawlett, A.M., Kozaki, M., Yao, Y.X., Jagessar, R.C., Dirk, S.M.,
Price, D.W., Reed, M.A., Zhou, C., Chen, J., Wang, W., Campbell, I., Chem.
Eur. J. 2001, 7, 5118-5134.
(55) Fan, F.-R.F., Yang, J., Dirk, S.M., Price, D.W., Kosynkin, D., Tour, J.M., Bard,
A.J., J. Am. Chem. Soc. 2001, 123, 2454-2455.
(56) Fan, F.-R.F., Yao, Y., Cai, L.T., Cheng, H., Tour, J.M., Bard, A.J., J. Am. Chem.
Soc. 2004, 126, 4035-4042.
(57) Prime, K.L., Whitesides, G.M., J. Am. Chem. Soc. 1993, 115, 10714-10721.
(58) Hui, S.W., Kuhl, T.L., Guo, Y.Q., Israelachvili, J., Colloid. Surface. B 1999, 14,
213-222.
(59) Harris, J.M., Poly(ethylene glycol) Chemistry: Biotechnical and Biomedical
Applications. Plenum Press: New York, 1992.
(60) Herrwerth, S., Rosendahl, T., Feng, C., Fick, J., Eck, W., Himmelhaus, M.,
Dahint, R., Grunze, M., Langmuir 2003, 19, 1880-1887.
(61) Fick, J., Steitz, R., Leiner, V., Tokumitsu, S., Himmelhaus, M., Grunze, M.,
Langmuir 2004, 20, 3048-3053.
(62) Lee, J.H., Kopeckova, P., Kopecek, J., Andrade, J.D., Biomaterials 1990, 11,
208
Chapter 6-An Interface Comprising Molecular Wires and Poly(ethylene glycol) Spacer Units Self-Assembled on Carbon Electrodes for Studies of Protein Electrochemistry
455-464.
(63) Mougin, K., Lawrence, M.B., Fernandez, E.J., Hillier, A.C., Langmuir 2004, 20,
4302-4305.
(64) Zheng, M., Li, Z., Huang, X., Langmuir 2004, 20, 4226-4235.
(65) Kane, R.S., Deschatelets, P., Whitesides, G.M., Langmuir 2003, 19, 2388-2391.
(66) Bourdillon, C., Delamar, M., Demaille, C., Hitmi, R., Moiroux, J., Pinson, J., J.
Electroanal. Chem. 1992, 336, 113-23.
(67) Downard, A.J., Electroanalysis 2000, 12, 1085-1096.
(68) Allongue, P., Delamar, M., Desbat, B., Fagebaume, O., Hitmi, R., Pinson, J.,
Saveant, J.-M., J. Am. Chem. Soc. 1997, 119, 201-207.
(69) Saby, C., Ortiz, B., Champagne, G.Y., Belanger, D., Langmuir 1997, 13, 6805-
6813.
(70) Dequaire, M., Degrand, C., Limoges, B., J. Am. Chem. Soc. 1999, 121, 6946-
6947.
(71) Harnisch, J.A., Pris, A.D., Porter, M.D., J. Am. Chem. Soc. 2001, 123, 5829-
5830.
(72) Downard, A.J., Roddick, A.D., Electroanalysis 1995, 7, 376-8.
(73) Grabar, K.C., Freeman, R.G., Hommer, M.B., Natan, M.J., Anal. Chem. 1995,
67, 735-743.
(74) Liu, Y.-C., McCreery, R.L., J. Am. Chem. Soc. 1995, 117, 11254-11259.
(75) Guo, Y.Q., Guadalupe, A.R., Chem. Commun. 1997, 1437-1439.
(76) Delamar, M., Hitmi, R., Pinson, J., Saveant, J.M., J. Am. Chem. Soc. 1992, 114,
5883-5884.
(77) Anariba, F., Duvall, S.H., McCreery, R.L., Anal. Chem. 2003, 75, 3837-3844.
(78) Kariuki, J.K., McDermott, M.T., Langmuir 1999, 15, 6534-6540.
209
Chapter 6-An Interface Comprising Molecular Wires and Poly(ethylene glycol) Spacer Units Self-Assembled on Carbon Electrodes for Studies of Protein Electrochemistry
(79) Kariuki, J.K., McDermott, M.T., Langmuir 2001, 17, 5947-5951.
(80) Liu, J.Q., Paddon-Row, M.N., Gooding, J.J., J. Phy. Chem. B 2004, 108, 8460-
8466.
(81) Seo, K., Jeon, I.C., Yoo, D.J., Langmuir 2004, 20, 4147-4154.
(82) Honeychurch, M.J., Langmuir 1998, 14, 6291-6296.
(83) Rowe, G.K., Carter, M.T., Richardson, J.N., Murray, R.W., Langmuir 1995, 11,
1797-1806.
(84) Laviron, E., J. Electroanal. Chem. 1979, 101, 19-28.
(85) Liu, J.Q., Gooding, J.J., Paddon-Row, M.N., Chem. Commun. 2005, 631-633.
(86) Wooster, T.T., Gamm, P.R., Geiger, W.E., Oliver, A.M., Black, A.J., Craig,
D.C., Paddonrow, M.N., Langmuir 1996, 12, 6616-6626.
(87) Weber, K., Creager, S.E., Anal. Chem. 1994, 66, 3164-3172.
(88) Finklea, H.O., Yoon, K., Chamberlain, E., Allen, J., Haddox, R., J. Phys. Chem.
B 2001, 105, 3088-3092.
(89) Liu, G., Liu, J., Bocking, T., Eggers, P., Gooding, J.J., Chem. Phys. 2005, 319,
136-146.
(90) Hong, H.G., Mallouk, T.E., Langmuir 1991, 7, 2362-2369.
(91) Lay, P.A., J. Phys. Chem. 1986, 90, 878-885.
(92) Myles, A.J., Branda, N.R., J. Am. Chem. Soc. 2001, 123, 177-178.
(93) Sek, S., Misicka, A., Bilewicz, R., J. Phys. Chem. B 2000, 104, 5399-5402.
(94) Gorton, L., Jonsson-Pettersson, G., Csoregi, E., Johansson, K., Dominguez, E.,
Marko-Varga, G., Analyst 1992, 117, 1235-1241.
(95) Ruzgas, T., Gorton, L., Emneus, J., Marko-Varga, G., J. Electroanal. Chem.
1995, 391, 41-49.
(96) Ruzgas, T., Csoregi, E., Emneus, J., Gorton, L., Marko-Varga, G., Anal. Chim.
210
Chapter 6-An Interface Comprising Molecular Wires and Poly(ethylene glycol) Spacer Units Self-Assembled on Carbon Electrodes for Studies of Protein Electrochemistry
Acta 1996, 330, 123.
(97) Lindgren, A., Ruzgas, T., Gorton, L., Csoregi, E., Ardila, G.B., Sakharov, I.Y.,
Gazaryan, I.G., Biosens. Bioelectron. 2000, 15, 491-497.
(98) Ferapontova, E., Schmengler, K., Borchers, T., Ruzgas, T., Gorton, L., Biosens.
Bioelectron. 2002, 17, 953-963.
(99) Ferapontova, E.E., Grigorenko, V.G., Egorov, A.M., Borchers, T., Ruzgas, T.,
Gorton, L., Biosens. Bioelectron. 2001, 16, 147-157.
(100) Zhang, Z., Chouchane, S., Magliozzo, R.S., Rusling, J.F., Anal. Chem. 2002, 74,
163-170.
(101) Gajhede, M., Schuller, D.J., Henriksen, A., Smith, A.T., Poulos, T.L., Nat.
Struct. Biol. 1997, 4, 1032-1038.
(102) Leung, C., Xirouchaki, C., Berovic, N., Palmer, R.E., Adv. Mater. 2004, 16,
223-226.
(103) Blankespoor, R., Limoges, B., Schollhorn, B., Syssa-Magale, J.-L., Yazidi, D.,
Langmuir 2005, 21, 3362-3375.
(104) Lotzbeyer, T., Schuhmann, W., Schmidt, H.L., Sensor. Actuat. B-Chem. 1996,
33, 50-54.
211
Chapter 7-Exploration of Deeply Buried Active Sites of Glucose Oxidase Using Molecular Wires Self-Assembled on Carbon Electrodes
Chapter Seven
Exploration of Deeply Buried Active Sites of Glucose Oxidase
Using Molecular Wires Self-Assembled on Carbon Electrodes
212
Chapter 7-Exploration of Deeply Buried Active Sites of Glucose Oxidase Using Molecular Wires Self-Assembled on Carbon Electrodes
7.1 Introduction
Achieving direct electron transfer between the active centre of the enzyme and an
electrode is crucial for the development of novel enzyme biosensors or bioelectronics.1
Direct electron transfer has been observed on small redox proteins such as cytochrome
c,2-7 horseradish peroxidase (HRP),8, 9 laccase,10, 11 and azurin.6 Results in Chapter Six
have demonstrated that rigid molecular wires (MW) have high efficiency of electron
transfer and direct electron transfer has been achieved between HRP and the underlying
glassy carbon (GC) electrodes using MW as the conduit for electron transfer. However,
for most oxidoreductase enzymes, their active centres are embedded deep inside the
glycoproteins. Therefore it is far more difficult to incorporate these proteins into a
biosensor system due to the weak electrical communication to their surrounding
environment.
Understanding the principle of electron transfer (ET) in protein is critical to finding
strategies for facilitating electrical communication between proteins and their
surrounding environment. The most important factor that influences the electron
transfer rate is the distance between the redox centre and the electrode. The rate
constant exponentially decreases with the distance as shown in the expression:
)exp(0 dkkET
where kET is the rate constant, d is the distance between the redox centre and the
electrode surface, is the tunnelling coefficient, and the prefactor k0, represents the
effective rate constant as extrapolated to zero distance. In proteins, the electron-transfer
rates drop by ~104 when the distance between an electron donor and an acceptor is
213
Chapter 7-Exploration of Deeply Buried Active Sites of Glucose Oxidase Using Molecular Wires Self-Assembled on Carbon Electrodes
increased from 8 to 17 Å.12 X-ray structure studies13 have shown that the minimal
distance between the redox active centre flavin adenine dinucleotide (FAD) of GOx to
the periphery of the enzyme is 8 Å, and the minimal distance between the periphery of
GOx and the N 7 nitrogen of the isoalloxazine part of FAD, where the redox reaction
occurs, is 13-18 Å. In view of the rapid decay of electron transfer rates with distance it
is not surprising that GOx does not communicate electrically with simple underlying
electrodes. Thus, shortening the distance between the active centre of the enzyme and
the electrode is very important for appreciable electron transfer. Some groups have
achieved direct electron transfer between GOx and an electrode by trying to reduce this
distance.14-20 However, the rate of electron transfer is still very low. The rate of electron
transfer was found to be only 0.026 s-1 after covalently immobilising GOx on a short
self-assembled monolayer on gold surfaces.14 The electron transfer rate of GOx
adsorbed on graphite20 and carbon nanotubes17, 19 was found to be 1.6 s-1. Therefore,
some conduits such as molecular wires for electron transfer are necessary for the
efficient electron transfer communication between the active centre and the surrounding
environment of the enzyme.
Exploration of the amine oxidase enzyme using a rigid molecular wire has been
pioneered by Gray and coworkers21, and they found that the electrical communication
between the gold electrode and the active centre of amine oxidase was greatly enhanced
by a molecular wire with a diethylaniline group. Nevertheless, the activity of the
enzyme was not clearly delineated although the direct electron transfer was reported.
Gooding and coworkers have extended the principle to achieve electron tunnelling
directly to the electrode from the FAD by introducing a norbornylogous bridge as the
electron transfer linker.22 When the apo-GOx was refolded on the FAD modified
214
Chapter 7-Exploration of Deeply Buried Active Sites of Glucose Oxidase Using Molecular Wires Self-Assembled on Carbon Electrodes
electrode incorporated with the norbornylogous bridge, the enzyme was found to be
biocatalytically active. However, no biocatalytic event was observed under anaerobic
conditions and it is proposed insignificant direct electron transfer to the enzyme was
achieved due to poor electric coupling between the redox active FAD and the electrode.
The bioactivity of GOx is another crucial issue for a successful GOx biosensor. It has
been reported that GOx is electroactive in some cases and most of these electroactive
enzymes have proven to lose their enzyme activities,19, 20, 23 except that some
researchers obtained direct electron transfer of GOx without significant loss of its
activity.17, 24, 25 Thus, how to achieve significant direct electron transfer to GOx for the
fabrication of third generation biosensors with the biocatalytic activity of the enzyme
retained still needs further work.
It is very important to understand the structure of the GOx before finding a solution to
achieve significant direct electron transfer to GOx for the fabrication of third generation
biosensors. GOx from Aspergillus niger is an oxidoreductase enzyme, which is a
homodimeric protein with a molecular weight of 150 to 180 kDa, containing one tightly
bound FAD molecule per monomer as cofactor (actually two FAD per enzyme).13, 26
Two FAD molecules in GOx are separated by a distance of about 40 Å, a distance
which excludes any electrical communication between them. The dimeric protein has an
ellipsoidal shape with a high content of secondary structure (28% -helix, 18% -
sheets) shown in Figure 7.1 a. The monomeric GOx molecule with the active centre
FAD is shown in Figure 7.1 b. The tertiary structure of the enzyme is characterised by
two separate and distinctly different -sheet systems, which form part of the FAD
binding domain. The second is a large six stranded antiparallel -sheet supported by
four -helices on its back. This -sheet forms one side of the active site. Figure 7.2
215
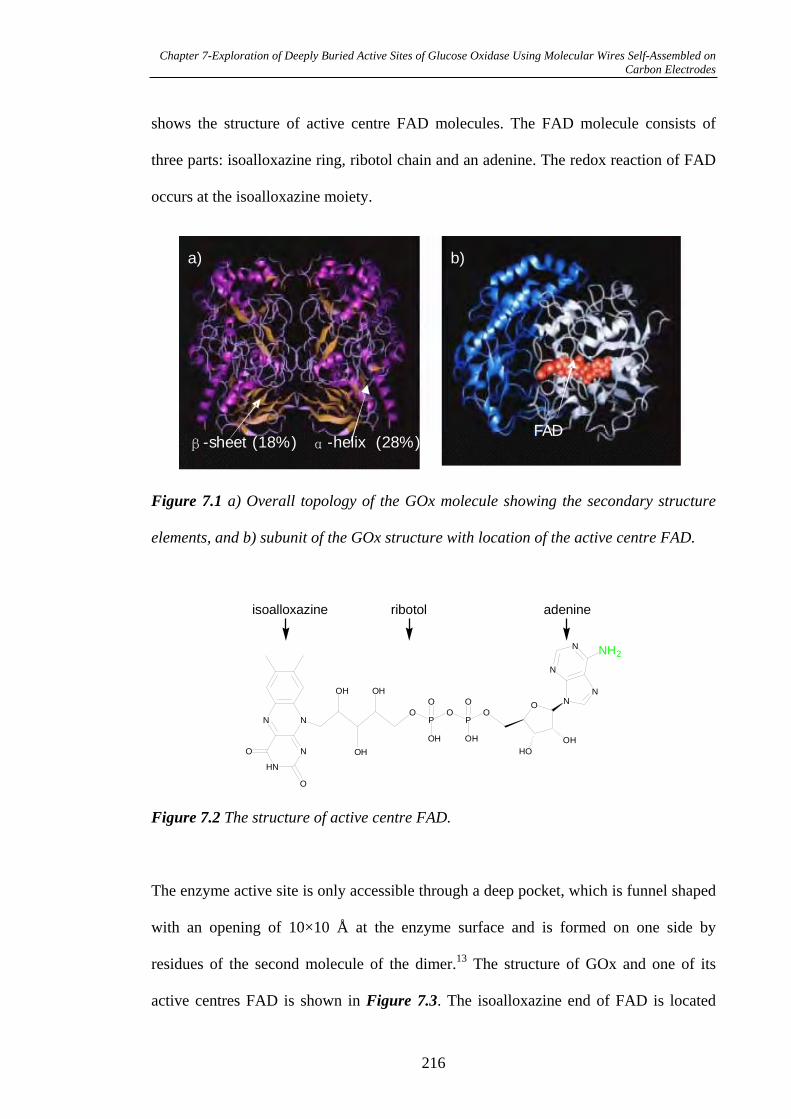
Chapter 7-Exploration of Deeply Buried Active Sites of Glucose Oxidase Using Molecular Wires Self-Assembled on Carbon Electrodes
shows the structure of active centre FAD molecules. The FAD molecule consists of
three parts: isoalloxazine ring, ribotol chain and an adenine. The redox reaction of FAD
occurs at the isoalloxazine moiety.
-helix (28%)-sheet (18%)FAD
-helix (28%)-sheet (18%)FAD
a) b)
Figure 7.1 a) Overall topology of the GOx molecule showing the secondary structure
elements, and b) subunit of the GOx structure with location of the active centre FAD.
N
OH
OHN
OH
NO
O
HN
O
PO
O
OH
PO
O
OH
O
HO
N
OH
N
N
NH2N
isoalloxazine ribotol adenine
Figure 7.2 The structure of active centre FAD.
The enzyme active site is only accessible through a deep pocket, which is funnel shaped
with an opening of 10×10 Å at the enzyme surface and is formed on one side by
residues of the second molecule of the dimer.13 The structure of GOx and one of its
active centres FAD is shown in Figure 7.3. The isoalloxazine end of FAD is located
216
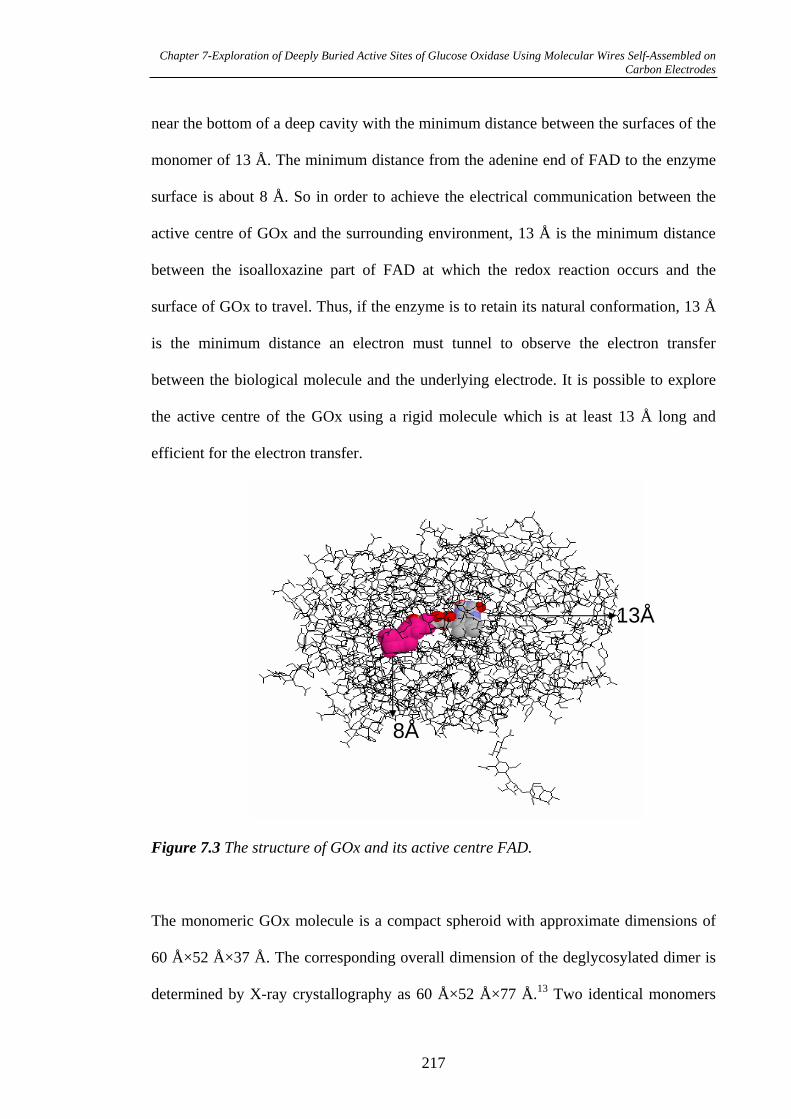
Chapter 7-Exploration of Deeply Buried Active Sites of Glucose Oxidase Using Molecular Wires Self-Assembled on Carbon Electrodes
near the bottom of a deep cavity with the minimum distance between the surfaces of the
monomer of 13 Å. The minimum distance from the adenine end of FAD to the enzyme
surface is about 8 Å. So in order to achieve the electrical communication between the
active centre of GOx and the surrounding environment, 13 Å is the minimum distance
between the isoalloxazine part of FAD at which the redox reaction occurs and the
surface of GOx to travel. Thus, if the enzyme is to retain its natural conformation, 13 Å
is the minimum distance an electron must tunnel to observe the electron transfer
between the biological molecule and the underlying electrode. It is possible to explore
the active centre of the GOx using a rigid molecule which is at least 13 Å long and
efficient for the electron transfer.
13Å
8Å
Figure 7.3 The structure of GOx and its active centre FAD.
The monomeric GOx molecule is a compact spheroid with approximate dimensions of
60 Å×52 Å×37 Å. The corresponding overall dimension of the deglycosylated dimer is
determined by X-ray crystallography as 60 Å×52 Å×77 Å.13 Two identical monomers
217
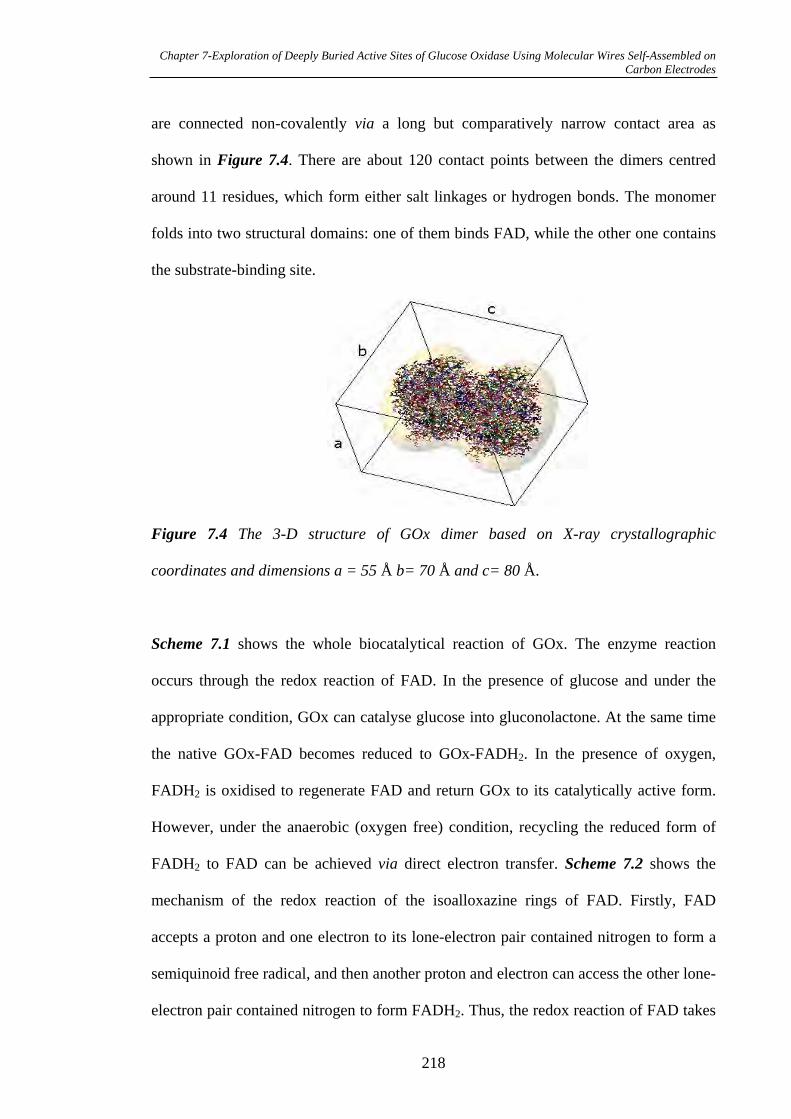
Chapter 7-Exploration of Deeply Buried Active Sites of Glucose Oxidase Using Molecular Wires Self-Assembled on Carbon Electrodes
are connected non-covalently via a long but comparatively narrow contact area as
shown in Figure 7.4. There are about 120 contact points between the dimers centred
around 11 residues, which form either salt linkages or hydrogen bonds. The monomer
folds into two structural domains: one of them binds FAD, while the other one contains
the substrate-binding site.
Figure 7.4 The 3-D structure of GOx dimer based on X-ray crystallographic
coordinates and dimensions a = 55 Å b= 70 Å and c= 80 Å.
Scheme 7.1 shows the whole biocatalytical reaction of GOx. The enzyme reaction
occurs through the redox reaction of FAD. In the presence of glucose and under the
appropriate condition, GOx can catalyse glucose into gluconolactone. At the same time
the native GOx-FAD becomes reduced to GOx-FADH2. In the presence of oxygen,
FADH2 is oxidised to regenerate FAD and return GOx to its catalytically active form.
However, under the anaerobic (oxygen free) condition, recycling the reduced form of
FADH2 to FAD can be achieved via direct electron transfer. Scheme 7.2 shows the
mechanism of the redox reaction of the isoalloxazine rings of FAD. Firstly, FAD
accepts a proton and one electron to its lone-electron pair contained nitrogen to form a
semiquinoid free radical, and then another proton and electron can access the other lone-
electron pair contained nitrogen to form FADH2. Thus, the redox reaction of FAD takes
218
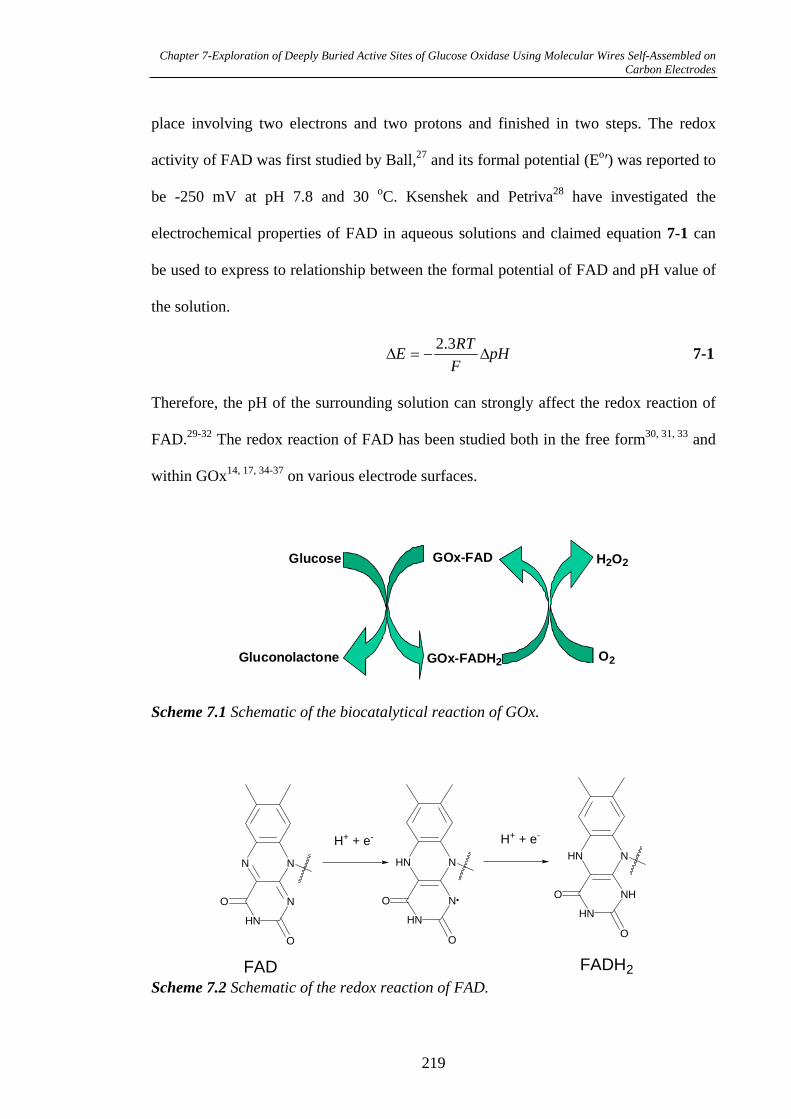
Chapter 7-Exploration of Deeply Buried Active Sites of Glucose Oxidase Using Molecular Wires Self-Assembled on Carbon Electrodes
place involving two electrons and two protons and finished in two steps. The redox
activity of FAD was first studied by Ball,27 and its formal potential (Eo ) was reported to
be -250 mV at pH 7.8 and 30 oC. Ksenshek and Petriva28 have investigated the
electrochemical properties of FAD in aqueous solutions and claimed equation 7-1 can
be used to express to relationship between the formal potential of FAD and pH value of
the solution.
pHFRTE 3.2 7-1
Therefore, the pH of the surrounding solution can strongly affect the redox reaction of
FAD.29-32 The redox reaction of FAD has been studied both in the free form30, 31, 33 and
within GOx14, 17, 34-37 on various electrode surfaces.
GOx-FAD
GOx-FADH2
H2O2
O2
Glucose
Gluconolactone
Scheme 7.1 Schematic of the biocatalytical reaction of GOx.
N
N
N
O
HN
O
N
N
HN
O
HN
O
N
NH
HN
O
HN
O
H+ + e- H+ + e-
FAD FADH2
Scheme 7.2 Schematic of the redox reaction of FAD.
219
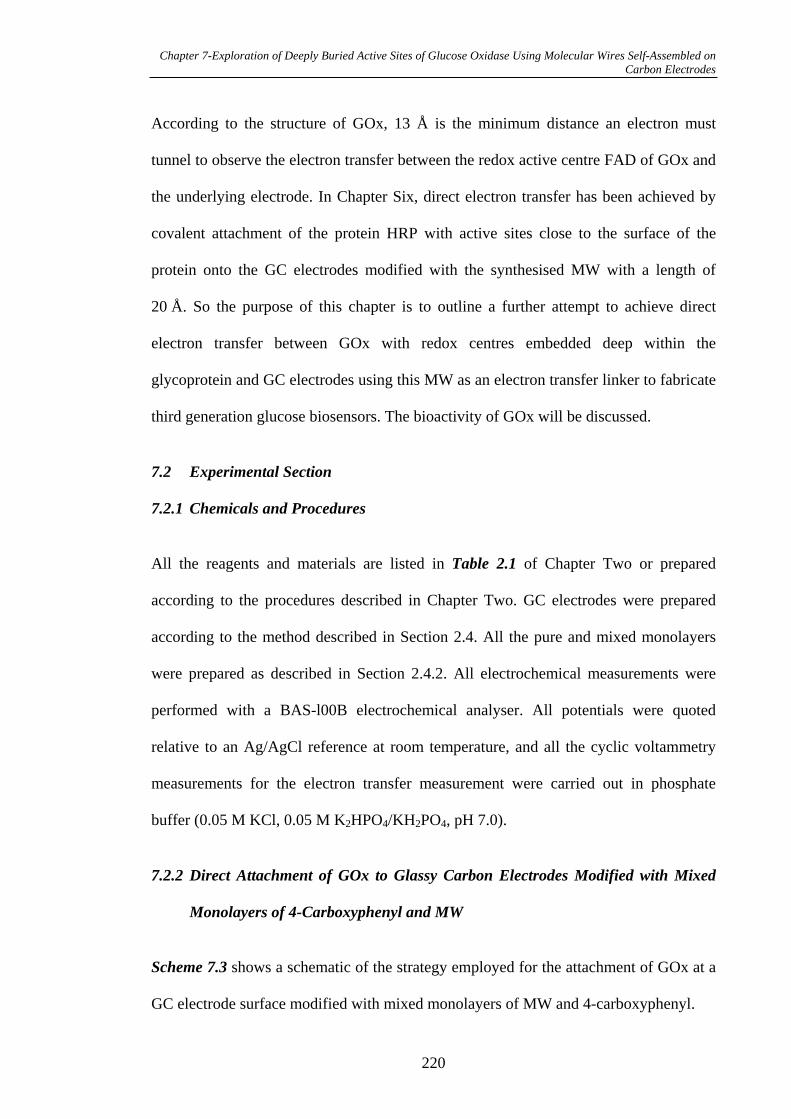
Chapter 7-Exploration of Deeply Buried Active Sites of Glucose Oxidase Using Molecular Wires Self-Assembled on Carbon Electrodes
According to the structure of GOx, 13 Å is the minimum distance an electron must
tunnel to observe the electron transfer between the redox active centre FAD of GOx and
the underlying electrode. In Chapter Six, direct electron transfer has been achieved by
covalent attachment of the protein HRP with active sites close to the surface of the
protein onto the GC electrodes modified with the synthesised MW with a length of
20 Å. So the purpose of this chapter is to outline a further attempt to achieve direct
electron transfer between GOx with redox centres embedded deep within the
glycoprotein and GC electrodes using this MW as an electron transfer linker to fabricate
third generation glucose biosensors. The bioactivity of GOx will be discussed.
7.2 Experimental Section
7.2.1 Chemicals and Procedures
All the reagents and materials are listed in Table 2.1 of Chapter Two or prepared
according to the procedures described in Chapter Two. GC electrodes were prepared
according to the method described in Section 2.4. All the pure and mixed monolayers
were prepared as described in Section 2.4.2. All electrochemical measurements were
performed with a BAS-l00B electrochemical analyser. All potentials were quoted
relative to an Ag/AgCl reference at room temperature, and all the cyclic voltammetry
measurements for the electron transfer measurement were carried out in phosphate
buffer (0.05 M KCl, 0.05 M K2HPO4/KH2PO4, pH 7.0).
7.2.2 Direct Attachment of GOx to Glassy Carbon Electrodes Modified with Mixed
Monolayers of 4-Carboxyphenyl and MW
Scheme 7.3 shows a schematic of the strategy employed for the attachment of GOx at a
GC electrode surface modified with mixed monolayers of MW and 4-carboxyphenyl.
220
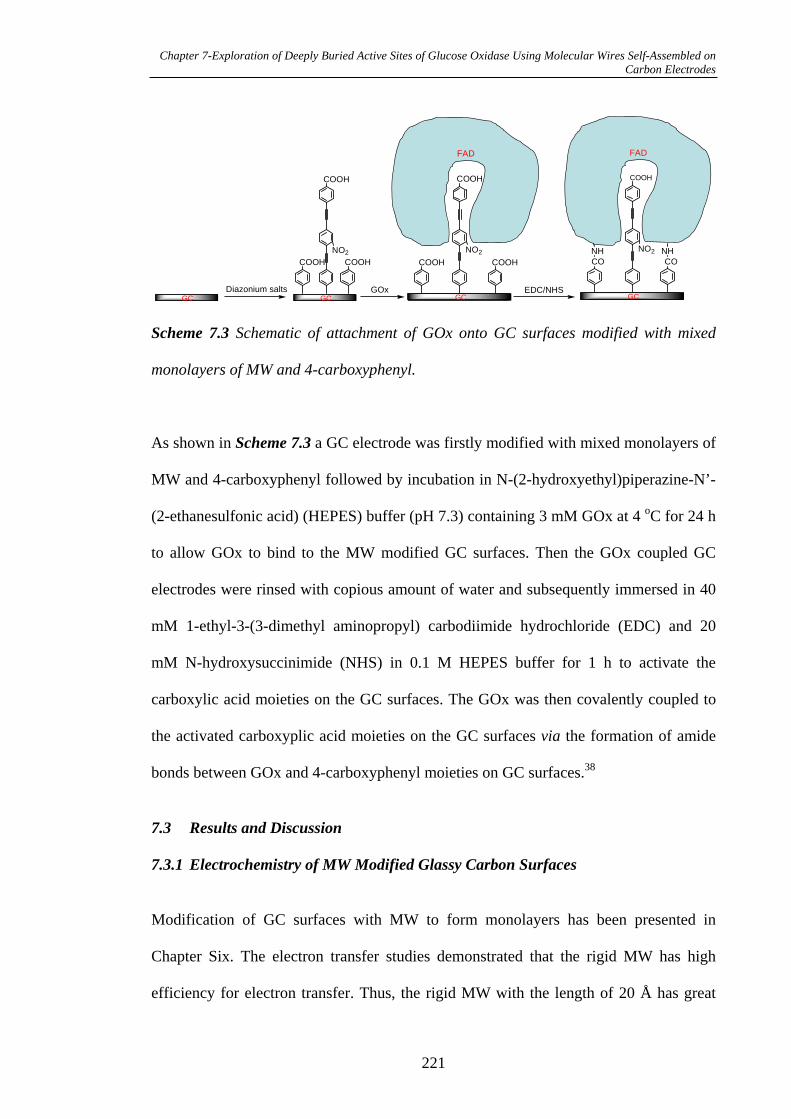
Chapter 7-Exploration of Deeply Buried Active Sites of Glucose Oxidase Using Molecular Wires Self-Assembled on Carbon Electrodes
NO2
COOH
CO CO
FAD
NO2
COOH
COOH COOH
GCGOx EDC/NHSDiazonium salts
NH NHNO2
COOH
COOH COOH
GC
FAD
GCGC
Scheme 7.3 Schematic of attachment of GOx onto GC surfaces modified with mixed
monolayers of MW and 4-carboxyphenyl.
As shown in Scheme 7.3 a GC electrode was firstly modified with mixed monolayers of
MW and 4-carboxyphenyl followed by incubation in N-(2-hydroxyethyl)piperazine-N’-
(2-ethanesulfonic acid) (HEPES) buffer (pH 7.3) containing 3 mM GOx at 4 oC for 24 h
to allow GOx to bind to the MW modified GC surfaces. Then the GOx coupled GC
electrodes were rinsed with copious amount of water and subsequently immersed in 40
mM 1-ethyl-3-(3-dimethyl aminopropyl) carbodiimide hydrochloride (EDC) and 20
mM N-hydroxysuccinimide (NHS) in 0.1 M HEPES buffer for 1 h to activate the
carboxylic acid moieties on the GC surfaces. The GOx was then covalently coupled to
the activated carboxyplic acid moieties on the GC surfaces via the formation of amide
bonds between GOx and 4-carboxyphenyl moieties on GC surfaces.38
7.3 Results and Discussion
7.3.1 Electrochemistry of MW Modified Glassy Carbon Surfaces
Modification of GC surfaces with MW to form monolayers has been presented in
Chapter Six. The electron transfer studies demonstrated that the rigid MW has high
efficiency for electron transfer. Thus, the rigid MW with the length of 20 Å has great
221
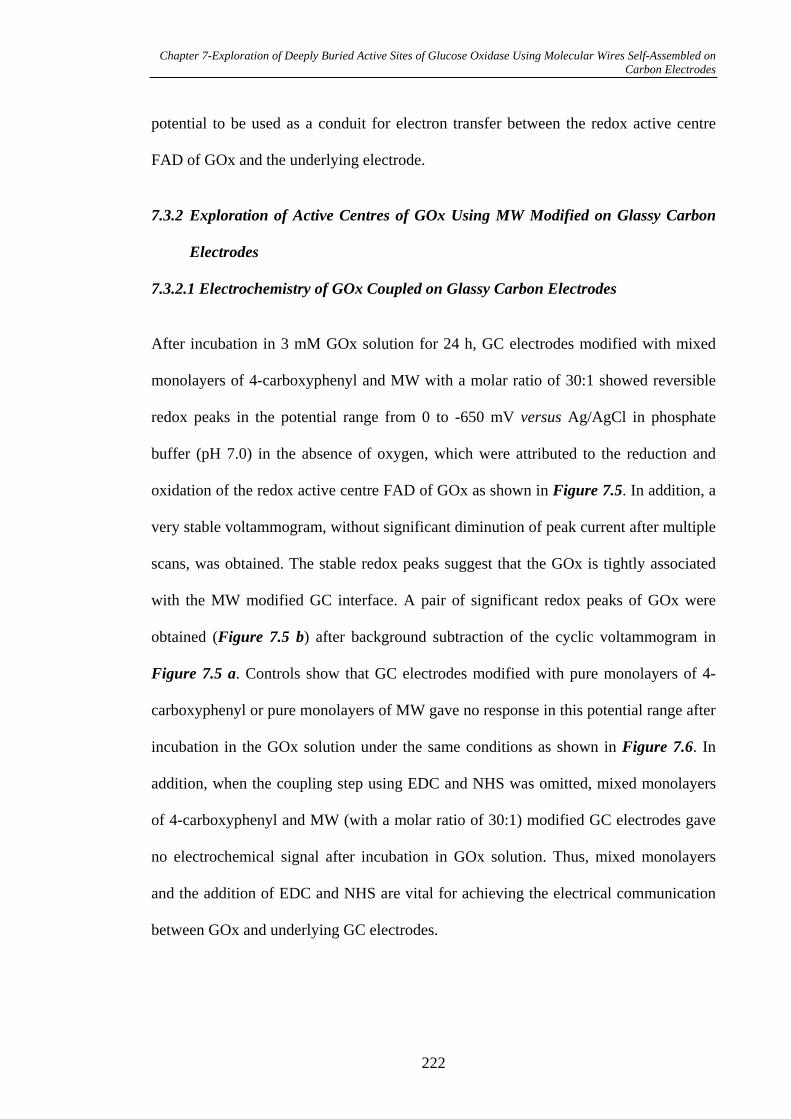
Chapter 7-Exploration of Deeply Buried Active Sites of Glucose Oxidase Using Molecular Wires Self-Assembled on Carbon Electrodes
potential to be used as a conduit for electron transfer between the redox active centre
FAD of GOx and the underlying electrode.
7.3.2 Exploration of Active Centres of GOx Using MW Modified on Glassy Carbon
Electrodes
7.3.2.1 Electrochemistry of GOx Coupled on Glassy Carbon Electrodes
After incubation in 3 mM GOx solution for 24 h, GC electrodes modified with mixed
monolayers of 4-carboxyphenyl and MW with a molar ratio of 30:1 showed reversible
redox peaks in the potential range from 0 to -650 mV versus Ag/AgCl in phosphate
buffer (pH 7.0) in the absence of oxygen, which were attributed to the reduction and
oxidation of the redox active centre FAD of GOx as shown in Figure 7.5. In addition, a
very stable voltammogram, without significant diminution of peak current after multiple
scans, was obtained. The stable redox peaks suggest that the GOx is tightly associated
with the MW modified GC interface. A pair of significant redox peaks of GOx were
obtained (Figure 7.5 b) after background subtraction of the cyclic voltammogram in
Figure 7.5 a. Controls show that GC electrodes modified with pure monolayers of 4-
carboxyphenyl or pure monolayers of MW gave no response in this potential range after
incubation in the GOx solution under the same conditions as shown in Figure 7.6. In
addition, when the coupling step using EDC and NHS was omitted, mixed monolayers
of 4-carboxyphenyl and MW (with a molar ratio of 30:1) modified GC electrodes gave
no electrochemical signal after incubation in GOx solution. Thus, mixed monolayers
and the addition of EDC and NHS are vital for achieving the electrical communication
between GOx and underlying GC electrodes.
222
Chapter 7-Exploration of Deeply Buried Active Sites of Glucose Oxidase Using Molecular Wires Self-Assembled on Carbon Electrodes
-36
-27
-18
-9
0
9
18
27
36
-0.7 -0.6 -0.5 -0.4 -0.3 -0.2 -0.1 0
Potential /V
Curr
ent
/nA
b)
-3
-2
-1
0
1
2
-0.7 -0.6 -0.5 -0.4 -0.3 -0.2 -0.1 0
Potential /V
Cu
rre
nt
/A
a)
Figure 7.5 (a) The cyclic voltammogram of GOx immobilised on GC electrodes
modified with mixed monolayers of 4-carboxyphenyl and MW with a molar ratio of 30:1
at a scan rate of 100 mV s-1, and (b) the cyclic voltammogram of GOx after the
background subtraction.
223
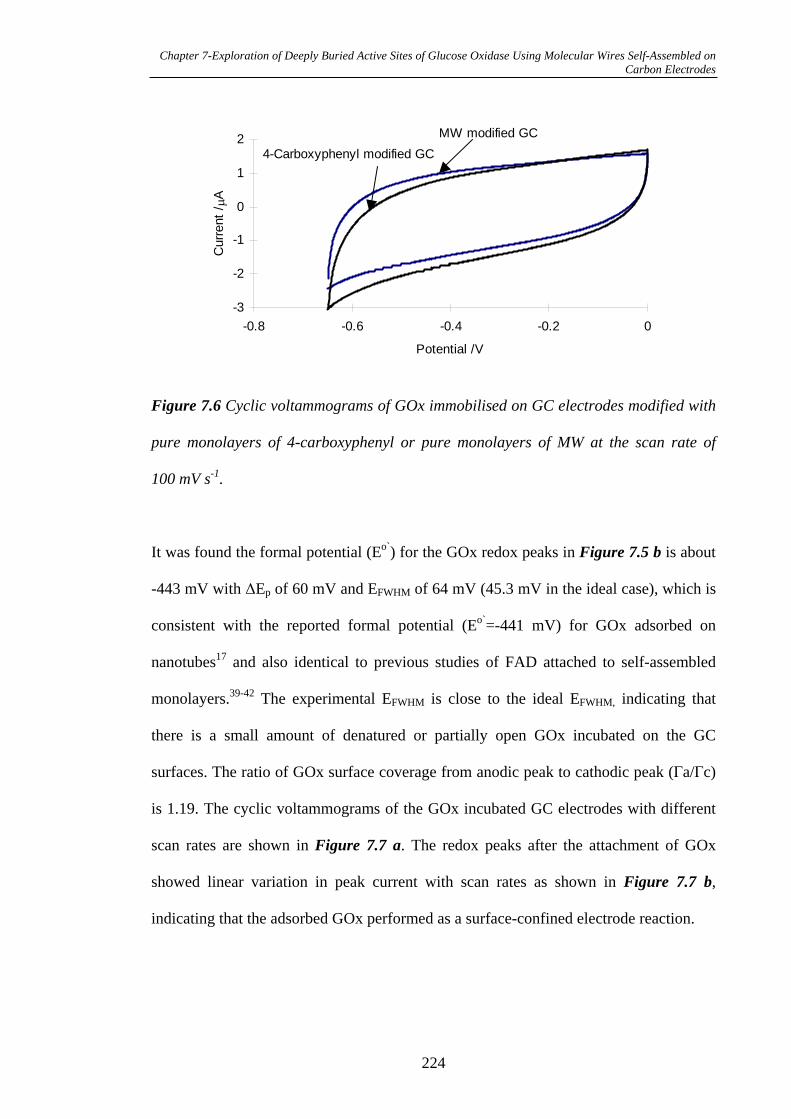
Chapter 7-Exploration of Deeply Buried Active Sites of Glucose Oxidase Using Molecular Wires Self-Assembled on Carbon Electrodes
-3
-2
-1
0
1
2
-0.8 -0.6 -0.4 -0.2 0
Potential /V
Curr
ent
/A
MW modified GC
4-Carboxyphenyl modified GC
Figure 7.6 Cyclic voltammograms of GOx immobilised on GC electrodes modified with
pure monolayers of 4-carboxyphenyl or pure monolayers of MW at the scan rate of
100 mV s-1.
It was found the formal potential (Eo`) for the GOx redox peaks in Figure 7.5 b is about
-443 mV with Ep of 60 mV and EFWHM of 64 mV (45.3 mV in the ideal case), which is
consistent with the reported formal potential (Eo`=-441 mV) for GOx adsorbed on
nanotubes17 and also identical to previous studies of FAD attached to self-assembled
monolayers.39-42 The experimental EFWHM is close to the ideal EFWHM, indicating that
there is a small amount of denatured or partially open GOx incubated on the GC
surfaces. The ratio of GOx surface coverage from anodic peak to cathodic peak ( a/ c)
is 1.19. The cyclic voltammograms of the GOx incubated GC electrodes with different
scan rates are shown in Figure 7.7 a. The redox peaks after the attachment of GOx
showed linear variation in peak current with scan rates as shown in Figure 7.7 b,
indicating that the adsorbed GOx performed as a surface-confined electrode reaction.
224
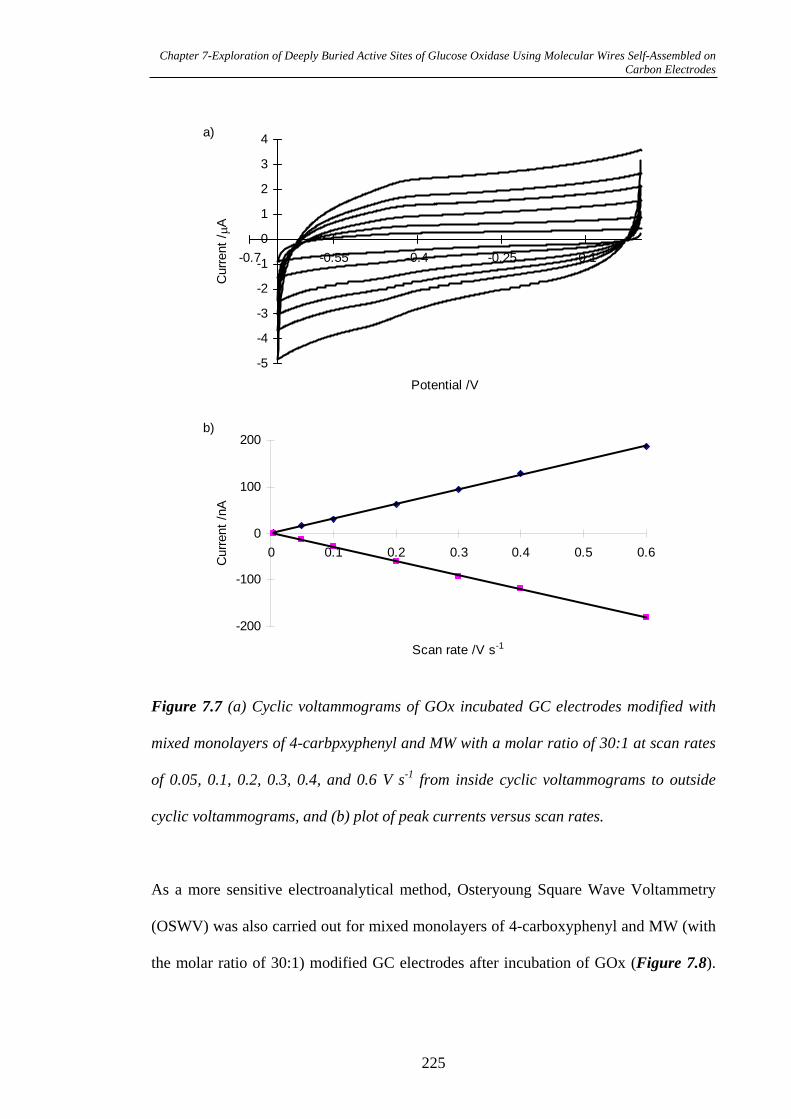
Chapter 7-Exploration of Deeply Buried Active Sites of Glucose Oxidase Using Molecular Wires Self-Assembled on Carbon Electrodes
-200
-100
0
100
200
0 0.1 0.2 0.3 0.4 0.5 0.6
Scan rate /V s-1
Curr
ent
/nA
b)
-5
-4
-3
-2
-1
0
1
2
3
4
-0.7 -0.55 -0.4 -0.25 -0.1
Potential /V
Curr
ent
/A
a)
Figure 7.7 (a) Cyclic voltammograms of GOx incubated GC electrodes modified with
mixed monolayers of 4-carbpxyphenyl and MW with a molar ratio of 30:1 at scan rates
of 0.05, 0.1, 0.2, 0.3, 0.4, and 0.6 V s-1 from inside cyclic voltammograms to outside
cyclic voltammograms, and (b) plot of peak currents versus scan rates.
As a more sensitive electroanalytical method, Osteryoung Square Wave Voltammetry
(OSWV) was also carried out for mixed monolayers of 4-carboxyphenyl and MW (with
the molar ratio of 30:1) modified GC electrodes after incubation of GOx (Figure 7.8).
225
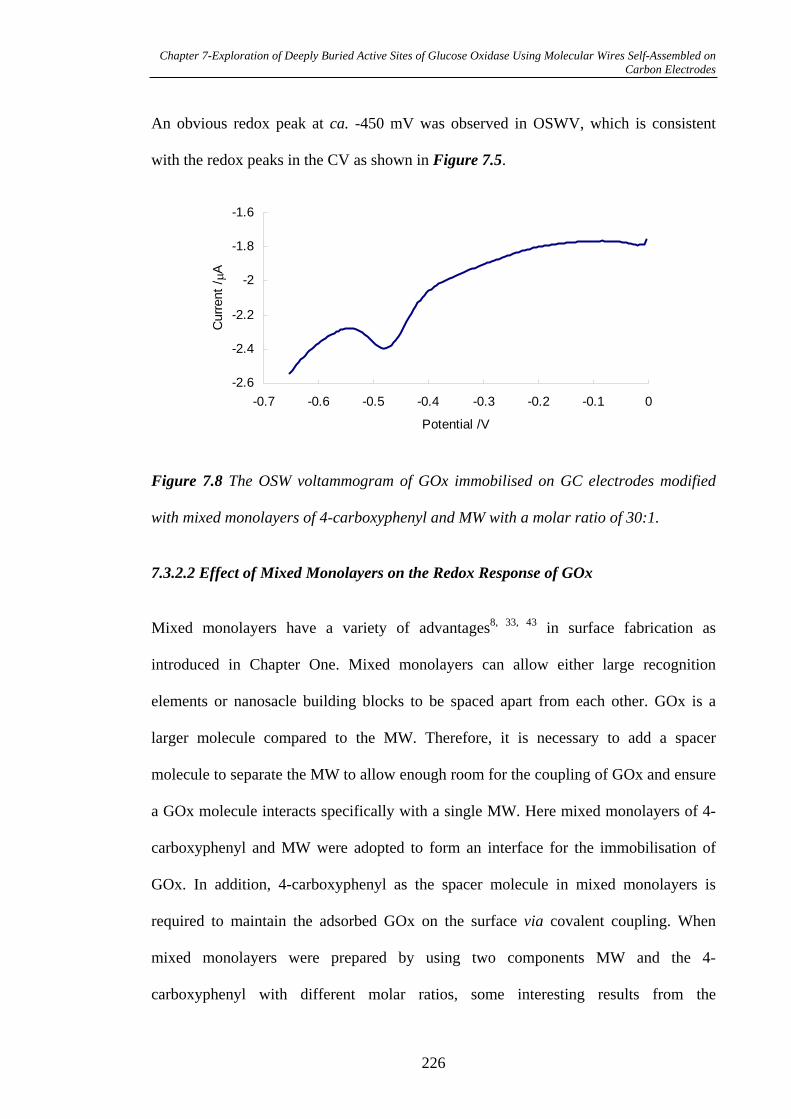
Chapter 7-Exploration of Deeply Buried Active Sites of Glucose Oxidase Using Molecular Wires Self-Assembled on Carbon Electrodes
An obvious redox peak at ca. -450 mV was observed in OSWV, which is consistent
with the redox peaks in the CV as shown in Figure 7.5.
-2.6
-2.4
-2.2
-2
-1.8
-1.6
-0.7 -0.6 -0.5 -0.4 -0.3 -0.2 -0.1 0
Potential /V
Curr
ent
/A
Figure 7.8 The OSW voltammogram of GOx immobilised on GC electrodes modified
with mixed monolayers of 4-carboxyphenyl and MW with a molar ratio of 30:1.
7.3.2.2 Effect of Mixed Monolayers on the Redox Response of GOx
Mixed monolayers have a variety of advantages8, 33, 43 in surface fabrication as
introduced in Chapter One. Mixed monolayers can allow either large recognition
elements or nanosacle building blocks to be spaced apart from each other. GOx is a
larger molecule compared to the MW. Therefore, it is necessary to add a spacer
molecule to separate the MW to allow enough room for the coupling of GOx and ensure
a GOx molecule interacts specifically with a single MW. Here mixed monolayers of 4-
carboxyphenyl and MW were adopted to form an interface for the immobilisation of
GOx. In addition, 4-carboxyphenyl as the spacer molecule in mixed monolayers is
required to maintain the adsorbed GOx on the surface via covalent coupling. When
mixed monolayers were prepared by using two components MW and the 4-
carboxyphenyl with different molar ratios, some interesting results from the
226
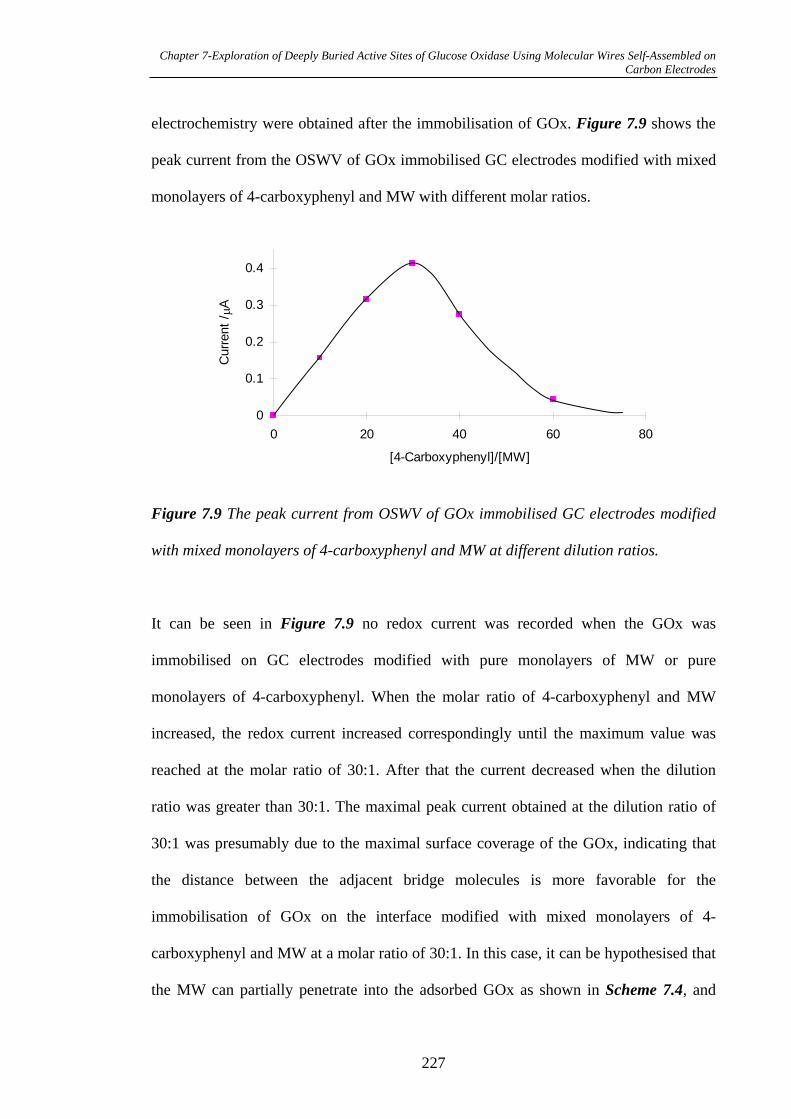
Chapter 7-Exploration of Deeply Buried Active Sites of Glucose Oxidase Using Molecular Wires Self-Assembled on Carbon Electrodes
electrochemistry were obtained after the immobilisation of GOx. Figure 7.9 shows the
peak current from the OSWV of GOx immobilised GC electrodes modified with mixed
monolayers of 4-carboxyphenyl and MW with different molar ratios.
0
0.1
0.2
0.3
0.4
0 20 40 60 8
[4-Carboxyphenyl]/[MW]
Curr
ent
/A
0
Figure 7.9 The peak current from OSWV of GOx immobilised GC electrodes modified
with mixed monolayers of 4-carboxyphenyl and MW at different dilution ratios.
It can be seen in Figure 7.9 no redox current was recorded when the GOx was
immobilised on GC electrodes modified with pure monolayers of MW or pure
monolayers of 4-carboxyphenyl. When the molar ratio of 4-carboxyphenyl and MW
increased, the redox current increased correspondingly until the maximum value was
reached at the molar ratio of 30:1. After that the current decreased when the dilution
ratio was greater than 30:1. The maximal peak current obtained at the dilution ratio of
30:1 was presumably due to the maximal surface coverage of the GOx, indicating that
the distance between the adjacent bridge molecules is more favorable for the
immobilisation of GOx on the interface modified with mixed monolayers of 4-
carboxyphenyl and MW at a molar ratio of 30:1. In this case, it can be hypothesised that
the MW can partially penetrate into the adsorbed GOx as shown in Scheme 7.4, and
227
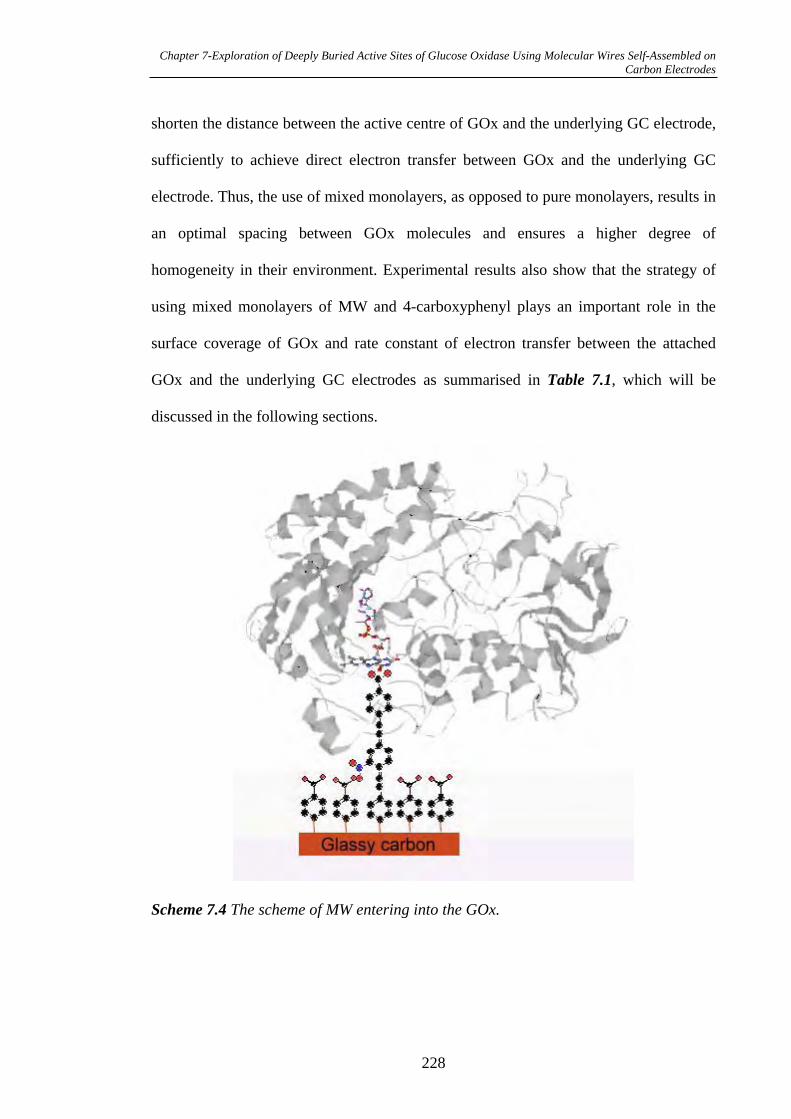
Chapter 7-Exploration of Deeply Buried Active Sites of Glucose Oxidase Using Molecular Wires Self-Assembled on Carbon Electrodes
shorten the distance between the active centre of GOx and the underlying GC electrode,
sufficiently to achieve direct electron transfer between GOx and the underlying GC
electrode. Thus, the use of mixed monolayers, as opposed to pure monolayers, results in
an optimal spacing between GOx molecules and ensures a higher degree of
homogeneity in their environment. Experimental results also show that the strategy of
using mixed monolayers of MW and 4-carboxyphenyl plays an important role in the
surface coverage of GOx and rate constant of electron transfer between the attached
GOx and the underlying GC electrodes as summarised in Table 7.1, which will be
discussed in the following sections.
Scheme 7.4 The scheme of MW entering into the GOx.
228
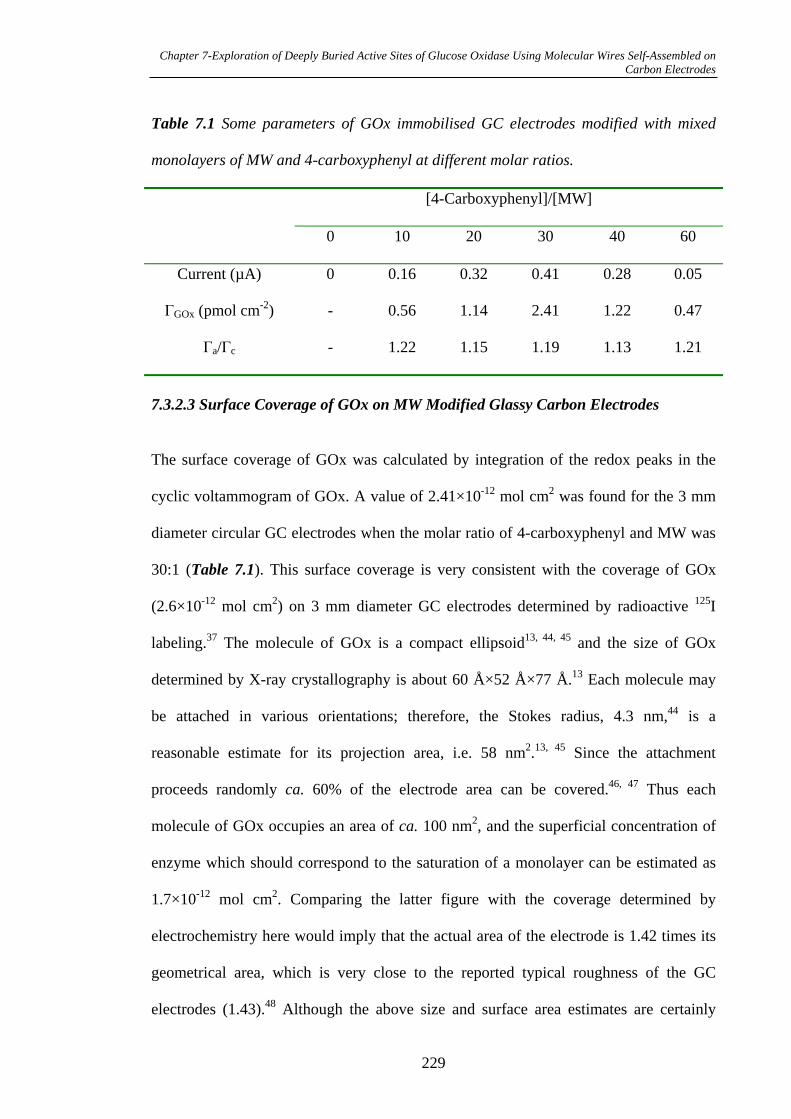
Chapter 7-Exploration of Deeply Buried Active Sites of Glucose Oxidase Using Molecular Wires Self-Assembled on Carbon Electrodes
Table 7.1 Some parameters of GOx immobilised GC electrodes modified with mixed
monolayers of MW and 4-carboxyphenyl at different molar ratios.
[4-Carboxyphenyl]/[MW]
0 10 20 30 40 60
Current (µA) 0 0.16 0.32 0.41 0.28 0.05
GOx (pmol cm-2) - 0.56 1.14 2.41 1.22 0.47
a/ c - 1.22 1.15 1.19 1.13 1.21
7.3.2.3 Surface Coverage of GOx on MW Modified Glassy Carbon Electrodes
The surface coverage of GOx was calculated by integration of the redox peaks in the
cyclic voltammogram of GOx. A value of 2.41×10⁻¹² mol cm2 was found for the 3 mm
diameter circular GC electrodes when the molar ratio of 4-carboxyphenyl and MW was
30:1 (Table 7.1). This surface coverage is very consistent with the coverage of GOx
(2.6×10⁻¹² mol cm2) on 3 mm diameter GC electrodes determined by radioactive 125I
labeling.37 The molecule of GOx is a compact ellipsoid13, 44, 45 and the size of GOx
determined by X-ray crystallography is about 60 Å×52 Å×77 Å.13 Each molecule may
be attached in various orientations; therefore, the Stokes radius, 4.3 nm,44 is a
reasonable estimate for its projection area, i.e. 58 nm2.13, 45 Since the attachment
proceeds randomly ca. 60% of the electrode area can be covered.46, 47 Thus each
molecule of GOx occupies an area of ca. 100 nm2, and the superficial concentration of
enzyme which should correspond to the saturation of a monolayer can be estimated as
1.7×10⁻¹² mol cm2. Comparing the latter figure with the coverage determined by
electrochemistry here would imply that the actual area of the electrode is 1.42 times its
geometrical area, which is very close to the reported typical roughness of the GC
electrodes (1.43).48 Although the above size and surface area estimates are certainly
229
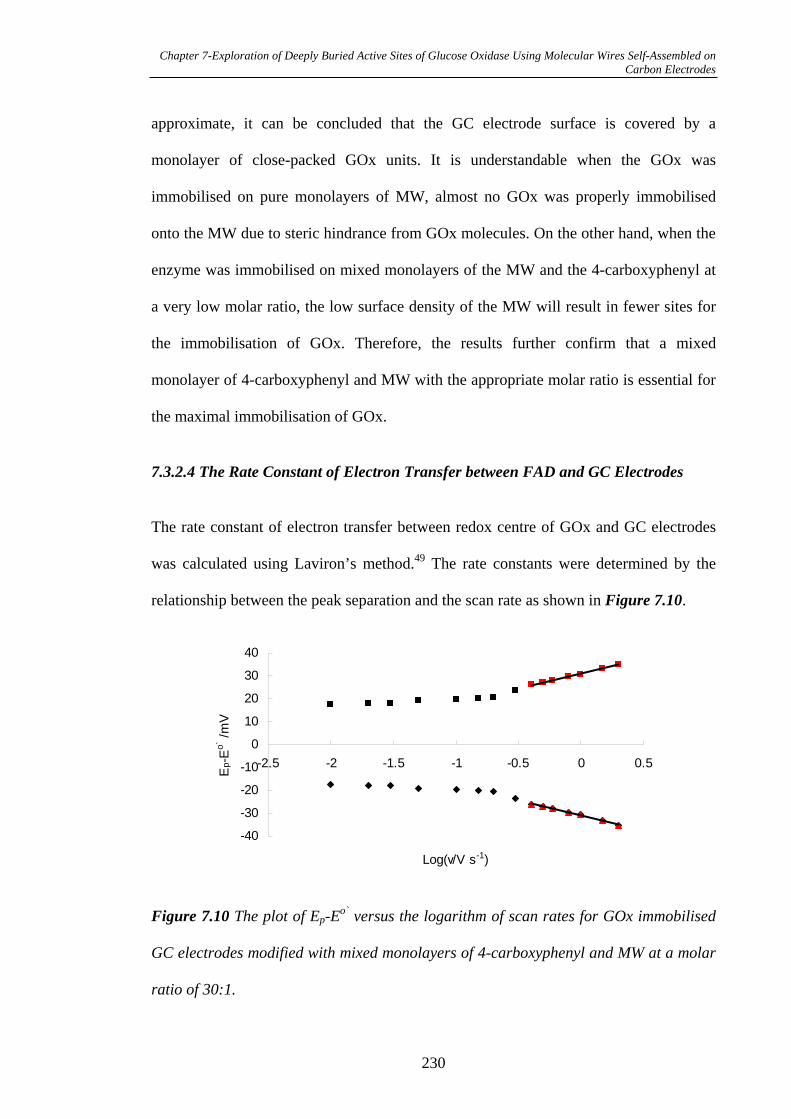
Chapter 7-Exploration of Deeply Buried Active Sites of Glucose Oxidase Using Molecular Wires Self-Assembled on Carbon Electrodes
approximate, it can be concluded that the GC electrode surface is covered by a
monolayer of close-packed GOx units. It is understandable when the GOx was
immobilised on pure monolayers of MW, almost no GOx was properly immobilised
onto the MW due to steric hindrance from GOx molecules. On the other hand, when the
enzyme was immobilised on mixed monolayers of the MW and the 4-carboxyphenyl at
a very low molar ratio, the low surface density of the MW will result in fewer sites for
the immobilisation of GOx. Therefore, the results further confirm that a mixed
monolayer of 4-carboxyphenyl and MW with the appropriate molar ratio is essential for
the maximal immobilisation of GOx.
7.3.2.4 The Rate Constant of Electron Transfer between FAD and GC Electrodes
The rate constant of electron transfer between redox centre of GOx and GC electrodes
was calculated using Laviron’s method.49 The rate constants were determined by the
relationship between the peak separation and the scan rate as shown in Figure 7.10.
-40
-30
-20
-10
0
10
20
30
40
-2.5 -2 -1.5 -1 -0.5 0 0.5
Log( /V s-1)
Ep-E
o` /
mV
Figure 7.10 The plot of Ep-Eo` versus the logarithm of scan rates for GOx immobilised
GC electrodes modified with mixed monolayers of 4-carboxyphenyl and MW at a molar
ratio of 30:1.
230
Chapter 7-Exploration of Deeply Buried Active Sites of Glucose Oxidase Using Molecular Wires Self-Assembled on Carbon Electrodes
The rate of electron transfer for immobilised GOx on GC surfaces was calculated to be
78 s-1 when the molar ratio of MW and 4-carboxyphenyl was 1:30. This value is similar
to the rate of electron transfer of FAD attached to the end of norbornylogous bridge
with the length of 18.3 Å self-assembled on gold electrodes (100 s-1).22 The rapid rate of
electron transfer through molecular wires is demonstrated by comparison with that for
FAD attached to mercaptoundecanoic acid which is three orders of magnitudes slower
(0.09 s-1).33
7.3.2.5 Measurement of Biocatalytical Activity of GOx
The question remains as to whether the adsorbed GOx retains its glucose-specific
enzyme activity once immobilised at the MW modified GC surface. According to the
biocatalytical reaction of GOx in Scheme 7.1, in the presence of glucose and under the
appropriate condition, GOx can catalyse glucose into gluconolactone and the native
GOx-FAD becomes reduced to GOx-FADH2. Oxygen plays an important role in the
biocatalytical reaction of GOx. So the glucose-specific enzyme activity here was
investigated under aerobic (in the presence of oxygen) and anaerobic (oxygen free)
conditions.
After immobilisation of GOx on GC electrodes modified with mixed monolayers of
MW and 4-carboxyphenyl with a molar ratio of 1:30, the biocatalytical activity of GOx
was firstly investigated under the aerobic condition. Figure 7.11 a shows the cyclic
voltammogram of a GOx/MW electrode obtained in oxygen-free (degassed with argon
for 30 min before measurement) phosphate buffer solution (pH 7.0) at a scan rate of 100
mV s-1. The phosphate buffer was later re-aerated to oxygen-saturation and another
cyclic voltammogram was obtained as shown in Figure 7.11 b. Under these conditions
231
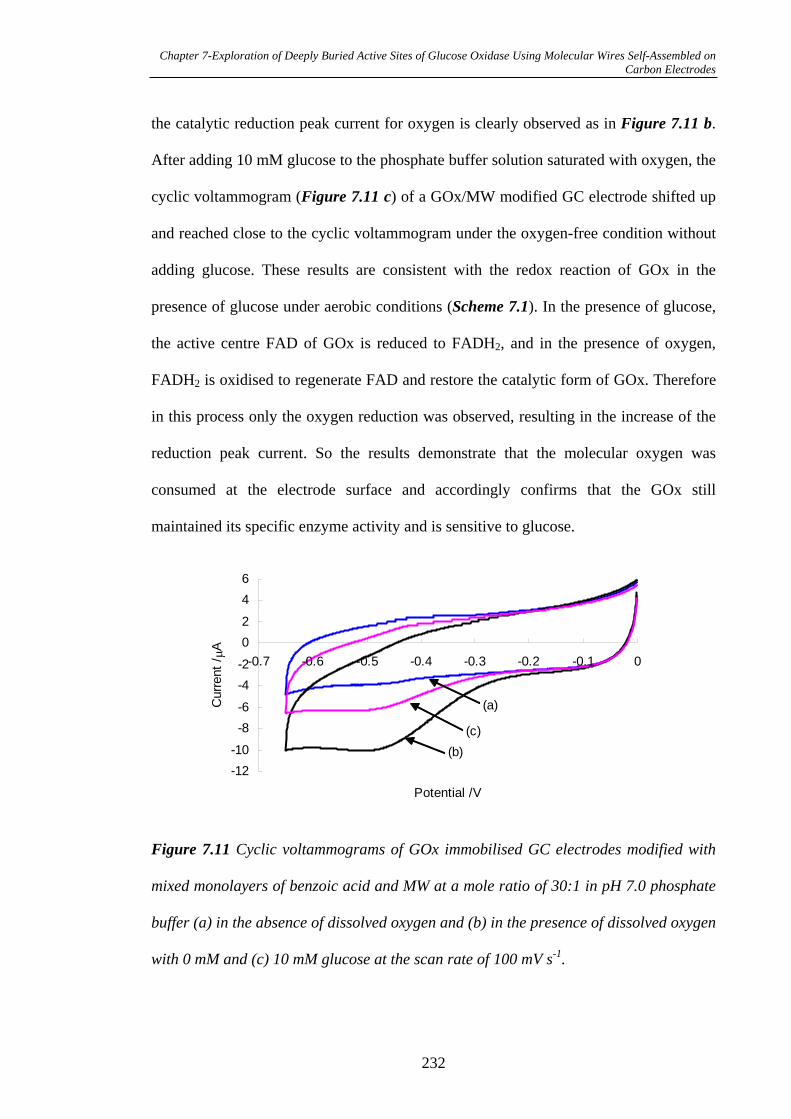
Chapter 7-Exploration of Deeply Buried Active Sites of Glucose Oxidase Using Molecular Wires Self-Assembled on Carbon Electrodes
the catalytic reduction peak current for oxygen is clearly observed as in Figure 7.11 b.
After adding 10 mM glucose to the phosphate buffer solution saturated with oxygen, the
cyclic voltammogram (Figure 7.11 c) of a GOx/MW modified GC electrode shifted up
and reached close to the cyclic voltammogram under the oxygen-free condition without
adding glucose. These results are consistent with the redox reaction of GOx in the
presence of glucose under aerobic conditions (Scheme 7.1). In the presence of glucose,
the active centre FAD of GOx is reduced to FADH2, and in the presence of oxygen,
FADH2 is oxidised to regenerate FAD and restore the catalytic form of GOx. Therefore
in this process only the oxygen reduction was observed, resulting in the increase of the
reduction peak current. So the results demonstrate that the molecular oxygen was
consumed at the electrode surface and accordingly confirms that the GOx still
maintained its specific enzyme activity and is sensitive to glucose.
-12
-10
-8
-6
-4
-2
0
2
4
6
-0.7 -0.6 -0.5 -0.4 -0.3 -0.2 -0.1 0
Potential /V
Curr
ent
/A
(a)
(b)
(c)
Figure 7.11 Cyclic voltammograms of GOx immobilised GC electrodes modified with
mixed monolayers of benzoic acid and MW at a mole ratio of 30:1 in pH 7.0 phosphate
buffer (a) in the absence of dissolved oxygen and (b) in the presence of dissolved oxygen
with 0 mM and (c) 10 mM glucose at the scan rate of 100 mV s-1.
232
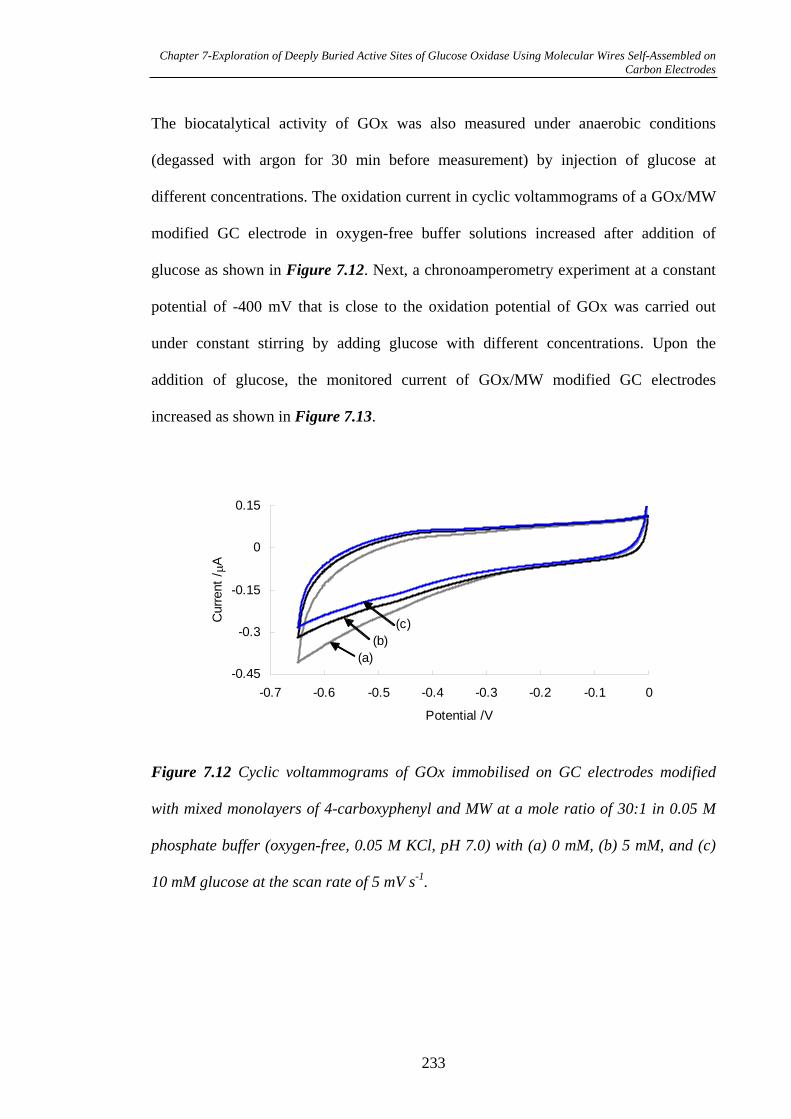
Chapter 7-Exploration of Deeply Buried Active Sites of Glucose Oxidase Using Molecular Wires Self-Assembled on Carbon Electrodes
The biocatalytical activity of GOx was also measured under anaerobic conditions
(degassed with argon for 30 min before measurement) by injection of glucose at
different concentrations. The oxidation current in cyclic voltammograms of a GOx/MW
modified GC electrode in oxygen-free buffer solutions increased after addition of
glucose as shown in Figure 7.12. Next, a chronoamperometry experiment at a constant
potential of -400 mV that is close to the oxidation potential of GOx was carried out
under constant stirring by adding glucose with different concentrations. Upon the
addition of glucose, the monitored current of GOx/MW modified GC electrodes
increased as shown in Figure 7.13.
-0.45
-0.3
-0.15
0
0.15
-0.7 -0.6 -0.5 -0.4 -0.3 -0.2 -0.1 0
Potential /V
Curr
ent
/A
(a)
(b)
(c)
Figure 7.12 Cyclic voltammograms of GOx immobilised on GC electrodes modified
with mixed monolayers of 4-carboxyphenyl and MW at a mole ratio of 30:1 in 0.05 M
phosphate buffer (oxygen-free, 0.05 M KCl, pH 7.0) with (a) 0 mM, (b) 5 mM, and (c)
10 mM glucose at the scan rate of 5 mV s-1.
233
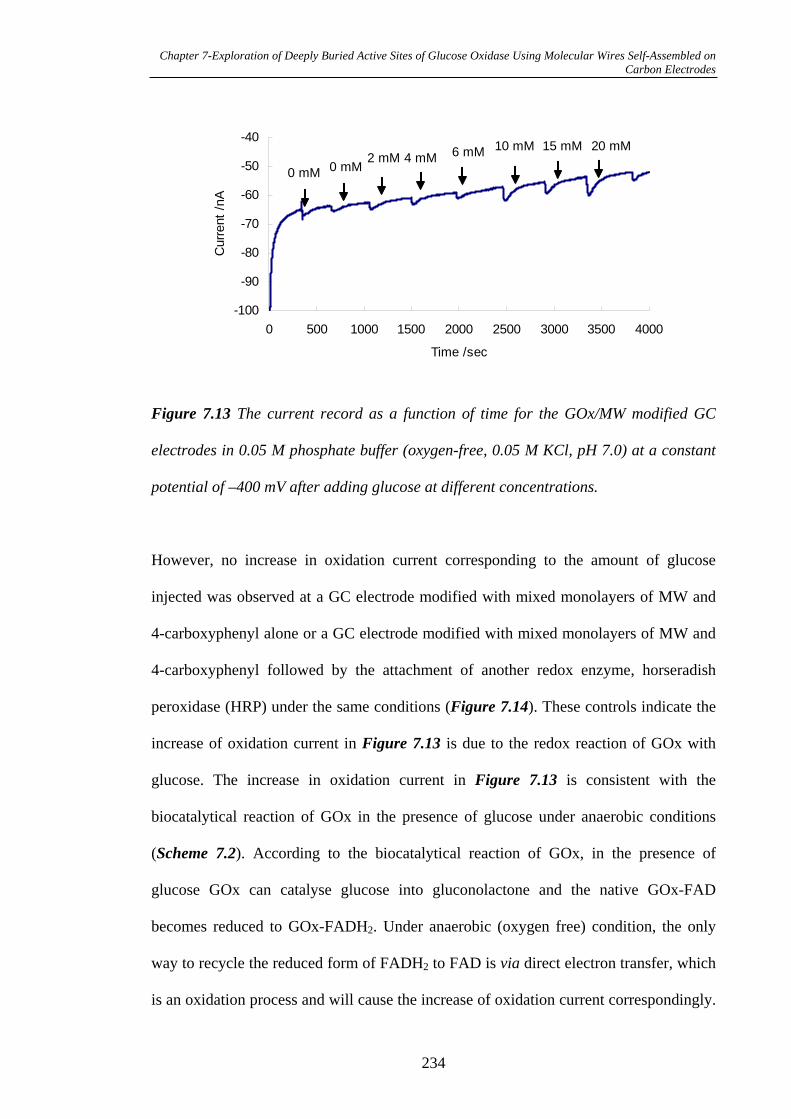
Chapter 7-Exploration of Deeply Buried Active Sites of Glucose Oxidase Using Molecular Wires Self-Assembled on Carbon Electrodes
-100
-90
-80
-70
-60
-50
-40
0 500 1000 1500 2000 2500 3000 3500 4000
Time /sec
Curr
ent
/nA
0 mM 0 mM2 mM 4 mM 6 mM 10 mM 15 mM 20 mM
Figure 7.13 The current record as a function of time for the GOx/MW modified GC
electrodes in 0.05 M phosphate buffer (oxygen-free, 0.05 M KCl, pH 7.0) at a constant
potential of –400 mV after adding glucose at different concentrations.
However, no increase in oxidation current corresponding to the amount of glucose
injected was observed at a GC electrode modified with mixed monolayers of MW and
4-carboxyphenyl alone or a GC electrode modified with mixed monolayers of MW and
4-carboxyphenyl followed by the attachment of another redox enzyme, horseradish
peroxidase (HRP) under the same conditions (Figure 7.14). These controls indicate the
increase of oxidation current in Figure 7.13 is due to the redox reaction of GOx with
glucose. The increase in oxidation current in Figure 7.13 is consistent with the
biocatalytical reaction of GOx in the presence of glucose under anaerobic conditions
(Scheme 7.2). According to the biocatalytical reaction of GOx, in the presence of
glucose GOx can catalyse glucose into gluconolactone and the native GOx-FAD
becomes reduced to GOx-FADH2. Under anaerobic (oxygen free) condition, the only
way to recycle the reduced form of FADH2 to FAD is via direct electron transfer, which
is an oxidation process and will cause the increase of oxidation current correspondingly.
234
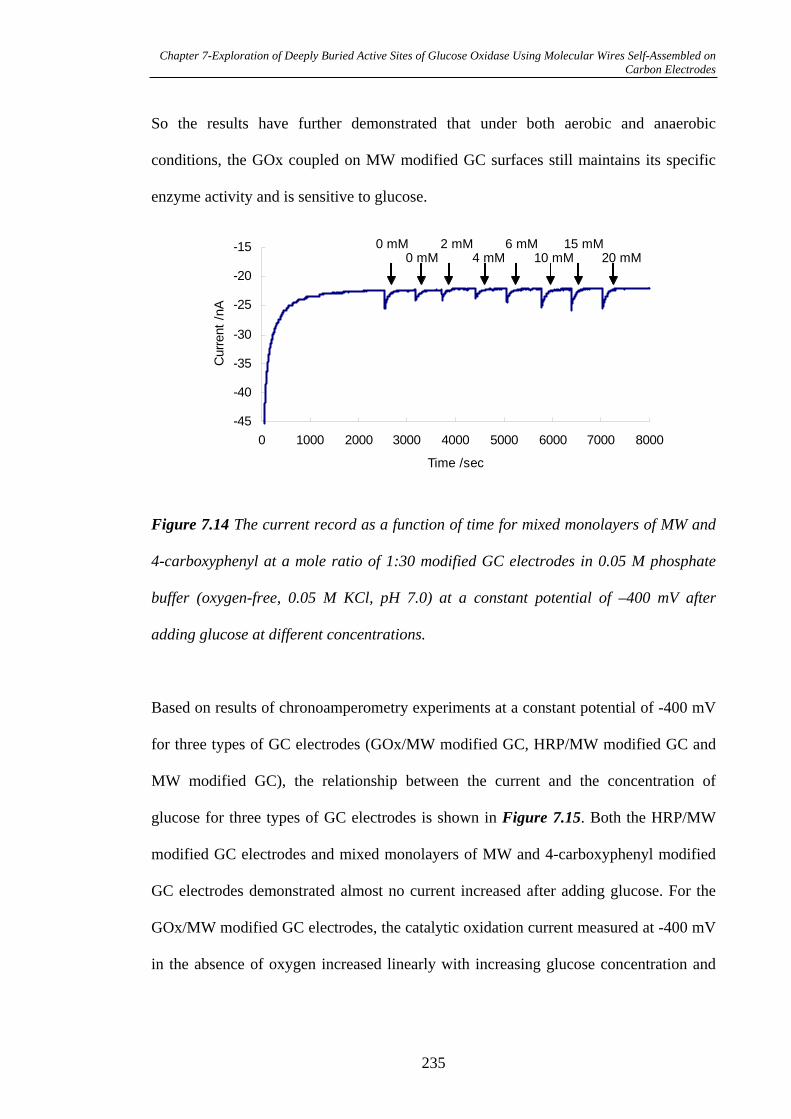
Chapter 7-Exploration of Deeply Buried Active Sites of Glucose Oxidase Using Molecular Wires Self-Assembled on Carbon Electrodes
So the results have further demonstrated that under both aerobic and anaerobic
conditions, the GOx coupled on MW modified GC surfaces still maintains its specific
enzyme activity and is sensitive to glucose.
-45
-40
-35
-30
-25
-20
-15
0 1000 2000 3000 4000 5000 6000 7000 8000
Time /sec
Curr
ent
/nA
0 mM0 mM
2 mM4 mM
6 mM10 mM
15 mM20 mM
Figure 7.14 The current record as a function of time for mixed monolayers of MW and
4-carboxyphenyl at a mole ratio of 1:30 modified GC electrodes in 0.05 M phosphate
buffer (oxygen-free, 0.05 M KCl, pH 7.0) at a constant potential of –400 mV after
adding glucose at different concentrations.
Based on results of chronoamperometry experiments at a constant potential of -400 mV
for three types of GC electrodes (GOx/MW modified GC, HRP/MW modified GC and
MW modified GC), the relationship between the current and the concentration of
glucose for three types of GC electrodes is shown in Figure 7.15. Both the HRP/MW
modified GC electrodes and mixed monolayers of MW and 4-carboxyphenyl modified
GC electrodes demonstrated almost no current increased after adding glucose. For the
GOx/MW modified GC electrodes, the catalytic oxidation current measured at -400 mV
in the absence of oxygen increased linearly with increasing glucose concentration and
235
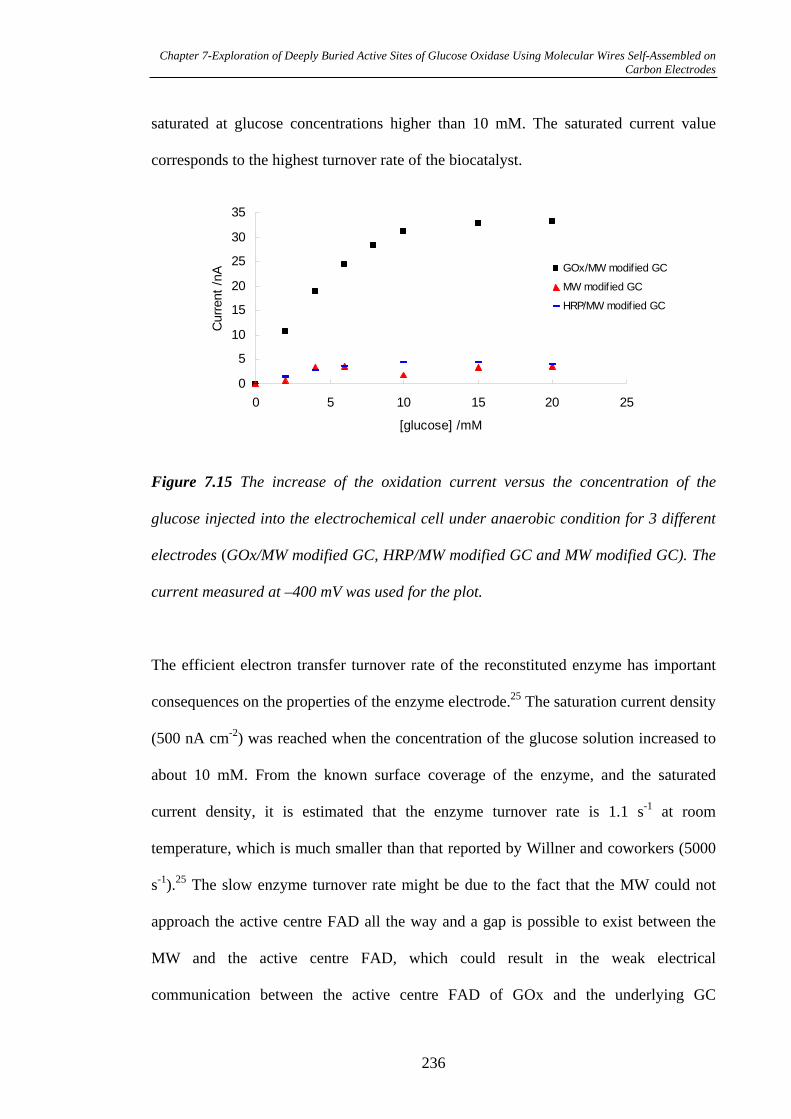
Chapter 7-Exploration of Deeply Buried Active Sites of Glucose Oxidase Using Molecular Wires Self-Assembled on Carbon Electrodes
saturated at glucose concentrations higher than 10 mM. The saturated current value
corresponds to the highest turnover rate of the biocatalyst.
0
5
10
15
20
25
30
35
0 5 10 15 20 25
[glucose] /mM
Curr
ent
/nA GOx/MW modif ied GC
MW modif ied GC
HRP/MW modif ied GC
Figure 7.15 The increase of the oxidation current versus the concentration of the
glucose injected into the electrochemical cell under anaerobic condition for 3 different
electrodes (GOx/MW modified GC, HRP/MW modified GC and MW modified GC). The
current measured at –400 mV was used for the plot.
The efficient electron transfer turnover rate of the reconstituted enzyme has important
consequences on the properties of the enzyme electrode.25 The saturation current density
(500 nA cm-2) was reached when the concentration of the glucose solution increased to
about 10 mM. From the known surface coverage of the enzyme, and the saturated
current density, it is estimated that the enzyme turnover rate is 1.1 s-1 at room
temperature, which is much smaller than that reported by Willner and coworkers (5000
s-1).25 The slow enzyme turnover rate might be due to the fact that the MW could not
approach the active centre FAD all the way and a gap is possible to exist between the
MW and the active centre FAD, which could result in the weak electrical
communication between the active centre FAD of GOx and the underlying GC
236
Chapter 7-Exploration of Deeply Buried Active Sites of Glucose Oxidase Using Molecular Wires Self-Assembled on Carbon Electrodes
electrodes and could compromise the catalytic response. So it is worthwhile to design
another molecular wire which can penetrate into the GOx and access to the active site
FAD to achieve significant electrical communication.
7.4 Conclusions
The conjugated and rigid MW was successfully used as an electron transfer linker for
the exploration of the deeply buried active centre of GOx. The results suggested that the
MW can extend into the interior of the glycoprotein and approach the active centre FAD
of GOx when the GC electrodes was modified with mixed monoalyers of MW and 4-
carboxyphenyl with the molar ratio of 1:30 followed by the coupling of GOx. Direct
electron transfer of GOx from the active centre FAD through the MW to the underlying
GC electrode has been demonstrated. The rate constant of electron transfer was found to
be 78 s-1. In addition, the immobilised GOx still retains its glucose-specific enzyme
activity. For the GOx/MW modified GC electrodes the catalytic oxidation current
measured at -400 mV in the absence of oxygen increased linearly with increasing
glucose concentration and saturates at glucose concentrations higher than 10 mM. So
the GOx/MW GC electrodes can be used as a glucose biosensor. However, the enzyme
turnover rate is only 1.1 s-1 at room temperature due to the weak electrical
communication between FAD and underlying GC electrodes.
7.5 References
(1) Willner, I., Science 2002, 298, 2407-2408.
(2) Wei, J.J., Liu, H.Y., Khoshtariya, D.E., Yamamoto, H., Dick, A., Waldeck,
D.H., Angew. Chem. Int. Edit. 2002, 41, 4700-4703.
237
Chapter 7-Exploration of Deeply Buried Active Sites of Glucose Oxidase Using Molecular Wires Self-Assembled on Carbon Electrodes
(3) Wei, J.J., Liu, H.Y., Dick, A.R., Yamamoto, H., He, Y.F., Waldeck, D.H., J.
Am. Chem. Soc. 2002, 124, 9591-9599.
(4) Di Gleria, K., Hill, H.A.O., Lowe, V.J., Page, D.J., J. Electroanal. Chem. 1986,
213, 333-8.
(5) Arnold, S., Feng, Z.Q., Kakiuchi, T., Knoll, W., Niki, K., J. Electroanal. Chem.
1997, 438, 91-97.
(6) Ruzgas, T., Wong, L., Gaigalas, A.K., Vilker, V.L., Langmuir 1998, 14, 7298-
7305.
(7) Liu, H., Yamamoto, H., Wei, J.J., Waldeck, D.H., Langmuir 2003, 19, 2378-
2387.
(8) Gorton, L., Lindgren, A., Larsson, T., Munteanu, F.D., Ruzgas, T., Gazaryan, I.,
Anal. Chim. Acta 1999, 400, 91-108.
(9) Yao, T., Harada, I., Nakahara, T., Bunseki Kagaku 1995, 44, 927-932.
(10) Lindgren, A., Larsson, T., Ruzgas, T., Gorton, L., J. Electroanal. Chem. 2000,
494, 105-113.
(11) Johnson, D.L., Thompson, J.L., Brinkmann, S.M., Schuller, K.A., Martin, L.L.,
Biochemistry 2003, 42, 10229-10237.
(12) Mayo, S.L., Ellis, W.R., Crutchley, R.J., Gray, H.B., Science 1986, 233, 948-
952.
(13) Hecht, H.J., Schomburg, D., Kalisz, H., Schmid, R.D., Biosens. Bioelectron.
1993, 8, 197-203.
(14) Jiang, L., McNeil, C.J., Cooper, J.M., Chem. Commun. 1995, 1293-1295.
(15) Wen, Z., Ye, B., Zhou, X., Electroanalysis 1997, 9, 641-645.
(16) Bourdillon, C., Demaille, C., Moiroux, J., Saveant, J.M., J. Am. Chem. Soc.
1994, 116, 10328-10329.
238
Chapter 7-Exploration of Deeply Buried Active Sites of Glucose Oxidase Using Molecular Wires Self-Assembled on Carbon Electrodes
(17) Guiseppi-Elie, A., Lei, C.H., Baughman, R.H., Nanotechnology 2002, 13, 559-
564.
(18) Godet, C., Boujtita, M., El Murr, N., New J. Chem. 1999, 23, 795-797.
(19) Zhao, Y.D., Zhang, W.D., Chen, H., Luo, Q.M., Anal. Sci. 2002, 18, 939-941.
(20) Chi, Q., Zhang, J., Dong, S.J., Electrochim. Acta 1994, 39, 2431-2438.
(21) Hess, C.R., Juda, G.A., Dooley, D.M., Amii, R.N., Hill, M.G., Winkler, J.R.,
Gray, H.B., J. Am. Chem. Soc. 2003, 125, 7156-7157.
(22) Liu, J.Q., Gooding, J.J., Paddon-Row, M.N., Chem. Phys. 2006, in press.
(23) Wen, Z., Ye, B., Zhou, X., Electroanalysis 1997, 9, 641.
(24) Zhang, W., Huang, Y., Han, D., Wang, X., Fan, C., Li, G., Anal. Biochem. 2004,
329, 85-90.
(25) Zayats, M., Katz, E., Willner, I., J. Am. Chem. Soc. 2002, 124, 2120-2121.
(26) Pazur, J.H., Kleppe, K., Biochemistry 1964, 3, 578-583.
(27) Ball, E.G., Cold Spring Harbor Symp. Quant. Biol. 1939, 180, 755.
(28) Ksenzhek, O.S., Petrova, S.A., Bioelectrochem. Bioenerg. 1983, 11, 105.
(29) Lowe, H.J., J. Biol. Chem 1956, 221, 983-989.
(30) Gorton, L., Johansson, G., J. Electroanal. Chem. 1980, 113, 151-158.
(31) Verhagen, M.F.J.M., Hagen, W.R., J. Electroanal. Chem. 1992, 334, 339-350.
(32) Durfor, C.N., Yenser, B.A., Bowers, M.L., J. Electroanal Chem. 1988, 244,
287-295.
(33) Liu, J.Q., Paddon-Row, M.N., Gooding, J.J., J. Phys. Chem. B 2004, 108, 8460-
8466.
(34) Degani, Y., Heller, A., J. Phys. Chem. 1987, 91, 1285-1289.
(35) Gooding, J.J., Situmorang, M., Erokhin, P., Hibbert, D.B., Anal. Commun. 1999,
36, 225-228.
239
Chapter 7-Exploration of Deeply Buried Active Sites of Glucose Oxidase Using Molecular Wires Self-Assembled on Carbon Electrodes
(36) Zayats, M., Raitman, O.A., Chegel, V.I., Kharitonov, A.B., Willner, I., Anal.
Chem. 2002, 74, 4763-4773.
(37) Bourdillon, C., Demaille, C., Gueris, J., Moiroux, J., Saveant, J.-M., J. Am.
Chem. Soc. 1993, 115, 12264-12269.
(38) Staros, J.V., Wright, R.W., Swingle, D.M., Anal. Biochem. 1986, 156, 220-2.
(39) Willner, I., HelegShabtai, V., Blonder, R., Katz, E., Tao, G.L., J. Am. Chem.
Soc. 1996, 118, 10321-10322.
(40) Zayats, M., Katz, E., Willner, I., J. Am. Chem. Soc. 2002, 124, 14724-14731.
(41) Tam-Chang, S.-W., Mason, J., Iverson, I., Kwang, K.-O., Leonard, C., Chem.
Commun. 1999, 65-66.
(42) Cooke, G., Duclairoir, F.M.A., John, P., Polwart, N., Rotello, V.M., Chem.
Commun. 2003, 2468-2469.
(43) Hong, H.G., Mallouk, T.E., Langmuir 1991, 7, 2362-2369.
(44) Szucs, A., Hitchens, G.D., Bockris, J.O.M., J. Electrochem. Soc. 1989, 136,
3748-3753.
(45) Nakamura, S., Hayashi, S., Koga, K., Biochem. Biophys. Acta 1976, 445, 294-
298.
(46) Finegold, L., Donnell, J.T., Nature 1979, 278, 443-445.
(47) Weibel, M.K., Bright, H.J., J. Biol. Chem 1971, 246, 2743-2751.
(48) Pontikos, N.M., McCreery, R.L., J. Electroanal. Chem. 1992, 324, 229-242.
(49) Laviron, E., J. Electroanal. Chem. 1979, 101, 19-28.
240
Chapter 8-Development of a Labe-Freel Immunosensor on Molecular Wire Modified Glassy Carbon Surfaces
Chapter Eight
Development of a Label-Free Immunosensor on Molecular
Wire Modified Glassy Carbon Surfaces
241
Chapter 8-Development of a Labe-Freel Immunosensor on Molecular Wire Modified Glassy Carbon Surfaces
8.1 Introduction
The transfer of electrons between an electrode and a redox centre in the presence of a
biological molecule is the basis of behind transduction in many bioelectronic devices
and electrochemical biosensors.1, 2 With enzyme based biosensors this transfer of
electrons is achieved either by the soluble redox active molecules shuttling electrons
between the redox active centres of the enzyme and the electrode3-7 or alternatively
electrons are transferred between the redox active centres and the electrode directly.8-10
In the case of affinity based biosensors, where biorecognition is via antibody-antigen
binding or hybridisation of DNA, the biorecognition event is more difficult to transduce
because of the absence of an obvious redox active centre. The typical solution to this
problem is to add redox labels which exhibit a change in affinity for the biosensing
interface upon the biorecognition event. An example of this approach is the transduction
of DNA hybridisation by long range electron transfer where after DNA hybridisation a
redox active intercalator is added to the solution containing the biosensor.11 When only
a single strand of DNA is present at the interface, the redox reporter has no affinity for
the DNA. However, upon hybridisation to form a duplex, sites for intercalation are
formed, and the redox molecule possesses an affinity for the DNA. The intercalation
then allows the redox reporter to be interrogated electrochemically by electrons
transferring through the DNA. Transduction of the biorecognition event in a typically
electrochemical immunosensor has related elements to the DNA example. The
electrochemical immmunosensors developed by Kuhr and coworkers reflect this
strategy.12 After binding of the antigen to the antibody modified electrode, a second
antigen containing an enzyme label competes with the antigen for binding sites in a
242
Chapter 8-Development of a Labe-Freel Immunosensor on Molecular Wire Modified Glassy Carbon Surfaces
competitive assay. Once equilibrium is attained the substrate for the enzyme is added
and a product of the enzyme reaction is detected electrochemically.
Both these examples have the same drawback however, the need to add a reporting
species to the sample solution being analysed at some point during the analysis so that
transduction of the biorecognition event can be achieved. The requirement to add the
reporting molecule necessitates user intervention during the performance of the
analysis. The need for user intervention means the final biosensor requires skills to
operate, contrary to the principles of biosensors that they should be usable by unskilled
operators. One solution to this problem has been to use label free approaches such as
using the quartz crystal microbalance, surface plasmon resonance,13 mechano-acoustical
spectroscopy,14 optical change in liquid crystals15 or a label free electrochemical
immunosensor developed by Tender and co-workers.16 The label free techniques are
however beset by problems of robustness when analysing real complex samples. The
robustness issue comes from non-specific binding at the biosensing interface also giving
a response as well as the specific immunoreaction.
This chapter is to present a new user-intervention-free immunobiosensor where the
electrochemical response is reliant on the change in the amount of antigen bound to the
antibody. The idea stems from the large body of work on direct electron transfer.
Throughout this large body of work there have been examples where the presence of the
protein has an adverse effect on the electrochemistry.4, 17, 18 This is perhaps illustrated
by the refolding of apo-glucose oxidase around its active centre FAD where
electrochemistry is essentially switched off when the protein folds. Willner proposed
this switching off of FAD was due to nonspecific incorporation on the protein.18
243
Chapter 8-Development of a Labe-Freel Immunosensor on Molecular Wire Modified Glassy Carbon Surfaces
Gooding expanded on this idea further and suggested that this switch off is a
consequence of poor electronic coupling.17 Support for the ideas of non-specific
adsorption comes from Rubin where glucose oxidase is attached to the gold electrodes
modified with a mixed monolayer of ferrocenylhexadecanethiol and aminoethanethiol
and the redox chemistry of ferrocene was switched off.4 Furthermore, the modulation of
redox electrochemistry by the presence of proteins has been demonstrated where
antibodies bind to an electrode containing a surface attached redox active species,16, 19
which opens the door for the development of immunosensors where the immunobinding
reaction is monitored by the modulation of the electrochemistry.
For the design of an immunosensor, the most vital factors that should be concerned are
reproducibility, specificity, and sensitivity. The design of the biorecognition interface
has the dominant effect on these performance parameters. General strategies for the
immobilisation of immuno-reagents onto solid electrode surfaces include physical
adsorption at a solid surface,20-22 microencapsulation, entrapment,23, 24 cross linking,
covalent bonding,25-27 and the use of biological binding proteins such as protein A or
protein G28, 29 or use of the avidin/biotin system. Furthermore, as mentioned above for
label-free immunosensors, non-specific adsorption of proteins and cross-reactivity of
non-target proteins affect the sensitivity as well as the reliability of the biosensor.
Nonspecific adsorption of proteins is generally minimised by masking the surfaces with
blocking agents such as bovine serum albumin (BSA)30 or a hydrophilic layer such as
poly(ethylene glycol) molecules (PEG).31
Many kinds of electrodes have been used to fabricate immunosensor devices including
carbon paste electrodes,32 screen-printed carbon electrodes,33 GC electrodes34, 35 and
244
Chapter 8-Development of a Labe-Freel Immunosensor on Molecular Wire Modified Glassy Carbon Surfaces
gold electrodes.36 Electrochemically reductive modification of GC surfaces with aryl
diazonium salts to form stable monolayers is of interest to electrochemistry37 due to the
potential advantages as introduced in Chapter One. GC electrodes can be covalently
modified with a long completely rigid molecular wire (MW) existing as the aryl
diazonium salts and the interface comprising mixed monolayers of MW and PEG
demonstrated good potential for the protein chemistry in Chapter Six. The modified
MW has demonstrated high efficiency of electron transfer and can be used as the
conduit for electron transfer to explore the active centres of glucose oxidase in Chapter
Seven. So this kind of conjugated aromatic molecule of precise length and composition
has great potential in the development of potential switches, wires, controllers, and
gates of a molecular computer due to the favorable conductivity.38-40
The purpose of this chapter is to present proof-of-concept results for the modulation of
electrochemistry by protein as the basis of an immunosensor. Scheme 8.1 a shows the
schematic of the label-free immunosensor which was fabricated in this study, and
Scheme 8.1 b shows the schematic of using the fabricated immunosensor for the
determination of antibiotin. As shown in Scheme 8.1 a, GC electrodes were firstly
modified with mixed monolayers of MW and PEG. Mixed monolayers on electrode
surfaces are promising as platforms for protein adsorption and immobilisation41 due to
the possibility to control chemical and structural properties of a surface by adjusting the
abundance, type, and spatial (both normal and lateral) distribution of the tail groups.
The redox probe ferrocenedimethylamine was subsequently attached to the carboxylic
acid terminated MW by forming an amide bond followed by the immobilisation of
biotin. After incubation this immunosensor to the antibiotin solution, the antibiotin can
be immobilised to the immunosensor surface as shown in Scheme 8.1 b due to the
245
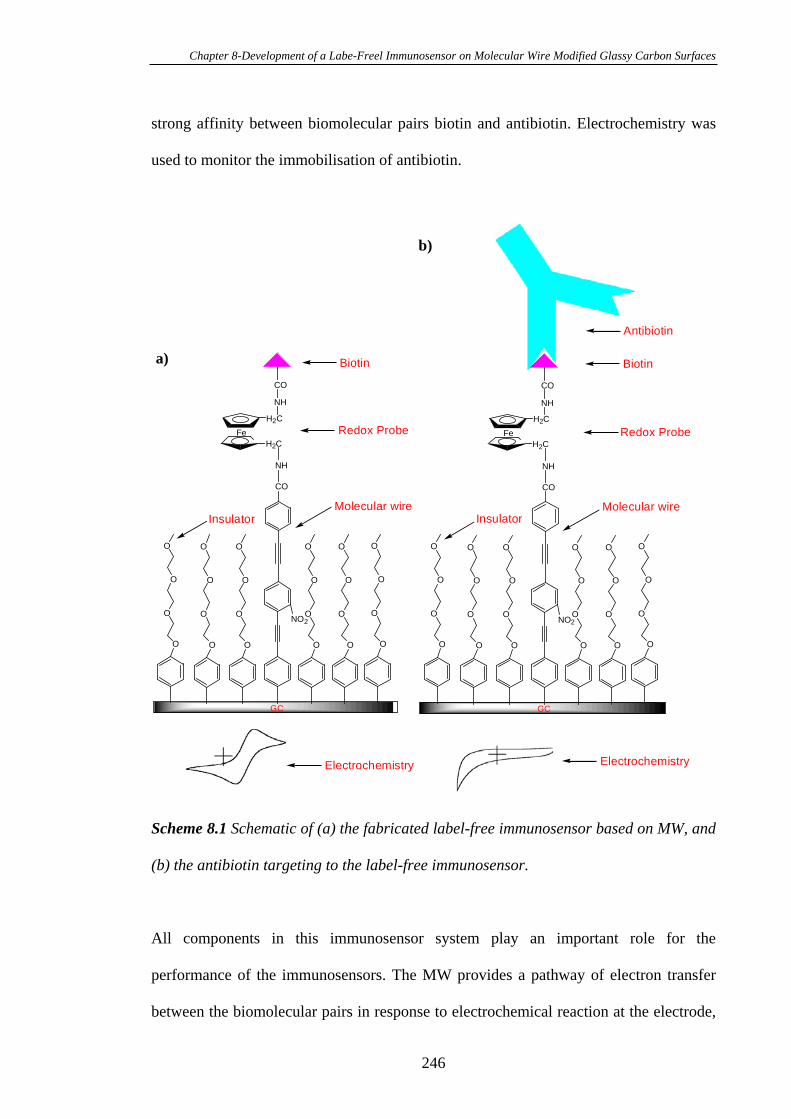
Chapter 8-Development of a Labe-Freel Immunosensor on Molecular Wire Modified Glassy Carbon Surfaces
strong affinity between biomolecular pairs biotin and antibiotin. Electrochemistry was
used to monitor the immobilisation of antibiotin.
O
O
O
O
GC
O
O
O
O
O
O
O
O
O
O
O
O
O
O
O
O
O
O
O
O
Molecular wireInsulator
NO2
CO
NH
NH
CO
Redox ProbeFe
H2C
H2C
Biotin
Electrochemistry
a)
Electrochemistry
O
O
O
O
GC
O
O
O
O
O
O
O
O
O
O
O
O
O
O
O
O
O
O
O
O
Molecular wireInsulator
NO2
CO
NH
NH
CO
Redox ProbeFe
H2C
H2C
b)
Biotin
Antibiotin
Scheme 8.1 Schematic of (a) the fabricated label-free immunosensor based on MW, and
(b) the antibiotin targeting to the label-free immunosensor.
All components in this immunosensor system play an important role for the
performance of the immunosensors. The MW provides a pathway of electron transfer
between the biomolecular pairs in response to electrochemical reaction at the electrode,
246
Chapter 8-Development of a Labe-Freel Immunosensor on Molecular Wire Modified Glassy Carbon Surfaces
and the PEG serves as insulators to resist the non-specific protein adsorption. Thus only
the electrical response from target biomolecules can directly access to the electrode and
the signal caused by interference to the electrode can be excluded. The redox probe
ferrocene can be used to transduce the interactions between bimolecular pairs. Before
the immobilisation of antibiotin, the electrochemistry of redox probe can be observed as
shown in Scheme 8.1 a, but association of the antibiotin to the biotinylation modified
GC electrode blocks the electrochemistry of ferrocene as shown in Scheme 8.1 b. The
extent of the electrode in solution by antibiotin is controlled by the antibiotin
concentration in the sample. Based on the changes in the microenviroments that
influence readily measurable redox properties of redox species, electrochemistry was
used to probe the specific biotin:antibody interactions.
8.2 Experimental Section
8.2.1 Chemicals and Procedures
All the reagents and materials are listed in Table 2.1 of Chapter Two or prepared
according to the procedures described in Chapter Two. GC electrodes were prepared
according to the method described in Section 2.4. All the pure and mixed monolayers
were prepared as described in Section 2.4.6. The procedures for the synthesis of MW,
PEG and ferrocenedimethylamine are shown in Section 2.2. All electrochemical
measurements were performed with a BAS-l00B electrochemical analyser. All
potentials were quoted relative to an Ag/AgCl reference at room temperature. All cyclic
voltammetry measurements for the ferrocene modified electrodes were carried out in
phosphate buffer (0.05 M KCl, 0.05 M K2HPO4/KH2PO4, pH 7.0).
247
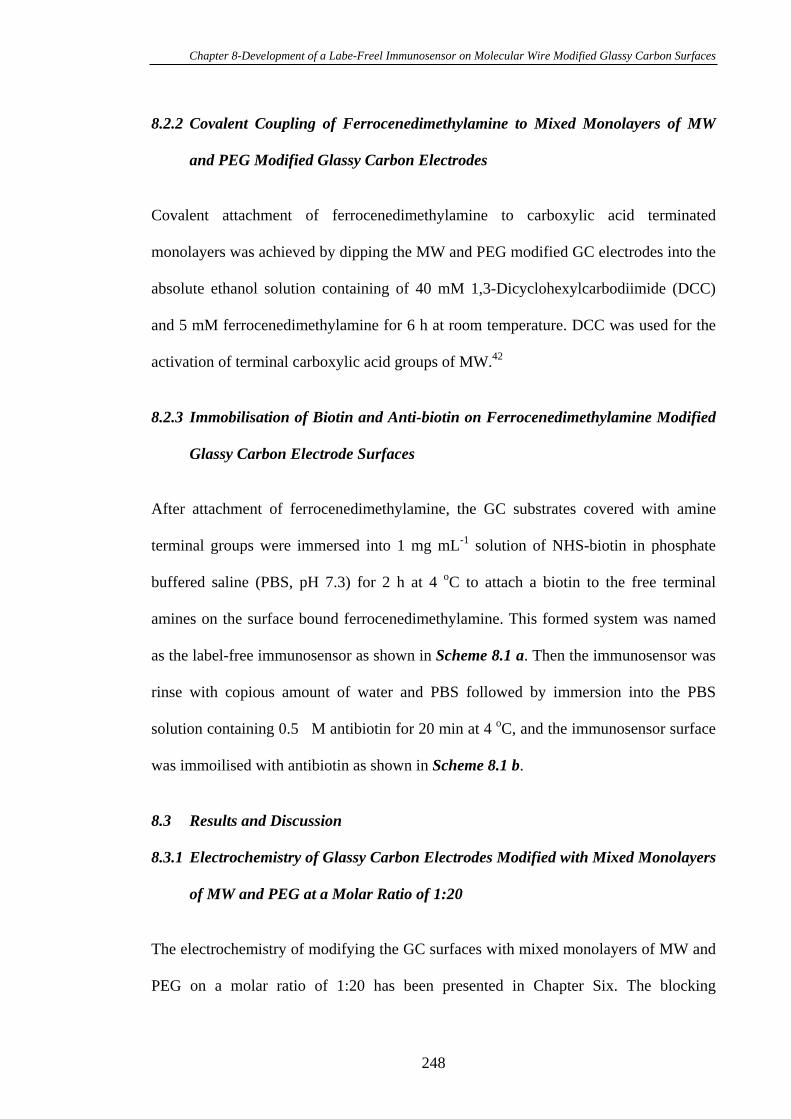
Chapter 8-Development of a Labe-Freel Immunosensor on Molecular Wire Modified Glassy Carbon Surfaces
8.2.2 Covalent Coupling of Ferrocenedimethylamine to Mixed Monolayers of MW
and PEG Modified Glassy Carbon Electrodes
Covalent attachment of ferrocenedimethylamine to carboxylic acid terminated
monolayers was achieved by dipping the MW and PEG modified GC electrodes into the
absolute ethanol solution containing of 40 mM 1,3-Dicyclohexylcarbodiimide (DCC)
and 5 mM ferrocenedimethylamine for 6 h at room temperature. DCC was used for the
activation of terminal carboxylic acid groups of MW.42
8.2.3 Immobilisation of Biotin and Anti-biotin on Ferrocenedimethylamine Modified
Glassy Carbon Electrode Surfaces
After attachment of ferrocenedimethylamine, the GC substrates covered with amine
terminal groups were immersed into 1 mg mL-1 solution of NHS-biotin in phosphate
buffered saline (PBS, pH 7.3) for 2 h at 4 oC to attach a biotin to the free terminal
amines on the surface bound ferrocenedimethylamine. This formed system was named
as the label-free immunosensor as shown in Scheme 8.1 a. Then the immunosensor was
rinse with copious amount of water and PBS followed by immersion into the PBS
solution containing 0.5 M antibiotin for 20 min at 4 oC, and the immunosensor surface
was immoilised with antibiotin as shown in Scheme 8.1 b.
8.3 Results and Discussion
8.3.1 Electrochemistry of Glassy Carbon Electrodes Modified with Mixed Monolayers
of MW and PEG at a Molar Ratio of 1:20
The electrochemistry of modifying the GC surfaces with mixed monolayers of MW and
PEG on a molar ratio of 1:20 has been presented in Chapter Six. The blocking
248
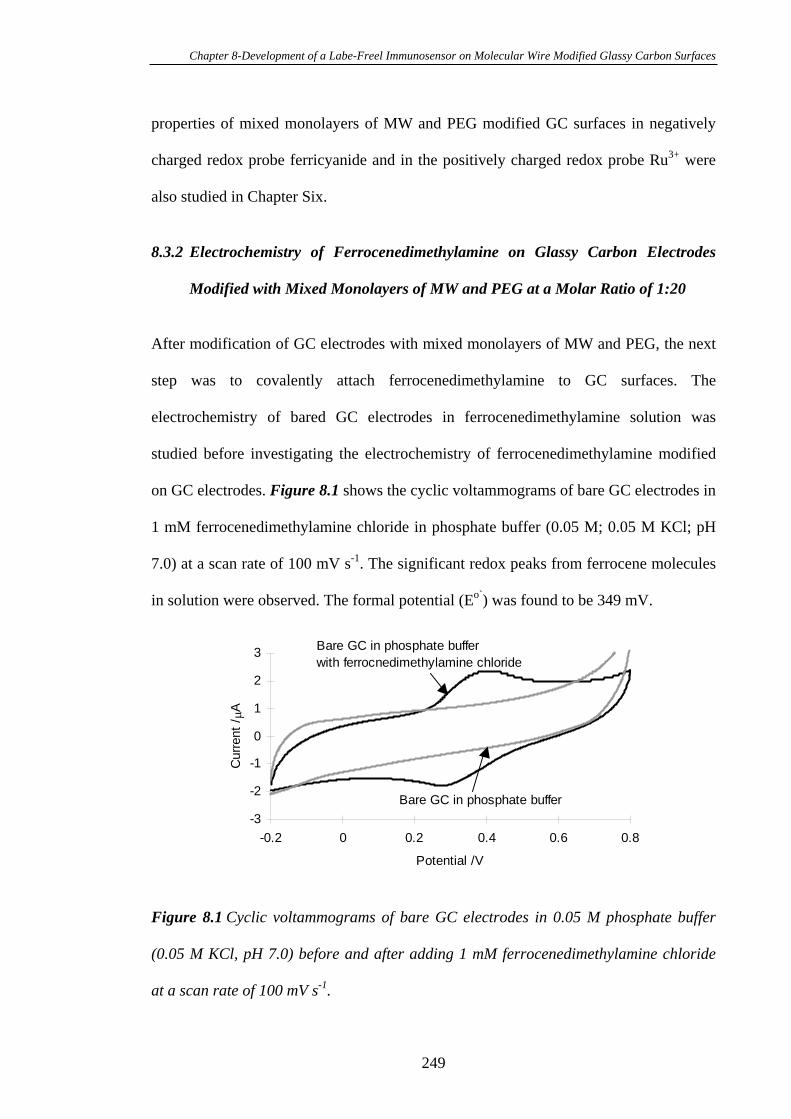
Chapter 8-Development of a Labe-Freel Immunosensor on Molecular Wire Modified Glassy Carbon Surfaces
properties of mixed monolayers of MW and PEG modified GC surfaces in negatively
charged redox probe ferricyanide and in the positively charged redox probe Ru3+ were
also studied in Chapter Six.
8.3.2 Electrochemistry of Ferrocenedimethylamine on Glassy Carbon Electrodes
Modified with Mixed Monolayers of MW and PEG at a Molar Ratio of 1:20
After modification of GC electrodes with mixed monolayers of MW and PEG, the next
step was to covalently attach ferrocenedimethylamine to GC surfaces. The
electrochemistry of bared GC electrodes in ferrocenedimethylamine solution was
studied before investigating the electrochemistry of ferrocenedimethylamine modified
on GC electrodes. Figure 8.1 shows the cyclic voltammograms of bare GC electrodes in
1 mM ferrocenedimethylamine chloride in phosphate buffer (0.05 M; 0.05 M KCl; pH
7.0) at a scan rate of 100 mV s-1. The significant redox peaks from ferrocene molecules
in solution were observed. The formal potential (Eo`) was found to be 349 mV.
-3
-2
-1
0
1
2
3
-0.2 0 0.2 0.4 0.6 0.8
Potential /V
Curr
ent
/A
Bare GC in phosphate buffer
Bare GC in phosphate buffer
with ferrocnedimethylamine chloride
Figure 8.1 Cyclic voltammograms of bare GC electrodes in 0.05 M phosphate buffer
(0.05 M KCl, pH 7.0) before and after adding 1 mM ferrocenedimethylamine chloride
at a scan rate of 100 mV s-1.
249
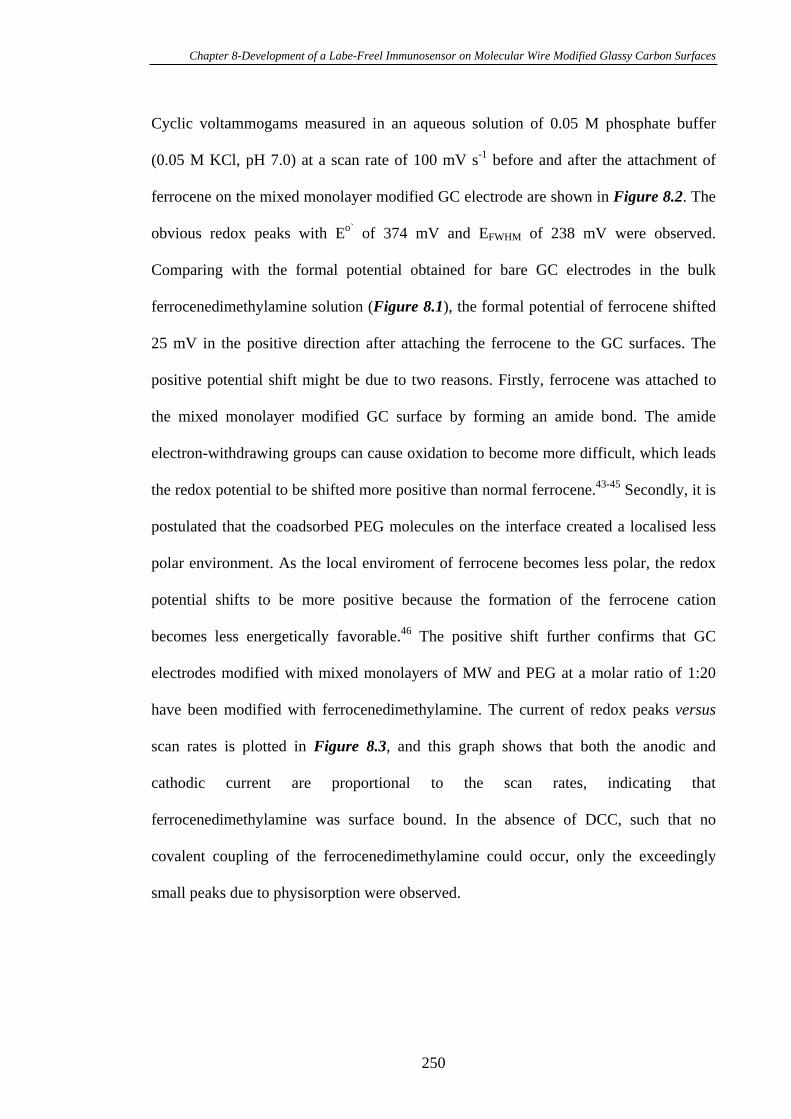
Chapter 8-Development of a Labe-Freel Immunosensor on Molecular Wire Modified Glassy Carbon Surfaces
Cyclic voltammogams measured in an aqueous solution of 0.05 M phosphate buffer
(0.05 M KCl, pH 7.0) at a scan rate of 100 mV s-1 before and after the attachment of
ferrocene on the mixed monolayer modified GC electrode are shown in Figure 8.2. The
obvious redox peaks with Eo` of 374 mV and EFWHM of 238 mV were observed.
Comparing with the formal potential obtained for bare GC electrodes in the bulk
ferrocenedimethylamine solution (Figure 8.1), the formal potential of ferrocene shifted
25 mV in the positive direction after attaching the ferrocene to the GC surfaces. The
positive potential shift might be due to two reasons. Firstly, ferrocene was attached to
the mixed monolayer modified GC surface by forming an amide bond. The amide
electron-withdrawing groups can cause oxidation to become more difficult, which leads
the redox potential to be shifted more positive than normal ferrocene.43-45 Secondly, it is
postulated that the coadsorbed PEG molecules on the interface created a localised less
polar environment. As the local enviroment of ferrocene becomes less polar, the redox
potential shifts to be more positive because the formation of the ferrocene cation
becomes less energetically favorable.46 The positive shift further confirms that GC
electrodes modified with mixed monolayers of MW and PEG at a molar ratio of 1:20
have been modified with ferrocenedimethylamine. The current of redox peaks versus
scan rates is plotted in Figure 8.3, and this graph shows that both the anodic and
cathodic current are proportional to the scan rates, indicating that
ferrocenedimethylamine was surface bound. In the absence of DCC, such that no
covalent coupling of the ferrocenedimethylamine could occur, only the exceedingly
small peaks due to physisorption were observed.
250
Chapter 8-Development of a Labe-Freel Immunosensor on Molecular Wire Modified Glassy Carbon Surfaces
-2
-1
0
1
2
-0.4 -0.2 0 0.2 0.4 0.6 0.8 1
Potential /V
Curr
ent
/A
After attachment
of ferroceneBefore attachment
of ferrocene
Figure 8.2 Cyclic voltammograms of mixed monolayers of MW and PEG modified GC
electrodes before and after the covalent attachment of ferrocenedimethylamine in
0.05 M phosphate buffer (0.05 M KCl, pH 7.0) at a scan rate of 100 mV s-1.
-1
-0.5
0
0.5
1
0 0.2 0.4 0.6 0.8
Scan rate /V s-1
Curr
ent
/A
Figure 8.3 Peak current verse the scan rate for the cyclic voltammograms after the
attachment of ferrocenedimethylamine. Triangles: anodic scan, squares: cathodic scan.
Cyclic voltammogams of the ferrocene coupled to the mixed monolayers of MW and
PEG in Figure 8.2 show non-ideal behaviour47 with regards to peak separation at slow
scan rates ( Ep 90 mV rather than the ideal Ep 0 mV) and the full width half
251
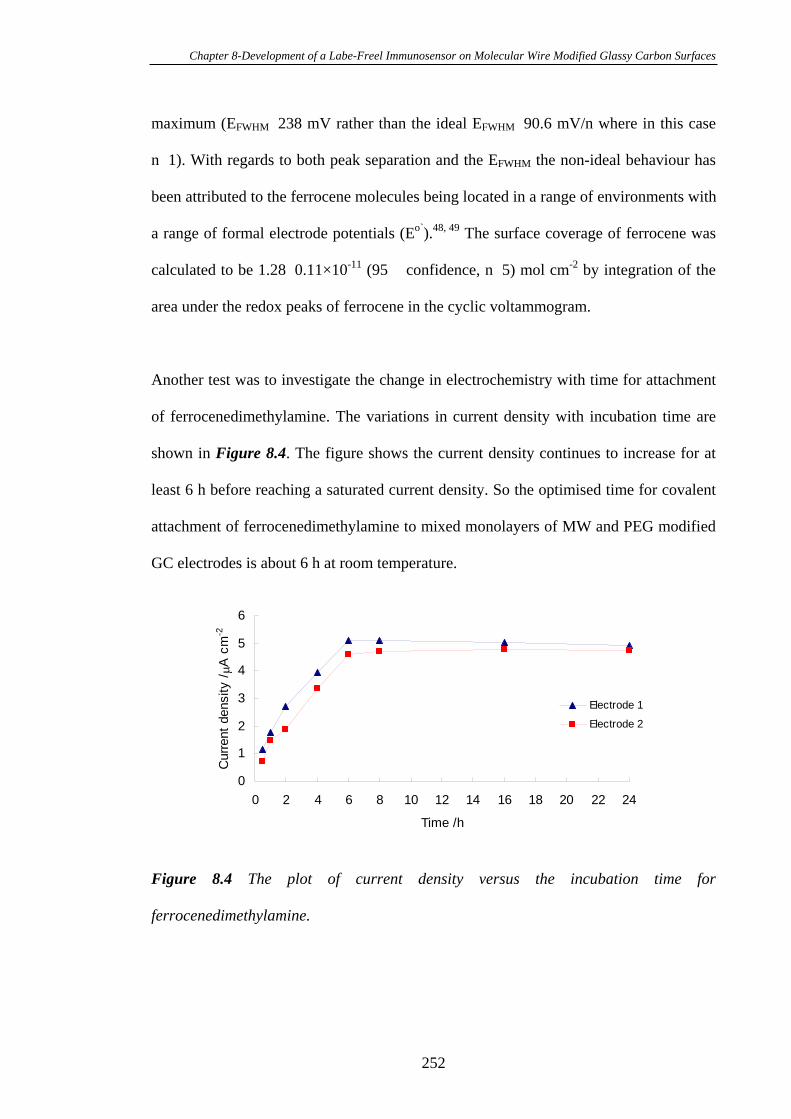
Chapter 8-Development of a Labe-Freel Immunosensor on Molecular Wire Modified Glassy Carbon Surfaces
maximum (EFWHM 238 mV rather than the ideal EFWHM 90.6 mV/n where in this case
n 1). With regards to both peak separation and the EFWHM the non-ideal behaviour has
been attributed to the ferrocene molecules being located in a range of environments with
a range of formal electrode potentials (Eo`).48, 49 The surface coverage of ferrocene was
calculated to be 1.28 0.11×10⁻¹¹ (95 confidence, n 5) mol cm-2 by integration of the
area under the redox peaks of ferrocene in the cyclic voltammogram.
Another test was to investigate the change in electrochemistry with time for attachment
of ferrocenedimethylamine. The variations in current density with incubation time are
shown in Figure 8.4. The figure shows the current density continues to increase for at
least 6 h before reaching a saturated current density. So the optimised time for covalent
attachment of ferrocenedimethylamine to mixed monolayers of MW and PEG modified
GC electrodes is about 6 h at room temperature.
0
1
2
3
4
5
6
0 2 4 6 8 10 12 14 16 18 20 22 24
Time /h
Curr
ent
density
/A
cm
-2
Electrode 1
Electrode 2
Figure 8.4 The plot of current density versus the incubation time for
ferrocenedimethylamine.
252
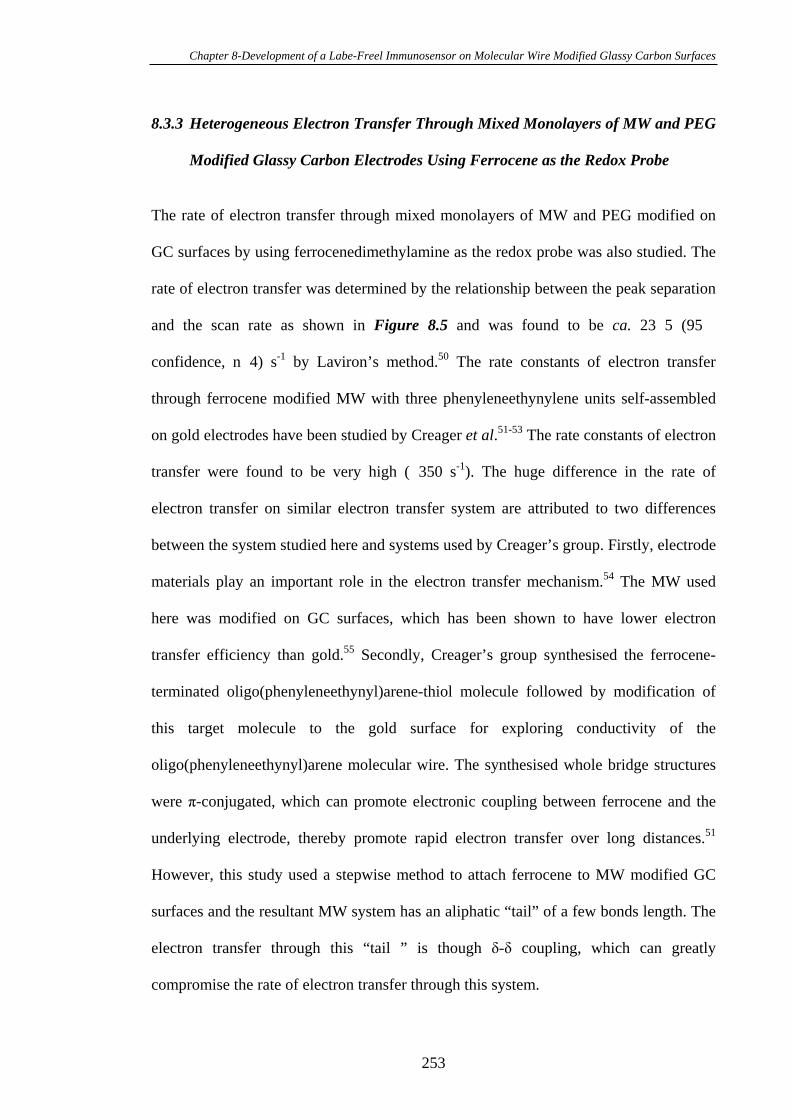
Chapter 8-Development of a Labe-Freel Immunosensor on Molecular Wire Modified Glassy Carbon Surfaces
8.3.3 Heterogeneous Electron Transfer Through Mixed Monolayers of MW and PEG
Modified Glassy Carbon Electrodes Using Ferrocene as the Redox Probe
The rate of electron transfer through mixed monolayers of MW and PEG modified on
GC surfaces by using ferrocenedimethylamine as the redox probe was also studied. The
rate of electron transfer was determined by the relationship between the peak separation
and the scan rate as shown in Figure 8.5 and was found to be ca. 23 5 (95
confidence, n 4) s-1 by Laviron’s method.50 The rate constants of electron transfer
through ferrocene modified MW with three phenyleneethynylene units self-assembled
on gold electrodes have been studied by Creager et al.51-53 The rate constants of electron
transfer were found to be very high ( 350 s-1). The huge difference in the rate of
electron transfer on similar electron transfer system are attributed to two differences
between the system studied here and systems used by Creager’s group. Firstly, electrode
materials play an important role in the electron transfer mechanism.54 The MW used
here was modified on GC surfaces, which has been shown to have lower electron
transfer efficiency than gold.55 Secondly, Creager’s group synthesised the ferrocene-
terminated oligo(phenyleneethynyl)arene-thiol molecule followed by modification of
this target molecule to the gold surface for exploring conductivity of the
oligo(phenyleneethynyl)arene molecular wire. The synthesised whole bridge structures
were -conjugated, which can promote electronic coupling between ferrocene and the
underlying electrode, thereby promote rapid electron transfer over long distances.51
However, this study used a stepwise method to attach ferrocene to MW modified GC
surfaces and the resultant MW system has an aliphatic “tail” of a few bonds length. The
electron transfer through this “tail ” is though - coupling, which can greatly
compromise the rate of electron transfer through this system.
253
Chapter 8-Development of a Labe-Freel Immunosensor on Molecular Wire Modified Glassy Carbon Surfaces
-120
-80
-40
0
40
80
120
-2.5 -2 -1.5 -1 -0.5 0 0.5 1
Log /V s-1
Ep-E
o`
/mV
Figure 8.5 The dependence of peak separation (Ep-Eo`) on the scan rate for
ferrocenedimethylamine attached to mixed monolayers of MW and PEG modified GC
electrode surfaces.
8.3.4 Electrochemistry of Ferrocene Modified Glassy Carbon Electrode Surfaces
after Immobilisation of Biotin and Antibiotin
After modification of ferrocenedimethylamine on mixed monolayers of MW and PEG
modified GC electrodes, the ferrocene modified GC surfaces with the terminal amine
groups can be modified with NHS-biotin followed by the immobilisation of antibiotin
through biomolecular affinity. The electrochemistry was used to monitor the step-wise
attachment of biomolecular pairs. Figure 8.6 a shows the cyclic voltammograms of
ferrocene modified GC surfaces before and after incubation of biotin and antibiotin.
After the attachment of biotin, the electrochemistry of GC surfaces showed only minor
change. However, cyclic voltammetry of biotinylated GC surfaces demonstrated
pronounced reductions in peak currents after incubation in antibiotin solution. The OSW
voltammograms, as a more sensitive electrochemical technique, of biotinylated GC
254

Chapter 8-Development of a Labe-Freel Immunosensor on Molecular Wire Modified Glassy Carbon Surfaces
surfaces also demonstrated pronounced reductions in peak currents after incubation with
antibiotin as s hown in Figure 8.6 b.
-1.5
-0.5
0.5
1.5
2.5
-0.4 -0.2 0 0.2 0.4 0.6 0.8 1
Potential /V
Curr
ent /
A
After attachment of Fc
After incubation of biotin
After incubation of
antibiotin
a)
-2.7
-2.6
-2.5
-2.4
-2.3
-2.2
-2.1
-2
0 0.2 0.4 0.6 0.8
Potential /V
Curr
ent /
A
After attachment of Fc
After attachment of biotin
After incubation in
antibiotin
b)
Figure 8.6 (a) Cyclic voltammograms and (b) OSW voltammograms of mixed
monolayers of MW and PEG modified GC surfaces after the step-wise attachment of
ferrocenedimethylamine, biotin and antibiotin in 0.05 M phosphate buffer (0.05 M KCl,
pH 7.0) at a scan rate of 100 mV s-1. Ferrocene was firstly covalent attached to mixed
monolayers of MW and PEG modified GC surfaces followed by the attachment of NHS-
biotin, and antibiotin was finally immobilised by the affinity between biotin and
antibiotin.
255
Chapter 8-Development of a Labe-Freel Immunosensor on Molecular Wire Modified Glassy Carbon Surfaces
The results in Figure 8.6 demonstrated that the electrochemistry of biotinylated GC
electrodes decreased after the immobilisation of antibiotin, which is consistent with the
results reported in the literature.16, 19, 56 It is hypothesised that the observed
electrochemistry changes reflect changes in the immediate microenvironment of the
redox probe concomitant with target binding.57, 58 The mechanism resulting in the
observed voltametric changes still remains unclear. One possible explanation is that the
immobilisation of antibiotin results in the formation of a biotin:antibiotin
immunocomplex on electrode surface,59 which covers the modified GC surface like a
cap and can block the ions to access the redox probe and thus decrease the current
correspondingly.
Controls revealed that no redox peaks were observed (Figure 8.7) when the similar
system was fabricated by using ethylenediamine, which is not a redox probe, to replace
ferrocenedimethylamine. The result indicates the obvious redox peaks formed in
Figure 8.6 were caused by the redox probe ferrocenedimethylamine. So the redox probe
is vital for the fabrication of this novel biosensing system. Moreover, in order to
investigate if the observed electrochemistry changes in Figure 8.6 were caused by the
interactions between biomolecular pairs biotin and antibiotin, other controls was carried
out. As shown in Figure 8.8, the cyclic voltammetry showed almost no change in peak
current when the biotin was excluded from the immunosensor system (Scheme 8.1 a).
Similarly, when the biotinylated GC electrodes were incubated in other proteins which
are not specific to biotin, such as BSA, and anti pig IgG under identical conditions
rather than antibiotin, almost no electrochemistry changes were observed as shown in
Figure 8.9.
256
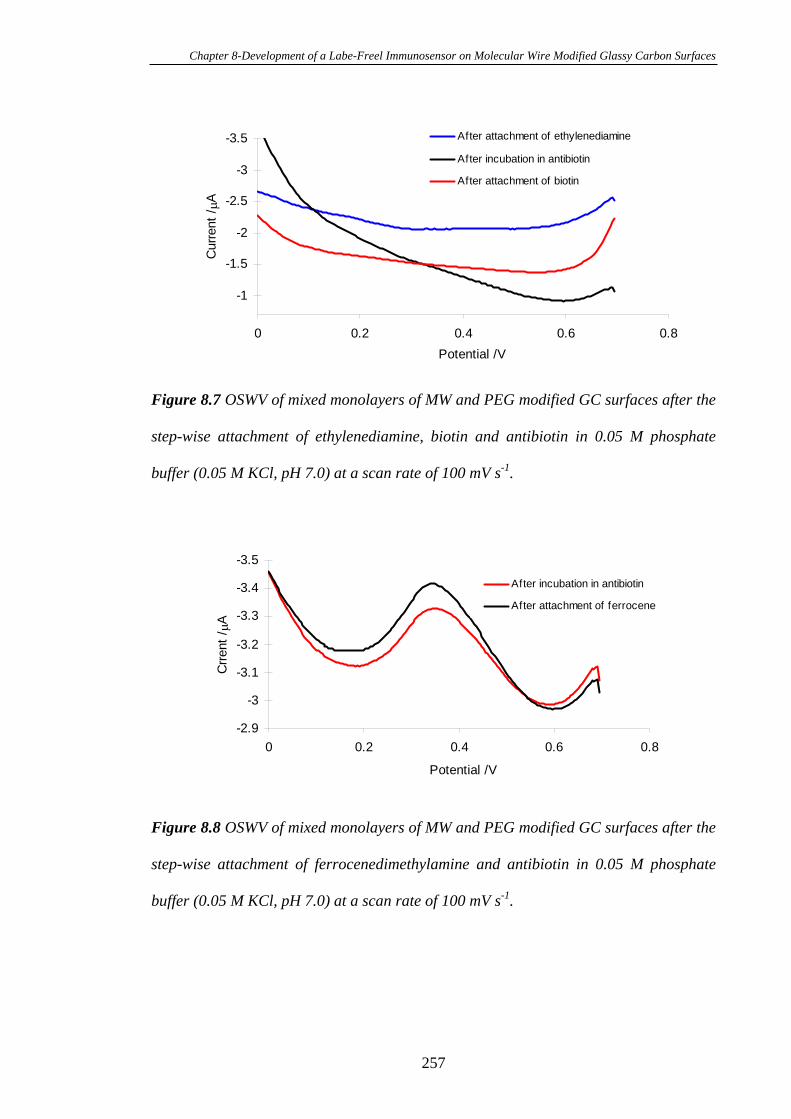
Chapter 8-Development of a Labe-Freel Immunosensor on Molecular Wire Modified Glassy Carbon Surfaces
-3.5
-3
-2.5
-2
-1.5
-1
0 0.2 0.4 0.6 0.8
Potential /V
Curr
ent
/A
After attachment of ethylenediamine
After incubation in antibiotin
After attachment of biotin
Figure 8.7 OSWV of mixed monolayers of MW and PEG modified GC surfaces after the
step-wise attachment of ethylenediamine, biotin and antibiotin in 0.05 M phosphate
buffer (0.05 M KCl, pH 7.0) at a scan rate of 100 mV s-1.
-3.5
-3.4
-3.3
-3.2
-3.1
-3
-2.9
0 0.2 0.4 0.6 0.8
Potential /V
Crr
ent
/A
After incubation in antibiotin
After attachment of ferrocene
Figure 8.8 OSWV of mixed monolayers of MW and PEG modified GC surfaces after the
step-wise attachment of ferrocenedimethylamine and antibiotin in 0.05 M phosphate
buffer (0.05 M KCl, pH 7.0) at a scan rate of 100 mV s-1.
257
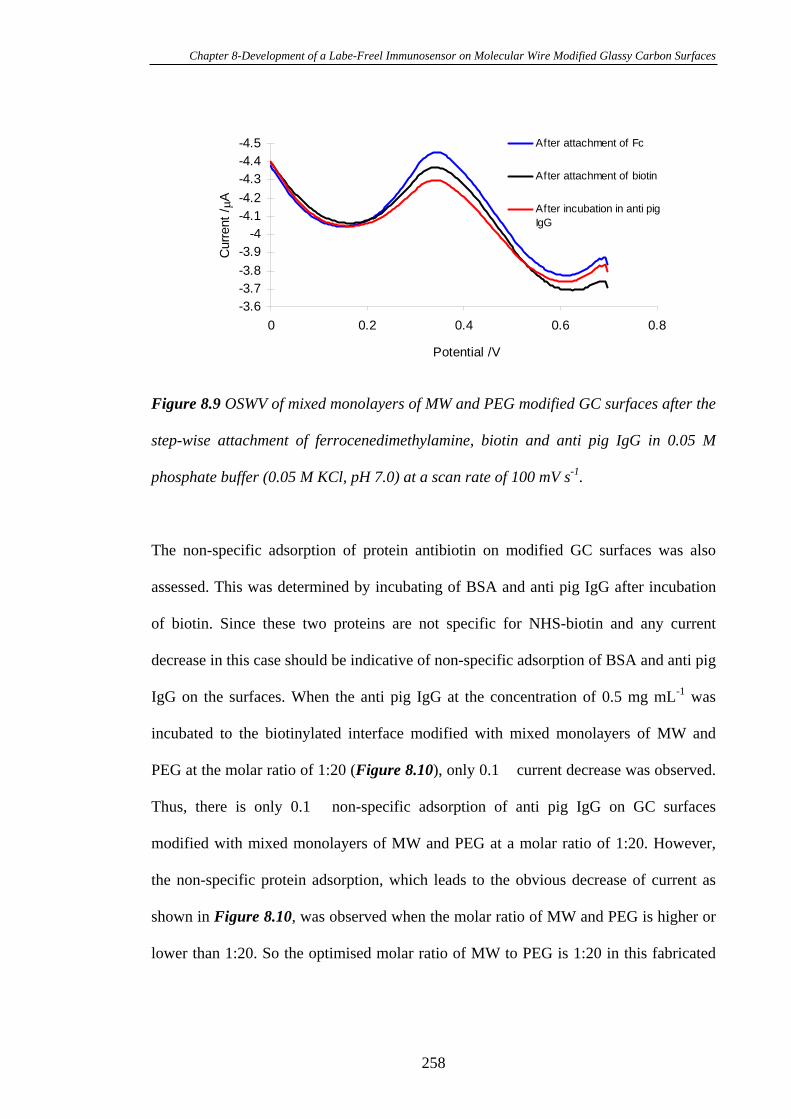
Chapter 8-Development of a Labe-Freel Immunosensor on Molecular Wire Modified Glassy Carbon Surfaces
-4.5
-4.4
-4.3
-4.2
-4.1
-4
-3.9
-3.8
-3.7
-3.6
0 0.2 0.4 0.6 0.8
Potential /V
Curr
ent
/A
After attachment of Fc
After attachment of biotin
After incubation in anti pig
IgG
Figure 8.9 OSWV of mixed monolayers of MW and PEG modified GC surfaces after the
step-wise attachment of ferrocenedimethylamine, biotin and anti pig IgG in 0.05 M
phosphate buffer (0.05 M KCl, pH 7.0) at a scan rate of 100 mV s-1.
The non-specific adsorption of protein antibiotin on modified GC surfaces was also
assessed. This was determined by incubating of BSA and anti pig IgG after incubation
of biotin. Since these two proteins are not specific for NHS-biotin and any current
decrease in this case should be indicative of non-specific adsorption of BSA and anti pig
IgG on the surfaces. When the anti pig IgG at the concentration of 0.5 mg mL-1 was
incubated to the biotinylated interface modified with mixed monolayers of MW and
PEG at the molar ratio of 1:20 (Figure 8.10), only 0.1 current decrease was observed.
Thus, there is only 0.1 non-specific adsorption of anti pig IgG on GC surfaces
modified with mixed monolayers of MW and PEG at a molar ratio of 1:20. However,
the non-specific protein adsorption, which leads to the obvious decrease of current as
shown in Figure 8.10, was observed when the molar ratio of MW and PEG is higher or
lower than 1:20. So the optimised molar ratio of MW to PEG is 1:20 in this fabricated
258
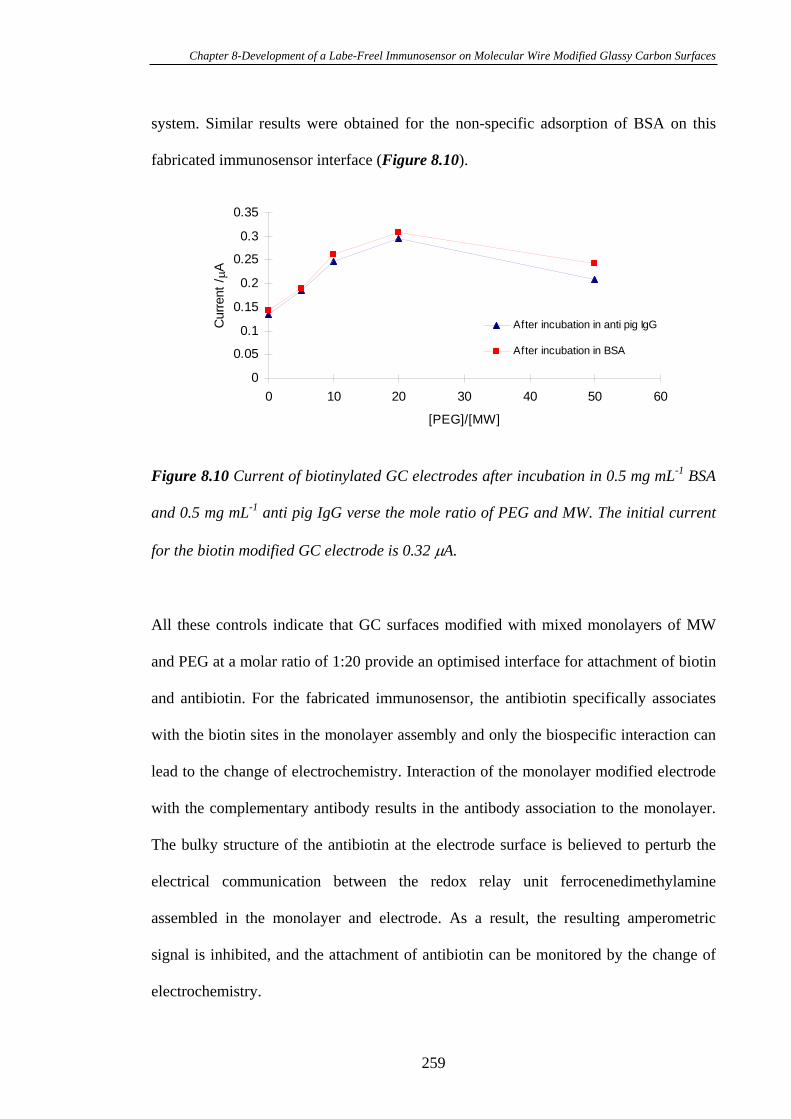
Chapter 8-Development of a Labe-Freel Immunosensor on Molecular Wire Modified Glassy Carbon Surfaces
system. Similar results were obtained for the non-specific adsorption of BSA on this
fabricated immunosensor interface (Figure 8.10).
0
0.05
0.1
0.15
0.2
0.25
0.3
0.35
0 10 20 30 40 50
[PEG]/[MW]
Curr
ent
/A
60
After incubation in anti pig IgG
After incubation in BSA
Figure 8.10 Current of biotinylated GC electrodes after incubation in 0.5 mg mL-1 BSA
and 0.5 mg mL-1 anti pig IgG verse the mole ratio of PEG and MW. The initial current
for the biotin modified GC electrode is 0.32 A.
All these controls indicate that GC surfaces modified with mixed monolayers of MW
and PEG at a molar ratio of 1:20 provide an optimised interface for attachment of biotin
and antibiotin. For the fabricated immunosensor, the antibiotin specifically associates
with the biotin sites in the monolayer assembly and only the biospecific interaction can
lead to the change of electrochemistry. Interaction of the monolayer modified electrode
with the complementary antibody results in the antibody association to the monolayer.
The bulky structure of the antibiotin at the electrode surface is believed to perturb the
electrical communication between the redox relay unit ferrocenedimethylamine
assembled in the monolayer and electrode. As a result, the resulting amperometric
signal is inhibited, and the attachment of antibiotin can be monitored by the change of
electrochemistry.
259
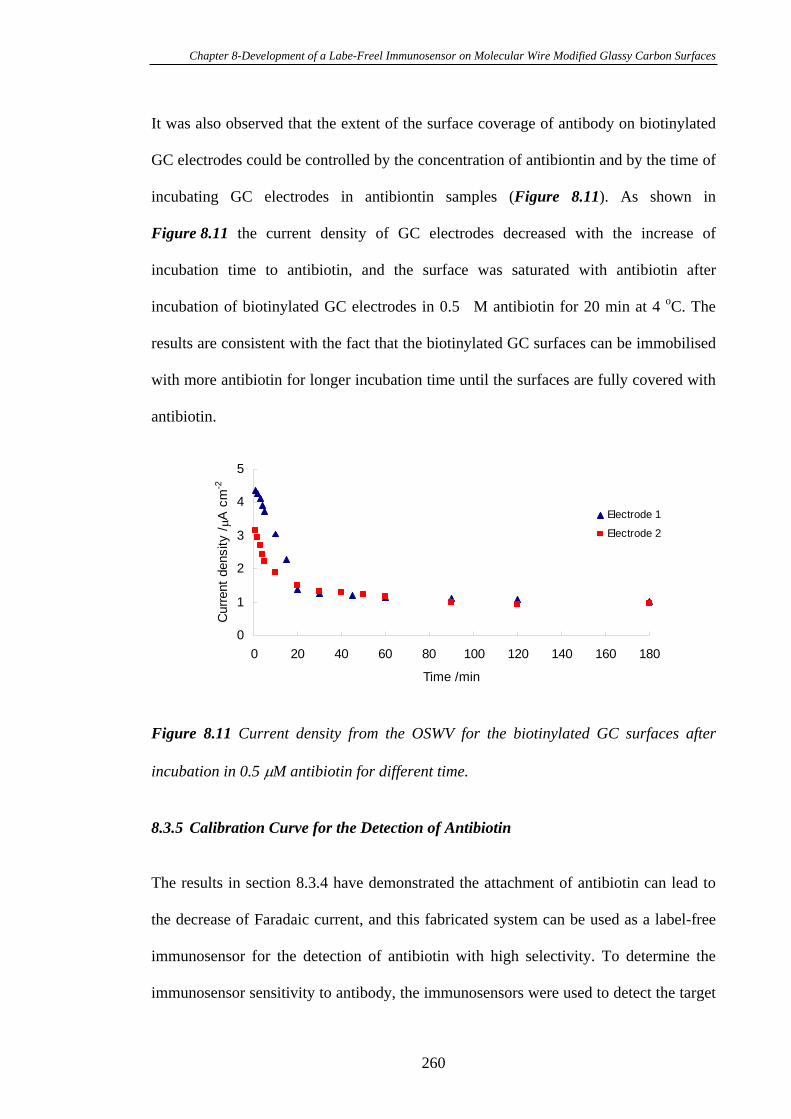
Chapter 8-Development of a Labe-Freel Immunosensor on Molecular Wire Modified Glassy Carbon Surfaces
It was also observed that the extent of the surface coverage of antibody on biotinylated
GC electrodes could be controlled by the concentration of antibiontin and by the time of
incubating GC electrodes in antibiontin samples (Figure 8.11). As shown in
Figure 8.11 the current density of GC electrodes decreased with the increase of
incubation time to antibiotin, and the surface was saturated with antibiotin after
incubation of biotinylated GC electrodes in 0.5 M antibiotin for 20 min at 4 oC. The
results are consistent with the fact that the biotinylated GC surfaces can be immobilised
with more antibiotin for longer incubation time until the surfaces are fully covered with
antibiotin.
0
1
2
3
4
5
0 20 40 60 80 100 120 140 160 180
Time /min
Curr
ent
density /
A c
m-2
Electrode 1
Electrode 2
Figure 8.11 Current density from the OSWV for the biotinylated GC surfaces after
incubation in 0.5 M antibiotin for different time.
8.3.5 Calibration Curve for the Detection of Antibiotin
The results in section 8.3.4 have demonstrated the attachment of antibiotin can lead to
the decrease of Faradaic current, and this fabricated system can be used as a label-free
immunosensor for the detection of antibiotin with high selectivity. To determine the
immunosensor sensitivity to antibody, the immunosensors were used to detect the target
260

Chapter 8-Development of a Labe-Freel Immunosensor on Molecular Wire Modified Glassy Carbon Surfaces
analyte with different concentrations. Experimental results show immersion of resulting
biotinylated GC electrode into phosphate buffer (pH 7.0) and stepwise addition of
antibiotin between 30 and 500 ng mL-1 resulted in a stepwise decrease in OSWV peak
current of the redox probe ferrocenedimethylamine. Figure 8.12 is the calibration curve
for the detection of antibiotin. This immunosensor allows for detecting antibiotin with
the concentration of 5 ng mL-1. This detection limit of the fabricated immunosensor for
the detection antibiotin is lower than that of an amperometric immunosensor for the
detection of rabbit IgG (0.33 g mL-1),60 and also lower than that of an amperometric
immunosensor for the detection of mouse IgG2a (0.02 g mL-1).29 Based on this
calibration curve, the affinity constant between biotin and antibiotin is calculated to be
ca. 109 M-1, which is higher than the affinity constant between rabbit IgG antigen and
anti-rabbit IgG antibody reported in the literature,36 and belongs to the typical affinity
constant for an antigen-antibody reaction (from the order of 108 to 1012 M-1).61
0
0.2
0.4
0.6
0.8
1
0.5 1 1.5 2 2.5 3
Log[Ab /ng mL-1]
Rela
tive c
urr
ent
Electrode 1
Electrode 2
Figure 8.12 Calibration plot of relative current against the logarithm of the antibiotin
concentration. Relative current is obtained by dividing the current before the incubation
of antibiotin with the current after the incubation of antibiotin.
261
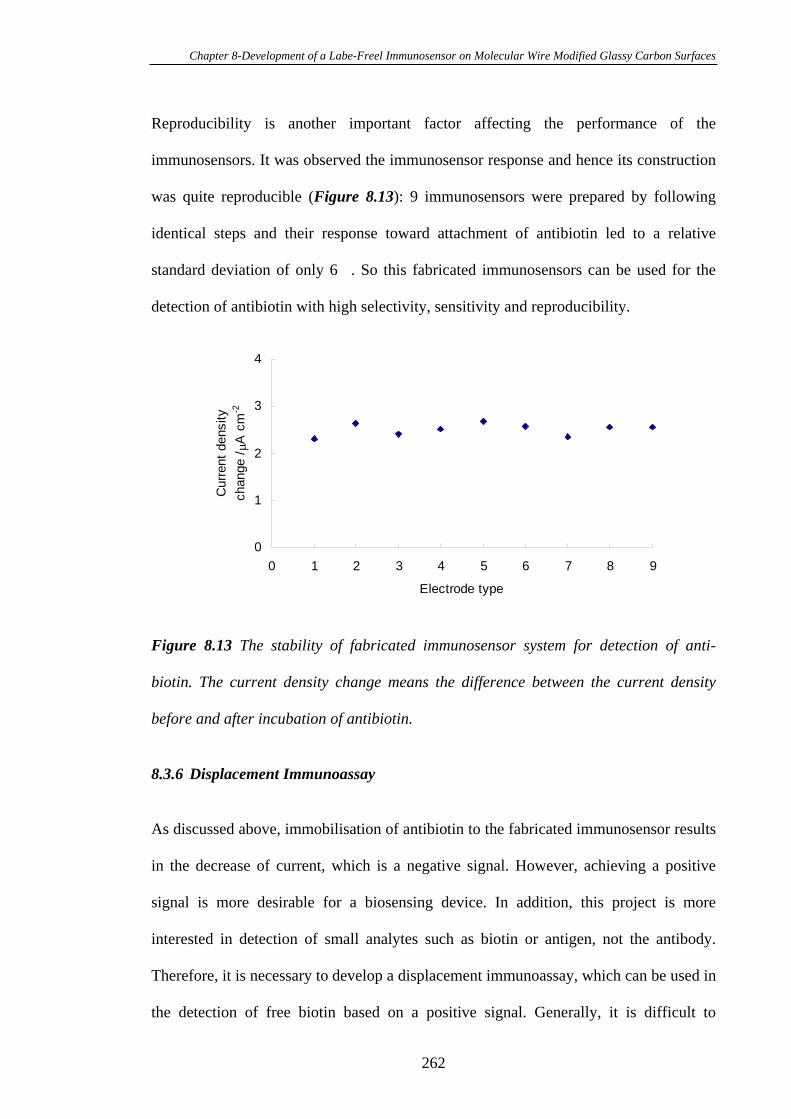
Chapter 8-Development of a Labe-Freel Immunosensor on Molecular Wire Modified Glassy Carbon Surfaces
Reproducibility is another important factor affecting the performance of the
immunosensors. It was observed the immunosensor response and hence its construction
was quite reproducible (Figure 8.13): 9 immunosensors were prepared by following
identical steps and their response toward attachment of antibiotin led to a relative
standard deviation of only 6 . So this fabricated immunosensors can be used for the
detection of antibiotin with high selectivity, sensitivity and reproducibility.
0
1
2
3
4
0 1 2 3 4 5 6 7 8 9
Electrode type
Curr
ent
density
change /
A c
m-2
Figure 8.13 The stability of fabricated immunosensor system for detection of anti-
biotin. The current density change means the difference between the current density
before and after incubation of antibiotin.
8.3.6 Displacement Immunoassay
As discussed above, immobilisation of antibiotin to the fabricated immunosensor results
in the decrease of current, which is a negative signal. However, achieving a positive
signal is more desirable for a biosensing device. In addition, this project is more
interested in detection of small analytes such as biotin or antigen, not the antibody.
Therefore, it is necessary to develop a displacement immunoassay, which can be used in
the detection of free biotin based on a positive signal. Generally, it is difficult to
262
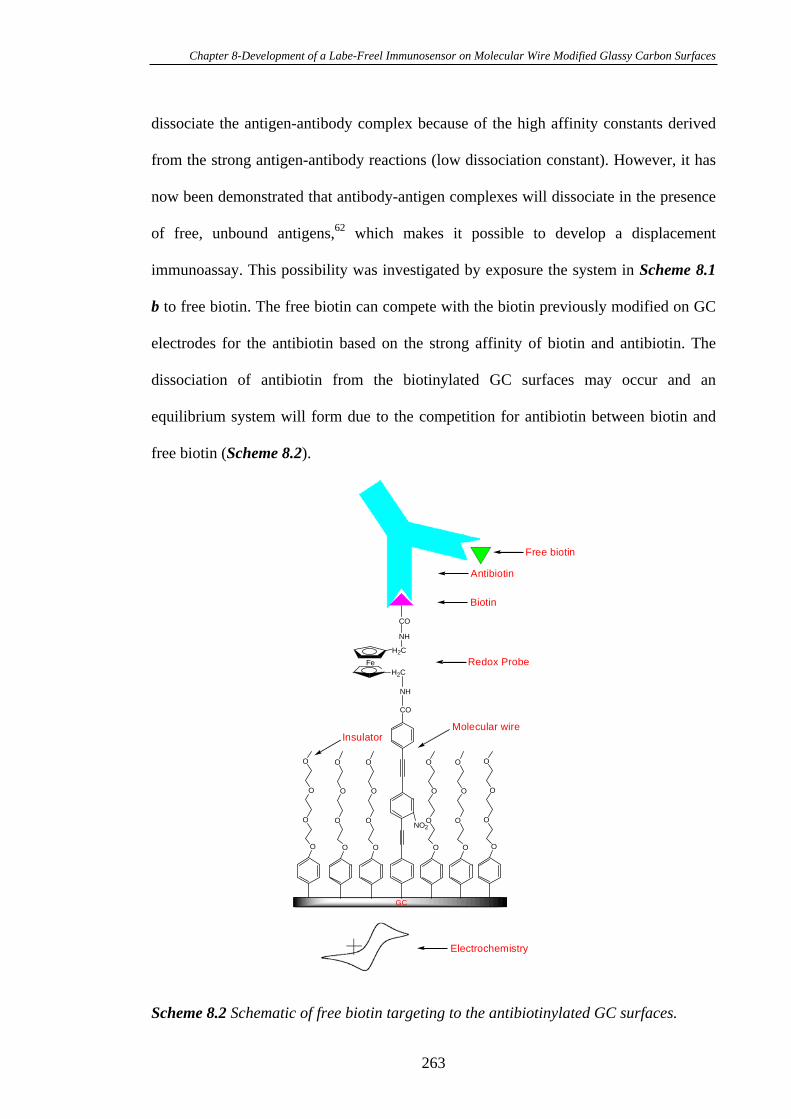
Chapter 8-Development of a Labe-Freel Immunosensor on Molecular Wire Modified Glassy Carbon Surfaces
dissociate the antigen-antibody complex because of the high affinity constants derived
from the strong antigen-antibody reactions (low dissociation constant). However, it has
now been demonstrated that antibody-antigen complexes will dissociate in the presence
of free, unbound antigens,62 which makes it possible to develop a displacement
immunoassay. This possibility was investigated by exposure the system in Scheme 8.1
b to free biotin. The free biotin can compete with the biotin previously modified on GC
electrodes for the antibiotin based on the strong affinity of biotin and antibiotin. The
dissociation of antibiotin from the biotinylated GC surfaces may occur and an
equilibrium system will form due to the competition for antibiotin between biotin and
free biotin (Scheme 8.2).
Electrochemistry
O
O
O
O
GC
O
O
O
O
O
O
O
O
O
O
O
O
O
O
O
O
O
O
O
O
Molecular wireInsulator
NO2
CO
NH
NH
CO
Fe
H2C
H2C
Redox Probe
Biotin
Antibiotin
Free biotin
Scheme 8.2 Schematic of free biotin targeting to the antibiotinylated GC surfaces.
263
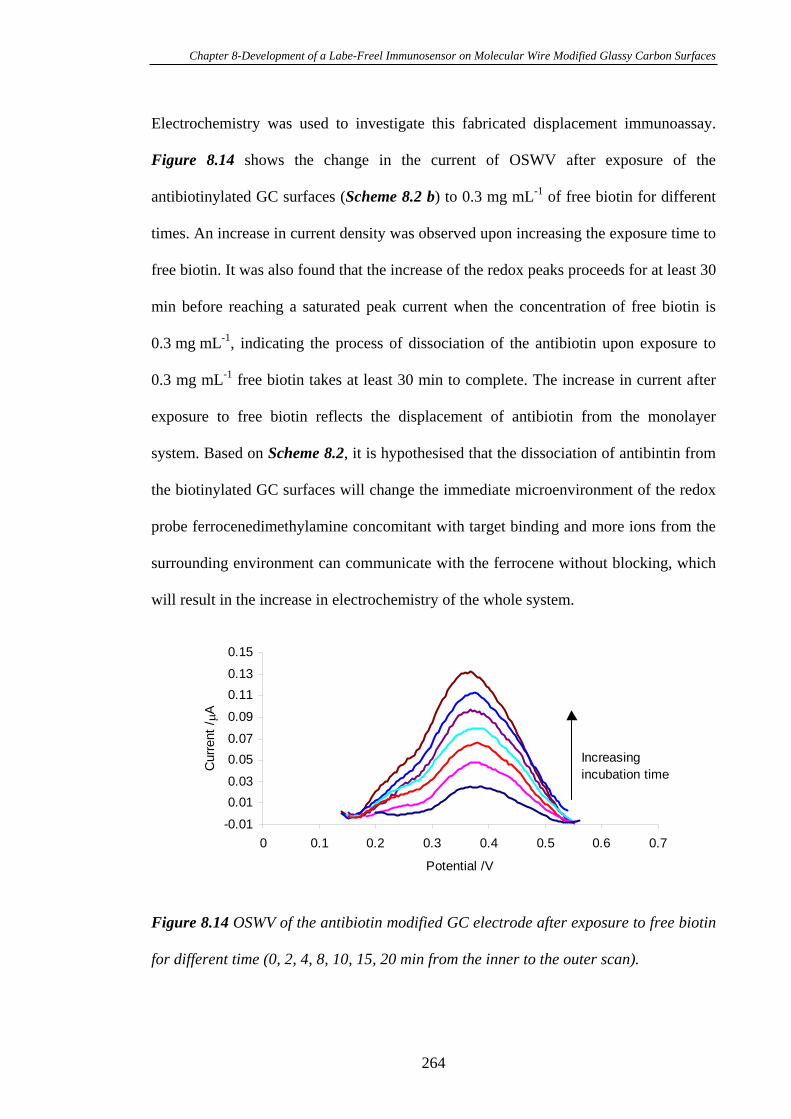
Chapter 8-Development of a Labe-Freel Immunosensor on Molecular Wire Modified Glassy Carbon Surfaces
Electrochemistry was used to investigate this fabricated displacement immunoassay.
Figure 8.14 shows the change in the current of OSWV after exposure of the
antibiotinylated GC surfaces (Scheme 8.2 b) to 0.3 mg mL-1 of free biotin for different
times. An increase in current density was observed upon increasing the exposure time to
free biotin. It was also found that the increase of the redox peaks proceeds for at least 30
min before reaching a saturated peak current when the concentration of free biotin is
0.3 mg mL-1, indicating the process of dissociation of the antibiotin upon exposure to
0.3 mg mL-1 free biotin takes at least 30 min to complete. The increase in current after
exposure to free biotin reflects the displacement of antibiotin from the monolayer
system. Based on Scheme 8.2, it is hypothesised that the dissociation of antibintin from
the biotinylated GC surfaces will change the immediate microenvironment of the redox
probe ferrocenedimethylamine concomitant with target binding and more ions from the
surrounding environment can communicate with the ferrocene without blocking, which
will result in the increase in electrochemistry of the whole system.
-0.01
0.01
0.03
0.05
0.07
0.09
0.11
0.13
0.15
0 0.1 0.2 0.3 0.4 0.5 0.6 0.7
Potential /V
Curr
ent
/A
Increasing
incubation time
Figure 8.14 OSWV of the antibiotin modified GC electrode after exposure to free biotin
for different time (0, 2, 4, 8, 10, 15, 20 min from the inner to the outer scan).
264
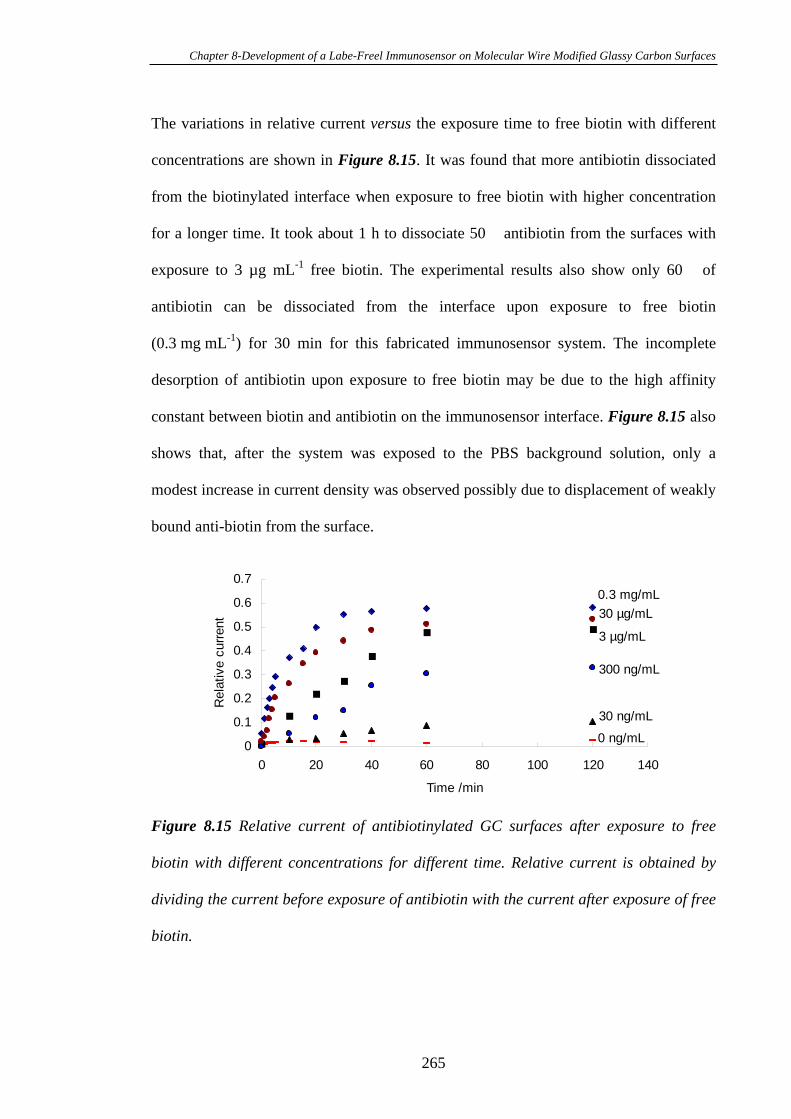
Chapter 8-Development of a Labe-Freel Immunosensor on Molecular Wire Modified Glassy Carbon Surfaces
The variations in relative current versus the exposure time to free biotin with different
concentrations are shown in Figure 8.15. It was found that more antibiotin dissociated
from the biotinylated interface when exposure to free biotin with higher concentration
for a longer time. It took about 1 h to dissociate 50 antibiotin from the surfaces with
exposure to 3 µg mL-1 free biotin. The experimental results also show only 60 of
antibiotin can be dissociated from the interface upon exposure to free biotin
(0.3 mg mL-1) for 30 min for this fabricated immunosensor system. The incomplete
desorption of antibiotin upon exposure to free biotin may be due to the high affinity
constant between biotin and antibiotin on the immunosensor interface. Figure 8.15 also
shows that, after the system was exposed to the PBS background solution, only a
modest increase in current density was observed possibly due to displacement of weakly
bound anti-biotin from the surface.
0
0.1
0.2
0.3
0.4
0.5
0.6
0.7
0 20 40 60 80 100 120 140
Time /min
Rela
tive c
urr
ent
0 ng/mL
30 ng/mL
300 ng/mL
3 µg/mL
0.3 mg/mL
30 µg/mL
Figure 8.15 Relative current of antibiotinylated GC surfaces after exposure to free
biotin with different concentrations for different time. Relative current is obtained by
dividing the current before exposure of antibiotin with the current after exposure of free
biotin.
265
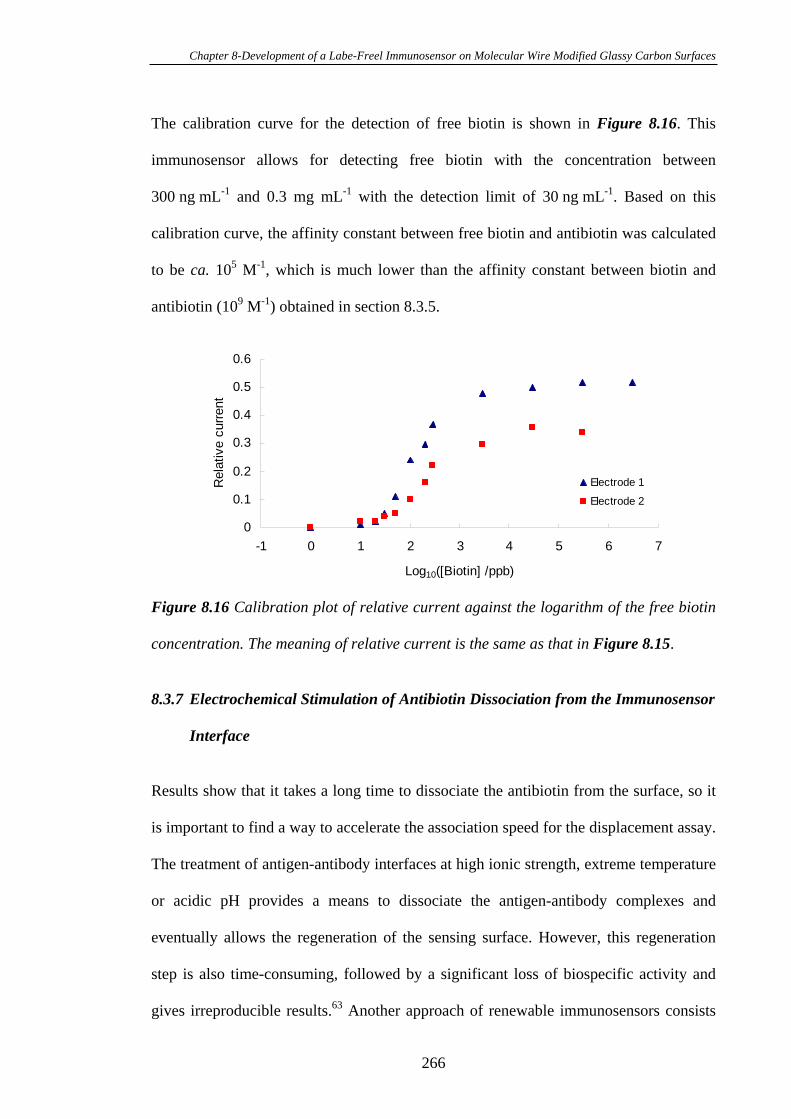
Chapter 8-Development of a Labe-Freel Immunosensor on Molecular Wire Modified Glassy Carbon Surfaces
The calibration curve for the detection of free biotin is shown in Figure 8.16. This
immunosensor allows for detecting free biotin with the concentration between
300 ng mL-1 and 0.3 mg mL-1 with the detection limit of 30 ng mL-1. Based on this
calibration curve, the affinity constant between free biotin and antibiotin was calculated
to be ca. 105 M-1, which is much lower than the affinity constant between biotin and
antibiotin (109 M-1) obtained in section 8.3.5.
0
0.1
0.2
0.3
0.4
0.5
0.6
-1 0 1 2 3 4 5 6 7
Log10([Biotin] /ppb)
Rela
tive c
urr
ent
Electrode 1
Electrode 2
Figure 8.16 Calibration plot of relative current against the logarithm of the free biotin
concentration. The meaning of relative current is the same as that in Figure 8.15.
8.3.7 Electrochemical Stimulation of Antibiotin Dissociation from the Immunosensor
Interface
Results show that it takes a long time to dissociate the antibiotin from the surface, so it
is important to find a way to accelerate the association speed for the displacement assay.
The treatment of antigen-antibody interfaces at high ionic strength, extreme temperature
or acidic pH provides a means to dissociate the antigen-antibody complexes and
eventually allows the regeneration of the sensing surface. However, this regeneration
step is also time-consuming, followed by a significant loss of biospecific activity and
gives irreproducible results.63 Another approach of renewable immunosensors consists
266
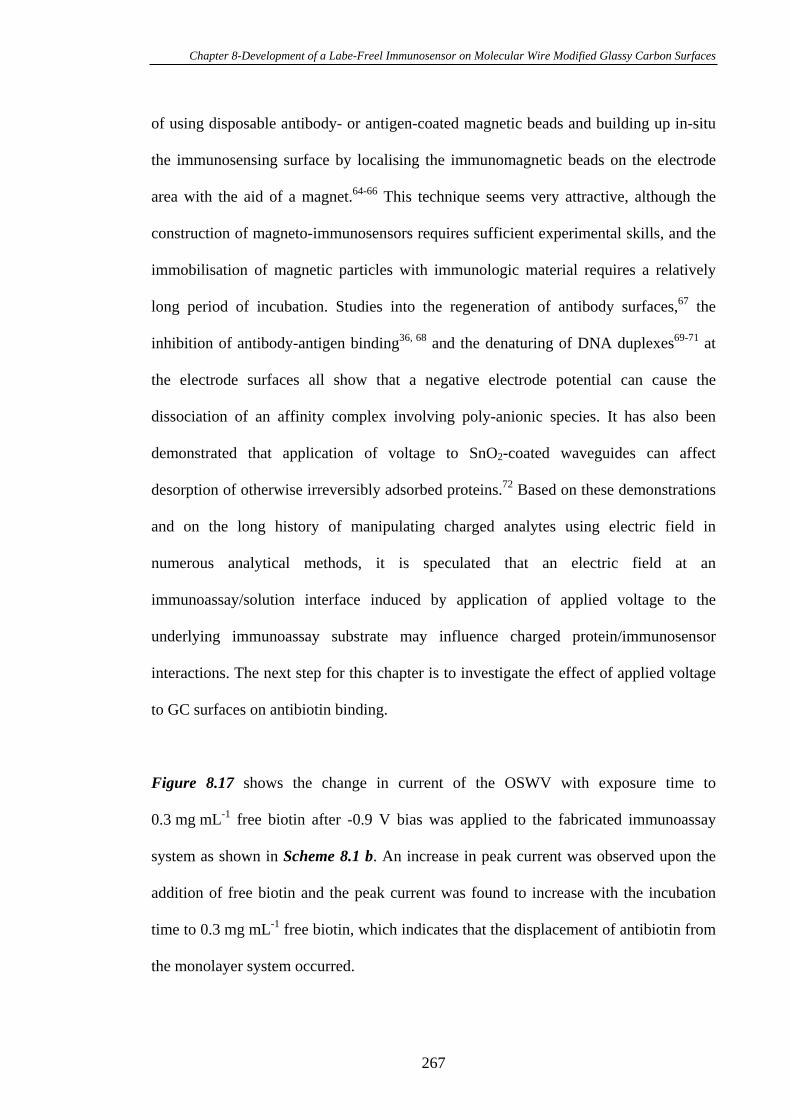
Chapter 8-Development of a Labe-Freel Immunosensor on Molecular Wire Modified Glassy Carbon Surfaces
of using disposable antibody- or antigen-coated magnetic beads and building up in-situ
the immunosensing surface by localising the immunomagnetic beads on the electrode
area with the aid of a magnet.64-66 This technique seems very attractive, although the
construction of magneto-immunosensors requires sufficient experimental skills, and the
immobilisation of magnetic particles with immunologic material requires a relatively
long period of incubation. Studies into the regeneration of antibody surfaces,67 the
inhibition of antibody-antigen binding36, 68 and the denaturing of DNA duplexes69-71 at
the electrode surfaces all show that a negative electrode potential can cause the
dissociation of an affinity complex involving poly-anionic species. It has also been
demonstrated that application of voltage to SnO2-coated waveguides can affect
desorption of otherwise irreversibly adsorbed proteins.72 Based on these demonstrations
and on the long history of manipulating charged analytes using electric field in
numerous analytical methods, it is speculated that an electric field at an
immunoassay/solution interface induced by application of applied voltage to the
underlying immunoassay substrate may influence charged protein/immunosensor
interactions. The next step for this chapter is to investigate the effect of applied voltage
to GC surfaces on antibiotin binding.
Figure 8.17 shows the change in current of the OSWV with exposure time to
0.3 mg mL-1 free biotin after -0.9 V bias was applied to the fabricated immunoassay
system as shown in Scheme 8.1 b. An increase in peak current was observed upon the
addition of free biotin and the peak current was found to increase with the incubation
time to 0.3 mg mL-1 free biotin, which indicates that the displacement of antibiotin from
the monolayer system occurred.
267
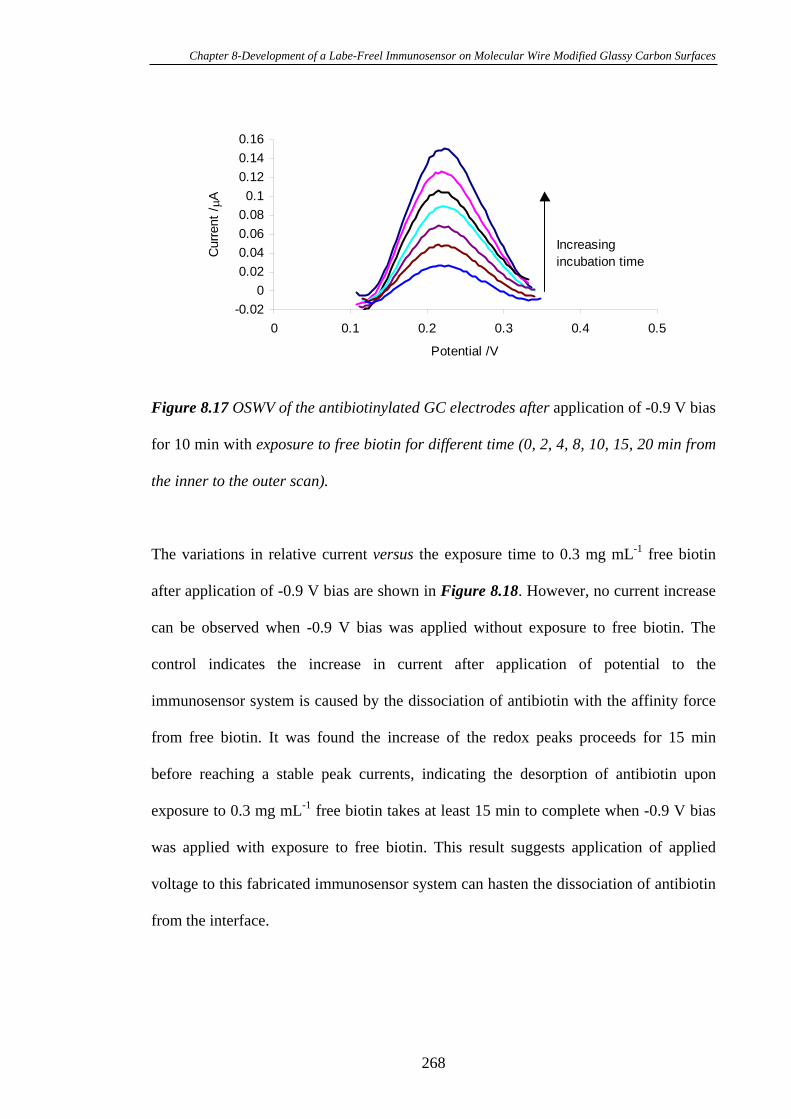
Chapter 8-Development of a Labe-Freel Immunosensor on Molecular Wire Modified Glassy Carbon Surfaces
-0.02
0
0.02
0.04
0.06
0.08
0.1
0.12
0.14
0.16
0 0.1 0.2 0.3 0.4 0.5
Potential /V
Curr
ent
/A
Increasing
incubation time
Figure 8.17 OSWV of the antibiotinylated GC electrodes after application of -0.9 V bias
for 10 min with exposure to free biotin for different time (0, 2, 4, 8, 10, 15, 20 min from
the inner to the outer scan).
The variations in relative current versus the exposure time to 0.3 mg mL-1 free biotin
after application of -0.9 V bias are shown in Figure 8.18. However, no current increase
can be observed when -0.9 V bias was applied without exposure to free biotin. The
control indicates the increase in current after application of potential to the
immunosensor system is caused by the dissociation of antibiotin with the affinity force
from free biotin. It was found the increase of the redox peaks proceeds for 15 min
before reaching a stable peak currents, indicating the desorption of antibiotin upon
exposure to 0.3 mg mL-1 free biotin takes at least 15 min to complete when -0.9 V bias
was applied with exposure to free biotin. This result suggests application of applied
voltage to this fabricated immunosensor system can hasten the dissociation of antibiotin
from the interface.
268
Chapter 8-Development of a Labe-Freel Immunosensor on Molecular Wire Modified Glassy Carbon Surfaces
0
0.2
0.4
0.6
0.8
1
0 20 40 60 80 100 120 140
Time /min
Rela
tive c
urr
ent
-0.9 V applied w ith free biotin
-0.9 V applied w ithout free biotin
Figure 8.18 Relative current of antibiotinylated GC surfaces after application of –0.9 V
bias with exposure of 0.3 mg mL-1 free biotin for different time. The meaning of relative
current is the same as that in Figure 8.15.
8.4 Conclusions
A novel strategy for electrochemically sensing biotin-antibiotin complex formation at
mixed monolayers modified GC electrode surfaces has been developed. The electrodes
were derivatised in a step-wise process. This method includes the assembly of
ferrocenedimethylamine on the mixed monolayers of MW and PEG by amide bond
coupling, which provides an interface effectively resisting the nonspecific adsorption of
protein. The biotin can be further attached to the ferrocene with terminal amine
functional groups. Based on the biotin-antibiotin interaction, this fabricated label-free
immunosensor can be used to detect antibiotin at the concentration between 30 and
500 ng mL-1. The detection limitation is 5 ng mL-1. In addition, the displacement assay
has shown that the free biotin can compete with the attached biotin for binding
antibiotin and the application of applied potential can increase the speed for dissociating
269
Chapter 8-Development of a Labe-Freel Immunosensor on Molecular Wire Modified Glassy Carbon Surfaces
the antibiotin from the biotinylated GC surfaces. Thus, this fabricated novel labe-free
immunosensor system can be used for the detection of analytes.
8.5 References
(1) Chen, Y., Jung, G.Y., Ohlberg, D.A.A., Li, X.M., Stewart, D.R., Jeppesen, J.O.,
Nielsen, K.A., Stoddart, J.F., Williams, R.S., Nanotechnology 2003, 14, 462-
468.
(2) Chen, J., Reed, M.A., Rawlett, A.M., Tour, J.M., Science 1999, 286, 1550-1552.
(3) Bourdillon, C., Demaille, C., Moiroux, J., Saveant, J.M., J. Am. Chem. Soc.
1994, 116, 10328-10329.
(4) Rubin, S., Chow, J.T., Ferraris, J.P., Zawodzinski, T.A., Langmuir 1996, 12,
363-370.
(5) Alzari, P., Anicet, N., Bourdillon, C., Moiroux, J., Saveant, J.M., J. Am. Chem.
Soc. 1996, 118, 6788-6789.
(6) Anicet, N., Anne, A., Moiroux, J., Saveant, J.M., J. Am. Chem. Soc. 1998, 120,
7115-7116.
(7) Guiomar, A.J., Guthrie, J.T., Evans, S.D., Langmuir 1999, 15, 1198-1207.
(8) Jiang, L., McNeil, C.J., Cooper, J.M., Chem. Commun. 1995, 1293-1295.
(9) Godet, C., Boujtita, M., El Murr, N., New J. Chem. 1999, 23, 795-797.
(10) Wen, Z., Ye, B., Zhou, X., Electroanalysis 1997, 9, 641-645.
(11) Wong, E.L.S., Gooding, J.J., Anal. Chem. 2003, 75, 3845-3852.
(12) Pantano, P., Kuhr, W.G., Electroanalysis 1995, 7, 405-416.
(13) Lahiri, J., Isaacs, L., Tien, J., Whitesides, G.M., Anal. Chem. 1999, 71, 777-790.
(14) Suleiman, A.A., Guilbault, G.G., In Handbook of Chemical and Biological
Sensors. Institute of Physics: Bristol, 1996; p 203.
270
Chapter 8-Development of a Labe-Freel Immunosensor on Molecular Wire Modified Glassy Carbon Surfaces
(15) Skaife, J.J., Abbott, N.L., Langmuir 2000, 16, 3529-3536.
(16) Jhaveri, S.D., Mauro, J.M., Goldston, H.M., Schauer, C.L., Tender, L.M.,
Trammell, S.A., Chem. Commun. 2003, 338-339.
(17) Liu, J.Q., Gooding, J.J., Paddon-Row, M.N., Chem. Commun. 2005, 631-633.
(18) Zayats, M., Katz, E., Willner, I., J. Am. Chem. Soc. 2002, 124, 2120-2121.
(19) Yan, J., Tender, L.M., Hampton, P.D., Lopez, G.P., J. Phys. Chem. B 2001, 105,
8905-8910.
(20) Karyakiu, A.A., Presnova, G.V., Rubtsova, M.Y., Egorov, A.M., Anal. Chem.
2000, 72, 3805-3809.
(21) O`Brien, J.C., Jones, V.W., Porter, M.D., Anal. Chem. 2000, 72, 703-711.
(22) Wu, Z.Y., Yan, Y.H., Shen, G.L., Yu, R.Q., Anal. Chim. Acta 2000, 412, 29-34.
(23) Sadik, O.A., Van Emon, J.M., Biosens. Bioelectron. 1996, 11, i-x.
(24) Wang, J., Pamidi, P.V., Anal. Chem. 1998, 70, 1171-1175.
(25) Eggins, B.R., Biosensors: An Introduction. John Wiley and Sons Inc: New York,
1996; p 1-117.
(26) Niwi, O., Xu, Y., Kalsall, H.B., Heineman, W.R., Anal. Chem. 1993, 65, 1559-
1563.
(27) Shriver-Lake, L.C., Donner, B., Eldestein, R., Breslin, K., Bathia, S.K., Ligler,
F.S., Biosens. Bioelectron. 1997, 12, 1101-1106.
(28) Kramer, P.M., Kast, R., Bilitewski, U., Bannierink, S., Bruss, U., ACS Symp.
Ser. 1997, 657, 133-139.
(29) Valat, C., Limoges, B., Huet, D., Romette, J.L., Anal. Chim. Acta 2000, 404,
187-192.
(30) Taitt, C.R., Goldston, H.M., Feldstein, M.J., Cras, J.J., Hoffman, K.E., Liger,
F.S., Biosens. Bioelectron. 2000, 14, 785-794.
271
Chapter 8-Development of a Labe-Freel Immunosensor on Molecular Wire Modified Glassy Carbon Surfaces
(31) Lahiri, J., Isaacs, L., Grzybowski, B., Carbeck, J.D., Whitesides, G.M.,
Langmuir 1999, 15, 7186-7198.
(32) Fernandez-Sanchez, C., Gonzalez-Garcia, M.B., Costa-Garcia, A., Biosens.
Bioelectron. 2000, 14, 917-924.
(33) Diaz-Gonzalez, M., Hernandez-Santos, D., Gonzalez-Garcia, M.B., Costa-
Garcia, A., Talanta 2005, 65, 565-573.
(34) Lonescu, R.E., Gondran, C., Gheber, L.A., Cosnier, S., Marks, R.S., Anal.
Chem. 2004, 76, 6808-6813.
(35) Millan, K.M., Mikkelsen, S.R., Anal. Chem. 1993, 65, 2317-23.
(36) Gooding, J.J., Wasiowych, C., Barnett, D., Hibbert, D.B., Barisci, J.N., Wallace,
G.G., Biosens. Bioelectron. 2004, 20, 260-268.
(37) McCreery, R.L., In Electroanalytical Chemistry, Bard, A.J., Ed. Dekker: New
York, 1991; Vol. 17, p 221.
(38) Collier, C.P., Wong, E.W., Belohradsky, M., Raymo, F.M., Stoddart, J.F.,
Kuekes, P.J., Williams, R.S., Heath, J.R., Science 1999, 285, 391-394.
(39) Tour, J.M., Chem. Rev. 1996, 96, 537-553.
(40) Tour, J.M., Acc. Chem. Res. 2000, 33, 791-804.
(41) Lahiri, J., Isaacs, L., Grzybowski, B., Carbeck, J.D., Whitesides, G.M.,
Langmuir 1999, 15, 7186-7198.
(42) Gooding, J.J., Wibowo, R., Liu, J., Yang, W., Losic, D., Orbons, S., Mearns,
F.J., Shapter, J.G., Hibbert, D.B., J. Am. Chem. Soc. 2003, 125, 9006-9007.
(43) Gorton, J.E., Lentzner, L., Watts, W.E., Tetrahedron 1971, 27, 4353-4360.
(44) Mason, J.G., Rosenblum, M., J. Am. Chem. Soc. 1960, 82, 4206-4208.
(45) Yu, C.J., Wan, Y., Yowanto, H., Li, J., Chunlin, T., James, M.D., Tan, C.L.,
Blackburn, G.F., Meade, T.J., J. Am. Chem. Soc. 2001, 123, 11155-11161.
272
Chapter 8-Development of a Labe-Freel Immunosensor on Molecular Wire Modified Glassy Carbon Surfaces
(46) Creager, S.E., Rowe, G.K., Anal. Chim. Acta 1991, 246, 233-239.
(47) Finklea, H.O., Electroanal. Chem. 1996, 19, 109-115.
(48) Honeychurch, M.J., Langmuir 1998, 14, 6291-6296.
(49) Rowe, G.K., Carter, M.T., Richardson, J.N., Murray, R.W., Langmuir 1995, 11,
1797-1806.
(50) Laviron, E., J. Electroanal. Chem. 1979, 101, 19-28.
(51) Creager, S., Yu, C.J., Bamdad, C., O'Connor, S., MacLean, T., Lam, E., Chong,
Y., Olsen, G.T., Luo, J., Gozin, M., Kayyem, J.F., J. Am. Chem. Soc. 1999, 121,
1059-1064.
(52) Sikes, H.D., Smalley, J.F., Dudek, S.P., Cook, A.R., Newton, M.D., Chidsey,
C.E.D., Feldberg, S.W., Science 2001, 291, 1519-1523.
(53) Sachs, S.B., Dudek, S.P., Hsung, R.P., Sita, L.R., Smalley, J.F., Newton, M.D.,
Feldberg, S.W., Chidsey, C.E.D., J. Am. Chem. Soc. 1997, 119, 10563-10564.
(54) Finklea, H.O., Yoon, K., Chamberlain, E., Allen, J., Haddox, R., J. Phys. Chem.
B 2001, 105, 3088-3092.
(55) Liu, G., Liu, J., Bocking, T., Eggers, P., Gooding, J.J., Chem. Phys. 2005, 319,
136-146.
(56) Goldston, H.M., Scribner, A.N., Trammell, S.A., Tender, L.M., Chem. Commun.
2002, 416-417.
(57) Creager, S.E., Rowe, G.K., J. Electroanal Chem. 1997, 420, 291-299.
(58) Smith, C.P., White, H.S., Anal. Chem. 1992, 24, 2398-2405.
(59) Berggren, C., Bjarnason, B., Johansson, G., Electroanalysis 2001, 13, 173-180.
(60) Darain, F., Park, S.-U., Shim, Y.-B., Biosens. Bioelectron. 2003, 18, 773-778.
(61) Green, N.M., Anfinsin, C.B., Edsall, J.T., Richards, F., Advances in Protein
Chemistry. Academic Press:San Diego: CA, 1975; Vol. 29, p 85-133.
273
Chapter 8-Development of a Labe-Freel Immunosensor on Molecular Wire Modified Glassy Carbon Surfaces
(62) Hammarback, G.T., Vallee, R.B., J. Biol. Chem 1990, 265, 12763-12766.
(63) Blonder, R., Levi, S., Tao, G.L., Bendov, I., Willner, I., J. Am. Chem. Soc. 1997,
119, 10467-10478.
(64) Liu, G.D., Lin, Y.H., J. Nanosci. Nanotech. 2005, 5, 1060-1065.
(65) Wijayawardhana, C.A., Wittstock, G., Halsall, H.B., Heineman, W.R.,
Electroanalysis 2000, 12, 640-645.
(66) Dequaire, M., Degrand, C., Limoges, B., Anal. Chem. 1999, 71, 2571-2576.
(67) Asanov, A.N., Wilson, W.W., Oldham, P.B., Anal. Chem. 1998, 70, 1156-1163.
(68) Liron, Z., Tender, L.M., Golden, J.P., Liger, F.S., Biosens. Bioelectron. 2002,
17, 489-494.
(69) Edman, C.F., Raymond, D.E., Wu, D.J., Tu, E.G., Sosnowski, R.G., Butler,
W.F., Nerenberg, M., Heller, M.J., Nucl. Acids Res. 1997, 25, 4907-4914.
(70) Heller, M.J., Forster, A.H., Tu, E., Electrophoresis 2000, 21, 157-164.
(71) Huang, Y., Ewalt, K.L., Tirado, M., Haigis, T.R., Forster, A., Ackley, D., Heller,
M.J., Anal. Chem. 2001, 73, 1549-1559.
(72) Fujita, K., Silver, J., Biotechniques 1993, 14, 608-617.
274
Chapter 9-Towards Fabrication of Immunosensors Using SWNTs as the Conduit for Electron Transfer
Chapter Nine
Towards the Fabrication of Immunosensors Using SWNTs as
the Conduit for Electron Transfer
275

Chapter 9-Towards Fabrication of Immunosensors Using SWNTs as the Conduit for Electron Transfer
9.1 Introduction
Molecular wires (MW) such as oligo(phenyl-ethynyl)1-4 and norbornylogous5, 6 bridges
have attractive advantages in that they are rigid, give well-defined molecular
architectures and efficient electron transfer. The rigidity allows the molecular wires to
stand free in space above a surface. They do, however, suffer the disadvantage of being
instable under air and difficult to synthesise in large quantities. Thus it is crucial to find
an alternative to these molecular wires. Since their discovery,7-9 carbon nanotubes have
attracted increasing attention due to their unique structural,10 mechanical11 and
electronic12 properties. Carbon nanotubes being small, rigid and simple to produce in
large quantities, and having functional groups at both ends of the tube after being cut
into different lengths, can be metallic13-15 or semi-conducting. Their small size and
conductivity means they can be regarded as the smallest possible electrodes with
diameters of less than one nanometer.16 SWNTs are known to have a number of
carboxylic acid groups at each end of the tubes, which are important for further
fabrication, after being cut in a 3:1 v/v mixture of concentrated H2SO4/HNO3. The
results based on transmission electron microscopy demonstrated that a longer cutting
time results in shorter tubes and most SWNTs possess lengths between 100 and 150 nm
after 4 h of cutting.17
The research in SWNTs is very active due to the good electrochemical properties owned
by SWNTs.17-19 Basic electrochemistry of SWNTs has been studied by a few groups.20-
23 Liu and coworkers24, 25 have successfully immobilised shortened SWNTs on gold
using a surface condensation method. Electrodes modified with carbon nanotubes have
been shown to have outstanding electrochemical properties,26-28 show fast electron
276

Chapter 9-Towards Fabrication of Immunosensors Using SWNTs as the Conduit for Electron Transfer
transfer properties29 and direct electron transfer to hemoglobin.30 Nanotubes modified
electrodes have been shown to allow direct electron transfer to enzymes with redox
centres close to the enzyme surface.17, 22, 31-33 Thanks to nanotubes being able to
penetrate the protein and get close to the redox centre due to the small size of the tubes
(diameters around 1 nm), Guiseppi-Elie et al.34 achieved the direct electron transfer
between absorbed glucose oxidase (GOx) and an underlying GC electrode. Direct
electron transfer has been observed by Zhao and coworkers35 for GOx adsorbed onto a
carbon nanotube power microelectrode. Gooding and coworkers19 investigated the
electrochemistry of GOx immobilised onto aligned nanotubes electrode arrays formed
by self-assembly with a view to achieving direct electron transfer to this enzyme. Most
protein-nanotube studies described above use electrodes modified with nanotubes
randomly deposited onto an electrode surface. Comparing with the randomly dispersed
nanotubes, the vertical alignment of the cut nanotubes results in electrodes which
possess better electrochemical properties because more of the oxygenated species form
at the ends of nanotubes during acid purification.36 There are many strategies for
aligning the nanotubes vertically from a surface either by growing the tubes vertically
from a surface27, 37, 38 or by self-assembly.17, 19, 21
The studies described above have confirmed that carbon nanotubes have high efficiency
for electron transfer and have great potential for the development of biosensors. The
rigid MW has been successfully used as the conductor for fabrication of immunosensors
in Chapter Eight. This chapter is to study the strategy for modification of SWNTs on
GC electrode surfaces, and to characterise the modified SWNTs on GC substrates using
electrochemistry and AFM. The possibility of replacing MW with SWNTs to fabricate a
label-free immunosensor system (Scheme 9.1) on GC surfaces is then investigated.
277
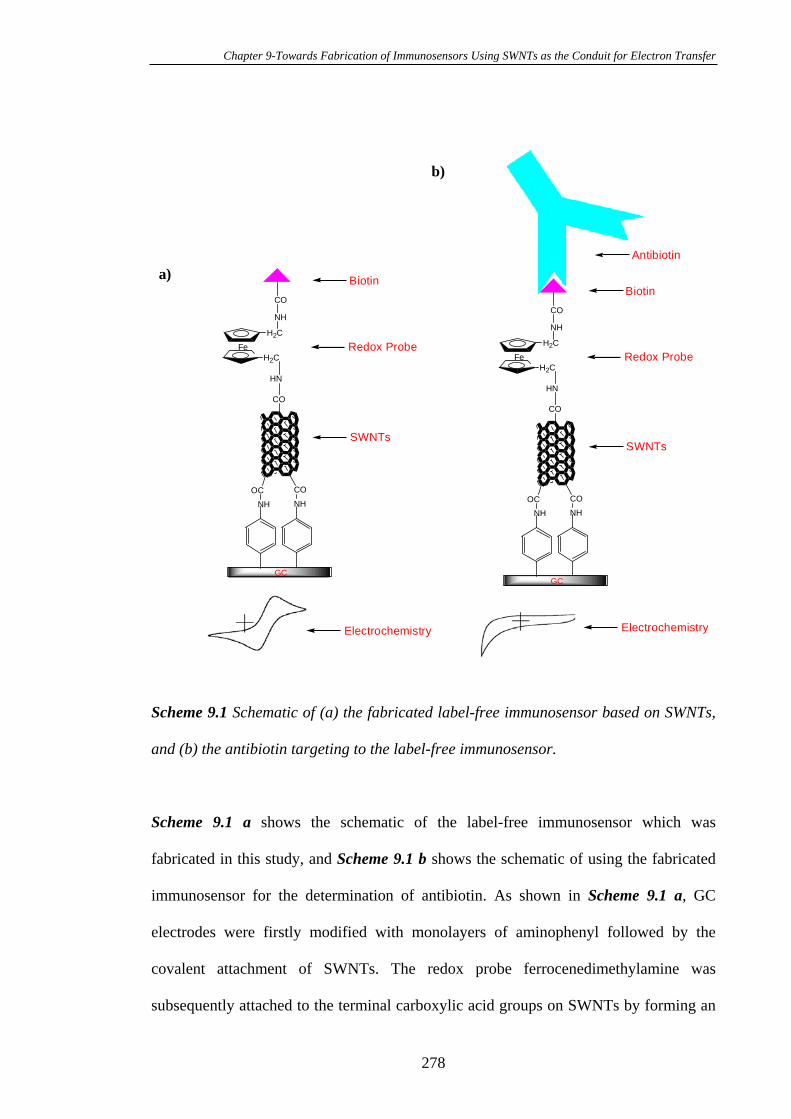
Chapter 9-Towards Fabrication of Immunosensors Using SWNTs as the Conduit for Electron Transfer
GC
CO
HN
NH
CO
Fe
H2C
H2C
NHOC
NH
CO
a)
Electrochemistry
Redox Probe
Biotin
SWNTs
GC
CO
HN
NH
CO
Fe
H2C
H2C
NHOC
NH
CO
Redox Probe
Biotin
SWNTs
Antibiotin
b)
Electrochemistry
Scheme 9.1 Schematic of (a) the fabricated label-free immunosensor based on SWNTs,
and (b) the antibiotin targeting to the label-free immunosensor.
Scheme 9.1 a shows the schematic of the label-free immunosensor which was
fabricated in this study, and Scheme 9.1 b shows the schematic of using the fabricated
immunosensor for the determination of antibiotin. As shown in Scheme 9.1 a, GC
electrodes were firstly modified with monolayers of aminophenyl followed by the
covalent attachment of SWNTs. The redox probe ferrocenedimethylamine was
subsequently attached to the terminal carboxylic acid groups on SWNTs by forming an
278
Chapter 9-Towards Fabrication of Immunosensors Using SWNTs as the Conduit for Electron Transfer
amide bond followed by the attachment of biotin. After incubation this immunosensor
in the antibiotin solution, the antibiotin can be immobilised to the immunosensor
surface as shown in Scheme 9.1 b due to the strong affinity between biomolecular pairs
biotin and antibiotin. Electrochemistry was used to monitor the immobilisation of
antibiotin.
9.2 Experimental Section
9.2.1 Chemicals and Procedures
All the reagents and materials are listed in Table 2.1 of Chapter Two or prepared
according to the procedures described in Chapter Two. GC electrodes were prepared
according to the method described in Section 2.4. All the pure and mixed monolayers
were prepared as described in Section 2.4.6. Ferrocene and SWNTs were covalently
attached on the monolayers according to the procedures described in Chapter Two. All
electrochemical measurements were performed with a BAS-l00B electrochemical
analyser. All potentials were quoted relative to an Ag/AgCl reference at room
temperature. All the cyclic voltammetry measurements for the ferrocene modified
electrodes were carried out in phosphate buffer (0.05 M KCl, 0.05 M K2HPO4 and
adjusted the pH to 7.0 with KH2PO4).
9.2.2 Preparation of the Cut SWNTs
Typically preparation of the cut SWNTs was similar to the procedure of Liu et al.39
10 mg of purified SWNT (from Carbon Nanotechnologies, Inc.) was weighed into a 250
mL flat bottom flask containing 40 mL of a 3:1 v/v solution of concentrated sulfuric
acid (98%) and concentrated nitric acid (70%), and sonicated in a water bath at 35-40
for 4 hours. The resultant suspension was then diluted to 200 mL with water. The cut
279
Chapter 9-Towards Fabrication of Immunosensors Using SWNTs as the Conduit for Electron Transfer
SWNTs were collected on a 220 nm pore filter membrane (type: Millipore) and washed
with 10 mM NaOH aqueous solution, followed by Milli-Q water until the pH of the
filtrate reached 7.0. The cut SWNTs were dispersed in DMF and formed a very good
suspension without any aid of surfactant.
9.2.3 Fabrication of the Cut SWNTs on the 4-Aminophenyl Modified Glassy Carbon
Electrodes
There are two strategies for modification of 4-aminophenyl modified GC electrodes
with cut SWNTs. The first method is to covalently attach the SWNT to the 4-
aminophenyl modified GC electrodes by dispersing the cut SWNT (0.2 mg) in 1 mL of
dimethylformamide (DMF) with 0.5 mg of dicyclohexyl carbodiimide (DCC). DCC
converts the carboxylic acid group at the end of the shortened SWNTs into an active
carbodiimide ester.25 The 4-aminophenyl modified GC electrode was then placed in the
SWNT solution for 6 hours during which the amine at the terminus of the monolayer on
GC surfaces forms an amide bond with one end of each nanotube. The second method is
to apply droplets of SWNTs (10 µL, 0.1 mg mL-1) dispersed in ethanol onto the 4-
aminophenyl modified GC surface to give a bed of randomly orientated SWNT.
9.3 Results and Discussion
9.3.1 Modification of the Glassy Carbon Electrodes with 4-Nitrophenyl Diazonium
Tetrafluoroborate
GC electrodes can be modified with aryl diazonium salts by electrochemically reductive
adsorption as described in Chapter Three. Scheme 9.2 shows the schematic of
modification GC electrodes with 4-nitrophenyl diazonium tetrafluoroborate. Cyclic
280
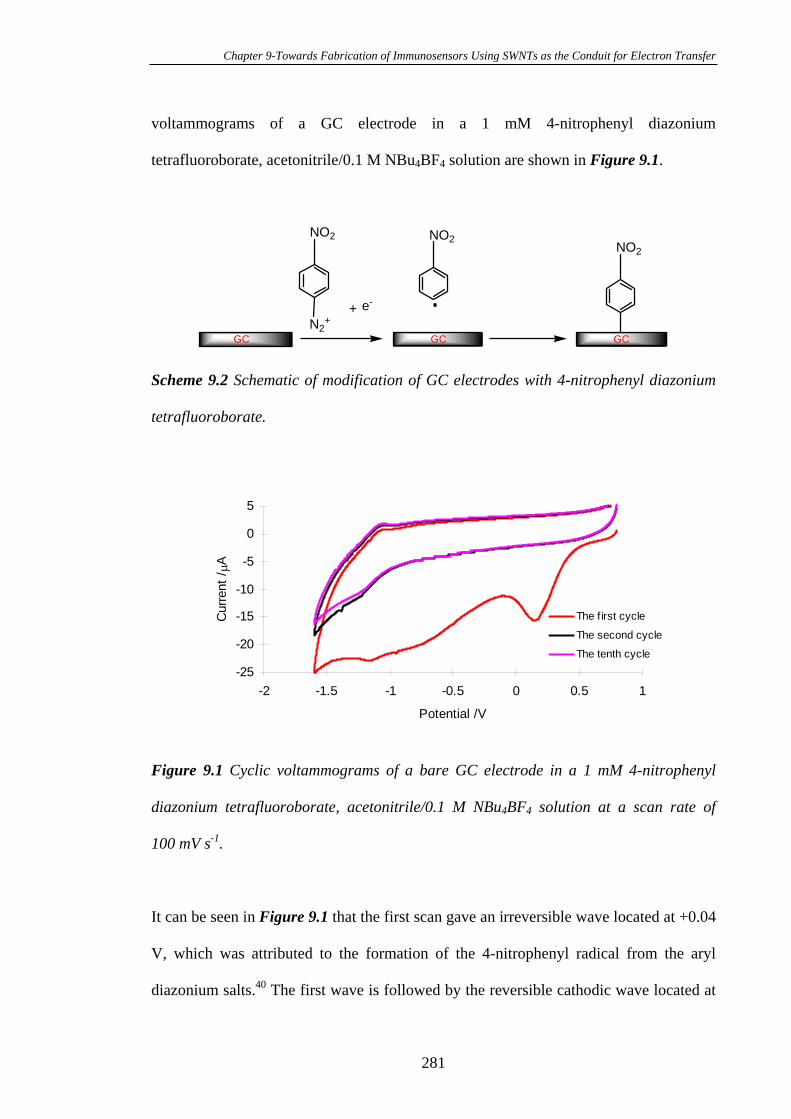
Chapter 9-Towards Fabrication of Immunosensors Using SWNTs as the Conduit for Electron Transfer
voltammograms of a GC electrode in a 1 mM 4-nitrophenyl diazonium
tetrafluoroborate, acetonitrile/0.1 M NBu4BF4 solution are shown in Figure 9.1.
NO2
GC
NO2
GC GC
e-+ .
NO2
N2+
Scheme 9.2 Schematic of modification of GC electrodes with 4-nitrophenyl diazonium
tetrafluoroborate.
-25
-20
-15
-10
-5
0
5
-2 -1.5 -1 -0.5 0 0.5 1
Potential /V
Cur
rent
/A
The f irst cycle
The second cycle
The tenth cycle
Figure 9.1 Cyclic voltammograms of a bare GC electrode in a 1 mM 4-nitrophenyl
diazonium tetrafluoroborate, acetonitrile/0.1 M NBu4BF4 solution at a scan rate of
100 mV s-1.
It can be seen in Figure 9.1 that the first scan gave an irreversible wave located at +0.04
V, which was attributed to the formation of the 4-nitrophenyl radical from the aryl
diazonium salts.40 The first wave is followed by the reversible cathodic wave located at
281
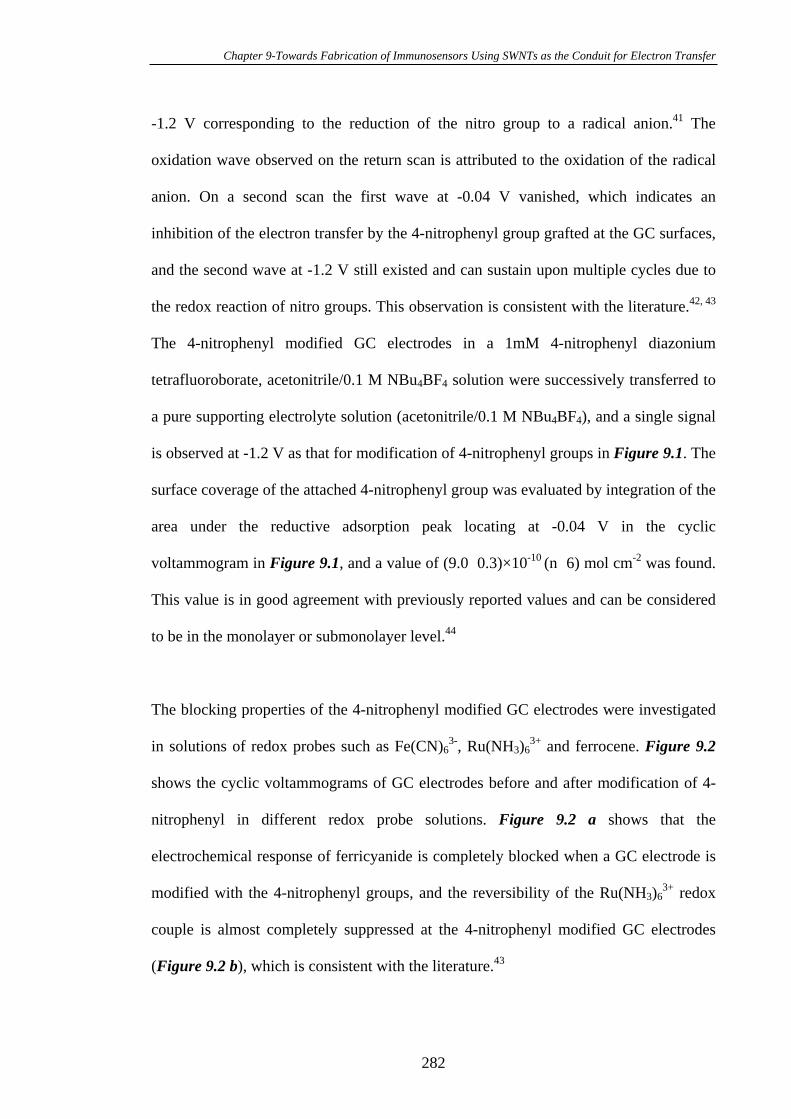
Chapter 9-Towards Fabrication of Immunosensors Using SWNTs as the Conduit for Electron Transfer
-1.2 V corresponding to the reduction of the nitro group to a radical anion.41 The
oxidation wave observed on the return scan is attributed to the oxidation of the radical
anion. On a second scan the first wave at -0.04 V vanished, which indicates an
inhibition of the electron transfer by the 4-nitrophenyl group grafted at the GC surfaces,
and the second wave at -1.2 V still existed and can sustain upon multiple cycles due to
the redox reaction of nitro groups. This observation is consistent with the literature.42, 43
The 4-nitrophenyl modified GC electrodes in a 1mM 4-nitrophenyl diazonium
tetrafluoroborate, acetonitrile/0.1 M NBu4BF4 solution were successively transferred to
a pure supporting electrolyte solution (acetonitrile/0.1 M NBu4BF4), and a single signal
is observed at -1.2 V as that for modification of 4-nitrophenyl groups in Figure 9.1. The
surface coverage of the attached 4-nitrophenyl group was evaluated by integration of the
area under the reductive adsorption peak locating at -0.04 V in the cyclic
voltammogram in Figure 9.1, and a value of (9.0 0.3)×10-10 (n 6) mol cm-2 was found.
This value is in good agreement with previously reported values and can be considered
to be in the monolayer or submonolayer level.44
The blocking properties of the 4-nitrophenyl modified GC electrodes were investigated
in solutions of redox probes such as Fe(CN)63-, Ru(NH3)6
3+ and ferrocene. Figure 9.2
shows the cyclic voltammograms of GC electrodes before and after modification of 4-
nitrophenyl in different redox probe solutions. Figure 9.2 a shows that the
electrochemical response of ferricyanide is completely blocked when a GC electrode is
modified with the 4-nitrophenyl groups, and the reversibility of the Ru(NH3)63+ redox
couple is almost completely suppressed at the 4-nitrophenyl modified GC electrodes
(Figure 9.2 b), which is consistent with the literature.43
282
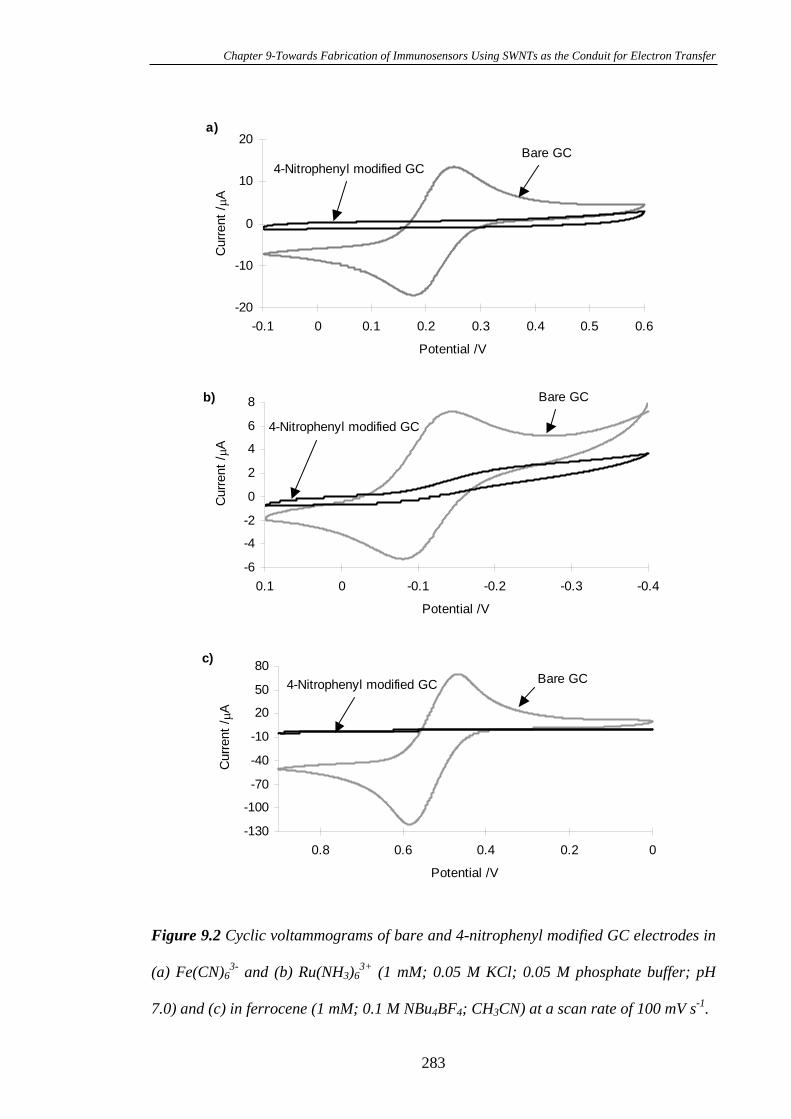
Chapter 9-Towards Fabrication of Immunosensors Using SWNTs as the Conduit for Electron Transfer
-20
-10
0
10
20
-0.1 0 0.1 0.2 0.3 0.4 0.5 0.6
Potential /V
Cur
rent
/A
4-Nitrophenyl modified GC
a)
Bare GC
-130
-100
-70
-40
-10
20
50
80
00.20.40.60.8
Potential /V
Cur
rent
/A
4-Nitrophenyl modified GC
c)Bare GC
-6
-4
-2
0
2
4
6
8
-0.4-0.3-0.2-0.100.1
Potential /V
Cur
rent
/A
b)
4-Nitrophenyl modified GC
Bare GC
Figure 9.2 Cyclic voltammograms of bare and 4-nitrophenyl modified GC electrodes in
(a) Fe(CN)63- and (b) Ru(NH3)6
3+ (1 mM; 0.05 M KCl; 0.05 M phosphate buffer; pH
7.0) and (c) in ferrocene (1 mM; 0.1 M NBu4BF4; CH3CN) at a scan rate of 100 mV s-1.
283
Chapter 9-Towards Fabrication of Immunosensors Using SWNTs as the Conduit for Electron Transfer
The suppression of the electrochemical response for hydrophilic species such as
Fe(CN)63- and Ru(NH3)6
3+ at the 4-nitrophenyl modified GC electrode may be due to
the hydrophobicity of the film. It is reported that the electrochemical reduction of
nitroaromatic compounds leads to the formation of phenylhydroxylamine and aniline
depending on the experimental conditions.45 The reduction of nitro to amine can also
occur for the electrochemically generated nitrophenyl layers.42, 44 Thus, although the 4-
nitrophenyl groups are expected to undergo some chemical modification upon cycling
on aqueous media, the results here suggest that the resulting film still retains a
significant hydrophobic character. The blocking properties of the 4-nitrophenyl groups
on GC electrodes were also evaluated in non-aqueous electrolyte. Figure 9.2 c shows
that the electrochemical response of ferrocene is completely blocked at the 4-
nitrophenyl modified GC electrodes. This agrees with the presence of a compact and
dense 4-nitrophenyl monolayers on GC electrode surfaces blocking the access of
ferrocene molecules.
9.3.2 Conversion of the 4-Nitrophenyl Groups on Glassy Carbon Electrode Surfaces
into 4-Aminophenyl Groups
The electrochemistry of nitroaromatic compounds has been widely studied in the past,
and the functionalised aromatic group could be modified by classical chemical reactions
once they are attached to the carbon surfaces.45 So the obtained 4-nitrophenyl groups on
GC electrodes could be reduced electrochemically to the 4-aminophenyl groups.
Scheme 9.3 shows the process for transformation of NO2 groups into NH2 groups. The
electrode is first derivatised by 4-nitrophenyl radicals as described earlier, thus giving
rise to the reversible cyclic voltammetric pattern of the grafted 4-nitrophenyl groups in a
CH3CN/0.1 M NBu4NBF4 solution. It is then transferred to a protic solution (90:10 v/v
284
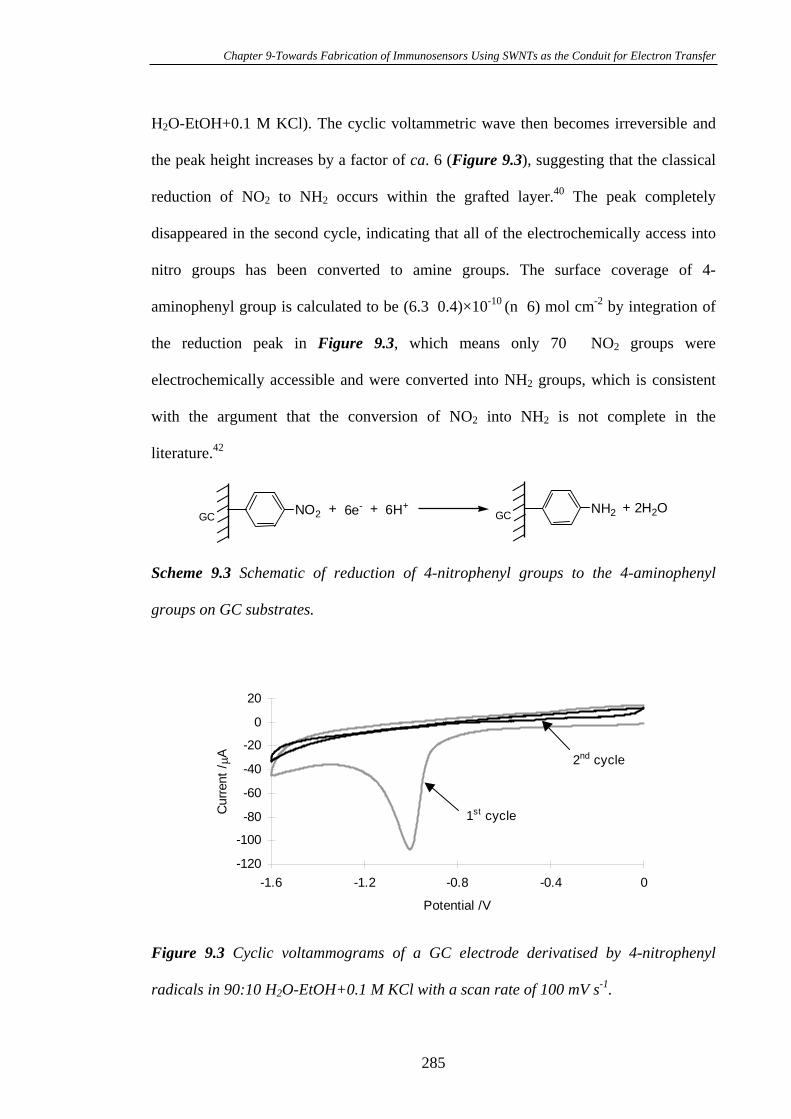
Chapter 9-Towards Fabrication of Immunosensors Using SWNTs as the Conduit for Electron Transfer
H2O-EtOH+0.1 M KCl). The cyclic voltammetric wave then becomes irreversible and
the peak height increases by a factor of ca. 6 (Figure 9.3), suggesting that the classical
reduction of NO2 to NH2 occurs within the grafted layer.40 The peak completely
disappeared in the second cycle, indicating that all of the electrochemically access into
nitro groups has been converted to amine groups. The surface coverage of 4-
aminophenyl group is calculated to be (6.3 0.4)×10-10 (n 6) mol cm-2 by integration of
the reduction peak in Figure 9.3, which means only 70 NO2 groups were
electrochemically accessible and were converted into NH2 groups, which is consistent
with the argument that the conversion of NO2 into NH2 is not complete in the
literature.42
GC NO2 + 6e- +6H+ 2H2O+ GC NH2
Scheme 9.3 Schematic of reduction of 4-nitrophenyl groups to the 4-aminophenyl
groups on GC substrates.
-120
-100
-80
-60
-40
-20
0
20
-1.6 -1.2 -0.8 -0.4 0
Potential /V
Cur
rent
/A
1st cycle
2nd cycle
Figure 9.3 Cyclic voltammograms of a GC electrode derivatised by 4-nitrophenyl
radicals in 90:10 H2O-EtOH+0.1 M KCl with a scan rate of 100 mV s-1.
285

Chapter 9-Towards Fabrication of Immunosensors Using SWNTs as the Conduit for Electron Transfer
The blocking behaviour of the 4-aminophenyl modified GC surfaces was investigated in
the redox probe solution (1 mM ferricyanide in 0.05 M pH 7.0 phosphate buffer with
0.05 M KCl) as shown in Figure 9.4. The redox peaks of ferrocyanide observed with a
bare GC electrode disappeared after the modification of 4-aminophenyl, indicating the
formed 4-aminophenyl monolayers can block the access of the
ferricyanide/ferrocyanide species to GC electrodes.
-30
-20
-10
0
10
20
30
-0.2 0 0.2 0.4 0.6
Potential /V
Cur
rent
/A
4-Aminophenyl modified GCBare GC
Figure 9.4 Cyclic voltammograms of bare and 4-aminophenyl modified GC electrodes
in ferricyanide solution at the scan rate of 100 mV s-1.
9.3.3 Attachment of Ferrocenecarboxylic Acids on 4-Aminophenyl Modified Glassy
Carbon Electrodes
The 4-aminophenyl modified GC electrodes can be covalently attached with
ferrocenecarboxylic acid by forming the amide bond as shown in Scheme 9.4. This was
achieved by dipping the modified GC electrodes in the N-(2-Hydroxyethyl)piperazine-
N'-(2-ethanesulfonic acid) (HEPES) buffer solution (pH 7.3) containing 1 mM
ferrocenecarboxylic acid, 4 mM N-hydroxysuccinimide (NHS) and 20 mM 1-ethyl-3-
286

Chapter 9-Towards Fabrication of Immunosensors Using SWNTs as the Conduit for Electron Transfer
(3-dimethyl aminopropyl) carbodiimide hydrochloride (EDC) for 24 h with stirring in
room temperature.
Fe
NO2
GCAryl diazonium salt
NH2
GC GC90:10 H2O-EtOH
NH
GCFc-COOH
C=O
EDC/NHS
Scheme 9.4 Schematic of ferrocenecarboxylic acid attached covalently on the 4-
aminophenyl modified GC surfaces.
Cyclic voltammograms measured in an aqueous solution of 0.05 M phosphate buffer
(0.05 M KCl, pH 7.0) at a scan rate of 100 mV s-1 before and after the modification of
ferrocenecarboxylic acid on the 4-aminophenyl modified GC electrode with the
EDC/NHS activation are shown in Figure 9.5 a. The appearance of the reversible redox
peaks with the formal potential (Eo`) of 321 mV indicates that ferrocenecarboxylic acid
has been attached to the electrode surface. The strong redox peaks after the attachment
of ferrocene showed linear variation in peak current with scan rates, indicating that the
ferrocene was surface bound. In the absence of EDC and NHS such that no covalent
coupling of the ferrocene could occur, only very weak and broad redox peaks due to
physisorption were observed (Figure 9.5 b). The control shows that the 4-aminophenyl
modified GC electrodes has been covalently attached with ferrocenecarboxylic acid
moieties.
287
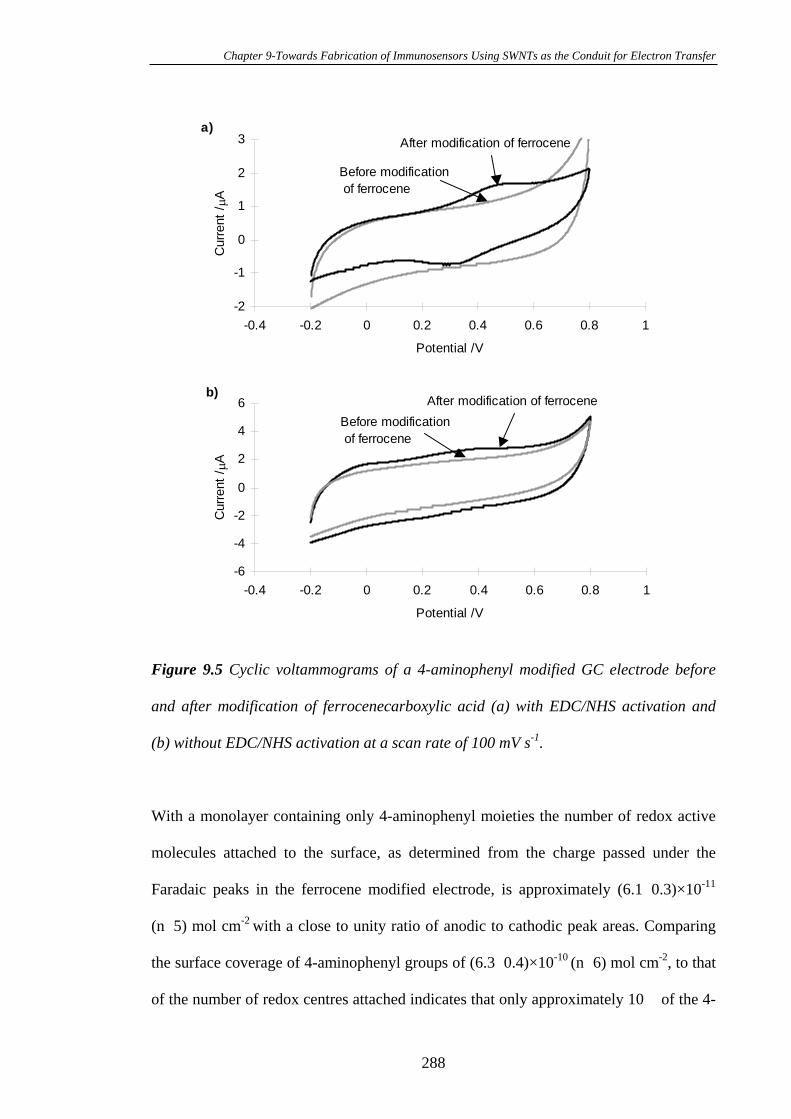
Chapter 9-Towards Fabrication of Immunosensors Using SWNTs as the Conduit for Electron Transfer
-6
-4
-2
0
2
4
6
-0.4 -0.2 0 0.2 0.4 0.6 0.8 1
Potential /V
Cur
rent
/A
After modification of ferroceneBefore modification of ferrocene
b)
-2
-1
0
1
2
3
-0.4 -0.2 0 0.2 0.4 0.6 0.8 1
Potential /V
Cur
rent
/A
a)After modification of ferrocene
Before modification of ferrocene
Figure 9.5 Cyclic voltammograms of a 4-aminophenyl modified GC electrode before
and after modification of ferrocenecarboxylic acid (a) with EDC/NHS activation and
(b) without EDC/NHS activation at a scan rate of 100 mV s-1.
With a monolayer containing only 4-aminophenyl moieties the number of redox active
molecules attached to the surface, as determined from the charge passed under the
Faradaic peaks in the ferrocene modified electrode, is approximately (6.1 0.3)×10-11
(n 5) mol cm-2 with a close to unity ratio of anodic to cathodic peak areas. Comparing
the surface coverage of 4-aminophenyl groups of (6.3 0.4)×10-10 (n 6) mol cm-2, to that
of the number of redox centres attached indicates that only approximately 10 of the 4-
288
Chapter 9-Towards Fabrication of Immunosensors Using SWNTs as the Conduit for Electron Transfer
aminophenyl monolayers had a ferrocene attached. At this surface coverage the average
area per ferrocene molecule, assuming homogeneous distribution, is 2.7 nm2 which
suggests there is a high possibility of interaction between redox active centres.46, 47
The rate constant of electron transfer for ferrocenecarboxylic acid attached on GC
electrodes modified with 4-aminophenyl was calculated to be 7.9 s-1 using the method
of Laviron,48 which relies on the change in peak potential separation ( Ep) with scan
rate ( ) to obtain the appreciate rate constant of electron transfer (kET). This value is
similar to that studied in Chapter Four for ferrocenemethylamine attached to 4-
carboxyphenyl modified GC electrode surfaces (kET 12 s-1).49
9.3.4 Characterisation of the SWNT Modified Glassy Carbon Surfaces by AFM
The cut SWNTs with the carboxylic acid groups on the end of tubes also can be
covalently attached to the 4-aminophenyl modified GC substrates based on the
procedures described in the experimental section. The modified GC surfaces were
imaged by AFM as shown in Figure 9.6. Comparing with the AFM image of the 4-
aminophenyl modified GC substrates (Figure 9.6 a), the surface of the GC substrates
after modification of SWNT was much rougher as illustrated in Figure 9.6 b indicating
the shortened SWNT aligned normal to the electrode surface. The AFM image also
shows that aligned tubes assemble on the surface not as individual tubes but as bundles,
which is consistent with the literature.17 The assembly of the tubes as bundles is
attributed to the strong hydrophobic attractions between the tubes.24 The observed
lengths of the SWNTs from the AFM image are apparently shorter than those observed
using the TEM image.36 This might be due to the broadening effect of the AFM tip.25
Further evidence that these images represent aligned bundles of nanotubes is that with
289
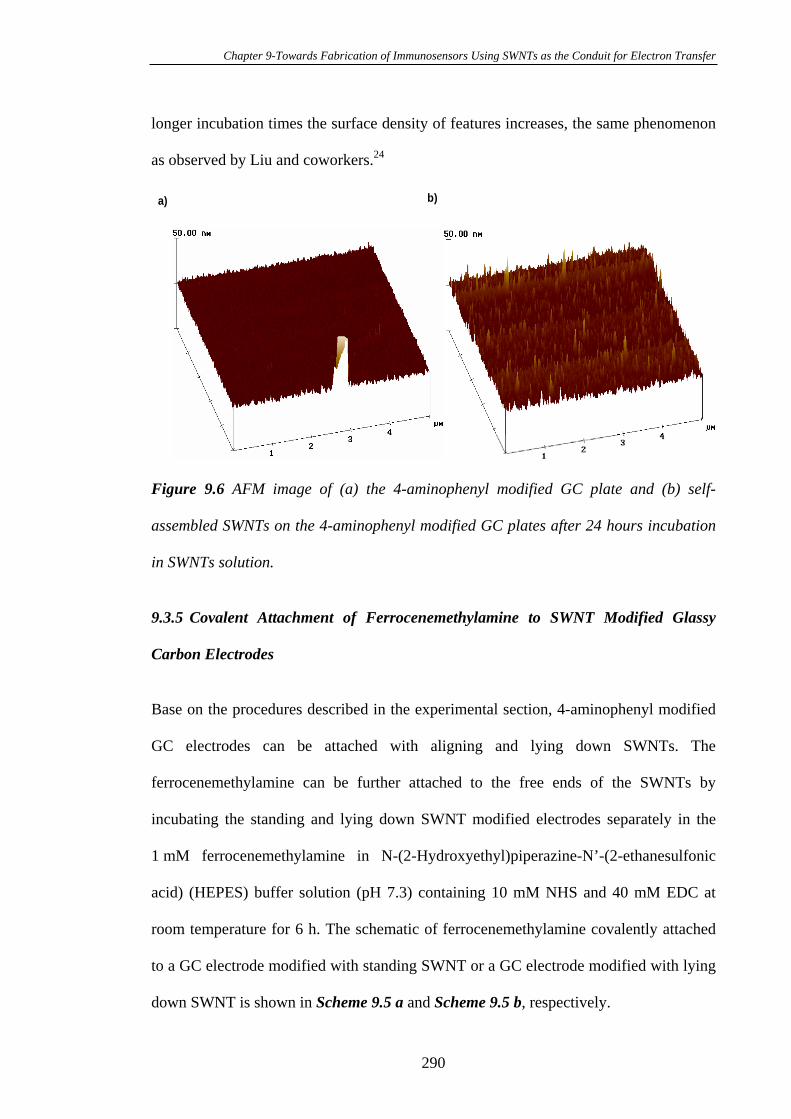
Chapter 9-Towards Fabrication of Immunosensors Using SWNTs as the Conduit for Electron Transfer
longer incubation times the surface density of features increases, the same phenomenon
as observed by Liu and coworkers.24
a) b)
Figure 9.6 AFM image of (a) the 4-aminophenyl modified GC plate and (b) self-
assembled SWNTs on the 4-aminophenyl modified GC plates after 24 hours incubation
in SWNTs solution.
9.3.5 Covalent Attachment of Ferrocenemethylamine to SWNT Modified Glassy
Carbon Electrodes
Base on the procedures described in the experimental section, 4-aminophenyl modified
GC electrodes can be attached with aligning and lying down SWNTs. The
ferrocenemethylamine can be further attached to the free ends of the SWNTs by
incubating the standing and lying down SWNT modified electrodes separately in the
1 mM ferrocenemethylamine in N-(2-Hydroxyethyl)piperazine-N’-(2-ethanesulfonic
acid) (HEPES) buffer solution (pH 7.3) containing 10 mM NHS and 40 mM EDC at
room temperature for 6 h. The schematic of ferrocenemethylamine covalently attached
to a GC electrode modified with standing SWNT or a GC electrode modified with lying
down SWNT is shown in Scheme 9.5 a and Scheme 9.5 b, respectively.
290
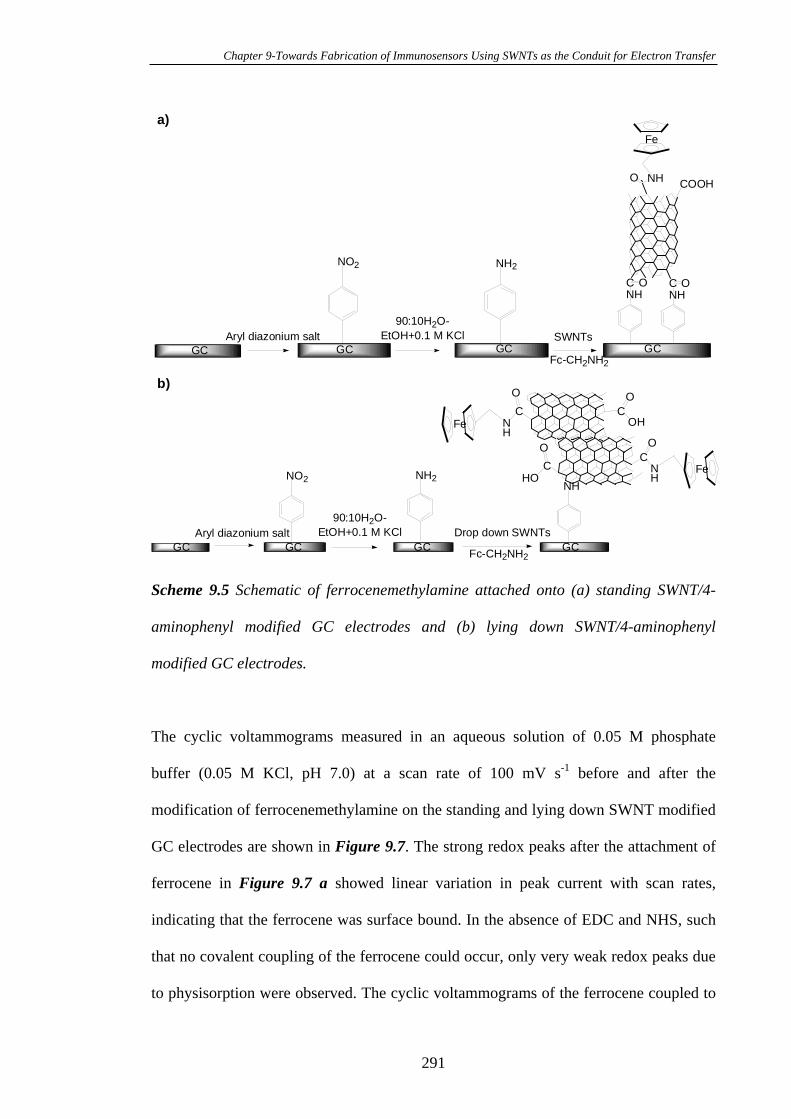
Chapter 9-Towards Fabrication of Immunosensors Using SWNTs as the Conduit for Electron Transfer
COOH
C ONH
C ONH
NO2
90:10H2O-EtOH+0.1 M KCl
NH2
GCGCAryl diazonium salt
GC GC
NHO
Fe
Fc-CH2NH2
SWNTs
NO2
90:10H2O-EtOH+0.1 M KCl
NH2
GCAryl diazonium salt Drop down SWNTs
Fc-CH2NH2GC GC GC
NHFe
Fe
CO
NH
CO
NH
CO
OH
CO
HO
a)
b)
Scheme 9.5 Schematic of ferrocenemethylamine attached onto (a) standing SWNT/4-
aminophenyl modified GC electrodes and (b) lying down SWNT/4-aminophenyl
modified GC electrodes.
The cyclic voltammograms measured in an aqueous solution of 0.05 M phosphate
buffer (0.05 M KCl, pH 7.0) at a scan rate of 100 mV s-1 before and after the
modification of ferrocenemethylamine on the standing and lying down SWNT modified
GC electrodes are shown in Figure 9.7. The strong redox peaks after the attachment of
ferrocene in Figure 9.7 a showed linear variation in peak current with scan rates,
indicating that the ferrocene was surface bound. In the absence of EDC and NHS, such
that no covalent coupling of the ferrocene could occur, only very weak redox peaks due
to physisorption were observed. The cyclic voltammograms of the ferrocene coupled to
291
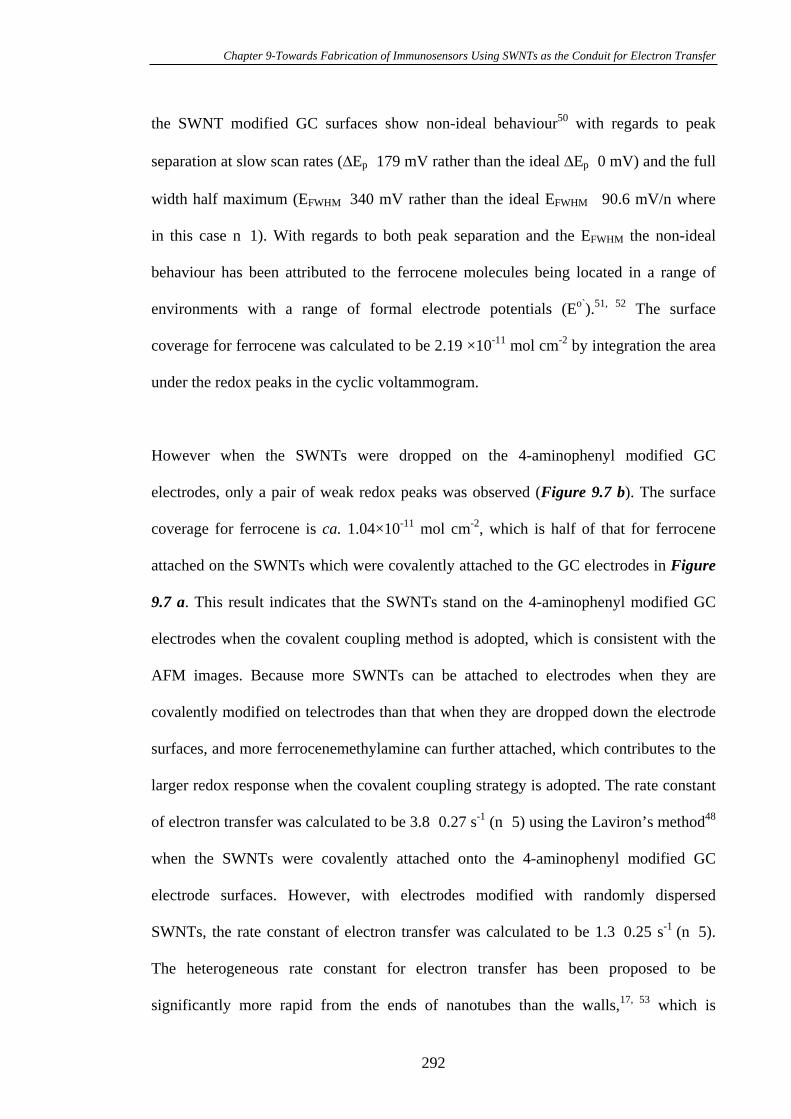
Chapter 9-Towards Fabrication of Immunosensors Using SWNTs as the Conduit for Electron Transfer
the SWNT modified GC surfaces show non-ideal behaviour50 with regards to peak
separation at slow scan rates ( Ep 179 mV rather than the ideal Ep 0 mV) and the full
width half maximum (EFWHM 340 mV rather than the ideal EFWHM 90.6 mV/n where
in this case n 1). With regards to both peak separation and the EFWHM the non-ideal
behaviour has been attributed to the ferrocene molecules being located in a range of
environments with a range of formal electrode potentials (Eo`).51, 52 The surface
coverage for ferrocene was calculated to be 2.19 ×10⁻¹¹ mol cm-2 by integration the area
under the redox peaks in the cyclic voltammogram.
However when the SWNTs were dropped on the 4-aminophenyl modified GC
electrodes, only a pair of weak redox peaks was observed (Figure 9.7 b). The surface
coverage for ferrocene is ca. 1.04×10⁻¹¹ mol cm-2, which is half of that for ferrocene
attached on the SWNTs which were covalently attached to the GC electrodes in Figure
9.7 a. This result indicates that the SWNTs stand on the 4-aminophenyl modified GC
electrodes when the covalent coupling method is adopted, which is consistent with the
AFM images. Because more SWNTs can be attached to electrodes when they are
covalently modified on telectrodes than that when they are dropped down the electrode
surfaces, and more ferrocenemethylamine can further attached, which contributes to the
larger redox response when the covalent coupling strategy is adopted. The rate constant
of electron transfer was calculated to be 3.8 0.27 s-1 (n 5) using the Laviron’s method48
when the SWNTs were covalently attached onto the 4-aminophenyl modified GC
electrode surfaces. However, with electrodes modified with randomly dispersed
SWNTs, the rate constant of electron transfer was calculated to be 1.3 0.25 s-1 (n 5).
The heterogeneous rate constant for electron transfer has been proposed to be
significantly more rapid from the ends of nanotubes than the walls,17, 53 which is
292
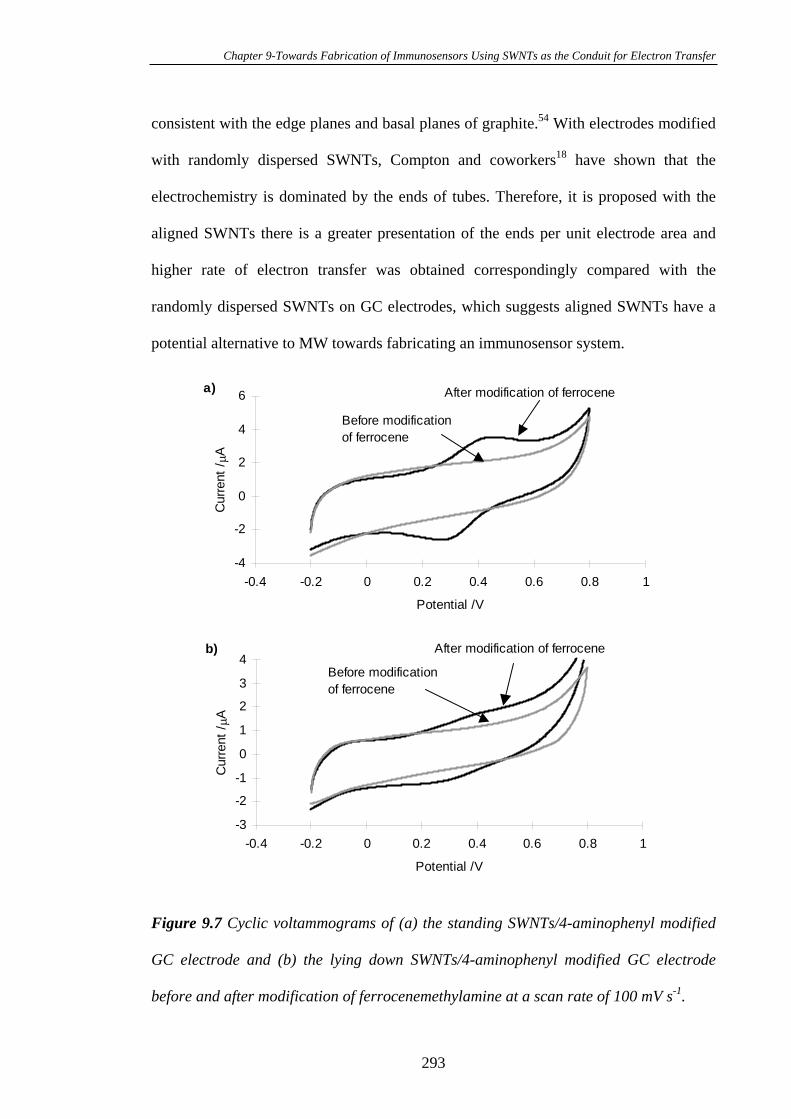
Chapter 9-Towards Fabrication of Immunosensors Using SWNTs as the Conduit for Electron Transfer
consistent with the edge planes and basal planes of graphite.54 With electrodes modified
with randomly dispersed SWNTs, Compton and coworkers18 have shown that the
electrochemistry is dominated by the ends of tubes. Therefore, it is proposed with the
aligned SWNTs there is a greater presentation of the ends per unit electrode area and
higher rate of electron transfer was obtained correspondingly compared with the
randomly dispersed SWNTs on GC electrodes, which suggests aligned SWNTs have a
potential alternative to MW towards fabricating an immunosensor system.
-3
-2
-1
0
1
2
3
4
-0.4 -0.2 0 0.2 0.4 0.6 0.8 1
Potential /V
Cur
rent
/A
After modification of ferrocene
Before modificationof ferrocene
b)
-4
-2
0
2
4
6
-0.4 -0.2 0 0.2 0.4 0.6 0.8 1
Potential /V
Cur
rent
/A
After modification of ferrocenea)
Before modificationof ferrocene
Figure 9.7 Cyclic voltammograms of (a) the standing SWNTs/4-aminophenyl modified
GC electrode and (b) the lying down SWNTs/4-aminophenyl modified GC electrode
before and after modification of ferrocenemethylamine at a scan rate of 100 mV s-1.
293
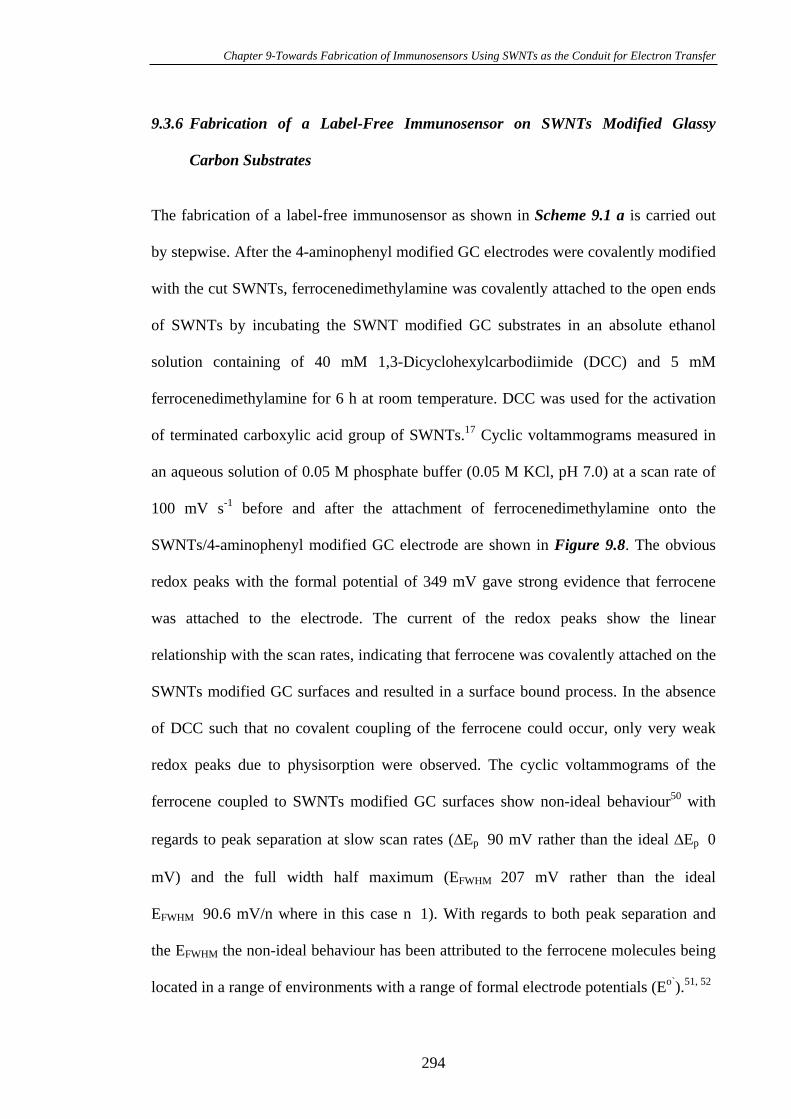
Chapter 9-Towards Fabrication of Immunosensors Using SWNTs as the Conduit for Electron Transfer
9.3.6 Fabrication of a Label-Free Immunosensor on SWNTs Modified Glassy
Carbon Substrates
The fabrication of a label-free immunosensor as shown in Scheme 9.1 a is carried out
by stepwise. After the 4-aminophenyl modified GC electrodes were covalently modified
with the cut SWNTs, ferrocenedimethylamine was covalently attached to the open ends
of SWNTs by incubating the SWNT modified GC substrates in an absolute ethanol
solution containing of 40 mM 1,3-Dicyclohexylcarbodiimide (DCC) and 5 mM
ferrocenedimethylamine for 6 h at room temperature. DCC was used for the activation
of terminated carboxylic acid group of SWNTs.17 Cyclic voltammograms measured in
an aqueous solution of 0.05 M phosphate buffer (0.05 M KCl, pH 7.0) at a scan rate of
100 mV s-1 before and after the attachment of ferrocenedimethylamine onto the
SWNTs/4-aminophenyl modified GC electrode are shown in Figure 9.8. The obvious
redox peaks with the formal potential of 349 mV gave strong evidence that ferrocene
was attached to the electrode. The current of the redox peaks show the linear
relationship with the scan rates, indicating that ferrocene was covalently attached on the
SWNTs modified GC surfaces and resulted in a surface bound process. In the absence
of DCC such that no covalent coupling of the ferrocene could occur, only very weak
redox peaks due to physisorption were observed. The cyclic voltammograms of the
ferrocene coupled to SWNTs modified GC surfaces show non-ideal behaviour50 with
regards to peak separation at slow scan rates ( Ep 90 mV rather than the ideal Ep 0
mV) and the full width half maximum (EFWHM 207 mV rather than the ideal
EFWHM 90.6 mV/n where in this case n 1). With regards to both peak separation and
the EFWHM the non-ideal behaviour has been attributed to the ferrocene molecules being
located in a range of environments with a range of formal electrode potentials (Eo`).51, 52
294
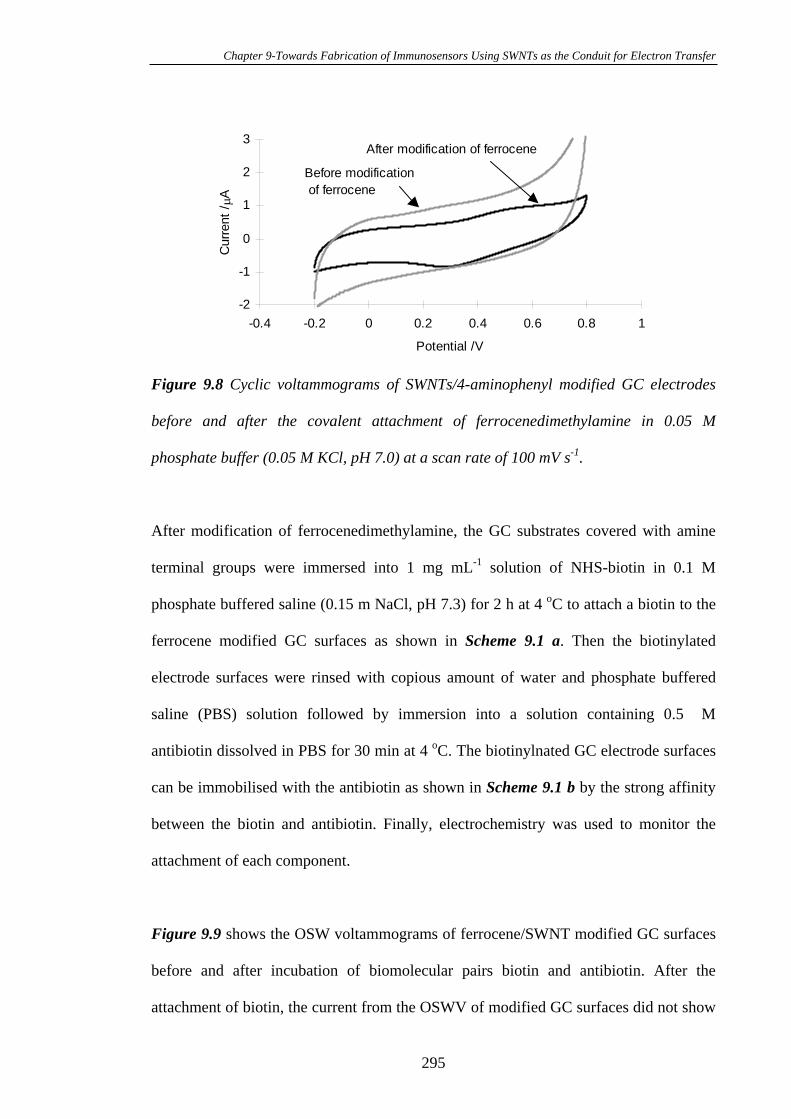
Chapter 9-Towards Fabrication of Immunosensors Using SWNTs as the Conduit for Electron Transfer
-2
-1
0
1
2
3
-0.4 -0.2 0 0.2 0.4 0.6 0.8 1
Potential /V
Cur
rent
/A
After modification of ferrocene
Before modification of ferrocene
Figure 9.8 Cyclic voltammograms of SWNTs/4-aminophenyl modified GC electrodes
before and after the covalent attachment of ferrocenedimethylamine in 0.05 M
phosphate buffer (0.05 M KCl, pH 7.0) at a scan rate of 100 mV s-1.
After modification of ferrocenedimethylamine, the GC substrates covered with amine
terminal groups were immersed into 1 mg mL-1 solution of NHS-biotin in 0.1 M
phosphate buffered saline (0.15 m NaCl, pH 7.3) for 2 h at 4 oC to attach a biotin to the
ferrocene modified GC surfaces as shown in Scheme 9.1 a. Then the biotinylated
electrode surfaces were rinsed with copious amount of water and phosphate buffered
saline (PBS) solution followed by immersion into a solution containing 0.5 M
antibiotin dissolved in PBS for 30 min at 4 oC. The biotinylnated GC electrode surfaces
can be immobilised with the antibiotin as shown in Scheme 9.1 b by the strong affinity
between the biotin and antibiotin. Finally, electrochemistry was used to monitor the
attachment of each component.
Figure 9.9 shows the OSW voltammograms of ferrocene/SWNT modified GC surfaces
before and after incubation of biomolecular pairs biotin and antibiotin. After the
attachment of biotin, the current from the OSWV of modified GC surfaces did not show
295
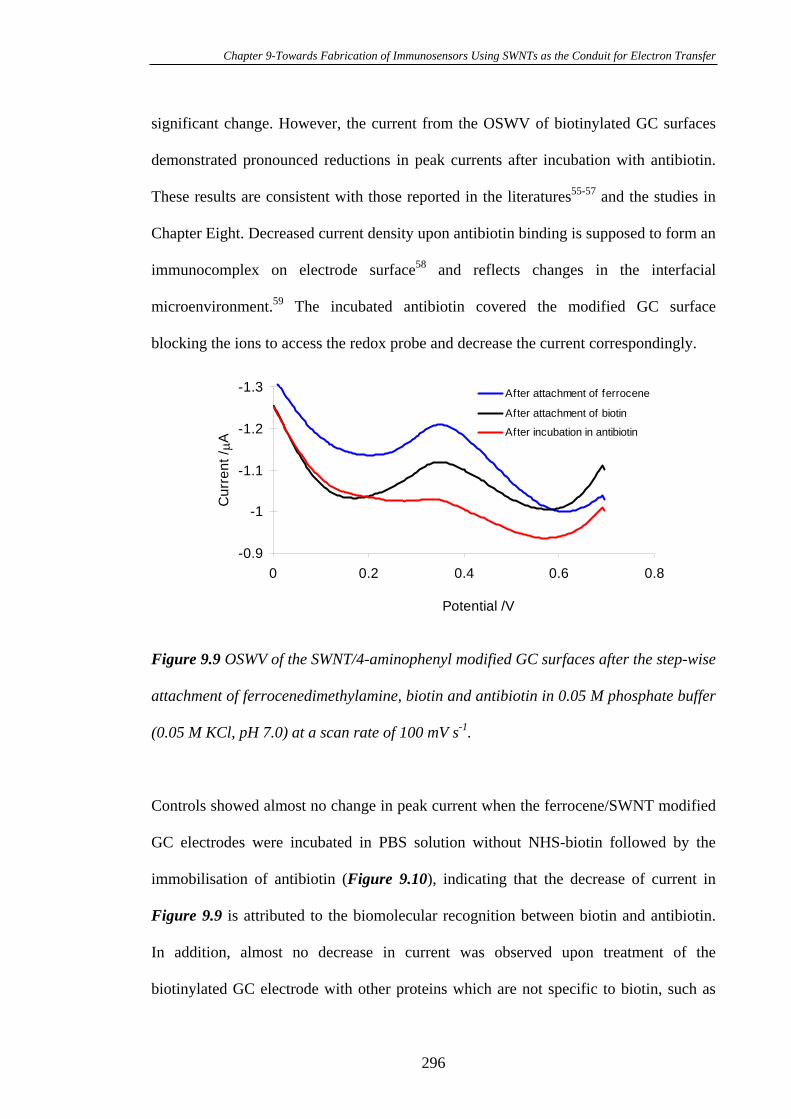
Chapter 9-Towards Fabrication of Immunosensors Using SWNTs as the Conduit for Electron Transfer
significant change. However, the current from the OSWV of biotinylated GC surfaces
demonstrated pronounced reductions in peak currents after incubation with antibiotin.
These results are consistent with those reported in the literatures55-57 and the studies in
Chapter Eight. Decreased current density upon antibiotin binding is supposed to form an
immunocomplex on electrode surface58 and reflects changes in the interfacial
microenvironment.59 The incubated antibiotin covered the modified GC surface
blocking the ions to access the redox probe and decrease the current correspondingly.
-1.3
-1.2
-1.1
-1
-0.90 0.2 0.4 0.6 0.8
Potential /V
Cur
rent
/A
After attachment of ferrocene
After attachment of biotin
After incubation in antibiotin
Figure 9.9 OSWV of the SWNT/4-aminophenyl modified GC surfaces after the step-wise
attachment of ferrocenedimethylamine, biotin and antibiotin in 0.05 M phosphate buffer
(0.05 M KCl, pH 7.0) at a scan rate of 100 mV s-1.
Controls showed almost no change in peak current when the ferrocene/SWNT modified
GC electrodes were incubated in PBS solution without NHS-biotin followed by the
immobilisation of antibiotin (Figure 9.10), indicating that the decrease of current in
Figure 9.9 is attributed to the biomolecular recognition between biotin and antibiotin.
In addition, almost no decrease in current was observed upon treatment of the
biotinylated GC electrode with other proteins which are not specific to biotin, such as
296
Chapter 9-Towards Fabrication of Immunosensors Using SWNTs as the Conduit for Electron Transfer
BSA and anti-pig IgG, but not antibiotin under identical conditions. These results
indicate that the antibiotin specifically associates with the biotin sites in the monolayer
assembly and only the biospecific interaction can lead to the change of
electrochemistry. Based on the change of electrochemistry after immobilisation of
antibiotin, this SWNTs fabricated system in Scheme 9.1 a can be used as an
immunosensor system for detecting the antibiotin.
-5
-4.5
-4
-3.50 0.2 0.4 0.6 0.8
Potential /V
Cur
rent
/A
After attachment of ferrocene
After incubation in antibiotin
Figure 9.10 OSWV of the SWNT modified GC electrodes after the stepwise attachment
of ferrocenedimethylamine and antibiotin in 0.05 M phosphate buffer (0.05 M KCl, pH
7.0) at a scan rate of 100 mV s-1.
Figure 9.11 is the calibration curve for the detection of antibiotin with the detection
limit of 10 ng mL-1. This fabricated immunosensor system based on SWNTs can be
used for detecting of antibiotin with the concentration between 50 and 500 ng mL-1.
Based on this calibration curve, the affinity constant between biotin and antibiotin is
calculated to be ca. 108 M-1, which is quite similar to the affinity constant between
biotin and antibiotin obtained in Chapter Eight (109 M-1), and belongs to the typical
affinity constant for an antigen-antibody reaction (from the order of 108 to 1012 M-1).60
297
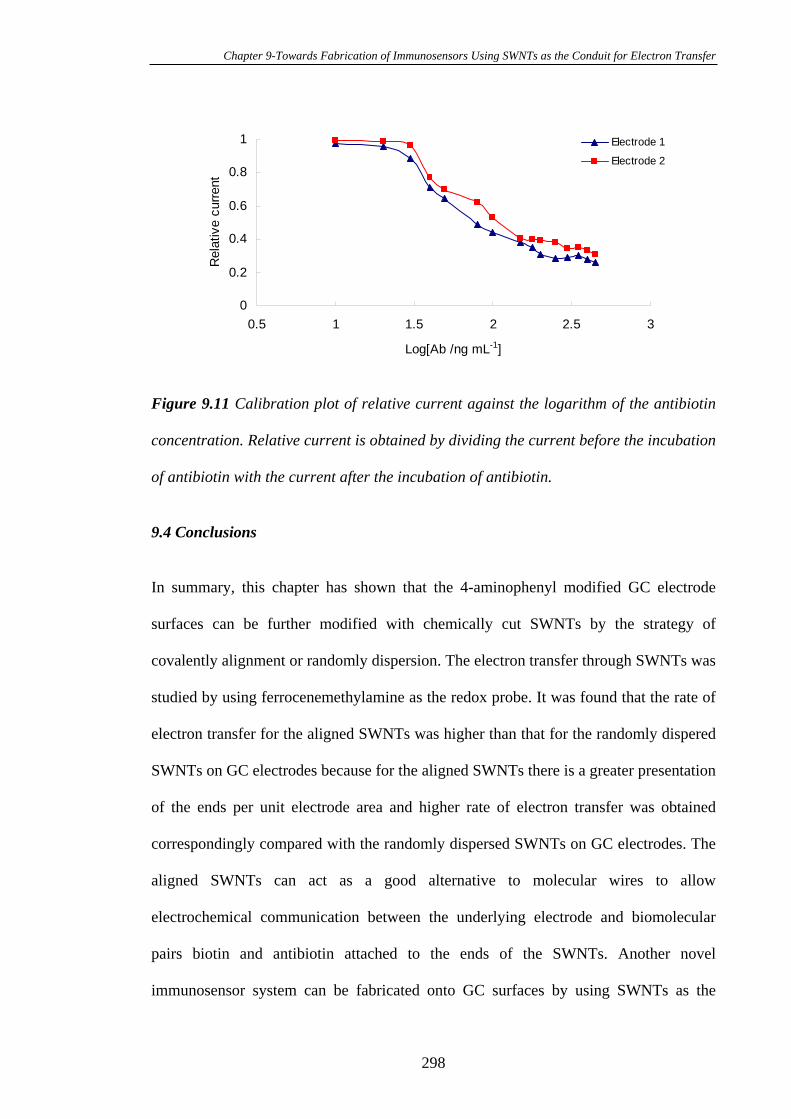
Chapter 9-Towards Fabrication of Immunosensors Using SWNTs as the Conduit for Electron Transfer
0
0.2
0.4
0.6
0.8
1
0.5 1 1.5 2 2.5 3
Log[Ab /ng mL-1]
Rel
ativ
e cu
rrent
Electrode 1
Electrode 2
Figure 9.11 Calibration plot of relative current against the logarithm of the antibiotin
concentration. Relative current is obtained by dividing the current before the incubation
of antibiotin with the current after the incubation of antibiotin.
9.4 Conclusions
In summary, this chapter has shown that the 4-aminophenyl modified GC electrode
surfaces can be further modified with chemically cut SWNTs by the strategy of
covalently alignment or randomly dispersion. The electron transfer through SWNTs was
studied by using ferrocenemethylamine as the redox probe. It was found that the rate of
electron transfer for the aligned SWNTs was higher than that for the randomly dispered
SWNTs on GC electrodes because for the aligned SWNTs there is a greater presentation
of the ends per unit electrode area and higher rate of electron transfer was obtained
correspondingly compared with the randomly dispersed SWNTs on GC electrodes. The
aligned SWNTs can act as a good alternative to molecular wires to allow
electrochemical communication between the underlying electrode and biomolecular
pairs biotin and antibiotin attached to the ends of the SWNTs. Another novel
immunosensor system can be fabricated onto GC surfaces by using SWNTs as the
298
Chapter 9-Towards Fabrication of Immunosensors Using SWNTs as the Conduit for Electron Transfer
conductor. This fabricated immunosensor can be used for the detection of antibiotin
with the detection limit of 10 ng mL-1.
9.5 References
(1) Creager, S., Yu, C.J., Bamdad, C., O'Connor, S., MacLean, T., Lam, E., Chong,
Y., Olsen, G.T., Luo, J., Gozin, M., Kayyem, J.F., J. Am. Chem. Soc. 1999, 121,
1059-1064.
(2) Hess, C.R., Juda, G.A., Dooley, D.M., Amii, R.N., Hill, M.G., Winkler, J.R.,
Gray, H.B., J. Am. Chem. Soc. 2003, 125, 7156-7157.
(3) Umek, R.M., Lin, S.W., Vielmetter, J., Terbrueggen, R.H., Irvine, B., Yu, C.J.,
Kayyem, J.F., Yowanto, H., Blackburn, G.F., Farkas, D.H., Chen, Y.-P., J. Mol.
Diagnostics 2001, 3, 74-84.
(4) Fan, F.R.F., Yang, J.P., Cai, L.T., Price, D.W., Dirk, S.M., Kosynkin, D.V.,
Yao, Y.X., Rawlett, A.M., Tour, J.M., Bard, A.J., J. Am. Chem. Soc. 2002, 124,
5550-5560.
(5) Paddon-Row, M.N., Aust. J. Chem. 2003, 56, 729-748.
(6) Paddon-Row, M.N., Acc. Chem. Res. 1994, 27, 18-25.
(7) Iijima, S., Nature 1991, 354, 56-58.
(8) Iijima, S., Ichihashi, T., Nature 1993, 363, 603-605.
(9) Bethune, D.S., Kiang, C.H., De Vries, M.S., Gorman, G., Savoy, R., Vazquez,
J., Beyers, R., Nature 1993, 363, 605-607.
(10) Ajayan, P.M., Chem. Rev. 1999, 99, 1787-1793.
(11) Salvetat-Delmotte, J.P., Rubio, A., Carbon 2002, 40, 1729-1731.
(12) Colbert, D.T., Smalley, R.E., Trends Biotechnol. 1999, 17, 46-48.
299
Chapter 9-Towards Fabrication of Immunosensors Using SWNTs as the Conduit for Electron Transfer
(13) Tang, Z.K., Zhang, L.Y., Wang, N., Zhang, X.X., Wen, G.H., Li, G.D., Wang,
J.N., Chan, C.T., Sheng, P., Science 2001, 292, 2462-2465.
(14) Ouyang, M., Huang, J.L., Cheung, C.L., Lieber, C.M., Science 2001, 292, 702-
705.
(15) Tans, S.J., Devoret, M.H., Dai, H.J., Thess, A., Smalley, R.E., Geerligs, L.J.,
Dekker, C., Nature 1997, 386, 474-477.
(16) Zhao, Q., Gan, Z.H., Zhuang, Q.K., Electroanalysis 2002, 14, 1609-1613.
(17) Gooding, J.J., Wibowo, R., Liu, J., Yang, W., Losic, D., Orbons, S., Mearns,
F.J., Shapter, J.G., Hibbert, D.B., J. Am. Chem. Soc. 2003, 125, 9006-9007.
(18) Banks, C.E., Moore, R.R., Davies, T.J., Compton, R.G., Chem. Commun. 2004,
1804-1805.
(19) Liu, J.Q., Chou, A., Rahmat, W., Paddon-Row, M.N., Gooding, J.J.,
Electroanalysis 2005, 17, 38-46.
(20) Luo, H.X., Shi, Z.J., Li, N.Q., Gu, Z.N., Zhuang, Q.K., Anal. Chem. 2001, 73,
915-920.
(21) Diao, P., Liu, Z.F., Wu, B., Nan, X.L., Zhang, J., Wei, Z., Chemphyschem 2002,
3, 898-901.
(22) Wang, J.X., Li, M.X., Shi, Z.J., Li, N.Q., Gu, Z.N., Anal. Chem. 2002, 74, 1993-
1997.
(23) Barisci, J.N., Wallace, G.G., Baughman, R.H., J. Electrochem. Soc. 2000, 147,
4580-4583.
(24) Liu, Z.F., Shen, Z.Y., Zhu, T., Hou, S.F., Ying, L.Z., Shi, Z.J., Gu, Z.N.,
Langmuir 2000, 16, 3569-3573.
(25) Nan, X.L., Gu, Z.N., Liu, Z.F., J. Colloid. Interf. Sci. 2002, 245, 311-318.
(26) Wang, J., Musameh, M., Lin, Y.H., J. Am. Chem. Soc. 2003, 125, 2408-2409.
300
Chapter 9-Towards Fabrication of Immunosensors Using SWNTs as the Conduit for Electron Transfer
(27) Gao, M., Dai, L.M., Wallace, G.G., Electroanalysis 2003, 15, 1089-1094.
(28) Valentini, F., Amine, A., Orlanducci, S., Terranova, M.L., Palleschi, G., Anal.
Chem. 2003, 75, 5413-5421.
(29) Nugent, J.M., Santhanam, K.S.V., Rubio, A., Ajayan, P.M., Nano Lett. 2001, 1,
87-91.
(30) Cai, C.X., Chen, J., Anal. Biochem. 2004, 325, 285-292.
(31) Yamamoto, K., Shi, G., Zhou, T., Xu, F., Xu, J., Kato, T., Jin, J., Jin, L., Analyst
2003, 128, 249-254.
(32) Zhao, Y.D., Zhang, W.D., Chen, H., Luo, Q.M., Li, S.F.Y., Sens. Actuators B
2002, 87, 168-172.
(33) Yu, X., Chattopadhyay, D., Galeska, I., Papadimitrakopoulos, F., Rusling, J.F.,
Electrochem. Commun. 2003, 5, 408-411.
(34) Guiseppi-Elie, A., Lei, C.H., Baughman, R.H., Nanotechnology 2002, 13, 559-
564.
(35) Zhao, Y.D., Zhang, W.D., Chen, H., Luo, Q.M., Anal. Sci. 2002, 18, 939-941.
(36) Chou, A., Bocking, T., Singh, N.K., Gooding, J.J., Chem. Commun. 2005, 842-
844.
(37) Gao, M., Huang, S.M., Dai, L.M., Wallace, G., Gao, R.P., Wang, Z.L., Angew.
Chem. Int. Edit. 2000, 39, 3664-3667.
(38) Koehne, J., Li, J., Cassell, A.M., Chen, H., Ye, Q., Ng, H.T., Han, J.,
Meyyappan, M., J. Mater. Chem. 2004, 14, 676-684.
(39) Liu, J., Rinzler, A.G., Dai, H.J., Hafner, J.H., Bradley, R.K., Boul, P.J., Lu, A.,
Iverson, T., Shelimov, K., Huffman, C.B., Rodriguez-Macias, F., Shon, Y.S.,
Lee, T.R., Colbert, D.T., Smalley, R.E., Science 1998, 280, 1253-1256.
301
Chapter 9-Towards Fabrication of Immunosensors Using SWNTs as the Conduit for Electron Transfer
(40) Delamar, M., Desarmot, G., Fagebaume, O., Hitmi, R., Pinson, J., Saveant, J.M.,
Carbon 1997, 35, 801-807.
(41) Delamar, M., Hitmi, R., Pinson, J., Saveant, J.M., J. Am. Chem. Soc. 1992, 114,
5883-5884.
(42) Allongue, P., Delamar, M., Desbat, B., Fagebaume, O., Hitmi, R., Pinson, J.,
Saveant, J.-M., J. Am. Chem. Soc. 1997, 119, 201-207.
(43) Saby, C., Ortiz, B., Champagne, G.Y., Belanger, D., Langmuir 1997, 13, 6805-
6813.
(44) Liu, Y.-C., McCreery, R.L., J. Am. Chem. Soc. 1995, 117, 11254-11259.
(45) Cyr, A., Huot, P., Belot, G., Lessard, J., Electrochim. Acta 1990, 35, 147-152.
(46) Liu, J.Q., Gooding, J.J., Paddon-Row, M.N., Chem. Commun. 2005, 631-633.
(47) Seo, K., Jeon, I.C., Yoo, D.J., Langmuir 2004, 20, 4147-4154.
(48) Laviron, E., J. Electroanal. Chem. 1979, 101, 19-28.
(49) Liu, G., Liu, J., Bocking, T., Eggers, P., Gooding, J.J., Chem. Phys. 2005, 319,
136-146.
(50) Finklea, H.O., Electroanal. Chem. 1996, 19, 109-115.
(51) Honeychurch, M.J., Langmuir 1998, 14, 6291-6296.
(52) Rowe, G.K., Carter, M.T., Richardson, J.N., Murray, R.W., Langmuir 1995, 11,
1797-1806.
(53) Li, J., Cassell, A.M., Delzeit, L., Han, J., Meyyappan, M., J. Phys. Chem. B
2002, 106, 9299-9305.
(54) McCreery, R.L., In Electroanalytical Chemistry, Bard, A.J., Ed. Dekker: New
York, 1991; Vol. 17, p 221.
(55) Jhaveri, S.D., Mauro, J.M., Goldston, H.M., Schauer, C.L., Tender, L.M.,
Trammell, S.A., Chem. Commun. 2003, 338-339.
302
Chapter 9-Towards Fabrication of Immunosensors Using SWNTs as the Conduit for Electron Transfer
(56) Yan, J., Tender, L.M., Hampton, P.D., Lopez, G.P., J. Phys. Chem. B 2001, 105,
8905-8910.
(57) Goldston, H.M., Scribner, A.N., Trammell, S.A., Tender, L.M., Chem. Commun.
2002, 416-417.
(58) Berggren, C., Bjarnason, B., Johansson, G., Electroanalysis 2001, 13, 173-180.
(59) Creager, S.E., Rowe, G.K., J. Electroanal. Chem. 1997, 420, 291-299.
(60) Green, N.M., Anfinsin, C.B., Edsall, J.T., Richards, F., Advances in Protein
Chemistry. Academic Press:San Diego: CA, 1975; Vol. 29, p 85-133.
303

Chapter 10-Conclusions and Future Directions
Chapter Ten
Conclusions and Future Directions
304
Chapter 10-Conclusions and Future Directions
10.1 Introduction
This thesis has reported the study of creating more stable and versatile self-assembled
monolayer systems on glassy carbon (GC) substrates relative to gold, by
electrochemically reductive adsorption of aryl diazonium salts for sensors and other
applications. The rate constants of electron transfer through aromatic molecules,
synthesised molecular wires (MW) and single wall carbon nanotubes (SWNTs) on GC
electrodes have been studied. An electrochemical sensor for the detection of copper ions
has been successfully developed on the tripeptide Gly-Gly-His modified GC and
pyrolised photoresist film (PPF) electrode surfaces. The rigid and conjugated MWs can
be used as the efficient conduit for electron transfer to fabricate the mediatorless
glucose biosensor. Moreover, a novel immunosensor system fabricated on an
electrochemical interface comprising mixed monolayers of MW and poly(ethylene
glycol) (PEG) can be used to detect the biomolecular pairs such as biotin and antibiotin.
SWNTs can serve as an alternative to MW for the fabrication of immunosensors.
Despite the fact that summaries and conclusions have been given in each chapter, it is
worthwhile to give a broader summary relating to the whole project followed by the
discussion of the future directions emanating from the current research. It is important
to emphasise that the detailed mechanism of electron transfer, particularly in biological
systems, is far from clear, furthermore the approach towards the fabrication of third
generation glucose biosensors using a conduit for electron transfer, and the development
of novel immunosensors suitable to the detection of analytes are just at the beginning of
their research life.
305
Chapter 10-Conclusions and Future Directions
10.2 Brief Summary
The results in Chapter Three have demonstrated that GC, PPF and gold electrodes can
be successfully modified with pure and mixed aryl diazonium salts using the two-cycle
cyclic voltammetry method to form stable and covalently bonded monolayers. The rates
of heterogeneous electron transfer on GC, PPF and gold surfaces have been studied
using ferrocene as the redox probe in Chapter Four. It was concluded the rate of electron
transfer is an order of magnitude higher for gold electrodes in comparison to carbon
electrodes due to the mixing of delocalised electrons between the electrode material and
the monolayer occurring to a greater extent for gold than for GC. However, the higher
stability of monolayer created on GC surface serves as a good alternative for the
development of electrochemical sensors as described in Chapter Five. The tripeptide
Gly-Gly-His modified GC surfaces being characterised by XPS techniques have been
successfully used for the detection of copper ions in solutions. The detection limit could
reach 0.32 ppb using both GC electrodes and PPF substrates. The surface coverage of
complexed copper ions has been systematically investigated by attachment of Gly-Gly-
His to a series of mixed monolayers of 4-carboxyphenyl and phenyl on GC surfaces.
The tripeptide Gly-Gly-His modified GC electrode for the detection of copper was
found to be very stable. After one-month storage and frequent usage, the measured
sensitivity did not show much decay. PPF has proved to be a good alternative to the GC
electrode for the commercialisation of the fabricated electrochemical sensors. The
strategy for fabrication of the copper sensors can serve as a good example for the
fabrication of other electrochemical sensors built with other oligopeptides for the
analysis of other metal ions and also supplies an effective tool for medical diagnosis.
306
Chapter 10-Conclusions and Future Directions
The rigid and conjugated MW as the efficient conduit for electron transfer, and a PEG
molecule as an insulator for reducing the non-specific protein adsorption were
successfully synthesised. The ability of the interface comprising mixed monolayers of
MW and PEG to facilitate efficient electron transfer is demonstrated in Chapter Six
using ferrocenemethylamine attached to the end of MW whilst the protein resistance of
the interface is studied using protein modified gold nanoparticles, changes in electrode
capacitance when exposed to solutions of proteins and the electrochemical response of
the electrode when incubated in the enzyme horseradish peroxidase (HRP). Direct
electron transfer to HRP has been achieved by covalent attachment of HRP onto MW
and the activity of the immobilised HRP is determined from the response of the
electrode interface to hydrogen peroxide. As described in Chapter Seven, the rigid MW
was also successfully used as an efficient tool for the exploration of the active centre of
GOx utilising the mixed monolayer technique to achieve direct electron transfer of GOx
from the active centre FAD through the MW to the underlying GC electrode. The
biocatalytical activity was also investigated using glucose as a substrate. Thus, utilising
the rigid molecules incorporating the mixed monolayer technique supplies a feasible
method to explore the active centres of some other redox enzymes, and also has great
potential to be used as a convenient strategy to fabricate third generation biosensor.
A novel label-free immunosensor system has been successfully developed in Chapter
Eight for electrochemical sensing of biotin-antibiotin biomolecular pairs based on
mixed monolayers of MW and PEG modified GC electrode surfaces. The so-prepared
sensor system can be used to detect one of the antigen-antibody pairs with low detection
limitation. In addition, a displacement assay has shown that the free biotin can compete
with the attached biotin for binding antibiotin. As studied in Chapter Nine the SWNTs
307
Chapter 10-Conclusions and Future Directions
can be used as an alternative to molecular wire to fabricate another immunosensor
system due to the high efficiency of electron transfer that SWNTs have exhibited.
10.3 Future Directions
10.3.1 Further Investigation of Heterogeneous Electron Transfer within and between
the Enzymes
The heterogeneous electron transfer through the pure and mixed monolayers of organic
molecules modified on GC surfaces has been studied in this thesis. As introduced in
Chapter One the rate constant of electron transfer could be affected by many factors,
such as the electrode materials, the nature of the molecules, the electrolytes and density
of the redox probes. However, because of their diversity and rich behaviour, the kinetics
and mechanism for the electron transfer processes are difficult to identify, a lot of more
issues need to be investigated. Even more complicated is the electron transfer behaviour
between and within the enzymes as pioneered by many groups.1-6 Though the
exploration of the GOx using MW and the fabrication of the glucose biosensor have
given a lot of invaluable information, the molecular basis of the microscopic mechanism
of the electrical communications within and between the enzymes still remains unclear
because of the complexity and inhomogenity of biomolecular systems.
10.3.2 Optimisation of the Fabricated Immunosensors
As discussed in Chapter Eight and Chapter Nine, the fabricated immunosensors using
MWs or SWNTs as the conductor have demonstrated the capability for quantitative
analysis of antibiotin, and the free biotin can also be analysed by the displacement assay.
However, it took half an hour to achieve the quantitative analysis response, which is not
applicable for a real time analysis. Thus, it is valuable to investigate the strategies to
308
Chapter 10-Conclusions and Future Directions
speed the detection of biomolecules in order to optimising this fabricated
immunosensors, such as fabricating a more stable sensor interface on GC surfaces or
finding more stable reodox probes. In addition, it is worthwhile using such fabricated
immunosensor system for the detection of the real biological samples.
10.3.3 Development of the Immunosensor Arrays
After optimisation, the MW fabricated immunosensors is supposed to have the ability
for rapid, sensitive and quantitative analysis of biomolecular pairs in real samples. An
additional feature of immunosensor performance becomes more and more important:
the immunosensor should be able to discriminate between multiple analytes in a single
pot of samples. A number of groups have described optical biosensors capable of
simultaneous detection of multiple analytes.7-10 However, demonstration of the ability to
use a single sensor substrate for simultaneous, multi-analyte detection is limited.11-14
The ability to perform multiple analyses on a single sensing surface has a number of
advantages15 over performing multiple parallel analyses on different substrates. i) A
single set of positive and negative controls can be used for all the assays. These controls
can be used to correct for variations in substrate chemistry, illumination, or detector
sensitivity. ii) A series of standards may be analysed at the same time as unknown
samples, allowing construction of standard curves for quantification. iii) Performing
multiple assays simultaneously decreases the assay times compared with sequential
analyses. iv) Fluidic manipulations are less complicated when using a single sensor
substrate than when multiple substrates are used. v) Use of a single substrate provides
more effective (and valid) comparisons of the experimental data and the controls.
309
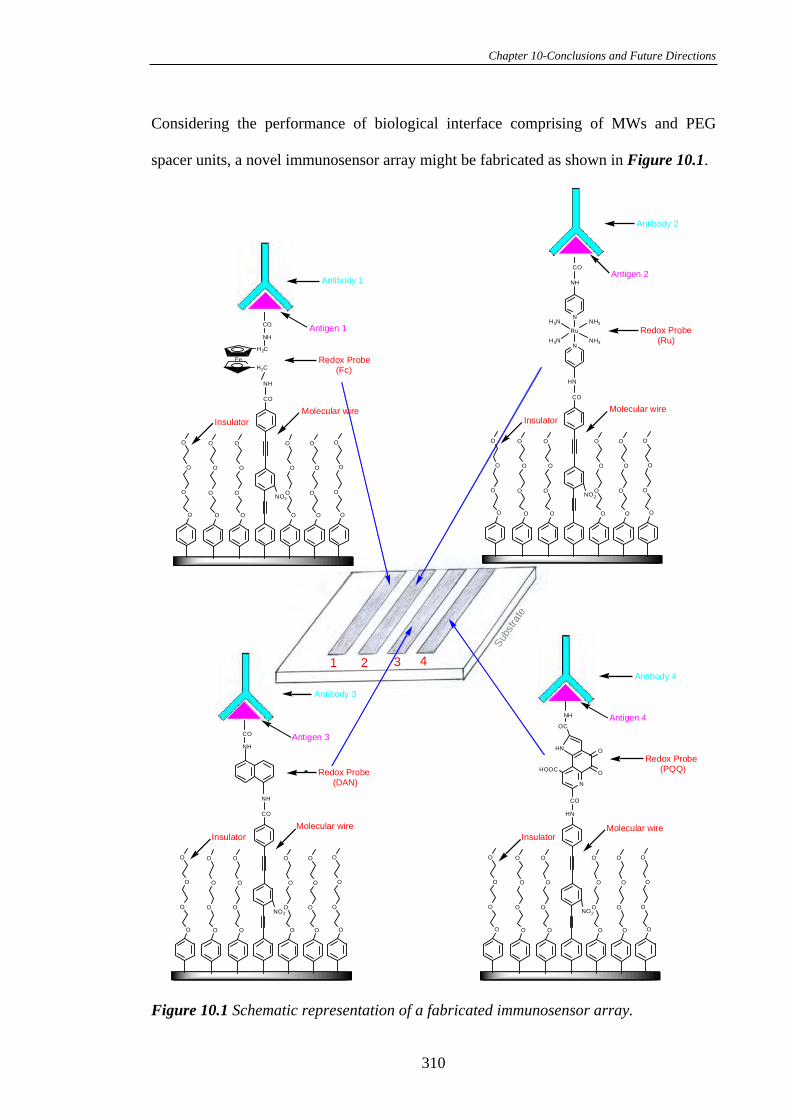
Chapter 10-Conclusions and Future Directions
Considering the performance of biological interface comprising of MWs and PEG
spacer units, a novel immunosensor array might be fabricated as shown in Figure 10.1.
1 2 3 4
Subs
trate
O
O
O
O
O
O
O
O
O
O
O
O
O
O
O
O
O
O
O
O
O
O
O
O
Molecular wireInsulator
NO2
CO
NH
Redox Probe (DAN)
Antigen 3
Antibody 3
NH
CO
O
O
O
O
O
O
O
O
O
O
O
O
O
O
O
O
O
O
O
O
O
O
O
O
Molecular wireInsulator
NO2
CO
NH
NH
CO
Redox Probe(Fc)
Fe
H2C
H2C
Antigen 1
Antibody 1
O
O
O
O
O
O
O
O
O
O
O
O
O
O
O
O
O
O
O
O
O
O
O
O
Molecular wireInsulator
NO2
HN
Redox Probe(PQQ)
Antigen 4
Antibody 4
NH
N
O
OHN
HOOC
CO
OC
O
O
O
O
O
O
O
O
O
O
O
O
O
O
O
O
O
O
O
O
O
O
O
O
Molecular wireInsulator
NO2
CO
HN
CO
Redox Probe (Ru)
Antigen 2
Antibody 2
NH
N
N
RuH3N
H3N
NH3
NH3
Figure 10.1 Schematic representation of a fabricated immunosensor array.
310
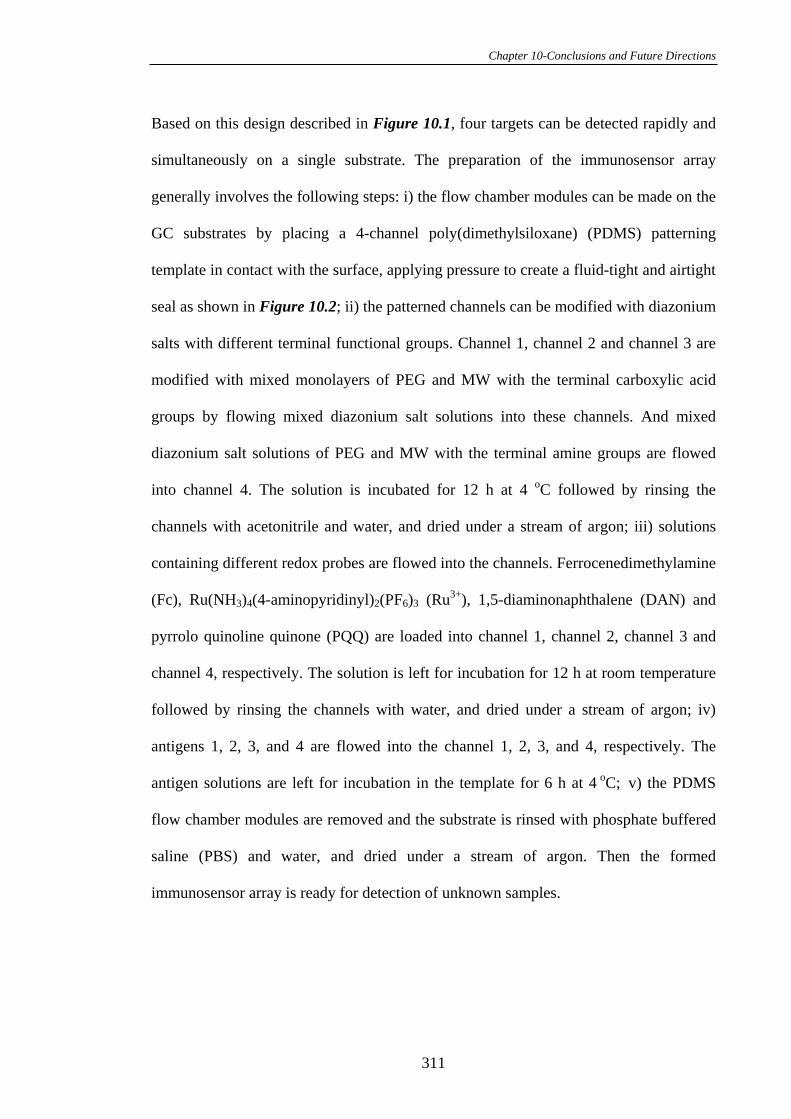
Chapter 10-Conclusions and Future Directions
Based on this design described in Figure 10.1, four targets can be detected rapidly and
simultaneously on a single substrate. The preparation of the immunosensor array
generally involves the following steps: i) the flow chamber modules can be made on the
GC substrates by placing a 4-channel poly(dimethylsiloxane) (PDMS) patterning
template in contact with the surface, applying pressure to create a fluid-tight and airtight
seal as shown in Figure 10.2; ii) the patterned channels can be modified with diazonium
salts with different terminal functional groups. Channel 1, channel 2 and channel 3 are
modified with mixed monolayers of PEG and MW with the terminal carboxylic acid
groups by flowing mixed diazonium salt solutions into these channels. And mixed
diazonium salt solutions of PEG and MW with the terminal amine groups are flowed
into channel 4. The solution is incubated for 12 h at 4 oC followed by rinsing the
channels with acetonitrile and water, and dried under a stream of argon; iii) solutions
containing different redox probes are flowed into the channels. Ferrocenedimethylamine
(Fc), Ru(NH3)4(4-aminopyridinyl)2(PF6)3 (Ru3+), 1,5-diaminonaphthalene (DAN) and
pyrrolo quinoline quinone (PQQ) are loaded into channel 1, channel 2, channel 3 and
channel 4, respectively. The solution is left for incubation for 12 h at room temperature
followed by rinsing the channels with water, and dried under a stream of argon; iv)
antigens 1, 2, 3, and 4 are flowed into the channel 1, 2, 3, and 4, respectively. The
antigen solutions are left for incubation in the template for 6 h at 4 oC; v) the PDMS
flow chamber modules are removed and the substrate is rinsed with phosphate buffered
saline (PBS) and water, and dried under a stream of argon. Then the formed
immunosensor array is ready for detection of unknown samples.
311
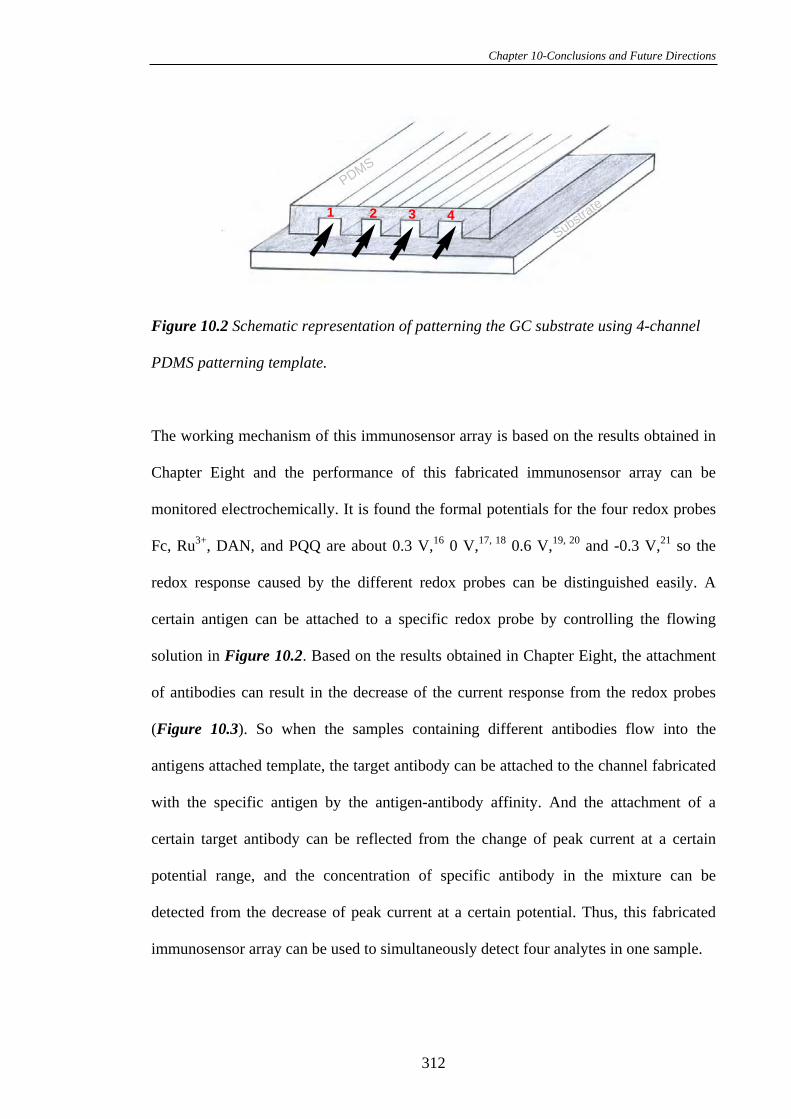
Chapter 10-Conclusions and Future Directions
1 2 3 4Substra
te
PDMS
Figure 10.2 Schematic representation of patterning the GC substrate using 4-channel
PDMS patterning template.
The working mechanism of this immunosensor array is based on the results obtained in
Chapter Eight and the performance of this fabricated immunosensor array can be
monitored electrochemically. It is found the formal potentials for the four redox probes
Fc, Ru3+, DAN, and PQQ are about 0.3 V,16 0 V,17, 18 0.6 V,19, 20 and -0.3 V,21 so the
redox response caused by the different redox probes can be distinguished easily. A
certain antigen can be attached to a specific redox probe by controlling the flowing
solution in Figure 10.2. Based on the results obtained in Chapter Eight, the attachment
of antibodies can result in the decrease of the current response from the redox probes
(Figure 10.3). So when the samples containing different antibodies flow into the
antigens attached template, the target antibody can be attached to the channel fabricated
with the specific antigen by the antigen-antibody affinity. And the attachment of a
certain target antibody can be reflected from the change of peak current at a certain
potential range, and the concentration of specific antibody in the mixture can be
detected from the decrease of peak current at a certain potential. Thus, this fabricated
immunosensor array can be used to simultaneously detect four analytes in one sample.
312
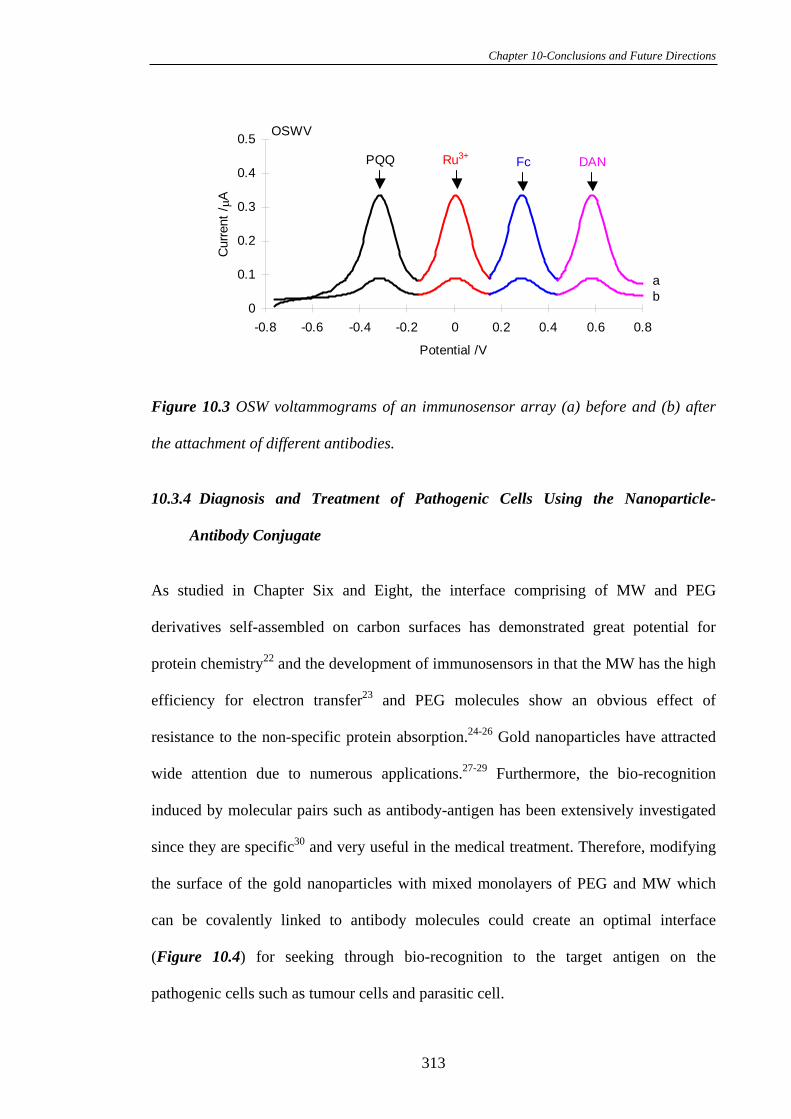
Chapter 10-Conclusions and Future Directions
0
0.1
0.2
0.3
0.4
0.5
-0.8 -0.6 -0.4 -0.2 0 0.2 0.4 0.6 0.8
Potential /V
Cur
rent
/A
PQQ Ru3+ Fc DAN
ab
OSWV
Figure 10.3 OSW voltammograms of an immunosensor array (a) before and (b) after
the attachment of different antibodies.
10.3.4 Diagnosis and Treatment of Pathogenic Cells Using the Nanoparticle-
Antibody Conjugate
As studied in Chapter Six and Eight, the interface comprising of MW and PEG
derivatives self-assembled on carbon surfaces has demonstrated great potential for
protein chemistry22 and the development of immunosensors in that the MW has the high
efficiency for electron transfer23 and PEG molecules show an obvious effect of
resistance to the non-specific protein absorption.24-26 Gold nanoparticles have attracted
wide attention due to numerous applications.27-29 Furthermore, the bio-recognition
induced by molecular pairs such as antibody-antigen has been extensively investigated
since they are specific30 and very useful in the medical treatment. Therefore, modifying
the surface of the gold nanoparticles with mixed monolayers of PEG and MW which
can be covalently linked to antibody molecules could create an optimal interface
(Figure 10.4) for seeking through bio-recognition to the target antigen on the
pathogenic cells such as tumour cells and parasitic cell.
313
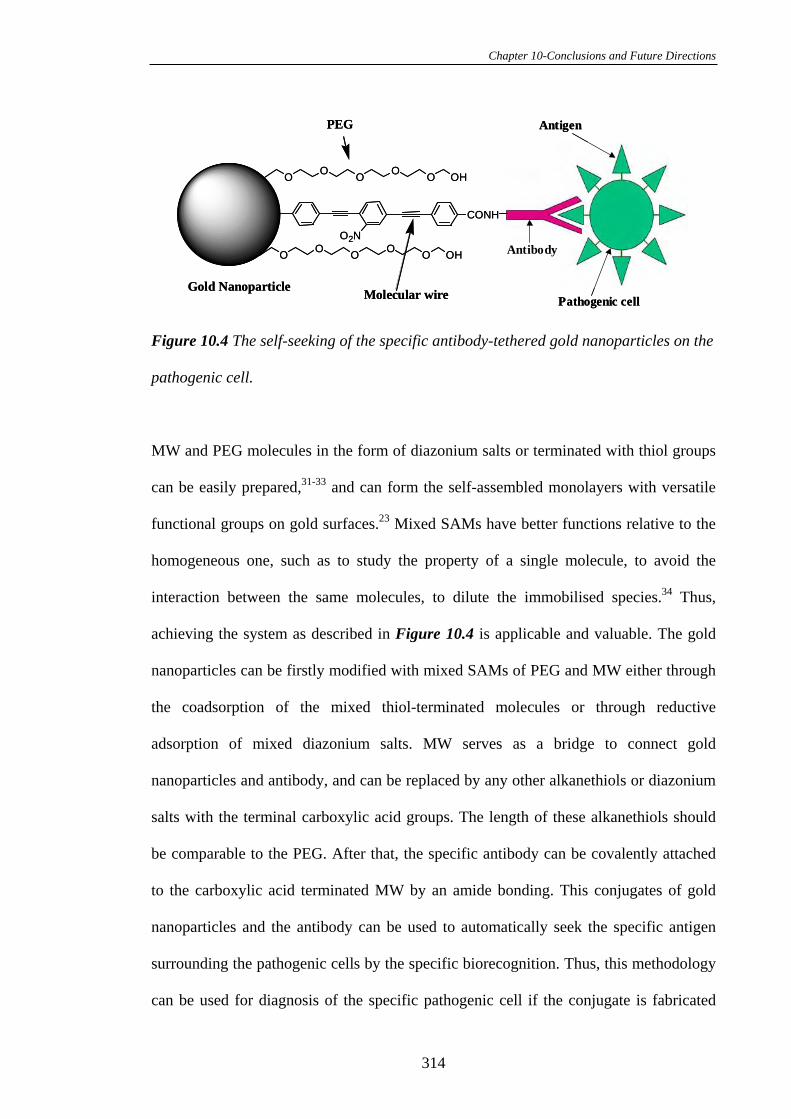
Chapter 10-Conclusions and Future Directions
Gold Nanoparticle
PEG
O2N
CONH
O O O O O OH
O O O O O OH
Molecular wire
Antibody
Antigen
Pathogenic cellGold Nanoparticle
PEG
O2N
CONH
O O O O O OH
O O O O O OH
Molecular wire
Antibody
Antigen
Pathogenic cell
Figure 10.4 The self-seeking of the specific antibody-tethered gold nanoparticles on the
pathogenic cell.
MW and PEG molecules in the form of diazonium salts or terminated with thiol groups
can be easily prepared,31-33 and can form the self-assembled monolayers with versatile
functional groups on gold surfaces.23 Mixed SAMs have better functions relative to the
homogeneous one, such as to study the property of a single molecule, to avoid the
interaction between the same molecules, to dilute the immobilised species.34 Thus,
achieving the system as described in Figure 10.4 is applicable and valuable. The gold
nanoparticles can be firstly modified with mixed SAMs of PEG and MW either through
the coadsorption of the mixed thiol-terminated molecules or through reductive
adsorption of mixed diazonium salts. MW serves as a bridge to connect gold
nanoparticles and antibody, and can be replaced by any other alkanethiols or diazonium
salts with the terminal carboxylic acid groups. The length of these alkanethiols should
be comparable to the PEG. After that, the specific antibody can be covalently attached
to the carboxylic acid terminated MW by an amide bonding. This conjugates of gold
nanoparticles and the antibody can be used to automatically seek the specific antigen
surrounding the pathogenic cells by the specific biorecognition. Thus, this methodology
can be used for diagnosis of the specific pathogenic cell if the conjugate is fabricated
314
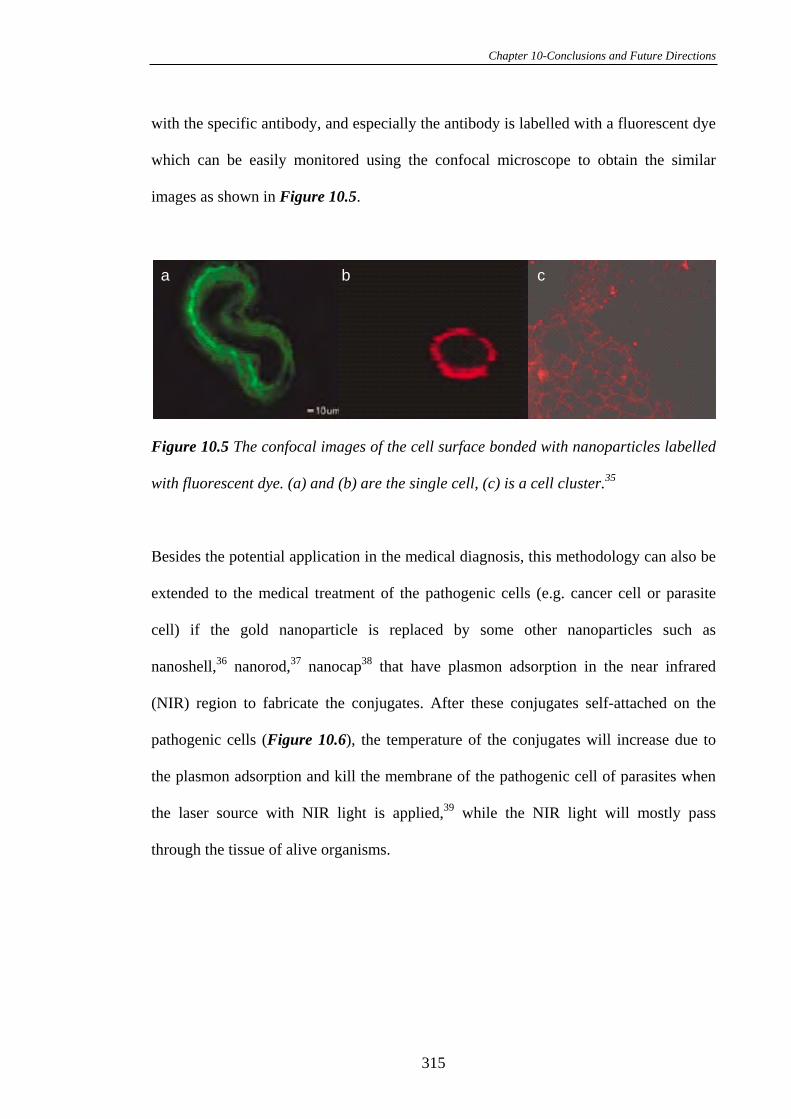
Chapter 10-Conclusions and Future Directions
with the specific antibody, and especially the antibody is labelled with a fluorescent dye
which can be easily monitored using the confocal microscope to obtain the similar
images as shown in Figure 10.5.
a b c
Figure 10.5 The confocal images of the cell surface bonded with nanoparticles labelled
with fluorescent dye. (a) and (b) are the single cell, (c) is a cell cluster.35
Besides the potential application in the medical diagnosis, this methodology can also be
extended to the medical treatment of the pathogenic cells (e.g. cancer cell or parasite
cell) if the gold nanoparticle is replaced by some other nanoparticles such as
nanoshell,36 nanorod,37 nanocap38 that have plasmon adsorption in the near infrared
(NIR) region to fabricate the conjugates. After these conjugates self-attached on the
pathogenic cells (Figure 10.6), the temperature of the conjugates will increase due to
the plasmon adsorption and kill the membrane of the pathogenic cell of parasites when
the laser source with NIR light is applied,39 while the NIR light will mostly pass
through the tissue of alive organisms.
315
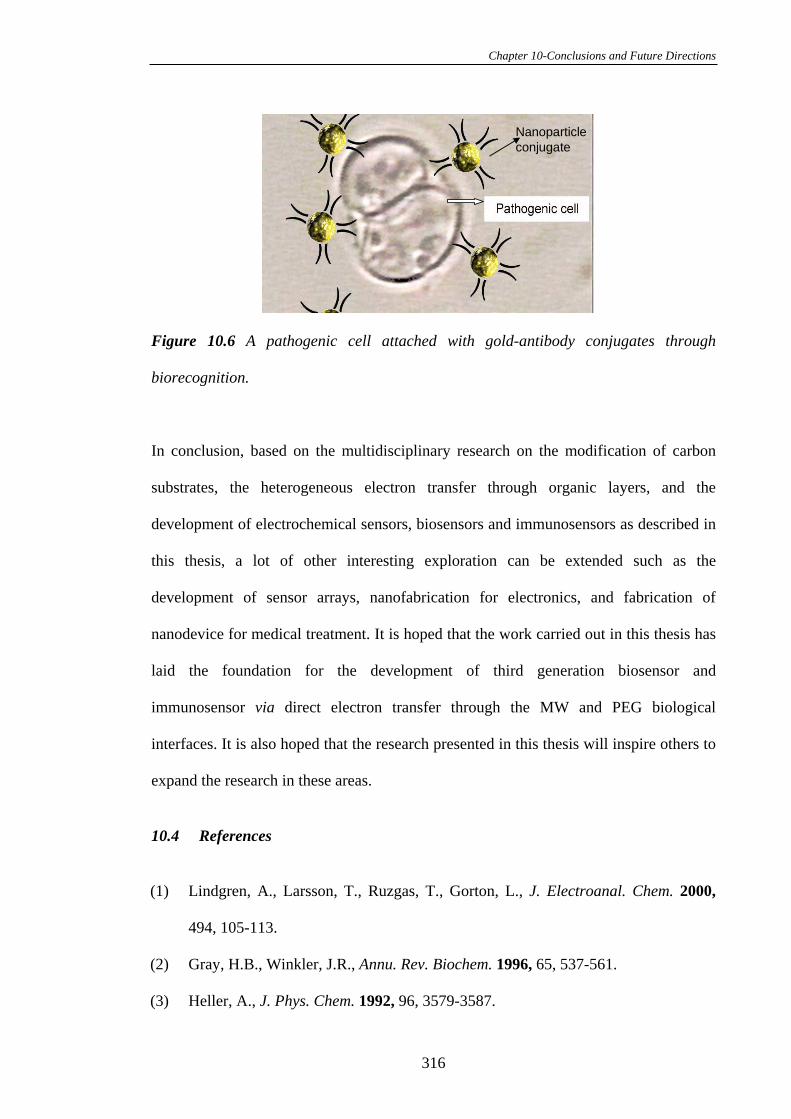
Chapter 10-Conclusions and Future Directions
Nanoparticleconjugate
Figure 10.6 A pathogenic cell attached with gold-antibody conjugates through
biorecognition.
In conclusion, based on the multidisciplinary research on the modification of carbon
substrates, the heterogeneous electron transfer through organic layers, and the
development of electrochemical sensors, biosensors and immunosensors as described in
this thesis, a lot of other interesting exploration can be extended such as the
development of sensor arrays, nanofabrication for electronics, and fabrication of
nanodevice for medical treatment. It is hoped that the work carried out in this thesis has
laid the foundation for the development of third generation biosensor and
immunosensor via direct electron transfer through the MW and PEG biological
interfaces. It is also hoped that the research presented in this thesis will inspire others to
expand the research in these areas.
10.4 References
(1) Lindgren, A., Larsson, T., Ruzgas, T., Gorton, L., J. Electroanal. Chem. 2000,
494, 105-113.
(2) Gray, H.B., Winkler, J.R., Annu. Rev. Biochem. 1996, 65, 537-561.
(3) Heller, A., J. Phys. Chem. 1992, 96, 3579-3587.
316
Chapter 10-Conclusions and Future Directions
(4) Liu, J.Q., Chou, A., Rahmat, W., Paddon-Row, M.N., Gooding, J.J.,
Electroanalysis 2005, 17, 38-46.
(5) Willner, I., Heleg-Shabtai, V., Katz, E., Rau, H.K., Haehnel, W., J. Am. Chem.
Soc. 1999, 121, 6455-6468.
(6) Wei, J.J., Liu, H.Y., Khoshtariya, D.E., Yamamoto, H., Dick, A., Waldeck, D.H.,
Angew. Chem. Int. Edit. 2002, 41, 4700-4703.
(7) Ekins, R.P., Chu, F., Biggart, E., Clin. Chim. Acta. 1990, 194, 91-114.
(8) Anderson, G.P., King, K.D., Gaffney, K.L., Johnson, L.H., Biosens. Bioelectron.
1999, 14, 771-778.
(9) Blawas, A.S., Oliver, T.F., Pirrung, M.C., Reichert, W.M., Langmuir 1998, 14,
4243-4250.
(10) Ekins, R.P., Chu, F., Clin. Chem. 1993, 39, 369-370.
(11) Taitt, C.R., Anderson, G.P., Lingerfelt, B.M., Feldstein, M.J., Liger, F.S., Anal.
Chem. 2002, 74, 6114-6120.
(12) Rowe-Taitt, C.A., Hazzard, J.W., Hoffman, K.E., Cras, J.J., Golden, J.P., Ligler,
F.S., Biosens. Bioelectron. 2000, 15, 579-589.
(13) Rowe, C.A., Scruggs, S.B., Feldstein, M.J., Golden, J.P., Ligler, F.S., Anal. Chem.
1999, 71, 433-439.
(14) Plowman, T.E., Durstchi, J.D., Wang, H.K., Christensen, D.A., Herron, J.N.,
Reichert, W.M., Anal. Chem. 1999, 71, 4344-4352.
(15) Rowe, C.A., Tender, L.M., Feldstein, M.J., Golden, J.P., Scruggs, S.B.,
MacCraith, B.D., Cras, J.J., Ligler, F.S., Anal. Chem. 1999, 71, 3846-3852.
(16) Connelly, N.G., Geiger, W.E., Chem. Rev. 1996, 96, 877-910.
(17) Ando, I., Ishimura, D., Ujimoto, K., Kurihara, H., Inorg. Chem. 1996, 35, 3504-
3508.
317

Chapter 10-Conclusions and Future Directions
(18) Jhaveri, S.D., Trammell, S.A., Lowy, D.A., Tender, L.M., J. Am. Chem. Soc.
2004, 126, 6540-6541.
(19) Hong, S.-Y., Park, S.-M., J. Electrochem. Soc. 2003, 150, E360-E365.
(20) Vidal, J.C., Garcia-Ruiz, E., Espuelas, J., Aramendia, T., Castillo, J.R., Anal.
Bioanal. Chem. 2003, 377, 273-280.
(21) Katz, E., Schlereth, D.D., Schmidt, H.L., J. Electroanal. Chem. 1994, 367, 59-70.
(22) Liu, G., Gooding, J.J., Langmuir 2006, 22, 7421-7430.
(23) Creager, S., Yu, C.J., Bamdad, C., O'Connor, S., MacLean, T., Lam, E., Chong,
Y., Olsen, G.T., Luo, J., Gozin, M., Kayyem, J.F., J. Am. Chem. Soc. 1999, 121,
1059-1064.
(24) Prime, K.L., Whitesides, G.M., Science 1991, 252, 1164-1167.
(25) Prime, K.L., Whitesides, G.M., J. Am. Chem. Soc. 1993, 115, 10714-10721.
(26) Lahiri, J., Isaacs, L., Grzybowski, B., Carbeck, J.D., Whitesides, G.M., Langmuir
1999, 15, 7186-7198.
(27) Daniel, M.C., Astruc, D., Chem. Reviews 2004, 104, 293-346.
(28) Liu, G.D., Lin, Y.H., J. Nanosci. Nanotech. 2005, 5, 1060-1065.
(29) Ashoori, R.C., Nature 1996, 379, 413-419.
(30) Pantano, P., Kuhr, W.G., Electroanalysis 1995, 7, 405-416.
(31) Tour, J.M., Acc. Chem. Res. 2000, 33, 791-804.
(32) Tour, J.M., Chem. Rev. 1996, 96, 537-553.
(33) Tour, J.M., Rawlett, A.M., Kozaki, M., Yao, Y.X., Jagessar, R.C., Dirk, S.M.,
Price, D.W., Reed, M.A., Zhou, C., Chen, J., Wang, W., Campbell, I., Chem. Eur.
J. 2001, 7, 5118-5134.
(34) Gooding, J.J., In Encyclopedia of Nanoscience and Nanotechnology, Nalwa, H.S.,
Ed. American Scientific Publishing: California, 2004; Vol. 1, pp 17-49.
318
Chapter 10-Conclusions and Future Directions
(35) Sokolov, K., Aaron, J., Hsu, B., Nida, D., Gillenwater, A., Follen, M., Macaulay,
C., Adler-Storthz, K., Korgel, B., Descour, Michael, Pasqualini, R., Arap, W.,
Lam, W., Richards-Kortum, R., Tech. in Cancer Res. & Treatment 2003, 2, 491-
504.
(36) Prodan, E., Radloff, C., Halas, N.J., Nordlander, P., Science 2003, 302, 419-422.
(37) Aslan, K., Leonenko, Z., Lakowicz, J.R., Geddes, C.D., J. Phys. Chem. B 2005,
109, 3157-3162.
(38) Liu, J., Maaroof, A.I., Wieczorek, L., Cortie, M., Adv. Mater. 2005, 17, 1276-
1281.
(39) O'Neal, D.P., Hirsch, L.R., Halas, N.J., Payne, J.D., West, J.L., Cancer Letters
2004, 209, 171-176.
319