
Player evaluation in Twenty20 cricket - IOS Press
13
Journal of Sports Analytics 1 (2015) 19–31 DOI 10.3233/JSA-150002 IOS Press 19 Player evaluation in Twenty20 cricket Jack Davis, Harsha Perera and Tim B. Swartz ∗ Department of Statistics and Actuarial Science, Simon Fraser University, Burnaby BC, Canada Received: 3 November 2014; revised 7 March 2015; accepted: 26 April 2015 Abstract. This paper introduces a new metric for player evaluation in Twenty20 cricket. The proposed metric of “expected run differential” measures the proposed additional runs that a player contributes to his team when compared to a standard player. Of course, the definition of a standard player depends on their role and therefore the metric is useful for comparing players that belong to the same positional cohort. We provide methodology to investigate both career performances and current form. Our metrics do not correlate highly with conventional measures such as batting average, strike rate, bowling average, economy rate and the Reliance ICC ratings. Consequently, our analyses of individual players based on results from international competitions provide some insights that differ from widely held beliefs. We supplement our analysis of player evaluation by investigating those players who may be overpaid or underpaid in the Indian Premier League. Keywords: Relative value statistics, simulation, Twenty20 cricket 1. Introduction Player evaluation is the Holy Grail of analytics in professional team sports. Teams are constantly attempting to improve their lineups through player selection, trades and drafts taking into account rele- vant financial constraints. A salary cap is one financial constraint that is present in many professional sports leagues. If a team spends excessively on one player, then there is less money remaining for his teammates. In sports of a “continuous” nature (e.g. basketball, hockey, soccer), player evaluation is a challenging problem due to player interactions and the subtleties of “off-the-ball” movements. Nevertheless, a wealth of simple statistics are available for comparing players in these sports. For example, points scored, rebounds, assists and steals are common statistics that provide insight on aspects of player performance in basketball. More complex statistics are also available, and we refer the reader to Oliver (2004) for basketball, Gramacy, Taddy and Jensen (2013) for hockey and McHale, Scarf and Folker (2012) for soccer. ∗ Corresponding author: Tim B. Swartz, Department of Statis- tics and Actuarial Science, Simon Fraser University, Burnaby BC, V5A1S6 Canada. Tel.: +1 778 782 4579; E-mail: [email protected]. In sports of a “discrete” nature (e.g. baseball) where there are short bursts of activity and players have well-defined and measurable tasks that do not depend greatly on interactions with other players, there is more hope for accurate and comprehensive player evalu- ation. There has been much written about baseball analytics where Bill James is recognized as a pioneer in the subject area of sabermetrics. A biography of James and his ideas is given by Gray (2006). James was given due credit in the book Moneyball (Lewis, 2003) which was later developed into the popular Hollywood movie starring Brad Pitt. Moneyball chronicled the 2002 sea- son of the Oakland Athletics, a small-market Major League Baseball team who through advanced analytics recognized and acquired undervalued baseball play- ers. Moneyball may be the inspiration of many of the advances and the interest in sports analytics today. In particular, the discipline of sabermetrics continues to flourish. For example, Albert and Marchi (2013) provide baseball enthusiasts with the skills to explore baseball data using computational tools. Cricket is another sport which may be character- ized as a discrete game and it shares many similarities with baseball. Both sports have innings where runs are scored, and whereas baseball has batters and pitchers, cricket has batsmen and bowlers. Although analytics ISSN 2215-020X/15/$35.00 © 2015 – IOS Press and the authors. All rights reserved This article is published online with Open Access and distributed under the terms of the Creative Commons Attribution Non-Commercial License.
-
Upload
khangminh22 -
Category
Documents
-
view
4 -
download
0
Transcript of Player evaluation in Twenty20 cricket - IOS Press
Journal of Sports Analytics 1 (2015) 19–31DOI 10.3233/JSA-150002IOS Press
19
Player evaluation in Twenty20 cricket
Jack Davis, Harsha Perera and Tim B. Swartz∗Department of Statistics and Actuarial Science, Simon Fraser University, Burnaby BC, Canada
Received: 3 November 2014; revised 7 March 2015; accepted: 26 April 2015
Abstract. This paper introduces a new metric for player evaluation in Twenty20 cricket. The proposed metric of “expected rundifferential” measures the proposed additional runs that a player contributes to his team when compared to a standard player.Of course, the definition of a standard player depends on their role and therefore the metric is useful for comparing players thatbelong to the same positional cohort. We provide methodology to investigate both career performances and current form. Ourmetrics do not correlate highly with conventional measures such as batting average, strike rate, bowling average, economy rateand the Reliance ICC ratings. Consequently, our analyses of individual players based on results from international competitionsprovide some insights that differ from widely held beliefs. We supplement our analysis of player evaluation by investigatingthose players who may be overpaid or underpaid in the Indian Premier League.
Keywords: Relative value statistics, simulation, Twenty20 cricket
1. Introduction
Player evaluation is the Holy Grail of analyticsin professional team sports. Teams are constantlyattempting to improve their lineups through playerselection, trades and drafts taking into account rele-vant financial constraints. A salary cap is one financialconstraint that is present in many professional sportsleagues. If a team spends excessively on one player,then there is less money remaining for his teammates.
In sports of a “continuous” nature (e.g. basketball,hockey, soccer), player evaluation is a challengingproblem due to player interactions and the subtletiesof “off-the-ball” movements. Nevertheless, a wealthof simple statistics are available for comparing playersin these sports. For example, points scored, rebounds,assists and steals are common statistics that provideinsight on aspects of player performance in basketball.More complex statistics are also available, and we referthe reader to Oliver (2004) for basketball, Gramacy,Taddy and Jensen (2013) for hockey and McHale, Scarfand Folker (2012) for soccer.
∗Corresponding author: Tim B. Swartz, Department of Statis-tics and Actuarial Science, Simon Fraser University, Burnaby BC,V5A1S6 Canada. Tel.: +1 778 782 4579; E-mail: [email protected].
In sports of a “discrete” nature (e.g. baseball) wherethere are short bursts of activity and players havewell-defined and measurable tasks that do not dependgreatly on interactions with other players, there is morehope for accurate and comprehensive player evalu-ation. There has been much written about baseballanalytics where Bill James is recognized as a pioneer inthe subject area of sabermetrics. A biography of Jamesand his ideas is given by Gray (2006). James was givendue credit in the book Moneyball (Lewis, 2003) whichwas later developed into the popular Hollywood moviestarring Brad Pitt. Moneyball chronicled the 2002 sea-son of the Oakland Athletics, a small-market MajorLeague Baseball team who through advanced analyticsrecognized and acquired undervalued baseball play-ers. Moneyball may be the inspiration of many of theadvances and the interest in sports analytics today.In particular, the discipline of sabermetrics continuesto flourish. For example, Albert and Marchi (2013)provide baseball enthusiasts with the skills to explorebaseball data using computational tools.
Cricket is another sport which may be character-ized as a discrete game and it shares many similaritieswith baseball. Both sports have innings where runs arescored, and whereas baseball has batters and pitchers,cricket has batsmen and bowlers. Although analytics
ISSN 2215-020X/15/$35.00 © 2015 – IOS Press and the authors. All rights reserved
This article is published online with Open Access and distributed under the terms of the Creative Commons Attribution Non-Commercial License.
20 J. Davis et al. / Player evaluation in Twenty20 cricket
papers have been written on cricket, the literature isfar less extensive than what exists in baseball. A some-what dated overview of statistical research in cricket isgiven by Clarke (1998).
There are various formats of cricket where thegoverning authority for the sport is the InternationalCricket Council (ICC). This paper is concerned withplayer evaluation in the version of cricket known asTwenty20 cricket (or T20 cricket). Twenty20 is a recentform of limited overs cricket which has gained pop-ularity worldwide. Twenty20 cricket was showcasedin 2003 and involved matches between English andWelsh domestic sides. The rationale behind Twenty20was to provide an exciting version of cricket wherematches conclude in roughly three hours duration.There are now various professional Twenty20 com-petitions where the Indian Premier League (IPL) isregarded as the most prestigious. The IPL has beenbolstered by the support of Bollywood stars, extensivetelevision contracts, attempts at competitive balance,short but intense seasons, lucrative sponsorships, etc.
In Twenty20 cricket, there are two common statisticsthat are used for the evaluation of batting performance.However, before defining the statistics it is importantto remind the reader that there are two ways in whichbatting ceases during the first innings. Batting is termi-nated when the batting team has lost 10 wickets. Thatis, there have been 10 dismissals (“outs” in baseballparlance). Batting is also terminated when a team hasused up its 20 overs. This means that the batting teamhas faced 120 bowled balls (i.e. six balls per over) notincluding extras. With this background, the first popu-lar batting statistic is the batting average which is thetotal number of runs scored by a batsman divided bythe number of innings in which he was dismissed. Alogical problem with this statistic can be seen from thepathological case where over the course of a career,a batsman has scored a total of 100 runs during 100innings but has been dismissed only once. Such a bats-man has an incredibly high batting average of 100.0 yethe would be viewed as a detriment to his team sincehe scores so few runs per innings. The second popularbatting statistic is the batting strike rate which is cal-culated as the number of runs scored by a batsman per100 balls bowled. A logical problem with this statisticcan be seen from the pathological case where a bats-man always bats according to the pattern of scoringsix runs on the first ball and then is dismissed on thesecond ball. Such a batsman has an incredibly highbatting strike rate of 300.0 yet he would be viewed
as a detriment to his team since he uses up wicketsso quickly. We remark that similar logical flaws existfor the two main bowling statistics referred to as thebowling average and the bowling economy rate.
Although various authors have attempted tointroduce more sophisticated cricket statistics (e.g.Croucher, 2000; Beaudoin & Swartz, 2003; vanStaden, 2009), it is fair to say that these approacheshave not gained traction. We also mention the RelianceICC Player Rankings (www.relianceiccrankings.com)which are a compilation of measurements based ona moving average and whose interpretation is notstraightforward. Despite the prevalence and the offi-cial nature of the rankings, the precise details of thecalculations may be proprietary as they do not appearto be available.
In this paper, we propose a method of player eval-uation in Twenty20 cricket from the point of viewof relative value statistics. Relative value statisticshave become prominent in the sporting literatureas they attempt to quantify what is really impor-tant in terms of winning and losing matches. Forexample, in Major League Baseball (MLB), theVORP (value over replacement player) statistic hasbeen developed to measure the impact of playerperformance. For a batter, VORP measures howmuch a player contributes offensively in compari-son to a replacement-level player (Woolner, 2002).A replacement-level player is a player who can bereadily enlisted from the minor leagues. Baseballalso has the related WAR (wins above replacement)statistic which is gaining a foothold in advanced ana-lytics (http://bleacherreport.com/articles/1642919). Inthe National Hockey League (NHL), the plus-minusstatistic is prevalent. The statistic is calculated as thegoals scored by a player’s team minus the goals scoredagainst the player’s team while the player is on the ice.More sophisticated versions of the plus-minus statistichave been developed by Schuckers et al. (2011) andGramacy, Taddy and Jensen (2013).
In Twenty20 cricket, a team wins a match when theruns scored while batting exceed the runs concededwhile bowling. Therefore, it is run differential that isthe key measure of team performance. It follows thatan individual player can be evaluated by consideringhis team’s run differential based on his inclusion andexclusion in the lineup. Clearly, run differential can-not be calculated from match results in a meaningfulway since conditions change from match to match.For example, in comparing two matches (one with
J. Davis et al. / Player evaluation in Twenty20 cricket 21
a specified player present and the other when he isabsent), other players may also change as well as theopposition. Our approach to player evaluation is basedon simulation methodology where matches are repli-cated. Through simulation, we can obtain long runproperties (i.e. expectations) involving run differen-tial. By concentrating on what is really important (i.e.expected run differential), we believe that our approachaddresses the essential problem of interest in playerevaluation.
In Section 2, we provide an overview of the sim-ulator developed by Davis, Perera and Swartz (2015)which is the backbone of our analysis and is used inthe estimation of expected run differential.
In Section 3, we analyze player performance whereplayers are divided into the following broad categories:pure batsmen, bowlers and all-rounders. Our analyseslead to ratings, and the ratings have a clear interpre-tation. For example, if one player has an expected rundifferential that is two runs greater than another player,we know exactly what this means. We observe thatsome of our results are in conflict with the RelianceICC ratings. In cases like these, it provides opportuni-ties for teams to implement positive changes that arein opposition to commonly held beliefs. This is the“moneyball” aspect of our paper. We extend our anal-yses further by looking at salary data in the IPL wherewe indicate the possibility of players being both over-paid or underpaid. We conclude with a short discussionin Section 4.
2. Overview of simulation methodology
We now provide an overview of the simulator devel-oped by Davis, Perera and Swartz (2015) which we usefor the estimation of expected run differential. Thereare 8 broadly defined outcomes that can occur when abatsman faces a bowled ball. These batting outcomesare listed below:
outcome j = 0 ≡ 0 runs scored
outcome j = 1 ≡ 1 runs scored
outcome j = 2 ≡ 2 runs scored
outcome j = 3 ≡ 3 runs scored
outcome j = 4 ≡ 4 runs scored
outcome j = 5 ≡ 5 runs scored
outcome j = 6 ≡ 6 runs scored
outcome j = 7 ≡ dismissal
(1)
In the list (1) of possible batting outcomes, weexclude extras such as byes, leg byes, wide-balls and noballs. We later account for extras in the simulation bygenerating them at the appropriate rates. Extras occurat the rate of 5.1% in Twenty20 cricket. We note thatthe outcome j = 5 is rare but is retained to facilitatestraightforward notation.
According to the enumeration of the batting out-comes in (1), Davis, Perera and Swartz (2015)suggested the statistical model:
(Xiow0, . . . , Xiow7) ∼ multinomial
(miow; piow0, . . . , piow7)(2)
where Xiowj is the number of occurrences of outcome j
by the ith batsman during the oth over when w wicketshave been taken. In (2), miow is the number of balls thatbatsman i has faced in the dataset corresponding to theoth over when w wickets have been taken. The datasetis “special” in the sense that it consists of detailedball-by-ball data. The data were obtained using aproprietary parser which was applied to the commen-tary logs of matches listed on the CricInfo website(www.espncricinfo.com). We considered Twenty20matches involving full member nations of the ICC.Currently, the 10 full members of the ICC are Australia,Bangladesh, England, India, New Zealand, Pakistan,South Africa, Sri Lanka, West Indies and Zimbabwe. Intotal, we obtained data from 282 matches that spannedthe period from January 2005 to August 2014. Thefirst innings data consist of 35356 balls bowled wherej = 1 in (1) is the most common occurrence with14542 (41.1%) cases. The outcomes j = 5 and j = 3are the least frequent occurrences with 67 (0.2%) and214 (0.6%) cases respectively.
The estimation of the multinomial parameters in (2)is a high-dimensional and complex problem. The com-plexity is partly due to the sparsity of the data; thereare many match situations (i.e. combinations of oversand wickets) where batsmen do not have batting out-comes. For example, bowlers typically bat near the endof the batting order and do not face situations when zerowickets have been taken.
To facilitate the estimation of the multinomialparameters piowj , Davis, Perera and Swartz (2015)introduced the simplification
piowj = τowj pi70j∑
j τowj pi70j
. (3)
22 J. Davis et al. / Player evaluation in Twenty20 cricket
In (3), the parameter pi70j represents the baseline char-acteristic for batsman i with respect to batting outcomej. The characteristic pi70j is the probability of outcomej associated with the ith batsman at the juncture ofthe match immediately following the powerplay (i.e.the 7th over) when no wickets have been taken. Themultiplicative parameter τowj scales the baseline per-formance characteristic pi70j to the stage of the matchcorresponding to the oth over with w wickets taken.The denominator in (3) ensures that the relevant proba-bilities sum to unity. There is an implicit assumption in(3) that although batsmen are unique, their batting char-acteristics change with respect to overs and wicketsby the same multiplicative factor which is essentiallyan indicator of aggression. For example, when aggres-siveness increases relative to the baseline state, onewould expect τow4 > 1 and τow6 > 1 since bolder bat-ting leads to more 4’s and 6’s.
Given the estimation of the parameters in (3) (seeDavis, Perera and Swartz 2015), an algorithm for sim-ulating first innings runs against an average bowleris available. One simply generates multinomial bat-ting outcomes in (1) according to the laws of cricket.For example, when either 10 wickets are accumu-lated or the number of overs reaches 20, the firstinnings is terminated. Davis, Perera and Swartz (2015)also provide modifications for batsmen facing specificbowlers (instead of average bowlers), they accountfor the home field advantage and they provide adjust-ments for second innings simulation. In summary, withsuch a simulator, we are able to replicate matches,and estimate the expected runs scored when TeamA (lineup specified) plays against Team B (lineupspecified). Davis, Perera and Swartz (2015) demon-strate that the simulator generates realistic Twenty20matches.
3. Player evaluation
Recall that our objective in player evaluation is thedevelopment of a metric that measures player contri-bution in terms of run differential relative to baselineplayers. We restrict our attention to first innings per-formances since the second innings involves a targetscore whereby players alter their standard strategies.Accordingly, we define Rs(l) as the number of runsscored in the first innings with a batting lineup l. Let-ting tbat denote a typical batting lineup, the quantityRs(tbat) is therefore the standard of comparison and
E(Ds(l)) = E(Rs(l) − Rs(tbat))
= E(Rs(l)) − E(Rs(tbat)) (4)
is the expected differential for runs scored due to bat-ting lineup l. An above average batting lineup l isone which produces a positive value of E(Ds(l)) and abelow average batting lineup l is one which produces anegative value of E(Ds(l)). Operationally, the calcula-tions of E(Rs(l)) and E(Rs(tbat)) are obtained via matchsimulation. The simulation follows the description pro-vided in Section 2 where the batting characteristics ofplayer i who forms part of a batting lineup are givenby piowj .
Since success in cricket depends on both scoringruns and preventing runs, we introduce analogous mea-sures for bowling. Accordingly, we define Rc(l) as thenumber of runs conceded by the bowling lineup l inthe first innings. Letting tbowl denote a typical bowlinglineup, the quantity Rc(tbowl) is therefore the standardof comparison and
E(Dc(l)) = E(Rc(l) − Rc(tbowl))
= E(Rc(l)) − E(Rc(tbowl)) (5)
is the expected differential for runs conceded due tobowling lineup l. An above average bowling lineup l isone which produces a negative value of E(Dc(l)) and abelow average batting lineup l is one which producesa positive value of E(Dc(l)). The simulations used inthe calculation of (5) require bowling characteristicsfor each of the bowlers in the bowling lineups. Thebowling characteristics qiowj for player i are analogousto the batting characteristics.
Summarizing, (4) measures the batting contributionof a batting lineup l. Similarly, (5) measures the bowl-ing contribution of a bowling lineup l. We now wish tosynthesize these two components to evaluate the over-all contribution of an individual player. For player i,let lbat,i = tbat except that player i is inserted into thebatting lineup. Similarly, let lbowl,i = tbowl except thatplayer i is inserted into the bowling lineup. If player i isa pure batsman, then he is not inserted into the bowlinglineup and lbowl,i = tbowl. It follows that
E(D(i)) = E(Ds(lbat,i)) − E(Dc(lbowl,i)) (6)
is the overall expected run differential due to player i.The quantity (6) is interpreted as the average number ofruns that player i contributes to his team over a baselineplayer. Since runs is the currency of winning matches,E(D(i)) provides a direct evaluation of player worth.
J. Davis et al. / Player evaluation in Twenty20 cricket 23
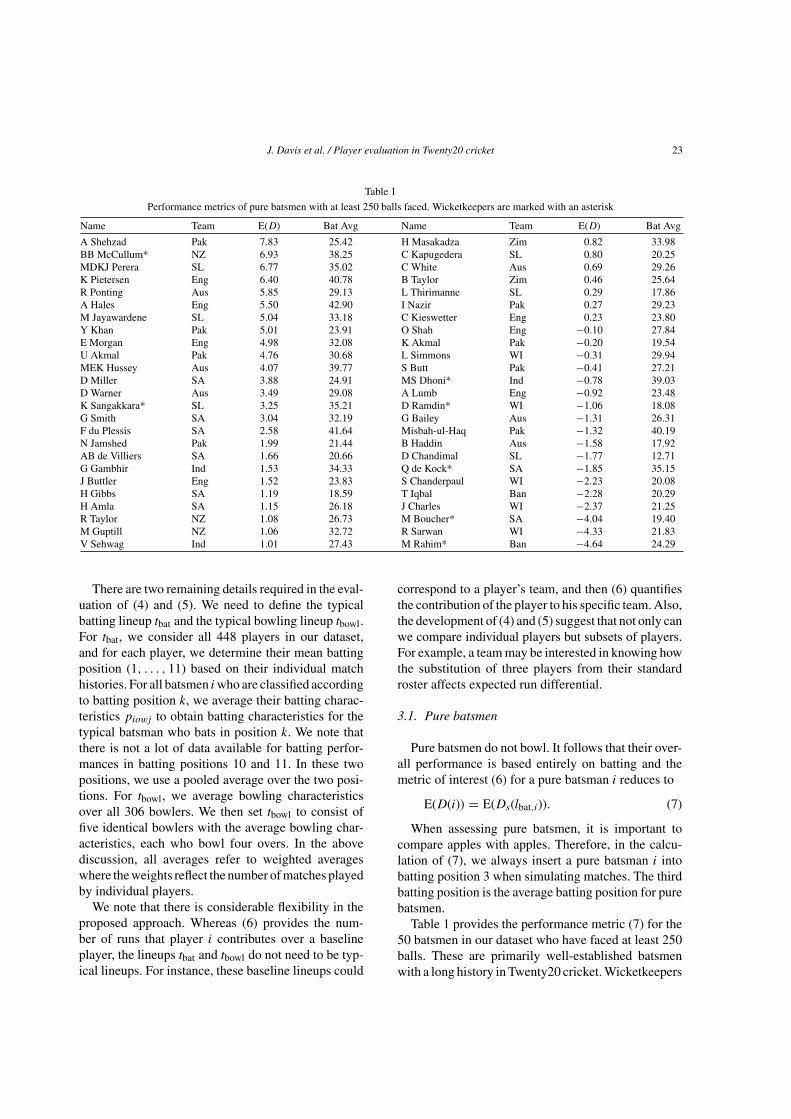
Table 1
Performance metrics of pure batsmen with at least 250 balls faced. Wicketkeepers are marked with an asterisk
Name Team E(D) Bat Avg Name Team E(D) Bat Avg
A Shehzad Pak 7.83 25.42 H Masakadza Zim 0.82 33.98BB McCullum* NZ 6.93 38.25 C Kapugedera SL 0.80 20.25MDKJ Perera SL 6.77 35.02 C White Aus 0.69 29.26K Pietersen Eng 6.40 40.78 B Taylor Zim 0.46 25.64R Ponting Aus 5.85 29.13 L Thirimanne SL 0.29 17.86A Hales Eng 5.50 42.90 I Nazir Pak 0.27 29.23M Jayawardene SL 5.04 33.18 C Kieswetter Eng 0.23 23.80Y Khan Pak 5.01 23.91 O Shah Eng −0.10 27.84E Morgan Eng 4.98 32.08 K Akmal Pak −0.20 19.54U Akmal Pak 4.76 30.68 L Simmons WI −0.31 29.94MEK Hussey Aus 4.07 39.77 S Butt Pak −0.41 27.21D Miller SA 3.88 24.91 MS Dhoni* Ind −0.78 39.03D Warner Aus 3.49 29.08 A Lumb Eng −0.92 23.48K Sangakkara* SL 3.25 35.21 D Ramdin* WI −1.06 18.08G Smith SA 3.04 32.19 G Bailey Aus −1.31 26.31F du Plessis SA 2.58 41.64 Misbah-ul-Haq Pak −1.32 40.19N Jamshed Pak 1.99 21.44 B Haddin Aus −1.58 17.92AB de Villiers SA 1.66 20.66 D Chandimal SL −1.77 12.71G Gambhir Ind 1.53 34.33 Q de Kock* SA −1.85 35.15J Buttler Eng 1.52 23.83 S Chanderpaul WI −2.23 20.08H Gibbs SA 1.19 18.59 T Iqbal Ban −2.28 20.29H Amla SA 1.15 26.18 J Charles WI −2.37 21.25R Taylor NZ 1.08 26.73 M Boucher* SA −4.04 19.40M Guptill NZ 1.06 32.72 R Sarwan WI −4.33 21.83V Sehwag Ind 1.01 27.43 M Rahim* Ban −4.64 24.29
There are two remaining details required in the eval-uation of (4) and (5). We need to define the typicalbatting lineup tbat and the typical bowling lineup tbowl.For tbat, we consider all 448 players in our dataset,and for each player, we determine their mean battingposition (1, . . . , 11) based on their individual matchhistories. For all batsmen i who are classified accordingto batting position k, we average their batting charac-teristics piowj to obtain batting characteristics for thetypical batsman who bats in position k. We note thatthere is not a lot of data available for batting perfor-mances in batting positions 10 and 11. In these twopositions, we use a pooled average over the two posi-tions. For tbowl, we average bowling characteristicsover all 306 bowlers. We then set tbowl to consist offive identical bowlers with the average bowling char-acteristics, each who bowl four overs. In the abovediscussion, all averages refer to weighted averageswhere the weights reflect the number of matches playedby individual players.
We note that there is considerable flexibility in theproposed approach. Whereas (6) provides the num-ber of runs that player i contributes over a baselineplayer, the lineups tbat and tbowl do not need to be typ-ical lineups. For instance, these baseline lineups could
correspond to a player’s team, and then (6) quantifiesthe contribution of the player to his specific team. Also,the development of (4) and (5) suggest that not only canwe compare individual players but subsets of players.For example, a team may be interested in knowing howthe substitution of three players from their standardroster affects expected run differential.
3.1. Pure batsmen
Pure batsmen do not bowl. It follows that their over-all performance is based entirely on batting and themetric of interest (6) for a pure batsman i reduces to
E(D(i)) = E(Ds(lbat,i)). (7)
When assessing pure batsmen, it is important tocompare apples with apples. Therefore, in the calcu-lation of (7), we always insert a pure batsman i intobatting position 3 when simulating matches. The thirdbatting position is the average batting position for purebatsmen.
Table 1 provides the performance metric (7) for the50 batsmen in our dataset who have faced at least 250balls. These are primarily well-established batsmenwith a long history in Twenty20 cricket. Wicketkeepers
24 J. Davis et al. / Player evaluation in Twenty20 cricket
in Table 1 are marked with an asterisk; it may be rea-sonable to assess them separately from the other purebatsmen since wicketkeepers contribute in a meaning-ful way that goes beyond batting.
Ahmed Shehzad is the best pure batsman withE(D) = 7.83. This means that if an average pure bats-man is replaced by Shehzad, a team’s scoring wouldincrease by 7.83 runs on average. There are somesurprises in Table 1. For example, AB de Villiersdoes not have an exceptional expected run differen-tial (E(D) = 1.66) yet he is regarded as one of the bestTwenty20 batsmen. On the other hand, MDKJ Pererais rated as the best Sri Lankan pure batsman, and isranked above the Sri Lankan legends Jayawardene andSangakkara.
There are no pure batsmen who are much worsethan E(D) = 0, likely because their poor performancesprevented them from playing long enough to face 250balls. We also observe that there are few wicketkeep-ers at the top of the list (only BB McCullum and KSangakkara). This might be anticipated because thespecialized skills of a wicketkeeper may be sufficientfor their continued selection.
The E(D) measure can also be used to estimate theeffect of specific player replacements. For example,although they did not play during the same time period,it is interesting to compare the South African wick-etkeepers Mark Boucher (now retired) and Quintonde Kock. With de Kock (E(D) = −1.85) in the bat-ting lineup instead of Boucher (E(D) = −4.04), SouthAfrica could expect to score −1.85 − (−4.04) = 2.19additional runs.
3.2. Bowlers
Surprisingly, the term “bowler” is not well-defined.The intention is that a player designated as a bowler isone who specializes in bowling and is not “good” atbatting. We are going to make the term precise anddefine a bowler as a player who bowls and whoseaverage batting position is 8, 9, 10 or 11. Since abowler bats late in the lineup, he does not bat often andhis expected differential for runs scored E(Ds(lbat,i))is negligible. Therefore the metric of interest (6) forbowler i reduces to
E(D(i)) ≈ E(Dc(lbowl,i)).
The calculation of (6) is obtained by simulation wherefour bowling overs are uniformly selected from theinnings and these are the overs that are assigned to
bowler i. The simulation is based on estimated bowlingcharacteristics where qiowj denotes the probability ofoutcome j by bowler i in the oth over when w wicketshave been taken.
As any cricket fan knows, the taking of wickets issomething that distinguishes bowlers and is highly val-ued. We wish to emphasize that wicket taking is animportant component of our metric (6). A bowler i
who takes wickets regularly has larger bowling char-acteristics qiow7 than a typical bowler. Therefore, in thesimulation procedure, such bowlers take wickets moreoften, runs conceded are reduced and wicket takingability is recognized.
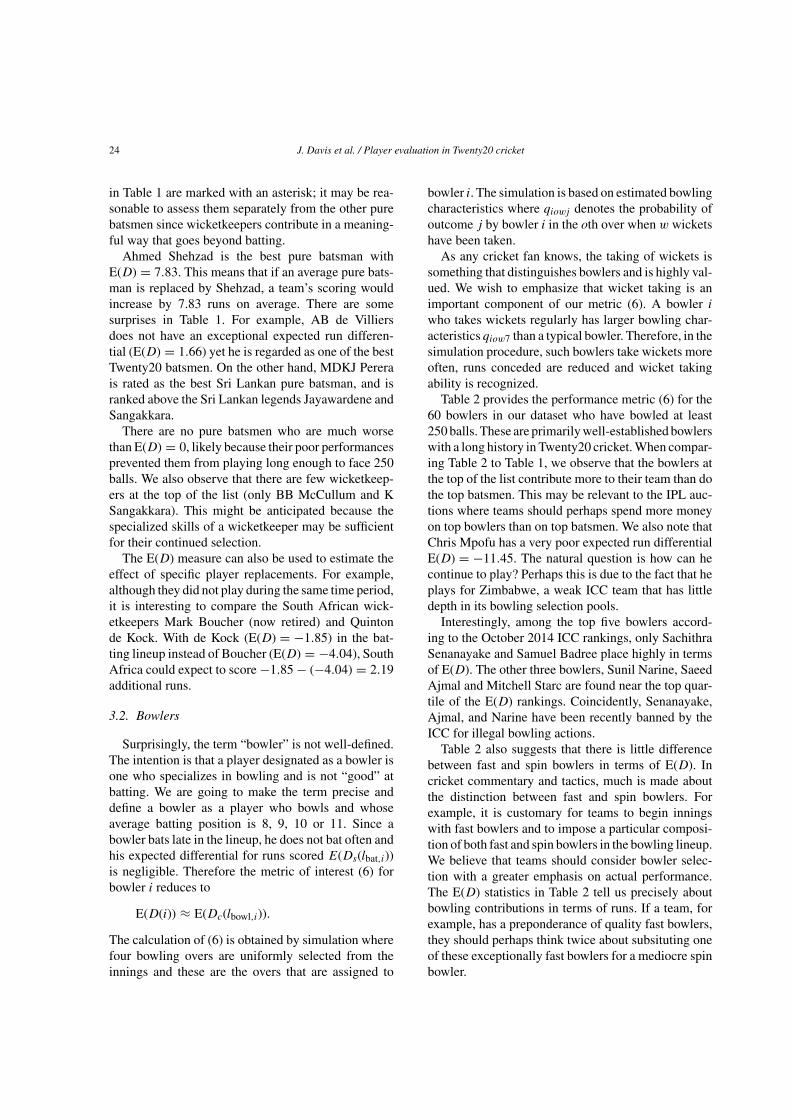
Table 2 provides the performance metric (6) for the60 bowlers in our dataset who have bowled at least250 balls. These are primarily well-established bowlerswith a long history in Twenty20 cricket. When compar-ing Table 2 to Table 1, we observe that the bowlers atthe top of the list contribute more to their team than dothe top batsmen. This may be relevant to the IPL auc-tions where teams should perhaps spend more moneyon top bowlers than on top batsmen. We also note thatChris Mpofu has a very poor expected run differentialE(D) = −11.45. The natural question is how can hecontinue to play? Perhaps this is due to the fact that heplays for Zimbabwe, a weak ICC team that has littledepth in its bowling selection pools.
Interestingly, among the top five bowlers accord-ing to the October 2014 ICC rankings, only SachithraSenanayake and Samuel Badree place highly in termsof E(D). The other three bowlers, Sunil Narine, SaeedAjmal and Mitchell Starc are found near the top quar-tile of the E(D) rankings. Coincidently, Senanayake,Ajmal, and Narine have been recently banned by theICC for illegal bowling actions.
Table 2 also suggests that there is little differencebetween fast and spin bowlers in terms of E(D). Incricket commentary and tactics, much is made aboutthe distinction between fast and spin bowlers. Forexample, it is customary for teams to begin inningswith fast bowlers and to impose a particular composi-tion of both fast and spin bowlers in the bowling lineup.We believe that teams should consider bowler selec-tion with a greater emphasis on actual performance.The E(D) statistics in Table 2 tell us precisely aboutbowling contributions in terms of runs. If a team, forexample, has a preponderance of quality fast bowlers,they should perhaps think twice about subsituting oneof these exceptionally fast bowlers for a mediocre spinbowler.
J. Davis et al. / Player evaluation in Twenty20 cricket 25
Table 2
Performance metrics of bowlers with at least 250 balls bowled
Name Team E(D) Econ Style Name Team E(D) Econ Style
S Senanayake SL 9.94 5.72 Spin J Botha SA 1.84 6.51 SpinH Singh Ind 9.43 6.50 Spin S Tait Aus 1.69 6.66 FastD Vettori NZ 9.34 5.63 Spin J Butler NZ 1.68 8.12 FastI Tahir SA 8.44 5.57 Spin R Price Zim 1.38 6.47 SpinB Lee Aus 7.88 7.46 Fast F Edwards WI 1.33 7.82 FastS Badree WI 6.66 5.72 Spin W Parnell SA 0.87 7.67 FastBAW Mendis SL 6.34 6.65 Spin J Anderson Eng 0.82 7.55 FastR Peterson SA 5.97 7.54 Spin R Ashwin Ind 0.75 7.16 SpinD Steyn SA 5.57 6.37 Fast R McLaren SA 0.74 7.46 FastG Swann Eng 5.34 6.45 Spin A Razzak Ban 0.74 7.24 SpinM Amir Pak 5.33 7.19 Fast D Nannes Aus 0.70 7.50 FastJ Taylor WI 4.79 7.59 Fast D Fernando SL 0.58 7.43 FastS Bond NZ 4.60 7.11 Fast S Benn WI 0.36 7.00 SpinS Narine WI 4.51 5.93 Spin R Jadeja Ind −0.11 7.34 SpinU Gul Pak 4.31 7.21 Fast R Hira NZ −0.18 7.73 SpinM Morkel SA 4.24 7.10 Fast Z Khan Ind −0.41 7.24 FastS Ajmal Pak 4.17 6.41 Spin T Southee NZ −0.62 8.52 FastM Starc Aus 4.15 6.89 Fast S Broad Eng −1.09 7.69 FastM Yardy Eng 4.11 6.38 Spin S Akhtar Pak −1.14 8.36 FastN Kulasekara SL 4.10 7.12 Fast M Muralitharan SL −1.24 6.60 SpinS Finn Eng 3.60 7.58 Fast T Bresnan Eng −1.44 7.88 FastM McClenaghan NZ 3.57 8.29 Fast IK Pathan Ind −2.70 7.84 FastN Bracken Aus 3.43 6.93 Fast J Dernbach Eng −3.64 8.35 FastS Tanvir Pak 3.28 7.06 Fast K Mills NZ −3.77 8.22 FastNL McCullum NZ 2.83 6.86 Spin J Tredwell Eng −4.12 8.21 SpinR Sidebottom Eng 2.66 7.22 Fast B Hogg Aus −6.66 7.86 SpinL Malinga SL 2.45 7.14 Fast I Sharma Ind −7.38 8.69 FastM Johnson Aus 2.04 6.98 Fast M Mortaza Ban −7.83 9.09 FastS Pollock SA 1.98 7.35 Fast R Rampaul WI −8.37 8.45 FastP Utseya Zim 1.93 6.66 Spin C Mpofu Zim −11.45 8.84 Fast
3.3. All-rounders
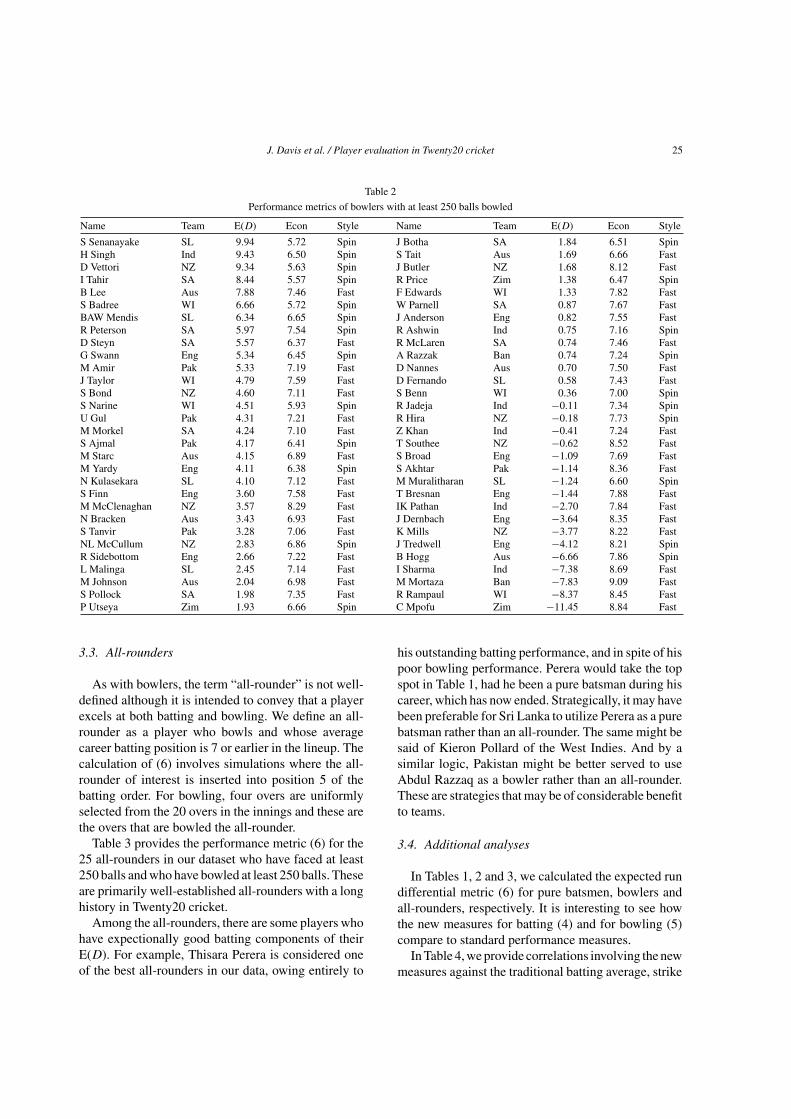
As with bowlers, the term “all-rounder” is not well-defined although it is intended to convey that a playerexcels at both batting and bowling. We define an all-rounder as a player who bowls and whose averagecareer batting position is 7 or earlier in the lineup. Thecalculation of (6) involves simulations where the all-rounder of interest is inserted into position 5 of thebatting order. For bowling, four overs are uniformlyselected from the 20 overs in the innings and these arethe overs that are bowled the all-rounder.
Table 3 provides the performance metric (6) for the25 all-rounders in our dataset who have faced at least250 balls and who have bowled at least 250 balls. Theseare primarily well-established all-rounders with a longhistory in Twenty20 cricket.
Among the all-rounders, there are some players whohave expectionally good batting components of theirE(D). For example, Thisara Perera is considered oneof the best all-rounders in our data, owing entirely to
his outstanding batting performance, and in spite of hispoor bowling performance. Perera would take the topspot in Table 1, had he been a pure batsman during hiscareer, which has now ended. Strategically, it may havebeen preferable for Sri Lanka to utilize Perera as a purebatsman rather than an all-rounder. The same might besaid of Kieron Pollard of the West Indies. And by asimilar logic, Pakistan might be better served to useAbdul Razzaq as a bowler rather than an all-rounder.These are strategies that may be of considerable benefitto teams.
3.4. Additional analyses
In Tables 1, 2 and 3, we calculated the expected rundifferential metric (6) for pure batsmen, bowlers andall-rounders, respectively. It is interesting to see howthe new measures for batting (4) and for bowling (5)compare to standard performance measures.
In Table 4, we provide correlations involving the newmeasures against the traditional batting average, strike
26 J. Davis et al. / Player evaluation in Twenty20 cricket
Table 3
Performance metrics of all-rounders with at least 250 balls faced and 250 balls bowled
Name Team Style E(D)Bat E(D)Bowl E(D) BowlEcon BatAvg
A Razzaq Pak Fast 0.30 8.25 8.55 7.39 19.75T Perera SL Fast 7.95 0.56 8.50 8.31 34.90D Sammy WI Fast 2.38 5.62 7.99 7.24 18.97A Mathews SL Fast 2.96 3.76 6.72 6.98 26.76Y Singh Ind Spin 4.98 0.39 5.37 7.46 31.39M Samuels WI Spin 3.43 1.19 4.62 7.78 28.59K Pollard WI Spin 7.00 −2.50 4.50 8.11 25.47S Afridi Pak Spin 1.90 2.35 4.25 6.66 18.99C Gayle WI Spin 5.14 −1.35 3.79 7.23 36.70S Styris NZ Spin 0.56 3.13 3.69 6.69 20.26J Kallis SA Spin 1.80 1.83 3.63 7.34 36.12DJ Hussey Aus Spin 1.70 1.92 3.62 6.57 21.69JA Morkel SA Fast 2.07 1.07 3.15 7.99 23.09J Franklin NZ Fast −0.37 3.26 2.88 7.46 23.06S Al Hasan Ban Spin −0.85 2.91 2.06 6.57 17.58M Hafeez Pak Spin −0.66 2.16 1.50 6.61 21.84S Watson Aus Fast 1.51 −0.13 1.37 7.69 26.20S Malik Pak Spin −1.04 2.30 1.27 6.69 23.10JP Duminy SA Spin 3.58 −3.28 0.29 7.62 41.87R Bopara Eng Spin −2.13 1.04 −1.09 7.05 23.34J Oram NZ Fast −0.85 −0.43 −1.28 8.53 22.23DJ Bravo WI Fast 1.79 −4.10 −2.31 8.49 30.68L Wright Eng Spin −1.04 −1.88 −2.93 8.21 14.51M Mahmudullah Ban Fast −1.05 −2.21 −3.26 7.78 24.81S Jayasuriya SL Spin −1.28 −3.06 −4.34 7.56 20.32
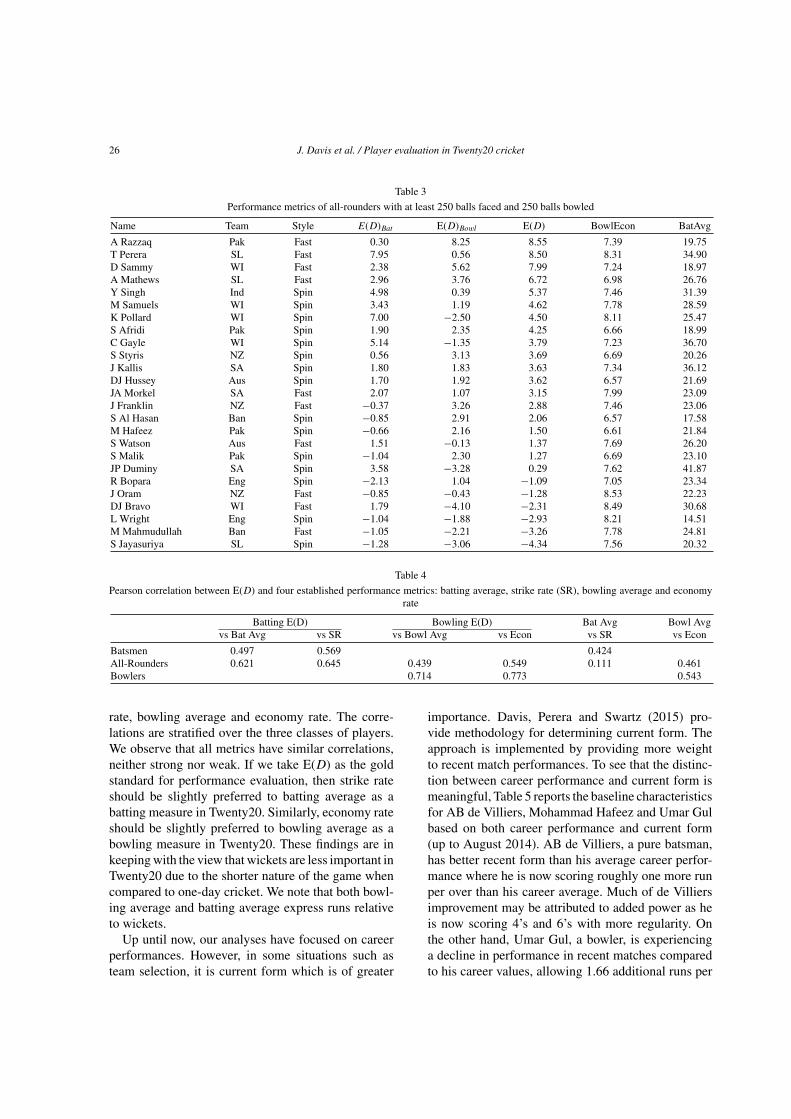
Table 4
Pearson correlation between E(D) and four established performance metrics: batting average, strike rate (SR), bowling average and economyrate
Batting E(D) Bowling E(D) Bat Avg Bowl Avgvs Bat Avg vs SR vs Bowl Avg vs Econ vs SR vs Econ
Batsmen 0.497 0.569 0.424All-Rounders 0.621 0.645 0.439 0.549 0.111 0.461Bowlers 0.714 0.773 0.543
rate, bowling average and economy rate. The corre-lations are stratified over the three classes of players.We observe that all metrics have similar correlations,neither strong nor weak. If we take E(D) as the goldstandard for performance evaluation, then strike rateshould be slightly preferred to batting average as abatting measure in Twenty20. Similarly, economy rateshould be slightly preferred to bowling average as abowling measure in Twenty20. These findings are inkeeping with the view that wickets are less important inTwenty20 due to the shorter nature of the game whencompared to one-day cricket. We note that both bowl-ing average and batting average express runs relativeto wickets.
Up until now, our analyses have focused on careerperformances. However, in some situations such asteam selection, it is current form which is of greater
importance. Davis, Perera and Swartz (2015) pro-vide methodology for determining current form. Theapproach is implemented by providing more weightto recent match performances. To see that the distinc-tion between career performance and current form ismeaningful, Table 5 reports the baseline characteristicsfor AB de Villiers, Mohammad Hafeez and Umar Gulbased on both career performance and current form(up to August 2014). AB de Villiers, a pure batsman,has better recent form than his average career perfor-mance where he is now scoring roughly one more runper over than his career average. Much of de Villiersimprovement may be attributed to added power as heis now scoring 4’s and 6’s with more regularity. Onthe other hand, Umar Gul, a bowler, is experiencinga decline in performance in recent matches comparedto his career values, allowing 1.66 additional runs per
J. Davis et al. / Player evaluation in Twenty20 cricket 27
Table 5
Comparison of career average and current form characteristics for selected players where the final column denotes the expected number of runsper over
Role Name Form pi700 pi701 pi702−3 pi704 pi706 pi70w E(R)/Over
BattingAB de Villiers
Career 0.305 0.389 0.109 0.136 0.028 0.033 7.97Current 0.294 0.367 0.099 0.176 0.036 0.029 8.96
M HafeezCareer 0.368 0.365 0.091 0.113 0.027 0.037 7.02Current 0.343 0.373 0.109 0.107 0.032 0.037 7.31
BowlingU Gul
Career 0.400 0.322 0.098 0.117 0.022 0.041 6.78Current 0.340 0.306 0.127 0.153 0.037 0.037 8.44
M HafeezCareer 0.349 0.422 0.084 0.090 0.029 0.026 6.86Current 0.351 0.422 0.081 0.094 0.029 0.023 6.78
over. We observe that the current form of MohammadHafeez is in keeping with his average career perfor-mance in both batting and bowling.
More generally, it is interesting to investigate howcurrent form compares with career performancesacross all players. We look at the correlation betweenE(D) in (6) with respect to current form and career forthe players available in our dataset. The correlations are0.77 for pure batsmen, 0.91 for bowlers and 0.68 forall-rounders. This suggests that although performanceschange over time, the changes are not typically great.The cases of AB de Villiers and Umar Gul (discussedabove) are two of the most dramatic in our dataset.
With the availability of batting and bowling char-acteristics representing current form as in Table 5, wecarry out further simulations to obtain the expected rundifferential metric (6) based on current form. It is inter-esting to compare our metric (6) with the Reliance ICCratings which also reflect current form. The RelianceICC ratings are taken from October 5, 2014.
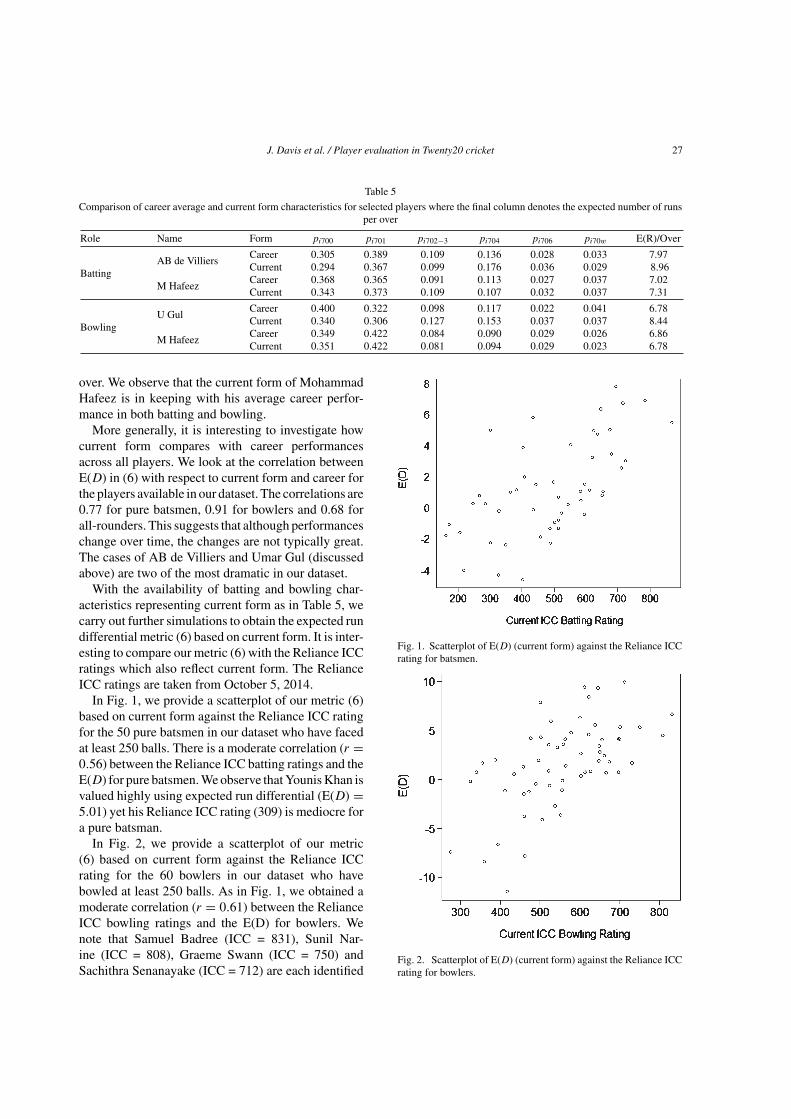
In Fig. 1, we provide a scatterplot of our metric (6)based on current form against the Reliance ICC ratingfor the 50 pure batsmen in our dataset who have facedat least 250 balls. There is a moderate correlation (r =0.56) between the Reliance ICC batting ratings and theE(D) for pure batsmen. We observe that Younis Khan isvalued highly using expected run differential (E(D) =5.01) yet his Reliance ICC rating (309) is mediocre fora pure batsman.
In Fig. 2, we provide a scatterplot of our metric(6) based on current form against the Reliance ICCrating for the 60 bowlers in our dataset who havebowled at least 250 balls. As in Fig. 1, we obtained amoderate correlation (r = 0.61) between the RelianceICC bowling ratings and the E(D) for bowlers. Wenote that Samuel Badree (ICC = 831), Sunil Nar-ine (ICC = 808), Graeme Swann (ICC = 750) andSachithra Senanayake (ICC = 712) are each identified
Fig. 1. Scatterplot of E(D) (current form) against the Reliance ICCrating for batsmen.
Fig. 2. Scatterplot of E(D) (current form) against the Reliance ICCrating for bowlers.
28 J. Davis et al. / Player evaluation in Twenty20 cricket
Fig. 3. Scatterplot of E(D) (current form) against the Reliance ICCrating for all-rounders.
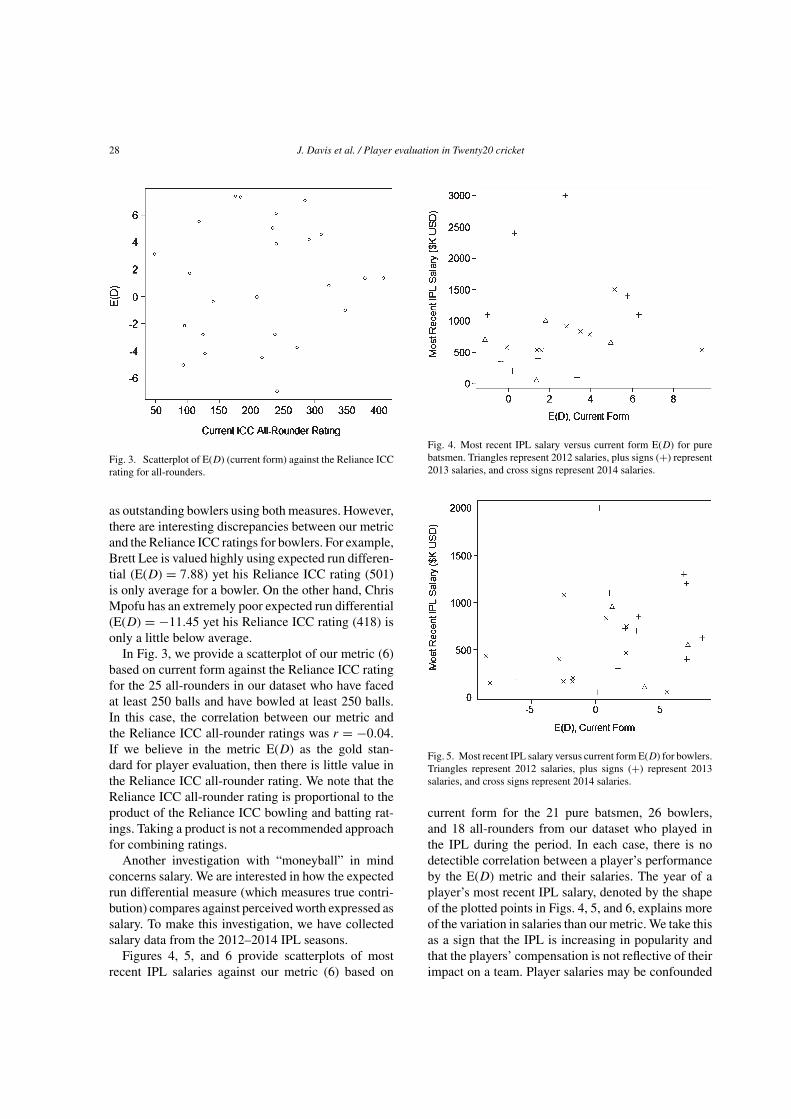
as outstanding bowlers using both measures. However,there are interesting discrepancies between our metricand the Reliance ICC ratings for bowlers. For example,Brett Lee is valued highly using expected run differen-tial (E(D) = 7.88) yet his Reliance ICC rating (501)is only average for a bowler. On the other hand, ChrisMpofu has an extremely poor expected run differential(E(D) = −11.45 yet his Reliance ICC rating (418) isonly a little below average.
In Fig. 3, we provide a scatterplot of our metric (6)based on current form against the Reliance ICC ratingfor the 25 all-rounders in our dataset who have facedat least 250 balls and have bowled at least 250 balls.In this case, the correlation between our metric andthe Reliance ICC all-rounder ratings was r = −0.04.If we believe in the metric E(D) as the gold stan-dard for player evaluation, then there is little value inthe Reliance ICC all-rounder rating. We note that theReliance ICC all-rounder rating is proportional to theproduct of the Reliance ICC bowling and batting rat-ings. Taking a product is not a recommended approachfor combining ratings.
Another investigation with “moneyball” in mindconcerns salary. We are interested in how the expectedrun differential measure (which measures true contri-bution) compares against perceived worth expressed assalary. To make this investigation, we have collectedsalary data from the 2012–2014 IPL seasons.
Figures 4, 5, and 6 provide scatterplots of mostrecent IPL salaries against our metric (6) based on
Fig. 4. Most recent IPL salary versus current form E(D) for purebatsmen. Triangles represent 2012 salaries, plus signs (+) represent2013 salaries, and cross signs represent 2014 salaries.
Fig. 5. Most recent IPL salary versus current form E(D) for bowlers.Triangles represent 2012 salaries, plus signs (+) represent 2013salaries, and cross signs represent 2014 salaries.
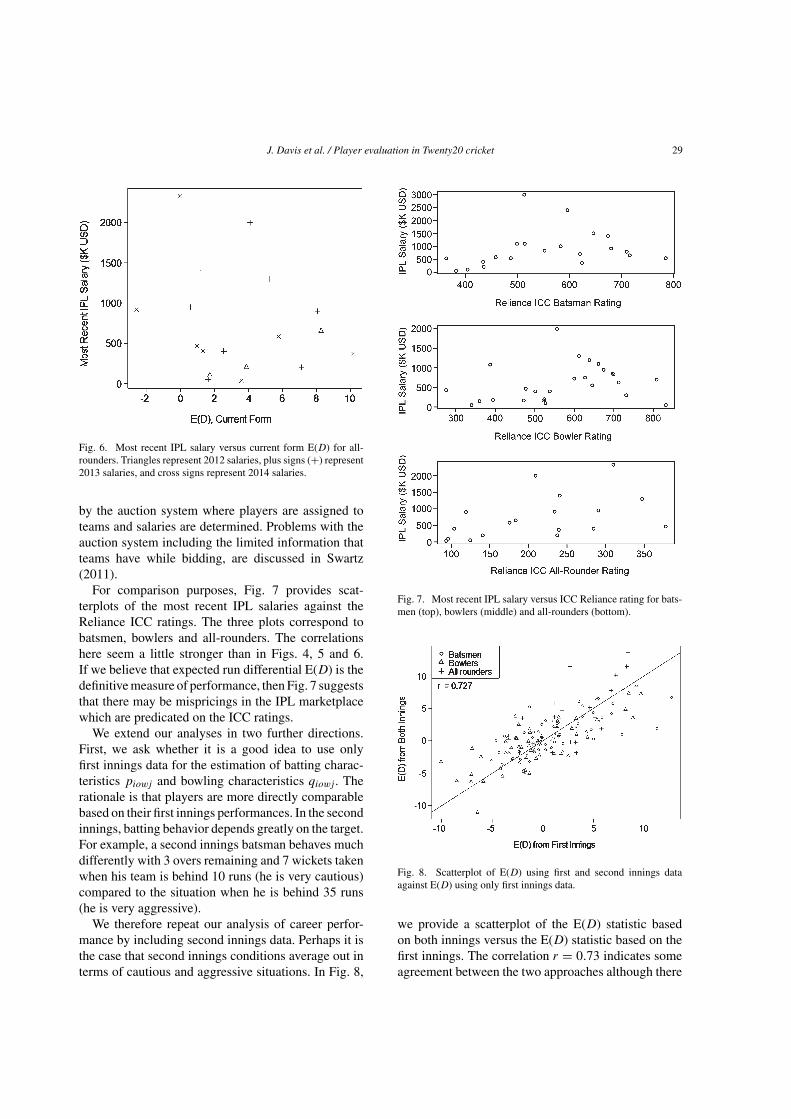
current form for the 21 pure batsmen, 26 bowlers,and 18 all-rounders from our dataset who played inthe IPL during the period. In each case, there is nodetectible correlation between a player’s performanceby the E(D) metric and their salaries. The year of aplayer’s most recent IPL salary, denoted by the shapeof the plotted points in Figs. 4, 5, and 6, explains moreof the variation in salaries than our metric. We take thisas a sign that the IPL is increasing in popularity andthat the players’ compensation is not reflective of theirimpact on a team. Player salaries may be confounded
J. Davis et al. / Player evaluation in Twenty20 cricket 29
Fig. 6. Most recent IPL salary versus current form E(D) for all-rounders. Triangles represent 2012 salaries, plus signs (+) represent2013 salaries, and cross signs represent 2014 salaries.
by the auction system where players are assigned toteams and salaries are determined. Problems with theauction system including the limited information thatteams have while bidding, are discussed in Swartz(2011).
For comparison purposes, Fig. 7 provides scat-terplots of the most recent IPL salaries against theReliance ICC ratings. The three plots correspond tobatsmen, bowlers and all-rounders. The correlationshere seem a little stronger than in Figs. 4, 5 and 6.If we believe that expected run differential E(D) is thedefinitive measure of performance, then Fig. 7 suggeststhat there may be mispricings in the IPL marketplacewhich are predicated on the ICC ratings.
We extend our analyses in two further directions.First, we ask whether it is a good idea to use onlyfirst innings data for the estimation of batting charac-teristics piowj and bowling characteristics qiowj . Therationale is that players are more directly comparablebased on their first innings performances. In the secondinnings, batting behavior depends greatly on the target.For example, a second innings batsman behaves muchdifferently with 3 overs remaining and 7 wickets takenwhen his team is behind 10 runs (he is very cautious)compared to the situation when he is behind 35 runs(he is very aggressive).
We therefore repeat our analysis of career perfor-mance by including second innings data. Perhaps it isthe case that second innings conditions average out interms of cautious and aggressive situations. In Fig. 8,
Fig. 7. Most recent IPL salary versus ICC Reliance rating for bats-men (top), bowlers (middle) and all-rounders (bottom).
Fig. 8. Scatterplot of E(D) using first and second innings dataagainst E(D) using only first innings data.
we provide a scatterplot of the E(D) statistic basedon both innings versus the E(D) statistic based on thefirst innings. The correlation r = 0.73 indicates someagreement between the two approaches although there
30 J. Davis et al. / Player evaluation in Twenty20 cricket
are cases where the differences are considerable. Thenatural question is which of the measures should bemore trusted for player evaluation? We take the viewthat there is value in considering both measures. Whenthere are large discrepancies between the two mea-sures, it indicates a difference in performance betweenthe two innings. We believe in such cases it wouldbe useful to look at the circumstances associated withthe second innings. For example, it is conceivable thatsome players may be well-suited or ill-suited for thepressure of a chase during the second innings.
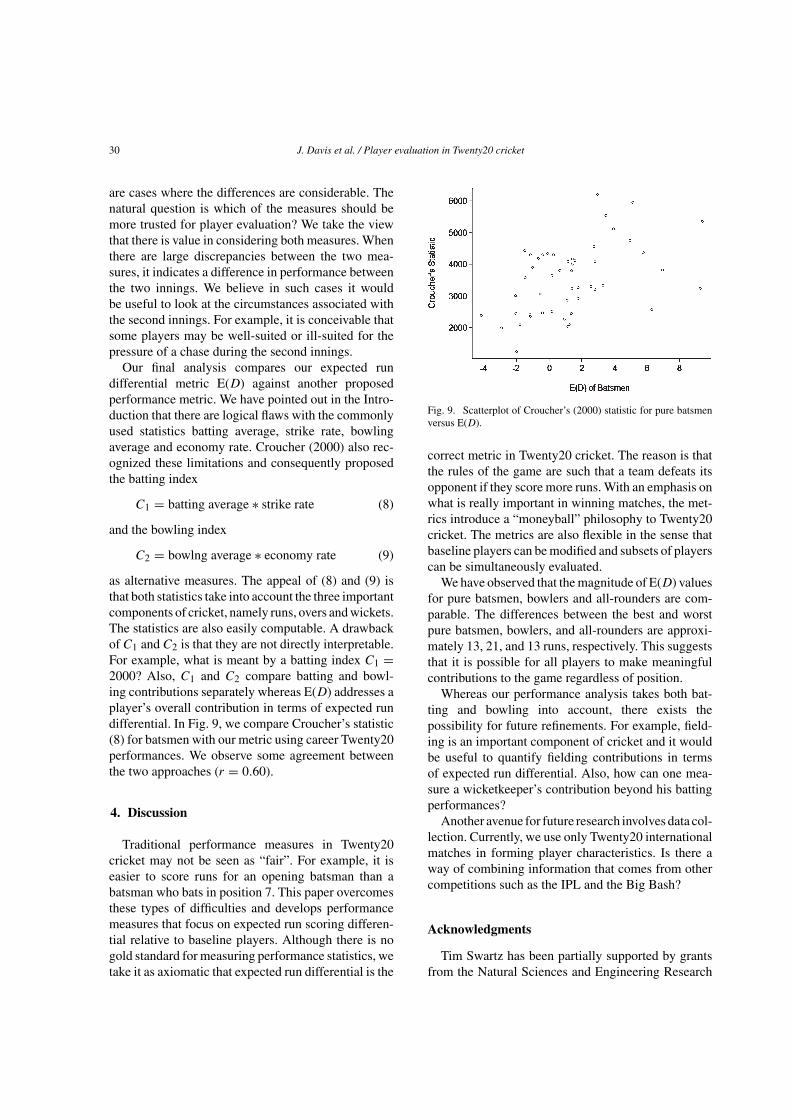
Our final analysis compares our expected rundifferential metric E(D) against another proposedperformance metric. We have pointed out in the Intro-duction that there are logical flaws with the commonlyused statistics batting average, strike rate, bowlingaverage and economy rate. Croucher (2000) also rec-ognized these limitations and consequently proposedthe batting index
C1 = batting average ∗ strike rate (8)
and the bowling index
C2 = bowlng average ∗ economy rate (9)
as alternative measures. The appeal of (8) and (9) isthat both statistics take into account the three importantcomponents of cricket, namely runs, overs and wickets.The statistics are also easily computable. A drawbackof C1 and C2 is that they are not directly interpretable.For example, what is meant by a batting index C1 =2000? Also, C1 and C2 compare batting and bowl-ing contributions separately whereas E(D) addresses aplayer’s overall contribution in terms of expected rundifferential. In Fig. 9, we compare Croucher’s statistic(8) for batsmen with our metric using career Twenty20performances. We observe some agreement betweenthe two approaches (r = 0.60).
4. Discussion
Traditional performance measures in Twenty20cricket may not be seen as “fair”. For example, it iseasier to score runs for an opening batsman than abatsman who bats in position 7. This paper overcomesthese types of difficulties and develops performancemeasures that focus on expected run scoring differen-tial relative to baseline players. Although there is nogold standard for measuring performance statistics, wetake it as axiomatic that expected run differential is the
Fig. 9. Scatterplot of Croucher’s (2000) statistic for pure batsmenversus E(D).
correct metric in Twenty20 cricket. The reason is thatthe rules of the game are such that a team defeats itsopponent if they score more runs. With an emphasis onwhat is really important in winning matches, the met-rics introduce a “moneyball” philosophy to Twenty20cricket. The metrics are also flexible in the sense thatbaseline players can be modified and subsets of playerscan be simultaneously evaluated.
We have observed that the magnitude of E(D) valuesfor pure batsmen, bowlers and all-rounders are com-parable. The differences between the best and worstpure batsmen, bowlers, and all-rounders are approxi-mately 13, 21, and 13 runs, respectively. This suggeststhat it is possible for all players to make meaningfulcontributions to the game regardless of position.
Whereas our performance analysis takes both bat-ting and bowling into account, there exists thepossibility for future refinements. For example, field-ing is an important component of cricket and it wouldbe useful to quantify fielding contributions in termsof expected run differential. Also, how can one mea-sure a wicketkeeper’s contribution beyond his battingperformances?
Another avenue for future research involves data col-lection. Currently, we use only Twenty20 internationalmatches in forming player characteristics. Is there away of combining information that comes from othercompetitions such as the IPL and the Big Bash?
Acknowledgments
Tim Swartz has been partially supported by grantsfrom the Natural Sciences and Engineering Research
J. Davis et al. / Player evaluation in Twenty20 cricket 31
Council of Canada. The authors thank the two EditorsPhilip Maymin and Eugene Shen, and three anony-mous reviewers whose comments have helped improvethe manuscript.
References
Albert, J., Marchi, M., 2013. Analyzing Baseball Data withR. Chapman & Hall/CRC The R Series, New York.
Beaudoin, D., Swartz, T.B., 2003. The best batsmen and bowlers inone-day cricket. South African Statistical Journal. 37, 203-222.
Clarke, S.R., 1998. Test statistics. In Statistics in Sport, J. Bennett(editor), Arnold Publishers, London, pp. 83-104.
Croucher, J.S., 2000. Player ratings in one-day cricket. In Mathemat-ics and Computers in Sport, G. Cohen and T. Langtry (editors),University of Technology, Sydney, Australia, pp. 95-106.
Davis, J., Perera, H., Swartz, T.B., 2015. A simulator for Twenty20cricket. Australian and New Zealand Journal of Statistics. 57,55-71.
Gramacy, R.B., Taddy, M.A., Jensen, S.T., 2013. Estimating playercontribution in hockey with regularized logistic regression.Journal of Quantitative Analysis in Sports. 9, 97-112.
Gray, S., 2006. The Mind of Bill James: How a Complete OutsiderChanged Baseball. Doubleday, New York.
McHale, I.G., Scarf, P.A., Folker, D.E., 2012. On the developmentof a soccer player performance rating system for the EnglishPremier League. Interfaces. 42, 339-351.
Oliver, D., 2004. Basketball on Paper: Rules and Tools for Perfor-mance Analysis. Brassey’s Inc, Dulles,VA.
Lewis, M., 2003. Moneyball: The Art of Winning an Unfair Game.WW Norton, New York.
Schuckers, M.E., Lock, D.F., Wells, C., Knickerbocker, C.J., Lock,R.H., 2011. National Hockey League skater ratings based uponall on-ice events: An adjusted minus/plus probability (AMPP)approach. Unpublished manuscript.
van Staden, P.J., 2009. Comparison of cricketers’ bowling and bat-ting performances using graphical displays. Current Science.96, 764-766.
Swartz, T.B., 2011. Drafts versus auctions in the Indian PremierLeague. South African Statistical Journal. 45, 249-272.
Woolner, K., 2002. Understanding and measuring replacement level.In Baseball Prospectus 2002, J. Sheehan (editor), Brassey’s Inc,Dulles, VA, pp. 55-66.