Planning for Water Shortages - Mountain Scholar
280
Planning for Water Shortages Water Reallocations and Transfers Drought Management Proceedings from the 1989 Regional Meetings Boise, Idaho St. Louis, Missouri August 24-26,1989 October 19-21, 1989 Sponsored by U. S. Committee on Irrigation and Drainage Edited by Jerry Schaack Consultant David S. WUson, Jr. Salt River Project Susan S. Anderson U.S. Committee on Irrigation and Drainage Published by U.S. Committee on Irrigation and Drainage P.O. Box 15326 Denver, CO 80215 303-236-B960
-
Upload
khangminh22 -
Category
Documents
-
view
1 -
download
0
Transcript of Planning for Water Shortages - Mountain Scholar

Planning for Water Shortages
Water Reallocations and Transfers Drought Management
Proceedings from the 1989 Regional Meetings Boise, Idaho
St. Louis, Missouri August 24-26,1989 October 19-21, 1989
Sponsored by
U.S. Committee on Irrigation and Drainage
Edited by
Jerry Schaack Consultant
David S. WUson, Jr. Salt River Project
Susan S. Anderson U.S. Committee on Irrigation and Drainage
Published by
U.S. Committee on Irrigation and Drainage P.O. Box 15326
Denver, CO 80215 303-236-B960

USCID
The U.S. Committee on Irrigation and Drainage (USOD) Is a nonprofit professional society whose members share an Interest In the planning, design, construction, operation and maintenance of Irrigation, drainage and flood control works; Irrigation agriculture and economics; and water law.
USCID publishes the USCID Newsletter, proceedings of USOD meetings and special reports; organizes and sponsors periodic technical meetings and conferences; and distributes publications of the International Commission on Irrigation and Drainage. ICID publications include the biannuallCID Bulletin, Irrigation and Drainage In the World, and the Multilingual Technical Dictionary on Irrigation and Drainage.
Membership categories and dues are:
Indivldual... ................. $35 Institutional .............. $175
Ubrary ........................ $85 Corporate ................ $350
The U.S. Committee on Irrigation and Drainage accepts no responsibility for the statements made or the opinions expressed In this publication.
Copyright ©1990, U.S. Committee on Irrigation and Drainage
Printed In the United States of America
Ubrary of Congress Catalog Card Number: 90-70091
ISBN 0-9618257-5-8
PREFACE
I n recent years, many areas of the United States have faced Increasingly severe water shortages, due not only to drought, but also to changing demand patterns and competition among water users. Those not facing Immediate shortages are examining current water availabilities In order to forestaU or alleviate Mure shortages.
In light of these current or anticipated shortages, the U.S. Committee on Irrigation and Drainage (USOD) sponsored two Regional Meetings during 1989 with the topic, "Planning lor Water Shortages." Heid in Boise, Idaho, and St. Louis, Missouri, each Regional Meeting focused OIl a theme relating to water shortages. The theme of the Balsa Regional Meeting was 'Water Reallocations and Transfers" and the theme of the St. Louis Regional Meeting was 'Orought Management."
The papers presented at the Meetings and Included in thesa Proceedings were either Invited by USOD or accepted In response to a Call for Papers. The authors represent academia; federal, state and local government agencies; and the private sector.
Each Regional Meeting featured keynote and luncheon speakers of regional and national prominence; the formal presentation of papers; a meeting-ending Panel Discussion; and a day-long study tour.
The U.S. Committee on Irrigation and Drainage and the 1989 Regional Meeting Co-Chairrnen extend their appreciation to all speakers, authors, participants and session chairmen.
iii
Jerry Schaack Co-Chalrrnan Denver, Coiorado
David S. Wilson, Jr. Co-Chalrrnan Phoenix, Arizona


TABLE OF CONTENTS
WATER REALLOCATIONS AND TRANSFERS
Boise Regional Meeting
Water Marketing in California by James L. Easton ................................................... .
The Carson and Truckee Rivers - Objects of Competing Demands for Water by Franklin E. Dimick. . . . . . . . . . . . . . . . . . . . . . . . . . . . . . . . . . . . . . . . . . . . . . . . .. 13
A Stochastic Programming Model of Salinity In the Colorado River Basin by Donna J. Lee and Richard E. Howitt. . . . . . . . . . . . . . . . . . . . . . . . . . . . . . . . . .. 21
Change in Nature of Use from Irrigation to Municipal - Case Histories in the Boise River Basin
by David R. Tuthill, Jr. ................................................. 33
A Management Improvement Process to Effectively Change Irrigated Agriculture by A. R. Dedrick, Wayne Clyma and J. D. Palmer ........................... 45
Structural Solutions for Alleviating Water Shortages: The Case of Two Forks Dam and Reservoir
by Kenneth Mitchell and Edward E. Pokorney ............................. 59
Water Transfer Administration In California - Experiences on the Yuba River by Herbert W. Greydanus .............................................. 73
I nstitutional Change for Efficient Water Resource Allocation by Andrew F. Rose. . . . . . . . . . . . . . . . . . . . . . . . . . . . . . . . . . . . . . . . . . . . . . . . . . .. 83
Managing Utah's Water Through Interbasin Transfer by Franklin E. Dimick. . . . . . . . . . . . . . . . . . . . . . . . . . . . . . . . . . . . . . . . . . . . . . . . .. 91
Economic and Environmental Impacts of a Large Scale Water Transfer in the Colorado River Basin
by George Oamek and Stanley R. Johnson. . . . . . . . . . . . . . . . . . . . . . . . . . . . . .. 101
Water Banking in Idaho byRichardM.Rigby ................................................. 113
Impacts of Urbanization on Water Demand in the Phoenix, Arizona, Area by Charles Ester and Darrell Jordan .................................... 119
Luncheon Address: Water Transfers and Water Marketing by R. Keith Higginson. . ..... . .. ....... .. . ... .. ...... . . ... . . . . . . . . . . .. 131
DROUGHT MANAGEMENT St. Louis Regional Meeting
Effectiveness of Drought Predictions by Lewis Moore. . . . . . . . . . . . . . . . . . . . . . . . . . . . . . . . . . . . . . . . . . . . . . . . . . . .. 137
A Complete Plan ..... Experiences from the U.S." by Peter Macy . . . . . . . . . . . . . . . . . . . . . . . . . . . . . . . . . . . . . . . . . . . . . . . . . . . . .. 145
v

The Drought of 1988/89: A Success Story by David R. Busse. . . . . . . . . . . . . . . . . . . . . . . . . . . . . . . . . . . . . . . . . . . . . . . . . . . 159
Drought Management In Northeastern Colorado by Darell D. Zimbelman. . . . . . . . . . . . . . . . . . . . . . . . . . . . . . . . . . . . . . . . . . . . . .. 167
Designing a Supplemental Irrigation System by Zohrab A. Samanl and George H. Hargreaves. . . . . . . . . . . . . . . . . . . . . . . . .. 175
The Bureau of Reclamation and the Drought Relief Acts of 19n and 1988 by Tom Phillips and Jane Ludwig...... . . ....... . . . .... . ... .. . ... . . ... .. 189
A Methodology for Analyzing Altematlve Reservoir Shortage and Operating Criteria by George Oamek, Larry Schluntz, Loren Boltorff and Eldon Johns ............ 199
US Army Corps of Engineers Drought Planning and Response by John P. Elmore ................................................... 211
The Role of Drought Management Measures In Water Resource Investigations by Uli Kappus, Blaine N. Dwyer and Ralph L. Kerr . . . . . . . . . . . . . . . . . . . . . . . .. 221
Water Banking - Ground Water Recharge, Recovery, and Exchange Systems by Ronald M. Willhite and Richard A. Randall. . . . . . . . . . . . . . . . . . . . . . . . . . . .. 235
Managing Water Scarcity in Phoenix, Arizona by David S. Wilson, Jr. . . . . . . . . . . . . . . . . . . . . . . . . . . . . . . . . . . . . . . . . . . . . . . .. 245
The Benefits of I rrigation in Mitigating the Impacts of Drought by Larry J. Schluntz . . . . . . . . . . . . . . . . . . . . . . . . . . . . . . . . . . . . . . . . . . . . . . . . .. 251
Impacts and Some Lessons Taught by the 1988 Drought by Stanley A. Changnon .............................................. 263
Tennessee's Drought Management Plan by Lee Keck and John McClurkan . . . . . . . . . . . . . . . . . . . . . . . . . . . . . . . . . . . . .. 271
vi

WATER MARKETING IN CALIFORNIA
James L. Easton*
ABSTRACT
Few things have been talked about more and done less in California than water marketing. It's interesting that in one of the world's consummate entrepreneurial environments, a commodity as vital as water is so difficult to buy and sell. Why has water marketing become widely used in the rest of the southwestern United states and even in the Midwest and not in California? The answer to that question is complex. The discussion of water marketing will be divided to treat surface and subsurface water separately.
Introduction
To adequately understand the role of water marketing in California's present and future water supply picture, one must first consider the importance of water in the State's history and the role it will play in California's continued economic and population expansion.
California's explosive growth following World War II could not have occurred without the remarkably farsighted construction of dams, reservoirs and a marvelous aqueduct system to carry water from the Sierra Nevada Mountains, Owens Valley and the Colorado River. All of this remarkable construction was done at considerable cost to the environment and to the goodwill of the people in the areas of the water's origin. Southern California's growing need for water and the conflicting need to protect the Northern California environment remains an emotional and divisive issue.
Current Water Usage
California uses about 34 million acre-feet of water annually. Nearly 85% of that amount is used to irrigate approximately 10 million acres of farmland. Agribusiness contributes $16 billion annually to California's economy.
*Vice President, Sacramento Regional Manager, Willdan Associates, 1121 L St., Suite 1000, Sacramento, CA 95814.
1

2 USCID Regional Meetings -- 1989
Pressure continues to mount from powerful and sophisticated environmental groups to restrict and reduce export of northern water in order to increase and enhance "in-stream" use of water. Recent high court decisions concerning the public trust doctrine supports more use of water for recreation, habitat, fisheries and other in-stream uses. This constitutes a substantial threat to existing exports and a big problem for future water development.
About 40% of the state's land is underlain with groundwater basins. Useable groundwater in California probably exceeds 400 million acre-feet. However, total annual overdraft of several key basins exceeds 2 million acre-feet and can be much higher in dry years.
Future water Needs
Between now and 2010, California's population is projected to increase by 25% from 28 million to in excess of 36 million people.
Irrigated lands will probably remain in the 10 million acre range.
Southern California's entitlement to Colorado River water will be reduced by over 600,000 acre-feet/year as Arizona takes its full Central Arizona Project entitlement.
Use of several important groundwater supply sources may be curtailed because of pollution and/or subsidence.
Estimates of the additional water needed annually by the year 2010 range from a minimum of 1.4 million acre-feet to 3 million acre-feet or more. Even the minimum figure assumes the construction of several expensive and environmentally sensitive storage and conveyance projects by the State. New source development costs are soaring. other important elements of a successful future water supply program are:
o Increased water reclamation and re-use o Aggressive (and perhaps mandatory) water
conservation programs involving both urban and agricultural usage
Water Marketing in California
o water banking (underground storage of excess surface water in wet years for extraction in dry years)
o Water transfers and water marketing o Improved groundwater management
3
o Full utilization of the dependable yield of the Bureau of Reclamation's Central Valley Project (about 1.5 million acre-feet remain to be marketed)
o A determination of balanced use of water in the Delta and how much is available for export considering all of the current and future beneficial uses.
Water Marketing - General
California has an exceptional and sophisticated system of water storage and conveyance facilities throughout the state. The utilization of these existing facilities to maximize the use of existing water supply sources and to reduce the cost of new sources makes abundant sense. So does providing a tangible monetary incentive for more extensive and effective water conservation and conjunctive use programs. We should stress, however, that although water marketing should be an important part of providing the State with an adequate future water supply, it will only be a portion of a multi-faceted program that will require cooperation, willingness to change, and probably new legislation.
Marketing Surface Water
California is a water-rich State when compared to many states in the southwest . Surface water has long been considered to be a resource that should be owned and allocated for the benefit of all the people of the State. This is reflected in a carefully structured system of water rights that is administered by the State Water Resources Control Board (SWRCB).
Riparian Water; Owners of property adjacent to watercourses have riparian rights to sufficient water to meet their needs on the land contiguous to these streams. Riparian water rights go with the land and cannot be exported to other locations.
Appropriative Water; Surface water is appropriated through a permit or license granted by SWRCB. All appropriators, including the state and federal

4 USCID Regional Meetings -- 1989
governments who own and operate the state's largest water supply systems, are subject to regulation by SWRCB.
CUrrent water law presents three obstacles to marketing appropriated water:
1. Marketing and export can only take place if there is DQ damage to other water right holders on the subject stream. SWRCB has the authority to work out arrangements to reduce the impact to "no significant damage" for temporary transfers but doesn't have that flexibility for the more desirable permanent transfers. Legislation is needed to correct this.
2. Legislative "area of origin" protection allows upstream areas to retain senior rights to water that may be needed for future benefit and development of those areas. These protections may require some tangible consideration for the areas of origin to prevent future reversion of the water right if a sale or transfer is intended to be permanent.
3. Export of appropriative water requires a change in the place of use and most often the purpose of use in the water right permit or license. This requires a lengthy hearing process before the state water Resources Control Board.
There have been mixed signals from environmental interests regarding sale of surface water. On one hand, they've strongly supported legislative efforts to facilitate water marketing. They believe that maximizing use of already developed sources of supply is environmentally preferable lo new source development. On the other hand, they are actively pressing for more in-stream uses which will constrain surface water marketing.
Another obstacle to selling Northern California water in Southern California is the lack of conveyance capacity through the Delta. This prevents the State Water project from delivering its full allotment and

Water Marketing in California
is the primary impediment to sale and export of additional water originating north of the Delta.
5
"Wheeling" water from a seller to a buyer will, in most cases, involve conveyances belonging to other water agencies. Not all of these agencies support the concept of water marketing. Even though current laws generally mandate the use of available conveyances, they're sufficiently vague (particularly pertaining to what's "reasonable" compensation for conveyance usage) to allow circumvention.
Another important variable that can complicate or thwart surface water sales is demands by regulatory agencies and environmental groups for dedication of more water for in-stream uses such as fisheries, habitat, recreation, etc. These demands have tended to be unpredictable and often unrealistic, but must be dealt with. This is often accomplished as part of complying with California's environmental quality laws. Compliance with the CEQA process is probably the greatest impediment to private involvement in surface water sales because of the extent and unpredictability of its cost.
Allocated Water: Water rights for the state Water Project (SWP) and the Federal Central Valley Project have been granted by the SWRCB to the state Department of Water Resources (DWR) and the united states Department of the Interior-Bureau of Reclamation (USBR), respectively.
DWR contracts with 30 water agencies to deliver water to them through the state Water Project facilities. Most of these agencies are wholesalers who market water to purveyors who deliver it to customers. The state Water Contractors are repaying all the capital costs of constructing eXisting SWP facilities even though several contractors don't have the physical facilities or the need to take their full entitlements. They all pay operation, maintenance and transportation costs for the water they do use. One of the provisions of the state Water Contract prevents any contractor from marketing water in the service area of another contractor without permission. A controversy has arisen because some of the water purveyors (retailers) have attempted to sell state water within the service area of state Water Contractors other than the one that supplies their water. Threatened legal action by one or more state water contractors has, thus far, blocked these

6 USCID Regional Meetings -- 1989
proposed sales. It can be argued that inability of retail water purveyors to export a portion of the state or federal water they are entitled to buy is resulting in inefficient use of both the SWP and CVP.
Some of the State Water contractors strongly believe that since the State can't fulfill its contractual obligations to provide the full design capacity of the SWP without the construction of new facilities, current "surpluses" should be reserved for the benefit of the contractors. There is also a pervasive fear among the state contractors that water marketing could cause a false public perception that it is less urgent to complete the SWP, which is essential to assure Southern California of adequate future water supply.
The USBR is currently preparing an Environmental Impact Statement which is the first step in a proposal to market 1.5 million acre-feet of currently unallocated CVP water. The initial draft of the EIS (the result of a $3 million effort) was recently scrapped by the Bureau because of strong objections to the proposed marketing plan by environmental interests and prospective customers. The sale of this water is a key factor in the state's water supply, but how much will ultimately be sold and for what purposes remains in substantial doubt.
Agricultural water conservation presents the most potential to make currently allocated CVP water available for sale. Pressure is mounting on the Bureau to allow that to happen. The Bureau recently issued guidelines for transfers and sales, but they are rather vague. New faces in Washington and at the Bureau's Regional Office in Sacramento may affect the politics of the Bureau's role in water marketing.
Colorado River Water is allocated among the states by federal law. California's 4.4 million acre-foot allocation is distributed in hierarchical order among several irrigation districts and the Metropolitan Water District of Southern California (MWD). MWD's allocation is being reduced by 662,000 acre-feet when Arizona takes its full entitlement for the Central Arizona Project. MWD recently concluded negotiations with the Imperial Irrigation District whereby MWD will construct and pay for nearly $15,000,000 of water conservation facilities in the Imperial Valley in exchange for 100,000 acre-feet of Colorado River water that Imperial was "wasting." The successful
Water Marketing in California 7
conclusion of those negotiations immediately prompted a lawsuit by the Coachella Valley water District, which is above MWD in the entitlement hierarchy. It is almost certain that the federal "Law of the River" precludes buying and selling Colorado River water as a commodity now and in the future. However, assuming that MWD and lID can assure protection of Coachella's water rights, there is a strong possibility of MWD obtaining an additional 100,000 to 200,000 acre-feet through an expansion of this agreement.
Marketing Groundwater
California is rich in groundwater resources. In stark contrast to the rigorous management of its surface water is the fact that the state has no statewide groundwater management. Numerous attempts have been made by the state Legislature to enact such a system, but all have failed. The utility of groundwater has and still is viewed as a property right in California. The only constraint in most of the State on a property owner's use of underlying groundwater is the threat that his neighbors may bring civil suit against him if they can prove damage from his activities.
Reliance on groundwater is heavy in the southern half of the State. Most of the State's 2 million acrefeet annual overdraft occurs in the San Joaquin Valley. Agriculture uses groundwater in times of drought and at other times because it's often cheaper than surface sources (especially state Water Project water). Groundwater supplies about 40% of the municipal and industrial water in the largest urban areas of Southern California. It's interesting that the combination of imported water and local groundwater has given the much drier south far more drought protection than many northern locations that are solely or mostly dependent on surface sources.
There have been some effective efforts to manage groundwater quantity in several large basins in Southern California and one in Northern California. This has resulted from court adjudication or formalization of voluntary user agreements and has been quite successful in minimizing stabilizing groundwater levels through strict pumping allocations and aggressive recharge programs.
Most of these management programs have not adequately addressed groundwater quality which is an

8 USCID Regional Meetings •• 1989
increasingly serious problem in both agricultural and urban areas. The state Legislature and regulatory agencies are addressing the problem, but progress is slow. Another serious threat to groundwater quality is the absence of an aggressive comprehensive statewide waste management plan. Public misperception (the NIMBY syndrome) of a number of needed waste management programs and facilities coupled with slow progress on programs to clean up leaking underground tanks, toxic pits, and waste disposal sites are all contributing to serious ongoing groundwater pollution. A crisis looms.
On the brighter side, several large agencies are becoming increasingly active in groundwater "banking." This process recharges (or "banks") surplus surface water into groundwater basins during wet years to be extracted during dry or drought years. The state DWR's Kern Water Bank and several efforts by the Metropolitan Water District of Southern California are very promising in terms of increasing dependable supplies.
There are substantial quantities of undeveloped groundwater in the Sacramento Valley and along the eastern slopes of the Sierra Nevada Mountains. There are potentially important sources of developable groundwater along the coast as well. These sources have the greatest potential of producing significant quantities of marketable water.
Marketing groundwater is made somewhat simpler by the absence of State law and regulation pertaining to groundwater. The environmental protection laws still have to be complied with. The time and expense associated with that process can be a substantial impediment to marketing.
A key element in any successful groundwater marketing program is the demonstration that the proposed export is within the basin's "safe yield" and will not result in overdrafting. The necessary data to determine a "safe yield" is often not available. Obtaining that data can be an expensive and time consuming process.
Groundwater "mining" (the planned extraction of groundwater that exceeds natural and artificial recharge) may be feasible at some specific locations, but the possibility of damage to overlying property through subsidence, potential loss of production from

Water Marketing in California
existing wells and adverse public perception of overdraft, makes new "mining" proposals unattractive as a source of marketable groundwater.
Public perception is a vitally important element of groundwater marketing. "Public" includes all of the basin's overlying land owners plus the affected general public. All need to be assured that the proposed export will not result in economic damage, that the present and future water supply of the area will not be adversely affected, and that adverse environmental effects won't occur or will be mitigated.
Water Brokering
9
The state Department of Water Resources is the principal water broker in the state. It functions in that capacity in times of drought. The state bought 200,000 acre-feet of water this year from Yuba County Water Agency and sold 90,000 acre-feet to santa Clara Valley Water District for M&I use, with the remainder going to agricultural water interests at a substantially reduced unit cost. DWP charged their buyers the unit cost charged by Yuba County Water Agency plus the cost of transporting the water through the Department's facilities. The unit price paid to Yuba County Water Agency varied from $45 per acre-foot for the M&I water to as low as $5 per acrefoot for some of the irrigation water.
DWR has also been charged by the Legislature to assist and facilitate the sale and transfer of water. That task is being handled by a new Division of Local Assistance. Private sector water brokerage is not abundant, but will probably be more available once some "break-through" water transactions are consummated.
Attitudes About Water Marketing
Although there are more than 1,100 water purveyors in the state, California has a remarkably close-knit water "community." Those who have been in the water business the longest seem the most reluctant to accept water marketing as a viable, important part of California's future water supply picture. Some believe that water should continue to belong to all of the people and be allocated rather than bought and sold as a commodity. others fear that reallocation

10 USCID Regional Meetings -- 1989
of current supplies will weaken the argument for completing the state water project. There is also concern that even a modest water market will drive up the price of water and make relatively inexpensive "surplus" water from the state and federal water projects less available.
The attitude toward water marketing of influential elements of the water community is as important to its future utility as its legal, regulatory and legislative aspects. Hopefully these attitudes will become more supportive as more sales are consummated, and some of the fears about water marketing prove to be unjustified.
Trends
The recent (and in some parts of the state, current) drought has heightened interest in water marketing. During 1987, 1988, and 1989 Yuba County water Agency sold water to DWR. As previously mentioned, DWR brokered the water it bought in 1989 to water purveyors. In the two previous years it used the water to meet Delta water Quality standards. In 1988 and again this year the state Department of Fish and Game has purchased water to protect salmon spawning and bird migration areas. Yuba County Water Agency sold water to several agencies this year other than DWR. It can be concluded that sales between public water agencies are becoming more prevalent and, during drought "emergencies," can be concluded quickly. There are a number of other water purveyors throughout the state (both agricultural and urban) that would like to purchase additional water but are finding it difficult because of legal, political and physical problems. Competition among environmental interests, agribusiness and urban water purveyors for water from currently developed sources will continue to increase. This trend, combined with the everincreasing cost of new supply source development will favor increased water marketing.
Conclusions
Marketing water in California is not easy and won't be for the foreseeable future. But it is "do-able." Powerful political and economic interests will combine to prevent water supply deficiencies from impeding the state's continued growth and economic
Water Marketing in California 11
well-being. supplying those needs will require consideration of the growing and appropriate demands for water-related environmental protection. An important part of the future supply picture will be efficient use of existing supplies. water marketing will be an important part of that aspect of water supply . New legislation, attitude changes, more public involvement, and carefully crafted proposals that are mutually beneficial will all be elements of an emerging water market in California. How quickly all these things occur is an interesting, difficult question; but in the author's opinion, it will be sooner rather than later.

I

THE CARSON AND TRUCKEE Rl VERS
OBJEcrS OF COMPETING DEMANDS FOR WATER
Franklin E. Dimick * ABSTRACT
The Carson and Truckee Rivers carry water from the tops of the Sierra Nevada Mountains to the arid desert of western Nevada. Almost from the moment white men began to settle and populate the area, competition for this very limited resource began. As the area continued to develop and new lands were irrigated, the need for water became critical. The population growth of areas such as Reno, Nevada demanded a dependable water supply from the two rivers.
\fhen a species of fish found in Pyramid Lake, the terminal point of the Truckee River, was listed as endangered under the Endangered Species Act, a significant new demand for water was introduced.
The intense competition for water from these two rivers has resulted in dozens of court actions among the various federal, state and local governments as well as Indian Tribes, private entities, and environmental groups. Some of these court actions have been resolved and some are still pending. The management of the river systems has been changed in some cases to comply with court actions.
Negotiations have been taking place among the various entities in an attempt to resolve the conflicting demands. These negotiations may result in settling some of the long standing legal disputes but unless some agreement is reached by all of the users of the river systems, continued growth will bring continued competition for the limited water supply in western Nevada.
HISTORY
The Carson and Truckee Rivers located in western Nevada and Eastern California are relatively small rivers when compared with other rivers such as the lUssissippi or Columbia Rivers. The Carson River is approximately 95
* Project Manager, Lahontan Basin Projects Office, U.S. Bureau of Reclamation, Carson City, Nevada.
13

14 USCID Regional Meetings -- 1989
miles long and has an average annual discharge of only 300,000 acre-feet. The Truckee River is approximately 120 miles long and has an average annual discharge of 600,000 acre-feet. These two rivers have a combined drainage area of approximately 3,450 square miles. Although relatively small these two rivers play an extremely important role in the economy and development of Western Nevada and to a somewhat lesser degree, Eastern California.
The two rivers have their origin at the crest of the Sierra Nevada Mountains in California. They wind their way down the eastern slopes of the Sierras and travel a short distance across the arid Nevada desert. The Truckee then ends in Pyramid Lake which has no outlet, while the Carson River ends in the Carson Sink area which also has no outlet. The water that reaches these two terminal points is evaporated to the atmosphere. The Truckee River also passes through Lake Tahoe on its way down the Sierras.
The natural flows in these two rivers is characterized by rather high flows during the spring snow melt period with little or no flow occurring in the late summer and early fall. Approximately 60 percent of the total runoff of these two rivers occurs in the three months of April, May, and June, while the three months of August, September and October account for only 10 percent of the total flow.
Settlement of Western Nevada by white men began in 1849 with the founding of Genoa, Nevada (also known as Mormon Station). With the discovery of gold in the mountains around this area in 1859, a mass influx of people occurred. For example, Virginia City which was the center of the gold mining activity grew to a population of 35,000 people by 1865. During this same time, farmers found their way to the lands along the Truckee and Carson rivers where they diverted small streams as well as the main rivers to irrigate their crops. Irrigation of the area where Reno, Nevada now sits started in 1858. By the turn of the century (1900) the farmers had claimed all of the natural flow of the rivers available in the late summer. From that time on, competition for the waters of these two rivers became a significant issue for the people of western Nevada.
DEVELOPMENT
As early as 1880 people recognized that the limited supply of water from these two streams must be managed to provide

Competing Demands for Water
a more reliable source of water and to meet a continued increase of demand from various sources. Studies were initiated to determine the best possible methods of increasing the availability of the water. The results of these early studies as well as many studies that followed through the years showed that storage of the short lived spring flows was needed to provide additional water supplies during the late summer months. These studies and the demand for a more stable supply of water resulted in the first dam being built on the Truckee River in the late 1800's. Surpdsingly though, the dam was not built to provide a supply for irrigation use but was built to provide a municipal supply for San Francisco. That scheme proved to be infeasible so the dam was then used to provide a stable water supply for electrical power production. The dam was built and owned at the outlet of Lake Tahoe by the Truckee River General Electric Company (now known as the Sierra Pacific Power Company). The dam provided a storage reservoir on top of the natural Lake Tahoe that captured the spring runoff and allowed controlled releases during the drier months. This dam and the storage it created have been a source of conflict among competitors for Truckee River water from the time it was constructed until the present. The original dam was rebuilt in 1913.
As studies continued, the potential use of the Carson and Truckee Rivers for water to irrigate large areas of the desert was recognized. In 1902 the Newlands Project near the present area of Fallon, Nevada, was authorized by the Secretary of Interior. The purpose of this project was to irrigate approximately 282,800 acres using water from both rivers. To accomplish this, several dams would have to be constructed as well as a transbasin canal to take water from the Truckee River to the Carson River. The plan was to use Carson River water and supplement it with water diverted from the Truckee River as needed. Work commenced on the project in 1903 and Derby Dam, which diverts water from the Truckee River into the Carson River via the Truckee Canal was completed. This was the first dam ever designed and constructed by the Reclamation Service, now known as the Bureau of Reclamation. Other features of the project were soon completed including the 315,000 acrefoot capacity Lahontan Dam, completed in 1915, and several smaller diversion dams on the Carson River.
15

16 USCID Regional Meetings -- 1989
EARLY CONFLI crs
As the construction was completed and irrigation commenced, it was apparent that the available water supply would not be sufficient to irrigate the planned 282,800 acres of desert land. Therefore, in 1926, the project was scaled back to 87,500 acres.
The development of this project also brought about the realization that the Lake Tahoe Dam, built for power production, must be controlled and operated to benefit the irrigators in the Newlands Project. This resulted in the first lawsuit between competing demands on the Truckee River. The U.S. Government filed suit to condemn the dam and surrounding land for operation and use by the Newlands Project. This suit was settled by a decree in 1915 wherein the Government was given an easement for the dam and surrounding land but had operating restrictions on the dam that protect the power production rights of Truckee River Genersl Electric Company.
The first court action on the Carson River was the Anderson-Bassman Decree of November 27, 1905 which adjudicated water rights on the west fork of the Carson River between certain users in California and users in Nevada. These two cases were the first of over 30 court cases (including appeals) that have been filed concerning disputes over the water in these two rivers.
Other dams have been built on streams that flow into the Truckee River in order to provide a more stable water supply for competing demands. Donner and Independence dams are owned by Sierra Pacific Power Company for municipal and industrial purposes in the Reno and Sparks area. The Truckee-Carson 1 rrigation District owns 1/2 of the water rights for Donner Lake but have not yet used that water for irrigation purposes. The water is generally leased to Sierra Pacific Power Company or released to the stream for general use by all water right holders. Boca Dam was constructed to provide municipal and industrial water to the Reno and Sparks area as well as supplemental irrigation water to the Truckee Meadows area which surrounds Reno and Sparks. Prosser Creek Dam was constructed to provide flood protection as well as accomplish an exchange of water with Lake Tahoe for the purpose of maintaining in-stream fishery enhancement flows in the Truckee River below Lake Tahoe Dam. Stampede Dam was constructed to provide flood control, fish and wildlife benefits, recreation, supplemental irrigation, and municipal and industrial water supply.

Competing Demands for Water
RECENT CONFLI cr S
The various lawsuits brought by the competitors for the water throughout the last eighty years has resulted in clarification of water rights and changes in operation of structures. However, the event that has probably created the most controversy and associated lawsuits, was the discovery of an endangered species of fish, the cui-ui, in Pyramid Lake. This discovery and subsequent designation by the U.S. Fish and Wildlife Service started a series of interrelated events that has cost millions of dollars and kept engineers, biologists, hydrologists, and lawyers busy ever since.
The cui-ui is the last remaining species of its kind and is found only in Pyramid Lake. These fish are river spawners and require significant flows of water in the Truckee River just upstream from Pyramid Lake to allow upstream migration, spawning, and downstream migration for continued survival. Attempts to propogate these fish through normal hatchery processes have been relatively unsuccessful. Fishery Biologists and others feel that the increased demand for Truckee River water for all purposes but particularly diversions for the Newlands Project have depleted flows in the lower Truckee River to the point that the cui-ui are unable to move from the lake into the stream to spawn. This reduced the number of cui-ui to the point that they were placed on the endangered species list. At the present time, the only known way to increase the spawning runs in an attempt to save these fish from extinction, is to provide more water in the lower Truckee River during the spawning season.
In order to provide more water for the cui-ui, the Secretary of Interior determined in 1973 that since the waters in the newly completed Stampede reservoir had not yet been committed by contract to the various users, the entire 226,000 acre-foot capacity of the reservoir would be made available for spawning runs of the cui-ui. The Secretary also determined in 1967 that the diversions to the Newlands Project must be reduced, thereby leaving additional water in the Truckee River. The reduced diversions would be compensated by increased efficiency of the distribution system and not by reducing the amount of water a water right holder was entitled to. To accomplish this increased efficiency, the Secretary issued Operating Criteria and Procedures (OCAP) to the Truckee Carson Irrigation District who operate the Newlands Project. These OCAP provide methods to be used in maximizing the use of the Carson River and reducing the diversions from
17
18 USCID Regional Meetings .. 1989
the Truckee River. These two decisions resulted in extensive court battles, some of which continue today.
This reduction of water diversion from the Truckee River to the Newlands Project has had a negative side effect. As mentioned earlier, the Carson River terminates in a wetland just downstream of the Newlands Project. When the waters of the Carson River were captured in Lahontan Reservoir for use on the Newlands Project, the wetlands became dependent almost entirely upon the drainwater and operational spills of the project. As the efficiency of the projects is increased, the wetlands receive less water and so begin to suffer. It is estimated by the Bureau of Reclamation that approximately 9,000 acres of wetlands will be destroyed when all aspects of OCAP are met. This action has caused great concern among fish and wildlife supporters and has also resulted in legal actions which are still pending.
The U.S. Fish and Wildlife Service, which operates in cooperation with the Nevada Department of Wildlife, the Stillwater Wildlife Management Area in these wetlands, is attempting to mitigate the loss of this drain and operational spill water by obtaining water rights for the wetlands. However, a court decree (the Alpine Decree) stated that the waters of the Carson River were fully appropriated. Therefore, the only way the FWS can obtain a water right for the wetlands is to purchase those rights from another user, such as agriculture.
Recently, another competing demand for water on these two rivers has arisen. That demand is for enough water to maintain minimum water quality standards. The cities of Reno and Sparks presently discharge their treated sewage into the Truckee Rivers. In the past, the river contained enough water to dilute the sewage so that minimum standards could be met. However, as diversions from the river increased through the years, there are times that there is not sufficient dilution water in the river. Therefore, the cities must construct treatment facilities to provide additional treatment for the sewage or find another manner of disposal. The cities are presently working with the Environmental Protection Agency and the U.S. Fish and Wildlife Service, as well as water users on the Truckee River to examine the feasibility of delivering the treated sewage to the Lahontan Valley wetlands. This proposal has several advantages. First, it allows the city to dispose of their sewage without additional treatment other than land application within the wetlands. The cost of delivering the sewage to the wetlands is

Competing Demands for Water
estimated to be less than the cost of constructing and operating additional treatment facilities. Second, the wetlands will benefit from the water delivered to them which is expected to be as much as 60,000 acre-feet per year. Third, the quality of water in the lower Truckee River will be significantly enhanced.
The major problem with this proposal is that a water supply must be found to replace the 60,000 acre-feet of water taken out of the Truckee River and delivered to the wetlands. Since there is no excess water in the system to replace this water, it must be obtained from other users or sources outside the basin.
The most obvious sources within the basin are agricultural users. Economically, water for use on agricultural lands cannot compete with water used for municipal and industrial purposes. Many farmers will find it more profitable to sell their water rights for municipal use rather than to raise crops.
Several sources from outside the basin have been or are presently being considered. These sources are generally ground water from nearby basins such as Dixie Valley east of Fallon, Nevada and the Honey Lake area north of Reno, Nevada. High costs of extracting and transporting the water has usually ruled these sources out. However, as the value of the water increases because of demand, these sources become more viable. Threat of damage to other existing rights by removal of water from a basin also creates problems with the concept of water exportation. These issues will continue to be worked on in an attempt to help resolve the water shortage problems within the Truckee River Basin.
Sierra Pacific Power Company provides most of the municipal and industrial water for the Reno and Sparks area. They are continuing to purchase water rights from other water users in order to keep pace with the continued increase in demand as the population grows. Their present demand is approximately 60,000 acre-feet and they expect a demand of 119,000 acre-feet by the year 2020.
CONCLUSION
All of these competing uses place a heavy demand on the waters of the Truckee and Carson Rivers. Individuals and entities that own water rights on these two rivers recognize that there are two ways an entity can increase
19

20 USCID Regional Meetings -- 1989
their available water supply. One way is through better management. This offers a very limited increase in supplies. The other is through the purchase of other users rights. Since the demand will continue to increase, water users are even more concerned about the security of their rights. They fear that if their right is not protected in some manner then it may be taken from them for some other use. This problem is becoming a new and critical issue on both rivers. As an example, the Nevada Legislature recently passed a law which created a nine member board water sub-conservancy district for protecting and managing the water rights on the Carson River between the California-Nevada border and Lahontan Reservoir. Many attempts have been made over the years to reach agreements on the rivers among the various water users. Some agreements have been established through the courts and others through negotiations, but an overall agreement has never been reached. In the last few years an attempt has been made by most major parties involved to reach a negotiated settlement. This settlement would include an allocation agreement between California and Nevada for the water supply of these two rivers as well as how the allocated supplies would be used. However, because of the diverse interests of the users, no agreement has been reached, leaving the many problems to be solved.
The competition for water among the various users will continue to cause disagreements and conflicts unless a complete settlement can be reached that includes all users.

A STOCHASTIC PROGRAMMING MODEL OF SAliNITY IN mE COLORADO RIVER BASIN
Donna J. Lee· Richard E. Howitt"
ABSTRACI'
Along the Colorado River, naturally occurring salts underlie basin soils. Irrigation water leaches salt from the soil and return flows transport the salt to the river. As a result of salinity, downstream agricultural, municipal, and industrial uses suffer millions of dollars in damages each year. Weather variability can induce large swings in river flow volume, and hence river salinity. During periods of drought, problems due to salinity are worst. Currently, water quality policy decisions are based on average river flows. As a result, river water quality may exceed federal salinity standards during low flow years. This research details an approach for selecting mitigation alternatives to meet or exceed water quality standards under variable river flow conditions. Decisions are based on the value of clean water to downstream agriculture, the cost of mitigation, the variability of river flows, and the risk criteria of policy makers. Regions included in the model are the Grand Valley and Lower Gunnison Basin in Colorado, the Uinta Basin and the Price and San Rafael Regions in Utah, and the Imperial Valley in California.
INTRODUCTION
Prehistoric seas once covered the area comprising the Colorado River Basin. Although the sea has long since resided, vast salt deposits
• Assistant ProCessor, Dept. of Agricultural and Resoun:e Economics, University of Hawaii, Honolulu.
* ·Professor, Dept. of Agricultural Economics, University of California, Davis.
21

22 USCID Regional Meetings •• 1989
remain beneath basin soils. Shale deposits four to five thousand feet thick underlie soils in the Grand Valley. The salinity of water diverted from the upper reaches of the basin average 300 mg/I. Return flow salinity can exceed 20,000 mg/I. The Colorado River Basin drains over 242,000 square miles of land. From off-farm canals and laterals, and from on-farm ditches and irrigated fields, millions of tons of salt from agricultural irrigation are loaded into the Colorado River each year. Because river water is diverted and used many times, it becomes progressively more saline as it moves downstream.
High costs inhibit upstream farmers from reducing salt loads voluntarily. Transactions costs impede opportunities for arbitrage. As a result, salinity affects 63% of the irrigated acreage in the Lower Basin. Because rights to water quality are not clearly defined, downstream recipients have no recourse. Along the Colorado River, salinity is the most important water quality problem.
Previous Work
Predictions by the Bureau of Reclamation of rising salinity through 2010, motivated several economic studies. Moore et al. [1974] simulated Imperial farm production with linear programming and estimated farm losses for salinity levels between 480 and 1920 mg/I. Kleinman and Brown [1980] sought damages to agricultural, municipal and industrial uses for salinity levels up to 1400 mg/I. Gardner [1983] compared the Upper Basin cost of input taxes, discharge penalties, cost share options, and land removal to Imperial Valley production losses for salinity levels between 800 and 1100 mg/I.
Recently, however, the Bureau has revised salinity estimates downward. Based on projected agricultural expansion, water development, and weather patterns, the Bureau predicted in 1985 that Imperial Dam salinity levels would be 1012 mg/l by 2010. In 1989 the Bureau's estimate for year 2010 was 970 mg/I.3 The federally mandated water quality standard at Imperial Dam is 879 mg/I.
Previous studies have estimated the losses to downstream uses that would result from a rise in salinity to Bureau predicted levels under
3palling estimates can, in part, be attributed to construction or three Buteau wattr quality impJ"OYement projects. Together, these projects reduce annual Upper Basin salt loading by about 88,800 tons.

Salinity in the Colorado River Basin 23
static flow assumptions. These studies compared the losses to the cost of avoidance. This study examines the influence of Upper Basin agricultural activities and stochastic river flows on Lower Basin river water quality. The model developed provides an analytical framework for assessing existing water quality standards, for evaluating proposed mitigation alternatives, and for analyzing theoretical risk criteria.
MODEL DEVEWPMENT
The basin model contains three major components. A salt load component, a hydrology component, and an agricultural production component. Upper Basin salt loads are modelled as functions of water use, acreage planted, and investment in irrigation capital. An equation of motion relates Upper Basin salt loads and river flow volume with downstream water salinity. Regional agriculture is modelled as a function of land, capital, water, and water salinity. A stochastic programming problem comprises these models and in a series of equations that represent the hydrology, the agronomics, and the economics of irrigated river basin agriculture.
Modelling Agricultural Salt Load
The primary sources of agriculturally induced salt loads are runoff, field deep percolation, on-farm and off-farm ditches and laterals, and off-farm canals. Federal projects proposed under the Colorado River Basin Salinity Control Act will reduce return flows from these salt sources. Installation of water measuring devices, pipe laterals, and canal lining are examples of the type of projects under consideration. The high capital investment costs and the long term nature of some of the federal projects warrants consideration of alternative, less capital intensive options. Thus, reducing upstream water use, switching to less water intensive crops, and removing land from irrigated production are included in the model as alternative means of improving downstream water quality.
Return flow: Because ground aquifer volumes are large compared to irrigation return flow volume, return flow salinities (ecst) can be assumed constant with respect to both return flow volume (RF st) and irrigation water salinity (ECst). Salinity of runoff water is assumed

24 USCID Regional Meetings -- 1989
equal to the salinity of the water diverted for irrigation, so the net load from runoff is zero.
Upper Basin irrigation practices are assumed to follow those required for long term production. Soils are leached and root zone salinity is in balance with irrigation water salinity. Return flows from fields are proportional to the volume of water applied (Wit) up to the amount that maximizes consumptive use. The leached fraction and the water applied in excess of maximum consumptive use deep percolates. Thus, return flows from fields are linear in acreage planted (Lit) and nonlinear in water applied. Land levelling and water measuring devices can reduce salt load from irrigated fields by improving water application uniformity and water use efficiency (Zit).
Through dirt ditches, unlined laterals, and leaky canals, water in transport percolates through the soil and carries salt to the river. Return flow from laterals and ditches are linear in acreage planted and independent of water applied. Laterals and ditches can be lined, head and tailwater ditch structures can be constructed, and pipe laterals (Z,t) can be installed to conserve water and reduce return flows. Return flow from canals are independent of applied water and planted acreage.
Salt load: Let j represent the set [field, ditch, lateral, canal]. Salt load flux is
Salt load flux is function of return flow salinity, previous year return flow, water use, irrigated acreage, and investment in salt load reduction capital.
Model\jDI: Stochastic Riyer Flows
Gunnison River flow past the Grand Valley and Colorado River flow below the Imperial Dam fluctuates with annual deviations in mean precipitation (and evaporation). Though annual precipitation is an 'independent, random event, river water and salt can be retained in the system for many years in large basin reservoirs. Thus, annual river flows are dependent on the level of precipitation in the current
Salinity in the Colorado River Basin
year and on the level of precipitation in past years. River operation requirements to meet multiple basin uses place lower bounds on and skew the distribution of expected river flows at Grand Junction and below Imperial Dam. For these two particular locations, water quality policy analysis requires estimates of three river flow parameters; the mean (~1)' variance (~2)' and degree of skewness (~3)' The variance and degree of skewness parameters provide additional information regarding the range of possible flows and the probability of a severe drought.
Modelling Surface Water Quality
25
A reduction in upstream salt load or a rise in river flow volume will improve downstream water quality. Quantifying the level of improvement is requisite to water quality policy analysis. Existing computer models of Colorado River Basin hydrology (i.e. Udis et al., 1973; and the Bureau's Colorado River Simulation System, 1987) rely on large databases and numerous equations to simulate a wide range of hydrologic scenarios. Incorporating disaggregate hydrologic interactions into a multiregional optimization framework is inherently difficult. Thus, in a previous economic study [Gardner, 1983] river flows were assumed static and the effects of salt load on downstream salinity were approximated with simple conversion ratios: Modelling river flows as static precludes water conservation as a mitigation alternative. Conservation as a means of improving water quality had been considered by Scherer [1977] who modelled a hypothetical stream system in which stream flow could be transferred downstream to dilute salty irrigation water. Flows were assumed to be deterministic. Modelling river flows as deterministic, however, neglects the losses incurred during periods of drought. This section develops a model in which downstream water salinity is stochastic in upstream water use and upstream salt loading.
Stochastic Mass Transport Model: Where TGt is the flow of salt in the river past location G at time t and V Gt is the volume of river
4 Assuming mean river flows below Imperial Dam of eight million aCle-feet per year, a 10,000 ton salt load reduction will lower Imperial Valley water salinity by 1.01 mg/!.

26 USCID Regional Meetings -- 1989
flow past location G at time t, the change in the concentration of salts in the river at location G in time t (dECot) can be expressed
(2)
Let WD,t represent the volume of water diverted from the river upstream of G at location g. Salt load flux at G is expressed
dTGt = dT(TG.t-1, dV,t, dWD,t, dS,t, EC,. t-l' dEC,t> (3)
Let dWGt measure the deviation from mean precipitation. The fluctuation in river flow volume at G is modelled
Application to the Colorado River Basin: Hydraulically, the Lower Gunnison Basin, the Grand Valley, and the Imperial Valley are in series. The Grand Valley, the Uinta Basin, the Price River Basin, and the San Rafael River Basins are parallel to each other and are in series with the Imperial Valley.
Substitute Eqs. (3) and (4) into Eq. (2). Equation (5) models the hydrologic link between water use and salt loading at the Lower Gunnison River Basin (gO) and river salinity at Grand Valley (gl). The subscript f denotes the time that it takes salts to travel the Lower Gunnison River from the Lower Gunnison Basin to the Grand Valley. Salinity flux at the Grand Valley is
dECg1 .t = dEC(EC,l,t_lr V,l,t-lr dV,o,t-rr dWDgo,t-rr dRF,O,t-" ECgO,t-l-rr dEC.o,t-rr ecgO ' dW,l,t) (5)
Salinity flux below the Imperial Dam is modelled as a function of the changes in water use and salt loading from the Lower Gunnison Basin (gO), Grand Valley (gl), Uinta Basin (g2), Price River Basin (g3), and San Rafael River Basin (g4). To reduce notation, bolded variables are 5xl vectors. The vector elements represent the variable values for all five of the Upper Basin regions. For example, dV t.' =
[dV,o,t dV,l,t dV,2,t dV,3,t dV,4,t). The subscript f denotes the

Salinity in the Colorado River Basin 27
time required for salts to travel between the Upper Basin regions and the Imperial Dam. Equation (6) links Imperial Dam (G) salinity with water use and salt loading from the five Upper Basin regio~.
Equations (5) and (6) model the physical links between the spatially separated producing regions. More explicit detail of hydrology model appears in Lee, et al. [1989].
Modellinl: Regional Production
Salt from irrigation water raises the soil osmotic potential. As salinity levels rise, the rate of evapotranspiration falls off and plant growth diminishes. Plants under severe osmotic stress are often stunted and appear to suffer from drought. Salt sensitivity, as measured by yield decline, varies widely across crops and growing conditions. Cotton and barley are naturally tolerant to salinity. Alfalfa by comparison is salt sensitive.
Salinity of Grand Valley irrigation water averages 500 mg/l. Leaching prevents salts from accumulating in the soil. Water from the Imperial Dam arriving at the Imperial Valley averages 756 mg/l. Tiles drain over 90% of the irrigated acreage in the Imperial Valley. Because, abundant irrigation water and good drainage typifies production in both areas, root zone salinity is assumed in balance with irrigation water salinity.
To model the relationship between river salinity and irrigated agriculture, regional production is expressed as a function of water quality. Let Vat denote the production vector of crops grown in region g at time t. Inputs to production are land (Lat), capital (Kat), and irrigation water (Wat). Regional production as a function traditional inputs and irrigation water salinity is
(7)

28 USCID Regional Meetings -- 1989
Model Objectiye
The program chooses factor inputs, X; = [Lst Kgt Wst1 and salt load reduction capital, Zst> to maximize returns to basin agriculture. Agricultural production (f), regional resource constraints (h), irrigation water quality (v), and water quality criteria (q) restrict the solution.
Choose Xst Zst to Max I:s Ps'Y s - Cxa'Xs - czs'Zs for g = gO •.. g4, G Subject to
f(Xst> Zst) = Y s for g = gO, g2, g3, g4 f(Xst, Zst, ECst . f(Xso) . .f(Xs4» = Ys for g= gl, G h(X, Z) ~ 0 v(X, Z) ~ 0 q(X, Z) ~ 0 (8)
EMPIRICAL APPROACH
Because of the long retention time of water and salts in the river, decisions to reduce upstream salt loads must be made well before actual flow levels are realized. Mitigation alternatives to control water quality can be undertaken to meet water quality standards, but because river flows are stochastic, water quality standards can be met only in probability. All decisions regarding water quality therefore assume a level of risk (a). The realized level of water quality ECt will meet water quality standard EC· lOO(1-a)% of the time. In other words, river water salinity will exceed the standard lOOa% of the time.
Pr{ EC· ~ ECt } ~ l-a (9)
If the desired level of water quality is very high (small EC·) or if the selected level of risk is very low, then meeting the objectives will cost more than less stringent standards. Model simulations provide information regarding the costs and expected benefits of various policy criteria under different river flow scenarios. Five model scenarios for salinity at Imperial Dam are described below.
I l \
Salinity in the Colorado River Basin
Baseline: The baseline model simulates agriculture and river flows for the scenario in which no additional water quality improvement is undertaken. Under various low flow conditions, the baseline model will provide the worst case scenario (in terms of water qUality).
29
Modell: This model chooses the least cost mitigation alternatives to meet the mandated 879 mg/l standard at Imperial Dam 90% of the time. (EC·=879, a=.10).
Model 2: Model 2 minimizes the cost of meeting federal water quality standards 95% of the time. Under this scenario, standards will be exceeded only once every 20 years. (EC· = 879, a = .05).
Model 3: This model relaxes the risk criteria and chooses the least cost mitigation alternatives necessary to meet the 879 mg/l standard at Imperial Dam 75% of the time. (EC·=879, a=.25).
Model 4: Model 4 solves for the level of water quality that maximizes expected net returns to basin water uses.
DISCUSSION
The baseline model presents the worst case scenario for water salinity during drought years. It also provides a lower bound for net economic returns to basin agriculture. For example, an overly stringent water quality policy could lower net economic returns to agriculture. A policy of this sort would improve lower basin agriculture productivity at a cost greater than is warranted by the downstream benefits.
From a legislative standpoint, meeting legal water quality standards with a high degree of probability is desirable. Results from Models 1 through 3 can indicate whether the expense is warranted by providing information about the marginal cost of risk aversion.
Results from Model 4 provide an additional measure of comparison regarding the economic efficiency of existing water quality standards. If existing water q~ality standards are too stringent, Model 4 will prescribe a lower standard (higher Ee·) which is equivalent to

30 USCID Regional Meetings -- 1989
recommending a lower rate of compliance. If net economic gains are available from a higher standard of water quality, then Model 4 will suggest a lower EC*, which is essentially the same as increasing the frequency of compliance.
In the Colorado River Basin. river salinity is worst during periods of drought. Water quality policy decisions are currently based on mean river flows. As a result, salinity levels will on the average be in compliance with existing water quality standards. In a given year, however, actual river salinity may exceed the legal standard. Consequently, failure of compliance may occur more frequently than is tolerable. This research provides the framework for evaluating water quality policy. Within the model, politically acceptable compliance rates can be specified directly. The model then solves for the required level of mitigation. In addition, the model can provide policy makers with economic information for selecting water quality criteria and the level of mitigation necessary for meeting those standards.
REFERENCES
1. Bernstein, Leon. 1981. "Effects of Salinity and Soil Water Regime on Crop Yields." Salinity in Irrigation and Water Resources. Dan Yaron ed. Hebrew Univ.
2. Bliesner, Ron D., RJ. Hanks, LG. King, L.S. Willardson. 1977. "Effects of Irrigation Management on the Quality of Irrigation Return Flows in Ashley Valley." Soil Sci. Soc. Am J. Division S-6-Soil and Water Management and Conservation. 41:424-428.
3. Bresler, E. B.L McNeal, and D.L Carter. 1982. Saline and Sodic Soils. No. 10.
4. EI-Ashry, Mohamed, Jan van Schilfgaarde, and Susan Schiffman. 1985. "Salinity Pollution from Irrigated Agriculture." J. of Soil and Water Conservation. 40(1):48-52.
5. Gardner, Richard L 1983. "Economics and Cost Sharing of Salinity Control in the Colorado River Basin." Ph.D. Dissertation. Colorado State Univ., Fort Collins.
6. Kleinman, Alan P. and Bruce Brown. 1980. "Colorado River Salinity Economic Impacts on Agricultural, Municipal, and

Salinity in the Colorado River Basin
Industrial Users." Colorado River Water Quality Office, Engineering and Research Center, DOl. Denver, CO.
31
7. Law, James P., Jr. and Arthur Hornsby. 1982. "The Colorado River Salinity Problem." Water Supply and Management. 6(1/2):87-103.
8. Lee, Donna J. 1989. "Salinity in the Colorado River Basin: A Dynamic Modelling Approach to Policy Analysis." Ph.D. Dissertation. University of California, Davis.
9. Lee, Donna J., Richard E. Howitt, and Miguel A Marino. 1989. "A Stochastic Model of River Water Quality: Application to Salinity in the Colorado River Basin." Working Paper. Dept. of Agricultural and Resource Economics. University of Hawaii.
10. Loucks, Daniel P., Jerry R. Stedinger, and Douglas A Haith. 1981. Water Resource Systems Planning and Analysis. Prentice-Hal~ Inc.
11. Moore, C.V., J.H. Snyder, and Peter Sun. 1974. "Effects of Colorado River Quality and Supply on Irrigated Agriculture." Water Resources Research. 10(2):137-144.
12. Riley, J. Paul and Jerome J. Jurinak. 1979. "Irrigation Management for River Salinity Control." 1. Irrigation and Drainage Management Division. Proceedings of the American Society of Civil Engineers. Vol. 105 IR4.
13. Scherer, Charles R. 1977. "Water Allocation and Pricing for Control of Irrigation Related Salinity." Water Resources Research. 13(2):225-238.
14. Udis, B.C., C.W. Howe, and J.F. Kreider. 1973. "Chapter 8 -Description of Salient Hydrologic and Salinity Features of the Upper Main Stem." The Inte"elationship of Economic Development and Environmental Quality in the Upper Colorado River Basin.' An Interindustry Analysis. Report to the U.S. Economic Development Administration. Com-73-11970. pp 109-196.
15. U.S. Department of Interior. Bureau of Reclamation. 1987. 'The Colorado River Simulation System - An Executive Summary." by Ronald J. Schuster.
16. U.S. Department of Interior. 1989. "Quality of Water in the Colorado River Basin." Progress Report No. 14.

I i

CHANGE IN NATURE OF USE FROM IRRIGATION TO MUNICIPAL
CASE HISTORIES IN THE BOISE RIVER BASIN
David R. Tuthill Jr., P.E. 1
ABSTRACT
The Boise River Drainage Basin in Southwestern Idaho is the site of increasing urbanization. A municipal water supplier is presently purchasing irrigation water rights to be used for municipal purposes. This paper identifies the methods of analysis used to determine the amount of water eligible for reallocation to municipal use when a specific irrigation water right is transferred. Consumptive irrigation requirements are computed and compared with river flow records to determine historic beneficial use. Three case studies represent a variety of water right situations ranging from simple to complex. These case studies represent transactions conducted in 1988 and 1989, thus current Idaho water right considerations and interpretations are demonstrated.
INTRODUCTION
Waterusers in Idaho have had the capability to change the points of diversion and places O2 use of their water rights since the last century. However, the potential to change the na3ure of use has been available only since 1981. Since then, the Idaho Department of water Resources (IDWR) has developed an administrative procedu~e to evaluate proposed changes in nature of use. This paper describes the application of quantification methodologies to three situations of transfer from irrigation use to municipal use that have occurred in the Boise River Basin.
Case I depicts the general situation, where a specific water right is transferred from an irrigation canal to a municipal diversion. Case II incorporates the differences in analysis relating to quantification of water available for transfer when water rights are
1. Manager, western Regional Office, Idaho Department of water Resources.
2. Idaho Code 542-108. 3. Idaho Code 542-222 (amended 1981 Sess. Laws,
ch. 147, 53, p.253). 4. Administrator's Memorandum, "Sample Calculations
for Change in Nature of Use," September 24, 1982.
33
34 USCID Regional Meetings -- 1989
removed from multiple small tracts. Case III describes a situation where an irrigation company opted to transfer its most senior water rights to junior lands, with the intent of marketing the junior water rights.
GENERAL SITUATION
Boise River
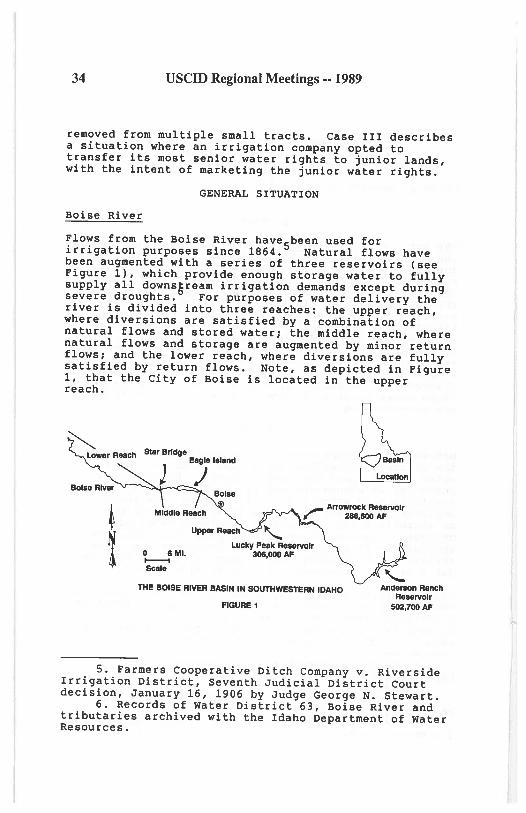
Flows from the Boise River haveSbeen used for irrigation purposes since 1864. Natural flows have been augmented with a series of three reservoirs (see Figure 1), which provide enough storage water to fully supply all downs~ream irrigation demands except during severe droughts. For purposes of water delivery the river is divided into three reaches: the upper reach, where diversions are satisfied by a combination of natural flows and stored water; the middle reach, where natural flows and storage are augmented by minor return flows; and the lower reach, where diversions are fully satisfied by return flows. Note, as depicted in Figure 1, that the City of Boise is located in the upper reach.
~ h Star Bridge
Lower Reae Eagle 1.land
o 8MI. 1------1 Scale
)
THE BOISE RIVER BASIN IN SOUTHWESTERN IDAHO
FIGURE 1
AndenIon Ranch Reservoir
502,700AF
5. Farmers Cooperative Ditch Company v. Riverside Irrigation District, Seventh Judicial District Court decision, January 16, 1906 by Judge George N. Stewart.
6. Records of water District 63, Boise River and tributaries archived with the Idaho Department of Water Resources.

Change in Use •• Boise River Basin 35
Most of the City of Boise municipal supply is provided by deep wells located throughout the city. However, there are four locations where river water is diverted to augment the municipal supply, via Ranney Collectors. Each of these devices consists of a vertical caisson located adjacent to the river, with horizontal screened laterals which project from the bottom of the caisson toward the river. The devices, in effect, utilize the bed of the river as a sand and gravel filter for drawing water from both the river and from the underlying groundwater aquifer. During some months there is natural flow in the river which satisfies the 15.0 cubic feet per second (cfs) water right associated with the collectors. However, when natural flow is not available for junior priority water rights, augmentation water is needed to furnish this flow. storage water is available for purchase from the United States Bureau of Reclamation, but the municipal supplier has sought a less costly means to supply these flows.
Laws and Policies Regarding water Right Transfers
The Idaho Code requires that the Director of the IDWR shall approve a transfer of a water right only if (1) no other water rights would be injured, (2) the change does not constitute an enlargement of the original right, (3) the change is in the local public interest, defined as the affairs of the people in the area directly affected by the proposed use, and (4) a change in the nature of use from agricultural use woulq not change the agricultural base of the local area. In addition, there is a requirement that if a water right is not applied to a beneficial use for a period of fige (5) consecutive years it shall be lost and forfeited.
With respect to injury to other water rights, the IDWR considers third-party effects due to (a) change in season, (b) stream conveyance losses, (c) changes in patterns of water rights on a s~ream, (d) temporary storage, and (e) water quality. In the situations described below these effects are negligible because a change in season was not proposed, the points of diversion, places of use and locations of return flow are all in the upper reach of the Boise River, and the
7. Idaho Code, §42-222 (Supp. 1989). 8. Ibid. 9. See discussion in George A. Gould, "Water
Rights Transfers and Third-Party Effects," Land and water Review, Vol. 23, No.1, 1988, pp 1-41.

36 USCID Regional Meetings -- 1989
water quality is not significantly impaired.
with respect to potential enlargement of the water right, the IOWR considers each water right in the state to be quantified by (1) the rate of flow, (2) the total volume of water diveloed, and (3) the volume of water consumed by the use. Thus, to ensure that there is no enlargement as a result of a proposed transfer, none of the parameters are allowed to be increased. The change in nature of use from irrigation to municipal use in the Boise City area constitutes a change fr£f a higher consumptive use to a lower consumptive use. Therefore, volume consumed is not a controlling parameter in this type of transfer and does not need to be considered further in this analysis.
SPECIFIC SITUATIONS
Case I -- Transfer of an Individual water Right
In Case I, IOWR received a proposal for a change in nature of use for a portion of irrigation water right no. 63-01690 diverted via the Thurman Mill Ditch (See Figure 2), to be changed to a municipal water right supplied via the Ranney Collectors. IOWR's evaluation of the proposal included the following sequence of events.
The first step was to determine the number of acres from which the water was eligible to be transferred. To be eligible for transfer, all water rights must12e removed from the land as a result of the transfer. IOWR verified the irrigation history of the acreage identified in the transfer, ensuring use within the past 5 (five) years, by using microfiche prints of 1:120,000 scale infrared photographs taken from U-2 aircraft.
10. Administrator's Memorandum, op cit. 11. In the Boise City area there are currently
few consumptive industrial uses, and most municipal uses other than lawn watering are essentially non-consumptive.
12. It is generally not acceptable to transfer a primary water right from a parcel of land, leaving supplemental water rights to continue to irrigate the land. This is generally considered to be an enlargement of the water right.

Change in Use -- Boise River Basin
o 1 MI. I-----i S.,.,.
3 Ranney CoHectora
SELECTED CANALS IN THE CITY OF BOISE AREA
FIGURE 2
37
The second step was the determination of ownership of the water right. In Case I, the water right was originally decreed to a specific individual, but the delivery has historically been made by a ditch company. In this situation, approval for the transfer was required from both the land owner and the ditch company. Approval from the land owner was complicated since the land had been subdivided and many of the lots had been sold prior to the filing of the transfer application. IOWR required approval signatures by more than half of the land owners, and by the homeowners' association.
The third step was the determination of the amount of water eligible for transfer. The rate of flow was the rate decreed for the land from which the water was to be removed, which was 0.814 cfs for the irrigation of 37 acres. The determination of the volume diverted was based on the relationship of two parameters, the amount of water needed by the crop, and the availability of water to satisfy the need. These parameters were computed as follows.

38 USCID Regional Meetings -- 1989
requirement is based on the watering of alfalfa, which is the hig~3st water requirement crop in most areas of the state. In the Caldwell Climatic Area (within which Boise is located), the mean annual irrigation requiremi~t for irrigation is 3.08 acre feet per acre (af/ac). Allowing a typical irrigation efficiency of 60 percent, the annual irrigation requirement at the field headgate was computed to be 5.13 af/ac.
In addition to the amount of water required at the field headgate, the water right holder is entitled to a reasonable conveyance loss from the point of diversion at the source, through the ditch, to the field headgate. Field measurements of such losses are not commonly available, and the IDWR typically uses a computed value to assess the magnitude of loss. Based on investigations of various methods for computing ditch loss, IDWR has developed a computer adaptation of the Moritz formula, in which ditch loss is estimated as a function of rate of flow delivered, length of the ditch from the point of diversion to the delivery section, length of ditch within the delivery section, and soil type within the ditch. For Case I, ditch loss above this field headgate was computed to be about 24 percent. Adding this ditch loss to the field headgate volume yielded an annual diversion requirement of 6.36 af/ac (or 235 af for 37 acres). This diversion requirement is less than the 345 af that would be diverted at a continuous flow throughout the irrigation season of 0.814 cfs. Thus, if unlimited flow were available to satisfy this water right, the volume eligible to be transferred would be 235 af.
Historical Diversion: This technique for determining volumetric requirements is based on recorded historical diversions into the Thurman Mill ditch. A 76 year record of flow gage data on the Boise River was used to determine that water year 1980 was close to average (within 3 percent). Based on water district records, during 1980 the Thurman Mill ditch diverted an average of 28.5 cfslguring the period from April 18 through October 11. water district records are not
13. Administrator's Memorandum, op cit. 14. Richard Allen and Charles E. Brockway,
"Estimating Consumptive Irrigation Requirements for Crops in Idaho," Research Tech. Completion Report, Idaho water Research Inst., Moscow, Id. App. E, August, 1983.
15. David R. Tuthill, Jr., "Computation of AcreFeet Allowed to be Transferred for water Right No. 63-0169F," January 29, 1988.
16. Records of water District 63, op cit.
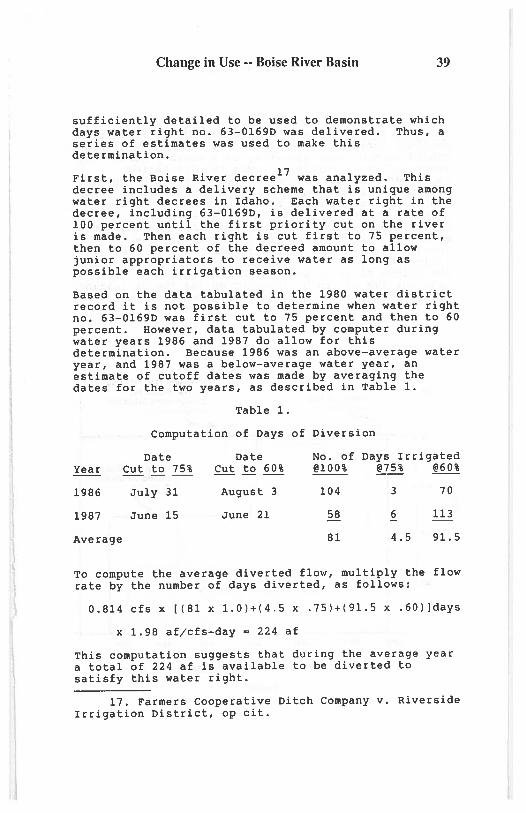
Change in Use -- Boise River Basin 39
sufficiently detailed to be used to demonstrate which days water right no. 63-01690 was delivered. Thus, a series of estimates was used to make this determination.
First, the Boise River decree17 was analyzed. This decree includes a delivery scheme that is unique among water right decrees in Idaho. Each water right in the decree, including 63-01690, is delivered at a rate of 100 percent until the first priority cut on the river is made. Then each right is cut first to 75 percent, then to 60 percent of the decreed amount to allow junior appropriators to receive water as long as possible each irrigation season.
Based on the data tabulated in the 1980 water district record it is not possible to determine when water right no. 63-01690 was first cut to 75 percent and then to 60 percent. However, data tabulated by computer during water years 1986 and 1987 do allow for this determination. Because 1986 was an above-average water year, and 1987 was a below-average water year, an estimate of cutoff dates was made by averaging the dates for the two years, as described in Table 1.
Table 1.
computation of Days of Diversion
Date Date No. of Days Irrigated Year Cut to 75% Cut to 60% @100% @75% @60% ----- -----1986 July 31 August 3 104 3 70
1987 June 15 June 21 58 6 113
Average 81 4.5 91.5
To compute the average diverted flow, multiply the flow rate by the number of days diverted, as follows:
0.814 cfs x [(81 x 1 . 0)+(4.5 x .75)+(91.5 x .60)]days
x 1.98 af/cfs-day = 224 af
This computation suggests that during the average year a total of 224 af is available to be diverted to satisfy this water right.
17. Farmers Cooperative Ditch Company v. Riverside Irrigation District, op cit.

40 USCID Regional Meetings -- 1989
Combined Method: Based on a review of the two methods outlined above, the IOWR Hydrology Section developed a hybrid method which examines, on a monthly basis, the amount of water available under the irrigation requirement method in combination with the historical diversion method. For each month the lesser of these two values is selected, because the amount of water eligible for transfer should not exceed either the volume required or the volume available for any given month. Values are depicted in Figure 3. The cumulative amount of water available for an average irrigation season was computed to be 199 af . Thus, the volume of water authorized for transfer in this case was 199 af, to be diverted during the irrigation season at a rate of flow not to exceed 0.814 cfs.
1.0
0.8
0.0
0.4
0.2
MAXIMUM RATE 0.814 c:fs
r
diversion rate required at river baaed on consumptive '"'gatlon requirements
r----.~
----------------historical diversion
'-----, baaed on deer .. %7J -------,
I I I
, .:/.:~ ." r:: . . '~.~.~:I ... ,::. :: ".:/. >'., .. >:, ~ : : .. :,~:.~' ::, I
[{~:!c~:~F2f2?m~~?f' ... >-;:,:..t]t---+ • r 'o" , ~
APR MAY JUN JUl AUG SEP OCT
DIVERSION RATeS FOR 37 ACRES ON THURMAN MILL CANAL
FIGURE 3

Change in Use -- Boise River Basin
Case II -- Transfer From Multiple Parcels Within a Canal Company
41
In Case II, IDWR received a proposal from the Boise City Canal Company for a change in nature of use for 65 land parcels of varying sizes that had historically been irrigated by the company under decreed water right no. 63-00l65J. Due to urbanization the parcel owners had returned their shares to the company.
In this case as well, the first step was to determine the number of acres from which the water was eligible to be transferred. The acres were identified by the company via copies of parcel locations, and the sizes of the parcels were computed. Field investigations were conducted at 13 randomly selected sites, and in each case the examiner assessed the amount of land at the site that appeared to have been irrigated within the past five (5) years. Based on this survey the average parcel irrigation was computed to have been 65 percent of the parcel size. The total area of the 65 parcels was about 39.6 acres, 65 percent of which yields an estimated 24 acres from which water was eligible to be removed.
The second step was to determine ownership of the water right. In this case copies of the signed relinquishments of shares, in conjunction with the application submitted by the company, provided sufficient ownership information.
The determination of the volume of water available for transfer under this water right was analogous to that determined for Case I. In this case an additional analysis was conducted regarding the effect of soil moisture holding capacity (SMHC). Based on information provided by the U.S. Soil Conservation Service, for the types of soil found in the place of use, the SMHC is considered to vary from about 1.5 inches for home lawns to about 3.9 inches for pasture. Assuming that about half of the 24 acres is the former and half is the latter, the resulting average would be about 2.7 inches per acre or a total of 5.4 acre-feet.
If there were no storage available as a supplemental supply for this decreed water right, a portion of the 5.4 acre-feet would be added to the computed volume of water available to be transferred under this water right, because the soil moisture would be at least partially depleted by the vegetative cover during water-short months and would be replaced during water-abundant months. However in this case the canal

42 USCID Regional Meetings -- 1989
company has storage water rights so that when the direct flow water right is cut the storage water right continues to provide an ample water supply. Therefore, the SMHC has not been historically utilized, and soil moisture considerations do not increase the amount of water available for transfer.
Case III -- Redistribution of Places of Use
Presently the IOWR is receiving claims to water rights as part of the general adjudication of the waters of the Snake River Basin and tributaries. Accordingly, some water delivery organizations are updating water right records. In Case III, the South Boise Mutual Irrigation Company, Ltd. has applied for a transfer which proposes to move most of the water rights in the company.
The Company delivers water via the Bubb Canal to essentially two areas, which for the purpose of this discussion will be termed Area A and Area B. Area A is near the river and has traditionally been the site of large irrigated tracts of pasture. Area B is away from the river, and consists of small irrigated tracts in an urban environment.
During the past five years Area A has experienced rapid urbanization. The housing developments that have been placed on the irrigated land have not installed systems to utilize the irrigation water, so the water rights on these lands will be lost due to forfeiture if the water rights are not transferred. Area B, on the other hand, has experienced only minor reductions in irrigated acreage during recent years. Company officers envision continued use of the existing irrigation system on most of these lands.
The proposal submitted by the Company is to move the water rights from Area A, where the senior water rights are located, to the lands in Area B, and vice versa. The proposal envisions and describes the subsequent marketing of the resulting junior water rights on Land A to the municipal water supply company, to be conducted as phase two of the transfer.
IOWR personnel assisted the Company officers in the preparation of the Application for Transfer which describes the first phase of this proposal. The application describes the proposed disposition of all eight water rights, totaling 10.84 cfs, which the Company officers contend are presently valid. The application has been advertised and is presently
Change in Use -- Boise River Basin 43
awaiting the consent of all land owners from whom water is proposed to be removed. Upon submittal of this information, phase one can be completed and phase two can be initiated. The amount of water eligible for transfer will be computed in a manner analogous to that used for Cases I and II.
SUMMARY
During the eight years that have passed since the addition of the change in nature of use capability to the Idaho water transfer statute, use of the capability has been infrequent. However, IOWR is presently experiencing increasing interest in this capability, and the proposals for use of the statute are becoming increasingly complex. Idaho is a western state that has ma~K transfer statute similarities with neighboring states , and it is desirable that interpretations regarding acceptable transfers of water rights be relatively consistent throughout the West. By encouraging orderly and consistent changes of water rights via timely and current state processes, water administrators can make improvements to the existing water allocation systems which will allow water use to be enhanced.
18. Bonnie G. Colby, Mark A. McGinnis, Ken A. Rait, Richard W. Wahl, "Transferring Water Rights in the Western States -- A Comarison of Policies and Procedures", Natural Resources Law Center, Univ. of Colo. School of Law, 1989.

I I , I I I
l I I
I , ,

A MANAGEMENT IMPROVEMENT PROCESS TO EFFECTIVELY CHANGE IRRIGATED AGRICULTURE
A. R. Dedrickl Wayne Clyma2
J. D. Palmer3
ABSTRACT
A management improvement program to improve the performance of irrigated agriculture is described. The improvement process entails three general phases . Diagnostic analysis is an interdisciplinary field study to thoroughly understand the actual performance of an irrigation system. Areas of high and low performance are identified. Management planning is a process for organizational change. The process uses the information and understanding obtained from the diagnostic analysis to make important changes in physical structures and/or management procedures for improving irrigation system performance. Management performance is carrying out the management plan . Monitoring and evaluation is included to assist in management decision making and to measure the impact of the changes on system performance. The management planning is done by the key managers in an irrigated area, farmer representatives, and representatives from other involved organizations. Conscious, deliberate applications of the processes offer important advantages to the farming community and to water management professionals. The results are effective, appropriate solutions to many relevant problems in irrigation.
INTRODUCTION
In many parts of the world, and in much of the western United States, irrigated agriculture depends on large water delivery systems. In many instances these systems need to be rehabilitated and improved. But simply rebuilding an existing physical infrastructure may not achieve the high performance delivery service needed to improve on-farm irrigation. Improvements which are appropriate to a given delivery system must help meet the farmer's objectives in using water. If performance of an irrigation system is to be improved, then goals of productivity, economic feasibility, and environmental sustainability must be achieved on a project-wide scale, down to the farm level. As
lAgricultural Engineer, U.S. Water Conservation Laboratory, USDAARS, Phoenix, Arizona
2Professor, Agricultural and Chemical Engineering Department, Colorado State University, Fort Collins, Colorado
3Hydraulic Engineer, U.S. Water Conservation Laboratory, USDA-ARS, Phoenix, Arizona
45

46 USCID Regional Meetings -- 1989
Replogle and Merriam (1981) noted "The project and the farmers must be considered as a single integrated unit . The farm produces all of the wealth. All costs occurring on the project and on the farm are either paid for by the farmer or must be subsidized, which absorbs wealth from other sources."
But addressing change many times results in a dilemma for an irrigation project manager, as the following hypothetical narrative suggests:
I am the manager of an irrigation project in an arid climate where we must irrigate to grow crops . Farmers pay little for the use of water , less that 5% of their production costs. The cost is a small fraction of its value. The water supply has always been adequate, even in years of drought. I know the cost of water does not reflect its value as perceived by farmers. Farmers attempt to manage their water carefully - not because of the cost - but because the value of good water management is high in terms of improving production .
Farmers continue to install improved field irrigation systems. I know farmers have various criteria for scheduling irrigations. Some use a service that is commercially available, some use the extension service information in the newspaper, and some use their own scheduling process . Other farmers want to order water differently because they have changed their crops . Some water delivery problems have developed when farmers order water in ways that violate at least the spirit of o.ur rules. I know this is caused in part by the district not making rule changes to accommodate needed on-farm changes.
Some engineers and some of the farmers have been suggesting improvements in the district. We should be using new or better structures. We should change our rules. We should be measuring water. We should be scheduling district deliveries of water from the farmers' projected schedule . We should be managing our district according to an updated plan . We should be training our staff regularly. We should be providing training to farmers.
In the past few decades industry at large has experienced tremendous changes, resulting in improved manufacturing, communications, and services to consumers. Agriculture as an industry has also changed greatly, with unprecedented improvements in production and productivity. But have we changed as a water district? Not much!

Management Improvement Process
We use different equipment now, but to accomplish functions that were defined many years ago. The basic rules, roles, responsibilities and actions to provide water to farmers remain about the same as when we started. Why haven't our operations improved more? Why hasn't the way farmers order, access and manage their water been improved? Is the modern world leaving us behind?
My district manages water according to habits formed over the years. My employees deliver water according to tradition, not necessarily because it's the right way to do things, but because it's the way things have always been done.
We cannot improve what we do without involving farmers since what we do affects them. Certain farmers keep suggesting we should change because they say there are better ways to do things now. In many instances the farmer cannot change unless we change.
Where should I start? How can I decide what is "right" and what is "wrong" to change? Who should decide? If I decide to change and I am wrong, some farmers may go bankrupt and I would probably lose my job! It seems like there is a lot of risk. What should I do?
47
The observations and questions of this hypothetical irrigation district manager reflect our perceptions of the conditions, problems and issues that irrigated agriculture faces. For change to be successful, the problems constraining performance improvement must be considered carefully. Addressing these problems is complex and rarely as easy as simply continuing tradition. Adopting "off-the-shelf" technology such as canal lining, new gates or other solutions may not address the key problems and issues or accomplish the needed change.
Effective improvement requires a) a thorough understanding of the existing overall system, b) involvement by several key decision makers in a joint decision process, and c) responsible decision makers carrying out the planned changes. A management improvement process can accomplish these three key goals. The objectives of this paper are to describe and discuss such a management improvement approach for changing the performance of irrigated agriculture and to present an example of applying the first step, diagnostic analysis, to an irrigation district.
MANAGEMENT IMPROVEMENT PROCESS
Diagnostic analysis (DA) is a process which leads to thorough understanding of system performance. Management planning builds

48 USCID Regional Meetings -- 1989
on the understanding from the DA: changes which are necessary to sustain and improve performance are planned. Management performance is the process of carrying out the management plan and monitoring and evaluating the impact of changes made in an irrigation project or organization. These three processes represent a management improvement approach to improving the performance of irrigated agriculture.
The purpose of a management improvement program is to improve the performance of an irrigated area. The program involves farmer representatives and individuals from the relevant organizations (the team) in a field study of the irrigated area to identify opportunities for improving performance. The team decides how system and management changes can improve performance. Some key objectives of the effort are to :
--reach a common understanding of the general process of management improvement including its purpose, outcomes and approach to meet specific project needs;
--develop a common understanding of the most important aspects of system performance, including areas of high and low performance and the causes of each performance level;
--develop a management plan for improved performance that includes system improvements and improved management for low performance areas;
--carry out the management plan with monitoring and evaluation to improve management decision making, and periodic replanning to continue improving performance.
The general approach to the management improvement process is illustrated in Fig. 1. The process is cyclic in that once commitments and plans are made to improve performance, the management and field performance of the irrigation unit is assessed (DA). A management plan is then developed to improve the performance using the understanding gained from the DA. The management plan is then implemented and evaluated to assess the impact of changes made within the irrigation unit , and replanning is done on this basis to adjust the management plan (path B, Fig . 1) . Another diagnostic analysis is completed if needed (path A, Fig. 1), and the cycle is repeated .

I I t
I
Management Improvement Process
Figure 1. Management improvement process phases for improving performance of irrigated agriculture.
49
The decision to improve the management of an irrigation project can be made at any level. Farmers, irrigation districts, or other agricultural or irrigation related agencies may make the decision to initiate a management improvement program. The next step is to get managers in the key organizations to commit to an improvement program.
The management improvement steps are conducted by teams of individuals, with each individual filling a defined role . A team leader provides overall leadership to the program to assure that stated purposes and outcomes are accomplished. A management planning specialist provides management knowledge and skills needed to effectively carry out the program. The management planning specialist also serves as a facilitator to the entire management improvement program. In most cases, the team will be learning to plan organizational change while planning organizational change during the management improvement process. A facilitator can greatly improve this learning process.
The key to successful management improvement of an irrigation unit lies in involving the leaders of all concerned groups (e . g. farmers, project upper and middle [operational] level managers,
50 USCID Regional Meetings .. 1989
managers of government assistance and regulatory agencies, etc . ) in the entire management improvement process. The personnel involved must be in decision making positions. The exact role of a project manager is defined for each improvement effort and is flexible . Middle level operational managers should be mandated by higher level managers to accomplish the goals of the improvement program . High level managers provide input during and after the planning process. The operational managers will then be involved in the entire cycle and will have the understanding of high and low performance areas . They will do the management planning and carry out change where change is needed. They will see to it that monitoring and evaluation are carried out, and will be involved in replanning .
Diagnostic analysis
Diagnostic analysis. is approached from the perspective that the familiar, day-to-day view a person has of a system, an irrigation system in our case, may be very different from the "actual" system; that a better view of the system can be realized through a deliberate sequence of activities ; and that this better view makes improvement easier . Diagnostic analysis, as defined by elyma and Lowdermilk (1988), is a field study of an irrigation system to understand needs for sustaining high performance and for improving low performance. Diagno~tic analysis uses an interdisciplinary team for lexamining interrelated components of an operating irrigation system (Lowdermilk, et al., 1983).
The main objective of diagnostic analysis is to collect information that can provide a basis for understanding management performance. Both the management and field performance of the important management units within an irrigation project are assessed. The management units, in the case of an irrigation district, include the entire delivery system as well as on-farm water control systems . Important areas of high and low performance are determined and causes of this performance are identified. The diagnostic analysis phase can be broken into the following steps :
--A detailed plan for completing the diagnostic analysis is developed .
--A rapid diagnosis is completed in which project personnel at all levels and farmers, farm managers and irrigators are interviewed to establish how the irrigation project is being operated/managed. Background data and additional data on the physical system are used as needed to define the actual performance of the system .
--A detailed diagnosis is organized which includes analyzing data and synthesizing an understanding of the performance of the irrigated area. The result of this step is a report which defines the performance of the key management units of

Management Improvement Process 51
the related organizations, including farmer operations, the areas of high and low performance, and the causes of high or low performance.
--The report is presented to key managers and farmers and initial plans are developed for the management planning phase.
Team members for planning the diagnostic analysis include key design and management personnel from the irrigation project being studied, plus other outside specialists as needed. A planning workshop, facilitated by a management specialist, establishes the context and needs for the irrigated area, the. purpose and objectives for the effort, the roles and responsibilities for the team, and the plans for the overall process. Team members for the interviews and data collection step include key district representatives and in some instances farmers.
Management planning is the process of determining opportunities for sustaining and improving performance and detailing the plans to make improvements (Jones and Clyma, 1988). The purpose of this phase is to reach a common understanding of the performance of the irrigation project including the causes of high and low performance, based upon the results of the diagnostic analysis and from the knowledge and experience of the participants. The management planning process generalll involves the following steps:
--A detailed plan for completing the management planning phase is developed.
--A workshop is organized to define opportunities for improvement. Team members reach a common understanding of the performance of the district and the causes of high and low performance. The outcomes of this phase are to determine which low (and high) performance areas have most significant impact, determine what conditions are causing this level of performance, assign priorities to the performance areas with high impact which can feasibly be improved, and develop general strategies for accomplishing the improvements.
--Problem solving and planning, accomplished through another workshop, focuses on setting goals for improvement, defining objectives, and planning activities necessary for improved performance of the system. This will result in a plan to improve facilities and management procedures, to provide a monitoring and evaluation program to objectively evaluate system performance, and to assist in decision making.

52 USCID Regional Meetings -- 1989
--Finalization of the management planning process involves review, additional input, and approval of the management plan written during the problem solving and planning step.
The management planning process should be facilitated by a management specialist. The management planning team will include the operational managers of the irrigation project, key farmer representatives and individuals from other involved organizations. The team establishes time frames and responsibilities for activities to carry out the management plan.
Management performance
The management performance process involves carrying out the management plan. The monitoring and evaluation parts of the management plan assist the managers' decision making process and help to assess system performance. Monitoring and evaluation provide a basis for objectively judging the effectiveness and impact of the management plan. Experience with the improved system, along with the monitoring and evaluation information, provide the basis for periodic replanning, path B in Fig. 1. When alternative, potential improvements are not sufficiently understood the cycle should be restarted with a diagnostic analysis, path A in Fig. 1. The main steps in the management performance process include:
--Carry out the management plan to improve facilities and management procedures within the irrigation project.
--Initiate the monitoring and evaluation parts of the management plan. Monitoring and evaluation of the changes initiated for both the management practices and facilities are included.
--Assess the performance of the management plan on a regular basis using the monitoring and evaluation results. Revise plans as needed and report changes in performance to key managers.
--After a period of time, generally six to nine months, initiate replanning to assess the management performance and accomplishment. Review progress under the management plan. For those improvements and management changes not performing adequately develop a new or revised improvement process. Include additional important improvements when identified.
Replanning can often be accomplished on the basis of understanding gained from carrying out the initial management plan, from the results of the monitoring and evaluation phases, and/or by reassessing the information gained from the original diagnostic analysis. In other instances, another diagnostic analysis may be required if certain performance areas are inadequately understood.

Management Improvement Process S3
The replanning is accomplished by the original planning team with assistance from the various involved agencies and appropriate outside consultants.
A new or modified management plan is the result of the replanning process and is developed either by the diagnostic analysis and management planning route (Path A) or by the management planning route only (Path S), Fig. 1. Hence, the cycle of management improvement is completed. Conscientious management replanning can be repeated and potentially institutionalized. The entire management improvement process can be applied recursively to irrigated agriculture within a project area to eventually achieve improvements in many aspects of performance.
DIAGNOSTIC ANALYSIS OF AN IRRIGATION DISTRICT
The authors and others at the U.S. Water Conservation Laboratory (USWCL) conducted a diagnostic analysis of a southwestern U.S. irrigation district to a) learn how to use the diagnostic analysis concepts and procedures, and b) increase the understanding of district operations both to determine needed improvements and to develop an appropriate research agenda for our research program. The DA could be considered incomplete in that an interdisciplinary team was not used; hence, items like crop production performance and economics were not considered, and no one responsible for implementing and evaluating change was involved. The DA did, however, serve to facilitate our understanding of the management improvement processes. Simultaneously, while learning about the processes, certain understandings of the district's operation and on-farm performance were developed. These understandings, though limited, would be shared with district personnel and other interested parties.
The team members from the USWCL had conducted research in the district for a number of years and were familiar with the irrigation process in the area . Most of the research studies had focused on-farm and concerned application systems, water management, automation and water measurement. In 1985 we began to intensively monitor the operations of several district canals to study interactions at the district-farm interface.
The canal monitoring project showed a large amount of fluctuation in flow rates at farm turnouts (Palmer, et al., 1989), which could be traced to actions by ditchriders, physical or hydraulic constraints, and the type and sequence of actions taken to adjust canal structures. It was shown (Palmer, et a1., 1987) that such fluctuations could limit the farm irrigator's ability to make accurate judgments about when to change irrigation sets or when to end an irrigation.
The monitoring data helped quantify certain aspects of district delivery service, but many questions were yet unanswered: How do

54 USCID Regional Meetings -- 1989
the delivery personnel actually schedule deliveries? How do they decide when and how to adjust structures? How do farmers and farm irrigators communicate with one another and with the district to negotiate flow rates and durations? What if changes have to be made during an irrigation? Does the farmer have the management capability to make use of an improved delivery system? Are the fluctuating flows really a problem? How do district and farm personnel know if they are doing a good job or a poor job?
Background information about the district was assembled and discussed by the team. The team tried to determine the objectives for the water delivery system, and to describe the necessary functions of such systems. Various hypotheses were formed about the performance of the irrigation district in meeting these objectives, and best estimates were made of the causes for that performance.
From a water delivery standpoint the canal monitoring study in the district had produced quantitative data about delivery operations. Additional data needs were seen to mostly concern management decision-making, the behavior of canal operators, and interactions between the district and farmers: information that could be largely obtained through interviews. The team therefore planned for three days of interviews with district management and staff, farmers and farm irrigators.
From an on-farm standpoint, additional information was needed on how farmers were actually making management decisions regarding when, how much and ~ to irrigate. Two of the team members planned four additional days for interviewing farmers and farm irrigators.
An initial meeting was held with district managers to briefly explain the purpose, objectives and methodology of the DA. A series of interviews was then conducted with the chief engineer, the district manager, the watermaster, the dispatcher, a main canal operator, several lateral canal operators, several farmers, and several irrigators. Interviews were generally from one to two hours long. They were designed to capture the interviewee's understanding about what the system should be doing (examples would be how a canal lateral should operate or how a farmer decides when to irrigate), about the problems and needs of the system, and about the causes of low and high performance. Leading questions were avoided.
Examples of Diagnostic Analysis Results
Deliverv System Related: The performance of the delivery system was separated into physical and managerial processes. From a physical process standpoint a number of items were identified that could lead to inadequate water delivery service. Examples were: a) operators had not been trained in hydraulics or canal
Management Improvement Process 55
operations; b) the written procedures for controlling structures were not applicable under many circumstances and had largely been discarded by operators in favor of highly individualized, experience-driven rules; and c) canals were operated at higher than necessary levels for administrative reasons.
Managerial processes, both district and on-farm, that generally act to over-supply water to the farms included: a) the delivery of extra volumes of water was considered by district personnel to be an additional benefit of delivery service to the farmer, b) at any given time there was 15-25% more water in the system than had been ordered for delivery, available for unscheduled demand, c) farmers have no incentive to order accurate durations of flow, and d) ditchriders usually try to deliver a higher rate than is ordered.
Farm Related: The on-farm decisions regarding ~, how much, and ~ to irrigate were generally not based on adequate or sufficient quantitative information. Level-basin irrigation is the primary irrigation technique used in the irrigation district. The basic criteria for irrigating level basins is to apply the required volume of water to the basin at each irrigation. Factors to consider are contained in the familiar relationship:
where
Qt-L.!! DU
Q flow rate, cfs t set time per basin, hours a - basin area, acres d net application depth, inches
DU distribution uniformity, decimal form
An expected operational statement, which is based on the basic criteria of how to irrigate level basins, was "Farmers apply water to the level basins volumetrically." That is, 2 is measured at the time of design or construction, g is determined by measurement (scheduling process), DU is known from the design and/or is field verified, and Q is measured at the time of delivery. The set time for irrigating each basin (~), can then be calculated once these variables are quantified.
Findings from the diagnostic analysis indicated that essentially none of the farmers interviewed applied water according to time, or volumetrically, to the level basins being irrigated. In nearly all cases, the farmer or irrigator used a point in the field to determine when to stop an irrigation. Hence, how the fields were being irrigated was at odds with the systems' design.
More reasons for not irrigating as originally intended were identified from additional DA findings. For example, an expected operational statement, based on the criteria that g be determined

56 USCID Regional Meetings -- 1989
by measurement, was "Irrigations are scheduled using widely recognized approaches of determining when to irrigate and how much water to apply." We found that the farmers were using indicators such as plant temperature, plant appearance, crop harvesting schedule, or historical guidelines to determine when to irrigate. They were, however, generally not using definitive soil, plant or climatic measurements to define how much water to apply. Hence, Q in the equation was not being adequately defined which leaves the irrigator in a position of trying to apply an unknown amount of water.
Another expected operational statement, related to Q in the basic design, was "Water is delivered to the farm at the flow rate ordered and remains constant throughout the delivery." In this case we found that the flow rate (Q in the equation) a~ the delivery point to the farm tends to be different from what the farmer ordered (ge~erally higher). Further, as we had found in the monitoring program, the flow rates fluctuate during the delivery period. Both conditions prevent the irrigator from determining set times (tl before irrigating, even if Q were known.
These findings from the DA helped to identify reasons why volumetric control of the level basin systems in the irrigation district becomes essentially unmanageable.
Research Identification
A number of research items can be developed from these preliminary findings. The obvious, and historically traditional items, would be engineering solutions such as new structures, hydraulic modeling, automation and remote control. But, as can be seen from the sampling of results, it is apparent that the irrigation system is a complex mix of engineering works and human elements, that the objectives and operations of such systems evolve over time, and that they are not operated by trained personnel. Further, there is a widening gap between the state-of-the-art and field-level applied technology both in canal operations and on-farm. Research is needed to develop strategies for transferring existing knowledge into effective, appropriate improvements. It is obvious from the items noted in the DA that there is a relative urgency to improve the management of level basins, to develop procedures for transferring management skills to farmers and irrigators, and to develop strategies for widespread adoption of irrigation scheduling procedures.
Presentation of Results to District Management
Since the district personnel were not part of the DA team, two meetings were held to brief the project manager, project engineer, and other key project officers. The discussions illustrated the value of direct district involvement in that it was apparent in some instances that the USWCL's understanding of the water

Management Improvement Process 57
delivery operations was lacking and would have been enhanced with earlier input by the district. Nevertheless, the meetings stimulated fruitful discussions and potentially may result in cooperative studies in which performance improvement opportunities are considered.
SUMMARIZING THOUGHTS
The management improvement processes involving diagnostic analysis, management planning and management performance could help our hypothetical irrigation project manager address some of the concerns noted in the introduction. The diagnostic analysis process gives the manager a place to start. The manager's concern about "how do I decide what is 'right'?" need not be a concern since farmers will be involved in the processes and the decisions that result. "Who should decide?" is inherent to the processes. The concerns regarding incorrect decisions and the financial problems that could develop would be tempered by involvement of all parties, starting with the farmers. The underlying theme for the entire management improvement program is that the farm must benefit. The systematic approach used in the management improvement processes removes much of the risk associated with change. Before changes are made all parties will have agreed on what must and will be done.
The diagnostic analysis that we performed provided new insight and understanding about an irrigation project's performance, both from the water delivery and on-farm standpoints. The process helped illustrate how such a systematic performance improvement program might be used in irrigation projects. Approaches for institutionalizing such programs need to be identified and assessed.
REFERENCES
1. Clyma, W. and M.K. Lowdermilk. 1988. Improving the management of irrigated agriculture: A methodology for diagnostic analysis. D. Fowler, Editor. Water Management Synthesis II Project. WMS Report 95. Colorado State University, Ft. Collins, CO. 88 pp .
2. Jones, A.L., and W. Clyma. 1988. Improving the irrigated agriculture: The management training program for command water management, Pakistan. Editor. Water Management Synthesis II Project. Professional Paper 3. Colorado State University, CO. 14 pp.
management of and planning
D. Fowler, WMS Ft. Collins,
3 . Lowdermilk, M.K., W. Clyma, L.E. Dunn, M.T. Haider, W.R. Laitos, L.J. Nelson, D.K. Sunada, C.A. Podmore, and T.H. Podmore. 1983. Diagnostic analysis of irrigation systems, Volume 1: Concepts & methodology. D. Fowler, editor. Water

S8 USCID Regional Meetings -- 1989
Management Synthesis Project, Colorado State University, Ft. Collins, CO.
4. Palmer, J.D., A.J. Clemmens, and A.R. Dedrick. 1989. Several sources of non-uniformity in irrigation delivery flows. J. Irrig . Drain. Eng. Am . Soc. Civ. Eng., New York, NY . IN PRESS, tentatively December .
5 . Palmer , J.D . , A.R. Dedrick, and A.J. Clemmens. 1987 . Impacts of nonuniform deliveries on surface irrigation systems . Am . Soc. Agr . Eng . winter meeting, Chicago, IL. December 15-18 . ASAE paper no. 87-2638 .
6 . Replogle, J.A., and J.L . Merriam. 1981. Scheduling and management of irrigation water delivery systems . In : Irrigation challenges of the 80's, the proceedings of the second national irrigation symposium. October 20-23, 1980. American Society of Agricultural Engineers. St. Joseph, MI. ASAE Publication 6-81.

STRUCTURAL SOLUTIONS FOR ALLEVIATING WATER SHORTAGES: THE CASE OF TWO FORKS DAM AND RESERVOIR
Kenneth Mitchell* Edward E. Pokorney**
ABSTRACT
The heart of water supply in the arid western portion of the United States has historically been reservoir storage. From stored water comes the ability to sustain agricultural production, as well as major metropolises. From that same stored water also comes the ability to capitalize on various techniques for extending water supply: conservation; acquifers; and reuse. Together with reservoirs, these techniques constitute the basic methods for increasing or extending a given water supply. Without reservoirs, however, none of these techniques can long sustain a population and a growing economy in the arid West.
Since the mid-1970s and the Carter Administration, reservoirs as a structural solution for coping with drought, have increasingly been eliminated from this formula. It started with federally-funded water storage projects whose termination was justified on the grounds of federal budget tightening. But in the 1980s, it has moved to all reservoir storage proposals -- whether federally- or locally-funded -and has been rationalized on the basis of protecting the environment. The federal laws passed in the late 1960s and early 1970s to protect the environment have now taken on the coloration of anti-water storage statutes, effectively removing reservoirs as structural solutions to alleviate water shortages.
Nowhere is this clearer than in the case of Denver's proposed Two Forks Dam and Reservoir project. A totally locally-funded project with broad-scale local government support through most of Colorado's urbanized Front Range, the Two Forks project has been arbitrarily derailed late in the 11th hour of federal consideration by a newly-appointed National Administrator of the Environmental Protection Agency (EPA).
* Director of Planning, Denver Water Department
** Coordinator of Intergovernmental Affairs, Denver Water Department
59

60 USCID Regional Meetings -- 1989
The derailment comes after almost eight years and $40 million spent by Denver area governments on an exhaustive and open Environmental Impact Statement (EIS) process which managed to get the approval or intended approval of every local, state, and regional federal agency in the project review process.
THE CARTER WATER LEGACY
Since the mid-1970s when President Jimmy Carter created his infamous 'hit list' for eliminating some federally-funded water supply projects, all reservoir projects have found themselves involved in an uphill battle. The combination of political pressure and regulatory requirements in the past two decades has made structural solutions -- that is, dams and reservoirs -- to water shortage a difficult proposition at best.
Yet despite this changed political, regulatory, and environmental landscape, the techniques for increasing or extending a given water supply are finite in number. They consist essentially of four principal techniques, each of which is subject to various modifications or configurations: conservation, aquifers, reuse, and reservoir storage. Unfortunately, when President Carter developed his 'hit list' in the 1970s, he managed to drop the pivotal item among these four, that of reservoir storage.
There is no question that the use of three of these water augmentation or extension techniques -- water conservation, aquifers (or groundwater), and reuse (including leases, exchanges and marketing in a generic sense) -- is alive and well. What is not well and what may be nearing the point of needing artificial resuscitation is the fourth leg of the stool; reservoir storage.
The fact of the matter is that water utilities ·cannot get there from here" in alleviating permanent water shortages by depending on conservation, groundwater, and reuse alone. Each of these techniques depends -- in greater or lesser measure -- on having a continuous supply of water throughout the year which can be conserved, reused, leased, marketed, or used to replenish groundwater aquifers.
What, after all, does one conserve, market, lease or exchange in a desert-like climate if there is no

Two Forks Dam and Reservoir 61
stable supply of stored water? If snow-melt from lofty mountains in arid states is permitted to flow out of state unfettered in a 60-day period -- leaving nothing behind for the remaining months -- then techniques for extending water supply become useless.
The fourth element -- reservoir storage -- is vital, and a total package for addressing future water shortages must include all of the weapons at our disposal. Critics of western water development are correct in pointing out that the West cannot cope with its long-term water challenges by reservoir storage alone. But neither can the West's future water problems be addressed solely through conservation, groundwater, and reuse. Thus it makes little sense to deny ourselves the possibility of using the one tool -- reservoir storage -- which makes a broad-ranging package of water initiatives effective.
THE ENVIRONMENTAL ARGUMENT
Despite this need by the arid Western United States for as many drought alleviation tools as possible, the record of the past two decades in bringing needed reservoir storage on line is dismal. Since the Carter Mhit list M days; few, if any, major storage reservoirs have been built; whether financed by federal, state, or local government. Initially, the rationale was the imperative to cut spending in the bloated federal budget by eliminating a few ·porkbarrel M federal projects. However, now the assault on proposed reservoirs has expanded across the board and is justified on the basis of protecting the environment. In this new atmosphere, an atmosphere where federal environmental laws of the late 1960s and early 1970s are turned wholesale against potential reservoir storage projects, no proposal -- whether federally-, state-, locally-, or privately-funded -- can come through unscathed.
Increasingly the arid West is existing on the reservoirs which its early settlers were prescient enough to bring on line. However, water utilities are running out the string on those reservoirs, without creating new water storage capacity for those who will come after us. A momentous question of stewardship or guardianship is before us. Too often that stewardship is painted simply as a case of not disturbing our natural environment. But stewardship also involves providing the infrastructure needs for

62 USCID Regional Meetings -- 1989
our children's future and, in that obligation, we may be falling woefully short.
The principal obstacle to needed future water storage is the laundry list of environmental laws, skillfully used by environmental opponents and those in federal regulatory agencies sympathetic to environmental causes. With the aid of federal laws and the courts, environmentalists are in a position to throw interminable, costly roadblocks in the path of a potential storage project. What is euphemistically called "the federal regulatory process" is no "process" at all. Instead, it has become a gigantic federal bureaucratic maze game, in which the contest is often prolonged until all parties quit the arena out of exhaustion, frustration, or financial destitution.
Recently Jack Mannion, Executive Director of the American Water Works Association, noted that "the central thesis of the environmental movement is that nature is good, and the works of human beings •.• are bad."l We in the water supply area are part of the "works of human beings," thereby making us "bad" by definition.
The idea that anything which disturbs the environment is ~~, "bad" is a novel concept in the American experience. The historical pattern of western civilization is an almost unbroken line of taming the environment, of following the biblical dictate to "subdue the earth." Virtually no advance in civilization has been made without some alteration of man's environment.
Sometimes those alterations have spilled over into excesses, creating wanton destruction of the environment. But just as often, the works of humanity -- including tilling of the soil to produce irrigated crops -- have been accomplished in harmony with nature so that man and nature have been able to co-exist symbiotically. Were the philosophy of those who rail against this historical pattern to have dominated the course of human events, the prevailing form of human existence might still be the Indian cliff dwellings of 1000 A.D. In such event, few of
1 Mannion, John B., "Reflections", American Water Works Association Journal, August 1988, p. 12.

Two Forks Dam and Reservoir 63
those espousing an anti-growth philosophy today would have been able to survive west of Chicago.
In the arid west, man's ability to "tame" the snow melt by capturing it in reservoirs and making it available for municipal, industrial and agricultural use throughout the year has made possible advanced civilization. That ability to harness the raging waters of Spring makes possible the existence in our midst of the very people who rage at the environmental "damage" created in man's effort to tame nature's snow melt.
THE TWO FORKS' EXPERIENCE
The City of Denver's excruciating experience with attempting to gain permits for its proposed Two Forks Dam and Reservoir project clearly illustrates the obstacles in the way of future water storage projects. That experience provides a case example of the transformation which the western water picture has undergone as a result of the combination of exponential increases in federal environmental statutes and regulations; strident opposition by environmental groups; and reporting by news media, which converts to the green flag of environmentalism.
The proposed Two Forks Dam would be located on the South Platte River about 30 miles upstream from Denver, where the mainstem of the South Platte and its North Fork join. It would impound 1.1 million acre-feet of water, producing a "safe annual yield" of 98,000 acre-feet. In addition, the reservoir would be capable of storing some 15,000 acre-feet of water from other Metro Denver cities. The combined yield would support an added urban population -along with the governmental, commercial, and other sectors which blossom with such a population -- of over 400,000 additional people. Since many of the metro governments involved in Two Forks are water-short but can expect future population growth, the need for water from Two Forks in the early part of the 21st Century is of paramount importance to those governments.
Denver's predecessors began the long battle to bring Two Forks on line in the late 1800s by filing for water rights and -- during ensuing decades -- taking the steps necessary to proceed with the project at such time as it would be needed. Other less costly, more modest steps were sufficient during that period

64 USCID Regional Meetings -- 1989
and, by putting these into place, the overall water system was created which could ultimately make optimal use of Two Forks.
In 1961, the active steps to get Two Forks permits in hand began in earnest as Denver and 43 Metro Denver area local governments started the series of environmental impact studies which would ultimately lead to permits for Two Forks. Eight years later, approximately $40 million had been spent on EIS studies. Those monies, as well as any dollars needed for future construction, would come strictly from local governments, without one cent of federal or state expenditures on the project.
By 1969, every local, state, and federal agency with a review role in the Two Forks proposal -- including all of the metro government participants, the Denver Regional Council of Governments, three counties directly impacted by the Two Forks site, the Colorado Wildlife Commission, the Colorado water Quality Control Commission, the Colorado Department of Natural Resources, the Colorado State Engineer, the Colorado General Assembly, the Governor of Colorado, the U.S. Army Corps of Engineers, the U.S. Forest Service, the U. S. Bureau of Reclamation, the U.S. Fish and Wildlife Service, and Region VIII of the Environmental Protection Agency -- had either approved the project or had expressed its intent to approve the project. Outside the Metro Denver area, most of the local governments along Colorado's urbanized Front Range and its rural eastern plains -an area which represents more than 3/4 of the state's total population -- also endorsed the project.
The consensual support from so many urban and agricultural areas in Eastern Colorado is remarkable in itself. Water for municipal supply in Colorado's semi-arid climate has always been contentious between geographic regions, between agricultural irrigators and urban dwellers, and among municipalities themselves. Furthermore, the Metro Denver intergovernmental cooperation around this course of water action has blossomed into discussions on other metro cooperation problems and needs, with the subject of water supply being central to the general cooperative spirit.
Part of the reason for these approvals relates back to the "total package" concept previously discussed. Two Forks was not intended as the sole element of a water supply plan. Instead, the overall water

Two Forks Dam and Reservoir 65
package on which the entire Metro Denver area has agreed includes aggressive conservation measures, a number of small-scale water supply efforts (such as exchanges, leases, and marketing), and judicious use of groundwater by some metro entities. Two Forks was intended as a part -- though a crucial part -- of that overall supply package.
The various decisions shaping this package came through innumerable meetings and public hearings with countless governmental agencies and citizenry of every size and type. At the height of the Two Forks EIS, the equivalent of 31 full-time Denver Water Department staff were engaged in the effort. Counting local, state, and federal staff, consultants, private environmental interest groups, and others, the equivalent of 200 full-time individuals were working on the project at its apex. In any given week, over 400 people were attending one or another meeting in the EIS.
During the EIS, 65 separate consultants were under contract working on various environmental impact assessments and other aspects of the studies. Fifty-four official public meetings and hearings were held to obtain public input, and literally thousands of technical meetings were attended by participants.
There are many reasons why the Two Forks proposal has been acknowledged by all official entities -- local, state, and federal -- with any review function in the process to be the superior storage alternative of the 50 sites studied. It fulfills a number of essential purposes for the metro area, including:
Two Forks is the most economic alternative;
it most efficiently uses the water system structures and water rights which Denver and other metro cities have put in place during the past century;
by virtue of Denver's historical diligence in preparation of the Two Forks site, the project has the least legal and institutional obstacles of any alternative;
the project helps to foster Metro Denver cooperation, since most of the water supplying entities of the metro area are financial participants in the project;

66 USCID Regional Meetings -- 1989
the Two Forks project does not preclude other water supply steps in the future, whether structural or non-structural; and
Two Forks avoids the need of metro cities to look at taking water from agriculture to fill their future needs.
For these reasons, all of the official entities with a review role in the process had generally reached the same conclusions:
that neither water conservation, nor small-scale supplies, nor large-scale water storage alone would suffice to assure the Denver area's water future;
that Two Forks as part of a water package was the most economical and efficient of all of the water storage options; and
that while Two Forks would create some adverse environmental impact, the damage resulting from future water shortages for a growing Denver area and the potential environmental devastation from Metro Denver drying up agricultural lands for future water was deemed a far greater ecological threat.
NATIONAL EPA INTERVENTION
After the years of review, input, and approvals, the Two Forks permit process was suddenly brought to a halt late in its 11th hour. Newly-appointed EPA National Administrator William Reilly directed his Region VIII Administrator -- who had previously determined his regional office should approve permit issuance by the u.s. Army Corps of Engineers -- to initiate a "veto process" of Two Forks under Sec. 404(c) of the Federal Clean Water Act.
There is a unique arrangement between the Corps and the EPA in the implementation of the Federal Clean Water Act. The Corps, which served as the lead agency throughout the Two Forks EIS, is empowered to issue or deny 404 'dredge and fill' permits under the Act. After what was probably the most exhaustive and expensive EIS ever conducted under the National Environmental Policy Act, the Corps was prepared to issue a 404 permit for the construction of Two Forks.

1\vo Forks Dam and Reservoir 67
EPA, in turn, is given 'oversight' of the 404 process under the Federal Clean Water Act. EPA can intervene when a project has an 'unacceptable' adverse effect on municipal water supplies, fishery areas, wildlife, or recreational areas. The absurdity in the Two Forks situation is that it is generally acknowledged Two Forks will vastly improve municipal water supplies and recreation; two of the elements EPA is charged with protecting. Yet EPA "ostensibly" intervened because it believes two other aspects of its charge -- fisheries and wildlife -- are being harmed, and that there are "practicable" alternatives to Two Forks which would do less harm. The term "ostensibly" is used appropriately here, since EPA's Reilly never specified to the project applicant the particular concerns which led him to initiate the 404(c) process.
By overriding the intended approval of Two Forks by his regional administrator, Reilly was departing from a long EPA tradition of deference by the national administrator to his regional administrators. Never before in EPA's history had a national administrator overridden the decision of his regional administrator in such a circumstance. EPA's operating philosophy had been that the regional administrator on the scene -- that person closest to the issues who had been involved in extended consultations and negotiations on those issues -- was best situated to make the ultimate call. Region VIII Administrator James Scherer had decided to approve the issuance of the Two Forks permit, based on the permit conditions on water conservation, wetlands, aquatics, and other issues he had been able to negotiate with the project applicant in exhaustive discussions lasting several weeks.
Had Scherer decided DQt to approve the issuance of the Two Forks permit, he could have taken one of two actions: Scherer could have elevated the decision to Washington under the 404(q) process whereby the decision would have been thrashed out between the EPA, the Corps, and the President's Council on Environmental Quality; or he could have recommended that a veto process be started on Two Forks under 404(c) of the Clean Water Act. In the latter case, Scherer would have become the "hearing officer" for the veto process, reviewing the project anew before making a final recommendation to his national headquarters on whether Two Forks out to be vetoed or not.

68 USCID Regional Meetings -- 1989
Scherer did neither; instead, Scherer indicated his intention to approve issuance of the Two Forks permit. Since the 404(c) veto process is legally required to start with the recommendation of the Regional Administrator, Reilly then ordered Scherer to initiate the 404(c) process. Scherer did so by letter, but he also noted he could not serve as hearing officer for the review of Two Forks because of his belief that the project permit should be issued. Reilly then appointed the Deputy Regional EPA Administrator in Atlanta, Lee DeHihns, to come to Colorado and act as Hhearing officer." For the purpose of the Two Forks review; DeHihns, in effect, became the Region VIII EPA Administrator, replacing Scherer.
Reilly had been in office less than 50 days at the time of his veto and, by his own admission, knew nothing of Two Forks before being appointed to his post. Slightly more than a month after assuming his post, Reilly received a scathing critique on Two Forks in a March 9 letter from opposition environmental groups. The letter caught Reilly's attention, and he later indicated the communication had much to do with his adverse decision on Two Forks.
The environmentalist letter also got the attention of the Omaha office of the u.S. Army Corps of Engineers. The Corps had been the lead agency for the Two Forks EIS during the entire period of the study, with Colonel Steven West in charge of the EIS for its final three years. In an unprecedented step, Colonel West wrote Reilly on March 22 that:
I have reviewed ... the March 9, 1989 letter to you from leaders of major environmental organizations regarding the Two Forks Dam and Reservoir project.
A preliminary review of the • . . letter has noted approximately 30 instances where the information presented was inaccurate, distorted, or misrepresented, and where unrelated issues have been intermingled.
Two days later, on March 24, Reilly initiated the 404(c) veto process.

Two Forks Dam and Reservoir 69
TWO FORKS AND ENVIRONMENTAL MITIGATION
Reilly's action was apparently based in large measure on his belief that the Two Forks site is some kind of "national treasure," a "one-of-a-kind" mountain valley resource with exceptional fishing. The fact of the matter is that most of Colorado's mountainous terrain is picturesque, with hundreds of attractive valleys. No Colorado mountain valley leaps out as being a prime candidate for reservoir inundation by virtue of its ugliness.
The Two Forks location, in comparison to highlyprized scenic and recreational sites, such as Colorado's Glenwood Canyon or Black Canyon of the Gunnison, is neither pristine nor spectacular. It is, in truth, quite unremarkable. Even its "exceptional" fishing is largely "man-made,- since the prime fishery occurs in the aquaticallyproductive tailwaters of an existing Denver dam, and since the stream is stocked by the Colorado Division of wildlife and by a private fishing club.
However, recognizing that some adverse environmental impact would result from the construction of Two Forks, Denver and its suburban neighbors proposed a -mitigation" package of almost $50 million to ameliorate such impacts. In subsequent discussions with the Corps and EPA, the added permit conditions demanded by these and other agencies inflated the mitigation cost to approximately $90 million. The base construction cost of Two Forks is calculated at about $320 million, while the combination of $40 million for the EIS study and $90 million for mitigation totals an added $130 million. This means, in effect, that for every $1 of project construction cost, about 40~ will have to be spent to appease federal and state agencies. Certainly that ratio of study/mitigation to construction costs must break new ground in transit charges for a local governmental project trying to navigate its way through the federal bureaucratic maze game.
Even so, the $90 million in mitigation may not be nearly enough, if EPA has its way. The reason is that in the federal permit process, the Corps and EPA have varying interpretations of 404 Clean Water Act regulations. The Corps interpets Sec. 404 regulations to mean a project's environmental impacts must be assessed with proposed mitigation in place. If a project with its mitigation in place has acceptable environmental consequences and is no more damaging

70 USCID Regional Meetings -- 1989
than other practicable alternatives, the project is "permittable." With the mitigation proposed for Two Forks, the Corps found the project worthy of receiving permits.
Conversely, the EPA interprets Sec. 404 to mean a project and its environmental impacts must be evaluated in the absence of any proposed mitigation. If without any mitigation a proposed project creates greater environmental impact than a given practicable alternative, the proposed project cannot be permitted. Since EPA does not take into account the proposed $90 million of mitigation for Two Forks, and since both the Corps and EPA agree that in the absence of mitigation Two Forks is the most damaging alternative, EPA leans heavily toward the denial of permits for Two Forks.
The differing interpretation between the two agencies is critical. If EPA's view prevails -- and it certainly appears to be in the ascendancy -- then proposed mitigation by a project applicant is meaningless, and potential projects are evaluated solely on the criterion of environmental impact without regard to cost, social impact, system efficiency, need, mitigation, and other pertinent factors.
THE ROAD AHEAD
In summary, the indictment of the national office of EPA in the case of Two Forks falls into two categories:
that the national headquarters belatedly, precipitously, and without requisite knowledge interjected itself in opposition to a locally financed project, thereby rendering useless the long and laborious planning processes undertaken at the local, state, and regional federal levels; and
that differing interpretations of the Clean Water Act between the Corps of Engineers and the EPA -with EPA's interpretation decidedly less favorable to the project applicant's position -delay, frustrate, deny, and increase the expense of attempts by local water utilities to cope with their capital development needs.

Two Forks Dam and Reservoir 71
The cynic might view national EPA action on Two Forks as a comedy of errors, except that no one at the local governmental level is laughing. If EPA's action in this matter portends a standard pattern of agency behavior for the future, then local and state governmental efforts to address their water and wastewater problems -- problems for which they must payout of their own limited budgets -- may be doomed. It can scarcely be in the federal interest for a financially-strapped federal appartus to parlayze local and state government in the latter's attempt to pick up reins of the capital spending.
The City of Denver is now fighting the action by the national EPA to kill the Two Forks project. Denver is not alone; various other local governments around the country find themselves in somewhat similar circumstances with regard to 404 permitting and the EPA. In Denver's case, Reilly's action makes a mockery of local planning for future infrastructure needs, even when those needs are to be totally financed by local governments.
Should the national EPA's heavy-handed intrusion succeed, it could signal the death knell for western water development efforts to use reservoir storage as a hedge against the spectre of future drought conditions. That, in turn, bodes ill for the water future of the semi-arid West, for it means that reservoirs will be permanently removed from the Western water solution, and those in the West will be compelled by national fiat to make do with conservation, aquifers, and reuse.

I ,
I I
I I

WATER TRANSFER ADMINISTRATION IN CALIFORNIA,
EXPERIENCES ON THE YUBA RIVER
Herbert W. Greydanus*
ABSTRACT
Water reallocations or transfers are popularly considered to be simple and economical alternatives to traditional conservation by storage of otherwise unusable runoff. The direct and third party effects of changes in water use and the administrative constraints for such transfers are not generally recognized and are frequently unacceptable to some interests.
Experiences gained with six temporary, interagency transfers of seasonally surplus water of the Yuba County Water Agency, California, in 1987, 1988 and 1989 are described. The hydrologic and local water supply assurances were readily evaluated and supported. Instream flow changes and their effects were controversial and uncertain. Water needs in areas which would receive the transferred water received less consideration than the effects of real and perceived changes in streamflows and pumping rates. These issues were the focus of required changes in water rights permits. The paper briefly describes the water needs and supply conditions basic to the transfer and summarizes the administrative process and experiences in securing the required approvals for the transfers.
INTRODUCTION
Changing public perceptions regarding natural and traditional development/economic objectives have increasingly influenced value judgments during the past two decades. These changes have had dramatic impacts on construction and operation of infrastructure works, such as highways, energy supplies and water supplies. Legislative and administrative changes at all levels of government have made it possible for interest groups with various, and sometimes narrow, persuasions to have a disproportionate influence.
*Principal Planning Engineer, Bookman-Edmonston Engineering, Inc., Sacramento, California
73
74 USCID Regional Meetings -- 1989
New water development projects are difficult, if not impossible, to undertake. Claims are made that water conservation, i.e. reduced use, water transfers, reuse and discontinuance of some irrigated agriculture can be used to meet present overdrafted ground water basins and future new demands, particularly for urban uses. Legislation has been enacted in California in recent years with the objective of encouraging and facilitating water transfers. Experience of the Yuba County Water Agency during 1987, 1988 and 1989 in transferring water to areas with shortages demonstrates that this sound objective can be difficult to achieve and water supplies for existing irrigation are questioned by some special interest groups.
YUBA RIVER DEVELOPMENT
In the 1960s, the Yuba County Water Agency undertook a multipurpose project in the Yuba River Basin which is the fourth largest water producer in the Central Valley of California - average unimpaired runoff of 2.4 million acre-feet annually. Principal project features include (1) the New Bullards Bar Dam and Reservoir on the North Yuba River with 966,000 acrefeet of storage for flood control, water conservation, hydroelectric power, recreation and fisheries enhancement by streamflow releases, (2) diversions to the Reservoir from the Middle Yuba River and a tributary, (3) the Colgate Power Tunnel and Power Plant with 316 MW of installed capacity and (4) the Narrows II Power Plant with 55 MW of capacity at the existing downstream Narrows debris dam. New Bullards Bar Dam and Colgate Power Plant replaced a smaller reservoir and power plant owned by the Pacific Gas and Electric Company.
The project was financed principally by revenue bonds supplemented by federal flood control contributions and loans and grants from the State of California for recreation and fish enhancement. The revenue bonds were backed by a power supply contract with the PGandE Co.
The project was planned with canal and distribution facilities to serve irrigation water in southern Yuba County_ Inflation of construction costs required use of most of the authorized bond issue for storage and power facilities and there was not enough remaining to construct the diversion and water distribution works. Some works have been constructed by local districts, but all of the irrigable land is not yet

Water Transfer Administration 75
receiving surface water from the Yuba River. Consequently, the Agency has had extra water even during the last three dry years.
WATER TRANSFERS
In 1987, the YCWA was able to transfer 83,100 acrefeet during August and September to the California Department of Water Resources (DWR) for distribution to areas served by the State Water Project (SWP). Water released from the Yuba River Development into the Feather River replaced an equivalent amount which would have otherwise been released from Lake Oroville on the Feather River. YCWA contracted to transfer the water for a two-part rate comprised of a base price of $5 per acre-foot and $10 per acre-foot additional which would be paid if the water did not spill from Lake Oroville the following winter.
In 1988, the YCWA transferred 122,000 acre-feet to DWR for the SWP during July-September with the same storage exchange arrangement as in 1987. The YCWA received $11.50 per acre-foot without an adjustment provision for possible spill from Lake Oroville.
In both 1987 and 1988, which were critically dry years, releases for fish in the Yuba River could have been reduced 30 percent under a 1965 agreement between the YCWA and the California Department of Fish and Game (DFG). The YCWA agreed to provide normal year fishery flow which required additional releases of 50,000 acre-feet.
In 1989, classified as a dry year, the YCWA transferred (1) 60,000 acre-feet to the East Bay Municipal Water District at $45 per acre-foot for urban use in the east San Francisco Bay area, (2) 7,000 acre-feet to the City of Napa for $45 per acre-foot and (3) 200,000 acre-feet to DWR for delivery of 90,000 acre-feet for urban use in the Santa Clara Valley Water District at $45 per acre-foot and 110,000 acrefeet for irrigation to offset further ground water overdrafting in the Tulare Lake Basin Water Storage District and the Empire Westside Irrigation District at $11.00 per acre-foot. Runoff from the Yuba River Basin was, percentage wise, the best in the Central Valley and normal year fishery releases are required.

76 USCID Regional Meetings -- 1989
ADMINISTRATIVE REQUIREMENTS FOR TRANSFERS
Temporary transfer for up to one year are permitted under the California Water Code. A permit from the Division of Water Rights of the State Water Resources Control Board (SWRCB) for a change in point of diversion and place of use is needed to permit the purchaser to divert and use the transferred water. Natural water courses may be used for the transfer and the permit entitles the purchaser to enforcement action by the SWRCB against anyone who may attempt to divert the transferred water.
1987 Transfer
In 1987, the YCWA petitioned the Division of Water Rights, SWRCB, for a change in point of diversion under Water Code Section 1725 et seq. which provided for temporary changes in water rights. Such petitions would become operative after 30 days if the Division did not object. The Code required that such a transfer should not injure other legal users and should not unreasonably affect fish, wildlife and other instream beneficial uses. If the Division objected, requirements of the California Environmental Quality Act (CEQA) would have applied and an environmental impact study required. Although there were complaints citing possible adverse impacts from three fishing interest groups, the Division advised the Agency that it did not object to the transfer.
1988 Transfer
The need for additional water for the SWP in 1988 and the probability of extra water from the Yuba River Development, which had storage reserves, were known early in the year. Consequently, negotiations for transfer were begun in January.
The Division of Water Rights believed that more thorough study was needed than in 1987 and recommended use of Water Code Section 1735 et seq. which provides for trial transfers for up to one year. These sections required evaluation under CEQA provisions plus specific findings by the SWRCB of no adverse impact on other water users and no unreasonable impacts on fish, wildlife and other instream beneficial uses.
The first step under CEQA was preparation of an Initial Study and a specific finding of no unreasonable adverse environmental impacts for transfer of up to 185,000 acre-feet. This study was completed by DWR

/
Water Transfer Administration 77
and a negative declaration was issued on April 15. On April 18, the YCWA petitioned the SWRCB for transfer of up to 185,000 acre-feet under Water Code Section 1735 et seq.
Estimates of the amount of water available for transfer were reduced in early May when snowpack surveys confirmed that anticipated spring precipitation had failed to materialize. It was estimated that only about 110,000 acre-feet could be transferred. Even though the Initial Study was based on transfer of up to 185,000 acre-feet and no significant environmental impacts were expected, the DWR felt it was necessary to amend the Initial Study to reflect transfer of 110,000 acre-feet.
Although an understanding had been reached with the Department of Fish and Game (DFG) that there would not be any unreasonable adverse impacts on fish and the YCWA had agreed to provide normal year fishery releases, a DFG regional representative appeared at the SWRCB hearing. (A hearing by the Board was required by the Water Code.) The departmental level of DFG did not object to the trial transfer, but requested several conditions for studies and monitoring on both the Yuba and Feather Rivers before any consideration would be given by the Board to a permanent transfer. Preliminary discussions and studies for a long-term transfer to DWR were then underway.
The U.S. Fish and Wildlife Service filed a list of possible impacts which it requested be evaluated by the SWRCB while acknowledging that several impacts could not be evaluated until after the transfer.
The California Sportfishing Protective Alliance (CSPA) also filed alleged probable objections, but did not provide technical documentation.
The SWRCB on July 6, six days after the planned initiation of the transfer, and six months after the initial steps for a transfer, issued an approval order for transfer of 110,000 acre-feet with several conditions for monitoring and reporting. Although CSPA requested the Board to condition its approval on requiring studies and changes in new fishery flows in the Yuba River before it would approve any additional transfers by YCWA, the Board refused to do so. The Board noted that there could be critical water shortages prior to approval of fishery flows. (The Water Code does not require a showing of water need to permit a transfer.) The Board did, however, state that

78 USCID Regional Meetings -- 1989
it would not approve a permanent transfer arrangement until further fishery studies were completed. The actual water supply was sufficient to transfer 122,000 acre-feet and an urgency change for an increase of 12,000 acre-feet was requested and approved by the SWRCB. This required approval of one Board member and ratification by the Board within 30 days.
Water Code Amendments
The administrative effort and expense required for the 1988 transfer, most of which was required for conformance with CEQA and responses to claimed mitigation requirements for temporary transient conditions, prompted representatives of water agencies to seek legislation to revise Section 1725 et seq. to facilitate temporary transfers. The changes were enacted by the California Legislature, with the concurrence of the SWRCB and the Governor signed the legislation. Trial transfer provisions were abolished.
The legislation made technical changes to clarify the definition of water which could be transferred and expressly stated that conformance with CEQA is not required. There are only two findings in this section which must be made by the SWRCB. These are (1) no adverse impacts on other water users and (2) that the transfer would not unreasonably affect fish, wildlife or other instream beneficial uses. The Board has 60 days in which to make its findings and, if it - cannot do so in that period, it must schedule a hearing. The Board delegated authority to the Chief, Division of Water Rights, to approve Sec. 1725 transfers.
1989 Transfers
Work on 1989 transfers began in November 1988 with discussions with the East Bay Municipal Utility District (EBMUD), whose reserved storage was nearly exhausted. Work with others continued through midAugust 1989. In addition to four completed transfers, the City of San Francisco also sought water from YCWA through the DWR and the SWP, but later withdrew when its supply improved in March.
EBMUD and City of Napa: The YCWA, on February 2, 1989, filed a petition under the revised Water Code Section 1725 et seq for transfer of up to 60,000 acrefeet to the East Bay Municipal Water District (EBMUD) in the San Francisco Bay area. Up to 30 percent of

Water Transfer Administration 79
the rate of diversion from the Delta would additionally need to be released for "carriage" water to control water quality in the Delta at certain times of the year. The transfer period would extend through February 1990 with a maximum rate of diversion by EBMUD of 90 cfs.
On February 27, YCWA filed a petition for transfer of 7,000 acre-feet to the City of Napa, et aI, to be delivered by September 30 at a maximum diversion rate of 21 second-feet. Carriage water releases would not be required because the point of diversion is in the northern half of the Delta.
The Division of Water ~ights of the SWRCB noticed these two petitions and received objections from CSPA and the U.S. Fish and Wildlife Service. As a result of earlier coordination by YCWA with DFG, the DFG early in the process acknowledged that the increased releases would not result in adverse impacts on fish and requested that flows increased for transfers to EBMUD in the spring and in the fall and winter be continued through February 1990 even if EBMUD ceased diversions. The Agency agreed to do so.
On the last day of the allowable comment period, the DFG submitted a letter to the Division requesting flows for fish up to eight times greater in the spring and 7.5 percent greater in the fall, coupled with maximum water temperatures in the Yuba River. Temperature limits are not now in the 1965 YCWA/ DFG agreement.
The turnabout by DFG, similar to that in 1987, threatened to stop the transfer to EBMUD and Napa because the temperature conditions could not be met. With drought impacted urban and agricultural areas facing severe water shortages, this year the issue reached the Governor's council and the DFG withdrew its demands. A new DFG representative not previously involved was given responsibility to coordinate with all parties.
The Chief of the Division of Water Rights approved, on April 3, 1989, the petitions for transfer to EBMUD and Napa, but included some of the temperature and flow rate requests from the withdrawn DFG letter. Although fishery interests still opposed, the Environmental Defense Fund commented in support of the transfer to EBMUD.

80 USCID Regional Meetings -- 1989
Department of Water Resources: The petition to transfer up to 200,000 acre-feet to DWR was filed on March 28 under Sec. 1725 et seq. In addition to California Sportfishing Protective Alliance (CSPA), objecting comments were made by United Anglers and the San Francisco Bay Institute which also represented the Pacific Coast Federation of Fisherman's Association and CSPA. The chief issue of the latter group was the effect on fish due to additional pumping by the SWP in the Sacramento-San Joaquin Delta. At a subsequent hearing, the local chapter of United Anglers acknowledged the plans for improved flow on the Yuba River and supported the transfer. DFG did not submit any further comments since its position in support of the transfer was included in its second letter on the EBMUD transfer. U.S. Fish and Wildlife Service submitted additional comments on "might be" effects.
The Environmental Defense Fund opposed the transfer of irrigation water citing improved water supply conditions and that the two districts which would receive the irrigation water would receive their full entitlements from the SWP. EDF did not acknowledge that the water supply of the Kings River was only 53 percent of average and the Tulare Lake Basin Water Storage District would not receive any water (about one-third of its total supply) from that source under its junior water rights.
The Chief of the Division of Water Rights declined to exercise his delegated authority to approve the transfer due to continuing comments by opponents to the Board members. Near the end of the allowable 60-day review period, the Board set a hearing. Parties were allowed to present sworn testimony which was subject to cross examination, or policy statements which were not subject to cross examination. Agencies involved in the transfer submitted technical and expert witness testimony. Opponents made brief policy statements, but were allowed to conduct lengthy cross examination of the agency witnesses. Supporting entities were not permitted under the rules for the hearing to cross examine those who made policy statements.
The Division of Water Rights drafted a proposed order with many conditions which would have approved transfer of 90,000 acre-feet for urban use in the Santa Clara Valley and would reserve approval, pending further evidence of need and impacts of pumped diversions, for transfer of 110,000 acre-feet for

Water Transfer Administration
irrigation in the San Joaquin Valley. The Board declined to approve the draft order and instead allowed an additional 15 days for evidence, comments and responses.
81
The draft order included some water temperature conditions which could not practically be met. These conditions were proposed by the Division of Water Rights and not at the recommendation of the DFG. During the IS-day period, an acceptable flow and temperature program for the Yuba and Feather Rivers was jointly worked out with the DWR, DFG and YCWA and all three parties recommended a common program to the SWRCB. (The transfer would also make it possible, by exchanges with water from the federal CVP, to improve fish flows in the Sacramento River and improve conditions for the winter run Chinook salmon, recently added to the endangered species list.) DWR also clarified plans for pumping transferred water from the Delta during October and November when the risk to juvenile salmon is the least.
On July 20, four months after the petition was filed, the Board approved the petition with several monitoring and reporting conditions and set April 1, 1990 for submittal of a joint YCWA!DWR plan to be coordinated with DFG for fishery studies on the Yuba and Feather Rivers.
Department of Fish and Game: A fourth petition, for temporary urgency change, was filed by the YCWA on August 8, for retransfer of a portion of the EBMUD water to the DFG. After approval of the EBMUD petition and the YCWA!EBMUD contract, the water supply from the Mokelumne Riv~r in the Sierra Nevada improved sufficiently that EBMUD decided to not divert any Yuba River water from the Delta with lower quality than its Mokelumne River water. EBMUD will, however, pay YCWA for all of its contract amount.
DFG has requested 30,000 acre-feet for waterfowl habitat in the Grassland Water District in western Merced County in the San Joaquin Valley. This water, which would be pumped during October and conveyed by the sWP, would be stored in duck hunting ponds during the winter and water remaining in the spring would be released to the San Joaquin River where it would help to maintain water quality objectives and improve conditions for fish. DFG will pay EBMUD $5 per acrefoot for 39,000 acre-feet, including water for "carriage" losses in transfer through the Delta. DFG

82 USCID Regional Meetings -- 1989
will also pay DWR for the costs of pumping and conveyance.
Although the petition was for a temporary urgency change for water already approved for transfer and previous experience had shown support for water for fish and wildlife, it required 15 days until August 23 when the petition was approved by a member of the Board. Approval by the Board is required within 30 days.
SUMMARY
In spite of legislative policy to encourage water transfers, the administrative procedures for even temporary water transfer in California make them difficult to implement. The outlook for long-term transfers, based on experience with temporary transfers, is even more complex. Provisions of CEQA apply to long-term transfers.
The simplistic concept that water transfers, where the rights remain with the transferor, can be a major source of water for urban areas remains to be demonstrated.
Possible adverse pumping impacts on fish were considered acceptable for diverting water for urban purposes, or wildlife uses, but not for irrigation. This view was held by SWRCB staff and transfer objectors.
The threat of legal challenge by special interest groups was a key factor in the laborious procedures of the SWRCB to make findings of no significant impact on fish, despite the joint position of DFG, DWR and YCWA to enhance fish flow conditions.
The fresh water "plumbing system" of the State Water Project, the federal Central Valley Project and the Yuba River Development, plus many other local projects, offers numerous opportunities for exchanges or transfers to meet short and long-term needs. Where cooperative, reasonable effort is applied, such as with DFG, DWR and YCWA, there are also opportunities for fish and wildlife enhancement, but long lead time must be scheduled to work through the administrative procedures.

INSTITUTIONAL CHANGE FOR
EFFICIENT WATER RESOURCE ALLOCATION
Andrew F. Rose*
As the number of water spigots increase in the public distribution network, agricultural water users sell or lease ditch company shares, water transfers increase, and exchanges become more complex. How do the legal and administrative systems we have in the western u.S. react to these changes and in what ways could they improve? Is the appropriation doctrine applicable today, or is it an outdated creed? How much water will change from agricultural to municipal use?
The basis for transfer is proof of historic consumptive use and noninjury to existing water rights. Accounting today translates into greater benefits on future transfers. As is often the case, however, a ditch company has only a rough guess on diversions through a major canal, and rarely has accurate records for diversions through individual laterals. state and district officials maintain records that are generally more reliable, but discrepancies occur with employee turnover.
In spite of problems in quantifying major diversions, the court cases refer to such amounts as 0.01 cfs for transfer. The anomaly between court allocation of water and administrative realities in the field is a serious problem. With the work demands of a water master, he can only concentrate on bulk diversions, not minor amounts. Still, the courts continue to evaluate these small quantities of transfer.
WATER RESOURCE INSTITUTIONS
The states are given primary duty for allocation, administration, and creation of location-specific law. This is handled through the court system and/or state engineer. Although state laws address most issues, when conflicts occur between state and federal laws, under the Supremacy Clause, federal laws prevail.
* Graduate Assistant, University of Idaho, MOscow, 10.
83

84 USCID Regional Meetings -- 1989
At the federal level, authority is exercised through four lead agencies. These include the u.s. Bureau of Reclamation (USSR), U.S. Army Corps of Engineers (USAC), Federal Energy Regulatory Commission (FERC), and Environmental Protection Agency (EPA). water conservancy districts, ditch companies and municipalities have authority from beyond their headgate or wellhead to the service area.
Federal Authority
The federal government creates independent bodies of law and policy specific to agency, project and water use. In its broadest sense, this authority is granted through the constitutional powers of commerce, propriety, general welfare, judicial, and compact. Major legislation was passed for the following specific water issues:
The Reclamation Act (1902) for establishing irrigated agriculture as a national policy. The Flood Control Act (1917) for flood control improvements outside the Mississippi Valley. The Transportation Act (1920) to promote transportation. The Federal water Power Act (1920) created FERC to control non federal development of hydroelectric power through licensing requirements.
A host of other legislation was passed to address additional uses for recreation, fisheries, and conservation. Water quality and environ~ental concerns are also addressed through the National Environmental Policy Act (1970) and Clean water Act (1982).
The federal government has tremendous influence in water management through established operating agreements on federal projects, the existence of federal reserved rights, and complex licensing/permitting requirements. In fact, the Supreme Court implied through the Rio Grande Case [1] that the states only have authority as an ~ of the United states to allocate private rights in water. Management of the irrigation component of USBR projects, which account for the largest percentage of water withdrawals in the west, is assigned through contract with water conservancy districts. Flood control and transportation operations are handled directly by the USAC and permitting for hydroelectric projects is handled by FERC.
I,

Institutional Change 8S
Federal ownership of land in the u.s. amounts to 740 million acres, most of which is in the west. The doctrine of federal reserved rights holds that when the federal government removed lands from the public domain it also reserved enough water to accomplish the principal purpose of the reservation.
For nearly any project to proceed through planning to construction, a host of federal permits and approvals are required. Examples include modification of a stream channel, which requires the US~C section 404 permit; operation of a hydroelectric project, which requires licensing by FERC; and, completion of the environmental impact statement required by EPA.
state Authority
The federal acts of 1866 and 1870 [2] effectively gave states authority to define water rights and documented separation of water from federally patented land titles. state statutes provide for appointment of the state engineer as the chief administrative agent for each state. The state engineer is the general steward for the resource. with the help of a diverse staff he identifies and manages all state water and resolves interstate issues.
state law historically has centered on irrigation uses that divert and consume water. In recent times states have created law to address specific public needs. For example, the water Rights Determination and Administration Act was passed by the Colorado legislature in 1969 to recognize the interrelationship of surface and ground water, and allow augmentation plans [3]. Augmentation plans permit " .•. a detailed program to increase the supply of water available for beneficial use in a division or portion thereof by the development of a new or alternate means or points of diversion, by a pooling of water resources, by providing SUbstitute supplies of water, or by any other appropriate means."
Nearly all western states have enacted a water plan. California has the oldest (1957) and perhaps most comprehensive plan. These plans assign the authority for planning, development, and management issues to existing or newly-created state entities.

86 USCID Regional Meetings .. 1989
Local and Agency Authority
Conservancy districts have local control and management of water reclamation projects. These quasigovernmental organizations have power to acquire and hold property (eminent domain), power to construct on state lands, contract with the U.S., and to levy taxes on all real and personal property. Districts can be as simple or complex as the project they manage. Colorado set precedence in 1937 with the first conservancy district. The Colorado Conservancy District Act [4] created the Northern Colorado water Conservancy District. This district operates the irrigation component of the Colorado Big Thompson Project, a multi-purpose USBR project.
An example of a larger district is the Imperial Irrigation District in southern California. This district oversees water deliveries on the All-American Canal, a major straw in the Colorado River diverting 3.2 million acre-feet annually. Districts distribute water to share holders through several techniques. The proportional rule is the most common technique and results in each district share yielding a percentage of total allotment. Commonly, water users acquire surplus shares for leasing water or long term holding.
WATER RIGHT CHANGES
In all the western states virtually no new (unappropriated) water is available. cities in population growth areas, such as the Front Range of Colorado, must purchase existing rights as a potential supply source for their public works systems. Water court resumes for the South Platte River Division show municipalities routinely seeking changes of use for irrigation water. The court process can be long and expensive. Several years may elapse before a plan is approved, often at great legal and engineering expense. Two conditions must be met before court approval: (1) the historic consumptive use must be established, (2) the applicant must prove lack of injury to other water rights.

Institutional Change 87
Historic Consumptive Use
Generally, consumptive use calculations are computed using the Blaney-Criddle or Jensen-Haise formulas. These equations yield evapotranspiration for a crop based on environmental parameters. Potential consumptive use is what the crop would use if given a full irrigation supply; actual consumptive use is what was actually supplied by irrigation water. Actual unit consumptive use values can be applied to the historically irrigated land to arrive at the transferable portion of a water right.
Problems arise when inadequate diversion records are available, when several water rights are taken through the same structure, or when several types of water are intermingled. Controversy also occurs with selection of the study period, record of crops irrigated, and crop coefficients. In the court process the parties reach a resolution through long and involved negotiation.
Injury
While laws are flexible in acknowledging changes to water rights, the courts are firm in requiring the applicant prove lack of injury to existing water rights. Injury can occur through a greater period of diversion or greater quantity of diversion. During the technical analysis of a proposed change of water right the engineer must address all impacts to downstream water rights and intervening rights. Once factual determination of potential injury is identified, terms and conditions must be agreed to by objectors.
Current Problems
Because each proposed transfer is unique within the hydrologic network, a complete technical analysis is required on each transfer. Often sUbjective judgement is accepted when no alternatives exist to determine thE! facts. When expert witnesses on opposing sides have differing opinions, how can an equitable decision be reached? Another problem is that the bulk of water rights are owned by public agencies or large companies, the interests of older and more valued rights are not protected.

88 USCID Regional Meetings -- 1989
water rights are ambiguous, attenuated, and spatially distributed in random fashion. As surface diversions increase, instream uses such as hydropower, fish habitat, recreation and transportation suffer. Competition between hydropower and new irrigation is such that the marginal value of agriculture is not greater then the marginal cost of power replacement. While economics dictate use of water for power generation, state laws have historically supported irrigated agriculture. A recent development is that FERC is now implementing a decision of the u.s. 9th Circuit Court, permitting interference in state allocations.
WATER MANAGEMENT STRATEGIES
The federal-state partnership has historically worked very well. National objectives of economic prosperity through reclamation, stricter water quality standards, and protection of the environment are being met. New legislation such as the Reclamation Reform Act [5] have served to protect the public farming interests and maintain a strong federal presence. The strong federal opinions on select issues is important to assure future support in reclamation.
State water resource agencies could take a more active role as a manager, rather then an administrator. On the positive side unified policies would have greater effect and decisions could be reached more quickly. Conversely, a centralized agency may have difficulty to adjust to changed conditions. Also, a state regulator would have to calculate benefits and costs in view of strong pressures from special interests.
All but one of the western states have a recognized water plan. These plans create a commission to appropriate instream flows, act as caretaker of public interest, and lead in planning efforts. Kansas has one of the newest and most comprehensive plans. Three areas--management, conservation and development--are mandated by the Act. Statewide and basin-specific sections force the authorities to address specific issues.

Institutional Change 89
CONCLUSIONS
We need to review our policy-making procedures to effectively deal with the changing demand for municipal and instream uses above irrigated agriculture. The historical concept of gaining maximum beneficial use of the resource by removing it from the river is changing to one of maximizing storage and generating power. Generating kilowatts yields a firmer, more continuous, and dependable revenue stream then weather-susceptible crops.
Water resource planning at the state level must take a more visible role. The attitude among parties involved in water transactions seems to be a behind-the-scenes approach and lack of thorough research before the transfer. We need to understand more clearly just what is intended by transfer and within the intentions of the doctrine of prior appropriation. Water transfer to the highest valued uses, as dictated by the market, serves societies best need. Therefore, legal, institutional and cultural barriers than prevent this should be removed. The level of administrative detail to prevent injury to existing water rights has become so complex that augmentation plans become very elaborate.

90 USCID Regional Meetings -- 1989
REFERENCES
[1] 174 U.S. 690, 702, 43 L. Ed. 1136, 19 Sup. ct. 770 (1899)
[2] 30 U.S.C. Sec. 51 & 52 (1866, 1870)
[3] S.B. 81 (1969)
[4] H.B 714 (1937)
[5] Pub. L. No. 97-293, 96 Stat. 1263 (1982)
Frederick, Kenneth D. 1986. Scarce water and Institutional Change, Resources for the Future, Inc., washington, D.C.
Gould, David J. 1979. ~L9a~w~awn~d~t~hue~A~d~m~1~'n~1~'s~t~r~a~t~i~v£e Process: Analytic Frameworks for Understanding Public Policymaking, University Press of America, Inc. ,Washington, D.C.
Rice, Leonard & White, Michael D. 1987. Engineering Aspects of Water Law, John Wiley & Sons, Inc.
speidel, David H., Ruedisili, Lon C. & Agnew, Allen F. 1988. Perspectives on Water Uses and Abuses, Oxford University Press, Inc., New York.

r--I
MANAGING UTAH'S WATER THROUGH I NTERBASI N TRANSFER
Franklin E. Dimick *
ABSTRAC!
In order to utilize and manage the portion of Colorado River Water allotted to the State of Utah to the fullest extent, a significant problem has to be overcome. Approximately 80% of the population of Utah lives along the Wasatch Front between Ogden and Provo in the Bonneville Basin. The area in the eastern part of the state that is in the Colorado River Drainage Basin is very sparsely populated and has relatively little irrigab1e land. This means that in order to maximize the use of this water, it must be transferred between basins.
The Bureau of Reclamation planned, designed and is constructing the Central Utah Project to achieve this interbasin transfer. The purpose of this project is to divert water from streama that are tributary to the Colorado River and transport it to the Bonneville Basin where the major population centers and the prime irrigab1e lands are located.
The major features of the Project used for the interbasin transfer are the Strawberry Aqueduct, three storage reservoirs (one with a capacity of over one million acrefeet), and seven diversions structures of various capacities.
Additional storage reservoirs have also been built downstream of the aqueduct to capture and store excess runoff to minimize the impacts created by diverting the water.
Proper operation and management of this system will result in the interbasin transfer of 142,500 acre-feet of-water annually, in addition to the 56,700 acre-feet diverted for the Strawberry Project, thus utilizing a portion of Utah's Colorado River water.
* Project Manager, Lahontan Basin Projects Office, U.S. Bureau of Reclamation, Carson City, Nevada.
91

92 USCID Regional Meetings -- 1989
HISTORY
The Colorado River and its tributaries flow through the States of Wyoming, Utah, Colorado, New Mexico, Arizona, Nevada, and California before it passes across the international border into Mexico. This mighty river is one of the major sources of water for these states as well as Mexico. Almost from the time that early pioneers began settling this part of the west, conflicts over the river have arisen. These early settlers realized that water from this river was a precious commodity that was necessary for any development of this arid land. As these western states continued to develop, the demand for water increased rapidly. Initially, the demand was for irrigation water but as the metropolitan areas continued to develop, the demand for municipal and industrial water was added. Soon it became apparent to those people with foresight and vision that the Colorado River could not meet all of the demands that would be placed on it. Competition among the various states and Mexico for this precious commodity became heated.
In an effort to resolve these conflicts, a compact was approved in 1922. This compact divided the Colorado River into three areas, the Upper Colorado Basin, the Lower Colorado Basin, and Mexico, and then allotted the water in the river system to the various divisions. The division between the upper and lower basins was at Lee's Ferry where the Colorado River crosses the Utah-Arizona border just downstream of Glen Canyon Dam. Under the terms of the compact, the upper Basin was to have the right to use 7,000,000 acre-feet of water from the river, the Lower Basin was to have the right to use 7,000,000 acre-feet, and Mexico was to have the right to 1,500,000 acre-feet. This compact, however, did not settle many of the issues between the various states, and as time went on, it was also determined that the allotted amount of 7,000,000 acre-feet to the upper basin was in excess of what was available in the river.
Therefore, in the 1940's, a new compact was reached that reduced the amount of water available for use in the Upper Basin to 5,800,000 acre-feet and divided that amount among the five states included in the basin. The upper Basin water was allotted as follows: Wyoming 14%, Utah 23%, Colorado 51.75%, New Mexico 11.25%, and Arizona 50,000 acre-feet. Arizona also received an allotment from the Lower Basin. Based on the long term average of the Colorado River flow at Lee's Ferry prior to 1949, Utah's
Interbasin Transfer 93
23% amounted to 1,322,000 acre-feet of water that could be diverted.
PROBLEM
Of this allowable diversion, it was realized that Utah was only using approximately 684,000 acre-feet. Another 397,000 acre-feet has been committed for use, leaving 241,000 acre-feet of water available for future development.
Studies were initiated to determine the best way to utilize the water allocated to Utah but not yet committed in meeting the demands of the state. Planners immediately became aware of a significant obstacle that would prevent the use of Utah's share of water from the Colorado River. Utah's portion of the Colorado River Basin lies in the sparsely populated eastern half of the State. This eastern section of the state contains less than 10% of the total state population. Agricultural land is very limited also with most of the terrain being either mountainous or rocky desert, not capable of being irrigated for agricultural production. Approximately 80% of the state's population resides along the ''Wasatch Front" which is the western side of the Wasatch Range of Mountains. This area also encompasses the major portion of the irrigable acres of agricultural land in the state. This area of high population and extensive agricultural production is in the Bonneville Basin which drains to the Great Salt Lake. The water supply for this area is limited to the water originating on the west slope of the Wasatch Mountains.
With the highest demand for water being in the Bonneville Basin and the largest water supply being in the upper Colorado River Basin, it was very obvious that if Utah was to utilize its allotted portion of Colorado River water then a transbasin diversion must occur to move the water from the east side of the state across the Wasatch Mountains to the Wasatch Front.
SOLUTION
The concept of such an interbasin transfer of water along with other aspects of developing the Colorado River water supply was studied by the Bureau of Reclamation starting in 1928 under the authority of the Boulder Csnyon Project Act. Subsequent studies showed that it would be feasible to capture water from tributaries of the Colorado River in

94 USCID Regional Meetings -- 1989
Eastern Utah and transmit it to the Bonneville Basin. A plan was developed and on April II, 1956, Congress authorized the Central Utah Project through Public Law 84-485. The project involved developing a water supply for three separate sub-basins, the Uinta Basin, the Bonneville Basin, and the Sevier River Basin. To do this, the project was divided into SiK separate units; (1) Jensen (2) Vernal (3) Uinta (4) Upalco (5) Bonneville (6) Ute Indian. The first four units were designed to develop a water supply for the Bonneville and Sevier River Basins from tributaries of the Colorado River through a transbasin diversion. The SiK units were to develop a total water supply of 486,900 AF during the initial phase and a total comprehensive development of 1,018,700 acrefeet, with the Bonneville Unit developing 281,850 acrefeet. Of this amount developed by the Bonneville Unit the Wasatch Front counties of Utah, Salt Lake and Juab would receive 71%. This would require a transmountain diversion of 151,000 acre-feet, allowing delivery of 142,500 acrefeet after transmission and storage losses. This diversion would be in addition to the 56,700 AF of transmountain water already delivered to the Strawberry Project constructed in the 1900's. This interbasin transfer of water would be accomplished by the construction and operation of the Strawberry Collector System. The concept of the collector system was to intercept and divert the flow of several streams on the south slope of the Uinta Mountain range. These streams are tributaries of the Duchesne River which flows into the Green River which flows into the Colorado River. The diversion points were to be connected with a series of tunnels and open channels, termed the Strawberry Aqueduct. The diverted water was to be carried through this aqueduct to a terminal reservoir for storage. Water would then be drawn from the reservoir via a tunnel through the Wasatch Mountains as needed to supply the demands of the Wasatch Front and the Sevier River Bssin.
CONSTRUcrr ON OF COLLECTOR SYSTEM
Construction of the Strawberry Collector System commenced in 1966 and was completed in 1988. A schematic of the collector system is shown in Figure 1. The upper end of the collector system consists of the Upper Stillwater Dam on Rock Creek. The dam is a roller compacted concrete (RCC) structure 275 feet high and 2,665 feet long. The dam captures the spring flows of Rock Creek and stores them in the 33,123 acre-foot reservoir. Water from the reservoir can be diverted into the head of the 7.5 foot
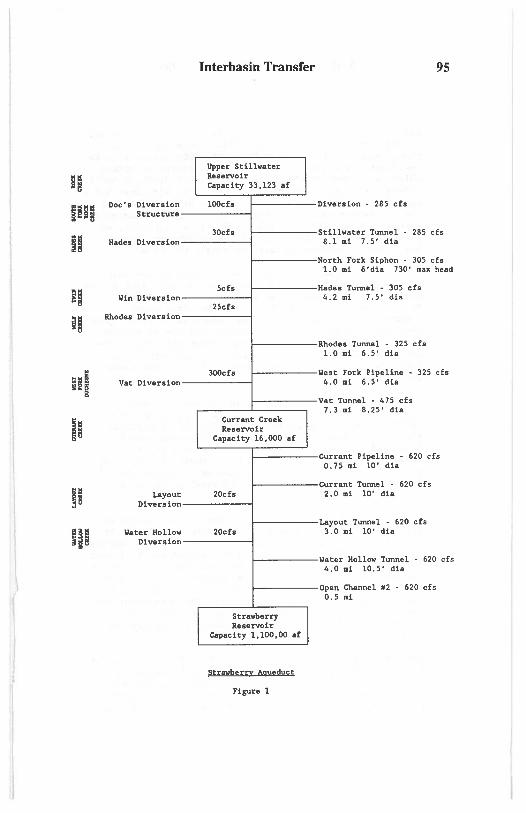
HI
~U~
n
~I
;1
nl U
Doc's Diversion Structure
Hades Diversion
Win Diversion
Rhodes Diversion
Vat Diversion
Layout Diversion
Water Hollow Diversion
I
Interbasin Transfer
Upper Stillwater l Reservoir Capacity 33,123 af
loocfa
30cf.
Scf.
2Scfs
300cfs
I Currant Creek
I Reservoir Capacity 16,000 af
20cf.
20cfs
I Strawberry
af I Reservoir capacity 1,100,00
Strawberry Aqueduct
Figure 1
95
Diversion· 285 cfs
Stillwater Tunnel • 285 cfs 8.1 mi 7.S' dia
North Fork Siphon • 30S cfs 1.0 .. i 6'dia 730' max head
Hades Tunnel • 30S cf. 4.2 IIi 7.S' dia
Rhodes Tunnel • 325 cf. 1.0 mi 6 . 5' dia
West Fork Pipeline • 325 cfs 4.0 IIi 6.S' dia
Vat Tunnel • 475 cf. 7.3 mi 8.25' dia
Currant Pipeline . 620 cf. 0.75 mi 10' dia
Currant Tunnel • 620 cf. 2.0 IIi 10' dia
Layout Tunnel . 620 cf. 3 . 0 mi 10' dia
Water Hollow Tunnel • 620 cf. 4.0 IIi 10.5' dia
Open Channel #2 . 620 cf. 0.5 IIi

96 USCID Regional Meetings -- 1989
diameter 8.1 mile long Stillwater Tunnel at a maximum rate of 285 cubic feet per second (cfs). Connected to the downstream end of the Upper Stillwater Dam outlet pipe to the tunnel is a pipeline from Doc's Diversion Structure which is located on the South Fork of Rock Creek, a small stream just downstream from the dam. This structure has a capacity of 100 cfs. The water can be delivered either to the Stillwater tunnel or backflowed through the dam outlet works to be stored in Stillwater Reservoir depending on whether or not the lower end of the Strawberry Aqueduct has enough available capacity to handle the flow.
At the downstream end of Stillwater Tunnel is the North Fork Siphon which drops 730 feet down the east side of the canyon to the bottom at which point the Hades Feeder Pipeline bringing up to 30 cfs of water from Hades Diversion Structure is far enough upstream of this siphon that the head created in the feeder pipeline is greater than the head in the siphon. The siphon then climbs the west side of the canyon and enters the head end of the Hades Tunnel, a 7.5 foot diameter, 4.2 mile long tunnel with a capacity of 305 cfs.
At the downstream end of the Hades Tunnel is 3 short siphon across another canyon. Two more pipelines from diversion structures enter the aqueduct at this point. The first Is the 5 cfs capacity win Diversion from Twin Creek and the second is the 25 cfs capacity pipeline from Rhodes Diversion Structure located a short distance away on Wolf Creek. From this point the water enters the 6.5 foot diameter, 1 mile long Rhodes Tunnel which has a capacity of 325 cfs.
The downstream end of the Rhodes Tunnel is connected to the 4 mile long West Fork Pipeline which has a 6.5 foot diameter and a capacity of 325 cfs. This pipeline empties into the Vat Tunnel which is 7.3 miles long and 8.25 feet in diameter and a capacity of 475 cfs. The Vat Diversion Dam also introduces water at the upstream end of the Vat Tunnel. The Vat Diversion Dam diverts up to 300 cfs from the West Fork of the Duchesne River. This diversion dam has a small reservoir that is designed to handle daily variations in the runoff volume caused by warm days and cool nights.
The Vat Tunnel empties into the 16,000 acre foot capacity Currant Creek Reservoir. This reservoir is formed by Currant Creek Dam a 130 foot high, 1,600 foot long earth fill dam on Currant Creek. This reservoir is designed to provide recreation as well as divert water. The dam was

Interbasin Transfer 97
designed so that the water surface of the reservoir would only fluctuate a maximum of 4 feet while handling the variable flow of Currant Creek. Water is released from Currant Creek Reservoir into the .75 mile long, 10 foot diameter Currant Pipeline which has a capacity of 620 cfs.
The Currant Pipeline discharges into the 2 mile long, 10 foot diameter Currant Tunnel which also has a capacity of 620 cfs. This tunnel ends at a small siphon that crosses Layout Creek. A small diversion structure, Layout Diversion, diverts a maximum of 20 cfs from this creek and empties it into the aqueduct. The 10 foot diameter Layout Tunnel extends another 3 miles from this point and has a capacity of 620 cfs. This tunnel also ends in a siphon. This siphon crosses Water Hollow Creek which also has a 20 cfs capacity diversion structure on it. The Water Hollow Diversion Structure diverts water into the aqueduct at the upstream end of Water Hollow Tunnel. This 620 cfs capacity, 4 mile long tunnel has a diameter of 10.5 feet and empties into a 1/2 mile long section of open channel which carries the water from the Water Hollow Tunnel to the enlarged Strawberry Reservoir which is the terminal storage reservoir for the collector system. This reservoir has a capacity of 1.1 million acre-feet and is formed by Soldier Creek Dam on the Strawberry River.
This 251 foot high 1,290 foot long dam replaced the old Strawberry Dam and increased the capacity of the reservoir approximately fourfold. The Strawberry Dam was built in the early 1900's to provide carryover storage for the Strawberry Project on the Wasatch Front near Spanish Fork, Utah. A tunnel was drilled through the Wasatch Mountains from the Spanish Fork River to the Strawberry Reservoir to carry the water to the project use area. A similar tunnel will be used to carry Bonneville Unit water diverted by the Strawberry Collector system to the Bonneville Unit service area as well as Strawberry Project water.
Because the collector systems diverts so much water from the Duchesne River, consideration had to be given for assuring prior water rights on this river would be met. Consequently, Starvation Dam was built on the Duchesne River near the town of Duchesne, Utah. This 163 foot high and 2,720 foot long earthfill dam has a reservoir capacity of 167,310 acre-feet. Flood waters of the Duchesne River originating downstream of the collector system diversions and those flows that exceed the capacity of the diversion structures are captured in Starvation and later released to meet prior rights on the Duchesne River. To supplement the water captured by Starvation Dam, Knight Diversion Dam
98 USCID Regional Meetings -- 1989
was constructed on the North Fork of the Duchesne River about 5 miles North of the town of Duchesne. A 0.6 mile long pipeline and 1 mile long tunnel carry the diverted water to Starvation Reservoir. Again, the waters diverted are excess flows in the river not needed to meet downstream water rights.
OPERATION OF SYSTEM
The unusual operating conditions created by this large collection system are significant. The elevation differences in the various watersheds as well as the daily fluctuations in flow caused by the warm daytime temperatures and cool nighttime temperatures cause many operational problems. To complicate the situation even more, the tunnels all have the operational restriction that they must never become pressurized but must have a free water surface at all times. These factors require frequent changes of regulating gates on the diversion structures and dams. To optimize the operation of the collection system, a Programmable Master Supervisory Control System is being developed. This system will allow complete automation and remote control of the system from a central control point scheduled to be located in Duchesne, Utah.
Water gathered by the Strawberry Collector System and stored in Strawberry Reservoir is carried through the Wasatch Mountains and used in the Bonneville and Sevier River Basins. The water will be released as needed to the 5.7 mile long Syar Tunnel. This 8.5 foot diameter tunnel has a total capacity of 600 cfs and terminates at the 6th Water Aqueduct. Water scheduled for delivery to the Sevier River Basin will be carried through a system of canals, tunnels, and pipelines to the project area for use as supplemental irrigation. Water used to meet the Municipal and Industrial demands of the Wasatch Front area of Provo and Salt Lake City, Utah as well as many surroundings smaller towns takes a very different path.
The quality of the water that is collected from the tributaries of the Colorado River and stored in Strawberry Reservoir is adequate for irrigation purposes but is poor enough quality that it would require extensive treatment to supply municipal needs. However, water that flows down the western slope of the Wasatch Mountains in the Provo River is of a high quality and very well suited for municipal use. Some of the Provo River water flows to Utah Lake to satisfy irrigation rights as well as maintain

Interbasin Transfer 99
the lake. In order to best utilize these two sources of water an exchange was effected wherein Provo River water that normally flows to Utah Lake is used for the Municipal and Industrial demands and Colorado River water will flow through the Syar Tunnel and down the Spanish Fork River into Utah Lake to replace the diverted Provo River water. In order to divert and fully utilize the Provo River water the Jordanelle Dam is presently being built on the Provo River about 8 miles north of Heber City, Utah. The earthfill dam will be 300 feet high and 3,700 feet long with a reservoir capacity of 320,000 acre-feet. This reservoir stores the excess flows of the Provo River as well as those flows that go to satisfy rights in Utah Lake and release the water as needed for diversions into aqueducts for treatment and delivery along the Wasatch Front.
CONCLUSION
Through the use of this complicated and extensive system of collection, storage, and distribution faCilities, the Bureau of Reclamation has been able to help the residents of the State of Utah utilize approximately 181,000 acrefeet of their allotted share of Colorado River water, including the 56,700 acre-feet of Strawberry project water. The Bonneville Unit of the Central Utah Project will meet the water demands of the Ilasatch Front area for many years to come.

I j,

ECONOMIC AND ENVIRONMENTAL IMPACfS OF A LARGE SCALE WATER 'mANSFER IN 1lIE COLORADO RIVER BASIN
George Oamek' and Stanley R. Johnson·
ABS1RACf
The direct economic, and offsite enviTonmenta~ impacts of a 400,()()(} acre foot water transfer between irrigators in the Upper Basin of the Coloradb River and urban users in the Lower Basin was examined. Results indicated that the transfer would result in considerable offsite benefits, with minimal disluption to local agriculture.
IN1RODUcrION
Recent legislative actions by Western states are evidence of their "coming to terms" with pressures to use economic criteria in allocating surface waters. California, for instance, opened the door for increased intrastate transfers by allowing individuals access to unused capacity in conveyance facilities (1). The Colorado state legislature imposed a $50 per acre foot tax on water exported from the state in excess of established compacts, despite the fact that such interstate tranfers between individuals are prohibited (2). In addition, the Western Governors Association sponsored research which encouraged orderly voluntary tranfers of existing water rights as an alternative to expensive water development programs (3). Even the traditionally conservative Bureau of Reclamation has promised to "facilitate the transfer of water between willing buyers and sellers" (4).
Two interested parties who could potentially be affected, and possibly benefit, from the above institutional changes are the water users of Southern California and private sector investors attempting to divert excess water from the Upper Colorado .River basin to San Diego. Southern California, especially member agencies of the Metropolitan Water District (MWD), is facing the loss of nearly one-half million acre feet due to the Central Arizona Project's (CAP) ability to draw Arizona's full share of the Colorado River for the first time. This situation - plus growing northern California opposition to a cross Delta facility, continued rapid population growth in their service area, and a recent legal setback with diversions from the Mono basin - puts a great deal of pressure upon MWD to find additional economical short and long term water supplies. Hoping to profit from this situation is a consortium of private investors under the name of the Galloway Group Ltd. Their controversial 1984 proposal was to impound from 300,000 to 500,000 acre feet of agricultural and other less perfected water rights from the Upper Colorado basin, particularly Colorado's Yampa and White sub-basins, and lease it to San Diego County Water Authority for an indefinite period (5). Although apparently dead for lack of initial investment (6), the Galloway proposal might have withstood the significant institutional barriers in its path if its backers had been willing
, Economist, CH2M Hill, 3840 Rosin Court, Suite 110, Sacramento, California, 95834, (916) 920-0300
• Professor of Agricultural Economics, Iowa State University, Ames, 50011, (515) 294-3133
101

102 USCID Regional Meetings -- 1989
to wait out the litigation. Among the more notable barriers are the Colorado River Compact, Arizona v. California, the Upper Basin Agreement, state water laws, and Bureau of Reclamation contracts tying water to certain project areas.
Challenging this institutiomrl structure are the above recent state level changes and the well publicized Sporhase decision, which ruled that water is an article of interstate commerce as defined by the Commerce Clause (102 S. Ct. 613, 1982) and states that any legislation or regulation which poses an "impermissable burden" on interstate commerce can be judicially invalidated.
A serious obstacle to the success of the Galloway proposal was the ajudication of the water they claimed rights to. Colorado, like most states employing the prior appropriation doctrine, allows only the consumptive use portion of a water right can be transferred. Much of Galloway's water is suspected of having no history of consumptive use, making it difficult to assess the volume eligible for transfer.
OBJECI1VES
This paper analyzes the direct economic and offsite environmental impacts of the Galloway proposal assuming that the water rights in question come out of one of the lowest valued, quantifiable use in the Upper Basin, namely irrigated agriculture. Specifically, it estimates the marginal value of water for irrigated agriculture to the Upper Basin for the amount involved in the transfer, and estimates the land use, production, agriculture income, and input expenditure changes in the region that result. It also estimates the changes in river quality, as measured by salinity, and changes in the river flow, measured by hydroelectic energy produced at the intervening dam sites, stemming from the transfer. The recipient of this transferred water is presumably San Diego, but the analysis could apply equally to any Lower Basin user.
ME'IHOD OF ANALYSIS
Three mathematical programming models were developed to measure the value of water to irrigated agriculture, each corresponding to a sub-basin within the Upper Colorado River. The models were originally subsets of the Center for Agricultural and Rural Development (CARD) linear programs of U.S. agricultural production and corresponded to their producing areas (PA's) 82, 83, and 84 (7). PA 82 represents the Green River system, including the Yampa and White Rivers (Figure 1). PA 83 encompasses the Colorado main stem, and the Grand, Dolores, and Gunnison Valleys. The upper and lower San Juan Valleys are represented by PA 84. These PA's correspond to the Water Resource Council's aggregate subareas 1401, 1402, and 1403, respectively. The three models were developed with a profit maximizing criteria, incorporating both dryland and irrigated crop production activities. Irrigated crops include com grain and silage. wheat, barley, alfalfa, and "other" hay. Wheat and other hay are the dryland crop alternatives. RotatiOns, rather than single crop alternatives, were considered for this analysis. Both irrigated and dry cropland are divided into 8 groups reflecting qualitative differences in land and corresponding yield differences.
Although land and water are the only constraining resources, other resources and inputs are tracked with accounting rows for insight to the severity of secondary impacts on the local economies. Land contraints for endogenous crops and potential cropland were obtained from the 1982 National Resources Inventory (8). The upper limit on surface

Large Scale Water Transfer 103
Figure 1. The Colorado River and its tributaries
t .-N-
1

104 USCID Regional Meetings --1989
water supplies is the sum of the consumptive use requirements for the crops times their base year acreages.
The models assume irrigators are price takers through fIXed output prices. und use, output prices, and input costs are based at 1984 levels, the most recent year for which full information is available. Each assumes a fIXed technology in the sense that there is no opportunity to move down the production function by practicing deficit irrigation to conserve water. On-farm irrigation application efficiencies are also assumed fixed at approximately 50 percent for each PA The value of irrigation water implied by the models would have to be considered on the high side in light of the lack of technological substitution possiblities.
Preliminary baseline results indicated implausible specialization in certain profitable crops and virtually no acreage of other crops. As an alternative to the traditional cropland flexibility constraints, the models then incorporated Positive Quadratic Programming (PQP), as put forth by Howitt and Mean (9). This technique avoids flexibility constraints by first calibrating the models with land use constraints intact, and then using the dual values associated with them to derive a quadratic cost term to add to the objective function value of the crop production activities. This quadratic term accounts for the unmeasurable costs of risk, seasonal machinery and labor availability, qualitative differences in soil types, and other unobservable factors inherent in agricultual production.
Although convenient in implementing and defendable in short run applications, PQP has the obvious shortcoming of distorting the Objective function in order to achieve a given base level of land use. The Objective function value then becomes a poor indicator of net regional income. For example, one P A had a value of $835,000 when constrained to base year acreage levels. Adding the PQP term increased the objective to $13.6 mil. The impact of this undesirable characteristic of PQP was much less noticeable on the dual value of irrigation water, having minimal impact until water became severely constrained.
Offsite environmental impacts were assessed with the Bureau of Reclamation's Colorado River Simulation System (CRSS) (10), adapted for this research. The model is particularly well suited for this analysis due to its regional delineation along SUb-basins and the ability to easily alter its institutional constraints.
Historical river and tributary flows are the hydrological inputs to the CRSS which can be varied by the user to match any historical record desired. For this study, a 30 year period of record was used incorporating the flow pattern of 1922 through 1951. Sectoral water demands, return flows, institutional constraints, and river operation criteria are exogenous input to CRSS. The bureau supplied necessary information for the their 1986 baseline values.
Linking the two modeling frameworks was a straight forward process. Output from the CRSS model regarding irrigation water delivery to each sub-basin for each year of record was aggregated to the PA level. The annual variation in these deiveries was then used to adjust the surface water constraint in .the PQP models. The latter are then solved for each year of record.

Large Scale Water Transfer 105
PROCEDURES
Activities were developed to transfer water to the Lower Basin when it becomes more profitable than its value to irrigation. By parameterizing water's selling (or leasing) price in the POP models and summing the water transferred at each price across PA's, a normative supply curve for Upper Basin irrigation water can be derived. This supply curve can then be used to observe how much water might be forthcoming from the basin as a whole at given water prices.
The volume of water transferred in this analysis is assumed to be 400,000 acre feet, the mid-range of the Galloway Proposal. The above supply relationship determines where in the basin this amount could be most economically obtained and its marginal value was to irrigation.
Drought years will surely drive up water's marginal value to agriculture. Annual variation in deliveries were observed from the CRSS model over its 30 year period of record and the corresponding change in water value resulting from it can be derived from the supply curves.
Adjusting the CRSS model to reflect the transfer proposal involves allowing an additional 400,000 acre feet in excess of existing compacts to pass through Glen Canyon and Hoover Dams annually to reach the intake of the Colorado River Aqueduct at Lake Havasu. Upper Basin demand and return flow figures are adjusted, based on the results of the previous exercise, to capture the decreased salt loading and increasing flows at certain locations on the river system. Resulting changes in salinity and hydropower production resulting from this were then observed over the period of record and valuated with estimates from other previous studies.
RESULTS OF TIlE ANALYSIS
Parameterizing the selling price of water resulted in two normative supply curves depending on how land conversion was handled. Assuming that after the water is sold the formerly irrigated land can revert to dryland production yielded a lower marginal value of water than a no conversion situation (Figures 2 and 3). With conversion possiblities, about 1.8 million acre feet of Upper Basin irrigation water have a marginal value of $40 per acre foot or less. Without conversion, the same volume has a value topping out at $70 per acre fool. Both situations illustrate the low value of irrigation water here and are generally consistent with previOUS studies by Gisser (11) and Howe (12).
At a transfer level of 400,000 acre feet, with conversion possibilities, a marginal value of $5.05 was derived from Figure 3. Similarly, but without conversion, a value of S9.4O resulted. It is difficult to definitively state whether conversion to dryland production is feasible or not. In some areas of the Upper Basin it would be possible, but in other areas possibly not due to extreme aridity. For brevity, the remainder of the analysis will present only the results for the case with conversion.
Table 1 illustrates changes resulting from the transfer of water use, cropping patterns, production, and other itemized variables from their base levels. Of note in Table 1 is the slight increase in land use in PA 82 resulting from previously idle lands being brought into dryland production. More important, however, is the observation that a 22 percent reduction in total consumptive of irrigation water results in a much less than proportional decrease in the recorded variables.

106 USCID Regional Meetings -- 1989
Figure 2. A normative supply curve for Upper Basin irrigation water assuming land conversion from irrigated to dryland is feasible
0.. , ~:I;~)
Figure 3. A normative supply curve for Upper Basin irrigation water assuming no land conversion from irrigated to dryland production

Large Scale Water Transfer 107
Table 1. Result, or reducing Upper Coror.do Baoln agricultural water uoo by
400,000 acr ... root, alllUmlng the posolbllity or land converolon to drytand
production Producing area:
TotaUOV8I'III 82 83 84 weighted average
Reduction in consumptive water UN from bal8linaleval (t ,000 AF): t53 208 47 408
Percentage reduction in consumptive water use: (15) (3e) (t6) (22)
Percentage change In land u .. : Corn grain S (8) I (2) Corn lilag. 3 (38) (3) (18)
Allwhaal 5 (13) (5) Barley 8 (3) 1 1 Logumehay (18) (4) (e) Nonlegume hay 31 3 18
Percentage change In production: Corn grain 5 (8) (2) (2) Corn ailage 3 (38) (3) (18) All wheat 18 (18) 4 (3) Barley 9 (3) 1 2 Legume hay 1 (3) (5) (2) Nonlegum. hay (6) (38) (31) (25)
Other percentage chang •• : ~ Soil eroolon (water) (20) 13 (I) (1) Soil eroalon (wInd) 7 4 (6) 5 Machinery expenditure. (12) (1) (6)
Peollclde e.pendlture. (15) 22 (7) Fertilizer expenditure. (17) 2 (8) laJlor uaage (8) (1) (4)
Reduction In regional
not farm Income ($1,000): (489.48) (101 .38) (27.55) (818.43)

108 USCID Regional Meetings --1989
With conversion, there are obviously substitution possibilities between crops and between irrigated and dryland production, both of which help to minimize the impacts to regional agriculture despite the loss of 400,000 acre feet The last item of Table 1, the reduction of agriculturally generated profits, can be subtracted from the total revenues of the water transfer to approximate the producer surplus of the transfer strategy. At 55.05 and 400,000 acre feet, annual revenues would be $2.02 million dollars annually, resulting in an annual producer surplus of 51.4 mil.
The modified CRSS model was simulated over the 30 year period 1986 through 2015, incorporating the historical streamflow records of the period 1922 through 1951. The irrigation water delivery schedule resulting from this was used to adjust the surface water constraints in the agricultural models. These PQP models were then solved for each year of the period 1986-2015. The resulting total annual value of irrigation water is given in the second column of Table 2. Some of the near term values of less than 52.02 mil ($5.05 x 400,000 AF) reflect that reservoirs were currently near full capacity in 1986 and the likely continued excess deliveries to the Lower Basin until CAP becomes fully operational Longer run annual values of the 400,000 AF usually exceed $2.02 mil. because regional Shortages, particularly in the Green River sub-basin, are explicitly considered in valuing the water. Accounting for the shortages resulted in a long term average value of 55.53 per acre foot. The net present value of irrigation over the 30 year period is given at the bottom of Table 2, using discount rates of 3 and 6 percent.
Of equal interest to policymakers are the transfer's offsite impacts. As seen in the third and fourth columns of Table 2, CRSS estimated long term salinity reductions of about 37 milligrams per liter (mg/l) at Lake Havasu and 43 mg/l at Imperial Dam resulting from the transfer. Using the mid-range of Gardner's estimates of the benefit of salinity reduction to agriculture in the Imperial Valley of S46,OOO per milligram per liter yielded the fifth column of Table 2 (13). These benefits are attributable to increased crop yields. It is of interest to note the time lag of 6 to 7 years in realizing the full benefits of salinity reduction. Estimates of the municipal and industrial (M&I) value of reduced river salinity cited in Gardner, with a mid-range of $234,500 per milligram, resulted in the final column. These benefits stem from increased useful life of plumbing fixtures and wastewater facilities. The decreased salinity content of the river results in an economic ~nefit to Lower Basin water users apparently far in excess of the value of decreased agricultural production in the Upper Basin.
The CRSS model indicated an approximate 450 gigawatt hour increase in annual hydroelectric production from increased river flows associated with the transfer. Valuing this at a wholesale rate of $.015 per kilowatt hour yields the third column of Table 3. The value of the increased power production, even when valued at such a conservative rate, dominates the value of both agriculture and salinity changes. The remainder of Table 3 examines the value of increased power production for alternative power rates. It is worth noting that the additional power is "firm" since the CRSS model explicitly considers turbine capacity of the power system. However, it does not consider any additional transmission capabilities that may be needed as a result.
CONCLUSIONS
This analysis, like many before, illustrates the low marginal value of water in crop irrigation. This is not suggesting, however, the wholesale dismantling of the institutional structure allocating its use. Rather, it suggests that state or Federal

-Large Scale Water Transfer 109
Table 2. Value of transferred water in terms of net farm income and reduced salinity benefits
Value of water Salinity reduction 11
Year In r:rop production lake Havasu Imperial Dam
($1,000) mg/l mg/l
1986 1,571 0 0 1987 1,656 1 4 1988 1,742 6 7 1989 1,951 10 12 1990 2,016 13 15 1991 2,001 19 23 1992 1,914 22 28 1993 1,914 25 29 1994 1,986 28 31 1995 2,244 29 35 1996 1,986 29 32 1997 2,122 30 33 1998 3,813 33 37 1999 2,145 35 41 2000 2,128 42 48 2001 2,096 46 56 2002 2,136 50 59 2003 2,272 53 62 2004 2,416 51 60 2005 2,100 55 64 2006 2,116 56 66 2007 2,184 56 65 2008 2,120 51 61 2009 2,180 51 59 2010 2,264 50 59 2011 2,064 51 60 2012 2,272 53 60 2013 2,020 53 59 2014 2,052 53 60 2015 2,196 52 57
Annual avg. 2,123 37 43 AvO. SlAF 5.31
Net present v lue: @3'Mo 41,008 @6'MI 28,307
11 Source: Colorado River Simulation System (CRSS) 21 Based on Gardner, 1983 3/ Based on Kleinman and Brown, 1980
Value of salinity reduction
Imperial Valley 12 M&l/3 ($1,000) ($1,000)
0 0 184 235 322 1,407
552 2,345
690 3,049 1,058 4,456 1,288 5,159 1,334 5,863 1,426 6,566 1,610 6,801 1,472 6,801 1,518 7,035 1,702 7,739 1,886 8,208 2,208 9,849 2,576 10,787 2,714 11,725 2,852 12,429 2,760 11,960 2,944 12,898 3,036 13,132 2,990 13,132 2,806 11,960 2,714 11,960 2,714 11,725 2,760 11,960 2,760 12,429 2,714 12,429 2,760 12,429 2,622 12,194
1,966 8,622 4.91 21.55
34,114 149,137 20,940 91,213

110 USCID Regional Meetings -- 1989
Table 3. Estimale or increased power production due 10 the transrer, and the value or the power at alternative power rates, assuming a 1922-1951 period or record
Additional energy $.015/kwh $.025/kwh $.05Ikwh $.08Ikwh Year Pfoductlon 11
(GWH) ($1,000) ($1 ,000) ($1,000) ($1,000)
1986 478 7,170 11,950 23,900 38,240 1987 479 7,185 11,975 23,950 38,320 1988 478 7,170 11,950 23,900 38,240 1989 502 7,530 12,550 25,100 40,160 1990 629 9,435 15,725 31,450 50,320 1991 348 5,220 8,700 17,400 27,840 1992 496 7,440 12,400 24,800 39,680 1993 527 7,905 13,175 26,350 42,160 1994 502 7,530 12,550 25,100 40,160 1995 491 7,365 12,275 24,550 39,280 1996 439 6,585 10,975 21,950 35,120 1997 385 5,775 9,625 19,250 30,800 1998 452 6,780 11,300 22,600 36,160 1999 437 6,555 10,925 21,850 34,960 2000 474 7,110 11 ,850 23,700 37,920 2001 411 6,165 10,275 20,550 32,880 2002 455 6,825 11,375 22,750 36,400 2003 454 6,810 11,350 22,700 36,320 2004 428 6,420 10,700 21,400 34,240 2005 439 6,585 10,975 21,950 35,120 2006 468 7,020 11,700 23,400 37,440 2007 483 7,245 12,075 24,150 38,640 2008 458 6,870 11,450 22,900 36,640 2009 475 7,125 11,875 23,750 38,000 2010 461 6,915 11,525 23,050 36,880 2011 467 7,005 11,675 23,350 37,360 2012 444 6,660 11 ,100 22,200 35,520 2013 471 7,065 11,775 23,550 37,680 2014 474 7,110 11,850 23,700 37,920 2015 489 7,335 12,225 24,450 39,120
Annual average 466 6,997 11,662 23,323 37,317 Annual avg. $IAF 17.49 29.15 58.31 93.29
Net PfaBrlt value: @3% 137,854 229,757 459,513 735,221 @f!q4, 97,394 162,324 324,647 519,435
11 Source: Colorado River Simulation System (CRSS)
Large Scale Water Transfer 111
policymakers should be aware of the direct and offsite impacts of individual transfer proposals before reacting with legislation. For a transfer similar to that proposed by Galloway, substitution among crops and dryland conversion opportunities can minimize the adverse secondary impacts. In Radosevich's words, states should not "cut off their nose to spite their face" by categorically prohibiting such transfers (14). There is also the obvious benefit of increased income accruing to the basin, although there is no assurance that its recipients will remain there to spend it The main cost of such a plan is the long term sacrifice of an important resource such as water, whose ability to draw an emotional response is hard to understate. Future research may discover that more flexible transfer plans, such as a lease option by the urban user during dry years, may furthur reduce these adverse impacts.
The offsite impacts of changes in river salinity and hydropower production appear to overshadow the agricultural impacts, from an economic standpoint. Although evaluated here in a rather "back of the envelop" fashion, these impacts are significant and should be considered in evaluating transfers.
Whether Southern California interests, such as San Diego, will continue to attempt to gain use of Upper Basin agricultural water depends on the economic and political feasiblity of their other alternatives. However, it appears there are possibilities of net gains to both parties involved in a transfer of 400,000 acre feet of agricultural water to Lower Basin urban uses.
REFERENCES
(1) California General Assembly Bill 2746 (AB2746).
(2) Holme, H.K., "Obstacles to Interstate Transfers of Water: Many a Slip 'Twixt the Cup and Lip." Pages 267-286 L.J. MacDonnell, ed. Perspectives on Colorado Water Law. University of Colorado School of Law, 1986.
(3) Driver, B., "Western Water: Tuning the System." Report to the Western Governors Association, Denver, Colorado, 1986.
(4) Twin Falls Times-News, "Limits on Water Sales in West May be Eased." Twin Falls, Idaho, 1986.
(5) Landry, S., "The Galloway Proposal and Colorado Water Law; The Limits of the Doctrine of Prior Appropriation." Natural Resources Journal. 25(4), 1986.
(6) Getches, D., Associate Professor, University of Colorado School of Law, Boulder, and former Executive Director, Colorado Department of Natural Resources. Personal communication, July, 1987.
(7) English, B.C., "Assumptions in the CARD/RCA Crop Sector: A Review." Center for Agricultural and Rural Development, Series Paper 85-1, 1985.
(8) United States Department of Agriculture, "1982 National Resources lnventory." Soil Conservation Service, 1984.
(9) Howitt, R.E. and P. Mean, "Positive Quadratic Programming Models." Working paper, unnumbered. Department of Agricultural Economics, University of California, Davis. 1985.

112 USCID Regional Meetings -- 1989
(10) United States Bureau of Reclamation, Colorado River Simulation System: System Overview. USBR Engineering and Research Center, Denver, Colorado, 1985.
(11) Gisser, M., RR Lansford, W.D. Gorman, B.J. Creel, and M. Evans, 'Water TradeOff Between Electric Energy and Agriculture in the Four Corners Area.' Water Resources Research. 15(3), 1979.
(12) Howe, C.W., 'Economic, Legal, and Hydrologic Dimensions of Interstate Water Markets.' American Journal of Agricultural Economics. 67(5) pp. 1226-1230, 1985.
(13) Gardner, RL, 'Economics and Cost Sharing of Salinity Control in the Colorado River Basin'. Unpublished Ph.D. dissertation, Colorado State University, Ft. Collins, CO., 1983.
(14) Radosevich, G., 'Interstate Water Transfers WorkshOp'. LJ. MacDonnell, ed. Perspectives on Colorado Water Law. Natural Resources Law Center, University of Colorado School of Law, Boulder, Colorado, 1986.

WATER BANKING IN IDAHO
by Richard M. Rigby1
ABSTRACT
Some irrigation projects in the Pacific Northwest are 50 - 70 years old. Storage and delivery facilities were originally constructed based on the best available data and permanent water allocations were made to meet the identified agricultural water needs. The intervening years have brought changes in farming practices and associated water needs, as well as the identification of new competing demands for water. When water supplies are fully allocated to existing users, the opportunities to develop new uses may be very limited. Water banking provides an opportunity to temporarily transfer water from an established water right holder to another.
Two water banks are presently functioning within the State of Idaho. These banks enable water users to transfer their storage entitlements to other users. Water banking is expressly authorized by Idaho law and the existing water banks function with the support and assistance of the Bureau of Reclamation and the Idaho Department of Water Resources.
BACKGROUND
Minidoka-Pal i sades Project:
Two water banks presently function within the State of Idaho, one within the Minidoka-Palisades Project on the Upper Snake River and the other within the Arrowrock Division of the Boise Project on the Boise River. The Upper Snake water bank has existed in some form since the 1930's, and since 1980 it has been formally recognized by State law and regulation. The Boise River water bank began in 1988, partly in response to drought impacts, '~ith State and Reclamation approval.
Jackson Lake Dam, near the headwaters of the Snake River in Wyoming, was the first major storage reservoir constructed in the Upper Snake area. American Falls Dam was constructed next downstream in Idaho. Construction of Island Park and Grassy Lake Dams followed on the Henry's Fork of the Snake to serve the northern and eastern parts of the Project. These developments were in place by the end of the 1930's. Some of the storage lcontract SpeCialist, U.S. Bureau of Reclamation, Pacific Northwest Region, Box 043, 550 W. Fort St., Boise 10 83724
113

114 USCID Regional Meetings -- 1989
developed was committed to develop new lands but the bulk of the storage was used to supplement the supply of water to already of Palisades Dam was initiated in 1951 to supply supplemental water to the lands in the Upper Snake area. Allocations of reservoir space to the different contracting entities were based on needs as perceived at the time. A winter "water savings" program was authorized and implemented with construction of Pal isades Dam. The purpose of the "water savings" program was to improve water supplies available for storage by eliminating some winter time diversions of water for livestock watering and domestic uses. The intervening years have also brought significant changes in irrigation practices, including sprinkler irrigation and laser leveling of fields. Total irrigation diversions have trended lower over the years and water supplies for most irrigators are abundant in most years and adequate in recenr-dry years.
Boise Project:
Development of the Arrowrock Division of the Boise Project followed a somewhat similar pattern as the Minidoka-Palisades Project. Arrowrock Dam was the first storage facility constructed in 1911-1915. It was built to provide water mainly to new lands. Arrowrock proved insufficient to meet the identified needs and dry periods of the 1930's brought forth urgent appeals for more storage. Anderson Ranch Dam was authorized in 1940 and completed in 1950. Anderson Ranch Dam and Reservoir added essentially no new land to the Project. The Corps of Engineers subsequently constructed tucky Peak Dam further downstream mainly for flood control. Part of the storage space in Lucky Peak was marketed to augment the water supplies of existing i rri gators.
Spaceholder Contracts:
On both Projects, all water marketing was through spaceholder contracts. This means that Reclamation sold each contractor a share of the reservoir space. Carry-over storage rights were also granted in some cases, meaning that water not used one year can be retained in the reservoir as a contingency against future drought.
The use of spaceholder contracts differs from the way water is marketed on most Reclamation projects. On most projects, water entitlements are conveyed to water user entities. These con:-tracts establish the amount of water to be made available, sometimes specifying a given quantity of water, and set forth the criteria under which the project water supply is to be apportioned during conditions of shortage. Shortages are often shared equally by all project users. Spaceholder contracts do

Water Banking in Idaho 115
not convey a water entitlement, rather they convey reservoir }ei,e, or a specific share of the reservoir. If the reservoir
1 s, the spaceho1der's space is full. If the reservoir fails to fill, the spaceho1der's space is only partly full. Apportioning water during shortage conditions is different with spaceho1der contracts, because a normal accounting of carryover storage and accruals to storage precisely determines the amount of water in the reservoir available to each spaceho1der. With spaceho1der contracts, if all of the reservoir space has been marketed, Reclamation has no means of meeting other needs for diversion of water regardless of whether the reservoir spaceho1ders use their stored water. On projects where Reclamation simply promises to meet a contractor's needs, surplus water that may exist can be marketed to other users as long as Reclamation assures that the water supply needs of existing contractors can still be met. Depending on specific conditions new uses mayor may not share equally in the water supply under shortage conditions.
WATER BANKS
Upper Snake:
Water transfers have occurred in the Upper Snake for many years. During construction of Palisades Dam it was widely accepted that surplus supplies would exist in many years due to the supplemental nature of the new storage. The repayment contracts thus provided that the reservoir spaceho1ders could rent water to others. The contracts specified that water could be rented for one year at a time under a controlled price. Water rentals did occur in many years, with considerable activity in the dry year of 1977. In 1979, due largely to concerns that State Law could be interpreted to cause}orfeiture of a water right if water is leased to others, the Idaho State legislature authorized the establishment of such water banks statewide (Sections 42 IC 1761-1766). A key provision of this law was that water placed in the water bank would be considered a beneficial use.
In recent years the Idaho Power Company has purchased water from the Upper Snake River water bank to augment hydroelectric power generation. In 1988, a dry year, 235,325 acre-feet were made available to the Upper Snake water bank, of which 159,215 (68%) acre-feet were sold, leaving 76,110 acre-feet unsold. Irrigation users purchased 109,215 acre-feet and the Idaho Power Company purchased 50,000 acre-feet. Irrigation needs were considered prior to making water available to the Power Company.

116 USCID Regional Meetings .. 1989
Table 1. Upper Snake Water Bank Activity - 1979-88 ================3==============================================
Consigned Total Used By Used By Year to the Bank Used Power Irrigation
1979 88,870 73,960 50,000 23,960 1980 72,190 14,575 0 14,575 1981 170,107 149,039 125,000 24,039 1982 290,426 203,515 200,000 3,515 1983 540,606 353,084 350,000 3,084 1984 806,400 277 ,433 275,000 2,433 1985 497,302 362,169 350,000 12,169 1986 895,642 159,735 150,000 9,735 1987 365,006 192,506 150,000 42,506 1988 235,325 159,215 50,000 109,215 =============================================================== aAll figures are in acre-feet
Boise:
As a result of dry conditions in 1987, the possibility of creating a Boise River water bank was discussed. In the spring of 1988 the Idaho Water Users Association sponsored a seminar on the possibility of a Boise water bank with the support and encouragement of the Bureau of Reclamation and the Idaho Department of Water Resources. Water users from the Upper Snake participated in the seminar and explained the functioning of the Upper Snake water bank. Their comments appeared to allay many concerns of the Boise area water users. The Boise water users responded favorably to the water bank concept and the Idaho Water Resources Board established the Boise River water bank on May 24, 1988. The rules and regulations for the new water bank were drafted by staff of Reclamation and State Water Resources with assistance from the watermaster, and were patterned after the rules and regulations governing the Upper Snake water bank. They were modified slightly by the water bank committee prior to implementation. In 1988, 22,000 acre feet were made available to the Boise River water bank and all were purchased. As of August 1989, only about 800 acre-feet of water have been made available to the water bank and fewer than 400-acre feet have been purchased.
The significant reduction in water bank activity from 1988 is probably due to different water supply conditions. Water users have likely placed less water in the water bank in 1989 because they believe most users have adequate supplies. Neither the watermaster nor Reclamation's Project Superintendent have actively encouraged water users to consign water to the bank as they did in 1988. Perhaps the most important reason less water

Water Banking in Idaho 117
has been consigned to the water bank is simply the newness of the bank. Irrigators are like the general population in that it takes a high degree of motivation to change from the status quo. In time, change will undoubtedly occur. Catalysts of change could come in the form of new customers or recurrence of drought conditions.
Operation of the Water Banks:
The 2 banks are naturally similar in many respects. Each bank is managed by the local Watermaster under the direction and advise of a committee of local irrigators. Nearly all of the reservoir space is held by irrigation users. The only water that can be traded in the 2 banks is designated "stored water" which happens to exist entirely in Federal Reservoirs. Stored water has advantages over "natural flow" for water banking in Idaho since the trading of natural flow involves the requirement of State law that impacts to third parties be evaluated. Such evaluation can prove to be a rather imposing task for short term changes of use. Idaho State law does not require an analysis of third party impacts for changes in place or point of use of stored water. Indeed, if a noncontracting party claims potential harm from another party's change in diversion or use of stored water, the reservoir owner has probably found a new custaner who should be paying for the benefits received. The water banks are open only to districts or individual diverters. Water transfers within districts still occur outside of the water bank frame~ut the only short term transfers from one district to another explicitly permissible under S~ate Law are through the water bank.
A key point is that irrigation diversions have not been reduced to make water available to the water bank. Reservoir spaceholders have only committed water to the water bank which they did not expect to use in the then current year. The spaceholders decided to rent the space to others and have less reservoir storage to carryover into the next season.
Water committed to the bank by July 1 is placed into a cOlllnon pool and is not identified as coming from a given lessor. The lessors who commit water to the bank by the July 1 deadline share proportionately in the proceeds from the bank. For example, if District A places 50,000 acre feet of water in the water bank, and if a total of 500,000 is available in the pool on July 1 from all sources, District A will receive 10% (50,000/500,000) of the proceeds distributed to the lessors.
In the vernacular of the water bank, sellers are termed lessors and buyers are lessees. Lessees pay $2.50 per acre-foot for water from the Upper Snake water bank and $5.50 per acre-foot

118 USCID Regional Meetings -- 1989
from the Boise water bank. The Watermaster retains $.50 per acre-foot on the Upper Snake and $.32 on the Boise to use for system improvements that provide common benefits to the water users, such as improved measuring devices and HYDROMET facilities. The rates are different partly because the Boise water bank is patterned after the Upper Snake water bank and the contract rate paid to Reclamation is higher on the Boise. In addition, the rates are set by the water bank committees of the local areas. These local farmers attempt to set a price that is fair to buyer and seller alike, taking into consideration that sellers argue for high rates and buyers argue for low rates.
Changes:
Along with supporting implementation of the Boise water bank, the Bureau of Reclamation has taken active steps to expand the potential viability of the Upper Snake water bank. The language in the Palisades spaceholder contracts that permitted the leaSing of water also constrained any leases to one year only. At the urging of State and other interested parties, Reclamation has offered contract amendments to all spaceholders allowing them to lease their space for up to 20 years. No other contract changes were proposed in the amendments. Reclamation requirements associated with irrigation will follow the water, including irrigability requirements and acreage limitation. Ten contractors have responded favorably to this offer. At the present time no specific long term lessees have been identified.
IMPACI'S OF URBANIZATION ON WATER DEMAND IN THE PHOENIX, ARIZONA, AREA
Charles Esterl Darrell Jordan2
ABSTRACf
The Salt River Project is a water and power utility serving the water needs of agricultural and urban water users within its 250,000 acre (101,175 ha) water service area. The Project area which initially was in agricultural production is being urbanized at a rapid rate. Agricultural water use is quickly being replaced by increasing municipal and industrial uses. Complete conversion to urban use is expected to occur during the first half of the next century. Expectations are that total water demand after urbanization could be as great or greater than those under an agricultural economy. This, coupled with the nature of urban water use, will place greater demands upon the water resource systems and the regional water planners who must provide water service to the metropolitan area. Education, conservation, and additional new supplies of water may be required to provide adequate water service during periods of drought.
INTRODUCTION
The Salt River Project (SRP) is the nation's oldest multipurpose reclamation project. When created in 1904, its function was to manage the surface water supplies of the Salt and Verde Rivers for agricultural shareholders. Its service area includes 250,000 acres (101,175 ha) within the Salt River Valley of central Arizona. As of 1988, 72% or 179,300 acres (72,563 ha) now require water for urban developments. For decades, SRP has been the largest deliverer of water in Arizona. See Fig. 1.
1 Senior Hydrologist, Salt River Project, Phoenix, Arizona
2 Manager, Water Resources, Salt River Project, Phoenix, Arizona
119

120 USCID Regional Meetings -- 1989
13,000 Sq. Mile Project
Watershed
• Tucson
Fig. 1 Map of ArIzona, Watershed, and exploded service area.
Electrical power generation has been an integral part of the Project since 1906. Following the long standing reclamation principle, the Project uses a small portion of its electric revenues to help support water operations. This helps keep water costs low. At the same time, the Project maintains electric rates competitive with the rates of Arizona's other major utilities. In recent years, SRP has grown to become one of the three largest public power utilities in the country. The combination of dependable supplies of power and water has promoted the economic growth of this desert valley (SRP 1987).
Today, the Project area is home to the nation's 9th largest city, Phoenix, and the surrounding rapidly growing metropolitan area. The growth of the Phoenix area has eliminated a large portion of farming and replaced it wi th new subdivisions, businesses, and high-tech industry. Water deliveries, once dominated by agricultural demands, are increasingly made to urban water users. Since 1984, more water has been delivered for M&I (Municipal and Industrial) use than for agricultural use. The conversion of agricultural lands to domestic uses has caused SRP to become increasingly concerned with meeting the needs of its new urban water users. This paper will discuss the impacts of urbanization on water demand in the Phoenix area.

Impacts of Urbanization 121
BACKGROUND
The Salt River Valley consists of over 1/2 million acres (202,350 ha) in central Arizona. The area is a large alluvium filled basin stretching generally north and east from the confluence of the Salt and Gila Rivers. It is classified as Sonoran desert with rich arable soils, but an average ofless than 8 inches (20.32 cm) rain per year. Therefore, to fully utilize the nearly yearlong growing season, successful agribusiness operations require supplemental water supplies.
The Salt and Verde Rivers, draining a 13,000 mi2 (33,670 km2) watershed which ranges in elevation from 1100 feet (335 m) to over 12,000 feet (3658 m), provide a highly erratic average of 1.2 million af (1,480,200,000 m3) of annual runoff. See Fig. 2.
8 0 .,.. >< I-w W IL iii a: 0 «
5,000
4,000
3,000
2,000
1,000
1910 1920 1930 1940 1950 1980 1970 1980 1980
YEAR
Fig. 2 Plot of annual Salt and Verde nows.
Modern agribusiness and, more recently, large-scale urban and commercial development, were not possible without large water conservation storage dams on the upstream river system to capture the highly variable river flows and provide a dependable water supply. The stage was set for the transformation of the Valley from desert to productive farmland to bustling metropolis.

122 USCID Regional Meetings -- 1989
HISTORY
The earliest settlers to the Salt River Valley were Hohokam Indians who arrived as early as 200 B.c. As their culture developed, the Hohokam dug canals to carry water from the Salt River to their fields of vegetables and cotton. Archaeologists consider the extensive Hohokam irrigation system to be one of the greatest irrigation achievements by ancient man on this continent. However, for reasons still unclear, the Hohokam abandoned the Salt River Valley by AD. 1400.
The city of Phoenix got its start in 1867 as a hay camp for the calvary stationed nearby at Fort McDowell. Wild grasses growing along the Salt River were harvested for feed. A few men of vision, led by John W. "Jack" Swilling, saw the remains of the 250 miles (402 km) of Hohokam irrigation canals and realized the canals could be cleared and used once again to irrigate valuable crops for the military post. The Swilling Irrigation Canal Company was organized in November 1867. Construction began on the first modern canal, the Swilling Ditch, in December and by March 1868 the first crops were harvested.
Homesteaders quickly learned of the successful new farming practice and moved to the Valley. By year's end, Phoenix boasted 100 permanent residents. More and more desert succumbed to the settlers and the growing number of canals. By 1888, over 100,000 acres (40,470 ha) were being farmed. Today, SRP manages 7 main canals whose total length is 133 miles (214 km). Another 1132 mi (1821km) oflaterals and ditches deliver water directly to the water users.
Farmers of the late 1800's in the Valley faced a myriad of obstacles which often seemed insurmountable. Diversion works for the various canals were crude and inefficient. Flooding, spawned by spring snowmelt high in the mountains or heavy rains, often washed away their headings. Then, during the summer months, the flow of the Salt became a mere trickle and was inadequate to meet everyone's needs. Crops withered and died; conflicts arose over rights to what little water remained. Clearly, the settlers in the Valley were at the mercy of the tempermental Salt River. Many settlers left the Valley at the turn of the century after finally surrendering to the river's recurring periods of flood and drought.
However, many still believed in the future of farming in the Salt River Valley. A committee to investigate the feasibility of a water storage system was named. Their recommendation: a dam at the confluence of the Salt River and Tonto Creek 80 mi (129 km) east of Phoenix. The cost of such an ambitious project was too great for the Valley citizens to bear alone. Without federal assistance the dreams of a water storage reservoir would quickly fade.

Impacts of Urbanization 123
Fortunately, then President Theodore Roosevelt realized water development in the West was essential to the future prosperity of the nation. He also recognized that the federal government would have to finance any large reclamation program. Finally, the United States Congress on June 17, 1902, approved the Hansbrough-Newlands Bill, the National Reclamation Act. The Act provided monies from the sale of Western public lands for reclamation projects (SRP 1987).
Before the government would agree to finance projects, three conditions had to be met: 1. Assurance of repayment was required, 2. All local differences between landowners over water rights had to be settled, and 3. A single entity must represent all landowners. Thus was born the Salt River Valley Water Users Association. The agreement with the government to build Roosevelt Dam was signed on June 25, 1904.
Construction began on Roosevelt Dam in 1905 and was finished in 1911. The dam is the world's highest masonry dam and forms the cornerstone of the Salt River Project reservoir storage system. Five additional dams were built which included three reservoirs downstream of Roosevelt on the Salt River and two on the Verde River. The total storage capacity of the reservoir system today is just over 2,000,000 af (2,466,978,000 m3). See Fig. 3.
Fig.3 Reservoir System

124 USCID Regional Meetings -- 1989
URBANIZATION PROCEEDS
When the Salt River Project was formed, essentially all of the 250,000 acre (101,175 ha) service area was in agricultural production. This held true up to the second World War. During and after the war, the Salt River Valley entered a period of rapid urban growth which continues to this day. As Phoenix and the nine other communities within the SRP service area began to grow, residential, commercial, and industrial development began replacing farmland at a rate of 3000 to 7000 acres (1214 to 2833 ha) per year (Sands 1987). By 1956, agricultural land had been reduced to 80% of the total service area. In 1988, the percentage had been further reduced to 28% with no limiting factors foreseen to prevent this number from continuing to decline. See Fig. 4. The commodities necessary for continued growth remain: land, water, good weather, an attractive lifestyle, and jobs. Agricultural land use will continue to drop until its eventual demise in the SRP service area sometime in the first half of the 21st century.
270,000
240,000 --~------------------iii
210,000
W 180,000 a: 0 150,000 ~
120,000 « w 90,000 a: « 60,000
........ '- ....... ~ .. ~ ~ -- ......
.r ........ ".-
30,000
o 1960 1970 1980 1988
YEAR
Urban _ .. - AgriculbJre - - - - Total
Fig. 4 Plot of ag decline
WATER DEMANDS
As the metropolitan development in the Valley continued with agricultural lands being replaced by homes, lawns, and businesses, the need for city water increased. In 1952, SRP entered into a contractual partnership with the city of Phoenix. The city pays SRP the annual assessment for urban acreage

Impacts of Urbanization 125
which no longer is irrigated. In turn, the Project delivers to Phoenix the water to which this urban acreage is entitled. After treatment by the city, which acts as agent for SRP, the water is delivered to the user. In this way, the land's right to water is preserved while the transition from agricultural use to M&I use is completed. Seven other cities within the SRP service area have similar domestic water contracts with SRP.
When land is converted from agricultural to urban sprawl or low density residential usage, it initially uses less water. However, with urban planning, the infrastructure becomes more densely populated over time with infilling and rebuilding. High-rise buildings, townhomes, and apartment complexes replace single family homes and small businesses as a city matures. The final phase of urbanization entails building upwards and filling in any vacant land. Both the increase in density and the eventual use of vacant land will lead to increased water use for on-Project areas. In 1987, the amount of undeveloped land within the City of Phoenix SRP service area was estimated to be as high as 20 - 25%. This suggests Phoenix is still maturing as an urban area and has not reached its capacity for land or water use (Perry 1987). Furthermore, there will be a significant corresponding increase in commercial and industrial growth to support the new residential areas. The net result is a fully urbanized acre using as much or more water than an agricultural acre depending, of course, upon the density of development (Sands and Perry 1987). Figure 5 shows the the increasing water use in acre feet per acre as land use changes from low water uses to high intensity water uses associated with planned businesses and high density residential areas.
_ SAP Deliveries
ItI±m COP Deliveries
(In Acre Feet Per Acre)
r::zJ Private Source (Wells)
2.74 4.65 4.69
City of AgrIcuHure Subdlv. CamellNlck Motorola St. Phx./SRP Irrigation lbwer 52nd St. Joseph's
Water ApI&. HospItal Contract
(G. Perry 11187)
Fig.5 Comparison or water use rates.
165.24
Valley NaUonaI
Bank Center

126 USCID Regional Meetings -- 1989
From Fig. 5, one can see that it would not take many acres of high use water industries to produce a significant impact on water use. .
The total Project water delivery is presented in Fig. 6.
~ W W IL W II: 0 ~ W (/) :::J
1,000,000
900,000
800,000
700,000
600,000
500,000
400,000
300,000
200,000
100,000
o
.A ,' .. .\ , \
'~' ... -' " i,-,,,I V
,,~ r, • ,-.1 \.. /. #\
'. ,-. J \. ~" , -------....",..,-
1960 1970 1980 YEAR
" #'>
--,--
1988
Urban _. - AgrteuIture - - - - Total
Fig. 6 Total delivery, with Ag and Urban.
Also displayed on this figure is the corresponding agricultural and urban water deliveries over time. The graphical display shows that total Project water use has not decreased as land is taken out of agricultural production. In fact, the trend is surprisingly constant although there are year to year fluctuations which are the result mainly of high runoff years making more water available for all uses. This observation is directly related to the increase in households over time. In 1987, the average quantity of households within the SRP service area was 4.65 households per acre (11.5 householdslha). The corresponding base water demand per household acre has risen from 1.58 acre feet/acre (4816 m3/ha) to 1.69 acre feet/acre (5151 m3/ha) since 1978. This calculation assumes 60% of SRP's M&I water deliveries in a given year are required to meet household demand regardless of the number of people per household.
Even though total Project deliveries have remained stable, there are significant differences between agricultural demand and urban demand worth discussing. Urban water demand tends to be much more constant throughout the year when compared to the wide ranging seasonal fluctuations in agricultural demand. In addition, urban demand is much less elastic in relation to supply than agricultural demand. In times of water shortages, farmland can easily lay fallow while once an area urbanizes, its demand is constantly placed on the water supply system. This will eventually lead to reduced flexibility in

Impacts of Urbanization
operating the reservoir system in times of drought which presents a major challenge to urban water resource planners.
WEAmER CONSIDERATIONS
127
Because weather factors play such a major role in forecasting water demands, SRP has undertaken a major study to develop weather normalization schemes for use in SRP's Water Demand Model. Temperature was identified early on as one of the primary influences on water demand in the Phoenix area. An analysis of Phoenix temperatures indicates a significant rise in average temperatures for both summer and winter since 1948 confirming the existence of a major urban "heat island" in the metropolitan area. See Fig. 7.
Preliminary results from the study indicate that per household water demand, for an established urbanized area, would have increased by approximately 5% during the period from 1948 to 1988. Based on a calculation from SRP deliveries, actual water demand per household has increased approximately 7% during the ten-year period, 1978-1988.
The implications of these results are clear. The continued urbanization will cause the "heat island" to spread across the metropolitan area causing subsequent increases in demand. Couple this with the possibilities of a global warming and a possible reduction in surface water supplies and the result may be an increasing demand placed upon a system less able to meet those demands.
w 115 a:
::;)
~ 113 Ww OIL 91 c:::E a: w WI- 89 :;;:a:
w Ir7 :::E
:::E ::;) as UI
1_ 1955 1_ 1975 1_
YEAR
Average SUmrMr (July, August) temperatu ..... (1948-1988). Tbese temperatu ..... have Incre .... linearly by 4° over the study period. Most of this rise Is assocIaIad with IncreesIng minimum tempenIture
w a: ::;)
w~ Ow CIL a::::E WW >1-Ca:
W !z 3
82
58
54
50
1955 1_ 1975 1_
YEAR
Average Winter (December, January) temperalUres over the 1948-1988 study period. Tbese ~ have Inc""" linearly by tf over the study period.
Fig. 7 Graph showing average summer/winter temp rise. (oF) Source: ASU

128 USCID Regional Meetings --1989
FUTURE EXPECTATIONS
The SRP service area is expected to continue to urbanize. Forecasts predict that full urbanization could be achieved as early as the year 2013 to as late as the year 2034 under the low growth scenario (SRP 1984). As a result, water demands will continue to shift and become totally urban. Figure 8 shows the gradual conversion of agricultural lands to urban areas for the years 1988 and 2008. These maps from the SRP Land Use Model do not necessarily predict which parcel is urbanized but do give a good estimation of the urbanization rate as the inverse of agricultural decline based on the programmed assumptions in the model. Figure 9 shows the expected change in SRP water deliveries from 1986 (actual) to the 2005 planning case. The increase in M&I deliveries and the decrease in agricultural deliveries is apparent.
The different benchmark years in Figs. 8 and 9 are the result of different studies and model simulations being done in different years. The trends are the important point because the uncertainties when making projections far into the future become quite significant.
Mter complete urbanization occurs, the Project area will continue to increase its density and intensity of water use. In 1986, about 1.1 million people lived within the SRP urbanized area at a density of 6.9 people per acre (17.0 people/ha). By 2005, density levels should increase to 8.3 people/acre (20.5 people/ha) with 1.5 - 1.8 million people in the urbanized area (SRP 1986). Ultimately, SRP (Hayslip 1982) projects a density of 10.5 people/acre ( 25.9 people/ha). This equates to over 2.6 million people within the water service area. Total Project demand, following a period of slow decline, is expected to increase again after the year 2030 as the urban demand drives the total upward (SRP 1984). Should population increase more rapidly to the saturation level of 2.6 million, the increase in total demand will be more pronounced and occur earlier.

Losses 122,900
1986
Impacts of Urbanization
Fig.8 Land Use Model Maps
UltJan n;g.tion
97,700
0Iher Contracts
90,900
11&. 470,000
2005
Fig. 9 1986 and 2005 Water Use Pie Charts (AF)
129

130 USCID Regional Meetings -- 1989
CONCLUSIONS
The Project water service area will continue to urbanize to the exclusion of agriculture and then enter a period of more intensive land use development to the point of saturation. The effect on water demand will be a slight decrease initially but then a steady increase as the population grows and M&I water use drives the total water use up again. Ultimate water use could likely be as great or greater than preurbanization water use. Regional water resource planners will face challenges which were not apparent in an agricultural environment as they attempt to provide an adequate supply of water during periods of drought. Their plight is only complicated further by the uncertainties of the global climate in general. Water conservation programs will likely be necessary to reduce the base demand per household and to increase the reliability of a variable supply; yet, urban demand is not readily reduced. Conservation programs are difficult to enforce and require education and mandatory restrictions be placed upon a constantly growing, changing, and dynamic population. Additional new water sources may be necessary to provide water service to the urban area in times of severe drought unless draconian efforts are taken during these times.
In the late 1800's, settlers knew that reliable water supplies were the key to making the desert bloom. The success of the Salt River Project and the growth of the Phoenix metropolitan area bears witness to their foresight and wisdom.
REFERENCES
1. Balling, R. C. May 1989. Analysis of Seasonal Mean Temperatures and Extreme Value Distributions in Phoenix. Final report to Salt River Project.
2. Hayslip, R. M. April 1982. A Saturation Scenario for the Salt River Project Electric Service Area. Salt River Project.
3. Perry, G. T. June 1987. Urban Water Use Study: The Agricultural Decline. Salt River Project.
4. Sands, T. G. July 1987. The Urbanization of the Salt River Project. Salt River Project.
5. Sands, T. G. and G. T. Perry. 1987. Impacts of Changing Land Use on Water Demands in Central Arizona. Salt River Project.
6. Salt River Project. 1984. Water Demand Study. 54-61 pgs.
7. Salt River Project. 1986. Our Desert Oasis. 2-8 pgs.
8. Salt River Project. 1987. AVaIleyRebom: The Story of the Salt River Project. 1-12pgs.

WATER TRANSFERS AND WATER MARKETING
R. Keith Higginson*
So much has been written and said on this subject by many commentators, including some of you, that it is difficult to know what I might add that would be new and interesting. The marketing of water in the western United States and the transferring of the use of water from one location to another or from one beneficial use to another has been going on from the time of the first settlements. Yet there continues to be a lot of interest and confusion on the subject matter. Those of us who work with water resource issues and water rights on a daily basis are left to wonder if this interest is caused by lack of understanding of the mechanism or laws relative to transfers and marketing or some other reason.
Some have suggested that there are "institutional barriers" to market transfers of water resources, and that such barriers must be removed to facilitate the reallocation of water resources in the public interest. In my opinion what is really needed is a better understanding of the reasons for the institutional mechanisms governing transfers, and an appreciation for the public values in protecting the system which provides stability and reliability of water supply delivery, thus sustaining the economic base on which the western United States is dependent.
There is also a good deal of confusion over terms used when this subject is discussed. Some are unable to distinguish between the marketing of water and the marketing of water rights. But it is important that we understand the terms of reference in any discussion of this subject.
For example, you could define water marketinq as the process of purchasing water or water rights. But within this definition we need to understand that there are two entirely separate activities, water rights marketing and water supply marketing.
*Director, Idaho Department of Water Resources, Boise, Idaho. Luncheon Address presented at USCID Boise Regional Meeting.
Dl
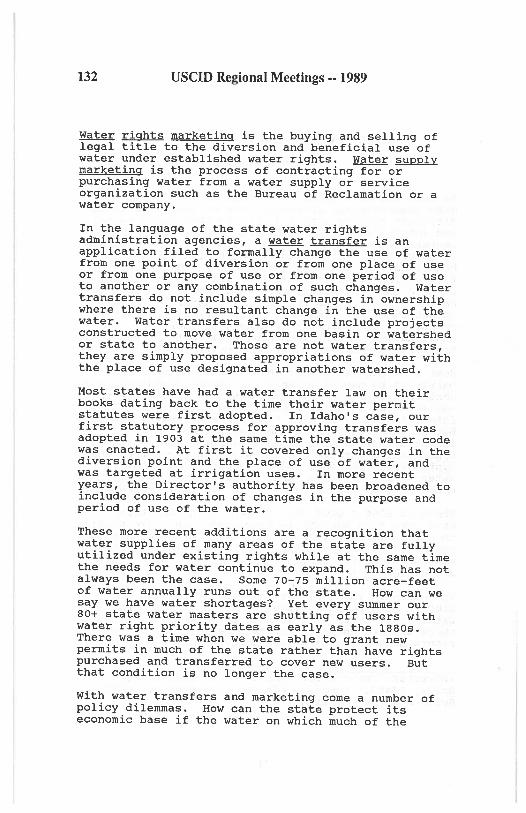
132 USCID Regional Meetings -- 1989
water rights marketing is the buying and selling of legal title to the diversion and beneficial use of water under established water rights. Water supply marketing is the process of contracting for or purchasing water from a water supply or service organization such as the Bureau of Reclamation or a water company.
In the language of the state water rights administration agencies, a water transfer is an application filed to formally change the use of water from one point of diversion or from one place of use or from one purpose of use or from one period of use to another or any combination of such changes. water transfers do not include simple changes in ownership where there is no resultant change in the use of the water. Water transfers also do not include projects constructed to move water from one basin or watershed or state to another. Those are not water transfers, they are simply proposed appropriations of water with the place of use designated in another watershed.
Most states have had a water transfer law on their books dating back to the time their water permit statutes were first adopted. In Idaho's case, our first statutory process for approving transfers was adopted in 1903 at the same time the state water code was enacted. At first it covered only changes in the diversion point and the place of use of water, and was targeted at irrigation uses. In more recent years, the Director's authority has been broadened to include consideration of changes in the purpose and period of use of the water.
These more recent additions are a recognition that water supplies of many areas of the state are fully utilized under existing rights while at the same time the needs for water continue to expand. This has not always been the case. Some 70-75 million acre-feet of water annually runs out of the state. How can we say we have water shortages? Yet every summer our 80+ state water masters are shutting off users with water right priority dates as early as the 1880s. There was a time when we were able to grant new permits in much of the state rather than have rights purchased and transferred to cover new users. But that condition is no longer the case.
With water transfers and marketing come a number of policy dilemmas. How can the state protect its economic base if the water on which much of the

Water Transfers and Water Marketing
agriculture of the state depends is moved to new uses? Is there value (political or economic) in maintaining rural communities, for example?
133
I remember a discussion a few years ago when the Chairman of the Western states Water council was giving a report of the Council's activities at a meeting of the Western Governors. He was asked by Governor Lamm of Colorado how the west was going to meet the growing need for water resources in light of the scarcity of water supply. He gave his opinion that the water market mechanism would govern the reallocation of existing supplies to new uses. Governor Lamm took him to task for suggesting that any state sacrifice its agricultural land base for the sake of new industry.
But that policy dilemma is a reality. In considering a proposed transfer of water from agricultural use in Idaho, I must follow a statute which provides, " ••. the director shall not approve a change in the nature of use from agricultural use where such change would significantly affect the agricultural base of the local area."
Another current issue relates to the desire of many interest groups to see water restored to streams which have been completely diverted during the summer irrigation season of most years. They would like to purchase existing water rights and then file transfers to provide that the water will be left in the stream and not diverted by either the original appropriator or someone holding a subsequent water right. There is no direct legislation on this matter but neither is it prohibited by existing law. Some western states do have statutes on this subject. We are waiting for someone to propose such a transfer and we will process the filing. Questions which may be raised include:
1. Can a private entity hold an instream flow water right in Idaho given the state Supreme Court's findings in our Malad Canyon case in which appropriation of water in place by a state agency in the public interest was upheld?
2. If diversion rights are purchased, can the water be left in stream without raising a claim from the holder of a lesser priority water right that he should be entitled to divert it?

134 USCID Regional Meetings -- 1989
3. What would it take to maintain the right? Most rights require application of the water to some beneficial use. If the purpose of putting the water back into the stream is for recreation or fishing and no one uses the stream for such purpose, has the right been abandoned or forfeited from nonuse?
Under our laws, if an application for transfer is filed, I may approve it " •.. provided no other water rights are injured thereby, the change does not constitute an enlargement in use of the original right, and the change is in the local public interest •.. " One further statutory direction in considering transfers of stored water is that even where more acres are to be served, that shall not be considered an enlargement in use of the original right if no other water rights are injured thereby.
I have the privilege of serving on a committee of the National Research Council's water Science and Technology Board. Our committee is just commencing a study on Western Water Management Change. The study results from the growing realization that, as water becomes increasingly valued in the western united states in an era of diminished federal funding for water resources development projects, a change in the use of water resources from agricultural to municipal and industrial uses has become increasingly attractive to achieve societal objectives. The federal role in facilitating water transfers is important and questions of third-party effects need to be addressed. The study will:
* Assess western water use patterns and prospective changes in the use of water
* Analyze state and federal laws and administrative practices that influence changes in water use
* Describe third party effect of water transfers
* Summarize opportunities to incorporate mechanisms established to change the use of water in the West.
Case studies are to be conducted for a number of areas where transfers are an accepted way of accommodating new uses. Proposed areas for study include the Reno, Nevada, area along the TruckeeCarson Rivers, the Imperial Valley of California, the

Water Transfers and Water Marketing 135
Arkansas Valley in Colorado, the Phoenix and Tucson areas of Arizona, the east slope Denver, Colorado, area and the Yakima Valley of Washington. Specific transfer mechanisms employed in several locations, such as the Idaho Water Bank, will be given special consideration. The study will provide advice to federal agencies in this important water management area.


EFFECTIVENESS OF DROUGHT PREDICTIONS by Lewis Moore·
Drought is really a diabolical subject; its like some of life's other unpleasant things; we generally don't anticipate it until we've got it and then its a little too late to do much about it. Drought is hard to define (until it gets out of hand) and when it does get established, there's no telling when it will break. This is the bad news, but the rest is even worse; there's no predicting drought -- a least nothing you'd want to bet the farm on.
From the Record,the first person to successfully make and verify a long-range drought/famine forecast was Joseph back in about 1880 B.C. You'll recall at that time Joseph was the Pharaoh's prisoner, doing time for some trumped up charges by Potiphar's wife. When referred by some of his jailhouse contacts, Joseph was summoned to interpret the Pharaoh's dreams of fat and thin cattle and heads of grain. Joseph then relayed God's second long-range weather forecast -- for the next 14 years -- which verified in spades and Joseph's government career was made. (Genesis 41:25-30)
There were other long-range forecasts recorded in the Bible, the most famous of which was the widespread flood advisory given to Noah earlier in Genesis. Later, about 1000 years after Joseph's Egyptian famine forecast, Elijah relayed God's first conditional drought forecast, for "two or three years (which ever I choose)" to Ahab and Jezebel. (1 Kings 17:1)
The forecasts mentioned above were precisely accurate according to the biblical account, but since that time and many more forecasts handed down by a variety of seers, the verification rate has really deteriorated. In fact, drought predictions are now so bad that it is questionable whether any of them should be taken seriously. But that doesn't mean people haven't continued to believe that we can foretell drought and harbor the notion that somewhere out there -- there's a voice crying in the wilderness with a silver bullet for forecasting drought. 1
I think there are two reasons we keep trying to foretell drought: for survival and science. Drought continues to top the hierarchy of natural disasters which modern science and technology has not been able to neutralize. Drought puts a lot on the line: money, security, power and the ability to hold nations and civilizations together; this is even more true as populations swell and we depend evermore on technological fixes to remedy global overload.
The second reason we hang onto the hope of drought prediction is a little more intellectual because there must be a reason when
• Meteorologist, U.S. Bureau of Reclamation, Washington, D.C.
137

138 USCID Regional Meetings -- 1989
the rain stops. Consequently we're constantly hearing about drought cycles, obscure associations, and celestial determinants which supposedly control weather (or foretell drought).
Why do we try to attribute drought to something other than a completely random event - an "Act of God" in legal parlance? A lot of us would like to see the same periodicity in the weather that is present in the orbits of the planets and the changing of the seasons and in our quest, we tend to draw out pseudo correlations between weather and heavenly bodies. For instance, when I was (a lot) younger and out on the farm, I learned from my father that a "wet" crescent moon was one that "the hunter could hang his powder horn on" (because the "hunter" (Orion? -- Daniel Boone?) obviously didn't want to hunt in the rain -- I guess).
Sure enough, I could easily see this correlation in the "cupped" new moon and precipitation, or so it seemed until I got old enough to read that this orientation of the new moon was actually "dry" because its bowl-like tilt would actually catch the rain which might otherwise fall. I mention this because in meteorology, just like in economics and psychology, it is easy to construe data as supporting any particular predictive notion so long as it isn't subjected to both rigorous definition and statistical analysis. 2
Why We Haven't Progressed in Drought Prediction
We haven't been making drought forecasts like the ones handed down by Joseph and Elijah because (1) obviously God hasn't taken a direct role in the prediction business and (2) specific weather predictions by mortals are limited by the chaotic motion of the atmosphere which cannot be predicted for much more than a week. Lorenz discovered this over 30 years ago 3 when he let a simple computer model of the atmosphere run into extra innings. He found that only infinitesimal rounding errors in the input data caused wide divergences in the longer-range model predictions.
Lorenz realized the profound significance of these divergent forecasts; because it was always impossible to specify exact initial conditions for input into atmospheric models, output from those models would not be accurate for more than a few day's time. Extending the length of the prediction would only magnify the magnitude of the error. Consequently, atmospheric models now produce good short-term predictions, but they are fed new data every few hours and run again to keep in contact with reality. The National Weather Service does issue monthly and seasonal outlooks for temperature and precipitation, but these are trend forecasts and aren't intended to give the specificity which is the goal of the operational atmospheric forecast models.
The basis of this unpredictability in the atmosphere is the sporadic occurrence of turbulence or chaotic flow which is random

Drought Predictions 139
and unpredictable. 4 These "turbulent bursts" which are present in all scales of atmospheric motion from the curling smoke of a cigarette to the buckling of the jet stream create the unpredictable events which in turn make long-term weather an enigma.
Jet streams, the globe-girdling high level winds, control (or at least define) patterns of moisture and drought. When their meanders change, which can happen suddenly, so do the patterns of precipitation and drought on the Earth's surface. Just like river systems, the meanders of the jet stream can seemingly become entrenched, producing long periods of stable weather patterns. But suddenly, these flow patterns can break down in a turbulent burst and reform in a completely new pattern which may be accompanied by a totally different surface weather regime.
It would be wonderful if we could predict these spasms in the jet stream, but right now we can't. The best we can do is to hedge our bets on climatology and trends, while making maximum use of short-range weather predictions which are useful for periods of up to a week. 5 And, we need to continue the search for useful correlations or "teleconnections" which may someday make long-term drought probabilities less murky.
It's tempting to believe that weather fluctuations or periodic shifts in meteorological patterns can be correlated to other more ordered events and lots of effort has gone into this search. While most of these supposed "relationships" break down with larger samples of data and more statistical scrutiny, a few do not. One phenomenon currently exciting climatologists is the surprising association between high level wind shifts (QuasiBiennial Oscillation -- QBO) over the equatorial regions and surface temperature trends at some stations. While this correlation appears to be highly significant, it appears to be predictive of temperature rather than precipitation. 6
A generation ago much meteorologic research focused on the possibility of "weather typing" or attempting to forecast weather by "reading the plays" or identifying analogous weather conditions in the past and extrapolating or forecasting future weather events based on these past weather records. Generally this technique fails for the same reason atmospheric modelling fails -- it is impossible to duplicate the exact present initial conditions in any past weather sequence. Just like snowflakes -- there are no two weather situations that are exactly alike. 7
What Has Been Done in Operational Long-Term Forecasting
With the chaotic behavior of atmospheric motion and the inability to specify how the aggregate perturbances will form storms in one track and suppress precipitation in another zone, it seems a little remarkable that anyone would venture a long-range

140 USCID Regional Meetings -- 1989
prediction. However, the National Weather Service's Climate Analysis Center has been doing this since the 1950s. Although the forecasts are general monthly and seasonal outlooks (above, normal or below average) and the accuracy is generally less than 10 percent over what could be expected using pure climatology and stat i st i cal ana lysi s, there is some "skill" in the forecasts and that means potential value depending on how these outlooks are applied to business decisions.
NOAA's monthly and seasonal outlooks vary greatly in their skill as outlined below:
- Temperature advisories are about twice as accurate as those for precipitation;
- The skill scores for individual stations are highly dependent on location and season; and
- Winter forecasts are generally best.
While most of the temperature and almost of the precipitation advisories are less than amazing, there is a high degree of accuracy for temperature forecasts above and below normal in the Southeastern United States. NOAA categorizes its longer-term forecasts on two (above or below) or three (above, normal or below) classes as is the case in Table 1. These forecasts are graded by skill scores which can range from 100 percent for total accuracy down to negative percentages depending on the magnitude of the "busted" forecast. As indicated above, the ability to foretell future precipitation is hardly worth mentioning and may be even worse than useless overall for monthly spring precipitation forecasts.
Table 1: Climate Analysis Center Forecast Skill Scores
, (# forecasts correct - # expected correct) x 100 Skill. (total # forecasts - expected # correct) Monthly Forecasts Summer Fall Winter
Temperature 10.3 , 10.9 18.3 < , Prec'ip)tation 4.1 1.6 10.7 .. Seasoria 1 Forecasts ' (3 months)
Spring g.O
-2.3
Temperature 7.8 7.6 14.7 3.2 '~, Precipitation 4.4 .2.5 6.6 3.2
. Source: L ' Kal nay and R. livezey, ·Weather Predictabil ity Beyond a Week: An Introductory Review", in Turbylence
", arid Predictabiljtyin Geophysics, 1985. p.340
The procedure for these forecasts is to generate the forecast of the 700 millibar pressure level which is the height of an imaginary surface of constant pressure above approximately 30 percent of the Earth's atmosphere. Next, the Climate Analysis Center specifies temperature and precipitation anomalies
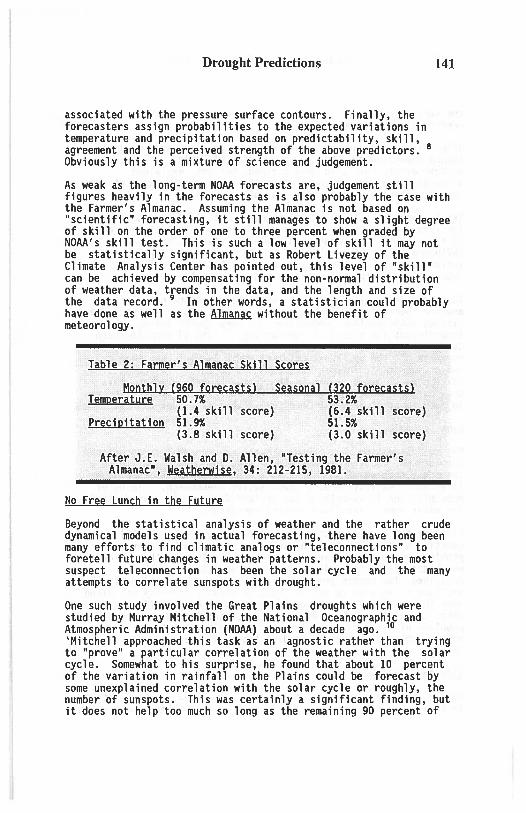
Drought Predictions
associated with the pressure surface contours. Finally, the forecasters assign probabilities to the expected variations in temperature and precipitation based on predictability, skill, agreement and the perceived strength of the above predictors. 8 Obviously this is a mixture of science and judgement.
141
As weak as the long-term NOAA forecasts are, judgement still figures heavily in the forecasts as is also probably the case with the Farmer's Almanac. Assuming the Almanac is not based on "scientific" forecasting, it still manages to show a slight degree of skill on the order of one to three percent when graded by NOAA's skill test. This is such a low level of skill it may not be statistically significant, but as Robert Livezey of the Climate Analysis Center has pointed out, this level of "skill" can be achieved by compensating for the non-normal distribution of weather data, trends in the data, and the length and size of the data record. 9 In other words, a statistician could probably have done as well as the Almanac without the benefit of meteorology.
Table ·Z; FBrm~['~ AlmBDB~ Skill SCo[~S
Monthl:i (960 fo[eca§ts) SeBsonBl (320 for~cBsts) Temlleraty[e 50.7% 53.2%
(1.4 skill score) (6.4 skill score) Pr~cillitBtjoD 51.9% 51.5%
(3.8 skill score) (3.0 skill score)
After J.E. Walsh and D. Allen, "Testing the Farmer's Almanac·, Weathe[Wi se, 34: 212-215, 1981. ..
No Free Lunch in the Future
Beyond the statistical analysis of weather and the rather crude dynamical models used in actual forecasting, there have long been many efforts to find climatic analogs or "teleconnections" to foretell future changes in weather patterns. Probably the most suspect teleconnection has been the solar cycle and the many attempts to correlate sunspots with drought.
One such study involved the Great Plains droughts which were studied by Murray Mitchell of the National Oceanographic and Atmospheric Administration (NOAA) about a decade ago. 10 'Mitchell approached this task as an agnostic rather than trying to "prove" a particular correlation of the weather with the solar cycle. Somewhat to his surprise, he found that about 10 percent of the variation in rainfall on the Plains could be forecast by some unexplained correlation with the solar cycle or roughly, the number of sunspots. This was certainly a significant finding, but it does not help too much so long as the remaining 90 percent of

142 USCID Regional Meetings -- 1989
the variation doesn't appear correlated without any other predictable phenomenon.
After Mitchell's work correlating the solar cycle and tendency toward expanding drought, various claims of lunar influence upon weather events have also been claimed, but not explained, although there is some speculation as to the significance of a superpositioning of the solar and lunar cycles. "
Still, weak statistical correlations do not yield the bases for future predictions which people would want to bet money on. It's likely the sun, moon, and maybe the stars do have a an influence on Earth's weather, but determining just how these influences work and how they blend into the other, unknown determinants of future weather are still a mystery.
The correlation of drought and sea surface temperature is another theoretical climatic connection, but data to support the various water-weather connections are verI sparse and as yet, insufficient for practical forecasting.' The El Nino Southern Oscillation (ENSO), a dramatic shift in the warm and cold ocean currents off the northwest coast of South America, has been a recent subject of intense interest as a potential teleconnection portending climatic shifts in the United States. However, this data base is relatively short and the correlation of Pacific sea surface temperatures with American weather is cloudy at best.
Back to Basics
Beyond determining what causes drought or even what is associated with drought and therefore could be used for prediction, there's the messy problem of just what is a drought. Many times drought is as much qualitative as a quantitative phenomenon. Timing of precipitation is everything for dryland farming and just as it is for water supply and flood control operations.
Likewise the areal extent of precipitation events and total quantity of precipitation falling in a watershed has been a problem because of the sparsity of gaging sites and the degree to which data from these sites can be extrapolated over the watershed. The common practice of averaging precipitation of all stations in an area to get an index of drought severity may blend away the local nature of drought and dilute the significance of other correlations which might be investigated. So along with the problems of predicting a deficit of precipitation, there is the added problem of having to predict the significance of that deficit.
Sidestepping Drought
Rather than trying to predict drought, we may have to be content in trying to sidestep its effects -- at least for the foreseeable

Drought Predictions 143
future. ' A lot can be learned from climatology: the means, standard deviations, and extremes of climate. Given a large data base of weather data from a station, we can compute the probabilities of certain weather chan~es or the likelihood that drought will become a problem. '
One proactive approach is Stephen Schneider's "Genesis Strategy" based on Chapter 41 of that book of the Bible and Joseph's guidance for the Pharaoh. 14 This is simply saving up for a not-so-rainy day. It works with grain, money, water, and even political favors, but it carries the burden of huge overhead expenses and attendant bureaucracies; still, it works for nations rich enough to afford the cost of storage.
Another approach is the "Response Farming" strategy as articulated by J.I. Stewart. 15 This is a dynamic practice of varying cropping based on climatology and the present weather. If farmers can change planting and crops quickly in response to available moisture, Response Farming should boost total production, but it must be combined with a Genesis Strategy to be effective in offsetting the effects of prolonged and severe drought .
Conclusjons
Long term prediction of drought is not now and may never be a viable technique. Determinants of weather patterns and the duration of those patterns are largely unknown and/or unpredictable. While some weak correlations of drought and other natural phenomena have been discovered, we have virtually no skill in connecting these predictors with the really severe droughts which we would most like to predict. For the foreseeable future, the best defense against drought would appear to be contingency planning and storage of surplus agricultural production.
References
1. See a variety of tongue-in-cheek sources, for instance, Leo Rosten, "The Myths by Which We Live", Address presented at the Opening General Session of the 20th National Conference on Higher Education, March 7, 1965, p.2.
"One of the difficulties of being a writer or a teacher or a physicist is that people project magic onto you, and they think that you know the answer to a problem, and they want the answer, simple, incontrovertible, absolute, permanent and universal. Men can't stand uncertainty. They want certitude because they need reassurance against their own uncertainty, their own anxiety, their own fears of the unknown, and they never come to terms with the horrifying fact that some things may never be known but life can go on with honor and in truth."

144 USCID Regional Meetings •• 1989
2. e.g. see H.C.S. Thorn, "A Statistical Method of Evaluating augmentation of Precipitation by Cloud Seeding", Final Report of the Statistical Advisory Panel to the Advisory Committee on Weather Control. Washington: 1957 p. 5-25.
3. E.N lorenz, "Deterministic Nonperiodic Flow", Journal of Atmospheric Sciences, 20:130-141, 1963, as referenced in A.A. Tsonis and J.B. Elsner, "Chaos, Strange Attractors, and Weather", Bulletin of the American Meteorological Society, Vol. 70: Nr. 1, January 1989, p.17, 19.
4. C.S. Ramage, "Prognosis for Weather Forecasting", Bulletin of the American Meteorological Society, 57:1, January 1976, p.4.
5. Richard A. Kerr, "Telling Weathermen When to Worry", Science, June 9, 1989, p.1137.
6. Anthony G. Barnston and Robert E. livezey, " A Closer look at the Effect of the II-Year Solar Cycle and the QBO on Nothern Hemisphere 700mb Height and Extratropical North American Surface Temperature", paper submitted for publication, May 1989.
7. Robert Pool, "Chaos Theory: How Big an Advance?", Science, Vol. 245:26, July 1989, p. 26.
8. E. Kalnay and R. livezey, "Weather Predictability beyond a Week", Tyrbulence and Predictabil ity in Geophysical Fluid Dynamics and Climate Dynamics. Bologna: Soc. Ital. di Fisica, 1985, p.342.
9. Robert E. livezey, "Caveat Emptor! The Evaluation of Skill in Climate Predictions" in Uwe Radok ed. Toward Understanding Climate Change, Boulder: Westview Press, 1987. p 131-162.
10. Murray Mitchell, interview at the National Center for Atmospheric Research, October 1978.
11. Richard A. Kerr, "The Moon Influences Western U.S. Drought", Science ,May 11, 1984. P 587.
12. William K, Stephens, "Scientists link '88 Drought to Natural Cycle in Tropical Pacific", New York Times, January 3, 1989, p. C1.
13. Nathaniel B. Guttman, "Statistical Descriptors of Climate", Bull.of the Am. Meteorological Soc., 70; Nr. 6, June 1989, p. 602.
14. Stephen Schneider with lynne E. Mesirow, The Genesis Strategy, New York: Plenum, 1976.
15. J.Ian Stewart, "Response Farming in Rainfed Agriculture", Davis, California: The WHARF Foundation Press, 1988.

A COMPLETE PLAN " ••• EXPERIENCES FROM THE U.S."
Peter Macy*
INTRODUCTION
A drought occurs when water supply is reduced to a level that cannot support existing demands. A drought may be caused by natural forces or system component failure and could last 2 to 3 months or extend over several seasons.
While many of you have not suffered a recent drought, the 1987-88 dust bowl conditions in other parts of the country have raised the question "Are we prepared for a drought?" This paper presents an overview of the necessary steps for completing a drought response plan. They reflect what has been done successfully throughout the country, especially in California.
Preparation of a drought response plan can be divided into four parts: inventorying existing supply, understanding demand, forecasting a supply shortfall, and analyzing supply augmentation and demand management measures.
INVENTORYING EXISTING SUPPLY
Decisions on how to mitigate a drought call for accurate knowledge of available and emergency supplies.
The first step is to collect existing supply informationfacility data: stream flow data: readings of reservoir levels, groundwater table elevations, soil moisture, snowpack, and precipitation records. The reliable yield must be defined for each source, as must any weak links in getting water to customers such as limited pumping capacity.
The next step is to look at supply augmentation methods. These can be grouped into five categories: (1) increasing existing supplies, (2) drawing from reserve supplies, (3) increasing efficiency, (4) modifying operations, and (5) entering into cooperative efforts with other agencies. Specific measures include increasing use of reclaimed water, using reservoir dead storage, adding or deepening wells, and participating in water exchanges.
Agencies need to evaluate and document the efforts required for supply augmentation. Agreements or contracts should be written up ahead of time for such
*Brown and Caldwell Consulting Engineers, Denver, CO
145

146 USCID Regional Meetings -- 1989
measures as water transfers. Costs and time requirements should also be determined.
UNDERSTANDING DBKAHD
Understanding demand requires knowledge of existing and predicted future consumption patterns as well as a determination of realistic demand management opportunities.
Demand
Demand can be estimated from:
Production records and forecasts.
Water-use records and forecasts.
Long-term weather forecasts.
Precipitation records and forecasts.
Service area population and growth projection.
Customer class characteristics.
Demand Management
Efforts to reduce water demand are best directed at customer uses that are inefficient or wasteful or those that can be temporarily cut back or suspended. Techniques for reducing demand include restricting landscape irrigation and retrofitting plumbing fixtures with low-flow devices.
Two measures often imposed on all customer classes are rationing and restructuring of rates to encourage conservation (or discourage high water use).
Rationing: Consumer response to rationing programs, in the form of reduced water use, is more predictable than response to other measures. Thus these are generally the most effective programs for achieving significant demand reduction. In nearly every instance where mandatory rationing is implemented, consumers respond by reducing water use further than is requested.

Experiences from the U.S. 147
A successful rationing program should be as equitable as possible, and customers should be kept informed about the status of the shortage. Pertinent information regarding water use and supply must be published and disseminated at least weekly if customer commitment is to be maintained.
Rationing programs are generally patterned after one of four basic allocation schemes: (1) percentage reduction, (2) seasonal allotment, (3) fixed allotment, and (4) specific use bans. A percentage reduction assigns each customer class a consumption reduction goal as a percentage of the consumption level in a similar billing period during a normal (nondrought) season. The fixed allotment is similar to the percentage reduction except the consumption reduction goal varies according to the time of year.
Rates: The ability of a price change to affect consumption is termed price elasticity. Price elasticity is a measure of the relative influence that a change in price of a given commodity (water) has on the demand for that commodity. Several variables effect price elasticity, such as whether the use is indoors or outdoors or whether use is in an affluent or depressed neighborhood. Using rates to encourage water conservation requires individual metering of customers.
significant water conservation is unlikely to be achieved through the use of standard rate increases. However, there are several pricing structures that lend themselves to drought response plans. These include seasonal rates, excess-use charges, penal ty charges, and drought surcharges.
Under a seasonal rate schedule, unit prices are higher -during peak-use months. An excess-use charge (or inclining-block-rate structure) applies a higher unit price to the volume consumed above a set limit. Penalty charges are similar to excess-use charges except that the same unit price is charged for the entire volume consumed and a flat fee is assessed if total use exceeds a set ceiling. with either seasonal or excess use pricing structures, care must be taken in defining excess consumption for each of the customer classes. A drought surcharge, which is a percentage increase in user fees to pay the costs associated with the drought, may also cause reduction in water use.

148 USCID Regional Meetings -- 1989
FORBCASTIBa A SUPPLY SHORTFALL
Accurate forecasting requires coordinated efforts between those at a water utility who understand demand and those who measure and predict state and local water supplies.
Supplv Forecasting
Wholesalers will need to manage the allocation and delivery of source supplies or supplies from primary water suppliers such as the u.s. Bureau of Reclamation.
water retailers will need to make their own findings and collect information from wholesalers, where appropriate. supplies available from (1) snowpack, (2) groundwater, (3) storage, (4) exchanges, (5) etc., must be determined. They need to determine the total forecasted supply in each month for the coming 12 months as well as how much of the supply should be carried over as insurance against a possible subsequent drought year.
Demand Forecasting
Each agency should use its own forecasting method to predict demand. Various methods such as production records and weather forecasts were suggested earlier in this paper. The forecasts will need to be made for each month in the year to demonstrate the differences between summer and winter consumption.
Defining ~ Drought Shortfall
The agencies' next step is to compare the estimate of drought year water demand to available water supplies and identify those months, if any, during which a shortage is anticipated. This assessment will enable the utility to forecast what level of supply augmentation and/or demand reduction needs to be achieved.
Forecasted supply can be plotted on a graph and forecasted demand superimposed on it, as shown on Figure 1. This figure illustrates that a water shortage will occur by the end of February and that supply augmentation will be necessary in the beginning of May, as the drought worsens.

21
20
It
18
17
~ " IS . .,.
51 ,. '71 u "':. c u 12 c
11
10
8
JAN
Experiences from the U.S.
DROUCHTYUR -"LYWITH AUGM(NTATION
JU\. AUG Si'
MONTH
f2/' //1 ~T AUCiMINTATIOH /, . YOLU'"
149
DROUGHT YIAR D!MAND
OCi NOV DEC
Figure 1 Projected Supply Deficit Condition.

150 USCID Regional Meetings -- 1989
TO help motivate those who need to support the plan and to determine what level of effort and budget to apply d~ring a drought, a preliminary drought impact assessment is important. What short and long-term impact would a drought have? Economic impacts, such as the likely effects on utility revenues and the landscaping business, should also be reviewed.
ANALYZING SUPPLY AUGKBNTATION/DEHAND MAllAGBllBNT IlBASURBS
The triggering of successive drought response phases should be correlated with a series of realistic deficit reduction goals. Most communities adopt phased response plans. Three to five phases are common. The triggering of successive drought response phases should be correlated with a series of realistic deficit reduction goals.
Trigger Levels
Agencies must identify the specific supply deficit data they will use to "trigger" sequential drought response phases. Then they must quantify their deficit reduction goals and select the appropriate water-saving measures for the demand reduction phase. Comparison of forecasted supply and demand to the preestablished "trigger" levels provides the basis for initiating or upgrading a drought emergency.
A sliding scale for trigger values is often represented graphically. In the drought response plan for the Delaware River Basin, for example several stages of diversions, reservoir releases, emergency reservoir operations, and conservation measures are keyed to four drought conditions. The agency determines when it has reached these conditions according to a set of operation curves based on the total remaining available storage capacity in three reservoirs. Typical operation curves are shown on Figure 2.
Deficit reduction objectives for each drought phase are commonly expressed as a percentage of average demand levels or as a quantity (volume or tate) of water saved. A sample phased program has been developed as a guide:

Experiences from the U.S.
OP~~"'T1CN C',JAVU FOA C>NNONSVII.I.!. P!?,ocrON ... NO N(VEilSI,." AE.S.;lVQIAS
SDwt~: ~Mmwf ~I'V''',,",''' O~ tlf !,..",Ot"!IIttW''QI ....... I!;.'ft. ~""CII tit .IIHDWtc.t ~~. luttllilll 0' -".1" :;lj~~ ... ~'" ~1"'''''''''.~ c.,...._~~.,..''Or'':'>. e~a-.,.:II,..,., ~h"'_ .".va\ :ias.
Fi9ure 2 Craohic: Method o( Crought Staging 3ased on Rcaservoir l.dvels
151

152 USCID Regional Meetings -- 1989
Phase wate;r;: ~hor.:I:age Target water Savings, eercent
I Moderate 5 to 10 II Severe 10 to 20
III Critical 20 to 35
Phase I relies upon voluntary action by the water consumers in anticipation of a modest water shortage. Subsequent phases are in response to increasingly severe drought conditions. Phase II utilizes some mandatory measures, and Phase III involves water rationing. Phase III would be initiated only in rare circumstances and aims at the maximum level of water savings that could be achieved in a community without severe hardship.
The phases should be designed to be somewhat flexible. An agency does not necessarily move through each phase in every circumstance. It is more likely that a voluntary program (Phase I) would be tried at the first sign of a drought and then, if the drought worsened, the agency would begin Phase II or III.
Evaluation of Water Saved ~ Phased Reductions
The water saved by the measures included in any of the phases will vary from month to month. For instance, the effectiveness of measures emphasizing outside water use reduction will be higher in the warmer months.
Agencies can use the estimated water savings from the sample three-phase plan to decide which phase to select to reduce demand to match available supply. The following procedure, illustrated in Figure 3, is recommended.
1. Graph projected water supply. Include supplemental sources in determining . the available water supply for the coming year.
2. Estimate dry year water demand. Apply the percent savings anticipated for each phase to the projected dry year demand (reduction) curve. Graph the results as a series of three adjusted demand curves together with the projected dry year demand.
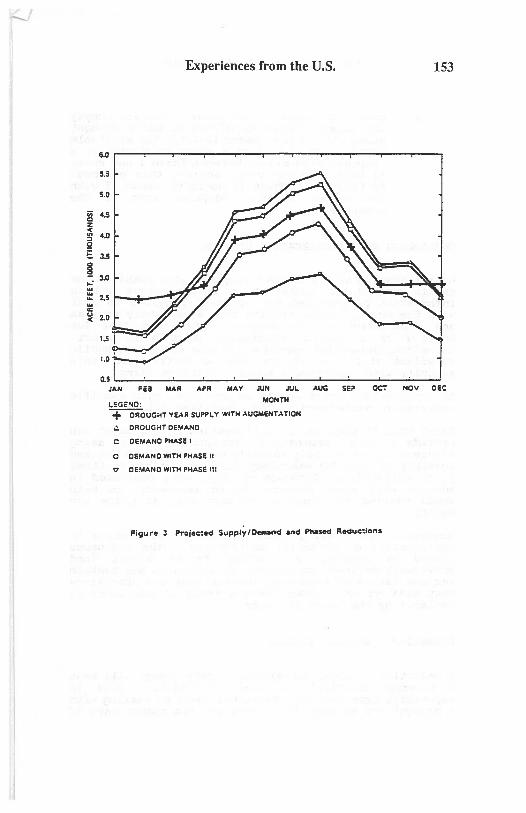
Experiences from the U.S. 153
6.0
5.5
5.0
iii c.s Q Z -< .. c.o :> Q
E 3.5
~ 3.0 .: .. ::! 2.5 .. a: u 2.0 -<
1.51
1.0
0.51 JAN F.a MAR APR MAY JUN JU\. AUG SE~ O~ NOV DEC
1.5GEI\IO: MONTH
+ DROUGHT YEAR SUPP\. Y WITH AUGMENTATION
~ DROUGHT DEMAND
C DEMAND PHASE 1
o DEMAND WITH PHASe II
f; DEMAND WITH PHASE 111
Figure 3 Projected Supply/Demand ond Phased Reduc:ions

154
3.
USCID Regional Meetings -- 1989
Select the appropriate phase. Compare supply and demand curves to determine which drought phase will reduce demand to match the available supply. In the example shown on Figure 3, a response plan midway between Phase I and Phase II would theoretically achieve this balance. In this case, Phase II would be selected with the option of only adopting some of the measures.
Developing ~ Administration Program
Administration of the drought response plan combines the skills needed to undertake a comprehensive public information program and the judgment required to deal with the equity issues arising from a mandatory program and enforcement of the program. The lead time for setting up a public information program is short. Therefore, unless the agency has access to a large public relations staff, it may be wise to contract for this activity with experienced public relations firms.
An organization chart should be developed with specific individuals designated in the identified roles.
Joint utility planning in anticipation of a drought can provide a common approach to drought management among adjacent utilities, help identify emergency supplies, and possibly provide for emergency interconnections or other joint activities. Interagency agreements confirmed in advance will speed response to an emergency and help avoid hurried decisions on matters such as price and equity.
Ordinances restricting water use should be drafted in anticipation of potential emergencies. The ordinance should be adopted in response to an actual (and previously defined) emergency. An ordinance may contain various levels of mandatory restrictions and provisions that will go into effect when a state of emergency is declared by the governing body.
Preparing g Revenue Program
A reduction in water use without a rate change will me~n a revenue shortfall for most utilities. This 1S especially true when the additional costs of dealing with a drought are brought in. There are two common ways of

Experiences from the U.S. ISS
balancing the budget: (1) raising water rates and (2) imposing a drought surcharge. Two additional possibilities are to use the financial reserves in the· general or water revenue fund and to draw from a designated drought emergency account. Various combinations of these methods can be used to create a comprehensive revenue program.
Regardless of the method selected, it is necessary to do the following:
1. Estimate the amount of water use reduction that will be achieved and the associated lost revenue.
2. Design a rate adjustment or dr~ught surcharge that will cover the anticipated revenue deficit.
3. Monitor actual revenue and compare with forecasted revenue; adjust drought surcharges as needed (but not too often).
Adopting the Drought Response Plan
Once it is decided that a drought plan is needed, the water agency should move quickly to adopt a plan. The process can usually be completed within 1 to 3 months. When all issues and procedures are defined as much as possible, the plan should undergo a formal public review process before the finalized document is adopted. This will help minimize surprises and future objections when mandatory provisions are called for.
Opposition to the plan should be anticipated from those involved with potentially affected business activities. The "green" industry--Iandscape contractors, nurseries, etc.--will probably suffer economic harm during a water shortage and can be expected to have concerns about certain elements of the plan. The best way to mitigate these objections is through communication and fairness. All concerned parties should be informed of the action plan well in advance of when it might be adopted. They should also be aware of the agency's efforts to make the plan as equitable as possible.

156 USCID Regional Meetings -- 1989
Monitoring Supplv Accordingly
Versus Demand Responding
Implementation of a drought response plan includes ongoing monitoring of the effectiveness of the individual conservation measures, monitoring supply availability, and monitoring actual water use. The following procedure, illustrated by Figure 4, is suggested.
1. Overlay actual water supply and demand on the graph previously prepared (Figure 3). A 7-day average can be used to smooth out daily fluctuations. Update this graph weekly.
2. Compare actual demand and supply with projected demand and supply to determine if an adjustment within the phase is needed. Before moving to the next demand reduction phase, consider program adjustments such as raising the level of expenditure on public information and increasing enforcement efforts within the existing phase. If this does not achieve the required stabilization, then move into the next phase.
In the example on Figure 4, water supply is anticipated to be cut back. An appropriate response would be to implement Phase II in March. In this example, it would be advisable to implement Phase II early, and if the savings are not SUfficient, initiate Phase III.
CONCLUSION
If water agencies have a complete understanding of supply and demand and a preplanned and carefully constructed drought management plan in place, the impact of a drought can be significantly reduced. Public relations of the responsible authorities will remain intact, and the economic impact on businesses and residential customers will be kept to a minimum. The main ingredients for success are good information, planning, and execution.

Vi 0 z
~ g E ~ ~ ... ~ ... cz: u <
Experiences from the U.S. 157
e
3
2
OL-__ ~ __ ~ __ ~ ____ ~ __ ~ __ ~ ____ ~ __ ~ __ ~ __ ~ __ ~
JAN FU MAR APR MAY JUN J\Il AUG SEP OCT NOV DEC
LEGEND :
o DEMAND WIPHASE II
-._.- ACTUAL DEMAND +
MONTH
ACTUAL SUPPLY
DROUGHT YEAR supn Y WITH AUGMENT A TlON
Figure 4 Avoilable Supply/Actual C ..... nd and Required Pha ••


THE DROUGHT OF 1988/89: A SUCCESS STORY
David R. Bussel
ABSTRACT
A discussion of the experiences of the St . Louis District, Corps of Engineers, with regard to navigation concerns during the drought of 1988/89 is presented. The drought has shown the importance of the many different kinds of structures that have been built to improve navigation. The drought has required adjustments in regulation procedures in order to facilitate navigation on the Mississippi River near St. Louis , Missouri . For the period January 1988 through December 1989, navigation has moved through the St . Louis District with a surprisingly small number of drought related delays . A number of structural and nonstructural changes in the regulation of the Mississippi River have been proposed as a result of the drought . Structures built since the 1930's and the new methods of regulation have turned a potential disaster into a success story.
INTRODUCTION
Droughts are a strange phenomenon. No one can say for sure what causes them or how long they will last. Theories abound on the causes of droughts; the greenhouse effect , El Nino, split jetstreams, depletion of the ozone layer or even the position of the planet Jupiter. One thing is for sure, the Mississippi River Basin has been suffering from a drought since the summer of 1988. The watershed above St. Louis, Missouri received only 77% of the normal rainfall in 1988 (see FIG I), and only 86% of normal in 1989 (see FIG 2). The St. Louis District, Corps of Engineers has the responsibility for maintaining navigation for approximately 300 miles of the Mississippi River from near Hannibal, Missouri to the confluence with the Ohio River near Cairo, Illinois. The drought has focused attention on many of the structures built by the United States Army Corps of Engineers since the early 1930's, the regulation procedures used during low flow periods, as well as special actions taken by the Corps of Engineers to keep navigation moving.
lWater Control Manager and Hydraulic Engineer , P. E., St . Loui s District, U.S . Army Corps of Engineers, St. Loui s , Mi ssouri
159
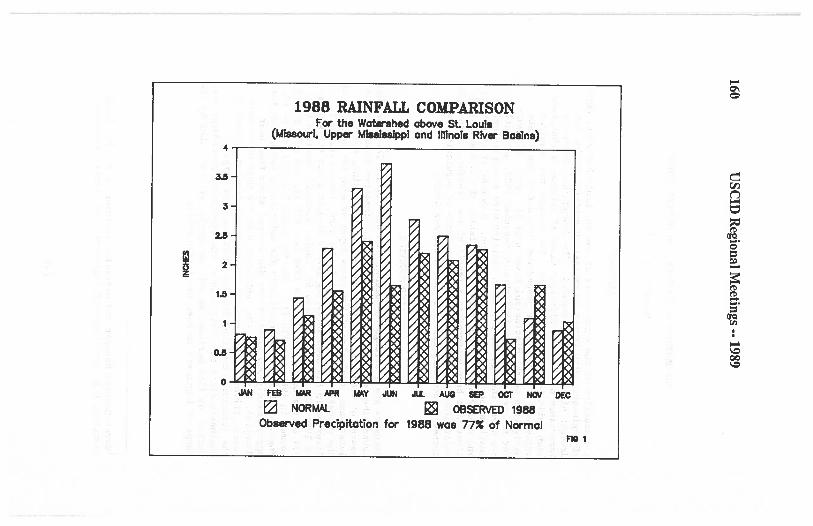
4
3.5
.3
2.6
I 2
1.5
o.a
o
1988 RAINFALL COllP.ARISON For the Watershed above St. Louie
(Mleeenr!. UPI*' Mleeleelppl and 1I0noie RIv .. Bcii1ne)
~ ~ -"H FEB MAR APR WAY .JUN .JI.l. AUG IEP ocr NClY DEC
~ NORMAl... ~ OBSERVED 1988 Oberved Precipitation for 1988 woe 77X of Normal
FlO 1
.... C\ :>
d 00
9 ~
IrQ o· = ~
s= ~ ~ ... s·
IrQ CI)
.... I.::> 00 I.::>

I
1989 RAINFALL COMPARISON For the Wawsheel above st. Loula
(Missouri, Upper MI88I .. rppl and IIlInola RIv~ Basins) 4~,--------------------------------------~
u
3
2.0
2
1.11
o.a
o 1<,.' ''I'" ''Ix' '''lx, "<t'd K4I X' K," ",- ,<,.11 ",.' 1<'fI" ~ ~ ~ ~ ~ ~ a ~ • ~ ~
~ NORMAL ~ OBSERVED 1989 Observed Precipitation for 1989 through November was 86" of Normal
FlO 2
>-3 =I'D t:;;
~ ~ .... o .... "" \C QC
~ QC \C
"" ~ ""

162 USCID Regional Meetings •• 1989
THE SUCCESS STORY
Before the drought of 1988/89, the locks and dams on the Upper Mississippi River, upstream of St. Louis, Missouri, were operated in a parochial manner. Local concerns carried a greater weight than did the concerns of the entire river navigation system in regard to how each individual lock and dam was operated. This parochial type of operation creates minimal problems when the flow rate is greater than or equal to the average low flow. This past drought has pointed out that during periods of record low flow, this manner of regulation at times produced negative effects to downstream locks and dams as well as navigation on the open river below St. Louis, Missouri. During the recent drought, adjustments were made in regulation procedures and the locks and dams were operated in a manner in which concerns of the whole navigation system played a greater part in the decision making process.
As a result of the nature of locks and dams the outflow stage hydro graph from the dam has a greater amplitude than does a natural stage hydrograph. The locks and dams on the Mississippi River are regulated based on pool instructions . The water control manager will instruct the lock and dam personnel to maintain the pool between certain limits. In most cases the water control manager will not give any limits on the maximum allowable change in tailwater elevations. Gate changes need to be made manually in order to change the outflows from a dam. Lock and Dam personnel are normally told that helping traffic pass through the lock is their highest priority . This being the case, gate changes are not always made at the optimum time. Navigation pools go outside their limits and compensative gate openings or closures are made. This action often causes the next lock and dam downstream to take a greater compensative action, thereby compounding the amplitude of the flow hydrograph. Ultimately the fluctuating flow, wherever it originates, makes its way to the open river below St. Louis, Missouri as it finally passes through Locks and Dam 26 at Alton, Illinois. The change in flow rates can be as large as 12,000 cubic feet per second (cfs). At the mean flow for the St. Louis gage (approximately 180,000 cfs) , a flow change of this size will cause a stage change of approximately 1 foot. At a flow rate of 40,000 cfs, a decrease of 12,000 cfs will cause a drop of approximately 3.5 feet. The effect of gate changes on the stage at St. Louis is much more drastic at the lower flows than it is during the higher flows.
The channel improvement works (dikes and revetments) along the open river are designed to maintain navigation depth at a flow rate of 54,000 cfs. At extreme low flows a fluctuation of 12,000 cfs can result in a temporary loss of these navigation

The Drought of 1988/89 163
depths. The success story of maintaining adequate navigation depths during this drought consists of 7 parts. First, an effort was made to decrease the size of each gate change at each lock and dam thereby decreasing the amplitude of the flow hydrograph. In conjunction with this, the frequency of gate changes at each lock and dam had to be increased. This would have been impossible under the priority that gate changes had been given in the past. Under the new procedure, gate changes are given the highest priority even if this means that tows will have to wait for lockages while gate changes are being made. The reasoning behind this is that if there is a loss of navigation depth or if barges go aground in the channel at St. Louis, traffic would come to a halt anyway and it would not matter if a backup occurred at the locks.
The second part of the success story was due to increased coordination and awareness between all the locks and dams on the Mississippi River. The St. Louis District contacted both the Rock Island and St. Paul Districts to inform them of the sensitivity of their actions upon the gage at St. Louis during low flows. It was also agreed that before anything out of the ordinary would be done, the lowest downstream district (St. Louis) would be consulted to determine the effects. This meant that, at times, each individual lock and dam might suffer in a small way so that navigation, on the whole, would not suffer in a much larger way. After the two changes above were implemented, the amplitude of the fluctuations in the daily hydro graph was decreased by at least 50%. The Mississippi River at St. Louis had experienced low flows on many days, that in conjunction with a 12,000 cfs decrease would have caused temporary loss of navigation depths had it not been for the new regulation plan.
Fluctuations, due to gate manipulation, would have been a moot point had it not been for the augmented flows out of the Missouri River. A series of six dams in North Dakota, South Dakota, and Montana supplied up to 50% of the Mississippi River water passing St. Louis, Missouri during the summers of 1988/89, and made up the third part of the success story. The first reservoir, Fort Peck, was built in 1930. The last reservoir to be completed was Big Bend in 1963. The system reached full operating levels in 1967. The Missouri River reservoirs made it possible to maintain a nine-foot navigation channel on the Middle Mississippi River during the summer and fall of 1988. The nine-foot navigation channel would not have been possible in the St. Louis District for 59 consecutive days starting on July 22, 1988 and running through September 19, 1988 had it not been for the augmented flows out of the Missouri River reservoirs. Similar numbers are expected when the analysis is complete for 1989.

164 USCID Regional Meetings -- 1989
Even with the augmented flow out of the Missouri River reservoirs, the nine-foot navigation channel on the Middle Mississippi River would not have been maintained had it not been for the dikes and revetments that line the river. These constitute the fourth part of the success story. Revetment serves to stabilize the bankline along the river and the dikes serve to reshape the river to create a deeper channel than would not be available if the river were left to its own devices. Dikes are placed at critical points in order to maintain navigation depths with the goal of using minimal amounts of dredging. In the St. Louis District, this channel improvement program is 80% complete with a scheduled completion date in the year 2000.
The fifth part of the story was the cooperation of government and industry - the River Industry Advisory Committee (RIAC). RIAC is a group made up of people from the Private River Industry (Barge Lines), with the United States Coast Guard, and the Corps of Engineers, attending. This group meets on a frequent basis to discuss common concerns, problems, and to exchange information. The ability of anyone of these groups to cope with the drought would have been hindered had it not been for the cooperation of the other two.
Barge traffic would have come to a halt near Grand Tower, Illinois on the Mississippi River (approximately 98 miles south of St. Louis) for 6 days in 1988 and at least 15 days in 1989 had it not been for the work accomplished by the Corps of Engineers in 1988. Rock has been removed in two separate areas of the river; first in the Grand Tower reach and then in the Thebes Gap reach (approximately mile 38-46 miles above the confluence of the Ohio River). Rock removal is the sixth part of the success story. These portions of the river have a rock bottom, as compared to dredgeable alluvium bottom. This rock has always been there. In fact, when Mark Twain was a Mississippi River Boat Captain he wrote about the Thebes Gap reach: " ... for it is a chain of sunken rocks admirably arranged to capture and kill steamboats on bad nights. A good many steamboat corpses lie buried there, out of sight .. . " However, it has not been a problem in the modern era until the current drought. In 1988, the Corps of Engineers started to remove rock in these areas. Had it not been for this work, navigation would have ceased for part of November and December 1989.
The seventh and last part of the story in maintaining the ninefoot navigation channel is dredging. Dredges are sent to the critical locations on the river where the channel is too shallow or too narrow. The goal of the dredges is to be at least one step ahead of the river; their responsibility is to provide

The Drought of 1988/89 165
adequate channel dimensions and to anticipate future trouble spots. Dredging is used as a last resort by the river engineers. During the winter of 1989, six dredges were working the stretch of river between St. Louis and Cairo, a record number for this section of the river. When all the dike and revetment work is complete, dredging should playa smaller role in the maintenance of the nine-foot navigation channel.
Even during droughts, navigation can take a back seat to other concerns. For example, as a result of the Endangered Species Act of 1973, it was necessary for the Corps of Engineers not to fully increase the flows from Gavins Point to aid navigation because that would have threatened the nests of the federally protected Piping Plover and the Interior Least Tern. Another example was the decision not to divert water out of Lake Michigan into the Illinois River, which flows into the Mississippi River in order to provide more water for navigation. This decision was made in part to avoid a resulting 0.1 foot decrease in the water level in the Great Lakes that would have adversely effected hydropower generation in that region.
Navigation in the St. Louis District, from near Hannibal, Missouri to the mouth of the Ohio River, while experiencing problems, was maintained during the drought of 1988/89. The channel narrowed as flows decreased, but barge traffic was able to pass through the St. Louis District without an abnormal number of delays. The tonnage passing through the four sets of locks in the St. Louis District has increased during 1988/89 as compared to 1987.
CONCLUSION
The drought of 1988/89 was one of the most severe that has occurred on the Mississippi River Basin and yet navigation depths were, for the most part, maintained due to structures built previously, cooperation of all interested parties, rock removal, and innovative river regulation procedures. While the drought of 1988/89 was severe, it truly is a success story.
This discussion represents the views of the writer and is not necessarily the views of the Corps of Engineers.

/
DROUGHT MANAGEMENT IN NORTHEASTERN COLORADO
Darell D. Zimbelman*
ABSTRACT
The Northern Colorado Water Conservancy District (the District) has established a set of policies and procedures and constructed a water storage and distribution system that allows for the effective and efficient transfer of water, on an annual rental basis or on a permanent basis, to meet changing demands or climatalogical conditions, including drought. In fact, the District was created and the Project designed during and following the drought of the 1930's. The District operates and maintains the Colorado-Big Thompson Project, which captures runoff from the head waters of the Colorado River on the West Slope of the Rocky Mountains. The stored water is then transferred to storage reservoirs on the East Slope of the mountains, for subsequent delivery to District allottees. The District delivers an annual average of 240,000 acre-feet to supplement the runoff of six East Slope drainages, namely the Cache la Poudre River, the Big Thompson River, the Little Thompson River, and St. Vrain River, Left Hand Creek, and Boulder Creek. The amount of water delivered by the District is directly related to the anticipated runoff from the East Slope drainages, and in most years can offset the impact of below normal runoff. Approximately 30 percent of the deliveries are for municipal and industrial uses, with the remainder being for agricultural uses.
The District's policies and procedures allow water to be transferred from one allottee to another on an annual rental basis, without regard to type of use or location, simply by filling out a post card type form and mailing it to the District offices. This is a powerful management system which allows water transfers to be made on an annual basis to the individual or entity with the "greatest" demand. Water can also be transferred permanently. While administratively a permanent transfer is a bit more lengthy, it allows water to be transferred to meet the overall changing demands of the area, namely from agriculture to municipal use. These transfers can occur without being encumbered by the very lengthy, and on occasion costly, process placed on other water supplies by the Colorado water rights system. The Colorado water rights system is a judicial process in which
*Associate General Manager, Northern Colorado Water Conservancy District, Loveland, Colorado
167

168 USCID Regional Meetings .. 1989
a transfer in water right must be submitted to the water court along with necessary legal and engineering reports which demonstrates that senior water rights holders will not be adversely impacted by the transfer. Since this process is open to legal objection, it can, if the transfer is protested, result in a substantial delay in time and a significant commitment of funds to complete the transfer. Ultimately it may result in less water being transferred than was desired.
INTRODUCTION
The Northern Colorado Vater Conservancy District (the District) was formed in 1937 under the Conservancy District Act for the purpose of being the local sponsor and contractor with the U.S. Bureau of Reclamation, Department of the Interior, for the operation, maintenance and repayment of the water storage and delivery features of the Colorado-Big Thompson (C-BT) Project. Farming on the high plains of northeastern Colorado began in the late 1800's as miners, who had come to the Colorado Rocky Mountains in pursuit of gold and silver, diverted their livelihood from mining to providing food and fiber for the miners and their animals, and for the U.S. Cavalry. Annual precipitation on the high plains, which averages less than 12 inches, was inadequate, so the farmers banded together to construct diversion structures and storage reservoirs which captured the spring runoff from the local stream and diverted it to their farm and reservoirs. The reservoirs were needed to provide water during July, August, and September when many of the natural streams dried up. As the agricultural economy grew with additional lands being put under cultivation, and with the advent of the drought in the early 1930's, it became obvious to many agricultural leaders that a supplemental water supply was needed to stabilize and augment the native stream runoff. Former state engineer, Royce J. Tipton, had studied the possibilities of diverting water from the wetter western slopes of the Colorado Rocky Mountains to provide additional water to the streams originating in the mountains on the eastern slope. In fact, some of the more visionary water leaders and their irrigation and reservoir companies had already developed the Grand River Ditch transbasin diversion. The agricultural leaders in northeastern Colorado banded together as the "Northern Colorado Vater Users Association" to actively promote the construction of a transbasin project in order to stabilize and supplement their water supplies. The U.S. Bureau of Reclamation agreed to construct the proposed project but required that a local entity, who had the ability and authority to be the local sponsor of the

Colorado Drought Management
project and to sign a repayment contract, had to be identified. To meet this requirement, the state legislature passed the Conservancy District Act in 1937. The District was organized under this act following almost immediately on the heels of the enactment of the Conservancy District Act.
169
The Project that was finally settled upon is known as the Colorado-Big Thompson Project. The C-BT Project transports water from the Colorado River watershed on the Vest Slope of the Colorado Rocky Mountains, under Rocky Mountain National Park, and introduces that water into the watersheds on the eastern slope of the Rocky Mountains. The western slope of the Rocky Mountains receives more precipitation than does the eastern slope because moisture from the Pacific Ocean is deposited on the western slopes as the moisture laden air raises up over the Rocky Mountains and the Continental Divide.
The water storage components of the C-BT Project consist of Villow Creek and Granby Reservoirs on the Vest Slope and Horsetooth, Carter and Boulder reservoirs on the East Slope. Vater is delivered from the three East Slope reservoirs during the summer months to supplement the flows of the six East Slope streams, namely the Cache la Poudre River, the Big Thompson River, Little Thompson River, St. Vrain Creek, Left Hand Creek and Boulder Creek. Vater is transferred from the Vest Slope to refill the East Slope reservoirs during the winter months. The Vest Slope reservoirs are refilled by the spring runoff.
VATER ALLOTMENT POLICIES AND PROCEDURES
It was originally calculated that the C-BT Project would be able to store and deliver an annual average of 310,000 acre-foot. It was decided to create 310,000 acre-feet units. During the construction phase of the Project, all 310,000 units were allotted to individual water users and municipalities located within the seven front range counties of Larimer, Boulder, Veld, Morgan, Vashington, Logan, and Sedgwick, which are all in the South Platte River Basin downstream from the Denver metropolitan area. These units are allotted through an allotment contract, which is a "contractual right of use". The District has a contractual obligation to deliver an amount of water to each unit, which is 1/310,000 of the total amount of water declared available for delivery by the District's Board of Directors.
The District's Board of Directors set the annual amount of water available for delivery in April of each year. This annual amount is expressed in terms of a "quota" which

170 USCID Regional Meetings -- 1989
represents the percentage of an acre-foot be available for delivery. An 80 percent each allottee will have available to them acre-foot for each unit allotted to them. ranged from a maximum of 100 percent to a with the average for the thirty two years the Project being 75 percent.
per unit which will quota means that eight tenths of an The quota has
low of 50 percent, of operations of
The Board of Directors takes into consideration a broad range of issues and data as a part of establishing the quota, including:
1. The water currently in storage in the C-BT system and the amount of runoff forecasted to enter the system during the runoff season;
2. The water currently in storage in the East Slope reservoirs and the amount of runoff forecasted to be available for diversion from the East Slope streams;
3. The forecast for temperatures and precipitation in the irrigated area of the District;
4. The forecasted amount of carry-over water which will be in storage, both in the C-BT Project and in East Slope reservoirs, at the end of the current water year;
5. The status of the crops already planted and the need for irrigation water to insure adequate moisture for germination;
6. The general economics of irrigated agricultural products.
Once the quota has been set, each allottee's account is credited with their proportionate volume of water and the allottee is free to request delivery. Account balances are maintained by the District to ensure that delivered amounts do not exceed entitlement.
Control of the allotment contracts rest with the District Board of Directors. The District staff is responsible for administering the contracts in accordance with the rules, policies, and procedures established by the Board.
The allotment contracts associated with agricultural use must be attached to a parcel of land to which the water can be delivered. Since the C-BT water is a supplemental supply, the parcel of land to which the units are to be attached must have been previously irrigated. To discourage speculation,

Colorado Drought Management
the District staff physically inspects each parcel and makes a determination of the amount of water which can reasonably be used on that parcel based on soil type, land slopes, cropping patterns, etc. The difference between the yield provided by non C-BT supplies and the total amount which can reasonably be used establishes the limit on the number of units which can be attached to an individual parcel.
171
For municipal and industrial purposes, the Board of Directors allows the entity responsible for providing the water to accumulate twice their demonstrated need, which is established based on existing demand pattern plus an allowance for planned developments. The difference between demand and the yield from non C-BT supplies represent their demonstrated need. That need in acre-feet divided by two establishes the limit for C-BT units. This policy ensures that municipal and industrial needs are satisfied even when the Board sets a 50 percent quota. This recognizes that municipal demands are less able to deal with drought related shortages than are agricultural users.
TRANSFERS
In order to enhance water management, District policies and procedures allow water to be transferred between allottee accounts. On an annual basis, allot tees who have "more" water than they need will "rent" water to those allot tees who need additional water. An informal network exists amongst the allot tees, through which allot tees can find the names of other allottees who have water to rent or need to rent water. The two allot tees agree on a price for the water to be rented. Once that financial transaction has been agreed to, the renter of the water is required to submit a post card sized form to the District. The District then debits the account of the renter by the amount transferred and credits the account of the rentee by a like amount. The District does not share financially in the transaction nor does the District charge an administrative fee for making the transfer. Of the 240,000 acre-feet delivered on an annual average, approximately 50 percent is transferred on an annual rental basis. The District does not monitor or control the volume of water transferred to any individual account during the water year.
The allotment contracts can also be transferred permanently; however this is less effective in meeting the changes in demand from year-to-year in reaction to actual runoff, including drought.

172 USCID Regional Meetings •• 1989
WATER MANAGEMENT BENEFITS
The allotment contracts and the associated administrative procedures are a very powerful and viable water management policy. It allows water on a yearly basis to be efficiently and effectively transferred from an entity or individual who has more water than needed to an entity or individual who needs the water. It also allows the Board of Directors to set the quota based on district wide conditions, but allows the water to be transferred from a watershed where the runoff that year is above "normal" to a watershed that is below "normal". This situation happened in 1987 when the Boulder Creek basin had above normal runoff, but the Cache la Poudre basin was well below normal. In that year, allot tees in the Boulder Creek basin transferred water to the Cache la Poudre basin allot tees. This can be an effective drought management alternative.
The Board's policy of permitting municipal water suppliers to acquire twice as many units as their acre-feet demands results in municipalities having the water they need regardless of the quota. In any year when the quota is above 50 percent, the municipalities generally have more water than they need. This unneeded water is generally leased to agriculture.
This is an economical benefit to irrigated agriculture because the municipalities have to pay the annual fixed cost for carrying the water in their portfolio, but the irrigators can use it in most years. By renting water on an annual basis, the irrigator is able to adjust his available water supplies to more closely meet his individual demands taking into account cropping patterns, weather etc. In 1988 municipal and industrial allotments were 30 percent of the total allotments. Actual deliveries for municipal and industrial use for 1986 through 1989 averaged 23 percent. The difference between water allotted for municipal needs less actual deliveries is available for lease to agriculture. Again, this allows the municipalities to have the water they need in drought years, while at the same time in non-drought periods the water is put to beneficial use elsewhere.

Colorado Drought Management 173
SUMMARY
The Northern Colorado Water Conservancy District has developed a water storage and distribution system and a set of policies and procedures which allows water to be transferred easily and conveniently to meet changing demands. By allowing and promoting the transfer the water supplies made available to water users within the District boundaries, the management of the area's water resources is enhanced for the benefit of all.


r--'
DESIGNING A SUPPLEMENTAL IRRIGATION SYSTEM
1 2 Zohrab A. Samani and George H. Hargreaves
ABSTRACT
In the dry season when the rainfall contribution to crop water requirement is not significant, the amount of land to be irrigated for maximum profit with a limited supply of water, can be easily calculated. However, in the rainy season when rainfall contributes a significant amount of the crop water requirement, the amount of land which can be irrigated by a supplemental irrigation system varies due to spatial variability of rainfall. In designing a supplemental irrigation system the long term variability of rainfall as well as economical parameters should be taken into account.
This paper describes a methodology for designing a supplemental irrigation system and for calculating the optimum amount of land which should be irrigated with a limited supply of water. The optimum amount of land to be irrigated is calculated for one station in EI Salvador using crop yield models, long-term climatological data and economical parameters.
since the day to day climatological data are not often available in many countries, the paper describes how a climatological data-base together with a weather generating model can be used to design a supplemental irrigation system.
INTRODUCTION
A dry season followed by a rainy season is typical of the climatic conditions in Latin America. During the dry season, water is often limited and only part of the land is cultivated. The amount of land to be irrigated with limited water in the dry season can be calculated using the continuity equation as follows:
Q*EI*T A= ------- (1)
ET
1- Asst. Professor, Civil Engr. Dept. New Mexico State university Box 3CE, Las Cruces,NM 88003
2- Research Professor Emeritus, International Irrigation Center, utah State University, Logan, Utah 84322
175

176 USCID Regional Meetings -- 1989
in which: A= area to be irrigated for maximum yield Q= available flow rate EI= irrigation efficiency, % T= Duration of irrigation during the peak use period ET= peak crop consumptive use
The area calculated by equation 1 will result in maximum yield per unit area under the available resources. The -maximum yield per unit area does not necessarily result in maximum benefit. Hargreaves and Samani(1984) discussed the parameters which affect the optimum area to be irrigated with limited water supply. Using production parameters from California, Hargreaves and Samani(1984) concluded that irrigating for maximum yield per unit area will result in maximum profit under the following conditions:
1- Land is limited and water is abundant. 2- Crop value and yields are high. 3- Rainfall makes little contribution to the crop water supply. 4- The irrigation costs are low.
Hargreaves and Samani(1984) concluded that under current economical conditions when rainfall makes little contribution to crop water requirement, irrigating for maximum yield normally results in maximum economical return. Using their common sense, Farmers who are faced with limited water supply and little rainfall often choose to irrigate for maximum yield and limit the area under cUltivation. However, during the rainy season which follows the dry season, farmers have the opportunity to increase their benefit by spreading their limited irrigation water on more land.
This paper describes how crop yield models and economical parameters can be used to calculate the optimum amount of land which should be irrigated when rainfall contributes a significant amount of the crop water requirement.
CROP YIELD MODELS
Various crop growth simulation models have been developed for use with daily climatic data. Models designed for use with daily weather values include the Hanks(1974) PLANTGRO model; CERES-MAIZE, Jones and Kiniry(1986) and other CERES crop models (PNUTGRO, SOYGRO and CERES-WHEAT, IBSNAT publications, (1989). The use of predictive models

Supplemental Irrigation System Design 177
to evaluate plant yield as a function of soil water status has been reviewed by Hanks and Hill(1980) and by Vaux and Pruitt(1983). Hanks(1974) PLANTGRO model has proven applicable for reasonable estimation of seasonal crop yield, as affected by differential water application (irrigation and rainfall). Hanks et al. (1977) validated the PLANTGRO model under several field conditions and concluded that this approach was a good tool to
simulate the effect of actual water application on Corn crop. There are two versions of the PLANTGRO model available. The first version relates the relative yield to relative transpiration as follows:
Y/Yp = T/Tp (2)
where Yp is potential yield when transpiration is equal to potential transpiration Tp; Tp is defined as transpiration when soil water availability does not limit transpiration, and T is the actual transpiration. Equation (2) is recommended for dry matter prediction. In the second version of the PLANTGRO model which is recommended for grain prediction, the growing season is divided into several stages, according to the approach presented by Jensen(1968) as follows:
Y/Yp = (Tl/Tpl)Ll* (T2/Tp2)L2 •••••••••• (3)
Where L is stage weighing factor. In a personal communication with the senior author, Hanks(1987) recounted the second version of his model stating that the spatial variability of stage weighing factors(L) is so significant that the second version of the model does not provide any improvement over the first version and that until a suitable approach for evaluating the complicated process of stage stress on final grain yield is found we might as well use the first version for both grain and dry matter prediction.
Based on the authors experience no yield model can always predict the final yield with 100 percent accuracy. Nevertheless, Until better crop yield models are developed ,the existing models are good tools for decision making in agricultural management. In describing the methodology for designing a supplemental irrigation system in this paper, the PLANTGRO model was used. The methodology is not limited to PLANTGRO model and any other model can be used for this purpose.
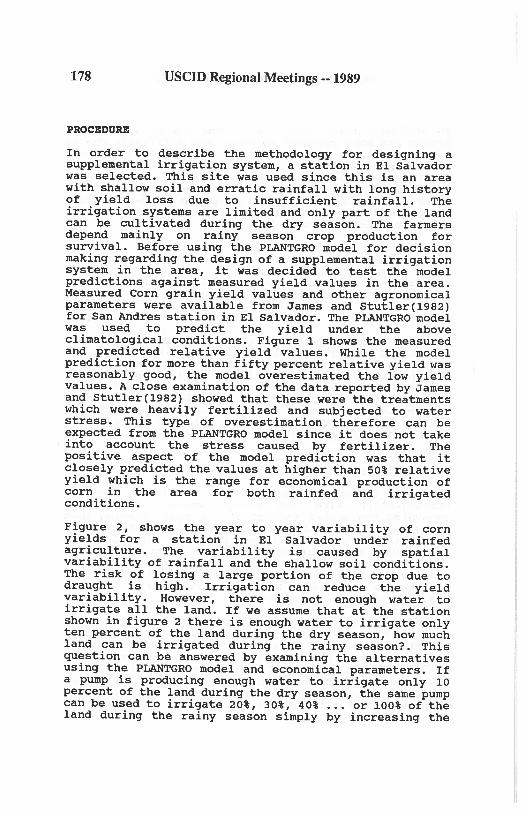
178 USCID Regional Meetings -- 1989
PROCEDURE
In order to describe the methodology for designing a supplemental irrigation system, a station in El Salvador was selected. This site was used since this is an area with shallow soil and erratic rainfall with long history of yield loss due to insufficient rainfall. The irrigation systems are limited and only part of the land can be cUltivated during the dry season. The farmers depend mainly on rainy season crop production for survival. Before using the PLANTGRO model for decision making regarding the design of a supplemental irrigation system in the area, it was decided to test the model predictions against measured yield values in the area. Measured Corn grain yield values and other agronomical parameters were available from James and Stutler(1982) for San Andres station in El Salvador. The PLANTGRO model was used to predict the yield under the above climatological conditions. Figure 1 shows the measured and predicted relative yield values. While the model prediction for more than fifty percent relative yield was reasonably good, the model overestimated the low yield values. A close examination of the data reported by James and Stutler(1982) showed that these were the treatments which were heavily fertilized and subjected to water stress. This type of overestimation therefore can be expected from the PLANTGRO model since it does not take into account the stress caused by fertilizer. The positive aspect of the model prediction was that it closely predicted the values at higher than 50% relative yield which is the range for economical production of corn in the area for both rainfed and irrigated conditions.
Figure 2, shows the year to year variability of corn yields for a station in El Salvador under rainfed agriculture. The variability is caused by spatial variability of rainfall and the shallow soil conditions. The risk of losing a large portion of the crop due to draught is high. Irrigation can reduce the yield variability. However, there is not enough water to irrigate all the land. If we assume that at the station shown in figure 2 there is enough water to irrigate only ten percent of the land during the dry season, how much land can be irrigated during the rainy season? This question can be answered by examining the alternatives using the PLANTGRO model and economical parameters. If a pump is producing enough water to irrigate only 10 percent of the land during the dry season, the same pump can be used to irrigate 20%, 30%, 40% or 100% of the land during the rainy season simply by increasing the

Supplemental Irrigation System Design 179
irrigation interval or decreasing the depth of applied water proportionally. To do this extra irrigation equipment at additional cost needs to be purchased. The PLANTGRO model together with long-term climatological data and soil parameters are used to generate a series of yield values from each of these alternatives. The net benefit from each alternative is then calculated by subtracting the total income from the cost of production. Figure 3, shows the calculated long-term average net benefit using 13 years of climatological data and other local economical parameters (irrigation cost, price of yield etc.). As is shown in figure 3, the average income has increased by $15 per hectare by stretching the water to 50% of the land. Based on the analysis shown in figure 3 irrigating 50% of the land would be the optimum if the objective is to increase the long-term average income. However, when dealing with low income farmers, it might be desirable to try to increase the minimum income during the worst year instead of increasing the average benefit. Figure 4 shows the optimum amount of land(20%) to be irrigated to maximize the minimum farmer's income during the worst year.
The optimum amount of land to be irrigated also depends on the extra cost of irrigation system. Figure 5 shows the effect of irrigation cost on optimum percent of irrigable land. As is shown in figure 5, as the cost of irrigation increases, the optimum percent of irrrigable land approaches that of the dry season.
WEATHER GENERATING MODEL
In the above analysis, the actual measured climatological data was used to calculate the optimum amount of irrigable land during the rainy season. In many cases the long-term day to day climatological data are very difficult to obtain. In this case the alternative would be to use a weather generating model to simUlate the long term climatological data using a data base. One such model was described by Samani et al(1987). The WMAKER model described by Samani et al (1987) can be used together with the data base which is now available for Latin America, Africa and part of Asia, to generate the long-term climatological values. Figure 6 compares the optimum irrigable area calculated using WMAKER generated climatic values and measured climatic values. The result obtained from using WMAKER is reasonably close to the result obtained from measured climatic data.

180 USCID Regional Meetings -- 1989
SUMMARY AND CONCLUSIONS
The optimum amount of land to be irrigated for maximum benefit under a limited water supply was calculated for a station in El Salvador. PLANTGRO model was used to calculate the long-term yield values for each alternative. The long-term yield values together with local economical parameters were then used to calculate the net benefit. It was shown that the optimum amount of land to be irrigated in the rainy season with a limited water supply is a dynamic parameter which depends on spatial variability of rainfall, soil parameters, economical parameters and management objectives.
When the long-term climatological data are not available, a weather generating model can be used together with a data base to generate the climatological information. Even though the present crop yield models leave more to be desired, they can be used as a tool to project the optimum amount of land that can be irrigated in the rainy season. The crop yield models, the weather generating models and some common sense combined with local farmers experience can lead to better water management practices.
REFERENCES
Hanks, R. J., 1974 "Model for predicting plant yield as influenced by water use" Agro. J.,66:660-665.
Hanks, R. J. and R.W. Hill, 1980 "Modeling crop response to irrigation in relation to soils, climate and salinity. IIIC Publ. 6, International Irrigation Information Centre, Bet Dagan, Israel, 57 pp.
Hanks, R.J. , Stewart, J.I. and Riley, J.P., 1977. "Four state comparison of models used for irrigation management n Proc. ASCE Irrig. Drainage Special Conf. Water Management for Irrigation and Drainage, P. 283-294.
Hargreaves G. H. and Z. A. Samani, 1984 "Economic Consideration of Deficit Irrigation" ASCE Journal of Irrigation and Drainage Engineering, Vol.110, No. 4:343-357.
IBSNAT publications (Crop Models for D.S.S.A.T), 1989 , Dept. of Agronomy and Soil Science, Univ. of HawaiiManoa.

Supplemental Irrigation System Design 181
James D.W. and R.K. Stutler. 1982 management research and demonstration Wet/Dry climate. 171p.
"ON-farm water in a tropical
Jensen, M.E. 1968 "Water consumption by agricultural plants" Ch.l, Vol. II, Water Deficits and Plant Growth. T.T. Kozlowski, ed., Academic Press Inc., New York, N.Y.
Jones, C. A. and J. R. Kiniry. 1986. " CERES-MAIZE, a simulation model of maize growth and development" Texas A-M University press, College Station, 194p.
Samani, Z. A., G. H. Hragreaves, E. Zuniga and A. A. Keller" Estimating crop yields from simulated daily weather data". ASAE Journal of Applied Engineering in Agriculture. Vol. 3., No.2:290-294.
Vaux, H.J. and pruitt, W.O. 1983 "Crop water production functions" Adv. Irrig. 2:61-99.
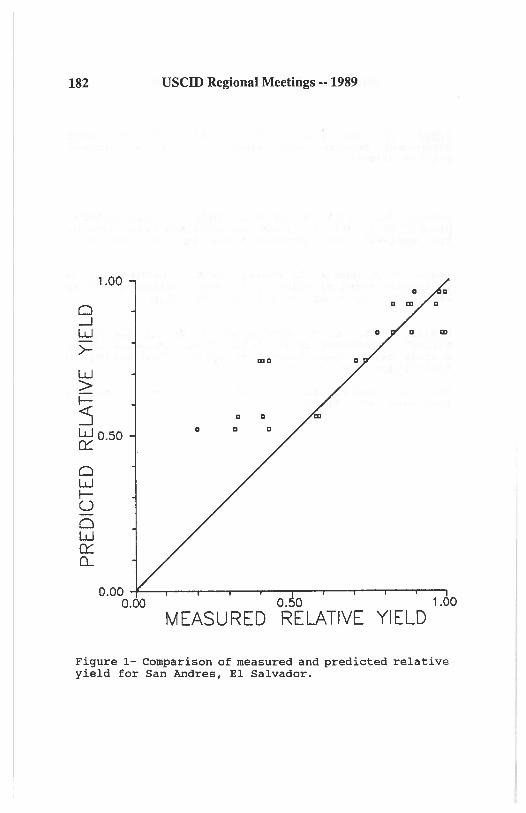
182
o ......J W
>W > I-:s
1.00
USCID Regional Meetings -- 1989
CII
ClIO
a a
~0.50 o a 0
o W I-U o w 0::: 0..
0.00 -F--....---,.---...---.---r---r--r--.---.---, 0.00 o. 0 1.00
MEASURED RELATIVE YIELD
Figure 1- Comparison of measured and predicted relative yield for San Andres, El Salvador.

99.00
~ 89.00
o --.J W >- 79.00
--.J « f-Z 69.00 W f-o Cl- 59.00
Supplemental Irrigation System Design 183
49.00 +----1'----.--,-----.--,---,---.--.-....-----,---,----, 57.00 59.00 61.00 63.00 65.00 67.00 69.00
YEARS
Figure 2- Year to year variability of corn grain yield simulated by PLANTGRO model for La Union, El Salvador.

184
« 320.00
I ~ W
w .2 315.00
o U Z
I- 310.00 W Z
W C)
~ 305.00
W
~
USCID Regional Meetings -- 1989
300.00 -t--.,----r---,r----,----.-----,----,--.,----.------, 0 .00 20.00 40.00 60.00 80.00 100.00
PERCENT OF IRRIGATED AREA
Figure 3- LOng-term average net income versus percent of irrigated area during the rainy season(La union, E. S.).

« 250 .00
I ~245.00
ffl 240.00
W :2 0235.00
U Z 230 .00
f- 225 .00 W
Z 220 .00
:2 ~ 215.00
:2 Z 210 .00
2205.00
Supplemental Irrigation System Design 185
200.00 i--.--"--lr----r--,-.--.---.---.-----.-_ 0 .00 20.00 40 .00 60.00 80.00 100.00
PERCENT OF IRRIGATED AREA
Figure 4- Long-term minimum net benefit versus percent of irrigated area during the rainy season (La union, E.S.)

186
100.00
~
« 90.00
W cr:: 80.00 « W
70.00
--.J m 60.00 « C)
50.00 cr:: cr::
40.00
:2 30.00 ~ :2 I-
20.00
0.-0 10.00
0 .00 0 .00
USCID Regional Meetings .. 1989
- - -. DRY SEASON
20.00 40.00 60.00 80.00 100.00
IRRIGATION COST $/HA
Figure 5-Effect of irrigation cost on optimum irrigable area (La union, E.S.).

Supplemental Irrigation System Design 187
« 320.00
I ~ / - - .........
" t4 ,/ "-
/ "-
W I 2315.00 I
0 / .......
U Z
f-- 310.00 W Z
W 0 ~ 305.00
W
~ 300.00
0.00 20.00 40.00 60.00 80.00 100.00
PERCENT OF IRRIGATED AREA
Figure 6- Long-term average net income versus percent of irrigated area using measured climatological data(solid curve) and WMAKER generated data(Oashed curve).


THE BUREAU OF RECLAMATION AND
THE DROUGHT RELIEF ACTS OF 1977 AND 1988
Tom Phi1lips l Jane Ludwigl
ABSTRACT
Drought conditions in widespread portions of the Western United States occurred in 1977 and again in 1987 and 1988. In each case, the Congress of the United States responded by passing legislation directing the Bureau of Reclamation to mitigate the effects of the drought through financial aid and resource management .
The Drought Act of 1977 and the Reclamation States Drought Assistance Act of 1988 are essentially repetitive, differing in some implementation constraints and in some areas of emphasis. Both acts are inadequate to address the emergency nature of drought programs due to time-consuming Federal restrictions that are not waived, a lack of existing directives for implementing contingency plans, and a myriad of conflicting local, state, and Federal laws and policies. The drought crisis has passed before programs can be implemented to conserve or redistribute scarce water resources or to provide financial aid. The paper compares the two acts and provides suggestions for more appropriate legislation response for future droughts.
INTRODUCTION
The drought relief acts of 1977 and 1988 were both designed to respond to a national drought emergency and the economic, social, and environmental hardships that ensued. The Emergency Drought Act of 1977 (Public Law 95-107) was intended to mitigate the effects of widespread drought conditions in the United States during 1976 and 1977. Authorities granted to Reclamation under the Disaster Assistance Act of 1988 (Public Law 100-387) were largely patterned after sections of the Act of 1977 and were in response to a drought cycle that began in 1987.
Although similar in intent, the acts differed in their emphasis and authorization of programs, the effects of administrative and legislative restrictions on program
1 Bureau of Reclamation, Denver Office
189

190 USCID Regional Meetings -- 1989
implementation, and the availability of funding. Reclamation was able to provide some relief from the effects of drought. Still, our response has been much less than we, the public, or the Congress would wish.
Both the 1977 and the 1988 acts contain serious shortcomings in their ability to address emergency conditions. This paper compares the two acts and concludes that emergency drought legislation, by its nature, cannot provide the timely and equitable relief desired. The paper closes with a proposal for the future--a way to plan for drought emergencies before they occur.
SUMMARY OF DROUGHT ACT AUTHORITIES
Both the Act of 1977 and the Act of 1988 authorized Reclamation to undertake actions to augment, utilize, and conserve water on Reclamation projects, most Indian irrigation projects, and some other, non-Federal irrigation projects. The emphasis of the Act of 1977 was to provide loans to irrigators for minor structural actions (such as digging wells and lining irrigation canals) to augment water supplies and for management actions to facilitate water markets or conservation. In comparison, the Act of 1988 emphasized nonstructural solutions such as water conservation, water banking, and management measures. Authority was denied to use loans for any construction. This change reflects the prevailing preference for non structural solutions to water-related problems. Nevertheless, the potential for construction solutions was not entirely eliminated in the 1988 act; Reclamation was authorized to use funds for construction.
Drought program implementation occurred rapidly in 1977 and, at best, sporadically in 1988. Two circumstances may be implicating. In 1977, the drought act was passed at the beginning of the irrigation season but not until the end of the season in 1988. Further, Reclamation was able to publish rules and regulations implementing the act authorities much more quickly in 1977.
Procedural constraints associated with publishing the rules were more rigorous in 1988 due to law and policy not in effect at the time of the 1977 drought. The most telling sign of delay associated with procedural constraints is the swiftness with which implementation rules were published in the "Federal Register" after the acts were signed by the President. The Emergency Drought Act of 1977 was signed on April 7, 1977, and rules were

1977 and 1988 Drought Relief Acts 191
published on April 14, 1977. By contrast, the Disaster Assistance Act of 1988 was signed on August 11, 1988, but rules were not published until the following year--April 10, 1989.
The Act of 1977 was passed at the beginning of the irrigation season--early enough to allow some decisionmaking concerning that year's use of water and to partially mitigate the effects of the drought. Further, Congress worked with the Department of the Interior while the legislation was being drafted; therefore, the rules were ready for publishing at the time the bill was signed. More importantly, several legislative and administrative initiatives were prescribed after the 1977 act, and these initiatives constrained early implementation of the 1988 act. Language in the 1977 act, recognizing the drought crisis as an emergency, exempted actions under the Act from the assessment requirements of the National Environmental Policy Act. Only one procedural constraint remained for development of rules for the 1977 act--an Inflation Impact Statement as required by Executive Order 11821 (which has since been rescinded). By working with the Congress, Reclamation was able to complete that analysis quickly, determining that the action did not fall under the requirements of the executive order. (There was, however, one important delay in implementing the 1977 loan program. Reclamation does not have internal capability to process loan applications from individuals and, consequently, the Farmers Home Administration (FmHA) processed loan applications for Reclamation. A memorandum of agreement between the two agencies was not completed until August of 1977, thus delaying drought mitigation actions authorized by the Act.)
By contrast, the Act of 1988 was unable to affect water supply issues in the year it was passed due to the late summer enactment of the bill. Nevertheless, the rules for implementation of the Act were not published in the "Federal Register" for another 8 months! Some of the delay can be attributed to the fact that the Bureau of Reclamation was in the midst of a major reorganization, with the normal attendant disorientation. However, the major reason for the delay was the need to complete analyses of procedural details that were not required at the time of the 1977 act. The 1988 act required Reclamation to consider the National Environmental Policy Act and also required an analysis of the Federal Paperwork Reduction Act, the Regulatory Flexibility Act, and a Regulatory Impact Analysis as required by Executive Order 11291. The Federal Paperwork Reduction Act commanded the most time because clearance was required
192 USCID Regional Meetings -- 1989
from the Office of Management and Budget for the public reporting burden. That approval was not granted until shortly before the rules were published.
The effect of delayed publication of the rules would normally have been critical to implementation of programs in 1988. But, due to another aspect of the legislation, it proved to be inconsequential. Although the Congress authorized expenditures of $25 million for the implementation of the 1988 act programs, no monies were appropriated. Reclamation was expected to reprogram funds; but, funds were not available for that purpose. Some otherwise budgeted activities were reprogrammed to conduct studies directed toward water conservation. However, due to the lack of appropriated funds in 1988 and 1989, no loans were made available to water users for conservation and management programs, and no minor construction was performed by Reclamation to obtain alternative water supplies (such as reservoir pumping from dead or inactive pools) .
In comparison, within 30 days of enactment of the 1977 law, Congress appropriated $100 million for the implementation of programs. Thirty million dollars of additional funding was appropriated for disbursement from the Reclamation Emergency Fund for drought mitigation. That year, Reclamation was able to provide $32.4 million in reimbursable loans to irrigation districts, water districts, and public utility districts in 10 of the Western States hardest hit by drought. An additional $42 million was provided for other drought mitigating activities including nonreimbursable loans to states and expenditures for fish and wildlife mitigation. Clearly, in 1977, the Congress was not constrained by the massive Federal budget deficits of today and had more flexibility to provide funds for drought relief.
Other comparisons between the Acts of 1977 and 1988 are as follows:

1977 and 1988 Drought Relief Acts 193
Emergency Drought Act of 1977
1. Areas of the united States eligible for assistance are designated by the President or the Secretary of the Interior.
2. Reclamation was authorized to establish a water bank to buy and sell water .
3. Water supplies could be augmented through construction loans.
4. Authority of the Secretary of the Interior under the Emergency Fund Act of 1948 was broadened to allow the obligation of nonreimbursable monies up to $1 million for eligible non-Federal projects.
s . Nonreimbursable funds up to $1 million could be disbursed to states for general water management activities. Up to $10 million was authorized to purchase water for fish and wildlife mitigation on a nonreimbursable basis.
6. Existing payment obligations for capital costs and/or operation and maintenance payments could be deferred and added to the remaining repayment period.
7. Reclamation was to conduct studies to find ways to mitigate the effects of drought recurrence and report the findings to the Congress.
Disaster Assistance Act of 1988
1. Areas of the United States eligible for assistance require declaration of drought emergency by the affected state's governor and must meet the eligibility requirements for assistance under rules promulgated by the Department of Agriculture.
2. Reclamation was authorized to bring together willing buyers and willing sellers of water supplies but was not authorized to establish a water bank.
3. Water supplies could not be augmented through construction loans.
4. and 5. Loans are reimbursable or nonreimbursable in accordance with current law and policy. Non-Federal projects are eligible for loans only if they are irrigation projects. Fish and wildlife mitigation loans were nonreimbursable. The Act does not mention the Reclamation Emergency Fund.
6. Existing capital cost repayment obligations are deferrable but could not be added to the remaining repayment period.
7. Reclamation shall report to the Congress about the programs implemented under the Act, expenditures, and provide recommendations for administrative and legislative initiatives to mitigate the impacts of future droughts.

194 USCID Regional Meetings -- 1989
It is important to note that in the legislation of 1977, the Congress asked for proposals about ways to alleviate the effects of future drought. Although Reclamation mentioned the need for standing drought legislation in its final report, a comprehensive program was not proposed. Now the Nation has suffered another series of drought years. Again, the Congress has asked for answers about appropriate ways to mitigate drought.
WHY DROUGHT EMERGENCY LEGISLATION IS INEFFECTIVE
Timely implementation of drought programs is critical. Mitigation efforts can be effective only if water management initiatives are inaugurated early in the water diversion season. Individuals, irrigation districts, water projects, and public entities must develop strategies and coordinate actions to find prudent ways to cope with drought-induced water shortages. If emergency legislative authorities and program implementation issues are unknown at the time that these strategies are developed, knowledgeable decisionmaking about available alternatives is not possible.
The prudent irrigator plans ahead. Markets must be identified, and crop production plans must be devised for those markets. Contracts must be signed, financing arranged, and other preparations made before the planting season begins. All of these arrangements are made under conditions of faith that the weather will be good for growing, that markets will provide an adequate return, and that there will be enough water. The wise irrigator takes whatever actions are necessary to reduce risks.
Under adverse conditions, even the most prudent irrigator can be hurt. The extent of water shortages caused by drought are not known at the time most of the arrangements for crop production are made. Winter precipitation in most areas of the West--the precipitation that spells the difference between a normal year with adequate water supplies and a drought year-comes in the late winter and early spring. February and Ma~ch snowfall can mean the difference between economic prosperity or devastation. The technology is not available to accurately predict precipitation levels for each local area.
Carryover water supplies in Bureau of Reclamation reservoirs alleviate the effects of drought most years if the drought is not prolonged for too many successive years and if water allocations are appropriate to meet all water requirements. If designed using acceptable

1977 and 1988 Drought Relief Acts 195
hydrological rule curves, reservoir sizes can provide adequate water for three consecutive drought years. Each reservoir's annual water requirements are based upon use estimates at the time of construction. However, actual water needs may have changed considerably due to new cropping patterns or collateral water uses--such as streamflow releases for fish and wildlife. Nevertheless, one year of drought usually does not create water shortages at most Reclamation projects, although it may have significant impacts in neighboring, nonproject areas. If a drought year is followed by another year of drought, project operations may need to change. After three consecutive years of drought (a situation that we may now be entering), the water availability situation becomes desperate--reservoirs have been emptied of carryover storage and there is no winter precipitation replacement.
To be truly effective, Federal emergency drought legislation must, by definition, be broad enough to encompass the idiosyncracies of all projects. Not all projects .can be helped by promoting water marketing or water banking because state law may be constraining or water may not be physically available for banking. Most projects can be assisted by water conservation programs and by minor construction, but by the time legislation is passed and funding is available, it is too late. Studies for drought mitigation are appropriate, but they do not, in themselves, mitigate the effects of drought when that drought is occurring; implementation of study findings can alleviate effects, but often after the fact. By addressing the problem of drought through emergency legislation, the Congress can do little more than provide compensation for losses that have already occurred.
We believe that the intent of the Congress was to help those suffering from drought. Nevertheless, the very nature of drought renders eleventh-hour legislation ineffectual.
RECLAMATION'S PROPOSAL
Water shortages are not the same as drought. Areas where water is over-appropriated experience water shortages even in so-called normal years. Many of these areas could provide adequate supplies if water conservation programs, tailored to fit the local conditions, are implemented. By contrast, drought-induced water shortages occur when precipitation is significantly less than normal, affecting soil moisture content, evaporation rates, and storage water supply and carryover.

196 USCID Regional Meetings -- 1989
In considering the possible means for dealing with drought, Reclamation is now formulating a two-stage program. First, a conservation program would target operational efficiency and flexibility to optimize the use of available water supplies, but would consider all other means to conserve water in each project area. Second, a drought contingency plan to minimize economic and environmental hardship when droughts occur and designed with local interests and conditions in mind would then be developed once conservation plans are complete. Standing legislation would provide the Secretary of the Interior with the authority to "trigger" contingency plans when indicated by drought conditions and when requested by the governor of the affected state or states.
As envisioned, conservation programs would be developed and implemented using existing Reclamation programs and new initiatives. Reclamation would work with Federal projects to find means to implement water conservation as a standard of doing business. Both structural and nonstructural means to better use and conserve water supplies would be developed through an interactive dialogue with water users, state and Federal entities, and other interested parties.
The potential for water savings is a key feature of Reclamation's ongoing activities and is a focus of the agency's mission. Operation and maintenance activities, project planning investigations, research activities, loan programs, and other existing programs have been directed to emphasize the potential of innovative water conservation actions in problem solving. Other programs such as the System Optimization and Joint Use program, the Water Management and Conservation program, and the water conservation plans required of irrigators by the Reclamation Reform Act of 1982 all contain elements that promote the efficient and effective use of limited water resources through conservation. These programs could be used to design a site-specific conservation plan for each project area.
To assure the availability of up-to-date information concerning water conservation options, Reclamation is also proposing a new initiative to develop a water conservation center. The center would provide us with the capability to take a leadership role in fostering water use and management stewardship. The center would become a source of technical, legal, and institutional information for those desiring to plan and implement a water conservation program. The primary action of the center would be an aggressive education demonstration

1977 and 1988 Drought Relief Acts 197
program to promote a "holistic" approach to water management and conservation opportunities. The center would cooperate with other Federal agencies, universities, irrigation districts, cities, states, professional societies, and others to develop and promote water conservation.
Contingency plans would consist of agreements with the many water-related interests associated with Federal Reclamation projects, projects for which Reclamation has administrative authority, existing river basin compacts, and other interested non-Federal parties. Consultations would be held with state and local interests including municipalities, fish and wildlife agencies, and others to come to agreement about the potential uses of water under various shortage conditions. Contingency plans could include a myriad of actions including water banking, use of purchase options, agreements for prioritization of limited supply distribution, use of dead or inactive storage, and special plans to protect wildlife refuges, vegetation, and fish and wildlife resources. Further, during formulation of contingency plans, Reclamation would consult with other Federal agencies that could be called upon to provide emergency assistance such as the Farmers Home Administration and Small Business Administration. Some options may require special Federal legislation to permit the temporary actions; and, in those cases, legislation would need to be enacted as part of the contingency planning process.
Contingency plans are useless unless they can be implemented quickly. Therefore, we intend to ask the Congress for standing legislation for the Secretary of the Interior to activate the contingency plans when a prediction of drought occurs in accordance with the definition of drought conditions that will be contained in each contingency plan. The standing legislation and/or the rules to implement that legislation would also address the regulatory requirements of the National Environmental Policy Act, the Federal Paperwork Reduction Act, Executive Order 12291 (requirements for Regulatory Impact Analyses), the Regulatory Flexibility Act, the Reclamation Reform Act, and rules to guide the definition of repayment requirements and capability and loan financing. Thus, procedural constraints that have delayed implementation of drought relief programs would be avoided.
In pursuing this program with the Congress, Reclamation is mindful of several realities. The foremost reality is that Western water law, contracts, and river basin compacts must be observed . However, the public--both

198 USCID Regional Meetings -- 1989
authorized water users and other interested parties--must be included in the development of both conservation and contingency plans. Another reality is that the public tends to be concerned about water shortages only when they are occurring. During times of normal water, our national priority for water resource planning is lowered. When many other national problems take precedence, it may be difficult to find the funding support to implement this proposal.
SUMMARY
The inadequacies of the drought relief acts of 1977 and 1988 lie not in the intent of the acts but the circumstances that the Congress was trying to address. Drought is an emergency; once the drought begins, it is too late to start designing relief programs and accommodating procedural constraints.
Reclamation believes that the best solution to avoiding drought-induced damages is to be prepared for emergency action. Such preparation includes the best utilization of existing water supplies even when supplies are plentiful (a conservation program) and having standing emergency plans available for implementation by the Secretary of the Interior when a drought cycle is imminent (contingency plans) . Using this two-stage program, the Nation can be better assured that we are using our available resources wisely and that we can respond to an emergency.
Reclamation will be presenting the proposal outlined above to the President and the Congress in the spring of 1990 in our final report on actions taken to fulfill the Disaster Assistance Act of 1988. That report will include suggested legislative and administrative initiatives to manage future droughts. Unless we are ready, the Drought Disaster Act of 1994 or 1996 or 2003 will look depressingly similar to the drought acts of 1977 or 1988, and we will again be talking about how we were not prepared. Reclam~tion doesn't want to mitigate damages next time; we want to curtail them!

A METIIODOLOGY FOR ANALYZING ALTERNATIVE RESERVOIR SHORTAGE AND OPERATING CRITERIA
George Oamek" Larry Schluntz", Loren Bottorff', and Eldon Johns'
ABS1RACT
The Bureau of Reclamation's shifting emphasis [rom a construction oriented agency to a water management agency has initiated the development of analytical tools for estimating the benefits, and changes in benefits, of alternative reservoir sizes (jor new projects) and operating criteria (jor existing projects). This paper presents a new methodological approach for estimating the margina~ or change in, economic benefits for a project and applies it to several case studies.
The modeling system developed from this effort links a spreadsheet-based model of reservoir operations to economic models of various demand sectors, including irrigation, municipal and industrial uses (M&l), and instream flow. Linking thl? models results in quick response in estimating the annual marginal economic benefits of alternative reservoir sizes and operating criteria.
When applied to a case study of an existing Southern California reservoir, the modeling system estimated the annual benefits of reservoir enlargment and changes in operating criteria. Additional case studies for projects in Oregon, Kansas, and Colorado have demonstrated the ability of the methodology to be adiJpted to a wide range of hydrologic conditions and project purposes.
INIRODUCTION
Evaluating the economic trade-offs between competing uses of water is of critical importance during times of drought. Under normal conditions, volume and timing of Bureau of Reclamation project deliveries are contractually fIXed. Specific contract provisions provide for the operation of the facilities during drought conditions. However, the Bureau of Reclamation is interested in the re-evaluation of the marginal, or change in, economic benefits of alternative water allocations during drought conditions and to re-evaluate reservoir operation strategies which, in turn, would maximize the economic benefits of available supplies. This paper presents a methodology for measuring the marginal benefits of alternative reservoir operation plans which explicitly consider priority of use for various types of users and alternative shortage criteria.
The methodology is a linked system consisting of two models, a reservoir operations
1 Economist, CH2M Hill, 3840 Rosin Court, Suite 110, Sacramento, California, 95834
2 Economist, Bureau of Reclamation, D-5442, Box 25007, Denver, Colorado, 80225
3 Water Resource Engineer, CH2M Hill
• Hydrologist, Bureau of Reclamation
199

200 USCID Regional Meetings •• 1989
model which incorporates hydrologic data, water demands, priorities in use, shortage criteria, and other information, and an economic model to estimate the economic benefits of alternative combinations of the above variables. The operations model drives the system by computing water deliveries for three groups of users over a period of record. Irrigation, municipal and industrial (M&I), and instream flows are the water uses considered. The modeling system is sufficiently flexible to be applied to a range of geographic areas, hydrologic conditions, and project uses.
The following sections describe the models and their application to two case studies.
RESERVOIR OPERATIONS MODEL
A spreadsheet-based model of reservoir operations simulates annual and monthly deliveries to project uses considered. Based on a water balance concept, it uses a homogeneous hydrologic sequence (adjusted for historical use) to construct a monthly time series of reservoir inflows. Using this, and data regarding the physical characteristics of the reservoir site, including area-capacity, rainfall, and pan evaporation, a monthly time series of deliveries to each sector is constructed for each reservoir operation strategy considered. Operating criteria concerning priority of use and shortage criteria for each user group are explicitly considered, and can be altered to consider a range of criteria.
During a drought period, the operations model assumes the reservoir operator, whether it be the Bureau or a private agency, has two variables to consider for allocating available water. One is the shortage trigger, which defines the beginning of drought period operations. Defining a shortage, or drought condition, within the operations model requires the user to specify a reservoir level at which reduced deliveries are initiated. In the first case study, for example, deliveries to irrigators are reduced when the volume of water in the reservoir falls below 90,000 acre-feet. This level is referred to as the "trigger" level because it initiates reduced deliveries to one or more groups of water users. The model assumes each group of water users has a unique shortage trigger. Priority of use in times of shortages is directly related to the trigger since the lower the trigger is set, the higher priority for water the user has.
The second variable, shortage criteria, is defined as the reduction in deliveries imposed when the reservoir falls below the trigger level. Shortage criteria is expressed in percentage terms. For the case study example, the baseline shortage criteria for irrigation uses is 50 percent. Therefore, when the reservoir volume falls below 90,000 acre-feet, deliveries to irrigators are reduced 50 percent of normal.
Figure 1 contains a flowchart of the reservoir operations model. The data input requirements, shown on the left side of the figure, illustrate the flexibility of the modeling system. Any of the listed data parameters can be varied to observe their effect on economic benefits. Of interest is the priority of use, Shortage trigger, and Shortage criteria for each water use classification. However, the second box, identifying reservoir and conveyance capacities, has been of interest in past studies regarding reservoir sizing or enlargement. As can be seen in Figure 1, other variables such as alternative periods of record, flood pool requirements, and intra-season demand distribution can be examined within this methodology.
The output of the operations model mainly consists of deliveries to the water user groups. Additional output includes reservoir contents at user-specified intervals, and the

Reservoir Operating Criteria
Reservoir operations spreadsheet
Figure 1. Operations model flowchart
201
/ Res. contents. /
shortoge trigger!
shortage crll.rl{

202 USCID Regional Meetings •• 1989
shortage trigger and shortage criteria for irrigation uses. The purpose of the latter output will be explained in the following section.
ECONOMICS MODEL
The Economics model consists of three sectors corresponding to the water uses identified above - irrigation, M&I, and instream flow. The methodologies for estimating marginal benefits within each sector vary In complexity, ranging from a detailed optimization framework for the irrigation sector to a single- valued avoided cost technique for M&1.
Irrigation component
The net benefit of alternative reservoir operation plans for the irrigation sector is the change in net farm income resulting from a proposed plan minus net farm income from a baseline plan. Net farm income is defined as gross revenue from irrigated crop production minus production expenses. In years when simulated project deliveries are 100 percent of norntal, cropping patterns are assumed to generally follOW historical acreages. During low flow periods, when water deliveries to irrigation uses are reduced, irrigators are assumed to adjust their cropping patterns and water application rates in a manner which minimizes the economic damages of the low flows. This is accomplished with a mathematical programming model which maximizes net farm income subject to water and other resource availability.
Figure 2 describes the Irrigation component of the economics model in terms of a flowchart. Eight boxes stacked vertically summarize its input. The two top boxes contain economic information necessary to compute net farm income. Crop prices and yields, along with irrigated acreage, are used to calculate gross income. Production costs can then be subtracted from this to arrive at net farm income.
The remaining boxes contain additional information used by the mathematical programming model to estimate income maximizing levels of crop production. The crop/Water production function describes the relationship between water application and crop yield. When faced with a Shortage, an irrigator will typically face the decision of whether to reduce irrigated acreage and maintain a normal water application rate, or maintain normal acreage and reduce water application rates. Critical to this decision is information on how crop yields relate to water application, or alteratively stated, how tolerant the crops are to drought.
Crop irrigation requirements, the fourth box, report the crops' consumptive water use requirements, net of rainfall, on a month by month basis. Availability of other water sources in addition to project water, such as groundwater, is the fifth box. Other water sources are of obvious importance because they can help mitigate the adverse impacts of reduced project deliveries. The sixth box contain water costs from project and nonproject sources. Water costs may include pumping costs, ditch assessments, and other related costs. Non-water irrigation costs, such as labor and equipment are included as production expenses in the first box.
The reservoir operations model provides information in the final two boxes. As previously mentioned, in addition to monthly water deliveries the operations model provides the irrigation component with periodic reservoir contents, the shortage trigger, and the shortage criteria. The latter parameters are used in the irrigation component to

. . 0
li. .., u ;; ,; g- -;;.
G ~
Reservoir Operating Criteria
-'" 0" " 0 __
'0 .,,~ :;::E ,,:> °E "i 03 ~e ." 010
.<:'" 0 'C'C
oe E .: 0'
:::Eo. °
I c .
c . .2 c IT!] 0 g .. ~
o 0
-g ~ ~ u
"l: ~ .;: -" .a Q.
~ li. 0 .:;
203
c Q)
c o a. E o u
c ~ o 0> -;: .....
-o
N Q) ..... ::J
_2' L.....

204 USCID Regional Meetings -- 1989
estimate "expected" water deliveries for an irrigation season. Their significance is explained below.
Many water projects cannot assure irrigators 100 percent reliable deliveries from year to year. The volume of water deliveries to irrigators is then a random variable due to the variability of rainfall amI/or winter snowpack. Obviously, reservoirs help to smootb out this variability, but tbe remaining uncertainty has an impact on how irrigators make decisions. Since tbey may not be 100 percent certain of normal water deliveries in a given year, irrigators must develop an expectation of their future water supply on which to base their cropping decisions. As a result tbis expectation of water delivery can be nearly as important as the actual delivery. If, for example, reduced deliveries are expected, and are realized, the irrigator has minimized the adverse impacts of the sbortage by cutting back some of his irrigated acreage, reduced water application rates, or both.
The process of bow expectations are formed is a current issue in economic tbeory. This paper assumes the expectation of water delivery is formed rationally. Irrigators are assumed to be aware of the decision process used by the reservoir operator to allocate shortages and can anticipate changes in reservoir operation. A three step process is used in the mathematical programming model to implement this expectations approach:
(1) At the beginning of a crop year (January 1 in the first case study) irrigators observe the reservoir contents. If the volume in the reservoir is greater than the shortage trigger level for irrigation uses, they expect a full water delivery for the coming crop year and base their cropping decisions accordingly. If the reservoir volume is below the sbortage trigger, expected delivery is reduced to the percent specified by the shortage criteria.
(2) Net income maximizing cropping patterns and irrigation water application rates are determined based on the expected water delivery.
(3) As actual water deliveries are realized, irrigators can update their farm plans to make best use of available water. If actual deliveries are lower than expected, irrigators can reduce water application rates and/or abandon some previously irrigated acreage to maintain a full irrigation on remaining acres.
The output of the mathematical programming model includes net farm income for every year of the period of record considered, and a summary of crop production, land use, and water use, also for all years considered. Net farm income is the critical output, since changes in net farm income are the marginal benefits of alternative reservoir operation strategies. However, the remaining output can provide insigbt to the magnitude of indirect impacts of alternative operations, such as increased or decreased farm input sales and output processing.
Municipal and industrial component
In contrast to the relative complexity of modeling the irrigation component, the M&I component uses a single value measure to calculate benefits, and cbange in benefits, of project deliveries. Specifically, tbe per unit cost of the next cheapest Single purpose alternative available to the municipality is used to measure M&I benefits. This approacb is consistent with Bureau of Reclamation project planning procedures, altbough little consideration is given to seasonal variabilities in delivery. As a result,
Reservoir Operating Criteria 205
only annual deliveries from the reservoir to the M&I sector are transferred from the Operations model to the M&I component.
Instream flow component
As its name indicates the instream flow component estimates the benefits, and change in benefits, of making reservoir releases to maintain flows in the watercourse. Instream flow releases, if they are made at all, can be made for a number of reasons. Some examples are maintenance of riparian and fish habitat, increased recreation opponunities, and improved downstream water quality. Appropriate valuation techniques will likely be different depending on the purpose of the instream releases.
Instream flow releases are considered in only one of the case studies examined here. In this instance they are made for water quality purposes. The benefit of releases were estimated as the avoided cost of water treatment. Similar to the M&I component, annual deliveries from the Operations model are considered rather than monthly deliveries.
CASE S1UDIES
Two case studies demonstrate the modeling system. The first looks directly at alternative operating criteria by examining a range of shortage triggers and Shortage criteria. The second focuses on the ability of the models to evaluate alternative reservoir sizes for a given site.
It is important to note that the case studies are for illustration of the methodologies and are not intended to accurately represent the actual situation in the study areas. However, since a portion of the hydrolOgic and economic data come from actual Bureau projects, the case studies carry the names of actual reservoirs.
Lake Cachuma. California
Lake Cachuma is a mUlti-purpose reservoir located about 30 miles northwest of Santa Barbara. Its annual average release of approximately 30,000 acre-feet is distributed to irrigation in the Santa Ynez valley (3,300 AF), irrigation along the Pacific South Coast (13,300 AF), and municipal supply for Santa Barbara. No releases are made specifically for maintenance of instream flows. This is an area of extremely tight water supplies, whose geography prohibits economical importing of additional water supplies. Groundwater is Cully utilized. Pumping in excess of annual safe yield results in salt water intrusion within a short period of time.
The Santa Ynez region is characterized by a ranching economy, where project water is dedicated (in order of magnitude) to irrigated pasture, grass hay, alfalfa, barley, wheat, dry beans, and tomatoes. Conversely, irrigation in the South Coast area concentrates on high valued tree crops, such as avocados and lemons. The difference in types of agriculture between these two sub-areas motivated a decision to consider separate shortage triggers and shonage criteria for each.
A 30 year period of record, using the flow years 1945-1974 were used to generate a baseline series of monthly deliveries to the irrigation and M&I components. An extreme drought during the late 1940's and early 50's resulted in 57 months of zero reservoir
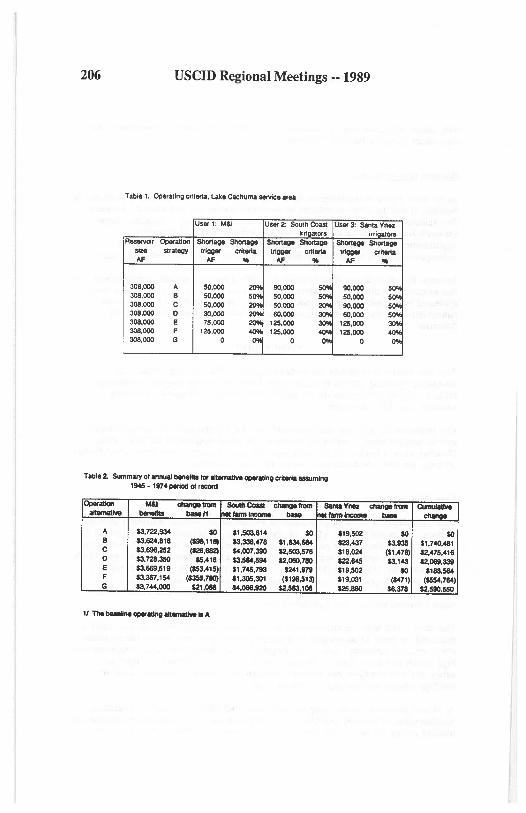
206 USCID Regional Meetings -- 1989
Table 1. Operating criteria , Lake Cachuma serviCe area
Reswvoir size ~
308.000 308.000 308.000 308.000 308.000 308.000 308.000
Operallon strategy
,.. B C o E F G
Usar 1: M&I
Shortage Shortage lrigger ~
50.000 50.000 50.000 30.000 75.000
'25.000 o
criloria ~
user 2: SoUlh Coast irrl lors
Short_ ~ lrigger cr~oria
AI' ~
Tabl.2. s..mm.,., 01 annuat _ tor aII_ oporatlnv crllOrlo.-unlnv 1945 - 1974 period 01 record
US8f' 3: Santa Ynez irrigators
~~
'"- erharta AI' ~
Oper- W&J clYWlgetram SouIItc- chlnQell'- SonIa V_ chlnQetram - - ~It '*-- ~ '*-- -,.. $3.722.930' 10 $1.503.814 10 "9.502 10 B $3.624.818 ($98.118) $3.338.478 $1.834 •• $23.437 $3.935 C $3.696.252 (S2!I.882l "'.007.390 $2,503,578 $18,024 ($1.478) 0 $3.726.350 sa.418 $3,584,594 $2,080.780 122.645 $3.143 E $3.669,519 ($53.415) $1 .745.793 S241.979 $19.502 10 F $3.367.154 ($355.780) $1.305.301 ($198.513) $19.031 ("'71) G $3.744.000 S21.088 "'.068.920 S2.583.108 S25.880 $6.378
11 Th._oporatlngall_IIA
~
.~
10 $1.740.481 $2,475.416 $2,069.339
$188.584 ($854.784)
S2.590.55O

Reservoir Operating Criteria 207
inflows, making this the most critical period of record. For purposes of illustration, it was assumed the reservoir at Lake Cachuma has a capacity of 308,000 acre-feet, rather than its current 205,000 acre-foot capacity.
The irrigation model was modified to better recognize longer term effects that drought periods have on avocados and citrus fruits. Contact with area horticulturalists and water district personnel indicated that, when expecting a water shortage, avocado growers will cut back acreage to give a full irrigation to remaining acres rather than attempt to practice deficit irrigation. Additionally, a full two year post-drought recovery period is needed before a yield can be expected from avocados. Citrus can be deficit irrigated and the recovery period for non-irrigated acreage is a single year.
The next cheapest single purpose alternative for acquiring M&I supplies appears to be reclamation of wastewater. The recycled water would mainly be used for irrigation of parks and golf courses in Santa Barbara. A per acre-foot cost of reclamation was estimated to be approximately $240.
In addition to baseline operating criteria, 6 other reservoir operation strategies are considered, encompassing a range of shortage triggers and shortage criteria. Table 1 summarizes the strategies for the two subareas of the irrigation component and the M&I component. Each strategy is designated by a letter, with Strategy A serving as the baseline operating criteria.
Strategy A favors M&I uses by declaring a smaller shortage trigger (50,000 acre-feet, compared to 90,000 acre-feet for irrigation users), and a lower shortage criteria (20 percent reduction in deliveries in shortage situations, as opposed to a 50 percent reduction to irrigators). Strategies F and G are of interest because they treat all water users equally in terms of the shortage trigger and shortage criteria. However, Strategy F is conservative in the sense that shortages are imposed when there is still a significant volume of water remaining in the reservoir (125,000 acre-feet). In contrast, Strategy G does not define either a shortage trigger or criteria.
Incorporating the above operating criteria into the modeling system over the period of record 1945-1974 yielded the results summarized in Table 2. From the perspective of an M&I water user, only operating strategies D and G would be preferred to the baseline strategy. South Coast irrigators would prefer all strategies, except F, over the baseline. Santa Ynez irrigators would prefer alternatives B, D, and F. Only strategies D and F increase benefits to all water use groups. However, cumulative results summarized in the last column of Table 2 indicate that from a project-wide perspective, all operating strategies except F result in higher overall economic benefits.
The results for alternatives B, C, D, and G indicate that an operating strategy which raises the relative priority of use for a component, or lowers their shortage trigger, will tend to be favored. For instance, Santa Ynez irrigators would likely support alternative B because they are put on equal footing with M&I users. They would also support D because it lowers the shortage trigger and leads to increased average annual net income. For the same reasons, South Coast irrigators would favor either of B, C, or D, and the M&I component would favor D.
Ironically, the alternative which maximizes economic benefits, and benefits all components, is Strategy G. This strategy states that maximum benefits are achieved when full deliveries are maintained until the reservoir runs dry, implying that reservoir operators may not need a drought strategy at all. It should be noted, however, that

208 USCID Regional Meetings -- 1989
some non-consumptive uses of the reservoir which may have an effect on its operation, such as recreation, are not considered in this analysis. Nor is the variance of economic benefits from year to year considered.
Whether the strategy of running the reservoir dry is acceptable from a standpoint of risk management is beyond the scope of this study.
Tualatin Project, Oregon
Economic theory would suggest the optimal size of a multi-purpose reservoir is where the marginal benefits of the reservoir, summed across all uses, are equal to the marginal cost of the reservoir development costs. The modeling system is capable of estimating marginal benefits of alternative reservoir sizes for proposed projects. This is illustrated in an ex post analysis of the Tualatin Project in Northwest Oregon.
The Tualatin Project area lies near the City of Portland, Oregon. The main project features are Scoggins Dam, which forms Henry Hagg Lake. The reservoir has an active capacity of 59,170 acre-feet. Of approximate annual releases of 62,000 acre-feet, about 25,000 acre-feet are dedicated to M&I uses in suburban Portland, 20,000 acre-feet are used to maintain water quality in the Tualatin River, and the remaining 17,000 acre-feet are tagged for irrigation purposes. Due to the difference in climate and related hydrology the Tualatin can deliver more water than Lake Cachuma with a reservoir less than one-third the size.
Little modification of the OperatiOns model was necessary to accommodate the Tualatin case study. Historical inflows were estimated for the period of record 1929 through 1952. Annual and monthly demands were obtained from the Bureau's 1970 Definite Plan Report (DPR), and updated with information published in their annual project reports. Physical coefficients, such as area capacity and pan evaporation were obtained form the DPR also.
The next cheapest single purpose alternative for suburban Portland to acquire additional M&I supplies is contracting directly with the city itself. The suburbs face a delivered price of $180 per acre-foot for Portland city water of similar quality.
The economic benefit of instream flow releases is the avoided cost of advanced water treatment. The Tualatin DPR estimated the avoided cost to be $13.60. Updating this cost with a construction cost index results in a 1988 avoided cost of $45 per acre-foot.
Ten crops are considered in the irrigation component: alfalfa, grass hay, pasture, corn silage, processing beans, sweet corn, onions, potatoes, seed crops (clover and bluegrass), and berries (strawberries and blackberries). Unlike the Cachuma case study, the perennial crops considered in the Tualatin Project do not suffer the longer term drought impacts such as those seen with avocados and citrus. Therefore, little modification of the model was necessary. The rainfall volume in the study area is more than adequate to provide crop consumptive water use requirements. However, rainfall is seasonal. Supplemental irrigation is required in the months of May through August to ensure acceptable crop yields.
Active capacity of the reservoir is reduced by 30,000 acre-feet in the months of October and November for flood control purposes. Occurring after the irrigation season, this can result in nearly draining the reservoir. Rood space requirements are relaxed to

Reservoir Operating Criteria 209
25,000 acre-feet in December, 17,000 acre-feet in January, and 5,500 acre-feet and 2,000 acre-feet in February and March, respectively.
The Tualatin Project has never experienced a significant water shortage since it was developed. Intuitively, this suggests the marginal benefit of extra capacity in the reservoir is near zero. As part of the ex post analysis, smaller reservoir capacities are considered to observe how project benefits change with reservoir size. Capacities considered range from 50 percent of the current size, about 29,500 acre-feet, and incrementally increase up to its current capacity, 59,170 acre-feet. Operating criteria are not defined for this case study; the shortage trigger and shortage criteria are set at zero for all users.
Results of the model runs are summarized in Table 3. The first column details the reservoir size considered and the last column shows cumulative changes in economic benefits over the range. The middle columns summarize the marginal benefits of the alternative reservoir sizes for the individual components.
Marginal benefits for irrigation go to zero at capacities greater than 40,680 acre-feet, implying that capaCity between this level and the current size has little economic value to irrigators. Marginal benefits of additional capacity go to zero at sizes larger than 33,283 acre-feet for M&I uses. For water quality purposes, the point of zero marginal benefits is reached at sizes larger than 48,076 acre-feet. It should be reiterated, however, that despite carrying the name of the Tualatin Project, this case study is Simply for illustration and does not reflect actual conditions in the study area.
Figure 3 plOts the marginal benefits of alternative reservoir sizes. Recall these are marginal, or change in benefits, rather than total benefits. Marginal benefit curves are typically downward sloping, implying diminishing marginal benefits as reservoir capacity increases. Note that the curve meets the X-axis at a capacity Slightly larger than 48,076 acre-feet. This indicates that regardless of reservoir construction and maintenance costs, additional capacity above this level has little economic value. If marginal costs of reservoir construction and maintenance were known, they could be plotted on in the same graph as an upward sloping curve. The intersection of the marginal benefit curve and the marginal cost curve would indicate the economically optimal reservoir capacity.
CONCLUDING REMARKS
The above case stUdies, and additional case studies involving the Dolores Project in Colorado and the Cheney Project in Kansas, have demonstrated the adaptability of the modeling system to a variety of hydrologic conditions and economic Objectives. In addition to examining alternative reservoir operating criteria and reservoir sizes, the models can assess alternative hydrologic records, demand data, conveyance capacities, water costs, and a host of other parameters affecting project management. Subsequent case studies will be less hypothetical in nature, beginning with an operations study of the Sevier River system. This case study will focus on reservoir operations, particularly how alternative operating plans will affect marginal benefits of irrigated agriculture in the Sevier basin.

210 USCID Regional Meetings -- 1989
TABLE 3 Summary of annual benelns for altOlnatlve rese!Voir sizes, Tualatin Project -, Hal farm changelrom M&l changelrom Waterquailly change- Cumul_
sIza(AF) Income base It benefllS - beneftts - change
29,585 $3,985,026 ($222,012) $3,902,871 ($597,129) $633,3n ($316,419) ($1 ,135,560) 33,283 $3,955,353 ($251,685) ",368,606 ($131,194) $669,053 (S280,744) (1663,623) 35,132 $3,998,864 (S208,174) ",500,000 $0 1722,568 ($227,230) (1435,404) 36,961 ",096,425 ($106,613) ",500,000 $0 $776,079 ($173,717) ($282,330) 40,680 ",197,967 (S9,051) ",500,000 $0 $807,307 (5142,489) ($151,540) 44,378 ",207,038 $0 ",500,000 $0 $838,535 ($111,261) ($111,261) 48,076 ",207,038 $0 ",500,000 $0 $938,000 ($11,796) (SII ,796) 51,n4 ",207,038 SO ",500,000 $0 $949,796 $0 $0 59,170 ",207,038 $0 ",500,000 $0 $949,796 $0 $0
11 The baseline case Is lhe rese!Voir's current capacity of 59,170 AF
FIGURE 3 Average annual marginal benflta of Illarnativl reservoir siz_.
Tualatin Project
'~.-------------------------------------------, ... 0.0
S 0 ..
il 0.7
0.6 r 0"
0.-
0"
O~
0.'
0 ..... ..... lO'" .-. 4OUO 64.l7' 48071 51774 "'70
........... (Acr ... 'Ml)

US ARMY CORPS <F ENGINEERS
DROUGHT PLANNING AND RESPONSE
John P. Elroore*
ABSTRACT
The US Army Corps of Engineers operates and maintains many lock and dam, lake and channel projects as part of its Civil Works mission. These projects have been designed to serve navigation, flood control, hydropower, water supply/quality, fish and wildlife and recreation needs across the Nation. The Drought of '88 negatively impacted all of these project purposes except flood control. This paper addresses the impacts of Drought '88 on Corps projects, the flexibility at these projects to prepare for and mitigate drought impacts, the Corps emergency water supply authority, and what the Corps is doing, nationwide, to reevaluate project functional priorities and capabilities during drought conditions to serve the most urgent needs first. In addition, it addresses Drought '89 from the perspective of lessons learned from Drought '88.
CORPS DROUGHT PLANNING AND RESPONSE
Hydrology of Drought '88
The 1988 Drought was brought on by a deficient volume of spring runoff resulting from less-than-normal winter snowpacks in the Pacific Northwest, California and the Western Plains States and by below-normal winter and spring snow- and rainfall, respectively, in many of the Midwestern and Southeastern States. In March 1988, the Corps began monitoring drought conditions and relied upon both internal and external resources to assess and predict impacts throughout the country. Corps reservoirs in California entered 1988 with below-normal levels because of the previous year's deficient runoff. Low basin yields (inflows) in the upper Mississippi and Missouri River, and in the Red River of the North were the result of the below-normal snowpacks. Parts of the southern Ohio River basin were already suffering from three previous years of dry weather - so that the dry Spring and early Summer of 1988 were reflected in very low reservoir levels and streamflows. Nearly the entire Southeast had been suffering under
*Chief, Operations, Construction and Readiness Division HQ, U.S. Army Corps of Engineers, Washington, DC
211

212 USCID Regional Meetings .. 1989
drought conditions for most of this decade, and especially from below-normal runoff for the past three consecutive years.
Drought Impacts and Responses in the River Basins
Navigation: While monitoring the low snowpack, low runoff, and below-normal precipitation during March through May last year, the Corps became concerned that a major drought might occur during the normally drier months of the year (June through September). In May, climatological data (current and projected) and early coordination with the Corps field offices convinced Headquarters that unless sufficient rainfall and runoff occurred soon, major navigation waterways across the midwest and southeastern portions of the country would need to be dredged to maintain adequate channel depths and widths for barge and towboat traffic. The Corps and private dredging fleets were inventoried to determine where, how many, and what types of dredges would be available to help clear the problem areas and keep traffic moving. River stages continued to drop in May and June, 1988, particularly in unregulated river reaches such as the middle and lower Mississippi River downstream from St. Louis and along the Ohio River downstream from Lock and Dam 53. While the streamflow rates were rapidly declining in June and early July, the alluvial river beds were responding with major downcutting and shoaling as the rivers sought to achieve equilibrium under extremely low flows. During this period of precipitous decline in river stage, the scouring and shoaling action of the rivers caused severe navigation maintenance problems.
Early in June, Corps Headquarters in Washington, DC began receiving reports from Corps district and division offices about increased "bottom bumping" and "hanging up" incidents along the major waterways. The first grounding and river closure occurred on the White River portion of the McClellan-Kerr Waterway on June 7th. River closures on the upper and lower Mississippi River followed 1 and 3 days later, respectively. The first closure on the Ohio River occurred on June 15th in the Mound City area (River mile 973).
The first dredge began working on June 3rd to increase channel depths along the Ohio River. As water levels in the major rivers continued to decline, field offices added more contractor and Corps dredges to remove shoals which were stopping or delaying commercial traffic. As many as 4 Corps and 9 contractor dredges worked day and night to maintain the navigation channels. Waterways that were dredged because of the drought include the White, Mississippi, Ohio, Missouri and Alabama Rivers.

Drought Planning and Response 213
While dredging was a major component of the Corps success in maintaining navigation on the Nation's waterways, equally as important was regulation of Federal reservoirs in the basins. During the worst of the drought in mid-July 1988, two-thirds of the total Mississippi River flow above Cairo, IL, and, at times, two-thirds of the water flowing past New Orleans came from controlled storage. Throughout the drought period, controlled releases of water from Federal projects in the Missouri and Ohio River basins kept the water levels in the Mississippi River high enough to permit movement of commercial and recreational traffic. In addition to Corps reservoirs, the Tennessee Valley Authority provided releases from its Tennessee River basin projects. Throughout most of the drought last year, reservoir releases from the Missouri River basin provided 65 percent of the flow in the Mississippi River at St. Louis and 35 percent at Memphis. Without the Missouri River mainstem releases, it is arguable that there would have been no commercial navigation on the lower Mississippi River.
The US Coast Guard and the navigation industry, working closely with Corps field offices, identified zones along the major waterways where special procedures were required to keep commercial traffic moving. Safety (or restricted operation) zones were set up and coordinated with the river industry where the depth, width, and length of river reaches was inadequate to pass normally-loaded or configured barge tows. Maximum barge draft, tow width and length, number of loaded and empty barges per tow, and allowable time of passage were specified and enforced in these zones.
Another important relief valve during the height of the drought was the Tennessee-Tombigbee Waterway. Because the lower Mississippi River was experiencing numerous extended closures in June and July, the river industry began using the TennesseeTombigbee Waterway to move commerce between the upper Mississippi and Ohio Rivers and New Orleans. This increased usage was first reported by Mobile District on June 23rd and continued to be reported through the end of October.
From June 7th to July 12th, there were 29 closures of the White, Mississippi and Ohio Rivers and the Apalachicola, Chattahoochee and Flint (ACF) waterway that persisted for longer than 24 hours.
The number of closures of navigation channels dropped dramatically to 3 during the July 12th to August 5th period as a result of the rivers stabilizing at extremely low stages and actions taken by the Corps and others to keep traffic moving. Increases in rainfall and runoff in early Fall subsequently improved conditions. Most basins were reporting normal to above-normal streamflow and reservoir conditions by late November 1988.

214 USCID Regional Meetings -- 1989
As river stages on the Mississippi River fell during the drought to record low levels, concern arose about rock ledges or outcroppings in the vicinity of Grand Tower (upper Mississippi River mile 78 - 80). Navigation could have been terminated at that point if stages dropped low enough, especially after releases from Missouri River reservoirs were cut back in mid-November (as part of the annual operating plan for the six Missouri River mainstem projects). To ensure that river traffic would continue on the upper Mississippi past mid-November last year, rock removal began on November 2nd. The rock removal is continuing this year, so that a 9-foot navigation channel will be available for stages down to -6.0 feet on the St. Louis gage.
Through a combination of planning, coordination, judicious reservoir regulation, and Herculean dredging efforts, the Corps, navigation interests, the U.S. Coast Guard and local and state interests, collectively, were able to sustain navigation during unprecedented low flows on the Nation's waterways.
Water Quality: The Southeast experienced its fourth year of drought last year. The rainfall deficit over just the previous two years exceeded 22 inches. Inflows to Corps reservoirs were the lowest since 1925. Actions taken in 1987 to manage Corps lakes in the Southeast in anticipation of another year of low rainfall in 1988 assured maximum effective use of available water. Essentially all the flow in the Chattahoochee River past Atlanta last July that was necessary for water supply and water quality was being released from the Corps Lake Sidney Lanier.
One of the more dramatic water quality impacts to which the Corps responded last summer was the intrusion of a saltwater wedge from the Gulf of Mexico up the Mississippi River. The intrusion of a saltwater wedge is not an uncommon phenomenon as low water flows each summer allow a wedge of dense saltwater to move upriver to approximately mile 30 or 40. Historically, the greatest incursion of the wedge was to near mile 120 above New Orleans. Major concern developed last year that the wedge would again travel past New Orleans affecting the City's water supply.
When considering the saltwater wedge moving up the Mississippi River to New Orleans, our computer model indicated that construction of a sill or submerged barrier would help reduce the extent of intrusion and, in conjunction with flows down the Mississippi River, dilute any saline water already beyond the yetto-be-constructed sill. Even after only partial completion of the sill at Mississippi River mile 63.7, the wedge began to recede. Dilution of the wedge occurred more rapidly than projected due to the sill and increased flows in the river. The construction of the sill was central to assuring a continUing fresh water supply at New Orleans.

Drought Planning and Response 215
These two examples of the Corps response to water quality problems were the most visible, but, in reality, Corps actions at many of our projects throughout the Nation were critical to the maintenance of water quality.
Recreation; The Corps is the second largest recreation supplier in the Federal Government, entertaining over 500 million visitor days annually. Drought impacts were felt at many Corps lakes as lake levels declined last year, resulting in closed beaches, marinas, boat ramps and private docks and moorages. There also was some impact on the quality of sport fishery due to low water levels.
Recreation facilities at 54 Corps projects in 7 of the 10 divisions in the continental United States were affected by the drought. The Southeast and Ohio River basin reported the largest number of facilities affected. In some cases, facility closures simply resulted in the shift of a portion of the usual visitation to other areas. At Corps projects in the Midwest, Southeast and Southwest, boat ramps were extended and other measures taken to permit access and public use during continued drought conditions.
Hydropower Generation; The Corps operates 73 multi-purpose projects with hydroelectric power production. The Corps generates the power, but the Department of Energy sells it through its regional marketing agencies. The Corps produces 30 percent of the total hydropower in the United States during a normal year -enough power to satisfy the needs of 6,000,000 households for the entire year. Due to the drought in 1988, Corps hydropower production was only 78 percent of normal during the summer months. This resulted in lost revenues of $145 million.
Emergency Water Supply; As surface and groundwater levels dropped during the drought, communities and private companies and citizens began experiencing no, low or contaminated water supplies.
The Corps has authority under Public Law 84-99 to; (1) provide emergency supplies of clean water for communities in situations where the normal source is contaminated; and (2) transport water or drill wells for farmer, ranchers, or political subdivisions in drought distressed areas. This authority to assist during drought is supplemental to state and local efforts and is available only after a Governor's or eligible local applicant's request. That is, the Corps can provide the temporary assistance necessary to minimize threats to the public health and welfare after available state and local resources and alternatives have been used. Public health and welfare take priority over other uses of the water.

216 USCID Regional Meetings •• 1989
The Corps received 19 formal requests for assistance in providing emergency water supplies during the drought. Four projects were approved and completed under the limited drought authority.
Planning; Mr. Robert W. Page, Assistant Secretary of the Army for Civil Works, served on the President's Interagency Drought Policy Committee. Other Federal agencies participating on the committee included: Departments of Agriculture, Commerce, Energy, Interior, State, Transportation and the Council of Economic Advisors, Federal Emergency Management Agency, Office of Management and Budget, Tennessee Valley Authority, and the White House. This committee monitored the drought and coordinated the Federal response.
Public Affairs; Corps district, division and headquarters public affairs offices played a major role in keeping the public informed concerning drought conditions and Corps responses. A National Drought Public Affairs Continigency Plan is now in-place which prescribes public affairs actions in the event of fUrther drought conditions.
Drought Reporting; Corps headquarters maintained close coordination with its drought-affected divisions and districts. Daily navigation situation reports were first prepared to keep Corps personnel at the WaShington level informed of not only the problems that the river industry was experiencing, but also what the Corps, the US Coast Guard, and industry were doing to clear the groundings and river closures and to keep commercial traffic moving on the waterways. As the drought impacts rapidly worsened and other project purposes were affected, the navigation report was expanded to include hydrologic, hydropower, recreation, emergency water supply, and public affairs information. Summary reports (both written and verbal) of field conditions and actions were presented to Mr. Robert W. Page, Assistant Secretary of the Army for Civil Works on a daily basis until late last year, when rainfall and runoff conditions began to improve.
Because of the magnitude and range of drought impacts across the country and the close attention given to the drought by the Administration and others, Headquarters assumed the role and remains the drought point-of-contact for Capitol Hill, other agenCies and Department of the Army. Many meetings between Headquarters staff and Congressional committees or special interests were held to describe the drought impacts and explain Corps policies and actions in response. The purpose behind this reporting system was to free-up the field offices to do what was needed to minimize the impacts of the drought and to keep interested parties at all levels informed as to what was occurring in the various river basins and what was being done to mitigate impacts.

Drought Planning and Response 217
Close, continuous coordination with the Coast Guard, navigation industry and other local interests was critical in dealing with initial drought impacts. As the drought affected more of the Corps Civil Works missions, coordination was expanded to help the Corps monitor all drought impacts to Corps activities.
Drought '89 Activities
Unfortunately, hydrologic conditions reported last year have continued this year in much of the country west of the Mississippi River. California, the southwestern states and the Missouri River basin have been hardest hit by drought conditions this year. In response, many of the activities initiated in 1988 have continued into 1989. The Corps is monitoring low water conditions for the impacts on Corps missions and resources. Division offices have been reporting drought conditions to Washington, DC since February. Mr. Page at ASA(CW) has been receiving bi-weekly or weekly drought reports since February. Congressional staffs on Capitol Hill have received situation reports periodically. Coordination with other agencies continues. Channel restrictions have been either imposed on waterways or voluntarily adopted to ensure the movement of commercial navigation during low water periods. As many as five dredges have been used to clear droughtrelated problem areas. Boat ramp extensions are continuing. Corps lakes are being managed to conserve water and minimize drought impacts. Nine communities are currently receiving water supplies under Corps emergency authorities. Regional marketing agencies have had to purchase alternative power in the southeast and Missouri River basin.
The Army Corps of Engineers people and projects were proactive in meeting the challenges presented by extreme drought situations throughout the country last year. The Corps is monitoring the continuing drought effects this year and remains ready to meet the challenges as conditions demand.
Drought Planning
When Corps multiple-purpose reservoir projects are formulated, low water conditions are considered in sizing the project reservoir storage. Each reservoir project or system of reservoirs is sized to meet authorized project purposes (albeit at reduced service levels) during the lowest water period of record for that basin or area. Corps channel projects are designed much the same way, so that even during low water periods there is the likelihood that navigation will still be possible. Project sizing is based upon historic low water periods. The ideal situation is to be able to satisfy as many local needs (purposes) as are economically feasible and environmentally acceptable even during drought conditions. But when low water conditions persist longer than the

218 USCID Regional Meetings -- 1989
design period or set new record low flows and stages, then there will not be enough water to meet all needs. This is what happened last year and is happening in some river basins again this year.
Water Management During Drought Study
In coordinating with Federal, state and local interests last year and again this year, there have been many discussions about which (if any) project purposes should be satisfied first when there is not enough water available to meet all needs. It is very difficult to satisfy all interests in a river basin because Corps dam and lake projects are multi-purpose projects operated to meet the needs of many local, state and regional purposes. Where projects are part of a system, 8 to 10 states or more may be affected by how the reservoir storage at each project is utilized.
The excellent coordination and combined drought response activities of Federal, state and regional agencies significantly minimized the impacts of the Drought of 1988. While this was a commendable accomplishment, we certainly recognize the need to better manage our water resources. During Drought '88, the Corps considered a number of strategies on how best to respond to a major drought. As a result, the Army sought and received approval and funding, in Fiscal Year 1990, to initiate a study of National Water Management During Drought.
The study is a multi-year study with the recommendation on whether or not to continue beyond 1990 based on the results of the first year of study.
The prime objective for the first year of study is to determine what changes, if any, should be made to the Nation's strategy for managing water during drought. The process for making that assessment is:
1. Determine how water is managed during drought now by surveying Federal agenCies, states and other water managers;
2. Develop a system of standards against which water management policies can be evaluated;
3. Identify where the shortcomings in the current system are, and where there is potential for improvement;
4. Collect or formulate alternatives, and evaluate them in at least a preliminary fashion, according to the system of standards; and,
5. Identify the extent of the Federal and Corps role and interest in the solutions, and recommend areas for fUrther study.
Drought Planning and Response 219
We recognize the importance of coordination with and active participation of state and local agencies in the conduct of the study, and we certainly see this aspect of the study as the key to its success. The Corps wants to work closely with other Federal and non-Federal agencies so that the views we hear and the conclusions we reach will reflect the entire water resources community, not just the Corps.
Since we are still in the early phase of the study, various offers for assistance from Federal and non-Federal groups and agencies are being evaluated to see how these groups could effectively participate in the study.
Summary
The drought of 1988 was, indeed, an extreme situation that tested the will and capability of the Nation's citizens and their institutions. The combined efforts of citizens, industry and governmental institutions proved that working together, there exists sufficient expertise and infrastructure to significantly mitigate the impacts of drought. Drought '88 presented an opportunity for the Corps to serve the Nation, and our projects and our people performed tirelessly and well in this time of extreme. The challenge is to be even better prepared for such events in the future through better and more coordinated planning efforts.


THE ROLE OF DROUGHT MANAGEMENT MEASURES IN WATER RESOURCE INVESTIGATIONS
Uli Kappus, P.E.* Blaine N. Dwyer, P.E.* Ralph L. Kerr, P.E.*
ABSTRACT
This paper summarizes the evaluation of drought management measures considered in several recent river basin studies conducted by the Colorado Water Resources and Power Development Authority. More than 30 measures were evaluated as potential means to meet water supply needs during periods of drought. These measures include both structural and nonstructural options. This paper emphasizes the non-structural measures and the improved operation of structural facilities through innovative water resource management techniques. These measures provide a means for reducing the size of more costly large-scale water storage projects. The nonstructural measures may be grouped in the following three categories: 1) measures which increase available supplies, 2) measures which reduce demand, and 3) measures which remove institutional constraints to improved water management. The paper provides an overview of each basin evaluation and discusses the applicability of each of the measures as a function of that basin's needs. Based on these case studies, the paper illustrates that the potential for each measure to satisfy various drought management objectives is closely related to the specific needs and resources of the area in question.
INTRODUCTION
The Colorado Water Resources and Power Development Authority (Authority) has recently conducted four basin-wide water resource investigations to provide for future water supply needs in those basins. One of the aspects of these studies was to identify and evaluate alternative drought management measures. Each investigation was conducted in response to a request from one or more water interests operating in the basin. Although each investigation was tailored to meet the specific needs of the local area, the general objective of
i~sp;~ti~;l;:-E;~utive Director, Project Manager, and Project Manager with the Colorado Water Resources and Power Development Authority, Denver, Colorado
221

222 USCID Regional Meetings -- 1989
each was to define a combination of water management alternatives, both structural and non-structural, to provide for the efficient and environmentally sound development of the basin's resources. Each evaluation was conducted at a prefeasibility level of analysis. This means that it was completed in sufficient detail to distinguish the major differences between alternatives, to describe the viability of each alternative, and to determine if more refined studies are warranted.
The Authority investigations discussed in this paper are:
1)
2)
3)
4)
The Cache la Poudre Basin Water and Hydropower Resources Management Study (1987)
The Upper Gunnison-Uncompahgre Basin - Phase I Feasibility Study (1989)
The Cherry Creek Water Resources Project - Phase Feasibility Study (1987)
The Clear Creek Project - Phase I Feasibility Study (1987, 1989)
The locations of the study areas are shown on Figure 1.
DROUGHT MANAGEMENT MEASURES CONSIDERED
Table 1 lists the drought management measures considered in each of the four studies. The following four sections of the paper present general descriptions of the studies and their physiographic settings, the drought management measures included in alternative water management plans, and findings related to costs and benefits associated with the drought management measures.
CACHE LA POUDRE STUDY
Basin Setting and Study Description
The Cache la Poudre River Basin is located in north central Colorado and drains an area of almost 1,900 square miles conSisting of two distinct components. The mountainous upper basin provides the major portion of surface water runoff from annual snowmelt. The lower basin is a plains area where the water is used by agriculture, municipalities, and industry.

* L 11I1I'l"ml t;lllTII ! .J \ { (I I ® FEASISILITY STUDY
CONSTRUCTION FUNDING
COL()IIIADQ WATER RESOURCES AND POWER DEVELOII'MENT AUTHORITY
PROJECT MAP ~ 11111 FIgure 1
~ Ii ~ III o = ~
~ III ... ~ . ... o· = III
~

224 USCID Regional Meetings •• 1989
TABlE 1. DR<XJGHT IWIAGlH£HT flEASURES
Heesurt:
Phr-qtoph,.t, Control/Vell,hUon --., Ditch Ltnl",
ConJuacU .. U .. of Grouhdwet.,. end Sutfae. Wat,,.
Oredve bbUftg Rls,not,.s
H)'dro1OVlc Instr.-ntaUon
Reus. of ... "lc1p.1 Wute W.ter
Tran.' .... of Stor.,. o.cre"
Tt,,.,'''' of Potnts of Dtventon
Modtftceth:wt of R, .. ,n01r f t 11 'hi Sequenus
R.owe. """tctpal Ohtrtbutton Sys t_ L"'''lg,
EYI.,., ... ttOft Suppression
W..UI .... bUftceUon
Deften !trtgetton P,..cttcu
W.ter ''''''''¥llion rtts/Pvblic 1"'o .... tloo
IItt""I"g 810d R.t.esJ~r Sure"' ....
Low o..nd P1U11blnv Ftlt41",
Uniren,1 Mtt ... 11I9
he",,.n wt"" Effh,,,nt f,.. Wnk Vater ',..at.nt Pl.nh
Outdoor W.hrtn9 Re,t,.tcUOftS
Witt,. u .. RaUonlng
la_hetpl", Rutrlct1CIM for ... -. Prohtbtttons on flew tonnectlons
Ian on Outdoor U .. e
eo-.rchl/lrw:tu,trl.l COftl .... nttOft
' ... "ure hductton
lendscept IrrlgettOft 5)'.t_ t .. ro ...... "
Irrigation [fftetlne, blproy_nts
Drought Insurance
Basinwide eocp.r.U .. MIMI_fit Org,ni,'tion
Rtver e .. ln Authorlt)' wtth R'gulatory Power
RaStnc1MNd Water Rlglits
I.pro,,";: W.t4'r ",n'i_ftt Throuvh ... r .... t Proc,,,
Wat,r RI,ht hchan,"
W.hr Court £ftforc_"t af W,t.,. Us. [ff'cleM), &o.ls
RKMI"9I' af AUu.",1 Aquif,rs
JftJtct Ion Into De-s». Nontdbuurl ,\qulf.",
CUN 1. I'oud,.. Study
Gunnison StudJ

Water Resource Investigations 225
Extensive agricultural water supply systems have been developed and the Cache la Poudre River is among the most carefully managed and controlled river systems in the western United States.
The Cache la Poudre Study began in June 1985 and the final report was issued in January 1987. The Study was composed of two phases. The first phase forecasted future water needs in the Basin, while the second phase identified and evaluated alternative water management plans to meet those needs. Each plan included a group of drought management measures as discussed below.
Drought Management Measures
Thirty-two candidate drought management measures were identified and screened to determine those that should be considered in plan formulation. Measures were eliminated from further consideration if:
o The measure already had been implemented and/or was accounted for in making water demand forecasts;
o Adverse environmental effects, expected to be serious in nature, could occur with implementation of the measure;
o Reductions in water consumption or increases in water supply would be small in relation to expected costs and implementation requirements;
o There appeared to be no clear advantage for the measure in comparison to present methods of water system operation and management in the Basin; and
o Only minimal reductions in consumptive use would be achieved.
Drought management measures included with each of the seven alternative plans are identified in Table 2.
Findings
The total water shortage during a 1-in-25 drought can be reduced from 450,000 acre-feet (af) to 250,000 af using the twelve drought management measures. The total investment cost for implementing the twelve drought management measures was estimated to be about $34 million and the total annual cost was estimated to be approximately $3.7 million. Water

226 USCID Regional Meetings •• 1989
TABLE 2. CACHE LA POUDRE DROUGHT MANAGEMENT MEASURES ____ aD ____ -*~ __ ~ ____ • ______ _
Element
Conjunct i ve Use
Additional Metering
Water Use Restrictions
Landscape Res tri ct ions
Ditch Lining
Hydrologic Instrumentation
Trans fer of Storage Decrees
Transfer of Diversion Points
Deficit Irrigation Practices
Public Information
Drought Insurance
Basinwide Organization
Purpose
Integrate further development of ground water resources and surface water supp li es
Reduce M&I water diversions
Reduce M&I water diversions
Reduce M&I water diversions
Reduce non-benefi cia 1 consumptive use of irrigation water
Provide additional data to support water management and cropping deCisions
ProVide the opportunity to place existing storage rights in a larger, more efficient reservoir
Increase efficiency of existing diverSion points
PrOVide less-than-optimum water supplies to crops during a drought
Educate the pub 1 i c with respect to water issues and encourage good water use practices
Formalize existing "defacto" program to provide drought protection through leasing arrangements
Establish an organization to administer conjunctive use and drought insurance programs
Yield
12,000 af/yr new supp 1 y; up to 85,000 af during a drought
4,300 af/yr (ea. year)
12,000 af/yr during water short periods
5,600 af/yr (ea. yr.)
Not quant ifi ed( a)
Not quantified
Not quantified
Not quantified
Not quantified; would affect reservoir sizing
Not quantified
Not quantified; wou ld affect reservoir sizing
Not quantified
-{~e lds fr~;;-:~n-structura 1 e lement;-:;;:~~because of inadequate data to characterize water savings or uncertainties with regard to the amount of water savings that might be attained.

Water Resource Investigations 227
savings from several of the drought management measures are very difficult to quantify. However, if only those measures that produce a quantifiable annual water savings are considered, their annual cost per af is estimated to be in the range of $5 per af up to over $200 per af. By comparison, structural measures result in unit annual costs for water yield in the range of $500 to $1500/per af, thus emphasizing the cost effectiveness and, therefore, the importance of drought management measures.
Extensive cooperation among water users in the Basin would be needed to implement the drought management measures, particularly a planned conjunctive use operation. Various legal and institutional issues would need to be resolved before some of the measures can be effective. Changes in existing laws also may be required. A basinwide cooperative water management organization, comprised of water users, administrators, and other interests, would be useful in securing the necessary cooperation and in avoiding excessive litigation.
The effectiveness of a basinwide management organization can be enhanced significantly through the use of the Colorado Satellite-Linked Water Resources Monitoring System. This satellite system has been providing real-time data on stream discharge throughout Colorado, and is being expanded to provide select water quality data. The satellite system was evaluated as a drought management measure, as noted in Tables 1 and 2, under the title "hydrologic instrumentation." Increasing benefits are antiCipated as this satellite system is better utilized to refine water management techniques. These benefits include both increased raw water supplies and assistance in meeting stringent water quality standards.
GUNNISON STUDY
Basin Setting and Study Description
The Gunnison River Basin is located in west central Colorado. Its boundary encompasses an area of 8,020 square miles and irrigated agriculture utilizes approximately 98 percent of the developed water supplies. Recreation has recently become the other predominant sector in the local economy. Recreation water demands are primarily for non-consumptive instream uses.
228 USCID Regional Meetings -- 1989
The Gunnison Study was initiated in June 1987 and the final report was issued in May 1989. The study included the evaluation of recreational improvements. water development needs. potential large-scale water diversions to eastern Colorado. and potential hydroelectric power development.
Drought Management Measures
A number of water management and conservation measures were evaluated as potential means of reducing future water demands especially during drought conditions. It was determined that measures related to reducing agricultural diversions had very limited potential due to the irrigation practices and topography of the basin. Most of the agricultural production takes place in the bottom of relatively steep mountain valleys. Therefore. any diversions in excess of crop consumptive-use needs. return to the stream within a short period of time and are available for other uses. It was also determined that most other non-structural measures related to the agricultural sector were generally not practical because of economic or legal considerations.
The M&I sector in the study area presently accounts for less than 1.5 percent of the total consumptive use in the study area. Any savings achieved through conservation and/or improved management of M&I water supplies would therefore have a negligible impact on reducing the overall future demands in the study area.
The two measures which were judged to have potential for implementation are: drought insurance whereby the owner of an agricultural water right agrees to lease his water during drought periods for other purposes including the enhancement of instream flows; and water rights transfers. exchanges. and/or purchases.
Findings
It was determined that water rights' transfers and exchanges might play an important role in enhancing water supplies and instream flows during droughts. For example. the minimum annual yield (that is. the minimum amount of water available during any year in a 3D-year hydrologic study period) for one of the out-of-basin diversion alternatives was increased from zero to 36.500 af by implementing a water rights exchange agreement.

Water Resource Investigations 229
Drought leasing was recommended for consideration in future evaluations as a means of enhancing instream flows. It was not considered to have much potential in this study area in relation to its usual application of transfering agricultural water to M&I use during droughts. This was due to very small forecasted increases in M&I demands over the study's long term planning horizon.
CHERRY CREEK STUDY
Basin Setting and Study Description
The Cherry Creek Basin, located in the semi-arid plains southeast of Denver, flows in a north1y direction where it joins the South Platte River within the City of Denver. The geographical area within this study is the Upper Cherry Creek Basin, a 385 square-mile drainage area located upstream of the Cherry Creek Dam. This dam lies along the southeast edge of the City of Denver. The population of the Upper Cherry Creek Basin is projected to reach some 300,000 people at the time of build-out in the region, a six-fold increase over today's population. The study completed in December 1987 estimated total unconstrained demand for municipal and industrial water supply at 70,000 af/yr, with 20,800 af/yr of that amount being supplied by existing or impending projects and 2,000 af/yr supplied through individual wells. It was also forecast that unconstrained demand would ultimately be reduced by 17 percent or 11,900 af/yr through conservation measures instituted by individual water users, as documented in the recent Systemwide Environmental Impact Statement for the metro Denver Two Forks Project. The resulting shortfall of water supply at build-out, to be addressed by the Cherry Creek Study was therefore 35,300 af/yr.
Drought Management Measures
To provide for these forecast needs of 35,300 af/yr, the following resources were evaluated: Cherry Creek (surface water and tributary ground water); nontributary groundwater from the Denver Basin aquifer (underlying the Cherry Creek Basin); importations from either the Arkansas River (purchase of agriculture water) or the lower South Platte River (purchase of water recharged by agriculture ditch companies); and indirect potable reuse of waste water. Four alternatives were evaluated to meet the demand for 35,300 af/yr. Each alternative used two or more of the identified water resources. The high cost of traditional methods of water

230 USCID Regional Meetings -- 1989
development, the non-renewable nature of the deep nontr1butary groundwater, and the almost total lack of surface water resources within the Cherry Creek Basin required consideration of innovative means of supplying water. These included:
o injection and storage of water in the Denver Basin aquifers using deep wells drilled for water supply;
o importation of water recharged into the alluvial aquifer along the lower South Platte River;
o recovery of a portion of the incremental runoff produced in the Cherry Creek Basin from the future population growth;
o recovering water through indirect potable reuse, by injecting or recharging tertiary treated waste water into the Cherry Creek alluvial aquifer.
Findings
The implementation of each of the four drought management measures requires either a pilot project to resolve technical and public health questions and/or the resolution of institutional constraints. Neither these technical nor the institutional questions appear very formidable when compared with federal permitting requirements for water storage projects under the Clean Water Act (Section 404) or NEPA (National Environmental Policy Act). The unit costs of firm yield from the four alternatives ranged from $3l0/af/yr to $1, 110/af/yr. However, these costs must be evaluated in terms of the level of technical and institutional uncertainties involved in each alternative. Since approximately one third of the 35,300 af/yr demand is supplied by indirect potable reuse for each of the four alternatives studied, none of these alternatives can avoid the technical and institutional concerns associated with utilizing this resource.
CLEAR CREEK STUDY
Basin Setting and Study Description
The Clear Creek Basin is located in central Colorado and is bordered by the Continental Divide to the west and the confluence of Clear Creek and the South Platte River in the
Water Resource Investigations 231
City of Denver to the east. The Clear Creek Basin is composed of an upper and lower basin, which combined, drain an area of about 575 square miJes. The mountainous upper basin (398 square miles) provides the major portion of surface water runoff from the basin in the form of annual snowmelt. The lower basin (177 square miles) is a plains area where the water is used for agriculture and by municipalities and industry. Because most of the streamflow occurs during snowm~lt in spring and early summer, reservoir storage is required near the downstream end of the upper basin to conserve water for beneficial use during periods of low flow.
The initial investigation for the Clear Creek Study was completed in November 1987. That study forecast the growth in water demand, considered in-basin surface and ground water as well as potential imported water resources available to meet those demands, and evaluated potential water and hydropower projects throughout the basin which could develop a firm supply of water and provide revenues, where possible, from generation of hydroelectricity.
The results and conclusions of the first investigation were the basis of the second investigation which was undertaken to consider a large on-stream storage project near the lower end of the upper basin. The second investigation was completed in June 1989.
Drought Management Measures
A traditional storage project utilizing only that water available under a junior water right was evaluated as a base alternative. Several methods to enhance firm yield from this storage project were evaluated by means of a daily operation model. The two significant enhancements, or drought management measures, include: 1) water exchanges either with effluent from waste water treatment plants or with purchased agriculture water rights on the South Platte; 2) cooperative management of all direct flow water rights and storage rights within the Clear Creek Basin.
Findings
A firm yield of only 16,100 af/yr could be produced by the base project using only junior storage rights. The storage requirements and the unit cost per acre foot of firm yield developed by this base project are shown in Table 3 as Scenario A. Scenario B could develop an additional firm

232 USCID Regional Meetings -- 1989
yie1d of 22,600 af/yr (for a total of 38,700 af/yr) over the base project (Scenario A) by also maximiz.ing the exchange potential with waste water eff.luent and providing for a minimal level of cooperative management among water users. Scenario C is a combination of the base project in Scenario A plus maximum cooperative ~fforts among water users. Scenario D combines the base proJect, with full cooperative management and maximum exchange potenti.al. The unit cost of firm yield for Scenario D ($630/~f/yr) is approximately. ~he same as the recent selling price-of senior water rlghts Qn Clear Creek.
TABLE 3. RESULTS OF CHAR 'eHEEK STUDY
Scenario
A
B
C
D
Firm Yield af/yr
16,100
38, 700
43,200
61,000
Unit Cost Of Firm Yield $/af/yr
1780
930
840
630
Required Storage
af
158,000
175,000
230,000
189,000 =========================c:a:=c=============~~========~
CONCLUSIONS
The four water resource investigations discussed here illustrate a wide variety of future water development needs and resources available to meet those needs. As plans are developed to meet critical water needs occuring during droughts, the planners must develop innovative approaches to utilizing a resource that is becoming more limited. The measures presented herein represent such innovative approaches. Unfortunately, innovative approaches are often accompanied by institutional complexities. Resolving the associated conflicts can only begin with the quantification of the costs and benefits of implementing the measures on a case-by-case basis. As the economic and environmental benefits of these drought management measures are demonstrated to water suppliers and consumers, the institutional barriers to their implementation will begin to dissolve.
Water Resource Investigations 233
REFERENCES
1. Colorado Water Resources and Power Development Authority. 1987. Cache 1a Poudre Basin Study. Denver, CO.
2. Colorado Water Resources and Power Development Authority. 1989. Upper Gunnison-Uncompahgre Basin Phase I - Feasibility Study. Denver, CO.
3. Colorado Water Resources and Power Development Authority. 1987. Cherry Creek Water Resources Project Phase I Feasibility Study. Denver, CO.
4. Colorado Water Resources and Power Development Authority. 1987. Clear Creek Project Phase I -Feasibility Study. Denver, CO.
5. Colorado Water Resources and Power Development Authority. 1989. Clear Creek Project Phase I -Feasibility Study, Step 2 Final Report. Denver, CO.


WATER BANKING--GROUND WATER RECHARGE,
RECOVERY, AND EXCHANGE SYSTEMS
Ronald M. Willhite1 Richard A. Randal1 2
ABSTRACT
To respond to ever-growing water demands, water planners are now focusing on large-scale ground-water recharge and recovery systems (water banking). Water banking can help augment existing water supplies by increasing annual yields, enhancing the feasibility of using alternative supplies, facilitating exchanges, and providing environmental benefits. The technical, institutional, and economic constraints impacting water banking may appear insurmountable, but can often be overcome with creative planning, proper engineering, institutional coordination, and making use of available funding sources.
The feasibility of specific water-banking projects depends on the existing institutional framework, operational practices, land use, and environmental priorities in the project area. Water exchanges, opportunities for interagency coordination, and potential cost-sharing and partnership agreements, among Federal, state, and local agencies, can also greatly affect project feasibility.
Many new and innovative water projects have water banking features as a key ingredient. Waste-water reclamation and reuse offer some of the greatest potential for water banking applications.
IMPETUS FOR RECHARGE
Increasingly, water purveyors throughout the country are being faced with new challenges in meeting short- and long-term needs for water. As they use greater percentages of their surface and ground-water allotments, shortages result, especially during times of drought. As the ability to tap new sources of supply becomes more limited, underground storage via artificial
1loan Program Coordinator, Bureau of Reclamation, Denver, Colorado
2Engineer, Water Resources, CH2M Hill, Inc., Tucson, Arizona
235

236 USCID Regional Meetings -- 1989
ground-water recharge or water banking is rapidly becoming the water management tool of choice.
Reuse of treated waste water for both nonpotable and indirect potable uses are increasing. Local and regional water resource plans are calling for more aggressive development of this growing water source in the future. Opportunities for reuse of treated waste water, as a new water supply (source), are enhanced by water banking concepts.
Water agencies are showing increased interest in creative regional water management strategies, including water transfers and exchanges. Such agreements have promoted long-range, basin-wide planning and state controls over the movement of water between basins. Some states are requiring preparation of long-range water resource master plans by all purveyors. State agencies are exercising greater overall control over statewide planning, adjudication of ground water, and other aspects of regional water management. These types of changes in the institutional framework, associated with water management, have also served to promote the development of water banking programs.
WATER BANKING METHODS
Artificial ground-water recharge can be accomplished through surface methods (spreading basins, pits, in-channel basins, or canals) or injection wells.
Surface recharge requires permeable soils to obtain suitable infiltration rates. Large land areas may be required for surface methods, and wells are needed to recover the recharged water. However, because of water quality improvement achieved within the soil profile, lower quality water (e.g., effluent and stormwater runoff) can often be used. Surface recharge systems can also be planned as multipurpose projects to incorporate flood control, create wetland areas, promote recreation, and provide a surplus source for irrigation.
Injection well recharge can be equated with a production well operated in a reverse direction. Often, existing conveyance systems and wells can be incorporated into an injection well recharge program, and excess capacity in the existing system can be used to deliver recharge flows. Well injection systems require water that is relatively free of biological matter and suspended solids; however, once treated for injection, only minimal treatment (disinfection) may be required when the water is recovered.

Water Banking 237
WATER BANKING POTENTIAL
Ground water is a sole or primary source of potable water in broad areas of the United States. Aquifers in many of these areas have been overdrafted for many years, virtually since the advent of the vertical turbine pump. This has created a tremendous volume of "freed-up" storage in ground-water basins that have been subject to years of mining and, as a result, is now available for water banking.
Artificial ground-water recharge has been practiced throughout the world for many years. Recharge programs have been developed to provide both short- and long-term storage, enhance water quality, serve as a barrier to intrusion of saltwater or poor quality ground water, and to address other secondary issues. These programs use many sources of water for recharge and recovery systems which include:
o Unappropriated sources o Floodwaters o Surplus appropriated supplies o Reclaimed water o Water obtained through exchanges
Specific characteristics unique to each source will dictate, to a large degree, if and how the supply can be used as a source for recharge. The cost to acquire the supply and use it in the intended manner; the volume of water available; water quality constraints; seasonal availability; and the cost and institutional factors for conveying the supply to the recharge site are important considerations in evaluating each source.
Storing water underground offers several distinct advantages over surface impoundments. Perhaps most important is that aquifer storage has minimal impacts on environmental resources. Water stored underground is not subject to evaporation or seepage losses. The receiving aquifer need not be a potable water source, as demonstrated at numerous sites where potable water is stored and recovered from a brackish water aquifer. Recharge systems often have lower capital and operation and maintenance costs per equivalent volume of storage, and offer greater operational flexibility. Generally, water can also be stored closer to the point of use.
Recharge systems are becoming an important tool to optimize watershed yield and reliability through conjunctive management of surface and ground water. The potential to maximize the capabilities of existing surface storage reservoirs, by operating them in tandem with water banking facilities, needs to be examined. Early seasonal drawdown of conservation storage could provide greater overall storage capabilities. Ground-

238 USCID Regional Meetings -- 1989
water recharge and recovery programs can also provide a low cost alternative to expansion of water treatment or distribution systems. Banked ground water can be used during peak demand periods to help avoid the cost of increasing treatment or transmission capacity to meet seasonal peak demands.
Recharge also enhances the feasibility of waste water reclamation and reuse programs. Seasonal aquifer storage enables the constant supply of waste water to be stored for use during peak irrigation periods. Thus, the waste-water treatment and distribution facilities can be sized for average rather than peak conditions. Surface recharge methods can improve the quality of the final product water through physical/chemical processes in the soil/aquifer profile. Water purveyors are also banking available waste water for future recovery for potable uses when potable reuse has been more widely demonstrated and treatment costs become more competitive with other sources.
Water banking also offers many indirect or secondary benefits, depending on the needs of the responsible agency and its surrounding area. Flood control capabilities of existing surface reservoirs can be increased by early drawdown of reservoirs prior to the wet periods. Multi-use projects can help to enhance wetlands and other wildlife benefits.
FEASIBILITY ISSUES
Numerous factors must be addressed before a ground-water recharge and recovery project can be successfully implemented. Institutional factors may have the greatest impact on the feasibility of specific programs. Water rights, water quality, floodplain impacts, land use planning, environmental considerations, and other related issues greatly affect project feasibility. These issues are addressed by a variety of interrelated Federal, state, and local regulations.
Technical issues are also significant and may strongly affect the institutional and economic issues. The proximity of available source waters to suitable recharge/recovery sites and the related costs for conveyance can have a major economic impact on project feasibility. Site suitability issues include depth to ground water, soil/aquifer permeability, in situ ground-water quality, potential for contamination due to previous land use, available aquifer storage volume, and recovery pumping rates.
Water quality is a critical issue in site selection and recharge planning. The use of ground water sources for potable purposes must not be adversely affected by artificial recharge activities. Careful screening of potential sites is necessary
Water Banking 239
to avoid leaching of contaminants in areas where landfills exist or past land use has resulted in the presence of contaminants. Recharge of effluent may require careful management to avoid unacceptable degradation of potable supplies. The chemistry of the existing ground water and the recharge water must also be evaluated to assess potential geochemical interactions that can reduce recharge rates over time.
Surface recharge methods require sites that have sufficient size, permeable soils, and an absence of confining layers down to the water table. Spreading basins require careful management and regular maintenance to mitigate basin clogging due to suspended solids, algae, and geochemical reactions. Several individual basins are needed to allow the alternating wetting and drying cycles necessary to optimize hydraulic loading and/or treatment efficiency.
Injection well recharge requires sufficient well capacity and high quality source water to minimize well clogging due to suspended solids, bacterial growth, and geochemical reactions. Periodic redevelopment of the well may be required to mitigate clogging and disposal of the nonpotable water used for redevelopment must be taken into account.
ECONOMIC CONSIDERATIONS
The economics of ground-water recharge and recovery systems are driven by a myriad of project-specific institutional, technical, environmental, and financial considerations. Ground-water recharge and recovery systems are often the least-cost alternatives when compared to other water storage or treatment options, or development of a new source of supply. Where imported water is purchased for long-term storage, the water alone can be a significant cost factor. Justifying long-term benefits to current ratepayers can be difficult, as can placing a value on the ability to respond to short-term water shortages. In some instances, state-mandated reductions in ground-water pumping in critical management areas, such as in Arizona and Nevada, may make artificial recharge systems necessary even with high relative costs.
Through careful planning and cooperation between local and regional agencies, recharge and recovery water supply systems can provide significant economic benefits in controlling floods and land subsidence, avoiding intrusion of poor quality water into potable aquifers, reducing pumping costs, creating wetland habitats, and recreation. The allocation of costs and benefits must consider the overall impacts on the community, as a whole, rather than the narrow interests of a single agency. Often, including other water interests as project participants can
240 USCID Regional Meetings -- 1989
increase project feasibility. As an example, by allocating a portion of a water banked and delivery system to irrigated agriculture can provide not only a source of income for the project, but could also make available needed sources of public funding available that would otherwise only be available to irrigation functions.
PROJECT FINANCING
Recharge and recovery systems may be more difficult to fund with traditional private sector bonding mechanisms because of a lack of experience of bonding agencies with these types of projects. However, careful planning and coordination can help maximize multipurpose benefits and beneficiaries of a project, thus increasing the opportunities for funding.
Many states have established, or are in the process of establishing, water resource development funds for providing low interest loans and/or grants for local development of water supply projects. A likely source of Federal funding is the Bureau of Reclamation's Small Reclamation Projects Act (Public Law 84-984) loan program. This Bureau of Reclamation program provides both financial and technical assistance for small to mid-size non-Federal sponsored projects with the current limits on the project costs and loan ceiling being $45 and $29 million, respectively. There are currently eight projects with water banking and recharge features under this loan program. In addition, there are several new small reclamation projects under consideration which will include reclaimed waste water in tandem with water banking concepts. Some water must be delivered for irrigation purposes to qualify for funding under this loan program.
WATER BANKING APPLICATIONS
The projects briefly described in the following paragraphs are a sample of the variety of the opportunities for water banking.
Rancho California Project
The Rancho California Water District, southeast of Los Angeles, is dependent on ground-water pumping and imported water supplies. Demands for irrigation and municipal and industrial (M&I) uses are expected to double in 20 years. The Rancho California Project is predicated on the need for more efficient use of existing supplies and the use of new sources.
The project concept involves the conjunctive-use and operation of all available water supplies. Sources of supply include

Water Banking 241
natural recharge, flood flows, imported water, and reclaimed waste water. With the aid of artificial recharge and ideal ground-water aquifer characteristics, the underground basin is being used as an active short- and long-term storage reservoir (i.e., water bank) to optimize the yield from these supplies.
A computerized operation program is being used to monitor and integrate the use of surplus or off-peak water and energy resources. This will help to minimize costs and increase the reliability and safe yield from this water banked system. A balanced operational yield of 41,000 acre-feet per year is expected. Artificial recharge will vary from 15,000 to 44,000 acre-feet per year using 277 acres of spreading basins. The water delivery systems, including wells and pipelines, are designed for conjunctive-use, again, to optimize yield and for conservation of resources.
Monterey Waste Water Reclamation Project
The central coastal area of California is well-known for its fruit and vegetable industry. Truck farms near Monterey are being threatened by shortages of water and saltwater intrusion and urbanization is competing for the available water supplies. Meanwhile, since 1981 over 100 shallow irrigation wells have been abandoned due to high chlorides.
The Monterey Regional Water Pollution Control Agency is planning a waste water reclamation and reuse program to provide 32,000 acre-feet/year of reclaimed water for direct irrigation and water banking applications. In this case, providing reclaimed waste water for direct irrigation use will help mitigate current ground-water overdraft under the Salinas Valley and reduce the rate of sea water intrusion.
Winter storage of 10,000 acre-feet/year of reclaimed water is also needed to meet summer demands. About 15 dual purpose injection/recovery wells are being considered to provide the seasonal storage needs within the salt-laden aquifer. Experience at other sites has indicated that little mixing within the aquifer will occur and thus provide a recovery efficiency of nearly 100 percent.
Lake Okeechobee Aquifer Storage and Recovery Project
Southern Florida's Lake Okeechobee is the second largest freshwater lake in the United States. It supplies drinking water for a population of 4 million, and irrigation water for 400,000 acres of prime agricultural lands. An accelerated rate of eutrophication, caused by high phosphorus and nitrate concentrations from inflows, threatens the high quality of the

242 USCID Regional Meetings -- 1989
lake water. A study of the problem indicated that the total phosphorus loading needs to be reduced by 40 percent.
A demonstration project is being conducted to determine if lake inflows containing the high concentrations of nutrients can be stored in a brackish water aquifer 300 feet below land surface. Inflows recharged via injection wells, during the rainy season, would be recovered by pumping from these wells to meet irrigation demands during the dry season. Diverting these flows for irrigation purposes will greatly reduce the nutrients entering the lake. An added advantage of underground storage is the reduction of phosphorus by adsorption in the limestone surfaces in the aquifer matrix. Reduction of nitrates by subsurface biological denitrification may also occur.
Tucson Water Management Plan
Tucson, Arizona, is the largest city in the United States that is totally dependent on ground water. In the Tucson area the annual ground water withdrawals for M&I and irrigation use far exceed the volume of water naturally replenished to the aquifer. Water banking is playing a vital role in Tucson's water management plans, and declining water levels of greater than 100 feet will provide ample space for future underground storage.
In 1991, the Central Arizona Project (CAP) will begin deliveries of Colorado River water. Recharge pilot projects are underway to develop the technical capabilities needed to implement a large-scale recharge program to bank excess CAP water that cannot be used directly. The plan is to recharge a maximum of 60,000 acre-feet per year; the volume of water recharged annually will decline over 20 years as direct use increases. Tucson's existing production wells and distribution systems will be used to recharge surplus CAP water that has been treated in the city's new water treatment plant (now under construction). Spreading basins constructed near the CAP aqueduct will be used to recharge untreated water.
Tucson has a rapidly expanding waste-water reuse program which delivers reclaimed water to golf courses, parks, and schools for landscape irrigation. Recharge is practiced via spreading basins and the water is recovered with wells; thus, the system provides treatment and seasonal storage. About 20 percent of the available waste-water effluent will be used for landscape irrigation.
Since 1971, Tucson has purchased about 22,000 acres of irrigated farmland in nearby Avra Valley, which was developed by mining ground water. By retiring these lands the city can reduce pumping and; thus, bank and preserve ground water for future M&I

Water Banking 243
use. Although these historically irrigated lands are now fallow, they could be returned to productivity if another source of irrigation water could be provided.
Treated waste-water effluent, not committed to the city's reuse program (i.e., some 80 percent), is currently discharged into the Santa Cruz River channel for non-beneficial use. More restrictive discharge standards will soon be enforced that will require construction of additional and costly treatment facilities. Under the water banking concept the potential exists for constructing conjunctive-use facilities to convey treated effluent to Avra Valley to reestablish the irrigation of farmland and thus, recycle reclaimed waste water for beneficial (economic) use. This exchange opportunity to recycle effluent back for farm use (including city-owned farmland) should also offset the need for constructing new treatment facilities. Recharge and recovery for seasonal storage and treatment purposes would be a necessary component of the delivery system. In fact, recharge of all the effluent, with recovery via existing irrigation wells, may be the most economical delivery system and it would provide high-quality reclaimed water. As effluent flow increases the excess supplies could be banked for future M&I use and expanded irrigated agriculture. Additionally, an open canal conveyance system, recharge basins, and other wetland features designed into the project, could provide environmental benefits and offset any loss of habitat in the Santa Cruz River due to reduced effluent flows and recharge.
SUMMARY
Artificial ground-water recharge and recovery is fast becoming an important element of water resource management programs throughout the country. In-place systems are providing new flexibility in responding to short-term water supply needs in critical ground-water management areas and maximizing the use of available supplies over the long term. It is apparent that water banking systems will continue to have increasing importance, and new applications will be developed to suit specific opportunities for cost-saving and multi-use benefits.
Downstream reaches of major river and stream systems, with substantial ground-water basins, offer the best opportunities to divert and recharge large volumes of unappropriated surplus surface water and effluent. Potential underground storage sites should be evaluated to assess aquifer characteristics and to determine recharge and recovery capabilities. The studies should address available storage volume, in situ ground-water quality, properties of the soil, subsurface hydrogeologic characteristiCS, and the quality of the source water. Surface

244 USCID Regional Meetings -- 1989
recharge is best suited for lower-quality source water, and the best sites are generally located near river channels and washes. For injection wells a high-quality source water is required; the higher the well capacity, the more suitable it is for recharge/recovery purposes.
Finally, when recharge and recovery methods are coupled with the opportunities to recycle reclaimed waste waters back into the local water supply and demand picture, optimization of both natural resources and economic returns should be realized. Recycling reclaimed waters back into local systems may also offer some unique opportunities for water exchanges and reallocating reclaimed (or secondary) water supplies to a lower level of economic use (i.e., irrigated agricultural and environmental enhancement) thereby "freeing-up" primary (native) water supplies for domestic uses (M&I). In our prime irrigated areas in the west where important food and fibers are on the decline due to the purchase of land and water rights for transfer to M&I uses, these water banking concepts would appear to be an important option for consideration by the water purveyor.

MANAGING WATER SCARCITY
IN PHOENIX, ARIZONA
David S. Wilson, Jr. 1
Salt River Project (SRP) is the oldest and most successful mUlti-purpose reclamation project in the United States. SRP was founded in 1903 as a federal water reclamation project operated by an association of water users who needed a reliable water supply to grow their crops. Later, in 1937, SRP also became a municipal-type improvement district with responsibility for providing electric service in a 2900 square mile valley service area as well as the mining area around Globe, Arizona.
Today, SRP serves 250,000 acres in Central Arizona with a low-cost, dependable water supply for agricultural, municipal and industrial uses. The surface water supply for the water service area of the Project is runoff from a watershed consisting of 13,000 square miles. This runoff is stored in six reservoirs four of which are located on the Salt River and two on the Verde River.
The Salt River Project's purpose was to function as a water conservation and drought management agency. The extreme variability of river flows negated any possibility of dependable water supplies without storage capability. In response to this need, the Project developed personnel, a storage and delivery system and management tools to effectively manage it's limited surface water resource. This water was used to develop and support an extremely productive agricultural economy. Today, in addition to agriculture, that water supports a population in excess of 1,000,000 people. As urbanization continues,
lAssociate General Manager, Planning & Resources, Salt River Project
245

246 USCID Regional Meetings -- 1989
-rfij-----FG~a'e _ ---......
Tollpon. ~Ie do • Phoenlx~ I
Avondale? ~ ;-., / ~Tempe • Gilbert
~Chandler
13,000 ~q. Mile Project
Watershed
• Tucson

Water Scarcity in Phoenix
eventually all agricultural use will be converted to municipal and industrial uses.
247
As the Project has urbanized, potential drought is still a reality, and managing for scarcity is now more acute than ever. Today, in addition to natural causes, water scarcity can result from legal, political, regulatory, social or environmental pressures.
To mitigate against scarcity, the mission of SRP has been to develop an array of tools and methodologies for managing scarce water resources to insure adequate but reliable supplies of water to meet the needs of its member lands. The Project conjunctively manages surface and groundwater supplies to meet the average annual demand for water which is approximately 1,150,000 acre feet per year. The surface water component averages 1,000,000 acre feet per year, but varies significantly from lows of less than 500,000 acre feet to highs in excess of 3,000,000 acre feet per year. This variability is directly tied to the amount of winter time snow fall which occurs in the high mountain regions of the SRP watershed. Unfortunately, snow packs are frequently spotty and most years produce less than 1,000,000 acre feet of runoff. Frequent dry periods extend for 4 to 7 years at a time. To compensate for the variability in surface water supply, the Project has developed a system of some 250 deepwell pumps and on the average pumps more than 30% of each year's supply from the groundwater acquifer.
Annual operating plans are developed for use of surface and groundwater that maximizes water conservation and reduces the risk of damage to both SRP's facilities and private property in the event of severe storm and flooding conditions. Historically, the Project has been able to meet its water supply mission while providing for the needs of agricultural, municipal, and industrial water use with few occasions where water rationing was required.

248 USCID Regional Meetings -- 1989
The limits on the availability of water resources have grown in number during the past decade. In 1980, the State of Arizona passed a very stringent Groundwater Management Act (GMA) that recognized the need to conserve groundwater in critical areas of the state where use greatly exceeded natural recharge. The Phoenix area is one of the three management areas established with an objective to reduce groundwater pumping to safe yield by the year of 2025. This means that there can be no routine pumping which exceeds natural replenishment of the acquifer. Natural replenishment is a very small amount. This is to be accomplished through a series of management plans which require incremental reductions in the amount of groundwater pumped. Thus, a combination of improved water conservation and increased use of non-traditional supply will be required. In addition to the GMA, other restrictions on available supply include: both groundwater and surface water contamination; competition among various interests - agriculture, municipal, industrial, recreation and environmental; and the growth in demand associated with the state's growth as a population center and important area of commerce. State adjudications of water rights in the three major drainages (Gila, San Pedro and Little Colorado Rivers) will ultimately result in a final resolution of water rights and will likely reduce water use by non-Indian communities.
How is Salt River Project preparing for future water storage? SRP is making significant delivery improvements which include piping and lining of the water conveyance systems, reducing water using vegetation within the canals and along the the canal banks, improved measurement facilities, implementation of a real-time telemetry system to monitor and adjust water flows, and extensive operator training. Additionally, we provide customer assistance

Water Scarcity in Phoenix 249
programs to both urban and agricultural water users to help ensure that water is used efficiently. The Project supports current research programs to evaluate the potential for weather modification and artificial groundwater recharge projects in the Salt River bed upstream of metropolitan Phoenix. Through both resea~ch and operating programs SRP has been involved in watershed management to enhance the production of natural resources from the state's wildland areas. Potential benefits include increases in timber, forage and stream flow.
The Project is actively monitoring progress being made in waste water reclamation with an interest in ultimately being able to transport reclaimed waste water through our transmission and delivery system to places of use throughout the valley. The Project is also actively involved in regional water planning. SRP recognizes that only through the involvement and coordinated effort of all entities affected by or responsible for water resources management can the future needs of the valley be met.
While not actively engaged in importation of water into the Phoenix area, SRP has supported efforts to import water from rural areas while mitigating the negative impacts on those areas from which the water is taken.
In summary, SRP's mission is to provide an adequate, reliable supply of water at the lowest reasonable cost. This is a difficult challenge because of the variability of stream flows, man-imposed limitations on the available supplies, population growth and the increase in competition for water. SRP employs supply and demand side management strategies to accomplish it's mission. On the supply side, conjunctive management and use of both surface

250 USCID Regional Meetings .. 1989
water and groundwater is practiced. Additionally, agumentation programs, importation, and use of non-traditional sources of supply, such as reclaimed effluent, are being studied.
Conservation is promoted through facility improvements, employee training, customer assistance and public education. Additionally, joint planning for both augmentation and conservation strategies is conducted with others at the federal, state and local levels.
A comprehensive approach to planning and implementing effective water resources programs will be the means by which water scarcity can be effectively managed in Central Arizona.

THE BENEFITS OF IRRIGATION IN MITIGATING
THE IMPACTS OF DROUGHT
Larry J. SChluntz l
ABSTRACT
A few comments regarding the economic impacts of drought are made, then a model of a livestock ranch with and without irrigation is presented. The hypothesis is that irrigation reduces risk and stabilizes production of roughage, consequently there is better utilization of the cow herd and associated production factors. A dynamic linear programming model was constructed which captured the variations in yields and prices over time. Results verified that irrigation has a positive impact on income for ranchers, and a dynamic model more accurately simulates these impacts than a static model.
INTRODUCTION
All of the crop producing areas of the United States are subject to recurring droughts. The West may seem to be more subject to them, but the East and Northeast have had their share. However, production of most of the major commodities is widely disbursed, and consequently the whole country is virtually never totally impacted by drought. Droughts cause economic hardship for producers in local areas, but supplies are generally not reduced enough to cause consumer shortages. Lack of knowledge concerning appropriate production practices early in our history gave rise to misuse of resources which exacerbated the impacts of weather. Governmental support for research and education since the 1930's has mitigated these impacts to a large extent.
Severe or extreme drought can result in complete loss of crops in the worst affected areas, lack of water and feed for livestock, impacts on transportation, and increases in forest and range fires. Continued dry conditions, often coupled with poor management, leads to desertification, as has been occurring in parts of Africa. Although we cannot exercise much control over the weather, we have the knowledge and technology for proper management, consequently desertification is not likely to occur over the shorter term. However, considerable concern is being expressed over global warming, and the
lEconomist, Bureau of Reclamation, Denver, Colorado
251
252 USCID Regional Meetings -- 1989
long term impacts of this phenomenon are indeterminate at this time.
The economic manifestations of drought are fairly well known, therefore it is not necessary to spend a lot of time on the obvious. More time will be spent discussing the economic benefits of irrigation citing a specific research study recently completed. In the most severe of drought circumstances, the consequences make news. Production is reduced and prices rise. However, the economy is very complex and the direct results cannot always be identified. It may seem to be heresy, but drought can have some advantages in economies with surplus productive capacity. In economic terms, most agricultural production is inelastic. That is, a small change in production can make a larger percentage change in prices.
The consequences in 1988 are a case in point. Reductions in production due to the drought caused farm product prices to rise considerably. The stable production levels on irrigated areas coupled with the increasing prices resulted in large increases in gross income. This was certainly true on Bureau of Reclamation projects in 1988. Price levels rose 27 index points (based on 1977=100) while overall production and irrigated acreage declined slightly, consequently gross income rose by 15 index points.
Drought can also lead to inefficient use of resources. Labor is underutilized because of lower production levels. Ranches, in particular, can incur severe problems because of poor grass conditions, and if they are unable to obtain hay or forage, they are often forced to liquidate part or all of the herd. This additional beef coming onto the market often forces prices lower, and a downward spiral of prices and income ensues.
IRRIGATION BENEFITS FOR LIVESTOCK RANCHES
Having talked some about these general consequences of drought, a specific example of the economic impacts of drought on livestock ranchers and how irrigation can serve to mitigate those consequences will be discussed. A stable feed supply and associated stability in herd size are often cited as benefits of supplemental irrigation for forage-based livestock ranchers. However, the traditional comparison of average ranch returns with and without irrigation fails to include these economic benefits. Recognizing that this might be the case, the Bureau of Reclamation contracted with North Dakota State University to investigate this particular benefit of irrigation in drought mitigation.
Benefits of Irrigation 253
The study developed a dynamic model that traces the effects of drought cycles on ranch profitability. The model is demonstrated for a ranch in the Lake Andes-Wagner Irrigation Project in southeastern South Dakota. The working hypothesis is that the calculated benefits of irrigation of a western beef cow ranch are underestimated by comparing average net returns with and without irrigation. A model that includes changes in ranch organization due to drought will more accurately reflect the benefits of irrigation over time. Higher irrigation benefits are due to better use of forage and increased efficiency in the operation of the cow herd. Increased year-to-year income stability is another benefit demonstrated in a dynamic model.
The specific irrigation benefits to a beef cow ranch that are better estimated in a dynamic than a static model are:
1. A longer cow life because the disposal of productive cows due to drought can be reduced or eliminated.
2. Fewer purchases of replacement animals because with a stable herd size all replacements are raised. This assumes raised replacements are less expensive than purchased ones because labor and facilities for replacement stock exist on the ranch.
3. Less beef sold at lower prices (or more at higher prices) to the extent that herd liquidation due to drought is widespread enough to influence market price.
4. Use of labor and facilities nearer capacity by eliminating herd reductions because of drought.
5. A larger percentage of calves backgrounded and/or finished because adequate forage is available every year.
6. Less purchase of hay at above-average prices.
7. Reduced loss of hay due to deterioration in storage from high-yield years to low-yield years. Irrigated forage production reduces the need for long-term hay storage as a precaution against drought. In addition, the irrigated forage is generally of higher quality.
8. Less supplementation of pasture with hay.

254 USCID Regional Meetings -- 1989
Methods of Analysis
Benefits of irrigation on ranch income are normally estimated using a static model comparing average net returns to a typical ranch with and without irrigation. Depending upon the purpose of the analysis and the irrigation project involved, a point in time is selected to make the comparison based on projected yields, normalized prices, and costs. Discounted present value of the returns over the life of the project is used to calculate agricultural benefits of the irrigation project.
The difference in benefits between the dynamic model developed in this research project and its static equivalent is illustrated for a case study ranch. For the static analysis, a I-year model with 31-year average yields, levels of production, and prices was used to compare the irrigated and nonirrigated situation. Differences between the irrigated and nonirrigated return above variable costs are the static model's measure of the benefits of irrigation. The same comparison was made using the dynamic model. Fixed irrigation costs are unchanged between the static and dynamic models. The dynamic model calculates return above variable costs for each of 31 years, so results for both dryland and irrigation were divided by 31 to get average benefits of irrigation over the period. Comparing irrigation benefits from the I-year model with the dynamic model tests the hypothesis as well as the usefulness of the model.
A sequential multiyear maximizing linear programming model was used in the dynamic analysis. A schematic diagram of the model is shown in figure 1.
Individual linear programming models are solved for winter and summer periods for each of the years of simulation. The modeling process is sequential because the solution values of importance from each period's model is passed to the following period. Exogenous events of yields and market prices are provided as historical data sets.
Returns above variable costs are maximized each period based upon information available to the producer at the simulated time. An accounting row in the LP model monitors the actual income and cost that would take place. Therefore, the economic decisions and actual cash impacts are separated to reflect yield and price outcomes different from those used to make decisions.
The model can run for as many years as desired or for which data are available. The Lake Andes-Wagner application was run for 31 years using data for the years 1955-1985 inclusive. Since the purpose is to show irrigation impacts in mitigating

It in
SOLvE FOR SlIt4ER ACnv ITI ES
TRANSFER NEEDED SlHWt ACTIVITY LEvas
10 IIINTER LP
INSERT YIELDS AND PRICES FOR
YEAR OF SIIIUUTlOI
SOLVE FOR IIINTER ACTlVInES
Quit
Benefits of Irrigation
STORE SUI9I£R SOlUTION. VAlUES
HISTORiCAl DATA SET
STORE III HTER SOLUTION VAlUES
TRAIISFER NEEDED IIINTER ACTIVITY
LEVELS 10 SUflE:R LP
255
Figure 1. Schematic Diagram of Multiyear Sequential Linear Programming Model, Lake Andes-Wagner Irrigation Study

256 USCID Regional Meetings -- 1989
drought, a drought period should be included in the time sequence if at all possible. The summer period runs from May through October. During this period decisions are made concerning what crops to produce based on anticipated profitability subject to limitations imposed by land availability, rotational considerations, labor, and/or machinery constraints. The size of the beef herd can also be increased to a maximum or decreased based on the carrying capacity of the pasture and the amount of hay carry-over from the winter period. The grazing period is divided into early grazing (May to August) and late grazing (September and October). The late grazing period includes the use of small grain aftermath grazing. For the irrigation situation, backgrounded calves are fed to slaughter weight during the summer period. The cattle finishing decision is based on feed availability and profitability of feeding considering feed prices and expected slaughter steer prices.
The winter period encompasses November through April. During this period, crop decisions are made to bale straw for feed, make corn silage, and purchase hay. Hay sales are only allowed in the irrigation model. Decisions concerning livestock include whether to sell producing cows and whether to wean calves or feed through the winter on a backgrounding ration. Under irrigation, the decision to hold backgrounded calves into summer to finish is also made in this period. Least-cost cow and feeder rations are determined within the model. The decision to purchase hay or sell cows is based on hay purchase price relative to projected losses from early sale of cows. Losses from sale of cows increase with the number sold as progressively younger cows must be selected.
Cattle numbers and feed inventories are transferred from one period to the next. Forage losses associated with storage are specified in the program. An accounting of actual income and variable costs is made each period. The accounting income is based on actual prices and yields. In contrast, management decisions are based on planning prices and yields. Planning prices are a weighted average of prices lagged for 3 years reflecting that farmers plan based on their most recent experience.
Model Ranch
The Lake Andes-Wagner irrigation unit in southeastern South Dakota was used as a case study. The present land use is a mixture of row crops, alfalfa, small grains, and tame and native grasses. The model ranch has 1,000 acres. Dryland and irrigated land use is summarized in table 1. Labor supply consists of 2,500 hours by the ranch operator which is evenly divided between the summer and winter periods. Additional
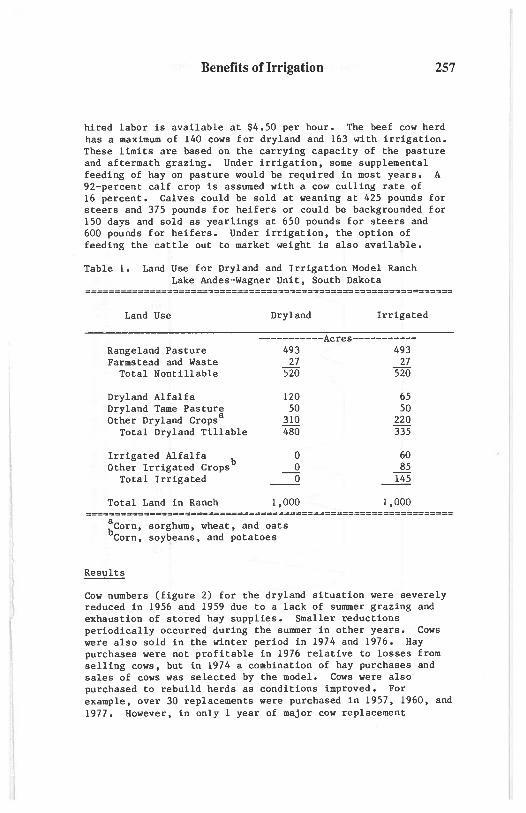
Benefits of Irrigation 257
hired labor is available at $4.50 per hour. The beef cow herd has a maximum of 140 cows for dryland and 163 with irrigation. These limits are based on the carrying capacity of the pasture and aftermath grazing. Under irrigation, some supplemental feeding of hay on pasture would be required in most years. A 92-percent calf crop is assumed with a cow culling rate of 16 percent. Calves could be sold at weaning at 425 pounds for steers and 375 pounds for heifers or could be backgrounded for 150 days and sold as yearlings at 650 pounds for steers and 600 pounds for heifers. Under irrigation, the option of feeding the cattle out to market weight is also available.
Table 1. Land Use for Dryland and Irrigation Model Ranch Lake Andes-Wagner Unit, South Dakota
Land Use
Rangeland Pasture Farmstead and Waste
Total Nontillable
Dryland Alfalfa Dryland Tame Pastur~ Other Dryland Crops
Total Dryland Tillable
Irrigated Alfalfa b Other Irrigated Crops
Total Irrigated
Total Land in Ranch
Dryland Irrigated
-----------Acres-----------493 493
27 27 520 520
120 65 50 50
310 220 480 335
0 60 0 85
-0 145
1,000 1,000 ===============================================================
a bCorn, sorghum, wheat, and oats Corn, soybeans, and potatoes
Results
Cow numbers (figure 2) for the dryland situation were severely reduced in 1956 and 1959 due to a lack of summer grazing and exhaustion of stored hay supplies. Smaller reductions periodically occurred during the summer in other years. Cows were also sold in the winter period in 1974 and 1976. Hay purchases were not profitable in 1976 relative to losses from selling cows, but in 1974 a combination of hay purchases and sales of cows was selected by the model. Cows were also purchased to rebuild herds as conditions improved. For example, over 30 replacements were purchased in 1957, 1960, and 1977. However, in only 1 year of major cow replacement

/I)
~ 0 u ... 0
c.. Q)
.0 E ::J Z
160 'V' Irrigated
140 Dryland
120
100
80
'55 '60 '65 '70 '75 '80 '85
Year
Figure 2. Comparison of Cow Numbers Under Dryland and Irrigation, Ranch Model II, Lake Andes-Wagner Unit, South Dakota, 1955-1985
N (II QIO
c 00
~ E Q. ::I e:..
f .... :;-(JQ rn
.... \C QIO \C

I \
I
Benefits of Irrigation 259
purchases were cows selling at a premium over their slaughter value. This muted the negative economic impact of cow purchases on net return. The irrigated ranch, even at the higher stocking level, showed almost no variation in herd size (figure 2) because irrigated forage was available.
A comparison of the key results between dryland and irrigation is summarized in table 2. This comparison provides a test of the hypothesized advantages of ranch irrigation benefits over dryland. The following shows the results relative to the list of hypotheses on page 3.
1. The reduction in sales of productive cows between the dryland and irrigated models indicated the longer average productive cow life with irrigation.
2. The reduction in purchase of replacement cows illustrates this advantage of irrigation. The reduction in cow sale and purchased replacement cost of $366.46 annually with irrigation was due to greater herd stability. The premium paid for replacement cows in some of the years purchased plus the loss from selling some cows 1 to 2 years before the end of their normal productive life were captured by the dynamic model versus the static model.
3. Reduced calf production due to herd reduction in the dynamic dryland model occurred during periods of below-average calf prices resulting in slightly higher calf values under dryland than under irrigation. Apparently, droughts in this application were not widespread enough to significantly affect prices.
4. Herd size increase was greater with the dynamic model resulting in better use of labor and facilities.
5. Fewer calves were backgrounded, but more calves were finished giving inconclusive results.
6. Hay purchases of 3.9 tons per year were eliminated with irrigation in the dynamic model. Purchased hay was charged a transportation cost above the price received for hay sold.
7. The model ranch did not show a reduction in hay carryover with irrigation as hypothesized. Drought periods reduced hay carryover to zero in many years under dryland, while a constant but reduced hay carryover was programmed into the irrigated model. The dryland model exhibited a trade off between setting lower maximum cow numbers and more hay carry over or the converse.

260 USCID Regional Meetings .. 1989
8. There was more supplemental hay fed with pasture under irrigation in the dynamic model. This was due to a hay shortage under dryland necessitating the sale of cows.
Table 2. Dynamic Model Comparisons of Dryland and Irrigated Ranches
Item
Beef cows Backgrounded Calves
for Sale Supplemental Forage
on Pasture Small Grains
Aftermath Grazed Corn or Sorghum
Aftermath Grazed Alfalfa Carried
Over to Summer Alfalfa Sold Corn Grain Corn Silage Sorghum Wheat Alfalfa
Irrigated Crops Potatoes Corn Soybeans Alfalfa
Hired Labor
Return above Variable Costs
Unit
Hd Hd
Tons
Ac
Ac
Tons
Tons Ac Ac Ac Ac Ac
Ac Ac Ac Ac
Hr
Dol
Dryland Irrigated Mean Range Mean Range
134.1 22.6
9.0
73.6
83.9
6.9
0.0 94.1 25.7 93.4
122.0 120.0
85-140 0-103
0-84
36-116
13-112
0-62
0-0 60-208
0-56 0-148
102-155 120-120
162.9 17.9
75.0
50.8
79.1
33.1
92.6 66.5 26.7 43.6 83.0 65.0
40.0 40.8 4.2
60.0
2.0 0-63 360.7
35,381. 14,510- 71,414. 65,678
160-163 0-120
24-108
31-65
22-124
12-84
0-461 60-110
0-60 0-50
83-83 65-65
40-40 2-45 0-43
60-60
307-729
38,601-113,573
The average return above variable costs under dryland conditions was $35,381 with a range of $14,510 to $65,678. Under irrigation, the average was $71,414 with a range of $38,601 to $113,573. It is important to note the percentage change in returns from low to high under dryland (352 percent) is much higher than under irrigation (194 percent). This would indicate that irrigation is helping to stabilize income levels

Benefits of Irrigation 261
over the period of analysis. Both irrigated and dryland are still subject to variations in yields and prices, therefore there is still considerable variation in income levels over the 31-year period.
It is also interesting to note the difference between the static and the dynamic model in terms of income measures. The increased returns above variable costs between dryland and irrigation were $36,518 annually from the static model and $39,831 from the dynamic model. The $3,313 higher irrigation benefit from the dynamic model was as hypothesized. This occurs because of the large reductions in cow numbers in droughts and purchases of hay, which the dynamic model captures, but the static model would average out. Under irrigation, the irrigated forages were sufficient to virtually eliminate herd size variability.
The difference between the static and dynamic model depends upon the ranch situation being modeled. Some of the hypothesized benefits of irrigation were increased under the dynamic model, but not all. Livestock number variations due to drought appear to be the most important variable modeled in a dynamic context. This would suggest the improved benefits from a dynamic model would be even greater in dryer areas.
In conclusion, this is an example of the mitigation characteristics of irrigation in recurring drought situations. This case study was perhaps unusual in some respects in that it dealt with livestock, something not often considered in discussing irrigation benefits. The results showed that there were positive impacts and that it was best to use the dynamic modeling approach to measure them.
The economic and social impacts from this are a reduction of risk, more certainty regarding production, and less anxiety. There are also community impacts that were not included in the model, but that certainly exist. These would include the stability of income and higher levels of production, which precipitate stable secondary impacts in the retail establishments in the local communities.
REFERENCES
1. Ali, Mir B., Roger G. Johnson, Larry J. Schluntz, and David L. Watt. September 1987. Benefits of Irrigation in Mitigating the Impacts of Drought in a Range Livestock Economy, Department of Agricultural Economics, North Dakota State University, Fargo, North Dakota.

I I
I
I I !

IMPACTS AND SOME LESSONS TAUGHT BY mE 1988 DROUGHT
Stanley A Changnont
ABSTRACT
One of the worst droughts of the 20th Century peaked in the contiguous United States during 1988. Its impacts were pervasive, affecting agriculture, water resources, transportation, recreation, and wildlife. Costs and losses amount to nearly $40 billion, making it the worst natural hazard of this Century. Governmental responses were typically made in a crisis mode, reflecting poor preparation and lack of planning. The drought impacts and responses suggest several actions are needed at the federal level to address future droughts including a standing interagency task force, updated water management plans, development of drought contingency plans where none exist, and improvements in the system for predicting, detecting, and monitoring drought at the local, regional, and national scales.
INTRODUCTION
The physical, social and economic impacts of the drought, which started in 1987 and reached a peak severity in the summer of 1988, were ubiquitous, pervasive, and will reverberate through the U.S. environment and economy for some time to come. The 'drought pointedly reminded scientists, the pUblic, and policymakers how sensitive environmental and socio-economic systems are to a simple hazard: lack of normal rainfall and above normal temperatures. Major impacts occurred in agriculture, water resources, transportation, recreation/tourism, wildlife and other elements of the country's environmental and economic infrastructure, though, of course, losses in some areas were balanced by gains in others.
The President's Interagency Drought Policy Committee (1988) estimated that the total drought losses in agriculture alone during the last three-quarters of 1988 were $13 billion of direct GNP. Second- and third-quarter GNP growth was reduced to 0.9% and 0.6%, respectively, due mostly to reduced agricultural production. This increased retail food prices in the U.S. by 0.5%. In combination with impacts on energy, water, ecosystems, and other aspects of the economy, the drought cost the U.S. roughly $40 billion, making it the most costly natural disaster ever to affect the nation.
tPrincipal Scientist and Chief Emeritus, Illinois State Water Survey, Champaign, Illinois
263

264 USCID Regional Meetings --1989
IMPACTS
Because of the great extent and intensity of the drought, all aspects of our environment and society were affected The greatest economic loss was in agriculture, where more than $15 billion in crop losses occurred. There were 20 to 50% reductions in corn, soybean, and spring wheat production. The high value specialty crops of the east and west coasts were also detrimentally affected: Maryland experienced $300 million losses to high value crops. The full dimension of the impacts on agriculture will never be fully assessed, though we know of impacts on seed development, continuing effects on the livestock industry, and a slow trailing off of effects on the consumer due to food price increases. Crop prices soared in 1988, but major grain surpluses accumulated from prior years saved the nation from any form of shortages in 1988-89.
The summer 1988 heat wave was extensive with summer temperatures rated as the highest on record over 13% of the nation, including the major metropolitan areas of the Midwest and Northeast. The result was an estimated 5,000 to 10,000 deaths related to heat stress (Avery, 1988), though the wide range of this estimate testifies to how poorly this critical effect is monitored.
The environment was notably affected with major reductions in water supplies and diminished water quality in streams and wetlands. Forest fire damage in the West was the greatest on record, and the populations of certain species of wildlife in the Mississippi River Basin were reduced from 5 to 30%. The environmental effects will be the most long-lasting of all the effects of the drought of 1988; and there are few, if any, winners from the environmental losses.
Transportation was also uniquely affected by the drought in the central United States. Rapidly falling river levels in the Mississippi River Basin led to stoppages of barge traffic in June and July, with 50% reductions in barge shipments throughout the summer. This caused shipping disruptions and price increases for the shipment of bulk commodities such as coal, grains, and petroleum products.
The drought in the central U.S. was sufficiently short-lived that effects on urban-industrial water supplies in the Midwest were mostly minor. However, it was the second year of a growing water supply drought in the Pacific Northwest, and the fourth year of a continuing drought in the southeastern U.S.; both areas experienced serious water supply problems.
A fifth major area of effect was to the government operations. Local, state, and federal government agencies were affected by the need for added services, and requests for funds and for technical assistance. Governmental responses included the $4 billion in drought relief to relieve the most serious losses to farmers and, in turn, to agribusiness, plus $3 billion in insurance payments. Governments also dealt with a myriad of drought-induced controversies including those relating to the management of forest fires in the West, and the proposed diversion of waters from the Great Lakes to enhance flow of the Mississippi River.

The 1988 Drought 265
As in all droughts, there were economic "winners." The drought did not embrace the entire nation and farmers growing grain and specialty crops in non-drought areas (the Deep South, southern Great Plains, and the Southwest) achieved higher profits as prices rose. Railroads in the Midwest recorded major profits due to the diversion of shipments from the river systems. In the water supply area, well drillers received much more demand for their service as rural and small urban water system managers came to realize how vulnerable they were. However, though one cannot estimate with any confidence the proportion of the $39 billion total losses that were compensated, the winnings are believed to be small relative to the losses.
Types of Impacts
The values (dollar and otherwise) presented here are estimates and are not derived from in-depth economic or environmental analyses. One must recognize that in many instances, these values are imprecise and subject to errors of unknown sizes.
The drought effects were pervasive and had some form of influence on all U.S. citizens by the end of 1988. In some instances the influences were large, such as among Midwestern and northern Great Plains farmers, and in others they were small, especially on people whose livelihood is not closely associated with natural resources supply. Regardless, the drought broadly affected elements of everyday life such as food prices, which touched everyone from school children to elderly retired persons living in places where the drought did not occur.
Table 1 itemizes many of the drought impacts identified, illustrating the wide diversity of its effects. The sectors most impacted were agriculture, human health, and the environment. Agriculture was especially impacted because the intensity and areal extent of the drought was greatest during the growing season of most primary crops, May-August.
=====~=================~====~============
Table 1. Roster of Drought Impacts
A Environmental
1. Wildlife - reduced populations, food loss for migration 2. Insects - populations greatly changed, some increased 3. Forests - major losses; fires, growth stunted, delayed death 4. Ornamentals - worse than realized to trees and bushes, delayed
death 5. Fish - major losses in low streams, and poor quality 6. Soil - increased wind erosion 7. Water - quality very poor, unable to handle industrial
discharges and agricultural pollution

266 USCID Regional Meetings -- 1989
B. Human Health (physical and mental)
1. Deaths - number of persons totally or partly attributed to heat is in thousands
2 Illness - asthma, heat stress, etc. 3. Emotional problems - anxiety over heat stress, loss of income,
higher costs for cooling and ornamental treatments, loss of recreational opportunities, concern over climate change
C Agriculture
1. Surpluses reduced 2. Prices up for corn, soybeans, and wheat 3. National vs. regional impacts varied 4. Farmers in drought areas hurt, those elsewhere helped
economically 5. Long-term impacts difficult to assess due to subsidies for
exports and production 6. Showed inability to accurately estimate magnitude of losses
during drought 7. Means to adjust to continuing drought available 8. Commercial forestry and inland fisheries hurt 9. Increased crop insects and enhanced spraying
D. Transportation
1. Rivers - barge traffic hurt 2. Railroads - enhanced 3. Great Lakes - shipping increased 4. Airlines - fewer weather delays
E. Power Generation
1. Record consumption of electrical power 2. Hydropower generation reduced, costly fossil fuel required 3. Brownouts, damaged electrical equipment, discomfort to
humans 4. Increased income to power companies
F. Commerce and Industry
1. Rain insurance hoax 2 All-weather peril insurance overwhelmed 3. Recreation industry - hurt, less revenue 4. Construction - fewer delays 5. Shippers - higher costs
G. Urban Areas
1. Reduced water supplies 2. Deaths of elderly citizens due to heat

The 1988 Drought 267
3. Inexperience in dealing with drought and choosing of proper responses
4. Increased water consumption 5. Developed conservation procedures and penalties
H. Water Resources
1. Low streamflows 2 Lowered Great lakes, reservoirs, and farm ponds 3. Lowered groundwater levels 4. New sources developed· wells drilled, piping for diversions 5. Increased public awareness of water value and need for
conservation 6. Increased costs for water and sewage treatment 7. Interstate conflict heightened
I. Education
1. School hours reduced by heat
J. Government Issues
1. Conflicts between states, especially over water 2 Establishment of drought task forces 3. Increased services and costs to government: river channeling,
fire fighting, relief payments, etc. 4. Concern over CO2 as cause of drought 5. Effect on election and efforts of new Administration 6. Need for national attention and planning for future droughts 7. New legislation for drought relief
Table 2 itemizes some of the sectors and activities that benefitted from the drought. The role of countervailing benefits is best illustrated in agriculture. The USDA estimated that the net agricultural income in the U.S. in 1988 would be $57 billion, almost exactly the total income received in 1987. This fact, despite crop losses of about $15 billion, reflects three general factors. First, producers of specialty crop, corn, soybeans, wheat, and cotton in areas that escaped the drought (portions of the South, southern Great Plains, and Southwest) had average to above average yields. With increased prices, they experienced major income gains. Second, some farmers, and most grain companies in the drought areas, sold surpluses acquired from 1987 and 1986 at 1988's higher prices, helping to ameliorate their physical crop losses. Farmers with irrigation in drought regions also were able to sustain high yields and were also beneficiaries of increased commodity prices.
Railroads in the Midwest benefitted because of the reduced shipment of bulk commodity goods on the Mississippi River system. Low flows from June through the fall of 1988 reduced barge shipment by 50%, producing an increase of barge prices, with the net result of increased shipments of coal, petroleum products, and grains on the railroads of the central United States.

268 USCID Regional Meetings -- 1989
The estimated additional income of the railroads in this area was $200 million.
==========~==============================
Table 2. Roster of Winners from Drought Conditions
1. Agricultural producers in non-drought areas and those with large surplus stocks
2. Railroads 3. Water-producing technologies (well drillers, weather modification
companies, evaporation suppressants) 4. Electric utilities (increased power sales) 5. Coal companies (increased sales from greater use of coal at coal-fired
utilities) 6. Great Lakes ports (+ 15% increase in shipping) 7. Construction Industry (increased profits due to fewer rain stoppages) 8. Commercial Aviation (increased profits with fewer weather delays)
Those dealing in "water technologies" were also beneficiaries. This included well drillers, companies providing weather modification services, and companies providing chemicals for evaporation suppression.
The electrical utility sector experienced general income increases due to the record high temperatures during July-August, which increased sales of power for air conditioning. Coal-fired utilities realized further profits as the generation of hydroelectric power was reduced by low river flows, and hydroelectric-based utilities were forced to purchase power from the coalbased utilities. This led to another winner, the coal companies, which had increased sales.
Another beneficiary was the Great Lakes ports and shippers. The diversion of grain and commoditie& export grain shipments to the railroads led to increased movement of these grains through Great Lakes ports with the corresponding decrease in shipping from Gulf ports. In general, all weather events of consequence produce winners as well as losers, but the net effect of an event like the drought is likely to be negative, given the physical damages and transaction costs of alternatives.
RESPONSE TYPE PROBLEMS AND LESSONS LEARNED
Analysis of the drought impacts revealed a series of major problems relating to reactions and responses. The first of these related to the slow detection of the drought with inadequate monitoring until it was well defined, and poor interpretation of the drought severity. The second problem area was related to the lack of information as to management options available to decisionmakers. In the agricultural sector there was confusion over the use of agricultural relief versus crop insurance to deal with agricultural losses. Another noted response problem related to scientific

The 1988 Drought 269
information about the drought. Differing pronouncements about the seriousness of the drought and its causes, including the potential that the drought was due to the Greenhouse Effect, led to confusion in decisionmaking. A fifth response problem noted was that even when information about the severity of the drought was available, many agencies and industries reacted extremely slowly. This apparently relates to a lack of experience and no available contingency plans. Considering the extent of public anxiety in drought areas, and the high loss of life due to the heat wave, there was an amazingly little government attention to the effects on humans. The lack of a standing or permanent interagency drought task force was obvious in reacting to the developing 1988 drought or the continuing drought into 1989.
Given these response problems and the findings as to sizable impacts, what were some of the lessons learned from the drought, at least those that would help minimize future losses to drought? Several of these lessons relate to the federal government. Clearly, all federal agencies impacted by the drought (water and agriculture particularly), need contingency plans. Even for those with plans, particularly at the basin scale, need to be updated.
Models defining relationships between climate conditions and various functions or activities (crop yields, forest management, forest growth, etc.) need to be developed or if they exist, they need to be updated to deal with changing cultural conditions. The nation needs to establish a standing drought task force at the high levels.
Improvements in drought monitoring and prediction are needed. Organizations with clear lines of responsibility need to monitor impending drought and to assess its status on regional and local scales. Research will be needed to improve drought-related predictions.
A federal program is needed to deal effectively with the issue of protecting human life from heat-caused deaths. This involves education, provision of equipment, and a variety of other activities to aid the low income elderly from unnecessary death.
Changes in federal policies are needed. These include the need to make new policy about how damaged agriculture is to be served, whether by crop insurance or by special relief funds. Agricultural policies relating to size of grain reserves and export policies must be redefined, as should policies relating to forest protection and fire management. In general, the ever growing population, coupled with diminishing resources means that the nation must have greater flexibility in its systems.
SUMMARY
Overall, national analysts saw the effects of the drought of 1988 as relatively minor in terms of the national economy. The Interagency Drought Committee's final report to the President concluded that there will be "little effect on the overall growth rate of the U.S. economy from the drought of 1988." When examined as GNP and Consumer Price Index effects, the

270 USCID Regional Meetings -- 1989
national impacts do not seem significant. Nevertheless, the economic, environmental, and health impacts collectively make the drought of 1988 one of the nation's great natural disasters, and clearly it affected some regions and localities severely. It can be argued that several ameliorating factors, like surplus grain stores and federal monies earmarked for agricultural subsidies which could be changed to drought relief without impacting the budget, may not be as available during the next drought.
Although the environmental damages of the drought of 1988 are less well known than others, they may well be the most sizable and long lasting effects of the drought. Economically, the agricultural sector was hardest hit: the nation lost 31 % of its usual grain production, which could have precipitated a food supply crisis had there not been large surpluses from prior years. Human health impacts included an estimated 5,000 or more deaths.
The total economic losses and costs of the drought were roughly $39 billion, though we suspect that this is an underestimate, and that later accounting of enduring and cumulative effects will increase the loss figure.
REFERENCES
1. Avery, M., 1988: Heat Death Toll in 1988. Center for Environmental Physiology, Washington, D.C, 2 pp.
2. Interagency Drought Policy Committee, December 30, 1988: The Drought of 1988. Final Report of the President's Interagency Drought Policy Committee, Washington, D.C, 63 pp.

TENNESSEE'S DROUGHT MANAGEMENT PLAN
Lee Keck l John McClurkan2
ABSTRACT
Many water utilities in Tennessee could face significant operational and supply-related problems during droughts or other emergencies. Drought problems are caused by the combined effects of less water available from the source of supply, increased demands for water from system customers, stress on system equipment and water quality degradation. Other water shortages may be caused by accidents and natural or man-made disasters that disrupt water service or degrade water quality. Many u~ilities face droughts and emergencies unprepared to mitigate or deal with the health, economic and social disruptions that result. Timely actions based on a clear understanding of potential impacts can reduce drought effects on local water users . To facilitate the identification and implementation of appropriate and acceptable actions to deal with water supply shortages, water utilities should undertake the preparation and adoption of a local drought management plan.
SUMMARY
The Tennessee Drought Management Plan reflects the current thinking of the Office of Water Management on the planning and management of water during periods of drought. It should be used as a guide by water managers, industries, environmentalists, farmers and others . Impacts of drought on both water quantity and water quality are major concerns to the Office of Water Management, which is mandated to protect water quality and to insure provision of safe drinking water. Because drought affects similar users across the state differently, responses of municipalities, utility districts, businesses, farmers, and others to a drought will vary. Because circumstances and needs differ locally, the state's
lChief of Enforcement, TN Di vision of Water Supply, Nashville, TN 2Engineer, TN Division of Water Supply, Nashv i lle, TN
271

272 USCID Regional Meetings -- 1989
role will be to provide guidance and assist in coordinating efforts. Management strategies developed by local suppliers are extremely important in lessening impacts and delaying or averting further local water use restrictions. Conflicts involving water rights will be handled on an emergency, caseby-case basis.
An effective management plan for drought accounts for characteristics of the water source, whether the source is a well, spring, major stream, minor tributary or reservoir. Seasonal variations, previous weather conditions and topographic and geologic differences are important considerations in evaluating a source and management of its use. In addition, public suppliers should know their ability to deliver water under heavy demand. Delivery of water depends on treatment capacity, delivery capability, storage and management practices. Consideration is given to the source's flow necessary to maintain water quality. Another factor is water use and the relative importance of each use in terms of livelihood. Priorities are established relative to essential and non-essential uses.
Responses to water shortages vary with time available for planning and implementation. Some responses require a longer period of time to implement. These responses usually consider long-term and seasonal changes in demand, water supply commitments to meet essential needs and other uses, including stressing of environmental conditions .
Relatively short-term actions consist of planning and improvements in management which can be adopted or implemented within several months. These are generally "demand-side" oriented, focusing on water conservation or curtailment. Typically, short-term action involves development of a "phased" drought management plan. This plan phases in various management responses to increasingly severe drought conditions . In developing plans, local officials should consider public education, enforcement, monitoring procedures, conservation objectives and other actions necessary to achieve plan goals. Three phases are recommended: "Conservation," "Restrictions ll and "Emergency .. "
Drought responses consist of actions by a community or selfsupplied user facing a water shortage. Activation of a phase depends on meeting criteria specified in the plan.

Tennessee's Drought Management Plan 273
Remedies are best implemented by local government and should be developed at the local level. Problems and needs which are regional or statewide should be addressed by agencies having a state or regional water management responsibility. Some problems may be beyond the state·s authority or ability to manage and have national impact.
Any future drought response plan for the state needs to define a process for dealing with water use conflicts, such as declaring "limited" or regional water conservation emergencies. Future planning for water management under shortage conditions should allow full participation by public water systems and others in developing specific standards and procedures.

i i