PINNICATT NIGERIA LIMITED - ReliefWeb
99
United Nations Development Programme Nigeria Report On Water Resource Management and Geo-Physical Survey in Selected Communities of Borno State By PINNICATT NIGERIA LIMITED Block B3 AMAC Plaza, Nanka Close, Wuse Zone 3, Abuja, Nigeria +2348067811585 JULY 2018
-
Upload
khangminh22 -
Category
Documents
-
view
0 -
download
0
Transcript of PINNICATT NIGERIA LIMITED - ReliefWeb
United Nations Development Programme
Nigeria
Report On
Water Resource Management and Geo-Physical Survey in Selected
Communities of Borno State
By
PINNICATT NIGERIA LIMITED Block B3 AMAC Plaza,
Nanka Close, Wuse Zone 3, Abuja, Nigeria
+2348067811585
JULY 2018

.
------------------------------------------------------------------------------------------------------------------------------------------------------------------------------------------------------ Water Resource Management and Geo-Physical Survey in Selected Communities of Borno State
i
TABLE OF CONTENTS
Page
1.0 EXECUTIVE SUMMARY 1
2.0 BACKGROUND 3
2.1 Background 3
2.2 Project Objectives 3
2.3 Scope of Services 3
3.0 METHODOLOGY 5
3.1 Water Needs Assessment 5
3.2 Geophysical Survey 7
3.3 Capacity Analysis 7
4.0 FINDINGS AND ACCOMPLISHMENTS 11
4.1 MAIDUGURI 11
4.1.1 Existing Situation 11
4.1.2 Treatment Plant 11
4.1.3 Motorized Borehole 12
4.1.4 The Water Supply Gap 17
4.1.5 Bridging the Gap 17
4.1.6 Immediate Intervention 17
4.1.7 Long Term Intervention 18
4.1.8 Costs of Intervention 18
4.1.9 Conclusions concerning Maiduguri 19
4.2 BIU 21
4.2.1 Presentation of investigations 21
4.2.2 Water works 22
4.2.3 Mandara Abdu Waterworks 22
4.2.4 Jigwal Waterworks 23
4.2.5 Galdimare Waterworks 24
4.2.6 Gamaje Waterworks 25
4.2.7 Surface Water Resources 26
4.2.8 The Water Supply Gap 27
4.2.9 Bridging the Gap 27
4.2.10 Immediate Intervention 27
4.2.11 Medium to Long Term intervention 30
4.2.12 Preliminary cost estimates 30
4.2.13 Conclusions concerning Biu 32
.
------------------------------------------------------------------------------------------------------------------------------------------------------------------------------------------------------ Water Resource Management and Geo-Physical Survey in Selected Communities of Borno State
ii
4.3 BAMA 33
4.3.1 Presentation of investigations 33
4.3.2 Water works 34
4.3.3 Present Supply Capacity 35
4.3.4 The Water Supply Gap 36
4.3.5 Bridging the Gap 36
4.3.6 Immediate Intervention 36
4.3.7 Medium to Long Term intervention 37
4.3.8 Preliminary cost estimates 37
4.3.9 Conclusions concerning Bama 39
4.4 ASKIRA 40
4.4.1 Presentation of investigations 40
4.4.2 Water works 41
4.4.3 Present Supply Capacity 41
4.4.4 The Water Supply Gap 42
4.4.5 Bridging the Gap 42
4.4.6 Immediate Intervention 43
4.4.7 Medium to Long Term intervention 43
4.4.8 Preliminary cost estimates 43
4.4.9 Conclusions concerning Askira 45
4.5 GWOZA 47
4.5.1 Presentation of investigations 47
4.5.2 Water works 48
4.5.3 Present Supply Capacity 49
4.5.4 The Water Supply Gap 50
4.5.5 Bridging the Gap 51
4.5.6 Immediate Intervention 51
4.5.7 Medium to Long Term intervention 51
4.5.8 Preliminary cost estimates 52
4.5.9 Conclusions concerning Gwoza 53
4.6 DAMBOA 55
4.6.1 Presentation of investigations 55
4.6.2 Water works 56
4.6.3 Present Supply Capacity 56
4.6.4 The Water Supply Gap 57
4.6.5 Bridging the Gap 58
4.6.6 Immediate Intervention 58
4.6.7 Medium to Long Term intervention 59
4.6.8 Preliminary cost estimates 59
4.6.9 Conclusions concerning Damboa 60
.
------------------------------------------------------------------------------------------------------------------------------------------------------------------------------------------------------ Water Resource Management and Geo-Physical Survey in Selected Communities of Borno State
iii
4.7 GEOPHYSICAL SURVEY 61
4.7.1 Geophysical Survey of Pulka 61
4.7.2 Method of Study and Data Acquisition 63
4.7.3 Data Analysis and Interpretation 66
4.7.4 Conclusion 67
4.7.5 Recommendation and Observation 67
4.7.6 Geophysical Survey of Damboa Town 68
4.7.7 Geologic Settings 69
4.7.8 Method of Study and Data Acquisition 70
4.7.9 Data Analysis and Interpretation 72
4.7.10 Discussion and Conclusion 73
4.7.11 Recommendation and Observation 74
4.8 CAPACITY TRAINING 75
4.8.1 Training 75
4.8.2 Evaluation of Training Programme 75
4.8.3 Conclusion 87
4.8.4 Action Plan Formulation 89
4.8.5 Recommendation 90
5.0 CHALLENGES 92
6.0 RECOMMENDATION 94
.
1
Water Resource Management and Geo-Physical Survey in Selected Communities of Borno State
1.0 EXECUTIVE SUMMARY
The existing water supply schemes at Maiduguri, Biu, Bama, Gwoza, Damboa
and Askira have been studied to evaluate the water need of the present and
future population. Detailed information on water production, population
and water demand were collected and analysed. Problems that hamper the
systems from operating at design capacities have been identified and
rehabilitation measures recommended for restoring the systems to original
design capacities. Where the installed capacities of the water schemes are
inadequate to meet the present water demand even after full restoration of
installed capacities, alternative water supply scheme were recommended as
either short or long term interventions.
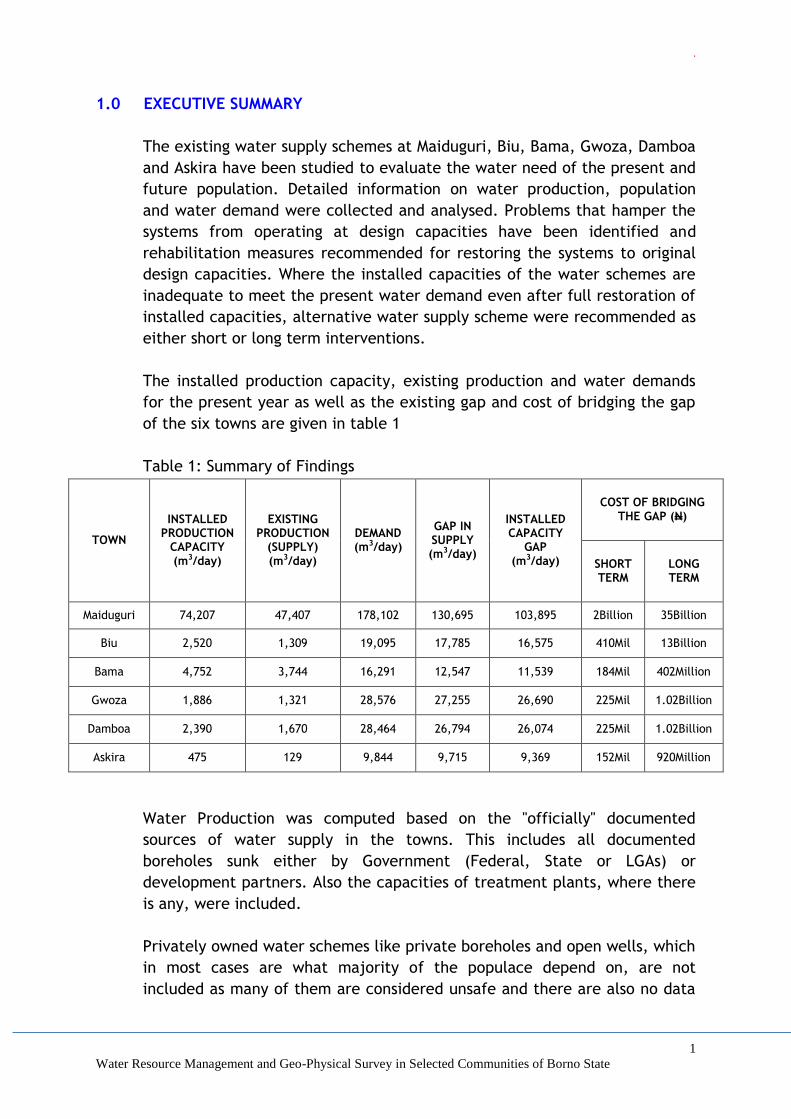
The installed production capacity, existing production and water demands
for the present year as well as the existing gap and cost of bridging the gap
of the six towns are given in table 1
Table 1: Summary of Findings
TOWN
INSTALLED PRODUCTION
CAPACITY (m3/day)
EXISTING PRODUCTION
(SUPPLY) (m3/day)
DEMAND (m3/day)
GAP IN SUPPLY (m3/day)
INSTALLED CAPACITY
GAP (m3/day)
COST OF BRIDGING THE GAP (N)
SHORT TERM
LONG TERM
Maiduguri 74,207 47,407 178,102 130,695 103,895 2Billion 35Billion
Biu 2,520 1,309 19,095 17,785 16,575 410Mil 13Billion
Bama 4,752 3,744 16,291 12,547 11,539 184Mil 402Million
Gwoza 1,886 1,321 28,576 27,255 26,690 225Mil 1.02Billion
Damboa 2,390 1,670 28,464 26,794 26,074 225Mil 1.02Billion
Askira 475 129 9,844 9,715 9,369 152Mil 920Million
Water Production was computed based on the "officially" documented
sources of water supply in the towns. This includes all documented
boreholes sunk either by Government (Federal, State or LGAs) or
development partners. Also the capacities of treatment plants, where there
is any, were included.
Privately owned water schemes like private boreholes and open wells, which
in most cases are what majority of the populace depend on, are not
included as many of them are considered unsafe and there are also no data

.
2
Water Resource Management and Geo-Physical Survey in Selected Communities of Borno State
to confirm their yields and production capacities. This explains the huge gap
in water demand and supply in most of the towns studied.
The baseline for water demand computation is usually the population of an
area, but due to insurgency, there is a large scale displacement of people
all across the state. These have impacted on the population and the normal
population projections will not represent the true situation in these towns.
Based on our consultations with the officials of Borno State Ministry of
Water Resources (BSMWR) and Rural Water Supply and Sanitation Agency
(RUWASA), visits to these towns and the analysis of International
Organization for Migration (IOM) Nigeria Displacement Tracking Matrix (DTM)
Rounds, an empirical formula was arrived at which uses a percentage of the
2006 Census figures and the IOM DTM IDPs figures for these areas.
The main constraints to meeting installed capacities of the water schemes
have been identified to be due to lack of maintenance, breakdown of
electro-mechanical equipment as a result of voltage fluctuation, erratic
power supply, low borehole yield, and age of the equipment. The treatment
plant in the past relied on power supply from Power Holding Company of
Nigeria (PHCN) through Yola Electricity Distribution Company (YEDC). Due to
instability in the power supply and frequent power surges and fluctuation in
voltage which damaged some of their equipment, the system was
disconnected from PHCN and is now been powered entirely by generators.
The capacity building training is aimed at enabling Borno state water and
sanitation institutions (Borno State Ministry of Water Resources (BSMWR) and
Rural Water Supply and Sanitation Agency (RUWASSA)) and their respective
water professionals to improve their ability to perform their tasks and
produce outputs in a sustainable way, accord the staff the ability to define,
solve problems and make informed decisions.
The specific objectives of the training is to expose the participants to new
productive thinking and global best practices, techniques and processes in
the water sector; foster attitudinal change whilst building upon existing
knowledge and experiences; encourage the practical application of learning
in the work environment; as well as evaluate and document the learning
experience.
Based on the outcome of this training it can be suggested that subsequent
capacity building programmes has to be all inclusive of politicians, decision
makers and top management of both organisations. The training should also
be extensive, accommodate more practical session technical visits to learn
from existing best practices.
.
3
Water Resource Management and Geo-Physical Survey in Selected Communities of Borno State
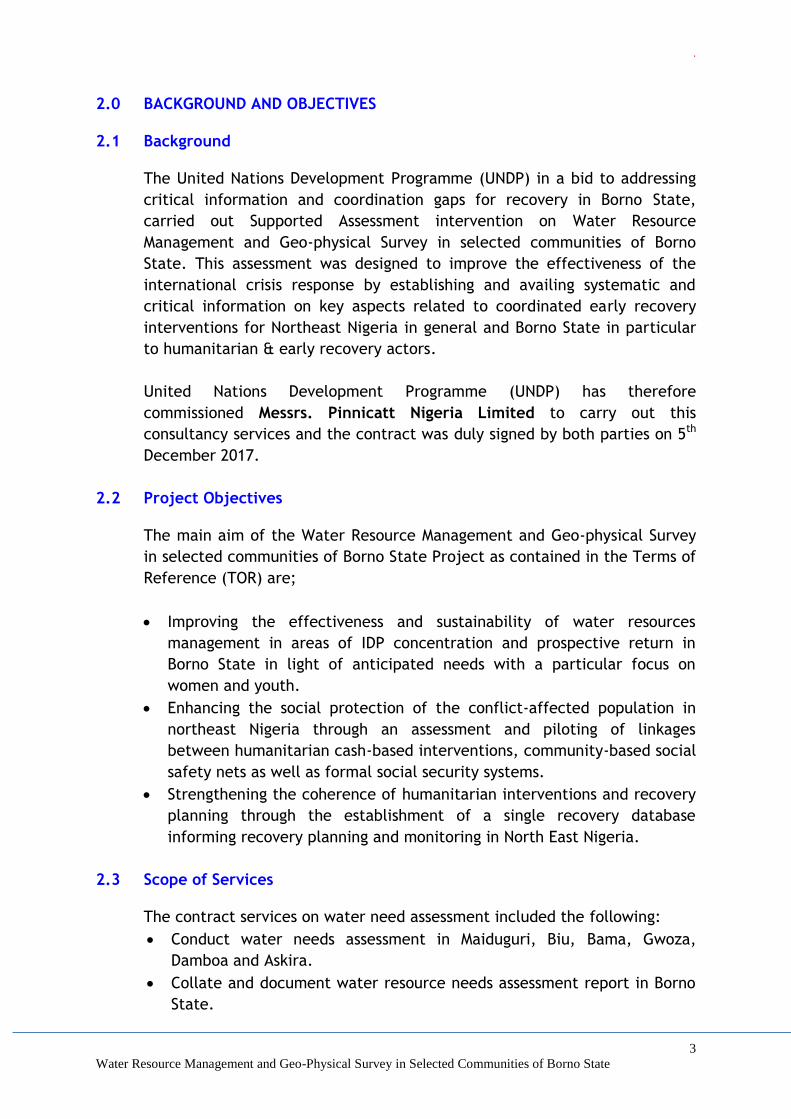
2.0 BACKGROUND AND OBJECTIVES
2.1 Background
The United Nations Development Programme (UNDP) in a bid to addressing
critical information and coordination gaps for recovery in Borno State,
carried out Supported Assessment intervention on Water Resource
Management and Geo-physical Survey in selected communities of Borno
State. This assessment was designed to improve the effectiveness of the
international crisis response by establishing and availing systematic and
critical information on key aspects related to coordinated early recovery
interventions for Northeast Nigeria in general and Borno State in particular
to humanitarian & early recovery actors.
United Nations Development Programme (UNDP) has therefore
commissioned Messrs. Pinnicatt Nigeria Limited to carry out this
consultancy services and the contract was duly signed by both parties on 5th
December 2017.
2.2 Project Objectives
The main aim of the Water Resource Management and Geo-physical Survey
in selected communities of Borno State Project as contained in the Terms of
Reference (TOR) are;
Improving the effectiveness and sustainability of water resources
management in areas of IDP concentration and prospective return in
Borno State in light of anticipated needs with a particular focus on
women and youth.
Enhancing the social protection of the conflict-affected population in
northeast Nigeria through an assessment and piloting of linkages
between humanitarian cash-based interventions, community-based social
safety nets as well as formal social security systems.
Strengthening the coherence of humanitarian interventions and recovery
planning through the establishment of a single recovery database
informing recovery planning and monitoring in North East Nigeria.
2.3 Scope of Services
The contract services on water need assessment included the following:
Conduct water needs assessment in Maiduguri, Biu, Bama, Gwoza,
Damboa and Askira.
Collate and document water resource needs assessment report in Borno
State.

.
4
Water Resource Management and Geo-Physical Survey in Selected Communities of Borno State
Conduct geo-physical survey in Damboa and Pulka axes.
Produce and submit geo-physical survey maps and reports.
Conduct capacity analysis of Borno State MWR and RUWASA.
Conduct 4 focused training sessions each for MWR and RUWASA officials.
.
5
Water Resource Management and Geo-Physical Survey in Selected Communities of Borno State
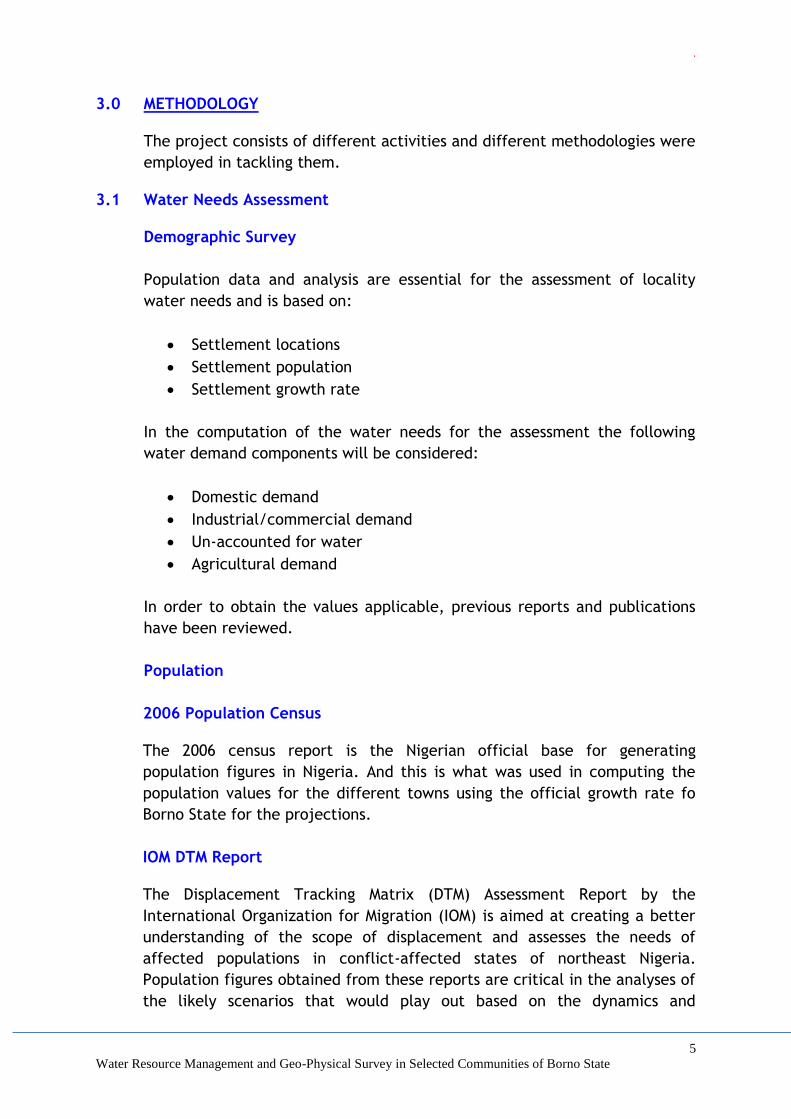
3.0 METHODOLOGY
The project consists of different activities and different methodologies were
employed in tackling them.
3.1 Water Needs Assessment
Demographic Survey
Population data and analysis are essential for the assessment of locality
water needs and is based on:
Settlement locations
Settlement population
Settlement growth rate
In the computation of the water needs for the assessment the following
water demand components will be considered:
Domestic demand
Industrial/commercial demand
Un-accounted for water
Agricultural demand
In order to obtain the values applicable, previous reports and publications
have been reviewed.
Population
2006 Population Census
The 2006 census report is the Nigerian official base for generating
population figures in Nigeria. And this is what was used in computing the
population values for the different towns using the official growth rate fo
Borno State for the projections.
IOM DTM Report
The Displacement Tracking Matrix (DTM) Assessment Report by the
International Organization for Migration (IOM) is aimed at creating a better
understanding of the scope of displacement and assesses the needs of
affected populations in conflict-affected states of northeast Nigeria.
Population figures obtained from these reports are critical in the analyses of
the likely scenarios that would play out based on the dynamics and
.
6
Water Resource Management and Geo-Physical Survey in Selected Communities of Borno State
complexities of the various humanitarian challenges such as the insurgency
that are being addressed.
Because of the massive displacement of people in the North-Eastern region
of the Country due to insurgency, the figures from the DTM Nigeria Round
XXII (April, 2018) Dataset of Baseline Assessments were obtained and
factored into the population projections for the different towns.
Adopted Values
Population
For the purposes of this Project, statistical approach method is adopted
using the population figures provided in the 2006 Census figures as the
baseline for the population projections and adding the IOM DTM Round XXII
report IDPs population. Also, the Inter-census growth rates of 3.22% for
Borno state was used for our projections on the census figures.
Water Demand
National Water Supply and Sanitation Policy (2000)
The policy aims at providing sufficient portable water and sanitation to all
Nigerians in an affordable and sustainable way.
Consumption standards have been set for the three socio-economic profiles
of the population as follows:
1. Rural Water Supply
Communities with population of between 150 to 5,000 people – 30
litres per capita per day.
2. Semi – urban (small towns) Water Supply
Settlements with population of between 5000 to 20,000 with a fair
measure of social infrastructure and some level of economic activity
with reticulation and limited or full house connections – 60 litres per
day per capita.
3. Urban Water Supply
Urban areas with population greater than 20,000 inhabitants to be
served by full reticulation and consumer premises connections – 120
litres per day per capita.

.
7
Water Resource Management and Geo-Physical Survey in Selected Communities of Borno State
Adopted Values
The water demands as specified in the National Water Supply and Sanitation
Policy publication (2000) was used in computing the water demands of the
respective towns. However, the consultants have adopted the policy
demand rates, but lower rates were used for Damboa and Gwoza
considering the level of commercial and industrial activities in these areas.
3.2 Geophysical Survey
The combined EM/VES geophysical investigation method was adopted for
this project. This method involve carrying out Electromagnetic traversing of
the area using GEONICS EM-34 CONDUCTIVITY METER. The 20m coil
separation was be used to delineate conductive zones, which invariably will
indicate thick overburden and or fractured zones.
These conductive zones were then subjected to Vertical Electrical Sounding
(VES) to arrive at the layered parameters (resistivity’s and thickness). ABEM
AC TERRAMETER was be used with AB/2 ranging from 0-200m.
VES data was then interpreted by empirical techniques and Zohdy computer
modelling techniques
Techniques Applied
Surface reconnaissance geologic study
Planetary studies
Geo-electrical resistivity depth soundings for vertical probes, the
Schlumberger configuration was specifically utilized to attain desired
results.
Resonoid reflection sensors will be used for most likely prolific
zones/spots in the first phase approach
3.3 Capacity Analysis
The methodology involved both the Institutional capacity and individual
skills assessments of BSMWR and RUWASA. The capacity and skills gaps was
determined by subtracting the supply from the demand as follows:
1. Capacity Gap = Capacity Demand – Capacity Supply
2. Skills Gap = Skills Demand – Skills Supply
.
8
Water Resource Management and Geo-Physical Survey in Selected Communities of Borno State
Capacity Gap Assessment
Capacity in this study refers to the staff requirement of the whole
institution (BSMWR and RUWASA). It is described by the job title with
predetermined minimum qualification and years of experience
requirements, whereas capacity gap refers to the difference between the
demand for capacity and the supply of capacity in an organization. The
capacity gap assessment was carried out as follows:
Level 1: Determine the Demand for capacity:
a) The mandate of the institution (BSMWR and RUWASA) was selected (as
stated in legislation)
b) The mandates was be mapped onto an organogram, and further onto
individual job titles.
c) The unit that primarily controls each mandate/responsibility was
identified for each function
d) The amount of schedule that one job title or a team of job titles can
handle over period of time was determined.
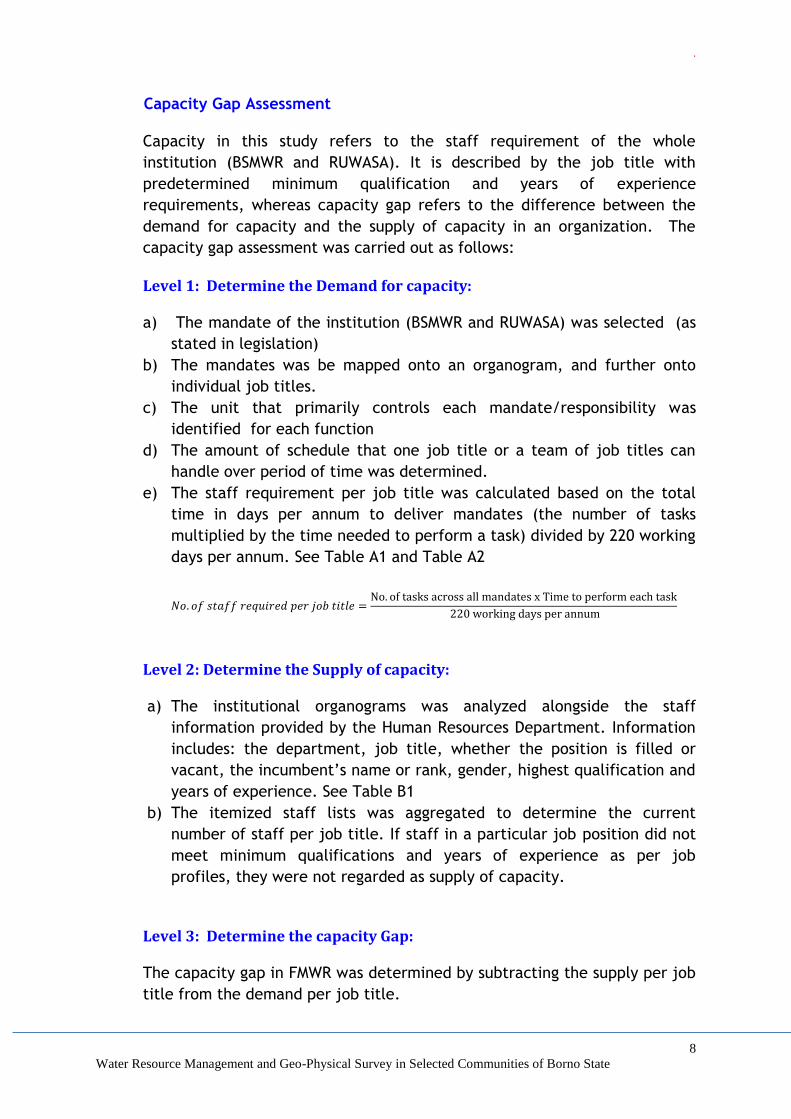
e) The staff requirement per job title was calculated based on the total
time in days per annum to deliver mandates (the number of tasks
multiplied by the time needed to perform a task) divided by 220 working
days per annum. See Table A1 and Table A2
𝑁𝑜. 𝑜𝑓 𝑠𝑡𝑎𝑓𝑓 𝑟𝑒𝑞𝑢𝑖𝑟𝑒𝑑 𝑝𝑒𝑟 𝑗𝑜𝑏 𝑡𝑖𝑡𝑙𝑒 =No. of tasks across all mandates x Time to perform each task
220 working days per annum
Level 2: Determine the Supply of capacity:
a) The institutional organograms was analyzed alongside the staff
information provided by the Human Resources Department. Information
includes: the department, job title, whether the position is filled or
vacant, the incumbent’s name or rank, gender, highest qualification and
years of experience. See Table B1
b) The itemized staff lists was aggregated to determine the current
number of staff per job title. If staff in a particular job position did not
meet minimum qualifications and years of experience as per job
profiles, they were not regarded as supply of capacity.
Level 3: Determine the capacity Gap:
The capacity gap in FMWR was determined by subtracting the supply per job
title from the demand per job title.
.
9
Water Resource Management and Geo-Physical Survey in Selected Communities of Borno State
Skills Gap Assessment
The skills gap is the difference between the demand for skills (i.e. the skills
requirements of the job) and the supply of skills (i.e. the actual skills held
by staff). The demand for skills was established using a ‘Skills Matrix’, while
the supply was measured through a self-administered survey.
Level 1: Determine the Demand for skills
The demand for skills refers to the skills required by job titles both
institutions (BSMWR and RUWASA). Hence, four basic components were used
in order to determine the demand for technical and non-technical skills,
they are:
Understanding of different types of skills;
Understanding of a competency framework;
Understanding of a skills matrix;
The use of a rating scale.
Level 2: Determination of the Supply of Skills
The supply of skills will be the sum total of skills held by incumbents and
these was measured through the skills audit survey. A skills audit is a
procedure of measuring and recording the skills of an individual or group of
individuals leading to the identification of skills and knowledge that
individuals currently possesses.
The supply of skills was determined in such a way as to enable comparison
with the demand for skills. Therefore the list of skills that will be provided
to individuals against which to rate themselves is the same list that will be
used when determining the demand for skills.
Level 3: Determination of the Skills Gap
The skills gap is the difference between the demand for skills and the supply
of skills.
Training Need Development
Training Matrix for Competency Development
The training matrix refers to the predefined training that is necessary for a
given job title. For every job title there were required and exclusive set of
trainings. Similarly, there were also some generic training needs also as
determined by the capacity analysis.
.
10
Water Resource Management and Geo-Physical Survey in Selected Communities of Borno State
The job titles and competencies (vertical axis) were mapped against the
required training (horizontal axis) and a training matrix for all job titles in
BSMWR and RUWASA was established.
Conduct Trainings
The various scheduled trainings for the staff of Borno State Ministry of Water
Resources and Rural Water and Sanitation Agency in Borno State were
conducted in 4 phases.
.
11
Water Resource Management and Geo-Physical Survey in Selected Communities of Borno State
4.0 FINDINGS AND ACCOMPLISHMENTS
4.1 MAIDUGURI
4.1.1 Background/Existing Situation
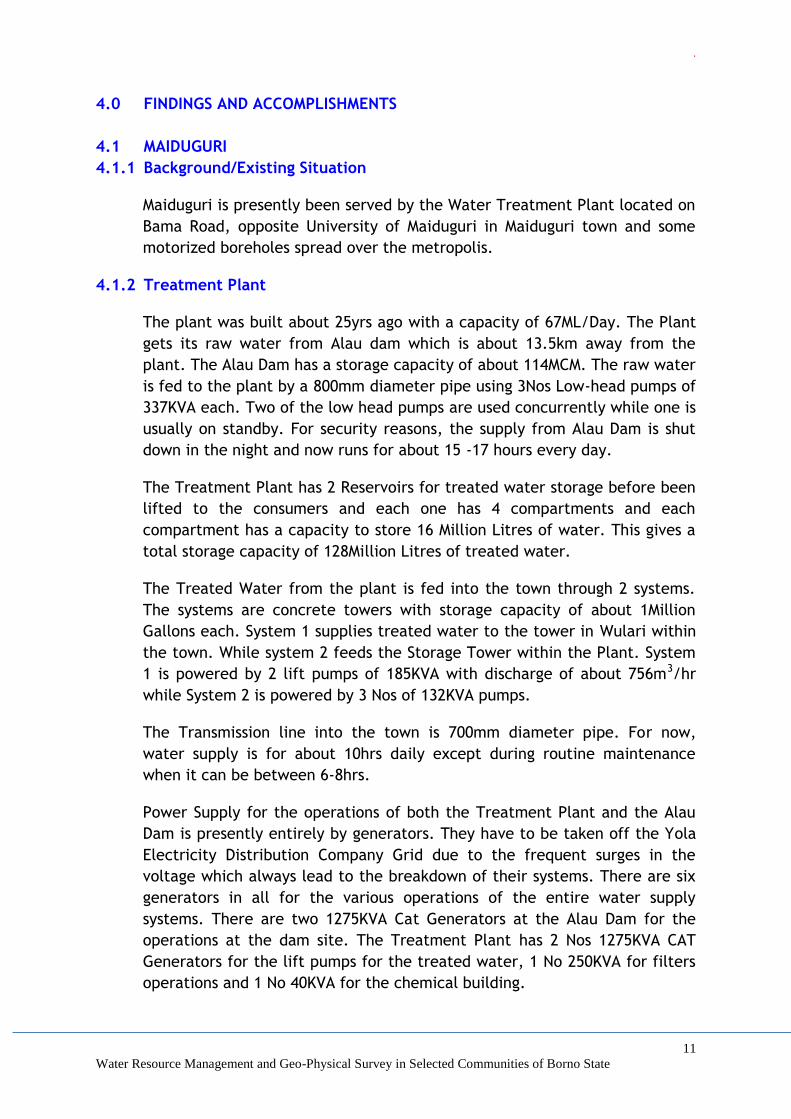
Maiduguri is presently been served by the Water Treatment Plant located on
Bama Road, opposite University of Maiduguri in Maiduguri town and some
motorized boreholes spread over the metropolis.
4.1.2 Treatment Plant
The plant was built about 25yrs ago with a capacity of 67ML/Day. The Plant
gets its raw water from Alau dam which is about 13.5km away from the
plant. The Alau Dam has a storage capacity of about 114MCM. The raw water
is fed to the plant by a 800mm diameter pipe using 3Nos Low-head pumps of
337KVA each. Two of the low head pumps are used concurrently while one is
usually on standby. For security reasons, the supply from Alau Dam is shut
down in the night and now runs for about 15 -17 hours every day.
The Treatment Plant has 2 Reservoirs for treated water storage before been
lifted to the consumers and each one has 4 compartments and each
compartment has a capacity to store 16 Million Litres of water. This gives a
total storage capacity of 128Million Litres of treated water.
The Treated Water from the plant is fed into the town through 2 systems.
The systems are concrete towers with storage capacity of about 1Million
Gallons each. System 1 supplies treated water to the tower in Wulari within
the town. While system 2 feeds the Storage Tower within the Plant. System
1 is powered by 2 lift pumps of 185KVA with discharge of about 756m3/hr
while System 2 is powered by 3 Nos of 132KVA pumps.
The Transmission line into the town is 700mm diameter pipe. For now,
water supply is for about 10hrs daily except during routine maintenance
when it can be between 6-8hrs.
Power Supply for the operations of both the Treatment Plant and the Alau
Dam is presently entirely by generators. They have to be taken off the Yola
Electricity Distribution Company Grid due to the frequent surges in the
voltage which always lead to the breakdown of their systems. There are six
generators in all for the various operations of the entire water supply
systems. There are two 1275KVA Cat Generators at the Alau Dam for the
operations at the dam site. The Treatment Plant has 2 Nos 1275KVA CAT
Generators for the lift pumps for the treated water, 1 No 250KVA for filters
operations and 1 No 40KVA for the chemical building.

.
12
Water Resource Management and Geo-Physical Survey in Selected Communities of Borno State
The daily diesel consumption for the entire system is estimated at about
3,800 litres per day. The Alau Dam and the Treatment Plant operations
require 1,800 litres and 2,000 litres respectively per day which amounts to
about 950,000 naira (2,750 dollars) per day. This is about N28,500,000
($81,000) per month.
Even though the Plant has a capacity of 67ML/Day, the present utilization
stands at about 34ML/Day which is barely 54% of the installed capacity. The
reason for this is that many of the equipment are obsolete and now function
below installed capacity. Also, the plant was designed as semi-automatic
but is now manually run due to the breakdown of many of its components
(see Section 3.5.1 for details) which are not replaced or adequately
repaired.
4.1.3 Motorized Borehole
Our investigations and findings show that there are about fifty one (51)
documented boreholes in Maiduguri metropolis. The actual numbers of
boreholes are more than this, but relevant information and data concerning
others are not available as they were neither forwarded nor submitted to
the Ministry of Water Resources or RUWASSA, especially the ones dug by
private individuals. Without these data and information, their contributions
to the overall water supply cannot be estimated correctly. Therefore, we
are constrained to use the fifty one documented boreholes for our analysis
and calculations.
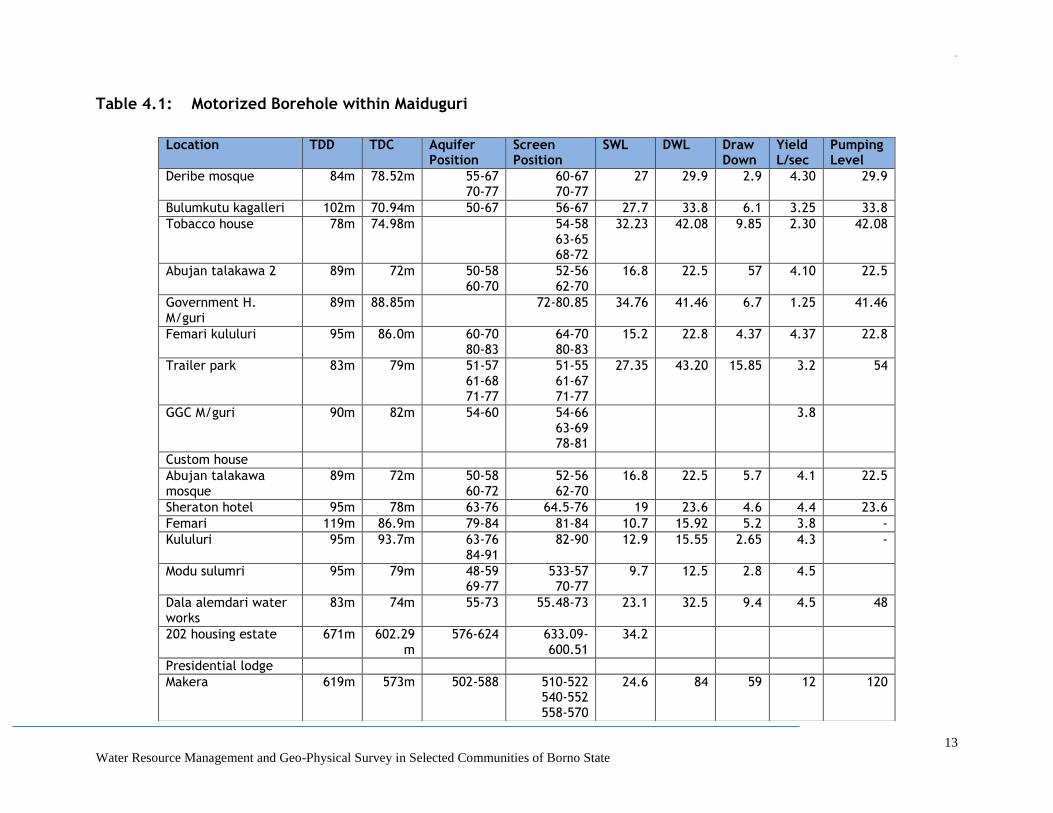
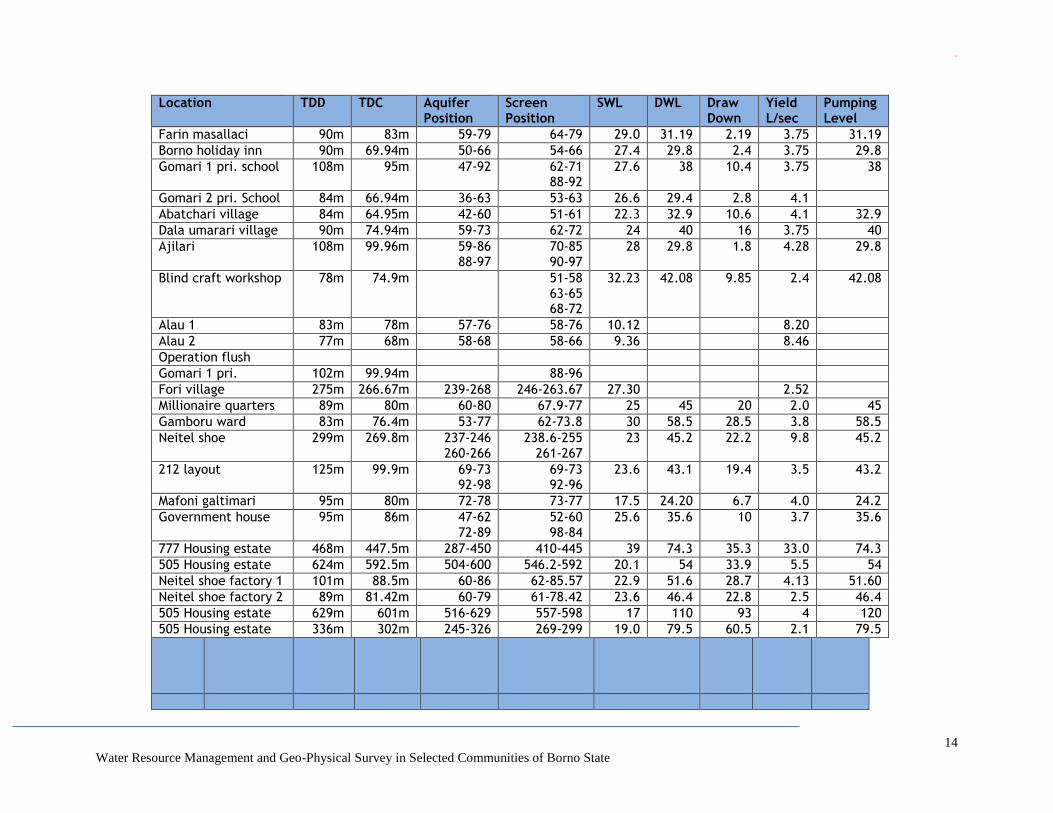
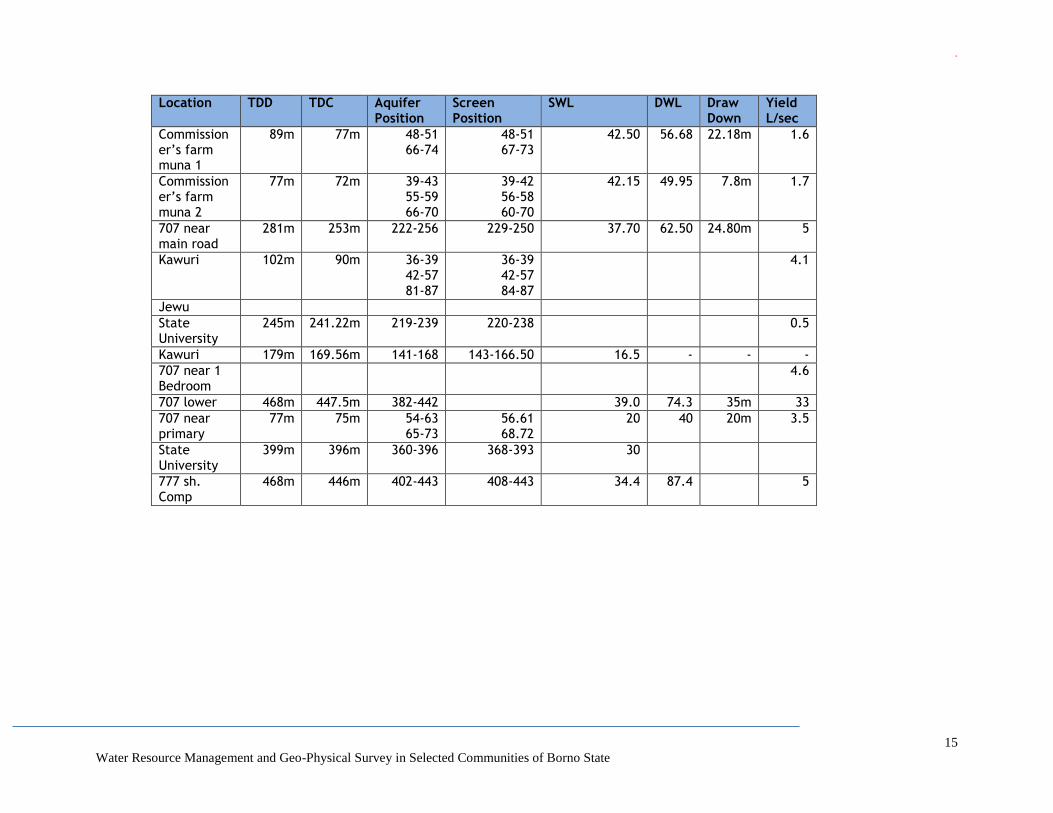
The Tables below, Table 3.1, indicates the location, depth, yield and some
other details about the boreholes.
Total yield of all the boreholes = 250.26L/sec
For 8 hrs of pumping daily = 7.2ML/day
This brings the total contribution of borehole schemes to Maiduguri daily
production to 7,207.48m3/day
.
13
Water Resource Management and Geo-Physical Survey in Selected Communities of Borno State
Table 4.1: Motorized Borehole within Maiduguri
Location TDD TDC Aquifer
Position Screen Position
SWL DWL Draw Down
Yield L/sec
Pumping Level
Deribe mosque 84m 78.52m 55-67 70-77
60-67 70-77
27 29.9 2.9 4.30 29.9
Bulumkutu kagalleri 102m 70.94m 50-67 56-67 27.7 33.8 6.1 3.25 33.8
Tobacco house 78m 74.98m 54-58 63-65 68-72
32.23 42.08 9.85 2.30 42.08
Abujan talakawa 2 89m 72m 50-58 60-70
52-56 62-70
16.8 22.5 57 4.10 22.5
Government H. M/guri
89m 88.85m 72-80.85 34.76 41.46 6.7 1.25 41.46
Femari kululuri 95m 86.0m 60-70 80-83
64-70 80-83
15.2 22.8 4.37 4.37 22.8
Trailer park 83m 79m 51-57 61-68 71-77
51-55 61-67 71-77
27.35 43.20 15.85 3.2 54
GGC M/guri 90m 82m 54-60 54-66 63-69 78-81
3.8
Custom house
Abujan talakawa mosque
89m 72m 50-58 60-72
52-56 62-70
16.8 22.5 5.7 4.1 22.5
Sheraton hotel 95m 78m 63-76 64.5-76 19 23.6 4.6 4.4 23.6
Femari 119m 86.9m 79-84 81-84 10.7 15.92 5.2 3.8 -
Kululuri 95m 93.7m 63-76 84-91
82-90 12.9 15.55 2.65 4.3 -
Modu sulumri 95m 79m 48-59 69-77
533-57 70-77
9.7 12.5 2.8 4.5
Dala alemdari water works
83m 74m 55-73 55.48-73 23.1 32.5 9.4 4.5 48
202 housing estate 671m 602.29m
576-624 633.09-600.51
34.2
Presidential lodge
Makera 619m 573m 502-588 510-522 540-552 558-570
24.6 84 59 12 120
.
14
Water Resource Management and Geo-Physical Survey in Selected Communities of Borno State
Location TDD TDC Aquifer Position
Screen Position
SWL DWL Draw Down
Yield L/sec
Pumping Level
Farin masallaci 90m 83m 59-79 64-79 29.0 31.19 2.19 3.75 31.19
Borno holiday inn 90m 69.94m 50-66 54-66 27.4 29.8 2.4 3.75 29.8
Gomari 1 pri. school 108m 95m 47-92 62-71 88-92
27.6 38 10.4 3.75 38
Gomari 2 pri. School 84m 66.94m 36-63 53-63 26.6 29.4 2.8 4.1
Abatchari village 84m 64.95m 42-60 51-61 22.3 32.9 10.6 4.1 32.9
Dala umarari village 90m 74.94m 59-73 62-72 24 40 16 3.75 40
Ajilari 108m 99.96m 59-86 88-97
70-85 90-97
28 29.8 1.8 4.28 29.8
Blind craft workshop 78m 74.9m 51-58 63-65 68-72
32.23 42.08 9.85 2.4 42.08
Alau 1 83m 78m 57-76 58-76 10.12 8.20
Alau 2 77m 68m 58-68 58-66 9.36 8.46
Operation flush
Gomari 1 pri. 102m 99.94m 88-96
Fori village 275m 266.67m 239-268 246-263.67 27.30 2.52
Millionaire quarters 89m 80m 60-80 67.9-77 25 45 20 2.0 45
Gamboru ward 83m 76.4m 53-77 62-73.8 30 58.5 28.5 3.8 58.5
Neitel shoe 299m 269.8m 237-246 260-266
238.6-255 261-267
23 45.2 22.2 9.8 45.2
212 layout 125m 99.9m 69-73 92-98
69-73 92-96
23.6 43.1 19.4 3.5 43.2
Mafoni galtimari 95m 80m 72-78 73-77 17.5 24.20 6.7 4.0 24.2
Government house 95m 86m 47-62 72-89
52-60 98-84
25.6 35.6 10 3.7 35.6
777 Housing estate 468m 447.5m 287-450 410-445 39 74.3 35.3 33.0 74.3
505 Housing estate 624m 592.5m 504-600 546.2-592 20.1 54 33.9 5.5 54
Neitel shoe factory 1 101m 88.5m 60-86 62-85.57 22.9 51.6 28.7 4.13 51.60
Neitel shoe factory 2 89m 81.42m 60-79 61-78.42 23.6 46.4 22.8 2.5 46.4
505 Housing estate 629m 601m 516-629 557-598 17 110 93 4 120
505 Housing estate 336m 302m 245-326 269-299 19.0 79.5 60.5 2.1 79.5
.
15
Water Resource Management and Geo-Physical Survey in Selected Communities of Borno State
Location TDD TDC Aquifer Position
Screen Position
SWL DWL Draw Down
Yield L/sec
Commissioner’s farm muna 1
89m 77m 48-51 66-74
48-51 67-73
42.50 56.68 22.18m 1.6
Commissioner’s farm muna 2
77m 72m 39-43 55-59 66-70
39-42 56-58 60-70
42.15 49.95 7.8m 1.7
707 near main road
281m 253m 222-256 229-250 37.70 62.50 24.80m 5
Kawuri 102m 90m 36-39 42-57 81-87
36-39 42-57 84-87
4.1
Jewu
State University
245m 241.22m 219-239 220-238 0.5
Kawuri 179m 169.56m 141-168 143-166.50 16.5 - - -
707 near 1 Bedroom
4.6
707 lower 468m 447.5m 382-442 39.0 74.3 35m 33
707 near primary
77m 75m 54-63 65-73
56.61 68.72
20 40 20m 3.5
State University
399m 396m 360-396 368-393 30
777 sh. Comp
468m 446m 402-443 408-443 34.4 87.4 5
.
16
Water Resource Management and Geo-Physical Survey in Selected Communities of Borno State
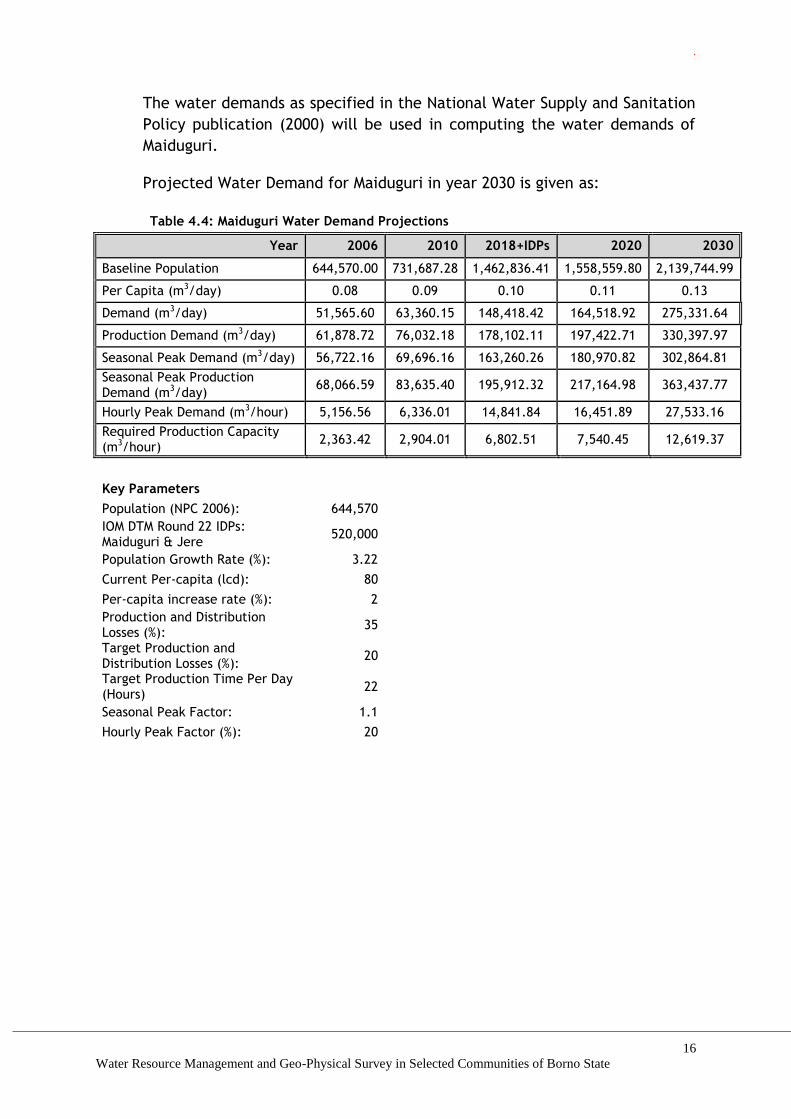
The water demands as specified in the National Water Supply and Sanitation
Policy publication (2000) will be used in computing the water demands of
Maiduguri.
Projected Water Demand for Maiduguri in year 2030 is given as:
Table 4.4: Maiduguri Water Demand Projections
Year 2006 2010 2018+IDPs 2020 2030
Baseline Population 644,570.00 731,687.28 1,462,836.41 1,558,559.80 2,139,744.99
Per Capita (m3/day) 0.08 0.09 0.10 0.11 0.13
Demand (m3/day) 51,565.60 63,360.15 148,418.42 164,518.92 275,331.64
Production Demand (m3/day) 61,878.72 76,032.18 178,102.11 197,422.71 330,397.97
Seasonal Peak Demand (m3/day) 56,722.16 69,696.16 163,260.26 180,970.82 302,864.81
Seasonal Peak Production Demand (m3/day)
68,066.59 83,635.40 195,912.32 217,164.98 363,437.77
Hourly Peak Demand (m3/hour) 5,156.56 6,336.01 14,841.84 16,451.89 27,533.16
Required Production Capacity (m3/hour)
2,363.42 2,904.01 6,802.51 7,540.45 12,619.37
Key Parameters
Population (NPC 2006): 644,570
IOM DTM Round 22 IDPs: Maiduguri & Jere
520,000
Population Growth Rate (%): 3.22
Current Per-capita (lcd): 80
Per-capita increase rate (%): 2
Production and Distribution Losses (%):
35
Target Production and Distribution Losses (%):
20
Target Production Time Per Day (Hours)
22
Seasonal Peak Factor: 1.1
Hourly Peak Factor (%): 20
.
17
Water Resource Management and Geo-Physical Survey in Selected Communities of Borno State
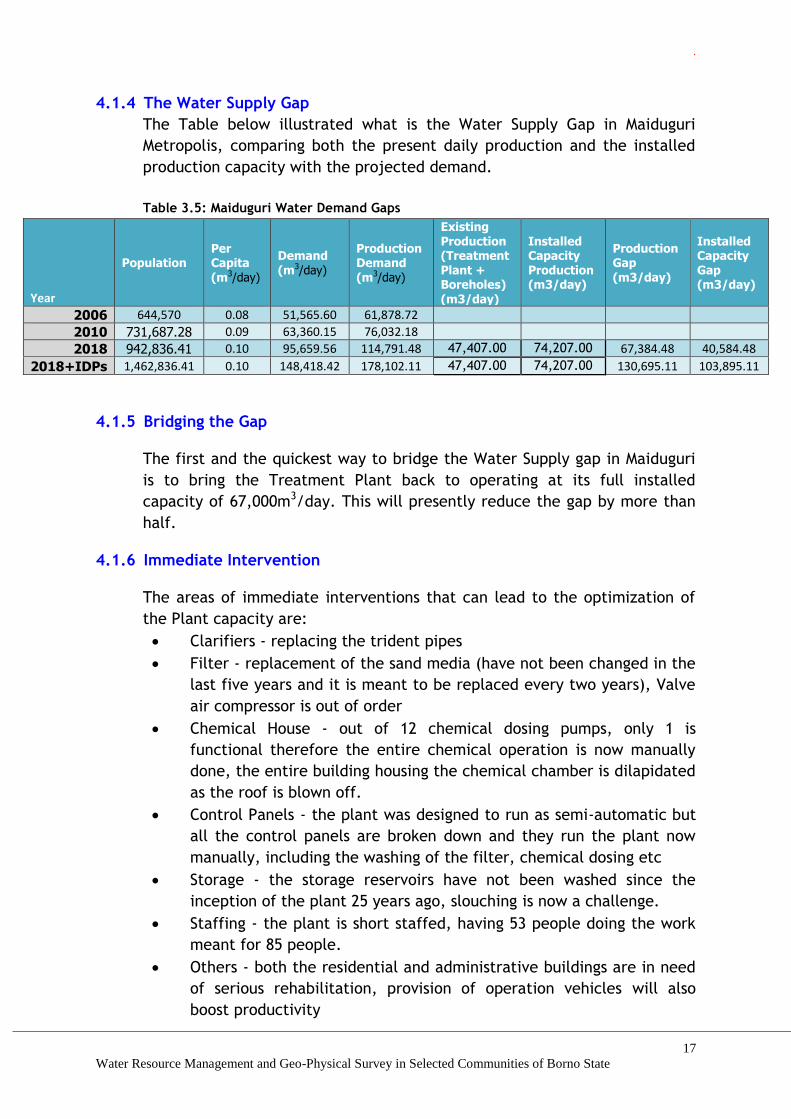
4.1.4 The Water Supply Gap
The Table below illustrated what is the Water Supply Gap in Maiduguri
Metropolis, comparing both the present daily production and the installed
production capacity with the projected demand.
Table 3.5: Maiduguri Water Demand Gaps
Year
Population Per Capita (m3/day)
Demand (m3/day)
Production Demand (m3/day)
Existing Production (Treatment Plant + Boreholes)
(m3/day)
Installed Capacity Production (m3/day)
Production Gap (m3/day)
Installed Capacity Gap (m3/day)
2006 644,570 0.08 51,565.60 61,878.72
2010 731,687.28 0.09 63,360.15 76,032.18
2018 942,836.41 0.10 95,659.56 114,791.48 47,407.00 74,207.00 67,384.48 40,584.48
2018+IDPs 1,462,836.41 0.10 148,418.42 178,102.11 47,407.00 74,207.00 130,695.11 103,895.11
4.1.5 Bridging the Gap
The first and the quickest way to bridge the Water Supply gap in Maiduguri
is to bring the Treatment Plant back to operating at its full installed
capacity of 67,000m3/day. This will presently reduce the gap by more than
half.
4.1.6 Immediate Intervention
The areas of immediate interventions that can lead to the optimization of
the Plant capacity are:
Clarifiers - replacing the trident pipes
Filter - replacement of the sand media (have not been changed in the
last five years and it is meant to be replaced every two years), Valve
air compressor is out of order
Chemical House - out of 12 chemical dosing pumps, only 1 is
functional therefore the entire chemical operation is now manually
done, the entire building housing the chemical chamber is dilapidated
as the roof is blown off.
Control Panels - the plant was designed to run as semi-automatic but
all the control panels are broken down and they run the plant now
manually, including the washing of the filter, chemical dosing etc
Storage - the storage reservoirs have not been washed since the
inception of the plant 25 years ago, slouching is now a challenge.
Staffing - the plant is short staffed, having 53 people doing the work
meant for 85 people.
Others - both the residential and administrative buildings are in need
of serious rehabilitation, provision of operation vehicles will also
boost productivity

.
18
Water Resource Management and Geo-Physical Survey in Selected Communities of Borno State
4.1.7 Medium to Long Term Intervention
The long term solution includes:
To bring the second phase of the Treatment Plant on board. From the
conception of the Treatment Plant, it was designed to be in 2 phases.
The present arrangement was meant to be the first phase while the
second phase was meant to come on board 10 years after the
completion of the first phase. The raw water supply pipe is already in
place (see Pic. 1 below) for the commencement of the construction
of the second phase. With another 67,000m3/day, the projected
demand can be adequately met.
Also, with a daily diesel consumption for the entire system estimated
at about 3,800 litres per day equivalent to N 950,000 or $2,650 (i.e.
N250 per Liter of diesel), it will be difficult for the system to sustain
itself. It was revealed during the assessment that each house hold, no
matter the size and water facilities in it pays a flat rate of N300 per
month as water tariff, this is grossly inadequate. In view of the
foregoing, a solar based technology to cater for the power need of
the plant is now proposed as a long term solution to effectively power
the plant with less running/maintenance cost.
A computerized billing and collection system that charges customers
based on consumption should be adopted to cater for an adequate
rate of return on investment.
If possible, the distribution Network and billing/collection section be
privatized with government and stakeholders agreeing on tariff rate
4.1.8 Costs of Intervention
The costs provided below are estimates for sole purpose of planning and not
for tendering. The tender costs can only be determined after detailed study
and evaluations.

.
19
Water Resource Management and Geo-Physical Survey in Selected Communities of Borno State
Table 4.6: Maiduguri: Preliminary cost estimate for Immediate Intervention
S/No
Item Description Unit Qty Rate (N) Amount (N)
1 Rehabilitation of Treatment Plant to install capacity
1,250,000,000.00
2 Rehabilitation of residential and administrative buildings
200,000,000.00
3
Construction of 200mm dia. boreholes complete with installation of pumps, accessories and power supply
No. 20 10,000,000.00
200,000,000.00
4 Leak detection studies, mapping and repairs on distribution Network
Lump sum 50,000,000.00
Sub Total 1,700,000,000.00
5 Preliminaries and Contingencies 15% 255,000,000.00
Total 1,955,000,000.00
Table 4.7: Maiduguri: Preliminary cost estimate for Medium to Long Term Intervention
S/No
Item Description Unit Qty Rate (N) Amount (N)
1 Construction Water Treatment Plant Phase II
26,000,000,000.00
2 Construction of Solar based power plant
5,000,000,000.00
3 Rehabilitation of residential and administrative buildings
200,000,000.00
4 Improvement on Transmission Mains and distribution networks
5,000,000,000.00
5 Leak detection studies, mapping and repairs on distribution Network
Lump sum 100,000,000.00
Sub Total 36,300,000,000.00
3,630,000,000.00 6 Preliminaries and Contingencies 10%
Total 39,930,000,000.00
4.1.9 Conclusions concerning Maiduguri
As the result of insurgency in the North-eastern part of Nigeria, Maiduguri
town has become the town with the largest IDPs concentration in the
country with IDP population hitting 1.3million in February 2016 (DTM Nigeria
Round VIII). As of May 2018 when this report was conducted, Maiduguri still
.
20
Water Resource Management and Geo-Physical Survey in Selected Communities of Borno State
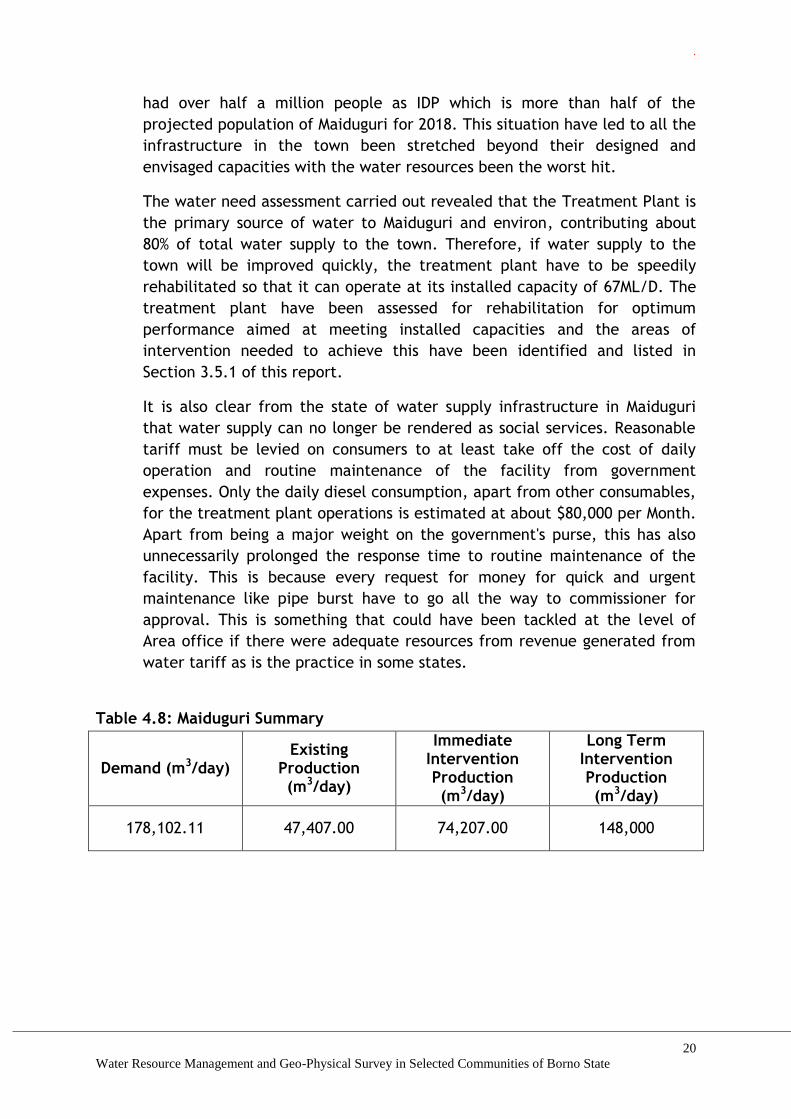
had over half a million people as IDP which is more than half of the
projected population of Maiduguri for 2018. This situation have led to all the
infrastructure in the town been stretched beyond their designed and
envisaged capacities with the water resources been the worst hit.
The water need assessment carried out revealed that the Treatment Plant is
the primary source of water to Maiduguri and environ, contributing about
80% of total water supply to the town. Therefore, if water supply to the
town will be improved quickly, the treatment plant have to be speedily
rehabilitated so that it can operate at its installed capacity of 67ML/D. The
treatment plant have been assessed for rehabilitation for optimum
performance aimed at meeting installed capacities and the areas of
intervention needed to achieve this have been identified and listed in
Section 3.5.1 of this report.
It is also clear from the state of water supply infrastructure in Maiduguri
that water supply can no longer be rendered as social services. Reasonable
tariff must be levied on consumers to at least take off the cost of daily
operation and routine maintenance of the facility from government
expenses. Only the daily diesel consumption, apart from other consumables,
for the treatment plant operations is estimated at about $80,000 per Month.
Apart from being a major weight on the government's purse, this has also
unnecessarily prolonged the response time to routine maintenance of the
facility. This is because every request for money for quick and urgent
maintenance like pipe burst have to go all the way to commissioner for
approval. This is something that could have been tackled at the level of
Area office if there were adequate resources from revenue generated from
water tariff as is the practice in some states.
Table 4.8: Maiduguri Summary
Demand (m3/day) Existing
Production (m3/day)
Immediate Intervention Production (m3/day)
Long Term Intervention Production (m3/day)
178,102.11 47,407.00 74,207.00 148,000
.
21
Water Resource Management and Geo-Physical Survey in Selected Communities of Borno State
4.2 BIU
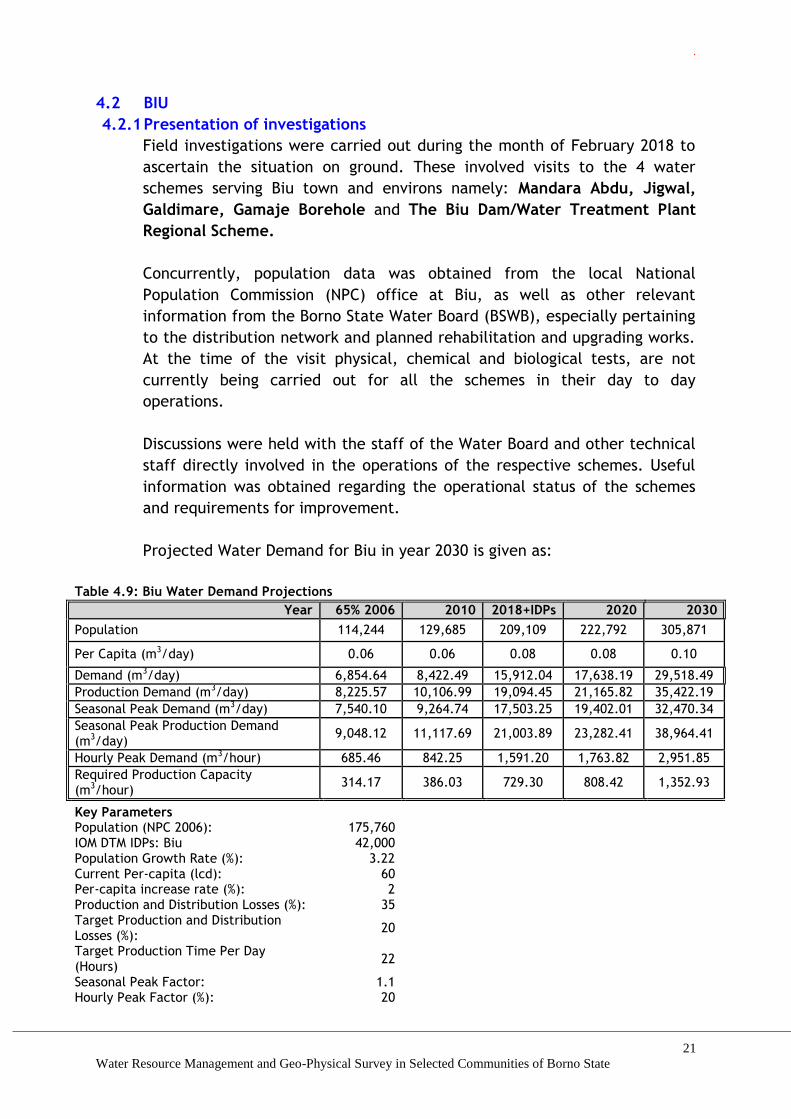
4.2.1 Presentation of investigations
Field investigations were carried out during the month of February 2018 to
ascertain the situation on ground. These involved visits to the 4 water
schemes serving Biu town and environs namely: Mandara Abdu, Jigwal,
Galdimare, Gamaje Borehole and The Biu Dam/Water Treatment Plant
Regional Scheme.
Concurrently, population data was obtained from the local National
Population Commission (NPC) office at Biu, as well as other relevant
information from the Borno State Water Board (BSWB), especially pertaining
to the distribution network and planned rehabilitation and upgrading works.
At the time of the visit physical, chemical and biological tests, are not
currently being carried out for all the schemes in their day to day
operations.
Discussions were held with the staff of the Water Board and other technical
staff directly involved in the operations of the respective schemes. Useful
information was obtained regarding the operational status of the schemes
and requirements for improvement.
Projected Water Demand for Biu in year 2030 is given as:
Table 4.9: Biu Water Demand Projections
Year 65% 2006 2010 2018+IDPs 2020 2030
Population 114,244 129,685 209,109 222,792 305,871
Per Capita (m3/day) 0.06 0.06 0.08 0.08 0.10
Demand (m3/day) 6,854.64 8,422.49 15,912.04 17,638.19 29,518.49
Production Demand (m3/day) 8,225.57 10,106.99 19,094.45 21,165.82 35,422.19
Seasonal Peak Demand (m3/day) 7,540.10 9,264.74 17,503.25 19,402.01 32,470.34
Seasonal Peak Production Demand (m3/day)
9,048.12 11,117.69 21,003.89 23,282.41 38,964.41
Hourly Peak Demand (m3/hour) 685.46 842.25 1,591.20 1,763.82 2,951.85
Required Production Capacity (m3/hour)
314.17 386.03 729.30 808.42 1,352.93
Key Parameters
Population (NPC 2006): 175,760
IOM DTM IDPs: Biu 42,000
Population Growth Rate (%): 3.22
Current Per-capita (lcd): 60
Per-capita increase rate (%): 2
Production and Distribution Losses (%): 35
Target Production and Distribution Losses (%):
20
Target Production Time Per Day (Hours)
22
Seasonal Peak Factor: 1.1
Hourly Peak Factor (%): 20
.
22
Water Resource Management and Geo-Physical Survey in Selected Communities of Borno State
4.2.2 Water works
Biu is presently supplied through 4 complementary schemes, all of which are
borehole based. These schemes are not all integrated but rather targeted to
supply specific areas of the town. Thus, not all the schemes are connected
to the main reticulation system.
These schemes are described individually hereunder.
A. Mandara Abdu Waterworks
B. Jigwal Waterworks
C. Galdimare Waterworks
D. Gamaje Waterworks
4.2.3 Mandara Abdu Waterworks
This is the largest scheme serving mainly the South Eastern part of town
(Zara mabbu,Tashan Danfulani and part of Emir Palace area).
I. Capacity
The scheme has an installed capacity of 36m3/hr (720 m3/day).
Based on our assessment, current production is estimated at only
28.8m3/hr (432m3/day) over an average 15 hours of operation.
II. Source/Intake
Raw water source is from 4 nos. 200mm dia. boreholes. All of these
boreholes are functional. Water is pumped directly into the
distribution networks.
III. Treatment Process
The raw water is considered of sufficient physical and chemical
quality by BSWB not to warrant any form of treatment. There is no
chlorination against potential contamination downstream along the
distribution network.
IV. Transmission
Water is pumped to town through a 200mm dia. AC riser main. This is
facilitated using 4nos. submersible pumps installs in the boreholes
each with H=100m Minimum. Only 2 out of the 4 are functional at
present. There is no surge protection along the transmission line.
Flow meters are not in place.
.
23
Water Resource Management and Geo-Physical Survey in Selected Communities of Borno State
V. Storage and Distribution
The distribution network comprises of a range of pipe sizes of 200mm,
150mm, 100mm, 75mm and 50mm dia. in combination of AC and uPvc
pipes. There are no storage reservoirs on the network.
VI. Water Quality
Raw water quality is satisfactory, considering that all the schemes are
borehole based, with no discernible source of contamination..
VII. System Efficiency:
System efficiency appears to be very low with an apparent wide gap
between production and effective supply to consumers. Discussions
with consumers indicate no supply at all to many areas meant to be
served by the network. Intermittent supply of water is reportedly
available only to consumers located very close to the main.
4.2.4 Jigwal Waterworks
This waterworks serves the southern and central section of the town (Jigwal
and part of Galdimare areas).
I. Capacity
The scheme has an installed capacity of 54m3/hr (1,080 m3/day at
20hour production). However, the survey has estimated current
production at only 38.0m3/hr (570 m3/day) over an average 15 hours
of operation.
II. Source/Intake
Raw water source is from 3nos. 200mm dia. boreholes. Of which all
are functional. Water is pumped directly into the distribution with no
balancing tank or reservoir.
III. Treatment Process
The raw water is considered of sufficient physical and chemical
quality by BSWB not to warrant any form of treatment. There is no
chlorination against potential contamination downstream along the
distribution network.
IV. Transmission
Water is pumped to town through a 200mm dia. AC riser main. This is
facilitated using 3nos. submersible pumps installs in the boreholes
each with Minimum H=94m. These pumps are all functional at
.
24
Water Resource Management and Geo-Physical Survey in Selected Communities of Borno State
present. There is no surge protection along the transmission line.
Flow meters are not in place.
V. Storage and Distribution
The distribution network comprises of a range of pipe sizes of 200mm,
150mm, 100mm, 75mm and 50mm dia. in combination of AC and uPvc
pipes. There are no storage reservoirs on the network.
VI. Water Quality
Raw water quality, both physical and chemical, is satisfactory,
considering that all the schemes are borehole based, with no
discernible source of contamination.
VII. System Efficiency
System efficiency appears to be very low with an apparent wide gap
between production and effective supply to consumers. Discussions
with consumers within the main part of the town in particular
indicate that households within that area have not received water
from the network in a long time and have had to resort to other
alternative means. Leakages along the distribution networks are
believed to further compound the system inefficiency.
4.2.5 Galdimare Waterworks
This waterworks serves the Eastern part of the town (Emir's Palace and Zara
wuyakwu areas).
I. Capacity
The scheme has an installed capacity of 14.40m3/hr. (288 m3/day at
20hour production) However, the survey has estimated current
production at only at 10.0m3/hr. Based on average 15 hours of
operation, the total production is 150m3/day.
II. Source/Intake
Raw water source is from 1no. 200mm dia. borehole. Water is
pumped directly into the distribution with no balancing tank or
reservoir.
III. Treatment Process
The raw water is considered of sufficient physical and chemical
quality by BSWB not to warrant any form of treatment. There is no
chlorination against potential contamination downstream along the
distribution network.

.
25
Water Resource Management and Geo-Physical Survey in Selected Communities of Borno State
IV. Transmission
Water is pumped to the town through a 200mm dia. AC riser main.
This is facilitated using 1no. Submersible pump install in the borehole
with Minimum H=94m. There is no surge protection along the
transmission line. Flow meter is not installed.
V. Storage and Distribution
The distribution network comprises of a range of pipe sizes of 150mm
100mm, 75mm and 50mm dia. in combination of AC and uPvc pipes.
There are no storage facilities on the network.
VI. Water Quality
Raw water quality is satisfactory, considering that all the schemes are
borehole based, with no discernible source of contamination.
VII. System Efficiency
Due to lack of consistent power supply, pumping is intermittent,
depending on the cycle of blackouts and availability of diesel to run
the standby generator. Most often, these generators serve as the
main source of power at considerable costs to the BSWB. It has not
been possible therefore, to achieve the desirable 22 hour continuous
pumping, the ideal situation for an urban settlement.
4.2.6 Gamaje Waterworks
This waterworks serves the Eastern part of the town (Zara Mirnga,Tashan
Gandu and Mbulamel).
I. Capacity
The scheme has an installed capacity of 21.6m3/hr. (432m3/day at
20hour production) However, at present it has estimated current
production of 17.5m3/hr. Based on a 9 hour operation per day, the
total production is 157.5m3/day.
II. Source/Intake
Raw water source is from 1no 200mm dia. Boreholes that is
functional. Water is pumped directly into the distribution with no
balancing tank or reservoir.
III. Treatment Process
The raw water is considered of sufficient physical and chemical
quality by BSWB not to warrant any form of treatment. There is no
.
26
Water Resource Management and Geo-Physical Survey in Selected Communities of Borno State
chlorination against potential contamination downstream along the
distribution network.
IV. Transmission
Water is pumped to the town through a 200mm dia. AC riser main.
This is facilitated using 1no. Submersible pump install in the borehole
with Minimum H=94m. There is no surge protection along the
transmission line. Flow meter is not installed.
V. Storage and Distribution
The distribution network comprises of a range of pipe sizes of 150mm
100mm, 75mm and 50mm dia. in combination of AC and uPvc pipes.
There are no storage facilities on the network.
VI. Water Quality
Raw water quality, both physical and chemical, is satisfactory,
considering that all the schemes are borehole based, with no
discernible source of contamination.
VII. System Efficiency
Due to lack of consistent power supply, pumping is intermittent,
depending on the cycle of blackouts and availability of diesel to run
the standby generators. Most often, these generators serve as the
main source of power at considerable costs to the BSWB. It has not
been possible therefore, to achieve the desirable 22 hour continuous
pumping, the ideal situation for an urban settlement.
4.2.7 Surface Water Resources
Surface water is available in significant quantities in rivers and tributaries
during the rainy season. As most of the rivers are thus seasonal,
rainfall/runoff can be harvested by the use of a dam as in the case of the
Biu Dam. The Biu dam as built has the following characteristics:
Type of Dam Earth-fill Dam
Dam Crest Length 300m
Dam Height 18.00m
Reservoir Capacity 11.1MCM
River Ndivana
Owner BSMWR/BSWB
.
27
Water Resource Management and Geo-Physical Survey in Selected Communities of Borno State
The Dam was designed and constructed to serve as the raw water supply to
the proposed Biu water treatment plant. At the time of writing this report
we could not establish contact with any of the FMWR staff on the project to
get the design capacity and level of completion of the WTP, but from our
visit to site (Pictures attached), works on the WTP will not be more than
25% completed.
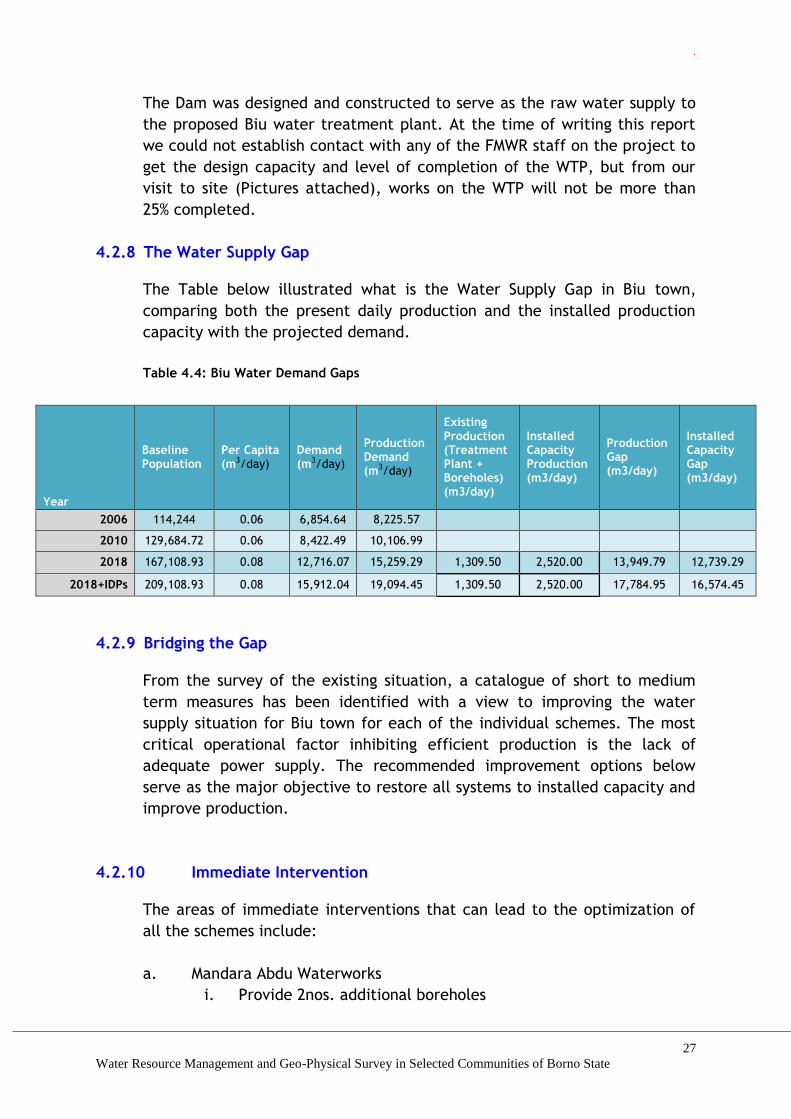
4.2.8 The Water Supply Gap
The Table below illustrated what is the Water Supply Gap in Biu town,
comparing both the present daily production and the installed production
capacity with the projected demand.
Table 4.4: Biu Water Demand Gaps
Year
Baseline Population
Per Capita (m3/day)
Demand (m3/day)
Production Demand (m3/day)
Existing Production (Treatment Plant + Boreholes) (m3/day)
Installed Capacity Production (m3/day)
Production Gap (m3/day)
Installed Capacity Gap (m3/day)
2006 114,244 0.06 6,854.64 8,225.57
2010 129,684.72 0.06 8,422.49 10,106.99
2018 167,108.93 0.08 12,716.07 15,259.29 1,309.50 2,520.00 13,949.79 12,739.29
2018+IDPs 209,108.93 0.08 15,912.04 19,094.45 1,309.50 2,520.00 17,784.95 16,574.45
4.2.9 Bridging the Gap
From the survey of the existing situation, a catalogue of short to medium
term measures has been identified with a view to improving the water
supply situation for Biu town for each of the individual schemes. The most
critical operational factor inhibiting efficient production is the lack of
adequate power supply. The recommended improvement options below
serve as the major objective to restore all systems to installed capacity and
improve production.
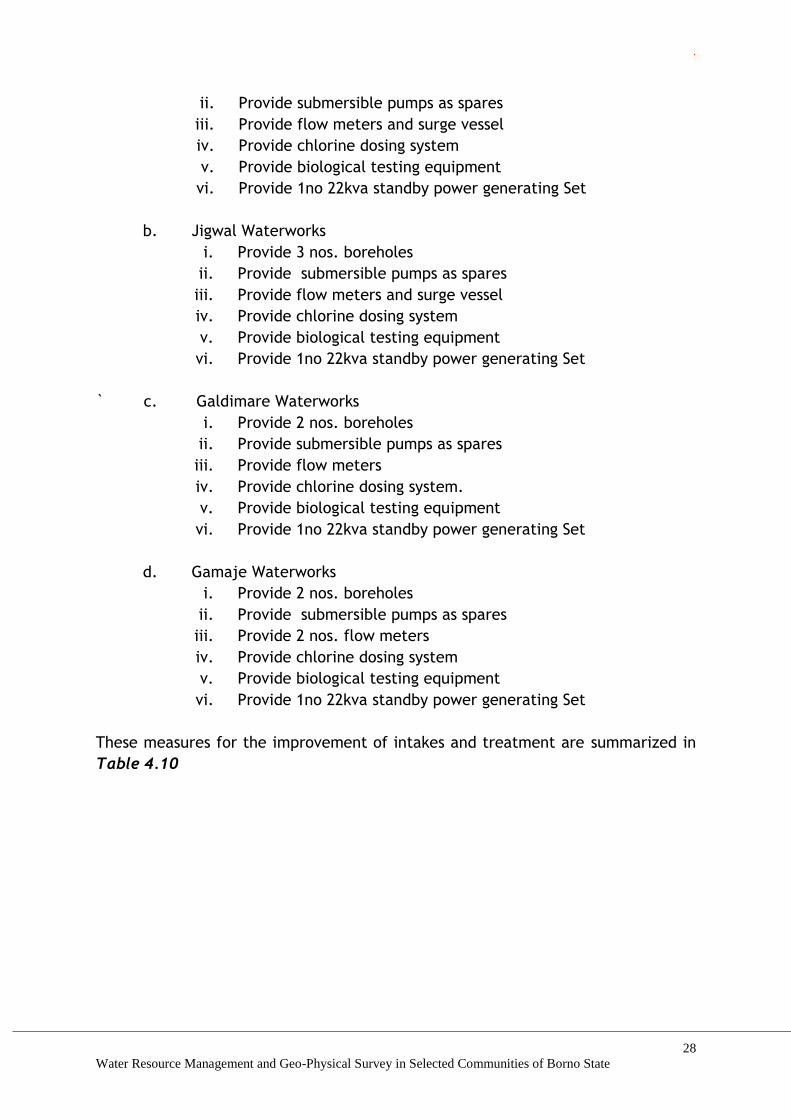
4.2.10 Immediate Intervention
The areas of immediate interventions that can lead to the optimization of
all the schemes include:
a. Mandara Abdu Waterworks
i. Provide 2nos. additional boreholes
.
28
Water Resource Management and Geo-Physical Survey in Selected Communities of Borno State
ii. Provide submersible pumps as spares
iii. Provide flow meters and surge vessel
iv. Provide chlorine dosing system
v. Provide biological testing equipment
vi. Provide 1no 22kva standby power generating Set
b. Jigwal Waterworks
i. Provide 3 nos. boreholes
ii. Provide submersible pumps as spares
iii. Provide flow meters and surge vessel
iv. Provide chlorine dosing system
v. Provide biological testing equipment
vi. Provide 1no 22kva standby power generating Set
` c. Galdimare Waterworks
i. Provide 2 nos. boreholes
ii. Provide submersible pumps as spares
iii. Provide flow meters
iv. Provide chlorine dosing system.
v. Provide biological testing equipment
vi. Provide 1no 22kva standby power generating Set
d. Gamaje Waterworks
i. Provide 2 nos. boreholes
ii. Provide submersible pumps as spares
iii. Provide 2 nos. flow meters
iv. Provide chlorine dosing system
v. Provide biological testing equipment
vi. Provide 1no 22kva standby power generating Set
These measures for the improvement of intakes and treatment are summarized in
Table 4.10
.
29
Water Resource Management and Geo-Physical Survey in Selected Communities of Borno State
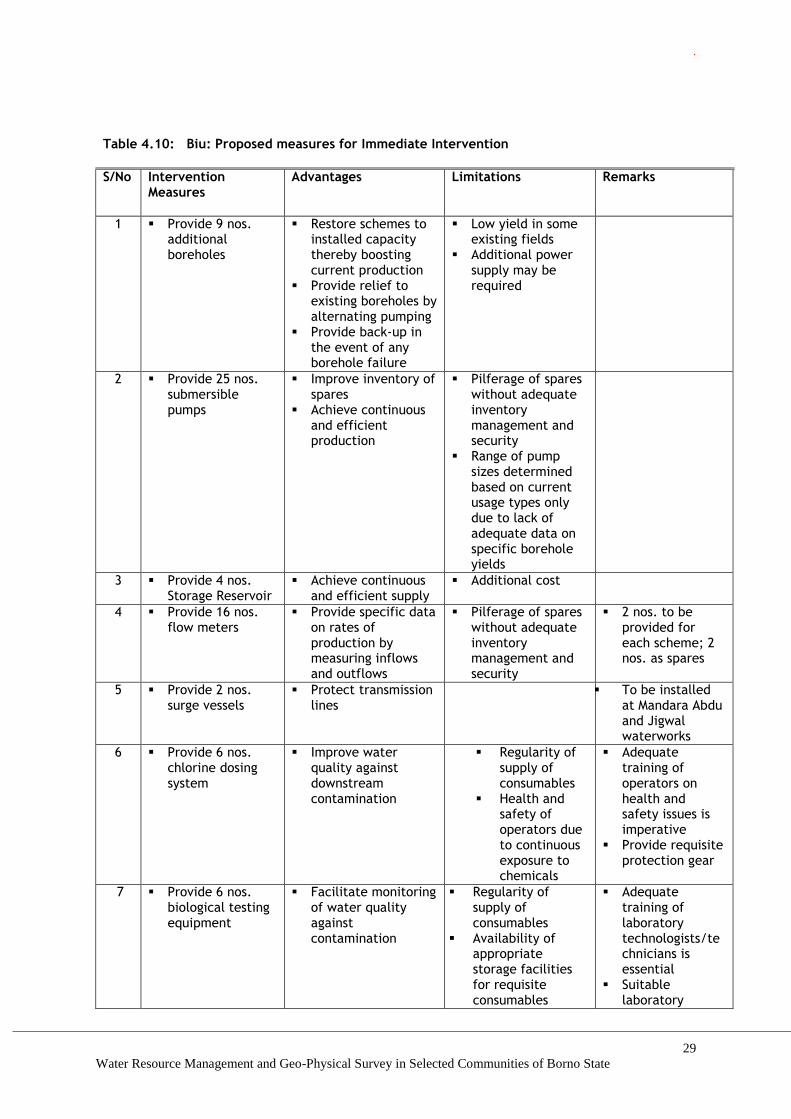
Table 4.10: Biu: Proposed measures for Immediate Intervention
S/No Intervention Measures
Advantages Limitations Remarks
1 Provide 9 nos. additional boreholes
Restore schemes to installed capacity thereby boosting current production
Provide relief to existing boreholes by alternating pumping
Provide back-up in the event of any borehole failure
Low yield in some existing fields
Additional power supply may be required
2 Provide 25 nos. submersible pumps
Improve inventory of spares
Achieve continuous and efficient production
Pilferage of spares without adequate inventory management and security
Range of pump sizes determined based on current usage types only due to lack of adequate data on specific borehole yields
3 Provide 4 nos. Storage Reservoir
Achieve continuous and efficient supply
Additional cost
4 Provide 16 nos. flow meters
Provide specific data on rates of production by measuring inflows and outflows
Pilferage of spares without adequate inventory management and security
2 nos. to be provided for each scheme; 2 nos. as spares
5 Provide 2 nos. surge vessels
Protect transmission lines
To be installed at Mandara Abdu and Jigwal waterworks
6 Provide 6 nos. chlorine dosing system
Improve water quality against downstream contamination
Regularity of supply of consumables
Health and safety of operators due to continuous exposure to chemicals
Adequate training of operators on health and safety issues is imperative
Provide requisite protection gear
7 Provide 6 nos. biological testing equipment
Facilitate monitoring of water quality against contamination
Regularity of supply of consumables
Availability of appropriate storage facilities for requisite consumables
Adequate training of laboratory technologists/technicians is essential
Suitable laboratory

.
30
Water Resource Management and Geo-Physical Survey in Selected Communities of Borno State
Availability of relevant skills and know-how
buildings and storage facilities are required
8 Leak detection, repairs and mapping of distribution network
More efficient distribution, especially with increased production at source. Will also increase output to consumers by reducing leakages and waste.
Protection of pipelines against potential contaminants
Mapping will facilitate adequate information and therefore better planning and management of the network
Requires special expertise and equipment
An essential component of any water supply intervention measure for Biu
9 Provide assorted circuit breakers, contactors and overload relays
Improve inventory of spares
Achieve continuous and efficient production
Pilferage of spares without adequate inventory management and security
4.2.11 Medium to Long Term intervention
With the Biu Dam in place with a capacity of about 11.1MCM which is a
sufficient source of raw water to the treatment plant. The long term
solution will be to complete the construction of the Biu Water Treatment
Plant (20,000m3/day) which is on-going.
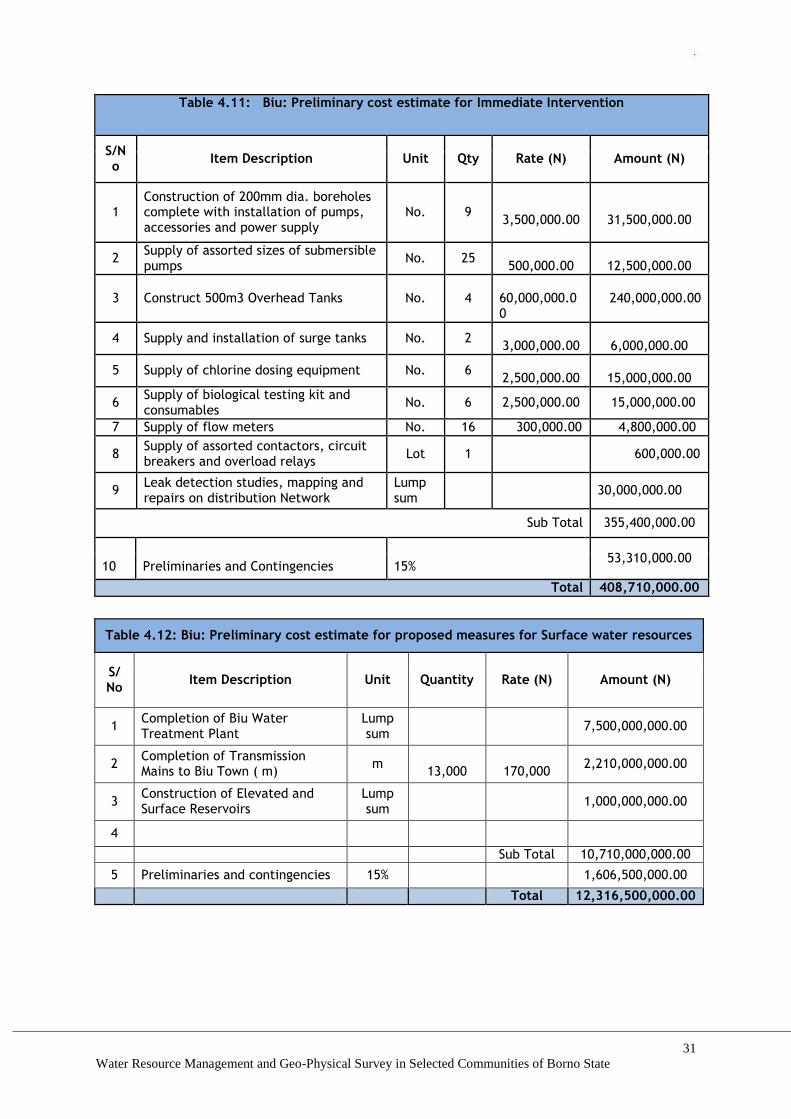
4.2.12 Preliminary cost estimates
Preliminary cost estimates are given for each of the recommended
interventions in a tabulated form. A lump sum is given for some aspects
because they will require detailed field measurements and the scope of
some may be expanded or narrowed.
.
31
Water Resource Management and Geo-Physical Survey in Selected Communities of Borno State
Table 4.11: Biu: Preliminary cost estimate for Immediate Intervention
S/No
Item Description Unit Qty Rate (N) Amount (N)
1 Construction of 200mm dia. boreholes complete with installation of pumps, accessories and power supply
No. 9
3,500,000.00
31,500,000.00
2 Supply of assorted sizes of submersible pumps
No. 25
500,000.00
12,500,000.00
3 Construct 500m3 Overhead Tanks No. 4 60,000,000.00
240,000,000.00
4 Supply and installation of surge tanks No. 2
3,000,000.00
6,000,000.00
5 Supply of chlorine dosing equipment No. 6
2,500,000.00
15,000,000.00
6 Supply of biological testing kit and consumables
No. 6 2,500,000.00 15,000,000.00
7 Supply of flow meters No. 16 300,000.00 4,800,000.00
8 Supply of assorted contactors, circuit breakers and overload relays
Lot 1 600,000.00
9 Leak detection studies, mapping and repairs on distribution Network
Lump sum
30,000,000.00
Sub Total 355,400,000.00
53,310,000.00
10 Preliminaries and Contingencies 15%
Total 408,710,000.00
Table 4.12: Biu: Preliminary cost estimate for proposed measures for Surface water resources
S/ No
Item Description Unit Quantity Rate (N) Amount (N)
1 Completion of Biu Water Treatment Plant
Lump sum
7,500,000,000.00
2 Completion of Transmission Mains to Biu Town ( m)
m
13,000
170,000 2,210,000,000.00
3 Construction of Elevated and Surface Reservoirs
Lump sum
1,000,000,000.00
4
Sub Total 10,710,000,000.00
5 Preliminaries and contingencies 15% 1,606,500,000.00
Total 12,316,500,000.00
.
32
Water Resource Management and Geo-Physical Survey in Selected Communities of Borno State
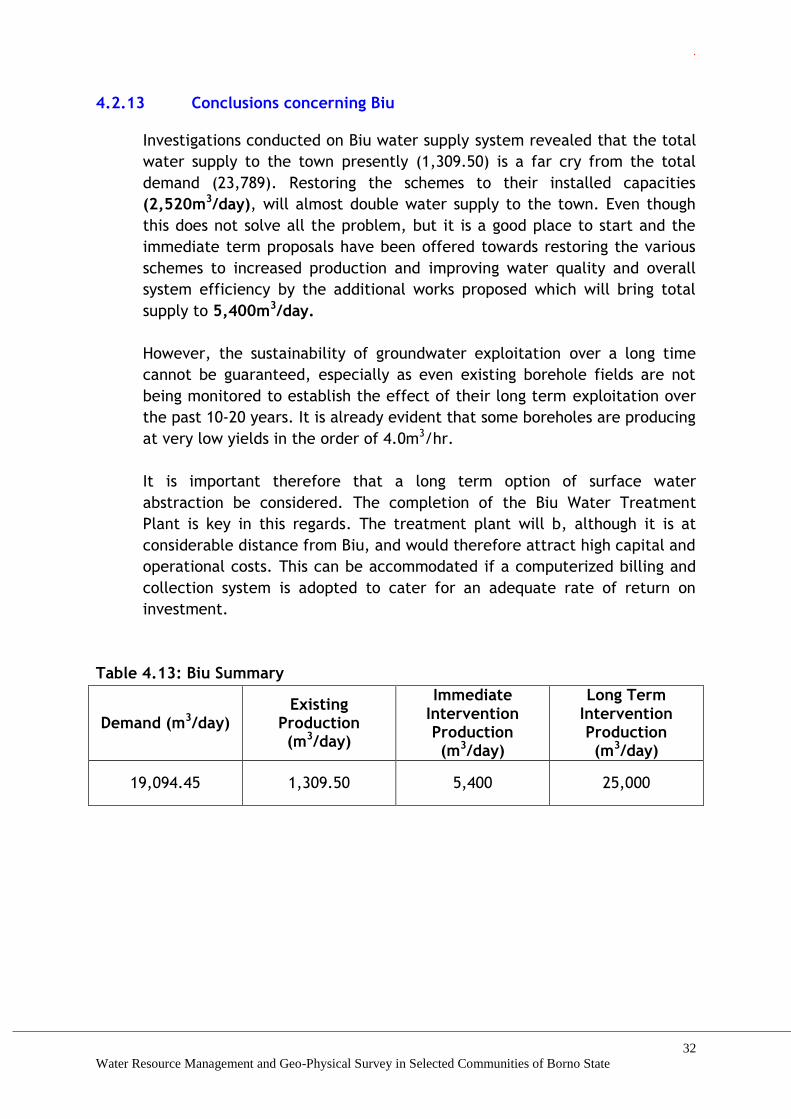
4.2.13 Conclusions concerning Biu
Investigations conducted on Biu water supply system revealed that the total
water supply to the town presently (1,309.50) is a far cry from the total
demand (23,789). Restoring the schemes to their installed capacities
(2,520m3/day), will almost double water supply to the town. Even though
this does not solve all the problem, but it is a good place to start and the
immediate term proposals have been offered towards restoring the various
schemes to increased production and improving water quality and overall
system efficiency by the additional works proposed which will bring total
supply to 5,400m3/day.
However, the sustainability of groundwater exploitation over a long time
cannot be guaranteed, especially as even existing borehole fields are not
being monitored to establish the effect of their long term exploitation over
the past 10-20 years. It is already evident that some boreholes are producing
at very low yields in the order of 4.0m3/hr.
It is important therefore that a long term option of surface water
abstraction be considered. The completion of the Biu Water Treatment
Plant is key in this regards. The treatment plant will b, although it is at
considerable distance from Biu, and would therefore attract high capital and
operational costs. This can be accommodated if a computerized billing and
collection system is adopted to cater for an adequate rate of return on
investment.
Table 4.13: Biu Summary
Demand (m3/day) Existing
Production (m3/day)
Immediate Intervention Production (m3/day)
Long Term Intervention Production (m3/day)
19,094.45 1,309.50 5,400 25,000
.
33
Water Resource Management and Geo-Physical Survey in Selected Communities of Borno State
4.3 BAMA
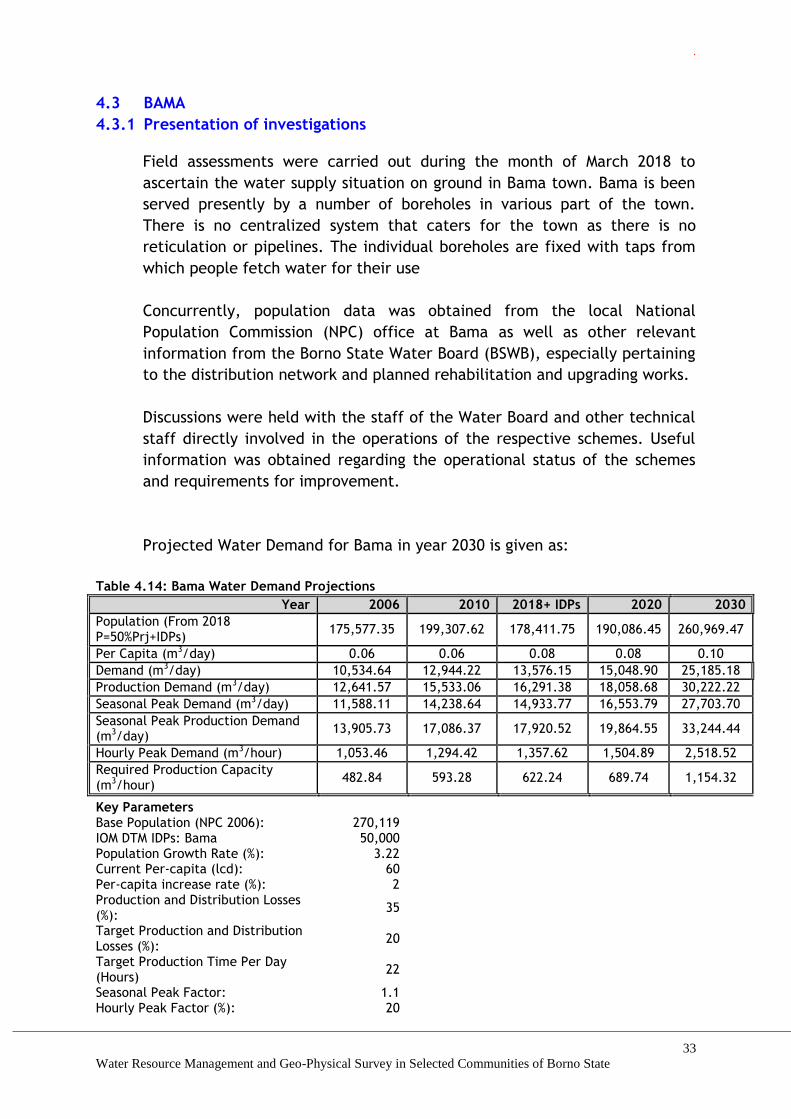
4.3.1 Presentation of investigations
Field assessments were carried out during the month of March 2018 to
ascertain the water supply situation on ground in Bama town. Bama is been
served presently by a number of boreholes in various part of the town.
There is no centralized system that caters for the town as there is no
reticulation or pipelines. The individual boreholes are fixed with taps from
which people fetch water for their use
Concurrently, population data was obtained from the local National
Population Commission (NPC) office at Bama as well as other relevant
information from the Borno State Water Board (BSWB), especially pertaining
to the distribution network and planned rehabilitation and upgrading works.
Discussions were held with the staff of the Water Board and other technical
staff directly involved in the operations of the respective schemes. Useful
information was obtained regarding the operational status of the schemes
and requirements for improvement.
Projected Water Demand for Bama in year 2030 is given as:
Table 4.14: Bama Water Demand Projections Year 2006 2010 2018+ IDPs 2020 2030
Population (From 2018 P=50%Prj+IDPs)
175,577.35 199,307.62 178,411.75 190,086.45 260,969.47
Per Capita (m3/day) 0.06 0.06 0.08 0.08 0.10
Demand (m3/day) 10,534.64 12,944.22 13,576.15 15,048.90 25,185.18
Production Demand (m3/day) 12,641.57 15,533.06 16,291.38 18,058.68 30,222.22
Seasonal Peak Demand (m3/day) 11,588.11 14,238.64 14,933.77 16,553.79 27,703.70
Seasonal Peak Production Demand (m3/day)
13,905.73 17,086.37 17,920.52 19,864.55 33,244.44
Hourly Peak Demand (m3/hour) 1,053.46 1,294.42 1,357.62 1,504.89 2,518.52
Required Production Capacity (m3/hour)
482.84 593.28 622.24 689.74 1,154.32
Key Parameters
Base Population (NPC 2006): 270,119
IOM DTM IDPs: Bama 50,000
Population Growth Rate (%): 3.22
Current Per-capita (lcd): 60
Per-capita increase rate (%): 2
Production and Distribution Losses (%):
35
Target Production and Distribution Losses (%):
20
Target Production Time Per Day (Hours)
22
Seasonal Peak Factor: 1.1
Hourly Peak Factor (%): 20

.
34
Water Resource Management and Geo-Physical Survey in Selected Communities of Borno State
4.3.2 Water works
Bama is presently supplied through arrays of motorized boreholes as shown below. These schemes are not all integrated but rather targeted to supply specific areas of the town, thus, not all the schemes are connected to the main reticulation system
At the time of the visit physical, chemical and biological tests, are not currently being carried out for all the schemes in their day to day operations. There are twenty six (26) motorized/solar functional boreholes. Seven (7) of the motorized/solar boreholes are out of use.
Table 4.15: Borehole Scheme within Bama Town
S/N Ward Location Hand Pump
Motorized /Solar
NF F
1. Shehuri Goniri Road 1 1
Goniri Road II 1 1
Blind Street 1 1
Fato Sandi 1 1
Old Bama 1 1
Abuja I 1 1
Abuja II 1 1
GRA I 1 1
GRA II 1 1
Gwange I 1 1
Gwange II 1 1
Custom 1 1
New York 1 1
New York II 1 1
Kaigamari 1 1
2. Kusugula Bololo Village I 1 1
Bololo Village II 1 1
Kasugula I 1 1
Kasugula II 1 1
Kasugula Fulatari 1 1
Malarima 1 1
Malarima II 1 1
Gulumba Road 1 1
Shuwari 1 1
Bukar Tela 1 1
Bukar Tela II 1 1
Bukar Tela III 1 1
SDWA – A 1 1
Bulama Bashir 1 1
New Yobe I 1 1
New Yobe II 1 1
Molai I 1 1
Molai II 1 1
TOTAL 33 7 26

.
35
Water Resource Management and Geo-Physical Survey in Selected Communities of Borno State
4.3.3 Present Supply Capacity
Capacity
The water supply system presently have 26 functional motorized boreholes.
The observed yield of the boreholes in Bama is given as:
Motorized = 5l/s
For Motorized boreholes, the total yield is
5 x 26 = 130
Assuming 8hrs of pumping
130 x 60 x 60 x 8
= 3,744,000L per day
= 3,744m3/day
The total capacity of water supply scheme to Bama presently by these
boreholes is 3,744m3/Day
Storage and Distribution
There are two significant storage reservoirs on the system, one at Mbusube
ward around sport center having a capacity of about 60m3 and the other at
GRA having a capacity of 460m3. Of importance to the system is the GRA
Scheme which has GRA I and GRA II Boreholes with a 460m3 braithwaite
elevated steel tank but out of use for the past 12years. The sport center
tank is currently underutilized due to leakage
The distribution network comprises of a range of pipe sizes of 150mm,
100mm and 75mm dia. in combination of DI, AC and uPvc pipes.
Water Quality
Raw water quality is satisfactory, considering that all the schemes are
borehole based, with no discernible source of contamination.
System Efficiency:
System efficiency appears to be very low with an apparent wide gap
between production and effective supply to consumers. . Discussions with a
staff of BSWB indicate that households within the town have not received
water from the network in a long time and have had to resort to other
alternative means. Leakages along the distribution networks are believed to
.
36
Water Resource Management and Geo-Physical Survey in Selected Communities of Borno State
further compound the system inefficiency. Areas where is no storage and
distribution, people have to come and queue up at the borehole location to
get water.
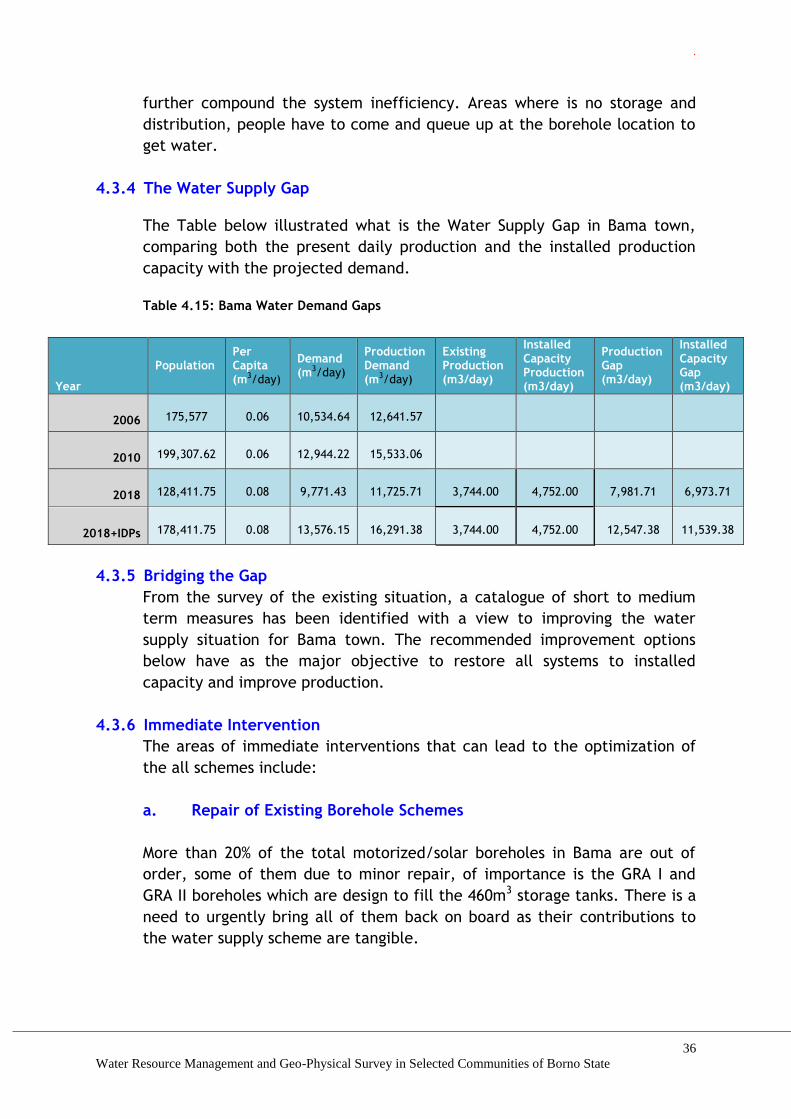
4.3.4 The Water Supply Gap
The Table below illustrated what is the Water Supply Gap in Bama town,
comparing both the present daily production and the installed production
capacity with the projected demand.
Table 4.15: Bama Water Demand Gaps
Year
Population Per Capita (m3/day)
Demand (m3/day)
Production Demand (m3/day)
Existing Production (m3/day)
Installed Capacity Production (m3/day)
Production Gap (m3/day)
Installed Capacity Gap (m3/day)
2006 175,577 0.06 10,534.64 12,641.57
2010 199,307.62 0.06 12,944.22 15,533.06
2018 128,411.75 0.08 9,771.43 11,725.71 3,744.00 4,752.00 7,981.71 6,973.71
2018+IDPs 178,411.75 0.08 13,576.15 16,291.38 3,744.00 4,752.00 12,547.38 11,539.38
4.3.5 Bridging the Gap
From the survey of the existing situation, a catalogue of short to medium
term measures has been identified with a view to improving the water
supply situation for Bama town. The recommended improvement options
below have as the major objective to restore all systems to installed
capacity and improve production.
4.3.6 Immediate Intervention
The areas of immediate interventions that can lead to the optimization of
the all schemes include:
a. Repair of Existing Borehole Schemes
More than 20% of the total motorized/solar boreholes in Bama are out of
order, some of them due to minor repair, of importance is the GRA I and
GRA II boreholes which are design to fill the 460m3 storage tanks. There is a
need to urgently bring all of them back on board as their contributions to
the water supply scheme are tangible.
.
37
Water Resource Management and Geo-Physical Survey in Selected Communities of Borno State
b. Drilling of more Boreholes
Even though the sustainability of groundwater exploitation over a long time
cannot be guaranteed, it still remains the most feasible option to improving
water supply within the shortest time possible.
Therefore an interconnected and reticulated deep boreholes spread over the
town will bring an improvement into the water supply of the town within a
short time and provide relief to existing boreholes by alternating pumping.
With the yield for deep boreholes in Bama, twelve (12) additional deep
boreholes (final depth depend on geophysical survey) in Bama will go a long
way in bridging the gap in water supply to Bama.
There is also a need to put up a deliberate programme to monitor
groundwater exploitation so as to increase the effectiveness of these
projects and increase their life span.
c. Repair of Existing Storage Facilities
This option goes hand in hand with the drilling of additional boreholes. The
idea is to rehabilitate or reactivate storage reservoirs within the system,
this will sustain supply throughout the night and/or time when pumping is
limited.
4.3.7 Medium to Long Term intervention
In an event that about 80% of Bama initial inhabitant returns, there might
be a need to look at the possibility of harnessing surface water to augment
water supply to Bama.
The major river close enough to Bama for harnessing is the Yadsaram River.
Yadsaram is one of the major tributary that feeds Lake Chad in the North-
eastern part of Nigeria.
A floating intake on the River will be fed into Package Treatment Plants and
from there serve the future need of Bama town.
4.3.8 Preliminary cost estimates
Preliminary cost estimates are given for each of the recommended
interventions in a tabulated form. A lump sum is given for some aspects
because they will require detailed field measurements and the scope of
some may be expanded or narrowed.
.
38
Water Resource Management and Geo-Physical Survey in Selected Communities of Borno State
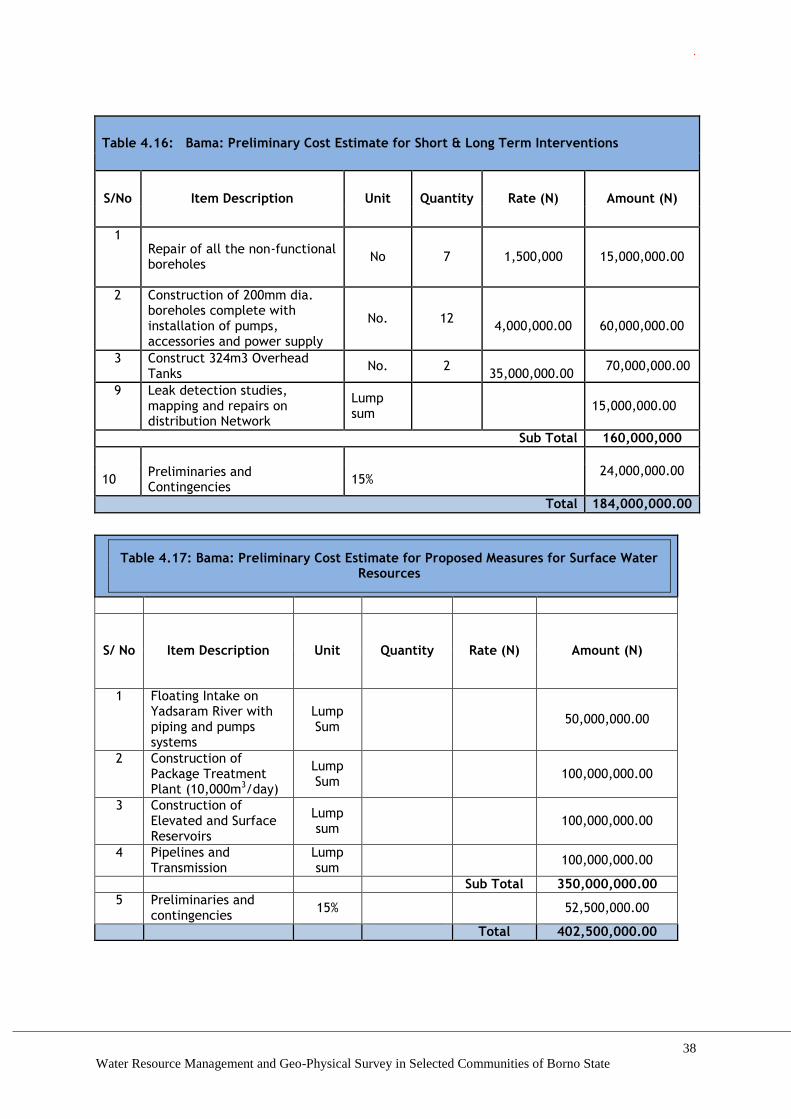
Table 4.16: Bama: Preliminary Cost Estimate for Short & Long Term Interventions
S/No Item Description Unit Quantity Rate (N) Amount (N)
1 Repair of all the non-functional boreholes
No 7 1,500,000 15,000,000.00
2 Construction of 200mm dia. boreholes complete with installation of pumps, accessories and power supply
No. 12
4,000,000.00
60,000,000.00
3 Construct 324m3 Overhead Tanks
No. 2 35,000,000.00
70,000,000.00
9 Leak detection studies, mapping and repairs on distribution Network
Lump sum
15,000,000.00
Sub Total 160,000,000
24,000,000.00 10
Preliminaries and Contingencies
15%
Total 184,000,000.00
Table 4.17: Bama: Preliminary Cost Estimate for Proposed Measures for Surface Water Resources
S/ No Item Description Unit Quantity Rate (N) Amount (N)
1 Floating Intake on Yadsaram River with piping and pumps systems
Lump Sum
50,000,000.00
2 Construction of Package Treatment Plant (10,000m3/day)
Lump Sum
100,000,000.00
3 Construction of Elevated and Surface Reservoirs
Lump sum
100,000,000.00
4 Pipelines and Transmission
Lump sum
100,000,000.00
Sub Total 350,000,000.00
5 Preliminaries and contingencies
15% 52,500,000.00
Total 402,500,000.00
.
39
Water Resource Management and Geo-Physical Survey in Selected Communities of Borno State
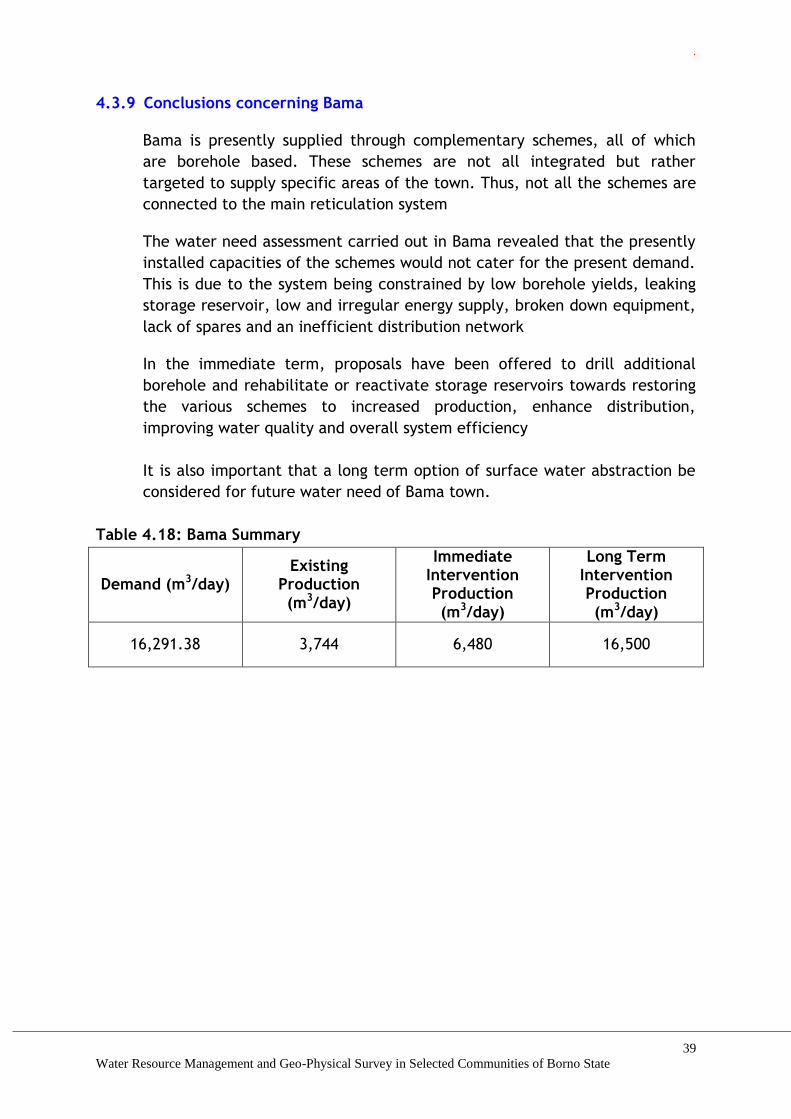
4.3.9 Conclusions concerning Bama
Bama is presently supplied through complementary schemes, all of which
are borehole based. These schemes are not all integrated but rather
targeted to supply specific areas of the town. Thus, not all the schemes are
connected to the main reticulation system
The water need assessment carried out in Bama revealed that the presently
installed capacities of the schemes would not cater for the present demand.
This is due to the system being constrained by low borehole yields, leaking
storage reservoir, low and irregular energy supply, broken down equipment,
lack of spares and an inefficient distribution network
In the immediate term, proposals have been offered to drill additional
borehole and rehabilitate or reactivate storage reservoirs towards restoring
the various schemes to increased production, enhance distribution,
improving water quality and overall system efficiency
It is also important that a long term option of surface water abstraction be
considered for future water need of Bama town.
Table 4.18: Bama Summary
Demand (m3/day) Existing
Production (m3/day)
Immediate Intervention Production (m3/day)
Long Term Intervention Production (m3/day)
16,291.38 3,744 6,480 16,500

.
40
Water Resource Management and Geo-Physical Survey in Selected Communities of Borno State
4.4 ASKIRA
4.4.1 Presentation of investigations
Field assessments were carried out during the month of March 2018 to
ascertain the water supply situation on ground in Askira town. Askira is been
served presently by a number of boreholes in various part of the town.
There is no centralized system that cater for the town even though some of
the boreholes are reticulated. There are also some individual boreholes with
battery of taps near them for people to fetch water for their use.
Concurrently, population data was obtained from the local National
Population Commission (NPC) office at Askira as well as other relevant
information from the Borno State Water Board (BSWB), especially pertaining
to the distribution network and planned rehabilitation and upgrading works.
Discussions were held with the staff of the Water Board and other technical
staff directly involved in the operations of the respective schemes. Useful
information was obtained regarding the operational status of the schemes
and requirements for improvement.
Projected Water Demand for Askira in year 2030 is given as:
Table 4.19: Askira Water Demand Projections Year 2006 2010 2018+IDPs 2020 2030
Population (50% of LGA Population) 71,656.50 81,341.28 107,814.62 114,869.66 157,704.43
Per Capita (m3/day) 0.06 0.06 0.08 0.08 0.10
Demand (m3/day) 4,299.39 5,282.79 8,204.10 9,094.08 15,219.46
Production Demand (m3/day) 5,159.27 6,339.34 9,844.92 10,912.90 18,263.35
Seasonal Peak Demand (m3/day) 4,729.33 5,811.06 9,024.51 10,003.49 16,741.41
Seasonal Peak Production Demand (m3/day)
5,675.19 6,973.28 10,829.41 12,004.19 20,089.69
Hourly Peak Demand (m3/hour) 429.94 528.28 820.41 909.41 1,521.95
Required Production Capacity (m3/hour)
197.06 242.13 376.02 416.81 697.56
Key Parameters
Base Population (NPC 2006): 143,313
IOM DTM IDPs: Damboa 3,000
Population Growth Rate (%): 3.22
Current Per-capita (lcd): 60
Per-capita increase rate (%): 2
Production and Distribution Losses (%):
35
Target Production and Distribution Losses (%):
20
Target Production Time Per Day (Hours)
22
Seasonal Peak Factor: 1.1
Hourly Peak Factor (%): 20

.
41
Water Resource Management and Geo-Physical Survey in Selected Communities of Borno State
4.4.2 Water works
Askira is presently supplied through arrays of motorized and solar powered
boreholes as shown below. As of the time of visit, there are eleven (11)
motorized/solar boreholes. Eight (8) of the motorized/solar boreholes are
out of use.
These schemes are not all integrated but rather targeted to supply specific
areas of the town.
Table 4.20: Borehole in Askira Town
LOCATION OF THE BOREHOE FUNCTIONAL NONE FUNCTIONAL SYSTEM
Low-cost Functional Motorized
Anguwar gabar Non Functional Motorized
Federal Lowcost Non Functional Motorized
General Hospital Non Functional Motorized
Zadawa Pry school Non Functional Motorized
Bolori behind secretariat Non Functional Motorized
Zadawa New borehole Non Functional Motorized
Zadawa Behind cattle market Functional Solar
Bilawafi Market Functional Solar
GSS Askira Non Functional Motorized
Police Barracks Non Functional Motorized
TOTAL 3 8
4.4.3 Present Supply Capacity
Capacity
The water supply system presently have 3 functional motorized boreholes
out of 11 borehole meant to be serving the town.
The observed yield of the boreholes are given as:
Motorized = 1.5l/s
For Motorized boreholes, the total yield is
1.5 x 3 = 4.5
Assuming 8hrs of pumping
4.5 x 60 x 60 x 8
= 129,600L
= 129m3
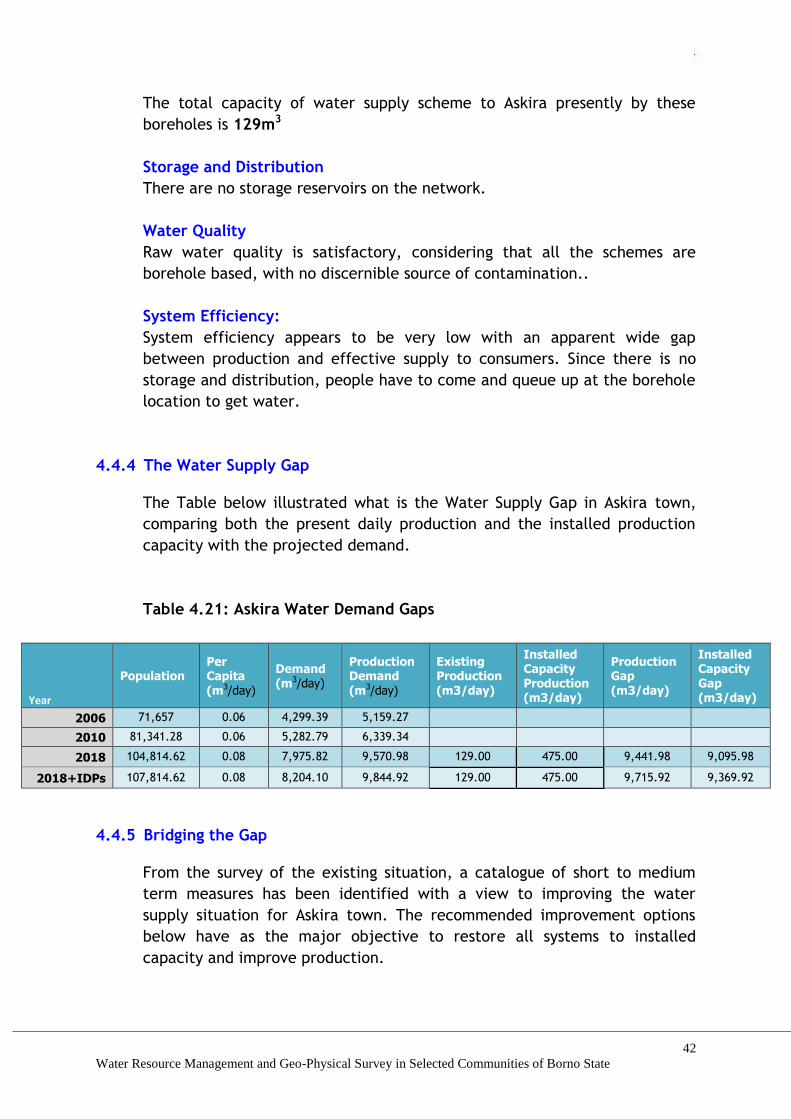
.
42
Water Resource Management and Geo-Physical Survey in Selected Communities of Borno State
The total capacity of water supply scheme to Askira presently by these
boreholes is 129m3
Storage and Distribution
There are no storage reservoirs on the network.
Water Quality
Raw water quality is satisfactory, considering that all the schemes are
borehole based, with no discernible source of contamination..
System Efficiency:
System efficiency appears to be very low with an apparent wide gap
between production and effective supply to consumers. Since there is no
storage and distribution, people have to come and queue up at the borehole
location to get water.
4.4.4 The Water Supply Gap
The Table below illustrated what is the Water Supply Gap in Askira town,
comparing both the present daily production and the installed production
capacity with the projected demand.
Table 4.21: Askira Water Demand Gaps
Year
Population Per Capita (m3/day)
Demand (m3/day)
Production Demand (m3/day)
Existing Production (m3/day)
Installed Capacity Production (m3/day)
Production Gap (m3/day)
Installed Capacity Gap (m3/day)
2006 71,657 0.06 4,299.39 5,159.27
2010 81,341.28 0.06 5,282.79 6,339.34
2018 104,814.62 0.08 7,975.82 9,570.98 129.00 475.00 9,441.98 9,095.98
2018+IDPs 107,814.62 0.08 8,204.10 9,844.92 129.00 475.00 9,715.92 9,369.92
4.4.5 Bridging the Gap
From the survey of the existing situation, a catalogue of short to medium
term measures has been identified with a view to improving the water
supply situation for Askira town. The recommended improvement options
below have as the major objective to restore all systems to installed
capacity and improve production.
.
43
Water Resource Management and Geo-Physical Survey in Selected Communities of Borno State
4.4.6 Immediate Intervention
The areas of immediate interventions that can lead to the optimization of
the all schemes include:
a. Repair of Existing Boreholes
Less than 30% of the total motorized/solar boreholes in Askira are functional
leaving the bulk of them (70%) out of order, some of them due to minor
repair. There is a need to urgently bring all of them back on board as their
contributions to the water supply scheme is tangible.
b. Drilling of more Boreholes
This option is the next most feasible to improve water supply in the town.
Interconnected and reticulated 10 deep (final depth depend on geophysical
survey) boreholes spread over the town will bring an improvement into the
water supply of the town within a short time.
4.4.7 Medium to Long Term intervention
With a production gap of almost 10,000m3 per day in Askira as of 2018,
there is a need to look towards the possibility of harnessing surface water
for water supply to Askira.
River Gatamarua provides a very good source of surface water that can be
harnessed for water supply after thorough study and evaluation. River
Gatamarua is one of the tributary that supplies River Tum, a tributary of
River Hawul which empties into Benue River
A dam of about 10m high on the river can serve as raw water source to a
package treatment plant to serve Askira.
4.4.8 Preliminary cost estimates
Preliminary cost estimates are given for each of the recommended
interventions in a tabulated form. A lump sum is given for some aspects
because they will require detailed field measurements and the scope of
some may be expanded or narrowed.
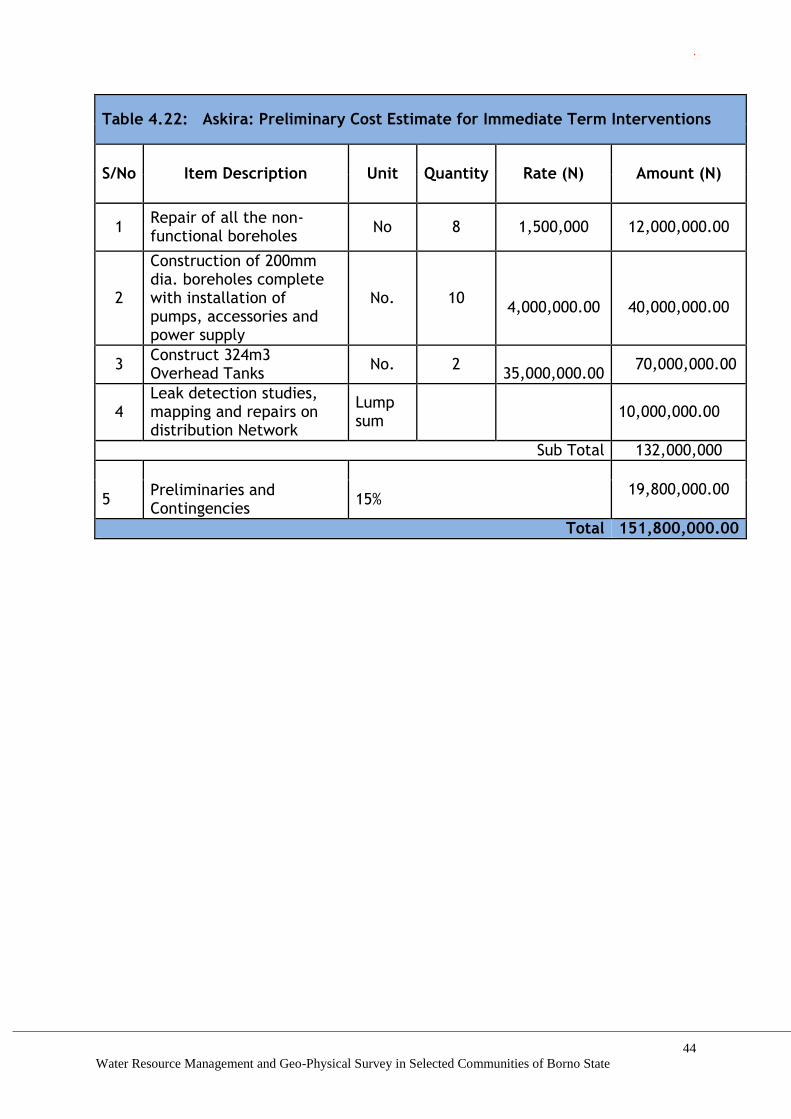
.
44
Water Resource Management and Geo-Physical Survey in Selected Communities of Borno State
Table 4.22: Askira: Preliminary Cost Estimate for Immediate Term Interventions
S/No Item Description Unit Quantity Rate (N) Amount (N)
1 Repair of all the non-functional boreholes
No 8 1,500,000 12,000,000.00
2
Construction of 200mm dia. boreholes complete with installation of pumps, accessories and power supply
No. 10
4,000,000.00
40,000,000.00
3 Construct 324m3 Overhead Tanks
No. 2 35,000,000.00
70,000,000.00
4 Leak detection studies, mapping and repairs on distribution Network
Lump sum
10,000,000.00
Sub Total 132,000,000
19,800,000.00 5
Preliminaries and Contingencies
15%
Total 151,800,000.00
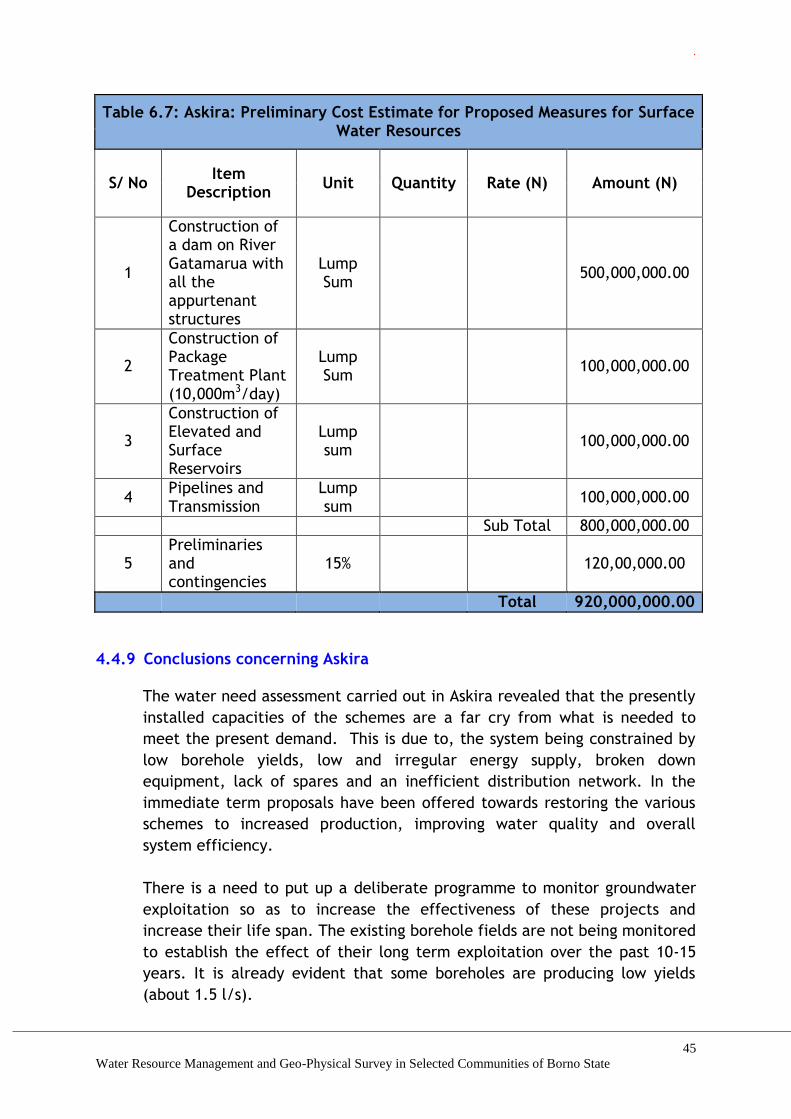
.
45
Water Resource Management and Geo-Physical Survey in Selected Communities of Borno State
Table 6.7: Askira: Preliminary Cost Estimate for Proposed Measures for Surface Water Resources
S/ No Item
Description Unit Quantity Rate (N) Amount (N)
1
Construction of a dam on River Gatamarua with all the appurtenant structures
Lump Sum
500,000,000.00
2
Construction of Package Treatment Plant (10,000m3/day)
Lump Sum
100,000,000.00
3
Construction of Elevated and Surface Reservoirs
Lump sum
100,000,000.00
4 Pipelines and Transmission
Lump sum
100,000,000.00
Sub Total 800,000,000.00
5 Preliminaries and contingencies
15% 120,00,000.00
Total 920,000,000.00
4.4.9 Conclusions concerning Askira
The water need assessment carried out in Askira revealed that the presently
installed capacities of the schemes are a far cry from what is needed to
meet the present demand. This is due to, the system being constrained by
low borehole yields, low and irregular energy supply, broken down
equipment, lack of spares and an inefficient distribution network. In the
immediate term proposals have been offered towards restoring the various
schemes to increased production, improving water quality and overall
system efficiency.
There is a need to put up a deliberate programme to monitor groundwater
exploitation so as to increase the effectiveness of these projects and
increase their life span. The existing borehole fields are not being monitored
to establish the effect of their long term exploitation over the past 10-15
years. It is already evident that some boreholes are producing low yields
(about 1.5 l/s).

.
46
Water Resource Management and Geo-Physical Survey in Selected Communities of Borno State
It is important therefore that a long term option of surface water
abstraction be considered.
Table 4.22: Askira Summary
Demand (m3/day) Existing
Production (m3/day)
Immediate Intervention Production (m3/day)
Long Term Intervention Production (m3/day)
9,844.92 129 1,051 11,100
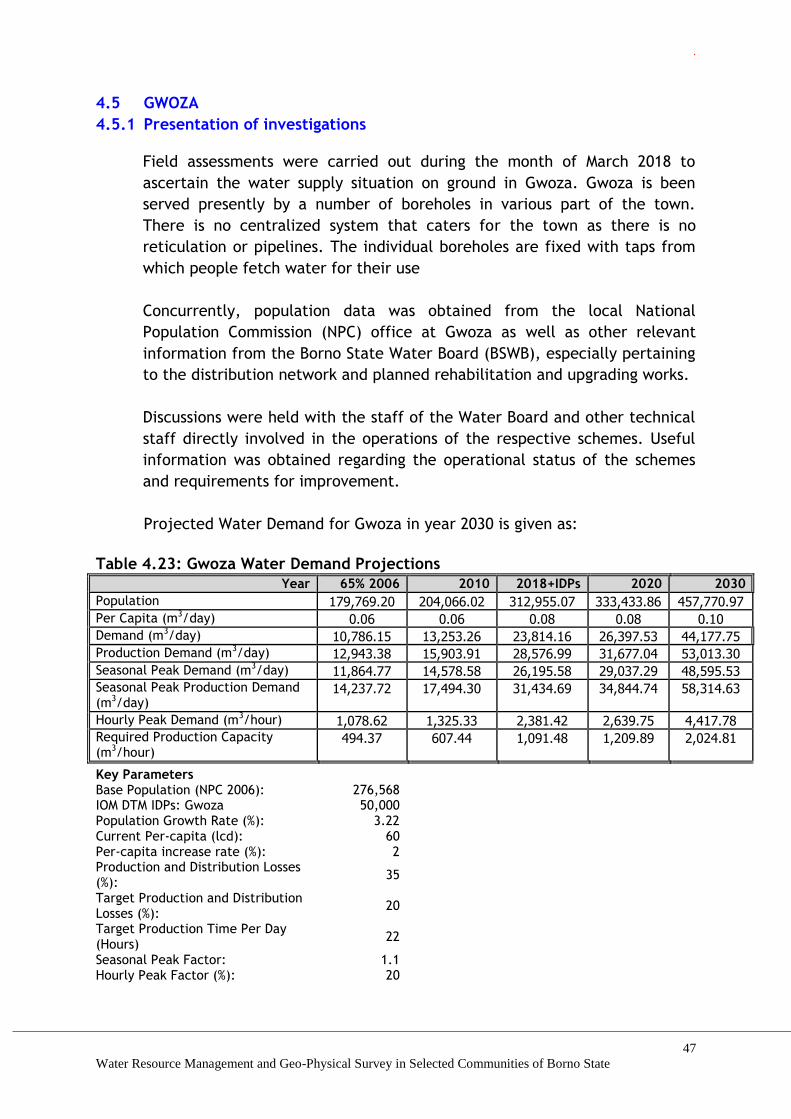
.
47
Water Resource Management and Geo-Physical Survey in Selected Communities of Borno State
4.5 GWOZA
4.5.1 Presentation of investigations
Field assessments were carried out during the month of March 2018 to
ascertain the water supply situation on ground in Gwoza. Gwoza is been
served presently by a number of boreholes in various part of the town.
There is no centralized system that caters for the town as there is no
reticulation or pipelines. The individual boreholes are fixed with taps from
which people fetch water for their use
Concurrently, population data was obtained from the local National
Population Commission (NPC) office at Gwoza as well as other relevant
information from the Borno State Water Board (BSWB), especially pertaining
to the distribution network and planned rehabilitation and upgrading works.
Discussions were held with the staff of the Water Board and other technical
staff directly involved in the operations of the respective schemes. Useful
information was obtained regarding the operational status of the schemes
and requirements for improvement.
Projected Water Demand for Gwoza in year 2030 is given as:
Table 4.23: Gwoza Water Demand Projections
Year 65% 2006 2010 2018+IDPs 2020 2030
Population 179,769.20 204,066.02 312,955.07 333,433.86 457,770.97
Per Capita (m3/day) 0.06 0.06 0.08 0.08 0.10 Demand (m3/day) 10,786.15 13,253.26 23,814.16 26,397.53 44,177.75 Production Demand (m3/day) 12,943.38 15,903.91 28,576.99 31,677.04 53,013.30
Seasonal Peak Demand (m3/day) 11,864.77 14,578.58 26,195.58 29,037.29 48,595.53 Seasonal Peak Production Demand (m3/day)
14,237.72 17,494.30 31,434.69 34,844.74 58,314.63
Hourly Peak Demand (m3/hour) 1,078.62 1,325.33 2,381.42 2,639.75 4,417.78 Required Production Capacity (m3/hour)
494.37 607.44 1,091.48 1,209.89 2,024.81
Key Parameters
Base Population (NPC 2006): 276,568
IOM DTM IDPs: Gwoza 50,000
Population Growth Rate (%): 3.22
Current Per-capita (lcd): 60
Per-capita increase rate (%): 2
Production and Distribution Losses (%):
35
Target Production and Distribution Losses (%):
20
Target Production Time Per Day (Hours)
22
Seasonal Peak Factor: 1.1
Hourly Peak Factor (%): 20
.
48
Water Resource Management and Geo-Physical Survey in Selected Communities of Borno State
4.5.2 Water works
Gwoza is presently supplied through arrays of both hand-pump and
motorized boreholes as shown below. As of the time of visit, there are ten
(10) hand-pump and nineteen (19) motorized/solar functional boreholes.
Four (4) of the motorized/solar boreholes are out of use. About four
boreholes used to be reticulated. All others have battery of taps at the
borehole sites. The four boreholes that used to be reticulated within the
wards have average discharge of 2-4 l/sec.
These schemes are not all integrated but rather targeted to supply specific
areas of the town.

.
49
Water Resource Management and Geo-Physical Survey in Selected Communities of Borno State
Table 4.24: Borehole within Gwoza Town
4.5.3 Present Supply Capacity
Capacity
The water supply system presently have 10 functional hand pump and 15
motorized boreholes.
The observed yield of the boreholes are given as:
Hand pump = 0.85l/s
Motorized = 3.0l/s
Therefore, total yield for hand pump is
0.85 x 10 = 8.5l/s
Assuming 8hrs of pumping
8.5 x 60 x 60 x 8
= 244,800L
= 244.8m3
For Motorized boreholes, the total yield is
3.0 x 15 = 45
Ward Location Hand Pump
Motorized/ Solar
Functional/ Non Functional
BULABULIN/WAKANE D. HEAD HOUSE “ NON FUNCTIONAL
C. MOSQUE “ “
M. HUDU “ “
NEAR PRI. SCH. “ “
BUBA JIGE “ “
GUDUF A-B LAWAN B/H Motorized NON FUNCTIONAL
BULAMA B/H “ “
DUMMA “ “
KUSARHA “ “
B. YAGWA “ “
K. BASSA/N. SAMA LAWAN Motorized NON FUNCTIONAL
IB. GWARA “ “
B. HAMMAN “ “
ALH. NDURWA “
ALH. YAKUBU Solar NON FUNCTIONAL
KWATARA “ “
KWATARA “ “
KWATARA “ “
TAKASKALA “ “
TOTAL 10 19
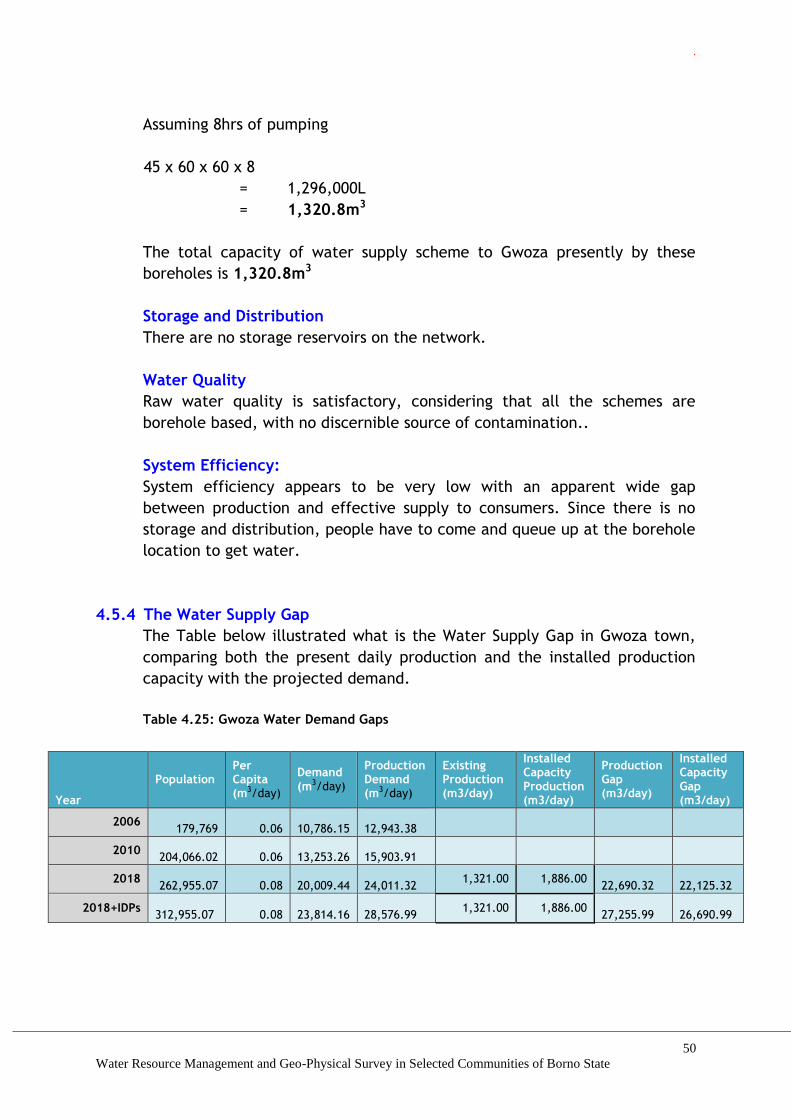
.
50
Water Resource Management and Geo-Physical Survey in Selected Communities of Borno State
Assuming 8hrs of pumping
45 x 60 x 60 x 8
= 1,296,000L
= 1,320.8m3
The total capacity of water supply scheme to Gwoza presently by these
boreholes is 1,320.8m3
Storage and Distribution
There are no storage reservoirs on the network.
Water Quality
Raw water quality is satisfactory, considering that all the schemes are
borehole based, with no discernible source of contamination..
System Efficiency:
System efficiency appears to be very low with an apparent wide gap
between production and effective supply to consumers. Since there is no
storage and distribution, people have to come and queue up at the borehole
location to get water.
4.5.4 The Water Supply Gap
The Table below illustrated what is the Water Supply Gap in Gwoza town,
comparing both the present daily production and the installed production
capacity with the projected demand.
Table 4.25: Gwoza Water Demand Gaps
Year
Population Per Capita (m3/day)
Demand (m3/day)
Production Demand (m3/day)
Existing Production (m3/day)
Installed Capacity Production (m3/day)
Production Gap (m3/day)
Installed Capacity Gap (m3/day)
2006 179,769 0.06
10,786.15
12,943.38
2010
204,066.02 0.06 13,253.26
15,903.91
2018
262,955.07 0.08 20,009.44
24,011.32
1,321.00 1,886.00 22,690.32
22,125.32
2018+IDPs 312,955.07 0.08
23,814.16
28,576.99
1,321.00 1,886.00 27,255.99
26,690.99
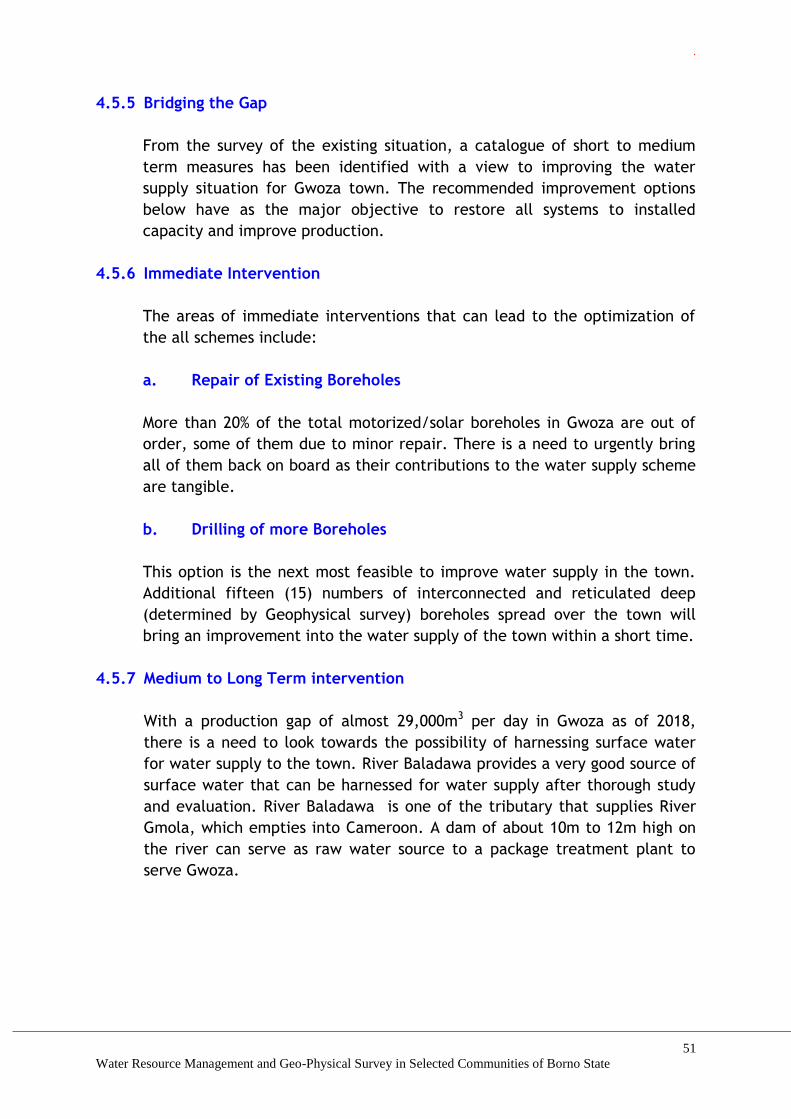
.
51
Water Resource Management and Geo-Physical Survey in Selected Communities of Borno State
4.5.5 Bridging the Gap
From the survey of the existing situation, a catalogue of short to medium
term measures has been identified with a view to improving the water
supply situation for Gwoza town. The recommended improvement options
below have as the major objective to restore all systems to installed
capacity and improve production.
4.5.6 Immediate Intervention
The areas of immediate interventions that can lead to the optimization of
the all schemes include:
a. Repair of Existing Boreholes
More than 20% of the total motorized/solar boreholes in Gwoza are out of
order, some of them due to minor repair. There is a need to urgently bring
all of them back on board as their contributions to the water supply scheme
are tangible.
b. Drilling of more Boreholes
This option is the next most feasible to improve water supply in the town.
Additional fifteen (15) numbers of interconnected and reticulated deep
(determined by Geophysical survey) boreholes spread over the town will
bring an improvement into the water supply of the town within a short time.
4.5.7 Medium to Long Term intervention
With a production gap of almost 29,000m3 per day in Gwoza as of 2018,
there is a need to look towards the possibility of harnessing surface water
for water supply to the town. River Baladawa provides a very good source of
surface water that can be harnessed for water supply after thorough study
and evaluation. River Baladawa is one of the tributary that supplies River
Gmola, which empties into Cameroon. A dam of about 10m to 12m high on
the river can serve as raw water source to a package treatment plant to
serve Gwoza.
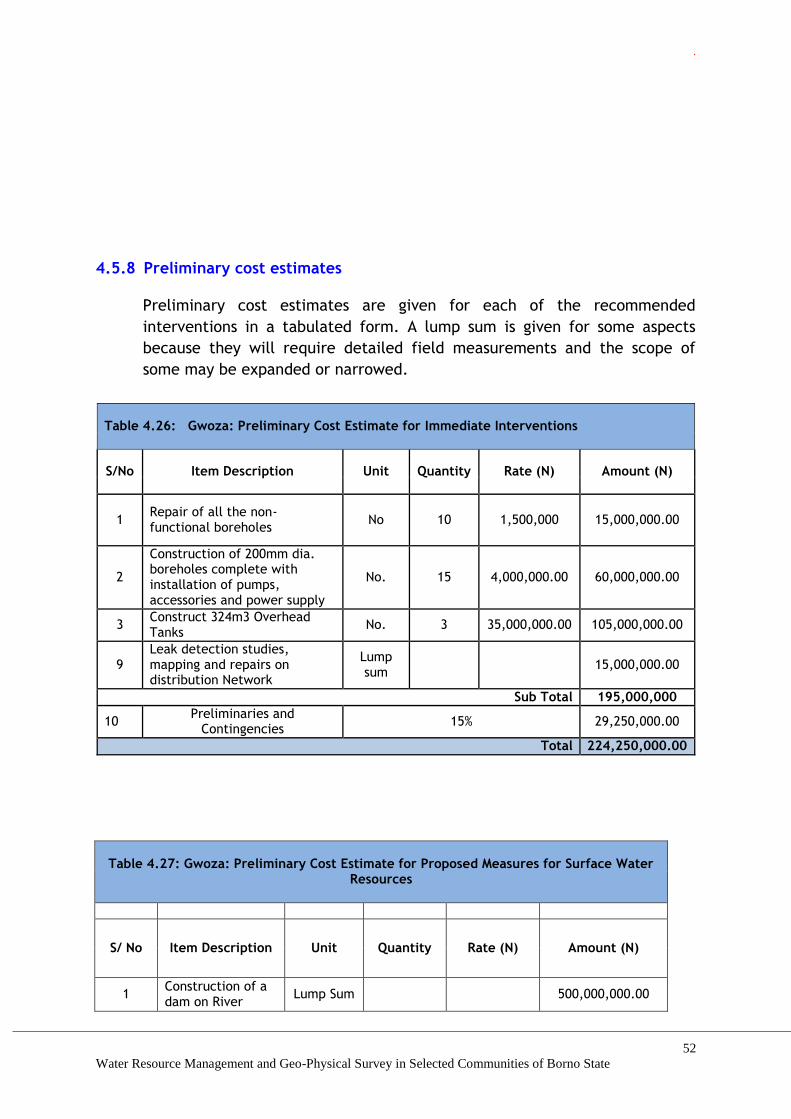
.
52
Water Resource Management and Geo-Physical Survey in Selected Communities of Borno State
4.5.8 Preliminary cost estimates
Preliminary cost estimates are given for each of the recommended
interventions in a tabulated form. A lump sum is given for some aspects
because they will require detailed field measurements and the scope of
some may be expanded or narrowed.
Table 4.26: Gwoza: Preliminary Cost Estimate for Immediate Interventions
S/No Item Description Unit Quantity Rate (N) Amount (N)
1 Repair of all the non-functional boreholes
No 10 1,500,000 15,000,000.00
2
Construction of 200mm dia. boreholes complete with installation of pumps, accessories and power supply
No. 15 4,000,000.00 60,000,000.00
3 Construct 324m3 Overhead Tanks
No. 3 35,000,000.00 105,000,000.00
9 Leak detection studies, mapping and repairs on distribution Network
Lump sum
15,000,000.00
Sub Total 195,000,000
10 Preliminaries and
Contingencies 15% 29,250,000.00
Total 224,250,000.00
Table 4.27: Gwoza: Preliminary Cost Estimate for Proposed Measures for Surface Water Resources
S/ No Item Description Unit Quantity Rate (N) Amount (N)
1 Construction of a dam on River
Lump Sum 500,000,000.00

.
53
Water Resource Management and Geo-Physical Survey in Selected Communities of Borno State
Baladawa with all the appurtenant structures
2
Construction of Package Treatment Plant (20,000m3/day)
Lump Sum
200,000,000.00
3 Construction of Elevated and Surface Reservoirs
Lump sum 100,000,000.00
4 Pipelines and Transmission
Lump sum 100,000,000.00
Sub Total 800,000,000.00
5 Preliminaries and contingencies
15% 120,00,000.00
Total 1,020,000,000.00
4.5.9 Conclusions concerning Gwoza
The water need assessment carried out in Gwoza revealed that the
presently installed capacities of the schemes would not cater for the
present demand. This is due to, the system being constrained by low
borehole yields, low and irregular energy supply, broken down equipment,
lack of spares and an inefficient distribution network. In the immediate
term proposals have been offered towards restoring the various schemes to
increased production, improving water quality and overall system efficiency.
There is a need to put up a deliberate programme to monitor groundwater
exploitation so as to increase the effectiveness of these projects and
increase their life span. The existing borehole fields are not being monitored
to establish the effect of their long term exploitation over the past 10-15
years. It is already evident that some boreholes are producing low yields
(about 1.3 l/s). It is important therefore that a long term option of surface
water abstraction be considered.
Table 4.28: Gwoza Summary
Demand (m3/day) Existing
Production (m3/day)
Immediate Intervention Production (m3/day)
Long Term Intervention Production (m3/day)
28,576.99 1,321 3,400 25,000

.
54
Water Resource Management and Geo-Physical Survey in Selected Communities of Borno State
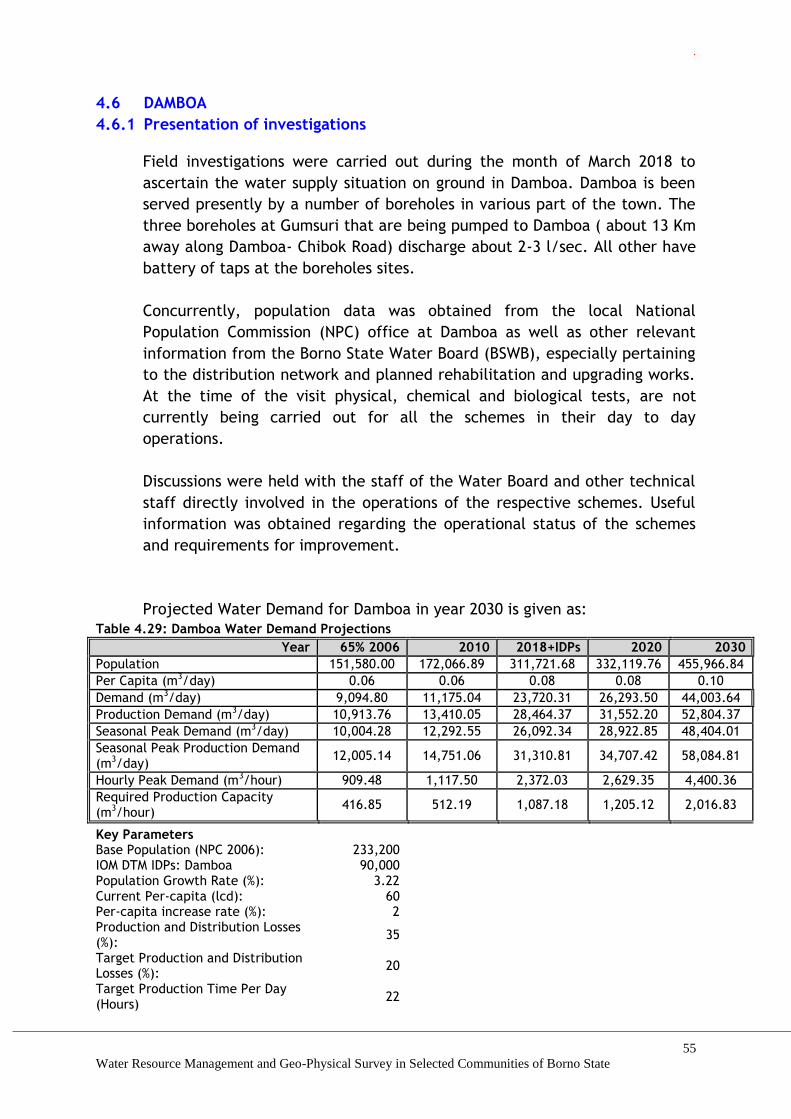
.
55
Water Resource Management and Geo-Physical Survey in Selected Communities of Borno State
4.6 DAMBOA
4.6.1 Presentation of investigations
Field investigations were carried out during the month of March 2018 to
ascertain the water supply situation on ground in Damboa. Damboa is been
served presently by a number of boreholes in various part of the town. The
three boreholes at Gumsuri that are being pumped to Damboa ( about 13 Km
away along Damboa- Chibok Road) discharge about 2-3 l/sec. All other have
battery of taps at the boreholes sites.
Concurrently, population data was obtained from the local National
Population Commission (NPC) office at Damboa as well as other relevant
information from the Borno State Water Board (BSWB), especially pertaining
to the distribution network and planned rehabilitation and upgrading works.
At the time of the visit physical, chemical and biological tests, are not
currently being carried out for all the schemes in their day to day
operations.
Discussions were held with the staff of the Water Board and other technical
staff directly involved in the operations of the respective schemes. Useful
information was obtained regarding the operational status of the schemes
and requirements for improvement.
Projected Water Demand for Damboa in year 2030 is given as:
Table 4.29: Damboa Water Demand Projections Year 65% 2006 2010 2018+IDPs 2020 2030
Population 151,580.00 172,066.89 311,721.68 332,119.76 455,966.84
Per Capita (m3/day) 0.06 0.06 0.08 0.08 0.10
Demand (m3/day) 9,094.80 11,175.04 23,720.31 26,293.50 44,003.64
Production Demand (m3/day) 10,913.76 13,410.05 28,464.37 31,552.20 52,804.37
Seasonal Peak Demand (m3/day) 10,004.28 12,292.55 26,092.34 28,922.85 48,404.01
Seasonal Peak Production Demand (m3/day)
12,005.14 14,751.06 31,310.81 34,707.42 58,084.81
Hourly Peak Demand (m3/hour) 909.48 1,117.50 2,372.03 2,629.35 4,400.36
Required Production Capacity (m3/hour)
416.85 512.19 1,087.18 1,205.12 2,016.83
Key Parameters
Base Population (NPC 2006): 233,200
IOM DTM IDPs: Damboa 90,000
Population Growth Rate (%): 3.22
Current Per-capita (lcd): 60
Per-capita increase rate (%): 2
Production and Distribution Losses (%):
35
Target Production and Distribution Losses (%):
20
Target Production Time Per Day (Hours)
22
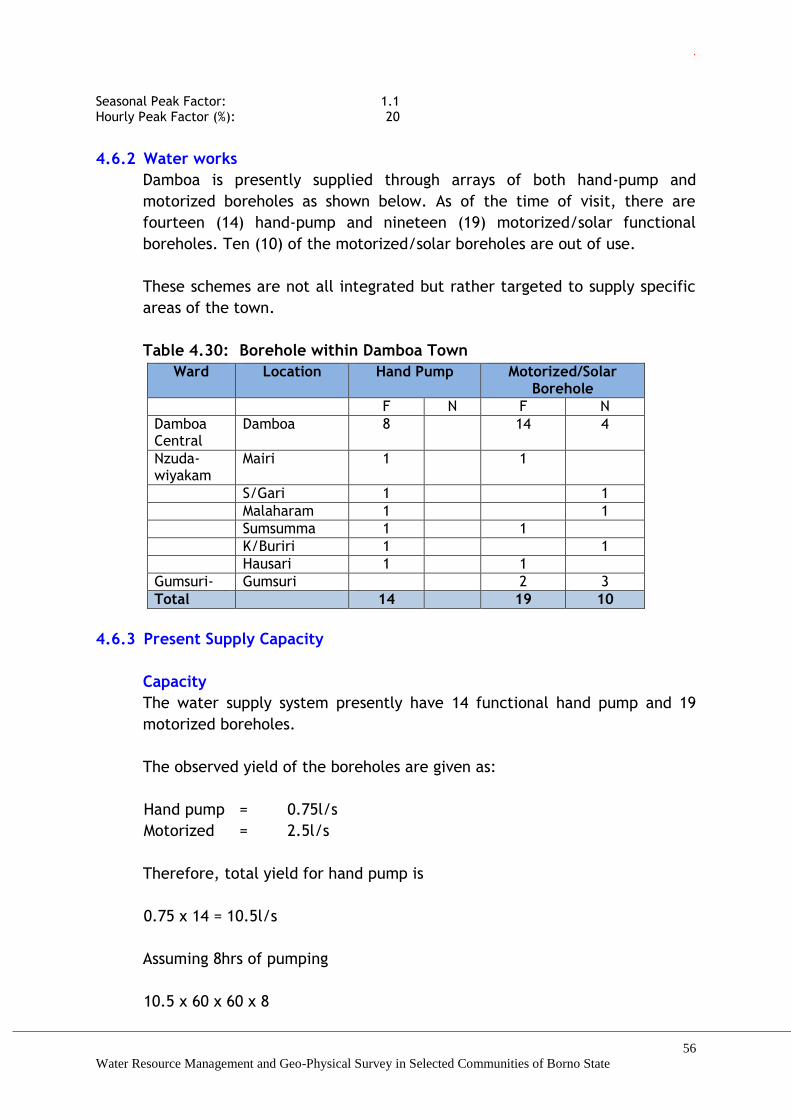
.
56
Water Resource Management and Geo-Physical Survey in Selected Communities of Borno State
Seasonal Peak Factor: 1.1
Hourly Peak Factor (%): 20
4.6.2 Water works
Damboa is presently supplied through arrays of both hand-pump and
motorized boreholes as shown below. As of the time of visit, there are
fourteen (14) hand-pump and nineteen (19) motorized/solar functional
boreholes. Ten (10) of the motorized/solar boreholes are out of use.
These schemes are not all integrated but rather targeted to supply specific
areas of the town.
Table 4.30: Borehole within Damboa Town
Ward Location Hand Pump Motorized/Solar Borehole
F N F N
Damboa Central
Damboa 8 14 4
Nzuda-wiyakam
Mairi 1 1
S/Gari 1 1
Malaharam 1 1
Sumsumma 1 1
K/Buriri 1 1
Hausari 1 1
Gumsuri- Gumsuri 2 3
Total 14 19 10
4.6.3 Present Supply Capacity
Capacity
The water supply system presently have 14 functional hand pump and 19
motorized boreholes.
The observed yield of the boreholes are given as:
Hand pump = 0.75l/s
Motorized = 2.5l/s
Therefore, total yield for hand pump is
0.75 x 14 = 10.5l/s
Assuming 8hrs of pumping
10.5 x 60 x 60 x 8
.
57
Water Resource Management and Geo-Physical Survey in Selected Communities of Borno State
= 302,400L
= 302m3
For Motorized boreholes, the total yield is
2.5 x 19 = 47.5
Assuming 8hrs of pumping
47.5 x 60 x 60 x 8
= 1,368,000L
= 1,368m3
The total capacity of water supply scheme to Damboa presently by these
boreholes is 1,670m3
Storage and Distribution
There are no storage reservoirs on the network.
Water Quality
Raw water quality is satisfactory, considering that all the schemes are
borehole based, with no discernible source of contamination.
System Efficiency:
System efficiency appears to be very low with an apparent wide gap
between production and effective supply to consumers. Since there is no
storage and distribution, people have to come and queue up at the borehole
location to get water.
4.6.4 The Water Supply Gap
The Table below illustrated what is the Water Supply Gap in Damboa town,
comparing both the present daily production and the installed production
capacity with the projected demand.
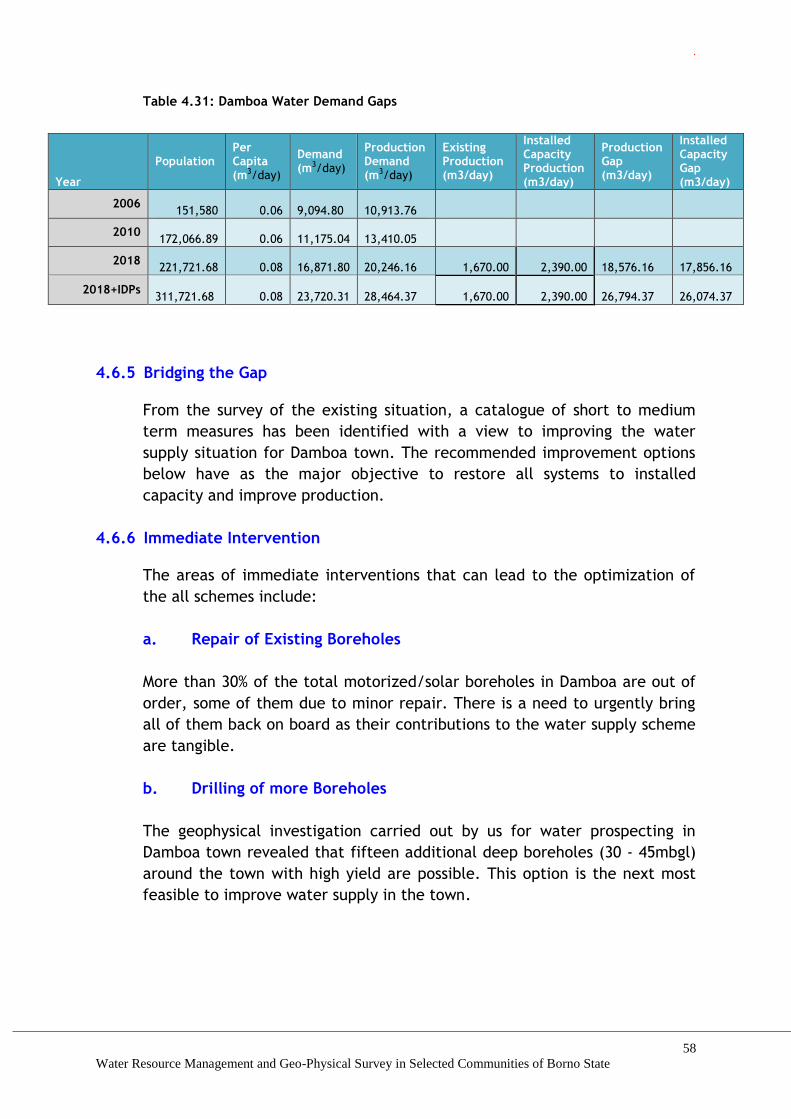
.
58
Water Resource Management and Geo-Physical Survey in Selected Communities of Borno State
Table 4.31: Damboa Water Demand Gaps
Year
Population Per Capita (m3/day)
Demand (m3/day)
Production Demand (m3/day)
Existing Production (m3/day)
Installed Capacity Production (m3/day)
Production Gap (m3/day)
Installed Capacity Gap (m3/day)
2006 151,580 0.06
9,094.80
10,913.76
2010
172,066.89 0.06 11,175.04
13,410.05
2018
221,721.68 0.08 16,871.80
20,246.16
1,670.00
2,390.00
18,576.16
17,856.16
2018+IDPs 311,721.68 0.08
23,720.31
28,464.37
1,670.00
2,390.00
26,794.37
26,074.37
4.6.5 Bridging the Gap
From the survey of the existing situation, a catalogue of short to medium
term measures has been identified with a view to improving the water
supply situation for Damboa town. The recommended improvement options
below have as the major objective to restore all systems to installed
capacity and improve production.
4.6.6 Immediate Intervention
The areas of immediate interventions that can lead to the optimization of
the all schemes include:
a. Repair of Existing Boreholes
More than 30% of the total motorized/solar boreholes in Damboa are out of
order, some of them due to minor repair. There is a need to urgently bring
all of them back on board as their contributions to the water supply scheme
are tangible.
b. Drilling of more Boreholes
The geophysical investigation carried out by us for water prospecting in
Damboa town revealed that fifteen additional deep boreholes (30 - 45mbgl)
around the town with high yield are possible. This option is the next most
feasible to improve water supply in the town.
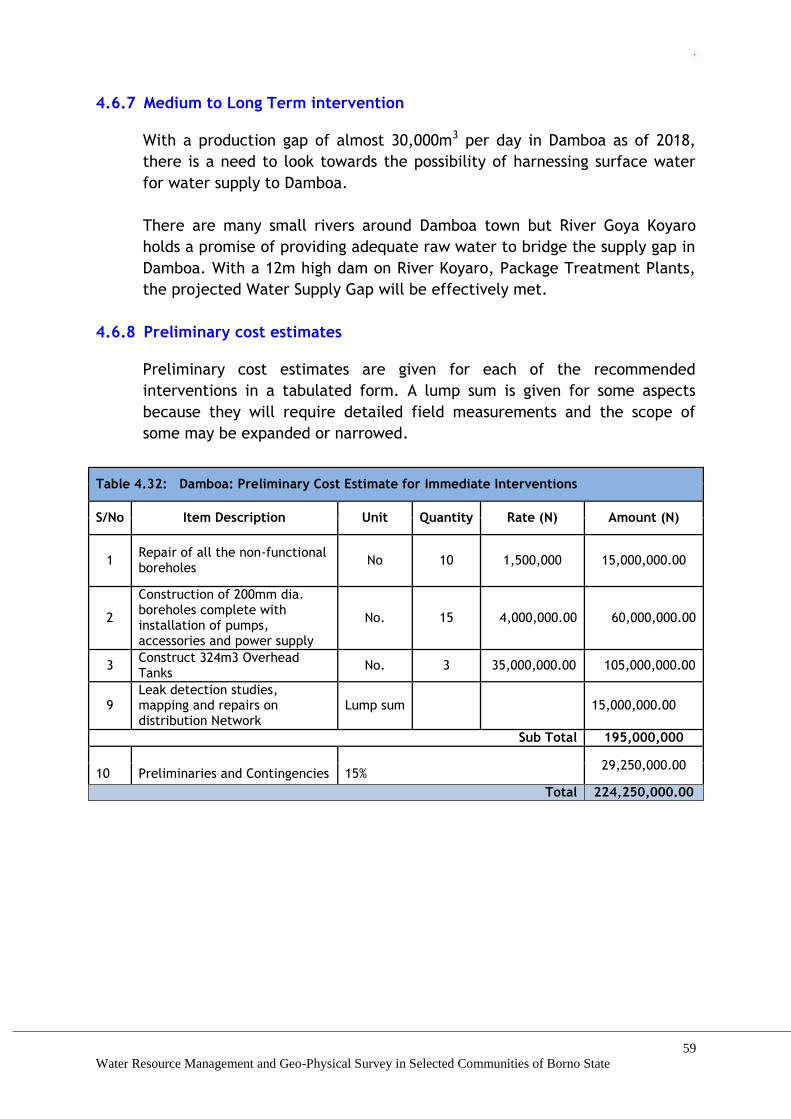
.
59
Water Resource Management and Geo-Physical Survey in Selected Communities of Borno State
4.6.7 Medium to Long Term intervention
With a production gap of almost 30,000m3 per day in Damboa as of 2018,
there is a need to look towards the possibility of harnessing surface water
for water supply to Damboa.
There are many small rivers around Damboa town but River Goya Koyaro
holds a promise of providing adequate raw water to bridge the supply gap in
Damboa. With a 12m high dam on River Koyaro, Package Treatment Plants,
the projected Water Supply Gap will be effectively met.
4.6.8 Preliminary cost estimates
Preliminary cost estimates are given for each of the recommended
interventions in a tabulated form. A lump sum is given for some aspects
because they will require detailed field measurements and the scope of
some may be expanded or narrowed.
Table 4.32: Damboa: Preliminary Cost Estimate for Immediate Interventions
S/No Item Description Unit Quantity Rate (N) Amount (N)
1 Repair of all the non-functional boreholes
No 10 1,500,000 15,000,000.00
2
Construction of 200mm dia. boreholes complete with installation of pumps, accessories and power supply
No. 15 4,000,000.00 60,000,000.00
3 Construct 324m3 Overhead Tanks
No. 3 35,000,000.00 105,000,000.00
9 Leak detection studies, mapping and repairs on distribution Network
Lump sum 15,000,000.00
Sub Total 195,000,000
29,250,000.00
10 Preliminaries and Contingencies 15%
Total 224,250,000.00

.
60
Water Resource Management and Geo-Physical Survey in Selected Communities of Borno State
Table 4.33: Damboa: Preliminary Cost Estimate for Proposed Measures for Surface Water Resources
S/ No
Item Description Unit Qty Rate (N)
Amount (N)
1 Construction of a 12m high dam on River Goya Koyaro with all the appurtenant structures
Lump Sum
500,000,000.00
2 Construction of Package Treatment Plant (20m3/day)
Lump Sum
200,000,000.00
3 Construction of Elevated and Surface Reservoirs
Lump sum
100,000,000.00
4 Pipelines and Transmission Lump sum
100,000,000.00
Sub
Total 800,000,000.00
5 Preliminaries and contingencies 15% 120,00,000.00
Total 1,020,000,000.00
4.6.9 Conclusions concerning Damboa
The water need assessment carried out in Damboa revealed that the
presently installed capacities of the schemes would not cater for the
present demand. This is due to, the system being constrained by low
borehole yields, low and irregular energy supply, broken down equipment,
lack of spares and an inefficient distribution network. In the immediate
term proposals have been offered towards restoring the various schemes to
increased production, improving water quality and overall system efficiency.
However, the sustainability of groundwater exploitation cannot be
guaranteed, especially as even existing borehole fields are not being
monitored to establish the effect of their long term exploitation over the
past 10-15 years. It is already evident that some boreholes are producing at
very low yields in the order of 1.3 l/s. It is important therefore that a long
term option of surface water abstraction be considered.
Table 4.34: Damboa Summary
Demand (m3/day) Existing
Production (m3/day)
Immediate Intervention Production (m3/day)
Long Term Intervention Production (m3/day)
28,464.37 1,670 2,500 25,000
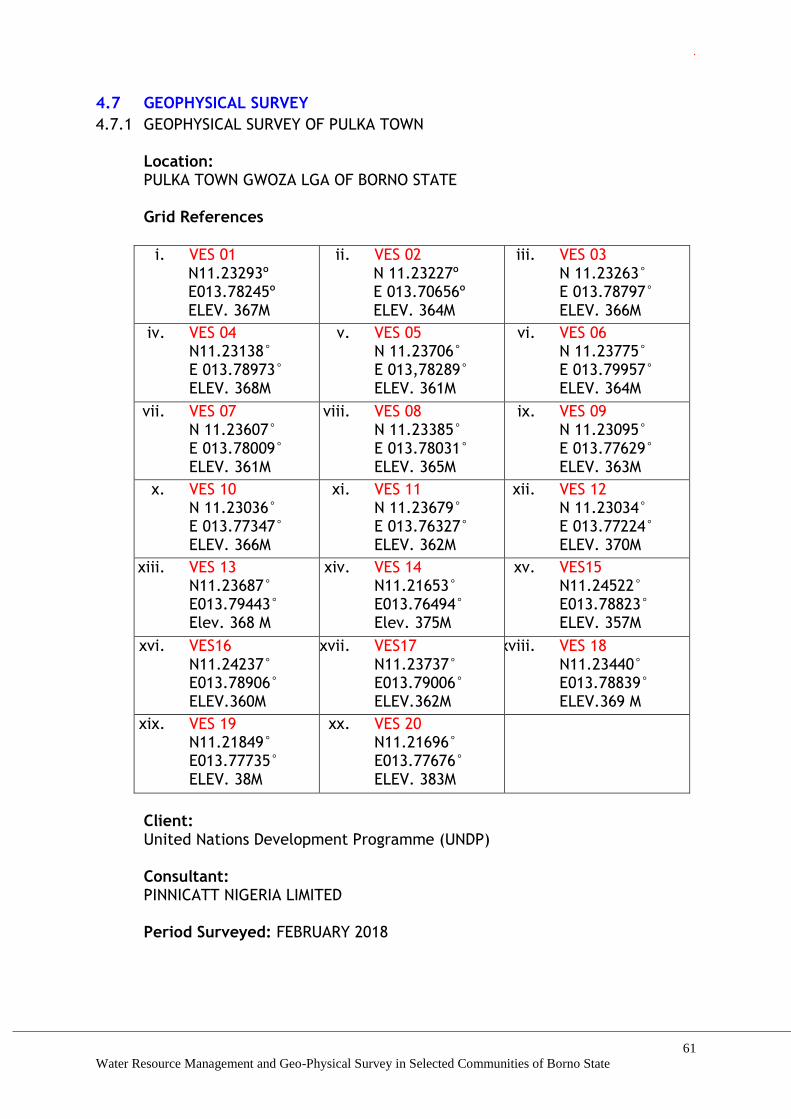
.
61
Water Resource Management and Geo-Physical Survey in Selected Communities of Borno State
4.7 GEOPHYSICAL SURVEY
4.7.1 GEOPHYSICAL SURVEY OF PULKA TOWN
Location: PULKA TOWN GWOZA LGA OF BORNO STATE
Grid References
i. VES 01 N11.23293º E013.78245º ELEV. 367M
ii. VES 02 N 11.23227º E 013.70656º ELEV. 364M
iii. VES 03 N 11.23263° E 013.78797° ELEV. 366M
iv. VES 04 N11.23138° E 013.78973° ELEV. 368M
v. VES 05 N 11.23706° E 013,78289° ELEV. 361M
vi. VES 06 N 11.23775° E 013.79957° ELEV. 364M
vii. VES 07 N 11.23607° E 013.78009° ELEV. 361M
viii. VES 08 N 11.23385° E 013.78031° ELEV. 365M
ix. VES 09 N 11.23095° E 013.77629° ELEV. 363M
x. VES 10 N 11.23036° E 013.77347° ELEV. 366M
xi. VES 11 N 11.23679° E 013.76327° ELEV. 362M
xii. VES 12 N 11.23034° E 013.77224° ELEV. 370M
xiii. VES 13 N11.23687° E013.79443°
Elev. 368 M
xiv. VES 14 N11.21653° E013.76494° Elev. 375M
xv. VES15 N11.24522° E013.78823° ELEV. 357M
xvi. VES16 N11.24237° E013.78906° ELEV.360M
xvii. VES17 N11.23737° E013.79006° ELEV.362M
xviii. VES 18 N11.23440° E013.78839° ELEV.369 M
xix. VES 19 N11.21849° E013.77735° ELEV. 38M
xx. VES 20 N11.21696° E013.77676° ELEV. 383M
Client:
United Nations Development Programme (UNDP) Consultant:
PINNICATT NIGERIA LIMITED Period Surveyed: FEBRUARY 2018
.
62
Water Resource Management and Geo-Physical Survey in Selected Communities of Borno State
GEOLOGIC SETTINGS
Geology
The geology of Pulka in Gwoza LGA is made up of two main units, namely,
the crystalline rocks of the basement complex and the superficial alluvial
deposits mainly within the intermontane valleys and plains. The basement
complex is exposed mostly towards the East of the area surveyed. The
geology of the area is made up of granites and undifferentiated
metamorphic rocks. These rocks constitute the principal and oldest
stratigraphic unit in Nigeria and consist mainly of granites, gneiss,
migmatites and subordinates schistose rocks.
Basement complex granites are 5-6000 million Years old while the
migmatitic inclusions are over 2000 million Years old. The basement region,
in which the study area lies, is exposed over much of the southern part of
Borno State and is defined tectonically by fault-bounded basins containing
sediment, which vary in age from Cretaceous to Quaternary.
The geological map of the study Area shows Basement complex granites
overlain by extensive alluvium and young alluvium with more restricted
deposits of colluvium.
The four principal units in the study area are described below.
Basement complex include all the pre-Mesozoic rocks in Nigeria. It consists
mainly of granites, gneisses, and migmatites, with subordinate base rocks.
In order of age form the oldest to the most resent, it is possible to
distinguish the following litho types: -
- Gabbros and diorites.
- Undifferentiated migmatitic rocks.
- Granite-gneiss.
- Granites
- Dykes
Alluvial deposit:- This geological unit includes most soils and comprises
those deposits formed in situ by the chemical and physical decomposition of
the bedrock. It occurs wherever weathering exceeds the rate of the erosion
and is therefore best developed in topographically subdued area.
Alluvium covers about 40% of the study area and occupies the slightly
elevated ground between the two main drainage systems on which study
area as situated. This alluvium deposit which is mostly due to seasonal
flooding in the study area, is consists of fine to silty sand has been
deposited over a wide area. We also find along the narrow river channels,
in few meters deposits of medium sand.
Colluvium: This unit is not widespread in the study area. The term
.
63
Water Resource Management and Geo-Physical Survey in Selected Communities of Borno State
colluviums is intended here as colluvial deposits i.e. deposits composed of
debris accumulated by gravity and/or deposited by unconcentrated surface
runoff or sheet erosion. It is distinguished from alluvium by the fact that it
is not concentrated along the watercourses and generally has much coarser
grain with little or no classification and rounding of the constituent
particles.
Hydrogeology
The most important hydrogeologic units are the alluvium and or weathered
part of the basement complex and the fractured zone of the basement
rocks. Evidence from the depth of hand-dug wells and from the previously
drilled boreholes suggest that thickness of the alluvium/weathered zone
vary considerably with location, but may be about five to fifteen meters on
the average in places within the intermontane areas and where available.
Hydrology, Climate and Vegetation
The area of Pulka has a thick vegetation cover in some parts while some
parts are very scanty covered by shrubs, which are mostly found in the
valley and between jointed outcrops of the granitic rocks.
The area has a wide seasonal range of temperature ranging from as low as
24oc to as high as 42oc. This falls under semi-arid climate. Another
characteristic of this climate is that it has a short wet season of five months
and long dry season of about seven months. Rainfalls within the area, for a
greater part of the year, begin around May and ends up in September
although sometimes it extends to early October. Maximum rainfall is
recorded between the month of July and August. This is best described as
the savannah climate.
Temperature during March to May exceed 42oc. This high temperature may
drop to 29oc on cloudless nights. The dusty Harmattan blows off the desert
winds during the months of November to February.
4.7.2 METHOD OF STUDY AND DATA ACQUISITION.
Methods Applied
Equipment/Instrumentation:
The equipment used for the survey is Syscal Junior resistivity meter. The
Syscal Junior resistivity meter is an ideal instrument for applications with
depths of investigation in the range of 100- 120 meters or less. The 100W
transmitting power is quite adequate at these depths and the light weight of
the junior resistivity meters, only 7 kg with internal battery, makes easy
work of moving along your profile. The combined transmitter/receiver unit
is micro processor based and features a large, easy to read LCD display.

.
64
Water Resource Management and Geo-Physical Survey in Selected Communities of Borno State
Measurement is fully automatic. Pressing the Start/Stop key to initiate a
measurement will first cause the SP value to be measured and then stored.
The Junior will then display the average values of voltage and current, with
standard deviation, until the stop key is pressed. If the operator has
selected the appropriate electrode array and spacing parameters the
apparent resistivity value is calculated. Memory storage for 1000 sets of
readings with all related parameters is provided.
The SP value is displayed so that noisy conditions may be observed. SP
compensation is recalculated during stacking with every third stack,
providing excellent linear drift correction. Automatic ranging during digital
stacking improves noise reduction. A 20 bit A/D converter is used to provide
the best resolution and highest quality data.
Power is supplied from internal rechargeable battery, or external 12V. The
battery charger is external and may be switched between 110 or 220V.
Typical operation time on the fully charged internal battery is greater than
3,000 cycles. Data transfer is provided by standard RS232 port.
The unique two channel design of the Syscal resistivity meters, allows for
measurement of both voltage and current during stacking. This provides the
most optimized design to ensure the best data quality and noise rejection.
Noise rejection is greater than 120 dB at power line frequencies. Voltage
resolution after stacking is 1 microvolt, with accuracy of better than 0.5%.
Techniques Applied
Principles of Resistivity Method
The principle of resistivity surveys is based on introducing a direct current
(DC) or very low frequency current in to the ground via two electrodes. If
the four electrodes are arranged in any several possible patterns, the
current and the potential measurements may be used to calculate the
resistivity.
The Schlumberger Array
This array is the most widely used in electrical prospecting. Four electrodes
are placed in a straight line on the earth's surface in the same order, AMNB,
with AB 5MN. For any linear, symmetric array AMNB of electrodes, the
equation of a can be written in the form of the equation below
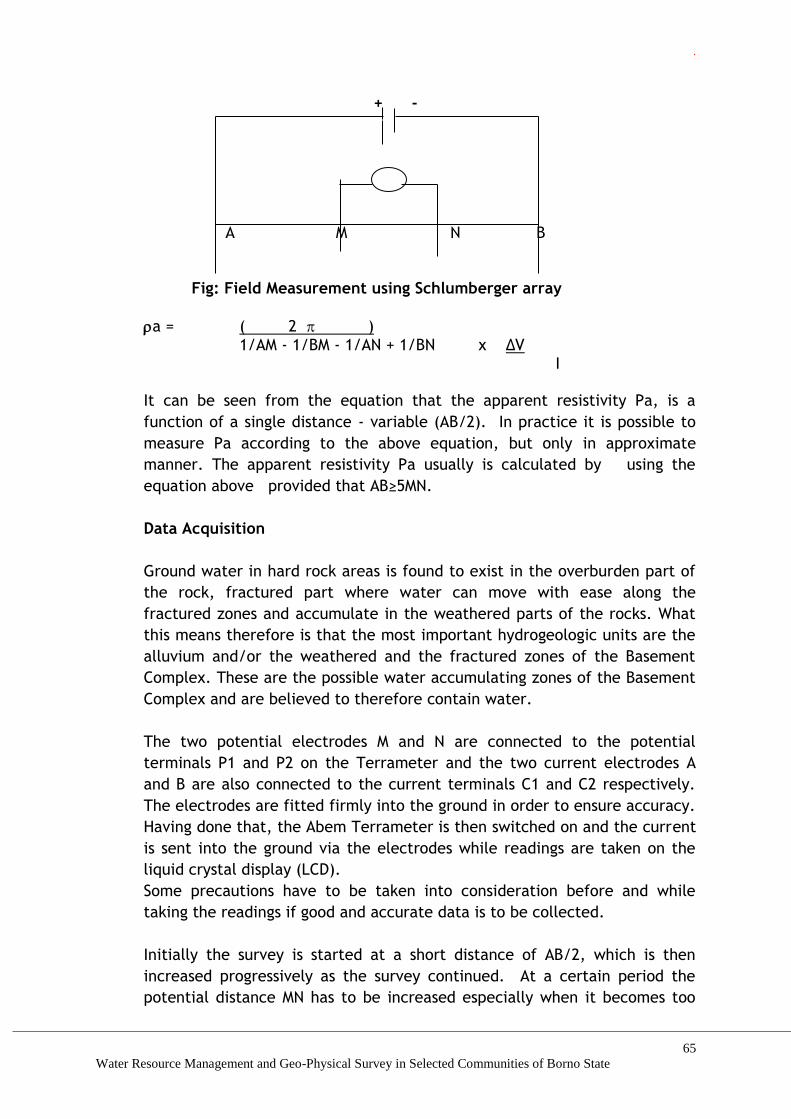
.
65
Water Resource Management and Geo-Physical Survey in Selected Communities of Borno State
+ - A M N B
Fig: Field Measurement using Schlumberger array
a = ( 2 ) 1/AM - 1/BM - 1/AN + 1/BN χ ∆V
I
It can be seen from the equation that the apparent resistivity Pa, is a
function of a single distance - variable (AB/2). In practice it is possible to
measure Pa according to the above equation, but only in approximate
manner. The apparent resistivity Pa usually is calculated by using the
equation above provided that AB≥5MN.
Data Acquisition
Ground water in hard rock areas is found to exist in the overburden part of
the rock, fractured part where water can move with ease along the
fractured zones and accumulate in the weathered parts of the rocks. What
this means therefore is that the most important hydrogeologic units are the
alluvium and/or the weathered and the fractured zones of the Basement
Complex. These are the possible water accumulating zones of the Basement
Complex and are believed to therefore contain water.
The two potential electrodes M and N are connected to the potential
terminals P1 and P2 on the Terrameter and the two current electrodes A
and B are also connected to the current terminals C1 and C2 respectively.
The electrodes are fitted firmly into the ground in order to ensure accuracy.
Having done that, the Abem Terrameter is then switched on and the current
is sent into the ground via the electrodes while readings are taken on the
liquid crystal display (LCD).
Some precautions have to be taken into consideration before and while
taking the readings if good and accurate data is to be collected.
Initially the survey is started at a short distance of AB/2, which is then
increased progressively as the survey continued. At a certain period the
potential distance MN has to be increased especially when it becomes too
.
66
Water Resource Management and Geo-Physical Survey in Selected Communities of Borno State
small to give reliable reading of resistance. However the condition of AB/2
≥ 5 MN has to be fulfilled. Measurement of resistance is taken directly from
the Terrameter, which is then multiplied by K factor to calculate the
apparent resistivity. This is then plotted on a bi-logarithmic paper, the
resistivity values plotted against the distance AB/2.
The obtained data is plotted on a graph sheet called log-log graph with a
values plotted on the ordinate against distance AB/2 on the abscissa of the
graph. The plotting is done only on the log-log graph because the field curve
can be compared with calculated theoretical curve and the form of
electrical sounding does not depend on the resistivity or thickness of the
first layer provided 2/1, 3/1…. n/1 and the ratio h2/h1, h3/h1… hn/h1
remains constant. High values cannot be plotted on an ordinary graph sheet,
hence the choice of bi-logarithmic paper.
.
67
Water Resource Management and Geo-Physical Survey in Selected Communities of Borno State
4.7.3 DATA ANALYSIS AND INTERPRETATION.
Introduction
A total of twenty (20) vertical electrical soundings (VES) were carried out at
different locations covering all parts of Pulka town using Schlumberger
Configuration. A total maximum AB separation distance of 260m of the
electrical electrodes was achieved.
To interpret properly, the understanding of the geology of Pulka is
necessary. Based on this therefore Vertical Electrical Soundings were carried
out at different locations including where boreholes were already drilled.
These include both productive and abortive ones, even the ones wild
cutting. The team also carried out hydrogeological, geological and
topographical investigations.
It is worth noting that after obtaining the data from the field, the data is
then processed and interpreted and the results discussed. Normally, the
data can be interpreted either qualitatively or quantitatively which could
either be manual or through the use of computer programme. Quantitative
interpretation can be analytical or empirical, both of these leads to getting
the layer parameters, which includes thickness, depth and resistivities of
the successive layers.
Apart from the data gathered in the field, to get an accurate and reliable
interpretation, one has to interpret the data in the light of
The existing geological maps of the locality
Hydrogeology of the wells and streams in the locality
Rock type in the area and
Enquiring the community members living there all possible questions that
might help you in your final interpretation
Analyses and Interpretation
To interpret the data, IPI2Win software was used. The data is first entered
into the computer (AB/2 vs. a). Layered model consisting of depth (m) or
thickness (m) and resistivity (m) is input into the computer for each set of
field data. It is expected that the number of layers for the model should
agree with the field curves. After inputting the data into the computer, it
then generates a VES curve from the model entered into. At this point both
the field curve and model curve can be viewed on the screen. If the model
curve doesn’t match with the field curve accurately, another model is tried
so as to obtain a better match. During the modeling, iteration of the curve
is repeated several times until the best match between the field curve and
the computer generated curve is obtained. The iteration adjusts the field
.
68
Water Resource Management and Geo-Physical Survey in Selected Communities of Borno State
curve to match with the computer curve. As iteration is done, the root mean
square (RMS) error is reduced to minimum.
As mentioned earlier above, computer software programme IPI2Win was
used to interpret the data collected. It is a user friendly interactive
interpreting.
It also smoothens the field curve through the process of filtering technique
that involves single point correction, eccentricity correction and vertical
curve segment shift. Interpretation of the layer parameters was also carried
out by comparing various concepts of geological structure along the
surveyed observation line rather than independent informal sounding curve
inversion in the approach implemented in IPI2Win. This approach provides
the opportunity to use the priory geological data and extract information to
the greatest possible extent in the complicated geological situations.
4.7.4 CONCLUSION
Both qualitative and quantitative interpretations were carried out. 90% of
the curves indicate H-type of curve with very little differing features,
especially the depth to the basement. A lot ambiguity in the apparent
resistivity values were seen before the modelling.
From the interpreted results, the hydrogeological, geological and the
topographical studies carried out, it reveals that tectonic activities have
positively affected the area with respect to groundwater accumulation.
Pulka groundwater fall into a specific zone that is not guided by the over
burden but by the concentration of fractures. From the results so far, the
eastern, western and the northern flanks of the town are prosperous zones
for groundwater exploitation. Hence from the above analysis, a reasonable
number of productive boreholes could be drilled, and can be located at
appropriate distances from each other minding and allowing for possible
interference when sitting the boreholes. For now we have tentatively sited
Eight locations for borehole drilling
.
69
Water Resource Management and Geo-Physical Survey in Selected Communities of Borno State
4.7.5 RECOMMENDATION AND OBSERVATION
Recommendation
Based on the interpreted results from the 20 soundings carried out, eight
sites are being recommended for exploitation. These are,
S/No VES POINT RECOMMENDED DRILL DEPTH
1 VES 3 33mbgl±8m
2 VES 4 28mbgl±12m
3 VES 7 34mbgl±5m
4 VES 11 28mbgl±9m
5 VES 12 30mbgl±6m
6 VES 13 45mbgl±6m
7 VES 14 32mbgl±8m
8 VES 17 34mbgl±7m
This does not in any way mean suggest that the remaining twelve (12) sites
are completely useless, but based on the probable yields, the sites listed
above should be given priority. Their Geographic coordinate and interpreted
model curves are detailed in appendix II.
Additional recommendations include:
1. Borehole should be logged before constructions
2. Gravel pack/cement grout borehole annulus to a depth greater than
60% of the overburden
3. Conduct DTH geo-electric logging to ascertain best screen positions
4. Pumping test should be conducted to ascertain aquiferous strength
for the installation of appropriate capacity pumps
5. Water quality analysis should be conducted to ascertain that the
water is potable for human consumption
Observation
This exercise is a scientific tool of guide for groundwater prospecting. The
results obtained therefrom may not be the exact representation of the
substrata. This is acceptable provided the predictions/findings do not fall
below 50% of the true subsurface situation. The hydro-geophysicist
surveyor/investigator is not liable for any geologic variance/deviation or
construction failure thereat.
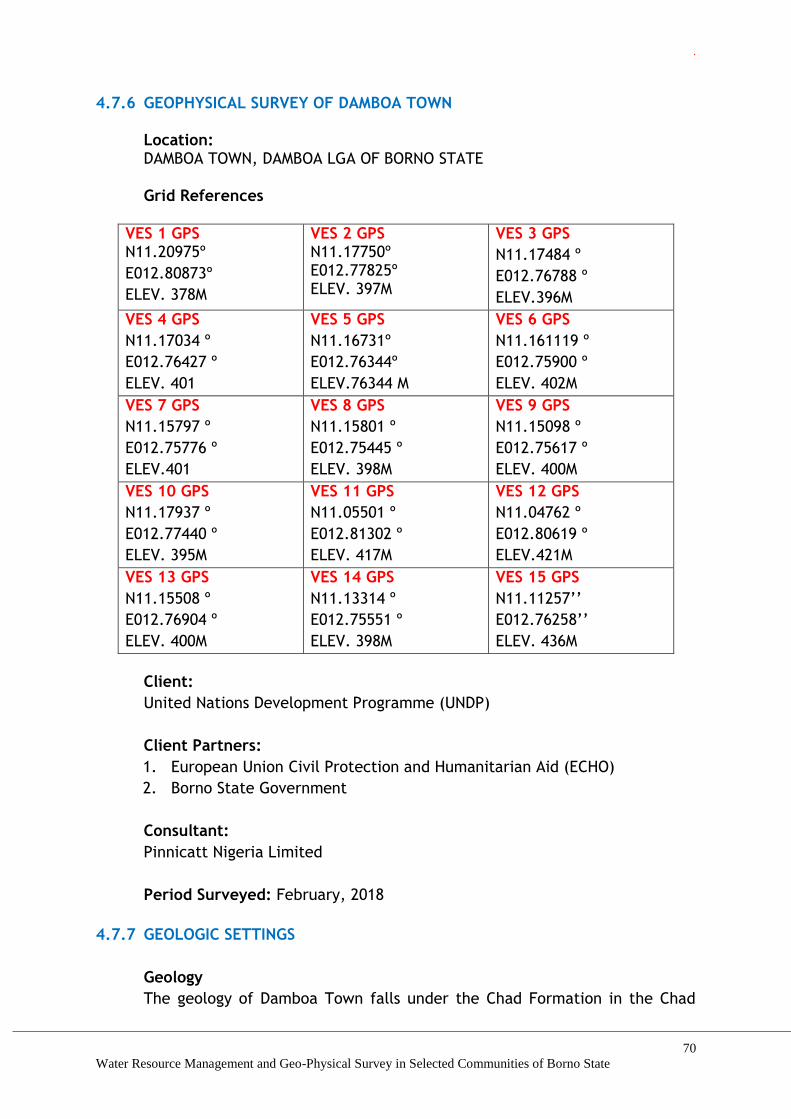
.
70
Water Resource Management and Geo-Physical Survey in Selected Communities of Borno State
4.7.6 GEOPHYSICAL SURVEY OF DAMBOA TOWN Location:
DAMBOA TOWN, DAMBOA LGA OF BORNO STATE Grid References
VES 1 GPS N11.20975º
E012.80873º
ELEV. 378M
VES 2 GPS N11.17750º E012.77825º ELEV. 397M
VES 3 GPS
N11.17484 º
E012.76788 º
ELEV.396M
VES 4 GPS
N11.17034 º
E012.76427 º
ELEV. 401
VES 5 GPS
N11.16731º
E012.76344º
ELEV.76344 M
VES 6 GPS
N11.161119 º
E012.75900 º
ELEV. 402M
VES 7 GPS
N11.15797 º
E012.75776 º
ELEV.401
VES 8 GPS
N11.15801 º
E012.75445 º
ELEV. 398M
VES 9 GPS
N11.15098 º
E012.75617 º
ELEV. 400M
VES 10 GPS
N11.17937 º
E012.77440 º
ELEV. 395M
VES 11 GPS
N11.05501 º
E012.81302 º
ELEV. 417M
VES 12 GPS
N11.04762 º
E012.80619 º
ELEV.421M
VES 13 GPS
N11.15508 º
E012.76904 º
ELEV. 400M
VES 14 GPS
N11.13314 º
E012.75551 º
ELEV. 398M
VES 15 GPS
N11.11257’’
E012.76258’’
ELEV. 436M
Client:
United Nations Development Programme (UNDP)
Client Partners:
1. European Union Civil Protection and Humanitarian Aid (ECHO)
2. Borno State Government
Consultant:
Pinnicatt Nigeria Limited
Period Surveyed: February, 2018
4.7.7 GEOLOGIC SETTINGS
Geology
The geology of Damboa Town falls under the Chad Formation in the Chad
.
71
Water Resource Management and Geo-Physical Survey in Selected Communities of Borno State
Basin. It is worth noting that the geological history of the Chad Basin started
during the upper Cretaceous (upper most Albian) when over 1000m of
continental sediments constituting the Bima Sandstone was deposited
uncomformably on the Precambrian basement (Baker 1965) following the
regression of the sea during Albian- Cenomanian time. These beds are
distributed mainly to the Southwestern margin of the basin. In the Nigerian
Chad basin, the oldest rock is the basement complex rocks, which are
Precambrian in age. These are uncomformably overlain by a sedimentary
cover about 3500m thick.
In Damboa Town however, is more or less a transition zone between Chad
Formation in the Chad Basin and Basement Complex rocks of southern part
of Borno state as it is located at the tip ends of the Chad Basin.
In the Pleistocene and probably during the Pliocene, the Chad Formation
was deposited uncomformably on the Keri-Keri Formation. The sediments of
lacustrine origin vary both laterally and vertically in lithology. The
formation is mainly an argillaceous sequence of impersistant arenaceous
horizon. Towards the center of the basin, lacustrine clays are prominent in
the sequence but near the margin fluviatile sand, grits and gravels became
more important.
Hydrogeology
Hydrogeologically, the Chad Formation aquifers are well demarcated and
describe as Upper, Middle and Lower aquifers around Maiduguri. Elsewhere
however, these horizons do not exist. In the northern part, there exist at
depths about two horizons, with the upper one absent, but replaced with
water table aquifer and in the southern parts of the Basin, only the one
horizon is found which is replaced with water table aquifer in some parts,
especially in Damboa Town and its immediate environs.
4.7.8 METHOD OF STUDY AND DATA ACQUISITION.
Methods Applied
Equipment/Instrumentation:
The equipment used for the survey is Syscal Junior resistivity meter. The
Syscal Junior resistivity meter is an ideal instrument for applications with
depths of investigation in the range of 100- 120 meters or less. The 100W
transmitting power is quite adequate at these depths and the light weight of
the junior resistivity meters, only 7 kg with internal battery, makes easy
work of moving along your profile. The combined transmitter/receiver unit
is micro processor based and features a large, easy to read LCD display.
.
72
Water Resource Management and Geo-Physical Survey in Selected Communities of Borno State
Measurement is fully automatic. Pressing the Start/Stop key to initiate a
measurement will first cause the SP value to be measured and then stored.
The Junior will then display the average values of voltage and current, with
standard deviation, until the stop key is pressed. If the operator has
selected the appropriate electrode array and spacing parameters the
apparent resistivity value is calculated. Memory storage for 1000 sets of
readings with all related parameters is provided.
The SP value is displayed so that noisy conditions may be observed. SP
compensation is recalculated during stacking with every third stack,
providing excellent linear drift correction. Automatic ranging during digital
stacking improves noise reduction. A 20 bit A/D converter is used to provide
the best resolution and highest quality data.
Power is supplied from internal rechargeable battery, or external 12V. The
battery charger is external and may be switched between 110 or 220V.
Typical operation time on the fully charged internal battery is greater than
3,000 cycles. Data transfer is provided by standard RS232 port.
The unique two channel design of the Syscal resistivity meters, allows for
measurement of both voltage and current during stacking. This provides the
most optimized design to ensure the best data quality and noise rejection.
Noise rejection is greater than 120 dB at power line frequencies. Voltage
resolution after stacking is 1 microvolt, with accuracy of better than 0.5%.
Techniques Applied
Principles of Resistivity Method
The principle of resistivity surveys is based on introducing a direct current
(DC) or very low frequency current in to the ground via two electrodes. If
the four electrodes are arranged in any several possible patterns, the
current and the potential measurements may be used to calculate the
resistivity.
The Schlumberger Array
This array is the most widely used in electrical prospecting. Four electrodes
are placed in a straight line on the earth's surface in the same order, AMNB,
with AB 5MN. For any linear, symmetric array AMNB of electrodes, the
equation of a can be written in the form of the equation below

.
73
Water Resource Management and Geo-Physical Survey in Selected Communities of Borno State
+ - A M N B
Fig: Field Measurement using Schlumberger array
a = ( 2 ) 1/AM - 1/BM - 1/AN + 1/BN χ ∆V
I
It can be seen from the equation that the apparent resistivity Pa, is a
function of a single distance - variable (AB/2). In practice it is possible to
measure Pa according to the above equation, but only in approximate
manner. The apparent resistivity Pa usually is calculated by using the
equation above provided that AB≥5MN.
Data Acquisition
Ground water in hard rock areas is found to exist in the overburden part of
the rock, fractured part where water can move with ease along the
fractured zones and accumulate in the weathered parts of the rocks. What
this means therefore is that the most important hydrogeologic units are the
alluvium and/or the weathered and the fractured zones of the Basement
Complex. These are the possible water accumulating zones of the Basement
Complex and are believed to therefore contain water.
The two potential electrodes M and N are connected to the potential
terminals P1 and P2 on the Terrameter and the two current electrodes A
and B are also connected to the current terminals C1 and C2 respectively.
The electrodes are fitted firmly into the ground in order to ensure accuracy.
Having done that, the Abem Terrameter is then switched on and the current
is sent into the ground via the electrodes while readings are taken on the
liquid crystal display (LCD). Some precautions have to be taken into
consideration before and while taking the readings if good and accurate
data is to be collected.
Initially the survey is started at a short distance of AB/2, which is then
increased progressively as the survey continued. At a certain period the
potential distance MN has to be increased especially when it becomes too
.
74
Water Resource Management and Geo-Physical Survey in Selected Communities of Borno State
small to give reliable reading of resistance. However the condition of AB/2
≥ 5 MN has to be fulfilled. Measurement of resistance is taken directly from
the Terrameter, which is then multiplied by K factor to calculate the
apparent resistivity. This is then plotted on a bi-logarithmic paper, the
resistivity values plotted against the distance AB/2.
The obtained data is plotted on a graph sheet called log-log graph with a
values plotted on the ordinate against distance AB/2 on the abscissa of the
graph. The plotting is done only on the log-log graph because the field curve
can be compared with calculated theoretical curve and the form of
electrical sounding does not depend on the resistivity or thickness of the
first layer provided 2/1, 3/1…. n/1 and the ratio h2/h1, h3/h1… hn/h1
remains constant. High values cannot be plotted on an ordinary graph sheet,
hence the choice of bi-logarithmic paper.
4.7.9 DATA ANALYSIS AND INTERPRETATION.
Introduction
A total of twenty (15) vertical electrical soundings (VES) were carried out at
different locations covering all parts of Damboa town using Schlumberger
Configuration. A total maximum AB separation distance of 260m of the
electrical electrodes was achieved.
To interpret properly, the understanding of the geology of Damboa is
necessary. Based on this therefore Vertical Electrical Soundings were carried
out at different locations including where boreholes were already drilled.
These include both productive and abortive ones, even the ones wild
cutting. The team also carried out hydrogeological, geological and
topographical investigations.
It is worth noting that after obtaining the data from the field, the data is
then processed and interpreted and the results discussed. Normally, the
data can be interpreted either qualitatively or quantitatively which could
either be manual or through the use of computer programme. Quantitative
interpretation can be analytical or empirical, both of these leads to getting
the layer parameters, which includes thickness, depth and resistivities of
the successive layers.
Apart from the data gathered in the field, to get an accurate and reliable
interpretation, one has to interpret the data in the light of
The existing geological maps of the locality
Hydrogeology of the wells and streams in the locality
Rock type in the area and
.
75
Water Resource Management and Geo-Physical Survey in Selected Communities of Borno State
Enquiring the community members living there all possible questions that
might help you in your final interpretation
Analyses and Interpretation
To interpret the data, IPI2Win software was used. The data is first entered
into the computer (AB/2 vs. a). Layered model consisting of depth (m) or
thickness (m) and resistivity (m) is input into the computer for each set of
field data. It is expected that the number of layers for the model should
agree with the field curves. After inputting the data into the computer, it
then generates a VES curve from the model entered into. At this point both
the field curve and model curve can be viewed on the screen. If the model
curve doesn’t match with the field curve accurately, another model is tried
so as to obtain a better match. During the modeling, iteration of the curve
is repeated several times until the best match between the field curve and
the computer generated curve is obtained. The iteration adjusts the field
curve to match with the computer curve. As iteration is done, the root mean
square (RMS) error is reduced to minimum.
As mentioned earlier above, computer software programme IPI2Win was
used to interpret the data collected. It is a user friendly interactive
interpreting.
It also smoothens the field curve through the process of filtering technique
that involves single point correction, eccentricity correction and vertical
curve segment shift. Interpretation of the layer parameters was also carried
out by comparing various concepts of geological structure along the
surveyed observation line rather than independent informal sounding curve
inversion in the approach implemented in IPI2Win. This approach provides
the opportunity to use the priory geological data and extract information to
the greatest possible extent in the complicated geological situations.
4.7.10 DISCUSSION AND CONCLUSION
Discussion
The true resistivity values of the curves were computed and the low values
between 1 to 30 ohm.m consist of clays, while the medium consist of the
silt and clayey silt between 30 to 80 ohm –m and the 100 to 180 ohm.m. or
there about consist of the sands of various grades. During drilling however,
their intercalations are common. These grades of sand constitute the
aquifereous zone which is common in all the fifteen soundings conducted.
.
76
Water Resource Management and Geo-Physical Survey in Selected Communities of Borno State
Conclusion
Based on the interpretation of the fifteen soundings conducted, three of the
fifteen soundings were carried outside Damboa town, but few kilometres
away to compare and contrast the results. It is found out contrary to the
earlier opinion that there is no groundwater in Damboa, groundwater do
exists.
4.7.11 RECOMMENDATION AND OBSERVATION
Recommendation
Based on the interpreted results from the 15 soundings carried out, all the
soundings could be drilled for groundwater exploitation. However, the
discharge inside Damboa town might be low. Towards the Northern flack of
the town is also low. It however has reasonable discharge towards the
eastern part of the town and further away may increase. Drilling depth is
relatively shallow between 30 to 45 mbgl
Additional recommendations include:
6. Borehole should be logged before constructions
7. Gravel pack/cement grout borehole annulus to a depth greater than
60% of the overburden
8. Conduct DTH geo-electric logging to ascertain best screen positions
9. Pumping test should be conducted to ascertain aquiferous strength
for the installation of appropriate capacity pumps
10. Water quality analysis should be conducted to ascertain that the
water is potable for human consumption
Observation
This exercise is a scientific tool of guide for groundwater prospecting. The
results obtained therefrom may not be the exact representation of the
substrata. This is acceptable provided the predictions/findings do not fall
below 50% of the true subsurface situation. The hydro-geophysicist
surveyor/investigator is not liable for any geologic variance/deviation or
construction failure thereat.
.
77
Water Resource Management and Geo-Physical Survey in Selected Communities of Borno State
4.8 CAPACITY TRAINING
4.8.1 Training
Training is vital when there is a gap between the desired performance, and
the current performance in an organization. The skill Gap assessment earlier
conducted had established the Gap in both capacity of the institution as
well the desired skills required to achieve the mandate and based on the
study the training that required by water professional and personnel’s in
Borno state includes:
Non-Technical Modules
Effective communication for organisational performance;
Work ethics & attitudinal change for enhanced performance;
Time management for organisational efficiency;
Human Resources management;
Basic computing for water resource management;
Improving information management for water quality & quantity;
Technical Modules
Critical and analytical thinking for enhanced productivity
Project planning and management
Engineering skills and design for water resource management
Operation and maintenance of plants and equipment
Ground water investigations Borehole structure design, Installation and
rehabilitation;
Management and adaptation for climate change impacts;
GIS as a tool for storing, analysing and managing water quantity data
4.8.2 Evaluation of the Training Programme
Training assessments was conducted immediately after the training event to
evaluate the effectiveness of the training by the participants. A Standard
Training evaluation Form (with scoring/rating of training under key
categories) as shown in the appendix was administered to the participants.
The Training evaluation Report include the opinion of the various
participants with regards to the overall training, the training objectives, the
presentations made, the materials distributed, the trainers, the duration of
training, the venue, recommendations future improvement of training
programs, the lessons learnt and areas of application in workplace. A total
of 25 participants attended the management training session and a total of
25 participants also attended the Technical training session and all the
participants were administered the training evaluation form and the rate of
return of the training assessment form was 100%.
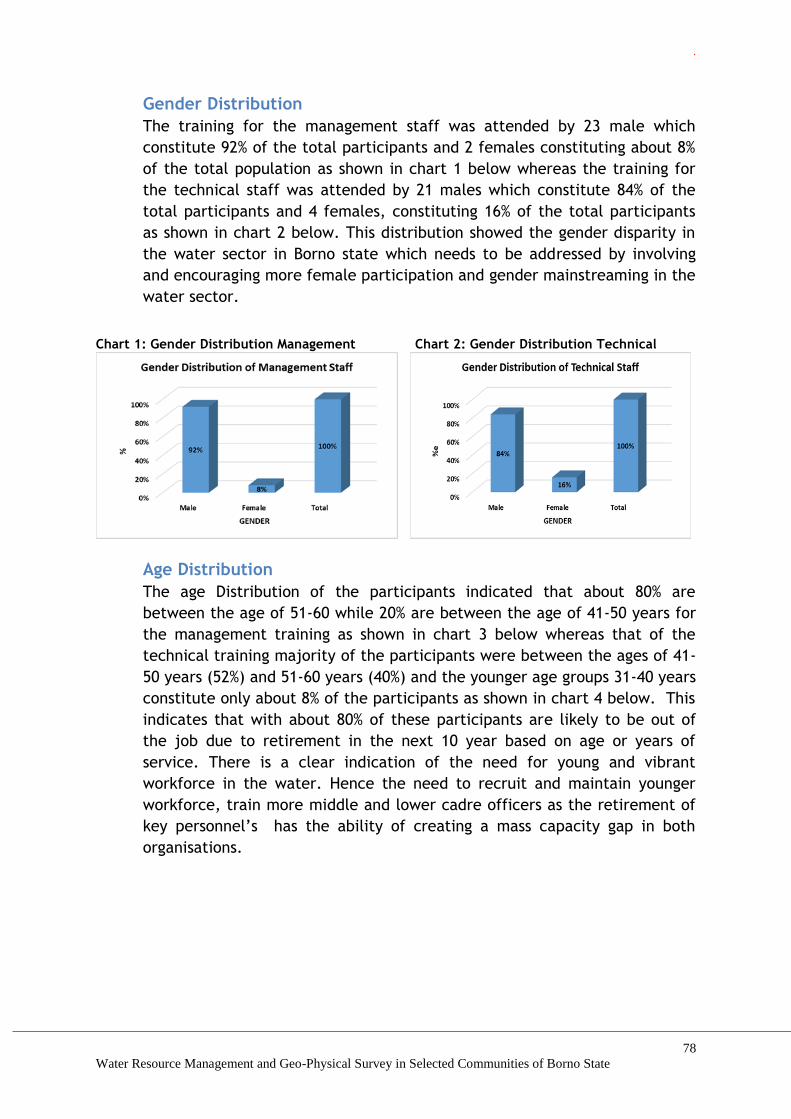
.
78
Water Resource Management and Geo-Physical Survey in Selected Communities of Borno State
Gender Distribution
The training for the management staff was attended by 23 male which
constitute 92% of the total participants and 2 females constituting about 8%
of the total population as shown in chart 1 below whereas the training for
the technical staff was attended by 21 males which constitute 84% of the
total participants and 4 females, constituting 16% of the total participants
as shown in chart 2 below. This distribution showed the gender disparity in
the water sector in Borno state which needs to be addressed by involving
and encouraging more female participation and gender mainstreaming in the
water sector.
Chart 1: Gender Distribution Management Chart 2: Gender Distribution Technical
Age Distribution
The age Distribution of the participants indicated that about 80% are
between the age of 51-60 while 20% are between the age of 41-50 years for
the management training as shown in chart 3 below whereas that of the
technical training majority of the participants were between the ages of 41-
50 years (52%) and 51-60 years (40%) and the younger age groups 31-40 years
constitute only about 8% of the participants as shown in chart 4 below. This
indicates that with about 80% of these participants are likely to be out of
the job due to retirement in the next 10 year based on age or years of
service. There is a clear indication of the need for young and vibrant
workforce in the water. Hence the need to recruit and maintain younger
workforce, train more middle and lower cadre officers as the retirement of
key personnel’s has the ability of creating a mass capacity gap in both
organisations.
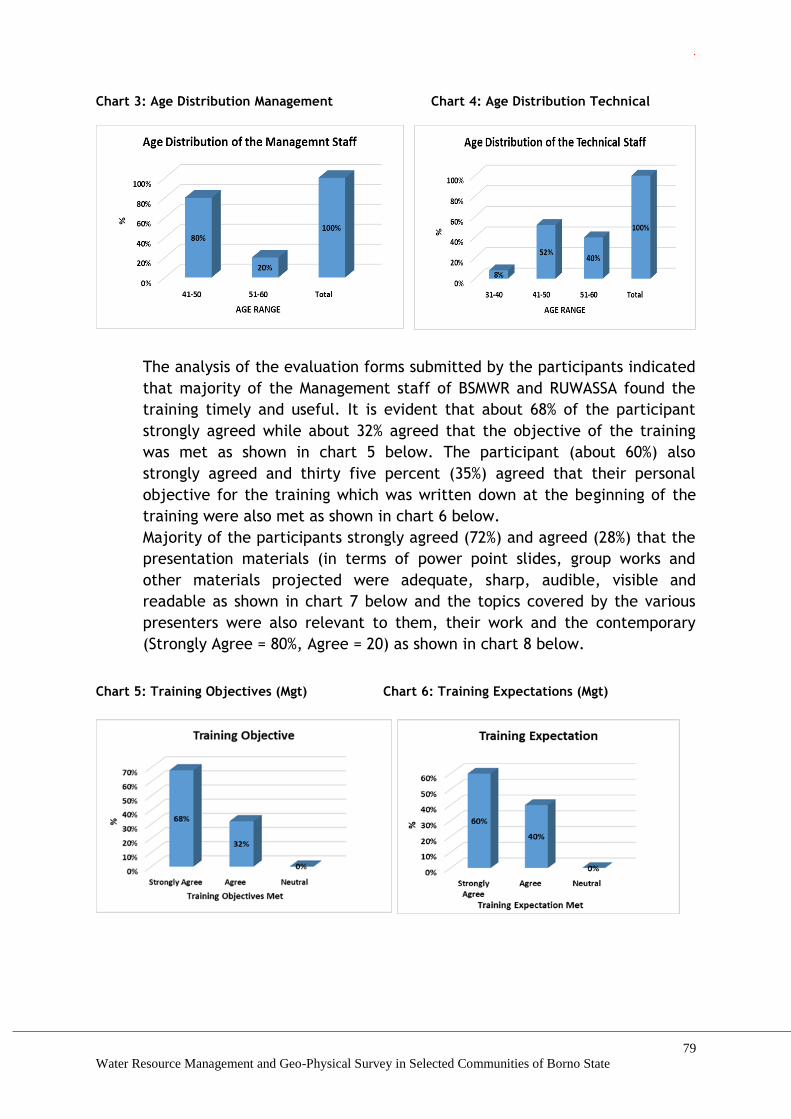
.
79
Water Resource Management and Geo-Physical Survey in Selected Communities of Borno State
Chart 3: Age Distribution Management Chart 4: Age Distribution Technical
The analysis of the evaluation forms submitted by the participants indicated
that majority of the Management staff of BSMWR and RUWASSA found the
training timely and useful. It is evident that about 68% of the participant
strongly agreed while about 32% agreed that the objective of the training
was met as shown in chart 5 below. The participant (about 60%) also
strongly agreed and thirty five percent (35%) agreed that their personal
objective for the training which was written down at the beginning of the
training were also met as shown in chart 6 below.
Majority of the participants strongly agreed (72%) and agreed (28%) that the
presentation materials (in terms of power point slides, group works and
other materials projected were adequate, sharp, audible, visible and
readable as shown in chart 7 below and the topics covered by the various
presenters were also relevant to them, their work and the contemporary
(Strongly Agree = 80%, Agree = 20) as shown in chart 8 below.
Chart 5: Training Objectives (Mgt) Chart 6: Training Expectations (Mgt)
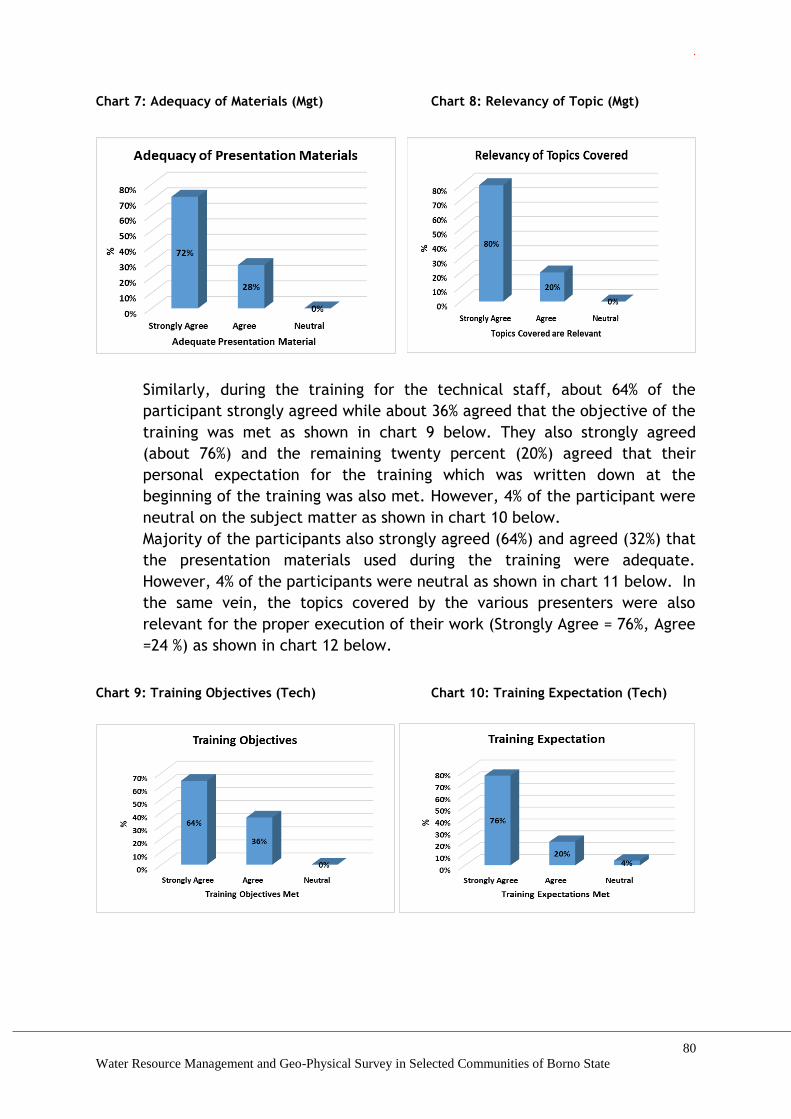
.
80
Water Resource Management and Geo-Physical Survey in Selected Communities of Borno State
Chart 7: Adequacy of Materials (Mgt) Chart 8: Relevancy of Topic (Mgt)
Similarly, during the training for the technical staff, about 64% of the
participant strongly agreed while about 36% agreed that the objective of the
training was met as shown in chart 9 below. They also strongly agreed
(about 76%) and the remaining twenty percent (20%) agreed that their
personal expectation for the training which was written down at the
beginning of the training was also met. However, 4% of the participant were
neutral on the subject matter as shown in chart 10 below.
Majority of the participants also strongly agreed (64%) and agreed (32%) that
the presentation materials used during the training were adequate.
However, 4% of the participants were neutral as shown in chart 11 below. In
the same vein, the topics covered by the various presenters were also
relevant for the proper execution of their work (Strongly Agree = 76%, Agree
=24 %) as shown in chart 12 below.
Chart 9: Training Objectives (Tech) Chart 10: Training Expectation (Tech)
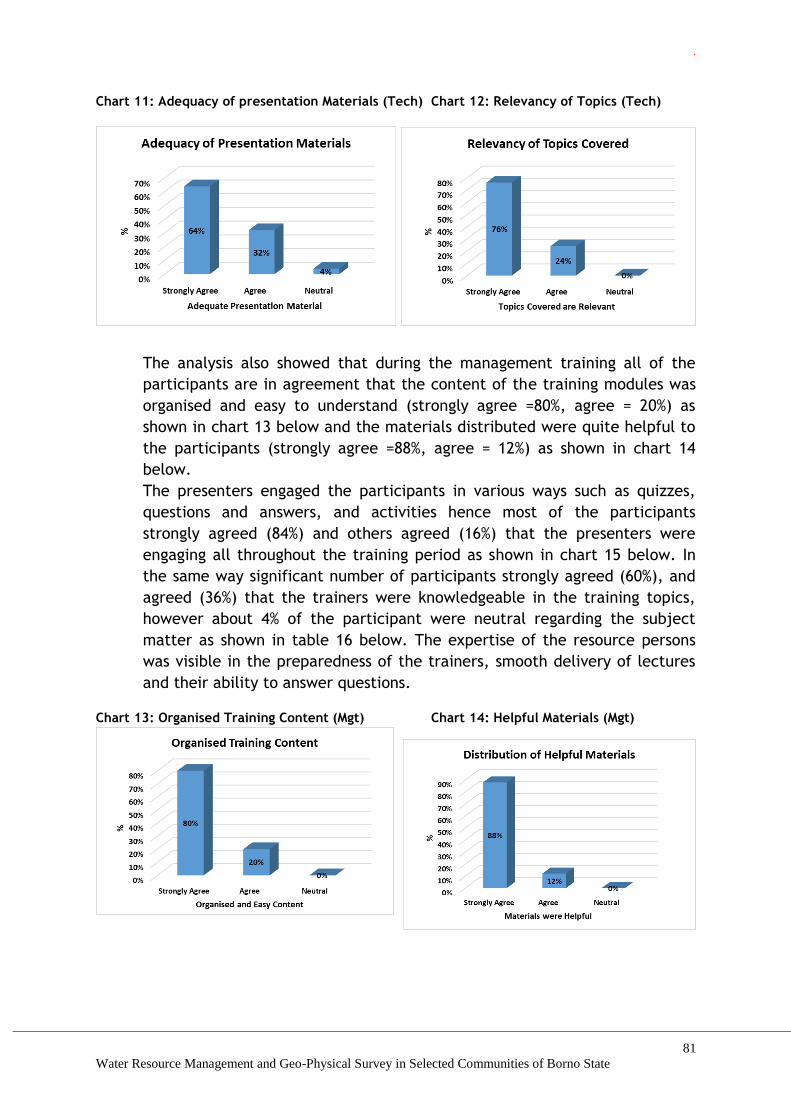
.
81
Water Resource Management and Geo-Physical Survey in Selected Communities of Borno State
Chart 11: Adequacy of presentation Materials (Tech) Chart 12: Relevancy of Topics (Tech)
The analysis also showed that during the management training all of the
participants are in agreement that the content of the training modules was
organised and easy to understand (strongly agree =80%, agree = 20%) as
shown in chart 13 below and the materials distributed were quite helpful to
the participants (strongly agree =88%, agree = 12%) as shown in chart 14
below.
The presenters engaged the participants in various ways such as quizzes,
questions and answers, and activities hence most of the participants
strongly agreed (84%) and others agreed (16%) that the presenters were
engaging all throughout the training period as shown in chart 15 below. In
the same way significant number of participants strongly agreed (60%), and
agreed (36%) that the trainers were knowledgeable in the training topics,
however about 4% of the participant were neutral regarding the subject
matter as shown in table 16 below. The expertise of the resource persons
was visible in the preparedness of the trainers, smooth delivery of lectures
and their ability to answer questions. Chart 13: Organised Training Content (Mgt) Chart 14: Helpful Materials (Mgt)
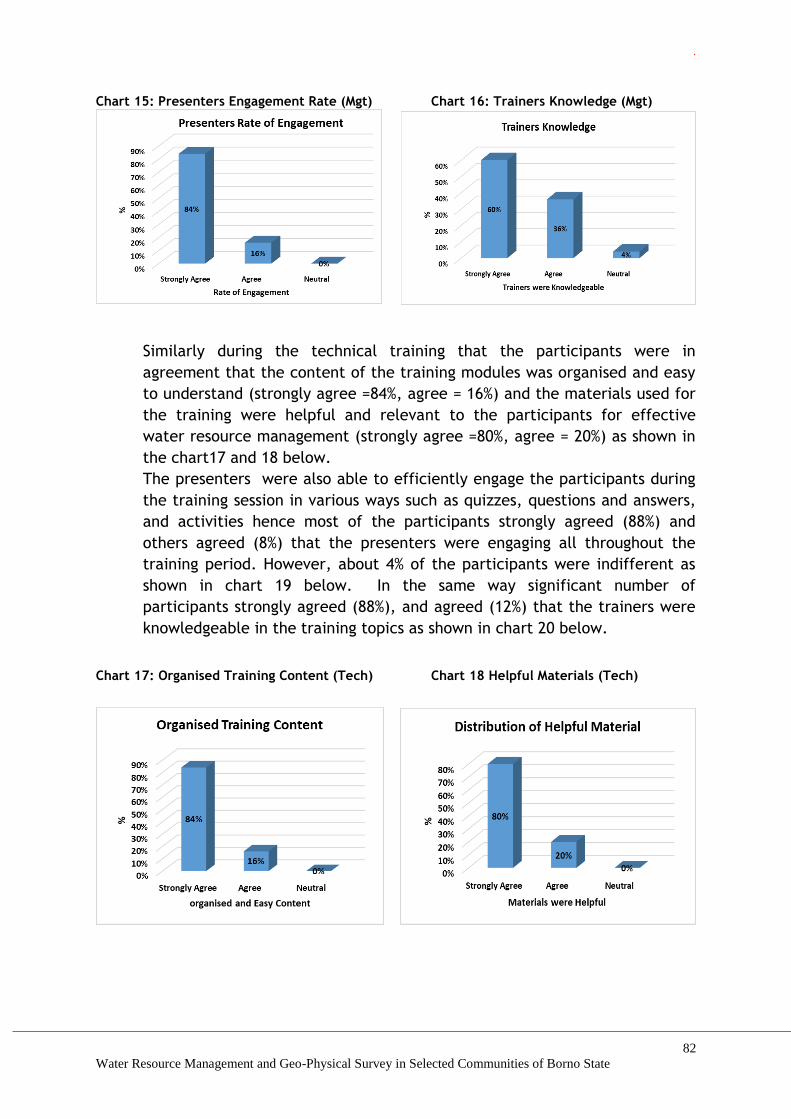
.
82
Water Resource Management and Geo-Physical Survey in Selected Communities of Borno State
Chart 15: Presenters Engagement Rate (Mgt) Chart 16: Trainers Knowledge (Mgt)
Similarly during the technical training that the participants were in
agreement that the content of the training modules was organised and easy
to understand (strongly agree =84%, agree = 16%) and the materials used for
the training were helpful and relevant to the participants for effective
water resource management (strongly agree =80%, agree = 20%) as shown in
the chart17 and 18 below.
The presenters were also able to efficiently engage the participants during
the training session in various ways such as quizzes, questions and answers,
and activities hence most of the participants strongly agreed (88%) and
others agreed (8%) that the presenters were engaging all throughout the
training period. However, about 4% of the participants were indifferent as
shown in chart 19 below. In the same way significant number of
participants strongly agreed (88%), and agreed (12%) that the trainers were
knowledgeable in the training topics as shown in chart 20 below.
Chart 17: Organised Training Content (Tech) Chart 18 Helpful Materials (Tech)
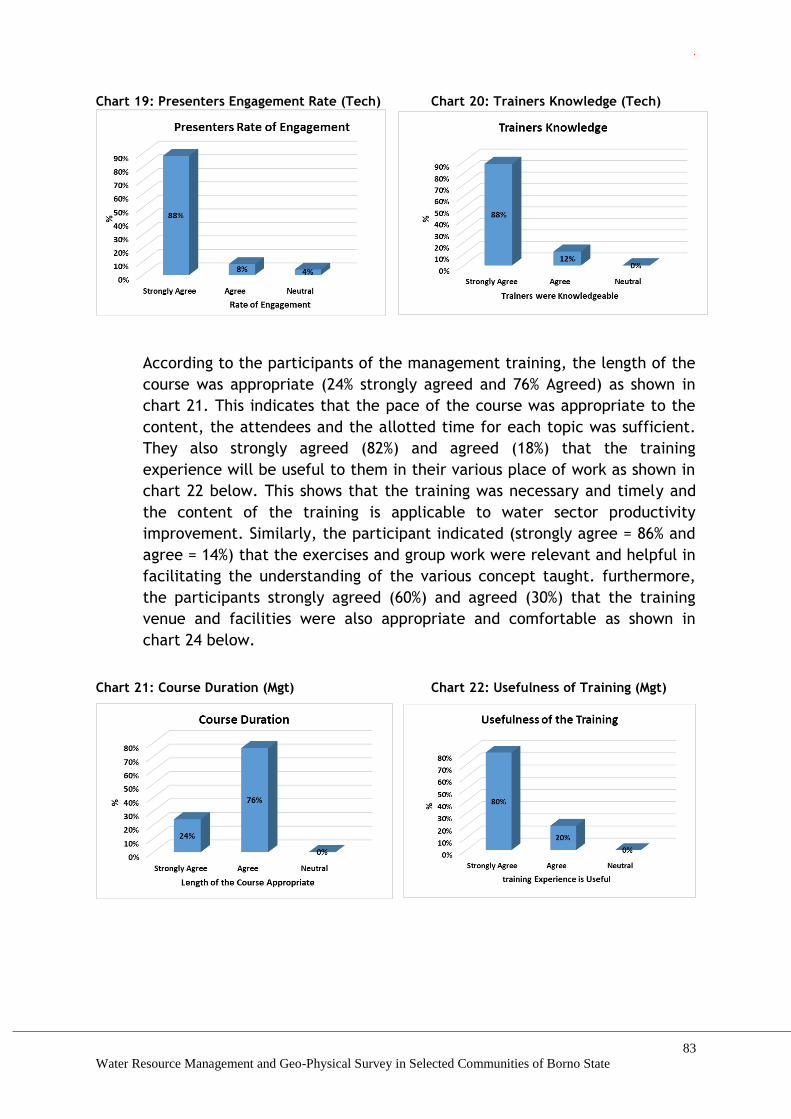
.
83
Water Resource Management and Geo-Physical Survey in Selected Communities of Borno State
Chart 19: Presenters Engagement Rate (Tech) Chart 20: Trainers Knowledge (Tech)
According to the participants of the management training, the length of the
course was appropriate (24% strongly agreed and 76% Agreed) as shown in
chart 21. This indicates that the pace of the course was appropriate to the
content, the attendees and the allotted time for each topic was sufficient.
They also strongly agreed (82%) and agreed (18%) that the training
experience will be useful to them in their various place of work as shown in
chart 22 below. This shows that the training was necessary and timely and
the content of the training is applicable to water sector productivity
improvement. Similarly, the participant indicated (strongly agree = 86% and
agree = 14%) that the exercises and group work were relevant and helpful in
facilitating the understanding of the various concept taught. furthermore,
the participants strongly agreed (60%) and agreed (30%) that the training
venue and facilities were also appropriate and comfortable as shown in
chart 24 below.
Chart 21: Course Duration (Mgt) Chart 22: Usefulness of Training (Mgt)

.
84
Water Resource Management and Geo-Physical Survey in Selected Communities of Borno State
Chart 23: Exercises and Group work (Mgt) Chart 24: Training Facility (Mgt)
The participants of the Technical training indicated that the length of the
course was appropriate (40% strongly agreed and 60% Agreed) as shown in
chart 25 below. They also strongly agreed (62%) and agreed (48%) that the
training experience will be useful to them in their various place of work as
shown in chart 26 below. Given the right tools to work, the participants will
be able to translate what they have learnt from the training into practice.
Similarly, the participant indicated (strongly agree = 80% and agree = 16%)
that the exercises and group work were relevant and helpful in facilitating
the understanding of the various concept taught. However, 4% of the
participants were neutral as shown in chart 27 below. Furthermore, the
participants strongly agreed (72%) and agreed (20%) that the training venue
and facilities were appropriate and comfortable. However, about 8% of the
participant were indifferent as shown in chart 28 below.
Chart 25: Course Duration (Tech) Chart 26: Usefulness of the Training (Tech)

.
85
Water Resource Management and Geo-Physical Survey in Selected Communities of Borno State
Chart 27: Exercise /Group work (Tech) Chart 28: Training Facility (Tech)
The Highlight of the Training
The participant for the management training indicated that what they liked
the most about the training are as follows:
The training facilitate the application of technical and managerial
knowledge to real life experience in the workplace.
The topics were beneficial, well discussed and the presentations was
good
The group work and group presentation facilitated learning, exchange
of ideas and bonding with colleagues and has the ability to increase
organisational performance
The friendliness and punctuality of the resource persons was
exceptional
The interaction of the trainers with the participants created a
conducive atmosphere for learning.
Similarly, the participants for the Technical training also stated what they
liked the most about the training in addition to that by the management
staff as follows:
The modern way of undertaking engineering design
Action plan formulation and the technical sessions,
Project management and Scheduling as well as use of visual aids
Favourable learning environment, group work and exercises
Geophysical investigation for ground water resources management
Cordial interactions between facilitators and participant as well as
with co-participants.
Basic computing and management
The Training Aspect to be improved
Majority of the participants for both management and technical training
stated the training was exceptional and there is little or nothing to be

.
86
Water Resource Management and Geo-Physical Survey in Selected Communities of Borno State
improved upon, however, some of the participants were of the opinion that
the areas of safety and security of workers and asset, climate change
management and adaptation as well as water resources management should
be made a tailor-made training to enable proper understanding of the
subject matters. Some participants also suggested that the training be
conducted on a quarterly basis so the water professionals will continually be
abreast on water resources issues. In addition, the participant also indicated
that the practical sessions and some technical sessions such as solar
installation, ground water investigation as well as basic computing should be
improved by allotting more time. They also suggested that the duration of
future trainings should be extended to enhance proper coverage of modules.
However, effective time management during the training programme is also
essential.
Lessons Learnt during the Training Session
The participants for the management training indicated that they have
learnt the following during the training session:
Effective and efficient water resource management for productivity
enhancement
Proper human resources management and keeping financial record is
vital for organisational performance.
Staff motivation to ensure organisational excellence
The relevance of effective communication and information
management in an organisation
The essentials of time management , punctuality, honesty, trust,
mentorship and disciple
The importance of security and safety of workers and assets
Development of new initiation and creativity in discharging of duties
Similarly, the participants for the Technical training also indicated the
lessons learnt during the training in addition to those stated by the
management staff are:
Geophysical survey method, interpretation of field data and computer
modelling techniques
Techniques for the application of solar power for efficient utilisation of
water resources
Critical and analytical thinking for organisational performance
Revenue generation and financial management
Surface and ground water management after insurgency
Design and mapping of water distribution network
Interaction with a broad spectrum of water professionals

.
87
Water Resource Management and Geo-Physical Survey in Selected Communities of Borno State
Changes to be effected by the participant
The participants for both management and technical training stated that
they intend to make changes in their professional practice. The changes
outlined below are as a result of the training obtained.
Enhance the productivity of the water sector in Borno state by
motivating the staff and involving them in decision making and through
exemplary leadership
Effective way of disseminating information in the workplace
Improve the safety of staff, asset and the environment
Exhibiting attitudinal change and dedication to duty
Implementing lessons learnt regarding project, facility as well as
human resources planning and management.
Any other Comment
The participants for the management training made the following comments
and suggestion:
The training was very helpful and beneficial and suggested the training
to be undertaken by more intermediate and technical staff to achieve
organisational excellence.
There is also need for continuous training and re-training of water
professionals and personnel’s in Borno state to enhance the
productivity of water resources in the state.
Other specific water related professional courses should be undertaken
by the staff such as water distribution networks design, Bills of
Quantities, procurements, construction and management).
There is a dire need for training of staff at the lower cadre since they
execute most of the jobs in the water sector.
The duration of the training could be extended to enable adequate
training on topical subject matter.
Training of area mangers in the water sector is essential to enhance
the efficiency of water distributions.
Brainstorming session / workshop should be organised for political
leaders and the top management
Maximum commitment and co-operation of the political leaders is vital
for water governance
4.8.3 Conclusion
Lack of capacity as well as inadequate capacity of water professionals is a
constraint to sustainable water development in Borno state. This training is
designed to improve water Resource Management in Borno State so that
water professionals’ and personnel’s in the communities can effectively
manage water for peoples' health, economic development, and
environmental sustainability.
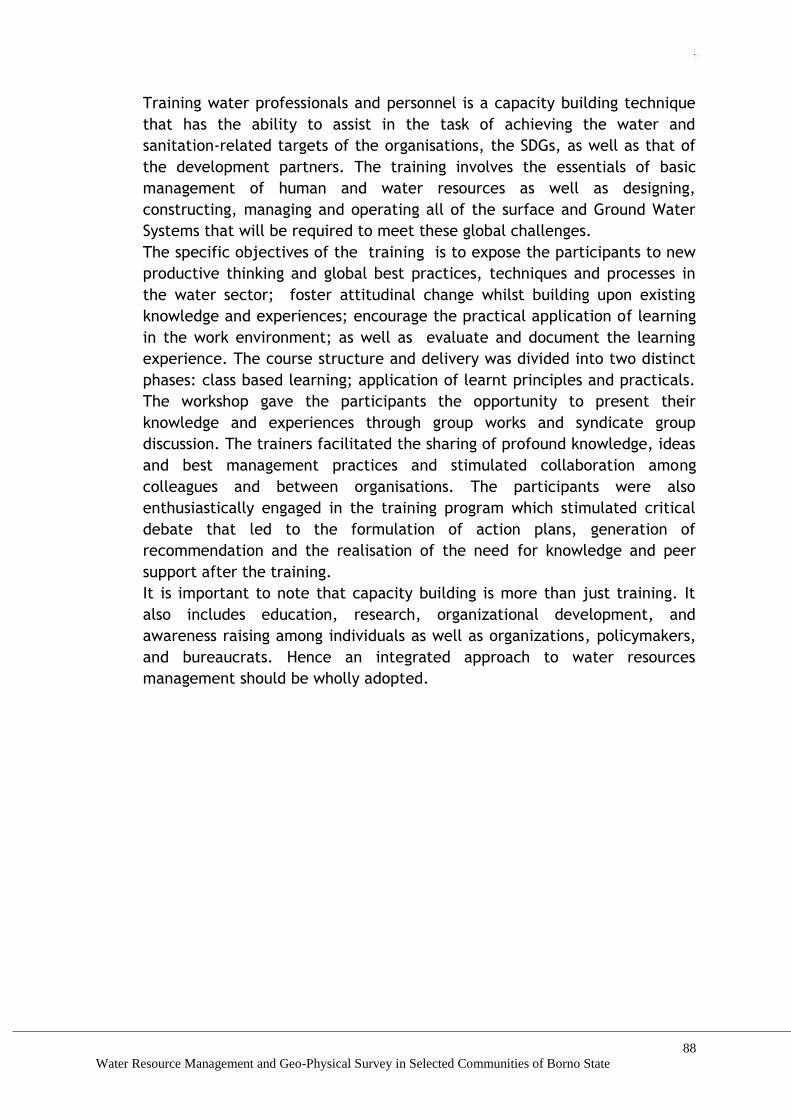
.
88
Water Resource Management and Geo-Physical Survey in Selected Communities of Borno State
Training water professionals and personnel is a capacity building technique
that has the ability to assist in the task of achieving the water and
sanitation-related targets of the organisations, the SDGs, as well as that of
the development partners. The training involves the essentials of basic
management of human and water resources as well as designing,
constructing, managing and operating all of the surface and Ground Water
Systems that will be required to meet these global challenges.
The specific objectives of the training is to expose the participants to new
productive thinking and global best practices, techniques and processes in
the water sector; foster attitudinal change whilst building upon existing
knowledge and experiences; encourage the practical application of learning
in the work environment; as well as evaluate and document the learning
experience. The course structure and delivery was divided into two distinct
phases: class based learning; application of learnt principles and practicals.
The workshop gave the participants the opportunity to present their
knowledge and experiences through group works and syndicate group
discussion. The trainers facilitated the sharing of profound knowledge, ideas
and best management practices and stimulated collaboration among
colleagues and between organisations. The participants were also
enthusiastically engaged in the training program which stimulated critical
debate that led to the formulation of action plans, generation of
recommendation and the realisation of the need for knowledge and peer
support after the training.
It is important to note that capacity building is more than just training. It
also includes education, research, organizational development, and
awareness raising among individuals as well as organizations, policymakers,
and bureaucrats. Hence an integrated approach to water resources
management should be wholly adopted.
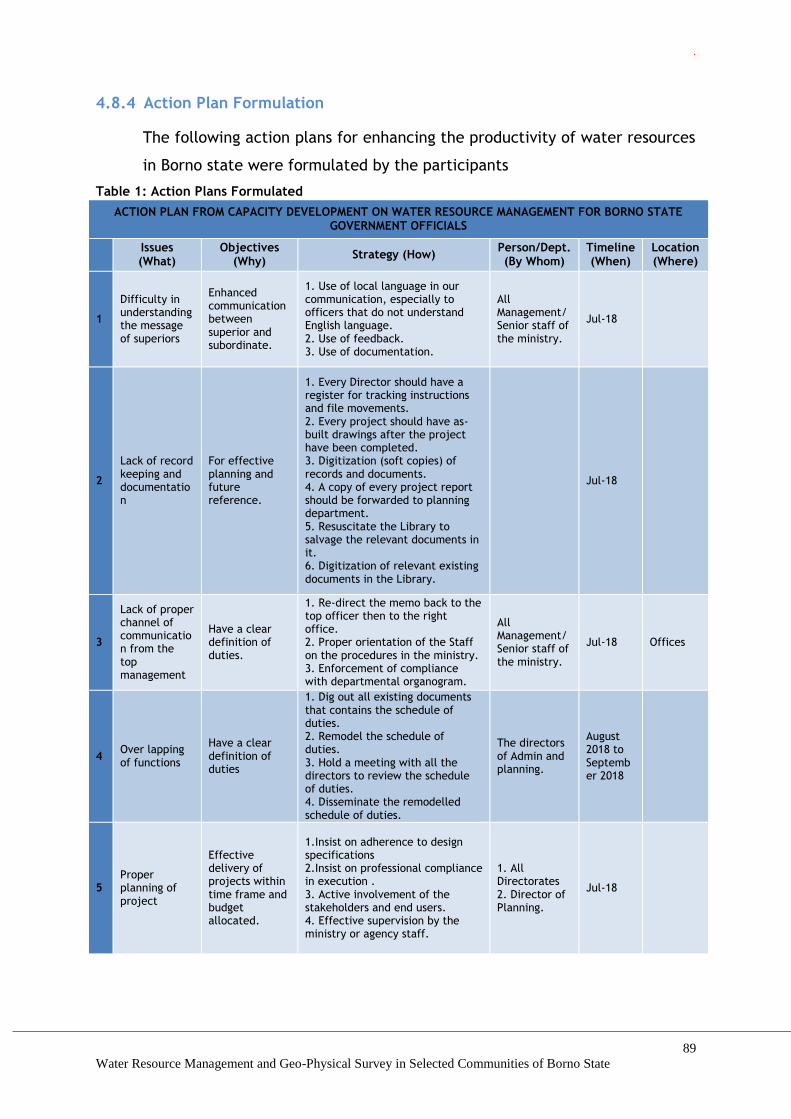
.
89
Water Resource Management and Geo-Physical Survey in Selected Communities of Borno State
4.8.4 Action Plan Formulation
The following action plans for enhancing the productivity of water resources
in Borno state were formulated by the participants
Table 1: Action Plans Formulated
ACTION PLAN FROM CAPACITY DEVELOPMENT ON WATER RESOURCE MANAGEMENT FOR BORNO STATE GOVERNMENT OFFICIALS
Issues (What)
Objectives (Why)
Strategy (How) Person/Dept. (By Whom)
Timeline (When)
Location (Where)
1
Difficulty in understanding the message of superiors
Enhanced communication between superior and subordinate.
1. Use of local language in our communication, especially to officers that do not understand English language. 2. Use of feedback. 3. Use of documentation.
All Management/Senior staff of the ministry.
Jul-18
2
Lack of record keeping and documentation
For effective planning and future reference.
1. Every Director should have a register for tracking instructions and file movements. 2. Every project should have as-built drawings after the project have been completed. 3. Digitization (soft copies) of records and documents. 4. A copy of every project report should be forwarded to planning department. 5. Resuscitate the Library to salvage the relevant documents in it. 6. Digitization of relevant existing documents in the Library.
Jul-18
3
Lack of proper channel of communication from the top management
Have a clear definition of duties.
1. Re-direct the memo back to the top officer then to the right office. 2. Proper orientation of the Staff on the procedures in the ministry. 3. Enforcement of compliance with departmental organogram.
All Management/Senior staff of the ministry.
Jul-18 Offices
4 Over lapping of functions
Have a clear definition of duties
1. Dig out all existing documents that contains the schedule of duties. 2. Remodel the schedule of duties. 3. Hold a meeting with all the directors to review the schedule of duties. 4. Disseminate the remodelled schedule of duties.
The directors of Admin and planning.
August 2018 to September 2018
5 Proper planning of project
Effective delivery of projects within time frame and budget allocated.
1.Insist on adherence to design specifications 2.Insist on professional compliance in execution . 3. Active involvement of the stakeholders and end users. 4. Effective supervision by the ministry or agency staff.
1. All Directorates 2. Director of Planning.
Jul-18
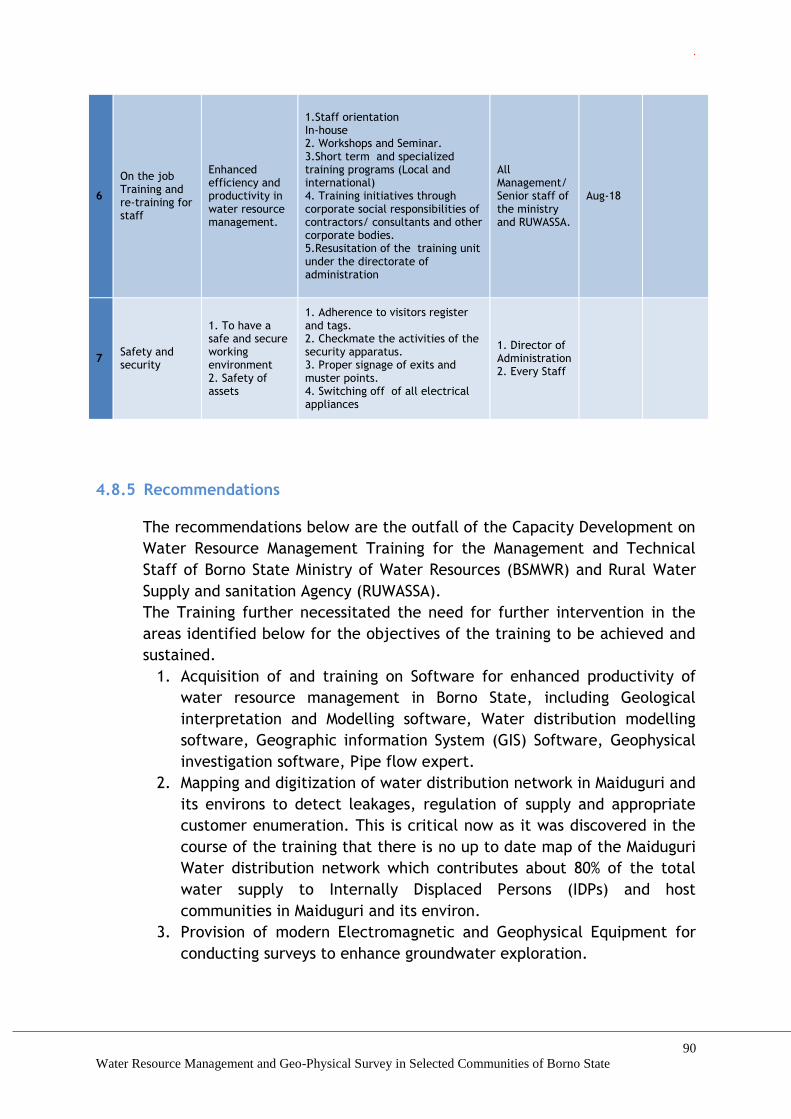
.
90
Water Resource Management and Geo-Physical Survey in Selected Communities of Borno State
6
On the job Training and re-training for staff
Enhanced efficiency and productivity in water resource management.
1.Staff orientation In-house 2. Workshops and Seminar. 3.Short term and specialized training programs (Local and international) 4. Training initiatives through corporate social responsibilities of contractors/ consultants and other corporate bodies. 5.Resusitation of the training unit under the directorate of administration
All Management/ Senior staff of the ministry and RUWASSA.
Aug-18
7 Safety and security
1. To have a safe and secure working environment 2. Safety of assets
1. Adherence to visitors register and tags. 2. Checkmate the activities of the security apparatus. 3. Proper signage of exits and muster points. 4. Switching off of all electrical appliances
1. Director of Administration 2. Every Staff
4.8.5 Recommendations
The recommendations below are the outfall of the Capacity Development on
Water Resource Management Training for the Management and Technical
Staff of Borno State Ministry of Water Resources (BSMWR) and Rural Water
Supply and sanitation Agency (RUWASSA).
The Training further necessitated the need for further intervention in the
areas identified below for the objectives of the training to be achieved and
sustained.
1. Acquisition of and training on Software for enhanced productivity of
water resource management in Borno State, including Geological
interpretation and Modelling software, Water distribution modelling
software, Geographic information System (GIS) Software, Geophysical
investigation software, Pipe flow expert.
2. Mapping and digitization of water distribution network in Maiduguri and
its environs to detect leakages, regulation of supply and appropriate
customer enumeration. This is critical now as it was discovered in the
course of the training that there is no up to date map of the Maiduguri
Water distribution network which contributes about 80% of the total
water supply to Internally Displaced Persons (IDPs) and host
communities in Maiduguri and its environ.
3. Provision of modern Electromagnetic and Geophysical Equipment for
conducting surveys to enhance groundwater exploration.
.
91
Water Resource Management and Geo-Physical Survey in Selected Communities of Borno State
4. Brainstorming session between the political and administrative heads
for effective and productive water resource management in Borno
state.
5. Provision of piezo-metric boreholes across the state for monitoring and
generation of data on groundwater resource.
6. Acquisition and training on Borehole CCTV and logger for design,
investigation, inspection and maintenance of boreholes.
7. Acquisition of basic maintenance tools and PPE (Personal Protective
Equipment) for routine maintenance and safety to improve water
resource management.
8. Continuous capacity development on water resource management to
all categories of staff of the Ministry/RUWASSA to enhance
productivity.
9. Provision of chemical dosing and treated water pumps for effective
water treatment and enhanced productivity in water distribution.
10. Provision of modern security gadgets and firefighting equipment on
critical water installations in Borno State to safeguard the water
facilities.
11. Digitization of the relevant existing document in the Ministry to
safeguard data and enhance easy access.
12. Setting up of a Geographical Information System (GIS) Centre to
enhance easy access to real-time information on water facilities in
Borno State.
13. Provision of leak detection equipment to reduce wastage of water and
to prevent pollution.
14. Acquisition of solar based technology for powering Maiduguri water
treatment plant system to reduce the huge operational and
maintenance cost in power generation.
15. Utilization of solar based technology in rural water supply systems due
to lack of access to power supply.
16. Implementation of National Water Policy by establishing all the
agencies provided in the policy to improve Water Resource and
Sanitation Management in Borno state.
17. Enlightenment on hazardous use of chemical for fishing in the Alau
Dam reservoir, and enforcement of the law on use of hazardous
chemicals by various regulatory agencies.
.
92
Water Resource Management and Geo-Physical Survey in Selected Communities of Borno State
5.0 CHALLENGES
There were several challenges and constraints experienced by the
Consultant in the process of carrying out this assignment and they can be
summarized broadly under two headings: access to sites and data collection
at the establishments that were visited.
Due to the insurgency and the security problem in the entire North-East
region of the country, gaining access to some of the towns and the water
works locations within the towns was very difficult. There were times that
field agents will have to wait for weeks before they could secure the
approval of the security agents to travel to some arrears. When we decided
to organize our own security apparatus to work with us, the bureaucratic
bottlenecks were so many that it took intervention of some senior military
officers to get the approval and have a team of soldiers to work with us.
The second major challenge was access to data and records from the two
major government agencies we worked with : Borno State Ministry of Water
Resources (BSMWR) and Rural Water and Sanitation Agency (RUWWASA). In
some cases, the Consultant visited between 3 and 5 times and in the end
was told that data are not available. Where data were available, they were
scattered and scanty, this made it difficult to harmonize, collate and
analysed as is necessary for. In some cases, the available data are old and
have not been frequently updated which render most of them irrelevant to
the study.
We discovered that relevant documents were not usually stored in the
establishments’ libraries, but in individual staff data base. Documents kept
in individual staff’s custody are usually taken away on their retirement or
when transferred and therefore not available.
Documents stored in hard copies are usually torn and destroyed by insects,
age, fire and weathering. Where available, the documents are often
scattered and not well arranged, therefore difficult to retrieve.
.
93
Water Resource Management and Geo-Physical Survey in Selected Communities of Borno State
Despite the letter of introduction from the consultant to the
establishments, some officers still withheld relevant data. This may be due
to lack of trust, which may be associated with poor quality and authenticity
of their data. Such establishment applied bureaucratic process to delay and
eventually state one reason or the other why it was not feasible to supply
the required data.
Most of these constraints associated with data collection and collation could
have been overcome if the system of storing data and information in
electronic forms (websites) has been in use in these establishments.
And lastly, the mode of payment by the client became a major challenge to
the consultant. Only 10% of the contract sum was paid on commission and
the next payment is not due until the submission of Water Need Assessment,
Capacity Gap Evaluation and the Geophysical Survey Reports which
constitute about 80% of the scope of work. The consultant was put under
serious pressure in sourcing for fund to carry out the project.
.
94
Water Resource Management and Geo-Physical Survey in Selected Communities of Borno State
7.0 RECOMMENDATION
There is an urgent need to bring the Maiduguri treatment plant back to its
installed capacity as the system is under serious stress. The large population
of displaced people in Maiduguri which at a time was almost getting to a
million people has placed so much pressure on the Water Supply System in
the Metropolis that it is beginning to break down. There is also a need to
start plan to immediately bring the second phase of the project on board as
the present first even if returned to the installed capacity cannot meet the
projected water demand.
Relative peace seems to be returning to the North-Eastern part of the
country as the insurgents are been pushed out of more and more towns and
villages. There is now a concerted effort on the side of both the Federal and
State Government and their development partners to resettle the displaced
people back to their communities. This has brought up the need for safe
water and sanitation for these returnees.
From the conclusions drawn for all the studied towns, reliance on borehole
based water supply system as the only source of water supply cannot meet
the water demand. There is a need for serious attention to be given to
surface water exploration as a long term solution to the perennial water
supply shortage in these towns and communities. The findings show that
even if all the dilapidated boreholes were to be refurbished, there will still
be a big gap in supply and demand of water.
It is also important to strongly recommend that water supply can no longer
be provided and effectively maintained as a social service. A situation
where three hundred naira is been charged per household in Maiduguri
metropolis is no longer sustainable. There is a need to have an effective
metering system that will help in revenue generation which will go a long
way to ease the pressure on Borno State Government meager resources to
cater for maintenance of the facilities for water supply.
The training of the staff who provide the manpower requirement for the
water supply management is very critical and should no longer be
.
95
Water Resource Management and Geo-Physical Survey in Selected Communities of Borno State
overlooked. Some of the participants at the training sessions have never
been to any training since they came into service and some of them have
over fifteen years in the service.