Pineapple - FruiTrop
76
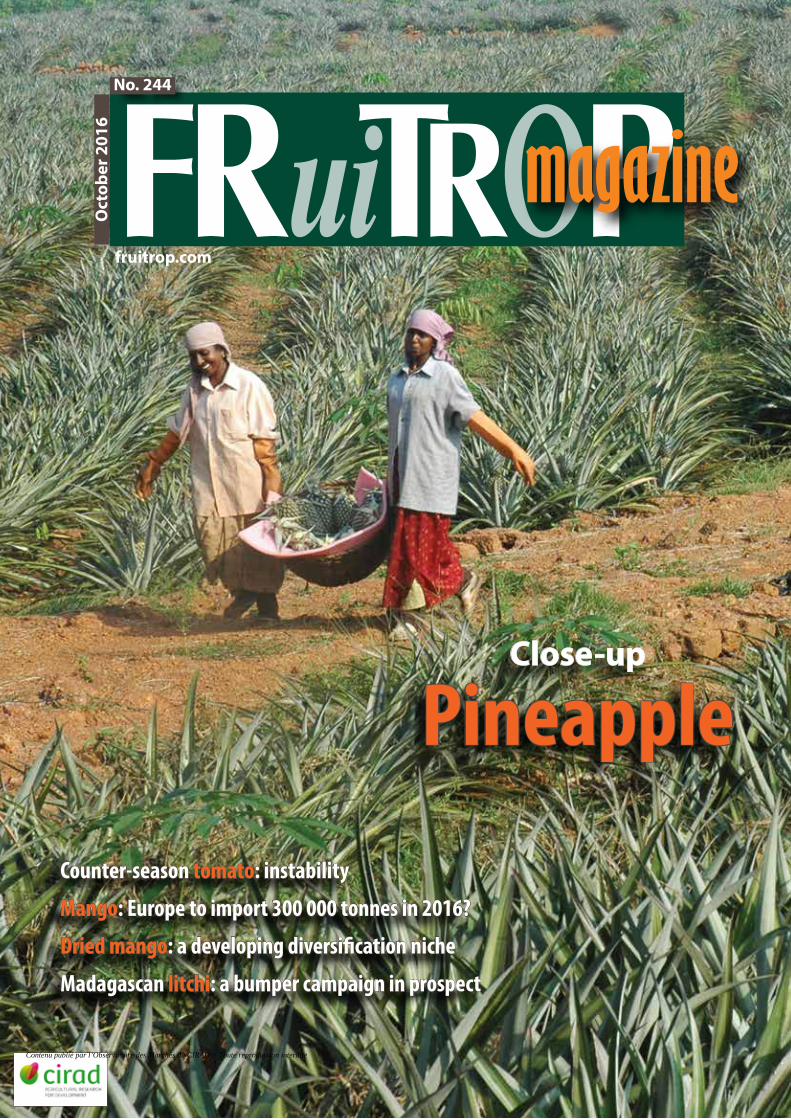
October 2016 magazine Counter-season tomato : instability Dried mango : a developing diversification niche Mango : Europe to import 300 000 tonnes in 2016? Close-up Pineapple No. 244 fruitrop.com Madagascan litchi : a bumper campaign in prospect Contenu publié par l’Observatoire des Marchés du CIRAD - Toute reproduction interdite
-
Upload
khangminh22 -
Category
Documents
-
view
1 -
download
0
Transcript of Pineapple - FruiTrop
Oct
ober
201
6
magazine
Counter-season tomato: instability
Dried mango: a developing diversification niche
Mango: Europe to import 300 000 tonnes in 2016?
Close-up
Pineapple
No. 244
fruitrop.com
Madagascan litchi: a bumper campaign in prospect
Contenu publié par l’Observatoire des Marchés du CIRAD − Toute reproduction interdite
Our sales team is ready and waiting: +33 1 56 34 26 26www.compagniefruitiere.fr
COMPAGNIE FRUITIERE IMPORT, S.A.S au capital de 164.456 euros, 33 boulevard Ferdinand de Lesseps 13014 MARSEILLE. RCS MARSEILLE N° 057.818.759
Trading campaign from November to February
Customised services : girsacs, net-bags, trays
As an essential market player, Compagnie Fruitière distributes more than 8000 tonnes of Madagascar litchis every year
COMPETITION:1 TRIP
and plenty of other gifts up for grabs
Contenu publié par l’Observatoire des Marchés du CIRAD − Toute reproduction interdite

1No. 244 October 2016
THE LATEST ON...
“Between hope and despair”: it is into this no man’s land of the emotions that we are thrust by the European Commission’s recent study on fruit and vegetable consump-tion in the EU-28. Taking the despair first, overall more than one third of Europeans do not even consume one portion of fruit or vegetables a day. Worse still, just 14 % follow the famous nutrition
rule of 5 portions a day. Only the United Kingdom bucks the trend, with one third of consumers (aged over 15) following the rule, and just 21 % only rarely coming into contact with this type of food. Which is a shame with Brexit now in full swing! Bottom of the class are Bulgaria and Romania, the absolute opposites of the United Kingdom, with respectively just 4.4 % and 3.5 % of consumers following good practice. The study also finds a positive correlation between education level and consumption level of these products.
Yet the results of this consultation are also a source of hope for all producers and operators in the sector. Namely, to hoist fruit and vegetable consumption up from hardly anything to one or two portions a day, if only for a tiny percentage of the population. There is immense growth potential. It is up to these same operators to convince the recalcitrant to do themselves a favour, the public authorities having failed miserably to do so. Yet there is every reason to hope, since the study also
shows that for the same education level, women consume much more fruit and vegetables than men. Given that women are the future of men, as the saying goes, and since wisdom (the goddess Sophia) is womankind’s prerogative, fruit and vegetable consumption should soon be soaring.
Denis Loeillet
ContentsDirect from the markets (E. Imbert, D. Loeillet, C. Dawson, P. Gerbaud, T. Paqui, C. Céleyrette, R. Bright)
p. 2 • Reviews: September 2016
• Banana: Purée price in Europe in September 2016 — Ecuador to make a half-euro gain in com-petiveness from 2017 — Banana consumption back with a vengeance in August 2016.
• Avocado: New Zealand avocado: a fine season paving the way for future ones — No avocado from Jalisco to the United States before spring 2017.
• Citrus: Juice prices in Europe in September 2016 — Floridian orange production: from free fall to steady decline? — Floridian grapefruit: a harvest with no nice surprises.
• Exotics: Pineapple: juice prices in Europe in September 2016 — Mango: juice and purée prices in Europe in September 2016 — Other fruits: juice and purée prices in Europe in September 2016 — Dominican pineapple: how long until take-off?
• Temperate fruits and vegetables: European potato: yields falling — European kiwi: a slight slowdown in Italy, but good potential elsewhere — Chilean cherry: the comeback.
• Sea freight and sector news: An innovative punnet at Idyl — Seatrade extending its fleet.
The latest on...
p. 18p. 24p. 30p. 34
• Counter-season tomato — Russo-Turko-Anglo-European instability (Cécilia Céleyrette)• European mango market — Europe to import 300 000 tonnes in 2016? (Pierre Gerbaud)• Dried mango — A developing diversification niche (Pierre Gerbaud)• Madagascan litchi — 2016-17 forecasts: a bumper campaign in prospect? (Pierre Gerbaud)
Close-up by Denis Loeillet and Thierry Paqui: PINEAPPLE
p. 40p. 47p. 49p. 50p. 52p. 55
p. 59p. 61p. 62p. 64p. 66p. 69
• World fresh pineapple market — A market of uncommon simplicity• Fresh and processed pineapple production and trade• Costa Rica: stick or twist?• United States: a more resilient market• 2015-2016 Victoria campaign — Small sizes too often finding their way onto the shelves• 2015-2016 sea-freight campaign — Does the pineapple market have what it takes to reinvent
itself, or does it really want to?• 2015-2016 air-freight campaign — Sugarloaf sent back to its niche...• Ethephon misuse blacklisted• World statistics• Quality defects• Pineapple cultivation• The main varieties
Wholesale market prices in Europep. 71 SEPTEMBER 2016
Cover photograph: © Claude Teisson
© V
ikto
r Han
acek
Publisher Cirad TA B-26/PS4 34398 Montpellier cedex 5, France Tel: 33 (0) 4 67 61 71 41 Fax: 33 (0) 4 67 61 59 28 Email: [email protected] www.fruitrop.com
Publishing Director Hubert de Bon
Editors-in-chief Denis Loeillet and Eric Imbert
Editor Catherine Sanchez
Computer graphics Martine Duportal
Iconography Régis Domergue
Website Actimage
Advertising Manager Eric Imbert
Subscriptions www.fruitrop.com
Translators James Brownlee, Tradeasy
Printed by Impact Imprimerie n°483 ZAC des Vautes 34980 Saint Gély du Fesc, France
ISSN French: 1256-544X English: 1256-5458 Separate French and English editions © Copyright Cirad
Subscription rate EUR 300 / 8 issues per year
(paper and electronic editions)
This document was produced by the Markets News Service of the PERSYST department at CI-RAD, for the exclusive use of subscribers. The data presented are from reliable sources, but CIRAD may not be held responsible for any error or omis-sion. Under no circumstances may the published prices be considered to be transaction prices. Their aim is to shed light on the medium and long-term market trends and evolutions. This pub-lication is protected by copyright, and all rights of reproduction and distribution are prohibited.
Contenu publié par l’Observatoire des Marchés du CIRAD − Toute reproduction interdite

2 October 2016 No. 244
Direct from the markets
Banana
EUROPE - RETAIL PRICE
CountrySeptember 2016 Comparison
type euro/kg August 2016
average for last 3 years
France normal 1.55 - 10 % 0 %special offer 1.28 - 23 % + 3 %
Germany normal 1.38 - 2 % + 4 %discount 1.25 0 % + 3 %
UK (£/kg) packed 0.99 0 % - 13 %loose 0.72 0 % - 3 %
Spain platano 2.01 - 2 % - 3 %banano 1.28 0 % - 4 %
EUROPE
14.114.2
14.214.1
14.014.1
13.913.913.8
J F M A M J J A S O N D
euro
/col
is
2016 2015 2014
Allemagne - Prix vert (2e et 3e marques)
NORTHERN EUROPE — IMPORT PRICESeptember
2016euro/box
Comparisonprevious
monthaverage for last 2 years
13.78 - 1 % - 3 %
September 2016The market collapsed, with the incoming volumes outweighing demand. Despite the launch of large-scale promotions, the summer fruit campaigns ending on-time and the new school year, overall European demand remained idling. In addition, the ongoing summery tem-peratures did nothing to help revitalise consumption. Overall dollar banana im-ports continued their seasonal increase. In spite of more moderate Ecuadorian volumes (2015 level) than in August, the overall supply peaked, reaching levels 22 % above the three-year aver-age, especially because of the rise from Colombia (peak expected in October) and the Costa Rican production peak. In addition, imports from Africa and the French West Indies continued to increase, reaching record levels at the end of the month (+ 32 % on the three-year average). Hence given this distinct swelling of the market, re-exports to Eastern Europe helped more or less re-strict stocks in Western Europe, though to the detriment of prices, on the slide since August. Rates came undone, to reach much lower levels than in 2015, and 12 % below the three-year average. In Spain, Canaries volumes increased due to the seasonal increase in supply and the end of the quota. Green banana prices stagnated at low levels. In Russia, the market started to deteriorate under the effect of a newly rising supply, at a higher level than last year.
Banana: purée price in Europe in September 2016.
Type Price (USD/t) Source Comments
ss aseptic, 22°Brix
650-725 cfr Rotterdam Ecuador Demand and supply balanced. Prices
stable.
Note: cfr: cost and freight / Source: MNS-ITC Geneva
Banana: Ecuador to make a half-euro gain in competitiveness from 2017. Deliverance has never been so close for Ecuadorian exporters. The rati-fication process of the EU-Ecuador agreement will be complete in December 2016. From 1st January 2017, their bananas will be subject to (practically) the same import duty into the EU-28 as their Latin American competitors, i.e. 97 euros/t. Hence the Ecuadorian industry will save nearly 55 cents per box, thereby boosting its competitiveness. Nit-pickers will ask who benefits from this reduction. The Ecuadorian State hopes that it will improve the earnings of banana plantation labourers, or more generally their working conditions. Exporters, for their part, hope to increase margins or improve their competitiveness; unless the importers manage to convince all the parties to accept, for 2017, purchase prices half a euro lower.
Source: CIRAD
127 122 117 114 114103
9689
8275
10497
9083
75
2016 2017 2018 2019 2020+
MFNAssociation agreement members* + Colombia + PeruEcuador (July 2014 agreement)**
Banana - EU - Customs duty for third countries excl. ACP (euro/tonne)
* Costa Rica, Panama, Honduras, Guatemala, Nicaragua, El Salvador / ** Ecuador should benefit from the agreement from 1st January 2017 / Processed by Cirad-FruiTrop
© R
égis
Dom
ergu
e
Germany - Green price (2nd/3rd brands)
euro
/box
Contenu publié par l’Observatoire des Marchés du CIRAD − Toute reproduction interdite

Contenu publié par l’Observatoire des Marchés du CIRAD − Toute reproduction interdite

4 October 2016 No. 244
Direct from the markets
Banana
Banana consumption back with a vengeance in August 2016. After going through a bad patch in July, European banana consumption returned to a strong upward tempo in August. This powerful surge saw a supply of 470 000 tonnes, i.e. 50 000 t more than in August 2015. Converted into annual terms (September 2015 to August 2016), EU-28 consump-tion was equivalent to 6 million tonnes, an absolute record. Over the first eight months of 2016, the supply exceeded 4 million tonnes for the first time, i.e. a rise of 4.6 %! The African sources, especially Côte d’Ivoire, month after month confirmed an excellent dynamic. Costa Rica is also on fire with a gain of 100 000 t since the beginning of the year. Yet it is simpler to make a list of sources scaling down on the European market. Ecuador, which prioritises the North American market, saw a slump, as did Colom-bia and Panama. As for the ACP, Belize and Surinam ebbed under the effect of the flooding for the former, and a disease for the latter. European production too followed a very positive trend over the eight months. All the main production
regions (Canaries, Martinique and Guadeloupe) contributed to these good results. The current data of course does not take into account the effects of Cyclone Matthew, which caused major damage in Martinique in early October.
The North American market is in a completely different situation to the European market. While a leap in consumption could also be observed, over twelve months it reached only 4.1 million tonnes, i.e. a gain of 65 000 t (+ 1.6 %), barely exceeding the population increase. In terms of sources, and as is the case on the European market, Cos-ta Rica saw a boom taking it back to its highest levels: + 31 % over the first eight months. Guatemala was off-form (- 4 %), as were Honduras and Mexico. A special mention goes to Colombia which also scaled down on the North Amer-ican market, with a 22 % drop over eight months.
Source: CIRAD
EUROPE - IMPORTED VOLUMES - SEPTEMBER 2016
SourceComparison
August 2016
September2015
2016 cumulative total compared to 2015
French West Indies + 12 % + 8 %Cameroon/Ghana/Côte d’Ivoire + 18 % + 13 %Surinam = + 15 % - 15 %Canaries + 17 % + 12 %Dollar :
Ecuador = + 1 % - 1 %Colombia* + 3 % - 3 %Costa Rica + 20 % + 12 %
CANARIES - IMPORT PRICE*
September 2016
euro/box
Comparison
previousmonth
average forlast 2 years
13.90 0 % - 24 %
CANARIES
* 18.5-kg box equivalent Estimate made thanks to professional sources / * total for all destinations
RUSSIA - IMPORT PRICE
September 2016
USD/box
Comparison
previousmonth
average forlast 2 years
10.24 - 12 % - 24 %
R U S S I A
UNITED STATES - IMPORT PRICE
September 2016
USD/box
Comparison
previousmonth
average forlast 2 years
16.47 - 2 % + 1 %
UNITED
STATES
Banana — January to August 2016 (provisional)
000 tonnes 2014 2015 2016 Difference 2016/2015
EU-28 — Supply 3 787 3 891 4 068 + 5 %Total imports, of which 3 374 3 478 3 619 + 4 %
MFN 2 662 2 775 2 873 + 4 %ACP Africa 373 362 407 + 12 %
ACP others 339 341 338 - 1 %Total EU, of which 412 413 450 + 9 %
Martinique 124 127 136 + 6 %Guadeloupe 47 41 43 + 4 %
Canaries 227 231 258 + 12 %USA — Imports 3 092 3 114 3 146 + 1 %
Re-exports 371 371 377 + 2 %Net supply 2 722 2 743 2 769 + 1 %
EU sources: CIRAD, EUROSTAT (excl. EU domestic production) / USA source: US Customs
17.017.417.016.6
16.216.516.716.9
16.5
J F M A M J J A S O N D
USD
/col
is
2016 2015 2014
Etats-Unis - Prix vert (spot)
12.4
11.013.2
16.4
14.8
10.6
12.711.6
10.2
J F M A M J J A S O N D
USD
/col
is
2016 2015 2014
Russie - Prix vert CIF St Petersburg
14.813.9
12.6
13.6
13.0
13.513.9 13.9
13.9
J F M A M J J A S O N D
euro
/col
is
2016 2015 2014
Espagne - Prix vert platano*
© R
égis
Dom
ergu
e
USA - Green price (spot)
USD
/box
Russia - Green price CIF St. Petersburg
USD
/box
euro
/box
Spain - Platano - Green price
Contenu publié par l’Observatoire des Marchés du CIRAD − Toute reproduction interdite

Mango Avocado Sunrise OrriMedjol Dates Sharon
www.mehadrin.co.il
Nature at it's best
Contenu publié par l’Observatoire des Marchés du CIRAD − Toute reproduction interdite

6 October 2016 No. 244
Direct from the markets
VO L U M E S
P R I C E
VO L U M E S
AvocadoSeptember 2016The transition between the summer and winter seasons came in a tight market context. Hass volumes from Peru, South Africa and Kenya waned more signifi-cantly, into shortfall. In addition, imports from Mexico and Chile continued to rise rapidly, though they could not make up for the decline from the summer sourc-es, or for the demand growing year on year. Hence the market remained tight throughout the month, and import pric-es rose to set records for a September. The only dark cloud was that from week 38, sales started to suffer from the high price levels charged, at both the import and retail stages. For the green varieties, the fall of the supply into shortfall helped maintain exceptional prices throughout the month. A slight drop was registered in week 39, with the arrival of the Medi-terranean sources.
Varieties
Comparison
previousmonth
average forlast 2 years
Green - 8 %
Hass + 13 %
Varieties
Averagemonthly
priceeuro/box
Comparisonwith the last
2 years
Green 11.94 + 49 %
Hass 12.99 + 62 %
Source
Comparison
ObservationsCumulative total /
cumulative average for last 2 years
previousmonth
average forlast 2 years
Peru - 17 % Volumes rapidly subsiding after being concentrated in the summer. + 26 %
South Africa - 2 % Hass shipments on the wane but near average (7 %); more pronounced shortfall in green varieties (- 11 %). + 1 %
Kenya + 2 % Supply on the slide, but levels still normal for the season. - 11 %
Mexico + 75 % Volumes progressing, followed by stabilisation and downturn from mid-September. + 78 %
Chile + 94 % Early start, with large volumes. + 101 %
up to 3 750 ha), and the dynamic seems solid (two-year wait to obtain plants). Local consumption still barely exceeds 2 kg/capita/year, whereas Australia is nearing the 3.5-kg mark, and the Mexican giant is knocking insistently on the door (negotiations in progress to open up the market).
Source: NZ avocado growers
No avocado from Jalisco to the United States before spring 2017. The first avocado exports from Jalisco to the US market ought not to happen until at least spring 2017, according to predictions by the State’s agricultural authorities. The market has been open since May, but traceability regulations have still not been defined, and exporters will still have to implement them.
Source: infohass.com
0.0
0.5
1.0
1.5
2.0
2.5
3.0
3.5
O N D J F M A M J J A S
euro
/kg
Avocat - France - Prix import
15/16 14/15 13/14
New Zealand avocado: a fine season paving the way for future ones. No two passing years are the same for New Zealand’s Hass producers. After a particularly meagre harvest in 2015-16, a record level slightly over 40 000 t should be reached in 2016-17. More than 70 % of volumes should be exported, with as usual 70-80 % earmarked for Australia. This market has the twofold advantage of being close and highly lucrative: more than 3 850 USD/t in 2015-16 according to Australian Customs! Nonetheless, diversification to new consumer countries in Asia is as active as ever for New Zealand’s exporters, two-thirds of which operate under the Avoco banner. Surface area expansion is back on the agenda, after a few seasons of technical rationalisation (+ 237 ha last year,
13.2
10.6 11
.823
.010
.826
.814
.421
.116
.434
.014
.526
.939
.122
.941
.8*
02/0
3
04/0
5
06/0
7
08/0
8
10/1
1
12/1
3
14/1
5
16/1
7
Avocado - New ZealandProduction
(000 t / * estimate / source: nzavocado)
© Eric Imbert
Avocado - France - Import price
Contenu publié par l’Observatoire des Marchés du CIRAD − Toute reproduction interdite

Contenu publié par l’Observatoire des Marchés du CIRAD − Toute reproduction interdite
8 October 2016 No. 244
Direct from the markets
P R I C E
VO L U M E S
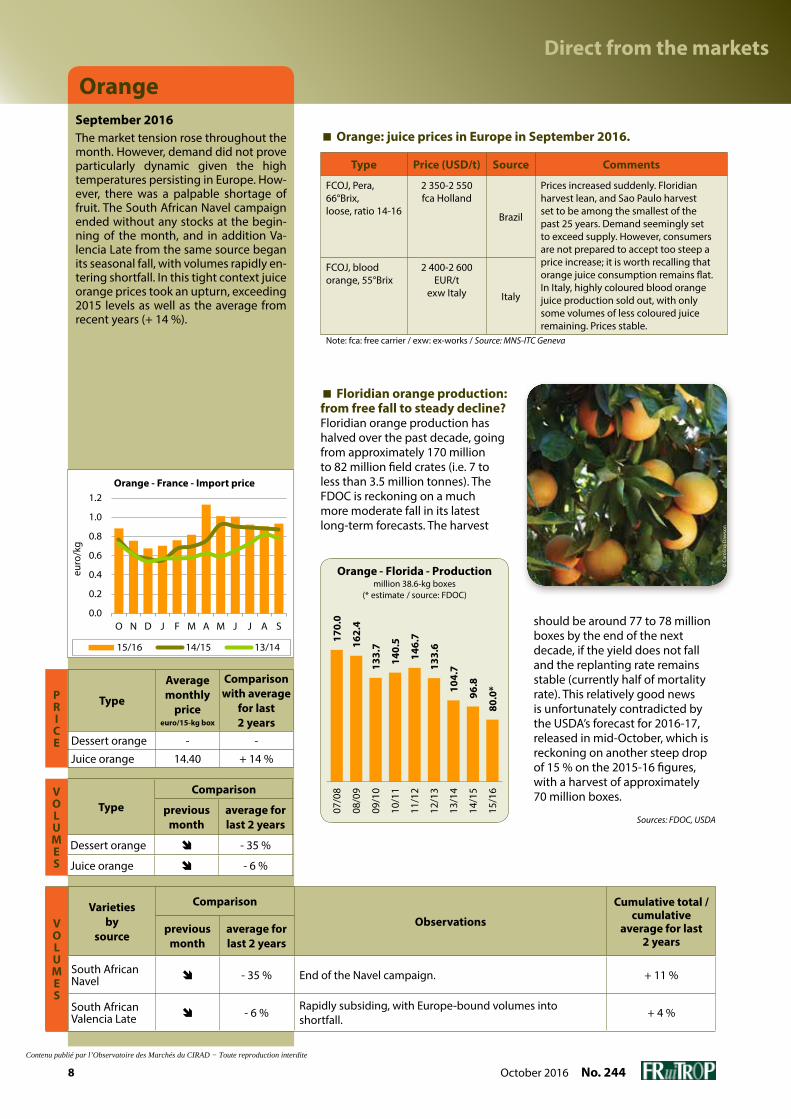
OrangeSeptember 2016The market tension rose throughout the month. However, demand did not prove particularly dynamic given the high temperatures persisting in Europe. How-ever, there was a palpable shortage of fruit. The South African Navel campaign ended without any stocks at the begin-ning of the month, and in addition Va-lencia Late from the same source began its seasonal fall, with volumes rapidly en-tering shortfall. In this tight context juice orange prices took an upturn, exceeding 2015 levels as well as the average from recent years (+ 14 %).
TypeComparison
previous month
average for last 2 years
Dessert orange - 35 %
Juice orange - 6 %
Type
Average monthly
priceeuro/15-kg box
Comparison with average
for last 2 years
Dessert orange - -
Juice orange 14.40 + 14 %
VO L U M E S
Varietiesby
source
Comparison
Observations
Cumulative total / cumulative
average for last 2 years
previousmonth
average forlast 2 years
South African Navel - 35 % End of the Navel campaign. + 11 %
South African Valencia Late - 6 % Rapidly subsiding, with Europe-bound volumes into
shortfall. + 4 %
Floridian orange production: from free fall to steady decline? Floridian orange production has halved over the past decade, going from approximately 170 million to 82 million field crates (i.e. 7 to less than 3.5 million tonnes). The FDOC is reckoning on a much more moderate fall in its latest long-term forecasts. The harvest
0.0
0.2
0.4
0.6
0.8
1.0
1.2
O N D J F M A M J J A S
euro
/kg
Orange - France - Prix import
15/16 14/15 13/14
Orange: juice prices in Europe in September 2016.
Type Price (USD/t) Source Comments
FCOJ, Pera, 66°Brix, loose, ratio 14-16
2 350-2 550fca Holland
Brazil
Prices increased suddenly. Floridian harvest lean, and Sao Paulo harvest set to be among the smallest of the past 25 years. Demand seemingly set to exceed supply. However, consumers are not prepared to accept too steep a price increase; it is worth recalling that orange juice consumption remains flat. In Italy, highly coloured blood orange juice production sold out, with only some volumes of less coloured juice remaining. Prices stable.
FCOJ, blood orange, 55°Brix
2 400-2 600 EUR/t
exw Italy Italy
Note: fca: free carrier / exw: ex-works / Source: MNS-ITC Geneva
should be around 77 to 78 million boxes by the end of the next decade, if the yield does not fall and the replanting rate remains stable (currently half of mortality rate). This relatively good news is unfortunately contradicted by the USDA’s forecast for 2016-17, released in mid-October, which is reckoning on another steep drop of 15 % on the 2015-16 figures, with a harvest of approximately 70 million boxes.
Sources: FDOC, USDA
170.
0
162.
4
133.
7
140.
5
146.
7
133.
6
104.
7
96.8
80.0
*
07/0
8
08/0
9
09/1
0
10/1
1
11/1
2
12/1
3
13/1
4
14/1
5
15/1
6
Orange - Florida - Productionmillion 38.6-kg boxes
(* estimate / source: FDOC)
© C
arol
ina
Daw
son
Orange - France - Import price
Contenu publié par l’Observatoire des Marchés du CIRAD − Toute reproduction interdite

9No. 244 October 2016
Direct from the markets
GrapefruitSeptember 2016The grapefruit market had a lacklustre month. However, the supply was not excessive: the last South African batches were shipped in early September, and only moderate stocks remained availa-ble until the end of the month. Similarly, Mexican imports progressed to mod-erate levels, though with small sizes in the majority, and some quality concerns over some of the supply. However, the start of the waves of large-scale promo-tions, with contract prices below mar-ket prices, dragged the average down. Hence import prices suffered under this pressure, and maintained levels lower than last year. Some initial early batch-es from Israel were available, though in small quantities and of early-campaign quality.
V O L U M E S
Source
Comparison
previous month
average for last 2 years
South Africa - 13 %
Mexico -
PRICE
Source
Average monthly
priceeuro/17-kg box
equivalent
Comparison with average
for last 2 years
South Africa 14.88 - 5 %Mexico 15.00 - 3 %
V O L U M E S
Source
Comparison
Observations
Cumulative total / cumulative
average for last 2 years
previousmonth
average forlast 2 years
South Africa - 13 %Rapidly subsiding, with volumes into shortfall, though stocks available until the end of the month.
0 %
Mexico - Incoming shipments peak at moderate levels, with small sizes in the majority, plus sorting rejects due to quality concerns. -
Israel + 47 % Initial shipments early and limited, typical quality for early season. + 47 %
0.0
0.2
0.4
0.6
0.8
1.0
1.2
1.4
O N D J F M A M J J A S
euro
/kg
Pomelo - France - Prix import
15/16 14/15 13/14
Grapefruit: juice prices in Europe in September 2016.
Type Price (USD/t) Source Comments
Frozen concentrate,58°Brix, red, ratio 6-8.5
1 400-1 550cfr Holland
South Africa
Demand down, and easily covered by availability. The South African harvest, below average, sold out. The Caribbean harvest will start in November, which should cause price increases before the juice production is available. Demand for coloured grapefruit juice improving, with prices strengthening slightly.
Frozen concentrate,58°Brix, white, ratio 7-9
1 800-2 000cfr Rotterdam
Frozen concentrate,58°Brix, white, ratio 9<
2 000-2 150cfr Rotterdam Caribbean
Note: cfr: cost and freight / Source: MNS-ITC Geneva
Floridian grapefruit: a harvest with no nice surprises. According to the USDA forecast, the 2016-17 harvest will for the first time fall below 10 million field crates (370 000 t). This figure, down by approximately 10 % from the 2015-16 figures, confirms the Floridian citrus industry’s torment. Within a dozen years, the grapefruit gravest has been quartered due to greening, while production costs have
Lemon: juice prices in Europe in September 2016.
Type Price (USD/t) Source Comments
Frozen concentrate,cloudy, 500 gpl
3 200-3 500cfr Rotterdam
Argentina
Argentinean harvest undermined by rain, with low yields. Juice production sold out, and pending the European harvest, prices were up.
Frozen concentrate,clear, 500 gpl
3 700-4 000 cfr Rotterdam
Note: cfr: cost and freight / Source: MNS-ITC Geneva
registered a steep increase. It was especially fortunate that Hurricane Matthew seems not to have further aggravated the situation, with losses apparently limited at the time of going to press. The rain could even have a positive impact on the sizing, currently smaller than last season and below average.
Source: FDOC
6.0 5.9 5.4 5.3 4.2 3.2 2.5 2.1
14.3 13.9 13.5 13.111.5
9.78.3 7.5
11/1
2
10/1
1
11/1
2
12/1
3
13/1
4
14/1
5
15/1
6
16/1
7
whitecoloured
20.3
Grapefruit - Florida - Production(million 38.6-kg boxes / source: FDOC)
19.8 18.9 18.415.7
12.910.8 9.6
0
2
4
6
8
10
12
S O N D J
%
2015
average
Grapefruit - FloridaSize 40 share of production
(source: FDOC)
September 2016
Grapefruit - France - Import price
Contenu publié par l’Observatoire des Marchés du CIRAD − Toute reproduction interdite

10 October 2016 No. 244
Direct from the markets
PineappleSeptember 2016During the first half-month, the overall Sweet supply was well below demand, with several operators barely receiv-ing 20 % of their usual volumes. The extreme paucity of the supply led to a big increase in rates, which peaked at the end of the first half-month. During the second half-month, the gradual but substantial increase in Sweet volumes, while demand was flat, drove prices downward. Sales were more compli-cated and only operators involved in promotions managed to maintain their fluidity, and prevent stocks from form-ing. At the very end of the month, rates charged were much lower than at the beginning of the month, and the weak-ness of demand raised fears of a distinct deterioration of the market conditions for the coming months.
Throughout the month, the overall air-freight supply was limited. Fruits from Benin and Cameroon above all were less abundant. The more substantial Ivori-an supply did not manage to make up the shortfall from the other sources. Over the month as a whole, the market maintained a positive trend, with rates constantly strengthening. Sugarloaf sales, still affected by demand averse to fruit with low coloration, were nonetheless fluid, with price levels very high and stable at 2.00 euros/kg.
The supply was also very limited on the Victoria market. The lack of vol-umes on the market facili-tated sales of fruit at high rates throughout the month.
Pineapple: juice prices in Europe in September 2016.
Type Price (USD/t) Source Comments
Frozen concentrate, 60°Brix, Smooth Cayenne variety
2 900-3 250fca Holland
Thailand
Rates stabilised. Demand curbed by price increases in previous months and by the irregularity of quality and supply. Winter harvest underway in Thailand. Stocks still limited on most markets.
Aseptic concentrate, 60°Brix, Smooth Cayenne variety
2 900-3 250cfr Rotterdam
NFC, ss aseptic, 12°Brix, MD-2 variety
850-950ddp London Costa Rica
Note: fca: free carrier / cfr: cost and freight / ddp: delivered duty paid / Source: MNS-ITC Geneva
Dominican pineapple: how long until take-off? Dominican producers hardly seem in a hurry to hit the external markets, because of an eminently attractive price on the local market. The conversion to new-generation Sweet, backed by a government campaign with 10 million sprouts imported from Costa Rica in 2012, is coming to completion. However, its impact is slow in making itself felt on exports. The conventional domestic market, above
all, as well as the tourism sector, continue to absorb around
85 % of production. The United States (sea-freight), Europe (sea and air-freight) and the Caribbean (sea and air-freight) share the majority of export volumes. However, the country is trying to revive the industry from the ashes, after the transnationals pulled out during the 1990s, and it
would seem that exports have embarked on an upward
trajectory. Our forecasts for 2016 point to a quantity of between
8 500 and 9 000 tonnes, with growth set to be confirmed in 2017 and 2018. Nonetheless, while locally there is a genuine frenzy for this produce, consolidating the export flow will take some time yet, due to the industry’s ongoing structuring, with the export sector for the time being still in the hands of a few hardened operators committed to the process.
Source: Bettina Balmer
PINEAPPLE - IMPORT PRICE IN FRANCE - MAIN SOURCES
Weeks 2016 36 37 38 39Air-freight (euros/kg)
Smooth Cayenne Benin 1.90-2.00 1.90-2.00 1.90-2.00 2.00-2.10Cameroon 1.90-2.00 1.90-2.00 1.90-2.00 2.00-2.10Côte d’Ivoire 1.80-2.00 1.80-2.00 1.80-2.00 1.95-2.10
Victoria Reunion 3.00-3.80 3.00-3.80 3.00-3.80 3.00-3.80Mauritius 3.00-3.50 3.00-3.80 3.00-3.80 3.00-3.60
Sea-freight (euros/box)Smooth Cayenne Côte d’Ivoire 11.00-12.00 11.00-12.00 10.00-11.00 -Sweet Côte d’Ivoire 9.50-13.00 9.50-13.00 9.50-13.00 9.50-13.00
Ghana 9.50-13.00 9.50-13.00 9.50-13.00 9.50-13.00Costa Rica 11.00-15.00 12.00-14.00 12.00-14.00 8.00-10.00
EUROPE
PINEAPPLE — IMPORT PRICE
Weeks36 to 39 Min Max
Air-freight (euros/kg)
Smooth CayenneVictoria
1.803.00
2.103.80
Sea-freight (euros/box)
Smooth CayenneSweet
10.00 8.00
12.00 15.00
265
389
465
215
1
387
5
591
6
454
84
591
489
8
649
04
251*
2006
2007
2008
2009
2010
2011
2012
2013
2014
2015
2016
Pineapple - Dominican Rep. - Exports(tonnes / sources: DGA, CEI-RD)
* 6 first months
Contenu publié par l’Observatoire des Marchés du CIRAD − Toute reproduction interdite

11No. 244 October 2016
Direct from the markets
MangoSeptember 2016In September, the European mango market remained fairly balanced. Senegal and Israel gradually finished their campaigns and were replaced by Bra-zil and Spain, with vol-umes progressing. In the ab-sence of sea-freight Kent in the second half of the month, purchasers switched to Brazilian Keitt and Palmer, the prices of which remained fairly steady. Spain began its Kent campaign early at the end of the month, earning high sale prices. The sale price for Osteen from the same source dipped as the supply progressed. The shipment of large-sized fruits in the second half-month contributed to pric-es deteriorating, with demand more fo-cused on medium-sized fruits. Senegal ended its campaign in more turmoil, given the qualitative disparity of its pro-duce. Rising demand also contributed to the relative balance of the market.
The air-freight mango market proved fairly steady due to the low supply lev-els, especially for Kent. The final batches from Senegal, particularly late this year, earned good value in the case of good quality produce. The big price differenc-es for this source attest to the uneven quality of the fruit. Egypt wound down its export campaign gradually with moderate shipments selling at steady prices in spite of the unattractive visual appearance. With Kent availability low, purchasers switched to Israeli Keitt or Spanish Irwin, of fine quality overall but offered at high prices. It was only at the end of the period that the Kent supply expanded with the receipt of the first batches from Spain and Brazil.
Mango: juice and purée prices in Europe in September 2016.
Type Price (USD/t) Source Comments
Aseptic purée, 7°Brix, Alphonso variety
1 450-1 750cfr Rotterdam
India
Price stable for Alphonso, with high availability. Demand and harvest levels lower for Totapuri. Normal harvest in Northern Mexico, though the South saw nearly a one-third fall on the previous one. Demand down in the Middle East, but strong in North America.
Aseptic concentrate, 28°Brix, Totapuri variety
1 250-1 350cfr Rotterdam
Aseptic concentrate, 28°Brix, T. Atkins variety
1 200-1 300fca Holland Mexico
Note: cfr: cost and freight / fca: free carrier / Source: MNS-ITC Geneva
EUROPE
MANGO - INCOMING SHIPMENTS (estimates in tonnes)
Weeks2016 36 37 38 39
Air-freight
Brazil - - - 60
Senegal 10 5 5 3
Israel 10 5 5 5
Sea-freight
Brazil 1 400 1 320 1 700 2 350
MANGO - IMPORT PRICE ON THE FRENCH MARKET
Weeks 2016 36 37 38 39 Sept. 2016 average
Sept. 2015average
Air-freight (euro/kg)Egypt Kent 4.50 4.20-4.50 4.50 4.50 4.40-4.50 4.50-4.75Spain Irwin 4.50-5.50 4.50-5.50 4.50-5.50 4.00-5.00 4.50-5.35 4.70-5.70Spain Kent - - - 4.80-5.00 4.80-5.00 5.00-5.50Brazil Kent - - - 4.50-5.50 5.00 5.00-5.50Senegal Kent 3.50-5.00 3.50-5.00 3.50-5.00 3.50-5.00 3.50-5.00 -Israel Others 2.50-4.00 - - - 2.50-4.00 4.00-4.15Israel Kent 3.50-4.00 3.50-4.00 - - 3.50-4.00 4.00-4.50Israel Keitt 3.50-4.00 3.50-4.00 3.50-4.00 3.50-4.00 3.50-4.00 4.00-4.50
Sea-freight (euro/box)Brazil T. Atkins - 5.50-6.00 6.00 5.50-6.00 5.65-6.00 -Brazil Palmer 6.00-7.00 7.00 7.00-8.00 6.00-8.00 6.50-7.50 8.50-9.25Brazil Keitt 6.00-7.00 7.00 7.00-8.00 6.00-8.00 6.50-7.50 -Senegal Kent 4.00-7.00 5.00-7.50 - - 4.50-7.25 4.00-8.00Israel Kent/keitt 6.00-6.50 6.00 6.00 6.00 6.00-6.10 7.60-8.90
By truck (euro/box)Spain Osteen 8.00-11.00 7.50-9.00 7.00-9.00 7.00-8.00 7.35-9.25 9.90-12.80Morocco Osteen 10.00 8.00-9.00 7.00-8.00 7.00 8.00-8.50 -
Other fruits: juice and purée prices in Europe in September 2016.
Type Price (USD/t) Source Comments
Acerola
ss frozen, 6-8°Brix 1 150-1 200cfr Rotterdam
Brazil
Market still well supplied and balanced.
Frozen concentrate,20-22°Brix, clear
3 000-3 100fob Santos
Passionfruit
Frozen concentrate,52°Brix
8 000-8 500cfr Holland
Ecuador
Prices on the increase in recent months, as no more stocks available from Ecuador or Peru. Yet price tension eased thanks to a fairly good harvest peak from both sources.
Guava
Concentrated purée, 19°Brix, pink
1 150-1 250cfr Holland South
Africa
Demand and supply balanced for white purée, and prices stable. South African production of pink purée particularly low because of the drought in the south of the country. Fresh fruit 30 % more expensive than last year. The white guava harvest should be around average. Hence prices set to remain stable.
Concentrated purée, 20°Brix, white
1 150-1 250cfr Rotterdam
India
Pome- granate
Clarified aseptic concentrate, 65°Brix
3 200-3 700EUR/t
fca Rotterdam TurkeyIran
Demand on the up and prices strengthening during the 1st half of 2016, but availability continuing to fall. Next harvest set to begin in October.
Note: cfr: cost and freight / fob: free on board / fca: free carrier / Source: MNS-ITC Geneva
Contenu publié par l’Observatoire des Marchés du CIRAD − Toute reproduction interdite

12 October 2016 No. 244
Direct from the markets
Temperate fruits & vegetables
European potato: yields falling. The NEPG (North-Western European Potato Growers) has estimated the total conservation potato harvest in the five main European producer countries (Germany, Belgium, France, United Kingdom, Netherlands) at ap-proximately 24.9 million tonnes in 2016, i.e. down 2 % from 2015 and on the five-year average, although surface areas were up by more than 4 % (446 500 ha). The low yields are the consequence of highly particular climate conditions, especially variable from spring onwards. Certain zones saw floods, and then a very dry harvest period, which increased the risk of tuber damage. In addi-tion, this year the dry matter content was high and the sizing on the small side. The harvest should be around average in Germany, but smaller in France, the United Kingdom and the Netherlands. There will be a particularly marked fall in Belgium from 2015, despite surface areas increasing by 12 %.
Sources: NEPG, Infofruit
European kiwi: a slight slowdown in Italy, but good potential elsewhere. European kiwi production for this campaign should be down by approximately 14 %, because of a fall in the potential, primarily in Italy. Hence according to IKO estimates, a production of 714 000 t is expect-ed (- 3 % on the 3-year average), bearing in mind that 2015-16 was a record season, especially in Italy. Italian production could actually return to its 2014 level (469 000 t, i.e. - 20 % from 2015), with a shortfall in all regions, particularly Lazio (- 30 %) and Calabria. Conversely, Greece, Spain, Portugal and France should enjoy a good harvest level, fairly close to last year.
Sources: IKO, CSO, Infofruit
Chilean cherry: the comeback. The intense frenzy for the cherry in Chile is not flagging. Surface areas saw a 22 % increase last year, and could increase by 10 % this year according to the USDA. Cherry orchards thus cover an area of 22 650 ha, mainly located in the O’Higgins and Maule regions (each with more than 8 000 ha). So production could this year reach 135 000 t (+ 32 % on 2015 and + 28 % on the three-year average), now that the El Niño phenomenon is over, whereas it slightly curbed the potential last year. Hence exports should bounce back, and could exceed 100 000 t once more. More than 80 % of volumes are aimed at China (67 800 t in 2015), far ahead of the United States (5 700 t), the number 2 destination for Chil-ean cherries. Shipments to the EU were no more than 2 500 t last campaign (4 000 t in 2014-15).
Sources: Odepa, Asoex, USDA, Infofruit
662
557 63
3
669
629 71
8
636 67
7
702
857
714
2006
-07
2007
-08
2008
-09
2009
-10
2010
-11
2011
-12
2012
-13
2013
-14
2014
-15
2015
-16
2016
-17
Kiwi - EU - Production(000 tonnes / source: IKO)
Processed by Infofruit
9.9
10.1 12
.5 13.1 14
.1 16.1
16.2
16.9
20.6 22
.6
2007
2008
2009
2010
2011
2012
2013
2014
2015
2016
Cherry - Chile - Surface areas(000 ha / source: Odepa, Asoex, USDA)
24 1
62
23 9
99
24 8
13
24 2
11
26 7
74
22 3
09
24 2
06
28 5
07
25 3
10
24 9
10
2007
2008
2009
2010
2011
2012
2013
2014
2015
2016
*EU-5 : UK, Netherlands, Germany, Belgium, France
Conservation potatoes - EU-5*Production
(000 tonnes / source: NEPG)
Photos © Guy Bréhinier
Contenu publié par l’Observatoire des Marchés du CIRAD − Toute reproduction interdite

Contenu publié par l’Observatoire des Marchés du CIRAD − Toute reproduction interdite

14 October 2016 No. 244
Direct from the markets
Roots & tubers
1.8
1.9
2.0
2.1
2.2
2.3
2.4
2.5
27 28 29 30 31 32 33 34 35 36 37 38 39
euro
s/kg
Costa Rica
Eddoe - France - Weekly average wholesale price(Rungis)
0.900.951.001.051.101.151.201.251.301.351.40
27 28 29 30 31 32 33 34 35 36 37 38 39
euro
s/kg
Costa Rica
Cassava - France - Weekly average wholesale price(Rungis)
0.5
1.0
1.5
2.0
2.5
27 28 29 30 31 32 33 34 35 36 37 38 39
euro
s/kg
Ghana white Ghana PunaBrazil white Brazil Cuscus
Yam - France - Weekly average wholesale price(Rungis)
Sweet potato: RO: red-skinned, orange-fleshed / RW: red-skinned, white-fleshed / WW: white-skinned, white-fleshed / Source: Pierre Gerbaud
Q3 2016
Sweet potato (SP)Shipments of white-fleshed Egyptian SPs, after being suspended in early June, re-sumed in mid-September, with rates dip-ping after the first incoming shipments. During the summer, South Africa and Honduras provided the white-fleshed SP supply. While prices were stable overall, Honduran produce sold at slightly high-er prices, strengthening somewhat from mid-August.
Orange-fleshed SP from Honduras, Israel and the United States earned fair-ly constant prices. However, Israeli pro-duce sold for at least 0.20 euro/kg more. Rates strengthened in the second half of August, especially for Honduras, the biggest and most regular procurement source.
The Spanish orange-fleshed SP campaign got off to an early start at the beginning of September, nearly one month ahead of the 2015 campaign. A marginal source a few years ago, it has rapidly become im-portant to the European market, which should be further underlined this year
with varietal diversification. Jerew supple-mented the shipments, hitherto compris-ing only the Beauregard variety.
In July, and up until mid-August, Honduras shipped white-skinned and white-fleshed SP, previously hardly if at all exported by this source, which underlines the prod-uct’s expansion on European markets. Italy took over in mid-September with its typical Veneto varieties.
YamThe market saw major variations, primar-ily due to fluctuations in shipments from Ghana, the main source for the European market. By June they were already dwin-dling, representing the last stocks from the previous campaign. Prices saw a dis-tinct rise, whereas paradoxically, the qual-ity of produce was becoming increasing-ly uncertain. The late arrival in mid-July of batches from the new harvest further strengthened prices. In mid-August ship-ments, hitherto limited, were stepped up and drove prices into a marked fall until the end of the period. White or Puna yams followed the same trend. The shortage of
produce at the beginning of the period encouraged operators to find an alter-native, with Brazil able to supply white yams and Cuscus. They sold fairly steadi-ly throughout the period, with rates dip-ping in September due to the magni-tude of shipments from Ghana and quiet demand.
Cassava
The price for Costa Rican cassava fell in August, a time when incoming shipments remained steady, but when demand dipped. In September, the trend reversed with a more modest supply whereas de-mand picked up.
EddoeThe dwindling supply from Costa Rica, the main supplier to the European mar-ket, caused a price increase, limited in July and then more marked in August. Price differences were considerable, de-pending on the size, with some sales at as much as 2.70 euros/kg, a level rarely at-tained. Those batches that were received from China in July and August, and from Ecuador in July, obtained lower prices.
0.6
0.8
1.0
1.2
1.4
1.6
1.8
2.0
2.2
27 28 29 30 31 32 33 34 35 36 37 38 39
euro
s/kg
RO RW WW
Sweet potato - France - Weekly average wholesale market price(Rungis)
Contenu publié par l’Observatoire des Marchés du CIRAD − Toute reproduction interdite

15No. 244 October 2016
Direct from the markets
Other exoticsQ3 2016
Plantain bananaGiven the relatively limited imports, the Colombian plantain rate maintained a fairly strong level until September, when it came undone under the effect of abun-dant shipments, while demand was treading water. Sales were even made at knock-down prices for ripe merchan-dise, with rapidly deteriorating quality. In September, the less abundant Ecuadorian shipments suffered under the saturation of the market caused by the dispropor-tionate flows from Colombia.
Chayote and christophineWith shipments decreasing in August, Costa Rican produce saw its prices in-crease. From late August, the first French-produced chayotes and christophines en-tered the market. Their sale price dipped, while Costa Rican imports subsided in the face of this competition. Some air-freight batches from Martinique topped up the supply at times.
Dasheen
There was a steep increase in the rate of dasheens from Saint Vincent, from mid-August to mid-September, corre-sponding to a fall in incoming shipments from this source. This decrease in the sup-ply was only very partially offset by small air-freight shipments from Martinique (4.00 euros/kg), incomparable with the usual flows from Saint Vincent.
Chilli pepperThe Dominican Rep. was the main suppli-er until French produce appeared, taking over in terms of both volume and price. The rate of French produce declined as the supply progressed, gradually falling from 5.00 to 4.00 euros/kg. Until mid-Au-gust, the market received batches from Guadeloupe and Holland. Yet the fall in prices, driven by Dominican and then French shipments, rapidly drove these sources away. Those Moroccan batches that came onto the market at the begin-ning of the period met with little success.
1.5
2.5
3.5
4.5
5.5
6.5
7.5
27 28 29 30 31 32 33 34 35 36 37 38 39
euro
s/kg
Dom. Rep. France Guadeloupe Netherlands
Chilli pepper - France - Weekly average wholesale price (Rungis)
2.02.22.42.62.83.03.23.43.63.84.04.2
27 28 29 30 31 32 33 34 35 36 37 38 39
euro
s/kg
St Vincent Martinique
Dasheen - France - Weekly average wholesale price(Rungis)
0.9
1.1
1.3
1.5
1.7
1.9
2.1
2.3
27 28 29 30 31 32 33 34 35 36 37 38 39
euro
s/kg
Christophine, France Chayote, FranceChayote, Costa Rica Christophine, Costa Rica
Chayote and christophine - France - Weekly average wholesale price (Rungis)
Sweet potatoes
0.40
0.50
0.60
0.70
0.80
0.90
1.00
1.10
1.20
27 28 29 30 31 32 33 34 35 36 37 38 39
euro
s/kg
Colombia Ecuador
Plantain - France - Weekly average wholesale price(Rungis)
Contenu publié par l’Observatoire des Marchés du CIRAD − Toute reproduction interdite

16 October 2016 No. 244
Direct from the markets
EUROPE
Sea freightSeptember 2016After many months of managed inactiv-ity, the charter market sprang to life in September, fed by surplus bananas from the Philippines, Central America and Co-lombia. That charter rates in the Atlantic showed no signs of improving was part-ly a measure of latent over-capacity and partly the result of vessels redelivering from southern hemisphere citrus and kiwifruit. At the start of October, there were few signs to suggest that much would change in the short term.
This was because the oil price remained low and the charter market was weak — the combination did much to encourage fruit to be shipped but little to stimulate banana demand in Russia, North Africa and the eastern Med, not least because the USD remained strong. With attrac-tively low charter rates, expectations of a similar scenario to last year’s banana disaster developing were realistic.
Hurricane Matthew, the strongest Car-ibbean storm since 2007, blazed a trail across banana production in the French West Indies and then turned northwards to threaten the industry in Hispaniola. Early indications were that a significant proportion of the industry in Martiniq-ue had been severely affected, while all last year’s optimism in Haiti surrounding the creation of a banana export business evaporated as the storm passed over-head.
Demand for smaller units was intermit-tent: just when it appeared that some momentum was beginning to build, there was neither the fish catch nor the call from customers to underpin a rise in rates. At one stage rates fell back when a handysize unit entered the bidding for a cut load cargo.
Perhaps most significantly, there was some bad news for the reefer industry
MONTHLY SPOT AVERAGE
USD cents/cubic foot x 30 days
Largereefers
Smallreefers
September 2016 34 75
September 2015 39 78
September 2014 41 84
0
25
50
75
100
125
150
1 6 11 16 21 26 31 36 41 46 51
Grands reefers
201620152014
US
Cent
s / C
ubft
x 3
0 jo
urs
Semaines / Source : Reefer Trends
0
25
50
75
100
125
150
1 6 11 16 21 26 31 36 41 46 51
Petits reefers201620152014
US
Cent
s / C
ubft
x 3
0 jo
urs
Semaines / Source : Reefer Trends
Seatrade extending its fleet. The Seatrade Orange, a ship with a capacity of 2 200 TEU, made its maiden voyage in in September for Africa Express line. With this launch the Dutch company, the world number one in refrigerated shipping, inaugurated a major fleet expansion plan. Its “Color class” will be reinforced by five other ships in 2016 and 2017. An option has also been given on six additional units with the Yangfang shipyard in China, which built the first ships.
Source: Seatrade
An innovative punnet at Idyl. Organic tomatoes under the “Tribu écolo” brand will now be sold in a cardboard punnet made from tomato plant fibres. After the harvesting, the tomato stems and leaves are recovered and crushed. The fibres obtained are mixed with recycled paper fibres to make this original cardboard.
Source: Idyl
in general and Seatrade in particular. Traditional reefer charterers Del Monte (Lombok and Luzon Strait) and Turba-na (Santas Lucia and Maria) switched to containers for their respective Central American and Colombian services into the USEC. With the exception of the 4 Star vessels under charter to Del Monte, all banana shipments to the US are now containerized.
The redelivery of the four units to the Seatrade operation will add pressure to what is likely to be a difficult market in early 2017. It will be especially interest-ing to see whether the carriers will be able to leverage the scale advantages of-fered for the first time by the expanded Panama Canal in the Chile to US grape season.
Large reefers Small reefers
Weeks / Source: Reefer Trends Weeks / Source: Reefer Trends
US
Cent
s / C
ubft
x 3
0 da
ys
US
Cent
s / C
ubft
x 3
0 da
ys
Contenu publié par l’Observatoire des Marchés du CIRAD − Toute reproduction interdite

in cooperation with
F RUC H T H ANDE LMAG A Z I N E
#25FRUITS@FRUIT_ LOGISTICA
Promo Intex2, rue Wauthier 78100 Saint Germain en Laye Tel +33 1 39 62 11 93Fax +33 9 70 06 82 33 [email protected]
Contenu publié par l’Observatoire des Marchés du CIRAD − Toute reproduction interdite

18 October 2016 No. 244
THE LATEST ON...
The fruit and vegetables trade has been facing great instability in recent times. This is down to increasingly capricious weather, against a backdrop of global warming, but above all to a highly unstable period of European politics: Russian embargos, Brexit, EU-Morocco relations, etc.). Meanwhile, we are seeing demand switch toward local production, which is hitting imported produce increasingly hard.
Russo-Turko-Anglo-European instability
Counter-season tomato
© Eric Imbert
Contenu publié par l’Observatoire des Marchés du CIRAD − Toute reproduction interdite

Opening of the
The whole range of Mediterranean tomatoes and vegetables,plus the 2017 “Saveur de l’Année” prizewinning melon, and extra early fruit,
from October to AprilIdyl s.a.s Chemin du Barret 13160 Châteaurenard France
[email protected] 33 (0)4 90 24 20 00 www.idyl.fr
2017 Season
Presented by
MEDITERRANEAN
CROPSFESTIVAL
21st
Contenu publié par l’Observatoire des Marchés du CIRAD − Toute reproduction interdite

20 October 2016 No. 244
THE LATEST ON...
A very mixed 2015-16 campaign
The Mediterranean campaign began last year under particular circumstances, after the sum-mer heat curtailed the Spanish potential (very big shortfall in the Murcia zone, and delayed planting in Almeria) and brought forward the end of the European season. So the winter cam-paign started with high prices, around 1 euro/kg into Europe for round tomatoes. The mar-ket swelled abruptly after mid-October, as the Moroccan supply progressed, with its shipments climbing from 5 000 t to 8 000 t per week into Perpignan, saturating the European market until early November. Local demand and the first ship-ments to Russia were insufficient to ease ship-ments bound for Europe. The price for Moroccan round tomatoes dropped to 0.49 euro/kg in week 45.
Business was then in a terrible state in France, as a result of the Paris attacks. Nonetheless the situation improved at the end of the year for the round tomato, with strong Russian demand following the implementation of the Turkish boycott. Trade also picked up in the small seg-ment in the run-up to the end-of-year festivities. Rates were able to be revised upward. However, sales were mixed for the holidays, with demand switching more significantly to the vine tomato and local tomatoes produced with artificial light.
Business struggled to pick up again afterwards, with difficulties selling off the stocks formed at the end of the year. Shipments to Russia slowed down (with the let-up by confectioners), while the heat was boosting the Mediterranean produc-tion. So rates again neared 0.48-0.50 euro/kg at the import stage for Moroccan round tomatoes. Thereafter, the market settled a little, though re-taining some pressure due to the now early start to the European campaigns (mid-February), with good volumes from the beginning of the season given the mild winter. So prices fluctuated be-tween 0.60 and 0.75 euro/kg until mid-March.
The Easter holidays enabled prices to strengthen slightly, though the market remained highly un-certain until mid-April. The paucity of the small segment Spanish supply fortunately helped keep rates high at the end of the season. Volumes were also lighter in Morocco, including for the round to-mato. In late April, only the operators involved in programmes remained. However, rates were ebb-ing constantly, given the very poor spring weath-er, which greatly reduced demand.
391 401 451 455 450
425 403
447 421
481
2006
-07
2007
-08
2008
-09
2009
-10
2010
-11
2011
-12
2012
-13
2013
-14
2014
-15
2015
-16
Tomato - European UnionExtra-EU imports from October to May
(000 tonnes / source: Eurostat)
© R
égis
Dom
ergu
e
Contenu publié par l’Observatoire des Marchés du CIRAD − Toute reproduction interdite

21No. 244 October 2016
THE LATEST ON...
A protective downturn on the European market…
Hence Spanish tomato exports to the EU-28 were a bit smaller than the previous year (812 000 t, i.e. - 4 % on 2014-15). Nonetheless, they remain overall around average for the past three years, according to the figures from the European Customs from between October and May, while most of the extra-European suppliers registered a rise after a lukewarm 2014-15. There was a marked increase for Turkey to Europe (+ 53 % on the 3-year average) due to the Russian embargo, and to a lesser degree for Senegal (+ 3 %) and Tunisia (+ 7 %). Imports from Morocco, the main supplier to the European winter market, were up again (+ 8 %), while Israel continued its down-turn (- 71 %).
…which was blowing hot and cold!
Notwithstanding the increasingly disturbed weather, against the backdrop of global warming, the 2016-17 campaign has already been marked by uncertainties given the political tensions destabi-lising the economic sphere in recent years. Nonetheless, it began with some rather positive signals, especially the reopening of the Russian market to Turkish fruit and vegetables. This reopening re-sulted in tomato orders from September, and should indirectly ease the European market, which had been under greater strain since early 2016 due to the embargo.
Conversely, we are not expecting any real softening in relations be-tween the EU and Russia which would enable exports to resume to this destination, especially from Spain. Indeed, the forthcoming ne-gotiations between the two big blocks are not planned before early 2017. Europe is due to rule in January on whether to retain its sanc-tions, which were implemented following the conflict in Ukraine, but there is little chance of it being lifted before late 2017, according to European Union experts. For their part, the Russian authorities are asserting that the country could maintain the boycott for several years, thanks to subsidies granted to Russian growers.
However, the big disturbances could come from Brexit, which will also entail adjustments over the coming years. The talks with the European Union for the UK’s withdrawal are not due to start until late March 2017, and not conclude until summer 2019. However, this Sword of Damocles could change the hand, hitting Spanish exports hard; especially from the Canaries, for which the UK is the main to-mato destination. The UK imports 220 000 t of tomatoes between October and May, 124 000 t of which from Spain and 39 000 t from Morocco. Yet even before the negotiations, experts fear the UK could hit a phase of economic and political turbulence, with the ongoing fall in the pound, which could lead to payment conditions becom-ing harder. If the fall in shipments to the UK is confirmed, exporters will need to find alternative markets, with the risks inherent to these new headings.
Tomato — European Union Imports from main supplier countries from October to May
tonnes 2015-16Comparison
2014-15 Average for last 3 years
Spain 812 060 - 4 % 0 %Morocco 378 602 + 8 % + 8 %Turkey 54 257 + 61 % + 53 %Senegal 10 996 + 10 % + 3 %Tunisia 10 152 + 24 % + 7 %Israel 1 521 - 65 % - 71 %Other extra-EU suppliers 25 556 + 70 % + 86 %
Total extra-EU suppliers 481 084 + 14 % + 14 %
Source: Eurostat
© Régis Domergue
Contenu publié par l’Observatoire des Marchés du CIRAD − Toute reproduction interdite
22 October 2016 No. 244
THE LATEST ON...
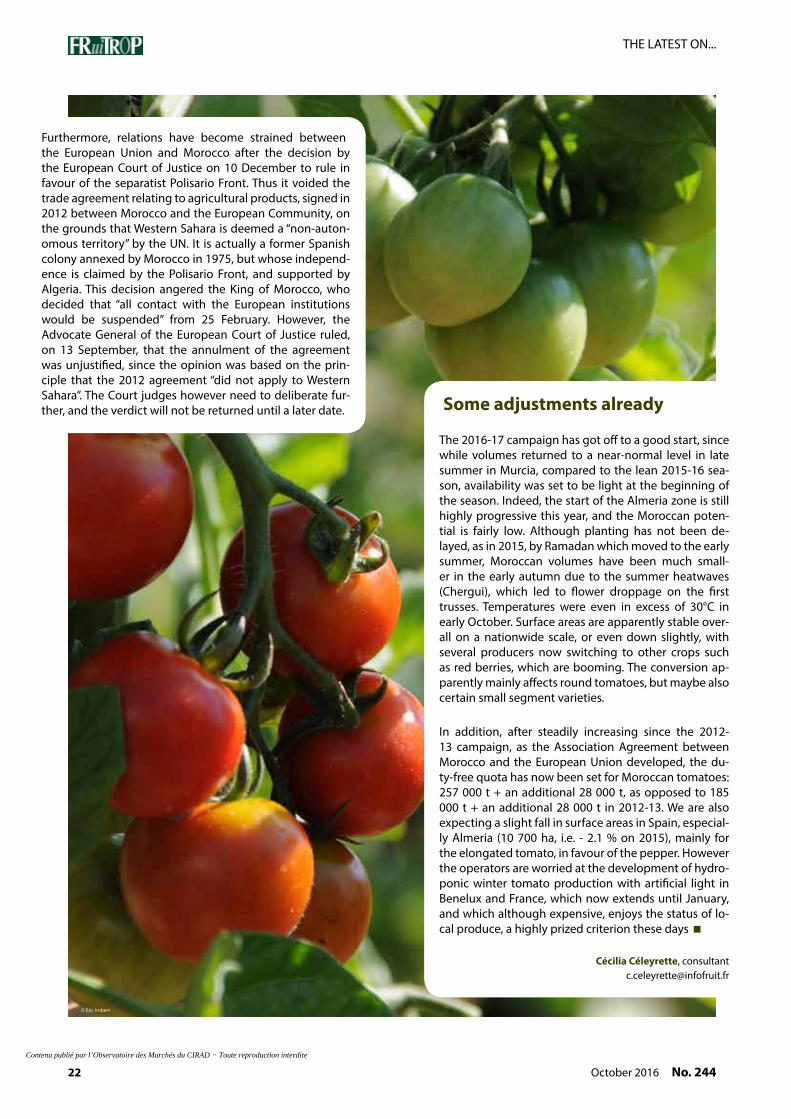
Furthermore, relations have become strained between the European Union and Morocco after the decision by the European Court of Justice on 10 December to rule in favour of the separatist Polisario Front. Thus it voided the trade agreement relating to agricultural products, signed in 2012 between Morocco and the European Community, on the grounds that Western Sahara is deemed a “non-auton-omous territory” by the UN. It is actually a former Spanish colony annexed by Morocco in 1975, but whose independ-ence is claimed by the Polisario Front, and supported by Algeria. This decision angered the King of Morocco, who decided that “all contact with the European institutions would be suspended” from 25 February. However, the Advocate General of the European Court of Justice ruled, on 13 September, that the annulment of the agreement was unjustified, since the opinion was based on the prin-ciple that the 2012 agreement “did not apply to Western Sahara”. The Court judges however need to deliberate fur-ther, and the verdict will not be returned until a later date. Some adjustments already
The 2016-17 campaign has got off to a good start, since while volumes returned to a near-normal level in late summer in Murcia, compared to the lean 2015-16 sea-son, availability was set to be light at the beginning of the season. Indeed, the start of the Almeria zone is still highly progressive this year, and the Moroccan poten-tial is fairly low. Although planting has not been de-layed, as in 2015, by Ramadan which moved to the early summer, Moroccan volumes have been much small-er in the early autumn due to the summer heatwaves (Chergui), which led to flower droppage on the first trusses. Temperatures were even in excess of 30°C in early October. Surface areas are apparently stable over-all on a nationwide scale, or even down slightly, with several producers now switching to other crops such as red berries, which are booming. The conversion ap-parently mainly affects round tomatoes, but maybe also certain small segment varieties.
In addition, after steadily increasing since the 2012-13 campaign, as the Association Agreement between Morocco and the European Union developed, the du-ty-free quota has now been set for Moroccan tomatoes: 257 000 t + an additional 28 000 t, as opposed to 185 000 t + an additional 28 000 t in 2012-13. We are also expecting a slight fall in surface areas in Spain, especial-ly Almeria (10 700 ha, i.e. - 2.1 % on 2015), mainly for the elongated tomato, in favour of the pepper. However the operators are worried at the development of hydro-ponic winter tomato production with artificial light in Benelux and France, which now extends until January, and which although expensive, enjoys the status of lo-cal produce, a highly prized criterion these days
Cécilia Céleyrette, consultant [email protected]
© Eric Imbert
Contenu publié par l’Observatoire des Marchés du CIRAD − Toute reproduction interdite

5th INTERNATIONAL EXHIBITION FOR THE FRESH PRODUCE INDUSTRY IN UKRAINE
AND CIS COUNTRIES
29 NOVEMBER -
1 DECEMBER2016
International Exhibition Centre (IEC)Kiev, Ukraine
CONTACTS:Nova Exhibitions B.V.
P.O. Box 257 | 3740 AG Baarn | The NetherlandsTel: +31 85 401 73 97
E-mail: [email protected]
www.freshbusiness-expo.com
KievUkraine
Contenu publié par l’Observatoire des Marchés du CIRAD − Toute reproduction interdite

24 October 2016 No. 244
THE LATEST ON...
Europe to import 300 000 tonnes in 2016?
European mango market
Will European imports for 2016 exceed 300 000 tonnes? Is this figure, barely grazed in 2015, now to be consigned to history? Is the mango soon to attain the level of the avocado? The year is not yet over, but we can assume that this momentum, which has been gathering speed for the past five or six years, is not about to come to a sudden halt in 2016.
© Régis Domergue
Contenu publié par l’Observatoire des Marchés du CIRAD − Toute reproduction interdite

31, Avenue de l’Europe - Zone des Entrepôts - Bât. I 9BP 70122 - 94538 Rungis Cedex - FRANCETel +33 (0)1 46 87 30 00 - Fax : +33 (0)1 45 12 96 [email protected]
Con
cept
ion
TPC
: 01
41
31 5
8 90
- Ph
oto
: Ste
w P
atrik
ian©
... the expertise of specialistsat the service of our customers!
The best of exoticsare now part of our range!
and fruits available all the year round...fruits availabble all the year rounHigh quality, various origins
Contenu publié par l’Observatoire des Marchés du CIRAD − Toute reproduction interdite

26 October 2016 No. 244
THE LATEST ON...
of the shadows to which they had been confined hitherto. These three countries ship a total of nearly 43 000 tonnes to Europe, without counting exports to other regional or more distant destinations. If we add to this fundamental trio Guinea and Senegal, which have a later calendar, the 50 000-tonnes threshold is easily cleared. Already impor-tant to the European mango supply, West Africa is once more becoming essential, as was the case in the past.
Furthermore, while the Dominican Republic has been stagnant in 2016, Puerto Rico is up by 4 000 tonnes, easi-ly wiping out the latter’s slight shortfall, and contributing to the general increase in European imports. We should also add the positive results of the Israeli campaign which has just finished, with 15 500 tonnes shipped as opposed to 13 800 tonnes in 2015. The autumn campaign is being dominated by Brazil, whose total shipments will not be known until the beginning of next year, but also by Spain, which is stepping up its production year on year. After a lacklustre campaign in 2015 (9 000 to 10 000 tonnes) giv-en the poor weather conditions, 2016 got off to a more auspicious start with forecasts matching the 2014 level, namely 18 000 to 20 000 tonnes. Again, these summer-au-tumn sources have contributed to the progression of overall imports into the European Union, hinting that the 300 000-tonnes mark will be broken this year.
The number of sources supplying the European market re-mains very high, though the top six alone represent near-ly 84 % of total European imports. Hence the variations in volume over recent years are due more to the tempo-rary withdrawal of one of the top 10 exporter countries than to fluctuations by minor sources. With around 43 mil-lion tonnes produced worldwide and 1.5 million tonnes’ worth of international trade, the supply potential for the European market is in no danger of causing a significant quantitative shortfall.
The year 2016, in the absence of the total quantities shipped by Brazil, which intensify at the end of the year, seems to confirm the evolution observed in recent years. Brazil and Peru have remained the top two suppliers to the European market, with variable quantities, which are nonetheless much greater than those from the other ex-porter countries. Peru has registered a downturn of 10 000 tonnes in 2016 from 2015, though it has still accounted for nearly 70 000 tonnes.
The driving force of 2016 has definitely been the rise in exports from intermediate sources; which are among the top ten suppliers, but whose exports have stabilised for several campaigns at around 10 000 tonnes. As such, the West African sources have been particularly dynam-ic, led by Côte d’Ivoire, whose shipments more than doubled within the space of a few years, going from a rate of 8 000 to 12 000 tonnes per campaign to 30 000 tonnes this year. Neighbouring countries are chipping in with distinctly smaller quantities: 7 300 tonnes for Mali and 5 500 tonnes for Burkina Faso. However, when com-bined these volumes bring the West African sources out
© Carolina Dawson
0
50
100
150
200
250
300
350
1991
1993
1995
1997
1999
2001
2003
2005
2007
2009
2011
2013
2015
000
tonn
es
Mango - European UnionEvolution of exports
Source: Eurostat
Contenu publié par l’Observatoire des Marchés du CIRAD − Toute reproduction interdite

Contenu publié par l’Observatoire des Marchés du CIRAD − Toute reproduction interdite

28 October 2016 No. 244
THE LATEST ON...
try operatives, all the more impressive since the quantities exported have grown considerably. The implementation of programmes to combat fly propagation, but also the possible reduction in parasite pressure due to the weather conditions of the past two campaigns (harmattan), have aided the steep reduction in infestation. Senegal seems to be following the same trend. Conversely, Mali and Burkina Faso are distinguished by their particularly high level of interceptions, both in terms of absolute figures and worse still if we compare these numbers to the export volumes. Strangely, these countries have not been the subject of particular alerts. Could this point to special treatment in view of their geopolitical situation?
As for Latin America, the fruit fly problem seems to be better controlled, apart from in the Dominican Republic, bearing in mind that it is the only country exporting very few mangoes to the United States. Brazil and Peru, mean-while, are hardened to the US regulations, which have forced them to develop in-cultivation and post-harvest treatment methods guaranteeing zero fruit flies in man-goes earmarked for this market.
True, West Africa is making progress in fruit fly manage-ment, yet still too slowly and unevenly between the sourc-es. This disparity is partially hindering the homogeneous development of the West African production area
Pierre Gerbaud, consultant [email protected]
Fruit fly: the scourge of the African mango industry
While the volumes shipped by the West African sources to Europe have seen a remarkable surge, driven by Côte d’Ivoire, the issue of fruit fly infestation of certain batch-es nonetheless remains in place. Although major efforts have been made, especially by Côte d’Ivoire for the past two campaigns, there is no sign of a solution to the prob-lem. Several fly management projects have been imple-mented, though the effects are slow in making them-selves felt (see table).
There is a glaring difference between Latin America and West Africa. Although Latin American countries are not free from parasites, the number of seizures in Europe is in-finitely smaller than for West African countries. Côte d’Ivo-ire, subject to particularly close monitoring in 2014, seems to have managed, though not to resolve the mango fruit fly infestation problem, at least to limit its development. The considerable reduction in the number of seizures demon-strates better control of the problem by the Ivorian indus-
© R
égis
Dom
ergu
e
Mango — EU — Number of seizures made by the phytosanitary services of
Member States on imported mango batches
Sources 2014 2015 2016*Exported volume
in 2016 (t)
West Africa
Côte d'Ivoire 62 10 10 30 000
Mali 23 11 66 7 300
Burkina Faso 3 15 16 5 500
Senegal 11 14 2 8 500
Latin America
Brazil 4 3 1 46 000 *
Peru 8 4 1 69 000
Dominican Rep. 27 6 11 12 500
Puerto Rico 0 0 0 11 400* Provisional figures / Source: European Union
Contenu publié par l’Observatoire des Marchés du CIRAD − Toute reproduction interdite
Contenu publié par l’Observatoire des Marchés du CIRAD − Toute reproduction interdite
30 October 2016 No. 244
THE LATEST ON...
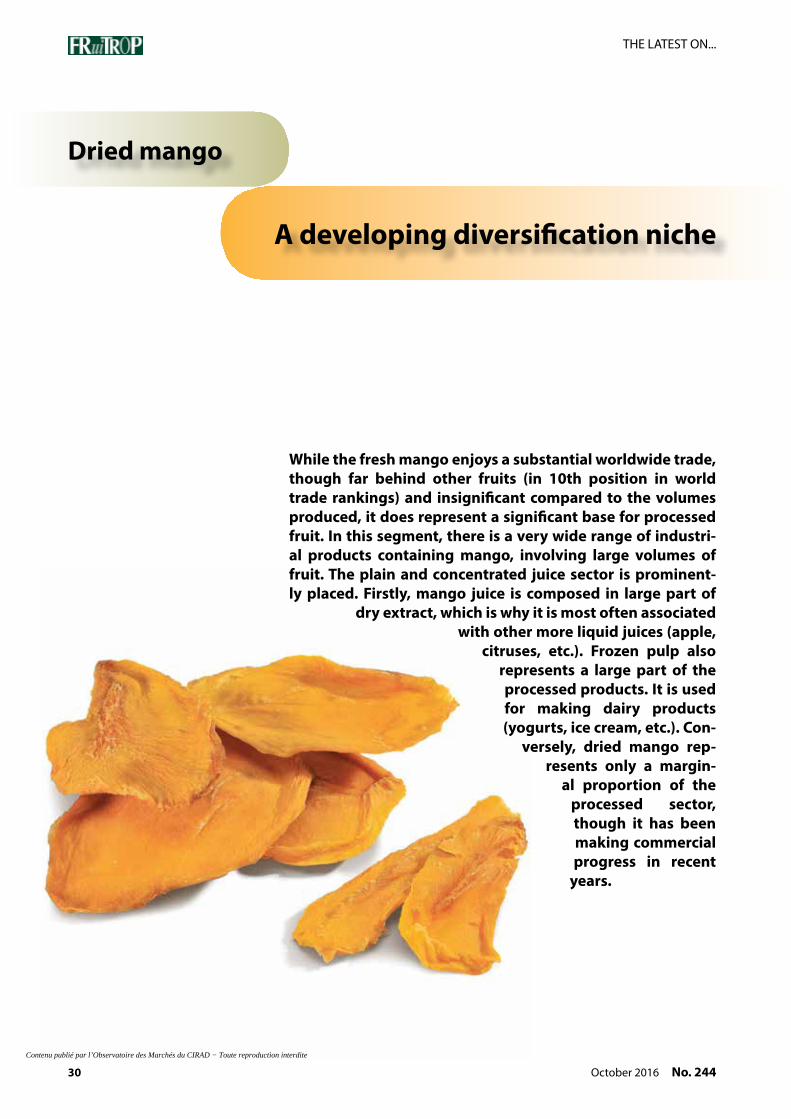
A developing diversification niche
Dried mango
While the fresh mango enjoys a substantial worldwide trade, though far behind other fruits (in 10th position in world trade rankings) and insignificant compared to the volumes produced, it does represent a significant base for processed fruit. In this segment, there is a very wide range of industri-al products containing mango, involving large volumes of fruit. The plain and concentrated juice sector is prominent-ly placed. Firstly, mango juice is composed in large part of
dry extract, which is why it is most often associated with other more liquid juices (apple,
citruses, etc.). Frozen pulp also represents a large part of the processed products. It is used for making dairy products (yogurts, ice cream, etc.). Con-
versely, dried mango rep-resents only a margin-
al proportion of the processed sector, though it has been making commercial progress in recent
years.
Contenu publié par l’Observatoire des Marchés du CIRAD − Toute reproduction interdite

31No. 244 October 2016
THE LATEST ON...
There are three distinct main types of dried mango:
• Crystallised mango pieces made by steeping the fruit in a mixture of water and sugar, and then drying. This produc-es cubes which retain a fairly soft consistency, but which lose a large part of the flavour of the fruit, and which are high in added sugar.
• Dried mango slices or pieces, with added sulphites for a longer shelf life. These fruit pieces retain some softness, and the drying process generally provides fairly uniform preservation.
• Dried mango slices or pieces, most often sold under the organic label, generally produced using a more or less artisanal processing technique. These products have an often heterogeneous quality in terms of shape and coloration, as well as a limited shelf life. They are rather unpleasant to consume because of their highly sticky appearance.
It takes 12 to 15 tonnes of fresh fruit to obtain 1 tonne of dry fruit. So this type of processing represents an interest-ing niche for boosting mango production value in producer countries, alongside other processing operations, and the local, regional or international markets. The longer shelf life of the processed products also makes their marketing a bit less dependent on the marked seasonality of the fruit.
European imports of dried mango are estimated at be-tween 1 600 and 3 400 tonnes, depending on the year. A large proportion involves the first type of product (35 %). The main producer and exporter countries are Thailand and the Philippines, which process mangoes of various Asian varieties. This is an intermediate industrial prod-uct, since it is mainly earmarked for dried fruit mixes and muesli. It is imported in high-volume containers.
So-called “conventional” dried mangoes, with added pre-servative, are primarily produced in South Africa, and rep-resent nearly 50 % of European imports. The most com-monly used varieties are Keitt and Kent, and to a lesser degree Tommy Atkins, which is more fibrous. The indus-trial processes give the products a longer shelf life. In addition, thanks to a residual moisture content of 14 to 18 %, the dried product retains some softness, without the sticky appearance often criticised in this type of dried fruit. Furthermore, the mango flavours and aromas remain more intense than in the crystallised fruits.
Artisanal and/or organic dried mangoes represent ap-proximately 15 % of European imports. Their qualitative heterogeneity and their sticky appearance make them harder to market. This is the main type of dried mango supplied by West Africa. The processed varieties are pri-marily Amélie, Brooks, Keitt and Kent.
© Guy Bréhinier
Contenu publié par l’Observatoire des Marchés du CIRAD − Toute reproduction interdite

32 October 2016 No. 244
THE LATEST ON...
The dried mango in West Africa
Mango drying in West Africa is not a recent phenomenon. As such, it dates back to the 1990s. Burkina Faso seems to have been the trailblazer in the field, followed by Mali and Senegal. Mango drying in Burkina Faso saw rapid progress, driven by NGOs dedicated to the development of agricultural industries. These involved finding new uses for abundant fruit production with high availability, but highly seasonal. Thus a host of mango drying pro-jects emerged via small village projects, often based on women’s associations, for the purpose of boosting fami-ly earnings. The progressive structuring of these projects around federations of processing plants has yielded more advanced techniques than natural (sun) drying, to satis-fy growing demand. The organic dried fruits option has also contributed to the development of the activity. Yet the steep fall in European demand in the years 2008-2009 weakened this activity, rivalled by products from more competitive sources.
The main impediments to the mango drying business in West Africa, as found by several studies, are as follows:
• The seasonality of mango production precludes year-round activity, and therefore hinders the competitive-ness of the products to some extent, especially on ex-ternal markets.
• While interesting, the organic label option is no less re-strictive in terms of demand, and frequently leads to production of mediocre or variable quality dry fruit, detrimental to marketing in Europe up against prod-ucts from competing sources.
• The drying equipment generally used in West Africa is of old design, unproductive and geographically scattered.
• The modes of transport for supplying the drying units with fresh mangoes are unsuitable, and often un-dermine the intrinsic quality of the fruit even before processing.
• Manual fruit processing (handling, peeling, cutting, etc.) is also a handicap, not only for productivity, but also in sanitary terms: a dried mango has been handled 5 or 6 times in total in the course of processing.
• The packing, storage and transport conditions after drying are not suited to the product either: high-tem-perature storage limits the product’s shelf life and de-tracts from its visual appearance.
These factors, listed non-exhaustively, are responsible for the average quality of dried fruits marketed by the West African sources. The main criticisms in relation to the product may be summarised as follows:
• unequal slices or pieces, although there are attempts at homogenisation by size or grade;
• varied coloration, changing over time (brown colora-tion due to ageing), which gives the product an unat-tractive appearance;
• hard and sticky appearance of fruits when consumed;
• the packaging (plastic sachet) is often still unattractive: type of sachet used, and marketing fairly rudimentary.
Conversely, the taste quality of West African dried man-goes seems to be universally recognised.
South African products more industrial
A comparison is often made between West African and South African products. The latter, produced using more industrial processes, seem to be a better match for the expectations of European distributors and consumers. South African drying units are considerably bigger in terms of processing capacity, and more efficient (main-taining temperatures suitable for forced ventilation dry-ing). The products have added preservatives, which pro-vide a longer shelf life and help maintain homogeneous coloration. The slices are bigger and thicker, obtained by mechanised cutting. The chilled storage conditions are suitable. Nonetheless, South African production also has its impediments, such as the shortage of fresh produce and the vagaries of energy distribution which can disrupt the drying operations.
© G
uy B
réhi
nier
Contenu publié par l’Observatoire des Marchés du CIRAD − Toute reproduction interdite
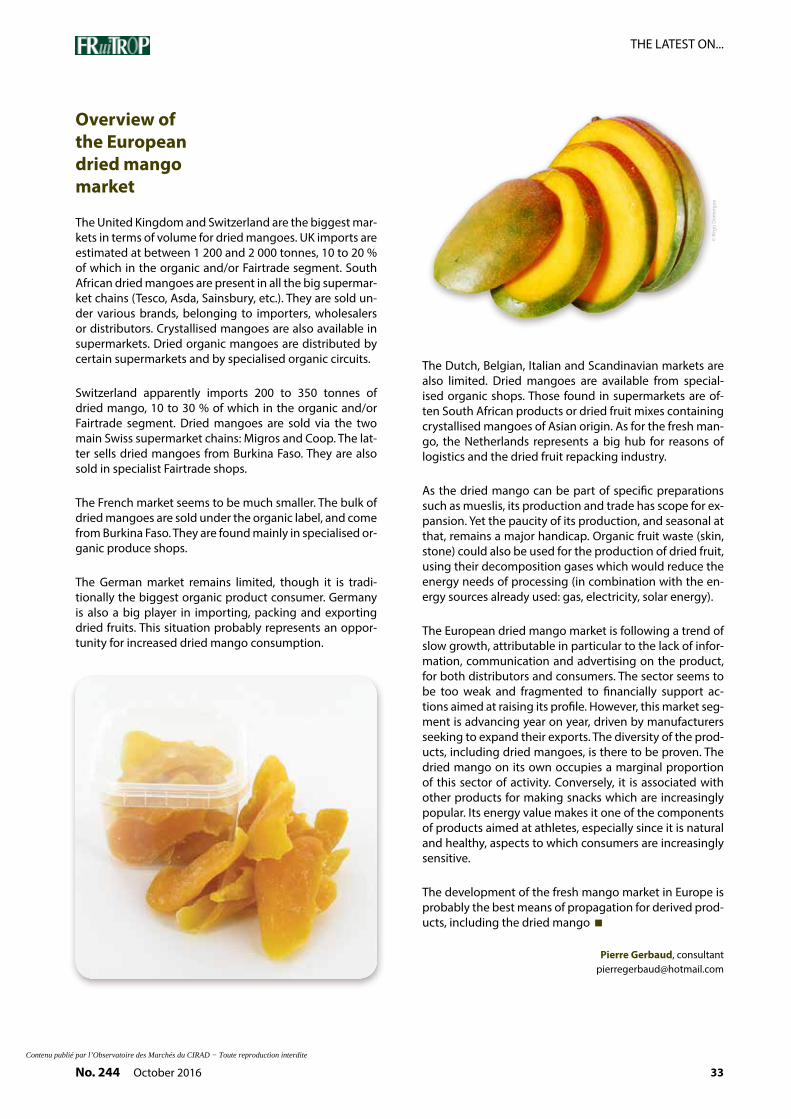
33No. 244 October 2016
THE LATEST ON...
Overview of the European dried mango market
The United Kingdom and Switzerland are the biggest mar-kets in terms of volume for dried mangoes. UK imports are estimated at between 1 200 and 2 000 tonnes, 10 to 20 % of which in the organic and/or Fairtrade segment. South African dried mangoes are present in all the big supermar-ket chains (Tesco, Asda, Sainsbury, etc.). They are sold un-der various brands, belonging to importers, wholesalers or distributors. Crystallised mangoes are also available in supermarkets. Dried organic mangoes are distributed by certain supermarkets and by specialised organic circuits.
Switzerland apparently imports 200 to 350 tonnes of dried mango, 10 to 30 % of which in the organic and/or Fairtrade segment. Dried mangoes are sold via the two main Swiss supermarket chains: Migros and Coop. The lat-ter sells dried mangoes from Burkina Faso. They are also sold in specialist Fairtrade shops.
The French market seems to be much smaller. The bulk of dried mangoes are sold under the organic label, and come from Burkina Faso. They are found mainly in specialised or-ganic produce shops.
The German market remains limited, though it is tradi-tionally the biggest organic product consumer. Germany is also a big player in importing, packing and exporting dried fruits. This situation probably represents an oppor-tunity for increased dried mango consumption.
The Dutch, Belgian, Italian and Scandinavian markets are also limited. Dried mangoes are available from special-ised organic shops. Those found in supermarkets are of-ten South African products or dried fruit mixes containing crystallised mangoes of Asian origin. As for the fresh man-go, the Netherlands represents a big hub for reasons of logistics and the dried fruit repacking industry.
As the dried mango can be part of specific preparations such as mueslis, its production and trade has scope for ex-pansion. Yet the paucity of its production, and seasonal at that, remains a major handicap. Organic fruit waste (skin, stone) could also be used for the production of dried fruit, using their decomposition gases which would reduce the energy needs of processing (in combination with the en-ergy sources already used: gas, electricity, solar energy).
The European dried mango market is following a trend of slow growth, attributable in particular to the lack of infor-mation, communication and advertising on the product, for both distributors and consumers. The sector seems to be too weak and fragmented to financially support ac-tions aimed at raising its profile. However, this market seg-ment is advancing year on year, driven by manufacturers seeking to expand their exports. The diversity of the prod-ucts, including dried mangoes, is there to be proven. The dried mango on its own occupies a marginal proportion of this sector of activity. Conversely, it is associated with other products for making snacks which are increasingly popular. Its energy value makes it one of the components of products aimed at athletes, especially since it is natural and healthy, aspects to which consumers are increasingly sensitive.
The development of the fresh mango market in Europe is probably the best means of propagation for derived prod-ucts, including the dried mango
Pierre Gerbaud, consultant [email protected]
© R
égis
Dom
ergu
e
Contenu publié par l’Observatoire des Marchés du CIRAD − Toute reproduction interdite

34 October 2016 No. 244
THE LATEST ON...
2016-17 forecasts: a bumper campaign in prospect?
Madagascan litchi
For the sixth consecutive year, the Madagascan litchi industry operators have decided to stick with the same campaign organisation. With 16 000 to 18 000 tonnes exported to the European markets, the Madagascan industry seems to have found a satisfactory cruising speed in terms of organisation and economic results, so important for a country which remains one of the poorest on the planet.
© Clio Delanoue
Contenu publié par l’Observatoire des Marchés du CIRAD − Toute reproduction interdite

Contenu publié par l’Observatoire des Marchés du CIRAD − Toute reproduction interdite
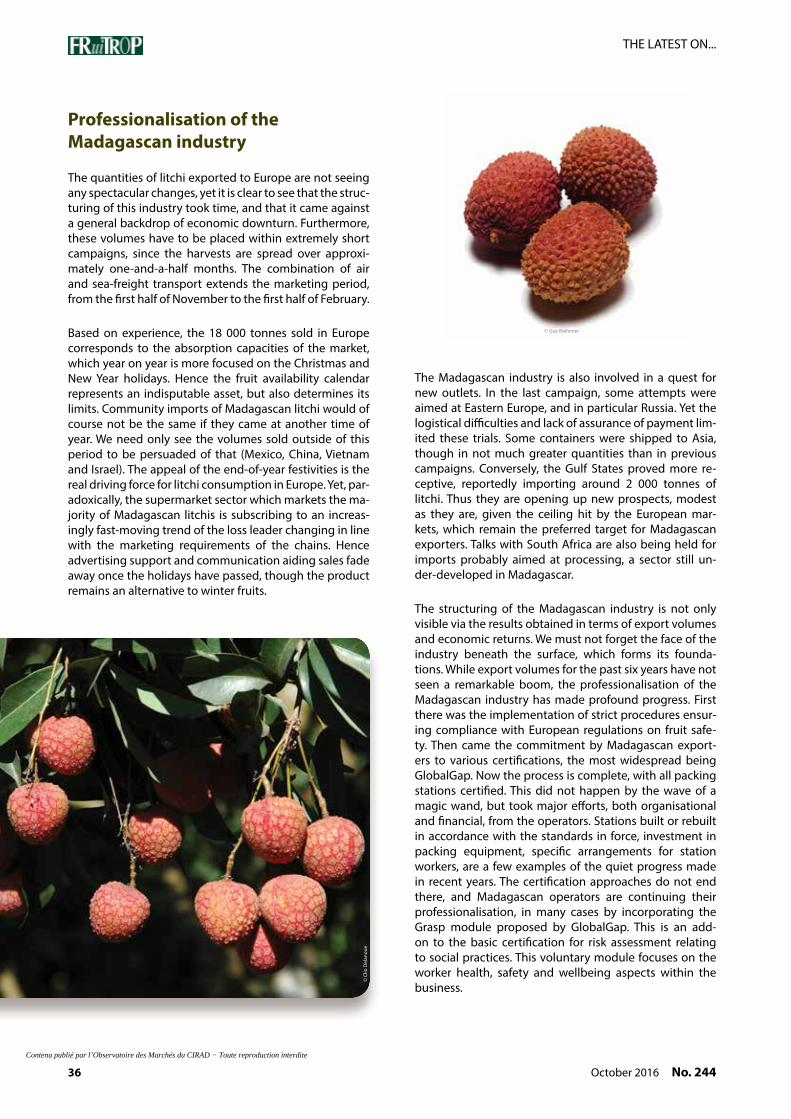
36 October 2016 No. 244
THE LATEST ON...
Professionalisation of the Madagascan industry
The quantities of litchi exported to Europe are not seeing any spectacular changes, yet it is clear to see that the struc-turing of this industry took time, and that it came against a general backdrop of economic downturn. Furthermore, these volumes have to be placed within extremely short campaigns, since the harvests are spread over approxi-mately one-and-a-half months. The combination of air and sea-freight transport extends the marketing period, from the first half of November to the first half of February.
Based on experience, the 18 000 tonnes sold in Europe corresponds to the absorption capacities of the market, which year on year is more focused on the Christmas and New Year holidays. Hence the fruit availability calendar represents an indisputable asset, but also determines its limits. Community imports of Madagascan litchi would of course not be the same if they came at another time of year. We need only see the volumes sold outside of this period to be persuaded of that (Mexico, China, Vietnam and Israel). The appeal of the end-of-year festivities is the real driving force for litchi consumption in Europe. Yet, par-adoxically, the supermarket sector which markets the ma-jority of Madagascan litchis is subscribing to an increas-ingly fast-moving trend of the loss leader changing in line with the marketing requirements of the chains. Hence advertising support and communication aiding sales fade away once the holidays have passed, though the product remains an alternative to winter fruits.
The Madagascan industry is also involved in a quest for new outlets. In the last campaign, some attempts were aimed at Eastern Europe, and in particular Russia. Yet the logistical difficulties and lack of assurance of payment lim-ited these trials. Some containers were shipped to Asia, though in not much greater quantities than in previous campaigns. Conversely, the Gulf States proved more re-ceptive, reportedly importing around 2 000 tonnes of litchi. Thus they are opening up new prospects, modest as they are, given the ceiling hit by the European mar-kets, which remain the preferred target for Madagascan exporters. Talks with South Africa are also being held for imports probably aimed at processing, a sector still un-der-developed in Madagascar.
The structuring of the Madagascan industry is not only visible via the results obtained in terms of export volumes and economic returns. We must not forget the face of the industry beneath the surface, which forms its founda-tions. While export volumes for the past six years have not seen a remarkable boom, the professionalisation of the Madagascan industry has made profound progress. First there was the implementation of strict procedures ensur-ing compliance with European regulations on fruit safe-ty. Then came the commitment by Madagascan export-ers to various certifications, the most widespread being GlobalGap. Now the process is complete, with all packing stations certified. This did not happen by the wave of a magic wand, but took major efforts, both organisational and financial, from the operators. Stations built or rebuilt in accordance with the standards in force, investment in packing equipment, specific arrangements for station workers, are a few examples of the quiet progress made in recent years. The certification approaches do not end there, and Madagascan operators are continuing their professionalisation, in many cases by incorporating the Grasp module proposed by GlobalGap. This is an add-on to the basic certification for risk assessment relating to social practices. This voluntary module focuses on the worker health, safety and wellbeing aspects within the business.
© C
lio D
elan
oue
© Guy Bréhinier
Contenu publié par l’Observatoire des Marchés du CIRAD − Toute reproduction interdite

37No. 244 October 2016
THE LATEST ON...
All these improvements are laudable and without doubt necessary for the long-term future of the industry. However, the past several years have confirmed a recur-rent theme, that of the intrinsic quality of the fruit export-ed by Madagascar. There has been a great deal of feed-back from consumers and distributors about fruit sizing and taste. Taste quality remains a complex field, since it employs purely subjective assessments, i.e. difficult to quantify; though this does not preclude research into the vast field of the aromatic principle of the fruit. Conversely, sizing improvement seems easier to achieve. There are of course limiting factors, such as the weather conditions which have repercussions in part on fruit production or loss during the sea-freight voyage. Nonetheless, the ef-forts should be feasible, taking into account that exports represent only approximately one fifth of Madagascan li-tchi production. Criticism of fruit sizing is especially sig-nificant since the South African industry has much better command of this aspect, though admittedly with smaller tonnages. That is one reason for which the Madagascan industry is undertaking new approaches based on GlobalGap certification. It is about implementing cer-tification at production level, whereas previously they were restricted to exporters. Like green bean producers in Kenya for example, litchi producers are being urged to team up to take advantage of the certification approach-es. The launch of the process should be hailed, since it is leading to better integration of the various links of the industry. With certification from the production stage, ex-porters hope for better control of their fruit procurement and to be able to take stronger action to improve quality of fruit earmarked for export. This gradually progressing trend appears vital in order to maintain Madagascan li-tchi exports, but its implementation seems complex. It will probably be several campaigns before we can assess the tangible results.
An early and bumper campaign
The Southern winter, highly marked this year, favoured plentiful flowering and fruit-bearing across the Indian Ocean sources. Besides substantial production the litchi harvest is set to be early, reportedly one week ahead of schedule. However, the weather variations of the two months preceding the possible harvest date may influ-ence the final harvest, both in terms of earliness and fruit quality. For Madagascar, the lack of rain in recent times seems to indicate that a sufficient proportion of the fruits will reach maturity for an early start, though the aver-age litchi size could suffer. The first air-freight batches should be available from week 44, from across the ex-porter sources (South Africa, Mozambique, Mauritius and Madagascar), with the exception of Reunion, whose cam-paign should begin around mid-November as usual. The
simultaneous early start of the exports could saturate a market with not yet much interest in festive produce.
The sea-freight campaign too is set to be early. It should follow the same pattern as in previous years in terms of volume. Two conventional ships are scheduled to bring the fruit supplying the supermarket sector for the Christmas and New Year holidays. The earliness of the harvest should extend the consumption period thanks to two weekends’ sales before the holidays. Last year’s calendar allowed sales on just one weekend before Christmas. The campaign will continue with the deliv-ery of containers at the beginning of the year. Since de-mand for Fairtrade labelled fruit has risen in recent years, Madagascan exporters are counting on developing this niche with an increase in volumes. This label will be in place on some of the litchis transported by conventional ships, as was already the case in previous campaigns, but also on those transported by container. This will extend the campaign for these specific products which were hitherto available for only part of the campaign. They are traditionally aimed at Scandinavia, the United Kingdom and Germany, though demand is gradually extending southwards to markets such as France and Spain.
If the forecasts for early and bumper production are re-alised, the 2016-17 campaign should be commercially tough, given the ongoing difficult economic context on the European markets
Pierre Gerbaud, consultant [email protected]
© C
lio D
elan
oue
Contenu publié par l’Observatoire des Marchés du CIRAD − Toute reproduction interdite

October 2016 No. 244 38
A report by Denis Lœillet
and Thierry Paqui
Contents
p. 40 World fresh pineapple market — A market of uncommon simplicity
p. 47 Fresh and processed pineapple production and trade
p. 49 Costa Rica: stick or twist?
p. 50 United States: a more resilient market
p. 52 2015-2016 Victoria campaign — Small sizes too often finding their way onto the shelves
p. 55 2015-2016 sea-freight campaign — Does the pineapple market have what it takes to reinvent itself, or does it really want to?
p. 59 2015-2016 air-freight campaign — Sugarloaf sent back to its niche...
p. 61 Ethephon misuse blacklisted
p. 62 World statistics
p. 64 Quality defects
p. 66 Pineapple cultivation
p. 69 The main varieties
Pineapple
PineapplePineapple
© Agnès Delefortrie
Contenu publié par l’Observatoire des Marchés du CIRAD − Toute reproduction interdite

The Extra SweetPineapple from Ecuador
Contenu publié par l’Observatoire des Marchés du CIRAD − Toute reproduction interdite
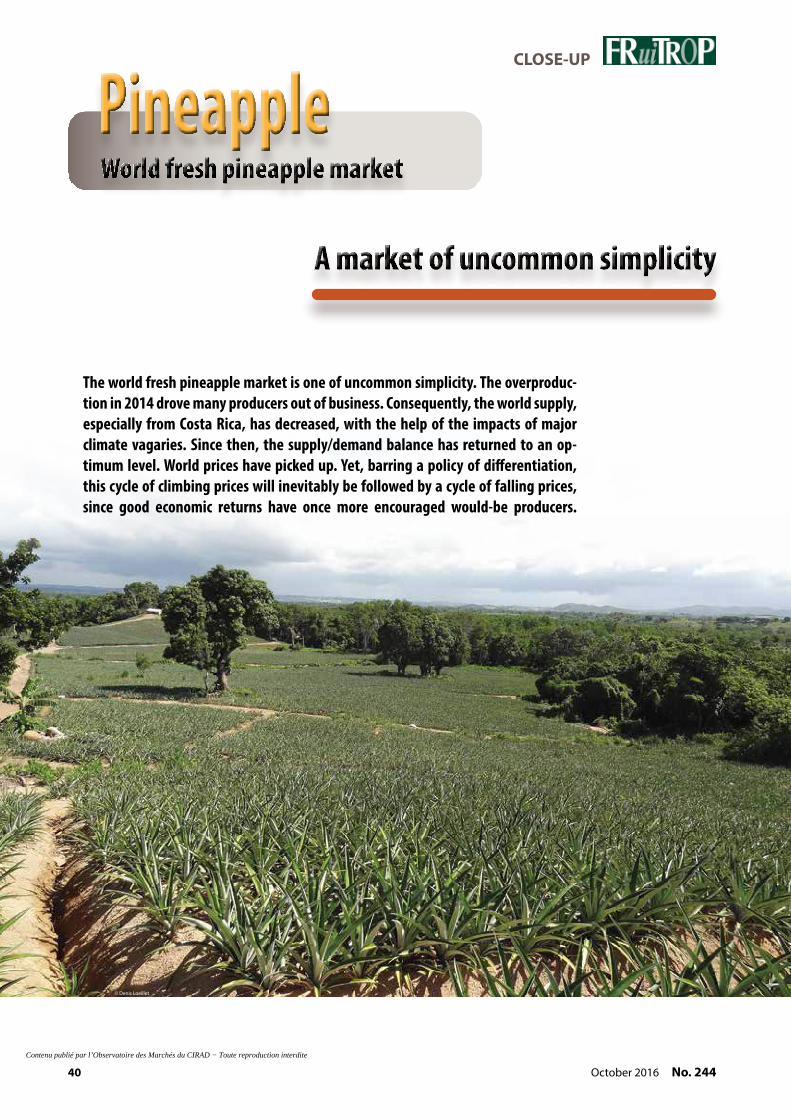
40 October 2016 No. 244
CLOSE-UP
A market of uncommon simplicity
The world fresh pineapple market is one of uncommon simplicity. The overproduc-tion in 2014 drove many producers out of business. Consequently, the world supply, especially from Costa Rica, has decreased, with the help of the impacts of major climate vagaries. Since then, the supply/demand balance has returned to an op-timum level. World prices have picked up. Yet, barring a policy of differentiation, this cycle of climbing prices will inevitably be followed by a cycle of falling prices, since good economic returns have once more encouraged would-be producers.
© Denis Loeillet
Contenu publié par l’Observatoire des Marchés du CIRAD − Toute reproduction interdite

Contenu publié par l’Observatoire des Marchés du CIRAD − Toute reproduction interdite
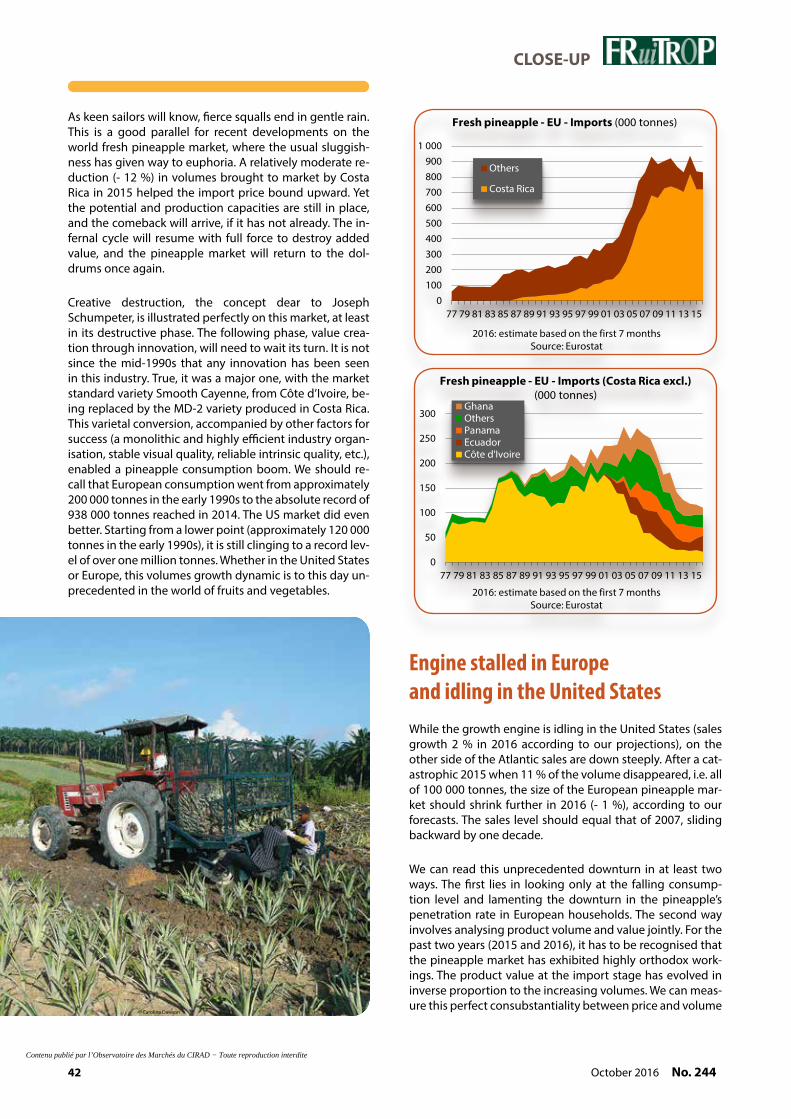
42 October 2016 No. 244
CLOSE-UP
As keen sailors will know, fierce squalls end in gentle rain. This is a good parallel for recent developments on the world fresh pineapple market, where the usual sluggish-ness has given way to euphoria. A relatively moderate re-duction (- 12 %) in volumes brought to market by Costa Rica in 2015 helped the import price bound upward. Yet the potential and production capacities are still in place, and the comeback will arrive, if it has not already. The in-fernal cycle will resume with full force to destroy added value, and the pineapple market will return to the dol-drums once again.
Creative destruction, the concept dear to Joseph Schumpeter, is illustrated perfectly on this market, at least in its destructive phase. The following phase, value crea-tion through innovation, will need to wait its turn. It is not since the mid-1990s that any innovation has been seen in this industry. True, it was a major one, with the market standard variety Smooth Cayenne, from Côte d’Ivoire, be-ing replaced by the MD-2 variety produced in Costa Rica. This varietal conversion, accompanied by other factors for success (a monolithic and highly efficient industry organ-isation, stable visual quality, reliable intrinsic quality, etc.), enabled a pineapple consumption boom. We should re-call that European consumption went from approximately 200 000 tonnes in the early 1990s to the absolute record of 938 000 tonnes reached in 2014. The US market did even better. Starting from a lower point (approximately 120 000 tonnes in the early 1990s), it is still clinging to a record lev-el of over one million tonnes. Whether in the United States or Europe, this volumes growth dynamic is to this day un-precedented in the world of fruits and vegetables.
Engine stalled in Europe and idling in the United StatesWhile the growth engine is idling in the United States (sales growth 2 % in 2016 according to our projections), on the other side of the Atlantic sales are down steeply. After a cat-astrophic 2015 when 11 % of the volume disappeared, i.e. all of 100 000 tonnes, the size of the European pineapple mar-ket should shrink further in 2016 (- 1 %), according to our forecasts. The sales level should equal that of 2007, sliding backward by one decade.
We can read this unprecedented downturn in at least two ways. The first lies in looking only at the falling consump-tion level and lamenting the downturn in the pineapple’s penetration rate in European households. The second way involves analysing product volume and value jointly. For the past two years (2015 and 2016), it has to be recognised that the pineapple market has exhibited highly orthodox work-ings. The product value at the import stage has evolved in inverse proportion to the increasing volumes. We can meas-ure this perfect consubstantiality between price and volume
0100200300400500600700800900
1 000
77 79 81 83 85 87 89 91 93 95 97 99 01 03 05 07 09 11 13 15
Fresh pineapple - EU - Imports (000 tonnes)
Others
Costa Rica
2016: estimate based on the first 7 monthsSource: Eurostat
0
50
100
150
200
250
300
77 79 81 83 85 87 89 91 93 95 97 99 01 03 05 07 09 11 13 15
GhanaOthersPanamaEcuadorCôte d'Ivoire
Fresh pineapple - EU - Imports (Costa Rica excl.)(000 tonnes)
2016: estimate based on the first 7 monthsSource: Eurostat
© Carolina Dawson
Contenu publié par l’Observatoire des Marchés du CIRAD − Toute reproduction interdite

Tél : 04 91 43 44 45www.canavese.fr
45f
Cueillimûr à point
Contenu publié par l’Observatoire des Marchés du CIRAD − Toute reproduction interdite

44 October 2016 No. 244
CLOSE-UP
Desperately predictableTo finish on this point, the pineapple market looks just like that of an ordinary industrial consumer good. Barring seri-ous climate vagaries, the well-known agronomic techniques enable multi-annual production scheduling. The supply comprises practically a single variety: MD-2. One source, Costa Rica, supplies 87 % of the EU’s consumption and 82 % of US consumption, i.e. the two main markets. The sole dif-ferentiation lies in terms of quality. While at the export and import stages, the qualitative differences are sometimes striking, they fade toward the downstream part of the chain. Although this is less true in periods of under-supply, we are a long way from a quest for excellence within the supermar-ket sector. Pineapple shelves in Europe are often eye-catch-ing, but for the wrong reasons: repulsive fruits, with a green-brown coloration, withered crowns and at an advanced stage of maturity, to the delight of small flies, and some-times even emitting an aroma of rotten fruit. Such situations are not uncommon, especially in small shops. If on top of that we take into account that the pineapple is not easy to prepare, retail deserves congratulations for being able to sell such large quantities!
So differentiation is the sole remedy for this depressed and depressing market. And there have been no new develop-ments on this front. There are rumours, never with any com-mercial follow-up, announcing the launch of a new, more coloured, tastier, variety; more this, that and the other... Except that there are no developments on the horizon. To fill the gap, there is even talk of a new MD-2 variety, a sort of return to the Costa Rican Sweet sources of the 1990s, or 2000s. They are trying to regenerate the Smooth Cayenne. Malaysia, unknown on the big import markets, is promoting the local clone, the Sarawak pineapple. A Brazilian breeder has announced two new accessions: Cesar and David. The Philippines are promoting their new pineapple: the Super Sweet Snack Pineapple. Ghana, like the Dominican Republic, is advocating the use of a new MD-2 variety, etc. This may
at the same time on both big markets, the US and EU. As the analysis of the 2015-16 campaign proposed by Thierry Paqui shows later on in this dossier, after a low point reached in 2014 at 6.6 euros/box (MD-2 variety into the EU), barring a commercial catastrophe at the end of the year, the average import price in 2016 should exceed 9 euros, i.e. an increase of nearly 50 %. It was in 2015 that the curve reached the inver-sion point. We should recall that in 2014 volumes sold broke records, with nearly 940 000 tonnes, and that 2015 brought a big ebb, of around 100 000 tonnes. This provides a pow-erful and unambiguous demonstration that the destruction of value is directly linked to the increase in volumes. We can even estimate, from the data of the past decade, the theo-retical potential fall in the average annual price. If volumes on the market increase by 10 %, we potentially get a fall of more than 3 % in the annual import price.
In the United States, where volumes have stabilised at their highest level (more than one million tonnes) for three years, the causes are producing the same effects: prices, estimated by means of import unit value, are rising half-heartedly. In view of the price dynamic, the market is saturated at above one million tonnes for the United States, and 850 00 tonnes for the EU. Further volumes can be absorbed only by a fall in prices.
0.00.20.40.60.81.01.21.41.61.82.0
88 90 92 94 96 98 00 02 04 06 08 10 12 14 16
Fresh pineapple - EU - Consumption per capita(000 tonnes)
Incl. EU enlargments / Source: Eurostat
4
5
6
7
8
9
10
11
12
13
2006
2007
2008
2009
2010
2011
2012
2013
2014
2015
2016
Source: Thierry Paqui
Sea-freight Sweet pineapple - Germany - Import price(euro/box - 2016: January to September)
© Denis Loeillet
Contenu publié par l’Observatoire des Marchés du CIRAD − Toute reproduction interdite

45No. 244 October 2016
CLOSE-UP
seem like an innovation race, but it all seems to be going nowhere; they are either rehashing old ideas or erring into fantasy. Nothing very serious is emerging. We are waiting for a big operator to pull out from under its hat, or indeed from its genetic enhancement programme, an improved or different variety, one that is able, beyond a niche market (air-freight pineapple, Smooth Cayenne, Sugarloaf or Victoria), to restore distributor and consumer interest in this fruit.
Others are going back to the root of all things in agriculture: complying with good agronomic practices. Older readers will recall that, in the 1990s, the Ivorian pineapple empire fell because it failed to respect the physiological stage of the fruit. Bending the product to the constraints of transport and the market invariably leads to a general fall in quality, adversely affects the value level, and in extreme cases, de-ters consumers from the product. Certain operators, who have control of their supply, have committed themselves to this differentiation approach with relish. True, this is noth-ing amazing; after all it is the minimum that we can expect from a fresh fruit professional, but it is effective. What ulti-mately counts, unfortunately, is not the absolute quality of the product but the fact that it is better than the next one. Downward levelling is a value earner for good professionals. That is at least one positive effect from this modern malaise.
For a few years now, operators have been able to revitalise or maintain pineapple demand thanks to on-the-shelf cutting and to the pre-prepared fresh segment. This is a very effec-tive way of cleaning up this fruit’s poor image, with its labo-rious preparation and deteriorated quality on the shelf. It is also a way of boosting value for the sector, since the retail prices per kilo climb steeply the closer you go toward this pre-prepared fresh segment. Yet the service provided seems to be popular, and furthermore it brings this fruit into the world of snacking and packed lunches, where the biggest pockets of growth are. And this will remain the case as long as consumers are unconcerned at the price per kilo they are paying.
0%
20%
40%
60%
80%
100%
77 79 81 83 85 87 89 91 93 95 97 99 01 03 05 07 09 11 13 15
Côte d'Ivoire
Costa Rica
Others
Fresh pineapple - EU - Market shares by source
2016: estimate based on the first 7 monthsSource : Eurostat
400
500
600
700
800
900
1 000
1 10020
02
2003
2004
2005
2006
2007
2008
2009
2010
2011
2012
2013
2014
2015
2016
2016: estimate / Source: Eurostat
Côte d'Ivoire
Costa Rica
All sources
Fresh pineapple - EU - Price at import stage(euro/tonne)
0
100
200
300
400
500
600
700
800
900
1 000
500
550
600
650
700
750
800
850
900
950
1 000
1980
1983
1986
1989
1992
1995
1998
2001
2004
2007
2010
2013
2016
000
tonn
es
euro
/ton
ne
000 tonnes
euro/tonne
Fresh pineapple - EU - Imports(2016: estimate / source: Eurostat)
Contenu publié par l’Observatoire des Marchés du CIRAD − Toute reproduction interdite

46 October 2016 No. 244
CLOSE-UP
Weak signalsThat’s all in terms of the marketing side. Let’s get back to de-velopments by the big suppliers. At first glance, nothing is changing. Costa Rica holds 82 % and 87 % market shares in the United States and the EU respectively; almost a Soviet-style monopoly, so few crumbs remain for the rest. However, this situation does not seem to be as fixed as we might sus-pect. For example, if we look at its decline on the EU mar-ket by 100 000 tonnes between 2014 and 2015 (confirmed in 2016), certain weak signals can be detected. Not all the sources have suffered the same fate. Production difficulties have been focused exclusively in Costa Rica, and slightly in Panama. Other sources, namely African ones, have also cut their exports, but often at the strategic choice of the tradi-tional operators. Conversely, and this is where things be-come interesting, certain sources have caught fire. There are four countries emerging in this category: Mexico, Ecuador, the Dominican Republic and Colombia. Mexico has made a surprising leap forward. It exports exclusively to the United States and its season comes later than Costa Rica’s. If the trend persists in 2016, it will have a flow of nearly 100 000 tonnes, i.e. 9 % of the US market. Among the older newcom-ers, Ecuador is also sparking. After a low point in 2013, i.e. a combined total of 20 000 tonnes on the two markets, it has resumed growth and will finish the year 2016 with nearly 37 000 tonnes (projection). Ultimately, the latter two sourc-es belong to the category of micro-suppliers (between 6 000 and 8 000 tonnes each), but have very steep growth curves.
It would of course be a great exaggeration to think that it is the beginning of the end for the Costa Rican pineapple. The country leaves only a supporting role for the other sup-pliers to the international market, and this situation will not change in the near future. Yet since nothing is fixed for ever, the king could be dethroned, if we look at the recent devel-opments in the sector. The Costa Rican professional associa-tion announced in late 2015 a production area of 38 000 hec-tares, as opposed to 45 000 ha one year previously. Indeed, the failure and shutdown of some plantations, which led to a distinct downturn in production in 2015 — which will persist in 2016 and doubtless into 2017 — show the eco-nomic difficulties that the industry must face. Profitability is no longer ensured by international prices, which have fallen greatly, and the financial returns are on the slide due to the strength of the local currency against the euro. Finally, cer-tain operators have been forced out of the sector. This has helped re-balance world supply and demand, pushing pric-es upward. Returns to the producer have improved, though still insufficiently to restore the appetite among investors for this product, especially if they plan to sell it on the European market. The exchange rate, with the euro falling against the dollar and the colon, has mitigated the effects of the price boom on the European market. In 2016, the impact of the increase in international pineapple prices has above all fa-voured dollar zone shipments. Hence whereas for a very long time all observers were wondering whether the Costa Rican pineapple cost anything, such was the extent of plant-ing, overproduction and its corollary, falling international prices, have prevailed over the madness.
0
50
100
150
200
250
300
2010
2011
2012
2013
2014
2015
2016
Costa Rica
Ecuador
Côte d'Ivoire
Ghana
Panama
Mexico
Dom. Rep.
Pineapple - US + EU imports(index 100: 2010 / 2016 : provisional)
Source: Customs
250 000
268 000
286 000
304 000
322 000
340 000
358 000
376 000
394 000
500
525
550
575
600
625
650
675
700
2008
2009
2010
2011
2012
2013
2014
2015
2016
colo
n/to
nne
USD
/ton
ne
USD/tonne
colon/tonne
Costa Rican pineapple - Import value in the USAin dollar and colon
(2016: projection / sources: Customs, Cirad)
370 000
383 000
396 000
409 000
422 000
435 000
448 000
461 000
474 000
487 000
500 000
500
550
600
650
700
750
800
850
900
950
1 000
2008
2009
2010
2011
2012
2013
2014
2015
2016
colo
n/to
nne
euro
/ton
ne
euro/tonne
colon/tonne
Costa Rican pineapple - Import value in the EUin euro and colon
(2016: projection / sources: Eurostat, Cirad)
Contenu publié par l’Observatoire des Marchés du CIRAD − Toute reproduction interdite

47No. 244 October 2016
CLOSE-UP
According to FAO figures, world pineapple production is continuing to grow. It has doubled in 25 years to reach 24 million tonnes. Analysing the pineapple market boils down to looking at two very different seg-ments: processed (juice and canned fruit) and fresh fruit. In terms of im-ports, juice and canned fruit dom-inate the business. Two-thirds of pineapple trade is in processed form. Within this segment, two-thirds of trade is dedicated to juice, with the remainder going to canned fruit.
These two segments (processed and fresh) organise production in geo-graphic and industrial terms, with a high degree of specialisation in the production zones. Asia is the nerve centre for the processed pineap-ple, and has been for decades. Latin America, and more specifically Costa Rica, supplies the international fresh fruit market. Yet that has not always been the case. Until the early 2000s, Côte d’Ivoire was in sole charge, be-fore ceding its place to the Central American bulldozer. In less than two decades, Costa Rica has hoist-ed itself up to number one, leaving its competitors only a few crumbs. According to our estimates for 2016, the source holds an 82 % market share in the United States (consump-
tion 1 million tonnes) and a “mere” 87 % for the EU-28 (830 000 tonnes). Very few sources have been able to withstand this surge, especially since Costa Rica has also imposed a new standard: the MD-2, Sweet or Extra-Sweet variety. The Smooth Cayenne has been consigned to the dustbin of history… though perhaps not completely. Africa is attempting to revitalise this variety which brought success to its producers, and which enjoys many assets, including taste quality if the production and har-vesting rules are obeyed. It is also the pineapple used in Asia by the juice and canning industry.
As regards the processed market, it could hardly have a more contrast-ing trend. It too has been going through a crisis, but a supply crisis! One figure pinpoints the extent of the phenomenon: the rate of frozen pineapple concentrate in October 2015 reached the staggering figure of 3 800 USD/tonne (cfr Rotterdam). The previous record was just 2 000 USD, in late 2010. For the sake of completeness, the lowest level ever recorded was in 2000 at approxi-mately 650 USD. The bubble burst slightly in 2016, though the Q4 price was still 2 900 USD/tonne. As ever, it is Thailand which sets the direction
Fresh and processed pineapple production and trade
and scale of change in this sector. And it sounded a wakeup call when it announced a production cutback of more than 35 %, while Indonesia and the Philippines were unable to provide a top-up. The canned fruit market reacted as intensely as the juice market. The high point was reached in the second half of 2015, when the standard can (6xA10 grade rings in light syrup) exceeded 20 USD fob Bangkok, which it has main-tained ever since. We should beware the cycle repeating, but also disinfor-mation, the art of which Asian man-ufacturers have mastered. Farmers, encouraged by very good produc-tion returns, are already engaged in an intense planting and replanting campaign. By 18 months’ time, we could see the trend reversed, due to more abundant harvests. In any event, at these price levels demand has shrunk, especially rapidly for pineapple juice, which could serve the purposes of orange and apple juice producers seeking reasons to go on believing. Thai operators are not set to return to a normal supply before 2018
by Denis Loeillet, after Cyclope 2016
0
500
1 000
1 500
2 000
2 500
3 000
3 500
4 000
Pineapple - ThailandConcentrate world price
60°Brix cfr Rotterdam(USD/tonne - source: Agra-net)
Jan-
92N
ov.-9
4Se
pt. 9
7
Jul.
00M
ay 0
3
Mar
. 06
Nov
. 11
Sept
. 14
Jan.
09
Contenu publié par l’Observatoire des Marchés du CIRAD − Toute reproduction interdite

48 October 2016 No. 244
CLOSE-UP
Back to the environmentAfter the economy, the second wall facing Costa Rican pro-ducers comprises both a technical and above all environmen-tal impediment. Technical, since the United States is inter-cepting more and more insect-infected pineapple batches, and is even considering stricter import rules. Intensive pro-duction systems, of both banana and pineapple, entail a high sanitary pressure and therefore use of numerous chemical treatments. Besides the repercussions on human health and the environment, which we will return to shortly, these prac-tices may in certain cases generate biological imbalances, causing the proliferation of pests which, due to the insecti-cide treatments for example, no longer have any predators. Hence the move toward more environmentally-friendly prac-tices is also beneficial for plant and fruit health.
The need to safeguard the environment or halt its continu-ous deterioration is another threat weighing down the sec-tor. We talk about it every year, and every year new scandals appear. You will recall the phytopharmaceutical products found after analysis in humans, animals and river water of the villages neighbouring certain production zones. In July 2016, the realisation seemed to have been materialised by a ban on extending pineapple cultivation. At any rate it applied to one district, Los Chiles, in northern Costa Rica (Huerta Norte region: 47 % of surface areas), which imposed a moratorium on expanding surface areas dedicated to the pineapple. The scope of this decision is extremely narrow, yet it has a power-ful symbolic content, and could create ripples.
Working conditions have also been in the limelight. Furthermore, an Oxfam report which appeared in 2016 is highly critical about the working conditions of the workers in the Costa Rican pineapple sector. For the sake of complete-ness on the subject, the report also singles out the attitude of
European distributors, who through their policy of ever low-er purchase prices, are forcing producers into crime. In short, the golden age of the Costa Rican pineapple is no more, and the model needs to be renewed. Margins for progress for the sector are based on good agricultural practices inspired by the principles of agro-ecology (or even organic agriculture), a product differentiation policy, management of volumes to regain economic margins for manoeuvre, and finally the ap-plication of minimum international social standards.
Life beyond sea-freight MD-2Differentiation as a bulwark against erosion of added value is a classic recipe which has proven its worth in all indus-tries. The pineapple is no exception, though it involves rel-atively small volumes compared to the core range, i.e. sea-freight MD-2. These niche markets are centred on the Victoria pineapple (Reunion and Mauritius), the air-freight Smooth Cayenne pineapple, amounting to more than 12 000 tonnes (Cameroon, Côte d’Ivoire, Ghana, Benin, etc.), and also the air-freight Sugarloaf (Benin). Here too, care must be taken not to corrupt the segment! Alerts over excessive ethephon levels, for example, have been calamitous for Benin (see ethephon inset). The occasional overuse of this classic, near-magical remedy for the overly green coloration, not to consumers’ liking, corrupts the product and the production source. The pineapple, especially in the air-freight segment, is a top-end product, purchased and consumed by a demanding clien-tele. Africa has also carved itself out a choice place on this market, with operators structured vertically to give this seg-ment all the attention it requires on a separate basis.
A giant with feet of claySo will it last? There is no denying that the pineapple market has been one of the big successes of the fruit sector over the past two decades. Driven by innovation and flawless com-mercial organisation initially, it has forgotten the fundamen-tals, which has led to a crisis of overproduction as well as a general fall in fruit quality. The reduction of the supply, fol-lowing producer withdrawals and climate vagaries, has au-tomatically pushed up world rates since 2015. The very con-siderable improvement in economic returns to the producer, in Costa Rica as elsewhere, will provide renewed incentives. However, without being a perennial plant, the pineapple has a relatively long production cycle, especially if we include the preparations: preparing the land, irrigation, plant produc-tion, packing station, personnel training, etc. We can assume that 2017 could largely be spared a turnaround in the trend; but definitely not beyond then, since the factors for failure are already in place
Denis Lœillet, CIRAD [email protected]
© D
enis
Loe
illet
Contenu publié par l’Observatoire des Marchés du CIRAD − Toute reproduction interdite

49No. 244 October 2016
CLOSE-UP
Costa Rica is in charge of an empire, of fresh export pineapple. For practically two decades, it has dominated world trade. Production of MD-2 pineapple extends over 38 000 hectares at pres-ent, as opposed to 45 000 ha in 2014. The leading production region is Huerta Norte (17 860 ha, i.e. 47 % of to-tal surface areas), followed by Huerta Atlantica (11 780 ha, i.e. 31 %) and the Pacific region (8 360 ha, i.e. 22 %). The sector crisis, due to the constant in-crease in export volumes (more than 2 million tonnes in 2014), has driven many producers out of business. In late 2015, the annual export potential shrank by more than 200 000 tonnes. Given this source’s hold over the world market, this had a very rapid effect on rates, which dipped steeply (see world market article). A historical analysis shows that, besides the devastating effect of the El Niño phenomenon in 2008-2009, the sector has never had to go through such a severe streamlin-ing crisis.
Sector challenged in terms of genuine sustainabilityThe sector is also regularly singled out for the poor working conditions on the plantations, and the adverse ef-fects on the environment and human populations of intensive pesticide use.
Analysis of the exports structure does not reveal any major breakthroughs. The EU and United States have a stran-glehold of 97 % of the Costa Rican supply. Initiated in 2008, the tenden-cy to favour the US market over the European market was confirmed in 2016. The United States, due also to livelier demand than in Europe and definitely better returns, now imports 53 % of the Costa Rican supply. The seasonality of exports remains the same: a peak in March, April and May,
and then in November (in prepara-tion for the end-of-year holidays) and troughs in the summer and autumn, as well as January and February. 2016 was harder hit, with a record surge in February and a very lean March. In terms of volumes, annual exports were around 1 860 000 tonnes in 2015 and will without doubt be of a comparable level in 2016, a long way off the 2014 record level of 2 071 000 tonnes. Finally, the export value, cal-culated from the Customs export data, climbed again slightly in 2015 and 2016 to exceed 440 USD/tonne
Costa Rica: stick or twist?by Denis Loeillet
0200400600800
1 0001 2001 4001 6001 8002 0002 200
1997
1999
2001
2003
2005
2007
2009
2011
2013
2015
USAEUTotal, of which
Pineapple - Costa RicaAnnual exports
(000 tonnes / source: Customs)
40
60
80
100
120
140
160
180
200
220
J F M A M J J A S O N D
201620152014
Pineapple - Costa RicaMonthly exports
(000 tonnes / source: Customs)
340
360
380
400
420
440
460
1997
1999
2001
2003
2005
2007
2009
2011
2013
2015
Professional sources
Pineapple - Costa Rica - Export value(USD/tonne / 2016: provisional)
© Denis Loeillet
Contenu publié par l’Observatoire des Marchés du CIRAD − Toute reproduction interdite

50 October 2016 No. 244
CLOSE-UP
Pineapple consumption in the United States exceeded 900 000 tonnes in 2014 and is continuing to rise, albe-it very modestly. According to our projections, the net supply will be approximately 950 000 t in 2016, plus the roughly 100 000 t set to transit the United States for immediate re-export to neighbouring Canada. Unsurprisingly, it is Costa Rica which holds the bulk of the market (market share 82 %). The Central American source does not leave much room for its competitors, which are nonetheless trying to make the most of their assets, like Mexico, Honduras and Guatemala which managed to sur-pass the market’s annual growth rate. After a trough in 2012 and 2013, the import unit price has picked up for the past three years, peaking in 2016. The scaling back of the Costa Rican supply has enabled a vital recovery in terms of value. The pegging of the colon against the US dollar has mechanically increased returns in Costa Rica, and in all the countries where the US currency holds in-fluence. So ultimately, the US market seems more sound and resilient than the European market
United States: a more resilient marketby Denis Loeillet
Mexico 9%
Fresh pineapple - USA - Imports in 2016(projection)
Costa Rica82 % Honduras
5%Guatemala
2%Others
1%
0
200
400
600
800
1 000
1 200
1989
1991
1993
1995
1997
1999
2001
2003
2005
2007
2009
2011
2013
2015
000
tonn
es
OthersEcuadorGuatemalaHondurasMexicoCosta Rica
Fresh pineapple - USA - Imports(2016: projection / source: Customs)
0
200
400
600
800
1 000
1 200
1 400
1 600
300
350
400
450
500
550
600
650
700
1989
1991
1993
1995
1997
1999
2001
2003
2005
2007
2009
2011
2013
2015
000
tonn
es
USD
/ton
ne
000 tonnes
USD/tonne
Fresh pineapple - USA - Imports(2016: estimate / source: Eurostat)
© P
aulin
e Fe
sche
t
Contenu publié par l’Observatoire des Marchés du CIRAD − Toute reproduction interdite

Tissue culture produc�on of tropical fruit plants
Your banana �ssue culture plant specialist
What we promise youThe most produc�ve selected elite varie�es
Prime bunch quality
Op�mum homogeneity in the �eld
The best sanitary guarantees of the market
Unequalled responsiveness
Tel: +33 (0)4 67 55 34 58Fax: +33 (0)4 67 55 23 05
ZAE des Avants34270 Saint Mathieu de Tréviers
FRANCEwww.vitropic.fr
A uniquerange
of elitevarieties
f189 pub vitropic pleine page.ai 1 24/05/2011 10:27:49
f189 pub vitropic pleine page ver3 ANG.pdf 1 01/06/2011 09:26:46
Contenu publié par l’Observatoire des Marchés du CIRAD − Toute reproduction interdite

52 October 2016 No. 244
CLOSE-UP
Small sizes too often finding their way onto the shelves
The Victoria campaign was marked by a fall in the supply level, especially during the criti-cal periods in terms of demand, enabling the fruit to earn decent value despite some qual-ity concerns. The Reunion supply, often imbalanced at the beginning of the campaign by the abundance of small fruits, gradually stabilised over the campaign. Conversely, the Mauritian supply, with a more regular sizing, had lower availability at the end of the campaign. The market continues to favour Victoria from Reunion, whose average rates were, as so often, higher than those of the Mauritian supply, barring a few exceptions.
© Patrick Fournier
Contenu publié par l’Observatoire des Marchés du CIRAD − Toute reproduction interdite

53No. 244 October 2016
CLOSE-UP
Indian Ocean Victoria production did not suffer from the cy-clone events which often hit the region. However, the sup-ply from both Reunion and Mauritius saw flutters which af-fected the fruit availability on the markets, and helped keep prices relatively stable. At the end of the campaign, heavy rains in the production zones had an impact on the fruit quality and availability from Mauritius.
Steadier and bigger in terms of volume, the Mauritian supply was also steadier in terms of sizing available. More abundant in the supermarket chains, it was the subject of numerous promotions, as in previous years. Although it is deemed of lower quality than its rival from Reunion, it nonetheless sold on a good price footing.
The Reunion supply, always highly rated by consumers, did however have its usual hiccups, namely too many unpop-ular small-sized fruits, which struggle to earn value. The presence of these small fruits, sometimes in very large vol-umes available at low prices, contributed to widening the range of rates for this source, and bringing down the results of certain operators. Reunion fruits were sold above all by specialised shops.
2.0
2.2
2.4
2.6
2.8
3.0
3.2
3.4
3.6
3.8
J F M A M J J A S O N Deu
ro/k
g
Source: Thierry Paqui
2016 average
2015 average
2014 average
Victoria pineapple - FranceMonthly average import price
Origine
Ile de la RéunIon
Philibon exotic fruits, the promise
of unique flavours
With all the taste of the originwww.philibon.com
Contenu publié par l’Observatoire des Marchés du CIRAD − Toute reproduction interdite

54 October 2016 No. 244
CLOSE-UP
The campaign over the monthsOverall, the past campaign went rather smoothly, with aver-age rates up for both sources from the previous campaign. Hence import prices fluctuated between 3.15 and 4.00 euros/kg for Reunion fruits, and between 2.75 and 3.75 euros/kg for Mauritian fruits.
From week 41 to week 53 2015, the Victoria supply increased steadily. Throughout October, the Reunion supply was unbal-anced by the overabundant small fruits, of sizes 9 and 10. The operators were forced to readjust their prices for these sizes, in order to prevent stocks from forming. At the end of the month, when demand was affected by the school holidays, the oper-ators managed to remain fluid thanks to implementing pro-motions. In November, the Reunion supply rebalanced at the expense of size 8 fruits, which were more abundant. Again, it was the promotions which helped keep rates stable, as well as good sales fluidity. Less regular in terms of quality, the Mauritian supply struggled to capture demand, which often told on rates. At the end of the year, the Reunion supply, up steeply and more balanced in terms of sizes, had no trouble selling; aided, if truth be told, by the waning Mauritian supply. Demand, stronger in the run-up to the end-of-year holidays, once again confirmed the festive side of Victoria. The average rates during this first period fluctuated between 3.15 and 3.75 euros/kg for Reunion fruits, and between 2.85 and 3.30 euros/kg for Mauritian fruits.
As in every campaign, the market was less lively after the end of the year. From week 1 to week 12 2016, demand was distinctly lower. Nonetheless, rates remained very strong, and even rose since the overall Victoria supply was limited, and was unable to cover demand. The increase in volumes before Easter was readily absorbed, since the market was short of fruit. It simply resulted in a fall in prices, which had reached their highest lev-el of the campaign. During this period, the average rates were 3.75 euros/kg for Mauritian fruits, and fluctuated between 3.25 and 4.00 euros/kg for Reunion fruits.
From week 13 to week 35, demand gradually switched to sea-sonal fruits, with their higher availability and low prices. So the Victoria market was quieter. Meanwhile, the overall supply was smaller. We saw the range of rates synchronise between the two sources, due in part to the fact that only pineapple die-hards were still purchasing. This synchronisation came at the expense of the Reunion supply, unbalanced by an overabun-dance of size 8 fruit, with prices having to be revised down-ward. From week 33, the average prices for both sources were approximately 3.25 euros/kg.
From the beginning of September, the Victoria market seems to have revived somewhat. However the supply is still fairly limited, though it should gradually build up for the end-of-year holidays
Thierry Paqui, consultant [email protected]
NOMAD Ananas Victoria (Victoria pineapple)
A market information bulletin (in French) is available on the ODEADOM website:
www.odeadom.fr/
This bulletin is prepared by CIRAD for ODEADOM
Nouvel Observatoire des Marchés Agricoles D’outremer
© Guy Bréhinier
Contenu publié par l’Observatoire des Marchés du CIRAD − Toute reproduction interdite

55No. 244 October 2016
CLOSE-UP
Can we really talk about a miracle when a situation repeats itself twice in succession? Is it not simply a trend that all sectors should follow? The European pineapple market is fuelling this debate, so exceptional have been the prices charged over the past twelve months, once more. And yet again, it was the extreme paucity of the Sweet supply that enabled them to scale the heights, while in addition, the periods of high rates lasted for longer. However, the majority of operators were not involved in cutting the supply, actually increasing their volumes. It was only a few key players, in Africa or Costa Rica, which opted to considerably scale back their production, and consequently strengthen their prices. Yet nothing seems to indicate that others want to follow in their footsteps; though it seems to be the only way of continuing to create value on the fresh pineapple market.
Does the pineapple market have what it takes to reinvent itself, or does it really want to?
© Thierry Lescot
Contenu publié par l’Observatoire des Marchés du CIRAD − Toute reproduction interdite

56 October 2016 No. 244
CLOSE-UP
With the exception of the previous campaign (December 2014 to September 2015), during which average import prices were between 7.00 and 9.00 euros/box, average rates over the past ten years have actually fluctuated between 6.00 and 8.00 eu-ros, depending on the size. Of course, there were periods when prices were higher, though they were fairly short-lived. During the last campaign (week 41 2015 to week 39 2016), average rates fluctuated between 8.00 and 11.00 euros/box, with occasional peak periods when they reached and even exceed-ed 13.00 euros. The small brands were able to take advantage of these rates since the big brands often sold at distinctly higher prices, depending on the markets.
Costa Rica once more confirmed its role as the main player on the pineapple market. Despite a fall of nearly 12 % in its exports to the EU-28, it remained the number one supplier to the European market in 2015 with more than 720 000 tonnes, maintaining its market share at 86 %. This fall is due to several factors. First there were the heavy rains and flood-ing which hit the country between late 2014 and early 2015, which also affected fruit availability for the canning industry. Hence on several occasions, the processing industry paid up to 1 dollar per kilo more than the market price to ensure the supply. This aggressive policy had the consequence of lim-iting fresh fruit availability for the European market even further. In addition, the attractiveness of the North American market was high, fuelled by a de-mand slightly more dynamic than in Europe.
The good prices obtained in 2014-15, a campaign when the supply was very considerably scaled down, would therefore seem to indicate a path to follow. Hence the brands which deliberately cut back their production, and whose produce exhib-ited a high quality level, were able to enjoy stable prices. This seems to justify their choice, with a view to regaining some profitability on the pineapple market.
Increasing flatness in demandHowever, there is a cloud looming over the scene. While the Costa Rican pineapple supply underwent an unprecedented fall, demand had never been so uninterested in the fruit. It is evident that the price increases were more due to the extreme paucity of the supply at certain times in the campaign, rather than to genuinely lively demand.
What can be done to revitalise demand? Certain brands have already asked themselves the ques-
0.0
2.0
4.0
6.0
8.0
10.0
12.0
14.0
16.0
1 12 23 34 45 4 15 26 37 48 7 18 29 40 51 9 20 31
euro
/box
Weeks / Source: Thierry Paqui
Smooth CayenneMax MD-2Min MD-2
2013 2016
Sea-freight pineapple - European Union - Import price
2014 2015
© Régis Domergue
Contenu publié par l’Observatoire des Marchés du CIRAD − Toute reproduction interdite

57No. 244 October 2016
CLOSE-UP
tion, and are opting to offer more coloured fruits, which can earn more value from customers. Outside of these rare cases, the general and increasing flat-ness in demand for Sweet on the market must be recognised. Due to this weak overall demand, op-erators are nearly all coming to fear the irregular arrival of big volumes, which practically every time force them to lower their prices to prevent stocks from forming.
The past campaign also confirmed the increasingly dominant role played by the supermarket sector in selling imported pineapples. The operators under contracts with the supermarket sector are those which had the steadiest sales. Yet they also suffered more from the fruit shortage, often forced to pur-chase batches at high prices in order to meet their contractual obligations and retain their listing with the supermarkets.
Over the past two campaigns, the duration of the natural flowering phenomenon has constantly de-creased. During the last campaign, it lasted less than four weeks, with smaller volumes reaching the market. Nonetheless this burdened the market, forcing rates down fairly steeply. All the operators are wondering whether the fall in volumes due to natural flowering will persist, or whether it is just a calm before the storm. Furthermore, the reduc-tion in surface areas in Costa Rica should also affect availability during natural flowering periods.
The campaign over the monthsFrom early October to early November 2015 (weeks 41 to 45), the pineapple market followed a very positive trend. The Costa Rican supply, which was limited, remained below demand for a long time. The long-planned promotions struggled to be im-plemented, because of the restricted nature of the supply. Operators not signed up with purchasing centres took advantage of this to sell their fruit to those which were, which often gave rise to specu-lative sales. The lean supply was unable to satisfy all customers, and average rates very quickly climbed, before stabilising at between 11.00 and 12.00 euros/box.
As is often the case, November was a fairly com-plicated month for pineapple sales. The abrupt in-crease in supply, at a time when demand had little interest in the fruit, resulted in an increase in stocks. It should be recognised that the general context was fairly unfavourable at the end of 2015. Between the attacks in France and the cancellation of sales to the Russian market, sales in general were very qui-
4
5
6
7
8
9
10
11
12
J F M A M J J A S O N D
euro
/box
Source: Thierry Paqui
201620152014
Sea-freight Costa Rican Sweet pineapple - GermanyImport price
4
5
6
7
8
9
10
11
12
13
J F M A M J J A S O N D
euro
/box
Source: Thierry Paqui
201620152014
Sea-freight Costa Rican Sweet pineapple - NetherlandsImport price
Contenu publié par l’Observatoire des Marchés du CIRAD − Toute reproduction interdite

58 October 2016 No. 244
CLOSE-UP
et. The situation was especially critical since the mar-ket was expecting a slump in the Costa Rican supply and the opposite happened. Though not excessive, it was nonetheless substantial. Only the operators implementing promotions managed to sell off their fruit with a bit less difficulty. Average rates were be-tween 6.00 and 9.00 euros/box from November to late December, leaving the market saturated at the end of the year, and raising fears of the worst for ear-ly 2016.
From the beginning of the year until the end of May (weeks 1 to 21 2016), Latin American and African vol-umes decreased. This fall, which occurred very rapid-ly at the beginning of the year, helped clear up the situation sooner by facilitating the clearance of the stored batches which were weighing down the mar-ket at the end of the year. Hence the market became under-supplied again, with the supply well below demand. The difficulties in obtaining fruit from Latin America were the consequence of rains in produc-tion zones and of a higher demand from the process-ing industry, which also due to the fruit shortage, purchased all the available pineapples it could get its hands on. So the market remained buoyant, with average rates of between 7.00 and 11.00 euros/box.
With the arrival of the first summer fruits in early June, consumers abandoned the pineapple. In addi-tion, the Latin American supply saw an unforeseen increase. In early June the US phytosanitary authori-ties stepped up their scale insect inspections (a quar-antine organism in the USA but not in Europe), re-sulting in a transfer to the European market of large and unexpected volumes. Although this situation did not last long, the operators complained of the weakness of sales and low prices. However, average rates remained fairly stable, at between 6.00 and 8.00 euros/box.
From mid-July to late September, the supply was on a distinct slide. So limited were the volumes availa-ble that despite its lifelessness, demand managed to stay ahead. To provide a rough idea, when the sup-ply was lowest, certain operators received just under 20 % of their usual quantities for the time of year. The increase in volumes in late September marked the end of a ten-week period during which average rates fluctuated between 9.00 and 12.00 euros/box, with peaks of 14.00 euros/box or more!
The considerable fall in rates in late September, with average prices going within one week from 12.00 to 9.00 euros/box, hinted at more complicated weeks ahead for the pineapple market
Thierry Paqui, consultant [email protected]
4
5
6
7
8
9
10
11
12
13
J F M A M J J A S O N D
euro
/box
Source: Thierry Paqui
201620152014
Sea-freight Costa Rican Sweet pineapple - Belgium Import price
© Guy Bréhinier
Contenu publié par l’Observatoire des Marchés du CIRAD − Toute reproduction interdite

59No. 244 October 2016
CLOSE-UP
The more frequent and sys-tematic inspections carried out by the French Fraud Con-trol service (DGCCRF), initial-ly on Sugarloaf from Benin and then on the other main air-freight market sources (Cameroon, Côte d’Ivoire and Ghana), have emphasised the structural problems of the Beninese industry, but above all the difficulties in managing ethephon applica-tion on Sugarloaf. The export forecasts for Benin predicted that this variety would fair-ly soon overtake Cayenne. Within the space of one year, the steep fall in Sugarloaf shipments seems to have doused the hopes of Beninese exporters. This market has once again become a niche market, which is dwindling with every passing month.
Sugarloaf sent back to its niche...
© E
ric Im
bert
Contenu publié par l’Observatoire des Marchés du CIRAD − Toute reproduction interdite

60 October 2016 No. 244
CLOSE-UP
The 2015-16 campaign was marked by the DGCCRF step-ping up its inspections on the French market. The Beninese supply was hard hit, since they revealed ethephon con-tents exceeding the MRL (set at 2 mg/kg) on several occa-sions. The extension of these inspections to other sources (Cameroon, Ghana and Côte d’Ivoire), and to Cayenne ex-ports, led to the air-freight supply being restructured, with two main players, Cameroon and Côte d’Ivoire, the only ones regularly supplying the market.
Yet these two sources alone could not manage to provide the volumes required to fully satisfy demand. So the op-erators had to continue to work with Benin, though im-porting fruits with less and less coloration, and therefore increasingly difficult to sell. The air-freight pineapple con-sumer seeks ready-to-eat, and above all, highly coloured fruit.
The lack and non-uniformity of coloration of the Cayenne batches made marketing complicated. Yet what can we say about the sales of Sugarloaf offered to consumers still green? Importers made several attempts to explain that the fruit had in no way lost any of its organoleptic qualities (see ethephon inset), unfortunately without much success for the time being.
In this context the arrival onto the market in late June of additional small batches of highly coloured Sweet from Cuba, and subsequently from the Dominican Republic, did not go unnoticed, especially since these fruits sold very quickly and at high rates. After ousting Cayenne from the sea-freight market, is Sweet preparing to pull off an-other coup on the air-freight market?
The campaign over the monthsAs in previous campaigns, average rates were fairly stable, mostly fluctuating between 1.85 and 1.95 euro/kg.
From week 41 to week 53 of 2015, the campaign was above all marked by the DGCCRF stepping up its spot in-spections. After initially focusing on Sugarloaf batches, they were then extended to Cayenne batches. We then observed a distinct decrease in shipments from Benin, and a loss of coloration of the fruits on the market. In the run-up to the end-of-year holidays, the overall supply was very limited. The Cameroonian supply, was particularly hard hit by freight problems. The few batches reaching the market very readily found takers, and at high rates. The average rates fluctuated between 1.80 and 1.90 euro/kg for Cayenne, and between 1.90 and 1.95 euro/kg for Sugarloaf, though sales were well down for this variety.
From January to June (weeks 1 to 22 of 2016), the over-all air-freight market supply fell. With volumes available lower than demand, the market appeared livelier from the
beginning of the year. Freight problems continued and in-tensified in Cameroon with the closure of Douala airport, while Benin was still struggling to resolve its ethephon MRL concerns. At the beginning of the year, only Côte d’Ivoire was managing to provide a regular supply to the air-freight market. Despite the small volumes available, it remained buoyant with fairly high rates. At Easter, when the market was short of fruit, operators managed to or-ganise a cargo operation (30 tonnes) out of Cameroon. Throughout this period, the majority of fruits on the mar-ket originated from Cameroon and Côte d’Ivoire. Despite some quality concerns over certain Cameroonian batch-es, sales remained fluid since the supply was well below demand. Average rates for the period fluctuated between 1.85 and 2.00 euros/kg for Cayenne, and between 1.90 and 2.05 euros/kg for Sugarloaf.
From June, seasonal fruits gradually captured the bulk of demand. Although limited, the overall supply really struggled to sell, considerably complicating the situation on the air-freight market. The inspections carried out by the DGCCRF went on unabated, and during week 23, all Sugarloaf batches received from Benin underwent inspec-tion, and all were destroyed due to exceeding the MRL. The average Sugarloaf and Cayenne rates for the period varied between 1.85 and 1.90 euro/kg.
In September, the very limited supply was well below de-mand, which enabled operators to charge average rates of between 1.90 and 2.00 euros/kg for Cayenne, and 2.00 euros/kg for Sugarloaf
Thierry Paqui, consultant [email protected]
1.60
1.65
1.70
1.75
1.80
1.85
1.90
1.95
2.00
J F M A M J J A S O N Deu
ro/k
g
Source: Thierry Paqui
2016 average
2015 average
2014 average
Air-freight pineapple - France - Import price
Contenu publié par l’Observatoire des Marchés du CIRAD − Toute reproduction interdite
61No. 244 October 2016
CLOSE-UP
Ethephon is widely used in the agri-cultural world as a growth regulator. In pineapple cultivation, it is used above all for fruit regulation and mat-uration, as well as to ensure homoge-nous coloration (degreening). Unlike the banana and avocado, which are climacteric fruits par excellence, the pineapple is non-climacteric, i.e. it does not ripen after harvesting. So it is harvested ripe, and its coloration has no impact on its maturity. As they are already mature upon harvesting, non-climacteric fruits can only devel-op toward senescence.
Since autumn 2015, the French Fraud Control services have paid particular attention to the residual ethephon content in pineapples from several African sources. Analyses conducted on various batches revealed signifi-cant breaches of the MRL, set at 2 mg/kg by European regulations.
Benin’s Sugarloaf industry was par-ticularly affected. Uncontrolled use and mismanagement of ethephon by producers in the country, initially con-sidered to be a minor problem which would be rapidly resolved, has unfor-tunately not been rectified. Quite the contrary, the difficulties in managing MRL levels have led to the inspections carried out on shipments from this source being stepped up, including on Cayenne.
Subsequently, these inspections were extended to Cayenne and Sugarloaf batches from Cameroon. Unfortunately, it proved that use of ethephon on Sugarloaf is less well managed than on Cayenne. For their part, Ivorian air-freight exports (Cayenne only), which enjoy a long tradition built on integrated produc-tion, passed the MRL tests without difficulty.
The stepped-up MRL inspections on Beninese and Cameroonian exports
initially affected the main importers from these sources most of all. After being caught by the Fraud Control ser-vices, they were reminded of the max-imum thresholds, as well as the penal risk incurred (in France) as the primary traders. They responded by increasing their self-checks on their incoming shipments, and by alerting their sup-pliers so that they could rapidly adapt their treatment protocols. Meanwhile, they limited or even suspended their imports from the least reliable or least responsive suppliers.
However, the efforts made by the big-gest traders were compromised by im-ports with residual contents exceed-ing the authorised threshold, from suppliers with little involvement in pineapple production and little abili-ty to influence the treatment methods used by a plethora of producers.
In early June, a crackdown by the Fraud Control service blocked all batches from Benin. The positive anal-yses led to their withdrawal from the market, which represented anoth-er warning shot for the African in-dustries. Incoming shipments from Benin decreased and became irregu-lar, which is damaging to the market supply and to the development of the Beninese sector. Cameroon seems to have weathered the storm better due to the greater involvement by the shippers in fruit production. Thanks to the greater attention paid to the treat-ment protocol, steadier flows were maintained, though with less colour-ed fruits.
Furthermore, the difficulties in setting up a specific technical itinerary for the Sugarloaf drove importers to take a bold gamble on importing more or less untreated fruits, i.e. greener but more compliant with European reg-ulations. However, customers are re-luctant to accept fruit with little or
Ethephon misuse blacklisted
no coloration. This led to great dis-affection among purchasers, which grew constantly over the months as the Sugarloafs lost their coloration. Importers embarked on communica-tion campaigns to explain that this variety maintained its organolep-tic properties despite being green. For the moment, they have had lit-tle effect and interest in the fruit has waned constantly.
While the green coloration of Sugarloaf could bit by bit make its way into common practice since it is a recent and marginal product, the same cannot be said for Cayenne. Consumers are long used to buying coloured (yellow-orange) fruits. Time may bring acceptance of a somewhat green coloration, unless the treat-ment protocols are more uniformly applied, while adhering to the meas-ures stipulated by the regulations. Above all, physiologically immature fruits, but with the same coloration, must not find their way onto the mar-ket. At present, there are still some highly coloured Sugarloaf batches, with definitely high ethephon con-tents, which are contributing to dis-torting the message on coloration.
The recent reduction of Mauritian Victoria shipments is also apparent-ly in part due to positive ethephon inspections. All of which leads us to believe that it is the air-freight indus-try as a whole which is blacklisted. What will be the next target of the French authorities; the more modest Sugarloaf volumes from Togo, or the rising volumes of highly-coloured Sweet from Cuba or the Dominican Republic, offered at distinctly higher prices? Finally, we might also express our amazement at the purely nation-wide scale of this crisis. Is France alone in its concern at ethephon contents exceeding the MRL under European regulations?
by Pierre Gerbaud and Thierry Paqui
Contenu publié par l’Observatoire des Marchés du CIRAD − Toute reproduction interdite

62 Octobre 2016 n°244
PINEAPPLE - Production (2013)
PINEAPPLE - Exports (2015)
PINEAPPLE - Imports (2015)
Pineapple — Top 10 producer countriestonnes 2013
Costa Rica 2 685 131 Brazil 2 483 831
Philippines 2 458 420 Thailand 2 209 351
Indonesia 1 837 155 India 1 745 230 China 1 571 000
Nigeria 1 420 000 Mexico 771 942
Colombia 643 039 Source: FAO
Pineapple — Top 6 exporter countries
tonnes 2015
Costa Rica 1 859 326
Philippines 360 000
Mexico 76 987
Ecuador 66 076
Honduras 60 031
Panama 45 979
Sources: national Customs, professionals
USA - Imports - Main supplier countriestonnes 2011 2012 2013 2014 2015
Total 817 131 924 526 975 591 1 047 066 1 028 693Costa Rica 697 648 788 463 853 894 938 281 868 779
Mexico 36 440 55 222 54 182 40 634 75 165Honduras 27 241 37 288 38 894 38 154 47 734
Guatemala 14 664 14 105 13 804 14 858 15 956Ecuador 21 557 7 875 3 188 3 883 5 972
Panama 14 113 14 676 5 093 4 522 5 276
Thailand 3 964 4 516 3 264 3 466 2 336
Others 1 504 2 381 3 271 3 268 7 474Source: US Customs
Pineapple — Top 6 importer countries
tonnes 2015
United States 1 028 693
Netherlands 250 600
Japan 150 598
United Kingdom 127 890
Italy 125 295
Belgium 120 043
Source: national Customs
Canada - Imports - Main supplier countriestonnes 2011 2012 2013 2014 2015
Total 108 672 121 314 122 630 126 289 109 493 Costa Rica 99 769 112 751 114 929 118 079 100 461
USA 3 012 2 480 3 289 2 649 2 687
Honduras 2 098 2 879 1 508 2 008 1 835
Ecuador 1 183 610 691 1 342 1 033
Others 2 610 2 594 2 213 2 211 3 477 Source: COMTRADE
Sour
ce: F
AO, C
IRA
D /
Gra
phic
s: C
hez
Vinc
ent,
Cira
d-Fr
uiTr
op
World production 24.8 million tonnes
Asia
Latin America
45%
37% Africa
18%
World exports 2 600 000 tonnes
Sour
ce: F
AO, C
IRA
D /
Gra
phic
s: C
hez
Vinc
ent,
Cira
d-Fr
uiTr
op
Africa
Asia
80%
17%
3%
Latin America
World imports 2 600 000 tonnes
Sour
ce: F
AO, C
IRA
D /
Gra
phic
s: C
hez
Vinc
ent,
Cira
d-Fr
uiTr
op
EU-27+ Switzerland
+ Norway Asia
North America+ Canada
34%44%
14%
Central and South America - Main markets
tonnes 2011 2012 2013 2014 2015
Total 63 331 46 214 55 841 62 091 65 298
Chile 37 328 20 146 28 735 30 288 30 749
El Salvador 9 605 10 151 11 866 16 624 20 154
Argentina 12 095 10 394 10 970 11 890 11 564
Uruguay 715 779 910 1 155 1 507
Paraguay 331 537 746 881 812
Mexico 685 1 018 1 035 760 511
Peru 2 271 3 133 1 397 153 1
Colombia 301 56 182 340 - Source: COMTRADE
Contenu publié par l’Observatoire des Marchés du CIRAD − Toute reproduction interdite
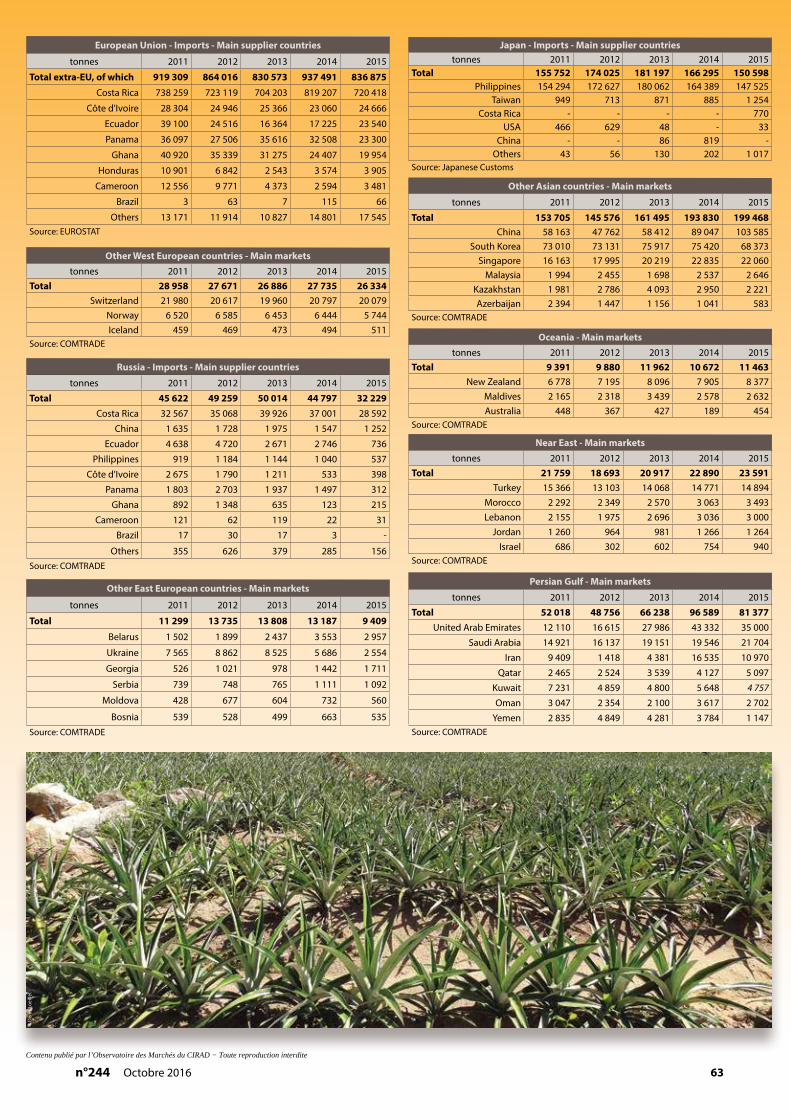
63n°244 Octobre 2016
European Union - Imports - Main supplier countries
tonnes 2011 2012 2013 2014 2015
Total extra-EU, of which 919 309 864 016 830 573 937 491 836 875
Costa Rica 738 259 723 119 704 203 819 207 720 418
Côte d'Ivoire 28 304 24 946 25 366 23 060 24 666
Ecuador 39 100 24 516 16 364 17 225 23 540
Panama 36 097 27 506 35 616 32 508 23 300
Ghana 40 920 35 339 31 275 24 407 19 954
Honduras 10 901 6 842 2 543 3 574 3 905
Cameroon 12 556 9 771 4 373 2 594 3 481
Brazil 3 63 7 115 66
Others 13 171 11 914 10 827 14 801 17 545 Source: EUROSTAT
Other West European countries - Main marketstonnes 2011 2012 2013 2014 2015
Total 28 958 27 671 26 886 27 735 26 334 Switzerland 21 980 20 617 19 960 20 797 20 079
Norway 6 520 6 585 6 453 6 444 5 744 Iceland 459 469 473 494 511
Source: COMTRADE
Russia - Imports - Main supplier countries
tonnes 2011 2012 2013 2014 2015
Total 45 622 49 259 50 014 44 797 32 229 Costa Rica 32 567 35 068 39 926 37 001 28 592
China 1 635 1 728 1 975 1 547 1 252
Ecuador 4 638 4 720 2 671 2 746 736
Philippines 919 1 184 1 144 1 040 537
Côte d'Ivoire 2 675 1 790 1 211 533 398
Panama 1 803 2 703 1 937 1 497 312
Ghana 892 1 348 635 123 215
Cameroon 121 62 119 22 31
Brazil 17 30 17 3 -
Others 355 626 379 285 156 Source: COMTRADE
Other Asian countries - Main markets
tonnes 2011 2012 2013 2014 2015
Total 153 705 145 576 161 495 193 830 199 468 China 58 163 47 762 58 412 89 047 103 585
South Korea 73 010 73 131 75 917 75 420 68 373 Singapore 16 163 17 995 20 219 22 835 22 060
Malaysia 1 994 2 455 1 698 2 537 2 646 Kazakhstan 1 981 2 786 4 093 2 950 2 221 Azerbaijan 2 394 1 447 1 156 1 041 583
Source: COMTRADE
Oceania - Main marketstonnes 2011 2012 2013 2014 2015
Total 9 391 9 880 11 962 10 672 11 463 New Zealand 6 778 7 195 8 096 7 905 8 377
Maldives 2 165 2 318 3 439 2 578 2 632 Australia 448 367 427 189 454
Source: COMTRADE
Persian Gulf - Main markets
tonnes 2011 2012 2013 2014 2015
Total 52 018 48 756 66 238 96 589 81 377 United Arab Emirates 12 110 16 615 27 986 43 332 35 000
Saudi Arabia 14 921 16 137 19 151 19 546 21 704
Iran 9 409 1 418 4 381 16 535 10 970
Qatar 2 465 2 524 3 539 4 127 5 097
Kuwait 7 231 4 859 4 800 5 648 4 757
Oman 3 047 2 354 2 100 3 617 2 702
Yemen 2 835 4 849 4 281 3 784 1 147 Source: COMTRADE
Other East European countries - Main markets
tonnes 2011 2012 2013 2014 2015
Total 11 299 13 735 13 808 13 187 9 409
Belarus 1 502 1 899 2 437 3 553 2 957
Ukraine 7 565 8 862 8 525 5 686 2 554
Georgia 526 1 021 978 1 442 1 711
Serbia 739 748 765 1 111 1 092
Moldova 428 677 604 732 560
Bosnia 539 528 499 663 535 Source: COMTRADE
Near East - Main markets
tonnes 2011 2012 2013 2014 2015Total 21 759 18 693 20 917 22 890 23 591
Turkey 15 366 13 103 14 068 14 771 14 894 Morocco 2 292 2 349 2 570 3 063 3 493 Lebanon 2 155 1 975 2 696 3 036 3 000
Jordan 1 260 964 981 1 266 1 264 Israel 686 302 602 754 940
Source: COMTRADE
© D
enis
Loe
illet
Japan - Imports - Main supplier countriestonnes 2011 2012 2013 2014 2015
Total 155 752 174 025 181 197 166 295 150 598 Philippines 154 294 172 627 180 062 164 389 147 525
Taiwan 949 713 871 885 1 254 Costa Rica - - - - 770
USA 466 629 48 - 33 China - - 86 819 -
Others 43 56 130 202 1 017 Source: Japanese Customs
Contenu publié par l’Observatoire des Marchés du CIRAD − Toute reproduction interdite

64 October 2016 No. 244
CLOSE-UP
Internal browning Internal browning
Thielaviopsis paradoxa on a lateral blemish
Incipient Thielaviopsis paradoxa on peduncle
Thielaviopsis paradoxa external appearance
Sun scald on ‘Victoria’ Sun scald on ‘Victoria’ Over-ripeness
Scales Attack by insects Crack malformation or deformity
Photos © Pierre Gerbaud
Colour variation in the same batch Damaged, scorched crown Crown too long
and crushed by box lidContenu publié par l’Observatoire des Marchés du CIRAD − Toute reproduction interdite

65No. 244 October 2016
CLOSE-UP
Incipient internal browning Incipient internal browningin ‘Victoria’ Thielaviopsis paradoxa
Incipient Thielaviopsis paradoxa on a blemish
External symptom of Penicillium funiculosum on Sugarloaf
Internal symptom of Penicillium funiculosum on Sugarloaf
Translucent Mould (Penicillium) on peduncle after transport
Mould after transport(Penicillium)
Micro-bruising Dry bracts on ‘Victoria’
Peduncle cut irregularity
Irregular crown size Poorly reduced crown Double crownContenu publié par l’Observatoire des Marchés du CIRAD − Toute reproduction interdite

66 October 2016 No. 244
CLOSE-UP
This article is drawn from three main sources: • ‘Crop management sequence - Pineapple’, PIP, 52 pages. www.coleacp.org • ‘L’ananas’, Alain Guyot, ISTOM lectures • ‘L’ananas, sa culture, ses produits’, Claude Py & Claude Teisson, 568 pages,
Maisonneuve et Larose
The pineapple exhibits three main phases:
• the vegetative phase from planting to the differ-entiation of the inflorescence (flowering);
• the fruiting phase running from differentiation to fruit harvesting;
• the sucker growth phase: from fruit harvesting to the destruction of the plant.
The parts of an adult pineapple plant are as follows:
• stalk: a short club-shaped stem that contains starch reserves and has a fibrous structure that makes me-chanical destruction difficult;
• leaves: with a maximum of 70 to 80, these can be more than 1 m long and 7 cm broad. Their ap-pearance indicates the state of health of the plant and growth vigour;
• fruit: a compound fruit that is the equivalent of a fused, compressed bunch. Its weight depends on plant size at floral induction and the nutritional state of the plant at that stage. It is determined first of all by the number of eyes;
• crown: a leafy part topping the fruit;
• roots: underground and above-ground. The under-ground roots are fragile and the slightest discon-tinuity of the soil profile strongly disturbs growth. The roots are put out in the first month after plant-ing. They then just lengthen and no new root emis-sion takes place before the fourth or fifth month;
• shoots: these are of two types—slips that grow on the stalk beneath the fruit, and true shoots that grow at the leaf insertion point on the stalk.
The pineapple, Ananas comosus, a member of the Bromeliaceae family, originated in South America. The cultivated pineapple still has sev-eral traits of this parentage:
• its root system is extremely fragile and the plant prefers light, well-tilled soil;
• it tolerates very dry spells by strongly reduc-ing growth but still surviving;
• the base of the leaves is the most efficient zone for uptake of nutrients and it responds well to foliar fertilisation;
• flowering is induced by low temperatures and short days and is erratic under natural conditions. This gives rise to the most re-markable feature of cultivation—flowering induced artificially by a cropping operation.
Growers can thus—almost at will—control har-vest date and yield, as fruit weight depends on the size of the plant at the moment at which flowering is induced artificially. Fruit quality is determined primarily by sugar content and acidity, and varies considerably according to weather conditions and the fertilisation ap-plied. In simple terms, nitrogen intake deter-mines weight and potassium intake deter-mines quality. It is an extremely heterogeneous compound fruit whose base is always at a lat-er stage of development than the upper part. The pineapple is not climacteric and after har-vesting the main change in the fruit is a grad-ual loss of its qualities. This deterioration must therefore be limited in the fresh fruit packing and transport chain—fast transport and sales with no breaks in the cold chain. When the fruit is processed, this must be performed as quickly as possible.
Plant cycle
Contenu publié par l’Observatoire des Marchés du CIRAD − Toute reproduction interdite

67No. 244 October 2016
CLOSE-UP
Ethephon is widely used around the world on flow-er, grain and fruit crops. France alone has no less than 24 registered uses in fruit growth, flowering and maturation processes.
Ethephon is registered for two specific uses in pineapple growing: for triggering the flowering process (floral induction treatment) and the regu-lation of fruit ripening (degreening). In both cases, the ethylene released by the product acts on phys-iological mechanisms.
Pineapple possesses the feature of being able to flower on demand, and floral induction is general-ly performed using gaseous ethylene dissolved in water. As application is a big operation, the process is generally used only on mechanised plantations. Another method used on non-mechanised small-holdings is calcium carbide. However, this is some-what dangerous as the acetylene gas released is inflammable and even explosive if it comes into contact with copper.
The product that is easiest to use is Ethephon, even though it is less effective on varieties such as ‘Smooth Cayenne’ and MD-2, more popularly known as ‘Sweet’.
• Soil: alluvial or volcanic at an elevation of less than 600 metres. Deep soil. Good drain-age. Gentle slopes (less than 4%). As ‘Sweet’ is susceptible to Phytophthora (a fungal dis-ease), the ideal soil pH range is 5.0 to 6.5.
• Plants: 50 000 to 70 000 plants per hectare. The quality of planting stock is of funda-mental importance: genetically pure ‘Sweet’ stock with no defects (spines, diseases, etc.), of uniform size (calibrated in 100 g catego-ries), propagules must be as heavy as pos-sible to shorten the cultivation period (but not too heavy as natural flowering should be avoided) and treated with registered pesticides to prevent the spread of pests and diseases.
• Post-harvest: ‘Sweet’ is susceptible to bruising.
• Nutrition: fertiliser is applied by spray-ing every two weeks. The fertilisation pro-gramme starts after the harvest.
• Weeds: these can reduce yields and har-bour pests and diseases that attack planted fields if they are not eradicated in time.
© Agnès Delefortrie © Thierry Lescot
Ethephon Cultivation
Contenu publié par l’Observatoire des Marchés du CIRAD − Toute reproduction interdite

68 October 2016 No. 244
CLOSE-UP
When the plant reaches the appropriate stage of development it becomes sensitive to climatic factors and meteorological factors (day-length, decrease of minimum temperature and cloud cover) that determine the differentiation of the inflorescence. Natural flowering then occurs that is not compatible with the commercial manage-ment of a plantation. Floral induction treatment (FIT) consists of changing the natural cycle of the plant for the following purposes:
• homogenisation of flowering; • control of production; • control of average fruit weight; • harvest planning.
The date of FIT is determined according to: • the harvest date desired; • the FIT/harvest date interval for the peri-
od (historical or calculated from the sums of temperatures);
• plant weight (a good indicator being the weight of leaf ‘D’) that determines that of the fruit.
Three floral induction substances are used: • acetylene in calcium carbide form: grains
are placed in the centre of the floral rosette or mixed with water to make an acetylene solution;
• ethylene gas: less dangerous than acetylene, treatment with an ethylene solution can be mechanised;
• ethephon (Ethrel®): this is an ethylene gener-ator. It is much easier to use than the first two alternatives but the results are often mediocre, especially in very hot conditions.
Sun scalding
Phot
os ©
Cla
ude
Teis
son
Controlling flowering
Degreening treatment
This is performed by application of Ethrel and is to achieve homogeneous fruit colour and re-duce the number of picking operations. Ethrel releases ethylene as it breaks down. It does not have an effect on all maturation phenomena but mainly targets colour. It must be applied fairly close to natural fruit maturity in order to be effective with no major disadvantages. Fruits treated in this way are easy to recognise as their colour is not scaled from bottom to top but uniform throughout the shell.
Protection from sun scald
This seasonal phenomenon occurs above all during very sunny periods. Fruits that have lodged, whose stalks are too long or that have a deficient leaf system are those most exposed to sun scald. Several protec-tive methods can be used: tying the leaves in a bunch over the fruit or the whole crop ridge, mulching with grass, or lifting up lodged fruits.
Contenu publié par l’Observatoire des Marchés du CIRAD − Toute reproduction interdite

69No. 244 October 2016
CLOSE-UP
Note: data collected under production conditions in Martinique except for the ‘Observations’ section (source: CIRAD)
Phot
os ©
Guy
Bré
hini
er
Smooth CayenneLeaf edges: spines behind tip onlyFruit shape: cylindricalFruit colour: green & yellowFruit eye diameter: mediumFruit eye profile: slightly prominentFlesh colour: pale yellowFlesh firmness: mediumFlesh texture: smoothWeight without crown: 1 500 gHeight without crown: 148 mmDiameter: 121 mm°Brix : between 14.5 and 16.5Acidity (meq%ml): between 13.5 and 15.0Sugar/acid ratio: between 1.0 and 1.2Flesh maturity homogeneity from bottom to top: with a gradientAgronomic potential: high yield Susceptibility: susceptible to core rot, susceptible to Phytophthora, susceptible to soil pests Post-harvest potential: good, susceptible to internal browning
VictoriaLeaf edges: spines along all marginsFruit shape: trapezoidFruit colour: golden yellowFruit eye diameter: smallFruit eye profile: prominentFlesh colour: yellowFlesh firmness: mediumFlesh texture: crispWeight without crown: 1 300 gHeight without crown: 172 mmDiameter: 108 mm°Brix : 14.8Acidity (meq%ml): 10.9Sugar/acid ratio: 1.36Flesh maturity homogeneity from the bottom to the top: with a medium gradientAgronomic potential: good yield. Maturation more rapid than Smooth Cayenne (- 10 to - 15 days)Susceptibility: highly susceptible to core rot, suscepti-ble to Phytophthora, susceptible to soil pests
Post-harvest potential: highly susceptible to internal browning
Observations made on commercial plantations in Reunion: • average weight of exported fruits: 700 to 800 g • °Brix: average 13° in July-August and 18° from November to April • Free acidity (meq%ml): average 16 in July-August and 13 from
November to April • Sugar/acid ratio: average 0.8 in July-August and 1.4 from November
to April • Crown weight: 15% of total fruit weight from August to December
and 30% from March to May
SweetLeaf edges: spines occur irregularly along both marginsFruit shape: cylindricalFruit colour: green & yellowFruit eye diameter: mediumFruit eye profile: flatFlesh colour: yellowFlesh firmness: mediumFlesh texture: smoothWeight without crown: 1 400 gHeight without crown: 143 mmDiameter: 116 mm°Brix : between 12.8 and 13.7Acidity (meq%ml): between 6.15 and 10.10Sugar/acid ratio: between 1.31 and 2.11Flesh maturity homogeneity from bottom to top: homogeneousAgronomic potential: high yield. Maturation more rapid than Smooth Cayenne (- 4 to - 5 days)Susceptibility: low susceptibility to core rot, highly susceptible to Phytophthora, average susceptibility to soil pests Post-harvest potential: good, not susceptible to internal browning
Observations made on commercial plantations in Central and West Africa:
• average weight of exported fruits (size B10, B9, A8, A7, A6, A5): 1 430 g, varying from 1 150 to 1 890 g
• °Brix: min 13.4° (October), max 14.5° (January) • Free acidity (meq%ml): min 6.0 (April), max 7.7 (February) • Sugar/acid ratio: min 1.8 (February), max 2.4 (April)
‘Smooth Cayenne’ was for a long time practically the only variety exported fresh and tinned. The Hawaiian hybrid ‘MD-2’ took over its position on the fresh pineapple market, mainly as a result of its extraordinary capacity for withstanding cold and transport. The robustness of this fruit after harvesting was hitherto unknown and is opening up new prospects in the breeding of new varieties by hybridisation. Other varieties with good taste qualities are preferred on domestic markets but do not keep at all well: ‘Perola’ in Brazil and ‘Queen’ in Asia and the Indian Ocean.
Contenu publié par l’Observatoire des Marchés du CIRAD − Toute reproduction interdite

Market News Network (RNM : Réseau des Nouvelles des Marchés)real times prices
www.rnm.franceagrimer.fr
RNM / FRANCEAGRIMER
FOWARDING STAGEFruits and vegetables
Flowers
Pork
SHIPMENT OR IMPORT STAGEFruits and vegetables
Flowers
Pork
Poultry
WHOLESALE STAGEFruits and vegetables
Flowers
Pork
Poultry
Ruminants
Dairy products
Fish products
RETAIL STAGEFruits and vegetables
Flowers
Pork
Poultry
Ruminants
Dairy products
Fish products
TOTAL (excluding tax) €€
TOTAL (inclusive of tax) €€
The Market News Network (RNM) is controlled by FranceAgriMer and provides real time information about prices and economic climate concerning 500 food products at every commercialisation stages over the all French territory.
The RNM provides economic data:» Receive quotations in your e-mail box or by fax ;» Consult them on our website.
Free consultation of the data after 45 days. Recent data available under subscription
The RNM provides information about the business climate:In e-mail messages or fax:» Find our products experts comments ;
On our website:» Campaign assessment ;» Weekly economic watch ;» Conjonctural crises information.
Did you know?
Quality approach of the RNMThe RNM is certified ISO 9001 since 2006.
The RNM is committed into a continual improvement in order
to satisfy its users and subscribers and to guarantee the
relevance and the reliability of its surveys and information.
Contenu publié par l’Observatoire des Marchés du CIRAD − Toute reproduction interdite

71No. 244 October 2016
WHOLESALE MARKET PRICES IN EUROPE - SEPTEMBER 2016
Wholesale market prices in Europe
September 2016EUROPEAN UNION - EURO
Germany Belgium France Holland UKAVOCADO Air TROPICAL BRAZIL Box 14.40
DOMINICAN REP. Box 12.80Sea FUERTE PERU Box 11.00
SOUTH AFRICA Box 12.00HASS BRAZIL Box 13.97
CHILE Box 14.00 15.00 12.83 16.25KENYA Box 12.25 11.42MEXICO Box 12.83 16.25PERU Box 16.50 15.00 12.42 16.25 15.13SOUTH AFRICA Box 12.42 16.25 15.42TANZANIA Box 16.25
PINKERTON SOUTH AFRICA Box 12.75RYAN SOUTH AFRICA Box 13.00 15.50
Truck BACON SPAIN Box 11.50 14.50
BANANA Air RED ECUADOR kg 5.25SMALL COLOMBIA kg 6.90
ECUADOR kg 5.67Sea SMALL ECUADOR kg 1.85
CARAMBOLA Air BRAZIL kg 5.24MALAYSIA kg 6.67 5.31
CHAYOTE Sea COSTA RICA kg 1.63
COCONUT Sea NOT DETERMINED COTE D'IVOIRE Bag 16.00 9.00 11.67 12.80SRI LANKA Bag 8.73
YOUNG THAILAND Bag 9.75
DATE Sea BAHRI JORDAN kg 2.00DEGLET ALGERIA kg 5.20KOUAT ALIGH TUNISIA kg 1.88MEDJOOL ISRAEL kg 11.00 6.90
SOUTH AFRICA kg 9.20NOT DETERMINED ISRAEL kg 3.49GOLDEN PERU kg 4.00STONELESS TUNISIA kg 2.75
GINGER Sea BRAZIL kg 1.23CHINA kg 1.31 1.60 1.17 1.16PERU kg 2.23
GUAVA Sea BRAZIL kg 2.56
KUMQUAT Air SOUTH AFRICA kg 4.38 4.23
LIME Sea BRAZIL kg 1.89 2.59 2.90 2.35 1.55MEXICO kg 1.89 2.59 2.45 3.06
MANGO Air NOT DETERMINED MEXICO kg 4.88NAM DOK MAI THAILAND kg 11.50PALMER BRAZIL kg 4.16HADEN BRAZIL kg 4.00
Sea ATKINS BRAZIL kg 1.63 1.50 1.60KEITT BRAZIL kg 1.63 2.15
ISRAEL kg 1.82 1.82KENT ISRAEL kg 1.82
SENEGAL kg 2.25 1.06NOT DETERMINED BRAZIL kg 1.42PALMER BRAZIL kg 1.56 1.88
Truck OSTEEN SPAIN kg 2.55 2.38 2.62
Contenu publié par l’Observatoire des Marchés du CIRAD − Toute reproduction interdite

72 October 2016 No. 244
WHOLESALE MARKET PRICES IN EUROPE - SEPTEMBER 2016
These prices are based on monthly information from the Market News Service, International Trade Centre UNCTAD/WTO (ITC), Geneva. MNS - International Trade Centre, UNCTAD/WTO (ITC), Palais des Nations, 1211 Geneva 10, Switzerland — T. 41 (22) 730 01 11 / F. 41 (22) 730 09 06
Note: according to grade
EUROPEAN UNION - EUROSGermany Belgium France Holland UK
MANGOSTEEN Air THAILAND kg 8.50
MANIOC Sea COSTA RICA kg 1.45 1.39
MELON Sea CHARENTAIS BRAZIL kg 1.77CANTALOUP BRAZIL kg 1.67 1.92GALIA BRAZIL kg 1.81 1.98HONEY DEW BRAZIL kg 1.15 1.20SEEDLESS WATER BRAZIL kg 0.99WATERMELON BRAZIL kg 0.91 1.06
PAPAYA Air FORMOSA BRAZIL kg 2.86NOT DETERMINED BRAZIL kg 3.78 3.70 3.64 4.27
Sea FORMOSA BRAZIL kg 2.06
PASSION FRUIT Air NOT DETERMINED COLOMBIA kg 4.75 6.25 5.50 6.50 4.81PURPLE SOUTH AFRICA kg 6.50
VIET NAM kg 9.00ZIMBABWE kg 6.25
YELLOW COLOMBIA kg 8.08
PHYSALIS Air PREPACKED COLOMBIA kg 7.50 6.67Sea COLOMBIA kg 6.25
PINEAPPLE Air MD-2 BENIN kg 2.25VICTORIA MAURITIUS Box 14.00
REUNION kg 4.40Sea MD-2 COSTA RICA Box 11.33 12.00 12.79 13.39
COSTA RICA kg 1.30COTE D'IVOIRE kg 1.30ECUADOR Box 9.75PANAMA Box 14.67
PITAHAYA Air RED THAILAND kg 7.17VIETNAM kg 7.17
YELLOW ECUADOR kg 10.60
PLANTAIN Sea COLOMBIA kg 1.15ECUADOR kg 1.10 1.13
POMEGRANATE Air NOT DETERMINED EGYPT kg 1.80WONDERFUL CHILE kg 2.25
EGYPT kg 2.03PERU kg 1.80
EARLY RED ISRAEL kg 2.57EMEK ISRAEL kg 2.57
RAMBUTAN Air GUATEMALA kg 8.25
SWEET POTATO Sea NOT DETERMINED CHINA kg 1.22EGYPT kg 1.10 1.16SOUTH AFRICA kg 0.76
PURPLE HONDURAS kg 1.85RED/RED HONDURAS kg 1.19RED/WHITE HONDURAS kg 1.45WHITE HONDURAS kg 1.50ORANGE CHINA kg 0.92
EGYPT kg 0.97
TAMARILLO Air COLOMBIA kg 7.10
TAMARIND Air THAILAND kg 3.45
TARO Sea COSTA RICA kg 2.70
YAM Air BRAZIL kg 2.00Sea BRAZIL kg 1.00
GHANA kg 1.40 1.43
Contenu publié par l’Observatoire des Marchés du CIRAD − Toute reproduction interdite
FruiTrop magazine is specialised in the international
fresh fruits and vegetables trade. Recognised for its extremely
professional editorial line, it is a sector reference thanks to its original, amply documented
analyses.
contact: fruitrop.com or [email protected]
All the economic and technical information at a click in English and French at fruitrop.comonlineonline
A website
A magazine
ww
w.fr
uitr
op.c
om
Banana
Apr
il 20
16 -
No.
240
English edition
Avocado
magazine
magazine
Market information Every week, you can access a genuine decision-making tool, thanks to its exclusive information on the banana and avocado markets: production, exports, markets, etc.
magazineonlineonline Thema
FOCUS
understand & decide
weekly
weekly
Contenu publié par l’Observatoire des Marchés du CIRAD − Toute reproduction interdite

Contenu publié par l’Observatoire des Marchés du CIRAD − Toute reproduction interdite


![Influence of weight and type of planting material on fruit quality and its heterogeneity in pineapple [Ananas comosus (L.) Merrill]](https://static.fdokumen.com/doc/165x107/6335e40d64d291d2a302aa04/influence-of-weight-and-type-of-planting-material-on-fruit-quality-and-its-heterogeneity.jpg)