An Analysis of Developing Countries in the Pineapple Market
34
© Author(s) 2013. Licensed under the Creative Commons License - Attribution 3.0 Discussion Paper No. 2013-10 | January 31, 2013 | http://www.economics-ejournal.org/economics/discussionpapers/2013-10 Knowing Where Organic Markets Move Next – An Analysis of Developing Countries in the Pineapple Market Linda Kleemann Abstract As consumers’ demand for organic products grows, selling organic products potentially opens up profitable market participation options for farmers in developing countries. This paper studies two aspects of profitability for the producers. It uses hedonic demand theory and empirical analysis to examine the relation between conventional and organic markets using the strongly growing pineapple market as an example. This analysis confirms a nonlinear dependence of the organic market on the conventional one and a non-declining premium. The author concludes that there is a larger potential of the organic market and hence the number of farmers in developing countries who can potentially benefit from growing organic products. JEL L11 O13 Q13 Q17 Keywords Price transmission; private voluntary standards; organic agriculture; organic markets Authors Linda Kleemann, The Kiel Institute for the World Economy, Hindenburgufer 66, 24105 Kiel, Germany, [email protected] I would like to thank Alexandra Effenberger for her valuable help and input in the preparation of this paper. Citation Linda Kleemann (2013). Knowing Where Organic Markets Move Next – An Analysis of Developing Countries in the Pineapple Market. Economics Discussion Papers, No 2013-10, Kiel Institute for the World Economy. http://www.economics-ejournal.org/economics/discussionpapers/2013-10
-
Upload
khangminh22 -
Category
Documents
-
view
1 -
download
0
Transcript of An Analysis of Developing Countries in the Pineapple Market

© Author(s) 2013. Licensed under the Creative Commons License - Attribution 3.0
Discussion PaperNo. 2013-10 | January 31, 2013 | http://www.economics-ejournal.org/economics/discussionpapers/2013-10
Knowing Where Organic Markets Move Next – AnAnalysis of Developing Countries in the PineappleMarket
Linda Kleemann
AbstractAs consumers’ demand for organic products grows, selling organic products potentially opens upprofitable market participation options for farmers in developing countries. This paper studies twoaspects of profitability for the producers. It uses hedonic demand theory and empirical analysisto examine the relation between conventional and organic markets using the strongly growingpineapple market as an example. This analysis confirms a nonlinear dependence of the organicmarket on the conventional one and a non-declining premium. The author concludes that there isa larger potential of the organic market and hence the number of farmers in developing countrieswho can potentially benefit from growing organic products.
JEL L11 O13 Q13 Q17Keywords Price transmission; private voluntary standards; organic agriculture; organicmarkets
AuthorsLinda Kleemann, The Kiel Institute for the World Economy, Hindenburgufer 66, 24105 Kiel,Germany, [email protected] would like to thank Alexandra Effenberger for her valuable help and input in the preparation of this paper.
Citation Linda Kleemann (2013). Knowing Where Organic Markets Move Next – An Analysis of DevelopingCountries in the Pineapple Market. Economics Discussion Papers, No 2013-10, Kiel Institute for the World Economy.http://www.economics-ejournal.org/economics/discussionpapers/2013-10
2
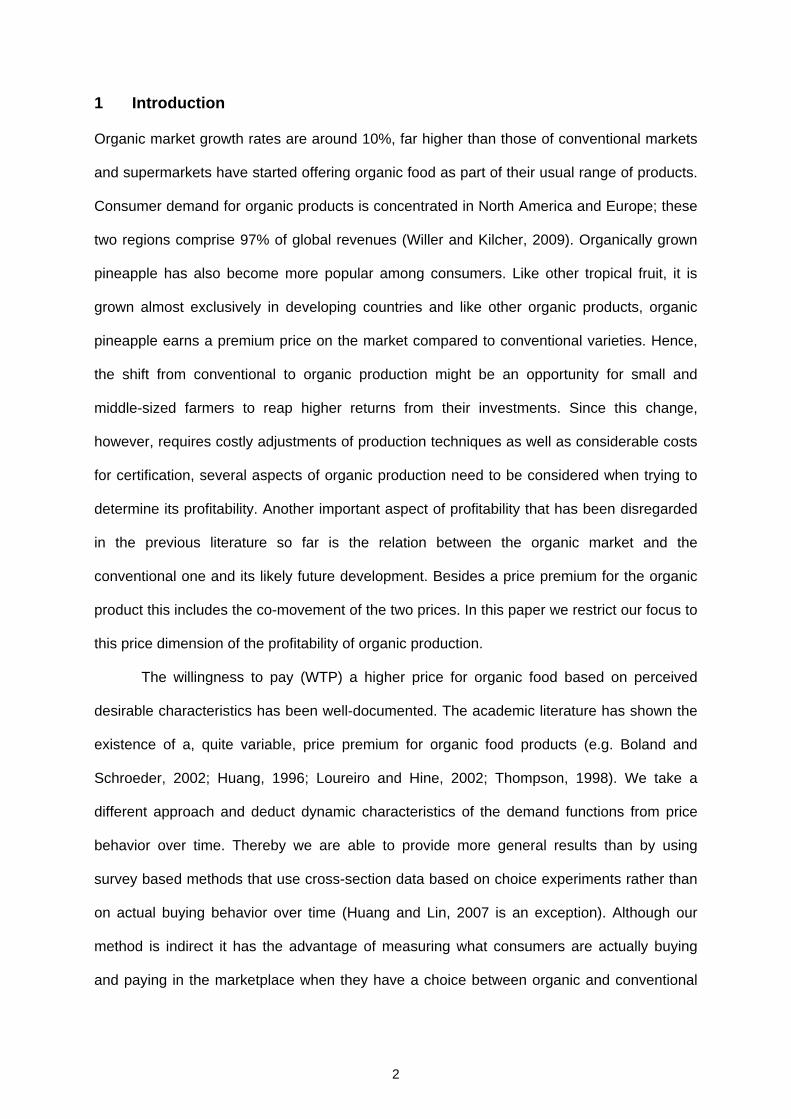
1 Introduction
Organic market growth rates are around 10%, far higher than those of conventional markets
and supermarkets have started offering organic food as part of their usual range of products.
Consumer demand for organic products is concentrated in North America and Europe; these
two regions comprise 97% of global revenues (Willer and Kilcher, 2009). Organically grown
pineapple has also become more popular among consumers. Like other tropical fruit, it is
grown almost exclusively in developing countries and like other organic products, organic
pineapple earns a premium price on the market compared to conventional varieties. Hence,
the shift from conventional to organic production might be an opportunity for small and
middle-sized farmers to reap higher returns from their investments. Since this change,
however, requires costly adjustments of production techniques as well as considerable costs
for certification, several aspects of organic production need to be considered when trying to
determine its profitability. Another important aspect of profitability that has been disregarded
in the previous literature so far is the relation between the organic market and the
conventional one and its likely future development. Besides a price premium for the organic
product this includes the co-movement of the two prices. In this paper we restrict our focus to
this price dimension of the profitability of organic production.
The willingness to pay (WTP) a higher price for organic food based on perceived
desirable characteristics has been well-documented. The academic literature has shown the
existence of a, quite variable, price premium for organic food products (e.g. Boland and
Schroeder, 2002; Huang, 1996; Loureiro and Hine, 2002; Thompson, 1998). We take a
different approach and deduct dynamic characteristics of the demand functions from price
behavior over time. Thereby we are able to provide more general results than by using
survey based methods that use cross-section data based on choice experiments rather than
on actual buying behavior over time (Huang and Lin, 2007 is an exception). Although our
method is indirect it has the advantage of measuring what consumers are actually buying
and paying in the marketplace when they have a choice between organic and conventional

3
produce. Despite its importance for the further promotion of organic certification in
developing countries, this has not been studied before.
Applying state of the art time series methods, we analyze spatial price transmission
between conventional and organic pineapple on the European market by looking at prices for
pineapple from Africa and Latin America respectively. Our observations not only confirm the
existence of a non-declining price premium for organic products, the analysis also shows that
the conventional market seems to act as a price leader for the organic market while being
unaffected by organic price behavior. However, organic prices do not follow conventional
prices one by one. Our results show the existence of lags and thresholds below which
organic prices are unaffected by conventional price changes. These thresholds and the
corresponding price adjustment behavior do not change over time, even while the organic
niche market expands. Theoretically, this observation can be explained when the core
demand for organic products expands faster than supply. Hence, one important implication of
our analysis is the potential for the scalability of the organic market.
The rest of this paper is organized as follows. First, an introduction to the market for
pineapple is given. Then, a theoretical background for the study is presented. Afterwards, the
price data for conventional and organic pineapple is described and spatial price transmission
between the organic and conventional markets is analyzed using time series techniques
such as co-integration and vector error correction models. The paper ends with a conclusion.
2 The Market for Pineapple
Pineapple is well suited for this analysis because it is a relatively homogeneous good,
compared to, for instance coffee, where a lot of different varieties and quality grades prevail.
This homogeneity is relevant in trade and exists because it is difficult to control for quality of
single pineapple at low transaction costs. In the definition of Nelson (1970) pineapple can be
seen as an experience good.
The world market for fresh and dried pineapple1 is dominated by one variety (although
this variety may change from time to time) and kilogram prices are relatively uniform across

4
fruit sizes and qualities. In addition, the fresh pineapple market has been recording
exceptional growth rates: the European market for fresh and dried pineapple has grown on
average by 19% between 2003 and 2007 (FruiTrop, 2008)2, where world pineapple
production totals nearly 16 million metric tons. In 2007, the main consumers of fresh
pineapples were the US (2.5 kg per capita per year), followed by the EU (2.1 kg per capita
per year) and Japan (1.3 kg per capita per year) (FruiTrop, 2008). Measured by volume and
value of net imports, the European Union (EU 27) is the world’s largest consumer. Fresh
pineapple in Europe comes mainly from Latin America (around 80%) and Africa (10 - 15%,
Figure A.3.1). The market in the United States is completely dominated by Latin American
pineapple, complemented by some domestic production. In order to study the price
developments of pineapple produced in various world regions, we have therefore chosen the
European market as a case study.
Africa had been Europe's major supplier of fresh pineapples until it was replaced by
Central America. Up to the late 1990s, the EU market was dominated by pineapples from
West Africa, especially from Côte d’Ivoire. Costa Rica, which was almost absent from the
world market in the late 1980s, is now by far the largest fresh pineapple exporter to Europe
and North America. Whereas in 2000, with 24%, Costa Rica held a lower market share in
Europe than Côte d’Ivoire with 29%, its share of the European market for fresh pineapple has
grown from 44% in 2003 to 73% in 2009 (Figure A.3.1). Exports from Côte d’Ivoire have
meanwhile developed the opposite way. Being the European market leader in the 1970s,
Côte d’Ivoire’s market share has been constantly declining since then and was around 6% in
2009 (Figure A.3.1). Ghana is the second largest African pineapple exporter to Europe after
Côte d’Ivoire and is expected to increase its market share.
The rise of Costa Rica as a market leader for fresh pineapple in Europe is strongly
linked to a new pineapple variety called MD2 that was introduced by the company Fresh Del
Monte Produce in 1996. This variety, grown exclusively in Latin America at that time, rapidly
took over the US market. The success of MD2 has been explained by a combination of the
characteristics of this variety and commercial strategy (for example Fold and Gough, 2008).
5
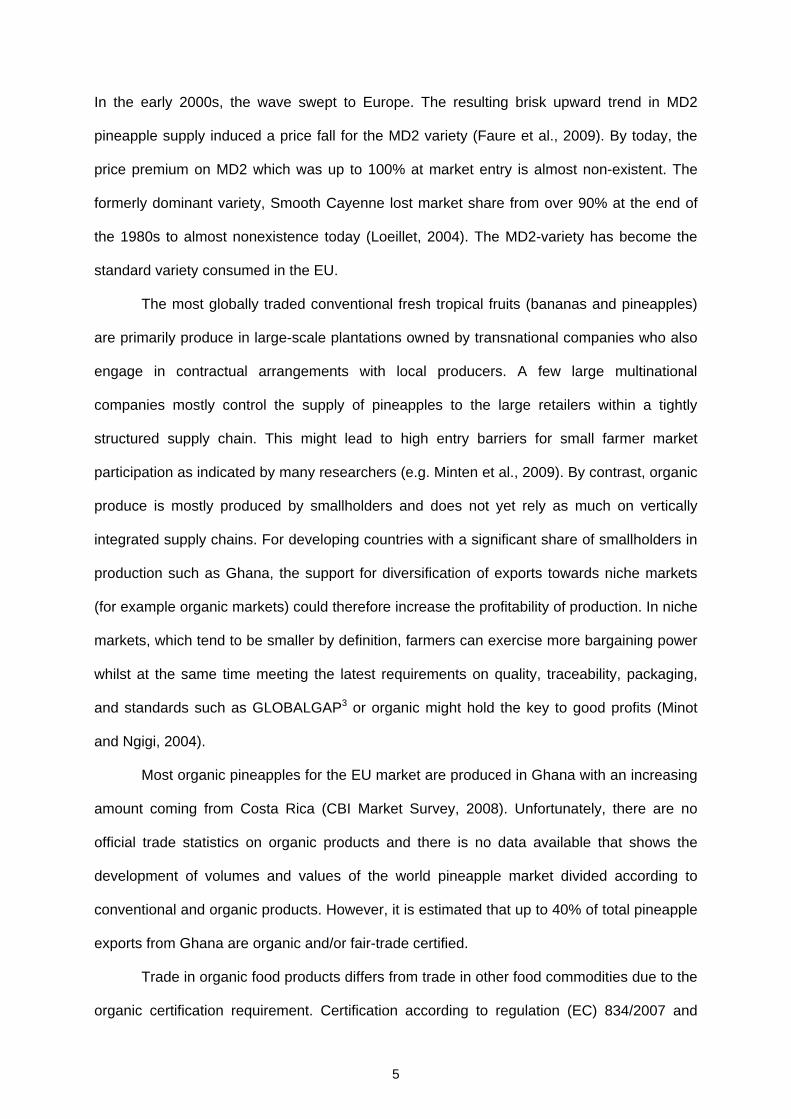
In the early 2000s, the wave swept to Europe. The resulting brisk upward trend in MD2
pineapple supply induced a price fall for the MD2 variety (Faure et al., 2009). By today, the
price premium on MD2 which was up to 100% at market entry is almost non-existent. The
formerly dominant variety, Smooth Cayenne lost market share from over 90% at the end of
the 1980s to almost nonexistence today (Loeillet, 2004). The MD2-variety has become the
standard variety consumed in the EU.
The most globally traded conventional fresh tropical fruits (bananas and pineapples)
are primarily produce in large-scale plantations owned by transnational companies who also
engage in contractual arrangements with local producers. A few large multinational
companies mostly control the supply of pineapples to the large retailers within a tightly
structured supply chain. This might lead to high entry barriers for small farmer market
participation as indicated by many researchers (e.g. Minten et al., 2009). By contrast, organic
produce is mostly produced by smallholders and does not yet rely as much on vertically
integrated supply chains. For developing countries with a significant share of smallholders in
production such as Ghana, the support for diversification of exports towards niche markets
(for example organic markets) could therefore increase the profitability of production. In niche
markets, which tend to be smaller by definition, farmers can exercise more bargaining power
whilst at the same time meeting the latest requirements on quality, traceability, packaging,
and standards such as GLOBALGAP3 or organic might hold the key to good profits (Minot
and Ngigi, 2004).
Most organic pineapples for the EU market are produced in Ghana with an increasing
amount coming from Costa Rica (CBI Market Survey, 2008). Unfortunately, there are no
official trade statistics on organic products and there is no data available that shows the
development of volumes and values of the world pineapple market divided according to
conventional and organic products. However, it is estimated that up to 40% of total pineapple
exports from Ghana are organic and/or fair-trade certified.
Trade in organic food products differs from trade in other food commodities due to the
organic certification requirement. Certification according to regulation (EC) 834/2007 and

6
(EC) 889/2008 is a prerequisite for any producer wishing to export organic produce to the
European market. Organic certification requires producers to adopt certain environmental
standards, most importantly to refrain from using synthetic inputs. The rapid growth of the
organic food sector with an average growth rate of 13% between 2002 and 2006 creates
niche market opportunities. The market value was estimated at US$46 billion in 2007 (double
the value of 2000), and is expected to increase to US$67 billion by 2012 (UNCTAD, 2008;
Willer et al., 2008). In the EU, it is now estimated between 2.5 and 4.5% of total food sales.
For organic pineapples market growth has been even larger. It is assumed that the
permission to use ethylene for flower induction in organic production in 2005 played an
important role in the high growth rates in the organic pineapple market. Taken as a whole,
Europe is the largest market for organic products, and although available data is very
imprecise and often out-dated, it is assumed that this holds also for the organic pineapple
market. According to estimations by the Sustainable Markets Intelligence Centre (CIMS), the
European market for organic pineapple was about five times the size of the US market in
20044.
However, not only the growing demand makes organic cultivation attractive for
producers. Some studies explain the growing interest in organic agriculture in developing
countries also by the fact that it requires less financial input and places more reliance on the
natural and human resources available (Willer et al., 2008 amongst others). Hence, it is
worthwhile to analyse if switching from conventional to organic production might indeed
result in higher profits for farmers. As a starting point, integration of the two markets is
evaluated by looking at the price developments for organic compared to conventional
pineapple.
3 Theoretical Background
Consumers who buy organic products do so because of their perceived superior attributes.
Hedonic demand theory can help to formalize the relation between conventional and organic
prices in order to provide an analytical framework for the interpretation of empirical results.

7
The hedonic approach disaggregates commodities into characteristics and estimates implicit
values for units of the characteristics. The hedonic price function specifies how the
market price ( of the commodity varies as its characteristics (z) vary (Ladd and Suvannunt,
1976). The simple assumption behind this theory is that utility is derived from the properties
or characteristics of goods. We focus on one attribute of interest only, the organic nature of a
product which is assumed to be otherwise homogeneous.
Standard maximization of a consumers’ utility function U(z, x; ) subject to a budget
constraint, where x is the commodity, and is a vector of parameters characterizing the
individual consumer, gives rise to a vector of demand functions for the characteristics of the
good:
, ;, ;
, ; (3.1)
denotes the vector of first derivatives of a hedonic price function with respect to its
arguments, i.e. the vector of implicit prices of each property. If the distribution of and z is
known, then the hedonic price function can also be written as a function of these arguments,
and hence the price function depends on the parameters that characterize the distribution of
preferences and supply (Epple, 1987)5.
Our case is a simple hedonic model, where the number of characteristics is fixed and
z has only two values; let z = 1 if a product is organic and z = 0 otherwise. We add a time
dimension in which the price when z=1 in time t depends on past prices of the good in both
states (organic and conventional) and other hedonic characteristics of the good. We assume
that the other hedonic characteristics are time invariant. Hence if organic pineapple is on
average yellower from the outside in time t=1, we assume that this is also the case in all
other periods. In addition, if information is imperfect, rational consumers gather information
about a characteristic if the marginal cost of obtaining the information is smaller than or equal
to the marginal utility it generates (Combris et al., 1997). For most consumers, it is not easy
to judge the taste from the outside of a pineapple. Accordingly consumers may decide to
make their choice primarily on the basis of the easily accessible characteristics, for instance
size and certification status. This limits the number of relevant characteristics. Hence, if the

8
status of z is valuable and easy to assess, ignoring other product characteristics may not be
a problem. These simplifications make it easier to estimate the value of the organic attribute,
which can then be approximated by the price difference between organic and conventional
pineapple. Furthermore, we ignore the household budget constraint because, by focusing on
the organic pineapple price premium, we touch such a tiny part of the overall household
budget that we can safely assume the constraint to be non-binding. Hence, we refer to the
case in which households have identical incomes and characteristics, and different tastes.
We do not estimate a (reduced form) hedonic model, but use it to understand the
empirical results from the estimation of the dynamic relationship between the conventional
and organic prices. For this purpose we derive a number of hypotheses from the above
described hedonic price theory that can be investigated with our price transmission analysis.
Hypothesis 1: The organic price moves along with the conventional price, but with a lag.
This phenomenon can be explained with imperfect information. In Rosen's original
framework, consumers and producers make their decisions on the basis of perfect
information. This assumption is in reality often not met. In our simple example the consumer
might not observe the prices for z=1 and z=0 at the same time and might consider it too
costly to look for the reference product in another shop as long as the price stays within a
certain range that is perceived as “normal”. On the other side, assuming that the wholesaler
estimates the size of the WTP for an organic premium, he will use the conventional prices as
reference. But he might only have knowledge about yesterday’s pineapple prices not about
pineapple sold at the same time. FOB (free on board) prices may also be pre-fixed with the
supplier for a certain shipload (which takes between 10 and 15 days). These two
considerations would lead to lags in the dynamic relationship between the observed prices.
Hypothesis 2: Cross-price elasticities are low within a certain range of price changes, and
high when crossing a certain threshold.
This can be represented by two related demand curves that are connected by cross-price
elasticities. Imagine the price for the good where z=0 falls, while the price stays constant for

9
z=1. Then we assume that there is a tolerance range in which consumers do not react to this
price change. This range exists due to imperfect information about the price difference
between the two regimes and sluggish demand response which can be explained by habits.
Since pineapple is a perishable non-staple food product, small price ranges will not switch,
postpone or anticipate buying decisions. This causes low cross-price elasticities within this
tolerance range of price changes and considerably higher ones when crossing the tolerance
threshold. This threshold cannot be expected to be the same for all consumers, but again
falls within a certain range, and hence a (fuzzy) jump in the elasticity is expected. Because
markets for perishable products have to adjust fast to changes, this hypothesis should be
reflected in prices changes.
Hypothesis 3: The organic premium and hence the WTP for organic products depends on
the relative size of the two markets in a non-linear way.
When the organic market is expanding at a different speed than the conventional market, the
premium is likely not constant over time. The demand curves shift with changing consumer
preferences. The supply curves move to the right as more farmers start to produce
pineapple, and the movements of the curves are interrelated, but not perfectly collinear.
Changes in preferences affect both demand curves, but the size and timing of the effect may
differ. We expect the demand for organic pineapple to shift faster than the demand for
conventional pineapple, since the former market is in an earlier stage of the product life
cycle. This may trigger several countervailing effects.
On the one hand, the WTP for the organic attribute may decrease when the size
difference between the two markets decreases. This would be in line with observations in
marketing research, that the price difference between a standard product and a specialty
product decreases when the latter becomes less rare, and therefore less special. This also
makes sense when we separate the hedonic demand into consumer groups with different
marginal monetary values of the organic characteristic (Ladd and Suvannunt, 1976) and
assume that the relative WTP between groups is constant. The first consumer group that
buys organic products is the one with the highest WTP, the second group has the second
10
highest WTP, and so on. When the market grows beyond the core market (the first consumer
group), it can do so only by expanding into consumer groups with lower WTP for organic.
Hence, as the organic pineapple market expands, prices for organic pineapple might drop.
On the supply side economies of scale in production, transport (which are included
and comprise up to 50% of import prices), distribution and marketing could also lead to
decreasing premia due to decreasing costs that affect the supply curve.
On the other hand, if consumer preferences for organic expand fast enough, they
might absorb the increasing supply. When the core market for the organic attribute increases
against an inelastic short run supply, the premium rises. In the longer run more producers
can start producing organically and the premium will be adjusted downwards. Since
conversion to organic takes several years, where preferences can change very rapidly, shifts
in the supply curve occur much slower than they may in the demand curve.6
In sum, we can derive information about the hedonic demand forces at work by
studying the transmission between organic and conventional prices over time. The
interaction between demand and supply for the organic attribute will determine the
development of the organic relative to the conventional price. We have described three
different effects: lagged response, a threshold effect, and demand and supply shifts.
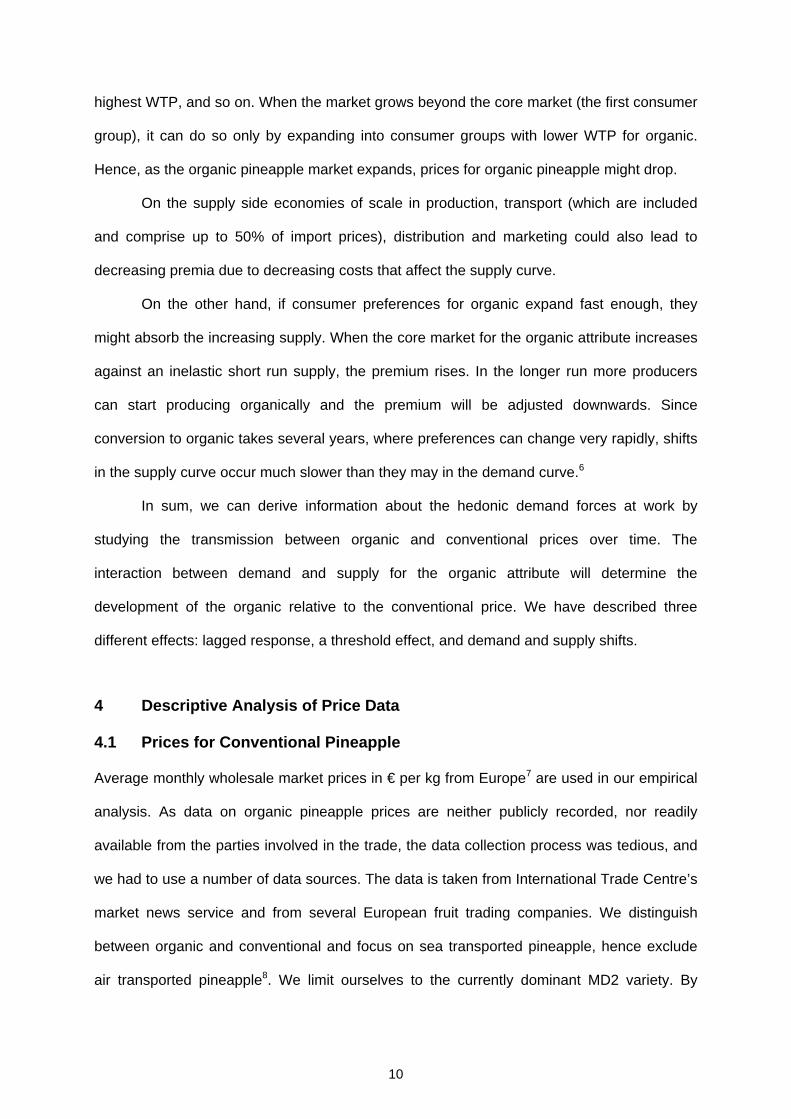
4 Descriptive Analysis of Price Data
4.1 Prices for Conventional Pineapple
Average monthly wholesale market prices in € per kg from Europe7 are used in our empirical
analysis. As data on organic pineapple prices are neither publicly recorded, nor readily
available from the parties involved in the trade, the data collection process was tedious, and
we had to use a number of data sources. The data is taken from International Trade Centre’s
market news service and from several European fruit trading companies. We distinguish
between organic and conventional and focus on sea transported pineapple, hence exclude
air transported pineapple8. We limit ourselves to the currently dominant MD2 variety. By

11
doing so, we deliberately exclude a number of hedonic characteristics (such as the variety)
that might otherwise bias our results.
The data could be obtained from the two dominant regions of origin for fresh and
dried pineapple in Europe, Latin America (in our dataset - as in reality - mainly Costa Rica
and less dominant Ecuador) and West Africa (Côte d’Ivoire, Ghana and Togo). Due to severe
gaps in the data for single destination countries, the monthly prices for conventional
pineapple were averaged over all destination countries for each of the two regions of origin.
Through this averaging, a conventional time series over the period January 2001 to July
2011 could be obtained. The data for organic pineapple prices covers the period September
2007 to August 2011. In this section, the time series for organic and conventional prices is
analyzed using descriptive and graphical methods separately and jointly. Whenever we
examine both prices jointly, we restrict ourselves to the shorter period (2007 – 2011).
Nevertheless showing the longer time series for conventional pineapple allows us to explain
some general trends.
The evolution of prices over the last 10 years for conventional pineapple from the
three sample countries is shown in Figures 3.1-3.3. There is a general trend towards lower
pineapple prices observed in the market. The widening gap between volumes and values of
EU pineapple imports in Figure 3.1 makes the fall in prices in general for pineapple clear.
Whereas the volume of pineapple imports has more than doubled since 2003, the value of
pineapple imports has increased only by about 50%.
We then look at the prices in more detail. Figure 3.2 shows the evolution of prices
over the last 10 years for conventional pineapple from the two major origins. The graph,
which includes only sea-freight MD2 pineapple, shows clearly the strong downward trend in
its price until 20059. The price development for both regions of origin is similar. However, up
to 2007 the price for African pineapple was consistently lower than for Latin American
pineapple. According to information obtained through interviews with experts in Europe in
September 2009 and Ghanaian producers, this fact is attributed this to the initial difficulties

12
with the cultivation, and thus the quality, of the MD2 variety in West Africa. In addition, Costa
Rica had a first mover advantage.
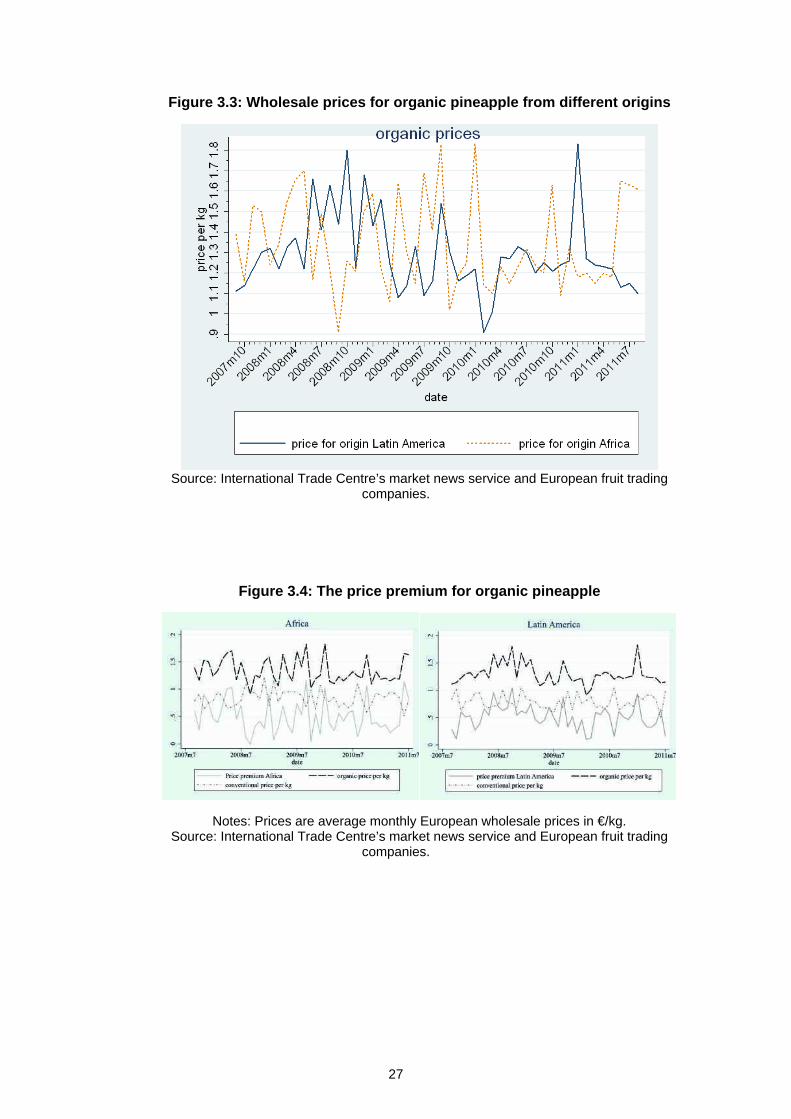
Figure 3.3 shows the development of organic pineapple prices. The graph right of the
vertical line in Figure 3.2 corresponds to the period that organic pineapple data was available
data for. During this period the price for conventional pineapple stabilized around a mean of
0.83 (0.15) €/kg for African and 0.79 (0.13) for Latin American pineapple and 1.34 (0.23) €/kg
for African organic and 1.29 (0.19) for Latin American organic pineapple. Standard deviations
are in parenthesis and the differences between the origins are not statistically significant.
There are seasonal fluctuations in pineapple prices with usually low prices early in the year
and in (European) summer and high prices around Christmas and Easter.
4.2 Organic Premia
Organic certification is a value-addition method. In fact, organic products are usually sold at
significantly higher prices than conventional products. According to CBI (2008) organic
products generally fetch price premia of between 15 and 25% and numerous scientific
studies have also shown the existence of price premiums for organic products (e.g. Teisl et
al., 2002; Nimon and Beghin, 1999; Bjorner et al., 2004).
With regard to the potential benefits of organic farming for producers, an important
question is if such price premia can be sustained in the long run or if they will vanish, as in
the case of the MD2 variety. The recent developments in typical agricultural commodities like
wheat or milk show that the price premium for organic products seems to be relatively
constant10. Whether this is a temporary development or a long-term trend depends on
changes in supply characteristics and in consumers’ perception about the value added by the
organic certification label (hypothesis 3).
The data shows that, for the period from September 2007 to July 2011, price premia
have fluctuated between €0.14 and €1.02 with mean (standard deviation) of €0.51 (0.20)
respectively on average (Figure 3.4)11. A declining trend cannot be observed over this period.
This might tell us which forces are at work with respect to hypothesis 312. The comparison of

13
the price behavior in Figure 3.4 also shows that the premium is far from stable over the
observed time period. Obviously the two curves are interdependent. In this context we should
take note of a particularity of the pineapple market. The supply of conventional pineapple is
highly dependent on harvests in Latin America, especially in Costa Rica (see section 2
above), whereas organic pineapples are reported to come from a variety of source countries.
Hence, for instance weather conditions or new plant diseases in Latin America would
influence the two markets differently. This is unobservable without information about such
supply shocks. However apart from this, there are potentially market inherent explanations
for these fluctuations, which will be studied in the next section, the econometric study of price
transmission.
5 Econometric Analysis of Spatial Price Transmission
The notion of price transmission is used in different contexts in the literature. First of all,
some authors test for price transmission within the value chain of a product. For example, it
is analyzed if the world market price of a commodity is transmitted to domestic producers.
Other authors are interested in the difference of prices between different markets within one
country, the so-called spatial price transmission. In this paper however, we study spatial
price transmission between the markets for organic and conventional pineapple from Latin
America and Africa in the European market. We do not use panel data methods, since there
are only two regions for which data are available, which can arguably be hardly called a
panel. As a result there is no information loss from analyzing the two regions separately.
We test the hypothesis that prices in the organic market are dependent on prices in
the conventional market due to its dominance in size (hypothesis 1). Secondly, we analyze if
small and large price changes have different effects on the respective other price (hypothesis
2). Finally, we explore if such a possible integration between the two markets decreases or
increases over time as a result of the growth of the organic market and possible supply and
demand shifts (hypothesis 3).
14
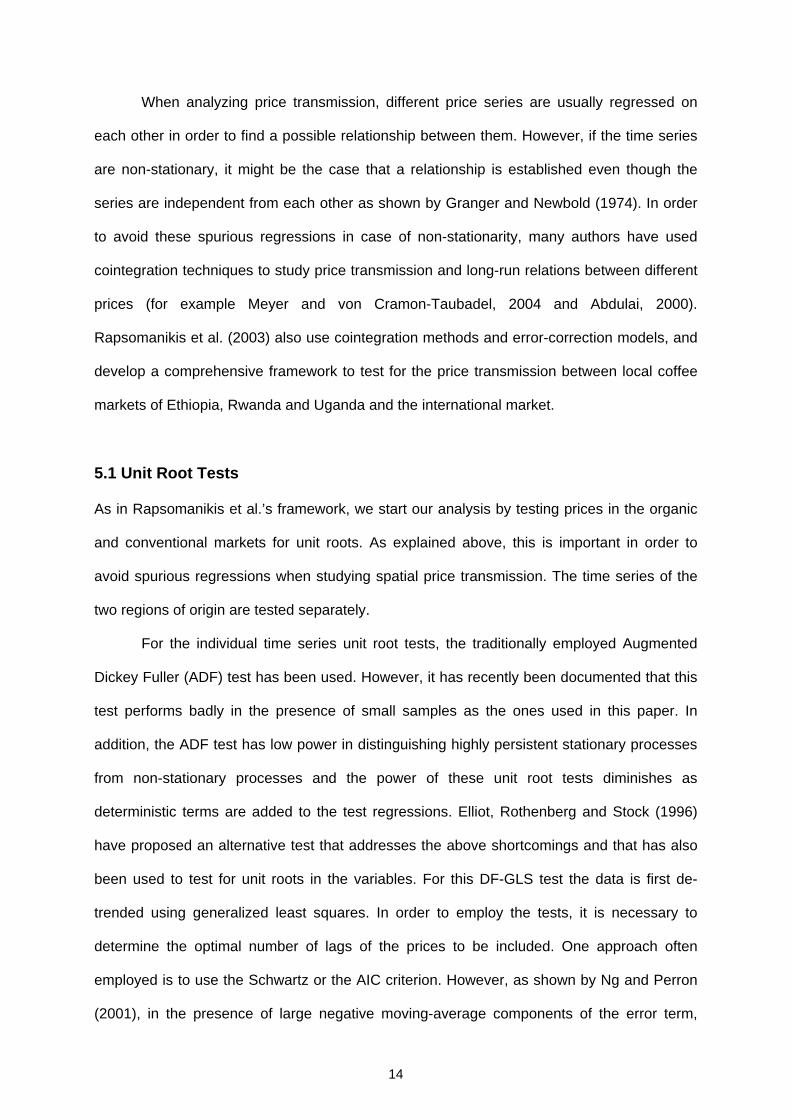
When analyzing price transmission, different price series are usually regressed on
each other in order to find a possible relationship between them. However, if the time series
are non-stationary, it might be the case that a relationship is established even though the
series are independent from each other as shown by Granger and Newbold (1974). In order
to avoid these spurious regressions in case of non-stationarity, many authors have used
cointegration techniques to study price transmission and long-run relations between different
prices (for example Meyer and von Cramon-Taubadel, 2004 and Abdulai, 2000).
Rapsomanikis et al. (2003) also use cointegration methods and error-correction models, and
develop a comprehensive framework to test for the price transmission between local coffee
markets of Ethiopia, Rwanda and Uganda and the international market.
5.1 Unit Root Tests
As in Rapsomanikis et al.’s framework, we start our analysis by testing prices in the organic
and conventional markets for unit roots. As explained above, this is important in order to
avoid spurious regressions when studying spatial price transmission. The time series of the
two regions of origin are tested separately.
For the individual time series unit root tests, the traditionally employed Augmented
Dickey Fuller (ADF) test has been used. However, it has recently been documented that this
test performs badly in the presence of small samples as the ones used in this paper. In
addition, the ADF test has low power in distinguishing highly persistent stationary processes
from non-stationary processes and the power of these unit root tests diminishes as
deterministic terms are added to the test regressions. Elliot, Rothenberg and Stock (1996)
have proposed an alternative test that addresses the above shortcomings and that has also
been used to test for unit roots in the variables. For this DF-GLS test the data is first de-
trended using generalized least squares. In order to employ the tests, it is necessary to
determine the optimal number of lags of the prices to be included. One approach often
employed is to use the Schwartz or the AIC criterion. However, as shown by Ng and Perron
(2001), in the presence of large negative moving-average components of the error term,

15
these information criteria usually choose a lag length that is too short. This in turn leads to
size distortions and hence overrejection of the null hypothesis. Ng and Perron (2001)
propose a modified version of the AIC (MAIC) that improves on these problems. In the
analysis below both the Schwartz criterion as well as the MAIC are employed.
As is visible from Tables A.3.1 and A.3.2, the time series for the prices of
conventional pineapple from Latin America are clearly I(1). This is largely supported by both
the standard ADF test as well as the modified DF-GLS test. For African conventional
pineapple the case is less clear. Only when using the MAIC criterion for lag length selection
the time series might be I(1), but the results of the tests point generally toward stationarity13.
The unit root test results for organic prices are similar but clearer. Latin American
pineapple prices have one unit root and African pineapple prices seem to be stationary.
Hence, we test Latin American pineapple for cointegration next. Since African pineapple
prices are presumably stationary there is no need to test for cointegration.
5.2 Analysis of Cointegration and Price Dynamics between Markets
Since both Latin American price series are integrated of order one we test for cointegration. If
the linear combination of the two time series is stationary, it would describe the long-run
relation between the two variables. The number of cointegrating vectors in the system is
determined using the Johansen test. We consider the cases without a constant or trend and
with a constant in the cointegrating relationship because the series do not exhibit an
apparent trend when plotted in levels (over the period 2007 to 2011, see Figure 3.4). The
results are illustrated in Table A.3.5. There is clearly one cointegrating vector. We then test
for granger causality. Table A.3.6 shows that Latin American conventional prices granger
cause organic prices, that is lags of conventional prices improve the forecast of organic
prices but not vice versa. We expected the conventional market to act as a leader due to its
dominance in size; hence this result confirms our a priori expectations. The results on
cointegration mean that there exists a long-run relation between the conventional and

16
organic Latin American pineapple prices and a linear combination of the two prices that is
stationary.
For African pineapple prices, since they are stationary, we do not test for
cointegration. Even though we would be able to analyze the data on African pineapple in
levels, for reasons of comparability we use the same models as for Latin American
pineapple.
Let p = (pc po) where pc and po are the conventional and organic prices respectively.
Then there exists β such that βp is stationary. Then, the long-run relation between the two
prices has to be taken into account by a cointegrated version of the VAR. Therefore, the
following vector error correction model (VEC) has been applied in our analysis:
(3.2)
∆ is the difference operator, c indicates a constant, pct-i and pot-i indicate the ith lag of pct, and
pot, i describes the short-run relation among pt and the ith lag, and =β, where β is the
cointegrating vector defined above and measures the speed of adjustment of the two
prices to deviations from their long-run relation. All variables are transformed into natural
logarithms. In order to employ this approach, the optimal lag length for the differenced price
vector has to be determined. Akaike and Schwarz’s Bayesian and Hannan and Quinn
information criteria were used to determine the optimal number of lags to include in the
cointegrated VAR. All of them suggested that estimating the model by using one lag was
optimal. Therefore, the model above with only one lag has been estimated. Results are
reported in Table 3.1. The cointegration equation for Latin American prices is given by:
co pp 089.0273.0 (3.3)
This represents the long-run relation between the two Latin American prices.
Estimating the VEC model indicates that a price increase in the conventional market, which
generates a deviation from this long-run relation between the two prices, generates a price
increase in the organic market, whereas an equivalent price increase in the organic market
tot
ct
iot
ict
i iot
ct up
p
p
pc
p
p
1
1

17
produces no significant change in the price for conventional pineapple. We see asymmetric
transmission of price changes between the two markets in the sense that organic prices do
not respond in the same way to changes in conventional prices as conventional prices to
changes in organic prices14.
Considering the short-run dynamics, 1 cp has significant effects on both cp
and
op. The cross-price elasticity of current organic prices with respect to lagged conventional
prices is 0.36 for Latin America and 0.38 for Africa (i.e. a one percentage change in
conventional prices changes organic prices by 0.38%). This effect is larger than the effect of
the organic price AR term (0.28 in Africa, not significant in Latin America). The highest and
most significant effect is of lagged on current conventional prices. On the other hand, lagged
organic prices do not have a significant effect on conventional prices. Hence, both the
adjustments to deviations from the long-run equilibrium as well as the short-run adjustments
suggest that organic prices are strongly influenced by conventional price movements,
whereas this is not true in the opposite direction. This confirms our hypothesis 1 that the
conventional market acts as a price leader for the organic one.
Although our results suggest that organic prices follow prices in the conventional
market, there is no reason to believe that this relation is linear. Niche markets might change
at a different speed than the main market for various reasons (see hypothesis 3). Hence, the
following section investigates the possibility of a non-linear relation with a threshold
autoregressive (TAR) model and thereby tests hypotheses 2 and 3.
5.3 Testing for Nonlinear Price Dynamics between Conventional and Organic
Markets
Previous studies explained non-linearities by transaction costs of spatially separated markets
for the same good (e.g. Baulch, 1997; Fafchamps, 1992; Sexton et al., 1991). Unlike in these
studies, in our example transaction costs are not the result of costs and risks associated with
trade between such separated markets and the speed of adjustment is not necessarily
dependent on the traders’ access to market information. At the wholesale level information
about prices in conventional markets is readily available. And we have found out that organic

18
prices follow the price in the main market (that is the conventional market) and not vice
versa.
In our case, thresholds may exist when consumers see conventional and organic
pineapple as two different products. This may happen when there is a physical separation -
still a considerable part of organic pineapple is traded by way of organic specialty markets as
opposed to mainstream food multinationals - or when marketing and branding efforts of
companies are successful. A threshold also exists due to the switching behavior of
consumers: when the price difference between the organic and the conventional pineapple
increases beyond the willingness to pay for an organic pineapple, then the consumer may
switch and buy a conventional pineapple instead, and vice versa.
The organic premium is not constant over time (Figure 3.2). If hypothesis 2 is correct,
it is possible that due to a certain willingness to pay for organic products relative to
conventional goods, organic prices only respond to movements in conventional prices when
the difference between these two prices exceeds a certain threshold. On the supply side,
both thresholds and non-immediate adjustment can be caused by differences in competitive
structures: a small number of fiercely competing food multinationals in the conventional
market versus a larger number of smaller competitors and limited possibilities consumers to
compare prices in the niche market. In addition, if conventional prices vary as a result of
changing supply conditions from Costa Rica, organic prices might not adjust or not as much.
The possibility of a threshold would in this case be owed to menu costs and competitive
structures.
In addition, the size of thresholds themselves may vary over time with the relative
WTP of consumers for organic over conventional products. As stated in hypothesis 3, the
threshold may vary when cross-price elasticities change over time.
In this paper, we follow the analysis by Van Campenhout (2007) who uses a
threshold autoregressive model to test for integration of several Tanzanian maize markets
over time. As explained by the author, the threshold autoregressive (TAR) model can be
preferred over a parity bounds model (PBM) because the TAR model allows separating the

19
two market components of transaction costs and speed of adjustment of prices. Moreover, it
allows for time-varying thresholds. To analyze possible non-linearities in the relation between
organic and conventional prices, we estimate the following TAR model:
out mt-1 + t mt-1 > θ
∆mt = in mt-1 + t - θ ≤ mt-1 ≤ θ
out mt-1 + t mt-1 < -θ
(3.4)
where mt = pc,t – po,t is the difference between the conventional and the organic price
in period t, t ~ N (0, ²). in and out measure the adjustment speed, the change in the price
difference as result of the previous difference itself, within the band created by the threshold
θ and outside this band respectively. If the hypothesis of a threshold was wrong, these two
parameters should be the same.
It is possible that the threshold is not constant but changing over time. To incorporate
this possibility, the threshold θ can be modeled as a function of time:
(3.5)
where t ϵ (0,T).
In addition, we will allow for a time trend in the adjustment parameters in and out.
These two extensions can be expressed by the following second model:
out mt-1 + ´out t mt-1 + t mt-1 > θt
∆mt = in mt-1 + ´in t mt-1 + t - θt ≤ mt-1 ≤ θt
out mt-1 + ´out t mt-1 + t mt-1 < -θt
(3.6)
To estimate these two models, the data was converted into first differences. Data in
this form was stationary for all the time series. To determine the threshold parameters θ, θo
and θT, a grid search over all possible values has been performed. Furthermore, according to
tT
tt
)( 00

20
the hypothesis that prices only respond if the difference between them is large enough, in is
set to zero in the analysis.
The results are shown in Table 3.2. The threshold is at 63% (Latin America) and 53%
(Africa) of the average differenced price in the simple TAR model, confirming hypothesis 2.
This number is quite high, but one should remember that the price changes are rather small
compared to the absolute value of the price. When including time trends, thresholds for Latin
American pineapple stay the same and thresholds for African pineapple increase from 46%
to 61%. On the other hand, above the thresholds, adjustment speeds (ρ) are almost
unaffected by the inclusion of a trend and the coefficients that measure the interaction
between adjustment and time are not statistically significantly different from zero. The
adjustment speeds in the model without time trends outside the band formed by theta are -
0.335 (Latin America) and -0.479 (Africa), which imply a half-life of 1-2 months. In the model
with time trends the adjustment speeds outside the band are -0.365 (Latin America) and -
0.350 (Africa), which imply a half-life of 1.350 (Latin America) and 1.609 (Africa) months, not
very different from the regression without trend. Hence, there is no evidence for an
overestimation of half-lives and underestimation of adjustment speeds by simple TAR
models as stated by Van Campenhout (2007). The results indicate that over time there is not
much change in thresholds below which no adjustment of organic prices to conventional
price changes takes place. This implies that these markets do not become more integrated
and cross-price elasticities remain indeed constant over time. Adjustment speeds also
remain unchanged, which suggests that neither market information nor competitive
structures change. Hence, hypothesis 3 cannot be confirmed.
There is also no indication that the premium on organic pineapple is bound to
decrease. However, since our database covers only four years, this rather indicates that
more research should be done to answer this question when more data is available than a
strong rejection of the hypothesis. Still, overall these results indicate thresholds in price
responses that did not change significantly over the past four years, and there is also no
difference in regions of origin. These results may help farmers, traders, retailers, and

21
agencies promoting organic certification to better understand the market and predict future
price movements. The availability of more data over time will improve the results.
6 Conclusions
As the demand for organic products is growing, this paper has tried to shed light on the
longer-term profitability of organic production. Taking hedonic demand theory as basis, we
empirically analyzed spatial price transmission between organic and conventional pineapple
on the world’s largest organic market Europe as a case study. The analysis is set up with a
development perspective since organic products in general and organic pineapple in
particular are niche markets that exhibit premium prices. As a result, organic production is
currently promoted as a valuable agricultural alternative for developing countries. Our results
imply that the conventional market acts as a price leader for the organic one. While prices for
conventional pineapple are independent of organic prices, organic price movements are
responding to their conventional counterparts. However, threshold analysis indicates that
organic prices only react to changes in conventional prices if these changes are sufficiently
large. In addition, this threshold does not change over time. Hence, despite an expanding
organic niche, market integration does not increase. Our observations also do not show an
upward or downward trend for the organic price premium in the pineapple market. When
there is neither more integration, nor a declining price premium to be observed, while the
organic market is expanding faster than the main market, this happens, according to theory,
only when the core market expands faster than supply. One important implication of this
observation is the potential for the scalability of the organic market. Accordingly, these
results suggest that organic production can indeed be a profitable alternative for small
farmers in developing countries, and it is likely to remain so in the near future. Furthermore,
being founded in hedonic demand theory allows this analysis to be applied to other similar
niche-main market situations. Other environmental or ethical certifications such as Fair trade
may provide a very similar context.
22
However, some questions remain to be analyzed. In order to understand price premia
and their behavior in more detail, future research might investigate what part of the price
premium can be attributed to the organic nature and what part to other product
characteristics such as quality using hedonic demand models. We have deliberately chosen
a relatively homogeneous experience good for our analysis, assuming that it is relevant for
search goods as well. However this remains to be shown. In addition, longer time series data
would help to strengthen the analysis of the sustainability of the organic premium on the
producer and retail level and may be able to show when the current dynamics of demand
and supply shifts are likely to change in the future.

23
7 References
Abdulai, A. (2000). Spatial price transmission and asymmetry in the Ghanaian maize market. Journal of Development Economics, 63 (2), pp. 327-349.
Achuonjei, P. (2003). Analysis of the Ghanaian Fresh Fruit and vegetable Industry. Ghana Private-Public Partnership Food Industry Development Program Mission Report. East Lansing, MI: Partnerships for Food Industry Development – Fruits and Vegetables, Michigan State University.
Baulch, B., (1997). Transfer costs, spatial arbitrage, and testing for food market integration. American Journal of Agricultural Economics, 79 (2), pp. 477–487.
Bjorner T., L. Hansen, and C.S. Russell. (2004). Environmental Labelling and Consumers’ Choice - An Empirical Analysis of the Effect of the Nordic Swan. Journal of Environmental Economics and Management, 47 (3), pp. 411-434.
Boland, M. and T. Schroeder (2002). Marginal Value of Quality Attributes for Natural and Organic Beef. Journal of Agricultural and Applied Economics, 34, pp. 39–49.
CBI Market Survey (2008). The EU market for pineapple. February 2008 CBI Market Information Database, available at: http://www.cbi.eu/marketinfo.
Combris, P., S. Lecocq, and M. Visser (1997). Estimation of a Hedonic Price Equation for Bordeaux Wine: Does Quality Matter? The Economic Journal, 107 (441), pp. 390-402.
Elliott, G., T.J. Rothenberg, and J.H. Stock (1996). Efficient tests for an autoregressive unit root. Econometrica , 64 (4), pp. 813-836.
Epple, D. (1987). Hedonic Prices and Implicit Markets: Estimating Demand and Supply Functions for Differentiated Products. Journal of Political Economy, 95 (1), pp. 59-80.
Fafchamps, M. (1992). Cash crop production, food price volatility, and rural market integration in the third world. American Journal of Agricultural Economics, 74 (1), pp. 90–99.
Faure, G., I. Vagneron, and D. Loeillet (2009). Is there a pilot in the chain? Identifying the key drivers of change in the fresh pineapple sector. Food Policy, 34 (5), pp. 437-446.
Fold, N., and K.V. Gough. (2008). From smallholders to transnationals: The impact of changing consumer preferences in the EU on Ghana’s pineapple sector. Geoforum, 39 (2008), pp. 1687–1697.
FruiTrop, 2008. Dossier du mois: l’ananas. Fruitrop Close-up report, Cirad-flhor, Observatoire des marches, FruiTrop Journal, 154, March, pp 6-30, available at: http://passionfruit.cirad.fr.
Granger, C.W.J. and P. Newbold (1974). Spurious regressions in econometrics. Journal of Econometrics, 2, pp. 111-120.
Huang, C.L. (1996). Consumer Preferences and Attitudes toward Organically Grown Produce. European Review of Agricultural Economics, 23 (3), pp. 331–42.
Huang, C.L. and B-H. Lin (2007). Hedonic Analysis of Fresh Tomato Prices Regional Markets. Review of Agricultural Economics, 29 (4), pp. 783–800.
Ladd, G.W. and V. Suvannunt (1976). A Model of Consumer Goods Characteristics. American Journal of Agricultural Economics, 58, pp. 504–10.
Levin, A., C.F. Lin, and C.S.J. Chu (2002). Unit root tests in panel data: asymptotic and finite-sample properties. Journal of Econometrics, 108 (1), pp. 1-24.

24
Loeillet, D. (2004). The European fresh pineapple market - Costa Rica takes over. Cirad-flhor, Observatoire des marches, Revue FruiTrop 114, July/August, pp. 4-9, available at: http://passionfruit.cirad.fr.
Loureiro M.L. and L. Hine (2002). Discovering Niche Markets: A Comparison of Consumer Willingness to Pay for Local (Colorado Grown), Organic, and GMO-Free Products. Journal of Agricultural and Applied Economics, 34, pp. 477–87.
Market Intelligence Report (MIR) Europe pineapple, 2007-2009. Available from: www.ghanafreshproduce.org.
Meyer, J. and S. von Cramon-Taubadel (2004). Asymmetric price transmission: a survey. Journal of Agricultural Economics, 55 (3), pp. 581-611.
Minot, N. and M. Ngigi (2004). Are Horticultural Exports a Replicable Success Story? Evidence from Kenya and Côte d’Ivoire. EPTD Discussion Paper 120 and MTID Discussion Paper 73. International Food Policy Research Institute, Washington D.C.
Minten, B., L. Randrianarison, and J. Swinnen (2009). Global Retail Chains and Poor Farmers: Evidence from Madagascar. World Development, 37 (11), pp. 1728–1741.
Nelson, P. (1970). Information and Consumer Behaviour. Journal of Political Economy, 78 (2), pp. 311-329.
Ng, S. and P. Perron (2001) Lag length selection and the construction of unit root tests with good size and power. Econometrica, 69 (6), pp. 1519-1554.
Nimon, W. and J.C. Beghin (1999). Are Eco-Labels Valuable? Evidence from the Apparel Industry. American Journal of Agricultural Economics, 81, pp. 801-811.
O’Connell, P.G.J. (1998), The overvaluation of purchasing power parity. Journal of International Economics, 44, pp. 1-19.
Rapsomanikis, G., D. Hallam, and P. Conforti (2003). Market integration and price transmission in selected food and cash crop markets of developing countries: review and applications. In FAO Commodity Market Review 2003-2004, pp. 51-75.
Rosen, S. (1974) Hedonic Prices and Implicit Markets: Product Differentiation in Pure Competition. Journal of Political Economy, 82, pp. 34–55.
Sexton, R.J., C.L. Kling, and H.F. Carman (1991). Market integration, efficiency of arbitrage, and imperfect competition: methodology and application to U.S. celery. American Journal of Agricultural Economics, 73 (3), pp. 569–580.
Teisl, M., B. Roe, and R.L. Hicks (2002). Can Eco-Labels Tune a Market. Journal of Environmental Economics and Management, 43, pp. 339-359.
Thompson, G.D. (1998). Consumer Demand for Organic Foods: What We Know and What We Need to Know. American Journal of Agricultural Economics, 80, pp. 1113–18.
United Nations Conference on Trade and Development (UNCTAD) (2008). Certified Organic Export - Implications for economic welfare and gender equality among smallholder farmers in tropical Africa. United Nations, New York and Geneva.
Van Campenhout, B. (2007). Modelling trends in food market integration: Method and an application to Tanzanian maize markets. Food Policy, 32, pp. 112–127.
Willer, H. and L. Kilcher (Eds.) (2009). The World of Organic Agriculture. Statistics and Emerging Trends 2009. FIBL-IFOAM Report, IFOAM, Bonn; FiBL, Frick; ITC, Geneva.
Willer, H., M. Yussefi, and N. Sorensen (Eds.) (2008). The world of organic agriculture: statistics and emerging trends 2008. International Federation of Organic Agriculture

25
Movements (IFOAM, Bonn, Germany) and Research Institute of Organic Agriculture (FiBL, Frick, Switzerland).

26
Figures and Tables
Figure 3.1: Volumes and values of EU pineapple imports
Source: Eurostat Comext 06/06/2011
Figure 3.2: Wholesale prices for conventional pineapple from different origins
0
100000
200000
300000
400000
500000
600000
700000
800000
900000
1000000
Total EU27 Imports of Pineapple
Import Value in1000Eur
Import Quantity MT
27
Figure 3.3: Wholesale prices for organic pineapple from different origins
Source: International Trade Centre’s market news service and European fruit trading
companies.
Figure 3.4: The price premium for organic pineapple
Notes: Prices are average monthly European wholesale prices in €/kg. Source: International Trade Centre’s market news service and European fruit trading
companies.

28
Table 3.1: Estimation Results for VEC
LATIN AMERICA AFRICA
cp op cp op
1 cp -1.191*** (0.153)
0.361*** (0.153)
-1.07*** (0.16)
0.382** (0.196)
1 op -0.084 (0.149)
-0.084 (0.149)
0.120 (0.215)
0.283* (0.155)
c -0.001 (0.025)
0.005 (0.025)
0.001 (0.029)
0.003 (0.035)
-0.580*** (0.172)
0.073 (0.323)
-0.497*** (0.197)
0.150 (0.236)
Test results R² 0.428 0.174 0.428 0.174 F-statistic 6.988** 3.181* 6.988** 3.181* Log Likelihood 30.87 16.57 LM-Test (p-values) for autocorrelation, lag 1 0.252 0.511 lag 2 0.413 0.508
Notes: pc is the conventional price, po is the organic price in natural logarithms.
Table 3.2: Estimation results for TAR model and TAR model with trend
LATIN AMERICA AFRICA TAR model TAR model with
trend TAR model TAR model with
trend 0.630 0.530
)1( t 0.630 0.460
)34( t 0.630 0.610 -0.335***
(0.095) -0.365* (0.197)
-0.479*** (0.102)
-0.350* (0.194)
t* -0.012 (0.008)
-0.007 (0.008)
half-live 1.697 1.350 1.064 1.609 N 46 46 46 46 R² 0.217 0.258 0.330 0.352 F-statistic 12.47*** 7.65*** 22.13*** 11.93***
Notes: Dependent variable is the change between two periods in the price difference between the two market prices. All models are estimated without a constant. Rho ( ) denotes the adjustment parameter on the lagged
price difference expressed as the percentage of mean price in the two markets, theta ( ) is the threshold expressed again as the percentage of mean price in the two markets and t is a time trend. The TAR models are three regime symmetric models with unit root behavior imposed within the band formed by the thresholds. The thresholds are identified through a grid search over candidate thresholds with as model selection criterion the minimal sum of squared residuals. As starting values for the thresholds, at least 20% of the observations were either within or outside the band formed by the thresholds. Half-lives are expressed in months and in brackets when they are based on a coefficient that was estimated not significantly different from zero. Standard errors are in brackets. *, ** and *** denote parameter estimates significantly different from zero at the 10%, 5% and 1% significance, respectively. N is the number of observations used in the estimation.

29
Appendix
Figure A.3.1: European Market Shares in Fresh and Dried Pineapple 2003 and 2009
Source: Eurostat Comext Notes: Classification: pineapple fresh or dried, 90percent sea, 10 percent air freight,
Varieties: Smooth Cayenne, MD2, Victoria

30
Table A.3.1: T-statistics of ADF-test for conventional prices
Lags by Schwartz criterion Lags by MAIC
no trend trend no trend trend
Levels
Latin America (1/11)a -2.476 -3.922** -1.558 0.224
Africa (1/11) -3.617*** -4.787*** -3.501** -3.031*
First Differences
Latin America (1/6)a -11.056*** -11.047*** -6.300*** -6.433***
Africa (3/3) -9.856*** -9.878*** -9.856*** -9.878***
Note: (***) indicates a rejection of the null hypothesis at the 1% significance level, (**) at the 5% significance level, (*) at the 10% significance level. a In brackets are the number of lags by Schwartz/ MAIC criterion.
Table A.3.2: Test statistics of DF-GLS test for conventional prices a
Lags by Schwartz criterion Lags by MAIC
Levels
Latin America (1/11) b -2.927 -0.378 Africa (1/11) -4.455*** -1.420
First Differences
Latin America (1/6) b -8.662*** -2.543*
Africa (3/3) -3.174** -3.174** Note: (***) indicates a rejection of the null hypothesis at the 1% significance level, (**) at the 5% significance level, (*) at the 10% significance level. a By default, the test includes a trend. b In brackets are the number of lags by Schwartz/ MAIC criterion.
31
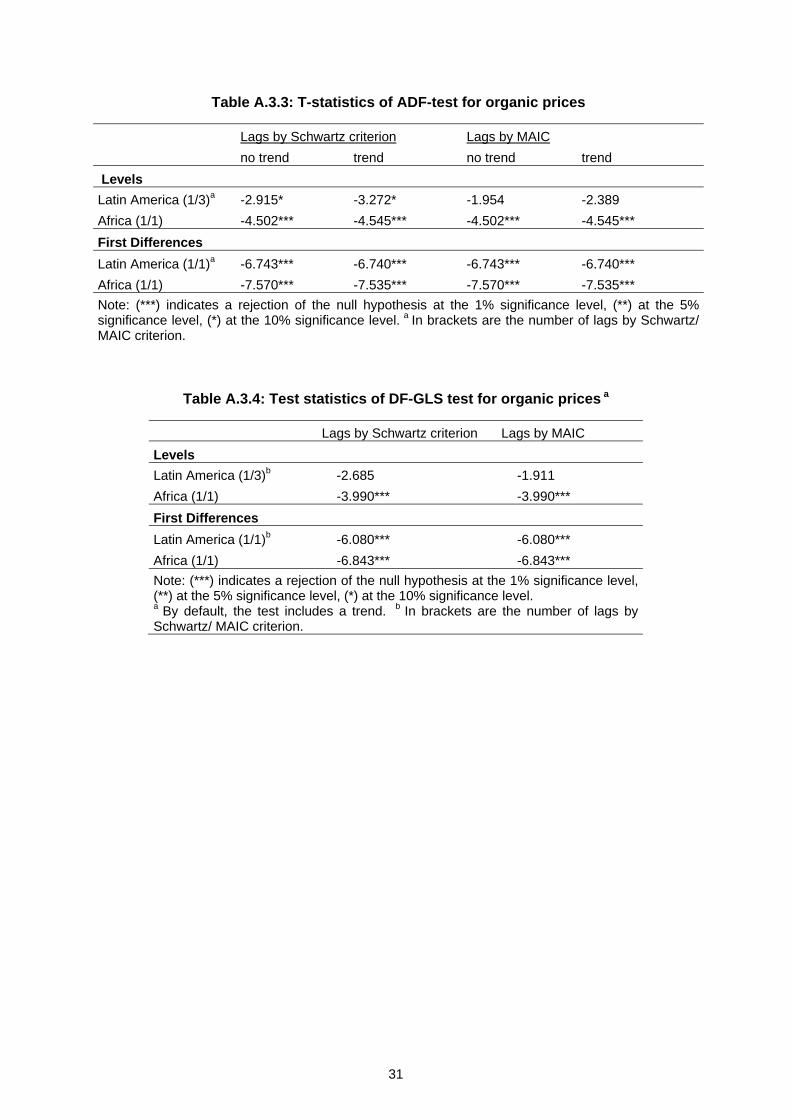
Table A.3.3: T-statistics of ADF-test for organic prices
Lags by Schwartz criterion Lags by MAIC
no trend trend no trend trend
Levels
Latin America (1/3)a -2.915* -3.272* -1.954 -2.389
Africa (1/1) -4.502*** -4.545*** -4.502*** -4.545***
First Differences
Latin America (1/1)a -6.743*** -6.740*** -6.743*** -6.740***
Africa (1/1) -7.570*** -7.535*** -7.570*** -7.535***
Note: (***) indicates a rejection of the null hypothesis at the 1% significance level, (**) at the 5% significance level, (*) at the 10% significance level. a In brackets are the number of lags by Schwartz/ MAIC criterion.
Table A.3.4: Test statistics of DF-GLS test for organic prices a
Lags by Schwartz criterion Lags by MAIC
Levels
Latin America (1/3)b -2.685 -1.911
Africa (1/1) -3.990*** -3.990***
First Differences
Latin America (1/1)b -6.080*** -6.080***
Africa (1/1) -6.843*** -6.843***
Note: (***) indicates a rejection of the null hypothesis at the 1% significance level, (**) at the 5% significance level, (*) at the 10% significance level. a By default, the test includes a trend. b In brackets are the number of lags by Schwartz/ MAIC criterion.

32
Table A.3.5: Johannsen Cointegration Test for Latin American prices
rank Trace statistic (5% critical value) Max. eigenvalue (5% critical value) No intercept, no trend No intercept, no trend
0 33.51 (12.53) 33.34 (11.44)
1 0.17*** (3.84) 0.17*** (3.84)
Intercept Intercept
0 50.62 (19.96) 41.83 (15.67)
1 8.80** (9.24) 8.80** (9.24)
Note: ** indicates the rank selected by a trace statistics test at 5% level.
*** indicates the rank selected by maximum eigenvalue statistic test at 5% level.
Table A.3.6: Granger Causality Test (p-values) for Latin American prices
cp 0.67
op 0.07

33
Notes 1 Since in market statistics fresh and dried pineapple are generally grouped together, we do so too in this paper. 2 Because the analysis is concerned with prices for fresh pineapple only, figures for processed pineapple are omitted here. 3 GLOBALGAP is a private standard founded in 1997 as EurepGAP by European retailers. It is a business-to-business standard with the aim to establish one standard for Good Agricultural Practices (GAP).Many of the large European retail and food service chains, producers/suppliers are members (www.globalgap.org). 4 The US National Organic Program allowed the use of ethylene gas for flower induction in pineapple in 2002, the EU only in 2005. It is therefore expected that this difference is even larger today. 5 Rosen (1974) provides a theoretical framework in which is endogenously determined by the interaction between suppliers and demanders of the commodity. Since, without information on quantities and consumer characteristics, we cannot use the full model for our example, we refrain from describing it here. 6 The production cycle for pineapple is between 11 and 18 months. Conversion to organic production takes on average three years. 7 The countries included in the analysis are the following: Austria, Belgium, Denmark, Finland, France, Germany, Holland, Italy, Spain, Sweden, Switzerland and United Kingdom. 8 Transport costs constitute an important factor for pineapple pricing in Europe. They account for up to 50% of the price for both sea and air transport (€0.38 and €0.83 respectively). Consequently, the prices for sea- and air-transported pineapple differ greatly and are hardly comparable. Since the majority of pineapple is transported by sea, we focus on pineapple transported by sea. Surprisingly, sea transport costs do not differ greatly between Latin America and West Africa even though the former is further away from European harbors (e.g. Achuonjei, 2003). The difference is negligible in per kilo prices and conventional and organic fruit can be transported in the same container. 9 Compared to other pineapple varieties MD2 had the highest start and the strongest downward development in prices (see section 2). By today, the difference in prices between varieties has vanished according to International Trade Centre’s market news service. 10 Information from AMI for Germany: http://www.ami-informiert.de/. 11 Means and standard deviations for Africa are 0.50 (0.31) and for Latin America 0.50 (0.22) respectively. 12 However, since the available time series is short and we do not have sufficient data about the development of the size of the two markets, our conclusions have to be taken with care. 13 This result might reflect the problem of overrejection of the null hypothesis when using the Schwartz criterion, as explained above. The larger number of lags is also able to account for seasonality in the price data. On the other hand the large number of lags might reduce the significance of the results. 14 We could extend the model to incorporate asymmetries in the transmission of positive price changes in contrast to negative ones. Apart from data constraints (short time series), this is also questionable for other reasons in this case. Since it would mean that price increases in conventional prices are transmitted more rapidly or slowly to organic prices than price decreases, the rationale behind different adjustment speeds for price increases and price decreases are according literature usually market power. In our case this would mean that wholesalers in the organic market would have the market power to asymmetrically transmit prices changes in the conventional pineapple market to their customers (retailers and specialty shops). As retailers often also engage in wholesales, this is not very plausible on aggregate level. Alternatively exporters in developing countries would have the market power to asymmetrically adjust organic prices when conventional ones change. This is even more unlikely because pineapple is a perishable fruit so exporters are dependent on selling fast. In such cases actors at the beginning of the value chain usually have relatively little power. The second possibility would be information asymmetries, that is exporters or importers having different information about market prices than wholesalers and retailers, which is quite unlikely in this case at least when regarding monthly data. It might be more relevant with price data of higher frequency.

Please note:
You are most sincerely encouraged to participate in the open assessment of this discussion paper. You can do so by either recommending the paper or by posting your comments.
Please go to:
http://www.economics-ejournal.org/economics/discussionpapers/2013-10
The Editor
© Author(s) 2013. Licensed under the Creative Commons Attribution 3.0.