Phytoplankton abundance and structural parameters of the critically endangered protected area Vaya...
8
This article was downloaded by: [Maya Stoyneva] On: 12 December 2014, At: 11:36 Publisher: Taylor & Francis Informa Ltd Registered in England and Wales Registered Number: 1072954 Registered office: Mortimer House, 37-41 Mortimer Street, London W1T 3JH, UK Biotechnology & Biotechnological Equipment Publication details, including instructions for authors and subscription information: http://www.tandfonline.com/loi/tbeq20 Phytoplankton abundance and structural parameters of the critically endangered protected area Vaya Lake (Bulgaria) Ralits Dimitrova a , Elena Nenova b , Blagoy Uzunov a , Maria Shishiniova b & Maya Stoyneva a a Department of Botany, Faculty of Biology, Sofia University “St. Kliment Ohridski”, Sofia, Bulgaria b Department of Zoology and Anthropology, Faculty of Biology, Sofia University “St. Kliment Ohridski”, 1164 Sofia, Bulgaria Published online: 31 Oct 2014. To cite this article: Ralits Dimitrova, Elena Nenova, Blagoy Uzunov, Maria Shishiniova & Maya Stoyneva (2014) Phytoplankton abundance and structural parameters of the critically endangered protected area Vaya Lake (Bulgaria), Biotechnology & Biotechnological Equipment, 28:5, 871-877, DOI: 10.1080/13102818.2014.947718 To link to this article: http://dx.doi.org/10.1080/13102818.2014.947718 PLEASE SCROLL DOWN FOR ARTICLE Taylor & Francis makes every effort to ensure the accuracy of all the information (the “Content”) contained in the publications on our platform. Taylor & Francis, our agents, and our licensors make no representations or warranties whatsoever as to the accuracy, completeness, or suitability for any purpose of the Content. Versions of published Taylor & Francis and Routledge Open articles and Taylor & Francis and Routledge Open Select articles posted to institutional or subject repositories or any other third-party website are without warranty from Taylor & Francis of any kind, either expressed or implied, including, but not limited to, warranties of merchantability, fitness for a particular purpose, or non-infringement. Any opinions and views expressed in this article are the opinions and views of the authors, and are not the views of or endorsed by Taylor & Francis. The accuracy of the Content should not be relied upon and should be independently verified with primary sources of information. Taylor & Francis shall not be liable for any losses, actions, claims, proceedings, demands, costs, expenses, damages, and other liabilities whatsoever or howsoever caused arising directly or indirectly in connection with, in relation to or arising out of the use of the Content. This article may be used for research, teaching, and private study purposes. Terms & Conditions of access and use can be found at http://www.tandfonline.com/page/terms-and-conditions It is essential that you check the license status of any given Open and Open Select article to confirm conditions of access and use.
Transcript of Phytoplankton abundance and structural parameters of the critically endangered protected area Vaya...

This article was downloaded by: [Maya Stoyneva]On: 12 December 2014, At: 11:36Publisher: Taylor & FrancisInforma Ltd Registered in England and Wales Registered Number: 1072954 Registered office: Mortimer House,37-41 Mortimer Street, London W1T 3JH, UK
Biotechnology & Biotechnological EquipmentPublication details, including instructions for authors and subscription information:http://www.tandfonline.com/loi/tbeq20
Phytoplankton abundance and structural parametersof the critically endangered protected area Vaya Lake(Bulgaria)Ralits Dimitrovaa, Elena Nenovab, Blagoy Uzunova, Maria Shishiniovab & Maya Stoynevaa
a Department of Botany, Faculty of Biology, Sofia University “St. Kliment Ohridski”, Sofia,Bulgariab Department of Zoology and Anthropology, Faculty of Biology, Sofia University “St. KlimentOhridski”, 1164 Sofia, BulgariaPublished online: 31 Oct 2014.
To cite this article: Ralits Dimitrova, Elena Nenova, Blagoy Uzunov, Maria Shishiniova & Maya Stoyneva (2014) Phytoplanktonabundance and structural parameters of the critically endangered protected area Vaya Lake (Bulgaria), Biotechnology &Biotechnological Equipment, 28:5, 871-877, DOI: 10.1080/13102818.2014.947718
To link to this article: http://dx.doi.org/10.1080/13102818.2014.947718
PLEASE SCROLL DOWN FOR ARTICLE
Taylor & Francis makes every effort to ensure the accuracy of all the information (the “Content”) contained inthe publications on our platform. Taylor & Francis, our agents, and our licensors make no representations orwarranties whatsoever as to the accuracy, completeness, or suitability for any purpose of the Content. Versionsof published Taylor & Francis and Routledge Open articles and Taylor & Francis and Routledge Open Selectarticles posted to institutional or subject repositories or any other third-party website are without warrantyfrom Taylor & Francis of any kind, either expressed or implied, including, but not limited to, warranties ofmerchantability, fitness for a particular purpose, or non-infringement. Any opinions and views expressed in thisarticle are the opinions and views of the authors, and are not the views of or endorsed by Taylor & Francis. Theaccuracy of the Content should not be relied upon and should be independently verified with primary sourcesof information. Taylor & Francis shall not be liable for any losses, actions, claims, proceedings, demands,costs, expenses, damages, and other liabilities whatsoever or howsoever caused arising directly or indirectly inconnection with, in relation to or arising out of the use of the Content. This article may be used for research, teaching, and private study purposes. Terms & Conditions of access anduse can be found at http://www.tandfonline.com/page/terms-and-conditions It is essential that you check the license status of any given Open and Open Select article to confirmconditions of access and use.

ARTICLE; BIODIVERSITY AND ECOSYSTEMS
Phytoplankton abundance and structural parameters of the critically endangered protected area
Vaya Lake (Bulgaria)
Ralits Dimitrovaa, Elena Nenovab*, Blagoy Uzunova, Maria Shishiniovab and Maya Stoynevaa
aDepartment of Botany, Faculty of Biology, Sofia University “St. Kliment Ohridski”, Sofia, Bulgaria; bDepartment of Zoologyand Anthropology, Faculty of Biology, Sofia University “St. Kliment Ohridski”, 1164 Sofia, Bulgaria
(Received 20 March 2014; accepted 23 June 2014)
Vaya (Ramsar site, protected area and Natura 2000 site) is the biggest natural lake in Bulgaria and the shallowest Black Seacoastal lake, which during the last decades has undergone significant changes and was included as critically endangered inthe Red List of Bulgarian Wetlands. Our studies were conducted during the summer and autumn months of three years �2004�2006. The paper presents results on the phytoplankton abundance (numbers, biomass and carbon content) incombination with the indices of species diversity, evenness and dominance. Phytoplankton abundance was extremely high(average values of 1135 £ 106 cells/L for the quantity and of 46 mg/L for the biomass) and increased in the end of thestudied period (years 2005�2006), when decrease of species diversity and increase of the dominance index values weredetected. The carbon content of the phytoplankton was at an average value of 9.7 mg/L and also increased from 2004 to2006. Cyanoprokaryota dominated in the formation of the total carbon content of the phytoplankton, in its numbers(88%�97.8%), and in the biomass (62%�87.9%). All data on phytoplankton abundance and structural parameters in Vayaconfirm the hypertrophic status of the lake and reflect the general negative trend in its development.
Keywords: numbers; biomass; carbon content; diversity; evenness; dominance; cyanoprokaryotes
Introduction
Vaya ( D Burgas Lake) is the biggest natural lake in
Bulgaria and the shallowest Black Sea coastal lake. Vaya
is a part of the large wetland complex of several Burgas
lakes (including Atanasovsko Lake and Mandra Dam),
located on the ‘Via Pontica’ ornithological migratory
route and is important for the conservation of rare and
endangered species of national, European and global sig-
nificance. The lake is a Ramsar site, a protected area in
the Bulgarian legislation and the national ecological net-
work Natura 2000. During the last decades the aquatic
ecosystem of Vaya has undergone significant changes due
to different anthropogenic factors. The main among them
are the disturbance of the water balance and the introduc-
tion of biogenic elements in the lake, combined with
decreased halinity, which have a negative effect on the
hydrochemical composition of the water and its flora and
fauna. Therefore it has been included as critically endan-
gered in the Red List of Bulgarian Wetlands.[1,2]
Complex study of the lake hydrobiology, carried out
in 2004�2006 [3] forerunned in October 2003 by hydro-
chemical studies,[4] include phytoplankton investigation,
a part of which, concerning its taxonomic structure, is
published elsewhere.[5] In the present study the quantita-
tive characteristics of the Vaya phytoplankton (numbers,
biomass and carbon content) and its key structural indices
(of species diversity, evenness and dominance) in the
changed conditions of the lake due to the anthropogenic
impact, summarized in Michev and Stoyneva [2], are pre-
sented. A comparison of our results with those from other
phytoplankton investigations [5�9] is made.
Materials and methods
The study with the focus on the phytoplankton was
conducted during the summer and autumn months of three
consecutive years � 2004, 2005 and 2006, as a part of a
more complete hydrobiological investigation of the lake
physico-chemistry and the invertebrate fauna of Vaya
Lake in 14 sites of the lake.[3] In this paper the results
from processing of samples from eight selected sites are
presented (sample points 1�5, 8, 9 and 11) � Figure 1.
These eight sites were chosen also for the evaluation of
the species composition of the phytoplankton [5] � the
basis of the trophic webs � as most representative in
reflecting the anthropogenic impact on the lake and are
briefly described in the following.
The sites were visited by a speedboat and detected by
means of GPS ‘GARMIN’. The rivers Aytoska, Chukar-
ska and Sanardere are flowing in the western part of Vaya
where the sampling point 1 (N42�29.655, E27�20.925) issituated. Against Gorno Ezerovo district sampling point 2
*Corresponding author. Email: [email protected]
� 2014 The Author(s). Published by Taylor & Francis.
This is an Open Access article distributed under the terms of the Creative Commons Attribution License (http://creativecommons.org/licenses/by/3.0/), which permits
unrestricted use, distribution, and reproduction in any medium, provided the original work is properly cited. The moral rights of the named author(s) have been asserted.
Biotechnology & Biotechnological Equipment, 2014
Vol. 28, No. 5, 871�877, http://dx.doi.org/10.1080/13102818.2014.947718
Dow
nloa
ded
by [
May
a St
oyne
va]
at 1
1:36
12
Dec
embe
r 20
14
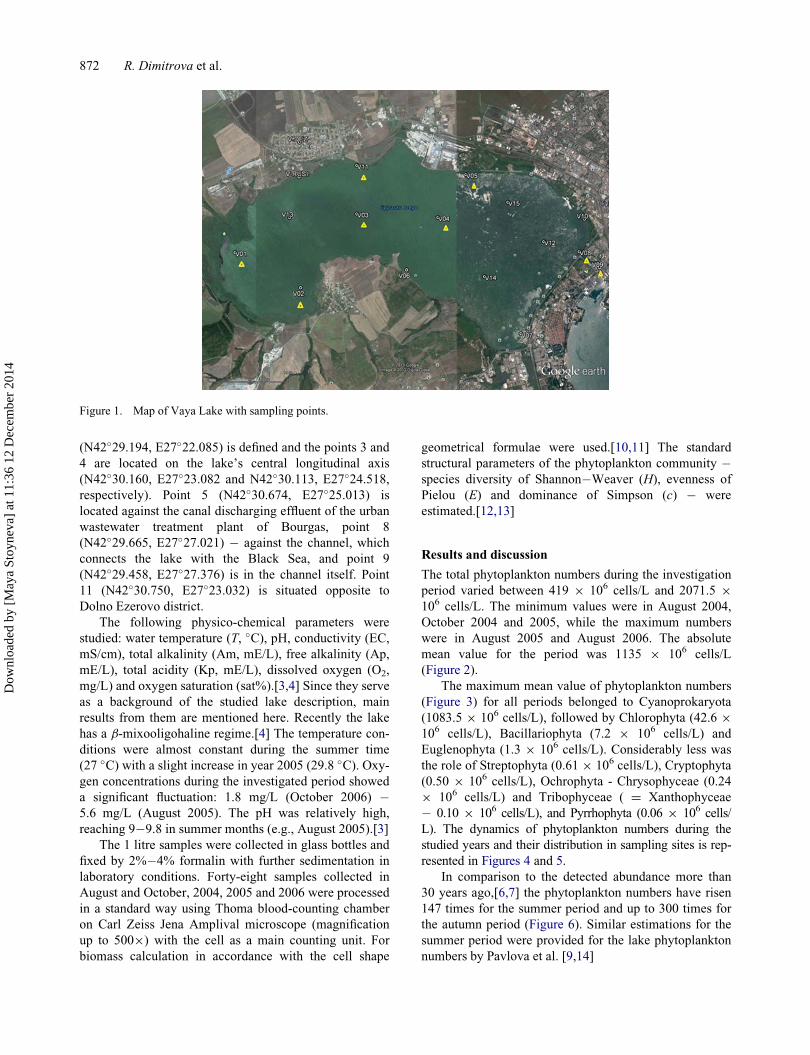
(N42�29.194, E27�22.085) is defined and the points 3 and
4 are located on the lake’s central longitudinal axis
(N42�30.160, E27�23.082 and N42�30.113, E27�24.518,respectively). Point 5 (N42�30.674, E27�25.013) is
located against the canal discharging effluent of the urban
wastewater treatment plant of Bourgas, point 8
(N42�29.665, E27�27.021) � against the channel, which
connects the lake with the Black Sea, and point 9
(N42�29.458, E27�27.376) is in the channel itself. Point
11 (N42�30.750, E27�23.032) is situated opposite to
Dolno Ezerovo district.
The following physico-chemical parameters were
studied: water temperature (T, �C), pH, conductivity (EC,
mS/cm), total alkalinity (Am, mE/L), free alkalinity (Ap,
mE/L), total acidity (Kp, mE/L), dissolved oxygen (O2,
mg/L) and oxygen saturation (sat%).[3,4] Since they serve
as a background of the studied lake description, main
results from them are mentioned here. Recently the lake
has a b-mixooligohaline regime.[4] The temperature con-
ditions were almost constant during the summer time
(27 �C) with a slight increase in year 2005 (29.8 �C). Oxy-gen concentrations during the investigated period showed
a significant fluctuation: 1.8 mg/L (October 2006) �5.6 mg/L (August 2005). The pH was relatively high,
reaching 9�9.8 in summer months (e.g., August 2005).[3]
The 1 litre samples were collected in glass bottles and
fixed by 2%�4% formalin with further sedimentation in
laboratory conditions. Forty-eight samples collected in
August and October, 2004, 2005 and 2006 were processed
in a standard way using Thoma blood-counting chamber
on Carl Zeiss Jena Amplival microscope (magnification
up to 500£) with the cell as a main counting unit. For
biomass calculation in accordance with the cell shape
geometrical formulae were used.[10,11] The standard
structural parameters of the phytoplankton community �species diversity of Shannon�Weaver (H), evenness of
Pielou (E) and dominance of Simpson (c) � were
estimated.[12,13]
Results and discussion
The total phytoplankton numbers during the investigation
period varied between 419 £ 106 cells/L and 2071.5 £106 cells/L. The minimum values were in August 2004,
October 2004 and 2005, while the maximum numbers
were in August 2005 and August 2006. The absolute
mean value for the period was 1135 £ 106 cells/L
(Figure 2).
The maximum mean value of phytoplankton numbers
(Figure 3) for all periods belonged to Cyanoprokaryota
(1083.5 £ 106 cells/L), followed by Chlorophyta (42.6 £106 cells/L), Bacillariophyta (7.2 £ 106 cells/L) and
Euglenophyta (1.3 £ 106 cells/L). Considerably less was
the role of Streptophyta (0.61 £ 106 cells/L), Cryptophyta
(0.50 £ 106 cells/L), Ochrophyta - Chrysophyceae (0.24
£ 106 cells/L) and Tribophyceae ( D Xanthophyceae
� 0.10 £ 106 cells/L), and Pyrrhophyta (0.06 £ 106 cells/
L). The dynamics of phytoplankton numbers during the
studied years and their distribution in sampling sites is rep-
resented in Figures 4 and 5.
In comparison to the detected abundance more than
30 years ago,[6,7] the phytoplankton numbers have risen
147 times for the summer period and up to 300 times for
the autumn period (Figure 6). Similar estimations for the
summer period were provided for the lake phytoplankton
numbers by Pavlova et al. [9,14]
Figure 1. Map of Vaya Lake with sampling points.
872 R. Dimitrova et al.
Dow
nloa
ded
by [
May
a St
oyne
va]
at 1
1:36
12
Dec
embe
r 20
14
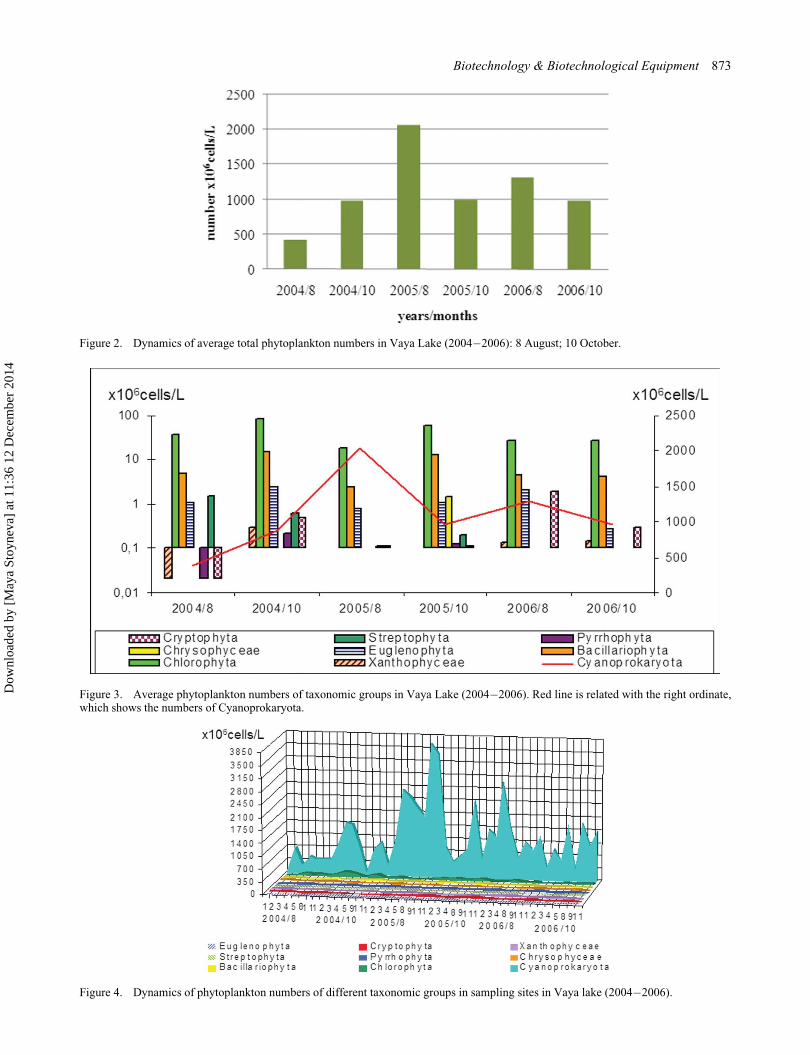
Figure 3. Average phytoplankton numbers of taxonomic groups in Vaya Lake (2004�2006). Red line is related with the right ordinate,which shows the numbers of Cyanoprokaryota.
Figure 2. Dynamics of average total phytoplankton numbers in Vaya Lake (2004�2006): 8 August; 10 October.
Figure 4. Dynamics of phytoplankton numbers of different taxonomic groups in sampling sites in Vaya lake (2004�2006).
Biotechnology & Biotechnological Equipment 873
Dow
nloa
ded
by [
May
a St
oyne
va]
at 1
1:36
12
Dec
embe
r 20
14
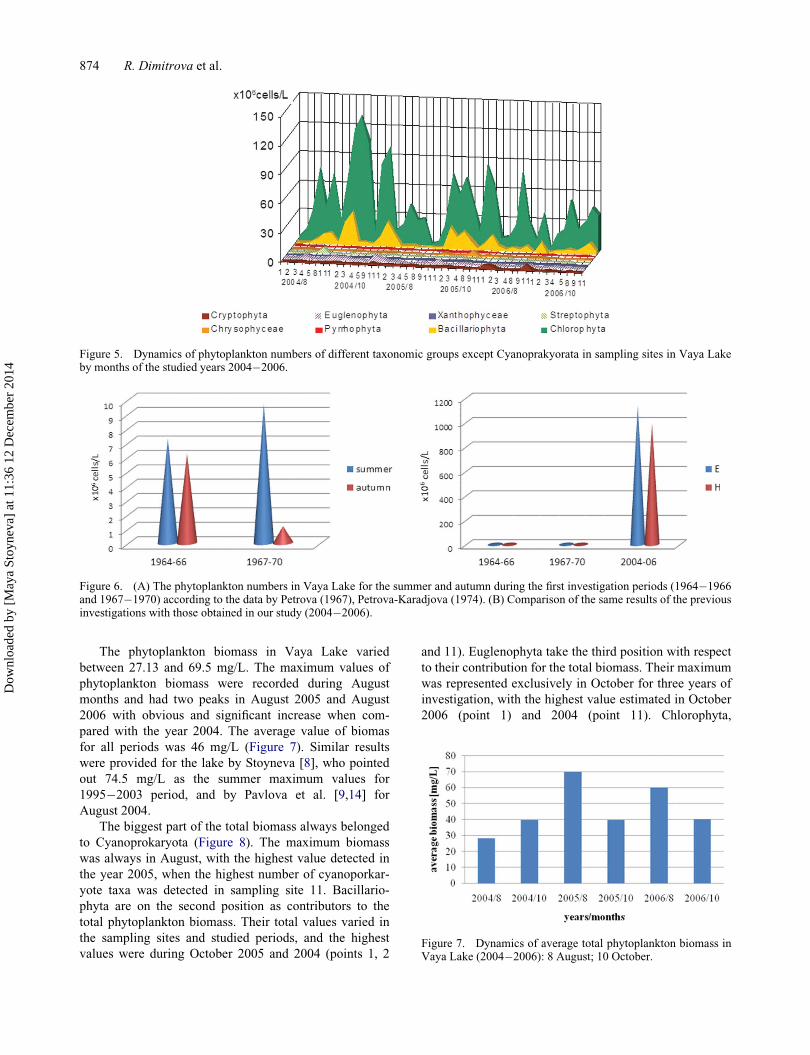
The phytoplankton biomass in Vaya Lake varied
between 27.13 and 69.5 mg/L. The maximum values of
phytoplankton biomass were recorded during August
months and had two peaks in August 2005 and August
2006 with obvious and significant increase when com-
pared with the year 2004. The average value of biomas
for all periods was 46 mg/L (Figure 7). Similar results
were provided for the lake by Stoyneva [8], who pointed
out 74.5 mg/L as the summer maximum values for
1995�2003 period, and by Pavlova et al. [9,14] for
August 2004.
The biggest part of the total biomass always belonged
to Cyanoprokaryota (Figure 8). The maximum biomass
was always in August, with the highest value detected in
the year 2005, when the highest number of cyanoporkar-
yote taxa was detected in sampling site 11. Bacillario-
phyta are on the second position as contributors to the
total phytoplankton biomass. Their total values varied in
the sampling sites and studied periods, and the highest
values were during October 2005 and 2004 (points 1, 2
and 11). Euglenophyta take the third position with respect
to their contribution for the total biomass. Their maximum
was represented exclusively in October for three years of
investigation, with the highest value estimated in October
2006 (point 1) and 2004 (point 11). Chlorophyta,
Figure 5. Dynamics of phytoplankton numbers of different taxonomic groups except Cyanoprakyorata in sampling sites in Vaya Lakeby months of the studied years 2004�2006.
Figure 6. (A) The phytoplankton numbers in Vaya Lake for the summer and autumn during the first investigation periods (1964�1966and 1967�1970) according to the data by Petrova (1967), Petrova-Karadjova (1974). (B) Comparison of the same results of the previousinvestigations with those obtained in our study (2004�2006).
Figure 7. Dynamics of average total phytoplankton biomass inVaya Lake (2004�2006): 8 August; 10 October.
874 R. Dimitrova et al.
Dow
nloa
ded
by [
May
a St
oyne
va]
at 1
1:36
12
Dec
embe
r 20
14

Cryptophyta, Ochrophyta (Tribophyceae ( D Xanthophy-
ceae) and Chrysophyceae), Pyrrhophyta and Streptophyta
had lower contribution in the phytoplankton biomass.
Our data for the mean biomass value (46 mg/L) during
the studied period allowed us to classify Vaya Lake as a
hypereutrophic basin according to the open-boundary
OECD system as it is compiled in Michev & Stoyneva.[2]
They are strongly supported by the cyanoprokaryote dom-
inance, which is generally known to attend the eutrophica-
tion events.[15] The strong phytoplankton development,
leading to visible water blooms is supported by the high
pH values (pH> 10), detected during the summer months,
especially in sites 2 and 11 (see the text below).[3]
The carbon content showed maxima in August 2005
and 2006 and minima in August 2004 (Figure 8). The
mean value for the investigated period was 9.7 mg/L
(Figure 9).
Cyanoprokaryota dominated in the total carbon con-
tent of the phytoplankton with maximum value in August
2005 and August 2006 (Figure 10). The absolute maxima
(25.1 4 26.9 mg/L) were detected in sampling points 2
and 11. Chlorophyta and Bacillariophyta were with the
highest carbon content in October 2004 and October
2005. The highest values for both groups were in point 1.
Euglenophyta contributed to the total phytoplankton car-
bon content with highest values in October 2004 and in
August 2006 (maxima in points 1 and 11). The carbon
content of Cryptophyta was with maxima in August 2006
in points 1, 2 and 11. The other groups had a low contribu-
tion to the total carbon content.
The results for the phytoplankton numbers, biomass
and carbon content, which point the highest abundance
and carbon values, as well as the highest contribution of
indicative groups of cyanoprokaryotes and euglenophytes
in sites 1, 2 and 11, clearly reflect the anthropogenic
impact with organic pollution mainly from Dolno and
Gorno Ezerovo districts. This is also supported by the
data on the phytoplankton species composition, in which
Cyanoprokaryota is second by species richness group after
Chlorophyta during the same period [5] and eight years
before.[8] Additional proof comes from the hydrochemi-
cal situation and the low oxygen content in site 1, in par-
ticular. There, during the summer, oxygen is almost
lacking, leading to anaerobic conditions and appearance
of sulphate reduction. In the same site, in winter and
autumn, the oxygen content is the lowest for the lake. The
results on conductivity also show the highest conductivity
values in site 1 during the summer of 2004, related to the
anaerobic processes and increase of hydrocarbonate and
hydrosulphide ion concentration.[3]
The dynamics of the biodiversity index, the indices of
dominance and evenness are shown in Figure 11. The val-
ues of biodiversity index (H) of Shannon�Weaver, for
the investigated period varied from 0.55 (October 2006,
point 11) to 3 (August 2004, point 8). The highest mean
values of the biodiversity index were estimated for August
2004, followed by October 2005, and October 2004. A
strong tendency for index decrease was detected in August
and especially in October 2006.
The phytoplankton evenness index of Pielou (E) var-
ied (from 0.17 to 0.78), keeping relatively high levels for
Figure 8. Phytoplankton biomass of taxonomic groups in sampling sites of Vaya Lake (2004�2006).
Figure 9. Dynamics of average phytoplankton carbon contentin Vaya Lake (2004�2006); 8 August, 10 October.
Biotechnology & Biotechnological Equipment 875
Dow
nloa
ded
by [
May
a St
oyne
va]
at 1
1:36
12
Dec
embe
r 20
14

the investigated period, but with a trend for decrease in
2006. High values for the evenness were calculated for
August 2004 (sample points 1, 3, 5 and 8) and for August
2005 (sample point 2). The lowest evenness was regis-
tered in October 2006 (Figure 11).
The values of the coefficient of dominance of Simpson
(c) varied from 0.09 (August 2004 in point 5) to 0.78
(October 2006 in point 11).
The strong decrease of species biodiversity index
along with the increased coefficient of dominance and
strong cyanoprokaryote dominance generally is known to
accompany the change of the trophic level of different
natural water basins with achievement of the eutrophic to
hypertrophic status. For some work along these lines, see
[16�20]. The same was proved for northern Bulgarian
coastal lakes.[21] This statement corresponds fully with
the results from our recent work, which demonstrate a
decrease of biodiversity in the year 2006 with an increase
of the coefficient of dominance (Figure 11).
Conclusions
The data obtained on phytoplankton abundance (numbers,
biomass and carbon content) with constant domination of
Cyanoprokaryota clearly show that during the studied
period Vaya Lake was a hypereutrophic basin. A trend of
increase in the phytoplankton abundance has been estab-
lished in comparison with previous phytoplankton studies,
carried out around 30 years ago, as well as within the stud-
ied period from 2004 to 2006 [6�9,14] and is generally
supported by the obtained hydrochemical results.[3] In
this period, the values of the species diversity index and
evenness decreased, while the values of the coefficient of
dominance increased. The data collected reflect the total
Figure 10. Average phytoplankton biomass of taxonomic groups in Vaya Lake (2004�2006).
Figure 11. Dynamics of the biodiversity index (H), the indices of dominance (c) and evenness (E) in sampling sites in Vaya Lake(2004�2006).
876 R. Dimitrova et al.
Dow
nloa
ded
by [
May
a St
oyne
va]
at 1
1:36
12
Dec
embe
r 20
14
unfavourable direction of the wetland development and
confirmed the site being declared earlier as a critically
endangered one.[1,2] The proof of the extremely rapid
increase of the abundance of the lake’s primary producers
could serve as an ‘alarm’ for starting the manangement
activities for its restoration and conservation.
References
[1] Michev TM, Stoyneva MP. Red list of Bulgarian wetlands:conception, creation and application. Ann Univ Sof.2005;96:71�76.
[2] Michev TM, Stoyneva MP, editors. Inventory of Bulgarianwetlands and their biodiversity. Part 1: non-lotic wetlands.Sofia: Publ. House Elsi-M; 2007.
[3] Nenova E. KaRecH&e> 4 ko:4RecH&e> cXcHa& >a >bko4oc>o&>4 (pyB4 $e2(pX$>aR>4 04&oH>4 c &a0>o2>aRe>4e 2a e2epoHo %ab [Qualitative and quantitativecomposition of some major groups of invertebrates withimportant implications for Vaya Lake] [dissertation]. SofiaUniversity “St Kliment Ohridski”; in prep. Bulgarian.
[4] Nenova E, Tishkov S, Shishinyova M. Investigation ofhydrochemical parameters of the Vaya Lake and theirinfluence on the quantitative composition of planktoninvertebrates. Ecol Eng Environ Prot. 2007;1:13�20.
[5] Dimitrova R, Nenova E, Uzunov B, Shishiniova M, Stoy-neva M. Phytoplankton composition of Vaya Lake(2004�2006). Bulgarian J Agric Sci. (in press).
[6] Petrova V. Ee2o>>a 4 (o*4T>a *4>a<4ka >a L4HoB:a>kHo>a & $X:(apck4He kpa6<opck4 e2epa c p4$ocHoBa>cko 2>aRe>4e [Seasonal and annual dynamics of the phy-toplankton in Bulgarian coastal lakes of industrial fishingimportance] Izv. NIIRSO-Varna. 1967;8:131�153.Bulgarian.
[7] Petrova-Karadjova V. )4>a<4ka >a L4HoB:a>kHo>a &#yp(ackoHo e2epo 4 b2o&4p “;a>*pa” [Dynamics of thephytoplankton in Burgas Lake and in “Mandra” reservoir].Izv. NIIORS-Varna. 1974;13:35�49. Bulgarian.
[8] Stoyneva M. Steady-state phytoplankton assemblages in shal-low Bulgarian wetlands. Hydrobiologia. 2003;502:169�176.
[9] Pavlova V, Babica P, Todorova D, Bratanova Z, Mar�salekB. Contamination of some reservoirs and lakes in Republic
of Bulgaria by microcystins. Acta Hydrochimica Hydro-biol. 2006;34:437�441.
[10] Deisinger G. Leitfaden zur Bestimmung der planktischenAlgen der K€artner Seen und ihrer Biomasse [Handbook fordetermination of planktonic algae of lakes of Karintia andtheir biomass]. Klagenfurt: K€artner Institut f€ur Seenfor-schung; 1984.
[11] Rott E. Some results from phytoplankton counting intercal-ibration. Schweizerische Zeitschrift f€ur Hydrologie.1981;43:34�62.
[12] Peet RK. Relative diversity indeces. Ecology. 1975;56:496�498.
[13] Rusev B. ?c>o&4 >a caBpo$4o:o(4bHa [Bases of saprobi-ology]. Sofia: Univ. Publ. House “St Kliment Ohridski”;1994.
[14] Pavlova V, Stoyneva M, Babica P, Kohoutek J, BratanovaZ. Microcystins contamination and cyanoprokaryoteblooms in some coastal Bulgarian wetlands. In: BULA-QUA 2007, Second International Conference and Exhibi-tion of Water Resources, Technologies and Services,Proceedings; 2007 June 22; Sofia; 2007.
[15] Temnsikova D, Stoyneva M. A:(o:o(4b [Algology].Sofia-Moscow: Pensoft; 2011. Bulgarian.
[16] Fabbro L, Duivenvoorden LJ. Profile of a bloom of thecyanobacterium Cylindrospermopsis raciborskii (Wolos-zynska) Seenaya and Subba Raju in the Fitzroy River intropical central Queensland. Marine Freshwater Res.1996;47:685�694.
[17] Dokulil M, Teubner K. Cyanobacterial dominance in lakes.Hydrobiologia. 2000;438:1�12.
[18] Uzunov Y, Kovachev S. X4*po$4o:o(4b [Hydrobiology].Sofia-Moscow: Pensoft; 2002. Bulgarian.
[19] Stoyneva MP. Development of the phytoplankton ofthe shallow Srebarna lake (North-Eastern Bulgaria) acrossthe trophic gradient. Hydrobiologia. 1998;369/370:259�367.
[20] Scheffer M. Ecology of shallow lakes. Dordrech: KluwerAcademic Publishers; 2004.
[21] Stoyneva M. Algological Studies of Bulgarian coastalwetlands. II. Quantitative structure of the phytoplankton ofDurankulak and Shabla-Ezeretz lakes. Ann Univ Sof.2002;92:91�109.
Biotechnology & Biotechnological Equipment 877
Dow
nloa
ded
by [
May
a St
oyne
va]
at 1
1:36
12
Dec
embe
r 20
14
![TOURISM | Greece - Bulgaria: People & Statistics [GR]](https://static.fdokumen.com/doc/165x107/6321d64d61d7e169b00c591b/tourism-greece-bulgaria-people-statistics-gr.jpg)