


Physical Properties of M aterials - Virtual Campus Sign In
458
www.ebook3000.com
-
Upload
khangminh22 -
Category
Documents
-
view
0 -
download
0
Transcript of Physical Properties of M aterials - Virtual Campus Sign In

Materials Science
ISBN: 978-1-4398-6651-1
9 781439 866511
90000
“This book stands out as a unique resource for students and established scientists working at the modern materials/chemistry/technology interface. … This second edition includes many new state-of-the-art topics that have emerged as major fields over the last decade including carbon nanotubes, quantum dots, and spintronics. … I defy the readers to not find many gems of insightful knowledge to enhance their understanding of the physical materials world.”
—Timothy M. Swager, Massachusetts Institute of Technology, Cambridge, USA
“I am very impressed with the text. This text provides wonderful coverage of many of the basic properties of materials that we care about as scientists and as engineers.”
—Paul C. Canfield, Ames Laboratory, Iowa State University, USA
“… this is an excellent book to base an introductory materials course on or to read for pleasure by scientists in other fields who wish to riffle through an excellent survey of what materials science has become today.”
—Martin Moskovits, University of California, Santa Barbara, USA
Physical Properties of Materials, Second Edition establishes the principles that control the optical, thermal, electronic, magnetic, and mechanical properties of materials. Using an atomic and molecular approach, this fully revised and updated second edition now covers materials sustainability, crystalline structures, graphene, carbon nanotubes, nanocomposites, quantum dots, magnetocaloric effect, spintronics, and polymer classifications. It also contains numerous tutorials (including a new capstone tutorial on the materials science of cymbals), 300 end-of-chapter problems (more than 60 of them new), numerous real-life examples and illustrations, and updated references. A host of ancillaries are available on a companion website.
w w w . c r c p r e s s . c o m
K12969
www.crcpress.com
Physical Properties of Materials
White
Second Edition
K12629 cvr mech.indd 1 5/20/11 11:09 AM
www.ebook3000.com

Physical Properties of MaterialsSecond Edition
nteractive Companion Website
The website offers a wealth of ancillary resources for students and instructorsthat enhance the material in the text.
• Updates to the Further Reading sections
• Links to relevant movies and podcasts for each chapter
• Video demonstrations of thermochromism, the thermoelectric effect, memory metal, magnetic levitation with superconductors, and more
• Additional problems and errata
Student Resources:
• Sources of demonstration materialsfor lectures
• PowerPoint slides of figures from the book
• Solutions manual
• A link to request an exam copy
Instructor Resources:
www.physicalpropertiesofmaterials.com
K12969_Insert:Layout 1 5/11/11 11:13 AM Page 1

PhysicalPropertiesof Materials
Second Edition
Mary Anne White

CRC PressTaylor & Francis Group6000 Broken Sound Parkway NW, Suite 300Boca Raton, FL 33487-2742
© 2012 by Taylor & Francis Group, LLCCRC Press is an imprint of Taylor & Francis Group, an Informa business
No claim to original U.S. Government worksVersion Date: 20110727
International Standard Book Number-13: 978-1-4398-9532-0 (eBook - PDF)
This book contains information obtained from authentic and highly regarded sources. Reasonable efforts have been made to publish reliable data and information, but the author and publisher cannot assume responsibility for the validity of all materials or the consequences of their use. The authors and publishers have attempted to trace the copyright holders of all material reproduced in this publication and apologize to copyright holders if permission to publish in this form has not been obtained. If any copyright material has not been acknowledged please write and let us know so we may rectify in any future reprint.
Except as permitted under U.S. Copyright Law, no part of this book may be reprinted, reproduced, transmit-ted, or utilized in any form by any electronic, mechanical, or other means, now known or hereafter invented, including photocopying, microfilming, and recording, or in any information storage or retrieval system, without written permission from the publishers.
For permission to photocopy or use material electronically from this work, please access www.copyright.com (http://www.copyright.com/) or contact the Copyright Clearance Center, Inc. (CCC), 222 Rosewood Drive, Danvers, MA 01923, 978-750-8400. CCC is a not-for-profit organization that provides licenses and registration for a variety of users. For organizations that have been granted a photocopy license by the CCC, a separate system of payment has been arranged.
Trademark Notice: Product or corporate names may be trademarks or registered trademarks, and are used only for identification and explanation without intent to infringe.
Visit the Taylor & Francis Web site athttp://www.taylorandfrancis.com
and the CRC Press Web site athttp://www.crcpress.com
www.ebook3000.com

Dedicated to my first teachers, my parents

ix
Contents
Preface to the Second Edition ............................................................................ xiiiPreface to the First Edition ...................................................................................xvAcknowledgments ............................................................................................. xviiAbout the Author ................................................................................................ xix
Part I Introduction
1 Introduction to Materials Science ...............................................................31.1 History ....................................................................................................31.2 More Recent Trends ..............................................................................41.3 Impact on Daily Living ........................................................................61.4 Future Materials ....................................................................................61.5 Structures of Materials .........................................................................81.6 Problems ............................................................................................... 10Further Reading ............................................................................................. 11
Part II Color and Other Optical Properties of Materials
2 Atomic and Molecular Origins of Color .................................................. 192.1 Introduction ......................................................................................... 192.2 Atomic Transitions ..............................................................................222.3 Black-Body Radiation .........................................................................232.4 Vibrational Transitions as a Source of Color ................................... 262.5 Crystal Field Colors ............................................................................ 272.6 Color Centers (F-Centers) ................................................................... 292.7 Charge Delocalization, Especially Molecular Orbitals ................. 322.8 Problems ...............................................................................................38Further Reading .............................................................................................42
3 Color in Metals and Semiconductors .......................................................453.1 Introduction .........................................................................................453.2 Metallic Luster .....................................................................................453.3 Colors of Pure Semiconductors .........................................................503.4 Colors of Doped Semiconductors ..................................................... 523.5 Problems ............................................................................................... 61Further Reading .............................................................................................63
x Contents
4 Color from Interactions of Light Waves with Bulk Matter .................. 674.1 Introduction ......................................................................................... 674.2 Refraction ............................................................................................. 674.3 Interference ..........................................................................................754.4 Scattering of Light ............................................................................... 824.5 Diffraction Grating .............................................................................84
4.5.1 An Example of Diffraction Grating Colors: Liquid Crystals .......................................................................86
4.6 Problems ............................................................................................... 92Further Reading ............................................................................................. 96
5 Other Optical Effects ................................................................................. 1015.1 Introduction ....................................................................................... 1015.2 Optical Activity and Related Effects .............................................. 1015.3 Birefringence ...................................................................................... 1055.4 Circular Dichroism and Optical Rotatory Dispersion................. 1065.5 Nonlinear Optical Effects ................................................................ 1085.6 Problems ............................................................................................. 115Further Reading ........................................................................................... 117
Part III Thermal Properties of Materials
6 Heat Capacity, Heat Content, and Energy Storage ............................... 1236.1 Introduction ....................................................................................... 1236.2 Equipartition of Energy ................................................................... 123
6.2.1 Heat Capacity of a Monatomic Gas ................................... 1256.2.2 Heat Capacity of a Nonlinear Triatomic Gas ................... 125
6.3 Real Heat Capacities and Heat Content of Real Gases ................ 1266.3.1 Joule’s Experiment ............................................................... 1306.3.2 Joule–Thomson Experiment ............................................... 131
6.4 Heat Capacities of Solids .................................................................. 1356.4.1 Dulong–Petit Law ................................................................ 1356.4.2 Einstein Model ..................................................................... 1366.4.3 Debye Model ......................................................................... 1376.4.4 Heat Capacities of Metals ................................................... 140
6.5 Heat Capacities of Liquids ............................................................... 1416.6 Heat Capacities of Glasses ............................................................... 1426.7 Phase Stability and Phase Transitions, Including Their
Order ................................................................................................... 1466.8 (CP – CV): An Exercise in Thermodynamic Manipulations ......... 1526.9 Problems ................................................................................................. 159Further Reading ........................................................................................... 164
www.ebook3000.com

Contents xi
7 Thermal Expansion .................................................................................... 1677.1 Introduction ....................................................................................... 1677.2 Compressibility and Thermal Expansion of Gases ...................... 1677.3 Thermal Expansion of Solids .......................................................... 1727.4 Problems ............................................................................................. 182Further Reading ........................................................................................... 186
8 Thermal Conductivity ............................................................................... 1878.1 Introduction ....................................................................................... 1878.2 Thermal Conductivity of Gases ...................................................... 1878.3 Thermal Conductivities of Insulating Solids ................................ 1938.4 Thermal Conductivities of Metals .................................................. 1978.5 Problems .............................................................................................200Further Reading ........................................................................................... 203
9 Thermodynamic Aspects of Stability .................................................... 2059.1 Introduction ....................................................................................... 2059.2 Pure Gases .......................................................................................... 2059.3 Phase Equilibria in Pure Materials: The Clapeyron Equation ......2079.4 Phase Diagrams of Pure Materials ................................................. 2099.5 The Phase Rule .................................................................................. 2219.6 Liquid–Liquid Binary Phase Diagrams .........................................2259.7 Liquid–Vapor Binary Phase Diagrams ..........................................2279.8 Relative Proportions of Phases: The Lever Principle ................... 2319.9 Liquid–Solid Binary Phase Diagrams ............................................ 2329.10 Compound Formation ...................................................................... 2409.11 Three-Component (Ternary) Phase Diagrams ............................. 2439.12 Problems .............................................................................................250Further Reading ........................................................................................... 259
10 Surface and Interfacial Phenomena ........................................................ 26510.1 Introduction ....................................................................................... 26510.2 Surface Energetics ............................................................................. 26610.3 Surface Investigations ....................................................................... 26710.4 Surface Tension and Capillarity ...................................................... 26910.5 Liquid Films on Surfaces ................................................................. 27510.6 Problems .............................................................................................280Further Reading ........................................................................................... 282
11 Other Phases of Matter .............................................................................. 28911.1 Introduction ....................................................................................... 28911.2 Colloids ............................................................................................... 28911.3 Micelles ............................................................................................... 29111.4 Surfactants .......................................................................................... 29411.5 Inclusion Compounds ...................................................................... 296

xii Contents
11.6 Problems .............................................................................................302Further Reading ...........................................................................................303
Part IV Electrical and Magnetic Properties of Materials
12 Electrical Properties ...................................................................................30912.1 Introduction .......................................................................................30912.2 Metals, Insulators, and Semiconductors: Band Theory ...............309
12.2.1 Metals .................................................................................... 31212.2.2 Semiconductors .................................................................... 31312.2.3 Insulators............................................................................... 315
12.3 Temperature Dependence of Electrical Conductivity ................. 31612.3.1 Metals .................................................................................... 31712.3.2 Intrinsic Semiconductors .................................................... 318
12.4 Properties of Extrinsic (Doped) Semiconductors ......................... 32212.5 Electrical Devices Using Extrinsic (Doped) Semiconductors ..... 324
12.5.1 p,n-Junction ........................................................................... 32412.5.2 Transistors .............................................................................330
12.6 Dielectrics ........................................................................................... 33212.7 Superconductivity .............................................................................33512.8 Problems .............................................................................................342Further Reading ...........................................................................................348
13 Magnetic Properties ................................................................................... 35713.1 Introduction ....................................................................................... 35713.2 Origins of Magnetic Behavior ......................................................... 35713.3 Magnetic Induction as a Function of Field Strength ....................36413.4 Temperature Dependence of Magnetization ................................36813.5 Problems ............................................................................................. 375Further Reading ........................................................................................... 377
Part V Mechanical Properties of Materials
14 Mechanical Properties ...............................................................................38314.1 Introduction .......................................................................................38314.2 Elasticity and Related Properties ....................................................38814.3 Beyond the Elastic Limit .................................................................. 39414.4 Defects and Dislocations .................................................................. 39714.5 Crack Propagation .............................................................................40014.6 Adhesion ............................................................................................40514.7 Electromechanical Properties: The Piezoelectric Effect .............. 40714.8 Problems ............................................................................................. 416Further Reading ...........................................................................................422
www.ebook3000.com

Contents xiii
Appendix 1: Fundamental Physical Constants ............................................429
Appendix 2: Unit Conversions ........................................................................ 431
Appendix 3: The Greek Alphabet ..................................................................433
Appendix 4: Sources of Lecture Demonstration Materials .......................435

xv
Preface to the Second Edition
Materials science offers a wonderful opportunity to introduce students to basic principles of matter through forefront research topics of immediate or near-future direct application to their lives.
Materials research is advancing rapidly. New topics in this second edition include materials and sustainability, carbon nanotubes, other nanomaterials such as nanocomposites, quantum dots, spintronics, and magnetoresistance. In addition, in response to comments from other professors who taught from the first edition, this new edition includes an introductory section on struc-tures of materials and more discussion concerning polymers.
All aspects of the text have been edited and revised to correct some minor shortcomings in the first edition, and to clarify points where readers kindly indicated a need. The format is similar to the first edition in that the text is brought alive through Comments and Tutorials that illustrate the role of materials in our lives. In this second edition, several new Comments and a new cap-stone Tutorial on the materials science of cymbals have been added. References at the ends of chapters, to be used by the reader for further depth, have also been updated. In addition, more than 60 new end-of-chapter prob-lems have been added, bringing the total number of problems to 300. To guide students through the myriad equations, a margin marker for the most important equations has been introduced in this second edition.
Since 1991, I have been teaching a materials science course at the junior (third-year) undergraduate level, cross-listed as a chemistry/physics course. Initially I taught with the notes that became the first edition, and then I taught from the first edition, most recently supplanted with additional information that is now in the second edition. This is a 13-week course, with three hours of lectures per week. Within that envelope, I also include Tutorials.* For the most part, I cover all the topics, in the order of the textbook. Sometimes in my lectures I have to omit or abbreviate topics, and, if so, what is covered in Chapters 10 and/or 11 is reduced. Mostly, I include the introductory parts of Chapter 14 after presenting Chapter 5, so the students have a foreshadow-ing of the importance of mechanical properties. This course has now been enthusiastically taken by about 800 students, mostly in chemistry and phys-ics programs, but also in engineering, earth science, and biochemistry, and they frequently comment on how much they appreciate the links to their everyday lives. I have managed to find lecture demonstrations for each and every lecture, many from everyday life. And I enjoy learning more examples from the students!
* For details concerning presentation, see M. A. White, 1997. Tutorials as a teaching method for materials science. Journal of Materials Education, 19, 23–26.

xvi PrefacetotheSecondEdition
The background colors on the front cover were produced by viewing a CD case through crossed polarizers, with backlighting. See Chapter 14 for d iscussion of color from stress-induced polarization.
We will encounter many equations in this book. The most important are designated with ▮ to the left of the equation.
Finally, to emphasize that this book concerns the physical properties of materials, the word “physical” has been added to the first-edition title of Properties of Materials.
A website for Physical Properties of Materials is maintained by the publisher. Further updates and contact information for reader suggestions are available at www.physicalpropertiesofmaterials.com.
Enjoy learning about physical properties of materials!
Mary Anne WhiteHalifax, Nova Scotia, Canada
www.ebook3000.com

xvii
Preface to the First Edition
The idea for this book germinated at a public lecture in about 1989. The lecturer had mentioned in passing, “and you all know how a photocopier works.” Most of the remainder of the lecture was lost on me, in wondering what fraction of that educated audience knew how a photocopier worked. Then I began to realize that there was no place in our curriculum where such an important concept was taught to our students. After that lecture I decided to take advantage of revision of the physical chemistry curriculum going on in my department at that time, to prepare a curriculum for a class based on properties of materials. The class was launched in 1991. Finding no appropri-ate textbook, I wrote out my lecture notes for the students to use. With subse-quent revisions and additions, these have become the book before you.
The purpose of this book is to introduce the principles of materials science through an atomic and molecular approach. In particular, the aim is to help the reader to learn to think about properties of materials in order to under-stand the principles behind new (or old) materials. A “perfect goal” would be for the reader to be able to learn about a new material in the business pages of the daily newspaper, giving minimal scientific information, and from that decipher the scientific principles on which the use of the material is based.
Properties of materials have interested many people. When speaking of his youth, Linus Pauling* said: “I mulled over the properties of materials: why are some substances colored and others not, why are some minerals or inorganic compounds hard and others soft.”† It is noteworthy that such deep considerations of the world around us eventually led Pauling to make semi-nal contributions in many areas. It is hoped that encouragement of wonder in the variety and nature of properties of materials will be of benefit to those who read these pages.
This textbook should be viewed as an introductory survey of principles in materials science. While this book assumes basic knowledge of physical sci-ences, many of the concepts are presented with introductory mathematical and theoretical rigor. This is largely to refrain from use of tensors (avoided in all but a few places) in this presentation; the interested reader will find more detailed presentations and derivations in the bibliography.
This book is divided into parts based on various properties of materials. After a general introduction to materials science issues, origins of colors and other optical properties of materials are considered. The next part con-cerns thermal properties of materials, including thermal stability and phase
* Linus Pauling (1901–1994) was an American chemist and winner of the 1954 Nobel Prize in Chemistry for research into the nature of the chemical bond and its applications to elucida-tion of structure of complex substances. Pauling also won the 1962 Nobel Peace Prize.
† John Horgan, 1993. Profile: Linus Pauling. Scientific American, March 1993, 36.

xviii PrefacetotheFirstEdition
diagrams. A further part is about electrical and magnetic properties of mate-rials, followed by a final part on mechanical stability.
This book has been used for the basis of a one-semester class in materials science, offered in a chemistry department, and taken by students in chemis-try, biochemistry, physics, engineering, and earth sciences. The prerequisite for the class is prior introduction to the laws of thermodynamics.
A feature of this book is the introduction of tutorials, in which the stu-dents, working in small groups, can apply the principles exposed in the text to work out for themselves the physical principles behind applications of materials science.
An Instructors’ Supplement, containing complete discussion of all the points raised in the tutorials, and complete worked solutions to all the end-of-chapter problems, is available through the publisher to instructors who have chosen the book for class use.
This book has aimed to present the principles behind various properties of materials and, since it is a survey of a large subject, additional reading suggestions are given at the end of each chapter as sources of more detailed information. References to recent developments also are given, in order to expose the readers to the excitement of current materials science research. Updates to these references will be made available through the publisher’s Web site, www.physicalpropertiesofmaterials.com.
The presentation for this book is by type of property—optical, thermal, electrical, magnetic and mechanical. Types of materials—metals, semi-conductors (intrinsic and extrinsic), insulators, glasses, orientationally disordered crystals, defective solids, liquid crystals, Fullerenes, Langmuir-Blodgett films, colloids, inclusion compounds, and more—are introduced through their various properties. As new types of materials are made or dis-covered, it is hoped that the approach of exposing principles that determine physical properties will have a lasting effect on future materials scientists and many others.
www.ebook3000.com

xix
Acknowledgments
This book has been helped through the comments of many people, espe-cially those who have taught from the first edition, and those who have used it as students at Dalhousie University and elsewhere all around the world. I hope that readers will help me to continue to refine this text by bringing sug-gestions for improvement and inclusion to my attention.
I particularly want to thank N. Aucoin, P. Bessonette, R. J. C. Brown, R. J. Boyd, W. Callister, P. Canfield, D. B. Clarke, A. Cox, J. Dahn, S. Dimitrijevic, R. Dumont, A. Ellis, J. E. Fischer, H. Fortier, J. M. Honig, M. Jakubinek, N. Jackson, B. Kahr, C. Kittel, B. London, M. Marder, T. Matsuo, M. Moskovits, K. Nassau, G. Nolas, N. Pelot, R. Perry, L. Schramm, J.-M. Sichel, E. Slamovich, T. Stevens, T. Swager, I. Tamblyn, and M. Tan for constructive comments. Special thanks to A. Inaba for detailed comments as a result of his translation of the first edition to Japanese, and to chemistry/music student P. MacMillan, who introduced me to the materials science of cymbals. Thanks also to M. LeBlanc for preparation of most of the diagrams for the first edition, and to J. E. Burke, D. Eigler, F. Fyfe, Ch. Gerber, M. Gharghouri, M. Jericho, C. Kingston, A. Koch, M. Marder, K. Miller, J.-M. Phillipe, R. L. White, and K. Worsnop for photographs or other assistance with graphical contributions. I thank the Dalhousie University Faculty of Science for a teaching award that made it possible to hire assistance for the first edition. In addition, I am grateful to S. Gillen, J. S. Grossert, K. J. Lushington, M. Meyyappan, A. J. Paine, D. G. Rancourt and R. L. White for providing useful informa-tion, and to members of my current research group, A. Bourque, C. Bryan, A. Cerqueira, L. Desgrosseilliers, K. Miller, M. Johnson, A. Ritchie, C. Romao and C. Weaver, for assistance reading proofs. Thanks also to Jill Jurgensen, Joette Lynch, Allison Shatkin and the other staff at CRC Press for excellent support.
Writing a book takes time. My now-grown children, David and Alice, have never really known a time when I was not working on this book! For their forbearance while I have been preoccupied, I sincerely thank my fam-ily, especially my husband Rob, as this would not have been accomplished without his loving support.

xxi
About the Author
Mary Anne White is an active materials research chemist and a highly recog-nized educator and communicator of science. Dr. White presently holds the distinguished title of University Research Professor at Dalhousie University, Halifax, Nova Scotia, Canada, where she has been since 1983, after receiv-ing a BSc in honors chemistry from the University of Western Ontario, a PhD in chemistry from McMaster University, and a postdoctoral fellowship at Oxford University. From 2002 to 2006, she was the founding director of the Institute for Research in Materials at Dalhousie University, and since 2010 she has been director of the multidisciplinary graduate program, Dalhousie Research in Energy, Advanced Materials and Sustainability (DREAMS).
Dr. White’s research area is energetics and thermal properties of materials. She has made significant contributions to understanding how heat is stored and conducted through materials. Her work has led to new materials that can convert waste heat to energy, and materials that can trap solar energy. Her research contributions have been recognized by national and international awards, and she is an author of more than 130 research papers and several book chapters. She also is the editor for materials science for the McGraw-Hill Encyclopedia of Science and Technology. She has trained more than 30 graduate students and postdoctoral fellows, and more than 50 undergraduate research students.
Dr. White enjoys sharing her knowledge with students and with the gen-eral public. She is especially well known for presenting clear explanations of difficult concepts. Mary Anne’s outstanding abilities as an educator have been recognized by the Union Carbide Award for Chemical Education from the Chemical Institute of Canada. Mary Anne has given more than 150 invited presentations at conferences, universities, government laboratories, and industries around the world.
Dr. White has been active throughout her career in bringing science to the general public. This includes helping establish a hands-on science center; many presentations for schools, the general public and others (including a lecture for members of Canada’s parliament and senate); booklets on science activities for children (published by the Canadian Society for Chemistry); serving as national organizer of National Chemistry Week; more than 150 articles for educators or the general public; and appearances on television. Since 2001, she has been a regular contributor on CBC Radio’s “Maritime Noon,” where she and a colleague field listeners’ science questions, live on

xxii AbouttheAuthor
air to an audience of about 20,000. For her contributions to public awareness of science, Mary Anne was awarded the 2007 McNeil Medal of the Royal Society of Canada. In 2008 she received a Doctor of Science (honoris causa) from McMaster University, her PhD alma mater.
Knowledge comes, but wisdom lingers.
Alfred Lord Tennyson
www.ebook3000.com

Part I
Introduction
Good material often stands idle for want of an artist.
Lucius Annæus Seneca

3
1IntroductiontoMaterialsScience
1.1 History
In some sense, materials science began about two million years ago when people began to make to make tools from stone at the start of the Stone Age. At this time, emphasis was on applications of materials, with no understand-ing of the microscopic origins of material properties. Nevertheless, the pos-session of a stone axe or other implement certainly was an advantage to an individual.
The Stone Age ended about 5000 years ago with the introduction of the Bronze Age in the Far East. Bronze is an alloy (a metal made up of more than one element), mostly composed of copper with up to 25% tin, and possibly other elements such as lead (which makes the alloy easier to cut), zinc, and phosphorus (which strengthens and hardens the alloy). Bronze is a much more workable material than stone, especially since it can be hammered, beaten, or cast into a wide variety of shapes. After a surface oxide film forms, bronze objects corrode only slowly.
Although bronze is still used today, about 3000 to 3500 years ago iron working began in Asia Minor. The Iron Age continues to this time. The main advantage of iron over bronze is its lower cost, bringing metallic implements into the budget of the ordinary person. The Iron Age ushered in the common use of coins, which greatly improved trade, travel, and communications. Even today these three activities are strongly tied to materials usage.
Throughout the Iron Age many new types of materials have been intro-duced. Today we may take for granted the properties of glass, ceramic, semi-conductors, polymers, composites, etc.
One major change over the millennia of the “Materials Age” has been our understanding of the properties of materials, and our consequent abil-ity to develop and prepare materials for particular applications. Materials research has been defined as the relationships between and among the struc-ture, properties, processing, and performance of materials (see Figure 1.1). Understanding the principles that give rise to various properties of materials is the aim of our journey.
4 PhysicalPropertiesofMaterials
1.2 More Recent Trends
A report written in 1953* shows how far we have come. It listed objectives for future materials research: materials to behave well at extremely high and extremely low temperatures; more basic knowledge about the behavior of metals (e.g., to predict strength, fatigue); production of metals of higher purity; preparation of new alloys to replace stainless steel (due to the then-shortage of nickel); preparation of better conductors and heat-resistant insulators for miniature electronic circuits; improvements in welding and soldering; and development of adhesion methods to allow applications of fluorocarbons and other new alloys and plastics. Most of these goals have been achieved, but the list, which now seems quite dated, shows the empha-sis on metals and metallurgy that was prevalent at that time.
About 20 years later, another report† again listed current topics of interest to materials researchers. This time, the issues were quite different: strategic materials, fuel availability, biodegradable materials, and scrap recovery. This list shows the close connection between materials science and economic and political issues.
In the 1980s, it was said that the “field of materials science and engi-neering is entering a period of unprecedented intellectual challenge and productivity.”‡ Although metals will always be important, emphasis in the subject has moved from metallurgy to ceramics, composites, polymers, and
* Science and the Citizen. Scientific American, August 1953.† Materials and Man’s Needs. National Research Council’s Committee on the Survey of Materials
Science and Technology, 1975.‡ Materials Science and Engineering for the 1990s. National Academy Press, Washington, DC,
1989.
Structure
Processing
Performance
PropertiesMaterials
FIGURE 1.1Materials research is the investigation of the relationships among structure, properties, p rocessing, and performance of materials.
www.ebook3000.com
IntroductiontoMaterialsScience 5
other molecular materials. Important considerations include semiconduc-tion, magnetic properties, photonic properties, superconduction, and biomi-metic properties. Furthermore, perceived barriers between types of materials are falling away (e.g., metals can be glasses and molecular materials can be conductors or magnets). Following the clues that nature provides, we now understand that different end products depend on assembly and addition of other phases. This is an example of complexity depending on the differ-ent length scales—from nanostructures to macrostructures. With structure–composition–properties relationships now more fully understood, some materials can be tailor-made. Nevertheless, new materials with novel prop-erties will continue to surprise us.
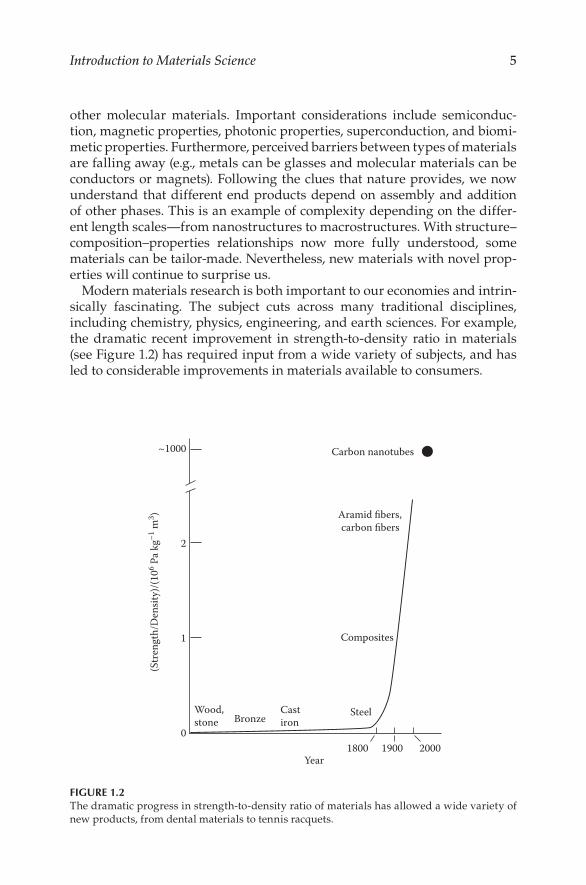
Modern materials research is both important to our economies and intrin-sically fascinating. The subject cuts across many traditional disciplines, including chemistry, physics, engineering, and earth sciences. For example, the dramatic recent improvement in strength-to-density ratio in materials (see Figure 1.2) has required input from a wide variety of subjects, and has led to considerable improvements in materials available to consumers.
~1000
2
1
0
Wood,stone
1800 20001900
(Str
engt
h/D
ensit
y)/(1
06 Pa k
g–1 m
3 )
BronzeCastiron
Steel
Composites
Aramid fibers,carbon fibers
Carbon nanotubes
Year
FIGURE 1.2The dramatic progress in strength-to-density ratio of materials has allowed a wide variety of new products, from dental materials to tennis racquets.

6 PhysicalPropertiesofMaterials
1.3 Impact on Daily Living
Modern materials have had immeasurable impact on our daily lives. New materials and processes have led to diverse products and applications: fiber optics, better computers, durable outdoor plastics, cheaper metal alloys to replace gold in electrical connections, more efficient liquid crystal and plasma displays, and many microelectronic applications. Materials develop-ment is important to many industrial sectors: aerospace, automotive, biologi-cal, chemical, electronic, energy, metals, and telecommunications. Indeed, economic growth is no longer linked to production of basic materials, but rather to their use in goods and services.
The understanding of behavior and properties of materials underlies every major technology. For example, in the space industry, the following material properties must be considered: strength, thermal conductivity, outgassing, flammability, effect of radiation, and stability under thermal cycling. Every manufacturing industry depends on materials research and development.
While fields such as plastics started to have a major impact on consum-ers a few decades ago, there are still areas for improvement. New materials are being developed for applications such as bulletproof vests, pop bottles that can be recycled as polyester clothing, and food containers that can be composted. So-called smart materials have led to products such as airplane wings that deice themselves and buildings that stabilize themselves in earth-quakes. The drive to miniaturization, especially of electronic components, is opening new fields of science. For example, the development of blue light-emitting diodes has allowed more compact storage of digital information. New materials are being tested for applications as diverse as artificial body parts and new applications in semiconductor technology.
1.4 Future Materials
Future developments in materials science could include the predictable (cot-ton shirts that never require ironing!) and the unimaginable. We will learn some lessons from nature: spider silk mimics; composites that are based on the structure of rhinoceros horn, which is a natural composite similar to that used on the Stealth aircraft, and shells, which are as strong as the most advanced laboratory-produced ceramics; and biocompatible adhesives fashioned after mollusk excretions. We might also learn from nature how molecules assemble themselves into complex three-dimensional arrays. Electronic components will certainly be miniaturized further, exploiting new properties when the length scale is comparable to atomic sizes and no
www.ebook3000.com

IntroductiontoMaterialsScience 7
longer divisible. Quantum mechanics will govern the processes and studies of these nanomaterials that will lead to new materials.
Some questions are of immediate importance. For example, we need a fun-damental understanding of high-temperature superconductors. With this, room-temperature superconductivity might be achieved. We also need to understand complex structures, such as quasicrystals, composites, and nano-material composites. In the interests of our planet, we need to find materials that can be produced with less waste, using abundant elements that can be recycled with greater efficiency. In the development of new chemical sensors, issues are sensitivity, longevity, and selectivity. In the automotive area, high power density, low fuel consumption, low emission of greenhouse gases, and lightweight aerodynamic bodies with a high degree of recyclability are some of the goals. Other questions are too preposterous to even pose at present!
With a firm understanding of the principles on which materials research is based, we can proceed confidently into the future with new materials and processes.
COMMENT: MATERIALS SUSTAINABILITY
It is humbling to realize that everything around us is made of fewer than a hundred types of atoms, giving rise to enormous varieties of materials and objects. As materials scientists, we should embrace the concept that virtually all of our building materials come from the earth and atmosphere, and will return there after we are done with them.
However, precious materials can become “lost” through use, a matter to consider when we take into account that the earth’s supply of mate-rials is not limitless (see Table 1.1). So many of our natural resources have been mined and then implemented into “disposable” products that landfill sites now are one of the richer sources of elements such as copper. At the present rate of consumption, it is estimated that the world supply of indium will be exhausted—that is, dispersed widely in items such as indium tin oxide coatings and indium gallium arsenide semiconductors—by 2020.
With these factors in mind, forward-thinking architect William McDonough, along with chemist Michael Braungart, have introduced the “Cradle to Cradle” concept of ecologically intelligent design. In their vision, the “waste” of one process becomes the input material of another. For example, they have been working with the chemical com-pany BASF to retrieve and reuse Nylon 6 in closed loop cycles. The “used” Nylon 6, (e.g., from old carpets) is depolymerized and then “upcycled” into a product of higher quality, rather than being down-cycled into a material with less value. There is considerable promise for other manufacturing and industrial processes making use of similar concepts.

8 PhysicalPropertiesofMaterials
1.5 Structures of Materials
One of the most basic properties of materials, underlying almost all mate-rial properties, is structure. This can range from the random “organiza-tion” of an amorphous material to the beautiful morphology associated with a crystal. As a basis for the properties of materials presented in the coming chapters, here we present some of the basics of crystal structures. Noncrystalline structures, such as quasicrystals and glasses, are intro-duced in later chapters.
It has been known since ancient times that the smallest building blocks in nature, when packed together in regular structures, often result in beautiful crystals. We now know, especially based on x-ray diffraction studies, that the number of ways in which atoms can pack in a regular fashion in a crystal is not unlimited, and can be categorized according to the shape of the smallest building block that will fill space by repetitive translation, known as the unit
TABLE 1.1
Natural Abundance of Elements in the Earth’s Crust
Element Natural Abundance in the Earth’s Crust (%)
O 46.1Si 28.2Al 8.2Fe 5.6Ca 4.2Na 2.4Mg 2.3K 2.1Ti 0.57H 0.14Cu 0.005B 0.001In 2 × 10⁻⁵
Ag 1 × 10⁻⁵
Bi 2 × 10⁻⁶
Ru 1 × 10⁻⁶
He 5 × 10⁻⁷
Au, Pt, Ir 1 × 10⁻⁷
Te 8 × 10⁻⁸
Rh 4 × 10⁻⁸
Source: Data from Encyclopedia Britannica, Inc.Note: As originally deduced by the geochemist, Frank W. Clarke
(1847–1931), and extended by others.
www.ebook3000.com

IntroductiontoMaterialsScience 9
cell. The lengths of the unit cell are designated a, b, and c, and the correspond-ing angles are α, β, and γ, as defined in Figure 1.3.
Of all the possible unit cell shapes, only certain categories pack together tightly to fill space. These are known as the seven crystal classes, as described by Table 1.2.
COMMENT: UNITS AND UNIT PRESENTATION
For the most part, units in this book are given according to Système International (SI) conventions. Fundamental physical constants are given in Appendix 1, and unit conversions are presented in Appendix 2.
The presentation of units in tables and graphs in this book is accord-ing to quantity calculus (i.e., the algebraic manipulation method), as rec-ommended by IUPAC. Briefly, a quantity is treated as a product of its value and its units:
quantity = value × units (1.1)
so, for example, the value of the strength/density ratio for composites (Figure 1.2) is 1 × 10⁶ Pa kg–1 m3:
strength/density = 1 × 10⁶ Pa kg–1 m3 (1.2)
so the value (=1) plotted on the y-axis in Figure 1.2 is given by:
1 = (strength/density)/(106 Pa kg–1 m3)
Labels on graphs and tables are treated similarly throughout this book.*
* See M.A. White, 1998. Quantity calculus: Unambiguous presentation of data in tables and graphs. Journal of Chemical Education 75, 607.
c
b
a
β α
γ
FIGURE 1.3Dimensions and angles for a generalized unit cell.

10 PhysicalPropertiesofMaterials
For several of the members of the crystal classes, there are different types of unit cells, giving a total of 14 possible Bravais lattices, as shown in Figure 1.4.
By combining all possible symmetry elements with the 14 Bravais lattices, we get 230 space groups that can be used to classify crystal structures.
1.6 Problems
1.1 The packing fraction, F, of a crystal lattice is defined as the frac-tion of space that is filled, that is,
FVV
= filled
total
(1.3)
where Vfilled is the volume occupied by the atoms, and Vtotal is the total volume of the unit cell. Calculate the packing fraction for:
a. a simple cubic unit cell; b. a body-centered cubic unit cell; c. a face-centered cubic unit cell; d. a hexagonal unit cell.
1.2 In 2002, the price of indium was ∼US$100 kg−1 and yet the price reached over US$1000 kg−1 within the following few years. Suggest reasons for this increase.
TABLE 1.2
Crystal Classes
System Unit Cell
Cubic a = b = cα = β = γ = 90°
Tetragonal a = b ≠ cα = β = γ = 90°
Orthorhombic a ≠ b ≠ cα = β = γ = 90°
Rhombohedral (also called trigonal)
a = b = c α = β = γ ≠ 90°<120°
Hexagonal a = b ≠ c
α = β = 90°, γ = 120°
Monoclinic a ≠ b ≠ cα = γ = 90°; β ≠ 90°
Triclinic a ≠ b ≠ cα ≠ β ≠ γ ≠ 90°
www.ebook3000.com

IntroductiontoMaterialsScience 11
Further Reading
See also the lists at the end of individual chapters.
General References
General sources include: Advanced Materials, Annual Review of Materials Science, Chemical and Engineering News, Chemistry of Materials, Journal of Chemical Education, Journal of Materials Education, Materials Research Society (MRS) Bulletin, Materials Today, Physics Today, Scientific American.
Dictionary of Materials Science, 2003. McGraw-Hill, New York.The Encyclopedia of Advanced Materials, 1994. Pergamon Press, Oxford.Scientific American, September 1967. Special Issue: Materials.Scientific American, October 1986. Special Issue: Advanced Materials and the Economy.H. R. Allcock, 2008. Introduction to Materials Chemistry. John Wiley & Sons, Hoboken,
NJ.M. Alpert, S. Ashley, G. P. Collins, C. Ezzell, M. Fischetti, W. W. Gibbs, M. May, P. E. Ross,
and G. Stix, 2002. Chemical and Materials. Scientific American, December 2002, 48.
Simple Body-centered
Simple Body-centered
Face-centered
Simple Body-centered Face-centeredEnd-centered
Simple End-centered
Cubica = b = cα = β = γ = 90º
Tetragonala = b ≠ cα = β = γ = 90º
Orthorhombica ≠ b ≠ cα = β = γ = 90º
Rhombohedrala = b = cα = β = γ ≠ 90º < 120º
Hexagonala = b ≠ cα = β = 90ºγ = 120º
Triclinica ≠ b ≠ cα ≠ β ≠ γ
Monoclinica ≠ b ≠ cα = γ = 90º ≠ β
FIGURE 1.4The 14 Bravais lattice types.
12 PhysicalPropertiesofMaterials
I. Amato, 2006. The Gorgeous Inside Stories of Metal. Chemical and Engineering News, May 15, 2006, 14.
M. Ashby and K. Johnson, 2002. Materials and Design. Elsevier, Oxford.P. Ball, 1997. Made to Measure. Princeton University Press, Princeton.A. Barton, 1997. States of Matter: States of Mind. Institute of Physics Publishing, Bristol,
UK.L. A. Bloomfield, 1997. How Things Work. John Wiley & Sons, Hoboken, NJ.R. W. Cahn, P. Haasen, and E. J. Kramer, Eds., 2006. Materials Science and Technology: A
Comprehensive Treatment. John Wiley & Sons, Hoboken, NJ.R. W. Cahn, 2001. The Coming of Materials. Pergamon, Oxford.W. D. Callister, Jr. and D. G. Rethwisch, 2010. Materials Science and Engineering: An
Introduction, 8th ed. John Wiley & Sons, Hoboken, NJ.B. S. Chandrasekhar, 1998. Why Things Are the Way They Are. Cambridge University
Press, Cambridge.R. Cotterill, 2008. The Material World. Cambridge University Press, Cambridge.M. de Podesta, 2002. Understanding the Properties of Matter, 2nd ed. Taylor & Francis,
Washington.J. P. Droske and C. E. Carraher, Jr., 2006. Polymers: Cornerstones of construction.
Journal of Chemical Education 83, 1428.A. B. Ellis, M. J. Geselbracht, B. J. Johnson, G. C. Lisensky, and W. R. Robinson, 1993.
Teaching General Chemistry: A Materials Science Companion. American Chemical Society, Washington.
A. C. Fischer-Cripps, 2008. The Materials Physics Companion. Taylor & Francis, Washington.
M. C. Flemings and R. W. Cahn, 2000. Organization and trends in materials science and engineering education in the US and Europe. Acta Materialia 48, 371.
J. I. Gersten and F. W. Smith, 2007. The Physics and Chemistry of Materials. John Wiley & Sons, Hoboken, NJ.
D. L. Goodstein, 1985. States of Matter. Dover, New York.M. Gross, 2005. Where Biology Meets Chemistry. Chemical World, November 2005, 46.L. V. Interrante, L. A. Casper, and A. B. Ellis, Eds., 1995. Materials Chemistry. American
Chemical Society, Washington.L. V. Interrante and M. J. Hampden-Smith, Eds., 1998. Chemistry of Advanced Materials:
An Overview. Wiley-VCH, Hoboken, NJ.I. P. Jones, 2001. Materials Science for Electrical and Electronic Engineers. Oxford
University Press, New York.J. S. Langer, 1992. Issues and Opportunities in Materials Research. Physics Today,
October 1992, 24.D. C. MacLaren and M. A. White, 2003. The chemistry of cement. Journal of Chemical
Education, 80, 623.J. P. Mercier, G. Zambelli, and W. Kurz, 2004. Introduction to Materials Science. Elsevier,
Oxford.W. J. Moore, 1967. Seven Solid States. W.A. Benjamin, New York.W. W. Mullins, 1996. Remarks on the Evolution of Materials Science. Materials Research
Society Bulletin, July 1996, 20.R. J. Naumann, 2009. Introduction to the Physics and Chemistry of Materials. Taylor &
Francis, Washington.J. W. Nicholson and H. M. Anstice, 1999. The chemistry of modern dental filling mate-
rials. Journal of Chemical Education, 76, 1497.
www.ebook3000.com

IntroductiontoMaterialsScience 13
G. A. Ozin, A. C. Arsenault, and L. Cademartiri, 2009. Nanochemistry. Royal Society of Chemistry, Cambridge.
D. W. Pashley, Ed., 2001. Imperial College Inaugural Lectures in Materials Science and Engineering. Imperial College Press, London.
S. L. Sass, 1998. The Substance of Civilization: Materials and Human History from the Stone Age to the Age of Silicon. Arcade Publishing, New York.
L. E. Smart and E. A. Moore, 2005. Solid State Chemistry, 3rd ed., CRC Press, Boca Raton, FL.
P. A. Thrower, 1992. Materials in Today’s World. McGraw-Hill, New York.M. A. White, 2006. Concrete. Journal of Chemical Education, 83, 1425.D. B. Williams, A. R. Pelton, and R. Gronsky, 1991. Images of Materials. Oxford
University Press, New York.A. Wold and K. Dwight, 1993. Solid State Chemistry: Synthesis, Structure, and Properties
of Selected Oxides and Sulphides. Chapman & Hall, New York.
Biomaterials
Special Issue on Biomaterials. Chemistry in Britain, March 1992.
Sustainable Materials Approaches
M. Ashby, 2009. Materials and the Environment. Elsevier, Oxford.D. Cohen, 2007. Earth’s Natural Wealth: An Audit, New Scientist, May 23, 2007, 34.W. McDonough and M. Braungart, 2002. Cradle to Cradle: Remaking the Way We Make
Things. North Point Press, New York.
Reference Textbooks
M. F. Ashby and D. H. R. Jones, 2006. Engineering Materials 2: An Introduction to Microstructures, Processing and Design. 3rd ed. Elsevier, Oxford.
D. J. Barber and R. Loudon, 1989. An Introduction to the Properties of Condensed Matter. Cambridge University Press, Cambridge.
R. S. Berry, S. A. Rice, and J. Ross, 2000. Physical Chemistry. 2nd ed. Oxford University Press, New York.
R. J. Borg and G. J. Dienes, 1992. The Physical Chemistry of Solids. Academic Press, Oxford.D. W. Bruce and D. O’Hare, Eds., 1997. Inorganic Materials. John Wiley & Sons,
Hoboken, NJ.A. K. Cheetham and P. Day, Eds., 1992. Solid State Chemistry: Compounds. Clarendon
Press, Oxford.J. H. W. de Wit, A. Demaid, and M. Onillon, Eds., 1992. Case Studies in Manufacturing
with Advanced Materials, Vols. 1 and 2. North-Holland, Amsterdam.R. A. Dunlap, 1988. Experimental Physics: Modern Methods. Oxford University Press,
New York.H. F. Franzen, 1994. Physical Chemistry of Solids: Basic Principles of Symmetry and Stability
of Crystalline Solids. World Scientific, Singapore.D. Gay and S. V. Hoa, 2007. Composite Materials. CRC Press, Boca Raton, FL.J. I. Gersten, 2001. The Physics and Chemistry of Materials. John Wiley & Sons, Hoboken,
NJ.
14 PhysicalPropertiesofMaterials
A. Guinier and R. Jullien, 1989. The Solid State. Oxford University Press, New York.G. G. Hall, 1991. Molecular Solid State Physics. Springer-Verlag, New York.R. A. Higgins, 1994. Properties of Engineering Materials. 2nd ed. Industrial Press,
New York.R. E. Hummel, 2004. Understanding Materials Science. 2nd ed. Springer, New York.C. Kittel, 2005. Introduction to Solid State Physics, 8th ed. John Wiley & Sons, Hoboken,
NJ.J. P. Mercier, G. Zambelli, and W. Kurz, 2003. Introduction to Materials Science. Elsevier,
Oxford.R. J. Naumann, 2008. Introduction to the Physics and Chemistry of Materials. CRC Press,
Boca Raton, FL.R. J. Newnham, 2005. Properties of Materials: Anisotropy, Symmetry, Structure. Oxford
University Press, New York.D. V. Ragone, 1995. Thermodynamics of Materials, Vols. I and II. John Wiley & Sons,
Hoboken, NJ.C. N. R. Rao, Ed., 1993. Chemistry of Advanced Materials. Blackwell Scientific
Publications, Oxford.C. N. R. Rao and J. Gopalakrishnan, 1997. New Directions in Solid State Chemistry.
Cambridge University Press, Cambridge.R. M. A. Roque-Malherbe, 2009. The Physical Chemistry of Materials. CRC Press, Boca
Raton, FL.H. M. Rosenberg, 1988. The Solid State, 3rd ed. Oxford University Press, New York.J. F. Shackelford, 2004. Introduction to Materials Science for Engineers, 6th ed. Prentice
Hall, Upper Saddle River, NJ.J. F. Shackelford and W. Alexander, 2000. The CRC Materials Science and Engineering
Handbook, 3rd ed. CRC Press, Boca Raton, FL.J. P. Sibilia, 1996. A Guide to Materials Characterization and Chemical Analysis. 2nd ed.
Wiley-VCH, Hoboken, NJ.L. E. Smart and E. A. Moore, 2005. Solid State Chemistry: An Introduction. 3rd ed. CRC
Press, Boca Raton, FL.W. F. Smith, 2004. Foundations of Materials Science and Engineering, 3rd ed. McGraw-
Hill, New York.D. Tabor, 1991. Gases, Liquids and Solids and Other States of Matter, 3rd ed. Cambridge
University Press, Cambridge.R. J. D. Tilley, 2004. Understanding Solids: The Science of Materials. John Wiley & Sons,
Hoboken, NJ.L. H. Van Vlack, 1989. Elements of Materials Science and Engineering, 6th ed. Addison-
Wesley, Reading, MA.A. J. Walton, 1983. Three Phases of Matter, 2nd ed. Oxford University Press,
New York.M. T. Weller, 1994. Inorganic Materials Chemistry. Oxford University Press, New York.J. K. Wessel, Ed. 2004. The Handbook of Advanced Materials: Enabling New Designs. John
Wiley & Sons, Hoboken, NJ.
Structure/Crystallography
MRS Bulletin, 1999. Special Issue: Synchrotron Radiation Techniques as Tools for In Situ Characterization in Materials Processing. January 1999.
www.ebook3000.com

IntroductiontoMaterialsScience 15
MRS Bulletin, 1999. Special Issue: Neutron Scattering in Materials Research. December 1999.
S.-W. Chen and M. Kotlarchyk, 2007. Interactions of Photons and Neutrons with Matter. World Scientific, Singapore.
Interactive Media
C. J. McMahon, Jr., 1996. Interactive Glossary for Materials Science and Engineering. Merion Media, Enfield, NH.
J. C. Russ, 1996. Materials Science: A Multimedia Approach (CD-ROM). PWS Publishing, Boston.
Web Sites
http://www.howstuffworks.com (a useful website concerning the workings of many things).
http://goldbook.iupac.org/src_G.B..html (a useful website from IUPAC concerning quantities, units and symbols).
http://www.mcdonough.com/ (a useful website concerning Cradle to Cradle approaches).

Part II
Color and Other Optical Properties of Materials
It is the pure white diamond Dante broughtTo Beatrice; the sapphire Laura woreWhen Petrarch cut it sparkling out of thought;The ruby Shakespeare hewed from his heart’s core;The dark, deep emerald that Rosetti wroughtFor his own soul, to wear for evermore.
Eugene Lee-Hamilton“What Is a Sonnet?”

19
2AtomicandMolecularOriginsofColor
2.1 Introduction
For many, the colors in nature and in the laboratory are one of the inspirations for studying science. Perhaps this is partly because of our perception of color. Including hue, saturation, brightness, and intensity, we can distinguish about 10 million colors with our eyes. Few laboratory-built detectors are as sensitive!
Color in materials is caused by interactions of light waves with atoms, and especially with their electrons. In fact, color is a manifestation of many subtle effects that are important in determining the structure of matter.
In practical terms, it is the relative contributions of light of various wave-lengths that determine the color of a material. In order to pursue this further, it is useful to review the electromagnetic spectrum (Figure 2.1), keeping in mind that light is an electromagnetic wave. The energy of the radiation, E, is related to its wavelength, λ, and frequency, ν, by*
E hhc
= =νλ
(2.1)
where h is Planck’s constant and c is the speed of light. (See Appendix 1 for values of physical constants.)
As shown by Equation 2.1, when the wavelength is longer, the energy per photon is lower. Very long wavelength radiation (e.g., a radio wave) passes through us without damage, whereas radiation that does biological damage is of much shorter wavelength and higher energy. For example, high doses of x-rays can be very damaging because their high energy can initiate unfavor-able chemical reactions in the body. It is easy to see from Equation 2.1 why it is safe to stand under an infrared lamp to dry oneself after a bath, but an ultraviolet (UV) light requires more safeguards.
Color is often the result of transitions between electronic states; this can involve energy absorption or emission. Most sources of color can be categorized as originating from absorption or emission of light, and it
* The most important equations in this chapter are designated with ▮ to the left of the equation.

20 PhysicalPropertiesofMaterials
is useful to keep in mind which of these dominates in the discussion in this chapter, and in Chapters 3, 4, and 5. A useful general consideration is that emission can be seen in the dark, whereas absorption requires a source of light. (Color also can arise from either transmission or reflec-tion of light [see Comment: Transmission or Reflection?]. Other sources of color are light scattering, dispersion, and interference; these are dis-cussed in Chapter 4.) In considering these changes in states, it is useful to keep in mind that electronic states are much more widely separated than vibrational states, which are themselves more widely separated than rotational states. This is shown schematically in Figure 2.2. If an electronic transition involves core electrons or localized electrons in a closed-shell electron configuration, the energy involved is so high that it will be in the UV or even in the x-ray region of the electromagnetic spectrum. Many colors that we see are caused by electronic transitions involving valence electrons, the electrons that form chemical bonds, as these transitions can be at low enough energy for us to see their effects with our eyes.
In this chapter, we introduce atomic and molecular origins of color in insu-lating materials.
Cosm
ic ra
ys
X-ra
ys
γ-ra
ys
UV
IR Far I
R
Mic
row
aves
Radi
o
Viol
et
Blue
Gre
en
Yello
wO
rang
e
Red
1020 1015
10–15 10–10 10–5 100 105
1010 105ν/s–1
λ/m
Visible region
λ = 400 nm λ = 700 nm
FIGURE 2.1The electromagnetic spectrum. Note that the boundaries between regions are not sharp and the spacing of the visible colors is not even.
www.ebook3000.com

AtomicandMolecularOriginsofColor 21
COMMENT: TRANSMISSION OR REFLECTION?
When an opaque material derives its color primarily from absorption of light, the color observed is due to the absorption of certain colors from the ambient white light. The light that reaches the eye and causes color perception is due to reflection and scattering, and it is depleted of the absorbed color(s). The color observed is the complementary color (see Figure 2.3) to the color that is absorbed.
If a material is transparent, we may perceive its color due to the wave-lengths of light that are transmitted. Again, relative to ambient light,
Ener
gy
E1
E0 Rot.
v3ʹ
v2ʹ
v1ʹv0ʹ
v3
v2
v1v0
≈ 10,000 cm–1
≈ 1000 cm–1
≈ 5 cm–1
FIGURE 2.2Schematic representations of the relative spacings of electronic energy levels (marked E0 and E1 ), vibrational energy levels (marked v0, v1, … and v0 , v1 , …) and rotational energy levels (marked Rot.). The approximate energies are given in units of cm–1, called wavenumbers and abbreviated �ν , where �ν = 1/λ. 1 cm–1 = 1.239 × 10⁻⁴ eV = 1.985 × 10⁻²³ J.
OrangeYellow
Green
BlueIndigo
Violet
Red
FIGURE 2.3The “color wheel” of Newton. Colors opposite to each other are complementary. If one color is absorbed by a material, the reflected light will make the material appear the complementary color to the color absorbed.

22 PhysicalPropertiesofMaterials
2.2 Atomic Transitions
Electronic transitions within a given atom can give rise to color through emis-sion of light. A well-known example of atomic emission is the yellow color of sodium in the flame test for this element. The ground electronic configura-tion of Na is 1s22s22p63s1, so the “outermost” electron is the 3s1 electron. The ground state of this valence electron has two closely spaced energy levels above it, one 2.105 eV above the 3s1 level, and one 2.103 eV above the 3s1 level. (The electron volt, or eV, is a convenient method for measuring energies of electrons. 1 eV = 1.602 × 10⁻¹⁹ J; see Appendix 2 for more energy conversions.)
the transmitted light will be depleted in the colors of the absorbed light. Looking through this material, it will appear as the color that complements the absorbed color or colors.
If the color of a transparent object is due only to absorption, the trans-mitted and reflected colors would be the same. However, surface reflec-tivity can have some dependence on wavelength, and this can lead to different colors in reflection and transmission. Reflection and trans-mission are illustrated in Figure 2.4.
Incident light
Transmitted light
Reflected light
FIGURE 2.4Some light is reflected from a material, and other light is transmitted. Surface scattering and internal scattering are omitted here.
Excitedstates
3p 2.105 eV3p 2.103 eV
3sGround state
FIGURE 2.5The electronic energy levels of Na. Excitation is caused by heat, and emission of yellow light results. The separation between the excited states is exaggerated in this diagram.
www.ebook3000.com

AtomicandMolecularOriginsofColor 23
The corresponding wavelengths of light of these energies are 589.1 and 589.6 nm, where, of course, the longer wavelength corresponds to the lower energy emission shown in Figure 2.5.
These wavelengths of light emitted from excited sodium atoms, at about 590 nm, correspond to the yellow part of visible light. Therefore, when a sodium-containing material is heated in a flame such that 3s1 electrons are promoted to the 3p excited levels, each electron can then return to the ground state (3s1 configuration), concurrent with emission of yellow light. This light is often referred to as the sodium D line, in reference to it being the fourth prominent line (hence D line) recorded by Fraunhofer* as missing from the otherwise nearly continuous emission from sunlight. We now know that this wavelength of light is missing because it is absorbed by sodium atoms pres-ent in the sun’s atmosphere. Close examination also shows that the D “line” is really two closely spaced absorptions (see Figure 2.5).
The light emitted in this way from an atom is characteristic of the par-ticular element because each element has its own characteristic electronic energy levels. For example, the red glow of a neon sign is characteristic of the electronic energy scheme of Ne. The blue color of a mercury lamp is caused by two emissions, one green and one violet (green and violet mixed together produce blue). Other examples of colors arising from atomic emis-sion include the colors of lasers making use of monatomic gases (such as the Ar-ion laser). In addition, lightning and arcs (e.g., around spark welding or a skate-sharpening device) derive some of their color from electronic excita-tions of the atoms in the surrounding gases. Northern lights (aurora borealis) arise from atomic emissions caused by interaction of atmospheric atoms or molecules (mostly oxygen, nitrogen, and hydrogen) with solar wind, that is, charged species from the sun entering our atmosphere. Emissions from various elements are used in fireworks—for example, strontium for red and barium for green.
In general, gases have relatively sharp emission and absorption lines (see Figure 2.6). This is, at least in part, caused by the low density of gas mole-cules because at higher pressures there would be more collisions that would increase the linewidth.
2.3 Black-Body Radiation
As the name implies, black-body radiation also involves emission. Whereas gases have sharp emission lines, condensed matter (solids and liquids) usu-
* Joseph Fraunhofer (1787–1826) was a German physicist who studied optical properties of matter in order to design and produce fine optical and mechanical instruments.

24 PhysicalPropertiesofMaterials
ally gives a broad emission over a wide range of wavelengths. This is shown schematically in Figure 2.6.
A “black body” is an idealized material that absorbs light of all wave-lengths (it does not reflect or transmit any light, hence the adjective “black”), and it also is a perfect emitter of light of all wavelengths. The study of the intensity distribution of radiation from black bodies by Max Planck* in 1900 led to the development of the quantum theory. An ideal black body emits a “spectrum” of light, and this spectrum depends only on the temperature of the black body. Black-body radiation is often referred to as incandescence.
For example, at T = 0 K, all the atoms and subatomic particles in the black body are in their ground state, so there can be no light emitted at any wavelength.
At a temperature T, where T > 0 K, the occupancy of states from which the black body can emit light depends on the energy of the state. The body both absorbs and emits light, but when its temperature exceeds the temperature of the surroundings, emission will dominate. Therefore, there is a distribution of emission (spectrum) as shown in Figure 2.7.
As the temperature is increased, the distribution of emitted light moves, as shown in Figure 2.7, such that the maximum intensity is at shorter wave-length (higher energy) at the higher temperature. Of course, because of the higher occupancy of excited states at the higher temperature, the overall intensity of emitted light (i.e., the area under the entire curve) is greater at higher temperature than at lower temperature.
The exact spectrum is determined solely by the temperature of the ideal black-body emitter, independent of the type of material. This can be of con-siderable importance.
* Max Karl Ludwig Planck (1858–1947) was a German theoretical physicist who made major contributions to the fields of thermodynamics, electrodynamics, radiation theory, and rela-tivity. He also contributed to the philosophy of science and was an accomplished musician. He was awarded the 1918 Nobel Prize in Physics for the discovery of energy quanta.
Emitt
ance
Emitt
ance
Wavelength Energy
Wavelength Energy
Gas Solid(a) (b)
FIGURE 2.6Schematic emissions from (a) a gas and (b) a solid.
www.ebook3000.com

AtomicandMolecularOriginsofColor 25
At room temperature, black-body radiation is negligible to our eyes. At a temperature of about 700°C, the emission maximum is still in the infra-red (IR) region, but some long wavelength (red) light is perceptible and an object at this temperature glows red. We are familiar with this in glowing red embers in a fire. As the temperature of the black-body emitter increases, the “glow” moves from red to orange to yellow to white (the spectrum covers the whole visible range, and when all colors are emitted, it appears to be white*) to very pale blue. The progression of the emission over a range of tempera-tures is shown in Figure 2.8.
Examples of color caused by black-body radiation can be found in high-temperature bodies in our world. For example, carbon of a candle flame or log on a fire glows orange-yellow at a temperature of about 1700°C. The tungsten filament of an incandescent light bulb glows yellow-white at a temperature of about 2200°C. The filament of a flash bulb provides virtu-ally “white” light because it is at a higher temperature still, about 4000°C. The light appears white because its emission peak covers the whole vis-ible range and almost exactly matches the sensitivity of the eye to various colors.
As mentioned earlier, the ideal black-body radiation spectrum is charac-teristic of the temperature of an object and does not depend on the type of material. This knowledge, combined with a chance observation of unexpect-edly high levels of radiation at a particular wavelength, led researchers from Bell Labs to determine that the average temperature of our universe is 3 K, a souvenir of the Big Bang that is thought to have created the universe 12 bil-
* When white light is broken into its parts (e.g., with a prism) it can be seen to be composed of red, orange, yellow, green, blue, and violet constituents. In a similar but reverse manner, when all of the colors of the rainbow are emitted, they combine to produce white light.
10–6 10–5 10–4
λ/m
Emitt
ance
T = 400 K
T = 300 K
FIGURE 2.7Typical ideal black-body radiation spectra at two temperatures. Note the increase in the emit-ted radiation (curve area) and the shift in the peak to lower wavelength (higher energy) when the temperature is increased.

26 PhysicalPropertiesofMaterials
lion years ago. The discovery of this black-body radiation has considerably advanced theories of the origins of our universe.*
2.4 Vibrational Transitions as a Source of Color
In general, vibrational transitions are relatively rare as a source of color to our eyes. The energies of most vibrational excitations fall in the infrared region, so this does not noticeably affect the color of white light that falls upon a sample. However, there are some exceptions, and one rather prominent one in our lives is H2O, both in the liquid and solid state.
Excitation of a complex many-molecule motion in the hydrogen-bonding network in water or in ice involves absorption of a little red-orange light. This is a rather high-energy excitation (higher energy than the usual IR range for molecular vibrations) because the excitation is to a highly excited vibrational overtone (i.e., leading to a much higher vibrational level). The absorption of red-orange light depletes white light of red-orange and leaves
* For further details, see Jeremy Bernstein, 1984. Three Degrees above Zero: Bell Labs in the Information Age. Charles Scribner’s Sons, New York.
Emitt
ance
10–8 10–7 10–6 10–5 10–4
T = 30,000 K
T = 10,000 K×250
T = 3000 K×105 T = 1000 K
×2.5 × 107
T = 300 K×1010
Violet Red
λ/m
FIGURE 2.8Black-body radiation as a function of temperature, highlighting how the color changes as the temperature changes from T = 300 K to T = 30,000 K. In order to have all the peaks appear to have approximately the same area, the emittance values at lower temperatures have been multiplied by the factors shown in the figure. Note the shift in the peak to longer wavelength (lower energy) and the much smaller peak area with lower temperature.
www.ebook3000.com

AtomicandMolecularOriginsofColor 27
the complementary green-blue color. (The visible colors and their comple-ments were shown in Figure 2.3.)
The absorbance, A, is related to the incident light intensity, I0, and the exit-ing light intensity, I, through the Beer*–Lambert† law (also known as the Beer–Bouger‡–Lambert law):
log100II
A c l= = ε (2.2)
where ε is the absorption coefficient, c is the concentration, and l is the length of the sample in the light path. Because ε is rather small for this excitation in H2O, it takes a large path length, l, to produce a detectable color. We are familiar with this, as a glass of water and an ice cube both appear colorless, whereas the blue color of light observed through a large body of water or through ice in a glacier is readily apparent. For example, with a 3-m path length, 56% of incident red light is absorbed by water and the liquid appears blue-green in transmitted light. (The color of water seen in reflection is caused by both absorption of red light and light scattering; see Chapter 4 for a discussion of the latter effect.)
Although vibrational excitation is not a common source of visible color, it gives water its familiar color.
2.5 Crystal Field Colors
Another case of absorption as a source of color involves ions present in sol-ids. These may be ions in a pure solid or impurity ions.
When atoms are free, as in the gas phase, we have seen that their valence elec-trons can be thermally excited, giving rise to emission colors, as in the case of sodium in a flame. However, when valence electrons combine with one another to form chemical bonds, the ground state energy of the atom is lowered and much more energy is then required to promote the electrons to excited states. In many compounds the outermost electrons are so stabilized by chemical bond-ing that their excitation takes energy in the UV region, so no visible color is associated with these materials, although they do absorb UV light.
One exception is compounds containing transition metals with incomplete d-shells. The excitation of these valence electrons can fall in the visible region of the spectrum, and these compounds can have beautiful colors. This is also true
* August Beer (1825–1863) was a German physicist and optical researcher who worked at Bonn University.
† Johann Heinrich Lambert (1728–1777) was a German mathematical physicist who discovered a method for measuring light intensities.
‡ Pierre Bouger (1698–1758) was a French mathematician who invented the photometer.

28 PhysicalPropertiesofMaterials
of compounds containing transition metal impurity ions. For example, the well-known cobalt blue pigment derives its color from excitation of the cobalt ions.
All electronic energy levels are sensitive to their environment; electrostatic and other interactions can make the levels move relative to one another. An ion in the electric field in a crystal (i.e., in a crystal field, or, if the field arises from the presence of ligands, it is called a ligand field) can have different energy levels from the free ion. The interaction of an ion with an electric field can provide information concerning the electronic environment of the ion. In the cases considered here, the crystal field can give rise to observable colors.
The Cr3+ ion in ruby lies at the center of a distorted octahedron of O2– ions. The Cr–O distance is about 1.9 Å, and the Cr–O bonds are quite ionic (esti-mated at more than 50% ionic character), so the Cr3+ ion exists in a strong electric potential (crystal field). The effect of the crystal field on the electronic energy levels of Cr3+ is shown in Figure 2.9.
At the crystal field strength of Cr3+ in ruby, the higher-energy absorption is in the violet region of the spectrum, and the lower-energy absorption is yellow-green. Therefore, white light is depleted of violet and yellow-green, and ruby appears red. The main color of ruby is due to absorption of violet and yellow-green light; it is only coincidental that the color of fluorescence* in ruby (Figure 2.9) also is red.
Interestingly, emeralds, which are green, derive their color from Cr3+ ions, this time in a material with composition Be3Al2Si6O8 (known as beryl when pure). The Cr3+ in this structure is in a very similar environment to that in ruby, but it experiences a different crystal field strength. The difference in color subtly illustrates the importance of the magnitude of the crystal field strength. Determination of whether the crystal field strength is less than or greater than in ruby is left as an exercise for the reader.
* See Section 2.7 for a discussion of fluorescence.
Viol
et
Cr3+
in ru
by
Yello
w-g
reen
Abs
orpt
ions
Fluo
resc
ence
Emiss
ions
(hea
t)4T1
4T2
4A2g
4T1
4T2
2E2E
3
2
1
0
3
2
1
0Crystal field strength
Ener
gy/e
V
Ener
gy/e
V
FIGURE 2.9The effect of crystal field strength on the splitting of the energy levels of Cr3+ ions in a lattice. (Styled after K. Nassau, 1980. Scientific American, October 1980, 134.)
www.ebook3000.com

AtomicandMolecularOriginsofColor 29
Electronic transitions of other ions in solids can give rise to crystal field colors. Some further examples are alexandrite (Cr3+ in BeAl2O4), aquama-rine (Fe3+ in Be3Al2Si6O18), jadeite form of jade (Fe3+ in NaAl(SiO3)2), citrine quartz (Fe3+ in SiO2), blue and green azurite (Cu3(CO3)2(OH)2), malachite (Cu2CO3(OH)2), and red garnets (Fe3Al2(SiO4)3). In the last three cases, the color comes from the transition metal ions (Cu2+ or Fe2+) of the pure salt rather than impurity ions. When the color of a mineral is inherent (said to be ideochromatic; the color will remain even if finely divided), it is often caused by its pure composition, which is usually independent of the origin of the mineral. A mineral of variable color (called allochromatic) generally derives its color from impurities (also called dopants) or other factors that depend on location and geological history.
2.6 Color Centers (F-Centers)
Electronic excitation can give rise to visible colors, but the electrons being excited do not need to be bound to ions; they also could be “free.” For exam-ple, the “electric blue” color of Na dissolved in liquid ammonia comes from
COMMENT: DEFECTS IN CRYSTALS
In contrast with the perfect crystalline structures shown in Figure 1.4, real crystals have imperfections. These can be point defects (i.e., occupational imperfections) or line defects (i.e., imperfections in trans-lational symmetry). Some examples are shown in Figure 2.10. ( See also Chapter 14.)
Defects play an important role in crystals and can greatly modify optical, thermal, electrical, magnetic, and mechanical properties. For example, photovoltaic solar cells rely on defects (see Chapter 3).
FIGURE 2.10Defects in a solid: (a) point defect due to impurity (shown as a lighter-colored atom); (b) line defect due to a packing fault.

30 PhysicalPropertiesofMaterials
the absorption of light in the yellow region by solvated electrons in solution (the solution contains NH3, Na+, and e–).
Unattached electrons also can exist in solids. For example, if there is a structural defect, such as a missing anion, an electron can locate itself in the anion’s usual position, as shown in Figure 2.11 for the salt M+X–.
An “extra” electron also could be associated with an impurity of mis-matched valence. For example, if Mg2+ is an impurity in the M+X– lattice, there would be an extra electron located near Mg2+ to balance electrical charge, as shown in Figure 2.12.
Similarly, the absence of an electron, which is termed a hole (See Figure 2.13), locates itself near an impurity ion or structural defect. Holes are as important as electrons in discussion of electrical properties of solids because both electrons and holes are charge carriers. Whereas electrons carry nega-tive charge, holes carry positive charge (see Comment: Holes).
M+
X– X–
X– X–
M+
M+
M+
M+
M+
M+Mg2+
e–
M+
FIGURE 2.12Presence of an extra electron associated with a hypervalent impurity (i.e., an impurity with an extra charge, shown here as Mg2+) in the idealized two-dimensional salt MX.
M+
M+
M+
M+
X– X–
X–e–
M+
M+
M+
M+
M+
FIGURE 2.11Presence of a trapped electron in an idealized two-dimensional lattice of salt MX.
www.ebook3000.com

AtomicandMolecularOriginsofColor 31
Extra charge centers (electrons or holes) are called color centers or some-times F-centers (“F” is an abbreviation of “Farbe,” the German word for “color”). They give rise to color centers because the excitation of electrons (or holes) falls in the visible range of the spectrum.
As an example, consider the sometimes violet color of fluorite, CaF2. This color arises when some F– ions are missing from their usual lattice sites, giv-ing rise to an extra electron in the lattice. This can happen in one of several ways: the crystal may have been grown in the presence of excess Ca; the crystal may have been exposed to high-energy radiation that displaced an ion from the usual lattice site; or the crystal may have been in an electric field that was strong enough to remove F– electrochemically. In any case, electrons exist in the places where F– would be in a perfect lattice. These electrons give rise to the color, as the electron absorbs yellow light, leaving behind a violet color.
Because a color center could arise from radiation, the intensity of the color of a material like fluorite can be used to monitor radiation dosage. This has
COMMENT: HOLES
In some ways, it is difficult to imagine holes since they are really not matter but more like the absence of matter. However, there are instances where we are familiar with the motion of the absence of matter. One example is the bubbles that are seen to rise in a fish tank. Although most of the matter in view is water, the bubbles can be considered to be an “absence of water”; as a bubble rises from the bottom to the top of the tank, the net flow of water is in the opposite direction (i.e., toward the bottom). This is similar to the case of electrons and holes: while the negative charge (electrons) flow in one direction, the positive charge (holes) “flow” in the opposite direction.
M+
M+
M+
M+
M+
M+
M+
X– X–
X–Y2–
h+
M+
M+
FIGURE 2.13A hole, h+, is present in a lattice of MX in order to compensate for the charge of the impurity Y2–.

32 PhysicalPropertiesofMaterials
laboratory applications (e.g., in radiation safety badges worn by people who work with x-rays), and it can be used in the field to determine the radiation dosage that a geological sample has received from its environment.
The color of amethyst also is caused by a color center, this time by the absorption of energy associated with the electronic energy levels of a hole. The hole exists because of the presence of Fe3+ in SiO2. Fe3+ substitutes for Si4+ in the lattice, and this requires the presence of a hole for electrical n eutrality. The energy levels of the hole allow absorption of yellow light, leaving ame-thyst with its familiar violet color. The intensity of the color is an indication of the concentration of iron impurity ions.
Color centers are often irreversibly lost on heating because increased tem-perature can mobilize imperfections and cause them to go to more regular sites. For example, amethyst turns from violet to yellow or green on heating; the loss of violet is because of the loss of the color centers, and the remain-ing color, which was there all along but was not as intense as the violet, is because the Fe3+ transition metal ion absorbs light due to crystal field effects. If it is yellow, this form is citrine quartz, described previously under crystal field effects.
2.7 Charge Delocalization, Especially Molecular Orbitals
When electrons are paired in chemical bonds, their electronic excited states are usually so high that electronic excitations are in the UV range, and these materials are not colored (i.e., there is no absorbance in the visible range). This is especially true if the pair of electrons is localized to a particular chemical bond.
In molecular systems with extensive conjugation such as alternating single and double carbon–carbon bonds, the electrons are delocalized throughout a number of chemical bonds. The electronic excitation is from the highest occupied molecular orbital (HOMO) to the lowest unoccupied molecular orbital (LUMO). For a conjugated system the HOMO–LUMO transition is of lower energy than for electrons localized to one bond; if the transition is low enough in energy, absorption of visible light can cause the promotion of an electron to this excited state. If visible light is absorbed, the material with conjugated bonds will be colored. (If only more energetic UV light is absorbed, the material might have promise as a component in a sunscreen.)
Many organic molecules derive their colors from the excitation from elec-tronic states that involve large degrees of conjugation. For example, the more than 8000 dyes in use today derive their color from this mechanism. The part of the molecule that favors color production is called a chromophore, meaning “color bearing.” The main distinction between a dye and a pigment is the state of matter: dyes are used in liquid form, whereas pigments are used as solids.
www.ebook3000.com
AtomicandMolecularOriginsofColor 33
The color of organic materials can be changed substantially by the pres-ence of electron-withdrawing and/or electron-donating side groups, as this changes the electronic energy levels. These are called auxochromes (“color enhancers”).
As an example of the dependence of the color of an organic compound on structure, we can consider the case of an organic acid-base indicator. These materials are often weak organic acids, which will be deprotonated in basic solution. The loss of the proton can be detected visually, as the color of the acid and its conjugate base can be substantially different, especially due to different degrees of delocalization. This is taken up further in Problem 2.9 at the end of this chapter.
Retinal is the pigment material of the photoreceptors in our eyes. Its color changes in the presence of light, as retinal undergoes a photo-induced trans-formation from cis-retinal to trans-retinal form. In the absence of light, it con-verts from the trans form back to the cis form, assisted by an enzyme. The dominance of the cis or the trans form signals the light level.
Another example of charge delocalization and its associated color can be seen in the case of charge transfer from one ion to another—for example, in blue sapphire. This material is Al2O3 with Fe2+ and Ti4+. An excited electronic state is formed when adjacent Fe2+ and Ti4+ ions exchange an electron to give Fe3+ and Ti3+ by a photochemically induced oxidation−reduction reaction. It takes energy of about 2 eV to reach this excited state; this corresponds to light of wavelength 620 nm. This light is yellow, and since the material is absorb-ing yellow from the incident white light, sapphire appears blue. Only a few hundredths of 1% of Fe2+ and Ti4+ are required to achieve a deep blue color. The deep colors of many mixed-valence transition metal oxides (e.g., Fe3O4, which can be represented as FeO∙Fe2O3) arise from homonuclear charge transfer mechanisms.
Some molecules with delocalized electrons also are capable of lumines-cence (i.e., light emission from a cool body*), which includes fluorescence, phosphorescence, and chemiluminescence. In fluorescence, an excited state decays to an intermediate state that differs from the ground state by an energy that corresponds to rapid emission of light in the visible range of the spectrum, as shown in Figure 2.14. An example is compounds that are added to detergents as fabric brighteners. These absorb UV components of daylight (to get to an excited state) and then fluoresce, giving off blue light. This blue light makes the material appear bright by combining with the yellow of dirt (blue and yellow are complementary colors) to give white.
Phosphorescence is the slow emission of light following excitation to a higher- energy state. Phosphorescence is discussed further in Chapter 3.
* The lower temperature of luminescence distinguishes it from incandescence associated with black-body radiation.

34 PhysicalPropertiesofMaterials
Chemiluminescence is fluorescence initiated by chemical reactions that give products in an excited state. The material may decay to its ground state energy level by a fluorescent pathway, as described earlier. An example is a glow stick. When chemiluminescence takes place in a biological system, it is referred to as bioluminescence, such as the glow of fireflies or some deep sea fish.
COMMENT: CARBONLESS COPY PAPER
Carbonless copy paper, used to make countless forms, is a 109-kg busi-ness annually, and is based on simple chemistry in which organic reac-tants change color on protonation. Copies are made when the pressure of a pen ruptures microcapsules that are coated on the lower surface of the top page. These microcapsules contain organic dye precursor molecules that, after rupture of the microcapsules, can react with a proton-donating reagent layer that is coated on the upper surface of the lower paper. In the acidic conditions, the organic dye precursor becomes colored, making a copy of the top page’s written message onto the bottom page.
COMMENT: DALTON’S COLOR BLINDNESS
In 1794, the great chemist John Dalton (1766–1844), gave the first formal account of color blindness— his own. He believed that he was unable to distinguish red from green because he had a blue tint in the vitreous humor of his eyes that could selectively absorb the long wavelengths of light. He had ordered that his eyes be examined after his death, but no blue tint was found. More recent DNA tests have shown that Dalton’s
Excited state
Intermediate state
Ground state
Fluorescence (visible light)
FIGURE 2.14Schematic representation of fluorescence.
www.ebook3000.com

AtomicandMolecularOriginsofColor 35
Light of Our Lives: A Tutorial
Probably, the most common lights in our homes have been incandescent lights. These have a wire inside them that glows when current is passed through it.
a. The early developers of light bulbs had to struggle to get bulbs that would last for a long time. Suggest some of their difficulties, and how they have been overcome.
COMMENT: LASERS
Lasers derive their name from light amplification by stimulated emis-sion of radiation. The light produced can be very intense, and it has the special property of coherence, i.e., the waves produced are all in phase.
The action of a laser can be understood in terms of the energy levels of the system. A laser requires excitation (pumping) from the ground state energy to an excited state (absorption level). This excitation can be elec-trical, optical, or chemical; an example is shown schematically in Figure 2.15. From this absorption level, the energy rapidly decreases as the sys-tem goes to a long-lived excited state. From this state, the energy can decrease further as the system returns to the ground state; this process can be stimulated by light, and more light is emitted in this process.
In the laser cavity, which is a tube with perfectly aligned end mir-rors, the emitted light that is directed exactly along the length of the cavity will cause additional stimulations along the length of the cav-ity. Emission will also take place in other directions, but it will not be reflected by the mirrors as the emission along the length of the cavity is. The emission in this particular direction will be coherent and very intense. One of the mirrors is slightly transparent, and typically 1% of the coherent stimulated emission escapes from this end.
In a helium–neon laser, direct current or radio frequency radiation is used to excite the helium atoms, and then these collide with neon atoms, exciting them into a long-lived excited state. The emission from this state gives rise to the familiar red light of a helium–neon laser.
color blindness was caused by alteration of the red-responsive visual pigment. Although Dalton would not have been able to distinguish the color red, he possessed the red receptor and would have perceived light throughout the visible region, including red; this has been confirmed from the writings of his contemporaries.

36 PhysicalPropertiesofMaterials
b. Tungsten is now the preferred material for the filaments of incan-descent bulbs, whereas carbon was initially used. Why is tung-sten superior?
c. Incandescent light bulbs get hot when they have been operating for some time. Why?
d. If a drop of water falls on an operating light bulb, the bulb will crack. Within a few minutes or less, the bulb will dim and sput-ter and then stop working. Describe the process of this failure.
Fluorescent lights are otherwise known as gas discharge tubes. Electrical discharge along the tube excites the Hg atoms in the vapor phase in the tube. These atoms emit some visible light and considerable light in the UV region, which we cannot see. The UV light causes excitations in the fluo-rescent coating (e.g., magnesium tungstate, zinc silicate, cadmium borate, cadmium phosphates) on the inside of the tube; this coating then emits additional light in the visible range.
e. Draw energy level diagrams to depict the fluorescent light processes.
f. Discuss factors that are important in choosing materials for the vapor phase. Consider the full life cycle (manufacturing to dis-posal) of the fluorescent light.
g. Discuss factors that are important in choosing materials for the fluorescent coating.
h. How does the temperature of a fluorescent light compare with that of an incandescent light during use? Comment on relative energy efficiencies.
i. How can incandescent lights be made more energy efficient?
Absorption level
Long-lived level
Ground state
PumpingSlowlaser transition(stimulated by light)
Rapid
FIGURE 2.15Schematic energy level diagram for a laser.
www.ebook3000.com

AtomicandMolecularOriginsofColor 37
A halogen (or quartz halogen) lamp has a tungsten filament housed inside a smaller quartz casing, inside the bulb. There is halogen gas, such as iodine or bromine, inside the quartz casing. The tungsten filament is heated to a very high temperature, and some of the tungsten atoms vaporize and react with the halogen. In a subsequent step, they redeposit as tungsten metal on the filament. This recycling process increases the durability of the tungsten filament and allows the lamp to produce more light for less energy input than normal incandescent lamps.
j. Why does the inner casing need to be quartz, not ordinary glass?
High-intensity discharge lights are now commonly used for car headlights, giving an intense bluish light. These lights contain high-pressure mercury and metal halides such as sodium and scandium iodides and sometimes also xenon (which shortens start-up times). The process by which they work is similar to fluo rescent lamps except that the light is produced directly with no need for phosphors. A great deal of UV light also is produced.
k. How would this influence the material choice for the outer bulb?
Neon lights are useful because the glass tubes can be bent into virtually any shape. Within the tube, neon atoms are excited by electrons knocked off other neon atoms by electrical discharge across the tube. The excited neon atoms decay back to their ground state, emitting red light.
l. Would other discharge gases be expected to emit the same color of light?
Some of the most energy efficient lights are light-emitting diodes (LEDs; see Chapter 3 for the principles of their operation). Most of the LEDs that are used to provide white light contain an active element that emits at short wave-length in the visible region (e.g., blue emission) and another material that absorbs the blue light and converts it to longer wavelength light. The most common converters are phosphors (see Chapter 3 for further discussion).
m. If the active element of the LED emits blue light, what color(s) of light should be emitted by the phosphor in order to make the overall LED produce light that appears white?
n. A problem was encountered in the use of LED traffic lights in the midwestern United States in the winter. The lights last lon-ger and are more efficient than the previously used incandescent lights, but snow can accumulate on the LED lights and block the view of them. Why is this a problem with the LEDs and not with incandescent lights?

38 PhysicalPropertiesofMaterials
2.8 Problems
2.1 If six paints (red, orange, yellow, green, blue, and violet) are mixed in equal portions, the resulting paint is black. However, if six lights (red, orange, yellow, green, blue, and violet) of equal intensity shine at the same spot, the resultant spot is white. Explain why two different “colors” (white versus black) arise.
2.2 The jadeite form of jade is composed of NaAl(SiO3)2, and its green color results from the presence of a small amount of iron.
a. It would appear that the color in jade could be caused by a color center or transition metal absorption. Describe the source and physical processes involved in each.
b. Suggest an experiment that would distinguish between the above possibilities. Explain what you would do, what you would expect to observe in each case (and why), and how this would distinguish between the two possibilities.
2.3 The equation describing radiant power (M) for black-body radiation as a function of temperature (T) and wavelength (λ) is given by the Planck energy distribution:
Mh c
ehckT
=
−
2 1
1
2
5
π
λλ
(2.3)
where h is Planck’s constant, k is Boltzmann’s constant, and c is the speed of light.
a. Calculate M for T = 1000 K at the following wavelengths (in m): 10–4, 10–5, 7 × 10⁻⁶, 5 × 10⁻⁶, 3 × 10⁻⁶, 2 × 10⁻⁶, 1.3 × 10⁻⁶, 10–6, 9 × 10⁻⁷, 8 × 10⁻⁷, 10–7. Show a sample calculation (com-plete with working out of units, three significant figures in M), and put the results in a table that includes log10(λ/m).
b. Calculate M for T = 2000 K at the following wavelengths (in m): 10–4, 10–5, 3 × 10⁻⁶, 2 × 10⁻⁶, 1.5 × 10⁻⁶, 10–6, 9 × 10⁻⁷, 8 × 10⁻⁷, 7 × 10⁻⁷, 6 × 10⁻⁷, 5 × 10⁻⁷, 3 × 10⁻⁷. Put the results in a table that includes log10(λ/m).
c. Calculate M for T = 4000 K at the following wavelengths (in m): 10–4, 10–5, 3 × 10⁻⁶, 2 × 10⁻⁶, 1.5 × 10⁻⁶, 10–6, 9 × 10⁻⁷, 8 × 10⁻⁷, 7 × 10⁻⁷, 6 × 10⁻⁷, 5 × 10⁻⁷, 3 × 10⁻⁷, 2 × 10⁻⁷. Put the results in a table that includes log10(λ/m).
d. On the same graph, plot the results of (a), (b), and (c). Plot the graph as M versus log10(λ/m). Use different symbols for the three sets of results and draw smooth curves. Use three sets of ordinate axes, one for (a), one for (b), and one for (c), so that each curve nearly fills the page.
e. Mark the visible light region on your graph.
www.ebook3000.com

AtomicandMolecularOriginsofColor 39
f. Comment, based on your graph, on the relative areas under the three peaks. If they are different, explain why.
g. Comment, based on your graph, on the color(s) of black-body radiation from an object at T = 1000, 2000, and 4000 K.
2.4 Rubies are red because of the absorption of light by Cr3+ ions. The color of emeralds also is because of absorption of light by Cr3+ ions; emerald is Be3Al2Si6O18 doped with Cr3+. Based on the fact that emeralds are green, explain whether the crystal field experienced by Cr3+ is less in emeralds or in ruby. Refer to Figure 2.9.
2.5 Some types of old glass contain iron and manganese. After many years of intense exposure to sunlight, this type of glass turns violet through the development of color centers. Why is exposure to light needed?
2.6 Some materials develop color from exposure to radiation. This is because of formation of color centers, and the number formed is proportional to the radiation dosage received. Suggest a method that could be used to quantify the radiation exposure, leaving the material in “new condition” to be used again.
2.7 When heated, some materials, such as diamond, give off a faint glow that decays with time. This effect is called thermolumines-cence. Suggest a plausible reason for it. Explain how thermolu-minescence could be used to determine the age and location of geological materials.
2.8 An old “magic” trick involves taking a seemingly normal piece of pale pink cloth and holding it over a glowing light bulb. While the audience watches, the cloth turns blue. The “magician” can return its color to pale pink by blowing on it. The cloth has been treated by dipping it in cobalt (II) chloride. CoCl2 is a blue salt, and CoCl2·2H2O and CoCl2·6H2O are red salts. Suggest an explanation for the “magic” trick, including the physical basis for the origins of the colors.
2.9 A large organic molecule with an acidic group can be used as an acid/base indicator. It has an equilibrium between its acid form (call it HA for RCOOH) and its conjugate base (call it A– for RCOO–), as follows:
R C
O
OH H R C
O
O− − + − −+ −|| ||
�
In the presence of acid, the HA form is favored. In the presence of base, the A– form is favored (as H+ is consumed, pulling the equilibrium to the right). The color depends on pH such that in one pH range the color is red and in another it is blue.
a. In the red form, what color is absorbed from white light? b. In the blue form, what color is absorbed from white light? c. Are electrons in organic acids more delocalized in the acid
form or in the base form? Why?

40 PhysicalPropertiesofMaterials
d. When the electrons are more delocalized, does this cause the absorption of visible light to be at lower or higher energy? Explain briefly.
e. On the basis of your answers to (a), (b), (c), and (d), which is red and which is blue (of HA and A–)? Explain.
2.10 It is possible to make a dill pickle “glow” by attaching both ends to leads to a 110-V power source. (Safety note: This experi-ment requires safe handling procedures; see Journal of Chemical Education, 1993, 70, 250, and Journal of Chemical Education, 1996, 73, 456, for details of a safe demonstration.) The glow is yellow. What is the origin of the color?
2.11 What color would a flower that is white in daylight appear to be when observed in red light? Explain.
2.12 Most clothing stores have fluorescent lighting. In this light, two items can appear to be color-matched but, when viewed in sun-light, they are not well matched. Explain.
2.13 The window panes in some very old houses have a violet tint. Faraday noticed that this was because of the effect of sunlight on the glass, and it has been determined that this effect requires a small amount of manganese. If you heat the glass, the color disappears, and it does not reappear on cooling. What is the cause of the color?
2.14 Stars with different surface temperatures are different colors (e.g., bluish-white, orange, red, yellow, white). Arrange these star colors in order of increasing surface temperature.
2.15 By differentiating the expression for M(λ) given in Equation 2.3, show that λmax, the wavelength of the most intense black-body radiation, is inversely proportional to the temperature, that is
λmax.
=0 0029 m K
T (2.4)
where T is in kelvin and λmax is in m. Equation 2.4 is known as Wien’s law.
2.16 Some types of white plastic turn from white to yellow over time. Explain the physical origin of the color, including an explana-tion of the yellow color and why it has turned yellow rather than, for example, red.
2.17 A convenient new type of thermometer determines body tem-perature by placement of a probe in the ear. The device must be placed accurately in the ear canal as the thermometer mea-sures infrared energy from the eardrum and “translates” this into a temperature reading. Using the Stephan–Boltzmann law that the radiant power (M) for black-body radiation is given by
M = σ T 4 (2.5)
where T is the temperature in kelvin, and σ, the Stephan con-stant, has a value of 5.67 × 10⁻⁸ W m–2 K–4, calculate the increase
www.ebook3000.com

AtomicandMolecularOriginsofColor 41
in energy flux with an increase in temperature from 37°C to 38°C.
2.18 Some polymers, such as polycarbonate, change color when exposed to gamma radiation. Explain the physical principle that gives rise to the color change and suggest an application of this property.
2.19 A glass head representing a Pharaoh, made about 3400 years ago, is presently housed in an American museum. The work of art was once bright blue, but now is faded. Discuss possible origins of the color and reasons why it has changed.
2.20 From the data given in Figure 2.16 for a particular object, what is the observed color of the object (i.e., observed by reflected light; assume that the surface is smooth so that scattering of light can be neglected)? Explain your reasoning.
2.21 Some brown or yellow topaz (aluminum fluorosilicate) gem-stones have their color created artificially by irradiation, and this has been controversial because some of the resulting gem-stones have been left highly radioactive. Suggest the origin of the color.
2.22 Would a mercury-based fluorescent light be expected to work at very low temperature? Explain.
2.23 On the basis of Equation 2.2 and the data in Section 2.4, what percentage of red light would be absorbed by a 1-cm path length of water?
2.24 The flame from a glass-blowing torch is yellow-orange. As a safety measure to reduce the intensity of light that reaches a glass-blower’s eyes, what color should the glassblower’s glasses be? Explain your reasoning briefly.
2.25 A commercial hand-held digital infrared thermometer uses emissivity to measure surface temperatures of materials such as asphalt, ceramics, and highly oxidized metals. The ther-mometer does not work on aluminum or other shiny metals. Why not?
Absorbance
Transmittance
400 700
100
0
%
Reflectance
λ/nm
FIGURE 2.16Absorption, transmission, and reflection as functions of wavelength.

42 PhysicalPropertiesofMaterials
2.26 Some mail is now irradiated with intense electromagnetic radi-ation in order to kill biologically active substances. It is said that some precious gems are colored after this radiation and should not be sent through the mail. (Not that you should send a pre-cious gem in the mail anyhow!)
a. Explain the origin of the color. b. Suggest a possible means of removing the color.
Further Reading
General References
Most introductory physical chemistry textbooks describe aspects of electro-magnetic radiation and black-body radiation. Books on rocks and minerals often contain information concerning color and composition of geological materials.
P. Bamfield, 2009. Chromic Phenomena, 2nd ed. Royal Society of Chemistry, Cambridge.
R. S. Berns, 2000. Billmeyer and Saltzman’s Principles of Colour Technology, 3rd ed. John Wiley & Sons, Hoboken, NJ.
W. D. Callister Jr. and D. G. Rethwisch, 2010. Materials Science and Engineering: An Introduction, 8th ed. John Wiley & Sons, Hoboken, NJ.
R. M. Evans, 1948. An Introduction to Color. John Wiley & Sons, Hoboken, NJ.M. Gouterman, 1997. Oxygen quenching of luminescence of pressure sensitive paint
for wind tunnel research. Journal of Chemical Education, 74, 697.P. Gregory, 2000. Colouring the jet set. Chemistry in Britain, August 2000, 39.M. Jacoby, 2000. Bright prospects for organic lasers. Chemical and Engineering News,
July 31, 2000, 10.A. Javan, 1967. The optical properties of materials. Scientific American, September
1967, p. 239.M. J. McKelvy, P. Mitian, K. Hintze, E. Patrick, K. Allagadda, B. L. Ramakrishna, C.
Denny, B. Pryor, A. V. G. Chizmeshya, and V. Pizziconi, 2000. Why does a light bulb burn out? Journal of Materials Education, 22, 5.
C. G. Mueller, M. Rudolph, and the Editors of LIFE, 1966. Light and Vision. Life Science Library, Time Inc.
K. Nassau, 1980. The causes of colour. Scientific American, October 1980, p. 124.K. Nassau, 2001. The Physics and Chemistry of Colour, 2nd ed. Wiley-Interscience,
Hoboken, NJ.T. D. Rossing and C. J. Chiaverina, 1999. Light Science: Physics and the Visual Arts.
Springer, New York.H. Rossotti, 1983. Colour. Princeton University Press, Princeton.B. Schwarzschild, 2006. Mather and Smoot share Nobel physics prize for measuring
cosmic microwave background. Physics Today, December 2006, 18.
www.ebook3000.com

AtomicandMolecularOriginsofColor 43
R. Tilley, 2000. Colour and the Optical Properties of Materials. John Wiley & Sons, Hoboken, NJ.
D. R. Tyler, 1997. Organometallic photochemistry: Basic principles and applications to materials science. Journal of Chemical Education, 74, 668.
V. F. Weisskopf, 1968. How light interacts with matter. Scientific American, September 1968, 60.
C. Wolinsky, 1999. The quest for color. National Geographic, July 1999, 72.G. Wyszecki and W. S. Stiles, 2002. Color Science, 2nd ed. Wiley-Interscience, Hoboken,
NJ.
Color of Water
C. L. Braun and S. N. Smirnov, 1993. Why is water blue? Journal of Chemical Education, 70, 612.
Carbonless Copy Paper
M. A. White, 1998. The chemistry behind carbonless copy paper. Journal of Chemical Education, 75, 1119.
Black-Body Radiation
http://www.usask.ca/chemistry/courses/243/links/BBR/BBR.html (Interactive black-body radiation).
Lasers
N. M. Johnson, A. V. Nurmikko, and S. P. DenBaars, 2000. Blue diode lasers. Physics Today, October 2000, 31.

45
3ColorinMetalsandSemiconductors
3.1 Introduction
In the previous chapter, we looked at atomic and molecular origins of color, emphasizing insulating materials. For the most part, the principles involved only a single atom (e.g., an electronic transition) or a small group of atoms (e.g., colors due to electronic transitions in molecules and crystal field effects). In this chapter we look at colors and luster in metals, and origins of color in semiconductors. In both metals and semiconductors, very large numbers of atoms are usually responsible for the presence of color.
3.2 Metallic Luster
Electrons have their maximum possible delocalization in metals, where the free electron gas model (i.e., electrons modeled as virtually floating in a sea of positive charges) has been used to describe many features.
In a metal, all the conduction electrons are essentially equivalent because they can freely exchange places with one another, but they do not all have the same energy due to the quantum mechanical limitation that no two elec-trons in the same system (meaning the metal, in this case) can have the same set of quantum numbers. Therefore, for a chunk of metal, there will be of the order of 1023 electrons and nearly as many energy levels. (If all the levels were filled, there would be half as many levels as electrons since each level can accommodate only two electrons, one of each spin. This is in keeping with the Pauli* exclusion principle, which states that no two electrons in a sys-tem can occupy the same quantum state simultaneously.) With this many energy levels in a metal, its energy ladder can be considered to be a virtual continuum.
* Wolfgang Pauli (1900–1958) was born in Vienna, and studied under Arnold Sommerfeld, Max Born, and Niels Bohr. Pauli helped to lay the foundations of quantum theory and was awarded the Nobel Prize in Physics in 1945 for his discovery of the exclusion principle.

46 PhysicalPropertiesofMaterials
Fermi* and Dirac† worked out that P(E), the probability that a state with energy E will be occupied in a free electron gas, is
P Ee E E kT( ) ,( )/=
+−
11F
(3.1)
where EF , the Fermi energy, is the energy at which P(E) = ½, k is the Boltz-mann‡ constant, and T is temperature. Equation 3.1 is known as the Fermi–Dirac distribution function.
This function looks “square” at T = 0 K, as one would expect since all the energy levels are filled up one by one at T = 0 K, up to the Fermi energy. This is shown in Figure 3.2.
* Enrico Fermi (1901–1954) was an Italian-born physicist who made major contributions to the foundations of quantum mechanics and the first controlled self-sustaining nuclear reactor; he was the winner of the 1938 Nobel Prize in Physics.
† Paul A. M. Dirac (1902–1984) was a British theoretical physicist noted for his contributions to quantum mechanics. Dirac shared the 1933 Nobel Prize in Physics with Schrödinger. From 1932 to 1969, Dirac was the Lucasian Professor of Mathematics at Cambridge University, a position previously held by Sir Isaac Newton.
‡ Ludwig Boltzmann (1844–1906) was an Austrian theoretical physicist. Boltzmann was an engaging lecturer who demanded discipline of his students, and, in return, they were devoted to him. Although revered today for his work in the areas of thermodynamics, statis-tical mechanics, and kinetic theory of gases, Boltzmann’s work was not well received by his colleagues in his lifetime. This was largely due to his espousal of the unfashionable corpus-cular theory of matter. Boltzmann took his own life in 1906. Today his grave site, in the same Viennese cemetery where Beethoven lies, bears Boltzmann’s famous equation: S = k log ω (Figure 3.1).
FIGURE 3.1Boltzmann’s gravesite in Vienna. (Photo by Robert L. White. With permission.)
www.ebook3000.com

ColorinMetalsandSemiconductors 47
COMMENT: BAND STRUCTURE
In going from localized molecular orbitals to delocalized molecular orbitals, the increased number of electrons makes the electronic energy levels become more numerous until they become a virtual continuum, as shown schematically as bands in Figure 3.3.
At higher temperatures, some energies above the Fermi energy are occupied. The spill-over (to states beyond EF) depends on T, as shown in Figure 3.2.
Because a metal has a near continuum of excited energy levels (ener-gies above the Fermi energy), a metal can absorb light of any wave-length, including visible wavelengths. If this were the only effect operable here, all metals would appear black because all visible light would be absorbed by them. However, when an electron in a metal absorbs a photon of light, it is promoted to an excited state that has many other energy levels available for de-excitation (due to the virtual continuum of levels). Light can be absorbed easily, and since light is an electromagnetic wave, and a metal is a good conductor of electricity, the absorbed light induces alternating electrical currents on the metal surface. These currents rapidly emit light out of the metal. This rapid and efficient re-radiation means that the surface of a metal is reflective.
Although all metals are shiny, and this is due to the effects described above, not all metals have the same color. For example, the colors of gold and silver are quite distinct from each other. This is due to subtle dif-ferences in the number of states above the Fermi level. The reflectances
0 0.5 4.5 5.0 5.5
1
0
P(E)
E/eV EF
T = 0 K
T = 300 KT = 1000 K
FIGURE 3.2Probability distribution for electrons in a metal, according to the Fermi–Dirac distribution function (Equation 3.1), at various temperatures. EF is the Fermi energy, where EF separates the filled levels from the unoccupied levels at T = 0 K. Here, EF = 5.0 eV.

48 PhysicalPropertiesofMaterials
of gold and silver are compared in Figure 3.4. Silver reflects all colors of visible light with high efficiency; gold does not reflect very much high-energy visible light (blue and violet) because of the absence of levels in this energy region. Since gold reflects predominantly at the low-energy end of the visible range, it appears yellow.
800 700 600 500 400 300
100
50
0
Gold Silver
% Re
flect
ance
λ/nm
FIGURE 3.4Reflectance spectra of gold and silver as functions of wavelength. Gold reflects red, orange, and yellow strongly but less so at blue and violet, and it appears yellow. In contrast, silver reflects incident light over most of the visible region of the spectrum. (Adapted from A. Javan. Scientific American, September 1967, 244.)
Energy
C2H4 C4H6 C8H10 C16H18 (CH)xpolymer
Densityof
statesN(E)
Antibondingπ*
orbital
Bondingπ*
orbital
FIGURE 3.3In going from localized molecular orbitals (smaller molecules, left side of diagram) to delocalized molecular orbitals (larger molecules, right side of diagram), electronic energy levels become more numerous until they become a virtual continuum, as shown schematically here. The density of states, N(E), is defined as N(E) dE being the number of allowed energy levels per unit volume in the range between E and E + dE. N(E) is zero in the band gap, the forbidden region between the bonding and antibonding orbitals in this case. Metals have energy bands but no band gap (see Figure 3.2).
www.ebook3000.com
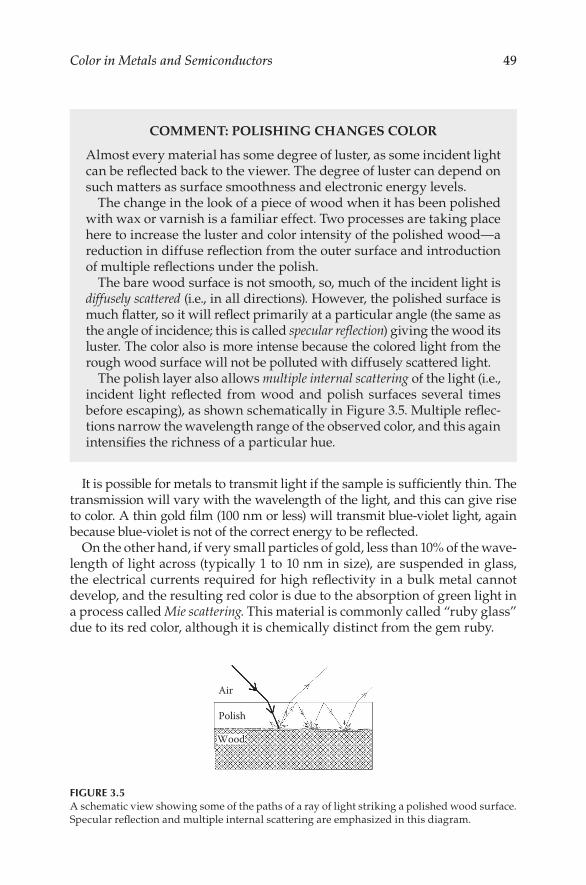
ColorinMetalsandSemiconductors 49
It is possible for metals to transmit light if the sample is sufficiently thin. The transmission will vary with the wavelength of the light, and this can give rise to color. A thin gold film (100 nm or less) will transmit blue-violet light, again because blue-violet is not of the correct energy to be reflected.
On the other hand, if very small particles of gold, less than 10% of the wave-length of light across (typically 1 to 10 nm in size), are suspended in glass, the electrical currents required for high reflectivity in a bulk metal cannot develop, and the resulting red color is due to the absorption of green light in a process called Mie scattering. This material is commonly called “ruby glass” due to its red color, although it is chemically distinct from the gem ruby.
COMMENT: POLISHING CHANGES COLOR
Almost every material has some degree of luster, as some incident light can be reflected back to the viewer. The degree of luster can depend on such matters as surface smoothness and electronic energy levels.
The change in the look of a piece of wood when it has been polished with wax or varnish is a familiar effect. Two processes are taking place here to increase the luster and color intensity of the polished wood—a reduction in diffuse reflection from the outer surface and introduction of multiple reflections under the polish.
The bare wood surface is not smooth, so, much of the incident light is diffusely scattered (i.e., in all directions). However, the polished surface is much flatter, so it will reflect primarily at a particular angle (the same as the angle of incidence; this is called specular reflection) giving the wood its luster. The color also is more intense because the colored light from the rough wood surface will not be polluted with diffusely scattered light.
The polish layer also allows multiple internal scattering of the light (i.e., incident light reflected from wood and polish surfaces several times before escaping), as shown schematically in Figure 3.5. Multiple reflec-tions narrow the wavelength range of the observed color, and this again intensifies the richness of a particular hue.
Air
Polish
Wood
FIGURE 3.5A schematic view showing some of the paths of a ray of light striking a polished wood surface. Specular reflection and multiple internal scattering are emphasized in this diagram.

50 PhysicalPropertiesofMaterials
3.3 Colors of Pure Semiconductors
When an electron in a metal is at an energy higher than the Fermi energy, it is said to be conducting as it contributes to the electrical and thermal con-ductivities of a metal (see Chapters 8 and 12). The probability diagram of Figure 3.2 can be turned on its side to reveal an energy diagram for a metal as shown in Figure 3.6.
Materials called semiconductors do not conduct electricity very well due to the gap between their valence band and their conduction band, as shown in Figure 3.7. The distance marked Eg is the energy gap (or band gap); there are no energy levels in this region in pure semiconductors. A similar gap appeared in the energy range between the bonding and antibonding orbitals (see Figure 3.3). The semiconductor energy gap changes from element to ele-ment; for example, it increases on going through the series Sn, Ge, Si, C. This is the same order as increasing bond interaction, and shorter, stronger bonds lead to a larger band gap energy. For a given element, application of pressure or dramatic lowering of temperature can shorten the interatomic distance and increase the band gap.
If there is sufficient thermal energy available, large numbers of electrons in a semiconductor could be promoted from the valence band to the conduction band, but this thermal energy might correspond to a temperature in excess of 1000 K, and the material could very well melt before achieving electrical conduction comparable to that in a metal.
However, visible light may provide sufficient energy to promote electrons from the valence band to the conduction band of a semiconductor, and this gives semiconductors their colors.
EF EF
20°C500°C0.2
0–0.2
0 1P(E)
Ener
gy/e
V
(a) (b)
FIGURE 3.6Other ways to view the Fermi–Dirac distribution for electrons in a metal: (a) occupational probability, P(E), for energy levels in a typical metal at various temperatures; (b) occupational probability schematically for T > 0 K, with • representing excited electrons and ⚬ representing holes.
www.ebook3000.com

ColorinMetalsandSemiconductors 51
For a pure semiconductor, the color depends on the value of Eg. If Eg is less than the lowest energy of visible light (red light, λ ~ 700 nm, E ~ 1.7 eV), then any wavelength of visible light will be absorbed by this semiconductor. (Excess energy beyond Eg will be used to promote the electrons higher in the conduction band.) Because all visible light is absorbed, the semiconductor will appear black. If reemission is rapid and efficient (this depends on the energy levels), then this material will have a metal-like luster; Si is an exam-ple. If reemission is not rapid, then this semiconductor will appear black and lusterless (e.g., CdSe).
If Eg is greater than the highest energy of visible light (violet light, λ ~ 400 nm, E ~ 3.0 eV), then no visible light is absorbed and the material is color-less. Pure diamond, with Eg of 5.4 eV (corresponding to light of wavelength 230 nm, i.e., UV), is an example.
When a semiconductor has Eg falling in the energy range of visible light, the material has a color that depends on the exact value of Eg. The value of Eg depends on two factors: the strength of the interaction that separates bond-ing and antibonding orbitals, and the spread in energy of each band. Periodic trends in lattice parameters, bond dissociation energies, and band gap are summarized for one isostructural group of the periodic table in Table 3.1. The shorter, stronger bonds can be seen to give rise to larger values of Eg.
Let us now consider the colors of pure semiconductors. For example, HgS (called by the mineral name cinnabar, or the pigment name vermilion), has Eg of 2.1 eV, which corresponds to λ = 590 nm, that is, yellow light. So, in HgS all light with energies greater than 2.1 eV (wavelengths shorter than 590 nm,
Conductionband EF
Eg
(a) (b)
Conductionband
Valenceband
FIGURE 3.7Energy bands in (a) a metal, and (b) a semiconductor. EF is the Fermi energy and Eg is the energy gap.
TABLE 3.1
Periodic Trends in Diamond Structures in Group 14
Element Lattice Parameter/Å Bond Dissociation Energy/kJ mol–1 Eg/eV
C (diamond) 3.57 346 5.4Si 5.43 222 1.1Ge 5.66 188 0.66α-Sn 6.49 146 0.1

52 PhysicalPropertiesofMaterials
i.e., red and orange) is absorbed. This means that, in white light, only wave-lengths greater than 590 nm are transmitted, and HgS is red-orange.
As another example, consider CdS. Here the band gap energy is 2.4 eV, which corresponds to light of wavelength 520 nm (blue light). Since blue and higher-energy (i.e., violet) light are absorbed, this leaves behind a region of the visible spectrum that is centered on yellow, and CdS appears yellow-orange.
To generalize, the colors of pure semiconductors in order of increasing Eg, are black, red, orange, yellow, and colorless. Some examples are given in Table 3.2.
If the semiconductor has a large gap, it will be colorless if it is pure, but the presence of impurities can introduce color in the semiconductor, as we will see in the next section.
3.4 Colors of Doped Semiconductors
There are two categories of impurities in semiconductors, and these are defined here. These definitions are also important to discussions of electrical properties of semiconductors (see Chapter 12).
An impurity that donates electrons to the conduction band of a semicon-ductor creates what is known as an n-type semiconductor. The “n” stands for negative as this impurity gives rise to negative charge carriers (electrons in the conduction band). This is also known as a donor impurity.
Conversely, when an impurity produces electron vacancies that behave as positive charge centers (holes) in the valence band, this is known as a p-type semiconductor. The “p” stands for positive as the holes act as positive charge
TABLE 3.2
Some Examples of Colors and Band Gaps in Pure Semiconductors
Material Color Eg/eV
C (diamond) Colorless 5.4ZnS Colorless 3.6ZnO Colorless 3.2CdS Yellow-orange 2.4HgS Red 2.1GaAs Black 1.43Si Metallic gray 1.11
www.ebook3000.com

ColorinMetalsandSemiconductors 53
carriers. Because the impurity accepts an electron (giving rise to the hole), this also is known as an acceptor impurity.
The impurity in a semiconductor often can introduce a set of energy levels intermediate between the valence band and the conduction band, as shown in Figure 3.8.
Because the transition to the impurity levels takes less energy than the transition across the entire band gap, this transition can influence the color of a wide-band-gap semiconductor.
For example, if a small number of nitrogen atoms are substituted into the diamond lattice, the extra electrons can form a donor impurity level within the wide band gap of diamond since nitrogen has one more electron than carbon. Excitation from this impurity band absorbs violet light, depleting white light of violet and making nitrogen-doped diamonds appear yellow at nitrogen levels as low as 1 atom in 105.
Conversely, boron has one electron less than carbon, and doping boron into diamond gives rise to acceptor (hole) levels in the band gap. These inter-mediate levels can be reached by absorption of red light (but not shorter wavelength light—do you know why?) so boron-doped diamonds appear blue. The Hope diamond is an example.
Doped semiconductors also can act as phosphors, which are materials that give off light with high efficiency when stimulated, for example, by an elec-trical pulse. (Phosphorescence results when light is emitted some time after the initial excitation; the delay is caused by the change in spin between the excited state and the ground state. In fluorescence, which is a faster process, the spins of the excited and ground states are the same.) On the surface of the picture tube of a traditional color television there are three phosphors:
(a) (b) (c) (d) (e)
EF
FIGURE 3.8Simple view of energy bands in (a) a metal, (b) an insulator, (c) a pure semiconductor, (d) an n-type semiconductor, and (e) a p-type semiconductor. EF is the Fermi energy.

54 PhysicalPropertiesofMaterials
COMMENT: TRIBOLUMINESCENCE
Some materials emit light when they are stimulated mechanically; this phenomenon is known as triboluminescence. One of the best-known examples is Wint-O-Green Lifesavers®, which can give rise to flashes of blue-green light when crushed. In this case, the sugar leads to tribolu-minescence due to the production of large electric fields during the for-mation of a newly charged crystal surface, the acceleration of electrons in this field, and the subsequent production of cathodoluminescence (fluorescence induced by cathode rays that energize a phosphor to pro-duce luminescence) from the nitrogen atoms (from the air) adsorbed on the surface. The blue luminescence is associated with N2
+. Some of the light emitted during this process is in the UV range; the UV stimulates the wintergreen (methyl salicylate) molecules, which then fluoresce in the visible range. Therefore, the presence of wintergreen flavoring enhances the observed triboluminescence.
BlueBlue-green
Green
E
E
T2
T2
A2
A1
T2
T1
T1
FIGURE 3.9Schematic view of phosphorescence due to emission from excited states in the blue phosphor ZnS doped with Ag+. (Adapted from Y. Uehara, 1975. Journal of Chemical Physics, 62, 2983.)
www.ebook3000.com

ColorinMetalsandSemiconductors 55
one emitting red light, one emitting green light, and one emitting blue light; emission is stimulated by excitation with an electron beam. The energy level diagram for the blue phosphor ZnS doped with Ag+ is shown in Figure 3.9.
When an n-type semiconductor is placed next to a p-type semiconduc-tor, interesting features can result. Here we concentrate on color, but in Chapter 12 we will look at the importance of p,n-junctions to electronic properties of semiconductors. When an electrical potential is applied to a p,n-junction such that electrons are supplied through an external circuit to the n-side of the junction, the extra electrons in the conduction band of the n-type semiconductor drop down in energy and neutralize the holes in the valence band of the p-type semiconductor, as shown in Figure 3.10. As the electrons go to the lower energy state, they can emit energy in the form of light. This is the basis of the electronic device known as the light-emitting diode (LED), and it is GaAs0.6P0.4 that emits the red light that is commonly associated with these devices in applications such as digital displays. An LED shows electroluminescence, that is, the production of light from electri-cal stimulus. Various colors can be emitted depending on the materials; see Table 3.3.
p n
p n
EFEF
EF
+
(a) (b)
p n
EF
e–
h+
+ –
FIGURE 3.10The electronic band structure of a p,n-type junction forms a light-emitting diode (LED). (a) When a p-type semiconductor is placed beside an n-type semiconductor, the Fermi levels become equalized. (For simplicity, the donor and acceptor levels are assumed to be negligible here.) (b) When a field is applied to a p,n-junction, as shown, electrons in the n-conduction band migrate to the positive potential on the p-side and return to the valence band, recom-bining with the holes in the p-semiconductor. Similarly, the holes in the p-type semiconduc-tor migrate toward the negative n-side and recombine with electrons. The electrons dropping from the conduction band to the valence band emit light corresponding to the energy of the band gap. For example, the emission from GaAs0.6P0.4 is red.

56 PhysicalPropertiesofMaterials
COMMENT: NEW DIRECTIONS IN LIGHT-EMITTING DIODES
Relatively recent advances in light-emitting diodes include emission of white light nearly as bright as a fluorescent lamp. This particular device uses layers of polymers, with blue, green, or red light, depending on the layer. The combination of blue, green, and red makes the emission appear white, extending the utility of LEDs.
Some other new LEDs are not limited to one color of emitted light. An LED composed of layers of cadmium selenide nanocrystals between layers of poly(p-phenylenevinylene) can have different colors, depend-ing on the voltage and the preparation. At low voltage, CdSe is the light emitter, and the color can be changed from red to yellow by varying the size of the nanocrystals. (The latter is a consequence of quantum effects.) At higher voltages, the polymer is the emitter, and the emitted light is green. Materials like these might one day be used for display devices in which the color of the pixel (dot of light on a screen) is deter-mined by the applied voltage.
Much of the current excitement about LEDs involves the use of organic materials. Organic light-emitting diodes (OLEDs) are expected to have reduced power consumption and improved efficiency relative to inorganic-based LEDs. The change in materials also is expected to add mechanical flexibility to the displays using OLEDs.
The performance of LEDs has certainly improved over time. Performance is quantified as the number of lumens (lm) produced per watt (W) of energy consumed, where a lumen is the luminous flux emit-ted within a solid unit angle (1 steradian) from a point source having a uniform intensity of 1 candela. Early LEDs, such as GaAsP, had a per-formance of about 0.1 lm W–1, making them less efficient than Edison’s first light bulb (2 lm W–1), and much less efficient than halogen lamps (20 lm W–1) and fluorescent lights (80 lm W–1). More recent develop-ments in LEDs have brought them into the range of 100 lm W–1, with expectations of twice that value in the next few years.
TABLE 3.3
Colors of LEDs
Semiconductor λemission/nm Color
GaAlAs/GaAs 880 IRAlGaInP 663 RedGaAsP/GaP 605 OrangeGaP 555 GreenGaN/SiC 470 BlueInGaN/SiC 395 UV
www.ebook3000.com

ColorinMetalsandSemiconductors 57
The Photocopying Process: A Tutorial
Semiconductors also are important in the photoelectric process that we know as photocopying. The photocopying process, or xerography (which means “dry copying,” literally from the Greek xeros graphy), relies on a few basic physical principles and a fair bit of ingenuity. The process was developed by Chester Carlson in the mid-1930s.
One of the two main parts of a photocopy machine is a corona dis-charge wire, which has so strong an electric field, > 30,000 V cm–1, that it ionizes air to make O2
+ and makes the air in its immediate vicinity glow green due to photons emitted by excited electrons. The other main part is a semiconductor. Traditionally, this was amorphous selenium, a semi-conductor with a band gap of 1.8 eV. (Although new photocopiers use organic semiconductors, the principles are the same.)
a. What color is a bulk sample of amorphous selenium?b. After you run a photocopying machine for quite a while, why
does the surrounding air smell like ozone (O3)?c. After the corona wire passes by the drum that is coated with
amorphous selenium, the Se is charged positively. Why?d. A very strong light then shines on the document to be copied,
and this light is then reflected onto the Se drum. Does the light uniformly strike the drum, or is there an “image” from the docu-ment on the drum? Explain.
e. Where the light “image” hits the Se drum, electron/hole pairs are formed. Why? (This results in this area becoming electrically neutral since the drum is grounded, and the holes move to the
COMMENT: SOLAR CELLS
The sun provides energy density of about 1000 W m–2 at the earth’s sur-face, and there is great interest in harvesting this solar energy. Photovoltaic cells directly convert sunlight into electrical energy. Traditional photovol-taics are based on the semiconductor silicon, and solar energy promotes electrons from the valence band to the conduction band. Phosphorous-doped silicon is an n-type semiconductor, and boron-doped silicon is a p-type semiconductor. An electric field is formed when the n-doped and p-doped semiconductors come together to form a diode (see Chapter 12), and when light hits the device, electrons move to the n-side and holes move to the p-side, providing a current. Another important optical aspect of solar photovotaics is the antireflective coating needed to increase light absorbance by reducing losses due to reflection. Considerable materials research is focused on increased efficiency of solar cell materials.

58 PhysicalPropertiesofMaterials
ground and the electrons move to the surface where they locally neutralize the positive charge.)
f. Where the dark “image” hits the drum, the surface stays posi-tively charged. Why is it not neutral everywhere?
g. Devise a way to convert the latent electrical image (i.e., an electrical image that is present but not yet visible) on the Se drum to an image on paper.
h. Another form of Se has a band gap of 2.6 eV. Will this be useful as a direct replacement for amorphous selenium? What other fac-tors could be important?
i. What areas of the xerographic process would you suggest for im -provement or advancement?
A laser printer works on a very similar principle to a photocopier. In the case of a printer, the light, from a laser or a bank of LEDs, hits the drum in the printer. However, there is a major difference in the creation of an electrostatic image for photocopiers and most laser printers. In the photocopier, light reflects off the paper onto the photoreceptor cor-responding to the white areas, but not the dark areas. The background is discharged, and the positive charge remains in the areas of the drum corresponding to the print. This method is called “write-white” since the light “whitens” the background. On the other hand, most laser printers use the reverse process, referred to as “write-black,” in which the laser gives a pulse of light for every dot to be printed, and no pulse for a dot to be left unprinted. The areas to be left unprinted therefore have a positive charge, while the areas to be printed have a negative charge.
j. Do you expect the charge of the toner for a write-black laser printer to be the same as for a photocopier? Explain.
k. Why is the write-black process more efficient for a laser printer than the write-white process?
l. Although selenium was used in the traditional photocopier, now organic semiconductors are more commonly used for the pho-toreceptive element. Which do you expect is easy to process to make a photosensitive drum: selenium or an organic material? Explain.
The Photographic Process: A Tutorial
The basis of classic “wet” film photography is the reactivity of silver halides, especially silver bromide and silver chloride, in the presence of light.
A photographic film contains silver halide particles (typically 50 to 2000 nm in size) embedded in an emulsion. When the silver halide particles are illuminated by a light of sufficient energy, conduction band
www.ebook3000.com

ColorinMetalsandSemiconductors 59
electrons and valence band holes are created efficiently. The electrons move through the silver halide particle until, eventually, one becomes localized at a defect site. This trapped electron can combine with an interstitial silver ion (Ag+) to form a neutral silver atom (Ag). Because a single silver atom is unstable in the lattice, it is energetically favorable for additional electrons and interstitial Ag+ ions to arrive at the trapped site, and their combination causes more silver atoms to form from Ag+. Eventually, a stable silver cluster of 3 to 5 silver atoms forms; this takes somewhere between 6 and 30 absorbed photons. At this site there is said to be a stable latent image in the film.
a. When a photographic film is exposed to a white object, is the corresponding area of the film more or less subject to Ag cluster formation than the area corresponding to exposure to a black object?
b. The band gap in silver halides is about 2.7 eV. What does this cor-respond to in terms of wavelength? Does this explain why silver halides are sensitive to visible light?
c. After a film is exposed to a subject, why can it not be handled in daylight? Why can it be handled in red light?
d. Once the latent image has been formed, the exposed film is placed in a developer that contains a reducing agent such as hydroquinone. The regions of the latent image that have Ag clus-ters undergo further reduction of Ag+ in their immediate region, “amplifying” the number of Ag clusters in highly exposed regions of the film by as much as a factor of 109. The unexposed grains of silver halide, unchanged by photographic development, are then removed by dissolution. Explain why the image formed on the film is a “negative” (dark subject appears light and vice versa).
e. How could a “positive” print be produced from the negative film? Consider the black and white process only at this stage.
f. Chemical and spectral sensitizing agents, often containing sul-fur and/or gold and/or organic dye molecules, are present with the silver halide in the film. These create sensitive sites on cer-tain surfaces of silver halide microcrystals, thereby sensitizing the film to sub-band-gap light. Films of different “speeds” (i.e., meeting different light level requirements) exist; speculate on how films of different speeds can be made.
g. Formation of a color image is more complex than for black-and-white, although it still relies on silver halides. Simple color film contains three layers of emulsion, each containing silver halide and a coupler that is sensitive to particular colors. In the order in which light hits the film, the first layer is sensitive to blue, and next there is a filter that stops blue and violet. The second

60 PhysicalPropertiesofMaterials
emulsion is sensitive to green; the third emulsion is sensitive to red. (In a good-quality color film, there will be many more emul-sions to get truer colors, but the principle is the same.) What color is the filter that stops the blue?
h. In the development of color film, the oxidized developer reacts with each coupler to produce a precursor to an organic dye mol-ecule. The colors of the dye molecules produced in the develop-ment process are the complements of the light that exposed the emulsions (i.e., orange color forms in the first layer since orange is the complement to blue; magenta [red-violet], the complement to green, forms in the second layer; cyan [bluish-green], the com-plement to red, forms in the third layer). What is the role of syn-thetic organic chemists in developing films?
i. What is the role of materials researchers who are interested in measurement and calculation of properties such as the effect of impurities and lattice defects on the mobility of ions and holes in silver halides, and topics such as the surface energies of different faces of silver halide crystals?
j. How do you expect the printing process for color film to work?k. Speculate on how the Polaroid® (instant processing) process
works.l. The Polaroid process depends rather critically on temperature.
Why?m. A digital camera does not use film. Instead, it has a semiconduc-
tor-based sensor that converts light into electrical charges. The sensor is a 2D array with thousands, or millions, of individual sensors (pixels). What type of materials likely is used to convert light to electrical charges?
n. Many digital cameras use a charge-coupled device (CCD).* The CCD transports the charge across the chip, and an analog-to-digital converter then turns each pixel’s value into a number cor-responding to the amount of charge at each photosite. Why does a digital camera require a lot of memory?
o. Some cameras use a different type of sensor called a comple-mentary metal oxide semiconductor (CMOS). CMOS devices use several transistors at each pixel to amplify and move the charge using more traditional wires. Since the CMOS signal is digital, analog-to- digital conversion is not required. CCD sensors give high-quality, low-noise images, while CMOS sensors are gen-erally more susceptible to noise. Furthermore, each pixel on a CMOS sensor has several transistors located next to it, and many of the photons hit the transistors instead of the photodiode,
* The 2009 Nobel Prize in Physics was awarded to Willard S. Boyle (1924–2011) and George E. Smith (1930–) for their invention of the CCD sensor.
www.ebook3000.com

ColorinMetalsandSemiconductors 61
making the light sensitivity of a CMOS chip lower than that of the CCD. Which technology, CMOS or CCD, do you expect to have lower power consumption?
3.5 Problems
3.1 The color of the heating coil in a toaster dies off slowly when the toaster is unplugged. However, the color of the light-emitting diode in a clock dies off quickly when the clock is unplugged. Comment on the sources of the difference.
3.2 Two very different materials both absorb light of wavelength 580 nm, which corresponds to yellow light.
a. One material is a pure semiconductor. What color is it? Explain your reasoning.
b. The absorption in the other material (which is an insula tor) is due to a transition metal impurity. What color is this material? Explain your reasoning.
3.3 Most camera film works on the silver halide process. Most sil-ver halides are semiconductors with band gaps of around 2.7 eV (λ = 460 nm). There are films available that can take “infrared” pictures. Briefly explain how the silver halide process would have to be modified to give an infrared film.
3.4 Photographic films come in different speeds. High-speed film requires less light to obtain an image, whereas low-speed film requires more light. Some people worry about passing their film camera through the x-ray process at security counters in airports in case the x-rays damage the film. Is high-speed or low-speed film more susceptible to x-ray damage? Explain.
3.5 The blood of invertebrates in the phyla Arthropoda and Mollusca (e.g., crab, crayfish, lobster, snail, slug, octopus) contains hemo-cyanin as its oxygen carrier. Hemocyanin contains copper, which is bound directly to a protein. The oxygenated form, oxy-hemocyanin, contains bound oxygen, and this species absorbs light. There are three regions of maximum absorbance; one at a wavelength of 280 nm (due to the protein), and two others due to the copper one at 346 nm and one at 580 nm.
a. Suggest the physical source of the color of their blood. Give your reasoning.
b. What color is the blood of species with hemocyanin? Give your reasoning.
3.6 Explain how the optical properties of a semiconducting chro-mophore can be influenced by different packing arrangements of the molecules in the solid state.
3.7 Lasers produce light by stimulated emission. Some lasers use semiconductors, with the light emission corresponding to the

62 PhysicalPropertiesofMaterials
energy of the band gap. This makes the light for a given system fixed at one energy.
a. Suggest how the addition of impurities to a semiconductor laser material can be used to change the wavelength of the emitted light.
b. Can the wavelength be both shortened and lengthened using this approach? Explain.
c. Stimulated emission leading to lasing requires a high density of lasing centers. How will this affect the intensity of lasing from a doped semiconductor, compared with an intrinsic semiconductor with the same effective energy gap?
3.8 The compound yttrium vanadate with 5% of the Y3+ ions re -placed by Eu3+ gives a very efficient red phosphor. This is the red phosphor that is commonly used as a red emitter in a traditional color television screen (the other emitters are blue and green); its emission is perceptively pure red radiation at 612 nm from its 5Do electronic state upon excitation. In a traditional television screen, what excites the phosphor causing it to emit light?
3.9 Photochromic glass changes its transparency depending on the light level. The principle involved is similar to the effect of light on silver halides in photography. This glass contains copper-doped silver halide crystallites. When ultraviolet light hits the glass, copper gives up an electron, which is captured by the silver ion, leading to aggregates of silver atoms that darken the glass. This glass becomes transparent again when the UV source is removed (e.g., on moving indoors). Propose a mecha-nism that would allow for this reversion to the original state.
3.10 Two walls are painted with orange paint; one is “plain” orange and the other is fluorescent orange. Use energy level diagrams to show the difference in the two paints.
3.11 A science museum is building a new exhibit concerning the photocopying machine. A museum employee suggested that part of the exhibit be a working photocopier with the front panel made of glass so that visitors can see the interior work-ings of the copier when in use. Explain whether or not the pho-tocopier would work if you could see inside.
3.12 How would the color of a light-emitting diode be expected to change on cooling from room temperature (where it emits red light) to the temperature of the boiling point of liquid nitrogen (T = 77 K)? Consider that the lattice will have contracted and this will affect Eg.
3.13 J. D. Bernal wrote, “All that glisters [“glistens”] may not be gold, but at least it contains free electrons.” Give an example that refutes this statement.
3.14 From the data in Table 3.1, what color is Ge? Explain your reasoning.
3.15 The pigment, zinc white (ZnO), is white at room temperature (i.e., colorless with a white appearance due to scattering from the powder) and bright yellow when heated. Explain the color change.
www.ebook3000.com

ColorinMetalsandSemiconductors 63
3.16 Blue color can be created in diamond by addition of boron as a dopant, or by irradiation to create lattice defects. How could measurement of the electrical conductivity distinguish between these sources of color in a blue diamond?
3.17 Use Equation 3.1 to calculate the probability of occupation of energy levels from 1.5 eV to 2.5 eV (in 0.05 eV increments) for a free electron gas with a Fermi energy of 2.0 eV, at (a) T = 300 K and (b) T = 1000 K. Graph your results, with results for both temperatures on the same graph.
3.18 Diamonds that are synthesized in laboratory conditions are often very strongly colored yellow. This is said to be due to an elemental contaminant from the atmosphere.
a. Since pure diamond is colorless, explain the origin of the yel-low color. Begin by explaining why pure diamond is color-less and how the presence of the impurity affects the color.
b. Naturally produced diamonds also have the same impu-rity present, but over the very long time of their formation, these impurity atoms have migrated and clumped together. Explain why natural diamonds, then, are usually colorless (i.e., why this impurity does not lead to color when the impurity atoms are clumped together).
3.19 Lasers have been developed to give blue light. These make use of semiconductors. Is the band gap wider or narrower for a blue lasing semiconductor compared with a red lasing semiconduc-tor material? Explain your reasoning.
3.20 It can be difficult to photocopy a document that has been writ-ten in pencil. The pencil color is dark and the light should be strongly absorbed, but it is not. Why not? (Consider the layered structure of graphite.)
3.21 The TELSTAR satellite, launched in 1962, suffered irreversible damage to its solar cells from an unexpectedly high number of electrons in its path in the Van Allen Belt surrounding the earth as a result of nuclear testing just before the TELSTAR launch. How did the extra electrons change the solar cells?
Further Reading
General References
Many introductory physical chemistry and solid-state physics textbooks con-tain information concerning metals and semiconductors.
W. D. Callister Jr. and D. G. Rethwisch, 2010. Materials Science and Engineering: An Introduction, 8th ed. John Wiley & Sons, Hoboken, NJ.
R. Cotterill, 2008. The Material World. Cambridge University Press, Cambridge.R. Dagani, 1998. Light-emitting polymer synthesis. Chemical and Engineering News,
January 19, 1998, 9.

64 PhysicalPropertiesofMaterials
M. de Podesta, 1996. Understanding the Properties of Matter. Taylor & Francis, Washington.R. M. Evans, 1948. An Introduction to Color. John Wiley & Sons, Hoboken, NJ.G. G. Hall, 1991. Molecular Solid State Physics. Springer-Verlag, New York.A. Javan, 1967. The optical properties of materials. Scientific American, September
1967, 239.I. P. Jones, 2001. Materials Science for Electrical and Electronic Engineers. Oxford
University Press, New York.T. A. Kavassalis, 1995. The application of quantum mechanics and molecular dynam-
ics to the design of new materials in an industrial laboratory. Physics in Canada, March/April 1995, 92.
C. Kittel and H. Kroemer, 1980. Thermal Physics, 2nd ed. Freeman, New York.G. C. Lisensky, R. Penn, M. J. Geslbracht, and A. B. Ellis, 1992. Periodic trends in a
family of common semiconductors. Journal of Chemical Education, 69, 151.G. J. Meyer, 1997. Efficient light-to-electrical energy conversion: Nanocrystalline TiO2
films modified with inorganic sensitizers. Journal of Chemical Education, 74, 652.C. G. Mueller, M. Rudolph, and the Editors of LIFE, 1966. Light and Vision. Life Science
Library, Time Inc, New York.K. Nassau, 1980. The causes of colour, Scientific American, October 1980, 124.K. Nassau, 2001. The Physics and Chemistry of Color, 2nd ed. John Wiley & Sons,
Hoboken, NJ.T. D. Rossing and C. J. Chiaverina, 1999. Light Science: Physics and the Visual Arts.
Springer, New York.R. J. D. Tilley, 2000. Colour and the Optical Properties of Materials. John Wiley & Sons,
Hoboken, NJ.R. J. D. Tilley, 2004. Understanding Solids: The Science of Materials. John Wiley & Sons,
Hoboken, NJ.V. F. Weisskopf, 1968. How light interacts with matter. Scientific American, September
1968, 60.E. A. Wood, 1977. Crystals and Light. Dover Publications, New York.G. Wyszecki and W. S. Stiles, 2002. Color Science, 2nd ed. Wiley-Interscience, Hoboken,
NJ.A. Zukauskas and M. S. Shur, 2001. Light-emitting diodes: Progress in solid-state
lighting. MRS Bulletin, October 2001, 764.
Color in Gems
A. Butler and R. Nicholson, 1998. Hope springs eternal. Chemistry in Britain, December 1998, 34.
Lasers
M. G. D. Baumann, J. C. Wright, A. B. Ellis, T. Kuech, and G. C. Lisensky, 1992. Diode lasers. Journal of Chemical Education, 69, 89.
LEDs
A. Bergh, G. Craford, A. Duggal, and R. Haitz, 2001. The promise and challenge of solid state lighting. Physics Today, December 2001, 42.
www.ebook3000.com

ColorinMetalsandSemiconductors 65
R. T. Collins, P. M. Fauchet, and M. A. Tischler, 1997. Porous silicon: From lumines-cence to LEDs. Physics Today, January 1997, 24.
C. Day, 2006. Light-emitting diodes reach for the ultraviolet. Physics Today, July 2006, 15.M. Freemantle, 2001. Color control for organic LEDs. Chemical and Engineering News,
August 27, 2001, 17.E. F. Schubert, 2003. Light-Emitting Diodes. Cambridge University Press.
Light-Sensitive Glass
D. M. Trotter Jr., 1991. Photochromic and photosensitive glass. Scientific American, April 1991, 124.
Photocopying Process
October 22, 1938: Invention of xerography. APS News, October 2003, 2.A. D. Moore, 1972. Electrostatics. Scientific American, March 1972, 47.J. Mort, 1994. Xerography: A study in innovation and economic competitiveness.
Physics Today, April 1994, 32.D. Owen, 1986. Copies in seconds. The Atlantic Monthly, 257(2), 64.
Photographic Materials and Processes
Silver halides in photography. MRS Bulletin, Volume XIV, Number 5, May 1989 (five research papers concerning this subject).
A. B. Bocarsly, C. C. Chang, and Y. Wu, 1997. Inorganic photolithography: Interfacial multicomponent pattern generation. Journal of Chemical Education, 74, 663.
C. A. Fleischer, C. L. Bauer, D. J. Massa, and J. F. Taylor, 1996. Film as a composite material. MRS Bulletin, 14, July 1996.
M. Freemantle, 2000. Doubling film speed, radically. Chemical and Engineering News, December 11, 2000, 9.
W. C. Guida and D. J. Raber, 1975. The chemistry of color photography. Journal of Chemical Education, 52, 622.
J. F. Hamilton, 1988. The silver halide photographic process. Advances in Physics, 37, 359.
W. L. Jolly, 1991. Solarization: The photographic Sabatier effect. Journal of Chemical Education, 68, 3.
J. Kapecki and J. Rodgers, 1993. Color photography. Kirk–Othmer Encyclopedia of Chemical Technology. John Wiley & Sons, Hoboken, NJ.
M. S. Simon, 1994. New developments in instant photography. Journal of Chemical Education, 71, 132.
Triboluminescence
R. Angelos, J. I. Zink, and G. E. Hardy, 1979. Triboluminescence spectroscopy of com-mon candies. Journal of Chemical Education, 56, 413.
L. M. Sweeting, A. L. Rheingold, J. M. Gingerich, A. W. Rutter, R. A. Spence, C. D. Cox, and T. J. Kim, 1997. Crystal structure and triboluminescence. Chemistry of Materials, 9, 1103.

67
4ColorfromInteractionsofLightWaveswithBulkMatter
4.1 Introduction
In Chapter 2, we saw that color can originate from single atoms or small numbers of atoms. Chapter 3 showed that very large numbers of atoms of metallic or semiconductor materials can give rise to energy bands that in turn can provide color when visible light is absorbed.
Light can interact in other ways with bulk matter (i.e., matter with of the order of the Avogadro* number of atoms), and this can also lead to color. In this chapter, we explore some of these sources of color.
4.2 Refraction
Thus far, the processes giving rise to color have involved absorption or emis-sion of light. However, there are other physical interactions that give rise to color by change in the direction of the light, and one of these is considered here.
Refraction results from the change in speed of light when passing from one medium to another. When a uniform, nonabsorbing medium, such as air or glass or salt, transmits light, the photons are absorbed and immediately re-emitted in turn by all the atoms in the path of the ray, slowing down the light. Light travels fastest in a vacuum, and more slowly in all other materi-als. Light travels faster in air than in a solid.
* Amedeo Avogadro (1776–1856) was an Italian lawyer and scientist. In 1811, in a paper that should have settled the dispute concerning the relationship between atomic weights and properties of gases, Avogadro proposed that equal volumes of gases under the same condi-tions should contain equal numbers of molecules. This work was ignored for about 50 years, but its importance is recognized today in naming Avogadro’s number.

68 PhysicalPropertiesofMaterials
Consider the case of monochromatic (i.e., single wavelength) light entering a piece of glass, as shown in Figure 4.1. One edge of the beam enters the prism and is slowed before the other edge hits the glass. This has the effect of bending the light toward the direction perpendicular to the edge of the glass. When exiting the prism, the side of the beam that exits first “pulls” the light in the direction that takes it away from the perpendicular direction. This bending of light as its velocity changes with a change in medium can be considered to be a consequence of Fermat’s* principle of least time which states that light rays will always take the path that requires the least time. Bending of light on changing media is shown by analogy in Figure 4.2.
The index of refraction (also known as the refractive index), n, is defined as†
n =vv
(4.1)
where v is the speed of light in vacuum and v′ is the speed of light in the medium under consideration; n depends on the material, the wavelength of the light used, and the temperature. Values for a range of materials (for the Na yellow line) are given in Table 4.1.
Although we are perhaps not aware of it, many optical phenomena are associated with refractive index (see Figure 4.3). For example, if we drop a
* Pierre de Fermat (1601–1665) was a French lawyer who studied mathematics as a hobby. He made several important contributions in the areas of number theory, analytic geometry (including the equation for a straight line), and calculus.
† The most important equations in this chapter are designated with ∎ to the left of the equation.
Air
Air
Glass
FIGURE 4.1As monochromatic light passes from air to glass, it is slowed. When the light hits the glass at a glancing angle, one side of the light beam is slowed first, causing the light to be bent toward the perpendicular on entering the glass, and away from the perpendicular on leav-ing the glass.
www.ebook3000.com

ColorfromInteractionsofLightWaveswithBulkMatter 69
piece of glass in water, we see the edges of the glass due to bending of light because the refractive index of glass is different from that of water. If alcohol and water are mixed, their mixing can be traced by the refraction associated with the small differences in their refractive indices. Similarly, the change in refractive index of air as it is heated is apparent in viewing an air mass above hot asphalt.
Road
Road
Lawn
FIGURE 4.2An analogy showing how light is bent as it changes speed on passing from one medium to another. When a pair of wheels hits a patch of soft lawn at a glancing angle, one side is slowed first, and this causes bending towards the perpendicular; it bends away from the perpendicu-lar on leaving the lawn.
TABLE 4.1
Refractive Indices for Some Common Materials at 25°C Except Ice, Which Is at 0°Ca
Material n
Air 1.00029Ice 1.305Water 1.33Acetone 1.357n-Heptane 1.385Tetrahydrofuran 1.404Fused quartz 1.456Benzene 1.498Aniline 1.584Light flint glass (average) 1.59Methylene iodide 1.738Dense flint glass (average) 1.75Diamond 2.42
a All values were determined using the sodium-D line (yellow light).
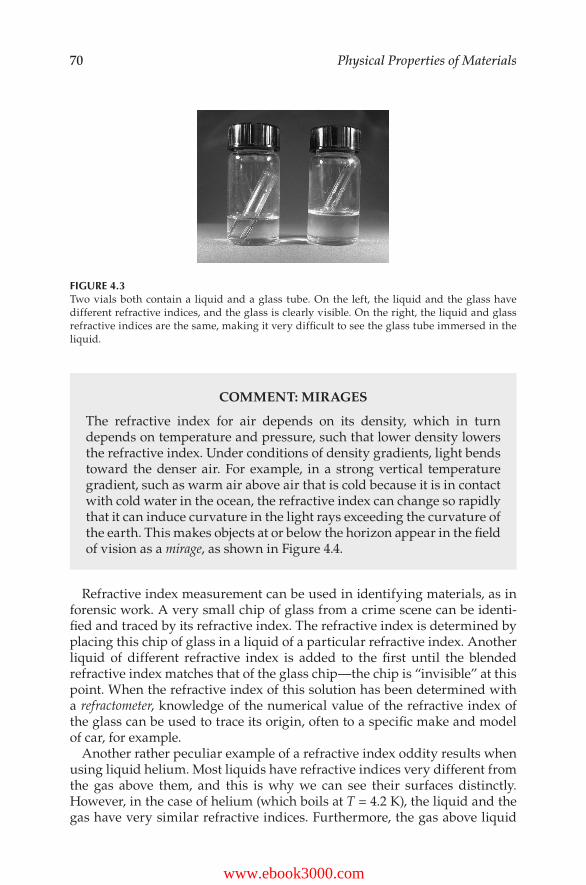
70 PhysicalPropertiesofMaterials
Refractive index measurement can be used in identifying materials, as in forensic work. A very small chip of glass from a crime scene can be identi-fied and traced by its refractive index. The refractive index is determined by placing this chip of glass in a liquid of a particular refractive index. Another liquid of different refractive index is added to the first until the blended refractive index matches that of the glass chip—the chip is “invisible” at this point. When the refractive index of this solution has been determined with a refractometer, knowledge of the numerical value of the refractive index of the glass can be used to trace its origin, often to a specific make and model of car, for example.
Another rather peculiar example of a refractive index oddity results when using liquid helium. Most liquids have refractive indices very different from the gas above them, and this is why we can see their surfaces distinctly. However, in the case of helium (which boils at T = 4.2 K), the liquid and the gas have very similar refractive indices. Furthermore, the gas above liquid
COMMENT: MIRAGES
The refractive index for air depends on its density, which in turn depends on temperature and pressure, such that lower density lowers the refractive index. Under conditions of density gradients, light bends toward the denser air. For example, in a strong vertical temperature gradient, such as warm air above air that is cold because it is in contact with cold water in the ocean, the refractive index can change so rapidly that it can induce curvature in the light rays exceeding the curvature of the earth. This makes objects at or below the horizon appear in the field of vision as a mirage, as shown in Figure 4.4.
FIGURE 4.3Two vials both contain a liquid and a glass tube. On the left, the liquid and the glass have different refractive indices, and the glass is clearly visible. On the right, the liquid and glass refractive indices are the same, making it very difficult to see the glass tube immersed in the liquid.
www.ebook3000.com

ColorfromInteractionsofLightWaveswithBulkMatter 71
helium is just pure helium, as any other gas would condense to its solid state. When using liquid helium, which must be transferred carefully from one closed container to another in an insulated siphon, it can sometimes be dif-ficult to see how much liquid has been transferred because the surface is almost “invisible.”
Figure 4.1 shows refraction for monochromatic light, but refraction can lead to beautiful effects when dealing with white light. For example, it is responsible for the beautiful colors in a rainbow. In Cambridge, England, in 1666, at the age of 23, Newton* described an experiment with a prism “to try therewith the phenomena of the colors.” He wrote,† “In a very dark Chamber, at a round hole . . . I placed a Glass Prism, whereby the Beam of the Sun’s Light, which came in at that hole, might be refracted upwards toward the opposite wall of the Chamber, and there form a color’d Image of the Sun.” We now know that the source of the spectrum of colors is the refraction property of glass, as first described correctly by Newton, using the term refrangibility (known today as refraction).
When white light, which we now know to be composed of the light of all visible colors, hits a prism, some colors are more refracted than others. In particular, higher-energy (shorter-wavelength) light is more refracted. This
* Sir Isaac Newton (1642–1727) was an English natural philosopher and mathematician. Owing to the Black Plague, Newton spent 1665–1666 in the English countryside where he laid the foundations for his great contributions in optics, dynamics, and mathematics.
† I. Newton, 1730. Opticks, W. Innys, London.
Warm air
Cold air
Cold water
Realposition
positionApparent
FIGURE 4.4A mirage results when light is bent toward the denser air in a strong vertical temperature gra-dient. Because light normally travels in straight line, we perceive a mirage, greatly exaggerated in elevation here.
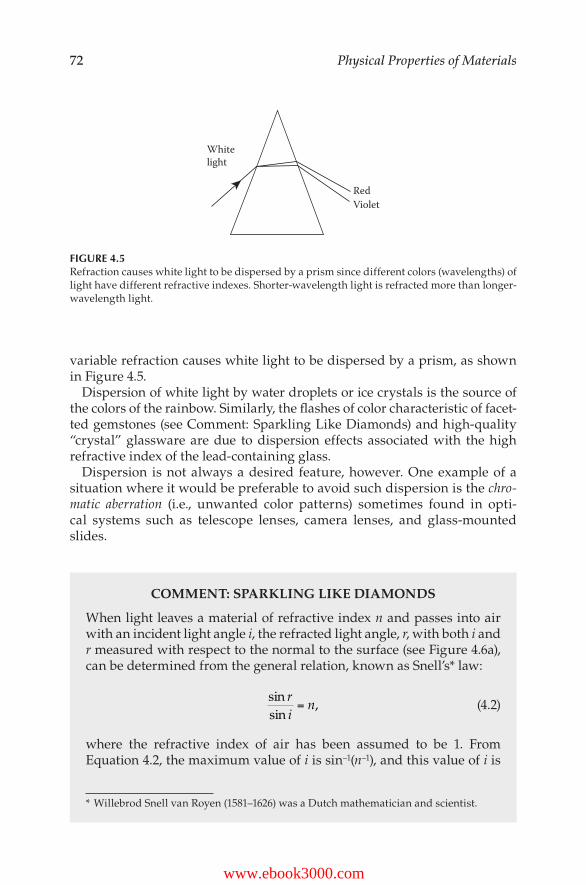
72 PhysicalPropertiesofMaterials
variable refraction causes white light to be dispersed by a prism, as shown in Figure 4.5.
Dispersion of white light by water droplets or ice crystals is the source of the colors of the rainbow. Similarly, the flashes of color characteristic of facet-ted gemstones (see Comment: Sparkling Like Diamonds) and high-quality “crystal” glassware are due to dispersion effects associated with the high refractive index of the lead-containing glass.
Dispersion is not always a desired feature, however. One example of a situation where it would be preferable to avoid such dispersion is the chro-matic aberration (i.e., unwanted color patterns) sometimes found in opti-cal systems such as telescope lenses, camera lenses, and glass-mounted slides.
COMMENT: SPARKLING LIKE DIAMONDS
When light leaves a material of refractive index n and passes into air with an incident light angle i, the refracted light angle, r, with both i and r measured with respect to the normal to the surface (see Figure 4.6a), can be determined from the general relation, known as Snell’s* law:
sinsin
,ri
n= (4.2)
where the refractive index of air has been assumed to be 1. From Equation 4.2, the maximum value of i is sin–1(n–1), and this value of i is
* Willebrod Snell van Royen (1581–1626) was a Dutch mathematician and scientist.
Whitelight
RedViolet
FIGURE 4.5Refraction causes white light to be dispersed by a prism since different colors (wavelengths) of light have different refractive indexes. Shorter-wavelength light is refracted more than longer-wavelength light.
www.ebook3000.com

ColorfromInteractionsofLightWaveswithBulkMatter 73
called the critical angle. For i greater than the critical angle, there is no refraction, and total internal reflection results (see Figure 4.6b).
For diamond, n = 2.42, and this leads to a critical angle of 24.4°. Therefore, a light ray that makes an angle of 65.6° (i.e., 90°–24.4°) or less with the outer surface of a diamond cannot pass through the surface to air but is totally reflected, as shown for monochromatic light in a dia-mond in Figure 4.7a. A properly cut diamond will appear opaque when viewed from below because no light from the upper surface will exit the bottom (Figure 4.7a). When white light hits the diamond’s surface, it is dispersed into its colors. The dispersion is illustrated in Figure 4.7b.
White lightColored light
(a) (b)
θ
FIGURE 4.7(a) Monochromatic light within a diamond that makes an angle θ of 65.6° or less with the sur-face will be totally reflected. A properly cut diamond can appear opaque when viewed from the bottom due to total internal reflection of the impingent light, as shown. (b) White light enters a cut diamond and is dispersed. With an appropriate cut, colored light exits from the top face and no light exits from the bottom face.
AirAir
i i
r
rʹ
i = rʹ
(a) (b)
FIGURE 4.6(a) When light leaves a medium to go to air, the angle of incidence, i, is related to the angle of refraction, r, by Snell’s law (Equation 4.2). (b) If the angle of incidence is greater than the critical angle, there is no refraction but only internal reflection. Note that the angle of incidence equals the angle of reflection, i = r′.

74 PhysicalPropertiesofMaterials
COMMENT: AN EXAMPLE OF REFRACTION: THE FRESNEL LENS
A Fresnel* lens is a flat, thin piece of plastic (typically a copolymer of polyvinyl acetate and polyvinyl butyrate) that can act as a lens (Figure 4.8). It does so using the principle of refraction. Into the lens are molded a series of small concentric stepped prisms, each step only a few thou-sandths of a centimeter wide. The steps extend concentrically from the center of the lens to its outer edges and can easily be felt with a finger. Each prism causes refraction, and this bends the light. Taken together, they form a lens. A Fresnel lens is relatively inexpensive to produce and much thinner than conventional lenses. They have many applications, including use in overhead projectors.
* Augustin Jean Fresnel (1788–1827) was a French physicist. He invented his lens design in order to allow efficient and effective light signaling between lighthouses.
COMMENT: NEGATIVE INDEX OF REFRACTION
A material with a negative refractive index, n < 0, would lead to both refracted and incident light on the same side of normal, as shown in Figure 4.9.
Negative index of refraction materials were first pondered theoreti-cally in 1968 and are now being realized through metamaterials, which are materials that derive their properties from their manipulated struc-ture rather than the properties of their components. (Sometime referred to as “artificial materials,” metamaterials are indeed real!) In principle,
FIGURE 4.8Piano keys viewed through a Fresnel lens. These lenses derive their optical properties from small concentric stepped prisms that refract light.
www.ebook3000.com

ColorfromInteractionsofLightWaveswithBulkMatter 75
4.3 Interference
Newton also was the first to document an understanding of the sources of color due to interference.
To understand interference patterns in light, it is instructive to first con-sider two extreme ways in which waves can interact. These interactions apply equally to light waves or any other waves such as sound or water waves.
When two waves of exactly the same wavelength come together, the result-ing wave depends very much on the phases of the waves. For example, if two identical waves exactly in phase (peaks and troughs at same time and location, as shown in Figure 4.10) interact, the resulting wave will be of the same wavelength, and its amplitude will be the sum of the amplitudes of the incident waves, as shown in Figure 4.10. These waves are said to undergo constructive interference.
Although there is only one way in which waves can be in phase, there are many ways for the waves to be “not in phase.” The most extreme case is two identical waves that are exactly out of phase with one another: when one has a peak, the other has a trough. Two such waves of exactly the same
materials with n = –1 can focus light perfectly without any curved sur-faces. Sometime called “left-handed materials” because the wave vec-tor is antiparallel to the usual right-hand cross product of the magnetic and electric fields, negative refractive index materials are now being used in many applications, especially in the microwave region.
FIGURE 4.9The path of light entering a negative refractive index material bends away from the normal.

76 PhysicalPropertiesofMaterials
wavelength and exactly the same amplitude will come together to result in total destruction: no wave results (see Figure 4.11). This is called destructive interference.
COMMENT: SOUND INTERFERENCE
Interference effects apply to any kind of wave, including both light and sound. Destructive interference effects are used in some ear-phones that remove background noise: they work by generating sound waves that exactly destructively interfere with the sound waves of the background.
COMMENT: MOIRÉ PATTERNS
When two sets of equally spaced lines are overlaid with a slight dis-placement angle, as shown in Figure 4.12, it gives rise to an interference pattern, called a moiré pattern, from the French word moiré, meaning “water-spotted.” The presence of moiré patterns has been used for more than a century to detect aberrations due to irregularities in opti-cal components.
FIGURE 4.11Destructive interference: Two identical waves exactly out of phase give no resultant wave.
FIGURE 4.10Constructive interference of two identical waves exactly in phase gives a resultant wave of the same wavelength and twice the amplitude.
www.ebook3000.com

ColorfromInteractionsofLightWaveswithBulkMatter 77
Interference effects are especially prominent when light interacts with thin films. In these cases, light can be reflected from the front face of the film and also reflected by the back face of the film. Whether the front-reflected and back-reflected light cancels (destructive interference) or reinforces (construc-tive interference) depends on the nature and thickness of the film, the color of the light, and the viewing angle.
If the extra distance traveled by monochromatic light causes the front- and back-reflected light to be exactly out of phase, no light of this color will be seen. If the front- and back-reflected light are exactly in phase, constructive interference results, and this color will be observed.
Therefore, in the case of interference due to front- and back-reflected white light from thin films, the color and intensity of light observed will depend on the viewing angle. We are familiar with this in such everyday experiences as the colors in a bubble or oil on water. Even thin slices of inorganic materials can derive their colors from interference of front- and back-reflected light. For example, the colors of silicon oxide wafers range from blue-green at a thickness of 0.92 × 10⁻⁶ m to maroon-red at 0.85 × 10⁻⁶ m, back to blue-green again at 0.72 × 10⁻⁶ m. The colors repeat as the thick-ness changes, as additional layers add integer multiples of the wavelength to the extra path, allowing the same color to interfere constructively at dif-ferent film thicknesses.
Interference colors in soap films bear further examination. Soap works as a cleansing agent because of its chemical structure: one end is polar, and the other is nonpolar. This is shown schematically in Figure 4.13 for a “typical” soap.
COO–Na+
FIGURE 4.13Schematic structure of a “typical” soap molecule, showing the alkyl (nonpolar) tail and polar head group.
FIGURE 4.12A moiré pattern.

78 PhysicalPropertiesofMaterials
The hydrocarbon “tail” of the soap molecule is hydrophobic and acts as a solvent for oils, and the polar end is attracted to water (hydrophilic). This property of being both oil-loving and water-loving makes soap amphiphilic and allows soap to attract both water and oils, thereby allowing cleansing action.
A soap film is composed of soap molecules and water molecules. The soap molecules prefer to have their hydrophobic ends away from the water point-ing out into the air, which can, at appropriate concentration, give a bilayer structure, as shown schematically in Figure 4.14.
The main difference between a thick soap film and a thin one is the num-ber of water molecules between the soap layers.
The soap film can be modeled schematically as a front and back sur-face, each reflecting light, as shown in Figure 4.15. Views of construc-tive and destructive interference from front- and back-reflection are also shown.
For light of wavelength λ and incident intensity Ii hitting the thin layer (soap film) of refractive index n, consideration of wave scattering gives the intensity of the reflected light, Ir, as*
* See C. Isenberg (1992). The Science of Soap and Soap Films. Dover Publications, p. 36, for a derivation.
H2OH2OH2O
H2O
H2O H2O
H2OH2O H2O
H2O H2O
H2OH2O
H2OH2O
H2OH2O
H2OH2OH2O
FIGURE 4.14Schematic bilayer structure of a typical soap film. The alkyl chains of the soap molecules point into the air, and the polar head groups of the soap molecules point into the water. Much more water would be present in a real soap film.
www.ebook3000.com

ColorfromInteractionsofLightWaveswithBulkMatter 79
I I Rnt
r i= +42
22cos cos ,
πλ
θπ
(4.3)
where t is the thickness of the soap film, θ is the angle defined in Figure 4.15, and R is the fraction of light reflected. Equation 4.3 shows that the intensity of reflected light observed depends on many factors, including the thickness of the soap film, the wavelength of the light, and the viewing angle. This is immediately familiar to us as the beautiful range of colors seen in a soap bubble.
Equation 4.3 also shows that the intensity of reflected light will depend on the thickness of the film. Due to gravity, a vertical soap film will not be of uniform thickness (see Figure 4.16). In this case, t varies with height. In monochromatic light, since the intensity of light will depend on t, there will be regions where the thickness is such that maximum constructive interfer-ence will be observed (the extra path length traveled by the back-reflected light combined with the phase change of the front-reflected light keeps them exactly in phase on exiting), and the reflected light will be very intense. There will be other regions in the soap film where maximum destructive interfer-ence will be observed (the extra path length traveled by the back-reflected light combined with the phase change of the front-reflected light puts the exiting beams exactly out of phase), and there will be no net reflected light. There will also be intermediates between these two extremes, again depend-ing on the thickness of the film. Therefore, for a wedge- shaped film observed in monochromatic light, there will be an interference pattern of fringes of light and dark areas, depending on the thickness of the film.
(a) (b)
t t
θθ
FIGURE 4.15Schematic view of front- and back-surface reflection of light from a thin film, such as a soap film: (a) constructive interference (the exiting waves add to give a resultant wave of larger amplitude); (b) destructive interference (the exiting waves exactly cancel to give no light out). Note that front reflection leads to a change in phase but back reflection does not.
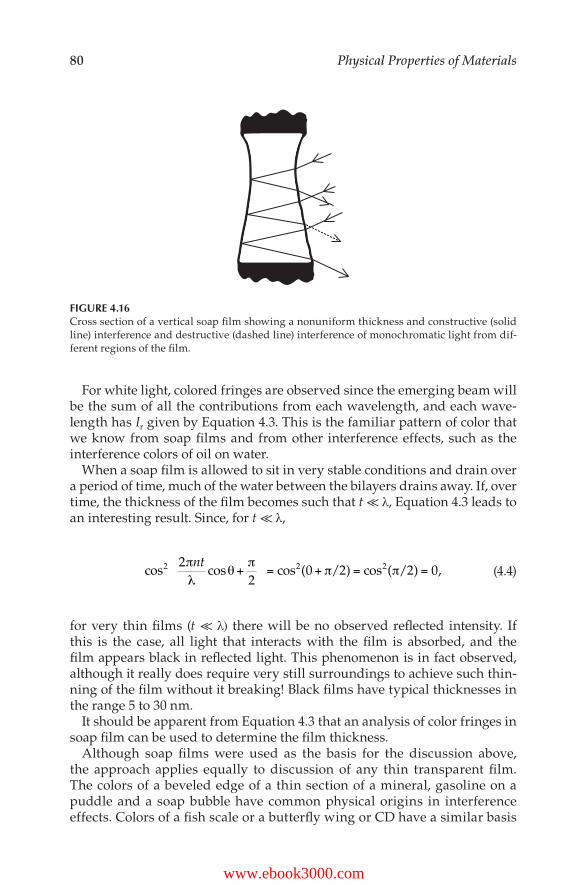
80 PhysicalPropertiesofMaterials
For white light, colored fringes are observed since the emerging beam will be the sum of all the contributions from each wavelength, and each wave-length has Ir given by Equation 4.3. This is the familiar pattern of color that we know from soap films and from other interference effects, such as the interference colors of oil on water.
When a soap film is allowed to sit in very stable conditions and drain over a period of time, much of the water between the bilayers drains away. If, over time, the thickness of the film becomes such that t ≪ λ, Equation 4.3 leads to an interesting result. Since, for t ≪ λ,
cos cos cos ( ) cos ( ) ,2 2 222
0 2 2 0πλ
θπ
π πnt
+ = + = =/ / (4.4)
for very thin films (t ≪ λ) there will be no observed reflected intensity. If this is the case, all light that interacts with the film is absorbed, and the film appears black in reflected light. This phenomenon is in fact observed, although it really does require very still surroundings to achieve such thin-ning of the film without it breaking! Black films have typical thicknesses in the range 5 to 30 nm.
It should be apparent from Equation 4.3 that an analysis of color fringes in soap film can be used to determine the film thickness.
Although soap films were used as the basis for the discussion above, the approach applies equally to discussion of any thin transparent film. The colors of a beveled edge of a thin section of a mineral, gasoline on a puddle and a soap bubble have common physical origins in interference effects. Colors of a fish scale or a butterfly wing or CD have a similar basis
FIGURE 4.16Cross section of a vertical soap film showing a nonuniform thickness and constructive (solid line) interference and destructive (dashed line) interference of monochromatic light from dif-ferent regions of the film.
www.ebook3000.com
ColorfromInteractionsofLightWaveswithBulkMatter 81
and are due to multilayer interference. Interference coloration is usually iridescent, that is, displaying all the colors of the rainbow. Furthermore, the color observed changes with the viewing angle, and changes on immersion in a fluid.
COMMENT: AN EXAMPLE OF INTERFERENCE EFFECTS: THE HOLOGRAM
The hologram was invented in 1947 by Gabor*; he was awarded the 1971 Nobel Prize in Physics for this invention.
The hologram is an example of the use of interference effects to pro-duce color. It also produces a three-dimensional image.
The production of a hologram requires film, a light source (usually a laser), and a small three-dimensional model for the object to be cap-tured on the hologram. To make a master hologram, the laser beam is split into two beams: the illuminating beam and the reference beam. The illuminating beam is aimed at the object, and then its reflection strikes a light-sensitive film. The reference beam meets the reflected beam at the film, and the interference between the reflected and ref-erence beam leaves a pattern on the film, representative of the object scanned.
The master holographic image is converted to a physical image of microscopic pits in a fine layer of nickel. A special plate is then created to emboss these microscopic pits into a clear plastic film. Then the film is coated with a thin reflective layer of aluminum. The master holo-gram can be used to produce many such holograms.
Viewing the hologram requires ambient light from the same direc-tion as the reference beam. This light interacts with the pattern on the film to reconstruct the three-dimensional image of the original object.
X-ray holograms with atomic resolution have been developed for use as data storage devices.
* Dennis Gabor (1900–1979) was a Hungarian-born electrical engineer who developed the holographic principles while carrying out research aimed to improve the resolu-tion of electron microscope images.

82 PhysicalPropertiesofMaterials
4.4 Scattering of Light
Light is bent or scattered when it hits the edge of an opaque object. This is usually a minor effect when the object is large but becomes a major effect when the size of the object approaches the wavelength of light involved.
Scattering of light was put on a firm basis by the studies of Rayleigh* and Tyndall,† and their names are often associated with light-scattering processes.
For a small object, about 10 nm to 300 nm in diameter, that scatters light of incident intensity Ii and wavelength λ, the intensity at a distance d from the scatterer and angle θ between incident and detected intensity, Iθ, is given by‡:
II di
θ π α θ
λ=
+8 14 2 2
2 4
( cos ) (4.5)
where α is the polarizability of the sample, a measure of how easy it is to displace electrons in the sample. Polarizability is important for interactions with light because light is electromagnetic radiation. Equation 4.5 describes Tyndall scattering.
Since Iθ is proportional to λ–4 in Tyndall scattering, the most intensely scattered light is that at the shortest wavelengths. For the visible range, this means that blue light is much more scattered than red light.
Tyndall scattering is responsible for the blue color of the daytime sky. The light from the sun contains all colors; we know that because we can see it dispersed into the whole spectrum when there is a rainbow. Of the visible wavelengths of light emitted by the sun, violet light will be most scattered by particles in our atmosphere, but the intensity of violet light from the sun is much less than that of blue light. When we stand beneath the noon sun and look at the sky, most of the color that we see in the sky, not looking directly at the sun, is therefore blue (Figure 4.17a).
On the other hand, we are all familiar with the beautiful red sky at sunset. In the direction of the sun, much of the shorter wavelength light has been scattered by the atmosphere. This is particularly so at sunset because the sun’s light has a longer path through the atmosphere to travel before getting
* Lord Rayleigh (born John William Strutt; 1842–1919) was a British mathematical physicist and winner of the 1904 Nobel Prize in Physics for accurate measurements of the density of the atmosphere and its component gases. This work led to the discovery of argon and other members of the previously unknown family of noble gases.
† John Tyndall (1820–1893) was an Irish-born physicist who carried out precise experiments on heat transfer and also on scattering of light by fine particles in air, known today as the Tyndall effect.
‡ See, for example, R. J. Hunter (1993), Introduction to Modern Colloid Science, Oxford, p. 42.
www.ebook3000.com

ColorfromInteractionsofLightWaveswithBulkMatter 83
to us. This leaves behind predominantly red color in the direction of the sun at sunset (Figure 4.17b).
The white color of clouds also is due to light scattering, but now the parti-cle size is much larger (>1000 nm). The clouds are made of water droplets that can scatter light. The scattering is due to surface roughening and is nearly equal at all wavelengths (as for a rough surface of paper or ground glass; see the Tutorial in Chapter 5), and clouds appear white.
Indeed, without an atmosphere, the sky would appear black even in day-time, as it does in space or on the moon.
COMMENT: COLOR-CHANGING SPECIES
The color-matching of the chameleon to its environment is largely a result of light scattering. The skin of a chameleon contains many lay-ers—an outer yellow carotenoid layer, followed by a red chromophore layer, then a granular guanine layer, and finally an inner granular mel-anin layer. The light level alters the stimulation of the nerves in the skin, and this, in turn, changes the degree of aggregation of the gua-nine layer. In low light levels, granules aggregate, and the layer appears dark. In higher light levels, the granules are more dispersed, and the incoming light is scattered (Tyndall effect) by the silvery blue guanine
(a) (b)
Earth
Earth
R O Y G B V
VBGYOR
FIGURE 4.17(a) The sky appears blue at noon because the shortest wavelengths of sunlight (corresponding to blue-violet light) are most highly scattered. The sun appears yellow-orange because red to yellow light is much less scattered. (b) At sunset the light from the sun travels a longer path through the light-scattering atmosphere to reach us. This scatters away even more of the short-wavelength light than at noon, and the sun appears red.

84 PhysicalPropertiesofMaterials
4.5 Diffraction Grating
Interference and scattering can act together to produce colors in the case of a diffraction grating, which has a very small slit (or number of slits), with each opening of the order of the wavelength of light. When the light passes through the slit, it is scattered in all directions. Alternatively, a diffraction grating can involve reflection from internal layers. In both cases, the optical effects arise from constructive and destructive interference.
For a single slit, the scattered light intensity varies with distance from the slit and angle. For many slits, the light coming from adjacent slits can inter-fere either constructively or destructively. For a given wavelength of light, there will be angles where there is complete constructive interference, and other angles where there is complete destructive interference (Figure 4.18; the Young* experiment). The exact angles will depend both on λ and on the spacing between the slits.
When white light is passed through a diffraction grating (or is reflected from it), each wavelength is enhanced in different sets of directions; so, as the diffraction grating is rotated in different directions, different wave-lengths come into view. This is the principle by which a grating mono-chromator (which means “single-color producer”) works. The diffraction elements can be made, for example, by engraving fine rulings on a glass plate.
One example of a natural diffraction grating is the gemstone opal (Figure 4.19). Opal is composed of spheres of SiO2 with a small proportion of water packed in a three-dimensional lattice with a repeat distance of about 25 nm.
* Thomas Young (1773–1829) was an English natural philosopher who made many contribu-tions to physical sciences, including the principle of interference and principles of elasticity (memorialized in the term “Young’s modulus”; see Chapter 14.)
layer, making the skin appear more brightly colored. The degree to which the red and yellow layers are activated is in direct response to the stimulation of light from the surroundings.
The Hercules beetle changes color in response to humidity. The upper layer of its skin is spongy and, when dry, it scatters yellow light. In moist conditions, this layer becomes translucent, and the black under-layer dominates, giving a black appearance. Thus, the beetle looks yellow in low-humidity daylight conditions and black in the humid night air or amid rotting fruit. Once again, light scattering can provide camouflage.
www.ebook3000.com

ColorfromInteractionsofLightWaveswithBulkMatter 85
When white light enters this three-dimensional grating, pure colors appear, but the colors change as the eye or the stone move, as this changes the view-ing angle and the observed constructive interference. The source of color in opals was not understood until the structure of opal was elucidated in 1964 with the use of an electron microscope.
Screen
TroughCrest
FIGURE 4.18Light passing through two very small slits can interact in such a way that both constructive and destructive interference is possible. This gives “fringe patterns” (white for constructive interference, black for destructive interference) as shown. This experiment was designed and first carried out by Thomas Young, and was the first proof of the wave nature of light.
Whitelight
Reflectedcoloredlight
FIGURE 4.19Spectral colors can arise from the interaction of light with a regular lattice array with a spacing close to or shorter than the wavelength of light. The reflected light interferes constructively, enhancing some colors, and also interferes destructively, depleting other colors. The color observed depends on the viewing angle. This is the source of color in opals.

86 PhysicalPropertiesofMaterials
4.5.1 An Example of Diffraction Grating Colors: Liquid Crystals
Liquid crystals can provide another example of diffraction-grating colors. Liquid crystals were first reported by the botanist Reinitzer* in 1888. He dis-covered that cholesteryl benzoate had two melting points. On heating, at 145°C it goes from a solid to a cloudy liquid; at 179°C it transforms from a cloudy liquid to a clear liquid. It is now known that the intermediate state (cloudy liquid) is liquid crystalline.
Liquid crystals derive their appropriate name from the facts that they are pourable (liquid) yet structured (crystal). They owe these seemingly conflicting properties to their molecular shapes: materials that form liq-uid crystals are long and thin (calamitic liquid crystals) or disc-shaped (discotic liquid crystals). Some typical molecular structures are shown in Figure 4.20.
Liquid crystals are mesophase (i.e., intermediate phase) materials. The liq-uid crystalline phase can be produced only in a certain temperature range (thermotropic liquid crystal) or by addition of a nonliquid crystalline solvent (lyotropic liquid crystal, e.g., concentrated aqueous soap solution). The molec-ular shape of a pure liquid-crystal-forming molecule allows liquid crystals to be pourable yet show some order (Figure 4.21). There are many types of liquid crystals and much nomenclature on this subject; the categories are defined by the molecular arrangements.
Nematic (Greek for “threadlike”) liquid crystals have their molecules aligned in the direction of the long axis, but they are interspersed, not in planes. This is shown schematically in Figure 4.22.
Smectic (Greek for “soap”) liquid crystals have layers of molecules aligned in planes, as shown in Figure 4.22. A soap bubble is an example of a smectic liquid crystal, with the number of layers reduced as the bubble expands.
Liquid crystals can be used to produce colors from the principle of a dif-fraction grating. This is due to the regularity of their stacking, which can
* Friedrich Reinitzer (1857–1927) was a Prague-born botanist who spent much of his working life in Austria. His insightful observation of a “double melting point” led to the discovery of liquid crystals.
CH3(CH2)nCOO–M+
DNA
CH3 CH3O N N O
O
FIGURE 4.20Some molecules that can form calamitic liquid crystals. Note that all have rod-like shapes.
www.ebook3000.com

ColorfromInteractionsofLightWaveswithBulkMatter 87
act as a diffraction grating, much as in the case of opal. As the tempera-ture changes, it changes the spacing in the liquid crystal because at higher temperatures the molecules require a little more room to jostle around. This change in spacing causes a change in color. The phenomenon of change in color as a result of change in temperature, which is not limited to liquid crys-tals, is called thermochromism. In general, on cooling of a diffraction-grating
FIGURE 4.21Liquid crystals are both pourable (liquid) and ordered (crystalline) because of their molecular shape. The molecular size is exaggerated here.
Phase Phase(a) (b)
Isotropicliquid
Nematicliquid crystal
Smecticliquid crystal
Crystallinesolid
Isotropicliquid
Nematicliquid crystal
Columnarliquid crystal
Crystallinesolid
Positional andorientational disorder
Positional disorder andorientational order
One-dimensional positionalorder
�ree-dimensional positionalorder
Positional andorientational disorder
Positional disorder andorientational order
Two-dimensional positionalorder
�ree-dimensional positionalorder
Incr
easin
g te
mpe
ratu
re
Incr
easin
g te
mpe
ratu
re
FIGURE 4.22Liquid crystal structures showing the wide variety of phases exhibited by liquid crystals. (a) Phases of calamitic (rod-shaped) liquid crystals. (b) Phases of discotic (disc-shaped) liquid crystals. In both cases, the liquid crystalline mesophases exist at temperatures intermediate between the isotropic liquid and the crystalline solid.

88 PhysicalPropertiesofMaterials
liquid crystal, the reflectance maximum moves from violet to blue to green to yellow to orange to red to colorless. The so-called “mood” rings make use of thermochromism in liquid crystals; their color, which indicates hand tem-perature and possibly correlates with mood, is due to the thin film of liquid crystalline material behind a bead of colorless transparent plastic. In some thermochromic liquid crystal devices, temperature changes as small as 0.001 K can be detected.
Both the color of a liquid crystal and the temperature of its color change can be modified chemically. For example, 20% cholesteryl chloride with 80% cholesteryl nanoate is green, but an added solvent can change the color: benzene changes the color to blue, and chloroform changes the color to red.
One important factor concerning liquid crystalline phases is that they are intermediate in the temperature range between low- temperature crys-talline forms and high-temperature “normal” liquid phases (see Figure 4.22). The latter is often referred to as an isotropic liquid phase, meaning that there is no preferential direction for molecular orientation in this phase. For materials that form liquid crystals, the isotropic liquid phase exists when the temperature is sufficiently high to allow the molecules to tumble freely in all directions. As the temperature is lowered, the mol-ecules prefer to be aligned (e.g., in a smectic or nematic structure), but they are still relatively free to translate. As the temperature is lowered further, there is not enough thermal energy for the molecules to translate, and the structure changes to a crystalline form. For this reason liquid crystal dis-plays (LCDs; see Chapter 5 for a discussion of their operating principles) have a limited temperature range of operation, only that of liquid crystal stability.
COMMENT: COLORS OF LIQUID CRYSTALS
An early application of liquid crystals was in the temperature-depen-dence of the color of thin films of cholesteric liquid crystals. Cholesteric liquid crystals (also called twisted nematic liquid crystals) have layers of chiral molecules arranged such that each layer has a different orienta-tion, as shown schematically in Figure 4.23. The repeat distance, called the pitch, changes with temperature. These types of liquid crystals have been used to sensitively detect temperature changes in applications as varied as detection of irregularities in blood circulation, metabolic changes due to breast cancer, and measurements of stress and strain in building components.
www.ebook3000.com

ColorfromInteractionsofLightWaveswithBulkMatter 89
COMMENT: COLORED LIQUID CRYSTAL DISPLAYS
Variable-colored liquid crystalline materials can be produced using pleochromic dyes in a nematic phase. A pleochromic dye has different light absorptions and therefore different colors along different axes due to its anisotropic nature (i.e., it has different properties in different direc-tions). The dye molecules will tend to align themselves along the axis of alignment of the liquid crystals, and the color observed will depend on the orientation of the liquid crystal molecules with respect to the viewer. When an electric field is applied across this phase, the liquid crystal molecules can reorient, moving the dye molecules to another orientation, changing the observed color of the film. An example of a pleochromic dye is shown in Figure 4.24.
Pitch
FIGURE 4.23A cholesteric liquid crystal has its molecules arranged in layers, with adjacent layers having different orientations, as shown by the arrows on the right. The distance between layers with the same orientation is the pitch. Light can be diffracted from layers with the same orientation, and constructive interference will result for a particular color. Since the pitch varies with tem-perature due to thermal expansion, the observed color is temperature dependent.
N
S
NN N(CH3)2O2N
FIGURE 4.24An example of a pleochromic dye for which the dominant color is blue.

90 PhysicalPropertiesofMaterials
Fiber Optics: A Tutorial
One of the most important devices using optical properties of materials is the optical fiber.* These fibers can transmit light signals for long distances
* Charles Kao (1933–) was awarded the 2009 Nobel Prize in Physics “for groundbreaking achievements concerning the transmission of light in fibers for optical communication.”
COMMENT: “SMART” GLASS
While we are most familiar with transparent glass, we would prob-ably find it convenient at times to be able to make the glass opaque. Two devices do just that; the glass changes transparency when a small electric field is applied.
The electrochromic device, so named to indicate that the material changes color due to changes in electric field, is 2 × l0–6 m thick, with outer layers of a mixture of indium and tin oxides acting as electrodes, with a middle layer of tungsten oxide. When voltage is applied, the tungsten oxide is reduced to metallic tungsten, which is bronze-colored and thereby reduces the amount of transmitted light. This process can be reversed with a change in the direction of the electric field.
Another “smart” glass contains a thin film of liquid crystals between transparent electrodes. When an electric field is applied, the crystals are aligned and the material is transparent. In the absence of an electric field, the liquid crystalline molecules are randomly oriented and light is scattered, giving the glass a frosted appearance.
Both these devices could have many uses, such as windows on buildings that can be adjusted to achieve optimum lighting and privacy. However, the cost will have to be reduced before we see widespread use.
COMMENT: PHOTONIC CRYSTALS
The periodic arrangement of atoms gives rise to crystal structures (Chapter 1), whereas periodic variation in refractive index can control how photons can be transmitted through a photonic crystal. For example, a periodic array of 1 mm sized voids in a high-refractive index material can make it totally absorbing for microwave radiation. These manipulated structures can provide the optical equivalent of a semiconductor band-gap where photons in the photonic material have only an allowed range of energies. The structures need not be laboratory made; some natural materials such as butterfly wings have structures that exhibit photonic properties. New photonic materials play an important role in develop-ment of ever faster computers and optical communication devices.
www.ebook3000.com

ColorfromInteractionsofLightWaveswithBulkMatter 91
with high efficiency. Internal reflection within the fiber can be used to propagate the light. A typical radius is of the order of 100 μm (=10–4 m).
a. To decrease the scattering of light along the fiber, will it be better to use shorter or longer wavelengths of light? Explain.
b. The core of the optical fiber is made of a drawn fiber of SiO2. What sorts of chemical impurities can be particularly harmful to the efficiency of transmission?
c. One advantage of fiber optics is that the fibers can transmit light of many different energies (wavelengths).i. How is this an advantage over transmission along metal wires?ii. Are there any limitations on possible energies for transmis-
sion? Explain.d. Efficient transmission is possible as long as sufficient care is taken
concerning the coating on the fiber. In particular, the coating (also called cladding) should allow for essentially complete internal reflection of the light that hits it. For the optical fiber shown in Figure 4.25, with a refractive index of n1 and a coating of refractive index n2, there is a critical angle, θc, for which any incident angle, θi > θc, leads to internal reflection. This is shown in Figure 4.25.
Extension of Equation 4.2 leads to the following relationship among θc, n1 and n2:
sinθc =nn2
1
. (4.6)
What should the relative values of n1 and n2 be in order to have maximum internal reflection?
e. Optical fibers can be either single-mode or multimode, depending on whether it carries just one or many light rays. Multimode fibers are used to transmit a greater amount of information but usually over shorter distances than single-mode fibers, which are used for long-distance transmission of telephone and cable television sig-nals. Why are multimode fibers used only for shorter distances?
f. What other properties of the optical fiber are important for its application?
n1
n2
θcθi
FIGURE 4.25The indices of refraction of the optical fiber and its cladding are n1 and n2, respectively. The critical angle is θc, where θi > θc leads to total internal reflection.

92 PhysicalPropertiesofMaterials
4.6 Problems
4.1 a. The depth of the water is not responsible for the difference in hue (color) between lake or ocean water close to the shore and water offshore. What difference does the depth make to the optical properties of water?
b. The difference in the color of water near the shore and off-shore is related to the abundance of suspended particles in the water near the shore due to the wave action on the shore. Explain briefly how the presence of suspended par-ticles might affect the color of the water.
4.2 There is a commercial product available for fever detection. It is a strip of material that is placed on the forehead, and it changes color if the person is feverish. Comment on the principles on which such a device could be based.
4.3 If you add a few drops of milk to a glass of water, darken the room, shine a flashlight directly at the glass, and observe the glass at right angles to the flashlight beam, what color will the milky suspension be? What color will be observed looking through the glass into the flashlight beam? Explain.
4.4 In a consumer column in a newspaper published in Ottawa, Canada, a reader reported trouble with the liquid crystal dis-play of a car’s dashboard features in the winter. The display was initially inoperable, but the problem was rectified after the car ran for some time. What do you think the problem was?
4.5 Toys that change color on exposure to sunlight are available commercially. Suggest an explanation for this phenomenon.
4.6 Toys that change color on exposure to water are available com-mercially. Suggest an explanation for this phenomenon.
4.7 Toys that change color on cooling are available commercially. Suggest an explanation for this phenomenon.
4.8 The Invisible Man is a famous science fiction novel. According to our understanding of scientific principles, should the invisible man be able to see? Explain.
4.9 Ammolite is a gemstone, part of the crushed, fossilized mother- of-pearl shell of the prehistoric ammonite. These rare gemstones are found near the banks of the St. Mary and Bow Rivers in southern Alberta, Canada. They can display dazzling primary colors, especially red. Ammolite was formed from mother-of-pearl when some elements were added or taken away. An important factor in the production is that the ammonite shell was crushed by ancient aquatic reptiles, leaving each fragment tilted at a slightly different angle. What physical process gives rise to the colors of ammolite?
4.10 If you were required to design a material for use in eye shadow, you might base your selection on light absorbance (for color) and light interference effects (for sparkle). One such material
www.ebook3000.com
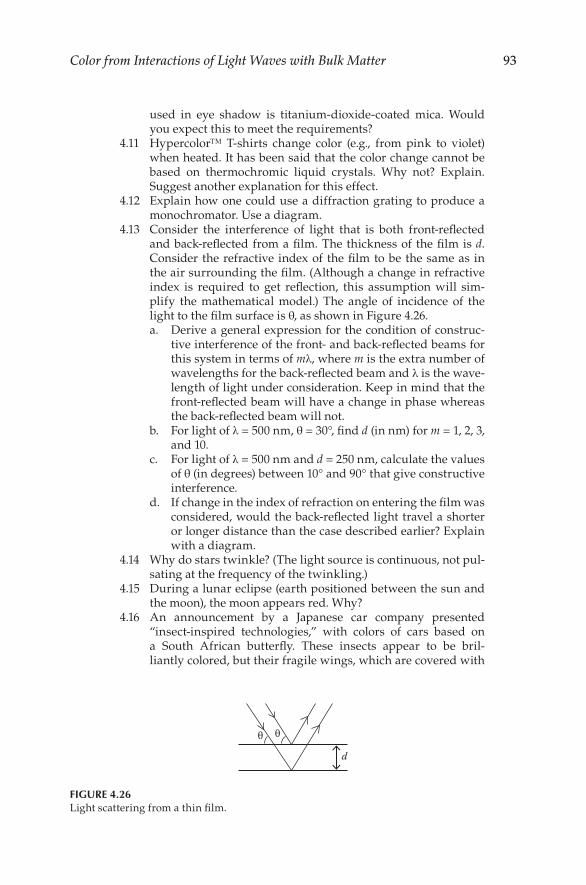
ColorfromInteractionsofLightWaveswithBulkMatter 93
used in eye shadow is titanium-dioxide-coated mica. Would you expect this to meet the requirements?
4.11 Hypercolor™ T-shirts change color (e.g., from pink to violet) when heated. It has been said that the color change cannot be based on thermochromic liquid crystals. Why not? Explain. Suggest another explanation for this effect.
4.12 Explain how one could use a diffraction grating to produce a monochromator. Use a diagram.
4.13 Consider the interference of light that is both front-reflected and back-reflected from a film. The thickness of the film is d. Consider the refractive index of the film to be the same as in the air surrounding the film. (Although a change in refractive index is required to get reflection, this assumption will sim-plify the mathematical model.) The angle of incidence of the light to the film surface is θ, as shown in Figure 4.26.
a. Derive a general expression for the condition of construc-tive interference of the front- and back-reflected beams for this system in terms of mλ, where m is the extra number of wavelengths for the back-reflected beam and λ is the wave-length of light under consideration. Keep in mind that the front-reflected beam will have a change in phase whereas the back-reflected beam will not.
b. For light of λ = 500 nm, θ = 30°, find d (in nm) for m = 1, 2, 3, and 10.
c. For light of λ = 500 nm and d = 250 nm, calculate the values of θ (in degrees) between 10° and 90° that give constructive interference.
d. If change in the index of refraction on entering the film was considered, would the back-reflected light travel a shorter or longer distance than the case described earlier? Explain with a diagram.
4.14 Why do stars twinkle? (The light source is continuous, not pul-sating at the frequency of the twinkling.)
4.15 During a lunar eclipse (earth positioned between the sun and the moon), the moon appears red. Why?
4.16 An announcement by a Japanese car company presented “insect-inspired technologies,” with colors of cars based on a South African butterfly. These insects appear to be bril-liantly colored, but their fragile wings, which are covered with
d
θ θ
FIGURE 4.26Light scattering from a thin film.

94 PhysicalPropertiesofMaterials
microscopic indentations, carry no pigment. The manufacturer produces colors by making the car’s surface with irregularities spaced only hundreds of nanometers apart.
a. What is the principle on which the color is produced? b. Discuss advantages and disadvantages of this type of color
compared with the more usual car color due to pigments in paint.
4.17 After the eruption of a volcano, the sunset can have even more spectacular color than usual. Why?
4.18 A particular polymer is thermochromic. When heated from room temperature to 240°C, the optical absorption peak blue shifts (i.e., goes to shorter wavelength). This has been associ-ated with a change in the degree of conjugation in the system.
a. Is the HOMO–LUMO gap larger or smaller at higher tem-perature? Explain your reasoning.
b. Is the system more or less conjugated at higher tempera-ture? Explain your reasoning.
c. Propose a physical explanation for the change in conjugation. 4.19 Liquid crystals can be used to orient molecules (e.g. to examine
direction-dependent properties, such as IR, UV-vis, and NMR parameters). How are liquid crystals useful for these studies? Suggest the advantages and limitations of this method.
4.20 Why are there no white gases? 4.21 A coffee mug has been advertised as having a “disappearing
STAR TREK® crew.” The crew appear on the mug when it is empty, but when the mug is filled with a hot beverage, the crew is no longer visible (“probably beaming down to some planet in distress”). Explain the principle of the disappearing crew.
4.22 The Paua shell, native to New Zealand waters, has beautiful colors, mostly in the blue-violet range. Part of its attraction is that the observed hue changes with angle of viewing. Suggest a plausible physical origin for the source of the color. Explain your reasoning.
4.23 Sketch the path of a beam of light focused by a Fresnel lens. Show details of the light path through two stepped prisms in the lens as the light enters, passes through, and exits. To sim-plify matters, consider the light to be monochromatic.
4.24 Ice crystals can cause a rainbow halo (circle of light with the full rainbow of colors) to appear around the sun. Would red or violet of the rainbow halo appear closer to the sun? Explain.
4.25 Titanium, niobium, and tantalum are all used by metalwork artists as materials that can have iridescent colors introduced by electrochemical oxidation of the surface. Explain why the color observed depends on the extent of the surface oxidation.
4.26 What color is the sky when viewed from outer space? Explain any difference from the color of the sky as viewed from earth.
4.27 A newly discovered mineral composed of Al, Ca, Mg, Fe, and O has a structure based on fibers somewhat like asbestos. This mineral has the remarkable quality of a striking blue color that changes to violet and cream on rotation. Draw a diagram that
www.ebook3000.com

ColorfromInteractionsofLightWaveswithBulkMatter 95
illustrates the interaction of light with this material and the resulting observed colors.
4.28 Air above hot pavement or desert sand has a steep tempera-ture gradient, with cooler air at the higher elevation. Sketch the resultant mirage effect under these conditions, comparable with the diagram in Figure 4.4. Consider the real image to be a vertical arrow (head at the top), and show both it and the appar-ent image (mirage).
4.29 Titania (TiO2) is sometimes added to laundry detergents to replace the TiO2 that has washed away from synthetic fibers. It was added to the synthetic fibers in the manufacturing process to make them appear white instead of transparent or translucent.
a. Describe the interaction of light with TiO2. It has a very high refractive index (about 2.6).
b. TiO2 is somewhat photoactive in that it can absorb a high-energy photon (e.g., UV light) and release an electron. Would this limit textile applications of TiO2? Explain.
4.30 Shampoos come in many colors but their foams are always white. Why?
4.31 At first glance, ordinary glass and diamond look quite a bit alike. If both were cut to the classic diamond cut (see Figure 4.7), how would the dispersion of light compare for cut glass and diamond? Note the indices of refraction: n(glass) = 1.4, n(diamond) = 2.4.
4.32 Is the refractive index for glass (n ≈ 1.4) greater or less for light of wavelength 400 nm compared with light of wavelength 700 nm?
4.33 The blue coloration of some bird feathers is due to Tyndall scat-tering of light from barbs, which have a colorless transparent outer layer about 10–5 m thick over a layer of melanin- containing cells with irregularly shaped air cavities, <30 nm to about 300 nm across. Explain whether or not the blue color is expected to remain if the feather is crushed, destroying the air cavities.
4.34 Fog lights are manufactured to produce yellow light, rather than white light, so that less scattering of the light occurs from fine droplets of water. Explain why the color results in a differ-ence in the light scattering.
4.35 It is well known in the television business that plaids and small checked patterns should not be worn on camera as they do not reproduce well on television. Explain why.
4.36 A CD works by having the light of a laser hit the CD and, from a given spot, the light is either reflected to the detector or not.
a. In a commercial CD, this effect is produced by having very small pits imprinted on the CD in the pressing process. Explain briefly why the presence of pits can lead to differ-ent light path for the monochromatic laser beam.
b. In a writable CD, the information is “burned” on the CD by local heating of some sections and not others. The heating process turns an organic layer from transparent (allowing the light to hit the metal layer beneath, and bounce back)

96 PhysicalPropertiesofMaterials
to opaque. Explain how this leads to an outcome similar to that in (a).
4.37 If the sun were cooler than it is, would this change the color of our sky as we perceive it? Explain your reasoning. Use one or more diagrams. (Assume that nothing else on earth was changed, and that we are still around!)
4.38 The moon has almost no atmosphere. If you were standing on the sunlit side of the moon, what color would the moon’s “sky” be? Explain.
4.39 Moissanite is a naturally occurring mineral. Its chemical compo-sition is silicon carbide, SiC. Moissanite is a very hard material, with a high refractive index (ca. 2.7). Synthetic moissanite costs about one tenth the cost of diamonds, so it is a cheaper alterna-tive for jewelry. How does moissanite compare with diamond for dispersion of light (the so-called brilliance of the gem)? Explain.
Further Reading
General References
Many introductory physics and physical chemistry textbooks contain infor-mation concerning physical interactions of light with bulk matter.
Negative index materials. Special issue. W. Park and J. Kim, Eds. MRS Bulletin, October 2008, 907–934.
All that glitters, 1999. Chemistry in Britain, November 1999, 20.D. J. Blumenthal, 2001. Routing packets with light. Scientific American, January 2001,
96.W. D. Callister Jr. and D. G. Rethwisch, 2010. Materials Science and Engineering: An
Introduction, 8th ed. John Wiley & Sons, Hoboken, NJ.B. S. Chandrasekhar, 1998. Why Things Are the Way They Are. Cambridge University
Press, Cambridge.G. P. Collins, 2003. Holographic control. Scientific American, July 2003, 22.G. P. Collins, 2003. Heat and light. Scientific American, January 2003, 26.C. Day, 2002. Why do lobsters change color when cooked? Physics Today, November
2002, 22.R. M. Evans, 1948. An Introduction to Color. John Wiley & Sons, Hoboken, NJ.R. E. Hummel, 2004. Understanding Materials Science. 2nd ed. Springer, New York.A. Javan, 1967. The optical properties of materials. Scientific American, September
1967, 239.M. G. J. Minnaert, 1993. Light and Colour in the Outdoors, 5th ed. Springer-Verlag, New
York.C. G. Mueller, M. Rudolph, and the Editors of LIFE, 1966. Light and Vision. Life Science
Library, Time Inc, New York.
www.ebook3000.com

ColorfromInteractionsofLightWaveswithBulkMatter 97
K. Nassau, 1980. The causes of colour. Scientific American, October 1980, 124.K. Nassau, 2001. The Physics and Chemistry of Color, 2nd ed. John Wiley & Sons,
Hoboken, NJ.I. P. Parkin and T. D. Manning, 2006. Intelligent thermochromic windows. Journal of
Chemical Education, March 2006, 393.T. D. Rossing and C. J. Chiaverina, 1999. Light Science: Physics and the Visual Arts.
Springer, New York.H. Rossotti, 1983. Colour. Princeton University Press, Princeton.F. C. Sauls, 2006. A Demonstration of refractive index matching using isopropyl alco-
hol and MgF2. Journal of Chemical Education 83, 1170.R. J. D. Tilley, 2004. Understanding Solids: The Science of Materials. John Wiley & Sons,
Hoboken, NJ.F. Vögtle, Ed., 1991. Supramolecular Chemistry: An Introduction. Chapter 8 “Liquid crys-
tals.” John Wiley & Sons, Hoboken, NJ.V. F. Weisskopf, 1968. How light interacts with matter. Scientific American, September
1968, 60.E. A. Wood, 1977. Crystals and Light: An Introduction to Optical Crystallography. Dover,
New York.G. Wyszecki and W. S. Stiles, 1967. Color Science. John Wiley & Sons, Hoboken, NJ.
Fiber Optics
A. M. Glass, 1993. Fiber optics. Physics Today, October 1993, 34.D. Hewak, 1997. Travelling light. Chemistry in Britain, May 1997, 26.
Films (Including Soap Films)
F. J. Almgren and J. E. Taylor, 1976. The geometry of soap films and soap bubbles. Scientific American, July 1976, 82.
C. V. Boys, 1959. Soap Bubbles. Dover, New York.C. Isenberg, 1992. The Science of Soap Films and Soap Bubbles. Dover, New York.
Interference Effects
S. K. Blau, 2004. Light as a feather: Structural elements give peacock plumes their color. Physics Today, January 2004, 18.
A. Goldberg-Gist, 2003. Opal. Chemical and Engineering News, January 27, 2003, 58.R. Greenler, 1994. Sunlight, ice crystals, and sky archeology. In The Candle Revisited,
P. Day and R. Catlow, Eds. Oxford University Press, Oxford.D. Hawaleshka, 2001. Fingerprinting diamonds. Maclean’s Magazine, February 26,
2001, 54.A. J. Kinneging, 1993. Demonstrating the optic principles of Bragg’s law with moiré
patterns. Journal of Chemical Education, 70, 451.G. Oster and Y. Nishijima, 1963. Moiré patterns. Scientific American, May 1963, 54.D. Psaltis and F. Mok, 1995. Holographic memories. Scientific American, November
1995, 70.P. Vukusic, J. R. Sambles, C. R. Lawrence, and R. J. Wootton, 2001. Structural colour:
Now you see it—now you don’t. Nature, 410, 36.

98 PhysicalPropertiesofMaterials
Liquid Crystals
Materials for flat panel displays. Special Issue. J. S. Im and A. Chiang, Eds. MRS Bulletin, March 1996, 27–68.
J. D. Brock, R. J. Birgeneau, J. D. Litser, and A. Aharony, 1989. Liquids, crystals and liquid crystals. Physics Today, July 1989, 52.
G. H. Brown, 1972. Liquid crystals and their roles in inanimate and animate systems. American Scientist, 60, 64.
P. G. Collings, 2002. Liquid Crystals: Nature’s Delicate Phase of Matter, 2nd ed. Princeton University Press, Princeton.
P. G. de Gennes and J. Prost, 1993. The Physics of Liquid Crystals, 2nd ed. Clarendon Press, Oxford.
E. Demirbas and R. Devonshire, 1996. A computer experiment in physical chemistry: Linear dichroism in nematic liquid crystals. Journal of Chemical Education, 73, 586.
J. L. Fergason, 1964. Liquid crystals. Scientific American, August 1964, 76.M. Freemantle, 1996. Polishing LCDs. Chemical and Engineering News, December 16,
1996, 33.M. Freemantle, 2002. Paintable liquid-crystal displays. Chemical and Engineering News,
May 6, 2002, 11.G. H. Heilmeier, 1970. Liquid-crystalline display devices. Scientific American, April
1970, 100.R. H. Hurt and Z.-Y. Chen, 2000. Liquid crystals and carbon materials. Physics Today,
March 2000, 39.M. Jacoby, 2005. Liquid-crystal collage. Chemical and Engineering News, January
2005, 7.S. Kumar, Ed., 2000. Liquid Crystals: Experimental Study of Physical Properties and Phase
Transitions. Cambridge University Press, Cambridge.A. J. Leadbetter, 1990. Solid liquids and liquid crystals. Proceedings of the Royal Institute
of Great Britain, 62, 61.S. G. Steinberg, 1996. Liquid crystal displays. Wired, January 1996, 68.R. Templer and G. Attard, 1991. The world of liquid crystals. The New Scientist, May
4, 1991, 25.J.-F. Tremblay, 2006. Riding on flat panels. Chemical and Engineering News, June 26,
2006, 13.J.-F. Tremblay, 2005. Thinning flat panels. Chemical and Engineering News, June 27,
2005, 20.G. R. Van Hecke, K. K. Karukstis, H. Li, H. C. Hendargo, A. J. Cosand, and M. M. Fox,
2005. Synthesis and physical properties of liquid crystals: An interdisciplinary experiment. Journal of Chemical Education, 82, 1349.
E. Wilson, 1999. Liquid crystals find their voice. Chemical and Engineering News, September 27, 1999, 13.
Opals
P. J. Darragh, A. J. Gaskin, and J. V. Saunders, 1976. Opals. Scientific American, April 1976, 84.
www.ebook3000.com

ColorfromInteractionsofLightWaveswithBulkMatter 99
Photonic Crystals
J. D. Joannopoulos, S. G. Johnson, J. N. Winn, and Robert D. Meade, 2008. Photonic Crystals: Molding the Flow of Light, 2nd ed. Princeton University Press, Princeton.
P. Vukusic and J. R. Sambles, 2003. Photonic structures in biology. Nature, 424, 852.E. Yablonovitch, 2001. Photonic crystals: Semiconductors of light. Scientific American,
December 2001, 46.
Thermochromism
D. Lavabre, J. C. Micheau, and G. Levy, 1988. Comparison of thermochromic equilib-ria of Co(II) and Ni(II) complexes, Journal of Chemical Education, 65, 274.
D. C. MacLaren and M. A. White, 2005. Design rules for reversible thermochromic mixtures. Journal of Materials Science, 40, 669.
M. A. White and M. LeBlanc, 1999. Thermochromism in commercial products. Journal of Chemical Education, 76, 1201.
101
5OtherOpticalEffects
5.1 Introduction
Although color is an aesthetically pleasing optical effect and can also have many uses, there are also other interesting optical properties of materials that do not necessarily involve color. Some of these are described in this chapter.
5.2 Optical Activity and Related Effects
Normally, light is unpolarized, that is, it contains waves with electromagnetic fields oscillating in all directions perpendicular to the direction of the light’s motion, as shown schematically in Figure 5.1.
When light passes through a filter called a polarizer, only one oscillation direction of the electromagnetic field is allowed through. On emerging from the polarizer, the light is said to be plane (or linearly) polarized (Figure 5.1).
Some materials have the property of rotating the oscillation direction of linearly polarized light; this property is called optical activity. Molecules or crystals that are chiral (i.e., not superimposable on their mirror image) have this property, but the degree of optical activity depends on the particular material. It also depends on the state of matter; a crystal can derive its opti-cal activity from its chiral packing arrangement or from the chirality of the constituent molecules. In the latter case, there will still be optical activity even if the crystal is melted or dissolved in solution. A 1-mm path length of quartz (which is an optically active crystal) can rotate the plane of polariza-tion by about 20°.
Cholesteric liquid crystals, which we met previously in Chapter 4, have layers of chiral molecules, arranged so that each layer has a different orien-tation. As shown schematically in Figure 5.2, the orientation of the plane of polarization rotates as it passes through the cholesteric liquid crystal, and the optical activity can be among the highest known, as much as 50 full rotations

102 PhysicalPropertiesofMaterials
(i.e., 50 × 360° = 18,000°) for a 1-mm path length! This optical activity can be used to advantage in a liquid crystal display device, as detailed below.
In a field-effect liquid crystal display (LCD), each digit of the display device is composed of seven pairs of electrode sandwiches (see Figure 5.3). The two outer layers, like the bread of a sandwich, are composed of a transparent, electrically conducting material, typically a thin layer of indium tin oxide; between these layers there is a layer of cholesteric liquid crystal. Activation
Polarizer
FIGURE 5.1Normal unpolarized light contains waves with oscillating electromagnetic fields in all direc-tions perpendicular to the direction of the light’s motion as indicated by the wheel at the start of the light wave (for clarity, only two wave oscillation directions are shown here). Plane polar-ized light contains light of only one oscillation direction, and this can be selected from unpo-larized (ordinary) light by a polarizer, giving linearly (or plane) polarized light.
FIGURE 5.2A schematic structure of a cholesteric liquid crystal. The arrows indicate the direction of the polarization vector, and this is rotated as it passes through the material.
www.ebook3000.com

OtherOpticalEffects 103
of each of the seven elements of the digit is caused by the application of an electric field; independent activation or deactivation of the seven electrodes can allow display of the digits from 0 to 9.
Another important factor in this display involves plane polarized light. Outside light passing into a liquid crystal display device first passes through a polarizer (Figure 5.4). It then travels into the cholesteric liquid crystal cell where the plane of polarization is rotated by the optically active liquid crystal. The display device is constructed so that this new direction of the plane of polarization exactly matches the direction of polarization of another polarizer in the light path. Because the polarization directions match, the light passes through this second polarizer. When the light hits a mirror at the back of the display device, it is reflected back toward the outside world. This light is still polarized in the direction of the innermost polarizer, and it continues outward. When this polarized light encounters the liquid crystal cell, the polarization is changed by an amount equal but opposite in direc-tion to the change on passing into the cell from the other side. For example, as shown in Figure 5.4a, if the change in polarization was +90° on entering the cell, it is –90° on leaving the cell. This allows the polarization of the light exiting the cell to match that of the outermost polarizer so that the light can exit the device. Since light entered the device and it also can exit the device, the cell appears transparent.
In the situation just described, there was no field applied across the seven electrode sandwiches in the cell. If a small electric field is applied (Figure 5.4b), the color of the electrodes is modified for the following reasons. Light still enters from the outside world and is polarized by the first polarizer. However, the electric field has the effect of slightly changing the optical activ-ity of the liquid crystal by slightly modifying the structure of the material. The change in optical activity means that the amount by which the liquid crystal rotates polarized light is not the same as it was without the field, and
FIGURE 5.3Seven pairs of electrodes are required for each digit in a liquid crystal display.

104 PhysicalPropertiesofMaterials
the new polarization on emerging from the liquid crystal no longer matches the innermost polarizer. Since the polarizer only passes light of the matched polarization, the light that hits this polarizer cannot go further. Therefore, light is only absorbed with no reemission, and the electrode elements appear black. Each of the seven elements actually has its own electric field control, so each can be on or off, allowing the full range of digits from 0 to 9 to be selectively produced.
This simple liquid crystal display device was made possible technically by the development of thin coatings of transparent electrodes, usually indium tin oxide. Without this development, light could not pass into the liquid crys-tal cell.
The type of LCD just described requires an external light source, and these are referred to as reflective. The external light is reflected back, or not, depending on the state of the electrodes. Ambient light is required to see the output.
Backlit LCDs use an internal light source. For example, most LCD computer monitors are lit with built-in fluorescent lights around and behind the LCD. The fluorescent light is diffused and scattered by a panel behind the LCD to provide uniform lighting. However, about half of this light is lost by absorp-tion in the device and eventually converted to heat.
The terms passive-matrix and active-matrix refer to the way in which each pixel in the LCD is activated. In the passive-matrix mode, a row and a column
(a) (b)
Mirror Polarizer Polarizer
Field off
Mirror Polarizer Polarizer
Field on
FIGURE 5.4A schematic view of a field effect liquid crystal display (LCD) device. (a) When the field across the electrode containing the cholesteric liquid crystals is off, the light enters, is linearly polar-ized (the direction is indicated by the double-headed arrow), has its plane of polarization rotated by the liquid crystal, passes through a matched polarizer, is reflected by a mirror, and reverses the entire process on the way back to the outside world. Since no light is absorbed, the LCD digit has no color. (b) When a field is applied across the electrode containing the choles-teric liquid crystal (switch closed), its optical activity is changed. This means that the entering polarized light is rotated by an amount different from in the field-off case, and the polarization no longer matches the second polarizer. Therefore, the light cannot pass through this polarizer and cannot reach the mirror to be reflected out. Since light is absorbed in this process, the LCD digit appears black in the presence of the electric field.
www.ebook3000.com

OtherOpticalEffects 105
in a grid supply voltage to the pixel at their intersection point. Active-matrix LCDs address a particular pixel by turning on the row and then sending a charge down the correct column; at the intersection, a thin-film capacitor can be carefully charged and the pixel activated. Although the passive-matrix device is simpler, it has the disadvantage of slow response time and ghost images on neighboring pixels, reducing resolution. These disadvantages are overcome with the active-matrix approach, but they are somewhat more complex (and expensive) to produce.
A colored LCD has three subpixels with red, green, and blue color filters for each pixel. Making use of light absorption properties, the resulting opti-cal effect can be color controlled. For an active-matrix LCD for a laptop com-puter, more than 3 million thin-film transistors need to be present. This is impressive, as is the fact that more than 15 million different shades can be produced at each pixel.
5.3 Birefringence
For materials that are anisotropic (not the same in all directions; this is the opposite of isotropic), an unusual optical property called birefringence (also known as double refraction) can occur. Birefringence was first described in 1669 by Bartholin,* and explained by Huygens† in 1678 using the wave theory of light. Examples of anisotropic materials are liquid crystals (e.g., the smec-tic and nematic structures have the molecules aligned along the long axis) and also noncubic solids. In a liquid, the atomic arrangements are, on aver-age, the same in the x-, y-, and z-directions, and therefore they are isotropic, but this is not so for an anisotropic solid.
Birefringence in an anisotropic material arises because unpolarized inci-dent light is split into polarized components (two components for tetrago-nal and hexagonal crystals; three components for less symmetric crystals) since the velocity of light is different in different directions (i.e., the refractive indices are different in different directions) (see Figure 5.5). Thus, parallel but displaced beams of polarized light emerge from the anisotropic material
* Erasmus Bartholin (1625–1698) was a Danish scientist who made contributions in mathematics and astronomy. His greatest contribution was his study of double refraction in Icelandic spar (collected by an expedition to Iceland in 1668), but his explanation was faulty: he assumed there was a double set of “pores” that led to two refraction rays.
† Christiaan Huygens (1629–1695) was a Dutch scientist who contributed to many areas, includ-ing mathematics, statics, dynamics, astronomy, and optics. In addition, Huygens discovered Titan (a satellite of Saturn), was the first to realize that Saturn’s odd shape was due to its rings, and also invented the pendulum clock. His wave theory of light was used to explain optical phenomena, including double refraction.

106 PhysicalPropertiesofMaterials
(Figure 5.5). Birefringence in a colorless transparent crystal of Iceland spar is shown in Figure 5.6.
The presence of birefringence is a straightforward way to detect anisotropy in a transparent material. In addition, birefringence can lead to dichroism, that is, two different colors of material when viewed in different directions.
5.4 Circular Dichroism and Optical Rotatory Dispersion
We have seen in Figure 5.1 that light can be polarized in a particular direc-tion; this is referred to as linearly (or plane) polarized light. Light also can be polarized such that the direction of polarization rotates in the plane per-pendicular to the direction of motion of the light wave. This rotation can be
FIGURE 5.5The effect of double refraction, also known as birefringence, in a hexagonal material. Because the material is anisotropic, the refractive index is not the same in all directions. This causes unpolarized incident light to be split into two polarized components with different speeds, giving rise to two emerging beams of light.
FIGURE 5.6A sample of Iceland spar (also known as calcite, CaCO3) showing birefringence, which makes a double image appear when looking through the crystal.
www.ebook3000.com

OtherOpticalEffects 107
clockwise or anticlockwise, giving rise to right- and left-circularly polarized light, respectively, as shown in Figure 5.7.
The refractive index, n, and also the absorption coefficient, ε, can depend on both the wavelength of light and whether the light is right- or left- circularly polarized. This is illustrated schematically in Figure 5.8.
The difference in the absorption coefficient for right- and left-circularly polar-ized light is referred to as circular dichroism (CD). The origin of this name is in the fact that the different absorption coefficients for left- and right-circularly polarized light lead to different colors (i.e., dichroism), depending on the circular polarization of the light used to make the observation.
(a) (b)
FIGURE 5.7(a) Right- and (b) left-circularly polarized light. The polarization vector (shown as an arrow) rotates in opposite directions for the two forms of circularly polarized light.
Increasing λIncreasing E
Increasing λIncreasing E
Refra
ctiv
e ind
ex, n
L
Refra
ctiv
e ind
ex, n
R
1 1
0 0
Left-circularly polarized light(a) (b)
Right-circularly polarized light
Abs
orpt
ion
coeffi
cien
t, ε L
Abs
orpt
ion
coeffi
cien
t, ε RεL
εR
nRnL
FIGURE 5.8The variation of refractive index, n, and molar absorption coefficient, ε, as functions of wave-length, as measured with left- and right-circularly polarized light.
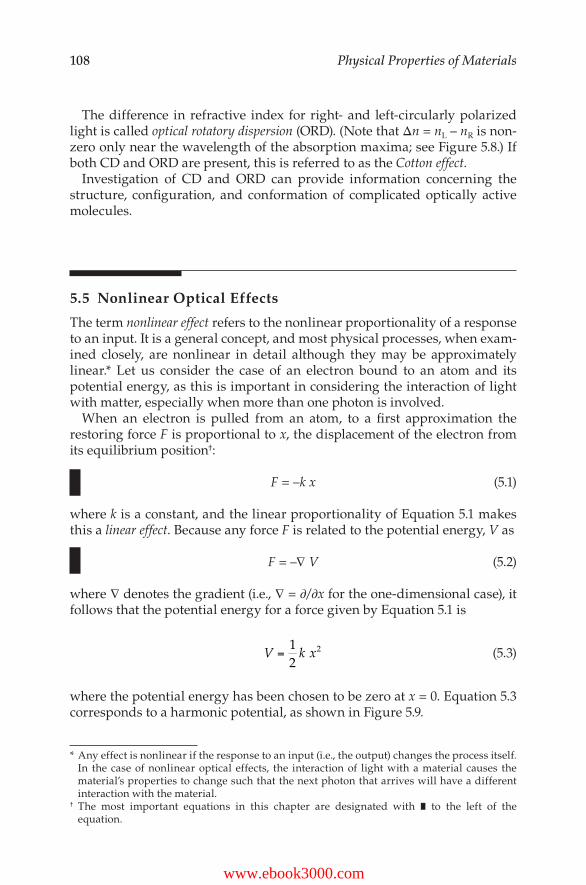
108 PhysicalPropertiesofMaterials
The difference in refractive index for right- and left-circularly polarized light is called optical rotatory dispersion (ORD). (Note that Δn = nL – nR is non-zero only near the wavelength of the absorption maxima; see Figure 5.8.) If both CD and ORD are present, this is referred to as the Cotton effect.
Investigation of CD and ORD can provide information concerning the structure, configuration, and conformation of complicated optically active molecules.
5.5 Nonlinear Optical Effects
The term nonlinear effect refers to the nonlinear proportionality of a response to an input. It is a general concept, and most physical processes, when exam-ined closely, are nonlinear in detail although they may be approximately linear.* Let us consider the case of an electron bound to an atom and its potential energy, as this is important in considering the interaction of light with matter, especially when more than one photon is involved.
When an electron is pulled from an atom, to a first approximation the restoring force F is proportional to x, the displacement of the electron from its equilibrium position†:
F = –k x (5.1)
where k is a constant, and the linear proportionality of Equation 5.1 makes this a linear effect. Because any force F is related to the potential energy, V as
F = –∇ V (5.2)
where ∇ denotes the gradient (i.e., ∇ = ∂/∂x for the one-dimensional case), it follows that the potential energy for a force given by Equation 5.1 is
V k x=12
2 (5.3)
where the potential energy has been chosen to be zero at x = 0. Equation 5.3 corresponds to a harmonic potential, as shown in Figure 5.9.
* Any effect is nonlinear if the response to an input (i.e., the output) changes the process itself. In the case of nonlinear optical effects, the interaction of light with a material causes the material’s properties to change such that the next photon that arrives will have a different interaction with the material.
† The most important equations in this chapter are designated with ∎ to the left of the equation.
www.ebook3000.com

OtherOpticalEffects 109
When an electric field E (e.g., light) interacts with electrons in a material, the electron density can be provoked to be displaced. When the optical effect is linear, this leads to an induced dipole (or polarization) of magnitude μi:
μi = α E (5.4)
where α is the linear polarizability. This is illustrated in Figure 5.10.Two important optical properties arise directly from linear optical effects—
the dielectric constant (ε) and the refractive index (n). The dielectric constant is defined as the ratio of the total electric field within the material, D (also called the displaced field), to the applied electric field of the light, E:
ε =DE
(5.5)
and, in the absence of absorption of light, the refractive index is related to the dielectric constant ε by the following equation:
ε(ν) = n2(ν) (5.6)
where the dependence on the frequency of the light, ν, is given explicitly. Both Equations 5.5 and 5.6 are written in their isotropic forms, but we know that refractive index can be anisotropic (as observed by birefringence, for exam-ple), and Equations 5.5 and 5.6 could be written in tensor form to account for this explicitly.
The harmonic restoring potential in a linear optical material gives rise to a motion of charge (i.e., electric field oscillation) that is of the same frequency as the light (Figure 5.10). From a quantum mechanical perspective, the oscil-lating applied electric field induces a time-dependent induced polarization of the molecule that can be expressed as a mixing of the ground state and polarized excited states. (These are called virtual transitions because there
Pote
ntia
l ene
rgy,
V
0x
FIGURE 5.9Potential energy as a function of x, displacement of an electron from an atom in the harmonic approximation.

110 PhysicalPropertiesofMaterials
is excited-state character but no long-lived population of the excited states.) The motion of charge (or, equivalently, mixing of excited states) leads to re-emission of the radiation at the same frequency as the polarizing light.
Many times in physical science the harmonic model is a good first approxi-mation, but closer examination indicates the importance of other terms in the potential. If the restoring force of Equation 5.1 can more accurately be written as
F kx k x= − −1 2
2 (5.7)
this is now nonlinear. Equation 5.7 leads to the following expression for potential energy:
++
–
–
Chargedistribution
Time
Inducedpolarization
t0 t1 t2
t0 t1 t2
Elec
tric
field
, E
Indu
ced
pola
rizat
ion,
µi
Indu
ced
pola
rizat
ion,
µi
Time
0
0
0Electric field, E
(a) (b)
(c)
FIGURE 5.10Linear optical effects: (a) The electric field (solid line) and the induced polarization wave (dot-ted line) as functions of time for an optically linear material, (b) Schematic of the induced polarization of an optically linear material interacting with light as a function of time, (c) The induced (linear) polarization as a function of applied field for an optically linear material. (Figure styled after S. R. Marder et al., Eds., 1991. Materials for nonlinear optics: Chemical perspectives. American Chemical Society Symposium Series 455, ACS.)
www.ebook3000.com

OtherOpticalEffects 111
V kx k x= +12
16
2 3 (5.8)
that is, there is an additional anharmonic term compared to Equation 5.3. This potential is illustrated in Figure 5.11.
Since the anharmonic potential depends on the direction of the displace-ment of the electron (whereas Equation 5.3 gives the same value of V for x and –x, Equation 5.8 gives values of V that depend on the sign of x), so will the magnitude of the polarization. An example of such a material is one where there is an anisotropic charge distribution in the absence of an electric field (e.g., a noncentrosymmetric polar molecule in the gas phase or a non-centrosymmetric polar crystal). In this case, the electric field of the light can displace the charge more in one direction than in the other, and the resulting polarization can be a nonlinear optical (NLO) effect (Figure 5.12).
In a nonlinear optical material, the polarization μ (= μ0 + μi where μ0 is the static dipole, that is, in the absence of the field, and μi is the induced dipole) can be written as a Taylor series expansion:
α β γ= + + + +0 1
216ij j ijk j k ijkl j k lE E E E E E . . . . (5.9)
where this is written in the tensor form. The terms beyond αE (which is the linear polarizability; see Equation 5.4) are not linear in E; they are referred to as nonlinear polarization terms and give rise to nonlinear optical effects. The parameters β and γ are referred to as the first and second hyperpolariz-abilities, respectively. For β to be nonzero, there must be no inversion center in the material. However, γ is nonzero for all materials although it induces
Pote
ntia
l ene
rgy,
V
0x
FIGURE 5.11Potential energy as a function of displacement coordinate for a material with a harmonic potential (solid line, Equation 5.3) and for a material with an additional anharmonic term (bro-ken line, Equation 5.8).

112 PhysicalPropertiesofMaterials
weaker effects. Since αE»βE2 and γE3, observation of nonlinear optical effects requires large electric fields, and lasers have been very important in develop-ing this subject.
In a linear optical material, β = 0, the induced electric field was at the same frequency as the light, and the light emitted was purely of the same frequency as the exciting light. In a nonlinear optical material, the induced polarization is not a pure sine wave at the frequency of the light (see Figure 5.12), but it can be considered to be composed of that frequency (the funda-mental) and its harmonics, as well as an offset (DC component), as shown in Figure 5.13. The static polarization gives rise to the DC component, the linear polarizability gives rise to the fundamental (as in linear optical materials), and the hyperpolarizabilities give rise to the harmonics.
Chargedistribution
Time
Dipole
Induceddipole
+++–
––
t0 t1 t2
t0 t1 t2
Elec
tric
field
, E
Indu
ced
pola
rizat
ion,
µi
Indu
ced
pola
rizat
ion,
µi
Time
0
0
0Electric field, E
(a) (b)
(c)
FIGURE 5.12Nonlinear optical effects. (a) The electric field (solid line) and the induced polarization wave (dotted line) as functions of time for an optically nonlinear material. Note that both the electric field and induced polarization have the same repeat time, but only the former is a pure sine wave. (b) Schematic of the dipole and induced dipole (which is the difference between the dipole at that time and at time t0) of an optically nonlinear material interacting with light as a function of time. Note that the magnitude of the induced dipole depends on the direction of polarization. (c) The induced (nonlinear) polarization as a function of applied field for an optically nonlinear material. (Figure styled after S. R. Marder et al., Eds., 1991. Materials for nonlinear optics: chemical perspectives. American Chemical Society Symposium Series 455, ACS.)
www.ebook3000.com

OtherOpticalEffects 113
If light of frequency ν is incident on a nonlinear optical material, light of frequency ν and 2ν (and to a lesser extent 3ν, 4ν, etc.) will result. The produc-tion of light of frequency 2ν in this manner is known as frequency doubling by second harmonic generation (SHG). This is used in practice in nonlinear optical devices to achieve frequencies twice that of the incident light, for example using Ba2NaNb5O15, KH2PO4, LiNbO3, or HIO3. (The associated DC compo-nent of the electric field is referred to as optical rectification.) SHG is consid-ered to be a three-wave mixing process since two photons with frequency ν are required to combine to give a single photon with frequency 2ν (energy is conserved). By analogy, third-order harmonics, at frequency 3ν from the γE3 term of Equation 5.9, require four-wave mixing.
In the case of two beams of light of frequencies ν1 and ν2 interacting with a nonlinear optical material, it is also possible to have emitted light at the sum frequency (ν1 + ν2) and at the difference frequency (ν1 – ν2) in processes referred to generally as sum frequency generation (SFG).
Other nonlinear optical effects include the dependence of the refractive index of a nonlinear optical material on the applied voltage (linear electrooptic [LEO] or Pockels effect) where the applied voltage distorts the electron density within the material.
Nonlinear optical properties present exciting challenges to the materials researcher. Advances in this area have been greatly helped by the use of high-powered lasers. Current research in this area includes design of mate-rials to have enhanced nonlinear optical properties, design of materials to examine the role of ground state and excited state structure in nonlinear optical properties, and further research in structure/property relations. One
Polarizationwave
Fundamental
Secondharmonic
DCcomponent
FIGURE 5.13Fourier analysis of the asymmetric polarization wave of Figure 5.12a, showing its compo-nents: the fundamental (frequency ν), the second harmonic (frequency 2ν), and the offset (DC component).

114 PhysicalPropertiesofMaterials
promising area involves polymeric nonlinear optical devices that could be used to carry more information than present optoelectronic devices.
Transparency: A Tutorial
For application of an optical material, one of the most important consid-erations is transparency. Of course, this is related in part to the color of the material.
a. Is it possible that a material can absorb visible light but be trans-parent to light outside the visible range? Consider narrow band gap semiconductors and organic chromophores.
b. If a material absorbs negligibly in the visible range, does this guarantee that it is transparent? Consider that SiO2 can be very transparent as in quartz tubing, or quite opaque as in sand at the beach.
c. If the material in question does not absorb visible light when pure, it can be made to have interactions that lead to opacity by the introduction of second-phase particles or pores. The basis of the opacity is refraction at the pores. Is the size of the pore impor-tant? If so, approximately what size range would be most impor-tant? What other factors concerning the pores are important?
d. Window glass can be frosted or dimpled, rendering it translu-cent. What principles are involved here?
e. Some materials are designed to be transparent to only certain polarizations of light. Explain the principles involved here.
f. Although some materials are quite transparent, a significant por-tion of the light impingent on them can be reflected. This reflec-tion might be unwanted as, in use, it could lead to glare. One way to reduce glare is to coat the material with another mate-rial. What factors will be important in selecting and applying the coating?
COMMENT: PHOTOREFRACTIVE EFFECT
Another nonlinear optical property is the photorefractive effect. This is the dependence of the index of refraction of the material on the local electric field. This property gives a change in refractive index of a material as light passes through it. The photorefractive effect allows the imprinting of an interference pattern on a material, and it is expected that new materials with better photorefractive properties will lead to more nearly perfect resolution and retrieval of digitized images.
www.ebook3000.com

OtherOpticalEffects 115
g. Early crystallographers knew that repeat units in crystal struc-tures were smaller than 400 nm because otherwise they would appear frosted on the surface. Explain.
h. What does optical transparency of ordinary glass imply about the band gap in this medium?
5.6 Problems
5.1 When linearly polarized light is passed through a normally iso-tropic transparent object that is under stress, and the transmit-ted light is viewed through another polarizer, colored fringe patterns can be observed. Suggest an explanation for this phenomenon.
5.2 Polaroid™ sunglasses have lenses that are polarized to absorb the glare from surfaces in front of the wearer, such as a road, water, and snow, preventing the glare from reaching the eyes. What polarization orientation do the glasses absorb? Explain briefly.
5.3 The absence of a center of symmetry in a crystal is essential for it to exhibit (second-order) nonlinear optical properties. However, this condition is not sufficient. Why not?
5.4 a. Give an example of a material (it can be hypothetical), that is i. isotropic and centrosymmetric; ii. anisotropic and centrosymmetric; iii. anisotropic and noncentrosymmetric.
b. Is it possible to give an example of a material that is isotro-pic and noncentrosymmetric? Explain.
5.5 Leonard Cohen’s song “Anthem” contains the following line in the refrain:
“There is a crack, a crack in everything. That’s how the light gets in.” Comment.
5.6 Dry sand is light brown in color, and water is virtually color-less. When water is added to dry sand, the resulting wet sand is dark brown. Why does the color of the sand depend on how dry it is?
5.7 Some polymer films are transparent but become translucent when stretched. Suggest an explanation. Consider the ordering of the polymer molecules in the original form compared with the stretched form.
5.8 Stained glass windows look rather dull from outside a build-ing but quite beautifully colored when viewed from inside the building. Why is there an apparent difference in color?
5.9 The difference in color of a material in reflected light, com-pared with transmitted light, can be an important design

116 PhysicalPropertiesofMaterials
consideration. For example, when a dye is bound to a transpar-ent backing and light is passed through it, this leads to color due to transmitted light. The color may appear very different in reflected light. Explain why the color is different in the two cases.
5.10 Iridescent plastic films are composed of thin layers of two or more types of polymer. These materials have different colors when viewed in reflection and transmission. Furthermore, the colors viewed on reflection depend on the viewing angle. Sketch diagrams that show these effects when white light is incident on such a film. For simplicity, just consider two poly-mer layers.
5.11 Why is solid candle wax translucent, whereas molten candle wax is transparent?
5.12 When chiral molecules (i.e., those that are not superimposable on their mirror image) are incorporated into cholesteric liquid crystals, the different enantiomers (i.e., nonsuperimposable mirror image pairs) perturb the pitch of the liquid crystals (and hence the color of the system) in different ways. It is often difficult to distinguish enantiomers by usual chemical means as they can have the same melting points, boiling points, etc. Can you suggest an application of the different colors in dis-tinguishing enantiomers? (This has been done successfully: T. Nishi, A. Ikeda, T. Matsuda, S. Shinkai, 1991. Journal of the Chemical Society, Chemical Communications, 339.)
5.13 Ruby can exhibit dichroism: purple-red versus orange-red. The 4T1 and 4T2 levels (see Figure 2.9) can each be split in two due to distortion of the octahedral symmetry at the Cr3+ site; if a ruby crystal is viewed in polarized light, it can be rotated to see the effect of absorption to one set of levels in one direc-tion and another set in another direction. In the direction in which the absorption is between the ground state and the higher excited state, is the color purple-red or orange-red? Explain.
5.14 a. When a crystal that is birefringent but transparent is placed over a piece of paper on which a straight line has been drawn, explain what the resulting image looks like from above, and why.
b. If the same crystal has a polarizer placed on top of it, what could one expect to see looking from above as the polarizer is rotated? Explain briefly.
5.15 Polarizers are traditionally made by adding small amounts of mineral components, such as tourmaline or peridot, to molten glass and stretching the glass in one direction while it is in its flexible state. What does this process indicate about the struc-ture of the mineral additive, and why is the glass stretched?
5.16 3D movies provide stereoscopic vision, usually by making separate images reach the viewers’ left and right eyes. The two main approaches are the use of complementary colors and the use of polarized light.
www.ebook3000.com
OtherOpticalEffects 117
a. In the case of anaglyph images, the projected image con-tains different aspects in different colors, and the movie is viewed through glasses in which the color of one lens is the complement to the other (most commonly red and cyan). Explain how the anaglyph lenses work to produce stereo-scopic vision.
b. In the case of polarized images, polarized light of opposite polarizations is projected separately. The light can be either polarized linearly (the opposite polarizations would be per-pendicular to or parallel to the vertical), or polarized cir-cularly (the two images would be left- and right-circularly polarized). The viewers would wear glasses in which the lenses are of opposite polarizations (linearly for the linear method, circularly for the circular method). One drawback to this method is the need for a very flat silver screen to maintain the polarization on reflection from the screen to the viewers’ eyes. Another drawback is the potential need for two projectors, one to project each image. Suggest some ways that the latter drawback could be overcome. Compare your suggestions with current technologies for 3D movies.
5.17 As discussed in Chapter 1, the consumption of indium for indium tin oxide (ITO) transparent electrode materials might soon outstrip the world’s supply.
a. If the layer of ITO is about 200 nm thick on each electrode, cal-culate the mass of indium in a display screen that is 30 cm × 20 cm. State and justify the assumptions in your calculation.
b. Based on your answer to (a), is it feasible to recover the indium from the display screen at the end of its useful life? Discuss.
Further Reading
General References
Many introductory physics and physical chemistry textbooks contain infor-mation concerning polarized light and its interaction with matter.
Materials for optical data storage. Special issue. H. Coufal and L. Dhar, Eds. MRS Bulletin, April 2006, 294–393.
R. Cotterill, 2008. The Material World. Cambridge University Press, Cambridge.M. Freemantle, 1994. Novel electro-optic materials discovered. Chemical and Engineering
News, September 12, 1994, 28.A. Javan, 1967. The optical properties of materials. Scientific American, September
1967, 239.M. G. Lagorio, 2004. Why do marbles become paler on grinding? Reflectance, spec-
troscopy, color, and particle size. Journal of Chemical Education, 81, 1607.

118 PhysicalPropertiesofMaterials
B. Kahr and J. M. McBride, 1992. Optically anomalous crystals. Angewandte Chemie International Edition in English, 31, 1.
J. M. Marentette and G. R. Brown, 1993. Polymer spherulites. I. Birefringence and morphology. Journal of Chemical Education, 70, 435.
K. Nassau, 2001. The Physics and Chemistry of Colour, 2nd ed. Wiley-Interscience, Hoboken, NJ.
T. D. Rossing and C. J. Chiaverina, 1999. Light Science: Physics and the Visual Arts. Springer, New York.
J. M. Rowell, 1986. Photonic materials. Scientific American, October 1986, 146.S. Sengupta, J. Kumar, A. Jain, and S. Tripathy, 1993. Functionalized polymeric mate-
rials for electronics and optics. Chapter 12 of Chemistry of Advanced Materials. Ed. by C.N.R. Rao. Blackwell Scientific Publications, Oxford.
R. Tilley, 2000. Colour and the Optical Properties of Materials. John Wiley & Sons, Hoboken, NJ.
V. F. Weisskopf, 1968. How light interacts with matter. Scientific American, September 1968, 60.
E. A. Wood, 1977. Crystals and Light: An Introduction to Optical Crystallography, 2nd ed. Dover Publications, New York.
Devices
The physics of digital color. Special issue. P. Roetling, Ed. Physics Today, December 1992, 24–65.
R. Dagani, 1996. Devices based on electro-optic polymers begin to enter marketplace. Chemical and Engineering News, March 4, 1996, 22.
S. W. Depp and W. E. Howard, 1993. Flat-panel displays. Scientific American, March 1993, 90.
E. Wilson, 1985. Nonlinear optical polymer device may speed up information super-highway. Chemical and Engineering News, August 14 1995, 27.
Liquid Crystals
G. H. Brown, 1983. Liquid crystals—the chameleon chemicals. Journal of Chemical Education, 60, 900.
J. Fünfscilling, 1991. Liquid crystals and liquid crystal displays. Condensed Matter News 1(1), 12.
Nonlinear Effects
Photonic materials for optical communications. Special issue. H. Hillmer and R. Germann, Eds. MRS Bulletin, May 2003, 340–376.
New functionality in glass. Special issue. S. Houde-Walter and P. Green, Eds. MRS Bulletin, November 1998, 27–67.
Emergence of chalcopyrites as nonlinear optical materials. Special issue. M. C. Ohmer and R. Pandey, Eds. MRS Bulletin, July 1998, 6–49.
Nonlinear optics. Special issue. E. Garmire, Ed. Physics Today, May 1994, 23–57.Refractive index changes its sign. Chemical and Engineering News, April 9, 2001, 31.
www.ebook3000.com

OtherOpticalEffects 119
R. T. Bailley, F. R. Cruickshank, P. Pavlides, D. Pugh, and J. N. Sherwood, 1991. Organic materials for non-linear optics: Inter-relationships between molecular properties, crystal structure and optical properties. Journal of Physics D: Applied Physics, 24, 135.
R. Dagani, 1995. Photorefractive polymers poised to play key role in optical technolo-gies. Chemical and Engineering News, February 20, 1995, 28.
J. Feinberg, 1988. Photorefractive nonlinear optics. Physics Today, October 1988, 46.M. Freemantle, 2001. Opal chips: Photonic jewels. Chemical and Engineering News,
January 22, 2001.M. Jacoby, 2001. Spiraling crystals designed for photonics. Chemical and Engineering
News, May 14, 2001.M. Jacoby, 1998. Photonic crystals: Whole lotta holes. Chemical and Engineering News,
November 23, 1998, 38.M. Jacoby, 1997. Photorefractive polymer stacks. Chemical and Engineering News, July
28, 1997, 8.B. G. Levi, 1995. New compound brightens outlook for photorefractive polymers.
Physics Today, January 1995, 17.S. R. Marder, J. E. Sohn, and G. D. Stucky, Eds., 1991. Materials for nonlinear optics:
Chemical perspectives. American Chemical Society Symposium Series 455, American Chemical Society.
S. R. Marder, 1992. Metal containing materials for nonlinear optics. Chapter 3 in Inorganic Materials. Ed. by D.W. Bruce and D. O’Hare. John Wiley & Sons, Hoboken, NJ.
S. Mukamel, 1995. Principles of Nonlinear Optical Spectroscopy. Oxford University Press, New York.
A. Rodger and B. Norden, 1997. Circular Dichroism and Linear Dichroism. Oxford University Press, New York.
Transparency
J. E. Burke, 1996. Lucalox alumina: The ceramic that revolutionized outdoor lighting. MRS Bulletin, June 1996, 61.

Part III
Thermal Properties of Materials
Passed through the fiery furnaceAs gold without alloy . . .
Philip Carringtonfrom a hymn, 1938

123
6HeatCapacity,HeatContent,andEnergyStorage
6.1 Introduction
The thermal properties of any material are among the most fundamental, whether directly or indirectly involved in the material’s application. For example, it is almost always important to know how properties of mate-rials change if the temperature is changed. In this section of the book, we explore the fundamentals of thermal properties, from basic thermodynam-ics to applications. This chapter emphasizes heat capacity, heat content, and energy storage. Heat capacity, which is the most fundamental of all thermal properties, is related to the strength of intermolecular interactions, phase stability, thermal conductivity, and energy storage capacity.
6.2 Equipartition of Energy
To understand the fundamentals of energy storage, it is useful to examine the basic theory of equipartition of energy.
First, let us consider the information needed to know where a molecule is. This will lead to considerations of how the energy of that molecule is partitioned.
For a single monatomic species, three coordinate positions must be speci-fied to know the atom’s position. For example, this can be expressed as three Cartesian coordinates (x, y, z) in orthogonal axes. We express the freedom of position by saying that a single atom has three degrees of freedom.
For a polyatomic molecule with N atoms per molecule, 3N coordinates (3 for each of the N atoms) must be known to specify the total molecular position. An N-atom polyatomic molecule has 3N degrees of freedom.
The molecule’s motion can be expressed in terms of three types of move-ment: translational (motion of whole molecule), rotational (rotation of whole molecule), and vibrational (internal vibrations within the molecule).

124 PhysicalPropertiesofMaterials
For a monatomic species, there is only one meaningful type of motion, and this is translation. The translational motion can be considered to take place in three orthogonal directions (e.g., x, y, z), and any motion of the monatomic molecule can be described as a vector sum of the motions in these three directions. This is another way of expressing the three degrees of freedom of a monatomic species.
For a diatomic molecule, there are also three degrees of freedom of trans-lational motion. In addition, there are two meaningful rotational motions for a diatomic molecule. (A third rotational motion, along the molecular axis, does not move the atoms and therefore does not contribute to the freedom of the molecule.) A diatomic molecule has one further vibrational degree of freedom due to an internal vibration. The sum of these degrees of freedom of motion (3 translational + 2 rotational + 1 vibrational = 6 total) is the same as the total number of degrees of freedom (for N = 2, 3N = 6).
For a linear polyatomic molecule with N atoms, there are three transla-tional degrees of freedom and two rotational degrees of freedom, leaving (3N – 5) vibrational degrees of freedom.
For a nonlinear polyatomic molecule, there can be three meaningful rota-tional motions. This gives, for N atoms per molecule, three translational degrees of freedom, three rotational degrees of freedom, and (3N – 6) vibrational degrees of freedom.
From quantum mechanical considerations, virtually any translational en -ergy value is allowed. Of course, translational energies are quantized, but their spacing is so close together that it results in a virtual continuum of energy levels.
It takes more energy to excite rotations than it does to excite translations, which is reflected in the wider spacing of rotational energy levels relative to the translational ladder.
Vibrational energy levels are even further apart than rotational levels, and it takes considerable energy to excite them. (Recall from the discussion of color of matter that electronic energy levels are even more widely spaced than vibrational levels, as shown in Figure 2.2 in Chapter 2, so we do not consider electronic excitation here.)
The principle of equipartition states that, for temperatures high enough that trans-lational, rotational, and vibrational degrees of freedom are all “fully” excited,* each type of energy contributes ½kT (where k is the Boltzmann constant and T is the temperature in kelvin) to the internal energy, U, per degree of freedom.
This means that each translational degree of freedom contributes ½kT to U, and each rotational degree of freedom contributes ½kT to U, but each vibra-tional degree of freedom contributes 2 × ½kT to U. The reason for the double contribution for vibration is that, whereas translation and rotation have only kinetic energies associated with them, vibrational motion has both kinetic and potential energy.
* Strictly speaking, all the degrees of freedom are fully excited only at infinite temperature.
www.ebook3000.com

HeatCapacity,HeatContent,andEnergyStorage 125
This simple theory of equipartition can be useful to work out the contribu-tions of degrees of freedom to U and hence to the heat capacity. Two exam-ples follow.
6.2.1 Heat Capacity of a Monatomic Gas
For a monatomic gaseous species, there are only three degrees of freedom in total, and all of these are translational degrees of freedom. Therefore, U = 3 × ½kT. This same result also is found from the kinetic theory of gases.
Considering that the heat capacity at constant volume, CV , is defined by*:
C
UTV
V
=∂∂
(6.1)
then CV = 1.5k per molecule for a monatomic gas.To scale up to a mole of gas, we need to multiply by the Avogadro constant,
NA, and this gives the molar heat capacity at constant volume, CV,m:
CV,m = CVNA (6.2)
so, for a gaseous monatomic, CV, m = 1.5 NAk = 1.5R at any temperature, where R (= NAk) is the gas constant.
6.2.2 Heat Capacity of a Nonlinear Triatomic Gas
For a nonlinear triatomic molecule, such as H2O, the high-temperature limit of the heat capacity can be calculated from the equipartition theory. Since N = 3, there are 3N = 9 degrees of freedom in total, partitioned as shown in Table 6.1.
Since the equipartition theory only considers the case where all the degrees of freedom are fully excited, this is the high-temperature limit of the heat capacity of gaseous H2O. In practice, at moderate temperatures, CV,m is much less. For example, CV,m (H2O gas, T = 298.15 K) = 3.038R. Since translational and rotational energies are most easily excited, and 3R is their summed contribution, the remaining 0.038R reflects the fact that the vibra-tions of gaseous water molecules are only slightly active at room tempera-ture because the vibrational energy spacings are greater than the available thermal energy, kT.
We will see later (Sections 6.4 and 6.5) how the equipartition theory can be used to assess heat capacity contributions in solids and liquids.
* The chapters in this section on Thermal Properties contain significantly more equations than the other sections. To aid the student, the most important equations are denoted with ▮ to the left of the equation. (Many of the equations not so designated can be derived from the marked equations.)
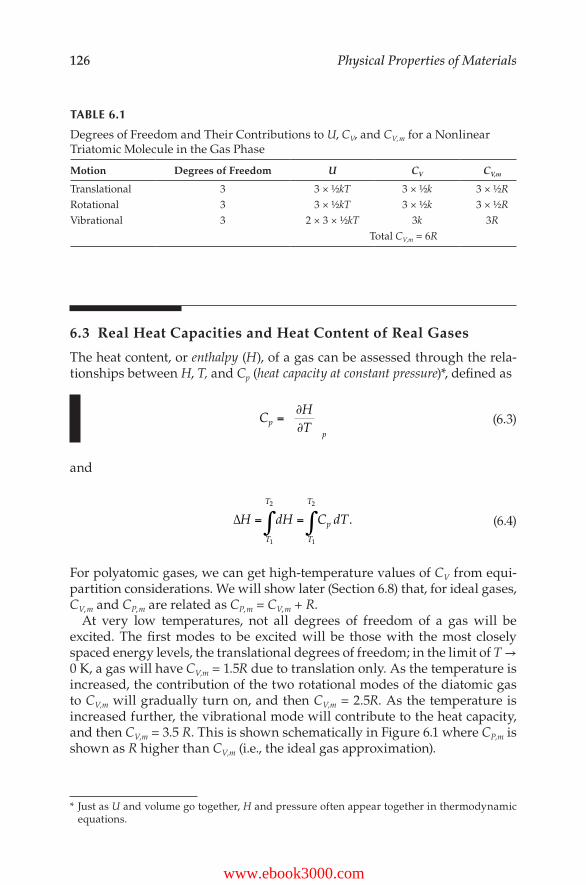
126 PhysicalPropertiesofMaterials
6.3 Real Heat Capacities and Heat Content of Real Gases
The heat content, or enthalpy (H), of a gas can be assessed through the rela-tionships between H, T, and Cp (heat capacity at constant pressure)*, defined as
CHTp
p
=∂∂
(6.3)
and
∆H dH C dTT
T
p
T
T
= =∫ ∫1
2
1
2
. (6.4)
For polyatomic gases, we can get high-temperature values of CV from equi-partition considerations. We will show later (Section 6.8) that, for ideal gases, CV, m and CP, m are related as CP, m = CV, m + R.
At very low temperatures, not all degrees of freedom of a gas will be excited. The first modes to be excited will be those with the most closely spaced energy levels, the translational degrees of freedom; in the limit of T → 0 K, a gas will have CV,m = 1.5R due to translation only. As the temperature is increased, the contribution of the two rotational modes of the diatomic gas to CV,m will gradually turn on, and then CV,m = 2.5R. As the temperature is increased further, the vibrational mode will contribute to the heat capacity, and then CV,m = 3.5 R. This is shown schematically in Figure 6.1 where CP,m is shown as R higher than CV,m (i.e., the ideal gas approximation).
* Just as U and volume go together, H and pressure often appear together in thermodynamic equations.
TABLE 6.1
Degrees of Freedom and Their Contributions to U, CV, and CV, m for a Nonlinear Triatomic Molecule in the Gas Phase
Motion Degrees of Freedom U CV CV,m
Translational 3 3 × ½kT 3 × ½k 3 × ½RRotational 3 3 × ½kT 3 × ½k 3 × ½RVibrational 3 2 × 3 × ½kT 3k 3R
Total CV,m = 6R
www.ebook3000.com

HeatCapacity,HeatContent,andEnergyStorage 127
Returning to the theme of heat storage, and taking into account that the heat content over a temperature range is the integrated heat capacity (Equation 6.4), the higher the heat capacity, the greater the heat storage ability. This is true for all phases of matter, and we will return to this later when consider-ing heat storage applications.
Now let us consider what happens when a gas is cooled to very low temper-atures. All gases liquefy when the temperature is sufficiently low. This may require a very low temperature; for example, helium liquefies at T = 4.2 K.
When a gas liquefies, it releases heat. Since enthalpy is a state function, the complete cycle from gas → liquid → gas would have ΔH = 0. Therefore, the enthalpy change on liquefaction (ΔliqH = Δgas→liquidH) is equal but of an oppo-site sign to the enthalpy change on vaporization (ΔvapH):
ΔliqH = –ΔvapH. (6.5)
The enthalpy change on vaporization, ΔvapH, is a very useful quantity, and some typical enthalpies of vaporization are given in Table 6.2, but ΔvapH is not known for all materials.
However, since the Gibbs* energy change, ΔG, can be written at constant temperature as
* Josiah Willard Gibbs (1839–1903) was an American theoretical physicist. Gibbs was a recipi-ent of one of the first American PhD degrees, from Yale in 1863 (his thesis was titled “On the Form of the Teeth of Wheels in Spur Gearing”). After his PhD, Gibbs spent three years in Europe, then returned to New Haven, and rarely traveled anywhere thereafter. This rather reclusive scientist made many great contributions, mostly in the areas of thermodynamics. Gibbs’ first scientific paper, published in 1873, set the record straight on the (then-confused) concept of entropy. Within five years, he published a 300-page memoir providing the basis of much of thermodynamics as it is taught to this day. Since most of the thermodynamic research at that time was carried out in Europe, especially Germany, it took some time (and Ostwald’s 1892 translation of Gibbs’ work to German) for Gibbs’ work to make its lasting impression.
C m/R
5
4
3
2
1
00 T/K
FIGURE 6.1Stylized temperature dependence of the molar heat capacity of an ideal diatomic gas at con-stant pressure (CP, m: _____) and at constant volume (CV, m: ).

128 PhysicalPropertiesofMaterials
ΔG = ΔH – TΔS (6.6)
where ΔS is the change in entropy, and the Gibbs energies of any two phases in equilibrium are identical (so ΔtrsG, the change in Gibbs energy due to tran-sition, equals zero), then
0 = ΔtrsH – TΔtrsS (6.7)
that is, ΔvapH = TΔvapS for the case of the vaporization transition. It is an experimental finding that many gases have values of ΔvapS of about 90 J K–1 mol–1 (See Table 6.2). This finding was generalized by Trouton,* and is usually called Trouton’s rule. It holds because the increase in disorder on going from the liquid phase (where molecules are translating and undergoing hindered rotations and perhaps muted vibrations) to the gas phase (where the mol-ecules translate and rotate more freely than in the liquid) is approximately independent of the type of material involved.
There are exceptions to Trouton’s rule, and one is H2O, with ΔvapS of 108.95 J K–1 mol–1. The main reason for the exceptionally large increase in disorder on vaporization of water is that its liquid phase has a relatively low entropy due to the order associated with hydrogen-bond networks, which hinder molecular motion. This is the same network that gives rise to the color of water through vibrational excitation, as seen in Chapter 2.
While we are looking at heat capacity and heat content, we should consider what happens to the heat capacity of a material at its boiling point. When a
* Frederick Thomas Trouton (1863–1922) was an Irish physicist who, in 1902, took up a profes-sorship at University College London. He discovered what we now call Trouton’s rule when he was an undergraduate student at Trinity College, Dublin.
TABLE 6.2
Enthalpy Changes on Vaporization, ΔvapH, and Entropy Changes on Vaporization, ΔvapS, for a Variety of Materials at Their Normal Boiling Points, Tb
Material ΔvapH/ J mol–1 ΔvapS/ J K–1 mol–1 Tb / K
He 8.37 × 10² 19.7 4.2N2 5.577 × 10³ 72.13 77.3CH4 8.180 × 10³ 73.26 111.7NH3 2.335 × 10⁴ 97.40 239.7CH3OH 3.527 × 10⁴ 104.4 337.9CC14 3.000 × 10⁴ 85.8 349.9C6H6 3.076 × 10⁴ 87.07 353.3H2O 4.0657 × 10⁴ 108.95 373.2Hg 5.812 × 10⁴ 92.30 629.7Zn 1.148 × 10⁵ 97.24 1180.0
www.ebook3000.com

HeatCapacity,HeatContent,andEnergyStorage 129
liquid is heated toward its boiling point, the material absorbs heat and the temperature rises until the boiling point is achieved. At that point, heat is absorbed without further increase in temperature until all the material has been converted to vapor. From either CV or CP considerations, with qV as heat taken up at constant volume and qP as heat taken up at constant pressure,
CqT
UTV
V
V
= =∂∂∆ (6.8)
and
Cq
THTp
p
p
= =∂∂∆
. (6.9)
Since, on boiling, ΔT = 0 (i.e., heat is input without temperature rise at the boil-ing point), CV = CP = ∞ at the boiling point, Tb. This is depicted in Figure 6.2.
Because ΔH is the integration of CP over temperature (Equation 6.4), H increases slightly with temperature over the liquid region and then has a step (integrating the infinite heat capacity) at the boiling point, followed by a further gentle increase as the temperature increases in the gas phase. This is shown in Figure 6.2. An infinite heat capacity is not limited to the case of a liquid → gas phase transition, as we shall see later.
Before turning to the heat content of a nonideal gas, it is worth stating a few basic concepts concerning ideal gases. An ideal gas is a theoretical gas for which PV = nRT is the equation of state for n moles under all circumstances. The equation of state for an ideal gas can be derived from the kinetic theory of gases, with two main assumptions: (1) the molecules of the gas have neg-ligible volume in comparison with the volume of the container, and (2) the
Tb TbT
C
(a)
∞
H
T
(b)
FIGURE 6.2Boiling of a liquid at Tb, at a fixed pressure. (a) Schematic of the heat capacity as a function of temperature of a material in the vicinity of the boiling point. (b) Schematic of the correspond-ing enthalpy as a function of temperature in the vicinity of the boiling point.

130 PhysicalPropertiesofMaterials
molecules exert no attraction or repulsion on each other. All gases approach ideality as P → 0 because these two conditions are most closely met at low pressures.
6.3.1 Joule’s Experiment
Joule* carried out an important experiment concerning ideal gases that led to the discovery of an important property: the internal energy of an ideal gas depends only on temperature.
In Joule’s experiment, two connected gas bulbs were placed in a water bath. One bulb was evacuated, and the other contained gas, as shown in Figure 6.3.
Joule opened the stopcock between the two bulbs and measured the result-ing temperature change in the water bath, ΔbathT. He found that
lim P1 → 0 ΔbathT = 0, (6.10)
where P1 is the pressure of the gas which expands into the vessel at P2 = 0.It can be shown, as follows, that this result leads to ΔU = 0 for the gas in the
limit of P → 0 (i.e., approaching ideality). By the first law of thermodynamics, the change in internal energy, ΔU, is
ΔU = q + w (6.11)
and work, w, is given by
w P dVext= −∫ (6.12)
where Pext is the external pressure. In this experiment, the gas expands within a fixed volume while doing no external work, so w = 0 here. This shows that expansion into a vacuum takes no work. Consideration of the heat, q,
q = CΔT (6.13)
and Joule’s finding that ΔbathT = 0 leads to q = 0. Since w = 0 and q = 0, it fol-lows from Equation 6.11 that ΔU = 0.
* James Prescott Joule (1818–1889) was an English scientist noted for the establishment of the mechanical theory of heat, and honored by the SI energy unit. He carried out his work on heat while he was in his early 20s and then made other contributions to the field of thermo-dynamics, including the first estimate of the speed of gas molecules (1848). Lord Kelvin wrote of Joule, “His boldness in making such large conclusions from such very small observational effects is almost as noteworthy and admirable as his skill in extorting accuracy from them.”
www.ebook3000.com

HeatCapacity,HeatContent,andEnergyStorage 131
In other words, when a low-pressure (ideal) gas is expanded, it does so without a change in internal energy, U. Since U is most simply expressed as a function of T and V (just as H is a function of T and P), an infinitesimal change in U, written as dU, can be expressed in terms of an infinitesimal change in T, written as dT, and an infinitesimal change in V, written as dV:
d d dU
UT
TUV
VV T
=∂∂
+∂∂
. (6.14)
From Joule’s experiment, dU = 0 and dT = 0, so (∂U/∂V)T dV = 0, but dV ≠ 0 so (∂U/∂V)T = 0 for an ideal gas. This shows that U is independent of volume for an ideal gas at constant temperature because the molecules are neither attracted nor repelled in an ideal gas. Therefore, for an ideal gas, U is a func-tion of temperature only, in accordance with the equipartition theorem (i.e., U depends only on T, not on V or P).
6.3.2 Joule–Thomson Experiment
Joule teamed up with Thomson* to carry out an important experiment that has allowed quantification of the nonideality of a gas. This experimental
* William Thomson (1824–1907) was a Belfast-born physicist later made Baron Kelvin of Largs and known as Lord Kelvin; the temperature unit is named after him. He graduated from Glasgow University at age 10 and was made professor of natural philosophy there at age 22. Thomson made major contributions to many areas: electrodynamics; thermodynamics including the absolute temperature scale and the second law (on his own and in collabora-tion with Joule); electromagnetism (with Faraday). He was knighted for his contribution to the laying of the first Atlantic cable, and made many other practical advances including the invention of a tide predictor and an improved mariner’s compass. He was the acknowledged leader in physical sciences in the British Isles during his lifetime.
P2P1
FIGURE 6.3Joule’s experiment. The gas at pressure P1 was allowed to expand to the other bulb, where P2 = 0, while the temperature of the water bath was recorded.

132 PhysicalPropertiesofMaterials
apparatus was basically an insulated double piston, as shown schematically in Figure 6.4.
Initially, the gas was all in the left chamber. When the left piston was pushed in, the gas moved through a porous plug (said to have been a linen handkerchief) into the right chamber. The gas state functions were trans-formed from initial values (on the left P = PL , T = TL , V = VL ; on the right P = PR, T = TR, V = VR = 0) to final values (on the left P P T T V V= = = =L L L, , 0; on the right P P T T V V= = =R R R, , ).
Since the piston was made of insulating material, there was no extraneous heat exchange with the surroundings (i.e., the experiment was carried out under an adiabatic condition: q = 0). This information can be used to show that the overall process was isenthalpic (i.e., at constant enthalpy, ΔH = 0) as follows. Since H is defined as
H ≡ U + PV (6.15)
it follows that
ΔH = ΔU + Δ(PV). (6.16)
Making use of the first law of thermodynamics (Equation 6.11), the change in PV for this process leads to
∆H q w P V PVR R L L= + + − (6.17)
PLVLTL
PLʹVLʹ = 0TLʹ
PRVR = 0TR
PRʹVRʹTRʹ
FIGURE 6.4The Joule–Thompson double-piston experiment, shown as a function of time with the initial conditions at the top. In this experiment, gas was pushed through a porous plug in the center of a piston, and taken from an initial set of pressure, volume, and temperature conditions on the left side of the piston (denoted by subscript L) to a final set of conditions (denoted by a prime) on the right side of the plug (denoted by subscript R).
www.ebook3000.com

HeatCapacity,HeatContent,andEnergyStorage 133
and here q = 0. From Equation 6.12,
w P V P V PV P VL
V
R
V
L L R R
L
R
= − − = −∫ ∫d d0
0
(6.18)
and substitution of this and q = 0 into Equation 6.17 leads to
∆H PV P V P V PVL L R R R R L L= − + − = 0, (6.19)
which shows that the process takes place at constant enthalpy.The Joule–Thomson experiment was carried out to see the change in tem-
perature of the gas with respect to pressure changes, at constant enthalpy. The Joule–Thomson coefficient, μJT, so determined, is defined as
JTH
TP
=∂∂
. (6.20)
Experimentally, it is found that μJT for a given gas is positive at relatively low temperatures, negative at relatively high temperatures, and zero at some intermediate temperature (the Joule–Thomson inversion temperature; the exact value of this temperature depends on the gas). This temperature dependence can be understood as follows.
Unlike an ideal gas in which the forces between molecules can be ignored, the molecules in real gases do “feel” each other. At infinitely large separa-tions, the force between molecules is vanishingly small, but as the inter-molecular separation, r, diminishes, the molecules begin to feel attraction for each other. It is this attraction that eventually leads to liquefaction of gases when they are compressed. This attraction lowers the energy of the system. At extremely short intermolecular distances, the intermolecular interaction becomes repulsive, increasing the energy of the system. This is shown sche-matically in Figure 6.5.
At relatively low temperatures, where μJT > 0, the definition of μJT implies that as the pressure decreases, so does the temperature, and the gas cools on expansion. This is because of intermolecular forces. When the gas is expanded (P decreased), this requires some work to overcome the attractive intermolecular forces. This work comes at the expense of the energy (or tem-perature) of the gas and causes the gas to cool on expansion.
At very high temperatures, where μJT < 0, the opposite situation exists. At these very high temperatures, the temperature increases when the pressure decreases (gas is expanded). This is because high temperatures allow for

134 PhysicalPropertiesofMaterials
many repulsive intermolecular interactions, so when the gas is expanded, energy is released, and this is manifested in increased temperature of the gas.
At the Joule–Thomson inversion temperature, there is an accidental cancel-lation of the attractive and repulsive forces, and there is no change in tem-perature on expansion of the gas; μJT = 0 at this temperature.
An ideal gas, with its negligible intermolecular interactions, also has μJT = 0. Therefore, μJT is a direct way to quantify the nonideality of a gas.
Most gases (exceptions noted below) are still below their Joule–Thomson inversion temperature at room temperature. Because these gases have μJT > 0, they cool on expansion and can be used as refrigerants. Examples are NH3, freons (chlorofluorocarbons), and CO2. In fact, CO2 can cool so much on expansion that an attachment can be placed on a CO2 gas cylinder to produce dry ice, that is, CO2 in its solid form, directly from expansion of the gas from the cylinder. Freons were originally developed to be nonreactive gases that would efficiently cool on expansion for use as refrigerants. We know now that some freons are rather unreactive on earth but quite reactive with ozone in the upper atmosphere,* and more recent research has led to replacement materials with suitable refrigeration capacity. However, some of these replacement gases contribute significantly to the greenhouse effect, so solid-state refrigerants (e.g., thermoelectric materials [see Chapter 12] and magnetocaloric materials [see Chapter 13]) are active areas of materials research.
* The 1995 Nobel Prize in Chemistry was awarded to Paul Crutzen (1933–, Max Planck Institute for Chemistry, Mainz, Germany), Mario Molina (1943–, MIT), and F. Sherwood Rowland (1927–, University of California–Irvine) for their work in atmospheric chemistry, particularly concerning the formation and decomposition of ozone.
100
0
–1500.2 0.4 0.6
Repulsive Attractive
r/nm
Ener
gy/K
FIGURE 6.5Intermolecular interaction energy as a function of intermolecular separation, r. The curve shown is for the interaction between two Ar atoms, and energy is expressed in units equivalent to thermal energy (= kT at temperature T).
www.ebook3000.com

HeatCapacity,HeatContent,andEnergyStorage 135
Low-boiling gases are already above their Joule–Thomson inversion tem-perature at room temperature. Examples are H2, He, and Ne. In order to use these gases as refrigerants that expand on cooling, they must first be pre-cooled below their Joule–Thomson inversion temperatures.
6.4 Heat Capacities of Solids
6.4.1 Dulong–Petit Law
In 1819, Dulong* and Petit† found experimentally that, for many nonmetal-lic solids at room temperature, the molar heat capacity at constant volume CV,m ≈ 3 R ≈ 25 J K–1 mol–1. Originally known as the law of atomic heats, this is now known as the Dulong–Petit law.
The Dulong–Petit law can be understood for monatomic solids by use of the equipartition theory, similar to the ideal monatomic gas presented in Section 6.2, except that solids have both kinetic and potential energy. For each atom in the monatomic solid, there are three degrees of freedom, and each atom’s three degrees of freedom can be expressed in terms of the vibra-tional motion of the atoms at a point of the lattice. From equipartition this gives, per atom,
UkT
kT= × =3 22
3 (6.21)
so CV = 3k and, on a molar basis, with kNA = R, this gives CV,m = 3R as found experimentally.
What the Dulong–Petit law does not address is the further experimental fact that all heat capacities decrease as the temperature is lowered (i.e., CV,m → 0 as T → 0 K). In fact, this is not explainable in terms of classical theories and requires quantum mechanics.
* Pierre Louis Dulong (1785–1838) was a French physicist who, with Petit, discovered the law of atomic heats, now known more commonly as the Dulong–Petit law. This work was particu-larly important in establishing atomic masses. Dulong’s work in his later life was hampered by inadequate funding (unlike most of his contemporaries, he had no funding from indus-trial connections) and the loss of an eye from his 1811 discovery of nitrogen chloride.
† Alexis Thérèse Petit (1791–1820) was a French physicist who, with Dulong, discovered the law of atomic heats (Dulong–Petit law). In 1810, at the age of 19, he was appointed a professor of Lycée Bonaparte in Paris. With Dulong, Petit was one of the first physical scientists to reject the caloric theory of heat (which treated heat as a fluid) and espouse the atomic theory of matter in 1819; this stand made little headway with his peers in France at that time.

136 PhysicalPropertiesofMaterials
6.4.2 Einstein Model
The Einstein* model of heat capacity of a solid (published by Einstein in 1906) was, historically, one of the first successes of quantum mechanics. In this model, thermal depopulation of vibrational energy levels is used to explain why CV,m → 0 as T → 0 K.
Einstein considered each atom in the solid to be sitting on a lattice site, vibrating at a frequency ν. For N atoms, this led to the following expression for the heat capacity:
C NkhkT
eeV
h kT
h kT=−
31
2
2
ν ν
ν
/
/( ) (6.22)
where h is Planck’s constant. The repeating factor (hν/kT), which must be unitless because it appears as an exponent, leads to units of s–1 (also called Hertz†) for ν. Often vibrational excitation information is given in the unit cm–1 (�ν , wavenumber), that is,
E hhc
hc= = =ν νλ
�, (6.23)
where c is the speed of light.Alternatively, hν/k can be expressed directly in terms of the Einstein charac-
teristic temperature, θE, defined as
θEhk
hck
= =ν ν�
. (6.24)
As the term hν/kT is the ratio of vibrational energy (hν) to thermal energy (kT), the use of θE makes the comparison even more direct. Written in terms
* Albert Einstein (1879–1955) was a German-born theoretical physicist. Einstein’s early life did not predict great success; his entry to university was delayed because of inadequacy in math-ematics, and when he completed his studies in 1901 he was unable to get a teaching post, so he took a junior position at a patent office in Berne. While working there he managed to publish three important papers: one on Brownian motion that led to direct evidence for the existence of molecules; the second connecting quantum mechanics and thermodynamics, proving that radiation consisted of particles (photons) each carrying a discrete amount of energy, which gave rise to the photoelectric effect; and the third concerning the special theory of relativity. In 1932 Einstein left Germany for a tour of America, but decided, as a Jew, that it was not safe to return to Germany, so he remained in the United States. Einstein received the Nobel Prize in Physics in 1921 for his work on the photoelectric effect.
† Heinrich Rudolf Hertz (1857–1894) was a German physicist. Hertz was an experimentalist who studied electrical waves and made important discoveries that led to significant advances in understanding of electricity. Hertz also discovered radio waves.
www.ebook3000.com

HeatCapacity,HeatContent,andEnergyStorage 137
of θE, the heat capacity for N atoms in the Einstein model can be expressed as
C NkT
eeV
ET
T
E
E=
−3
1
2
2
θ θ
θ
/
/( ). (6.25)
This gives a temperature-dependent molar heat capacity of a solid (Figure 6.6), approaching 3R as T→∞ (provided the solid does not melt!) in agreement with the Dulong–Petit finding, and approaching 0 as T → 0 K in agreement with the experiment. However, the Einstein model falls below the experi-mental heat capacity at low temperatures (Figure 6.6).
6.4.3 Debye Model
The 1912 Debye* model of heat capacity of a solid considers the atoms on lat-tice sites to be vibrating with a distribution of frequencies. Debye’s model assumed a continuum of frequencies in the distribution up to a maximum (cutoff) frequency, νD, the Debye frequency. The dependence of the distribu-tion of frequencies on the frequency is shown in Figure 6.7, where the (single-frequency) Einstein model also is shown for comparison.
Mathematically, the two models can be compared in terms of the fre-quency distribution function, g(ν), where g(ν) is the number of modes with frequency ν:
Einstein model: g(ν) = νE (6.26)
* Peter Joseph Wilhelm Debye (1884–1966) was a Dutch-born chemical physicist who, at age 27, succeeded Einstein as professor of theoretical physics at the University of Zurich. He moved to the United States in 1940. Debye’s contributions included fields as diverse as theory of specific heat, theory of dielectric constants, light scattering, x-ray powder (Debye–Scherrer) analysis, and Debye–Hückel theory of electrolytes. In 1936 he was awarded the Nobel Prize in Chemistry for his contribution to knowledge of molecular structure.
Hea
t cap
acity
/R
3
2
1
00
T/K
Einstein
Experiment
FIGURE 6.6The Einstein heat capacity for a monatomic solid, compared with the experiment.

138 PhysicalPropertiesofMaterials
Debye model: g(ν) = aν2 0 ≤ ν ≤ νD (6.27)
g(ν) = 0 ν > νD (6.28)
where a in Equation 6.27 is a constant, dependent on the material. This leads to the following expression for the Debye heat capacity for N particles:
C NkkTh
hkT
e
eV
D
h kT
h kT=
−( )9
1
3
4
2
0ν
ν ν
ν
/
/
hh DkT
hkT
ν
∫ dν
(6.29)
00
νE νD
ν
g (ν)
FIGURE 6.7Comparison of Debye (---) and Einstein ( ) distributions of frequencies. The corresponding frequencies, νD (=θD k/h) and νE (=θE k/h) are also shown.
T/θD
C v,m
/ J K
–1 m
ol–1
30
20
10
0 0 1 2 3
3R
FIGURE 6.8Heat capacity of a monatomic crystalline solid as a function of temperature scaled to the Debye temperature for the material. A material with a higher value of θD will have a given heat capac-ity at a higher temperature than another material with a lower value of θD. Note that the heat capacity approaches 3R at high temperature.
www.ebook3000.com

HeatCapacity,HeatContent,andEnergyStorage 139
and again, introducing a characteristic temperature, this time θD, the Debye characteristic temperature, where θD = hνD/k, leads to a simpler way of writing Equation 6.29:
C NkT x e
edxV
D
x
x
DT
=−∫91
3 4
2
0θ
θ
( ) (6.30)
where x = hν/kT.The Debye heat capacity equation (Equation 6.30) shows that, theoretically,
CV is a universal function of θD/T, with θD as the scaling function for different materials. This is borne out very well in experimental data. Figure 6.8, which illustrates CV as a function of temperature expressed in units of θD, fits the data for many materials. As a scaling function, θD reflects the strength of the interatomic interactions; that is, θD is a measure of the force constant between molecules or atoms in the solid. Some typical values of θD are given in Table 6.3, where it can readily be seen that materials that are harder to deform have higher values of θD. The higher the value of θD, the less the vibrational modes are excited at a given temperature, and the lower the heat capacity (in comparison with materials with lower values of θD).
Like the Einstein model, the Debye model of heat capacity correctly describes the experimental situation in the temperature extrema (CV,m → 3R as T → ∞ and CV,m → 0 as T → 0 K). The other major success of the Debye theory is that it correctly predicts the way in which CV → 0 as T → 0 K for a monatomic solid. In the limit of T → 0, the Debye heat capacity expression becomes, for N atoms,
lim T C NkT
VD
→ =0125
43
πθ
(6.31)
TABLE 6.3
Debye Temperatures for Selected Materialsa
Material θD /K
Diamond 2230Gold 225Neon 75Mercury (solid) 72
Source: C. Kittel, 2005. Introduction to Solid State Physics, 8th ed. John Wiley & Sons, Hoboken, NJ.
a Note that, at a given temperature, a material with a lower value of θD will have a higher heat capac-ity than a material with a higher value of θD.

140 PhysicalPropertiesofMaterials
that is, for T < θD/100, CV α T 3, as observed experimentally for nonmetals. This is referred to as the Debye-T3 law.
For a monatomic solid, the Debye model gives a more accurate description than the Einstein model because the frequency distribution (e.g., as deter-mined by inelastic neutron scattering) is more Debye-like. For a polyatomic molecular solid, the rigid-molecule contribution to the heat capacity will be Debye-like, but the contributions of internal vibrations (which are localized at particular frequencies and can be observed in infrared and/or Raman spectroscopy experiments) are better treated by the Einstein model. This is considered further in Problem 10 at the end of this chapter.
6.4.4 Heat Capacities of Metals
For metals, there is an additional factor to consider beyond the lattice contri-bution to the heat capacity. The extra degrees of freedom of the conducting electrons, that is, those with energy above the Fermi energy, must be taken into account. That this is a very small fraction of the valence electrons can be seen as follows.
The experimental molar heat capacity of a monatomic solid metal at high temperatures is usually a little more than 3R. We can use equipartition the-ory to determine the contribution of free electrons to heat capacity. On the basis of vibrations alone, the internal energy of a monatomic solid is 3kT (see Section 6.4.1). If the atoms each had one free-valence electron, the total inter-nal energy per atom would be
UkT kT
kT= × × + × =3 22
32
4 5. (6.33)
where the first term is from atomic vibrations and the second term is from the translation of one free election per atom. This would lead to CV, m = 4.5R, which is far in excess of the experimental observation that the molar heat
COMMENT: DEBYE TEMPERATURE AND AUDIO SPEAKERS
The Debye temperature, θD, and the speed of sound, v, are related as
θD
vhk
NV
=2π
6π21/3
(6.32)
where N is the number of particles, and V is the volume. The high Debye temperature of diamond, and consequently the high speed of sound of diamond, has led to the use of diamond-coating in diaphragms in tweeter speakers in order to reduce high-frequency sound distortion.
www.ebook3000.com

HeatCapacity,HeatContent,andEnergyStorage 141
capacity of a monatomic metal is just slightly in excess of 3R. Since 3R is the contribution from the vibrational degrees of freedom, only a small fraction of the valence electrons must be free to translate. This was the first indication that Fermi statistics (Equation 3.1) holds.
It can be shown from P(E), the probability distribution function for elec-trons (Chapter 3), that the electronic contribution to the molar heat capacity at low temperatures is given by
C TVmelec, = γ (6.34)
where γ depends on the particular metal. Therefore, the total molar heat capacity of a metal at very low temperatures is
lim ,T C T ATVmmetal→ = +0 3γ , (6.35)
where the first term is the electronic contribution and the second term is the lattice contribution.
6.5 Heat Capacities of Liquids
As for many liquid properties, a description of a liquid in terms of its degrees of freedom falls between solids, where low-frequency vibrations are dominant, and gases, where translation, rotation, and perhaps vibrational degrees of freedom are active. Rigid crystals and liquids can be further dis-tinguished by the excitement of configurational degrees of freedom in the latter. As is usual with other phases of matter, the heat capacity of a liquid usually increases as the temperature increases, due to the increased num-bers of excited degrees of freedom at elevated temperatures, requiring more energy to invoke the same temperature rise.
The heat capacity of liquid water, as many other physical properties of water, illustrates a special case. The heat capacity of water near room temperature historically was used to define the calorie.* For convenience of comparison, the heat capacity of water can be converted to units of R, as 1 cal K–1 g–1 ≈ 18 cal K–1 mol–1 ≈ 9R. This value can be used to illustrate a point concerning degrees of freedom in water. As a triatomic molecule, water has a total of 3 × 3 = 9 degrees of freedom per molecule. If these were partitioned as 3 translational, 3 rotational, and 3 vibrational degrees of freedom, then the internal energy
* The calorie was defined as the amount of energy required to increase the temperature of exactly 1 g of water from 14.5°C to 15.5°C. Since this is a relative measurement and the joule is based on SI concepts, the calorie has been redefined in terms of the joule: 1 cal ≡ 4.184 J.

142 PhysicalPropertiesofMaterials
per molecule would be given by Utrans + Urot + Uvib = 3kT/2 + 3kT/2 + 3kT = 6kT, and the molar heat capacity of water would be CV, m = 6R. However, this is not enough to account for the known molar heat capacity of water (9R). Since the only way to increase CV, m within the equipartition model is to increase the twice-weighted vibrational degrees of freedom, consider the extreme case of all 9 degrees of freedom being vibrational. This leads to the internal energy per molecule of 9kT and a molar heat capacity, CV, m , of 9R, as observed experimen-tally. This simplified view of water is rather like that of a solid: all the degrees of freedom would be vibrational. This could arise because of the extended hydrogen-bonding network in water, which prevents free translation and rota-tion and allows water to look lattice-like in terms of its heat capacity. (It also gave water its color; see Chapter 2.) Although this view of water is oversim-plified, detailed thermodynamic calculations of water are consistent with the existence of hydrogen-bonded clusters of water molecules in the liquid state.
6.6 Heat Capacities of Glasses
A glass can be defined as a rigid supercooled liquid formed by a liquid that has been cooled below its normal freezing point such that it is rigid but not crystalline. A glass is also said to be amorphous, which means without shape, showing its lack of periodicity on a molecular scale. A supercooled liquid (i.e., a liquid cooled below its normal freezing point) is metastable with respect to its corresponding crystalline solid. Metastability is defined as a local Gibbs energy minimum, with the global energy minimum being stable (see Figure 6.9). While a supercooled liquid is in an equilibrium state (the molecules obey the Boltzmann distribution), a glass, which is obtained by cooling a super-cooled liquid, is not in equilibrium with itself. This is because, in glasses, molecular configurations (i.e., the relative orientations and packing of the molecules) change slowly (sometimes hardly at all) so that Boltzmann distri-butions cannot be achieved. Given sufficient time, a glass would eventually convert to a crystalline form because it is more stable; an example of such a conversion is shown in Figure 6.10.
When a glass is heated, it does not have a well-defined melting point, but instead becomes gradually less viscous. Due to the irregularity of the molec-ular packing in a glass (see Figure 6.11 for a two-dimensional comparison of the arrangement of atoms in crystalline and glassy SiO2), a glass can flow when a stress is applied.*
* It has been said that window glass in ancient cathedrals is thicker at the bottom than at the top due to the flow of glass over the centuries. However, this effect has been shown to be insufficient to account for the observed difference in thickness. It is possible that it is due to mounting of panels of glass of irregular thickness: for stability, glaziers could have mounted the glass with the thickest edge to the bottom.
www.ebook3000.com
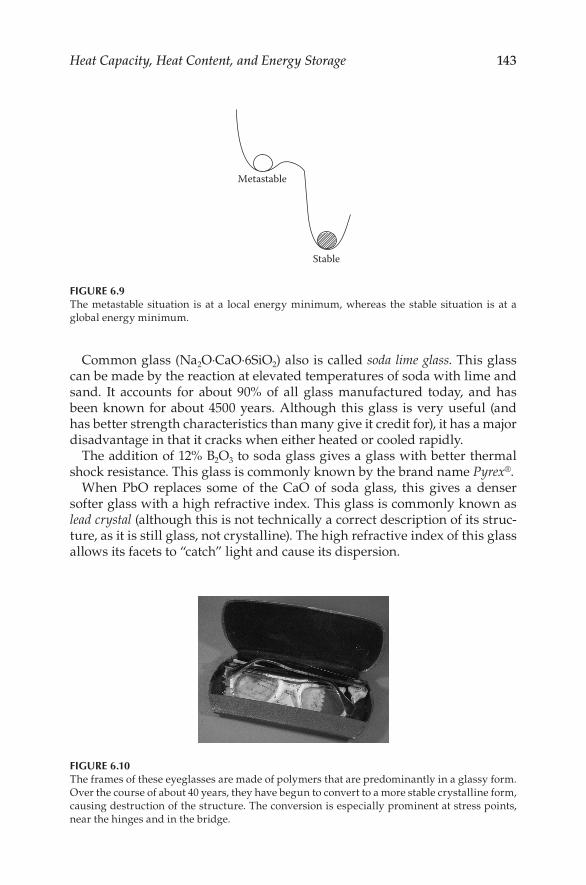
HeatCapacity,HeatContent,andEnergyStorage 143
Common glass (Na2O·CaO·6SiO2) also is called soda lime glass. This glass can be made by the reaction at elevated temperatures of soda with lime and sand. It accounts for about 90% of all glass manufactured today, and has been known for about 4500 years. Although this glass is very useful (and has better strength characteristics than many give it credit for), it has a major disadvantage in that it cracks when either heated or cooled rapidly.
The addition of 12% B2O3 to soda glass gives a glass with better thermal shock resistance. This glass is commonly known by the brand name Pyrex®.
When PbO replaces some of the CaO of soda glass, this gives a denser softer glass with a high refractive index. This glass is commonly known as lead crystal (although this is not technically a correct description of its struc-ture, as it is still glass, not crystalline). The high refractive index of this glass allows its facets to “catch” light and cause its dispersion.
Metastable
Stable
FIGURE 6.9The metastable situation is at a local energy minimum, whereas the stable situation is at a global energy minimum.
FIGURE 6.10The frames of these eyeglasses are made of polymers that are predominantly in a glassy form. Over the course of about 40 years, they have begun to convert to a more stable crystalline form, causing destruction of the structure. The conversion is especially prominent at stress points, near the hinges and in the bridge.

144 PhysicalPropertiesofMaterials
The addition of 5% A12O3 to soda glass gives a strong acid-resistant glass. When fibers of this glass are reinforced with an organic plastic, this is a com-posite material known as Fiberglass®.
The heat capacity of a typical glass is shown in Figure 6.12 in comparison with that of a crystalline solid. From this figure it can be seen that the heat capacity of a typical liquid is higher than that of the corresponding crystal-line solid due to the increased number of degrees of freedom in the liquid. Decreasing in temperature from the liquid, the heat capacity of the super-cooled liquid is in line with that of the liquid because no change in state occurred in passing below the melting point to the supercooled liquid state.
As the temperature of the supercooled liquid is lowered further, consider-able entropy is removed according to
(a) (b)
FIGURE 6.11A two-dimensional schematic comparison of (a) crystalline SiO2, which shows periodic atomic arrangement, and (b) glassy SiO2, in which the atoms are not periodically arranged.
Supercooledliquid Liquid
Rigidglass
Crystallinesolid0
0 Tg TmT/K
C
∞
FIGURE 6.12Heat capacity as a function of temperature showing typical crystalline solid, liquid, and rigid glass phases. Tm and Tg are the melting and glass transition temperatures, respectively.
www.ebook3000.com

HeatCapacity,HeatContent,andEnergyStorage 145
∆S
C
TTp= ∫ d . (6.36)
In fact the rate of entropy removal is so high in comparison with the rate of removal in the crystalline solid, because the heat capacity of a supercooled liquid is more than that of the crystalline solid, that if the heat capacity were to remain so high as the temperature was lowered, this would eventually lead to a negative entropy for the supercooled liquid. This unphysical situ-ation is avoided by the heat capacity of the supercooled liquid dropping down a step at a temperature characteristic of the material where concur-rently rigidity sets in. Below this temperature, known as the glass transition temperature, Tg, the material is a rigid glass. The drop in heat capacity below Tg arises from the change in degrees of freedom from the supercooled liq-uid (an equilibrium state in which configurational degrees of freedom are active) to the rigid glass (a nonequilibrium state in which the heat capacity is essentially vibrational because the configurational part is frozen). Tg is always an approximate temperature and less than the normal melting point of the pure crystalline material. For example, for SiO2, Tg ≈ 1200°C, and Tm = 1610°C.
The heat capacity of the rigid glass is still in excess of that of the crystal-line solid, and this can be understood in terms of Debye’s heat capacity theory applied to each phase. The fact that the heat capacity of the glass is higher than that of the crystal indicates that the effective Debye char-acteristic temperature of the glass is lower than that of the crystal. With reference to Figure 6.8, the temperature at which a given heat capacity is achieved in the glass will be lower than the temperature required for the crystal to have this same heat capacity, which implies that θ θD D
glass crystal< . This also means that atomic motion is easier in the glass than in the crys-tal. This is in line with the results of Table 6.3, which show that materi-als with lower Debye temperatures are softer. The relative ease of atomic motion in the glass reflects the lack of periodicity in its structure in com-parison with the crystalline solid, as can be anticipated from the two-di-mensional schematic look at the structures of glassy and crystalline SiO2 in Figure 6.11.
Many chemical systems, both simple and complex, can exhibit glassy behavior. An appropriate thermal treatment is required to trick the material into forming the metastable supercooled liquid rather than the stable crystal-line material. Examples of materials that form glasses include many biologi-cal materials, polymers (including plastics and paints), and foodstuffs. The glass transition temperature, Tg, can be very important in the characteriza-tion of materials from milk solids to paints, as is illustrated in the Tutorial on Thermal Analysis.

146 PhysicalPropertiesofMaterials
6.7 Phase Stability and Phase Transitions, Including Their Order
A number of useful thermodynamic results that can be readily applied to phase stability, and phase transition information can be derived from some basic thermodynamic definitions. These will be used here to investigate the relationships among derivatives of Gibbs energy and to consider phase sta-bility. Phase stability is very important in materials science because all the properties of a material—optical, thermal, electronic, magnetic, mechani-cal—depend critically on its phase.
Starting from the definitions of enthalpy, H (Equation 6.15), and Gibbs energy, G:
G ≡ H – TS = U + PV – TS, (6.37)
COMMENT: THERMODYNAMICS OF PIZZA
At one time or other, most people have burned the roof of their mouths by eating pizza. Although the pizza crust may have seemed to be at the correct temperature for eating, there is something about the pizza top-pings (tomato sauce, cheese, etc.) that makes it a potential hazard. We might as well learn something from the experience: this illustrates the difference between temperature and heat.
If a piece of bread and a piece of pizza are in the same oven at the same temperature, and both are pulled out at the same time, we know that the toast will be ready for safe consumption sooner than the pizza will be. Although they are at the same initial (oven) temperature, the toast cools faster because it has a lower heat capacity. On the other hand, the toppings on the pizza being very dense, and especially because of their high water content, have high heat capacities. For this reason, it takes much longer to dissipate the heat of the pizza. In other words, the toast and the pizza were at the same temperature when they were removed from the oven, but the toast had a much lower heat content (enthalpy) than the pizza. The higher enthalpy of the pizza means that it takes longer for it to cool off.
It’s all thermodynamics!
www.ebook3000.com

HeatCapacity,HeatContent,andEnergyStorage 147
and Helmholtz* energy, A:
A ≡ G – PV = H – TS – PV = U – TS, (6.38)
for a closed system, infinitesimal changes in H, G and A can, respectively, be written as
dH = dU + PdV + VdP, (6.39)
dG = dU + PdV + VdP – TdS – SdT, (6.40)
and
dA = dU – TdS – SdT. (6.41)
If the work is pressure-volume work, and it is carried out reversibly, then
dU = δq + δw =δqrev – PdV = TdS – PdV (6.42)
where the second law of thermodynamics,
dSqTrev=
δ (6.43)
has been used. Equations 6.39 to 6.42 can be used to give
dH = TdS + VdP, (6.44)
dA = – PdV – SdT, (6.45)
and
dG = VdP – SdT. (6.46)
These expressions for dU, dH, dG, and dA (Equations 6.42, 6.44, 6.45, and 6.46) are known collectively as the fundamental equations.
* Hermann Ludwig Ferdinand von Helmholtz (1821–1894) was a German physiologist and natural scientist. Helmholtz’s thesis on connections between nerve fibers and nerve cells led to his studies of heat in animals, and this led to his theories of conservation of energy. Helmholtz made contributions to a wide variety of subjects: thermodynamics, invention of the ophthalmoscope, structure and mechanism of the human eye, the role of the bones in the middle ear, electricity and magnetism, and music theory.

148 PhysicalPropertiesofMaterials
The fundamental equations can be used to derive important thermody-namic relations, known as the Maxwell* relations. Consider the fundamental equation for U, Equation 6.42. Since U is a state function of S and V, dU also can be written as
d d dUUS
SUV
VV S
=∂∂
+∂∂ (6.47)
and the coefficients of the two forms of dU (Equation 6.42 and 6.47) can be equated, so
∂∂
=US
TV
(6.48)
and
∂∂
= −UV
PS
. (6.49)
Since U is a state function, the order of differentiation for its second derivative does not matter, and
∂∂ ∂
=∂∂ ∂
2 2UV S
US V
, (6.50)
so
∂∂
= −∂∂
TV
PS
S V
(6.51)
which is the Maxwell relation from U.Similarly, from the fundamental equation for G (i.e., Equation 6.46), since G
is a state function of P and T, dG also can be written as
d d dGGP
PGT
TT P
=∂∂
+∂∂ (6.52)
and the coefficients of the two forms of dG (i.e., Equations 6.46 and 6.52) can be equated, so
* James Clerk Maxwell (1831–1879) was a Scottish-born physicist who made many important contributions to electricity, magnetism, color vision, and color photography. His studies of Saturn’s rings led to his seminal work on the kinetic theory of gases.
www.ebook3000.com
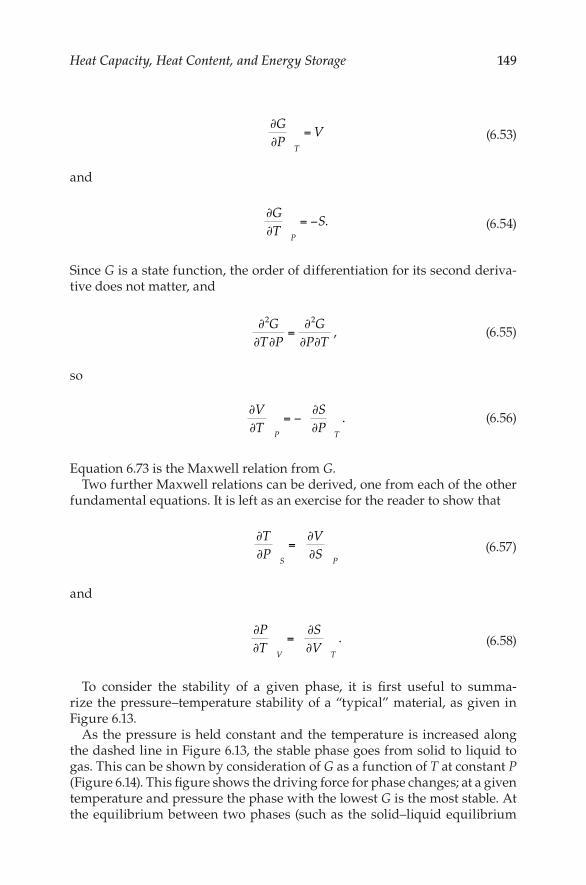
HeatCapacity,HeatContent,andEnergyStorage 149
∂∂
=GP
VT
(6.53)
and
∂∂
= −GT
SP
. (6.54)
Since G is a state function, the order of differentiation for its second deriva-tive does not matter, and
∂∂ ∂
=∂∂ ∂
2 2GT P
GP T
, (6.55)
so
∂∂
= −∂∂
VT
SP
P T
. (6.56)
Equation 6.73 is the Maxwell relation from G.Two further Maxwell relations can be derived, one from each of the other
fundamental equations. It is left as an exercise for the reader to show that
∂∂
=∂∂
TP
VS
S P
(6.57)
and
∂∂
=∂∂
PT
SV
V T
. (6.58)
To consider the stability of a given phase, it is first useful to summa-rize the pressure–temperature stability of a “typical” material, as given in Figure 6.13.
As the pressure is held constant and the temperature is increased along the dashed line in Figure 6.13, the stable phase goes from solid to liquid to gas. This can be shown by consideration of G as a function of T at constant P (Figure 6.14). This figure shows the driving force for phase changes; at a given temperature and pressure the phase with the lowest G is the most stable. At the equilibrium between two phases (such as the solid–liquid equilibrium

150 PhysicalPropertiesofMaterials
at the melting point, or the liquid–gas equilibrium at the boiling point), the Gibbs energies of the equilibrium phases are equal (Gsolid = Gliquid at the melt-ing point, Gliquid = Ggas at the boiling point).
The slope of the curve in the G(T) plot, (∂G/∂T)P, is identical to –S (Equation 6.54). Since S > 0 (always), all the slopes are negative in Figure 6.14. While the entropy increases on going from solid to liquid to gas, the slope becomes more negative from solid → liquid → gas. Even within a given phase, the entropy increases as the temperature increases, so the curves are concave down in Figure 6.14.
Within the constraints of model calculations, one can calculate G for vari-ous phases under specific temperature and pressure conditions, and the predicted most stable phase is the one with the lowest G. Comparison with experimental phase stabilities can indicate the validity of the assumed inter-atomic interactions.
TbTmT
SolidLiquid
GasG
FIGURE 6.14Gibbs energy, G, as a function of temperature for a typical material. Tm and Tb are the melting and boiling temperatures, respectively. Solid lines indicate the stable phase in a given region.
SolidGas
LiquidP
T
FIGURE 6.13The pressure–temperature phase diagram of a typical pure material. The solid lines denote the phase boundaries, and the dashed line indicates an isobaric change in temperature, as discussed in the text.
www.ebook3000.com

HeatCapacity,HeatContent,andEnergyStorage 151
The Ehrenfest* classification of phase transitions hinges on the behavior of G near the phase transformation. In this classification, phase transitions can be first-order (first derivatives of G are discontinuous) or second-order (first deriv-atives of G are continuous but second derivatives of G are discontinuous).
In a first-order phase transition, the first derivatives of G ((∂G/∂P)T = V and (∂G/∂T)P = –S) are discontinuous. As shown in Figure 6.15, since Gα = Gβ at the equilibrium of phase α with phase β, and given the preceding discussion, we find that ΔtrsV ≠ 0 and ΔtrsS ≠ 0 at a first-order phase transition. From ΔtrsG = 0 and Equation 6.6 it follows that
∆∆
trstrsSH
T= . (6.59)
Since there is a change in the amount of disorder at a transition,
ΔtrsS ≠ 0 (6.60)
and therefore
ΔtrsH ≠ 0 (6.61)
for a first-order phase transition. From Equation 6.4, with the integration to give ΔtrsH over the fixed temperature Ttrs, in order for ΔtrsH be nonzero, Cp must be infinite at the transition. This is illustrated in Figure 6.15. Examples of first-order transitions (i.e., transitions with the signatures of ΔtrsV ≠ 0,
* Paul Ehrenfest (1880–1933) was an Austrian-born theoretical physicist who studied for his PhD under Boltzmann’s supervision. As a teacher, Einstein described Ehrenfest as “peer-less” and “the best teacher in our profession I have ever known.” His students’ nicknamed him “Uncle Socrates,” for his probing but personable style. Ehrenfest’s contributions to thermodynamics and quantum mechanics stemmed from his ability to ask critical, probing questions. Depression due to the plight of his Jewish colleagues and personal difficulties led Ehrenfest to take his own life.
(b) (e)(d)(c)(a)
Ttrs T Ttrs T Ttrs T Ttrs T Ttrs T
G V S H CP
FIGURE 6.15Schematic view of (a) G(T), (b) V(T), (c) S(T), (d) H(T), and (e) Cp(T) for a first-order phase transi-tion. Ttrs designates the transition temperature.

152 PhysicalPropertiesofMaterials
ΔtrsS ≠ 0, ΔtrsH ≠ 0, Cp = ∞) include melting, boiling, sublimation, and some solid–solid transitions (e.g., graphite-to-diamond).
A second-order phase transition does not have a discontinuity in V (=(∂G/∂P) T ) or S (= –(∂G/∂P)p ), but the second derivatives of G ((∂2G/∂T∂P) = (∂V/∂T)p and (∂2G/∂P∂T) = –(∂S/∂P)T ) are discontinuous. This is illustrated in Figure 6.16; ΔtrsV = 0, ΔtrsS = 0, and ΔtrsH = 0 at a second-order transition. The third condition leads to the finite heat capacity at a second-order transition, as shown in Figure 6.16. The λ-shape of the heat capacity at this transition leads this to be called a λ-transition. An example of such a transition (which is much rarer than a first-order transition) is observed in liquid helium (see Chapter 9).
6.8 (CP – CV): An Exercise in Thermodynamic Manipulations
The aim here is to derive a useful thermodynamic relationship between CP and CV, and also to look at one special case of its use.
From the definitions of CP (Equation 6.3) and CV (Equation 6.1):
C CHT
UTp V
P V
− =∂∂
−∂∂ (6.62)
and (CP – CV) is a measure of the difference in energy required to increase temperature at constant pressure (which allows for P – V work of expansion on heating) relative to increasing the temperature at constant volume (where there is no expansion work).
The definition of H (Equation 6.15) leads to an expression for dH in terms of dU (Equation 6.39), which can be differentiated with respect to tempera-ture at constant pressure to give
(b) (e)(d)(c)(a)
Ttrs T Ttrs T Ttrs T Ttrs T Ttrs T
G V S H CP
FIGURE 6.16Schematic view of (a) G(T), (b) V(T), (c) S(T), (d) H(T), and (e) Cp(T) for a second-order phase transition. Ttrs is the transition temperature.
www.ebook3000.com

HeatCapacity,HeatContent,andEnergyStorage 153
∂∂
=∂∂
+∂∂
HT
UT
PVT
P P P
(6.63)
and substitution of Equation 6.63 into Equation 6.62 leads to
C CUT
PVT
UTP V
P P V
− =∂∂
+∂∂
−∂∂
. (6.64)
This expression can be simplified by finding another expression for (∂U/∂T) p. Since U is a function of V and T,
d d dUUV
VUT
TT V
=∂∂
+∂∂ (6.65)
which leads, on differentiation with respect to temperature at constant pres-sure, to
∂∂
=∂∂
∂∂
+∂∂
UT
UV
VT
UT
P T p V
. (6.66)
Substitution of Equation 6.66 into Equation 6.64 leads to
C CVT
UV
Pp Vp T
− =∂∂
∂+
d. (6.67)
Although both (∂V/∂T)P and P are directly experimentally accessible, (∂U/∂V) T is not, so it is useful to try to relate it to some other variables. From the funda-mental equation for U (Equation 6.42), differentiation with respect to volume at constant temperature leads to
∂∂
=∂∂
−UV
TSV
PT T
. (6.68)
Substitution of Equation 6.68 into Equation 6.67 gives
C C TVT
SVP V
P T
− =∂∂
∂∂
. (6.69)
Although (∂S/∂V)T is still awkward on its own, a Maxwell relation (Equation 6.58) allows

154 PhysicalPropertiesofMaterials
C C TVT
PTP V
P V
− =∂∂
∂∂
(6.70)
for all systems, with no approximations. However, Equation 6.70 is more usually written in terms of the coefficient of thermal expansion (α) and the iso-thermal compressibility (βT), defined as follows:
α =∂∂
1V
VT
P
(6.71)
and
βTT
VVP
=− ∂
∂1
. (6.72)
From these definitions, the units of α are K–1, and units of βT are recipro-cal pressure (e.g., Pa–1). The advantage to using α and βT over (∂V/∂T)p and (∂V/∂P) T is that α and βT are intensive properties (i.e., independent of the size of the system), whereas (∂V/∂T)p and (∂V/∂P)T require knowledge of the size of the system (i.e., they are extensive properties, dependent upon the size of the system). From the definition of α (Equation 6.71) it follows that
C C TVPTP V
V
− =∂∂
α . (6.73)
To obtain (∂P/∂T)V, consider that V is a function of P and T so that
d d dVVP
PVT
TT p
=∂∂
+∂∂
(6.74)
which leads to
∂∂
= −
∂∂
∂∂
PT
VT
VP
V
P
T
(6.75)
and
www.ebook3000.com

HeatCapacity,HeatContent,andEnergyStorage 155
∂∂
=−−
=PT
VV
V T T
αβ
αβ
. (6.76)
Substitution of Equation 6.76 into Equation 6.72 leads to the following gen-eral expression for (CP – CV):
C CTV
P VT
− =α
β
2
(6.77)
for isotropic materials. If the material is anisotropic, α and βT will depend on the direction, and a tensor form of Equation 6.77 specific to the system’s symmetry must be employed.
In general, (CP – CV) is small compared with CP for most solids; it is espe-cially small at low temperatures (since α → 0 as T → 0; see Chapter 7), and may be <1% of CP at T < θD. (CP – CV) typically is a few percent of CP for a solid at room temperature.
For the special case of ideal gases, (CP – CV) has an especially simple form. An ideal gas is described by the equation of state given by PV = nRT, so α for an ideal gas can be written as
α =
∂∂
=∂∂
=1V
VT
PnRT T
nRTP
PnRT
nRP
P
=1T
(6.78)
and βT for an ideal gas can be written as
βT
TV
VP
PnRT P
nRTP
PnRT
=− ∂
∂= −
∂∂
=1
nnRT PP
− =2 1 (6.79)
and substitution of these into Equation 6.77 leads to
C CTV TP
VPT
RP m V m, ,( )
− = = =−
−
2
1 (6.80)
for an ideal gas, where the result is written in terms of the molar heat capaci-ties CP,m and CV,m, i.e., n = 1.
Heat Storage Materials: A Tutorial
Heat storage materials have many applications, from scavenging heat from hot industrial exhaust to keeping electrical components from overheat-ing during soldering, to storing the energy from solar collectors, to mak-ing use of off-peak electricity.
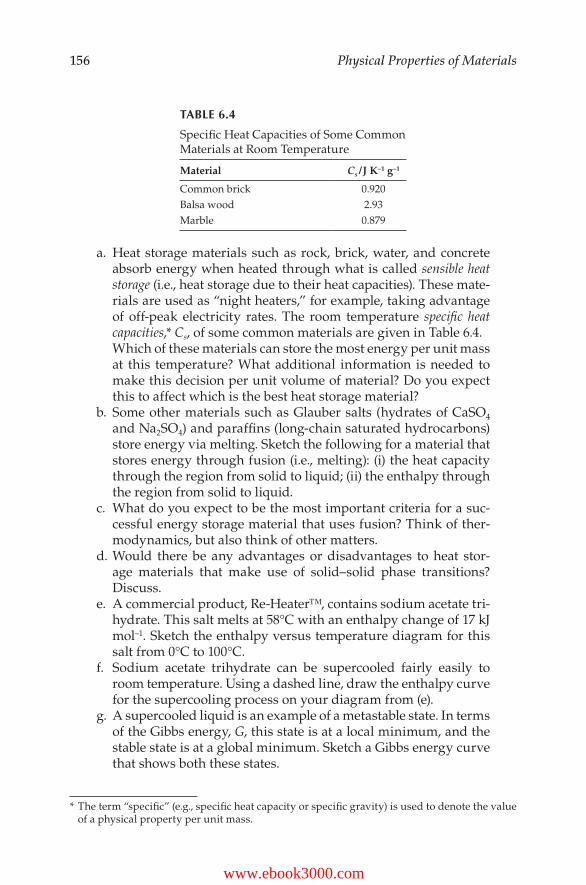
156 PhysicalPropertiesofMaterials
a. Heat storage materials such as rock, brick, water, and concrete absorb energy when heated through what is called sensible heat storage (i.e., heat storage due to their heat capacities). These mate-rials are used as “night heaters,” for example, taking advantage of off-peak electricity rates. The room temperature specific heat capacities,* Cs, of some common materials are given in Table 6.4.
Which of these materials can store the most energy per unit mass at this temperature? What additional information is needed to make this decision per unit volume of material? Do you expect this to affect which is the best heat storage material?
b. Some other materials such as Glauber salts (hydrates of CaSO4 and Na2SO4) and paraffins (long-chain saturated hydrocarbons) store energy via melting. Sketch the following for a material that stores energy through fusion (i.e., melting): (i) the heat capacity through the region from solid to liquid; (ii) the enthalpy through the region from solid to liquid.
c. What do you expect to be the most important criteria for a suc-cessful energy storage material that uses fusion? Think of ther-modynamics, but also think of other matters.
d. Would there be any advantages or disadvantages to heat stor-age materials that make use of solid–solid phase transitions? Discuss.
e. A commercial product, Re-Heater™, contains sodium acetate tri-hydrate. This salt melts at 58°C with an enthalpy change of 17 kJ mol–1. Sketch the enthalpy versus temperature diagram for this salt from 0°C to 100°C.
f. Sodium acetate trihydrate can be supercooled fairly easily to room temperature. Using a dashed line, draw the enthalpy curve for the supercooling process on your diagram from (e).
g. A supercooled liquid is an example of a metastable state. In terms of the Gibbs energy, G, this state is at a local minimum, and the stable state is at a global minimum. Sketch a Gibbs energy curve that shows both these states.
* The term “specific” (e.g., specific heat capacity or specific gravity) is used to denote the value of a physical property per unit mass.
TABLE 6.4
Specific Heat Capacities of Some Common Materials at Room Temperature
Material Cs / J K–1 g–1
Common brick 0.920Balsa wood 2.93Marble 0.879
www.ebook3000.com

HeatCapacity,HeatContent,andEnergyStorage 157
h. When a supercooled liquid is perturbed, for example when a seed crystal is added, the barrier between the stable and the metastable states is lowered and the stable state is achieved. This is a physical change. What do we usually call this effect for chemical changes?
i. How does a seed crystal lower the Gibbs energy path between the metastable supercooled liquid state and the stable crystalline state?
j. If you were able to lower the Gibbs energy path between the supercooled liquid state of sodium acetate trihydrate and its solid state, from the enthalpy diagram of part (e) and (f), what would happen energetically?
k. In a closed system it is not easy to add a seed crystal. How else could you induce crystallization in supercooled liquid sodium acetate trihydrate?
l. This application gives off heat when activated. Does the spon-taneous crystallization process always give off heat? Can you think of a similar principle that takes up heat when activated?
Thermal Analysis: A Tutorial
There are three main techniques in thermal analysis, and they each are known by their initials: TGA (thermogravimetric analysis), DTA (differ-ential thermal analysis), and DSC (differential scanning calorimetry).
a. Thermogravimetric analysis (TGA) is an analytical tool to carry out “gravimetry” (i.e., mass determination) of a sample as the temperature changes. This tool is straightforward: the sample is heated and mass is determined as a function of temperature. A typical plot is mass versus temperature. Suppose that a commer-cial sample of mass 10.0 mg is heated from room temperature and experiences a 3.0% mass loss at 80°C. Sketch the resulting thermogravimetric curve.
b. Thermogravimetry can be used to characterize pure samples and blends, and it is a very useful technique. An even more use-ful thermoanalytical tool is differential thermal analysis. In this technique, a sample and a reference (e.g., an empty sample cell) are both monitored as a function of temperature. The experiment can be carried out either in the heating or cooling mode, but the rate of sample heating (or cooling) is usually kept constant. In this experiment, the same power is input to the sample and the reference, and the temperature difference between the sample and the reference is measured as a function of temperature. If the heat capacities of the sample and reference are exactly the same throughout the temperature range of the measurement, the signal is “flat” as shown in Figure 6.17. What would the signal

158 PhysicalPropertiesofMaterials
look like if the sample container held a solid that melted during the temperature range of the scan?
c. Why do you suppose this technique is called differential thermal analysis?
d. What would the signal look like if a rigid glass were heated to well into the region where it is a supercooled liquid?
e. Differential scanning calorimetry is similar to DTA in several respects. Again, it is a differential technique, with a sample and a reference, and the setup is heated (or cooled) at a constant rate. What distin-guishes DSC from DTA is that in DTA the temperature difference between the sample and the reference is monitored, and in DSC the difference in power to the sample and reference to keep heat-ing (or cooling) them both at the same rate is measured. Sketch and label the DSC curve for the melting of a crystalline solid.
f. It would be very useful in a technique such as DTA or DSC if the area “under” peaks could be converted to enthalpy of the cor-responding process. Only one of the DTA and DSC has the area scaling to enthalpy. Which one? Hint: Consider what the peak area units are in each case.
g. How could one scale the area under the peak to determine the enthalpy?
h. As an example of an amorphous solid, consider the following. Sugar can be crystalline (e.g., big sugar crystals that one can grow out of sugar/water solutions; also white sugar—its crystal-linity is particularly obvious under a microscope). It also can be amorphous (or glassy, or vitreous; all mean the same thing). If sugar is heated to a high temperature (above the melting point) and then cooled very quickly—for example, by dropping it into cold water—it is transformed to a rigid glassy state. What is the confectionery name for this state of sugar?
i. Why should you not waste your time trying to make this confec-tionery unless you have a candy thermometer?
Samplehotter
Samplecolder
0
T or t
ΔT
FIGURE 6.17A flat signal from DTA when the sample and reference are perfectly matched in heat capacity.
www.ebook3000.com

HeatCapacity,HeatContent,andEnergyStorage 159
j. Is the rigid glassy state of sugar stable? What happens to this state of sugar if left for a long time?
k. If the melted sugar is allowed to cool more slowly, will it form the same rigid glassy state?
l. What are the white specks that sometimes form on the surface of chocolates that have been around for a long time? Should you eat these chocolates?
m. Why would a chocolate factory own a differential scanning calorimeter?
n. Although DSC can be used to determine the heat capacity of a sample, the precision of the results can be considerably greater than their accuracy. (The most accurate technique to determine heat capacities near and below room temperature is adiabatic calorimetry, in which the heat capacity is determined by the energy input and temperature rise [Equation 6.9] under constant pressure, adiabatic conditions.) Suggest some possible systematic errors in DSC determination of heat capacity.
o. The setting of cement takes place in two exothermic stages. The first stage starts at 143°C, with an enthalpy change of 11 J g–1, and the second stage starts at 196°C with an enthalpy change of 5.8 J g–1. Sketch the corresponding DSC curve.
6.9 Problems
6.1 The ideal gas law is a limiting law. a. Derive the relationship between pressure and density for
an ideal gas. b. Confirm the relationship (as a limiting law) on the basis of
the following data for dimethyl ether at T = –13.6°C.
P/atm 1.000 0.7000 0.5000 0.3000 0.2000 0.1000ρ/g L–1 2.4110 1.4684 1.0615 0.6635 0.4501 0.2247
Use a graph to answer this question. It may prove useful to know that the molecular formula of dimethyl ether is CH3OCH3.
6.2 The Einstein function for heat capacity is given by Equation 6.22. a. Calculate the value of CV from the Einstein function for
1 mol of a monatomic material with �ν = −100 cm 1 at the fol-lowing temperatures: 5.00, 10.00, 25.00, 50.00, 75.00, 100.0, 150.0, 200.0, 250.0, and 300.0 K. Give your answer for CV,m in terms of R, the gas constant.
b. What is the percentage difference between the calculated value of CV,m at T = 300.0 K compared with the Dulong–Petit law?

160 PhysicalPropertiesofMaterials
c. On the same graph, show CV,m both for your results from (a) and for �ν = 200 cm 1− , calculated for the same tempera-tures as in (a).
6.3 Derive the Maxwell Relations from the fundamental equations for
a. H; b. A.
6.4 Derive a plot of G as a function of pressure (analogous to G(T) given in Figure 6.14) for a material that goes from gas to liquid to solid as the pressure is increased. Show your reasoning as fully as possible.
6.5 A new molecular species was investigated with a view to using it as a commercial refrigerant. The temperature drops for a series of initial pressures, Pi, expanding into exactly 1 atm pres-sure were measured at 0°C, with the following results:
Pi/atm 32 24 18 11 8 5–ΔT/K 22 18 15 10 7.4 4.6
a. What is the value of the Joule–Thomson coefficient for this gas at these conditions? Hint: Consider the definition of the Joule–Thomson coefficient and also the definition of the partial derivative function.
b. Would another gas that would be a better refrigerant have a lower or higher Joule–Thomson coefficient? Explain.
6.6 Calculate (CP – CV) in J K–1 mol–1 for, (i) liquid water, and (ii) solid Zn, given the following information for 25°C:
𝛂/K–1 βT/atm–1 Vm /cm3 mol–1
H2O(1) 4.8 × 10⁻⁴ 4.6 × 10⁻⁵ 18Zn(s) 8.93 × l0–5 1.5 × l0–6 7.1
and calculate the percentage difference from the CP values: 75 J K–1 mol–1 for water, and 23 J K–1 mol–1 for Zn.
6.7 Sketch the differential scanning calorimeter trace for water on cooling from 15°C to –10°C. Label the temperature axis (includ-ing values and units), but just include the label and the units (i.e., no values) on the other axis.
6.8 A new gaseous species has been made in the laboratory, and it is found to be the triatomic molecule ABC. It is not known if ABC is linear or nonlinear. Explain how heat capacity measurements could differentiate between these possibilities. Be as explicit as possible, including stating expected values of the heat capaci-ties and the conditions under which you would carry out the measurements.
6.9 Very careful calorimetry can be used to carry out quality con-trol tests on pacemakers to determine the reliability of their power supplies. Suggest the physical basis for these tests.
www.ebook3000.com

HeatCapacity,HeatContent,andEnergyStorage 161
6.10 Although the Debye model is better able to describe the heat capacity of a monatomic solid, the Einstein model is useful in molecular solids with more than one atom per molecule. In this case, there are vibrational motions of the whole molecule (acoustic phonons) that are well described by the Debye model, and motions due to internal vibrations (optic phonons) that are described well by the Einstein model. In a unit cell with N atoms, there are 3 acoustic (Debye) modes and 3N – 3 optic (Einstein) modes. Calculate CV,m for a diatomic molecular solid with 2 atoms per unit cell and a Debye characteristic temper-ature of 300 K, and all Einstein modes at 200 cm–1. Plot your result as a function of temperature from T = 0 to 500 K.
6.11 An advertisement claims that a novel product could allow planting of outdoor crops earlier than would otherwise be possible in cold climates. It might even be possible, using this device, to plant before all danger of frost has passed. This prod-uct is a plastic container composed of vertical columns filled with water, which then surrounds the seedling with a cylinder of water. A top view is shown schematically in Figure 6.18.
a. How does this device work? Explain in thermodynamic terms. b. Would this device be as effective if it was filled with another
liquid, e.g., oil? Explain. c. Sketch the temperature as a function of time at the plant for
both cases (a) and (b) when the external temperature drops from 15°C to –10°C.
6.12 A gas at room temperature and at a constant pressure of 1 atm is going to be used to heat a material that is at a cooler tempera-ture. You are offered the option of using 1 mol of argon (Ar) gas or 1 mol of nitrogen (N2) gas for this purpose. Which will be more efficient? Explain your reasoning.
6.13 a. Which form of carbon do you expect to have the higher value of θD: diamond or graphite? Justify your answer.
FIGURE 6.18A seedling is surrounded by cylinders of water. This is a top view.

162 PhysicalPropertiesofMaterials
b. Sketch the molar heat capacity from T = 0 K to a tempera-ture high enough for equipartition to hold, for graphite and diamond. Put both on the same graph, and put a numeric scale on the heat capacity axis.
6.14 A consumer product made of a synthetic material (which looks very much like leather) is supple at room temperature but found to become brittle in the outdoors in the Canadian winter. It is thought that this is because the material is not very crystal-line (i.e., it is highly amorphous), and it undergoes a transfor-mation to a rigid glass at a temperature of about –10°C. Sketch the expected differential scanning calorimetry trace for such a material, from –30°C to 20°C.
6.15 When a natural material that is mostly amorphous but partially crystalline ages over tens of years, there is an increase in the ratio of the crystalline-to-amorphous portion of the material. Sketch the DSC curves of two pieces of this material, one newly produced and one well aged.
6.16 A bowl of frozen vegetables is to be cooked in a microwave oven. When the bowl is covered during the cooking process, two minutes is sufficient cooking time to produce steaming hot vegetables. If the bowl is not covered, after two minutes the vegetables are still cold. Why?
6.17 When a bicycle tire is inflated with a hand pump, the valve stem is noticeably warmed (temperature increase of about 10 K). Why?
6.18 For silver, θD = 225 K and γ = 6.46 × l0–4 J K–2 mol–1. Calculate CV of silver at 0.1 K and also at 1 K. Comment on the relative con-tributions of the lattice (Debye) heat capacity and the electronic heat capacity at each temperature.
6.19 Air in a container is at a pressure of about 1 atm and at room temperature. Inside the container there is a sensitive thermo-meter, and when the air is pumped out of the container with a vacuum pump, the temperature is seen to fall. Explain why the temperature falls, and what this indicates about the gas.
6.20 The fuels on the space shuttle Challenger leaked out during the flight, causing the shuttle to explode. The fuels were meant to be held in place by O-rings, i.e., soft rubbery materials that could be compressed to make tight seals. However, at the cold launch temperature (near 0°C), the soft rubbery material had become a rigid glass. On this basis, sketch the DSC (differential scanning calorimetric) curve for this rubber from 0°C to 25°C and indicate any features.
6.21 Polymers have been proposed as the basis of new electrooptic devices, but one of the problems is that the required molecu-lar alignment of amorphous polymers can decay over time. In order for a polymer to be useful in an electrooptic device, should its Tg be very high or very low? Explain.
6.22 The speed of sound varies considerably with depth in the earth’s crust. In the upper mantle, it is 8 km s–1, and it increases rapidly with depth to about 12 km s–1 in the lower mantle.
www.ebook3000.com

HeatCapacity,HeatContent,andEnergyStorage 163
a. How does the Debye characteristic temperature vary with depth?
b. What does this variation of the speed of sound indicate about the interactions within the crustal materials as a function of depth? Does this make sense?
c. Suggest an application of the variation of speed of sound with depth in the earth’s crust.
6.23 Fast-cooled slag from smelters is glassy and therefore less reac-tive with water from the environment than slow-cooled slag (which is more crystalline). Therefore, fast-cooled slag is pre-ferred because it leads to less runoff. Explain how DSC could be used for quality control of the slag-cooling process.
6.24 a. Sketch the DSC curve of a material that exhibits both a glass transition temperature at T = 40°C and then melting at T = 100°C.
b. If a given material shows both a glass transition and a melt-ing point in a DSC curve, what can we deduce about its crystallinity? Explain.
6.25 Sketch the DSC curve from 300 K to 400 K for an amorphous material with a glass transition temperature of 320 K; this mate-rial undergoes exothermic chemical decomposition starting at 395 K. Mark all features.
6.26 The Neumann–Kopp law is a generalized experimental finding that the heat capacity of a substance can be well approximated by the sum of the heat capacities of the constituent elements, weighted by their contribution to the total composition. For example, a generic salt represented by M2X5 would have a molar heat capacity close to 2CV, m(M) + 5CV, m(X), where M and X are both solids. Provide a reasonable theoretical explanation for the Neumann–Kopp law.
6.27 Plasticizers are added to many polymers to increase their flex-ibility. The most common plasticizers are phthalate derivatives. Plasticizers are absorbed into the polymer interstices, acting as a lubricant that enhances polymer chain mobility. The addition of a plasticizer to a polymer reduces the glass transition tem-perature. Sketch and label the DSC curves for the same amor-phous polymer with and without plasticizer, from below Tg to above Tg.
6.28 The molar heat capacity at constant volume, CV, m, for liquid water decreases as the temperature increases throughout the liquid range, whereas for most condensed materials (solids and liquids), CV, m increases as the temperature increases. Explain why water is anomalous, and what this indicates about the “structure” of water as a function of temperature.
6.29 A useful roof covering for some large buildings is a polymer composed of polyvinyl chloride, known by the trade name Sarnafil™. A study of Sarnafil roof coverings has shown their glass transition temperatures to be in the range –54°C to –11°C, with a trend to increased Tg as the roof material ages. Briefly discuss the implications of increased Tg of Sarnafil with age of

164 PhysicalPropertiesofMaterials
the material with respect to utility as a roof material in a wide range of climates.
6.30 Materials such as Ge2Sb2Te5 undergo thermally induced revers-ible changes between crystalline phases and amorphous phases. The two phases differ in physical properties such as electrical resistivity and reflectivity of light. The change in reflectivity on change of phase makes Ge2Sb2Te5 useful for optical data stor-age such as CDs and DVDs. The difference in electrical con-ductivity can be sufficient to represent two logic states, leading to phase-change random access memory (PRAM). Although PRAM technology can have significant advantages, such as fast read/write speeds and simple fabrication, there are some bar-riers that must be overcome for widespread use. Discuss your expectations of PRAM use with regard to power consumption and thermal interference (i.e., spread of heat from one bit to the next) and discuss ways to overcome these limitations.
Further Reading
General References
Many introductory physical chemistry and thermodynamics textbooks dis-cuss the concepts presented here (heat capacity, Maxwell Relations, phase transitions, etc.). In addition, the following address many of the general points raised in this chapter.
A. Barton, 1997. States of Matter: States of Mind. Institute of Physics Publishing, Bristol, UK.
P. W. R. Bessonette and M. A. White, 1999. Realistic thermodynamic curves describing a second-order phase transition. Journal of Chemical Education, 76, 220.
A. Bondi, 1968. Physical Properties of Molecular Crystal, Liquids and Glasses. John Wiley & Sons, Hoboken, NJ.
W. D. Callister Jr. and D. G. Rethwisch, 2010. Materials Science and Engineering: An Introduction, 8th ed. John Wiley & Sons, Hoboken, NJ.
R. DeHoff, 2006. Thermodynamics in Materials Science, 2nd ed. CRC Press, Boca Raton, FL.
M. de Podesta, 2002. Understanding the Properties of Matter, 2nd ed. Taylor & Francis, Washington.
D. R. Gaskell, 2008. Introduction to Thermodynamics of Materials, 5th ed. CRC Press, Boca Raton, FL.
A. Guinier and R. Jullien, 1989. The Solid State. Oxford University Press, New York.R. E. Hummel, 2004. Understanding Materials Science: History, Properties, Applications.
Springer, New York.T. Matsuo, A. Inaba, O. Yamamuro, M. Hashimoto, and N. Sotani, 2002. Rubber elas-
ticity in the introductory thermodynamics course. Journal of Thermal Analysis and Calorimetry, 69, 1015.
www.ebook3000.com

HeatCapacity,HeatContent,andEnergyStorage 165
J. B. Ott and J. Boerio-Goates, 2000. Chemical Thermodynamics. Vol. I: Principles and Applications; Vol. II: Advanced Applications. Academic Press, Oxford.
L. Qiu and M. A. White, 2001. A method to estimate heat capacities of complex inor-ganic solids. Journal of Chemical Education, 78, 1076.
H. M. Rosenberg, 1989. The Solid State. Oxford University Press, New York.M. Rouhi, 1999. A cool way to melt. Chemical and Engineering News, November 15,
1999, 8.R. L. Scott, 2006. The heat capacity of ideal gases. Journal of Chemical Education, 83,
1071.S. Stølen and T. Grande, 2004. Chemical Thermodynamics of Materials: Macroscopic and
Microscopic Aspects. John Wiley & Sons, Hoboken, NJ.A. J. Walton, 1983. Three Phases of Matter, 2nd ed. Oxford University Press, New York.M. A. White, 2001. Heat storage systems. 2002 McGraw-Hill Yearbook of Science and
Technology, p. 151, McGraw-Hill, New York.E. J. Windhab, 2006. What makes for smooth, creamy chocolate? Physics Today, June
2006, 82.
Glass and Amorphous Matter
K. Binder and W. Kob, 2005. Glassy Materials and Disordered Solids. World Scientific, Singapore.
R. H. Brill, 1963. Ancient glass. Scientific American, November 1963, 120.R. J. Charles, 1967. The nature of glasses. Scientific American, September 1967, 126.Y.-T. Cheng and W. L. Johnson, 1987. Disordered materials: A survey of amorphous
solids. Science 235, 977.E. Donth, 2001. The Glass Transition: Relaxation Dynamics in Liquids and Disordered
Materials. Springer-Verlag, New York.W. S. Ellis, 1998. Glass. Avon Books, New York.W. S. Ellis, 1993. Glass: Capturing the dance of light. National Geographic, 184, 37.C. H. Greene, 1961. Glass. Scientific American, January 1961, 92.S. J. Hawkes, 2000. Glass doesn’t flow and doesn’t crystallize and it isn’t a liquid.
Journal of Chemical Education, 77, 846.W. B. Jensen, 2006. The origin of Pyrex. Journal of Chemical Education, 83, 692.K. E. Kolb and D. K. Kolb, 2000. Glass – sand + imagination. Journal of Chemical
Education, 77, 812.R. C. Plumb, 1989. Antique windowpanes and the flow of supercooled liquids. Journal
of Chemical Education, 66, 994.K. E. Spear, T. M. Besmann, and E. C. Beahm, 1999. Thermochemical modeling of glass:
Application to high-level nuclear waste glass. MRS Bulletin, April 1999, 37.Y. M. Stokes, 1999. Flowing windowpanes: Fact or fiction? Proceedings of the Royal
Society of London A, 455, 2751.S. Szabó, K. Mazák, D. Knausz, and M. Rózsahegyi, 2001. Enchanted glass. Journal of
Chemical Education, 78, 329.E. D. Zanotto, 1998. Do cathedral glasses flow? American Journal of Physics, 66, 392.
Liquid Crystals
A. J. Leadbetter, 1990. Solid liquids and liquid crystals. Proceedings of the Royal Institute of Great Britain, 62, 61.
166 PhysicalPropertiesofMaterials
Thermal Analysis
R. Blaine, 1995. Determination of calcium sulfate hydrates in building materials using thermal analysis. American Laboratory, September 1995, 24.
M. A. White, 1996. Thermal analysis and calorimetry methods. Chapter 4 in Volume 8 of Comprehensive Supramolecular Chemistry. J.-M. Lehn, J. L. Atwood, D. D. MacNicol, J. E. D. Davies, and F. Vögtle, Eds. Pergamon Press, Oxford.
Thermodynamics of Water and Ice
S. W. Benson and E. D. Siebert, 1992. A simple two-structure model for liquid water. Journal of the American Chemical Society, 114, 4269.
E.-M. Choi, Y.-H. Yoon, S. Lee, and H. Kang, 2005. Freezing transition of interfacial water at room temperature under electric fields. Physical Review Letters, 95, 085701.
P. G. Debenedetti and H. E. Stanley, 2003. Supercooled and glassy water. Physics Today, June 2003, 40.
B. J. Murray and A. K. Bertram, 2006. Formation and stability of cubic ice in water droplets. Physical Chemical Chemical Physics, 8, 186.
V. Petrenko and R. W. Whitworth, 2002. Physics of Ice. Oxford University Press, Oxford.
R. Rosenberg, 2005. Why is ice slippery? Physics Today, December 2005, 50.H. E. Stanley, 1999. Unsolved mysteries of water in its liquid and glass states. MRS
Bulletin, May 1999, 22.
www.ebook3000.com

167
7ThermalExpansion
7.1 Introduction
Most materials expand when they are heated, regardless of the phase of mat-ter. This thermal expansion (quantified as the coefficient of thermal expansion, or CTE) can be related directly to the forces between the atoms. Different thermal expansions of materials used together in applications can lead to mechanical problems (loose fits or thermal stress). We begin here with con-sideration of the basis of thermal expansion in gases (ideal and nonideal) and then move on to the solid state.
7.2 Compressibility and Thermal Expansion of Gases
The defining equation (also called equation of state) for an ideal gas is PVm = RT, where Vm is the molar volume (=V/n). From the equation of state, it can be readily seen that as the temperature is increased at constant pressure for an ideal gas, the volume increases. In other words, gases expand on isobaric warming (i.e., they undergo thermal expansion).
For a nonideal gas, corrections must be introduced to the equation of state to account for the shortcomings of the ideal gas model. The compressibility factor, Z, is defined as
ZP VR T
= m (7.1)
and clearly, Z = 1 for an ideal gas and Z ≠ 1 for a nonideal gas. All gases approach ideality as P → 0, that is, Z → 1 in the limit P → 0.
For a nonideal gas in which Z < 1, at a given temperature and pressure, the molar volume is less than the ideal molar volume. This means that the gas is more compressed than if it had been ideal, which implies that the inter-molecular forces are dominantly attractive under these conditions (e.g., very low temperature).

168 PhysicalPropertiesofMaterials
The opposite would be true if Z > 1: at a given temperature and pressure, the molar volume would be greater than the ideal molar volume, reflecting the dominance of repulsive intermolecular interactions under these condi-tions (e.g., very high temperature).
For a real gas, Z varies both with temperature and with pressure, and with the type of gas. An example is shown in Figure 7.1 for N2.
It is worth considering how the value of Z might be qualitatively related to the Joule–Thompson coefficient, as both can be used to quantify nonideality in a gas. This is left as an exercise for the reader.
As it turns out, many gases can be placed together on a series of plots similar to that shown in Figure 7.1 by using appropriate scaling factors. The scaling factors are related to the exact conditions under which that particu-lar liquid is no longer distinguishable from its gas phase; this point is called the critical point (see Figure 7.2), and the temperature, pressure, and volume at this point are referred to as the critical temperature (Tc), critical pressure (Pc), and critical volume (Vc), respectively. Tc, Pc, and Vc depend on the gas, and some typical values are listed in Table 7.1.
Z =
PVm
/RT
150°C
50°C
–50°C
1
0.9
0 50 100P/atm
FIGURE 7.1Variation of compressibility factor, Z, for N2, with temperature and pressure.
Tc
PcLiquid
SolidVapor
P
T
FIGURE 7.2Stability of phases of matter for a typical pure material as functions of temperature and pres-sure, showing the critical pressure, Pc, and critical temperature, Tc, beyond which gas and liq-uid are no longer distinguishable.
www.ebook3000.com

ThermalExpansion 169
When the temperature is considered in units of Tc, this defines the reduced temperature, Tr = T/Tc; the reduced pressure is Pr = P/Pc, and reduced volume is Vr = V/Vc. A plot of compressibility, Z, as a function of Pr for various values of Tr (see Figure 7.3) is very nearly universal for all gases. This so-called Hougen–Watson plot is especially useful as it can be used to derive P, V, and T relationships for a gas in conditions in which the ideal equation of state does not hold.
TABLE 7.1
Critical Temperature, Pressures, and Volumes for Some Gases
Gas Boiling Point/K Tc /K Pc /atm Vc /cm3 mol–1
He 4.2 5.2 2.25 61.55Ne 27.3 44.75 26.86 44.30H2 20.7 33.2 12.8 69.69O2 90.2 154.28 49.713 74.42N2 77.4 125.97 33.49 90.03CO2 194.7 304.16 72.83 94.23H2O 373.2 647.3 218.5 55.44NH3 239.8 405.5 112.2 72.02CH4 109.2 190.25 45.6 98.77
Source: A. W. Adamson, 1973. A Textbook of Physical Chemistry. Academic Press, Oxford.
1.1
1.0
0.9
0.8
0.7
0.6
0.5
0.4
0.3
0.2
0.10 1 2 3 4 5 6 7
Pr
Tr = 2.0
Tr = 1.5
Tr = 1.3
Tr = 1.2
Tr = 1.1
Z =
PVm
/RT
Tr = 1.0
FIGURE 7.3Compressibility factor, Z, as a function of reduced pressure and reduced temperature, for a num-ber of gases. (Data from O.A. Hougen et al., 1959. Chemical Process Principles II Thermodynamics, 2nd ed. John Wiley & Sons, Hoboken, NJ.)

170 PhysicalPropertiesofMaterials
The near-universality of the Hougen–Watson plot suggests that there could be a relatively simple expression relating P, V, and T at high pressures where PVm ≠ RT. There are many high-pressure equations of state, and we now con-sider one: the van der Waals* equation of state. This equation of state accounts simply for the major shortcomings in the ideal gas model.
First, real molecules do take up space. The ideal gas model assumed this to be negligible, which is why it breaks down at higher pressures. Since the real volume is greater than the ideal volume, the van der Waals equation of state replaces Vm
ideal with ( ) ( )V b V bmreal
m=− − , where b is the effective volume occupied by the molecules in 1 mol of gas; it follows that b depends on the type of gas.
Secondly, the molecules in real gases experience intermolecular forces, whereas the ideal gas model assumed there were no intermolecular forces. At long range, the forces are dominantly attractive, so the observed pressure is less than the ideal pressure. On the basis of experiments, van der Waals’ proposed Pideal could be replaced with P a V+ / m
2 , where P is the observed pressure and a depends on the gas.
With these two substitutions, the ideal gas equation of state can be modi-fied to produce the van der Waals equation of state:
PaV
V b R Tm+ − =m2 ( ) . (7.2)
Values of the van der Waals constants (a and b) for some gases are given in Table 7.2.
The van der Waals equation of state is still too inaccurate to describe every gas in every circumstance. Other more advanced equations of state (includ-ing those taking anisotropy of molecular shape into account) are also avail-able, and the interested reader is referred to the “Further Reading” section at the end of this chapter for references to other equations of state. However, it is worth mentioning here that Kamerlingh Onnes† suggested in 1901 that the
* Johannes Diderik van der Waals (1837–1923) was a Dutch physicist. Although his career got off to a slow start (his PhD thesis [the subject was the equation of state that now carries his name] was not published until he was 35 years old), van der Waals’ accomplishments con-cerning equations of state for real gases were widely acclaimed. He was awarded the 1910 Nobel Prize in Chemistry for his work on states of matter.
† Heike Kamerlingh Onnes (1853–1926) was a Dutch physicist. In his inaugural lecture as professor of experimental physics at Leiden University, Kamerlingh Onnes stated, “In my opinion it is necessary that in the experimental study of physics the striving for quantitative research, which means for the tracing of measure relations in the phenomena, must be in the foreground. I should like to write ‘Door meten tot weten’ [‘Through measuring to knowing’] as a motto above each physics laboratory.” This outlook led him to build a laboratory for the first low-temperature research, including the first liquefaction of H2 (20.4 K) in 1906 and He (4.2 K) in 1908. Kamerlingh Onnes was awarded the 1913 Nobel Prize in Physics for low-temperature research.
www.ebook3000.com

ThermalExpansion 171
equation of state for a gas could be expressed as a power series (also called virial equation) such as
ZPVRT
B TV
C TV
D TV
m
m m m
= = + + + +1 2 3
( ) ( ) ( ). . . (7.3)
where the coefficients B(T), C(T), and D(T) are called the second, third, and fourth virial coefficients, respectively. Virial coefficients can be directly related to intermolecular forces.
In these considerations of nonideality, it may be interesting to note that, although gases deviate from nonideality at pressures as low as a few atmo-spheres, the gas in the sun (at pressures of billions of atmospheres and extremely high temperatures) can be expressed well by the ideal gas law,* presumably due to accidental cancellation of attractive and repulsive forces at these extreme conditions.
The thermal expansion, α, of a gas can be calculated for any equation of state, ideal or nonideal. When it is not possible to manipulate the equation of state to derive thermal expansion analytically, α can be evaluated numeri-cally by calculation of the volume at two close temperatures and use of the definition of α from Chapter 6, Equation 6.71; see Problem 7.2 at the end of this chapter.
* D. B. Clark, 1989. Journal of Chemical Education, 65, 826.
TABLE 7.2
van der Waals Constants for Selected Gases
Gas a/L2 atm mol–2 b/L mol–1
He 0.03412 0.02370Ne 0.2107 0.01709H2 0.2444 0.02661O2 1.360 0.03183N2 1.390 0.03913CO2 3.592 0.04267H2O 5.464 0.03049NH3 4.170 0.03707CH4 2.253 0.04278
Source: A. W. Adamson, 1973. A Textbook of Physical Chemistry. Academic Press.

172 PhysicalPropertiesofMaterials
7.3 Thermal Expansion of Solids
To a first approximation, a solid can be described as atoms (or molecules) interacting with their neighbors as if they are connected with springs. For two atoms separated by a distance x away from the equilibrium distance, the restoring force between them, F, can be expressed, to a first (harmonic) approximation, by Hooke’s* law†:
F = –k′x (7.4)
where kʹ is the Hooke’s law force constant.The potential energy, V(x), can be derived from the force, F(x), by the
g eneral relation
F xdV xdx
( )( )
= − (7.5)
that is,
V x F x dx( ) = ∫− ( ) (7.6)
where Equation 7.5 is a form of Equation 5.2 in Chapter 5. For a force given by Equation 7.4, the potential energy is
V xkx c x( ) = =
222 (7.7)
where V = 0 at x = 0. Since the potential function is parabolic in shape (see Figure 7.4 for a one-dimensional representation), the average separation of the atoms will be independent of temperature in the harmonic approximation. Although the energy of the atoms will be nearer the bottom of the well at low temperatures and higher up the well at higher temperatures, the average value of x, represented by the symbol <x> (where < > denotes the average over statis-tical fluctuations), would be independent of temperature due to the symmetric shape of the parabola. Of course, we know that most solids do expand as the temperature increases, and we must look further to see how this comes about.
* Robert Hooke (1635–1703) was an English scientist and inventor. Although during his lifetime his scientific reputation suffered due to conflicts with his contemporaries over scientific pri-ority, Hooke is now considered second only to Newton as the 17th century’s most brilliant English scientist. Hooke’s law was published in 1676 as Ut tensio sic vis, Latin for “as the tension, so the force.”
† The most important equations in this chapter are designated with ∎ to the left of the equation.
www.ebook3000.com
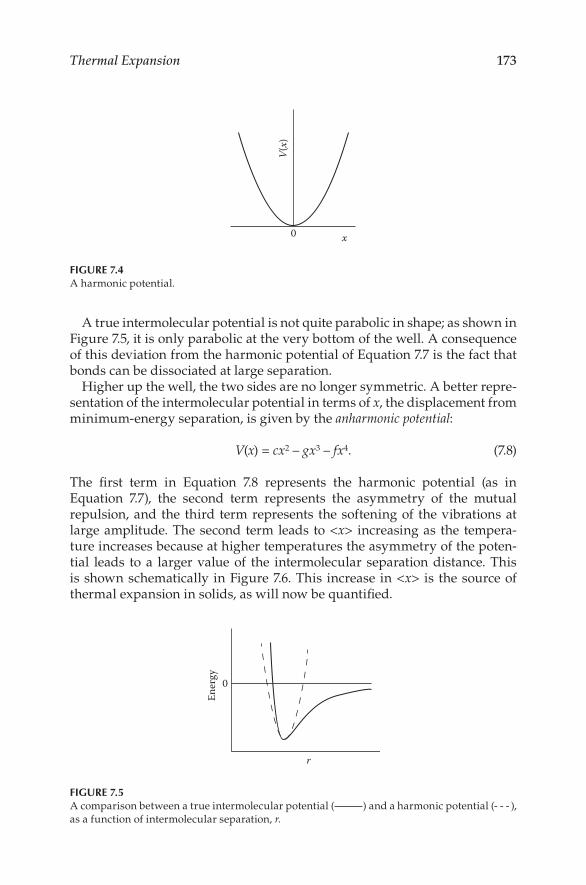
ThermalExpansion 173
A true intermolecular potential is not quite parabolic in shape; as shown in Figure 7.5, it is only parabolic at the very bottom of the well. A consequence of this deviation from the harmonic potential of Equation 7.7 is the fact that bonds can be dissociated at large separation.
Higher up the well, the two sides are no longer symmetric. A better repre-sentation of the intermolecular potential in terms of x, the displacement from minimum-energy separation, is given by the anharmonic potential:
V(x) = cx2 – gx3 – fx4. (7.8)
The first term in Equation 7.8 represents the harmonic potential (as in Equation 7.7), the second term represents the asymmetry of the mutual repulsion, and the third term represents the softening of the vibrations at large amplitude. The second term leads to <x> increasing as the tempera-ture increases because at higher temperatures the asymmetry of the poten-tial leads to a larger value of the intermolecular separation distance. This is shown schematically in Figure 7.6. This increase in <x> is the source of thermal expansion in solids, as will now be quantified.
0
V(x)
x
FIGURE 7.4A harmonic potential.
0
Ener
gy
r
FIGURE 7.5A comparison between a true intermolecular potential ( ) and a harmonic potential (- - - ), as a function of intermolecular separation, r.

174 PhysicalPropertiesofMaterials
For any property generalized as L, where the displacement of the atoms from their equilibrium position is one example of L, the value of L averaged over statistical fluctuations, represented by <L>, will be given by
< >L
L n
ni
i i
ii
=∑
∑
(7.9)
where Li is the value of L for state i, and ni is the population of state i, and the sum is over all states.* Since the number of possible states for the posi-tion of an atom in a solid is extremely large, the sum can be replaced with an integral. Furthermore, ni can be replaced with a Boltzmann factor to weight each state
n n eiV kTi= − / (7.10)
where Vi is the energy of state i, and n is a normalization factor. Therefore, Equation 7.9 can be replaced with
* It may help to consider an example: Consider <L> to be the average mark on a test where ni is the number of students with mark Li, and the sum is over all possible marks.
0
Ener
gy
r
FIGURE 7.6Thermal expansion for a harmonic (- - - ) and an anharmonic ( ) potential. The asymmetry in the anharmonic intermolecular potential leads to an increase in <x> (displacement from the minimum-energy separation) as the temperature is increased; ⚬, with a harmonic (para-bolic) intermolecular potential, <x> is independent of the energy level occupied; • , with a true (anharmonic) intermolecular potential, <x> depends on the energy of the system, and at higher energies (i.e., higher temperatures), <x> is increased.
www.ebook3000.com

ThermalExpansion 175
< >
/
/
L
L e dL
e dL
V L kT
V L kT
=
−
−∞
∞
−
−∞
∞
∫
∫
( )
( )
. (7.11)
For the average value of the displacement from minimum-energy separation, <x>, becomes
< >
/
/
x
x e dx
e dx
V x kT
V x kT
=
−
−∞
∞
−
−∞
∞
∫
∫
( )
( )
. (7.12)
From the potential energy (Equation 7.8), the exponentials in Equation 7.12 can be written as
e e e eV x kT x x fx kT cx kT gx fx− − − − − += =( )/ c g 3 4( )/ / ( )2 2 3 4 //kT (7.13)
and since, for small values of x,
egxkT
fxkT
gx fx kT( )/ . . . .3 4
13 4
+ = + + + (7.14)
where the higher-order terms can be neglected, Equation 7.12 can be written as
< >x
e xgxkT
fxkT
dx
e
cx kT
cx kT
=
+ +−
−∞
∞
−
−
∫2
2
4 5/
/
∞∞
∞
∫ + +13 4gx
kTfxkT
dx
. (7.15)
Since the second and third terms in the denominator are ≪1, Equation 7.15 can be approximated as
< >x
e xgxkT
fxkT
dx
e
cx kT
cx kT
=
+ +−
−∞
∞
−
−
∫2
2
4 5/
/
∞∞
∞
∫ dx
. (7.16)

176 PhysicalPropertiesofMaterials
Both the numerator and the denominator are standard integrals, and they can be solved analytically to give
< >x
gc
kT
kTc
=
34 5 2
3 2
1 2
π
π
//
/
( ), (7.17)
which simplifies to
< >xgkTc
=34 2
. (7.18)
Equation 7.18 predicts that the dimensions of a material (represented by the T = 0 K dimension plus <x> multiplied by a factor to account for the total number of atoms in the system) will increase by a factor that is linear in tem-perature. Experimental results show that the dimensions of a material nearly increase linearly in temperature above a certain temperature. An example is shown in Figure 7.7 for the lattice constant of solid Ar. Note the near-linear behavior at high temperatures in keeping with Equation 7.18, and the nearly constant lattice parameter at very low temperatures, as the Ar interactions become more harmonic.
Thermal expansion, α, was defined previously (Chapter 6, Equation 6.71) in terms of volume as
0.545
0.540
0.535
0.5300 20 40 60 80
T/K
a/nm
FIGURE 7.7The lattice constant, a, as a function of temperature for solid argon. (Data from O. G. Peterson et al., 1966. Physical Review, 150, 703. With permission.)
www.ebook3000.com

ThermalExpansion 177
α α= =V VdVdT
1, (7.19)
but α also can be defined in a particular direction in a solid. For a noncubic solid, the thermal expansion will usually be different in the different direc-tions, and it will be important to take account of this in considering the over-all thermal expansion. If the unit cell of a solid has one side of dimension a, the thermal expansion in this direction, αa, is defined as
αa1
=adadT
(7.20)
and in the case of Ar, αa at any temperature would correspond to the 1/a times the slope of the curve shown in Figure 7.7. For all materials, the dimensions approach a constant value as the temperature approaches absolute zero, so α → 0 as T → 0. This is a consequence of the Maxwell relation (Chapter 6, Equation 6.56) and the fact that S → 0 as T → 0.
Typical values of coefficients of thermal expansion for a variety of materi-als at different temperatures are given in Table 7.3.
TABLE 7.3
Values of Coefficients of Thermal Expansion of Selected Materials at Various Temperatures
Material T/K αa/K–1
Al 50 3.8 × l0–6
Al 300 2.32 × 10⁻⁵
Diamond 50 4 × 10⁻⁹
Diamond 300 1.0 × 10⁻⁶
Graphite (c-axis) 300 29 × 10–6
Graphite (a-axis) 300 –1 × 10⁻⁶
Cu 50 3.8 × l0–6
Cu 300 1.68 × 10⁻⁵
Ag 50 8 × 10⁻⁶
Ag 300 1.93 × 10⁻⁵
Quartz(cr) 50 –3.3 × 10⁻⁷
Quartz(cr) 300 7.6 × 10⁻⁶
Ice 100 1.27 × 10⁻⁵
Ice 200 3.76 × l0–5
Pyrex 50 5.62 × 10⁻⁵
Pyrex 300 –2.3 × 10⁻⁶
ZrW2O8 0.3 to 693 –8.7 × 10⁻⁶

178 PhysicalPropertiesofMaterials
Thermal expansion of a crystalline solid can be measured by scattering x-rays from a material and determining the lattice spacing as a function of temperature with Braggs’ law*:
n λ = 2 d sinθ (7.21)
which is the condition for constructive interference of the x-ray beam from successive layers of the solid; n is an integer; λ is the wavelength of the x-ray beam (of the order of the lattice spacing); d is the lattice spacing; and θ is the angle of incidence, as defined in Figure 7.8. In some instances, it is prefer-able to scatter neutrons rather than x-rays; the principles are much the same although x-rays are more readily available at laboratory sources, while neu-trons require a specialized source. However, since x-rays scatter from the electrons of the atoms involved, and neutrons scatter from the nuclei (and also interact magnetically, especially with unpaired electrons), the two tech-niques can be quite complementary.
Another way to determine thermal expansion is to use the sample to prop apart the plates of a capacitor and measure the capacitance as a function of tem-perature. The capacitance depends directly on the distance between the plates, so this can lead to a very accurate assessment of the dimensions of the sample as a function of temperature and, hence, the thermal expansion in the capaci-tance dilatometer.
As can be seen from Equation 7.18, thermal expansion reflects both the parameter c (which characterizes the strength of the interaction potential) and g (which represents the asymmetry of the intermolecular potential). More asymmetric potentials (larger g values) lead to larger thermal expansion,
* Sir William Henry Bragg (1862–1942), English scientist, was the founder of the science of crystal structure determination by x-ray diffraction. With his son (William Lawrence Bragg, 1890–1971) he was awarded the Nobel Prize in Physics in 1915 for seminal work showing the positions of atoms in simple materials such as diamond, copper, and potassium chloride.
d
θ
FIGURE 7.8The Bragg diffraction condition for x-rays or neutrons scattered from successive layers of a solid. Only some angles and wavelengths allow the scattered beam to be enhanced by con-structive interference; if the scattered beams are not completely in phase, then less intense scattering is observed. This diagram shows the diffracted waves from successive layers to be in phase, resulting in constructive interference.
www.ebook3000.com

ThermalExpansion 179
which makes sense considering that a harmonic potential, which is perfectly symmetric, has no thermal expansion, that is, αharmonic = 0. Larger values of c, which imply stiffer interactions and steeper walls to the potential, lead to lower coefficients of thermal expansion. Therefore, measurement of thermal expansion of a solid can directly provide information concerning the inter-molecular potential.
Thermal expansion can be an important property of a material as it can have some influence over other properties such as mechanics of fitting.* Thermal expansion can influence the color of a liquid crystal as in a mood ring (a piece of costume jewelry that changes color with temperature and could be used to indicate mood). Thermal expansion also can lead to stress
* Woodwind musical instruments only have the correct pitch when they are at the correct temperature; if they are cold, they sound flat. This is not due to contraction of the cold instru-ment, as the shorter cold instrument would sound sharp. The important factor here is the contraction of the cold gas. The velocity of sound in the gas decreases as the gas density increases (i.e., as the temperature decreases), and this decreases the frequency of the sound as temperature decreases, making a cold woodwind instrument sound flat. Although thermal expansion of the instrument also occurs as it warms up, this is a minor factor relative to the thermal expansion of the air.
COMMENT: X-RAY VERSUS NEUTRON SCATTERING
Neutrons have several advantages over x-rays for the study of the structure of matter. For example, neutrons of wavelength 1 nm have an energy of 78 J mol–1, whereas 1-nm x-rays have an energy of 1.2 × 10⁶ J mol–1, which exceeds that of a typical chemical bond, ≈2 × l05 J mol–1 Furthermore, typical x-ray wavelengths for x-ray diffraction are even shorter than 1 nm, so they are more energetic still, and therefore x-rays can cause more damage to samples than neutrons. Another fac-tor is penetration in the sample: 1 nm x-rays penetrate less than 1 mm into the sample, whereas 1 nm neutrons can penetrate 100 cm, probing the bulk properties of matter. Furthermore, since x-rays scatter from electrons and neutrons scatter from nuclei, neutrons can be used to “see” light atoms such as hydrogen much more accurately than x-rays can. Neutrons have an additional advantage because their intrinsic spin allows interaction with magnetic centers in the structure, help-ing delineate magnetic structures (ferromagnetic, antiferromagnetic, etc.; see Chapter 13). However, x-rays can use laboratory-based sources, whereas neutron sources for scattering investigations require a nuclear reactor or an accelerator.

180 PhysicalPropertiesofMaterials
in a material, and this can greatly influence mechanical stability. The thermal shock fracture resistance, RS, is given by
R
ES =κσα
, (7.22)
where κ is the thermal conductivity (see Chapter 8), σ is the strength of the material (see Chapter 14), α is the thermal expansion coefficient, and E is the elastic (or Young’s) modulus (see Chapter 14). It is apparent from Equation 7.22 that materials with high thermal expansion coefficients can have low thermal fracture resistance because large temperature gradients lead to higher thermal expansion in some spots than in others, leading to stress that can exceed the strength of the material.
Examples of Thermal Expansion: A Tutorial
Typical thermal expansion of a solid at room temperature is of the order 10–5 K–1.a. How much does the length of a 1-m-long rod change for 3 K
increase in temperature?b. In some applications, it is important not to have changes in
length as the temperature changes. One such example is the
COMMENT: A MATERIAL WITH NO THERMAL EXPANSION: INVAR
Although most materials increase in dimension as the temperature is increased, one rather curious material, an alloy of 35 atomic% nickel and 65 atomic% iron, has virtually zero thermal expansion through-out the temperature range from –50°C to 150°C. The discovery of this material was the subject of the 1920 Nobel Prize in Physics to Charles E. Guillaume of France. This material, commonly called Invar (to rep-resent its invariant thermal expansion) has many practical uses: it is used in laser optics labs where dimensional stabilities the order of the wavelength of light are required; it was used to determine the diurnal (day–night) height variations of the Eiffel Tower, and hulls of super-tankers can be made of Invar in order to avoid strains due to thermal expansion associated with welding processes. The unusual absence of thermal expansion in Invar is related to its magnetic properties, but it is not yet fully understood. Another low thermal expansion material is Zerodur (Schott Glass Technologies, α = 0 ± 0.10 × 10⁻⁶ K–1, 273 K < T < 323 K).
www.ebook3000.com

ThermalExpansion 181
pendulum of a clock where the time accuracy depends on the stability of the length of the pendulum. Many of the dec-orative metals have large values of thermal expansion near room temperature. Given that there will be variations in the temperature from time to time in the vicinity of the clock, it has been suggested that a bimetallic arrangement could be used for the pendulum, with a decorative metal (large ther-mal expansion) on the outside face, securely attached to a less attractive metal (smaller thermal expansion) on the inside face. In the case of extreme temperature fluctuations, will the pendulum remain straight?
c. Can the stress induced by differential thermal expansion in a bimetallic strip be used to amplify thermal expansion effects? Consider the change in the pointer position in the thermo-stat shown in Figure 7.9, in comparison with the change in dimension found in (a).
d. Suggest an application taking advantage of the thermal expansion of a material.
e. Explain why, in certain circumstances, thermal expansion can lead to thermal stress fracture of a material. (An example could be crazing of pottery for which the glaze and green body have mismatched thermal expansion coefficients, exac-erbated by the high temperature of the firing furnace.)
COMMENT: SOME MATERIALS CONTRACT WHEN HEATED
Most materials expand when heated (see Table 7.3), that is, α > 0 for most materials at most temperatures in accord with Equation 7.18, but, in some instances, α < 0. A few materials have α < 0 in one dimension as they are heated, but generally they expand in another dimension such that the overall thermal expansion is positive. Graphite at T = 300 K is one such example. However, when α < 0 in all directions, these materi-als are said to exhibit negative thermal expansion (NTE) over the tempera-ture range for which α < 0. Examples of materials that contract when heated include quartz at very low temperature and Pyrex® at room temperature. Zirconium tungstate, ZrW2O8, has the unusual property of shrinking uniformly in all three dimensions as the temperature is increased from 0.3 to 1050 K! When the linked polyhedral units within this material are heated, their thermal agitation leads to a more closely packed structure, and negative thermal expansion results. A familiar material with anomalous thermal expansion is H2O: when liquid water is heated from 0°C to 4°C, it contracts. Ice also shows negative thermal expansion at very low temperatures.

182 PhysicalPropertiesofMaterials
7.4 Problems
7.1 44.0 g of CO2 are contained in a 1.00 L vessel at 31°C. a. What is the pressure of the gas (in atm) if it behaves
ideally? b. What is the pressure of the gas if it obeys the van der Waals
equation of state? See Table 7.2 for data. Give your answer in atm.
c. Estimate the pressure of the gas (in atm) based on the Hougen–Watson plot (Figure 7.3), and the values of the criti-cal constants for CO2 given in Table 7.1.
7.2 Based on the data given in Problem 7.1, calculate the volume coefficient of thermal expansion, α, for CO2 at 31°C and P = 1.00 atm, for the following cases:
a. the gas is ideal; b. the gas obeys the van der Waals equation of state.
7.3 An apparatus consisting of a rod made of material A, placed inside a tube made of material B as shown in Figure 7.10, is being constructed. The aim is to have the rod fit tightly in the tube at room temperature. One way to achieve this is to cool both the rod and the tube (e.g., in liquid nitrogen), and put them together when they are cold and the fit is loose. As they warm to room temperature, the fit will be tight. This procedure is called cold welding. It relies on different thermal expansions of the two materials in order for the fit to be tight at room tem-perature and loose when much colder. Which material needs
Cooled
15 20 15 20
FIGURE 7.9The bimetallic strip inside a thermostat. As the temperature is reduced to 15°C, the coil tight-ens because the thermal expansion coefficient of the outer material (solid line) is less than that of the inner material (dashed line).
A B
FIGURE 7.10Rod A is placed inside tube B.
www.ebook3000.com

ThermalExpansion 183
to have greater thermal expansion for this to work: A (rod) or B (tube)? Explain.
7.4 Boiling water is poured into two glasses; the only difference between the glasses is that one is made of thick glass and the other is made of thin glass. Which glass is more likely to break? Why?
7.5 Consider the curves for intermolecular potential as a function of molecular separation, r, shown in Figure 7.11.
a. Which case, [1] or [2], has the stronger intermolecular poten-tial? Explain briefly.
b. Which case, [1] or [2], is more anharmonic? Explain briefly. c. Which case, [1] or [2], has greater thermal expansion?
Explain briefly. 7.6 Owens–Corning Fiberglas Corp. has introduced a form of
glass fiber for insulation. The fiber is composed of two types of glass fused together. At the cooling stage in the production, the components separate so that one side of the fiber is made of one component, and the other side has the other composition. When looked at in cross section under a microscope, one side of the fiber has one composition, and the other side has the other composition. The key to the applications of this material is that the fibers are coiled, not straight as for regular glass fibers: the coils in the new fibers allow them to spring into place, giving them excellent insulating properties. What causes the fiber to be coiled?
7.7 When a polymer is cooled below its glass transition temper-ature, Tg, there is an abrupt drop in its coefficient of thermal expansion. Given that the configurational degrees of freedom are frozen below Tg and become active above Tg, what does this imply about the harmonicity of the dominant intermolecular interactions in the rigid glass compared with the more flexible state? Explain.
7.8 The linear thermal expansion coefficient for a borosilicate crown glass is zero at T = 0 K, gradually rises to 80 × 10–5 K–1 at T = 600 K, and then rapidly rises to 500 × 10–5 K–1 at T = 800 K.
Ener
gy
r
[1]
[2]
FIGURE 7.11Two intermolecular potentials.
184 PhysicalPropertiesofMaterials
How will this increase in thermal expansion coefficient affect the high-temperature applications of this material?
7.9 On the basis of a tree’s structure, would you expect thermal expansion of wood to be isotropic or anisotropic? Explain how this could affect the design of a wooden musical instrument.
7.10 A gas-filled piston is central to the operation of a pneumatic window opener that opens and closes according to the temper-ature. The piston is attached to the window frame such that its extension determines the opening of the window.
a. Explain the principle on which this works. b. If the gas were ideal, would it be better (all other factors
being equal) to have it operate at low pressure or high pres-sure? Explain.
c. If the gas were not ideal, would it be preferable to have Z > 1 or Z < 1? Explain.
7.11 Invar was used on a space flight to determine the outside tem-perature of a space capsule during its voyage. Given that Invar does not change dimensions in the expected temperature range (–50°C to 150°C), why was it chosen?
7.12 For a particular application it is necessary to introduce a piece of wire into a glass tube. This will be done by heating the glass and inserting the wire. If you have a choice of platinum (linear expan-sion 8.6 × 10⁻⁶ K–1) or copper (linear expansion coefficient 1.7 × 10⁻⁵ K–1) to insert in glass with a linear thermal expansion coef-ficient of 8.6 × 10⁻⁶ K–1, which metal should you choose? Explain.
7.13 At some sinks, when the hot water tap is opened only slightly, the water first flows, and then slows until only a trickle, finally shutting off completely. A second opening of the hot water tap does not usually lead to a repeat of this behavior, and the cold water tap does not behave this way. Give an explanation for this phenomenon.
7.14 The coefficient of thermal expansion, α, of a sample could be measured by placing the sample between parallel circular cop-per plates to form a capacitor. Since the capacitance of the capaci-tor is directly proportional to the area of one of the plates and inversely proportional to the distance between the plates, α can be determined by monitoring the capacitance as a function of temperature. However, the sample is usually placed outside the capacitor plates (which are in vacuum) in such a way that it moves one of the capacitor plates when the temperature is changed. Why would it be better to determine the capacitance of the cell in this geometry than with the sample between the plates?
7.15 The speed of sound in the ocean varies with the depth, depend-ing mostly on the temperature of the water (i.e., salinity is of sec-ondary importance). The speed is highest in warmer water and can vary by a few percent from its average value of 1500 m s–1, depending on the depth.
a. Explain why the speed of sound varies as it does with temperature.
www.ebook3000.com

ThermalExpansion 185
b. Under certain conditions, such as shallow ocean water in the summer, the water temperature first decreases with increasing depth, reaches a minimum at a certain depth (approximately 50 m), and then increases again to a nearly constant value at depths greater than 150 m.
i. Sketch the sound speed (x-axis) as it changes with depth (y-axis) under these conditions.
ii. Like light, sound waves bend (refract) toward the lower velocity. Use this information to show how a sound wave can be guided by the ocean to travel great dis-tances without loss (similar to fiber optics acting as a wave guide; see Chapter 4).
7.16 a. Graphite is an anisotropic material due to its layered struc-ture. Explain why the coefficient of thermal expansion is lower along the layer directions (a-axis) than perpendicular to the layers (c-axis). See Table 7.3 for the data.
b. From the data in Table 7.3, explain the relative thermal expansion coefficients for diamond and graphite, and why they are not the same given that both are forms of carbon.
7.17 Near room temperature, polymers have higher thermal expan-sion coefficients than metals, which have higher thermal expan-sion coefficients than ceramics. Explain this order. Consider intermolecular forces.
7.18 Rubies can exhibit thermochromism. If a ruby of composi-tion 10% Cr2O3, 90% Al2O3 is heated from room temperature to 500°C, it will turn from red to green. The color is due to absorp-tion in both cases. Suggest a reason for the change in color.
7.19 Consider the bimetallic strip in Figure 7.9, and devise a ther-mometer that can indicate the minimum and maximum tem-perature reached during a given time period.
7.20 Is the thermal stress associated with heating a material higher or lower if the material is a poor conductor of heat? Explain.
7.21 Glass ceramics can have coefficients of thermal expansion less then 3 × 10⁻⁷ K–1, making them useful for cooktop panels and precision optical applications. Glass ceramics, for example with composition Li2O·Al2O3·nSiO2, are produced under carefully controlled crystallization conditions, leading to 30% to 60% crystalline content in a glass matrix. The crystallites are very small, on the order of microns (10–6 m), and they exhibit nega-tive thermal expansion, while the glass matrix exhibits normal positive thermal expansion, yielding an overall near-zero ther-mal expansion coefficient.
a. Why is low magnitude of thermal expansion coefficient required for precision optical applications? Give an example.
b. In cooktop use, the glass ceramic surface is above a series of electrical elements that provide the heat. Why is the low thermal expansion coefficient of the glass ceramic impor-tant? What other properties of the glass ceramic would be important for this application?

186 PhysicalPropertiesofMaterials
Further Reading
General References
New frontiers in the application of neutron scattering to materials science. Special issue. D. Richter and J. M. Rowe, Eds. MRS Bulletin, December 2003, 903–928.
A. W. Adamson, 1973. A Textbook of Physical Chemistry. Academic Press, Oxford.J. A. Barker and D. Henderson, 1981. The fluid phases of matter. Scientific American,
November 1981, 130.T. H. K. Barron and G. K. White, 1999. Heat Capacity and Thermal Expansion at Low
Temperatures. Springer, New York.R. S. Berry, S. A. Rice, and J. Ross, 2000. Physical Chemistry, 2nd ed. Oxford University
Press, New York.A. Bondi, 1968. Physical Properties of Molecular Crystal, Liquids and Glasses. John Wiley &
Sons, Hoboken, NJ.W. D. Callister Jr. and D. G. Rethwisch, 2010. Fundamentals of Materials Science and
Engineering: An Introduction, 8th ed. John Wiley & Sons, Hoboken, NJ.M. de Podesta, 2002. Understanding the Properties of Matter, 2nd ed. CRC Press, Boca
Raton, FL.A. Guinier, R. Jullien, and W. J. Duffin, 1990. The Solid State. Oxford University Press,
New York.R. E. Hummel, 2004. Understanding Materials Science, 2nd ed. Springer, New York.C. Kittel, 2005. Introduction to Solid State Physics, 8th ed. John Wiley & Sons, Hoboken, NJ.H. McGee, J. McInerney, and A. Harms, 1999. The virtual cook: Modeling heat trans-
fer in the kitchen. Physics Today, November 1999, 30.
Experimental Methods
G. K. White and P. J. Meeson, 2002. Experimental Techniques in Low-Temperature Physics, 4th ed. Oxford University Press, New York.
Materials with Unusual Thermal Expansion
A. N. Aleksandrovskii, V. B. Esel’son, V. G. Manzhelii, G. B. Udovidchenko, A. V. Soldatov, and B. Sundqvist, 1997. Low Temperature Physics, 23, 943.
S. W. Benson and E. D. Siebert, 1992. A simple two-structure model for liquid water. Journal of the American Chemical Society, 114, 4269.
M. Freemantle, 2003. Zero-expansion conductor. Chemical and Engineering News, October 20, 2003, 6.
M. B. Jakubinek, C. A. Whitman, and M. A. White, 2010. Negative thermal expansion materials: Thermal properties and implications for composite materials. Journal of Thermal Analysis and Calorimetry, 99, 165.
D. Lindley, 2004. Bake, shake and shrink. Physical Review Focus, 14, November 2004, story 21.
T. A. Mary, J. S. O. Evans, T. Vogt, and A. W. Sleight, 1996. Negative thermal expansion from 0.3 to 1050 Kelvin in ZrW2O8. Science, 272, 90.
J. Pellicer, J. A. Manzanares, J. Zúñiga, P. Utrillas, and J. Fernández, 2001. Thermo-dynamics of rubber elasticity. Journal of Chemical Education, 78, 263.
D. G. Rancourt, 1989. The Invar problem. Physics in Canada, 45, 3.
www.ebook3000.com

187
8ThermalConductivity
8.1 Introduction
Thermal conductivity determines whether a material feels hot or cold to the touch, and why some materials are good thermal insulators while others efficiently conduct heat. In this chapter, we consider thermal conductivities of gases and then of solids.
The symbol used to represent thermal conductivity is κ. (Some sources use λ, but we prefer to reserve λ for wavelength [already introduced] and mean free path [introduced later in this chapter].) The higher the value of κ, the better a material conducts heat. As for electrical conductivity, the values of thermal conductivity can vary by orders of magnitude from one mate-rial to another and even within a given material when the temperature is changed.
8.2 Thermal Conductivity of Gases
The theoretical thermal conductivity of gases, as derived by Peter Debye, is based on the kinetic theory of gases.
The model of a gas for kinetic theory is a swarm of molecules, each of mass m, all in continual random motion. The molecules are considered to have negligible size with respect to the average distance they travel between colli-sions. The average distance traveled by a gas molecule between collisions is called the mean free path and is denoted λ. In this model, the molecules within the gas do not interact except when they collide; in other words, long-range attractive forces are neglected.
The kinetic theory of gases has many important successes. For example, it leads to the equation of state for an ideal gas, PVm = RT. The kinetic theory of gases also leads to the distribution of molecular speeds within a gas, as shown in Figure 8.1. This figure shows that the distribution shifts to higher

188 PhysicalPropertiesofMaterials
speeds as the temperature is increased. In fact, it leads to a relationship between the weighted average speed, v, and the temperature of the gas:
v T2 = ×const (8.1)
which follows from consideration of the translational kinetic energy, KE:
KE m v kT= = ×12
const2 (8.2)
where the latter proportionality comes from the equipartition theory (Chapter 6).
Thermal conductivity is a transport property, involving the motion of heat (energy) from hot to cold. Other transport properties are effusion (mass transported out of a small orifice), diffusion (general mass transport), viscos-ity (momentum transfer), and electrical conductivity (charge transport). Much of the formalism of the derivation of various transport properties follows similar lines, so the derivation of the relationship between thermal conduc-tivity of a gas and other physical parameters will be presented here in some detail.
The flux, J(i), of some physical property, i, can be defined as the amount of i flowing per unit time per unit area. For example, in a box with a tempera-ture gradient (one end hot, one end cold, as shown in Figure 8.2), J(energy) is the energy flux or the amount of energy flowing per unit area per unit time. SI units of J(energy) are J m–2 s–1 = W m–2. The way the box of Figure 8.2 has been drawn, the temperature gradient is parallel to the z-axis, and this can be considered to be a one-dimensional problem in which the fluxes can be represented by the flux in the z-direction, Jz.
The energy flux along the z-direction can be written as
J energydTdzz ( ) = −κ (8.3)
SpeedPr
obab
ility
00
T1 T1 < T2
T2
FIGURE 8.1Distributions of molecular speeds in a gas at two different temperatures.
www.ebook3000.com

ThermalConductivity 189
where κ is the coefficient of thermal conductivity or, often, simply thermal con-ductivity; SI units of κ are W m–1 K–1. Since (dT/dz) < 0 here, Jz(energy) > 0, and energy flows from low to high z value (Figure 8.2), that is, from hot to cold. Equation 8.3 is Fourier’s first law of heat flux.*
The purpose now is to express κ in terms of physically meaningful param-eters. In order to do so, it is useful to start by expressing the energy flux in terms of the matter flux in the gas. If each molecule moving under the temperature gradient carries energy ε(z), where z is its position, we can cal-culate the net flux of molecules per unit area per unit time. In the box in Figure 8.2, consider the area A to be defined as exactly 1 unit area. To calcu-late Jz(energy), we need to know the net number of molecules passing through A per second.
The mean free path, λ, is defined as the average distance that a molecule in a gas can travel before colliding with another molecule. On average, molecules that hit area A from the left have traveled one mean free path (λ) since their last collision. Other molecules will be too far away (and will bump into other molecules before reaching A), or too close (and will pass through A). The number of molecules hitting A from the left per unit time is then ( )Nv/6 , where v is the average speed of the molecules and N is the number density. The factor of 1/6 accounts for the fact that, of the six directions (up, down, left, right, in, out), only one (to the right) leads to area A. The expression ( )Nv/6 can be seen to lead to units of molecules m–2 s–1 for the matter flux to A from the left, as one would expect. With an energy designated as ε(–λ) for
* Jean Baptiste Joseph Fourier (1768–1830) was a French mathematician and scientist. His study of the conduction of heat introduced mathematical expansions as functions of trigonomet-ric series, not appreciated by his contemporaries, but now known as the important area of Fourier series.
Hot Cold
A
0
T
z
z–λ λ
FIGURE 8.2A box of gas with a temperature gradient, used to consider the thermal conductivity of a gas. T is the temperature of the gas as a function of position z.

190 PhysicalPropertiesofMaterials
each molecule at a distance –λ from A (see Figure 8.2), this leads to left-to-right energy flux, Jz(energy)L→R:
J energyNv
zL R( ) ( ).→ = −
6ε λ (8.4)
There is also a flux of molecules to A from the right, of ( )Nv /6, giving right-to-left energy flux, Jz(energy)R→L:
J energyNv
zR L( ) ( ).→ =
6ε λ (8.5)
The net energy flux at A will be the difference between these two fluxes:
J energy N v N vz( ) ( ( ) ( ))= − − =16
16
ε λ ε λ ε∆ (8.6)
where Δε is the difference in energy per molecule at distance λ to the left of A (i.e., at z = –λ) compared to a distance λ to the right of A (i.e., at z = λ), that is, Δε = ε(–λ) – ε(λ). Furthermore, Δε can be written in terms of the energy gradient, dε/dz:
∆ ∆εε ε
λ= = −ddz
zddz
2 (8.7)
where Δz = –2λ. From Equations 8.6 and 8.7, the energy flux can be written:
J energy Nvddz
Nvddzz( ) .= − = −
16
213
ελ λ
ε (8.8)
Letting E be the total energy per unit volume, it follows that ε = E/N and
ddz N
dEdz
ε=
1. (8.9)
Further, dE is related to dT by the molar heat capacity at constant volume, CV,m, the number of moles, n, and the volume, V:
dEC nV
dTV m= , (8.10)
www.ebook3000.com

ThermalConductivity 191
so the energy gradient, dE/dz, can be expressed in terms of the temperature gradient, dT/dz:
dEdz
C nV
dTdz
V m= , . (8.11)
Substitution of Equations 8.11 and 8.9 into Equation 8.8 leads to
J energy v CdTdzz( ) = −
13
λ , (8.12)
where C = CV,mn/V is the heat capacity per unit volume (SI units of C are J K–1 m–3). Comparison of Equations 8.3 and 8.12 leads to*
κ λ=13C v . (8.13)
Equation 8.13 is known as the Debye equation for thermal conductivity, and it will prove to be very useful for both gases and solids.
Equation 8.13 shows that κ for a gas is governed by three factors: its heat capacity per unit volume, the mean free path of the molecules that carry the heat, and the average speed of these molecules. Each of these factors is tem-perature dependent, and since their temperature dependences do not cancel, it follows that κ for a gas also is temperature dependent.
What about the pressure dependence of κ? From the kinetic theory of gases it can be shown that the mean free path, λ, can be written as
λπ
=V
d n NA2 2 (8.14)
where V is the volume, n is the amount of gas in moles, and d is the diameter of the gas molecule under consideration. From Equation 8.13 it follows that
κπ
=v C
d NV m
A
,
3 2 2 (8.15)
which shows thermal conductivity, κ, to be independent of the pressure of the gas. This is true at moderate pressures, from about 0.01 to ~100 atm. However, Equation 8.15 shows κ to depend on CV,m and d, both of which depend on the nature of the gas, so at a given temperature, the thermal conductivity of a gas
* The most important equations in this chapter are designated with ∎ to the left of the equation.

192 PhysicalPropertiesofMaterials
will depend on its composition, but not pressure. This can be used to detect different gases and is used, for example, in thermal conductivity detectors in gas chromatography.
The physical interpretation of the pressure independence of thermal con-ductivity is as follows. As the pressure is increased, more molecules per unit volume are available to transport the heat—that is, the heat capacity per unit volume increases—and this would increase κ. However, the presence of more molecules decreases the mean free path, and this decreases κ. These equal and opposite effects lead to κ being independent of pressure.
However, if the pressure is extremely low, as in the case of a Thermos™ bottle, pressure can be important. The mean free path, λ, increases as the pressure decreases, but eventually λ is limited by the dimensions of the con-tainer, and it stays at this constant value no matter how much further the pressure is reduced. As the number density of molecules has been able to fall faster than the mean free path has been able to grow at very low pressure, this situation leads to very poor thermal conduction at these low pressures, and the use of vacuum flasks for insulation becomes possible.
Typical values of thermal conductivities of some gases and solids are pre-sented in Table 8.1.*
* Data for solids are taken from Y. S. Touloukian, R. W. Powell, C. Y. Ho, and P. G. Klemens, 1970. Thermal Conductivity: Nonmetallic Solids. Plenum, New York. Data for gases are from A. W. Adamson, 1973. A Textbook of Physical Chemistry. Academic Press, Oxford.
TABLE 8.1
Thermal Conductivities of Selected Materials at T = 300 K
Material κ/W m–1 K–1
Aerogel 0.2Al2O3 36.0Argon (gas) 0.02Boron 2.76Copper 398Diamond 2310Graphite 2000 along a-axis
9.5 along c-axisHelium (gas) 0.15Iodine 0.449MgO 60.0Nitrogen (gas) 0.025Black phosphorus 12.1White phosphorus 0.235Sapphire 46SiO2(crystalline) 10.4 along c-axis
6.2 along a-axisSiO2(amorphous) 1.38
www.ebook3000.com

ThermalConductivity 193
8.3 Thermal Conductivities of Insulating Solids
In a gas, molecules carry the heat. What carries the heat in a nonmetallic solid? The answer to this question was first considered by Debye: vibrations of the atoms in the solid, known as lattice waves (also known as phonons) carry the heat. A phonon is a quantum of crystal wave energy, and it travels at the speed of sound in the medium. The presence of phonons in a solid is a mani-festation of the available thermal energy (kT); the more the heat, the greater the number of phonons (i.e., more excited lattice waves). A depiction of a lat-tice wave is shown in Figure 8.3.
The thermal conductivity of a solid can be measured by heating the mate-rial (with power �q, this power being applied at one end and lost at the same rate at the other end, in order to achieve steady-state conditions; see Figure 8.4) while determining the temperature gradient, dT/dx. The thermal con-ductivity, κ, is given by
κ =�qA
dxdT
, (8.16)
where A is the cross-sectional area of the material.By analogy with the derivation of the thermal conductivity in gases
(Equation 8.13), for nonmetallic solids, thermal conductivity, κ, is given by
κ λsolid C v=13
. (8.17)
Equations 8.13 and 8.17 are identical, but some of the parameters have differ-ent meanings for gases (Equation 8.13) and insulating solids (Equation 8.17).
FIGURE 8.3Depiction of a lattice wave (phonon) in a two-dimensional solid. At T = 0 K, the atoms would be arranged on a regular grid, but this instantaneous picture shows the atoms displaced from their equilibrium positions, although the displacements here are greatly exaggerated for illus-trative purposes.

194 PhysicalPropertiesofMaterials
Explicitly, C is the heat capacity per unit volume (as before), but for insulating solids v is the mean phonon speed and λ is the mean free path of the phonons.
To understand the thermal conductivity of nonmetallic solids, we must first return to the simple harmonic oscillator. If all the atoms in a solid are connected by spring-like forces to each other (with all the force constants given by Hooke’s law; Equation 7.4), then the potential in all directions is shaped like a three-dimensional parabola; a schematic view of a solid is given in Figure 8.5.
As the lattice is heated, there is an increased probability of exciting high-energy phonons, and more of the atoms will be vibrated away from their equilibrium lattice sites. (Incidentally, the following will indicate just how far off their lattice site they could be. Vibration increases as temperature
A
dTq
dx
FIGURE 8.4The thermal conductivity, κ, of a single crystal (or well-compacted block) of a material can be determined by direct measurement. For a crystal of cross-sectional area A, with a temperature gradient along its face of dT/dx, the thermal conductivity is given by κ = −�q dx dT A( )/ 1, where �q is the power supplied to the top of the crystal. The measurement would be carried out at steady-state conditions, that is, the rate of power introduced to the top of the crystal equal to the loss at the bottom, such that the temperature of the crystal remains constant. In addition, for high-accuracy measurements, care would need to be taken to reduce extraneous heat exchange with the surroundings; for example, the crystal and its platform would be in vacuum, and the crystal could be surrounded with a temperature-matched heat shield.
FIGURE 8.5A solid can be considered to be a network of atoms, each connected to other atoms by “springs.”
www.ebook3000.com

ThermalConductivity 195
increases, and Lindemann* showed in 1912 that, at the melting point, the vibrations result in about 10% increase in volume over the volume at T = 0 K. This corresponds to about 3% increase in the lattice parameters over the T = 0 K values.)
If the lattice were perfectly harmonic, the phonons would carry heat per-fectly, with no resistance to heat flow, and the thermal conductivity would then be infinite. Clearly, nonmetallic solids must have some heat-flow resis-tance mechanism taking place since observed thermal conductivities are not infinite.
This problem was solved by Peierls† when he showed that phonon–phonon collisions can lead to “turning back” (“Umklapp” in German) processes, as shown in Figure 8.6. This requires the presence of anharmonicity in the intermolecular potential. Recall that anharmonicity also was responsible for thermal expansion, and now we see that it also leads to thermal resistance.
The thermal conductivity for a “typical” simple crystalline nonmetal-lic solid is shown in Figure 8.7, and its shape as a function of temperature can be understood simply in terms of the Debye equation (Equation 8.17) as follows.
At high temperatures (T > θD), C is approximately constant and v (which depends on the material as it reflects the force constant of interactions within the solid; the stiffer the lattice, the higher v) is nearly independent of tem-perature. The mean free path, λ, depends on temperature such that, as the temperature is increased, λ decreases (see Figure 8.7b) due to the increased probability of phonon–phonon collisions. Therefore, from Equation 8.17, at high temperatures, as T increases, κ decreases (Figure 8.7a).
As the temperature is decreased, κ increases because the mean free path, λ, is getting longer (Figure 8.7). This is because at low temperatures the pho-nons can travel for longer distances without colliding since there are fewer phonons around at lower temperatures. Eventually, λ will have grown so long that it is limited by the size of the crystal (if the crystal is perfect), or by the distance between defects (such as packing faults or even other isotopes) if the crystal is not perfect. Below this temperature, λ cannot increase fur-ther. However, as the temperature is lowered below the Debye characteristic temperature, θD, the heat capacity, C, falls. Given that the average phonon speed, v, is approximately independent of temperature, the Debye equation
* Frederick Alexander Lindemann (1886–1957) was a German-born physicist who spent most of his career at the University of Oxford in England. In addition to his melting point theory and his theory of unimolecular reactions, Lindemann was personal scientific advisor to Winston Churchill during World War II.
† Sir Rudolf Ernst Peierls (1907–1995) was a German-born theoretical physicist. His 1929 theory of heat conduction (predicting an exponential increase in thermal conductivity as a perfect crystal is cooled) was finally verified experimentally in 1951. Peierls also has made impor-tant contributions to nuclear science (including work on the Manhattan Project), quantum mechanics, and other aspects of solid state theory.

196 PhysicalPropertiesofMaterials
k1
k1
k1
k1
k1 k1 k2 k3 Gk2 k3
k2
k2
k2
k2
k3 k3
k3
G
k3
+ = + +=
(a) (b)
FIGURE 8.6(a) Two incident phonons (each shown as a wave) can interact to give a resultant phonon with a motion in the same general direction as the incident phonons. This process is known as a normal or N process; it does not resist heat flow. The vector view shows k
�1 and k
�2 as incident
momentum (wave) vectors, and k�
3 as the resultant wavevector. (b) Two incident phonons (each shown as a wave) can interact to give a resultant phonon with one component of the motion in a direction opposite to the general motion of the incident phonons. This process, since it “turns back” heat flow, is known as an Umklapp process. It is these sorts of processes that lead to ther-mal resistance (reducing thermal conductivity). The vector view shows k
�1 and k
�2 as incident
wavevectors, and k�
3 is the resultant wavevector. G��
represents a momentum transfer to the lat-tice, required for overall momentum conservation.
100000
10000
1000
100
10
1
5
4
3
2
1
0 1 10 100 4001 10 100 400T/K
λ/nm
κ/W
m–1
K–1
T/K
(a) (b)
FIGURE 8.7(a) The temperature dependence of the thermal conductivity of a “typical” simple insulating crystalline solid, a single crystal of very pure Y2Ti2O7, and (b) the corresponding mean free phonon path as a function of temperature, determined using Equation 8.17. (Data from M. B. Johnson et al., 2009. Journal of Solid State Chemistry 182, 725. With permission.)
www.ebook3000.com

ThermalConductivity 197
(Equation 8.17) shows that κ will decrease with decreasing temperatures at low temperatures (Figure 8.7a).
8.4 Thermal Conductivities of Metals
In metals there are two mechanisms to carry heat—the phonons and the free electrons—which is why metals are good thermal conductors. For a metal, the total thermal conductivity, κ, can be written as the sum of the phononic contribution, κphonon, and the electronic contribution, κelec:
κ = κphonon + κelec (8.18)
where κphonon is as given by Equation 8.17 and, by analogy, κelec is given by
κ λelec elec elec elecC v=13
(8.19)
where Celec is the electronic contribution to the heat capacity per unit volume, velec is the mean speed of the conducting electrons, and λelec is the mean free path of the conducting electrons.
Since, typically, κ for a metal is 10 to 100 times κ for a nonmetal, it is clear that most of the heat in a metal is carried by conducting electrons, not phonons.
Nevertheless, for parallel reasons, the thermal conductivity of a metal has a temperature dependence similar to that of a nonmetal. The temperature dependence of the thermal conductivity of Cu is shown in Figure 8.8 as a typical example.
10
105
104
103
102100 10001
Solid
Liquid
κ/W
m–1
K–1
T/K
FIGURE 8.8Temperature dependence of the thermal conductivity of a “typical” metal. The data shown are for Cu.

198 PhysicalPropertiesofMaterials
COMMENT: IS MIRACLE THAW™ A MIRACLE?
A commercial thawing tray (Figure 8.9) is advertised to thaw frozen food using a “superconducting” material. In reality, the thawing tray is a sheet of aluminum painted black. Since aluminum is a metal, it is a good conductor of heat. The black paint ensures efficient “capture” of ambient thermal energy, which is then transferred to the food.
COMMENT: POPPING CORN
Popcorn “pops” when it is heated because the inner moisture is vapor-ized, and this breaks open the hull. Measurements of the thermal con-ductivities of various types of corn show that popcorn hull is two to three times better as a thermal conductor than nonpopping corn ker-nels. This indicates that popcorn husks have more crystalline (less amorphous) cellulose than other corn kernels, and this has been con-firmed by spectroscopic experiments. The high thermal conductivity of popping corn ensures efficient heat transfer into the kernel, while the high mechanical strength associated with its more organized crystal-line structure means that the kernel can sustain a high pressure before popping.
COMMENT: SPACE VEHICLE TILES
Thermally insulating tiles play an important role in protecting space vehicles as they pass through the atmosphere. Most of the tiles are made of amorphous silica fibers. The fact that they are amorphous means that they are poor conductors of heat. The fiber structure cuts down
FIGURE 8.9Ice melts rapidly on the food-thawing tray.
www.ebook3000.com

ThermalConductivity 199
Thermal Conductivities of Materials: A Tutorial
a. Refer to the Debye equation (Equation 8.17), which describes the thermal conductivity of an insulating solid. Consider the effect of the perfection of a crystal on the phonon mean free path. Show what the presence of lattice imperfections would do to the ther-mal conductivity by sketching λ(T) and κ(T), both for a perfect crystal and for the same crystal with a few percent of imperfec-tions (e.g., impurities).
b. On the same λ(T) graph produced in (a), sketch the mean free path for the same composition of material, now in an amorphous state.
c. Again considering the Debye equation and the microscopic pic-ture of an amorphous material (compared with a perfect crystal), sketch how the thermal conductivity of an amorphous mate-rial could be expected to look as a function of temperature (see Figure 6.11 for a schematic structure of an amorphous material).
d. Ceramics are hard, brittle heat-resistant, inorganic, nonmetallic materials. The word “ceramics” comes from the Greek keramikos, which means “of pottery,” and many traditional ceramics are clay products. Often they are prepared by shaping and then firing at high temperatures. Other traditional ceramics include materials such as silicate glass and cement. Advanced ceramics include carbides (SiC), pure oxides (e.g., Al2O3 and BaTiO3) and nitrides (e.g., Si3N4). Why does coffee stay warm longer in a ceramic mug than in a metal cup?
e. Based on the Debye equation, how would you expect the thermal conductivity of a harder material to compare with a softer mate-rial? Does this explain why marble is a good heat conductor (and
further on heat conduction and reduces the density to about 0.1 g cm–3 (total mass is a major fuel consumption factor on space flights). In some areas of a space vehicle, tiles have added alumina-borosilicate content, which adds mechanical strength. The tiles are prepared by making a water slurry of the fibers, casting it into soft blocks to which colloidal silica binder has been added, and then sintering at high temperature to form a rigid block that can be machined to exact dimensions.
Thermal expansion is an important factor in the placement of the tiles; if they buckled against one another during heating, this would cause the tiles to fall off. For this reason, gaps of about 0.1 mm are left between tiles.

200 PhysicalPropertiesofMaterials
therefore a poor energy storage material [Tutorial in Chapter 6])? What about diamond?
f. Metals also have high thermal conductivities. Why is diamond so special with regard to its thermal conductivity in consider-ation of its other properties?
g. How could one make diamond have an even higher thermal conductivity?
h. An article titled “Hot Rocks” in the business pages of a news-paper reported on the finding that diamonds made from isoto-pically purified 12C are better conductors of heat than normal diamonds. What do you think of the title of the article? Would these diamonds feel hot to the touch?
8.5 Problems
8.1 a. Calculate the thermal conductivity for He at 25°C and 1 atm given the following information: at these conditions, v of He is 1360 m s–1, and the mean free path is 7.2 × 10⁻⁷ m.
b. Compare this with the following thermal conductivities at the same conditions (all in W m–1K–1): air, 2.4 × l0–2; crystal-line SiO2, 10; Cu, 400. Explain the relative thermal conduc-tivities in terms of the Debye equation.
8.2 Several expressions for κgas, the thermal conductivity of a gas, have been presented in this chapter. One of the expressions was given by Equation 8.15. Use this equation and the temperature dependence of the variables in it to show how κgas changes as temperature is increased.
8.3 Figure 8.10 shows the variation of thermal conductivity of a semiconductor after doping with n- or p-type impurities.
200 300 400100
10
5
0
κ/W
m–1
K–1
6 × 1025 m–3 n3 × 1025 m–3 n9 × 1024 m–3 n4 × 1023 m–3 n,p
T/K
FIGURE 8.10The temperature dependence of the thermal conductivity of a semiconductor with n- and p-type impurities at various concentrations, indicated as number of impurity sites per m3.
www.ebook3000.com

ThermalConductivity 201
Explain the origin of the change in thermal conductivity on introduction of the impurity.
8.4 At a trade show exhibiting new building materials, one of the energy-efficient products was a window with good thermal insulation. The window had two panes of glass, and the space between them contained argon gas. The advertisement said that this window gave much better insulation than could be achieved when the space was filled with air (the more common case for double-paned windows). Explain why argon is a bet-ter thermal insulator than air. Assume both to be at the same pressure. It may be helpful to know that the molecular mass of argon is 39.95 g mol–1, and that of air (which is about 80% N2 and 20% O2) is about 29 g mol–1, and to consider all factors in the Debye expression for thermal conductivity. State and justify any assumptions.
8.5 Ceramics are very useful inorganic materials composed of metallic and nonmetallic ions held together by partly ionic and partly covalent bonds. Ceramics are electrical insulators char-acterized by their hardness, strength, and heat and chemical resistance. They can be amorphous or crystalline. Explain how the microstructure, brought about by small changes in the com-position of a ceramic, can affect its thermal conductivity. Take into account the fact that the porosity (and hence density) of a ceramic can be modified by the introduction of impurities.
8.6 Incandescent light bulbs usually have an argon atmosphere sealed inside them. The purpose of the argon is to prevent the filament from oxidizing (in air) or subliming (in vacuum). A portion of the energy that is used to light an incandescent bulb is “lost” as heat. Suggest another inert gas that could be used in place of argon but is a better insulator. Explain your reasoning.
8.7 Appropriate materials properties of dental filling materials are key to their success. A large “silver” filling (made of an amal-gam, i.e., a mixture of silver with mercury) can make a tooth very sensitive to hot or cold food. However, this temperature sensitivity is not so dramatic when a white polymeric compos-ite filling material is used. Explain why these two materials, silver amalgam and polymeric composite, lead to such different thermal sensitivities. In this case, consider the nerve endings inside the tooth to be sensitive thermometers.
8.8 Two countertop materials look very similar: one is natural marble and the other is a synthetic material. They can be dis-tinguished easily by their feel: one is cold to the touch and the other is not. Explain which is which and the basis of the differ-ence in their thermal conductivities.
8.9 Stainless steel is iron with added chromium and possibly also nickel. It has good corrosion resistance. When stainless steel is used for pots for cooking, the pot bottoms are often made of copper. Why is stainless steel not used on the pot bottoms? Why is copper better for the pot bottoms?

202 PhysicalPropertiesofMaterials
8.10 Black phosphorus has a density of 2.7 g cm–3, while that of white phosphorus is 1.8 g cm–3 (both values are at room temperature). Use this information to explain the difference in thermal con-ductivities of the two forms of phosphorus (Table 8.1).
8.11 Brass is formed from copper with zinc; a common brass for-mulation gives two phases, one rich in Cu and the other with more Zn. Copper is very difficult to weld (welding is a method of joining metals that involves heating them together, possibly with another material) because it has a very high thermal con-ductivity. On the basis of its thermal conductivity, would brass be expected to be easier or more difficult to weld than copper? Explain.
8.12 The baking temperatures for a cake mix, as listed on the box, are different depending on whether the pans are glass or metal. Which type of pan requires lower baking temperature? Why?
8.13 An aerogel is a very low-density material, typically made of silica with about 50% to 99% air in its structure. The thermal conductivity of an aerogel is extremely low in comparison with more typical solids (see Table 8.1). Why?
8.14 Some negative thermal expansion (NTE) materials have low-frequency phonons associated with the movement of the atomic groups. These phonons can interact with the heat-carrying phonons to reduce the phonon mean free path. On this basis, would you expect NTE materials to have lower or higher ther-mal conductivities than other similar materials? Explain your reasoning.
8.15 Thermal conductivity, κ, is an important property of a material, but, for the function of a material, an important related prop-erty is thermal diffusivity, a, a measure of the speed of heat flow through a material, defined as
aCs
=κρ
(8.20)
where ρ is the density and Cs is the specific heat. Explain why a is proportional to κ and inversely proportional to ρ and Cs.
8.16 Moissanite is a form of SiC with many properties similar to dia-mond. For example, it is transparent and colorless, and has a high refractive index, so it sparkles. Moissanite has a hardness of 9.25 on the Mohs scale, while diamond has a hardness of 10. (Harder materials have higher values of Mohs hardness, with significantly larger steps between higher values of hardness.) Jewelers often use an instrument to determine the thermal con-ductivity of a diamond to show that it is genuine. Do you expect that moissanite could fool this instrument, leading unsuspect-ing consumers to buy the cheaper moissanite? Explain.
8.17 A subclass of polymorphism is known as polytypism. In this case, the structure is in layers, and the difference between the
www.ebook3000.com

ThermalConductivity 203
polytypes is the periodicity of the layers. For example, there could be three types of layers, A, B, and C, that have the same composition but are shifted laterally. One polytype could be ABCABC and another could be ABABCABABC and so forth. Examples of materials exhibiting polytypism are SiC, CdS2, GaSe, and some micas and clays. Would two different poly-types of a material be expected to exhibit the same thermal conductivity perpendicular to the layers? What about parallel to the layers? Explain.
Further Reading
General References
Many physical chemistry textbooks contain derivations of the kinetic theory of gases. In addition, the following address many of the general points raised in this chapter.
High thermal conductivity materials. Special issue. K. Watari and S. L. Shinde, Eds. MRS Bulletin, June 2001, 440–455.
A. W. Adamson, 1973. A Textbook of Physical Chemistry, Academic Press, Oxford.A. Bondi, 1968. Physical Properties of Molecular Crystal, Liquids and Glasses. John Wiley
& Sons, Hoboken, NJ.W. D. Callister Jr. and D. G. Rethwisch, 2010. Fundamentals of Materials Science and
Engineering: An Introduction, 8th ed. John Wiley & Sons, Hoboken, NJ.B. S. Chandrasekhar, 1998. Why Things Are the Way They Are. Cambridge University
Press, Cambridge.M. de Podesta, 2002. Understanding the Properties of Matter, 2nd ed. CRC Press, Boca
Raton, FL.A. B. Ellis, M. J. Geselbracht, B. J. Johnson, G. C. Lisensky, and W. R. Robinson, 1993.
Teaching General Chemistry: A materials science companion. American Chemical Society, Washington.
R. E. Hummel, 2004. Understanding Materials Science, 2nd ed. Springer, New York.C. Kittel, 2004. Introduction to Solid State Physics, 8th ed. John Wiley & Sons, Hoboken, NJ.V. Murashov and M. A. White, 2004. Thermal conductivity of insulators and glasses.
Chapter 1.3, pages 93–104 in Thermal Conductivity, T. Tritt, Ed. Kluwer/Plenum, New York.
T. N. Narasimhan, 2010. Thermal conductivity through the 19th century. Physics Today, August 2010, p. 36.
H. M. Rosenberg, 1989. The Solid State, 3rd ed. Oxford University Press, New York.R. Sun and M. A. White, 2004. Ceramics and glasses. Chapter 3.1, pages 23–254 in
Thermal Conductivity, T. Tritt, Ed. Kluwer/Plenum, New York.R. L. Sproull, 1962. Conduction of heat in solids. Scientific American, December 1962, 92.A. J. Walton, 1983. Three Phases of Matter, 2nd ed. Oxford University Press, New
York.

204 PhysicalPropertiesofMaterials
Experimental Techniques
M. E. Bacon, R. M. Wick, and P. Hecking, 1995. Heat, light and videotapes: Experiments in heat conduction using liquid crystal film. American Journal of Physics, 63, 359.
V. V. Murashov, P. W. R. Bessonette, and M. A. White, 1995. A first-principles approach to thermal conductivity measurements of solids. Proceedings of the Nova Scotian Institute of Science, 40, 71.
Implications of Thermal Conductivity
W. H. Corkern and L. H. Holmes Jr., 1991. Why there’s frost on the pumpkin. Journal of Chemical Education, 68, 825.
Thermal Conductivities of Specific Materials
D. R. Askeland, P. P. Fulay and W. J. Wright, 2010. The Science and Engineering of Materials, 6th ed. Cengage, Stamford, CT.
W. J. da Silva, B. C. Vidal, M. E. Q. Martins, H. Vargas, A. C. Pereira, M. Zerbetto, and L. C. M. Miranda, 1993. What makes popcorn pop. Nature, 362, 417.
C. A. Kennedy and M. A. White, 2005. Unusual thermal conductivity of the negative thermal expansion material, ZrW2O8. Solid State Communications, 134, 271.
Y. S. Touloukian, R. W. Powell, C. Y. Ho, and P. G. Klemens, 1970. Thermal Conductivity: Nonmetallic Solids, Plenum, New York.
M. A. White, V. Murashov, and P. Bessonette, 1996. Thermal conductivity of food-thawing trays. Physics Teacher, 34, 4.
K. M. Wong, 1990. Space shuttle thermal protection system. California Engineer, December 1990, 12.
www.ebook3000.com

205
9ThermodynamicAspectsofStability
9.1 Introduction
The thermal stability of a material, with respect to phase change and/or chemical change, can be very important in determining uses of a material. In this chapter we examine such properties, first for pure materials, then for two-component materials, and finally for three-component materials.
9.2 Pure Gases
A typical phase diagram for a pure material as a function of temperature and pressure is shown schematically in Figure 9.1, where several isotherms near the critical point are indicated.
The thermodynamic stability of a gas depends on its Gibbs energy being less than a condensed phase (liquid or solid). As we have seen already, an ideal gas cannot condense (because it has no intermolecular forces), but we know that real gases do condense to give liquids and/or solids as we com-press them, due to attractive intermolecular forces.
If we consider the pressure as a function of volume for the isotherms of Figure 9.1, this gives a series of curves as shown in Figure 9.2. At T1, which is greater than the critical temperature, compression of the gas just increases the pressure; it does not lead to condensation. However, at a temperature below the critical temperature (e.g., T3), a decrease in the volume of the gas leads first to an increase in pressure, and then to a sudden drop in volume at constant pressure, corresponding to the drop in volume due to liquefaction of the gas. Further compression at T3 leads to a rapid increase in pressure since liquids are not very compressible. At a lower temperature, T4, liquefac-tion also occurs. At T2 = Tc, the critical temperature, liquid and gas are indis-tinguishable throughout the whole volume range.
Although the ideal equation of state does not lead to the liquefaction of a gas, the van der Waals equation of state shows instabilities in the pressure-

206 PhysicalPropertiesofMaterials
volume curves below the critical temperature, Tc. The solutions of the van der Waals equation of state lead to the P(V) dashed curves indicated in Figure 9.2; the portion of those curves that leads to decreases in pressure with decreasing volume indicates their unphysical nature in this region. The isobaric condensation of the gas exactly balances the areas of the peak and inverse peaks of the P(V) plot from the van der Waals equation of state (dashed lines in Figure 9.2).
T
P
T4 T3 T2 = Tc T1
Liquid
Solid
Gas
FIGURE 9.1The generalized phase diagram for a pure material as a function of temperature (T) and pres-sure (P). The dashed lines correspond to constant-temperature lines (isotherms) considered further in Figure 9.2.
L + V V
T1T2 = TcT3T4
SCF
V
P
L
FIGURE 9.2The pressure (P) as a function of volume (V) for various isotherms of a real gas. The tempera-tures correspond to those shown in Figure 9.1. The dashed lines correspond to the solutions to the van der Waals equation of state, and the solid lines correspond to experimental find-ings. The shading indicates distinctions among the regions, L: liquid; V: vapor; L + V: liquid and vapor; SCF: supercritical fluid. At the critical temperature, T2 in Figure 9.1, compression of the gas leads to an inflection point in the P versus V curve shown here, corresponding to (∂P/∂V)T = 0 and (∂2P/∂V2)T = 0. This inflection point is the apex of the curve joining the ends of the constant pressure volume liquefaction lines, and this is another way to define the critical point of a gas.
www.ebook3000.com

ThermodynamicAspectsofStability 207
9.3 Phase Equilibria in Pure Materials: The Clapeyron Equation
Phase diagrams such as Figure 9.1 can be understood by examining the experimental pressure-temperature boundaries of the phases. In view of this comment, it would be useful to derive an expression for dP/dT along the phase equilibrium lines.
To do so, it is first useful to consider the fact that the Gibbs energies are identical for two single-component phases that are in equilibrium. This is true for liquid–solid equilibrium (Gsolid = Gliquid at the melting point), liquid–vapor equilibrium (Gliquid = Gvapor at the boiling point), or any equilibrium of phase α with phase β (Gα = Gβ).
If initial temperature and pressure conditions allow phase α to be in equi-librium with phase β,
G Ginitial initialα β= (9.1)
and the temperature and pressure are changed (changing G by dG) to final conditions such that the equilibrium of phases α and β is maintained, then
G Gfinal finalα β= ⋅ (9.2)
Since
G G dGfinal initialα α α= + (9.3)
and
G G dGfinal initialβ β β= + , (9.4)
it follows that
dGα = dGβ (9.5)
The fundamental equation for dG (Equation 6.46) can be written for phase α and also for phase β, in terms of the change in pressure (dP) and in tempera-ture (dT):
dGα = VαdP – SαdT = dGβ = V βdP – SβdT. (9.6)

208 PhysicalPropertiesofMaterials
This can be rearranged to give the quantity we were aiming for, dP/dT:*
dPdT
SV
HT V
= =∆∆
∆∆
trs
trs
trs
trs
(9.7)
where the transition changes are given by ΔtrsS = Sα – Sβ and ΔtrsV = Vα – Vβ, and the second equality makes use of the generalization
ΔG = ΔH – TΔS (9.8)
where, due to the equality of G for any two phases in equilibrium,
ΔtrsG = 0 (9.9)
and hence
∆∆
trstrs
trs
SH
T= (9.10)
where ΔtrsH is the enthalpy change of the transition and Ttrs is the temper-ature of the transition. Equation 9.7 is called the Clapeyron† equation. The Clapeyron equation can be applied to any first-order phase transition, and holds exactly.
To see how the Clapeyron equation can be used to determine the sign of the slope of phase boundaries, we consider two examples.
For the transition from solid to vapor, the Clapeyron equation gives
dPdT
HT V
=sol-vap
subl
subl
∆∆
(9.11)
where ΔsublH, the enthalpy change on sublimation, is positive (it always takes heat to convert a material from solid to vapor), and the volume change on sublimation, ΔsublV = Vvapor – Vsolid also is positive. Since T is always positive (on the kelvin scale), it follows that (dP/dT) on the solid–vapor equilibrium line (i.e., the slope of the solid–vapor equilibrium line) is always positive.
For the transition from solid to liquid, the Clapeyron equation gives
dPdT
HT V
= ⋅sol-liq
fus
fus
∆∆
(9.12)
* The most important equations in this chapter are designated with ▮ to the left of the equation.† Benoit Pierre Émile Clapeyron (1799–1864) was a French engineer who specialized in bridges
and locomotives. His only publication in pure science concerned the expression of vapor pressure as a function of temperature.
www.ebook3000.com

ThermodynamicAspectsofStability 209
Since ΔfusH, the enthalpy change on fusion (melting) is positive, and T is pos-itive, and ΔfusV = Vliquid – Vsolid is positive for most materials, dP/dT along the solid–liquid line is positive for most materials. However, for some materials Vliquid < Vsolid; an example is water (we know this because ice floats) and other examples are Ga, Sb, Bi, Fe, Ge, and diamond. The larger volume for the solid leads to dP/dT < 0. We will see this negative slope in P(T) in the experimen-tally determined water phase diagram later in this chapter.
To generalize, given that it takes heat (ΔH > 0) to proceed from a lower-temperature phase to a higher-temperature phase (another way to look at this is that the entropy of the higher-temperature phase exceeds that of the lower-temperature phase), the slope of P-T equilibrium lines in the phase diagram of a pure material can indicate, using the Clapeyron equation, the relative densities of the two phases.
Let us turn now to some specific phase diagrams for pure materials.
9.4 Phase Diagrams of Pure Materials
In Figure 9.3, the pressure-temperature phase diagram of carbon dioxide is shown. This diagram is an example of the simple P-T phase diagrams dis-cussed earlier. One particularly interesting feature here is that, at a pres-sure of 1 atmosphere, the solid converts directly to vapor, at a temperature of 194.7 K; this can be seen in the sublimation of dry ice, CO2(s), at room temperature, one of the few examples of conversion from solid to vapor at ambient pressure without first passing through the liquid phase.
Liquid
Solid
Vapor
194.7 216.8 298.15 304.2
72.8
67
5.1
1
T/K
P/at
m
FIGURE 9.3The pressure-temperature phase diagram for pure CO2. The scales are not linear.

210 PhysicalPropertiesofMaterials
The relatively moderate critical point of CO2 (Pc = 72.8 atm and Tc = 304.2 K) leads to supercritical CO2 relatively easily. Fluids beyond the critical point are called supercritical fluids, and they are neither gas nor liquid. Supercritical fluids have unusual properties such as much lower viscosity than the liquid and much higher density (and therefore greater solvent power) than the gas. Supercritical CO2 has such diverse uses as the carrier for some chromato-graphic separations and the extraction solvent for decaffeination of coffee.
In Figure 9.4, the pressure-temperature phase diagram of sulfur is shown. The solid lines represent the stable phase diagram. The main new feature in this phase diagram is the existence of two solid phases, one of monoclinic structure and the other of orthorhombic structure. The existence of more than one solid phase is called polymorphism, literally “many shape types.” The two polymorphs of sulfur have different temperature and pressure regions of stability. (For elements, polymorphs are also called allotropes.)
Figure 9.4 also shows, by the dashed lines, the metastable phase diagram for sulfur. By appropriate thermal treatment (rapid cooling from above the melting point) it is possible to trick sulfur into transforming directly from a supercooled liquid to the rhombic form, without first passing through the monoclinic form. In the region where the monoclinic form is most stable (i.e., the T and P range where monoclinic has the lowest G of all possible phases), the liquid or rhombic form can exist only metastably. That they can exist at all is testament to the high activation energy required for the conversion from the metastable form to the monoclinic form in this temperature-pressure region.
Figure 9.5a and b shows two views of the phase diagram of water. At low pressure (Figure 9.5a), the negative slope of the P-T solid–liquid line is read-ily apparent. This line indicates, as we have seen earlier in the discussion of the Clapeyron equation, that H2O(s) is less dense than H2O(1) under these
Monoclinic
RhombicLiquid
Vapor
95 119 151
1288
3×10⁻⁵
T/°C
P/at
m
FIGURE 9.4The pressure-temperature phase diagram for sulfur. The solid lines indicate the stable phases, and the dashed lines indicate metastability.
www.ebook3000.com

ThermodynamicAspectsofStability 211
conditions. The phase of ice in this temperature and pressure region is gen-erally referred to as ice Ih, where the “h” stands for “hexagonal.” (The hex-agonal structure is the origin of the six points in a snowflake.) The hexagonal structure of this form of ice (shown in Figure 9.6) is a very open structure (i.e., low-density structure) with dynamically disordered hydrogen bonds. The structure is not close-packed because of the hydrogen-bonding require-ments of the H2O molecules. It is the openness of this structure that leads to the low density of ice Ih relative to water, and the negative value of dP/dT in this region. It is worth considering that the negative value of dP/dT leads to a decrease in the melting point of ice when pressure is applied. Although this has been cited as the basis for ice skating, calculations* show that the temperature drop is insufficient to account for a liquid layer between the skate and ice.
* L. F. Louks, 1986. Journal of Chemical Education, 63, 115.
1000
(a)
(b)
Liquid water
Vapor
Ice lh
P/at
m
100
10
1
0.1
0.01
0.001
0 100 200T/ºC
300 400
Liquid
IIIII
VVI
VIIIVII
IX
X
XI lh
P/G
Pa
100
10
1
0.1
0 100 200T/K
300 400
FIGURE 9.5The pressure-temperature phase diagram of H2O, (a) at low pressure (note the negative P-T slope), and (b) over a wider pressure range (1 GPa ≈ 10,000 atm).

212 PhysicalPropertiesofMaterials
At higher pressures, more polymorphs of ice are observed, as illustrated in Figure 9.5b. The large number of polymorphs for H2O is due to the many ways in which H2O molecules can be arranged to satisfy their hydrogen-bonds to their neighbors, with different structures having lowest G in different pressure and temperature regions. Note that at high pressures (above about 0.2 GPa) the val-ues of dP/dT along the melting line for ice (in phase ice III) have become positive, indicating that the higher-pressure polymorphs of ice are denser than water. This is because the higher-pressure forms are compressed relative to ice Ih.
Figure 9.7 shows the temperature-pressure phase diagram of CH4. (The solid–liquid–vapor triple point of methane is at 90.69 K.) However, there are at least four solid phases for CH4, and polymorphism in this case can be attributed to the shape of the molecule. Although we may consider methane to be tetra-hedral, as in the ball-and-stick model of Figure 9.8a, the shape of any molecule is really more closely related to the electron density distribution and this is more nearly represented as a sphere with slight protuberances at tetrahedral locations (Figure 9.8b). The nearly spherical shape of the methane molecule means that it takes very little energy to rotate it even in the solid state. In fact, in Phase I of
FIGURE 9.6The oxygen positions in the hexagonal structure of ice Ih. The hydrogens are not shown because they are dynamically disordered. The very open structure makes ice Ih float in liquid water.
6
5
4
3
2
1
00 10 20 30 40 50
IV
III
II I
T/K
P/G
Pa
FIGURE 9.7The low-temperature phase diagram of CH4, showing only the solid phases.
www.ebook3000.com

ThermodynamicAspectsofStability 213
CH4, the methane molecules are nearly freely rotating, although they are located on particular lattice sites (Figure 9.9). Another way to express this is to say that they are translationally ordered but rotationally disordered. This phase is often referred to as an orientationally disordered phase.
As the temperature is lowered, CH4 molecules become more ordered, and Phase II has a rather unusual structure with some molecules in the unit cell ordered and some molecules in other positions in the unit cell dynamically disordered (Figure 9.9).
The structures of the other phases of CH4 are more complicated still and not yet fully sorted out. A complication here is that the CH4 molecule is so light that Newtonian mechanics cannot properly describe it at such low tem-peratures, and quantum mechanics must be used to describe the disorder in these solid phases.
The concept of an orientationally disordered solid also can be described from the point of view of thermodynamics. In particular, the idea of an orientation-ally disordered solid leads to the picture of a solid with an entropy that is higher
(a) (b)
FIGURE 9.8Two views of the CH4 molecule. (a) The ball-and-stick model is useful, but does not truly rep-resent the space-filling shape of the molecule. (b) A space-filling model of CH4 more accurately shows methane to be a nearly spherical molecule.
(a) (b)
FIGURE 9.9Structures of two phases of solid CH4. (a) Phase I, with the CH4 molecules orientationally disor-dered (shown as spheres to indicate rotating tetrahedra) on sites of a face-centered cubic lattice. (b) Phase II, with some CH4 molecules orientationally ordered (orientationally ordered tetrahedra), and some dynamically disordered (shown as a sphere in the center of the unit cell). The latter experience very low (practically zero) barrier to rotation and a spherically symmetric ground state at low temperature.

214 PhysicalPropertiesofMaterials
than the usual value for a solid. In fact, it has been suggested that one way to characterize an orientationally disordered solid is to describe it as one with an unusually low entropy change on fusion (=ΔfusS = Sliquid – Ssolid < 20 J K–1 mol–1 for an orientationally disordered solid), given that Sliquid is nearly the same for most liquids and Ssolid is unusually high for an orientationally disordered solid.
An orientationally disordered solid also has been referred to as a plastic crystal because of the ease of deformation of this type of material due to the rotating molecules that make it up. The term “orientationally disordered solid” is now preferred over “plastic crystal,” as the latter is sometimes too limiting, and the former term accurately describes the physical picture.
kT
r
r
U0
U(r
)
kTV0
θ
θ
V(θ)
(b)(a)
FIGURE 9.10The energy of interaction of two nearly spherical molecules that are capable of forming an orientationally disordered solid, as a function of (a) intermolecular separation, and (b) orien-tational angle at fixed separation. If the thermal energy is less than the binding energy (kT < U0 in a), the material will be a solid. For a material that can form an orientationally disordered solid, V0 ≪ U0 (i.e., the molecules can rotate more easily than they can translate). If the thermal energy (kT) is greater than V0, as shown here, then the material will be orientationally disor-dered. At lower temperatures, the stable structure will be that of an ordered solid.
kTU(r
)
U0
r
r
kT
V0V(θ)
θ
θ(a) (b)
FIGURE 9.11The energy of interaction of two rod-shaped molecules that are capable of forming a liquid crystalline phase, as a function of (a) intermolecular separation, and (b) orientational angle at fixed separation. For a material that can form a liquid crystal, U0 ≪ V0 (i.e., the molecules can translate more easily than they can rotate). If the thermal energy (kT) is nearly equal to U0, as shown here, then the material will be liquid crystalline. At lower temperatures, the stable structure will be that of an ordered solid.
www.ebook3000.com
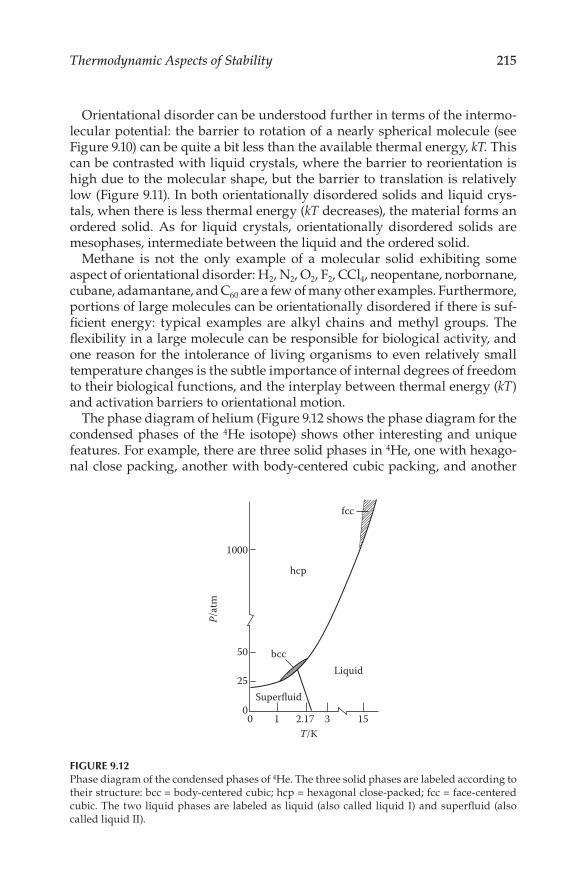
ThermodynamicAspectsofStability 215
Orientational disorder can be understood further in terms of the intermo-lecular potential: the barrier to rotation of a nearly spherical molecule (see Figure 9.10) can be quite a bit less than the available thermal energy, kT. This can be contrasted with liquid crystals, where the barrier to reorientation is high due to the molecular shape, but the barrier to translation is relatively low (Figure 9.11). In both orientationally disordered solids and liquid crys-tals, when there is less thermal energy (kT decreases), the material forms an ordered solid. As for liquid crystals, orientationally disordered solids are mesophases, intermediate between the liquid and the ordered solid.
Methane is not the only example of a molecular solid exhibiting some aspect of orientational disorder: H2, N2, O2, F2, CCl4, neopentane, norbornane, cubane, adamantane, and C60 are a few of many other examples. Furthermore, portions of large molecules can be orientationally disordered if there is suf-ficient energy: typical examples are alkyl chains and methyl groups. The flexibility in a large molecule can be responsible for biological activity, and one reason for the intolerance of living organisms to even relatively small temperature changes is the subtle importance of internal degrees of freedom to their biological functions, and the interplay between thermal energy (kT) and activation barriers to orientational motion.
The phase diagram of helium (Figure 9.12 shows the phase diagram for the condensed phases of the 4He isotope) shows other interesting and unique features. For example, there are three solid phases in 4He, one with hexago-nal close packing, another with body-centered cubic packing, and another
Liquidbcc
hcp
Superfluid
fcc
1000
50
25
00 1 2.17 3 15
T/K
P/at
m
FIGURE 9.12Phase diagram of the condensed phases of 4He. The three solid phases are labeled according to their structure: bcc = body-centered cubic; hcp = hexagonal close-packed; fcc = face-centered cubic. The two liquid phases are labeled as liquid (also called liquid I) and superfluid (also called liquid II).

216 PhysicalPropertiesofMaterials
with face-centered packing. Perhaps more interesting is the fact that helium does not exist as a solid except under applied pressure; it stays as a liquid right down to absolute zero. Furthermore, there are two liquid phases! The higher- temperature liquid form, liquid helium I, is the phase that exists at the critical point (Tc = 5.2 K), and this is the form of liquid helium that boils at 4.2 K and has wide use as a cryogen (a low-temperature fluid).
Liquid helium II has such fascinating properties that it is called a superfluid. For example, a suspended beaker filled with liquid helium II will spontaneously lose its contents due to creep up the sides of the beaker, followed by dripping until the beaker is empty. Liquid helium II can flow through the narrowest of openings, without any resistance (i.e., it has zero viscosity). Furthermore, the thermal conductivity of liquid helium II close to the liquid–liquid transition temperature is about 1000 times greater than that of copper (and remember that a liquid has neither phonons nor free electrons to carry heat!). The other He iso-tope, 3He, has at least three distinct superfluid phases.*
The phase transition from liquid helium I to liquid helium II is often referred to as a λ-transition, owing to the shape of the associated heat capac-ity anomaly. The source of the unusual properties of liquid helium II is the zero-momentum state of some of the helium atoms in this phase (moving at a speed of about 3 × 10⁻⁷ m s–1, which is very slow compared with the speed of the other He atoms which move about 109 faster (i.e., 300 m s–1 at absolute zero due to zero-point motion). The helium atoms in this phase are said to have undergone a Bose-Einstein condensation (i.e., they are “condensed” into their ground state energy), as suggested first by Fritz London in 1938 and now confirmed experimentally.†
* The discovery of superfluidity of 3He at 0.002 K was the topic of the 1996 Nobel Prize in Physics, awarded jointly to David M. Lee (1931–; Professor of Physics, Cornell University), Douglas D. Osheroff (1945–; Professor of Physics, Stanford University) and Robert C. Richardson (1937–; Professor of Physics, Cornell University).
† See, for example, John Bardeen, 1990. Superconductivity and other macroscopic quantum phenomena. Physics Today, December 1990, 25.
COMMENT: POLYMORPHISM IN NATURE
CaCO3 exists in two common polymorphs in nature, calcite and ara-gonite. Although the two crystal structures are very similar, calcite is the more thermodynamically stable form at room temperature and pressure. The form produced under biological conditions depends on nucleating macromolecules, and possibly on temperature and the pres-ence of other ions in solution. For example, the nacre (mother-of-pearl) in shells is typically aragonite “bricks” (~1 micron thick and 10 microns wide and deep) embedded in an organic matrix.
www.ebook3000.com

ThermodynamicAspectsofStability 217
As a final example of an interesting phase diagram of a pure material, we consider polymorphism in carbon. Figure 9.13 shows that the low-pressure stable form is graphite while at higher pressures (such as inside the earth) dia-mond is the stable form. Since we know that diamonds can exist at room tem-perature and pressure, we must conclude that they are metastable and should spontaneously convert to the more thermodynamically stable form, graphite. That diamonds do not convert before our eyes indicates that the activation energy for this conversion is very high. This makes sense in light of the great rearrangement that would be required to go from the 3-dimensional diamond lattice (Figure 9.14a) to the two-dimensional layered structure of graphite (Figure 9.14b). The differences between the diamond and the graphite structures are also responsible for the very large differences in their properties: diamond is hard (due to the three-dimensional structure) whereas graphite is so soft that it is the “lead”* in a pencil and also a useful lubricant (due to the weak [van der Waals] interaction holding the layers together).
Carbon has other polymorphs, including the family of compounds generally known as Fullerenes. The archetypal member of this family is the molecule C60, which was first discovered in 1985.† The geometry of the C60 molecule is that of a soccer ball (see Figure 9.15), with one carbon atom at each vertex. There
* This is called “lead” because the first deposit of graphite used to make pencils, which was revealed when a tree toppled over, was originally mistaken for the element lead.
† This discovery was recognized with the 1996 Nobel Prize in Chemistry, awarded jointly to Robert F. Curl Jr. (1933–; Professor of Chemistry, Rice University), Sir Harold W. Kroto (1939–; Professor of Chemistry, University of Sussex) and Richard E. Smalley (1943–2005; Professor of Chemistry, Rice University).
Diamond Liquid
Diamond +metastable graphite
Graphite +metastable diamond
400
300
200
100
00 1000 2000 3000 4000T/°C
P/kb
ar
FIGURE 9.13The pressure-temperature phase diagram of carbon. Solid lines indicate the regions of stable phases; metastability is indicated with a dashed line.

218 PhysicalPropertiesofMaterials
can be other molecules with similar structures, and the general family is called Fullerenes after R. Buckminster Fuller, the architect who designed geodesic domes as architectural structures. Although first synthesized in the laboratory only a few years ago, it is now known that Fullerenes exist naturally on earth and even in interstellar space. C60 has been found to occur naturally in a 2-billion-year-old impact crater in Sudbury, Canada. The dis-covery of C60 and its family members has led to very exciting new areas of materials research. Some metal atoms can be trapped inside the cage of Fullerenes, designated by the general formula M@Cn. For example, La@C82 and Y@C82 have been prepared. The combination of metals with the insulat-ing Fullerenes can lead to unusual optical and electronic devices: Fullerene derivatives can be made to be superconducting (e.g., K3C60; see Chapter 12 for a discussion of superconductivity). Other molecules with special properties can be added outside or inside the cage, and C60 even can be used to produce
FIGURE 9.15The molecular structure of C60.
(a) (b)
FIGURE 9.14Structures of two polymorphs of carbon, namely: (a) diamond and (b) graphite. The three-dimensional bonding network of diamond is one of the reasons why diamond is so hard. On the other hand, the layered structure of graphite, with the layers held together with weak van der Waals interactions, makes graphite useful as a lubricant.
www.ebook3000.com

ThermodynamicAspectsofStability 219
diamond films*. Pure C60 is yellow when in the solid form, and magenta when dissolved in benzene, indicating that its electronic energy levels depend on the environment.
The solid form of C60 is orientationally disordered at room temperature (see Figure 9.16), with the molecules sitting on the lattice sites of a face-centered cubic lattice. Below a solid–solid phase transition at about T = 250 K, the C60 molecules become more ordered.
* For a review, see R. F. Curl and R. E. Smalley, 1991. Fullerenes. Scientific American, October 1991, 32.
COMMENT: UNUSUAL OPTICAL PROPERTIES OF C60
C60, has an unusual optic property in that, when more intense light shines on it, less light is transmitted. Furthermore, C60 becomes a better “light limiter” at longer wavelengths, because the absorption cross sections of the ground state and the excited state both change with wavelength, but in opposite directions. This may lead to using C60 for protection from light radiation, but first materials researchers have to devise a way to produce stronger films of C60, and to keep them from oxidizing.
COMMENT: ANOTHER FORM OF CARBON–CARBON NANOTUBES
Another form of carbon that is attracting considerable attention can be considered as small graphite sheets folded into tubes. (Individual graphite sheets are another form of carbon, known as graphene.) Since
FIGURE 9.16The structure of C60 at room temperature, showing the C60 molecules dynamically orientation-ally disordered on their face-centered cubic lattice sites.

220 PhysicalPropertiesofMaterials
the tubes are made of carbon, and their width is on the nanometer length scale, these are often referred to as carbon nanotubes (or CNTs). CNTs come in many different forms, including single-walled (SWCNT) and multiwalled (MWCNT), as shown in Figure 9.17.
Carbon nanotubes have exceptional properties. For example, they can be as stiff as diamond and more than 10 times stronger than Kevlar (see Chapter 14 for further discussion of mechanical properties). As we shall see in Chapter 12, carbon nanotubes also can have unusual elec-trical properties, ranging from semiconductors to metals, depending on the exact folding of the tubes.
COMMENT: QUASICRYSTALS
The 14 crystal types shown in Chapter 1 are the smallest cells that can be regularly and repeatedly translated to produce periodic macroscopic crystalline structures. By contrast, glassy (or amorphous) materials do not have periodic atomic arrangements. For many years it was thought that these were the only possibilities for arrangements of atoms in solids—fully periodic or fully disordered. However, materials such as alloys of aluminum and manganese have been found which have qua-siperiodic structures, and they are called quasicrystals. These structures are similar to quasiperiodic tiling patterns worked out by the British mathematician Sir Roger Penrose; an example of a Penrose tiling pattern is shown in Figure 9.18. The main feature of the packing arrangement is that all space is filled, yet the arrangement is never exactly repeated.
(a)
(b) (c)
FIGURE 9.17Some examples of carbon nanotubes. (a) A schematic view of a single-walled carbon nanotube, and (b) a view into its interior. (c) A view of a multiwalled carbon nanotube. (Diagrams cour-tesy of Chris Kingston.)
www.ebook3000.com

ThermodynamicAspectsofStability 221
9.5 The Phase Rule
There is a very useful rule, called the phase rule (also known as Gibbs’ phase rule) that can be used to generalize the relationships between the number of free variables specifying the state of a system, the number of chemical components present and the number of phases present. The phase rule can provide very useful information concerning the phases present in a system.
Before deriving the phase rule, it is necessary to introduce a concept that is as important for many-component species as Gibbs energy is for single- component (pure) systems. This concept is chemical potential, where the chemical potential for component i, μi, is defined as
ii T P n
Gn
j i
=∂∂
≠, ,
, (9.13)
where the inequality in the constant-variable subscript indicates that the number of moles* of all components except component i are held constant. If the system has only component i (i.e., it is pure species i), then μi = Gm (i.e., the molar Gibbs energy is the same as the chemical potential for a pure material).
The reason for introducing chemical potential is that it is the multicom-ponent analogue to G. Just as G is equal for all phases at equilibrium, the chemical potential of a given species is the same in all equilibrated phases in which it is present. For example, if phase α is in equilibrium with phase β, and component i is present in both phases, then
α βi i= . (9.14)
* IUPAC recommends the term “amount of substance” in place of “number of moles.”
FIGURE 9.18A two-dimensional representation of a quasicrystalline structure.
222 PhysicalPropertiesofMaterials
We use the symbol F to represent the number of degrees of freedom* of a system, and it is the aim of the phase rule to determine F, the number of independent variables needed to specify the system. In other words,
F = number of variables – number of relations. (9.15)
The variables needed to describe the system will involve the composition of each phase, and possibly other variables (e.g., temperature and pressure), and we look at these in some detail below.
We use the symbol c to represent the number of chemical components in the system. This is the minimum number of chemical species needed to describe the composition of the system. Alternatively, c can be described as the number of independent chemical species. For example, in an aqueous sodium chloride solution, c = 2 whether it is considered that H2O and NaCl are the components, or whether the chemical species are considered to be H2O, NaCl, Na+, Cl–, H+, and OH–. In the latter case the number of chemical species is 6 but there are 4 independent relations: [OH–] = [H+]; [Na+] = [Cl–]; H2O ⇄ H+ + OH–; NaCl ⇄ Na+ + Cl–. This leaves 6 – 4 = 2 independent chemi-cal species, that is, c = 2.
We let p represent the number of types of phases within the system. A phase is considered to be a homogeneous region separated from other homoge-neous regions by a phase boundary (or surface of discontinuity). For exam-ple, an ice water solution with excess salt has p = 3. The discontinuities from one phase to the next can be considered to be the variation in density of the beaker’s contents from the top to the bottom of the beaker.
So, using the definition of F (Equation 9.15), we can first consider the num-ber of variables needed to describe the state of the system, and then consider the relations between the variables, to determine a useful relationship for F, that is, the phase rule.
We must know something about the compositions to know the state of the system. Within a given phase, we need to know (c – 1) of the compositions if there are c components present. The value (c – 1), rather than c, arises because the final composition, that is, the composition of the c-th component, can be derived from the other (c – 1) compositions from
∑ =i
iX 1 (9.16)
* This is distinct from the “degrees of freedom” used in Chapter 6 to designate the number of spatial and angular coordinates required to describe the motion and position of a molecule, but in both cases the term “degrees of freedom” is used to indicate the variables that are nec-essary to define the system.
www.ebook3000.com

ThermodynamicAspectsofStability 223
where Xi is the mole fraction of component i in the mixture, defined as
Xnni
i=tot
(9.17)
where ni is the number of moles of component i, and ntot is the total number of moles in the system. For p phases, this gives a total of p(c – 1) compositional variables that are required to specify the system.
Other variables might also be needed to specify the state of the system. For example, T and P can vary the state of the system, and, in some circumstances, electric field (for example, cholesteric liquid crystals) and/or magnetic field can vary the state of the system. We let n represent these other variables; in our examples often n will be 2 (T and P) or 1 (T or P), but we leave the value n unspecified for the general case. Combined with the composition variables, this leads to n + p(c – 1) variables needed to specify the system. However, not all these variables are independent, and we now address this point.
There are chemical potential relations among the phases that serve to reduce the number of variables needed to specify the state of the system. For each component i in the p equilibrated phases the chemical potentials are all the same, so we can write
i i ip1 2= = =… , (9.18)
and for the p phases there are (p – 1) such relations for each component i. Therefore, for c components, there are c(p – 1) such relations, each reducing the number of free variables necessary to specify the state of the system.
Putting this together, considering the definition of F (Equation 9.15), leads to
F = n + p(c – 1) – c(p – 1), (9.19)
which simplifies to
F = c – p + n (9.20)
where Equation 9.20 is the phase rule, first derived in 1875 by J. Willard Gibbs.
The phase rule can be used to describe the number of free variables in a system, and, since we have been discussing single-component phase dia-grams, we begin there with the use of the phase rule.
From the typical one-component phase diagram of Figure 9.19, and consider-ing that here c = 1 and n = 2 (T and P can, in principle, vary), this leads to F = 2 in the region where only solid exists. This value of F indicates that two variables

224 PhysicalPropertiesofMaterials
(T and P) are needed to specify the state of the system. Another way to express this is that P and T can vary independently. Similarly, in the liquid region, F = 2 and T and P are independent of each other. In the vapor region F = 2 also.
Along the liquid–solid coexistence line, c = 1, p = 2, so F = 1 – 2 + 2 = 1. This shows that, although T or P can be varied along this line, they cannot be varied independently; a new T specifies (through the phase diagram or the Clapeyron equation) what the new pressure will be. Similarly, F = 1 along the solid–vapor line, and along the liquid–vapor line. As long as we are on one of these lines, T and P are not independent of each other; there is only one degree of freedom.
At the triple point (the coexistence point of solid, liquid, and vapor), c = 1, p = 3, and F = 1 – 3 + 2 = 0. This is said to be an invariant point, since neither the temperature nor the pressure can be arbitrarily changed while remaining at the triple point. For this reason triple points (e.g., T = 273.16 K, P = 610.6 Pa for H2O) can be used for calibration of thermometers.
The minimum number of degrees of freedom is 0, as in the invariant triple point. This implies, for a situation where n = 2, that the maximum number of phases in equilibrium in a one-component system is 3. (See Figure 9.4 for sulfur, where there are four phases but no more than three phases coexist at any given temperature and pressure.)
If we consider isobarically warming a sample of the material described by the phase diagram of Figure 9.19 along the dashed line shown in the figure, the phase rule can be used to describe the heating curve (temperature as a function of time). As this is a constant pressure situation, n = 1. Therefore, F = 2 – p here. In region a, where there is one phase (solid), F = 2 – 1 = 1, and the temperature can increase. At point b, p = 2 (solid and liquid), so F = 0, and the temperature must be invariant throughout the time it takes to pass through b. In c, p = 1, F = 1, so the temperature increases again. At point d, p = 2 (liquid and vapor), F = 0, so the temperature remains constant until the liquid is fully vaporized. In region e, p = 1 (vapor) and F = 1, so the temperature
T
P
Liquid
Solid
Vapor
a b c d e
FIGURE 9.19Phase diagram for a typical pure material, showing the effect of pressure and temperature on phase stability. The solid lines indicate stable phase boundaries. The dashed line indicates heating at constant pressure (see text).
www.ebook3000.com

ThermodynamicAspectsofStability 225
can increase again. The corresponding temperature–time profile is shown in Figure 9.20. The horizontal lines in such a warming curve are called halts or arrest points, and they are particularly telling, as they indicate regions where F = 0. The determination of such warming curves, as we shall see, espe-cially for m ulticomponent phase diagrams, can be used to construct phase d iagrams. We turn next to phase diagrams consisting of two components.
9.6 Liquid–Liquid Binary Phase Diagrams
In the world of materials, mixtures of materials can be somewhat more important than pure materials. The main reason is that mixing materials allows one to tailor-make properties, intermediate between those of the pure materials, or sometimes giving new properties altogether different from those of the pure materials. Although nature has provided a lot of different types of pure materials (over 30,000,000 compounds catalogued in Chemical Abstracts, growing at more than 3000 per week!), mixtures can be very important.
When a system consists of more than one chemical component, it is referred to as a multicomponent system. In the case of two chemical components, it is called a binary system. In our discussion of binary systems, we begin by con-sidering a system prepared by mixing two liquids.
Generally speaking, liquids are considered to be miscible (fully soluble, e.g., two liquids with similar polarities, such as water and acetone), or immiscible (e.g., two liquids with very different polarities, such as CCl4 and H2O). In strict terms, at the lowest concentrations, every liquid will mix with every other liquid, but at higher concentrations there may be a miscibility gap (i.e., a range of concentrations for which two liquid phases coexist).
Liquid
Liquid
liquidSolidSolid
vapor
Vapor
Time
Tem
pera
ture
Tb
Tm ab
c
d
e
FIGURE 9.20The warming curve (temperature–time profile) corresponding to isobaric heating of a pure material from solid to liquid to gas (i.e., along the dashed line of Figure 9.19).

226 PhysicalPropertiesofMaterials
The miscibility of two liquids, like the solubility of a solid in a liquid, can change as the temperature is changed. Liquids with a miscibility gap can either increase or decrease their miscibility as the temperature is increased.
If the miscibility increases with increasing temperature, this can lead to a temperature above which the two liquids are completely miscible in all pro-portions. This temperature is referred to as the upper consolute temperature, Tuc. An example is shown in Figure 9.21.
In contrast, some liquids decrease their miscibility as the temperature is increased, so there is a temperature beneath which the two liquids are mis-cible in all proportions. This is a lower consolute temperature, Tlc. An example is shown in Figure 9.22.
There are a few liquid–liquid systems that show both an upper con-solute temperature and a lower consolute temperature. One is shown in Figure 9.23.
One liquid
Two liquids
A B
T
Tuc
FIGURE 9.21An example of a liquid–liquid system with increased solubility at increased temperature, showing an upper consolute temperature, Tuc, at a composition intermediate between pure A and pure B. An example of such a phase diagram is water–aniline, with Tuc = 441 K.
Two liquids
One liquid
A B
Tlc
T
FIGURE 9.22An example of a liquid–liquid system with increased solubility at decreased temperature, showing an lower consolute temperature, Tlc, at a composition intermediate between pure A and pure B. An example of such a phase diagram is water–triethylamine, with Tlc = 291.6 K.
www.ebook3000.com

ThermodynamicAspectsofStability 227
9.7 Liquid–Vapor Binary Phase Diagrams
If a liquid is heated sufficiently, it will eventually transform to the vapor phase; this is true for pure liquids and it is also true for binary liquid sys-tems. However, the variation of boiling point with composition can reveal interesting features in a binary liquid system. A few of those features are summarized here because similar features can be seen in some solid–liquid phase diagrams, which are relevant for materials.
If the components of a binary system are sufficiently similar chemically, they will interact much the same with each other as they do with themselves. In this case, the system is said to be an ideal solution and PA, the vapor pres-sure of component A, is given by Raoult’s law*:
P X PA A Ao= , (9.21)
where XA is the mole fraction of component A and PAo is the vapor pressure
of component A when pure. A similar equation applies to the second compo-nent (B), such that the total pressure over an ideal solution, Ptot, is given by
P X P X Ptot A Ao
B Bo= + (9.22)
* François Marie Raoult (1830–1901) was a leading French experimental physical chemist in the 19th century. He made major experimental contributions to electrochemistry and under-standing of solutions, including provision of experimental verification of Arrhenius’ theory that salts ionize in aqueous solution. His accurate measurements of vapor pressures led to what we now call Raoult’s law.
Two liquids
One liquid
A B
T
Tuc
Tlc
FIGURE 9.23A liquid–liquid system showing both an upper consolute temperature and a lower consolute temperature, both at compositions intermediate between pure A and pure B. An example of such a phase diagram is water–nicotine, with Tuc = 480 K and Tlc = 335 K.

228 PhysicalPropertiesofMaterials
where XB and PBo are the mole fraction of component B and vapor pressure of
pure component B, respectively. The resulting vapor pressure as a function of composition for a nearly ideal system is shown in Figure 9.24.
When a binary solution is not ideal, it is because the interactions between the component molecules (i.e., A-B interactions) are different from those between like molecules (i.e., A-A and B-B interactions).
If the A-B type interactions are more repulsive than the A-A and B-B inter-actions, then the vapor pressure of the solution will be higher than the ideal vapor pressure. An example of this is shown in Figure 9.25, where the increase in vapor pressure has given rise to a maximum in the vapor pressure plot. At
2-Methyl-1-propanol 3-Methyl-1-butanol0 1
100
0
Liquid
L + VVapor
X
P/kPa
FIGURE 9.24The pressure-composition diagram for 2-methyl-1-propanol with 3-methyl-1-butanol, T = 323.1 K, which forms a nearly ideal solution. The liquid curve is nearly a straight line, as given by Equation 9.22.
Ethylene chloride Ethanol
30
20
0 1
Liquid
Vapor
L + V L + VP/kPa
X
FIGURE 9.25The liquid–vapor phase diagram for the system ethylene chloride–ethanol at T = 313.1 K, show-ing pressures greater than ideal pressures, and an azeotrope.
www.ebook3000.com

ThermodynamicAspectsofStability 229
the composition of this maximum, the liquid boils at constant temperature, just like a pure component. This is called an azeotrope, which means “con-stant boiling mixture.”
On the other hand, if the A-B interactions in a binary solution are more attractive than the A-A of B-B interactions, then the vapor pressure will be lower than in the ideal system. An example of this is shown in Figure 9.26, where another azeotrope (this one at low vapor pressure) occurs.
An ideal binary solution, by virtue of its vapor pressure changing mono-tonically with composition (Equation 9.22), will have a boiling point that is intermediate between the boiling points of the two components. An example is shown in Figure 9.27. Note that at any composition intermediate between the two pure components, there is a temperature range of coexistence between liquid and vapor.
If the deviations from ideality lead to a vapor pressure that is higher than ideal, this corresponds to boiling points that are lower than ideal. (A solution
Acetone Chloroform
Liquid
0 1
50
40
30Vapor
L + VP/kPa
X
FIGURE 9.26A liquid–vapor diagram showing a low vapor pressure azeotrope. The components are acetone and chloroform at T = 308 K.
2-Butanone trans-DichloroethyleneX
0 1
350
340
330
320
Vapor
L + V
Liquid
T/K
FIGURE 9.27Temperature-composition boiling point diagram for 2-butanone with trans-dichloroethylene at P = 101.325 kPa = 1.00000 atm. This system shows nearly ideal behavior.

230 PhysicalPropertiesofMaterials
boils when the vapor pressure that it exerts equals the external pressure; if the vapor pressure is high, then a lower temperature will achieve boiling.) An example of a boiling point diagram for such a system is shown in Figure 9.28.
If the deviations from ideality make the vapor pressure lower than the ideal vapor pressure, then there will be a maximum in the boiling point dia-gram. An example is shown in Figure 9.29.
Carbon tetrachloride Methanol
350
340
330
3200 1
X
Vapor
L + VL + V
Liquid
T/K
FIGURE 9.28The boiling point diagram for carbon tetrachloride and methanol at P = 101.325 kPa = 1.00000 atm. This system exhibits deviations from ideality that lead to a low-boiling azeotrope. In dis-tillation of a mixture, the distillate (i.e., the portions that distils) would have the azeotropic composition, making separation of the components by distillation impossible.
Tetrahydrofuran cis-DichloroethyleneX
0 1
T/K
340
335
Vapor
L + V
Liquid
FIGURE 9.29Boiling point diagram for the system tetrahydrofuran with cis-dichloroethylene at P = 101.325 kPa = 1.00000 atm. The high-boiling azeotrope means that in distillation of any composition other than the azeotropic composition, the azeotrope will remain behind in the still pot. The azeotropic composition would distil at a fixed temperature, much like a pure component.
www.ebook3000.com

ThermodynamicAspectsofStability 231
9.8 Relative Proportions of Phases: The Lever Principle
Once we enter the realm of multicomponent systems, beginning with binary systems, the phase rule allows coexistence of two or more phases in fixed proportions at fixed temperature and pressure. In some applications it may be important to know the proportions of the phases that coexist, and it is this matter that is addressed here.
For a binary system at constant temperature and pressure, the number of components is two, the number of important other variables is zero (i.e., n = 0), and the minimum number of degrees of freedom (F) is zero. The phase rule (Equation 9.20) shows that the maximum number of phases that can coexist in this circumstance is two.
In order to consider the relative proportions of these two phases, we can use any phase diagram. Here we make use of the phase diagram for the boiling point of an ideal solution (as in Figure 9.27, redrawn for this purpose as Figure 9.30). At an overall composition XA and temperature T*, as shown in Figure 9.30, the composition of the liquid is given by XAʺ and that of the vapor is given by YA. (Note that X is the mole fraction in the liquid, and Y is the mole fraction in the vapor.)
With nA representing the overall number of moles of component A in the system, nliq representing the total number of moles of liquid (including both A and B), nvap representing the total number of moles of vapor (includ-ing both A and B), and ntot representing the total number of moles in the system,
n X n X n n X n Y nA A tot A liq vap A liq A vap= = + = +( ) . (9.23)
0 1
Vapor
Liquid
B A
L + V
T
XA
TAo
TBo
T*
XA XA YA
c b a
FIGURE 9.30A boiling point diagram for an ideal solution, for purposes of illustrating the lever principle.

232 PhysicalPropertiesofMaterials
In order to determine the ratio nliq/nvap, Equation 9.23 can be rearranged
n
nY XX X
abbc
liq
vap
A A
A A
= =−−
, (9.24)
where ab and bc refer to the lines in Figure 9.30. This shows that the mole ratio of the phases present is proportional to the “arms” of a lever (called tie lines) with the lever fulcrum at the overall composition. This makes sense; the greater the proportion of a given phase, the shorter the “arm” is to it. The proportionality of Equation 9.24 is called the lever principle.
Since no particular suppositions were made concerning the types of phases present, the lever principle applies to any coexisting two phases, regardless of the types of phases, and we will make use of it in the problems at the end of this chapter. An additional useful feature is that the same general form (ratio of tie line lengths) applies to a mass% diagram to give appropriate mass ratios.
9.9 Liquid–Solid Binary Phase Diagrams
By far the most important phases in materials science are condensed phases, including solids (crystalline or amorphous), liquids, and liquid crystals. We concentrate in this section on the phase diagrams of condensed phases of matter that arise when two components are mixed together.
In the case of a single-component (unary) phase diagram, the pressure–temperature profile could be represented in a two-dimensional diagram. When a second component is added, showing the pressure–temperature–composition profile would require a three-dimensional diagram. Although this can be done, it is more common to show a temperature–composition plot, at constant pressure, as laboratory conditions are most commonly isobaric.
The simplest case of mixing two solids would arise if the solids were so much alike that they dissolved in each other completely in the solid state, giv-ing a solid solution, the solid analogue of a liquid solution. Examined micro-scopically, a solid solution is homogeneous. An example of the formation of a solid solution is given in the copper-nickel phase diagram (Figure 9.31). Although copper melts at a lower temperature than nickel (Tm(Cu) = 1083°C; Tm(Ni) = 1453°C), both Cu and Ni form face-centered cubic solids. Since Cu and Ni are similar in size (the atomic radius is 1.28 Å for Cu and 1.25 Å for Ni), they mix completely in the solid state in all proportions. Note that the melting of a mixture of Cu and Ni begins at a temperature intermediate between the melting point of Cu and that of Ni, but an important differ-ence from either pure Cu or pure Ni is that for the mixture, solid and liquid co-exist over a temperature range at all compositions intermediate between pure Cu and pure Ni.
www.ebook3000.com

ThermodynamicAspectsofStability 233
Most pairs of solids (like some pairs of liquids) cannot dissolve in one another; in solids this often is due to incompatibility of crystal structures. When two solids are immiscible, this leads to a suspension or dispersion of one solid in the other. On a microscopic scale a dispersion is inhomogeneous (also called heterogeneous). A photograph of a dispersion (Figure 9.32) shows that particles of one solid exist in contact with particles of the other solid. In contrast with a solid solution, which is a single phase, a dispersion contains more than one phase.
A schematic example of a solid system that forms a dispersion is shown in Figure 9.33. The molecular sizes and packing of components A and B make it
0Cu XNi
T/°C
1Ni
Liquid
Solid solution
1083
Liquid +solid solution
1453
FIGURE 9.31Melting point diagram for copper with nickel. Note that only at the pure metal compositions is the melting point at one fixed temperature; at all other compositions, there is a temperature range over which liquid and solid coexist.
FIGURE 9.32An image of a solid dispersion, called pearlite, formed by Fe with 0.8 mass% carbon. This struc-ture is formed from bands of ferrite (<0.02 mass% C) and cementite (Fe3C, with 6.7 mass% C). (See Comment: The Iron Phase Diagram.) (Reprinted from Yi, H. L., Materials Science and Engineering: A, 527, 29–30. Copyright 2010, with permission from Elsevier.)

234 PhysicalPropertiesofMaterials
impossible for them to fit together in one solid phase, so they form a disper-sion. Note that as A is added to B, the freezing point is lowered; the same is true when B is added to A. This is the familiar freezing point depression. (The freezing point of Cu is not depressed by adding Ni in the Cu-Ni phase dia-gram [Figure 9.31] because one basic premise of freezing point depression is that the pure solid is formed on freezing the solution, whereas in the Cu-Ni case a solid solution is formed.) At low temperatures, the solids formed in the phase diagram of Figure 9.33 are pure solid A and pure B; a dispersion of one in the other would be observed microscopically. Examples of real phase diagrams that are similar to Figure 9.33 include ethylene glycol/water (in its metastable phase diagram; ethylene glycol/water also forms a solid hydrate in its stable phase diagram), and several alloys (As/Au, As/Pb, Au/Si, and Bi/Cd all show almost completely immiscible solids).
Consideration of the numbers of degrees of freedom in a few constant- composition slices of the phase diagram in Figure 9.33 allows plotting temperature– time profiles, to show how cooling (or heating) curves can be used to deduce phase diagrams. From the general form of the phase rule (Equation 9.20) and the fact that c = 2 here and n = 1 (T can vary but P is fixed), we find F = 3 – p. Slice 1 (Figure 9.33) on cooling gives the phases and degrees of freedom summarized in Table 9.1. The phase(s) in each region are determined by considering what regions an imaginary horizontal line (the tie line) touches. The change from two degrees of freedom to one at point b leads to a change in slope in the cooling curve; the cooling is not so fast because the precipitation of solid A is exothermic. This change in slope in a cooling curve is called a break point, and it is characteristic of a change in the number of degrees of freedom, with F ≠ 0. At point d, F = 0 so temperature is
Liquid
Liquid+ A(s)
Liquid+ B(s)
A
T*
T
B
A(s) + B(s)
gd
c
e
f
h
b
a
1
2
FIGURE 9.33A freezing point diagram showing completely immiscible solid phases. The constant-composition slices shown correspond to the cooling curves shown in Figures 9.34 and 9.35. The implied label on the x-axis is XB , ranging from 0 to 1.
www.ebook3000.com

ThermodynamicAspectsofStability 235
invariant, and there is a halt point (also called arrest) in the cooling curve cor-responding to this temperature. The cooling curve is shown in Figure 9.34.
Similar consideration of Slice 2 of Figure 9.33 leads to the phases and degrees of freedom summarized in Table 9.2. The corresponding cooling curve is shown in Figure 9.35.
Although cooling curves might provide more reliable experimental infor-mation than warming curves (slow cooling from the melt will generally ensure equilibrium as long as there are sufficient nucleation sites, whereas the solid might contain metastable states), we can consider the effects of warming an equilibrated solid. On warming along the line of Slice 1, the solid (which is a dispersion of solid A in solid B) first begins to melt at T*. The composition of the first liquid that appears, considering the tie line, will be the composition of point g. Note that this is not the same as the overall com-position of the system. As the sample is heated further, the composition of the liquid will change, becoming richer in A as the temperature is increased. The liquid and solid continue to co-exist throughout the range from point d to point b, and above b only liquid exists.
TABLE 9.1
The Phases and Degrees of Freedom in the Various Regions of the Phase Diagram along Slice 1, Shown in Figure 9.33a
Region Phase(s) p F
a Liquid 1 2b Liquid + A(s) 2 1 (Break)c Liquid + A(s) 2 1d Liquid + A(s) + B(s) 3 0 (Halt)e A(s) + B(s) 2 1
a P = 1 atm; F = 3 – p here.
Time
Tem
pera
ture
T*
abc d
e
FIGURE 9.34The cooling curve (temperature as a function of time) along Slice 1 of the phase diagram shown in Figure 9.33. Note the break at b and halt at d.

236 PhysicalPropertiesofMaterials
Note that the point g on Slice 2 is a special point. At any temperature higher than this point, the system is completely liquid. At any temperature lower than this point, the system is completely solid. Therefore, on heating at this composition, the system melts to give a liquid of the same composi-tion as the solid. This special composition is called the eutectic composition, which means that it melts at a single temperature without change in compo-sition. The corresponding temperature (T * in Figure 9.33) is called the eutectic temperature.
The existence of a eutectic can be useful in choosing materials with a particular melting point. For example, although both tin and lead melt too high to be useful as solders, a 26 atomic% Pb mixture of tin and lead (see Figure 9.36) can be useful as a solder in that it melts at a fixed temperature without change in composition. Some other useful low-melting alloys (sev-eral of which are eutectics) are listed in Table 9.3.
Just as liquids can show partial miscibility, so can some solids. The tin-lead phase diagram (Figure 9.36) shows partial miscibility. The two solids formed, S1 and S2, are solid solutions of variable composition, rich in tin and lead, respectively. The composition of S1 or S2 can be read from the phase diagram (e.g., S2 is 93 atomic % lead at T = 100°C).
g
f
h
Time
Tem
pera
ture
T*
FIGURE 9.35The cooling curve (temperature as a function of time) along Slice 2 of the phase diagram in Figure 9.33, at a constant pressure of 1 atm. Note the halt at g.
TABLE 9.2
The Phases and Degrees of Freedom in the Various Regions of the Phase Diagram along Slice 2, Shown in Figure 9.33a
Region Phase(s) p F
f Liquid 1 2g Liquid + A(s) + B(s) 3 0 (Halt)h A(s) + B(s) 2 1
a P = 1 atm; F = 3 – p here.
www.ebook3000.com

ThermodynamicAspectsofStability 237
Cooling of Slice A or Slice B (Figure 9.36) of the Sn/Pb phase diagram will lead to cooling curves like in the phase diagram of Figure 9.33, but Slice C will be slightly different. Again, F = 3 – p here, which gives the degrees of freedom listed in Table 9.4. The corresponding cooling curve is shown in Figure 9.37. Note that in this slice there is no invariant point (F = 0 point) and there is no halt in the cooling curve.
Liquid+ S1
S1
Liquid+ S2
S1 + S2
S2
B A
Liquid
g
f
edc
b aC
300
200
100
00Sn
1Pb
XPb
T/°C
FIGURE 9.36Melting point diagram of tin with lead. Note the eutectic at 26 atomic % Pb, which corresponds to tin-lead solder. S1, also expressed as (Sn), is solid rich in tin; S2, also written (Pb), is solid rich in lead.
TABLE 9.3
Compositions and Melting Points of Eutectic Solders
Melting Point/°C
Composition (mass%)
Bi Cd Pb Sn Hg
60 53.5 — 17 19 10.570 45.3 12.3 17.9 24.5 —80 35.3 9.5 35.1 20.1 —91.5 51.6 8.1 40.2 — —96 52.5 — 32 15.5 —100 50 — 32.2 17.8 —124 55.5 — 44.5 — —138 57 — — 43 —154 14 — 43 43 —177 — 32 — 68 —
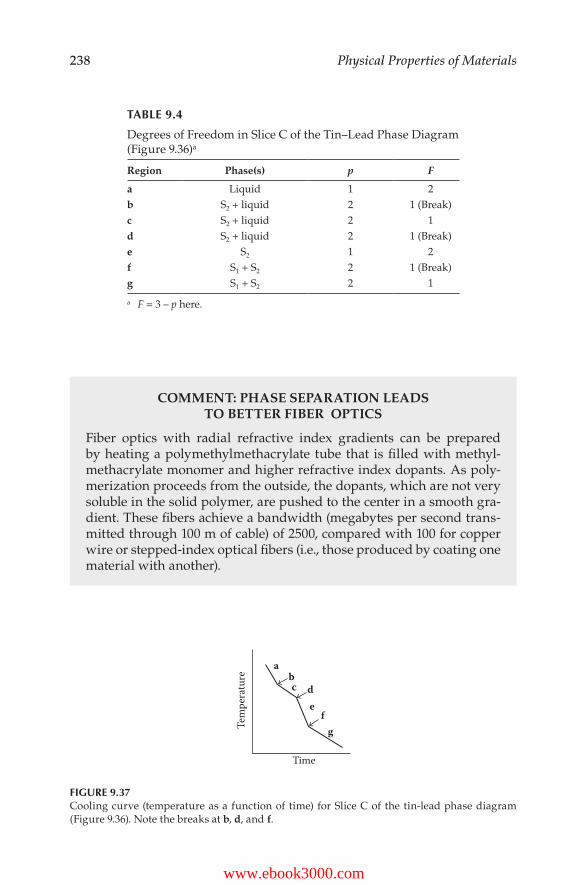
238 PhysicalPropertiesofMaterials
COMMENT: PHASE SEPARATION LEADS TO BETTER FIBER OPTICS
Fiber optics with radial refractive index gradients can be prepared by heating a polymethylmethacrylate tube that is filled with methyl-methacrylate monomer and higher refractive index dopants. As poly-merization proceeds from the outside, the dopants, which are not very soluble in the solid polymer, are pushed to the center in a smooth gra-dient. These fibers achieve a bandwidth (megabytes per second trans-mitted through 100 m of cable) of 2500, compared with 100 for copper wire or stepped-index optical fibers (i.e., those produced by coating one material with another).
TABLE 9.4
Degrees of Freedom in Slice C of the Tin–Lead Phase Diagram (Figure 9.36)a
Region Phase(s) p F
a Liquid 1 2b S2 + liquid 2 1 (Break)c S2 + liquid 2 1d S2 + liquid 2 1 (Break)e S2 1 2f S1 + S2 2 1 (Break)g S1 + S2 2 1
a F = 3 – p here.
abc d
efg
Time
Tem
pera
ture
FIGURE 9.37Cooling curve (temperature as a function of time) for Slice C of the tin-lead phase diagram (Figure 9.36). Note the breaks at b, d, and f.
www.ebook3000.com

ThermodynamicAspectsofStability 239
COMMENT: THE IRON PHASE DIAGRAM
The stable form of pure iron at room temperature has a body-centered cubic (bcc) structure and it is called α-iron. Below 760°C it is ferromagnetic (i.e., permanently magnetized by an applied magnetic field; see Chapter 13); above 760°C, there is too much thermal energy for ferromagnetism to be maintained, but the structure remains bcc until 906°C when it trans-forms to a face-centered cubic (fcc) structure (γ-iron). At 1401°C, pure iron transforms to another body-centered cubic phase, δ-iron, which is stable up to the melting point of 1530°C.
Additions of small amounts (<2 mass%) of carbon to iron leads to the formation of steel. Higher concentrations of carbon give cast iron. For this reason, the Fe-C phase diagram, a portion of which is shown in Figure 9.38, is among the most important phase diagrams known. As can be seen from the diagram, below 2 mass% C, heating can lead to a solid solution (γ-iron, which can be hot-rolled, pressed, drawn, or otherwise shaped), but above 2 mass% C (i.e., cast iron) heating does not achieve a malleable solid state and therefore shaping is done from the melt by casting.
The Fe-C phase diagram shows a number of features, including the eutectic at about 1150°C and 4.2 mass% C (liquid stable at higher temperatures) and the eutectoid (this is like a eutectic but with a solid solution stable at higher temperatures) at 723°C and about 1 mass% C.
Mass % C
Liquid
T/°C
1500
1000
500
00 1 2 3 4
δ + L
δδ + γ
α + γ
γ
γ + L
γ + Fe3C
α + Fe3C
α
Fe3C + L
FIGURE 9.38A portion of the Fe-C phase diagram showing the Fe-rich region.

240 PhysicalPropertiesofMaterials
9.10 Compound Formation
So far, in considering binary systems, we have only taken into account physical interaction, not stronger interactions. If there is a strong interaction between the two components this can lead to compound formation, and, in terms of their phase diagrams, compounds can be distinguished as congru-ently melting or incongruently melting.
A congruently melting compound is one in which the liquid formed on melting has the same composition as the solid compound. An example is shown in Figure 9.39, where AB is the 1:1 compound of components A and B. This dia-gram can be considered to be the sum of two other simple phase diagrams—the AB/B diagram (right side of Figure 9.39) and the A/AB diagram (left side of Figure 9.39).* When looked at this way, the features are not new. The com-
* The only difference from being two phase diagrams side-by-side is that the slope of the melt-ing point around the composition of AB is zero, whereas it is nonzero for the pure compo-nents, A and B. The slope is nonzero only when the liquid is the same chemical species as the solid, and A melts to give liquid A, and B melts to give liquid B, whereas AB melts to give A(liq) miscible with B(liq), not AB(liq).
The formation of the compound Fe3C plays an important role in the mechanical properties of steel and cast iron, and this can be controlled by heat treatment. The presence of Fe3C leads to brittle iron that can be cast into its final form. However, Fe3C is metastable with respect to graphite, and in some treatments the presence of graphite allows the production of malleable irons that can be worked into shape.
Figure 9.38 shows that α-iron dissolves only a little carbon (0.05 mass% carbon), whereas γ-iron dissolves up to 2 mass% carbon. This is because there is more room for carbon at interstitial octahedral sites (i.e., spaces within the lattice that have octahedrally placed neighbors) in the fcc structure of γ-iron than in the tetrahedral interstitial sites (spaces in the lattice with tetrahedral neighbors) of bcc α-iron.
The solid solution of carbon in γ-iron is called austentite; that for α-iron is called α-ferrite. If austentite is cooled slowly below the eutectoid at 723°C, it phase separates to α-ferrite and Fe3C (cementite); this phase sep-aration gives a heterogeneous material called pearlite (see Figure 9.32).
If austentite is cooled rapidly it forms a metastable structure called martensite in which carbon atoms are at the interstitial sites of a bcc lattice, but the crystal structure is tetragonal (expanded along one axis but with 90° angles retained). Martensite is the hardest component in quenched (rapidly cooled) steels because the tetragonal structure of the crystallites does not pack well in the cubic arrangements of their neighboring mate-rials. This is one way in which steel is hardened by heat treatment.
www.ebook3000.com

ThermodynamicAspectsofStability 241
pound AB melts to give a liquid of composition 50 mol% A, 50 mol% B, the same as the composition of the solid.
An incongruently melting compound gives, on melting, both a liquid and a solid with different compositions from the compound. This is shown schematically for compound AB in Figure 9.40. An example of this is KNa2, which decomposes on melting to give a solid rich in Na and a liquid that is depleted in Na relative to KNa2. The Na–K phase diagram is shown in Figure 9.41.
The K–Na phase diagram shows that the composition at 54.0 mass% Na (which corresponds to KNa2) begins to melt at 7°C, giving solid solution rich in Na, designated (Na), and a liquid depleted in Na relative to KNa2.
Liquid
Liquid+ AB(s)
Liquid+ A(s)
Liquid+ AB(s)
Liquid+ B(s)
AB(s) + B(s)
A(s) + AB(s)
0 0.5 1A AB B
XB
T
FIGURE 9.39The melting point diagram in the binary A-B system, at constant pressure. The compound AB melts congruently.
Liquid
Liquid+ A(s)
Liquid+ AB(s)
A(s) + AB(s)
AB(s) + B(s)
0 0.5 1A AB B
XB
Liquid+ B(s)
T
FIGURE 9.40Temperature-composition phase diagram for the system A-B at constant pressure, showing the incongruently melting compound AB.

242 PhysicalPropertiesofMaterials
As the temperature is increased, the proportion of liquid (which contains K and Na) and solid (Na-rich solid solution) changes, yielding more liquid as the temperature goes up. This liquid becomes richer in Na as the tempera-ture is increased, because it is forming from (Na). Eventually all the solid will become liquid. A major distinguishing feature between congruent and incongruent melting is that for congruent melting the vertical line at the compound composition directly reaches the liquid region; for incongruent melting the vertical line at the compound composition stops short of the liq-uid region, usually at a horizontal line in the phase diagram.
The K–Na phase diagram shows a eutectic (point ① in Figure 9.41) and also another special point (point ② in Figure 9.41), called a peritectic point. The peritectic point corresponds to the liquid composition that is formed at the
Liquid
Liquid+ (K)
Liquid+ (Na) (Na)
Liquid +KNa2 (s)
KNa2 (s)+ (Na)(K) + KNa2 (s)
12
140
100
60
20
-20
-600 20 40 60 80 100
Mass% Na
T/°C
(K)
ab
cd ef g
FIGURE 9.41The K–Na temperature-composition phase diagram at constant pressure. The compound KNa2 melts incongruently at 7°C. (K) is solid rich in potassium and (Na) is solid rich in sodium.
TABLE 9.5
Phases and Degrees of Freedom in the K–Na Systema
Region Phase(s) p F
a Liquid 1 2b Liquid + (Na)b 2 1 (Break)c Liquid + (Na)b 2 1d Liquid + (Na)b + KNa2(s) 3 0 (Peritectic halt)e Liquid + KNa2(s) 2 1f Liquid + KNa2(s) + (K)b 3 0 (Eutectic halt)g (K)b + KNa2(s) 2 1
a Regions correspond to those labeled in Figure 9.41; F = 3 – p here.b (Na) indicates solid rich in Na but containing some K, and (K)
indicates a phase rich in K but containing some Na.
www.ebook3000.com

ThermodynamicAspectsofStability 243
temperature of melting of an incongruently melting compound. This tem-perature is referred to as the peritectic temperature.
Cooling at constant composition along the dashed line in Figure 9.41 leads to the phases and degrees of freedom (from F = 3 – p), as noted in Table 9.5. The corresponding cooling curve is shown in Figure 9.42. The lower-temperature halt, from the phase diagram, is a eutectic halt, while the higher-temperature halt is a peritectic halt. It is not possible to distinguish whether a halt is eutectic or peritectic (or something else) from one cooling diagram alone; several cooling curves are necessary to determine the phase diagram. Indeed, this is often how phase diagrams are determined experimentally.
It can be important to know whether a compound melts congruently or incongruently, especially if there is some probability that the compound will melt in an application. This could be particularly worrisome in the case of an incongruently melting material as it may not be recoverable from solidification of the corresponding liquid, since cooling this liquid will first form another solid ((Na) in the K/Na case), which may not be able to rearrange itself on fur-ther cooling to provide the desired compound (KNa2, in the K/Na case).
The main factor determining whether a compound melts congruently or incongruently is the stability of the liquid phase relative to the pure solid components at the temperature at which there is too much thermal energy for the lattice to hold together (i.e., at the melting point). If it would lower the Gibbs energy to produce one of the solid components rather than just liquid, melting will be incongruent (to give the liquid and the more stable solid). Of course, the phase stability could change with a change in another parameter such as pressure. This is shown schematically in Figure 9.43.
9.11 Three-Component (Ternary) Phase Diagrams
In the single component (also known as unary) phase diagrams, we were able to plot the phase stability region as a function of temperature and pressure,
abc d
ef
g
Time
Tem
pera
ture
FIGURE 9.42The cooling curve (temperature as a function of time) for cooling at constant composition in the K–Na phase diagram shown in Figure 9.41. Note the break at b, the peritectic halt at d and the eutectic halt at f.

244 PhysicalPropertiesofMaterials
in a two-dimensional plot. For a two-component (binary) phase diagram in order to add the additional dimension of composition, the phase diagram was either three-dimensional (P, T, composition; see Figure 9.43) or two- dimensional (P and composition at constant temperature (e.g., Figure 9.25), or T and composition at constant pressure (e.g., Figure 9.28)).
For three components, there are two independent composition variables (X1 and X2 where the third, X3, the mole fraction of component 3, is given by the relation X1 + X2 + X3 = 1) as well as pressure and temperature to con-sider. Although it is possible to include a diagram that shows composition and temperature or composition and pressure, it is most common in three- component systems to show composition diagrams at constant temperature and constant pressure. The usual way to do this is using triangular coordi-nates, as shown in Figure 9.44.
In a triangular coordinate system, each vertex represents a pure compo-nent, A, B, or C, as shown in Figure 9.44. The advantage of triangular coordi-nates is that the three components are considered in a symmetric way. The side AB is as far as possible from C, so it contains no C, and has varying A-B compositions from 100% A at point A, to 100% B at point B. Similarly, the side AC represents the A-C binary phase diagram (no B), and the side B-C repre-sents the binary B-C phase diagram (no A).
The interior of the triangle presents intermediate compositions contain-ing A, B and C. For example, the composition 10% A is found along the “10” line parallel to side BC. (These lines start at 0%A on BC, and work up to 100% A at point A.) If the B composition is 20%, this is on the 20% line parallel to side AC. The composition 10% A, 20% B, is at the point where the 10% A line intersects the 20% B line, as shown in Figure 9.44. This meeting point also crosses the 70% C line, as it must since %C = 100% – %A – %B = 70% in this case. This is shown in Figure 9.44, and the additivity of the overall composition to 100% serves as a useful check in plotting points on ternary graphs.
A BAB3P1
P2
P3
T
T
T
FIGURE 9.43Various isobaric temperature-composition diagrams at different pressures. The effect of increasing pressure is to increase the stability of compound A3B, such that it transforms to A(s) and B(s) at low pressure (P1); it melts incongruently at intermediate pressure (P2); it melts congruently at high pressure (P3).
www.ebook3000.com

ThermodynamicAspectsofStability 245
A simple example of a ternary phase diagram at constant pressure and temperature is the ethanol–methanol–water phase diagram. At T = 25°C and P = 1 atm, ethanol, methanol, and water are soluble in one another in all pro-portions, so the entire interior of the triangle represents same phase, a liquid. This phase diagram is shown in Figure 9.45.
When water, acetone, and phenol are mixed at room temperature and pres-sure, the situation is not quite so simple. Water and acetone are miscible in
A
B C
9080706050403020100
FIGURE 9.44Triangular coordinates, to represent the constant-temperature, constant-pressure phase dia-gram of the A-B-C ternary system. Each vertex represents the pure component (A, B, or C, as labeled), and each side presents a binary phase diagram (A-B, opposite vertex C; A-C, opposite vertex B; B-C, opposite vertex A). The interior of the triangle represents non-tzero composi-tions of all three components. The numbers shown correspond to concentration of A in percent (mass or mole). The point marked ∙ represents 10% A, 20% B, 70% C.
Water
Methanol Ethanol
Oneliquidphase
FIGURE 9.45Ethanol-methanol-water phase diagram at T = 25°C, P = 1 atm. All three liquid components are miscible in all proportions.

246 PhysicalPropertiesofMaterials
all proportions, so there are no phase boundaries on the water–acetone axis. Similarly, acetone and phenol are miscible in all proportions, so there are no phase boundaries on the acetone–phenol axis. However, water and phenol exhibit only limited miscibility. When only a little phenol is added to water, the two mix, but beyond a certain amount the solution separates into two phases, one rich in water and the other rich in phenol. Similarly, if a little water is added to phenol, it will dissolve, but if more water is added so that the miscibility is exceeded, the solution will separate into two layers, one rich in phenol and the other rich in water. (Note that neither layer is pure as the other component will still dissolve to some extent.) The correspond-ing water–phenol– acetone phase diagram is shown in Figure 9.46, where the temperature– dependence (showing an upper consolute temperature) is included.
The 25°C water–K2CO3–methanol phase diagram is shown in Figure 9.47. If sufficient K2CO3 is added to water, past the solubility limit, the result would be a saturated solution with excess K2CO3 as the hydrate K2CO3·3/2H2O (solid). Similarly, K2CO3 has only limited solubility in methanol. These solu-bility limits are represented by the positions at which the phase boundary lines cross the H2O–K2CO3 and CH3OH–K2CO3 axes. At regions close to the H2O-CH3OH axis, there will be one solution, since these liquids are soluble in each other in all proportions when there is nothing else present. However, starting with a 1:1 (by mass) mixture of H2O and CH3OH, and adding a salt like K2CO3 can have a rather startling effect: addition of sufficient salt causes
(CH3)2CO (CH3)2CO
C6H5OH H2O C6H5OH H2O
3050687585
(a) (b)
FIGURE 9.46The ternary system, phenol-water-acetone (C6H5OH-H2O-(CH3)2CO): (a) at room temperature and (b) as a function of temperature. The heavy points on the C6H5OH-H2O axis indicate the limits of solubility, and at room temperature there are two liquid phases present at composi-tions poor in (CH3)2CO and intermediate in C6H5OH and H2O. From (b) we can see that by 68°C, C6H5OH and H2O are soluble in all proportions, but the addition of (CH3)2CO still leads to two liquid phases. Above about 90°C, the upper consulate temperature, there is only one liquid phase, regardless of the proportions.
www.ebook3000.com

ThermodynamicAspectsofStability 247
the formation of two separable liquids. One of these liquids is rich in water, and the other is rich in methanol; they separate because the salt (K2CO3) ties up water in ion hydration spheres, so there is less water available to dissolve the methanol. Furthermore, because the ionic strength of the aqueous solu-tion is now higher, methanol is no longer miscible. This process is used to cause separation of otherwise miscible solvents by the addition of a salt, and it is termed salting out. In the phase diagram it is represented by a region in which two immiscible liquid phases coexist. At higher K2CO3 concentrations (i.e., closer to the K2CO3 vertex), there are two liquids and excess K2CO3 is in the hydrate form, K2CO3·3/2H2O (solid).
COMMENT: SIZE EFFECTS AND THERMAL STABILITY
The discussions of phase stability in this chapter have focused on bulk materials (i.e., materials with [at least] millions of atoms). However, thermal stability can be quite different when the number of atoms becomes small, or the system is confined in certain ways.
As an example of the latter, consider the melting of water. Pure, bulk water melts at 273 K. However, water in confined environments can have a much lower melting point, (e.g., 214 K when confined in the chan-nels of silicate MCM-41). Therefore, the equilibrium phase diagram of
Twoliquids+ solidhydrate
Oneliquid+ solidhydrate
Oneliquid
Twoliquids
One liquid +solid hydrate
K2CO3
H2O CH3OH
K2CO3•3/2 H2O
Oneliquid +K2CO3(s) +K2CO3•3/2 H2O(s)
FIGURE 9.47The H2O–K2CO3–CH3OH system at T = 25°C.

248 PhysicalPropertiesofMaterials
A Tongue-in-Cheek Phase Diagram: A Tutorial
The phase diagram of Figure 9.48 has been proposed as an imagina-tive answer to the age-old problem “How do they get the caramel in the Caramilk™ bar?”
The idea is that the appropriate composition of chocolate and cara-mel (abut 50–50) is heated to a processing temperature, as noted on the diagram, and then cooled to room temperature (see Figure 9.48). This would cause phase separation, into solid chocolate and a liquid phase rich in caramel.
a. Does this proposed phase diagram seem to answer the question? Why or why not?
b. Speculate on how one could successfully create a liquid caramel phase inside a solid chocolate structure.
water (Figure 9.5) needs to be reconfigured for water in confined spaces, including water in biological systems.
Similarly, wires with cross sections of the order of nanometers (nano-wires) have different melting points from their bulk materials. The ease of motion at these shorter length scales can lead to significant diffusion between the components in nanowires that are composed of different materials for their core and their shell. See Chapter 10 for more infor-mation about nanoscale materials.
Solid chocolate + solid caramel
Two liquids
Solidchocolate+ liquid
Solidcaramel+ liquid
Processtemperature
Roomtemperature
Solid chocolate + liquid
Chocolate Caramel
T
FIGURE 9.48Proposed chocolate-caramel binary phase diagram.
www.ebook3000.com

ThermodynamicAspectsofStability 249
Applications of Supercritical Fluids: A Tutorial
Supercritical fluids are fluids at temperatures and pressures beyond the critical conditions. In this region, liquid and gas are not distinguishable.
a. Describe some expected physical properties of a supercritical fluid, such as density (compared with ordinary gas) and viscos-ity (compared with the liquid).
b. How could the critical point (temperature, pressure, molar vol-ume) for a given compound be determined experimentally?
c. Would you expect the solubility of a species in a supercritical fluid to be the same as in the same solvent in the liquid state? How could this be used to advantage? As an example, consider the extraction of caffeine from green coffee beans using supercritical CO2 (Pc = 72.8 atm, Tc = 304.2 K), reducing the caffeine in the beans from its initial range of 1 to 3% to as low as 0.02% without removing other flavor and aroma components. Following caffeine extraction, the solvent is removed, and the caffeine can be used for addition to other products. This process is now used commercially to decaf-feinate millions of kilograms of coffee beans annually.
d. Some mixtures of high boiling materials cannot easily be sepa-rated by fractional distillation. Can supercritical fluids be used to affect a suitable extraction procedure? Consider that supercritical fluids can be used as the carrier in chromatographic separations.
e. In some cases, such as SiO2 dissolved in water, the solubility is very low, only a few % even when the water is in its supercritical phase (Pc = 218.5 atm, Tc = 647.3 K). However, the viscosity of the solution changes considerably at the critical temperature: for SiO2 in H2O it is about 10–2 P (poise) at room temperature, and near 10–4 P in the supercritical region. This change in viscosity is very important in the growth of SiO2 crystals from supercritical water.
i. Why can SiO2 not be grown as single crystals from the melt? (See problem 9.9.)
ii. Why is the viscosity an important consideration in growth of rather insoluble materials from solution? Consider that large single crystals of SiO2 are required (e.g., for the electronics industry), and non-equilibrium growth of crystals can lead to dendrites rather than large single crystals.
iii. What laboratory conditions would be necessary in order to grow SiO2 crystals by hydrothermal growth methods (i.e., from supercritical water)?
iv. Can these conditions be achieved in nature? Consider the for-mation of a geode when a hydrothermal solution saturated with silicon dioxide fills a cavity in a rock matrix, as shown schematically in Figure 9.49.

250 PhysicalPropertiesofMaterials
9.12 Problems
9.1 At 20°C the vapor pressure of benzene is 100 Torr (760 Torr = 1 atm) and that of octane is 20 Torr. If 1.00 mol of octane is dissolved in 4.00 mol of benzene and the resulting solution is ideal, calculate:
a. the total vapor pressure; b. the composition of the vapor; c. the new vapor composition if the vapor is collected, recon-
densed and then allowed to re-equilibrate. 9.2 A sample of methane is known to be contaminated with some
N2(g). In order to determine the extent of the contamination, the sample is cooled in liquid nitrogen to the temperature of the normal boiling point of N2 (i.e., its boiling point at P = 1 atm). At this temperature the methane is fully condensed, and may be considered to have negligible vapor pressure. The observed pressure is found to be 11 Torr. What is the purity of the origi-nal sample (in mol% methane)?
9.3 CBr4 forms four solid phases. Phases II and III coexist at T = 350 K, P = 0.1 GPa, and also at T = 375 K, P = 0.2 GPa, with phase II stable at lower temperatures. Which phase is denser: II or III? Explain, using the Clapeyron equation.
9.4 Glycerol and m-toluidine form a binary phase diagram that has an upper and lower consolute temperature. Mixtures of vari-ous mass% m-toluidine (W) were found on warming to separate into two phases at T1 (i.e., become turbid), and lose their turbid-ity at T2 as follows:
Air
Soil
Sandstone
Sandstone
Shale
Geode
FIGURE 9.49In certain geological conditions pockets of supercritical aqueous solutions allow the growth of quartz crystals in geodes.
www.ebook3000.com

ThermodynamicAspectsofStability 251
W T1/ºC T2/°C
18 48 5320 18 9040 8 12060 10 11880 19 8385 25 53
a. Plot the phase diagram (T versus mass% m-toluidine), and find the upper and lower consolute temperatures.
b. Use the phase diagram to explain what happens when m-toluidine is added dropwise to glycerol at 60°C.
c. At 40 mass% m-toluidine at T = 70°C, what phases exist, and in what proportion (by mass)?
9.5 From the Clapeyron equation, derive the Clausius*–Clapeyron equation:
ln .PP
H
R T T2
1 1 2
1 1= −
∆vap (9.25)
Clearly state and justify all assumptions made in the deriva-tion. The Clausius–Clapeyron equation is useful in determin-ing the variation of vapor pressure with temperature.
9.6 The following data were obtained by cooling solutions of Mg and Ni.
XNi 0.00 0.044 0.139 0.202 0.383 0.669 0.752 1.00Tbreak/ºC — 608 — — 1050 — — —Tbreak/ºC 651 510 510 510&770 770 1180 1080 1450
It is found that two compounds form in this system; they are Mg2Ni and MgNi2. Plot and label the phase diagram for the Mg-Ni system.
9.7 In the thermal decomposition of BaCO3(s), which results in the formation of BaO(s) and CO2(g), it is found that the equilibrium pressure is a function of temperature only. (This applies whether one starts with BaCO3 alone, or two of BaCO3, BaO and/or CO2, or all three, i.e., BaCO3, BaO and CO2.) Does the equilibrium system consist of pure crystals of BaCO3 and pure crystals of BaO, or does it contain a solid solution of these compounds? Only one of these alternatives is allowed thermodynamically. Explain. Hint: Consider the phase rule.
* Rudolph Julius Emmanuel Clausius (1822–1888) was born in Prussia and was a professor of mathematical physics in Switzerland and Germany. Clausius made many contributions to thermodynamics, kinetic theory (he introduced the concept of mean free path), and electric-ity and magnetism.

252 PhysicalPropertiesofMaterials
9.8 The following information was obtained from a set of cooling curves for Sb-Cd:
XCd Break/(°C) Halt/(°C)
0 — 6300.188 550 4100.356 461 4100.412 — 4100.480 419 4100.600 — 4390.683 400 2950.925 — 2951 — 321
Sketch the T versus XCd phase diagram. Label all areas. 9.9 The binary phase diagram for SiO2 (quartz) and A12O3 shows
several interesting features. Pure SiO2 crystallizes from the melt at 1735°C as cristobalite. At 1475°C cristobalite undergoes a first-order phase transition to another quartz polymorph character-ized by its small (often triplet) crystals, tridymite. Aluminum oxide crystallizes at 2020°C to produce corundum, a very hard mineral often used as an abrasive. In the SiO2/Al2O3 phase dia-gram at 1540°C there is a eutectic. There is one compound in the binary phase diagram, and this is mullite, a rare clay mineral of disputed empirical formula, most likely Al6SiO11. Mullite melts incongruently at 1805°C. Sketch and label the SiO2/Al2O3 binary phase diagram (with the abscissa as mass% A12O3). Al6SiO11 is 83.5 mass% in A12O3.
9.10 Cooling curves for liquid mixtures of magnesium and zinc give the following results:
Mass% Zn Freezing Start/(°C) Freezing End/(°C)
0 651 65110 623 34620 580 34630 520 34640 443 34650 360 34660 437 34670 520 34680 577 34684.3 595 59590 557 36895 456 36897.5 379 368100 419 419
www.ebook3000.com

ThermodynamicAspectsofStability 253
a. Draw and label the phase diagram, temperature versus composition (mass% Zn) as accurately as possible.
b. If 100. g of a liquid mixture containing 75.0 mass% Zn is equilibrated at 460°C, what phase(s) will be formed and in what amounts?
9.11 The following data for the ternary system Li2SO4/(NH4)2SO4/H2O show the mass% composition of the liquid phase in equi-librium with solids as indicated, at 30°C.
Liquid Phase
Solid Phase(s)% Li2SO4 % (NH4)2SO4
25.1 0.0 Li2SO4·H2O23.7 6.7 Li2SO4·H2O23.0 9.4 Li2SO4·H2O21.9 12.4 Li2SO4·H2O + NH4LiSO4
16.6 19.3 NH4LiSO4
10.8 28.7 NH4LiSO4
7.8 35.6 NH4LiSO4
6.5 39.5 NH4LiSO4 + (NH4)2SO4
2.9 41.4 (NH4)2SO4
0.0 44.1 (NH4)2SO4
a. Draw the phase diagram using triangle coordinates. Label each area.
b. Consider a binary mixture of Li2SO4 and (NH4)2SO4 contain-ing 80.0 mass% Li2SO4. If this mixture is dissolved in water and then the resulting solution is evaporated to yield a ter-nary mixture containing 25% water by mass, what phase(s) will be present in the remaining mixture? Indicate this mix-ture on your phase diagram with ★. (Hint: As long as the Li2SO4/(NH4)2SO4 ratio is the same when the water is added, at all proportions of water this solution will fall on a straight line going from the original mixture to the water vertex.)
9.12 In a publication* concerning work on the high-temperature superconductor YBa2Cu3O6.5 (which is made from Y2O3, BaO, and CuO), the authors state “(a)t most three phases can coexist in this system when the temperature and partial pressure of O2 (0.21 atm) are fixed.” Justify this statement. Keep in mind that this is a ternary system.
9.13 Sketch the Ag/Sn phase diagram (T versus XSn) based on the following information. Pure Sn melts at 350°C; pure Ag melts at 980°; Ag3Sn is the only intermetallic compound formed and it melts incongruently at 440°C to give liquid and S1, where S1 is a solid rich in Ag; there is one eutectic (XSn = 0.91) and it melts at
* H. Steinfink, J. S. Swinnea, Z. T. Suí, H. M. Su, and J. B. Goodenough, 1987. Journal of American Chemical Society, 109, 3348.

254 PhysicalPropertiesofMaterials
210°C; Sn and Ag3Sn are insoluble in the solid state; Ag3Sn and S1 are insoluble in the solid state. Label the phase diagram.
9.14 The pressure–temperature coexistence line for solid–vapor equilibrium (sublimation) is always less steep in a P versus T plot for a pure material than is the melting line. Explain why. A diagram could be helpful.
9.15 The quotation at the start of Part III of this book reads, “Passed through the fiery furnace, As gold without alloy . . . ” The implication is that “gold without alloy” (i.e., pure gold) can pass through a fiery furnace without damage, whereas gold “with alloy” (i.e., impure gold) would be damaged in a furnace. Provide an expla-nation. Include a phase diagram.
9.16 The system Na2SO4/Na2MoO4/H2O was studied at 25°C by W.F. Linke and J.A. Cooper, 1956, Journal of Physical Chemistry, 60, 1662. They determined that the following solid phases just precipitate out of a saturated liquid at these compositions (compositions given are mass% in the liquid):
Liquid Phase
Solid Phase(s)Mass%Na2SO4 Mass%Na2MoO4
32.90 0.0 Na2SO4
28.14 5.89 Na2SO4
21.66 14.15 Na2SO4
15.40 22.73 Na2SO4
10.50 30.00 Na2SO4
9.47 31.89 Na2SO4 + NaMoO4·2H2O9.42 31.92 Na2SO4 + NaMoO4·2H2O9.46 31.90 Na2SO4 + NaMoO4·2H2O7.28 33.73 Na2MoO4·2H2O3 88 36.65 Na2MoO4·2H2O0.0 39.90 Na2MoO4·2H2O
The hydrate Na2MoO4·2H2O is 85.11 mass% Na2MoO4. a. Plot the points and then draw the ternary phase diagram
using triangular coordinates. b. Consider a dry sample that is 40% by mass Na2SO4 (i.e.,
60 mass% Na2MoO4). Imagine this sample to be completely dissolved in water, and describe what happens as the water present is allowed to evaporate.
9.17 Polymorphism can be a considerable problem when dealing with chromophores. For example, a compound can have dif-ferent optical properties in different polymorphs. Explain how temperature and pressure can influence the stability of a phase, and the resulting optical properties of a compound.
9.18 The silver–lanthanum isobaric binary phase diagram has three compounds. LaAg melts congruently at 886°C; LaAg2 melts incongruently at 864°C; LaAg3 melts congruently at 955°C. In
www.ebook3000.com

ThermodynamicAspectsofStability 255
the La-Ag phase diagram there are also three eutectics: 11 at% La and 778°C; 43.5 at% La and 741°C; 71 at% La and 518°C. Pure silver melts at 960.5°C and pure lanthanum melts at 812°C. Sketch and label the La-Ag binary phase diagram.
9.19 In the gold-lead phase diagram, there are two compounds, Au2Pb, which melts incongruently at 418°C, and AuPb2, which melts incongruently at 254°C. The peritectic compositions are 44 atomic% Pb and 72 atomic% Pb, respectively. In addition, there is a eutectic at 215°C, 84.4 atomic% Pb. Pure gold melts at 1063°C and pure lead melts at 327°C. Sketch and label the Au-Pb binary phase diagram.
9.20 A bar of a material has a small concentration of impurity (initial value C0), shown as a function of distance along the bar, x, in Figure 9.50. The portion of the melting point diagram near the pure material, showing the influence on the melting point of the addition of a small amount of this impurity, is also shown in Figure 9.50. The bar will be heated with a small heater, such that successive regions of the bar will be melted, as shown schemati-cally in Figure 9.51.
a. At the region of the molten material, is the solid purer or less pure than the liquid? Use the phase diagram in Figure 9.50 to answer this question.
b. As the heater moves along the sample from left to right, the purity profile (C versus x) changes. Sketch the final C versus x relationship, when the heater has travelled the full length of the bar, and then the bar has fully solidified.
Impurity concentration, CC0
C0T
x 0
Solid
FIGURE 9.50A bar of metal has an initial impurity concentration constant at C0 along its length. The melting diagram of the material at low impurity concentration, C, also is shown.
SolidLiquid
FIGURE 9.51A heater passes along the bar, melting material in the heater region.

256 PhysicalPropertiesofMaterials
c. This procedure is called zone refinement and it is used to purify materials such as silicon. How can the impurity of the final bar (or regions of it) be improved further?
9.21 Compound A is optically active; that is it comes in two molecular forms that are chemically identical except that they are non-superimposable mirror images of each other. One form (d-A) rotates polarized light in one direction, and the other form (l-A) rotates polarized light in the other direction. In the solid state, there are (at least) two possible arrangements for the race-mic mixture (this is equimolar d-A and l-A): the two isomers are totally insoluble in the solid state, or the two isomers form a racemic compound (d-A + l-A in a 1:1 mole ratio). Sketch binary phase diagrams (temperature versus mole fraction of d-A in l-A) for each of these possibilities.
9.22 In the phase diagram for H2O/Fe2Cl6, six chemically distinct spe-cies are possible: Fe2Cl6, Fe2Cl6·4H2O, Fe2Cl6·5H2O, Fe2Cl6·7H2O, Fe2Cl6·12H2O, and H2O. Use the definition of “component” to show why the Fe2Cl6/H2O phase diagram is a binary (two- component) phase diagram.
9.23 The Gibbs energy change for the mixing of two liquids is given by:
ΔmixG = ΔmixH – TΔmixS (9.26)
and if ΔmixH is independent of temperature, from Equation 6.54 it follows that
d GdT
S∆
∆mixmix= − .
(9.27)
a. For a binary system with an upper consolute temperature, what is the sign of (dΔmixG/dT)? What does this imply about ΔmixS? Explain.
b. For a binary system with a lower consolute temperature, what is the sign of (dΔmixG/dT)? What does this imply about ΔmixS? Explain.
9.24 The slope of the solid–liquid line in the phase diagram of H2O (Figure 9.5a) at atmospheric pressure is –135 atm K–1. Consider an ice skater whose mass is 80 kg with a contact surface between the skate blade and the ice of 20 cm2.
a. Calculate the pressure exerted on the ice by the skater. b. Determine how much this pressure lowers the melting
point of ice. c. From (b), do you think that the formation of a liquid layer
under the skate is a plausible explanation for the ice skating phenomenon?
9.25 4,4ʹ-dimethoxyazoxybenzene (DMAB) and 4,4ʹ-diethoxyazoxy-benzene (DEAB) both form liquid crystalline phases. Above
www.ebook3000.com

ThermodynamicAspectsofStability 257
135°C, DMAB is an isotropic liquid, as is DEAB above 160°C. In the isotropic liquid phase, DEAB and DMAB mix with each other in all proportions. At 135°C, pure DMAB transforms to a nematic liquid crystalline phase, as does pure DEAB at 160°C. The DMAB and DEAB nematic phases are miscible in each other in all proportions, and the isotropic liquid to ne -matic liquid crystal transition temperature changes smoothly as DEAB is added to DMAB. At 118°C, pure DMAB freezes to a crystalline solid. Similarly, pure DEAB freezes at 132°C. DMAB and DEAB are not soluble in the solid state, and they do not form compounds. However, they do form a eutectic at 97°C and XDEAB = 0.45. (All data are for P = 1 atm.)
a. Sketch and label the isobaric T versus XDEAB phase diagram. b. Deduce and draw the cooling curve (temperature versus
time) from 160°C to 90°C for XDEAB = 0.45. 9.26 The refractive index of a typical liquid is quite different from
that of its vapor, mostly due to differences in density. Therefore, there is a discontinuity in refractive index on passing from liq-uid to vapor. At and near the critical point there are large fluc-tuations in refractive index, leading to a phenomenon known as critical opalescence: the material appears milky and opaque. Use a diagram showing the light path to explain the origin of critical opalescence of a material in which both the liquid and vapor are transparent and colorless.
9.27 The following data are from Lightfoot and Prutton’s 1947 study of the CaCl2-KCl-H2O system at 75°C.
Saturated Solution (Mass%)
Solid Phase(s)CaCl2 KCl
0 33.16 KCl11.73 21.62 KCl18.27 16.00 KCl28.47 9.62 KCl37.65 6.77 KCl47.65 8.43 KCl50.19 10.32 KCl, 2KCl·CaCl2·2H2O50.92 9.36 2KCl·CaCl2·2H2O53.85 6.21 2KCl·CaCl2·2H2O56.33 4.51 2KCl·CaCl2·2H2O57.62 3.60 2KCl·CaCl2·2H2O, CaCl2·2H2O57.77 2.56 CaCl2·2H2O58.58 0 CaCl2·2H2O
a. Sketch and label the isothermal isobaric phase diagram. b. State what phases exist on evaporation of a solution that is
initially 80 mass% H2O, 10 mass% CaCl2 and 10 mass% KCl, until no water remains.

258 PhysicalPropertiesofMaterials
9.28 Label the phases in the following phase diagrams: a. Mg/Pb (Figure 9.52); b. Al/Zn (Figure 9.53).
9.29 Consider the binding forces within a carbon nanotube, and also the data for thermal conductivity of graphite (Table 8.1). On this basis, would you expect the thermal conductivity of carbon nanotubes to be exceptionally high or low? Explain.
9.30 The mineral leucite, KAlSi2O6, forms an incongruently melt-ing compound with SiO2, called potash feldspar, of formula KAlSi3O8.
a. What is the mass% of SiO2 in KAlSi3O8? Show your calculation.
b. KAlSi3O8 melts incongruently at 1150°C to give a liquid that is 40 mass% SiO2. This is the only compound formed in the KAlSi2O6/SiO2 binary phase diagram. There is a eutectic at 990°C and 55 mass% SiO2. Pure leucite melts at 1685°C and pure SiO2 melts at 1713°C. There is one more complication in this phase diagram; SiO2 has two polymorphs, cristobalite (stable above 1475°C), and tridymite (stable below 1475°C). Draw the KAlSi2O6/SiO2 binary phase diagram, expressed as a function of mass% SiO2. (Note that not all details of
Mg Pb
T
FIGURE 9.52The Mg/Pb phase diagram.
Al Zn
T
FIGURE 9.53The Al/Zn phase diagram.
www.ebook3000.com

ThermodynamicAspectsofStability 259
the phase diagram are known from the above information, but the main features should be consistent with the above.) Label all the areas in the phase diagram.
9.31 The ternary phase diagram for a hypothetical system A/B/C, given in mole %, is shown by the heavy lines in Figure 9.54.
a. State which binary mixtures (A/B, A/C and/or B/C) show binary compounds, and give the approximate composition.
b. As for binary diagrams (see Figure 9.30), a lever rule can be used to give the proportions of various components in ter-nary diagrams. Consider the point labeled ★ in Figure 9.54. At this composition, there are three phases: B, b and a. The relative molar proportions are given as follows, where the ℓ values are as shown on Figure 9.54: nb/(nB + na) = ℓ2/ℓ1 and nB/na = ℓ4/ℓ3. Use this information to estimate the numbers of moles of B, a and b if the total number of moles is 1.
Further Reading
General References
M. F. Ashby and D. R. H. Jones, 2005. Engineering Materials 2: An Introduction to Microstructures, Processing and Design, 3rd ed. Butterworth-Heinemann, Oxford.
D. R. Askeland, P. P. Fulay, and W. J. Wright, 2010. The Science and Engineering of Materials, 6th ed. Cengage-Engineering, Stamford, CT.
H. Baker, Ed., 1990. ASM Handbook. Vol. 3: Alloy Phase Diagrams. ASM International.A. Barton, 1997. States of Matter: States of Mind. Taylor & Francis, Washington.
A
B C
b
a
ℓ1
ℓ2
ℓ3 ℓ4
★
FIGURE 9.54The use of the lever principle for a ternary phase diagram.

260 PhysicalPropertiesofMaterials
R. J. Borg and G. J. Dienes, 1992. The Physical Chemistry of Solids. Academic Press, Oxford.
D. G. Clerc and D. A. Cleary, 1992. Spinodal composition and an interesting exam-ple of the application of several thermodynamic principles. Journal of Chemical Education, 72, 112.
W. D. Callister Jr. and D. G. Rethwisch, 2010. Fundamentals of Materials Science and Engineering: An Introduction, 8th ed. John Wiley & Sons, Hoboken, NJ.
M. de Podesta, 2002. Understanding the Properties of Matter, 2nd ed. CRC Press, Boca Raton, FL.
E. G. Ehlers, 1972. The Interpretation of Geological Phase Diagrams. Dover, New York.A. Findlay, revised by A. N. Campbell, 1938. The Phase Rule and Its Applications.
Longmans, Green and Co, London.G. G. Hall, 1991. Molecular Solid State Physics. Springer-Verlag, New York.R. A. Higgins, 1994. Properties of Engineering Materials, 2nd ed. Industrial Press, New
York.J. M. Honig, 2007. Thermodynamics: Principles Characterizing Physical and Chemical
Processes. Academic Press, Oxford.K. Knapman, 2000. Polymorphic predictions. Modern Drug Discovery, March 2000,
53.W. J. Moore, 1967. Seven Solid States. W.A. Benjamin, New York.N. Mott, 1967. The solid state. Scientific American, September 1967, 80.A. Navrotsky, 1997. Thermochemistry of new, technologically important inorganic
materials. MRS Bulletin, May 1997, 35.J. B. Ott and J. Boerio-Goates, 2000. Chemical Thermodynamics. Vol. I: Principles and
Applications; Vol. II: Advanced Applications. Academic Press, Oxford.C. N. R. Rao and J. Gopalakrishnan, 1997. New Directions in Solid State Chemistry.
Cambridge University Press, Cambridge.J. F. Shackelford, 2008. Introduction to Materials Science for Engineers, 7th ed. Prentice-
Hall, Upper Saddle River, NJ.N. O. Smith, 1997. The Gibbs energy basis and construction of melting point diagrams
in binary systems. Journal of Chemical Education, 74, 1080.W. F. Smith, 1990. Principles of Materials Science and Engineering. McGraw-Hill, New
York.R. S. Treptow, 1993. Phase diagrams for aqueous systems. Journal of Chemical Education,
70, 616.L. H. Van Vlack, 1989. Elements of Materials Science and Engineering, 6th ed. Prentice-
Hall, Upper Saddle River, NJ.
Fullerenes and Carbon Nanotubes
R. Baum, 1994. Endohedral fullerenes purified by porphyrin-silica. Chemical and Engineering News, October 10, 1994, 37.
M. W. Cole, V. H. Crespi, M. S. Dresselhaus, G. Dresselhaus, J. E. Fischer, H. R. Gutierrez, K. Kojima, G. D. Mahan, A. M. Rao, J. O. Sofo, M. Tachibana, K. Wako, and Q. H. Xiong, 2010. Structural, electronic, optical and vibrational properties of nanoscale carbons and nanowires: A colloquial review. Journal of Physics—Condensed Matter, 22, 334201.
www.ebook3000.com

ThermodynamicAspectsofStability 261
R. Dagani, 1999. Building with buckyballs. Chemical and Engineering News, October 18, 1999, 54.
R. Dagani, 2001. Molecular surgery on C60. Chemical and Engineering News, April 23, 2001.
T. W. Ebbesen, 1996. Carbon nanotubes. Physics Today, June 1996, 26.A. Hildebrand, U. Hilgers, R. Blume, and D. Wiechoczek, 1996. Playing with the soc-
cer ball—an experimental introduction to fullerene chemistry. Journal of Chemical Education, 73, 1066.
D. R. Huffman, 1991. Solid C60. Physics Today, November 1991, 22.R. Rawls, 2000. Fullerenes are out of this world. Chemical and Engineering News, March
27, 2000, 8.R. Van Noorden, 2011. The trials of the new carbon. Nature, 469, 14.A. P. E. York, 2004. Inorganic fullerenes, onions and tubes. Journal of Chemical Education,
81, 673.
Helium
B. Bertman and R. A. Grujer, 1967. Solid helium. Scientific American, August 1967, 65.R. J. Donnelly, 1988. Superfluid turbulence. Scientific American, November 1988, 100.
Ice and Water
Snow crystal physics. SnowCrystals.comL. Glasser, 2004. Water, water, everywhere: Phase diagrams of ordinary water sub-
stance. Journal of Chemical Education 81, 414; erratum 81, 645.H. E. Stanley, 1999. Unsolved mysteries of water in its liquid and glass states. MRS
Bulletin, May 1999, 22.
Liquids
R. E. Hummel, 1998. Understanding Materials Science. Springer, New York.S. R. Logan, 1998. The behavior of a pair of partially miscible liquids. Journal of
Chemical Education, 75, 339.
Orientationally Disordered Solids
N. G. Parsonage and L. A. K. Staveley, 1978. Disorder in Solids. Oxford University Press, Oxford.
Phase Diagrams and Phase Transitions
F. S. Bates and G. H. Fredrickson, 1999. Block copolymers—designer soft materials. Physics Today, February 1999, 32.
P. W. R. Bessonette and M. A. White, 1999. Thermodynamic curves describing a sec-ond order phase transition. Journal of Chemical Education, 76, 220.
N. Blagden and R. Davey, 1999. Polymorphs take shape. Chemistry in Britain, March 1999, 44.

262 PhysicalPropertiesofMaterials
D. Calvert, M. J. Smith, and E. Falcão, 1999. Equipment for a low-cost study of the naphthalene-biphenyl phase diagram. Journal of Chemical Education, 76, 668.
M. C. Flemings, 1998. Solidification science and engineering practice. MRS Bulletin, May 1998, 30.
S. J. Hawkes, 1999. There is no perceptible inflection at the triple point. Journal of Chemical Education, 76, 226.
J. M. Honig, 1999. Mean field theory of phase transitions. Journal of Chemical Education, 76, 848.
W. B. Jensen, 2006. The origin of the term allotrope. Journal of Chemical Education, 83, 838.W. J. Nellis, 2000. Making metallic hydrogen. Scientific American, May 2000, 84.R. Trautman. B. J. Griffin, and D. Scharf, 1998. Microdiamonds. Scientific American,
August 1998, 82.E. Wilson, 2001. Tin’s last waltz. Chemical and Engineering News, November 27, 2001,
4.J. K. Woodworth, J. C. Terrance, and M. M. Hoffmann, 2006. Using nuclear mag-
netic resonance spectroscopy for measuring ternary phase diagrams. Journal of Chemical Education, 83, 1064.
Quasicrystals
Special issue on quasicrystals. D. J. Sordelet and J. M. Dubois, Eds. MRS Bulletin, November 1997, 34–74.
C. Day, 2001. Binary quasicrystals discovered that are stable and icosahedral. Physics Today, February 2001, 17.
J.-M. Dubois, 2005. Useful Quasicrystals. World Scientific.R. A. Dunlap, 1990. Periodicity and aperiodicity in mathematics and crystallography.
Science Progress (Oxford), 74, 311.M. Jacoby, 1999. Quasicrystals: A new kind of order. Chemical and Engineering News,
March 15, 1999, 44.D. R. Nelson, 1986. Quasicrystals. Scientific American, August 1986, 42.P. W. Stephens and A. I. Goldman, 1991. The structure of quasicrystals. Scientific
American, April 1991, 44.H. C. von Baeyer, 1990. Impossible crystals. Discover, February 1990, 69.
Supercritical Fluids
T. Clifford and K. Bartle, 1993. Chemistry goes supercritical. Chemistry in Britain, June 1993, 499.
F. Hensel, 1988. Critical point phenomena of fluid metals. Chemistry in Britain, May 1988, 457.
R. A. Laudise, 1987. Hydrothermal synthesis of crystals. Chemical and Engineering News, September 26, 1987, 30.
S. G. Mayer, J. M. Gach, E. R. Forbes, and P. J. Reid, 2001. Exploring phase diagrams using supercritical fluids. Journal of Chemical Education, 78, 241.
C. L. Phelps, N. G. Smart, and C. M. Wai, 1996. Past, present, and possible future applications of supercritical fluid extraction technology. Journal of Chemical Education, 73, 1163.
www.ebook3000.com

ThermodynamicAspectsofStability 263
M. Poliakoff and S. Howdie, 1995. Supercritical chemistry: Synthesis with a spanner. Chemistry in Britain, February 1995, 118.
K. Shakesheff and S. Howdle, 2003. Gently does it. Chemistry in Britain, December 2003, 30.
R. W. Shaw, T. B. Brill, A. A. Clifford, C. A. Eckert, and E. U. Franck, 1991. Supercritical water. Chemical and Engineering News, December 23, 1991, 26.
E. K. Wilson, 2000. Materials made under pressure. Chemical and Engineering News, December 18, 2000, 34.
P. York, 2005. Supercritical fluids: realizing potential. Chemistry World, February 2005, 50.K. Zosel, 1978. Separation with supercritical gases: Practical applications. Angewandte
Chemie International Edition England, 17, 702.

265
10SurfaceandInterfacialPhenomena
10.1 Introduction
Although we have concentrated up until now on bulk properties of materi-als, the surfaces of materials can have special and important properties that are distinct from those inside the bulk of the solid or liquid. For a simple example, consider that in the interior of an ionic crystal the charges balance out when all directions are averaged, whereas at the surface there can be a layer of ions all of the same charge, and this will greatly influence the response of other ions to the surface.
One important property of a surface is its ability to interact with other atoms and molecules. These molecules may be absorbed into the interior of the material, as in the case of graphite intercalates (i.e., graphite with other types of atoms between the graphitic layers), an example of which is shown in Figure 10.1a.
The molecules could also be adsorbed onto the surface, as shown schemati-cally in Figure 10.1b. The strength of the interaction between the adsorbate (adsorbed species) and the surface determines the type of adsorption. If this interaction is relatively weak (ΔH ≈ –20 kJ mol–1, due to weak van der Waals interactions), this is termed physisorption (or physical adsorption). If the inter-action is stronger (ΔH ≈ –200 kJ mol–1, due to covalent bonding) this is termed chemisorption (or chemical adsorption).
Understanding the properties of surfaces can be very important in chem-istry. For example, many reactions are catalyzed on surfaces that allow ener-getically favorable reaction pathways, primarily through chemisorption of reactants.
In the study of surfaces, it may be important to have a large surface area and/or to have very well defined surfaces. The large surface area may be par-ticularly important in the case of an effect that scales with the amount of sur-face area, such as the enthalpy change associated with adsorption. However, the surface must be regular in order for measurements to be meaningful.
A very important surface, both for its homogeneity and its rather large surface area, is that of exfoliated graphite. This material, which is composed of graphitic particles, is produced from intercalated graphite (e.g., with bromine

266 PhysicalPropertiesofMaterials
between the layers) that has been reacted to remove the intercalating species, blowing apart the structure and leaving behind islands of graphitic structure with surface areas of several thousand m2 g–1. Exfoliated graphite is used in products as diverse as automotive gaskets, electrodes, fire retardants, and materials to absorb oil spills. Note that exfoliated graphite still has several layers of graphitic carbon. When the carbon sheets are only one-atom thick, this material is called graphene.
10.2 Surface Energetics
The Gibbs energy of a surface is always higher than that of the bulk material because the surface atoms are not able to achieve bonds in all directions as the interior atoms can. In this sense surfaces are unstable relative to the bulk material.
One consequence is that if there is flexibility within the surface, it will choose to have the minimum surface area. This, for example, is the reason why free-floating bubbles are spherically shaped; any other shape would require more surface area.
Another consequence is that it may be more favorable energetically for a material to be covered with another material. For a given mass, a group of small crystals is of higher energy (i.e., less favorable) than one large crys-tal due to the decreased surface area of the large crystal. This fact can be used to grow large crystals from small ones, as follows. If the small crystals are placed in a saturated solution and the temperature is increased, more material will dissolve (provided the temperature coefficient of solubility is positive, as is the usual situation). If the temperature is lowered, material will precipitate out due to the lowered solubility, and the most energetically
Absorbedspecies Graphite
layers
(a)
Adsorbedspecies
Graphitelayers
(b)
FIGURE 10.1Cross-sectional views of absorption into and adsorption onto graphite. (a) Atoms or molecules absorbed into a graphite structure to form a graphite intercalate. (b) Atoms or molecules also could be adsorbed onto a graphite structure.
www.ebook3000.com

SurfaceandInterfacialPhenomena 267
favored way for the precipitation to occur is onto the largest crystals present. Subsequent heating–cooling cycles can eventually transform many small crystals into a few larger crystals. This process is shown schematically in Figure 10.2.
The energy at a surface is always higher than the bulk, but the surface energy, Gs, depends on the material in question. The data in Table 10.1 show one aspect of the driving force of the rusting process: metal oxide has a lower surface energy than pure metal. If the metal surface is coated with an organic material, this lowers the surface energy below that of the metal oxide, and this is one reason why undercoating a car prevents rust formation, although the dominant effect is keeping oxygen away from the metal.
10.3 Surface Investigations
Surfaces can be investigated by many means. For example, the enthalpies of adsorption of species can be important in gaining understanding of the surface–adsorbate interactions. Many microscopic techniques can be used to investigate surfaces, and one family is highlighted here: the scanning
Heat Cool
FIGURE 10.2This diagram shows schematically how a group of small crystals (e.g., a powder) can be trans-formed to one large crystal, if (as is usual) the material is more soluble when the solution is heated. Heat leads to greater solubility, and cooling causes preferential precipitation on a seed crystal. After a number of cycles, powder can be transformed into a single crystal. This process is thermodynamically favored on the basis of lowest Gibbs energy for the sample with the low-est surface area (one large crystal).
TABLE 10.1
Surface Energies, Gs, of Some Materials
Material Gs/J m–2
Metal ~1Metal oxide ~0.3Ice ~0.1Wax ~0.07
Source: R. G. Linford, 1972. Chemical Society Reviews, 1, 445.

268 PhysicalPropertiesofMaterials
tunneling microscope (STM) and the related atomic force microscope (AFM), both of which are scanning probe microscopies.
The first scanning tunneling microscope was described in 1986.* Its prin-ciple involves the overlap of the wavefunctions of a very sharp (atomic reso-lution) “tip” that scans the surface, with the wavefunctions of the surface atoms. When the overlap is sufficient, electrons can tunnel between the sur-face and the tip, completing an electrical circuit. The tunneling current is very sensitive to the tip–substrate separation distance and, with fine control of the tip (0.01 nm), atomic resolution can be achieved. The STM is shown schematically in Figure 10.3a. An STM image of Si is shown in Figure 10.3b.
In STM the imaging relies on measurement of the tunneling current between the tip and a conducting substrate. For insulating materials, it is more useful to determine the topography by measuring the attractive (van der Waals) force between the tip and the surface. The force will be repul-sive if the distance between the tip and surface is very close (the so-called contact mode), or attractive if the distance is longer (noncontact mode). The force can be determined very accurately by the deflection of light hitting a cantilever that has the tip at one end. It also is possible to use an AFM tip to move individual atoms and image the result; an example is shown in Figure 10.4.
* Ch. Gerber et al., 1986. Review of Scientific Instruments, 57, 221. Gerd Binnig (1947–) and Heinrich Rohrer (1933–) are researchers at IBM Zurich, Switzerland, and co-winners of the 1986 Nobel Prize in Physics, for their design of the scanning tunneling microscope; their Nobel Prize was shared with Ernst Ruska (1906–1988), a researcher from the Fritz–Haber Max Planck Institute in Berlin, who was cited for his design of the first electron microscope.
A
(a) (b)
FIGURE 10.3(a) A schematic view of the scanning tunneling microscope. The overlap of the wavefunctions of the surface atoms with the scanning tip completes the circuit and allows a measurable tun-neling current. The fine control of the tip position is accomplished with a piezoelectric mate-rial. (b) An STM image of Si, courtesy of M. Jericho.
www.ebook3000.com

SurfaceandInterfacialPhenomena 269
10.4 Surface Tension and Capillarity
Just as in the solid state, the molecules at the surface of a liquid are energeti-cally different from those in the bulk of the liquid. This is shown schemati-cally in Figure 10.5 where the molecules in the bulk are shown to be attracted equally in all directions, whereas the molecules at the surface have a net inward attraction to their neighbors. This again shows that the surface is high in energy with respect to the bulk, and the most favorable situation would be to have as little surface as possible. This is why very small drops of liquid are very nearly spherical (although larger ones may be flattened by their weight): the spherical shape minimizes the surface area.
The energy required to increase the surface area leads to the definition of surface tension, γ, as*
γ =dGdA
(10.1)
where G is the Gibbs energy and A is the surface area, so SI units of γ are J m–2 (for a liquid, surface tension is the same as surface energy).
The presence of surface tension leads to some interesting facts. For example, surface tension is a major factor in allowing insects to reside on the surface of a pond; although gravitational forces would dictate that the insect (which is denser than water) should be at the bottom of the pond, the cost in increas-ing the surface area, as the “skin” of the pond is ripped and the insect sinks, is too high. The energetic cost of increasing the surface area of the water in the pond is related to the contact angle of the insect with the water and the degree of wetting of the solid phase (insect) by the liquid. The former can be seen by example: careful placement of a needle horizontally on a water sur-face will allow it to float, but more vertical placement allows the needle to fall to the bottom while only making a tiny (low-energy cost) slit. The latter can
* The most important equations in this chapter are designated with ▮ to the left of the equation.
FIGURE 10.4An AFM image of Fe atoms on a Cu surface. Image originally created by IBM Corporation.
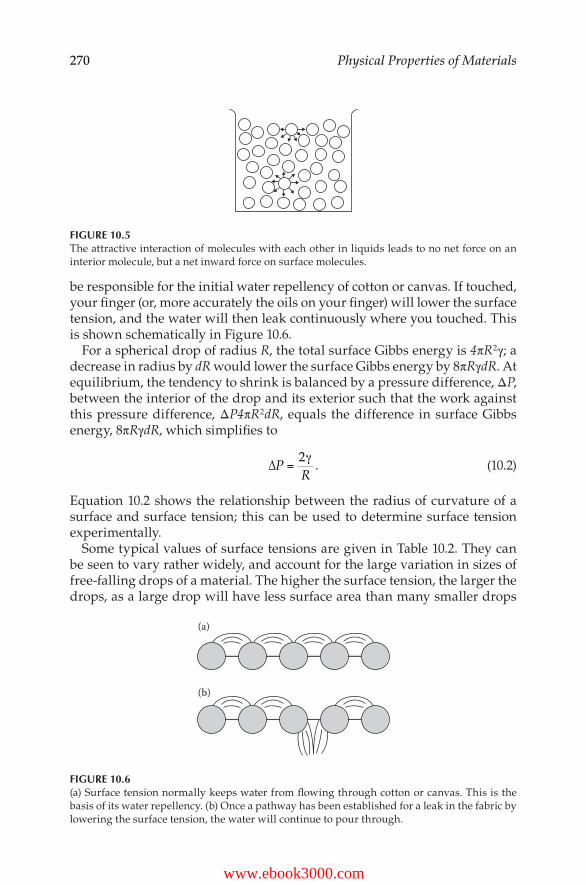
270 PhysicalPropertiesofMaterials
be responsible for the initial water repellency of cotton or canvas. If touched, your finger (or, more accurately the oils on your finger) will lower the surface tension, and the water will then leak continuously where you touched. This is shown schematically in Figure 10.6.
For a spherical drop of radius R, the total surface Gibbs energy is 4πR2γ; a decrease in radius by dR would lower the surface Gibbs energy by 8πRγdR. At equilibrium, the tendency to shrink is balanced by a pressure difference, ΔP, between the interior of the drop and its exterior such that the work against this pressure difference, ΔP4πR2dR, equals the difference in surface Gibbs energy, 8πRγdR, which simplifies to
∆PR
=2γ
. (10.2)
Equation 10.2 shows the relationship between the radius of curvature of a surface and surface tension; this can be used to determine surface tension experimentally.
Some typical values of surface tensions are given in Table 10.2. They can be seen to vary rather widely, and account for the large variation in sizes of free-falling drops of a material. The higher the surface tension, the larger the drops, as a large drop will have less surface area than many smaller drops
(a)
(b)
FIGURE 10.6(a) Surface tension normally keeps water from flowing through cotton or canvas. This is the basis of its water repellency. (b) Once a pathway has been established for a leak in the fabric by lowering the surface tension, the water will continue to pour through.
FIGURE 10.5The attractive interaction of molecules with each other in liquids leads to no net force on an interior molecule, but a net inward force on surface molecules.
www.ebook3000.com

SurfaceandInterfacialPhenomena 271
with the same total volume. The size of the drop can be used to quantify surface tension, γ, using Tate’s law:
mideal = 2πrγ/g (10.3)
where mideal is the ideal mass of a drop falling from an opening of a tube of radius r, and g is the gravitational constant. In this context, mideal is related to the observed mass, mobs, by
mobs = f mideal (10.4)
where f is a correction factor, given in Table 10.3, that accounts for residual liquid left behind when the drop detaches, as shown in Figure 10.7.
TABLE 10.2
Surface Tension, γ, for Some Liquids at T = 25°C
Liquid γ/10–3 J m–2
Br2 40.95H2O 71.99Hg 485.48CS2 31.58CH3OH 22.07CH3NH2 19.15CH3CH2OH 21.97
Source: J. J. Jasper, 1972. Journal of Physical and Chemical Reference Data, 1, 841.
TABLE 10.3
Correction Factors for the Drop Weight Method of Determining Surface Tensiona
r/V1/3 f
0.30 0.72560.40 0.68280.50 0.65150.60 0.62500.70 0.60930.80 0.60000.90 0.59981.00 0.60981.10 0.62801.20 0.6535
Source: A. W. Adamson, 1967. Physical Chemistry of Surfaces, 2nd ed. John Wiley & Sons, Hoboken, NJ.
a r is the tube radius, and V is the volume of the drop.

272 PhysicalPropertiesofMaterials
Another way to determine surface tension is the capillary effect. Water rises in small openings (capillaries) because the energy reduction on wetting the surface (a favorable effect) is balanced by the gravitational energy cost. The smaller the capillary diameter, the higher the water rises (less gravitational cost for a given increase in height due to the decreased diameter). If a liquid wets the walls of a capillary (e.g., water on glass) as shown in Figure 10.8, the radius of curvature, R, is related to the capillary radius, r:
∆PR r
= =2 2γ γ θcos
(10.5)
where now ΔP = P1 – P2, and P1 and P2 are pressures outside and inside the liquid, respectively, and θ quantifies the curvature of the meniscus (see Figure 10.8). (P1 – P2) corresponds to the change in the hydrostatic pressure of the liquid, ρgh, where ρ is the density, g is the gravitational constant, and h is the capillary rise. These forces balance, and therefore,
ρghr
=2γ θcos
(10.6)
and surface tension can be determined by direct measurement of capillarity.
FIGURE 10.7The sequence of shapes for a drop falling from an open tube. Note the residual liquid after the drop is detached.
2r
P1
P2h
θ
FIGURE 10.8Rise of water in a glass capillary.
www.ebook3000.com

SurfaceandInterfacialPhenomena 273
Water wets a glass surface, making h > 0, whereas for mercury, θ ≈ 140° (see Figure 10.9), which leads to h < 0, that is, capillary depression results.
The capillary rise for water at room temperature would be 2.8 cm for a 1-mm-diameter tube, and 28 cm for a 0.1-mm-diameter tube. The rise of water in a capillary accounts for the transport properties of fluids in plants and animals. It also partially accounts for the maximum possible height of a tree: it is limited by the molecular size which dictates the minimum possible diameter of the capillaries involved.
Typical capillary depression for mercury is –0.79 cm for a 2-mm-diameter tube, and –15.7 cm for a 0.1-mm-diameter tube. Although today pressures in laboratories are seldom measured using mercury manometers, when such manometers are used, the effects of capillarity on the “true” height of the mercury need to be taken into account for accurate pressure determination, especially in small capillaries.
COMMENT: NONSTICK COATING
A coating made by copolymerization of esters of fluoroalkyl alcohols with functionalized vinyl monomers gives a nonstick material that cannot be wetted by solvents. Its crosslinked structure makes it very durable, and its nonstick properties arise from the orientation of the perfluoro groups on the surface. There are commercial plans to use this material for coatings on consumer products such as countertops and bathroom tile. Although the nonstick surface has some similarities to Teflon (also a fluorinated polymer), there is a major difference in that Teflon must be heated to get a good coating, and this material is heat sensitive. However, the surface of this material is so nonstick that magic markers, which will wet Teflon, cannot wet this surface. (S. Borman, 1994. Uses for nonwettable, nonstick coating probed. Chemical and Engineering News, March 7, 1994, 6.)
2r
h
P1
P2
θ
FIGURE 10.9Mercury is depressed in a glass capillary.

274 PhysicalPropertiesofMaterials
COMMENT: SURFACE WETTING
When a small drop of liquid is placed on a flat surface, it can either wet the surface (contact angle, θc, is zero), or partially wet the surface (θc > 0). For partial wetting, at the contact point of the droplet, which is typically a circle on the surface, there are three phases in equilibrium: the solid, S; the liquid, L; and the vapor, V. Each interface has a certain Gibbs energy per unit area, given by γSL, γSV, and γLV, where the last is the familiar surface tension, usually represented by γ. The British scientist, Thomas Young, showed that, at equilibrium, the following relationship holds:
γSV – γSL – γcosθc = 0. (10.7)
Therefore, the measurement of the contact angle of a liquid droplet of known surface tension on a solid surface gives the difference in surface energetics of the S – V and S – L interfaces. Alternatively, we can predict the contact angle of a liquid droplet on a solid surface from knowledge of the three surface energies involved.
An example of the determination of the contact angle of water on a thin film of carbon nanotubes is shown in shown in Figure 10.10.
COMMENT: ANTIFOGGING
Fogging of windows and glasses occurs when very small water drop-lets condense on the surface. The water droplets scatter light and make the surface appear translucent. They form when the humidity increases (e.g., the mirror in a bathroom when the shower is running), or when warm, high-humidity air hits a cold surface (e.g., eyeglasses when you come in from the cold on a winter’s day). New coatings can prevent fogging. These coatings are composed of alternating layers of silica nanoparticles and a polymer. The nanoparticles in the coating are super-hydrophilic, leading to much smaller contact angles than on the uncoated surface. Instead of light-scattering droplets, the antifog coat-ing leads to a uniform, transparent sheet of water on the surface.
www.ebook3000.com

SurfaceandInterfacialPhenomena 275
10.5 Liquid Films on Surfaces
When amphiphilic molecules* (molecules that are both hydrophobic [water- hating], and hydrophilic [water-loving]) are dispersed on a water surface, they tend to orient themselves with their hydrophobic ends (e.g., alkyl tails) away from the water and their hydrophilic ends (e.g., polar head groups) pointing into the water. This is shown schematically at low surface coverage in Figure 10.11a.
If the water surface is compressed, the surface layer becomes more ordered until eventually the surface coverage is exactly one molecule thick, with each molecule occupying the smallest surface area that it can (Figure 10.11b); this is called a monolayer. As the water surface is compressed further, the struc-ture will collapse (Figure 10.11c).
The surface pressure (which has units of N m–1, compared with N m–2 for bulk pressure) can be measured by the force on a floating barrier, as shown in the trough in Figure 10.12. As the surface area is decreased, the pressure increases, until the monolayer is formed; with the collapse of the monolayer, the pressure falls, as shown in the phase diagram in Figure 10.13. The differ-ence in surface tension above and below what we now know to be monolayer coverage was first described by Pockels.†
* As we shall see in Chapter 11, amphiphilic molecules influence surface tension and therefore are usually called surface active agents often abbreviated as surfactants.
† Agnes Pockels (1862–1935) was born in Vienna and raised in Germany. Despite her lack of formal training (she had only high school education), she carried out seminal work related to surface films, starting with her first investigations at age 18. She carried out her work in her home, examining the effects of films on water. Ignored by most German scientists, she was encouraged by her brother, a professor of physics, to write to Lord Rayleigh about her results, and Lord Rayleigh aided her in publishing her work in Nature in 1891.
θc
FIGURE 10.10The contact angle, θc, of a 3-mm-diameter water droplet on a carbon nanotube thin film is about 100°. The water was dropped from a syringe that can be seen at the top of the image. Photo courtesy of M. Jakubinek.

276 PhysicalPropertiesofMaterials
Coherent (i.e., highly organized) films of this type are usually referred to as Langmuir–Blodgett films.* They have many special properties due to the highly regular arrangement of molecules one molecular layer thick. Although these films themselves are rather fragile, they can be transferred to solid substrates, giving rise to many applications. The process of the transfer of one or more layers is shown schematically in Figure 10.14. This transfer allows stacking of as many as 1000 monolayers on a substrate in either pure or doped forms.
Langmuir–Blodgett films can lead to interesting electrical and optical prop-erties, which can be tailor-made by changing the composition of the film. For example, insulating films can be placed on semiconducting substrates,
* Irving Langmuir (1881–1957) was an American chemical physicist who spent most of his career as a research scientist at the General Electric Company in Schenectady, New York where he worked on gases, films, and electrical discharges. He was awarded the 1932 Nobel Prize in Chemistry for contributions to surface science. Katherine Burr Blodgett (1898–1979), also was a scientist working at General Electric. Blodgett was the inventor of antireflective coating for glass.
(a) (b) (c)
FIGURE 10.11(a) A schematic view of surfactant molecules at low surface coverage on water. The polar head group points into the water and the nonpolar tail points out of the water, (b) As the pressure is increased (i.e., the surface area is decreased), a one-molecule-thick film (monolayer) is formed, (c) At higher pressures, the film collapses. Here the pressure is defined as the force per unit length of the edge of the monolayer. The nonpolar tails of the surfactant molecules would be dynamically disordered.
Torsion wire
Floating barrier
Fixed barrier
Pure water
Surface film
Torsion meter
FIGURE 10.12A schematic diagram of a floating-barrier trough for measuring the pressure of surface films. This is commonly referred to as a Langmuir–Blodgett trough.
www.ebook3000.com

SurfaceandInterfacialPhenomena 277
enhancing their electrical properties for use as photovoltaic devices. The microlithographic (literally “small printing”) possibilities of these films can lead to “wires” of 2–10 nm width. Special optical devices with second- or third-harmonic generation (recall that these take light of a certain frequency ν and produce light of frequency 2ν or 3ν, respectively; see Chapter 5) are possible by coating fibers with coherent films.
COMMENT: MORE USEFUL COATINGS
Special glass coatings made from tin or titanium oxides can change the reflection and transmission properties of glass. In certain conditions these coatings can allow greater amounts of solar energy into a build-ing, with less energy loss. Due to the low emissivity, these are known as low-E coatings. In other circumstances the material can be reversed to prevent unwanted heating.
> MonolayerSubmonolayer
Collapse ofmonolayer
Surface area
P
FIGURE 10.13Two-dimensional pressure versus area relationship for a Langmuir–Blodgett film showing the collapse of the film as the surface area is decreased.
(a)
(c) (d) (e)
(b)
FIGURE 10.14Deposition of a Langmuir–Blodgett film on a solid substrate by successive passes, (a) to (e), of a moveable barrier. In this case the layers are all head-to-head and tail-to-tail.
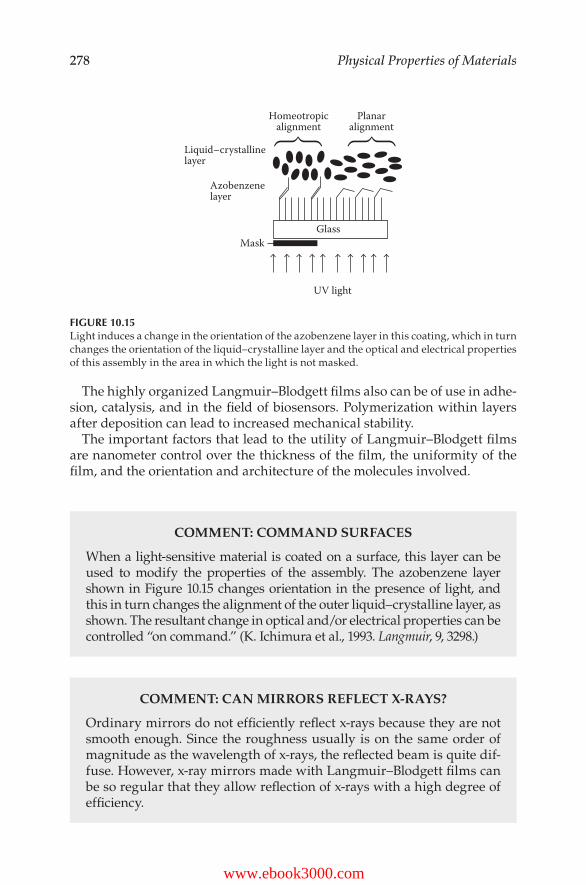
278 PhysicalPropertiesofMaterials
The highly organized Langmuir–Blodgett films also can be of use in adhe-sion, catalysis, and in the field of biosensors. Polymerization within layers after deposition can lead to increased mechanical stability.
The important factors that lead to the utility of Langmuir–Blodgett films are nanometer control over the thickness of the film, the uniformity of the film, and the orientation and architecture of the molecules involved.
COMMENT: COMMAND SURFACES
When a light-sensitive material is coated on a surface, this layer can be used to modify the properties of the assembly. The azobenzene layer shown in Figure 10.15 changes orientation in the presence of light, and this in turn changes the alignment of the outer liquid–crystalline layer, as shown. The resultant change in optical and/or electrical properties can be controlled “on command.” (K. Ichimura et al., 1993. Langmuir, 9, 3298.)
COMMENT: CAN MIRRORS REFLECT X-RAYS?
Ordinary mirrors do not efficiently reflect x-rays because they are not smooth enough. Since the roughness usually is on the same order of magnitude as the wavelength of x-rays, the reflected beam is quite dif-fuse. However, x-ray mirrors made with Langmuir–Blodgett films can be so regular that they allow reflection of x-rays with a high degree of efficiency.
Homeotropicalignment
Planaralignment
Glass
UV light
Mask
Azobenzenelayer
Liquid–crystallinelayer
FIGURE 10.15Light induces a change in the orientation of the azobenzene layer in this coating, which in turn changes the orientation of the liquid–crystalline layer and the optical and electrical properties of this assembly in the area in which the light is not masked.
www.ebook3000.com
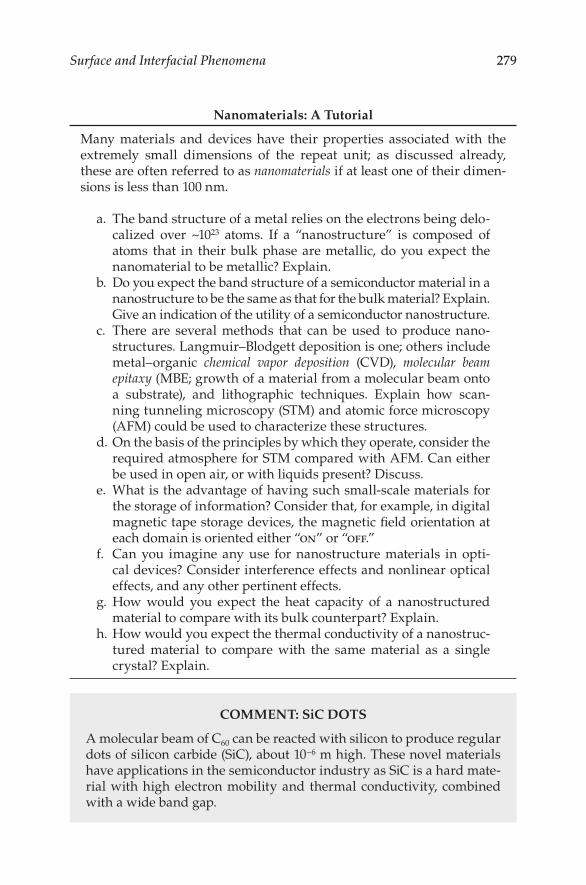
SurfaceandInterfacialPhenomena 279
Nanomaterials: A Tutorial
Many materials and devices have their properties associated with the extremely small dimensions of the repeat unit; as discussed already, these are often referred to as nanomaterials if at least one of their dimen-sions is less than 100 nm.
a. The band structure of a metal relies on the electrons being delo-calized over ~1023 atoms. If a “nanostructure” is composed of atoms that in their bulk phase are metallic, do you expect the nanomaterial to be metallic? Explain.
b. Do you expect the band structure of a semiconductor material in a nanostructure to be the same as that for the bulk material? Explain. Give an indication of the utility of a semiconductor nanostructure.
c. There are several methods that can be used to produce nano-structures. Langmuir–Blodgett deposition is one; others include metal–organic chemical vapor deposition (CVD), molecular beam epitaxy (MBE; growth of a material from a molecular beam onto a substrate), and lithographic techniques. Explain how scan-ning tunneling microscopy (STM) and atomic force microscopy (AFM) could be used to characterize these structures.
d. On the basis of the principles by which they operate, consider the required atmosphere for STM compared with AFM. Can either be used in open air, or with liquids present? Discuss.
e. What is the advantage of having such small-scale materials for the storage of information? Consider that, for example, in digital magnetic tape storage devices, the magnetic field orientation at each domain is oriented either “on” or “off.”
f. Can you imagine any use for nanostructure materials in opti-cal devices? Consider interference effects and nonlinear optical effects, and any other pertinent effects.
g. How would you expect the heat capacity of a nanostructured material to compare with its bulk counterpart? Explain.
h. How would you expect the thermal conductivity of a nanostruc-tured material to compare with the same material as a single crystal? Explain.
COMMENT: SiC DOTS
A molecular beam of C60 can be reacted with silicon to produce regular dots of silicon carbide (SiC), about 10–6 m high. These novel materials have applications in the semiconductor industry as SiC is a hard mate-rial with high electron mobility and thermal conductivity, combined with a wide band gap.

280 PhysicalPropertiesofMaterials
10.6 Problems
10.1 Calculate (a) the ideal mass, and (b) the observed mass of a drop of water falling from an opening of radius:
i. 1 mm ii. 3 mm
10.2 If a given surfactant molecule has a cross-sectional area of 0.06 nm2, calculate:
a. The number of such molecules that will be dispersed in a monolayer film of dimensions 15 cm × 30 cm.
b. The volume of 0.1 M solution (where 1M ≡ 1 mole of solute per liter of solution) of this surfactant in a nonpolar volatile solvent in order to produce the film in (a). (This can be dis-persed dropwise on the surface and the solvent will evapo-rate, leaving behind the surfactants on the surface of the water.)
10.3 STM and AFM are both very useful techniques for studying surfaces. Most researchers in this field agree that “the tip is everything.” Explain this comment.
10.4 Often, after a shower, there is still some water in the shower head. This water may stay for some time but, if there is some force applied to the shower head (which can be as little as the air pressure changing on closing the door to the bathroom), the water will drain away. Explain this phenomenon. Include ener-getics in your explanation.
10.5 Nippon Telephone & Telegraph (NTT) experienced trouble with snow sticking to wires and antennas in the Hida Mountains of Japan. As a result, NTT developed a coating to which snow would not stick. This coating, which can be painted on, is a fluo rine-containing compound with a low surface Gibbs energy, which only weakly interacts with water. As a result, when applied to a roof with a slope of at least 45°, snow does not accumulate.
a. Can you suggest other uses for a low water-surface interac-tion coating? Consider applications where materials must move through water.
b. The material does not absorb light in the visible range, and its fine particles on the surface disperse white light. What color is the coating? Does this lead to any practical applica-tions that would be ruled out if it were another color?
10.6 Two soap bubbles, one smaller than the other, are each attached to ends of glass tubes, and the tubes are connected via a stop-cock, as shown in Figure 10.16. When that stopcock is opened, will the bubbles change in size, and, if so, which will grow? Explain your answer.
10.7 Given the surface tension of water (7.2 × 10⁻² J m–1) at room tem-perature, calculate the minimum energy required to break a 1.0-cm-diameter sphere of water into 1 × 10⁻⁶ m diameter droplets.
www.ebook3000.com

SurfaceandInterfacialPhenomena 281
(This is the minimum energy because breaking a sphere will produce droplets of the required size and also smaller droplets.)
10.8 A clever way to determine surface energies of solids has been devised (F. H. Buttner et al., 1952. Journal of Physical Chemistry, 56, 657). A number of wires of the material, all of the same initial diameter and length, have weights of various masses attached to them. The wires are heated to about 90% of the absolute temperature of their melting point in order to increase atomic mobility. The gravitational pull on the wire will tend to elon-gate the wires, but, with increased atomic mobility, the surface tension will tend to decrease the length of the wire. The first factor will dominate with large weights, and the second will dominate with small weights. At some intermediate weight, the two forces balance such that no elongation is observed. Derive a relationship between the surface energy (Gs), the wire radius (r), and the mass of the weight that causes no elongation (m).
10.9 a. A bubble has a volume of 10 cm3. Calculate its surface area if its shape is a
i. Cube; ii. Tetrahedron; iii. Sphere.
b. Which shape gives the smallest surface area? 10.10 AgNO3 and NaCl are both quite soluble in water, whereas AgCl
is virtually insoluble. When aqueous solutions of AgNO3 and NaCl are mixed, a fine precipitate of AgCl forms. This precipi-tate has a much higher surface area than a large crystal of AgCl with an equivalent mass would have, and the large crystal would have a lower energy. Why is a large crystal of AgCl not formed?
10.11 a. A spherical bubble of volume V breaks into N smaller spherical bubbles, each of the same size. If A is the surface area of the original bubble, and AN is the total surface area of the smaller bubbles, derive a relationship for A/AN.
FIGURE 10.16Two soap bubbles, one larger than the other, are attached to glass tubes as shown here.

282 PhysicalPropertiesofMaterials
b. What is A/AN for: i. N = 2? ii. N = 10?
iii. N = 1000? iv. N = 106?
10.12 Magnesium oxide (MgO) easily forms a nanomaterial, with cubes of the order of nanometers formed by the combustion of magnesium metal. Calculate:
a. The surface area of: i. One MgO cube with 1 cm sides;
ii. The same total volume of MgO divided into cubes each with 40 nm sides.
b. The proportion of surface atoms on the cubes from each situation in (a), expressed in percent of the total number of atoms. The density of MgO is 3.6 g cm–3.
10.13 a. Take a clean beaker or glass and fill it with water. Sprinkle pepper on the surface of the water. Now put a tiny bit of soap on the end of your finger and dip it into the water. What happens? Why?
b. If you repeat the same experiment using oil in place of water, are your results the same? Explain.
10.14 The surface tension of water is more than 3 times that of methanol (see Table 10.2). Why?
10.15 After a snowfall, under certain weather conditions, the flakes of snow consolidate into larger ice crystals. What is the driving force for this transformation?
Further Reading
General References
Many physical chemistry textbooks include information on surface science. In addition, the following address many of the general points raised in this chapter.
Solid-liquid interfaces: Molecular structure, thermodynamics, and crystallization. Special issue. M. Asta, F. Spaepen and J. F. van der Veen, Eds. MRS Bulletin, December 2004, 920–966.
Diamond films: Recent developments. Special issue. D. M. Gruen and I. Buckley-Golder, Eds. MRS Bulletin, September 1998, 16–64.
Polymer surfaces and interfaces. Special Issue. J. T. Koberstein, Ed. MRS Bulletin, January 1996, 16–53.
V. K. Agarawal, 1988. Langmuir-Blodgett films. Physics Today, June 1988, 40.F. J. Almgren Jr. and J. E. Taylor, 1976. The geometry of soap films and soap bubbles.
Scientific American, July 1976, 82.
www.ebook3000.com

SurfaceandInterfacialPhenomena 283
A. E. Anwander, R. P. J. S. Grant, and T. M. Letcher, 1988. Interfacial phenomena. Journal of Chemical Education, 65, 608.
D. J. Barber and R. Loudon, 1989. An Introduction to the Properties of Condensed Matter. Cambridge University Press, Cambridge.
A. Barton, 1997. States of Matter: States of Mind. Taylor & Francis, Washington.F. E. Condon and F. E. Condon Jr., 2001. The floating needle. Journal of Chemical
Education, 78, 334.G. Cooke, 1997. Laying it on thin. Chemistry in Britain, April 1997, 54.V. S. J. Craig, A. C. Jones, and T. J. Senden, 2001. Contact angles of aqueous solu-
tions on copper surfaces bearing self-assembled monolayers. Journal of Chemical Education, 78, 345.
P. De Gennes, 1985. Wetting: Statics and dynamics. Reviews of Modern Physics, 57, 827.
M. Dionisio and J. Sotomayor, 2000. A surface chemistry experiment using an inex-pensive contact angle goniometer. Journal of Chemical Education, 77, 59.
G. Ertl and H.-J. Freund, 1999. Catalysis and surface science. Physics Today, January 1999, 32.
F. Frankel and G. M. Whitesides, 1997. On the Surface of Things: Images of the Extra-ordinary in Science. Chronicle Books, San Francisco.
H. D. Gesser, 2000. A Demonstration of surface tension and contact angle. Journal of Chemical Education, 77, 58.
L. C. Giancarlo, H. Fang, L. Avila, L. W. Fine, and G. W. Flynn, 2000. Molecular photography in the undergraduate laboratory: Identification of functional groups using scanning tunneling microscopy. Journal of Chemical Education, 77, 66.
M. Gross, 2000. The incredible nanoplotter. Chemistry in Britain, October 2000, 25.G. G. Hall, 1991. Molecular Solid State Physics. Springer-Verlag, New York.U. Henricksson and J. C. Eriksson, 2004. Thermodynamics of capillary rise: Why is
the meniscus curved? Journal of Chemical Education, 81, 150.L. V. Interrante, L. A. Casper, and A. B. Ellis, Eds., 1995. Materials chemistry: An
emerging discipline. Advances in Chemistry, Series 245, American Chemical Society, Washington.
M. Jacoby, 2001. Custom-made biomaterials. Chemical and Engineering News, February 5, 2001, 30.
K. Kabza, J. E. Gestwicki, and J. L. McGrath, 2000. Contact angle goniometry as a tool for surface tension measurements of solids, using Zisman plot method. Journal of Chemical Education, 77, 63.
M. Lagally, 1993. Atom motion on surfaces. Physics Today, November 1993, 24.J. Lahann and R. Langler, 2005. Smart materials with dynamically controllable sur-
faces. MRS Bulletin, March 2005, 185.L. C. McKenzie, L. M. Huffman, K. E. Parent, and J. E. Hutchison, 2004. Patterning
self-assembled monolayers on gold. Journal of Chemical Education, 81, 545.M. Meyyappan and M. K. Sunkara, 2010. Inorganic Nanowires. Taylor & Francis,
New York.T. Munguia and C. A. Smith, 2001. Surface tension determination through capillary
rise and laser diffraction patterns. Journal of Chemical Education, 78, 343.Y. Pomeau and E. Villermaux, 2006. Two hundred years of capillarity research. Physics
Today, March 2006, 39.
284 PhysicalPropertiesofMaterials
T. Richardson, 1989. Langmuir-Blodgett films. Chemistry in Britain, December 1989, 1218.
A. J. Rosenthal, 2001. Demonstration of surface tension. Journal of Chemical Education, 78, 332.
A. M. Rouhi, 1999. Contemporary biomaterials. Chemical and Engineering News, January 18, 1999, 51.
G. A. Somorjai and G. Rupprechter, 1998. The flexible surface: Molecular studies explain the extraordinary diversity of surface chemical properties. Journal of Chemical Education, 75, 162.
P. Spanoghe, J. Cocquyt, and P. Van de Meeren, 2001. A low-cost dynamic surface ten-sion meter with a LabVIEW interface and its usefulness in understanding foam formation. Journal of Chemical Education, 78, 338.
A. Swift, 1995. Skimming the surface. Chemistry in Britain, November 1995, 887.
Atomic Microscopy
Scanning probe microscopy in materials science. Special issue. E. Meyer, S. P. Jarvis and N. D. Spencer, Eds. MRS Bulletin, July 2004, 443–487.
R. Baum, 1994. Chemical force microscopy. Chemical and Engineering News, October 3, 1994, 6.
C. Bustamante and D. Keller, 1995. Scanning force microscopy in biology. Physics Today, December 1995, 32.
H. Carmichael, 1997. In search of atomic resolution. Chemistry in Britain, November 1997, 28.
R. Dagani, 1996. Putting the nano finger on atoms. Chemical and Engineering News, December 2, 1996, 20.
D. M. Eiger and E. K. Schweizer, 1990. Positioning single atoms with a scanning tun-neling microscope. Nature, 344, 524.
F. J. Giessibl and C. F. Quate, 2006. Exploring the nanoworld with atomic force micros-copy. Physics Today, December 2006, 44.
W. F. Heinz and J. H. Hoh, 2005. Getting physical with your chemistry: Mechanically investigating local structure and properties of surfaces with the atomic force microscope. Journal of Chemical Education, 82, 695.
C. M. Henry, 2001. Spectroscopy gets up close and personal. Chemical and Engineering News, April 30, 2001.
M. Jacoby, 1999. STM: An all-in-one tool. Chemical and Engineering News, November 29, 1999, 9.
J. Leckenby, 1995. Probing surfaces. Chemistry in Britain, March 1995, 212.C. Lieber, 1994. Scanning tunneling microscopy. Chemical and Engineering News, April
18, 1994, 28.S. Magonov and Y. Godovsky, 1998. Atomic force microscopy, Part 7: Studies of ther-
mal phase transitions in polymers. American Laboratory, November 1998, 15.M. M. Maye, J. Luo, L. Han, and C.-J. Zhong, 2002. Chemical analysis using scanning
force microscopy. An undergraduate laboratory experiment. Journal of Chemical Education, 79, 207.
G. Meyer and K. H. Rieder, 1998. Lateral manipulation of single absorbates and sub-strate atoms with the scanning tunneling microscope. MRS Bulletin, January 1998, 28.
C. O’Driscoll, 2001. Atoms in the spotlight. Chemistry in Britain, December 2001, 20.
www.ebook3000.com

SurfaceandInterfacialPhenomena 285
D. Rugar and P. Hansma, 1990. Atomic force microscopy. Physics Today, October 1990, 23.
M. Shusteff, T. P. Burg, and S. R. Manalis, 2006. Measuring Boltzmann’s constant with a low-cost atomic force microsope: An undergraduate experiment. American Journal of Physics 74, 863.
Y. E. Strausser and M. G. Heaton, 1994. Scanning probe microscopy. American Laboratory, April 1994, 20.
J. D. Todd and T. R. I. Cataldi, 1991. STM—a new image for surfaces. Chemistry in Britain, June 1991, 525.
S. Wilkinson, 1999. Chemical microscope identifies nanoscale materials. Chemical and Engineering News, May 17, 1999, 9.
Nanomaterials
Toward applications of ceramic nanostructures. Special issue. S. Seal and M.-I. Baraton, Eds. MRS Bulletin, January 2004, 9–47.
Advances in carbon nanotubes. Special issue. M. S. Dresselhaus and H. Dai, Eds. MRS Bulletin, April 2004, 237–285.
Nanoscale characterization of materials. Special issue. E. T. Yu and S. J. Pennycock, Eds. MRS Bulletin, August 1997, 17–61.
Optics of nanostructures. Special issue. D. S. Chemia, Ed. Physics Today, June 1993, 22–73.
Nanomaterial combines low density, stiffness, elasticity, 2000. Chemical and Engineer-ing News, December 11, 2000, 43.
Silicon nanocrystals amplify light, 2000. Chemical and Engineering News, Novem-ber 27, 2000, 21.
S. Ashley, 2001. Nanobot construction crews. Scientific American, September 2001, 84.R. Baum, 1999. “Tweezers” added to nanotoolbox. Chemical and Engineering News,
December 13, 1999, 7.R. Baum, 1998. Carbon nanotube syntheses. Chemical and Engineering News, November
9, 2001, 11.R. M. Baum, 1998. Nanotube characterization. Chemical and Engineering News, January
5, 1998, 6.R. M. Baum, 1997. Nurturing nanotubes. Chemical and Engineering News, June 30,
1997, 39.C. Q. Choi, 2006. Crystal steer. Scientific American, April 2006, 26.M. W. Cole, V. H. Crespi, M. S. Dresselhaus, G. Dresselhaus, J. E. Fischer, H. R.
Gutierrez, K. Kojima, G. D. Mahan, A. M. Rao, J. O. Sofo, M. Tachibana, K. Wako, and Q. H. Xiong, 2010. Structural electronic, optical and vibrational properties of nanoscale carbons and nanowires: A colloquial review. Journal of Physics—Condensed Matter, 22, 334201.
E. Corcoran, 1990. Diminishing dimensions. Scientific American, November 1990, 122.R. Dagani, 2001. Polymers “worms” line up on silicon. Chemical and Engineering News,
April 2, 2001.R. Dagani, 2001. Slimming down inorganic tubes. Chemical and Engineering News,
April 23, 2001.R. Dagani, 2001. Nanotube magic. Chemical and Engineering News, April 16, 2001, 6.R. Dagani, 2000. Nanotubes spun into long fibres. Chemical and Engineering News,
November 20, 2000, 9.

286 PhysicalPropertiesofMaterials
R. Dagani, 1999. Much ado about nanotubes. Chemical and Engineering News, January 11, 1999, 31.
R. Dagani, 1998. Architectural tour of the nano world. Chemical and Engineering News, September 21, 1998, 70.
R. Dagani, 1996. Carbon nanotube ropes. Chemical and Engineering News, July 29, 1996, 5.P. Day, 1996. Room at the bottom. Chemistry in Britain, July 1996, 29.C. Dekker, 1999. Carbon nanotubes as molecular quantum wires. Physics Today, May
1999, 22.J. T. Dickinson, 2005. Nanotribology: Rubbing on a small scale. Journal of Chemical
Education, 82, 734.K. E. Drexler, 2001. Machine-phase nanotechnology. Scientific American, September
2001, 74.B. D. Fahlman, 2002. Chemical vapor deposition of carbon nanotubes. An experiment
in materials chemistry. Journal of Chemical Education, 79, 203.M. Freemantle, 2006. Exploiting polymer nanostructures. Chemical and Engineering
News, April 24, 2006, 39.M. Freemantle, 2001. 3-D Images of nanoparticles. Chemical and Engineering News,
May 28, 2001, 9.M. Freemantle, 1996. Nanotubes shown to be flexible. Chemical and Engineering News,
June 24, 1996, 10.M. Freemantle, 1996. Filled carbon nanotubes could lead to improved catalysts and
biosensors. Chemical and Engineering News, July 15, 1996, 62.K. J. Gabriel, 1995. Engineering microscopic machines. Scientific American, September
1995, 150.D. Gammon and D. G. Steel, 2002. Optical studies of single quantum dots. Physics
Today, October 2002, 36.B. Halford, 2005. Inorganic menagerie. Chemical and Engineering News, August 29,
2005, 30.J. R. Heath, 1995. The chemistry of size and order on the nanometer scale. Science,
270, 1315.M. Jacoby, 2001. Wires for a nanoworld. Chemical and Engineering News, January 1,
2001, 28.M. Jacoby, 2001. Writing between the lines. Chemical and Engineering News, February
12, 2001, 10.M. Jacoby, 2001. Boron nitride nanotubes formed. Chemical and Engineering News,
March 19, 2001, 9.M. Jacoby, 1999. Nanotubes coil, story unfolds. Chemical and Engineering News, October
4, 1999, 31.M. Lagally, 1998. Self-organized quantum dots. Journal of Chemical Education, 75, 277.J. Leckenby and R. Eby, 2004. Toward industrial nanotechnology using a nanoscale
patterning technique. American Laboratory, January 2004, 11.S. Lindsay, 2005. Single-molecule electronic measurements with metal electrodes.
Journal of Chemical Education, 82, 727.G. Ozin and A. Arsenault, 2005. Nanochemistry. Royal Society of Chemistry,
Cambridge.P. M. Petroff, A. Lorke, and A. Imamoglu, 2001. Epitaxially self-assembled quantum
dots. Physics Today, May 2001, 46.M. J. Pitkethly, 2004. Nanomaterials—the driving force. Nanotoday, December 2004,
20.
www.ebook3000.com

SurfaceandInterfacialPhenomena 287
M. C. Roco, 2006. Nanotechnology’s future. Scientific American, August 2006, 39.A. M. Rouhi, 2001. From membranes to nanotubules. Chemical and Engineering News,
June 11, 2001.R. W. Siegel, 1993. Exploring mesoscopia: The bold new world of nanostructures.
Physics Today, October 1993, 64.N. Tao, 2005. Electrochemical fabrication of metallic quantum wires. Journal of Chemical
Education, 82, 720.M. Thayer, 2003. Nanomaterials. Chemical and Engineering News, September 1, 2003,
15.G. M. Whitesides, 2001. The once and future nanomachine. Scientific American,
September 2001, 78.E. Wilson, 1995. Microlithography uses metastable argon atoms. Chemical and
Engineering News, September 4, 1995, 8.X. Ye and C. M. Wai, 2003. Making nanomaterials in supercritical fluids: A review.
Journal of Chemical Education, 80, 198.P. Zurer, 2001. Nanostructures: Shells and tubes. Chemical and Engineering News,
March 12, 2001, 12.

289
11OtherPhasesofMatter
11.1 Introduction
Many of the phases of matter discussed so far, such as gases, liquids, pure solids, solid solutions, liquid crystals, and orientationally disordered crystals, are homogeneous (i.e., uniform throughout). Both in nature and in the labora-tory, materials can be combined (by alloying, coating, bonding, dispersion, lamination, etc.) to give new materials with different properties. There are important states of matter that are heterogeneous (not uniform throughout), and a Langmuir–Blodgett film is one example. The film is different from the substrate, and this is what makes it heterogeneous. Other examples of hetero-geneous materials are described in this chapter.
11.2 Colloids
A colloid is a system of particles too small to be visible in an optical micro-scope, typically 10 to 1000 nm in size. A colloid can be stable (e.g., a macro-molecular solution or a micellar system; see Section 11.3) or metastable (e.g., a colloidal dispersion). The word colloid is derived from the Greek for “glue-like,” as glue is a colloid. An important characteristic of colloids is that they do not pass through membranes that are permeable to (smaller) dissolved species.
A colloidal dispersion has its particles (dispersed phase) held in a dispersing medium. Gas, liquid or solid can be either the dispersed phase or the dispers-ing medium, and this leads to eight types of colloidal dispersion, listed with examples in Table 11.1.
In principle, colloidal dispersions are metastable with respect to the sepa-rated forms. This is apparent to anyone who has let whipped cream sit too long before eating it! However, they can be kinetically stabilized, and can last

290 PhysicalPropertiesofMaterials
for a long time. Gold sols prepared by Michael Faraday* more than 150 years ago are still in their dispersed form today; they are on display in the British Museum in London, England. Some colloidal dispersions can be kinetically stabilized by the presence of surface charges on the dispersed particles; they do not flocculate (coalesce) due to the mutual repulsion between particles.
Suspended charged particles can be made to move in electrical fields, and this is the basis for the separation process called electrophoresis. It can also be used preparatively, as an electrical field applied across a colloidal suspen-sion of rubber latex can cause flocculation at one electrode. The flocculated latex particles can take on the shape of the electrode, and this is how rubber gloves, for example, are produced.
* Michael Faraday (1791–1867) was an English scientist who gained his scientific training when Sir Humphrey Davy hired him as an assistant during his temporary loss of sight due to a laboratory accident. Faraday made many major contributions to the theories of electricity and magnetism.
COMMENT: COLLOIDAL SPONGES
Colloidal microgels are polymeric materials with cells of dimensions in the range 10–9 to 10–6 m, swollen with solvent molecules. One example is poly(N-isopropylacrylamide), which, in aqueous solution, shrinks on heating due to conformational changes in the polymer; this makes the polymer–solvent interaction less favorable at high temperature. This reversible transformation reduces the volume by a factor of 60 on heat-ing from 25°C to 50°C. The gels also are sensitive to pH and the pres-ence of other ions and molecules. Colloidal microgels have applications in drug delivery, oil recovery, and as viscosity modifiers.
TABLE 11.1
Colloidal Dispersion Compositions and Examples
Dispersed Phase Dispersing Medium System Name Examples
Solid Solid Solid dispersion Colored glassSolid Liquid Sol or suspension Gold in water, inkSolid Gas Aerosol of solid particles SmokeLiquid Solid Solid emulsion JellyLiquid Liquid Emulsion Milk, mayonnaiseLiquid Gas Aerosol of liquid droplets FogGas Solid Solid foam Pumice, styrofoamGas Liquid Foam Whipped cream
www.ebook3000.com

OtherPhasesofMatter 291
11.3 Micelles
Micelles are another heterogeneous phase of matter involving aggregates. At low concentrations of surfactant molecules (e.g., soap), individual ions are dispersed in aqueous solution. Above a certain temperature (the Krafft temperature, TK) and above a certain concentration (the critical micellar con-centration, abbreviated cmc) the solution will consist of ions and aggregates called micelles. A micelle is a three-dimensional structure which, in a polar solvent, usually has the hydrophilic ends of the molecules pointing out towards the solvent, and the hydrophobic ends pointing inwards. Examples of micellar structures are shown schematically in Figure 11.2. For T > TK, the hydrophilic part (hydrocarbon tail) of the surfactant molecule is mobile and dynamically disordered in trans and gauche configurations, entropically stabilizing the micellar phase. For T < TK, the stabilizing entropy effect is diminished, and the molecules are more rigid, making the crystalline form more stable than the micelles.
COMMENT: PROCESSING OF CERAMICS
Sol-gel processing can be used to prepare ceramics with considerable control, as schematically illustrated in Figure 11.1. The interactions between ceramic particles can be controlled by coating particles with surfactant (reducing the attraction) or with polymeric surface modifiers (reducing the repulsion). Sol-gel processing also is used to deposit thin films for chemical sensors and other sensors such as pH electrodes.
Repulsive
Attractive
Suspension
Solid
Mole fraction ceramic
Interparticleinteraction
0 1
FIGURE 11.1The balance between attractive and repulsive forces can determine the packing of ceramic particles in a gel phase, with packing fractions ranging from very low values to about 70%, depending on the interparticle interactions.

292 PhysicalPropertiesofMaterials
A micelle, typically consisting of 50 to a few hundred monomer ions,* is a dynamic entity, both with respect to the motion of the hydrophobic ends of the constituent species and with respect to exchange with the free ions in solution. The phase diagram of a micelle-forming solution is shown sche-matically in Figure 11.3.
The physical proof of the existence of micelles comes from many differ-ent types of experiments. Because the particle dimensions are of the same order of magnitude as the wavelength of visible light, light scattering can be used to determine the average particle size. A typical light-scattering set-up is shown in Figure 11.4.
* Typical cmc values for aqueous solutions at 20°C are: CH3(CH2)11N(CH3)3Br, 14.4 mol·L–1, ≈50 monomers per micelle; CH3(CH2)11SO4Na, 8.1 mol·L–1, ≈62 monomers per micelle; CH3(CH2)11(OCH2)6OH, 0.1 mol·L–1, ≈400 monomers per micelle.
Monomers
Micelles +monomers
Solid crystal +monomers
Concentrationcmc
TK
T
FIGURE 11.3A schematic temperature-composition phase diagram for an aqueous solution of surfactant mol-ecules indicating the region of micelle formation. TK is the Krafft temperature, and for T > TK and concentrations higher than the critical micellar concentration, cmc, micelles form.
(a) (b) (c)
(d) (e) (f ) (g)
FIGURE 11.2Schematic view of organized surfactant structures: (a) spherical micelle, (b) oblong micelle, (c) tubular micelle, (d) reverse micelle, (e) mixed reverse micelle, (f) lamellar micelle, and (g) oil droplet solubilized by micelle.
www.ebook3000.com
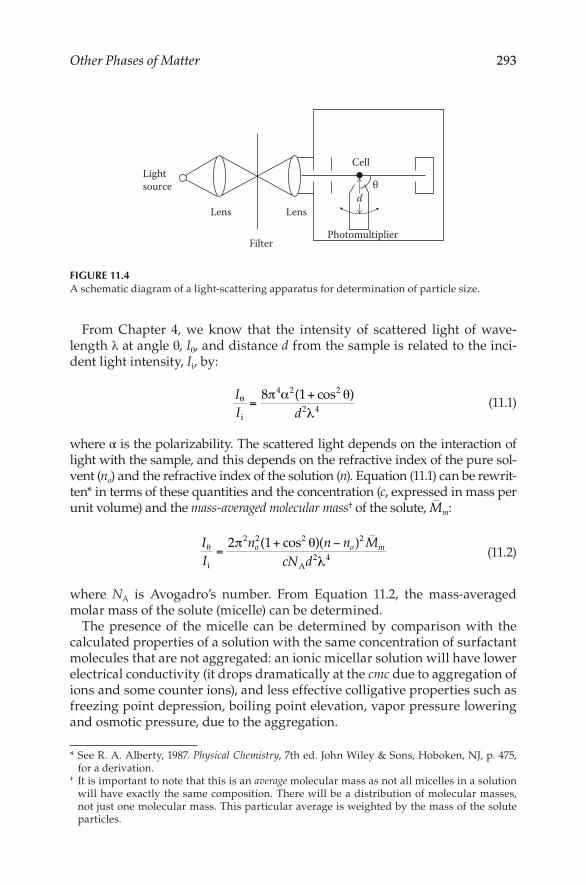
OtherPhasesofMatter 293
From Chapter 4, we know that the intensity of scattered light of wave-length λ at angle θ, Iθ, and distance d from the sample is related to the inci-dent light intensity, Ii, by:
II dθ π α θ
λi
=+8 14 2 2
2 4
( cos ) (11.1)
where α is the polarizability. The scattered light depends on the interaction of light with the sample, and this depends on the refractive index of the pure sol-vent (no) and the refractive index of the solution (n). Equation (11.1) can be rewrit-ten* in terms of these quantities and the concentration (c, expressed in mass per unit volume) and the mass-averaged molecular mass† of the solute, Mm:
II
n n n McN d
o o mθ π θ
λi A
=+ −2 12 2 2 2
2 4
( cos )( ) (11.2)
where NA is Avogadro’s number. From Equation 11.2, the mass-averaged molar mass of the solute (micelle) can be determined.
The presence of the micelle can be determined by comparison with the calculated properties of a solution with the same concentration of surfactant molecules that are not aggregated: an ionic micellar solution will have lower electrical conductivity (it drops dramatically at the cmc due to aggregation of ions and some counter ions), and less effective colligative properties such as freezing point depression, boiling point elevation, vapor pressure lowering and osmotic pressure, due to the aggregation.
* See R. A. Alberty, 1987. Physical Chemistry, 7th ed. John Wiley & Sons, Hoboken, NJ, p. 475, for a derivation.
† It is important to note that this is an average molecular mass as not all micelles in a solution will have exactly the same composition. There will be a distribution of molecular masses, not just one molecular mass. This particular average is weighted by the mass of the solute particles.
Lightsource
Lens Lens
Filter
Cell
θd
Photomultiplier
FIGURE 11.4A schematic diagram of a light-scattering apparatus for determination of particle size.

294 PhysicalPropertiesofMaterials
These properties can be used to determine the average molecular mass* of the aggregate in the micelle. For example, the osmotic pressure, Π, is the pressure that is developed inside a solution to bring it into equilibrium with pure solvent that is separated from it by a membrane (see Figure 11.5). The membrane is semipermeable; it allows passage of solvent but not solute. As the solvent passes into the solution, the pressure in the solution increases by Π, until equilibrium is attained. The increase in pressure can be reflected in the solution rising up a tube as shown in Figure 11.5, and the rise, h, will be proportional to Π:
Π = ρgh (11.3)
where g is the gravitational constant and ρ is the density of the solution. The osmotic pressure, Π, is directly related to the number-averaged molecular mass,† Mn:
Π =M RTVn
m
(11.4)
where Vm is the molar volume of the solvent.
11.4 Surfactants
Knowledge of the properties of surfactant molecules can lead to the stabiliza-tion of emulsions. As can be seen from Table 11.1, an emulsion results from a colloidal suspension of one liquid in another. Oil and water will form two
* This average can be by mass, that is, Mm, or by number, that is, Mn, where the former is deter-mined by light scattering and the latter is determined by osmotic pressure.
† That is, the average weighted in proportion to the probability of having a certain molecular mass.
Solution
Solvent
Semipermeablemembrane
h
FIGURE 11.5A schematic representation of a simple osmometer, which is a device used to measure osmotic pressure. The solvent flows through the semipermeable membrane into the solution to increase the pressure of the solution by Π, the osmotic pressure. This is reflected in h, the difference between the levels of the solution and the surrounding solvent at equilibrium.
www.ebook3000.com

OtherPhasesofMatter 295
layers if poured gently together, but if shaken vigorously (with the mechani-cal work going to increase the surface area of the droplets) an emulsion can be formed.
Although an emulsion will tend to separate out again over time, an amphi-philic material added to the emulsion will act as a surfactant (which is an abbre-viation for surface active agent) by lowering the interfacial tension between the oil and water. The surfactant is able to do this by solubilizing one end in the oil and the other in the water; this stabilizes the emulsion. Because surfactants lower the surface tension, they can lead to spreading, wetting, solubilization, emulsion and dispersion formation, and frothing. For example, foams are metastable, but can be made to last longer by the addition of a surfactant. For these reasons, surfactants are common additions to household products such as foods (e.g., as emulsifiers in salad dressing) and cleansing agents.
COMMENT: SURFACE TENSION IN LUNGS
It has been shown that low surface tension is important in our lungs, in order to keep them from collapsing. In premature babies, the absence of the surfactant that reduces the surface tension in their lungs has been related to their respiratory difficulties.
COMMENT: BIOMIMETIC GELS
Polymer gels that mimic some biological activities have been devel-oped. For example, a moving gel loop can be made to move by simple manipulations: in an electric field, surfactant molecules collect on the strand’s top surface, and electrostatic forces cause the gel to shrink; with a change in field polarity, the surfactant enters the aqueous phase again, and the strand extends to a new position. In this way, the gels can act as artificial muscles. (Y. Osada and S. B. Ross-Murphy, 1993. Intelligent gels. Scientific American, May 1993, 82.)
COMMENT: WAITING FOR THE PAINT TO DRY
Latex paints and Elmer’s Glue® contain a mixture of water, small poly-mer particles, and a surfactant. The surfactant stabilizes the polymer particles and prevents them from aggregating in the aqueous solution; surfactant molecules surround the polymer particles, in a micellar form, with their nonpolar parts facing inward to solubilize the polymers, and their polar head-groups facing outwards into the aqueous solution. After application of the paint or glue, over time the water evaporates, leaving behind the latex particles.

296 PhysicalPropertiesofMaterials
11.5 Inclusion Compounds
Inclusion compounds are multicomponent materials in which one type of spe-cies forms a host in which other species reside. They can exist in solution or in the solid state. In the latter, the range of topologies of the host lattice allows several different types of structures, as shown in Figure 11.6. Inclusion compounds belong to the larger family of materials known as supramolecular materials; these are defined by properties that stem from assemblies of mol-ecules. In the case of inclusion compounds, many physical and chemical properties are different in the supramolecular assembly than for the pure host or guest species. Supramolecular assemblies are generally held together by noncovalent forces such as hydrogen bonding, van der Waals interac-tions and Coulombic forces. Industrial applications of inclusion compounds include fixation of volatile fragrances and drugs, and inclusion of pesticides to make them safer to handle.
A clathrate is a material in which the host lattice totally traps the guest species. The term clathrate was coined in 1948 by H. M. Powell,* and a num-ber of materials are now known to form clathrates. Examples are clathrate hydrates (H2O molecules form the host lattice with a number of possible small molecules as guests; see Figure 11.7 and also the tutorial “Applications of Inclusion Compounds” at the end of this chapter).
The case of intersecting channels can be illustrated with the structures of zeolites. Zeolites are aluminosilicates that can both occur naturally (and are then usually given mineral names after the location of their discovery) and
* H. M. Powell, 1948. Journal of the Chemical Society, 61.
Isolatedcages
Nonintersectingchannels
IntersectingchannelsTwo-dimensional
sheets
FIGURE 11.6Schematic representations of possible inclusion compound topologies in the solid state. Isolated cages (e.g., clathrates), nonintersecting channels (e.g., urea compounds), sheets (e.g., graphite intercalates) and intersecting channels (e.g., zeolites) give extended structure in zero, one, two, and three dimensions, respectively.
www.ebook3000.com

OtherPhasesofMatter 297
can be synthesized in the laboratory. They are important for their ability to selectively take up small molecules (e.g., molecular sieves take up water to dry solvents), and also can be used as catalysts to crack petroleum. Some zeolite structures are illustrated in Figure 11.8.
If the host lattice forms layers with guests between the layers, this is an intercalate structure. For example, alkali metals can be intercalated into graphite. Another example is the clay minerals. The structure of one type of clay mineral is shown in Figure 11.9.
FIGURE 11.7A portion of the structure of methane clathrate hydrate. Only the oxygen atoms of the H2O mol-ecules that form the cage are shown; the hydrogen atoms of the water molecules are dynami-cally disordered. The methane molecule (CH4) resides as a guest in the cage.
(a) (b) (c)
FIGURE 11.8(a) A schematic representation of the building blocks of a zeolite. Four- and six-membered rings composed of tetrahedral TO4 units, with T = Si or Al, come together to form cages. For simplicity, only the T atoms are shown at the vertices in the lower right diagram, and the O atoms are omitted. The polyhedron is known as a sodalite cage, (b) Additions of other sodalite cages onto the four-membered rings of the central sodalite cage provide a three-dimensional structure with interconnected cages, known as the sodalite structure, and (c) Additions of a short channel then other sodalite cages onto the four-membered rings of the sodalite cage provide a three-dimensional structure with cages and channels, known as zeolite A. The final structures in (b) and (c) are common forms of representation of zeolite structures.

298 PhysicalPropertiesofMaterials
O
Si
AlOH
(a) (b)
FIGURE 11.9Two representations of the structure of Kaolinite, a clay mineral of idealized chemical compo-sition Al2Si2O5(OH)4, also sometimes written as Al2O3∙2(SiO2)∙2(H2O) to indicate its propensity to lose water at high temperatures. Its name comes from the location Kao-Ling, Jianxi, China. Kaolinite has a layered structure formed of tetrahedral silicate sheets linked through oxygen atoms to sheets of alumina octahedra called gibbsite layers. The layered structure of kaolin and the weak silicate-gibbsite interaction allows it to include other species between the layers. Rocks that are rich in Kaolinite is known as china clay or kaolin, and they are mined for use in fine china and glossy paper.
OH
OH
OH
O
O
O
O
O
O O
O
O
O
O
O
+
++
+ N
N
N
N
FIGURE 11.10This molecular self-assembly can be likened to threading a bead on a wire.
www.ebook3000.com

OtherPhasesofMatter 299
COMMENT: MOLECULAR SELF-ASSEMBLY
In the self-assembly shown schematically in Figure 11.10, the π-electron-rich 1,5-dioxynaphthalene unit combines with the π-electron deficient tetracationic cyclophane; this can be likened to threading a bead on a wire. The assembly can be monitored optically, as the resulting material has a charge-transfer band in the visible region. (R. Ballardini et al., 1993. Angewandte Chemie International Edition in English, 32, 1301.) Molecular level manipulation of structures is important in nanoscale devices.
COMMENT: COMPOSITES
Composites are a very important category of heterogeneous materials. Composite materials are composed of one component in a matrix of the other, but the compositions and forms can vary widely from fiber- reinforced polymers to concrete. The main features of composites are that the components are readily distinguishable (i.e., the material is heterogeneous), but the properties of the overall composite are distinct from the properties of the constituents. The matrix can range from plastic, to metal or ceramic. The other constituent, sometimes called a reinforcement, can be in the form of powder, fiber or even nanowires, and it can be oriented within the matrix, or randomly dispersed.
The properties of composites usually do not obey a rule of mixtures, in which property P would be given by:*
P f Pi
i i= ∑ (11.5)
where fi is the fraction of component i which has property value, Pi. For example, in a two-component composite, it is not unusual for a prop-erty such as strength to be very different from the weighted strength of the two components, given by Equation 11.5. In fact, the strength of a composite could very well be higher than the strength of the stronger component! Examples are considered in the problems at the end of this chapter.
Composites can offer superior performance compared with pure (monolithic) materials, and they are used widely in sporting goods, bridges, and even cutting tools.
* The most important equations in this chapter are designated with ▮ to the left of the equation.

300 PhysicalPropertiesofMaterials
Hair Care Products: A Tutorial
A large portion of the consumer economy is devoted to hair care prod-ucts. In many ways these are related to materials science; the material involved is the biomaterial we know as hair.
Several factors are considered when assessing hair quality: thickness of fiber (i.e., diameter), fiber density (number of hairs/cm2), stiffness, luster, configuration (curly or straight), and static charge. Some of these proper-ties can be controlled, while others (e.g., density) cannot.
Hair is a protein fiber, with an outer scaly cuticle and an inner cortex. Most of the properties of the hair are concerned with the state of the cuticle.
a. Proteins have both acidic and basic groups, and so does hair. Because of this, hair is amphoteric. The acidic groups are –COOH, and the basic groups are –NH2. The whole fiber appears neutral at pH = 5.5, and the cuticle is neutral at pH = 3.8. Why is the pH of a shampoo important? What happens to the functional groups of hair at low pH? What happens at high pH?
b. Hair conditioners are cationic surfactants (i.e., the surfactant ions carry a positive charge), usually with long chain fatty (hydrocar-bon) portions. Would these be expected to attach to hair better at low pH or at high pH? Explain.
c. The fatty portion of hair conditioner can act as a lubricant. Is this good or bad? How might the molecular mass of the surfactant play a role?
d. Hair conditioners can leave a film on hair. Is this a desirable fea-ture or not? Consider the reflective properties of films, and also their surface energies.
e. At high pH, hair will swell and high-molecular-weight molecules can be absorbed into the cortex. Can you see an application for this?
f. One of the most annoying things in winter, as anyone with long hair can tell you, is the build-up of static electricity in hair. Why is this not a problem in summer? How could hair conditioner help prevent static, fly-away hair?
g. If hair is curled when wet and then allowed to dry in a curled configuration, it retains its curl. Why?
h. How is curl in hair made “permanent”?
www.ebook3000.com

OtherPhasesofMatter 301
Applications of Inclusion Compounds: A Tutorial
Inclusion compounds can be synthesized in the laboratory, although many occur naturally.
a. Water, when mixed with suitable small molecules and cooled to an appropriate temperature and sometimes also requiring applied pressure, can form ice-like structures called clathrate hydrates, in which the water molecules form hydrogen-bonded cages in which the “guest” molecules reside. When the free guest is a gas, such as methane, the resulting materials are called gas hydrates. They can exist naturally, and have been found at the bottom of the ocean along the margins of the continents. It has been estimated that there is more combustible hydrocarbon mass in the hydrate form than in the terrestrial oil and gas reserves, but the challenge is to recover the hydrates efficiently. Clathrate hydrates can melt congruently or incongruently, depending on the guest species, the composition, and the overpressure of gas. The organic molecule tetrahydrofuran (THF) is a liquid at room temperature and mixes with water in all proportions. At a mole ratio of 1:17 with water, it forms a clathrate hydrate that melts congruently at 5°C. Given that pure ice melts at 0°C and pure THF melts at –108°C, and no compounds other than THF∙17H2O form, sketch and label the H2O–THF binary phase diagram.
b. Decomposition of naturally occurring clathrate hydrates has been proposed as an explanation for the Bermuda Triangle (i.e., the mysterious disappearance of ships and aircraft in that region). Explain.
c. Explain how an inclusion compound could be used to pro-duce a nonlinear optical material. Discuss advantages and disadvantages.
d. Explain how an inclusion compound could be used to produce a material with special electronic properties. Especially consider nanomaterials.
e. The few inclusion compounds that have been investigated to date appear to have thermal conductivities that increase with temperature at all investigated temperatures.* This characteris-tic is usually associated with glassy materials, but the inclusion compounds are crystalline. Explain this apparent contradiction.
* See, for example, D. Michalski and M. A. White, 1995. Journal of Physical Chemistry, 99, 3774.

302 PhysicalPropertiesofMaterials
11.6 Problems
11.1 Ethanol and water form a water-rich clathrate hydrate that melts incongruently at about –75°C. Sketch and label the H2O/CH3CH2OH phase diagram.
11.2 Choosing two phases each from a list of three phases would lead to nine combinations, but only eight types of colloids are listed in Table 11.1. Why is there no entry for a gas dispersed in a gas?
11.3 Aerogels are an interesting phase of matter. They are a subset of aerosols, composed of a suspension of fine particles in air. They were first formed in the 1930s by the preparation of a gel phase (from sodium silicate and hydrochloric acid), followed by the removal of the solvent under supercritical conditions. (Supercritical conditions are required because if the solvent is removed as a liquid, the gel collapses due to surface tension con-siderations.) Recent syntheses have produced aerogels with more than 99% air, and densities as low as 3 × l0–3 g cm–3. (The density of air is 1.2 × l0–3 g cm–3.)
a. One of the main uses of aerogels is in thermal insulation. Explain why an aerogel would conduct heat much less effi-ciently than the corresponding bulk material (e.g., silica aerogel compared with pure silica).
b. How could one determine the particle size within the aerogel?
c. Suggest other uses for aerogels. 11.4 When potassium atoms are intercalated between the layers of
carbon atoms in graphite, the extent of intercalation can be fol-lowed by color changes. For example, stage 2 intercalates are blue, whereas stage 1 intercalates are gold colored. (The des-ignation “stage n” indicates that there are n layers of graphite between each pair of intercalant layers.) On the basis of the col-ors, do you expect potassium–graphite intercalates to be semi-conductors or metals? Explain.
11.5 An advertisement for NonScents claims that it is a “100% natu-ral odor magnet”, “a zeolite,” which, by virtue of its “negative molecular ion charge,” attracts airborne odor molecules that have a “free ride on dust particles, which have a positive molec-ular ion charge”. The advertisement further claims that “mil-lions of tiny micropores . . . give the material a great adsorb ent surface area.” Is NonScents more likely to be useful to trap large organic molecules or small organic molecules? Explain.
11.6 An emulsion of two transparent liquids (e.g., oil and water) leads to a milky-white liquid if the refractive indices of the two phases differ. Why does the emulsion not appear transparent?
11.7 Figure 11.8 shows two zeolite structures, sodalite and zeolite A, that can be considered as building on the four-membered rings on the sodalite cage. Another zeolitic form could be built up by
www.ebook3000.com

OtherPhasesofMatter 303
adding hexagonal prisms onto the six-membered rings on the sodalite cage, and then adding another sodalite cage at the end of the hexagonal prisms. This forms the zeolite known as fauja-site. How would you expect faujasite to differ from sodalite and zeolite A in terms of the molecules that can be included inside the structure? Explain.
11.8 Ivory is a nanostructured composite material, composed mostly of collagen (40%) and the mineral hydroxyapatite (60%).
a. The room-temperature specific heat of dehydrated collagen is 1.3 J K–1 g–1, and that of pure hydroxyapatite is 0.77 J K–1 g–1. Use Equation 11.5 to predict the room-temperature spe-cific heat of ivory based on the rule of mixtures, and com-pare it to the observed value of 1.15 J K–1 g–1. Comment on the magnitude of the difference and possible origins.
b. The room-temperature thermal conductivity of pure col-lagen is 0.56 W m–1 K–1, and that of pure hydroxyapatite is 2.0 W m–1 K–1. Use Equation 11.5 to predict the room- temperature thermal conductivity of ivory based on the rule of mixtures, and compare it to the observed value of 0.37 W m–1 K–1. Comment on the magnitude of the differ-ence and possible origins.
c. The elastic modulus (see Chapter 14) of ivory is 10.4 GPa, while that of collagen is about 2 GPa and that of hydroxy-apatite is about 4 GPa. Again, compare the rule-of-mixtures value, now for elastic modulus, with the observed value, and comment on any differences.
Further Reading
General References
Supramolecular materials. Special issue. J. S. Moore, Ed. MRS Bulletin, April 2000, 26–58.
P. Ball, 1994. Designing the Molecular World. Princeton University Press, Princeton.A. Barton, 1997. States of Matter: States of Mind. Institute of Physics Publishing, Bristol,
UK.R. Dagani, 1994. New opportunities in materials science draw eager organometallic
chemists. Chemical and Engineering News, October 3, 1994, 31.R. Dagani, 1996. Chemists explore potential of macromolecules as functional materi-
als. Chemical and Engineering News, June 3, 1996, 30.M. F. Hawthorne and M. D. Mortimer, 1996. Building to order. Chemistry in Britain,
April 1996, 32.R. J. Hunter, 2001. Introduction to Modern Colloid Science, 2nd ed. Oxford University
Press, New York.L. F. Lindoy and I. M. Atkinson, 2000. Self-Assembly in Supramolecular Systems.
Cambridge University Press, Cambridge.

304 PhysicalPropertiesofMaterials
T. E. Mallouk and H. Lee, 1990. Designer solids and surfaces. Journal of Chemical Education, 67, 829.
J. B. Ott and J. Boerio-Goates, 2000. Chemical Thermodynamics. Vol. I: Principles and Applications; Vol. II: Advanced Applications. Academic Press, Oxford.
B. D. Wagner, P. J. MacDonald, and M. Wagner, 2000. A visual demonstration of supramolecular chemistry: Observable fluorescence enhancement upon host-guest inclusion. Journal of Chemical Education, 77, 178.
Colloids and Surfactants
New developments in colloid science. Special issue. D. A. Weitz and W. B. Russel, Eds. MRS Bulletin, February 2004, 82–106.
From dynamics to devices: Directed self-assembly of colloidal materials. Special issue. D. G. Grier, Ed. MRS Bulletin, October 1998, 21–50.
C. P. Ballard and A. J. Fanelli, 1993. Sol-gel route for materials synthesis. Chapter 1 in Chemistry of Advanced Materials. Ed. by C. N. R. Rao. Blackwell Scientific Publications, Oxford.
M. J. L. Castro, H. Ritacco, J. Kovensky, and A. Fernández-Cirell, 2001. A simpli-fied method for the determination of critical micelle concentration. Journal of Chemical Education, 78, 347.
J. A. Clements, 1962. Surface tension in the lungs. Scientific American, December 1962, 121.
R. Dagani, 1997. Intelligent gels. Chemical and Engineering News, June 9, 1997, 26.C. Day, 2006. Colloid particles crystallize in an increasingly wide range of structures.
Physics Today, June 2006, 15.A. P. Gast and W. B. Russel, 1998. Simple ordering in complex fluids. Physics Today,
December 1998, 24.M. Hair and M. D. Croucher, Eds., 1982. Colloids and Surfaces in Reprographic Technology.
ACS Symposium Series 200, Washington.M. Jacoby, 2002. 3-D structures from stable gels. Chemical and Engineering News, July
1, 2002, 7.C. D. Keating, M. D. Musick, M. H. Keefe, and M. J. Natan, 1999. Kinetics and thermo-
dynamics of Au colloid monolayer self-assembly. Journal of Chemical Education, 76, 949.
C. A. Murray and D. G. Grier, 1995. Colloidal crystals. American Scientist, 83, 23.Y. Osada and S. B. Ross-Murphy, 1993. Intelligent gels. Scientific American, May
1993, 82.E. Pefferkorn and R. Varoqui, 1989. Dynamics of latex aggregation. Modes of cluster
growth. Journal of Chemical Physics, 91, 5679.L. L. Schramm, 2005. Emulsions, Foams, and Suspensions: Fundamentals and Applications.
Wiley-VCH, Hoboken, NJ.P. C. Schulz and D. Clausse, 2003. An undergraduate physical chemistry experiment
on surfactants: Electrochemical study of commercial soap. Journal of Chemical Education, 80, 1053.
D. R. Ulrich, 1990. Chemical processing of ceramics. Chemical and Engineering News, January 1, 1990, 28.
H. B. Weiser, 1949. A Textbook of Colloid Chemistry. John Wiley & Sons, Hoboken, NJ.
www.ebook3000.com
OtherPhasesofMatter 305
E. Wilson, 1999. Out of the frying pan and onto the glass. Chemical and Engineering News, October 25, 1999, 10.
K. I. Zamaraev and V. L. Kuznetsov, 1993. Catalysts and adsorbents. Chapter 15 of Chemistry of Advanced Materials. Ed. by C. N. R. Rao. Blackwell Scientific Publications, Oxford.
Composites
H. R Clauser, 1973. Advanced composite materials. Scientific American, July 1973, 36.R. F. Gibson, 2010. A review of recent research on mechanics of multifunctional com-
posite materials and structures. Composite Structures, 92, 2793.A. Kelly, 1967. The nature of composite materials. Scientific American, September 1967,
160.M. B. Jakubinek, C. Samarasekera, and M. A. White, 2006. Elephant ivory: A low thermal
conductivity, high strength nanocomposite. Journal of Materials Research, 21, 287.
Inclusion Compounds
J. L. Atwood et al., Eds., 1996. Comprehensive Supramolecular Chemistry, 11 Volume Series. Pergamon Press, Oxford.
J. L. Atwood, J. E. D. Davies, and D. D. MacNicol, Eds., 1984. Inclusion Compounds, Vol. 1: Structural Aspects of Inclusion Compounds Formed by Inorganic and Organometallic Host Lattices. Academic Press, Oxford.
J. L. Atwood, J. E. D. Davies and D. D. MacNicol, Eds., 1984. Inclusion Compounds, Vol. 2: Structural Aspects of Inclusion Compounds Formed by Organic Host Lattices. Academic Press, Oxford.
J. L. Atwood, J. E. D. Davies, and D. D. MacNicol, Eds., 1984. Inclusion Compounds, Vol. 3: Physical Properties and Applications. Academic Press, Oxford.
J. L. Atwood, J. E. D. Davies, and D. D. MacNicol, Eds., 1991. Inclusion Compounds, Vol. 4: Key Organic Host Systems. Oxford University Press, New York.
J. L. Atwood, J. E. D. Davies, and D. D. MacNicol, Eds., 1991. Inclusion Compounds, Vol. 5: Inorganic and Physical Aspects of Inclusion. Oxford University Press, New York.
T. Bein, 2005. Zeolitic host–guest interactions and building blocks for the self-assembly of complex materials. MRS Bulletin, October 2005, 713.
S. Borman, 1995. Organic “Tectons” used to make networks with inorganic proper-ties. Chemical and Engineering News, January 2, 1995, 21.
S. Borman, 1997. Nanoporous sandwiches served to order. Chemical and Engineering News, April 28, 1997.
J. F. Brown Jr., 1962. Inclusion compounds. Scientific American, July 1962, 82.S. Carlino, 1997. Chemistry between the sheets. Chemistry in Britain, September 1997,
59.J. E. D. Davies, 1977. Species in layers, cavities and channels (or trapped species).
Journal of Chemical Education, 54, 536.J. M. Drake and J. Klafter, 1990. Dynamics of confined molecular systems. Physics
Today, May 1990, 46.J. Haggin, 1996. New large-pore silica zeolite prepared. Chemical and Engineering
News, May 27, 1996, 5.

306 PhysicalPropertiesofMaterials
K. D. M. Harris, 1993. Molecular confinement. Chemistry in Britain, February 1993, 132.
H. Kamimura, 1987. Graphite intercalation compounds. Physics Today, December 1987, 64.
G. T. Kerr, 1989. Synthetic zeolites. Scientific American, July 1989, 100.D. Michalski, M. A. White, P. Bakshi, T. S. Cameron, and I. Swainson, 1995. Crystal
structure and thermal expansion of hexakis(phenylthio)benzene and its CBr4 clathrate. Canadian Journal of Chemistry, 73, 513.
M. Ogawa and K. Kuroda, 1995. Photofunctions of intercalation compounds. Chemical Reviews, 95, 399.
D. O’Hare, 1992. Inorganic intercalation compounds. Chapter 4 in Inorganic Materials. Ed. by D. W. Bruce and D. O’Hare. John Wiley & Sons, Hoboken, NJ.
R. E. Pellenbarg and M. D. Max, 2001. Gas hydrates: From laboratory curiosity to potential global powerhouse. Journal of Chemical Education, 78, 896.
M. Rouhi, 1996. Container molecules. Chemical and Engineering News, August 5, 1996, 4.F. Vögtle, Ed., 1991. Supramolecular Chemistry: An Introduction John Wiley & Sons,
Hoboken, NJ.
Molecular Engineering
R. Baum, 1995. Chemists create family of “molecular squares” based on iodine or met-als. Chemical and Engineering News, February 13, 1995, 37.
S. Borman, 1994. Molecular “Brake”: Side chain reversibly slows rotating “wheel.” Chemical and Engineering News, April 25, 1994, 6.
R. Dagani, 1991. Building complex multimolecule assemblies poses big challenges. Chemical and Engineering News, May 27, 1991, 24.
M. J. Snowden and B. Z. Chowdhry, 1995. Small sponges with big appetites. Chemistry in Britain, December 1995, 943.
F. Stoddart, 1991. Making molecules to order. Chemistry in Britain, August 1991, 714.M. D. Ward, 2005. Directing the assembly of molecular crystals. MRS Bulletin, October
2005, 705.G. M. Whitesides, 1995. Self-assembling materials. Scientific American, September
1995, 146.
Other Materials
J. Banhart and D. Weaire, 2002. On the road again: Metal foams find favor. Physics Today, July 2002, 37.
M. Bloom, 1992. The physics of soft, natural materials. Physics in Canada, January 1992, 7.
P.-G. de Gennes and J. Badoz, 1996. Fragile Objects. Springer-Verlag, New York.N. Graham, 2001. Swell gels. Chemistry in Britain, April 2001, 42.L. D. Hansen and V. W. McCarlie, 2004. From foam rubber to volcanoes: The physical
chemistry of foam formation. Journal of Chemical Education, 81, 1581.M. Jacoby, 1998. Durable organic gels. Chemical and Engineering News, January 26,
1998, 34.B. Kahr, J. K. Chow, and M. L. Petterson, 1994. Organic hourglass inclusions. Journal
of Chemical Education, 71, 584.
www.ebook3000.com

Part IV
Electrical and Magnetic Properties of Materials
The missing link between electricity and magnetism was found in 1820, by Hans Christian Ørsted, who noticed that a magnetic compass needle is influenced by current in a nearby conductor. His discovery literally set the wheels of modern industry in motion.
Rodney CotterillThe Cambridge Guide to the Material World

309
12ElectricalProperties
12.1 Introduction
Although all the properties of materials—optical, thermal, electrical, mag-netic, and mechanical—are related, it is perhaps the electrical properties that most distinguish one material from another. This can be as simple a distinc-tion as metal versus nonmetal, or it can involve more exotic properties such as superconductivity. The aim of this chapter is to expose the principles that determine electrical properties of matter.
12.2 Metals, Insulators, and Semiconductors: Band Theory
The resistance to flow of electric current in a material, designated R, is deter-mined by the dimensions of the material (length L and cross-sectional area A) and the intrinsic resistivity (also known as resistivity, and represented by ρ) of the material:*
RLA
= ρ (12.1)
where R is in units of ohms† (abbreviated Ω) and ρ is typically in units Ω m. The intrinsic resistivity depends not just on the specific material but also on the temperature. (We will see later how this can be used to produce elec-tronic thermometers.) Some typical resistivities are given in Table 12.1.
* The most important equations in this chapter are designated with ▮ to the left of the equation.
† Georg Simon Ohm (1789–1854) was a German physicist. Ohm published his law (V = iR, where V is voltage, i is current, and R is resistance) in 1827, but it received little attention for nearly 20 years. It is now known to be one of the most fundamental principles of electronics and is called Ohm’s Law.

310 PhysicalPropertiesofMaterials
The electrical conductivity, σ, of a material is the reciprocal of its resistivity, ρ:
σρ
=1
(12.2)
so typical units of σ are Ω–1 m–1 (≡ S m–1, where S represents Siemens* and 1 S = 1 Ω–1). Electrical conductivity also can be equivalently expressed in terms of current density, J (units A m–2, where A is amperes†) and electric field, ε (units V m–1, where V is volts‡):
σε
=J
(12.3)
so, equivalently, units of σ can be expressed as A m–1 V–1 (≡ Ω–1 m–1 ≡ S m–1).
* The Siemens unit is named after Ernst Werner von Siemens (1816–1892), a German inven-tor and industrialist who made significant contributions to electric power generation and electrochemistry.
† André Marie Ampère (1775–1836) was a French mathematician and physicist who taught at École Polytechnique in Paris. Ampère carried out many experiments in electromagnetism and also provided a mathematical theory for electrodynamics.
‡ Count Alessandro Volta (1745–1827) was a member of the Italian nobility who carried out many important electrical experiments. Volta was the inventor of the electrical battery and the discoverer of electrolysis of water. His home town, Como, Italy, has a museum that houses many Volta artifacts, including experimental apparatus and lab notes.
TABLE 12.1
Electrical Resistivities, ρ, and Conductivities, σ (=ρ–1), of Selected Materials at 25°C
Material ρ/Ω m σ/Ω–1 m–1
MetalsAg 1.61 × 10⁻⁸ 6.21 × l07
Cu 1.69 × 10⁻⁸ 5.92 × l07
Au 2.26 × 10⁻⁸ 4.44 × 10⁷
Al 2.83 × l0–8 3.53 × l07
Ni 7.24 × 10⁻⁸ 1.38 × l07
Hg 9.58 × l0–7 1.04 × l06
SemiconductorsGe 0.47 2.1Si 3 × l03 3 × 10⁻⁴
InsulatorsDiamond 1 × 10¹⁴ 1 × 10–14
Quartz 3 × 10¹⁴ 3 × 10–15
Mica 9 × 10¹⁴ 1 × 10–15
Source: Supramolecular Chemistry: An Introduction, F. Vögtle, John Wiley & Sons, 1991, Hoboken, NJ.
www.ebook3000.com

ElectricalProperties 311
The distinguishing feature separating metals, semiconductors, and insula-tors is the range of σ: > 104 Ω–1 m–1 for metals, 10–3 to 104 Ω–1 m–1 for semicon-ductors, and < 10–3 Ω–1 m–1 for insulators (see Figure 12.1 and also Table 12.1).
In contrast with thermal conductivities, which span a range of about 6 orders of magnitude from the poorest thermal conductor to the best (see Chapter 8), electrical conductivities (see Figure 12.1) span more than 22 orders of magnitude from the least conductive insulator to the highest-conductivity metal. (Of course, superconductors have infinite conductivity.) The difference in ranges of thermal and electrical conductivity reflect the fact that thermal conductivity requires the collective action of phonons, whereas electrical conductivity is usually related to the motion of relatively indepen-dent electrons along a path of least resistance.
Graphite inclusioncompounds
Conductiveorganic crystals
Dopedpolyacetylene
Polyethylene
Polyacetylene
Organicdyes
Teflon, PVC,polystyrene
(SN)x
108
1010
106
104
102
100
10–2
10–4
10–6
10–8
10–10
10–12
10–14
10–16
Metals
Semiconductors
Insulators
Ag, CuFeBi
Ge
Si
Glass
DiamondQuartz
σ, Conductivity/Ω–1 m–1
FIGURE 12.1This diagram shows the wide range of electrical conductivity of common materials at room temperature, not including superconductors (for which σ = ∞).

312 PhysicalPropertiesofMaterials
The wide variety of electrical conductivities in different materials is asso-ciated with the availability of energy levels directly above the filled energy levels in the material. The presence (and width) of a gap between the filled electronic states and the next available electronic states leads to very differ-ent electrical properties for insulators and noninsulators.
12.2.1 Metals
As we have seen in Chapter 3 (especially Figures 3.2, 3.6, and 3.7), there is a continuum of electronic energy levels (called bands), and for a metal there are available unoccupied electronic energy levels (empty bands) immediately above the highest occupied levels. This is shown in Figure 12.2 for two spe-cific metals where a realistic density of states is shown; these figures can be contrasted with the simpler representations of Figures 3.6 and 3.7.
When there are available electronic energy levels immediately above the filled levels (i.e., there is no gap), the material is a metal, and excitation of the electrons takes place at all temperatures above 0 K. The presence of excited electrons allows facile conduction of electric current and gives rise to the high electrical conductivity (low electrical resistivity) of a metal. The con-duction electrons also are responsible for the shiny appearance of metals (see Chapter 3) and their high thermal conductivity (see Chapter 8).
The work function, Φ, for a metal is defined as the minimum energy required to remove an electron into vacuum far from the atom (see Figure 12.3a). Different metals have different values of work functions (Figure 12.3b) such
Density of states
Energy
3s 3p
EF
3p
3d4s
Density of states
Energy
EF
(a) (b)
FIGURE 12.2Electronic energy levels for metals. EF is the Fermi energy, the energy at which the probability of occupation is ½. The shaded areas represent the filled energy levels, and bands below the valence bands are omitted. In both cases, there are available energy levels immediately above the filled bands, which gives rise to metallic properties. (a) Energy bands of magnesium show the overlap in energy between the 3s band and the 3p band. (b) Energy bands of cobalt show the overlap of the energy range of the 3d and 4s bands.
www.ebook3000.com

ElectricalProperties 313
that, when dissimilar metals are in contact, an electrical potential results (Figure 12.3c). This contact potential can be used in devices such as thermom-eters (see the tutorial at the end of this chapter).
12.2.2 Semiconductors
A semiconductor has a gap (forbidden region) between the valence band and the conduction band (Figure 12.4a). At a temperature of 0 K, all the electrons of a semiconductor are in the valence band. However, for T > 0 K, there will be some thermally excited population of the conduction band, as shown in Figure 12.4b. It is this small population of the conduction band that allows slight electrical conductivity in semiconductors.
The structure of pure germanium, which is a semiconductor, is shown in Figure 12.5, along with a schematic representation of its electrical conductiv-ity mechanism.
The element tin occurs as two allotropes, white tin and gray tin. White tin is the more familiar form, as it is stable above 13°C, and we know this form to have the typical characteristics of a metal: it is shiny, ductile, and a good con-ductor of heat and electricity. White tin is denser than gray tin (their densities are 7.2 g cm–3 and 5.7 g cm–3, respectively), and this allows its electronic energy
COMMENT: MATTHIESSEN’S RULE
Matthiessen’s rule is an empirical conclusion that the total resistivity of a crystalline metal is the sum of the resistivity due to thermal motions of the metal atoms in the lattice and the resistivity due to the presence of imperfections in the crystal. This rule allows a basic understand-ing of the resistivity behavior of metals as a function of temperature.
+ –
Vacuum
EF EF
EF
EF
Φ ΦAΦB
A B
(a) (b) (c)
AB
FIGURE 12.3(a) The work function, Φ, for a metal is defined as the minimum energy required to remove an electron to vacuum far from the atom. (b) Different metals, shown here as A and B, have dif-ferent work functions. (c) Dissimilar metals, when placed in contact with each other, equalize their Fermi energies, giving a contact potential, shown here as an electric field.

314 PhysicalPropertiesofMaterials
(a) (b)
(c) (d)
Conduction band
G e G e G e G e G e
G e G e G e G e G e
G e G e G e G e G e
G e G e G e G e G e
G e G e G e G e G e
G e G e G e G e G e
G e G e G e G e G e
G e G e G e G e G e
G e G e G e G e G e
G e G e G e G e G eValence band
Gap0.7 eV
0
FIGURE 12.5The semiconductor germanium: (a) The crystal structure showing tetrahedral bonding among Ge atoms. (b) A schematic two-dimensional representation of the bonding in Ge. (c) The energy level diagram of Ge, showing the formation of a “hole” (absence of electron) in the valence band and an electron in the conduction band. This electron has been promoted from the valence band to the conduction band by thermal energy. (d) An electron-hole pair in Ge.
CB CB
VB VB
T = 0 K T > 0 K
EE
(a) (b)
FIGURE 12.4The energy bands of a semiconductor at (a) T = 0 K, and (b) T > 0 K. Thermal energy can cause some slight population of the conduction band of a semiconductor, and this gives it a nonzero (but low) electrical conductivity.
www.ebook3000.com

ElectricalProperties 315
bands to overlap more, giving white tin metallic character. In contrast, gray tin has a band gap of 0.1 eV, an electrical resistivity of 10–6 Ω m, and acts as a semi-conductor. Folklore has it that Napoleon lost many of his soldiers during his winter invasion of Russia due to the white tin to gray tin transformation of the tin buttons holding their uniforms closed. Since the gray form is not metallic, it is crumbly, and this is said to have led to the soldiers perishing in the cold.*
12.2.3 Insulators
An insulator has a very large gap between its valence band and conduction band. Although thermal energy could promote electrons across this gap, in practice the required thermal energy is sufficient to melt the solid! This large gap essentially prevents significant electrical conductivity in insulators.
* Although the transformation from white to gray tin is at 13°C, like many first-order transi-tions (e.g., freezing), the high-temperature phase can be supercooled. Therefore, the soldiers could have experienced temperatures slightly below 13°C without loss of their jacket clo-sures, but in the extreme cold of the Russian winter the tin was cooled sufficiently to ensure complete transformation of the buttons to the crumbly gray form.
COMMENT: QUANTUM DOTS
Quantum dots are nanoscale semiconductors that have quite different electrical properties from the corresponding bulk material. The electron-hole pairs are closer together in a quantum dot than in the bulk mate-rial, and this is referred to as quantum confinement. Because there are fewer atoms, the quantum dots’ electronic energy levels are no longer bands but are more discrete. Although quantum dots still exhibit a band gap, it is larger than in the bulk material. Furthermore, changing the size or shape of the quantum dot by moving or adding or removing just a few atoms can substantially change the band gap. This important property allows extremely precise control of the wavelength of light emitted from a quantum dot. Furthermore, quantum dots of the same material, but with different dimensions, can emit light of different col-ors. These special properties make quantum dots promising materials for optoelectronic applications.
COMMENT: ONE-DIMENSIONAL CONDUCTORS
Although most molecular systems are insulators, some have high elec-trical conductivity; one such system is the charge-transfer complex of tetrathiafulvalene (TTF) with tetracyanoquinodimethane (TCNQ). Molecular structures for TTF and TCNQ are shown in Figure 12.6.

316 PhysicalPropertiesofMaterials
12.3 Temperature Dependence of Electrical Conductivity
The temperature dependence of the electrical properties of a material can be used to provide important devices such as switches and thermometers. In this section we examine the principles involved in temperature depen-dence of electrical conductivity (or resistivity) for metals and pure (intrinsic) semiconductors.
COMMENT: ELECTRICAL ANISOTROPY
TTF-TCNQ is not the only material that is electrically anisotropic. Other examples include graphite, asbestos, and K2Pt(CN)4Br0.3·3H2O. The latter is composed of Pt(CN)4 units stacked to give Pt–Pt distances of 2.89 Å, that is, nearly the same distance along these chains as in Pt metal (2.78 Å). However, the Pt–Pt distance is much greater between chains, resulting in anisotropic structure and properties—the crystals are highly reflective and electrically conducting in the direction of the chains, and transparent and electrically insulating in directions per-pendicular to the chains.
In the crystalline complex, TTF and TCNQ form segregated regular stacks, and there is considerable delocalization of electrons (i.e., overlap of wave functions) along these columns. TTF-TCNQ forms a charge-transfer complex; on average, each TTF molecule donates 0.59 electrons to a TCNQ. This allows appreciable conductivity; σ is 5 × 10⁴ Ω–1 m–1 along the chains, but 100 times less in directions perpendicular to the chains; that is, this material is highly anisotropic. The unusually high metal-like electrical conductivity of TTF-TCNQ persists down to 60 K.
NC
NC
CN
CNC C
S S
SS
TTF
TCNQ
FIGURE 12.6The molecular structures of tetrathiafulvalene (TTF) and tetracyanoquinodimethane (TCNQ).
www.ebook3000.com

ElectricalProperties 317
12.3.1 Metals
The resistivity of a metal increases with temperature (see Figure 12.7), and this increase is essentially linear except at the lowest temperatures.
The increase in resistivity (decrease in electrical conductivity) with increased temperature in a metal can be directly associated with the increase in thermal motion of the atoms on their lattice sites at increased temperature. The increase in motion scatters the conduction electrons and decreases their mean free path, hence decreasing their ability to carry elec-trical charge.
COMMENT: WIEDEMANN–FRANZ LAW—A RELATIONSHIP BETWEEN ELECTRICAL AND THERMAL CONDUCTIVITIES FOR METALS
The Debye expression for thermal conductivity (Equation 8.13) can be combined with the electronic contribution to the heat capacity of a metal (Equation 6.34) to yield
κ γ λ=13
Tv (12.4)
where γ is the electronic coefficient of the heat capacity, v is the elec-tron’s speed, and λ is the electron’s mean free path. Since γ is related to the Fermi energy, EF, for N electrons per unit volume as
γ = π2Nk2/2EF (12.5)
where k is Boltzmann’s constant, and the electrical conductivity is given by
σ = Ne2λ/mvF (12.6)
Al
Cu
50
40
30
20
10
00 200 400 600
T/Kρ/
10–9
Ω m
FIGURE 12.7Resistivity as a function of temperature for two typical metals, aluminum and copper.

318 PhysicalPropertiesofMaterials
12.3.2 Intrinsic Semiconductors
In contrast with metals, the electrical resistivity of intrinsic (pure) semi-conductors decreases (electrical conductivity increases) with increasing tem-perature. Germanium is shown as an example in Figure 12.8.
This can be understood as follows. At low temperatures, few electrons are able to jump the gap from the valence band to the conduction band; in fact, none has jumped at T = 0 K. As the temperature is increased, the number of electrons that have sufficient thermal energy to jump from the valence band to
where vF is the electron speed at the Fermi energy, and m and e are the mass and charge of the electron, respectively, assuming v ≈ vF, this leads to a ratio of
κσ
=π
Tke
2 2
23 (12.7)
which has a value of 2.45 × 10⁻⁸ W Ω K–2 (≡ L, the Lorenz constant), for all metals. Equation 12.7, which shows that the ratio of thermal con-ductivity to electrical conductivity at a given temperature is constant for metals, is known as the Wiedemann–Franz law, and it holds quite well for metals. However, in very pure metals in the temperature range where phonon scattering is important, electron–phonon interactions (which have been neglected in this derivation) lead to a breakdown of the Wiedemann–Franz law. The Wiedemann–Franz law is important in the history of our understanding of metals as it shows the electrical conductivity to be proportional to temperature, in support of model-ing metals as gases of electrons. Note that the Wiedemann–Franz law holds only for metals, not for semiconductors or insulators.
300 400 500
1.0
0.5
0
T/K
ρ/Ω
m
FIGURE 12.8The electrical resistivity of pure germanium as a function of temperature.
www.ebook3000.com

ElectricalProperties 319
the conduction band is increased. From Fermi’s expression for P(E), the prob-ability of having a free electron at energy E (Equation 3.1) can be rewritten as
P Eee
E E kT
E E kT
F
F( )
( )/
( )/=+
− −
− −1 (12.8)
and for ∣E – EF∣ ≪ 1 (i.e., near the Fermi energy), this can be approximated by
P E e E E kTF( ) ( )/= − −12
(12.9)
which has the same form as the Boltzmann distribution:
n E e E E kT( ) ( )/∝ − − (12.10)
where n(E) is the number of species in energy state E, and E is the average energy of the system. For an intrinsic semiconductor, E is EF (since P(E) = ½ at the Fermi energy, by definition and the distribution is symmetric* about EF), and the most probable energy of an excited (conduction) electron will be EF + ½Eg (i.e., the bottom of the conduction band), so Equation 12.10 becomes
n E e E kT( ) /∝
− g 2 (12.11)
where n(E) is the number of conduction electrons. Since the electrical conduc-tivity, σ, is proportional to the number of conduction electrons, this gives
σ σ=−
02ge E kT/
(12.12)
where σ0 is a proportionality constant.Equation 12.12 shows an interesting feature: from measurements of electri-
cal conductivity as a function of temperature, the energy of the band gap, Eg, can be determined for a semiconductor (see Problem 12.3).
* Strictly speaking, the distribution is symmetric only if the density of states in the valence band and conduction band are equal, but even if they are not, the correction for asymmetry is usually small.
COMMENT: SILICON
Silicon-based semiconductors are at the heart of most of the computer devices that we use daily. Silicon (see Figure 12.9) has properties that make it very useful, and it is one of the most common elements on earth. It is hard and chemically rather inactive (mainly reacts with

320 PhysicalPropertiesofMaterials
oxygen); it has a high melting point (1685 K), which allows for doping by solid-state diffusion at high temperatures; and it has a low band gap (1.1 eV), which allows for low-power applications.
COMMENT: CARBON NANOTUBES AS METALS OR SEMICONDUCTORS
As we have seen in Chapter 9, graphene (i.e., individual sheets of car-bon with the graphite structure), can be rolled up to form seamless cyl-inders—carbon nanotubes (CNT). The different types of CNT can be understood in terms of their unit cell. An informative way to consider the structures is in terms of directional (so-called “chiral”) vectors that meet up when the graphene sheet is rolled up to form the cylindrical CNT. The chiral vector is defined by integer numbers of two unit vec-tors, â1 and â2, shown in Figure 12.10.
FIGURE 12.9A photograph of silicon, a very useful element.
a1
a2
FIGURE 12.10Portion of a graphene sheet showing the directional unit vectors â1 and â2 that define the chiral vector, generalized as mâ1 + nâ2, defining the structure of an (m,n) carbon nanotube.
www.ebook3000.com

ElectricalProperties 321
The ends of the chiral vector join to form the circumference of the CNT and the nanotube’s circular cross-section. Therefore, different val-ues of m and n lead give rise to different CNT structures. The (5,5) CNT chiral vector and overall structure is shown in Figure 12.11, and the (9,0) CNT chiral vector and overall structure is shown in Figure 12.12.
Three categories of CNT result from the rolled graphene sheets: arm-chair, zigzag, and chiral CNTs. The armchair structures are formed when m = n (as in (5,5) in Figure 12.11), whereas zigzag nanotubes are formed when either m or n is zero (e.g., (9,0) in Figure 12.11). All other CNTs are known as chiral.
The electronic properties of CNTs are especially interesting because of the diversity that arises despite all being formed of carbon with the same type and number of bonds. The unique electronic properties arise from the quantum confinement of electrons in the direction per-pendicular to the nanotube axis. Electrons can only propagate along the nanotube axis, and the resulting one-dimensional band structure depends on the standing waves that are set up around the circumfer-ence of the nanotube. The latter depend on the structure. Calculations of the electronic band structure of CNTs show that an (m,n) carbon nano-tube will be metallic when m – n = 3I, where I is an integer. Therefore, all armchair nanotubes are metallic, as are a third of all possible zig-zag nanotubes. The remaining possibilities are semiconducting. In a typical production of CNTs, about one third would be metallic and two thirds semiconducting. Separating CNTs by their electronic properties is one of the major challenges of materials research.
(a)
(b)
a1
a2
FIGURE 12.11The so-called (5,5) carbon nanotubes. The chiral vector, shown on the graphene sheet in (a), is 5â1 + 5â2, and it forms the circumference of the (5,5) carbon nanotube shown in (b). Diagram (b) courtesy of Chris Kingston.

322 PhysicalPropertiesofMaterials
12.4 Properties of Extrinsic (Doped) Semiconductors
Defects in a semiconductor can give rise to localized electronic states as seen previously in the discussion of optical properties of semiconductors (Chapter 3). The addition of defects by doping (addition of impurities) gives rise to extrinsic semiconductors.
COMMENT: SPINTRONICS
Conventional electronic devices use the charge of an electron to move information. As electronic devices become ever smaller, there inevitably will be a limit to their size. However, electrons have another property —their spin—that can be exploited to provide new electronic devices with higher speeds, reduced power needs, and enhanced functional-ity. Much of the research emphasis in this field of spintronics (i.e., spin electronics) concerns spin transport and spin injection to allow semi-conductors to work as spin polarizers and spin valves. While existing metal-based devices can act as switches or valves, they do not amplify. Semiconductor-based spintronic materials should, in principle, allow signal amplification. Furthermore, semiconductor-based spintronics could be processed with existing electronic device production facilities. A long-term goal of spintronics is the use of electronic spins for quan-tum information processing and quantum computing, as the electronic spins are excellent candidates for quantum bits (qubits).
(a)
(b)
a1
a2
FIGURE 12.12The so-called (9,0) carbon nanotubes. The chiral vector, shown on the graphene sheet in (a), is 9â1 + 0â2, (=9â1), and it forms the circumference of the (9,0) carbon nanotube shown in (b). Diagram (b) courtesy of Chris Kingston.
www.ebook3000.com

ElectricalProperties 323
For example, if Si (which has four valence electrons) is doped with P (which has five valence electrons), there is an extra electron in the lattice and a local-ized energy within the gap corresponding to this extra electron. This extra level (Figure 12.13) is called a donor level since P donates an extra electron. Electrons can be promoted from this level to the conduction band. Since the resultant current carriers are electrons, which are negatively charged, these are called n-type extrinsic semiconductors.
Holes also could carry charges, and, since holes are effective positive charges (they represent the absence of negative charge), these are termed p-type extrinsic semiconductors. An example is Si (four valence electrons) doped with Al (three valence electrons); the extra localized level in the gap due to electron deficiency in Al is an acceptor level since Al accepts electrons from Si, as depicted in Figure 12.14.
The importance of p-type and n-type semiconductors is realized when they are sandwiched together.
E
Si Si Si Si Si
Si Si Si Si Si
Si Si P Si Si
Si Si Si Si Si
Si Si Si Si Si
Si Si Si Si Si
Si Si Si Si Si
Si Si P Si Si
Si Si Si Si Si
Si Si Si Si Si
Conduction band
Valence band
Donorlevel0
Eg
(a) (b)
(c)
FIGURE 12.13An n-type extrinsic semiconductor. (a) P substitutes for Si in a lattice. (b) The extra electron of P (compared with Si) can be donated to the conduction band to carry electrical charge. (c) The band model showing the donor level in the band gap.
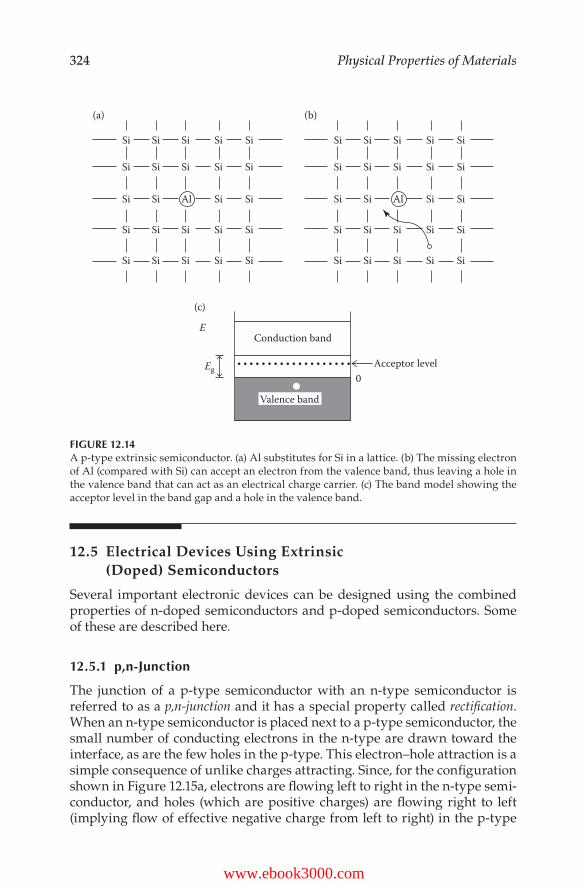
324 PhysicalPropertiesofMaterials
12.5 Electrical Devices Using Extrinsic (Doped) Semiconductors
Several important electronic devices can be designed using the combined properties of n-doped semiconductors and p-doped semiconductors. Some of these are described here.
12.5.1 p,n-Junction
The junction of a p-type semiconductor with an n-type semiconductor is referred to as a p,n-junction and it has a special property called rectification. When an n-type semiconductor is placed next to a p-type semiconductor, the small number of conducting electrons in the n-type are drawn toward the interface, as are the few holes in the p-type. This electron–hole attraction is a simple consequence of unlike charges attracting. Since, for the configuration shown in Figure 12.15a, electrons are flowing left to right in the n-type semi-conductor, and holes (which are positive charges) are flowing right to left (implying flow of effective negative charge from left to right) in the p-type
Si Si Si Si Si
Si Si Si Si Si
Si Si Al Si Si
Si Si Si Si Si
Si Si Si Si Si
Si Si Si Si Si
Si Si Si Si Si
Si Si Al Si Si
Si Si Si Si Si
Si Si Si Si Si
Conduction band
Acceptor level0
Valence band
Eg
E
(a) (b)
(c)
FIGURE 12.14A p-type extrinsic semiconductor. (a) Al substitutes for Si in a lattice. (b) The missing electron of Al (compared with Si) can accept an electron from the valence band, thus leaving a hole in the valence band that can act as an electrical charge carrier. (c) The band model showing the acceptor level in the band gap and a hole in the valence band.
www.ebook3000.com

ElectricalProperties 325
semiconductor, there is net (small) flow of electrons from left to right across the device. Because this exists even in the absence of an applied electric field, this is referred to as intrinsic electrical conductivity.
Now, if an electrical field is placed across the p,n-junction such that the negative terminal is next to the n-type semiconductor and the positive ter-minal is next to the p-type semiconductor (this arrangement is referred to as forward bias), the interactions of the moving charges (electrons or holes) with the field will enhance the flow of charge, and there will be a larger flow of electrons left-to-right, as shown in Figure 12.15b. The field-induced current is called extrinsic electrical conductivity.
If the field is reversed (reverse bias), the electrons in the n-type semiconductor will be pulled in both directions—toward the holes on the p side, and toward the positive terminal. Similarly, the holes in the p-type semiconductor will be attracted in both directions, toward the negative charge of the n-type semiconductor and toward the negative terminal (see Figure 12.15c). Therefore, reversing the poten-tial field across a p,n-junction has the effect of turning a large current into a small current; this property is called rectification. This is contrary to what is observed in normal conductors (i.e., metals), where a reversal of the field only causes the direction of the current flow to change, and its magnitude is maintained.
Recombinationzone
Depletionzone
No bias
Forward bias Reverse bias
n p n p n p
e–
– –+ +(b)(a) (c)
FIGURE 12.15A p,n-junction showing rectification. Electrons shown as ● and holes as ○. (a) With no field (no bias) there is a small net flow of negative charge due to electron-hole annihilation at the interface. (b) With a forward bias, there is net electron flow in the material from left-to-right. (c) With a reverse bias, extrinsic conductivity as in (b) disappears, and only a small amount of intrinsic electrical conductivity as in (a) remains.
n p(a)
(b)
FIGURE 12.16(a) A diode and (b) its electrical schematic symbol.

326 PhysicalPropertiesofMaterials
The p,n-junction is often referred to as a diode, which is an electrical device that makes use of the electrical properties of the p,n-junction. The symbol for a diode is shown in Figure 12.16; the arrow has been chosen to show the motion of current (opposite to electron motion) under forward bias.
The principle of rectification in a diode can be seen in Figure 12.17 where the total current is shown as a function of bias (forward and reverse), and the contributions to the current are explicitly shown.
The properties of a p,n-junction also can be understood in terms of the electronic energy distributions. Figure 12.18 shows the distributions for an n-type semiconductor and a p-type semiconductor when they are separated and when they are placed adjacent to each other. When the two are in contact,
Reverse bias Forward bias
Itotal = I1 + I2 + I3 +I4
I3
I2
I1I4
I
FIGURE 12.17The total current, Itotal, in a p,n-junction diode as a function of bias. Also shown are the con-tributions to the current: I1, due to mobile electrons in the p → n direction; I2, due to mobile electrons in the n → p direction; I3, due to mobile holes in the p → n direction; I4, due to mobile holes in the n → p direction.
EF EFEF EF
n np p
(a) (b)
FIGURE 12.18Electronic distributions for n-type semiconductors and p-type semiconductors, (a) when they are separated and (b) when they are in contact, showing the shift to equal Fermi energies (EF , defined as the energy at which P(E) = ½). Probabilities, ranging from zero (left side) to one (right side), are shown by the curved line.
www.ebook3000.com

ElectricalProperties 327
the gaps shift so as to equalize the Fermi energies. This shift causes a contact potential (due to the difference in work function; see Section 12.2), moving electrons from the n-type semiconductor to the p-type semiconductor.
In an electric field, the effect of bias on a p,n-junction can be seen in the electronic distributions shown in Figures 12.19 and 12.20.
With the rapid change in bias of an ac source and the rectification property of a p,n-junction, a device constructed of a p,n-junction can be used to turn alternating current into direct current—for example, in a wall adapter for use with a laptop computer.
A Zener diode is a special case of a diode in that it has little current flow at low reverse bias as usual, but more flow at large reverse bias (see Figure 12.21). This property results because large reverse biases can be suffi-cient to cause electrons to tunnel through the junction. That is, the overlap of the wavefunctions of the electrons on either side of the junction causes some enhancement of the probability of electrons getting across the junction, as shown schematically in Figure 12.21. As the reverse bias in a Zener diode is
(a) (b)– +
n p n ph+h+
e– e–
FIGURE 12.20Electronic distributions of a p,n-junction (a) without bias (small current), and (b) with forward bias (large current).
EFEF
n n np p p
– –+ +
(a) (b) (c)
FIGURE 12.19Electronic distributions for a p,n-junction, (a) with no bias; (b) with a forward bias (giving carriers in both the valence band and the conduction band); and (c) with a reverse bias (giving only a few carriers).

328 PhysicalPropertiesofMaterials
increased, the electric field across the depletion region becomes larger. When a charge carrier gets into the depletion region, it is efficiently carried to the appropriate side of the junction. This can be so efficient that the motion of the charge causes ionization (creation of a free electron and a hole), which means there are more charge carriers and an amplification of current referred to as an avalanche effect. A particularly useful feature of Zener diodes is that slight changes in the composition of the doped semiconductors can be used to tailor-make the threshold voltage for the dramatic reverse-bias current.
COMMENT: CARBON MONOXIDE SENSORS
The electrical properties of semiconductors can be very sensitive to the state of purity. For example, the introduction of band gap impurities can greatly change the resistivity of a semiconductor.
In addition, electrical properties can be used to sense slight changes in the semiconductor due to reactivity. This property can be used to design chemical sensors.
Semiconducting metal oxides, such as tin oxide and zirconium oxide, have been used in sensors to detect the presence of carbon monox-ide. CO is a very good reducing agent, as CO2 is more stable than CO. Metal oxide semiconductors will be reduced in the presence of CO, and the change in chemical composition will lead to a change in electrical properties, which can be used to sound an alarm in the event of harm-ful levels of CO.
Forward biasReverse bias
Reve
rse c
urre
ntFo
rwar
d cu
rren
t
n p
FIGURE 12.21Zener diode: (a) showing an increase in current at large reverse bias, and (b) showing the electronic bands that allow tunneling through the junction (from the conduction band of the n-type semiconductor to the valence band of the p-type semiconductor).
www.ebook3000.com

ElectricalProperties 329
COMMENT: CONDUCTING POLYMERS
Some conjugated organic polymer materials, which are normally semi-conductors with a substantial gap between the highest occupied molec-ular orbital (HOMO) and the lowest unoccupied molecular orbital (LUMO), can be made metallic by oxidation or reduction. The induced charge provides new energy states within the band gap. For example, polyacetylene can be converted to an electrically conducting material by oxidation or reduction. Alan Heeger,* Alan MacDiaimid,† and Hideki Shirakawa‡ won the 2000 Nobel Prize in Chemistry for their discovery and development of conductive polymers, especially notable for find-ing that the treatment of polyacetylene with halogen vapor increases the electrical conductivity up to 9 orders of magnitude. One of the most important properties of polymers is that they are quite robust, and this is leading to new plastic electrical materials, including transistors. See Figure 12.22.
* Alan J. Heeger (1936–) is a professor at the University of California–Santa Barbara.† Alan G. MacDiarmid (1927–2007) was a professor at the University of Pennsylvania in
Philadelphia.‡ Hideki Shirakawa (1936–) is a professor at the University of Tsukuba in Tokyo.
FIGURE 12.22A page from the original laboratory notebook of Hideki Shirakawa, on view at the Mitsubishi Museum in Yokohama, Japan, showing the great increase in electrical conductivity (y-axis, on a log scale) of polyacetylene on doping with halogen vapor (x-axis).
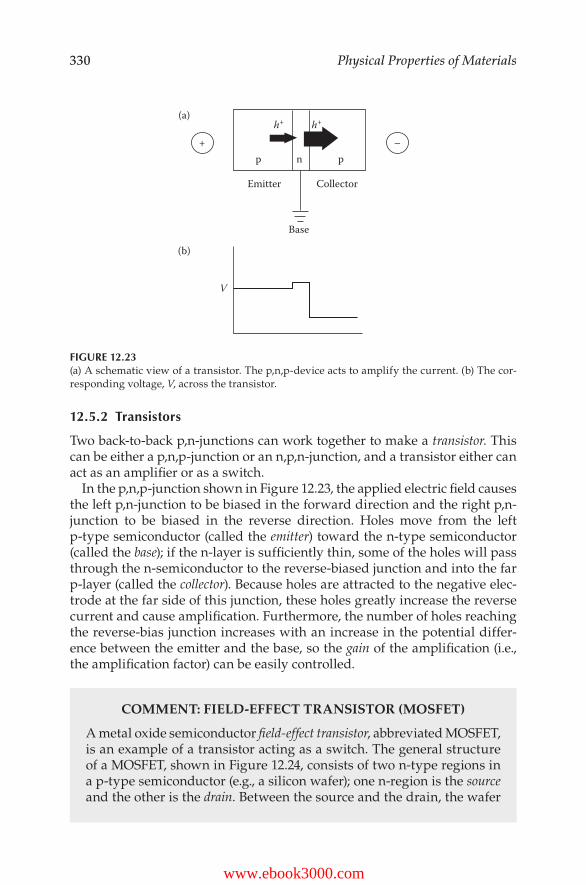
330 PhysicalPropertiesofMaterials
12.5.2 Transistors
Two back-to-back p,n-junctions can work together to make a transistor. This can be either a p,n,p-junction or an n,p,n-junction, and a transistor either can act as an amplifier or as a switch.
In the p,n,p-junction shown in Figure 12.23, the applied electric field causes the left p,n-junction to be biased in the forward direction and the right p,n-junction to be biased in the reverse direction. Holes move from the left p-type semiconductor (called the emitter) toward the n-type semiconductor (called the base); if the n-layer is sufficiently thin, some of the holes will pass through the n-semiconductor to the reverse-biased junction and into the far p-layer (called the collector). Because holes are attracted to the negative elec-trode at the far side of this junction, these holes greatly increase the reverse current and cause amplification. Furthermore, the number of holes reaching the reverse-bias junction increases with an increase in the potential differ-ence between the emitter and the base, so the gain of the amplification (i.e., the amplification factor) can be easily controlled.
COMMENT: FIELD-EFFECT TRANSISTOR (MOSFET)
A metal oxide semiconductor field-effect transistor, abbreviated MOSFET, is an example of a transistor acting as a switch. The general structure of a MOSFET, shown in Figure 12.24, consists of two n-type regions in a p-type semiconductor (e.g., a silicon wafer); one n-region is the source and the other is the drain. Between the source and the drain, the wafer
h+ h+
p n p
Emitter Collector
Base
+ –
V
(a)
(b)
FIGURE 12.23(a) A schematic view of a transistor. The p,n,p-device acts to amplify the current. (b) The cor-responding voltage, V, across the transistor.
www.ebook3000.com

ElectricalProperties 331
COMMENT: PELTIER COOLING DEVICE
The Peltier effect* (conversion of electrical energy into a temperature gra-dient) is a useful thermoelectric property. If current is passed through a bank of n- and p-type semiconductors, as shown in Figure 12.25, heat is absorbed at one side and released at the other. (These heat effects are in addition to the Joule heating, in which the rate of energy release is expressed as i2R, where i is the current and R is the resistance.) The Peltier effect can be used to make cooling devices using only electri-cal means and no moving parts. Furthermore, working in reverse, the Peltier effect can be used to convert waste heat into usable power. See also Problem 12.26.
* Jean Charles Athanase Peltier (1785–1845) was a French clockmaker. When his mother-in-law died in 1815, the inheritance allowed him to retire from his trade and take up scientific pursuits. These included studies of phrenology, electricity, microscopy, and meteorology. A field trip to collect data concerning electrical charges in the atmo-sphere and cloud formation led to a cold from which he did not recover.
is covered with an insulating layer (e.g., a 10–7 m thick layer of silicon dioxide), which is covered by a metal that acts as the gate. At a positive gate voltage, electrons from the p-type semiconductor are attracted to the surface and holes are repelled, allowing a current to pass from the source to the drain in the region near the surface. Therefore, it is the field at the gate that controls the current, and hence it is a field-effect transistor, acting as a switch. Since the gate does not consume much power, this low-power device can be very small (less than 10–3 mm2). Integrated circuits consist of several such transistors made on one wafer (or chip), with the transistors connected to each other through layers of metal deposited on the chip’s surface.
Source Gate Drain
n np
FIGURE 12.24A field-effect transistor consists of an n-type source and n-type drain in a p-type wafer that is coated with an insulator and a metal. When a field is applied to the metal, this makes a gate that controls the current between the source and the drain, acting as a switch.

332 PhysicalPropertiesofMaterials
12.6 Dielectrics
A dielectric is an insulating material that reduces the Coulombic force between two charges. When placed between the plates of an electrical capacitor, a dielectric increases its capacitance. If C and Co are the capacitances with and without the substance present, respectively, then ε, the dielectric constant (also called the relative permittivity) of the material, is defined as
ε =CCo
. (12.13)
Dielectric constants of some materials are listed in Table 12.2.Dielectric materials are polarized when they are placed in the electric field
of the capacitor. That is, their center of negative charge is displaced from the center of their positive charge, and there is an induced dipole moment (i.e., nonzero net vector of charge distribution in space). The dipole moment per unit volume is called the polarization, and is given the symbol P. The dipoles align themselves in the electric field, and the aligned dipoles create an elec-tric field that opposes the applied field, as shown schematically in Figure 12.26. Thus the presence of the dielectric has the effect of reducing the elec-tric field, which gives a lower voltage, V, between the capacitor plates. Since C ∝ V–1, capacitance increases when the dielectric is present.
An “ordinary” dielectric material will be unpolarized in the absence of an external electric field and can be polarized by the application of an external electric field. The sign of the polarization can be reversed by reversing the field, as shown in Figure 12.27a.
A pyroelectric crystal can have a nonzero electric polarization even in the absence of an applied electric field. The source of this behavior is the
e– e–
+
h+
Cold
Hot
MetalMetalnpn
–
FIGURE 12.25A schematic view of a Peltier cooling device. As current flows through the device, electrons in the n-type semiconductor and holes in the p-type semiconductor carry heat away from the upper surface, making it cooler than the lower surface. If the direction of the current is reversed, the flow of the electrons and holes is reversed, and so is the flow of heat. In a work-ing Peltier cooler there would be a number of banks of n-and p-type semiconductors similar to that shown here.
www.ebook3000.com

ElectricalProperties 333
arrangement of the ions in the internal structure of the crystal, as shown schematically in Figure 12.28a. A material is no longer pyroelectric above a phase transition temperature (also called critical temperature, Tc) because the available thermal energy brings about a more symmetric structure. This state is called paraelectric, indicating that it is not polarized but can be polar-ized under other circumstances, namely, lowered temperature.
TABLE 12.2
Dielectric Constants for Selected Materials at T = 300 K, Unless Specified Otherwisea
Material ε
n-Hexane 1.89CCl4 2.23Benzene 2.28Diamond 5.7AgNO3 9.0Ge 16Ethanol 24.3Methanol 32.6BaO 34Water 78.54Ice Ih 99 (at 243 K)Ice VI 193 (at 243 K)PbZrO3 200 (at 400 K)
a ε is dimensionless.
+
–
+–
+–
+–
+–
+–
+–
+–
+–
FIGURE 12.26The dipoles of a dielectric material tend to align themselves between the plates of a capacitor. This alignment opposes the applied electric field so that the capacitance increases with the dielectric present, relative to without the dielectric.

334 PhysicalPropertiesofMaterials
A crystal is ferroelectric if it is pyroelectric and the spontaneous polariza-tion can be reversed by the application of a small electric field. This is shown schematically in Figure 12.28b. Ferroelectrics can be distinguished from ordinary dielectrics by their very large dielectric constants (>1000) and by their retention of polarization even after the field is turned off. This leads to a hysteresis loop (i.e., different polarizations on increasing and decreasing the electric field) as shown in Figure 12.28b. The term ferroelectric is derived by analogy with the term ferromagnetic; in the former, electric dipoles are aligned, and in the latter, magnetic moments are aligned. Again, a ferroelec-tric material becomes paraelectric at high temperatures.
(a)
E
(b)
E
PP
FIGURE 12.27Polarization, P, as a function of electric field, E, for two types of materials: (a) a normal dielec-tric, showing zero polarization in zero field; (b) a ferroelectric material at T < Tc showing spon-taneous polarization even in the absence of an electric field, and also showing hysteresis.
(a) Pyroelectric
(b) Ferroelectric
(c) Antiferroelectric
+ +–
–
–
–
–
–
+ +–
–
–
–
–
–
+ +–
–
–
–
–
–
+ +–
–
–
–
–
–
+ +–
–
–
–
–
–
+ +–
–
–
–
–
–
+ +–
–
–
–
–
–
+ +–
–
–
–
–
–
+ +–
–
–
–
–
–
T< Tc , E = 0 T < Tc , E ≠ 0 T > Tc
FIGURE 12.28Schematic representations of structures of solids, all of which are paraelectric at temperatures in excess of Tc: (a) pyroelectric, showing a net spontaneous polarization even in the absence of an electric field; (b) ferroelectric, showing net spontaneous polarization that can be reversed by application of an electric field; and (c) antiferroelectric, showing microscopic ferroelectric regions that are exactly balanced by regions with the opposite polarity, so that there is no net polarization in the absence of a field but polarization can be induced by the application of an electric field.
www.ebook3000.com

ElectricalProperties 335
There are other crystal structures in which there is no net polarization of a cell in the absence of an electric field, but the cell is polarized when a field is applied. These structures are antiferroelectric, as shown schematically in Figure 12.28c. In this case, cells (or layers) each have their own nonzero polarization, but they cancel out over the whole crystal, so there is no net polarization. Again, at higher temperatures, T > Tc, an antiferroelectric crys-tal will have no net polarization, and so it will be paraelectric.
Some ferroelectric and antiferroelectric materials and their phase transi-tion temperatures are presented in Table 12.3.
12.7 Superconductivity
The superconducting state, in which a material has zero direct current resis-tivity, was first discovered in 1911 by Gilles Hoist and Professor Kamerlingh Onnes at the prominent low-temperature laboratory in Leiden. The first material found to be superconducting was mercury, and the first evidence
TABLE 12.3
Some Ferroelectric and Antiferroelectric Materials and Their Transition Temperatures
Material Tc/K
FerroelectricK2SeO4 93SrTiO3 110KH2PO4 123Thiourea 169KD2PO4 213BaTiO3 408NaNO2 436BaMF4 (M = Mn, Ni, Zn, Mg, Co) FE at all temperatures
AntiferroelectricNH4H2PO4 148NaOD 153KOH 227ND4D2PO4 242KOD 253PbZrO3 506WO3 1010

336 PhysicalPropertiesofMaterials
came from measuring its resistivity at T = 4.2 K, the boiling point of helium.* The transition to the superconducting state, as seen in electrical resistivity, is shown schematically in Figure 12.29.
The property of superconductivity is particularly useful in that supercon-ducting magnets, with their zero electrical resistivity, carry current indefi-nitely. For example, superconducting materials are used in nuclear magnetic resonance and magnetic resonance imaging to achieve very high magnetic fields. Since they have no electrical losses (resistance along wires causes elec-trical losses), superconductors can have many useful applications. In 2008, the world’s first high-temperature superconductor power-transmission cable system used in a commercial power grid was commissioned, but the cable requires substantial cooling to allow the superconducting state. For this rea-son, much effort has been expended toward increasing the superconducting transition temperature with the aim of producing materials that are super-conductors at room temperature. Although the maximum transition temper-ature has been rising over the years (the highest claimed superconducting transition temperature in early 2011 is 270 K), the progress in increasing the superconducting temperature is unpredictable. Advancement in theoreti-cal understanding of the superconducting state might be necessary before a room-temperature superconductor is realized.
One of the unusual properties of a superconductor is its interaction with a magnetic field. In its normal (nonsuperconducting state), the magnetic field can penetrate a material (see Figure 12.30a). Due to internal currents, the magnetic field is repelled by a material in its superconducting state (Figure 12.30b). This causes a material in its superconducting state to have a strong
* Kamerlingh Onnes (1853–1926; Nobel Prize in Physics, 1913, for the production of liquid helium) discovered both superconductivity and the superfluid transition in liquid helium on the same day, April 8, 1911.
00
5 10T/K
ρ
FIGURE 12.29Schematic view of the transition to the superconducting state in mercury, as studied by immer-sion of mercury in liquid helium (at its boiling point of 4.2 K).
www.ebook3000.com

ElectricalProperties 337
repulsive interaction with a magnetic field, giving levitation of a supercon-ductor above a magnet (Figure 12.30c), including the possibility of magnetic levitation trains (highly efficient due to low frictional losses) using super-conductors. The expulsion of magnetic field by a superconductor is called the Meissner effect.
Since the late 1980s there has been considerable interest in producing superconductors with very high superconducting temperatures. The main goal is to achieve a useful superconducting material in a convenient tem-perature range. Prior to 1986, all known superconductors were metals or alloys with very low transition temperatures. Tremendous excitement in this field arose when, in 1986, Bednorz and Müller at IBM, Zürich, found ternary perovskite-related structures with superconducting temperatures above 30 K.* This was followed in 1987 by the discovery, by Ching-Wu (Paul) Chu
* J. Georg Bednorz (1950–) and K. Alexander Müller (1927–) are researchers at IBM, Rüschlikan, Switzerland, and corecipients of the 1987 Nobel Prize in Physics for their important break-through in the discovery of superconductivity in ceramic materials.
(a) (b)
(c)
FIGURE 12.30(a) Magnetic field can penetrate a material when it is not in its superconducting state. (b) In the superconducting state, the external magnetic field is repelled. This is an example of the Meissner effect. (c) The Meissner effect of the cold superconducting material in the box causes levitation of the magnet above a magnetic track. (Photo taken at the Toshiba Museum, Kawasaki, Japan.)

338 PhysicalPropertiesofMaterials
and his colleagues at the Universities of Houston and Alabama, that related compounds could be made to superconduct by cooling with liquid nitrogen (i.e., Tc > 77 K). The importance of this discovery was that liquid nitrogen (which boils at T = 77 K) is relatively easily and inexpensively prepared by condensing air. The other cryogenic (low-temperature) fluid that had been used to cool earlier superconductors (Tc ≪ 77 K) is liquid helium (boiling point 4.2 K). The main disadvantages of liquid helium are its high cost and its being a nonrenewable resource since helium gas easily escapes the earth’s gravitational field.
One of the most important high-temperature superconductors (also known as high-Tc superconductors, where Tc is the critical temperature below which the material is in the superconducting state) is YBa2Cu3O8-y. This can be prepared from Y2O3, BaCO3, and CuO in the mole ratios 1:4:6. The overall stoichiometry of Y:Ba:Cu in the final compound often leads to the abbrevia-tion 1-2-3 superconductor. The treatment required to produce YBa2Cu3O8-y is rather specific and complicated; it is a bit of a wonder that the material was discovered! The preparation method requires the initial reactants be ground in stoichiometric amounts, heated to 960°C; then held for 10 hours, cooled, ground, sieved, and pressed into pellets; heated to 960°C for 17 hours; cooled in flowing oxygen, heated to 980°C, and held for 8 hours; then cooled slowly to 800°C and more quickly brought down to room temperature. The Y2O3, BaO, CuO phase diagram, showing the 1-2-3 compound, is shown in Figure 12.31. The final result is a brittle black pellet with a superconducting transi-tion temperature of about 120 K.
More recent developments in superconductivity include the surprising result that MgB2 is superconducting (Tc = 39 K) and that iron-containing com-pounds can be made to be superconducting.
CuO
YO1.5
A = Y2BaCuO5
Y2Cu2O5
BaCuO2BaO
B = YBa2Cu3O8-yA
B
FIGURE 12.31The YO1.5/BaO/CuO ternary phase diagram at 1000°C.
www.ebook3000.com

ElectricalProperties 339
One theory of superconductivity, commonly called BCS theory after its ini-tiators Bardeen, Cooper, and Schrieffer,* attributes the lack of electrical resis-tivity in the superconducting state to interactions between pairs of electrons (Cooper pairs), particularly at low temperatures. Although electrons normally repel each other due to their like charge, at very low temperatures they can have a special affinity for one another. This is especially so if they are paired with opposite spin so that a Cooper pair (one of each spin) travels together in the lattice. In the ionic lattice of a superconductor, one electron in the pair interacts with the cationic (i.e., positively charged) portion of the lattice by attracting it, causing a small deformation in the cationic sublattice (see Figure 12.32) corresponding to a lattice wave (phonon). This slight deviation from the equilibrium lattice leads to a potential gradient that makes it very favorable for the second electron in the pair to move to where the first electron just was. In this simplified view, the motion of the second electron is so facilitated that electrical resistivity is zero. The fuller picture of the superconducting state is one of a single coherent state involving many pairs of electrons.
Although it explains many features of low-temperature superconduc-tivity, the BCS theory only works if the temperature is low enough so that the available thermal energy is insufficient to break up the Cooper pairs. High-temperature superconductors (such as YBa2Cu3O8-y and its analogues) exist in a superconducting state at temperatures that exceed the range of the BCS theory; there would be too much thermal energy for the electrons to stay paired. Furthermore, there is experimental information concerning high-temperature superconductors that does not fit the BCS theory: isotopic
* John Bardeen (1908–1991) was an American physicist and the first person to be twice-winner of a Nobel Prize in Physics (in 1956 with William Shockley and W.H. Brattain for work leading to the invention of the transistor, and in 1972 with L.N. Cooper and J.R. Schrieffer for the superconductivity theory); Leon N. Cooper (1930–) is an American physicist who shared the 1972 Nobel Prize in Physics with Bardeen and Schrieffer for superconductivity theory work carried out while he was a research associate in Bardeen’s laboratory; John Robert Schrieffer (1931–) is an American physicist who shared the 1972 Nobel Prize in Physics with Bardeen and Cooper for work on the theory of superconductivity carried out as a PhD student under Bardeen’s supervision.
+
+
+
+
+
+
+
+
+
++
+– –
FIGURE 12.32A schematic view of BCS superconducting theory. The electrons travel in Cooper pairs, one of each spin. As the first electron moves through the lattice, the cations (positively charged ions) are attracted to it, and this deforms the lattice somewhat. The electric field from the deforma-tion attracts the second electron, which then moves with little effort. An analogue to the BCS motion is that the first person to push through a busy subway station makes a path along which an accompanying person can saunter with little resistance.

340 PhysicalPropertiesofMaterials
substitution (e.g., replacement of 16O with 17O) in the lattice does not change the superconducting transition temperature as the BCS theory predicts. The frequencies of the phonons would be affected by isotopic substitution, and in the BCS theory this would change the electron–phonon interactions that give rise to the superconducting transition.
The present directions of research in superconductivity include semira-tional approaches to finding new high-Tc materials. Another area of research is increasing the current capacity and mechanical properties of high-temper-ature superconductors. Considerable effort is going into further experiments and theory to try to understand the mechanisms of superconductivity in these materials. In addition, new materials with interesting superconducting properties continue to be found.
Thermometry: A Tutorial
Temperature is one of the most fundamental properties required in phys-ical measurement. Temperature can be measured many ways, from the rate of appearance of drops of sweat on a brow to the most sophisticated electronic instruments.
a. One of the most common methods of measurement of tempera-ture in everyday application involves thermal expansion (e.g., of the fluid in a capillary tube). Can you suggest applications where this would not be a convenient method?
b. Suggest properties that could be desirable for a thermometer.c. If the two ends of a piece of metal wire are at different tempera-
tures, there is an electrical potential gradient (voltage difference, ΔV) along the wire. The relationship between ΔV and the tem-perature difference, ΔT, is given by
ΔV = S(T) ΔT (12.14)
where S(T) is the thermoelectric power of the wire, also known as the Seebeck* coefficient. It is dependent on the wire’s composi-tion. If two wires of different material are connected as shown in Figure 12.33, then the measurement of the voltage across them, ΔVT , is obtained:
ΔVT = ΔV1 + ΔV2 (12.15)
* Thomas Johann Seebeck (1770–1831) was born in East Prussia and trained as a medical doc-tor. However, his true interest was physics. Seebeck studied the theory of color with German scientist Johann Goethe. Seebeck’s name is now mostly associated with his discovery of ther-moelectricity. Although he himself thought that the magnetic field arising from a tempera-ture gradient between junctions of dissimilar wires was fundamentally a thermomagnetic effect, we now realize that the magnetic field is due to current flow (thermoelectric effect).
www.ebook3000.com

ElectricalProperties 341
(where ΔV1 and ΔV2 are given by Equation 12.14 for each material, 1 and 2). Here, ∆VT is a direct measure of ΔT, as defined in Figure 12.33. This device is a thermocouple.
i. Could both arms of a thermocouple be made of the same metal? Why or why not?
ii. A thermocouple measures temperature differences. How could one use this device to measure absolute temperatures?
iii. Would a better (more sensitive) thermocouple have a higher or lower value of thermoelectric power, S?
iv. The thermoelectric power of a material depends on both its temperature and its composition. A “typical” thermo-electric power of a material used in a thermocouple is 1 × 10⁻⁵ V K–1. If a sensitivity of 0.1 K is needed in a measure-ment, how accurately does the thermocouple voltage need to be determined? (Note that this just takes account of one arm of a thermocouple, and we should really consider ΔS = S2 – S1 where S1 and S2 are the thermopowers for each of the arms.)
d. Many other electrical principles can be used to measure tem-perature. We have seen that the resistance of a metal will vary with temperature. How could this be used to produce a resis-tance thermometer? What important properties should be con-sidered? (Hint: One of the most useful resistance thermometers is the platinum resistance thermometer.) What determines the sensitivity of a resistance thermometer?
e. The resistance of intrinsic (pure) semiconductors changes with temperature. Could this be used to produce a semiconductor resistance thermometer? Do you foresee any problems at very low temperatures?
T + ΔT
T
ΔV1 ΔV2
FIGURE 12.33When dissimilar metals are joined together so that the junction is at a temperature different from the other ends, there is a voltage across them as shown. This voltage arises from the dif-ferent work functions of the two materials.

342 PhysicalPropertiesofMaterials
f. Semiconductors are notoriously difficult to purify, and many of their physical properties (including electrical resistivity) depend on their purity. One way to be sure of their purity is to pur-posefully add impurities that overwhelm any small traces of unwanted impurities. Does this solve the low-temperature prob-lem of using pure semiconductors? How?
g. Metal oxides that have been sintered and treated in oxidizing and/or reducing atmospheres to produce n-type semiconduc-tors on the outside and p-type semiconductors on the inside (or vice versa) give useful thermometers called thermistors. A typical room-temperature resistance for a thermistor might be 10 kΩ.i. Would its resistance increase or decrease as the temperature
is lowered? (Remember, they are semiconductors.)ii. Since thermistors have small particles, the electrical contact
between the particles can be varied by the manufacturing process. How can this be an advantage for thermometry?
iii. Thermistors can be made to be very small (less than 0.1 mm diameter). Why is this an advantage?
h. Figure 12.34 shows the temperature dependence of the forward-bias voltage of silicon and gallium arsenide diodes as functions of temperature. Could these be used to measure temperature? What voltage accuracy would be needed for each thermometer to determine the temperature at about 200 K to within 1 K?
12.8 Problems
12.1 Consider the following electrical resistivities at 0°C: Cu, 16 Ω nm; Ni, 69 Ω nm; Zn, 53 Ω nm; brass (Cu-Zn), ∼60 Ω nm; constantan (Cu-Ni), ∼500 Ω nm.
GaAs
Si
2
1
0 0 200 400T/K
Volta
ge/V
FIGURE 12.34Forward-bias voltages of Si and GaAs diodes as functions of temperature.
www.ebook3000.com

ElectricalProperties 343
a. From these data, how does the resistivity of a solid solu-tion (such as brass or constantan) compare with its pure components?
b. Suggest a microscopic (atomic scale) explanation for the findings of (a).
12.2 On the basis of the information in Figure 12.35, arrange the materials noted in order of decreasing electrical conductivity. Comment on how this correlates with the position in the peri-odic table and the atomic size.
12.3 From Figure 12.36, which shows the intrinsic conductivity of pure germanium as a function of reciprocal temperature, esti-mate the band gap, Eg, for Ge.
12.4 The black-body radiation of a material can be used as a form of thermometer.
a. Would this be more accurate at low or high temperatures? Explain.
b. What would have to be measured to determine the tem-perature of a black-body radiator?
12.5 Semiconductors are known to have low packing fractions (i.e., low densities), which could mean that they could be easily
CarbonSilicon
GermaniumTin (gray)C B
C BC B
C B6 eV1.1 eV
0.7 eV 0.1 eV
V B V B V B V B
FIGURE 12.35Various semiconductor materials, schematically showing their band gaps.
2 3 4
1000
100
10
1
103 T –1/K–1
σ/Ω
–1 m
–1
FIGURE 12.36Intrinsic electrical conductivity of Ge as a function of reciprocal temperature.

344 PhysicalPropertiesofMaterials
compressed. We saw with the case of tin that a change in density could be associated with a phase transformation that could transform a semiconductor into a metal. In general, compression of a semiconductor will increase Eg even if there is no phase change. Can you suggest an application for this principle?
12.6 An electronic security device involves a beam of light passing across the entryway to a home. When the beam is interrupted (e.g., as an intruder blocks it), a security bell sounds. What sort of material is likely used as the beam detector? Explain your reasoning.
12.7 Boron-doped diamonds are blue (see Chapter 3). Would you expect these diamonds to be electrically conducting? Explain.
12.8 A cholesteric (also called “twisted nematic”) liquid crystal has a structure as shown in Figure 5.2.
a. If the liquid crystal molecules are polar, explain how this material can be made ferroelectric.
b. Can the degree of polarity of the material be controlled? If so, how?
c. Suggest an application that makes use of controlled polar-ity of the material.
12.9 The ice crystals in storm clouds are ferroelectric. a. Will the local charge of the earth just prior to an electri-
cal storm influence the orientation of the ice crystals in the clouds? If so, how?
b. How might this affect the optical properties of the cloud? c. If clouds were made of nonpolar molecules, would thun-
derstorms be more or less dramatic? 12.10 In Figure 12.18, the Fermi energy of an n-type semiconductor
is shown as being higher than that of a p-type semiconductor. Explain why. (Assume that the n- and p-semiconductors have the same dominant material, to which either n- or p-impurities have been added.)
12.11 The intralayer electronic band structure of graphite is shown schematically in Figure 12.37; the bonding σ and π states are completely full at T = 0 K, and, since the band gap to the anti-bonding π* molecular orbital is essentially zero (Figure 12.37), the slightest thermal energy can promote electrons. The elec-tronic structure is quite anisotropic in graphite because the interatomic distance within the layers is 3.35 Å, compared with 1.415 Å between the layers. Use this information to explain the following:
a. Graphite is a poor electrical conductor in the direction per-pendicular to the layers, and much better within the layers;
b. Graphite is an excellent thermal conductor in the direction of the layers, and a poor thermal conductor in the direction perpendicular to the layers.
12.12 In most metals, the thermal conductivity is enhanced (over insu-lators) due to the transport of heat by free electrons. However, in order for this to happen, the electrons must be able to interact
www.ebook3000.com

ElectricalProperties 345
with lattice vibrations (phonons) that have thermal energy. In most superconductors, the superconducting state is due to electrons that travel together as “Cooper pairs,” and these elec-trons, because of their long wavelengths, cannot interact with phonons. On this basis, predict whether a material will have diminished or enhanced thermal conductivity in its supercon-ducting state.
12.13 Hydrogen, which is an insulator under 1 atm of pressure, will become metallic at very high pressures, such as within the core of the planet Jupiter. Explain why an insulator could become metallic at high pressures.
12.14 The difference between energy levels in a system can be expressed in many different units. The band gap of a typical semiconductor is of the order of 1 eV. Calculate the equivalent to 1 eV for the following units or parameters:
a. J mol–1
b. K (thermal energy) c. cm–1 (wavenumber) d. s–1 (frequency) e. nm (wavelength)
12.15 Ionic solids such as NaCl are normally considered to be insula-tors. However, such crystals always contain defects, for exam-ple, where a Na+ or C1– ion at a particular lattice site is missing.
a. Propose a mechanism for electrical conductivity due to such defects.
b. The number of defects in an ionic crystal is normally very small. What does this indicate about the electrical resistiv-ity of such a crystal?
c. The electrical conductivity of NaCl can be enhanced by doping with Ca2+ or Mg2+ ions. Explain why.
12.16 The field at which dielectric breakdown occurs is called the dielectric strength. Air is a dielectric with a relatively small
σ
σ*
π*
π
Density of states
Ener
gy
FIGURE 12.37Band structure of graphite within the layers.

346 PhysicalPropertiesofMaterials
dielectric strength. Use this information to explain how light-ning occurs.
12.17 Calculate the thermal energy, kT, at room temperature in com-parison with the band gap energy of a semiconductor with a band gap that corresponds to a wavelength of 1000 nm. Use this information to explain why infrared detectors using semicon-ductors are usually cooled to low temperatures (e.g., 77 K using liquid nitrogen) to reduce the dark current (i.e., electrical signal in the absence of an IR source).
12.18 A bolometer is a cooled semiconductor used to detect far infrared radiation (wavelengths as long as 5 mm). Use a density of states diagram to indicate why the bolometer’s resistance changes in the presence of infrared radiation.
12.19 In Chapter 3 we saw that amorphous selenium (used in photo-copiers) has a band gap of 1.8 eV. Another form of selenium, which is crystalline, has a band gap of 2.6 eV. Explain why the crystalline form has a higher band gap.
12.20 Phase diagram points with zero degrees of freedom are often used as standard points to calibrate electronic thermometers. Why?
12.21 Electrical conductivity in a metal can be changed by changing temperature, mechanical deformation, impurity concentration, or the size of crystallites. Discuss.
12.22 From Equation 12.6, and consideration of the temperature dependence of the mean free path of conduction electrons in a metal, explain the sign of the temperature dependence of the electrical conductivity of a metal.
12.23 The electrical and thermal conductivities of Al are both about 70% of that of Cu. Explain briefly why both types of conductiv-ity should be in about the same ratio for two such materials.
12.24 Ferroelectric liquid crystals (FLCs) use liquid crystal substances that have chiral molecules in a smectic type of arrangement because the spiral nature of the structure allows the micro-second switching response time that makes FLCs particularly suited to advanced displays. Why is it important that these materials be ferroelectric?
12.25 Carbon nanotubes have potential applications that arise from their special properties. However, production can lead to mixtures of metallic and semiconducting tubes. Explain why separation is important for use of carbon nanotubes to make composites with tailored electrical properties.
12.26 In a thermoelectric cooling device, there are competing heat flows across the device. By analogy with the thermal conduc-tion processes described in Chapter 8, the heat flux carried by the conducting electrons and holes, Jcond, is given by
J S TdTdzcond =
2σ (12.16)
www.ebook3000.com

ElectricalProperties 347
where S is the thermopower (Seebeck coefficient), σ is the elec-trical conductivity, and dT/dz is the thermal gradient across the device. The competing backflow of heat from thermal conduc-tivity, Jth, is given by
JdTdzth = −κ (12.17)
where κ is the thermal conductivity. The ratio of the coefficients of heat flux in Equations 12.16 and 12.17 is given by
ZTS T
=2σκ
(12.18)
where ZT is called the thermoelectric figure of merit. Note that ZT is dimensionless and represents the overall efficiency of the device. (Strictly speaking, there is one value of ZT for the n-arm and one for the p-arm of the thermoelectric device.) Comment on what physical properties of a thermoelectric material need to be increased or decreased to improve the efficiency of the device. Discuss both electrical and thermal properties.
12.27 Composites made with carbon nanotubes (CNT) as filler can have interesting properties. The electrical and thermal conduc-tivities of pure carbon nanotubes are ~108 S m–1 and 2000 W m–1 K–1, respectively. A typical matrix for a CNT composite would be epoxy with electrical and thermal conductivities of 10–13 S m–1 and 0.2 W m–1 K–1, respectively.
a. Based on the rule of mixtures (Equation 11.5), calculate the expected electrical and thermal conductivities of a CNT composite with 1% CNT loading.
b. Typical observed electrical and thermal conductivities of a CNT composite with 1% CNT loading are 10–6 S m–1 and 0.25 W m–1 K–1. Compare these with the calculated values from (a).
c. CNTs with electrical conductivity of 108 S m–1 are metallic, whereas epoxy, with an electrical conductivity of 10–13 S m–1, is an insulator, and a 1% CNT composite with an electrical conductivity of 10–6 S m–1 is a semiconductor. Explain why there is such a large difference in electrical conductivity with such a small loading of CNTs.
d. CNTs with thermal conductivity of 2000 W m–1 K–1 are excellent heat conductors, while epoxy, with a thermal con-ductivity of 0.2 W m–1 K–1, is a thermal insulator, as is a 1% CNT composite with a thermal conductivity of 0.25 W m–1 K–1. Explain why there not such a large difference in ther-mal conductivity with this loading of CNTs.
e. Suggest an application for materials with high electrical conductivity and low thermal conductivity.

348 PhysicalPropertiesofMaterials
Further Reading
General References
Advances in silicon carbide electronics. Special issue. J. C. Zolper and M. Skowronski, Eds. MRS Bulletin, April 2005, 273–311.
Molecular transport junctions. Special issue. C. R. Kagan and M. A. Ratner, Eds. MRS Bulletin, June 2004, 376–410.
M. Ya Axbel, I. M. Lifshitz, and M. I. Kganov, 1973. Conduction electrons in metals. Scientific American, January 1973, 88.
P. Ball, 1994. Designing the Molecular World. Princeton University Press, Princeton.A. Barton, 1997. States of Matter: States of Mind. Institute of Physics Publishing, Bristol
UK.R. J. Borg and G. J. Dienes, 1992. The Physical Chemistry of Solids. Academic Press,
Oxford.J. K. Burdett, 1995. Chemical Bonding in Solids. Oxford University Press, New York.R. A. Butera and D. H. Waldeck, 1997. The dependence of resistance on temperature
for metals, semiconductors, and superconductors. Journal of Chemical Education, 74, 1090.
W. D. Callister Jr. and D. G. Rethwisch, 2010. Materials Science and Engineering: An Introduction, 8th Edition. John Wiley & Sons, Hoboken, NJ.
B. S. Chandrasekhar, 1998. Why Things Are the Way They Are. Cambridge University Press, Cambridge.
P. Chaudhari, 1986. Electronic and magnetic materials. Scientific American, October 1986, 136.
A. K. Cheetham and P. Day, Eds. 1992. Solid State Chemistry Compounds. Oxford University Press, Oxford.
P. G. Collins and P. Avouris, 2000. Nanotubes for Electronics. Scientific American, December 2000, 62.
A. H. Cottrell, 1967. The nature of metals. Scientific American, September 1967, 90.P. A. Cox, 1987. The Electronic Structure and Chemistry of Solids. Oxford University
Press, New York.M. de Podesta, 2002. Understanding the Properties of Matter, 2nd ed. CRC Press, Boca
Raton, FL.R. A. Dunlap, 1988. Experimental Physics. Oxford University Press, New York.H. Ehrenreich, 1967. The electrical properties of materials. Scientific American,
September 1967, 195.A. B. Ellis, M. J. Geselbracht, B. J. Johnson, G. C. Lisensky, and W. R. Robinson, 1993.
Teaching General Chemistry: A Materials Science Companion. American Chemical Society, Washington.
A. Guinier and R. Jullien, 1989. The Solid State. Oxford University Press, New York.G. G. Hall, 1991. Molecular Solid State Physics. Springer-Verlag, New York.T. S. Hutchison and D. C. Baird, 1968. The Physics of Engineering Solids. John Wiley &
Sons, Hoboken, NJ.I. P. Jones, 2000. Materials Science for Electrical and Electronic Engineers. Oxford
University Press, New York.C. Kittel, 2005. Introduction to Solid State Physics, 8th ed. John Wiley & Sons, Hoboken,
NJ.
www.ebook3000.com

ElectricalProperties 349
P. G. Nelson, 1997. Quantifying electrical character. Journal of Chemical Education, 74, 1084.
C. N. R. Rao and J. Gopalakrishnan, 1997. New Directions in Solid State Chemistry. Cambridge University Press, Cambridge.
H. M. Rosenberg, 1988. The Solid State, 3rd ed. Oxford University Press, New York.J. F. Shackelford, 2004. Introduction to Materials Science for Engineers, 6th ed. Prentice
Hall, Upper Saddle River, NJ.J. Singleton, 2001. Band Theory and Electronic Properties of Materials. Oxford University
Press, New York.L. E. Smart and E. A. Moore, 2005. Solid State Chemistry: An Introduction, 3rd ed. CRC
Press, Boca Raton, FL.G. Stix, 1999. Bad Connections. Scientific American, December 1999, 50.A. P. Sutton, 1993. Electronic Structure of Materials. Oxford University Press,
New York.L. H. Van Vlack, 1989. Elements of Materials Science and Engineering, 6th ed. Addison-
Wesley, Reading, MA.A. Vijh, 1989. Electrochemical physics of materials. Transactions of the Royal Society of
Canada, V(IV), 283.F. Vögtle, Ed., 1991. Supramolecular Chemistry: An Introduction. Chapter 10 “Organic
semiconductors, conductors and superconductors” and Chapter 11 “Molecular wires, molecular rectifiers and molecular transistors.” John Wiley & Sons, Hoboken, NJ.
M. T. Weller, 1995. Inorganic Materials Chemistry. Oxford University Press, New York.
Disordered Systems
B. L. At’tshuler and P. A. Lee, 1988. Disordered electronic systems. Physics Today, December 1988, 36.
R. A. Webb and S. Washburn, 1988. Quantum interference fluctuations in disordered metals. Physics Today, December 1988, 46.
Electrochromic Materials
P. M. S. Monk, R. J. Mortimer, and D. R. Rosseinsky, 1995. Through a glass darkly. Chemistry in Britain, May 1995, 380.
Electronic Devices
Macroelectronics. Special issue. R. H. Reuss, D. G. Hopper and J.-G. Park, Eds. MRS Bulletin, June 2006, 447–485.
Harvesting energy through thermoelectrics: Power generation and cooling. Special issue. T. M. Tritt and M. A. Subramanian, Eds. MRS Bulletin, March 2006, 188–229.
Organic-based photovoltaics. Special issue. S. E. Shaheen, D. S. Ginley and G. E. Jabbour, Eds. MRS Bulletin, January 2005, 10–52.
Fabrication of sub-45-nm device structures. Special issue. J. J. Watkins and D. J. Bishop, Eds. MRS Bulletin, December 2005, 937–982.
Alternative gate dielectrics for microelectronics. Special issue. MRS Bulletin, March 2002.

350 PhysicalPropertiesofMaterials
Advanced flat-panel displays and materials. Special issue. R. M. Wallace and G. Wilk, Eds. MRS Bulletin, November 2002, 186–229.
Transparent conducting oxides. Special issue. B. G. Lewis and D. C. Paine, Eds. MRS Bulletin, August 2000, 22–65.
Polymeric and organic electronic materials and applications. Special issue. A. J. Epstein and Y. Yang, Eds. MRS Bulletin, June 1997, 13–56.
GaN and related materials for device applications. Special issue. S. J. Pearton and C. Kuo, Eds. MRS Bulletin, February 1997, 7–57.
Solid-state century. Special issue. Scientific American Presents, 1997.O. Auciello, J. F. Scott, and R. Ramesh, 1998. The physics of ferroelectric memories.
Physics Today, July 1998, 22.R. T. Bate, 1988. The quantum-effect device: tomorrow’s transistor? Scientific American,
March 1988, 96.S. Bauer, R. Gerhard-Multhaupt, and G. M. Sessler, 2004. Ferroelectrets: Soft electroac-
tive foams for transducers. Physics Today, February 2004, 37.D. Bradley, 2001. What memories are made of. Chemistry in Britain, March 2001, 28.S. M. Condren, G. S. Lisensky, K. R. Nordell, T. F. Kuech, and S. A. Stockman, 2001.
LEDs: New lamps for old and a paradigm for ongoing curriculum moderniza-tion. Journal of Chemical Education, 78, 1033.
M. G. Craford, N. Holonyak Jr. and F. A. Kish Jr., 2001. In pursuit of the ultimate lamp. Scientific American, February 2001, 62.
R. Dagani, 2001. Polymer transistors: Do it by printing. Chemical and Engineering News, January 1, 2001, 26.
R. Dagani, 2001. Here comes paper 2.0. Chemical and Engineering News, January 15, 2001.
R. Dagani, 2001. Semiconductor nanowires light up a nano-LED. Chemical and Engineering News, January 8, 2001, 7.
R. Dagani, 2001. Nanotube single-electron transistor works at room temperature. Chemical and Engineering News, July 9, 2001, 10.
R. Dagani, 2001. Single molecule wired into circuit. Chemical and Engineering News, October 22, 2001, 14.
R. Dagani, 1998. The dope on quantum dots. Chemical and Engineering News, January 5, 1998, 27.
R. Dagani, 1997. Simpler method for organic pixel patterning. Chemical and Engineering News, May 5, 1997, 56.
R. Dagani, 1996. Two photons shine in 3-D data storage. Chemical and Engineering News, September 23, 1996.
R. Dagani, 1994. New transistor class is based on GaS, GaAs. Chemical and Engineering News, March 21, 1994, 8.
M. Emmelius, G. Pawlowski, and H. W. Vollmann, 1989. Materials for optical data storage. Angewandte Chemie (International English Edition), 28, 1445.
B. Gross Levy, 2001. New printing technologies raise hopes for cheap plastics elec-tronics. Physics Today, February 2001, 20.
M. Gross, 2001. From e-ink to e-paper. Chemistry in Britain, July 2001, 22.N. G. Hingorani and K. E. Stahlkopf, 1993. High-power electronics. Scientific American,
November 1993, 78.N. Holonyak Jr. 2005. From transistors to lasers and light-emitting diodes. MRS
Bulletin, July 2005, 509.
www.ebook3000.com

ElectricalProperties 351
W. E. Howard, 2004. Better displays with organic films. Scientific American, February 2004, 76.
M. Jacoby, 2001. Carbon nanotube computer circuits. Chemical and Engineering News, September 3, 2001, 9.
M. Jacoby, 2000. Semiconductors meet organics. Chemical and Engineering News, April 17, 2000, 32.
M. Jacoby, 2000. Data storage. Chemical and Engineering News, June 12, 2000, 37.M. Jacoby, 2000. Data storage: New materials push the limits. Chemical and Engineering
News, June 12, 2000, 37.M. Jacoby, 2001. The ol’ switcheroo comes in a new size. Chemical and Engineering
News, June 25, 2001.A. C. Jones, 1995. The chip revolution continues. Chemistry in Britain, May 1995, 389.B. E. Kane, 2005. Can we build a large-scale quantum computer using semiconductor
materials? MRS Bulletin, February 2005, 105.D. Martindale, 2000. Chilly crystals. Scientific American, May 2000, 42.J. R. Minkel, 2005. Shrinking memory. Scientific American, February 2005, 33.J. R. Minkel, 2002. Falling in line. Scientific American, April 2002, 30.G. F. Neumark, R. M. Park, and J. M. DePuydt, 1994. Blue-green diode lasers. Physics
Today, June 1994, 26.R. E. Newnham, 1983. Structure-property relations in ceramic capacitors. Journal of
Materials Education, 5, 941.I. M. Ross, 1997. The foundations of the silicon age. Physics Today, December 1997, 34.P. E. Ross, 2006. Viral nano electronics. Scientific American, October 2006, 52.G. Sacripante and S. Kittelberger, 2001. Worth the paper. Chemistry in Britain, April
2001, 52.B. C. Sales, 1998. Electron crystals and phonon glasses: A new path to improved ther-
moelectric materials. MRS Bulletin, January 1998, 15.H. Sevian, S. Müller, H. Rudman, and M. F. Rubner, 2004. Using organic light-emitting
electrochemical thin film devices to teach materials science. Journal of Chemical Education, 81, 1620.
R. J. Sullivan and R. E. Newnham, 1993. Composite thermistors. Chapter 16 of Chemistry of Advanced Materials, Ed. by C.N.R. Rao. Blackwell Scientific Publications, Oxford.
A. H. Tullo, 2000. Diode developers: A bright future. Chemical and Engineering News, June 26, 2000, 20.
S. H. Voldman, 2002. Lightning rods for nanoelectronics. Scientific American, October 2002, 90.
G. M. Whitesides, 1988. Materials for advanced electronic devices. Chapter 9 in Biotechnology and Materials Science, Ed. by M. L. Good. American Chemical Society, Washington.
S. L. Wilkinson, 2000. Playing it cool. Chemical and Engineering News, April 3, 2000, 31.E. J. Winder, A. B. Ellis, and G. Lisensky, 1996. Thermoelectric devices: Solid-state
refrigerators and electrical generators in the classroom. Journal of Chemical Education, 73, 940.
P. Yang, 2005. The chemistry and physics of semiconductor nanowires. MRS Bulletin, February 2005, 85.
P. Zurer, 2001. Self-assembling solar cells. Chemical and Engineering News, August 13, 2001, 9.

352 PhysicalPropertiesofMaterials
Ice
B. Vonnegut, 1965. Orientation of ice crystals in the electric field of a thunderstorm. Weather, 20, 310.
Metals
J. Emsley, 1996. By Jove, metallic hydrogen! Chemistry in Britain, June 1996, 14.W. A. Harrison, 1969. Electrons in metals. Physics Today, October 1969, 23.A. R. Mackintosh, 1963. The Fermi surface of metals. Scientific American, July 1963, 110.E. Wilson, 1998. Deuterium goes metallic. Chemical and Engineering News, August 24,
1998, 11.
Molecular Materials and Plastics
Electronic properties of organic-based interfaces. Special issue. L. Kronik and N. Koch, Eds. MRS Bulletin, June 2010, 417–465.
Commercialization of organic electronics. Special issue. F. So, J. Kido and P. Burrows, Eds. MRS Bulletin, July 2008, 663–705.
Electroactive organic materials. Special issue. Z. Bao, V. Bulovic and A. B. Holmes, Eds. MRS Bulletin, June 2002, 441–464.
Hybrid organic-inorganic materials. Special issue. D. A. Loy, Ed. MRS Bulletin, May 2001, 364–401.
Electrifying plastics, 2000. Chemical and Engineering News, October 16, 2000.D. Bloor, 1995. Good conduct. Chemistry in Britain, 385, May 1995.S. Borman, 1999. Key step made toward molecular computing. Chemical and Engineering
News, July 19, 1999, 11.S. Borman, 1994. “Wires” of nanometer dimensions developed. Chemical and
Engineering News, June 20, 1994.G. P. Collins, 2005. A future in plastics. Scientific American, December 2005, 55.G. P. Collins, 2004. Next stretch for plastic electronics. Scientific American, August
2004, 74.D. O. Cowan and F. M. Wiygul, 1986. The organic solid state. Chemical and Engineering
News, July 21, 1986, 28.R. Dagani, 2003. Softer, pliable electronics. Chemical and Engineering News, January 6,
2003, 25.R. Dagani, 1999. Carbon-based electronics. Chemical and Engineering News, November
22, 1999, 11.S. R. Forest, 2004. The path to ubiquitous and low-cost organic electronic appliances
on plastic. Nature, 428, 911.M. Freemantle, 2003. Solutions for OLED Displays. Chemical and Engineering News,
February 24, 2003, 6.M. Freemantle, 2001. Superconducting organic polymer. Chemical and Engineering
News, March 12, 2001, 14.M. Freemantle, 2001. Organic materials get more active. Chemical and Engineering
News, April 23, 2001.B. Gross Levi, 2000. Nobel Prize in chemistry salutes the discovery of conducing poly-
mers. Physics Today, December 2000, 19.
www.ebook3000.com

ElectricalProperties 353
J. R. Heath and M. A. Ratner, 2003. Molecular electronics. Physics Today, May 2003, 43.
M. Jacoby, 2001. Nanotube conduction. Chemical and Engineering News, April 30, 2001.
R. B. Kaner and A. G. MacDiamid, 1988. Plastics that conduct electricity. Scientific American, February 1988, 105.
G. Malliaras and R. Friend, 2005. An organic electronics primer. Physics Today, May 2005, 53.
M. Najdoski, L. Pejov, and V. M. Petruševski, 1999. Pyroelectric effect of a sucrose monocrystal. Journal of Chemical Education, 76, 360.
A. M. Rouhi, 2001. Tinkertoy dreams. Chemical and Engineering News, July 30, 2001, 46.
M. D. Ward, 2001. Chemistry and molecular electronics: new molecules as wires, switches and logic gates. Journal of Chemical Education, 78, 321.
B. Wessling, 2001. Polymers show their metal. Chemistry in Britain, March 2001, 40.E. Wilson, 2000. A Nobel nod to the fathers of electronics technology. Chemical and
Engineering News, October 16, 2001.M. Wilson, 2006. Electrons in atomically thin carbon sheets behave like massless par-
ticles. Physics Today, January 2006, 21.P. Yam, 1995. Plastics get wired. Scientific American, July 1995, 82.
Nano
M. Gross, 2002. The smallest revolution. Chemistry in Britain, May 2002, 36.C. M. Leiber, 2001. The incredible shrinking circuit. Scientific American, September
2001, 58.M. Ouyang, J.-L. Huang, and C. M. Lieber, 2002. Fundamental electronic proper-
ties and applications of single-walled carbon nanotubes. Accounts of Chemical Research, 35, 1018.
Y.-W. Son, M. L. Cohen, and S. G. Louie, 2006. Half-metallic graphene nanoribbons. Nature, 444, 347.
G. M. Whitesides and J. C. Love, 2001. The art of building small. Scientific American, September 2001, 38.
Paraelectrics
R. E. Cohen, 2006. Relaxors go critical. Nature, 441, 941.S. B. Lang, 2005. Pyroelectricity: From ancient curiosity to modern imaging tool.
Physics Today, August 2005, 31.
Semiconductors
Semiconductor quantum dots. Special issue. A. Zunger, Ed. MRS Bulletin, February 1998, 15–53.
G. H. Döhler, 1983. Solid-state superlattices. Scientific American, November 1983, 144.M. W. Geis and J. C. Angus, 1992. Diamond film semiconductors. Scientific American,
October 1992, 84.

354 PhysicalPropertiesofMaterials
G. C. Lisensky, R. Penn, M. L. Geselbracht, and A. B. Ellis, 1992. Periodic properties in a family of common semiconductors. Journal of Chemical Education, 69, 151.
J. R. Minkel, 2002. Charging up diamonds. Scientific American, November 2002, 36.S. O’Brien, 1996. The chemistry of the semiconductor industry. Chemical Society
Reviews, 25, 393.A. Pisanty, 1991. The electronic structure of graphite. Journal of Chemical Education,
68, 804.E. Sandre, A. LeBlanc, and M. Danot, 1991. Giant molecules in solid state chemistry.
Journal of Chemical Education, 68, 809.H. I. Smith and H. G. Craighead, 1990. Nanofabrication. Physics Today, February
1990, 24.
Superconductors
Web site: www.superconductors.org (includes highest Tc claim to date).High performance YBCO-coated superconductor wires. Special issue. Y. P. Paranthaman
and T. Izumi, Eds. MRS Bulletin, August 2004, 533–589.C60 made to superconduct at 117 K, 2001. Chemical and Engineering News, September
3, 2001, 34.High-temperature superconductivity. Physics Today, June 1991 (special issue with sev-
eral articles on this topic).F. J. Adrain and D. O. Cowan, 1992. The new superconductors. Chemical and Engineer-
ing News, December 21, 1992, 24.J. Bardeen, 1990. Superconductivity and other macroscopic quantum phenomena.
Physics Today, December 1990, 25.P. C. Canfield and S. L. Bud’ko, 2005. Low-temperature superconductivity is warming
up. Scientific American, April 2005, 80.P. C. Canfield and G. W. Crabtree, 2003. Magnesium diboride: Better late than never.
Physics Today, March 2003, 34.R. J. Cava, 1990. Superconductors beyond 1-2-3. Scientific American, August 1990,
42.L. L. Chang and L. Esaki, 1992. Superconductor quantum heterostructures. Physics
Today, October 1992, 36.P. C. W. Chu, 1995. High-temperature superconductors. Scientific American, September
1995, 162.C. D. Cogdell, D. G. Wayment, and D. J. Casadonte Jr., 1995. A convenient, one-step
synthesis of YBa2Cu3O7-x superconductors. Journal of Chemical Education, 72, 840.
G. P. Collins, 2004. High-temp knockout. Scientific American, May 2004, 28.D. L. Cox and M. B. Maple, 1995. Electronic pairing in exotic superconductors. Physics
Today, February 1995, 32.R. Dagani, 2001. Superconductor stuns physicists. Chemical and Engineering News,
March 2, 2001, 13.R. Dagani, 1996. New entry in the superconducting tape derby. Chemical and
Engineering News, November 11, 1996, 38.R. Dagani, 1995. Superconductor milestone: Flexible tape carries record-high current.
Chemical and Engineering News, April 24, 1995, 6.S. Dann, 2001. No resistance. Chemistry in Britain, December 2001, 18.
www.ebook3000.com

ElectricalProperties 355
P. Day, Ed., 2006. Molecules into Materials. World Scientific, Singapore.A. de Lozanne, 2006. Hot vibes. Nature, 442, 522.J. de Nobel, 1996. The discovery of superconductivity. Physics Today, September 1996,
40.P. I. Djurovich and R. J. Watts, 1993. A simple and reliable chemical preparation of
YBa2Cu3O7-x superconductors. Journal of Chemical Education, 70, 497.P. P. Edwards and C. N. R. Rao, 1994. A new era for chemical superconductors.
Chemistry in Britain, September 1994, 722.E. A. Ekimov, V. A. Sidorov, E. D. Bauer, N. N. Mel’nik, N. J. Curro, J. D. Thompson,
and S. M. Stishov, 2004. Superconductivity in diamond. Nature, 428, 542.M. Freemantle, 2000. Holes raise C60 superconductivity temperature. Chemical and
Engineering News, December 4, 2000, 12.T. H. Geballe, 1993. Superconductivity: From physics to technology. Physics Today,
October 1993, 52.A. M. Goldman and N. Markovič, 1998. Superconductor-insulator transitions in the
two-dimensional limit. Physics Today, November 1998, 39.B. Gross Levi, 2004. New experiments highlight universal behavior in copper oxide
superconductors. Physics Today, September 2004, 24.B. Gross Levi, 2000. Learning about high-Tc superconductors from their imperfec-
tions. Physics Today, March 2000, 17.R. M. Hazen, 1988. Perovskites. Scientific American, June 1988, 74.L. Hoddeson, 1999. John Bardeen and the BCS theory of superconductivity. MRS
Bulletin, January 1999, 50.H. Hogan, 1997. Superconductor products poised for market. The Industrial Physicist,
March 1997, 7.K. D. Irwin, 2006. Seeing with superconductors. Scientific American, November 2006,
86.K. D. Irwin, 2006. How a superconductor detects light. Scientific American, November
2006, 89.J. R. Kirtley and C. C. Tsuei, 1996. Probing high-temperature superconductivity.
Scientific American, August 1996, 68.G. B. Lubkin, 1995. Applications of high-temperature superconductors approach
marketplace. Physics Today, March 1995, 20.G. B. Lubkin, 1996. Power applications of high-temperature superconductors. Physics
Today, March 1996, 48.Y. Maeno, T. M. Rice, and M. Sigrist, 2001. The intriguing superconductivity of stron-
tium ruthenate. Physics Today, January 2001, 42.A. P. Malozemoff, J. Mannhart, and D. Scalapino, 2005. High-temperature cuprate
superconductors get to work. Physics Today, April 2005.J. Mannhart and P. Chaudhari, 2001. High-Tc bicrystal grain boundaries. Physics Today,
November 2001, 48.A. McCook, 2001. A warmer superconductor? Scientific American, October 2001, 22.B. Raveau, 1992. Defects and superconductivity in layered cuprates. Physics Today,
October 1992, 53.D. van Delft and P. Kes, 2010. The discovery of superconductivity. Physics Today,
September 2010, 38.E. Wilson, 2001. Superconducting nanotubes. Chemical and Engineering News, July 2,
2001, 8.

356 PhysicalPropertiesofMaterials
E. Wilson, 2001. Boron gives up its resistance. Chemical and Engineering News, July 16, 2001, 7.
A. M. Wolsky, R. F. Giese, and E. J. Daniels, 1989. The new superconductors: prospects for applications. Scientific American, February 1989, 60.
Thermoelectrics
Thermoelectric materials and applications. Special issue. T. M. Tritt and M. A. Subramanian, Eds. MRS Bulletin, March 2006, 188–229.
D. M. Rowe, Ed., 2005. Thermoelectrics Handbook. CRC Press, Boca Raton, FL.
Thermometry
S. Carlson, 1999. A homemade high-precision thermometer. Scientific American, March 1999, 102.
S. Uchiyama, A. P. De Silva, and K. Iwai, 2006. Luminescent molecular thermometers. Journal of Chemical Education, 83, 720.
www.ebook3000.com

357
13MagneticProperties
13.1 Introduction
Magnetic materials have revolutionized our lives, from the recording and playing of our favorite music to readable magnetic strips on our charge cards to magnetic materials storing information in our computers. The great advantage of magnetic materials is that they can store so much information in such a small space.* In this chapter we explore the principles behind mag-netic materials.
13.2 Origins of Magnetic Behavior
The magnetic properties of a material can be understood in microscopic terms when we take into account some of the special properties of moving electrons. It is for this reason that electrical and magnetic properties are related, and some of the terms are parallel in their use. It is the motion of a charge (i.e., electrons; the motion of the nuclei contributes only about 0.1% as much as the electrons to magnetic properties) that creates a magnetic field. Before we can proceed to consider this in detail, it is useful to define some terms.
A magnetic field is a region surrounding a magnetic body. This region can induce magnetic fields in other bodies. Magnetic materials, such as iron filings, can align themselves to represent field lines (also called flux lines), as shown in Figure 13.1.
A magnet can be considered to be formed from two poles. We are familiar with this in a bar magnet. However, no matter how finely a bar magnet is
* Magnetic materials contain dramatically increasing amounts of information. Magnetic tape could store a few kilobytes in the 1940s. Four decades later, the 1-gigabyte-per-square-inch storage density barrier was broken using a magnetoresistive head. Compare that with the data storage capacity of today’s computers!

358 PhysicalPropertiesofMaterials
divided, both poles are always present. The unit pole (or magnetic mono-pole) concept is a useful theoretical idea to describe quantitative aspects of magnetism. A unit pole is defined as a body that will repel an equal unit pole placed 1 cm away in a vacuum, with a force of 10–5 N.
The magnetic field strength, H , is a vector that measures the force acting on a unit pole placed at a fixed point in a magnetic field (in vacuum). H also measures the magnitude and direction of the magnetic field. The SI units of the magnitude of the magnetic field strength, H, are A m–1.
The lines of force of a magnet describe the free path traced by an imagi-nary magnetic monopole in a magnetic field. For the space surrounding the source of the magnetic field, there is an induction whose magnitude, B, is the flux density. The induction and the magnetic field strength are related in vacuum by
B H= 0 (13.1)
where μ0 is the permeability of vacuum. If there is a material in the magnetic field, the relation is similar*:
B H= (13.2)
where μ is the permeability of that material.
* The most important equations in this chapter are designated with ▮ to the left of the equation.
FIGURE 13.1Magnetic field patterns, as indicated by aligned iron filings with a bar magnet.
www.ebook3000.com

MagneticProperties 359
Equation 13.2 is analogous to the electrical relation
JVl
= σ (13.3)
where J is the electrical current density, σ is the electrical conductivity, and Vl–1 is the voltage gradient. Comparison of Equations 13.2 and 13.3 shows that magnetic induction (B) is analogous to electric current density (J); mag-netic field strength (H) is analogous to voltage gradient (Vl–1), and perme-ability (μ) is analogous to electrical conductivity (σ).
Equation 13.2 can be rewritten to show the contribution of the material to the induction:
B H H M= = +0 ( ) (13.4)
where M is the magnetization of the material, and the term 0 M represents the additional magnetic induction field associated with the material. The SI units for induction, B, are tesla* (abbreviated as T), and for magnetization, M, are A m–1. The relative permeability, μr, of a material is defined as
r =0
(13.5)
and the magnetic susceptibility, χ, is defined as
χ =MH
(13.6)
where both μr and χ are unitless.The sign and magnitude of χ indicate the magnetic class of a material. If
χ is negative and independent of H, it means that the material is expelled from a magnetic field, and this material is diamagnetic. If χ is small and posi-tive (10–5 to 10–2) and independent of H, it means that the material is slightly attracted to a magnetic field; this material is paramagnetic. If χ is large and positive (10–2 to 106) and dependent on H, it means that the material is very attracted to a magnetic field; this material is ferromagnetic. The effects of the material on the magnetic field lines for a diamagnet (flux density decreases),
* Nikola Tesla (1856–1943) was born in Croatia and made his major contributions as an electri-cal engineer in the United States. He is best known as the inventor of the ac induction motor, an idea that he sold to George Westinghouse for commercialization. Tesla was an eccentric, brilliant, reclusive inventor; he carried out many dangerous electrical experiments in his private laboratory, often putting out the power in his region.

360 PhysicalPropertiesofMaterials
a paramagnet (flux density increases), and a superconductor (magnetic field repelled by the Meissner effect) are shown in Figure 13.2.
The origins of diamagnetism, paramagnetism, and ferromagnetism are all related to the electrons in the materials, and understanding this relation-ship draws heavily on quantum mechanics. Briefly, there are two important
COMMENT: SUPERCONDUCTORS AS THERMAL SWITCHES
One of the properties of the superconducting state is that electrical resistivity is exactly zero. Another property is that its normal resistiv-ity is restored in the presence of magnetic fields in excess of a critical magnetic field, Bc. The critical field depends on the critical temperature of the material, Tc, approximately as
Bc = B0(1 – (T/Tc)2) (13.7)
where B0 is the value of Bc as T → 0 K.Although conduction electrons allow metals to conduct heat more
efficiently than in insulators, the paired electrons (Cooper pairs) in a superconductor do not interact with thermal phonons, and therefore a superconductor does not conduct heat as well as a metal. This can allow a superconductor to be used as a thermal switch.
For example, a link of tin or lead can provide a connection between a low-temperature sample and its surroundings. In its metallic state it is an efficient thermal conductor when this is required (e.g., during cooling processes). Further cooling puts the link in its superconducting state and thermally isolates the system (e.g., to carry out thermal mea-surements). Similarly, the thermal link can be activated or deactivated by turning a magnetic field on and off. Such a thermal link avoids prob-lems such as vibration and heating associated with mechanical heat switches at very low (cryogenic) temperatures.
(a) (b) (c)
FIGURE 13.2Magnetic flux density contours in (a) a diamagnetic material; (b) a paramagnetic material, and (c) a superconducting material.
www.ebook3000.com

MagneticProperties 361
ways in which electrons contribute to magnetism: orbital magnetism (due to the motion and resulting orbital angular momentum of the electrons in “orbits” about the nucleus) and spin magnetism (due to the spin-up and spin-down properties of an electron).
Diamagnetic behavior, which is characterized experimentally by the (usu-ally weak) repulsion of the material from a magnetic field, arises due to the (orbital) motion of the electrons being affected by the presence of a magnetic field. In a diamagnetic material, all the spins are paired (represented as ⇅, i.e., spin up and spin down) so the atoms have no resultant magnetic moment, and an applied magnetic field has little effect except induction associated with the motion of the electrons (current flows in a direction to produce a magnetic field that opposes the inducing field, and repulsion results). All materials have this diamagnetic effect, but in materials with unpaired spins it can be overwhelmed by more powerful effects that attract the material into the magnetic field, such as paramagnetism and ferromagnetism.
If there are unpaired electrons, as in many transition metal species and also some other molecules such as O2, the total electronic spin must be nonzero, and paramagnetism results. We have already seen that spin can contribute to the magnetic properties of the system. In ordinary paramagnets (often referred to as Pauli* paramagnets) the magnetic properties are defined by the proper-ties of the individual atoms, and spin is one of two important considerations. The other is orbital magnetism, which can arise for certain electronic states of some atoms. Orbital magnetism can give additional attraction of this sys-tem to a magnetic field, similar to the magnetic effect associated with an electric current flowing in a closed-loop of wire.
In contrast with diamagnets and ordinary paramagnets, a ferromagnet relies on more than the single-atom properties to derive its interaction with a magnetic field. The origin of this strong, attractive force is cooperative interaction between the magnetic moments of individual atoms arranged on a lattice. Iron is the archetypal example from which this class of materials derives its name. There are two competing interactions involving magnetic spins to keep in mind: exchange interactions tend to keep spins aligned (⇈, due to electron–electron and electron–nuclear interactions), and magnetic dipole interactions tend to align spins antiparallel (⇅, due to long-range interactions that favor this configuration).
In a ferromagnetic metal, the importance of many-atom effects in determin-ing magnetism is directly related to the electronic band structure. A high den-sity of states in the bands makes it possible to have reduced electron repulsion (i.e., reduced energy) by having electrons with parallel spins singly occupying
* Wolfgang Pauli (1900–1958) was an Austrian theoretical physicist and winner of the 1945 Nobel Prize in Physics for the enunciation of what we now call the Pauli exclusion principle. Although a brilliant theoretician, his experimental contemporaries considered Pauli to be “jinxed,” and he was regarded as bad luck in a laboratory. One story has it that an important experiment went disastrously wrong, and this was blamed on Pauli passing through that city on the night train.
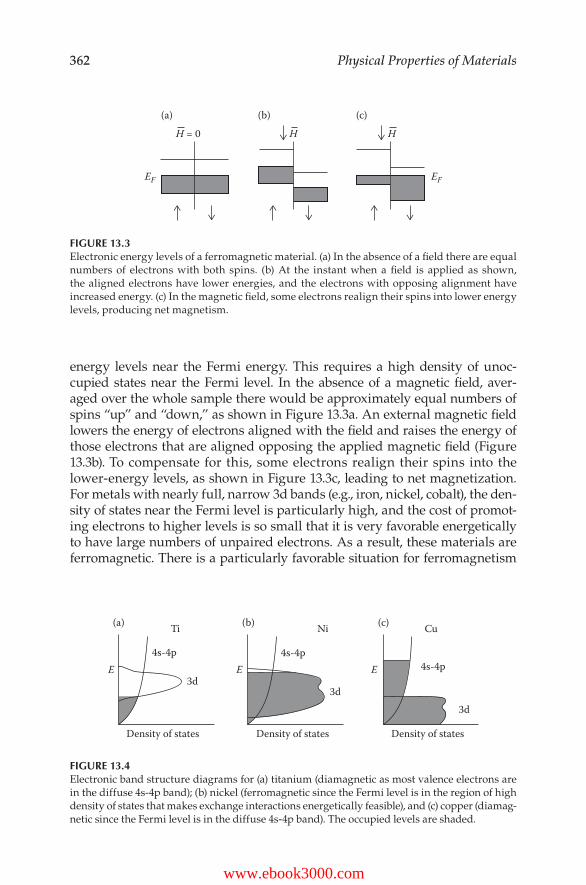
362 PhysicalPropertiesofMaterials
energy levels near the Fermi energy. This requires a high density of unoc-cupied states near the Fermi level. In the absence of a magnetic field, aver-aged over the whole sample there would be approximately equal numbers of spins “up” and “down,” as shown in Figure 13.3a. An external magnetic field lowers the energy of electrons aligned with the field and raises the energy of those electrons that are aligned opposing the applied magnetic field (Figure 13.3b). To compensate for this, some electrons realign their spins into the lower-energy levels, as shown in Figure 13.3c, leading to net magnetization. For metals with nearly full, narrow 3d bands (e.g., iron, nickel, cobalt), the den-sity of states near the Fermi level is particularly high, and the cost of promot-ing electrons to higher levels is so small that it is very favorable energetically to have large numbers of unpaired electrons. As a result, these materials are ferromagnetic. There is a particularly favorable situation for ferromagnetism
Density of states Density of states Density of states
4s-4p 4s-4p4s-4p
3d3d
3d
Ti Ni Cu
E E E
(a) (b) (c)
FIGURE 13.4Electronic band structure diagrams for (a) titanium (diamagnetic as most valence electrons are in the diffuse 4s-4p band); (b) nickel (ferromagnetic since the Fermi level is in the region of high density of states that makes exchange interactions energetically feasible), and (c) copper (diamag-netic since the Fermi level is in the diffuse 4s-4p band). The occupied levels are shaded.
EF EF
H = 0 H H(a) (b) (c)
FIGURE 13.3Electronic energy levels of a ferromagnetic material. (a) In the absence of a field there are equal numbers of electrons with both spins. (b) At the instant when a field is applied as shown, the aligned electrons have lower energies, and the electrons with opposing alignment have increased energy. (c) In the magnetic field, some electrons realign their spins into lower energy levels, producing net magnetism.
www.ebook3000.com

MagneticProperties 363
in the middle of the first row of the transition elements; the electronic band structures of some metals are shown in Figure 13.4.
In the absence of a magnetic field, a piece of iron (or other ferromagnet) might not be magnetized, depending on the sample’s history. The reason is that the spins are aligned in a given direction only within small volumes within the crystal (about 10–14 m3 each), called domains. Different domains have different magnetic orientations such that the overall crystal is not mag-netized. With only a few spins, the preferred orientation is aligned, but as more spins are added, magnetic dipolar interactions tend to favor antipar-allel arrangements. The result is domains of different spin orientations, as shown in Figure 13.5.
Diamagnetic, paramagnetic, and ferromagnetic effects are summarized in Table 13.1.
COMMENT: MOLECULAR MAGNETS
Chemists have been designing new magnetic materials with molecu-lar building blocks in order to have control over their properties. The first-discovered molecular magnet, [Fe(C5(CH3)5)2]∙+[(NC)2C=C(CN)2]∙ – is ferromagnetic below 4.8 K. Studies of molecular magnets have shown that spin coupling is not sufficient to cause ferromagnetism; inter-molecular interactions also are required. This can be investigated by making small changes to the molecular structure. Depending on the spin interaction, molecular magnets can be either ferromagnetic or antiferromagnetic.
Domain
DomainDomainwall
H
FIGURE 13.5Domains in a ferromagnetic material. The region between domains is called the domain wall.

364 PhysicalPropertiesofMaterials
13.3 Magnetic Induction as a Function of Field Strength
Equations 13.1 and 13.2 show the relations between induction, B, and mag-netic field strength, H, for free space (vacuum) and a material, respectively. For a paramagnetic material, μ > μ0 (typically μ = 1.01μ0), and this leads to the induction-field strength relation shown in Figure 13.6. For a diamagnetic material, μ < μ0 (typically, μ = 0.99995μ0); this induction-field strength relation is also shown in Figure 13.6.
Ferromagnetic materials show much more dramatic induction with increasing field strength, as shown in Figure 13.7 (see also Table 13.2). This
TABLE 13.1
Diamagnetic, Paramagnetic, and Ferromagnetic Effects
Effect Field χ Dominant OriginMagnitude of
Magnetic Effect
Diamagnetism Weak repulsion
<0, Independent of field strength
Induction associated with orbital motion;
due to paired electrons; always
present
Small
Pauli paramagnetism
Weak attraction
10–5–10–2, Independent of field strength
Unpaired spins of individual atoms +
possibly orbital magnetism
Small
Ferromagnetism Strong attraction
10–2–106, Depends on
field strength
Cooperative interactions;
exchange(↑↑) and magnetic dipole (↑↓)
compete
Large
ParamagnetVacuumDiamagnet
B
H
FIGURE 13.6Induction (B) as a function of magnetic field strength (H) for free space (vacuum), a typical paramagnetic material, and a typical diamagnetic material. The differences between the slopes in vacuum (slope = μ0) and the paramagnetic material (slope ≈ 1.01 μ0) and diamagnetic material (slope ≈ 0.99995 μ0) are exaggerated here.
www.ebook3000.com

MagneticProperties 365
is associated with their very large relative permeabilities that arise, as men-tioned already, due to cooperative effects among the magnetic moments within the material.
From Figure 13.7, the induction in a ferromagnetic material has some further interesting properties that are not observed for diamagnetic and paramag-netic materials. When the magnetic field strength is increased, the induction reaches a maximum value called the saturation induction (Bs). Furthermore, when the field is reduced to zero, there is still some induction, known as the remanent induction, Br. (This is a well-known phenomenon; when a previ-ously “unmagnetized” ferromagnetic material is brought up to a magnet, magnetism can be induced and can remain even after the first magnet has been removed.) If the field is reversed, at a certain value known as the coer-cive field, Hc, the induction finally becomes zero. The induction-field strength relation on increasing the field is not the same as on decreasing the field, and this gives rise to a hysteresis loop (Figure 13.7).
Slope =initial permeability
BrBs
Hc
B
H
FIGURE 13.7Induction (B)—magnetic field strength (H) relations for a ferromagnet. The broken line is the initial magnetization, and the solid line is the dependence after the first magnetization. Bs is the saturation induction, and Br is the remanent induction (induction remaining when the field is removed). Hc is the coercive field required to reach zero induction. The hysteresis loop shows that the induction on an increasing field is not the same as the induction on a decreasing field.
TABLE 13.2
Properties of Selected Soft Magnets
Material
Initial Relative Permeability (μr at B ≈ 0)
Hysteresis Loss / (J m–3 per Cycle)
Saturation Induction, Bs/T
Commercial iron 250 500 2.16Fe-4% Si, random 500 50–150 1.95Fe-3%Si, oriented 15,000 35–140 2.045 Permalloy (Ni45Fe55) 2700 120 1.6Mumetal (Ni75Cu5Cr2Fe18) 30,000 20 0.8Supermalloy (Ni79Fe15Mo5) 100,000 2 0.79

366 PhysicalPropertiesofMaterials
It is the cooperative effects of the magnetic moments on adjacent atoms that give such large magnetic effects in the case of a ferromagnet. This is shown schematically in Figure 13.8, where a trip along the hysteresis loop, starting at zero induction, first shows saturation to be a result of maximum spin alignment with the applied field. When the field is removed, there are still some residual aligned domains. As the field is reversed, more domains align in the reverse direction until finally they are fully aligned (saturation in the reverse direction).
The hysteresis loop of a ferromagnet can give rise to applications of these materials. The hysteresis loop can be very broad (these are called hard mag-nets because the domain walls are difficult to move) or narrow (these are called soft magnets because the domain walls are easier to move); this is illus-trated in Figure 13.9.
Hard
Soft
H
B
FIGURE 13.9Comparison of typical hysteresis loops for a hard and a soft ferromagnet.
Appliedfield
Appliedfield
0 H
B
FIGURE 13.8The induction-magnetic field hysteresis loop of a ferromagnetic material, showing schematic domain structures at various points in relation to the applied magnetic field.
www.ebook3000.com

MagneticProperties 367
One major use of metallic ferromagnets is in the core of power transform-ers. Soft magnets are used there because of the small width of their hys-teresis loop and consequent higher energy efficiency (the area of the loop is proportional to the energy loss in one pass through the loop). The ease of magnetization and demagnetization makes soft magnets particularly useful in alternating current applications. It is also important that a magnet used in this application have sufficiently high saturation induction in order to mini-mize the size of the transformer core. Properties of some soft magnetic mate-rials are given in Table 13.2.
Hard magnets are useful as so-called permanent magnets because their large hysteresis loop leads to large residual magnetization values. Alloys such as samarium–cobalt, platinum–cobalt, and alnico (an alloy of alumi-num, nickel, and cobalt) are useful hard magnets.
Experimentally, a soft magnet can be distinguished from a hard magnet by the value of the coercive field, Hc, necessary to return the induction to zero following magnetization, with ∣Hc∣ > 1000 A m–1 as the barrier beyond which a magnet is considered to be hard (permanent magnet). Another criterion is ∣BH∣max, as defined in Figure 13.10. This value is indicative of the energy required for demagnetization and is a measure of the magnetic strength of a material. Typical values of ∣BH∣max, Br, and Hc are given in Table 13.3.
B
H
|BH|max
BrB
|BH|
0
FIGURE 13.10Plotting of the product ∣BH∣ from the demagnetization quadrant as a function of B defines a maximum, designated ∣BH∣max, for a magnet, where ∣BH∣max is a measure of the power of a permanent magnet.

368 PhysicalPropertiesofMaterials
13.4 Temperature Dependence of Magnetization
For a normal paramagnetic material where the paramagnetic species act independently, the susceptibility obeys the Curie* law as the temperature, T (in kelvin), changes:
χ =
CT (13.8)
where C is the Curie constant. This is shown schematically in Figure 13.11, and the temperature dependence reflects the increase in thermal randomization with greater thermal energy.
When there is a possibility of cooperative magnetic behavior, the tempera-ture dependence of the susceptibility is different. At very high temperatures there is too much thermal energy to allow cooperative magnetism; below a threshold temperature such cooperation is possible. For a ferromagnet, this temperature is the Curie temperature, TC, and the Curie law becomes
χ =−
<C
T TT T
CC, . (13.9)
Below TC, a ferromagnet has aligned magnetic moments that give rise to spontaneous magnetization even in the absence of a field. The moments (aside from domain effects) would be totally aligned at T = 0 K. The Curie temperatures of selected ferromagnets are given in Table 13.4.
* Pierre Curie (1859–1906) was a French physicist and codiscoverer (with his brother Jacques-Paul Curie) of piezoelectricity in 1877. His famous PhD thesis concerned important work on magnetism; in 1903 he shared the Nobel Prize in Physics with his wife, Marie Sklodowska Curie, and Henri Becquerel for their work on radioactivity. His life ended prematurely when he was hit by a vehicle while crossing Rue Dauphine in Paris.
TABLE 13.3
Properties of Selected Hard Magnets
MaterialRemanence, Br /V s m–2
Coercive Field, Hc /kA m–1
Maximum Demagnetizing Product, ∣BH∣max /kJ m–3
Carbon steel 1.0 –4 1Alnico V 1.2 –55 34Ferroxdur (BaFe12O19) 0.4 –150 20Rare earth-cobalt 1.0 –700 200Nd2Fe14B – –1600 –
www.ebook3000.com

MagneticProperties 369
For some materials there is a different temperature dependence to χ, expressed as
χ =+
<C
T TT T
NN, (13.10)
where TN is the Néel* temperature. These materials are antiferromagnetic; their magnetic spins are aligned in layers, but alternate layers are of opposite mag-netic orientation such that there is no net alignment of spins in the system. An example of an antiferromagnetic structure is NiO; its magnetic structure is shown in Figure 13.12a. Antiferromagnetism arises in this case due to the superexchange interaction driven by the covalent Ni-O-Ni bonding as follows. The interaction of the d orbitals of Ni with the oxygen 2p orbital gives some covalent bonding, with partial transfer of an electron from the oxygen to the metal orbitals. As shown in Figure 13.12b, if one Ni has spin up, only a spin-down electron from oxygen can be transferred to this orbital (Pauli exclusion principle). Therefore, bonding to an adjacent Ni must involve the spin-up elec-tron of oxygen, which can only be transferred to Ni if its unpaired electron is in the spin-down state; this leads to an antiferromagnetic structure.
Another type of magnetism, ferrimagnetism, sometimes known as unbal-anced antiferromagnetism, is illustrated in Figure 13.13; in ferrimagnetism there are two spin alignments, but they are not balanced out. Ferrites are ferri-magnets with the general formula Fe2O3∙MO, where M is a metal cation (e.g., Zn, Cd, Fe, Ni, Cu, Co, Mg, etc.). Magnetite, Fe3O4, is an example of a ferrite that has been known and used (e.g., as a compass) since ancient times. More recently, ferrites have been used in recording tapes and transformer cores. Ferrites are among the most important materials in magnetic applications.
* Louis Eugène Néel (1904–2000) was a French physicist and winner of the 1970 Nobel Prize in Physics for work on antiferromagnetism and ferrimagnetism.
Ferromagnetic
Antiferromagnetic
Paramagnetic
Paramagnetic
Paramagneticχ χχ
T T TTNTC
(b) (c)(a)
FIGURE 13.11The temperature dependence of magnetic susceptibility for (a) a paramagnet; (b) a ferromagnet (showing the ferromagnetic–paramagnetic transition at TC); and (c) an antiferromagnet (show-ing the antiferromagnetic–paramagnetic transition at TN).

370 PhysicalPropertiesofMaterials
In practice, paramagnets, ferromagnets, and antiferromagnets can be dis-tinguished by the form of χ–1 as a function of temperature, as shown in Figure 13.14. Equations 13.8, 13.9, and 13.10 can be generalized as
χ =−C
T Θ (13.11)
where Θ, called the Weiss* constant, is zero for a paramagnet, positive for a ferromagnet, and negative for an antiferromagnet.
* Pierre Weiss (1865–1940) was a French physicist who developed a phenomenological theory of ferromagnetism.
Magneticunit cell Chemical
unit cell
Ni NiO
3dz2 3dz22pz
(a) (b)
FIGURE 13.12Antiferromagnetism in NiO. (a) The antiferromagnetic structure of this material. Alternate lay-ers of aligned Ni spins are oriented in opposing directions such that there is no net magnetic moment. (b) Antiferromagnetism in NiO arises from the Ni-O-Ni bonding arrangement that dictates that alternate nickel atoms have opposing spins; this is an example of superexchange.
TABLE 13.4
Curie Temperatures (TC, Ferromagnet) and Néel Temperatures (TN, Antiferromagnet) for Selected Materials
Ferromagnets TC/K
Co 1400Fe 1043Ni 631CrO2 392Gd 292EuO 69
Antiferromagnets TN/K
NiO 530CoO 292FeO 198MnO 122NiF2 83
www.ebook3000.com

MagneticProperties 371
COMMENT: MAGNETIC RESONANCE
Magnetic fields can influence the energy states of atoms and ions, and this can be used to probe the structure and dynamics of materials.
For a paramagnetic ion of spin ½, with a doubly degenerate ground state in the absence of a magnetic field, the energy levels will split as a function of magnetic field B (see Figure 13.15a), with a gap of gβB, where g is the Landé splitting factor (related to the spin of the system in question), and β is the Bohr magneton (a constant related to the magnetic moment of an electron). If at a given magnetic field B, the system is subject to radio frequency ν (energy hν) such that hν = gβB, the radio frequency will be absorbed, and g can be determined. The value of g (and its anisotropy) can indicate the magnetic environment of a given nucleus. In the slightly more complex case of a zero-field splitting of the ground state (Figure 13.15b), measurements at more than one field can be used to determine g.
Resonance experiments at microwave frequencies (≈ 1010 s–1) can be used to investigate electronic states of paramagnetic ions; this is electron spin resonance (ESR), also called electron paramagnetic resonance (EPR).
Similar principles can be used to investigate states associated with the nucleus of an atom with nonzero spin; this is nuclear mag-netic resonance (NMR) spectroscopy. NMR is arguably the most important structural technique in all of chemistry today, as it allows one to determine the atomic bonding arrangement (i.e., structure of molecules). NMR is a very sensitive technique; it is said that magnetic resonance imaging of brain processes during exposure to music can distinguish persons who have had musical training from those who have not.
FIGURE 13.13A schematic view of a ferrimagnetic structure. For Fe3O4, a ferrimagnetic material, unbalanced magnetic moments arise from different numbers of unpaired electrons on Fe3+ and Fe2+.

372 PhysicalPropertiesofMaterials
COMMENT: MAGNETORESISTANCE
Magnetoresistance is the change in electrical conductivity of a conductor when it is placed in a magnetic field. Usually the effect is small, of the order of a few per cent. In 1988, two research groups independently discovered that some layered materials showed large magnetoresistance, now called giant magnetoresistance (GMR). Peter Grünberg and Albert Fert shared the 2007 Nobel Prize in Physics for their discoveries. In both their investiga-tions, GMR resulted from magnetic multilayers, nanometer-thick layers of ferromagnetic (Fe), and paramagnetic (Cr or Cu) materials.
Only the electrons near the Fermi level participate in electrical con-duction. From Figure 13.3, it is clear that the properties of the electrons at the Fermi energy, including conduction, are different for spin-up and spin-down electrons in a ferromagnet, whereas for a paramagnetic material, spin-up and spin-down electrons contribute equally to elec-trical conduction. In the absence of a magnetic field, the system can be
(a) (b)
g βB = hν hν1 hν2Δ
0 0B B
EE
FIGURE 13.15(a) A paramagnetic ion with a doubly degenerate ground state has its ground state degeneracy lifted in a magnetic field. (b) The zero-field splitting of a ground state can be determined by energy absorptions at two different magnetic fields: hν1 = Δ + gβB1 and hν2 = Δ + gβB2.
AntiferromagnetParamagnet
Ferromagnet
T/K0
χ–1
FIGURE 13.14Variation of χ–1 as a function of temperature (extrapolated from high temperature) for a para-magnet, ferromagnet, and antiferromagnet. In each case the χ–1 = 0 intercept value allows the calculation of the Weiss constant, Θ, from Equation 13.11.
www.ebook3000.com
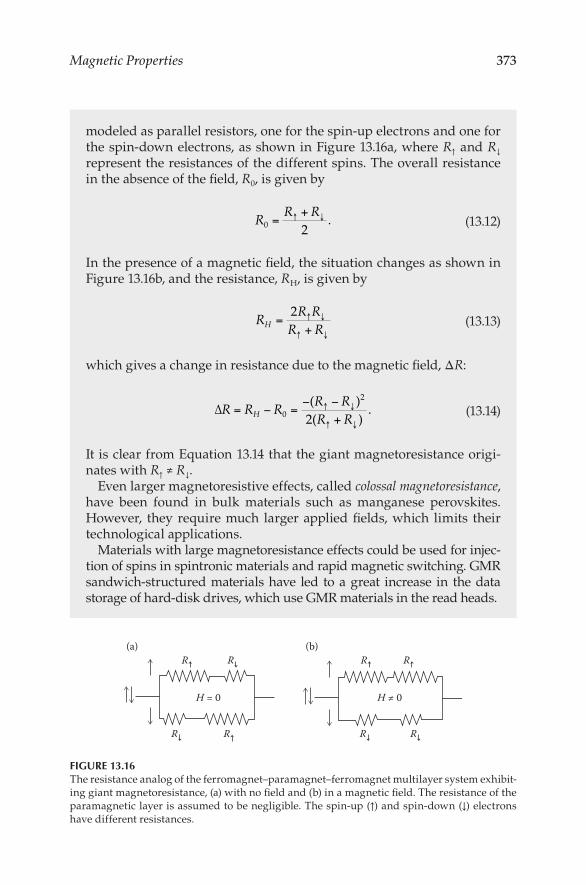
MagneticProperties 373
modeled as parallel resistors, one for the spin-up electrons and one for the spin-down electrons, as shown in Figure 13.16a, where R↑ and R↓ represent the resistances of the different spins. The overall resistance in the absence of the field, R0, is given by
RR R
0 =+↑ ↓
2. (13.12)
In the presence of a magnetic field, the situation changes as shown in Figure 13.16b, and the resistance, RH, is given by
RR R
R RH = +↑ ↓
↑ ↓
2 (13.13)
which gives a change in resistance due to the magnetic field, ΔR:
∆R R RR RR RH= − =
− −+
↑ ↓
↑ ↓0
2
2( )( )
. (13.14)
It is clear from Equation 13.14 that the giant magnetoresistance origi-nates with R↑ ≠ R↓.
Even larger magnetoresistive effects, called colossal magnetoresistance, have been found in bulk materials such as manganese perovskites. However, they require much larger applied fields, which limits their technological applications.
Materials with large magnetoresistance effects could be used for injec-tion of spins in spintronic materials and rapid magnetic switching. GMR sandwich-structured materials have led to a great increase in the data storage of hard-disk drives, which use GMR materials in the read heads.
H = 0 H ≠ 0
R R R R
R RR R
(a) (b)
FIGURE 13.16The resistance analog of the ferromagnet–paramagnet–ferromagnet multilayer system exhibit-ing giant magnetoresistance, (a) with no field and (b) in a magnetic field. The resistance of the paramagnetic layer is assumed to be negligible. The spin-up (↑) and spin-down (↓) electrons have different resistances.

374 PhysicalPropertiesofMaterials
Magnetic Devices: A Tutorial
a. Although much of the discussion in this chapter has concerned pure materials, one of the beauties of materials science is that it does not limit itself only to pure materials, and in purpose-fully added impurities, new properties can arise. Magnetic materials are no exception. Steel (which can be considered to be impure iron) is a much harder magnet than very pure iron. Why? Consider domain growth in a magnetic field. Will domains gen-erally affect hard or soft magnetic materials more?
b. Many of the first-row transition metals can have very useful fer-romagnetic properties; however, ferromagnetism is not observed in the second- and third-row transition metals. Given that the 4d and 5d bands are more diffuse than the 3d bands, can you rec-oncile this finding? Consider the cost of promotion of electrons (exchange interaction).
c. The first-row transition elements can be combined with lan-thanides to give among the most powerful magnets known. Examples are SmCo5 and Nd2Fe14B. Although they could poten-tially contribute directly to magnetism, the f electrons associ-ated with the lanthanide atoms are too localized to exhibit band structure. In pure ferromagnetic lanthanide metals, the source of the ferromagnetism is delocalized d electrons; these d electrons interact with the localized f electrons to cause alignment of the d and f electrons (via exchange interactions) to reduce electron repulsion. Suggest qualitatively how such powerful magnetism arises in the transition metal–lanthanide alloys.
d. Chromium dioxide, CrO2, was commonly used for audio cas-settes, where it was chosen for its magnetic properties. CrO2 is a ferromagnet with a Curie temperature of 392 K. Its 3d orbitals form a very narrow band, allowing ferromagnetism. Later tran-sition metal oxides (e.g., MnO2) have localized 3d electrons and are insulators or semiconductors. The earlier transition metal oxide, VO2, is a semiconductor at room temperature but becomes metallic above 340 K; although it is paramagnetic for T > 340 K, the spins are localized and not ordered cooperatively. This shows that CrO2 has a special place among the first-row transi-tion metal oxides.
i. The position of CrO2 among the first-row transition metal oxides is somewhat similar to that of Fe, Co and Ni in the pure transition metals: it is at the balance point between wide bands of delocalized electrons (earlier elements) and localized electrons (later elements). Why does this balance point occur at atomic number 24 for the oxides and somewhat later (atomic
www.ebook3000.com

MagneticProperties 375
numbers 26, 27, and 28) for the pure elements? Consider the metal–metal separation for the oxides compared to the pure metals and how the metal–metal separation affects the over-lap of the 3d orbitals and the width of the band.
ii. CrO2 is used in audiotapes. A recording tape consists of a polyester tape impregnated with needle-like crystals of CrO2. The sound to be recorded activates a diaphragm in a micro-phone, and the vibrations cause fluctuating electric current in a coil of wire wrapped around an iron core in the recorder head, over which the tape passes. The varying current causes a varying magnetic field in the iron core, which in turn mag-netizes the CrO2 particles on the tape. The direction and magnetization of the CrO2 particles is a record of the electri-cal impulses from the microphone. To play back a tape, the process is reversed. Sketch diagrams of the recording and playback mechanisms showing the magnet and the tape. Should the iron core be a hard ferromagnet or a soft ferro-magnet? What about CrO2? Are there any other consider-ations that are important for a good magnetic tape material? (You might consider the value of the Curie temperature for CrO2 among other factors.)
e. For a computer memory device, it is most useful to have a mag-netic material that switches cleanly between two different states (full induction in one direction or the other direction) as the magnetic field changes. Sketch the ideal B–H hysteresis loop for such a material. Examples of nearly ideal behavior are (CoFe)O and Fe2O3.
13.5 Problems
13.1 Although manganese is diamagnetic, some alloys containing manganese, such as Cu2MnAl, are ferromagnetic. The Mn–Mn distance in these alloys is greater than in pure manganese metal. Suggest why this could lead to ferromagnetism.
13.2 The sizes and orientations of magnetic domains in a material can be altered by mechanical means. For example, domain orienta-tions for two magnetic materials are shown in Figure 13.17 where the “textured” (oriented) structure is a result of cold rolling. Sketch the initial portion (starting at zero field) of the magnetiza-tion (B-H) plot for the random and for the textured materials.
13.3 Is there such an thing as a “nonmagnetic” material? Explain. 13.4 Suggest possible uses for the Meissner effect exhibited by super-
conducting magnetic materials.

376 PhysicalPropertiesofMaterials
13.5 Are magnetic effects in crystalline noncubic solids inherently isotropic or anisotropic? Explain.
13.6 From Equation 13.11, derive equations for the three lines in Figure 13.14.
13.7 The so-called permanent magnets maintain their magnetization even in the absence of magnetic fields. This is achieved by using fine-grained alloys with “nonmagnetic” inclusions that inhibit domain wall movement. In addition, rod-shaped particles aligned along the direction of magnetization will hinder demagnetiza-tion. Which would make a better permanent magnet: Fe with a coercive force of 50 A m–1 and remanence of 1.2 T, or SmCo5 with a coercive force of 6 × 10⁵ A m–1 and remanence of 0.9 T? Explain.
13.8 Arrange the transition metal oxides listed in Table 13.4 in order of increasing covalency on the basis of trends in their Néel temperatures.
13.9 Ferroelectric materials also can be described as “hard” or “soft”, by analogy with ferromagnetic materials. Sketch the diagram (analogous to Figure 13.9) that distinguishes a hard ferroelec-tric material from a soft ferroelectric material.
13.10 If a ferromagnetic material is cooled in the absence of a mag-netic field, its entropy changes as a function of temperature as shown in the upper curve of Figure 13.18.
H ≠ 0
H = 0
T
S
FIGURE 13.18The effect of magnetic field and temperature on the entropy of a ferromagnetic material.
Random Textured
FIGURE 13.17The initial magnetic structure is random, but cold rolling leads to a textured structure with magnetic alignment in the direction of rolling.
www.ebook3000.com

MagneticProperties 377
a. If a magnetic field is turned on while the temperature is held constant, what happens to the entropy, and what is the microscopic origin of the change in entropy?
b. If the field is then turned off, the entropy stays the same. What happens to the temperature of the sample (assuming it to be thermally isolated from its surroundings)?
c. Suggest an application for this magnetocaloric effect. 13.11 In 1879, Edwin H. Hall found that when charge passes through
a material in a magnetic field, as shown in Figure 13.19, a volt-age builds up across the material. We now call this the Hall effect, and recognize that the transverse Hall voltage, VH, is due to the transverse (Lorentz) force on the charge carriers. For a current, I, and a magnetic field, B, the Hall voltage is given by
VIBnedH = (13.15)
where n is the density of negative charge carriers, e is the elec-tron charge, and d is the thickness of the material. Explain how the Hall effect can provide useful information concerning semiconductors with very low dopant levels.
Further Reading
General References
Materials for magnetic data storage. Special issue. H. Coufal, L. Dhar and C. D. Mee, Eds. MRS Bulletin, May 2006, 374−418.
High-performance emerging solid-state memory technologies. Special issue. H. Goronkin and Y. Yang, Eds. MRS Bulletin, November 2004, 805−851.
New materials for spintronics. Special issue. S. A. Chambers and Y. K. Yoo, Eds. MRS Bulletin, 2003. October 2003, 706−748.
Transparent semiconductor has magnetic appeal, 2001. Chemical and Engineering News, January 15, 2001, 39.
VHB
I
+++++++– – – – – – – –
FIGURE 13.19A current (I) passing through a material that is in a magnetic field (B) will experience a trans-verse Hall voltage, VH.

378 PhysicalPropertiesofMaterials
D. D. Awschalom, M. E. Flatté, and N. Samarth, 2002. Spintronics. Scientific American, June 2002, 66.
A. Barton, 1997. States of Matter: States of Mind. Taylor & Francis, Washington.P. Berger, N. B. Adelman, K. J. Beckman, D. J. Campbell, A. B. Ellis, and G. C. Lisensky,
1999. Preparation and properties of an aqueous ferrofluid. Journal of Chemical Education, 76, 943.
W. D. Callister Jr. and D. G. Rethwisch, 2010. Materials Science and Engineering: An Introduction, 8th ed. John Wiley & Sons, Hoboken, NJ.
B. S. Chandrasekhar, 1998. Why Things Are the Way They Are. Cambridge University Press, Cambridge.
A.K. Cheetham and P. Day, Eds., 1992. Solid State Chemistry. Compounds. Oxford University Press, Oxford.
G. P. Collins, 2004. Magnetic soot. Scientific American, July 2004, 26.G. P. Collins, 2003. Getting warmer. Scientific American, March 2003, 30.P. A. Cox, 1987. The Electronic Structure and Chemistry of Solids. Oxford University
Press, New York.P. Day, Ed., 2006. Molecules into Materials. World Scientific, Singapore.M. de Podesta, 2002. Understanding the Properties of Matter, 2nd ed. Taylor & Francis,
Washington.J. H. W. de Wit, A. Demaid, and M. Onillon, Eds., 1992. Case Studies in Manufacturing
with Advanced Materials, Vol. 1. North-Holland, Amsterdam.A. Geim, 1998. Everyone’s magnetism. Physics Today, September 1998, 36.A. Guinier and R. Jullien, 1989. The Solid State. Oxford University Press, New York.G. G. Hall, 1991. Molecular Solid State Physics. Springer-Verlag, New York.R. E. Hummel, 1998. Understanding Materials Science. Springer, New York.M. Jacoby, 2006. Putting a spin on electronics. Chemical and Engineering News, August
28, 2006, 30.D. Jiles, 1998. Introduction to Magnetism and Magnetic Materials, 2nd ed. Taylor &
Francis, Washington.I. P. Jones, 2001. Materials Science for Electrical and Electronic Engineers. Oxford
University Press, New York.J. R. Minkel, 2004. A pulse for magnetic memory. Scientific American, January 2004, 31.A. P. Ramirez, 2005. Geometrically frustrated matter–magnets to molecules. MRS
Bulletin, June 2005, 447.C. N. R. Rao and J. Gopalakrishnan, 1997. New Directions in Solid State Chemistry.
Cambridge University Press, Cambridge.H. M. Rosenberg, 1988. The Solid State, 3rd ed. Oxford University Press, New York.J. F. Shackelford, 2004. Introduction to Materials Science for Engineers, 6th ed. Prentice
Hall, Upper Saddle River, NJ.L. E. Smart and E. A. Moore, 2005. Solid State Chemistry: An Introduction, 3rd ed. CRC
Press, Boca Raton, FL.S. A. Solin, 2004. Magnetic field nanosensors. Scientific American, July 2004, 71.N. A. Spaldin, 2003. Magnetic Materials: Fundamentals and Device Applications.
Cambridge University Press, Cambridge.S. Thompson, 2001. Magnets made to order. Chemistry in Britain, March 2001, 34.L. Van Vlack, 1989. Elements of Materials Science and Engineering, 6th ed. Addison-
Wesley Publishing Company, Reading, MA.M. Wilson, 2006. Scanning tunneling microscope measures the spin-excitation spec-
trum of atomic-scale magnets. Physics Today, July 2006, 13.
www.ebook3000.com
MagneticProperties 379
Disordered Systems
D. S. Fisher, G. M. Grinstein, and A. Khurana, 1988. Theory of random magnets. Physics Today, December 1988, 56.
D. L. Stein, 1989. Spin glasses. Scientific American, July 1989, 52.
Magnetic Devices and Processes
Materials for magnetic storage. Special issue. H. Coufal, L. Dhar and C. D. Mee, Eds. MRS Bulletin, May 2006, 374−418.
M. Emmelius, G. Pawlowski, and H. W. Vollmann, 1989. Materials for optical data storage. Angewandte Chemie, International Edition in English, 28, 1445.
M. H. Kryder, 1987. Data-storage technologies for advanced computing. Scientific American, October 1987, 117.
S. Langenbach and A. Hüller, 1991. Adiabatic demagnetization of antiferromagnetic systems: A computer simulation of a plane-rotor model. Physical Review B, 44, 4431.
R. M. White, 1980. Disk-storage technology. Scientific American, August 1980, 138.
Molecular Materials
Molecule-based magnets. Special issue. J. S. Miller and A. J. Epstein, Eds. MRS Bulletin, November 2000, 21−71.
Polymer is magnetic below 10 K, 2001. Chemical and Engineering News, November 19, 2001, 62.
D. O. Cwan and F. M. Wiygul, 1986. The organic solid state. Chemical and Engineering News, July 21, 1986, 28.
A. J. Epstein, 2003. Organic-based magnets: Opportunities in photoinduced magne-tism, spintronics. Fractal magnetism, and beyond. MRS Bulletin, July 2003, 492.
J. S. Miller and A. J. Epstein, 1994. Forthcoming attractions. Chemistry in Britain, June 1994, 477.
J. S. Miller and A. J. Epstein, 1995. Designer magnets. Chemical and Engineering News, October 2, 1995, p. 30.
P. F. Schewe, 2002. Light-activated plastic magnet. Physics Today, April 2002, 9.J.-F. Tremblay, 2000. Ferromagnetic, conductive molecular magnet created. Chemical
and Engineering News, November 27, 2000, 5.
Other Magnetic Systems
R. Dagani, 1992. New material is optically transparent, magnetic at room tempera-ture. Chemical and Engineering News, July 20, 1992, 20.
L. M. Falicov, 1992. Metallic magnetic superlattices. Physics Today, October 1992, 46.

Part V
Mechanical Properties of Materials
The power of any Spring is in the same proportion with the Tension thereof: That is, if one power stretch or bind it one space, two will bend it two, and three will bend it three, and so forward. And this is the Rule or Law of Nature, upon which all manner of Restituent or Springing motion doth proceed.
Robert Hooke, 1676

383
14MechanicalProperties
14.1 Introduction
In many cases, mechanical properties are the most important factor in deter-mining potential applications of a material. Stiffness, tensile strength, and elastic properties are important in material applications as seemingly diverse as sound production from piano strings to the strength of dental porcelain to the protection of a bullet-proof vest. Some high-temperature superconduc-tors have very useful electrical and magnetic properties but are limited in their applications due to their mechanical properties. The aim of this chapter is to provide a basis for consideration of mechanical properties, based on a microscopic picture that has developed from experimental observation. We begin with relevant definitions.
Many of the mechanical properties of a material take into account its behavior under certain forces. If a force F is applied to a material of cross section A, it develops a stress, σ:*
σ =FA
(14.1)
where the units of σ (e.g., N m–2 ≡ Pa) show that stress and pressure are simi-lar concepts.
Under this force, there also will be a strain, ε, due to a change from the original length, l0, by an amount Δl:
ε =∆ll0
. (14.2)
It is apparent from Equation 14.2 that strain is unitless.At low stress and low strain, stress is proportional to strain, that is,
σ ∝ ε (14.3)
* The most important equations in this chapter are designated with ▮ to the left of the equation.

384 PhysicalPropertiesofMaterials
so, at low σ and low ε,
σε= E (14.4)
where E, which is constant for a material at low ε, is called Young’s modulus (also known as elastic modulus) for the material. Equation 14.4, which gives a linear relationship between force and extension, is a form of Hooke’s law (see also Chapter 7). The proportionality constant, E, is a measure of the stiff-ness (that is, resistance to strain) of a material, but it is quite distinct from the strength. A small value of E means that a small stress gives a large extension (as in rubber); a large value of E indicates that the material is very stiff. For example, E for diamond is ~103 MPa, whereas E for rubber is about 7 MPa.
A related concept is Poisson’s ratio, ν, defined as
ν = −
∆
∆
lll
l
2
2
1
1
(14.5)
where l1 and l2 are the original dimensions, respectively, in the direction of and perpendicular to the extension force, and Δl1 and Δl2 are the respective changes in length.
Equation 14.4 describes the mechanical behavior of a material at low stress; a more complete picture is given in Figure 14.1. From this figure, the propor-tionality of stress to strain at low stress is shown, as well as the deviation from linearity at higher stress. The stress at which elongation is no longer reversible is called the elastic limit. Below the elastic limit, that is, in the region of elastic behavior, strain is reversible: it disappears after the stress is removed. For metallic and ceramic materials, the elastic region shows a lin-ear relationship between stress and strain, but for polymers such as rubber the relationship can be nonlinear.
The yield strength is defined as the value of the stress when the strain is 0.2% more than the elastic region would allow; that is, the strain is 1.002 times the extrapolated elastic strain.
Plastic deformation (plastic strain) is permanent strain, and it occurs beyond the yield strength, as removal of the stress leaves the material deformed.
The tensile strength is the maximum stress experienced by a material dur-ing a test in which it is being pulled in tension, and ductility is the strain at failure (usually expressed as percent).
Toughness is a measure of the energy required to break a material. It is dif-ferent from strength (a measure of the stress required to break or deform a material): tensile strength is the maximum stress value on a stress–strain
www.ebook3000.com
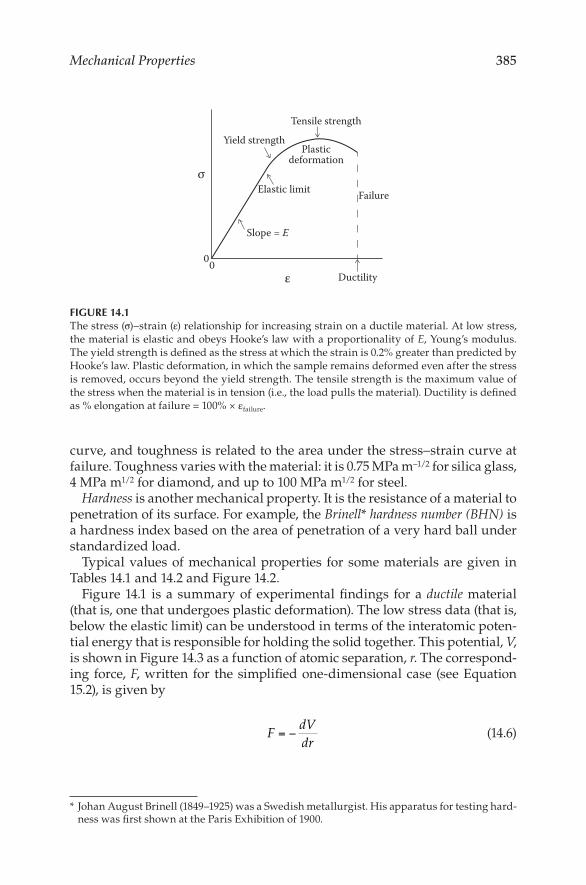
MechanicalProperties 385
curve, and toughness is related to the area under the stress–strain curve at failure. Toughness varies with the material: it is 0.75 MPa m–1/2 for silica glass, 4 MPa m1/2 for diamond, and up to 100 MPa m1/2 for steel.
Hardness is another mechanical property. It is the resistance of a material to penetration of its surface. For example, the Brinell* hardness number (BHN) is a hardness index based on the area of penetration of a very hard ball under standardized load.
Typical values of mechanical properties for some materials are given in Tables 14.1 and 14.2 and Figure 14.2.
Figure 14.1 is a summary of experimental findings for a ductile material (that is, one that undergoes plastic deformation). The low stress data (that is, below the elastic limit) can be understood in terms of the interatomic poten-tial energy that is responsible for holding the solid together. This potential, V, is shown in Figure 14.3 as a function of atomic separation, r. The correspond-ing force, F, written for the simplified one-dimensional case (see Equation 15.2), is given by
FVr
= −dd
(14.6)
* Johan August Brinell (1849–1925) was a Swedish metallurgist. His apparatus for testing hard-ness was first shown at the Paris Exhibition of 1900.
Tensile strength
Yield strengthPlastic
deformation
Elastic limit Failure
Slope = E
Ductility00
σ
ε
FIGURE 14.1The stress (σ)–strain (ε) relationship for increasing strain on a ductile material. At low stress, the material is elastic and obeys Hooke’s law with a proportionality of E, Young’s modulus. The yield strength is defined as the stress at which the strain is 0.2% greater than predicted by Hooke’s law. Plastic deformation, in which the sample remains deformed even after the stress is removed, occurs beyond the yield strength. The tensile strength is the maximum value of the stress when the material is in tension (i.e., the load pulls the material). Ductility is defined as % elongation at failure = 100% × εfailure.

386 PhysicalPropertiesofMaterials
and F(r) is also shown in Figure 14.3. The corresponding stress–strain relation-ship, as shown in Figure 14.1, is similar to the force–separation relationship, F(r), of Figure 14.3 (with stress comparable to force [but with opposite sign]) in the elastic region. Young’s modulus, E, is related to the interatomic potential as
Er
Vr
r r
=∂
∂=
1
0
2
2
0
, (14.7)
TABLE 14.1
Typical Values of Tensile Strength and Young’s Modulus (E) for Various Materials at Room Temperature
Material Tensile Strength/MPa E/MPa
Diamond ~ 103 1.2 × 10⁶
Carbon nanotubes ~ 105 1 × 10⁶
Kevlar 4000 1.8 × 10⁵
High-strength carbon fiber 4500 2 × 10⁵
High-modulus carbon fiber 2500 2 × 10⁵
High-tensile steel 2000 2 × 10⁵
Superalloy 1300 2 × 10⁵
Titanium 1200 1.2 × 10⁵
Spider webs (drag line) 1000 1 × 10⁴
Aluminum 570 7 × 10⁴
Bone 200 2 × 10⁴
Bamboo 100 1 × 10⁴
Nylon 100 3 × 10³
Rubber 100 ≈ 7Lexan 86 2.4 × 10³
TABLE 14.2
Poisson’s Ratio for Various Materials at Room Temperature
Material ν
Fe 0.17TiC 0.19Borosilicate glass 0.2Al2O3 0.26W 0.28Carbon steel 0.3Al 0.33Cu 0.36Pb 0.4Nylon 66 0.41
www.ebook3000.com

MechanicalProperties 387
SiC fibers DiamondPiano wire
Aluminum
Steels
Glass fibersPolymer fibers
HardwoodSoftwood
Polymers
Rubbers
100
10
1.0
0.1
0.01
0.1 1.0 10 100 1000E/GPa
Tens
ile st
reng
th/G
Pa
FIGURE 14.2Tensile strength and Young’s modulus ranges for a number of types of materials.
Repulsive Attractive
Equilibrium
0
0
r0
r0r
V
F
r
FIGURE 14.3An intermolecular potential, V(r), as a function of interatomic distance, r, leads to a force- separation relationship, F(r), which can be used to deduce the elastic portion of the stress–strain relationship for a material (i.e., below its elastic limit). The intermolecular separation marked r0 corresponds to the equilibrium position (F = 0).

388 PhysicalPropertiesofMaterials
which shows that E depends on the curvature of the potential well at r = r0. Note that the pairwise intermolecular potential does not directly explain stress–strain curves beyond the elastic limit because after this point the shapes of these curves are determined by progressive destruction of the crys-talline lattice that cannot be understood in terms of two-atom interactions.
14.2 Elasticity and Related Properties
Many materials with low values of Young’s modulus are also very elastic, that is, reversibly deformed. As with many other properties of materials, this property can be strongly temperature dependent.
An example of a highly elastic material is a polymer. Its elasticity stems from the coiling of long molecular chains; extension can take place by uncoil-ing without much change in interatomic distance, so it takes relatively little energy (see Figure 14.4). However, polymers with a high degree of structural organization (either a high degree of crystallinity or extensive crosslink-ing) are not very elastic, so it takes more energy to deform their structures,
COMMENT: AMORPHOUS METALS
Even metals can become amorphous or glassy when they are cooled so rapidly that the atoms cannot arrange themselves in the more stable crystalline form. The first amorphous metal discovered was a gold-based alloy, prepared by quenching from the melt at about 106 K s–1. The resulting metallic glass is amorphous. Its production can be assisted by the presence of many types of atoms of very different atomic radii in the alloy, which reduces the probability of nucleation and growth of crystals. Alloys based on zirconium and palladium are very good glass formers, but amorphous metals based on titanium, copper, magnesium, iron, and other metals have been made. Rapid quenching leads to thin samples of amorphous metals, but more recently, techniques have been developed to produce bulk metallic glass. Because amorphous met-als do not have the defects that limit the strength of their crystalline counterparts, they have higher fracture strengths, higher elastic lim-its, and they are harder. One commercial amorphous metal has almost twice the tensile strength of high-grade titanium. However, the lack of defects also means that amorphous metals are not very ductile, so they can easily shatter in tension. One of the most useful properties of amorphous metals is their processability: since they soften and flow, they can be shaped into objects by injection molding. This allows them to be used in applications where high strength and unusual shapes are required, such as golf club heads and cell phone cases.
www.ebook3000.com

MechanicalProperties 389
and the deformation is not reversible. It is found that polymer properties such as the glass transition temperature (Tg; whether the temperature is less than or greater than Tg reflects the rigidity of the polymer; see Chapter 6) can be related to mechanical properties such as Young’s modulus, strength, and toughness. For example, Lexan (a very strong polycarbonate with such diverse uses as bubbles on space helmets and impact-resistant bumpers) has a very high glass transition temperature (Tg = 149°C, compared with 45°C for nylon and –45°C for polyethylene), which means that Lexan is in its rigid glassy state at room temperature. This correlates with Lexan’s good strength and toughness characteristics at room temperature; polymers with lower Tg’s would require lower temperatures for similar mechanical properties.
COMMENT: STRETCHING A POLYMER
As a polymer is stretched, the polymer itself becomes more ordered due to the alignment of the previously disorganized chains. Thus, if the polymer is the thermodynamic system, entropy considerations for uncoiling indicate
ΔSsystem < 0. (14.8)
However, from the second law of thermodynamics, any process that can happen must have
ΔStotal > 0. (14.9)
and since
ΔStotal = ΔSsystem + ΔSsurroundings (14.10)
it follows that
ΔSsurroundings > 0. (14.11)
Coiled Stretched
FIGURE 14.4Uncoiling of an elastic polymer takes relatively little energy because the interatomic distances are not much affected.

390 PhysicalPropertiesofMaterials
Young’s modulus, E, is related to the speed of sound in a material, v, by
vE
=ρ
1 2/
(14.14)
where ρ is the density of the material. The speed of sound can be impor-tant in determining the desired properties for a material. For example, low-density (0.4–0.5 g cm–3) pine with high Young’s modulus (11–18 GPa) can be used to produce materials with high sound speeds (4800–6000 m s–1) used for construction of violins.
Young’s modulus is a measure of the elasticity of a material as it is extended or compressed. Considering compression further, by analogy with Equation 14.4, we can write
P = Kc (14.15)
where P is the hydrostatic pressure, c is the compression of the mate-rial (change in dimension/original dimension), and the proportionality constant in this version of Hooke’s law, K, is the isothermal bulk modulus, defined as
K VPV
T
= −∂∂
, (14.16)
that is, K is the reciprocal of the isothermal compressibility (βT) we saw in Chapter 6.
From the definition of reversible entropy change for the surroundings,
∆S =q
Tsurroundingssurroundings
(14.12)
and since T > 0, it follows that, on extension of a piece of elastic polymer,
qsurroundings > 0 so qelastic < 0. (14.13)
In other words, extension of the elastic polymer is an ordering process, which must therefore be exothermic, as can be verified by extending an elastic band while holding it next to your cheek or lip (very sensitive thermometers!). You will find that the polymer heats when stretched.
www.ebook3000.com

MechanicalProperties 391
COMMENT: SEEING STRESS WITH POLARIZED LIGHT
When an isotropic material is under a nonuniform mechanical stress, it can become anisotropic in some regions. If the material is transparent, then this stress can be revealed by observations through polarization filters. This is shown in Figure 14.5.
The principle involved is the production of birefringence within the stressed sample (see also Chapter 5). When linearly polarized light hits the sample, optical anisotropy leads to the production of two rays of light within the sample. When these rays emerge from the sample and reach the analyzer (another piece of polarizing film), light of only selected wavelengths will pass through, and the hue of the observed light will depend on the stress. This is shown schematically in Figure 14.6.
FIGURE 14.5A bar of Plexiglass under stress, viewed through crossed polarizers, shows stress polarization.
Polarizer
Sample
Analyzer
FIGURE 14.6Polarized light passing through an anisotropic material (e.g., a material under stress) leads to two exiting polarizations that can be separated by an analyzer. Each color (wavelength) will behave differently, and the observed color will depend on the stress.

392 PhysicalPropertiesofMaterials
COMMENT: MOLECULAR ORIGINS OF THE STRENGTH OF SPIDER SILK
Spider silk has amazing mechanical properties, and only recently scientists have begun to understand this at a molecular level. For example, 2H NMR studies of the dragline silk produced by deuteri-um-fed spiders shows that the crystalline fraction of the silk consists of two types of alanine-rich regions: one highly oriented and the other less densely packed and poorly oriented. The weakly oriented sheets may account for the high compressive strength of spider silk, and the coupling of the poorly oriented crystallites to the highly ori-ented crystalline domains and the amorphous regions, could be the source of spider silk’s toughness.
COMMENT: ARTIFICIAL BONES
Our bones are among the most important mechanical parts in our bodies. Although many broken bones will eventually heal themselves, there are conditions, such as weakened load-carrying bones, where replacements are required. Hydroxyapatite, the main part of the rigid structural material in natural bones, has been combined in the labo-ratory with organic polymers to produce strong artificial bones that promote natural bone growth by incorporating organic matter. The complex organoapatite has stiffness comparable with apatite; it also has more than twice the tensile strength.
COMMENT: HUMIDITY PLAYS A ROLE IN BASEBALL
Humidity can change the elastic properties of polymers, especially those in which hydrogen bonds play an important role. For example, due to its polyamide (wool) core, a baseball can lose as much as 12 g of water on heating at 100°C for 12 hours, and this leads to a harder ball that is less deformable, causing the collisions to be more elastic. This is why it is easier to hit a home run on a cool, dry evening than on a hot, humid night.
www.ebook3000.com

MechanicalProperties 393
COMMENT: “HAPPY” AND “UNHAPPY” BALLS
The importance of structure to mechanical properties can be illustrated by bouncing “happy” [neoprene] and “unhappy” [polynorbornene] balls,* as shown in Figure 14.7. The structures of the polymers are shown in Figure 14.8.
The differences in their elastic behavior stem from their composi-tions and their chain architectures: neoprene is a three-dimensional network polymer with linear chains and has a small portion of cross-links that prevent chain slippage; polynorbornene contains linked cyclic units and has a relatively large quantity of nonvolatile liquid such as naphthenic oil. The rigidity of the ring makes polynorbornene less elastic than neoprene (which can coil and uncoil in response to dif-ferent stresses). Furthermore, the liquid in polynorbornene can absorb the energy imparted to the “unhappy ball” when it is dropped. Thus, two materials that look and feel very similar can have remarkably dif-ferent mechanical properties.
* Available from Arbor Scientific, Ann Arbor, MI.
CH2 CHCH2CCln n
Neoprene Polynorbornene
FIGURE 14.8Molecular structures of the repeat units of neoprene and polynorbornene. Both materials are polymers.
FIGURE 14.7Although they look very similar, the neoprene ball (on the left) bounces, while the polynor-bornene ball (on the right) does not.

394 PhysicalPropertiesofMaterials
14.3 Beyond the Elastic Limit
In the region of reversible stress–strain relations—that is, the elastic region—a strained material will return to its original dimensions once the stress is removed. Furthermore, below the elastic limit, the strain observed is inde-pendent of the rate at which the stress is applied.
At larger stress, a brittle material fractures (that is, the reversible stress–strain region ends abruptly with failure), whereas a ductile material is per-manently deformed (that is, the deformation is no longer reversible). The distinction between brittle and ductile materials is illustrated in the stress–strain relations of Figure 14.9.
When a large stress (beyond the elastic limit) is applied to a ductile mate-rial, on removal and subsequent reapplication of the stress, the strain path does not retrace its original route, and hysteresis results (Figure 14.10); that is, there is residual strain within the material even when the stress is removed. The area within the hysteresis loop is proportional to the energy given to the system. For example, in the case of a fly landing in a spider web, the web extends due to the force of the fly landing, and then, when the stress is over, the kinetic energy of the fly has been transferred to the silk of the web, and it is manifest as a slight increase in both the temperature and the extension of the silk. The low Young’s modulus and high tensile strength of the spider silk ensure that the web does not break when the fly contacts it.
High stress can lead to inelastic deformation; in addition, at high stress the rate of application of the stress becomes important. For example, a bullet shot into ice will penetrate to about the same depth as one shot into water since at this high stress the H2O molecules do not have time to rearrange them-selves in either ice or water. In a less extreme example, polymers beyond
Fracture
FractureFracture
Fracture
ε
σ
ε
σ
(a) (b)
FIGURE 14.9Stress–strain relations, including compression (ε < 0) and tension (ε > 0), for (a) a ductile mate-rial and (b) a brittle material. The brittle material shown is stronger in compression than in tension.
www.ebook3000.com

MechanicalProperties 395
their elastic limit and subjected to stress may creep, that is, they continue to deform with time.
The temperature of a material can greatly influence the way in which it behaves at very high stress. For a polymer below its glass transition tempera-ture, brittle fracture will occur; that is, there will be fracture with little defor-mation. Amorphous materials tend to be brittle at relatively low temperature (often, room temperature is low enough) because the energy required to deform the material by moving atoms or molecules past one another is much greater than the energy required to propagate cracks (see Section 14.5). For a polymer above its glass transition temperature, the fracture mode will be ductile (that is, with considerable plastic deformation) and dependent on the strain rate, with slow strain rates allowing time for rearrangement of the polymer chains, leading to greater deformation.
Far beyond the elastic limit, pure metals or alloys (mixtures of several met als) can often be manipulated without fracture. For example, they can be rolled, extruded into wires, etc. The high ductility of metals can be attrib-uted to the atomic packing, that is, the rather nondirectional arrangement of the atoms, which provides mobility of dislocations (packing irregularities; also see Section 14.4). For example, if a piece of metal is bent, the atoms rear-range their bonds with other atoms by sending clouds of dislocations flying around but with little overall disruption of the packing. On the other hand, if a sheet of ice is bent, considering that the bonds in ice are more directional in their nature, much more reorganization of the bonding is required than for the piece of metal. Therefore, dislocations, which could allow bending, are less mobile in a solid such as ice because of the directional nature of its bonds. It might seem therefore that ice will simply continue to deform elastically, but in fact it fails in an entirely different way by propagation of a crack. This happens at rather low stresses. As a result, the nonductile (brittle) ice will dissipate the energy by failure at low stress, whereas metal will bend.
First yield strength
Second yield strengthafter loadingand unloading
ε
σ
FIGURE 14.10The application of stress beyond the elastic limit of a ductile material can lead to permanent deformation, as shown here by the hysteresis on removal of a high stress. The increase in yield strength after loading and unloading is due to work hardening.

396 PhysicalPropertiesofMaterials
COMMENT: CONTROLLED STRESS
Prince Rupert drops, named after a 17th-century prince who saw them at a Bavarian glassworks, are formed when drops of molten glass are rapidly cooled by dropping them into cold water. The exterior cools more quickly than the interior, so the outer surface of the drops is in compression. This stress, which makes the drops very strong, can be seen by viewing the glass through crossed polarizers (as in the stressed Plexiglass in Figure 14.5). If the tail of the droplet is broken, the stress is released explosively, and the glass shatters into many very small pieces. Since the glass breaks into so many pieces, these drops are much safer to handle than glass that breaks into sharp shards.
Glass that has been tempered (that is, toughened by having its outer surface in compression), either by quick cooling or by chemical treat-ment, has many applications, including eyeglasses, windshields, and cookware.
COMMENT: BULLET-PROOF VESTS
Kevlar, a form of poly(p-phenylene terephthalamide) (Figure 14.11) was invented by DuPont chemist Stephanie Kwolek; she was inducted into the National Inventor’s Hall of Fame in 1995 for this important inven-tion. Kevlar has an ultra-high Young’s modulus (1.8 × 10⁵ MPa), as well as high tensile strength and high thermal stability, and low extension at the break point. The strength of Kevlar is related to its structure: fibrils are interconnected by small tie bundles in a pleated sheet with a 500-nm repeat distance. The polymer is highly crystalline, and it would take a very large amount of energy to disturb the conformation of the chains. Conversely, the chains can absorb significant amounts of energy (buckling from trans to cis conformations) without much dam-age and this allows Kevlar to stop bullets in bullet-proof vests. Kevlar is an example of a material in which ease of microscopic deformation leads to macroscopic strength.
NH NH CO COn
Kevlar
FIGURE 14.11Molecular structure of Kevlar, showing the repeat unit of this important polymer.
www.ebook3000.com

MechanicalProperties 397
14.4 Defects and Dislocations
No material is perfect, and it is often the type and location of imperfections that determine the mechanical properties of a material. Examples of point defects (atoms missing or in irregular places in the lattice, including lattice vacancies, substitutional impurities, interstitial impurities, and proper [or self] interstitials) are shown in Figure 14.12. Examples of linear defects (groups of atoms in irregular positions, including screw dislocations and edge dislocations) are shown in Figures 14.13 and 14.14. An indication of the concentration of imperfections is that, if point defects and linear imperfections in 1 kg of alu-minum were placed side by side, the defects would cover the equator more than a thousand times!
Substitutionalimpurity
Properinterstitial
Interstitialimpurity
Latticevacancy
FIGURE 14.12Point defects in an otherwise periodic monatomic crystal. A lattice vacancy is the absence of an atom at a lattice site; a substitutional impurity indicates the presence of an impurity atom at a lattice site; an interstitial impurity indicates the presence of an impurity atom at a location other than a lattice site; a bulk atom at a position other than at a lattice site is called a proper interstitial.
FIGURE 14.13A screw dislocation in a crystal. This defect arises when atoms spiral around an axis, shown here with an arrow. Note that at the front of the crystal there is a step, but there is no step at the back edge.

398 PhysicalPropertiesofMaterials
The theoretical strength of a material could be calculated from the force required to break individual chemical bonds (see Figure 14.3), per unit area. For copper, this yields a theoretical strength of 2.5 × 10⁹ Pa, but copper is
COMMENT: HUME-ROTHERY RULES
Empirical rules established by William Hume-Rothery (1899–1968) describe the conditions under which an element can dissolve into a metal forming a solid solution. For substitutional solid solutions, the following are required: (1) the atomic radii of the solute and solvent should not differ by more than 15%; (2) the crystal structures of the solvent and solute must match; (3) the solvent and solute should have similar electronegativities; and (4) the solute and solvent should have similar valences for maximum solubility. For interstitial solid solutions, the rules are (1) the solute atoms should be smaller than the vacancies formed in the parent structure, and (2) the solute and solvent should have similar electronegativities.
(a)
(b)
(c)
Slip plane
x
x
x
FIGURE 14.14The motion of an edge dislocation (a layer of extra atoms within the crystal structure), indicated by x, from (a) start, to (b) intermediate time, to (c) finish. In the process of moving, bonds are broken and re-formed along the slip plane (the plane along which the slippage takes place, shown here as a dashed line). Arrows indicate that one side of the crystal is moving with respect to the other. This process is the basic way in which ductile materials rearrange bonds between atoms.
www.ebook3000.com

MechanicalProperties 399
known to deform and break at much lower stresses. In fact, many pure met-als start deforming at less than 1% of their theoretical strength. The reason for the difference is the ease of motion of dislocations in the lattice, allowing the material to deform, for example, through the breaking and reforming of a single row of atomic bonds along the dislocation line, as shown in the edge dislocation of Figure 14.14. The motion of a dislocation in a crystal can be considered to be similar to the motion of a wrinkle in a rug when the wrinkle is pushed. In some cases, such as tin, zinc, and indium, the high speed of dislocation-assisted motion leads to a “cry” that can be heard when rods of these materials are bent (see Section 14.5 for further discussion of the role of defects in the strength of a material).
Imperfections can also play a role in the hardness of a material. For exam-ple, a major practical aspect of metallurgy is development of harder mate-rials, and one method involves addition of impurities that will reduce the mobility of dislocations (see Figure 14.15). Hardness can be enhanced if there are small aggregates of impurities (for example, gold alloy with 10% copper is 10 times harder than pure gold). Thermal history can play an important role because impurities can be induced to clump together by heating, reducing the hardness of the material. Dislocations are immobilized at grain boundar-ies (the interfaces of homogeneous regions of the material), so decreasing the grain size can help harden a material. In a work-hardened material, a mechani-cal process has introduced more dislocations, reducing the overall disloca-tion mobility, making the material harder.
To summarize: a ductile material such as a metal bends well below its theo-retical strength because of dislocations, for example, those that allow planes to slip past one another easily. A metal can be strengthened by decreasing the number of dislocations (for example, by heat treatment that anneals out dislocations), or pinning dislocations by work hardening (deformation
Slipplane
Impurityprecipitate
FIGURE 14.15A dislocation associated with a slip plane can proceed no further when it encounters the grain boundary at an impurity precipitate, just as a wrinkle in a rug cannot move further along the rug when it encounters a piece of heavy furniture. The presence of the precipitate hardens the material. Annealing the material, that is, heating it to a high-enough temperature to mobilize impurity precipitates, allowing them to become larger but fewer in number, will allow dislocations to move more easily, and therefore, annealing decreases the hardness of the material.

400 PhysicalPropertiesofMaterials
causes dislocation tangles), and precipitation hardening or grain refining (by mechanical and/or heat treatment). However, if dislocations are too immo-bilized, the metal will no longer be able to bend, and it will snap in a brittle fashion under load.
14.5 Crack Propagation
One important factor concerning the mechanical strength of a material is the response of its structure to stress. Many materials will crack when they are stressed, and in this section we examine this in terms of both structure and energetics.
COMMENT: HEAT TREATMENT OF ALUMINUM
The binary Al-Cu phase diagram (Figure 14.16) allows an illustration of the influence of thermal treatment on mechanical properties. From the phase diagram, cooling 96 mass% Al/4 mass% Cu (this is so-called Duralumin, or 2000 series aluminum alloy), will give, at room tempera-ture, a phase of approximate (nonstoichiometric) composition CuAl2 dispersed in an aluminum-rich phase. If this mixture is cooled slowly from the melt, precipitates of CuAl2 are large and far apart; dislocations can rather easily avoid the precipitates in this material, and the material is soft. If cooled quickly, the dispersion of CuAl2 in the Al-rich phase is much finer (smaller grains), and the high concentration of (small) pre-cipitates ensures more interaction of dislocations, resulting in a harder material.
700600500400300200100
00 10 20 30 40 50 60Al Mass% Cu
T/°C
FIGURE 14.16A portion of the Al-Cu phase diagram. An intermetallic compound of approximate composi-tion CuAl2 is formed at 55 mass % Cu.
www.ebook3000.com

MechanicalProperties 401
The propagation of a crack in a material both releases energy (the strain energy) and costs energy (due to increased surface area [recall that surfaces are higher in energy than layers within the bulk materials] and energy to reorganize the material in the region of the crack). The competition between the energy cost and the energy gain can lead, in certain circumstances, to crack propagation.
First, let us consider the energy that is released when a stressed brittle material is cracked. In the schematic two-dimensional crack shown in Figure 14.17, a crack of depth d can release stress on both sides of the crack such that a total area of about d2 has its stress released. Therefore, the internal energy gained by the surroundings in this cracking process, ΔstressU, is
ΔstressU = – ad2 (14.17)
where a is a proportionality constant (≈ σ2/E), and the negative sign indi-cates that the energy of the system is lowered by ΔstressU. Lowering energy is always a favorable process. Since a is proportional to σ2, the more stress one puts on a body, the easier it is for a crack to grow.
However, there are also the energy costs of crack growth. One is the kinetic energy of the mobilized atoms, but we ignore this here and concentrate on the energy costs of increasing the surface area, ΔsurfU. For the two-dimen-sional crack shown in Figure 14.17, this is
ΔsurfU = 2Wd (14.18)
where W is the work of fracture, and the sign of ΔsurfU now shows that this costs energy. The work of fracture includes two contributions: a contribution for the energy to create a new surface and a contribution to reorganize the mate-rial in the region of the crack. These two components mean that more than just the surface energy of the material is important; one must also take into account how far into the material the damage extends. W can be expressed in terms of the surface energy of a material, Gs, where Gs is typically 1 J m–2 (see Chapter 10). For a ductile material (for example, a metal, that is, a material that can undergo permanent strain before it fractures), W is 104 to 106 times
dσ σ
FIGURE 14.17Schematic view of a crack of depth d in a material. Stress, σ, is released primarily in the shaded areas, which have a total area of ≈d2.

402 PhysicalPropertiesofMaterials
Gs since the crack motion is accompanied by defects* well below the surface of the material.† (Note that the equations here are for a two-dimensional sim-plification of a three-dimensional effect.) On the other hand, W for a brittle material such as glass is only about 10 Gs since the effects of stress do not reach very far below the its surface. Such a low value of W means that the material could be susceptible to brittle failure. This can be very important in practice: evidence indicates that components of the Titanic were brittle due to impurities in the steel, lowering W relative to better steel and leading to catastrophic failure (brittle fracture) on collision with an iceberg.
At the balance point between the release of stress energy and the cost of surface energy, the crack has a particular length, lG, called the Griffith length,‡ such that, with stress σ and Young’s modulus E,
lWE
G =2
2πσ. (14.19)
(Equation 14.19 holds for a three-dimensional crack; for an edge crack, lG = WE/σ2.) At crack lengths less than the Griffith length, the cost in surface energy and internal rearrangement energy exceeds the energy gain from release of stress. However, if the stress on the material is increased, more stress energy is released, and the crack will grow further. For cracks longer than the Griffith length, stress energy releases more energy than the ener-getic costs of increased surface area and internal rearrangement, and the crack grows spontaneously, provided that the stress remains.
Typical values of lG can vary considerably from one material to another. For example, a 1-m crack in the hull of a ship can be “safe” (less than the Griffith length under normal seagoing stresses; it would cost more energy to grow further, so it does not propagate spontaneously). On the other hand, a microscopic crack in a glass material can grow spontaneously when stressed. Anyone who has used a file to start a crack in a piece of glass tubing will be familiar with this; the crack will propagate across the tube with relatively lit-tle stress. This is also seen in automobile windshields: a small crack can exist for some time, but when the stress is sufficient (for example, from hitting a pothole, or from having the increased interior air pressure in a sun-warmed
* The defects are clouds of dislocations emerging from the crack tip.† We are familiar with the fact that defects decrease strength, in that metal can be broken eas-
ily by repeated bending. When a piece of metal is bent, the dislocation concentration at the bend site increases considerably. They tangle around one another, and this eventually leads to the material becoming brittle, so W is decreased and the material breaks. A piece of metal that has been bent is quite stiff (have you ever tried to bend a piece of copper tubing that has already been bent? It is very difficult!), but it can be returned to its original flexible state by heating it to anneal out the defects.
‡ Alan A. Griffith (1893–1963) was a British researcher who studied strengths of materials while a researcher at the Royal Aircraft Establishment, Farnborough, England.
www.ebook3000.com

MechanicalProperties 403
car), the crack can grow rapidly and spontaneously, causing the windshield to shatter.
The state of the surface of a crack also is important in determining the rate at which it will grow. For example, it is common to see a glassblower wet the scratch on a glass rod before breaking it. The reason is that the water wets the surface in the crack, lowering the surface energy of the glass, thus requiring less stress to achieve crack propagation. Indeed, moisture content can be one of the important variables in crack propagation rates.
COMMENT: ADDED STRENGTH IN FIBERS
In 1920, Griffith suggested that the strengths of materials are limited by microscopic cracks on their surfaces. Griffith based his conclusion on studies of glass rods and fibers, and his finding of remarkably high strength when the diameter was less than about 10–6 m. He concluded that these fibers were relatively free of surface cracks and therefore much stronger than glass rods. We now understand that the increased strength arises from the decreased probability of finding a strength-limiting flaw in a fiber compared with a bulk material.
An additional factor adding to the strength of crystalline fibers is the reduction in the number of dislocations and/or their mobilities in fibers, compared with bulk materials, especially since dislocations reduce the strength of the material.
Today, fibers are commonly used for strength; for example, sporting equipment such as fishing rods, bicycles, and tennis rackets often con-tains carbon fibers for added strength. Graphite/metal composite fibers with values of Young’s modulus over 600 GPa have been produced. Carbon nanotubes can provide fibers with strengths far in excess of that of steel (see Table 4.1).
COMMENT: IMPURITIES IMPORTANT IN FAILURE
Impurities tend to be concentrated at grain boundaries where they can be 105 times more abundant than in the bulk of the sample. This can make the material harder because dislocation motion is more difficult, but the material will be more susceptible to brittle failure because the grain boundaries cannot deform with the impurities there, and cracks will tend to begin at the grain boundaries. For example, phosphorous segregates at grain boundaries in steel, and, in order to maintain its mechanical properties, steel must have less than 0.05% phosphorous.

404 PhysicalPropertiesofMaterials
COMMENT: POLYMER CLASSIFICATIONS
Synthetic polymers can be categorized on the basis of their thermal behavior as thermoplastics or thermosets. Thermoplastics will repeat-edly soften when heated and harden when cooled, and this process is reversible and can be repeated. Examples include polystyrene, acrylics, polyethylenes, vinyls, nylons, and polyfluorocarbons. Thermoplastics consist of linear or branched polymer molecules that are not connected to the adjacent molecules; as they are heated, the thermal motion can overcome the van der Waals attraction, allowing softening. Thermoset polymers, as their name implies, become hard on heating. Furthermore, this process is irreversible as it happens due to the onset of new chemi-cal bonds (crosslinks) between adjacent polymer molecules. Many of the network polymers, such as vulcanized rubbers, epoxies, and phenolic and polyester resins, are thermosets, and they can be prepared in suit-able shapes by the use of a mold. Thermosets are usually stiffer, harder, and more brittle than thermoplastics.
Super-hard polymers have been produced by irradiation with high-energy ions, hardening the polymer from a tensile strength of about 0.1 GPa (unhardened) to 22 GPa (hardened), which is better than steel (2 GPa). The irradiation process breaks chemical bonds that can re-form with crosslinkage. The new bonds can also cause further delocalization of the π-bonds, and therefore increase both the strength and electrical conductivity of the polymers after irradiation.
COMMENT: CERMETS
A cermet, as the name implies, is a composite composed of a mixture of a ceramic and a metal, with properties different from either the ceramic or the metal. They can be formed by mixing the powdered components and compacting them under pressure, followed by sin-tering. Cermets also can be formed by internal oxidation of dilute solutions of one metal in another. The metal solute oxidizes, leaving a metal oxide in the main metal. Cermets can have properties differ-ent from either of their components, including increased strength and hardness, better high-temperature resistance, improved wear resis-tance, and better resistance to corrosion. Cermets are especially use-ful for cutting and drilling tools.
www.ebook3000.com

MechanicalProperties 405
14.6 Adhesion
Archaeologists have shown that adhesives were used thousands of years ago: pitch and natural resins held spearheads to shafts. Glue, one of the old-est adhesives known, is derived from animal skins and bones.
Adhesion of two materials results when the atoms or molecules are in such intimate contact that weak intermolecular forces (such as van der Waals interactions, which fall off as 1/r6, where r is the intermolecular distance) can collectively strengthen the contact. Even when two pieces of ceramic are broken and can be held back in place, the distances between all but a few contact points are too large to allow adhesion to take place on its own. An adhesive can flow into all the crevices and make intimate contact between both parts; when the adhesive hardens (due to evaporation of the solvent, or polymerization processes, for example), the interactions allow adhesion.
In order to adhere, an adhesive must first wet the substrate; that is, it must spread across its surface. For this reason, the surface tension of the liquid adhesive is an important consideration. A familiar experience is that all liquids bead up on Teflon® surfaces, and nothing will adhere to the surface.
COMMENT: MECHANICAL PROPERTIES OF GLASS CERAMICS
Small crystallites in a glass have been found to inhibit crack propa-gation. This is utilized in the production of glass ceramics known as Corningware. Very fine particles of titanium oxide act as highly dis-persed nuclei (1012 nuclei per mm3 of molten glass) on which SiO2 crys-tallites can form. In production, the object is first made by blowing or molding in order to achieve the appropriate shape. Then, controlled heat treatment is used to devitrify (that is, to crystallize) up to 90% of the material. Because the small grain sizes scatter visible light, the material loses its transparency and becomes white and opaque following devit-rification. It is thought that the small crystallites create many grain boundaries, and these immobilize dislocations (making the material harder) and also prevent crack propagation (making the material more resistant to failure). Furthermore, many glass ceramics have low ther-mal expansion coefficients (see Chapter 7) so that thermally induced stress is reduced. These two factors—high tensile strength and low thermal expansion—make it possible to place a cold Corningware dish in a hot oven without catastrophic failure. Glass ceramics were discov-ered in 1957 after the accidental overheating of a furnace.

406 PhysicalPropertiesofMaterials
A second criterion for a good adhesive is the strength of the interactions, both between the adhesive and substrate (adhesive strength) and within the adhesive (cohesive strength). For example, increased crosslinkage in polymers enhances cohesive strength.
Flexibility can be an important factor in a successful adhesive; for example, pure epoxy resins are brittle and subject to cohesive failure. However, the addition of a toughening agent, such as a liquid rubber, leads to micro-phase separation during the cure stage, with rubber-rich domains dispersed in the epoxy matrix. This leads to a tougher adhesive as fracture energy can be dis-sipated in the rubber particles. Of course, there must also be good adhesion between the rubber particles and the epoxy.
Although strong adhesives have such diverse applications as bookbindings from the last century to holding on the wings of modern airplanes, there are also applications where only mild adhesion is required. The most notable example of this is the development of Post-it® notes. Although the low-tack (that is, weak) adhesive was developed by 3M scientist Dr. Spence Silver, it was another 3M scientist, Art Fry, who, in seeking a way to temporarily mark his pages in a music book, found its first use. In this case, the adhesion is rather weak so that the bond can be easily broken.
COMMENT: UNUSUAL VISCOELASTIC BEHAVIORS
Some polymers behave elastically at low stress (or slow application of stress), yet behave like viscous liquids at high stress (or fast applica-tion of stress). This allows these materials to be liquid-like while under stress, yet solid-like when left alone. An example of this so-called non-Newtonian behavior is “no-spill” paint, which is solid-like in the paint can (exhibiting elastic behavior at low stress), and yet can be applied with a brush (viscous behavior under application of stress). The origin of this unusual behavior is the arrangement of the chains of the poly-mer (Figure 14.18): at low (or slow) stress, the polymer molecules cluster together and the material is “solid-like,” while under shear stress the molecules align and the network can be broken, allowing for flow as a viscous “liquid.”
Related principles explain why a mixture of corn starch and water thickens on rapid stirring (the molecules do not have time to align) but flows when left alone. Similarly, Silly Putty™ bounces (that is, acts elastically at high stress), and yet can be slowly extruded into threads (given sufficient time, molecules align). In these two cases, due to the molecular structures, the structure responds elastically to rapid shearing forces, but inelastically with slower application of stress.
www.ebook3000.com

MechanicalProperties 407
14.7 Electromechanical Properties: The Piezoelectric Effect
One very interesting effect that relates mechanical and electrical properties is the piezoelectric effect, first discovered by Pierre and Jacques-Paul Curie in 1870. This effect is responsible for such seemingly diverse phenomena as
COMMENT: THE IMPORTANCE OF OTHER PHASES AND MICROSTRUCTURE
When a material is composed of two or more other materials, some of its properties are additive and can be determined by suitably weighted values of the properties of the phases present, that is, obey a rule of mixtures. Color, density, heat capacity, and sometimes thermal and electrical conductivity can be considered to be additive, at least to a first approximation. However, mechanical properties are highly interactive, that is, different from the weighted average of the constituent phases, and this can be used to great advantage in designing materials with particular mechanical properties.
For example, materials can be strengthened by the addition of fillers, such as carbon with rubber, sand with clay, sand with tar or asphalt, or plastic with wood flour. The additives increase the resistance of the material to deformation or flow. Similarly, the additions of ferrite and carbide to steel increase the hardness and the tensile strength.
The coarseness of the microstructure also plays an important role in mechanical properties. Very fine sand, when added to asphalt, produces a more viscous mixture than an equal amount of gravel. Similarly, steel with a very fine microstructure of ferrite and carbide will be much harder and stronger than steel with the same carbon content but a much coarser microstructure. The microstructure of a material can be controlled by heat treatment.
Shear
FIGURE 14.18The arrangement of polymer chains changes under shear stress. Without stress, there is a rigid network. Under shear stress, the polymer chains can be aligned, and this allows easier flow, for example, in no-spill paint.

408 PhysicalPropertiesofMaterials
Wint-O-green lifesavers™ lighting up when crunched, and some children’s shoes illuminating when the shoe moves.
The requirement of the piezoelectric effect is an ionic crystal, such as quartz, that has a non-centrosymmetric structure (in quartz this is due to the tetrahedral arrangement of four oxygen atoms around each silicon atom). The difference between an ionic centrosymmetric structure (positive ions symmetrically surrounded by negative ions; no net dipole or electric polar-ization of the crystal) and an ionic non-centrosymmetric crystal (positive ions not symmetrically surrounded by negative ions; nonzero net dipole and electric polarization of the crystal) is shown schematically in Figure 14.19. As we have already seen in Chapter 12, a polar non-centrosymmetric ionic crys-tal can be ferroelectric, meaning it has a nonzero electric dipole. (Recall that the term ferroelectric was coined to be analogous to the term ferromagnetic, which refers to a collective net magnetic dipole moment in the structure and originally referred to iron-based permanent magnets.)
Stress applied to a centrosymmetric ionic crystal does not change the (zero) electric polarization of the crystal (see Figure 14.19a). However, if the structure is non-centrosymmetric, the stress would change the electric polarization (Figure 14.19b). In a non-centrosymmetric (piezoelectric) ionic crystal, stress has the effect of changing the electric field across the crystal. If this happens to be part of an electrical circuit, it can induce electrical changes. For exam-ple, the gravitational force of a 0.5-kg mass applied across a 0.5- mm- thick quartz plate of dimensions 10 cm × 2 m induces opposing charges of 2 × l0–9 C on the faces. The electric field from a piezoelectric device can amount to more than 104 V, and the resulting sparks can be used for ignition in piezo-electric propane barbecue lighters. The circuit for shoes that make use of the piezoelectric effect is shown schematically in Figure 14.20.
The converse also is true: if an electric field is applied across a piezoelectric crystal, the crystal will have an induced strain. This can be used to con-trol very fine manipulations. For example, very fine motions (on the order
(a) (b)
P = 0
P = 0
P
P
+ + + +
+ ++– –
+ +–+ +–
–– –
+ +
+ ++–
–– –
+ +–+ +–+ +–
FIGURE 14.19A schematic representation of (a) a centrosymmetric ionic crystal with and without an applied stress, showing no change in electric polarization, P, that is, no piezoelectric effect and (b) a non-centrosymmetric ionic crystal with and without an applied stress, showing a change in electric polarization, P, on application of stress, that is, the piezoelectric effect.
www.ebook3000.com

MechanicalProperties 409
of nanometers) can be controlled using a piezoelectric crystal in the circuit: a small change in the electric field across the crystal can stress the crystal, changing the crystal’s dimensions. This can be coupled to a mechanical part (for example, the tip of a scanning tunneling microscope) to control its motion. The head of an inkjet printer contains hundreds of piezoelectric ink-wells, and each can be electrically induced to contract and squirt its ink.
If the applied electric field is alternating, the thickness of the crystal oscil-lates with the same frequency, which can be of considerable amplitude if it is the frequency of a normal lattice mode. For quartz, a 1.5-V silver oxide bat-tery can be used to give 106 oscillations per second. The natural frequency in one particular direction in quartz is especially independent of tempera-ture such that frequency stabilities of 1 part in 3 × l08, corresponding to an accuracy of 1 s per 10 years in a quartz timepiece, can be achieved. Just a few decades ago, wristwatches were based on mechanical springs and required adjustment at least once a week. Now, quartz-crystal watches require adjust-ment less than once a year.
The conversion of mechanical energy in a piezoelectric material into electri-cal energy (and vice versa) is the basis for many transducers. One example is the piezoelectric crystals in our ears, which turn sound waves (mechanical motion) into electrical impulses that are carried along auditory nerves to our brain.
COMMENT: SMART MATERIALS
Materials that respond to their environment are known as smart materi-als. For example, buildings could respond to the strains induced by an
+
–
+
–
+
+ + + + +
–
+
–
– – – – –
+
–
+
–
FIGURE 14.20Schematic representation of a piezoelectric crystal in use in some running shoes. Stress on the shoe hitting the floor induces an electric field, which causes an electrical potential and a momentary burst of current and illumination of the light in the circuit.

410 PhysicalPropertiesofMaterials
earthquake, bandages could contract and apply pressure to a wound in response to bleeding, and other devices could change when under chemical stress or in magnetic fields. Such devices, which use compos-ite materials, sensors, piezoelectric devices, and shape-memory alloys and which rely on phase transformations for their various “states,” are already a reality.
COMMENT: SOUNDING OUT IMPROVED MATERIALS
Researchers have developed an inexpensive method to investigate the mechanical properties of new composite materials or film coatings. A test sample is submerged in water, and an acoustic wave transducer sends a pulsed sound wave through it. The speed of the reflected wave enables determination of Young’s modulus, and the direction of the reflected wave provides information concerning crystal planes or defects in the material. The instrument makes use of a curved trans-ducer (for a lensing effect) made of an inexpensive piezoelectric plastic film.
COMMENT: MODELING FRACTURE
There is a very successful theory for fracture that describes when a crack will begin to move in response to complicated applied stresses. It was created by George Irwin who, as a researcher at the Naval Research Laboratories in the 1940s, was called upon to find out why a large frac-tion of the first US missiles exploded during launch. The theory, called fracture mechanics, only needs as input the energy necessary to move a crack a small distance. However, calculating this energy requirement at the microscopic level is largely an unsolved problem.
There is one case in which the problem is beginning to be under-stood: crack motion in a brittle crystal at low temperatures. Cracks can move in two ways under these circumstances. At moderate velocities, up to some fraction of the speed of sound, the crack cleaves the crystal (that is, breaks it along a natural line of division), leaving only phonons in its wake. However, when there is too much energy in the crack tip, the motion of the crack becomes unstable, and the crack begins to gen-erate increasing amounts of subsurface damage and fissures in more than just the cleavage direction, leading to destruction.
www.ebook3000.com

MechanicalProperties 411
Memory Metals: A Tutorial
It is possible that a given material can exist in different polymorphs with very different mechanical properties. One example is carbon, in its graphite and diamond phases.
a. Give another example of a material with different properties in different solid phases.
Another material that can change its mechanical properties with a change in phase is an alloy of nickel and titanium, called Nitinol (after Nickel Titanium Naval Ordnance Laboratory, where it was discovered in 1965). This material has two phases, a high-temperature austenite phase that is very difficult to bend, and a low-temperature martensite phase that is very flexible. The high-temperature phase can be achieved by immersing a piece of Nitinol in boiling water. On cooling to room temperature, the austenite phase can remain, but it is metastable with respect to the mar-tensite phase. This metastability leads to a hysteresis loop in the physical properties.
b. Sketch Young’s modulus, E, for Nitinol as a function of tempera-ture (heating and cooling paths), from –50°C to 100°C.
The structure of Nitinol in the austenite phase is more symmetric than in the martensite phase, as shown in Figure 14.21. There are several varia-tions in the way that martensite cells can be oriented: two ways are shown schematically in Figure 14.22, in contrast with the single arrangement of the austenite form.
c. Based on Figure 14.22, explain why the martensite phase is more flexible than the austenite phase.
d. Nitinol can be bent easily into a new shape when it is in the mar-tensite phase. What do you expect will happen to the shape of a Nitinol wire when it is heated into the austenite phase?
e. Can you suggest applications for this interesting property of Nitinol (see Figure 14.23)?
f. It would be useful to be able to shape Nitinol wire in the high-temperature form so that when it is heated it returns to this
Austenite Martensite
FIGURE 14.21Nitinol in its austenite and martensite phases. ○ is Ni in the higher layer; ○ is Ni in the lower layer; ● is Ti in the higher layer; • is Ti in the lower layer.

412 PhysicalPropertiesofMaterials
particular shape (that is, not just a straight wire). This can be accomplished by annealing. Annealing takes place at high temperature, when there is sufficient thermal energy to allow easier mobility of the atoms, although the material does not melt. For example, intricate laboratory glassware is annealed to remove stress after the glass is blown and before it is used. Why?
g. Explain what happens to a Nitinol wire when it is heated and shaped to a “V” in a flame (austenite phase). Use a diagram to show a schematic view of the internal structure. Also show the structure in the martensite phase.
h. Although many applications of Nitinol can be imagined, these would be limited if the transition temperature were fixed at 70°C, as it is for the alloy Ni0.46Ti0.54. Can you suggest a way to modify the transition temperature?
(a) (b)
Two martensitearrangements
Austenite
FIGURE 14.22Packing arrangements in (a) martensite and (b) austenite structures of Nitinol.
(a) (b) (c)
FIGURE 14.23A sculpture made of Nitinol, ”Le Totem du Futur” by the late French sculptor Jean-Marc Phillipe. The photos are of the sculpture at (a) 5°C; (b) 20°C; (c) 35°C. (Photos by J.-M. Phillipe.)
www.ebook3000.com

MechanicalProperties 413
i. Ni-Ti is not the only memory metal (martensitic) system; others include Cu-Zn-Al and Cu-Al-Ni. Ni-Ti has an advantage in that it is more corrosion resistant. However, Ni-Ti is more difficult to machine. Discuss how corrosion resistance and machining abil-ity could be important in applications.
Cymbals: A Tutorial
The best cymbals are made from tin-rich bronze. Bronze is a solid solu-tion, mainly copper, with added tin and possibly other elements. (A solid solution of all metals is sometimes referred to as an alloy.) Brass is also sometimes used for cymbals, and, although it has inferior properties, it is cheaper. Brass is a solid solution of zinc (minor component) in copper (major component), sometimes also with other elements.
The atomic diameter of Sn is about 15% greater than that of Cu, whereas the atomic diameter of Zn is about 4% greater than that of Cu.
a. Would you expect higher solid-state solubility of Sn in Cu, or Zn in Cu? Explain, considering the Hume-Rothery rules (see Section 14.4).
b. The presence of Sn in Cu (giving bronze) or Zn in Cu (giving brass) gives a harder material than pure Cu. Why does the addi-tion of the second element harden Cu? Which element, Sn or Zn, would be expected to harden Cu more?
c. Which would you expect to have a higher speed of sound: Cu-Sn bronzes or Cu-Zn brasses?
The Cu-rich portion of the Cu-Sn phase diagram is shown in Figure 14.24. The phase labeled “α” is a solid solution of Sn in Cu, rich in Cu, com-monly known as α bronze.
d. If Cu-Sn with less than 10 mass % Sn is first heated to 700°C to make it homogeneous and then cooled slowly to room tempera-ture, how many phases will exist at room temperature? What if it is cooled quickly?
e. The material resulting from fast-cooling in (d) is stiff but brittle. Why is a brittle material not suitable for a cymbal?
f. For samples richer in Sn (≈ 20 mass %) and T < 800°C, a second phase will occur. This can be the body-centered cubic δ-phase, which is very brittle. However, the body-centered cubic β-phase is less brittle. How does the type of second phase depend on the cooling?
g. Which second phase would be more desirable for a good cymbal, δ or β?
The first step in making a cymbal is casting. The appropriate quantities, for example, ≈20% Sn and ≈80% Cu, of high-purity Cu and high-purity

414 PhysicalPropertiesofMaterials
Sn are combined with a small amount of silver. The metals are heated together to 1200°C. This is considerably above the liquid temperature (see Figure 14.24).
h. Why is the temperature so high when 20 mass% Sn in Cu melts at about 900°C?
i. Oxides are a problem in the manufacture of bronze, so high-grade carbon is added as a “flux.” What does the carbon do?
The molten alloy is poured into a rotating, centrifugal mold. The castings are left to cool and age at room temperature for up to a week. This aging step seems to lead to a better product, possibly due to formation of very small and finely distributed precipitates.
j. What would the presence of very small and finely distributed precipitates do to the hardness of the material?
The next step is rolling. The casting is heated to about 800°C and then subjected to several rolling steps, resulting in about 50% reduction in thickness. Each rolling step is in a different direction. This gives repeated recrystallization and a fine crystal structure with minimum alignment of crystallites, making the cymbal tougher with an increased speed of sound. Each casting is reheated and rolled from 8 to 15 times, depending on the size of the cymbal. The degree of heating (time and temperature) and variations in the rolling procedure are two sources of differences in acoustical properties of otherwise “identical” cymbals.
k. Traditionally, cymbals are made in open-pit fires, but now tem-perature-controlled ovens are used. Does this increase the repro-ducibility of the cymbal process?
1100
1000
900
800
700
600
500
400
300
2000 10 20 30
CuMass% Sn
α + L
α + β
α + γ
α + δ
α + ε
L
α
T/°C
FIGURE 14.24Copper−tin phase diagram in the copper-rich region. The solid lines indicate the equilibrium phase diagram, but the dashed line indicates the boundary most often encountered in indus-trial preparations of bronze.
www.ebook3000.com

MechanicalProperties 415
At this point, the casting is heated again, and the cup (central indenta-tion of the cymbal) is stamped with a hot press. This is called cupping. (In some simpler processes, the cup is shaped in the original casting.)
In the tempering step, the cymbal is toughened and strengthened by heating to 800°C, followed by quick cooling in an aqueous saline solu-tion. The purpose of the saline solution is to provide a rapid and repro-ducible means of quenching. Furthermore, the salt helps remove any residual oxides that form in the grain boundaries and decrease ductility and workability.
l. Explain why oxides at grain boundaries would decrease ductility.The tempering process replaces the brittle δ-phase with the quenched β-phase. While this technique is used in other aspects of metallurgy to make the material harder, here the purpose is to make the material less brittle.
In the next process, called pressing, the alloy is forced into a tapered concave cymbal shape, immediately after tempering and before crystals have a chance to grow. This ensures that slight residual tensile stresses occur in the metal; these are necessary to create the sound. For some cymbals, the pressing process is preceded by a step called back-bending, in which the stack of cymbals is bent backward by about 90° a few times, in different positions and directions, in order to reduce the elasticity of the metal.
m. The pressing process is an example of work-hardening. How does this change the yield strength of a material?
While the prior steps ensure that the phase of the bronze is appropriate (hard, high speed of sound), the hammering process controls the shape of the cymbal, which is important to introduce its acoustical properties. A traditional hand-hammered cymbal could take 90 min to hammer, but the first cymbal of the batch could take considerably longer to adjust for variations. Although traditionally done by hand, hammering is now also done by machine.
In the first of a three-step lathing process, the cutting tool is used to make one continuous cut on the backside from the central cup to the edge. The top is cut in two steps. The first stiffens the cymbal and puts it into its final shape by using a templated backer. The final cut of the top side introduces the tonal grooves, which are essential for the proper acoustics and the final taper. The final sound of the cymbal depends on a number of factors during the lathing process, including the speed, pres-sure, and shape of the tool, as each can influence the dissipation of heat.
n. Why is it important to consider heat dissipation in the lathing process?
One of the most important variations in the making of a cymbal is the material itself. In cheaper alloys, such as B8 bronze (8 mass% Sn), the α-phase is dominant (see Figure 14.24), but the material will not have a high speed of sound. This gives B8 cymbals a narrower frequency

416 PhysicalPropertiesofMaterials
spectrum than the B20s, and thus a “harder” sound. Still cheaper brass cymbals have a more compact sound with shorter sustain and less bright-ness. Variations in tempering, pressing, hammering, and lathing also can influence the sound.
o. How could post-manufacture conditions affect the sound of a cymbal?
14.8 Problems
14.1 Many polymers change their mechanical properties as a func-tion of temperature. With the same temperature (x) axis, sketch: (a) the DSC trace of a polymer passing through its glass transi-tion temperature, Tg, and (b) its Young’s modulus.
14.2 Two model bridges have been built, and they are identical in every way, except that one bridge is 1/2 scale in each dimension with respect to the other bridge. Which bridge would support a larger load? Explain.
14.3 Based on your answer to Problem 14.2, which is better to con-tain a gas at very high pressure: a small-diameter tube or a large-diameter tube?
14.4 Two materials, a and b, differ in their values of Young’s modu-lus, E, with Ea ≫ Eb. The two materials are polymers of the same molecular structure, and the only difference between them is that one material is crystalline and the other is amorphous.
a. Which material is crystalline? b. What are their relative values of
i. Debye temperatures? ii. Speed of sound? iii. Heat capacities at room temperature? iv. Thermal conductivities at room temperature?
14.5 a. Explain how the mechanical properties of a material can influence its applicability as a toner for use in the photo-copying process.
b. What role does temperature play in consideration of the properties of a toner?
14.6 The Leaning Tower of Pisa was being restored. During the work, the ground was frozen with liquid nitrogen (T = 77 K) in order to “prevent dangerous vibrations during the next phase of the salvage project.” What is the effect of temperature on the mechanical properties (Young’s modulus, speed of sound, Debye temperature) of the ground?
14.7 Most materials expand when heated. However, stressed rub-ber contracts when heated. Explain this phenomenon. Hint: Consider whether entropy increases or decreases on contrac-tion of rubber.
www.ebook3000.com

MechanicalProperties 417
14.8 A tub is to be made of metal, and in its use it will be under some (calculable) maximum stress. It does not matter for this appli-cation if there is a crack in the tub, but it is important that the material not fail; that is, any cracks must not propagate. Explain how knowing the Griffith length for several potential tub mate-rials will aid in the selection of an appropriate metal for this application.
14.9 The resin of fiber-reinforced composite materials (for example, FibreGlass® ) can be damaged by water. For example, the glass transition temperature, Tg, can be reduced by swelling of the resin caused by uptake of water. Explain how lowering Tg can adversely influence the mechanical properties of this material.
14.10 One of the most common construction materials is concrete, usually made by mixing Portland cement with sand, crushed rock, and water. The resulting material is very complex, result-ing primarily from the reaction of Portland cement with water, as the adhesion results from hydrates. The setting process of concrete is exothermic. In some situations, such as outdoor use in winter, the heat source is useful. In other applications, such as large concrete structures, the exothermicity of the reaction can lead to stress. What is the source of the stress? Discuss fac-tors that could be considered to lower the stress during con-crete setting.
14.11 An advance in materials for turbine blades is the production of a superalloy that forms as single crystals, that is, without grain boundaries. What properties will be affected by the absence of grain boundaries?
14.12 Glass can be strengthened chemically by ion exchange to give a surface of lower thermal expansion coefficient than the under-lying (bulk) glass. How does this strengthen the glass?
14.13 Glass can be strengthened thermally by prestressing it so that all components are under compression at high temperatures. This is followed by cooling.
a. Would this technique work best for low-thermal-expansion glass or for high-thermal-expansion glass?
b. Explain how the shape and size of the glass item may play an important role in the success of this tempering method.
14.14 Window glass that has been tempered (that is, heat-treated for strengthening) will show patterns when viewed through a polarizer. This can be observed for side and rear car windows, for example. (Windshields are laminated [layered] struc tures and do not show this effect.) Explain the origin of the polariza-tion patterns.
14.15 Piezomagnetism is the induction of a magnetic moment by stress. For example, some materials become magnetic after they are struck with another object. By analogy to the term piezoelectric-ity, explain the origins of piezomagnetism. Include a discussion of any necessary conditions.
14.16 Piezoresistivity is the variation in electrical resistivity of a mate-rial produced by applied mechanical stress. It is said that this

418 PhysicalPropertiesofMaterials
effect is observed to some extent in all crystals, but it is maxi-mal in semiconductors. Why is it largest in semiconductors?
14.17 Explain how stress on a crystal can change its degree of bire-fringence. (This is a piezooptic effect.)
14.18 The addition of a second metal to a pure metal usually leads to an alloy with higher yield strength, tensile strength, and hard-ness. However, the addition of the impurity can change other properties. Would you recommend adding a second component to copper wires used for transmission of electrical power? (The alloy could have greater strength than pure copper.) Explain.
14.19 When a rubber band is immersed in liquid nitrogen, it loses its elastic properties and can be shattered easily with a hammer. Why?
14.20 a. Diamond is a very hard material; yet if a diamond is struck with a hammer, it will shatter. Explain why the diamond, and not the hammer, breaks.
b. If a diamond is squeezed between two metal surfaces, the diamond will become embedded in the metal. Why do the diamond and metal not shatter as in (a)?
c. In designing diamond drills, it is important to prevent frac-ture of the diamonds. Explain why polycrystalline diamond is often used for these applications. Consider the force per unit area on the diamond surfaces.
14.21 Copper can be drawn into wires that are strengthened by work hardening due to increased concentration and entanglement of dislocations.
a. How would work-hardening a copper wire affect its electri-cal resistivity? Why?
b. How would the electrical resistivity of a drawn copper wire change after annealing and then cooling to room tempera-ture? Why?
14.22 Polyethylene bags are more difficult to stretch (that is, plasti-cally deform) along the polymer backbone direction than in perpendicular directions (between polymers). Explain.
14.23 Polymers are inherently weak materials. They can be strength-ened by various measures, for example, crosslinking (an exam-ple is the S-S bonds formed in vulcanization of rubber), chain stiffening (for example, addition of large groups such as C6H5 that introduce steric hindrance), and/or chain crystallization (by suitable preparation and/or heat treatment). Discuss why each of these methods leads to stronger polymers.
14.24 Give the relative values of Young’s modulus for a clean hair and a hair coated with (dried) hair gel.
14.25 Draw stress–strain diagrams for two materials, one very tough and one not so tough.
14.26 Explain how the temperature dependence of ductility could make a ship unsafe in cold waters and yet seaworthy in warm waters.
14.27 Pure gold (100% Au) is often referred to as 24 karat (or 24 k). This is not commonly used for jewelry because it is too soft.
www.ebook3000.com

MechanicalProperties 419
Other metals are usually added to the gold, lowering the karat number (for example, to 18 k or 10 k), making the material harder.
a. Explain how the impurities increase the hardness of the material.
b. If the “gold” was to be used for electrical contacts, explain how the impurities would be expected to change the elec-trical properties of the material.
c. Would you expect the impurities to change the thermal conductivity of the material? Explain.
14.28 A typical laptop computer display uses a very small fluorescent lamp for the backlight.
a. These lights do not produce much heat. How is that a par-ticular advantage for this application?
b. These lamps are very thin, but not very strong. Why is the latter property a concern?
14.29 Would the thermal conductivity of an alloy in its amorphous metal form be expected to be higher or lower than that of the corresponding crystalline form of the alloy? Explain.
14.30 Most materials have a positive Poisson ratio, and thin laterally when extended (Figure 14.25). However, some materials have the unusual property of lateral expansion when stretched, leading to a negative Poisson ratio. These materials are known as auxetic (from the Greek auxesis, meaning “increase”). An example of
(a)
(b)
w + Δww
ww + Δw
l + Δl
l + Δl
l
l
–Δw/wΔl/l
> 0v =
v = –Δw/wΔl/l
< 0
FIGURE 14.25When a material is extended, if the Poisson ratio, ν, is (a) positive, it thins laterally, but if the Poisson ratio is (b) negative, it expands laterally.

420 PhysicalPropertiesofMaterials
the type of structure that can lead to auxetic behavior is shown in Figure 14.26. Suggest applications for auxetic materials.
14.31 For ionic crystals, two special cases of point defects arise. One is from the loss of a cation–anion pair, leaving behind a vacancy on two adjacent sites (one cationic, the other anionic), leaving a Schottky defect, as shown in Figure 14.27a. The other is a Frenkel defect, formed when a lattice ion migrates into an interstitial position, leaving a vacancy behind, as shown in Figure 14.27b. The vacancy–interstitial pair is referred to as a Frenkel defect. Discuss ways in which the presence of Frenkel defects and Schottky defects could be expected to alter the optical, thermal, electronic, and mechanical properties of ionic materials.
14.32 Ferromagnetic shape-memory alloys change their shape in response to a magnetic field. The shape change is not due to change in structure as in conventional shape-memory alloys, but a change in the arrangement of the martensite structure when a mag-netic field is applied, as shown in Figure 14.28. Compositions showing ferromagnetic shape-memory effects include Fe-Pd, Fe-Pt, Co-Ni-Al, Co-Ni-Ga, and Ni-Mn-Ga. The latter can show strains up to 10% and has a high Curie temperature (103°C).
FIGURE 14.26A material composed of flexible cells can be auxetic, that is, exhibit a negative Poisson ratio, ν (lateral expansion when extended).
www.ebook3000.com

MechanicalProperties 421
What properties would be required to make these alloys useful for applications as actuators?
14.33 In a traditional ceramic, such as a clay, the firing process removes water from between the inorganic layers in the struc-ture. What does the firing process do to the Young’s modulus of the ceramic, compared with the so-called green body (unfired ceramic)?
14.34 The precursor to a thermoset plastic is a liquid that becomes hardened by thermally induced formation of chemical bonds, making crosslinks between the large molecules. This process is not reversible as the crosslinks are permanent chemical bonds. Thermosets are usually placed in a mold while in their liq-uid form, and the resultant crosslinked product conforms to the shape of the mold. A common thermoset is epoxy, which is crosslinked by the addition of a curing agent that typically contains reactive −NH2 groups. In contrast, thermoplastics have polymer chains that are not crosslinked. They are rigid at low temperature but become more flexible, adapting new shapes, above their glass transition temperature, Tg. This transition is reversible. Sketch Young’s modulus of a typical thermoset as a function of time on cooling from above its cure point. On the same graph, show Young’s modulus of a typical thermoplastic on cooling from above Tg.
+
+
+
+ ++
+
+
+++
+ + +
+
+++
+
+ +
++
– – –
–––
–
– – – –
–
–
–
– –
–
–
–
–––
–
(a) (b)
FIGURE 14.27(a) The missing cation–anion pair, shown here as a box, is referred to as a Schottky defect; (b) when an ion moves from its lattice site to an interstitial position, it forms a Frenkel defect.
B = 0 B > 0
FIGURE 14.28When the magnetic field, B, is imposed on a ferromagnetic shape-memory alloy, the cells align in the magnetic field, leading to a strain.

422 PhysicalPropertiesofMaterials
14.35 Nacre is a biocomposite, the iridescent material found inside shells, and sometimes called mother-of-pearl. It has a “brick-and-mortar” structure, as shown in Figure 14.29. The “bricks” are calcium carbonate in the aragonite form, about 10 μm long and 250 nm thick. These plates form about 95% of the mass of the structure and are surrounded by an organic matrix com-posed of proteins and polysaccharides.
a. Explain why the structure of nacre leads to iridescence. b. Nacre is about 3000 times tougher than pure aragonite.
Explain how the structure can lead to toughness, and espe-cially how it could prevent crack propagation.
Further Reading
General References
Properties of liquid metal alloy, http://www.liquidmetalgolf.com.ASM International, 2002. Atlas of Stress-Strain Curves, 2nd ed. ASM International,
Materials Park, OH.Superhard coating materials. Special issue. Y.-W. Chung and W. D. Sproul, Eds. MRS
Bulletin, March 2003, 164–202.Mechanical properties in small dimensions. Special issue. R. P. Vinci and S. P. Baker,
Eds. MRS Bulletin, January 2002, 12–53.Mechanical behavior of nanostructured materials. Special issue. H. Kung and T.
Foecke, Eds. MRS Bulletin, February 1999, 14–58.Materials for sports. Special issue. F. H. Froes, S. Haake, S. Fagg, K. Tabeshfar and X.
Velay, Eds. MRS Bulletin, March 1998, 32–58.
Organic matrix
CaCO3 (aragonite) plates
FIGURE 14.29Nacre is a natural composite with a brick-and-mortar structure in which the inorganic compo-nent is surrounded by a matrix of organic material.
www.ebook3000.com

MechanicalProperties 423
Interatomic potentials for atomistic simulations. Special issue. A. F. Voter, Ed. MRS Bulletin, February 1996, 17–49.
M. F. Ashby and D. H. R. Jones, 1998. Engineering Materials 2: An Introduction to Microstructures, Processing and Design. Butterworth-Heinemann, Oxford.
S. Ashley, 2003. Alloy by design. Scientific American, July 2003, 24.D. R. Askeland, P. P. Fulay and W. J. Wright, 2010. The Science and Engineering of
Materials, 6th ed. Cengage, Stamford, CT.P. Ball, 1994. Designing the Molecular World. Princeton University Press, Princeton.P. Ball, 1997. Made to Measure; New Materials for the 21st Century. Princeton University
Press, Princeton.D. J. Barber and R. Loudon, 1989. An Introduction to the Properties of Condensed Matter.
Cambridge University Press, Cambridge.J. D. Birchall and A. Kelly, 1983. New inorganic materials. Scientific American, May
1983, 104.W. D. Callister Jr. and D. G. Rethwisch, 2010. Materials Science and Engineering: An
Introduction, 8th ed. John Wiley & Sons, Hoboken, NJ.D. J. Campbell and M. K. Querns, 2002. Illustrating negative Poisson’s ratios with
paper cutouts. Journal of Chemical Education, 79, 76.B. S. Chandrasekhar, 1998. Why Things Are the Way They Are. Cambridge University
Press, Cambridge.R. Cotterill, 2008. The Material World. Cambridge University Press, Cambridge.J. H. W. de Wit, A. Demaid, and M. Onillon, Eds., 1992. Case Studies in Manufacturing
with Advanced Materials, Vol. 1. North-Holland, Amsterdam.J. P. Den Hartog, 1952. Advanced Strength of Materials. Dover, New York.A. B. Ellis, M. J. Geselbracht, B. J. Johnson, G. C. Lisensky, and W. R. Robinson, 1993.
Teaching General Chemistry: A Materials Science Companion. American Chemical Society, Washington.
J. Gilman, 2003. Electronic Basis of the Strength of Materials. Cambridge University Press, Cambridge.
J. E. Gordon, 1984. The New Science of Strong Materials, 3rd ed. Princeton University Press, Princeton.
P. Grünberg, 2001. Layered magnetic structures: History, highlights, applications. Physics Today, May 2001, 31.
A. Guinier and R. Jullien, 1989. The Solid State. Oxford University Press, New York.P. Hess, 2002. Surface acoustic waves in materials science. Physics Today, March 2002, 42.R. A. Higgins, 1994. Properties of Engineering Materials, 2nd ed. Industrial Press, New
York.D. Hull and D. J. Bacon, 2001. Introduction to Dislocations, 4th ed. Butterworth-
Heinemann, Oxford.R. E. Hummel, 1998. Understanding Materials Science. Springer, New York.I. P. Jones, 2001. Materials Science for Electrical and Electronic Engineers. Oxford
University Press, New York.B. H. Kear, 1986. Advanced materials. Scientific American, October 1986, 158.J. Krim, 1996. Friction at the atomic scale. Scientific American, October 1996, 74.D. W. Pashley, Ed., 2001. Imperial College Inaugural Lectures in Materials Science and
Engineering. Imperial College Press, London.W. E. Pickett and J. S. Moodera, 2001. Half metallic magnets. Physics Today, May 2001, 39.C. N. R. Rao and K. J. Rao, 1992. Ferroics. Chapter 8 in Solid State Chemistry: Compounds,
Eds. A. K. Cheetham and P. Day. Clarendon Press, Oxford.

424 PhysicalPropertiesofMaterials
H. M. Rosenberg, 1988. The Solid State, 3rd ed. Oxford University Press, New York.G. L. Schneberger, 1983. Metal, plastic and inorganic bonding: Practice and trends.
Journal of Materials Education, 5, 363.J. F. Shackelford, 2004. Introduction to Materials Science for Engineers, 6th ed. Prentice
Hall, Upper Saddle River, NJ.W. F. Smith, 2004. Foundations of Materials Science and Engineering, 3rd ed. McGraw-
Hill, New York.M. A. Steinberg, 1986. Materials for aerospace. Scientific American, October 1986, 66.P. A. Thrower, 1995. Materials in Today’s World, 2nd ed. McGraw-Hill, New York.J. D. Verhoeven, 2001. The mystery of Damascus blades. Scientific American, January
2001, 74.A. J. Walton, 1983. Three Phases of Matter, 2nd ed. Oxford University Press, New
York.M. A. White and P. MacMillan, 2003. The cymbal as an instructional device for materi-
als education. Journal of Materials Education, 25, 13.
Adhesion
Polymer first is sticky, then it isn’t, 1999. Chemical and Engineering News, August 23, 1999, 42.
The ties that bind abalone shells, 1999. Chemical and Engineering News, June 28, 1999, 23.
Materials science of adhesives: How to bond things together. Special issue. C. Creton and E. Papon, Eds. MRS Bulletin, June 2003, 419–454.
A. R. C. Baljon and M. O. Robbins, 1996. Energy dissipation during rupture of adhe-sive bonds. Science, 271, 482.
L. A. Bloomfield, 1999. Instant glue. Scientific American, June 1999,104.H. R. Brown, 1996. Adhesion of polymers. MRS Bulletin, 21(1), 24.R. Dagani, 2001. Sticking things to carbon nanotubes. Chemical and Engineering News,
May 7, 2001.N. A. de Bruyne, 1962. The action of adhesives. Scientific American, April 1962, 114.D. Eagland, 1990. What makes stuff stick? CHEMTECH, April 1990, 248.C. Gay and L. Leibler, 1999. On stickiness. Physics Today, November 1999, 48.G. F. Krueger, 1983. Design methodology for adhesives based on safety and durabil-
ity. Journal of Materials Education, 5, 411.J. R. Minkel Jr., 2006. Bubble adhesion. Scientific American, October 2006, 32.W. J. Moore, 1967. Seven Solid States. W.A. Benjamin, New York.J. T. Rice, 1983. The bonding process. Journal of Materials Education, 5, 95.R. V. Subramanian, 1983. The adhesive system. Journal of Materials Education, 5, 31.
Ceramics
H. K. Bowen, 1986. Advanced ceramics. Scientific American, October 1986, 168.R. E. Newnham, 1984. Structure-property relations in electronic ceramics. Journal of
Materials Education, 6, 807.K. M. Prewo, J. J. Brennan, and G. K. Layden, 1986. Fibre reinforced glasses and glass-
ceramics for high performance applications. American Ceramic Society Bulletin, 65, 305.
www.ebook3000.com

MechanicalProperties 425
Composites
T.-W. Chou, R. L. McCullough, and R. B. Pipes, 1986. Composites. Scientific American, October 1986, 192.
J. Economy, 1988. High-strength composites. Chapter 11 in Biotechnology and Materials Science, Ed. by M. L. Good. American Chemical Society, Washington.
J. Hay and S. Shaw, 2001. Into the labyrinth. Chemistry in Britain, November 2001, 34.
T. Kelly and B. Clyne, 1999. Composite materials—reflections on the first half century. Physics Today, November 1999, 37.
M. B. Jakubinek, C. Samarasekera, and M. A. White, 2006. Elephant ivory: A low ther-mal conductivity, high strength nanocomposite. Journal of Materials Research, 21, 287.
C. O. Oriakhi, 2000. Polymer nanoncomposition approach to advanced materials. Journal of Chemical Education, 77, 1138.
P. Scott, 2002. Heads on tails. Scientific American, April 2002, 24.A. Tullo, 1999. New DVDs provide opportunity for polymers. Chemical and Engineering
News, December 20, 1999, 14.
Elasticity and Strength
S. Ashley, 2003. A stretch for strong copper. Scientific American, January 2003, 31.M. Brennan, 1999. Carbon nanotubes flex their muscle. Chemical and Engineering News,
May 24, 1999, 6.R. A. Guyer and P. A. Johnson, 1999. Nonlinear mesoscopic behavior: Evidence for a
new class of materials. Physics Today, April 1999, 30.M. Reibold, P. Paufler, A. A. Levin, W. Kochmann, N. Pätzke, and D. C. Meyer, 2006.
Carbon nanotubes in an ancient Damascus sabre. Nature, 444, 286.M. Reisch, 1999. What’s that stuff? [Spandex]. Chemical and Engineering News, February
15, 1999, 70.A. M. Rouhi, 1999. Biomaterials for women. Chemical and Engineering News, June 28,
1999, 24.M.-F. Yu, B. S. Files, S. Arepalli, and R. S. Ruoff, 2000. Tensile loading of ropes of single
wall carbon nanotubes and their mechanical properties. Physical Review Letters, 84, 5552.
Fracture
Atomistic theory and simulation of fracture. Special issue. R. L. B. Selinger and D. Farkas, Eds. MRS Bulletin, May 2000, 11–50.
S. Ashley, 2004. Cryogenic cutting. Scientific American, March 2004, 28.M. Bain and S. Solomon, 1991. Cracking the secret of eggshells. New Scientist, March
30, 1991, 27.M. J. Buehler and H. Gao, 2006. Dynamical fracture instabilities due to local hyper-
elasticity at crack tips. Nature, 439, 307.M. E. Eberhart, 1999. Why things break. Scientific American, October 1999, 66.J. J. Gilman, 1960. Fracture in solids. Scientific American, February 1960, 95.D. G. Holloway, 1968. The fracture of glass. Physics Education, 3, 317.M. Marder and J. Fineberg, 1996. How things break. Physics Today, September 1996, 24.

426 PhysicalPropertiesofMaterials
T. A. Michalske and B. C. Bunker, 1987. The fracturing of glass. Scientific American, December 1987, 122.
J. W. Provan, 1988. An introduction to fracture mechanics. Journal of Materials Education, 10, 325.
C. N. Reid, 1988. An introduction to crack resistance (R-Curves). Journal of Materials Education, 10, 483.
I. Sage, 2001. Seeing the light. Chemistry in Britain, February 2001, 24.E. Wilson, 1997. New ceramic bends instead of breaking. Chemical and Engineering
News, September 8, 1997, 12.
Hardness and Toughness
R. Baum, 1993. Carbon nitride film synthesized, solid may be harder than diamond. Chemical and Engineering News, July 19, 1993, 34.
F. P. Bundy, 1974. Superhard materials. Scientific American, August 1974, 62.R. Dagani, 1995. Superhard-surfaced polymers made by high-energy ion irradiation.
Chemical and Engineering News, January 9, 1995, 24.H. Schubert and G. Petzow, 1988. What makes ceramics tougher? Journal of Materials
Education, 10, 601.D. M. Teter, 1998. Computational alchemy: The search for new superhard materials.
MRS Bulletin, January 1998, 22.
Smart Materials, Including Memory Metals
Responsive materials. Special issue. MRS Bulletin, C. A. Alexander and I. Gill, Eds. September 2010, 659–683.
Science and technology of shape memory alloys: New developments. Special issue. K. Otsuka and T. Kakeshita, Eds. MRS Bulletin, February 2002, 91–136.
R. Abeyaratne, C. Chu, and R. D. James, 1996. Kinetics of materials with wiggly ener-gies: theory and application of twinning microstructures in a Cu-Al-Ni shape memory alloy. Philosophical Magazine A, 73, 457.
S. Ashley, 2006. Muscling up color. Scientific American, November 2006, 27.S. Ashley, 2003. Artificial muscles. Scientific American, October 2003, 53.S. Ashley, 2001. Shape-shifters. Scientific American, May 2001, 20.M. Brennan, 2001. Suite of shape-memory polymers. Chemical and Engineering News,
February 5, 2001, 5.K. S. Brown, 1999. Smart stuff. Scientific American Presents: Your Bionic Future. 72.R. Dagani, 1995. Polymeric “smart” materials respond to changes in their environ-
ment. Chemical and Engineering News, September 18, 1995, 30.R. Dagani, 1997. Intelligent gels. Chemical and Engineering News, June 9, 1997, 26.M. Fischetti, 2003. Cool shirt. Scientific American, October 2003, 92.M. Freemantle, 2003. Stressed polymers change color. Chemical and Engineering News,
December 22, 2003, 10.K. R. C. Gisser, M. J. Geselbracht, A. Cappellari, L. Hunsberger, A. B. Ellis, J. Perepezko, and
G. C. Lisensky, 1994. Nickel-titanium memory metal. A “smart” material exhibiting a solid-state phase change and superelasticity. Journal of Chemical Education, 71, 334.
T. C. Halsey and J. E. Martin, 1993. Electrorheological fluids. Scientific American, October 1993, 58.
www.ebook3000.com

MechanicalProperties 427
A. J. Hudspeth and V. S. Markin, 1994. The ear’s gears: Mechanoelectrical transduc-tion by hair cells. Physics Today, February 1994, 22.
T. W. Lewis and G. G. Wallace, 1997. Communicative polymers: The basis for devel-opment of intelligent materials. Journal of Chemical Education, 74, 703.
R. E. Newnham, 1997. Molecular mechanisms in smart materials. MRS Bulletin, May 1997, 20.
K. Otsuka and C. M. Wayman, 1999. Shape Memory Metals. Cambridge University Press, Cambridge.
J. Ouellette, 1996. How smart are smart materials? The Industrial Physicist, December 1996, 10.
C. A. Rogers, 1995. Intelligent materials. Scientific American, September 1995, 154.L. McDonald Schetky, 1979. Shape-memory alloys. Scientific American, November
1979, 98.M. Schwartz, Ed., 2008. Smart Materials. CRC Press, Boca Raton, FL.R. Schweinfest, A. T. Paxton, and M. W. Finnis, 2004. Bismuth embrittlement of cop-
per is an atomic size effect. Nature, 432, 1008.A. V. Srinivasan and D. M. McFarland, 2001. Smart Structures: Analysis and Design.
Cambridge University Press, Cambridge.S. Stinson, 2001. Plastic mends its own cracks. Chemical and Engineering News, February
19, 2001, 13.D. W. Urry, 1995. Elastic biopolymer machines. Scientific American, January 1995, 64.T. A. Witten, 1990. Structured fluids. Physics Today, July 1990.P. Zurer, 1996. Self-powered “smart” window could control own transparency.
Chemical and Engineering News, October 21, 1996, 10.
Metals
A. H. Cottrell, 1967. The nature of metals. Scientific American, September 1967, 90.R. D. Doherty, 1984. Stability of the grain structure in metals. Journal of Materials
Education, 6, 841.
Polymers
E. Baer, 1986. Advanced polymers. Scientific American, October 1986, 192.F. L. Buchholz, 1994. A swell idea. Chemistry in Britain, August 1994, 652.G. B. Kauffman, S. W. Mason, and R. B. Seymour, 1990. Happy and unhappy balls:
Neoprene and polynorbornene. Journal of Chemical Education, 67, 199.C. O’Driscoll, 1996. Spinning a stronger yarn. Chemistry in Britain, December 1996, 27.W. Peng and B. Reidl, 1995. Thermosetting resins. Journal of Chemical Education,
72, 587.R. B. Seymour and G. B. Kauffman, 1990. Piezoelectric polymers. Journal of Chemical
Education, 67, 763.
Spider Webs
L. Lin, 1995. Studying spider webs: A new approach to structures. Siviele Ingnieurswese, May 1995, 14.

428 PhysicalPropertiesofMaterials
A. H. Simmons, C. A. Michal, and L. W. Jelinski, 1996. Molecular orientation and two-component nature of the crystalline fraction of spider dragline silk. Science, 271, 84.
P. Vollrath, 1992. Spider webs and silks. Scientific American, March 1992, 70.
Viscoelastic Behavior
R. J. Hunter, 1993. Introduction to Modern Colloid Science. Oxford University Press, New York.
T. W. Huseby, 1983. Viscoelastic behavior of polymer solids. Journal of Materials Education, 5, 491.
www.ebook3000.com

429
Appendix 1: Fundamental Physical Constants
Quantity Symbol Value with Units
Speed of light in vacuum c 299792458 m s–1
Permeability of vacuum μ0 4π × 10–7 N A–2
Permittivity of vacuum ε0 8.854187816 × 10⁻¹² F m–1
Newtonian constant of gravitation G 6.67259(85) × 10–11 m3 kg–1 s–2
Planck’s constant h 6.6260755(40) × 10–34 J sAvogadro constant NA 6.0221367(36) × 1023 mol–1
Molar gas constant R 8.314510(70) J K–1 mol–1
Boltzmann constant, R/NA k 1.380658(12) × 10–23 J K–1

431
Appendix 2: Unit Conversions
Energy/J ν/m–1 ν/s–1 T/K E/eV
1 J = 1 1/(hc) 1/h 1/k 1/e5.03411 × 1024 1.509189 × 1033 7.242925 ×
1022
6.241506 × 10¹⁸
1 m–1 = (hc) 1 c (hc)/k (hc)/e1.98645 × 10–25
299,792,458 0.01438769 1.2398242 × 10⁻⁶
1 s–1 = h 1/c 1 h/k h/e6.62608 × 10–34
3.335640952 × 10⁻⁹
4.799216 × 10⁻¹¹
4.1356692 × 10⁻¹⁵
1 K = k k/(hc) k/h 1 k/e1.380658 × 10–23
69.50388 2.083674 × 10¹⁰ 8.617386 × 10⁻⁵
1 eVa = e e/(hc) e/h e/k 11.602177 × 10⁻¹⁹
806,554 2.417988 × 10¹⁴ 11,604.45
a 1 eV corresponds to 80,6554 m–1.

433
Appendix 3: The Greek Alphabet
Name Lower Case Upper Case
Alpha α ΑBeta β ΒGamma γ ΓDelta δ ΔEpsilon ε ΕZeta ζ ΖEta η ΗTheta θ ΘIota ι ΙKappa κ ΚLambda λ ΛMu μ ΜNu ν ΝXi ξ ΞOmicron ο ΟPi π ΠRho ρ ΡSigma σ ΣTau τ ΤUpsilon υ ΥPhi ϕ ΦChi χ ΧPsi ψ ΨOmega ω Ω

435
Appendix 4: Sources of Lecture Demonstration Materials
Arbor Scientificwww.arborsci.com/
Edmund Scientificwww.scientificsonline.com/
Educational Innovationswww.teachersource.com
Efston Sciencewww.escience.ca
Flinn Scientific Ltd.www.flinnsci.com
Institute for Chemical Educationice.chem.wisc.edu
NADA Scientific Ltd.http://nadascientific.com
The shops at many museums and science centers also carry many interesting items that can be used to illustrate physical properties of materials.

Materials Science
ISBN: 978-1-4398-6651-1
9 781439 866511
90000
“This book stands out as a unique resource for students and established scientists working at the modern materials/chemistry/technology interface. … This second edition includes many new state-of-the-art topics that have emerged as major fields over the last decade including carbon nanotubes, quantum dots, and spintronics. … I defy the readers to not find many gems of insightful knowledge to enhance their understanding of the physical materials world.”
—Timothy M. Swager, Massachusetts Institute of Technology, Cambridge, USA
“I am very impressed with the text. This text provides wonderful coverage of many of the basic properties of materials that we care about as scientists and as engineers.”
—Paul C. Canfield, Ames Laboratory, Iowa State University, USA
“… this is an excellent book to base an introductory materials course on or to read for pleasure by scientists in other fields who wish to riffle through an excellent survey of what materials science has become today.”
—Martin Moskovits, University of California, Santa Barbara, USA
Physical Properties of Materials, Second Edition establishes the principles that control the optical, thermal, electronic, magnetic, and mechanical properties of materials. Using an atomic and molecular approach, this fully revised and updated second edition now covers materials sustainability, crystalline structures, graphene, carbon nanotubes, nanocomposites, quantum dots, magnetocaloric effect, spintronics, and polymer classifications. It also contains numerous tutorials (including a new capstone tutorial on the materials science of cymbals), 300 end-of-chapter problems (more than 60 of them new), numerous real-life examples and illustrations, and updated references. A host of ancillaries are available on a companion website.
w w w . c r c p r e s s . c o m
K12969
www.crcpress.com
Physical Properties of Materials
White
Second Edition
K12629 cvr mech.indd 1 5/20/11 11:09 AM