
Physical processes impacting passive particle dispersal in the Upper Florida Keys
13
This article appeared in a journal published by Elsevier. The attached copy is furnished to the author for internal non-commercial research and education use, including for instruction at the authors institution and sharing with colleagues. Other uses, including reproduction and distribution, or selling or licensing copies, or posting to personal, institutional or third party websites are prohibited. In most cases authors are permitted to post their version of the article (e.g. in Word or Tex form) to their personal website or institutional repository. Authors requiring further information regarding Elsevier’s archiving and manuscript policies are encouraged to visit: http://www.elsevier.com/copyright
-
Upload
independent -
Category
Documents
-
view
2 -
download
0
Transcript of Physical processes impacting passive particle dispersal in the Upper Florida Keys

This article appeared in a journal published by Elsevier. The attachedcopy is furnished to the author for internal non-commercial researchand education use, including for instruction at the authors institution
and sharing with colleagues.
Other uses, including reproduction and distribution, or selling orlicensing copies, or posting to personal, institutional or third party
websites are prohibited.
In most cases authors are permitted to post their version of thearticle (e.g. in Word or Tex form) to their personal website orinstitutional repository. Authors requiring further information
regarding Elsevier’s archiving and manuscript policies areencouraged to visit:
http://www.elsevier.com/copyright
Author's personal copy
Physical processes impacting passive particle dispersal in theUpper Florida Keys
Jerome Fiechter a,�, Brian K. Haus a, Nelson Melo b, Christopher N.K. Mooers a
a Rosenstiel School of Marine and Atmospheric Science, University of Miami, Miami, FL 33149, USAb Atlantic Oceanographic and Meteorological Laboratory, National Oceanic and Atmospheric Administration, Miami, FL 33149, USA
a r t i c l e i n f o
Article history:
Received 24 November 2007
Received in revised form
22 February 2008
Accepted 22 February 2008Available online 13 March 2008
Keywords:
Coral reefs
Lagrangian transport
Western boundary current
Ocean circulation model
Velocity profilers
Larval dispersion
a b s t r a c t
Physical processes affecting the dispersion of passive particles (e.g., coral larvae, pollutants) in the
Upper Florida Keys are investigated through in situ observations (acoustic Doppler current profilers and
surface drifters) and numerical ocean circulation modeling (horizontal resolution: 800 m, vertical
resolution: 0.1–1 m). During the study period in August 2006 (set to coincide with an annual coral
spawning event), Lagrangian trajectories in the vicinity of the reef tract indicate that alongshelf
advection was mainly poleward and due to the subtidal flow of the Florida Current, while cross-shelf
advection was mainly onshore and due to wind-driven currents. Tidal currents resulted in
predominantly alongshelf displacements, but did not contribute significantly to net passive particle
transport on a weekly timescale. Typical advection distances were of the order of 10 to 50 km for pelagic
durations of 1 week, with significant variability linked to geographical location. In contrast, the
direction of transport from the offshore reefs remained essentially constant (i.e., potential dispersion
pathways were limited). In addition, Lagrangian trajectories and progressive vector diagrams in the
vicinity of the reef tract indicate that alongshelf variations in the cross-shelf velocity gradient associated
with the FC are relatively weak on an alongshore scale of ca. 50 km. For August 2006, the highest
particle concentrations typically occur inshore of the reef tract, thereby suggesting that onshore
transport associated with wind-driven currents contributes significantly to the local retention of passive
organisms (and other tracers) in the Upper Florida Keys. Overall, the results illustrate the necessity of
conducting targeted in situ observations and numerical model predictions to quantify the physical
processes affecting reef-scale advection, especially in an effort to understand local retention and
dispersion mechanisms for larval marine organisms.
& 2008 Elsevier Ltd. All rights reserved.
1. Introduction
With increasing anthropogenic stress on marine populations,especially in nearshore waters, it becomes more urgent to betterunderstand and more efficiently protect living resources in thecoastal ocean. Because of the relationship between juvenile andadult populations, characterizing the distribution and abundanceof key species (e.g., commercially targeted fishes or reef-buildingcorals) requires knowledge of the larval dispersal rates andrecruitment patterns of those organisms (see Cowen et al., 2002for a review on population connectivity in marine systems). Oneof the central issues for the connectivity problem is then toquantify the relative importance of alongshore advection anddiffusion versus cross-shore advection and diffusion in the coastal
boundary layer, as well as possible modulations due to larvalbehavior (e.g., horizontal and vertical swimming) (Largier, 2003).Characterizing the connectivity patterns between reefs in aspecific region would also help address the issues of externallysupplied (open) versus self-sustained (closed) populations, re-cruitment limitation, and population regulation (Armsworth,2002).
Along the Florida Keys (FK), the motions of mesoscale andsubmesoscale frontal features associated with the Florida Current(FC) act as mechanisms modulating the cross-shelf exchange ofwater masses (Shay et al., 1998; Haus et al., 2004), transport ofbiological material (Lee et al., 1994; Sponaugle et al., 2003),plankton concentration (Lane et al., 2003), and fish larvaeabundance (Limouzy-Paris et al., 1997). External (barotropic)and internal (baroclinic) tidal currents, predominantly semi-diurnal in the FK region, are also expected to contribute to localcirculation patterns in the vicinity of the Upper FK (UFK) reeftract (Leichter et al., 1996). In addition to tidal and subtidal flows,wind-driven currents also contribute directly to alongshore and
ARTICLE IN PRESS
Contents lists available at ScienceDirect
journal homepage: www.elsevier.com/locate/csr
Continental Shelf Research
0278-4343/$ - see front matter & 2008 Elsevier Ltd. All rights reserved.
doi:10.1016/j.csr.2008.02.018
� Corresponding author. Present address: Ocean Sciences Department, Univer-
sity of California, Santa Cruz, CA 95064, USA. Tel.: +1831459 3924;
fax: +1831459 4882.
E-mail addresses: [email protected], [email protected] (J. Fiechter).
Continental Shelf Research 28 (2008) 1261– 1272
Author's personal copy
cross-shore transport, especially for biological organisms concen-trated near the ocean surface. The dominant westward windregime, with a northward component during the summer months,is fairly coherent and homogeneous in the Straits of Florida (SOF)(Peng et al., 1999). Since the orientation of the UFK coastline andreef tract is roughly SW to NE, both Ekman and Stokes drifttransports associated with the summer wind conditions willtypically have an onshore component.
Previous modeling studies of larval transport in the SOF regionhave indicated that the interactions between vertical diurnalmigration, tidal currents, and salinity gradients may haveimportant effects on the spatial abundance and distribution, aswell as the larval dispersal distances, of pink shrimp larvae (Wanget al., 2003; Criales et al., 2005). Larval transport modeling effortselsewhere have also attempted to predict both short- and long-range larval dispersal/recruitment patterns for diverse marineorganisms. For an offshore reef along the Great Barrier Reef,dispersal rates for coral larvae are strongly dependent on reef-scale physical processes (Wolanski et al., 1989), includingalongshore currents, tidally driven recirculations, and topogra-phically controlled fronts. In the same region, hydrodynamicalmodels have also been used to investigate the dispersal of reef fishlarvae, and to characterize self-recruitment levels and metapopu-lation connectivity (James et al., 2002; Bode et al., 2006). Inparticular, the studies illustrate the importance of a few singlereefs in maintaining population connectedness and thus allowingtransfer of genetic information between subregions of the domain.For Caribbean reef fishes, biophysical modeling studies suggestthat the dispersal distances important on ecological time scalesare of the order of 10–100 km, and that self-recruitment must besupplemented by outside larval import to sustain most Caribbeanfish populations (Cowen et al., 2006).
In the present study, a combination of in situ observations andocean circulation modeling is used to investigate the complexinteractions between the reef tract topography and the FCsubtidal, tidal, and local wind-driven currents, as well as theirpotential impact on Lagrangian transport and larval dispersalpathways in the UFK. Specific interest resides in quantifyingalongshelf and cross-shelf transport in relation to larval dispersionfollowing an annual spawning event of Montastrea faveolata, oneof the major reef-building coral species in the UFK, in August
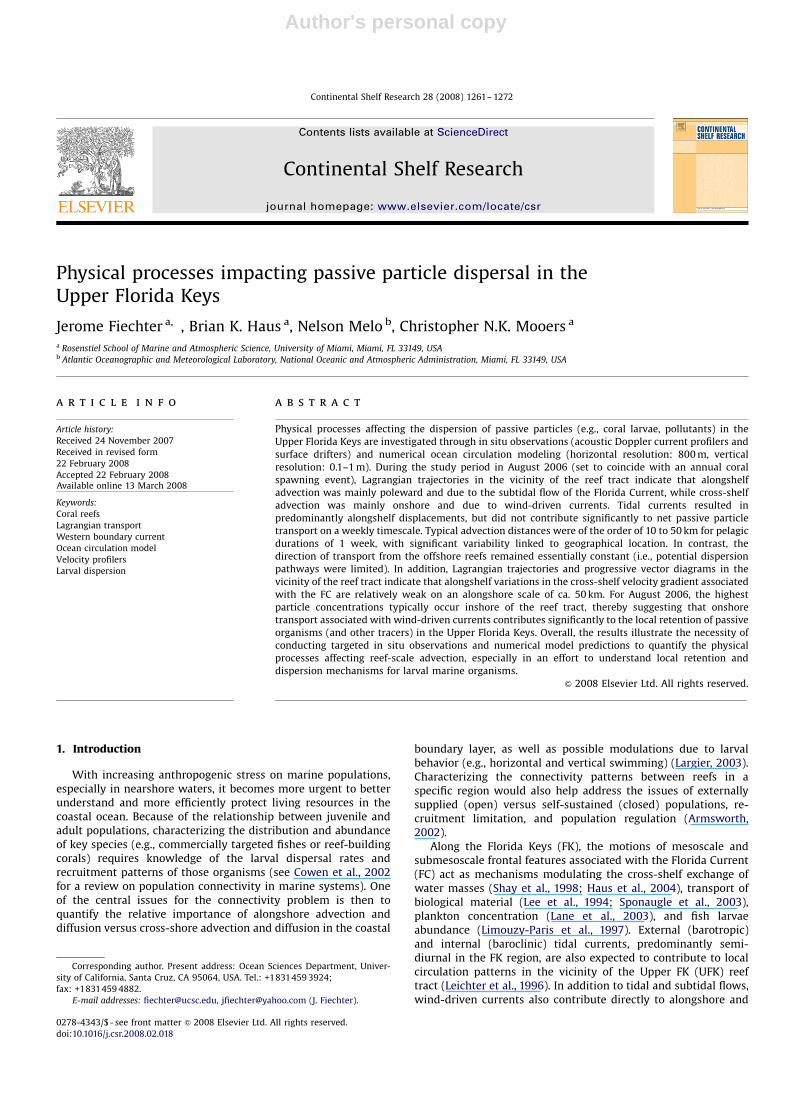
2006. M. faveolata larvae are positively buoyant and located nearthe surface for 2–3 days after being spawned, then acquire a weakvertical swimming ability and gradually migrate downwardduring their typical pelagic larval duration (PLD) of ca. 1 week(Szmant and Meadows, 2006). Due to the offshore presence of theFC, larval advection distances along the UFK reef tract couldpotentially range from hundreds of meters to hundreds ofkilometers. The specific reef targeted in the present study, KeyLargo Dry Rocks, is located ca. 7 km offshore of the UFK coastline(Fig. 1). Dry Rocks is within the jurisdiction of the Florida KeysNational Marine Sanctuary, as well as a designated SanctuaryPreservation Area (SPA). The annual M. faveolata spawning eventwas observed by divers at Dry Rocks on 16 August 2006 at ca.03:00 UTC.
2. In situ observations
Acquiring high-resolution in situ observations is critical forunderstanding larval transport mechanisms in a shallow-waterenvironment, and for providing a basis for model-data compar-isons in the vicinity of the reef tract. For this purpose, acombination of bottom-mounted acoustic Doppler current pro-filers (ADPs) and surface drifters is used to characterize thephysical environment directly inshore and offshore of Dry Rocks.
2.1. Acoustic Doppler current profilers
Two Sontek 1500 kHz autonomous ADPs were deployed onbottom mounts ca. 1.5 km inshore and offshore of Dry Rocks inwater depths of ca. 5 and 7 m, respectively (see Fig. 1). Thisdeployment strategy allowed capturing both reef-scale physicalprocesses and offshore mesoscale variability, as well as identifyingthe dominant cross-shelf and alongshelf transport mechanisms oneach side of the reef tract. In the relatively oligotrophic watersalong the UFK, these units have been successfully deployed for upto two months without any adverse effects from biologicalfouling. The use of high frequency acoustics in shallow waterallowed ADP measurements to be made within ca. 1 m of thesurface and bottom boundaries. A bin size of 0.25 m was used tomaximize vertical resolution and obtain measurements as close as
ARTICLE IN PRESS
Fig. 1. Geographical map of the Upper Florida Keys reef tract and in situ observations. Left: location of the Upper Florida Keys and Key Largo Dry Rocks (DR). Center:
locations of the eight SPA reefs in the Upper Florida Keys (Hen and Chickens (HC), Conch Reef (CR), Molasses Reef (ML), French Reef (FR), Grecian Rocks (GR), Key Largo Dry
Rocks (DR), Elbow Reef (EL), and Carysfort Reef (CA)). Right: locations of Key Largo Dry Rocks (DR; square), SPA buoys (circles), and inshore and offshore ADPs (triangles).
Gray shades indicate bottom topography (m).
J. Fiechter et al. / Continental Shelf Research 28 (2008) 1261–12721262
Author's personal copy
possible to the surface and bottom. This high vertical resolutionenables resolving over the shallow shelf the small scale, depth-dependent velocity structure in addition to the barotropic(i.e., depth-independent) flow. Two-minute bursts at a ping rateof 9 Hz were averaged to produce a single velocity profile. Theburst sampling was repeated every 10 min over the ca. 60-daymeasurement period (i.e., from 7 July to 26 August 2006). Due to ahurricane warning in the UFK, the ADP located inshore of DryRocks was recovered on 2 August and re-deployed on 11 August atits original location, resulting in a 10-day gap in the velocityrecord.
2.2. Surface drifters
CODE surface drifters (Davis, 1985) were deployed during theperiod corresponding to the annual M. faveolata spawning event inAugust. These drifters (drogued in the upper ca. 1 m) werespecifically designed to track near-surface currents in coastalwaters, with a negligible impact of wave-induced Stokes drift. Inaddition to the usual ARGOS satellite-tracking system, the drifterswere equipped with GPS receivers to increase position accuracyand sampling rate (order of minutes), as required to investigatesmall-scale circulation in a nearshore reef environment. For theexperiment, a cluster of four CODE surface drifters was deployedfrom Dry Rocks to observe initial advection/dispersion patternsdue to near-surface currents. To represent dispersion conditionsrelative to the whole surface area of the reef, the four drifters werereleased from each of the SPA buoys (i.e., Marine Sanctuarymarkers delimiting the Dry Rocks SPA) located ca. 250 m east,
west, north, and south of Dry Rocks (see Fig. 1). The three 6-hdeployments (on 15, 17, and 22 August 2006) corresponded,respectively, to ca. 12 h before, 36 h after, and 6 days after theM. faveolata spawning event observed at Dry Rocks. The 15 Augustdeployment was timed to release the surface drifters ca. 12 hbefore the predicted spawning time, so the trajectories wouldcorrespond to semi-diurnal tidal conditions similar to thoseexpected during the coral spawning event.
3. Ocean circulation and Lagrangian transport models
3.1. Ocean circulation model
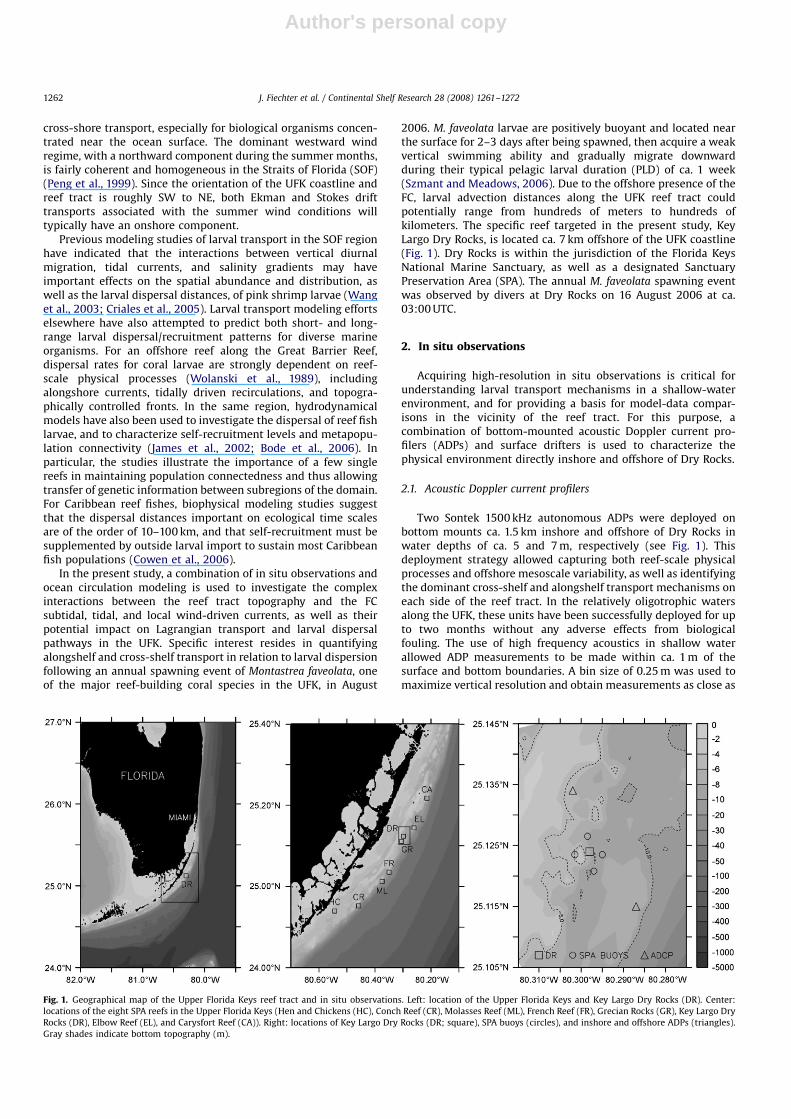
The SOF/FK coastal ocean circulation model, called FK-ROMS, isan implementation of the Regional Oceanic Modeling System(ROMS) (Shchepetkin and McWilliams, 2005). The version ofROMS used in the present study is called ROMS-AGRIF, as itincludes grid embedding capabilities based on the Adaptive GridRefinement in Fortran (AGRIF) package (Penven et al., 2006). Thegrid nesting approach provides the ability to resolve both theregional circulation in the SOF (parent grid) and the localcirculation along the FK reef tract (child grid), using only onemodel configuration (Fig. 2). The one-way nesting (i.e., informa-tion is only passed from the parent grid to the child grid) usedin FK-ROMS is performed on Cartesian grids, with a 1/321(ca. 3.2 km) horizontal resolution for the parent grid, and a 1/1281 (ca. 800 m) horizontal resolution for the child grid. Both gridshave 21 non-uniform sigma levels with refinement in the surface
ARTICLE IN PRESS
Fig. 2. FK-ROMS model domain and forcing. Left: nested Cartesian parent and child horizontal grid configurations for the Straits of Florida and Upper Florida Keys, with
bottom topography (grayscale; m) (grids are subsampled by a factor of 12 for clarity). Upper right: FK-ROMS inflow (western open boundary) transport (Sv; 1
Sv ¼ 106 m3 s�1) from global NCOM for August, compared with the AOML/NOAA FC cable transport data at 27 N for the same period. Lower right: Comparison between
hourly wind observations (gray) from C-MAN station at Molasses Reef (see Fig. 1 for location) and 12-hourly NOGAPS winds (black) interpolated to that location. Vertical
dashed lines in upper and lower right panels indicate time of coral spawning event.
J. Fiechter et al. / Continental Shelf Research 28 (2008) 1261–1272 1263
Author's personal copy
layer, which provide a vertical resolution ranging between 0.1 and100 m depending on the local water depth. The minimum waterdepth is set to 2 m and extends to the physical location of thecoastline.
The bottom topography mapped on the FK-ROMS grids is ablended product between ETOPO 5 (5 min resolution) and the 3-s(ca. 90 m) gridded water depth dataset from the National GeodeticData Center (NGDC). The resulting bottom topography hastherefore sufficient spatial coverage (lacking in the NGDC datasetalone) to include the entire SOF, but yet it provides a very detailedand accurate rendition of the FK reef tract (lacking in the ETOPO 5dataset alone). However, the 800-m horizontal resolution of thechild model is obviously not sufficient to reproduce some of thefine-scale topographic details associated with individual reefs.
FK-ROMS is driven on all open boundaries of the parent grid bysynoptic sea surface height, velocity, temperature, and salinityfields from the operational global Navy Coastal Ocean Model(NCOM) (Kara et al., 2006; Mooers et al., 2005), which are updatedevery third day (Fig. 2). Tidal forcing is derived from the OregonState University TPXO.6 (Egbert and Erofeeva, 2002) 0.25�0.251model for the North Atlantic region and includes eight constitu-ents (M2, S2, N2, K2, K1, O1, P1, and Q1). At the surface, FK-ROMSis forced by a wind stress based on the 12-hourly NOGAPS (Baylerand Lewit, 1992) surface winds (decimated to a 1�11 applicationgrid) (Fig. 2), and by a net heat flux, shortwave radiation, andsurface freshwater flux (E–P) based on the monthly 0.5�0.51COADS (Woodruff et al., 1987) climatology. Internal (baroclinic)time steps for the parent and child models are 600 and 200 s,respectively.
3.2. Lagrangian transport model
The Lagrangian particle-tracking model is a simple advectionscheme of passive particles based on the local simulated orobserved velocities. The model has been used previously todescribe sediment transport patterns in a South Florida tidal inlet,and validated to some extent against observed grain-sizecharacteristics (Fiechter et al., 2006). Online and offline trajectorycomputations indicate that the advection scheme providesadequate accuracy when the temporal resolution of the velocityfield is sufficiently high. While the particle-tracking approach
does not include a stochastic component, a random-walk orrandom-flight component (see Griffa, 1996 for a review ofLagrangian stochastic models) could be easily added once theLagrangian turbulent diffusion parameters near the reef tract areestimated from in situ observations. Furthermore, the high spatialresolution (800 m) of FK-ROMS is arguably sufficient to capturemost of the physical processes responsible for the advection anddiffusion of the particles and, therefore, minimizes the influenceof sub-grid scale processes needing to be represented through thestochastic component.
Since the particle trajectories are based on simulated andobserved Eulerian velocity fields, they do not account for theadvective component due to the Stokes drift associated with theorbital motion of wind-generated surface gravity waves. Apractical approach is to include the effect of Stokes drift onsurface trajectories by adding to the Eulerian velocity field anadvection velocity in the direction of the wind. Based on existingtheoretical evidence (Graber et al., 1997), the magnitude of theStokes drift is parameterized by using an Eulerian speed equal to1.5% of the wind speed and an Eulerian direction equal to the winddirection. Since the Stokes drift decays exponentially with depthon the scale of a typical wavelength, its influence on Lagrangiantrajectories is significant only for particles located near the surface(i.e., upper ca. 1 m). In the case of the broadcast spawning coralspecies, the larvae are known to gradually sink during theirpelagic duration (Szmant and Meadows, 2006), thus limiting theimpact of Stokes drift to the initial (first 72 h) dispersion of thelarval patch. The impact of vertical sinking on the transport ofcoral larvae in the vicinity of the UFK reef tract will be assessed, asa first approximation, by comparing near-surface and near-bottomtrajectories.
4. Results
4.1. Model-data comparisons
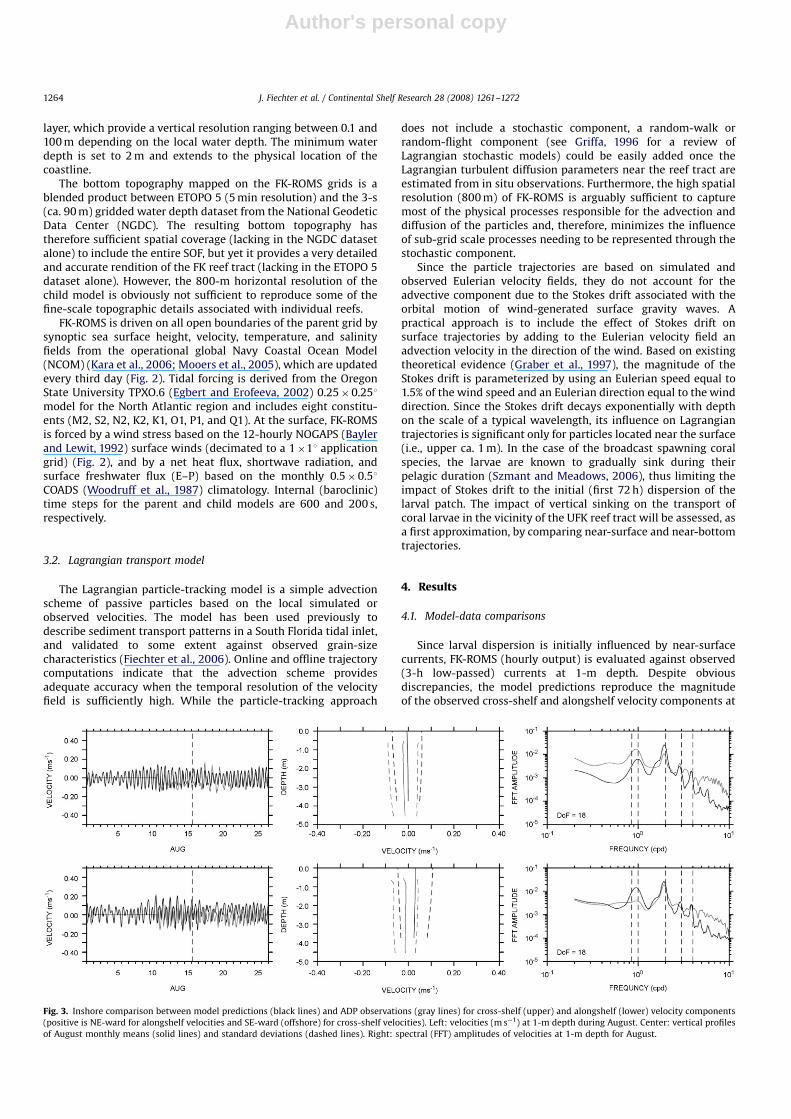
Since larval dispersion is initially influenced by near-surfacecurrents, FK-ROMS (hourly output) is evaluated against observed(3-h low-passed) currents at 1-m depth. Despite obviousdiscrepancies, the model predictions reproduce the magnitudeof the observed cross-shelf and alongshelf velocity components at
ARTICLE IN PRESS
Fig. 3. Inshore comparison between model predictions (black lines) and ADP observations (gray lines) for cross-shelf (upper) and alongshelf (lower) velocity components
(positive is NE-ward for alongshelf velocities and SE-ward (offshore) for cross-shelf velocities). Left: velocities (m s�1) at 1-m depth during August. Center: vertical profiles
of August monthly means (solid lines) and standard deviations (dashed lines). Right: spectral (FFT) amplitudes of velocities at 1-m depth for August.
J. Fiechter et al. / Continental Shelf Research 28 (2008) 1261–12721264
Author's personal copy
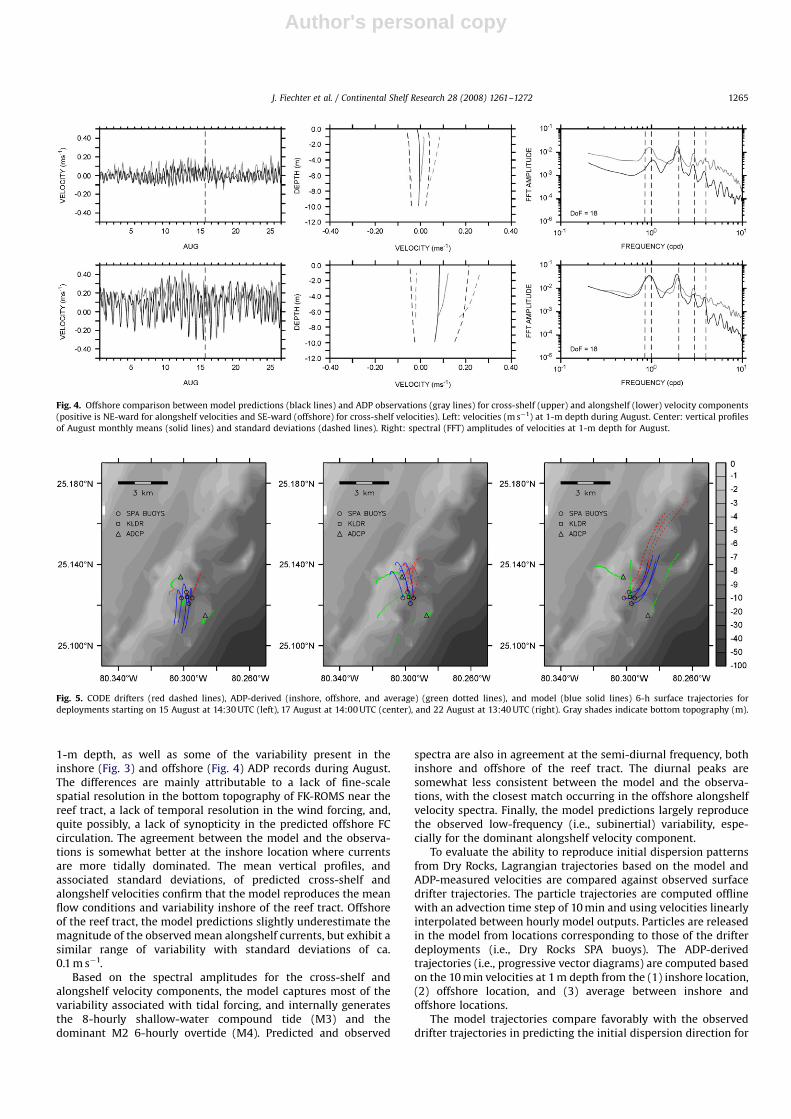
1-m depth, as well as some of the variability present in theinshore (Fig. 3) and offshore (Fig. 4) ADP records during August.The differences are mainly attributable to a lack of fine-scalespatial resolution in the bottom topography of FK-ROMS near thereef tract, a lack of temporal resolution in the wind forcing, and,quite possibly, a lack of synopticity in the predicted offshore FCcirculation. The agreement between the model and the observa-tions is somewhat better at the inshore location where currentsare more tidally dominated. The mean vertical profiles, andassociated standard deviations, of predicted cross-shelf andalongshelf velocities confirm that the model reproduces the meanflow conditions and variability inshore of the reef tract. Offshoreof the reef tract, the model predictions slightly underestimate themagnitude of the observed mean alongshelf currents, but exhibit asimilar range of variability with standard deviations of ca.0.1 m s�1.
Based on the spectral amplitudes for the cross-shelf andalongshelf velocity components, the model captures most of thevariability associated with tidal forcing, and internally generatesthe 8-hourly shallow-water compound tide (M3) and thedominant M2 6-hourly overtide (M4). Predicted and observed
spectra are also in agreement at the semi-diurnal frequency, bothinshore and offshore of the reef tract. The diurnal peaks aresomewhat less consistent between the model and the observa-tions, with the closest match occurring in the offshore alongshelfvelocity spectra. Finally, the model predictions largely reproducethe observed low-frequency (i.e., subinertial) variability, espe-cially for the dominant alongshelf velocity component.
To evaluate the ability to reproduce initial dispersion patternsfrom Dry Rocks, Lagrangian trajectories based on the model andADP-measured velocities are compared against observed surfacedrifter trajectories. The particle trajectories are computed offlinewith an advection time step of 10 min and using velocities linearlyinterpolated between hourly model outputs. Particles are releasedin the model from locations corresponding to those of the drifterdeployments (i.e., Dry Rocks SPA buoys). The ADP-derivedtrajectories (i.e., progressive vector diagrams) are computed basedon the 10 min velocities at 1 m depth from the (1) inshore location,(2) offshore location, and (3) average between inshore andoffshore locations.
The model trajectories compare favorably with the observeddrifter trajectories in predicting the initial dispersion direction for
ARTICLE IN PRESS
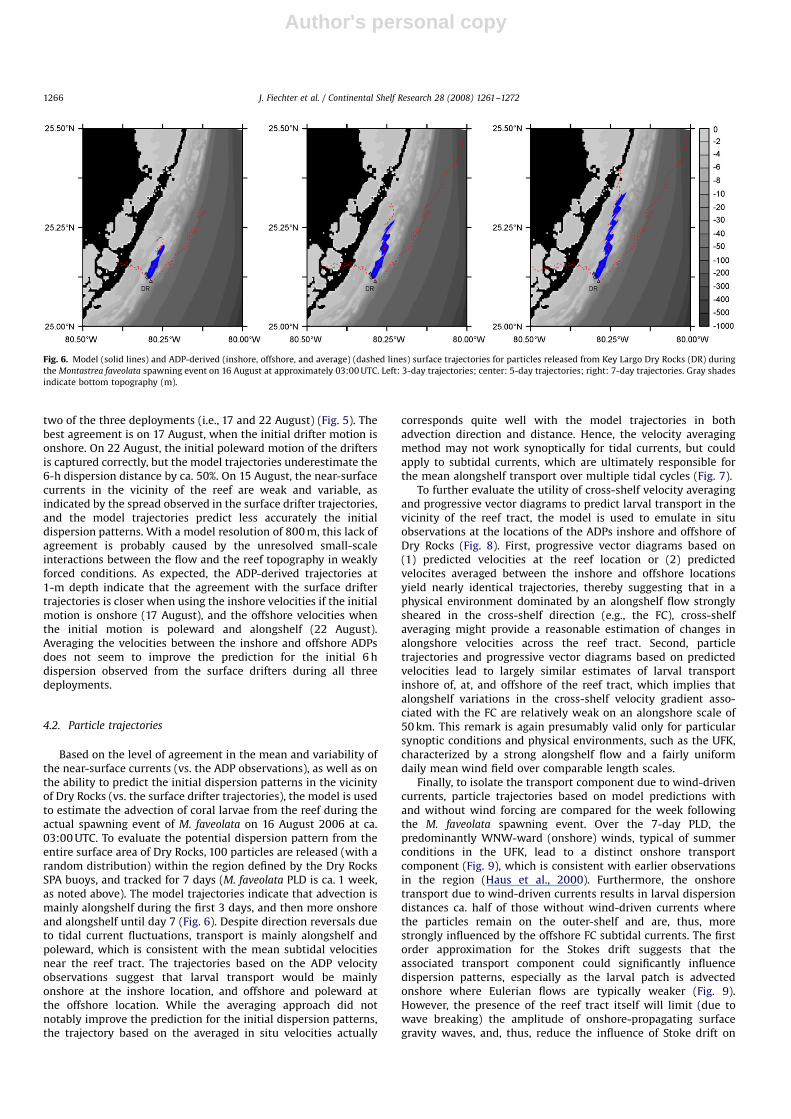
Fig. 5. CODE drifters (red dashed lines), ADP-derived (inshore, offshore, and average) (green dotted lines), and model (blue solid lines) 6-h surface trajectories for
deployments starting on 15 August at 14:30 UTC (left), 17 August at 14:00 UTC (center), and 22 August at 13:40 UTC (right). Gray shades indicate bottom topography (m).
Fig. 4. Offshore comparison between model predictions (black lines) and ADP observations (gray lines) for cross-shelf (upper) and alongshelf (lower) velocity components
(positive is NE-ward for alongshelf velocities and SE-ward (offshore) for cross-shelf velocities). Left: velocities (m s�1) at 1-m depth during August. Center: vertical profiles
of August monthly means (solid lines) and standard deviations (dashed lines). Right: spectral (FFT) amplitudes of velocities at 1-m depth for August.
J. Fiechter et al. / Continental Shelf Research 28 (2008) 1261–1272 1265
Author's personal copy
two of the three deployments (i.e., 17 and 22 August) (Fig. 5). Thebest agreement is on 17 August, when the initial drifter motion isonshore. On 22 August, the initial poleward motion of the driftersis captured correctly, but the model trajectories underestimate the6-h dispersion distance by ca. 50%. On 15 August, the near-surfacecurrents in the vicinity of the reef are weak and variable, asindicated by the spread observed in the surface drifter trajectories,and the model trajectories predict less accurately the initialdispersion patterns. With a model resolution of 800 m, this lack ofagreement is probably caused by the unresolved small-scaleinteractions between the flow and the reef topography in weaklyforced conditions. As expected, the ADP-derived trajectories at1-m depth indicate that the agreement with the surface driftertrajectories is closer when using the inshore velocities if the initialmotion is onshore (17 August), and the offshore velocities whenthe initial motion is poleward and alongshelf (22 August).Averaging the velocities between the inshore and offshore ADPsdoes not seem to improve the prediction for the initial 6 hdispersion observed from the surface drifters during all threedeployments.
4.2. Particle trajectories
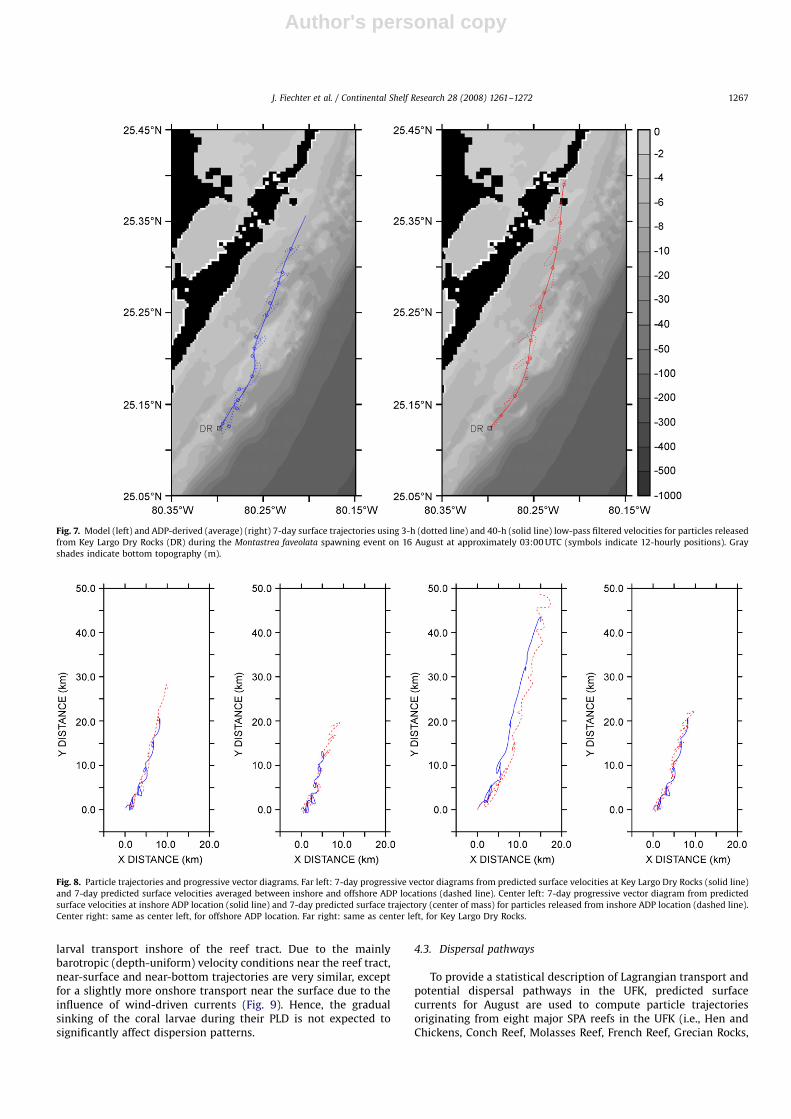
Based on the level of agreement in the mean and variability ofthe near-surface currents (vs. the ADP observations), as well as onthe ability to predict the initial dispersion patterns in the vicinityof Dry Rocks (vs. the surface drifter trajectories), the model is usedto estimate the advection of coral larvae from the reef during theactual spawning event of M. faveolata on 16 August 2006 at ca.03:00 UTC. To evaluate the potential dispersion pattern from theentire surface area of Dry Rocks, 100 particles are released (with arandom distribution) within the region defined by the Dry RocksSPA buoys, and tracked for 7 days (M. faveolata PLD is ca. 1 week,as noted above). The model trajectories indicate that advection ismainly alongshelf during the first 3 days, and then more onshoreand alongshelf until day 7 (Fig. 6). Despite direction reversals dueto tidal current fluctuations, transport is mainly alongshelf andpoleward, which is consistent with the mean subtidal velocitiesnear the reef tract. The trajectories based on the ADP velocityobservations suggest that larval transport would be mainlyonshore at the inshore location, and offshore and poleward atthe offshore location. While the averaging approach did notnotably improve the prediction for the initial dispersion patterns,the trajectory based on the averaged in situ velocities actually
corresponds quite well with the model trajectories in bothadvection direction and distance. Hence, the velocity averagingmethod may not work synoptically for tidal currents, but couldapply to subtidal currents, which are ultimately responsible forthe mean alongshelf transport over multiple tidal cycles (Fig. 7).
To further evaluate the utility of cross-shelf velocity averagingand progressive vector diagrams to predict larval transport in thevicinity of the reef tract, the model is used to emulate in situobservations at the locations of the ADPs inshore and offshore ofDry Rocks (Fig. 8). First, progressive vector diagrams based on(1) predicted velocities at the reef location or (2) predictedvelocites averaged between the inshore and offshore locationsyield nearly identical trajectories, thereby suggesting that in aphysical environment dominated by an alongshelf flow stronglysheared in the cross-shelf direction (e.g., the FC), cross-shelfaveraging might provide a reasonable estimation of changes inalongshore velocities across the reef tract. Second, particletrajectories and progressive vector diagrams based on predictedvelocities lead to largely similar estimates of larval transportinshore of, at, and offshore of the reef tract, which implies thatalongshelf variations in the cross-shelf velocity gradient asso-ciated with the FC are relatively weak on an alongshore scale of50 km. This remark is again presumably valid only for particularsynoptic conditions and physical environments, such as the UFK,characterized by a strong alongshelf flow and a fairly uniformdaily mean wind field over comparable length scales.
Finally, to isolate the transport component due to wind-drivencurrents, particle trajectories based on model predictions withand without wind forcing are compared for the week followingthe M. faveolata spawning event. Over the 7-day PLD, thepredominantly WNW-ward (onshore) winds, typical of summerconditions in the UFK, lead to a distinct onshore transportcomponent (Fig. 9), which is consistent with earlier observationsin the region (Haus et al., 2000). Furthermore, the onshoretransport due to wind-driven currents results in larval dispersiondistances ca. half of those without wind-driven currents wherethe particles remain on the outer-shelf and are, thus, morestrongly influenced by the offshore FC subtidal currents. The firstorder approximation for the Stokes drift suggests that theassociated transport component could significantly influencedispersion patterns, especially as the larval patch is advectedonshore where Eulerian flows are typically weaker (Fig. 9).However, the presence of the reef tract itself will limit (due towave breaking) the amplitude of onshore-propagating surfacegravity waves, and, thus, reduce the influence of Stoke drift on
ARTICLE IN PRESS
Fig. 6. Model (solid lines) and ADP-derived (inshore, offshore, and average) (dashed lines) surface trajectories for particles released from Key Largo Dry Rocks (DR) during
the Montastrea faveolata spawning event on 16 August at approximately 03:00 UTC. Left: 3-day trajectories; center: 5-day trajectories; right: 7-day trajectories. Gray shades
indicate bottom topography (m).
J. Fiechter et al. / Continental Shelf Research 28 (2008) 1261–12721266
Author's personal copy
larval transport inshore of the reef tract. Due to the mainlybarotropic (depth-uniform) velocity conditions near the reef tract,near-surface and near-bottom trajectories are very similar, exceptfor a slightly more onshore transport near the surface due to theinfluence of wind-driven currents (Fig. 9). Hence, the gradualsinking of the coral larvae during their PLD is not expected tosignificantly affect dispersion patterns.
4.3. Dispersal pathways
To provide a statistical description of Lagrangian transport andpotential dispersal pathways in the UFK, predicted surfacecurrents for August are used to compute particle trajectoriesoriginating from eight major SPA reefs in the UFK (i.e., Hen andChickens, Conch Reef, Molasses Reef, French Reef, Grecian Rocks,
ARTICLE IN PRESS
Fig. 7. Model (left) and ADP-derived (average) (right) 7-day surface trajectories using 3-h (dotted line) and 40-h (solid line) low-pass filtered velocities for particles released
from Key Largo Dry Rocks (DR) during the Montastrea faveolata spawning event on 16 August at approximately 03:00 UTC (symbols indicate 12-hourly positions). Gray
shades indicate bottom topography (m).
Fig. 8. Particle trajectories and progressive vector diagrams. Far left: 7-day progressive vector diagrams from predicted surface velocities at Key Largo Dry Rocks (solid line)
and 7-day predicted surface velocities averaged between inshore and offshore ADP locations (dashed line). Center left: 7-day progressive vector diagram from predicted
surface velocities at inshore ADP location (solid line) and 7-day predicted surface trajectory (center of mass) for particles released from inshore ADP location (dashed line).
Center right: same as center left, for offshore ADP location. Far right: same as center left, for Key Largo Dry Rocks.
J. Fiechter et al. / Continental Shelf Research 28 (2008) 1261–1272 1267
Author's personal copy
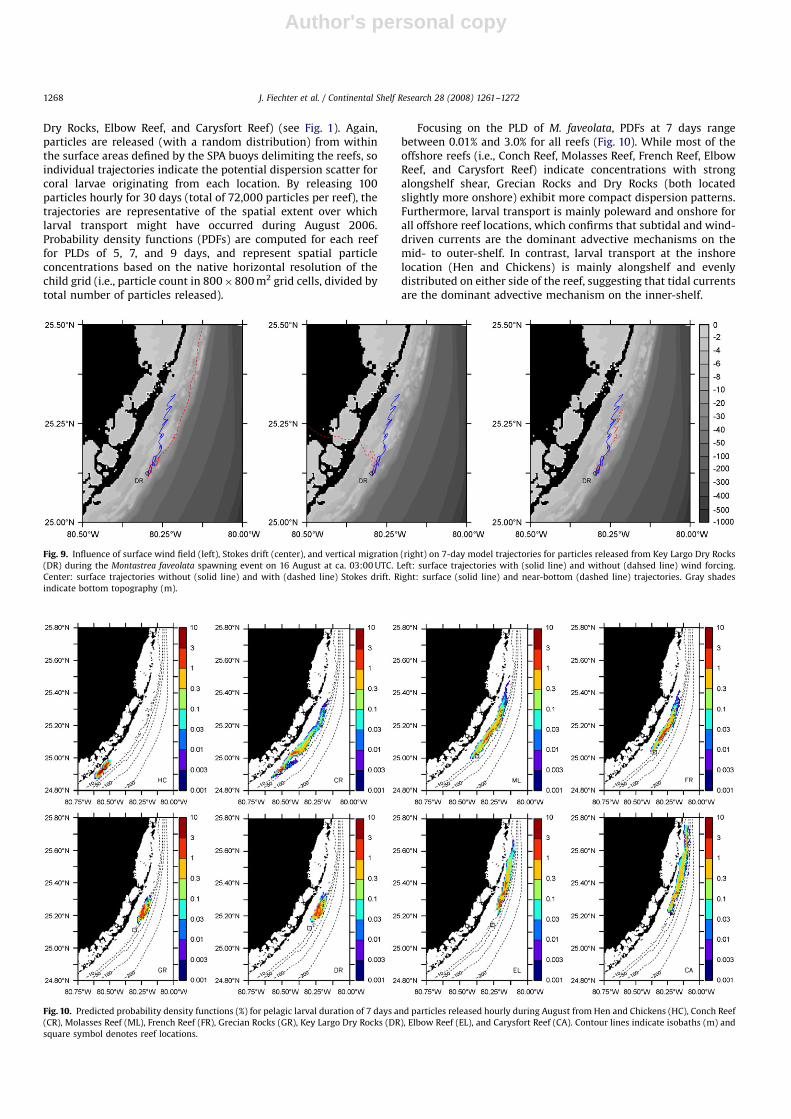
Dry Rocks, Elbow Reef, and Carysfort Reef) (see Fig. 1). Again,particles are released (with a random distribution) from withinthe surface areas defined by the SPA buoys delimiting the reefs, soindividual trajectories indicate the potential dispersion scatter forcoral larvae originating from each location. By releasing 100particles hourly for 30 days (total of 72,000 particles per reef), thetrajectories are representative of the spatial extent over whichlarval transport might have occurred during August 2006.Probability density functions (PDFs) are computed for each reeffor PLDs of 5, 7, and 9 days, and represent spatial particleconcentrations based on the native horizontal resolution of thechild grid (i.e., particle count in 800�800 m2 grid cells, divided bytotal number of particles released).
Focusing on the PLD of M. faveolata, PDFs at 7 days rangebetween 0.01% and 3.0% for all reefs (Fig. 10). While most of theoffshore reefs (i.e., Conch Reef, Molasses Reef, French Reef, ElbowReef, and Carysfort Reef) indicate concentrations with strongalongshelf shear, Grecian Rocks and Dry Rocks (both locatedslightly more onshore) exhibit more compact dispersion patterns.Furthermore, larval transport is mainly poleward and onshore forall offshore reef locations, which confirms that subtidal and wind-driven currents are the dominant advective mechanisms on themid- to outer-shelf. In contrast, larval transport at the inshorelocation (Hen and Chickens) is mainly alongshelf and evenlydistributed on either side of the reef, suggesting that tidal currentsare the dominant advective mechanism on the inner-shelf.
ARTICLE IN PRESS
Fig. 9. Influence of surface wind field (left), Stokes drift (center), and vertical migration (right) on 7-day model trajectories for particles released from Key Largo Dry Rocks
(DR) during the Montastrea faveolata spawning event on 16 August at ca. 03:00 UTC. Left: surface trajectories with (solid line) and without (dahsed line) wind forcing.
Center: surface trajectories without (solid line) and with (dashed line) Stokes drift. Right: surface (solid line) and near-bottom (dashed line) trajectories. Gray shades
indicate bottom topography (m).
Fig. 10. Predicted probability density functions (%) for pelagic larval duration of 7 days and particles released hourly during August from Hen and Chickens (HC), Conch Reef
(CR), Molasses Reef (ML), French Reef (FR), Grecian Rocks (GR), Key Largo Dry Rocks (DR), Elbow Reef (EL), and Carysfort Reef (CA). Contour lines indicate isobaths (m) and
square symbol denotes reef locations.
J. Fiechter et al. / Continental Shelf Research 28 (2008) 1261–12721268
Author's personal copy
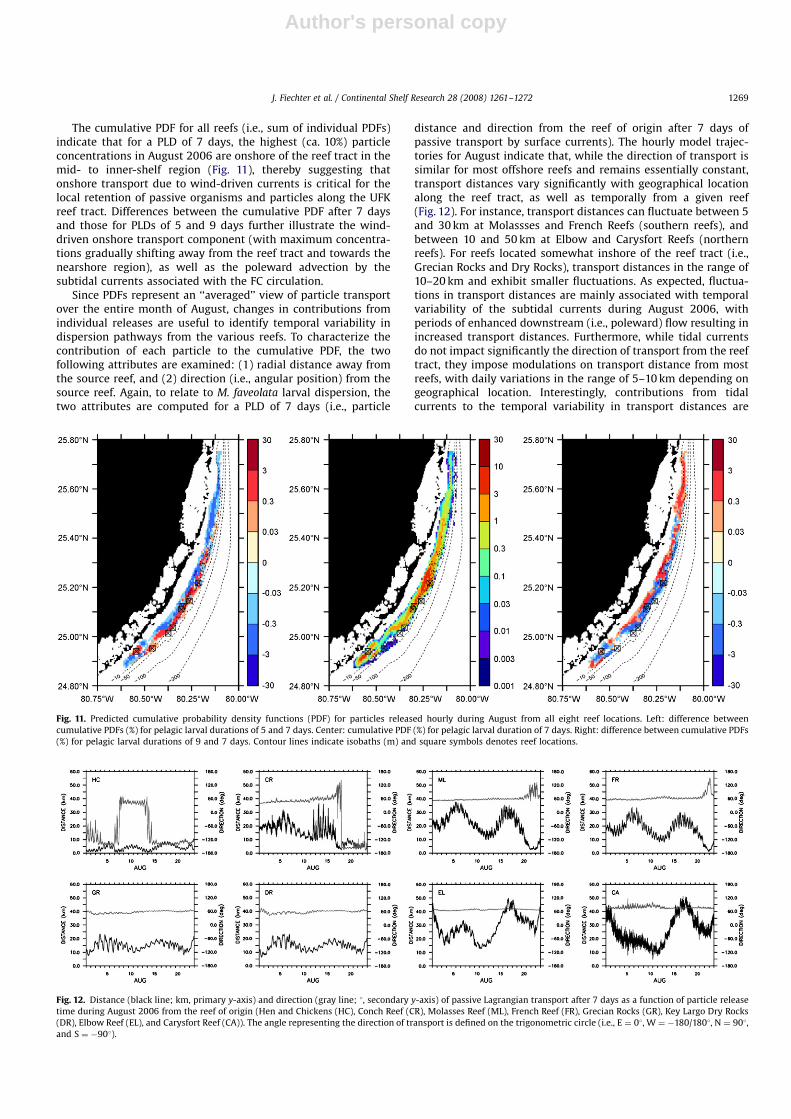
The cumulative PDF for all reefs (i.e., sum of individual PDFs)indicate that for a PLD of 7 days, the highest (ca. 10%) particleconcentrations in August 2006 are onshore of the reef tract in themid- to inner-shelf region (Fig. 11), thereby suggesting thatonshore transport due to wind-driven currents is critical for thelocal retention of passive organisms and particles along the UFKreef tract. Differences between the cumulative PDF after 7 daysand those for PLDs of 5 and 9 days further illustrate the wind-driven onshore transport component (with maximum concentra-tions gradually shifting away from the reef tract and towards thenearshore region), as well as the poleward advection by thesubtidal currents associated with the FC circulation.
Since PDFs represent an ‘‘averaged’’ view of particle transportover the entire month of August, changes in contributions fromindividual releases are useful to identify temporal variability indispersion pathways from the various reefs. To characterize thecontribution of each particle to the cumulative PDF, the twofollowing attributes are examined: (1) radial distance away fromthe source reef, and (2) direction (i.e., angular position) from thesource reef. Again, to relate to M. faveolata larval dispersion, thetwo attributes are computed for a PLD of 7 days (i.e., particle
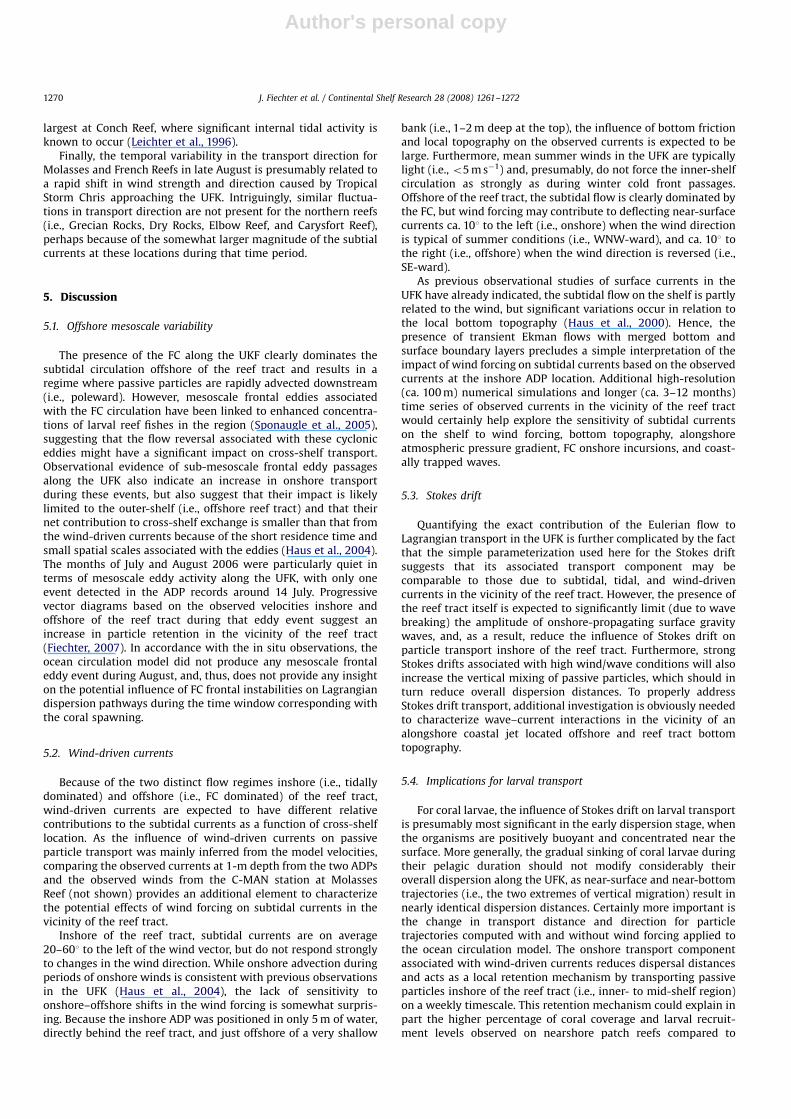
distance and direction from the reef of origin after 7 days ofpassive transport by surface currents). The hourly model trajec-tories for August indicate that, while the direction of transport issimilar for most offshore reefs and remains essentially constant,transport distances vary significantly with geographical locationalong the reef tract, as well as temporally from a given reef(Fig. 12). For instance, transport distances can fluctuate between 5and 30 km at Molassses and French Reefs (southern reefs), andbetween 10 and 50 km at Elbow and Carysfort Reefs (northernreefs). For reefs located somewhat inshore of the reef tract (i.e.,Grecian Rocks and Dry Rocks), transport distances in the range of10–20 km and exhibit smaller fluctuations. As expected, fluctua-tions in transport distances are mainly associated with temporalvariability of the subtidal currents during August 2006, withperiods of enhanced downstream (i.e., poleward) flow resulting inincreased transport distances. Furthermore, while tidal currentsdo not impact significantly the direction of transport from the reeftract, they impose modulations on transport distance from mostreefs, with daily variations in the range of 5–10 km depending ongeographical location. Interestingly, contributions from tidalcurrents to the temporal variability in transport distances are
ARTICLE IN PRESS
Fig. 11. Predicted cumulative probability density functions (PDF) for particles released hourly during August from all eight reef locations. Left: difference between
cumulative PDFs (%) for pelagic larval durations of 5 and 7 days. Center: cumulative PDF (%) for pelagic larval duration of 7 days. Right: difference between cumulative PDFs
(%) for pelagic larval durations of 9 and 7 days. Contour lines indicate isobaths (m) and square symbols denotes reef locations.
Fig. 12. Distance (black line; km, primary y-axis) and direction (gray line; 1, secondary y-axis) of passive Lagrangian transport after 7 days as a function of particle release
time during August 2006 from the reef of origin (Hen and Chickens (HC), Conch Reef (CR), Molasses Reef (ML), French Reef (FR), Grecian Rocks (GR), Key Largo Dry Rocks
(DR), Elbow Reef (EL), and Carysfort Reef (CA)). The angle representing the direction of transport is defined on the trigonometric circle (i.e., E ¼ 01, W ¼ �180/1801, N ¼ 901,
and S ¼ �901).
J. Fiechter et al. / Continental Shelf Research 28 (2008) 1261–1272 1269
Author's personal copy
largest at Conch Reef, where significant internal tidal activity isknown to occur (Leichter et al., 1996).
Finally, the temporal variability in the transport direction forMolasses and French Reefs in late August is presumably related toa rapid shift in wind strength and direction caused by TropicalStorm Chris approaching the UFK. Intriguingly, similar fluctua-tions in transport direction are not present for the northern reefs(i.e., Grecian Rocks, Dry Rocks, Elbow Reef, and Carysfort Reef),perhaps because of the somewhat larger magnitude of the subtialcurrents at these locations during that time period.
5. Discussion
5.1. Offshore mesoscale variability
The presence of the FC along the UKF clearly dominates thesubtidal circulation offshore of the reef tract and results in aregime where passive particles are rapidly advected downstream(i.e., poleward). However, mesoscale frontal eddies associatedwith the FC circulation have been linked to enhanced concentra-tions of larval reef fishes in the region (Sponaugle et al., 2005),suggesting that the flow reversal associated with these cycloniceddies might have a significant impact on cross-shelf transport.Observational evidence of sub-mesoscale frontal eddy passagesalong the UFK also indicate an increase in onshore transportduring these events, but also suggest that their impact is likelylimited to the outer-shelf (i.e., offshore reef tract) and that theirnet contribution to cross-shelf exchange is smaller than that fromthe wind-driven currents because of the short residence time andsmall spatial scales associated with the eddies (Haus et al., 2004).The months of July and August 2006 were particularly quiet interms of mesoscale eddy activity along the UFK, with only oneevent detected in the ADP records around 14 July. Progressivevector diagrams based on the observed velocities inshore andoffshore of the reef tract during that eddy event suggest anincrease in particle retention in the vicinity of the reef tract(Fiechter, 2007). In accordance with the in situ observations, theocean circulation model did not produce any mesoscale frontaleddy event during August, and, thus, does not provide any insighton the potential influence of FC frontal instabilities on Lagrangiandispersion pathways during the time window corresponding withthe coral spawning.
5.2. Wind-driven currents
Because of the two distinct flow regimes inshore (i.e., tidallydominated) and offshore (i.e., FC dominated) of the reef tract,wind-driven currents are expected to have different relativecontributions to the subtidal currents as a function of cross-shelflocation. As the influence of wind-driven currents on passiveparticle transport was mainly inferred from the model velocities,comparing the observed currents at 1-m depth from the two ADPsand the observed winds from the C-MAN station at MolassesReef (not shown) provides an additional element to characterizethe potential effects of wind forcing on subtidal currents in thevicinity of the reef tract.
Inshore of the reef tract, subtidal currents are on average20–601 to the left of the wind vector, but do not respond stronglyto changes in the wind direction. While onshore advection duringperiods of onshore winds is consistent with previous observationsin the UFK (Haus et al., 2004), the lack of sensitivity toonshore–offshore shifts in the wind forcing is somewhat surpris-ing. Because the inshore ADP was positioned in only 5 m of water,directly behind the reef tract, and just offshore of a very shallow
bank (i.e., 1–2 m deep at the top), the influence of bottom frictionand local topography on the observed currents is expected to belarge. Furthermore, mean summer winds in the UFK are typicallylight (i.e., o5 m s�1) and, presumably, do not force the inner-shelfcirculation as strongly as during winter cold front passages.Offshore of the reef tract, the subtidal flow is clearly dominated bythe FC, but wind forcing may contribute to deflecting near-surfacecurrents ca. 101 to the left (i.e., onshore) when the wind directionis typical of summer conditions (i.e., WNW-ward), and ca. 101 tothe right (i.e., offshore) when the wind direction is reversed (i.e.,SE-ward).
As previous observational studies of surface currents in theUFK have already indicated, the subtidal flow on the shelf is partlyrelated to the wind, but significant variations occur in relation tothe local bottom topography (Haus et al., 2000). Hence, thepresence of transient Ekman flows with merged bottom andsurface boundary layers precludes a simple interpretation of theimpact of wind forcing on subtidal currents based on the observedcurrents at the inshore ADP location. Additional high-resolution(ca. 100 m) numerical simulations and longer (ca. 3–12 months)time series of observed currents in the vicinity of the reef tractwould certainly help explore the sensitivity of subtidal currentson the shelf to wind forcing, bottom topography, alongshoreatmospheric pressure gradient, FC onshore incursions, and coast-ally trapped waves.
5.3. Stokes drift
Quantifying the exact contribution of the Eulerian flow toLagrangian transport in the UFK is further complicated by the factthat the simple parameterization used here for the Stokes driftsuggests that its associated transport component may becomparable to those due to subtidal, tidal, and wind-drivencurrents in the vicinity of the reef tract. However, the presence ofthe reef tract itself is expected to significantly limit (due to wavebreaking) the amplitude of onshore-propagating surface gravitywaves, and, as a result, reduce the influence of Stokes drift onparticle transport inshore of the reef tract. Furthermore, strongStokes drifts associated with high wind/wave conditions will alsoincrease the vertical mixing of passive particles, which should inturn reduce overall dispersion distances. To properly addressStokes drift transport, additional investigation is obviously neededto characterize wave–current interactions in the vicinity of analongshore coastal jet located offshore and reef tract bottomtopography.
5.4. Implications for larval transport
For coral larvae, the influence of Stokes drift on larval transportis presumably most significant in the early dispersion stage, whenthe organisms are positively buoyant and concentrated near thesurface. More generally, the gradual sinking of coral larvae duringtheir pelagic duration should not modify considerably theiroverall dispersion along the UFK, as near-surface and near-bottomtrajectories (i.e., the two extremes of vertical migration) result innearly identical dispersion distances. Certainly more important isthe change in transport distance and direction for particletrajectories computed with and without wind forcing applied tothe ocean circulation model. The onshore transport componentassociated with wind-driven currents reduces dispersal distancesand acts as a local retention mechanism by transporting passiveparticles inshore of the reef tract (i.e., inner- to mid-shelf region)on a weekly timescale. This retention mechanism could explain inpart the higher percentage of coral coverage and larval recruit-ment levels observed on nearshore patch reefs compared to
ARTICLE IN PRESS
J. Fiechter et al. / Continental Shelf Research 28 (2008) 1261–12721270
Author's personal copy
offshore reefs (Chiappone, 1996; Miller et al., 2000). Since pelagicmortality typically reduces larval concentrations by several ordersof magnitude, additional physical processes that could locallyenhance already existing retention or aggregation regions (e.g.,Stokes drift, mesoscale fronts and eddies, vertical mixing) mayalso have a significant impact on achieving ecologically significantlarval concentrations in the region.
To address some of the remaining issues, future studies shouldbe conducted to quantify the importance of turbulent transport(i.e., through introduction of a Lagrangian turbulent eddycoefficient in particle trajectory calculations) for mid- and inner-shelf shallow reef environments, and thus allow a properparameterization for the addition of a random-walk or arandom-flight component to the Lagrangian larval transportmodel. Furthermore, a simple vertical migratory pattern (e.g.,linear sinking over the PLD) could be added to the transport modelto identify subregions of the domain where Stokes drift or near-surface wind-driven currents would lead to significant variationsin larval transport with depth.
6. Conclusions
While specifically focusing on the larval dispersion of M.
faveolata after a spawning event in the UFK during August 2006,the combination of targeted in situ observations and numericalocean circulation modeling revealed fundamental physical pro-cesses affecting alongshelf and cross-shelf transport of passiveparticles in the UFK. In the vicinity of the reef tract, alongshelfadvection is mainly poleward and due to subtidal currentsassociated with the FC, while cross-shelf advection is mainlyonshore and due to wind-driven currents. Wind-driven onshoretransport also tends to reduce the overall advection distances bykeeping larvae inshore of the reef tract where alongshelf velocitiesare generally weaker. While tidal currents result in predominantlyalongshelf displacements, they do not contribute significantly tonet transport on a weekly timescale.
For August 2006, the direction of transport from the offshorereefs, mainly dictated by the subtidal FC flow and wind-drivencurrents, remains essentially constant, thereby suggesting limitedpotential dispersion pathways in the UFK. In contrast, advectiondistances for pelagic durations of ca. 1 week vary significantlywith location and time of release, ranging from 10 to 50 km for theouter-shelf reefs (i.e., Molasses, French, Elbow, and CarysfortReefs) and 10 to 20 km for the mid-shelf reefs (i.e., Grecian Rocksand Dry Rocks). While the variability in Lagrangian transportdistances is mainly associated with fluctuation in the alongshelfflow of the FC, tidal velocities may locally modulate transportdistances (daily variations in the range of 5–10 km depending ongeographical location), especially during periods of weakersubtidal currents. Since particle trajectories and progressivevector diagrams based on predicted and observed velocitiesproduce largely similar estimates of larval transport inshore of,at, and offshore of the UFK reef tract, the results suggest thatalongshelf variations in the cross-shelf velocity gradient asso-ciated with the FC are relatively weak on an alongshore scale of50 km. Similar conclusions would presumably be valid for otherphysical environments similarly characterized by a strong along-shelf flow and a fairly uniform daily mean wind field overcomparable length scales.
Because of the strong downstream (i.e., poleward) transportassociated with the presence of the FC offshore of the reef tract,the wind-driven onshore transport component might be a criticalmechanism for the local retention of passive larval organisms inthe UFK. However, early settling larvae may be important tomaintain self-recruitment and connectivity among the offshore
reefs, as maximum larval concentrations gradually shift onshoreand away from the reef tract with increasing pelagic durationunder the influence of wind-driven currents. In addition to earlylarval settling, reef-scale turbulent and mixing processes wouldalso play a significant role in retaining larvae near their spawningsite and enhancing self-recruitment for the typical PLD associatedwith M. faveolata.
Finally, the present study illustrates the necessity to conducttargeted in situ observations in combination with numericalocean circulation modeling to characterize the wide range ofvariability associated with physical processes occurring in ashallow reef environment, and to understand their potentialimpact on alongshelf and cross-shelf transport of passive particlesand other tracers. For larval organisms with a pelagic stage, suchstudies are a critical component to the identification, andultimately the protection, of specific source reefs contributing toregional connectivity, while maintaining their own local popula-tion through self-recruitment.
Acknowledgments
This research was mainly funded by a grant from the NationalOceanic and Atmospheric Administration’s Undersea ResearchCenter at the University of North Carolina at Wilmington pursuantto NOAA award number NA03OAR4300088. This research is also acontribution to the Southeast Atlantic Coastal Ocean ObservingSystem (SEACOOS) Program funded by the Office of NavalResearch. Dr. Elizabeth Johns, Grant Rawson, and Ryan Smith atNOAA/AOML are thanked for their assistance in planning andconducting the surface drifter deployments. Richard Curry atBiscayne National Park is thanked for his assistance with the ADPdeployments. This study was also inspired by discussions withDrs. Alina Szmant at the University of North Carolina atWilmington, and Christopher Taggart and Barry Ruddick atDalhousie University. Comments from Dr. James Leichter at theScripps Institution of Oceanography (UCSD) and one anonymousreviewer are greatly appreciated.
References
Armsworth, P.R., 2002. Recruitment limitation, population regulation, and larvalconnectivity in reef fish metapopulations. Ecology 83 (4), 1092–1104.
Bayler, G., Lewit, H., 1992. The Navy Operational Global and Regional AtmosphericPrediction System at the Fleet Numerical Oceanography Center. Weather andForecasting 7 (2), 273–279.
Bode, M., Bode, L., Armsworth, P.R., 2006. Larval dispersal reveals regional sourcesand sinks in the Great Barrier Reef. Marine Ecology Progress Series 308, 17–25.
Chiappone, M., 1996. Coral Watch Program Summary: A Report on Volunteer andScientific Efforts to Document the Status of the Reef in the Florida Key NationalMarine Sanctuary. The Nature Conservancy, Summerland Key, FL, unpublished.
Cowen, R.K., Gawarkiewicz, G., Pineda, J., Thorrold, S., Werner, F., 2002. Populationconnectivity in marine systems. Report of a Workshop to Develop ScienceRecommendations for the National Science Foundation, Durango, CO.
Cowen, R.K., Paris, C.B., Srinivasan, A., 2006. Scaling of connectivity in marinepopulations. Science 311, 522–527.
Criales, M.M., Wang, J., Browder, J.A., Robblee, M.B., 2005. Tidal and seasonal effectof transport of pink shrimp postlarvae. Marine Ecology Progress Series 286,231–238.
Davis, R.E., 1985. Drifter observations of coastal surface currents during CODE: themethod and descriptive view. Journal of Geophysical Research 90, 4741–4755.
Egbert, G., Erofeeva, S., 2002. Efficient inverse modeling of barotropic ocean tides.Journal of Atmospheric and Oceanic Technology 19, 183–204.
Fiechter, J., 2007. Living on the edge of the Florida Current: a study of the physicalprocesses affecting primary production and larval transport. Ph.D. Dissertation,University of Miami, Miami, FL.
Fiechter, J., Steffen, K.L., Mooers, C.N.K., Haus, B.K., 2006. Hydrodynamics andsediment transport in a southeast Florida tidal inlet. Estuarine, Coastal andShelf Science 70, 297–306.
Graber, H.C., Haus, B.K., Chapman, R.D., Shay, L.K., 1997. HF radar comparisons withmoored estimates of current speed and direction: expected differences andimplications. Journal of Geophysical Research 102 (C8), 18,749–18,766.
ARTICLE IN PRESS
J. Fiechter et al. / Continental Shelf Research 28 (2008) 1261–1272 1271
Author's personal copy
Griffa, A., 1996. Applications of stochastic particle models to oceanographicalproblems. In: Adler, R., Muller, P., Rozovskii, B. (Eds.), Stochastic Modeling inPhysical Oceanography. Birkhauser, Boston, pp. 114–140.
Haus, B.K., Wang, J.D., Rivera, J., Martinez-Pedraja, J., Smith, N., 2000. Remote radarmeasurement of shelf currents off Key Largo, Florida, USA. Estuarine, Coastaland Shelf Science 51, 533–569.
Haus, B.K., Wang, J.D., Rivera, J., Martinez-Pedraja, J., Smith, N., 2004.Southeast Florida Shelf circulation and volume exchange: observationsof km-scale variability. Estuarine, Coastal and Shelf Science 59 (2),277–294.
James, M.K., Armsworth, P.R., Mason, L.B., Bode, L., 2002. The structure of reef fishmetapopulations: modeling larval dispersal and retention patterns. Proceed-ings of the Royal Society of London B 269, 2079–2086.
Kara, A.B., Barron, C.N., Martin, P.J., Smedstad, L.F., Rhodes, R.C., 2006. Validation ofinterannual simulations from the 1/81 global Navy Coastal Ocean Model(NCOM). Ocean Modeling 11, 376–398.
Lane, V.Z., Smith, S.L., Graber, H.C., Hitchcock, G.L., 2003. Mesoscale circulation andthe surface distribution of copepods near the south Florida Keys. Bulletin ofMarine Science 72 (1), 1–18.
Largier, J.L., 2003. Considerations in estimating larval dispersal distances fromoceanographic data. Ecological Applications 13 (Suppl. 1), 71–89.
Lee, T.N., Clarke, M.E., Williams, E., Szmant, A.F., Berger, T., 1994. Evolution of theTortugas gyre and its influence on recruitment in the Florida Keys. Bulletin ofMarine Science 54 (3), 621–646.
Leichter, J.J., Wing, S.R., Miller, S.L., Denny, M.W., 1996. Pulsed delivery ofsubthermocline water to Conch Reef (Florida Keys) by internal tidal bores.Limnology and Oceanography 41 (7), 1490–1501.
Miller, M.W., Weil, E., Szmant, A.M., 2000. Coral recruitment and juvenile mortalityas structuring factors for reef benthic communities in Biscayne National Park,USA. Coral Reefs 19, 115–123.
Mooers, C.N.K., Meinen, C.S., Baringer, M.O., Bang, I., Rhodes, R., Barron, C.N.,Bub, F., 2005. Cross validating ocean prediction and monitoring systems.EOS 86 (29).
Limouzy-Paris, C.B., Graber, H.C., Jones, D.L., Roepke, A.W., Richards, W.J., 1997.Translocation of larval coral reef fishes via sub-mesoscale spin-off eddies fromthe Florida Current. Bulletin of Marine Science 60, 966–983.
Peng, G., Mooers, C.N.K., Graber, H.C., 1999. Coastal winds in South Florida. Journalof Applied Meteorology 38, 1740–1757.
Penven, P., Debreu, L., Marchesiello, P., McWilliams, J.C., 2006. Evaluation andapplication of the ROMS 1-way embedding procedure to the central Californiaupwelling system. Ocean Modelling 12, 157–187.
Shay, L.K., Lee, T.N., Williams, E.J., Graber, H.C., Rooth, C.G.H., 1998. Effects of low-frequency current variability on near-inertial submesoscale vortices. Journal ofGeophysical Research 103 (C9), 18,691–18,714.
Shchepetkin, A.F., McWilliams, J.C., 2005. The regional oceanic modeling system(ROMS): a split-explicit, free-surface, topography-following-coordinate ocea-nic model. Ocean Modelling 9, 347–404.
Sponaugle, S., Fortuna, J., Grorud, K., Lee, T., 2003. Dynamic of larval fishassemblages over a shallow coral reef in the Florida Keys. Marine Biology143, 175–189.
Sponaugle, S., Lee, T., Kourafalou, V., Pinkard, D., 2005. Florida Current frontaleddies and the settlement of coral reef fishes. Limnology and Oceanography 50(4), 1033–1048.
Szmant, A.M., Meadows, M.G., 2006. Developmental changes in coral larvalbuoyancy and vertical swimming behavior: implications for dispersal andconnectivity. In: Proceedings of the 10th International Coral Reef Symposium,Okinawa, pp. 431–437.
Wang, J.D., Luo, J., Ault, J.S., 2003. Flows, salinity, and some implications for larvaltransport in South Biscayne Bay, Florida. Bulletin of Marine Science 72 (3),695–723.
Wolanski, E., Burrage, D., King, B., 1989. Trapping and dispersion of coral eggsaround Bowden Reef, Great Barrier Reef, following mass coral spawning.Continental Shelf Research 9 (5), 479–496.
Woodruff, S.D., Slutz, R.J., Jenne, R.L., Steurer, P.M., 1987. A comprehensiveocean–atmosphere data set. Bulletin of American Meteorological Society 68,1239–1250.
ARTICLE IN PRESS
J. Fiechter et al. / Continental Shelf Research 28 (2008) 1261–12721272