Perception of depressive symptoms by the Sardinian public: results of a population study

Physical Activity and Depressive Symptoms among PregnantWomen: The PIN3 Study
Zewditu Demissie, PhD, MPHDepartment of Epidemiology CB# 7435 Gillings School of Public Health The University of NorthCarolina at Chapel Hill Chapel Hill, NC 27599-7435
Anna Maria Siega-Riz, PhD, RDDepartments of Epidemiology and Nutrition 2015A McGavran-Greenberg CB# 7435 GillingsSchool of Public Health The University of North Carolina at Chapel Hill Chapel Hill, NC27599-7435
Kelly R. Evenson, PhDDepartment of Epidemiology Gillings School of Public Health The University of North Carolina atChapel Hill 137 East Franklin Street, Suite 306 Chapel Hill, NC 27514
Amy H. Herring, ScDDepartment of Biostatistics 135 Dauer Drive CB# 7420 Gillings School of Global Public HealthThe University of North Carolina at Chapel Hill Chapel Hill, NC 27599-7420
Nancy Dole, PhDCarolina Population Center 517 Univ Square East CB# 8120 The University of North Carolina atChapel Hill Chapel Hill, NC 27516
Bradley N. Gaynes, MD, MPHDepartment of Psychiatry Rm 10306, 1st Floor Neurosciences Hospital CB# 7160 School ofMedicine The University of North Carolina at Chapel Hill Chapel Hill, NC 27599
Women are approximately twice as likely to be diagnosed with major depressive disorderthan men in the United States (U.S.) (Weissman et al. 1993). One in five American womenwill be diagnosed with depression over her lifetime with a mean age of onset at 28 years,during the childbearing years (Kessler et al. 1993; Weissman et al. 1993). As hormones havebeen shown to influence emotions and mood, certain life changes (i.e., puberty, pregnancy,menopause) can make women particularly vulnerable to the onset or return of depressivesymptoms (National Institute of Mental Health [NIMH] 2008; Bennett et al. 2004).Approximately 15% of pregnant women have their initial onset of depression duringpregnancy (Gaynes et al. 2005). A systematic review determined that 18.4% of pregnantwomen experience depression during pregnancy based on clinical interview or assessment(Gaynes et al. 2005). The authors also reported that the estimated prevalence of depressionduring pregnancy was 11.0%, 8.5%, and 8.5% for the first, second, and third trimestersrespectively (Gaynes et al. 2005).
Depressive symptoms include sad mood, loss of interest in activities, feelings ofhelplessness and hopelessness, decreased energy, decision-making difficulties, sleepproblems, restlessness, irritability, changes in eating patterns, suicidal ideations or attempts,and persistent physical symptoms that do not respond to treatment (NIMH 2007). When thisoccurs during pregnancy, the disease poses threats to the mother's health and hasimplications for the health of her newborn and family (Lusskin et al. 2007; Bowen and
(Corresponding author) [email protected] Phone: (515)451-8605 Fax: (919) 966-4914.
NIH Public AccessAuthor ManuscriptArch Womens Ment Health. Author manuscript; available in PMC 2012 July 18.
Published in final edited form as:Arch Womens Ment Health. 2011 April ; 14(2): 145–157. doi:10.1007/s00737-010-0193-z.
NIH
-PA Author Manuscript
NIH
-PA Author Manuscript
NIH
-PA Author Manuscript

Muhajarine 2006). There is evidence of antenatal depression resulting in pregnancy andobstetric complications (Bowen and Muhajarine 2006; Larsson et al. 2004; Bennett et al.2004), poor health behaviors (Bennett et al. 2004), and risk-taking behaviors (Bowen andMuhajarine 2006; Bennett et al. 2004). Depressed mothers-to-be are also less likely to attendregular prenatal visits (Lusskin et al. 2007; Lee and Chung 2007; Bowen and Muhajarine2006). Maternal depression may impact the child from the fetal stage through childhood,influencing birth outcomes, mother-infant relations, development, and behavior (Lusskin etal. 2007; Bowen and Muhajarine 2006; Hammond and Crozier 2007; Brown and Solchany2004).
The most commonly employed treatments for depression are antidepressant medication andpsychotherapy though these may not be desirable among pregnant women due to concernsover side effects, stigma, time and financial costs (NIMH 2007; Hammond and Crozier2007; Bowen and Muhajarine 2006; Daley et al. 2007). This prompts incentive to investigateother treatments for depression (Hammond and Crozier 2007). Several studies have reportedon the association between physical activity and depression in non-pregnant populations,mostly finding that being physically active is associated with better mental health(Teychenne et al. 2008). Research is now focusing on the utility of physical activity as a toolto prevent and manage depression (Teychenne et al. 2008). Some studies have shown thatphysical activity can be as effective a treatment for depression as medication and therapy(Dunn et al. 2005; Craft and Perna 2004; Martinsen 2008).
The risks of participating in moderate intensity physical activity during pregnancy areconsidered low and may contribute to health benefits for both mother and fetus (Vladutiu etal. In Press; U.S. Department of Health and Human Services [DHHS] 2008; Pivarnik et al.2006). It is recommended that pregnant women who are not regularly active or who engagein low intensity activity participate in at least 150 minutes/ week of moderate-intensityactivity while women who are highly active can continue at their pre-pregnancy activitylevels (U.S. DHHS 2008).
Though the role of physical activity in the development and treatment of depression hasbeen studied extensively in general populations, research on pregnant populations is limited.To date, research on pregnant women has focused on total and recreational physical activity.In a number of studies, participation in physical activity was associated with lower levels ofdepressive symptoms (Pottinger et al. 2009; Orr et al. 2006; Haas et al. 2004, Da Costa et al.2003; Koniak-Griffin 1994). However, other studies have found primarily no associationsbetween total or recreational physical activity and depressive symptoms (Goodwin et al.2000; Poudevigne and O'Connor 2005; Symons Downs et al. 2008). These studies have alsoprimarily focused on cross-sectional associations between physical activity and depression,not examining potential longitudinal associations.
The objective of this investigation was to expand previous research and examine theassociation between overall and domain-specific moderate-to-vigorous physical activity(MVPA) and depressive symptoms during pregnancy.
MethodsSetting and population
This investigation used data from the third phase of the Pregnancy, Infection, and NutritionStudy (PIN3), a prospective cohort of pregnant women. The main objectives of the overallPIN3 Study were to investigate whether physical activity or stress are associated withpreterm birth. Women were recruited between January 2001 and June 2005 from prenatal
Demissie et al. Page 2
Arch Womens Ment Health. Author manuscript; available in PMC 2012 July 18.
NIH
-PA Author Manuscript
NIH
-PA Author Manuscript
NIH
-PA Author Manuscript

clinics at the University of North Carolina (UNC) Hospitals in Chapel Hill, NC. TheInstitutional Review Board of the UNC School of Medicine approved the study protocols.
ProceduresPotential participants for PIN3 were identified through medical chart reviews of newprenatal patients at the UNC Hospitals. Written informed consent was obtained from eachparticipant. Women were asked to participate in two research clinic visits (at <20 and 24–29weeks' gestation) in order to obtain biological samples, two telephone interviews (at 17–22and 27–30 weeks' gestation), and two self-administered questionnaires which were given ateach of the clinic visits and mailed back to study staff. Most psychosocial factors wereassessed on the self-administered questionnaires. During the telephone interviews, generalhealth, additional psychosocial measures, sociodemographic information, occupationalinformation, physical activity, reproductive history, and health behaviors were assessed.Medical charts were abstracted after delivery to obtain information on pregnancycomplications and outcomes.
ParticipantsThe PIN3 Study recruited women who were less than or equal to 20 weeks gestation at theirsecond prenatal visit. Women were excluded if they were younger than 16 years of age, non-English speaking, were not planning to continue care or give birth at the study site, carryingmultiple gestations, or did not have a telephone to complete the phone interviews. Out of3203 eligible participants, 2006 (63%) women were recruited. Women were allowed toparticipate in the PIN3 Study for more than one pregnancy. However, this analysis wasrestricted to the first PIN3 pregnancy, eliminating 274 pregnancies. Women were alsoexcluded if they had no known delivery date (n=57) or no data on physical activity (n=2),depression (n=335) or both (n=117). Additionally, one woman's physical activity level wasconsidered an outlier (≥70 hours/week of total physical activity) so her data was alsoexcluded. This resulted in a total of 1220 participants available for analysis. When comparedto the 455 women excluded for incomplete data, our sample was composed of more White(73% vs. 55%) and married (77% vs. 54%) women. The included women were also older(29 vs. 27 years), had more education (16 vs. 14 years), were better off financially (426% vs.319% of the poverty line), and had higher parity (0.9 vs. 0.7 pregnancies). P-values for thesedifferences were all less than 0.0001.
Physical activity assessmentStructured recall of physical activity performed during the past seven days was recordedduring a telephone interview at 17–22 weeks' gestation (median gestational age= 19.4weeks; Evenson and Wen 2010). The questionnaire was designed to assess the frequencyand duration of moderate and vigorous occupational, recreational, household, child and adultcare, and transportation activities. Women were asked to report the number of sessions,average duration per session, and perceived intensity level of all activities in those domains.Perceived intensity was assessed based on the Borg scale- fairly light, somewhat hard, andhard or very hard (Borg and Linderholm 1974). Self-report of activities that were “fairlylight” corresponded with light activity, “somewhat hard” corresponded to moderate activity,and “hard or very hard” corresponded to vigorous activity.
Physical activity for this analysis was characterized in two ways: hours/week and metabolicequivalent (MET)-hours per week of MVPA, based on perceived and absolute intensity,respectively. Hours per week was calculated by multiplying the number of times aparticipant reported an activity by the number of hours she reported. MET-hours per weekwas calculated by multiplying the number of times the participant reported the activity bythe number of hours it is reported and then multiplying by the MET value for the activity.
Demissie et al. Page 3
Arch Womens Ment Health. Author manuscript; available in PMC 2012 July 18.
NIH
-PA Author Manuscript
NIH
-PA Author Manuscript
NIH
-PA Author Manuscript

The activities were coded based on compendium-established intensities (Pregnancy,Infection, and Nutrition Study 2007; Ainsworth et al. 2000; Ainsworth et al. 1993).Following standards for 20 to 39 year old adults, MET values of 4.8–7.1 were classified asmoderate intensity and values of 7.2+ were classified as vigorous activity (Pollock et al.1998). The exposures of interest for this analysis were total and all domain-specific physicalactivity measures that were of moderate-to-vigorous intensity at 17–22 weeks' gestation.
We additionally examined if meeting physical activity recommendations was associatedwith depressive symptoms. We used physical activity recommendations that were in placewhile these women were pregnant as this corresponds to how women would have beencounseled about physical activity. The variable was a comprehensive meets recommendationvariable of (1) the moderate intensity recommendation from Centers for Disease Control andPrevention (CDC) and the American College of Sports Medicine (ACSM) of at least 30minutes on most, preferably all, days of the week (U.S. DHHS 1996; Pate et al. 1995) and(2) the vigorous intensity recommendation from ACSM of 20–60 minutes of activity 3 ormore days/week (Pollock et al. 1998). This variable was based on participants' totalperceived physical activity.
Evidence for validity and reliability of the physical activity questionnaire was assessedamong a sample of pregnant women (Evenson and Wen 2010). To assess concurrent-relatedvalidity, 177 pregnant women were asked to wear an accelerometer and keep a physicalactivity diary for a week. These levels were compared to values reported during a telephone-administered physical activity questionnaire conducted at the end of the week. Thequestionnaire and structured diary were moderately to substantially correlated (Spearmancorrelation coefficients ranged from 0.47 to 0.69) for measures of moderate or vigorousphysical activity using either perceived or absolute intensity. Spearman correlationcoefficients comparing accelerometer physical activity levels with questionnaire-reportedMVPA ranged from 0.12 to 0.23 for absolute intensity (MET-hours/week) and 0.28 to 0.34using perceived intensity (hours/week). For the test-retest reliability analysis, 109 pregnantwomen participating in the PIN3 Study repeated their physical activity recall within 48hours of initial assessment. In general, the assessments had moderate to near perfectagreement. The intraclass correlation coefficient was 0.84 (95% CI 0.77–0.89) for perceivedMVPA and 0.84 (95% CI 0.78–0.89) for absolute MVPA.
Depression assessmentThe Center for Epidemiological Studies-Depression (CES-D) Scale (Radloff 1977) was usedto assess depression during pregnancy at <20 and 24–29 weeks' gestation. The scalemeasures depressive symptoms, particularly depressed mood in the general population;however, the results of the scale can not be used to make a diagnosis of depression. TheCES-D is a 20-item, structured self-administered questionnaire. Each response was given ascore of 0 to 3. A composite score is calculated summing responses and the score rangesfrom 0 to 60. A variety of cutoff scores have shown associations with a clinical diagnosis ofdepression, with a score of 16+ suggested as an appropriate positive screen for depression(Gaynes et al. 2005; Radloff 1977; Weissman 1977). In this analysis, a cutoff of 17 was usedas CES-D scores for pregnant women may be higher due to overlap between depressive andpregnancy symptoms (Hoffman and Hatch 2000; Orr and Miller 1995; Klein and Essex1994/1995). The outcome of interest was depressive symptoms at 24 –29 weeks' gestation.Depressive symptoms at < 20 weeks (median gestational age= 16.7 weeks) was included asa covariate.
Demissie et al. Page 4
Arch Womens Ment Health. Author manuscript; available in PMC 2012 July 18.
NIH
-PA Author Manuscript
NIH
-PA Author Manuscript
NIH
-PA Author Manuscript

CovariatesFactors previously found to be associated with both physical activity and depression inprevious research and factors adjusted for in previous analyses were considered potentialconfounders. This includes sociodemographic variables such as age (≤ 24, 25–29, 30–34,and 35+ years), race (White, Black, or other), and marital status (married or unmarried).Indicators of socioeconomic status included were: education (≤12, 13–15, 16, and 17+),employment status at time of first phone interview (yes, no), and poverty status (≤185% or>185% of the poverty line). Poverty status considers an individual's income and the numberof adults and children that live in the home (Proctor and Dalaker 2002). The value of 100 isequivalent to being at the poverty line. The 185% cut point is used as it is the Women,Infants, and Children income guideline cut point (U.S. Department of Agriculture 2009).Health indicators included were: parity (0, 1, and 2+), pre-pregnancy body mass index(Institute of Medicine 1990 categories: <19.8, 19.8–26, >26–29, and >29 kg/m2) based onpre-pregnancy height and weight reported at recruitment, smoking status for first six monthsof pregnancy (any smoking or nonsmoker), general health status (poor/fair, good, and verygood/excellent), vaginal bleeding (any or none), and gestational diabetes (indicated inmedical chart or not).
Psychosocial factors include number of negative life events and social support. Life eventswere assessed in the first telephone interview with the Life Experiences Survey (LES) whichexamines both acute and chronic life stresses (Sarason et al. 1978). It provides a compositescore of life events and the impact of those events. Women are asked if events occurredsince the start of pregnancy and, if so, they are asked to report the impact of each item ashaving a positive (+1 to +3), negative (−1 to −3), or no impact (0). The LES was modifiedby eliminating the item asking whether the respondent experienced a pregnancy, andcombining husband and boyfriend (details of marital status, cohabitation, and relation withthe father of the baby are obtained elsewhere), resulting in 39 items from the original 57 inthe LES. The composite score of the impact of negative events was examined as a covariateand was categorized as 0− <1, 1−<4, and 4+. Social support was assessed during the firstself-administered questionnaire with the Medical Outcomes Study Social Support Scalewhich assesses the availability of perceived social support in four categories (Sherbourneand Stewart 1991). It uses a five-category Likert response for 19 items. The overall scorewas used as a covariate and was categorized as 0− <78, 78− <89, and 89+.
Data analysisAnalysis was performed using version 9.1 of the SAS statistical software (SAS Institute Inc,Cary, NC). Univariate analysis was conducted to describe sample characteristics of potentialcovariates and physical activity. A covariate was considered a confounder in this analysis ifit was associated with both physical activity and depressive symptoms (using Chi-squareanalysis) and changed the estimate of the physical activity-depressive symptoms associationby ≥10% in the modeling stage using backwards deletion (Rothman and Greenland 1998).This was performed separately by physical activity domain and for the meeting physicalactivity recommendations variable. It was determined a priori that depressive symptoms at<20 weeks would be included as a covariate in all adjusted models, as previous history ofdepression is one of the most significant predictors of later depression (Brown and Solchany2004; Lusskin et al. 2007; Bowen and Muhajarine 2006) and is expected to be associatedwith physical activity given previous literature. However, estimates for the final adjustedmodels without adjustment for depressive symptoms at <20 weeks are also presented forcomparison. When no estimates are given, the only variable adjusted for in the final modeldepressive symptoms at <20 weeks. For each domain-specific model, additional adjustmentfor other MVPA was also performed to assess potential confounding.
Demissie et al. Page 5
Arch Womens Ment Health. Author manuscript; available in PMC 2012 July 18.
NIH
-PA Author Manuscript
NIH
-PA Author Manuscript
NIH
-PA Author Manuscript
Logistic regression modeling was utilized to calculate odds ratios (OR) and 95% confidenceintervals (CI). Regression models were restricted to participants that had complete data forexposure, outcome, and the covariates of interest that were determined to be potentialconfounders (n=1077). Depressive symptoms were considered high if the CES-D score wasat or above 17; otherwise, it was considered low. Physical activity was modeled as a three-level variable: none (reference), ≤ the median of non-zero values, and > the median of non-zero values. Estimates of the ORs were collapsed for adult and child care activity measuredin METS-hours/week due to the precision and because the estimates and the 95% CIs werethe same. Logistic B-spline regression analysis (Gregory et al. 2008) was conducted toexplore if other forms of the physical activity variables would be informative in describingthe association between total physical activity and depressive symptoms, but it did notcontribute over and above the logistic model so the results were not presented.
ResultsSample characteristics
Among the 1220 PIN3 participants with physical activity and depressive symptoms data,26% of the women were classified as having elevated depressive symptoms at 24–29 weeks'gestation. CES-D scores ranged from 0 to 55 with a median value of 10 and an interquartilerange (IQR) of 5–17. Table 1 presents selected sample characteristics overall and bydepressive symptoms status. The majority of the women were Whites (73%). Approximatelyone-third (34%) of the women belonged to the age group 30–34 years and 31% were of theage 25–29 years. Over three-quarters (77%) of the participants were married. The sample ofwomen was highly educated, with 63% of the women completing at least 16 years ofeducation. A low proportion of low income women were enrolled in this study sample; 19%of the women met the WIC income eligibility criteria. Most of the women, 53%, werewithin the normal range of BMI before becoming pregnant. Women with elevateddepressive symptoms were younger, had less education, were poorer, and were more likelyto be non-White, unmarried, and multiparous than women with non-elevated depressivesymptoms.
Participation in MVPA was examined descriptively among the women in the study samplewho had complete data on the physical activity measures and depressive symptoms(n=1220). A total of 409 (33.5%) women participated in no perceived, self-reported MVPAin hours/week. Median activity levels were 1.17 hours/week with IQR of 0–3.5. The highestproportion of women reported participating in moderate-to-vigorous recreational activity;43.2% of women participated in recreational activity of perceived moderate-to-vigorousintensity. Women were least likely to participate in outdoor household activity (6%). Figure1 presents the distribution of domain-specific activities by quartile of total MVPA in hours/week. For women with the highest levels of MVPA, recreational activity comprised thelowest proportion of their total activity as compared to women in other quartiles.
Focusing on absolute intensity in MET-hours/week, 742 (60.8%) of the women participatedin MVPA; median activity levels and IQR values were all 0. Women were most likely toparticipate in recreational activity (23.7%) and least likely to participate in adult and childcare activity (3%) when assessed in absolute intensity. All women were considered ashaving no transportation MVPA when using MET-hours/week because walking and bikingfor transportation have MET values of 4, below the threshold of 4.8 for moderate activity.
Differences in physical activity participation by depressive symptoms status were found.Women with elevated depressive symptoms were more physically active than women withlow depressive symptoms overall (p=0.0049) when using perceived intensity values. Forwomen with low depressive symptoms, median (IQR) total activity level was 1 (0–3.15)
Demissie et al. Page 6
Arch Womens Ment Health. Author manuscript; available in PMC 2012 July 18.
NIH
-PA Author Manuscript
NIH
-PA Author Manuscript
NIH
-PA Author Manuscript

hour/week. Meanwhile, for women with high depressive symptoms, median total activitylevel was 1.5 (0–5) hours/week. Though median values for all domain-specific activities forboth groups of women were 0, Wilcoxon Rank Sum tests found that women with elevateddepressive symptoms also participated in more work (p=0.02), adult and child care(p<0.0001), and indoor household (p<0.0001) MVPA. Median (IQR) of total MVPA usingabsolute intensity values was 0 (0–6.17) MET-hours/week for women with low depressivesymptoms and 0 (0–4) MET-hours/week (p=0.04). Though median values for all domain-specific activities for both groups of women were 0, Wilcoxon Rank Sum tests found thatwomen with elevated depressive symptoms participated in less recreational MVPA(p=0.0002).
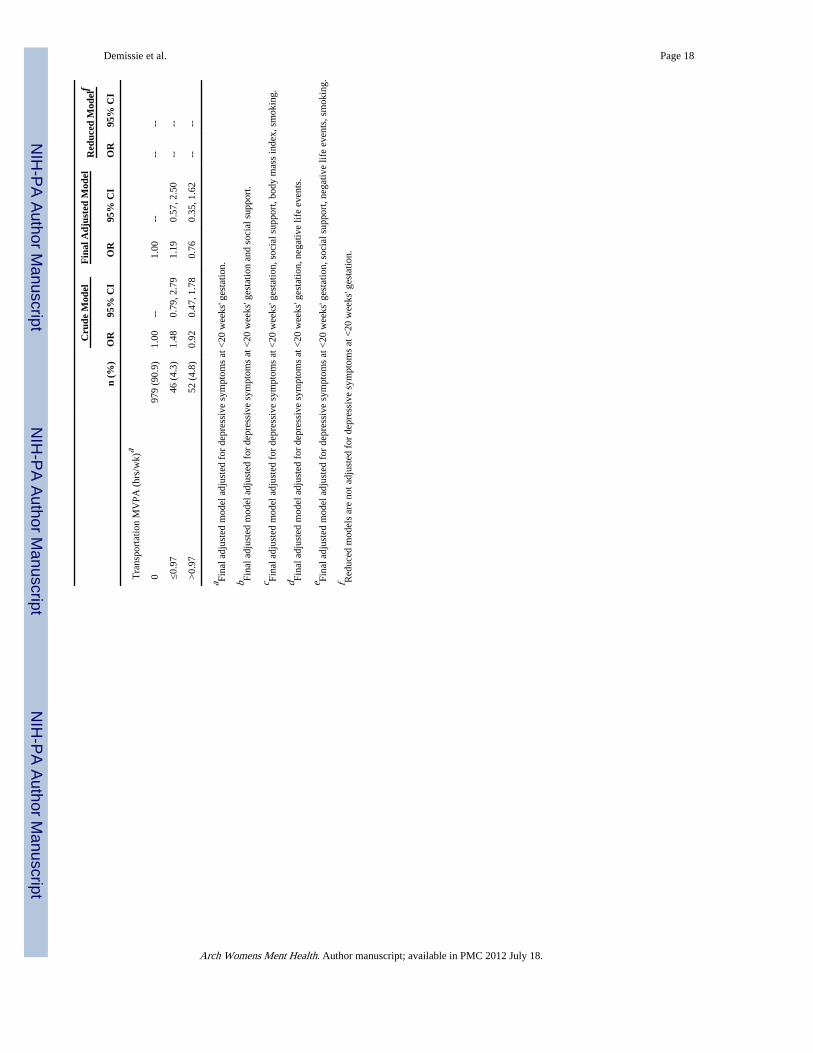
Physical activity associations with depressive symptomsCrude and adjusted models for the associations between perceived MVPA (hours/week) anddepressive symptoms are shown in Table 2. Significant associations between total MVPAand depressive symptoms were found in both the crude and adjusted models. In the finalmodel, women who participated in above zero and ≤2.67 total MVPA had a reduced odds ofdepressive symptoms as compared to inactive women (OR=0.56, 95% CI=0.38, 0.83). Therewas also a reduction in the odds for women participating in higher levels of total MVPA.There were slight increases in the odds of having elevated depressive symptoms for thoseactive at work as compared to women with no work MVPA. After adjustment, women whoparticipated in any activity but ≤ 2.25 hours/week of adult and child care activity had 1.84times the odds of elevated depressive symptoms than those who did not (95% CI=1.08,3.11). Those participating in more adult and child care MVPA also had increased odds,though the association was non-significant. Women who spent more than 1 hour/week inindoor household MVPA had 1.63 times the odds of high depressive symptoms than womenwith indoor household MVPA (0.98, 2.70). In contrast, women with any but less than 2.25hours/week of indoor household MVPA had somewhat lower odds. There were noassociations between outdoor household or transportation activity and depressive symptomsfor crude and adjusted models. When comparing the final adjusted models to modelsunadjusted for depressive symptoms at <20 weeks gestation, depressive symptoms wasfound to be a confounder for all associations.
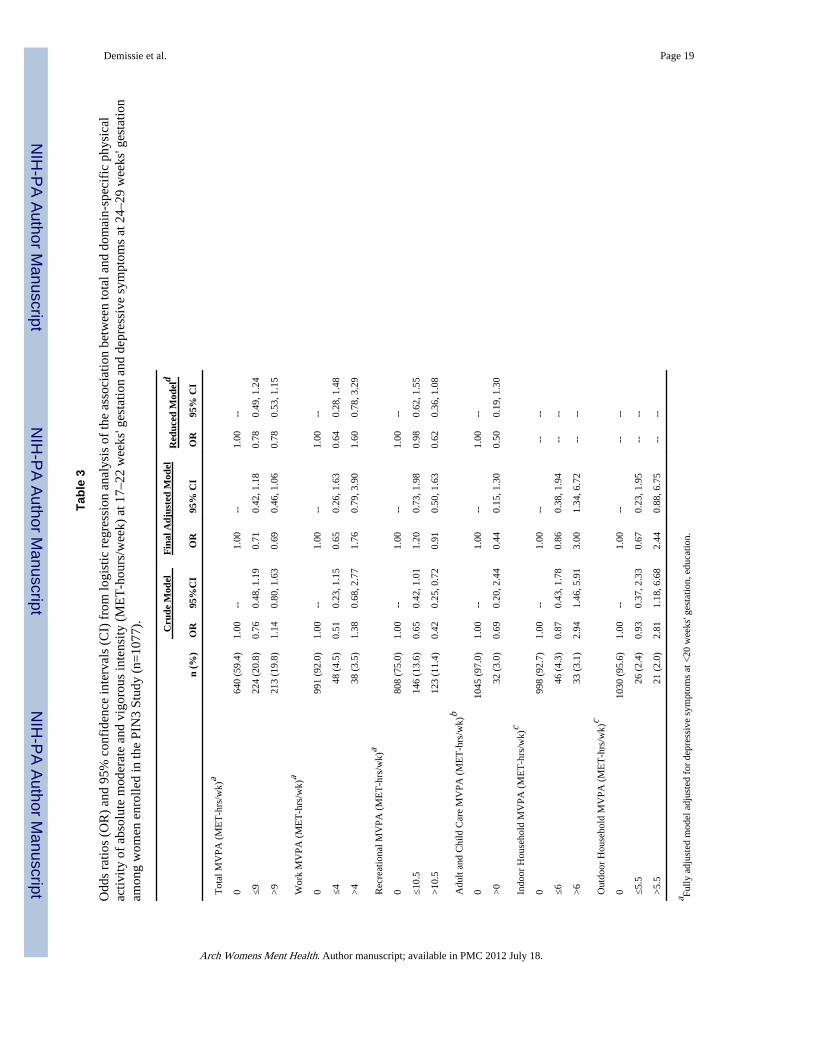
Crude and adjusted models for the association between absolute MVPA (MET-hours/week)and depressive symptoms associations are presented in Table 3. In the adjusted model,women with >9 MET-hours/week of total MVPA were 31% less likely to have elevateddepressive symptoms than those with less activity (OR=0.69, 95% CI=0.46, 1.06); this wasin the opposite direction from the crude model. Women with any but less than 9 MET-hours/week of total MVPA also had lower odds. There was no association between work MVPA,recreational MVPA, and outdoor household MVPA with depressive symptoms in adjustedmodels. The association between adult and child care activity showed a larger inverseassociation when adjusted as compared to the crude model, but it was still non-significantand precision was poorer. Participation in more than 6 MET-hours/week of indoorhousehold MVPA was significantly associated with depressive symptoms in the adjustedmodel (OR=3.00, 95% CI=1.34, 6.72) while women with any but less than 6 MET-hours/week of indoor household MVPA had 14% lower odds of having elevated depressivesymptoms (OR=0.86, 95% CI=0.38, 1.94). There was no association between outdoorphysical activity and depressive symptoms in either the crude or adjusted models. Whencomparing the final adjusted models to models unadjusted for depressive symptoms at <20weeks gestation, depressive symptoms was found to be a confounder for all associationsexcept indoor household MVPA.
For domain-specific measures of both perceived and absolute intensities, we re-ran alladjusted models, adding a covariate for MVPA outside of the specific domain of interest to
Demissie et al. Page 7
Arch Womens Ment Health. Author manuscript; available in PMC 2012 July 18.
NIH
-PA Author Manuscript
NIH
-PA Author Manuscript
NIH
-PA Author Manuscript

account for this potential confounding. For example, the recreational activity model wasadjusted for total activity subtracting out recreational activity. The models did notsubstantially change when other domains were included as covariates.
Women who met the physical activity recommendations according to perceived intensities at17–22 weeks' gestation had 1.35 (95% CI=0.98, 1.86) times the odds of having elevateddepressive symptoms at 24–29 weeks' gestation after adjusting for depressive symptoms at<20 weeks' gestation. For both intensity types, we combined participation levels of work,adult and child care, indoor household, outdoor household, and transportation activities intoone measure to represent non-elective (vs. recreational) activity. For those participating insome MVPA but less than or equal to the median (2 hours) of non-elective MVPA, the oddsof developing elevated depressive symptoms at 24–29 weeks' gestation compared to womenwith no MVPA was 0.69 (95% CI=0.46, 1.06) after adjusting for depressive symptom at <20weeks' gestation and life events. However, those with more than 2 hours of non-electiveMVPA were more likely to develop high depressive symptoms (OR=1.73, 95% CI=1.17,2.56). There was a null association between non-elective activity in METS and depressivesymptoms at 24–29 weeks' gestation among women with any MVPA but less than or equalto the median of 4.89 METS (OR=0.96, 95% CI=0.55, 1.66) with adjustment for depressivesymptoms at <20 weeks' gestation and education, but those with more than the medianMETS of non-elective activity had 1.77 times the odds of developing elevated depressivesymptoms (95% CI=1.08, 2.88).
DiscussionWe found few associations between total and domain-specific MVPA at 17–22 weeks'gestation and depressive symptoms at 24–29 weeks' gestation. Total perceived MVPA wasassociated with reduced odds of elevated depressive symptoms. Associations betweenrecreational activity and depressive symptoms, the mostly frequently investigated physicalactivity domain, produced estimates close to the null in adjusted modeling. Women whoparticipated in adult and child care activity of perceived moderate-to-vigorous intensity hadincreased odds of having high depressive symptoms. Women participating in high amountsof indoor household activity had increased odds of having high depressive symptoms.Increased odds of elevated depressive symptoms were found among women who metphysical activity recommendations and participated in more than median levels of non-elective MVPA for both perceived and absolute intensities.
There has been limited previous research into associations of physical activity withdepression in pregnant populations. Most studies reported cross-sectional associationsbetween physical activity and depressive symptoms or mood, failing to examine thelongitudinal associations between physical activity and subsequent depression. Associationshave been found with total or recreational activities and depressive symptoms and depressedmood among pregnant adolescents self-selected to participate in a trial in Los Angeles(Koniak-Griffin 1994) and cross-sectional analysis of pregnant Canadian women (Da Costaet al. 2003), pregnant California women (Haas et al. 2004), pregnant African-Americanwomen in Baltimore (Orr et al. 2006), and pregnant women in Jamaica (Pottinger et al.2009). In each study, active women were less likely to have depressive symptoms thaninactive women; however, Pottinger et al. (2009) found decreased odds for occasionalexercise, but not frequent exercise. Other studies have found primarily no associationsbetween total or recreational physical activity and depressive symptoms (Goodwin et al.2000; Poudevigne and O'Connor 2005; Symons Downs et al. 2008).
Symons Downs et al. (2008) was the only previous study reporting on the associationbetween physical activity during the second trimester and depressive symptoms during the
Demissie et al. Page 8
Arch Womens Ment Health. Author manuscript; available in PMC 2012 July 18.
NIH
-PA Author Manuscript
NIH
-PA Author Manuscript
NIH
-PA Author Manuscript

third trimester. They found no association for leisure-time physical activity, whichcorresponds with our reported findings on the association between recreational MVPA anddepressive symptoms. We also found increased odds of high depressive symptoms withadult and child care MVPA and indoor household MVPA. These tasks are associated withhome-keeping. A study of pregnant Italian women found that being a housewife wasassociated with increased odds of minor depression as compared to being a student,unemployed, or employed (Marchesi et al. 2009). We found that higher levels of non-elective MVPA (participation in work, adult and child care, indoor household, outdoorhousehold, and transportation activities) was associated with increased odds of developingelevated depressive symptoms. In comparison to recreational activities, these activities arenot usually performed for enjoyment or electively and may be considered burdensome.Molarius et al. (2009) found that the odds of being moderately or extremely depressed oranxious increased as the more burdensome the participants rated their domestic work.Simply higher participation levels in housework may be considered burdensome for women,which may explain why women with those with low levels of both indoor and householdMVPA have a slightly reduced odds of having elevated depressive symptoms while thosewith higher than median levels have increased odds.
Strengths and LimitationsThere are some limitations in our study. First, self-report depression scales such as the CES-D measure depressive symptoms. Clinical assessment is needed to diagnose depression.However, clinical assessments in population studies are costly and timely. Depressionscreening tools are frequently used in depression research involving large samples. TheCES-D is a commonly used, reliable, and valid measurement of depressive symptoms thatcorrelates well with clinical ratings (Radloff 1997; Weissman et al. 1977). Overall,investigating depression during pregnancy is difficult. Self-reported screening tools tend tofocus on somatic symptoms, including symptoms that overlap between pregnancy anddepression, which makes determining depression status difficult in a pregnant population(Ryan et al. 2005; Brown and Solchany 2004; Misri 2007; Klein and Essex 1994). Toaddress this, we used a slightly higher threshold for high depressive symptoms than used inthe general population. This cut point of 17 was compared to a method suggested byHoffman and Hatch (2000) where the four scale items related to pregnancy are removed andthe remaining items inflated so the scale range remains 0–60 and the 16 cut point is stillused. The scores calculated by each method were highly correlated with each other(Pearson's r=0.98) and the women were largely categorized into the same binary depressivesymptoms category (χ2=849.64, p<0.0001). When these re-categorized depressivesymptoms scores were used in modeling, they performed similarly to our original scoringmethod and there was no change in the interpretation of the results.
Determining if physical activity is a causal factor of elevated depressive symptoms is notpossible in this study. We did not assess levels of depressive symptoms or diagnoses ofdepressive disorders for the pre-pregnancy period. Therefore, our case group is a mix ofindividuals with incident, recurrent, and persistent elevated symptoms. However, we didcontrol for depressive symptoms at <20 weeks in all adjusted models. Furthermore,depression is not an acute condition; it is likely that it takes an extended period of time forphysical activity to have an effect on depression. The physical activity and depressivesymptoms measures in our study may be too close together in time; two weeks separated theend of the physical activity assessment and the start of the depressive symptoms assessment.In this exploratory study we have tested many associations, but chose not to adjust formultiple testing. Therefore, significance should be interpreted with caution, and replicationof results is needed.
Demissie et al. Page 9
Arch Womens Ment Health. Author manuscript; available in PMC 2012 July 18.
NIH
-PA Author Manuscript
NIH
-PA Author Manuscript
NIH
-PA Author Manuscript

Physical activity assessment was more extensive than conducted in previous pregnancystudies. From self-reported data of frequency and duration of various activities andcompendium-established MET values, we were able to calculate activity levels of bothperceived and absolute intensity and examine differences the associations with depressivesymptoms by domain. Another concern is that the MET values used for determiningabsolute intensity are not specific to pregnant populations, and pregnancy increases awoman's resting metabolic rate by 15–20% (Clapp 2002). Therefore, these values may notbe the most appropriate to use in this sample. However, no standards have yet beenestablished for pregnant women and they may change over the course of pregnancy.Physical activity in this sample was low, particularly for most domain-specific activities. Itis possible that different associations would be suggested in samples of more active womenwith wider ranges of physical activity levels. Another concern is that physical activity wasonly assessed during the past week. Physical activity behavior can change from week toweek and the reported values may not be representative of usual behavior.
Generalizability of the results may be of concern in this investigation as this sample wasmostly White, well-educated, married, and financially stable. Also, the women in the finalsample may not be representative of the overall PIN3 study sample. We excluded womenwho had no usable physical activity or depressive symptoms data (n=455). Excluded womenwere more likely to be a minority, unmarried, younger, less education, and poorer. Thesefactors are related to physical activity and depression and this may create bias in theassociations.
Despite these limitations, there are several strengths of our study. It is a large, prospectivecohort study that measured a variety of factors relevant to the health of pregnant women.The longitudinal design of the study allowed us to examine the association with earlierphysical activity with later depressive symptoms. Reliable and valid assessment tools wereused to measure physical activity (Evenson and Wen 2010), depression (Radloff 1977;Weissman et al. 1977), and a number of the covariates (Sarason et al. 1978; Sherbourne andStewart 1991). The physical activity assessment was comprehensive- collecting data onduration, frequency, intensity, and domain. Previous research has only investigated leisure-time or total activity. Data collection was extensive which allowed for good control forconfounders; however, as in any observational study, there may still be residualconfounding.
ConclusionThis study investigates how the association between physical activity and depressivesymptoms differs by domain of activity in a pregnant population. We found thatparticipation in total MVPA reduced the odds of high depressive symptoms, but thatparticipation in adult and child care MPVA and indoor household MVPA may heightendepressive symptoms rather than be beneficial. Future research should explore how theassociation between physical activity and depressive symptoms differs by domain.Furthermore, studies should investigate differences in association by intensity of activity(perceived vs. absolute and including light activities vs. MPVA). There has been anincreased focus on the potential for physical activity to serve as a non-drug treatment fordepression as antidepressant use concerns both mother and health providers (Hammond andCrozier 2007; Bowen and Muhajarine 2006; Manber et al. 2002). Physical activity is a goodcandidate as it has minimal side effects, is cost-effective, and has been shown to be aseffective as antidepressants and psychotherapy in non-pregnant populations (Daley et al2007; Dunn et al. 2005; Craft and Perna 2004; Martinsen 2008). Given adequate evidencefrom studies using pregnant populations, physical activity may be a useful treatment fordepression.
Demissie et al. Page 10
Arch Womens Ment Health. Author manuscript; available in PMC 2012 July 18.
NIH
-PA Author Manuscript
NIH
-PA Author Manuscript
NIH
-PA Author Manuscript
AcknowledgmentsThe third phase of the Pregnancy, Infection, and Nutrition Study (PIN3) was supported by National Institutes ofHealth (NIH) grants from the National Institute of Child Health and Human Development (#HD37584, HD39373),the National Institute of Diabetes and Digestive and Kidney Diseases (DK61981, DK56350), the National CancerInstitute (#RO1CA109804), and the General Clinical Research Center (#RR00046). The content is solely theresponsibility of the authors and does not necessarily represent the official views of the NIH. The authors wouldlike to thank Drs. David Savitz and John Thorp, Principal Investigators of the PIN3 Study, for their support of thisanalysis and Chyrise Bradley, Kathryn Carrier, Diane Kaczor, and Fang Wen for their assistance.
ReferencesAinsworth BE, Haskell WL, Leon AS, Jacobs DR Jr, Montoye HJ, Sallis JF, Paffenbarger RS Jr.
Compendium of physical activities: classification of energy costs of human physical activities. MedSci Sports Exerc. 1993; 25(10):71–80. [PubMed: 8292105]
Ainsworth BE, Haskell WL, Whitt MC, Irwin ML, Swartz AM, Strath SJ, O'Brien WL, Bassett DR Jr,Schmitz KH, Emplaincourt PO, Jacobs DR Jr, Leon AS. Compendium of physical activities: anupdate of activity codes and MET intensities. Med Sci Sports Exerc. 2000; 32(9 Suppl):S498–516.[PubMed: 10993420]
Bennett HA, Einarson A, Taddio A, Koren G, Einarson TR. Prevalence of depression duringpregnancy: systematic review. Obstet Gynecol. 2004; 103:698–709. [PubMed: 15051562]
Borg G, Linderholm H. Perceived exertion and pulse rate during graded exercise in various agegroups. Acta Med Scand. 1974; 472:194–206.
Bowen A, Muhajarine N. Antenatal depression. Can Nurse. 2006; 102(9):27–30.
Brown M-A, Solchany JE. Two overlooked mood disorders in women: subsyndromal depression andprenatal depression. Nurs Clin N Am. 2004; 39:83–95.
Clapp, JF, III. Exercising through your pregnancy. Addicus Books; Omaha, NE: 2002.
Craft LL, Perna FM. The benefits of exercise for the clinically depressed. Prim Care Companion J ClinPsychiatry. 2004; 6:104–111. [PubMed: 15361924]
Da Costa D, Rippen N, Drista M, Ring A. Self-reported leisure-time physical activity duringpregnancy and relationship to psychological well-being. J Psychosom Obstet Gynaecol. 2003;24(2):111–9. [PubMed: 12854395]
Daley AJ, MacArthur C, Winter H. The role of exercise in treating postpartum depression: a review ofthe literature. J Midwifery Womens Health. 2007; 52:56–62. [PubMed: 17207752]
Dunn AL, Trivedi MH, Kampert JB, Clark CG, Chambliss HO. Exercise treatment for depression:efficacy and dose response. Am J Prev Med. 2005; 28:1–8. [PubMed: 15626549]
Evenson KR, Wen F. Measuring physical activity in pregnant women: validity and reliability of astructured one-week recall questionnaire. Int J Behav Nutr Phys Act. 2010; 7:21. [PubMed:20302668]
Gaynes, BN.; Gavin, N.; Meltzer-Brody, S.; Lohr, KN.; Swinson, T.; Gartlehner, G.; Brody, S.; Miller,WC. AHRQ Publication No. 05-E006-2. Agency for Healthcare Research and Quality; Rockville,MD: 2005. Perinatal Depression: prevalence, screening accuracy, and screening outcomes.evidence report/technology assessment No. 119 (Prepared by the RTI-University of NorthCarolina Evidence-based Practice Center, under Contract No. 290-02-0016).
Goodwin A, Astbury J, McMeeken J. Body image and psychological well-being in pregnancy: acomparison of exercisers and non-exercisers. Aust N Z J Obstet Gynaecol. 2000; 40:43–7.
Gregory M, Ulmer H, Pfeiffer KP, Lang S, Strasak AM. A set of SAS macros for calculating anddisplaying adjusted odds ratios (with confidence intervals) for continuous covariates in logistic B-spline regression models. Comput Methods Programs Biomed. 2008; 92:109–114. [PubMed:18603325]
Haas JS, Jackson RA, Fuentes-Afflick E, Stewart AL, Dean ML, Brawarsky P, Escobar G. Changes inthe health status of women during and after pregnancy. J Gen Intern Med. 2004; 20:45–51.[PubMed: 15693927]
Hammond S, Crozier K. Depression: assessing the causes. Midwives. 2007; 10(8):365–368. [PubMed:17907721]
Demissie et al. Page 11
Arch Womens Ment Health. Author manuscript; available in PMC 2012 July 18.
NIH
-PA Author Manuscript
NIH
-PA Author Manuscript
NIH
-PA Author Manuscript

Hoffman S, Hatch MC. Depressive symptomatology during pregnancy: Evidence for an associationwith decreased fetal growth in pregnancies of lower social class women. Health Psychol. 2000;19(6):535–543. [PubMed: 11129356]
Institute of Medicine. Nutrition during pregnancy. National Academy Press; Washington, DC: 1990.
Kessler RC, McGonagle KA, Swartz M, Blazer DG, Nelson CB. Sex and depression in the NationalComorbidity Survey 1: Lifetime prevalence, chronicity, and recurrence. J Affect Disord. 1993;29:85–96. [PubMed: 8300981]
Klein MH, Essex MJ. Pregnant or depressed? The effect of overlap between symptoms of depressionand somatic complaints of pregnancy on rates of major depression in the second trimester.Depression. 1994/1995; 2(6):308–314.
Koniak-Griffin D. Aerobic exercise, psychological well-being, and physical discomforts duringadolescent pregnancy. Res Nurs Health. 1994; 17(4):253–63. [PubMed: 8036273]
Larsson C, Sydsjö G, Josefsson A. Health, sociodemographic data, and pregnancy outcome in womenwith antepartum depressive symptoms. Obstet Gynecol. 2004; 104:459–66. [PubMed: 15339754]
Lee DTS, Chung TKH. Postnatal depression: an update. Best Pract Res Clin Obstet Gynaecol. 2007;21(2):183–191. [PubMed: 17157072]
Lusskin SI, Pundiak TM, Habib SM. Perinatal depression: hiding in plain sight. Can J Psychiatry.2007; 52:479–88. [PubMed: 17955909]
Manber R, Allen JJB, Morris MM. Alternative treatments for depression: Empirical support andrelevance for women. J Clin Psychiatry. 2002; 63:628–640. [PubMed: 12143922]
Marchesi C, Bertoni S, Maggini C. Major and minor depression in pregnancy. Obstet Gynecol. 2009;113:1292–8. [PubMed: 19461425]
Martinsen EW. Physical activity in the prevention and treatment of anxiety and depression. Nord JPsychiatry. 2008; 62(Suppl 47):25–29. [PubMed: 18752115]
Misri S. Suffering in silence: The burden of perinatal depression. Can J Psychiatry. 2007; 52(8):477–478. [PubMed: 17955908]
Molarius A, Berglund K, Eriksson C, Eriksson HG, Lindén-Boström M, Nordström E, Persson C,Sahlqvist L, Starrin B, Ydreborg B. Mental health symptoms in relation to socioeconomicconditions and lifestyle factors- a population-based study in Sweden. BMC Public Health. 2009;9:302. [PubMed: 19695085]
National Institute of Mental Health. NIH Publication No. 07-3561. U.S. Department of Health &Human Services, National Institutes of Health, National Institute of Mental Health; Bethesda, MD:2007. Depression.
National Institute of Mental Health. Women and depression: discovering hope. U.S. Department ofHealth & Human Services, National Institutes of Health, National Institute of Mental Health;Bethesda, MD: 2008.
Orr ST, James SA, Garry J, Newton E. Exercise participation before and during pregnancy amonglow-income, urban, Black women: The Baltimore Preterm Birth Study. Eth Dis. 2006; 16:909–913.
Orr ST, Miller CA. Maternal depressive symptoms and the risk of poor pregnancy outcome: review ofliterature and preliminary findings. Epidemiol Rev. 1995; 17:165–71. [PubMed: 8521934]
Pate RR, Pratt M, Blair SN, Haskell WL, Macera CA, Bouchard C, Buchner D, Ettinger W, HeathGW, King AC, Kriska A, Leon AS, Marcus BH, Morris J, Paffenbarger RS Jr, Patrick K, PollockML, Rippe JM, Sallis J, Wilmore JH. Physical activity and public health: a recommendation fromthe Centers for Disease Control and Prevention and the American College of Sports Medicine.JAMA. 1995; 273(5):402–7. [PubMed: 7823386]
Pivarnik JM, Chambliss HO, Clapp JF, Dugan SA, Hatch MC, Lovelady CA, Mottola MF, WilliamsMA. Impact of physical activity during pregnancy and postpartum on chronic disease risk. MedSci Sports Exerc. 2006; 38(5):989–1006. [PubMed: 16672855]
Pollock M, Gaesser G, Butcher J, Després J-P, Dishman RK, Franklin BA, Garber CE. AmericanCollege of Sports Medicine position stand: the recommended quantity and quality of exercise fordeveloping and maintaining cardiorespiratory and muscular fitness, and flexibility in healthyadults. Med Sci Sports Exerc. 1998; 30(6):975–91. [PubMed: 9624661]
Demissie et al. Page 12
Arch Womens Ment Health. Author manuscript; available in PMC 2012 July 18.
NIH
-PA Author Manuscript
NIH
-PA Author Manuscript
NIH
-PA Author Manuscript

Pottinger AM, Trotman-Edwards H, Younger N. Detecting depression during pregnancy andassociated lifestyle practices and concerns among women in a hospital-based obstetric clinic inJamaica. Gen Hosp Psychiatry. 2009; 31:254–261. [PubMed: 19410104]
Poudevigne MS, O'Connor PJ. Physical activity and mood during pregnancy. Med Sci Sports Exerc.2005; 37(8):1374–1380. [PubMed: 16118585]
Pregnancy, Infection, and Nutrition Study. [Accessed 5 July 2009] PIN3 Physical Activity. 2007.http://www.cpc.unc.edu/projects/pin/design_pin3/docs_3/PIN-MET-Table-080207.pdf.
Proctor, BD.; Dalaker, J. Current Population Reports. U.S. Government Printing Office; Washington,DC: 2002. U.S. Bureau of the Census; p. 5Series P60-219, Poverty in the United States: 2001
Radloff LS. The CES-D Scale: A self-report depression scale for research in the general population.Appl Psychol Measure. 1977; 1:385–401.
Rothman, KJ.; Greenland, S. Modern Epidemiology. 2nd edn. Lippincott-Raven Publishers; Baltimore:1998. p. 256-257.
Ryan D, Milis L, Misri N. Depression during pregnancy. Can Fam Physician. 2005; 51:1087–1093.[PubMed: 16121830]
Sarason IG, Johnson JH, Siegel JM. Assessing the impact of the life experiences survey. J Consult ClinPsychol. 1978; 46:932–46. [PubMed: 701572]
Sherborne CD, Stewart AL. The MOS social support survey. Soc Sci Med. 1991; 32(6):705–14.[PubMed: 2035047]
Symons Downs D, DiNallo JM, Kirner TL. Determinants of pregnancy and postpartum depression:prospective influences of depressive symptoms, body image satisfaction, and exercise behavior.Ann Behav Med. 2008; 36:54–63. [PubMed: 18773252]
Teychenne M, Ball K, Salmon J. Physical activity and likelihood of depression in adults: a review.Prev Med. 2008; 46:397–411. [PubMed: 18289655]
U.S. Department of Agriculture, Food and Nutrition Service. Special supplemental nutrition programfor Women, Infants and Children (WIC): income eligibility guidelines. Fed Regist. 2009; 74(43):9780–9782.
U.S. Department of Health and Human Services. ODPHP Publication No. U0036. U.S. Department ofHealth & Human Services; Bethesda, MD: 2008. 2008 Physical activity guidelines for Americans.http://www.health.gov/paguidelines.
US Department of Health and Human Services. NIH Publication No. 07-3561. Department of Healthand Human Services, National Institutes of Health, National Institute of Mental Health; Bethesda,MD: 2007. Depression.http://www.nimh.nih.gov/health/publications/depression/nimhdepression.pdf.
U.S. Department of Health and Human Services. Physical activity and health: a report of the SurgeonGeneral. U.S. Department of Health and Human Services, Centers for Disease Control andPrevention, National Center for Chronic Disease Prevention and Health Promotion; Atlanta, GA:1996.
Vladutiu C, Evenson KR, Marshall S. Physical activity and injuries during pregnancy. J Phys ActHealth. In Press.
Ward DS, Evenson KR, Vaughn A, Rodgers AB, Troiano RP. Accelerometer use in physical activity:Best practices and research recommendations. Med Sci Sports Exerc. 2005; 37(11 Suppl):S582–S588. [PubMed: 16294121]
Weissman MM, Bland R, Joyce PR, Newman S, Wells JE, Wittchen H-U. Sex differences in rates ofdepression: cross-national perspectives. J Affect Disord. 1993; 29(2–3):77–84. [PubMed:8300980]
Weissman MM, Sholomskas D, Pottenger M, Prusoff BA, Locke BZ. Assessing depressive symptomsin five psychiatric populations: a validation study. Am J Epidemiol. 1977; 106(3):203–214.[PubMed: 900119]
Demissie et al. Page 13
Arch Womens Ment Health. Author manuscript; available in PMC 2012 July 18.
NIH
-PA Author Manuscript
NIH
-PA Author Manuscript
NIH
-PA Author Manuscript

FIGURE 1.Percentages of domain-specific moderate-to-vigorous physical activity (MVPA) in hours/week at 17–22 weeks gestation by quartile of total MVPA among women enrolled in thethird phase of the Pregnancy, Infection, and Nutrition Study with any MVPA. (a) 1st quartilen=203, range 0.03–1.17 (b) 2nd quartile n=202, range 1.23–2.53 (c) 3rd quartile n=206,range 2.57–5 (d) 4th quartile n=200, range 5.07–63.
Demissie et al. Page 14
Arch Womens Ment Health. Author manuscript; available in PMC 2012 July 18.
NIH
-PA Author Manuscript
NIH
-PA Author Manuscript
NIH
-PA Author Manuscript

NIH
-PA Author Manuscript
NIH
-PA Author Manuscript
NIH
-PA Author Manuscript
Demissie et al. Page 15
Table 1
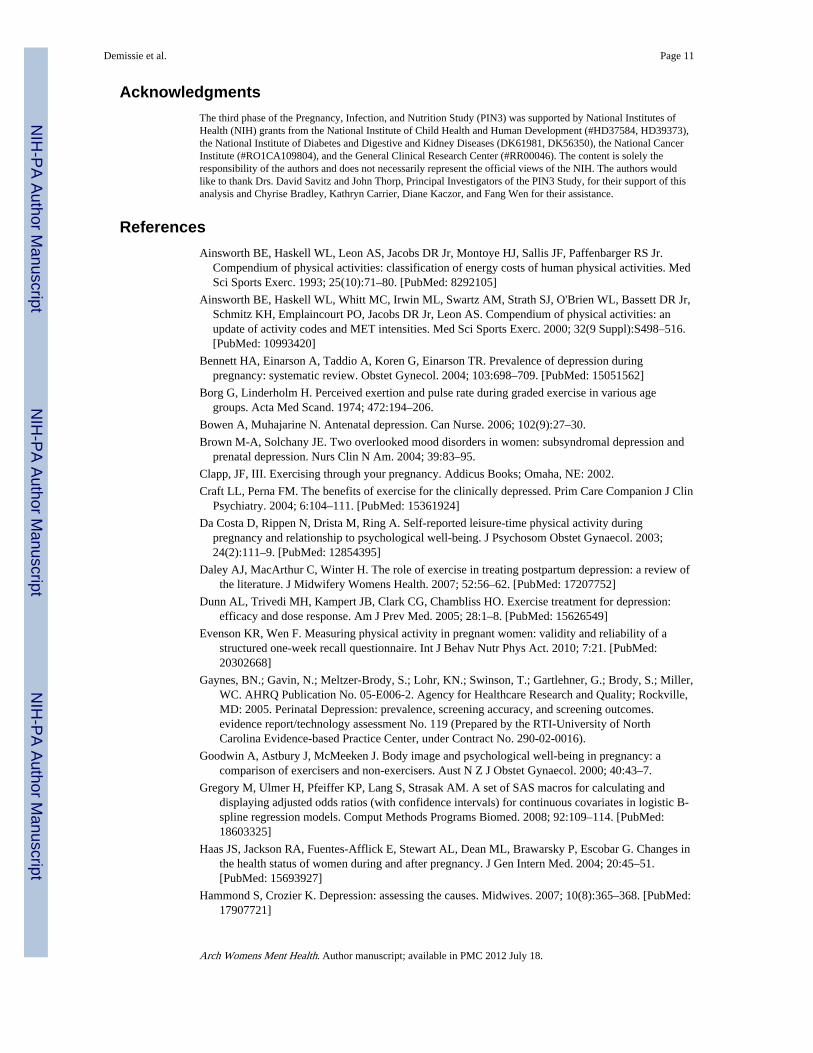
Selected characteristics of women enrolled in the third phase of the Pregnancy, Infection, and Nutrition Studywith non-missing values for physical activity at 17–22 weeks' gestation and depression at 24–29 weeks'gestation overall and by depressive symptoms status (<17 score on the Center for Epidemiological Studies-Depress ion [CES-D] scale versus ≥ 17 score on the CES-D) (n=1220).
CES-D
Total (n=1220) <17 (n=904) ≥17 (n=316)
n (%) n (%) n (%) χ2 (p-value)
Age (years) 34.27 (<.0001)
≤24 241 (20) 143 (16) 98 (31)
25–29 373 (31) 289 (32) 84 (27)
30–34 416 (34) 323 (36) 93 (29)
35+ 190 (16) 149 (16) 41 (13)
Race a 11.47 (.0029)
White 895 (73) 686 (76) 209 (66)
Black 202 (17) 134 (15) 68 (22)
Other 122 (10) 83 (9) 39 (12)
Marital status 58.27 (<.0001)
Married 945 (77) 749 (83) 196 (62)
Single 231 (19) 131 (14) 100 (32)
Widowed, Divorced, Separated 44 (4) 24 (3) 20 (6)
Education (years) 103.79 (<.0001)
≤12 225 (18) 117 (13) 108 (34)
13–15 228 (19) 148 (16) 80 (25)
16 361 (30) 291 (32) 70 (22)
17+ 406 (33) 348 (39) 58 (18)
Working at time of first phone interview 13.77 (.0002)
Yes 381 (31) 256 (28) 125 (40)
No 839 (69) 648 (72) 191 (60)
Income (percent of the poverty line) b 44.34 (<.0001)
≤185 222 (19) 127 (14) 95 (32)
>185 952 (81) 750 (86) 202 (68)
Parity 14.20 (.0008)
0 678 (56) 524 (58) 154 (49)
1 361 (30) 265 (29) 96 (30)
2+ 181 (15) 115 (13) 66 (21)
Pre-pregnancy body mass index (kg/m2) c 28.92 (<.0001)
<19.8 169 (14) 139 (16) 30 (10)
19.8–26 642 (53) 497 (56) 145 (46)
>26–29 126 (10) 89 (10) 37 (12)
>29 270 (22) 169 (19) 101 (32)
Smoked at least once in first 6 mo 58.02 (<.0001)
Arch Womens Ment Health. Author manuscript; available in PMC 2012 July 18.
NIH
-PA Author Manuscript
NIH
-PA Author Manuscript
NIH
-PA Author Manuscript
Demissie et al. Page 16
CES-D
Total (n=1220) <17 (n=904) ≥17 (n=316)
n (%) n (%) n (%) χ2 (p-value)
pregnancy d
Yes 126 (11) 59 (7) 67 (22)
No 1052 (89) 821 (93) 231 (78)
aMissing data on 1 woman
bMissing data on 46 women
cMissing data on 13 women
dMissing data on 42 women
Arch Womens Ment Health. Author manuscript; available in PMC 2012 July 18.

NIH
-PA Author Manuscript
NIH
-PA Author Manuscript
NIH
-PA Author Manuscript
Demissie et al. Page 17
Tabl
e 2
Odd
s ra
tios
(OR
) an
d 95
% c
onfi
denc
e in
terv
als
(CI)
fro
m lo
gist
ic r
egre
ssio
n an
alys
is o
f th
e as
soci
atio
n be
twee
n to
tal a
nd d
omai
n-sp
ecif
ic m
oder
ate-
to-
vigo
rous
phy
sica
l act
ivity
(M
VPA
) of
som
ewha
t har
d an
d ha
rd/v
ery
hard
per
ceiv
ed in
tens
ity (
hour
s/w
eek)
at 1
7–22
wee
ks' g
esta
tion
and
depr
essi
vesy
mpt
oms
at 2
4–29
wee
ks' g
esta
tion
amon
g w
omen
enr
olle
d in
the
PIN
3 St
udy
(n=
1077
).
Cru
de M
odel
Fin
al A
djus
ted
Mod
elR
educ
ed M
odel
f
n (%
)O
R95
% C
IO
R95
% C
IO
R95
% C
I
Tot
al M
VPA
(hr
s/w
k)a
035
6 (3
3.1)
1.00
--1.
00--
----
≤2.6
737
0 (3
4.4)
0.52
0.37
, 0.7
30.
560.
38, 0
.83
----
>2.
6735
1 (3
2.6)
0.63
0.45
, 0.8
80.
730.
50, 1
.07
----
Wor
k M
VPA
(hr
s/w
k)b
096
7 (8
9.8)
1.00
--1.
00--
1.00
--
≤1.4
960
(5.
6)1.
370.
77, 2
.42
1.47
0.76
, 2.8
41.
430.
79, 2
.57
>1.
4950
(4.
6)1.
951.
08, 3
.52
1.38
0.68
, 2.7
81.
710.
93, 3
.14
Rec
reat
iona
l MV
PA (
hrs/
wk)
c
059
8 (5
5.5)
1.00
--1.
00--
1.00
--
≤227
1 (2
5.2)
0.72
0.51
, 1.0
20.
930.
62, 1
.38
0.81
0.56
, 1.1
5
>2
208
(19.
3)0.
940.
66, 1
.35
1.29
0.85
, 1.9
81.
070.
74, 1
.56
Adu
lt an
d C
hild
Car
e M
VPA
(hr
s/w
k)d
091
4 (8
4.9)
1.00
--1.
00--
1.00
--
≤2.2
590
(8.
4)3.
051.
95, 4
.75
1.84
1.08
, 3.1
12.
611.
65, 4
.12
>2.
2573
(6.
8)2.
541.
55, 4
.16
1.46
0.81
, 2.6
12.
471.
48, 4
.10
Indo
or H
ouse
hold
MV
PA (
hrs/
wk)
e
084
3 (7
8.3)
1.00
--1.
00--
1.00
--
≤112
8 (1
1.9)
1.15
0.74
, 1.7
60.
770.
46, 1
.28
0.91
0.57
, 1.4
3
>1
106
(9.8
)2.
641.
74, 4
.00
1.63
0.98
, 2.7
02.
001.
28, 3
.12
Out
door
Hou
seho
ld M
VPA
(hr
s/w
k)a
010
09 (
93.7
)1.
00--
1.00
----
--
≤1.5
42 (
3.9)
0.95
0.46
, 1.9
70.
650.
28, 1
.49
----
>1.
526
(2.
4)1.
620.
71, 3
.67
2.08
0.83
, 5.2
4--
--
Arch Womens Ment Health. Author manuscript; available in PMC 2012 July 18.
NIH
-PA Author Manuscript
NIH
-PA Author Manuscript
NIH
-PA Author Manuscript
Demissie et al. Page 18
Cru
de M
odel
Fin
al A
djus
ted
Mod
elR
educ
ed M
odel
f
n (%
)O
R95
% C
IO
R95
% C
IO
R95
% C
I
Tra
nspo
rtat
ion
MV
PA (
hrs/
wk)
a
097
9 (9
0.9)
1.00
--1.
00--
----
≤0.9
746
(4.
3)1.
480.
79, 2
.79
1.19
0.57
, 2.5
0--
--
>0.
9752
(4.
8)0.
920.
47, 1
.78
0.76
0.35
, 1.6
2--
--
a Fina
l adj
uste
d m
odel
adj
uste
d fo
r de
pres
sive
sym
ptom
s at
<20
wee
ks' g
esta
tion.
b Fina
l adj
uste
d m
odel
adj
uste
d fo
r de
pres
sive
sym
ptom
s at
<20
wee
ks' g
esta
tion
and
soci
al s
uppo
rt.
c Fina
l adj
uste
d m
odel
adj
uste
d fo
r de
pres
sive
sym
ptom
s at
<20
wee
ks' g
esta
tion,
soc
ial s
uppo
rt, b
ody
mas
s in
dex,
sm
okin
g.
d Fina
l adj
uste
d m
odel
adj
uste
d fo
r de
pres
sive
sym
ptom
s at
<20
wee
ks' g
esta
tion,
neg
ativ
e lif
e ev
ents
.
e Fina
l adj
uste
d m
odel
adj
uste
d fo
r de
pres
sive
sym
ptom
s at
<20
wee
ks' g
esta
tion,
soc
ial s
uppo
rt, n
egat
ive
life
even
ts, s
mok
ing.
f Red
uced
mod
els
are
not a
djus
ted
for
depr
essi
ve s
ympt
oms
at <
20 w
eeks
' ges
tatio
n.
Arch Womens Ment Health. Author manuscript; available in PMC 2012 July 18.
NIH
-PA Author Manuscript
NIH
-PA Author Manuscript
NIH
-PA Author Manuscript
Demissie et al. Page 19
Tabl
e 3
Odd
s ra
tios
(OR
) an
d 95
% c
onfi
denc
e in
terv
als
(CI)
fro
m lo
gist
ic r
egre
ssio
n an
alys
is o
f th
e as
soci
atio
n be
twee
n to
tal a
nd d
omai
n-sp
ecif
ic p
hysi
cal
activ
ity o
f ab
solu
te m
oder
ate
and
vigo
rous
inte
nsity
(M
ET
-hou
rs/w
eek)
at 1
7–22
wee
ks' g
esta
tion
and
depr
essi
ve s
ympt
oms
at 2
4–29
wee
ks' g
esta
tion
amon
g w
omen
enr
olle
d in
the
PIN
3 St
udy
(n=
1077
). Cru
de M
odel
Fin
al A
djus
ted
Mod
elR
educ
ed M
odel
d
n (%
)O
R95
%C
IO
R95
% C
IO
R95
% C
I
Tot
al M
VPA
(M
ET
-hrs
/wk)
a
064
0 (5
9.4)
1.00
--1.
00--
1.00
--
≤922
4 (2
0.8)
0.76
0.48
, 1.1
90.
710.
42, 1
.18
0.78
0.49
, 1.2
4
>9
213
(19.
8)1.
140.
80, 1
.63
0.69
0.46
, 1.0
60.
780.
53, 1
.15
Wor
k M
VPA
(M
ET
-hrs
/wk)
a
099
1 (9
2.0)
1.00
--1.
00--
1.00
--
≤448
(4.
5)0.
510.
23, 1
.15
0.65
0.26
, 1.6
30.
640.
28, 1
.48
>4
38 (
3.5)
1.38
0.68
, 2.7
71.
760.
79, 3
.90
1.60
0.78
, 3.2
9
Rec
reat
iona
l MV
PA (
ME
T-h
rs/w
k)a
080
8 (7
5.0)
1.00
--1.
00--
1.00
--
≤10.
514
6 (1
3.6)
0.65
0.42
, 1.0
11.
200.
73, 1
.98
0.98
0.62
, 1.5
5
>10
.512
3 (1
1.4)
0.42
0.25
, 0.7
20.
910.
50, 1
.63
0.62
0.36
, 1.0
8
Adu
lt an
d C
hild
Car
e M
VPA
(M
ET
-hrs
/wk)
b
010
45 (
97.0
)1.
00--
1.00
--1.
00--
>0
32 (
3.0)
0.69
0.20
, 2.4
40.
440.
15, 1
.30
0.50
0.19
, 1.3
0
Indo
or H
ouse
hold
MV
PA (
ME
T-h
rs/w
k)c
099
8 (9
2.7)
1.00
--1.
00--
----
≤646
(4.
3)0.
870.
43, 1
.78
0.86
0.38
, 1.9
4--
--
>6
33 (
3.1)
2.94
1.46
, 5.9
13.
001.
34, 6
.72
----
Out
door
Hou
seho
ld M
VPA
(M
ET
-hrs
/wk)
c
010
30 (
95.6
)1.
00--
1.00
----
--
≤5.5
26 (
2.4)
0.93
0.37
, 2.3
30.
670.
23, 1
.95
----
>5.
521
(2.
0)2.
811.
18, 6
.68
2.44
0.88
, 6.7
5--
--
a Fully
adj
uste
d m
odel
adj
uste
d fo
r de
pres
sive
sym
ptom
s at
<20
wee
ks' g
esta
tion,
edu
catio
n.
Arch Womens Ment Health. Author manuscript; available in PMC 2012 July 18.

NIH
-PA Author Manuscript
NIH
-PA Author Manuscript
NIH
-PA Author Manuscript
Demissie et al. Page 20b Fu
lly a
djus
ted
mod
el a
djus
ted
for
depr
essi
ve s
ympt
oms
at <
20 w
eeks
' ges
tatio
n, s
ocia
l sup
port
, sm
okin
g.
c Fully
adj
uste
d m
odel
adj
uste
d fo
r de
pres
sive
sym
ptom
s at
<20
wee
ks' g
esta
tion.
d Red
uced
mod
els
are
not a
djus
ted
for
depr
essi
ve s
ympt
oms
at <
20 w
eeks
' ges
tatio
n.
Arch Womens Ment Health. Author manuscript; available in PMC 2012 July 18.
Copyright © 2022 FDOKUMEN