An Empirical Bayes Approach to Shrinkage Estimation ... - arXiv
Upload
independentCategory
view
0download
0
BioMed CentralBMC Evolutionary Biology
ss
Open AcceResearch articlePhylogenetic relationships of typical antbirds (Thamnophilidae) and test of incongruence based on Bayes factorsMartin Irestedt*1,2, Jon Fjeldså3, Johan AA Nylander4 and Per GP Ericson1Address: 1Department of Vertebrate Zoology and Molecular Systematics Laboratory, Swedish Museum of Natural History, P.O. Box 50007, SE-104 05, Stockholm, Sweden, 2Department of Zoology, University of Stockholm, SE-106 91 Stockholm, Sweden, 3Vertebrate Department, Zoological Museum, University of Copenhagen, Universitetsparken 15, DK-2100 Copenhagen Ø, Denmark and 4Department of Systematic Zoology, Evolutionary Biology, Centre, Uppsala University, Uppsala, Sweden
Email: Martin Irestedt* - [email protected]; Jon Fjeldså - [email protected]; Johan AA Nylander - [email protected]; Per GP Ericson - [email protected]
* Corresponding author
AbstractBackground: The typical antbirds (Thamnophilidae) form a monophyletic and diverse family of suboscinepasserines that inhabit neotropical forests. However, the phylogenetic relationships within this assemblageare poorly understood. Herein, we present a hypothesis of the generic relationships of this group basedon Bayesian inference analyses of two nuclear introns and the mitochondrial cytochrome b gene. The levelof phylogenetic congruence between the individual genes has been investigated utilizing Bayes factors. Wealso explore how changes in the substitution models affected the observed incongruence betweenpartitions of our data set.
Results: The phylogenetic analysis supports both novel relationships, as well as traditional groupings.Among the more interesting novel relationship suggested is that the Terenura antwrens, the wing-bandedantbird (Myrmornis torquata), the spot-winged antshrike (Pygiptila stellaris) and the russet antshrike(Thamnistes anabatinus) are sisters to all other typical antbirds. The remaining genera fall into two majorclades. The first includes antshrikes, antvireos and the Herpsilochmus antwrens, while the second cladeconsists of most antwren genera, the Myrmeciza antbirds, the "professional" ant-following antbirds, andallied species. Our results also support previously suggested polyphyly of Myrmotherula antwrens andMyrmeciza antbirds. The tests of phylogenetic incongruence, using Bayes factors, clearly suggests thatallowing the gene partitions to have separate topology parameters clearly increased the model likelihood.However, changing a component of the nucleotide substitution model had much higher impact on themodel likelihood.
Conclusions: The phylogenetic results are in broad agreement with traditional classification of the typicalantbirds, but some relationships are unexpected based on external morphology. In these cases their trueaffinities may have been obscured by convergent evolution and morphological adaptations to new habitatsor food sources, and genera like Myrmeciza antbirds and the Myrmotherula antwrens obviously needtaxonomic revisions. Although, Bayes factors seem promising for evaluating the relative contribution ofcomponents to an evolutionary model, the results suggests that even if strong evidence for a modelallowing separate topology parameters is found, this might not mean strong evidence for separate genephylogenies, as long as vital components of the substitution model are still missing.
Published: 30 July 2004
BMC Evolutionary Biology 2004, 4:23 doi:10.1186/1471-2148-4-23
Received: 26 April 2004Accepted: 30 July 2004
This article is available from: http://www.biomedcentral.com/1471-2148/4/23
© 2004 Irestedt et al; licensee BioMed Central Ltd. This is an open-access article distributed under the terms of the Creative Commons Attribution License (http://creativecommons.org/licenses/by/2.0), which permits unrestricted use, distribution, and reproduction in any medium, provided the original work is properly cited.
Page 1 of 16(page number not for citation purposes)

BMC Evolutionary Biology 2004, 4:23 http://www.biomedcentral.com/1471-2148/4/23
BackgroundThe typical antbirds (Thamnophilidae) is a speciose fam-ily within the furnariid radiation (sensu [1]) of the NewWorld suboscine clade. The family includes fully 200 spe-cies [2] that all are restricted to neotropical forests. Mostspecies are arboreal or undergrowth inhabitants, whileonly a few members are clearly terrestrially adapted,which otherwise seems to be the commonest lifestyle formost members in closely related clades (e.g., gnateatersConopophagidae, antpittas Grallariidae, tapaculos Rhi-nocryptidae, and antthrushes Formicariidae). The highestdiversity of typical antbirds is found in the Amazonianbasin, and differences in ecological specializations make itpossible to find as many as 40 species in the same area [3].Morphologically typical antbirds shows considerable var-iation in size and patterns and colors of the plumage(black and shades of grey, buff and chestnut, with sexualplumage dimorphism in many species), while the varia-tion in shape is more restricted. Many insectivorousniches are occupied, but the specialization of some spe-cies to follow army ants (to capture escaping insects) isperhaps the most well known. This habit has also givenraise to the vernacular family name.
In traditional classifications, the antpittas (Grallariidae)and antthrushes (Formicariidae) were grouped togetherwith typical antbirds in an even larger family. However,the support for the expanded antbird family was indeedweak, and both morphological [4-6] and molecular [1,7]evidence suggests that antpittas and antthrushes are dis-tantly related to typical antbirds. DNA sequence data [1,8]suggests that gnateaters (Conopophagidae) forms the sis-ter clade to typical antbirds, while antpittas and ant-thrushes are more closely related to tapaculos(Rhinocryptidae), woodcreepers and ovenbirds(Furnariidae).
Even though the monophyly of typical antbirds seems tobe well supported by both syrinx morphology [6] andmolecular data [1,7] the phylogenetic relationshipswithin this assemblage are poorly understood, and theconfusion extending to all taxonomic levels. Both themonophyly of several genera of typical antbirds has beenquestioned [3,9,10], as well as the delimitation of certainspecies [2,11-14]. Some species have also been movedfrom one genus to another (e.g., the black-hooded ant-wren that has been moved from the genus Myrmotherula toFormicivora [15]). The current knowledge of the phyloge-netic relationships among typical antbirds rests mainly oninterpretations drawn from external features, mostly ofbill and feet, and has remained essentially the same for150 years [2].
As typical antbirds are morphologically and ecologicallydiverse, they form a challenging group for studies of, e.g.
adaptive evolution. However, such studies, as well as bio-geographic interpretations, are difficult to make as long asthere is no phylogenetic hypothesis. The aim of this studyis therefore to create a hypothesis of generic relationshipsof typical antbirds that could be used as a framework formore detailed studies of the evolution of the group. Twonuclear introns, intron 2 in myoglobin and intron 11 inthe glyceraldehyde-3-phosphodehydrogenase gene(G3PDH), and the mitochondrial cytochrome b gene,have been sequenced for 51 typical antbird taxa represent-ing 38 out of the 45 genera recognized by Ridgely andTudor [3]. We have used Bayesian inference and Markovchain Monte Carlo (MCMC) to estimate the phylogeneticrelationships.
A common assumption made by molecular systematists isthat gene trees accurately reflect species trees. Neverthe-less, different data partitions may have different phyloge-nies due to processes as lineage sorting, gene duplicationfollowed by extinction, and lateral transfer by hybridiza-tion and introgression (reviewed in [16-18]).
Primarily, there are two contradictory strategies utilized tohandle data sets with significant phylogenetic incongru-ence between independent data partitions. Advocates fora "total evidence approach" (e.g., [19,20]) suggest thatavailable data always should be combined, even thoughindividual data partitions might be partly incongruent.The arguments are that a combination of different datapartitions might improve the total resolution as differentdata partitions might be useful to resolve different areas ofthe tree, and that additive data sets might enhance phylo-genetic informative characters that have been hidden bynoise in the individual partitions. Opponents to this view(e.g., [21,22]) advice that data partitions with a significantlevel of incongruence should not be combined, as reliablecharacters might be obscured by random or systematicerrors and in the worse case result in an erroneous topol-ogy (even though individual data partitions might pro-vide consistent estimates).
However, when independent evidence is lacking andincongruence occurs between individual data partitions, itmay be difficult to determine whether particular parti-tions are better estimates of the species tree than others.Researchers might favor the "total evidence approach" forthis particular reason (even though the argument for notcombining data partitions with significant levels of incon-gruence have strong merits). However, the degree ofincongruence between individual gene trees could be usedto determine whether the phylogenetic conclusionsshould be based on the combined data set, or only thoseparts that are similar among the different partitions. Acommonly used approach for analysing combined datawith maximum likelihood is to assume a single (the
Page 2 of 16(page number not for citation purposes)

BMC Evolutionary Biology 2004, 4:23 http://www.biomedcentral.com/1471-2148/4/23
same) substitution model for all of the combined genes(for exceptions, see [23,24]). A significant result of incon-gruence between the combined result and the individualgenes can then be hard to explain, since the incongruencecould be due to both true difference in gene phylogenyand a misfit in the assumed model of evolution for thecombined data [21,25]. This misfit could, for example, bea result of not allowing a heterogeneous model, that is,not allowing the different genes to have separate substitu-tion models in the combined analysis [26]. We have thusexplored our data partitions (the individual genes) by thecongruence test described by Nylander et al. [27], whichutilizes Bayes factors. The test is not an explicit signifi-cance test but compares the strength of evidence betweentwo models of character evolution.
Although nuclear genes (as when situated on differentchromosomes) may be considered as members of differ-ent linkage groups, the maternally inherited mitochon-drial genome is effectively independent from the nucleargenome. Organelle genomes have also been suggested tomore susceptible to "flow" between taxa during hybridiza-tion (although much less common in animals than inplants). In birds Degnan and Moritz [28] and Degnan[29], for example, have demonstrated that the mitochon-drial tree in Australian white-eyes misrepresented the treeof nuclear loci and the expected species tree, possibly dueto previous hybridization events. We have thus primarilybeen interested in the potential incongruence between themitochondrial cytochrome b and the two nuclear genes(myoglobin and G3PDH), but all combinations of thethree genes were examined. However, limitations in thesubstitution models might be the most important expla-nation to observed incongruence between data partitions,rather than an intrinsic phylogenetic incongruence [27].We also explored how changes in substitution modelsaffected the observed incongruence in our data set.
ResultsMolecular variation and sequence distancesAfter alignment, the concatenated sequences become2173 bp long. A total of between 679 bp (Sclerurus scan-sor) and 723 bp (Myrmotherula leucophthalma) wasobtained from myoglobin intron 2, between 351 bp (Rhe-gmatorina melanosticta) and 400 bp (Myrmeciza griseiceps)from G3PDH intron 11, and 999 bp from cytochrome b.The observed, pairwise distances between ingroup taxarange between 0, 7% and 10, 7% in myoglobin, between0, 3% and 19, 3% in G3PDH and between 6, 5% and 23,9% in cytochrome b. Indels were found both in themyoglobin intron 2 and in the G3PDH intron 11. In mostcases these are autapomorphic indels or occur in espe-cially variable and repeatable regions. Given the treetopologies obtained from the Bayesian analyses, somesynapomorphic indels were observed. For example, all
Thamnophilus representatives share with Sakesphorus ber-nardi an insertion in the G3PDH intron, and, togetherwith Dysithamnus mentalis and Herpsilochmus atricapillus,an insertion in the myoglobin intron.
Phylogenetic inference and molecular modelsA priori selection of substitution models showed thatfairly parameter rich models were the best fit for all datapartitions. Importantly, modeling rate variation seemedto be an important component. For the cytochrome b par-tition the GTR+I+Γ was the best fit, and for myoglobinintron 2, it was the GTR+ Γ. For the G3PDH intron 11 thesomewhat simpler HKY+ Γ model was chosen. Thesemodels were used in the consecutive MCMC of the indi-vidual genes as well in the combined analysis. The param-eter estimates from the two separate MCMC runs for eachdata set were found to be very similar (data not shown),thus allowing an inference from the concatenated output.After discarding the burn-in phase the inference for thecytochrome b was based on a total of 36, 000 samplesfrom the posterior, for myoglobin the inference was basedon 38, 000 samples, and for G3PDH and the combineddata, inference were based on 38, 000, and 55, 600 sam-ples, respectively. For the phylogenetic inference, themode of the posterior distribution of topologies was pre-sented as a majority-rule consensus tree from each analy-sis (Figures 1,2,3,4).
The trees obtained from the Bayesian analyses of the indi-vidual genes (cytochrome b, myoglobin and G3PDH) andthe combined data set all differ in topology and degree ofresolution. The G3PDH gene produced the poorestresolved tree (Figure 1) and also contains the smallestnumber of nodes with posterior probability values above0.90. The myoglobin (Figure 2) and cytochrome b (Figure3) genes produced trees with similar degree of resolutionand nodal supports, but there is a weak tendency for cyto-chrome b giving better resolution and support at terminalnodes. The combined data set (cytochrome b, myoglobinand G3PDH) produced the most resolved tree (Figure 4)with the highest number of strongly supported nodes(exceeding 0.90 posterior probability). Overall, themyoglobin, the cytochrome b and the combined trees aretopologically rather similar, while the G3PDH tree is themost deviant. A common pattern in all trees is that severalnodes are unresolved, or short with low or intermediateposterior probabilities support values (0.50–0.90). Theobserved topological conflicts between the obtained treesgenerally occur at these short nodes, and there are only afew nodes with posterior probabilities values above 0.90that are in conflict between the trees. Of these, one con-cerns the outgroup relationships (the G3PDH tree sup-ports with 0.96 posterior probability a position ofPteroptochos tarnii that differs from all other trees). Theother two conflicts concern internal relationships within
Page 3 of 16(page number not for citation purposes)

BMC Evolutionary Biology 2004, 4:23 http://www.biomedcentral.com/1471-2148/4/23
The G3PDH majority rule consensus treeFigure 1The G3PDH majority rule consensus tree. The 50% majority rule consensus tree obtained from the Bayesian analyses of the G3PDH (glyceraldehydes-3-phosphodehydrogenase) intron 11 data set. Posterior probability values are indicated to the right of the nodes.
Hypoedaleus guttatusBatara cinereaMackenziaena severa
Frederickena unduligera
Taraba major
Sakesphorus bernardiThamnophilus doliatus
Thamnophilus unicolor
Thamnophilus praecoxThamnophilus cryptoleucus
Thamnophilus caerulescens
Megastictus margaritatus
Neoctantes niger
Thamnistes anabatinus
Dysithamnus mentalisThamnomanes caesius
Myrmotherula obscura
Myrmotherula fulviventrisMyrmotherula leucophthalma
Myrmotherula axillaris
Myrmotherula behni
Myrmotherula menetriesii
Dichrozona cincta
Myrmorchilus strigilatus
Herpsilochmus atricapillus
Microrhopias quixensis
Formicivora rufa
Drymophila squamata
Terenura humeralis
Cercomacra melanaria
Pyriglena leuconota
Myrmoborus myotherinus
Hypocnemoides maculicauda
Hypocnemis cantator
Myrmochanes hemileucus
Gymnocichla nudiceps
Sclateria naeviaSchistocichla leucostigmaMyrmeciza griseiceps
Myrmeciza loricata
Myrmeciza hemimelaena
Myrmeciza berlepschi
Myrmeciza fortis
Pithys albifrons
Gymnopithys leucaspis
Myrmornis torquata
Rhegmatorhina melanosticta
Hylophylax naevia
Phlegopsis erythroptera
Phaenostictus mcleannani
Conopophaga auritaPteroptochos tarnii
Sclerurus scansorGrallaria squamigera
0.96
0.91
1.00
0.52
0.591.00
0.59
0.61
0.66
1.00
0.77
1.00
0.99
0.95
0.50
0.86
0.59
0.79
0.62
0.83
0.56
0.82
0.70
Pygiptila stellaris
1.00
Page 4 of 16(page number not for citation purposes)

BMC Evolutionary Biology 2004, 4:23 http://www.biomedcentral.com/1471-2148/4/23
The myoglobin majority rule consensus treeFigure 2The myoglobin majority rule consensus tree. The 50% majority rule consensus tree obtained from the Bayesian analyses of the myoglobin intron 2 data set. Posterior probability values are indicated to the right of the nodes.
1.00
0.86
0.60
0.69
1.001.00
0.94
0.82
1.00
0.64
1.00
0.940.76
1.00
1.00
0.941.00
1.00
0.99
0.751.00
1.001.00
0.99
0.55
1.00
0.52
0.85
1.00
0.98
0.59
Hypoedaleus guttatusBatara cinerea
Mackenziaena severaFrederickena unduligera
Taraba major
Sakesphorus bernardiThamnophilus doliatus
Thamnophilus unicolor
Thamnophilus praecoxThamnophilus cryptoleucus
Thamnophilus caerulescens
Pygiptila stellaris
Megastictus margaritatus
Neoctantes niger
Thamnistes anabatinus
Dysithamnus mentalis
Thamnomanes caesius
Myrmotherula obscura
Myrmotherula fulviventrisMyrmotherula leucophthalma
Myrmotherula axillaris
Myrmotherula behniMyrmotherula menetriesii
Dichrozona cincta
Myrmorchilus strigilatus
Herpsilochmus atricapillus
Microrhopias quixensis
Formicivora rufa
Drymophila squamata
Terenura humeralis
Cercomacra melanaria
Pyriglena leuconota
Myrmoborus myotherinus
Hypocnemoides maculicauda
Hypocnemis cantator
Myrmochanes hemileucus
Gymnocichla nudiceps
Sclateria naeviaSchistocichla leucostigmaMyrmeciza griseiceps
Myrmeciza loricata
Myrmeciza hemimelaena
Myrmeciza berlepschi
Myrmeciza fortis
Pithys albifrons
Gymnopithys leucaspis
Myrmornis torquata
Rhegmatorhina melanosticta
Hylophylax naevia
Phlegopsis erythroptera
Phaenostictus mcleannani
Conopophaga aurita
Pteroptochos tarniiSclerurus scansor
Grallaria squamigera
Page 5 of 16(page number not for citation purposes)

BMC Evolutionary Biology 2004, 4:23 http://www.biomedcentral.com/1471-2148/4/23
The cytochrome b majority rule consensus treeFigure 3The cytochrome b majority rule consensus tree. The 50% majority rule consensus tree obtained from the Bayesian anal-yses of the cytochrome b data set. Posterior probability values are indicated to the right of the nodes.
0.61
0.900.97
0.85
0.86
1.00
0.92
0.621.00
1.00
1.00
1.00
0.98
0.79
0.53
0.73
0.991.00
0.710.93
0.82
0.62
1.00
1.00
0.66
0.50
0.60
0.62
0.79
1.00
0.95
1.00
0.78
100
0.56
0.91
1.00
0.99
0.670.63
Hypoedaleus guttatusBatara cinerea
Mackenziaena severaFrederickena unduligera
Taraba major
Sakesphorus bernardiThamnophilus doliatus
Thamnophilus unicolorThamnophilus praecox
Thamnophilus cryptoleucusThamnophilus caerulescens
Pygiptila stellaris
Megastictus margaritatus
Neoctantes niger
Thamnistes anabatinus
Dysithamnus mentalis
Thamnomanes caesius
Myrmotherula obscura
Myrmotherula fulviventrisMyrmotherula leucophthalma
Myrmotherula axillarisMyrmotherula behni
Myrmotherula menetriesii
Dichrozona cincta
Myrmorchilus strigilatus
Herpsilochmus atricapillus
Microrhopias quixensis
Formicivora rufa
Drymophila squamata
Terenura humeralis
Cercomacra melanaria
Pyriglena leuconota
Myrmoborus myotherinus
Hypocnemoides maculicauda
Hypocnemis cantator
Myrmochanes hemileucus
Gymnocichla nudiceps
Sclateria naevia
Schistocichla leucostigma
Myrmeciza griseiceps
Myrmeciza loricata
Myrmeciza hemimelaena
Myrmeciza berlepschi
Myrmeciza fortis
Pithys albifrons
Gymnopithys leucaspis
Myrmornis torquata
Rhegmatorhina melanosticta
Hylophylax naevia
Phlegopsis erythroptera
Phaenostictus mcleannani
Conopophaga lineata
Pteroptochos tarniiSclerurus scansor
Grallaria squamigera
Page 6 of 16(page number not for citation purposes)

BMC Evolutionary Biology 2004, 4:23 http://www.biomedcentral.com/1471-2148/4/23
The combined majority rule consensus treeFigure 4The combined majority rule consensus tree. The 50% majority rule consensus tree obtained from the analyses of the combined data set (G3PDH intron 11, the myoglobin intron 2 and the cytochrome b data sets). Clades A, B and C are major groups of typical antbirds discussed in the text. Posterior probability values are indicated to the right of the nodes.
Grallaria squamigeraConopophaga aurita/lineata
Neoctantes nigerMyrmotherula fulviventris
Myrmotherula leucophthalma1.00
1.00
Myrmorchilus strigilatusMicrorhopias quixensis
0.83
1.00
Phaenostictus mcleannaniGymnopithys leucaspis
Rhegmatorhina melanosticta1.00
0.60
Pithys albifronsPhlegopsis erythroptera
0.51
1.00
Cercomacra melanariaHypocnemis cantator
Drymophila squamataMyrmeciza hemimelaena
0.59
0.93
0.98
1.00
Myrmotherula obscuraMyrmochanes hemileucus
1.00
Myrmotherula axillarisMyrmotherula menetriesii
Myrmotherula behniFormicivora rufa
0.53
0.52
1.00
1.00
Myrmoborus myotherinusGymnocichla nudicepsPyriglena leuconotaMyrmeciza fortis
0.52
1.001.00
Sclateria naeviaSchistocichla leucostigma
1.00
Myrmeciza griseicepsMyrmeciza berlepschi
1.00
Myrmeciza loricataHypocnemoides maculicauda
Hylophylax naevia1.00
0.820.76
1.00
0.54
Megastictus margaritatusThamnomanes caesius
Dichrozona cinctaTaraba major
Hypoedaleus guttatusBatara cinerea
1.00
Mackenziaena severaFrederickena unduligera
1.00
0.99
1.00
0.96
Sakesphorus bernardiThamnophilus doliatus
Thamnophilus praecoxThamnophilus cryptoleucus
Thamnophilus unicolorThamnophilus caerulescens
0.99
0.91
1.00
1.00
Dysithamnus mentalisHerpsilochmus atricapillus
1.00
0.89
0.95
1.00
Terenura humeralisMyrmornis torquata
Pygiptila stellarisThamnistes anabatinus
1.001.00
0.72
1.00
1.00
Pteroptochus tarniiSclerurus scansor0.97
1.00
Page 7 of 16(page number not for citation purposes)
BMC Evolutionary Biology 2004, 4:23 http://www.biomedcentral.com/1471-2148/4/23
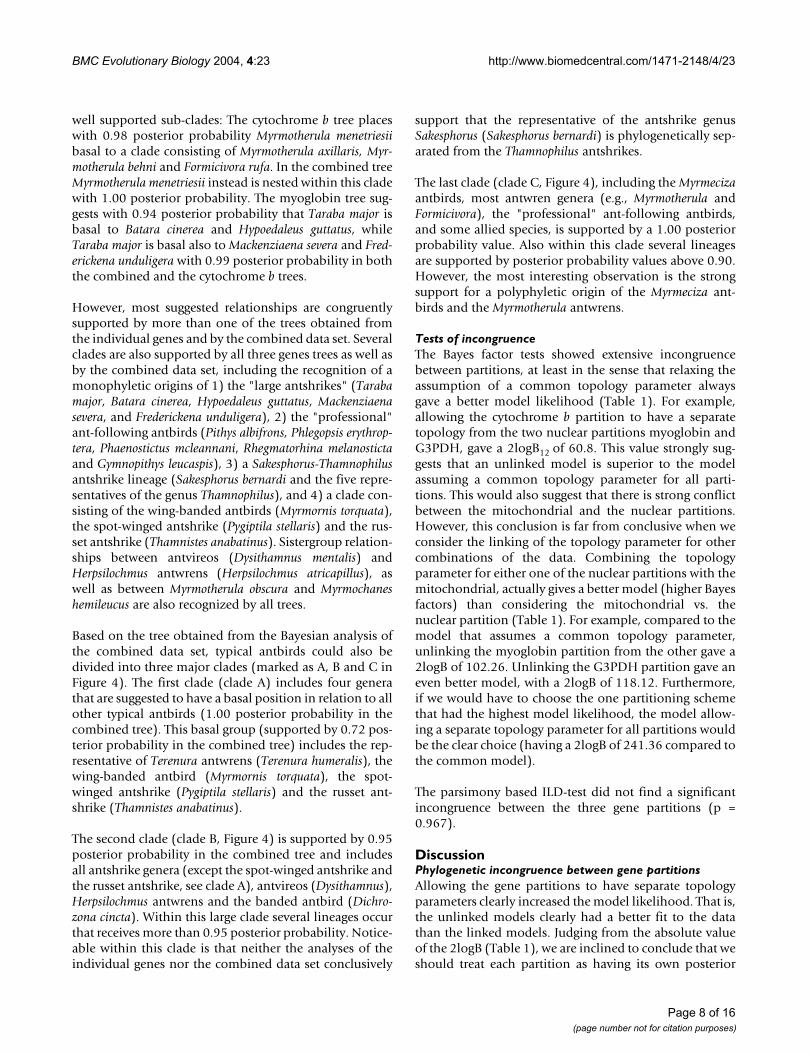
well supported sub-clades: The cytochrome b tree placeswith 0.98 posterior probability Myrmotherula menetriesiibasal to a clade consisting of Myrmotherula axillaris, Myr-motherula behni and Formicivora rufa. In the combined treeMyrmotherula menetriesii instead is nested within this cladewith 1.00 posterior probability. The myoglobin tree sug-gests with 0.94 posterior probability that Taraba major isbasal to Batara cinerea and Hypoedaleus guttatus, whileTaraba major is basal also to Mackenziaena severa and Fred-erickena unduligera with 0.99 posterior probability in boththe combined and the cytochrome b trees.
However, most suggested relationships are congruentlysupported by more than one of the trees obtained fromthe individual genes and by the combined data set. Severalclades are also supported by all three genes trees as well asby the combined data set, including the recognition of amonophyletic origins of 1) the "large antshrikes" (Tarabamajor, Batara cinerea, Hypoedaleus guttatus, Mackenziaenasevera, and Frederickena unduligera), 2) the "professional"ant-following antbirds (Pithys albifrons, Phlegopsis erythrop-tera, Phaenostictus mcleannani, Rhegmatorhina melanostictaand Gymnopithys leucaspis), 3) a Sakesphorus-Thamnophilusantshrike lineage (Sakesphorus bernardi and the five repre-sentatives of the genus Thamnophilus), and 4) a clade con-sisting of the wing-banded antbirds (Myrmornis torquata),the spot-winged antshrike (Pygiptila stellaris) and the rus-set antshrike (Thamnistes anabatinus). Sistergroup relation-ships between antvireos (Dysithamnus mentalis) andHerpsilochmus antwrens (Herpsilochmus atricapillus), aswell as between Myrmotherula obscura and Myrmochaneshemileucus are also recognized by all trees.
Based on the tree obtained from the Bayesian analysis ofthe combined data set, typical antbirds could also bedivided into three major clades (marked as A, B and C inFigure 4). The first clade (clade A) includes four generathat are suggested to have a basal position in relation to allother typical antbirds (1.00 posterior probability in thecombined tree). This basal group (supported by 0.72 pos-terior probability in the combined tree) includes the rep-resentative of Terenura antwrens (Terenura humeralis), thewing-banded antbird (Myrmornis torquata), the spot-winged antshrike (Pygiptila stellaris) and the russet ant-shrike (Thamnistes anabatinus).
The second clade (clade B, Figure 4) is supported by 0.95posterior probability in the combined tree and includesall antshrike genera (except the spot-winged antshrike andthe russet antshrike, see clade A), antvireos (Dysithamnus),Herpsilochmus antwrens and the banded antbird (Dichro-zona cincta). Within this large clade several lineages occurthat receives more than 0.95 posterior probability. Notice-able within this clade is that neither the analyses of theindividual genes nor the combined data set conclusively
support that the representative of the antshrike genusSakesphorus (Sakesphorus bernardi) is phylogenetically sep-arated from the Thamnophilus antshrikes.
The last clade (clade C, Figure 4), including the Myrmecizaantbirds, most antwren genera (e.g., Myrmotherula andFormicivora), the "professional" ant-following antbirds,and some allied species, is supported by a 1.00 posteriorprobability value. Also within this clade several lineagesare supported by posterior probability values above 0.90.However, the most interesting observation is the strongsupport for a polyphyletic origin of the Myrmeciza ant-birds and the Myrmotherula antwrens.
Tests of incongruenceThe Bayes factor tests showed extensive incongruencebetween partitions, at least in the sense that relaxing theassumption of a common topology parameter alwaysgave a better model likelihood (Table 1). For example,allowing the cytochrome b partition to have a separatetopology from the two nuclear partitions myoglobin andG3PDH, gave a 2logB12 of 60.8. This value strongly sug-gests that an unlinked model is superior to the modelassuming a common topology parameter for all parti-tions. This would also suggest that there is strong conflictbetween the mitochondrial and the nuclear partitions.However, this conclusion is far from conclusive when weconsider the linking of the topology parameter for othercombinations of the data. Combining the topologyparameter for either one of the nuclear partitions with themitochondrial, actually gives a better model (higher Bayesfactors) than considering the mitochondrial vs. thenuclear partition (Table 1). For example, compared to themodel that assumes a common topology parameter,unlinking the myoglobin partition from the other gave a2logB of 102.26. Unlinking the G3PDH partition gave aneven better model, with a 2logB of 118.12. Furthermore,if we would have to choose the one partitioning schemethat had the highest model likelihood, the model allow-ing a separate topology parameter for all partitions wouldbe the clear choice (having a 2logB of 241.36 compared tothe common model).
The parsimony based ILD-test did not find a significantincongruence between the three gene partitions (p =0.967).
DiscussionPhylogenetic incongruence between gene partitionsAllowing the gene partitions to have separate topologyparameters clearly increased the model likelihood. That is,the unlinked models clearly had a better fit to the datathan the linked models. Judging from the absolute valueof the 2logB (Table 1), we are inclined to conclude that weshould treat each partition as having its own posterior
Page 8 of 16(page number not for citation purposes)

BMC Evolutionary Biology 2004, 4:23 http://www.biomedcentral.com/1471-2148/4/23
distribution of trees. However, the question is if we fromthese results really can say that the gene partitions evolvedon different phylogenies? There are several reasons whydifferent data partitions may have different phylogenies,although being sampled from the same taxa, or even thesame individuals (se above). We cannot completely ruleout the occurrence of any of these processes in our data.However, we believe that the interpretation based solelyon Bayes factors might be hazardous. For instance, is itplausible that all three gene partitions had evolved onthree different phylogenies, or that the linking of cyto-chrome b and myoglobin is a more reasonable partition ofthe data, instead of the mitochondrial versus the nuclearpartitions? Nylander et al. [27], speculate that limitationsin the substitution models might be more reasonableexplanations to the high Bayes factors observed whencomparing unlinked and linked models. Changing a com-ponent of the nucleotide substitution model, e.g. addingparameters to model rate variation, had much higherimpact on the model likelihood than unlinkingparameters among data partition. To illustrate the impactof changing the substitution model in our data, we runadditional MCMC analyses under a different set of mod-els, and compared them with the previous analyses usingBayes factors. The results were striking (Table 2). Forexample, we compared two models without rate variation,one with linked and the other with unlinked topologies
(in both models GTR was used for cytochrome b and formyoglobin, and HKY for the G3PDH). The 2logB was295.98 in favor for the unlinked model. However, addingparameters for modeling rate variation to either of the twomodels increased the model likelihood tremendously.The 2logB in favor of a model having parameters for ratevariation (applying the same substitution models as theones chosen a priori using AIC, see material and meth-ods), varied between 5125.22 and 5662.56, depending onthe model being compared (Table 2). Similar observa-tions of magnitude changes in Bayes factors were made byNylander et al. [27], when allowing rate variation.Another striking feature was that once parameters formodeling rate variation had been incorporated into themodel, unlinking topologies did not seem to have as pro-nounced effect on the model likelihood (Table 2), com-pared to the models without rate variation. Thisobservation is in concordance with previous findings thatmany functional genes have a strong among-site rate var-iation and that adding the relevant parameters to themodel is likely to have a large effect on the likelihood[23,27,30,31].
It is worth noting that the parsimony based ILD-test didnot find a significant incongruence between the threegene partitions. The value of this observation is uncertain,however, as the ILD test is based on another optimality
Table 1: Summary of Bayes factor tests of incongruence. Entries are twice the log of the Bayes factor in the comparison between models M1 and M2 (2logB12). The row models are arbitrarily labeled M1; thus, positive values indicate support for the column model over the row model. A dash (-) indicates which partitions that have linked topology parameters.
Model Cyt b-Myo-G3PDH Cyt b, Myo-G3PDH Cyt b-Myo, G3PDH Cyt b-G3PDH, Myo Cyt b, Myo, G3PDH
Cyt b-Myo-G3PDH 0 60.84 118.12 102.26 241.36Cyt b, Myo-G3PDH 0 57.28 41.42 180.52Cyt b-Myo, G3PDH 0 -15.86 123.24Cyt b-G3PDH, Myo 0 139.1Cyt b, Myo, G3PDH 0
Table 2: Summary of Bayes factor tests showing the effect of changing substitution model components. Entries are twice the log of the Bayes factor in the comparison between models M1 and M2 (2logB12). The row models are arbitrarily labeled M1; thus, positive values indicate support for the column model over the row model. A dash (-) indicates which partitions that have linked topology parameters. Asterisks (*) indicate models where the rates are assumed to be equal.
Model Cyt b-Myo-G3PDH Cyt b, Myo, G3PDH Cyt b-Myo-G3PDH* Cyt b, Myo, G3PDH*
Cyt b-Myo-G3PDH 0 241.36 -5421.2 -5125.22Cyt b, Myo, G3PDH 0 -5662.56 -5366.58Cyt b-Myo-G3PDH* 0 295.98Cyt b, Myo, G3PDH* 0
Page 9 of 16(page number not for citation purposes)

BMC Evolutionary Biology 2004, 4:23 http://www.biomedcentral.com/1471-2148/4/23
criterion (parsimony). Furthermore, the strength of thetest and interpretation of the results have also been ques-tioned (e.g., [32])
In conclusion, allowing partitions to have separate topol-ogy parameters put fewer restrictions on the data. Hence,we should expect to find a better fit of the model to thedata. Bayes factors seem promising for evaluating therelative contribution of components to an evolutionarymodel. However, judging from the relative increase inmodel likelihood when unlinking topologies comparedto e.g., adding parameters for rate variation, we wouldanticipate components in the substitution model (forexample, allowing rate variation among lineages) to havemore effects on accommodating incongruence in the data.That is, even if we find strong evidence for a model allow-ing separate topology parameters, this might not meanstrong evidence for separate gene phylogenies, as long asvital components of the substitution model are still miss-ing. For further discussions on Bayesian approaches tocombined data issues see e.g., [25,26,33].
Phylogeny and morphological variation in typical antbirdsEven though we are unable to conclusively tell whetherthe observed phylogenetic incongruence between theindividual gene partitions is due to genuine differences inphylogeny, or to limitations in the models used, webelieve that the tree obtained from the combined data setrepresents the best estimate of the true relationshipswithin the typical antbird assemblage. Obviously, severalrelationships are strongly supported, by congruent recog-nition by the individual gene trees and/or by high nodalsupport values. Nevertheless, other relationships have tobe regarded as tentative, and especially those where any ofthe individual gene trees gives a strong nodal support foran alternative topology.
It is noticeable that, although the individual genes con-gruently support several terminal groups, basal relation-ships are generally less well resolved and more often inconflict. Even though this observation might be biaseddue to the use of improper molecular models when calcu-lating the trees, biased mutation rate in studied genes, ora biased taxon sampling, it could indicate that the diversi-fications of typical antbirds was characterized by somerapid speciation bursts. There are only a few recent studiesof typical antbirds with taxon samplings that includesrepresentatives from several genera, but these studiesshow similar difficulties in resolving generic relation-ships. For example, in a study of phylogenetic relation-ships of Myrmotherula antwrens that includedrepresentatives from several other typical antbird genera,Hackett and Rosenberg [10] obtained considerably differ-ent topologies from plumage characters, allozyme andmorphometric data, respectively. In addition, the phylo-
genetic relationships suggested from mitochondrial DNAsequence data within a partly comparable taxon sampling[9], have little resemblance to those in Hackett and Rosen-berg [10]. The nodes between typical antbirds in the DNA-DNA hybridization "tapestry" by Sibley and Ahlquist [[7]:Figure 372] also contain a high degree of short branches.
It is also apparent that earlier antbird taxonomists, usingexternal morphology, had difficulties in their taxonomicdecisions and interpretations of higher-level relation-ships. Ridgway [[34]: p. 9] expressed that "The classifica-tion of this group is very difficult, more so probably thanin the case of any American family of birds". Hackett andRosenberg [10] concluded that antwren speciation mainlyhas been followed by plumage differentiation (and tosome degree size differentiation) rather than changes inbody proportions. Overall, this evolutionary pattern, withgreat changes in plumage and more limited changes inbody proportions, seems to characterize the entire typicalantbird assemblage (in contrast to the situation in oven-birds, where there is a great variation in body proportionsbut not in plumage characters). However, Hackett andRosenberg [10] suggested that neither plumage nor mor-phometric data correctly predicted the genetic relation-ships among the studied taxa. Our results seem to supporttheir assumption as the traditionally used plumage char-acters in typical antbirds, as stripes, wingbars, and generalcoloration; seem to be irregularly distributed in the phyl-ogenetic tree. It is reasonable to assume that plumagecharacters in typical antbirds are variable to such a degreethat they are of limited use in studies of higher-level rela-tionships. High levels of homoplasy (convergences andreversals) in plumage characters have also been reportedin other passerine birds e.g., in Australian scrubwrens [35]brush-finches [36], and in New World orioles [37].
However, if excluding members in the "basal" group(clade A, Figure 4) and a few other aberrant taxa, the divi-sion of typical antbirds into the two main lineages in ourphylogeny (clade B and C, Figure 4) is overall in goodagreement with their body proportions (although there isa considerable size variation within both clades). The ant-shrikes (excluding Tamnistes and Pygiptila), antvireos andHerpsilochmus antwrens in clade B (Figure 4) are all moreor less robust birds with heavy and prominently hookedbills, and many of them have a barred plumage pattern.The taxa in clade C (Figure 4), which includes most ant-wren genera, the Myrmeciza antbirds, the "professional"ant-following antbirds and some allied species, are gener-ally slimmer birds with longer, thinner bills that have aless prominent hook. Most suggested relationships withinclade B and C are in good agreement with traditional clas-sifications. The recognition of monophyletic origins ofmost of the "professional" ant-following taxa (Phaenostic-tus, Gymnopithys, Rhegmatorhina, Pithys and Phlegopsis) and
Page 10 of 16(page number not for citation purposes)

BMC Evolutionary Biology 2004, 4:23 http://www.biomedcentral.com/1471-2148/4/23
the "large" antshrikes (Taraba, Hypoedaleus, Batara, Freder-ickena and Mackenziaena) are two examples where ourresults are congruent with traditional classifications. Thesuggested relationships between the Hypocnemis and Dry-mophila antbirds, and the Herpsilochmus antwrens and theantvireos (Dysithamnus), respectively, have also been pro-posed previously based on molecular data [9,10].Unfortunately, the genera Biatas, Clytoctantes, Percnostola,Rhopornis, Stymphalornis and Xenornis were lacking in ourstudy; while most of these should probably be referred toClade C, Biatas is difficult to place.
Some novel relationships and the phylogenetic positions of some aberrant taxaFor certain taxa the position in our combined phylogenyis unexpected considering the external morphology andtraditional classification. Most noticeable are the positionof the banded antbird (Dichrozona cincta), which is nestedwithin the clade with antshrikes, antvireos and Herpsiloch-mus antwrens (clade B, Figure 4), and the position of thewing-banded antbird (Myrmornis torquata) as sister to therusset antshrike (Thamnistes anabatinus) and the spot-winged antshrike (Pygiptila stellaris) (clade A, Figure 4).However, the increased number of molecular based phyl-ogenies in recent years have led to discoveries of severalexamples, at different phylogenetic levels, were birds havebeen misclassified due to significant morphological dif-ferences from the taxa to which they are most closelyrelated [38-40].
The phylogenetic position of the wing-banded antbird(Myrmornis torquata) has long been obscured and it waslong placed with the typical army-ant followers (e.g., [2]).The wing-banded antbird has also been suspected to berelated to ground antbirds (Formicariidae sensu [7])based on similarities in morphology and general appear-ance [7]. Our results confidently place it within typicalantbirds, a conclusion further supported by its vocaliza-tion [2] and choice of nest site and its white egg [41]. Thewell supported relationship to the arboreal russet ant-shrike (Thamnistes anabatinus) and spot-winged antshrike(Pygiptila stellaris), suggested by our data, has apparentlybeen obscured by structural differences caused by its adap-tation to a terrestrial life-style shared with for example theantthrushes. A similar explanation may apply to the pecu-liar position of the banded antbird (Dichrozona cincta) inthe combined phylogeny, as this taxon is also a mainlyterrestrial bird, unlike the other members in the "ant-shrike" clade (clade B, Figure 4). The fact that the bandedantbird has a rather long branch in the combined tree andthat its phylogenetic position alter between the individualgene trees, leads us to consider the phylogenetic positionof the banded antbird (Dichrozona cincta) as preliminary.However, it is obvious that it is not closely related to theHylophylax antbirds with which it has traditionally been
grouped (based on similarities in plumage patterns andweak sexual dimorphism). It should be noted that, due tothe peculiar position of Dichrozona cincta, a second indi-vidual (ZMUC 128217) have been sequenced for all threegenes. There were no variation at all found between thetwo individuals in G3PDH, in myoglobin 1 ambiguousposition were found, and in cytochrome b 24 base pairs(2.4%) that differed as well as 3 ambiguous positionswere found. Overall, this variation is within the variationthat could be suspected between individuals within a spe-cies. Thus, the strange position of Dichrozona cincta in ouranalyses is unlikely to be due to sample or sequence mix-up.
There are several other, less striking examples where theposition of taxa in our phylogeny conflicts with relation-ships suggested in classifications based on external mor-phology. The Herpsilochmus antwrens for example(traditionally placed among Myrmotherula, Microrhopiasand Formicivora antwrens), are quite different in appear-ance from their sister group Dysithamnus in being ratherslim, lacking a particularly hook-bill, and in having a dis-tinctly patterned plumage (however, as discussed above aclose relationship between Herpsilochmus and Dysithamnusis also supported by an independent molecular study).Other examples are the positions of Myrmorchilus andNeoctantes, respectively (see discussion below). In thesecases their true affinities may have been obscured by mor-phological adaptations to habitats or food sources thatdiffer from those preferred by their closest relatives.
The strong support in the combined tree for basal posi-tions of Myrmornis, Pygiptila, Thamnistes and Terenura rela-tive to all other typical antbirds is maybe the mostunexpected result of our study. In a majority of classifica-tions Terenura is placed close to other antwrens, but withno strong data support. Although the precise position ofthe Terenura antwrens is partly ambiguous in our analysis,they obviously belong to an ancient radiation that is onlydistantly related to the other "antwrens". The Terenuraantwrens differ from other "antwrens" in plumage patternand in being more slender and warbler-like with a thinnerbill and longer tail. In a study based on mitochondrialDNA the position of Terenura was ambiguous dependingon how the data set was analyzed [9] but clearly it was notclosely related to the other taxa included in that study(e.g., Myrmotherula, Formicivora, Herpsilochmus, Hypocne-mis, Drymophila).
The well-supported phylogenetic position of Pygiptila andThamnistes as the sistergroup to Myrmornis (instead ofbeing close to other antshrikes as suggested in many linearclassifications), is novel. However, Pygiptila and Tham-nistes resemble each other in their ways of feeding in thesub-canopy, Thamnistes also resembling the Pygiptila
Page 11 of 16(page number not for citation purposes)

BMC Evolutionary Biology 2004, 4:23 http://www.biomedcentral.com/1471-2148/4/23
female in appearance, and differing from most antshrikesin feeding behavior. DNA-DNA hybridization data [7]and protein electrophoresis [10] have previously shownPygiptila to be genetically distant from the Thamnophilusantshrikes. The general external resemblance of Pygiptilaand Thamnistes to other antshrikes is therefore bestexplained, as being plesiomorphic, and this may also bethe case with their suspended nest-type.
The polyphyly of Myrmotherula antwrens and Myrmeciza antbirdsOur results confirm both previous molecular studies thatsuggest the Myrmotherula antwrens are polyphyletic[9,10], and the suspicion based on morphology that alsothe rather diverse genus Myrmeciza constitutes an unnatu-ral taxon [3]. Nevetheless, most Myrmeciza antbirds stud-ied herein belong to the same clade, although they are notmonophyletic as several other genera (Myrmoborus, Gym-nocichla, Pyriglena, Sclateria, Schistocichla, Hypocnemoides,and Hylophylax) are nested among them. However, thechestnut-tailed antbird (Myrmeciza hemimelaena), whichrepresents a group of small and slim Myrmeciza antbirdswith prominent wing spots in both sexes, groups with theDrymophila, Hypocnemis and Cercomacra antbirds. Thesmall and slim Myrmeciza antbirds resembles morpholog-ically the Hypocnemis antbirds in having similar wingspots as well as a rather short and rufous-brown tail.
The clade that includes the remaining Myrmeciza antbirdsconsists of three unresolved lineage. The first includes agroup of large and heavily built Myrmeciza antbirds (rep-resented by Myrmeciza fortis). Next outside this group isthe fire-eye (Pyriglena leuconota), followed by the bare-crowned antbird (Gymnocichla nudiceps) and the Myr-moborus antbird representative (Myrmoborus myotherinus).These taxa have rather stout bodies and in most cases redeyes. Both the fire-eyes and the bare-crowned antbird werepreviously assumed to be related to the large, heavy-billedMyrmeciza antbirds (e.g., [3]). The second lineage consistsof the silvered antbird (Sclateria naevia) and the Schisto-cichla antbird representative (Schistocichla leucostigma).These relationships are in good agreement with the over-all plumage characters in these taxa [3], with the malesbeing rather uniform gray while the females are rufous.Such a plumage is also found in the genus Percnostola,with which the Schistocichla antbirds are considered to bemost closely related (Schistocichla and Percnostola haveeven been regarded as congeneric, but it has also been sug-gested that Percnostola could be polyphyletic).
In the third lineage, Myrmeciza griseiceps and Myrmecizaberlepschi form the sister clade to Myrmeciza loricata, Hypoc-nemoides maculicauda and Hylophylax naevia (the latter twoare sister taxa). This group consists of rather typicalshaped and sized "Myrmeciza" antbirds. Although it has a
shorter tail, Hylophylax naevia shares plumage pattern withMyrmeciza loricata (Hypocnemoides maculicauda is morediscretely patterned), while Myrmeciza griseiceps andMyrmeciza berleschi, on the other hand, are more uni-formly colored birds.
A non-monophyletic origin of Myrmotherula antwrens,suggested by our data, agrees with the results of previousmolecular studies [9,10]. The results also support Hackettand Rosenberg's [10] protein electrophoresis data suggest-ing that the "gray" and "streaked" forms of Myrmotherulaantwrens are more closely related to each other than eitheris to the "checker-throated" forms. The combined tree(Figure 4, clade C) suggests that the Myrmotherula antw-rens evolved along two separate phylogenetic lineages. Inthe first, the "checker-throated" forms (Myrmotherula ful-viventris and Myrmotherula leucophthalma) group with theblack bushbird (Neoctantes niger) and constitute the sisterto the dot-winged antwren (Microrhopias quixensis) andthe stripe-backed antbird (Myrmorchilus strigilatus). Basedon the external morphology these taxa indeed constitute arather heterogeneous group. For example, the stripe-backed antbird has previously been suggested to berelated to Formicivora and Drymophila antwrens [42],which are distantly related according to our results.However, Neoctantes, Microrhopias and Myrmorchilus aremonotypic genera that lack obvious close relatives. Myr-morchilus is essentially a terrestrial bird, living in chacoscrub, thus differing in habits and habitat from the "typi-cal" antwren lifestyle. Neoctantes lives in humid forest likemost Myrmotherula antwrens, but its bill is modified tohammers on stems, vines etc., and to be used as a wedgeto pry off strips of bark [2]. The morphological differencesbetween Neoctantes and Myrmorchilus on one hand, andthe "checker-throated" Myrmotherula antwrens on theother, could thus be the result of adaptive specializationsin the former taxa.
In the second lineage of Myrmotherula antwrens, the"streaked" forms represented by the short-billed antwren(Myrmotherula obscura) and the black-and-white antbird(Myrmochanes hemileucus) form the sister group to the"gray" forms (represented by Myrmotherula menetriesii,axillaris and behni) and Formicivora rufa. Although the sup-port for nesting Formicivora rufa among the "gray" formsof Myrmotherula is rather weak, it suggests that the genericboundary between Formicivora and "gray" Myrmotherulaantwren is far from unambiguously settled. This is alsoindicated by the recent transfer of the black-hooded ant-wren from the genus Myrmotherula to Formicivora [15].Bates et al. [9] also found a close relationship betweenMyrmotherula longipennis (belonging to the "gray" form ofMyrmotherula antwrens) and the genus Formicivora (Formi-civora grisea and Formicivora rufa).
Page 12 of 16(page number not for citation purposes)

BMC Evolutionary Biology 2004, 4:23 http://www.biomedcentral.com/1471-2148/4/23
ConclusionsThe phylogenetic results support that most antbirds couldbe divided into two major clades that are in broad agree-ment with traditional classifications. The first cladeincludes most antshrike genera, antvireos and the Herpsi-lochmus antwrens, while the second clade consists of theMyrmeciza antbirds, the "professional" ant-following ant-birds, and allied. However, some relationships withinthese clades, as well as the support for that Terenura antw-rens, the wing-banded antbird (Myrmornis torquata), thespot-winged antshrike (Pygiptila stellaris) and the russetantshrike (Thamnistes anabatinus) are basal to all othertypical antbirds, are unexpected based on external mor-phology. Possibly the true affinities of these taxa havebeen obscured by morphological convergence due toadaptations to new habitats or food sources. Our resultsalso strongly support that both the Myrmeciza antbirdsand the Myrmotherula antwrens are unnatural groupingsin need for taxonomic revisions. Also certain other taxamay be unnatural units, but definitive conclusions mustawait future analyses involving more taxa.
Bayes factors seem promising for evaluating the relativecontribution of components to an evolutionary model.However, changing a component of the nucleotide substi-tution model, e.g. adding parameters to model rate varia-tion, had much higher impact on the model likelihoodthan unlinking parameters among data partition. Thus,even though strong evidence for a model allowing sepa-rate topology parameters is found, this might not meanstrong evidence for separate gene phylogenies, as long asvital components of the substitution model are stillmissing.
MethodsTaxon sampling, amplification and sequencingTotally 51 typical antbird species were selected for themolecular analyses, including representatives from 38genera out of 45 genera recognized by Ridgely and Tudor[3]. From some antbird genera (Myrmeciza, Myrmotherulaand Thamnophilus) several species were included, as themonophyly for these genera had been questioned[3,9,10]. The phylogenetic trees were rooted using repre-sentatives from major furnariid lineages suggested byIrestedt et al. [1]. Sample identifications and GenBankaccession numbers are given in Table 3 (see additional file1).
Nucleotide sequence data were obtained from two nuclearintrons, myoglobin intron 2 and the glyceraldehydes-3-phosphodehydrogenase (G3PDH) intron 11, and fromthe mitochondrial cytochrome b gene. The completemyoglobin intron 2 (along with 13 bp and 10 bp of theflanking regions of exons 2 and 3, respectively) corre-sponding to the region between positions 303 (exon 2)
and 400 (exon 3) in humans (GenBank accession numberXM009949) and the complete G3PDH intron 11 (includ-ing 36 bp and 18 bp of exons 11 and 12, respectively) cor-responding to the region 3915 to 4327 in Gallus gallus(GenBank accession number M11213) were sequenced.From the cytochrome b gene 999 bp were obtained corre-sponding to positions 15037 to 16035 in the chickenmitochondrial genome sequence [43]. Some indels wereobserved in the alignments of myoglobin intron 2 and theG3PDH intron 11, respectively (see results), but all gapsin the sequences were treated as missing data in the anal-yses. No insertions, deletions, stop or nonsense codonswere observed in any of the cytochrome b sequences.
Extraction, amplification and sequencing procedures forcytochrome b and myoglobin intron 2 follow the descrip-tions in Ericson et al. [44] and Irestedt et al. [1]. A protocoldescribed by Fjeldså et al. [45] was followed for the ampli-fication and sequencing of the G3PDH intron.
For each gene and taxon, multiple sequence fragmentswere obtained by sequencing with different primers.These sequences were assembled to complete sequenceswith SeqMan II™ (DNASTAR inc.). Positions where thenucleotide could not be determined with certainty werecoded with the appropriate IUPAC code. Due to a ratherlow number of insertions in myoglobin intron 2 andG3PDH intron 11 the combined sequences could easilybe aligned by eye.
Phylogenetic inference and model selectionWe used Bayesian inference and Markov chain MonteCarlo (MCMC) for estimating phylogenetic hypothesisfrom DNA data (see recent reviews by Holder and Lewis,[46]; Huelsenbeck et al., [47]). Bayesian inference of phy-logeny aims at estimating the posterior probabilities oftrees and other parameters of an evolutionary model.Importantly, two components need to be specified (apartfrom the data): the model of nucleotide substitution andthe prior distributions for the parameters in that model.The models for nucleotide substitutions were selected foreach gene individually, prior to the MCMC, and using theAkaike Information Criterion (AIC [48]). This was doneusing the program MrModeltest [49] in conjunction withPAUP* [50]. Specifically, MrModeltest compares 24standard substitution models, including models allowingrate variation, utilizing the likelihood scores calculated byPAUP* on an initial, approximate phylogeny (see e.g.,[51]).
After models had been selected for the individual genepartitions, prior distributions for the model parameterswere specified. For stationary state frequencies, we used aflat Dirichlet prior, Dir(1, 1, 1, 1). A Dirichlet prior, Dir(1,1, 1, 1, 1, 1) were also used for the nucleotide substitution
Page 13 of 16(page number not for citation purposes)

BMC Evolutionary Biology 2004, 4:23 http://www.biomedcentral.com/1471-2148/4/23
rate ratios of the general time-reversible model (GTR [52-54]). A Beta distribution, Beta(1, 1), were used for thetransition/transversion rate ratio of the Hasegawa-Kishino-Yano model (HKY [55]). A uniform prior,Uni(0.1, 50), was used on the shape parameter of thegamma distribution of rate variation (Γ [56]), and aUni(0, 1) prior was used for the proportion of invariablesites (I [57]). An exponential prior, Exp(10), were used forbranch lengths, and all trees were assumed to be equallylikely (flat prior on topology).
The posterior probabilities of trees and parameters in thesubstitution models were approximated with MCMC andMetropolis coupling using the program MrBayes [58]. Thegene partitions were analyzed both separately and com-bined. In the combined analysis, each gene partition wasallowed to have separate parameters by using a rate mul-tiplier [27,58,59]. One cold and three incrementallyheated chains were run for 3 million generations, with arandom starting tree and a temperature parameter valueof 0.2. Trees were sampled every 100th generations, andthe trees sampled during the burn-in phase (i.e., beforethe chain had reached its apparent target distribution)were discarded. Two runs, starting from different, ran-domly chosen trees, were made to ensure that the individ-ual runs had converged on the same target distribution[60]. Convergence of parameters was checked by examin-ing parameter means and variances between runs. Afterchecking for convergence, final inference was made fromthe concatenated output from the two runs.
A Bayesian test of incongruenceBayesian methods provide us ways not only to estimateposterior probabilities for trees and parameters in amodel, but also to evaluate the model itself. Bayes factors[61], allow us to make sophisticated comparisonsbetween models used in phylogenetic analyses[27,62,63]. Bayes factors measure the strength of evidencein favor of one model M1 compared to another M2, giventhe data X, and is calculated as the ratio of the model like-lihoods, B12 = f(X|M1)/ f(X|M2). The model likelihoodsf(X|Mi) are difficult to calculate analytically but can beestimated by using the output from an MCMC [27,62].
Here we explore the congruence test described byNylander et al. [27], which utilizes Bayes factors. The testis not a significance test but merely compares the strengthof evidence between two models of character evolution.In the first model, data partitions are allowed to have theirown unique set of substitution parameters, but we assumethe data as having evolved on the same topology, but withpartition-specific branch lengths. Strictly speaking, we arerestricting the data partitions to have the same posteriordistribution for topologies, but (potentially) different dis-tributions in all other parameters. In the second model we
relax the assumption of a single distribution of topologiesfor all data partitions. That is, if the data partitions (genes)truly evolved on different phylogenies, they are allowed todo so in the model. The comparison or 'test' is to see if thesecond model provides compelling evidence as to beaccepted as superior. Here we use the log of the Bayes fac-tor and a value of >10 for 2 logB12 have been suggested asstrong evidence against the alternative model, M2 [61].
To accomplish the incongruence test we utilized the unlinkcommand in MrBayes, which allows the user to let param-eters as well as topologies to be unlinked between parti-tions. We calculated Bayes factors and compared theeffects on the model likelihood when linking or unlinkingtopologies between all the gene partitions. We were pri-marily interested in the potential incongruence betweenthe mitochondrial cytochrome b partition and the twonuclear partitions myoglobin and G3PDH, but all combi-nations of the three genes in our data set were examined.
For comparison, we also tested whether the different genepartitions were in significant conflict with each other byusing the parsimony based incongruence-length differ-ences test (ILD) [64], implemented in PAUP* [50]. Theresults are based on 10,000 replicates, with ten iterations(random additions of taxa) per replicate.
Authors' contributionMI designed the study, carried out the labwork, partici-pated in the phylogenetic analyses, and drafted the man-uscript. JF assisted with the design of the study and withthe draft of the manuscript. JN performed the phyloge-netic analyses, drafted parts of the results, and materialand methods section of the manuscript. PE conceived thestudy. All authors read and approved the manuscript.
Additional material
AcknowledgementsWe are grateful to many people and institutions that have been involved in this work. Most tissue and blood samples were obtained from the Zoolog-ical Museum, University of Copenhagen (ZMUC) and the Swedish Museum
Additional File 1Table 3. Samples used in the study. The classification follows Ridgely and Tudor [3] for typical antbirds, and Irestedt et al. [1] for families. Abbreviations: AHMN = American Museum of Natural History, New York; FMNH = Field Museum of Natural History, Chicago; LSUMZ = Louisiana State University, Museum of Natural Science; NRM = Swedish Museum of Natural History; ZMCU = Zoological Museum of the Univer-sity of Copenhagen. References: (1) Irestedt et al. [1]; (2) Fjeldså et al. [45]; (3) Johansson et al. [65]; Fjeldså et al. [66].Click here for file[http://www.biomedcentral.com/content/supplementary/1471-2148-4-23-S1.pdf]
Page 14 of 16(page number not for citation purposes)

BMC Evolutionary Biology 2004, 4:23 http://www.biomedcentral.com/1471-2148/4/23
of Natural History. Support to expeditions where tissue samples were acquired and stored at the ZMUC, was provided over many years by the Danish Natural Research Council (mainly grants 11-0380 and 9502155). Many samples at the Swedish Museum of Natural History were collected in Paraguay in collaboration with the Museo Nacional de Historia Natural del Paraguay, San Lorenzo. Important samples have also been obtained from the Field Museum, Chicago (Shannon Hackett, David E. Willard), Museum of Natural Science, Louisiana State University (Donna Dittman), and the American Museum of Natural History, New York (Paul Sweet). Jan Ohlson and Niels Krabbe are thanked for commenting on the manuscript. Mari Källersjö provided logistic support and advice for the work at the Molecular Systematics Laboratory at the Swedish Museum of Natural History, and Dario Zuccon is thanked for practical support at the laboratory. The Swed-ish Research Council (grant no. 621-2001-2773 to P.E.) funded the labora-tory work. Computational facilities were provided by Mikael Thollesson and the Linnaean Center of Bioinformatics, Uppsala.
References1. Irestedt M, Fjeldså J, Johansson US, Ericson PGP: Systematic rela-
tionships and biogeography of the tracheophone suboscines(Aves: Passeriformes). Mol Phyl Evol 2002, 23:499-512.
2. Zimmer KJ, Isler ML: Family Thamnophilidae (Typical ant-birds). In Handbook of the birds of the World. Broadbills to Tapaculos Vol-ume 8. 1st edition. Edited by: del Hoyo J, Elliott A, Christie DA.Barcelona: Lynx Edicions; 2003.
3. Ridgely RS, Tudor G: The Birds of South America Volume II. Austin: Uni-versity of Texas Press; 1994.
4. Heimerdinger MA, Ames PL: Variation in sternal notches of sub-oscine passeriform birds. Postilla 1967, 105:1-44.
5. Ames PL, Heimerdinger MA, Warter SL: The anatomy and sys-tematic position of the antpipits Conopophaga andCorythopis. Postilla 1968, 114:1-32.
6. Ames PL: The morphology of the syrinx in passerine birds. BullPeabody Mus Nat Hist 1971, 37:1-194.
7. Sibley CG, Ahlquist JE: Phylogeny and Classification of the Birds of theWorld New Haven: Yale University Press; 1970.
8. Irestedt M, Johansson US, Parsons TJ, Ericson PGP: Phylogeny ofmajor lineages of suboscines (Passeriformes) analysed bynuclear DNA sequence data. J Avian Biol 2001, 32:15-25.
9. Bates JM, Hackett SJ, Goerck JM: High levels of mitochondrialDNA differentiation in two lineages of antbirds Drymophilaand Hypocnemis. Auk 1999, 116:1093-1106.
10. Hackett SJ, Rosenberg KV: Comparison of phenotypic andgenetic differentiation in South American antwrens(Formicariidae). Auk 1990, 107:473-489.
11. Bierregaard RO, Cohn-Haft M, Stotz DF: Cryptic biodiversity: anoverlooked species and new subspecies of antbirds (Aves:Formicariidae) with a revision of Cercomacra tyrannina innortheastern South America. In Studies in Neotropical OrnithologyHonoring Ted Parker Edited by: Remsen JV. Washington, D.C.: Orn.Mon. 48. American Ornithologist's Union; 1997:111-128.
12. Isler ML, Isler PR, Whitney BM: Use of vocalizations to establishspecies limits in antbirds (Passeriformes: Thamnophilidae).Auk 1998, 115:577-590.
13. Isler ML, Isler PR, Whitney BM: Species limits in antbirds (Pas-seriformes: Thamnophilidae): The Myrmotherula complex.Auk 1999, 116:83-96.
14. Isler ML, Isler PR, Whitney BM, Walker B: Species limits in ant-birds: the Thamnophilus punctatus complex continued. Condor2001, 103:278-286.
15. Pacheco JF: Black-hooded Antwren Formicivora [Myrmother-ula] erythronotos rediscovered in Brazil. Bull Brit Ornithol Club1988, 108:179-182.
16. Moore WS: Inferring phylogenies from mtDNA variation:Mitochondrial-gene trees versus nuclear-gene trees. Evolution1995, 49:718-726.
17. Maddison WP: Gene trees in species trees. Syst Biol 1997,46:523-536.
18. Mindell DP: Avian molecular evolution and systematics California, SanDiego Academic press; 1997.
19. Barrett M, Donoghue MJ, Sober E: Against consensus. Syst Zool1991, 40:486-493.
20. Kluge AG: A concern for evidence and phylogenetic hypothe-sis relationships among Epicrates (Boidae, Serpentes). ZystZool 1989, 38:7-25.
21. Bull JJ, Huelsenbeck J, Cunningham CW, Swofford DL, Waddell PJ:Partitioning and combing data in phylogenetic analysis. SystBiol 1993, 42:384-397.
22. Miyamoto MM, Fitch WM: Testing species phylogenies and phy-logenetic methods with congruence. Syst Biol 1995, 44:64-76.
23. Yang Z: Maximum-likelihood models for combined analysesof multiple sequence data. J Mol Evol 1996, 42:587-596.
24. Pupko T, Huchon D, Cao Y, Okada N, Hasegawa M: Combiningmultiple data sets in a likelihood analysis: Which models arethe best? Mol Biol Evol 2002, 19:2294-2307.
25. Buckley TR, Arensburger P, Simon C, Chambers GK: Combineddata, Bayesian phylogenetics, and the origin of the New Zea-land cicada fauna. Syst Biol 2002, 51:4-18.
26. Suchard MA, Kitchen CMR, Sinsheimer JS, Weiss RE: Hierarchicalphylogenetic models for analyzing multipartite sequencedata. Syst Biol 2003, 52:649-664.
27. Nylander JA, Ronquist F, Huelsenbeck JP, Nieves-Aldrey JL: Bayesianphylogenetic analysis of combined data. Syst Biol 2004,53:47-67.
28. Degnan SM, Moritz C: Phylogeography of mitochondrial DNAin two species of white-eyes in Australia. Auk 1992,109:800-811.
29. Degnan SM: The perils of single gene trees – mitochondrialversus single-copy nuclear DNA variation in white-eyes(Aves: Zosteropidae). Mol Ecol 1993, 2:219-225.
30. Yang Z, Goldman N, Friday A: Comparison of models for nucle-otide substitution used in maximum-likelihood phylogeneticestimation. Mol Biol Evol 1994, 11:316-324.
31. Yang Z: Among-site rate variation and its impact on phyloge-netic analyses. Tree 1996, 11:367-372.
32. Yoder AD, Irwin JA, Payseur BA: Failure of the ILD to determinedata combinability for slow loris phylogeny. Syst Biol 2001,50:408-424.
33. Suchard MA, Weiss RE, Sinsheimer JS, Dorman KS, Petel M, McCabeERB: Evolutionary similarity among genes. J Amer Statistical Assoc2003, 98:653-662.
34. Ridgway R: The birds of North and Middle America. Part 5. U SNat Mus Bull 1911, 50:1-859.
35. Christidis L, Schodde R, Baverstock PR: Genetic and morpholog-ical differentiation and phylogeny in the Australo-Papuanscrubwrens (Sericornis, Acanthizidae). Auk 1988, 105:616-629.
36. García-Moreno J, Fjeldså J: Phylogeny and re-evaluation of spe-cies limits in the genus Atlapetes based on mtDNA sequencedata. Ibis 1999, 141:91-207.
37. Omland KE, Lanyon SM: Reonstructing plumage evolution inOrioles (Icterus): Repeated convergence and reversalpatterns. Evolution 2000:2119-2133.
38. Cibois A, Slikas B, Schulenberg TS, Pasquet E: An endemic radia-tion of Malagasy songbirds is revealed by mitochondrialDNA sequence data. Evolution 2001, 55:1198-1206.
39. James HF, Ericson PGP, Slikas B, Lei FM, Gill FB, Olson SL: Pseudopo-doces humilis, a misclassified terrestrial tit (Aves: Paridae) ofthe Tibetan Plateau: evolutionary consequences of shiftingadaptive zones. Ibis 2003, 145:185-202.
40. Paton TA, Baker AJ, Groth JG, Barrowclough GF: RAG-1sequences resolve phylogenetic relationships withinCharadriiform birds. Mol Phyl Evol 2003, 29:268-278.
41. Tostain O, Dujardin JL: Nesting of the wing-banded Antbirdsand the thrush-like Antpitta in the French Guiana. Condor1988, 90:236-239.
42. Remsen JV, Traylor MA, Parker KC: Range extension for someBolivian Birds, 2 (Columbidae to Rhinocryptidae). Bull BritOrnithol Club 1986, 106:22-32.
43. Desjardins P, Morais R: Sequence and gene organization of thechicken mitochondrial genome: A novel gene order in highervertebrates. J Mol Biol 1990, 212:599-634.
44. Ericson PGP, Christidis L, Irestedt M, Norman JA: Systematic affin-ities of the lyrebirds (Passeriformes: Menura), with a novelclassification of the major groups of passerine birds. Mol PhylEvol 2002, 25:53-62.
45. Fjeldså J, Zuccon D, Irestedt M, Johansson US, Ericson PGP: Sapayoaaenigma : a New World representative of 'Old Worldsuboscines'. Proc R Soc Lond B(Suppl) 2003, 270:238-241.
Page 15 of 16(page number not for citation purposes)

BMC Evolutionary Biology 2004, 4:23 http://www.biomedcentral.com/1471-2148/4/23
Publish with BioMed Central and every scientist can read your work free of charge
"BioMed Central will be the most significant development for disseminating the results of biomedical research in our lifetime."
Sir Paul Nurse, Cancer Research UK
Your research papers will be:
available free of charge to the entire biomedical community
peer reviewed and published immediately upon acceptance
cited in PubMed and archived on PubMed Central
yours — you keep the copyright
Submit your manuscript here:http://www.biomedcentral.com/info/publishing_adv.asp
BioMedcentral
46. Holder M, Lewis PO: Phylogeny estimation: Traditional andBayesian approaches. Nature Genetics 2003, 4:275-284.
47. Huelsenbeck JP, Ronquist F, Nielsen R, Bollback JP: Reverend Bayesmeets Darwin: Bayesian inference of phylogeny and itsimpact on evolutionary biology. Science 2001, 288:2349-2350.
48. Akaike H: Information theory as an extension of the maxi-mum likelihood principle. In Second International Symposium onInformation Theory Edited by: Petrov BN, Csaki F. Budapest: AkademiaiKiado; 1973:267-281.
49. Nylander JAA: MrModeltest v.1.0. Program distributed by the author.Department of Systematic Zoology, Uppsala University, Uppsala 2002[http://www.ebc.uu.se/systzoo/staff/nylander.html].
50. Swofford DL: PAUP*. Phylogenetic analysis using parsimony(*and other methods). version 4. Sunderland, Massachusetts: Sin-auer Associates 1988.
51. Posada D, Crandall KA: MODELTEST: testing the model ofnucleotide substitution. Bioinformatics 1998, 14:817-818.
52. Lanave C, Preparata G, Saccone C, Serio G: A new method for cal-culating evolutionary substitution rates. J Mol Evol 1984,20:86-93.
53. Rodríguez OJL, Marín A, Medina R: The general stochastic modelof nucleotide substitution. J Theor Biol 1990, 142:485-501.
54. Tavaré S: Some probabilistic and statistical problems on theanalysis of DNA sequences. Lec Math Life Sci 1986, 17:57-86.
55. Hasegawa M, Kishino H, Yano T: Dating of the human-ape split-ting by a molecular clock of mitochondrial DNA. J Mol Evol1985, 21:160-174.
56. Yang Z: Maximum likelihood phylogenetic estimation fromDNA sequences with variable rates over sites: Approximatemethods. J Mol Evol 1994, 39:306-314.
57. Gu X, Fu YX, Li WH: Maximum likelihood estimation of theheterogeneity of substitution rate among nucleotide sites.Mol Biol Evol 1995, 12:546-557.
58. Ronquist F, Huelsenbeck JP: MRBAYES 3: Bayesian phylogeneticinference under mixed models. Bioinformatics 2003,19:1572-1574.
59. Yang Z: Maximum likelihood models for combined analyses ofmultiple sequence data. J Mol Evol 1996, 42:587-596.
60. Huelsenbeck JP, Larget B, Miller RE, Ronquist F: Potential applica-tions and pitfalls of Bayesian inference of phylogeny. Syst Biol2002, 51:673-688.
61. Kass RE, Raftery AE: Bayes factors. J Am Stat Assoc 1995,90:773-795.
62. Aris-Brosou S, Yang Z: Effects of models of rate evolution onestimation of divergence dates with special reference to themetazoan 18S ribosomal RNA phylogeny. Syst Biol 2002,51:703-714.
63. Huelsenbeck JP, Imennov NS: Geographic origin of human mito-chondrial DNA: Accommodating phylogenetic uncertaintyand model comparison. Syst Biol 2002, 51:155-165.
64. Farris JS, Källersjö M, Kluge AG, Bult C: Constructing a signifi-cance test for incongruence. Syst Biol 1995, 44:570-572.
65. Johansson US, Irestedt M, Parsons TJ, Ericson PGP: Basal phylogenyof the Tyrannoidea based on comparisons of cytochrome band exons of nuclear c-myc and RAG-1 genes. Auk 2002,119:984-995.
66. Fjeldså J, Irestedt M, Ericson PGP: Molecular data reveal somemajor adaptational shifts in the early evolution of the mostdiverse avian family, the Furnariidae. J Ornithology 2004 in press.
Page 16 of 16(page number not for citation purposes)
Copyright © 2022 FDOKUMEN