estimasi effort pengembangan perangkat lunak menggunakan ...
Upload
futureuniversityCategory
view
0download
0
International Journal of Computer and Information Technology (ISSN: 2279 – 0764)
Volume 03 – Issue 03, May 2014
www.ijcit.com 661
Phased Effort Estimation of Legacy Systems
Migration to Service Oriented Architecture
Esraa A. Farrag
College of Computing and Information Technology (CCIT)
Arab Academy of Science and Technology and Maritime
Transport (AASTMT) Heliopolis, Cairo, Egypt
esraa_farag16 {at} yahoo.com
Ramadan Moawad
Faculty of Computers and Information Technology (FCIT)
Future University (FUE), Cairo, Egypt
Abstract— Cost estimation for Service Oriented Architecture
(SOA) has not been addressed properly in the existing literatures.
Most cost estimation approaches published in the literatures are
more guidelines than actual practical estimation techniques. On
the other hand, traditional software cost estimation techniques
don’t fit SOA characteristics properly. In this paper, a phased
effort distribution in legacy systems migration to SOA is
presented.
In this paper, we have identified several cost factors related to
SOA. These cost factors have been distributed among different
SOA project phases. Then weight for each cost factor has been
assigned. This approach has been applied to different service
migration strategies to SOA. The results have been obtained and
analyzed. This approach represents one possible way to estimate
the overall cost of a SOA project early and accurately by
estimating the cost of only one phase of the project.
Keywords— SOA; Effort Estimation; Service Migration;
Migration Strategies; Phased Cost Estimation; Legacy Migration.
I. INTRODUCTION
Business changes rapidly that organizations need to build IT
system that can cope with such speed. Organizations started to
migrate to SOA [1] to decrease the development costs. The only
way to verify this decreased cost is the proper cost estimation[2]
. This is crucial as most organizations don’t have a clue about
SOA cost estimation[3].
Legacy systems [3] are outdated systems that organization
still uses. It represents valuable financial assets[5][6] . Legacy
systems are crucial to the organization and their migration to
SOA is risky and expensive[7][8]. So the costs and benefits
must be carefully weighted[3].
There are many reasons that push the organization to go
through this risky migration. These reasons include: difficult
maintenance of the existing legacy system and adding new
features to this legacy system is considered to be a hard task.
Also, legacy systems could be no longer able to cope with rapid
business changes. Furthermore the legacy system technology
could be obsolete or could be running on outdated hardware[9].
Also the lack of experts of the legacy system and non-existence
of up-to-date documentation make the changes even harder. On
the other side, SOA has many benefits include clear separation
of service interface from implementation. This separation allows
many service upgrades to occur without impact on service users.
Moreover, loose coupling between services minimizes
interdependencies and facilitates reuse.
Traditional software cost estimation approaches [10][11] are
unsuitable for costing SOA projects .As SOA projects are more
complex , heterogeneous and dynamic than traditional
software[12].This is due to SOA characteristics that affect the
cost , including: loose coupling, reusability and composability.
There is limited publication in SOA cost estimation approaches
[1].They were more guidelines than estimation technique as
they cost only from high level and didn’t estimate the services in
details. It is very important to estimate the cost and effort
accurately in SOA projects. As inaccurate cost estimation will
lead to unpredicted risks, launch slips, mission failure and
major cost growth[10][11].
In this research cost factors related to SOA are extracted from
existing literatures .The extracted factors are then distributed
among different phases .Each factor is weighted from cost
perspective .This approach will be applied to different service
migration to SOA strategies .The aim of this research is
phased effort distribution. The results have been obtained and
analyzed as will be shown in details in this paper.
This paper is organized as follows: background and related
work will be shown in section 2 that discusses the different cost
estimation approaches. Our approach will be introduced in
International Journal of Computer and Information Technology (ISSN: 2279 – 0764)
Volume 03 – Issue 03, May 2014
www.ijcit.com 662
section 3, and will be applied for service migration in section 4
.Results will be presented and analyzed in section 5, and section
6 concludes the paper.
II. BACKGROUND AND RELATED WORK
There are several cost estimation approaches that have been
proposed to estimate the cost of software projects in general
and SOA in particular. But before introducing these approaches
it would be better to introduce characteristics of SOA. These
characteristics emphasize special treatment while estimating
the cost.
A. SOA characteristics and their impact on cost:
SOA has many characteristics[38] that differ from traditional
software. These characteristics include: loose coupling,
reusability, composability and discoverability which are detailed
as follows[14]:
1) Loose coupling:
In SOA each service is independent [12] and the services are
less cohesive[15]. Consequently SOA supports agility. Loose
coupling of the services will make it easier to change the
existing services. Thus flexibility will be increased [15] and the
cost of modifying the existing service will be decreased
compared to traditional applications, thus the cost of
maintenance will be decreased [1][16].Loose coupling of
services will encourage reuse of the services in various
applications [15].
2) Reusability
The same service can be used for other purposes, to prevent
redundancy in the system[17]. Reuse will occur only if the
services are clearly documented and identified [18].Also
designed and deployed in a manner which enables them to be
invoked by the independent service consumer[1] and the logic is
divided into services for the intention of reuse [12].Reusability
decreases development, operational, management and
maintenance costs, which decreases time to market.
3) Composability:
Composability [19] is combining several services into one
powerful service. So composing is a new form of reusability
[17]. Service could be composed of other services which are
coordinated and assembled. These services could be estimated
using Divide and Conquer approach [20] as will be shown later .
4) Discoverability:
Services can be found and used via a service registry [22] or
any discovery mechanism, this will encourage reusability of
service.
B. Cost Estimation Approaches:
In this section we will discuss the different cost estimation
techniques. We classified them into two categories: traditional
software cost estimation approaches and SOA specific cost
estimation approaches.
1) Traditional software cost estimation approaches:
a) Expert Judgment:
This approach depends on expert intuition and experience
based on cost of similar recent project [2][10]. It is the most
common approach used in industry [19] as it is highly adaptive
to different environments [23]. Consequently, past projects
circumstances, factors, details could be forgotten [19] as it
depends on expert’s memory[10]. Unless these historical data
are clearly documented [11], which is limited for SOA .
On the other side, it doesn’t give accurate estimation to the
cost of maintenance, as the most experienced engineers tended
to over-estimate the amount of work required for small tasks
and under-estimate the amount of work for large tasks[2].
Apparently this approach is inadequate for SOA, as it ignores
the reusability, discoverability and composability nature of
services. This approach is also insufficient to estimate SOA
projects as it doesn’t support separation of concerns and
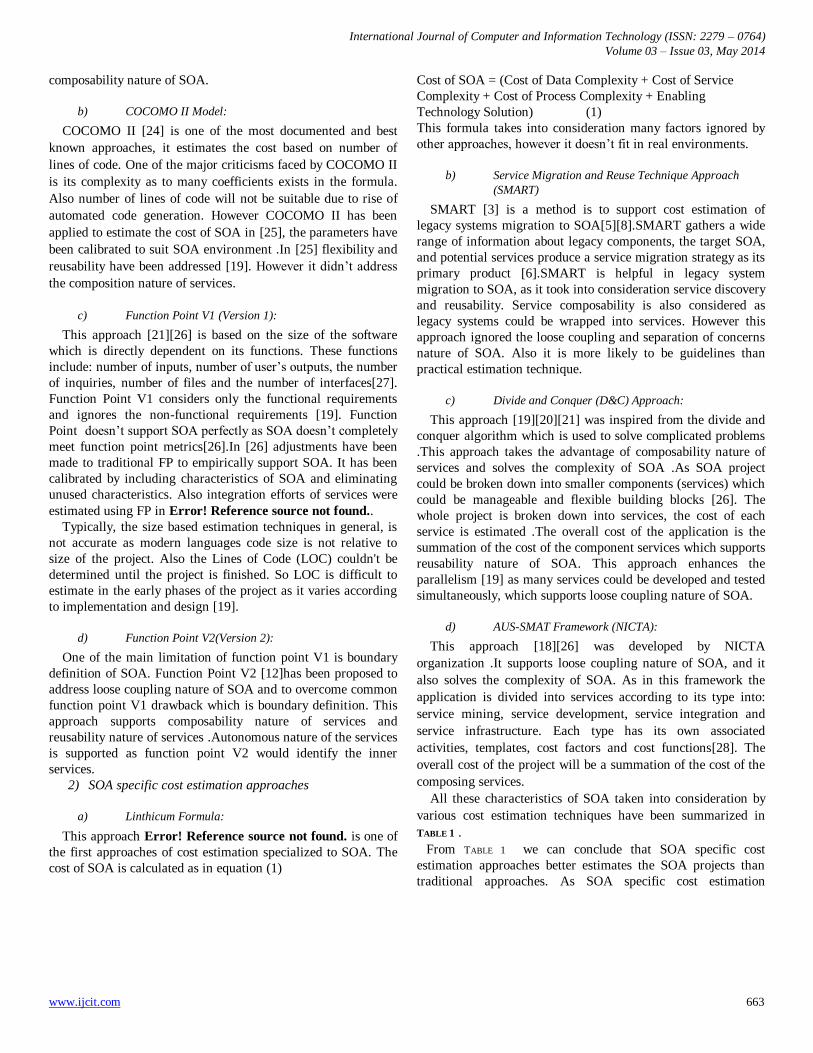
Reusability Loose CouplingSeparation Of Concerns
(Abstraction ) Composability
Autonomy
(Encapsulation)Discoverability
Expert
Judgment No No Bias No Bias No
COCOMO II Yes Yes No No No No
Function Point
V1 (IFPUG)No Yes No No No No
Function Point
V2 (COSMIC)Yes Yes Yes Yes yes No
Linthicum
FormulaNA NA NA NA NA NA
SMART Yes No No Yes Yes Yes
WBS - D&C yes yes yes yes yes Yes
Available
service Yes Yes
Migrated
Service Yes Yes Yes
New Service Yes Yes Yes
Composed
Service Yes Yes Yes
Yes
AUS_SMAT
frameworkYes Yes Yes Yes Yes Yes
Service Mining Yes Yes Yes
Service
Development
& Application
Development
Yes Yes Yes Yes Yes Yes
service
integration Yes Yes Yes Yes Yes
SOA
infrastructureYes Yes Yes Yes Yes
Traditional Approaches
SOA specific
Approaches
based on
classification
of services
TABLE 1 SUMMARY OF COST ESTIMATION APPROACHES VS SOA CHARACTERISTICS
International Journal of Computer and Information Technology (ISSN: 2279 – 0764)
Volume 03 – Issue 03, May 2014
www.ijcit.com 663
composability nature of SOA.
b) COCOMO II Model:
COCOMO II [24] is one of the most documented and best
known approaches, it estimates the cost based on number of
lines of code. One of the major criticisms faced by COCOMO II
is its complexity as to many coefficients exists in the formula.
Also number of lines of code will not be suitable due to rise of
automated code generation. However COCOMO II has been
applied to estimate the cost of SOA in [25], the parameters have
been calibrated to suit SOA environment .In [25] flexibility and
reusability have been addressed [19]. However it didn’t address
the composition nature of services.
c) Function Point V1 (Version 1):
This approach [21][26] is based on the size of the software
which is directly dependent on its functions. These functions
include: number of inputs, number of user’s outputs, the number
of inquiries, number of files and the number of interfaces[27].
Function Point V1 considers only the functional requirements
and ignores the non-functional requirements [19]. Function
Point doesn’t support SOA perfectly as SOA doesn’t completely
meet function point metrics[26].In [26] adjustments have been
made to traditional FP to empirically support SOA. It has been
calibrated by including characteristics of SOA and eliminating
unused characteristics. Also integration efforts of services were
estimated using FP in Error! Reference source not found..
Typically, the size based estimation techniques in general, is
not accurate as modern languages code size is not relative to
size of the project. Also the Lines of Code (LOC) couldn't be
determined until the project is finished. So LOC is difficult to
estimate in the early phases of the project as it varies according
to implementation and design [19].
d) Function Point V2(Version 2):
One of the main limitation of function point V1 is boundary
definition of SOA. Function Point V2 [12]has been proposed to
address loose coupling nature of SOA and to overcome common
function point V1 drawback which is boundary definition. This
approach supports composability nature of services and
reusability nature of services .Autonomous nature of the services
is supported as function point V2 would identify the inner
services.
2) SOA specific cost estimation approaches
a) Linthicum Formula:
This approachError! Reference source not found.is one of
the first approaches of cost estimation specialized to SOA. The
cost of SOA is calculated as in equation (1)
Cost of SOA = (Cost of Data Complexity + Cost of Service
Complexity + Cost of Process Complexity + Enabling
Technology Solution) (1)
This formula takes into consideration many factors ignored by
other approaches, however it doesn’t fit in real environments.
b) Service Migration and Reuse Technique Approach
(SMART)
SMART [3] is a method is to support cost estimation of
legacy systems migration to SOA[5][8].SMART gathers a wide
range of information about legacy components, the target SOA,
and potential services produce a service migration strategy as its
primary product [6].SMART is helpful in legacy system
migration to SOA, as it took into consideration service discovery
and reusability. Service composability is also considered as
legacy systems could be wrapped into services. However this
approach ignored the loose coupling and separation of concerns
nature of SOA. Also it is more likely to be guidelines than
practical estimation technique.
c) Divide and Conquer (D&C) Approach:
This approach [19][20][21] was inspired from the divide and
conquer algorithm which is used to solve complicated problems
.This approach takes the advantage of composability nature of
services and solves the complexity of SOA .As SOA project
could be broken down into smaller components (services) which
could be manageable and flexible building blocks [26]. The
whole project is broken down into services, the cost of each
service is estimated .The overall cost of the application is the
summation of the cost of the component services which supports
reusability nature of SOA. This approach enhances the
parallelism [19]as many services could be developed and tested
simultaneously, which supports loose coupling nature of SOA.
d) AUS-SMAT Framework (NICTA):
This approach [18][26] was developed by NICTA
organization .It supports loose coupling nature of SOA, and it
also solves the complexity of SOA. As in this framework the
application is divided into services according to its type into:
service mining, service development, service integration and
service infrastructure. Each type has its own associated
activities, templates, cost factors and cost functions[28]. The
overall cost of the project will be a summation of the cost of the
composing services.
All these characteristics of SOA taken into consideration by
various cost estimation techniques have been summarized in
TABLE 1 .
From TABLE 1 we can conclude that SOA specific cost
estimation approaches better estimates the SOA projects than
traditional approaches. As SOA specific cost estimation
International Journal of Computer and Information Technology (ISSN: 2279 – 0764)
Volume 03 – Issue 03, May 2014
www.ijcit.com 664
approaches take into consideration all or most of SOA
characteristics.
III. PROPOSED APPROACH
In this section our approach will be discussed in details. We
extracted factors related to cost of SOA from previous literatures
.These cost factors were distributed among SOA project phases.
Services have been classified from construction perspective into:
available service, migrated service, new service and composite
service. Our paper is mainly concerned with migrated services.
There are different service migration strategies to SOA, which
will be shown in details in section 4 .Service migration
strategies include: wrapping, re-engineering, replacement and
migration. Each cost factor has been weighted for each
migration strategy. All of the previous steps are detailed as
follows:
A. Exhaustive search for all factors (drivers) that affect cost of
SOA:
In this section we will focus on factors affecting the cost
which are extracted from previous literatures. A comparative
study among different migration strategies has been discussed
in[37]. The factors discussed were introduced in the context of
comparison .However, for the purpose of this paper we took only
factors related to cost which are: need for original requirements,
need for source code, flexibility and stable environment.
Another research[28] has been made on different migration
paths which showed comparison among wrapping, re-hosting,
componentization, re-engineering and COTS .In this paper we
have ignored both re-hosting and componentization, as re-
hosting is publishing the service on another host and it is out of
our scope. On the other side componentization cost has been
mentioned in details in [19] and will be out of our scope. From
[28], we extracted factors related to cost which include: business
agility, integration with partners, modifications require
considerable testing effort and business risk. Unnecessary
factors have been removed, these factors include: move from
batch processing to online processing and a near real time
enterprise and hard-coded business rules as they are not related
to cost.
On the other hand there were factors which were mentioned
in both researches [19][28], which mean that they have a deep
impact on cost. These factors are as follow: Migration duration,
level of tools support, performance post migration, integration
costs which involve systems integration with business partners
cost and difficult to integrate with new breed of technologies .
Furthermore maintainability after migration, Modifications
require considerable testing effort, and experienced resources
needed have been discussed in both [28]and [37].
Another research[29] sah evaluated migration strategies from
technical value and both cost and business value .We extracted
only business value factor from it.
Testing factors have been addressed in[34] , which showed
testing from two dimensions: testing level and testing
perspective. We have ignored testing perspective as it doesn’t
directly affect the cost, only testing level has been considered.
Testing level includes: functional testing, non-functional
testing, integration testing and regression testing.
B. Distribution of drivers into SOA project phases:
The extracted factors were distributed among different SOA
phases [30].These phases are as follows:
1) Requirements:
In this phase the major function of the service is defined.
Requirement gathering phase has many factors including:
business agility, cost of integration, business value and business
risk;
2) Design:
In this phase the target service is described in a sufficient way
that skilled developers can develop the service in minimal effort.
Service design phase has many factors which are: need for
original requirements, obsolete legacy system technology,
experienced resources needed and need for source code;
3) Development:
Development phase involves writing the code which satisfies
both requirements and design previously documented.
Development of the service has many factors which are:
flexibility, code size, tools support and time required for
migration;
4) Testing:
In this phase, all test cases are run to validate and verify the
service. However, classical testing techniques don’t fully fit
SOA, so testing should be done using common methods in
testing component or subsystem testing [31]. Testing of SOA
has two dimensions: testing level and testing perspective, as
detailed in [29]. In this paper we will focus only on testing
levels which are: functional testing, non-functional testing,
integration testing and regression testing [32] as will be
discussed in details in the next section;
5) Integration and transition
In this phase, the services are integrated with the desired
application and the gap between existing system and target
developed system is identified and these changes are made. This
phase has many factors which involve: stable environment,
maintainability post migration and solving existing problems in
legacy systems.
C. Classification of services:
Services are better estimated on their own by separation[12].
Each type of service has its own characteristics, considerations,

International Journal of Computer and Information Technology (ISSN: 2279 – 0764)
Volume 03 – Issue 03, May 2014
www.ijcit.com 665
templates and methods that are affect the cost[18] . svrevoahh
hrhorjosvforfvhothosvho aotrsrjosvhrhorjosvhr frsvso
hvoethvh [19].
Fig.1. Classification of services from construction perspective
Services could be classified based on construction perspective
[20][21] as available , migrated, new , and composing service as
in Fig.1.Service types are detailed as follows:
1) Available Service (Black Box):
A service that already exists and will be used as is. Available
services may be homegrown[28]or external services (3rd
party).The cost will vary between them [18] as homegrown
services will involve testing and integration of services . On the
other hand external services cost will involve service discovery
[22]and service integration[18];
2) Migrated Service (White Box):
A service that is generated through wrapping, replacing or
modifying existing services [4].Migration strategies will be
discussed in details below;
3) New Service:
A service that will be developed from scratch;
4) Composite Service:
A service which is composed of one or more of the above
types, which could be estimated using Divide and Conquer
approach as mentioned in details in the previous section.
In this paper we are concerned with the phased cost estimation
of migrated service type as will be shown in the next section.
D. Assigning relative weights of each driver according to
each Migration strategy:
The extracted cost factors were weighted from cost perspective
on the scale from 1 to 3. 1 represents lowest cost and 3
represents highest cost. The cost factors are weighted for each
service migration strategy. For example: Business value of
wrapping takes the weight 1 as it has lowest cost and
replacement will take weight 3 as it involves high cost .As re-
engineering has intermediate cost so it will take the weight
2.All the extracted cost factors are weighted in the same manner
as will be shown in details in section IV .
IV. APPLICATION OF THE PROPOSED APPROACH FOR SERVICE
MIGRATION:
In this section we will apply our proposed approach on
different migration strategies of service migration .Each of the
extracted cost factors from section III, will be distributed among
phases .Each factor will be weighted for each service type and
migration strategy. The weight of each factor reflects its relative
cost. The weights are scaled from 1 to 3 .Low cost is represented
by 1 and high cost is represented by 3, as mentioned earlier.
All the cost factors are grouped and aggregated by phase and
migration strategy. For each strategy, all the phased cost
weights will be summed. The overall cost of each phase will be
calculated for each service type and strategy. All the above steps
are summarized in Fig. 2 .
Fig. 2 . Block Diagram shows the steps of our proposed approach
For the purpose of this paper, we will focus only on the
migrated service type. In order to migrate legacy systems to
SOA, migration path should be taken.
A. Migration Strategies to SOA (Paths):
There are many migration strategies each has pros and cons as
detailed in [37]. However, relying on a single implementation
strategy is not preferred. Hence, multiple strategies could be
used. Various factors such as business value, business priority
and the technical qualities of the legacy applications can be used
to decide upon the selection of proper strategy [29]which is
decided at the final step of SMART [7].Those strategies are :
wrapping, re-engineering, replacement and migration as shown
in Error! Reference source not found. and they are as
follows:
1) Wrapping
Wrapping [37] is a black box migration strategy in which
interface is built to wrap the existing legacy system .This
strategy is used when legacy code is too expensive to rewrite ,
relatively small , high quality code , high business value and fast
solution is needed. This makes wrapping legacy is the most
attractive feature of SOA, as many organizations can’t take the
risk of re-developing new solution from scratch [4].However,
this strategy will not solve the existing problems of the legacy
system[9].Generally speaking, wrapping is not the optimal
strategy. However it allows a traditional system to easily gain
some of the benefits of service oriented architecture in limited
time.
International Journal of Computer and Information Technology (ISSN: 2279 – 0764)
Volume 03 – Issue 03, May 2014
www.ijcit.com 666
2) Re-engineering:
Re-engineering [37]is the adjustment of the application to be
in a new form to easily adding new functionality to the legacy
system.
Re-engineering is used in some cases as follows:
- Legacy system needs to be exposed as service, as it has
embedded reusable and reliable functionality with valuable
logic;
-some components are more maintainable than the whole system
or could be replaced without affecting the whole system;
3) Replacement
Replacement [37] is removing the old application and
replace it with new system. The new system could be either off
shelf product or build from scratch[18].This strategy is used
when business rules are well understood , the old application is
obsolete or costly in maintenance and if the other strategies
costs can't be justified [37] . This strategy is beneficial to the
organization as it is a customized solution which satisfies the
exact needs .However it is expensive , risky and time
consuming .In order to decrease the risk and time of
development, COTS could be used[37].However it should be
used carefully as the future modifications could be difficult and
expensive. Consequently, COTS are not good option if the
business changes rapidly .However, Replacement is less costly
in maintenance and gives high performance [9].
4) Migration
In migration[37] ,legacy code is separated from user
interface. User interface is modified to be compatible with SOA.
The core code is wrapped [9].
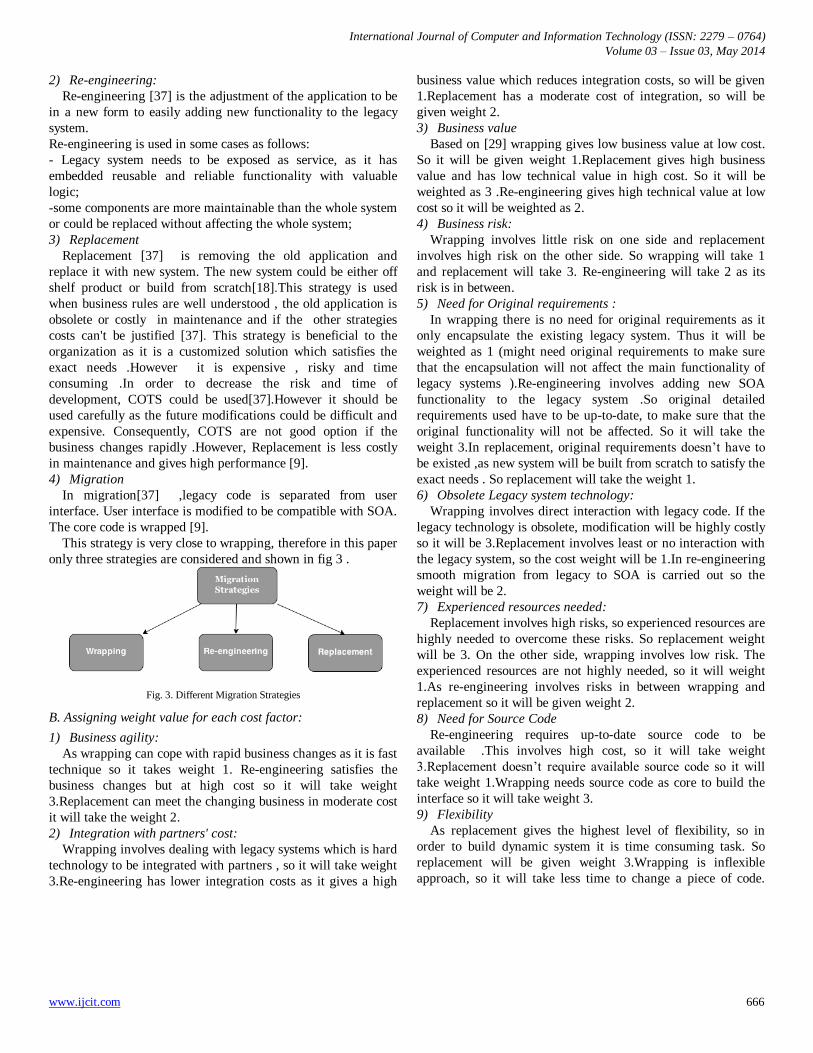
This strategy is very close to wrapping, therefore in this paper
only three strategies are considered and shown in fig 3 .
Fig. 3. Different Migration Strategies
B. Assigning weight value for each cost factor:
1) Business agility:
As wrapping can cope with rapid business changes as it is fast
technique so it takes weight 1. Re-engineering satisfies the
business changes but at high cost so it will take weight
3.Replacement can meet the changing business in moderate cost
it will take the weight 2.
2) Integration with partners' cost:
Wrapping involves dealing with legacy systems which is hard
technology to be integrated with partners , so it will take weight
3.Re-engineering has lower integration costs as it gives a high
business value which reduces integration costs, so will be given
1.Replacement has a moderate cost of integration, so will be
given weight 2.
3) Business value
Based on [29]wrapping gives low business value at low cost.
So it will be given weight 1.Replacement gives high business
value and has low technical value in high cost. So it will be
weighted as 3 .Re-engineering gives high technical value at low
cost so it will be weighted as 2.
4) Business risk:
Wrapping involves little risk on one side and replacement
involves high risk on the other side. So wrapping will take 1
and replacement will take 3. Re-engineering will take 2 as its
risk is in between.
5) Need for Original requirements :
In wrapping there is no need for original requirements as it
only encapsulate the existing legacy system. Thus it will be
weighted as 1 (might need original requirements to make sure
that the encapsulation will not affect the main functionality of
legacy systems ).Re-engineering involves adding new SOA
functionality to the legacy system .So original detailed
requirements used have to be up-to-date, to make sure that the
original functionality will not be affected. So it will take the
weight 3.In replacement, original requirements doesn’t have to
be existed ,as new system will be built from scratch to satisfy the
exact needs . So replacement will take the weight 1.
6) Obsolete Legacy system technology:
Wrapping involves direct interaction with legacy code. If the
legacy technology is obsolete, modification will be highly costly
so it will be 3.Replacement involves least or no interaction with
the legacy system, so the cost weight will be 1.In re-engineering
smooth migration from legacy to SOA is carried out so the
weight will be 2.
7) Experienced resources needed:
Replacement involves high risks, so experienced resources are
highly needed to overcome these risks. So replacement weight
will be 3. On the other side, wrapping involves low risk. The
experienced resources are not highly needed, so it will weight
1.As re-engineering involves risks in between wrapping and
replacement so it will be given weight 2.
8) Need for Source Code
Re-engineering requires up-to-date source code to be
available .This involves high cost, so it will take weight
3.Replacement doesn’t require available source code so it will
take weight 1.Wrapping needs source code as core to build the
interface so it will take weight 3.
9) Flexibility
As replacement gives the highest level of flexibility, so in
order to build dynamic system it is time consuming task. So
replacement will be given weight 3.Wrapping is inflexible
approach, so it will take less time to change a piece of code.
International Journal of Computer and Information Technology (ISSN: 2279 – 0764)
Volume 03 – Issue 03, May 2014
www.ijcit.com 667
Consequently, wrapping will take weight 1.Re-engineering will
be given 2 as it has intermediate cost.
10) Code size
Wrapping legacy systems involves small code writing, so it
will be given weight 1.Replacement involve building new
service from scratch, so size of code will be weighted as 3 .Re-
engineering involves adding new functionality to existing
system, will be given weight 2.
11) Tools support
Wrapping involves direct dealing with legacy systems that
could be obsolete technology .So tools could be no longer
available .Wrapping will take weight 3 .Re-engineering and
replacement involve new technology support so will be given
weight 1.
12) Time required for migration
Wrapping is fast as detailed in [37]it requires the least cost
compared to other approaches . Wrapping will be given 1
.Replacement is time consuming as mentioned in [37], will be
given 3.As re-engineering is in between it will be given 2.
13) Testing factors:
For the purpose of this paper we will take into consideration
testing level only as mentioned before. Testing level includes:
Functional and Non-functional testing, integration testing and
regression testing as follows:
a) Functional Testing:
Service functional testing could be done using common
methods in testing component or subsystem testing[34].In
wrapping it will be given 1, re-engineering will take 2,
replacement will take 3.
b) Non-functional Testing
Non-functional testing aims to make sure that Quality of
Service (QoS) meets Service Level Agreement (SLA). External
factors such as heavy network or server load could affect service
performance; Therefore stress testing on SLA has to be done
[34];. Non-functional testing could be getting more complex and
expensive.
Wrapping takes 3, as we have to make sure of stability and
reliability of the system. Re-engineering takes 1 , replacement is
given 1.
c) Integration Testing
The integration testing main concern is to make sure that any
problems caused due to the integration of the services are
eliminated [35]. Classical integration testing fail when the
service experience dynamic binding .Due to polymorphism of
SOA, testing all possible endpoints is costly and endpoints could
be unknown at testing time[34].Despite the complex automatic
discovery-and-composition mechanisms available, the integrator
must adequately test the service or composition before using it.
In this case, test time must be minimized because it affects
runtime performance. Wrapping will be given 3, as we need to
make sure that the modification can fit the system. Re-
engineering will take 2. Replacement will be given 3 as the
whole system is new and we want to make sure that it fits
properly.
d) Regression Testing:
Retesting piece of software after a round of changes to make
sure that the changes didn't adversely affect the delivered
service [34].Any service integrated into composition requires
regression testing, when the service has been updated.
Wrapping modification will have the lowest impact on the
system .It doesn’t need heavy testing effort, will be given 1
.Replacement will take weight 2 as the modifications need to be
heavily tested but not that risky. The re-engineering will have a
risky impact on the system and needs heavy test, so will be
given 3.
14) Stable environment:
Wrapping is the least risky approach, it will be given weight
1.On the other hand, replacement involves the highest risk
compared to other strategies, will be given weight 3. Re-
engineering involve compromise between the other approaches,
will be given weight 2.
15) Maintainability post migration:
As the [37] suggests , wrapping takes high cost. So it will be
given 3. Re-engineering will take limited cost , so will be given
1 . And replacement will have intermediate cost (weight 2) as it
is whole new system that needs maintenance.
16) Solving existing problems in legacy systems
(Maintenance)
As mentioned in section III, wrapping doesn’t solve the
existing problems in the legacy system. So wrapping will take
more effort to solve existing problems compared to other
approaches. So on the scale from 1 to 3 wrapping will be given
3. On the other side, replacement involves legacy system
elimination. Thus no legacy existing problems will occur.
Legacy system maintenance will take the weight 1.As re-
engineering involves adding new SOA functionality to an
existing legacy system as mentioned earlier. This will involve
solving existing problems and finding long term solutions for
them. So in the long term, the cost of solving legacy existing
problems will be lower than wrapping. Thus it will take weight
2.
V. RESULTS AND ANALYSIS
All the factors discussed in section IV were added to each
other and categorized by phase discussed in section III. The
International Journal of Computer and Information Technology (ISSN: 2279 – 0764)
Volume 03 – Issue 03, May 2014
www.ijcit.com 668
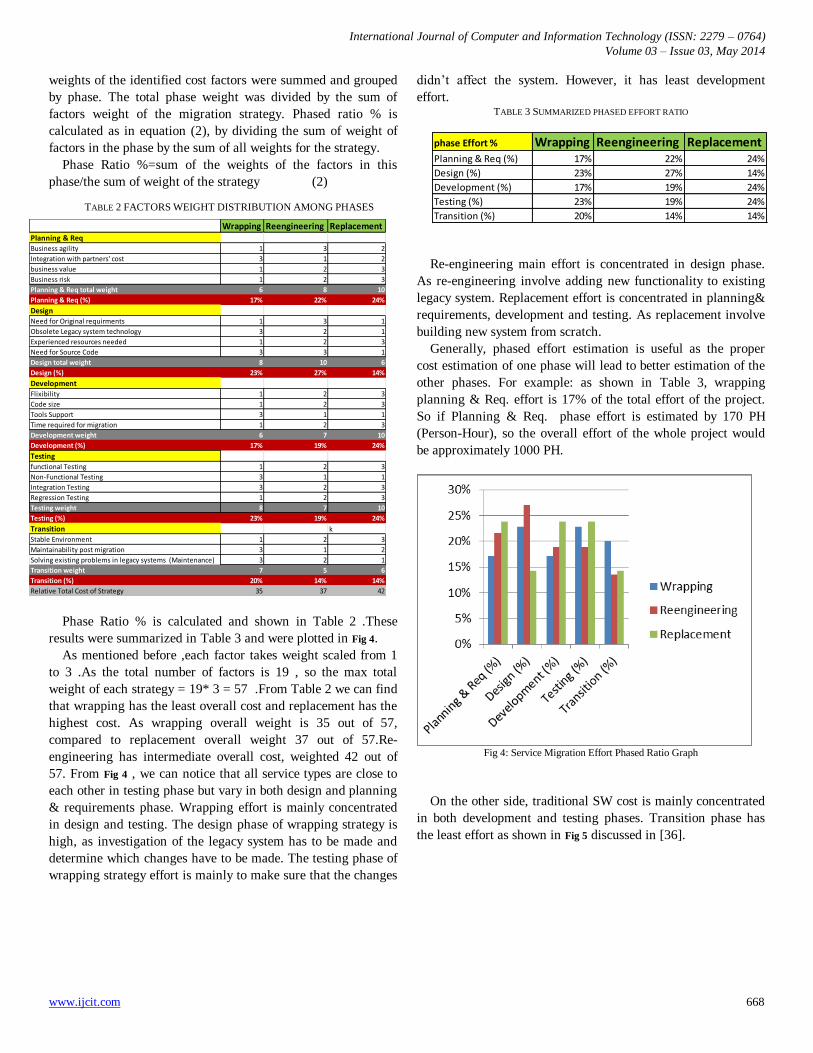
weights of the identified cost factors were summed and grouped
by phase. The total phase weight was divided by the sum of
factors weight of the migration strategy. Phased ratio % is
calculated as in equation (2), by dividing the sum of weight of
factors in the phase by the sum of all weights for the strategy.
Phase Ratio %=sum of the weights of the factors in this
phase/the sum of weight of the strategy (2)
Phase Ratio % is calculated and shown in Table 2 .These
results were summarized in Table 3 and were plotted in Fig 4.
As mentioned before ,each factor takes weight scaled from 1
to 3 .As the total number of factors is 19 , so the max total
weight of each strategy = 19* 3 = 57 .From Table 2 we can find
that wrapping has the least overall cost and replacement has the
highest cost. As wrapping overall weight is 35 out of 57,
compared to replacement overall weight 37 out of 57.Re-
engineering has intermediate overall cost, weighted 42 out of
57. From Fig 4 , we can notice that all service types are close to
each other in testing phase but vary in both design and planning
& requirements phase. Wrapping effort is mainly concentrated
in design and testing. The design phase of wrapping strategy is
high, as investigation of the legacy system has to be made and
determine which changes have to be made. The testing phase of
wrapping strategy effort is mainly to make sure that the changes
didn’t affect the system. However, it has least development
effort. TABLE 3 SUMMARIZED PHASED EFFORT RATIO
Re-engineering main effort is concentrated in design phase.
As re-engineering involve adding new functionality to existing
legacy system. Replacement effort is concentrated in planning&
requirements, development and testing. As replacement involve
building new system from scratch.
Generally, phased effort estimation is useful as the proper
cost estimation of one phase will lead to better estimation of the
other phases. For example: as shown in Table 3, wrapping
planning & Req. effort is 17% of the total effort of the project.
So if Planning & Req. phase effort is estimated by 170 PH
(Person-Hour), so the overall effort of the whole project would
be approximately 1000 PH.
Fig 4: Service Migration Effort Phased Ratio Graph
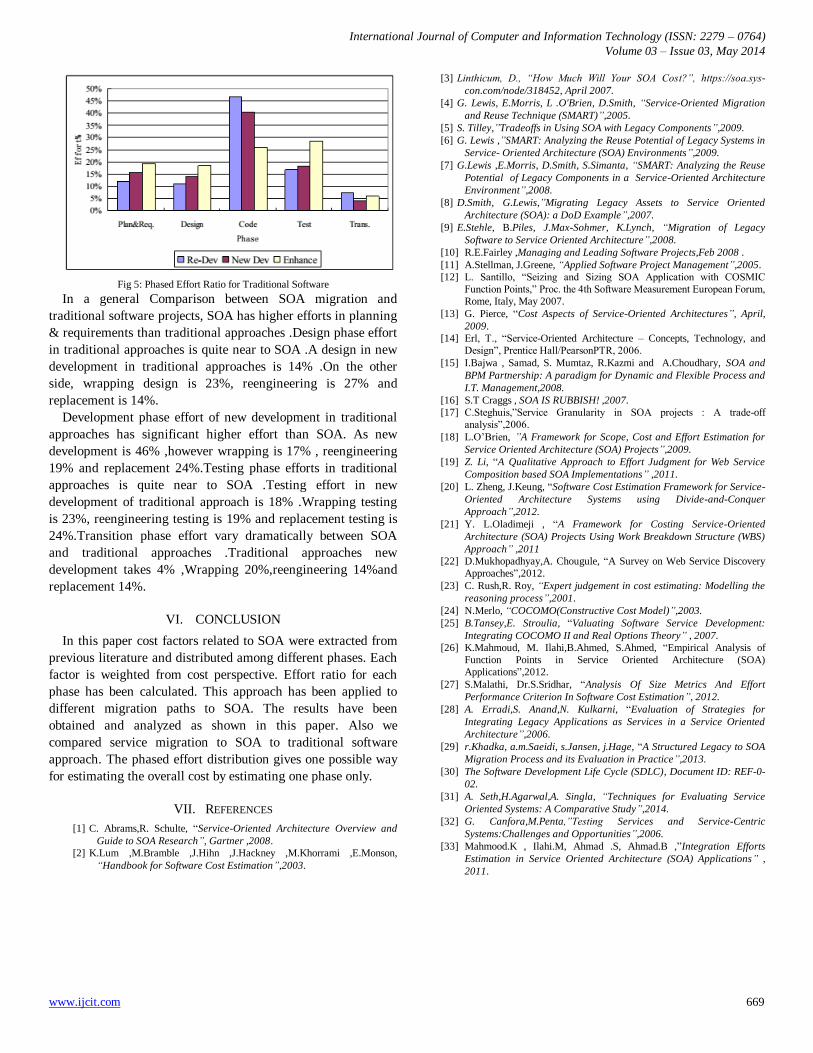
On the other side, traditional SW cost is mainly concentrated
in both development and testing phases. Transition phase has
the least effort as shown in Fig 5 discussed in [36].
TABLE 2 FACTORS WEIGHT DISTRIBUTION AMONG PHASES
Wrapping Reengineering ReplacementPlanning & ReqBusiness agility 1 3 2
Integration with partners' cost 3 1 2
business value 1 2 3
Business risk 1 2 3
Planning & Req total weight 6 8 10
Planning & Req (%) 17% 22% 24%
DesignNeed for Original requirments 1 3 1
Obsolete Legacy system technology 3 2 1
Experienced resources needed 1 2 3
Need for Source Code 3 3 1
Design total weight 8 10 6
Design (%) 23% 27% 14%
DevelopmentFlixibility 1 2 3
Code size 1 2 3
Tools Support 3 1 1
Time required for migration 1 2 3
Development weight 6 7 10
Development (%) 17% 19% 24%
Testingfunctional Testing 1 2 3
Non-Functional Testing 3 1 1
Integration Testing 3 2 3
Regression Testing 1 2 3
Testing weight 8 7 10
Testing (%) 23% 19% 24%
Transition k
Stable Environment 1 2 3
Maintainability post migration 3 1 2
Solving existing problems in legacy systems (Maintenance) 3 2 1
Transition weight 7 5 6
Transition (%) 20% 14% 14%
Relative Total Cost of Strategy 35 37 42
phase Effort % Wrapping Reengineering ReplacementPlanning & Req (%) 17% 22% 24%
Design (%) 23% 27% 14%
Development (%) 17% 19% 24%
Testing (%) 23% 19% 24%
Transition (%) 20% 14% 14%
International Journal of Computer and Information Technology (ISSN: 2279 – 0764)
Volume 03 – Issue 03, May 2014
www.ijcit.com 669
Fig 5: Phased Effort Ratio for Traditional Software
In a general Comparison between SOA migration and
traditional software projects, SOA has higher efforts in planning
& requirements than traditional approaches .Design phase effort
in traditional approaches is quite near to SOA .A design in new
development in traditional approaches is 14% .On the other
side, wrapping design is 23%, reengineering is 27% and
replacement is 14%.
Development phase effort of new development in traditional
approaches has significant higher effort than SOA. As new
development is 46% ,however wrapping is 17% , reengineering
19% and replacement 24%.Testing phase efforts in traditional
approaches is quite near to SOA .Testing effort in new
development of traditional approach is 18% .Wrapping testing
is 23%, reengineering testing is 19% and replacement testing is
24%.Transition phase effort vary dramatically between SOA
and traditional approaches .Traditional approaches new
development takes 4% ,Wrapping 20%,reengineering 14%and
replacement 14%.
VI. CONCLUSION
In this paper cost factors related to SOA were extracted from
previous literature and distributed among different phases. Each
factor is weighted from cost perspective. Effort ratio for each
phase has been calculated. This approach has been applied to
different migration paths to SOA. The results have been
obtained and analyzed as shown in this paper. Also we
compared service migration to SOA to traditional software
approach. The phased effort distribution gives one possible way
for estimating the overall cost by estimating one phase only.
VII. REFERENCES
[1] C. Abrams,R. Schulte, “Service-Oriented Architecture Overview and
Guide to SOA Research”, Gartner ,2008.
[2] K.Lum ,M.Bramble ,J.Hihn ,J.Hackney ,M.Khorrami ,E.Monson,
“Handbook for Software Cost Estimation”,2003.
[3] Linthicum, D., “How Much Will Your SOA Cost?”, https://soa.sys-
con.com/node/318452, April 2007.
[4] G. Lewis, E.Morris, L .O'Brien, D.Smith, “Service-Oriented Migration
and Reuse Technique (SMART)”,2005.
[5] S. Tilley,”Tradeoffs in Using SOA with Legacy Components”,2009.
[6] G. Lewis ,”SMART: Analyzing the Reuse Potential of Legacy Systems in
Service- Oriented Architecture (SOA) Environments”,2009.
[7] G.Lewis ,E.Morris, D.Smith, S.Simanta, “SMART: Analyzing the Reuse
Potential of Legacy Components in a Service-Oriented Architecture
Environment”,2008.
[8] D.Smith, G.Lewis,”Migrating Legacy Assets to Service Oriented
Architecture (SOA): a DoD Example”,2007.
[9] E.Stehle, B.Piles, J.Max-Sohmer, K.Lynch, “Migration of Legacy
Software to Service Oriented Architecture”,2008.
[10] R.E.Fairley ,Managing and Leading Software Projects,Feb 2008 .
[11] A.Stellman, J.Greene, “Applied Software Project Management”,2005.
[12] L. Santillo, “Seizing and Sizing SOA Application with COSMIC
Function Points,” Proc. the 4th Software Measurement European Forum,
Rome, Italy, May 2007.
[13] G. Pierce, “Cost Aspects of Service-Oriented Architectures”, April,
2009.
[14] Erl, T., “Service-Oriented Architecture – Concepts, Technology, and
Design”, Prentice Hall/PearsonPTR, 2006.
[15] I.Bajwa , Samad, S. Mumtaz, R.Kazmi and A.Choudhary, SOA and
BPM Partnership: A paradigm for Dynamic and Flexible Process and
I.T. Management,2008.
[16] S.T Craggs , SOA IS RUBBISH! ,2007.
[17] C.Steghuis,”Service Granularity in SOA projects : A trade-off
analysis”,2006.
[18] L.O’Brien, ”A Framework for Scope, Cost and Effort Estimation for
Service Oriented Architecture (SOA) Projects”,2009.
[19] Z. Li, “A Qualitative Approach to Effort Judgment for Web Service
Composition based SOA Implementations” ,2011.
[20] L. Zheng, J.Keung, “Software Cost Estimation Framework for Service-
Oriented Architecture Systems using Divide-and-Conquer
Approach”,2012.
[21] Y. L.Oladimeji , “A Framework for Costing Service-Oriented
Architecture (SOA) Projects Using Work Breakdown Structure (WBS)
Approach” ,2011
[22] D.Mukhopadhyay,A. Chougule, “A Survey on Web Service Discovery
Approaches”,2012.
[23] C. Rush,R. Roy, “Expert judgement in cost estimating: Modelling the
reasoning process”,2001.
[24] N.Merlo, “COCOMO(Constructive Cost Model)”,2003.
[25] B.Tansey,E. Stroulia, “Valuating Software Service Development:
Integrating COCOMO II and Real Options Theory” , 2007.
[26] K.Mahmoud, M. Ilahi,B.Ahmed, S.Ahmed, “Empirical Analysis of
Function Points in Service Oriented Architecture (SOA)
Applications”,2012.
[27] S.Malathi, Dr.S.Sridhar, “Analysis Of Size Metrics And Effort
Performance Criterion In Software Cost Estimation”, 2012.
[28] A. Erradi,S. Anand,N. Kulkarni, “Evaluation of Strategies for
Integrating Legacy Applications as Services in a Service Oriented
Architecture”,2006.
[29] r.Khadka, a.m.Saeidi, s.Jansen, j.Hage, “A Structured Legacy to SOA
Migration Process and its Evaluation in Practice”,2013.
[30] The Software Development Life Cycle (SDLC), Document ID: REF-0-
02.
[31] A. Seth,H.Agarwal,A. Singla, “Techniques for Evaluating Service
Oriented Systems: A Comparative Study”,2014.
[32] G. Canfora,M.Penta,”Testing Services and Service-Centric
Systems:Challenges and Opportunities”,2006.
[33] Mahmood.K , Ilahi.M, Ahmad .S, Ahmad.B ,”Integration Efforts
Estimation in Service Oriented Architecture (SOA) Applications” ,
2011.
International Journal of Computer and Information Technology (ISSN: 2279 – 0764)
Volume 03 – Issue 03, May 2014
www.ijcit.com 670
[34] G. Canfora and M. Di. Penta, “Testing services and service-centric
systems: Challenges and opportunities,” IEEE Computer Society,
2006.
[35] integration testing, Wikipedia [online], Available
at:http://en.wikipedia.org/wiki/Integration_testing [Accessed 12th May
2014].
[36] Y. Yang,M.He,M. Li,Q. Wang,B. Boehm, “Phase Distribution of
Software Development Effort”,2008.
[37] A. Almonaies, J.Cordy,. Dean ,”Legacy System Evolution towards
Service-Oriented Architecture”,2010.
[38] D. Krafzig, K. Banke, and D. Slama, “Enterprise SOA:
ServiceOriented Architecture Best Practices”, Upper Saddle River:
Prentice Hall PTR, Nov. 2004.
Copyright © 2022 FDOKUMEN