Pharmacological properties of members of the Sterculiaceae
265
Pharmacological properties of members of the Sterculiaceae KIRSTY ANN REID Submitted in fulfilment of the academic requirements for the degree of Doctor of Philosophy in the Research Centre for Plant Growth and Development, School of Botany and Zoology, University of Natal Pietermaritzburg 2002
-
Upload
khangminh22 -
Category
Documents
-
view
1 -
download
0
Transcript of Pharmacological properties of members of the Sterculiaceae

Pharmacological properties of
members of the Sterculiaceae
KIRSTY ANN REID
Submitted in fulfilment of the academic
requirements for the degree of
Doctor of Philosophy
in the
Research Centre for Plant Growth and Development,
School of Botany and Zoology,
University of Natal
Pietermaritzburg
2002

DECLARATION
I hereby declare that the experimental work described in this thesis was
conducted in the Research Centre for Plant Growth and Development, School
of Botany and Zoology, University of Natal Pietermaritzburg from January 1999
to September 2002, under the supervision of Professor J. van Staden and
Professor A. K. Jaqer.
These studies are a result of my own investigations, except where
acknowledgment of other work is specifically indicated in the text and have not
been submitted in any other form to another University.
Kirsty Ann Reid
I declare the above statement to be true.
Profes or J. van Staden
(SUPERVISOR)
Professor A. K. Jaqer
(CO-SUPERVISOR)
December 2002

ACKNOWLEDGEMENTS
I would like to extend my special thanks to my supervisor, Prof J. Van Staden
and my eo-supervisor Prof A. K. Jaqer for their steady supervision and
encouragement.
My sincere thanks goes to my research committee, Mike Smith and Esam
Elgorashi for their expertise and advise .
I have been most fortunate to have worked with great colleagues and I thank
them for their friendship and comradery. In particular, I would like to thank Gary
Stafford, Cath Ford, Shane Sparg, Marnie Light and Lyndy McGaw for their
continued support.
My thanks also goes to the technical staff of the Research Centre as well asthe
secretaries, Judy Fairlie and Lee Warren for their willingness to help.
I am most grateful to Prof Dulcie Mullholland from the school of Physical and
Applied Chemistry, Durban, for her analysis expertise.
Thank you to the people from the Pietermartizburg National Botanical Gardens,
Umgeni Valley Nature Reserve, Hawaan Forest and Chris Job for their aid in
plant material collection.
Thank you to the University Research Fund and the National Research
Foundation for financial assistance.
Last, but never least, I would like to thank my parents for their love, prayers and
support throughout my studies.
ii

ABSTRACT
There is a resurgence of interest in many countries in medicinal plants and their
curative properties (HARBORNE & BAXTER, 1993). Little work has previously
been conducted on the Sterculiaceae species, especially those located within
South Africa. This was a perfect opportunity to broaden the available
information on the medicinal properties and chemical constituents of this family,
within KwaZulu-Natal.
Of the 50 genera of the Sterculiaceae family, six are located in South Africa:
Cola, Oombeya, Hermannia, Melhania, Sterculia and Waltheria .
Seven Sterculiaceae species were chosen for investigation. They varied in
growth type and use in traditional medicine. These species included: Oombeya
rotundifolia, O. burgessiae, O. cymosa, Cola natalensis, C. greenwayi,
Hermannia depressa and Sterculia murex. Plant material used in the study was
collected from a variety of areas, all within KwaZulu-Natal or the Northern
Province. There were two collection sites for O. rotundifolia, from differing
habitats, and results were compared.
The material was screened pharmacologically for anti -bacterial activity using
the disc-diffusion assay and Minimal Inhibitory Assay (MIC), and for anti
inflammatory activity using the COX-1 assay.
Only D. rotundifolia and C. natalensis were tested for anti-bacterial activity
using the disc-diffusion assay as the disc-diffusion asay was found to show
inconsistencies in the results obtained. Bacteria used included: Escherichia coli
and Klebsiella pneumoniae being Gram-negative, and Micrococcus luteus,
Staphylococcus aureus and Staphylococcus epidermidis being Gram-positive.
O. rotundifolia exhibited activity J both anti-bacterial and bacteriostatic, in the
iii

leaf, twig and bark extracts from both collection sites. Only the water extract
obtained from the leaf material of C.natalensis exhibited slight anti-bacterial
activity against S. epidermidis. Minimal inhibitory concentration (MIC) values
were determined using a microdilution assay (25 mg mr' serially diluted 50 %
to 0.195 mg ml'). Bacteria used in the screening were: B. subtilis, E. coli, K.
pneumoniae and S. aureus. None of the water extracts showed any anti
bacterial activity. Good MIC values were exhibited by D. cymosa ethanolic leaf
extracts, C. greenwayi leaf ethyl acetate extracts especially against K.
pneumoniae (0.78 mg ml') and S. aureus (0.39 mg rnl') and H. depressa
ethanol and ethyl acetate leaf, stem and root extracts. D. burgessiae and S.
murex showed low activity, with insignificant MIC values.
D. rotundifolia plant material yielded the highest anti-inflammatory activity of all
the plant species, with the extracts from the Umgeni Valley Nature
Reserve(UVNR) showing the best results. The lowest activity was recorded in
the aqueous bark extracts (5% inhibition)and the highest from the ethanolic leaf
extract (97% inhibition). D. cymosa extracts showed high activity in ethanolic
leaf and twig extracts with low activity in all the other extracts. D. burgessiae,
C. greenwayi and S. murex extracts showed high activity in both ethanolic and
dichloromethane extracts from leaf and twig material. Activity occurred in the
dichloromethane extracts of H. depressa obtained from the stem (78%) and
root (81%) extracts. C. natalensis extracts showed insignificant activity.
Plant material was phytochemically screened for alkaloids, saponins, tannins,
cardiac glycosides and cyanogenic glycosides. No alkaloids were detected
using pH-partitioning and no cyanogenic glycosides were observed (TLC
sandwich method) in any of the extracts of the seven species screened. Using
the gelatin salt-block test, tannins were found to be present in the leaf and twig
material of D. rotundifolia, the leaf material of C. greenwayi and the leaf, stem
and root material of H depressa. The froth test indicated that saponins were
iv

present in the leaf and twig material of D. rotundifolia and leaf, root and stem
material of H. depressa. The haemolysis test indicated the presence of
saponins in the D. rotundifolia bark material. Screening for cardiac glycosides
detected cardienolides in the leaf, twig and bark material of D. rotundifolia, and
bufadienolides were detected in D. rotundifolia , D. cymosa, D. burgessiae and
S. murex.
Five species screened were selected for isolation of active anti-bacterial
compounds: D. rotundifolia, D. burgessiae, D. cymosa, C. greenwayi and H.
depressa. Material was extracted by Soxhlet and isolation techniques employed
were VLC, TLC separation, Sephadex LH-20 column chromatography and
HPLC techniques. The isolated compounds were analysed by NMR and GC
MS. All isolated compounds were fatty acids: Palmitic acid, Myristic acid , Lauric
acid, Stearic acid, Acetic acid as welll as stearyl alcohol, eicosane and
octadecane
The aqueous eaf extract of H. Depressa exuded a thick mucilage. The
production of this mucilage from the H. depressa aqueous extract may have
medicinal or commercial value. A technique to separate the mucilaginous
extract from the leaf material was devised. After extraction, the extract was
screened to determine its sugar content through gas chromatography. It was
screened for its pharmacological properties:antibacterial and anti-inflammatory
activity. The hydrolysing effect of ex -amylase and Hel on the extract was
determined to find its potential use as a bulking agent for use as an appetite
suppressant, laxative or against the effects of diarrhoea. It was concluded that
the extract is not likely to break down easily in the human digestive system and
may be effective against the three listed ailments .
v

PAPERS PUBLISHED FROM THIS THESIS
Reid, K.A., Jaqer, A.K. and Van Staden, J. 2001. Pharmacology and
phytochemical properties of Dombeya rotundifolia. South African Journal
of Botany 67: 349 - 353.
PAPERS IN PREPARATION
Reid, K.A., Jaqer, A.K. and Van Staden, J. 2003. Pharmacology and
phytochemical properties of Dombeya cymosa and Dombeya
burgessiae.
Reid, K.A., Jaqer, A.K. and Van Staden, J. 2003. Pharmacology and
phytochemical properties of Cola greenwayi and Cola natalensis.
Reid, K.A., Jaqer, A.K. and Van Staden, J. 2003. Pharmacology and
phytochemical properties of Hermannia depressa.
vi

CONFERENCE CONTRIBUTION FROM THIS
THESIS
1999
Fifth Joint Meeting of the American Soc. Of Pharmacognosy, Assoc.
Francaise pour l'Enseignment et la Recherche en Pharmagonosie,
GesellschaftfOr Arzneipflanzenforschung and the Phytochemical Society
of Europe, Amsterdam (The Netherlands):-
Poster: Isolation of an Anti-bacterial compound, vernodalin, from Vernonia
coloreie. (K. A. Reid, A. K. Jaqer and J. Van Staden).
2000
Sixth International Congress Society for Ethnopharmacology (lSE), Zurich
(Switzerland):-
Poster: Screening of Oombeya rotundifolia for Pharmacological and
Phytochemical properties. (K. A. Reid, A. K. Jaqer and J. Van
Staden).
Twenty-sixth South African Association of Botanists Congress,
Potchefstroom ( South Africa):-
Paper: Pharmacological and Phytochemical Screening of Oombeya
rotundifolia. (K. A. Reid, A. K. Jaqer and J. Van Staden).
2001
Twenty-seventh South African Association of Botanists Congress, RAU,
Johannesburg (South Africa):-
Paper: Are the Sterculiaceae species in KwaZulu-Natal being used in
traditional medicine in line with the compounds they contain? (K.
A. Reid, A. K. Jaqer and J. Van Staden).
vii

Workshop on the screening of Plant Species for Potential Medicinal Use,
Mol (Belgium):-
Paper: Pharmacological and phytochemical properties of three Dombeya
species. (K. A. Reid, A. K. Jaqer and J. Van Staden).
2002
Twenty-eighth South African Association of Botanists Congress,
Grahamstown (South Africa):-
Paper: Pharmacology of Hermannia depressa. (K. A. Reid, A. K. Jaqer
and J. Van Staden).
viii

TABLE OF CONTENTS
Declaration .
Acknowledgements ii
Abstract . . . . . . . . . . . . . . . . . . . . . . . . . . . . . . . . . . . . . . . . . . . . . . . . . .. ii i
Papers Published from this Thesis vi
Papers in Preparation vi
Conference Contributions from this Thesis vii
Table of Contents . . . . . . . . . . . . . . . . . . . . . . . . . . . . . . . . . . . . . . . . . .. ix
List of Figures xvii
List of Plates . . . . . . . . . . . . . . . . . . . . . . . . . . . . . . . . . . . . . . . . . . . .. xxiii
List of Tables xxx
List of Abbreviations xxxiv
CHAPTER 1 GENERAL INTRODUCTION
1.1 History of Ethnobotany. . 1
1.2 Ethnobotany and Westernised Medicine 2
1.3 Plants and Their Uses in Traditional Medicine 4
1.4 Depletion of Resources and Conservation due to the 'Muthi' Trade
in KwaZulu~Natal 5
1.5 The Ethnobotanical Approach to Drug Discovery 6
CHAPTER 2 LITERATURE REVIEW
2.1 The Family Sterculiaceae and its Distribution 8
2.2 Medicinal Uses and Chemical Constituents of Species of the Family
Sterculiaceae 18
2.3 Aims of the Study 33
ix

CHAPTER 3 PLANT COLLECTION
3.1 Plant Collection 36
3.2 Description of Plant Parts Used 39
CHAPTER 4 PHARMACOLOGICAL SCREENING
4.1 Introduction 42
4.2 Materials and Methods 44
4.2.1 Anti-bacterial Activity 44
Extraction of Plant Material 44
Anti-bacterialAssay 44
Minimal Inhibition Concentration (MIC) Assay 45
4.2.2 Anti-inflammatory Activity 46
Extraction of Plant Material 46
Cyclooxygenase Assay 46
4.3 Results and Discussion 48
Anti-bacterial Activity 48
Anti-inflammatory Activity 58
4.4 Summary 61
CHAPTER 5 PHYTOCHEMICAL SCREENING
5.1 Introduction 62
5.2 Materials and Methods 65
5.2.1 Cardiac Glycosides 65
Two-Deoxy-sugars/ Keller-Killiani Test 65
Unsaturated Lactone Ring Tests 66
5.2.2 Cyanogenic Glycosides 66
TLC Sandwich Method 66
5.2.3 Saponins 67
Froth Test 67
Haemolysis Test 67
x
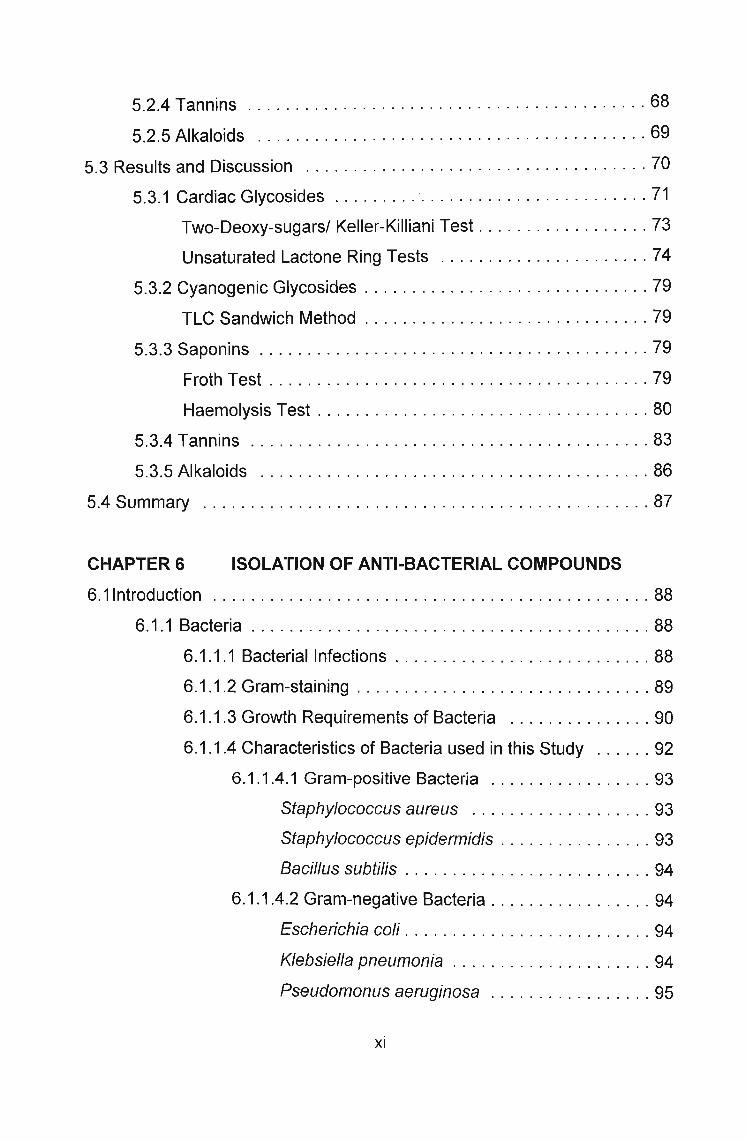
5.2.4 Tannins 68
5.2.5 Alkaloids 69
5.3 Results and Discussion 70
5.3.1 Cardiac Glycosides 71
Two-Deoxy-sugars/ Keller-Killiani Test 73
Unsaturated Lactone Ring Tests 74
5.3.2 Cyanogenic Glycosides 79
TLC Sandwich Method 79
5.3.3 Saponins 79
Froth Test 79
Haemolysis Test 80
5.3.4 Tannins 83
5.3.5 Alkaloids 86
5.4 Summary 87
CHAPTER 6 ISOLATION OF ANTI-BACTERIAL COMPOUNDS
6.1lntroduction 88
6.1.1 Bacteria 88
6.1.1 .1 Bacterial Infections 88
6.1.1.2 Gram-staining 89
6.1.1.3 Growth Requirements of Bacteria 90
6.1.1.4 Characteristics of Bacteria used in this Study 92
6.1.1.4.1 Gram-positive Bacteria 93
Staphylococcus aureus 93
Staphylococcus epidermidis 93
Bacillus subtilis 94
6.1.1.4.2 Gram-negative Bacter ia 94
Escherichia coli 94
Klebsiella pneumonia 94
Pseudomonus aeruginosa 95
xi

6.1.1.5 Neomycin as a Control 95
6.1.2 Chromatography , and its Techniques 95
Solvents Used in Chromatography 96
6.1.3 Nuclear Magnetic Resonance Spectroscopy 97
6.2 Aims 97
6.3 General Materials and Methods 98
6.3.1 Sterculiaceae Species Used for Anti-bacterial Isolation 98
6.3.2 Extraction of Plant Material by Soxhlet 98
Small Soxhlet Apparatus 98
Large Soxhlet Apparatus 99
6.3.3 Solvent Ratio Determination for Thin Layer Chromatography. 99
6.3.4 Bioautog raphic Spray Method 100
6.3.5 Isolation Techniques 100
6.3 .5.1 Vacuum Liquid Chromatography (VLC) 100
Column Preparation 100
Solvent Gradient Used 101
Addition and Collection of Solvents 101
6.3.5 .2 Sephadex LH-20 Column Chromatography 102
Preparation and Running of the Column 102
6.3.5.3 Preparative Thin Layer Chromatography 103
6.3.5.4 High Pressure Liquid Chromatography (HPLC) 104
6.3.6 Preparation of Compounds for NMR 104
6.3 .7 Gas Chromatography-Mass Spectroscopy 104
6.4 Anti-bacterial Compound Isolation 105
6.4.1 Dombeya rotundifolia 105
Materials and Methods 105
Results .. . . . . . . . . . . . . . . . . . . . . . . . . . . . . . . . . . . . . . . . 105
6.4.2 Oombeya burgessiae 110
Materials and Methods 110
Results 110
xii
CHAPTER 7
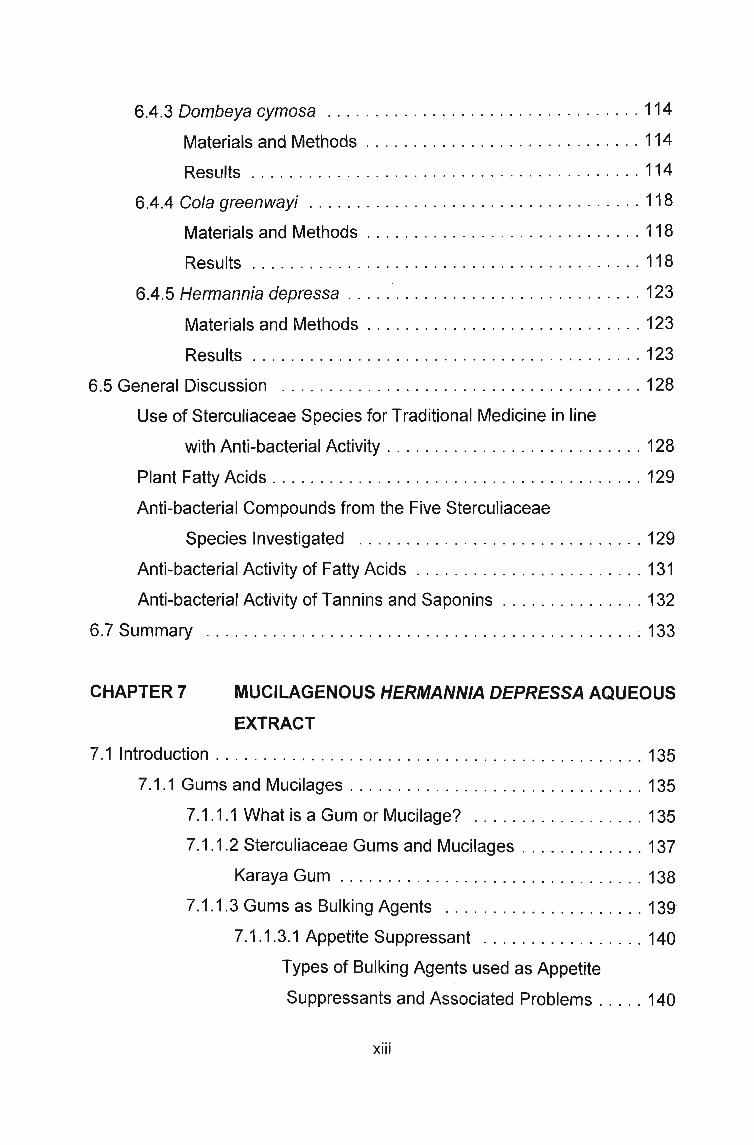
6.4 .3 Dombeya cymosa 114
Materials and Methods . . . . . . . . . . . . . . . . . . . . . . . . . . . . . 114
Results 114
6.4.4 Cola greenwayi 118
Materials and Methods 118
Results 118
6.4 .5 Hermannia depressa 123
Materials and Methods 123
Results 123
6.5 General Discussion 128
Use of Sterculiaceae Species for Traditional Medicine in line
with Anti-bacterial Activity 128
Plant Fatty Acids 129
Anti-bacterial Compounds from the Five Sterculiaceae
Species Investigated 129
Anti-bacterial Activity of Fatty Acids 131
Anti-bacterial Activ ity of Tannins and Saponins 132
6.7 Summary ~ 133
MUCILAGENOUS HERMANNIA DEPRESSA AQUEOUS
EXTRACT
7.1 Introduction 135
7.1.1 Gums and Mucilages 135
7.1.1 .1 What is a Gum or Mucilage? 135
7.1 .1 .2 Sterculiaceae Gums and Mucilages 137
Karaya Gum 138
7.1.1 .3 Gums as Bulking Agents 139
7.1.1.3.1 Appetite Suppressant 140
Types of Bulking Agents used as Appetite
Suppressants and Associated Problems ..... 140
xiii

7.1.1 .3.2 Bulking Agents as a Laxative and
Against Diarrhoea 141
7.1 .1.3.3 Digestion , Focussing Primarily on
Carbohydrate Digestion 142
7.1.1.4 Wound Healing 144
7.2 Aims 145
7.3 Extraction of Plant Material 145
7.4 Sugar Analysis by Gas Chromatography (GC) for Aqueous
Hermannia depressa Extracts 146
7.4.1 Introduction 146
7.4.2 Materials and Methods 146
Hydrolysis of Polysaccharides 146
Preparation of Sugar Standards for Gas Chromatography . 147
Gas Chromatography Analysis 147
7.4.3 Results . .148
7.5 Pharmacological Screening 149
7.5.1 Introduction 149
7.5.2 Materials and Methods 150
Anti-bacterial Screening 150
Anti-inflammatory Screening 150
7.5.3 Results 150
Anti-bacterial Screening 150
Anti- inflammatory Screening 151
7.6 The Effect of ex-Amylase and HCI on Hermannia depressa
Aqueous Extract 151
7.6.1 Introduction 151
7.6.2 Materials and Methods 152
Enzyme Hydrolysis 152
Acid Hydrolysis 152
7.6.3 Results 153
xiv

Enzyme Hydrolysis 153
Acid Hydrolysis 153
7.7 Degree of Hermannia depressa Aqueous Extract Hydrolysis
in the Presence of Bacteria 154
7.7.1 Introduction 154
Why the Chosen Bacteria? 154
7.7.2 Materials and Methods 154
Standard Curve 154
Experiment . . . . . . . . . . . . . . . . . . . . . . . . . . . . . . . . . . . . . . 155
7.7.3 Results 155
Standard Curve and Bacterial Hydrolysis of Extracts 155
7.8 The Effect of 60 % Ethanol on Hermannia depressa Aqueous
Extracts . . . . . . . . . . . . . . . . . . . . . . . . . . . . . . . . . . . . . . . . . . . . . . 159
7.8.1 Introduction 159
7.8.2 Materials and Methods 160
7.8.3 Results 160
7.9 General Discussion 160
Bulking Agent - Appetite Suppressant, Diarrhoeal and
Constipation Control 161
Wound Healing 162
7.10 Summary 163
CHAPTER 8 THIN LAYER CHROMATOGRAPHIC
FINGERPRINTING
8.1 Introduction 166
8.2 Materials and Methods 167
Preparation of Extracts 167
Loading of Extracts 167
TLC Separation 167
Visualization of TLC Plates 167
xv

Ultra-violet Light 168
Anisaldehyde Staining 168
8.3 Results and Discussion 169
Comparison of Extracts Within Species 170
Comparison of Extracts Between Species 170
Anti-bacterial Compounds 171
Saponins and Cardiac Glycosides 172
8.4 Summary 172
CHAPTER 9 GENERAL CONCLUSIONS 179
REFERENCES 181
APPENDICES
Appendix A - GC-MS Spectra of Isolated Anti-bacterial Compounds 197
Appendix B - Sugar Analysis Gas Chromatography Chromatograms 228
xvi

Figure 1
Figure 2
Figure 3
Figure 4
Figure 5
Figure 6
Figure 7
LIST OF FIGURES
Page
Sites where Sterculiaceae species were collected for
this study 36
Diagram showing the layout of the five 'cups' used in the
haemolysis test for saponins. (1) - (3) Plant extract; (4)
Water control; (5) Saponaria officinalis control 68
Diagrams showing the basis of bacteria cell walls: a) Gram-
negative and b) Gram-positive bacteria 89
Standard curve depicting viscosity (drops min') for
autoclaved and non-autodaved aqueous H. depressa
Extract A (HDEa) and Extract B (HDEb) 156
Viscosity (drops rnin') against a standard curve for non
autoclaved aqueous H. depressa Extract B to determine
bacterial hydrolysis on the extract after 48 h 156
Viscosity (drops rnin") against a standard curve for
autoclaved aqueous H. depressa Extract B to determine
bacterial hydrolysis on the extract after 48 h 157
Viscosity (drops rnin") against a standard curve for non
autoclaved aqueous H. depressa Extract A to determine
bacterial hydrolysis on the extract after 48 h 157
xvii

Figure 8
Figure A.1
Figure A.2
Figure A.3
Figure A.4
Figure A.5
Figure A.6
Figure A.7
Viscosity (drops min') against a standard curve for
autoclaved aqueous H. depressa Extract A to determine
bacterial hydrolysis on the extract after 48 h 158
D. rotundifolia GC-MS spectrum of isolated anti-bacterial
Compound 198
GC -MS library search of D. rotundifolia Compound A at a
retention time of 18.471 min corresponding with Myristic
(Tetradecanoic) acid spectrum 199
GC -MS library search of D. rotundifolia Compound A at a
retention time of 20.602 min, corresponding with Palmitic
(Hexadecanoic) acid spectrum 200
GC -MS library search of D. rotundifolia Compound A at a
retention time of 23.937 min corresponding with Stearic
(Octadecanoic) acid spectrum 201
D. rotundifolia GC-MS spectrum of isolated anti-bacterial
Compound B 202
GC -MS library search of O. rotundifolia Compound B at a
retention time of 11.315 min corresponding with Acetic
(Ethanoic) acid spectrum 203
GC -MS library search of D. rotundifolia Compound B at a
retention time of 17.034 min corresponding with Lauric
(Dodecanoic) acid spectrum 204
xviii

Figure A.S
Figure A.9
Figure A.10
Figure A.11
Figure A.12
Figure A.13
Figure A.14
Figure A.15
GC -MS library search of D. rotundifolia Compound 8 at a
retention time of 18.477 min corresponding with Myristic
(Tetradecanoic) acid spectrum 205
GC -MS library search of D. rotundifolia Compound 8 at a
retention time of 20.608 min corresponding with Palmitic
(Hexadecanoic) acid spectrum 206
D. burgessiae GC-MS spectrum of isolated anti-bacterial
Compound A 207
GC -MS library search of D. burgessiae Compound A at a
retention time of 20.596 min corresponding with Palmitic
(Hexadecanoic) acid spectrum 208
C. greenwayi GC-MS spectrum of isolated anti-bacterial
Compound 8 209
GC -MS library search of C. greenwayi Compound 8 at a
retention time of 17.660 min corresponding with Stearyl
alcohol spectrum 210
GC -MS library search of C. greenwayi Compound 8 at a
retention time of 15.689 min corresponding with Palmitic
(Hexadecanoic) acid spectrum 211
C. greenwayi GC-MS spectrum of isolated anti-bacterial
Compound C 212
xix

Figure A.16
Figure A.17
Figure A.18
Figure A.19
Figure A.20
Figure A.21
Figure A.22
Figure A. 23
GC -MS library search of C. greenwayi Compound C at a
retention time of 14.571 min corresponding with Eicosane
spectrum 213
C. greenwayi GC-MS spectrum of isolated anti-bacterial
Compound D 214
GC -MS library search of C. greenwayi Compound 0 at a
retention time of 14.577 min corresponding with Eicosane
spectrum 215
GC -MS library search of C. greenwayi Compound 0 at a
retention time of 18.465 min corresponding with Myristic
(Tetradecanoic) acid spectrum 216
GC -MS library search of C. greenwayi Compound D at a
retention time of 20.602 min corresponding with Palmitic
(Hexadecanoic) acid spectrum 217
H. depressa GC-MS spectrum of isolated anti-bacterial
Compound B(A) 218
GC -MS library search of H. depressa Compound B(A) at a
retention time of 11.316 min corresponding with Acetic
(ethanoic) acid spectrum 219
GC -MS library search of H. depressa Compound B(A) at a
retention time of 13.502 min corresponding with
Octadecane spectrum 220
xx

Figure A.24
Figure A.25
Figure A.26
Figure A.27
Figure A.28
Figure A.29
Figure A.30
GC -MS library search of H. depressa Compound B(A) at a
retention time of 17.028 min corresponding with Lauric
(Dodecanoic) acid spectrum 221
GC -MS library search of H. depressa Compound B(A) at a
retention time of 17.666 min corresponding with Stearyl
alcohol spectrum 222
GC -MS library search of H. depressa Compound B(A) at a
retention time of 18.471 min corresponding with Myristic
(Tetradecanoic) acid spectrum 223
GC -MS library search of H. depressa Compound B(A) at a
retention time of 20.602 min corresponding with Palmitic
(Hexadecanoic) acid spectrum 224
GC -MS library search of H. depressa Compound B(A) at a
retention time of 23.931 min corresponding with Stearic
(Octadecanoic) spectrum 225
H. depressa GC-MS spectrum of isolated anti-bacterial
Compound B(E) 226
GC -MS library search of H. depressa Compound B(E) at a
retention time of 20.602 min corresponding with Palmitic
(Hexadecanoic) acid spectrum 227
xxi

Figure 8.1
Figure 8.2
Representative chromatograms for sugar standards. Peak
(a) solvent (dichloromethane), (b) sucrose, (c) L(+)
rhamnose, (d) D(-)fructose, (e) D(+)glucose, (f) D-
glucuronic acid 229
Representative chromatogram for sugar detection with Sil-A
of H. depressa aqueous extract 230
xxii

Plate 1
Plate 2
LIST OF PLATESPage
Species screened in this study.
(A) Oombeya rotundifolia (1) tree with flowers in spring, (2) young
shoots and leaves , (3) tree with leaves in autumn and (4) outer
bark from trunk. (B) Oombeya burgessiae (1) leaf, (2) and (3)
shrub with drying flowers and developing fruit. (C) Cola greenwayi
(1) tree, (2) fruit and (3) leaves on branches. (0) Oombeya
cymosa (1) tree , (2) leaves and (3) branches full of leaves. (E)
Cola natalensis (1) leaves, (2) tree, and (3) flowers. (F) S. murex
and (G) H. depressa 35
Steps followed in collection, drying and storage of plant material.
(A) Plant material (1) was collected from the relevant species from
(2) Monato nature farm in Limpopo Province, (3) National
Botanical Gardens in Pietermaritzburg, (4) Umgeni Valley Nature
Reserve in Howick and (5) Hawaan Forest on the outskirts of the
coastal resort town of Umhlanga. (B) Material was taken to the
laboratory where it was separated into different plant parts and
placed in labeled brown paper bags. (C) The brown paper bags
were placed in an oven in the garden laboratory and the plant
material was dried at 50°C for 72 h. (0) The dried plant material
was ground in a Waring blender in the laboratory and placed in
labeled honey jars . (E) The honey jars were stored in a cupboard,
in the dark , until the plant material was required . (F) A voucher
specimen of plant material collected was identified and is housed
in the University of Natal Herbarium (NU) 40
xxiii

Plate 3
Plate 4
Extraction of plant material. (A) Material was obtained from
storage and a variety of extraction techniques were employed. (8)
Sonication and filter gravity extraction of small quantities of plant
material required for pharmacological and phytochemical
screening, (C) large Soxhlet for bulk extraction of D. rotundifolia
plant material for isolation of biologically active compounds, (0)
small Soxhlet for extraction of D. cymosa, D. burgessiae, C.
greenwayi and H. depressa plant material for the isolation of
biologically active compounds, and (E) centrifugation for
separation of aqueous H. depressa extract from leaf
material 41
Anti-bacterial activity was detected using the disc-diffusion assay
for D. rotundifolia extracts. Anti-bacterial activity was expressed as
a ratio of the inhibition zone of the extract to the inhibition zone of
the Neomycin control. (A) Leaf material from (1) UVNR and (2)
Monato aqueous extracts showed activity against S. epidermidis
(0.23 and 0.08), (3) UVNR and (4) Monato ethanolic extracts were
bacteriostatic against M. luteus (0.83 and 0.71). (8) Twig material
from (1) UVNR and (2) Monato aqueous extracts showed activity
against S. epidermidis (0.23 and 0.23), (3) UVNR aqueous
extracts showed activity against B. subtilis (0.12), and (4) Monato
aqueous extract showed activity against M. luteus (0.21) ... 52
xxiv

Plate 5
Plate 6
Plate 7
Plate 8
Anti-bacterial activity as determined using the minimal inhibition
concentration (MIC) assay. (A) O. rotundifolia leafextracts from (1)
Monato and (2) UVNR, (B) O. burgessiae leaf extract, (C) O.
cymosa leaf extract, (0) C. greenwayi (1) leaf and (2) twig
extracts, and (E) H.depressa (1) leaf and (2) root extracts.
(Bs - B. subtilis , Ec - E. coli , Kp - K. pneumonia, Sa - S. aureus)
(EtOH - ethanol, E.A. - ethyl acetate, water) 57
The Sterculiaceae species were screened for two-deoxy-sugars
using the (A) Keller-Killiani test. (1) O. rotundifolia from UVNR and
Monato, (2) O. cymosa, (3) O. burgessiae, (4) C. natalensis, (5) C.
greenwayi, (6) H. depressa, and (7) control. (B) O. rotundifolia
material from UVNR and Monato was screened for cardienolides
by staining with Kedde's reagent. Pink bands indicate positions of
cardienolides on TLC plate.
(L - leaf, T - twig, B- bark , S - stem, R - root) 76
The Sterculiaceae species were screened for bufadienolides by
staining with Antimony III Chloride reagent. (1) O. rotundifolia from
UVNR and Monato, (2) O. cymosa, (3) O. burgessiae, (4) C.
natalensis, (5) C. greenwayi, (6) H. depressa, and (7) S. murex.
Arrows indicate possible bufadienolides.
(L - leaf, T - twig, B- bark, S - stem, R - root) 77
The Sterculiaceae species were screened for bufadienolides by
staining with Chloramine T-trichloroacetic acid reagent. (1) D.
rotundifolia from UVNR and Monato, (2) O. cymosa, (3) O.
burgessiae, 4) C. natalensis, (5) C. greenwayi, and (6) S. murex.
Arrows indicate possible bufadienolides.
(L - leaf, T - twig, B - bark) 78
xxv

Plate 9 The Sterculiaceae species were screened for saponins using the
Froth and Haemolysis tests. (A) Froth test of D. rotundifolia
aqueous solution from (1) UVNR and (2) Monato aqueous and (3)
H. depressa aqueous solutions. (8) Haemolysis test results of
material fro m (1) D. rotundifolia (i) leaf, (ii) twig and (iii) bark, and
(2) H. depressa (i) leaf, (ii) stem and (iii) root extracts.
(L - leaf, T - twig, 8- bark, S - stem, R - root) 82
Plate 10 Isolation of anti-bacterial compounds from D. rotundifolia leaf
extract.
(A) Flow chart outlining the isolation procedure followed. (8) VLC
fractions (A - M) were spotted on TLC plates and analysed by (1)
staining with anisaldehyde spray reagent and (2) bioautography.
(C) A representative chromatogram indicates the position of bands
recovered by preparative TLC methods indicating fatty acid
composition 109
Plate 11 Isolation of anti-bacterial compounds from D. burgessiae leaf
extract.
(A) Flow chart outlining the isolation procedure followed. (8) VLC
fractions (A - M) were spotted on TLC plates and analysed by (1)
staining with anisaldehyde spray reagent and (2) bioautography.
(C) A representative chromatogram indicates the position of the
band recovered by preparative TLC methods indicating fatty acid
composition 113
xxvi

Plate 12 Isolation of anti-bacterial compounds from D. cymosa leaf extract.
(A) Flow cha rt outli ning the isolation procedure followed. (B) VLC
fractions (A - M) were spotted on TLC plates and analysed by (1)
bioautography. (C) Active fractions collected from Sephadex LH
20 column chromatography were spotted on TLC plates and
analysed by: (1) bioautography, (2) UV 366 nm light and 3) by
staining with anisaldehyde spray reagent. (0) (1) Representative
TLC chromatogram indicating colours and zones scrapped by
preparative TLC methods, (2) TLC plates were stained with
anisaldehyde spray reagent and (3) bioautography indicated
position of active compounds while (4) varying solvent gradients
determined the purity of Compound A 117
Plate 13 Isolation of anti-b acterial compounds from C. greenwayi twig
extract.
(A)Flow chart outlin ing the isolation procedure followed. (B) VLC
fractions (0 - M) were spotted on TLC plates and analysed by (1)
staining with anisal dehyde spray reagent and (2) bioautography.
(C) Preparative TLC methods were employed for further isolation.
TLC chromatograms composed of (1) mixture ofVLC Fractions 0
& E, (2) Fractions H & I and (3) Fraction J were analysed by (i)
bioautography and (ii) anisaldeyde spray reagent
techniques 122
xxvii

Plate 14 Isolation of anti-bacterial compounds from H. depressa leaf
extract. (A) Flow chart outlining the isolation procedure followed
(B) A TLC chromatogram of VLC Fraction A indicating the
position of compound A. (C)(1) A representative TLC
chromatogram indicating VLC Fraction B after further isolation by
preparative TLC methods. Additional isolation by HPLC
techniques was employed: (2) indicates HPLC fractions collected
near expected activity (i) after staining with anisaldehyde spray
reagent and (ii) bioautography, (3) A representative HPLC
chromatogram of the expected anti-bacterial compound. (0) (1) A
representative TLC chromatogram of VLC Fraction F indicating
colour and position of zones scrapped, and (2) A representative
TLC chromatogram of VLC Fraction G indicating colour and
position of zones scrapped , .127
Plate 15
\
Hermannia depressa aqueous leaf extract. (A) Extract A (1) a
slight viscous liquid when wet and (2) brittle and darker in colour
when dry. (B) Extract B (1) a very viscous, mucilaginous slime
when wet and (2) dark and hard when dry. (C) TLC fingerprints of
the aqueous extracts (i) Extract A and (ii) Extract B run in a
solvent solution of chloroform, methanol, water (60:35:8)(v/v/v),
viewed by (1) white light and (2) after staining with anisaldehyde
spray reagent. (D) Results of amylase hydrolysis test of Extract B
after 1 h in (1) (i) water control and ii) 5 % amylase solution, both
indicating much swelling from water uptake and no hydrolysis of
extract. These results were confirmed by TLC fingerprints of
Extract B after 1 h in (2) (i) water control (ii) 5 % amylase solution.
(E) Results of HCI hydrolysis of Extract B after 4 h in (1) 10% HCI,
and (2) water control suggested there was no hydrolysis of the
extract. (F) (i) Extract A and (ii) Extract B after (1) 1 hand (2) 18
h in 60 % ethanol solution 165
xxviii

Plate 16 TLC fingerprint chromatograms of O. rotundifolia (i) leaf, (ii) twig
and (iii) bark material viewed by (A) white light, (8)after
anisaldehyde spray reagent staining , and (C) UV 365 nm light.
(EtOH - ethanol) 174
Plate 17 TLC fingerprint chromatograms of (A) O. burgessiae and (8) O.
cymosa (i) leaf and (ii) twig material and (C) S. murex (i) twig
material viewed by (1) white light, (2) after anisaldehyde spray
reagent staining , and (3) UV 365 nm light.
(EtOH - ethanol , EA - ethyl acetate) 175
Plate 18 TLC fingerprint chromatograms of (A) C natalensis and (8) C.
greenwayi (i) leaf, (ii) twig, and (iii) fruit material viewed by (1)
white light , (2) after anisaldehyde spray reagent staining, and (3)
UV 365 nm light. (EtOH - ethanol , EA - ethyl acetate) . . . . 176
Plate 19 TLC fingerprint chromatograms of H. depressa (i) leaf, (ii) stem
and (iii) root material viewed by (A) white light, (8) after
anisaldehyde spray reagent staining and (C) UV 365 nm light.
(EtOH - ethanol) 177
Plate 20 TLC fingerprint chromatograms of water extracts of 1) O.
rotundifolia, 2) O. burgessiae, 3) O. cymosa, 4) C. natalensis, 5)
C. greenwayi and 6) H. depressa material viewed by (A) white
light, (8) after anisaldehyde spray reagent staining, (C) UV 365nm
light, and (0) UV 254 nm light.
(L - leaf, T =twig , S - stem , 8 - bark, F - fruit, R - root) . ... 178
xxix

Table 1
Table 2
Table 3
Table 4
Table 5
Table 6
Table 7
Table 8
Table 9
LIST OF TABLES
Page
Characteristics and habitats of South African and African
Sterculiaceae species 9
Medicinal and other human uses and chemical constituents of
South African and other Sterculiaceae species 19
Plant species collected for screening, their herbaria numbers and
collection sites 37
Comparison of the two collection sites for Oombeya
rotundifolia material 38
Anti-bacterial activity of extracts of O. rotundifolia using the disc-
diffusion assay 51
The minimum inhibitory concentration (MIC) of plant extracts
obtained from the Sterculiaceae species investigated . . . .. .53
The percentage inhibition of cyclooxygenase (COX-1) by
Sterculiaceae species investigated 58
A summary of results obtained from the investigation of seven
Sterculiaceae species for their anti-bacterial and anti-inflammatory
activity compared to their mentioned use in traditional medicine
.... .. ..... . ... ................. ..... . ... , 60
Results obtained from two cardiac glycoside tests: Keller-Killiani
test and the unsaturated lactone test 71
xxx

Table 10 Determination of the presence or absence of saponins in D.
rotundifolia and H. depressa using the Froth test 80
Table 11 Determination of the presence or absence of tannins in
Sterculiaceae species using the Gelatin salt-block test ..... 83
Table 12 Essential elements required for bacterial growth 91
Table 13 ATCC numbers, Gram-status and growth description of bacterial
strains used during this study 92
Table 14 Eluotropic series of solvents, arranged in order of increasing
polarity 96
Table 15 Plant species used in the isolation of active anti-bacterial
compounds 98
Table 16 Gradients of solvents (hexane: ethyl acetate) used in VLC for
further purification of samples 101
Table 17 Fractions (A - M) collected from VLC of D. rotundifolia ethyl
acetate leaf extract, showing relative information including mass
offractions eluted, percentage of total, colour offraction, presence
of activity and which compounds were mixed for TLC preparation
.............................. .... ...... ....... 106
Table 18 Preparative TLC zones recovered for D. rotundifolia VLC fractions
..... ...... . .......... .. .... .. . . . . . . ......... .. 107
xxxi

Table 19 Fractions (A - M) collected from VLC of O. burgessiae ethyl
acetate leaf extract , showing relative information including mass
of fractions eluted, percentage of total, colour of fraction, presence
of activity and which fractions were used in preparative TLC
111.... ... .... . . .. .. . ..... . . ... .. .. .... .... .... . . .
Table 20 Preparative TLC zones recovered for O. burgessiae VLC fractions
.. ... .... .... ................. . . . .............. 112
Table 21 Fractions (A - M) collected from VLC of 0. cymosa ethanol leaf
extract, showing relative information including mass of fractions
eluted , percentage of total, colour of fraction, presence of activity
and which fractions were used in preparative TLC 115
Table 22 Preparative TLC zones recovered for D. cymosa VLC
fractions 116
Table 23 Fractions (A - M) collected from VLC of C. greenwayi ethyl acetate
twig extract, showing relative information including mass of
fractions eluted, percentage of total , colour of fraction , presence
of activity and which fractions were used in preparative TLC 119
Table 24 Preparative TLC zones recovered for C. greenwayi VLC fractions
........... . . .. ......... .... .... ...... .. ... .... 120
Table 25 Fractions (A - M) collected from VLC of H. depressa ethyl acetate
leaf extract, showing relative information including mass of
fractions eluted , percentage of total , colour of fraction, presence
of activity and which fractions were used in preparative TLC 124
xxxii

Table 26 Preparative TLC zones recovered for H. depressa VLC fractions
... . . .. . . . . . . . . . . . . . . . . . . . . . . . . . . . . . ... . .. .. . . . 125
Table 27 The retention times of sugar standards 148 .
Table 28 The retention times of the sugar components of the aqueous H.
depressa extract 148
Table 29 Percentage inhibition of cyclooxygenase (COX-1) by H. depressa
aqueous extracts 151
xxxiii

Approx.
ATCC
CD30D
COX-1
GC-MS
Extract A
Extract B
HPLC
INT
MH
MIC
NMR
NSAIDS
TFA
TLC
UV light
UVNR
VLC
LIST OF ABBREVIATIONS
Approximately
American Type Culture Collection
Deuteromethanol
Cycloxygenase 1 Assay
Gas Chromatography-Mass Spectroscopy
H. depressa aqueous extract - slightly viscous
H. depressa aqueous extract - mucilaginous slime
High Pressure Liquid Chromatography
p-Iodonitrotetrazolium Violet
Mueller-Hinton
Minimal Inhibition Concentration
Nuclear Magnetic Resonance
Non-Steroidal Anti-Inflammatory Drugs
Trifluoroacetic Acid
Thin Layer Chromatography
Ultra Violet Light
Umgeni Valley Nature Reserve
Vacuum Liquid Chromatography
xxxiv

1
CHAPTER 1
GENERAL INTRODUCTION
1.1 HISTORY OF ETHNOBOTANY
Until the present century, most drugs were originally discovered from folk
knowledge that was disseminated throughout indigenous cultures, either orally
or through written form such as herbals. Such folk knowledge was of two kinds:
specialist knowledge held by a few individuals within the community, and
generalist knowledge available to all members of a community
(HOSTETTMANN, MARSTEN, MAILLARD & HAMBURGER, 1995).
In the early renaissance there was an explosion of interest in herbals, most of
which were based on the work of Dioscorides with incremental improvements
made from the author's own knowledge. The first herbal written in the Anglo
Saxon world was the eleventh-century codex known as the Herbarium of
Apuleius Platonicus. The earliest printed English herbal was an anonymous
quarto of 1525, printed by Richard Banckes (BALlCK & COX, 1996). A year
later a translation of a French herbal was published by Peter Treversi, and in
1538 William Turner published Libel/us de re Herbaria Novus. In 1551 Henry F.
Lyte published a translation of Rembert Dodoens's herbal Stirpium Historiae
Pemptades Sex, which had achieved renown on the Continent because of its
encyclopaedic scope and superb plates of flowers. But the most popular of all
sixteenth-century herbals was that of John Gerard, published in 1597. It is one
of the few books to remain in print for over 400 years and is one of the most
important books on plants ever published in the English language (BALlCK &
COX, 1996).

2
1.2 ETHNOBOTANY AND WESTERNISED MEDICINE
Although traditional medicine case is judged 'not proven' by Westernised
science, some cultures, notably in India and China, have evolved a philosophy
of disease and medicine which is very sophisticated and can explain the use of
particular plants. HOUGHTON & RAMAN (1998) state that it is rather arrogant
for Western scientists to claim that a preparation is worthless if it has a long
history of seemingly successful use . It is generally accepted that as many as
two-thirds of the people in developing countries rely on plants as sources of
drugs (FARNSWORTH, 1984), in South Africa it is estimated that 80% of the
people rely on traditional healing (JAGER, HUTCHINGS & VAN STADEN,
1996). It is clear that, whereas traditional healers recognise Western medicine
and refer their patients to it, the reverse is generally not true (SINDIGA,
NYAIGOTTI-CHACHA & KANUNAH, 1995). Many of the techniques or plants
used by traditional healers are not accepted by State Authorities or health
system. With ethnobotany this situation is slowly changing as the biological
activity of many plants are being investigated.
Frequently an inyanga's (Zulu traditional healer) pathological, anatomical and
physiological knowledge of the human body is very low. Despite the fact that
inyangas are so uninformed as to the causes and nature of diseases, they are
conversant enough with their symptoms. Their great rule of pathology is: 'As
many symptoms, so many diseases', therefore they tend to treat each symptom
individually (BRYANT, 1966). However, commonly with one disease there are
many related symptoms. An example would be an ear infection. The symptoms
range from sore, fever to loss of balance, all very different symptoms, but all
related and by treating the infection results in improvement of balance control.
Another of the main reasons why a number of Westernised societies find it hard
to accept traditional medicine is because much of it depends on some form of
magic (IWU, 1993).

3
An excerpt found in SINDIGA, NYAIGOTTI-CHACHA & KANUNAH (1995)
helps explain this factor even further: 'So we see these medicine men have to
be good and effective psychologists to justify their existence. They work by
instilling confidence in the sick. A patient believes in his imminent recovery
when the medicine man gives him the assurance that he will get better, and
almost invariably the sick person does get better. This confidence is founded
upon a false premise that because a medicine man is an authority in the art of
curing the sick, whenever he speaks, he certainly cannot go wrong.'
The prime advantage of traditional medicine, however, is that it is there, an
immediate, existing source of health care for people where they live. It may not
be as 'good' as what may be considered ideal, but, in the absence of better
alternative health care, there should be a focus on improving on what is
available. Added to its many other advantages is its relative cheapness; on the
average, folk medicine is cheaper than modern medicine (IWU, 1993).
There are however, some general problems with traditional medicine. The
following list was stated in SINDIGA, NYAIGOTTI-CHACHA & KANUNAH,
1995: Traditional medicine does not keep up with scientific and technological
advancement. The methods, techniques, ingredients and even training are
often kept secret. It is difficult to diagnose chronic illness in time. The rational
use of traditional medicine is not well defined; it relies on mysticism and
intangible forces, for example witchcraft. Some aspects are based on spiritual
and moral principles which are difficult to explicate. It lacks 'measured' doses of
drugs; sometimes the side effects of a combination of herbal medicines used it
not known. It has an alleged low quality of care because of lack of regulatory
mechanisms including control and licensing. It often keeps no written registers
of patients hence it is difficult to evaluate, and lastly it experiences loss of
knowledge or errors occasioned by large numbers of herbs and other
pharmacopoeia; and the diseases to be treated are many.

4
1.3 PLANTS AND THEIR USES IN TRADITIONAL MEDICINE
It is estimated that 265,000 flowering species grace the earth. Of these, less
than 0.5 % have been studied exhaustively for their chemical composition and
medicinal value (COX & BALlCK, 1994). Traditional medicine is widespread
within South Africa. In 1966, A. T. BRYANT registered some 777 different
plants in his Zulu-English Dictionary, of which 225 of these have some
medicinal use or property. The number of plants known to be used in traditional
medicine today has grown through better communication and understanding
with the traditional healers. Since plants may contain thousands or even tens of
thousands of metabolites, there is currently a resurgence of interest in the plant
kingdom as a possible source of new lead compounds for introduction into
therapeutical screening programs (HOSTETTMANN, MARSTEN, MAILLARD &
HAMBURGER, 1995). Modern studies in chemotaxonomy show that chemical
compounds are often characteristic of groups of plants. Thus it is possible that
active principles found in one species may be present in other members of the
genus or family (HUTCHINGS, 1992). Any species of living organisms displays
a variation within many of its important features due to differences in its genetic
characteristics, the environmental conditions under which it is grown and the
period in its life history when collection took place (HOUGHTON & RAMAN,
1998).
HUTCHINGS (1992) strongly stresses that conclusions reached on the
availability and functions of chemical compounds in plants are tentative and the
followinq factors should be noted: Chemical compounds found in a species may
not be present in all other members of the genus; chemical compounds known
in a species can vary, even within the population , and also with season and
stage of development; chemical compounds found in one part of the plant may
not be present in all other parts of the plant. Active principles found in plant
extracts may not be present in the medicines prepared from the same species;

5
active principles tested on animals do not necessarily produce the same effects
on humans and human responses to medicines vary with the individual.
Traditional medicines are prepared and administered in a variety of ways. Many
are similarto Westernised administration, but in a crude manner. They may be
by cold infusions (isiChonco), hot infusions (imFudumezelo) and decoctions
(imPeko). Treatment is either taken orally, by poultices, lotions, smearing,
rubbing into incisions, vapour baths, sweating baths, clyster and emetics
(BRYANT, 1966).
1.4 DEPLETION OF RESOURCES AND CONSERVATION DUE TO THE
'MUTHI' TRADE IN KWAZULU-NATAL
The demand for common, fast growing medicinal species is easily met,
particularly where only leaves or fruits are used. This category of plant has,
therefore, never been of concern to conservation biologists or to herbalists and
traders. The impact of the trade on the equally popular, but slow growing or
scarce species, is an entirely different matter, particularly where roots, bark,
bulb, or whole plants are processed (CUNNINGHAM, 1991).
In Durban in 1915, herbal medicines were sold mainly by herbalists and
diviners at the market called eMatsheni. Initially, most ofthe sellers were men,
and traditional medicines, both animal and plants, were marketed in small
quantities. Today, about 500 informal settlers, primarily women with no
specialist training as traditional medicine practitioners, bulk the Durban area
(CUNNINGHAM, 1991). Aboutthree and a half tons of bark and nearly 200 000
bulbs are traded at Durban's huge traditional medicine markets each week. All
material is harvested from the wild. Furthermore , what traders can't sell, they
simply throwaway (STREAK, 1995). This is a very disturbing fact when it is
realised that over 900 indigenous plants are used in traditional healing in

6
KwaZulu-Natal (SHERRIFFS, 1995).
Plants that face extinction in the wild include wild ginger (Siphonochilus
aethiopicus), black stinkwood (Ocotea bullata) , pepperbark (Warburgia
salutaris), assegai trees (Curtisia dentata) and cow-eye flower or mpila. These
plants are used to treat colds and flu, malaria and headaches and are often
given as emetics (SHERRIFFS, 1995). Most of the trees are ring barked or
whole plants are removed from the ground. This extensive exploitation of
indigenous plants has led to much concern, and conservation of these species
has therefore become very important. But, conservation may not be enough,
even though many of the plants are protected by law, the collectors rely on
collecting from the wild as a source of income, and are therefore willing to take
the risk of being caught. Another idea, which is in practice in KwaZulu-Natal is
teaching the collectors and Sangomas basic horticultural skills, to enable them
to grow their own plants. Here, the plants have to be sold at low enough prices
to take the pressure off the indigenous species in the wild. To take the pressure
off wild stocks, concerned people are looking at new and unusual places to
grow the plants, including roadside verges and back gardens (SHERRIFFS,
1995).
1.5 THE ETHNOBOTANICAL APPROACH TO DRUG DISCOVERY
In South Africa certain steps are taken before a plant is chosen to be
ethnopharmacologically studied. The followinq steps are adhered to by the
Research Centre for Plant Growth and Development at the University of Natal,
Pietermaritzburg: Data concerning plants that are used for various ailments;
which part of the plant is used; how the drug is prepared, are collected from
traditional healers. The plant material is then collected. All the material is
botanically identified. A voucher specimen for each species is kept in the
University Herbarium. The plant material is screened in a bioassay system that

7
is specific for the disease the plants are reputedly used for. Plants that contain
biological activity in the initial screening then undergo further investigation to
isolate the active compounds. The information that is obtained is given back to
the traditional healers.
In order to arrive at useful compounds in the shortest possible time, careful
selection of plant material is obviously very important. Random collection is one
method but it is more judicious to base the selection on certain criteria. Plants
used in traditional medicine are more likely to provide pharmacologically active
compounds. If a shrub or a tree shows no signs of being attacked by pests and
where the leaves have not been eaten nor show any discolourations due to the
presence of some microorganism, there is a good chance that some
metabolites are present which act as insecticides or antimicrobial agents
(HOSTETTMANN, MARSTEN, MAILLARD & HAMBURGER, 1995).

8
CHAPTER 2
LITERATURE REVIEW
2.1 THE FAMILY STERCULlACEAE AND ITS DISTRIBUTION
The family Sterculiaceae, often referred to as the chestnut family (VAN WYK,
1974) is found throughout the world (PALMER & PITMAN, 1961). It is quite a
large family with approximately 1 200 species (50 genera) which occurs in
tropical and subtropical regions and mainly includes trees and shrubs (VAN
WYK, 1974). However, some of the species are herbaceous (CODD, 1951) .
Six genera are located in South Africa: Cola, Oombeya, Hermannia, Melhania,
Sterculia and Waltheria. In South Africa several well known trees belong to the
genera Oombeya and Sterculia (CODD, 1951, PALMER & PITMAN, 1961).
Table 1 is an extensive literature review outlining the characteristics and
habitats of a number of Sterculiaceae species, broken down into the South
African and then other African species.
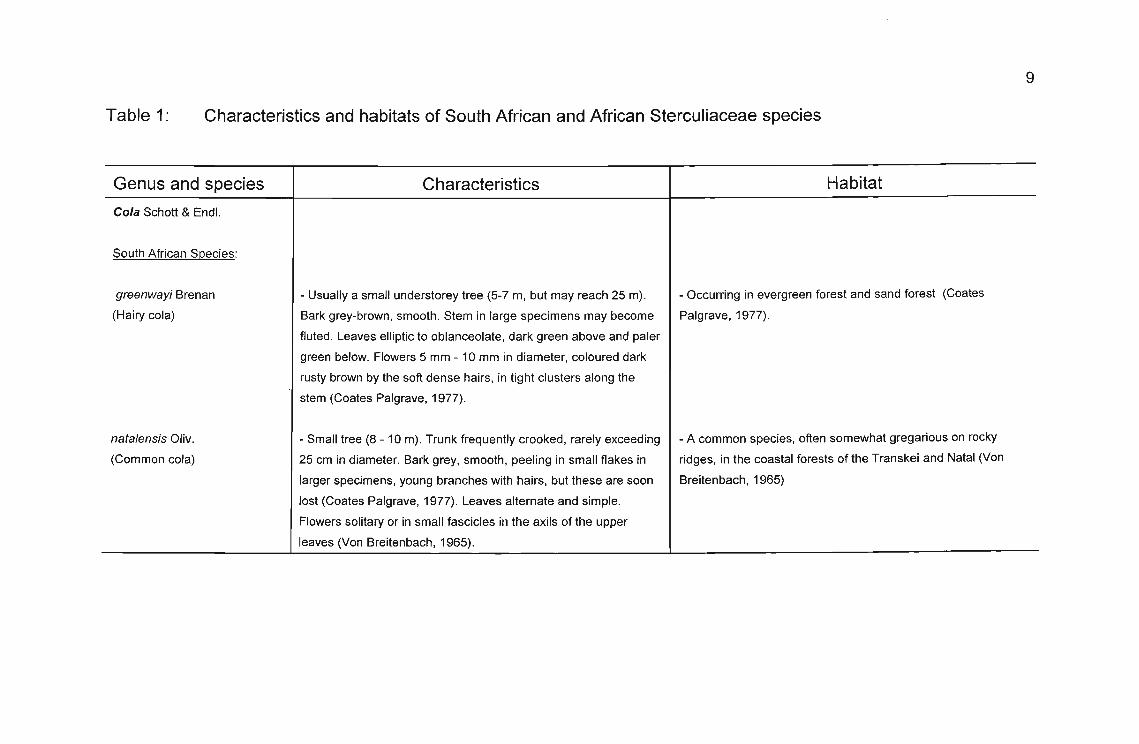
Table 1: Characteristics and habitats of South African and African Sterculiaceae species
9
Genus and species
Cola Schott & End!.
South African Species:
greenwayi Brenan
(Hairy cola)
natalensis Oliv.
(Common cola)
Characteristics
- Usually a small understorey tree (5-7 m, but may reach 25 m).
Bark grey-brown, smooth . Stem in large specimens may become
fluted. Leaves elliptic to oblanceolate, dark green above and paler
green below. Flowers 5 mm - 10 mm in diameter, coloured dark
rusty brown by the soft dense hairs, in tight clusters along the
stem (Coates Palgrave, 1977).
- Small tree (8 - 10 m). Trunk frequently crooked, rarely exceeding
25 cm in diameter. Bark grey , smooth, peeling in small flakes in
larger specimens, young branches with hairs, but these are soon
lost (Coates Palgrave, 1977). Leaves alternate and simple.
Flowers solitary or in small fascicles in the axils of the upper
leaves (Von Breitenbach, 1965).
Habitat
- Occurring in evergreen forest and sand forest (Coates
Palgrave, 1977).
- A common species, often somewhat gregarious on rocky
ridges, in the coastal forests of the Transkei and Natal (Von
Breitenbach, 1965)

Genus and species
Cola Schott & End!. Cont..
Other species :
Characteristics Habitat
10
acuminata (Pal.) Schott & End!. I - Slender, 6 - 12 m, sparsely foliaged mostly at the branch tips,
sometimes having tiny hooked spines on the twigs . The five
follicles are spread out at right angles, are rough, russet or
greenish brown, and many may have up to 14 or 15 seeds
(Morton, 1992).
nitida (Beauv.) Schott & Endl. I - Stout trunked, sometimes butressed, its long stemmed leaves
are abovate or elongated, and its clustered, ill-scented, five-parted
flowers are white and ivory with purple lines or dark red dots at the
base . The fruit consists of a whorl of four to five , very rough ,
beaked , leathery, or woody pods borne on a single, recurved stalk
(Morton, 1992).
- Grows wild on the mountains of Angola (Morton , 1992).
- Believed to be native to the Ivory Coast, but has spread
throughout the west coast of Africa (Morton, 1992) .

Genus and species
Dombeya Cav .
South African Species:
autumnalis Verdoorn
(Autumn dombeya)
burgessiae Gerr. Ex Harv.
(Pink dombeya)
buettneri K. Schum
cymosa Harv .
(Natal dombeya)
kirkii Mast.
(River dombeya)
pulchra N.E.Br.
(Silver wild pear)
Characteristics
- Shrub/small tree ( 5 m ). Flowers are small, produced in late
summer and autumn among leaves (Coates Palgrave, 1977).
- Shrub , 2-4 m tall, usually branching low down . Branches densely
villous when young , becoming glabrescent with a brown bark with
age. Leaves alternate and simple. Inflorescences axillary, many
flowered (Von Breitenbach, 1965). Pink and white flowers
(National Botanical Gardens, 1980).
-Shrub (Okwari et aI., 2000)
- Shrub/small slender tree , up to 8 m tall (Coates Palgrave, 1977) .
Bark whitish. Leaves alternate and simple. Inflorescences of
axillary panicles, small flowers (Gibson, 1975) .
- Much branched shrub or small tree, up to 9 m tall. Bark light
grey, smooth . Leaves alternate and simp le, up to 13 cm long and
10 cm broad. Inflorescences of axillary, many-flowered panicles
(Von Breitenbach, 1965, Coates Palgrave, 1977) .
- Shrub, 2-3 m tall. Leaves alternate and simple (Von Breitenbach,
1965)- Produces creamy white flowers which are rarely pink
(Fabian & Germishuizen, 1997).
11
Habitat
- Occurring on rocky hillsides and in riverine fringes (Coates
Palgrave, 1977) .
- Occurring at forest margins, or in woodland where there is
above-average humidity and same degree of shade , in
KwaZulu-Natal , Swaziland and the former Eastern and North
Eastern Transvaal, extending to tropical East Africa (Von
Breitenbach, 1965) .
- Southern parts of West Africa sub-region (Okwari et aI., 2000)
- Inhabiting coastal shrub, riparian vegetation, and wooded
kloofs , from the eastern Cape Province, through KwaZulu-Natal,
to Mpumalanga (Von Breitenbach, 1965) .
- Inhabiting riparian thickets, up to 1000 m altitude, in the former
north-eastern Transvaal, and extend ing throughout eastern
tropical Africa (Von Breitenbach, 1965) .
- Wooded river valleys, along stream banks (Coates Palgrave,
1977) , in the mountains of Swaziland and Mpumalanga, at
altitudes between 1000 and 1400 m (Von Breitenbach, 1965).

Genus and species
Dombeya Cav. Cont ...
Characteristics Habitat
12
Rotundifolia (Hochst.) Planch .
(Common wild pear)
ti/iacea Planch .
(Forest dombeya)
- Single-stemmed deciduous tree, 5-6 m tall, with a moderate,
irregular-shaped canopy (Immelman et aI., 1973) . Young tree has
a smooth, grey bark , but as it gets older, the bark becomes rough
and turns brownish-black (Immelman et aI.,1973) . It is deeply
fissured into irregular, long blocks (Thomas & Grant, 1998) and is
gnarled and corky (Van Gogh & Anderson, 1988) in the older
trunks. Leaves simple and alternate on older twigs, while spirally
arranged on young twigs (Thomas & Grant , 1998) . Marg ins of
leaves are irregularly and roundly toothed (Thomas & Grant,
1998), having three or more veins arising from the base (Coates
Palgrave et aI., 1985) . Upper leaf surface is dark green, with paler
undersurface (Van Gogh & Anderson, 1988; Thomas & Grant,
1998). Both sides have star-shaped hairs (Immelman et aI.,
1973). White or light pink star-shaped flowers (Thomas & Grant,
1998) appear in bunches in early spring before the leaves (Palmer
& Pitman, 1961). Fruit is a hairy capsule, which develops within
the dried-out flower (Immelman et aI., 1973).
- Shrub, 3-6 m tall , up to 30 cm in stem-diameter. Bark grey
brown, very thin, smooth. Leaves alternate, simple. Inflorescences
of 1-8 flowered, chymes (Von Breitenbach, 1965) .
- Occuring in woodland over a wide range of altitudes in the
former Transvaal, and KwaZulu-Natal (Coates Palgrave et aI.,
1985), occurs more abundantly in the warmer, drier parts
(Immelman et aI., 1973) . It is often found on rocky hillsides,
where it occurs in association with other, savanna woodland
trees and shrubs (Immelman et aI., 1973). With its thick bark ,
this tree is fire-resistant and can grow in exposed positions in
lower altitude grassland. It is also conspicuous growing singly
on drier, rocky slopes but also occurs in sheltered , woody
slopes (Thomas & Grant, 1998).
- Occurring at forest edges (Gibson , 1975). and in secondary
shrub, from coast, up to 1000 m altitude. From eastern Cape
province to KwaZulu-Natal (Von Breitenbach, 1965).

Genus and species
Hermannia L.
South African Species:
aurieoma (Szyszy.) K. Schum
(golden haired hermannia)
depressa N. E. Br.
(creeping red hermannia)
eoeeoearpa K. Schum.
eristata H. Bol. FP
(crested hermannia)
gerrardii Harv.
(Gerrard's yellow hermannia)
grandistipula (Buchinger ex
Hochst.) K. Schum.
(yellow granny bonnets)
Characteristics
-Stems prostrate . Covered with glands and rough hairs. Leaves
erect , finely toothed (Pooley, 1998).
- Prostrate herb. Sparsely hairy, slightly glandular. Leaves 40 x
25 mm, bluntly toothed. Flowers in slender inflorescences just
above leaves (Pooley, 1998).
- Much branched shrublet ( 300 mm) . Plant hairless to glandular
hairy. Leaves marg ins toothed, reddish , stalks short,. Flowers
occurring in two's , in terminal inflorescences, stem slender,
flowers purplish blue, stalks long, slender (Pooley, 1998).
- Grows up to 300 mm tall. Flowers are red orange (Pooley,
1998).
- Coarse prostrate herb ( 900 mm) . Stems simple or branched,
roughly hairy. Leaves hairy, margins slightly toothed, stalks short.
Flowers in branched inflorescences, flowers pale yellow to
orange . Flowers from March to May (Pooley, 1998).
- Shrublet up to 300 mm . Woody rootstock. Stems annual,
velvety. Leaves densely, softly hairy, margins toothed , stalks
short, stipules large. Flowers, nodding, in pairs, stem erect,
flowers yellow (Pooley, 1998).
13
Habitat
-Occurring in grassland (Pooley, 1998).
- Occurring in grassland, on edge of marshes, from the Cape to
Zimbabwe (Pooley, 1998) .
- Occurring in grassland (Pooley, 1998).
- Occurring in rocky grasslands, up to 1900 m altitude. Found in
the Eastern Cape through to the Northern Province (Pooley,
1998).
- Occurring on rocky , grassy slopes, 1200 - 2250 m altitude
(Pooley, 1998) .
- Occurring in open grassland, from the Cape to Mozambique
(Pooley, 1998).

Genus and species
Hermennie L. cant.
hyssopifolia L.
sandersonii Harv.
woodii Schinz
Characteristics
- Erect vigate branched shrub 15 cm - 1.25 m with slender woody
stems roughly and densely stellate-hairy. Leaves simple , stalked,
oblong-elliptic, broader in the upper-half, finely stellate hairy on
both surfaces, toothed at apex only. Inflorescence a bracteate
cyme occurring in clusters at the end of the branches and
branchlets. Petals yellow to pale greenish (Fox & Norwood Young ,
1988).
- Long growing shrublet. Woody rootstock. Leaves variable,
sparsely hairy, velvety yellowish beneath, stipules about 7 x 3
mm. Flowers found in term inal clusters, very hairy, petals
recurved in upper half (Pooley, 1998) .
- Prostrate herb. Flowers on long stalks, dull pink, red, cream or
yellow (Pooley, 1998) .
14
Habitat
- Widely distributed in Fynbos from the Cape Peninsula to Port
Elizabeth (Fox & Norwood Young, 1988).
- Occurring in grasslands (Pooley, 1998).
- Occurring in grasslands, 1300 - 1200 m altitude (Pooley ,
1998).

Genus and species
Melhania Forssk
South African species:
didyma Eckl & Zeyh.
Characteristics
Broad leaves, 25 - 40 mm, hairy above, margins shallowly toothed
(Pooley, 1998).
Habitat
15
prostrata DC.
suluensis Gerstner
- Perennial shrublet, 0.2 - 0.6 m. Stems branched from near base, I -Occurring in open woodland and grassland (Pooley, 1998).
grey velvety with reddish brown dots. Leaves thinly hairy to
hairless above , grey velvety below. Flowers pale yellow, scented
at night (Pooley, 1998).
- Weak shrublet, 600 - 900 mm. New growth covered in pale I - Occurring on rocky slopes, in bushveld (Pooley, 1998).
brownish hairs. Stems annual. Leaves thin, finely haired, silver
grey beneath, margins shallowly toothed. Flowers lemon yellow in
colour (Pooley, 1998) .

Genus and species
Sterculia L.
South African species:
africana (Lour.) Flori
(African star-chestnut)
alexandri Harv.
(Cape star-chestnut)
foetida L.
Characteristics
- Small to medium-sized tree, 10-25 m tall, with a stout trunk up to
1 m in diameter. Bark brownish , yellowish or whitish, peeling in
papery flakes to expose the green inner layers . Leaves congested
at the ends of the branches, alternate and simple. Inflorescences
of clustered, subterminal panicles (Von Breitenbach, 1965,
Coates Palgrave , 1977).
- Small tree, usually 3 -4 m tall, with a thick, usually decumbent
stem which is often underground when growing in the open. Bark
smooth , silvery , with regularly scattered lenticels. Leaves
congested near the ends of the branchlets. Inflorescences of
axillary, few-flowered racemes . Flowers pale greenish cream with
a few flecks of red or yellow with a rich claret-coloured centre.
Flowering season very variable (Von Breitenbach, 1965; Coates
Palgrave, 1977).
- Tree , deciduous in cold season, with whorled horizontal
branches. Red and yellow flowers (Mujumdar et aI., 2000) .
16
Habitat
- Occurring in hot and dry lowlands, usually below 1000 m
altitude, in Namibia , extending throughout tropical eastern
Africa as far as Ethiopia and the Sudan, also in southern
Arabia. (Von Breitenbach, 1965).
- Restricted to a few localities in the south-eastern Cape
Province, where it occurs on sandy soil in forest margins , scrub,
and on open slopes of valleys and kloofs (Von Breitenbach,
1965).
- Indian subcontinent, Eastern Tropical Africa (Mujumdar et aI.,
2000)

Genus and species
Sterculia L.
South African species cont. :
murex Hernsl .
(Lowveld chestnut)
quinqueloba (Garcke) K.
Schum.
(Large- leaved star-shestnut)
rogersii N. E. Br
(Common star-chestnut)
Characteristics
- Small tree, up to 10 m high. Bark rough, grey or blackish.
Leaves alternate. Inflorescences racemose, borne at the ends of
stout side shoots. Flowering in September and October. (Von
Breitenbach , 1965 ; Coates Palgrave, 1977).
- usually a thickset tree 5-12 m tall. Bark cream to pinkish-brown,
smooth and shiny. Leaves crowded near the ends of branches,
large, 5-lobed , dark yellowish green above, greyish to yellowish
below. Flowers yellow, 5 mm in diameter, in terminal , many
flowered, branched heads. Wood reddish-brown (Coates
Palgrave , 1977).
- Small tree, usually up to 5 m tall, with a thick, often bottle
shaped trunk, 30-60 cm in diameter at the base and tapering
rapidly. Bark smooth, shining , greyish -brown, peeling in papery
flakes . Branches rather slender. Leaves alternate and solitary, or
clustered on short side-shoots. Flowers yellowish-green with
reddish guide-lines within (Von Breitenbach, 1965).
17
Habitat
- Inhabiting dry and rocky situations in the lowveld of Swaziland
and the former eastern and north-eastern Transvaal, at altitudes
between 800 and 1200 m (Von Breitenbach, 1965) .
- Occurring at medium to low altitudes, on rock koppies and hill
slopes, in deciduous and dry bush (Coates Palgrave, 1977).
- A characteristic species of dry woodland and scrub , usually on
rocky hill-sides, in the lowlands of KwaZulu-Natal , Swaziland,
the former northern Transvaal, and also Mozambique and
Zimbabwe (Von Breitenbach, 1965) .
18
2.2 MEDICINAL USES AND CHEMICAL CONSTITUENTS OF SPECIES OF
THE FAMILY STERCULlACEAE
To a certain extent the African members of the family Sterculiaceae serve as sources
of medicine, fibre, firewood and timber suitable for furniture, as well as decorative
plants (VAN WYK, 1974). Probably the most important member economically is the
American cacao tree (Theobroma cacao), which is the source of commercial cocoa
and chocolate (CODD, 1951).
The continued use of plants as food, as a source of beverages and for their medicinal
propertiesdepends on knowledgeofthe chemical constituentsthat are present (HARBORNE
& BAXTER, 1993).Table 2 represents a detailed list of known medicinal properties and
chemical constituents of species from the family Sterculiaceae

Table 2:
19
Medicinal and other human uses and chemical constituents of South African and other Sterculiaceae species
Genus and species
Cola Schott & End!.
South African Species :
greenwayi Brenan
natalensis Oliv.
Medicinal and other human uses
- Used in traditional medicine (Pooley, 1993).
- No mention of use in traditional medicine
Chemical constituents

Genus and species
Cola Schott & Endl.
Other species:
acuminata (Pal.) Schott &
Endl.
nitida (Beauv.) Schott &
Endl.
acuminata (Pal.) Schott &
Endl.
Medicinal and other human uses
- Used medicinally in Angola (Watt & Breyer-Brandwijk,
1962).
- Fruits used as a stimulant and topical analgesic (Iwu ,
1993) .
Chemical constituents
-Stimulant Kola nuts - contain purines, caffeine,
theobromine.(Maillard et al., 1986) tannins ( Watt &
Breyer-Brandwijk, 1962; Hutchings et al. , 1996).
- Two phenol ic substances kolatin & kolatein ,
catechols, -(-)epicatechol & kolanin & a red
anthocyanin pigment (Hutchings et aI., 1996).
- Conta ins no alkaloids (Raffauf, 1996). Aqueous
extract of plant gives negative antibiotic tests (Watt &
Breyer-Brandwijk, 1962).
- Nut consists of tiratable acidity, sugars, 90%
general phenol compounds, flavonoid phenols and
phenolic acids. Contains 439 - 483 mg/ drn" caffeine
(Laisisi et al. , 1990).
20

Genus and species
Cola Schott & Endl.
Other species cont.:
nitida (Beauv.) Schott &
Endl.
cordifolia R. Br.
Medicinal and other human uses
- Stem bark used to treat arthritis and rhematism
(Ebana et ai., 1991). Fruits and leaves used as
stimulant and in healing rituals (Iwu, 1993).
- Produces gum. Local source of 'cola nut'. In West
Africa seed, containing caffeine, is used as leprosy
remedy (Watt & Breyer -Brandwijk, 1962).
Chemical constituents
- Contains no : Tannins, phlobatannins,
anthraquinones, anthranoids, hydroxymethyl
anthraquinones, glucides, saponins and flavanoids.
Consists of: Polyphenols, alkaloids, cardiac
glycosides and reducing compounds (Ebana et ai.,
1991 ).
21

Genus and species
Dombeya Cav
South African Species:
buettneri K. Schum.
burgessiae Gerr. Ex Harv.
cymosa Harv.
kirkii Mast.
cuinquesete (Del.) Exell
Medicinal and other human uses
- Aqueous extract of leaves for gastrointestinal disorders
(Okwari et aI., 2000) .
- The leaf decoction is drunk as an antimalarial, while
the crushed leaves are applied over the affected area
against leprosy. Roots used for stomach complaints
(Chhabra et aI., 1993).
- Roots used in traditional medicine (Hutchings et al.,
1996).
- The rootbark decoction is drunk against
schistosomiasis (Chhabra et aI., 1993).Roots are used
for stomach aches (Kokwaro, 1976).
Chemical constituents
- Polyphenols, cardiac glycosides, alkaloids, tannins,
flavonoids and anthrquinones (Okwari, 1999).
- Contains no alkaloids (Raffauf, 1996). Leaves
contain polyuronoids and steroids/triterpenoids
(Chhabra et aI., 1984)
- Contains no alkaloids (Raffauf, 1996).
- Contains alkaloids (Raffauf, 1996).
- Rootbark contains no alkaloids, flavonoids,
saponins and tannins (Chhabra & Uiso, 1990).
22

Genus and species
Dombeya Cav cont.
South African Species:
rotundifolia (Hochst) Planch.
tiliacea (Endl.) Planch.
Medicinal and other human uses
- Inner bark used to treat heart problems and nausea in
pregnant women (Thomas & Grant, 1998). Decoctions
of bark used in delayed labour (Van Wyk et aI., 1997)
and procuring abortion (Watt & Breyer-Brandwijk, 1962).
Infusions of bark or wood used for treatment of intestinal
ulcers, hE::adaches, stomach complaints (Coates
Palgrave et aI., 1985) , haemorroids and diarrhoea (Watt
& Breyer-Brandwijk, 1962; Van Wyk et al., 1997).
Roots used as a colic remedy (Venter & Venter, 1996),
and are made into a tonic (Watt & Breyer-Brandwijk,
1962; Coates Palgrave et al., 1985). They are taken as
enemas for dyspepsia and sharp pains in the stomach
(Hutchings et al., 1996). Leaves rubbed on abscesses
as a counter irritant (Watt & Breyer-Brandwijk, 1962).
Chemical constituents
- Contains no alkaloids (Raffauf, 1996).
Has anti-bacterial activity (McGaw, 2000) .
- Yield sterols and extracts have given negative
antibiotic tests (Watt & Breyer-Brandwijk, 1962) .
- 3-dimethyl sulfoniopropoinate (Paquet et al., 1995).
23

Genus and species
Dombeya
Other species:
calantha K. Schum.
cayeuxii Andre
c1aessensii De Wild .
wallichii (Lindl.) K. Schum.
shupangae K. Schum.
Medicinal and other human uses
- Roots and stem used to treat venereal diseases (Iwu,
1993).Root decoction is drunk in the case of abdominal
pains, irregular menses and to cause abortion (Chhabra
et al., 1993). Leaves are used to treat wounds and
prevent abortion (Kokwaro, 1976).
Chemical constituents
- Flavonoid : Diosmetin-7-glucuronide found in flowers
(Subramanian et al., 1973). Flavonoid: kaempferol 3
glycoside found in flowers (Nair & Subramanian,
1962).
- Contains no alkaloids (Raffauf, 1996).
- Contains no alkaloids (Raffauf, 1996).
- Contains no alkaloids (Raffauf, 1996).
- Leaves give negative results in antifungal and
antigonococcal tests (Sawhney et aI., 1978a,b).
24

Genus and species
Hermannia L.
South African species:
Medicinal and other human uses Chemical constituents
25
depressa N. E. Br.
grandistipula (Buchinger ex
Hochst.) K. Schum.
betonicaefolia E. & Z.
candicans Ait.
coccocarpa K. Schum.
- Zulu emetic. Leaf sap in water used for stomach ache I - Contains no alkaloids (Raffauf, 1996) .
(has purgative and diapharetic effect). Plant decoctions
taken for coughs. Plant used in mixtures for diarrhoea
(Watt & Breyer-Brandwijk, 1962; Hutchings et al.,
1996) . Used to treat diarrhoea and coughs (Pooley,
1998)
- Leaf infusions sprinkled on eggs to prevent dogs from
eating them (Hutchings et aI., 1996) .
- Root and leaf infusion drunk by Europeans for
treatment of respiratory diseases, especially asthma
(Watt & Breyer-Brandwijk, 1962) .
- Decoction of root used for dysuria (Watt & Breyer
Brandwijk, 1962).
- Crushed root used as a plaster for wounds and for
treatment of burns (Watt & Breyer-Brandwijk, 1962).
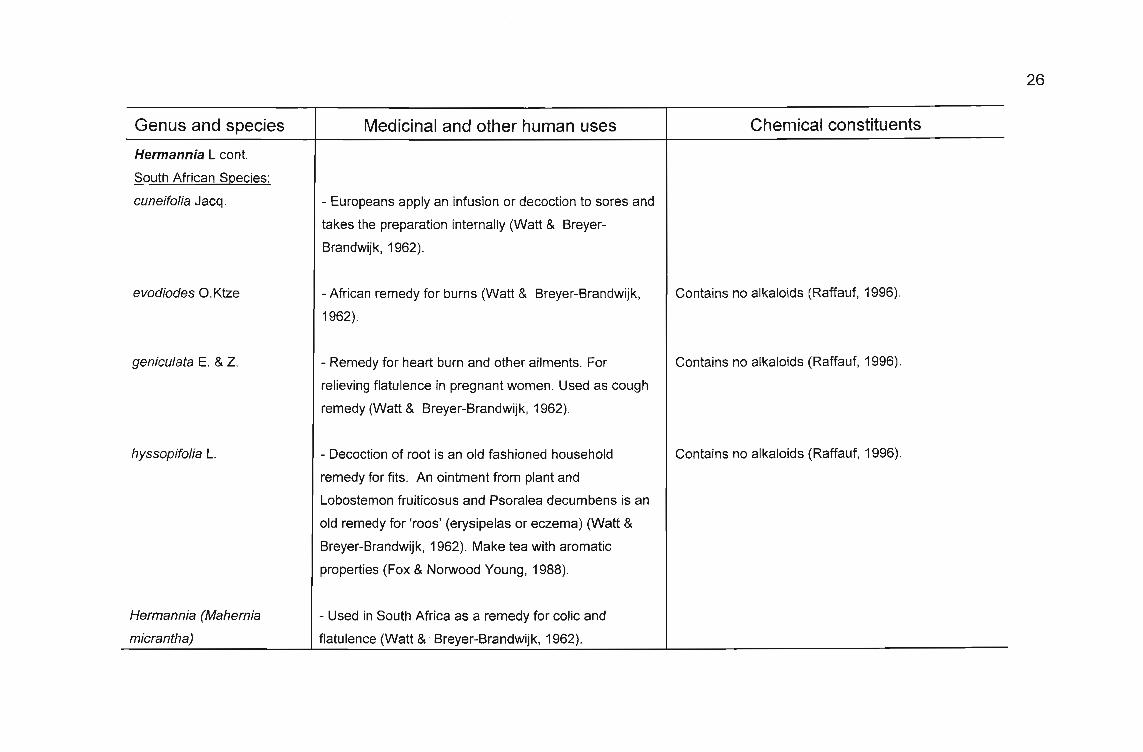
Genus and species
Hermannia L cont.
South African Species:
cuneifolia Jacq.
evodiodes O.Ktze
geniculata E. & Z.
hyssopifolia L.
Hermannia (Mahernia
micrantha)
Medicinal and other human uses
- Europeans apply an infusion or decoction to sores and
takes the preparation internally (Watt & Breyer
Brandwijk, 1962).
- African remedy for burns (Watt & Breyer-Brandwijk,
1962) .
- Remedy for heart burn and other ailments. For
relieving flatulence in pregnant women. Used as cough
remedy (Watt & Breyer-Brandwijk, 1962) .
- Decoction of root is an old fashioned household
remedy for fits . An ointment from plant and
Lobostemon fruiticosus and Psoralea decumbens is an
old remedy for 'roes' (erysipelas or eczema) (Watt &
Breyer-Brandwijk, 1962). Make tea with aromatic
properties (Fox & Norwood Young, 1988).
- Used in South Africa as a remedy for colic and
flatulence (Watt & .Breyer-Brandwijk, 1962).
Chemical constituents
Contains no alkaloids (Raffauf, 1996).
Contains no alkaloids (Raffauf, 1996).
Contains no alkaloids (Raffauf, 1996).
26

Genus and species
Melhania Forssk
South African species:
acuminata Mast.
didyma Eckl & Zeyh .
forbesii Planch . ex Mast
prostrata DC.
randii Bak.f.
rehmannii Szyszyl
Medicinal and other human uses
- Leaf used for barrenness in women by administration
of a cold infusion (Watt & Breyer-Brandwijk, 1962) .
Chemical constituents
- Contains no alkaloids (Raffauf, 1996).
- Contains no alkaloids (Raffauf, 1996).
- Contains no alkalo ids (Raffauf, 1996).
- Contains no alkaloids (Raffauf, 1996) .
- Contains no alkaloids (Raffauf, 1996).
- Contains alkaloids (Raffauf, 1996).
27

Genus and species
Sterculia L.
South African species :
Medicinal and other human uses Chemical constituents
28
africana (Lour.) Fiori
murex Hemsl.
quinqueloba (Garcke) K.
Schum
rogersii N. E. Br
- Decoction of roots is drunk treat backaches, vertigo I - Sterculic acid in seed (Hegnauer, 1973).
and hernia (Chhabra et aI., 1993). Roots , stembark and
leaves are used to treat fever and influenza (Kokwaro,
1976).
- Light petroleum extracts 17% of oil from the seed,
the residual meal containing a trace of alkaloidal
material and a small amount of cyanogenetic
glucosides (Watt & Breyer-Brandwijk, 1962).
- Contains no alkaloids (Raffauf, 1996).
- Contains no alkaloids (Raffauf, 1996).

Genus and species
Sterculia L.
Other species:
a/ata Roxb.
appendicu/ata K. Schum.
cinerea A. Rich .
cotorete Roxb.
Medicinal and other human uses
- Used as purgative for relief of abdominal pains (Watt &
Breyer-Brandwijk, 1962). Stembark decoction is drunk
against diabetes (Chhabra et al., 1993), snake bites
(Haerdi, 1964) abdominal pains and cerebral palsy
(Kokwaro, 1976). Roots treat diarrhoea, leaves treat
cardiac pains (Chhabra et al., 1993).
- Yields clear pinkish tragacanth- like gum, sometimes
used as an adulterantol gum-arabic (same way as
karaya gum) (Watt & Breyer-Brandwijk, 1962).
Chemical constituents
- Acid: sterculynic acid (Jevans & Hopkins, 1968;
Glasby, 1991). Contains alkaloids (Raffauf, 1996).
- Stem bark contains alkaloids, flavonoids and
tannins (Chhabra & Uiso, 1990)
- Flavonoids: 6-glucuronosyloxykluteolin, 5,7,3',4'
tetrahydroxy-6-0-~-D-glucuronylf1avone(Nair et al.,
1976; Glasby, 1991). Contains no alkaloids (Raffauf,
1996).
29

Genus and species
Sterculia L. cont.
Other species:
foetida L.
pal/ens Wall. ex Hochr.
pruriens (Aubl.)
Medicinal and other human uses
- Gum used in med icine (Mujumdar et aI., 2000) Leaves
used as aperient, diuretic and insect repellent (Chopra
et aI., 1992).
Chemical constituents
- ~-sitoserol (Desai et aI., 1976) . Roots contain
lupeol, n-triacontanol, stigmasterol and ~-stoserol-3
O-~-b-glucopyranoside). Has high anti-inflammatory
activity ( Mujumdar et aI., 2000) . Anthocyanin:
cyan idin 3-0-glucoside. Flavonoids: isoscutellarin,
luteolin 6-0-~-D-glucopyranoside procyanidin ~-D
glucopyranoside (Glasby, 1991) . Sterculic acid
(Harborne & Baxter, 1993) , malvalic acid (Badami et
al., 1980) ,dihydrosterculic acid (Hofmann et al.,
1954) .
- Acids: malvalic acid and sterculic acid (Glasby,
1991) . Flavanoids: Quercetin, quercetin 3-0 glucoside
and quercetin 3-diglucoside (Ranganathan &
Nagarajan, 1980).
- Cyanogenic compounds (Schults & Raffauf,
1990).Contains hydrocyanic acid (Worthley & Schott,
1969).
30

Genus and species
Sterculia L. cont.
Other species:
tragacantha Lindl.
rhynchocarpa K. Schum
urens Roxb .
Medicinal and other human uses
- Decoction of bark used for stomach troubles (Watt &
Breyer-Brandwijk, 1962) . Shoots, bark, seeds are used
to treat vernifuge, syphilis, inflammation, digestive
disorders. Used externally as poultice for boils , whitlow
(Iwu, 1993).
- Used as a laxative, aphrodisiac, the fine powder is
used in dentistry as dental adhesive. Also used as a
thickener and suspending agent in lotions, creams and
hair-setting preparations (Leung & Foster, 1996).
Chemical constituents
- Allantoin found in bark (Prista et aI., 1960). Malvalic,
sterculic and dihydrosterculic aacid Also Palmitic,
oleic and linoleic acids (Miralles et aI., 1993) .
- Gum karaya: partially acetylated polysaccharide, a
galacturonor hamnan, containing about 8% acetyl
groups and 37% uronic acid residues (Harborne &
Baxter, 1993). Contains no alkaloids (Raffauf, 1996).
Main constituent of resin is a phlobatannin
(Sreedharan Pillai & Madharan Pillai, 1954).
31

Genus and species
Waltheria .L
South African species:
indica L.
Other species:
americana L.
Medicinal and other human uses
- Women use decoction of root for barrenness. Chew
raw root or drink decoction for internal haemorrhages.
Used as febrifuge (Petrus, 1989). Used as antisyphilitic
(Haerdi, 1964). Decoction used in skin diseases and
cleansing wounds. (Watt & Breyer-Brandwijk, 1962).
Eyeaches (Kokwaro, 1976). Purgative, emollient,
abortifacient (plant), anti-tussive (dry powder of plant),
anti-rabies, anti-syphilitic (Petrus, 1989).
- Used by Hawaiians in traditional medicine (Ab bott &
Shimazu , 1985).
Chemical constituents
- Plant has given positive tests for flavonoids, sterols
and tannins. Powdered plant is astringent and yields
mucilage, tannin and sugar - no alkaloids (Watt &
Breyer-Brandwijk, 1962). Peptide alkaloids called X,
Y, Y' AND Z have been isolated from roots (Pais et
al., 1963, 1968). Anthocyanins, pelargonidin and
cyanidin glycosides have been isolated from petals
(Ogbede et al., 1986). Flowers have antifungal
activity (Sawhney et aI., 1978b). Kaempferol,
kaemfeerol-3-0-p-D-galactoside, herbacetin,
herbacitin-8-0-p-D-glucuronide, glossypetin,
glossypetin-8-0-p-D-glucuronide, 2"-O-P-D
glucosylvitexin, caffeic acid (Petrus, 1989).
- No diarrhoeic activity (Zavala et aI., 1998) .
32

33
2.3 AIMS OF THE STUDY
The aim of this study was to compile an in-depth pharmacological and
phytochemical investigation of species from the family Sterculiaceae, that are
located within KwaZulu-Natal.
After an extensive literature review, it was clearly evident how little work had
previously been conducted on the Sterculiaceae within southern Africa, thus
making this an ideal project to broaden the available information on the
medicinal properties and chemical constituents of this family, within KwaZulu
Natal.
This project involved the overall biological screening of seven Sterculiaceae
species (Plate 1):
Dombeya rotundifolia
Dombeya burgessiae
Cola greenwayi
Sterculia murex
Dombeya cymosa
Hermannia depressa
Cola natalensis
Extracts were made from various plant parts (bark, twigs, roots, stems and
leaves) with three solvents, namely ethyl acetate, ethanol and water. These
extracts were tested for activity by pharmacological screening for anti-bacterial
and anti-inflammatory activity, as well as phytochemical screening for cardiac
glycosides, cyanogenic glycosides, tannins, saponins and alkaloids.
Species showing good anti-bacterial activity were subsequently selected for
possible isolation of compounds. Isolation techniques employed were VLC,
preparative TLC, Sephadex LH-20 column chromatography and HPLC. The
species included: D. rotundifolia, D. burgessiae , D. cymosa, and H. depressa

34
leaf material; and C. greenwayi twig material.
H. depressa aqueous extract was investigated. The leaf material produced a
mucilage. The mucilage was tested for polysaccharide content and breakdown
caused by a-amylase, HCI and bacteria.
TLC fingerprints of the extracts from the seven Sterculiaceae species were
determined using white light, UV light ( 254 nm and 366 nm ) and staining with
anisaldehyde spray reagent.

Plate 1 Species screened in this study.
(A) Oombeya rotundifolia (1) tree with flowers in spring, (2)
young shoots and leaves, (3) tree with leaves in autumn and (4)
outer bark fr9m trunk. (8) Oombeya burgessiae (1) leaf, (2) and
(3) shrub with drying flowers and developing fruit. (C) Cola
greenwayi (1) tree, (2) fruit and (3) leaves on branches. (D)
Oombeya cymosa (1) tree, (2) leaves and (3) branches full of
leaves. (E) Cola natalensis (1) leaves, (2) tree, and (3) flowers.
(F) S. murex and (G) H. depressa.
A
c
B
D
E F

36
CHAPTER 3
PLANT COLLECTION
3.1 PLANT COLLECTION
Plant material of the seven species selected for this study was collected
from varying areas of KwaZulu-Natal (Fig. 1) (Table 3). All collection sites
were inland, with the exception of C. natalensis, which was collected on the
north coast. There were two collection sites of D. rotundifolia, one being
situated outside KwaZulu-Natal, in the Limpopo Province.
PlantColledion Points
Pielenmrilzburg
o UmgeniValley
o UmhIanga
WannBalhs
Fig. 1: Sites where Sterculiaceae species were collected for this study

Table 3:
37
Plant species collected for screening, their herbaria numbers
and collection sites
Plant species Collection site Herbarium Plant parts
voucher used
number
Oombeya rotundifolia 1. Umgeni Valley REID 1 NU Leaves,
Nature Reserve, twigs and
Howick REID 2 NU bark.
2. Nature farm , Leaves,
Monato, in the twigs and
Droogekloof area in bark.
the Limpopo Province
(approximately 30km
from Warm baths)
Oombeya cymosa Botanical Gardens, REID 3 NU Leaves and
PMB twigs.
Oombeya burgessiae Botanical Gardens, REID 4 NU Leaves and
PMB twigs.
Cola natalensis Hawaan forest, on the REID 5 NU Leaves and
outskirts of Umhlanga, twigs.
KwaZulu-Natal.
Cola greenwayi Botanical Gardens, REID 6 NU Leaves and
PMB twigs.
Hermannia depressa Open grassland REID 7 NU Leaves,
between Denison stems and
Residence and roots
Agriculture faculty,
UNP
Sterculia murex Botanical Gardens, REID 8 NU Leaves and
PMB twigs.

38
Two sites were chosen for the collection of the D. rotundifolia material. The
differences and similarities between the collection sites are recorded in
Table 4.
Table 4: Comparison of the two collection sites for Dombeya
rotundifolia material
Umgeni Valley Nature Reserve Monato Farm (Warmbaths)
- Mean annual rainfall 950 - 1100 - Mean annual rainfall: 500 - 650
mm mm
- Vegetation type: lowveld bushveld - Vegetation type: mixed bushveld
- Altitude: 1000 - 1500 m
- The trees were about 3 m tall
- Leaves were a dark green in
colour
- Altitude: 1500 - 1700 m
- Due to the larger distance between
the trees, the trees were able to
grow to about 4 - 6 m in height
- The leaves were a lighter green,
some with signs of yellowing. This
was probably due to the more acidic
nature of the soil
- There were a number of trees - There were a number of trees from
growing next to each other which the plant material was
collected, but they were scattered
over the hillside

39
3.2 DESCRIPTION OF PLANT PARTS USED
Plant material used for each species was collected from a number of trees
. or shrubs situated within the same vicinity. Explanation of the terminology
used to describe the parts of the plant used is given below:
'Leaves' - A combination of young and old leaves, small and large leaves of
each plant was used. In the case of H. depressa, all the leaves from
each plant were used.
'Twigs' - The small, thin, young woody branches to which the leaves had
been attached. Twigs were only obtained from the tree species.
'Stems' - The only 'stems' used were from H. depressa. This constituted the
remaining aerial parts of the shrublets after the removal of the
leaves.
'Bark' - Bark was only collected from D. rotundifolia. Outer, gnarled bark
from the trunk and older branches was collected as it peeled away
easily from the stem.
'Roots' - Roots were only collected from H. depressa. The whole root
section of each plant was used.
Plant material was dried in an oven at 50°C for 72 h and ground to a
homogenous powder and stored in honey jars in the dark at room
temperature until further processing (Plate 2).
Plant material was extracted using a number of methods (Plate 3),
depending on quantities of extracts required for the different screening and
isolation procedures.

~
w
c
u..
~
~
l'
l'o
«
m
Steps followed in collection, drying and storage of plant
material. (A) Plant material (1) was collected from the relevant
species from (2) Monato nature farm in Limpopo Province, (3)
National Botanical Gardens in Pietermaritzburg, (4) Umgeni
Valley Nature Reserve in Howick and (5) Hawaan Forest on the
outskirts of tt"!e coastal resort town of Umhlanga. (B) Material
was taken tp the laboratory where it was separated into
different plant parts and placed in labeled brown paper bags.
(C) The brown paper bags were placed in an oven in the
garden laboratory and the plant material was dried at 50°C for
72 h. (D) The dried plant material was ground in a Waring
blender in the laboratory and placed in labeled honey jars. (E)
The honey jars were stored in a cupboard, in the dark, until the
plant material was required. (F) A voucher specimen of plant
material collected was identified and is housed in the University
of Natal Herbarium (NU).
Plate 2

Plate 3 Extraction of, plant material. (A) Material was obtained from
storage and a variety of extraction techniques were employed.
(8) Sonication and filter gravity extraction of small quantities of
plant materia! required for pharmacological and phytochemical
screening, (C) large Soxhlet for bulk extraction of D. rotundifolia
plant material for isolation of biologically active compounds, (0)
small Soxhlet for extraction of D. cymosa, D. burgessiae, C.
greenwayi and H. depressa plant material for the isolation of
biologically active compounds, and (E) centrifugation for
separation of aqueous H. depressa extract from leaf material.
1
<C
.»
~
w
o
m

42
CHAPTER 4
PHARMACOLOGICAL SCREENING
4.1 INTRODUCTION
There are two main ways to screen and evaluate plant extracts for useful
pharmacological activities (RASOANAIRO & RATSIMAMANGA
URVERG, 1993): (1) Pharmacological approaches which utilize different animal
models also referred to as in vivo / in situ tests and in vitro models, (2) clinical
approaches which are not a clinical evaluation of a pharmacologically defined
compound but rather a clinical assay of a plant extract, having a history of
traditional uses, after appropriate toxicological investigation.
Plant material was screened pharmacologically for anti-bacterial and anti
inflammatory activity.
Bacteria are responsible for a variety of common illnesses. Inhibition of the
various bacteria, by plant extracts, would be beneficial in the study for
treatments of a number of ailments. The in vitro anti-bacterial assays used in
the screening were the disc-diffusion assay (RASOANAIRO &
RATSIMAMANGA-URVERG, 1993) and the minimal inhibitory concentration
assay (MIC) (ELOFF, 1998). These assays are used to determine the degree of
susceptibility of the bacterial strains to the plant extracts.
In the disc-diffusion assay the anti-bacterial activity was determined by the
formation of clear zones of inhibition around filter paper discs, lying on bacterial
rich agar, loaded with plant extracts which exhibited anti-bacterial activity. This
method works by the active plant extracts diffusing into the surrounding

43
bacteria rich agar, killing and inhibiting further bacterial growth.
The MIC assay involves the serial dilution by 50 % of the plant extracts in a
microtiter plate tested against a constant bacterial concentration to determine
the minimum concentration of the plant extract required to exhibit inhibition of
bacterial growth. This is an effective and accurate method requiring minimal
quantities of extract. Results may be difficult to interpret in dense coloured
extracts.
Plant extracts were screened for anti-inflammatory activity by screening for
prostaglandin-synthesis inhibition activity using the COX-1 assay. Inflammation
is a response to injury, amongst other factors, and involves the action of
prostaglandins. Prostaglandins are involved in the complex processes of
inflammation and are responsible for the sensation of pain (JAGER,
HUTCHINGS & VAN STADEN, 1996). If the production of prostaglandins can
be blocked or reduced one has a potential cure. Prostaglandins are
biosynthesised from phospholipids in the cell membrane. The biosynthesis can
be blocked in two phases. Firstly, at the phospholipase A2 level. This way is
effective, but it has severe side effects. The second phase is at the
cyclooxygenase level . Most over-the-counter painkillers inhibit cyclooxygenase
(COX). COX exists in two forms: COX-1 and COX-2, both having different
roles. To test for anti-inflammatory activity during this study the COX-1 assay
was employed (JAGER, HUTCHINGS & VAN STADEN, 1996). COX-1 is found
constitutively expressed in tissue such as stomach, kidney and platelets. The
enzyme is responsible for the production of prostanoids that maintain mucocal
blood flow, promote mucous secretion, inhibit neutrophil adherence, maintain
renal blood flow an dpromote platelet aggregation (WALLACE & CHIN, 1997).
In this assay, plant extracts with anti-inflammatory activity inhibit arachidonic
acid conversion into prostaglandins resulting in less prostaglandins being
synthesized. True anti-inflammatory testing involves the use of animal models,

46
To indicate bacterial growth 40 IJI of 0.2 mg rnl" p-iodonitrotetrazolium violet
(INT) was added to each well and the plates were incubated at 37°C for 30 min,
and then observed. Bacterial growth in the wells is indicated by a red colour. A
totally clear well indicates inhibition by the test substance.
4.2.2 Anti-inflammatory Activity
Extraction of Plant Material
Two separate samples of 1 g of the dried plant material were extracted with 10
ml water and ethanol respectively. Four grams of plant material were extracted
with 40 ml dichloromethane. Pill vials, containing plant extracts were placed in a
Julabo ultrasound bath (25°C) for 30 min. The extracts were separated from the
plant material using a Buchner funnel. The extracts were left to dry overnight in
a fume hood and their weight determined.
Cyclooxygenase Assay
The bioassay was performed according to JAGER, HUTCHINGS & VAN
STADEN (1996), using the Prostaglandin-synthesis inhibitor assay (COX -1).
Dried plant material was required for this experiment. Two reps were made for
each extract so an average could be determined. Ten IJI of stock enzyme
solution (Sheep seminal vesicle microsomes stored at -70°C) were suspended
in 90 IJI Tris buffer. Twenty five IJI of this solution were then suspended in 975
IJI Tris buffer to give 0.25% of the stock. Two thousand j,J1 of cofactor solution
(0.3 mg ml' L - adrenalin and 0.3 mg mr1 reduced glutathione in 0.1 M Tris
buffer, pH 8.2) and 400 IJI of enzyme solution were mixed and incubated on ice
for 15 min. Sixty j,J1 of enzyme! cofactor solution were added to 20 j,J1 of solvent!
test solution (20 j,J1 aqueous extracts; 25 j,J1 ethanol extracts + 17.5 j,J1 water; 25
IJI ethyl acetate extracts + 17.5 j,J1 water) or standard solution ( 2.5 j,J1 ethanolic

45
immediately over base plates forming a homogenous top layer. A concentration
of plant extract (1 mg) was applied to 6 mm diameter filter paper discs
(Whatman No. 3), which were then placed on the surface of the inoculated agar
medium. Filter paper discs of neomycin were prepared, as a positive control.
The neomycin was diluted to 200 I-Ig rnl", and 10 1-11 were pipetted onto each
disc. Each petri-dish contained four paper discs with plant extract and a disc
with the neomycin control. The plates were incubated at 37°C for 18 h. A clear
zone of inhibition formed around discs containing plant extracts which have
anti-bacterial activity. Anti-bacterial activity was expressed as the ratio of the
inhibition zone (mm) produced by the plant extract to the inhibition zone caused
by the neomycin control (RABE & VAN STADEN, 1997).
Minimal Inhibition Concentration (MIC) Assay
This method is the scaling down of the serial dilution technique (ELOFF, 1998),
using 96-well microplates to determine the MIC's of extracts. Five ml cultures of
four bacterial strains: Two Gram-positive: Bacillus subtilis (ATCC 6051),
Staphylococcus aureus (ATCC 12600) and two Gram-negative: Escherichia
coli (ATCC 11775), Klebsiella pneumoniae (ATCC 13883), were prepared and
placed in a waterbath overnight at 37°C. The following morning, the overnight
cultures were diluted with sterile MH broth (1/100). The test solution were
serially diluted 50% with water. One hundred ~I sterile water were added to
each well excluding that of the neomycin (control). One hundred ~I extract were
added to well A (4 replicas), and mixed well with the water. One hundred ~I of
well A were added to well B, mixed well, and then 1001-11 of well B was added to
well C. This serial dilution continued up to well H. One hundred ~I of well H
were discarded. One hundred ~I of each bacterial culture were added to the
wells of each replica. The microplates were covered and incubated overnight at
37°C.

46
To indicate bacterial growth 40 IJI of 0.2 mg rnl' p-iodonitrotetrazolium violet
(INT)was added to eachwell and the plateswere incubated at 37°Cfor 30 min,
and then observed. Bacterial growth in the wells is indicated by a red colour. A
totally clear well indicates inhibition by the test substance.
4.2.2 Anti-inflammatory Activity
Extraction of Plant Material
Two separate samples of 1 g of the dried plant materialwere extractedwith 10
ml water and ethanol respectively. Fourgrams of plant materialwere extracted
with 40 ml dichloromethane. Pill vials, containing plantextracts were placed in a
Julabo ultrasound bath (25°C) for 30 min. Theextracts were separated fromthe
plant material using a Buchnerfunnel. The extractswere left to dry overnight in
a fume hood and their weight determined.
Cyclooxygenase Assay
The bioassay was performed according to JAGER, HUTCHINGS & VAN
STADEN (1996), using the Prostaglandin-synthesis inhibitor assay (COX -1).
Dried plant materialwas required for this experiment. Two reps were madefor
each extract so an average could be determined. Ten IJI of stock enzyme
solution (Sheepseminalvesicle microsomes storedat -70°C) were suspended
in 90 IJI Tris buffer. Twenty five IJI of this solution were then suspended in 975
IJI Tris buffer to give 0.25% of the stock. Two thousand IJI of cofactor solution
(0.3 mg rnl" L - adrenalin and 0.3 mg rnl" reduced glutathione in 0.1 M Tris
buffer, pH 8.2) and 400 IJI of enzymesolutionwere mixedand incubated on ice
for 15 min. Sixty IJI of enzyme!cofactor solutionwere added to 20 IJI of solvent!
test solution (20 IJI aqueous extracts; 25 IJI ethanol extracts + 17.5 IJI water; 25
IJI ethyl acetate extracts + 17.5 IJI water) or standard solution ( 2.5 IJI ethanolic

47
indomethacin solution + 17.5 ~I water). Twenty ~114C - arachidonic acid (19
Ci/mole, 30 Mm) were added and the assay mixture then incubated at 37°C for
8 min. The reaction was terminated by adding 10 ~I 2N HCI. The enzyme
activity of background samples were inactivated prior to adding 14C-arachidonic
acid , and kept on ice. The 14C-labeled prostaglandins synthesized during the
assay was separated from unmetabolized arachidonic acid by column
chromatography. Silica gel in eluent 1 (hexane: dioxane: acetic acid 350: 150:
1) was packed in Pasteur pipettes to a height of 3 cm. One ml of eluent 1 was
added to each of the assay mixtures, which were then applied to the columns.
The arachidonic acid was eluted from the columns with a further 4 ml of eluent
1 and discarded. The labeled prostaglandins were then eluted with 3 ml of
eluent 2 (ethyl acetate:methanol 425:75) into scintillation vials. Four ml
scintillation cocktail (Beckman Ready Solve) were added to the eluent. After 30
min the radioactivity of the samples was counted using a Beckman LS3801
scintillation counter. The percentage inhibition of the test solutions was
obtained by analyzing the amount of radioactivity present relative to .the
radioactivity in the solvent blank (McGAW, JAGER & VAN STADEN, 1997).
The following equation was used:
1 - ~MPsamPle - DMPbackgroundJl.:>M P untreated - DMPbackground
+ 100

48
4.3 RESULTS AND DISCUSSION
Anti-bacterial Activity
Only 0. rotundifolia (Table 5) and C. natalensis plant extracts were screened in
the disc-diffusion assay. Anti-bacterial activity was expressed as a ratio of the
inhibition zone of the extract (100 mg ml") to the inhibition zone of the
reference (neomycin 500 I-Ig ml").
Only the aqueous extract obtained from the dried leaf material of C. natalensis
exhibited slight anti-bacterial activity (0.08) against S. epidermidis. Thus C.
natalensis plant material had low or no activity against the bacterial strains
screened.
The ethyl acetate, ethanol and water extracts of D. rotundifolia from both
collection sites showed varying amounts of anti-bacterial activity (Table 5).
For leaf material from both collection sites, aqueous extracts showed anti
bacterial activity against S. epidermidis (0.23 and 0.08) (Plate 4 A) , extractions
with ethyl acetate showed anti-bacterial activity against K. pneumoniae (0.19
and 0.13) and extractions with ethanol were bacteriostatic against M. luteus
(0.83 and 0.71) (Plate 4 A). Plant extracts are considered to be bacteriostatic
when they are able to inhibit the growth of the bacteria, but not able to kill them
(ABERCROMBIE, HICKMAN, JOHNSON & THAIN, 1990). Bacteriostatic
activity is differentiated from bacteriocidal activity by the presence of an opaque
inhibition zone rather than a clear zone, indicating antibacterial activity was
inhibited to an extent.
Aqueous twig extracts from both collection sites showed anti-bacterial activity
against S. epidermidis (0.23 and 0.23) (Plate 4 B), extractions with ethyl

49
acetate showed anti-bacterial activity against K. pneumoniae (0.14 and 0.07)
and extractions with ethanol were bacteriostatic against S. aureus (1.22 and
1.22). The aqueous extract obtained from the twig material from UVNR showed
anti-bacterial activity against B. subti/is (0.12), and the water extract obtained
from Monato showed anti-bacterial activity against M./uteus (0.21) (Plate 4 B).
The ethyl acetate extract from Monato showed anti-bacterial activity against B.
subtilis (0.07) and E. coli (0.07). The ethanol extract exhibited anti-bacterial
activity against M. /uteus (0.89).
Aqueous bark extracts collected from both sites showed anti-bacterial activity
against K. pneumoniae (0.13 and 0.13), while extractions with ethanol showed
anti-bacterial activity against K. pneumoniae (0.25 and 0.08). There was anti
bacterial activity detected with the ethyl acetate extracts. The aqueous extract
from bark material from Monato showed anti-bacterial activity against E. coli
(0.08). The ethyl acetate extract from the UVNR showed anti-bacterial activity
against S. aureus (0.07) and S. epidermidis (0.14), there was no anti-bacterial
activity from the ethyl acetate extract from Monato. The ethanol extract
exhibited anti-bacterial activity against B. subtilis (0.10).
It can be concluded that the extracts from both collection sites show overall
similarities in their inhibition of the bacterial strains. K. pneumoniae was
inhibited by four of the nine extracts from each of the two collection sites. K.
pneumoniae is a Gram-negative bacterium, a group which is considered to be
more resistant to inhibition. The presence of anti-bacterial activity in D.
rotundifolia is in line with its use in traditional medicine (Table 8). D. rotundifolia
is used to treat diarrhoea (COATES PALGRAVE,1977; VAN WYK, VAN
OUDTSHOORN & GERICKE, 1997).
Anti-bacterial activity was reported to be present in leaf material from D.
rotundifolia (McGAW, 2000). Ethanol, water and hexane extracts of the leaf

50
material were screened. Ethanol and water extracts had anti-bacterial activity
against B. subtilis (0.40 and 0.40) and S. aureus (0.33 and 0.36). These results
did not hold for the results obtained in this study.
The disc-diffusion assay was resolved to be an inaccurate technique and it
resulted in too many inconsistencies. Much of the extract applied to the filter
paper discs was not absorbed, therefore the concentration of extract per filter
paper disc varied. If filter paper discs were not placed flat on the agar
containing bacteria, less inhibition would be noted and the results could not be
considered accurate. A more accurate method was employed. This method
was advantages as it detected anti-bacterial activity and the MIC values within
one assay. The disc-diffusion assay indicated the lack of anti-bacterial activity
in extracts obtained from C. natalensis and therefore the determination of MIC
values was not attempted.

Table 5: Anti-bacterial activity" of extracts of D. rotundifolia using the disc-diffusion assay
Collection I Plant part IExtractionI
Bacteria tested"site analysed Solvent Gram-positive Gram-negative
B.s. M.I. S.a. S.e. E.c. K.p., I ,
Umgeni Leaves Water 0 0 0 0.23 0 0Valley Nature Ethyl acetate 0 0 0 0 0 0.19Reserve Ethanol 0 0.83c 0 0 0 0
Twigs Water 0.12 0 0 0.23 0 0Ethyl acetate 0 0 0 0 0 0.14Ethanol 0 0 1.22c 0 0 0
Bark Water 0 0 0 0 0 0.13Ethyl acetate 0 0 0.07 0.14 0 0Ethanol 0.10 0 0 0 0 0.25
Monato Leaves Water 0 0 0 0.08 0 0Ethyl acetate 0 0 0 0 0 0.13Ethanol 0 0.71 c 0 0 0 0
Twigs Water 0 0.21 0 0.23 0 0Ethyl acetate 0.07 0 0 1.22c 0 0.07 0.07Ethanol 0 0.89 0 0 0 0
Bark Water 0 0 0 0 0.08 0.13Ethyl acetate 0 0 0 0 0 0Ethanol 0 0 0 0 0.08
51
a - Anti-bacterial activity is expressed as a ratio of the inhibition zone of the extract ( 100 mg mr1) to the inhibition zone of the
reference (neomycin 500 ~g ml").b - Bacteria: B.s., Bacillus subtilis; E.c., Escherichia coli; K.p., Klebsiella pneumoniae; M.I., Micrococcus luteus; S.a., Staphylococcusaureus; S.e.,Staphylococcus epidermidis.c - Bacteriostatic

Plate 4
' "
Anti-bacterial; activity was detected using the disc-diffusion
assay for D. rotundifolia extracts. Anti-bacterial activity was
expressed aa a ratio of the inhibition zone of the extract to the
inhibition zone of the Neomycin control. (A) Leaf material from,
(1) UVNR and (2) Monato aqueous extracts showed activity
against S. epidermidis (0.23 and 0.08), (3) UVNR and (4)
Monato ethanolic extracts were bacteriostatic against M. luteus
(0.83 and 0.71). (8) Twig material from (1) UVNR and (2)
Monato aqueous extracts showed activity against S.
epidermidis (0.23 and 0.23), (3) UVNR aqueous extracts
showed activity against B. subtilis (0.12), and (4) Monato
aqueous extract showed activity against M. luteus (0.21)
A
B

53
MIC values of extracts from the Sterculiaceae species are shown in Table 6.
Table 6: The minimum inhibitory concentration (MIC) of plant extracts
obtained from the Sterculiaceae species investigated
Plant species Plant Extract Bacteria used (MIC(mg mr1)) 1
part8.s. E.c. K.p. S.a.
D. rotundifolia: Leaf H2O
- Monato Ethyl acetate 12.5Ethanol
Twig H2O
Ethyl acetate 12.5 6.25 12.5Ethanol
Bark H2O
Ethyl acetateEthanol 12.5 12.5
-UVNR Leaf H2O
Ethyl acetate 6.25Ethano l 12.5
Twig H2O
Ethyl acetate 12.5 6.25 12.5Ethanol 12.5
Bark H2O
Ethyl acetate 6.25Ethanol
D. cymosa Leaf H2O
Ethyl acetate 12.5 12.5 12.5 12.5Ethanol 1.56 1.56 0.78 0.195
Twig H2O
Ethyl acetate 12.5 12.5 6.25 12.5Ethanol 12.5
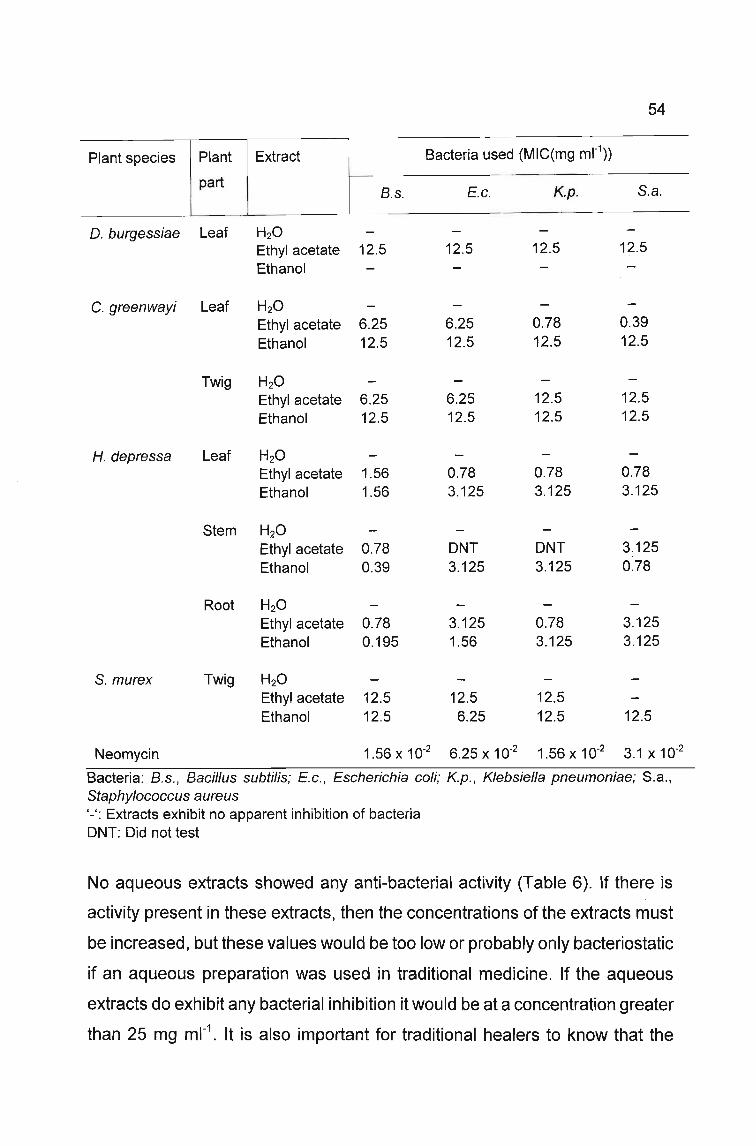
54
Plant species Plant Extract Bacteria used (MIC(mg mr1) )
partB.s. E.c. K.p. S.a.
D. burgessiae Leaf H2O
Ethyl acetate 12.5 12.5 12.5 12.5
Ethanol
C. greenwayi Leaf H2O
Ethyl acetate 6.25 6.25 0.78 0.39
Ethanol 12.5 12.5 12.5 12.5
Twig H2O
Ethyl acetate 6.25 6.25 12.5 12.5
Ethanol 12.5 12.5 12.5 12.5
H. depressa Leaf H2O
Ethyl acetate 1.56 0.78 0.78 0.78
Ethanol 1.56 3.125 3.125 3.125
Stem H2O
Ethyl acetate 0.78 DNT DNT 3.125
Ethanol 0.39 3.125 3.125 0.78
Root H2O
Ethyl acetate 0.78 3.125 0.78 3.125Ethanol 0.195 1.56 3.125 3.125
S. murex Twig H2O
Ethyl acetate 12.5 12.5 12.5Ethanol 12.5 6.25 12.5 12.5
Neomycin 1.56 x 10⁻² 6.25 X 10⁻² 1.56 X 10.2 3.1 X 10.2
Bacteria : B.s., Bacillus subtilis; E.c., Escherichia coli; K.p., Klebsiella pneumoniae; 8 .a.,Staphylococcus aureusI_I: Extracts exhibit no apparent inhibition of bacteriaDNT: Did not test
No aqueous extracts showed any anti-bacterial activity (Table 6). If there is
activity present in these extracts, then the concentrations of the extracts must
be increased, but these values would be too low or probably only bacteriostatic
if an aqueous preparation was used in traditional medicine. If the aqueous
extracts do exhibit any bacterial inhibition it would be at a concentration greater
than 25 mg ml'. It is also important for traditional healers to know that the

55
aqueous extracts are ineffective in treatment against bacterial infections at low
concentrations. Organic solvents should be used in the extraction process.
The results obtained from the disc-diffusion assay (Table 5) and the MIC assay
(Table 6) for extracts from D. rotundifolia plant material indicated some
similarities. However, there was no distinct correlation between the two
antibacterial assays employed. These results again did not agree with the
results reported by McGAW (2000). The MIC values were modest when
compared to those of D. cymosa and C. greenwayi (Plate 5). D. cymosa plant
extracts showed the best MIC values for the ethanolic leaf extracts, where the
extract showed activity against the four bacterial strains used. The ethyl acetate
leaf and twig extracts showed only slight activity. The roots of D. cymosa are
said to be used in traditional medicine (Table 8) (HUTCHINGS, HAXTON
SCOTT , LEWIS & CUNNINGHAM, 1996), but leaf extracts would be more
effective in the treatment of bacterial infections due to their lower MIC values.
D. burgessiae showed slight activity in the ethyl acetate leaf extracts. C.
greenwayi is said to be used in traditional medicine (HUTCHINGS, HAXTON
SCOTT, LEWIS & CUNNINGHAM, 1996), but it's use was not specified. The
MIC values in the leaf ethyl acetate extracts were good, especially against K.
pneumoniae (0.78 mg mt') and S. aureus (0.39 mg ml"), H. depressa ethanolic
and ethyl acetate leaf, stem and root extracts exhibited very good MIC values
(Plate 5). H. depressa extracts would have a noticeable affect against bacterial
infections in traditional medicines due to their high anti-bacterial activity. S.
murex showed low anti-bacterial activity, indicated by high MIC values, in the
ethanolic and ethyl acetate twig extracts.
The determined anti-bacterial activity could be due to the presence of a variety
of compounds. Some saponins are said to contain anti-fungal and anti
microbial activity (HARBORNE & BAXTER, 1993). Similarly, tannins are known
to have anti-viral, anti-tumour and possibly anti-bacterial activity . The plant

56
material screened during this study was therefore also screened for saponins
and tannins as anti-bacterial activity may be caused by these compounds
(Chapter 5).
It is commonly accepted that a major reason why living organisms produce
biologically active compounds is that they form part of the survival strategy in a
competitive environment. Complex chemical interactions are often involved in
attraction of pollinators and mating partners or the deterrence and repulsion of
predators or infecting agents. The production of such compounds is particularly
important where the organism is static and has little ability to move from a
hostile situation. It is therefore possible that organisms in these situations may
produce particularly interesting bioactive compounds (HOUGHTON & RAMAN,
1998).

E,A. EtOH water
A1Sa Kp Ec Bs
A
Plate 5 Anti-bacterial .activlty as determined using the minimal inhibition
concentration ,(MIC) assay. (A) D. rotundifolia leaf extracts from
(1) Monato and (2) UVNR, (B) D. burgessiae leaf extract, (C) D.
cymosa leaf extract, (D) C. greenwayi (1) leaf and (2) twig
extracts, and (E) H.depressa (1) leaf and (2) root extracts.(Bs
B. subtilis, Ec - E. coli, Kp - K. pneumonia, Sa - S. aureus)
(EtOH - ethanol, E.A. - ethyl acetate, water).
B
01
c
E1 E2

Anti-inflammatory Activity
58
Table 7: The average percentage inhibition of cyclooxygenase (COX -1) by Sterculiaceae species investigated
Inhibition (%)
Leaf Twig Bark Stem RootPlant species
analysed H20 EtOH CH2Cb H20 EtOH CH2Cb H20 EtOH CH2Cb H20 EtOH CH2Cb H20 EtOH CH2CI2
D. rotundifolia :- Monato 55 90 89 76 88 79 5 87 80-UVNR 79 97 95 65 87 94 5 87 93D. cymosa 39 78 70 14 84 39 'D. burgessiae 28 76 81 28 89 87C. natalensis 14 46 52 8 44 32C. greenwayi 52 75 78 7 74 65H. depressa 60 59 62 - - - - - - 51 55 78 58 58 81S. murex 41 85 87 18 72 97Indomethacin 68- Indicates plant parts not screened

59
The results in Table 7 indicate a pattern of lower anti-inflammatory activity in
the aqueous extracts. Both the ethanol and dichloromethane extracts exhibited
activity, with the ethanol extracts generally giving the highest activity.
D. rotundifolia exhibited the highest activity of all the plant species analyzed.
The results were very similar when comparing the two collection sites, with the
extracts from the UVNR showing slightly higher activity. The lowest activity was
recorded in the aqueous bark extracts (5%). The highest overall activity was
obtained from the ethanolic leaf extract (97%) from the UVNR collection site.
The presence of anti-inflammatory activity in 0. rotundifolia is in line with its use
in traditional medicine (Table 8). Infusions are used in the treatment of
intestinal ulcers, headaches and stomach complaints (COATES PALGRAVE,
1977; VAN WYK, VAN OUDTSHOORN & GERICKE, 1997).
D. cymosa extracts showed high activity in ethanolic leaf (78%) and twig (84%)
extracts. Activity was low for all the other extracts. D. burgessiae extracts
showed high activity in both ethanolic and dichloromethane extracts from leaf
(76 &81%) and twig (89 &87%) material. For C. greenwayi S. murex and C.
natalensis extracts showed very low activity. H. depressa water extracts
showed the lowest activity. Noticeable activity occurred in the dichloromethane
extracts obtained from the stem (78%) and root (81 %) extracts. All other activity
detected was considered as too low.
The suggested high anti-inflammatory activity in plant material containing
tannins may be false-positive. Tannins are phenolics which destroy enzymes
inhibiting their action . Plant material was screened for tannins in Chapter 5.
The COX-1 assay uses enzyme solution of sheep seminal vesicle microsomes.

60
Table 8: A summary of results obtained from the investigation of seven
Sterculiaceae species for their anti-bacterial and anti-inflammatory
activity compared to their mentioned use in traditional medicine
Anti-inflammatoryactivit CQX-1
Very good inhibitionby EtOH and CH2CI2
leaf, twig and barkextracts (76 - 97%).
. Related Uses inTraditional Medicine
Treatment ofintestinal ulcers,stomach ache,diarrhoea, wounds,headaches andcolic.
D. cymosa Fair inhibition by ethylacetate leaf and twigextracts. Very goodinhibition by EtOH leafextracts.
Good inhibition byEtOH and CH2CI2
leaf and extracts (70- 84%).
Roots used, but notspecified.
D. burgessiae Fair inhibition by leafethyl acetate extractsagainst all bacteria .
Very good inhibitionby EtOH and CH2CI2
leaf and twigextracts (76 - 89%).
Treatment ofmalaria , wounds andstomach ache.
C. natalensis No relevant activity. Very low inhibition. No mentioned use
C. greenwayi Good inhibition by leafethyl acetate extracts,fair inhibition by leafEtOH extracts and Twigethyl acetate and EtOHextracts.
Good inhibition byEtOH (75%), CH2CI2
(78%) and EtOHtwig (74%) extracts.
Mentioned use, butnot specified.
H. depressa Very good inhibition byleaf, stem and root ethylacetate and EtOHextracts.
Good inhibition byCH2CI2 stem (78%)and root (81%)extracts.
Treatment ofcoughs, diarrhoeaand stomach ache.
Not specified.Good inhibition byEtOH and CH2CI2
leaf and twigextracts (72 - 97%) .
Fair inhibition by ethylacetate and EtOHextracts
S. murex
EtOH - Ethanol
CH2CI2 - Dichloromethane
References for mentioned uses in traditional medicine are located in Chapter 2, Table 2

61
4.4 SUMMARY
• Seven selected Sterculiaceae species were screened pharmacologically
for anti-bacterial (disc-diffusion method and MIC assay) and anti
inflammatory (COX-1).
Anti-bacterial activity:
MIC values of plant extracts was detemined against four bacterial
strains: Two Gram-positive: Bacillus subtilis, Staphylococcus
aureus and two Gram-negative: Escherichia coli, Klebsiella
pneumoniae. Activity was exhibited by six of the species screened:
0. rotundifolia, O. cymosa, O. burgessiae, C. greenwayi, H.
depressa and S. murex. No inhibition of bacteria was noted in the
aqueous extracts.
Good anti-inflammatory activity was noted in ethanol and
dichloromethane extracts from D. rotundifolia (79 - 97%), O.
cymosa (78 - 84%), O. burgessiae (76 - 87%), C. greenwayi (65
78%) and S. murex (72 - 97%). Activity may be false-positive due
to the possible presence of tannins. All aqueous extracts exhibited
low activity.
• O. rotundifolia plant material was obtained from two collection sites:
UVNR and Monato. Results were compared. There were distinct
similarities in the anti-bacterial and anti-inflammatory properties of the
two collection sites.
• C. natalensis has no mentioned use in traditional medicine. Very low
anti-inflammatory activity and only a very low ratio of 0.08 bacterial
inhibition in the aqueous leaf extract against S. epidermidis was noted.

62
CHAPTER 5
PHYTOCHEMICAL SCREENING
5.1 INTRODUCTION
In this Chapter all the plant species were phytochemically screened for cardiac
glycosides, cyanogenic glycosides, saponins , tannins and alkaloids.
'Glycoside' is a general term covering a wide range of substances whose
common feature is that they consist of at least one sugar molecule linked via its
anomeric carbon to another moiety. Glycosides are relatively polar due to the
presence of one or more sugars in the molecule (HOUGHTON & RAMAN,
1998). Cardiac glycosides of plant origin remain chief drugs in the treatment of
heart related ailments. All of the organs, or parts thereof may contain cardiac
glycosides, but except for a few cases, the concentrations are low (lower than
1%) (BRUNETON, 1995). Cardiac glycosides are made up of both
cardienolides and bufadienolides, which are two related groups of C23 and C24
steroids respectively (HARBORNE & BAXTER, 1993; BRUNETON, 1995).
Some Sterculiaceae species are said to contain cardienolides (TREASE &
EVANS, 1983).
Cardienolide glycosides are defined by their aglycone structure (HOUGHTON
& RAMAN, 1998). They contain a tetracyclic steroidal ring system which is
substituted in the 17-position by an IJ, ~-unsaturated y-Iactone ring
(HARBORNE & BAXTER, 1993). They usually occur in plants as glycosides,
with a sugar attachment commonly at the 3-hydroxyl group or, less frequently,
at the 1-hydroxyl, 2-hydroxyl position (HARBORNE & BAXTER, 1993). They
are 'heart poisons' which, when used in small doses, are extremely valuable

63
clinically for controlling congestive heart failure.
Bufadienolides can be clearly distinguished from cardienolides by the fact the
lactone ring at C17 in the steroid nucleus is six-membered rather than five
membered. They occur, like the cardienolides, as O-glycosides but can also be
found in the free state (HARBORNE & BAXTER, 1993).
Many plants synthesize compounds which are capable of liberating hydrogen
cyanide upon hydrolysis (SIEGLER, 1977). This ability has been recognised for
centuries in such plants as apricots , peaches, almonds, and other important
food plants. There are two chemical types of hydrogen cyanide producing
substances (SIEGLER, 1977), namely cyanogenic glycosides and cyanolipids.
Plant material in this study was screened for cyanogenic glycosides. Both are
derivatives of oc-hydroxynitriles and both liberate a carbonyl component and
hydrogen cyanide when the sugar or the fatty acid moiety respectively is
removed (SIEGLER, 1977). Cyanogenic glycosides are known to occur in at
least 800 species of plants representing 70 - 80 families. The highest
concentrations are found in the leaves, but it may be found in the roots, seeds
and other plant tissues . The isolation of cyanogenic glycosides is extremely
difficult therefore only two compounds are available commercially: amygdalin
and linamarin (SIEGLER, 1977). Amygdalin was used as a positive control in
this study.
Saponins are a group of plant glycosides in which water-soluble sugars are
attached to a lipophilic steroid (C27) or triterpenoid (C30) moiety. This
hydrophobic/hydrophilic asymmetry means that they have the ability to lower
surface tension, and are soap-like. They form foams in aqueous solutions
(Froth test) and cause haemolysis of blood erythrocytes (Haemolysis test) .
They are toxic to cold-blooded animals but generally not to warm-blooded
animals. They are widely distributed in the flowering plants, having been

64
identified in more that 100 plant families (HARBORNE & BAXTER, 1993;
BRUNETON, 1995). Saponins are toxic to insects and molluscs and some of
the most useful natural agents for controlling schistosomiasis snails are
saponin in nature. Antifungal activity is present in some saponins, and some
saponins may aid plants such as ivy and oats to resist microbial infection
(HARBORNE & BAXTER, 1993).
Tannins occur widely in vascular plants, their occurrence in the angiosperms
being particularly associated with woody tissues. By definition they have the
ability to react with protein, forming water-insoluble copolymers (HARBORNE &
BAXTER, 1993). Most tannins that have been purified and studied are
biologically active. Chemically, there are two main types of tannin: condensed
tannins and hydrolysable tannins. Condensed tannins have been used in
medicine to aid the healing of wounds and burns. When applied to the skin,
they produce an impervious layer under which the healing process can take
place. They are also thought to have some protective value against toxins when
taken internally. Hydrolysable tannins are of pharmacological interest because
of their antiviral and antitumour properties (HARBORNE & BAXTER, 1993).
Knowledge of the toxicity and properties of plants containing alkaloids dates
back to ancient times: opium, cocoa, belladonna, Colchicum and Cinchona
having all been used for centuries (BRUNETON, 1995). However, only recently
has the concept of an 'alkaloid' been introduced. Alkaloids generally consist of
a nitrogen atom in their chemical structures as part of a heterocyclic ring
(HARBORNE & BAXTER, 1993; BRUNETON, 1995). Their major occurrence is
in the flowering plants, with 40% of all plant families having at least one
alkaloid-bearing member. Their distribution is uneven: they may be universal in
some families, and rare in others. They can be present throughout the plant or,
alternatively, restricted to certain tissues such as the root or bark. The
concentration can vary from a small fraction of less than 0.1 % to as much as

65
12% by dry weight (HARBORNE & BAXTER, 1993). Alkaloids are principally of
interest to humans because of their medicinal properties, and many are widely
used as drugs. Some are poisonous and others have hallucinogenic effects
(HARBORNE &BAXTER, 1993). Alkaloids are detected in plant extracts by a
number of well known colour tests. Some are general, like those used in this
study, Dragendorff and Mayer, while others are more specific (HARBORNE &
BAXTER, 1993).
5.2 MATERIALS AND METHODS
5.2.1 Cardiac Glycosides
One g of dried plant material was added to 30 ml 53% ethanol containing 3%
lead acetate (JAGER & VAN STADEN, 1995). The mixture was boiled for 15
min. It was allowed to cool before filtering and then acidified with acetic acid
before partitioning three times against 15 ml dichloromethane. The
dichloromethane extracts were filtered over anhydrous sodium sulphate and
taken to dryness under vacuum. The resulting residue was resuspended in 1 ml
dichloromethane:methanol (1:1).
Two-Deoxy-sugars/Keller-Killiani Test
Five hundred 1-11 of suspended residue were taken to dryness and resuspended
in 2 ml glacial acetic acid, containing 2.2 mM FeCI3 (EVANS, 1989). The
solution was layered on top of 2 ml H2S04 . If a reddish-brown-purple ring
appeared at the interphase, and the upper layer slowly became blueish-green,
then two-deoxy-sugars are present.

66
Unsaturated Lactone Ring Tests
Fifty 1-11 of the extracts were applied to TLC plates (Merck Silica 60). The TLC
plates were developed in ethyl acetate: methanol: water (81 :11:8). The plates
were sprayed with Kedde's reagent which indicate the presence of the y
lactone ring of cardienolides by pink/blue violet spots (WAGNER, BLADT &
ZGAINSKY, 1984; JAGER & VAN STADEN 1995). A second TLC plate was
sprayed with chloramine T-trichloroacetic acid reagent (WAGNER, BLADT &
ZGAINSKY, 1984) and heated for 10 min at 100°C, before being viewed under
ultraviolet light at 366 nm for yellow-orange zones, indicating bufadienolides. A
third TLC plate was sprayed with antimony (Ill) chloride reagent (WAGNER,
BLADT & ZGAINSKY, 1984) and heated at 100°C for 6 min before being
observed under ultraviolet light at 366 nm for yellow to yellow-brown spots,
again indicating bufadienolides.
5.2.2 Cyanogenic Glycosides
TLC Sandwich Method
Fresh plant material (about 500 mg) was cut into small pieces and extracted
with 5 ml of 80% methanol by boiling for five min. The extract was filtered
through Whatman No. 1 filter paper. One tenth of the extract was placed onto a
TLC plate (as well as 5 /1g of amygdalin, which was applied as the standard).
The TLC plate was developed using acetate:acetone:chloroform:methanol:
water (40:30:12:10:8). The plate was dried and the spots visible in white light,
under 254 nm and 366 nm, were marked. A piece of synthetic net fabric and a
sheet of sodium picrate paper was placed on the TLC plate, with a glass plate
on top. The edges were taped with scotch tape. The 'sandwich' was placed in
an oven at 35°C for about 1 h. Coloured spots on the picrate paper indicate the
presence of cyanogenic glucosides in the plant material.

67
5.2.3 Saponins
Froth Test
Dried, ground plant material (100 mg) was placed into a pill-vial. To this pill-vial
10 ml of distilled water was added. A lid was placed on the pill-vial and it was
vigorously shaken for 30 sec. The pill-vial was observed over a 30 min period.
A 'honey comb' froth occurring above the surface of the liquid after 30 min
indicates the presence of saponins in the plant material.
Haemolysis Test
Citrated cattle blood was added to Columbia Blood Agar Base (Oxoid CM 331)
giving a highly nutritious medium capable of supporting a wide variety of
organisms.
Thirty-nine grams Columba Blood Agar Base were suspended in 1 I distilled
water and brought to boil allowing the medium to dissolve completely. The
solution was autoclaved at 121°C for 15 min and cooled in a water bath set at
50°C. Sodium citrate (20%) was added to a bleeding bottle, before it was
autoclaved. Three ml of the solution were sufficient for 100 ml of whole blood.
Aseptically, 50 - 70 ml sterile citrated sheep or cattle blood was added to the
Columbia Blood Agar solution . Twelve ml of the blood agar were dispensed into
sterile petri-dishes (9 cm).
A portion of blood agar (approx.1cm in diameter) was removed from 5
equidistant areas of the blood agar plates. A heated Pasteur pipette was used
to seal off the agar at the bottom of each well (FONG, TIN-WA,
FARNSWORTH, 1974) (Fig. 2).

68
Fig. 2: Diagram showing the layout of the five 'cups' used in the
haemolysis test for saponins. (1) - (3) Plant extract; (4) Water
control; (5) Saponaria officinalis control
With the use of a micro-pipette, equal amounts of the extract were added to
three of the five cups. Distilled water was added to the fourth cup as a negative
control. Fresh root material of Saponaria officinalis was boiled in water for 10
min, over a Bunsen burner (0.1 g ml"). The cooled extract was added to the
fifth cup (centre) as a positive control. The plate was left to stand overnight at
room temperature on a sterile surface, in the dark. Development of clear zones
of haemolysis indicate the presence of saponins.
5.2.4 Tannins
The test used to screen the plant material for tannins was the gelatin-salt block
test (FONG, TIN-WA &FARNSWORTH, 1974, DUNCAN, 1998). Ground, dried
plant material (500 mg) was placed in a large pill vial with distilled water (5 ml)

69
which was sonicated in an ultrasound bath for 30 min. The extracts were filtered
through Whatman No. 1 filter paper into new pill vials. To the new pill vials, 2
drops of 10% NaCI solution was added to 'salt out' any non-tannin compounds.
The extracts were filtered through Whatman NO.1 filter paper and placed into
new pill vials. Four drops of the extract were placed into glass plates placed on
black cardboard. To this, 1 drop of 1% gelatin solution was added, and
observed for precipitate. One drop 1% gelatin solution and 1 drop 10% NaCI
was added to one well and again it was observed for precipitate. Finally, 1 drop
of 10% ferric chloride solution was added, and the extract was observed for
colour change.
Precipitation is indicative of the presence of tannins. Tannins precipitate
proteins (gelatin). Sodium chloride enhances the 'salting out' of the protein
tannin complex. If precipitation is observed only with the salt solution (Le. the
control), a false-positive is indicated. Positive tests are confirmed by the
addition of ferric chloride solution to the extract and should result in a blue,
blue-black, green or blue-green colour and precipitate.
5.2.5 Alkaloids
pH partitioning for alkaloids was performed according to BRIMER,
LORENTZEN & WAGNER SMITT (1989). Two g of dried, powdered plant
material were extracted with 20 ml 96% ethanol for 30 min, while constantly
stirring using a magnetic stirrer. The extract were filtered. Fifteen ml of water
was added to the filtrate, and the ethanol was removed by boiling it off over a
period of 1 h. The remaining extract was filtered, and taken to a basic pH with a
few drops of 2N NaOH, and then partitioned against 10 ml dichloromethane.
The organic phase was filtered over anhydrous sodium sulphate and partitioned
against 2 ml 0.1 HCI. The HCI phase was divided into two equal parts.
Dragendorffs reagent (WAGNER, BLADT & ZGAINSKY, 1984) was added to

70
one part, and Mayer's reagent (WAGNER, BLADT & ZGAINSKY, 1984) to the
other. Observations were made for the development of a red-orange precipitate
on the addition of Dragendorff's reagent , and a white precipitate on the addition
of Mayer's reagent.
5.3 RESULTS AND DISCUSSION
The seven Sterculiaceae species indicated the presence of numerous
phytochemical compounds. Phytochemical compounds are known to have
biological or toxic properties making them influential in the abilities of the plants
in traditional medicine. Cardiac glycosides are used in controlling congestive
heart failure. The cardiac glycosides, cardienolides are known to occur in many
Sterculiaceae species (TREASE & EVANS, 1983). Cyanogenic glycosides are
poisonous to humans in high doses, saponins contain anti-fungal and anti
microbial activity and tannins have wound and burn healing properties as well
as anti-viral and anti-tumour activity (SIEGLER, 1977; HARBORNE & BAXTER,
1993). The suggested high anti-inflammatory activity in plant material
containing tannins may be false-positive as tannins are phenolics which destroy
enzymes inhibiting their action. The presence of alkaloids was already
suggested present in the plant material of the five of the seven species
screened. However, the reference RAFFAUF (1992) which stated this
information did not verify which parts of the plants lacked alkaloids and it did not
give any references to where this information was obtained.

5.3.1 Cardiac Glycosides
71
Table 9: Results obtained from two cardiac glycoside tests: Keller-Killiani test and the unsaturated lactone tests
Collection site Plant part Keller- Unsaturated lactone ring tests
analysed Killianii testKedde's Chloramine T- trichloroacetic Antimony (Ill) chloride
reagent acid reagent
D. rotundifolia
Umgeni Valley Leaves ./ 1 pink zone ---------------- ----------------
Nature Reserve Twigs ./ 1 pink zone Yellow bands ----------------
Bark ./ 1 pink zone Yellow bands ----------------
Monato Leaves ./ / Yellow, orange bands ----------------
Twigs ./ 1 pink zone Orange yellow bands Yellow and grey bands
Bark ./ 1 pink zone Yellow bands Yellow bands
D. cymosa Leaves ./ / ---------------- Yellow band visible
Twigs / ---------------- ----------------
D. burgessiae Leaves ./ / ---------------- Yellow and green band visible .
Twigs ./ / ---------------- Yellow band visible
1 _I I 1

C. natalensis Leaves ./ I ---------------- ----------------
Twigs ./ I ---------------- ----------------
C. greenwayi Leaves ./ I ---------------- A number of grey and violet bands
Twigs ? I ---------------- Very faint violet band
H. depressa Leaves ? I ---------------- Violet and grey bands
Stems ? I ---------------- Violet bands
Roots ? I ---------------- Very light violet band
S. murex Leaves ? I ---------------- A few yellow bands
Twig ? I ---------------- ----------------
72
./ - Positive results obtained
/ - No cardienolides present
? - Results inconclusive
---------- - No corresponding colour zones present

73
Two-Deoxy-Sugarsl Keller-Killianii Test
A negative control was set up where no extract was added to the glacial acetic
acid (containing 2.2 mM FeCI3) phase. Visible brown rings formed at the
interphase of all D. rotundifolia extracts (Plate 6) (Table 9). The brown rings
were more evident in the leaf extracts from both sites. They immediately formed
with the addition of the glacial acetic acid solution and extract onto the H2S04.
The leaf extract from the material from Monato was more concentrated than
that obtained from the leaf material from UVNR. The brown ring was therefore
more noticeable in the latter. Brown rings formed in the bark and twig extracts
to a lesser extent. They were each approximately 2 mm thick and showed the
same intensity of brown colour. Twenty four h after the experiment was
conducted, the brown rings for all the extracts had increased in thickness while
the glacial acetic acid phase containing 2.2 mM FeCI3 and the extracts had
become clearer.
The twig and leaf extracts of D. burgessiae and the leaf extracts of D. cymosa
and C. greenwayi contained 2-deoxy sugars. The brown rings, at the
interphase, were initially 1 mm thick, after 3 h their thickness had increased to 3
mm (Plate 6) (Table 9). Directly after the experiment, no noticeable brown rings
were visible in the S. murex leaf and twig extracts, or the D. cymosa leaf
extract, but after about 1 h faint brown rings had formed. In the leaf extract of C.
natalensis a dark drown ring (3 mm thick) appeared at the interface while a
lighter brown ring (1 mm thick) formed with the twig extract. Initially no brown
rings formed with the H. depressa extracts at the interface of any of the three
plant parts screened. After 30 min brown rings began to form while the control
remained clear. The formation of the brown rings may be due to the presence
of 2-deoxy sugars or it may be due to a chemical reaction taking place between
the extracts and the sulphuric acid. Further tests were therefore important.
Due to the presence of the brown rings at the interphase in a number of the

74
extracts, suggesting the presence of 2-deoxy-sugars in the plant material the
extracts were tested for unsaturated lactone rings.
Unsaturated Lactone Ring Tests
After spraying with Kedde's reagent (Plate 6) (Table 9) pink zones appeared on
the TLC plate in the leaf, twig and bark extracts of D. rotundifolia from UVNR.
Twig and bark extracts from Monato showed pink zones with identical Rf values
to those from UVNR (0.71 and 0.86 respectively) indicating that similar cardiac
glycosides are present in material from both collection sites. Pink zones
suggest the presence of cardienolides. Unexpectedly, no pink zones appeared
in the leaf extract from Monato. No pink zones appeared in leaf and twig
extracts of D. cymosa, D. burgessiae, C. natalensis, C. greenwayi, H. depressa
and S. murex, and leaf, stem and root extracts of H. depressa indicating
cardienolides were not present in these species. TREASE & EVANS (1983)
mention some Sterculiaceae have been shown to contain cardienolides. This
was found true for D. rotundifolia.
Chloramine T-trichloroacetic acid reagent was viewed under ultraviolet light at
366 nm for yellow-orange zones. Identical compounds were extracted from
corresponding plant material from the two localities of D. rotundifolia (Plate 8)
(Table 9), however, there was a higher quantity from the Monato extracts .
Yellow bands appeared in the shoot and bark material collected at UVNR.
Several yellow-orange bands appeared in the leaf and twig extracts from
Monato, and yellow bands in the bark extracts, confirming the presence of
bufadienolides in the previously mentioned plant extracts. Blue-green bands
appeared in the UVNR leaf extract. D. cymosa, D. burgessiae, C. natalensis, C.
greenwayi, H. depressa and S. murex (Plate 8) extracts did not exhibit yellow
orange bands indicating the absence of bufadienolides. All extracts lacked
significant bands.

75
Antimony (Ill) chloride reagent sprayed TLC plates were observed under UV
light at 366 nm for yellow to yellow brown spots. The purple and grey bands
visible under 366 nm on the TLC plate, were visible as light to dark green when
viewed in white light. These bands consisted mainly of chlorophyll-type
compounds. Similar compounds were extract from corresponding plant material
from the two localities of o. rotundifolia, with a higher quantity from the Monato
extracts. Yellow bands appeared in the twig and bark extracts from Monato,
and the leaf extracts from O. cymosa, O. burgessiae and S. murex (Plate 7)
(Table 9). All other extracts exhibited grey and violet bands not associated with
the presence of cardiac glycosides.
c. natalensis, which is not used in traditional medicine contained no
cardienolides. No bands appeared on spraying of TLC plates with chloramine
trichloroacetic acid reagent. Bands appearing after spraying with antimony III
chloride reagent were very faint and were therefore considered insignificant.
In small doses cardiac glycosides are extremely valuable medicinally for
controlling congestive heart failure (HARBORNE & BAXTER, 1993). Plants
containing cardiac glycosides may be beneficial in cardiac treatments, but
without a known concentration on intake of prepared extracts, no significant
changes could occur due to a too low concentration or it could be fatal due to
toxicity. Generally the concentration of cardiac glycosides in plants is very low,
lower than 1% (BRUNETON, 1995), so using plant material should normally not
result in a fatality. Nevertheless, knowing the concentration is important for
proper treatment.

Plate 6 The Sterculiaceae species were screened for two-deoxy-sugars
using the (A) Keller-Killiani test. (1) o. rotundifolia from UVNR
and Monato, (2) O. cymosa, (3) O. burgessiae, (4) C.
natalensis, (5) C. greenwayi, (6) H. depressa, and (7) control.
(B) D. rotundifolia material from UVNR and Monato was
screened for cardienolides by staining with Kedde's reagent.
Pink bands indicate positions of cardienolides on TLC plate.
(L - leaf, T - twig, B- bark, S - stem, R - root).
A
B

Plate 7 The Sterculiaceae species were screened for bufadienolides by
staining with Antimony III Chloride reagent. (1) D. rotundifolia
from UVNR and Monato, 2) D. cymosa, (3) D. burgessiae, (4)
C. natalensis, (5) C. greenwayi, (6) H. depressa, and (7) S.
murex. Arrows indicate possible bufadienolides. (L - leaf, T
twig, B- bark, S - stem, R - root).

Plate 8 The Sterculiaceae species were screened for bufadienolides by
staining with Chloramine T-trichloroacetic acid reagent. (1) 0.
rotundifolia from UVNR and Monato, (2) D. cymosa, (3) D.
burgessiae, 4) C. natalensis, (5) C. greenwayi, and (6) S.
murex. Arrows indicate possible bufadienolides.
(L - leaf, T - twig, B - bark).
79
5.3.2 Cyanogenic Glycosides
TLC Sandwich Method
Fresh material of D. rotundifolia, D. cymosa, D. burgessiae, C. natalensis, C.
greenwayi, H. depressa and S. murex were used in the preparation of the
extracts used for this experiment. The sodium picrate paper did not develop any
colour changes by the termination of the experiment, indicating that cyanogenic
glycosides are not present. Absence of cyanogenic glycosides in the seven
species screened reduces the possible toxicity of the plants. Light petroleum
extracts of the residual meal from the seed of S. murex was reported to contain
cyanogenic glycosides (WATT & BREYER-BRANDWIJK, 1962). However,
seeds were not screened in this study.
5.3.3 Saponins
Saponins are often detected in plant extracts through their haemolytic activity
(Haemolysis test) or on the basis of their foam-producing properties (Froth
test).
Froth Test
Positive results were only obtained from extracts from D. rotundifolia and H.
depressa material (Table 10) (Plate 9 A). In D. rotundifolia, after 30 min there
were no bubbles on the reaction surface of the aqueous bark. There were a few
bubbles on the reaction surface of the aqueous solutions containing leaf and
twig material suggesting the possible presence of saponins. H. depressa
aqueous solutions showed the presence of bubbles on the reaction surface of
all plant material solutions also suggesting possible presence of saponins.

80
Table 10: Determination of the presence or absence of saponins in D.
rotundifoJia and H.depressa using the Froth test
Plant Plant part Persistence of Froth
Species analysed
D. rotundifolia:
Umgeni Valley Leaves After 30 min bubbles were present on the reactionNature Reserve surface. They were only visible on the edges.
Twigs After 30 min bubbles were present on the reactionsurface, but did not cover the entire surface.
Bark No bubbles were visible on the reaction surface.
Monato Leaves After 30 min bubbles were present over the wholereaction surface.
Twigs After 30 min bubbles were present on the reactionsurface.
Bark No bubbles were visible on the reaction surface
H. depressa Leaf After 30 min bubbles were present on the react ionsurface but only on the edges .
Stem After 30 min bubbles were present on the reactionsurface but only on the edges.
Root After 30 min bubbles were present on the reactionsurface but only on the edges. Most bubbles werevisible in the root extract
In the D. cymosa, D. burgessiae, C. nata/ensis, C. greenwayi and S. murex
aqueous solutions no bubbles persisted on the reaction surface, therefore no
saponins appear to be present in the plant material of these species.
Haemolysis Test
Haemolysis is the rupture of red blood cells with the release of haemoglobin
(ABERCROMBIE, HICKMAN, JOHNSON & THAIN, 1990). Saponaria officina/is
commonly known as soapwort, has long been widely used in household

81
detergents (BRUNETON, 1995). Due to its known abundance of saponins
Saponaria officinalis was used as the positive control in these experiments.
No clear zones were visible around the wells containing water (negative control)
and S. officinalis exhibited clear zones after 3 h (positive control). The results of
the positive and negative controls indicate the experiment had worked. The leaf
and twig extracts of D. rotundifolia material from both sites showed no clear
zones (Plate 9 B). The bark extracts developed clear zones 16 h after their
addition to the blood agar plates. H. depressa extracts indicated the presence
of saponins in all plant parts when performing the Froth test, however the
haemolysis test did not support this (Plate 9 B). The blood agar was not
haemolysised by the aqueous extracts as no clear zones formed around the
wells containing the extracts.
D. cymosa , D. burgessiae, C. natalensis, C. greenwayi and S. murex aqueous
extracts were expected to contain no saponins are indicated by the results
obtain in the Froth test. This was confirmed by the haemolysis test no clear
zones formed around the wells containing the plant extracts from these five
species. Saponaria officinalis containing 'cups' formed clear zones within a few
h.
Saponins are said to have a poisoning ability. They are toxic to cold-blooded
animals, but generally not to warm-blooded animals (HARBORNE & BAXTER,
1993). Plants containing saponin-type compounds are therefore not expected to
be harmful to humans on ingestion of traditional medicinal plants. Medicinally,
they are said to have anti-microbial activity (HARBORNE & BAXTER, 1993).

Plate 9 The Sterculiaceae species were screened for saponins using
the Froth and' Haemolysis tests. (A) Froth test of D. rotundifolia,
aqueous solution from (1) UVNR and (2) Monato aqueous and,
(3) H. cepresse aqueous solutions. (8) Haemolysis test results
of material from (1) D. rotundifolia (i) leaf, (ii) twig and (iii) bark,
and (2) H. depressa (i) leaf, (ii) stem and (iii) root extracts. (L _
leaf, T - twig, 8- bark, S - stem, R - root).
A
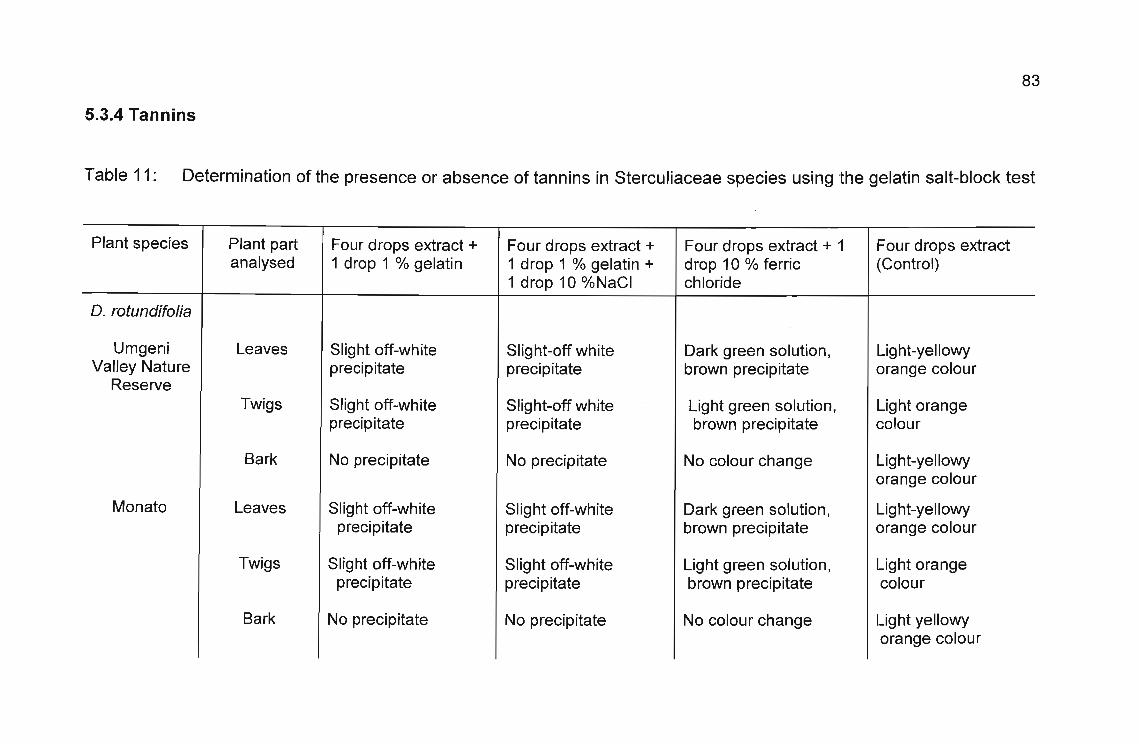
83
5.3.4 Tannins
Table 11: Determination of the presence or absence of tannins in Sterculiaceae species using the gelatin salt-block test
Plant species Plant part Four drops extract + Four drops extract + Four drops extract + 1 Four drops extractanalysed 1 drop 1 % gelatin 1 drop 1 % gelatin + drop 10 % ferric (Control)
1 drop 10 %NaCI chloride
D. rofundifolia
Umgeni Leaves Slight off-white Slight-off white Dark green solution, Light-yellowyValley Nature precipitate precipitate brown precipitate orange colour
ReserveTwigs Slight off-white Slight-off white Light green solution, Light orange
precipitate precipitate brown precipitate colour
Bark No precipitate No precipitate No colour change Light-yellowyorange colour
Monato Leaves Slight off-white Slight off-white Dark green solution , Light-yellowyprecipitate precipitate brown precipitate orange colour
Twigs Slight off-white Slight off-white Light green solution, Light orangeprecipitate precipitate brown precipitate colour
Bark No precipitate No precipitate No colour change Light yellowyorange colour

84
D. cymosa I Leaves I No precipitate I No precipitate I Slight colour change, Yellowy browngreeny yellow colour
Twigs No precipitate No precipitate No colour change Light yellow colour
D. burgessiae I Leaves No precipitate No precipitate Slight colour change, Yellow colourgreeny yellow
Twigs No precipitate No precipitate No colour change Very light yellow
C. natalensis I Leaves No precipitate No precipitate No colour change Light green colourTwigs No precipitate No precipitate No colour change Light orange
colour
C. greenwayi I Leaves I White precipitate I White precipitate I Blue-green colour Yellowy-brownchange colour
Twigs I No precipitate I No precipitate I Slight colour change Orange- browncolour
H. depressa I Leaves White precipitate White precipitate Green colour Yellow colourStem White precipitate White precipitate Brown colour Light yellow colourRoots White precipitate White precipitate Dark brown colour Light browny
orange colour
S. murex I Leaves I No precipitate I No precipitate I No colour change I Very light yellowcolour
Twigs I No precipitate I No precipitate I No colour change I Light yellow colour

85
During the Salting out, the extracts became murky, but there was no sign of
definite precipitation within any of the extracts. After filtering the extracts
through Whatman No 1, they became clearer.
Colour changes occurred immediately on the addition of the ferric chloride In
the gelatine salt-block test and all precipitates formed within seconds of the
addition of the various solutions.
The extracts from both collection sites for D. rotundifolia yielded similar results
(Table 11). The only noticeable difference was in the leaves, where on the
addition of ferric chloride to the UVNR extract there was an abundance of
precipitate. In the extract from Monato there was noticeably less. Condensed
tannins have been used in medicine to aid the healing of wounds and burns.
When applied to the skin, they produce an impervious layer under which the
healing process can take place (HARBORNE & BAXTER, 1993). The tannins in
the leaves of D. rotundifolia may be what causes the healing of abscesses
(WATT & BREYER-BRANDWIJK, 1962) when used in traditional medicine.
Precipitate formation occurred in the leaf extracts from C. greenwayi. There
was a noticeable change in extract colour from a yellowy-brown to a dark blue
green with the addition of 10% ferric chloride, indicative of the presence of
tannins in the extract. There were slight colour changes in the twig extract from
C. greenwayi and in the leaf extracts of both D. cymosa and D. burgessiae but
in all these extracts there was no sign of the formation of any precipitate.
Leaf, stem and root extracts from H. depressa were positive for tannins. The
leaf extract yielded least tannins and the root the most if measured by the
degree of colour change and precipitate formed.
It can therefore be suggested that tannins are present in the leaves and twigs of

86
D. rotundifolia, the leaf extracts of C. greenwayi, and the leaf, stem and root
extracts of H. depressa.
Plant material containing tannins may give false-positive results in assays using
enzymes. Tannins are phenolics which destroy enzymes inhibiting their action.
Plant material screened for anti-inflammatory activity using the CQX-1 assay
may indicate false-positive results (Table 7). D. rotundifolia leaf and twig (87
97 %), H. depressa stem (78 %) and root (81 %) and C. greenwayi leaf (78 %)
material suggest high anti-inflammatory activity, however, these results may be
false-positive due to the presence of tannins in the plant material.
5.3.5 Alkaloids
In all the extracts of D. rotundifolia, C. natalensis, C. greenwayi, D. cymosa, D.
burgessiae, S. murex and H. depressa no orange-red precipitate developed
with the addition of Dragendorff's reagent and no white precipitate developed
with the addition of Mayer's reagent indicating the absence of alkaloids.
Alkaloids were reported to be absent from D. rotundifolia, D. cymosa, D.
burgessiae, S. murex and H. depressa (RAFFAUF, 1996). Light petroleum
extracts from the residual meal obtained from the seed of S. murex contained a
trace of alkaloidal material (WATT & BREYER-BRANDWIJK, 1962).
87
5.4 SUMMARY
• Seven Sterculiaceae species were screened for the following
phytochemical compounds, using the test indicated:
- Cardiac glycosides (two-deoxy-sugars; unsaturated lactone ring test)
are used in controlling congestive heart failure (HARBORNE &
BAXTER, 1993). D. rotundifolia leaf, twig and bark material indicated
the presence of cardienolides and bufadienolides. The probable
presence of bufadienolides was indicated in the leaf material of D.
burgessiae, D. cymosa and S. murex.
Cyanogenic glycosides (sandwich method) are poisonous to humans
in high doses. They were lacking in all plant material of the seven
species investigated.
Saponins (froth test, haemolysis test) contain anti-fungal and anti
microbial activity. Saponins are expected to be present in leaves,
twigs and bark of D. rotundifolia and the leaves, stems and roots of H.
depressa.
Tannins (gelatin salt-block test) have wound and burn healing
properties as well as anti-viral and anti-tumour activity (SIEGLER,
1977; HARBORNE & BAXTER, 1993). Tannins are located in the
leaves and twigs of D. rotundifolia and the leaves, stems and roots of
H. depressa.
Alkaloids (pH partitioning) were found to be absent in all plant
material of the seven species investigated.
• D. rotundifolia indicated the same phytocemical compounds present in
plant material collected from two different collection sites, differing only in
the absence of cardienolides in the Monato leaf material.

88
CHAPTER 6
ISOLATION OF ANTI-BACTERIAL COMPOUNDS
6.1 INTRODUCTION
Bacterial infections especially in Third World countries are rife. Infectious
diseases caused by pathogenic bacteria have increased in terms of annual
prevalence of morbidity and mortality. Together with malnutrition and
malaria (and more recently AIDS) these diseases are largely responsible for
mortality and low life expectancies in most developing countries
(RASOANAIVO & RATSIMAMANGA-URVERG, 1993). Readily available,
cheap drugs or even easily obtainable local plant extracts, with anti-bacterial
activity, are important for the treatment of ailments brought about by
bacterial infections. Bacterial infections are highest in informal settlement
areas due to poor sanitation and unhygienic conditions.
6.1.1 Bacteria
6.1.1.1 Bacterial Infections
Poor preparation of food aids in infection by bacteria. Using polluted drinking
water, gross contamination of environment, residual contamination of
washed utensils (could be largely eliminated by use of soap) and personal
hygiene are all examples leading to poor food preparation (ROWLAND,
1985). A common ailment brought about by bacterial infections in the
human gut is diarrhoea. Proliferation of bacteria in the upper small intestine
of man in tropical and subtropical areas is associated with chronic diarrhoea
and mal-absorption, especially in severely malnourished children (GRACEY,
1979). Diarrhoea is a prominent clinical feature of childhood malnutrition and
is mostly due to gastrointestinal infections and infestations (GRACEY, 1985)

89
by bacteria, viruses and protozoa (SLEIGH & TIMBURY, 1998). Pollution, in
areas of poor sanitation and hygiene can increase 10 to 100 times within
days of the onset of rains and persists at these higher levels throughout the
rainy season, which is also the period of highest diarrhoeaI prevalence
(ROWLAND, 1985).
6.1.1.2 Gram-staining
Bacteria are stained with different dyes in order to make them visible under
the microscope. The most common method of staining is the Gram method
(VLOK & RYKHEER, 1966). Bacteria are divided into two main groups on
the basis of the Gram-staining reaction, a division which is reflected in the
differences in cell wall structure of the Gram-positive and Gram-negative
bacteria (Fig. 3) (GALE, CUNDLlFFE, REYNOLDS, RICHMOND &
WARING, 1981).
(A)
Fig. 3:
(B)
Diagrams showing the basis of bacteria cell walls A) Gram
negative and B) Gram-positive bacteria (SLEIGH & TIMBURY,
1998)

90
6.1.1.3 Growth Requirements of Bacteria
Bacteria, like all cells, require nutrients for the maintenance of their
metabolism and for cell division. They require a number of essential
elements for growth (Table 12) as well as amino acids, purines, pyrimidines
and vitamins (SLEIGH & TIMBURY, 1998). Optimal environmental
conditions are also essential: water, oxygen, carbon dioxide, temperature
and hydrogen ion concentration being the most important requirements
(SLEIGH & TIMBURY, 1998).

Table 12:
91
Essential elements required for bacterial growth (SLEIGH &
TIMBURY, 1998)
Group Element
Carbon
Hydrogen
Oxygen
Nitrogen
Phosphorus
Sulphur
2 Potassium
Calcium
Magnesium
Iron
3 Copper
Cobalt
Manganese
Molybdenum
Zinc
Role
Required for synthesis of carbohydrate,
lipid, protein, nucleic acids
Major cation; activates various enzymes
Enzyme cofactor: key role in spore
formation
Multi-enzyme cofactor: stabilizes
ribosomes , membranes, nucleic acids ;
required for enzyme substrate binding
Electron carrier in oxidation - reduction
reactions; many other functions
Activators and stabilizers of a wide
variety of enzymes
1.Elements required for the synthesis of structural components
2.Elements required for other cellular functions
3.Trace elements

92
6.1.1.4 Characteristics of Bacteria used in this Study
Table 13: ATCC numbers, Gram-status and growth description of
bacterial strains used during this study
Bacterial strain ATCC
Number
Gram
(+/-v)
Growth Description
S. aureus
B. subtilis
M.luteus
E. coli
P. aeruginosa
K. pneumonia
12600
6051
4698
11775
10145
13883
+
+
+
Colonies are entire, glistening,
circular and smooth.
Colonial variation is observed.
One type of colony is flat,
irregular-shaped and whitish in
colour (opague), the other is
smaller, more circular and
translucent also flat/rough.
Colonies are yellow pigmented
Colonies are entire, glistening,
smooth, translucent.
This strain forms two colony
types: 90 % rough, slightly
spreading and flat; 10 %
smooth glistening, entire and
pulvinate. This strain produces
two types of diffusible pigment
that may mask each other:
fluorescein - green or yellow
and pyocyanine - blue.
Two colony types: 1) Entire,
glistening, smooth, opague, 2
mm in diameter. 2) Smaller,
translucent.

93
6.1.1.4.1 Gram-positive Bacteria
Staphylococcus aureus
S. aureus is a Gram-positive bacterium that is a non-encapsulated, non
motile, non-sporeforming coccus that is arranged in grape-like clusters
(SNYDMAN & GORBACH, 1982). S. aureus is the main pathogen of the
staphylococcus strains and is responsible for pyogenic infections. It inhabits
body surfaces (SLEIGH & TIMBURY, 1998) and grows in any tissue in the
body (VLOK & RYKHEER, 1966), inhabiting the nose, and less often the
skin, throat and gut (SNYDMAN & GORBACH, 1982; SLEIGH & TIMBURY,
1998). On the skin it causes boils, carbuncles and impetigo contagiosa,
abscesses, impetigo, sycosis barbae, conjunctivitis, wound infections, deep
infections, toxic food poisoning, and skin exfoliation (VLOK & RYKHEER,
1966; SLEIGH & TIMBURY, 1998). The cocci grow to a diameter of 1 m,
growing well on ordinary media, at an optimal temperature of 37°C. S.
aureus is typically golden, but pigmentation varies from orange to white
(SLEIGH & TIMBURY, 1998). It is an enterotoxigenic bacteria (GRACEY,
1985).
Staphylococcus epidermidis
S. epidermidis is a Gram-positive bacterium. It is rarely pathogenic and does
not produce coagulase or ferment mannitol (SNYDMAN & GORBACH,
1982). It is a universal skin commensal. It inhabits the skin and the gut or
upper respiratory tract (SLEIGH & TIMBURY, 1998). S. epidermidis grows
as white colonies (SLEIGH & TIMBURY, 1998). It is of lower pathogenicity
than S. aureus but an important pathogen of implanted metal and plastic
devices and prostheses (SLEIGH & TIMBURY, 1998).

94
Bacillus subtilis
Members of the genus Bacillus are aerobic, sporing, Gram-positive,
chaining bacilli. B. subtilis bacteria are small celled, short and thin rod
shaped with rounded ends (VLOK & RYKHEER, 1966; SLEIGH &
TIMBURY, 1998).These bacteria cause urinary tract infections and subdural
haematoma. They are also associated with a number of allergies. B. subtilis
has the ability to produce antibiotics against other Gram-positive bacteria
(FARRAR & REBOLl, 1981).
6.1.1.4.2 Gram-negative Bacteria
Escherichia coli
Over the past few years enterotoxigenic bacteria (eg: E. coli) have become
recognised as important causes of infectious diarrhoea (GRACEY, 1985).
Bacteria which produce enterotoxins, such as enterotoxigenic E. coli, cause
intestinal fluid secretion which is stimulated by the enterotoxins and
mediated by enzymatic processes within the enterocytes (GRACEY, 1985).
E. coli is a normal inhabitant of the human and animal intestine. It grows
well as large colonies after overnight incubation. The principle diseases
caused by E. coli are wound infections, especially after lower intestinal tract
surgery, peritonis, biliary tract infection, septicaemia, neonatal meningitis
and urinary infections usually resulting in diarrhoea (SLEIGH & TIMBURY,
1998).
Klebsiella pneumoniae
K. pneumonia is an enterotoxigenic bacterium (GRACEY, 1985). It lives in
the human and animal intestine. It grows well on ordinary media, with
colonies which are often, but not always, large and mucoid. K. pneumoniae

95
is also involved in urinary infections, septicaemia and rarely pneumonia
(SLEIGH & TIMBURY, 1998).
Pseudomonus aeruginosa
P. aeruginosa is a Gram-negative bacterium that is also enterotoxigenic
(GRACEY, 1985). It lives in the human and animal gastrointestinal tract, as
well as in water and soil. It grows on routine media over a wide range of
temperatures (5°C - 42°C). It is however a strict aerobe. It grows in colonies,
and exhibits a fluorescence which has a greenish appearance due to the
production of pyocyanin (blue-green) and f1uorescein (yellow). It is an
important cause of hospital-acquired infections, causing infections in the
urinary tract, wound infections, lower respiratory tract infections and eye
infections (SLEIGH & TIMBURY, 1998).
6.1.1.5 Neomycin as a Control
Neomycin is an antibiotic effective against both Gram-positive and Gram
negative bacteria (PAGE, CURTIS, SUTTER, WALKER & HOFFMAN,
1997). It works by binding with 30S and in some cases 50S ribosomal
subunits causing miscoding, and inhibits initiation and elongation during
protein synthesis (SIGMA CATALOGUE, 2002/2003).
6.1.2 Chromatography, and its Techniques
The key to any successful program involving the investigation of biologically
active plant constituents is the availability and choice of chromatographic
techniques for the separation of pure substances. Chromatography is one of
the most important preparative separation techniques employed in the
isolation and purification of plant constituents (HEFTMANN, 1961). It is a
widely used experimental technique by which a mixture of compounds can

96
be separated into its individual components (BETTELHEIM &
LANDESBERG, 1991).
Solvents Used in Chromatography
Polarity gives some indication of the distribution of electrical charge across
the molecule and is particularly related to the number of electrons and
lone-pair electrons in a molecule. The relative size of the less polar region of
the molecule is also important, the larger this is the less polar the compound
will be compared to related molecules bearing the same functional groups
(HOUGHTON & RAMAN, 1998). Solvents can be classified on their polarity
(Table 14). The dielectric constant of a solvent is taken as a measure of
solvent polarity. It is defined as the ratio of work needed to separate two
oppositely charged particles a given distance in a vacuum to the work
required to separate them the same distance when they are in a liquid
(SCHMID, 1996).
Table 14: Eluotropic series of solvents, arranged in order of increasing
polarity
Solvent
Hexane
Cyclohexane
Chloroform
Ethyl acetate
Glacial acetic acid
Dichloromethane
Ethanol
Methanol
Water
Dielectric constant (at 25°C)
1.89
2.02
4.87
6.02
6.15
9.14
24.30
33.60
78.30

97
Hexane [CH3 (CH2)4 CH3] is very non-polar. There are no double bonds on
electronegative atoms. Ethyl acetate has appreciable polarity since both
electrons and lone pair electrons are present on the oxygen atom. Water
[H20 ] is polar. It is a small molecule and has no lipophilic non-polar portion
(HOUGHTON & RAMAN, 1998).
6.1.3 Nuclear Magnetic Resonance Spectroscopy
Nuclear magnetic resonance (NMR) is a branch of spectroscopy based on
the fact that atomic nuclei oriented by a strong magnetic field absorb
radiation at characteristic frequencies (JARDETZKY & ROBERTS, 1981). It
differs from mass spectrometry, as it is a non-destroying method. Like
electrons, both protons and neutrons have spin. A nucleus that contains an
odd number of protons and neutrons (or both) has spin and is magnetically
active. Nuclei can be induced to jump from a lower- to a higher- energy spin
state by electromagnetic energy of a frequency that matches the energy
difference between the two states. The spin responsible for creating the two
states is a property of the nucleus of the atom, and this is nuclear magnetic
resonance spectroscopy (FOX & WHITESALL, 1997).
6.2 AIMS
Isolation of anti-bacterial compounds involved a variety of techniques, using
different equipment. The aim of this Chapter was to isolate the anti-bacterial
compounds, while developing an understanding of the techniques.
Isolation of compounds from Sterculiaceae species showing good activity
against S. aureus in Chapter 4 was attempted. Isolation and purification
techniques included vacuum liquid chromatography (VLC), Sephadex LH-20
column chromatography, preparative thin layer chromatography and high
pressure liquid chromatography (HPLC).

98
6.3 GENERAL MATERIALS AND METHODS
6.3.1 Sterculiaceae Species Used for Anti-bacterial Isolation
Analysis of initial anti-bacterial screening determined which species would
be selected for isolation of the active compounds. The species used in the
isolation procedures were Dombeya rotundifolia, Dombeya burgessiae,
Dombeya cymosa, Cola greenwayi and Hermannia depressa (Table 15).
Table 15: Plant species used in the isolation of active anti-bacterial
compounds
Plant species Plant part Extracting solvent
D. rotundifolia leaf ethyl acetate
D. burgessiae leaf ethyl acetate
D. cymosa leaf ethanol
C. greenwayi twig ethyl acetate
H. depressa leaf ethyl acetate
With respect to D. rotundifolia, similar results were obtained from plant
material collected from both collection sites, UVNR and Monato. Material
used in the isolation of compounds was collected from the UVNR in
KwaZulu-Natal as this area was more accessible.
6.3.2 Extraction of Plant Material by Soxhlet
Small Soxhlet Apparatus
Plate 3 (0) shows the column assembly of the small Soxhlet apparatus. A
small Soxhlet apparatus was used in the extraction of D. cymosa (60 g), D.
burgessiae (80 g), C. greenwayi (100 g) and H. depressa (116 g) dry

99
material. Ten g of dried, crushed plant material were placed in a thimble.
Solvents (ethanol, ethyl acetate and dichloromethane) (150 ml) were placed
in a Buchi flask and heated. The extraction took place over 2 h or until there
was little or no further colour being extracted from the plant material. The
solvents were evaporated under vacuum and the mass of residues
determined.
Large Soxhlet Apparatus
Plate 3 (C) shows the column assembly of the large Soxhlet apparatus. A
large Soxhlet apparatus was used in the bulk extraction of plant material.
Only D. rotundifolia leaf material (250 g) was extracted in this way. Two
litres of ethanol were placed into the boiling flask. The extraction continued
over two days, with the system being switched off overnight as a safety
precaution. The ethanol leaf extract obtained by Soxhlet was evaporated
under vacuum. The dried residue was weighed and redissolved in ethanol.
6.3.3 Solvent Ratio Determination for Thin Layer Chromatography
In determining the best solvent ratios, hexane and ethyl acetate were used.
The solvents were mixed in the following ratios:
Hexane: ethyl acetate - 1:1 Hexane: ethyl acetate - 1:2
Hexane: ethyl acetate - 2:1 Hexane: ethyl acetate - 4:1
TLC plates were spotted with the relevant extracts and the TLC plates
run in the different solvent combinations. The best separation for extracts
from D. rotundifoIia, 0 cymosa, D. burgessiae and C. greenwayi was
obtained when using hexane: ethyl acetate (1:1)(v/v), while the best
separation for the H. depressa extract was a ratio of (4:1)(v/v). These ratios
were used in all TLC preparations throughout the study unless otherwise
stated. TLC plates used throughout the study were Merck Silica gel 60F254 ,
0.25 mm thick, sizes 20 x 20 cm and 20 x 5 cm respectively.

100
6.3.4 Bioautographic Spray Method
Cultures of Staphylococcus aureus were prepared under sterile conditions.
S. aureus was suspended in 20 ml MH broth, in two autoclaved centrifuge
tubes, which were placed in a waterbath (37°C) overnight. A thin layer
chromatography (TLC) plate was prepared, run in a solvent solution and the
solvent allowed to evaporate.
The overnight culture was centrifuged at 3 000 g for 10 min. The pellets
were resuspended with 10 ml fresh MH broth to give an optical density of
c.l/ 0.8. The plate was sprayed in a spray hood, placed in a metal tray on
moist Carlton paper and covered with c1ingwrap. It was incubated under
100% relative humidity at 38°C for 24 h.
The plate was removed from the oven and allowed to dry slightly. Ten ml (2
mg ml") INT solution were sprayed onto the plate. It was incubated at 100%
humidity for 6 h at 37°C. Inhibition of growth was indicated by clear zones
on the TLC plate.
6.3.5 Isolation Techniques
6.3.5.1 Vacuum Liquid Chromatography (VLC)
Column Preparation
A large column was used (400 ml). One hundred and forty-five g of silica
(Silica gel 60 (0.040 - 0.063 mm) were poured slowly into a column, on top
of a already placed filter paper disc and a thin layer of sand. Silica (5 g) was
mixed with the dry sample, which was placed neatly on top of the silica in
the column. Glass wool was placed on top of the silica and weighed down
with a few marbles.

101
Solvent Gradient Used
Solvents used were hexane and ethyl acetate. The gradient began with 100
% hexane, and ended with 100 % ethyl acetate (Table 16).
Table 16: Gradients of solvents (hexane: ethyl acetate) used in VLC for
further purification of samples
Sample Hexane (ml) Ethyl acetate (ml)
A 400 0
B 340 60
C 320 80
D 300 100
E 280 120
F 260 140
G 240 160
H 200 200
I 160 240
J 140 260
K 80 320
L 40 360
M 0 400
Addition and Collection of Solvents
With the addition of the solvent (400 ml) into the column, the vacuum was
switched on. The solvent was allowed to run through the column, until the
400 ml had been collected in the collection flask. The solvents were
removed under vacuum using a Buchi apparatus. The residues were placed

102
in pill vials and dried overnight. The weight of the extract was determined
and the extracts were redissolved (10 mg rnl") in ethyl acetate.
Anti-bacterial activity in the different fractions collected (A through M) was
determined using the bioautographic spray method. Anisaldehyde spray
reagent determined the position of additional compounds. TLC plates (20 x
20 cm glass plates, 0.25 mm and 1 mm) spotted with the fractions in 25 ~I
aliquots (0.25 mg of extract) were run in a solvent solution of hexane:ethyl
acetate (1:1) (v/v).
6.3.5.2 Sephadex LH-20 Column Chromatography
Preparation and Running of the Column
The stationary phase used was Sephadex LH-20, and the mobile phase
cyclohexane: dichloromethane: methanol (7:4:1)(v/v/v).
The Sephadex was swelled in the solvent mixture. The column was
assembled in a cold room (10°C) (This avoids the generation of air bubbles).
The amount of sample used was the equivalent of 1 % of the amount of
Sephadex LH-20 in the column (5 - 10 g sample was sufficient for 50 -100 g
Sephadex LH-20, with a column diameter of 1 - 2 cm). All the swollen
Sephadex LH-20 was poured into the column while the tap was open. The
column was washed with solvent mixture until the Sephadex LH-20 had
settled. The sample, dissolved in the same solvent mixture, was applied as
a narrow band to the top of the column, with the tap still open. Fractions (10
ml) were collected. Separation was noted by spotting fractions on TLC
plates and running a bioautographic assay to determine the location of anti
bacterial compounds.

103
6.3.5.3 Preparative Thin Layer Chromatography
TLC plates were strip loaded with active fractions from previous separation
with VLC. Extracts were dissolved in 50 mg ml" of the relevant solvent. The
extracts were streaked on glass plates (Merck Silica gel 60F254, 20 x 20 cm,
0.25 mm) in 25 ~I aliquots, and run in hexane: ethyl acetate (1:1) for all plant
extracts, except H. depressa which was run in hexane: ethyl acetate (1:4)
(v/v).
A small section (2 x 20 cm) of glass was cut from the plates and a
bioautographic assay performed on it to indicate the position of anti-bacterial
bands.
Bands containing active fractions were scrapped off using a blade. The
silica was placed in glass flasks (50 ml) containing 20 ml of the relevant
solvent. The flasks were placed in an ultra-sound bath for 15 min before the
solvent was separated using a Buchner funnel or gravity filtration through
Pasteur pipettes. For gravity filtration glass wool was placed in a pipette
acting as a filter, covered by a small quantity of silica (Silica gel 60 (0.040
0.063 mm). Up to 5 pipettes were secured together with an elastic band.
This procedure was repeated twice to ensure removal of all silica from
extract. Extracts were placed in glass pill vials, dried and their weights
determined.
Fractions were redissolved at 10 mg rnl' in the relevant solvent. To
determine purity, they were spotted onto 2 TLC plates (20 x 20 cm,
0.025cm). The TLC plates were run in a solvent solution of 1:1 hexane: ethyl
acetate. A bioautographic assay was used to determine the presence of
anti-bacterial compounds on the one plate and anisaldehyde spray reagent
used to visualize compounds present.

104
6.3.5.4 High Pressure Liquid Chromatography (HPLC)
The dried fractions showing anti-bacterial activity, which required further
isolation were redissolved in 100 mg ml" methanol. A Varian model 5000
Liquid Chromatograph HPLC apparatus was used in the isolation of
compounds through a column (Phenomenex, 260 x 10 mm, C18, 5 IJm).
Distilled water was prepared for HPLC by filtering through MilliporeR filter
paper (0.22 m). A gradient of methanol (HiperSolv™) and water were the
mobile phase. Flow rate was set at 2.5 ml rnin", One hundred IJI was
injected into the system per run. Detection was at wavelengths of 210 nm,
305 nm, and 400 nm respectively using a Spectrasystem UV3000 HR
detector
6.3.6 Preparation of Compounds for NMR
NMR was performed by Mr Martin Watson and Craig Grimmer of the School
of Chemistry and Physical Sciences (University of Natal Pietermaritzburg).
The compounds were redissolved in a solution of deuteromethanol or
chloroform. The 13C-NMR spectrum of the sample dissolved in CD30D was
recorded at 200 MHz using a Kratos MS 80RF double-focussing magnetic
sector instrument at 70eV. TMS was used as an internal standard.
6.3.7 Gas Chromatography - Mass Spectroscopy
GC-MS was performed by Mr James Ryan of the School of Chemistry and
Physical Sciences (University of Natal Pietermaritzburg) and Brett Parel of
the School of Pure and Applied Chemistry (University of Natal Durban). The
compounds were redissolved in chloroform. Instrumentation: MAT CH7 A
mass spectrometer (Finnigan MAT, Bremen) coupled with Varian type 1700
gas chromatograph; carrier gas: helium; column: optimal (M + N), 25 M x

105
0.32 mm, layer 0.5 m; injector temperature: 250°C; ionization energy: 70 eV;
gradient: 120°C isotherm for 1 min, linear with 10°C min" to 280°C.
6.4 ANTI-BACTERIAL COMPOUND ISOLATION
6.4.1 Dombeya rotundifolia
Materials and Methods
Plate 10 outlines the procedures used for the isolation of anti-bacterial
compounds from D. rotundifolia leaf material extracted with ethyl acetate.
Dried, ground leaf material (250 g) was extracted in ethyl acetate using a
large Soxhlet apparatus. The crude residue (2.56 g) obtained was separated
by VLC. Anti-bacterial activity was determined by bioautography. Fractions
indicating similar active zones with identical R, values and colours were
combined. Preparative TLC (Merck Silica gel 60F254 , 0.25 mm) ensured
purification of isolated compounds. The compounds were analysed by NMR
and GC-MS.
Results
Thirteen fractions (A - M) were collected by VLC and analysed for their anti
bacterial activity (Table 17). VLC of the ethyl acetate leaf extract of D.
rotundifolia (Plate 10 B) showed separation of compounds when viewing
after staining with ansialdehyde spray reagent. A bioautographic assay
indicated anti-bacterial areas in the form of white zones. The areas of anti
bacterial interest are indicated by a rectangle (Plate 10 B). Other white
zones not chosen for isolation contained fractions with insufficient residue.

106
Table 17: Fractions (A - M) collected from VLC of D. rotundifolia ethyl
acetate leaf extract, showing relative information including
mass of fractions eluted, percentage of total, colour of fraction,
presence of activity and which fractions were used in
preparative TLC
Fraction Mass of Percentage Activity Colour of Extract
Fraction of total against
(mg) (%) S. aureus
A 32 1.25 X White
B 329 12.85 X Mustard yellow
C 265 10.35 X Dark olive green
D 215 8.40 X Dark olive green
E 201 7.85 X Olive green
F 151 5.90 ./ Olive green 1
G 146 5.70 ./ Yellowy-green 1
H 140 5.47 X Yellowy-green
I 124 4.84 X Olive green
J 49 1.91 ./ Olive green 2
K 86 3.36 ./ Olive green 2
L 50 1.95 ./ Browny-green 2
M 42 1.64 ./ Browny-green 2
Total 1.83 g 71.48 %
1 - Fractions (F & G) combined for TLC preparation
2 - Fractions (J, K, L & M) combined for TLC preparation
Fractions F (260 ml hexane: 140 ml ethyl acetate), G (240 ml hexane: 160
ml ethyl acetate), J (140 ml hexane : 260 ml ethyl acetate), K (80 ml hexane:
320 ml ethyl acetate), L (40 ml hexane: 360 ml ethyl acetate), and M (0 ml
hexane: 400 ml ethyl acetate) all exhibited anti-bacterial activity (Plate 10
B).

107
Fractions F and G indicated the presence of anti-bacterial activity at the
same Rf value (0.82) and were combined for further isolation by preparative
TLC. Similarly, Fractions J, K, L, and M were combined as they exhibited
active anti-bacterial compounds at an Rf value of 0.025. Fractions F and G
were less polar as they were eluted from the VLC column where hexane
concentrations were higher than ethyl acetate concentrations. Hexane, with
a dielectric constant of 1.89 (25°C), is a very non-polar solvent as there are
no double bonds on electronegative atoms (HOUGHTON & RAMAN, 1998).
On the other hand, Fractions J, K, L, and M contained more polar
compounds as they exhibit a low Rf value (0.025) and eluted at high
concentrations of ethyl acetate.
Preparative TLC ensured further isolation of active compounds. Combined
Fraction FG was loaded onto four TLC plates and combined Fraction JKLM
onto four plates, one and two zones were obtained from each run,
respectively (Table 18) (Plate 10 C).
Table 18: Preparative TLC zones recovered for D. rotundifolia VLC
fractions
VLC Fraction/s Scraped Mass of Activity? Purity Mass sent
zone Fraction for NMR
(mg) (mg)
1) F &G A 15 ./ ./ 11
2) J, K, L &M B 35 ./ ./ 22
Compound A, obtained from combined Fraction FG (Table 18) showed anti
bacterial activity and reasonable purity of the compound after bioautography
and anisaldehyde spray reagent analysis, respectively. Of the two zones
scraped from combined Fraction JKLM, only Compound B showed
significant activity and purity after analysis. Compound C was discarded.

108
Compound A (11 mg) and Compound B (22 mg) were analysed by NMR
and GC-MS (Appendix A). NMR analysis indicated the compounds were
fatty acids , but they were not identifiable. GC-MS indicated the main
components of Compound A (Fig. A.1) to be a combination of Myristic acid
(95 %) (Fig. A.2), Palmitic acid (93 %) (Fig. A.3) and Stearic acid (78 %)
(Fig. A.4). Compound B (Fig. A.5) indicated the presence of Lauric acid (Fig.
A.7) MS m/z (reI. int.): 73.10 (100), 60.10 (83.54), 55.15 (67.36), 43.10
(68.88), 41.20 (77.35); Myristic acid (Fig. A.8) MS m/z (reI. int.): 73.10
(89.46), 60.10 (70.89), 55.10 (72.86), 43.15 (100), 41.20 (77.01) and
Palmitic acid (Fig. A.9) MS m/z (reI. int.): 73.10 (100), 60.10 (81.96), 55.10
(85.03), 43.15 (99.28), 41.15 (89.41); as well as a high concentration of
acetic acid (Fig. A.6) MS m/z (reI. int.): 60.10 (43.24), 45.10 (88.41), 43.10
(100), 42.10 (16.77) , 29.10 (12.85).
Polarity of the fatty acids could have been affected by a number of factors .
The combination of fatty acids the compound was composed of could have
effected the polarity resulting in the same fatty acid exhibiting different Rf
values . The salt and free acid of the same compound could have been
detected due to the pH of the TLC solvent system.

A Leaves ofD. rotundifolia
(250 g)
Soxhlet extraction- Ethyl acetate
B(22 mg)
PILC (4 plates, 1 mm thick)
IA
(11 mg)
PILC (4 plates, 1 mm thick)
I I~
Plate 10 Isolation of anti-bacterial compounds from D. rotundifolia leaf
extract. (A) ,Flow chart outlining the isolation procedure
followed. (8) VLC fractions (A - M) were spotted on TLC plates
and analysed by (1) staining with anisaldehyde spray reagent
and (2) bioautography. (C) A representative chromatogram
indicates the position of bands recovered by preparative TLC
methods indicating fatty acid composition.
B
c
.I!!!!I\I!IIIlI ----. Compou nd A (11 mg) ----.Rf- 0.82
-- ----. Compound B (22 mg) ----.Rf - 0.025
CH 2,0_~ --.- 3-ICHilw -....C:7\
OHPalmitic acidMyristic acid
.....~''''& h a
CH3-ICHzhz- c :7
jf 'oH/
/ . fiO
U CH3__{CH21.1.-C~/ OH
Myristic acidLauric acid 0Palmitic acid CH" /IAcetic acid ~ "\OH

110
6.4.2 Dombeya burgessiae
Materials and Methods
Plate 11 outlines the procedures used for the isolation of anti-bacterial
compounds from O. burgessiae leaf material extracted with ethyl acetate.
Dried, ground leaf material (80 g) was extracted in ethyl acetate using a
small Soxhlet apparatus. The crude ethyl acetate residue (2.65 g) obtained
was separated by VLC. Anti-bacterial activity was determined by
bioautography. Fractions indicating similar active zones were combined.
Preparative TLC ensured purification of isolated compounds (Merck Silica
gel 60F254, 20 x 20 cm, 0.25 mm). One compound was analysed by NMR
and GC-MS.
Results
Thirteen fractions (A - M) were collected by VLC and analysed for their anti
bacterial activity (Table 19). VLC of the ethyl acetate leaf extract of O.
burgessiae (Plate 11 B) verified the separation of compounds when viewing
after staining with ansialdehyde spray reagent and a bioautographic assay
indicated active zones (white zones on a red background). Black rectangles
indicate zones chosen for isolation (Plate 11 B).

111
Table 19: Fractions (A - M) collected from VLC of D. burgessiae ethyl
acetate leaf extract, showing relative information including
mass of fractions eluted, percentage of total, colour of fraction,
presence of activity and which fractions were used in
preparative TLC
Fraction Mass of Percentage Activity Colour of Extract
Fraction of total against
(mg) (%) S. aureus
A 36 1.36 X White
B 256 9.66 X Yellow green
C 174 6.57 X Dark green
D 127 4.79 X Dark green
E 108 4.08 ,/ Dark yellowy-brown 1
F 82 3.09 ,/ Yellowy-brown 1
G 51 1.92 X Yellowy-brown
H 47 1.77 X Yellow
I 35 1.32 X Yellowy-olive green
J 21 0.79 X Yellowy-olive green
K 27 1.02 X Olive green
L 19 0.72 X Olive green
M 10 0.38 X Olive green
Total 0.993 g 37.47 %
1 - Fractions (E & F) combined for TLC preparation
Fractions E (280 ml hexane: 120 ml ethyl acetate) and F (260 ml hexane:
140 ml ethyl acetate) exhibited anti-bacterial activity (Plate 11 B). The
activity exhibited by these fractions indicated the presence of anti-bacterial
activity at the same R, value (0.82) and they were combined for further
separation by preparative TLC. The anti-bacterial indicated a non-polar
nature as the fractions were eluted in a solvent solution of high hexane

112
concentration, hexane being a very non-polar solvent. Notably, the active
components exhibited the same Rf value and colour as the active
components from O. rotundifolia ethyl acetate leaf extract. Other indicated .
anti-bacterial active zones that were not further isolated contained fractions
consisting of a number of impurities or insufficient residue.
Preparative TLC ensured the isolation of the active compound from
combined Fraction EF (Table 20) (Plate 11 C).
Table 20: Preparative TLC zones recovered for O. burgessiae VLC
fractions
VLC Scraped Mass of Activity? Purity Mass sent
Fraction/s Zone Fraction for NMR
(mg) (mg)
1) E & F A 34 ./ ./ 10
Active Compound A (34 mg) (originally of combined Fraction EF) was
obtained from preparative TLC. The compound appeared to be pure by
staining with anisaldehyde spray reagent. Compound A (10 mg) from O.
burgessiae ethyl acetate leaf extract was analysed by NMR and GC-MS.
From NMR analysis Compound A was evidently a fatty acid. GC-MS
analysis (Appendix A) indicated the main component to be Palmitic acid
(Fig. A.11) MS m/z (reI. int.): 73.10 (100), 60.10 (85.61),55.15 (79.77),
43.15 (97.60), 41.15 (86.56).

A(10 mg)
Plate 11 Isolation of ant-bactertai compounds from D. burgessiae leaf
extract. (A) Flow chart outlining the isolation procedure
followed. (B) VLC fractions (A - M) were spotted on TLC plates
and analysed by (1) staining with anisaldehyde spray reagent
and (2) bioautography. (C) A representative chromatogram
indicates the position of the band recovered by preparative TLC
methods indicating fatty acid composition .
A
B
c
Leaves ofD. burgessiae
(80 g)
Soxhlet extraction- Ethyl acetate
VLC - 2.65 9 leaf residue (hexane: ethyl acetate)
r -ri I I I I I IA B C D~G H I J K L M
190
1
mg
PTLC (4 plates, 0.25 mm thick)
I I(~)
1rs ] --. Compound A (10 mg) --.. Rf- 0.82
Palmitic acid
oCH3-rCH..J14- c?
"OH

114
6.4.3 Dombeya cymosa
Materials and Methods
Plate 12 outlines the procedures used in the isolation of anti-bacterial
compounds from D. cymosa leaf material extracted with ethanol.
Dried, ground leaf material (60 g) was extracted in ethanol using a small
Soxhlet apparatus. The crude ethanol residue (2.65 g) obtained was
separated by VLC. Activity was determined by bioautography. .Fractions
indicating zones with similar activity were combined. A Sephadex LH-20
column was run with the combined fraction (277 mg). A total of 80 fractions
were collected from the Sephadex LH-20 column and activity was
determined by bioautographic methods. Preparative TLC ensured
purification of the isolated compounds (Merck Silica gel 60F254, 20 x 20 cm,
0.25 mm) Three compounds were analysed by NMR spectroscopy.
Results
Thirteen fractions (A - M) were collected by VLC (Table 21) and were
viewed after staining with anisaldehyde spray reagent. A bioautographic
assay indicated anti-bacterial areas and rectangles indicate the zones
showing good anti-bacterial activity which were chosen for isolation (Plate
12 B).

115
Table 21: Fractions (A - M) collected from VLC of D. cymosa ethanol leaf
extract, showing relative information including mass of fractions
eluted, percentage of total, colour of fraction, presence of
activity and which fractions were used in preparative TLC
Fraction Mass of Percentage Activity Colour of Extract
Fraction of total against
(mg) (%) S. aureus
A 65 2.45 X White
B 1080 40.08 X Orange
C 278 10.49 X Dark green
D 100 3.77 X Dark green
E 26 0.98 ./ Dark green 1
F 35 1.32 ./ Dark green 1
G 37 1.37 ./ Dark green 1
H 59 2.23 ./ Dark green 1
I 57 1.15 ./ Dark green 1
J 36 1.35 ./ Green 1
K 37 1.02 ./Green 1
L 13 0.49 X Ye 11owy-green
M 11 0.42 X Yellowy-green
Total 1.797 g 67.12 %
1 - Fractions (E through to K) combined for separation by Sephadex LH-20
Activity was visible in Fractions E (280 ml hexane: 120 ml ethyl acetate)
through to H (200 ml hexane: 200 ml ethyl acetate) (R, - 0.59), and
Fractions H (200 ml hexane: 200 ml ethyl acetate) through to K (80 ml
hexane: 320 ml ethyl acetate) (R, - 0.27). The latter group of fractions
exhibited a more polar nature. All active fractions (E - K) were combined and
further separated by Sephadex LH-20 column chromatography.

116
A total of 80 fractions were collected during the running of the Sephadex
LH-20 column. Of the 80 fractions collected, 24 exhibited anti-bacterial
activity (Plate 12 C). Of these active fractions, 8 were combined and further
separated by preparative TLC.
Table 22: Preparative TLC zones recovered for O. cymosa VLC
fractions
Sephadex Scraped Mass of Activity? Purity Mass sent
LH-20 Zone Fraction for NMR
Fraction (mg) (mg)
1) E - K A 6 ../ ../ 4
B 4 X - -
C 9 X - -
D 11 X - -
E 15 X - -
F 10 ../ ../ 4
G 13 ../ ../ 5
A total of seven zones were recovered for expected anti-bacterial activity
(Table 22), labelled alphabetically A through to G. Bioautography showed
three of these compounds were active and pure, namely Compound A (R,
0.82), Compound F (R, - 0.29) and Compound G (R, - 0.21) (Plate 12 0).
Compound A appeared as a broad band but after running in a solvent
solution gradient it was determined that the band was made up of one
compound only (Plate 12 0 4 ) .
From NMR analysis, Compounds A, F and G were all found to be
triglycerides, some with double bonds in the esterfying fatty acids.
Identification of the compounds was inconclusive.

ALeaves ofD. cymosa
(60 g)
Soxhlet extraction- Ethanol
M~ L
HGD L F
CBA
277
r
mg
Sephadex LH - 20 (cyclo-hexane: dichloromethane: methanol (7:4:1»
G.(5 mg)
F(4 mg)
A(4 mg)
I I I I I I I I I I I I I I I ~ I1 2 I 3 4 5 6 7 8 9 10 11 12 13 114 15 80
69mg B
ITLC preparation (4 plates, 0.25 mm thick)
c
Isolation of anti-bacterial compounds from D. cymosa leaf
extract. (A) \ Flow chart outlining the isolation procedure
followed. (8) .vLC fractions (A - M) were spotted on TLC plates
and analysed by (1) bioautography. (C) Active fractions
collected from Sephadex LH-20 column chromatography were
spotted on TLC plates and analysed by: (1) bioautography, (2)
UV 366 nm light and 3) by staining with anisaldehyde spray
reagent. (0) (1) Representative TLC chromatogram indicating
colours and zones scrapped by preparative TLC methods, (2)
TLC plates were stained with anisaldehyde spray reagent and
(3) bioautography indicated position of active compounds while
(4) varying solvent gradients determined the purity of
Compound A.
Plate 12

118
6.4.5 Cola greenwayi
Materials and Methods
Plate 13 outlines the procedures used in the isolation of anti-bacterial
compounds from C. greenwayi twig material extracted with ethyl acetate.
Dried, ground leaf material (176 g) was extracted in ethyl acetate using a
small Soxhlet apparatus. The crude ethyl acetate residue (2.0 g) obtained
was separated by VLC. Activity was determined by bioautography. Fractions
indicating similar active zones were combined. Preparative TLC ensured
purification of isolated compounds. The chemical structures of these
compounds were analysed by NMR and GC-MS.
Results
Thirteen fractions (A - M) were collected by VLC and analysed for their anti
bacterial activity (Table 23) (Plate 13 B).

Table 23:
119
Fractions (A - M) collected from VLC of C. greenwayi ethyl
acetate leaf extract, showing relative information including
mass of fractions eluted, percentage of total, colour of
fraction, presence of activity and which fractions were used in
preparative TLC.
Fraction Mass of Percentage of Active Colour of Extract
Fraction total against
(mg) (%) S. aureus
A 46 2.30 X White
B 360 18.00 X Bright yellow
C 104 5.20 X Bottle green
D 289 14.45 ../ Bottle green 1
E 161 8.05 ../ Dark mustard 1
F 96 4.80 ../ Green
G 54 2.70 ../ Green
H 56 2.80 ../ Yellow 2
I 50 2.50 ../ Yellow 2
J 33 1.65 ../Yellow 3
K 26 1.30../
Yellow
L 14 0.70../
Yellow
M 11 0.55../
Yellow
100%
MeOH../
655 32.75 Green
Total 1.955 g 97.75 %
1 - Fractions (D and E) mixed for TLC preparation
2 - Fractions (H and I) mixed for TLC preparation
3 - Fraction (J) isolated further by TLC preparation
Fractions 0 (300 ml hexane: 100 ml ethyl acetate) and E (280 ml hexane:
120 ml ethyl acetate), H (200 ml hexane: 200 ml ethyl acetate) and 1(160 ml

120
hexane 240 ml ethyl acetate), and J (140 ml hexane: 260 ml ethyl acetate)
all exhibited anti-bacterial activity (Plate 13 B).
Fractions D and E indicated the presence of anti-bacterial activity at the
same Rf value (0.48) and were combined for further separation by
preparative TLC. Similarly, Fractions H and I showed similar activity at Rf
values of 0.59 and 0.13 , and were combined. Fraction J exhibited activity at
an R, of 0.47 and further separated by preparative TLC. Ten plates were
used for preparative TLC of combined Fraction DE (400 mg), combined
Fraction HI (100 mg) used five plates and Fraction J (30 mg) used three
plates.
Table 24: Preparative TLC zones recovered for C. greenwayi VLC
fractions
VLC Scraped Mass of Activity? Purity Mass sent
Fraction/s Zone Fraction for NMR
(mg) (mg)
1) D & E A 15.0 ../ ../ 11.0
2) H & I B 5.0 ../ ../ 3.3
C 9.0 ../ ../ 6.1
3) J D 4.0 ../ ../ 2.8
Compound A (originally from combined Fraction DE), Compounds 8 and C
(originally from combined Fraction HI) and Compound D (originally J) were
obtained by preparative TLC (Table 24). The compounds were apparently
pure as indicated after staining with anisaldehyde spray reagent (Plate 13
C). Isolation of more anti-bacterial zones was attempted but resulted in too
little compound available for identification.

121
The four compounds were analysed by NMR and GC-MS (Appendix A). GC
MS analysis indicated no corresponding acids with Compound A , the main
components of Compound B were (Fig. A.12) Stearyl alcohol (95 %) (Fig.
A.13) and Palmitic acid (96 %) (Fig. A.14), Compound C (Fig. A.15) was
indicated to contain Eicosane (Fig. A.16) MS m/z (reI. int.): 85.15 (49.47),
71.20 (70.67), 57.15 (100), 43.15 (84.64), 41.20 (40.58) and the main
components of Compound 0 (Fig. A.17) were Eicosane (Fig. A.18) MS m/z
(reI. int.) : 85.15 (47.63), 71.20 (70.50), 57.15 (100) , 43.15 (80.67), 41 .20
(42.73); Myristic acid (Fig. A.19) MS m/z (reI. int.) : 73.10 (96.41), 60.10
(90.68), 55.20 (78.18),43.15 (100) , 41.10 (92.67) and Palmitic acid (Fig.
A.20) MS m/z (reI. int.) : 73.10 (100), 60.10 (83.19), 55.10 (75.76), 43.15
(98.25), 41 .15 (84.85).

,.
A Twigs ofC. greenwayi
(176 g)
Soxhlet extraction- Ethyl acetate
VLC - 2.00 9 leaf residue (hexane: ethyl acetate)
I I I I I I I I I I 1 [ I
A B C 1 ~o m: 1 F G 11~o~J J K L M
~- T ~- · IPTLC 0.25 mm thick: (10 plates) (7 plates) (7 plates)
I I I I I I I I I('~J) ('~) (3.3Cmg)(~ (6.1Emg)(2.:mg)(~) (~~
Plate 13 Isolation of anti-bacterial compounds from C. greenwayi twig
extract. (A) Flow chart outlining the isolation procedure
followed. (8) yLC fractions (0 - M) were spotted on TLC plates
and analysed by (1) staining with anisaldehyde spray reagent
and (2) bioautography. (C) Preparative TLC methods were
employed for further isolation. TLC chromatograms composed
of (1) mixture of VLC Fractions 0 & E, (2) Fractions H & I and
(3) Fraction J were analysed by (i) bioautography and (ii)
anisaldeyde spray reagent techniques.
C1
B
}A
C3
}- E (6.1 mg):J- D
}- C (3.3 mg)
GF (2.8 mg)H

123
6.4.4 Hermannia depressa
Materials and Methods
Plate 14 outlines the procedure used in the isolation of anti-bacterial
compounds from H. depressa leaf material extracted with ethyl acetate.
Dried, ground leaf material (116 g) was extracted in ethyl acetate using a
small Soxhlet apparatus. The crude ethyl acetate residue (5.26 g) obtained
was separated by VLC. Activity was determined by bioautography.
Preparative TLC allowed for further purification of compounds. HPLC
ensured isolation of specific compounds. The identification of compounds
was by NMR and GC-MS.
Results
Thirteen fractions (A - M) were collected by VLC and analysed for their anti
bacterial activity (Table 25).

Table 25:
124
Fractions (A - M) collected from VLC of H. depressa ethyl
acetate leaf extract, showing relative information including
mass of fractions eluted, percentage of total, colour of
fraction , presence of activity and which fractions were used in
preparative TLC.
Fraction Mass of Percentage Activity Colour of extract
Fraction of total against
(mg) (%) S. aureus
A 58 1.16 ./ White 1
B 932 18.64 ./ Dark browny-yellow 2
C 408 8.16 X Very dark green
D 249 4.98 X Very dark green
E 83 1.66 X Dark green
F 120 2.40 ./ Dark green 3
G 137 2.74 ./ Dark green 4
H 61 1.22 X Browny-mustard
I 41 0,82 X Browny-mustard
J 27 0.54 X Mustard yellow
K 23 0.46 X Mustard yellow
L 35 0.70 X Mustard yellow
M 21 0.42 X Mustard yellow
Total 2.195 g 43.88 %
1 - Isolated compound
2 - Fraction B further isolated by TLC preparation
3 - Fraction F further isolated by TLC preparation
4 - Fraction G further isolated by TLC preparation
Compound A (400 ml hexane: 0 ml ethyl acetate)(Rf - 1) was eluted as a
pure compound showing anti-bacterial activity , no further isolation was
attempted. It was a very non-polar compound as it moved with the solvent

125
front in 100 % hexane (Plate 14 B). Fractions B, F and G exhibited dense
residues with visible active zones. The fractions were impure so further
isolation was required using preparative TLC (Table 26).
Table 26: Preparative TLC zones recovered for H. depressa VLCfractions
VLC Scraped Mass of Activity? Purity Mass sent
Fraction/s ZoneFraction
for NMR(mg)
(mg)/ HPLC
1) A - - ./ ./ 5
2) B A 149 ./ ./ 22
B 15 ./ X -
C 116 ./ X -
D 33 ./ X -
E 57 ./ X HPLC
3) F A 7 ./ X -B 4
./ X -C 7
./ X -
4) G A 8 X - -B 6 X - -C 8 X - -
D 8 X - -
Compound 8 (A) (Rf - 0.95) was obtained by preparative TLC and was
indicated pure after staining with anisaldehyde spray reagent. H depressa
Fraction B part E (57 mg) through staining with anisaldehyde spray reagent
was resolved to be an impure compound. Further purification was attempted
by HPLC. A gradient elution of 50 to 80 % methanol for 15 min followed by
80 - 100 % methanol for 25 min exhibited good separation of the active
compound. Fraction 19, eluted between 82 and 85 % methanol facilitated
the active fraction (Plate 14 C). A total of 5 mg of this isolated fraction was
126
collected from 17 HPLC runs for NMR analysis. VLC Fraction F indicated
zones of activity, but after recovery, too little residue was available for
further isolation as the samples were still impure (Plate 14 D1) . No activity
was exhibited from zones recovered from Fraction G.
The three compounds obtained from H. depressa ethyl acetate leaf extract
were analysed by NMR, indicating that Compound A, Compound B(A) and
Compound B(E) to be fatty acids. GC-MS suggested Compound B(A) (Fig.
A.21) to be a combination of Acetic acid (Fig. A.22) MS m/z (reI. int.):60.05
(45.19), 45.10 (83.33), 43.10 (100), 42.10 (17.73), 29.20 (12.58); Lauric acid
(Fig. A.24) MS m/z (reI. int.): 73.10 (100), 60.10 (85.91), 55.10 (64.63),
43.20 (73.04), 41.20 (79.17); Stearyl alcohol (Fig. A.25) MS m/z (reI. int.):
83.15 (85.39), 69.10 (76.86), 55.15 (100), 43.15 (99.25), 41.15 (78.71);
Myristic acid (Fig. A.26) MS m/z (reI. int.): 73.10 (100), 60.10 (80.48), 55.10
(65.92) , 43.15 (76.94), 41.15 (78.27); Stearic acid (Fig. A.28) MS m/z (reI.
int.): 73.10 (81.56) , 60.10 (67.48), 55.10 (66.30), 43.15 (100), 41.15 (72.33)
and Palmitic acid (Fig. A.27) MS m/z (reI. int.): 73.10 (99.76), 60.10 (83.51),
55.10 (78.71), 43.15 (100), 41.20 (87.19) . For Compound B(E) (Fig. A.29)
the main component was Palmitic acid (Fig. A.30) MS m/z (reI. int.):73.10
(95.54),60.10 (87.97) ,55.10 (80.75), 43.10 (100), 41.15 (95.79) (Appendix
A).

iiiiiiiiiF"=======-----------~~~~~-~~' m
2I
<:::=:=:=:c::::==:::
D I~E ~
A
§c::':
c= le
Palmitic acid
-reCH3-[CHllh4- C
' OH
IIIIIIIIIIIIIIIIIIII ~I1 2 3 4 5 67 891011121314151617181 920 40
I(22 rng) (5 rng)
Leaves ofH. depressa
(116 g)
Soxhlet extraction- Ethyl acetate
I I I I I I I I I I f f IABCDEFGH I JKLM
I '932"'1~PTLC0.25 mmthick: ( Hexane:ethylacetate)(4:1):
1 ~lrl~~~ (22Arng)(XXX)(33Drng)(57~) X X X
I IHPLC (Water:rnethanoj)
VLC - 5.26 9 leaf residue (hexane: ethyl acetate)
c=
A
B
C '----
D+~HPE+ C _
E
Lauric acidMyristic acid
L--~~.I Stearic acidPalmitic acidAcetic acidStearyl alcohol
C1
A
~ -
Isolation of anti-bacterial compounds from H. depressa leaf
extract (A) Flow chart outlining the isolation procedure followed
(B).\A TLC chromatogram of VLC Fraction A indicating the
position of .compound A. (C)(1) A representative TLC
chromatogram indicating VLC Fraction B after further isolation
by preparativ,e TLC methods. Additional isolation by HPLC
techniques was employed: (2) indicates HPLC fractions
collected near expected activity (i) after staining with
anisaldehyde spray reagent and (ii) bioautography, (3) A
representative HPLC chromatogram of the expected anti
bacterial compound. (0) (1) A representative TLC
chromatogram of VLC Fraction F indicating colour and position
of zones scrapped, and (2) A representative TLC
chromatogram of VLC Fraction G indicating colour and position
of zones scrapped
Plate 14

128
6.5 GENERAL DISCUSSION
Use of Sterculiaceae species for Traditional Medicine in Line with Anti
bacterial Activity
Bacterial infections are a common occurrence in the numerous informal
settlements located within South Africa where water is obtained from
contaminated streams and where good sanitary methods of living are
lacking. Traditional healers are relied upon to provide treatment for the
common ailments caused by bacterial infections. Scientific research
demonstrates the effectiveness of the treatments used and is important in
bridging the gap between Westernised medicine and the traditional
medicines. Stomach aches and related gut infections as well as throat
infections are commonly caused by Gram-positive ailments. These
infections are largely not life threatening. Gram-negative bacteria are the
typical causes of diarrhoeal and dysenteric diseases. These are more
harmful and often associated with death.
The presence of anti-bacterial activity in the species screened is in line with
their uses in traditional medicine. D. rotundifolia is commonly used in
traditional medicine to treat intestinal ulcers, stomach complaints (COATES
PALGRAVE, COATES PALGRAVE & COATES PALGRAVE, 1985),
haemorroids and diarrhoea (WATT & BRANDWIJK, 1962; VAN WYK, VAN
OUDTSHOORN & GERICKE, 1997). D. burgessiae shrubs are applied over
affected areas in treatment against leprosy and the roots are used for
stomach complaints (CHHABRA, MAHUNNAH & MSHIU, 1993). H.
depressa is used in treatment against stomach ache, coughs and diarrhoea
(WATT & BRANDWIJK, 1962; HUTCHINGS, HAXTON-SCOTT, LEWIS &
CUNNINGHAM, 1996; POOLEY, 1998). C. greenwayi and the roots of D.
cymosa are used in traditional medicine by the Zulu people of KwaZulu-

129
Natal (POOLEY, 1993; HUTCHINGS, HAXTON-SCOTT, LEWIS &
CUNNINGHAM, 1996).
Plant Fatty Acids
By 1990, GUNSTONE stated that the number of natural plant fatty acids
discovered exceeded 1000. The general characteristics of plant fatty acids
are that they are unbranched saturated or unsaturated chains with an even
number of carbon atoms (GUNSTONE, 1990), however, there are fatty
acids which are branched or have an uneven carbon number. Fatty acids
occur mainly in plants in a bound form, esterfied to glycerol, as fats or lipids
(HADLEY, 1985). The length of the carbon chains vary depending on the
functions of the compounds. Short-chain fatty acid are made up of up to
eight carbons. They have substantial solubility in water (GURR & JAMES,
1971) and are rapidly digested and absorbed in the intestinal tract. Medium
chain fatty acids consist of eight to 14 carbon atoms, while long-chain fatty
acids have 16 and more carbon atoms. Long-chain fatty acids are less
soluble in water because of the size of the hydrocarbon chain (GURR &
JAMES, 1971).
In TLC, long-chain compounds are slightly less polar than their medium
chain analogues (GUNSTONE, 1990). Polyunsaturated compounds are
slightly more polar that their more saturated homologues (GUNSTONE,
1990). Normal saturated fatty acids are generally more soluble in
chloroform.
Anti-bacterial Compounds from the Five Sterculiaceae Species
Investigated
All the active anti-bacterial compounds isolated during this study were fatty
acids. This was evident after NMR and GC-MS analysis.
130
Lauric (Dodecanoic) acid (CH3(CH2)10COOH) is a saturated acid widely
distributed in plants and is a major component of some seed fats (GURR &
JAMES, 1971). Myristic (Tetradecanoic) acid (CH3(CH2)12COOH) is a
saturated acid widespread occasionally as a major component (GURR &
JAMES, 1971). Stearic (Octadecanoic) acid (CH3(CH2)16COOH) is less
prominent in leaf lipids, but is a major saturated acid in seed fats (GURR &
JAMES, 1971; HARBORNE & BAXTER, 1993) and vegetable oils and fats
(HARBORNE & BAXTER, 1993). Palmitic (Hexadecanoic) acid
(CH3(CH2)14COOH), a C16 acid, is one of the most common major saturated
acid in leaf lipids and also occurs in quantity in some seed oils (GURR &
JAMES, 1971; HARBORNE & BAXTER, 1993). Palmitic acid has previously
been reported to be the major anti-bacterial compound in a mixture of fatty
acids from Diplotaxis harra, Ericaria microcarpa (HASHEM & SALEH, 1999)
and Pentanisia prunelloides (YFF, L1NDSEY, TAYLOR, ERASMUS &
JAGER, 2002). Acetic acid (Ethanoic) acid occurs as alcohol acetates in
many plants and in some plant triglycerides (GURR & JAMES, 1971).
Triglycerides or triacylglycerides consist of glycerol triesters of fatty acids
therefore one compound may be consist of a number of fatty acids (VOET &
VOET, 1990).
Continual redissolving during the purification procedures of the extracts led
to contamination by solvents. Diisooctylphthalate was a common
contamination in all compounds isolated. It was visible by GC-MS at a
retention time of 25.20 min. Diisooctylphthalate is used in the manufacturing
of glass pill vials.
It is possible that anti-bacterial activity of some fatty acids during
bioautographic screening may be false positive due to the lipophilic
compounds having a hydrophobic affect on the aqueous anti-bacterial spray

131
solution. Anti-bacterial activity of fatty acids in the Sterculiaceae species is
not false positive as the MIC assay indicated activity in the extracts.
Anti-bacterial Activity of Fatty Acids
Fatty acids commonly show anti-bacterial properties. This has been the
topic of much research. The first known mention of the use of fatty acids as
antimicrobial agents appeared in 1899 (KABARA, 1986).Since 1966,
KABARA and coworkers have studied the structure-function (antimicrobial)
of some 500 natural and synthetic lipophilic compounds. The results from
these screening activities indicate strong relationships between lipid
structures and their biological activity (KABARA, 1986; MARSHALL &
BULLERMAN, 1994) Le. the anti-bacterial activities of fatty acids are
influenced by both fatty acid structure and bacterial species (NIEMAN, 1954;
KABARA, 1980).
Unsaturation is an important factor in determining the anti-bacterial activity
of fatty acids, activity increase with progressive unsaturation. However,
saturated fatty acids can act also as growth inhibitors (NIEMAN, 1954).
Activity is greater in saturated, monounsaturated and polyunsaturated fatty
acids with long carbon chains especially C12, C16:1 and C18:2 , respectively
(MARSHALL & BULLERMAN, 1994). Position and number of double bonds
are a greater influence on biological activity of long chain ( C12) fatty acids
as compared to short chain fatty acids (KABARA, 1980). Unsaturation in
contrast to esterfication is less effective with low chain fatty acids as
compared to higher chain fatty acids (KABARA, 1986). Fatty acids esterfied
to monohydric alcohols became inactive, while fatty acids with polyhydric
alcohols were generally more active (KABARA, 1980). Cis isomers are more
effective than trans isomers (MARSHALL & BULLERMAN, 1994).

132
Gram-positive bacteria are more susceptible to fatty acids than Gram
negative bacteria (MARSHALL & BULLERMAN, 1994). Anti-bacterial effects
of minute amounts of fatty acids have been noted with Gram-positive
bacteria (NIEMAN, 1954). Gram-negative organisms are affected by very
short chain fatty acids (C6) (KABARA, 1980).
The insertion of the non-polar moieties of the fatty acids into the
phospholipid layer of the bacterial cell membrane could explain the anti
bacterial action of fatty acids. This causes a change in membrane
permeability, alteration of the activity of some membrane proteins essential
for maintenance of cellular functions and uncoupling of the oxidative
phosphorylation system (SAITO &TOMIOKA, 1988).
Anti-bacterial Activity of Tannins and Saponins
D. rotundifolia leaves and H. depressa leaves contain tannins (Chapter 5,
Table 11). Tannins are known to be used for their anti -bacterial activity
(HARBORNE & BAXTER, 1993). They have been shown to decrease and
inhibit bacterial growth in both Gram-positive and Gram-negative bacteria
(DJ IPA, DELMEE & QUENTIN-LECLERCQ, 2000). Most frequently tannin
containing plants are used to treat diarrhoea and dysentry (LONGANGA
OTSHUDI, VERCRUYSSE & FORIERS, 2000). It may be due to the
presence of tannins that the extracts of these plant parts exhibit anti
bacterial activity.
A few of an abundance of examples in the literature where anti-bacterial
activity is associated with tannins include: Machaerium f1oribundum, Carob
pod extract, Lotus carniculatus, Wattle species, (SCALBERT, 1991)
Landolphia owrrience (EBI & OFOEFULE, 1997), Ocimum gratissimum,
(OFFIAH & CHIKWENDU, 1999) Roureopsis obliquifoliolata, Cissus

133
rubiginosa (LONGANGA OTSHUDI, VERCRUYSSE & FORIERS, 2000)
and Suzygium jambos (DJ IPA, DELMEE & QUENTIN-LECLERCQ, 2000).
Saponins are also known to have anti-microbial activity (HARBORNE &
BAXTER, 1993). O. rotundifolia and H. depressa leaf extracts contain
saponins (Chapter 5, Table 9). Some examples in the literature where anti
bacterial activity is associated with saponins include Yucca shidigera,
(WALLACE, ARTHAUA & NEWBOLD, 1994), Landolphia owrrience (EBI &
OFOEFULE, 1997), Astragalus melanophrurius (CAllS, TURUKER,
TASDEMIR, WRITE, STICHER, LUO & PEZZUTO, 1997) and Panax
ginseng root extract (FUKUDA, TANAKA &SHAYAMA, 2000).
6.6 SUMMARY
• Five of the seven Sterculiaceae species screened for anti-bacterial
activity were chosen for isolation of the active compounds. All species
indicated the isolated compounds to be fatty acids.
O. rotundifolia ethyl acetate leaf extract. Compound A
contained a combination of Palmitic acid, Myristic acid and
Stearic acid. Compound B contained a combination of Palmitic
acid, Myrsitic acid, Lauric acid and Acetic acid .
D. burgessiae ethyl acetate leaf extract. Compound A was
Palmitic acid.
D. cymosa ethyl acetate leaf extract. Compounds were
determined to be fatty acids.
C. greenwayi ethyl acetate twig extract. Compound B contained
a combination of Palmitic acid , Stearyl alcohol and Eicosane.
Compound C contained Eicosane. Compounds D contained a
combination of Palmitic acid, Myristic acid and eicosane.
H. depressa ethyl acetate leaf extract. Compound B (A)
contained a combination of Palmitic acid, Myristic acid, Stearic

134
acid, Lauric acid, stearyl alcohol and octadecane. Compound B
(E) was Palmitic acid.
• During the fractionation of the crude residue through the VLC column
resulted in a very low recovery rate. On addition of 100% methanol as
in the case of C. greenwayi twig extract, much of the remaining
extract was recovered (97.79%). The 100% methanol may improve
recovery but the fraction recovered was exceedingly impure and
bioautography determined only a small anti-bacterial zone. The 100%
methanol fraction was therefore not considered for further purification
and discarded. It was expected that overall, in the individual VLC
experiments, most of the anti-bacterially active compounds had been
recovered.
• Polarity of the isolated compounds was affected by the combination of
fatty acids it was composed of, thus resulting in the same fatty acid
exhibiting different Rf values.

135
CHAPTER 7
MUCILAGENOUS HERMANNIA DEPRESSA AQUEOUS EXTRACT
7.1 INTRODUCTION
7.1.1 Gums and Mucilages
A common occurrence in a number of the Sterculiaceae species screened
during this study was the production of mucilage by the aqueous extracts.
Leaf and twig extracts of O. burgessiae and O. cymosa , leaf extracts of S.
murex, leaf and stem extracts of H. depressa and the unripe fruit extract of
C. greenwayi all produced a mucilage. However, it was produced most
abundantly by the H. depressa leaf extract.
7.1.1.1 What is a Gum or Mucilage?
The Collins English Dictionary (1998) defines a gum as any of various sticky
substances that exude from certain plants , hardening on exposure to air and
dissolving or forming viscous masses in water, while a mucilage is defined
as a complex glutinous carbohydrate secreted by certain plants. The Oxford
Dictionary of Biology (1996) describes a gum as a variety of substances
obtained from plants. Typically they are insoluble in organic solvents but
form gelatinous or sticky solutions with water. A mucilage is defined as a
gum-like substance. They are hard when dry and slimy when wet.
Most commonly, the term gum as technically employed in industry refers to
plant polysaccharides or their derivatives which are dispersible in either cold
or hot water to produce viscous mixtures or solutions (WHISTLER, 1959).
An effort has been made to distinguish between mucilages and gums on the

136
basis that gums readily dissolve in water whereas mucilages form slimy
masses (TYLER, BRADY & ROBBERS, 1981). However, a classic example
of an important industrial gum, karaya gum (Sterculia urens), particles
imbibe large amounts of water to swell to great .size but they do not dissolve
or form homogeneous suspensions unless ground extremely fine or
subjected to treatment in an autoclave (MANTELL, 1947). Gums are
therefore best powdered. If they are unpowdered, addition of water yields a
non-homogenous colloidal solution. If finely powdered, each particle swells
and the appearance and behaviour of the solution is more like a
homogeneous solution (MANTELL, 1947).
Gums are natural plant hydrocolloids that may be classified as anionic or
nonionic polysaccharides or salts of polysaccharides. They are translucent,
amorphous substances that are frequently produced in higher plants as a
protective after injury (TYLER, BRADY & ROBBERS, 1981). Less pure
gums tend to exhibit varying colours, from pale yellow to brown.
The gum industry is a very productive one. Gums find diverse applications in
pharmacy. They are ingredients in dental and other adhesives and in bulk
laxatives (TYLER, BRADY & ROBBERS, 1981). Gum arabic (Acacia
senegalensis) is the most important polysaccharide gum of commerce. It
has been an article of commerce since pre-Christian times (WHISTLER &
SMART, 1953). Gum arabic is used as a demulcent, soothes irritations of
the mucous membranes in humans and is used as a food emulsifier,
stabilizer and thickener (HARBORNE & BAXTER, 1993). Another gum,
Gum tragacanth (Astragalus gummer) is used as a food emulsifier, stabilizer
and as a bulking agent (HARBORNE & BAXTER, 1993). Guar gum is used
in Herbex Appetite Control Tablets. This water soluble mucilage turns into
gel in the stomach when taken with liquid, naturally reducing hunger and the
'bottomless pit' feeling in the stomach.

137
7.1.1.2 Sterculiaceae Gums and Mucilages
The Sterculiaceae family consists of a large number of genera
encompassing species that produce gums or mucilaginous substances. The
various genera exuding these substances range from very small herbs to
large trees. The gum from some species, e.g. Sterculia urens (karaya gum),
are significant industrial gums.
Of the Cola species, C. cordifolia from west tropical Africa is known to yield
a gum (HOWES, 1949). Of the Brachychiton species which occur in
Australia, B. diversifolius trees can exude a bucket of gum from a single tree
(SMITH & MONTGOMERY, 1953). The gum is pale yellow, however, it may
be very dark in colour and form in lumps. B. rupestris is rich in a sweet
mucilaginous or gummy juice (HOWES, 1949). Of over a hundred Sterculia
species, at least a dozen and a half yield gum (HOWES, 1949). Some of the
Sterculia species known to exude gums are S. campanulata, S. foetida, S.
guttata, S. ornata and S. villosa which are all found in India, S. barteri, and
S. cinerea which are found in Africa, S. acerifolia, S. diversifolia, S.
plantanifolia, S. quadrifica and S. rupestris from Australia, and S. hypochroa
and S. thorelii from Indo-China (SMITH & MONTGOMERY, 1953). Gum
exudes from grey, corky bark of the tall tree S. tragacantha (Africa) and
sometimes from the fruit follicles when punctured by insects. The bark of S.
setigera (Africa) yields a pale tragacanth-like gum and a watery sap which is
refreshing to thirsty travellers. The gum is used to prepare indigo-dyed cloth,
dressing fabrics and a slightly granular jelly (HOWES,1949). S. scaphigera,
known to occur in Indo-China and Thailand yields a gum from the fruit and
not from the trunk of the tree (SMITH & MONTGOMERY, 1953). When the
fruit is macerated with water, the pericarp or outer shell increases
enormously in volume forming a gelatinous mass. The jelly is sweetened
and eaten as a delicacy, which the Chinese call 'ta-hai-tsze' and regard as a
specific in diarrhoea and dysentery treatment (HOWES,1949). The most

138
well known and commercially important of all the gums produced from this
family is karaya gum, from S. urens.
Karaya Gum
Sterculia urens exudes gum known as karaya gum (HOWES, 1949;
MORTON, 1977). Sometimes also S. viIJosa and S. tragacanth gums are
referred to as karaya gum (TYLER, BRADY & ROBBERS, 1981). Sterculia
urens is a large deciduous tree growing in the dry, elevated areas of North
and Central India (SMITH & MONTGOMERY, 1953). They are tall, reaching
a height of 8 to 10 m, and their trunks are large with a soft corky structure.
The gum exudes naturally or from incisions made to the heartwood. The
incisions produce knoblike masses of gum that are collected frequently for
nine months. The tree is then allowed to rest for two to three years
(MANTELL, 1947; SMITH & MONTGOMERY, 1953; TYLER, BRADY &
ROBBERS, 1981). All parts of the tree exude this soft gum when injured
(MORTON, 1977). The gum is obtained from the trees throughout the year
except the rainy season and the best quality of the gum is obtained during
the hot spell (March through to middle June) (MANTELL, 1947) before the
monsoon season (GOLDSTEIN & ALTER, 1959). As the weather becomes
warmer, gum yield, as well as quality increases (GOLDSTEIN & ALTER,
1959).
Karaya gum is the least soluble of all commercial plant exudates. It absorbs
water, swells to several times its original bulk, and forms a discontinuous
type of mucilage (TYLER, BRADY, & ROBBER~, 1981). Its viscous nature
decreases with storage, especially after being reduced to a powder and in
hot, humid environments (MORTON, 1977). It is insoluble in alcohol and
alkali (GOLDSTEIN & ALTER, 1959; MORTON, '1977). The gum swells in
60 % alcohol, but it is insoluble in organic solvents (LEUNG & FOSTER,
1996). It absorbs water rapidly (MORTON, 1977) and swells to form viscous

139
colloidal solutions or dispersions at low concentrations (e.g . 1 %). Higher
concentrations (up to 4 %) produce a viscous gel-like paste (MORTON,
1977; LEUNG & FOSTER, 1996).
Karaya gum is an acetylated polysaccharide, (8 % acetyl groups, 37 %
uronic acid residues) (MORTON, 1977; HARBORNE & BAXTER, 1993),
which is characterized by an acid nature (GOLDSTEIN & ALTER, 1959). It
has a high molecular weight (9 500 000), its structure is complicated and
has not been determined, but it is expected to have three different types of
chains (LEUNG & FOSTER, 1996). Karaya gum consists of an acetylated
branched heteropolysaccharide with a high component of D-galacturonic
acid (43 % yield) and D-glucuronic acid residues (TYLER, BRADY &
ROBBERS, 1981), D-galactose (14 %), L-rhamnose (15 %) (WHISTLER &
SMART, 1953) and ketohexose (SMITH & MONTGOMERY, 1953).
Dispersions of the gum in water have a pH of 3.6 - 4.4 (SMITH &
MONTGOMERY, 1953). It is used medicinally as a laxative (TYLER,
BRADY & ROBBERS, 1981, LEUNG & FOSTER, 1996) and for throat
inflammation (MORTON, 1977). Water in which the leaves and cut ends of
branches are placed becomes thick, like clear jelly. Indian vetinarians use
this mucilage as a remedy for pleuropneumonia in cattle (MORTON, 1977).
It is used in foods, including curries, making sweet meats, French dressing,
cheese spreads, sherbets, ice-cream sticks and meringues. It is also used in
the making of certain toiletries, cosmetics, adhesive for dentures (it is
resistant to bacterial and enzymatic hydrolysis) (TYLER, BRADY &
ROBBERS, 1981), lotions and papermaking (MORTON, 1977).
7.1.1.3 Gums as Bulking Agents
Bulking agents may be ingested for a number of reasons: as an appetite
suppressants, laxatives or in the treatment against diarrhoea. They are

140
usually dried substances that in the .presence of water swell to a much
greater volume.
7.1.1.3.1 Appetite Suppressant
To eat is important. It is a necessity for survival to obtain daily the required
nutrients and vitamins necessary for survival. However, many people overdo
it by ingesting more food (especially fats) than is required. Generally these
people are obese. One way to overcome overeating would be to suppress
the desire to eat. Anorectic, or appetite suppressant drugs, are drugs that
suppress the subjective awareness of hunger. They fall into two broad
categories: those acting directly on the central nervous system, and those
which act primarily on peripheral mechanisms (SllVERSTONE &
KYRIAKIDES, 1982). Bulking agents fall into the later category.
Obesity is a health risk. An increase in body weight of 20% or more above
desirable weight is considered a health hazard (COUNCil FOR
AGRICULTURAL SCIENCE AND TECHNOLOGY, 1987). It is associated
with an increased incidence of cancer of the colon, prostate and rectum in
men and breast, cervix, endometrium and ovary in women. Respiratory
problems are also common, as is the risks from anaesthesia and surgery,
above those of normal weight patients. Obese people are also more prone
to osteoarthritis (GILLHAM, PAPACHRISTODOULOU & HYWEL THOMAS,
1997), hypertension, hyperlipidemia, diabetes, gout, cardiovascular disease
and gallbladder diseases (KANNEl, 1983).
Types of Bulking Agents used as Appetite Suppressants and
Associated Problems
The pharmaceutical industry is a consistent user of methylcellulose. The
non-nutritive bulking action of methycellulose is accompanied by demulcent

141
and surfactant properties and it contains no protein contaminants that could
cause allergies. It is not metabolized and is useful where non-nutritive bulk
is desired for the treatment of obesity (GREMINGER & SAVAGE, 1959).
The idea of filling up the stomach with an inert, non-digestible bulk agent
has a refreshing simplicity about it. However, one example given, involving
trials of methylcellulose have failed to indicate that it helps obese patients to
lose weight by causing them to eat less (SILVERSTONE & KYRIAKIDES,
1982). COLGAN (1994) states that bulking agents and starch blockers that
are supposed to reduce food digestion do not work. Studies on women
using Plantago ovata as an appetite suppressor show these products are
useless and counterproductive, because the aim is not only to help patients
to lose weight, but also to learn adequate dietary habits that include the
consumption of fibre-rich foods (MORO & BASILE, 2000).
7.1.1.3.2 Bulking Agents as a Laxative and Against Diarrhoea
Bulking agents can be used as a laxative or in the treatment against
diarrhoea. To have a laxative effect, on ingestion of the bulking agent, it
absorbs water allowing it to form a mucilaginous consistency allowing the
stool to 'slide' with ease through the ileum. Alternatively, it aids in the
treatment of diarrhoea by absorbing excess water which causes attempted
hardening of the stool.
Many bulking agents have been offered to the constipated. Constipation can
be relieved by the use of a hydrophilic colloid of methylcellulose
(GREMINGER & SAVAGE, 1959). It is a bulking agent with little water
holding capacity and has a modest effect on stool weight (THOMPSON,
1989). Due to the fact that methylcellulose in aqueous media can swell to 40
times its dry volume, it is used in the treatment of various intestinal ailments,
such as diarrhoea, where bulking action is desirable (GREMINGER &
SAVAGE, 1959). Psyllium hydrophilic mucilloid is a powder derived from the

142
seed coat of the flowering plant, Plantago ovata (Plantago isbaghula) that is
native to India. The seed mucilage of Plantago ovata (psyllium) is a mixture
of polysaccharides (WHISTLER & SMART, 1953). In the United Kingdom, it
is known as 'isbaghula' and has been employed as a laxative in the Orient
for a millennium. The ' modern preparation consists of powdered natural
mucilage. When placed in water, the swelling may be 15 times the initial
volume. If ingested the mucilage increases the faecal volume and favours
defecation. Therefore it is important to drink large quantities of liquid with
this product. If not accompanied by liquids, in the gut this gelling action
results in firming up diarrhoea stools as it thickens the intestinal contents
(THOMPSON, 1989).
The products of certain vegetable gums, such as gum arabic (Acacia
senegalensis) and karaya (Sterculia urens) , are available for treatment of
constipation. They attract water and form a gel that is resistant to
mechanical action. Digestion by colon bacteria is unpredictable, but
metabolites of these gums are thought to have a laxative effect
(THOMPSON, 1989). As a bulk laxative, gum karaya, is a second to
psyllium seeds in importance. The coarse gum particles absorb water and
swell 60-100 times their original volume, forming a discontinuous type of
mucilage. It is believed that this type of mucilage is very effective as a
laxative (GOLDSTEIN & ALTER, 1959) due to its indigestible and non
absorbing properties by the body.
7.1.1.3.3 Digestion, Focussing Primarily on Carbohydrate Digestion
For a plant mucilage to be effective as a bulking agent it is important that it
will pass through the human digestive system without breaking down. A
major component of mucilages are polysaccharides.

143
In chemical digestion the large carbohydrates, lipids, protein and nucleic
acid molecules in food are split into smaller molecules by hydrolysis.
Digestive enzymes produced by the salivary glands, tongue, stomach,
pancreas and small intestine catalyse these catabolic reactions (TORTORA
& GRABOWSKI, 2000).
Chewing of food and mixing with saliva is the beginning of the hydrolysis of
food (CLAYMAN, 1995). Chemically saliva is 99.5 % water and 0.5 %
solutes. Two digestive enzymes make up part of these solutes, salivary
amylase which acts on starch and lingual lipase which acts on triglycerides.
Chloride ions in the saliva activate salivary amylase (TORTORA &
GRABOWSKI, 2000) which initiates the breakdown of starch (CLAYMAN,
1995; TORTORA & GRABOWSKI, 2000) by hydrolyses producing -limit
dextrins, maltotriose and maltose (GANONG, 1975).
Even though food is usually swallowed too quickly for all starches to be
reduced to disaccharides in the mouth, salivary amylase in the swallowed
food continues to act on the starches for about another h, at which time
stomach acids inactivate it (TORTORA & GRABOWSKI, 2000).
Carbohydrate digestion does not occur in the stomach.
The mucosal surface of the stomach is covered by columnar epithelial cells
which extend into gastric pits containing glands. The cell type found
particularly in the neck region of the gland is the oxyntic (acid forming) or
parietal cell, which is respons ible for the secretion of HCI (SANFORD,
1982).
The pancreas produces pancreatic juice, which is a clear colourless liquid
consisting mostly of water, some salts, sodium bicarbonate and several
enzymes. The sodium bicarbonate gives pancreatic juice a slightly alkaline
pH (7.1 - 8.2) that buffers acidic gastric juice in chyme, stops the action of

144
pepsin from the stomach and creates the proper pH for action of digestive
enzymes in the small intestine. The enzymes in pancreatic juice include a
carbohydrate-digesting enzyme called pancreatic amylase (TORTORA &
GRABOWSKI, 2000). In the duodenum, ex-amylase, an enzyme produced by
the pancreas breaks down starch into maltose, which is a disaccharide
(CLAYMAN, 1995). The pancreas produces pancreatic ex-amylase, which
breaks down starch similarly to salivary amylase (GANONG, 1975).
Small intestine juice is a clear yellow fluid. It contains water and mucus and
is slightly alkaline (pH 7.6). Together, pancreatic and intestinal juices
provide a liquid medium that aids the absorption of substances from chyme
as they come in contact with the microvilli. The absorptive epithelial cells
synthesize digestive enzymes, called brush border enzymes. Among the
brush-border enzymes are four carbohydrate-digesting enzymes called
dextrinase, maltase, sucrase and lactase (TORTORA & GRABOWSKI,
2000). In the small intestine maltase, sucrase and lactase are enzymes
secreted by certain glands in the intestinal wall. They convert disaccharide
sugars into monosaccharide sugars (CLAYMAN, 1995). The intestinal
mucosa contains the digestive enzymes maltase, lactase, sucrase and
isomaltase which break down maltose and maltotriose to form glucose,
lactose to form galactose and glucose, sucrose to form fructose and glucose
and -limit dextrins to form glucose, respectively (GANONG, 1975).
7.1.1.4 Wound Healing
Many African plants are used traditionally in the treatment of a number of
different wounds. The plants are used as first aids, in cleansing and washing
of wounds. Other uses include treatment of boils, abscesses, cuts, skin
lesions, snake and dog bites, insect stings, bruises, pains, soothing of
burns, inflammation, scabies and the dressing of wounds (ONAYADE,
ONAYADE & SOFOWARA, 1996). Gums are sticky substances that can

145
seal plant wounds (THOMPSON, 1989), however, they can also be used in
the repair of human wounds. A mucilaginous plant extract with anti-bacterial
or anti-inflammatory properties would invariably aid in quicker healing.
7.2 AIMS
The production of mucilage from the H. depressa aqueous extract may have
medicinal or commercial value. The aim of this part of the study was to
investigate the properties of the mucilage and in doing so determine its
effective use in traditional medicine. The extract was also investigated to
determine similar properties to S. urens, a commercially important species
from the same family. ,
7.3 EXTRACTION OF PLANT MATERIAL
Dried, ground leaf material (116 g) was extracted with ethyl acetate (10 g
leaf material/ 150 ml ethyl acetate) using a Soxhlet apparatus for 2 h. The
leaf material was removed from the Soxhlet and dried in a fume cupboard
allowing for evaporation of all ethyl acetate. The leaf material was then
placed in distilled water (11) and allowed to stand overnight. The solution
became very viscous. To extract the viscous solution from the leaf material,
the solution was centrifuged at 9 000 g for 20 min. Two different extracts
were obtained (Plate 15):
1. H. depressa extract A (Extract A): A slightly viscous liquid, golden
brown in colour (Plate 15 A). This extract was the top layer
removed after centrifugation;
2. H. depressa extract B (Extract B): A more viscous, mucilaginous
slime, dark cream in colour (Plate 15 B).

146
Extract A dried to become dark, brittle and shiny. As the more viscous
extract (Extract B) dried it took on a darker colour and became very hard
(Plate 15 B2) . With addition of water to separate this substance once again
exhibited a mucilaginous nature. The dry weight of the extract was 7.795 g.
During the study, both extracts were studied, however, there was greater
focus on the more viscous mucilage (Extract B).
Thin layer chromatography of the two extracts (Extract A and Extract B) was
performed. The extracts were loaded onto plates and run in a solvent
solution of chloroform, methanol and water in a ratio of 60:35:8 over a
distance of 8 cm. The TLC plates were viewed with white light before and
after spraying with anisaldehyde spray reagent (Plate 15 C).
7.4 SUGAR ANALYSIS BY GAS CHROMATOGRAPHY (GC) OF
AQUEOUS HERMANNIA DEPRESSA EXTRACTS
7.4.1 Introduction
The mucilage of H. depressa was expected to contain a number of sugars.
The smell of the dried H. depressa aqueous extract was sweet and caramel
like. On autoclaving the smell became molasses-like.
7.4.2 Materials and Methods
Hydrolysis of Polysaccharides
Plant material (0.5 mg) of Extract B was placed into a glass vial (screw cap).
The extract was taken to dryness under nitrogen. Two hundred I 2M
trifluoroacetic acid (TFA) were added to the extract. The solution was
incubated for 2 h at 100 C in a heating block (The screw cap ensured no
leaking/ evaporation of water). The TFA was removed under nitrogen.

147
Preparation of Sugar Standards for Gas Chromatography
Sugars used: Sucrose (Merck)
0(+) Glucose (Merck)
L(+) Rhamnose (Merck)
0(-) Fructose (Merck)
and 0 - Glucuronic acid (Sigma)
Sugars were dissolved in 80 % ethanol to a concentration of 1 mg rnl". Five
hundred I were taken to dryness under nitrogen.
Gas Chromatographic Analysis
Two hundred I of a pyridine solution, containing 25 mg ml' hydroxylamine
monohydrochloride , were added to both the extract and sugar preparations
and incubated at 40 C for 20 min in a heating block. One hundred I of the
pyridine solution were transferred to an Eppendorf tube and dried under
nitrogen. Fifty I Sil-A (Sigma catalogue number 139-1) were added to each
tube and allowed to react for 15 min at room temperature, before
centrifuging in a millifuge for 10 s.
One 1-11 of the supernatant was subjected to gas chromatography (GC) using
a Varian 3700 chromatograph fitted with a flame ionisation detector (using
helium), The column was 2 m by 6 mm and packed with Chromosorb warp
mesh 80 - 100. The carrier gases were nitrogen and air. The injector port
was set at 200 C and the detector at 280 C. The column temperature started
at 125 C and ramped up to 270 C at a rate of 4 C min". The final
temperature of 270 C was held for 10 min. A HP 3394A integrator was used
to record the retention times.

148
7.4.3 Results
Table 27: The retention times of the sugar standards
Sugar
Sucrose
D(+) -Glucose
D(-) Fructose
L(+) Rhamnose
D - Glucuronic acid
Average Retention Time (min)
32.20
18.42
16.38
13.79
19.82 (Main peak)
Tentative identification of the sugars from the chromatograms was made
possible using standard sugar samples (Table 27) (Appendix B). The
retention time of the peaks on the chromatograms produced from the H.
depressa aqueous extract could then be compared for tentative
identification (Table 28).
Table 28: The retention times of the sugar components of the aqueous
H. depressa extract
Retention Time (min)
7.17; 8.23; 10.52; 12.43
13.94
18.17
18.60
20.16
Corresponding Sugar
No corresponding sugars
L(+) Rhamnose
D(+) -Glucose
D(+) -Fructose
D - Glucuronic acid
The representative chromatograms for the sugar standards and the H.
depressa extract are located in Appendix B. The extract was injected 10
times to ensure accurate readings. Table 28 indicates the average of the
readings obtained. The chromatograms suggest that the H. depressa extract

149
(Extract B) is a polysaccharide composed of L(+) rhamnose, D(+) -glucose
and D - glucuronic acid. Karaya gum contains D-galacturonic acid, D
galactose, L-rhamnose (WHISTLER & SMART, 1953) and D-glucuronic acid
(TYLER, BRADY & ROBBERS, 1981). Unfortunately, a sample of Karaya
gum and galacturonic acid and galactose standards were not available
during the identification process.
7.5 PHARMACOLOGICAL SCREENING
7.5.1 Introduction
In informal settlements, the burning of wood or use of paraffin for cooking
and heating is common where electricity is not supplied. Burn wounds are
therefore prevalent in these areas. Westernized treatments are generally
inaccessible and the local people rely on what is available for the treatment
of injury as faster healing is desirable. Some communities use leaves of
specific plants to cover wounds and protect them from infection and to keep
them moist enabling them to heal faster. Using leaf material with
pharmacologically active compounds for example anti-bacterial or anti
inflammatory would hasten recovery.
H. depressa aqueous leaf extracts were indicated to have no or very little
anti-bacterial and anti-inflammatory activity in Chapter 4, pages 51 and 54,
respectively. No anti-bacterial activity was detected while anti-inflammatory
activity for aqueous leaf extracts gave 60 % inhibition which is considered
low. For this study the aqueous extracts, Extract A and Extract B were
screened.

150
7.5.2 Materials and Methods
Anti-bacterial Screening
Extract A and Extract B were screened for anti-bacterial activity. Extracts
were redissolved in distilled water (50 mg rnl"). Minimal inhibition
concentration (MIC) was determined using the serial dilution technique
devised by ELOFF (1998). Only Gram-positive bacteria were used, namely
Staphylococcus aureus and Bacillus subtilis as outlined in Chapter 4, pp 41
- 42.
Anti-inflammatory Screening
Extract A and Extract B were screened for anti-inflammatory activity.
Extracts were redissolved in distilled water (2.5 mg rnl"), The bioassay was
performed according to JAGER, HUTCHINGS & VAN STADEN (1996),
using the prostaglandin-synthesis inhibitor assay (COX-1) as outlined in
Chapter 4, pp 42 - 43.
7.5.3 Results
Anti-bacterial Screening
Extract A and Extract B showed no activity over the whole dilution range
tested. No activity was expected and this was confirmed with the results
obtained. In Chapter 4 of this study, aqueous extracts of H. depressa leaf
material were shown to have no anti-bacterial activity.

151
Anti-inflammatory Screening
Extract A and Extract B were screened for anti-inflammatory activity (2.5 mg
ml"), Both extracts exhibited low activity (44 % and 31 % respectively)
(Table 29).
Table 29: Percentage inhibition of cyclooxygenase (COX-1) by H.
depressa aqueous extracts
Extract
Extract A
Extract B .
Indomethacin (control)
Inhibition (%)
44
31
68
7.6 THE EFFECT OF ex-AMYLASE AND HCI ON HERMANNIA
DEPRESSA AQUEOUS EXTRACT
7.6.1 Introduction
H. depressa aqueous viscous mucilaginous slime (Extract B) exhibits
properties of a bulking agent. With addition to water it swells dramatically
absorbing large quantities of water. It may have a use as an appetite
suppressant, but more readily as a laxative or against diarrhoea. It is
important that it has the ability to pass through the digestive system of the
human while still exhibiting the mucilaginous nature and its ability to absorb
large quantities of water.
The objective of this experiment was to determine the level of mechanical
and chemical breakdown of the extract if it should pass through the human
digestive system.

152
7.6.2 Materials and Methods
Enzyme Hydrolysis
A simple method was devised to simulate the effect -amylase would have
on the aqueous H. depressa extract (Extract B). H. depressa extract is
composed of polysaccharides as determined previously in this Chapter.
Ground, dry powder (0.5 g) of Extract B was added to a solution of 100 ml
distilled H20 containing 50 I a-amylase in a Schott bottle. The pH was
maintained at 6.9 - 7.1. This technique simulates saliva which is 99.5 %
water and 0.5 % solutes (TORTORA & GRABOWSKI, 2000). A control was
set up, whereby 0.5 g of Extract B was added to 100 ml distilled water.
The heat stable a-amylase solution from Bacillus globigii (1,4- -D-Glucan
glucanohydrolase) was used. This is similar to the a-amylase obtained from
human saliva.
The Schott bottle was placed in a waterbath at 37°C (internal temperature of
human body) and shaken to simulate mechanical digestion for 1 h. Salivary
amylase continues to act on the starches for about 1 h after ingestion, at
which time the food reaches the stomach and the stomach acids inactivate it
(TORTORA & GRABNOWSKI, 2000).
Acid Hydrolysis
The concentration of HCI secreted by parietal cells is about 150 -160 m mol'1 .
(SANFORD, 1982). Extract B (0.4 g), autoclaved and non-autoclaved,
were placed in 4 ml 10 % HCI in a pill vial to determine the extent of acid
hydrolysis of the extract. The pill vial was placed in an ultrasound bath for 15

153
min. Whereafter it was allowed to stand. Changes and any breakdown of the
extracts were recorded.
7.6.3 Results
Enzyme Hydrolysis
After 1 h, the extract in the control and the experiment exhibited the same
characteristics. The small quantity of extract (0.5 g) granules had taken up
water and swelled considerably. The 100 ml solutions displayed a
mucilaginous consistency (Plate 15 D). No hydrolysis of extract was visibly
noted. TLC fingerprints confirmed these results as the control and
experiment produced similar chromatograms.
Acid Hydrolysis
Carbohydrates are not hydrolysed in the stomach, however, the release of
acids may effect the aqueous extract. The extract was therefore tested
using a simple test to simulate the action of HCI in the stomach.
On placing extracts into 10 % HCI the solutions became murky, the
autoclaved extract more so than the non-autoclaved solution. This may be
due to hydrolysis taking place during the autoclaving process. Within 5 min
extracts had swollen to more than five times their original sizes, from water
uptake from the solution. The extracts exhibited no signs of hydrolysing in
solution. After 4 h the extracts had not broken down, but exhibited a
mucilaginous nature due to uptake of water. Acid hydrolysis of the extracts
was minimal (Plate 15 E).

154
7.7 DEGREE OF HERMANNIA DEPRESSA AQUEOUS EXTRACT
HYDROLYSIS IN THE PRESENCE OF BACTERIA
7.7.1 Introduction
This test was performed to determine if there is a similarity between H.
depressa mucilage and karaya gum in the ability to resist bacterial
breakdown. Karaya gum is resistant to bacterial and enzymatic breakdown
(MORTON, 1977; PAGE, CURTIS, SUTTER, WALKER & HOFFMAN,
1997). With resistance to bacterial breakdown the mucilage can be used to
cover wounds, keeping them wet and aiding in protection from infection.
Why the Chosen Bacteria
Staphylococcus aureus is usually responsible for sores and boils appearing
on human skin. If H. depressa extracts are used as a replacement of the
vaseline base in ointments, it is important that S. aureus does not cause the
break down of the extract. It has previously been indicated that the aqueous
extract does not exhibit anti-bacterial activity (Table 6, Chapter 4).
Escherichia coli is a naturally occurring bacterial strain in the human
digestive system. Even though it occurs in minute quantities, by causing
rapid hydrolysis of the aqueous extract the extract would not be appropriate
in combatting diarrhoea or constipation.
7.7.2 Materials and Methods
Standard Curve
A standard curve measuring the viscosity of the extracts, which was
determined by drops rnin', was prepared (Fig. 4). Samples were prepared

155
of Extract A and Extract B (autoclaved and non-autoclaved) using a variety
of dilution gradients in distilled water, from 0 g ml' to 150 g ml", and placed
on a shaker overnight to ensure the extract swelled homogeneously in the
water.
Two ml of prepared, suspended extract were placed in a syringe (Promex)
where the plunger of the syringe had been removed. The syringe was held
vertically in place by a clamp facing downwards. The syringe ensured
standardization of drops. No air bubbles were formed ensuring accurate
results. The viscosity of the varying sample concentrations was determined
by counting the drops rnin' eluting from the syringe. Results for all four
extracts were recorded and plotted in a line graph (Fig. 4) to determine the
standard curves of each extract. The standard curves allowed for comparing
the viscosity of extracts after they were infected with bacteria.
Experiment
Autoclaved and non-autoclaved extracts of Extract A and Extract B were
used in this experiment. Two replicas were prepared of each, for each
bacterial strain. Extracts (250 g) were placed in 5 ml distilled water (50 g ml
1) in a small glass flask (25 ml) and shaken overnight. Overnight cultures of
Staphylococcus aureus and E. coli were grown in Mueller - Hinton (MH)
broth, in a waterbath at 35°C. The following day 200 g bacterial cultures
were added to each flask containing 50 g rnr ' extract solution, shaken in a
waterbath (35°C). Extracts were examined after 5 h, 24 hand 48 h.
7.7.3 Results
Standard Curve and Bacterial Hydrolysis of Extracts

156
2OO r--- - - - - - - - - - - - - - - - - - - -,
201------t~--------~~===-_=_~::::::_-1
IBO~~--------------------_j
i::J I60W~~~------------------_jr::'E "'o+-+---.J~=~~-------------_j...~ 120 -I-----'\---~--~------------_j
UIelOO +---\----\---~~----------___i
~ BO -I------'~-----l_=_---~---------_j
~'iij 60-I-------'~----~:__~~_==__--------j
olil 40 -I------~"<"---------'~~~-==--------j
s
15010080605020
o-l----_--_-~}___-_{]f___-_o--.:::o--__oo
Concentration of extract (1-19 ml-1)
--+- Autoclaved HDEb -D- HDEb ---tr- Autoclaved HDEa -.- HDEa
Fig, 4: Standard curve depicting viscosity (drops rnin") for autoclaved
and non-autoclaved aqueous H. depressa Extract A (HDEa)
and Extract B (HDEb)
E~~-_.
\~~\\~
"'\.\.\.~~
~ -- -
200
180
i 160::Jc'E 140
...~ 120
UIc.. 100e
"C~ 80
~'iij 60oUUI:> 40
20
oo 20 40 50 60 80 100 150
Concentration of extract (1-11 ml-1)
I-e--Standard -0-S. aureus treated - - E. coli treated I
Fig, 5: Viscosity (drops min') against a standard curve for non
autoclaved aqueous H. depressa Extract B to determine
bacterial hydrolysis on the extract after 48 h

157
2OO r--- - - - - - - - - - - - - - - - - - - - - - --,180 I~e-r-r-- - - --- - - - - -- - - - - - - - - - - - I
Q) 160t---"~---------------------t-~e'E 140
; 120 l-------~~~--------------IQ.
l/lQ. 100l---------~~...._------------I
2~ 80 t-----------~2'o...------------1
~"ii) 60 1-----------------..:~13t__---------1ool/l:> 40
20t----------------~~~-----1
1501008060504020
0 1---_--_---_--_---_---=~==--e
o
Concentration of extract (IJI ml-t)
I--+- Standard -0-S. aureus treated - E. coli treated I
Fig. 6: Viscosity (drops min') against a standard curve for autoclaved
aqueous H. depressa Extract B to determine bacterial
hydrolysis on the extract after 48 h
200 ,....-- - - - - - - - - - - - - - - - - - - - - - --,
180 .J---"'-....-- - - - - - - - - - - - - - - - - - - - - - - - 1
$' 160 t------"......- - - - - - - - - - - - - - - - - - - - I~
C"E 140 t-- - ·
...8. 120 t-----~--------
l/la. 100 t-- - - - - ' .'I.'\-- - - - - - - - - - -- - - - - - - - I
2"'C- 80 t--------.l;;;::::-~~=_-------------I
~"ii) 80 t---------------'~,____------------Ioe~ 40 t----------------"~::.s;;;;;;:=_--------I
20 t------------------==::~~;;;;;;::::a.~=c__-I
1501008060504020Ol--- - _ - - _ - - - _ - - - - - _ - - - -l
o
Concentration of extract (IJI ml-1)
1__Standard -0-S. aureustreated - E. coli treated I
Fig. 7: Viscosity (drops rnin") against a standard curve for non
autoclaved aqueous H, depressa Extract A to determine
bacterial hydrolysis on the extract after 48 h

158
200 - - - - - - - - - - - - - - - - - - - - - - 1
180 !~~c:__--------------------I
Gi 120L------~~~-------------IQ.
a loo I---------~~~-----------1o...~ 80l--------------..-:'"~'>;__---------_i~"iij 60 l------------~~---------IouIII:> 40
20L------~~~
Q) 160 J--~~;::~~---------------_1;:,.5 140L---------=:~,,~~---------------IE
1501008060504020ot...------------.--- ..--__-.--__--1
o
Concentration of extract (IJI ml-1)
I-tr- Standard -0-S. aureus treated - E. coli treated I
Fig. 8: Viscosity (drops rnin') against a standard curve for
autoclaved aqueous H. depressa Extract A to determine
bacterial hydrolysis on the extract after 48 h
Autoclaving extracts caused a decrease in viscosity of the extracts, the non
autoclaved Extract B extract was more viscous than the autoclaved Extract
B extracts and similarly with the Extract A extracts. Karaya gum dissolves
when its aqueous dispersions are autoclaved (MANTELL, 1947). Some
hydrolysis takes place because the gum occurs as the salt of an acidic
polysaccharide and some free acidic groups may exist (WHISTLER &
SMART, 1953). This may have occurred in the autoclaved H. depressa
aqueous extracts resulting in the less viscous nature.
The viscosity of the Extract B extracts is higher than that of Extract A
extracts (Fig. 4). The non-autoclaved Extract B extract showed the highest
viscosity. At 20 g mr' the extract was very viscous and at 50 g rnl" no more
extract passed from the syringe.

159
Measuring viscosity of the extracts was a difficult procedure as the extracts
swell in water, but do not necessary dissolve in it, therefore many solutions
are lumpy and these lumps clog the syringe especially in the more viscous,
slime extracts. The extracts were ground to a powder as gums are best
powdered. If they are unpowdered, addition of water yields a non
homogenous colloidal solution. If finely powdered, each particle swells and
the appearance and behaviour of the solution is more likely to be a
homogenous solution (MANTELL, 1947). The extracts were autoclaved in
case they contained other bacteria or pathogens that would possibly effect
the results.
The extracts were treated with bacterial strains of S. aureus and E. coli and
were examined after 5 h, 24 hand 48 h. Viscosity was recorded after 48 h.
Over time there were no changes. The S. aureus and E. coli bacteria did not
hydrolyse the extracts and therefore their viscosity remained constant. This
is apparent by comparison with standard curves (Figs 5 - 8). The bacterial
treated extracts generally showed a slightly less viscous nature. This can be
attributed to the addition of MH broth to these solutions.
7.8 THE EFFECT OF 60 % ETHANOL ON HERMANNIA DEPRESSA
AQUEOUS EXTRACTS
7.8.1 Introduction
A test was performed to determine if there is a similarity between H
depressa mucilage and Karaya gum as the latter is said to swell in 60 %
alcohol (LEUNG & FOSTER, 1996).

160
7.8.2 Materials and Methods
Dried pieces of Extract A and Extract B extracts were placed in pill vials
containing 10 ml of 60 % ethanol and allowed to stand : Changes in the
extracts were recorded.
7.8.3 Results
Small bubbles appeared from Extract A. A golden brown pigment was
released within seconds of it being added to the 60 % ethanol solution.
Within five min the extract had begun to swell , as it absorbed water from the
solution. After 10 min the extract was already more than five times its
original size. After a period of 18 h the 60% ethanol solution was golden
brown and the piece of extract was very brittle. The solution was slightly
viscous (Plate 15 F).
Small bubbles appeared from Extract B. After 10 min the solvent solution
remained clear. After 18 h, a yellow pigment had been released into the 60
% ethanol solution. The piece of extract remained the same size and was
very hard. It did not take in water from the 60 % ethanol solution. The
alcohol concentration in the solution inhibited the ability of the extract to
absorb water (Plate 16 F). The H. depressa extract did not exhibit the same
property as Karaya gum as it did not swell in 60 % ethanol.
7.9 GENERAL DISCUSSION
In addition to the mucilage formed by the aqueous extract of H. depressa
leaf extract; leaf and twig extracts of D. burgessiae and D. cymosa, leaf
extracts of S. murex, tWig extracts of H. depressa and the unripe fruit extract
of C. greenwayi also exuded mucilaginous aqueous extracts from dried
plant material. The mucilage produced by C. greenwayi fruit may be the

161
release of pectins. Many Sterculiaceae species produce either a gum or
mucilage. Some of which have important economical value and are also
used medicinally. S. urens, for example, yields an economically important
gum, Karaya gum, which has extensive use in food products, cosmetics and
medicine.
Bulking Agent - Appetite Suppressant, Diarrhoeal and Constipation
Control
The production of mucilage and the expected ability of the extract to pass
through the human digestive system without hydrolysing are in line with its
uses in traditional medicine. Leaf sap in water is used for stomach ache,
having a purgative effect (WATT & BREYER-BRANDWIJK, 1962), resulting
in the relief of constipation. It is also used in a mixture with other plants in
the treatment against diarrhoea (HUTCHINGS, HAXTON SCOTT, LEWIS &
CUNNINGHAM, 1996).
Sterculiaceae species which are used as bulking agents in appetite
suppressing includes karaya gum, which is not digested or absorbed by
humans. It is used as a filler and is an ingredient in some weight loss
formulations (LEUNG & FOSTER, 1996). In Portuguese Guinea many tribes
use the kola nut (Cola natida) which is consumed at any social gathering. It
reduces the craving for food considerably (MAY & MCLELLAN, 1971). This
function may be a property of the fruit acting as a bulking agent.
The idea of requiring a bulking agent in rural Africa may seem extreme if it is
to be used as an appetite suppressant. However, mass production and
selling of the product on the world market would result in bringing money
into the poor rural communities.

162
However more effective in the rural areas would be the use of the easily,
prepared aqueous extract in combat against diarrhoea and constipation, a
form of cheap, natural 'drug'. These are common ailments in informal
settlements where clean water and good sanitation are lacking. No vaccines
are available against the most frequent gastrointestinal infections. The
control of these infections requires preventative healthcare measures.
The dried, crushed leaf material could be ingested or soaked in water, dried,
ground with a mortar and pestle, then ingested. Local herbalists and 'muthi'
shops could prepare the homogeneously ground extract. Mixing with food
would ensure it passes easily through the digestive tract.
The bloated feeling that may result after ingestion would be a slight
discomfort to endure in order to rid the problems of frequent diarrhoeal and
constipation problems. Swallowing bulk extract could cause it to lodge in the
esophagus. Attempts to wash it down with water would result in swelling and
further obstruction, necessitating surgical removal (THOMPSON, 1989).
The problem could be overcome by ensuring patients mix a controlled
amount of the fine powdered gum with food.
Wound Healing
The covering of wounds is a necessity which has always been practised by
humans (ONAYADE, ONAYADE & SOFOWARA, 1996). It was for a long
time the only branch of the healing arts (FISH & DAWSON, 1967). There is
a high risk of infection through an open wound. Wounds should not be
allowed to dry out, as desiccation kills healthy cells (ONAYADE, ONAYADE
& SOFOWARA, 1996). In plants, gums and related compounds effect
wound healing by acting as protective agents that cover them (ROSS &
BRAIN, 1977). Cleaning of a wound followed by occlusion is important in
preventing dirt and exudates from accumulating which may lead to bacterial
infection. Healing is enhanced when plants with anti-septic activity are used

163
(VAN WYK & GERICKE, 2000). H. depressa aqueous extracts do not
exhibit significant pharmacological activity and would therefore not aid
pharmacologically in the healing process of wounds if used to cover them.
They may, however, still protect the wound from new infections and keep
the wound moist as it heals. Some plants used in dressings contain
mucilage, which provides a mechanical barrier and also keeps the wound
from drying out (VAN WYK & GERICKE, 2000). H. depressa leaves are
small (40 x 25 mm) and are inappropriate to wrap around wounds. The
mucilage extracted from the leaves can be used as a carrier for topical
applications. The application would allow the skin to breath, which is
preferable to lipophilic applications which include Vaseline, a common
application carrier of ointments.
A number of Hermannia species are used in the treatment of wounds. The
southern Sotho use the crushed root of H. coccocarpa K. Schum as a
plaster for wounds and for the treatment of burns. H. erodiodes O. Ktze is
an African remedy used to treat burns. The Europeans apply an infusion or
a decoction of H. cuneifolia Jacg. to sores, and the powdered leaves of H.
veronicaefolia Hochst to suppurating wounds (WATT & BREYER
BRANDWIJK, 1962).
7.10 SUMMARY
• The H. depressa aqueous extract can be described as a
polysaccharide composed of L(+) rhamnose, 0(+) -glucose and D
glucuronic acid, with the dispersions of gum in water having a slightly
basic pH of 7.1 - 7.3. The extract does not dissolve or hydrolyse in
boiling water. After 1 .Y in storage the dried, ground extract still
absorbs large quantities of water and takes on a mucilaginous nature.

164
• A number of basic experiments suggested that the extract had no
anti-bacterial or anti-inflammatory effects, however, it was not
hydrolysed by a-amylase enzyme, Hel or bacteria. It is expected that
its passage in the human digestive tract would not affect its
mucilaginous properties.
• It is important to determine the toxicity level of the extract for human
consumption

:,
Plate 15 Hermannia depressa aqueous leaf extract. (A) Extract A (1) a
slight viscous liquid when wet and (2) brittle and darker in
colour when dry. (B) Extract B (1) a very viscous, mucilaginous
slime when wet and (2) dark and hard when dry. (C) TLC
fingerprints of the aqueous extracts (i) Extract A and (ii) Extract
B run in a solvent solution of chloroform, methanol, water
(60:35:8)(v/v/v), viewed by (1) white light and (2) after staining
with anisaldehyde spray reagent. (0) Results of amylase
hydrolysis test of Extract B after 1 h in (1) (i) water control and
ii) 5 % amylase solution, both indicating much swelling from
water uptake and no hydrolysis of extract. These results were
confirmed by TLC fingerprints of Extract B after 1 h in (2) (i)
water control (ii) 5 % amylase solution. (E) Results of HCI
hydrolysis of Extract B after 4 h in (1) 10 % HCI, and (2) water
control suggested there was no hydrolysis of the extract. (F) (i)
Extract A and (ii) Extract B after (1) 1 hand (2) 18 h in 60 %
ethanol solution.
C1
~i i

166
CHAPTER 8
THIN LAYER CHROMATOGRAPHIC FINGERPRINTING
8.1 INTRODUCTION
Thin Layer Chromatographic (TLC) fingerprinting is an efficient way of
characterising analytical fingerprints of plant extracts (WAGNER & BLADT,
1996). A photographic atlas is an aid to the identification of plants used in
traditional medicine or the identification of a plant species from dried
specimens. If toxic plants have been used in a potion taken by a patient, a
comparison with TLC fingerprint chromatograms could establish the identity of
the toxic plant allowing for quicker, more direct treatment. A chromatogram of a
species may vary depending on the area the collection took place and the time
of year of harvesting. Plants adapt the ability to function adequately through
seasons of extreme heat with abundance of rain to long periods of cold with
little rain. A variety of new components may be produced by the plant during
each season. It is therefore important to record all collection information.
For TLC fingerprinting results to be employable, they must be carried out under
the same conditions, resulting in good colour visibility and clear separation of
the different components for identification. Note must be taken of harvesting
time of the material used. TLC fingerprints were developed of the seven
8terculiaceae species.
The aim of this study was to establish the fingerprinting chromatograms of each
species studied. Focussing on components within the same species obtained
using different solvents and on components of different species from the same
family.

167
8.2 MATERIALS AND METHODS
Preparation of Extracts
Plant material (1 g) was extracted in 10 ml water and ethanol and (2 g) 20 ml
ethyl acetate (only small quantities of extracts are obtained from ethyl acetate,
hence more plant material was required). Plant material was placed in an
ultrasound bath for 30 min, filtered and dried. The residues were redissolved at
a concentration of 10 mg ml'.
Loading of Extracts
Extracts were loaded by streaking onto plastic TLC plates (Merck Silica Gel 60
F254 • 10 x 10 cm) in 25 IJI aliquots, 1 cm band, 1 cm apart (0.5 mg extract).
Silica gel is an efficient absorbent for the TLC separation of most drug extracts
(TAYLOR, 1999)
TLC Separation
Solvents hexane and ethyl acetate were used in the separation of components
as they moved up the TLC plates. Solutions of hexane: ethyl acetate tested
were 1:2 (v/v), 1:1 (v/v) and 2:1(v/v). The best separation of the extract
components was 1:1(v/v) of the ethanol and ethyl acetate plant extracts. The
water extracts showed good separation in solvent solutions of chloroform:
methanol: water (60:35:8)(v/v/v). All plates were developed over a distance of 8
cm.
Visualization of TLC Plates
Once the extract had been separated by TLC and the solvents evaporated the

168
separated components were visualised under visible (white) and ultraviolet light
at 254 nm and 366 nm. The TLC plates were then stained with anisaldehyde
spray reagent and heated at 110°C for 8 min , allowing for the colour
development of various components previously not visible.
Data was recorded by scanning (visible light and anisaldehyde) and taking
photographs (UV light) of the different fingerprints of the various species. R,
values determine the locality of the various compounds. This value was
calculated by determining the ratio of the distance travelled by the band
maximum to the distance travelled by the leading edge of the mobile phase.
Ultra-violet Light
UV light detection is non-destructive (GIBBONS & GRAY, 1998) making it a
favourable technique for compound detection. Photographs were taken with a
Pentax ME super camera, with a 200 mm lens attached. The F-stop was set at
F 11, and the shutter speed was set on B. Photos were taken in a dark room
under UV light of 366 nm (long wavelength exposing blue light) and 254 nrn
(short wavelength exposing pale green light). The shutter release was held
down for intervals of 30 sec, 1 min and 1 min 30 sec; and 10 sec, 15 sec and
20 sec respectively. However, not all compounds absorb UV light, so a spray
reagent was also used.
Anisaldehyde Staining
This is a destructive method. A common method of rendering colourless
substances on chromatograms visible is to spray them with a reagent solution
(JORK, FUNK, FISCHER & WIMMER, 1990). Spray reagents, when applied to
a layer, produce colours from colourless substances. Some spray reagents are
very specific, but many others will react with a broadly based type of compound

169
(HOUGHTON & RAMAN, 1998). Anisaldehyde-sulphuric acid is a universal
reagent for natural products that makes colour differentiation possible (JORK,
FUNK, FISCHER, WIMMER, 1990).
The anisaldehyde stain was prepared in a fume hood. Ethanol (465 ml) was
cooled in a Schott bottle, on ice. Glacial acetic acid (5 ml), concentrated
sulphuric acid (13 ml) and para-anisaldehyde (13 ml) were added to the cold
ethanol in the order mentioned, keeping the solution constantly cold. A clean
glass pipette was used for each chemical as they activate each other when not
in the whole mixture The mixture was stored in the Schott bottle (covered with
tin-foil to eliminate all light) in a freezer. The clear mixture turns yellow or pink
as it 'goes off'.
The TLC plate was sprayed evenly with a glass sprayer (held 25 cm from the
plate) in a fume hood with anisaldehyde spray reagent, ensuring the
compounds did not 'run'. The surface of the plate was air-dried for a few
seconds and heated at 110°C for 8 min in an oven, until the plate turned pink.
8.3 RESULTS AND DISCUSSION
TLC analysis was used to compare the chemical composition of the crude
water, ethanol and ethyl acetate extracts of the seven Sterculiac~ae species.
This enabled for the comparison of extracts of different plant parts within a
species and at a species level (Plates 16 - 20). All plant material was collected
in early autumn (March/April). The seasonal profiles of the species were not
investigated. The Rf values and colours of the various components were
compared. The same substances indicate the same R, values and colours
under the same experimental conditions .
On viewing at UV366 nm light components were clear and distinct, while at UV

170
254 nm light many components were undetected. For ethanol and ethyl acetate
extracts the UV 254 nm chromatograms were not displayed. Ethanol is a
relatively polar solvent. TLC fingerprints of ethanol extracts, especially of leaf
material, displayed too many compounds to aid in distinguishing minor
differences between plant parts or species. The ethyl acetate extracts liberate
more distinguishable compounds , resulting in better TLC fingerprint
identification. Leaf extracts universally contained an abundance of components.
Notably chlorophyll is present in ethanol and ethyl acetate extracts, indicating
its very polar nature. Chlorophyll is evident when viewed under visible light as a
variety of green shades, blue after staining with ansialdehyde spray reagent
and purple or pink at UV 366 nm light.
Comparison of Extracts Within Species
Ethanol and ethyl acetate extracts from the same species largely separated
many similar compounds (Plates 16 - 19), with a few additional compounds
visible from either extract. Aqueous extracts (Plate 20) separated compounds
different to ethanol and ethyl acetate extracts, and could not be compared with
them in relation to Rf values due to developing in different solvent solutions.
Comparison of Extracts Between Species
There were a number of similarities within a genus. A comparison of TLC
fingerprints from the three Oombeya species screened, O. rotundifolia, 0,
burgessiae and O. cymosa, indicated numerous compounds exhibiting similar
chemical profiles. This is evident in plates 16 and 17, where solid arrows (right
pointing) indicate compounds present in D. rotundifolia, O. burgessiae and O.
cymosa. The non-solid arrows (left pointing) indicate compounds present in
O.burgessiae and O. cymosa only. These compounds exhibit the same Rf
values and colours, forming the basis of the qualitative process of TLC.

171
Differences were observed on a quantitative level by comparing the relative
intensities of the spots.
A comparison of TLC fingerprints of the two Cola species: C. natalensis and C.
greenwayi, indicated a number of similar components (Plate 18). Solid arrows
.indicate the common components. However, as revealed in Chapters 4 and 5,
these two species of Cola exhibit different pharmacological and phytochemical
properties. C. greenwayi exhibited good anti-inflammatory and anti-bacterial
activity, while C. natalensis exhibited no or little activity. C. greenwayitherefore
contains a number of compounds not associated with C. natalensis. These
compounds are in all likelihood not visible as they are available in very small
quantities.
H. depressa TLC fingerprint chromatograms exhibit many compounds not
present in any of the other species investigated. H. depressa exhibits a different
growth form to the other species. It is a herbaceous plant growing in
grasslands. This may account for the numerous compounds as it adapts to its
lifestyle.
Anti-bacterial Compounds
The symbol 'x' on the plates (Plate 16 - 19) indicates the position of anti
bacterial compounds, identified by bioautography and isolated by bioassay
guided fractionation (Chapter 6). Some of the active compounds are not visible
on the TLC fingerprint chromatograms as they are not very colourful, even after
viewing by UV light and after staining with anisaldehyde spray reagent. This is
possibly because their concentration is very low. After further purification the
active compounds would be more noticeable.

172
Saponins and Cardiac Glycosides
The TLC detection of saponins using an anisaldehyde spray reagent is
indicated by mainly blue, blue viole t and sometimes red and yellow brown
zones (WAGNER & BLADT, 1996). Inspection after anisaldehyde staining
exhibited yellow, blue violet and red zones in O. rotundifolia leaf, twig and bark
extracts and H. depressa mainly root, but also in leaf and stem extracts,
indicating the expected presence of saponins in these species. These results
are in line with experiments from Chapter 5. However, specific detection of
saponins by TLC is possible with blood reagent only (WAGNER, BLADT &
ZGAINSKY, 1984).
The TLC detection of cardiac glycosides by white light is indicated by weak
brown, violet and weak blue zones (WAGNER & BLADT, 1984) and under UV
366 nm exhibits blue flourescent, yellow brown or yellow green zones. On
inspection it was impossible to point out the position of possible cardiac
glycosides on the TLC chromatograms.
8.4 SUMMARY
TLC provides a chromatographic drug fingerprint (WAGNER, BLADT &
ZGAINSKI, 1984). TLC fingerprint chromatograms were developed of the seven
Sterculiaceae species to achieve a broader chemical knowledge of the species.
• Plant material was collected at the same time of year (March/April).
Material was dried and stored under the same conditions and the TLC
chromatograms were developed according to a uniform devised
technique, making the results obtained employable.

173
• The presence of similar bands between and within a species was
observed and illustrated. Many similar compounds were present within
the same genera, notably within the Oombeya species.
• The position of anti-bacterial compounds was indicated on the TLC
chromatograms. Most were not visible at a low concentration.

A ii iii
Plate 16 TLC fingerprint chromatograms of D. rotundifolia (i) leaf, (ii) twig
and (iii) bark material viewed by (A) white light, (8) after
anisaldehyde spray reagent staining, and (C) UV 365 nm light.
(EtOH - ethanol).
8
c

Plate 17 TLC fingerprint chromatograms of (A) D. burgessiae and (8) D.
cymosa (i) leaf and (ii) twig material and (C) S. murex (i) twig
material viewed by (1) white light, (2) after anisaldehyde spray
reagent staining, and (3) UV 365 nm light. (EtOH - ethanol, EA
ethyl acetate).
C1 i

iiiiiiiiiiiijiiiiiiioiiiliioiiiioiiiioiliioiiiioiiiioiiiiiiiiiiioioii.........................................---------~-------I ..
A B
Plate 18 TLC fingerprint chromatograms of (A) C natalensis and (B) C.
greenwayi (i) leaf, (ii) twig, and (iii) fruit material viewed by (1)
white light, (2) after anisaldehyde spray reagent staining, and
(3) UV 365 nmlight. (EtOH - ethanol, EA - ethyl acetate).

Plate 19 TLC fingerprint chromatograms of H. depressa (i) leaf, (ii) stem
and (iii) root material viewed by (A) white light, (8) after
anisaldehyde spray reagent staining and (C) UV 365 nm light.
(EtOH - ethanol).
A
B
c

c o m »
Plate 20 TLC fingerprint chromatograms of water extracts of 1) D.
rotundifolia, 2) D. burgessiae, 3) D. cymosa, 4) C. natalensis, 5)
C. greenwayi'and 6) H. depressa material viewed by (A) white
light , (8) after anisaldehyde spray reagent staining , (C) UV 365
nm light, and (0) UV 254 nm light. (L - leaf, T =twig, S - stem ,
8 - bark, F - fruit, R - root) .
179
CHAPTER 9
GENERAL CONCLUSIONS
The use of traditional medicine is widespread within South Africa.
Investigation by ethnobotanical screening for chemical constituents and
biological activity exhibited by medicinal plants leads to the discovery of new
drugs and is important in South Africa in preventing the loss of valuable
traditional knowledge which is important for the survival of its culture and
traditional beliefs. These studies are important in bridging the gap between
traditional and Westernised medicines.
There had been very little previous chemical investigation of South African
Sterculiaceae species used in traditional medicine. In this study seven
species were biologically investigated, varying in growth type (small herb,
shrubs and large trees) and traditional usage, allowing for a broad
investigation of the KwaZulu-Natal species of the family Sterculiaceae.
Screening revealed good anti-bacterial and anti-inflammatory activity in
most of the seven species screened. The presence of numerous
phytochemical compounds was also discovered. Many bacteria show a high
level of resistance to currently used antibiotics. It is important to focus on the
research and development of effective drugs. Five plants containing
biological activity in the initial anti-bacterial screening underwent further
investigation to isolate the active compounds. The active compounds
isolated were all common fatty acids. Biological activity of species
corresponded with their use in traditional medicine. C. natalensis has no
recorded use in traditional medicine and indicated the lack of biological
activity. TLC fingerprinting of extracts from the Sterculiaceae was another
step undertaken towards increasing the available information on the
chemical make-up of the Sterculiaceae species investigated.

180
Overall it was noted that the pharmacological and phytochemical properties
varied between members of the family and within a genus. There were
distinct similarities within the same species inhabiting different locations. It
was also noted that chemical compounds found in one part of the plant were
not always present in other parts of the plant.
Future recommendations related to this research would be to screen the
species investigated for more pharmacological activities to generate a
greater scope of the active biological diversity. The screening of plant
material for anti-inflammatory activity indicated excellent inhibition therefore
isolation of these active compounds could give beneficial results.
The investigation of the selected Sterculiaceae species actively used in
traditional medicine is an important step forward in drug discovery. This
study has resulted in new discoveries and has led to a broader knowledge
of the chemistry of KwaZulu-Natal Sterculiaceae species investigated.

181
REFERENCES
ABBOTT, I. A. & SHIMAZU, C. 1985. The geographical origin of the plants
most commonly used for medicine by Hawaiians. Journal of
Ethnopharmacology 14: 213 - 222.
ABERCROMBIE, M., HICKMAN, M., JOHNSON & THAIN, M. 1990. Dictionary
of Biology. Penguin Books, England.
BADAMI, R.C., PATIL, K.B ., SUBBARAO, Y.V., SASTRI , G.S.R. &
VISHVANATHRAO, G. K. 1980. Cyclopropenoid fatty acids of Sterculia
oils by gas liquid chromatography. Fette, Seifen, Ansstrichum 82: 317
318.
BAlICK, M.J. & COX, P.A. 1996. Plants, people, and culture: The science of
Ethnobotany. Scientific American Library, New York. ISBN 071675061
9.
BETTELHEIM, F.A. & LANDESBERG, J.M. 1991. Laboratory Experiments for
General, Organic and Biochemistry. 3rd Edition. Saunders College
Publishing, Fort Worth. ISBN 0 03 020333 3.
BRIMER, L., LORENTZEN, B. & WAGNER SMITT, V. 1989. 0ve/ser I
Farmakognosi K-25/9. Royal Danish School of Pharmacy, Copenhagen.
BRUNETON, J. 1995. Pharmacognosy, Phytochemistry, Medicinal Plants.Intercept Ltd., Andover.
BRYANT, A .T. 1966. Zulu Medicine and Medicine Men. Struik Publishers,Cape Town.
CAllS, I., TURUKER, A., TASDEMIR, D., WRITE, A.D., STICHER, 0., LUO,
Y.D. & PEZZUTO, J.M. 1997. Cycloartane triterpene glycosides from the
roots of Astragalus melanophrurius. Planta Medica 63: 183 - 186.

182
CHHABRA, S. C., UISO, F.C. & MSHIU, E. N. 1984. Phytochemical screeningof Tanzanian medicinal plants. Journal of Ethnopharmacology 11: 157
179.
CHHABRA, S.C. & UISO, F.C. 1990. A survey of the medicinal plants ofEastern Tanzania for alkaloids, flavonoids , saponins and tannins.
Fiterapia LXI: 307 - 316.
CHHABRA, S. C.; MAHUNNAH, R.L.A. & MSHIU, E. N. 1993. Plants used in
traditional medicine in Eastern Tanzania. VI. Angiosperms (Sapotaceae
to Zingiberaceae). Journal of Ethnopharmacology 39: 83 - 103.
CHOPRA, R.N., NAYAR, S.L. & CHOPRA, I.C. 1992. Glossary of Indian
Medicinal Plants. Publication and Information Directorate, CSIR, New
Delhi.
CLAYMAN, C. 1995. The Human Body. An Illustrated Guide to its Structure,
Function and Disorders. OK Publishing, New York. ISBN 1 564589927.
COATES PAlGRAVE, K. 1977. Trees of Southern Africa . Struik Publishers,Cape Town. ISBN 0 86977 081 O.
COATES PAlGRAVE, K., COATES PAlGRAVE, M. &COATES PAlGRAVE,
P. 1985. Everyones Guide to Trees in South Africa . National Book
Printers, Cape Town. ISBN 0620074388.
COOD, L.E.W. 1951. Trees and Shrubs of the Kruger National Park. TheGovernment Printer, Pretoria.
COlGAN, M. 1994. The New Nutrition : Medicine for the Millennium. C. I.Publications, San Diego. ISBN 0 96 24840 75.
COlLlNS ENGLISH DICTIONARY. 1998. Millennium Edition. Harper CollinsPublishers, Glasgow. ISBN 0 00 470453 3.
COUNCil FOR AGRICULTURAL SCIENCE AND TECHNOLOGY. 1987. Dietand Health. Report Number 111. ISSN 01944088.
183
COX, P.A. & BALlCK, M.J. 1994. The ethnobotanical approach to drug
discovery. Scientific America: 60 - 65.
CUNNINGHAM, A. 1991. The herbal medicine trade: resource depletion and
environmental management for the 'hidden economy' In: South Africa 's
informal economy. Preston-Whyte, E. & Rogerson, C. (eds) . Oxford
University Press, Cape Town.
DESAI, H.K., GAWAD, D.H., GOVINDACHARI, T.R., JASHI, B.S.,
PARTHASANTHY, P.C., RAMACHANDRAN, K.S., RAVINDRANATH,
K.R., SIDHAYE, A.R. & VISHWANATHAN, N. 1976. Chemical
Investigation of Wome Indian Plants: Part 9. Indian Journal ofChemistry
148: 473 -475.
DJIPA, C.D., DELMEE, M. & QUETIN-LECLERCQ, J. 2000. Anti-microbial
activity of bark extracts of Suzygium jambos (L.) Alston (Myrtaceae).
Journal of Ethnopharmacology 71: 307 - 313 .
DUNCAN, A.C. 1998. An investigation of plants used in South Africa for the
treatment of hypertension. M.Sc Thesis, University of Natal,
Pietermaritzburg.
EBANA, R.U.B., MADUNAGU, B.E., EKPE , E.D. & OTUNG, I.N. 1991 .
Microbiological exploitation of cardiac glycosides and alkaloids from
Garcinia kola, Borreria ocymoides, Kola nitida and Citrus aurantifolia.
Journal of Applied Bacteriology 71: 398 - 401.
EBI, G.C. & OFOEFULE, S.1. 1997. Investigations into the folkloric
antimicrobial activities of Landolphia owrrience. Phytotherapy Research1:149-151.
ELOFF, J.N. 1998. A sensitive and quick microplate method to determine the
minimal inhibitory concentration of plant extracts for bacteria. PlantaMedica 64: 711 - 713.
EVANS, C.W. 1989. Trease and Evans ' Pharmacognosy. Balliere 13th Edition.Tindal, London.

184
FABIAN, A. & GERMISHUIZEN, G. 1997. Wild flowers of Northern South
Africa. Fernwood Press, Cape Town. ISBN 1 874950296.
FARNSWORTH, N.O. 1984. The role of medicinal plants in drug development.
In: Natural Products and Drug Development. Krogsgaard-Larsen, P.,
Christensen, S. B. & Kofod, H. (Eds). Balliere, Tindall and Cox, London.
FARRAR, E.W. & REBOLl, A.C. 1981. The genus Bacillus - Medical. In: The
prokaryotes. 2nd Edition. Barlow, A., Truper, H.G., Dworkin, M., Harder,
W. & Schleifer, K.H. (Eds). Springer-Verlag, New Your. ISBN 0 387
972587. pp 1746 - 1768.
FISH, F. & DAWSON, J.O. 1967. Surgical dressings, ligatures and sutures.
Heinemann Medical, London.
FONG, H.H.S., TIN-WA, M. & FARNSWORTH, N.R. 1974. Practical manualfor
phytochemical screening. College of Pharmacy, University of Illinois.
FOX, F. W. & NORWOOD YOUNG, M. E. 1988. Food from the veld: ediblewild plants ofsouthern Africa. Delta Books, Craighall. ISBN 090838764
4.
FOX, M.A & WHITESELL, J.K. 1997. Organic Chemistry. 2nd Edition. Jones
and Bartlett Publishers, Boston. ISBN 0 7637 0178 5.
FUKUDA, N., TANAKA, H. & SHOYAMA, Y. 2000. Isolation of the
pharmacologically active saponin ginsenoside Rb 1 from Ginseng by
immunoaffinity column chromatography. Journal of Natural Products63: 283 - 285.
GALE, E.F. , CUNDLlFFE, E., REYNOLDS, P.E., RICHMOND, M.H. &WARING, M.J . 1981. The Molecular Basis of Antibiotic Action. 2nd
Edition. John Wiley and Sons, London. ISBN 0471 279153.
GANONG, W.F. 1975. Review of Medical Physiology. i h Edition. Lange
Medical Publications, California. ISBN 0 87041 133 O.

185
GIBBONS, S. & GRAY, A.T. 1998. Isolation by planar chromatography. In:
Natural Products Isolation - Methods in biotechnology. Cannell, R.J.P.
(Ed.) Hamana Press, New Jersey. ISBN 0 89603 262 7. pp 209-245.
GIBSON, J.M. 1975. Wild flowers of Natal (Coastal Region). The trustees of
the Natal Publishing Trust Fund, Durban. p 66.
GILLHAM, B., PAPACHRISTODOULOU, D.K. & HYWEL THOMAS, J. 1997.
Will's Biochemical Basis of Medicine. Butterworth-Heinemann, Oxford.
ISBN 0750620137.
GLASBY, J.S. 1991. Dictionary of plants containing secondary metabolites.
Taylor and Francis, London. ISBN 0 850664233.
GOLDSTEIN, A.M. & ALTER, E.N. 1959. Gum Karaya. In: Industrial Gums:
Polysaccharides and their derivatives. Whistler, RL. and BeMillar, .J.N.
(Eds). Academic Press, New York.
GRACEY, M. 1979. The contaminated small bowel syndrome: Pathogenesis,
diagnosis and treatment. The American Journal of Clinical Nutrition 32:
234- 243.
GRACEY, M. 1985. Diarrhoeal Disease and Malnutrition: A Clinical Update.
Churchill Livingstone, United Kingdom. ISBN 0443 028923.
GREMINGER, G.K. & SAVAGE, A.B. 1959. Methylcellulose and its Derivatives.
In: Industrial Gums: Polysaccharides and their derivatives. Whistler, RL.
and BeMillar, J.N. (Eds). Academic Press, New York.
GUNSTONE, F.D. 1990. Fatty Acids - Structural identification. In: Methods in
Plant Biochemistry. Volume 4. Lipids, membranes and aspects of
photobiology. Harwood, J.L. & Bowyer, J.R (Eds). Academic Press,
London. ISBN 0 124610145. pp 1 - 18.
GURR, M.1. & JAMES, A.T. 1971. Lipid Biochemistry: An introduction. 2nd
Edition. Chapman and Hall, London. ISBN 0412 13790 9. pp 18 - 84.

186
HADLEY, N.F. 1985. The Adaptive Role of Lipids in Biological Systems. John
Wiley and Sons, New York. ISBN 0471 09049. pp 2 - 8.
HAERDI, F. 1964. Die Eingeborenen-Heilflazen des Ulanga Distriktes
Tanganjikas (Ostafrica). Octa Tropica 8: 1 - 27.
HARBORNE, J.B. & BAXTER, H. 1993. Phytochemical Dictionary: A handbook
ofbioactive compounds from plants. Taylor and Francis, London. ISBN 0
850667364.
HASHEM, F.A. & SALEH, M.M. 1999. Antimicrobial components of some
Cruciferea plants (Diplotaxis harra Forsk and Erucaria microcarpa
Boiss). Phytotheraphy Research 13: 329 - 332.
HEFTMANN, E. 1961. Chromatography. Reinhold Publishing Corporation, New
York. ISBN 61 18047.
HEGNAUER, R. 1973. Chemotaxonomie der Pflanzen. Volume 6. Birkhauser
Verlag, Basel and Stuttgart. pp 882.
HOFMANN, K., JUCKER, 0., MILLER, W.M.R., YOUNG, Jr. A.C. & TAUSIG,
F. 1954. The structure of lactobacillic acid . Journal of the American
Chemistry Society 76: 1799 - 1804.
HOSTETTMANN, K., MARSTEN, A., MAILLARD, M. & HAMBURGER, H.
1995. Phytochemistry ofPlants used in Traditional medicine. ClarendonPress, Oxford. ISBN 0 19 8577753.
HOUGHTON, P.J. & RAMAN, A. 1998. Laboratory Handbook for the
Fractionation of Natural Extracts. Chapman and Hall, London. ISBN 0
412749106.
HOWES, F.N. 1949. Vegetable gums and resins. Chronica Botanica Company,
USA.
HUTCHINGS, A. 1992. Plants used for some stress related ailments in
Traditional Zulu, Xhosa and Sotho medicine. PhD, University of Natal.

187
HUTCHINGS, A., HAXTON SCOTT, A.H., LEWIS, S.G. & CUNNINGHAM, A.
1996. Zulu Medicinal Plants. An inventory. University Press,
Pietermaritzburg.
IMMELMAN, W.F.E., WICHT, C.L. & ACKERMAN, 0.0. 1973. Our GreenHeritage: The South African Book of Trees. Tafelberg-Uitgewers Beperk,
Cape Town. ISBN 0 624 00372.
IWU, M.M. 1993. Handbook of African Medicinal Plants. CRC Press, Boca
Raton. ISBN 0 84934266.
JAGER, A.K. & VAN STADEN, J. 1995. Screening for cardiac glycosides in
Schizobasis intricata. South African Journal of Botany 61: 101 -103.
JAGER, A.K., HUTCHINGS, A. & VAN STADEN, J. 1996. Screening of Zulu
medicinal plants for prostaglandin-synthesis inhibitors. Journal of
Ethnopharmacology 52: 95-100.
JARDETZKY, O. & ROBERTS, G.C.K. 1981. NMR in Molecular Biology.
Academic Press, New York. ISBN 0 123805805.
JEVANS, A.W. & HOPKINS, C.Y. 1968. Sterculynic acid, a fatty acid from the
seed oil of Sterculia alata. Tetrahedron Letters 18: 2167 - 2170.
JORK, H., FUNK, W., FISCHER, W. & WIMMER, H. 1990. Thin-Layer
Chromatography: Reagents and Detection Methods. Volume 1a:
Physical and Chemical Detection Methods: Fundamentals, Reagents I.
VCH, Germany. ISBN 0 89573 876 7.
KABARA, J.J. 1980. Lipids as host-resistance factors of humans milk. NutritionReviews 38: 65 -73.
KABARA, J.J. 1986. Dietary lipids as anticariogenic agents. In: Advances in
Human nutrition. Volume 3. Kabara, J.J. and Scherr, G.H. (Eds). Chem
Orbital, USA. ISBN 0 9330376 39 O. pp 87 - 113.

188
KANNEL, W.B. 1983. Health and Obesity: An Overview. In: Health and
Obesity. Kuo, P.T ., Conn, H.L. & DeFelice, E.A.(Eds). Raven Press,
New York. ISBN 0 89004 8096.
KOKWARO, O. 1976. Medicinal plants of East Africa. East African Literature
Bureau, Kampala, Nairobi, Oar es Salaam. p 384.
LAISISI, A., VLADIMIROR, G. & DIMITROR, D. 1990. Physico-chemical and
organoleptic indexes of extracts from Cola acuminata and Cola garcinia
nuts and Vernonia amygdalina leaves. Nauchi Tr. -Vissh. Inst. Khranit.
Vkusova Prom-st., Plovdiv. 37: 67 - 75.
LEUNG, AY. & FOSTER, S. 1996. Encyclopedia of common natural
ingredients used in food, drugs and cosmetics. John Wiley and Sons,
New York. ISBN 0471 50826 8.
LONGANGA OTSHUDI, A., VERCRUYSSE, A . & FORIERS, A. 2000.
Contribution to the ethnobotanical, phytochemical and pharmacological
studies of traditionally sed medicinal plants in treatment of dysentry and
diarrhoea in Lomela area, Democratic Republic of Congo. Journal ofEthnopharmacology 71: 411 - 423.
MAILLARD, C., OLLlVIER, B., BALANSARD, G. & DE MEO, M. 1986. Dosage
de cafeine, de theobromine, de catechine et d'epicatechine par
chromatographic liquide El haute performance dans un extrait de graines
fraiches stabllisees de Cola. Annales Pharmaceutiques Frenceises 44:495 - 500.
MANTELL, C.L. 1947. The Water-Soluble Gums. Reinhold Publishing
Corporation . New York.
MARSHALL, D.L. & BULLERMAN, L.B. 1994. Antimicrobial properties of
sucrose fatty acid esters. In: Carbohydrate polyesters as fat substitutes.
Akoh,.C.C. & Swanson, B.G. (Eds). Marcel Dekker, Inc, New York. ISBN
0.824790626. pp 149 - 167.

189
MAY, J.M. & MCLELLAN, D.L. 1971. The Ecology of Malnutrition in SevenCountries of Southern Africa and in Portuguese Guinea. Hafner
Publishing Company, New York. pp 381.
MCGAW, L.J., JAGER, A.K. & VAN STADEN, J. 1997 . Prostaglandin
Synthesis Inhibitory Activity in Zulu, Xhosa and Sotho Medicinal Plants.
Phytotherapy Research 11: 113 -117.
MCGAW, L.J. 2000. Screening for and Isolation of Anthelmintic, Antiamoebic
and Antibacterial Compounds from Traditional South African Medicinal
Plants. M.Sc upgrade. University of Natal, Pietermaritzburg.
MIRALLES, J., BASSENE, E. & GAYDOU, E.M. 1993. Determination of
cyclopropenoid fatty acids in Sterculia seed oils from Senegal. Journal of
the American Oil Chemists Society 70: 205 - 206.
MORO, C.O. & BASILE, G. 2000. Obesity and Medicinal plants. Fiterapia 71:573 - 582.
MORTON, J.F. 1977 Widespread tannin intake via stimulants and
masticatories, especially Guarana, kola nut, betel vine, and accessories.
In: Plant Polyphenols. R W. Hemingway & P. E. Laks (Eds). Plenum
Press, New York.
MUJUMDAR, A.M., NAIK, D.G., WAGHOLE, RJ., KULKARNI, D.K. &
KUMBHAJKAR, M.S. 2000. Pharmacological Studies of Sterculia foetidaLeaves. Pharmaceutical Biology 38: 13 - 17.
NAIR, A.G.R, RAMESH, P. & SUBRAMANIAN, S.S. 1976. 6-Glucuronosyloxy
luteolin and other 6 - oxygenated flavones from the leaves of Sterculiacolorata. Phytochemistry 15: 839.
NAIR, A.G.R & SUBRAMANIAN, S.S. 1962. Flavonoids of the flowers of
Dombeya calantha and Leucaena glauca. Current Science 31: 504 - 506.
NATIONAL BOTANICAL GARDENS. 1980. Wild Flowers of South Africa.Struik Publishers, Cape Town.

190
NIEMAN, C. 1954. Influence of trace amounts of fatty acids on the growth of
microorganisms. Bacteriological Reviews 18: 147 - 163.
OFFIAH, V .N. & CHIKWENDU, U.A. 1999. Antidiarrhoel effects of Ocimum
gratissimum leaf extract in experimental animals. Journal of
Ethnopharmacology 68 : 327 - 330.
OGBEDE, O. N., EGUAVOEN, O. I. & PAREZ, M. 1986. Chemical studies in
the anthocyanins of the flowers of local plants. Journal of the Chemical
Society of Pakistan 8: 545 - 547 .
OKWARI , 0.0. 1999. Pharmacological Properties of D. Buettneri in
Experimental Animals. PhD thesis. Department of Physiology, University
of Calabar, Calabar, Nigeria.
OKWARI, 0 .0., ETTARH, R.R ., AKPOGOMEH , B.A. & ETENG, M.U. 2000.
Gastric Anti-Secretory and Anti-Ulcerogenic effects of D. buettneri in
Rats. Jounal of Ethnopharmacology 71 : 315 - 319.
ONAYADE, O.A., ONAYADE, A.A. & SOFOWORA, A. 1996. Wound healing
with plants: The African perspective. In: Chemistry, biological and
pharmacological properties of African medicinal plants: proceedings of
the first International lOCO symposium, Victoria Falls, Zimbabwe,
February 25 - 28. Hostettmann , K., Chinyanganga, F., Maillard, M. &
Wolfender, J.L. (Eds). University of Zimbabwe, Harare. ISBN 0908307
594. pp 77 - 119.
OXFORD DICTIONARY OF BIOLOGY. 1996 . 3rd Edition. Oxford University
Press. ISBN 0 19 2800329.
PAGE, C.P. , CURTIS, M.J. , SUTTER, M.C. , WALKER, J.A. &HOFFMAN, B.B.
1997. Integrated Pharmacology. Mosby, Barcelona ISBN 0723425566.
PAIS, M.; MAINIL, J. & GOUTAREL, R. 1963. Les adouetines X, Y et Z,
alcaloides du Waltheria americana L. (Sterculiacees). AnnalesPharmaceutiques Franc;aises 21 : 139 - 146.

191
PAIS, M., MARCHAND, J., JARREAU, F. X. & GOUTAREL, R. 1968. Peptide
alkaloids. V. Structures of adouetines X, Y, y', Z, the alkaloids of
Waltheria americana (Sterculiaceae). Bulletin de la Societe Chimique de
France, 1145 - 1148 .
PALMER, E. & PITMAN, N. 1961. Trees of South Africa. A.A. Balkema,
Amsterdam.
PAQUET, L., LA FONTAINE, P.J., SAINI, H.S., JAMES, F. & HANSON, A.D.
1995. Evidence in favour of the presence of 3-dimethyl
sulfoniopropionate in a large range of angiosperms. Canadian Journal of
Botany 73: 1889 - 1896 .
PETRUS, A. J. A. 1989. Phenolic components of Waltheria indica. Fitoterapia
61: 371.
POOLEY, E. 1993. The complete field guide to trees of Natal, Zululand and
Transkei . Natal Flora Publication Trust, Durban. ISBN 0 620 17697 O.
POOLEY, E. 1998. A field guide to wild flowers: KwaZulu-Natal and Eastern
region. Natal Flora Publication Trust, Durban. ISBN 0 620 21500 3.
PRISTA, N. L., ALVES, C. A. & DE ARAUJO, M.F. C. 1960. "Allantoin in some
plants used in the treatment of wounds. Garcia Oria 8: 327 - 331.
RABE, 1. & VAN STADEN, J. 1997. Anti-bacterial activity of South Africanplants used for medicinal purposes. Journal of Ethnopharmacology 56:81 - 87.
RAFFAUF, R.F. 1996. Plant Alkaloids. A Guide to their Discovery andDistribution. Food Products Press, New York.
RANGANATHAN, R. M. & NAGARAJAN, S. 1980. Flavonoids of the leaves of
Sterculia pal/ens. Current Science 49 : 309 -310.

192
RASOANAIRO, P. & RATSIMAMANGA-URVERG, S. 1993. Biological
evolution of plants with reference to Malagasy flora. Monograph for the
IFS - NAPRECA Workshop on Bioassays, Antanavivo, Madagascar.
ROSS, M.S.F. &BRAIN, K.R. 1977. An Introduction to Phytopharmacy. Pitman
Medical, Kent.
ROWLAND, M.G.M. 1985. Bacterial Diarrhoeas: Contaminated food and water.
In: Diarrhoeal Disease and Malnutrition: A Clinical Update. Gracey, M.
(Ed.). Churchill Livingstone, UK. ISBN 0443 028923.
SAITO, H. &TOMIOKA, H. 1988. Susceptibilities of transparent, opaque, and
rough colonial variants of Mycobacterium avium complex to various fatty
acids. Antimicrobial Agents and Chemotherapy 32: 400 -402.
SANFORD, P.A. 1982. Digestive System Physiology. Edward Arnold, London.
SAWHNEY, A.N., KHAN, M.R., NDAALlO, G., NKUNYA, M.H.H. &WEVERS,
H. 1978a. Studies on the rationale of African traditional medicine. Part 11.Preliminary screening of medicinal plants for anti-gonococcal activity.
Pakistan Journal of Scientific and Industrial Research 21: 189 - 192.
SAWHNEY, A.N., KHAN, M.R., NDAALlO, G., NKUNYA, M.H.H. & WEVERS,
H. 1978b. Studies on the rationale of African traditional medicine. Part Ill.
Preliminary screening of medicinal plants for antifungal activity. Pakistan
Journal of Scientific and Industrial Research 21: 193 - 196.
SCALBERT, A . 1991. Antimicrobial properties of tannins. Phytochemistry 30:3875 - 3883.
SCHMID, G.H. 1996. Organic Chemistry. Mosby, St Louis. ISBN 080167490
5.
SCHULTES, R. E. & RAFFAUF, R. F. 1990. The healing forest. Dioscorides
Press, Oregon. ISBN 0931146 143.

193
SHERRIFFS, P. 1995. Former foes setoutto save muti plants. Natal Witness,
22 August 1995.
SIEGLER, D.S. 1977. The naturally occurring cyanogenic glycosides. In:
Progress in Phytochemistry. Reinhold , L., Harborne, J.B. & Swain, T.
(Eds) . VolA, pp 83 -84.
SIGMA CATALOGUE. 2002/2003. Biochemicals and Reagents for Life Science
Research.
SILVERSTONE, 1. & KYRIAKIDES , M. 1982. Clinical Pharmacology on
Appetite. In: Drugs and Appetite. T. Silverstones (Ed.). Academic Press,
London. ISBN 0 126437807.
SINDIGA, I., NYAIGOTTI-CHACHA, C. & KANUNAH , M.P. 1995. Traditional
Medicine in Africa East African. Educational Publishers Ltd, Nairobi.
ISBN 996646 548 O.
SLEIGH, D.J. & TIMBURY, M.C. 1998. Notes on Medicinal Bacteriology. s"Edition. Churchill Livingstone, New York. ISBN 0443058474.
SMITH, F. & MONTGOMERY, R. 1953. The Chemistry of Plant Gums and
Mucilages and some related Polysaccharides . Reinhold Publishing
Corporation, New York .
SNYDMAN , D.R. & GORBACH, S.L. 1982. Bacterial Food Poisoning. In:Bacterial Infections ofHumans: Epidemiology and Control. Evans,A.S. &
Feldman, H.A. (Eds) . Plenum Medical Book Company. New York. ISBN
0306409674.
SREEDHARAN PILLAI, M. & MADHARAN PILLAI , K. S. 1954. Chemistry and
utilization of Travancore forest products VI. Chemical examination of the
resin of Sterculia urens . Bulletin of the Central Research Institute,University of Travancore, Trivandrum, Sev. 3: 133 - 137.
STREAK, D. 1995. Back to our roots. Fair Lady Magazine , September 1995.

194
SUBRAMANIAN, S.S., NAIR, A. G. R. & NAGARAJAAN, S. 1973. Diosmetin-7
glucuronide from the flowers of Dombeya ca/antha. Current Science 42:
438 - 439 .
TAYLOR, J.L.S. 1999. An Investigation into the Biology and Medicinal
Properties of Eucomis Species. PhD thesis, University of Natal,
Pietermaritzburg.
THOMAS, V. & GRANT, R. 1998. Sappi Tree Spotting. Jacana Education Ltd,
Johannesburg . ISBN 1874955506.
THOMPSON, W.G. 1989. Gut Reactions: Understanding Symptoms of the
Digestive Tract. Plenum Press, New York. ISBN 0 30643303 6.
TORTORA, G.J. & GRABOWSKI, S.R . 2000. Principles of Anatomy and
Physiology. 9th Edition. John Wiley and Sons, New York. ISBN 0 471
366927.
TREASE, G. E. & EVANS, W.C. 1983. Pharmacognosy. iz" Edition. Bailllere
Tindall, London. ISBN 0 7020 1007 3. P 508 .
TYLER, V.E., BRADY, L.R. & ROBBERS, J.E . 1981. Pharmacognosy. 8th
Edition. Lea and Febiger, Philadelphia. ISBN 0 8121 17934.
VAN GOGH, J. & ANDERSON, J. 1988 . Trees and Shrubs of the
Witwatersrand, Magaliesberg and Pilansberg. Struik Publishers, Cape
Town.
VAN WYK, P. 1974. Trees in the Kruger National Park. Volume 2. Purnell,
Cape Town.
VAN WYK, B., VAN OUDSHOORN, B. & GERICKE, N. 1997. Medicinal Plantsof South Africa . Briza Publications, Pretoria. ISBN 1875093 095.
VAN WYK, B. & GERICKE, N. 2000. Peoples Plants. Briza Publications,
Pretoria. ISBN 1 875093 192.

195
VENTER, F. & VENTER, J.A. 1996. Making the most of Indigenous Trees.
Briza Publications, Pretoria. ISBN 1875093 052.
VLOK, M.E. & RYKHEER, G.M. 1966. Manual for General Nurses: A textbook
for the South African general nurse. Randford Adlington LTO,
Johannesburg.
VOET, O. & VOET, J.G. 1990. Biochemistry. John Wiley and Sons, New York.
ISBN 0471 617695. pp 618 - 677.
VON BREITENBACH, F. 1965. The Indigenous Trees ofSouthern Africa. Part
3, Volume 4. The Government Printer, Pretoria.
WAGNER, H., BLAOT, S. & ZGAINSKY, E. M. 1984. Plant Drug Analysis.
Springer-Verlag, Berlin.
WAGNER, H. & BLAOT, S. 1996. Plant Drug Analysis. A Thin Layer
Chromatography Atlas. 2nd Edition. Springer-Verlag, Berlin. ISBN
3540586786.
WALLACE, R.J., ARTHAUA, L. & NEWBOLO, C.J. 1994. Influence of Yucca
shidigera extract on ruminal ammonia concentrations and ruminal
microorganisms. Applied and Environmental Microbiology 60: 1762
1767.
WALLACE, J.L. & CHIN, B.C. 1997. New Generation NSAIOS: The benefitswithout the risks? Drugs of Today 33: 371 - 378.
WATT, J.M. & BREYER-BRANOWIJK, M.G. 1962. The Medicinal and
Poisonous Plants of Southern and Eastern Africa. E & S LivingstoneLTO, Edinburgh.
WHISTLER, R.L. 1959. Factors Influencing Gum Costs and Applications. In:
Industrial Gums: Polysaccharides and Their Derivatives. Whistler, R.L.
and BeMiller, J.N. (Eds). Academic Press, New York.

196
WHISTLER, R.L. & SMART, C.L. 1953. Polysaccharide Chemistry. Academic
Press, New York.
WORTHLEY, E. G. &SCHOTT, C. D. 1969. Biologically active compounds in
some flowering plants. Life Sciences 8: 225 - 238.
YFF , B.1.S. , L1NDSEY, K.L. TAYLOR, M.B ., ERASMUS, D.G. &JAGER, A.K.
2002. The pharmacological screening of Pentanisia prunelloides and the
isolation of the antibacterial compound palmitic acid. Journal of
Ethnopharmacology79: 101 -107.
ZAVALA, M. A. , PEREZ, S., PEREZ, C., VARGAS, R. & PEREZ, R. M. 1998.
Anti-diarrhoeal activity of Wa/theria americana, Commelina coelestis and
Alternanthera repens . Journal of Ethnopharmacology 61: 41 - 47.

APPENDIX A
197

v..bundance
950000
900000
850000
800000
750000
700000
650000
600000
550000
500000
450000
400000
350000
198
TIC:A_2.D2a.60
Palmitic acid~
Myristic acid ~
300000
250000
200000.\li\'~ v;~
Stearic acid·Contaminant:
Diisooctylphthalale
tfime-->
Fig.A.1:
1O~00 12~00 14~00 16~00 18~00 20:00 22.00 24~00 26.100
28~00 30.00 32~00 34~00
D. rotundifolia GC-MS spectrum of isolated anti-bacterial Compound
A

199
Library SearchedQualityID
C:\Database\PMW_TOX2.L95Myristic acid PI035
V\bundance4~ 73
Scan 1692 (18.471 min): A_2.D (-)
9000
8000
7000
6000
5000 129
4000
3000 185
2282000
100: '-rlrr1"~r'ln"I+I_'J-ffT'/t'ITI'l"r'~;MJ:7, , ~03 , ,>5~270 ,289 " '.~, " ~i~ ,,~~., ,~~i~1~"",7~1' ~,~~, ~~."~~~" ,'m/zoo> 0 20 40 60 80 100 120 140 160 180 200 220 240 260 280 300 320 340 360 380 400 420 440 460 480 500 520 540Abundance #1140: Myristic acid P1035
9000
58000
7000
6000
5000
4000129
3000
2000 97 185228
1000
~/z-->
j I I
Fig. A.2: GC -MS library search of D. rotundifolia Compound A at a retention
time of 18.471 min corresponding with Myristic (Tetradecanoic) acid
spectrum

Library SearchedQualityID
. C:\Database\PMW_TOX2.L93Palmitic acid P1210
200
~bundance
43 7PScan 2039 (20.602 min): A_2.D (-)
129
97
185
213 256
L,..,,""';"-\!\-,.ljl~J+iIIjl4I'-HWJl¥\lh~'.J 157 . ,I [239 278 306 340 364 392 428446467485 510 535
60 80 100 120 1'40160 1'80200 220 240 260 280 300 320 340 360 380 400 420 440 460 480 500 520 540#822: Palmitic acid P1210
7~
9000
8000
7000
6000
5000
4000
3000
2000 97
129
157 185213
256
100: 11
m/zoo> 0 20 40 60 80 100 do 1'40160 1'80200220240260280300320340360380400420440460480 500 520 540
Fig.A.3: GC -MS library search of D. rotundifolia Compound A at a retention
time of20.602 min, corresponding with Palmitic (Hexadecanoic) acid
spectrum

Library SearchedQualityID
C:\Database\Nist98.l78Octadecanoic acid
201
Abundance
9000
8000
7000
6000
5000
4000
3000
45 7PScan 2582 (23.937 min): A_2.D (-)
129
2000
1000
o I
m/z~-> 0V\bundance
9000
8000
7000
6000
5000
4000
3000
2000
7~
43
97
#114902: Octadecanoic acid
129
284
185
241
1000
m/z-->0
0I 2'1
0 40 60
I 157 213[
.11 , Ji .I"~ Jr l [265
Fig. AA: GC -MS library search of D. rotundifolia Compound A at a retention
time of23.937 min corresponding with Stearic (Octadecanoic) acid
spectrum

bundance
1250000
1200000
1150000
1100000
1050000
1000000
950000
900000
850000
800000
750000
700000
650000
600000
550000
500000
TIC: 0.0
Palmitic acid20.61
15.69
Myrislicacid
18.48
6.25
15. 7
Lauricacid -+-H---JH+17),.03 1 .71
2:1.14
ContaminanlDiisooctylphlhalale
202
450000
400000
350000
300000
250000
200000
150000
100000
11.32 .
Acetic acid ,.I .
ime--> 10.00 12.00 14.00 16.00 18.00 20.00 22.00 24.00 26.00 28.00 30.00 32.00 34.00
Fig. A.5: D. rotundifolia GC-MS spectrum of isolated anti-bacterial Compound
B

Library Search Report - Che mstation Integrator
203Unknown Spectrum based on Apex minus start of peak~bundance Scan 527 (11.315 min): 0.0 (-) m/z 43 .10 100.00%
43
5000 ~1,5
l1 •• ,
11~40 11~6011.00 11.20170 98 133164 199 268301 342 415 481509 m/ z 45. 1 0 88. 41 %0 ,
50 100 200 250m/zoo> 0 150 300 350 400 450 500Abundance #109429: Acetic acid
43
j \ JlSOOO 15 ~'j"'i , I I I I I I I I I I i I I I rrr'"]"
JI '11.00 11.20 11.40 11.60
m/ z 60 .10 43.2 4 %
,rro 50 100
I I250 300 350 400 450m/zoo> 150 200 500
~bundance #4896: Acelic acid, anhydride with formic acid4~ -.
. 111~60
I11.00 11.20 11.40
5000 m/z 42 . 1 0 16 .77%
01. 1
50 100I I I
350 400 450 500= J ~~m/z-> 0 150 200 250 300
V\bundance #110823: 2-Propanone, 1-melhoxy-45 ~" I I I ' " i I I I I i I
11.00 11.20 11.40 11.60m/z 29 .10 12.8 5%
sooo
yJ 88 A- A- ~0 150 150 200 250 300 350 400
I I11~oo ' 11 ~20 11~40 11~60
Im/z-> 0 100 450 500
Peak Number: 1 at 11.32 min Area: 90 4157 4 Area % 5.75
The 3 best hits from each library. Re f # CAS# Qual-- - - -- - ---- --- - - - - - - - - - - -- -- - --- - - --- - -- - -- - - - --- - - - -- - - - - - - - - - - - - - - -
15 48 000064-19-7 781546 000067 -63 -0 43779 000109-86- 4 1
109429 000064-19-7 904896 002258-42-6 40
110823 005878-19 -3 28
C:\Database\HPPest.L No hits were retrieved.C:\Database\PMW TOX2.L
1 Acetic acid 2 Isopropanol3 Ethylene glycol monomethylethe r
C:\Database\Nist98.l1 Acetic a c i d2 Acetic acid, anhydride with form ...3 2-Propanone, 1-methoxy-
Fig.A.6: GC -MS library search of D. rotundifolia Compound B at a retention
time of 11.315 min corresponding with Acetic (Ethanoic) acid
spectrum

Library Search Report - Chemstation Integrator
Unknown Spectrum based on Apex minus startbundance Scan 1458 (17.034 min): 0 .0 (-)
7~41
5000
of peakm z 73.10
..204
100.00%
i I I I I I I i I I I I I I I I i I i I i I i
16.80 17.00 17.20 17.40
i i i • I i i i I I i i i i I i I I i I i i i
16.80 17.00 17.20 17.40
m z 41.20 77.35%
m z 60.10 83.54%
:...-=;:::;::;:;;:::;:::;:~;;'-r""~-:;::""""""~i i i i I i r i r I I I I i I--.--r-TO..,,--.--r
16.80 17.00 17.20 17.40
129
41
5000
5000
!z--> 0 50bundance
O~~~~~HII~t:.r-~~", 1""1"" I'" 'I"" I" "I" " I 'tdz-> 0 50 100 150 200 250 300 350 400 450 500 550bundance #114892: Lauric anhydride
100 150 200 250 300 350 400 450 500 550ol,rrW'r&HLfY'I-Pr+'t'-,+l-rrt,....,,..,.,-rrr,,-.,..,.,-rrr,....,..,.--rrrrrrr---rrorrrrrrr
!z--> 0 50bundance
G#25385: Telradecanoic acid
i i I I I I I I i I I i i i I I I I I I I i I
16.80 17.00 17.20 17.40
5000
!z--> 50
129
100 150 200 250 300 350 400 450 500 550I I I I II I I I I i , i i I I i I i I I I I
16.80 17.00 17.20 17.40
Peak Number: 9 at 17.03 min Area: 2873171 Area % 1.83
The 3 best hits from each library. Ref# CAS# Qual---------------------------------------------------------------------
C:\Database\HPPest.LC:\Database\PMW TOX2.L
1 Myristic acid2 Acetic acid3 Cyclamate-M AC
C:\Database\Nist98.11 Dodecanoic acid2 Lauric anhydride3 Tetradecanoic acid
No hits were retrieved.
1140 000544-63-81548 000064-19-71229 001124-53-4
25776 000143-07-7114892 000645-66-9
25385 000544-63-8
5241
948158
Fig.A.7: GC -MS library search of O. rotundifolia Compound B at a retention
time of 17.034 min corresponding with Lauric (Dodecanoic) acid
spectrum

Library Search Report - Chemstation Integrator
205~bundance Scan 1693 (18.477 min): 0 .0 (-) m/z 43.15 100.00%
43 73
Jvi\.~1295000
,J J\JIJI .
185
o 12 ,,I 111 . I ,I II 22811 ' I I 11 i l ' 1 , 1 1 I I I , I ' i l l
I 394 18.20 18.40 18.60 18.80275 312341 I 437 492 524 m/ z 73.10 89 . 46%
~• I ' I I '
200 250 300 3501" " 1 " " 1 " .11 '
~_~Jm/zoo> 50 100 150 400 450 500 550'Abundance #25385: Tetradecanoic acid
43 7';3
5000 I i I I i 1 i ll i , 1 '1" I i 1 i l l 1129 18.20 18.40 18.60 18.80
I 185 m/z 41.20 77.01%
o ~ . ~I I~ l l; I1 ~l, \, ~~~ 1i' i i I i '" I i " i I i ' " I ' i i i I ' " i I'
~"~~~m/zoo> 0 50 100 150 200 250 300 350 400 450 500 550~bundance #114896: Penladecanoic acid
43 / 3
I I I I I I i i I I I I I I 1 I i I I I I I i
18.20 18.40 18.60 18.80
5000 129
: Jl::JI ~ I1
199 242
O.! b,!j>8 .1~1'l ill l ll ll'l l ii'III "IIII" ' I I'1m/zoo> 0 56 100 150 200 250 300 350 400 450 500 550Abundance #114893: Hepladecanoic acid I i I I ' I i i I i i i I I I I I I I I I I I
7~ 18.20 18.40 18.60 18.80m/z 60.10 70.89%
43
5000129
I
lI ~L, 1 ~11227
.I I 2~0 '"o ~50
I150 200 250 350 550
I i I I i I i , I i I I I I I I I I I I I I I
rnlz-> 0 100 300 400 450 500 18.20 18.40 18.60 18.80
Unknown Spectrum based on Apex minus s tart of pea k
Peak Number: 10 at 18.4 8 min Area: 20227920 Area % 12.87
The 3 best hits from each library. Ref# CAS# Qual
C : \ Da t a base \HPPest .LC:\Database\PMW TOX2.L
1 Myristic acid2 Aceca rbromal a rtifac t3 Dibutyladipate
C:\Database\Nist98 .l1 Tetradecanoic acid2 Pentadecanoic acid3 Heptadecanoic acid
No hi ts we re re t r ieved.
1 140 0005 44-63- 81026 000000-0 0- 0
722 000105-99-7
2 5385 00054 4-63 - 8114896 001002-8 4 - 2114893 000506 -12-7
7010
9
987058
Fig.A.S: GC -MS library search of 0. rotundifolia Compound B at a retention
time of 18.477 min corresponding with Myristic (Tetradecanoic) acid
spectrum

206100.00%
I I , , I I ' I , , I ' , , I I I I I I I I I
20.20 20.40 20.60 20.80 21.00m z 43 .15 99.28%294322 368396428461 498 540
#109984: n-Hexadecanoic acid
I '1""1""1""1100 150 200 250 300 350 400 450 500
129
50
43 7
4 i
5000
bundance Scan 2040 (20.608 min): D.D (-) m z 73 . 10
Library Search Report - Chemstation Integrator
Unknown Spectrum based on Apex minus start of peak
50
5000
otz-> 0bundance
129
~-¥+ir+f1J ,)~\ ~r~,6, , I I I I , I I I , I I I ' I I I I I I I , I ' , , , I
100 150 200 250 300 350 400 450 500#114895: Tridecanoic acid
43 7'
I i , , I I ' I , I I ' , , I I ' , I , I ' I
20.20 20.40 20.60 20.80 21.00m z 41.15 89.41%
I I i I i I i I i I I i i I i I I I I ' I I i
20.20 20.40 20.60 20.80 21.00m z 60.10 81.96%
I I I I I I I I I i I i i I I I I I i I I I I
20.20 20.40 20.60 20.80 21.00m z 55.10 85.03%
5000
5000
o'-r-r-,...v,-\l~fl\Y\4l,-++I"rl-ft,.--,-l,-rrr...-r--rrrrr,....,.,--rrrrr,....,.,-.--.rrr,....,.,-.--rr
fz·-> 0 50 100 150 200 250 300 350 400 450500bundance #114896: Pentadecanoic acid
199 242
'-r-r-r+1"-."H'~'"tY'++rH-t:tlJ I ' I , , I I I , ',I I , , I I ' , I I I ' , I I I ' , I , Ifz-> 50 100 150 200 250 300 350 400 450 500 20.20 20.40 20.60 20.80 21.00
Peak Number: 12 at 20.61 min Area: 27617924 Area % 17.58
The 3 best hits from each library. Ref# CAS# Qual
C:\Database\HPPest.LC:\Database\PMW TOX2.L
1 Palmitic acid2 Myristic acid3 Acetic acid
C:\Database\Nist98.l1 n-Hexadecanoic acid2 Tridecanoic acid3 Pentadecanoic acid
No hits were retrieved.
822 000057-10-31140 000544-63-81548 000064-19-7
109984 000057-10-3114895 000638-53-9114896 001002-84-2
4637
5
969087
Fig.A.9: GC -MS library search of D. rotundifolia Compound B at a retention
time of20.608 min corresponding with Palmitic (Hexadecanoic) acid
spectrum

ft\bundance
1100000
1050000
1000000
950000
900000
850000
800000
750000
700000
650000
600000
550000
500000
450000
400000
350000
15.68
16.71
16.0
18.66
TIC: B.D2060
Palmitic acid
25.11
ContaminantDiisooctylphlhalale
207
300000
250000
200000
150000
100000 J~~50000 I I ~l.1I
~L.JJ.~o i I i I I I I i I I I I I i I I I I I I I i i I I I i I I I I I I I I i I I i I I I I I I I i I i I i i • I I I i I I I I I I I I I i I i
IT"ime--> 10.00 12.00 14.00 16.00 18.00 20.00 22.00 24.00 26.00 28.00 30.00 32.00 34.00
Fig.A.10: O. burgessiae GC-MS spectrumof isolated anti-bacterial Compound
A
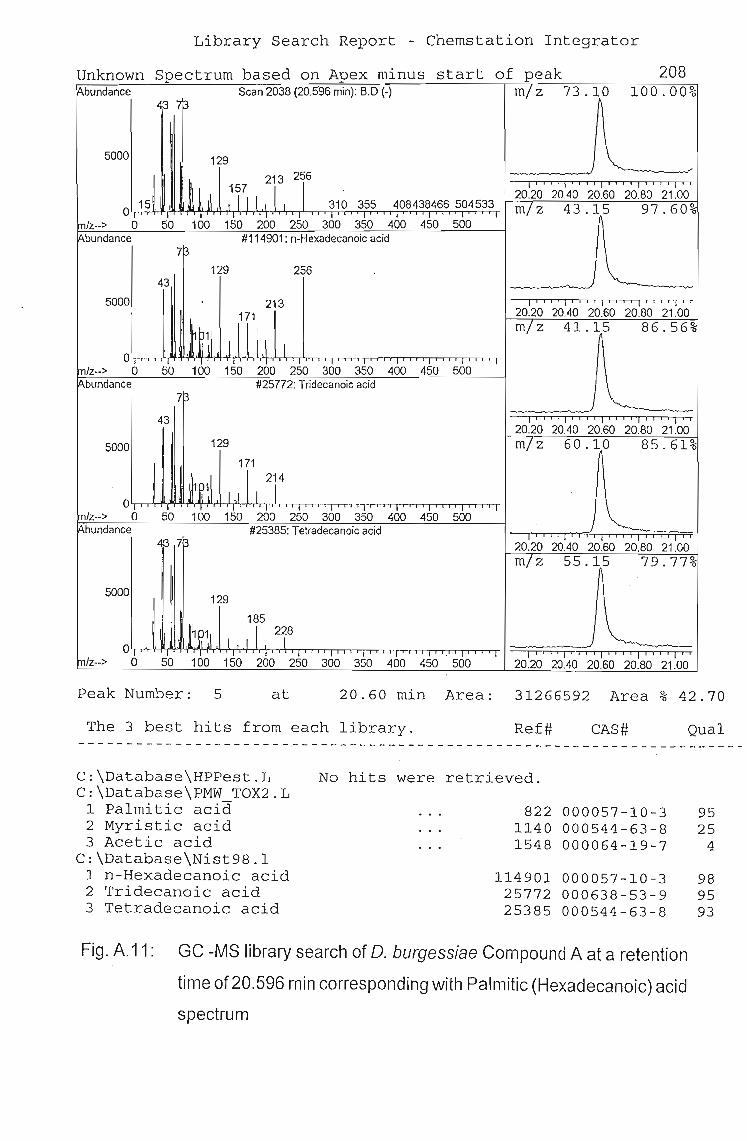
Library Se arch Report - Chemstation I n t e g r a t o r
208I\bundance Scan 2038 (20.596 min): B.D (-) m/ z 73. \ 0 100.00%
~~ (3
5000 129J /
~ illl213 256 I ' , i . I ' , , , I ' , , , I' , , , I ' ,
157 I I 20.20 20.40 20.60 20.80 21.0015 I 111 .1 I 310 355 408438466 504533 m/z
4 3'~97.60%0
50I'
150 200 250 300 450 500I
m/zoo> 0 100 350 400Abundance #114901: n-Hexadecanoic acid
73
129 25643
5000 213 I' , . 1""1 " "1""1"
,1~~~l jJJA" I ,
20.20 20.40 20.60 20.80 21.00m/ z 41. 1
A586.56%
0300 350 400 450 500
,mlz--> 0 50 100 150 200 250~bundance #25772: Tridecanoic acid
7~.J
43 I I I I. I i I i i I i i I i I i i • i I i I
20.20 20.40 20.60 20.80 21.00
5000 129 m/ z 6 0 . 1p 85. 61%
~lLhI ~ 214
0,
, 1 ..L "" "' I " " " " " " "" " "" "Im/z--> 0 5'0 100 150 200 250 300 350 400 450 500 )~bundance #25385: Tetradecanoic acid
20~20. . I i " , 1 "
Lf3 713 20.40 20:60 20~80 21.00m/ z 55. \5 7 9.77%
5000129
kt~:1185
I I I I 218 -------.J0 ,5'0 100 150 200 250 300 350 400 450 . 500
I I i i I j I i i i I I I i I i I I , I I I I I
rn/z-> 0 20.20 20.40 20.60 20.80 21.00
Unknown Spectrum based on Apex minus start of peak
Peak Number: 5 at 20.60 min Ar ea: 31 2 66592 Are a % 42 .70
The 3 b e s t hits from each library . Ref# CAS# Qual
C:\Datab ase\HPPest.LC:\Database\PMW TOX2 .L
1 Palmitic ac id2 Myristic acid3 Acetic acid
C:\Database\Nist98.l1 n -H e xadecanoic ac id2 Tridecanoic acid3 Te t radecanoic a c i d
No hit s were r e tr i eve d .
82 2 0000 57-10- 31140 0005 44-6 3- 8154 8 000064-19-7
114901 000057-10- 325772 000638-53 - 925385 00054 4-6 3- 8
9525
4
989593
Fig. A.11 : GC -MS library search of O. burgessiae Compound A at a retention
time of20.596 min corresponding with Palmitic (Hexadecanoic) acid
spectrum
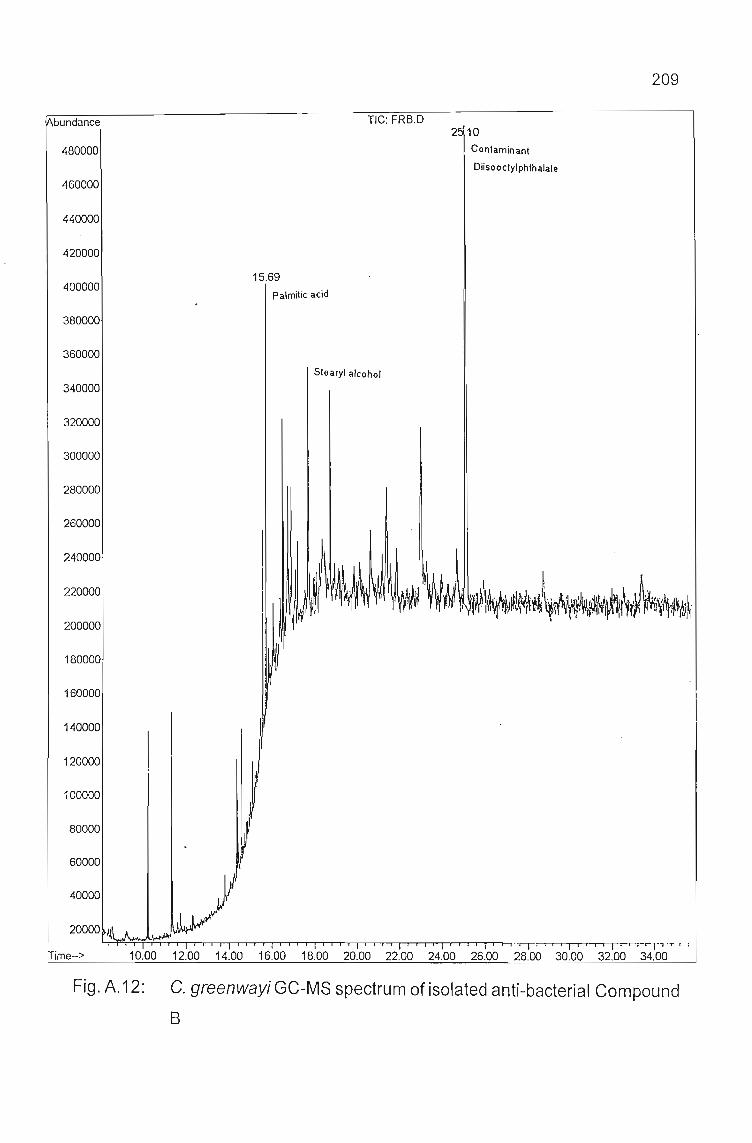
bundance
480000
460000
440000
420000
400000
380000
360000
340000
320000
300000
280000
260000
240000
220000
200000
180000
160000
140000
120000
100000
80000
60000
40000
209
TIC: FRB.D2 10
Conlaminant
Diisooclylphlhalale
15.69Palmitic acid
Slearyl alcohol
,I .
ime--> 10.00 12.00 14.00 16.00 18.00 20.00 22.00 24.00 26.00 28.00 30.00 32.00 34.00
Fig. A.12: C. greenwayi GC-MS spectrum ofisolated anti-bacterial Compound
B

210
Library SearchedQualityID
C :\Database\ PMW_TOX2 .L95Stearyl alcohol P1298
83
111
Scan 1560 (17.660 min): FRB.D (-)
111
83
224I 252 270
#2356 : Stearylalcohol P129880 100 120 140 160 180 200 220 240 260 280 300 320 340 360 380400 420 440 460 480 500 520 540
'1 " ' I " " I '11 " . , . . . 'I'! 'I
80 100 120 140 160 180 200 220 240 260 280 300 320 340 360 380 400 420 440 460 480 500 520 540
31 153 224ll . , I I J t l'l " I ~ ? 1 1 29~ I . 252 2F 302 334 3~7 390 424 484 521 542'I ' ' 1 ' 1 ' 1 ' j " "I, oI'lj ' 'il l ' i ~ 'II I" I' " '1 '" i I"" I" i ' I ' """ "I " " I" "1"" 1"" ,, ," I" i ' I' "'I " " I
Abundance
9000
8000
7000
6000
5000
4000
3000
200029
1000
hvz-->o .!
20 40 600V\bundance
55
9000
8000
7000
6000
5000
4000
3000
2000
1000
0 ,20 40 60m/z--> 0
Fig. A. 13: GC -MS library search of C. qteenweyi Compound B at a retention
time of 17.660 min corresponding with Stearyl alcohol spectrum

211
Library SearchedQualityI D
C:\Database\PMW TOX2.L9 6Palmitic a c i d ME P1297
bundance1.4
Scan 1239 (15.689 min): FRB.D (-)
9000
8000
7000
6000
5000 43
4000
3000
2000
1000 227
150 'I 'I
lz-> 0 20 40 60bundance
i
9000
8000
7000
6000
5000
4000 55
3000
2000143
270
o " I
1000
Iz--> 0 20 40 60 80 100 120 140 160 180 200 220 240 260 280 300 320 340 360380 400420440 460 480 500 520 540
.Fig. A.14: GC -MS library search of C. greenwayi Compound B at a retention
time of 15.689 min corresponding with Palmitic (Hexadecanoic) acid
spectrum

\A.bundance
1900000
1800000
1700000
1600.000
1500000
1400000
1300000
1200000
1100000
1000000
900000
800000
700000
600000
500000
400000
300000
200000
100000
I0
10~00tTime-->
212
TIC: FRC.D2913
Conl aminanl ~Diisoocly lphlhal al e
15.5514.57
Eicosane-i
17.3518.7116.52
I I
12.00 14.00 16~00 18.00 20.00 22:00 24 ~00 26~00 .28~00 30~00 32~00 34~00
Fig. A.15 : C. greenwayi GC-MS spectrum of isolated anti-bac terial Compound
C

213
~bundance Scan 1057 (14.571 min): FRC.D (-) m/z 57 .15 100.00%57
500085
---'-1"9 i I ·-t, ..,.- A -----l14~60
I'
27. I pOf 14.20 14.40 14.80 15.00169 211 253282 327 384 430 494 538 m/z 43. 1 5 84.64 %0,
5'0 100 150 300 350 400 450 500i
rn/z-> 0 200 250V\bundance #112345: Eicosane
5f7
J\ -..--J5000 I I " I , I I I i I I I I I I I I I i I I i
14.20 14.40 14.60 14.80 15.00m/ z 71.20 7 0.67%
{ ~992 127 169 211 2532820, ", Wrf-r'1\I I I I I i I I i i I I I I I I i I I I i I I I I I I I I i i I I i i i I I
m/z·_> 0 50 100 150 200 250 300 350 400 450 500~bundance #16420: Heptadecane
~ t7
---r-r ', . ;9'n I I I ,"i j T iq,......--r-~14.20 14.40 14.60 14.80 15.00
5000 m/ z 85 . 1 5 4 9. 47 %
99
0,27, i J1~7 169 211240
50 100 150 200 250 300 350 400 450 500i
vdz-> 0V\bundance #112312: Octacosane - ~
. t.'. : I-.;L517 14~20 ' '14~40 14~60 14.80 15.00
m/z 41. 20 40. 58 %
5000
2199
127 169 225 281 337 394 A A Ij I'0 1 I .
100 150 200 250 300 350 400 450 500I I I I •• , I I i I I ( I i I i I I I I I I I
m/z-·> 0 50 14.20 14.40 14.60 14.80 15.00
Library Search Report - Chemstation Integrator
Unknown Spect rum based on Apex minus start of pea k
Peak Number: 1 at 14 .57 mi n Area : 539 1331 Area % 5 .10
The 3 best hits from each library. Ref # CAS # Qual
C:\Database\HPPest. LC:\Database\PMW_TOX2.L
1 Tricosane2 Nonad e c a n e3 Hexadecane
C:\Database\Nist98.l1 Eicosane2 Heptadecane3 Octacosane
No h its were r e t r i eved .
236 4 000638-67- 5236 3 000629-92- 5235 3 000544 -7 6- 3
112345 000112 -95 -816420 000629-78-7
112 312 000630-0 2- 4
909090
989791
Fig. A. 16: GC -MS library search of C. greenwayi Compound C at a retention
time of 14.571 min corresponding with Eicosane spectrum

214
---V'-bundance TIC: FRD.D
2" 20Contaminant :
5500000 Diisooclylphlhalate
5000000
4500000
4000000
3500000
3000000
2500000Palmitic acid
20 .60
2000000
1500000
Myristic acid
18.461000000
17.01
500000 15.56 J~-J____.U ~B'"'"01:1..1' ~l ij r,
11 .A /'0
I0
l~
tr ime > 1O~OO 12~OO 14 ~OO 16~00 18~00 20~OO 22~00 24~OO 26~OO 28~OO 30~00 32 ~OO 34~OO
Fig. A.17: C. greenwayi GC-MSspectrum of isolated anti-bacterial Compound
o

215Library Search Report - Chemstation Integrator
Unknown Spectrum based on Apex minus start of peakIt\bundance Scan 1058 (14.577 min): FRD.D (-) m/z 57.15 100.00%
5i7
5000 85
~)29 1
/\
I I I i I I I I I I I I I I I i I I I I i I I
-J n~j~I~I~69197 239 282311 365 426 491 53114.20 14.40 14.60 14.80 15.00
I m/z 43.15 80.67%0 1 1 ' ""I I I i i I i I Il, I I I I i I' " i I i I I I I' I I I 1' I I I IInfz--> 0 50 100 150 200 250 300 350 400 450 500y\bundance #16454: Eicosane
57
~1\
j
5000 85 I 1 I I I , 1 I I I I I I I i i I I I I r--r-r14.20 14.40 14.60 14.80 15.00
29 m/z 71. 20 70.50%
~0 1
f13141169197225253282
5'0I I ! I It I I'. " "I ') f ,', I I I I ,
l , I i i i I I I I i I I I i I I I I I I , I I I I I Imfz--> 0 100 150 200 250 300 350 400 450 500Abundance #109557: Heptadecane
)4~~..-.N
I I I I j I I I I I I I I i i I I I I i i I I
7114.20 14.40 14.60 14.80 15.00
5000 m/z 85.15 47.63%
0 1
9? 127155183211240
5'0I I"'" f )'1 " ,I I I i i I I, i I t i I I i I i I i I I i I' I i I I' I I I 1'1 I I I
)Infz--> 0 100 150 200 250 300 350 400 450 500\A.bundance #16468: Eicosane, 10-methyl- /\
I I I I I I I I I I I I i I I I I I i i i I I
::17 14.20 14.40 14.60 14.80 15.00m/z 41.20 42.73%
5000 85
~1~J1 ]3 154
O!I 1183211239 281
50 100 150 200 250 3001 I
4~0 500I I I I I "1 I i I I I I i i I I I i j I I i
mfz--> 0 350 400 14.20 14.40 14.60 14.80 15.00
Peak Number: 1 at 14.58 min Area: 2203744 Area % 0.53
The 3 best hits from each library. Ref# CAS# Qual---------------------------------------------------------------------
C:\Database\HPPest.LC:\Database\PMW_TOX2.L
1 Octacosane2 Hexadecane3 Nonadecane
C:\Database\Nist98.11 Eicosane2 Heptadecane3 Eicosane, 10-methyl-
No hits were retrieved.
3797 000630-02-42353 000544-76-32363 000629-92-5
16454 000112-95-8109557 000629-78-7
16468 054833-23-7
908683
979493
Fig. A.18: GC -MS library search of C. greenwayi Compound D at a retention
time of 14.577 min corresponding with Eicosane spectrum

Library Search Report - Chemstation Integrator
216100.00%~bundance Scan 1691 (18.465 min): FRD.D (-) m/ z 43 . \5
.<16 73 1\
Unknown Spectrum based on Apex minus start of peak
1295000
~bundance
185
! ~ 1. 22811 ' Iilllli1,;l ~I I,I. [ , I 275 321351 314 431 467_I • • ~ •• 1 I ~ 1 -'- I50 100 150 200 250 300 350 400 450 500
#25385: Telradecanoic acid
I I I I I i i i i I i I I I I I I i I I I I I i
18.20 18.40 18.60 18.80m/z 73.10 96.41%
J
5000129
O~i~~~/lJl\1\.~~~ ,~I~ 1 ' , , , 1 ' , , , 1 ' , , , I ' , , , I ' , , , I ' , , , I 'rnlz--> 0 50 100 150 200 250 300 350 400 450 500
I I I I I i i I I I i I I i I I I I i I I I I i
18,20 18.40 18,60 18,80m/z 41.10 92.67%
Abundance #114892: Lauricanhydride73
41
11J IJJlr." I"" I"" I"" I" " .1 "" I"" 1 '50 100 150 200 250 300 350 400 450 500
5000
oin/z-> 0Abundance
7'3#114893: Hepladecanoic acid
I I I I I I I I I I I i I I I I I I I I I I I I
18.20 18.40 18.60 18.80m/z 60.10 90.68%
I I I I I I I i 1 I i I , I I i i I I I I i I i
18.20 18.40 18.60 18.80
43m/z 55.20 78.18%
5000
rnlz-->
129
0, I,: Ihi "..:1\ I"" I~l~ ,1" " I " " I " " I ' " , I " " I 'o 50 100 150 200 250 300 350 400 450 500I j I I I I I I I I I I , i I i i i I I I I i I
18.20 18.40 18.60 18.80
Peak Number: 4 at 18.46 mln Area: 32152564 Area % 7.71
The 3 best hits from each library. Ref# CAS# Qual
C:\Database\HPPest.L No hits were retrieved.C:\Database\PMW TOX2.L
1 Myristic acid 1140 000544-63-8 892 Diethylene glycol dipivalate 1904 000000-00-0 93 Dibutyladipate 722 000105-99-7 7
C:\Database\Nist98.l1 Tetradecanoic acid 25385 000544-63-8 992 Lauric anhydride 114892 000645-66-9 813 Heptadecanoic acid 114893 000506-12-7 62
Fig. A.19: GC -MS library search of C. greenwayi Compound Dat a retention
time of 18.465 min corresponding with Myristic (Tetradecanoic) acid
spectrum
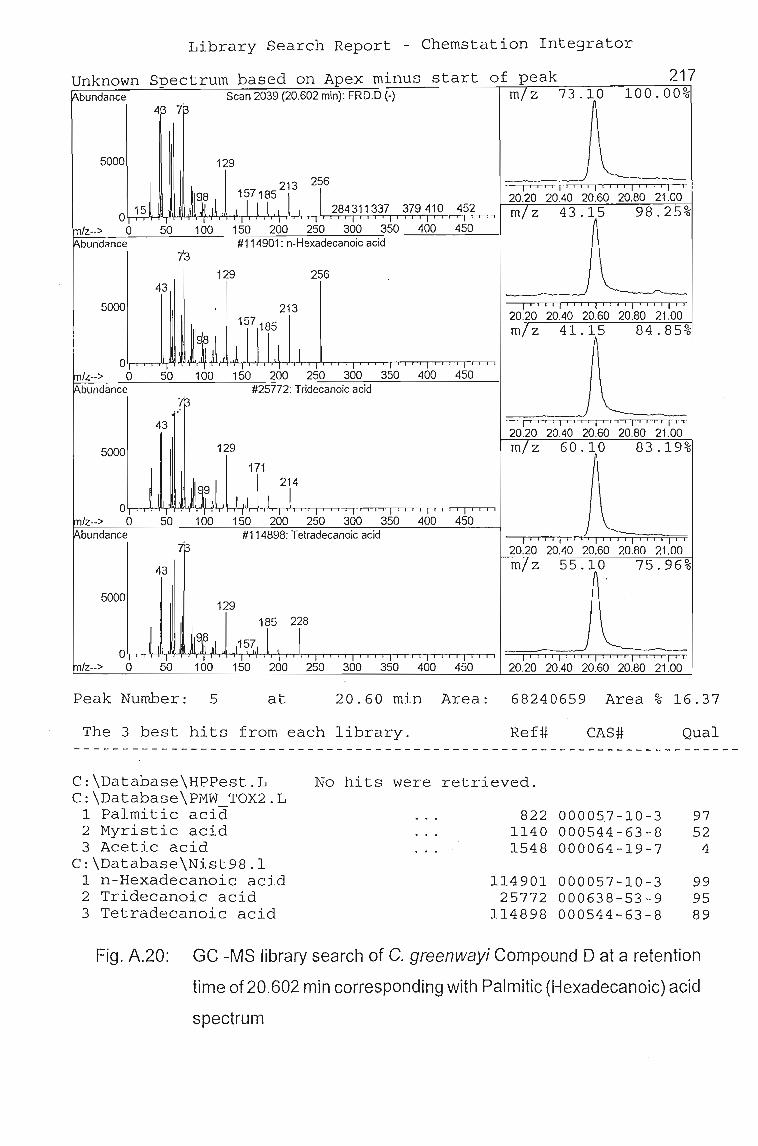
Library Search Report - Chemstation Integrator
217100.00%
I i I , I I I I "1 I I I I I I I I 'T""20.20 20.40 20.60 20.80 21.00
m Z 41.l84.85%
I i i I I I I I I I I I I I I I i i i i I I I
20.20 20.40 20.60 20.80 21.00m z 43.15 98.25%
256
#114901: n-Hexadecanoic acid
#25772 : Tridecanoic acid
129
100
129
213 256
~[J, 12~~f11,~~711~~~(1~ I ~~~, I I
100 150 200 250 300 350 400 450
213
'~IJ,L.iUt-"HL,-' 1lL, " ,'I' " , I' " , I' " , I~150 200 250 300 350 400 45050/z--> 0
5000
bundance
bundance Scan 2039 (20.602 min): FRD.D (-) m z 73 . 104B 7
Unknown Spectrum based on Apex minus start of peak
bundance #114898: Tetradecanoic acid
J' I I t I I I I I I i I I I I I I I i I I i
20.20 20.40 20.60 20.80 21.00m z 60.10 83.19%
I1 i I i I • • I I I I i I i I I i I i I I i
20.20 20.40 20.60 20.80 21.00m z 55.10 75.96%
I I i I I I I i I i I I I i ill I I i I i I
20.20 20.40 20.60 20.80 21.00
129
50
50 100 150 200 250 300 350 400 450
43
43
5000
5000 129
0l,--,-,--'t-\l!.,JIH..,...,..H
9 LL~r.,I ' , , , I ' , , , I ' , , , I ' , , , I ' , , ,/z--> 0 100 150 200 250 300 350 400 450
o!,,-r"r-1''-r'''I--'H''r''I-1P-r''1--+r-Y't-,..J,-'t-rr--r--'r-r--,....,..-v-r--r-r-rr-r-r-rr--r- -r-r-r-f--r-tr-r--r-r-r-f--r-t
/z--> 0
Peak Number: 5 at 20.60 min Area: 68240659 Area % 16.37
The 3 best hits from each library. Ref# CAS# Qual
C:\Database\HPPest.LC:\Database\PMW TOX2.L
1 Palmitic acid2 Myristic acid3 Acetic acid
C:\Database\Nist98.l1 n-Hexadecanoic acid2 Tridecanoic acid3 Tetradecanoic acid
No hits were retrieved.
82 2 00005.7- 1 0 - 31140 000544-63-81548 000064-19-7
114901 000057-10-325772 000638-53-9
114898 000544-63-8
9752
4
999589
Fig. A.20: GC -MS library search of C. greenwayi Compound 0 at a retention
time of20.602 min corresponding with Palmitic (Hexadecanoic) acid
spectrum

218
bundance TIC:C.D1458
4400000
420000015.57
4000000
3800000
3600000
3400000
3200000
3000000
2800000
2600000 13.50
2400000Octadecane
2200000
2000000
1800000 17.03 20.60
-Lauric acid Palmiticacid
1600000
28.00 30.00 32.00 34.00
25.13Contaminant:Diisooctylphlhalate
Stearic acid
22,98124,6,
21.71 23.9
400000
600000
800000
200000
1200000
1400000
1000000
ime-->
Fig. A.21: H. depressa GC-MS spectrum of isolated anti-bacterial Compound
B(A)

Library Search Report - Chemstation Integrator
219Abundance Scan 527 (11.316 min): C.D (-) m/z 43.10 100.00%
4'
5000
"'" "A"", \" 'r1f I,
11.00 11.20 11.40 11.6098 135166201 257288318 365 408 494 533 m/z 45.10 83.33%0,
50 150 200 250 400 450 500m/z·-> 0 100 300 350Abundance #109430: Acetic acid
43
~-~''''''''~F{ ,':-, ' , , , , ' ,~5000
o.:tJ- r~""","',,,"',"","","",""," no"
11.00 11.20 11.40 11.60m/z 60.05 45.19%
m/zoo> o 50 100 150 200 250 300 350 400 450 500V\bundance #4896: Acetic acid,anhydridewith formicacid
4~"'-.
11~OO 11'20 11~40'''1''''1
11.60
5000 m/z 42.10 17.73%
0,I,
100 150 200 250 300 400 450 500,_~'v~~Lm/zoo> 0 50 350
Abundance #11728: Hydrazine, ethyl- I I I I I I I I I I I I I i i i I I I i i i I4'5 11.00 11.20 11.40 11.60
m/z 29.20 12.58%
5000
~ A ~ ~0, J100 150 200 250 300 350 400 450 500
, ri, I I n I I I I I I i I 1'1 I , I i Irn/zoo> 0 50 11.00 11.20 11.40 11.60
Unknown Spectrum based on Apex minus start of peak
Peak Number: 2 at 11.32 min Area: 6234583 Area % 1.04
The 3 best hits from each library. Ref# CAS# Qual
1548 000064-19-7 781546 000067-63-0 23779 000109-86-4 1
109430 000064-19-7 904896 002258-42-6 64
11728 000624-80-6 38
C:\Database\HPPest.L No hits were retrieved.C:\Database\PMW TOX2.L
1 Acetic acid 2 Isopropanol3 Ethylene glycol monomethylether
C:\Database\Nist98.l1 Acetic acid2 Acetic acid, anhydride with form ...3 Hydrazine, ethyl-
Fig A. 22: GC -MS library search of H. depressa Compound B(A) at a retention
time of 11.316 min corresponding with Acetic (ethanoic) acid
spectrum

Library Search Report - Chemstation Integrator220
Unknown Spectrum based on Apex minus start of peakV\bundance Scan 883 (13.502 min): C.D (-) m/z 57.15 100.00%
5000 85
- / \
PP1411691972252~4282 318351 398 443477 520I I 1"" 1""1'"'1'''' 1''''1''''1'' '
100 150 200 250 300 350 400 450 500
, '1~~2~' '1~~4iO' 13~60 13~8~i' ,
m/z 43.15 78.84%
V\bundance #112330 : Octadecane
29 ',I,
50
m/z 71.15 69 .18%
Abundance #109630 : Eicosane
I I I I ' 1I I 11 I I I 11 i liT. I I I
m/z 85.15 49.00%
#112320 : Heptadecane
71
500°'-r-r--,-,--\l_,AI_JJ.YI,,~7"15~,'mm~~ ,~~~ I' , , , I' , , , I ' , , , I ' , , , I' , ,
50 100 150 200 250 300 350 400 450 500V\bundance
orn/z--> 0
13.20 13.40 13.60 13.80m/z 41.15 42.63%
~ Y, ]:f,1 ~,~ n~ ~~1,~7, ,~1~ ,," ,' " ,I " " I " , , I " , , I ' "mrz-> 0 50 100 150 200 250 300 350 400 450 500
.' , , (i=T'"F'T" f9 I , f} I I , ,~ , -;",13.20 13.40 13.60 13.80
Peak Number: 4 at 13.50 min Area: 29763168 Area % 4.95
The 3 best hits from each library. Ref# CAS# Qual
C:\Database\HPPest.LC:\Database\PMW_TOX2.L
1 Octacosane2 Eicosane3 Hexadecane
C:\Database\Nist98.l1 Octadecane2 Eicosane3 Heptadecane
No hits were retrieved.
3797 000630-02-42352 000112-95-82353 000544-76-3
112330 000593-45-3109630 000112-95-8112320 000629-78-7
818074
999797
Fig. A. 23: GC -MS library search of H. depressa Compound B(A) at a retention
time of 13.502 min corresponding with Octadecane spectrum

Library Search Report - Chemstation Integrator
Unknown Spectrum based on Apex minus start of peak 221100.00%
I I . i I I i i i I I i i i i I I I i I I i I J
16.60 16.80 17.00 17.20 17.40m z 60.10 85.91%
129
71200I 247278307337 375 416445 489 547
I I I " I i
100 150 200 250 300 350 400 450 500 550tz-> 0 50
5000
bundance Scan 1457 (17.028 min): C.D (-) m z 73 .10
41
bundance #114903: Dodecanoic acid
5000
otz-> 0bundance
5000
oIz--> 0bundarice
129 .
ti[ ~;Jl;::J"" 'I ",' I ""I" "I"" I' "'I"" I '50 100 150 200 250 300 350 400 450 500 550
#114892: Lauric anhydride
129
[1071200
u, rL I""" " " """ "" " " "" " "" ,-r50 100 150 200 250 300 350 400 450 500 550#6591: Pentadecanoic acid
43 73
I ' . . I I I I I I I i i i I I i I I I I i
16.60 16.80 17.00 17.20 17.40m z 41.20 79.17%
I I , , , I ' I I I I I , , , I I I , , I ' , ,
16.60 16.80 17.00 17.20 17.40m z 43.20 73.04%
I I j I i I i I I • I I I i I I i I i I I i I I
16.60 16.80 17.00 17.20 17.40m z 55.10 64.63%
5000
. 129 242
O'-r,,....,.,.-l"-..-H','+II~ ,111~~ 1'1~t.J I' i , , , ' , i i I ' , , , , ' i , , I i , i i I ' , , , I 'Iz--> 0 50 100 150 200 250 300 350 400 450 500 550
Peak Number: 23 at 17.03 min Area: 25124282 Area % 4~18
The 3 best hits from each library. Ref# CAS# Qual
C:\Database\HPPest.LC:\Database\PMW TOX2.L
1 Myristic acid2 Acetic acid3 Cyclamate-M AC
C:\Database\Nist98.l1 Dodecanoic acid2 Lauric anhydride3 Pentadecanoic acid
No hits were retrieved.
1140 000544-63-81548 000064-19-71229 001124-53-4
114903 000143-07-7114892 000645-66-9
6591 001002-84-2
7451
949481
Fig. A.24: GC -MS library search of H. depressa Compound B(A) at a retention
time of 17.028 min corresponding with Lauric (Dodecanoic) acid
spectrum

Library Search Report - Chemstation Integrator
Unknown Spectrum based on Apex minus start of p eak 222l'\bundance
5000
97
Scan 1561 (17.666 min): C.D (-)
, , , , I .. , , I ' , , , I ' , , , I ' , , ,
17.40 17.60 17.80 18.00m/ z 43 . 1 5 99.25 %
~AA#2356: Slearyl alcohol P1298
97
.1 ~t6 168 224 269 311 356386 429 474504 549 f---.-~~~~":':"::=-=~::";""'::-::-lI ~
100 150 200 250 300 350 400 450 500 550
55Abundance
5000 I i I I I I , I , I i I I i I I i I I I I I I i
17.40 17.60 17.80 18.00
0 1m/zoo> 0l'\bundance
5rJ
I 224 270 m/ z J83. 1~5 85 .39%I I I ! ""I""I" "I " " I''''I'
100 150 200 250 300 350 400 450 500 550
97 r i i i I i I I I I I i i I I I I I I I I i I I
17.40 17.60 17.80 18.00
I I ' , , , I . , , , I ' , , , I ' , " 1' , , ,500 550 17.40 17.60 17.80 18.00
5000
0 1
271 ~f~ 168 210 252
50I I
250 300 350 400 450m/zoo> 0 100 150 200l'\bundance #5273: 1-0ctadecanol
43 83
5000
t25
0, I1154 1952242~3
m/zoo> ° 50 100 150 200 250 300 350 400 450
-I 1500 550
m/z 41 .15 78.71 %
~~A,-J\,.I'I I i I I I I I i I ' i i i I i i I i f i i I I
17.40 17.60 17.80 18.00m/z 69.10 76.86 %
~,-~Peak Number: 24 at 17.67 min Area: 6228682 Area % 1.04
The 3 b e s t hits f rom each library. Ref# CAS# Qua l--- - - - -- --- - --- - - - - - - - -- - - - --- - - - - - - -- - - - - -- - - - - ---- - - - - ----- ---- --_ .
C:\Database\HPPest .L1 CYCLOATE
C:\Database\PMW TOX2.L1 Stearyl alcohol2 Cyclohe xadecane3 Cyclotetradecane
C:\Database\Nist98.l1 1-0ctadecene2 1 -0ctadecanol3 9-Nonadecene
112 0011 34- 23- 2
2 356 000112-92 -52355 000295-65 -8235 4 .0002 95 - 1 7 - 0
112298 000112 -8 8-95273 000112-92-5
1304 2 03103 5-07 -1
1
95947 6
959592
Fig. A.25: GC -MS library search of H. depressa Compound B(A) at a retention
time of 17.666 min corresponding with Stearyl alcohol spectrum

Library Search Report - Chemstation Integrator
Unknown Spectrum based on Apex minus start of peakbundance Scan 1692(18.471 min):C.D(-) m z 73.10
223100.00%
741
5000 129
185
#25385: Telradecanoic acid
I I I I I I I I I I i i i I I i I I I I I I I I
18.20 18.40 18.60 18.80m z 60.10 80.48%
228254281 332364 410437 498 I--,':':::::~~-:;::-;;:-='c::.=...;::;,;::==;r;oi
'1""(""1'150 200 250 300 350 400 450 500100
ibundance
5000 129
o 1L.J~,irl ,~IB, ,"","","","",'",,'z--> 0 50 100 150 200 250 300 350 400 450 500bundance #20154: n-Decanoicacid
I i I i I I I I I I i I I i I I I I I I I i I i
18.20 18.40 18.60 18.80m z 41.15 78.27%
I I i I I I I I I I i i I i I i I I j I I i I I
18.20 18.40 18.60 18.80
5000 m z 43.15 76.94%
50
29129
oc,-,-r'r-\"Y'H"-t"r'H,-1 ,', :i~, ,',,,,',,,,',,,,'",," ,,,',,,,''z--> 0 100 ' 150 200 250 300 350 400 450 500bundance #114893: Heptadecanoic acid
7I I I I I I I i I I I I i i I I I i I I i i I I
18.20 18.40 18.60 18.80
43m z 55.10 65.92%
50
5000
'z-->
129
J,-.-,-r'h'Y'f-JI-Y~1 ",T,~~,T, ,~j~ ,,' ,,," ,,,,' ,,,,' ,,,,'100 150 200 250 300 350 400 450 500
i i I i I i i i i I i i I I I i I i i I I I i I
18.20 18.40 18.60 18.80
Peak Number: 25 at 18.47 min Area: 21137518 Area % 3.51
The 3 best hits from each library. Ref# CAS# Qual
C:\Database\HPPest.LC:\Database\PMW TOX2.L
1 Myristic acid2 Acetic acid3 Cyclamate-M AC
C:\Database\Nist98.l1 Tetradecanoic acid2 n-Decanoic acid3 Heptadecanoic acid
No hits were retrieved.
1140 000544-63-81548 000064-19-71229 001124-53-4
25385 000544-63-820154 000334-48-5
114893 000506-12-7
9541
996862
Fig.A.26: GC -MS library search of H. depressa Compound B(A) at a retention
time of 18.471 min corresponding with Myristic (Tetradecanoic) acid
spectrum

Library Search Report - Chemstation Integrator
224
1" I i I I , , , I I 1 I I 1" i i I I i
20.20 20.40 20.60 20.80 21.00m/z 73.\0 99.76%
Scan 2039 (20.602 min): C.D (-) m/ z 43 15 100 00%
~L48 7~
Spectrum based on Apex minus start of peak
5000 129
11<;71P's213 256
0 J..,..r .;..:15~I-I'!~,' .'lIrolJltLJ, I 1~~7, , ~~T,3,7~, ~~~~~71 ,47161~0,6, .m/z--> 0 50 100 150 200 250 300 350 400 450 500
Abundance
Unknown
Abundance #114901 : n-Hexadecanoic acid
129 256
I I I r I I I I I I I I i i I I I I I '--r-rr20.20 20.40 20.60 20.80 21.00m/z 41.~0 87.19%
43
5000 213
O'r-r!.,..-,","1'H'bl JIT, I m-rp , , , I ' , , , I ' , , , I ' , , , I ' , ,
m/z--> 0 50 100 150 200 250 300 350 400 450 500Abundance #25772: Tridecanoic acid
43
5000 129
O~I~,~l~~~I~" I ' ' , , I ' , , , I ' , , , I ' , , , I ' , , , I ' , ,m/z--> 0 50 100 150 200 250 300 350 400 450 500Abundance #114896: Pentadecanoic acid
43 13
l ' I I i I I I I I I i i I I I I I I I I I I
20.20 20.40 20.60 20.80 21.00m/z 60.\0 83.51%
'I i ''- ~ r 'H"'i' "TJ!,-,'r-r-t=;:::;::;::;::;:::r;::::r:r20 .20 20.40 20.60 20.80 21.00m/z 55.\0 78.71%
5000
m/z-->0 1
oI i I I I 1 I I I I I I i i i II i I I I I I
20.20 20.40 20.60 20.80 21.00
Peak Number: 27 at 20.60 min Area: 52918266 Area % 8.80
The 3 best hits from each library. Ref# CAS# Qual
C:\Database\HPPest.L No hits were retrieved.C:\Database\PMW TOX2.L
1 Palmitic acid 822 000057-10-3 972 Myristic acid 1140 000544-63-8 583 Diethylene glycol dipivalate 1904 000000-00-0 9
C:\Database\Nist98.l1 n-Hexadecanoic acid 114901 000057-10-3 992 Tridecanoic acid 25772 000638-53-9 953 Pentadecanoic acid 114896 001002-84-2 83
Fig. A.27: GC -MS library search of H. depressa Compound B(A) at a retention
time of20.602 min corresponding with Palmitic (Hexadecanoic) acid
spectrum

Library Search Report - Chemstation Integrator
129
4' 73
I5000
Unknown Spectrum based on Apex minus start of peak 225bundance Scan 2581 (23.931 min): C.D (-) m z 43 . 15 100 . 00%
~~,~\.~~"~,
50 100
4373
284
, I I I , , , I ' I I I I ' , I , I ' , i , I23.60 23.80 24.00 24.20
m Z 73./\ .::~~-~) ~
5000129
i I I i I " 1 ' i I I I ' I , I I ' , , , I23.60 23.80 24.00 24.20
bundance #114896: Penladecanoic acid
i I I I I i I I i i i i I I i i I I i I I I I23.60 23.80 24.00 24.20
m z 41.15 72.33%
~~-v-«V""'-"..J"."\-....rv
" I iI " I ' rr-Tj50 100 150 200 ' 250 ' 300 350 400 450 500
#114898: Tetradecanoic acid
sooo
185 241
0 ......1.;++' -f'-r"I~~'i""H'T'15'ri7~ .,.., , I ' " , I iI iI I
tz-> 0 50 100 150 200 250 300 350 400 450 500
o'-r-r-,...-'r-l"-r"H~'i-+!r'l-+r'.-++'r1--,J-,-rh..,.....r-rrTT"T--rr-rrr.......,rrrTT"T--rr-rrr-1
Iz--> 0bundance
i
i I I I I i I I I i I i I i I i I I ~ I I I I23.60 23.80 24.00 24.20
185 228
150 200 250 300 350 400 450 500
129
43
sooo
ol,n.-'t-f'~'-'Y'Hlr"hLrYI---A-I--rr-h-r.......,r-rrTT"T--rr-rrr.......,-rr.,..,..,--rr-rrr,...".,
Iz--> 0 50
Peak Number: 30 at 23.93 min Area: 15291215 Area % 2.54
The 3 best hits from each library. Ref# CAS# Qual
C:\Database\HPPest.L No hits were retrieved .C:\Database\PMW TOX2.L
1 Stearic acid- 969 000057-11-4 862 Myristic acid 1140 000544-63-8 433 Diethylene glycol dipivalate 1904 000000-00-0 9
C:\Database\Nist98.11 Octadecanoic acid 109378 000057-11-4 942 Pentadecanoic acid 114896 001002-84-2 863 Tetradecanoic acid 114898 000544-63-8 62
Fig. A. 28: GC -MS library search of H. depressa Compound B(A) at a retention
time of 23.931 min corresponding with Stearic (Octadecanoic)
spectrum

bundance
800000
750000
700000
650000
600000
550000
500000
450000
400000
350000
17.03
TIC: ED
20.60Palmitic acid
226
35.1~
300000
250000
200000
150000
100000
ime--> 10.00 12.00 14.00 16.00 18.00 20.00
Fig. A.29: H. depressa GC-MS spectrum of isolated anti-bacterial Compound
B(E)

Library Search Report - Chemstation Integrator
227Unknown Spectrum based on Apex minus s tart of peak~bundance Scan 2039 (20.602 min): E.D (-) m/ z 43.10 100.00%
lG 7p
~~,~Jl~5000 129
213 256
:~~ ~ ~ll l : 1 111~7,I~lJ, , ~~~ ~~~ ~~?, ,3?,5, , ~~~~?1, I ~1~ , I
I' , i I I I , , , I I I i ' I ' , , i I i ,
I, 20.20 20.40 20.60 20.80 21.0015 m/ z 4 1 . 1 5 95.79 %0 . -,.
~,J~m/zoo> 0 50 100 150 200 250 300 350 400 450 500IA.bundance #822: Palmitic acid P1210
7G
5000 I ' , I i I i i , , I i i i I I i , , i I i ,
'129 20.20 20.40 20.60 20.80 21.00
Irw157185213 T m/ z 73.10 95.54%
0 111 1 I
~,~~,~."100 150 200 250I 1 1 " "1" "1
m/zoo> 0 50 300 350 400 450 500IA.bundance #114901: n-Hexadecanoic acid
76
129 256 I I I i I I I i i i I i I i i I i I i i I i I
43 20.20 20.40 20.60 20.80 21.005000 213 m/z 60 . 1~0 87 . 97%
157185
0~~11 ,I r1.1 I
T ' , 1 I200 250 300 350 400
I500
Im/zoo> 0 50 100 150 450Abundance #114893: Heptadecanoic acid ~ ~,~
76I' , , , I I I , , I I , , , I ' , , I I ' I
20.20 20.40 20.60 20.80 21.00
43 rn/z 55'j\ 80.75%5000
129
I~rp11 171 2r2~0
~/V~ ~'h~0 .I '1 ~99
1100 150 200 250 300 350
I I
500I I ' . i i i I I I I I I I I I i I i I I I I I Im/Zoo> 0 50 400 450 20.20 20.40 20.60 20.80 21.00
Peak Number: 4 at 20.60 min Area: 7302086 Area % 6.61
The 3 best hits from each library . Ref# CAS# Qual-- - -- -- - - - - -- - - - - -- - --- -- - -- -- ---- - - -- -- - -------- -- - - - - - -- -- -- - - -- -_ .
C:\Databa s e\HPPest.LC:\Database\PMW TOX2.L
1 Palmitic acid2 My r i s t i c acid3 Acet ic acid
C:\Database\Nist98.l1 n-Hexadecanoic ac id2 Heptadecanoic acid3 La u r i c anhydride
No hit s were retri e v ed .
82 2 000057-10-31140 000544-63-815 48 000064-19-7
114901 000057-10-3114 89 3 000506-12-711489 2 000645-66-9
9364
7
907064
Fig. A .30: GC -MS library search of H. depressa Compound B(E) at a retention
time of20.602 min corresponding with Palmitic (Hexadecanoic) acid
spectrum

APPENDIX B
228
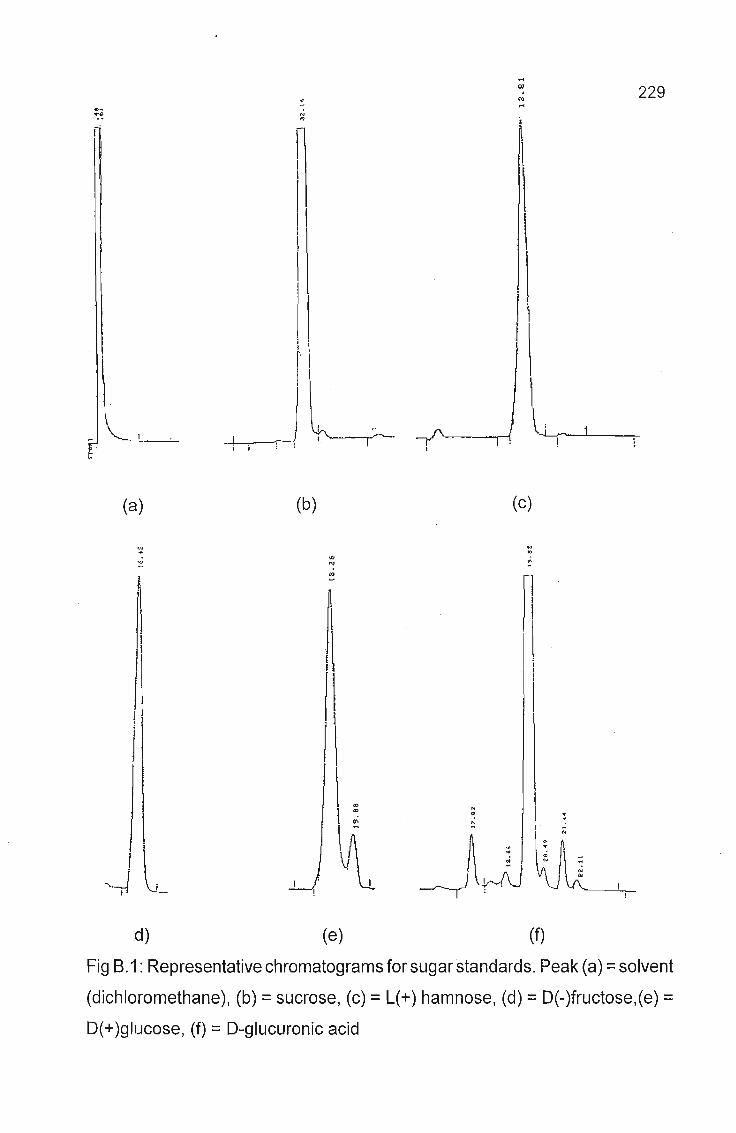
L! -...........L._--:-
....Cl> 229'":': ........, N
'"
~1
II
\
. \\
(a) (b) (c)
d) (e) (f)
Fig B.1: Representative chromatograms for sugar standards. Peak (a) =solvent
(dichloromethane), (b) = sucrose, (c) = L(+) hamnose, (d) = D(-)fructose,(e) =
D(+)glucose, (f) =D-glucuronic acid

~Cl:)en
m' il
~
~eneni _ _f\
0 n Cl:)~ 0.;. en ~III '" N \ ...~ .~ \ f\ A. ~, ~ ,\ r, A
.... \ I ,f ~ r»:\ ."r ' ; ~ ,. !'I '~ ,
! I I II
Fig 8.2: Representative chromatogram for sugar detection with Sil-A of H. depressa aqueous extract.