
Mexican Americans: A Sociological Introduction - University of ...
RESEARCH ARTICLE
Exploring the Distribution of GeneticMarkers of Pharmacogenomics Relevancein Brazilian and Mexican PopulationsVania Bonifaz-Pena1, Alejandra V. Contreras2, Claudio Jose Struchiner3,Rosimeire A. Roela4, Tatiane K. Furuya-Mazzotti4, Roger Chammas4, ClaudiaRangel-Escareno1,10, Laura Uribe-Figueroa5¤a, Marıa Jose Gomez-Vazquez1¤b,Howard L. McLeod6,11, Alfredo Hidalgo-Miranda7, Esteban J. Parra8.,Juan Carlos Fernandez-Lopez1*, Guilherme Suarez-Kurtz9*
1. Computational Genomics Consortium, National Institute of Genomic Medicine, Mexico City, Mexico,2. Nutrigenetics and Nutrigenomics Laboratory, National Institute of Genomic Medicine, Mexico City,Mexico, 3. Programa de Computacao Cientıfica, Fundacao Oswaldo Cruz, Rio de Janeiro, Rio de Janeiro,Brazil, 4. Departamento de Radiologia e Oncologia, Universidade de Sao Paulo, Sao Paulo, Sao Paulo,Brazil, 5. Genotyping and Expression Analysis Unit, National Institute of Genomic Medicine, Mexico City,Mexico, 6. DeBartolo Family Personalized Medicine Institute, University of South Florida Moffitt CancerCenter, Tampa, Florida, United States of America, 7. Cancer Genomics Laboratory, National Institute ofGenomic Medicine, Mexico City, Mexico, 8. Department of Anthropology, University of Toronto atMississauga, Mississauga, Ontario, Canada, 9. Divisao de Farmacologia, Instituto Nacional de Cancer,Rio de Janeiro, Rio de Janeiro, Brazil, 10. Institute of Mathematical Sciences, Claremont GraduateUniversity, Claremont, California, United States of America, 11. Pharmacogenomics Department,Pharmacogenetics for Every Nation Initiative, Tampa, Florida, United States of America
*[email protected] (JCFL); [email protected] (GSK)
. These authors contributed equally to this work.
¤a Current address: Latin America Marketing, Affymetrix Incorporation, Santa Clara, California, United Statesof America¤b Current address: Department of Applied Mathematics and Theoretical Physics, University of Cambridge,Cambridge, United Kingdom
Abstract
Studies of pharmacogenomics-related traits are increasingly being performed to
identify loci that affect either drug response or susceptibility to adverse drug
reactions. However, the effect of the polymorphisms can differ in magnitude or be
absent depending on the population being assessed. We used the Affymetrix Drug
Metabolizing Enzymes and Transporters (DMET) Plus array to characterize the
distribution of polymorphisms of pharmacogenetics and pharmacogenomics (PGx)
relevance in two samples from the most populous Latin American countries, Brazil
and Mexico. The sample from Brazil included 268 individuals from the southeastern
state of Rio de Janeiro, and was stratified into census categories. The sample from
Mexico comprised 45 Native American Zapotecas and 224 self-identified Mestizo
individuals from 5 states located in geographically distant regions in Mexico. We
evaluated the admixture proportions in the Brazilian and Mexican samples using a
OPEN ACCESS
Citation: Bonifaz-Pena V, Contreras AV, StruchinerCJ, Roela RA, Furuya-Mazzotti TK, et al. (2014)Exploring the Distribution of Genetic Markers ofPharmacogenomics Relevance in Brazilian andMexican Populations. PLoS ONE 9(11): e112640.doi:10.1371/journal.pone.0112640
Editor: Yan Gong, University of Florida, UnitedStates of America
Received: July 8, 2014
Accepted: October 9, 2014
Published: November 24, 2014
Copyright: � 2014 Bonifaz-Pena et al. This is anopen-access article distributed under the terms ofthe Creative Commons Attribution License, whichpermits unrestricted use, distribution, and repro-duction in any medium, provided the original authorand source are credited.
Data Availability: The authors confirm that all dataunderlying the findings are fully available withoutrestriction. All relevant data are within the paperand its Supporting Information files.
Funding: FUNDERS: (1) Funding supported byConselho Nacional do Desenvolvimento Cientıfico(CNPq) CNPq no. 304063/2011-8, http://www.cnpq.br (GS-K). (2) Funding supported by Fundacao deAmparo a Pesquisa do Estado do Rio de Janeiro(FAPERJ) FAPERJ no. E-26/102796/2012, URL:http://www.faperj.br; FAPERJ no. E-26/110683/2012, URL: http://www.faperj.br (GS-K). (3) Fundingsupported by Financiadora de Estudos e Projetos(FINEP) FINEP no. 01.08.0123.00, URL: http://www.finep.gov.br (GS-K). The funders had no role instudy design, data collection and analysis, decisionto publish, or preparation of the manuscript.SPONSORSHIPS: (1) The Affymetrix DMETpluschips were provided by the Pharmacogenetics forevery nation initiative (PGENI), a USA-based globalhealth non-profit organization. PGENI is supportedby individual donors and does not solicit fundingfrom health care-oriented companies. (2) TheAffymetrix DMET Plus array data for the European,African and East Asian HapMap samples wereprovided by Affymetrix Inc.
Competing Interests: The authors have read thejournal’s policy and have the following competinginterests to declare: Co-author Roger Chammashas a potential conflict of interest as a member ofthe academic editorial board of the journal. Co-author Laura Uribe-Figueroa is an employee of thecommercial company Affymetrix Inc. This does notalter the authors’ adherence to PLOS ONE policieson sharing data and materials.
PLOS ONE | DOI:10.1371/journal.pone.0112640 November 24, 2014 1 / 22
panel of Ancestry Informative Markers extracted from the DMET array, which was
validated with genome-wide data. A substantial variation in ancestral proportions
across census categories in Brazil, and geographic regions in Mexico was
identified. We evaluated the extent of genetic differentiation (measured as FST
values) of the genetic markers of the DMET Plus array between the relevant
parental populations. Although the average levels of genetic differentiation are low,
there is a long tail of markers showing large frequency differences, including
markers located in genes belonging to the Cytochrome P450, Solute Carrier (SLC)
and UDP-glucuronyltransferase (UGT) families as well as other genes of PGx
relevance such as ABCC8, ADH1A, CHST3, PON1, PPARD, PPARG, and
VKORC1. We show how differences in admixture history may have an important
impact in the distribution of allele and genotype frequencies at the population level.
Introduction
The development of high-throughput and rapid genotyping technologies in
parallel with the completion of the Human Genome Project led to a wealth of
information on human genetic diversity and its impact on disease susceptibility
and drug response. Pharmacogenetics and pharmacogenomics research explores
the contribution of genetic individuality to variability in drug response, to provide
relevant information for personalized drug therapy. A common finding in PGx
studies is that the frequency of genetic variants associated with drug response
differs across and within populations. One distinct example is the VKORC1
3673G.A transition, a major determinant of warfarin dose requirement for
appropriate anticoagulation [1]. The frequency of the 3673A allele, associated with
low warfarin dose, ranges from ,10% in sub-Saharan Africans to.90% in
Southeast Asian populations [2], and from 10 to 40% among the predominant
population strata of Brazil [3]. This variability has a major impact on the
usefulness of the VKORC1 3673G.A SNP to predict warfarin dosage across
populations worldwide [1, 4, 5]. A corollary to human diversity is that differences
in frequency of clinically-relevant genetic variants might be used advantageously
for PGx-informed drug therapy. Either to prevent adverse effects (e.g.
carbamazepine-induced Stevens-Johnson syndrome in Southeast Asian popula-
tion) to maximize clinical benefit or to rescue withdrawn medicines for use in
populations which might not be adversely affected. The Pharmacogenetics for
Every Nation Initiative (PGENI) addresses these goals, through the creation of an
international consortium to assess the prevalence of genetic variants related to
pharmacological response in an ethnically diverse set of samples, coming from
different participating countries [6]. These include Brazil and Mexico, the two
most populous countries in Latin America, with 194 million [7] and 112 million
[8] people, respectively, which are the focus of the present study. Admixture of
Distribution of Pharmacogenomic Genetic Markers in Brazil and Mexico
PLOS ONE | DOI:10.1371/journal.pone.0112640 November 24, 2014 2 / 22
Native American, European and sub-Saharan African ancestral roots is extensive
in both countries, but their population structure is quite different: European and
sub-Saharan ancestry predominate largely over Native American ancestry in
Brazilians [9, 10] whereas in Mexico the main ancestral contribution is European
and Native American, and the African contribution is relatively small [11, 12, 13].
Together, Brazilian and Mexican populations provide an interesting illustration of
the heterogeneity of Latin American peoples, regarding the kaleidoscopic
combinations of individual proportions of Native American, European and sub-
Saharan African ancestries.
In this study, we used the Affymetrix Drug Metabolizing Enzymes and Transporters
(DMET) Plus array to characterize the distribution of PGx polymorphisms in a
combined cohort of Brazilians and Mexicans. The DMET array interrogates variants
in 231 genes involved in drug pharmacokinetics [14]. We evaluated the admixture
proportions in the Brazilian and Mexican samples using a panel of Ancestry
Informative Markers extracted from the DMET chip, which was validated with
genome-wide data. We discuss the implications of the history of admixture in Brazil
and Mexico for the distribution of genetic variants of PGx relevance.
Materials and Methods
Study participants and sample collection
The Brazilian cohort consisted of 268 healthy, unrelated adults recruited in the
city of Rio de Janeiro in the Southeast region. The study protocol was approved by
the Ethics Committee of the Instituto Nacional de Cancer, Rio de Janeiro. Each
individual signed an informed consent to participate, and was asked to self-
identify according to the ‘‘race/color’’ classification scheme adopted by the official
Brazilian Census [7]. The cohort comprised 89 individuals in the branco (White),
90 individuals in the pardo (Brown) and 89 individuals in the preto (Black)
Census categories. These ‘‘Color’’ categories will be capitalized to call attention to
their special meaning in the context of the Brazilian census classification.
The Mexican cohort included 45 Native American Zapotecas (NAT) individuals
and 224 self-identified Mestizo individuals (MEX) from 5 states located in
geographically distant regions in Mexico. In our study, the Native American
parental frequencies were estimated based on a Zapoteca sample recruited in the
State of Oaxaca. Previous research has indicated that Zapotecas were the most
useful population for building an admixture mapping map for Latino populations
[11, 13, 15]. However, it is important point out there is not a single native group
that could represent the full ancestry of Native American component in the
Americas. Unfortunately, the Zapoteca sample was the only Native American
sample that was available to us, and we could not evaluate the extent to which the
allele frequencies observed for the panel of AIMs selected from the DMET array
may differ between the Zapotecas and other Native American groups throughout
the Americas. The Mestizos were recruited in the States of Sonora in the north,
Guerrero in the south-Pacific, Guanajuato in the center, Yucatan in the southeast
Distribution of Pharmacogenomic Genetic Markers in Brazil and Mexico
PLOS ONE | DOI:10.1371/journal.pone.0112640 November 24, 2014 3 / 22
and Veracruz in the center-Gulf. The protocol was approved as part of a
comprehensive genotypic characterization within the Mexican Genome Diversity
Project (MGDP) [11] by the Scientific, Ethics, and Biosafety Review Boards of the
National Institute of Genomic Medicine, where all Mexican participants signed an
informed consent in their native language.
Genotyping with the DMET Plus platform
Samples were genotyped using the Affymetrix DMET Plus platform, using standard
protocols. This platform interrogates 1,936 genetic variants across 231 genes of PGx
relevance, including biallelic and triallelic SNPs, copy-number variants and
insertion/deletions. Quality control tests were performed on data using PLINK [16].
We excluded individuals with more than 5% missing genotypes and included only
SNPs with at least 95% genotyping rate (,5% missing). The final dataset was based
on 1,647 genetic markers in 214 genes and 537 individuals that comprise Brazilians,
and Mexican Native Americans and Mestizos populations. Data are provided as
Data S1 (Supporting Information - Compressed/ZIP File Archive:
Supporting_information_file-1-genotyping_data.zip).
Estimation and validation of ancestry proportions
In order to evaluate the ancestry proportions of the Brazilian and Mexican
samples, we identified 71 unlinked Ancestry Informative Markers (AIMs) from
the DMET Plus array. The selection of AIMs was based on frequency differences
between the three main parental groups relevant for Latin American populations:
European, African and Native American. We used as representatives of the
parental groups 59 individuals from Europe (Hapmap CEU from northwestern
Europe), 208 individuals from Africa (Hapmap YRI from Ibadan, Nigeria
combined with Hapmap LWK from Webuye in Kenia) [17], and 45 Native
Americans (Zapotecas from the State of Oaxaca, Mexico).
To validate the DMET Latin American AIMs panel, we used the program
STRUCTURE v 2.3.4 [18, 19, 20] to estimate, based on the DMET AIMs panel, the
individual ancestry proportions of the 224 Mexican Mestizo individuals analyzed
in this project. The estimates obtained were then compared with genome-wide
estimates (based on the Affymetrix 100K and Illumina 550K arrays) available for a
subset of the samples [11, 21, 22].
Principal Component Analysis and estimates
A Principal Component Analysis (PCA) was carried out with the program
EIGENSOFT [23]. Analysis based on genotype data for the Brazilian and Mexican
admixed samples, as well as representatives of the three parental populations:
HapMap Europeans CEU (EUR), Africans YRI+LWK (AFR) and Native
Americans (NAT). The program EIGENSOFT was also used to obtain FST
estimates for all the pairwise comparisons.
Distribution of Pharmacogenomic Genetic Markers in Brazil and Mexico
PLOS ONE | DOI:10.1371/journal.pone.0112640 November 24, 2014 4 / 22
Genetic differentiation analysis
The program PHASE v 2.1.1 [24, 25, 26] was used to estimate haplotype
frequencies in the genes included in the DMET Plus microarray. Allele frequencies
were estimated with the toolset PLINK [16]. This program was also used to
perform chi-square tests evaluating allele differences between populations. The
p-values were adjusted for multiple testing using Bonferroni’s correction. We
applied Wright’s FST to allele frequencies to characterize differentiation at specific
SNPs as previously reported [27].
Graphical representation of the log odds of having a variant of
PGx relevance depending on admixture proportions
We assessed the relationship between allele frequencies and ancestry proportions
by fitting non-linear piece-wise smooth logistic regression models [28]. In these
models, the response variable was the presence/absence of the relevant PGx
variant, and ancestry was entered in the model as a predictor variable transformed
as a linear tail-restricted cubic spline allowing for nonlinear contributions. The
result of the model fitting exercise is presented as surface plots describing the
predicted relationship between the frequency of the relevant variant, expressed as
the natural log odds [i.e. ln(p/(1–p), where p is the proportion of variant alleles]
and ancestry. This method, described in Harrell [28] is implemented as function
‘lrm’ available in the R package ‘rms’ [29]. Analysis of variance tables describe the
Wald statistics for testing the model components.
Results
Estimation and validation of ancestry proportions
We estimated ancestry proportions in the Brazilian and Mexican samples using a
panel of 71 unlinked, highly informative AIMs included in the DMET Plus array.
The panel was identified based on the frequency differences between the relevant
parental populations (African, European and Native American). Detailed
information about the panel of AIMs, including parental frequencies, is provided
in Table S1. The program STRUCTURE was used to estimate the individual
admixture proportions, as well as the average admixture proportions in each
sample.
Table 1 shows the average African, European and Native American genetic
contributions to the Brazilian sample stratified by census categories, and to the
Mexican sample stratified by State. The average African, European and Native
American contributions to the Brazilian sample were estimated to be 29%, 62%
and 7% respectively. The African contribution is highest for Black Brazilians (54%
vs. 25.3% in Brown and 9.7% in White individuals). Conversely, the European
contribution is highest for the White category (84.6% vs. 64.7% in Brown and
38% in Black individuals). The average Native American ancestral contributions
range between 5.6% and 10% across the 3 Color groups. In contrast to Brazil,
Distribution of Pharmacogenomic Genetic Markers in Brazil and Mexico
PLOS ONE | DOI:10.1371/journal.pone.0112640 November 24, 2014 5 / 22
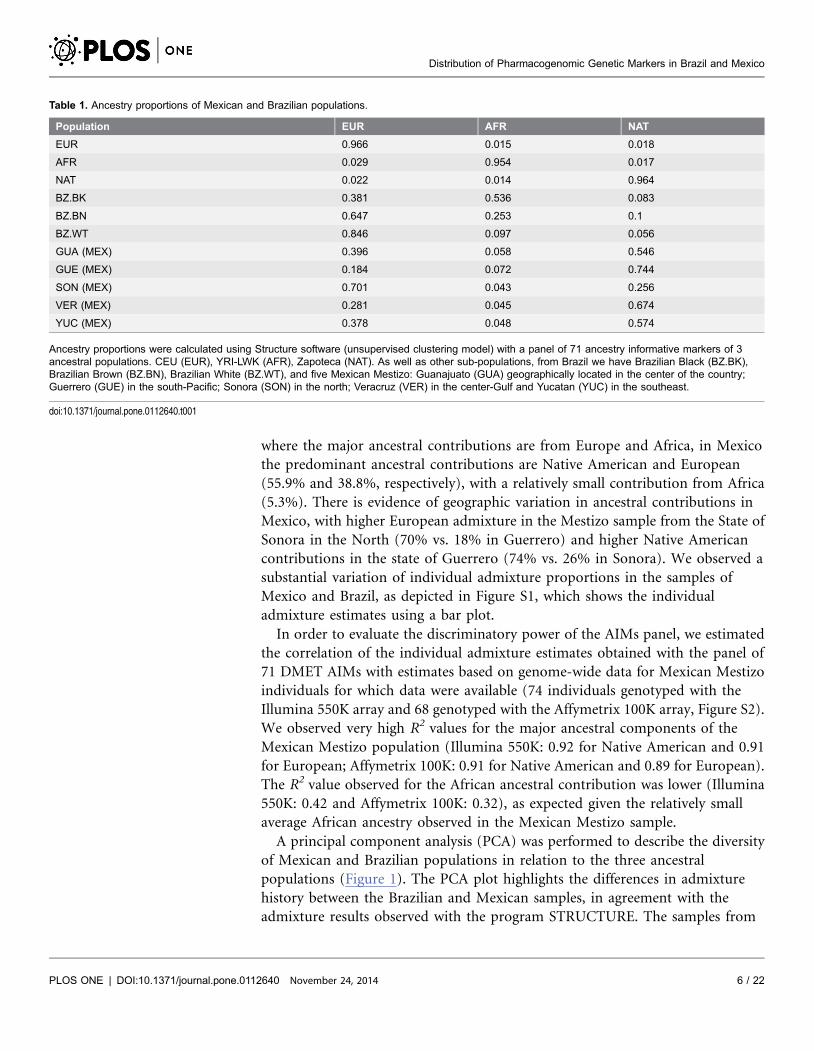
where the major ancestral contributions are from Europe and Africa, in Mexico
the predominant ancestral contributions are Native American and European
(55.9% and 38.8%, respectively), with a relatively small contribution from Africa
(5.3%). There is evidence of geographic variation in ancestral contributions in
Mexico, with higher European admixture in the Mestizo sample from the State of
Sonora in the North (70% vs. 18% in Guerrero) and higher Native American
contributions in the state of Guerrero (74% vs. 26% in Sonora). We observed a
substantial variation of individual admixture proportions in the samples of
Mexico and Brazil, as depicted in Figure S1, which shows the individual
admixture estimates using a bar plot.
In order to evaluate the discriminatory power of the AIMs panel, we estimated
the correlation of the individual admixture estimates obtained with the panel of
71 DMET AIMs with estimates based on genome-wide data for Mexican Mestizo
individuals for which data were available (74 individuals genotyped with the
Illumina 550K array and 68 genotyped with the Affymetrix 100K array, Figure S2).
We observed very high R2 values for the major ancestral components of the
Mexican Mestizo population (Illumina 550K: 0.92 for Native American and 0.91
for European; Affymetrix 100K: 0.91 for Native American and 0.89 for European).
The R2 value observed for the African ancestral contribution was lower (Illumina
550K: 0.42 and Affymetrix 100K: 0.32), as expected given the relatively small
average African ancestry observed in the Mexican Mestizo sample.
A principal component analysis (PCA) was performed to describe the diversity
of Mexican and Brazilian populations in relation to the three ancestral
populations (Figure 1). The PCA plot highlights the differences in admixture
history between the Brazilian and Mexican samples, in agreement with the
admixture results observed with the program STRUCTURE. The samples from
Table 1. Ancestry proportions of Mexican and Brazilian populations.
Population EUR AFR NAT
EUR 0.966 0.015 0.018
AFR 0.029 0.954 0.017
NAT 0.022 0.014 0.964
BZ.BK 0.381 0.536 0.083
BZ.BN 0.647 0.253 0.1
BZ.WT 0.846 0.097 0.056
GUA (MEX) 0.396 0.058 0.546
GUE (MEX) 0.184 0.072 0.744
SON (MEX) 0.701 0.043 0.256
VER (MEX) 0.281 0.045 0.674
YUC (MEX) 0.378 0.048 0.574
Ancestry proportions were calculated using Structure software (unsupervised clustering model) with a panel of 71 ancestry informative markers of 3ancestral populations. CEU (EUR), YRI-LWK (AFR), Zapoteca (NAT). As well as other sub-populations, from Brazil we have Brazilian Black (BZ.BK),Brazilian Brown (BZ.BN), Brazilian White (BZ.WT), and five Mexican Mestizo: Guanajuato (GUA) geographically located in the center of the country;Guerrero (GUE) in the south-Pacific; Sonora (SON) in the north; Veracruz (VER) in the center-Gulf and Yucatan (YUC) in the southeast.
doi:10.1371/journal.pone.0112640.t001
Distribution of Pharmacogenomic Genetic Markers in Brazil and Mexico
PLOS ONE | DOI:10.1371/journal.pone.0112640 November 24, 2014 6 / 22
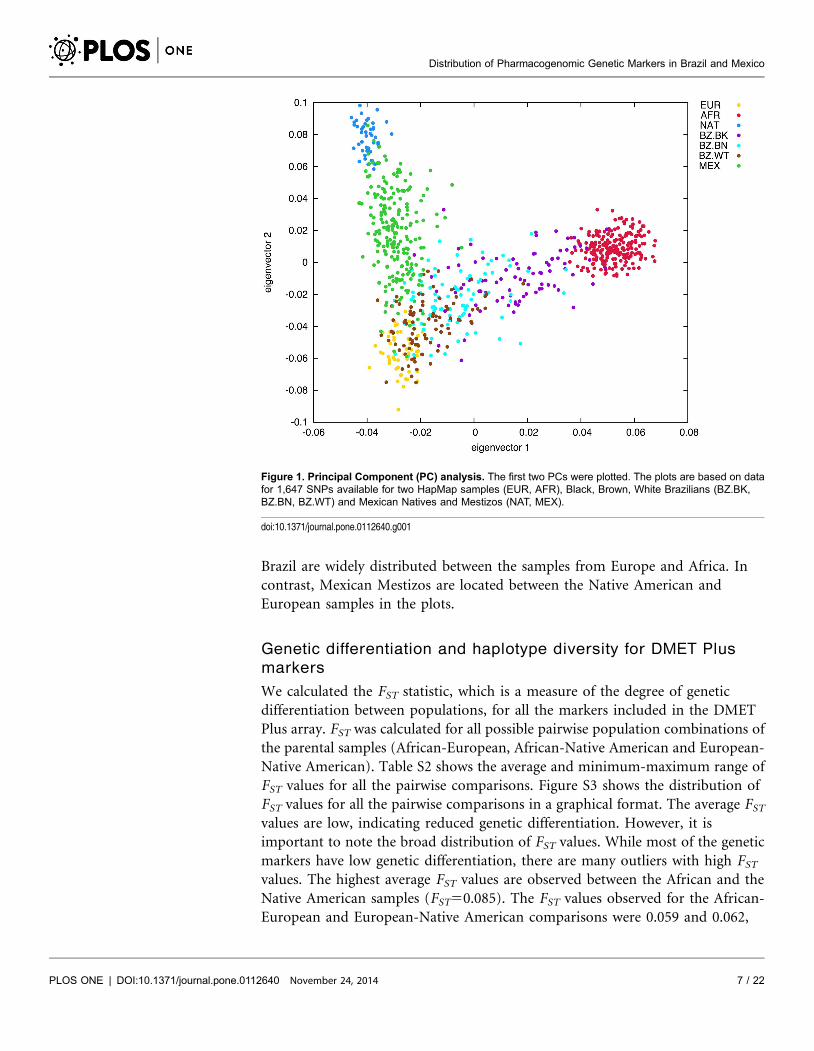
Brazil are widely distributed between the samples from Europe and Africa. In
contrast, Mexican Mestizos are located between the Native American and
European samples in the plots.
Genetic differentiation and haplotype diversity for DMET Plus
markers
We calculated the FST statistic, which is a measure of the degree of genetic
differentiation between populations, for all the markers included in the DMET
Plus array. FST was calculated for all possible pairwise population combinations of
the parental samples (African-European, African-Native American and European-
Native American). Table S2 shows the average and minimum-maximum range of
FST values for all the pairwise comparisons. Figure S3 shows the distribution of
FST values for all the pairwise comparisons in a graphical format. The average FST
values are low, indicating reduced genetic differentiation. However, it is
important to note the broad distribution of FST values. While most of the genetic
markers have low genetic differentiation, there are many outliers with high FST
values. The highest average FST values are observed between the African and the
Native American samples (FST50.085). The FST values observed for the African-
European and European-Native American comparisons were 0.059 and 0.062,
Figure 1. Principal Component (PC) analysis. The first two PCs were plotted. The plots are based on datafor 1,647 SNPs available for two HapMap samples (EUR, AFR), Black, Brown, White Brazilians (BZ.BK,BZ.BN, BZ.WT) and Mexican Natives and Mestizos (NAT, MEX).
doi:10.1371/journal.pone.0112640.g001
Distribution of Pharmacogenomic Genetic Markers in Brazil and Mexico
PLOS ONE | DOI:10.1371/journal.pone.0112640 November 24, 2014 7 / 22
respectively. The average genetic differentiation between the Brazilian and
Mexican samples with respect to the parental samples is lower than the genetic
differentiation observed between the parental samples (FST50.012), as expected
given the history of admixture in Brazil and Mexico.
We also explored haplotype diversity using the program PHASE. We used this
program to estimate haplotype frequencies based on 1,647 biallelic SNPs located
on 214 DMET genes. We restricted our analysis to common haplotypes with
frequencies equal or higher than 5% in each sample. We identified slightly more
than 1,000 different haplotypes with these characteristics. The African sample
shows the highest haplotype diversity (more than 68% of the common haplotypes
are found in the African sample) and the Native American sample shows the
lowest haplotype diversity (only 46.5% of the common haplotypes are found in
the Native American sample). In agreement with expectations based on
population history, the Brazilian sample has intermediate haplotype diversity
between the African and European samples, and the Mexican Mestizo sample has
intermediate haplotype diversity between the European and Native American
samples (Figure S4).
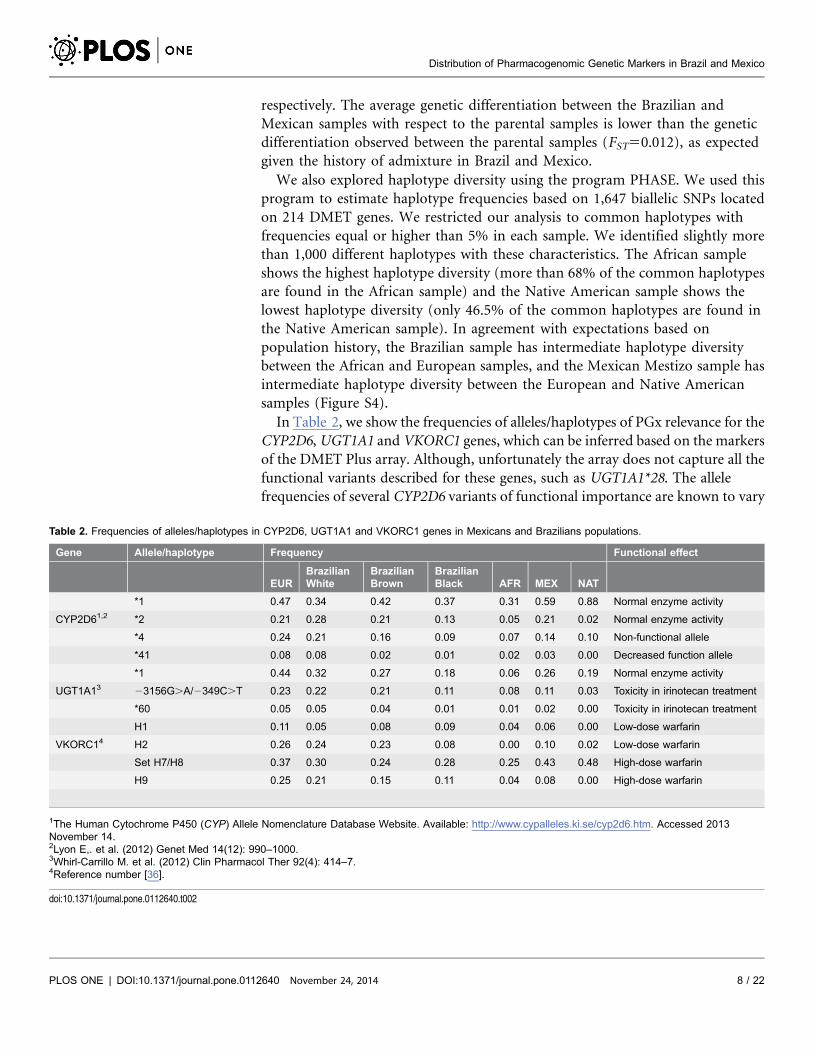
In Table 2, we show the frequencies of alleles/haplotypes of PGx relevance for the
CYP2D6, UGT1A1 and VKORC1 genes, which can be inferred based on the markers
of the DMET Plus array. Although, unfortunately the array does not capture all the
functional variants described for these genes, such as UGT1A1*28. The allele
frequencies of several CYP2D6 variants of functional importance are known to vary
Table 2. Frequencies of alleles/haplotypes in CYP2D6, UGT1A1 and VKORC1 genes in Mexicans and Brazilians populations.
Gene Allele/haplotype Frequency Functional effect
EURBrazilianWhite
BrazilianBrown
BrazilianBlack AFR MEX NAT
*1 0.47 0.34 0.42 0.37 0.31 0.59 0.88 Normal enzyme activity
CYP2D61,2 *2 0.21 0.28 0.21 0.13 0.05 0.21 0.02 Normal enzyme activity
*4 0.24 0.21 0.16 0.09 0.07 0.14 0.10 Non-functional allele
*41 0.08 0.08 0.02 0.01 0.02 0.03 0.00 Decreased function allele
*1 0.44 0.32 0.27 0.18 0.06 0.26 0.19 Normal enzyme activity
UGT1A13 23156G.A/2349C.T 0.23 0.22 0.21 0.11 0.08 0.11 0.03 Toxicity in irinotecan treatment
*60 0.05 0.05 0.04 0.01 0.01 0.02 0.00 Toxicity in irinotecan treatment
H1 0.11 0.05 0.08 0.09 0.04 0.06 0.00 Low-dose warfarin
VKORC14 H2 0.26 0.24 0.23 0.08 0.00 0.10 0.02 Low-dose warfarin
Set H7/H8 0.37 0.30 0.24 0.28 0.25 0.43 0.48 High-dose warfarin
H9 0.25 0.21 0.15 0.11 0.04 0.08 0.00 High-dose warfarin
1The Human Cytochrome P450 (CYP) Allele Nomenclature Database Website. Available: http://www.cypalleles.ki.se/cyp2d6.htm. Accessed 2013November 14.2Lyon E,. et al. (2012) Genet Med 14(12): 990–1000.3Whirl-Carrillo M. et al. (2012) Clin Pharmacol Ther 92(4): 414–7.4Reference number [36].
doi:10.1371/journal.pone.0112640.t002
Distribution of Pharmacogenomic Genetic Markers in Brazil and Mexico
PLOS ONE | DOI:10.1371/journal.pone.0112640 November 24, 2014 8 / 22
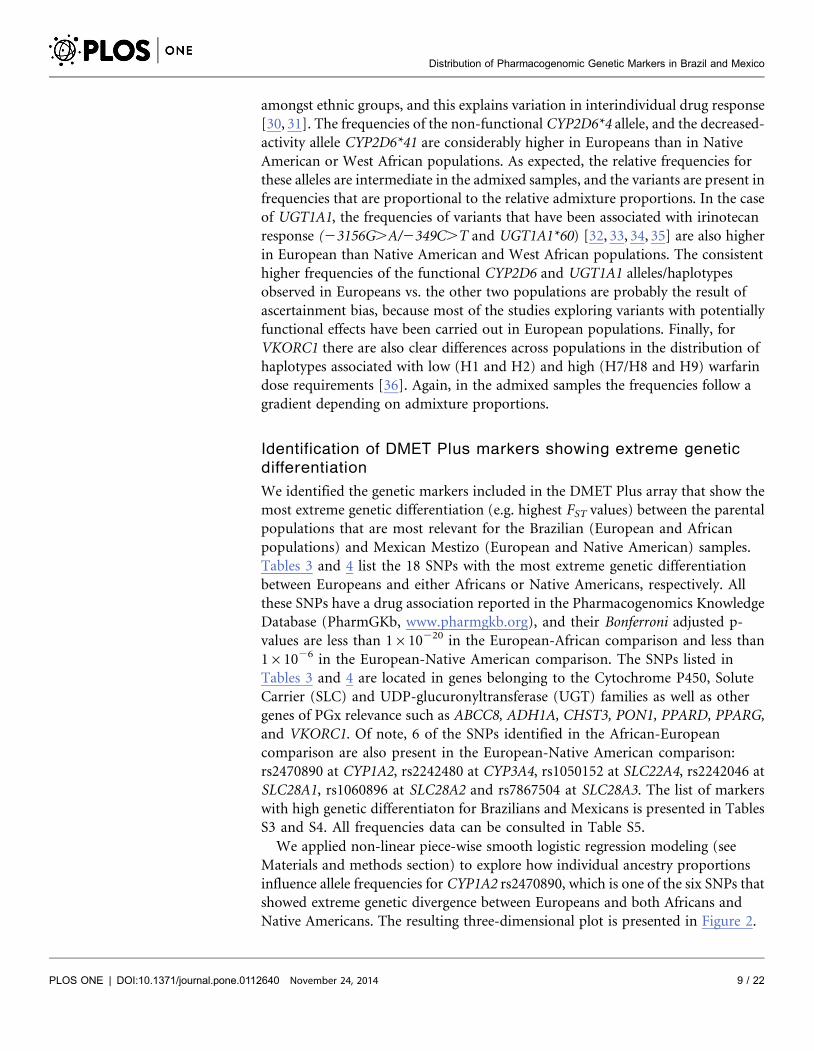
amongst ethnic groups, and this explains variation in interindividual drug response
[30, 31]. The frequencies of the non-functional CYP2D6*4 allele, and the decreased-
activity allele CYP2D6*41 are considerably higher in Europeans than in Native
American or West African populations. As expected, the relative frequencies for
these alleles are intermediate in the admixed samples, and the variants are present in
frequencies that are proportional to the relative admixture proportions. In the case
of UGT1A1, the frequencies of variants that have been associated with irinotecan
response (23156G.A/2349C.T and UGT1A1*60) [32, 33, 34, 35] are also higher
in European than Native American and West African populations. The consistent
higher frequencies of the functional CYP2D6 and UGT1A1 alleles/haplotypes
observed in Europeans vs. the other two populations are probably the result of
ascertainment bias, because most of the studies exploring variants with potentially
functional effects have been carried out in European populations. Finally, for
VKORC1 there are also clear differences across populations in the distribution of
haplotypes associated with low (H1 and H2) and high (H7/H8 and H9) warfarin
dose requirements [36]. Again, in the admixed samples the frequencies follow a
gradient depending on admixture proportions.
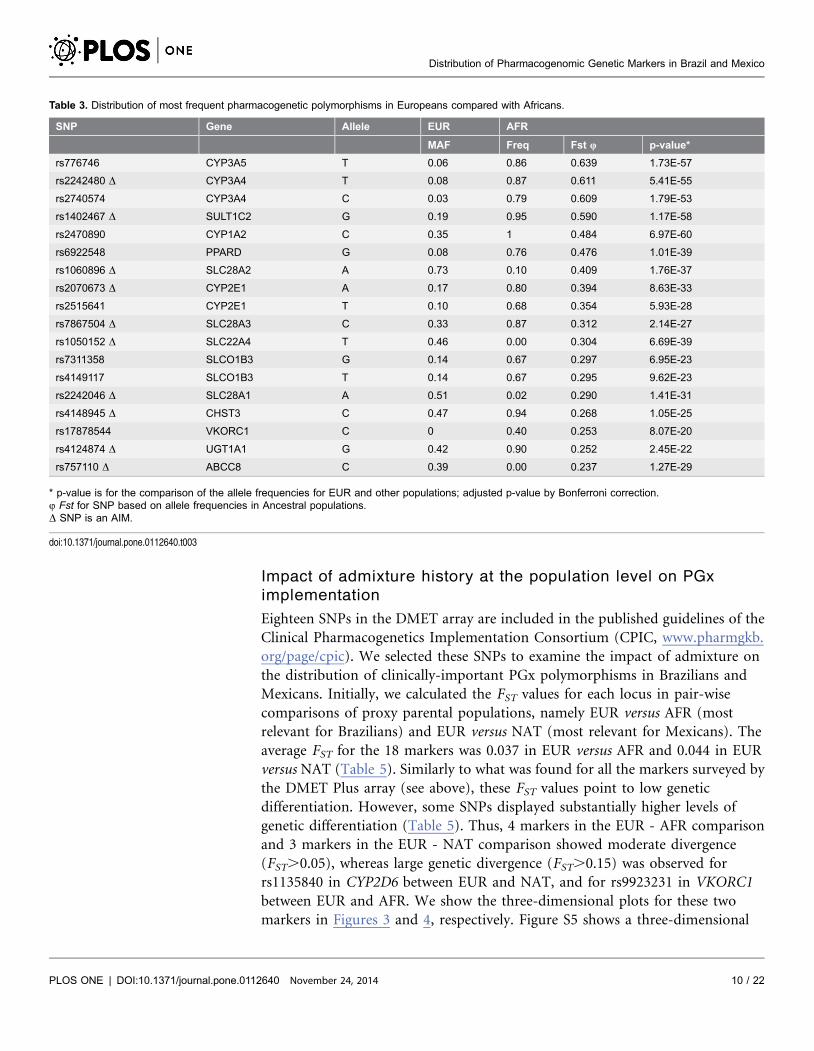
Identification of DMET Plus markers showing extreme genetic
differentiation
We identified the genetic markers included in the DMET Plus array that show the
most extreme genetic differentiation (e.g. highest FST values) between the parental
populations that are most relevant for the Brazilian (European and African
populations) and Mexican Mestizo (European and Native American) samples.
Tables 3 and 4 list the 18 SNPs with the most extreme genetic differentiation
between Europeans and either Africans or Native Americans, respectively. All
these SNPs have a drug association reported in the Pharmacogenomics Knowledge
Database (PharmGKb, www.pharmgkb.org), and their Bonferroni adjusted p-
values are less than 1610220 in the European-African comparison and less than
161026 in the European-Native American comparison. The SNPs listed in
Tables 3 and 4 are located in genes belonging to the Cytochrome P450, Solute
Carrier (SLC) and UDP-glucuronyltransferase (UGT) families as well as other
genes of PGx relevance such as ABCC8, ADH1A, CHST3, PON1, PPARD, PPARG,
and VKORC1. Of note, 6 of the SNPs identified in the African-European
comparison are also present in the European-Native American comparison:
rs2470890 at CYP1A2, rs2242480 at CYP3A4, rs1050152 at SLC22A4, rs2242046 at
SLC28A1, rs1060896 at SLC28A2 and rs7867504 at SLC28A3. The list of markers
with high genetic differentiaton for Brazilians and Mexicans is presented in Tables
S3 and S4. All frequencies data can be consulted in Table S5.
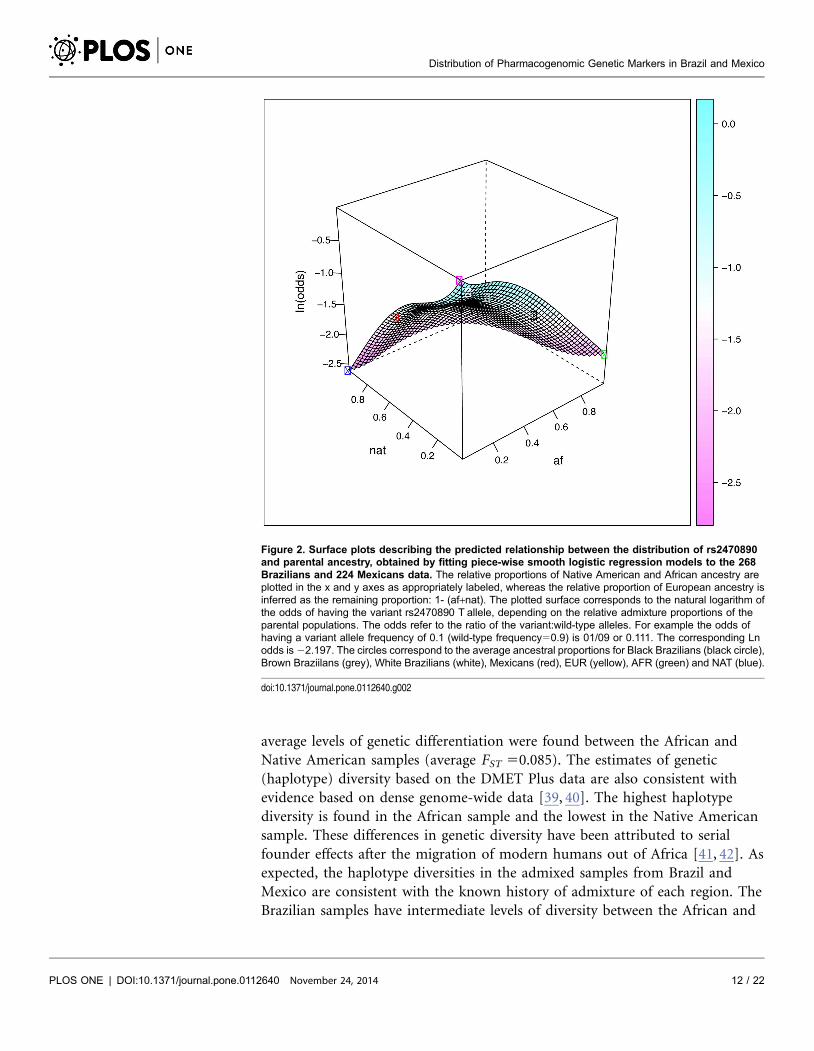
We applied non-linear piece-wise smooth logistic regression modeling (see
Materials and methods section) to explore how individual ancestry proportions
influence allele frequencies for CYP1A2 rs2470890, which is one of the six SNPs that
showed extreme genetic divergence between Europeans and both Africans and
Native Americans. The resulting three-dimensional plot is presented in Figure 2.
Distribution of Pharmacogenomic Genetic Markers in Brazil and Mexico
PLOS ONE | DOI:10.1371/journal.pone.0112640 November 24, 2014 9 / 22
Impact of admixture history at the population level on PGx
implementation
Eighteen SNPs in the DMET array are included in the published guidelines of the
Clinical Pharmacogenetics Implementation Consortium (CPIC, www.pharmgkb.
org/page/cpic). We selected these SNPs to examine the impact of admixture on
the distribution of clinically-important PGx polymorphisms in Brazilians and
Mexicans. Initially, we calculated the FST values for each locus in pair-wise
comparisons of proxy parental populations, namely EUR versus AFR (most
relevant for Brazilians) and EUR versus NAT (most relevant for Mexicans). The
average FST for the 18 markers was 0.037 in EUR versus AFR and 0.044 in EUR
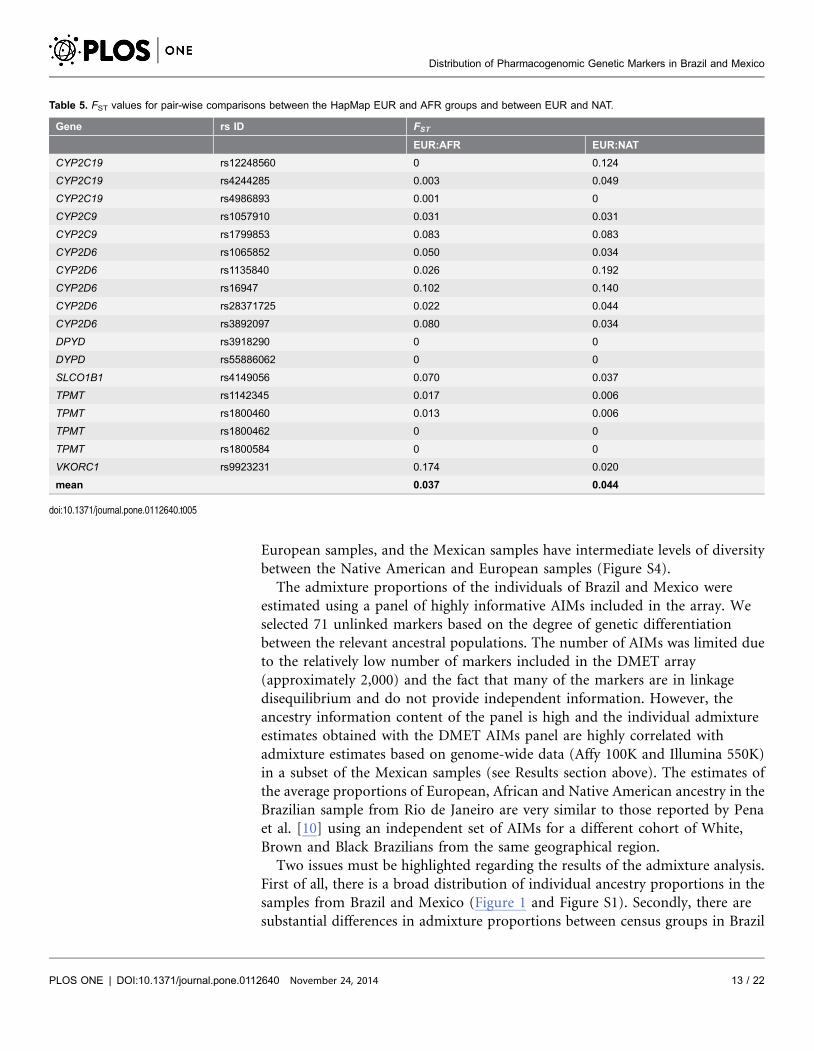
versus NAT (Table 5). Similarly to what was found for all the markers surveyed by
the DMET Plus array (see above), these FST values point to low genetic
differentiation. However, some SNPs displayed substantially higher levels of
genetic differentiation (Table 5). Thus, 4 markers in the EUR - AFR comparison
and 3 markers in the EUR - NAT comparison showed moderate divergence
(FST.0.05), whereas large genetic divergence (FST.0.15) was observed for
rs1135840 in CYP2D6 between EUR and NAT, and for rs9923231 in VKORC1
between EUR and AFR. We show the three-dimensional plots for these two
markers in Figures 3 and 4, respectively. Figure S5 shows a three-dimensional
Table 3. Distribution of most frequent pharmacogenetic polymorphisms in Europeans compared with Africans.
SNP Gene Allele EUR AFR
MAF Freq Fst Q p-value*
rs776746 CYP3A5 T 0.06 0.86 0.639 1.73E-57
rs2242480 D CYP3A4 T 0.08 0.87 0.611 5.41E-55
rs2740574 CYP3A4 C 0.03 0.79 0.609 1.79E-53
rs1402467 D SULT1C2 G 0.19 0.95 0.590 1.17E-58
rs2470890 CYP1A2 C 0.35 1 0.484 6.97E-60
rs6922548 PPARD G 0.08 0.76 0.476 1.01E-39
rs1060896 D SLC28A2 A 0.73 0.10 0.409 1.76E-37
rs2070673 D CYP2E1 A 0.17 0.80 0.394 8.63E-33
rs2515641 CYP2E1 T 0.10 0.68 0.354 5.93E-28
rs7867504 D SLC28A3 C 0.33 0.87 0.312 2.14E-27
rs1050152 D SLC22A4 T 0.46 0.00 0.304 6.69E-39
rs7311358 SLCO1B3 G 0.14 0.67 0.297 6.95E-23
rs4149117 SLCO1B3 T 0.14 0.67 0.295 9.62E-23
rs2242046 D SLC28A1 A 0.51 0.02 0.290 1.41E-31
rs4148945 D CHST3 C 0.47 0.94 0.268 1.05E-25
rs17878544 VKORC1 C 0 0.40 0.253 8.07E-20
rs4124874 D UGT1A1 G 0.42 0.90 0.252 2.45E-22
rs757110 D ABCC8 C 0.39 0.00 0.237 1.27E-29
* p-value is for the comparison of the allele frequencies for EUR and other populations; adjusted p-value by Bonferroni correction.Q Fst for SNP based on allele frequencies in Ancestral populations.D SNP is an AIM.
doi:10.1371/journal.pone.0112640.t003
Distribution of Pharmacogenomic Genetic Markers in Brazil and Mexico
PLOS ONE | DOI:10.1371/journal.pone.0112640 November 24, 2014 10 / 22
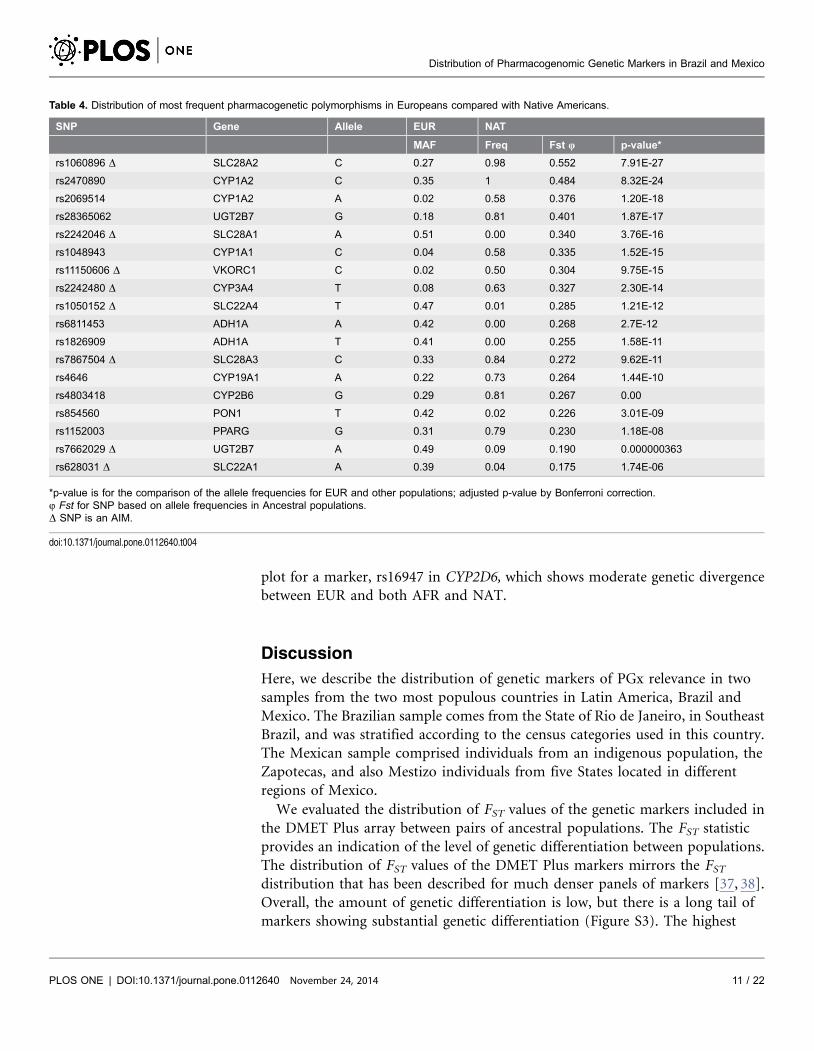
plot for a marker, rs16947 in CYP2D6, which shows moderate genetic divergence
between EUR and both AFR and NAT.
Discussion
Here, we describe the distribution of genetic markers of PGx relevance in two
samples from the two most populous countries in Latin America, Brazil and
Mexico. The Brazilian sample comes from the State of Rio de Janeiro, in Southeast
Brazil, and was stratified according to the census categories used in this country.
The Mexican sample comprised individuals from an indigenous population, the
Zapotecas, and also Mestizo individuals from five States located in different
regions of Mexico.
We evaluated the distribution of FST values of the genetic markers included in
the DMET Plus array between pairs of ancestral populations. The FST statistic
provides an indication of the level of genetic differentiation between populations.
The distribution of FST values of the DMET Plus markers mirrors the FST
distribution that has been described for much denser panels of markers [37, 38].
Overall, the amount of genetic differentiation is low, but there is a long tail of
markers showing substantial genetic differentiation (Figure S3). The highest
Table 4. Distribution of most frequent pharmacogenetic polymorphisms in Europeans compared with Native Americans.
SNP Gene Allele EUR NAT
MAF Freq Fst Q p-value*
rs1060896 D SLC28A2 C 0.27 0.98 0.552 7.91E-27
rs2470890 CYP1A2 C 0.35 1 0.484 8.32E-24
rs2069514 CYP1A2 A 0.02 0.58 0.376 1.20E-18
rs28365062 UGT2B7 G 0.18 0.81 0.401 1.87E-17
rs2242046 D SLC28A1 A 0.51 0.00 0.340 3.76E-16
rs1048943 CYP1A1 C 0.04 0.58 0.335 1.52E-15
rs11150606 D VKORC1 C 0.02 0.50 0.304 9.75E-15
rs2242480 D CYP3A4 T 0.08 0.63 0.327 2.30E-14
rs1050152 D SLC22A4 T 0.47 0.01 0.285 1.21E-12
rs6811453 ADH1A A 0.42 0.00 0.268 2.7E-12
rs1826909 ADH1A T 0.41 0.00 0.255 1.58E-11
rs7867504 D SLC28A3 C 0.33 0.84 0.272 9.62E-11
rs4646 CYP19A1 A 0.22 0.73 0.264 1.44E-10
rs4803418 CYP2B6 G 0.29 0.81 0.267 0.00
rs854560 PON1 T 0.42 0.02 0.226 3.01E-09
rs1152003 PPARG G 0.31 0.79 0.230 1.18E-08
rs7662029 D UGT2B7 A 0.49 0.09 0.190 0.000000363
rs628031 D SLC22A1 A 0.39 0.04 0.175 1.74E-06
*p-value is for the comparison of the allele frequencies for EUR and other populations; adjusted p-value by Bonferroni correction.Q Fst for SNP based on allele frequencies in Ancestral populations.D SNP is an AIM.
doi:10.1371/journal.pone.0112640.t004
Distribution of Pharmacogenomic Genetic Markers in Brazil and Mexico
PLOS ONE | DOI:10.1371/journal.pone.0112640 November 24, 2014 11 / 22
average levels of genetic differentiation were found between the African and
Native American samples (average FST 50.085). The estimates of genetic
(haplotype) diversity based on the DMET Plus data are also consistent with
evidence based on dense genome-wide data [39, 40]. The highest haplotype
diversity is found in the African sample and the lowest in the Native American
sample. These differences in genetic diversity have been attributed to serial
founder effects after the migration of modern humans out of Africa [41, 42]. As
expected, the haplotype diversities in the admixed samples from Brazil and
Mexico are consistent with the known history of admixture of each region. The
Brazilian samples have intermediate levels of diversity between the African and
Figure 2. Surface plots describing the predicted relationship between the distribution of rs2470890and parental ancestry, obtained by fitting piece-wise smooth logistic regression models to the 268Brazilians and 224 Mexicans data. The relative proportions of Native American and African ancestry areplotted in the x and y axes as appropriately labeled, whereas the relative proportion of European ancestry isinferred as the remaining proportion: 1- (af+nat). The plotted surface corresponds to the natural logarithm ofthe odds of having the variant rs2470890 T allele, depending on the relative admixture proportions of theparental populations. The odds refer to the ratio of the variant:wild-type alleles. For example the odds ofhaving a variant allele frequency of 0.1 (wild-type frequency50.9) is 01/09 or 0.111. The corresponding Lnodds is 22.197. The circles correspond to the average ancestral proportions for Black Brazilians (black circle),Brown Braziilans (grey), White Brazilians (white), Mexicans (red), EUR (yellow), AFR (green) and NAT (blue).
doi:10.1371/journal.pone.0112640.g002
Distribution of Pharmacogenomic Genetic Markers in Brazil and Mexico
PLOS ONE | DOI:10.1371/journal.pone.0112640 November 24, 2014 12 / 22
European samples, and the Mexican samples have intermediate levels of diversity
between the Native American and European samples (Figure S4).
The admixture proportions of the individuals of Brazil and Mexico were
estimated using a panel of highly informative AIMs included in the array. We
selected 71 unlinked markers based on the degree of genetic differentiation
between the relevant ancestral populations. The number of AIMs was limited due
to the relatively low number of markers included in the DMET array
(approximately 2,000) and the fact that many of the markers are in linkage
disequilibrium and do not provide independent information. However, the
ancestry information content of the panel is high and the individual admixture
estimates obtained with the DMET AIMs panel are highly correlated with
admixture estimates based on genome-wide data (Affy 100K and Illumina 550K)
in a subset of the Mexican samples (see Results section above). The estimates of
the average proportions of European, African and Native American ancestry in the
Brazilian sample from Rio de Janeiro are very similar to those reported by Pena
et al. [10] using an independent set of AIMs for a different cohort of White,
Brown and Black Brazilians from the same geographical region.
Two issues must be highlighted regarding the results of the admixture analysis.
First of all, there is a broad distribution of individual ancestry proportions in the
samples from Brazil and Mexico (Figure 1 and Figure S1). Secondly, there are
substantial differences in admixture proportions between census groups in Brazil
Table 5. FST values for pair-wise comparisons between the HapMap EUR and AFR groups and between EUR and NAT.
Gene rs ID FST
EUR:AFR EUR:NAT
CYP2C19 rs12248560 0 0.124
CYP2C19 rs4244285 0.003 0.049
CYP2C19 rs4986893 0.001 0
CYP2C9 rs1057910 0.031 0.031
CYP2C9 rs1799853 0.083 0.083
CYP2D6 rs1065852 0.050 0.034
CYP2D6 rs1135840 0.026 0.192
CYP2D6 rs16947 0.102 0.140
CYP2D6 rs28371725 0.022 0.044
CYP2D6 rs3892097 0.080 0.034
DPYD rs3918290 0 0
DYPD rs55886062 0 0
SLCO1B1 rs4149056 0.070 0.037
TPMT rs1142345 0.017 0.006
TPMT rs1800460 0.013 0.006
TPMT rs1800462 0 0
TPMT rs1800584 0 0
VKORC1 rs9923231 0.174 0.020
mean 0.037 0.044
doi:10.1371/journal.pone.0112640.t005
Distribution of Pharmacogenomic Genetic Markers in Brazil and Mexico
PLOS ONE | DOI:10.1371/journal.pone.0112640 November 24, 2014 13 / 22
and geographic regions in Mexico (Table 1). In Brazil, the average contribution of
European ancestry decreased progressively from self-reported White (84.6%), to
Brown (64.7%) and then to Black individuals (38.1%), whereas the opposite trend
was observed with respect to African ancestry, which averaged 9.7%, 25% and
54% in White, Brown and Black persons, respectively. Native ancestry ranged
from 5.6 to 10% across the three groups. The Brazilian individuals included in this
study came exclusively from Rio de Janeiro (Southeast Brazil), so it was not
possible to evaluate geographic variation in admixture proportions in Brazil.
However, there is evidence pointing to the presence of substantial variation in
admixture proportions in different regions of Brazil, even within census
categories. For instance, [10] recently reported that self-classified Brown
individuals from the North region had on average 68.6% European ancestry,
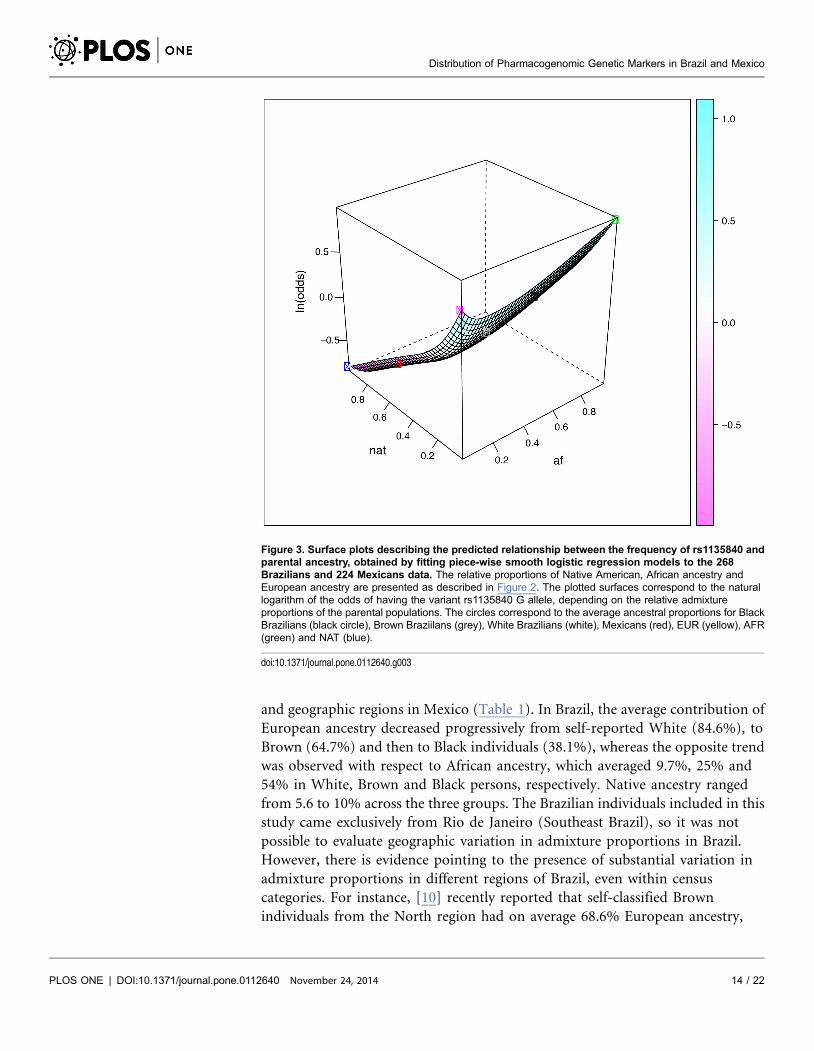
Figure 3. Surface plots describing the predicted relationship between the frequency of rs1135840 andparental ancestry, obtained by fitting piece-wise smooth logistic regression models to the 268Brazilians and 224 Mexicans data. The relative proportions of Native American, African ancestry andEuropean ancestry are presented as described in Figure 2. The plotted surfaces correspond to the naturallogarithm of the odds of having the variant rs1135840 G allele, depending on the relative admixtureproportions of the parental populations. The circles correspond to the average ancestral proportions for BlackBrazilians (black circle), Brown Braziilans (grey), White Brazilians (white), Mexicans (red), EUR (yellow), AFR(green) and NAT (blue).
doi:10.1371/journal.pone.0112640.g003
Distribution of Pharmacogenomic Genetic Markers in Brazil and Mexico
PLOS ONE | DOI:10.1371/journal.pone.0112640 November 24, 2014 14 / 22
compared to 44.4% in the South region. Similarly, European ancestry in self-
reported Blacks ranged from 29.3% in the South to 53.9% in the Northeast region.
This variability reflects the fact that self-identification based on the ‘‘race/Color’’
categorizations for Brazilians in our manuscript correspond to the categories
adopted by the official Brazilian Census, where White, Brown and Black categories
for Brazilians is influenced by phenotypic variables such as skin and eye
pigmentation and facial features, as well as family history, sunlight exposure,
income level, social class and schooling [10, 42, 43, 44]. Collectively, these factors
underlie the tenuous correlation between self-reported color and biogeographical
ancestry among Brazilian [10, 46].
Based on the results obtained with the panel of AIMs, in Mexico there is also
evidence of regional variation in admixture proportions, in particular between the
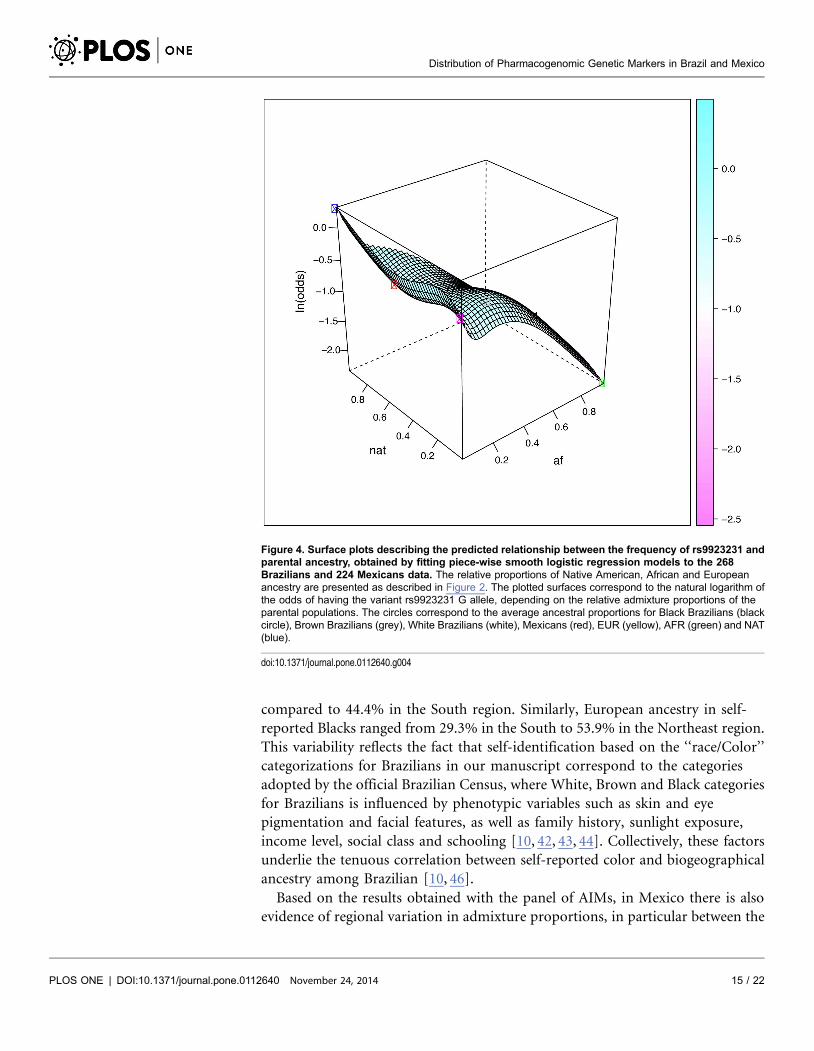
Figure 4. Surface plots describing the predicted relationship between the frequency of rs9923231 andparental ancestry, obtained by fitting piece-wise smooth logistic regression models to the 268Brazilians and 224 Mexicans data. The relative proportions of Native American, African and Europeanancestry are presented as described in Figure 2. The plotted surfaces correspond to the natural logarithm ofthe odds of having the variant rs9923231 G allele, depending on the relative admixture proportions of theparental populations. The circles correspond to the average ancestral proportions for Black Brazilians (blackcircle), Brown Brazilians (grey), White Brazilians (white), Mexicans (red), EUR (yellow), AFR (green) and NAT(blue).
doi:10.1371/journal.pone.0112640.g004
Distribution of Pharmacogenomic Genetic Markers in Brazil and Mexico
PLOS ONE | DOI:10.1371/journal.pone.0112640 November 24, 2014 15 / 22
northern State of Sonora and the other States. The European admixture
proportions in Sonora are 50% higher than the proportions observed in the
Southern State of Guerrero. This geographic variation in admixture proportions
within Mexico has also been described based on genome-wide panels of markers
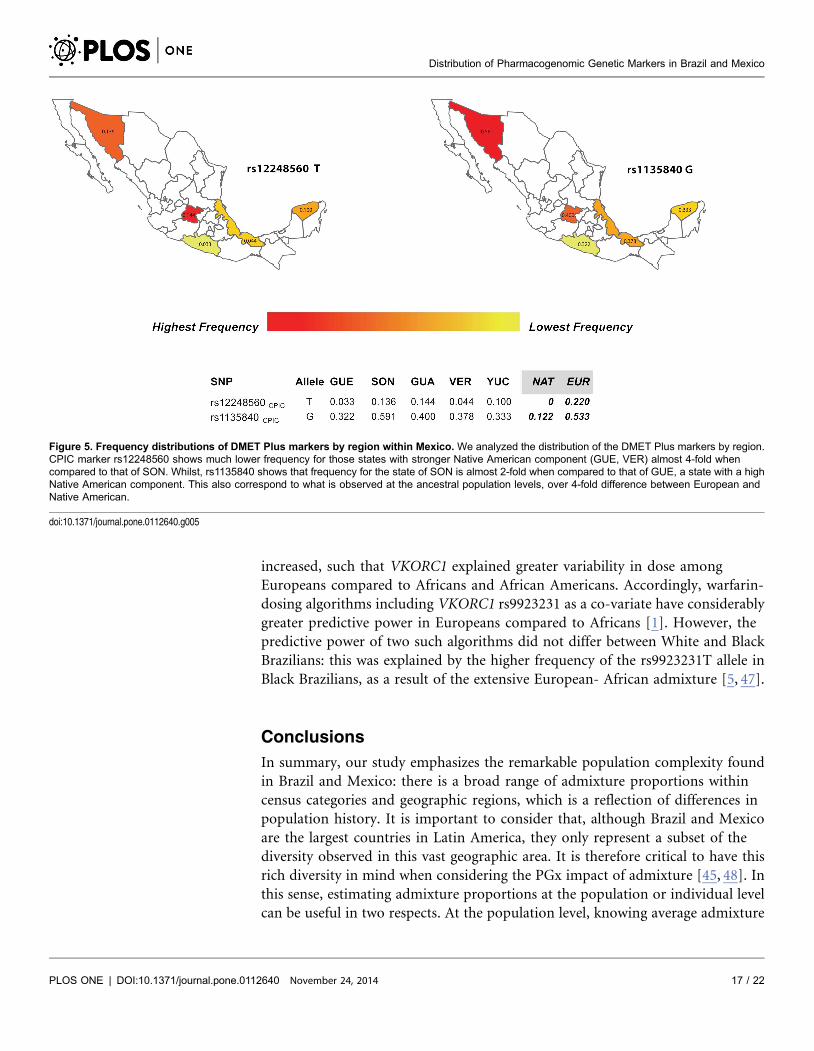
[11]. Indeed, when we analyzed the distribution of the DMET Plus markers by
region within Mexico, we observed that a number of markers show substantial
variation between regions, including a marker of clinical relevance (rs12248560)
located in the CYP2C19 gene, which has been classified by CPIC as CPIC level A
(annotation used to indicate that genetic information should be used to change
prescribing of affected drug) and PharmGKB level 1A (annotation used for
variant-drug combinations in a CPIC or medical society-endorsed PGx guideline).
The CYP2C19 allele rs12248560 T (CYP2C19*17) is an ultrarapid metabolizer of
drugs such as amitriptyline and clopidogrel. The frequency of this allele is more
than 4-fold higher in states with high European admixture proportions (e.g
Sonora: 0.144 and GUA: 0.136) than in states with high Native American
admixture proportions (e.g. GUE: 0.033) (Figure 5).
As stated above, although the overall genetic differentiation of the markers
interrogated in the DMET Plus array is low, there are many loci that show high
levels of genetic differentiation between the parental populations relevant for
contemporary Brazilians and Mexicans. Given the broad range of admixture
proportions observed in Brazil (both in terms of census categories and geographic
regions) and Mexico (geographic regions), this has clear PGx implications. We
displayed graphically in Figure 2, 3 and 4 the impact of admixture proportions
using three-dimensional graphs that depict the relationship of alleles and ancestry.
The odds of having a variant of PGx relevance vary over ranges determined by the
frequency of the polymorphisms in the relevant ancestral populations, i.e. mainly
Europeans and Africans for Brazilians, and European and Native Americans for
Mexicans. The larger the difference in frequency between the relevant parental
populations, the more inappropriate it is to refer to a ‘‘Brazilian’’ or ‘‘Mexican’’
allele frequency. In reality, there will be variation in allele (and genotype)
frequencies depending on geographic areas or census categories. Therefore, it may
be misleading to extrapolate the allele (and genotype) frequencies found in a given
geographic area or census group to another geographic area or census group. In
addition, most of the available data are from people of European ancestry, so
clinical translation in non-Europeans can be challenging [45], thus our results
highlight the importance of studies in admixed populations because they present
opportunities for discovery of genetic markers that would be missed.
The VKORC1 rs9923231 SNP, a major determinant of warfarin dose in CPIC
guidelines, may be used as an example of the practical PGx implications of
admixture history. The frequency of the rs9923231T allele, which associates with
high warfarin sensitivity, varies 13-fold among proxy parental populations of
Brazilians and Mexicans: 4.1% in sub-Saharan Africans (HapMap YRI and LWK),
38.1% in Europeans (HapMap CEU) and 52.2% in Native Americans (Zapotecas).
Limdi et al [4] showed that the proportion of variation in warfarin dose explained
by the VKORC1 rs9923231 SNP increases as the frequency of the A allele
Distribution of Pharmacogenomic Genetic Markers in Brazil and Mexico
PLOS ONE | DOI:10.1371/journal.pone.0112640 November 24, 2014 16 / 22
increased, such that VKORC1 explained greater variability in dose among
Europeans compared to Africans and African Americans. Accordingly, warfarin-
dosing algorithms including VKORC1 rs9923231 as a co-variate have considerably
greater predictive power in Europeans compared to Africans [1]. However, the
predictive power of two such algorithms did not differ between White and Black
Brazilians: this was explained by the higher frequency of the rs9923231T allele in
Black Brazilians, as a result of the extensive European- African admixture [5, 47].
Conclusions
In summary, our study emphasizes the remarkable population complexity found
in Brazil and Mexico: there is a broad range of admixture proportions within
census categories and geographic regions, which is a reflection of differences in
population history. It is important to consider that, although Brazil and Mexico
are the largest countries in Latin America, they only represent a subset of the
diversity observed in this vast geographic area. It is therefore critical to have this
rich diversity in mind when considering the PGx impact of admixture [45, 48]. In
this sense, estimating admixture proportions at the population or individual level
can be useful in two respects. At the population level, knowing average admixture
Figure 5. Frequency distributions of DMET Plus markers by region within Mexico. We analyzed the distribution of the DMET Plus markers by region.CPIC marker rs12248560 shows much lower frequency for those states with stronger Native American component (GUE, VER) almost 4-fold whencompared to that of SON. Whilst, rs1135840 shows that frequency for the state of SON is almost 2-fold when compared to that of GUE, a state with a highNative American component. This also correspond to what is observed at the ancestral population levels, over 4-fold difference between European andNative American.
doi:10.1371/journal.pone.0112640.g005
Distribution of Pharmacogenomic Genetic Markers in Brazil and Mexico
PLOS ONE | DOI:10.1371/journal.pone.0112640 November 24, 2014 17 / 22
proportions it is possible to infer the allele (and genotype) frequencies of relevant
PGx variants. In turn, this distribution determines the proportion of the variance
of traits of PGx importance explained by the polymorphisms. At the individual
level, individual ancestry proportions will determine the probability of having a
PGx relevant genotype. For these reasons, it is important to carry out further
efforts to characterize admixture in the Americas. In particular, our under-
standing of the variation in admixture proportions within countries is still quite
incomplete, and there are many gaps in our knowledge of the frequency
distributions in the relevant parental populations (in particular, Native American
groups).
Supporting Information
Figure S1. Population structure analysis using 71 AIMs. Individual ancestry
proportions in Brazilians (BR.BK, BR.BN, BR.WT) and Mexican Mestizo (MEX).
doi:10.1371/journal.pone.0112640.s001 (TIF)
Figure S2. Analysis of correlation of individual ancestry estimates for Mexican
Mestizo individuals for which data are available for the DMET Plus array and
genome-wide arrays. Data for 74 individuals were available for both the DMET
Plus array and the Illumina 550K array. Data for 68 individuals were available for
both the DMET Plus array and the Affymetrix 100K array. Individual ancestry
estimates for the Illumina 550K array were obtained with the program
ADMIXTURE. Individual ancestry estimates for the Affymetrix 100K array were
obtained with the program STRUCTURE using 1814 AIMs [11].
doi:10.1371/journal.pone.0112640.s002 (TIF)
Figure S3. Distribution of FST values. Pairwise comparisons were done for the
three ancestral populations and for the admixed populations Mexico and Brazil,
a) Europe vs Africa; b) Europe vs Native American; c) Africa vs Native American;
and d) Mexico vs Brazil.
doi:10.1371/journal.pone.0112640.s003 (TIF)
Figure S4. Percentage of total common haplotypes observed per population. In
order to prepare this plot, first we identified all the haplotypes present in each
sample with a frequency equal or higher than 5%. The combined number of
haplotypes observed was 1017. The Bar plots represent the percentage of
haplotypes observed in each individual sample (e.g. 100% would correspond to
the 1017 haplotypes observed in the combined sample). The data set presented
includes all the Mexican admixed samples (MEX(MX)), all the Brazilian census
groups (BZ.BK, BZ.BN, BZ.WT), the Native American Zapoteca sample
(NAT(ZAP)), and several HapMap samples (EUR, AFR, MEX(LA), JPT.CHB).
doi:10.1371/journal.pone.0112640.s004 (TIF)
Figure S5. Surface plots describing the predicted relationship between the
frequency of rs16947 and parental ancestry, obtained by fitting piece-wise smooth
logistic regression models to the 268 Brazilians and 224 Mexicans data. The
Distribution of Pharmacogenomic Genetic Markers in Brazil and Mexico
PLOS ONE | DOI:10.1371/journal.pone.0112640 November 24, 2014 18 / 22
relative proportions of Native American, African ancestry and European ancestry
are presented as described in Figure 2. The plotted surfaces correspond to the
natural logarithm of the odds of having the variant rs16947A allele, depending on
the relative admixture proportions of the parental populations. The circles
correspond to the average ancestral proportions for Black Brazilians (black circle),
brown Braziilans (grey), White Brazilians (white), Mexicans (red), EUR (yellow),
AFR (green) and NAT (blue).
doi:10.1371/journal.pone.0112640.s005 (TIF)
Table S1. Allele Frequencies and FST values for 71 Ancestry Informative Markers
(AIMs) in ancestral populations.
doi:10.1371/journal.pone.0112640.s006 (XLSX)
Table S2. FST values for all pairwise comparisons among HapMap populations,
Zapotecos (NAT), Brazilians (BK, BN, WT) and Mexicans (MEX).
doi:10.1371/journal.pone.0112640.s007 (XLSX)
Table S3. Polymorphisms showing the highest genetic differentiation between
Native Americans and the Admixed populations.
doi:10.1371/journal.pone.0112640.s008 (XLSX)
Table S4. Polymorphisms showing the highest genetic differentiation between
Africans and the Admixed populations.
doi:10.1371/journal.pone.0112640.s009 (XLSX)
Table S5. Minor Allele Frequencies (MAF) for 1,647 genetic markers. The markers
are those included in the DMET Plus array and for all populations: Europeans
(Hapmap CEU), Africans (Hapmap YRI and LWK), Native Americans
(Zapotecas), Brazilians and Mexican mestizos (Guanajuato (GUA); Guerrero
(GUE); Sonora (SON); Veracruz (VER) and Yucatan (YUC)).
doi:10.1371/journal.pone.0112640.s010 (XLSX)
Data S1. Genotype data with 1,647 genetic markers from 537 individuals form
Brazil and Mexico.
doi:10.1371/journal.pone.0112640.s011 (ZIP)
Acknowledgments
The authors would like to thank all individuals from Brazil and Mexico for their
participation in this study as well as Raul Mojica-Espinosa and Dan J. Gutierrez-
Fuentes from the Microarray High Technology Unit at INMEGEN.
Author ContributionsConceived and designed the experiments: JCFL GSK EJP VBP. Performed the
experiments: RAR TKFM RC LUF. Analyzed the data: VBP AVC CJS EJP JCFL
GSK. Contributed reagents/materials/analysis tools: VBP AVC CJS RAR TKFM
RC CRE LUF MJGV HLM AHM EJP JCFL GSK. Wrote the paper: JCFL GSK EJP
VBP AVC.
Distribution of Pharmacogenomic Genetic Markers in Brazil and Mexico
PLOS ONE | DOI:10.1371/journal.pone.0112640 November 24, 2014 19 / 22
References
1. Klein TE, Altman RB, Eriksson N, Gage BF, Kimmel SE, et al. (2009) Estimation of the warfarin dosewith clinical and pharmacogenetic data. N Engl J Med 360: 753–764.
2. The Single Nucleotide Polymorphism database website. Available: http://www.ncbi.nlm.nih.gov/snp/?term59923231. Accessed 2013 December 17.
3. Rede Nacional de Farmacogenetica website. Available: http://www.refargen.org.br/article.php3?id_article550. Accessed 2014 January 14.
4. Limdi NA, Wadelius M, Cavallari L, Eriksson N, Crawford DC, et al. (2010) Warfarinpharmacogenetics: a single VKORC1 polymorphism is predictive of dose across 3 racial groups.Blood 115: 3827–3834.
5. Suarez-Kurtz G (2011) Population diversity and the performance of warfarin dosing algorithms. Br J ClinPharmacol 72: 451–453.
6. Ramos E, Doumatey A, Elkahloun AG, Shriner D, Huang H, et al. (2014) Pharmacogenomics,ancestry and clinical decision making for global populations. Pharmacogenomics J 14(3): 217–22.
7. Instituto Brasileiro de Geografia e Estatistica website. Available: www.ibge.gov.br/home/estatistica/populacao/estimativa2012/. Accessed 2013 December 12.
8. Instituto Nacional de Estadıstica y Geografıa website. Available: http://www.inegi.org.mx/sistemas/olap/proyectos/bd/consulta.asp?p517118&c527769&s5est. Accessed 2013 December 30.
9. Salzano FM, Bortolini MC (2002) The Evolution and Genetics of Latin American Populations.Cambridge: Cambridge University Press.
10. Pena SD, Di Pietro G, Fuchshuber-Moraes M, Genro JP, Hutz MH, et al. (2011) The genomic ancestryof individuals from different geographical regions of Brazil is more uniform than expected. PLoS One 6:e17063.
11. Silva-Zolezzi I, Hidalgo-Miranda A, Estrada-Gil J, Fernandez-Lopez JC, Uribe-Figueroa L, et al.(2009) Analysis of genomic diversity in Mexican Mestizo populations to develop genomic medicine inMexico. Proc Natl Acad Sci U S A 106: 8611–8616.
12. Bryc K, Velez C, Karafet T, Moreno-Estrada A, Reynolds A, et al. (2010) Colloquium paper: genome-wide patterns of population structure and admixture among Hispanic/Latino populations. Proc Natl AcadSci U S A. 11; 107 Suppl 2: 8954–61.
13. Galanter JM, Fernandez-Lopez JC, Gignoux CR, Barnholtz-Sloan J, Fernandez-Rozadilla C, et al.(2012) Development of a panel of genome-wide ancestry informative markers to study admixturethroughout the Americas. PLoS Genet 8(3): e1002554.
14. Burmester JK, Sedova M, Shapero MH, Mansfield E (2010) DMET microarray technology forpharmacogenomics-based personalized medicine. Methods Mol Biol 632: 99–124.
15. Price AL, Patterson N, Yu F, Cox DR, Waliszewska A, et al. (2007) A Genomewide Admixture Map forLatino Populations. Am. J. Hum. Genet 80(6): 1024–1036.
16. Purcell S, Neale B, Todd-Brown K, Thomas L, Ferreira MA, et al. (2007) PLINK: a tool set for whole-genome association and population-based linkage analyses. Am J Hum Genet 81: 559–575.
17. Altshuler DM, Gibbs RA, Peltonen L, Altshuler DM, Gibbs RA, et al; The International HapMap 3Consortium (2010) Integrating common and rare genetic variation in diverse human populations. Nature467: 52–58.
18. Pritchard JK, Stephens M, Donnelly P (2000) Inference of population structure using multilocusgenotype data. Genetics 155: 945–959.
19. Falush D, Stephens M, Pritchard JK (2003) Inference of population structure using multilocusgenotype data: linked loci and correlated allele frequencies. Genetics 164: 1567–1587.
20. Hubisz MJ, Falush D, Stephens M, Pritchard JK (2009) Inferring weak population structure with theassistance of sample group information. Mol Ecol Resour. 9(5): 1322–32.
21. Reich D, Patterson N, Campbell D, Tandon A, Mazieres S, et al. (2012) Reconstructing NativeAmerican population history. Nature 16; 488(7411): 370–4.
Distribution of Pharmacogenomic Genetic Markers in Brazil and Mexico
PLOS ONE | DOI:10.1371/journal.pone.0112640 November 24, 2014 20 / 22
22. Moreno EA, Gignoux CR, Fernandez JC, Zakharia F, Sikora M (2014) The genetics of Mexicorecapitulates Native American substructure and affects biomedical traits. Science 344(6189)): 1280–1285.
23. Patterson N, Price AL, Reich D (2006) Population structure and eigenanalysis. PLoS Genet 2(12):e190.
24. Stephens M, Donnelly P (2003) A comparison of bayesian methods for haplotype reconstruction frompopulation genotype data. Am J Hum Genet 73(5): 1162–9.
25. Stephens M, Smith NJ, Donnelly P (2001) A new statistical method for haplotype reconstruction frompopulation data. Am J Hum Genet 68: 978–989.
26. Stephens M, Scheet P (2005) Accounting for decay of linkage disequilibrium in haplotype inference andmissing-data imputation. Am J Hum Genet 76: 449–462.
27. Suarez-Kurtz G, Pena SD, Hutz MH (2012) Application of the F(ST) statistics to explorepharmacogenomic diversity in the Brazilian population. Pharmacogenomics 13: 771–777.
28. Harrell FE (2002) Regression Modeling Strategies With Applications to Linear Models, LogisticRegression, and Survival Analysis. New York: Springer.
29. R Development Core Team (2011) R: a language and environment for statistical computing. Vienna,Austria: the R Foundation for Statistical Computing.
30. Contreras AV, Monge-Cazares T, Alfaro-Ruiz L, Hernandez-Morales S, Miranda-Ortiz H, et al.(2011) Resequencing, haplotype construction and identification of novel variants of CYP2D6 in MexicanMestizos. Pharmacogenomics 12: 745–756.
31. Hicks JK, Swen JJ, Gaedigk A (2014) Challenges in CYP2D6 Phenotype Assignment from GenotypeData: A Critical Assessment and Call for Standardization. Curr Drug Metab 15: 218–232.
32. Kim SY, S Hong Y, K Shim E, Kong SY, Shin A, et al. (2013) S-1 plus irinotecan and oxaliplatin for thefirst-line treatment of patients with metastatic colorectal cancer: a prospective phase II study andpharmacogenetic analysis. Br J Cancer 17; 109(6): 1420–7.
33. Cha PC, Mushiroda T, Zembutsu H, Harada H, Shinoda N, et al. (2009) Single nucleotidepolymorphism in ABCG2 is associated with irinotecan-induced severe myelosuppression. J Hum Genet54(10): 572–80.
34. Cote JF, Kirzin S, Kramar A, Mosnier JF, Diebold MD, et al. (2007) UGT1A1 polymorphism canpredict hematologic toxicity in patients treated with irinotecan. Clin Cancer Res 13(11): 3269–75.
35. Saito Y, Sai K, Maekawa K, Kaniwa N, Shirao K, et al. (2009) Close association of UGT1A9IVS1+399C. T with UGT1A1*28, *6, or *60 haplotype and its apparent influence on 7-ethyl-10-hydroxycamptothecin (SN-38) glucuronidation in Japanese. Drug Metab Dispos 37(2): 272–6.
36. Rieder MJ, Reiner AP, Gage BF, Nickerson DA, Eby CS, et al. (2005) Effect of VKORC1 haplotypeson transcriptional regulation and warfarin dose. N Engl J Med 352: 2285–2293.
37. Weir BS, Cardon LR, Anderson AD, Nielsen DM, Hill WG (2005) Measures of human populationstructure show heterogeneity among genomic regions. Genome Res 15: 1468–1476.
38. Elhaik E (2012) Empirical distributions of F(ST) from large-scale human polymorphism data. PLoS One7: e49837.
39. Li JZ, Absher DM, Tang H, Southwick AM, Casto AM, et al. (2008) Worldwide human relationshipsinferred from genome-wide patterns of variation. Science 319: 1100–1104.
40. Auton A, Bryc K, Boyko AR, Lohmueller KE, Novembre J, et al. (2009) Global distribution of genomicdiversity underscores rich complex history of continental human populations. Genome Res 19: 795–803.
41. Henn BM, Cavalli-Sforza LL, Feldman MW (2012) The great human expansion. Proc Natl AcadSci U S A 109: 17758–17764.
42. Deshpande O, Batzoglou S, Feldman MW, Cavalli-Sforza LL (2009) A serial founder effect model forhuman settlement out of Africa. Proc Biol Sci 276: 291–300.
43. Telles EE (2002) Racial Ambiguity among the Brazilian Population. Ethnic and Racial Studies 25(3):415–441.
44. Bastos JL, Peres MA, Peres KG, Dumith SC, Gigante DP (2008) [Socioeconomic differences betweenself- and interviewer-classification of color/race]. Rev Saude Publica 42: 324–334.
Distribution of Pharmacogenomic Genetic Markers in Brazil and Mexico
PLOS ONE | DOI:10.1371/journal.pone.0112640 November 24, 2014 21 / 22
45. Suarez-Kurtz G, Pena SD, Struchiner CJ, Hutz MH (2012) Pharmacogenomic Diversity amongBrazilians: Influence of Ancestry, Self-Reported Color, and Geographical Origin. Front Pharmacol 3: 191.
46. Perera MA, Cavallari LH, Johnson JA (2014) Warfarin pharmacogenetics: an illustration of theimportance of studies in minority populations. Clin Pharmacol Ther 95(3): 242–4.
47. Perini JA, Struchiner CJ, Silva-Assuncao E, Santana IS, Rangel F, et al. (2008) Pharmacogenetics ofwarfarin: development of a dosing algorithm for brazilian patients. Clin Pharmacol Ther 84: 722–728.
48. Suarez-Kurtz G, Pena SD (2006) Pharmacogenomics in the Americas: the impact of genetic admixture.Curr Drug Targets 7(12): 1649–58.
Distribution of Pharmacogenomic Genetic Markers in Brazil and Mexico
PLOS ONE | DOI:10.1371/journal.pone.0112640 November 24, 2014 22 / 22
Copyright © 2022 FDOKUMEN