PESTEL analysis for the Islamic state of Iran with focus on the ...
82
PESTEL analysis for the Islamic state of Iran with focus on the methanol market Master Thesis of Markus Tscherner, BSc Technical University of Graz Faculty of Mechanical Engineering and Business Economics Institute of Business Economics and Industrial Sociology O.Univ.-Prof. Dipl.-Ing. Dr.techn. Ulrich Bauer Graz, in September 2017
-
Upload
khangminh22 -
Category
Documents
-
view
0 -
download
0
Transcript of PESTEL analysis for the Islamic state of Iran with focus on the ...

PESTEL analysis for the Islamic state of Iran
with focus on the methanol market
Master Thesis
of Markus Tscherner, BSc
Technical University of Graz
Faculty of Mechanical Engineering and Business Economics
Institute of Business Economics and Industrial Sociology O.Univ.-Prof. Dipl.-Ing. Dr.techn. Ulrich Bauer
Graz, in September 2017

In cooperation with:
Christof Group

I
EIDESSTATTLICHE ERKLÄRUNG Ich erkläre an Eides statt, dass ich die vorliegende Arbeit selbstständig verfasst, andere als die angegebenen Quellen/Hilfsmittel nicht benutzt und die den benutzten Quellen wörtlich und inhaltlich entnommenen Stellen als solche kenntlich gemacht habe. Graz, am …………………………… ……………………………………………….. (Unterschrift)
STATUTORY DECLARATION
I declare that I have authored this thesis independently, that I have not used other than the declared sources / resources, and that I have explicitly marked all material which has been quoted either literally or by content from the used sources. …………………………… ……………………………………………….. date (signature)

II
Kurzfassung
Das Projekt zwischen der Johann Christof Apparatebau (JCA) Holding und dem Institut für Betriebswirtschaftslehre und Betriebssoziologie zielt auf eine Umweltanalyse nach dem “Political, Economic, Social, Technical, Environmental, Legal” (PESTEL) Framework ab. Diese Arbeit ist ein Teil der Strategieentwicklungs-Initiative des Unternehmens, welche Umwelteinflüsse in die Entscheidungsfindungsprozesse einbeziehen möchte. Diese Arbeit beschreibt einen firmenunabhängig anwendbaren Prozess, welcher Produkte und Dienstleistungen des Unternehmens nach der Profitabilität und dem Potential für die Ausweitung des Marktanteils in spezifischen geographischen Regionen auflistet. Wenn das Produktportfolio kein Produkt oder keine Dienstleistung mit einem zugehörigen Marktbedarf enthält, inkludiert der Prozess eine Produktdiversifikations-Analyse, die durch ein neues Produkt oder eine neue Dienstleistung neue Märkte aufzeigt, welche mit der PESTEL Analyse untersucht werden. Der entwickelte PESTEL Prozess wurde bei der JCA Holding ausgeführt und der Bedarf für eine Produkt-Diversifikationsanalyse aufgezeigt. Aus diesem Grund wurde mit Hilfe einer Marktanalyse, Experten-Einschätzungen und Kreativitätstechniken eine Ideensammlung von Produkten mit hohem Potential erstellt. Eine dieser Ideen, der Methanol-Prozess, wurde für die weitere PESTEL Analyse herangezogen. Die Analyse wurde mit dem Fokus auf den Iran durchgeführt, da das Aufzeigen der durch die Umwelt gegebenen Rahmenbedingungen im Iran hohe Priorität für das Unternehmen hat. Die Ergebnisse der Umweltanalyse wurden durch Chancen und Risiken für die Firma ausgedrückt. Der Iran bietet hohes Potential für die Markteinführung, da die gegen ihn verhängten Sanktionen teilweise aufgehoben wurden und ein hohes Wachstum in der Methanol-Industrie verzeichnet wurde. Nichtsdestotrotz stellen die potentiellen Risiken durch die politische Instabilität, sowie die regionalen als auch internationalen Konflikte und die mögliche Wiedereinführung der Sanktionen Gefahren für Geschäftsbeziehungen in diesem Land dar, welche für die Entscheidung über eine Markteinführung berücksichtigt werden müssen.

III
Abstract
The project between Johann Christof Apparatebau Holding and the Institute of Business Economics and Industrial Sociology at Technical University of Graz aims for an environmental analysis after the “Political, Economic, Social, Technical, Environmental, Legal” (PESTEL) framework. This thesis is a part of the company’s strategy development effort, which has the goal to include environmentally given circumstances into the decision-making process concerning the entering of new markets. Within this thesis, a company independent process has been described, which evaluates products and services of the company after profitability and their potential for the expansion of market shares in specific geographic regions. If the portfolio of the company does not contain a product or service with an associated market need, the process includes a product diversification analysis to then find high potential markets which will be analyzed with the PESTEL framework. The developed PESTEL process has been executed and after the need for a product diversification analysis was determined, an idea pool of high potential product ideas has been created. One of these ideas, the methanol process, has been further considered for a PESTEL analysis of the Islamic state of Iran, since the acquisition of information about the given boundary conditions within Iran has highest priority for the company. The findings of the environmental analysis have been expressed with an opportunities and threats statement. The Islamic state of Iran offers high potential for market introduction since international sanctions against the nation have been lifted and a high growth within the methanol market has been recorded. Nevertheless, the potential risks caused by the political instability and regional as well as international conflicts and the threat of the potential reintroduction of sanctions have to be included when deciding whether to enter the Iranian market or not.

IV
Inhaltsverzeichnis
1 INTRODUCTION.....................................................................................................................................1
1.1 COMPANYSTRUCTURE...............................................................................................................................11.2 INITIALSTATE...........................................................................................................................................21.3 TARGETS.................................................................................................................................................31.4 TASKS.....................................................................................................................................................41.5 STRUCTUREOFTHETHESIS..........................................................................................................................5
2 THEORETICALBACKGROUNDOFTHETHESIS.........................................................................................6
2.1 ENVIRONMENTALANALYSIS.........................................................................................................................62.1.1 PESTELFramework..........................................................................................................................72.1.2 PrimaryandSecondaryResearch..................................................................................................11
2.2 SWOTANALYSIS....................................................................................................................................122.3 PRODUCTPERFORMANCEANALYSIS............................................................................................................14
2.3.1 FixedandVariableCosts................................................................................................................142.3.2 ContributionMarginandEBIT.......................................................................................................15
2.4 PRODUCTDIVERSIFICATION.......................................................................................................................162.4.1 MarketandCompetitionAnalysis.................................................................................................17
2.4.1.1 MarketAnalysis....................................................................................................................................172.4.1.2 CompetitionAnalysis............................................................................................................................182.4.1.3 PortfolioAnalysis..................................................................................................................................192.4.1.4 CustomerAnalysis................................................................................................................................19
2.4.2 Innovation......................................................................................................................................202.5 BUSINESSMODELCANVAS........................................................................................................................212.6 ECONOMICBASICS..................................................................................................................................23
2.6.1 GrossDomesticProductandEconomicGrowthRate....................................................................232.6.2 InflationRate.................................................................................................................................242.6.3 InterestRate..................................................................................................................................242.6.4 UnemploymentRate......................................................................................................................242.6.5 MoneyandFiscalPolicy.................................................................................................................242.6.6 TradeRatiosandTradeBalance....................................................................................................25
3 PRACTICALPART.................................................................................................................................26
3.1 JCAPESTELFLOWCHART........................................................................................................................263.1.1 CompanyScreening.......................................................................................................................26
3.1.1.1 StrategyAnalysis..................................................................................................................................273.1.1.2 SWOTAnalyses.....................................................................................................................................273.1.1.3 ExistingMarketAnalysis.......................................................................................................................273.1.1.4 PerformanceData................................................................................................................................273.1.1.5 GatewayDecision1..............................................................................................................................27
3.1.2 ProductDiversificationAnalysis....................................................................................................283.1.3 IdeaAssessmentandGatewayDecision2.....................................................................................293.1.4 IdeaConcretion..............................................................................................................................303.1.5 GlobalPETAnalysis........................................................................................................................31
3.1.5.1 GlobalPoliticalAnalysis........................................................................................................................31

V
3.1.5.2 GlobalEconomicAnalysis.....................................................................................................................313.1.5.3 GlobalTechnologicalAnalysis..............................................................................................................323.1.5.4 GatewayDecision3..............................................................................................................................32
3.2 EXECUTIONOFTHEJCAPESTELPROCESS...................................................................................................333.2.1 ProductDiversificationAnalysis....................................................................................................34
3.2.1.1 ChemicalIndustryOverview................................................................................................................353.2.1.2 OverviewHighPressureApparatuses..................................................................................................373.2.1.3 OutcomeInnovationWorkshop...........................................................................................................40
3.2.2 ConclusionProductDiversificationAnalysis..................................................................................403.3 NATIONALPESTELANALYSIS....................................................................................................................41
3.3.1 PoliticalEnvironment.....................................................................................................................423.3.1.1 OrganizationofthePoliticalSystem....................................................................................................423.3.1.2 StabilityofthePoliticalSystem............................................................................................................433.3.1.3 PoliticalRisks........................................................................................................................................443.3.1.4 CorruptionLevel...................................................................................................................................443.3.1.5 GovernmentalInvolvementinTradeAgreements...............................................................................443.3.1.6 TradePolicy..........................................................................................................................................453.3.1.7 Import-ExportRegulations...................................................................................................................453.3.1.8 WorkingandSocialPolicy....................................................................................................................453.3.1.9 SanctionsandJointComprehensivePlanOfAction.............................................................................45
3.3.2 EconomicEnvironment..................................................................................................................463.3.2.1 EconomicOverview..............................................................................................................................463.3.2.2 MethanolMarketOverview.................................................................................................................473.3.2.3 FreeTradeZonesandSpecialEconomicZones....................................................................................50
3.3.3 SocialEnvironment........................................................................................................................513.3.4 TechnologicalEnvironment...........................................................................................................533.3.5 EnvironmentalCircumstances.......................................................................................................54
3.3.5.1 Geography............................................................................................................................................543.3.5.2 Cities.....................................................................................................................................................543.3.5.3 Climate.................................................................................................................................................553.3.5.4 PollutionandEmissions........................................................................................................................553.3.5.5 Infrastructure.......................................................................................................................................563.3.5.6 AvailabilityofNaturalResources.........................................................................................................56
3.3.6 LegalEnvironment.........................................................................................................................563.3.6.1 LegalFramework..................................................................................................................................573.3.6.2 ProducerAccountability.......................................................................................................................573.3.6.3 IntellectualPropertyRights..................................................................................................................573.3.6.4 TaxPolicy..............................................................................................................................................573.3.6.5 ForeignerInvestmentRight..................................................................................................................58
3.3.7 OpportunitiesandThreats.............................................................................................................583.3.7.1 Opportunities.......................................................................................................................................583.3.7.2 Threats.................................................................................................................................................58
4 SUMMARYANDOUTLOOK..................................................................................................................61
5 BIBLIOGRAPHY....................................................................................................................................63
6 LISTOFTABLES....................................................................................................................................67
7 LISTOFFIGURES..................................................................................................................................68

VI
8 ABBREVIATIONS..................................................................................................................................69
9 APPENDICES........................................................................................................................................71

Introduction 1
1 Introduction
Christof group is a globally acting company which offers plant construction, industrial services, apparatus construction, electrical measurement, steering and regulating (EMSR) – technique and oilfield services. The company is supplying the chemical, petrochemical, fertilizer, building material, steel and paper industry as well as the energy sector. This thesis is conducted for the Johann Christof Apparatebau (JCA) holding GmbH. The holding consists of four companies which can resort to over hundred years of experience in the apparatus industry, with core competences in project management, detail engineering, apparatus and vessel construction, plant and machine assembly, pipe construction and Quality, Safety and Environment (QSE) management. The holding has been formed to use synergies between the single companies, standardize processes and to develop a common strategy to be prepared for future challenges. In apparatus production, companies rely on process licensors for whom the apparatus producer has to qualify so that he is listed as potential producer for the customers. The apparatus industry is a very conservative industry concerning contract awarding, since it relies on references and experience as the capital investment for an apparatus is relatively high. The companies within the JCA holding are licensed for a variety of processes and offer grass root apparatuses, revamps and service for existing apparatuses in a plurality of branches within the chemical industry.
1.1 Company Structure
Figure 1 shows the organigram and the structure of the JCA holding. The holding company JCA consist of four separately steered companies.

Introduction 2
Figure 1: Organigram JCA1
• ACE Apparatebau Construction & Engineering Gmbh, Lieboch, Austria: Specialized
apparatus and all in one solutions for refineries, petro chemistry, plastic, paper, chemical and food industry.
• ACE Metalna, Marburg, Slovenia: Mechanical editing of bigger parts.
• APB Apparatebau Schweisstechnik GmbH, Kapfenberg, Austria: Pressure vessels and
specialized valves for polymer creation, highly concentrated nitric acid tanks and highly pressurized pipes.
• SBN Schoeller-Beckmann Nitec GmbH, Ternitz, Austria: High pressurized apparatuses
for ammonia and urea production for the fertilizer industry.
1.2 Initial State
This thesis is part of the JCA strategy initiative. The board as well as external advisors have been working on a strategy roadmap, analyzed internal strengths and weaknesses, external opportunities and threats, created a mission and vision and defined strategic objectives for the JCA. This information serves as a basis for the creation of an environmental analysis under the PESTEL framework.
1 Christof Group

Introduction 3
1.3 Targets
Main-Target: Development of an analysis scheme for the PESTEL framework. Systematic selection of further considered products or services and markets. If needed, creation of a product diversification analysis and assessment of generated ideas. Weighting of importance for investigation of the PESTEL areas for the selected products or services and execution of the PESTEL analysis. Formulation of chances and risks for the considered areas. Sub-Target 1: A PESTEL analysis process flowchart should be created. The process should be usable for the JCA holding as a whole as well as for the single companies on their own. Further the PESTEL process should be usable for the variety of branches in which the products and services of the JCA holding are positioned. Sub-Target 2: A literature research concerning environmental analysis and the areas of examination within the PESTEL framework should be conducted. Sub-Target 3: The results of the PESTEL analysis should be represented within an opportunities and threats analysis, therefore a literature research concerning “Strengths, Weaknesses, Opportunities and Threats” (SWOT) analysis should be conducted. Sub-Target 4: Since the product portfolio of the companies within the JCA holding is very diverse, the product or service chosen for the further PESTEL analysis should be selected systematically. Therefore, a company screening, which includes several tools for the selection of the product or service with the highest potential for environmental analysis, should be created. Sub-Target 5: If the potential of the selected product or service is not satisfying, a product diversification analysis should be conducted. Sub-Target 6: When a high potential product or service is chosen, the geographical region for the PESTEL analysis should be systematically selected after the potential for market penetration. Sub-Target 7: The chosen areas of examination from Sub-Target 2 should be weighted after their importance for investigation for the selected product or service in the specific region. Sub-Target 8: The PESTEL analysis should be executed for the selected areas of examination for the previously defined product or service in the chosen geographical region. Sub-Target 9: The results of the PESTEL analysis should be represented within an opportunities and threats analysis.

Introduction 4
1.4 Tasks
Analysis of the existing information The initial state will be analyzed through management interviews and internal as well as external data sources. The goal is to create an understanding of the current state the companies of the JCA holding are dealing with. Creation of a PESTEL Analysis Process (ad Target 1) A global process flow chart for the execution of a PESTEL analysis should be created. The process should include an analysis guideline tailored to the specific needs of the JCA holding, from the initial state to an environmental analysis for high potential products or services in high potential markets. Preparation for the PESTEL analysis (ad Target 2 & 7) The single factors of the PESTEL areas should be defined with the help of a literature research. Further the weighting of importance of the specific area should be prepared within a separate document. Preparation of the SWOT analysis (ad Target 3 & 9) For the representation of the results of the PESTEL analysis, literature should be searched for the formulation of an opportunities and threats analysis. Definition of the areas of examination (ad Target 4 & 6) The products and services of the portfolio of the JCA holding should be assessed after their potential and high potential services or products should be defined for the further PESTEL analysis in a high potential geographic region. Execution of a product diversification analysis (ad Target 5) If the definition of the areas of examination delivers no satisfying result concerning high potential products and markets, a product diversification analysis should be created. New high potential products should be found with the help of market analysis, expert interviews and creativity techniques. Execution of the PESTEL analysis for the defined areas (ad Target 8) The PESTEL analysis should be executed for the most promising product, defined in the previous steps in the geographical region with the most promising conditions. Elaboration of opportunities and threats (ad Target 9) The results of the PESTEL analysis should be represented within an opportunities and threats analysis.

Introduction 5
1.5 Structure of the Thesis
Table 1 shows the structure of the thesis. After the introduction, the theoretical background for the further analysis is described. Then the analysis concept is created which deals as guideline for the rest of the practical part of the thesis. The definition of the analyzed product or service is conducted with the procedures defined within the concept creation phase. Furthermore, the examined geographical region is defined after its potential for market expansion. In the execution phase the PESTEL analysis is executed for a predefined service or product in a specific nation. The research findings are summarized and an outlook will be created.
Table 1: Structure of the thesis2
2 Own representation

Theoretical Background of the Thesis 6
2 Theoretical Background of the Thesis
In the following chapter the fundamentals needed for the further analysis will be described. Therefore, the environmental analysis after the PESTEL framework with its areas of examination is defined as found in literature. Then procedures needed for the overall PESTEL process flow are explained. At the end of this theory overview the economic basics are described.
2.1 Environmental Analysis
Companies are in permanent interaction with the environment. They offer products or services to potential customers, order material from suppliers, pay taxes, hire employees, follow laws and compete with competitors for customers, suppliers and employees.3 The environmental analysis is used to recognize the influence of external conditions and to assess them as regards to their risk for the company. The chosen analytic frame and the areas examined within an environmental analysis differ from company to company since not all factors are relevant for every company. The bigger part of this factors changes over longer periods of time, so that companies have time to adopt to these changes at an early state.4 The environmental analysis can be split in three steps:
• Examination of possible external factors influencing the business • Selection of most important factors affecting the business • Documentation and evaluation of most important influences5
There are two different perspectives for the environmental analysis, the stakeholder oriented and the planning oriented approach. The stakeholder oriented approach sees the environment as system of its stakeholders (e.g. customers, suppliers, investors, media), and focusses on their key interests. The planning oriented perspective splits the environment into different groups such as the general environment (e.g. Political, Economic, Social, Technological, Environmental, Legal; PESTEL) and the competitive environment.6
3 Sabine Reisinger, 2013, p. 30 f. 4 Heiko Asum, 2015, p. 122 f. 5 Heiko Asum, 2015, p. 122 f. 6 Sabine Reisinger, 2013, p. 30 f.

Theoretical Background of the Thesis 7
2.1.1 PESTEL Framework
The acronym PESTEL stands for “Political”, “Economic”, “Social”, “Technological”, “Environmental” and “Legal”. A successful introduction of a product into a new market or the preservation or expansions of already existing market shares implies accurate knowledge of circumstances and boundary conditions as well as relationships between analyzed areas of the environment. The PESTEL framework divides the macro environment into six specific spheres:7 Political: Table 2 shows the political circumstances which are influencing the business in different areas. The organization of the political system should help to understand how decision making processes concerning the direction of the state and policies are conducted and how the leading entities are connected with each other. The stability of the political system and the political risks indicate threats which are caused by the national government. Another important risk factor is the corruption level. Corrupt structures are influencing business in a plurality of aspects and have to be evaluated before creating business within a foreign nation. Beside the governmental involvement in trade unions and trade agreements, the trade policy and import export regulations play a major role when a company wants to sell products within another nation’s borders. Whether there are limitations or facilitations, both have to be recognized in an early stage to evaluate a nation’s potential for market introduction. Money and fiscal policy show how the money supply within the country is managed and how interest rates and salaries are influenced. The working and social policy as well as the health and safety policy can be crucial if a company wants to employ persons in another nation. The regulations from professional associations can be relevant in specific branches and deliver key information for certain businesses. Further there can be political and economic sanctions by other states which are influencing elements which are in connection with potential ventures. Sanctions have to be evaluated before entering into the new market since a lot of risk is exposed by them. The examined areas are shown in Table 2.8
Table 2: Political circumstances9
Organization of the political system Import export regulations
Stability of the political system Money and fiscal policy
Political risks Working and social policy
Corruption level Health and safety policy
Governmental involvement in trade unions and agreements
Regulations from professional associations
Trade policy Sanctions
7 Ralph Berndt, 2016, p. 28 ff., Heiko Asum, 2015, p. 123, Philip Kotler, 2007, p. 115 ff. 8 Ralph Berndt, 2016, p. 28 ff., Heiko Asum, 2015, p. 123, Philip Kotler, 2007, p. 115 ff. 9 Ralph Berndt, 2016, p. 28 ff., Heiko Asum, 2015, p. 123, Philip Kotler, 2007, p. 115 ff.

Theoretical Background of the Thesis 8
Economic: Economic circumstances, economic key performance indicators and branch specific figures are shown in Table 3. They include the gross domestic product (GDP) and the GDP growth rate as key figures which indicate the performance and the growth of a national economy. The governmental spending, the governmental debt, the inflation rate and the interest rate are taken into account to understand how money and fiscal policies are influencing the economic parameters of the nation. Further these factors help to understand if extensive or contractive money politics are applied to the economy. The consumer price index gives an indication about how the price level of a predefined group of goods is at the moment. It is used to compare price levels between different countries. The unemployment rate shows how efficient the labor market is managed by the state and how many workers are not able to find an adequate occupation. Currency stability and exchange rates are a major parameter for understanding the correlation between the development of the volume of money in circulation and the development of the national income. Instable currencies indicate nations with unstable financial markets which could lead to risks for ventures within the nation. Import, export and the trade ratio offer an overview of how the exchange of goods is structured within an economy. These parameters indicate how intensive the economic connections to foreign countries are. Another important factor, especially when exporting goods into a foreign nation, are tolls. They are connected with bureaucracy and costs and can influence the favorability of creating business opportunities in other countries.10
Table 3: Economic circumstances11
Gross domestic product (GDP) Unemployment rate
GDP growth rate Currency stability
Governmental spending Exchange rate
Governmental debt Import
Inflation rate Export
Interest rate Trade ratio
Consumer price index Tolls These were economic factors given by the nation itself, Table 4 shows circumstances given by the specific markets. The market volume and the market growth helps to understand how the target market is situated. While a high market volume with high market growth illustrates a potential possibility for the market introduction, a low market volume with low market growth does the opposite. Further it can be interesting for a company to have an overview of customers and competitors with their associated market shares.12
10 Ralph Berndt, 2016, p. 28 ff., Heiko Asum, 2015, p. 123, Philip Kotler, 2007, p. 115 ff. 11 Ralph Berndt, 2016, p. 28 ff., Heiko Asum, 2015, p. 123, Philip Kotler, 2007, p. 115 ff. 12 Ralph Berndt, 2016, p. 28 ff., Heiko Asum, 2015, p. 123, Philip Kotler, 2007, p. 115 ff.

Theoretical Background of the Thesis 9
Table 4: Market circumstances13
Market volume Competitor overview
Market growth Market share
Customer overview Social: The demographic characteristics of the society are shown in Table 5. These characteristics help to understand with which boundary conditions the population within a country is dealing with. Foreign companies can benefit from this information, since these circumstances have to be considered when building businesses and relationships with foreigners. Values, mindsets, traditions, religion and believes can have a major influence on how people are acting within negotiations and have to be understood in advance so that no conflicts occur because of the cultural differences. The attitudes towards foreign investments and imported products and services show how easy it is for a company to create business relations within another country.14
Table 5: Social circumstances15
Population structure Traditions
Population growth rate Religions and beliefs
Age distribution Immigration
Education structure Attitudes towards investment
Values Attitudes towards imported products and services
Mindsets Attitudes towards work Technological: Table 6 shows technological circumstances allowing to evaluate the technological advancement of a nation. The availability of technological knowledge supports ventures and opens a variety of possibilities for benefiting from the step towards another nation. The power supply and energy consumption show how the nation’s power generation is handled, the telecommunication usage shows how the population is connected to the different communication networks and the strong presence of technologies in specific areas shows if there are regions which promote certain technologies.16
13 Ralph Berndt, 2016, p. 28 ff., Heiko Asum, 2015, p. 123, Philip Kotler, 2007, p. 115 ff. 14 Ralph Berndt, 2016, p. 28 ff., Heiko Asum, 2015, p. 123, Philip Kotler, 2007, p. 115 ff. 15 Ralph Berndt, 2016, p. 28 ff., Heiko Asum, 2015, p. 123, Philip Kotler, 2007, p. 115 ff. 16 Ralph Berndt, 2016, p. 28 ff., Heiko Asum, 2015, p. 123, Philip Kotler, 2007, p. 115 ff.

Theoretical Background of the Thesis 10
Table 6: Technological circumstances17
Research and Development investments Telecommunication usage
Universities and research institutions Strong presence of technologies in specific areas
Power supply and energy consumption Environmental: In Table 7 environmental circumstances are shown. They give basic information concerning geography, cities, geology, climate and weather. Further information about the infrastructure, the availability of natural resources and pollution and emissions is taken into consideration.18
Table 7: Environmental circumstances19
Geography Infrastructure
Cities Availability of natural resources
Geology Pollution and emissions
Climate and weather Legal: Legal conditions and influence factors are shown in Table 8. The legal framework and the constitution deliver the basis for the understanding of how the legal system within a nation is structured. Further, policies and regulations touching the creation of business within a foreign country are described. The tax policy does help to understand how earnings are taxed within the nation. When products are produced, the producer accountability, the environmental policy as well as the intellectual property rights point out potential challenges caused by the nation’s legal framework. Further, knowledge about competition regulations and foreigner investment right should be compiled in advance since they could cause threats to the business in a foreign country.20
Table 8: Legal circumstances21
Legal framework Intellectual property rights
Constitution Environmental policy
Tax policy Competition regulations
Producer accountability Foreigner investment right
17 Ralph Berndt, 2016, p. 28 ff., Heiko Asum, 2015, p. 123, Philip Kotler, 2007, p. 115 ff. 18 Ralph Berndt, 2016, p. 28 ff., Heiko Asum, 2015, p. 123, Philip Kotler, 2007, p. 115 ff. 19 Ralph Berndt, 2016, p. 28 ff., Heiko Asum, 2015, p. 123, Philip Kotler, 2007, p. 115 ff. 20 Ralph Berndt, 2016, p. 28 ff., Heiko Asum, 2015, p. 123, Philip Kotler, 2007, p. 115 ff. 21 Ralph Berndt, 2016, p. 28 ff., Heiko Asum, 2015, p. 123, Philip Kotler, 2007, p. 115 ff.

Theoretical Background of the Thesis 11
2.1.2 Primary and Secondary Research
For the different analyses, primary and secondary research will be conducted. Primary research is the acquisition of data which has not been captured yet. The basic instruments of primary research are the interview, the observation and the experiment.22 Interviews are the most important tool for primary research. It has to be differentiated between different types of interviews:
• Written Interview • Personal Interview • Interview over phone • Online interview23
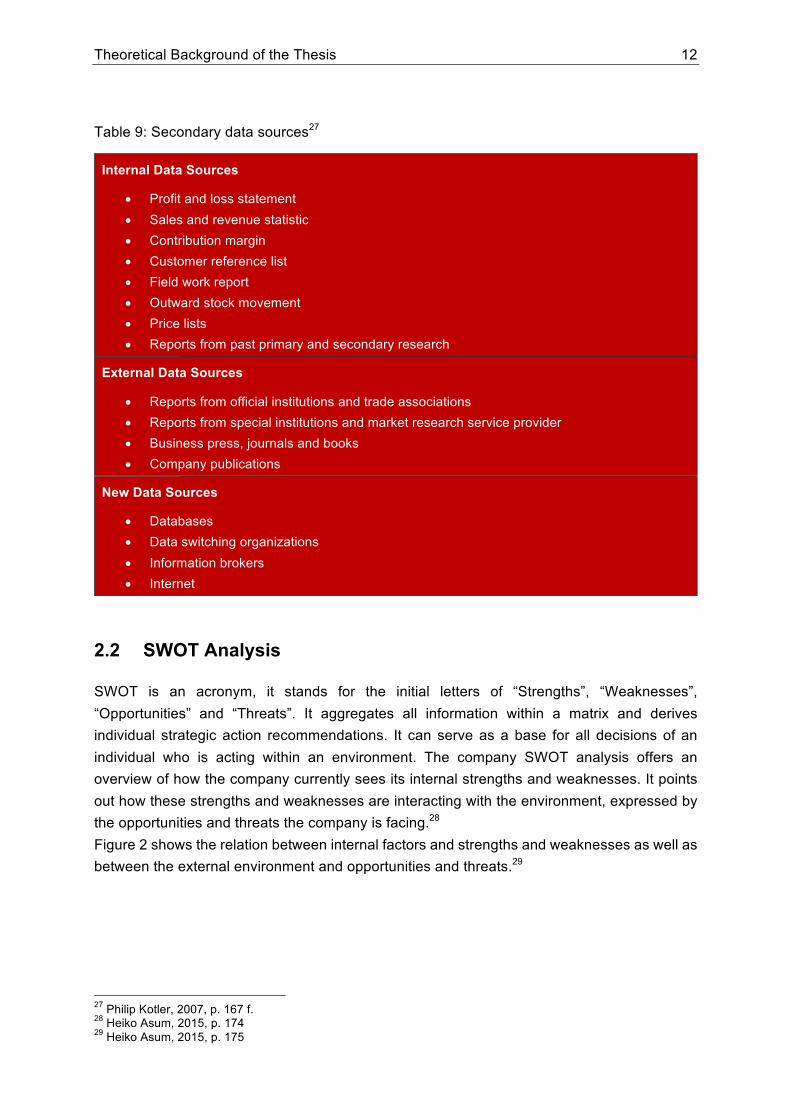
Which interview type is chosen depends on the situation. The written interview as well as the online interview requires more information in advance as conversational interviews since questionaries have to be prepared. A main influence is the anonymity within the written and online questionary. Because of that reason it is more likely that the interviewee is answering critical questions. In personal interviews and interviews over phone there is the possibility that the interviewees can explain important or interesting topics in greater detail.24 Secondary research or desk research is the acquisition of information collected by a third party for the similar or also different purposes. This type of data is mostly available in vast amounts and its analysis can extremely improve the efficiency of a research effort.25 Secondary data sources can be split in three different categories as shown in Table 9. Internal data sources are the base for the understanding of the own business and from these sources a lot of important information can be derived. The external data sources deliver vital information about the external market. New data sources are professional deliverers of highly specified information of professional databases, data switching organizations and information brokers. The internet is another powerful new data source, although it has to be assured that reliable information is collected.26
22 Heribert Meffert, 2009, p. 154 23 Jürgen Bortz, 2006 24 Jürgen Bortz, 2006 25 Ludwig Berkenhoven, 1999, p. 42 f. 26 Philip Kotler, 2007, p. 167 f.
Theoretical Background of the Thesis 12
Table 9: Secondary data sources27
Internal Data Sources
• Profit and loss statement • Sales and revenue statistic • Contribution margin • Customer reference list • Field work report • Outward stock movement • Price lists • Reports from past primary and secondary research
External Data Sources
• Reports from official institutions and trade associations • Reports from special institutions and market research service provider • Business press, journals and books • Company publications
New Data Sources
• Databases • Data switching organizations • Information brokers • Internet
2.2 SWOT Analysis
SWOT is an acronym, it stands for the initial letters of “Strengths”, “Weaknesses”, “Opportunities” and “Threats”. It aggregates all information within a matrix and derives individual strategic action recommendations. It can serve as a base for all decisions of an individual who is acting within an environment. The company SWOT analysis offers an overview of how the company currently sees its internal strengths and weaknesses. It points out how these strengths and weaknesses are interacting with the environment, expressed by the opportunities and threats the company is facing.28 Figure 2 shows the relation between internal factors and strengths and weaknesses as well as between the external environment and opportunities and threats.29
27 Philip Kotler, 2007, p. 167 f. 28 Heiko Asum, 2015, p. 174 29 Heiko Asum, 2015, p. 175

Theoretical Background of the Thesis 13
Figure 2: SWOT analysis 30
The course of action is divided into 3 steps:
• Identification of strengths and weaknesses Performance potential compared to competitors
• Identification of opportunities and threats
Observation of the environment with the PESTEL framework
• Representation of the combined portfolio Matrix representation31
The SWOT analysis can also be conducted for single products. It shows strengths and weaknesses of products compared to competing products and indicates opportunities and threats for products or product groups. The product SWOT analysis gives multiple information for the evaluation if a product or service has high potential for further increase in sales and if an external analysis after the PESTEL framework is beneficial. Further the SWOT analysis can be conducted for the analysis of a target market. The knowledge about own resources is opposed to the knowledge about the environment the company is interacting with. The strengths express the abilities of the company to reach or tackle market opportunities. For weaknesses the disadvantage in terms of competition is pointed out. Opportunities deliver chances concerning the market and the branch which are favorable for the company. Threats are the developments which can cause harm to the
30 Heiko Asum, 2015, p. 175 31 Heiko Asum, 2015, p. 175

Theoretical Background of the Thesis 14
company. The competitive position of the company in a market expressed through a SWOT analysis is shown in Figure 3.32
Figure 3 SWOT analysis result33
2.3 Product Performance Analysis
The product performance analysis delivers information about the profitability of products. The product group contribution margin and the product group “Earnings Before Interest and Taxes” EBIT ratio are consulted for the relevance of a product for the earnings of the company.34
2.3.1 Fixed and Variable Costs
Fixed costs are costs which are independent of occupation. They also occur when no product is produced and cover expenses which are needed to keep the production infrastructure up and running. Fixed costs are generated over periods of time, not over production output. Examples for fixed costs are rent, salaries and depreciation payments. Variable costs are changing with occupation. They are in direct correlation with the extent of the provided service or product which are causing the costs.35 Equation 1 shows the overall costs:
32 Nagl, 2014, p. 30 f. 33 Nagl, 2014, p. 30 f. 34 Messner, 2016, p. 170 35 Szyszka, 2015, p. 54 f.

Theoretical Background of the Thesis 15
𝐶"#$%&'' = 𝑐*+, + 𝑐#&% ∗ 𝑥 Equation 136
Coverall… overall costs cvar… variable costs cfix… fixed costs x… produced units
As seen in Equation 1, the overall costs are the sum of the fixed costs and the variable costs multiplied by the produced units. In Figure 4 the dependency of the variable costs on the occupation x* can be seen.37
Figure 4: Overall costs38
2.3.2 Contribution Margin and EBIT
The contribution margin per unit is the difference of the revenue per piece and the variable costs as seen in Equation 2. For several products, the overall contribution margin is the sum of all contribution margins of all products together.39
𝐶𝑀 = 𝑟 − 𝑐#&% Equation 2
CM… Contribution margin cvar… variable costs r… revenue
36 Szyszka, 2015, p. 54 f. 37 Wullf Plinke, 2015 38 Wullf Plinke, 2015 39 Horsch, 2015, p. 197 f.

Theoretical Background of the Thesis 16
A positive contribution margin does not only imply that expenses which are connected with the creation of the product or service are covered, it says that a surplus can be reached with which a part of the fixed costs can be covered. A negative contribution margin indicates that the arisen revenues are smaller than the additional cost.40 The contribution margin ratio (CMR) sets the contribution margin and the net sales into relation as seen in Equation 3. 41
𝐶𝑀𝑅 =𝐶𝑀
𝑁𝑒𝑡𝑆𝑎𝑙𝑒𝑠 Equation 3
CMR… Contribution margin ratio CM… Contribution margin
The CMR ranges between zero and one. The higher the ratio, the more profitable the product.42 The operational result or the earnings before interest and taxes (EBIT) is the contribution margin minus the fixed costs as seen in Equation 4.43
𝐸𝐵𝐼𝑇 = 𝐶𝑀 − 𝑐*+, Equation 4
CM… Contribution margin 𝑐*+,… Fixed costs
This calculation ignores non-recurring expenditures, interests, financial expenses and earnings and taxes since they did not originate from the operating activity.44 The EBIT ratio as seen in equation 5 sets the relation between EBIT and the revenue. It is a key performance indicator which is particularly suitable for the comparison of profitability of different product groups.45
𝐸𝐵𝐼𝑇𝑟𝑎𝑡𝑖𝑜 =𝐸𝐵𝐼𝑇
𝑅𝑒𝑣𝑒𝑛𝑢𝑒 Equation 5
2.4 Product Diversification
Stimulus for the development of ideas comes from the market, if products of a company are not competitive or the customer requirements are changing. The idea collection for product diversification can be enriched by internal and external idea sources as seen in Table 10.
40 Horsch, 2015, p. 197 f. 41 Horsch, 2015, p. 223 42 Horsch, 2015, p. 223 43 Staroßom, 2013, p. 84 f. 44 Staroßom, 2013, p. 84 f. 45 Staroßom, 2013, p. 84 f.

Theoretical Background of the Thesis 17
Table 10: Idea sources46
Internal idea sources External idea sources Customer service reports Customers Customer demands Experts Customer complaints Competition analysis Proposals from employees Publications in journals Publications from branch institutions Inventors License providers Patent institutions Publications from research institutions Marketing and innovation advisors
2.4.1 Market and Competition Analysis
Market and competition analysis play a major role in managerial economics and environmental analysis. Both deliver key information for the development of corporate and market strategies and enable the company to benchmark with competing companies. Market analysis can become very extensive, the level of detail should be determined before and should be tailored to the specific needs of the company.47
2.4.1.1 Market Analysis
With the help of general market data, a market overview can be created, which offers information about market size, market segmentation and the most important players.48 The market size can be split in the following parts:
• Overall market: The totality of the market • Potential market: The totality of customers with an interest in a market offer • Accessible market: The totality of the customers which have not only the interest in a
market offer but also have the needed spending power and the needed access to a concrete market offer
• Qualified accessible market: The totality of customers which in addition to the requirements of the accessible market also have the qualification for a specific market offer
• Served market: Part of the qualified accessible market which the company wants to serve, also called the target market
46 Hermann, 1998, p. 515 f. 47 Seiler, 2001, p. 70 ff. 48 Philip Kotler, 2007, p. 195 f.

Theoretical Background of the Thesis 18
• Penetrated market: The totality of the possible customers which already bought the product49
The market segmentation is an element of marketing and is used to split the overall market into smaller groups called segments. The segmentation is carried out after several segmentation criteria.50 Basically, classic and modern characteristics can be distinguished:
• Classic: • Geographic • Demographic • Socio-economic criteria
• Modern:
• Personality characteristics • Expectations and opinions • Lifestyle characteristics51
For the market overview, the geographical area has to be defined, whether the worldwide market, regional markets like the European Union or national markets are analyzed. The relevant market is defined by the product group, the geography and by characteristics of customers. The initial step for the analysis is the clear definition of the potential group of the offered product or service.52
2.4.1.2 Competition Analysis
Further the market data concerning size and positioning of competing companies should be acquired to generate an understanding of the risks these competitors are causing. The size of the market share of a company plays a key role. The higher the market share the generally lower is cost structure and the more likely it is to influence the market for one’s own end. In the area of capital equipment production, it is common that companies only focus on revenue increase, although it could be the case that despite rising sales the market share is shrinking. Therefore, it is important to check the connection between the market and competing companies.53
49 Philip Kotler, 2007, 195 f. 50 Runia, 2007, p. 98 f. 51 Runia, 2007, p. 98 f. 52 Seiler, 2001, p. 70 ff. 53 Seiler, 2001, p. 70 ff.

Theoretical Background of the Thesis 19
2.4.1.3 Portfolio Analysis
The portfolio analysis is one of the most common strategic analysis instruments. The McKinsey-Portfolio shows how the product is situated on the market within two dimensions. The market activity indicates the attractiveness of the product market segment in which a business unit is competing. Not only the market growth is considered but also market quality and other environmental influences.54 The competitive strength is a combination of the relative market share, the relative market position, the relative production potential and the relative development potential. The circle diameter shows the overall market volume and the market share is represented in the form of a pie chart as seen in Figure 5. “Product 3” shows a relatively low market volume but a high market share due to high competitive strength, the market activity is low. “Product 2” is within a highly active market, the market share is low compared to the overall market volume. The competitive strength is average to high.55
Figure 5: Portfolio analysis56
2.4.1.4 Customer Analysis
Customers are persons or organizations who are likely to buy the chosen product. A customer analysis requires the deep understanding of the situation the customer is given by the market. Further it is important which criteria the customer is checking before the buying decision is taken. The better the understanding, the easier it is to work towards the desired market behavior. Customer desires differ from segment to segment as well as buying decision criteria.57
54 Heiko Asum, 2015, p. 97 f. 55 Heiko Asum, 2015, p. 97 f. 56 Heiko Asum, 2015, p. 97 f. 57 Seiler, 2001, p. 75

Theoretical Background of the Thesis 20
Industrial goods are needed by customers to produce their own services or goods. The decision-making process differs from the one of consumer goods since the decision-making process for a product passes several levels within the company and is proven from a variety of aspects. This implicates specific behaviors:
• Buying decision by several persons as collective • Strong interaction and relationship behavior between seller and buyer • High weight of trust and personal communication • Low number of customers and the need for individual solutions • System solutions which consist of several products and services • Direct marketing • High amount of international business relations58
2.4.2 Innovation
An innovation is finding an economic application for an idea. Innovation is not limited to products or services, it can also happen within corporate or technological processes. There are two different degrees of innovation, the incremental innovation which is following established market fields and offers little chances and risks and the radical innovation which is distinguished by fundamental changes which offer high economic and technical chances and risks. .59 60 The idea funnel as seen in Figure 6 shows how ideas become inventions to be then processed into products or services which then have to prove it on the market. It is common that a variety of ideas channel into an idea pool of only several ideas which offer potential for becoming real innovations. Further not all innovative products are successful on the market so that only very few innovations find the way through the idea funnel.61 62
58 Seiler, 2001, p. 34 59 Weis, 2014, p. 37 f 60 Schallmo, 2014, p. 7 61 Weis, 2014, p. 37 f 62 Schallmo, 2014, p. 7

Theoretical Background of the Thesis 21
Figure 6: Idea funnel63
6-3-5 Method: The 6-3-5 method is a brainwriting method which encourages six persons to write down three product ideas. The ideas get passed around and everyone has to further develop the ideas of the previous person. This happens five times so that in the end there are six sheets with potential ideas. They are finished and ready for further assessment. The goal is the intuitive writing of ideas with the goal of idea quantity, there is no room for criticism on previous ideas to not prevent creativity.64
2.5 Business Model Canvas
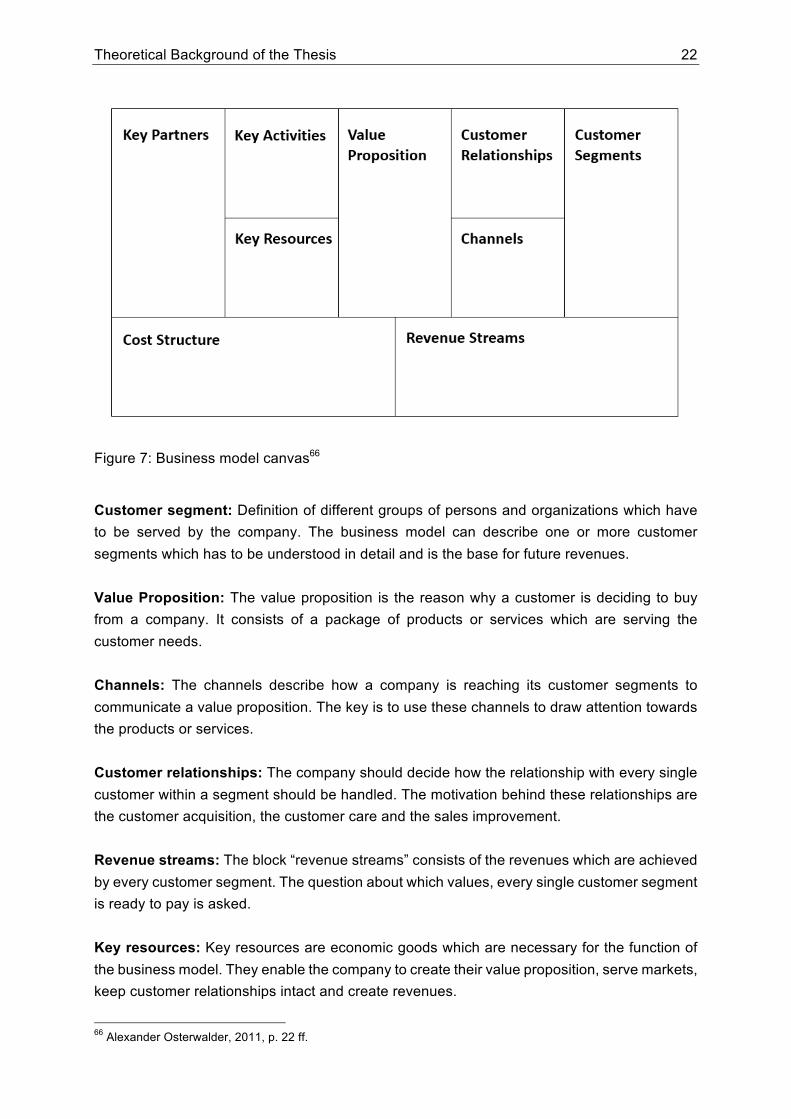
With the business model canvas an organization describes the basic principle of how values are created, determined and captured. It is easy to understand and enables the teams within the organization to create business model innovations in an intuitive way without the risk of oversimplification of the functionality of companies. The model creates a common understanding and language with the consideration of nine basic building blocks which distinguish how an organization is earning money. This strategic plan is then implemented by organizational structures, processes and systems.65 The nine building blocks are as seen in the following Figure 7.
63 Weis, 2014, p. 38) 64 Bruhn, 2004, p. 132 f. 65 Alexander Osterwalder, 2011, p. 22 ff.
Theoretical Background of the Thesis 22
Figure 7: Business model canvas66
Customer segment: Definition of different groups of persons and organizations which have to be served by the company. The business model can describe one or more customer segments which has to be understood in detail and is the base for future revenues. Value Proposition: The value proposition is the reason why a customer is deciding to buy from a company. It consists of a package of products or services which are serving the customer needs. Channels: The channels describe how a company is reaching its customer segments to communicate a value proposition. The key is to use these channels to draw attention towards the products or services. Customer relationships: The company should decide how the relationship with every single customer within a segment should be handled. The motivation behind these relationships are the customer acquisition, the customer care and the sales improvement. Revenue streams: The block “revenue streams” consists of the revenues which are achieved by every customer segment. The question about which values, every single customer segment is ready to pay is asked. Key resources: Key resources are economic goods which are necessary for the function of the business model. They enable the company to create their value proposition, serve markets, keep customer relationships intact and create revenues.
66 Alexander Osterwalder, 2011, p. 22 ff.

Theoretical Background of the Thesis 23
Key activities: Key activities describe the most important things a company has to do so that the business model is functioning. The goals of these activities are the same as the ones of the key resources. Key partners: Key partners are the network of suppliers and organizations which are crucial for the value generation. There are different kinds of partnerships:
• Strategic alliances between non-competitors • Strategic alliances between competitors • Joint ventures for the development of new businesses • Buyer supplier relationships
Cost structure: It describes the most important costs which are generated by the prosecution of the business model. The creation and communication of value, the care for the customer relationship and the generation of revenue imply costs. They can be allocated to key resources, key activities and key partnerships.67
2.6 Economic Basics
The following sub-chapter describes economic parameters used within the economic analysis within the PESTEL framework.
2.6.1 Gross Domestic Product and Economic Growth Rate
The gross domestic product (GDP) is a measure for the overall economic performance of an economy. There are several methods to calculate the GDP, one is to sum up all value creations out of goods and services for end-consumers which are produced over a certain amount of time within one nation’s frontiers.68 We have to differ between the nominal and the real gross domestic product. The nominal GDP shows the sum of all end products referred to their particular prices, while the real gross domestic product shows the change in production output due to the exclusion of the effect of price increase. The rate of growth of the real GDP indicates how much the sum of all end products increased compared to the previous period adjusted for price.69 Further there can be differentiated between extensive economic growth and intensive economic growth. While extensive economic growth means that production grows in correlation with population, intensive economic growth shows the increase of the gross domestic product per person.70 67 Alexander Osterwalder, 2011, p. 22 ff. 68 Olivier Blanchard, 2006, p. 146 ff. 69 Olivier Blanchard, 2006, p. 146 ff. 70 Olivier Blanchard, 2006, p. 146 ff.

Theoretical Background of the Thesis 24
2.6.2 Inflation Rate
The inflation rate is a continuing increase in the general price level of goods and services, which is equal to a reduction of the purchasing power of money. In times of rising prices, not all prices and salaries are increasing equally. This is why inflation influences the income
distribution within a national economy and can lead to uncertainty and distortion.71
2.6.3 Interest Rate
The nominal interest rate is the rate with which money increases when stored on a bank. The increase in buying power, however, is called the real interest rate, it is the difference between interest rate and the inflation rate. 72 The interest rate is influenced by the balance between money supply and money demand. The central bank can influence this interest rate by regulating money supply by open market operations which is the buying or selling of value papers.73
2.6.4 Unemployment Rate
Unemployment is the actuality that people who are actively looking for a paid job cannot find one. The unemployment rate is the ratio between unemployed people and the overall working population. The overall working population are all people who are working or are looking for work. Not included are children and adolescents who have not reached the working age, retired persons and people who do not want to work or gave up looking for work.74
2.6.5 Money and Fiscal Policy
There are two different basic strategies in money politics, the expansive strategy, if the money supply is increased, and contractive money politics, where the money supply is decreased. An increase in money supply leads to higher incomes and a falling interest rate. A decrease in money supply results in falling salaries and higher interest rates.75 Two simple mechanisms of expansive fiscal politics, the tax relief and the increase in governmental spending, trigger the increase in investments in an economy. Vice versa there is a decrease in investments when contractive money politics such as tax increase and lower governmental spending, are applied. It results in lower incomes and lower interest rates.76
71 Olivier Blanchard, 2006, p. 46 72 Mankiv, 2011, p. 119 73 Mankiv, 2011, p. 119 74 Michael Burda, 2009, p. 7 75 Olivier Blanchard, 2006, p. 155 f. 76 Olivier Blanchard, 2006, p. 155 f.

Theoretical Background of the Thesis 25
2.6.6 Trade Ratios and Trade Balance
The export ratio represents the fraction of exports of goods and services of the GDP. An understanding of how big the dependence on economic developments in foreign countries for a national economy is given. In reverse the import ratio represents the import dependency of the national economy. The trade balance is defined as the exports minus the imports of goods related to the GDP. Are the exports bigger than the imports, there is a trade balance surplus. Are the exports smaller than the imports, it is said to be a trade balance deficit.77
77 Michael Burda, 2009, p. 43

Practical Part 26
3 Practical Part
The practical part describes the JCA PESTEL process with each process entity and each sub-procedure step which is needed to reach the final process entity, the national PESTEL analysis. In 3.2 the described process is executed on the example of the JCA holding.
3.1 JCA PESTEL Flowchart
The JCA PESTEL Flowchart describes the procedure from the initial situation towards the national PESTEL analysis. The flowchart consists of main procedure entities in red, sub-procedure steps in grey and gateways as grey rhombuses, seen in Figure 8.
Figure 8: JCA PESTEL Flowchart78
3.1.1 Company Screening
Goal of the company screening is the understanding of the strategic direction of a company and the definition of a product or product group which is most relevant for further external analysis. The company screening procedure presented within this sub-chapter has been created with experts from the JCA holding. The company screening consists of four sub-procedure steps. The sub-process steps help to understand the company and to deliver outputs which are key for the following gateway
78 Own representation

Practical Part 27
decision. If the predetermined information is not yet available within the company, the gathering of information in preparation of this sub-procedure step has to be evaluated.
3.1.1.1 Strategy Analysis
A company’s strategy defines the roadmap of the common effort for reaching pre-defined goals. Since the strategy is very individual for every company, it has to be analyzed carefully. The existing strategy analysis gives an overview of how the company is strategically positioned and how its products are situated on the market. Therefore, strategy documents should be inspected and management interviews have to be conducted. The analysis of the strategic status quo is crucial for further process steps since it is the base for decision making and could give a perspective on which direction the external PESTEL analysis should be conducted.
3.1.1.2 SWOT Analyses
SWOT analyses deliver important information concerning the company itself, about products and markets as described in chapter 2.2. Existing SWOT analyses should be gathered and taken into consideration for the further analysis.
3.1.1.3 Existing Market Analysis
Market analyses as described in chapter 2.4.1 gather structured information about products in existing markets which have to be studied before further external analysis. They offer insights about how branch specific analyses are conducted and offer vital information concerning customers, competitors and the market itself.
3.1.1.4 Performance Data
The performance analysis described in chapter 2.3 gives the direct link between the product, its markets and the profit generation. The product performance is a major part of the decision-making process concerning the initialization of a PESTEL analysis, since more performant products could be favorable for an external analysis as profit generation plays a major role for companies.
3.1.1.5 Gateway Decision 1
The gateway decision seen in Figure 9 asks if the company screening with the internal inputs delivered a high potential product in a relevant market with the potential for expansion. If the gateway decision delivers the output “yes", the chosen product or service is taken to the global ”Political, Economic, Technological”, PET analysis as seen in Figure 8 and further described in 3.1.5. If the gateway decision delivered a “no”, a product diversification analysis is initiated.

Practical Part 28
Figure 9 Gateway decision 179
3.1.2 Product Diversification Analysis
The product diversification is described in chapter 2.4. The analysis consists of three sub-procedure steps, the market research, the expert interview and the innovation workshop as seen in Figure 10. At first the core market in which the company is acting has to be analyzed. For the market research, official sources, publications of market research institutions, information of unions and organizations, economic press and journals are taken to create a market overview to get information about the potential and growth of the core market. If potential product ideas can be derived from the market overview, they are taken into the idea pool. The second sub-procedure is the expert interview. After giving them an overview about the existing information about the company screening and the market research, internal and external experts are asked for their evaluation about which new products could offer potential for market introduction and are simultaneously realizable with the existing know how of the company. The resulting ideas are also added to the idea pool. The third sub-procedure step is the innovation workshop. A group of open minded people from the company is gathered and does an idea creation workshop with the help of creativity techniques and innovation tools. The ideas are also taken into the idea pool and are further processed in the following chapter 3.1.3.
79 Own representation

Practical Part 29
Figure 10: Product diversification80
3.1.3 Idea Assessment and Gateway Decision 2
The generated idea pool of the previous steps serves as input for the idea assessment as seen in Figure 11. The further processed output of the idea assessment are high potential ideas, one category with high implementation effort, labelled as question mark, one with low implementation effort, labelled as top idea. These two labels give the instruction for the following gateway decisions 2 as seen in Figure 11. While top ideas should be processed with a “Business Model Canvas”, described in chapter 2.5, the knowledge about question mark rated ideas should be intensified with an “Idea Concretion Scheme” described in chapter 3.1.4. After the concretion of the idea is finished, the idea should pass through another iteration step and should be reassessed with the “Four-Field Method”. The result is either a top idea on the high potential side or an idea on the low potential side split again into high realization effort and low realization effort. While low potential ideas with high realization effort are “thrown into the paper bin”, low potential ideas with low realization effort are put into the “drawer”, where they can be reexamined when implementation capacity is available.
80 Own representation

Practical Part 30
Figure 11: Four-field method and gateway decision 281
3.1.4 Idea Concretion
The idea concretion aims for better understanding of the quality of an idea for the following reassessment with the four-field method. The following points should be examined:
• Idea potential, potential savings and value added for customers • Risks and disadvantages of the solution • Do I have the technological knowhow to implement this product? • Is the idea applicable for other products? • Description of the status quo on the market • How big is the potential market? • Are intellectual property rights considered? • Potential threats to the idea • Cost estimation and implementation plan • Execution requirements • Next steps
The concretion with these points serves as basis for the second iteration step for the idea assessment and leads to the allocation to one of the other three fields of the “Four-Field Method”.
81 Own representation

Practical Part 31
3.1.5 Global PET Analysis
The purpose of the global “Political, Economic, Technological” PET Analysis is the creation of an overview of global influences interacting with the business. It delivers essential information as to whether external conditions are favorable for a product entering a new market or not. Social, environmental and legal information has been left aside since it is not a key decision criteria whether a new market has high potential for the chosen product. Table 11 shows the examined areas of the global PET Analysis.
Table 11: Global PET analysis82
Political Economic TechnologicalGLOBAL Internationalconflicts Marketvolume Developmentofkey
technology
GLOBAL Importantpoliticalinfluences Marketgrowth Productsubstitution
potential
GLOBAL Competition Productinnovations
GLOBAL Customers
GLOBAL Attractiveforeignmarkets
GLOBAL Newindustrializedcountries
3.1.5.1 Global Political Analysis
International conflicts can cause major difficulties in international business relations and can lead to instabilities in sales and markets themselves. Political conflicts should be analyzed with the top to bottom approach and help to understand which global affairs can lead to risks. Further important political influences should be checked. A variety of information can be screened within this point, the relevant information differs from company to company or from product to product. The focus of this analysis has to be determined by the analyst himself.
3.1.5.2 Global Economic Analysis
The global economic analysis should deliver a clear view concerning market related information. Global market volume and market growth are a key information before launching a new product or before launching a product into a new market. It can be the case that the global PET analysis should be sent into the next iteration step in the process flow if this 82 Ralph Berndt, 2016, p. 28 ff., Heiko Asum, 2015, p. 123, Philip Kotler, 2007, p. 115 ff.

Practical Part 32
information is gathered and delivers no satisfying results. If it is not sure if there is a promising market for the product, it has to be evaluated if further analysis effort for the same product is legitimate. When entering a new market with an existing product, information about global competitors and customers should be available. If a new market is tackled this information could be vital for estimating the effort for market penetration and planning the strategy. Attractive foreign markets and new industrialized countries could offer high yield possibilities if entered in an early state. This can also be countries under sanctions which are likely to be abolished within the next years.
3.1.5.3 Global Technological Analysis
The global technological analysis checks if obsolescence of the chosen technology is given and if the key technology is in danger of substitution through new innovations. This could either trigger a rejection of the chosen product or product idea, which leads to an iteration in the process flow, an exchange of the chosen product technology with the new upcoming technology or the approval of relevance of the chosen technology.
3.1.5.4 Gateway Decision 3
The global PET analysis delivers the base for decision for the following gateway as seen in Figure 12. It collects information as to whether the market for the chosen product is given and shows tendencies where the national PESTEL analysis is reasonable. If there is no promising market for the chosen product an iteration step is initiated. If the gateway decision delivers a yes, the next procedure step, the “National PESTEL Analysis” is conducted for the chosen product in the high potential market.

Practical Part 33
Figure 12: Gateway decision 383
3.2 Execution of the JCA PESTEL Process
The following chapter describes the execution of the JCA PESTEL process for the JCA holding. The company screening delivered the result that both ACE and APB have several branches which they supply with apparatuses with acceptable order amounts and solid revenues. It has been decided that no urgent need for further environmental analysis is given. SBN focusses on ammonia and urea branches only, both strongly dependent on the fertilizer industry. Since the nitrogen fertilizer prices have been declining over the last years and the demand for apparatuses in this niche is also scaling down, the company is encouraged to produce high pressure apparatuses for other branches. In the JCA PESTEL Flowchart, the gateway decision seen in Figure 13 delivered a “no” decision concerning the product portfolio of SBN. There are no high potential products or product groups with potential markets for expansion. This led to the decision to create a product diversification analysis for SBN.
83 Own representation

Practical Part 34
Figure 13: Result gateway decision 184
3.2.1 Product Diversification Analysis
In apparatus production, welding technology is key for the manufacturing process. SBN is an expert in welding technologies for high wall thicknesses, used in high pressure apparatuses. This unique selling proposition has been taken as a key strength for the following product diversification analysis. As described in chapter 3.1.2, the product diversification analysis consists of three sub-procedure steps as seen in Figure 14. At first a market overview about the chemical industry has been created. Second, company internal and external experts evaluated the feasability of entering the production of other high pressure process apparatuses for the chemical industry. Third, an external advisor held an innovation workshop with employees of SBN.
84 Own representation

Practical Part 35
Figure 14: Product diversification85
3.2.1.1 Chemical Industry Overview
The market overview should give a basic understanding of the boundary conditions within the core branch of the company. The global market volume and market growth tendencies help to understand the business. For product diversification it can be interesting to check similar branches which can be entered with the company’s core technologies or strengths. This market research should be carried out roughly, since the analyst is acting after the top to bottom approach. The chemical industry has undergone major changes within the last several years. The global turnover of chemicals was 3,534 billion € in 2015, it grew by 118% compared to 2005. Figure 15 shows world’s chemical sales by geographical region:86
85 Own representation 86 Chemical Industry Facts and Figures Report, 2016

Practical Part 36
Figure 15: Worlds chemical turnover 201587
Global chemical production is estimated to grow by 3,4 % in 2017, which is the same as in 2016. The global growth rate is heavily driven by the developments of the chemical industry in China which delivers more than one third of the worldwide production capacity. 88 From 2005 till 2015, the European Union’s sales dropped from 28,2% of worlds sales to 14,7%, North American Free Trade Agreement (NAFTA) sales dropped from 25,3% worlds sales to 16,5%, while Chinese sales rose from 11,6% to 39,9% of worldwide turnover of chemicals since they follow an ambitious industrial policy strategy.89 Figure 16 gives an overview of the European chemical industry sales split into five main categories with their main products. 90
87 Chemical Industry Facts and Figures Report, 2016 88 BASF, 2016 89 Chemical Industry Facts and Figures Report, 2016 90 Chemical Industry Facts and Figures Report, 2016

Practical Part 37
Figure 16: Chemical industry overview91
3.2.1.2 Overview High Pressure Apparatuses
The motivation behind high pressure technology is the selectivity of reaction processes with increased product properties and improved efficiency due to better physicochemical and thermodynamic reaction conditions. However, the general trend goes to pressure reduction when the process development offers chances, for instance, by the introduction of catalysts. This is because high pressure technology comes with high costs in development, operation and safety efforts.92 Overviews about high pressure applications have been analyzed for the expert evaluation of producible apparatuses in the high-pressure process area. Figure 17 shows solid, liquid and gaseous applications with pressures ranging from 1 MPa to 10000 MPa.93
91 Chemical Industry Facts and Figures Report, 2016 92 Vetter, 2001 93 Witschakowski, 1974

Practical Part 38
Figure 17: High-pressure process overview94
The second overview about high pressure processes with pressure ranges is shown in the Appendix 1. This structure has been chosen for the expert evaluation since it covers methods with their product application including operating pressures. It has to be mentioned that it covers all relevant processes common in 2001.95 Expert Evaluation: For the evaluation of potential high pressure processes, five experts have been assigned with the assessment of processes which are feasible for introduction into SBN’s apparatus portfolio: DI Markus Fuchsbichler is technical director of the JCA Holding and CEO from ACE Apparatebau Construction and Engineering GmbH, Lieboch.
94 Witschakowski, 1974 95 Vetter, 2001
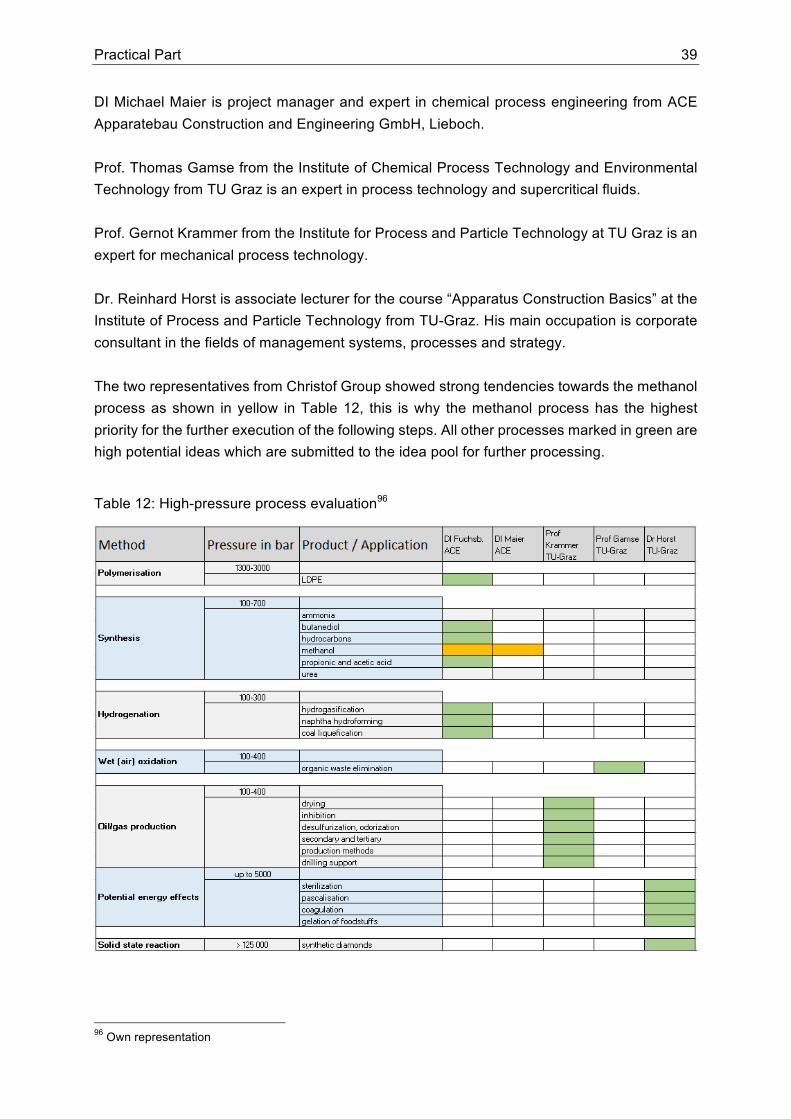
Practical Part 39
DI Michael Maier is project manager and expert in chemical process engineering from ACE Apparatebau Construction and Engineering GmbH, Lieboch. Prof. Thomas Gamse from the Institute of Chemical Process Technology and Environmental Technology from TU Graz is an expert in process technology and supercritical fluids. Prof. Gernot Krammer from the Institute for Process and Particle Technology at TU Graz is an expert for mechanical process technology. Dr. Reinhard Horst is associate lecturer for the course “Apparatus Construction Basics” at the Institute of Process and Particle Technology from TU-Graz. His main occupation is corporate consultant in the fields of management systems, processes and strategy. The two representatives from Christof Group showed strong tendencies towards the methanol process as shown in yellow in Table 12, this is why the methanol process has the highest priority for the further execution of the following steps. All other processes marked in green are high potential ideas which are submitted to the idea pool for further processing.
Table 12: High-pressure process evaluation96
96 Own representation
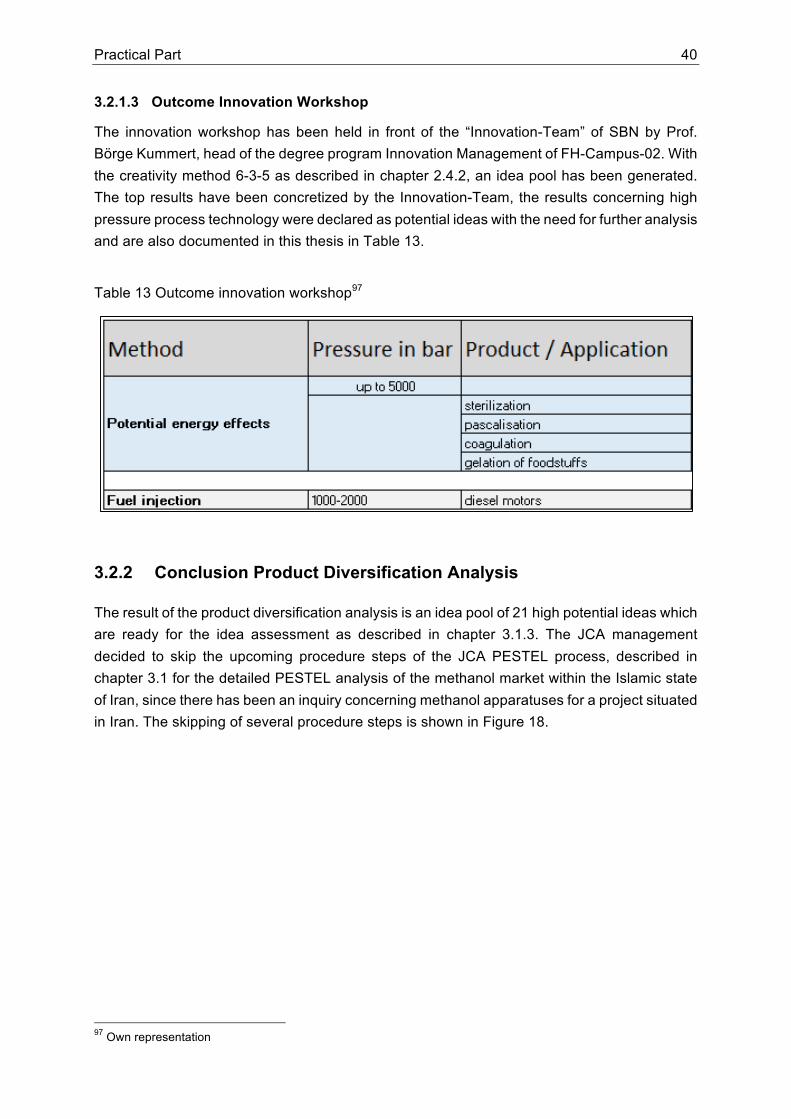
Practical Part 40
3.2.1.3 Outcome Innovation Workshop
The innovation workshop has been held in front of the “Innovation-Team” of SBN by Prof. Börge Kummert, head of the degree program Innovation Management of FH-Campus-02. With the creativity method 6-3-5 as described in chapter 2.4.2, an idea pool has been generated. The top results have been concretized by the Innovation-Team, the results concerning high pressure process technology were declared as potential ideas with the need for further analysis and are also documented in this thesis in Table 13.
Table 13 Outcome innovation workshop97
3.2.2 Conclusion Product Diversification Analysis
The result of the product diversification analysis is an idea pool of 21 high potential ideas which are ready for the idea assessment as described in chapter 3.1.3. The JCA management decided to skip the upcoming procedure steps of the JCA PESTEL process, described in chapter 3.1 for the detailed PESTEL analysis of the methanol market within the Islamic state of Iran, since there has been an inquiry concerning methanol apparatuses for a project situated in Iran. The skipping of several procedure steps is shown in Figure 18.
97 Own representation

Practical Part 41
Figure 18: Flowchart shortcut98
3.3 National PESTEL Analysis
The national PESTEL analysis which has been conducted after the evaluation of the most important influence factors described in chapter 2.1.1, focuses on the methanol market and the Islamic republic of Iran. The Islamic republic of Iran has 28 provinces. The form of government is an Islamic presidential republic led by supreme leader Ali Khamenei. The head of government Hassan Rouhani has been reelected in May 2017 for a period of four years. Table 14: Nation overview shows a map of Iran with provinces and gives basic information which have not been allocated to one specific chapter of the PESTEL environment.99
98 Own representation 99 BBC News, 2017

Practical Part 42
Table 14: Nation overview 100 101
3.3.1 Political Environment
The Iranian political system is unique, since it includes republican, democratic and theocratic authoritarian elements. The Islamic republic of Iran is branded by ideological contrarieties, internal and foreign political crises and fights concerning the states direction within the elite. With the election of Hassan Rouhani, the trust in the political system rose and the political and economic opening towards western countries was initiated. After the signing of the Joint Comprehensive Plan Of Action (JCPOA) in 2015, which abandoned the sanctions against Iran under certain conditions (further described in chapter 3.3.1.9), it returned to the stage of world politics after recent developments in the conflict with the United States of America.102
3.3.1.1 Organization of the Political System
Iran’s political system is not assessable into a category common in political science. The most powerful function in the state is the supreme leader, who is leading as a representative of Imams Muhammad al-Mahdi and has nearly unlimited power. Nominated by the expert council, the supreme leader is defining the political direction, is surveilling the execution, is the commander-in-chief of the army and is nominating the highest positions in the system of justice and safety and law enforcement forces.103 The second highest function in the state is the president, who is leading the executive and nominates the senior administration officials, who have to be confirmed by the parliament. The
100 BBC News, 2017 101 Google Maps, 2017 102 Germany Trade & Invest, 2017 103 Schmidt, 2011, p. 66 ff.
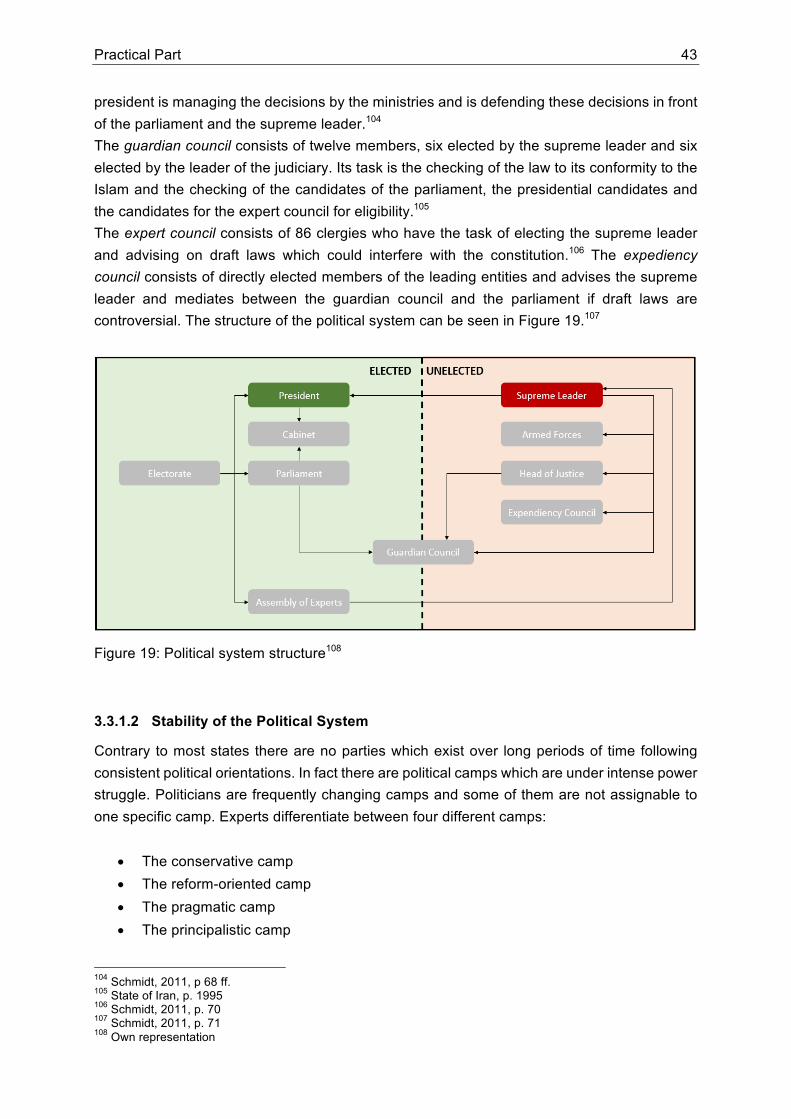
Practical Part 43
president is managing the decisions by the ministries and is defending these decisions in front of the parliament and the supreme leader.104 The guardian council consists of twelve members, six elected by the supreme leader and six elected by the leader of the judiciary. Its task is the checking of the law to its conformity to the Islam and the checking of the candidates of the parliament, the presidential candidates and the candidates for the expert council for eligibility.105 The expert council consists of 86 clergies who have the task of electing the supreme leader and advising on draft laws which could interfere with the constitution.106 The expediency council consists of directly elected members of the leading entities and advises the supreme leader and mediates between the guardian council and the parliament if draft laws are controversial. The structure of the political system can be seen in Figure 19.107
Figure 19: Political system structure108
3.3.1.2 Stability of the Political System
Contrary to most states there are no parties which exist over long periods of time following consistent political orientations. In fact there are political camps which are under intense power struggle. Politicians are frequently changing camps and some of them are not assignable to one specific camp. Experts differentiate between four different camps:
• The conservative camp • The reform-oriented camp • The pragmatic camp • The principalistic camp
104 Schmidt, 2011, p 68 ff. 105 State of Iran, p. 1995 106 Schmidt, 2011, p. 70 107 Schmidt, 2011, p. 71 108 Own representation

Practical Part 44
The tendency, that a growing part of the population, especially the young people don’t feel represented by a political camp, leads to potential sources of instability.109 110 111 In 2015, the political stability index of the global economy which is within a scale ranging from -2,5 (low) to 2,5 (high), stood at -0,91. It was constantly increasing since an overall low in 2010 with -1,62. In comparison, the political stability in Austria was rated with 1,19 in 2015.112
3.3.1.3 Political Risks
Iran is still confronted with business regulations since the nuclear deal in 2015 was signed. Foreign investors are invited to invest in Iran by the government if the workforce is hired within Iran and if technological knowledge is shared. Many foreign investors are still hesitating with commitments in Iran, since the nuclear deal could be cancelled by the United States causing the reintroduction of the sanctions Iran had to deal with since 1995.113
3.3.1.4 Corruption Level
The corruption perception index 2016 ranks Iran on position 131 out of 176 countries with an equal score with Kazakhstan, Nepal, Russia, and Ukraine.114 Western companies with zero corruption tolerance level are hesitating with commitments in Iran, since corruption is evident in every area of business.115 Under the leadership of President Rouhani an anti-corruption drive went through the government, but there are still corrupt systems of patronage within the institutions of the government.116
3.3.1.5 Governmental Involvement in Trade Agreements
Iran is not member of the World Trade Organization (WTO), it is world’s biggest economy not within the WTO. Since 2005 Iran has the status of an observer, this implies the start of negotiations for participation within several years.117 Since Iran holds tight to its plans for the uranium enrichment program, the United Nations imposed severe sanctions concerning trade on the Iranian state in 2006, which have been kept active until 2016.118 Iran is a founding member of the Organization of the Petroleum Exporting Countries (OPEC).
109 Arash Sarkohi, 2011, p. 193 f. 110 David E. Thaler, 2010, p. 68 ff. 111 Arash Sarkohi, 2011, p. 200 112 The Global Economy, 2015 113 William Maclean, 2016 114 Transparency.org, 2016 115 Hegmann, 2016 116 World Economic Forum, 2016 117 Arjomandy, 2014 118 Haidar, 2015

Practical Part 45
3.3.1.6 Trade Policy
After the United Nations dropped its sanctions against the Islamic Republic of Iran, the trade between European countries and the Iranian state is subject to the general EU trade regime, since Iran is not a member of WTO.119
3.3.1.7 Import-Export Regulations
The import-export regulations for petrochemical equipment have been defined by the Iranian state in the export-import act 2016 as follows: “The import duty applicable to components materials, parts, and equipment required for reforming petrochemical, oil and gas industries falling under any tariff lines this chapter shall be 5% value. Subject to confirmation of necessity by the ministry of oil and within the discretion of the ministry industry, mines and trade stating that they are not manufactured domestically.”120 This regulation is not relevant in special economic zones or free trade zones.
3.3.1.8 Working and Social Policy
Foreigners who are travelling for business purposes are able to apply for a visa with 72 hours of residence permit directly at the airport of Teheran. For longer residence, a standard visa has to be permitted. For both procedures an Iranian company has to "invite" the foreigner into the country by organizing a permit number. Foreigners who want to work in Iran need a working permission from the Iranian labor department which will be issued if skilled personnel cannot be found in Iran.121
3.3.1.9 Sanctions and Joint Comprehensive Plan Of Action
After the International Atomic Energy Agency confirmed that Iran is in accord with the Vienna convention and the Joint Comprehensive Plan of Action (JCPOA) by the United Nations (UN) security council, the European Union and the USA suspended parts of the sanctions held against Iran.122 The core of the JCPOA treaty is that the Islamic republic of Iran is using nuclear power for civil purposes only and retracts the development plan of weapon grade uranium and plutonium. Nevertheless, under certain conditions, the reintroduction of the sanctions is possible for every party of the JCPOA (snap back). After the JCPOA was introduced, the Islamic state of Iran came into focus for foreign investments in the areas of oil, natural gas, automotive production and civil aviation.123
119 European Comission, 2016 120 Trade Promotion Organization of Iran, 2016 121 Germany Trade & Invest, 2017 122 Germany Trade & Invest, 2016 123 Germany Trade & Invest, 2016

Practical Part 46
Although Iran is in compliance with the JCPOA, the United States of America (USA) introduced new sanctions against Iran after a long-distance missile test has been conducted by the Iranian government. The sanctions affect Iran’s military efforts.124
3.3.2 Economic Environment
According to the World-Bank, the Islamic state of Iran is the second biggest economic nation in the region of the Middle-East and North-Afrika (MENA), with an estimated GDP of 412,2 billion USD in 2016. Iran’s economy is characterized by a strong natural resources sector, micro agriculture and a service sector as well as production and finance sectors. Iran is on the second place Worldwide in natural gas resources and place four on approved raw oil capacity. The GDP is strongly dependent on oil sales, therefore it has volatile characteristics. The country offers numberless possibilities for local and international investors with twenty special free-trade zones and special economic zones as described in 0, which offer different benefits for investments.125
3.3.2.1 Economic Overview
The economic overview expresses the economies key performance indicators as described in 2.6 in Table 15: Economic factsheet
124 The Guardian, 2017 125 Esmaeil Karimian, 2017, p. 12

Practical Part 47
Table 15: Economic factsheet126
Economic order Commando economy, centralized decision making by the government
Economic planning 6th 5 year plan started 21. March 2016
Gross domestic product 412,2 billion USD
Governmental spending 17,25% of GDP
GDP growth rate 4,2%
Governmental debt 35% of GDP (131,6 billion USD)
Inflation rate 8,57%
Interest rate 18%
Unemployment rate 12,45%
Import 40 billion USD
Export 66 billion USD
Trade ratio 6,9% of GDP
Exchange rate 1 Rial 0,000027€
3.3.2.2 Methanol Market Overview
The methanol market is focused on three locations. The existing methanol capacity of 5.044.000 tons per year is mainly concentrated in the Petrochemical Special Economic Zone in Mahshahr. The planned capacity of 21.390.000 tons is distributed between the Pars Special Economic Zone in Assaluyeh and the Bushehr Special Economic Zone in Busher with 81% and 19% as seen in Table 16.127
Table 16: Methanol market Iran128
Methanol in 1000 [t/y]
Growth till 2020
Existing methanol capacity 5044 424%
Planned methanol capacity 21390
Percentage planned in Pars Special Economic Zone 81%
Percentage planned in Bushehr Special Economic Zone 19%
126 Worldbank, 2016, Worldbank, 2017, Quandl, 2016, Country Economy, 2016, Trading Economics, 2016, Statista, 2016, Finanzen.net, 2017 127 National Petrochemical Company, 2017 128 National Petrochemical Company, 2017

Practical Part 48
Table 17 shows all methanol production projects in Iran which are under construction with their location, the start of operation, the methanol process licensor and the planned production output per year. 129 Process licensors: The existing capacity of methanol as shown in Table 16 is realized by different projects, with two process licensors: Lurgi, with 80% of the capacity and Haldor Topsoe with 20%. The planned methanol producing industries are licensed by two process licensors, on the one hand Haldor Topsoe and on the other hand Casale as can be seen in Table 17.130
Table 17: Methanol production projects Iran131
Nr. Company Region OperationStart Licensor
CapacityofMethanol1000[t/y]
1MarjanPetrochemicalCo.
SouthParsSpecialEconomic,EnergyZone 2017
HaldorTopsoe 1650
2SabalanPetrochemicalCo.
SouthParsSpecialEconomic,EnergyZone 2018
HaldorTopsoe 1650
3
MiddleEastKimiyaParsCompany
SouthParsSpecialEconomic,EnergyZone 2019
HaldorTopsoe 1650
4BushehrPetrochemicalCo.
SouthParsSpecialEconomic,EnergyZone 2019 Casale 1650
5KavehMehanolCo.
BushehrSpecialEconomicZone 2017 Casale 2310
6SirafEnergyInvestmentCo.
BushehrSpecialEconomicZone 2019
HaldorTopsoe 1650
7FatehKimiaPetrochemicalCo.
BushehrSpecialEconomicZone 2020 Casale 1650
8VenirannApadanaPetrochemicalCo.
SouthParsSpecialEconomic,EnergyZone - - 1650
9DenaPetrochemical
SouthParsSpecialEconomic,EnergyZone - - 1650
10DiPolymerArianPetrochemicalCo.
SouthParsSpecialEconomic,EnergyZone - - 1650
11ArmanMethanolCo.
SouthParsSpecialEconomic,EnergyZone - - 1650
12ArgShimiParsaCo.
SouthParsSpecialEconomic,EnergyZone - - 1290
13
LavanIndustryDevelopmentCompany
SouthParsSpecialEconomic,EnergyZone - - 1290
Overallmethanolcapacity 21390 129 National Petrochemical Company, 2017 130 National Petrochemical Company, 2017 131 National Petrochemical Company, 2017

Practical Part 49
The following Table 18 shows detailed information about seven of the thirteen projects with associated contractors for detailed engineering, procurement, construction and commissioning and ownership relationships for these projects.
Table 18 Contractors and ownership methanol projects132
Nr. Company Contractors Ownership
1 MarjanPetrochemicalCo.
Detailedengineering&procurement:Namvaran/CCEC
Shasta(49%),FanavaranPetrochemicalCo.(17%),TaminOil,Gas&PetrochemicalInvestment(17%),OtherShareholders(17%)
2 SabalanPetrochemicalCo.
Engineering&Procurement:PIDEC
SepehrEnergyCo.(99.6%),OtherShareholders(0.4%)
3 MiddleEastKimiyaParsCompany
Detailedengineering,procurement,Constuction&commissioning:TCC
PetroFarhang(84.1%),InternationalMiddleEastPersianIndustryCo.(10.8%),OtherShareholders(5.1%)
4 BushehrPetrochemicalCo.
Engineering&procurement:Nargan,IPIP,Casale,PIDEC,EIED,NardisConstructionContractors:Sokaf,AzarSimab,KandovanPars,Zamiran,AsfaltToos&Kason
Shasta(60%),MarunPetrochemicalCo.(40%)
5 KavehMehanolCo.
Basic&detailedengineering&procurement:PIDEC/PetroKavehOfoghinstallationandconstruction:PetroKavehOfogh
PrivateSector(100%)
6 SirafEnergyInvestmentCo.
Basicengineering:TopsoeDetailedengineering&procurement:Namvaran
EnergySepehrCo.(100%)
7 FatehKimiaPetrochemicalCo.
License&basicengineering:AmmoniaCasaleDetailedengineering&procurement:PIDEC
PrivateSector(100%)
Application of methanol: Table 19 shows the application of the produced methanol. This information has been documented since there could be associated business opportunities within the downstream applications for the companies of the JCA.
132 National Petrochemical Company, 2017

Practical Part 50
Table 19: Application of methanol133
MTBE Acetic acid
Solvents Resins
Formaldehyde Anti-freeze
Plastics DME
MTP MTO
Diesel fuel
3.3.2.3 Free Trade Zones and Special Economic Zones
The purpose of free trade zones and special economic zones is the boost of wealth and economic growth, increase in investments, creation of presence in local and international markets, creations of goods and services and the increase in income and occupation. These zones have special arrangements for trade and industrial activities including reduction of formalities in toll processes, in bank, finance and insurance procedures, in labor law, the access of foreigners and so on. Especially free trade zones offer massive advantages, the biggest one is that they are organized by an independent organization, the High Council of Free Trade Industrial Zones. Since the ultimate goal of these zones is the investment encouragement, every attempt of industrial activity is supported generously. Following the definition of free trade zones and special economic zones, these are regions with special laws and rules not following the boundary conditions given by the state law. These zones are not under control of custom authorities and have free import and export conditions of goods and items of trade.134 Investments in special economic zones and free trade zones offer following incentives:
• Tax release for 20 years • Permission for investments of foreigners with full ownership • Free import and export of money • Protection and guaranties for foreign investments • Release of entry visa and facilitation for residence permit • Facilitated rules concerning labor law and social insurance • Transfer of semi-finished goods without tolls • Release of entry tolls for imports out of the zone • Acquisition of expert staff independent from qualifications and occupation group • Usage of raw materials, oil and gas as source and fuel for all industrial activities135
The incentives in investments in special economic zones are: 133 National Petrochemical Company, 2017 134 Esmaeil Karimian, 2017, p. 27 f. 135 Esmaeil Karimian, 2017, p. 27 f.

Practical Part 51
• The import of goods from these zones into the main country are under normal toll
restrictions, the export into foreign countries doesn’t have to be declared • The import of the goods from foreign countries or from special economic zones underlie
minimum toll formalities, the internal transit follows normal state rules • Log files from trade goods do not underlie toll formalities • Goods which were imported from foreign countries or other industrial or free zones can
be exported to foreign countries without formalities • The authorities of the region can distribute parts of the region between natural persons
and legal persons after classification • The owners of goods which are imported into a region can temporarly import parts or
all of their goods into the country • If the processing of imported goods changes the toll classification of the goods, the
commercial benefit of the good is equally calculated to the commercial benefit of raw materials from the country.
• Importers of goods can transfer their goods into a voucher at the authorities so that the owner of the voucher is the owner of the goods.
• The authorities are justified to proof the evidence of origin in cooperation with toll agencies
• All imported goods which are needed for the production or value creation are freed from standard import export regulations. The export of goods to the rest of the country is subjected to normal import export regulations.
• The ratio of produced goods in the zone and imported to the country is allowed with any limitation. Additionally, it is not required to order and open a letter of credit.
• Produced goods or raw materials and imported parts are not subjected to price bindings for unused resources and allocated currencies.136
3.3.3 Social Environment
Cultural differences play a major role in business relations and must not be underestimated. Though Iranian companies respond favorable towards goods, services and the mentality from middle Europe, conflicts can arise when the understanding for the cultural differences is not given. The ruling social system in Iran follows the rules of the collective society as it is in many other Near East states. Compared to more individualist societies, this can lead to points of friction since it influences the overall behavior, the habits and moral concept and the decision-making processes, the behavior in conflicts and the approach in partnerships.137 Table 20 shows an overview of the investigated areas of Iran’s social parameters.
136 Invest in Iran, 2017 137 Roedl & Partner, 2016
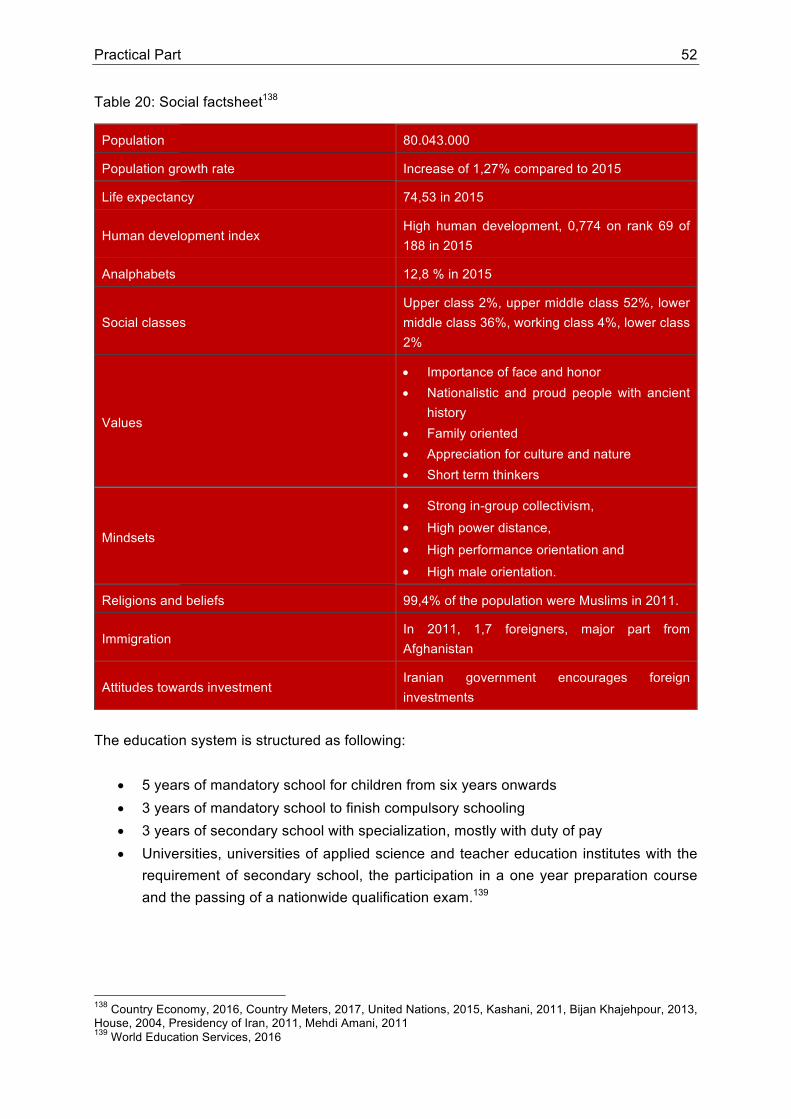
Practical Part 52
Table 20: Social factsheet138
Population 80.043.000
Population growth rate Increase of 1,27% compared to 2015
Life expectancy 74,53 in 2015
Human development index High human development, 0,774 on rank 69 of 188 in 2015
Analphabets 12,8 % in 2015
Social classes Upper class 2%, upper middle class 52%, lower middle class 36%, working class 4%, lower class 2%
Values
• Importance of face and honor • Nationalistic and proud people with ancient
history • Family oriented • Appreciation for culture and nature • Short term thinkers
Mindsets
• Strong in-group collectivism, • High power distance, • High performance orientation and • High male orientation.
Religions and beliefs 99,4% of the population were Muslims in 2011.
Immigration In 2011, 1,7 foreigners, major part from Afghanistan
Attitudes towards investment Iranian government encourages foreign investments
The education system is structured as following:
• 5 years of mandatory school for children from six years onwards • 3 years of mandatory school to finish compulsory schooling • 3 years of secondary school with specialization, mostly with duty of pay • Universities, universities of applied science and teacher education institutes with the
requirement of secondary school, the participation in a one year preparation course and the passing of a nationwide qualification exam.139
138 Country Economy, 2016, Country Meters, 2017, United Nations, 2015, Kashani, 2011, Bijan Khajehpour, 2013, House, 2004, Presidency of Iran, 2011, Mehdi Amani, 2011 139 World Education Services, 2016

Practical Part 53
3.3.4 Technological Environment
The technological environment describes the significance of science and technology within the Islamic state of Iran and shows the availability of technologies for the population as seen in Table 21. Although sanctions have been influencing many research fields, the Islamic state of Iran has highly developed research institutions and is fertile soil for startups and technology projects.
Table 21: Technological factsheet140
R & D investment 1.108.881.360
Universities and research institutions
• 95 universities and 72 institutions affiliated to the Ministry of Science, Research and Technology
• 84 universities and 16 institutions affiliated to the Ministry of Health and Medical Training
• 22 universities and institutions affiliated to the Ministry of Defense
• 32 science and technology parks • 184 institutions affiliated to the Ministries of
Industry and Agriculture
• 23 institutions affiliated to the Presidency • 63 other organizations
Telecommunication usage • Internet users: 39,35 % in 2014
• Telephone lines: 37,78 % in 2014 • Cellular subscribers: 91,09 % in 2014
Electricity production and consumption • Electricity production in 2014: 274.609 GWh
• Electricity consumption in 2014: 221.411 GWh
Fractions of electricity production are distributed as shown in the following Table 22.
140 UNESCO, 2015, International Energy Agency, 2014, Statistic Center of Iran, 2014

Practical Part 54
Table 22: Electricity production by origin141
Resource Production in GWh
Coal 530
Oil 59.493
Gas 195.847
Biofuels 47
Nuclear 4.472
Hydro 13.862
Wind 358
Overall 274.609
3.3.5 Environmental Circumstances
The environment boundary conditions of the Islamic state of Iran are described in this chapter. After giving basic information about the geography and the climate, the analysis gives an overview of the natural resources which are key for the development of business in the Islamic state of Iran.
3.3.5.1 Geography
The country is split into five natural regions. The core area is the Iranian highlands which accounts for over 700 km north-south expansion, it is the biggest part of the surface and is characterized by an 800-1000 meters high desert and steppe landscape, oases and up to 4000 meter high mountains. The biggest deserts are the Dasht-e Kavir and the Dasht-e Lut which clame 15% of Irans surface area. The Zargos mountain chain separates the highlands to west, southwest and south. It consists of parallel chains, which are divided by deep valleys. The mountain chains Alborz and Khorâsâns are another big region of Iran, with the highest elevation, the Damâvand with 5671 meters. The south Caspian lowlands are over 600 km long and offer highly fertile landscapes with rivers and forests. As the neighbor states on the Caspian Sea, this area is exposed to earthquakes. Compared to the Caspian lowlands, the lowlands of the golf coast do not offer good boundary conditions for human life.142
3.3.5.2 Cities
There are more than 80 cities in the Islamic state of Iran, 8 of them with more than a million inhabitants as shown in the following Table 23.
141 International Energy Agency, 2014 142 Claudia Stodte, 2015, p. 19 f.

Practical Part 55
Table 23: Biggest cities of Iran143
City Inhabitants
Tehran 8.153.051
Mashhad 2.766.258
Isfahan 1.756.126
Karaj 1.614.626
Tabriz 1.494.998
Shiraz 1.460.665
Ahvaz 1.112.021
Qom 1.074.036
3.3.5.3 Climate
The central area is characterized by continental climate, with hot dry summers and cold winters. Rainfalls are limited to late fall till early spring and are decreasing from west to east, in winter snowfall occurs, reaching to Tehran. On the Caspian-Sea, there is recurring rainfall over the whole year. In the south, winters are mild and summers are very hot as seen in Table 24.144
Table 24: Temperatures in Iran145
3.3.5.4 Pollution and Emissions
The average pollution output per inhabitant were 7,97 tons of CO2 in 2013 compared to 9,39 tons in Germany. Zambol on the boarder to Afghanistan and Pakistan was ranked world’s most 143 Lexas forex, 2016) 144 Kerber, 2015, p. 26 f. 145 Kerber, 2015, p. 26 f.

Practical Part 56
polluted city in 2012. Three more cities are rated under world’s top ten most polluted cities. The main pollution comes from the transportation sector, the fact that cities are located in between mountains increases the formation of smog. Although Tehran is one of the cleanest cities in Iran, it still counts to one of the dirtiest cities worldwide.146
3.3.5.5 Infrastructure
In 2011, the overall road network had 173.000 km of roads from which 73 % were paved. The ministry for infrastructure plans to install 1400 km of expressways and 700 km of highways every year till 2025 with private partners. From 2010 till 2014 the highway network has been extended for 3.700 km to 16.400 km overall.147 The Islamic state of Iran wants to expand its railway network till 2025 from 14.000 km to 25.000 km with the help of foreign partners including electrification, extension to double track rails and the improvement of the connection to the international rail network. After an estimation of the Ministry of Roads and Urban development, 28 billion USD are required in the next five years. The Iranian government strongly encourages the development of Iranian ports. The state-owned Ports and Maritime Organization is planning to modernize existing ports and to build contracts with foreign operating companies. Till the end of 2017, projects worth 2,5 billion USD will be initiated.148
3.3.5.6 Availability of Natural Resources
Agrarian resources: Caviar, wool, dairy products, cotton, nuts, fruits, sugar cane, sugar beets, grains, rice, wheat. Mineral resources: Zinc, manganese, lead, iron ore, copper, coal, natural gas, oil. Natural gas production in 2016 was 202,4 billion cubic meters from world’s second largest capacity after Russia. Oil production in 2016 was 4.600.000 barrels per day from world’s forth biggest oil capacity.149
3.3.6 Legal Environment
The Iranian legal system combines elements of the Islamic right (Sharia) with elements of western legal systems. Big parts of the Iranian legal system are in correlation with the French, Belgian and Swiss jurisdiction but have to follow Islamic principles.150
146 The Guardian, 2016 147 Germany Trade & Invest, 2017 148 Germany Trade & Invest, 2017 149 Germany Trade & Invest, 2017 150 Germany Trade & Invest, 2017

Practical Part 57
3.3.6.1 Legal Framework
The Islamic republic of Iran has a well-established legal framework which grew constantly over the last decades. It has a differentiated legal situation and a fully working justice system, both not easy to understand due to their complexity. The sanctions which had been imposed over Iran decelerated not only the economy, also the legal processes are not at the level of international business relations yet. Since the Islamic revolution in 1979, the legal framework has been strongly influenced by the Islamic law (Sharia), for the future it can be expected that a gradual adaptation towards the needs of international business relations will be conducted including a new commercial law, which will also regulate intellectual property rights and conflict resolution. For these changes the Iranian government is open for guidance by international institutions such as the WTO.151
3.3.6.2 Producer Accountability
The accountability of producers is integrated in the law on protection of consumer rights introduced in 2009. Outside of the law of consumer rights, the product accountability has to be checked for its accordance within the principles of unlawful acts which are regulated within the civil code.152
3.3.6.3 Intellectual Property Rights
In 2009, the Iranian Parliament renewed the law of registration of patents, industrial designs and trademarks. The protection period of patents is twenty years, for trademarks ten years and for industrial designs five years. These protection periods can be doubled. The Islamic republic of Iran is member of the World Intellectual Property Organization, which includes Iran in terms of international trademark registration.153
3.3.6.4 Tax Policy
Legal basis is the Direct Taxation Act of 2002. The regular corporate income tax for domestic as well as for foreign companies is 25% of the taxable earnings. The delivery of goods and service delivery underlie taxation under the Value Added Tax Act from 2008. The value added tax rate is 9%, some goods and services are excluded from this regulation such as pesticides, staple food like flour, bread and rice, passenger transportation and research activities. Personal income tax is graded after income and ranges from 15% to 35 %. Dividends are not taxed.154
151 Roedl & Partner, 2016 152 Germany Trade & Invest, 2017 153 Germany Trade & Invest, 2017 154 Germany Trade & Invest, 2017

Practical Part 58
3.3.6.5 Foreigner Investment Right
The “Foreign Investment Promotion and Protection Act” (“FIPPA”) has been adopted by the Parliament in 2002, with several benefits for foreign investors:
• Extension of the accessibility for several areas including infrastructure. • Approval of various forms of project financing including joint ventures, repurchase
agreements, countertrade and the Build Operate Transfer (BOT) model. • Fast and efficient licensing and permission procedure for investments. • Creation of a central entity for investments, the so called “Center for Foreign Investment
Services”. • Simplification of the regulations concerning accessibility of foreign capital. • Every foreign investor is free to transfer capital and dividends abroad.155
3.3.7 Opportunities and Threats
With the collected information of the national PESTEL analysis an opportunities and threats analysis for the Islamic state of Iran has been created.
3.3.7.1 Opportunities
Since the ease of the sanctions in January 2016 the economic ban on the Islamic state of Iran has been lifted. Many companies send business delegations to invest or export in the national economy and revive business relations. The Islamic state of Iran offers perfect conditions for chemical industry operations since it has vast amounts of oil and gas reserves, which are now open for development by international petrol companies. In the area of chemical industry, Iran offers unique circumstances for boosting branch activity with special economic zones. If an imported good is needed for the production or value creation of another product, it is freed from standard import export regulations and underlies minimum toll bureaucracy. This leads to very favorable conditions for the export of any kind of apparatuses to Iran. The Iranian methanol market is expected to experience a production output growth of 424% from 2010 till 2020, and more projects are currently in negotiations.156
3.3.7.2 Threats
All examined areas of the PESTEL framework have been evaluated with a risk factor for the JCA holding, ranging from zero for zero risk to five, for highly risky. The following Table 25 shows the areas which have been rated with 3 or higher:
155 Esmaeil Karimian, 2017, p. 13 156 National Petrochemical Company, 2017

Practical Part 59
Table 25: Risk factors PESTEL157
Category Risk (0-5)
Stability of the political system 4
Corruption level 4
Sanctions 5 The in-stability of the political system causes major risk to operations planned in Iran. The instability, which is expressed in the political stability rating could cause turbulences within business relations. The conflict between liberals and conservatives is fierce, the liberal impulses of President Rouhani are causing resistance by the conservatives. Another risk, which is influencing business in Iran, is the political instability within the Near East region and the conflict potential with Saudi Arabia, Yemen, Syria, Afghanistan and others. These imbalances have long histories and could intensify in the future. The economic development is strongly dependent on international sanctions which could be reintroduced by the United Nations. The fact that the United States of America recently introduced new sanctions against the military efforts of Iran although no violations of the nuclear deal could be identified, leads to further setbacks for the overall climate for companies trying to create business in Iran especially since foreign bank institutions are still very restrained when it comes to the trust in ventures in the Islamic state of Iran. This is also caused by the strong involvement of the state into private businesses and the risk of governmental intervention into business processes. Another category with high risk potential is the corruption level in Iran. Businesses could face major troubles during the execution of business relations when exposed to corrupt structures within the countries boundaries. Although there has been an anti-corruption initiative since 2013, it is still evident within the counties structures. Although there are major risks for entering the Iranian market there is huge international competition, since the market offers great potential. The following Figure 20 shows the opportunities and threats.
157 Own representation

Practical Part 60
Figure 20: Opportunities and threats158
158 Own representation

Summary and outlook 61
4 Summary and outlook
This thesis has been conducted in line with a strategy development process of the JCA holding which consists of four separate apparatus production companies. The target was the creation of an environmental analysis with the PESTEL framework, which externally analyzes given factors for specific products or services within specific nations. Therefore, an JCA PESTEL process has been created, which guides through predefined steps which deliver outputs for gateway decisions by using specifically selected tools. The theoretical part of this thesis describes these chosen tools and the analyzed factors within the PESTEL framework. In the practical part, every process step of the JCA PESTEL process has been described in detail. It is leading from the initial situation to the national PESTEL analysis. Further, the JCA PESTEL process has been executed. The JCA company screening delivered the urgent necessity of a product diversification analysis for one of the four examined companies, Schöller-Bleckmann Nitec (SBN). SBN is a major player in the highly specified apparatus production for the fertilizer industry. The company is an expert in the high-pressure range apparatus production. This key strength has been taken as a base for the product diversification analysis. As initial step a market overview of the global and European chemical market has been created. Further, an overview about the most relevant high pressure processes within the chemical industry has been evaluated by experts after their potential for the market penetration by SBN. The combination of the expert evaluation, which indicated the favorability of the methanol process, and the high potential of the market of the Near East located Islamic state of Iran, led to the skipping of several steps within the JCA PESTEL process as described in chapter 3.2.2. The boundary conditions given by the Islamic state of Iran were analyzed with the PESTEL framework and delivered opportunities and threats SBN has to face when entering the Iranian market as described in 3.3.7. The main outcome is that the Iranian market offers great potential for creating business since the political and economic sanctions have been lifted partly. The combination of the existence of special economic zones and the strong initiative for the expansion of the chemical industry leads to a fertile ground for market penetration. However, the political instability within the country and the whole region as well as the omnipresent corruption in Iran and the potential risk of sanction snap back are threats which have to be considered and evaluated carefully. The developed JCA PESTEL process has proven itself to be effective in the selection of the most relevant product or service for the environmental analysis. The analysis of internal data, such as the company’s strategy documents, profitability calculations of the created products and services and existing market information deliver an understanding of which product or service offers the highest potential for external analysis. Although this thesis does not focus on an environmental analysis for an existing product or service produced by the companies of the JCA holding due to the need for product diversification for SBN, the company should reapply the PESTEL process on the existing product and service portfolio, since there is still a

Summary and outlook 62
lot of potential. Further the Iranian market offers high potential for the chemical industry as a whole, so if the decision for further external analysis of an existing product or service within the portfolio of the JCA holding has been made, the Iranian market is likely to offer high market growth. In future, the JCA PESTEL process can also be applied to other companies within the Christof Group, it has been designed to be fully branch independent and can be adjusted to the specific needs of other business units.

Bibliography 63
5 Bibliography
AMANI, M.; ZANJANI, H.; YARSHATER E.: Migration and Remittances Factbook, Washington DC, 2011.
ASUM, H., KERTH, K., STICH V.: Die besten Strategietools in der Praxis, Hanser, München, 2015.
BERKENHOVEN, L.; ECKERT W.; ELLENRIEDER P.: Markforschung- Methodische Grundlagen und praktische Anwendungen, Gabler, Wiesbaden, 1999.
BERNDT R.; FANATAPIÉ, A. C.; SANDER M.: Internationales Marketing Management, 5. Edition, Springer Gabler, Berlin, 2016. BLANCHARD, O.; ILLING, G.: Makroökonomie, 6. Edition, Pearson, London, 2006. BORTZ J.; DÖRING N.: Forschungsmethoden und Evaluation, Springer, Berlin, 2006. BRUHN, M.: Marketing, Gabler, Wiesbaden, 7. Edition, 2004. BURDA, M. WYPLOSZ, C.: Makroökonomie, 3. edition, Vahlen, München, 2009 HERMANN, A.; HUBER, F.: Produktmanagement, 3. edition, Springer, München, 2013. HORSCH, J.: Kostenrechnung, Klassische und neue Methoden in der Unternehmenspraxis,
Springer, Wiesbaden, 2015. HOUSE, R., J.: Global Leadership and Organizational Behaviour Effectiveness study, 2004. KARIMIAN, E.; et al.: Investment im Iran, Springer Gabler, Wiesbanden, 2017. KERBER, P.: Iran, Islamische Republik und jahrtazsendealte Kultur, Trescher, Berlin, 2015. KOTLER P.; KELLER K.; BLIEMEL, F.: Marketing Management- Strategien für
wertschaffendes Handeln, 12. edition, Pearson, München, 2007. MANKIV, G.: Makroökonomik, Schäffer Poeschel, Stuttgart, 2011. MEFFERT, H., BURMANN, C., KIRCHGEORG M.: Marketing: Grundlagen marktorientierter
Unternehmensführung, Springer Gabler, 12. edition, Wiesbaden, 2009. MESSNER, S.; KREIDL C.; WALA, T.:. Grundlagen der Betriebswirtschaftslehre, 5. edition, LexisNexis, Wien, 2016. NAGL, A., Der Business Plan, 7. edition, Gabler, Wiesbaden, 2014. OSTERWALDER, A.; PIGNEUR, Y.: Business Model Generation, 1. edition, Campus,
Frankfurt 2011. PLINKE W.; RESE M.; UTZIG P.: Industrielle Kostenrechnung, Springer, Berlin, 2015. REISINGER S.; GATTRINGER R.; STREHL F.: Strategisches Managemen, 1. edition,
Pearson, London, 2013. RUNIA, P.; Marketing, Walter de Gruyter, Berlin, 2007. SARKOHI, A.; ZAMIRIRAD A.: Jenseits von grün - Iran seit den Wahlen von 2009, Welttrends,
Podsdam 2011. SCHALLMO, D.: Kompendium Geschäftsmodell-Innovation. 1. edition, Springer, Ulm, 2014. SEILER A.: Marketing, 5. edition, Füssli, Zürich, 2001. STAROSSOM, H.. Corporate Finance Teil 1, 1. edition, Springer, Wiesbaden, 2013. STODTE, C.; SCHMERBECK, B.: Iran, Edition Temmen, 6. edition, Bremen, 2015. SZYSZKA, U.: It-gestützte Kostenrechnung, 1. edition, Springer, Flennsburg, 2015. THALER, E.,T.; et al.: Mullahs, Guards, and Bonyads, Rand Pubn, 2010.

Bibliography 64
THE EUROPEAN CHEMICAL INDUSTRY COUNCIL: Chemical Industry Facts and Figures Report, 2016.
VETTER, A.; BERTUCCO G.: High Pressure Process Technology: Fundamentals and Applications, Elsevier, Amsterdam, 2011.
WEIS, B.: Praxishandbuch Innovation, Springer, Stuttgart, 2014. WITSCHAKOWSKI, W.: Hochdrucktechnik, Schriftenreihe des Archivs der BASF AG, 1974. ZAMIRIRAD, A.: Das politische System Irans, Universität Potsdam, 2011.
Online-Sources ARJOMANDY, D.: Taylor & Francis Online, Retrieved 09 09 2017, from
http://www.tandfonline.com/doi/abs/10.1080/00210862.2013.859810, 2014. BASF, Outlook for the chemical industry, Retrieved 29 08 2017, from
https://report.basf.com/2016/en/managements-report/forecast/economic-environment/chemical-industry.html, 2016.
BBC, News, Retrieved 09 09 2017 from http://www.bbc.com/news/world-us-canada-39950827, 2017.
BBC, News, Retrieved 09 09 2017 from http://www.bbc.com/news/world-middle-east-14541327, 2017.
CHRISTOF GROUP, Retrieved 20. 09 2017 from http://www.christof-group.at/home/, 2017 COUNTRY ECONOMY: Population in Iran 2016, Retrieved 29 08 2017, from
http://countryeconomy.com/demography/population/iran, 2016. COUNTRY METERS, Retrieved 29 08 2017, from http://countrymeters.info/en/Iran, 2017. BUNDESZENTRALE FÜR POLITISCHE BILDUNG.: Die Islamische Republic Iran, Retrieved
31 08 2017, from http://www.bpb.de/internationales/asien/iran/40110/das-politische-system, 2009.
EUROPEAN COMISSION, Retrieved 10 09 2017, from http://ec.europa.eu/trade/policy/countries-and-regions/countries/iran/, 2016.
EUROPEAN UNION EXTERNAL ACTIONS, Retrieved 10 09 2017, from http://eeas.europa.eu/archives/docs/statements-eeas/docs/iran_agreement/iran_joint-comprehensive-plan-of-action_en.pdf, 2015.
FINANZEN.NET, Waehrungsrechner, Retrieved 29 08 2017, from http://www.finanzen.net/waehrungsrechner/rial_euro, 2017.
GERMANY TRADE & INVEST: Recht kompakt, Retrieved 01 09 2017, from https://www.gtai.de/GTAI/Navigation/DE/Trade/Recht-Zoll/Wirtschafts-und-steuerrecht/recht-kompakt,t=recht-kompakt-iran,did=1398162.html, 2016.
GERMANY TRADE & INVEST: Retrieved 01 09 2017, from https://www.gtai.de/GTAI/Navigation/DE/Trade/Maerkte/suche,t=iran-bringt-verkehrsprojekte-auf-den-weg,did=1656090.html, 2017.
GOOGLE MAPS: Retrieved 18 09 2017 from https://www.google.de/maps/place/Iran/@31.9740371,44.6740084,5z/data=!3m1!4b1!4m5!3m4!1s0x3ef7ec2ec16b1df1:0x40b095d39e51face!8m2!3d32.427908!4d53.688046?hl=en, 2017.

Bibliography 65
HAIDAR, J.: Sanctions and Exports Deflection: Evidence from Iran. Retrieved 10 09 2017, from
http://www.economic-policy.org/wp-content/uploads/2016/04/Sanctions-and-Export-Deflection-Evidence-from-Iran.pdf, 2015.
HEGMANN, G.: Es wird geschmiert an allen Ecken und Enden, Retrieved 10 09 2017 from https://www.welt.de/wirtschaft/article159707267/Es-wird-geschmiert-an-allen-Ecken-und-Enden.html, 2016.
INTERNATIONAL ENERGY AGENCY. Retrieved 29 08 2017, from https://www.iea.org/statistics/statisticssearch/report/?country=Iran%20&product=electricityandheat, 2014.
INVEST IN IRAN, Retrieved 10 09 2017 from http://www.investiniran.ir/en/whyiran1/investmentincentives/specialeconomiczones.
KASHANI, M.: Iran Journal. Retrieved 08 29, 2017, from http://iranjournal.org/gesellschaft/rueckkehr-des-analphabetismus, 2011.
KHAJEHPOUR, B.; NAMAZIE, P.; HONARI, A.: The Simorgh. Retrieved 29 08 2017, from http://thesimorgh.eu/wp-content/uploads/2014/11/131014-Study-on-Iranian-Values-October-2013-pdf1.pdf, 2013.
LEXAS FOREX: Basisinformationen Iran, Retrieved 29 08 2017, from http://www.lexas.biz/laenderlexikon/iran.aspx.
MACLEAN, W.; HERITAGE T., Reuters Retrieved 10 09 2017 from http://www.reuters.com/article/us-iran-nuclear-investment-idUSKCN0UY1S8, 2016.
NATIONAL PETROCHEMICAL COMPANY, Retrieved 10 09 2017 from http://english.nipc.ir/, 2017.
PRESIDENCY OF IRAN, Retrieved 29 08 2017, from https://www.amar.org.ir/Portals/1/Iran/90.pdf, 2011.
QUANDL, Retrieved 29 08 2017, from https://www.quandl.com/data/ODA/IRN_GGX_NGDP-Islamic-Republic-of-Iran-General-Government-Total-Expenditure-of-GDP, 2016.
ROEDL & PARTNER: Iranisches Recht, Retrieved 29 08 2017, from http://www.roedl.de/themen/iranisches-recht-rechtsanwalt-iran, 2016.
STATE OF IRAN, Constitution of Iran, Article 4. Retrieved 10 09 17 from http://www.wipo.int/edocs/lexdocs/laws/en/ir/ir001en.pdf
STATISTA, Retrieved 29 08 2017, from https://www.statista.com/statistics/294305/iran-unemployment-rate/, 2016.
STATISTIC CENTER OF IRAN, Retrieved 29 08 2017, from https://www.amar.org.ir/english/MDG-2014/MDG-Goal-8/MDG-Goal-8-P5, 2014.
THE GLOBAL ECONOMY, Retrieved 10 09 17, from http://de.theglobaleconomy.com/rankings/wb_political_stability/, 2015.
THE GUARDIAN, Retrieved 01 08 2017, from https://www.theguardian.com/world/2017/jul/18/iran-is-complying-with-nuclear-deal-but-is-in-default-of-its-spirit-says-us, 2017.
THE GUARDIAN, Retrieved 01 08 2017, from https://www.theguardian.com/environment/2016/may/12/which-are-the-worlds-two-most-polluted-cities-and-why, 2016.

Bibliography 66
TRADE PROMOTION ORGANIZATION OF IRAN, Retrieved 10 09 2017 from http://farsi.tpo.ir/uploads/mogarrarat1395_16_ok_16253.pdf, 2016.
TRADING ECONOMICS, Iran Zinssatz, Retrieved 29 08 2017, from https://de.tradingeconomics.com/iran/interest-rate, 2016.
TRANSPARENCY.ORG, Corruption Percepations index 2016, Retrieved 10 09 2017 from https://www.transparency.org/news/feature/corruption_perceptions_index_2016, 2016.
UNESCO, UNESCO Science Report, Retrieved 29 08 2017, from http://unesdoc.unesco.org/images/0023/002354/235406e.pdf, 2016. UNITED NATIONS, Retrieved 29 08 2017, from
http://hdr.undp.org/sites/default/files/hdr_2015_web.pdf, 2015. WORLD ECONOMIC FORUM, Retrieved 10 09 2017 from http://reports.weforum.org/global-
competitiveness-report-2015-2016/, 2016. WORLD EDUCATION SERVICES, Retrieved 10 09 2017, from
https://www.wes.org/ca/wedb/iran/firedov.htm, 2016. WORLDBANK, Retrieved 29 08 2017, from
http://www.worldbank.org/en/country/iran/publication/economic-outlook-spring-2016, 2016.
WORLDBANK, Retrieved 29 08 2017, from http://www.worldbank.org/en/country/iran/overview, 2017.

List of Tables 67
6 List of Tables
Table 1: Structure of the thesis ................................................................................................ 5
Table 2: Political circumstances ............................................................................................... 7
Table 3: Economic circumstances ............................................................................................ 8
Table 4: Market circumstances ................................................................................................ 9
Table 5: Social circumstances .................................................................................................. 9
Table 6: Technological circumstances ................................................................................... 10
Table 7: Environmental circumstances .................................................................................. 10
Table 8: Legal circumstances ................................................................................................. 10
Table 9: Secondary data sources ........................................................................................... 12
Table 10: Idea sources ........................................................................................................... 17
Table 11: Global PET analysis ............................................................................................... 31
Table 12: High-pressure process evaluation .......................................................................... 39
Table 13 Outcome innovation workshop ................................................................................ 40
Table 14: Nation overview .................................................................................................... 42
Table 15: Economic factsheet ................................................................................................ 47
Table 16: Methanol market Iran ............................................................................................. 47
Table 17: Methanol production projects Iran .......................................................................... 48
Table 18 Contractors and ownership methanol projects ........................................................ 49
Table 19: Application of methanol .......................................................................................... 50
Table 20: Social factsheet ...................................................................................................... 52
Table 21: Technological factsheet .......................................................................................... 53
Table 22: Electricity production by origin ................................................................................ 54
Table 23: Biggest cities of Iran ............................................................................................... 55
Table 24: Temperatures in Iran .............................................................................................. 55
Table 25: Risk factors PESTEL .............................................................................................. 59

List of Figures 68
7 List of Figures
Figure 1: Organigram JCA ....................................................................................................... 2
Figure 2: SWOT analysis ...................................................................................................... 13
Figure 3 SWOT analysis result ............................................................................................... 14
Figure 4: Overall costs ........................................................................................................... 15
Figure 5: Portfolio analysis ..................................................................................................... 19
Figure 6: Idea funnel .............................................................................................................. 21
Figure 7: Business model canvas .......................................................................................... 22
Figure 8: JCA PESTEL Flowchart .......................................................................................... 26
Figure 9 Gateway decision 1 .................................................................................................. 28
Figure 10: Product diversification ........................................................................................... 29
Figure 11: Four-field method and gateway decision 2 ........................................................... 30
Figure 12: Gateway decision 3 ............................................................................................... 33
Figure 13: Result gateway decision 1 .................................................................................... 34
Figure 14: Product diversification ........................................................................................... 35
Figure 15: Worlds chemical turnover 2015 ............................................................................. 36
Figure 16: Chemical industry overview .................................................................................. 37
Figure 17: High-pressure process overview ........................................................................... 38
Figure 18: Flowchart shortcut ................................................................................................. 41
Figure 19: Political system structure ...................................................................................... 43
Figure 20: Opportunities and threats ...................................................................................... 60

Abbreviations 69
8 Abbreviations
ACE Apparatebau construction & engineering GmbH
APB Apparatebau Schweißtechnik GmbH
BOT Build Operate Transfer
CCEC China Chengda Engineering Co.
CM Contribution Margin
CMR Contribution Margin Ratio
DI Diplom Ingenieur
DME Dimethyl ether
Dr Doctor
e.g. example given
EBIT Earnings Before Interest and Taxes
EIED Energy Industries Engineering & Design
EMSR Elektro-, Mess-, Steuer- und Regelungstechnik
EU European Union
FH Fachhochschule
FIPPA Foreign Investment Promotion and Protection Act
GDP Gross Domestic Product
GmbH Gesellschaft mit begrenzter Haftung
GWh Giga Watt hours
IPIP Romania IPIP
IRR Iranian Rial
JCA Johann Christof Apparatebau
JCPOA Joint Comprehensive Plan Of Action
LDPE Low Density Poly Ethylene
MENA Middle East and North America
MPa Mega Pascal
MTBE Methyl-tert-butyl-ether
MTO Methanol to olefines
MTP Methanol to propylene
NAFTA North American Free Trade Agreement
OPEC Organization of the Petroleum Exporting Countries
PESTEL Political Economic Social Technical Environmental Legal
PET Political Economic Technical
PIDEC Petrochemical Industries Design and Engineering Company
Prof Professor
QSE Quality Safety Engineering

Abbreviations 70
R&D Research and Development
SBN Schöller-Bleckmann Nitec
SWOT Strength Weaknesses Opportunities Threats
TCC China Tianchen Engineering Cooperation
TU Technical University
USA United States of America
USD United States Dollar
UTC Coordinated Universal Time
WTO World Trade Organization
y year

Appendices 71
9 Appendices
APPENDIX1:HIGHPRESSUREPROCESSOVERVIEW......................................................................................72

Appendix 1: High pressure process overview 72
Appendix 1: High pressure process overview
Method Pressureinbar Product/ApplicationPolymerisation 1300-3000
LDPE
Synthesis
100-700 ammonia butanediol hydrocarbons methanol propionicandaceticacid urea
Hydrogenation
100-300 edibleoils hydrogasification hydrocracking desulflurization catalyticcracking naphthahydroforming coalliquefication fattyalcohols 1-6-hexanediol 1-4-butanediol hexamethylenediamine
C4toC15products(hydroformylation)
Wet(air)oxidation 100-400 organicwasteelimination
Leachingofores 100-300
aluminium(frombauxide) technicalgases
Cryoprocessing gasliquefaction
Oil/gasproduction
100-400 drying inhibition desulfurization,odorization secondaryandtertiary productionmethods drillingsupport
Separationofisotopes 300 heavywater

Appendix 1: High pressure process overview 73
Thermalpowergeneration 100-250 steampowerplants
Extractionwithsupercriticalfluids
80-300 decaffeination spices,hops colours drugs oils,lecithineandfats tobacco perfumes
Micronizationwithsupercriticalfluids 80-300 Crystallization
fineparticlesandpowdersfromvariosproductsandofdesignedproperties
Rapidexpansion Gasanti-solventRecrystallization Precipitationwithcompressedanti-solvent Solution-enhanceddispersion Particlesfromgas-saturatedsolutions Dyeingwithsupercriticalfluids 80-300 Cellstructuretreatmentwithsupercriticalfluids dyeingoffabrics tobaccoimpregnation
Potentialenergyeffects
upto5000 sterilization pascalisation coagulation
gelationoffoodstuffs Solidstatereaction >125000 syntheticdiamonds Fuelinjection 1000-2000 dieselmotors
Leachingofores
100-300 aluminium technicalgases gasliquefaction
Fluidconveying 100-200 pipelinetransportoforesandcoal

74
Polymerprocessing
100-400 polymerspinning polymerfiltration polymerextrusion
Highperformanceliquidchromatography 100-700 analyticalchemistry
Kineticfluid(jet)energywithwater
upto4000 jetcuttingupto2000 jetcleaningupto600 jettreatmentoffabrics
Kineticfluidenergy
upto1500 foodstuffs cosmetics pharmaceuticalproducts chemicalproducts bio-products
Potential(pressure)fluidenergy
upto10000 autofrettageupto5000 hydroformingupto4000 isostaticpressing
Spraydrying 50-200 finepowdersofvariousproducts
159
159 Vetter, 2001