Periostin-like-factor and Periostin in an animal model of work-related musculoskeletal disorder
11
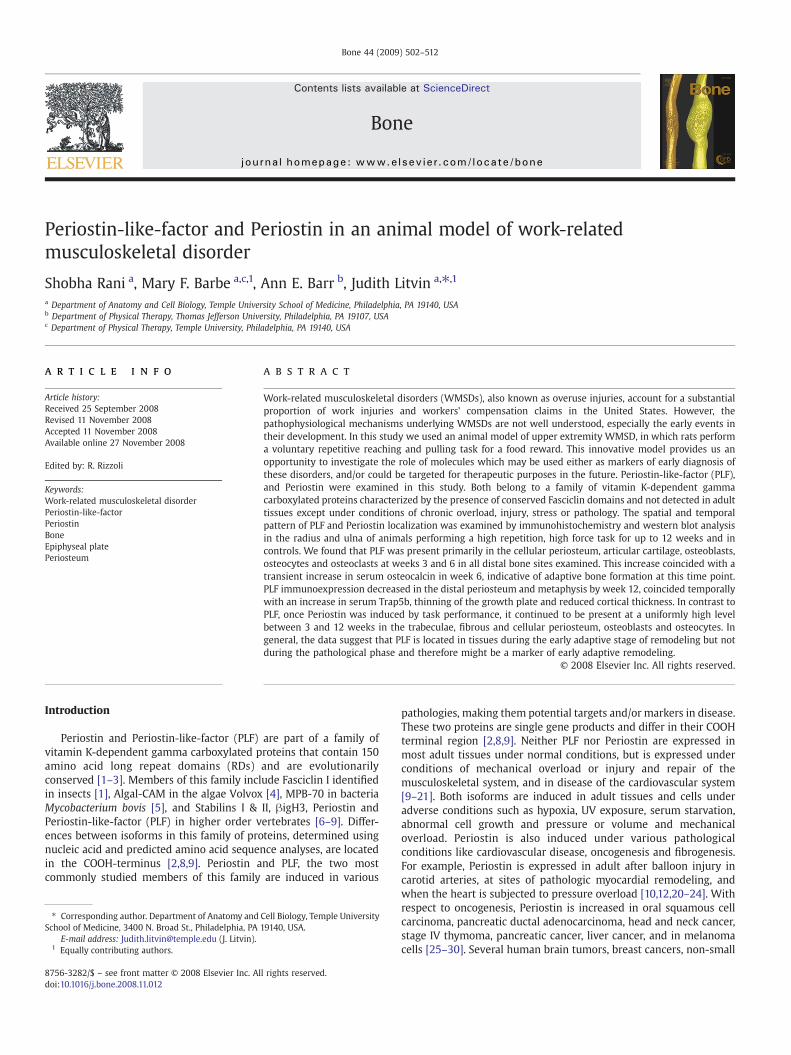
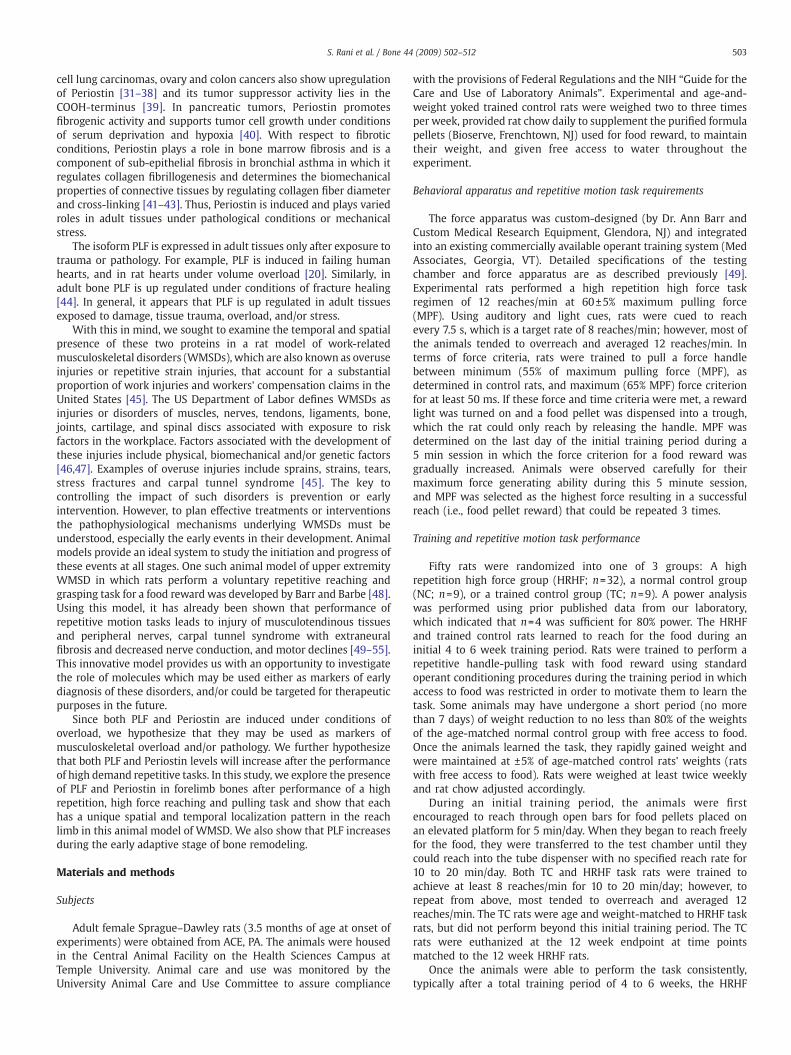
Periostin-like-factor and Periostin in an animal model of work-related musculoskeletal disorder Shobha Rani a , Mary F. Barbe a,c, 1 , Ann E. Barr b , Judith Litvin a, ⁎ , 1 a Department of Anatomy and Cell Biology, Temple University School of Medicine, Philadelphia, PA 19140, USA b Department of Physical Therapy, Thomas Jefferson University, Philadelphia, PA 19107, USA c Department of Physical Therapy, Temple University, Philadelphia, PA 19140, USA abstract article info Article history: Received 25 September 2008 Revised 11 November 2008 Accepted 11 November 2008 Available online 27 November 2008 Edited by: R. Rizzoli Keywords: Work-related musculoskeletal disorder Periostin-like-factor Periostin Bone Epiphyseal plate Periosteum Work-related musculoskeletal disorders (WMSDs), also known as overuse injuries, account for a substantial proportion of work injuries and workers' compensation claims in the United States. However, the pathophysiological mechanisms underlying WMSDs are not well understood, especially the early events in their development. In this study we used an animal model of upper extremity WMSD, in which rats perform a voluntary repetitive reaching and pulling task for a food reward. This innovative model provides us an opportunity to investigate the role of molecules which may be used either as markers of early diagnosis of these disorders, and/or could be targeted for therapeutic purposes in the future. Periostin-like-factor (PLF), and Periostin were examined in this study. Both belong to a family of vitamin K-dependent gamma carboxylated proteins characterized by the presence of conserved Fasciclin domains and not detected in adult tissues except under conditions of chronic overload, injury, stress or pathology. The spatial and temporal pattern of PLF and Periostin localization was examined by immunohistochemistry and western blot analysis in the radius and ulna of animals performing a high repetition, high force task for up to 12 weeks and in controls. We found that PLF was present primarily in the cellular periosteum, articular cartilage, osteoblasts, osteocytes and osteoclasts at weeks 3 and 6 in all distal bone sites examined. This increase coincided with a transient increase in serum osteocalcin in week 6, indicative of adaptive bone formation at this time point. PLF immunoexpression decreased in the distal periosteum and metaphysis by week 12, coincided temporally with an increase in serum Trap5b, thinning of the growth plate and reduced cortical thickness. In contrast to PLF, once Periostin was induced by task performance, it continued to be present at a uniformly high level between 3 and 12 weeks in the trabeculae, fibrous and cellular periosteum, osteoblasts and osteocytes. In general, the data suggest that PLF is located in tissues during the early adaptive stage of remodeling but not during the pathological phase and therefore might be a marker of early adaptive remodeling. © 2008 Elsevier Inc. All rights reserved. Introduction Periostin and Periostin-like-factor (PLF) are part of a family of vitamin K-dependent gamma carboxylated proteins that contain 150 amino acid long repeat domains (RDs) and are evolutionarily conserved [1–3]. Members of this family include Fasciclin I identified in insects [1], Algal-CAM in the algae Volvox [4], MPB-70 in bacteria Mycobacterium bovis [5], and Stabilins I & II, βigH3, Periostin and Periostin-like-factor (PLF) in higher order vertebrates [6–9]. Differ- ences between isoforms in this family of proteins, determined using nucleic acid and predicted amino acid sequence analyses, are located in the COOH-terminus [2,8,9]. Periostin and PLF, the two most commonly studied members of this family are induced in various pathologies, making them potential targets and/or markers in disease. These two proteins are single gene products and differ in their COOH terminal region [2,8,9]. Neither PLF nor Periostin are expressed in most adult tissues under normal conditions, but is expressed under conditions of mechanical overload or injury and repair of the musculoskeletal system, and in disease of the cardiovascular system [9–21]. Both isoforms are induced in adult tissues and cells under adverse conditions such as hypoxia, UV exposure, serum starvation, abnormal cell growth and pressure or volume and mechanical overload. Periostin is also induced under various pathological conditions like cardiovascular disease, oncogenesis and fibrogenesis. For example, Periostin is expressed in adult after balloon injury in carotid arteries, at sites of pathologic myocardial remodeling, and when the heart is subjected to pressure overload [10,12,20–24]. With respect to oncogenesis, Periostin is increased in oral squamous cell carcinoma, pancreatic ductal adenocarcinoma, head and neck cancer, stage IV thymoma, pancreatic cancer, liver cancer, and in melanoma cells [25–30]. Several human brain tumors, breast cancers, non-small Bone 44 (2009) 502–512 ⁎ Corresponding author. Department of Anatomy and Cell Biology, Temple University School of Medicine, 3400 N. Broad St., Philadelphia, PA 19140, USA. E-mail address: [email protected] (J. Litvin). 1 Equally contributing authors. 8756-3282/$ – see front matter © 2008 Elsevier Inc. All rights reserved. doi:10.1016/j.bone.2008.11.012 Contents lists available at ScienceDirect Bone journal homepage: www.elsevier.com/locate/bone
-
Upload
independent -
Category
Documents
-
view
3 -
download
0
Transcript of Periostin-like-factor and Periostin in an animal model of work-related musculoskeletal disorder
Bone 44 (2009) 502–512
Contents lists available at ScienceDirect
Bone
j ourna l homepage: www.e lsev ie r.com/ locate /bone
Periostin-like-factor and Periostin in an animal model of work-relatedmusculoskeletal disorder
Shobha Rani a, Mary F. Barbe a,c,1, Ann E. Barr b, Judith Litvin a,⁎,1
a Department of Anatomy and Cell Biology, Temple University School of Medicine, Philadelphia, PA 19140, USAb Department of Physical Therapy, Thomas Jefferson University, Philadelphia, PA 19107, USAc Department of Physical Therapy, Temple University, Philadelphia, PA 19140, USA
⁎ Corresponding author. Department of Anatomy andSchool of Medicine, 3400 N. Broad St., Philadelphia, PA
E-mail address: [email protected] (J. Litvin).1 Equally contributing authors.
8756-3282/$ – see front matter © 2008 Elsevier Inc. Aldoi:10.1016/j.bone.2008.11.012
a b s t r a c t
a r t i c l e i n f oArticle history:
Work-related musculoskele Received 25 September 2008Revised 11 November 2008Accepted 11 November 2008Available online 27 November 2008Edited by: R. Rizzoli
Keywords:Work-related musculoskeletal disorderPeriostin-like-factorPeriostinBoneEpiphyseal platePeriosteum
tal disorders (WMSDs), also known as overuse injuries, account for a substantialproportion of work injuries and workers' compensation claims in the United States. However, thepathophysiological mechanisms underlying WMSDs are not well understood, especially the early events intheir development. In this study we used an animal model of upper extremity WMSD, in which rats performa voluntary repetitive reaching and pulling task for a food reward. This innovative model provides us anopportunity to investigate the role of molecules which may be used either as markers of early diagnosis ofthese disorders, and/or could be targeted for therapeutic purposes in the future. Periostin-like-factor (PLF),and Periostin were examined in this study. Both belong to a family of vitamin K-dependent gammacarboxylated proteins characterized by the presence of conserved Fasciclin domains and not detected in adulttissues except under conditions of chronic overload, injury, stress or pathology. The spatial and temporalpattern of PLF and Periostin localization was examined by immunohistochemistry and western blot analysisin the radius and ulna of animals performing a high repetition, high force task for up to 12 weeks and incontrols. We found that PLF was present primarily in the cellular periosteum, articular cartilage, osteoblasts,osteocytes and osteoclasts at weeks 3 and 6 in all distal bone sites examined. This increase coincided with atransient increase in serum osteocalcin in week 6, indicative of adaptive bone formation at this time point.PLF immunoexpression decreased in the distal periosteum and metaphysis by week 12, coincided temporallywith an increase in serum Trap5b, thinning of the growth plate and reduced cortical thickness. In contrast toPLF, once Periostin was induced by task performance, it continued to be present at a uniformly high levelbetween 3 and 12 weeks in the trabeculae, fibrous and cellular periosteum, osteoblasts and osteocytes. Ingeneral, the data suggest that PLF is located in tissues during the early adaptive stage of remodeling but notduring the pathological phase and therefore might be a marker of early adaptive remodeling.
© 2008 Elsevier Inc. All rights reserved.
Introduction
Periostin and Periostin-like-factor (PLF) are part of a family ofvitamin K-dependent gamma carboxylated proteins that contain 150amino acid long repeat domains (RDs) and are evolutionarilyconserved [1–3]. Members of this family include Fasciclin I identifiedin insects [1], Algal-CAM in the algae Volvox [4], MPB-70 in bacteriaMycobacterium bovis [5], and Stabilins I & II, βigH3, Periostin andPeriostin-like-factor (PLF) in higher order vertebrates [6–9]. Differ-ences between isoforms in this family of proteins, determined usingnucleic acid and predicted amino acid sequence analyses, are locatedin the COOH-terminus [2,8,9]. Periostin and PLF, the two mostcommonly studied members of this family are induced in various
Cell Biology, Temple University19140, USA.
l rights reserved.
pathologies, making them potential targets and/or markers in disease.These two proteins are single gene products and differ in their COOHterminal region [2,8,9]. Neither PLF nor Periostin are expressed inmost adult tissues under normal conditions, but is expressed underconditions of mechanical overload or injury and repair of themusculoskeletal system, and in disease of the cardiovascular system[9–21]. Both isoforms are induced in adult tissues and cells underadverse conditions such as hypoxia, UV exposure, serum starvation,abnormal cell growth and pressure or volume and mechanicaloverload. Periostin is also induced under various pathologicalconditions like cardiovascular disease, oncogenesis and fibrogenesis.For example, Periostin is expressed in adult after balloon injury incarotid arteries, at sites of pathologic myocardial remodeling, andwhen the heart is subjected to pressure overload [10,12,20–24]. Withrespect to oncogenesis, Periostin is increased in oral squamous cellcarcinoma, pancreatic ductal adenocarcinoma, head and neck cancer,stage IV thymoma, pancreatic cancer, liver cancer, and in melanomacells [25–30]. Several human brain tumors, breast cancers, non-small
503S. Rani et al. / Bone 44 (2009) 502–512
cell lung carcinomas, ovary and colon cancers also show upregulationof Periostin [31–38] and its tumor suppressor activity lies in theCOOH-terminus [39]. In pancreatic tumors, Periostin promotesfibrogenic activity and supports tumor cell growth under conditionsof serum deprivation and hypoxia [40]. With respect to fibroticconditions, Periostin plays a role in bone marrow fibrosis and is acomponent of sub-epithelial fibrosis in bronchial asthma in which itregulates collagen fibrillogenesis and determines the biomechanicalproperties of connective tissues by regulating collagen fiber diameterand cross-linking [41–43]. Thus, Periostin is induced and plays variedroles in adult tissues under pathological conditions or mechanicalstress.
The isoform PLF is expressed in adult tissues only after exposure totrauma or pathology. For example, PLF is induced in failing humanhearts, and in rat hearts under volume overload [20]. Similarly, inadult bone PLF is up regulated under conditions of fracture healing[44]. In general, it appears that PLF is up regulated in adult tissuesexposed to damage, tissue trauma, overload, and/or stress.
With this in mind, we sought to examine the temporal and spatialpresence of these two proteins in a rat model of work-relatedmusculoskeletal disorders (WMSDs), which are also known as overuseinjuries or repetitive strain injuries, that account for a substantialproportion of work injuries and workers' compensation claims in theUnited States [45]. The US Department of Labor defines WMSDs asinjuries or disorders of muscles, nerves, tendons, ligaments, bone,joints, cartilage, and spinal discs associated with exposure to riskfactors in the workplace. Factors associated with the development ofthese injuries include physical, biomechanical and/or genetic factors[46,47]. Examples of overuse injuries include sprains, strains, tears,stress fractures and carpal tunnel syndrome [45]. The key tocontrolling the impact of such disorders is prevention or earlyintervention. However, to plan effective treatments or interventionsthe pathophysiological mechanisms underlying WMSDs must beunderstood, especially the early events in their development. Animalmodels provide an ideal system to study the initiation and progress ofthese events at all stages. One such animal model of upper extremityWMSD in which rats perform a voluntary repetitive reaching andgrasping task for a food reward was developed by Barr and Barbe [48].Using this model, it has already been shown that performance ofrepetitive motion tasks leads to injury of musculotendinous tissuesand peripheral nerves, carpal tunnel syndrome with extraneuralfibrosis and decreased nerve conduction, and motor declines [49–55].This innovative model provides us with an opportunity to investigatethe role of molecules which may be used either as markers of earlydiagnosis of these disorders, and/or could be targeted for therapeuticpurposes in the future.
Since both PLF and Periostin are induced under conditions ofoverload, we hypothesize that they may be used as markers ofmusculoskeletal overload and/or pathology. We further hypothesizethat both PLF and Periostin levels will increase after the performanceof high demand repetitive tasks. In this study, we explore the presenceof PLF and Periostin in forelimb bones after performance of a highrepetition, high force reaching and pulling task and show that eachhas a unique spatial and temporal localization pattern in the reachlimb in this animal model of WMSD. We also show that PLF increasesduring the early adaptive stage of bone remodeling.
Materials and methods
Subjects
Adult female Sprague–Dawley rats (3.5 months of age at onset ofexperiments) were obtained from ACE, PA. The animals were housedin the Central Animal Facility on the Health Sciences Campus atTemple University. Animal care and use was monitored by theUniversity Animal Care and Use Committee to assure compliance
with the provisions of Federal Regulations and the NIH “Guide for theCare and Use of Laboratory Animals”. Experimental and age-and-weight yoked trained control rats were weighed two to three timesper week, provided rat chow daily to supplement the purified formulapellets (Bioserve, Frenchtown, NJ) used for food reward, to maintaintheir weight, and given free access to water throughout theexperiment.
Behavioral apparatus and repetitive motion task requirements
The force apparatus was custom-designed (by Dr. Ann Barr andCustom Medical Research Equipment, Glendora, NJ) and integratedinto an existing commercially available operant training system (MedAssociates, Georgia, VT). Detailed specifications of the testingchamber and force apparatus are as described previously [49].Experimental rats performed a high repetition high force taskregimen of 12 reaches/min at 60±5% maximum pulling force(MPF). Using auditory and light cues, rats were cued to reachevery 7.5 s, which is a target rate of 8 reaches/min; however, most ofthe animals tended to overreach and averaged 12 reaches/min. Interms of force criteria, rats were trained to pull a force handlebetween minimum (55% of maximum pulling force (MPF), asdetermined in control rats, and maximum (65% MPF) force criterionfor at least 50 ms. If these force and time criteria were met, a rewardlight was turned on and a food pellet was dispensed into a trough,which the rat could only reach by releasing the handle. MPF wasdetermined on the last day of the initial training period during a5 min session in which the force criterion for a food reward wasgradually increased. Animals were observed carefully for theirmaximum force generating ability during this 5 minute session,and MPF was selected as the highest force resulting in a successfulreach (i.e., food pellet reward) that could be repeated 3 times.
Training and repetitive motion task performance
Fifty rats were randomized into one of 3 groups: A highrepetition high force group (HRHF; n=32), a normal control group(NC; n=9), or a trained control group (TC; n=9). A power analysiswas performed using prior published data from our laboratory,which indicated that n=4 was sufficient for 80% power. The HRHFand trained control rats learned to reach for the food during aninitial 4 to 6 week training period. Rats were trained to perform arepetitive handle-pulling task with food reward using standardoperant conditioning procedures during the training period in whichaccess to food was restricted in order to motivate them to learn thetask. Some animals may have undergone a short period (no morethan 7 days) of weight reduction to no less than 80% of the weightsof the age-matched normal control group with free access to food.Once the animals learned the task, they rapidly gained weight andwere maintained at ±5% of age-matched control rats' weights (ratswith free access to food). Rats were weighed at least twice weeklyand rat chow adjusted accordingly.
During an initial training period, the animals were firstencouraged to reach through open bars for food pellets placed onan elevated platform for 5 min/day. When they began to reach freelyfor the food, they were transferred to the test chamber until theycould reach into the tube dispenser with no specified reach rate for10 to 20 min/day. Both TC and HRHF task rats were trained toachieve at least 8 reaches/min for 10 to 20 min/day; however, torepeat from above, most tended to overreach and averaged 12reaches/min. The TC rats were age and weight-matched to HRHF taskrats, but did not perform beyond this initial training period. The TCrats were euthanized at the 12 week endpoint at time pointsmatched to the 12 week HRHF rats.
Once the animals were able to perform the task consistently,typically after a total training period of 4 to 6 weeks, the HRHF
504 S. Rani et al. / Bone 44 (2009) 502–512
experimental animals began the task regimen at the rate of12 reaches/min at 60±5% maximum pulling force (MPF), for 2 h/day,3 days/week (Monday, Wednesday, Friday) for 3, 6, 8 or 12 weeks. The
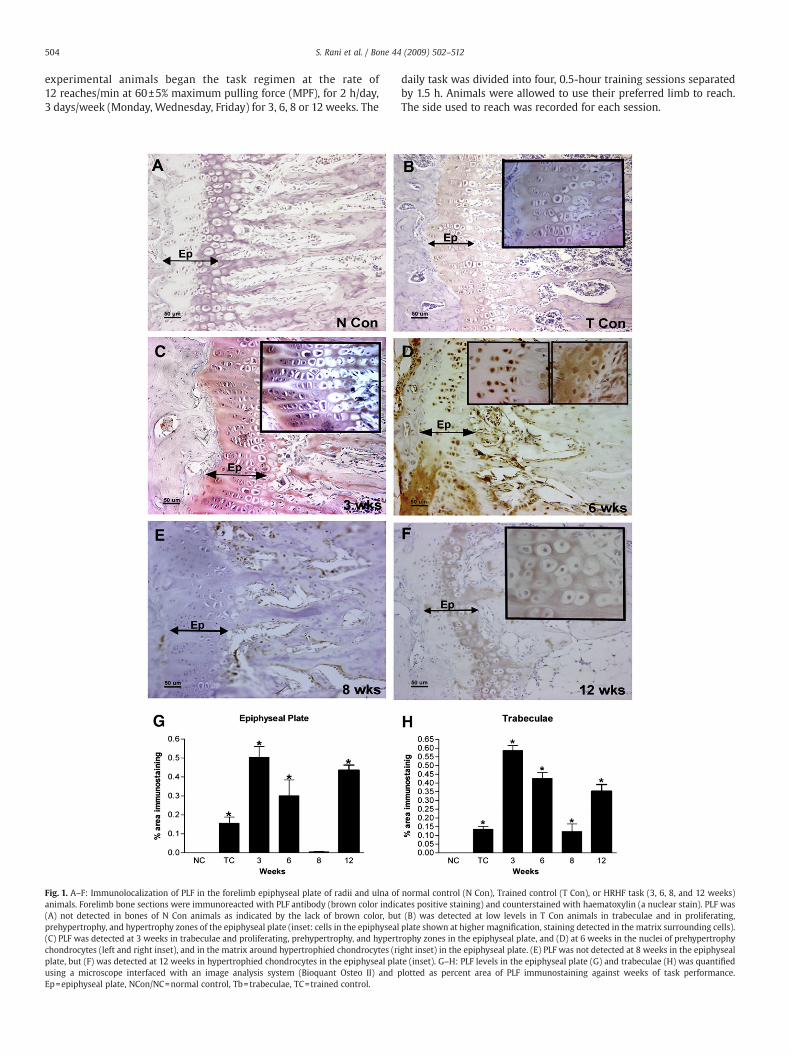
Fig. 1. A–F: Immunolocalization of PLF in the forelimb epiphyseal plate of radii and ulna ofanimals. Forelimb bone sections were immunoreacted with PLF antibody (brown color indic(A) not detected in bones of N Con animals as indicated by the lack of brown color, buprehypertrophy, and hypertrophy zones of the epiphyseal plate (inset: cells in the epiphyseal(C) PLF was detected at 3 weeks in trabeculae and proliferating, prehypertrophy, and hypertchondrocytes (left and right inset), and in the matrix around hypertrophied chondrocytes (riplate, but (F) was detected at 12 weeks in hypertrophied chondrocytes in the epiphyseal plausing a microscope interfaced with an image analysis system (Bioquant Osteo II) and pEp=epiphyseal plate, NCon/NC=normal control, Tb=trabeculae, TC=trained control.
daily task was divided into four, 0.5-hour training sessions separatedby 1.5 h. Animals were allowed to use their preferred limb to reach.The side used to reach was recorded for each session.
normal control (N Con), Trained control (T Con), or HRHF task (3, 6, 8, and 12 weeks)ates positive staining) and counterstained with haematoxylin (a nuclear stain). PLF wast (B) was detected at low levels in T Con animals in trabeculae and in proliferating,plate shown at higher magnification, staining detected in the matrix surrounding cells).rophy zones in the epiphyseal plate, and (D) at 6 weeks in the nuclei of prehypertrophyght inset) in the epiphyseal plate. (E) PLF was not detected at 8 weeks in the epiphysealte (inset). G–H: PLF levels in the epiphyseal plate (G) and trabeculae (H) was quantifiedlotted as percent area of PLF immunostaining against weeks of task performance.
505S. Rani et al. / Bone 44 (2009) 502–512
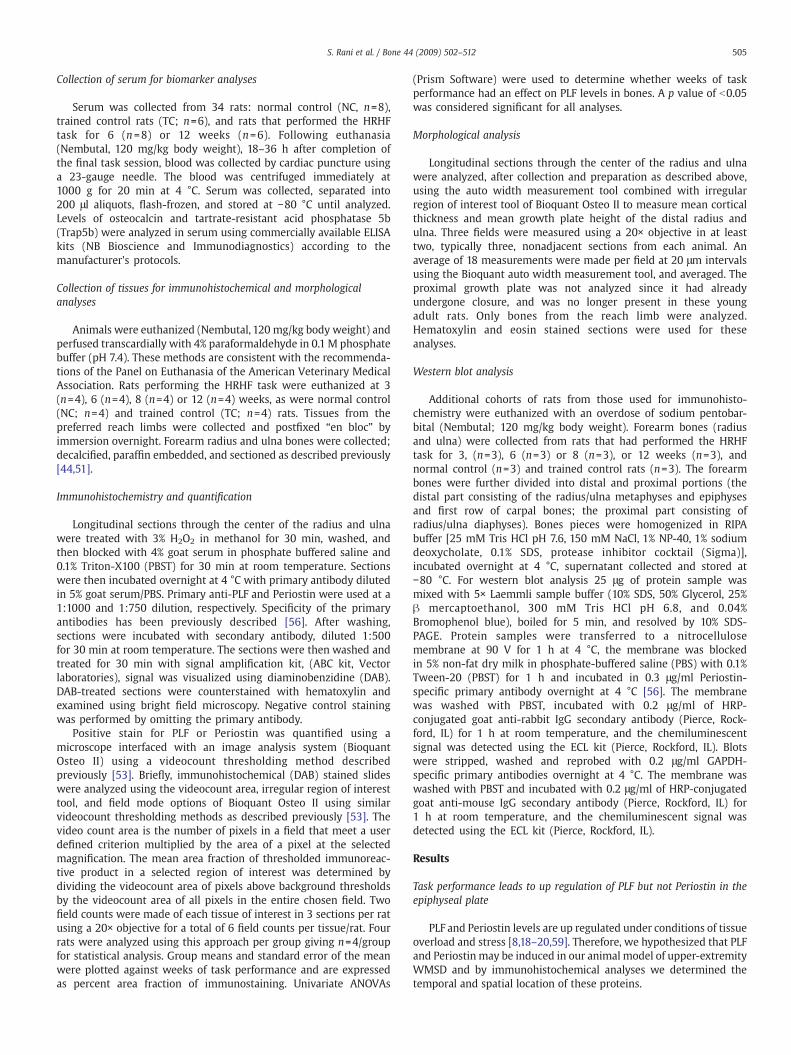
Collection of serum for biomarker analyses
Serum was collected from 34 rats: normal control (NC, n=8),trained control rats (TC; n=6), and rats that performed the HRHFtask for 6 (n=8) or 12 weeks (n=6). Following euthanasia(Nembutal, 120 mg/kg body weight), 18–36 h after completion ofthe final task session, blood was collected by cardiac puncture usinga 23-gauge needle. The blood was centrifuged immediately at1000 g for 20 min at 4 °C. Serum was collected, separated into200 μl aliquots, flash-frozen, and stored at −80 °C until analyzed.Levels of osteocalcin and tartrate-resistant acid phosphatase 5b(Trap5b) were analyzed in serum using commercially available ELISAkits (NB Bioscience and Immunodiagnostics) according to themanufacturer's protocols.
Collection of tissues for immunohistochemical and morphologicalanalyses
Animals were euthanized (Nembutal, 120 mg/kg body weight) andperfused transcardially with 4% paraformaldehyde in 0.1 M phosphatebuffer (pH 7.4). These methods are consistent with the recommenda-tions of the Panel on Euthanasia of the American Veterinary MedicalAssociation. Rats performing the HRHF task were euthanized at 3(n=4), 6 (n=4), 8 (n=4) or 12 (n=4) weeks, as were normal control(NC; n=4) and trained control (TC; n=4) rats. Tissues from thepreferred reach limbs were collected and postfixed “en bloc” byimmersion overnight. Forearm radius and ulna bones were collected;decalcified, paraffin embedded, and sectioned as described previously[44,51].
Immunohistochemistry and quantification
Longitudinal sections through the center of the radius and ulnawere treated with 3% H2O2 in methanol for 30 min, washed, andthen blocked with 4% goat serum in phosphate buffered saline and0.1% Triton-X100 (PBST) for 30 min at room temperature. Sectionswere then incubated overnight at 4 °C with primary antibody dilutedin 5% goat serum/PBS. Primary anti-PLF and Periostin were used at a1:1000 and 1:750 dilution, respectively. Specificity of the primaryantibodies has been previously described [56]. After washing,sections were incubated with secondary antibody, diluted 1:500for 30 min at room temperature. The sections were then washed andtreated for 30 min with signal amplification kit, (ABC kit, Vectorlaboratories), signal was visualized using diaminobenzidine (DAB).DAB-treated sections were counterstained with hematoxylin andexamined using bright field microscopy. Negative control stainingwas performed by omitting the primary antibody.
Positive stain for PLF or Periostin was quantified using amicroscope interfaced with an image analysis system (BioquantOsteo II) using a videocount thresholding method describedpreviously [53]. Briefly, immunohistochemical (DAB) stained slideswere analyzed using the videocount area, irregular region of interesttool, and field mode options of Bioquant Osteo II using similarvideocount thresholding methods as described previously [53]. Thevideo count area is the number of pixels in a field that meet a userdefined criterion multiplied by the area of a pixel at the selectedmagnification. The mean area fraction of thresholded immunoreac-tive product in a selected region of interest was determined bydividing the videocount area of pixels above background thresholdsby the videocount area of all pixels in the entire chosen field. Twofield counts were made of each tissue of interest in 3 sections per ratusing a 20× objective for a total of 6 field counts per tissue/rat. Fourrats were analyzed using this approach per group giving n=4/groupfor statistical analysis. Group means and standard error of the meanwere plotted against weeks of task performance and are expressedas percent area fraction of immunostaining. Univariate ANOVAs
(Prism Software) were used to determine whether weeks of taskperformance had an effect on PLF levels in bones. A p value of b0.05was considered significant for all analyses.
Morphological analysis
Longitudinal sections through the center of the radius and ulnawere analyzed, after collection and preparation as described above,using the auto width measurement tool combined with irregularregion of interest tool of Bioquant Osteo II to measure mean corticalthickness and mean growth plate height of the distal radius andulna. Three fields were measured using a 20× objective in at leasttwo, typically three, nonadjacent sections from each animal. Anaverage of 18 measurements were made per field at 20 μm intervalsusing the Bioquant auto width measurement tool, and averaged. Theproximal growth plate was not analyzed since it had alreadyundergone closure, and was no longer present in these youngadult rats. Only bones from the reach limb were analyzed.Hematoxylin and eosin stained sections were used for theseanalyses.
Western blot analysis
Additional cohorts of rats from those used for immunohisto-chemistry were euthanized with an overdose of sodium pentobar-bital (Nembutal; 120 mg/kg body weight). Forearm bones (radiusand ulna) were collected from rats that had performed the HRHFtask for 3, (n=3), 6 (n=3) or 8 (n=3), or 12 weeks (n=3), andnormal control (n=3) and trained control rats (n=3). The forearmbones were further divided into distal and proximal portions (thedistal part consisting of the radius/ulna metaphyses and epiphysesand first row of carpal bones; the proximal part consisting ofradius/ulna diaphyses). Bones pieces were homogenized in RIPAbuffer [25 mM Tris HCl pH 7.6, 150 mM NaCl, 1% NP-40, 1% sodiumdeoxycholate, 0.1% SDS, protease inhibitor cocktail (Sigma)],incubated overnight at 4 °C, supernatant collected and stored at−80 °C. For western blot analysis 25 μg of protein sample wasmixed with 5× Laemmli sample buffer (10% SDS, 50% Glycerol, 25%β mercaptoethanol, 300 mM Tris HCl pH 6.8, and 0.04%Bromophenol blue), boiled for 5 min, and resolved by 10% SDS-PAGE. Protein samples were transferred to a nitrocellulosemembrane at 90 V for 1 h at 4 °C, the membrane was blockedin 5% non-fat dry milk in phosphate-buffered saline (PBS) with 0.1%Tween-20 (PBST) for 1 h and incubated in 0.3 μg/ml Periostin-specific primary antibody overnight at 4 °C [56]. The membranewas washed with PBST, incubated with 0.2 μg/ml of HRP-conjugated goat anti-rabbit IgG secondary antibody (Pierce, Rock-ford, IL) for 1 h at room temperature, and the chemiluminescentsignal was detected using the ECL kit (Pierce, Rockford, IL). Blotswere stripped, washed and reprobed with 0.2 μg/ml GAPDH-specific primary antibodies overnight at 4 °C. The membrane waswashed with PBST and incubated with 0.2 μg/ml of HRP-conjugatedgoat anti-mouse IgG secondary antibody (Pierce, Rockford, IL) for1 h at room temperature, and the chemiluminescent signal wasdetected using the ECL kit (Pierce, Rockford, IL).
Results
Task performance leads to up regulation of PLF but not Periostin in theepiphyseal plate
PLF and Periostin levels are up regulated under conditions of tissueoverload and stress [8,18–20,59]. Therefore, we hypothesized that PLFand Periostin may be induced in our animal model of upper-extremityWMSD and by immunohistochemical analyses we determined thetemporal and spatial location of these proteins.

506 S. Rani et al. / Bone 44 (2009) 502–512
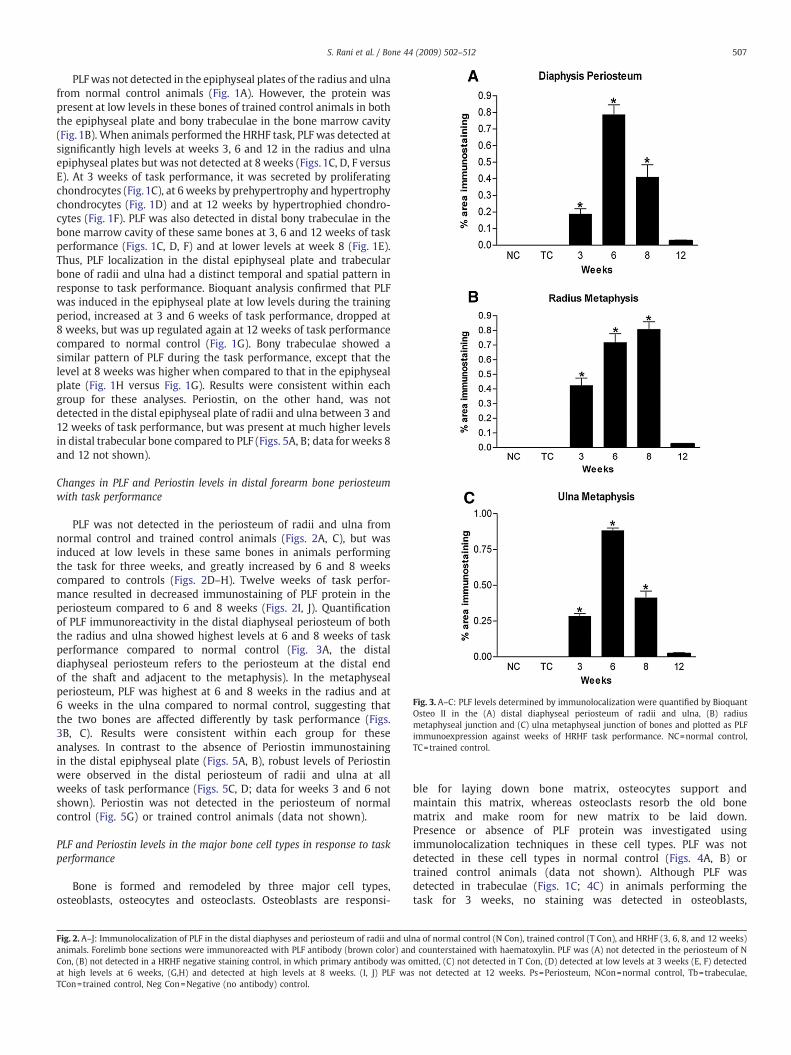
Fig. 3. A–C: PLF levels determined by immunolocalization were quantified by BioquantOsteo II in the (A) distal diaphyseal periosteum of radii and ulna, (B) radiusmetaphyseal junction and (C) ulna metaphyseal junction of bones and plotted as PLFimmunoexpression against weeks of HRHF task performance. NC=normal control,TC=trained control.
507S. Rani et al. / Bone 44 (2009) 502–512
PLFwas not detected in the epiphyseal plates of the radius and ulnafrom normal control animals (Fig. 1A). However, the protein waspresent at low levels in these bones of trained control animals in boththe epiphyseal plate and bony trabeculae in the bone marrow cavity(Fig. 1B). When animals performed the HRHF task, PLF was detected atsignificantly high levels at weeks 3, 6 and 12 in the radius and ulnaepiphyseal plates but was not detected at 8 weeks (Figs. 1C, D, F versusE). At 3 weeks of task performance, it was secreted by proliferatingchondrocytes (Fig.1C), at 6 weeks by prehypertrophy and hypertrophychondrocytes (Fig. 1D) and at 12 weeks by hypertrophied chondro-cytes (Fig. 1F). PLF was also detected in distal bony trabeculae in thebone marrow cavity of these same bones at 3, 6 and 12 weeks of taskperformance (Figs. 1C, D, F) and at lower levels at week 8 (Fig. 1E).Thus, PLF localization in the distal epiphyseal plate and trabecularbone of radii and ulna had a distinct temporal and spatial pattern inresponse to task performance. Bioquant analysis confirmed that PLFwas induced in the epiphyseal plate at low levels during the trainingperiod, increased at 3 and 6 weeks of task performance, dropped at8 weeks, but was up regulated again at 12 weeks of task performancecompared to normal control (Fig. 1G). Bony trabeculae showed asimilar pattern of PLF during the task performance, except that thelevel at 8 weeks was higher when compared to that in the epiphysealplate (Fig. 1H versus Fig. 1G). Results were consistent within eachgroup for these analyses. Periostin, on the other hand, was notdetected in the distal epiphyseal plate of radii and ulna between 3 and12 weeks of task performance, but was present at much higher levelsin distal trabecular bone compared to PLF (Figs. 5A, B; data for weeks 8and 12 not shown).
Changes in PLF and Periostin levels in distal forearm bone periosteumwith task performance
PLF was not detected in the periosteum of radii and ulna fromnormal control and trained control animals (Figs. 2A, C), but wasinduced at low levels in these same bones in animals performingthe task for three weeks, and greatly increased by 6 and 8 weekscompared to controls (Figs. 2D–H). Twelve weeks of task perfor-mance resulted in decreased immunostaining of PLF protein in theperiosteum compared to 6 and 8 weeks (Figs. 2I, J). Quantificationof PLF immunoreactivity in the distal diaphyseal periosteum of boththe radius and ulna showed highest levels at 6 and 8 weeks of taskperformance compared to normal control (Fig. 3A, the distaldiaphyseal periosteum refers to the periosteum at the distal endof the shaft and adjacent to the metaphysis). In the metaphysealperiosteum, PLF was highest at 6 and 8 weeks in the radius and at6 weeks in the ulna compared to normal control, suggesting thatthe two bones are affected differently by task performance (Figs.3B, C). Results were consistent within each group for theseanalyses. In contrast to the absence of Periostin immunostainingin the distal epiphyseal plate (Figs. 5A, B), robust levels of Periostinwere observed in the distal periosteum of radii and ulna at allweeks of task performance (Figs. 5C, D; data for weeks 3 and 6 notshown). Periostin was not detected in the periosteum of normalcontrol (Fig. 5G) or trained control animals (data not shown).
PLF and Periostin levels in the major bone cell types in response to taskperformance
Bone is formed and remodeled by three major cell types,osteoblasts, osteocytes and osteoclasts. Osteoblasts are responsi-
Fig. 2. A–J: Immunolocalization of PLF in the distal diaphyses and periosteum of radii and ulanimals. Forelimb bone sections were immunoreacted with PLF antibody (brown color) anCon, (B) not detected in a HRHF negative staining control, in which primary antibody was oat high levels at 6 weeks, (G,H) and detected at high levels at 8 weeks. (I, J) PLF waTCon=trained control, Neg Con=Negative (no antibody) control.
ble for laying down bone matrix, osteocytes support andmaintain this matrix, whereas osteoclasts resorb the old bonematrix and make room for new matrix to be laid down.Presence or absence of PLF protein was investigated usingimmunolocalization techniques in these cell types. PLF was notdetected in these cell types in normal control (Figs. 4A, B) ortrained control animals (data not shown). Although PLF wasdetected in trabeculae (Figs. 1C; 4C) in animals performing thetask for 3 weeks, no staining was detected in osteoblasts,
na of normal control (N Con), trained control (T Con), and HRHF (3, 6, 8, and 12 weeks)d counterstained with haematoxylin. PLF was (A) not detected in the periosteum of Nmitted, (C) not detected in T Con, (D) detected at low levels at 3 weeks (E, F) detecteds not detected at 12 weeks. Ps=Periosteum, NCon=normal control, Tb=trabeculae,
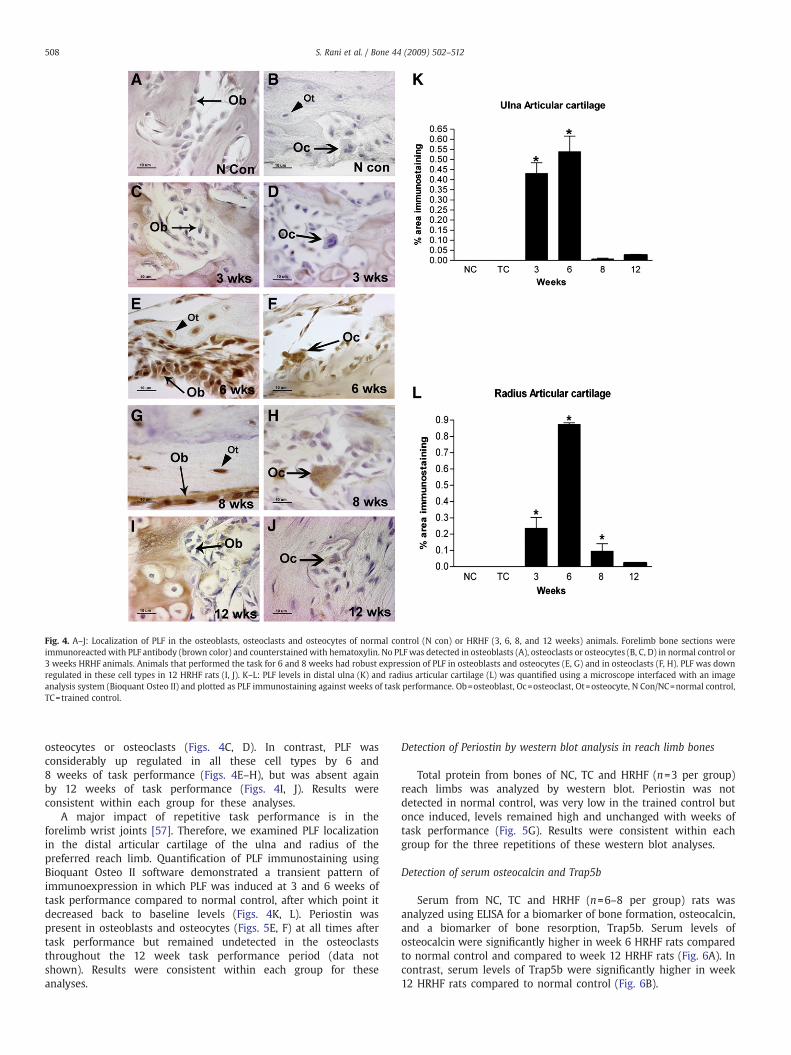
Fig. 4. A–J: Localization of PLF in the osteoblasts, osteoclasts and osteocytes of normal control (N con) or HRHF (3, 6, 8, and 12 weeks) animals. Forelimb bone sections wereimmunoreacted with PLF antibody (brown color) and counterstained with hematoxylin. No PLF was detected in osteoblasts (A), osteoclasts or osteocytes (B, C, D) in normal control or3 weeks HRHF animals. Animals that performed the task for 6 and 8 weeks had robust expression of PLF in osteoblasts and osteocytes (E, G) and in osteoclasts (F, H). PLF was downregulated in these cell types in 12 HRHF rats (I, J). K–L: PLF levels in distal ulna (K) and radius articular cartilage (L) was quantified using a microscope interfaced with an imageanalysis system (Bioquant Osteo II) and plotted as PLF immunostaining against weeks of task performance. Ob=osteoblast, Oc=osteoclast, Ot=osteocyte, N Con/NC=normal control,TC=trained control.
508 S. Rani et al. / Bone 44 (2009) 502–512
osteocytes or osteoclasts (Figs. 4C, D). In contrast, PLF wasconsiderably up regulated in all these cell types by 6 and8 weeks of task performance (Figs. 4E–H), but was absent againby 12 weeks of task performance (Figs. 4I, J). Results wereconsistent within each group for these analyses.
A major impact of repetitive task performance is in theforelimb wrist joints [57]. Therefore, we examined PLF localizationin the distal articular cartilage of the ulna and radius of thepreferred reach limb. Quantification of PLF immunostaining usingBioquant Osteo II software demonstrated a transient pattern ofimmunoexpression in which PLF was induced at 3 and 6 weeks oftask performance compared to normal control, after which point itdecreased back to baseline levels (Figs. 4K, L). Periostin waspresent in osteoblasts and osteocytes (Figs. 5E, F) at all times aftertask performance but remained undetected in the osteoclaststhroughout the 12 week task performance period (data notshown). Results were consistent within each group for theseanalyses.
Detection of Periostin by western blot analysis in reach limb bones
Total protein from bones of NC, TC and HRHF (n=3 per group)reach limbs was analyzed by western blot. Periostin was notdetected in normal control, was very low in the trained control butonce induced, levels remained high and unchanged with weeks oftask performance (Fig. 5G). Results were consistent within eachgroup for the three repetitions of these western blot analyses.
Detection of serum osteocalcin and Trap5b
Serum from NC, TC and HRHF (n=6–8 per group) rats wasanalyzed using ELISA for a biomarker of bone formation, osteocalcin,and a biomarker of bone resorption, Trap5b. Serum levels ofosteocalcin were significantly higher in week 6 HRHF rats comparedto normal control and compared to week 12 HRHF rats (Fig. 6A). Incontrast, serum levels of Trap5b were significantly higher in week12 HRHF rats compared to normal control (Fig. 6B).
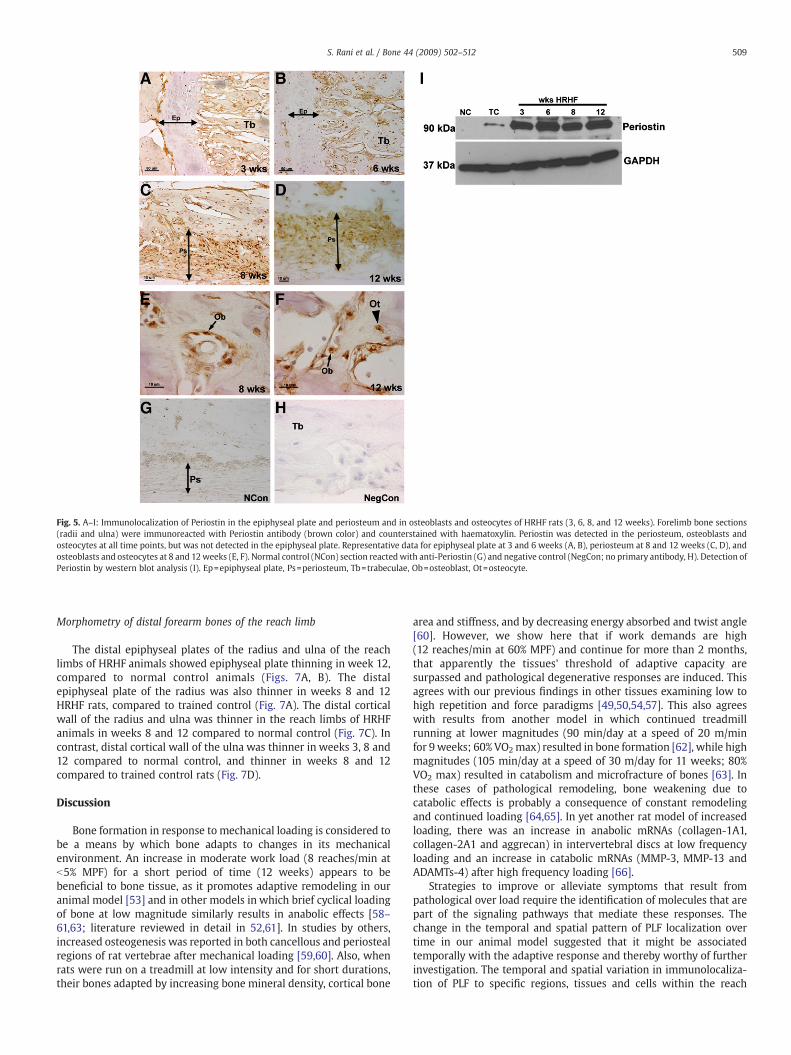
Fig. 5. A–I: Immunolocalization of Periostin in the epiphyseal plate and periosteum and in osteoblasts and osteocytes of HRHF rats (3, 6, 8, and 12 weeks). Forelimb bone sections(radii and ulna) were immunoreacted with Periostin antibody (brown color) and counterstained with haematoxylin. Periostin was detected in the periosteum, osteoblasts andosteocytes at all time points, but was not detected in the epiphyseal plate. Representative data for epiphyseal plate at 3 and 6 weeks (A, B), periosteum at 8 and 12 weeks (C, D), andosteoblasts and osteocytes at 8 and 12weeks (E, F). Normal control (NCon) section reactedwith anti-Periostin (G) and negative control (NegCon; no primary antibody, H). Detection ofPeriostin by western blot analysis (I). Ep=epiphyseal plate, Ps=periosteum, Tb=trabeculae, Ob=osteoblast, Ot=osteocyte.
509S. Rani et al. / Bone 44 (2009) 502–512
Morphometry of distal forearm bones of the reach limb
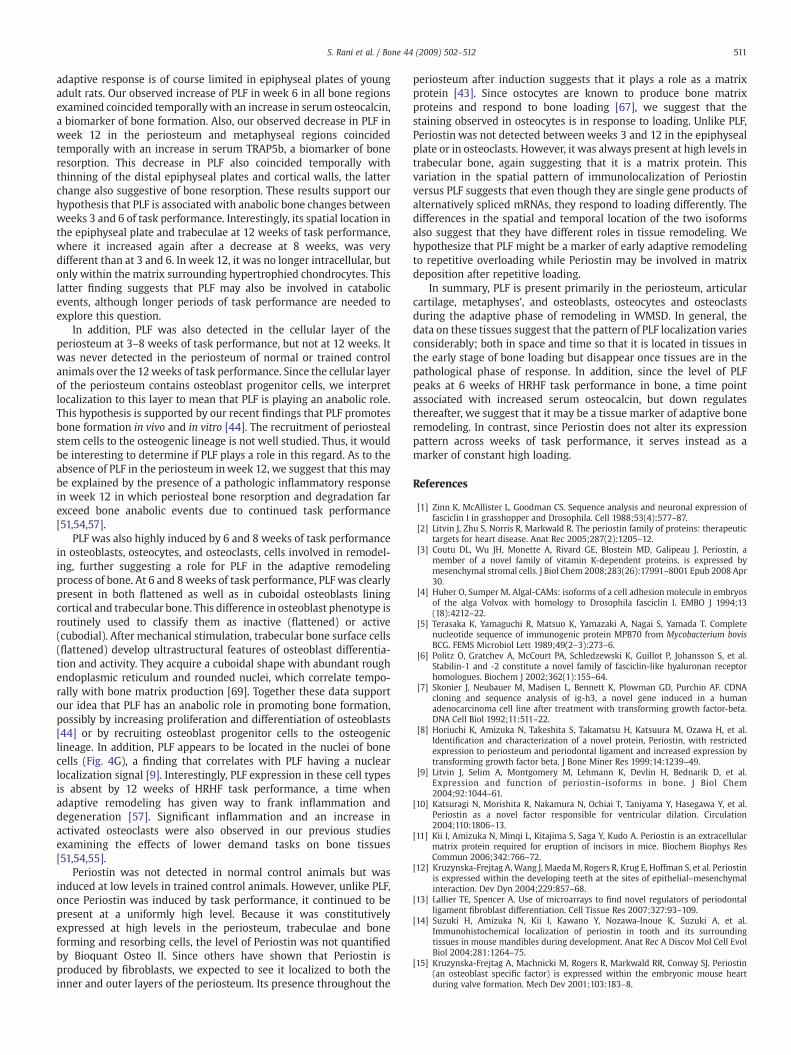
The distal epiphyseal plates of the radius and ulna of the reachlimbs of HRHF animals showed epiphyseal plate thinning in week 12,compared to normal control animals (Figs. 7A, B). The distalepiphyseal plate of the radius was also thinner in weeks 8 and 12HRHF rats, compared to trained control (Fig. 7A). The distal corticalwall of the radius and ulna was thinner in the reach limbs of HRHFanimals in weeks 8 and 12 compared to normal control (Fig. 7C). Incontrast, distal cortical wall of the ulna was thinner in weeks 3, 8 and12 compared to normal control, and thinner in weeks 8 and 12compared to trained control rats (Fig. 7D).
Discussion
Bone formation in response to mechanical loading is considered tobe a means by which bone adapts to changes in its mechanicalenvironment. An increase in moderate work load (8 reaches/min atb5% MPF) for a short period of time (12 weeks) appears to bebeneficial to bone tissue, as it promotes adaptive remodeling in ouranimal model [53] and in other models in which brief cyclical loadingof bone at low magnitude similarly results in anabolic effects [58–61,63; literature reviewed in detail in 52,61]. In studies by others,increased osteogenesis was reported in both cancellous and periostealregions of rat vertebrae after mechanical loading [59,60]. Also, whenrats were run on a treadmill at low intensity and for short durations,their bones adapted by increasing bone mineral density, cortical bone
area and stiffness, and by decreasing energy absorbed and twist angle[60]. However, we show here that if work demands are high(12 reaches/min at 60% MPF) and continue for more than 2 months,that apparently the tissues' threshold of adaptive capacity aresurpassed and pathological degenerative responses are induced. Thisagrees with our previous findings in other tissues examining low tohigh repetition and force paradigms [49,50,54,57]. This also agreeswith results from another model in which continued treadmillrunning at lower magnitudes (90 min/day at a speed of 20 m/minfor 9 weeks; 60% VO2max) resulted in bone formation [62], while highmagnitudes (105 min/day at a speed of 30 m/day for 11 weeks; 80%VO2 max) resulted in catabolism and microfracture of bones [63]. Inthese cases of pathological remodeling, bone weakening due tocatabolic effects is probably a consequence of constant remodelingand continued loading [64,65]. In yet another rat model of increasedloading, there was an increase in anabolic mRNAs (collagen-1A1,collagen-2A1 and aggrecan) in intervertebral discs at low frequencyloading and an increase in catabolic mRNAs (MMP-3, MMP-13 andADAMTs-4) after high frequency loading [66].
Strategies to improve or alleviate symptoms that result frompathological over load require the identification of molecules that arepart of the signaling pathways that mediate these responses. Thechange in the temporal and spatial pattern of PLF localization overtime in our animal model suggested that it might be associatedtemporally with the adaptive response and thereby worthy of furtherinvestigation. The temporal and spatial variation in immunolocaliza-tion of PLF to specific regions, tissues and cells within the reach
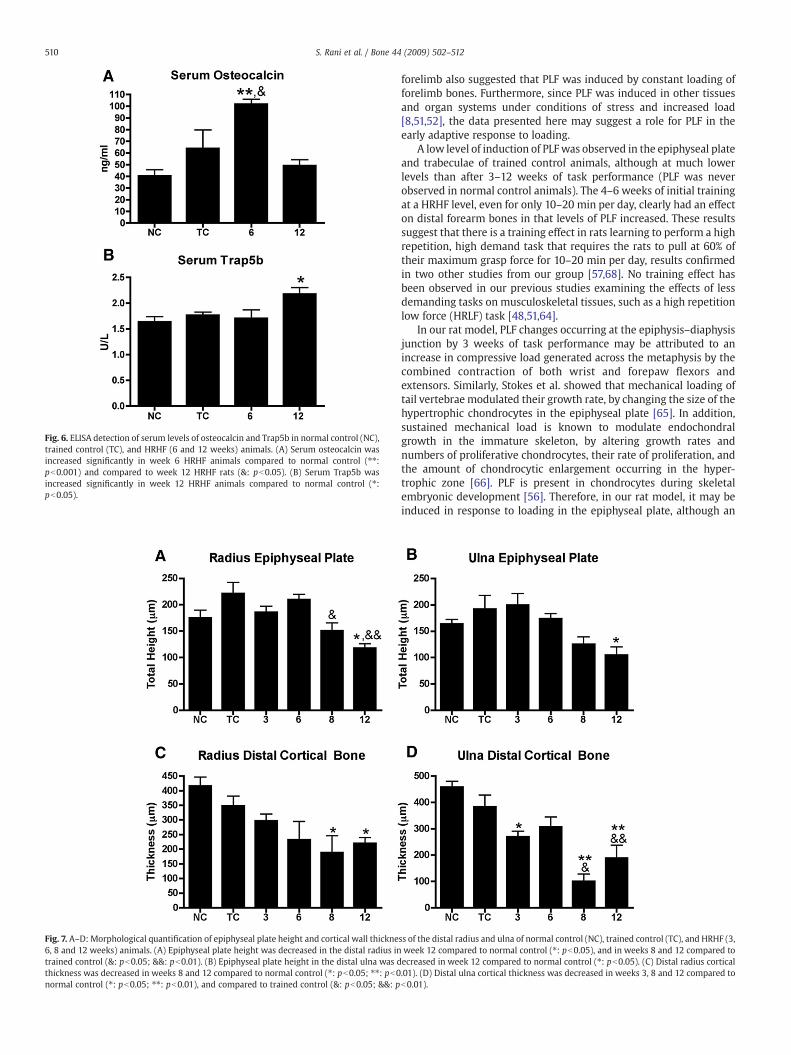
Fig. 6. ELISA detection of serum levels of osteocalcin and Trap5b in normal control (NC),trained control (TC), and HRHF (6 and 12 weeks) animals. (A) Serum osteocalcin wasincreased significantly in week 6 HRHF animals compared to normal control (⁎⁎:pb0.001) and compared to week 12 HRHF rats (&: pb0.05). (B) Serum Trap5b wasincreased significantly in week 12 HRHF animals compared to normal control (⁎:pb0.05).
Fig. 7. A–D: Morphological quantification of epiphyseal plate height and cortical wall thickne6, 8 and 12 weeks) animals. (A) Epiphyseal plate height was decreased in the distal radius intrained control (&: pb0.05; &&: pb0.01). (B) Epiphyseal plate height in the distal ulna was dthickness was decreased in weeks 8 and 12 compared to normal control (⁎: pb0.05; ⁎⁎: pb0normal control (⁎: pb0.05; ⁎⁎: pb0.01), and compared to trained control (&: pb0.05; &&: p
510 S. Rani et al. / Bone 44 (2009) 502–512
forelimb also suggested that PLF was induced by constant loading offorelimb bones. Furthermore, since PLF was induced in other tissuesand organ systems under conditions of stress and increased load[8,51,52], the data presented here may suggest a role for PLF in theearly adaptive response to loading.
A low level of induction of PLFwas observed in the epiphyseal plateand trabeculae of trained control animals, although at much lowerlevels than after 3–12 weeks of task performance (PLF was neverobserved in normal control animals). The 4–6 weeks of initial trainingat a HRHF level, even for only 10–20 min per day, clearly had an effecton distal forearm bones in that levels of PLF increased. These resultssuggest that there is a training effect in rats learning to perform a highrepetition, high demand task that requires the rats to pull at 60% oftheir maximum grasp force for 10–20 min per day, results confirmedin two other studies from our group [57,68]. No training effect hasbeen observed in our previous studies examining the effects of lessdemanding tasks on musculoskeletal tissues, such as a high repetitionlow force (HRLF) task [48,51,64].
In our rat model, PLF changes occurring at the epiphysis–diaphysisjunction by 3 weeks of task performance may be attributed to anincrease in compressive load generated across the metaphysis by thecombined contraction of both wrist and forepaw flexors andextensors. Similarly, Stokes et al. showed that mechanical loading oftail vertebrae modulated their growth rate, by changing the size of thehypertrophic chondrocytes in the epiphyseal plate [65]. In addition,sustained mechanical load is known to modulate endochondralgrowth in the immature skeleton, by altering growth rates andnumbers of proliferative chondrocytes, their rate of proliferation, andthe amount of chondrocytic enlargement occurring in the hyper-trophic zone [66]. PLF is present in chondrocytes during skeletalembryonic development [56]. Therefore, in our rat model, it may beinduced in response to loading in the epiphyseal plate, although an
ss of the distal radius and ulna of normal control (NC), trained control (TC), and HRHF (3,week 12 compared to normal control (⁎: pb0.05), and in weeks 8 and 12 compared toecreased in week 12 compared to normal control (⁎: pb0.05). (C) Distal radius cortical.01). (D) Distal ulna cortical thickness was decreased in weeks 3, 8 and 12 compared tob0.01).
511S. Rani et al. / Bone 44 (2009) 502–512
adaptive response is of course limited in epiphyseal plates of youngadult rats. Our observed increase of PLF in week 6 in all bone regionsexamined coincided temporally with an increase in serum osteocalcin,a biomarker of bone formation. Also, our observed decrease in PLF inweek 12 in the periosteum and metaphyseal regions coincidedtemporally with an increase in serum TRAP5b, a biomarker of boneresorption. This decrease in PLF also coincided temporally withthinning of the distal epiphyseal plates and cortical walls, the latterchange also suggestive of bone resorption. These results support ourhypothesis that PLF is associated with anabolic bone changes betweenweeks 3 and 6 of task performance. Interestingly, its spatial location inthe epiphyseal plate and trabeculae at 12 weeks of task performance,where it increased again after a decrease at 8 weeks, was verydifferent than at 3 and 6. Inweek 12, it was no longer intracellular, butonly within the matrix surrounding hypertrophied chondrocytes. Thislatter finding suggests that PLF may also be involved in catabolicevents, although longer periods of task performance are needed toexplore this question.
In addition, PLF was also detected in the cellular layer of theperiosteum at 3–8 weeks of task performance, but not at 12 weeks. Itwas never detected in the periosteum of normal or trained controlanimals over the 12weeks of task performance. Since the cellular layerof the periosteum contains osteoblast progenitor cells, we interpretlocalization to this layer to mean that PLF is playing an anabolic role.This hypothesis is supported by our recent findings that PLF promotesbone formation in vivo and in vitro [44]. The recruitment of periostealstem cells to the osteogenic lineage is not well studied. Thus, it wouldbe interesting to determine if PLF plays a role in this regard. As to theabsence of PLF in the periosteum inweek 12, we suggest that this maybe explained by the presence of a pathologic inflammatory responsein week 12 in which periosteal bone resorption and degradation farexceed bone anabolic events due to continued task performance[51,54,57].
PLF was also highly induced by 6 and 8 weeks of task performancein osteoblasts, osteocytes, and osteoclasts, cells involved in remodel-ing, further suggesting a role for PLF in the adaptive remodelingprocess of bone. At 6 and 8 weeks of task performance, PLF was clearlypresent in both flattened as well as in cuboidal osteoblasts liningcortical and trabecular bone. This difference in osteoblast phenotype isroutinely used to classify them as inactive (flattened) or active(cubodial). After mechanical stimulation, trabecular bone surface cells(flattened) develop ultrastructural features of osteoblast differentia-tion and activity. They acquire a cuboidal shape with abundant roughendoplasmic reticulum and rounded nuclei, which correlate tempo-rally with bone matrix production [69]. Together these data supportour idea that PLF has an anabolic role in promoting bone formation,possibly by increasing proliferation and differentiation of osteoblasts[44] or by recruiting osteoblast progenitor cells to the osteogeniclineage. In addition, PLF appears to be located in the nuclei of bonecells (Fig. 4G), a finding that correlates with PLF having a nuclearlocalization signal [9]. Interestingly, PLF expression in these cell typesis absent by 12 weeks of HRHF task performance, a time whenadaptive remodeling has given way to frank inflammation anddegeneration [57]. Significant inflammation and an increase inactivated osteoclasts were also observed in our previous studiesexamining the effects of lower demand tasks on bone tissues[51,54,55].
Periostin was not detected in normal control animals but wasinduced at low levels in trained control animals. However, unlike PLF,once Periostin was induced by task performance, it continued to bepresent at a uniformly high level. Because it was constitutivelyexpressed at high levels in the periosteum, trabeculae and boneforming and resorbing cells, the level of Periostin was not quantifiedby Bioquant Osteo II. Since others have shown that Periostin isproduced by fibroblasts, we expected to see it localized to both theinner and outer layers of the periosteum. Its presence throughout the
periosteum after induction suggests that it plays a role as a matrixprotein [43]. Since ostocytes are known to produce bone matrixproteins and respond to bone loading [67], we suggest that thestaining observed in osteocytes is in response to loading. Unlike PLF,Periostin was not detected between weeks 3 and 12 in the epiphysealplate or in osteoclasts. However, it was always present at high levels intrabecular bone, again suggesting that it is a matrix protein. Thisvariation in the spatial pattern of immunolocalization of Periostinversus PLF suggests that even though they are single gene products ofalternatively spliced mRNAs, they respond to loading differently. Thedifferences in the spatial and temporal location of the two isoformsalso suggest that they have different roles in tissue remodeling. Wehypothesize that PLF might be a marker of early adaptive remodelingto repetitive overloading while Periostin may be involved in matrixdeposition after repetitive loading.
In summary, PLF is present primarily in the periosteum, articularcartilage, metaphyses', and osteoblasts, osteocytes and osteoclastsduring the adaptive phase of remodeling in WMSD. In general, thedata on these tissues suggest that the pattern of PLF localization variesconsiderably; both in space and time so that it is located in tissues inthe early stage of bone loading but disappear once tissues are in thepathological phase of response. In addition, since the level of PLFpeaks at 6 weeks of HRHF task performance in bone, a time pointassociated with increased serum osteocalcin, but down regulatesthereafter, we suggest that it may be a tissue marker of adaptive boneremodeling. In contrast, since Periostin does not alter its expressionpattern across weeks of task performance, it serves instead as amarker of constant high loading.
References
[1] Zinn K, McAllister L, Goodman CS. Sequence analysis and neuronal expression offasciclin I in grasshopper and Drosophila. Cell 1988;53(4):577–87.
[2] Litvin J, Zhu S, Norris R, Markwald R. The periostin family of proteins: therapeutictargets for heart disease. Anat Rec 2005;287(2):1205–12.
[3] Coutu DL, Wu JH, Monette A, Rivard GE, Blostein MD, Galipeau J. Periostin, amember of a novel family of vitamin K-dependent proteins, is expressed bymesenchymal stromal cells. J Biol Chem 2008;283(26):17991–8001 Epub 2008 Apr30.
[4] Huber O, Sumper M. Algal-CAMs: isoforms of a cell adhesion molecule in embryosof the alga Volvox with homology to Drosophila fasciclin I. EMBO J 1994;13(18):4212–22.
[5] Terasaka K, Yamaguchi R, Matsuo K, Yamazaki A, Nagai S, Yamada T. Completenucleotide sequence of immunogenic protein MPB70 from Mycobacterium bovisBCG. FEMS Microbiol Lett 1989;49(2–3):273–6.
[6] Politz O, Gratchev A, McCourt PA, Schledzewski K, Guillot P, Johansson S, et al.Stabilin-1 and -2 constitute a novel family of fasciclin-like hyaluronan receptorhomologues. Biochem J 2002;362(1):155–64.
[7] Skonier J, Neubauer M, Madisen L, Bennett K, Plowman GD, Purchio AF. CDNAcloning and sequence analysis of ig-h3, a novel gene induced in a humanadenocarcinoma cell line after treatment with transforming growth factor-beta.DNA Cell Biol 1992;11:511–22.
[8] Horiuchi K, Amizuka N, Takeshita S, Takamatsu H, Katsuura M, Ozawa H, et al.Identification and characterization of a novel protein, Periostin, with restrictedexpression to periosteum and periodontal ligament and increased expression bytransforming growth factor beta. J Bone Miner Res 1999;14:1239–49.
[9] Litvin J, Selim A, Montgomery M, Lehmann K, Devlin H, Bednarik D, et al.Expression and function of periostin-isoforms in bone. J Biol Chem2004;92:1044–61.
[10] Katsuragi N, Morishita R, Nakamura N, Ochiai T, Taniyama Y, Hasegawa Y, et al.Periostin as a novel factor responsible for ventricular dilation. Circulation2004;110:1806–13.
[11] Kii I, Amizuka N, Minqi L, Kitajima S, Saga Y, Kudo A. Periostin is an extracellularmatrix protein required for eruption of incisors in mice. Biochem Biophys ResCommun 2006;342:766–72.
[12] Kruzynska-Frejtag A,Wang J, MaedaM, Rogers R, Krug E, Hoffman S, et al. Periostinis expressed within the developing teeth at the sites of epithelial–mesenchymalinteraction. Dev Dyn 2004;229:857–68.
[13] Lallier TE, Spencer A. Use of microarrays to find novel regulators of periodontalligament fibroblast differentiation. Cell Tissue Res 2007;327:93–109.
[14] Suzuki H, Amizuka N, Kii I, Kawano Y, Nozawa-Inoue K, Suzuki A, et al.Immunohistochemical localization of periostin in tooth and its surroundingtissues in mouse mandibles during development. Anat Rec A Discov Mol Cell EvolBiol 2004;281:1264–75.
[15] Kruzynska-Frejtag A, Machnicki M, Rogers R, Markwald RR, Conway SJ. Periostin(an osteoblast specific factor) is expressed within the embryonic mouse heartduring valve formation. Mech Dev 2001;103:183–8.
512 S. Rani et al. / Bone 44 (2009) 502–512
[16] Norris RA, Kern CB, Wessels A, Moralez EI, Markwald RR, Mjaatvedt CH.Identification and detection of the periostin gene in cardiac development. AnatRec A Discov Mol Cell Evol Biol 2004;281(2):1227–33.
[17] Norris RA, Kern CB,Wessels A, Wirrig EE, Markwald RR, Mjaatvedt CH. Detection ofbetaig-H3, a TGFbeta induced gene, during cardiac development and itscomplementary pattern with periostin. Anat Embryol (Berl) 2005;210(1):13–23.
[18] Kern CB, Hoffman S, Moreno R, Damon BJ, Norris RA, Krug EL, et al.Immunolocalization of chick periostin protein in the developing heart. Anat RecA Discov Mol Cell Evol Biol 2005;284:415–23.
[19] Lindsley A, Li W, Wang J, Maeda N, Rogers R, Conway SJ. Comparison of the fourmouse fasciclin-containing genes expression patterns during valvuloseptalmorphogenesis. Gene Expr Patterns 2005;5:593–600.
[20] Litvin J, Blagg A, Mu A, Matiwala S, Montgomery M, Berretta R, et al. Periostin andPeriostin-like factor in the human heart: possible therapeutic targets. CardiovascPathol 2006;15(1):24–32.
[21] Litvin J, Chen X, Keleman S, Zhu S, Autieri M. Expression and function of periostin-like factor in vascular smooth muscle cells. Am J Physiol Cell Physiol 2007;292(5):C1672–80 Epub 2006 Nov 8.
[22] Lindner V, Wang Q, Conley BA, Friesel RE, Vary CP. Vascular injury inducesexpression of periostin: implications for vascular cell differentiation andmigration. Arterioscler Thromb Vasc Biol 2005;25:77–83.
[23] Stanton LW, Garrard LJ, Damm D, Garrick BL, Lam A, Kapoun AM, et al. Alteredpatterns of gene expression in response to myocardial infarction. Circ Res2000;86:934–9.
[24] Wang D, Oparil S, Feng JA, Li P, Perry G, Chen LB, et al. Effects of pressure overloadon extracellular matrix expression in the heart of the atrial natriuretic peptide-nullmouse. Hypertension 2003;42:88–95.
[25] Choi P, Jordan CD, Mendez E, Houck J, Yueh B, Farwell DG, et al. Examination of oralcancer biomarkers by tissue microarray analysis. Arch Otolaryngol Head Neck Surg2008;34(5):539–46.
[26] Fukushima N, Kikuchi Y, Nishiyama T, Kudo A, FukayamaM. Periostin deposition inthe stroma of invasive and intraductal neoplasms of the pancreas. Mod Pathol2008;21(8):1044–53.
[27] Kudo Y, Ogawa I, Kitajima S, Kitagawa M, Kawai H, Gaffney PM, et al. Periostinpromotes invasion and anchorage-independent growth in the metastatic processof head and neck cancer. Cancer Res 2006;66(14):6928–35.
[28] Sasaki H, Auclair D, Kaji M, Fukai I, Kiriyama M, Yamakawa Y, et al. Serum level ofthe periostin, a homologue of an insect cell adhesion molecule, in thymomapatients. Cancer Lett 2001;172:34–7.
[29] Crnogorac-Jurcevic T, Missiaglia E, Blaveri E, Gangeswaran R, Jones M, Terris B, et al.Molecular alterations in pancreatic carcinoma: expression profiling shows thatdysregulated expression of S100 genes is highly prevalent. J Pathol 2003;201(1):63–74.
[30] Tilman G, Mattiussi M, Brasseur F, van Baren N, Decottignies A. Human periostingene expression in normal tissues, tumors and melanoma: evidences for Periostinproduction by both stromal and melanoma cells. Mol Cancer 2007;17(6):80.
[31] Lal A, Lash AE, Altschul SF, Velculescu V, Zhang L, McLendon RE, et al. A publicdatabase for gene expression in human cancers. Cancer Res 1999;59(21):5403–7.
[32] Sasaki H, Yu CY, Dai M, Tam C, Loda M, Auclair D, et al. Elevated serum periostinlevels in patients with bone metastases from breast but not lung cancer. BreastCancer Res Treat 2003;77(3):245–52.
[33] Shao R, Bao S, Bai X, Blanchette C, Anderson RM, Dang T, et al. Acquired expressionof periostin by human breast cancers promotes tumor angiogenesis through up-regulation of vascular endothelial growth factor receptor 2 expression. Mol CellBiol 2004;24(9):3992–4003.
[34] Puglisi F, Puppin C, Pegolo E, Andreetta C, Pascoletti G, D'Aurizio F, et al. Expressionof periostin in human breast cancer. J Clin Pathol 2008;61(4):494–8.
[35] Sasaki H, Auclair D, Fukai I, Kiriyama M, Yamakawa Y, Fujii Y, et al. Serum level ofthe periostin, a homologue of an insect cell adhesion molecule, as a prognosticmarker in non-small cell lung carcinomas. Cancer 2001;92(4):843–8.
[36] Matei D, Graeber TG, Baldwin RL, Karlan BY, Rao J, Chang DD. Gene expression inepithelial ovarian carcinoma. Oncogene 2002;21(41):6289–98.
[37] Bao S, Ouyang G, Bai X, Huang Z, Ma C, Liu M, et al. Periostin potently promotesmetastatic growth of colon cancer by augmenting cell survival via the Akt/PKBpathway. Cancer Cell 2004;5(4):329–39.
[38] Kikuchi Y, Kashima TG, Nishiyama T, Shimazu K, Morishita Y, Shimazaki M, et al.Periostin is expressed in pericryptal fibroblasts and cancer-associated fibroblastsin the colon. J Histochem Cytochem 2008;56(8):753–64.
[39] Yoshioka N, Fuji S, Shimakage M, Kodama K, Hakura A, Yutsudo M, et al.Suppression of anchorage-independent growth of human cancer cell lines by theTRIF52/periostin/OSF-2 gene. Exp Cell Res 2002;279(1):91–9.
[40] Erkan M, Kleeff J, Gorbachevski A, Reiser C, Mitkus T, Esposito I, et al. Periostincreates a tumor-supportive microenvironment in the pancreas by sustainingfibrogenic stellate cell activity. Gastroenterology 2007;132(4):1447–64.
[41] Oku E, Kanaji T, Takata Y, Oshima K, Seki R, Morishige S, et al. Periostin and bonemarrow fibrosis. Int J Hematol 2008;88(1):57–63.
[42] Takayama G, Arima K, Kanaji T, Toda S, Tanaka H, Shoji S, et al. Periostin: a novelcomponent of subepithelial fibrosis of bronchial asthma downstream of IL-4 andIL-13 signals. J Allergy Clin Immunol 2006;118(1):98–104.
[43] Norris RA, Damon B, Mironov V, Kasyanov V, Ramamurthi A, Moreno-Rodriguez R,et al. Periostin regulates collagen fibrillogenesis and the biomechanical propertiesof connective tissues. J Cell Biochem 2007;101(3):695–711.
[44] Zhu S, Barbe MF, Liu C, Hadjiargyrou M, Popoff SN, Rani S, Safadi FF, Litivn J.Periostin-like-factor in Osteogenesis. Journal of Cellular Physiology. 2008. In Press.J Cell Physiol.
[45] Bureau of Labor Statistics. Lost-work time injuries and illnesses: characteristicsand resulting, days away from work. United States Department of Labor NewsUSDL 2005:05–521.
[46] Bernard. In: Bernard BP, editor. Musculoskeletal Disorders (MSDs) and Workplacefactors: A Critical Review of Epidemiological Evidence for Work-related Muscu-loskeletal Disorders of the Neck, Upper Extremity, and LowBack. Cincinnati, OH: U.S. Department of Health and Human Services, Public Health Service, Centers forDisease Control. National Institute for Occupational Safety and Health; 1997.(1997) Publication no. 97–141.
[47] National Research Council and Institute of Medicine. Musculoskeletal Disordersand the Workplace. Washington, DC: National Academy Press; 2001. p. 57–9.
[48] Barbe MF, Barr AE, Gorzelany I, Amin M, Gaughan JP, Safadi FF. Chronic repetitivereaching and grasping results in decreased motor performance and widespreadtissue responses in a rat model of MSD. J Orthop Res 2003;21:167–76.
[49] Clark BD, Al-Shatti T, Barr AE, AminM, Barbe MF. Performance of a high-repetition,high-force task induces carpel tunnel syndrome in rats. J Orthop Sports Phys Ther2004;34:244–53.
[50] Clark BD, Barr AE, Safadi FF, Beitman L, Al-Shatti T, Amin M, et al. Median nervetrauma in a rat model of work-related musculoskeletal disorder. J Neurotrauma2003;20:681–95.
[51] Barr AE, Safadi FF, Gorzelany I, Amin M, Popoff SN, Barbe MF. Repetitive,negligible force reaching in rats induces pathological overloading of upperextremity bones. J Bone Miner Res 2003;18(11):2023–32.
[52] Barr AE, Barbe MF, Clark BD. Systemic inflammatory mediators contribute towidespread effects in work-related musculoskeletal disorders. Exerc Sport Sci Rev2004;32(4):135–42.
[53] Al-Shatti T, Barr AE, Safadi FF, Amin M, Barbe MF. Increase in inflammatorycytokines in median nerves in a rat model of repetitive motion injury. JNeuroimmunol 2005;167(1–2):13–22.
[54] Barbe MF, Elliott MB, Abdelmagid SM, Amin M, Popoff SN, Safadi FF, et al. Serumand tissue cytokines and chemokines increase with repetitive upper extremitytasks. J Orthop Res 2008;26:1320–6.
[55] Elliott MB, Barr AE, Kietrys DM, Al-Shatti T, Amin M, Barbe MF. Peripheral neuritisand increased spinal cord neurochemicals are induced in a model of repetitivemotion injury with low force and repetition exposure. Brain Res2008;1218:103–13.
[56] Zhu S, Barbe MF, Amin N, Rani S, Popoff SN, Safadi FF, et al. Immunolocalization ofPeriostin-like factor and Periostin during embryogenesis. J Histochem Cytochem2008;56(4):329–45.
[57] Driban JB, Barr AE, AminM, SitlerMR, ZiskinM, Kendrick ZV, et al. A novelmodel forinducing joint inflammation and degeneration with a pharmacological interven-tion to reduce its effects. Osteoarthritis and Cartilage 2008 Submitted.
[58] Chow JW, Jagger CJ, Chambers TJ. Characterization of osteogenic response tomechanical stimulation in cancellous bone of rat caudal vertebrae. Am J Physiol1993;265(2 Pt 1):E340–7.
[59] Chambers TJ, Evans M, Gardner TN, Turner-Smith A, Chow JW. Induction of boneformation in rat tail vertebrae by mechanical loading. Bone Miner 1993;20(2):167–78.
[60] Wheeler DL, Graves JE, Miller GJ, Vander Griend RE, Wronski TJ, Powers SK, et al.Effects of running on the torsional strength, morphometry, and bone mass of therat skeleton. Med Sci Sports Exerc 1995;27(4):520–9.
[61] Barr AE, Barbe MF. Pathophysiological tissue changes associated with repetitivemovement: a review of the evidence. Phys Ther 2002;82(2):173–87 Review.
[62] Bourrin S, Palle S, Pupier R, Vico L, Alexandre C. Effect of physical training on boneadaptation in three zones of the rat tibia. J Bone Miner Res 1995;10(11):1745–52.
[63] Bourrin S, Genty C, Palle S, Gharib C, Alexandre C. Adverse effects of strenuousexercise: a densitometric and histomorphometric study in the rat. J Appl Physiol1994;76(5):1999–2005.
[64] Maclean JJ, Lee CR, Alini M, Iatridis JC. Anabolic and catabolic mRNA levels of theintervertebral disc vary with the magnitude and frequency of in vivo dynamiccompression. J Orthop Res 2004;22(6):1193–200.
[65] Stokes IA. Mechanical effects on skeletal growth. J Musculoskelet NeuronalInteract 2002;2(3):277–80.
[66] Stokes IA, Clark KC, Farnum CE, Aronsson DD. Alterations in the growth plateassociated with growthmodulation by sustained compression or distraction. Bone2007;41(2):197–205.
[67] Colopy SA, Benz-Dean J, Barrett JG, Sample SJ, Lu Y, Danova NA, et al. Response ofthe osteocyte syncytium adjacent to and distant from linear microcracks duringadaptation to cyclic fatigue loading. Bone 2004;35(4):881–91.
[68] Albrecht PJ, Thachara A, Vickers J, Barne MF, Barr AE, Rice FL. Alterations incutaneous innervation and epidermal chemistry following repetitive motioninjury in rats. Society for Neuroscience 2008 Poster Number 154.6.