Performance of the Cerebral State Index During Increasing Levels of Propofol Anesthesia: A...
6
Performance of the Cerebral State Index During Increasing Levels of Propofol Anesthesia: A Comparison with the Bispectral Index Luis I. Cortı ´nez, MD Alejandro E. Delfino, MD Ricardo Fuentes, MD Herna ´n R. Mun ˜ oz, MD, MSc BACKGROUND: The cerebral state monitor is a new device to measure depth of anesthesia. In this study we compared the cerebral state monitor with the bispectral index (BIS) monitor during propofol anesthesia. METHODS: Fifteen healthy patients received a continuous infusion of propofol (300 mL/h). The cerebral state index (CSI) and the BIS values were recorded until burst suppression ratio 60%. Baseline variability, prediction probability, and agreement analysis between indices were evaluated. Clinical markers of loss of consciousness were also assessed. RESULTS: Mean awake BIS and CSI values were 95.6 and 91.6, respectively (P 0.01). BIS and CSI prediction probability values (mean sd) were estimated to be 0.87 0.08 and 0.86 0.08, respectively (NS). The CSI tended to stabilize at values of 60 – 40 when estimated propofol concentrations at the effect site increased from 5 to 8 g/mL. The BIS stabilized at values of 40 –20 when the propofol concentra- tions at the effect site increased from 7 to 10 g/mL. The mean BIS-CSI difference was 7.4 with 95% limits of agreement of 22.2 and 36.9. The BIS and CSI correlation with the burst suppression ratio was 0.60 and 0.97, respectively (P 0.01). Predicted BIS and CSI values for loss of eyelash reflex in 50% and 95% of the patients were different (P 0.05). CONCLUSION: The overall performance of both monitors during propofol induction was similar. However, the different dynamic profiles of these monitors indicate that BIS may be a more useful index for evaluating intermediate anesthetic levels, whereas CSI may be better for evaluating deeper anesthetic levels. (Anesth Analg 2007;104:605–10) Electroencephalographic (EEG) monitors are in- creasingly being used to measure the hypnotic effect of anesthetic drugs. The most extensively validated device used for this purpose is the bispectral index (BIS) monitor (Aspect Medical Systems, Newton, MA). This monitor calculates the “bispectral index” using multiple subparameters of the EEG as a measure of the hypnotic effect (1,2). The cerebral state monitor (CSM) (Danmeter A/S, Odense, Denmark) has re- cently been introduced as a new device to measure the hypnotic component of anesthetics drugs. Both the BIS and the CSM use proprietary algorithms to process the EEG signal and estimate dimensionless indices that are expected to approach 100 for the awake patient and progressively decrease as hypnosis increases. Both manufacturers state that index values between 40 and 60 indicate an adequate depth of hypnosis. The cerebral state index (CSI), calculated by the CSM, uses four subparameters derived from the time domain analysis (burst-ratio) and frequency domain analysis (-ratio, -ratio, -ratio–-ratio) of the EEG (3). These subparameters are then used as inputs to a fuzzy logic inference system that calculates the CSI. Fuzzy logic is a problem-solving control system meth- odology that incorporates a simple, rule-based “IF X AND Y THEN Z” approach to a solving control problem rather than attempting to model a system mathematically. The potential advantage of this ap- proach is that because the relationship between the EEG subparameters and the clinical state cannot be easily modeled by a mathematical function, the neuro- fuzzy method might offer a better alternative to estab- lish this relationship (4). The aim of this study was to compare the change in EEG indices by both the CSI and the BIS over a wide range of hypnotic effects induced by propofol. METHODS After institutional ethics committee approval (Fac- ultad de Medicina, Pontificia Universidad Cato ´ lica, Santiago, Chile), written informed consent was ob- tained from 15 ASA I patients, aged 20 – 40 yr, sched- uled to undergo surgery under general anesthesia. From the Departamento de Anestesiologı ´a, Facultad de Medi- cina, Pontificia Universidad Cato ´ lica de Chile. Santiago, Chile. Accepted for publication November 6, 2006. Address correspondence and reprint requests to Luis I. Cortı ´nez, MD, Departmento de Anestesiologı ´a, Hospital Clı ´nico U.C., Marco- leta 367, Santiago, Chile. Address e-mail to [email protected]. Copyright © 2007 International Anesthesia Research Society DOI: 10.1213/01.ane.0000255152.96354.17 Vol. 104, No. 3, March 2007 605
-
Upload
independent -
Category
Documents
-
view
1 -
download
0
Transcript of Performance of the Cerebral State Index During Increasing Levels of Propofol Anesthesia: A...

Performance of the Cerebral State Index DuringIncreasing Levels of Propofol Anesthesia: A Comparisonwith the Bispectral Index
Luis I. Cortınez, MD
Alejandro E. Delfino, MD
Ricardo Fuentes, MD
Hernan R. Munoz, MD, MSc
BACKGROUND: The cerebral state monitor is a new device to measure depth ofanesthesia. In this study we compared the cerebral state monitor with the bispectralindex (BIS) monitor during propofol anesthesia.METHODS: Fifteen healthy patients received a continuous infusion of propofol (300mL/h). The cerebral state index (CSI) and the BIS values were recorded until burstsuppression ratio �60%. Baseline variability, prediction probability, and agreementanalysis between indices were evaluated. Clinical markers of loss of consciousnesswere also assessed.RESULTS: Mean awake BIS and CSI values were 95.6 and 91.6, respectively (P �0.01). BIS and CSI prediction probability values (mean � sd) were estimated to be0.87 � 0.08 and 0.86 � 0.08, respectively (NS). The CSI tended to stabilize at valuesof 60–40 when estimated propofol concentrations at the effect site increased from5 to 8 �g/mL. The BIS stabilized at values of 40–20 when the propofol concentra-tions at the effect site increased from 7 to 10 �g/mL. The mean BIS-CSI differencewas �7.4 with 95% limits of agreement of 22.2 and �36.9. The BIS and CSIcorrelation with the burst suppression ratio was �0.60 and �0.97, respectively (P �0.01). Predicted BIS and CSI values for loss of eyelash reflex in 50% and 95% of thepatients were different (P � 0.05).CONCLUSION: The overall performance of both monitors during propofol inductionwas similar. However, the different dynamic profiles of these monitors indicatethat BIS may be a more useful index for evaluating intermediate anesthetic levels,whereas CSI may be better for evaluating deeper anesthetic levels.(Anesth Analg 2007;104:605–10)
Electroencephalographic (EEG) monitors are in-creasingly being used to measure the hypnotic effectof anesthetic drugs. The most extensively validateddevice used for this purpose is the bispectral index(BIS) monitor (Aspect Medical Systems, Newton, MA).This monitor calculates the “bispectral index” usingmultiple subparameters of the EEG as a measure ofthe hypnotic effect (1,2). The cerebral state monitor(CSM) (Danmeter A/S, Odense, Denmark) has re-cently been introduced as a new device to measure thehypnotic component of anesthetics drugs. Both the BISand the CSM use proprietary algorithms to process theEEG signal and estimate dimensionless indices thatare expected to approach 100 for the awake patientand progressively decrease as hypnosis increases.Both manufacturers state that index values between 40and 60 indicate an adequate depth of hypnosis.
The cerebral state index (CSI), calculated by theCSM, uses four subparameters derived from the timedomain analysis (burst-ratio) and frequency domainanalysis (�-ratio, �-ratio, �-ratio–�-ratio) of the EEG(3). These subparameters are then used as inputs to afuzzy logic inference system that calculates the CSI.Fuzzy logic is a problem-solving control system meth-odology that incorporates a simple, rule-based “IF XAND Y THEN Z” approach to a solving controlproblem rather than attempting to model a systemmathematically. The potential advantage of this ap-proach is that because the relationship between theEEG subparameters and the clinical state cannot beeasily modeled by a mathematical function, the neuro-fuzzy method might offer a better alternative to estab-lish this relationship (4).
The aim of this study was to compare the change inEEG indices by both the CSI and the BIS over a widerange of hypnotic effects induced by propofol.
METHODSAfter institutional ethics committee approval (Fac-
ultad de Medicina, Pontificia Universidad Catolica,Santiago, Chile), written informed consent was ob-tained from 15 ASA I patients, aged 20–40 yr, sched-uled to undergo surgery under general anesthesia.
From the Departamento de Anestesiologıa, Facultad de Medi-cina, Pontificia Universidad Catolica de Chile. Santiago, Chile.
Accepted for publication November 6, 2006.Address correspondence and reprint requests to Luis I. Cortınez,
MD, Departmento de Anestesiologıa, Hospital Clınico U.C., Marco-leta 367, Santiago, Chile. Address e-mail to [email protected].
Copyright © 2007 International Anesthesia Research SocietyDOI: 10.1213/01.ane.0000255152.96354.17
Vol. 104, No. 3, March 2007 605

Exclusion criteria included a body mass index �30%,any known cerebrovascular disease, long- or short-term (within the previous 48 h) intake of any drugacting on the central nervous system, and any knownadverse effect to the study drugs.
After arrival in the operating room, standard moni-toring (heart rate, noninvasive arterial blood pressureand arterial oxygen saturation) was initiated and aperipheral IV line was installed. At this time, thesensors of the Aspect A-2000 BIS� monitor (versionXP) and the CSM were attached according to themanufacturer’s recommendations. The smoothingtime period of the BIS monitor was set at 15 s. The dataof the CSM and BIS were automatically recorded inintervals of 1 and 5 s, respectively. BIS values wererecorded using Microsoft� Hyper Terminal Version5.1(Microsoft Corporation) and transferred to a com-puter hard disk for off-line analysis. The values of CSIwere recorded using the Danmeter A/S CSM captureV2.02 onto the computer hard disk.
All patients were breathing spontaneously througha facemask delivering 100% oxygen at 10 L/minthroughout the study period. No patient receivedpreoperative medication or any other drug during thestudy period. Before propofol administration a base-line period of 2 min was recorded. During this period,patients were kept undisturbed with the operatingroom in silence. Then, a continuous infusion of 1%propofol was started at 300 mL/h using a Pilot 2syringe infusion pump (Fresenius Vial Infusion Sys-tems, Brezins, France) and maintained until eitherburst suppression levels �60% were reached in bothmonitors or until mean arterial blood pressure �50mm Hg. Three clinical end points of loss of conscious-ness were assessed every 5 s from the start of propofolinfusion and recorded when they occurred. Theseclinical end points were: loss of response to verbalcommand, loss of eyelash reflex, and drop of aweighted syringe from the patient’s hand.
The performance of both monitors was comparedduring baseline by computing the mean and thecoefficient of variation (CV%) of the BIS and CSIbefore propofol administration. During anesthesia, thepredictive capacity of both indices for detecting thelevel of anesthesia was evaluated with the predictionprobability (Pk) statistic. To determine the Pk statistic,estimated propofol concentrations at the effect site(CePROP) were calculated and used as an objectivemeasure of the level of anesthesia. Pharmacokineticparameters of Schnider et al. (5) and a ke0 valuepredicting a peak effect at 1.6 min after a bolus dose(5,6) were used to estimate CePROP. The Pk betweenCePROP and both EEG indices was then calculated foreach individual patient using the PKMACRO, devel-oped by Smith et al. (7). The Pk can range from 0.5 to1. A Pk value of 0.5 means no predictive ability (50%chance) and a Pk of 1 means that the monitor alwayscorrectly predicts increments or decrements in thelevel of anesthesia. In addition, agreement between
CSI and BIS throughout the study period was assessedwith a Bland–Altman analysis.
The burst suppression ratios (BSR) recorded byeach of these monitors were used to evaluate theinfluence of burst suppression activity on BIS and CSI.Agreement between the BSR calculated by both moni-tors was also assessed.
EEG indices values were compared with pairedStudent’s t-test. The probability of being unconsciousat different BIS or CSI levels was calculated usinglogistic regression analysis, and multiple comparisonsbetween these values were performed with ANOVA.A P value �0.05 was considered statistically signifi-cant. Statistical analyses were performed using R(language and environment for statistical computing,freely available from http://www.r-project.org/).
RESULTSAll patients, seven women and eight men, age
30.5 � 6.5 yr, weight 69.0 � 12.5 kg and height 168.5 �8.8 cm (mean � sd) completed the study. All patientswere able to maintain spontaneous ventilationthroughout the study period. The lowest mean arterialblood pressure values recorded in each patient were76.3 � 10.5 mm Hg (mean � sd). In all patients, BISand CSI values progressively decreased during propo-fol infusion and the end point of a BSR �60% wasreached.
Before propofol administration, BIS values werehigher with less fluctuation in time than CSI values.The mean (CV%) was 95.6 (3.9) and 91.6 (7.8), respec-tively (P � 0.01).
The predictive ability of both indices measuredwith the Pk statistic (mean � sd) were 0.87 � 0.08 forBIS and 0.86 � 0.08 for CSI (NS). The individual rawBIS and CSI values versus CePROP are shown inFigures 1a and b.
The degree of agreement between BIS and CSI, andbetween the BSR calculated by each monitor, is shownin Figures 2a and b. At very deep levels of anesthesia,the BIS was relatively insensitive to burst suppressionuntil a BSR of 40% or more (Fig. 3a). This was not thecase with CSI, which was very sensitive to burstsuppression changes (Fig. 3b). The Pearson correlationcoefficient (r) between BIS and BSR (r � �0.60) waslower than the one obtained between CSI and BSR (r ��0.97), (P � 0.01).
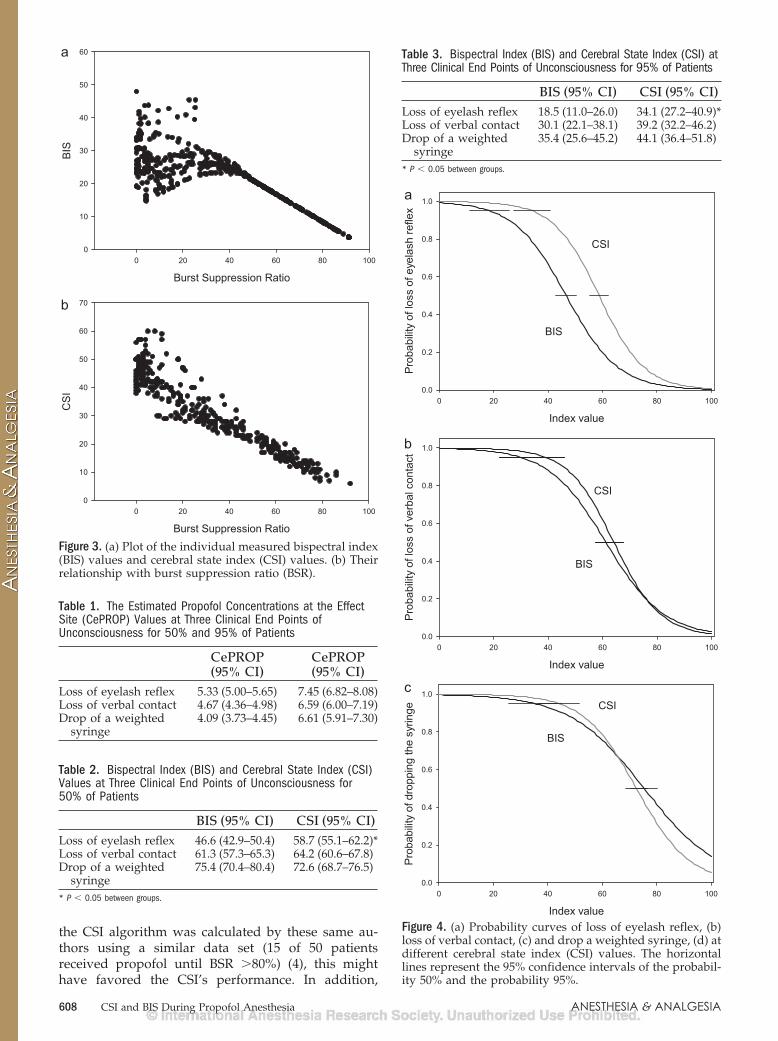
The CePROP values at three clinical end points ofunconsciousness for 50% and 95% of patients areshown in Table 1. The predicted BIS and CSI values atthese three clinical end points for 50% and 95% ofpatients are shown in Tables 2 and 3. The three clinicalend points occurred at different BIS and CSI values(P � 0.01). Figures 4a–c show the probability curves ofthese three clinical end points with both monitors.Finally, the predicted CePROP that have a 95% prob-ability of producing BIS or CSI values �60, �50, �40,�30 and �20 are shown in Figure 5.
606 CSI and BIS During Propofol Anesthesia ANESTHESIA & ANALGESIA

DISCUSSIONIn general, during propofol induction, both moni-
tors showed similar predictive capacities for detectingthe level of anesthesia. However, neither the BIS northe CSI linearly decreased at increasing levels ofCePROP. Although the CSI tended to stabilize atvalues of 60–40 at intermediate levels of hypnosis(when CePROP increased from 5 to 8 �g/mL), the BISstabilized at values of 40–20 at deeper anestheticlevels (when CePROP increased from 7 to 10 �g/mL).The different dynamic profiles showed by both moni-tors might indicate a superiority of BIS with respect toCSI to adequately discriminate intermediate anes-thetic levels, and a superiority of CSI with respect toBIS at deeper anesthetic levels.
The predictive capacity of CSM and BIS for detect-ing the level of anesthesia evaluated with the Pkstatistic showed a good performance for both moni-tors (mean BIS-CePROP Pk value of 0.87 and meanCSI-CePROP Pk values of 0.86). This is consistent witha recent study by Zhong et al. (8) comparing the CSIwith the BIS in patients undergoing general anesthesia
with propofol. In this study, the authors performedstepwise increments in propofol concentration andfound that both indices showed similar correlationsbetween CePROP-BIS (r2 � 0.787) and CePROP-CSI(r2 � 0.792). Jensen et al. (4) compared the perfor-mance of the CSI with that of the BIS and the A-LineARX index. For this, they used raw EEG records fromtwo earlier studies (9,10) and performed an off-linecalculation of the CSI. In agreement with our results,the authors showed that during propofol infusion at300 mL/h (protocol 1) the behavior of the CSI and theBIS was comparable. However, they found that thecorrelation between propofol concentration and CSI(�0.94) was higher than that of the BIS (�0.82) and theA-Line ARX index (�0.89). It is possible that because
Figure 1. (a) Plots of the individual measured bispectralindex (BIS) values and cerebral state index (CSI) values. (b)Their relationship with estimated propofol concentrations atthe effect site (CePROP). BIS and CSI values progressivelydecreased during propofol infusion in all patients.
Figure 2. Bland–Altman plots. (a) The differences betweenbispectral index (BIS) and cerebral state index (CSI). (b)Difference between burst suppression ratio (BSR)BIS andBSRCSM are plotted against their averages. The solid line isthe mean difference (bias) and the dotted lines are the meandifference plus and minus 1.96 times the standard deviationof the differences (95% limits of agreement). Figure 2a showsthat the agreement between BIS and CSI vary with the levelof anesthesia. The mean BIS-CSI difference was �7.4 with95% limits of agreement of 22.2 and �36.9. Figure 2b showsthat there is a good degree of agreement with very little biasbetween the BSR calculated by each monitor. The mean BSRdifference was �3.4 with 95% limits of agreement of 30.3and �37.1.
Vol. 104, No. 3, March 2007 © 2007 International Anesthesia Research Society 607
the CSI algorithm was calculated by these same au-thors using a similar data set (15 of 50 patientsreceived propofol until BSR �80%) (4), this mighthave favored the CSI’s performance. In addition,
Figure 3. (a) Plot of the individual measured bispectral index(BIS) values and cerebral state index (CSI) values. (b) Theirrelationship with burst suppression ratio (BSR).
Table 1. The Estimated Propofol Concentrations at the EffectSite (CePROP) Values at Three Clinical End Points ofUnconsciousness for 50% and 95% of Patients
CePROP(95% CI)
CePROP(95% CI)
Loss of eyelash reflex 5.33 (5.00–5.65) 7.45 (6.82–8.08)Loss of verbal contact 4.67 (4.36–4.98) 6.59 (6.00–7.19)Drop of a weighted
syringe4.09 (3.73–4.45) 6.61 (5.91–7.30)
Table 2. Bispectral Index (BIS) and Cerebral State Index (CSI)Values at Three Clinical End Points of Unconsciousness for50% of Patients
BIS (95% CI) CSI (95% CI)Loss of eyelash reflex 46.6 (42.9–50.4) 58.7 (55.1–62.2)*Loss of verbal contact 61.3 (57.3–65.3) 64.2 (60.6–67.8)Drop of a weighted
syringe75.4 (70.4–80.4) 72.6 (68.7–76.5)
* P � 0.05 between groups.
Table 3. Bispectral Index (BIS) and Cerebral State Index (CSI) atThree Clinical End Points of Unconsciousness for 95% of Patients
BIS (95% CI) CSI (95% CI)Loss of eyelash reflex 18.5 (11.0–26.0) 34.1 (27.2–40.9)*Loss of verbal contact 30.1 (22.1–38.1) 39.2 (32.2–46.2)Drop of a weighted
syringe35.4 (25.6–45.2) 44.1 (36.4–51.8)
* P � 0.05 between groups.
Figure 4. (a) Probability curves of loss of eyelash reflex, (b)loss of verbal contact, (c) and drop a weighted syringe, (d) atdifferent cerebral state index (CSI) values. The horizontallines represent the 95% confidence intervals of the probabil-ity 50% and the probability 95%.
608 CSI and BIS During Propofol Anesthesia ANESTHESIA & ANALGESIA
possible differences in the way the authors calculatedthe CSI (off-line calculation from filtered EEG signalsacquired with an A-Line monitor) might also haveinfluenced their results.
Recently, Anderson and Jakobsson (11) comparedthe CSM with the BIS monitor in a population ofday-surgery patients using several anesthetics. Inter-estingly, the authors found that when BIS valuesdecreased below 40, the CSI tended to stabilize athigher values. This tendency was also observed in astudy by Jensen et al. (4) and in the present study (Fig.2a). The different relationships observed in our studybetween indices and CePROP (Figs. 1a and 1b) sug-gest a better dynamic profile of BIS to discriminateintermediate levels of anesthesia, but a better profile ofCSI at deeper anesthetic levels. This is also in agree-ment with the second protocol in the study by Jensenet al. (4). In that section, the authors assessed the levelof consciousness through the observer’s assessment ofalertness and sedation (OAA/S) scale at differentsteady-state CePROP and showed that BIS, but not theCSI, adequately discriminated between OAA/S levels3 and 2, whereas the opposite occurred at deeperanesthesia (OAA/S levels 0 and 1).
During deep anesthesia, an EEG pattern known as“burst suppression” may appear. This pattern is char-acterized by alternating periods of normal to highvoltage activity changing to low voltage or evenisoelectricity (2). Although both monitors use theirown algorithms to quantify this phenomenon (2,12), agood agreement was observed between the BSR cal-culated by each monitor (Fig. 2b). With the initiationof burst suppression activity, we found that the dy-namic profile of the CSI improved and was highlycorrelated to BSR indicating a virtually total depen-dency on BSR at all BSR values (Fig. 3a). On the
contrary, BIS was not significantly affected by thisphenomenon until a BSR �40%. This is probably thereason for the superiority of CSI over BIS to ad-equately detect deeper anesthetic levels.
Electromyographic (EMG) activity can contaminateEEG signals, and could alter the value of EEG-derivedindices. In our protocol, we did not include adminis-tration of a muscle relaxant to test this possibility.Although, it has been shown that the neuromuscularblock level does not alter BIS during propofol anes-thesia (13), this possibility has not been explored withthe CSI. It might be hypothesized that part of thestabilization of the CSI at values of 60–40 at interme-diate anesthetic levels might have been due to EMGartifact in the CSI. However, we did not observesignificant EMG activity (recorded with the CSMelectrodes) during these periods. A different protocoldesign with and without muscle relaxant is probablynecessary to exclude this hypothesis.
The three clinical end points of loss of conscious-ness used in this study were reached at differentindices values either with the BIS or with the CSM.Predicted BIS and CSI values for loss of eyelash reflexin 50% and 95% of patients were different (Tables 2and 3). For the other two clinical end points used inthis study (loss of verbal contact and drop of aweighted syringe), no differences between monitorswere observed. The discrepancies observed betweenmonitors for loss of eyelash reflex and not for the othertwo clinical end points were probably because loss ofeyelash reflex occurred at hypnotic levels that occurwithin the less dynamic range of the CSI (Table 1). Wealso observed a wide interindividual variability of BISand CSI values at these three clinical end points. Therehave been many studies analyzing the relationshipbetween clinical end points and EEG-derived indicesduring propofol anesthesia (14–16). Most of thesestudies have found that these indices are useful toolsfor predicting the anesthetic level. However, there arewide variations in the values (14–16). Different defi-nitions of clinical end points and different propofoladministration schemes are mainly responsible forthese disparities. To accurately estimate the value ofthe BIS or CSI associated with a clinical end pointunder dynamic conditions, it is important to ad-equately predict the estimated effect site concentra-tions of the drug, and to know the exact time delay ofthe index calculation. The method of administration ofpropofol has been shown to affect the accuracy of thepharmacokinetic model (17), resulting in a reductionof the ability of prediction as the rate of administrationof propofol increases.
One limitation of this study is that we infusedpropofol at a relatively rapid rate (300 mL/h). Weused this infusion rate because it was used in twostudies comparing EEG monitors (4,18), which al-lowed as to compare our results with earlier findings.Another limitation of the present study is that we have
Figure 5. Estimated propofol concentrations at the effect site(CePROP) that have a 95% probability of producing relevantcerebral state index (CSI) values. This figure shows that ifpropofol administration is titrated to obtain an index valuebetween 40 and 60, the CSI may result in deeper anesthesiathan bispectral index (BIS).
Vol. 104, No. 3, March 2007 © 2007 International Anesthesia Research Society 609

not corrected for possible time delays in index calcu-lations. This was because we wanted to show the realvalues that the clinicians would see using eithermonitor during propofol infusion. These factors mightexplain the higher EC50/EC95 values for loss of verbalcontact (4.7/6.6 �g/mL) found in our study, com-pared with those estimated by Struys et al. (19) atsteady-state (2.9/3.8 �g/mL). A recent study (12)showed that BIS and CSI have different time lags forreacting to a simulated change in the level of anesthe-sia. These delays ranged between 14 and 155 s andvaried depending on the speed of change of theanesthetic level (12). This makes time delay correc-tions of their indices very difficult to perform. As aconsequence, it is not surprising to find wide differ-ences between pharmacodynamic studies using thesemonitors, and their results should always be inter-preted cautiously and with clinical judgment.
CONCLUSIONThe overall performance of both monitors during
propofol induction was similar. However, the differentdynamic profiles showed by both monitors indicate thatBIS may be a more useful index for evaluating interme-diate anesthetic levels, whereas CSI may be better forevaluating deeper anesthetic levels. Further study isneeded to determine if a significantly different dose ofpropofol would result when using either the CSI orBIS to guide drug administration.
REFERENCES
1. Sigl JC, Chamoun NG. An introduction to bispectral analysis forthe electroencephalogram. J Clin Monit 1994;10:392–404.
2. Rampil IJ. A primer for EEG signal processing in anesthesia.Anesthesiology 1998;89:980–1002.
3. Rodriguez BE, Jensen EW, Martinez P. Definition of a new indexfor depth of anesthesia using EEG sup-parameters combined byfuzzy logic. Abstract presented at Seventh EuroSIVA Meeting,Lisbon, 2004.
4. Jensen EW, Litvan H, Revuelta M, et al. Cerebral state indexduring propofol anesthesia: a comparison with the bispectralindex and the A-line ARX index. Anesthesiology 2006;105:28–36.
5. Schnider TW, Minto CF, Shafer SL, et al. The influence of age onpropofol pharmacodynamics. Anesthesiology 1999;90:1502–16.
6. Struys MM, De Smet T, Depoorter B, et al. Comparison of plasmacompartment versus two methods for effect compartment–controlled target-controlled infusion for propofol. Anesthesio-logy 2000;92:399–406.
7. Smith WD, Dutton RC, Smith NT. Measuring the performanceof anesthetic depth indicators. Anesthesiology 1996;84:38–51.
8. Zhong T, Guo QL, Pang YD, et al. Comparative evaluation ofthe cerebral state index and the bispectral index during target-controlled infusion of propofol. Br J Anaesth 2005;95:798–802.
9. Vereecke HE, Struys MM, Mortier EP. A comparison of bispec-tral index and ARX-derived auditory evoked potential index inmeasuring the clinical interaction between ketamine and propo-fol anaesthesia. Anaesthesia 2003;58:957–61.
10. Struys MM, Jensen EW, Smith W, et al. Performance of theARX-derived auditory evoked potential index as an indicator ofanesthetic depth: a comparison with bispectral index and he-modynamic measures during propofol administration. Anes-thesiology 2002;96:803–16.
11. Anderson RE, Jakobsson JG. Cerebral state monitor, a new smallhandheld EEG monitor for determining depth of anaesthesia: aclinical comparison with the bispectral index during day-surgery. Eur J Anaesthesiol 2006;23:208–12.
12. Pilge S, Zanner R, Schneider G, et al. Time delay of indexcalculation: analysis of cerebral state, bispectral, and narcotrendindices. Anesthesiology 2006;104:488–94.
13. Greif R, Greenwald S, Schweitzer E, et al. Muscle relaxationdoes not alter hypnotic level during propofol anesthesia. AnesthAnalg 2002;94:604–8.
14. Irwin MG, Hui TW, Milne SE, Kenny GN. Propofol effectiveconcentration 50 and its relationship to bispectral index. Anaes-thesia 2002;57:242–8.
15. Iannuzzi M, Iannuzzi E, Rossi F, et al. Relationship betweenbispectral index, electroencephalographic state entropy andeffect-site EC50 for propofol at different clinical endpoints. Br JAnaesth 2005;94:613–6.
16. Milne SE, Troy A, Irwin MG, Kenny GN. Relationship betweenbispectral index, auditory evoked potential index and effect-siteEC50 for propofol at two clinical end-points. Br J Anaesth2003;90:127–31.
17. Schnider TW, Minto CF, Gambus PL, et al. The influence ofmethod of administration and covariates on the pharmacokinet-ics of propofol in adult volunteers. Anesthesiology 1998;88:1170–82.
18. Vereecke HE, Vasquez PM, Jensen EW, et al. New compositeindex based on midlatency auditory evoked potential andelectroencephalographic parameters to optimize correlationwith propofol effect site concentration: comparison with bispec-tral index and solitary used fast extracting auditory evokedpotential index. Anesthesiology 2005;103:500–7.
19. Struys MM, Vereecke H, Moerman A, et al. Ability of thebispectral index, autoregressive modelling with exogenousinput-derived auditory evoked potentials, and predicted propo-fol concentrations to measure patient responsiveness duringanesthesia with propofol and remifentanil. Anesthesiology2003;99:802–12.
610 CSI and BIS During Propofol Anesthesia ANESTHESIA & ANALGESIA