Performance of Modern Passive Stack Ventilation in a ... - MDPI
27
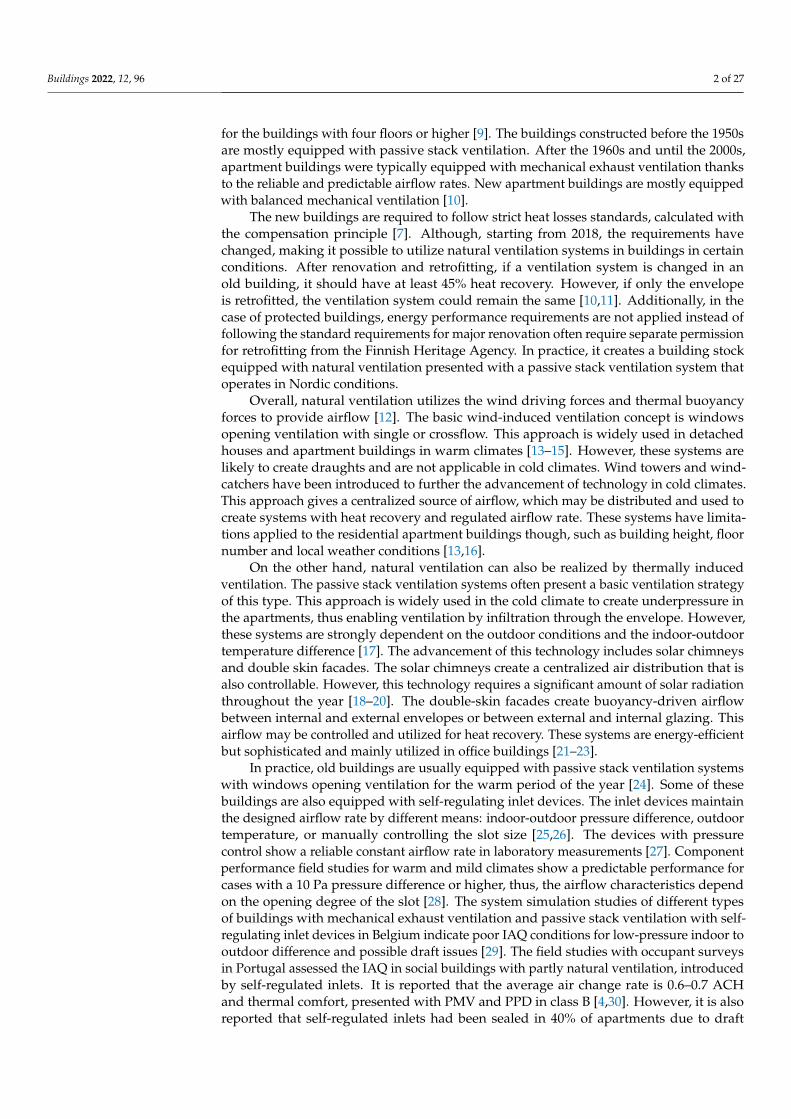
Citation: Kravchenko, I.; Kosonen, R.; Jokisalo, J.; Kilpeläinen, S. Performance of Modern Passive Stack Ventilation in a Retrofitted Nordic Apartment Building. Buildings 2022, 12, 96. https://doi.org/10.3390/ buildings12020096 Academic Editors: Ashok Kumar, M. Amirul I. Khan, Alejandro Moreno Rangel and Michal Piasecki Received: 29 November 2021 Accepted: 13 January 2022 Published: 20 January 2022 Publisher’s Note: MDPI stays neutral with regard to jurisdictional claims in published maps and institutional affil- iations. Copyright: © 2022 by the authors. Licensee MDPI, Basel, Switzerland. This article is an open access article distributed under the terms and conditions of the Creative Commons Attribution (CC BY) license (https:// creativecommons.org/licenses/by/ 4.0/). buildings Article Performance of Modern Passive Stack Ventilation in a Retrofitted Nordic Apartment Building Ilia Kravchenko 1, * , Risto Kosonen 1,2,3 , Juha Jokisalo 1,3 and Simo Kilpeläinen 1 1 Department of Mechanical Engineering, School of Engineering, Aalto University, 02150 Espoo, Finland; risto.kosonen@aalto.fi (R.K.); juha.jokisalo@aalto.fi (J.J.); simo.kilpelainen@aalto.fi (S.K.) 2 Department of HVAC, College of Urban Construction, Nanjing Tech University, Nanjing 211800, China 3 Smart City Center of Excellence, TalTech, 19086 Tallinn, Estonia * Correspondence: ilia.kravchenko@aalto.fi Abstract: The paper analyses the performance of a five-storey apartment building equipped with modern passive stack ventilation in Nordic conditions. The passive stack ventilation system was retrofitted in 2019, and novel self-regulating air inlet devices with filters were equipped. The building was simulated with IDA ICE software, where the model of the self-regulating terminal units was developed using manufacturer product data. Several case scenarios were created to analyze the effects of poor maintenance, improved airtightness, and window opening on the system performance. For the analysis, one-room and three-room apartments on the second and fifth floors have been chosen. The CO 2 concentration and indoor air temperature were analyzed and compared with EN 16798-1 standard guidelines. The results show a significant effect of poor maintenance and possibility to open windows on the CO 2 concentration. The results also show a trend for the one-room apartments to overheat despite having a higher air change rate than the three-room apartments. The three- room apartments tolerate over-heating, although they are much more sensitive to poor maintenance. Furthermore, the apartments on the fifth floor are even more sensitive to poor maintenance, and three-room apartments there showed warning levels of CO 2 . Improving the envelope airtightness does not benefit the IAQ of the apartments. Keywords: natural ventilation; Nordic climate; apartment building; building overheating; indoor climate; retrofitting 1. Introduction The general function of the building ventilation system is to provide occupants with enough fresh air while maintaining high energy efficiency. According to the WHO, IAQ is one of the most important determinants of human health and well-being, thus playing a significant role in the indoor environment of the building [1]. In the European Union (EU), most countries have their national building codes and normative documentation for the building design, which are binding [2]. The preferable indoor air quality and airflow rates are presented in the EU directives, binding for EU countries and standards. They are presented in such documents as Energy performance of buildings directive with levels of Energy performance Certification, EN 16798-1 standard in general, and EN 15214 in specific for the IAQ (indoor air quality) [3–5]. Most recommendations and buildings codes consider the minimum airflow rate, temperature level and CO 2 concentration. In Finland, the building stock ventilation construction and design requirements are provided by the Ministry of Environment [3,6,7]. The documents consider new and retrofitted buildings separately as buildings of different ages present the stock [8]. Mainly, in Finland, the residential building stock is presented by 85% of all buildings. Blocks of flats represent only 4% of this number. However, they account for approximately 30% of the total floor area of the residential building stock and around 1.3 million occupants Buildings 2022, 12, 96. https://doi.org/10.3390/buildings12020096 https://www.mdpi.com/journal/buildings
-
Upload
khangminh22 -
Category
Documents
-
view
1 -
download
0
Transcript of Performance of Modern Passive Stack Ventilation in a ... - MDPI
�����������������
Citation: Kravchenko, I.; Kosonen, R.;
Jokisalo, J.; Kilpeläinen, S.
Performance of Modern Passive Stack
Ventilation in a Retrofitted Nordic
Apartment Building. Buildings 2022,
12, 96. https://doi.org/10.3390/
buildings12020096
Academic Editors: Ashok Kumar, M.
Amirul I. Khan, Alejandro
Moreno Rangel and Michał Piasecki
Received: 29 November 2021
Accepted: 13 January 2022
Published: 20 January 2022
Publisher’s Note: MDPI stays neutral
with regard to jurisdictional claims in
published maps and institutional affil-
iations.
Copyright: © 2022 by the authors.
Licensee MDPI, Basel, Switzerland.
This article is an open access article
distributed under the terms and
conditions of the Creative Commons
Attribution (CC BY) license (https://
creativecommons.org/licenses/by/
4.0/).
buildings
Article
Performance of Modern Passive Stack Ventilation in aRetrofitted Nordic Apartment BuildingIlia Kravchenko 1,* , Risto Kosonen 1,2,3 , Juha Jokisalo 1,3 and Simo Kilpeläinen 1
1 Department of Mechanical Engineering, School of Engineering, Aalto University, 02150 Espoo, Finland;[email protected] (R.K.); [email protected] (J.J.); [email protected] (S.K.)
2 Department of HVAC, College of Urban Construction, Nanjing Tech University, Nanjing 211800, China3 Smart City Center of Excellence, TalTech, 19086 Tallinn, Estonia* Correspondence: [email protected]
Abstract: The paper analyses the performance of a five-storey apartment building equipped withmodern passive stack ventilation in Nordic conditions. The passive stack ventilation system wasretrofitted in 2019, and novel self-regulating air inlet devices with filters were equipped. The buildingwas simulated with IDA ICE software, where the model of the self-regulating terminal units wasdeveloped using manufacturer product data. Several case scenarios were created to analyze the effectsof poor maintenance, improved airtightness, and window opening on the system performance. Forthe analysis, one-room and three-room apartments on the second and fifth floors have been chosen.The CO2 concentration and indoor air temperature were analyzed and compared with EN 16798-1standard guidelines. The results show a significant effect of poor maintenance and possibility toopen windows on the CO2 concentration. The results also show a trend for the one-room apartmentsto overheat despite having a higher air change rate than the three-room apartments. The three-room apartments tolerate over-heating, although they are much more sensitive to poor maintenance.Furthermore, the apartments on the fifth floor are even more sensitive to poor maintenance, andthree-room apartments there showed warning levels of CO2. Improving the envelope airtightnessdoes not benefit the IAQ of the apartments.
Keywords: natural ventilation; Nordic climate; apartment building; building overheating; indoorclimate; retrofitting
1. Introduction
The general function of the building ventilation system is to provide occupants withenough fresh air while maintaining high energy efficiency. According to the WHO, IAQis one of the most important determinants of human health and well-being, thus playinga significant role in the indoor environment of the building [1]. In the European Union(EU), most countries have their national building codes and normative documentation forthe building design, which are binding [2]. The preferable indoor air quality and airflowrates are presented in the EU directives, binding for EU countries and standards. Theyare presented in such documents as Energy performance of buildings directive with levelsof Energy performance Certification, EN 16798-1 standard in general, and EN 15214 inspecific for the IAQ (indoor air quality) [3–5]. Most recommendations and buildings codesconsider the minimum airflow rate, temperature level and CO2 concentration. In Finland,the building stock ventilation construction and design requirements are provided by theMinistry of Environment [3,6,7]. The documents consider new and retrofitted buildingsseparately as buildings of different ages present the stock [8].
Mainly, in Finland, the residential building stock is presented by 85% of all buildings.Blocks of flats represent only 4% of this number. However, they account for approximately30% of the total floor area of the residential building stock and around 1.3 million occupants
Buildings 2022, 12, 96. https://doi.org/10.3390/buildings12020096 https://www.mdpi.com/journal/buildings
Buildings 2022, 12, 96 2 of 27
for the buildings with four floors or higher [9]. The buildings constructed before the 1950sare mostly equipped with passive stack ventilation. After the 1960s and until the 2000s,apartment buildings were typically equipped with mechanical exhaust ventilation thanksto the reliable and predictable airflow rates. New apartment buildings are mostly equippedwith balanced mechanical ventilation [10].
The new buildings are required to follow strict heat losses standards, calculated withthe compensation principle [7]. Although, starting from 2018, the requirements havechanged, making it possible to utilize natural ventilation systems in buildings in certainconditions. After renovation and retrofitting, if a ventilation system is changed in anold building, it should have at least 45% heat recovery. However, if only the envelopeis retrofitted, the ventilation system could remain the same [10,11]. Additionally, in thecase of protected buildings, energy performance requirements are not applied instead offollowing the standard requirements for major renovation often require separate permissionfor retrofitting from the Finnish Heritage Agency. In practice, it creates a building stockequipped with natural ventilation presented with a passive stack ventilation system thatoperates in Nordic conditions.
Overall, natural ventilation utilizes the wind driving forces and thermal buoyancyforces to provide airflow [12]. The basic wind-induced ventilation concept is windowsopening ventilation with single or crossflow. This approach is widely used in detachedhouses and apartment buildings in warm climates [13–15]. However, these systems arelikely to create draughts and are not applicable in cold climates. Wind towers and wind-catchers have been introduced to further the advancement of technology in cold climates.This approach gives a centralized source of airflow, which may be distributed and used tocreate systems with heat recovery and regulated airflow rate. These systems have limita-tions applied to the residential apartment buildings though, such as building height, floornumber and local weather conditions [13,16].
On the other hand, natural ventilation can also be realized by thermally inducedventilation. The passive stack ventilation systems often present a basic ventilation strategyof this type. This approach is widely used in the cold climate to create underpressure inthe apartments, thus enabling ventilation by infiltration through the envelope. However,these systems are strongly dependent on the outdoor conditions and the indoor-outdoortemperature difference [17]. The advancement of this technology includes solar chimneysand double skin facades. The solar chimneys create a centralized air distribution that isalso controllable. However, this technology requires a significant amount of solar radiationthroughout the year [18–20]. The double-skin facades create buoyancy-driven airflowbetween internal and external envelopes or between external and internal glazing. Thisairflow may be controlled and utilized for heat recovery. These systems are energy-efficientbut sophisticated and mainly utilized in office buildings [21–23].
In practice, old buildings are usually equipped with passive stack ventilation systemswith windows opening ventilation for the warm period of the year [24]. Some of thesebuildings are also equipped with self-regulating inlet devices. The inlet devices maintainthe designed airflow rate by different means: indoor-outdoor pressure difference, outdoortemperature, or manually controlling the slot size [25,26]. The devices with pressurecontrol show a reliable constant airflow rate in laboratory measurements [27]. Componentperformance field studies for warm and mild climates show a predictable performance forcases with a 10 Pa pressure difference or higher, thus, the airflow characteristics dependon the opening degree of the slot [28]. The system simulation studies of different typesof buildings with mechanical exhaust ventilation and passive stack ventilation with self-regulating inlet devices in Belgium indicate poor IAQ conditions for low-pressure indoor tooutdoor difference and possible draft issues [29]. The field studies with occupant surveysin Portugal assessed the IAQ in social buildings with partly natural ventilation, introducedby self-regulated inlets. It is reported that the average air change rate is 0.6–0.7 ACHand thermal comfort, presented with PMV and PPD in class B [4,30]. However, it is alsoreported that self-regulated inlets had been sealed in 40% of apartments due to draft
Buildings 2022, 12, 96 3 of 27
issues and cold sensations during the winter [31]. Further laboratory device testing andinvestigation showed malfunction of pressure-control inlets due to the membrane, leadingto an inconsistent airflow rate that differs from manufacturer data [32]. Another field studyin Porto of 40 social residential buildings showed an air change rate level of 0.35 ACHin winter, best-case scenario, and around 0.1 ACH in August, in the worst-case scenario.Some of the inlets were also sealed by the occupants [33]. A study in the UK has identifiedthat, for a significant period of time, the supply of outdoor air via the inlet devices will notprovide a Category A according to the UK building regulation [30] perceived indoor airquality index [34].
In the Nordic climate, the interest in implementing such devices is presented inretrofitting protected or heritage buildings. These buildings have limited or no access tothe retrofit of the envelope and ventilation system. Some retrofitted apartment multi-storeybuildings in Finland are equipped with self-regulating inlets with outdoor temperaturecontrol to preserve a natural passive stack ventilation system. The ventilation system isdesigned for the nominal conditions; however, natural ventilation performance depends onthe outdoor conditions, and yearly performance has not been assessed. Some studies haveinvestigated the performance of the self-regulated inlet devices in cold climate via CFDanalysis [35,36]; yet, no studies regarding the building ventilation system performancein Nordic climate were found. Another investigated performance of slot-controlled orpressure-controlled inlet devices, although the self-regulating inlet device with outdoortemperature control, which works on reducing the inlet area when the outdoor temperaturedecreases, was not assessed or simulated in the literature.
The paper novelty comes from the performance assessment of a multi-storey apart-ment building with natural ventilation retrofitted with self-regulated air inlets in Nordicclimate. The building presents old heritage and protected building stock with limited orno access to the ventilation system reconstruction, demanding to be retrofitted to performaccording to the EN energy and IAQ standards [37,38]. The importance of renovation anddecarbonization of old stock buildings also empathizes with the recent European reno-vation wave strategy [39]. Natural ventilation systems performance depends on outdoorand weather conditions and may significantly vary during the year, making it essential tomake a simulation to meet the requirements. The building performance simulation reflectsvarious cases with the effect of poor maintenance, different retrofit strategies such as theimplementation of shading and improved envelope airtightness, and effect of buildingsuser behaviour. Such a ventilation system has individual filters for each apartment, makingmaintenance demanding. The poor maintenance cases investigate the influence of dirtyinlet device filter, passive stack duct, and a combination of those. The different airtightnesscases describe the influence of envelope retrofitting. The air movement is also providedby infiltration and exfiltration through the building envelope; thus, the airtightness of thebuilding might also influence the ventilation system performance. The occupant behaviourcases describe different schedules for opening windows and doors as the occupants operatedoors, possibly creating additional airflow resistance. The research evaluates the impactof these factors on the system performance, along with weather conditions and buildingheight. In this study, a building model was created in IDA ICE with a custom componentto describe the temperature-dependent self-regulating inlet. The IAQ parameters werecalculated and evaluated concerning requirements and legislation. The internal airflowswere also calculated for various periods and assessed. The main research question is if theventilation system with modern passive stack ventilation has sufficient performance in amulti-storey building in the Nordic climate.
2. Materials and Methods2.1. Target Values
The chosen parameters reflect such metrics as CO2—the direct IAQ indicator andreflection of the EN standards, temperature—thermal comfort and overheating indicator,internal airflow and air change rate as an indicator of IAQ, internal airflow patterns and re-
Buildings 2022, 12, 96 4 of 27
flection pf EN standards. The target values used in this paper are based on national Finnishbuilding codes, legislations and European standards EN 16798-1 [38] and EN 15251 [37] forthe IAQ parameters, the CO2 concentration in residential apartments in specific.
The requirements forced by the Ministry of the Environment define overheating inthe living spaces of the buildings as apartments being more than 150 ◦Ch over 27 ◦C [7].This requirement applies to the simulated indoor temperature from June to August inthe design phase of the new building, and the simulation input data required by thebuilding code are used. In this paper, this rule is used to evaluate overheating risk andthermal comfort. However, it is not applicable to fulfil this requirement due to the differentbuilding code input data. Additionally, the requirement by the Ministry of Social Affairsand Health of Finland for all the existing residential buildings or other living spaces is 30 ◦Cas the maximum health-related temperature for the elderly people who are cared for in theresidential living spaces and 32 ◦C as the overall maximum indoor air temperature [40].
The guidelines suggested by EN 15251 are applied for CO2 concentration analysis. TheCO2 concentration is presented for the I to IV indoor air categories with a base concentrationassumed to be 430 ppm [41]. The categories from I to III present acceptable CO2 levels, alsoreferring to the apartment airflow rates. The IV category presents all other possible casesallowed in the apartments only for a limited period of the year.
All the data are presented in hourly mean values. The degree hours are also calculatedwith hourly mean values.
2.2. Building Description
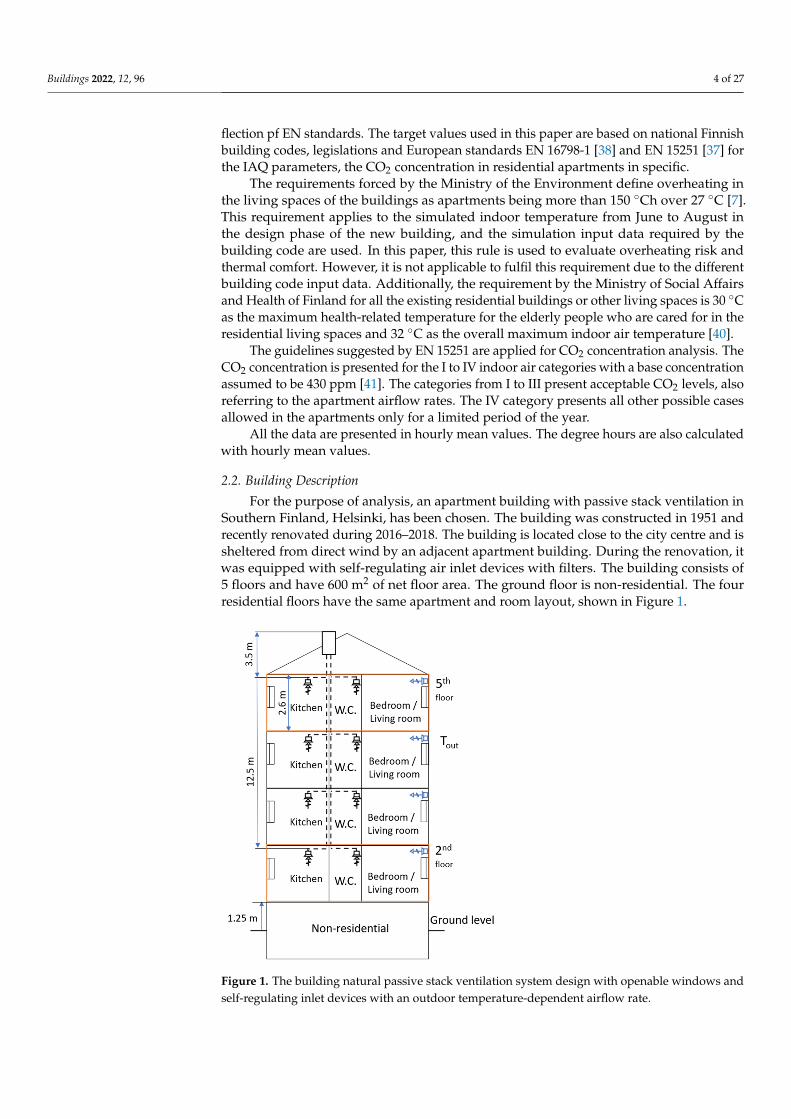
For the purpose of analysis, an apartment building with passive stack ventilation inSouthern Finland, Helsinki, has been chosen. The building was constructed in 1951 andrecently renovated during 2016–2018. The building is located close to the city centre and issheltered from direct wind by an adjacent apartment building. During the renovation, itwas equipped with self-regulating air inlet devices with filters. The building consists of5 floors and have 600 m2 of net floor area. The ground floor is non-residential. The fourresidential floors have the same apartment and room layout, shown in Figure 1.
Buildings 2022, 12, x FOR PEER REVIEW 4 of 27
internal airflow and air change rate as an indicator of IAQ, internal airflow patterns and
reflection pf EN standards. The target values used in this paper are based on national
Finnish building codes, legislations and European standards EN 16798‐1 [38] and EN
15251 [37] for the IAQ parameters, the CO2 concentration in residential apartments in spe‐
cific.
The requirements forced by the Ministry of the Environment define overheating in
the living spaces of the buildings as apartments being more than 150 °Ch over 27 °C [7].
This requirement applies to the simulated indoor temperature from June to August in the
design phase of the new building, and the simulation input data required by the building
code are used. In this paper, this rule is used to evaluate overheating risk and thermal
comfort. However, it is not applicable to fulfil this requirement due to the different build‐
ing code input data. Additionally, the requirement by the Ministry of Social Affairs and
Health of Finland for all the existing residential buildings or other living spaces is 30 °C
as the maximum health‐related temperature for the elderly people who are cared for in
the residential living spaces and 32 °C as the overall maximum indoor air temperature
[40].
The guidelines suggested by EN 15251 are applied for CO2 concentration analysis.
The CO2 concentration is presented for the I to IV indoor air categories with a base con‐
centration assumed to be 430 ppm [41]. The categories from I to III present acceptable CO2
levels, also referring to the apartment airflow rates. The IV category presents all other
possible cases allowed in the apartments only for a limited period of the year.
All the data are presented in hourly mean values. The degree hours are also calcu‐
lated with hourly mean values.
2.2. Building Description
For the purpose of analysis, an apartment building with passive stack ventilation in
Southern Finland, Helsinki, has been chosen. The building was constructed in 1951 and
recently renovated during 2016–2018. The building is located close to the city centre and
is sheltered from direct wind by an adjacent apartment building. During the renovation,
it was equipped with self‐regulating air inlet devices with filters. The building consists of
5 floors and have 600 m2 of net floor area. The ground floor is non‐residential. The four
residential floors have the same apartment and room layout, shown in Figure 1.
Figure 1. The building natural passive stack ventilation system design with openable windows andself-regulating inlet devices with an outdoor temperature-dependent airflow rate.
Buildings 2022, 12, 96 5 of 27
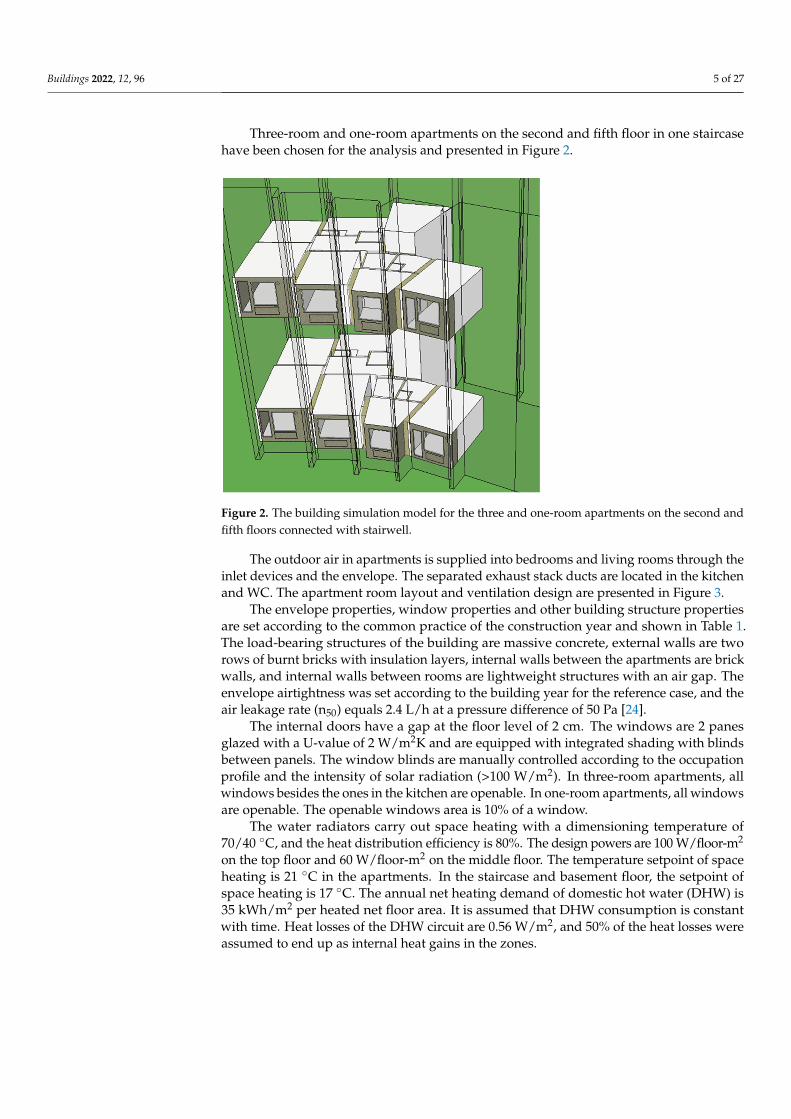
Three-room and one-room apartments on the second and fifth floor in one staircasehave been chosen for the analysis and presented in Figure 2.
Buildings 2022, 12, x FOR PEER REVIEW 5 of 27
Figure 1. The building natural passive stack ventilation system design with openable windows and
self‐regulating inlet devices with an outdoor temperature‐dependent airflow rate.
Three‐room and one‐room apartments on the second and fifth floor in one staircase
have been chosen for the analysis and presented in Figure 2.
Figure 2. The building simulation model for the three and one‐room apartments on the second and
fifth floors connected with stairwell.
The outdoor air in apartments is supplied into bedrooms and living rooms through the
inlet devices and the envelope. The separated exhaust stack ducts are located in the kitchen
and WC. The apartment room layout and ventilation design are presented in Figure 3.
Figure 2. The building simulation model for the three and one-room apartments on the second andfifth floors connected with stairwell.
The outdoor air in apartments is supplied into bedrooms and living rooms through theinlet devices and the envelope. The separated exhaust stack ducts are located in the kitchenand WC. The apartment room layout and ventilation design are presented in Figure 3.
The envelope properties, window properties and other building structure propertiesare set according to the common practice of the construction year and shown in Table 1.The load-bearing structures of the building are massive concrete, external walls are tworows of burnt bricks with insulation layers, internal walls between the apartments are brickwalls, and internal walls between rooms are lightweight structures with an air gap. Theenvelope airtightness was set according to the building year for the reference case, and theair leakage rate (n50) equals 2.4 L/h at a pressure difference of 50 Pa [24].
The internal doors have a gap at the floor level of 2 cm. The windows are 2 panesglazed with a U-value of 2 W/m2K and are equipped with integrated shading with blindsbetween panels. The window blinds are manually controlled according to the occupationprofile and the intensity of solar radiation (>100 W/m2). In three-room apartments, allwindows besides the ones in the kitchen are openable. In one-room apartments, all windowsare openable. The openable windows area is 10% of a window.
The water radiators carry out space heating with a dimensioning temperature of70/40 ◦C, and the heat distribution efficiency is 80%. The design powers are 100 W/floor-m2
on the top floor and 60 W/floor-m2 on the middle floor. The temperature setpoint of spaceheating is 21 ◦C in the apartments. In the staircase and basement floor, the setpoint ofspace heating is 17 ◦C. The annual net heating demand of domestic hot water (DHW) is35 kWh/m2 per heated net floor area. It is assumed that DHW consumption is constantwith time. Heat losses of the DHW circuit are 0.56 W/m2, and 50% of the heat losses wereassumed to end up as internal heat gains in the zones.

Buildings 2022, 12, 96 6 of 27Buildings 2022, 12, x FOR PEER REVIEW 6 of 27
Figure 3. The building floor level ventilation system design and airflow rates at nominal conditions
of 5 Pa pressure difference over the inlet device and outdoor temperature of 15 °C.
The envelope properties, window properties and other building structure properties
are set according to the common practice of the construction year and shown in Table 1.
The load‐bearing structures of the building are massive concrete, external walls are two
rows of burnt bricks with insulation layers, internal walls between the apartments are
brick walls, and internal walls between rooms are lightweight structures with an air gap.
The envelope airtightness was set according to the building year for the reference case,
and the air leakage rate (n50) equals 2.4 1/h at a pressure difference of 50 Pa [24].
The internal doors have a gap at the floor level of 2 cm. The windows are 2 panes
glazed with a U‐value of 2 W/m2K and are equipped with integrated shading with blinds
between panels. The window blinds are manually controlled according to the occupation
profile and the intensity of solar radiation (>100 W/m2). In three‐room apartments, all win‐
dows besides the ones in the kitchen are openable. In one‐room apartments, all windows
are openable. The openable windows area is 10% of a window.
The water radiators carry out space heating with a dimensioning temperature of
70/40 °C, and the heat distribution efficiency is 80%. The design powers are 100 W/floor‐m2
on the top floor and 60 W/floor‐m2 on the middle floor. The temperature setpoint of space
heating is 21 °C in the apartments. In the staircase and basement floor, the setpoint of
space heating is 17 °C. The annual net heating demand of domestic hot water (DHW) is
35 kWh/m2 per heated net floor area. It is assumed that DHW consumption is constant
with time. Heat losses of the DHW circuit are 0.56 W/m2, and 50% of the heat losses were
assumed to end up as internal heat gains in the zones.
Figure 3. The building floor level ventilation system design and airflow rates at nominal conditionsof 5 Pa pressure difference over the inlet device and outdoor temperature of 15 ◦C.
Table 1. The structural building details and properties of windows.
Description Building Details
U-values, (W/m2K)Roof 0.5Floor 0.5
External walls 0.5Entrance doors 1.1
Apartment doors 2.2Windows propertiesU-value, (W/m2K) 2
Total solar heat transmittance (g-value) 0.44Direct solar transmittance (ST) 0.72
Integrated shading BlindsExternal shading No
2.3. Inlet Device
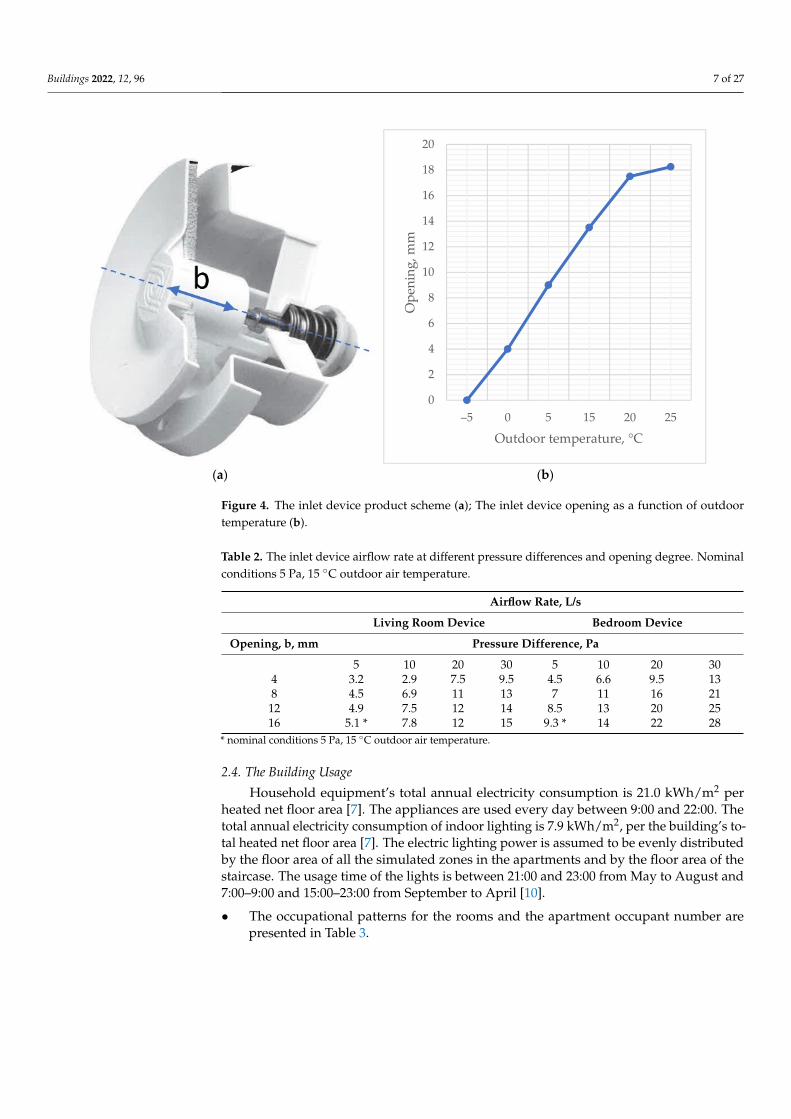
The self-regulating inlet devices are installed in the living rooms and bedrooms ofthe apartments. The inlet device regulates airflow based on the outdoor temperature. Theminimum opening is 4 mm, and the maximum is 16 mm for −5 ◦C and lower, and +15 ◦Cand higher, respectively, and the settings are linear. The inlet device flow characteristics arepresented in Figure 4. The bedrooms are equipped with a 160 mm diameter inlet devicewith a nominal setting of 9.3 L/s at a pressure difference of 5 Pa. The living rooms areequipped with 100 mm diameter inlet devices with a nominal setting of 5.1 L/s at a pressuredifference of 5 Pa. The flow characteristics are presented in Table 2.
Buildings 2022, 12, 96 7 of 27
Buildings 2022, 12, x FOR PEER REVIEW 7 of 27
Table 1. The structural building details and properties of windows.
Description Building Details
U‐values, (W/m2K)
Roof 0.5
Floor 0.5
External walls 0.5
Entrance doors 1.1
Apartment doors 2.2
Windows properties
U‐value, (W/m2K) 2
Total solar heat transmittance (g‐value) 0.44
Direct solar transmittance (ST) 0.72
Integrated shading Blinds
External shading No
2.3. Inlet Device
The self‐regulating inlet devices are installed in the living rooms and bedrooms of
the apartments. The inlet device regulates airflow based on the outdoor temperature. The
minimum opening is 4 mm, and the maximum is 16 mm for −5 °C and lower, and +15 °C
and higher, respectively, and the settings are linear. The inlet device flow characteristics
are presented in Figure 4. The bedrooms are equipped with a 160 mm diameter inlet de‐
vice with a nominal setting of 9.3 L/s at a pressure difference of 5 Pa. The living rooms are
equipped with 100 mm diameter inlet devices with a nominal setting of 5.1 L/s at a pres‐
sure difference of 5 Pa. The flow characteristics are presented in Table 2.
(a) (b)
Figure 4. The inlet device product scheme (a); The inlet device opening as a function of outdoor
temperature (b).
0
2
4
6
8
10
12
14
16
18
20
–5 0 5 15 20 25Opening, m
m
Outdoor temperature, °C
Figure 4. The inlet device product scheme (a); The inlet device opening as a function of outdoortemperature (b).
Table 2. The inlet device airflow rate at different pressure differences and opening degree. Nominalconditions 5 Pa, 15 ◦C outdoor air temperature.
Airflow Rate, L/s
Living Room Device Bedroom Device
Opening, b, mm Pressure Difference, Pa
5 10 20 30 5 10 20 304 3.2 2.9 7.5 9.5 4.5 6.6 9.5 138 4.5 6.9 11 13 7 11 16 21
12 4.9 7.5 12 14 8.5 13 20 2516 5.1 * 7.8 12 15 9.3 * 14 22 28
* nominal conditions 5 Pa, 15 ◦C outdoor air temperature.
2.4. The Building Usage
Household equipment’s total annual electricity consumption is 21.0 kWh/m2 perheated net floor area [7]. The appliances are used every day between 9:00 and 22:00. Thetotal annual electricity consumption of indoor lighting is 7.9 kWh/m2, per the building’s to-tal heated net floor area [7]. The electric lighting power is assumed to be evenly distributedby the floor area of all the simulated zones in the apartments and by the floor area of thestaircase. The usage time of the lights is between 21:00 and 23:00 from May to August and7:00–9:00 and 15:00–23:00 from September to April [10].
• The occupational patterns for the rooms and the apartment occupant number arepresented in Table 3.
Buildings 2022, 12, 96 8 of 27
Table 3. The apartment occupancy and occupancy patterns.
Apartment Occupancy Bedroom 1 Bedroom 2 Living Room Kitchen
Three-room 4 22.00–9.002 Occ.
22.00–9.002 Occ.
9.00–22.002 Occ.
9.00–22.002 Occ.
One-room 1 22.00–9.001 Occ.
9.00–22.001 Occ.
• The windows opening schedule is set according to the script, that during the coldperiod, from September to April, the windows are closed. The windows are openedfrom May to August if the outdoor temperature exceeds 12 ◦C, and indoor temperatureexceeds 22 ◦C.
• The internal doors of the bathrooms or WCs are always closed, but the other internaldoors inside the apartments are always opened.
• The apartments’ occupant activity level is 1.2 MET.
2.5. Weather Data
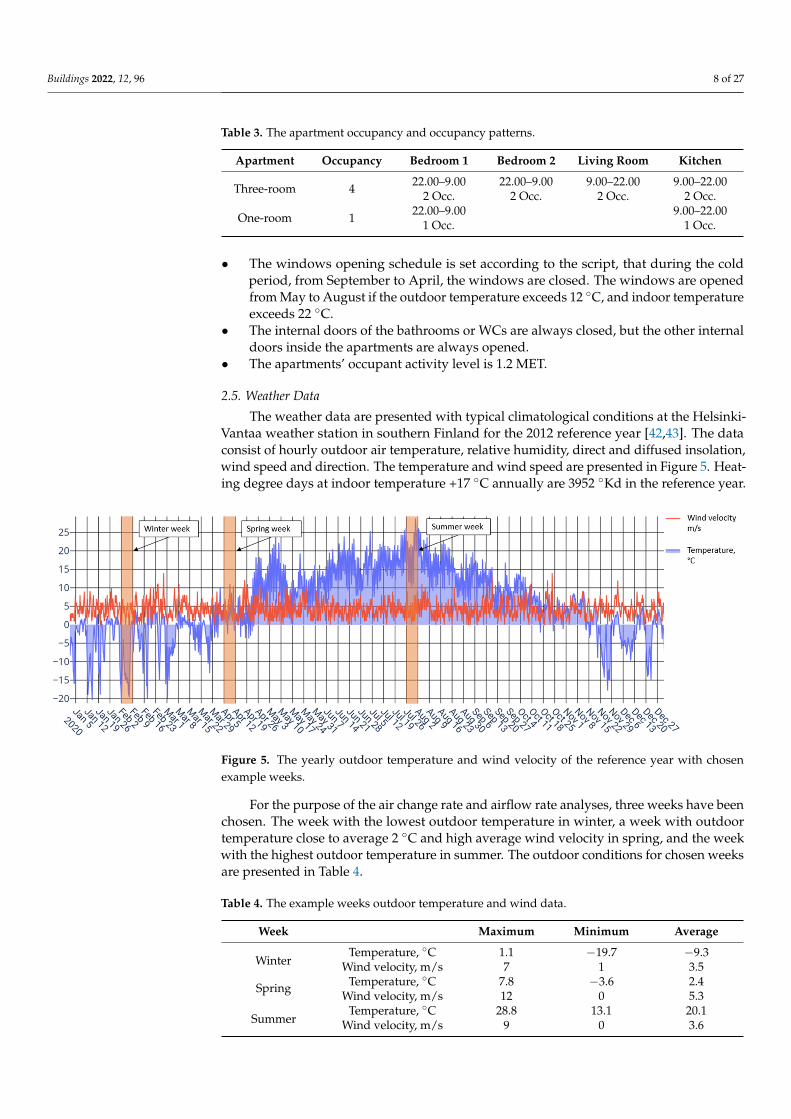
The weather data are presented with typical climatological conditions at the Helsinki-Vantaa weather station in southern Finland for the 2012 reference year [42,43]. The dataconsist of hourly outdoor air temperature, relative humidity, direct and diffused insolation,wind speed and direction. The temperature and wind speed are presented in Figure 5. Heat-ing degree days at indoor temperature +17 ◦C annually are 3952 ◦Kd in the reference year.
Buildings 2022, 12, x FOR PEER REVIEW 9 of 27
Figure 5. The yearly outdoor temperature and wind velocity of the reference year with chosen ex‐
ample weeks.
Table 4. The example weeks outdoor temperature and wind data.
Week Maximum Minimum Average
Winter Temperature, °C 1.1 −19.7 −9.3
Wind velocity, m/s 7 1 3.5
Spring Temperature, °C 7.8 −3.6 2.4
Wind velocity, m/s 12 0 5.3
Summer Temperature, °C 28.8 13.1 20.1
Wind velocity, m/s 9 0 3.6
2.6. IDA ICE Simulation Tool
The model of the building has been created with the IDA ICE dynamic building sim‐
ulation tool [42,44]. The software allows the modelling of multi‐zone buildings and pro‐
vides simultaneous dynamic simulation of heat transfer and airflows, considering flows
between zones, building envelope and windows. It calculates the interactions between
building structures, HVAC systems, operational and occupancy schedules of the building,
and outdoor climate conditions. The infiltration airflows are calculated by wind pressure
on each façade combined with zones stack effects.
2.6.1. Façade Pressure Calculation
Wind pressure distribution around the house is simulated using the normal assump‐
tion in building engineering that the wind flow is horizontal and an atmospheric bound‐
ary layer is neutral without vertical airflow. The wind conditions of the environment were
approximated using the wind profile equation reported in [34], see Equation (1).
Wind pressure on facades corresponds to the LBL model wind profile:
𝑈 ℎ 𝑈 ∙ 𝑘 ∙ , (1)
where 𝑈 ℎ is the wind speed at height ℎ (m/s), 𝑈 is the wind speed measured on
open ground at the weather station (m/s), ℎ is the height from the surface of the ground (m), ℎ is the height of the measurement equipment (10 m), and parameters 𝑘 and 𝑎 are terrain‐dependent constants.
The simulated building is located in a typical Finnish city center area with closely
built houses where the height of adjacent houses is approximately the same as the simu‐
lated one.
However, this study simplified the calculation of wind conditions, and wind pres‐
sure coefficients were not measured nor simulated.
Figure 5. The yearly outdoor temperature and wind velocity of the reference year with chosenexample weeks.
For the purpose of the air change rate and airflow rate analyses, three weeks have beenchosen. The week with the lowest outdoor temperature in winter, a week with outdoortemperature close to average 2 ◦C and high average wind velocity in spring, and the weekwith the highest outdoor temperature in summer. The outdoor conditions for chosen weeksare presented in Table 4.
Table 4. The example weeks outdoor temperature and wind data.
Week Maximum Minimum Average
WinterTemperature, ◦C 1.1 −19.7 −9.3
Wind velocity, m/s 7 1 3.5
Spring Temperature, ◦C 7.8 −3.6 2.4Wind velocity, m/s 12 0 5.3
SummerTemperature, ◦C 28.8 13.1 20.1
Wind velocity, m/s 9 0 3.6
Buildings 2022, 12, 96 9 of 27
2.6. IDA ICE Simulation Tool
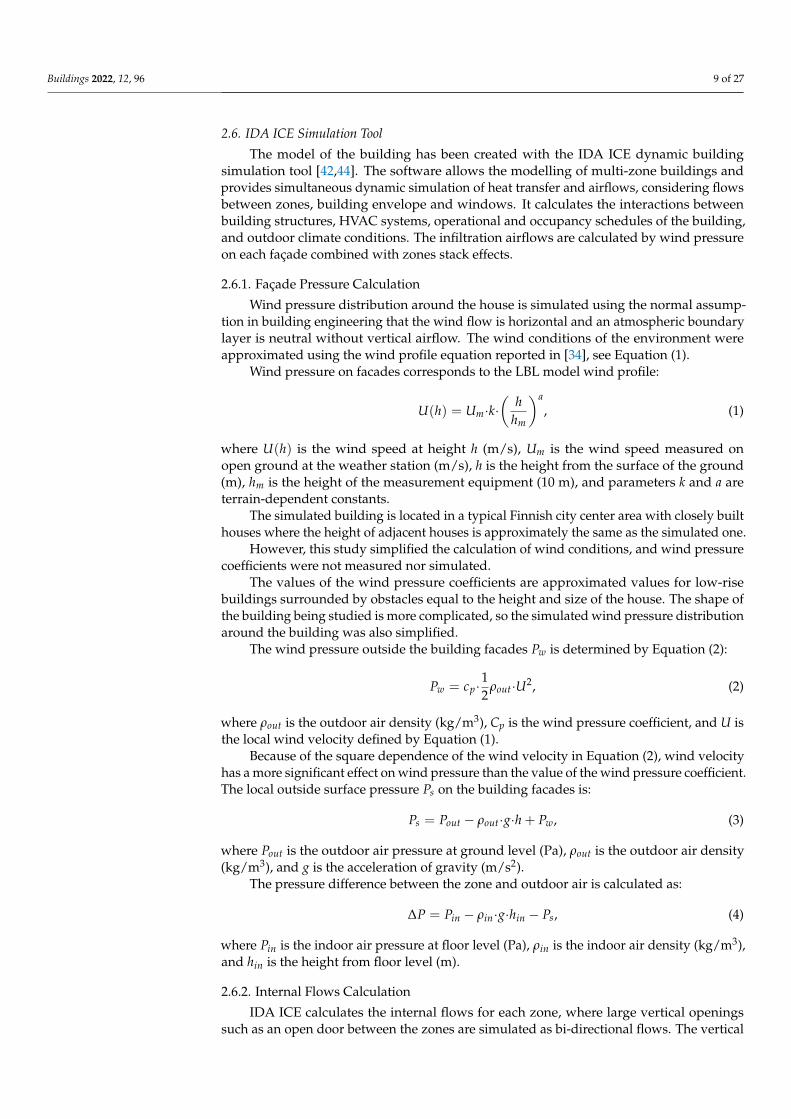
The model of the building has been created with the IDA ICE dynamic buildingsimulation tool [42,44]. The software allows the modelling of multi-zone buildings andprovides simultaneous dynamic simulation of heat transfer and airflows, considering flowsbetween zones, building envelope and windows. It calculates the interactions betweenbuilding structures, HVAC systems, operational and occupancy schedules of the building,and outdoor climate conditions. The infiltration airflows are calculated by wind pressureon each façade combined with zones stack effects.
2.6.1. Façade Pressure Calculation
Wind pressure distribution around the house is simulated using the normal assump-tion in building engineering that the wind flow is horizontal and an atmospheric boundarylayer is neutral without vertical airflow. The wind conditions of the environment wereapproximated using the wind profile equation reported in [34], see Equation (1).
Wind pressure on facades corresponds to the LBL model wind profile:
U(h) = Um·k·(
hhm
)a, (1)
where U(h) is the wind speed at height h (m/s), Um is the wind speed measured onopen ground at the weather station (m/s), h is the height from the surface of the ground(m), hm is the height of the measurement equipment (10 m), and parameters k and a areterrain-dependent constants.
The simulated building is located in a typical Finnish city center area with closely builthouses where the height of adjacent houses is approximately the same as the simulated one.
However, this study simplified the calculation of wind conditions, and wind pressurecoefficients were not measured nor simulated.
The values of the wind pressure coefficients are approximated values for low-risebuildings surrounded by obstacles equal to the height and size of the house. The shape ofthe building being studied is more complicated, so the simulated wind pressure distributionaround the building was also simplified.
The wind pressure outside the building facades Pw is determined by Equation (2):
Pw = cp·12
ρout·U2, (2)
where ρout is the outdoor air density (kg/m3), Cp is the wind pressure coefficient, and U isthe local wind velocity defined by Equation (1).
Because of the square dependence of the wind velocity in Equation (2), wind velocityhas a more significant effect on wind pressure than the value of the wind pressure coefficient.The local outside surface pressure Ps on the building facades is:
Ps = Pout − ρout·g·h + Pw, (3)
where Pout is the outdoor air pressure at ground level (Pa), ρout is the outdoor air density(kg/m3), and g is the acceleration of gravity (m/s2).
The pressure difference between the zone and outdoor air is calculated as:
∆P = Pin − ρin·g·hin − Ps, (4)
where Pin is the indoor air pressure at floor level (Pa), ρin is the indoor air density (kg/m3),and hin is the height from floor level (m).
2.6.2. Internal Flows Calculation
IDA ICE calculates the internal flows for each zone, where large vertical openingssuch as an open door between the zones are simulated as bi-directional flows. The vertical
Buildings 2022, 12, 96 10 of 27
flow profile in the opening depends on the density differences between the adjusted zones.If the densities are equal, the flow profile is flat. Otherwise, it is slanted. In the case of a flatvelocity profile, the air mass flow between the zones is calculated with the standard orificeflow equation:
Q = Cd·A√
2ρ·∆P, (5)
where Cd is a discharge coefficient and A is the area of the opening (m2). In the case of aslanted profile, the airflow between the zones is simultaneously bi-directional.
• The windows are also presented with bi-directional flow openings and have 0.65 dis-charge coefficient, and 10% of those openable are for the mean of airflow calculation.
• The envelope cracks (leakage) are presented as external area infiltration distributedbased on the power law. The exfiltration and infiltration are separated.
• The internal doors have a 2 cm gap for air movement. The apartment entrance door hasthe mail slot, which is a crack with a k coefficient equal to 9.3 × 10⁻⁴ and power-lawexponent 0.7 [45].
• The model for the internal nodes of the simulation model is fully mixed for theconcentration calculation, such as CO2 level.
2.6.3. Passive Stack
The passive stack ventilation is implemented with the standard IDA ICE chimneymodel with stacks of different heights according to the floor. The chimney model considersthe inlet and outlet loss coefficient, duct roughness, duct shape and height. The modelcalculates bi-directional flow.
2.6.4. Inlet Device
The self-regulating inlet device was created as a custom model based on the infiltrationmodel with temperature-dependent power-law k-factor and exponent equal 0.5. The modelhas a simultaneous single direction flow.
The k-values for the inlet device and filter were calculated from the manufacturerproduct data for designed airflows. The following equation was used for the volumetricairflow rate:
qv = k·√
∆p, (6)
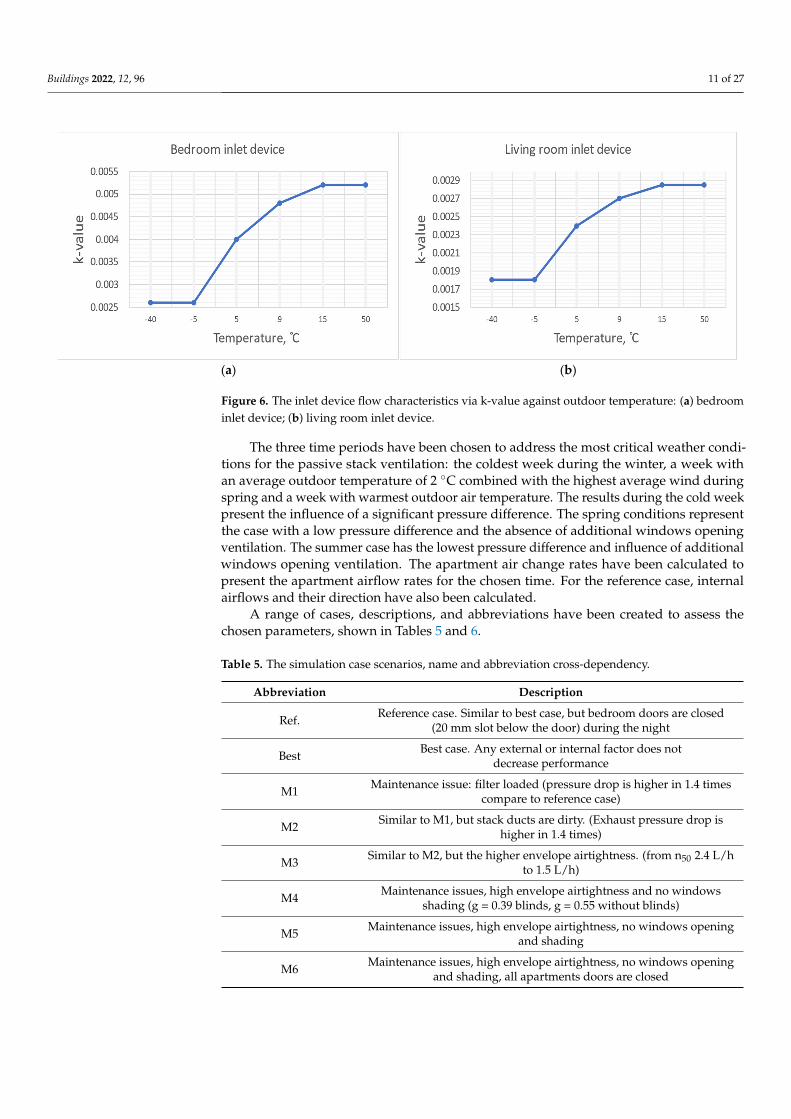
where qv is volumetric airflow rate and ∆p is component pressure drop.The k-value has been calculated for the given inlet device positions and linearly inter-
polated between the data points. The k-value has been coupled with outdoor temperatureand presented as a function in Figure 6.
The calculated function for the bedroom and living room inlet devices has been usedin the simulation model to calculate the airflow according to the pressure difference andoutdoor temperature. Dirty filters were simulated by decreasing k-values twice, assumingthat the filter had been working for the year without maintenance [46].
2.7. The Simulation Case Description
The CO2 level during the year and indoor air temperature during the summer havebeen chosen to assess the IAQ. The CO2 level is used as an indirect indicator for theroom and personal airflow rate and compared against standards [7,10]. The indoor airtemperature has been used to assess the influence of the airflow rate in apartments andoccupant personal conditions.
The apartments on the second and fifth floors were chosen to represent the influenceof the height on the stack effect. One and three-room apartments were selected to representthe influence of different floor areas and inlet supply ventilation system configuration.
Buildings 2022, 12, 96 11 of 27
Buildings 2022, 12, x FOR PEER REVIEW 11 of 27
The self‐regulating inlet device was created as a custom model based on the infiltra‐
tion model with temperature‐dependent power‐law k‐factor and exponent equal 0.5. The
model has a simultaneous single direction flow.
The k‐values for the inlet device and filter were calculated from the manufacturer
product data for designed airflows. The following equation was used for the volumetric
airflow rate:
q k ∙ ∆𝑝, (6)
where q is volumetric airflow rate and ∆𝑝is component pressure drop.
The k‐value has been calculated for the given inlet device positions and linearly in‐
terpolated between the data points. The k‐value has been coupled with outdoor tempera‐
ture and presented as a function in Figure 6.
(a) (b)
Figure 6. The inlet device flow characteristics via k‐value against outdoor temperature: (a) bedroom
inlet device; (b) living room inlet device.
The calculated function for the bedroom and living room inlet devices has been used
in the simulation model to calculate the airflow according to the pressure difference and
outdoor temperature. Dirty filters were simulated by decreasing k‐values twice, assuming
that the filter had been working for the year without maintenance [46].
2.7. The Simulation Case Description
The CO2 level during the year and indoor air temperature during the summer have
been chosen to assess the IAQ. The CO2 level is used as an indirect indicator for the room
and personal airflow rate and compared against standards [7,10]. The indoor air temper‐
ature has been used to assess the influence of the airflow rate in apartments and occupant
personal conditions.
The apartments on the second and fifth floors were chosen to represent the influence
of the height on the stack effect. One and three‐room apartments were selected to repre‐
sent the influence of different floor areas and inlet supply ventilation system configura‐
tion.
The three time periods have been chosen to address the most critical weather condi‐
tions for the passive stack ventilation: the coldest week during the winter, a week with an
average outdoor temperature of 2 °C combined with the highest average wind during
spring and a week with warmest outdoor air temperature. The results during the cold
week present the influence of a significant pressure difference. The spring conditions rep‐
resent the case with a low pressure difference and the absence of additional windows
Figure 6. The inlet device flow characteristics via k-value against outdoor temperature: (a) bedroominlet device; (b) living room inlet device.
The three time periods have been chosen to address the most critical weather condi-tions for the passive stack ventilation: the coldest week during the winter, a week withan average outdoor temperature of 2 ◦C combined with the highest average wind duringspring and a week with warmest outdoor air temperature. The results during the cold weekpresent the influence of a significant pressure difference. The spring conditions representthe case with a low pressure difference and the absence of additional windows openingventilation. The summer case has the lowest pressure difference and influence of additionalwindows opening ventilation. The apartment air change rates have been calculated topresent the apartment airflow rates for the chosen time. For the reference case, internalairflows and their direction have also been calculated.
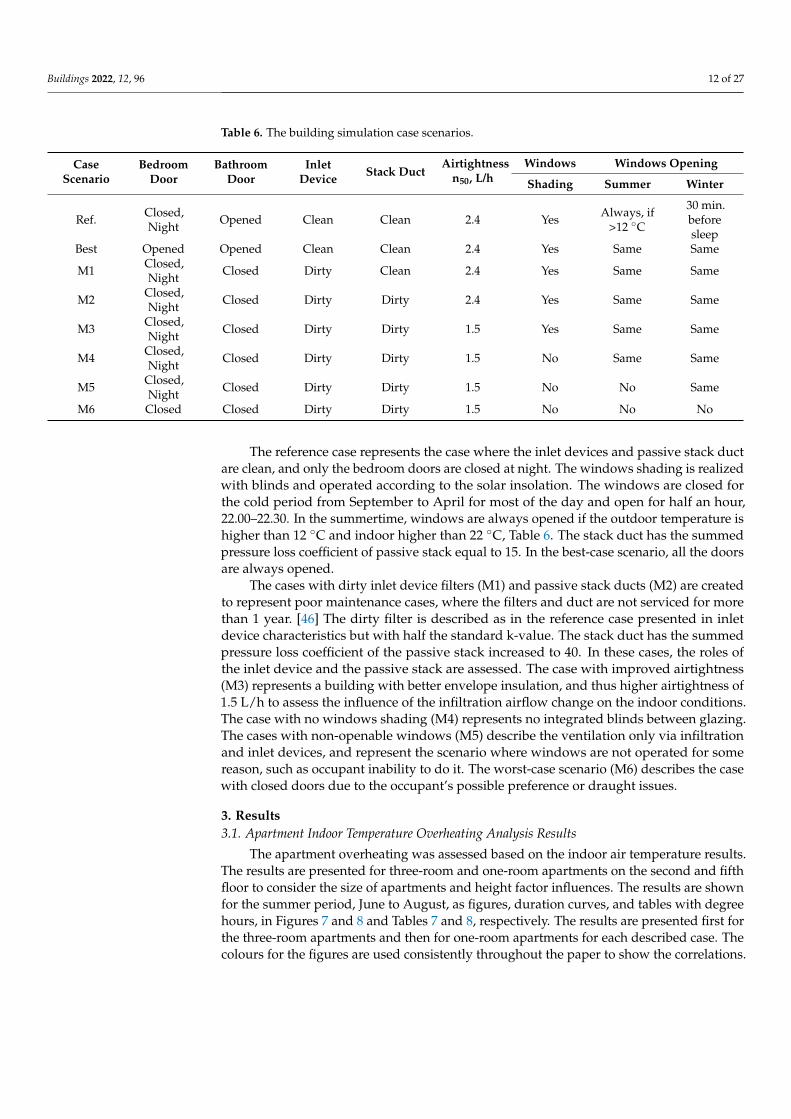
A range of cases, descriptions, and abbreviations have been created to assess thechosen parameters, shown in Tables 5 and 6.
Table 5. The simulation case scenarios, name and abbreviation cross-dependency.
Abbreviation Description
Ref. Reference case. Similar to best case, but bedroom doors are closed(20 mm slot below the door) during the night
Best Best case. Any external or internal factor does notdecrease performance
M1 Maintenance issue: filter loaded (pressure drop is higher in 1.4 timescompare to reference case)
M2 Similar to M1, but stack ducts are dirty. (Exhaust pressure drop ishigher in 1.4 times)
M3 Similar to M2, but the higher envelope airtightness. (from n50 2.4 L/hto 1.5 L/h)
M4 Maintenance issues, high envelope airtightness and no windowsshading (g = 0.39 blinds, g = 0.55 without blinds)
M5 Maintenance issues, high envelope airtightness, no windows openingand shading
M6 Maintenance issues, high envelope airtightness, no windows openingand shading, all apartments doors are closed
Buildings 2022, 12, 96 12 of 27
Table 6. The building simulation case scenarios.
CaseScenario
BedroomDoor
BathroomDoor
InletDevice Stack Duct
Airtightnessn50, L/h
Windows Windows Opening
Shading Summer Winter
Ref. Closed,Night Opened Clean Clean 2.4 Yes Always, if
>12 ◦C
30 min.beforesleep
Best Opened Opened Clean Clean 2.4 Yes Same Same
M1 Closed,Night Closed Dirty Clean 2.4 Yes Same Same
M2 Closed,Night Closed Dirty Dirty 2.4 Yes Same Same
M3 Closed,Night Closed Dirty Dirty 1.5 Yes Same Same
M4 Closed,Night Closed Dirty Dirty 1.5 No Same Same
M5 Closed,Night Closed Dirty Dirty 1.5 No No Same
M6 Closed Closed Dirty Dirty 1.5 No No No
The reference case represents the case where the inlet devices and passive stack ductare clean, and only the bedroom doors are closed at night. The windows shading is realizedwith blinds and operated according to the solar insolation. The windows are closed forthe cold period from September to April for most of the day and open for half an hour,22.00–22.30. In the summertime, windows are always opened if the outdoor temperature ishigher than 12 ◦C and indoor higher than 22 ◦C, Table 6. The stack duct has the summedpressure loss coefficient of passive stack equal to 15. In the best-case scenario, all the doorsare always opened.
The cases with dirty inlet device filters (M1) and passive stack ducts (M2) are createdto represent poor maintenance cases, where the filters and duct are not serviced for morethan 1 year. [46] The dirty filter is described as in the reference case presented in inletdevice characteristics but with half the standard k-value. The stack duct has the summedpressure loss coefficient of the passive stack increased to 40. In these cases, the roles ofthe inlet device and the passive stack are assessed. The case with improved airtightness(M3) represents a building with better envelope insulation, and thus higher airtightness of1.5 L/h to assess the influence of the infiltration airflow change on the indoor conditions.The case with no windows shading (M4) represents no integrated blinds between glazing.The cases with non-openable windows (M5) describe the ventilation only via infiltrationand inlet devices, and represent the scenario where windows are not operated for somereason, such as occupant inability to do it. The worst-case scenario (M6) describes the casewith closed doors due to the occupant’s possible preference or draught issues.
3. Results3.1. Apartment Indoor Temperature Overheating Analysis Results
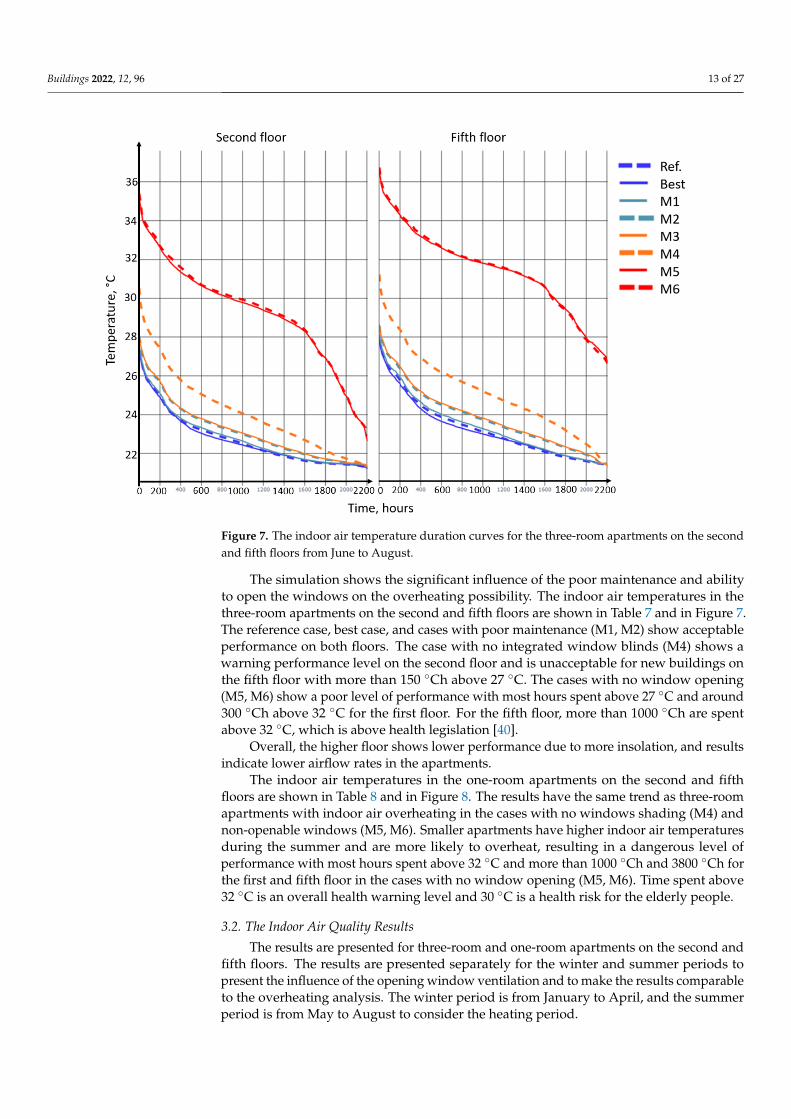
The apartment overheating was assessed based on the indoor air temperature results.The results are presented for three-room and one-room apartments on the second and fifthfloor to consider the size of apartments and height factor influences. The results are shownfor the summer period, June to August, as figures, duration curves, and tables with degreehours, in Figures 7 and 8 and Tables 7 and 8, respectively. The results are presented first forthe three-room apartments and then for one-room apartments for each described case. Thecolours for the figures are used consistently throughout the paper to show the correlations.
Buildings 2022, 12, 96 13 of 27Buildings 2022, 12, x FOR PEER REVIEW 14 of 27
Figure 7. The indoor air temperature duration curves for the three‐room apartments on the second
and fifth floors from June to August.
The indoor air temperatures in the one‐room apartments on the second and fifth
floors are shown in Table 8 and in Figure 8. The results have the same trend as three‐room
apartments with indoor air overheating in the cases with no windows shading (M4) and
non‐openable windows (M5, M6). Smaller apartments have higher indoor air tempera‐
tures during the summer and are more likely to overheat, resulting in a dangerous level
of performance with most hours spent above 32 °C and more than 1000 °Ch and 3800 °Ch
for the first and fifth floor in the cases with no window opening (M5, M6). Time spent
above 32 °C is an overall health warning level and 30 °C is a health risk for the elderly
people.
Table 8. The one‐room apartment on the second and fifth floor overheating results—number of
degree hours over 27 °C, 30 °C and 32 °C during the year.
Second Floor Degree hours, °C h
27 30 27
Ref. 2 0 0
Best 4 0 0
M1 7 0 0
M2 47 0 0
M3 49 0 0
M4 676 71 5
M5 7957 2958 1159
M6 7971 2970 1167
Fifth floor
Ref. 41 0 0
Best 54 0 0
M1 79 0 0
Figure 7. The indoor air temperature duration curves for the three-room apartments on the secondand fifth floors from June to August.
The simulation shows the significant influence of the poor maintenance and abilityto open the windows on the overheating possibility. The indoor air temperatures in thethree-room apartments on the second and fifth floors are shown in Table 7 and in Figure 7.The reference case, best case, and cases with poor maintenance (M1, M2) show acceptableperformance on both floors. The case with no integrated window blinds (M4) shows awarning performance level on the second floor and is unacceptable for new buildings onthe fifth floor with more than 150 ◦Ch above 27 ◦C. The cases with no window opening(M5, M6) show a poor level of performance with most hours spent above 27 ◦C and around300 ◦Ch above 32 ◦C for the first floor. For the fifth floor, more than 1000 ◦Ch are spentabove 32 ◦C, which is above health legislation [40].
Overall, the higher floor shows lower performance due to more insolation, and resultsindicate lower airflow rates in the apartments.
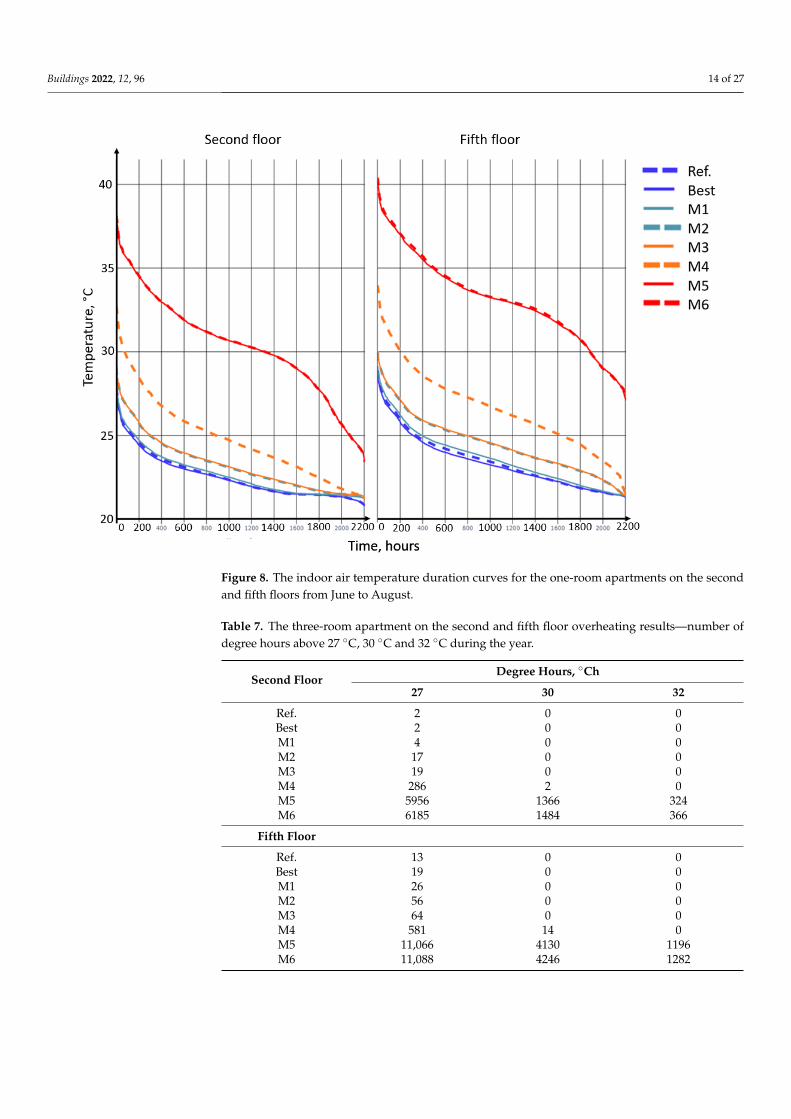
The indoor air temperatures in the one-room apartments on the second and fifthfloors are shown in Table 8 and in Figure 8. The results have the same trend as three-roomapartments with indoor air overheating in the cases with no windows shading (M4) andnon-openable windows (M5, M6). Smaller apartments have higher indoor air temperaturesduring the summer and are more likely to overheat, resulting in a dangerous level ofperformance with most hours spent above 32 ◦C and more than 1000 ◦Ch and 3800 ◦Ch forthe first and fifth floor in the cases with no window opening (M5, M6). Time spent above32 ◦C is an overall health warning level and 30 ◦C is a health risk for the elderly people.
3.2. The Indoor Air Quality Results
The results are presented for three-room and one-room apartments on the second andfifth floors. The results are presented separately for the winter and summer periods topresent the influence of the opening window ventilation and to make the results comparableto the overheating analysis. The winter period is from January to April, and the summerperiod is from May to August to consider the heating period.
Buildings 2022, 12, 96 14 of 27
Buildings 2022, 12, x FOR PEER REVIEW 15 of 27
M2 215 0 0
M3 227 0 0
M4 2328 298 35
M5 15,814 7898 3887
M6 15,987 8083 4047
Figure 8. The indoor air temperature duration curves for the one‐room apartments on the second
and fifth floors from June to August.
3.2. The Indoor Air Quality Results
The results are presented for three‐room and one‐room apartments on the second
and fifth floors. The results are presented separately for the winter and summer periods
to present the influence of the opening window ventilation and to make the results com‐
parable to the overheating analysis. The winter period is from January to April, and the
summer period is from May to August to consider the heating period.
3.2.1. Apartment Bedroom Average CO2 Concentration Analysis Results
The CO2 concentration in the three‐room apartments on the second floor is shown in
Table 9 and Figure 9. In winter, in the best‐case scenario, the occupants spend more than
40% of the time in indoor air categories II and III and in I [37] for the rest, and the concen‐
tration is around 720 ppm on average. The reference case shows a significant effect of the
occupant and door schedules, transitioning to more than 50% in the II and III categories
and 890 ppm on average. Cases with maintenance issues (M1, M2) show the effects of
dirty inlet device filter and passive stack duct, further deteriorating the IAQ to 25% and
35% at the IV category for the dirty filter and its combination with stack duct, with the
concentrations at 960 ppm and 1200 ppm on average. High airtightness (M3) and non‐
openable window (M4) cases show the worst performance, with an average of around
45% of the time in the IV category and 1350 ppm.
Figure 8. The indoor air temperature duration curves for the one-room apartments on the secondand fifth floors from June to August.
Table 7. The three-room apartment on the second and fifth floor overheating results—number ofdegree hours above 27 ◦C, 30 ◦C and 32 ◦C during the year.
Second FloorDegree Hours, ◦Ch
27 30 32
Ref. 2 0 0Best 2 0 0M1 4 0 0M2 17 0 0M3 19 0 0M4 286 2 0M5 5956 1366 324M6 6185 1484 366
Fifth Floor
Ref. 13 0 0Best 19 0 0M1 26 0 0M2 56 0 0M3 64 0 0M4 581 14 0M5 11,066 4130 1196M6 11,088 4246 1282
Buildings 2022, 12, 96 15 of 27
Table 8. The one-room apartment on the second and fifth floor overheating results—number ofdegree hours over 27 ◦C, 30 ◦C and 32 ◦C during the year.
Second FloorDegree hours, ◦Ch
27 30 27
Ref. 2 0 0Best 4 0 0M1 7 0 0M2 47 0 0M3 49 0 0M4 676 71 5M5 7957 2958 1159M6 7971 2970 1167
Fifth floor
Ref. 41 0 0Best 54 0 0M1 79 0 0M2 215 0 0M3 227 0 0M4 2328 298 35M5 15,814 7898 3887M6 15,987 8083 4047
3.2.1. Apartment Bedroom Average CO2 Concentration Analysis Results
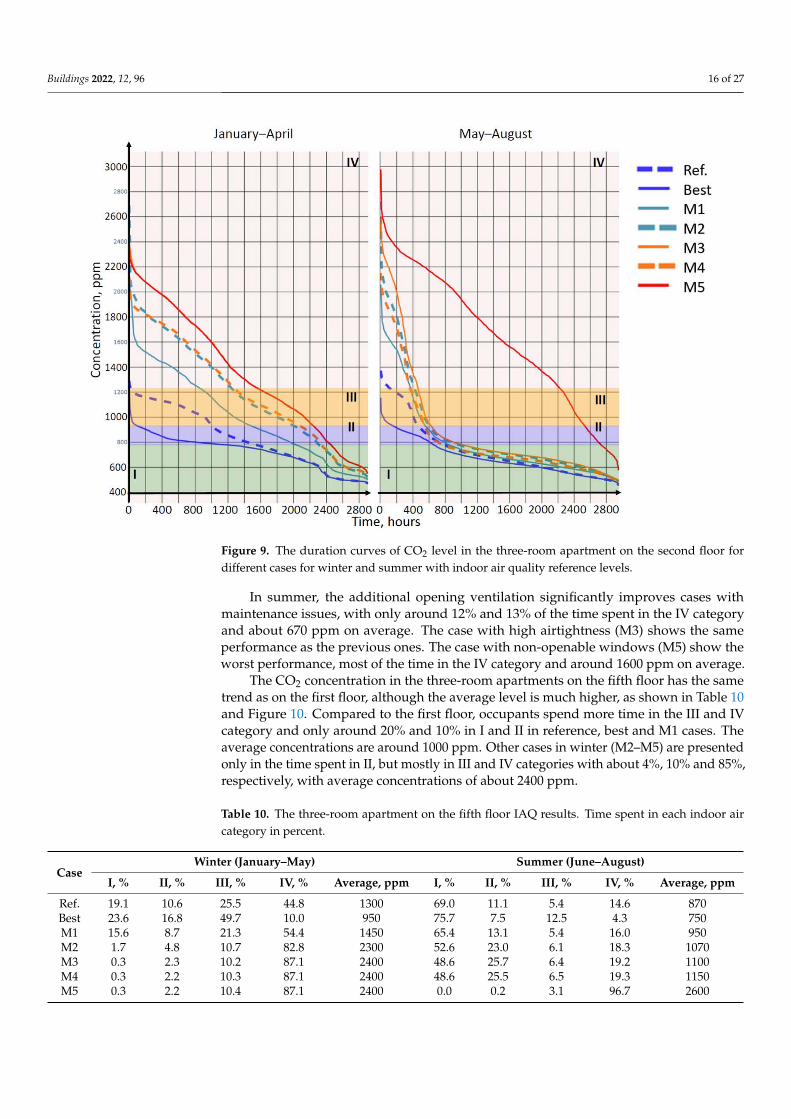
The CO2 concentration in the three-room apartments on the second floor is shownin Table 9 and Figure 9. In winter, in the best-case scenario, the occupants spend morethan 40% of the time in indoor air categories II and III and in I [37] for the rest, and theconcentration is around 720 ppm on average. The reference case shows a significant effect ofthe occupant and door schedules, transitioning to more than 50% in the II and III categoriesand 890 ppm on average. Cases with maintenance issues (M1, M2) show the effects ofdirty inlet device filter and passive stack duct, further deteriorating the IAQ to 25% and35% at the IV category for the dirty filter and its combination with stack duct, with theconcentrations at 960 ppm and 1200 ppm on average. High airtightness (M3) and non-openable window (M4) cases show the worst performance, with an average of around 45%of the time in the IV category and 1350 ppm.
Table 9. The three-room apartment on the second floor CO2 level results. Percentage of hours in eachindoor air quality category (I–IV) during the year.
CaseWinter (January–May) Summer (June–August)
I, % II, % III, % IV, % Average, ppm I, % II, % III, % IV, % Average, ppm
Ref. 47.1 18.4 34.1 0.5 890 73.2 10.9 12.1 3.8 720Best 59.8 36.8 3.4 0.0 720 77.8 17.0 5.2 0.0 670M1 32.4 19.7 22.0 25.9 960 71.8 10.6 6.3 11.3 760M2 20.4 10.3 26.3 43.0 1200 67.6 11.9 6.4 14.1 860M3 15.2 7.5 23.1 54.2 1350 66.0 12.8 5.6 15.7 900M4 15.1 7.6 23.1 54.2 1350 65.0 13.5 5.9 15.7 910M5 15.4 7.5 23.4 53.8 1350 7.5 6.7 10.6 75.3 1630
Buildings 2022, 12, 96 16 of 27
Buildings 2022, 12, x FOR PEER REVIEW 16 of 27
In summer, the additional opening ventilation significantly improves cases with maintenance issues, with only around 12% and 13% of the time spent in the IV category and about 670 ppm on average. The case with high airtightness (M3) shows the same per-formance as the previous ones. The case with non-openable windows (M5) show the worst performance, most of the time in the IV category and around 1600 ppm on average.
Table 9. The three-room apartment on the second floor CO2 level results. Percentage of hours in each indoor air quality category (I–IV) during the year.
Case Winter (January–May) Summer (June–August)
I, % II, % III, % IV, % Average, ppm I, % II, % III, % IV, % Average, ppm Ref. 47.1 18.4 34.1 0.5 890 73.2 10.9 12.1 3.8 720 Best 59.8 36.8 3.4 0.0 720 77.8 17.0 5.2 0.0 670 M1 32.4 19.7 22.0 25.9 960 71.8 10.6 6.3 11.3 760 M2 20.4 10.3 26.3 43.0 1200 67.6 11.9 6.4 14.1 860 M3 15.2 7.5 23.1 54.2 1350 66.0 12.8 5.6 15.7 900 M4 15.1 7.6 23.1 54.2 1350 65.0 13.5 5.9 15.7 910 M5 15.4 7.5 23.4 53.8 1350 7.5 6.7 10.6 75.3 1630
Figure 9. The duration curves of CO2 level in the three-room apartment on the second floor for different cases for winter and summer with indoor air quality reference levels.
The CO2 concentration in the three-room apartments on the fifth floor has the same trend as on the first floor, although the average level is much higher, as shown in Table 10 and Figure 10. Compared to the first floor, occupants spend more time in the III and IV category and only around 20% and 10% in I and II in reference, best and M1 cases. The average concentrations are around 1000 ppm. Other cases in winter (M2–M5) are pre-sented only in the time spent in II, but mostly in III and IV categories with about 4%, 10% and 85%, respectively, with average concentrations of about 2400 ppm.
Figure 9. The duration curves of CO2 level in the three-room apartment on the second floor fordifferent cases for winter and summer with indoor air quality reference levels.
In summer, the additional opening ventilation significantly improves cases withmaintenance issues, with only around 12% and 13% of the time spent in the IV categoryand about 670 ppm on average. The case with high airtightness (M3) shows the sameperformance as the previous ones. The case with non-openable windows (M5) show theworst performance, most of the time in the IV category and around 1600 ppm on average.
The CO2 concentration in the three-room apartments on the fifth floor has the sametrend as on the first floor, although the average level is much higher, as shown in Table 10and Figure 10. Compared to the first floor, occupants spend more time in the III and IVcategory and only around 20% and 10% in I and II in reference, best and M1 cases. Theaverage concentrations are around 1000 ppm. Other cases in winter (M2–M5) are presentedonly in the time spent in II, but mostly in III and IV categories with about 4%, 10% and 85%,respectively, with average concentrations of about 2400 ppm.
Table 10. The three-room apartment on the fifth floor IAQ results. Time spent in each indoor aircategory in percent.
CaseWinter (January–May) Summer (June–August)
I, % II, % III, % IV, % Average, ppm I, % II, % III, % IV, % Average, ppm
Ref. 19.1 10.6 25.5 44.8 1300 69.0 11.1 5.4 14.6 870Best 23.6 16.8 49.7 10.0 950 75.7 7.5 12.5 4.3 750M1 15.6 8.7 21.3 54.4 1450 65.4 13.1 5.4 16.0 950M2 1.7 4.8 10.7 82.8 2300 52.6 23.0 6.1 18.3 1070M3 0.3 2.3 10.2 87.1 2400 48.6 25.7 6.4 19.2 1100M4 0.3 2.2 10.3 87.1 2400 48.6 25.5 6.5 19.3 1150M5 0.3 2.2 10.4 87.1 2400 0.0 0.2 3.1 96.7 2600
Buildings 2022, 12, 96 17 of 27
Buildings 2022, 12, x FOR PEER REVIEW 17 of 27
In summer, the additional opening ventilation significantly affects cases with open-able windows (Ref., Best, M1–M4) showing better performance, with only around 16% and 18% of the time in the IV category and about 1000 ppm on average. Although, the case with non-openable windows (M5) shows the worse performance, with most of the time in the IV category and around 2600 ppm on average as the stack effect is lower in summer and the stack duct length in fifth floor apartments is also about three times shorter.
Table 10. The three-room apartment on the fifth floor IAQ results. Time spent in each indoor air category in percent.
Case Winter (January–May) Summer (June–August)
I, % II, % III, % IV, % Average, ppm I, % II, % III, % IV, % Average, ppm Ref. 19.1 10.6 25.5 44.8 1300 69.0 11.1 5.4 14.6 870 Best 23.6 16.8 49.7 10.0 950 75.7 7.5 12.5 4.3 750 M1 15.6 8.7 21.3 54.4 1450 65.4 13.1 5.4 16.0 950 M2 1.7 4.8 10.7 82.8 2300 52.6 23.0 6.1 18.3 1070 M3 0.3 2.3 10.2 87.1 2400 48.6 25.7 6.4 19.2 1100 M4 0.3 2.2 10.3 87.1 2400 48.6 25.5 6.5 19.3 1150 M5 0.3 2.2 10.4 87.1 2400 0.0 0.2 3.1 96.7 2600
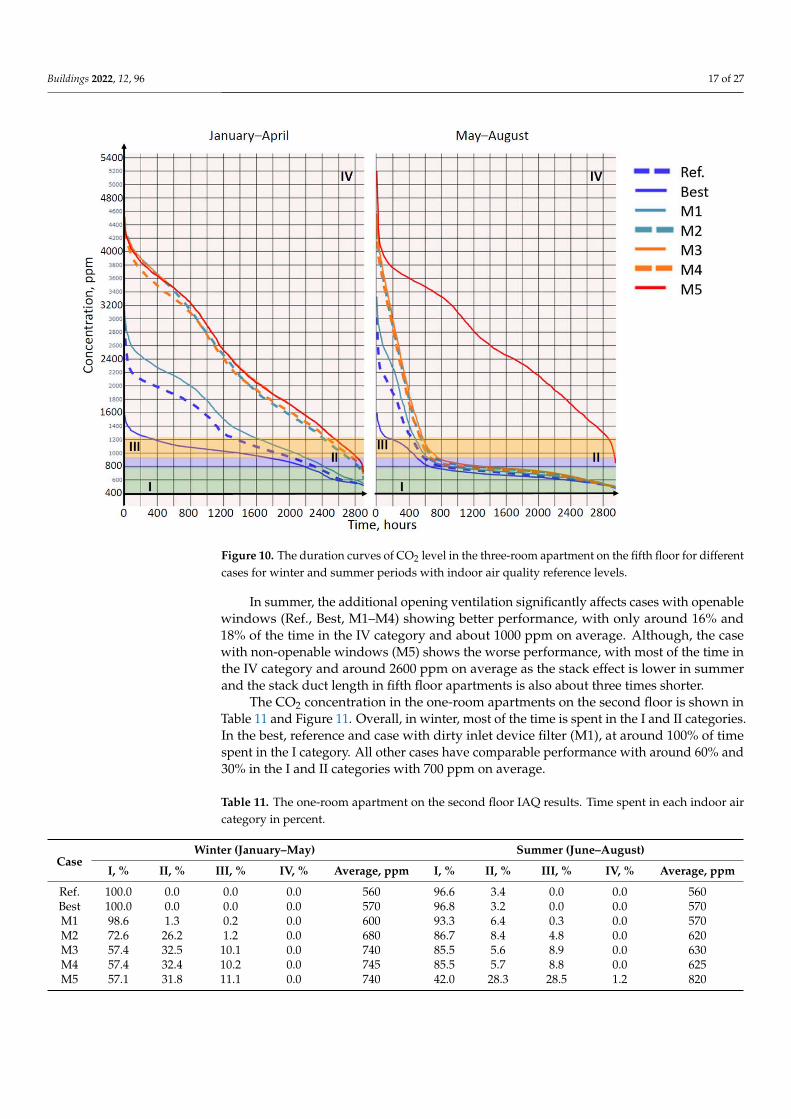
Figure 10. The duration curves of CO2 level in the three-room apartment on the fifth floor for differ-ent cases for winter and summer periods with indoor air quality reference levels.
The CO2 concentration in the one-room apartments on the second floor is shown in Table 11 and Figure 11. Overall, in winter, most of the time is spent in the I and II catego-ries. In the best, reference and case with dirty inlet device filter (M1), at around 100% of time spent in the I category. All other cases have comparable performance with around 60% and 30% in the I and II categories with 700 ppm on average.
Figure 10. The duration curves of CO2 level in the three-room apartment on the fifth floor for differentcases for winter and summer periods with indoor air quality reference levels.
In summer, the additional opening ventilation significantly affects cases with openablewindows (Ref., Best, M1–M4) showing better performance, with only around 16% and18% of the time in the IV category and about 1000 ppm on average. Although, the casewith non-openable windows (M5) shows the worse performance, with most of the time inthe IV category and around 2600 ppm on average as the stack effect is lower in summerand the stack duct length in fifth floor apartments is also about three times shorter.
The CO2 concentration in the one-room apartments on the second floor is shown inTable 11 and Figure 11. Overall, in winter, most of the time is spent in the I and II categories.In the best, reference and case with dirty inlet device filter (M1), at around 100% of timespent in the I category. All other cases have comparable performance with around 60% and30% in the I and II categories with 700 ppm on average.
Table 11. The one-room apartment on the second floor IAQ results. Time spent in each indoor aircategory in percent.
CaseWinter (January–May) Summer (June–August)
I, % II, % III, % IV, % Average, ppm I, % II, % III, % IV, % Average, ppm
Ref. 100.0 0.0 0.0 0.0 560 96.6 3.4 0.0 0.0 560Best 100.0 0.0 0.0 0.0 570 96.8 3.2 0.0 0.0 570M1 98.6 1.3 0.2 0.0 600 93.3 6.4 0.3 0.0 570M2 72.6 26.2 1.2 0.0 680 86.7 8.4 4.8 0.0 620M3 57.4 32.5 10.1 0.0 740 85.5 5.6 8.9 0.0 630M4 57.4 32.4 10.2 0.0 745 85.5 5.7 8.8 0.0 625M5 57.1 31.8 11.1 0.0 740 42.0 28.3 28.5 1.2 820
Buildings 2022, 12, 96 18 of 27
Buildings 2022, 12, x FOR PEER REVIEW 18 of 27
In summer, the performance has the same trends as in the three-room apartments. The average time spent in the I category for all cases slightly decreased for the best refer-ence and case with a dirty inlet device filter (M1). However, more maintenance issues (M2) and improved envelope airtightness (M3) showed better performance due to the ad-ditional airflow through the windows. The performance of the worst-case scenario is around 20%, 30% and 50% at the III, II, and I categories and indicates the significance of the additional airflow through the windows.
Table 11. The one-room apartment on the second floor IAQ results. Time spent in each indoor air category in percent.
Case Winter (January–May) Summer (June–August)
I, % II, % III, % IV, % Average, ppm I, % II, % III, % IV, % Average, ppm Ref. 100.0 0.0 0.0 0.0 560 96.6 3.4 0.0 0.0 560 Best 100.0 0.0 0.0 0.0 570 96.8 3.2 0.0 0.0 570 M1 98.6 1.3 0.2 0.0 600 93.3 6.4 0.3 0.0 570 M2 72.6 26.2 1.2 0.0 680 86.7 8.4 4.8 0.0 620 M3 57.4 32.5 10.1 0.0 740 85.5 5.6 8.9 0.0 630 M4 57.4 32.4 10.2 0.0 745 85.5 5.7 8.8 0.0 625 M5 57.1 31.8 11.1 0.0 740 42.0 28.3 28.5 1.2 820
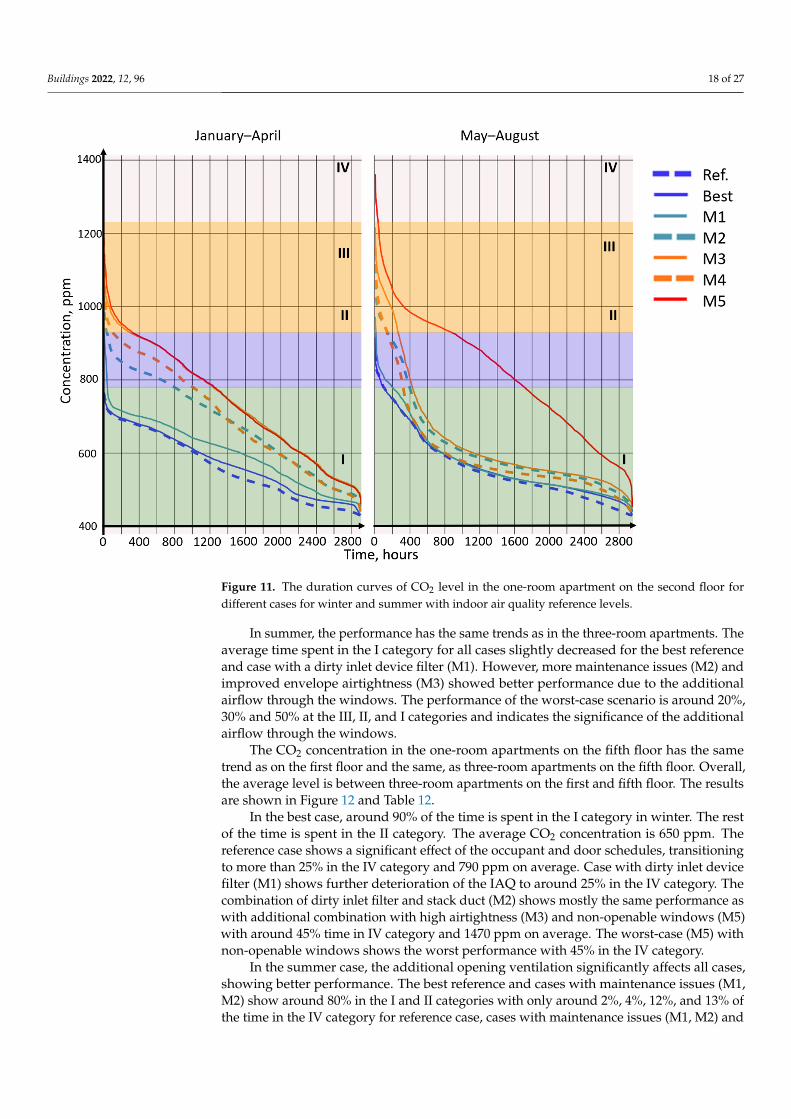
Figure 11. The duration curves of CO2 level in the one-room apartment on the second floor for dif-ferent cases for winter and summer with indoor air quality reference levels.
The CO2 concentration in the one-room apartments on the fifth floor has the same trend as on the first floor and the same, as three-room apartments on the fifth floor. Over-all, the average level is between three-room apartments on the first and fifth floor. The results are shown in Figure 12 and Table 12.
Figure 11. The duration curves of CO2 level in the one-room apartment on the second floor fordifferent cases for winter and summer with indoor air quality reference levels.
In summer, the performance has the same trends as in the three-room apartments. Theaverage time spent in the I category for all cases slightly decreased for the best referenceand case with a dirty inlet device filter (M1). However, more maintenance issues (M2) andimproved envelope airtightness (M3) showed better performance due to the additionalairflow through the windows. The performance of the worst-case scenario is around 20%,30% and 50% at the III, II, and I categories and indicates the significance of the additionalairflow through the windows.
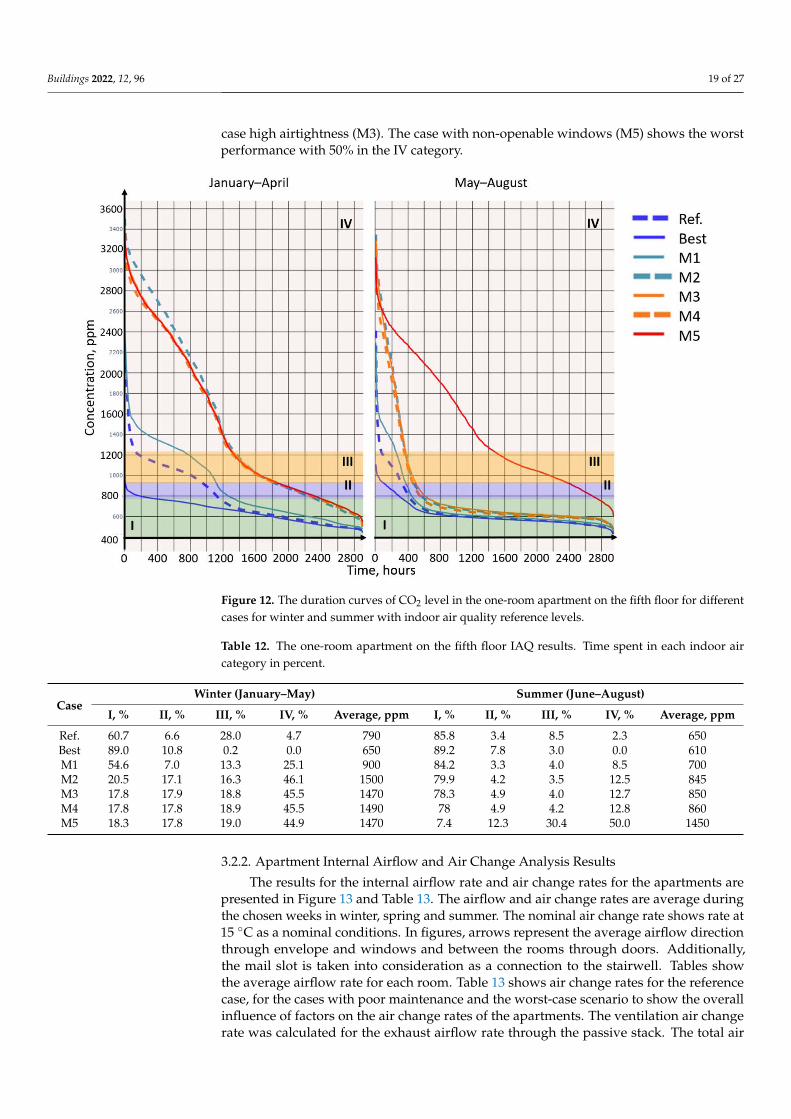
The CO2 concentration in the one-room apartments on the fifth floor has the sametrend as on the first floor and the same, as three-room apartments on the fifth floor. Overall,the average level is between three-room apartments on the first and fifth floor. The resultsare shown in Figure 12 and Table 12.
In the best case, around 90% of the time is spent in the I category in winter. The restof the time is spent in the II category. The average CO2 concentration is 650 ppm. Thereference case shows a significant effect of the occupant and door schedules, transitioningto more than 25% in the IV category and 790 ppm on average. Case with dirty inlet devicefilter (M1) shows further deterioration of the IAQ to around 25% in the IV category. Thecombination of dirty inlet filter and stack duct (M2) shows mostly the same performance aswith additional combination with high airtightness (M3) and non-openable windows (M5)with around 45% time in IV category and 1470 ppm on average. The worst-case (M5) withnon-openable windows shows the worst performance with 45% in the IV category.
In the summer case, the additional opening ventilation significantly affects all cases,showing better performance. The best reference and cases with maintenance issues (M1,M2) show around 80% in the I and II categories with only around 2%, 4%, 12%, and 13% ofthe time in the IV category for reference case, cases with maintenance issues (M1, M2) and
Buildings 2022, 12, 96 19 of 27
case high airtightness (M3). The case with non-openable windows (M5) shows the worstperformance with 50% in the IV category.
Buildings 2022, 12, x FOR PEER REVIEW 19 of 27
In the best case, around 90% of the time is spent in the I category in winter. The rest of the time is spent in the II category. The average CO2 concentration is 650 ppm. The reference case shows a significant effect of the occupant and door schedules, transitioning to more than 25% in the IV category and 790 ppm on average. Case with dirty inlet device filter (M1) shows further deterioration of the IAQ to around 25% in the IV category. The combination of dirty inlet filter and stack duct (M2) shows mostly the same performance as with additional combination with high airtightness (M3) and non-openable windows (M5) with around 45% time in IV category and 1470 ppm on average. The worst-case (M5) with non-openable windows shows the worst performance with 45% in the IV category.
In the summer case, the additional opening ventilation significantly affects all cases, showing better performance. The best reference and cases with maintenance issues (M1, M2) show around 80% in the I and II categories with only around 2%, 4%, 12%, and 13% of the time in the IV category for reference case, cases with maintenance issues (M1, M2) and case high airtightness (M3). The case with non-openable windows (M5) shows the worst performance with 50% in the IV category.
Table 12. The one-room apartment on the fifth floor IAQ results. Time spent in each indoor air category in percent.
Case Winter (January–May) Summer (June–August)
I, % II, % III, % IV, % Average, ppm I, % II, % III, % IV, % Average, ppm Ref. 60.7 6.6 28.0 4.7 790 85.8 3.4 8.5 2.3 650 Best 89.0 10.8 0.2 0.0 650 89.2 7.8 3.0 0.0 610 M1 54.6 7.0 13.3 25.1 900 84.2 3.3 4.0 8.5 700 M2 20.5 17.1 16.3 46.1 1500 79.9 4.2 3.5 12.5 845 M3 17.8 17.9 18.8 45.5 1470 78.3 4.9 4.0 12.7 850 M4 17.8 17.8 18.9 45.5 1490 78 4.9 4.2 12.8 860 M5 18.3 17.8 19.0 44.9 1470 7.4 12.3 30.4 50.0 1450
Figure 12. The duration curves of CO2 level in the one-room apartment on the fifth floor for differentcases for winter and summer with indoor air quality reference levels.
Table 12. The one-room apartment on the fifth floor IAQ results. Time spent in each indoor aircategory in percent.
CaseWinter (January–May) Summer (June–August)
I, % II, % III, % IV, % Average, ppm I, % II, % III, % IV, % Average, ppm
Ref. 60.7 6.6 28.0 4.7 790 85.8 3.4 8.5 2.3 650Best 89.0 10.8 0.2 0.0 650 89.2 7.8 3.0 0.0 610M1 54.6 7.0 13.3 25.1 900 84.2 3.3 4.0 8.5 700M2 20.5 17.1 16.3 46.1 1500 79.9 4.2 3.5 12.5 845M3 17.8 17.9 18.8 45.5 1470 78.3 4.9 4.0 12.7 850M4 17.8 17.8 18.9 45.5 1490 78 4.9 4.2 12.8 860M5 18.3 17.8 19.0 44.9 1470 7.4 12.3 30.4 50.0 1450
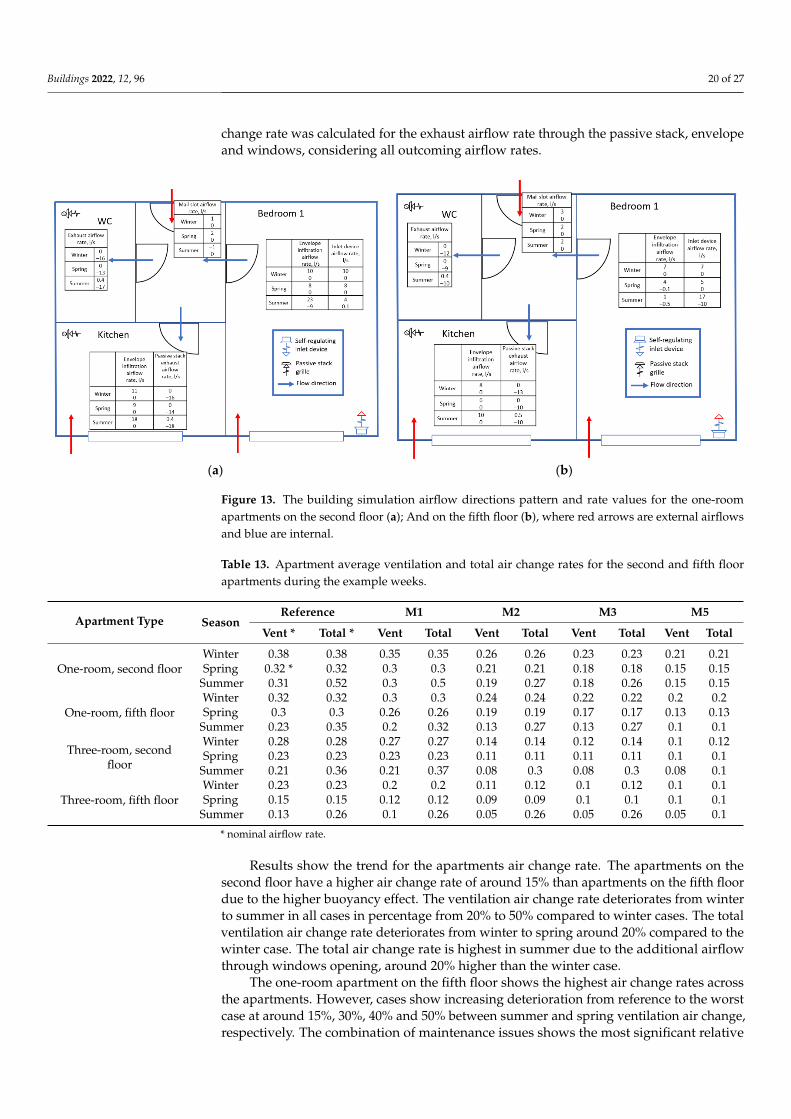
3.2.2. Apartment Internal Airflow and Air Change Analysis Results
The results for the internal airflow rate and air change rates for the apartments arepresented in Figure 13 and Table 13. The airflow and air change rates are average duringthe chosen weeks in winter, spring and summer. The nominal air change rate shows rate at15 ◦C as a nominal conditions. In figures, arrows represent the average airflow directionthrough envelope and windows and between the rooms through doors. Additionally,the mail slot is taken into consideration as a connection to the stairwell. Tables showthe average airflow rate for each room. Table 13 shows air change rates for the referencecase, for the cases with poor maintenance and the worst-case scenario to show the overallinfluence of factors on the air change rates of the apartments. The ventilation air changerate was calculated for the exhaust airflow rate through the passive stack. The total air
Buildings 2022, 12, 96 20 of 27
change rate was calculated for the exhaust airflow rate through the passive stack, envelopeand windows, considering all outcoming airflow rates.
Buildings 2022, 12, x FOR PEER REVIEW 21 of 27
Table 13. Apartment average ventilation and total air change rates for the second and fifth floor
apartments during the example weeks.
Apartment
Type Season
Reference M1 M2 M3 M5
Vent * Total * Vent Total Vent Total Vent Total Vent Total
One‐room, sec‐
ond floor
Winter 0.38 0.38 0.35 0.35 0.26 0.26 0.23 0.23 0.21 0.21
Spring 0.32 * 0.32 0.3 0.3 0.21 0.21 0.18 0.18 0.15 0.15
Summer 0.31 0.52 0.3 0.5 0.19 0.27 0.18 0.26 0.15 0.15
One‐room,
fifth floor
Winter 0.32 0.32 0.3 0.3 0.24 0.24 0.22 0.22 0.2 0.2
Spring 0.3 0.3 0.26 0.26 0.19 0.19 0.17 0.17 0.13 0.13
Summer 0.23 0.35 0.2 0.32 0.13 0.27 0.13 0.27 0.1 0.1
Three‐room,
second floor
Winter 0.28 0.28 0.27 0.27 0.14 0.14 0.12 0.14 0.1 0.12
Spring 0.23 0.23 0.23 0.23 0.11 0.11 0.11 0.11 0.1 0.1
Summer 0.21 0.36 0.21 0.37 0.08 0.3 0.08 0.3 0.08 0.1
Three‐room,
fifth floor
Winter 0.23 0.23 0.2 0.2 0.11 0.12 0.1 0.12 0.1 0.1
Spring 0.15 0.15 0.12 0.12 0.09 0.09 0.1 0.1 0.1 0.1
Summer 0.13 0.26 0.1 0.26 0.05 0.26 0.05 0.26 0.05 0.1
* nominal airflow rate.
(a) (b)
Figure 13. The building simulation airflow directions pattern and rate values for the one‐room
apartments on the second floor (a); And on the fifth floor (b), where red arrows are external airflows
and blue are internal.
The apartment airflow rate in the one‐room apartments on the fifth floor is shown in
Figure 14. Due to the vertical location differences of second and fifth floors the airflow
rate is lower by around 20%. The infiltration airflow rate in the bedroom is mostly equal
to the inlet device airflow rate in winter and spring cases. In summer, the windows open‐
ing ventilation combined with infiltration accounts for around 80% of outdoor airflow.
The lowest apartment total supply airflow rates are presented during the springtime
on both floors, with 27 L/s and 17 L/s for the second and fifth floors, respectively. In win‐
ter, the apartment total airflow rate is around 32 L/s and 25 L/s. The total apartment and
supply airflows are the highest in summer, around 45 L/s and 28 L/s, respectively. During
the summer, the reversed airflow may occur due to the apartment overheating. This also
indicates a low apartment airflow rate in that period. Although, a low average reverse
airflow rate indicates that it is a rare occurrence.
The apartment airflow rate in the three‐room apartments has the same trend as in
one‐room apartments and shown in Figure 14, with the fifth floor lower by around 30%
Figure 13. The building simulation airflow directions pattern and rate values for the one-roomapartments on the second floor (a); And on the fifth floor (b), where red arrows are external airflowsand blue are internal.
Table 13. Apartment average ventilation and total air change rates for the second and fifth floorapartments during the example weeks.
Apartment Type SeasonReference M1 M2 M3 M5
Vent * Total * Vent Total Vent Total Vent Total Vent Total
One-room, second floorWinter 0.38 0.38 0.35 0.35 0.26 0.26 0.23 0.23 0.21 0.21Spring 0.32 * 0.32 0.3 0.3 0.21 0.21 0.18 0.18 0.15 0.15
Summer 0.31 0.52 0.3 0.5 0.19 0.27 0.18 0.26 0.15 0.15
One-room, fifth floorWinter 0.32 0.32 0.3 0.3 0.24 0.24 0.22 0.22 0.2 0.2Spring 0.3 0.3 0.26 0.26 0.19 0.19 0.17 0.17 0.13 0.13
Summer 0.23 0.35 0.2 0.32 0.13 0.27 0.13 0.27 0.1 0.1
Three-room, secondfloor
Winter 0.28 0.28 0.27 0.27 0.14 0.14 0.12 0.14 0.1 0.12Spring 0.23 0.23 0.23 0.23 0.11 0.11 0.11 0.11 0.1 0.1
Summer 0.21 0.36 0.21 0.37 0.08 0.3 0.08 0.3 0.08 0.1
Three-room, fifth floorWinter 0.23 0.23 0.2 0.2 0.11 0.12 0.1 0.12 0.1 0.1Spring 0.15 0.15 0.12 0.12 0.09 0.09 0.1 0.1 0.1 0.1
Summer 0.13 0.26 0.1 0.26 0.05 0.26 0.05 0.26 0.05 0.1
* nominal airflow rate.
Results show the trend for the apartments air change rate. The apartments on thesecond floor have a higher air change rate of around 15% than apartments on the fifth floordue to the higher buoyancy effect. The ventilation air change rate deteriorates from winterto summer in all cases in percentage from 20% to 50% compared to winter cases. The totalventilation air change rate deteriorates from winter to spring around 20% compared to thewinter case. The total air change rate is highest in summer due to the additional airflowthrough windows opening, around 20% higher than the winter case.
The one-room apartment on the fifth floor shows the highest air change rates acrossthe apartments. However, cases show increasing deterioration from reference to the worstcase at around 15%, 30%, 40% and 50% between summer and spring ventilation air change,respectively. The combination of maintenance issues shows the most significant relative
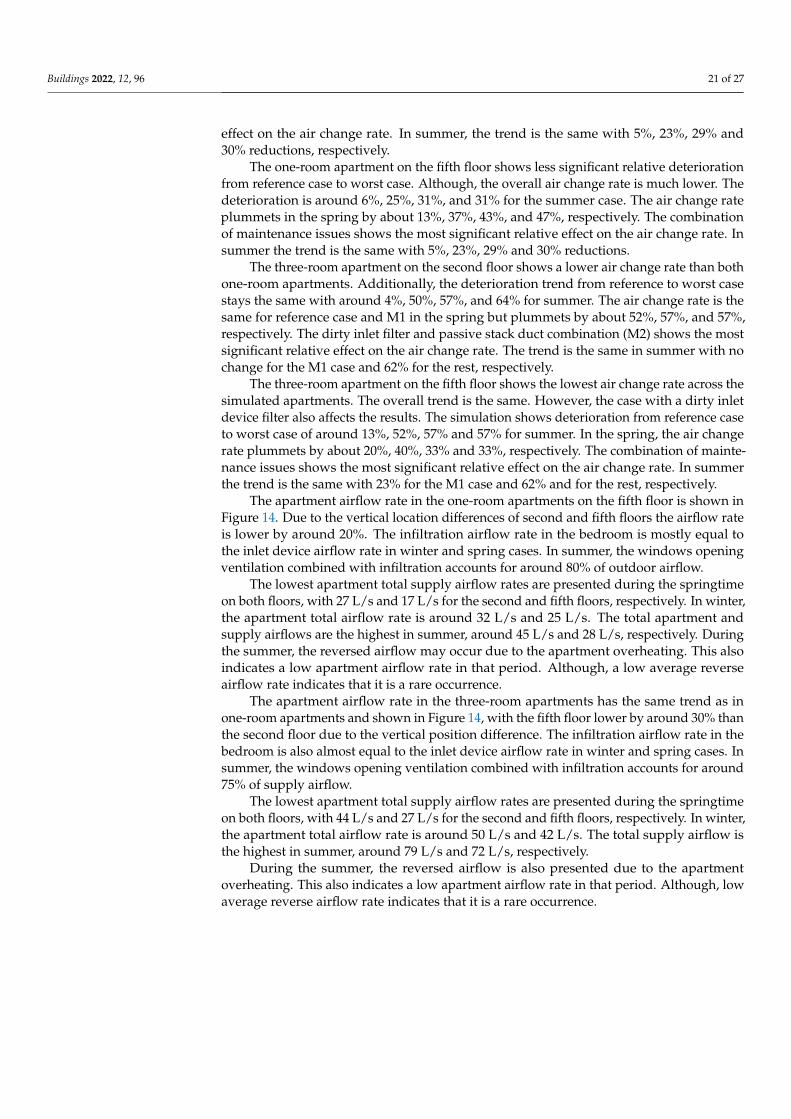
Buildings 2022, 12, 96 21 of 27
effect on the air change rate. In summer, the trend is the same with 5%, 23%, 29% and30% reductions, respectively.
The one-room apartment on the fifth floor shows less significant relative deteriorationfrom reference case to worst case. Although, the overall air change rate is much lower. Thedeterioration is around 6%, 25%, 31%, and 31% for the summer case. The air change rateplummets in the spring by about 13%, 37%, 43%, and 47%, respectively. The combinationof maintenance issues shows the most significant relative effect on the air change rate. Insummer the trend is the same with 5%, 23%, 29% and 30% reductions.
The three-room apartment on the second floor shows a lower air change rate than bothone-room apartments. Additionally, the deterioration trend from reference to worst casestays the same with around 4%, 50%, 57%, and 64% for summer. The air change rate is thesame for reference case and M1 in the spring but plummets by about 52%, 57%, and 57%,respectively. The dirty inlet filter and passive stack duct combination (M2) shows the mostsignificant relative effect on the air change rate. The trend is the same in summer with nochange for the M1 case and 62% for the rest, respectively.
The three-room apartment on the fifth floor shows the lowest air change rate across thesimulated apartments. The overall trend is the same. However, the case with a dirty inletdevice filter also affects the results. The simulation shows deterioration from reference caseto worst case of around 13%, 52%, 57% and 57% for summer. In the spring, the air changerate plummets by about 20%, 40%, 33% and 33%, respectively. The combination of mainte-nance issues shows the most significant relative effect on the air change rate. In summerthe trend is the same with 23% for the M1 case and 62% and for the rest, respectively.
The apartment airflow rate in the one-room apartments on the fifth floor is shown inFigure 14. Due to the vertical location differences of second and fifth floors the airflow rateis lower by around 20%. The infiltration airflow rate in the bedroom is mostly equal tothe inlet device airflow rate in winter and spring cases. In summer, the windows openingventilation combined with infiltration accounts for around 80% of outdoor airflow.
The lowest apartment total supply airflow rates are presented during the springtimeon both floors, with 27 L/s and 17 L/s for the second and fifth floors, respectively. In winter,the apartment total airflow rate is around 32 L/s and 25 L/s. The total apartment andsupply airflows are the highest in summer, around 45 L/s and 28 L/s, respectively. Duringthe summer, the reversed airflow may occur due to the apartment overheating. This alsoindicates a low apartment airflow rate in that period. Although, a low average reverseairflow rate indicates that it is a rare occurrence.
The apartment airflow rate in the three-room apartments has the same trend as inone-room apartments and shown in Figure 14, with the fifth floor lower by around 30% thanthe second floor due to the vertical position difference. The infiltration airflow rate in thebedroom is also almost equal to the inlet device airflow rate in winter and spring cases. Insummer, the windows opening ventilation combined with infiltration accounts for around75% of supply airflow.
The lowest apartment total supply airflow rates are presented during the springtimeon both floors, with 44 L/s and 27 L/s for the second and fifth floors, respectively. In winter,the apartment total airflow rate is around 50 L/s and 42 L/s. The total supply airflow isthe highest in summer, around 79 L/s and 72 L/s, respectively.
During the summer, the reversed airflow is also presented due to the apartmentoverheating. This also indicates a low apartment airflow rate in that period. Although, lowaverage reverse airflow rate indicates that it is a rare occurrence.
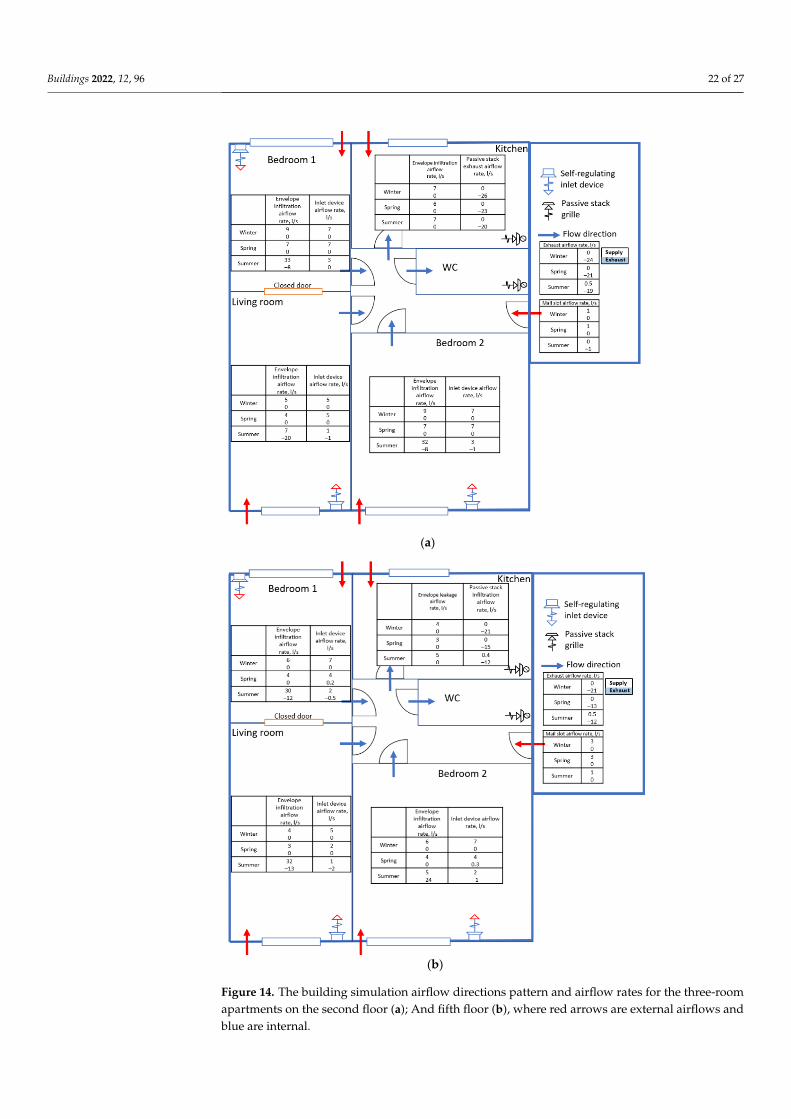
Buildings 2022, 12, 96 22 of 27
Buildings 2022, 12, x FOR PEER REVIEW 22 of 27
than the second floor due to the vertical position difference. The infiltration airflow rate
in the bedroom is also almost equal to the inlet device airflow rate in winter and spring
cases. In summer, the windows opening ventilation combined with infiltration accounts
for around 75% of supply airflow.
The lowest apartment total supply airflow rates are presented during the springtime
on both floors, with 44 L/s and 27 L/s for the second and fifth floors, respectively. In win‐
ter, the apartment total airflow rate is around 50 L/s and 42 L/s. The total supply airflow
is the highest in summer, around 79 L/s and 72 L/s, respectively.
During the summer, the reversed airflow is also presented due to the apartment over‐
heating. This also indicates a low apartment airflow rate in that period. Although, low
average reverse airflow rate indicates that it is a rare occurrence.
(a)
Buildings 2022, 12, x FOR PEER REVIEW 23 of 27
(b)
Figure 14. The building simulation airflow directions pattern and airflow rates for the three‐room
apartments on the second floor (a); And fifth floor (b), where red arrows are external airflows and
blue are internal.
4. Discussion
Apartment retrofitting requires a simple but efficient solution to provide adequate
IAQ, energy performance, and retrofit costs. It is particularly important for protected or
heritage buildings with natural passive stack ventilation and no or limited access to the
building envelope or ventilation system changes. One of the solutions is the implementa‐
tion of self‐regulating inlet devices to preserve the initial ventilation system and envelope
and provide designed airflow rates and low costs as it is commonly assumed that natural
ventilation does not have much maintenance. However, modern self‐regulating inlet de‐
vices have filters that require at least yearly maintenance, which should be done by the
service company or by occupants. The results clearly show that maintenance of the mod‐
ern passive stack system with openable apartment windows is essential. These results are
to consider, as if it is the occupant responsibility to do maintenance, it might be a challenge
doing that without much experience. On the other hand, if the service company does it, it
requires labour and the ability to visit apartments to be carried out. Additionally, the
maintenance of the passive stack duct should be carefully planned to prevent its clogging.
It is also crucial to avoid overheating in the cases of a group of vulnerable people,
such as elderly people who have openable windows but cannot operate them. Otherwise,
the apartment temperature exceeds 30 °C, which is a health risk for elderly people. In
some cases, the temperature exceeds 32 °C, which is a health limit for other occupants.
The three‐room and one‐room apartments, both equipped with the same exhaust sys‐
tem, consist of two passive stacks in the bathroom and kitchen. The difference is the num‐
ber of rooms with inlet devices and an external surface for infiltration, thus lowering sys‐
tem resistance. In general, it means that three‐room apartments are more sensible for the
passive stack ventilation system poor maintenance than one‐room apartments. Therefore,
Figure 14. The building simulation airflow directions pattern and airflow rates for the three-roomapartments on the second floor (a); And fifth floor (b), where red arrows are external airflows andblue are internal.
Buildings 2022, 12, 96 23 of 27
4. Discussion
Apartment retrofitting requires a simple but efficient solution to provide adequate IAQ,energy performance, and retrofit costs. It is particularly important for protected or heritagebuildings with natural passive stack ventilation and no or limited access to the buildingenvelope or ventilation system changes. One of the solutions is the implementation ofself-regulating inlet devices to preserve the initial ventilation system and envelope andprovide designed airflow rates and low costs as it is commonly assumed that naturalventilation does not have much maintenance. However, modern self-regulating inletdevices have filters that require at least yearly maintenance, which should be done by theservice company or by occupants. The results clearly show that maintenance of the modernpassive stack system with openable apartment windows is essential. These results are toconsider, as if it is the occupant responsibility to do maintenance, it might be a challengedoing that without much experience. On the other hand, if the service company does it,it requires labour and the ability to visit apartments to be carried out. Additionally, themaintenance of the passive stack duct should be carefully planned to prevent its clogging.
It is also crucial to avoid overheating in the cases of a group of vulnerable people, suchas elderly people who have openable windows but cannot operate them. Otherwise, theapartment temperature exceeds 30 ◦C, which is a health risk for elderly people. In somecases, the temperature exceeds 32 ◦C, which is a health limit for other occupants.
The three-room and one-room apartments, both equipped with the same exhaustsystem, consist of two passive stacks in the bathroom and kitchen. The difference is thenumber of rooms with inlet devices and an external surface for infiltration, thus loweringsystem resistance. In general, it means that three-room apartments are more sensible for thepassive stack ventilation system poor maintenance than one-room apartments. Therefore,three-room apartments on the fifth floor with a low buoyancy effect show a CO2 levelhigher than 4000 ppm. On the other hand, improved airtightness in such apartments doesnot benefit the ventilation system and IAQ performance.
It is presented in the simulation of the reference case that the CO2 level in one-roomapartments is lower than in three-room apartments. However, they are much more likelyto overheat. Although, this is partly mitigated by the fact that the air movement rate in aone-room apartment is higher, creating more pleasant indoor thermal conditions.
In cases with poor maintenance, with dirty inlet devices and passive stack, the mostcrucial effect is shown on the fifth-floor apartments for the CO2 level, which rises due tothe significantly lower passive stack exhaust rates. The case with improved airtightnessrestricts infiltration and exfiltration airflow rate in all the apartments. It leads to significantoverheating in the one-room apartments with an indoor air temperature of 30 ◦C andhigher. The additional airflow rate of the windows opening ventilation shows a crucialeffect with a much lower CO2 level in summer. However, the window opening ventilationhas its limitation due to the outdoor airborne and noise pollution, and it is preferable not tobe utilized in the cities with high population density, near roads and traffic lines.
The limitations of the study are mostly presented with physical model limitationsand case-specific input data. This simulation analysis assesses the average airflow and airchange rates calculated via hourly average outdoor conditions. However, the momentaryairflow rate may be significantly different. The building simulation model considersbuilding design and structure, device parameters, occupant behaviour, and lighting andheating schedule, but it still has some limitations. The simulation model is created withseparate nodes for each room, but each node represents the entire room. All the nodes arecalculated to be in balance. The distribution of the parameters within each node is calculatedonly for the boundary elements, such as inlets, doors and windows. As the distribution ineach node, room, is even as for the mixed model, the calculated values are average, but localvalues are needed to analyze draught. This means that cold draughts, airflow patterns etc.,may be calculated indirectly and may significantly change the occupant thermal comfortsensations. The case-specific input is presented with the Nordic climate weather andoutdoor conditions. The façade wind pressure coefficients and building structure materials
Buildings 2022, 12, 96 24 of 27
were assumed according to the building age. Furthermore, the inlet device model is createdbased on the design manufacturer data, representing its theoretical performance and placedaccording to the building documentation. The pressure drop in filters and stack ducts incases of poor maintenance has been assumed based on literature. The case building ispresented with five floors; thus, the simulation results for high-rise buildings might differdue to the significant effect of the wind pressure.
The simulation results of ACH may be compared against previous experimentalstudies of passive stack ventilation. The study was conducted in the warm climate ofPortugal and showed a good correlation. The average air change rate was 0.6–0.7 ACHwith window opening ventilation [31] and the air change level of 0.35 ACH in winter,best-case scenario, and around 0.1 ACH in August, in the worst-case scenario for thecases without opening ventilation [33]. Additionally, the results agree with previous fieldstudies in Nordic climate, Helsinki, where the mean air-exchange rates in apartments had ahigh variation (average 0.6 L/h, range 0.1–1.2 L/h) [47]. The ASHRAE minimum valueof 0.35 L/h was not achieved in 28% of all dwellings, and the average air change ratein the naturally ventilated apartments is 0.64 L/h [47]. Some previous studies assessedthe CO2 in the cold climate, Beijing, in bedrooms, concluding the necessity of additionalwindows opening ventilation. The maximum CO2 level was observed at around 4000 to5000 ppm [48].
Natural ventilation advancements present the trend of making systems less dependenton outdoor weather conditions and having reliable and constant airflow rates. In practice,one of the most demanding paths is the building stock retrofit, which requires high IAQ,but simple solutions, presented with such devices as self-controlled air inlets or passivestack outlets and wise windows opening strategies. The results and highlighted points maybe considered in the renovation design for the buildings with passive stack ventilation inthe Nordic conditions to ensure good IAQ and prevent apartment overheating, especiallyin homes of vulnerable groups of people.
5. Conclusions
The regulations and standards are developed to ensure high indoor environmentquality in the building stock, and that the classification of the IAQ parameters reflects thedesirable level in residential buildings. In practice, the lowest level considers the effect ofhealth; thus, renovation and retrofit of the old buildings should aim to provide a high IAQlevel. The paper analyses the performance of a retrofitted five-storey apartment buildingequipped with modern passive stack ventilation in Nordic conditions. The passive stackventilation system was retrofitted in 2018, and novel self-regulating air inlet devices withfilters were equipped. The building was simulated with IDA ICE software, where themodel of the self-regulating inlet devices was developed using manufacturer product data.Several case scenarios were created to analyze the effect of poor maintenance, improvedairtightness, and window opening on the system performance. For the analysis, one-roomand three-room apartments on the second and fifth floors were chosen. The CO2 levels andindoor air temperature were analyzed and compared with EN 16798-1 to assess the IAQ.The results are separated for the winter and summer to show the influence of additionalairflow from opening ventilation. The apartment air change rate and internal airflowpatterns were assessed and compared case by case.
The results show a trend for the one-room apartment to overheat, despite having ahigher air change rate than the three-room apartments. The three-room apartments tolerateoverheating, although they are much more sensible considering the poor maintenance.Improving the envelope airtightness does not benefit the IAQ of the apartments. Theresults show a significant effect of poor maintenance and window opening possibility onthe CO2 concentration. Furthermore, the apartments on the fifth floor are more sensitiveto poor maintenance, and three-room apartments situated there showed warning levelsof CO2. The case with non-openable windows showed more than 150 ◦Ch over 32 ◦C inall apartments.
Buildings 2022, 12, 96 25 of 27
Filter replacement is essential for the desired operation of the modern passive stackventilation system. Additionally, the maintenance of the passive stack duct should becarefully planned to prevent its clogging. It is crucial to prevent overheating due towindows being left closed. Otherwise, the temperature in the apartments can reach above32 ◦C, which is a health risk.
The results and highlighted points are crucial as the protected and heritage buildingswith natural ventilation and limited or no access to the envelope or ventilation systemreconstruction require retrofit to meet current building codes requirements. The results maybe applied to retrofit the buildings with passive stack ventilation in the Nordic conditions toensure good IAQ and prevent apartment overheating, especially in the homes of vulnerablegroups of people.
Author Contributions: Conceptualization, I.K., R.K., J.J., S.K.; methodology, I.K., J.J., R.K.; software,I.K., J.J.; validation, I.K., J.J., S.K.; formal analysis, I.K.; investigation, I.K., J.J.; resources, I.K.; datacuration, I.K.; writing—original draft preparation, I.K.; writing—review and editing, R.K., J.J., S.K.;visualization, I.K.; supervision, R.K.; project administration, R.K.; funding acquisition, R.K., J.J. Allauthors have read and agreed to the published version of the manuscript.
Funding: This research was funded by HEATCLIM (Heat and health in the changing climate, GrantNo. 329306) funded by the Academy of Finland within the CLIHE (Climate change and health)program. SUREFIT (Sustainable solutions for affordable retrofit of domestic buildings) funded by theEuropean Union (Horizon 2020 program, Grant No. 894511).
Institutional Review Board Statement: Not applicable.
Informed Consent Statement: Not applicable.
Acknowledgments: The authors would like to acknowledge Mika Vuolle from Equa SimulationFinland Ltd. for developing the inlet device model, IDA ICE software support and cooperation.
Conflicts of Interest: The authors declare no conflict of interest.
References1. World Health Organization. The World Health Report 2000: Health Systems: Improving Performance; WHO: Geneva, Switzerland, 2000;
ISBN 978-92-4-156198-3.2. Olesen, B.W. Indoor Environment Criteria for Design and Calculation of Energy Performance of Buildings EN15251. In Proceed-
ings of the 6th International Conference on Indoor Air Quality, Ventialtion & Energy Conservation in Buildings: SustainableBuild Environment, Sendai, Japan, 28–31 October 2007.
3. Brelih, N.; Seppanen, O. Ventilation Rates and IAQ in European Standards and National Regulations. In Proceedings of the 32ndAIVC Conference and 1st TightVent Conference, Brussels, Belgium, 12–13 October 2011.
4. Fernbas Energy Performance of Buildings Directive. Available online: https://ec.europa.eu/energy/topics/energy-efficiency/energy-efficient-buildings/energy-performance-buildings-directive_en (accessed on 5 November 2020).
5. Dimitroulopoulou, C. Ventilation in European Dwellings: A Review. Build. Environ. 2012, 47, 109–125. [CrossRef]6. The National Building Code of Finland. Available online: https://ym.fi/en/the-national-building-code-of-finland (accessed on
11 November 2020).7. Ministry of the Environment (Finland). Ministry of Environment Decree (1010/2017) on the Energy Performance of the New Building;
Ministry of the Environment: Helsinki, Finland, 2018.8. Ahola, M.; Säteri, J.; Sariola, L. Revised Finnish Classification of Indoor Climate 2018. E3S Web Conf. 2019, 111, 02017. [CrossRef]9. Rämö, A. Statistics Finland—Building Stock 2019. Available online: http://www.stat.fi/til/rakke/2019/rakke_2019_2020-05-27_
kat_002_en.html (accessed on 5 November 2020).10. Department of Built Environment, Ministry of the Environment (Finland). National Building Code of Finland. Part D2. Indoor
Climate and Ventilation of Buildings Regulations and Guidelines; Department of Built Environment, Ministry of the Environment(Finland): Helsinki, Finland, 2012.
11. International Energy Agency. Ministry of the Environment Decree (4/13, Amendment 2/17) on Improving the Energy Performance ofBuildings Undergoing Renovation or Alteration; International Energy Agency: Paris, France, 2013.
12. Nazaroff, W.W. Residential Air-Change Rates: A Critical Review. Indoor Air 2021, 31, 282–313. [CrossRef] [PubMed]13. Liddament, M.; Axley, J.; Heiselberg, P.; Li, Y.; Stathopoulos, T. Achieving Natural and Hybrid Ventilation in Practice. Int. J. Vent.
2006, 5, 115–130. [CrossRef]14. Gou, Z.; Gamage, W.; Lau, S.S.-Y.; Lau, S.S.-Y. An Investigation of Thermal Comfort and Adaptive Behaviors in Naturally
Ventilated Residential Buildings in Tropical Climates: A Pilot Study. Buildings 2018, 8, 5. [CrossRef]
Buildings 2022, 12, 96 26 of 27
15. Saif, J.; Wright, A.; Khattak, S.; Elfadli, K. Keeping Cool in the Desert: Using Wind Catchers for Improved Thermal Comfort andIndoor Air Quality at Half the Energy. Buildings 2021, 11, 100. [CrossRef]
16. Calautit, J.K.; O’Connor, D.; Hughes, B.R. A Natural Ventilation Wind Tower with Heat Pipe Heat Recovery for Cold Climates.Renew. Energy 2016, 87, 1088–1104. [CrossRef]
17. Gong, J.; Hang, J. Buoyancy-Driven Natural Ventilation in One Storey Connected with an Atrium. Int. J. Vent. 2018, 18, 281–302.[CrossRef]
18. Hussain, S.; Oosthuizen, P.H. Numerical Investigations of Buoyancy-Driven Natural Ventilation in a Simple Atrium Building andIts Effect on the Thermal Comfort Conditions. Appl. Therm. Eng. 2012, 40, 358–372. [CrossRef]
19. Khanal, R.; Lei, C. Solar Chimney—A Passive Strategy for Natural Ventilation. Energy Build. 2011, 43, 1811–1819. [CrossRef]20. Salata, F.; Alippi, C.; Tarsitano, A.; Golasi, I.; Coppi, M. A First Approach to Natural Thermoventilation of Residential Buildings
through Ventilation Chimneys Supplied by Solar Ponds. Sustainability 2015, 7, 9649–9663. [CrossRef]21. Barbosa, S.; Ip, K. Perspectives of Double Skin Façades for Naturally Ventilated Buildings: A Review. Renew. Sustain. Energy Rev.
2014, 40, 1019–1029. [CrossRef]22. Kim, Y.-M.; Kim, S.-Y.; Shin, S.-W.; Sohn, J.-Y. Contribution of Natural Ventilation in a Double Skin Envelope to Heating Load
Reduction in Winter. Build. Environ. 2009, 44, 2236–2244. [CrossRef]23. Hsu, H.-H.; Chiang, W.-H.; Huang, J.-S. Hybrid Ventilation in an Air-Conditioned Office Building with a Multistory Atrium for
Thermal Comfort: A Practical Case Study. Buildings 2021, 11, 625. [CrossRef]24. Vinha, J.; Manelius, E.; Korpi, M.; Salminen, K.; Kurnitski, J.; Kiviste, M.; Laukkarinen, A. Airtightness of Residential Buildings in
Finland. Build. Environ. 2015, 93, 128–140. [CrossRef]25. Biler, A.; Unlu Tavil, A.; Su, Y.; Khan, N. A Review of Performance Specifications and Studies of Trickle Vents. Buildings 2018,
8, 152. [CrossRef]26. Choi, Y.; Song, D. How to Quantify Natural Ventilation Rate of Single-Sided Ventilation with Trickle Ventilator? Build. Environ.
2020, 181, 107119. [CrossRef]27. Karava, P.; Stathopoulos, T.; Athienitis, A.K. Investigation of the Performance of Trickle Ventilators. Build. Environ. 2003, 38,
981–993. [CrossRef]28. Willems, L.; Janssens, A. Performance Prediction of Dwelling Ventilation with Self-Regulating Air Inlets. In Proceedings of the
26th AIVC Conference: Ventilation in Relation to the Energy Performance of Buildings, Brussels, Belgium, 21–23 September 2005;pp. 197–202.
29. Janssens, A.; Willems, L.; Laverge, J. Performance Evaluation of Residential Ventilation Systems Based on Multi-Zone Venti-lation Models. In Proceedings of the 4th International Building Physics Conference: Energy Efficiency and New Approaches,Istanbul, Turkey, 15–18 June 2009; 7p.
30. Building Regulation—GOV.UK. Available online: https://www.gov.uk/housing-local-and-community/building-regulation(accessed on 3 August 2021).
31. Pinto, M.; Freitas, V.; Viegas, J.; Matias, L. Residential Hybrid Ventilation Systems in Portugal: Experimental Characterization.In Proceedings of the 8th International Conference and Exhibition on Healthy Buildings 2006, Lisbon, Portugal, 1–8 June 2006;Volume 4, pp. 357–362.
32. Pinto, M.; Viegas, J.; de Freitas, V.P. Air Permeability Measurements of Dwellings and Building Components in Portugal. Build.Environ. 2011, 46, 2480–2489. [CrossRef]
33. Ramos, N.M.M.; Almeida, R.M.S.F.; Curado, A.; Pereira, P.F.; Manuel, S.; Maia, J. Airtightness and Ventilation in a Mild ClimateCountry Rehabilitated Social Housing Buildings—What Users Want and What They Get. Build. Environ. 2015, 92, 97–110.[CrossRef]
34. Ward, I.C. The Potential Impact of the New (UK) Building Regulations on the Provision of Natural Ventilation in Dwellings—ACase Study of Low Energy Social Housing. Int. J. Vent. 2008, 7, 77–88. [CrossRef]
35. Neve, J.D.; Denys, S.; Pieters, J.G.; Pollet, I.; Denul, J. CFD Analysis of the Effect of Self-Regulating Devices on the Distributionof Naturally Supplied Air. In Proceedings of the 26th AIVC Conference: Ventilation in Relation to the Energy Performance ofBuildings, Brussels, Belgium, 21–23 September 2005; 6p.
36. Arendt, K.; Krzaczek, M. Co-Simulation Strategy of Transient CFD and Heat Transfer in Building Thermal Envelope Based onCalibrated Heat Transfer Coefficients. Int. J. Therm. Sci. 2014, 85, 1–11. [CrossRef]
37. Indoor Environmental Input Parameters for Design and Assessment of Energy Performance of Buildings Addressing Indoor Air Quality,Thermal Environment, Lighting and Acoustics; EN 15251:2007; European Committee for Standardization: Brussels, Belgium, 2007.
38. Energy Performance of Buildings—Ventilation for Buildings—Part 1: Indoor Environmental Input Parameters for Design and Assessmentof Energy Performance of Buildings Addressing Indoor Air Quality, Thermal Environment, Lighting and Acoustics; EN 16798-1:2019;European Committee for Standardization: Brussels, Belgium, 2019.
39. Renovation and Decarbonisation of Buildings. Available online: https://ec.europa.eu/commission/presscorner/detail/en/ip_21_6683 (accessed on 29 December 2021).
40. Ministry of Social Affairs and Health (Finland). 35. Decree (525/2015) of the Ministry of Social Affairs and Health on Health-relatedConditions of Housing and Other Residential Buildings and Qualification Requirements for Third-party Experts; Ministry of Social Affairsand Health (Finland): Helsinki, Finland, 2015.
Buildings 2022, 12, 96 27 of 27
41. Observations in Finland—Finnish Meteorological Institute. Available online: https://en.ilmatieteenlaitos.fi/observations-in-finland (accessed on 22 June 2021).
42. Validation & Certifications—Simulation Software|EQUA. Available online: https://www.equa.se/en/ida-ice/validation-certifications (accessed on 22 June 2021).
43. Kalamees, T.; Jylhä, K.; Tietäväinen, H.; Jokisalo, J.; Ilomets, S.; Hyvönen, R.; Saku, S. Development of Weighting Factors forClimate Variables for Selecting the Energy Reference Year According to the EN ISO 15927-4 Standard. Energy Build. 2012, 47,53–60. [CrossRef]
44. Kontonasiou, E. Analysis of Indoor Air Quality & Thermal Comfort Parameters in Building Regulations in 8 MemberStates. In Proceedings of the 36th AIVC Conference “Effective Ventilation in High Performance Buildings”, Madrid, Spain,23–24 September 2015; 10p.
45. Jokisalo, J.; Kurnitski, J.; Vuolle, M.; Torkki, A. Performance of Balanced Ventilation with Heat Recovery in Residential Buildingsin a Cold Climate. Int. J. Vent. 2003, 2, 223–236. [CrossRef]
46. REHVA Guidebook 29. Available online: https://www.rehva.eu/hvac-guidebook-repository/rehva-guidebook-29 (accessed on7 July 2021).
47. Ruotsalainen, R.; Ronnberg, R.; Sateri, J.; Majanen, A.; Seppanen, O.; Jaakkola, J.J.K. Indoor Climate and the Performance ofVentilation in Finnish Residences. Indoor Air 1992, 2, 137–145. [CrossRef]
48. Lei, Z.; Liu, C.; Wang, L.; Li, N. Effect of Natural Ventilation on Indoor Air Quality and Thermal Comfort in Dormitory duringWinter. Build. Environ. 2017, 125, 240–247. [CrossRef]


![Passive design[1]](https://static.fdokumen.com/doc/165x107/63215c9580403fa2920cb59b/passive-design1.jpg)