
Performance of Automatic Control Drip Irrigation System and ...
10
Global Advanced Research Journal of Agricultural Science (ISSN: 2315-5094) Vol. 4(8) pp. 415-424, August, 2015. Available online http://garj.org/garjas/home Copyright © 2015 Global Advanced Research Journals Full Length Research Paper Performance of Automatic Control Drip Irrigation System and Farm Topography for Soil Moisture Distribution, Mung Bean Grain Yield and Water Productivity 1 H.A., Mansour, 1 Sabreen Kh. Pibars and 2 V.F. Bralts 1 WRFI Department, National Research Center (NRC), Giza, Egypt. 2 ABE Dept., Purdue University, West Lafayette, IN, USA. Accepted 16 July, 2015 A field experiment was conducted at Abu-Ghalib Village, Giza Governorate, Egypt, Lt. 30 o 16.2" N and Ln. 30 o 56.6" E with the aim to study the effect of automation controller of drip irrigation system, different slopes conditions, different Field capacities on soil moisture distribution patterns, water amounts and mung bean (Vigna Radiate L.) yield. Under automation controller drip irrigation system, three irrigation rates 60, 80, and 100 from the field capacity and two land slopes 0% and 5 % conditions were selected for the study. Observations revealed that soil distributions patterns were affected significantly by the different field capacities according to the following order: 100% FC > 80% FC > 60% FC. Whereas could be arrange the slopes order to 0 % < 5% and the effect on soil distributions patterns were not significant. The interactions of field capacities and slopes were significant. Finally, it can be concluded to using the third field capacity of 60% FC because the treatment of with two slopes 0 and 5% water amount has been saved and it gave mung bean yield not different significantly with other treatments of field capacities. Keywords: Automation controller, drip irrigation, slopes, field capacity, soil moisture distribution, water, Mung bean yield. INTRODUCTION Drip or high frequency irrigation will often maintain low soil moisture suction (high moisture content) in a portion of the effective root zone. Root growth can possibly augment the influence of low soil moisture suction and maintain more favorable soil water intake characteristics around the emitters Gerard (1974) mentioned that the wetting pattern *Corresponding Author's Email: [email protected] can be affected by the soil hydrological properties. The author indicated that, the reduction in the ability of the soil to conduct water could be large enough to create saturated soil conditions and cause a significant loss of effective roots area. However, as was found by the reduction in the ability of soil to conduct water can be serious enough to create saturated soil conductions and significant loss of effective roots. Earl and Jury (1977) reported that moisture profiles for the daily irrigation treatment under cropped conditions showed that downward water movement is
-
Upload
khangminh22 -
Category
Documents
-
view
0 -
download
0
Transcript of Performance of Automatic Control Drip Irrigation System and ...

Global Advanced Research Journal of Agricultural Science (ISSN: 2315-5094) Vol. 4(8) pp. 415-424, August, 2015. Available online http://garj.org/garjas/home Copyright © 2015 Global Advanced Research Journals
Full Length Research Paper
Performance of Automatic Control Drip Irrigation System and Farm Topography for Soil Moisture Distribution,
Mung Bean Grain Yield and Water Productivity
1H.A., Mansour, 1Sabreen Kh. Pibars and 2V.F. Bralts
1WRFI Department, National Research Center (NRC), Giza, Egypt.
2ABE Dept., Purdue University, West Lafayette, IN, USA.
Accepted 16 July, 2015
A field experiment was conducted at Abu-Ghalib Village, Giza Governorate, Egypt, Lt. 30o16.2" N and
Ln. 30o 56.6" E with the aim to study the effect of automation controller of drip irrigation system,
different slopes conditions, different Field capacities on soil moisture distribution patterns, water amounts and mung bean (Vigna Radiate L.) yield. Under automation controller drip irrigation system, three irrigation rates 60, 80, and 100 from the field capacity and two land slopes 0% and 5 % conditions were selected for the study. Observations revealed that soil distributions patterns were affected significantly by the different field capacities according to the following order: 100% FC > 80% FC > 60% FC. Whereas could be arrange the slopes order to 0 % < 5% and the effect on soil distributions patterns were not significant. The interactions of field capacities and slopes were significant. Finally, it can be concluded to using the third field capacity of 60% FC because the treatment of with two slopes 0 and 5% water amount has been saved and it gave mung bean yield not different significantly with other treatments of field capacities. Keywords: Automation controller, drip irrigation, slopes, field capacity, soil moisture distribution, water, Mung bean yield.
INTRODUCTION Drip or high frequency irrigation will often maintain low soil moisture suction (high moisture content) in a portion of the effective root zone. Root growth can possibly augment the influence of low soil moisture suction and maintain more favorable soil water intake characteristics around the emitters Gerard (1974) mentioned that the wetting pattern *Corresponding Author's Email: [email protected]
can be affected by the soil hydrological properties. The author indicated that, the reduction in the ability of the soil to conduct water could be large enough to create saturated soil conditions and cause a significant loss of effective roots area. However, as was found by the reduction in the ability of soil to conduct water can be serious enough to create saturated soil conductions and significant loss of effective roots. Earl and Jury (1977) reported that moisture profiles for the daily irrigation treatment under cropped conditions showed that downward water movement is

416. Glo. Adv. Res. J. Agric. Sci. restricted to depth 60 cm in which lateral movement occurs no further than 60 cm from the emitter and commented that water movement is observed to almost 100 cm from the emitter, while downward movement is restricted to about 75 cm. The rate of water application in drip irrigation will affect the distribution of the applied chemicals. By varying the parameters of the irrigation regime different distribution may be obtained. Levin et al. (1979) studied the soil moisture distribution pattern when a certain amount of water was applied form a point source, but with different discharge rates. The continuous irrigation treatment showed a loss, by deep percolation, of 26% of the total amount of irrigation water below 60-cm depth after 12 hours. The lateral distribution, in the same treatment, showed that 80% of the water in the wetted volume was distributed up to 45 and 43cm horizontally from the point source after 12 and 24 hours, respectively. Only 12% loss under the depth of 60 cm was found with pulsed irrigation group and 29 and 40 cm lateral distribution after 12 and 24 hours, respectively. Bacon and Davy (1982) observed that irrigation resulted in outward movement of water from the application point to from a wetted zone in the shape of a shallow dish. The size and duration of the wetted zone depended on the length and season of irrigation while the shallow depth was caused by the lower hydraulic conductivity of the sub soil.Norris and Tennessee (1985) indicated that lateral movement is enhanced if the soil is stratified, the initial soil moisture is low, and the application rate is low. They also observed that, at high moisture tension (low moisture content) lateral movement is more pronounced in finer soil layers than in coarser layers. El-Gindy (1988) reported that, the moisture content of the top soil (0-20 cm) was higher in the drip irrigated field than those of surface, and sprinkler ones. Meanwhile the lowest moisture content in the same layer was in the surface irrigated field. Hanafy (1993) said that the major fluctions in soil water tension occurred in the top 30 cm of the soil profile. This is mainly due to that most crops moisture withdrawal from the soil is near the surface where more roots are normally growing.
Bresler, 1977stated that in drip-irrigated soils, normally the soil water distribution is done through a soil surface wetted area that is small relative to the total soil surface area. In point source emitters, the water distribution into the soil follows a three-dimensions infiltration pattern, different from the one-dimension (vertical) infiltration type of conventional irrigation systems, where the soil surface wetted area (through which water penetrates into the soil) is the whole soil surface area. Mansour et al., (2015 a) reported that the high frequency of automation controller irrigation, types of localized irrigation such as drip systems, involves that the infiltration process prevails, relative to other irrigation systems, over the soil water extraction phase of the irrigation cycle. Mansour et al., (2014), and Mansour et al., (2015 b) states that under automation
controller of drip irrigation system, of discharge rate mean of the drippers, the hydraulic characteristics of the soil and the evaporation rate from the soil surface determine the size of the horizontal soil surface wetted area through which infiltration takes place had been positive affected.
Mansour, (2006) states that under drip irrigation, the wetted zone that develops around the dripper is strongly related to both the irrigation water application rate and the soil physical properties. Consequently, the water application rate is one key factor determining the soil water content around the emitter and the water uptake pattern Mansour, et al, 2013. Mansour et al., (2012) reported that water application has significant effects on drip irrigation system or final grain yield. For instance, very high rates of water application can eliminate crop water stress, but it will also lessen drip irrigation efficiency by increasing the amount of water and nutrients that leach below the root zone.
Mansour and Abdel-Hady, (2014) reported that very low rates of water application, by contrast, can cause saline water stress, especially in sandy soils, by failing to meet the water requirement of the plants. Therefore, a proper drip irrigation rate is one that both minimizes the amount of water leached from the root zone and maintains a high soil matrix potential to reduce plant saline water stress. The saturated soil surface area under automation controller drip irrigation system increased when the rate of water application is increasing and when the ability of the soil to conduct water (dependent on the soil texture, among other physical properties) is low, with a corresponding decrease in the vertical direct. These aspects have a great importance for the type and density of emitters’ choices.
The objectives of current study is the effect of automation controller of drip irrigation system, different slopes conditions, different Field capacities on soil moisture distribution patterns, water amounts and mung bean yield. MATERIAL AND METHODS This study was conducted at Abu-Ghalib Village, (Lt. 30
o
16.2" N and Ln. 30o 56.6" E and 41.9m high above sea
level), Giza Governorate, Egypt. Field experiments were carried out under drip irrigation by automation controller system, three treatments of field capacity were used,100%, 80% and 60% FC. The 100 % FC were used as control. Soil of experimental field represents the (Nile alluvial) caly loam texture.
Soil particle size distribution was carried out using pipette method after Gee and Bauder (1986) as shown in Table (1). Soil bulk density (B.D.) was measured after Black and Hartage (1986).Ground water is the source of irrigation water.
Soil moisture content at field capacity (F.C) and permanent wilting point (P.W.P) were measured according

Mansour et al. 417 Table 1: Soil physical properties of the experimental site
Soil sample
Depth(cm)
Particle size distribution (%) Texture
class
*
FC
*
WP
*
AW
***
BD
(g/cm3)
**
HC
(cm/h)
Coarse
sand
Fine
sand Silt Clay (V/V %)
0-15 0.8 27.8 41.6 29.8 **** 0.32 0.17 0.15 1.33 0.42
15-30 0.7 27.5 41.2 30.6 **** 0.32 0.17 0.15 1.32 0.40
30-45 0.6 27.9 38.5 33.0 **** 0.33 0.18 0.15 1.31 0.33
45-60 0.6 28.7 37.0 33.7 **** 0.33 0.19 0.14 1.31 0.31
(*) Determined as percentage in (V/V %) cm3 Water: cm
3 Soil; (**) HC: Hydraulic conductivity; (*** ) BD: Bulk density and
(****) : Clay loam
to Walter and Gardener (1986) as shown Table (1). The available water (AW) was calculated from the following equation:
AW=F.C - P.W.P…………………(1) Where: AW= available water (�w %), F.C = field capacity (�w %) and P.W.P = permanent wilting point (�w %).
The automation controller system The automation controller system consists of moisture sensors, temperature sensors, Signal conditioning circuit, Digital to analog converter, LCD Module, Relay driver, solenoid control valves, etc. The unit is expressed in Figure (1). the important parameters to be measured for automation of drip irrigation system are soil moisture and temperature. The entire field is first divided into small sections such that each section should contain one moisture sensor and a temperature sensor. RTD like PT100 can be used as a temperature sensor while densitometer can be used as the moisture sensor to detect moisture contents of soil showed in Figure (2). these sensors are installed in the ground at required depth. Once the soil has reached desired moisture level the sensors send a signal to the micro controller to turn off the relays, which control the valves of surface drip irrigation systems used. Electronic Soil measurements For the determination of soil’s Mechanical constitution it was used the Bougioukou method, pH was measured with a pH electronic meter and the organic matter with the method of humid combustion of sample with divine acid. Also, as a result of the distance between drippers and the drip lateral length, it was achieved high uniformity of irrigation that approaches 95-97%. Measurements were
taken of the volumetric soil moisture (v/v %)in the experimental plots daily, and were taken from soil at the depths (0, 10, 20, 30, and 40 cm) depths and (5, 10, 15, and 20cm) distances from dripper in that time. Throughout the entire irrigation season.
The TDR (Time Domain Reflect to meter) method was used, anon-radioactive method which has been proved to be quick and reliable, irrespective of soil type (except extreme cases of soils).
The working principle of TDR is based on the direct measurement of the dielectric constant of soil and its conversion to water volume content.(Figure 3)
Testing the soil moisture content is a very complex process and the placing of a sensor at the root level of the crop is, in the majority of cases, not sufficient for a satisfactory performance of the test. As a solution to this problem, researchers were recommended using two or more sensors at various depths, so that a greater area of the root level is covered. In order to do this and to ensure greater accuracy, soil moisture probes with five sensors each were used and lay permanently installed in the 12 experimental plots, where they were in continuous contact with the soil. Each probe had sensors which measured the soil moisture content at five different depths: 0–10, 10–20, 20–30, and 30–40 cm. From the measurements taken at each position, the average value was calculated from the five depths for each treatment. Statistical analysis MSTATC program (Michigan State University) was used to carry out statistical analysis. Treatments mean were compared using the technique of analysis of variance (ANOVA) and the least significant difference (L.S.D) between systems at 1 % had been done. The randomized complete block design according to Steel and Torrie (1980).

418. Glo. Adv. Res. J. Agric. Sci.
Figure 1: Automatic Controller unit
Figure 2: Application to field
RESULTS AND DISCUSSION Effect of different slopes conditions and different field capacities treatments under drip irrigation by automation controller systems on moisture distribution pattern.
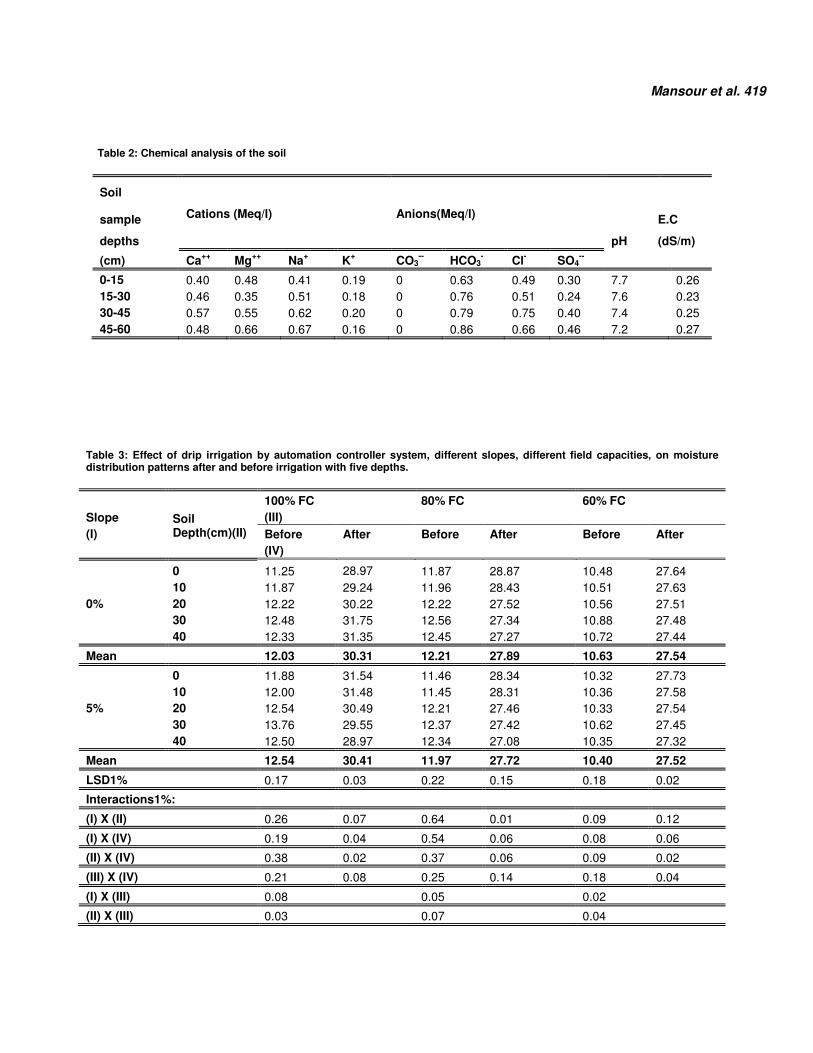
Data of Table (3) and Figures. (3 and 4) show the effect of different slopes conditions and different FC treatments on moisture distribution pattern on soil moisture distribution pattern in volumetric percentage basis (v/v %). It is important to mention that, when slope 0% conditions the mean soil moisture content v/v % were 12.03, 12.21 and 10.63 % under 100% FC, 80% FC, and 60% FC before irrigation, respectively. Whereas, they were 30.31, 27.89 and 27.54 % after irrigation in the same sequence. On the
other hand under 5 % slope condition, the means of moisture (v/v %) were 12.54, 11.97 and 10.40 % before irrigation, respectively. while they were 30.41, 27.72 and 27.52 % after irrigation under 100% FC, 80% FC, and 60% FC, respectively. There is a slight increase in (v/v %) with depth, whether soil moisture was measured before or after irrigation. This may be attributed to decreasing clay fraction with depth.
According to the mean soil moisture content (v/v %), irrigation systems used could be arranged in the following ascending orders: 60% FC<100% FC<80% FC before irrigation, and 60% FC<80% FC<100% FC after irrigation when slope 0 %conditions. Differences in (v/v %) between any two irrigation systems were significant at the 1 % level.
Mansour et al. 419
Table 2: Chemical analysis of the soil
Soil
Cations (Meq/l) Anions(Meq/l)
sample
E.C
depths pH (dS/m)
(cm) Ca++
Mg++
Na+ K
+ CO3
-- HCO3
- Cl
- SO4
--
0-15 0.40 0.48 0.41 0.19 0 0.63 0.49 0.30 7.7 0.26
15-30 0.46 0.35 0.51 0.18 0 0.76 0.51 0.24 7.6 0.23
30-45 0.57 0.55 0.62 0.20 0 0.79 0.75 0.40 7.4 0.25
45-60 0.48 0.66 0.67 0.16 0 0.86 0.66 0.46 7.2 0.27
Table 3: Effect of drip irrigation by automation controller system, different slopes, different field capacities, on moisture distribution patterns after and before irrigation with five depths.
Slope
(I)
Soil Depth(cm)(II)
100% FC 80% FC 60% FC
(III)
Before After Before After Before After
(IV)
0 11.25 28.97 11.87 28.87 10.48 27.64
10 11.87 29.24 11.96 28.43 10.51 27.63
0% 20 12.22 30.22 12.22 27.52 10.56 27.51
30 12.48 31.75 12.56 27.34 10.88 27.48
40 12.33 31.35 12.45 27.27 10.72 27.44
Mean 12.03 30.31 12.21 27.89 10.63 27.54
0 11.88 31.54 11.46 28.34 10.32 27.73
10 12.00 31.48 11.45 28.31 10.36 27.58
5% 20 12.54 30.49 12.21 27.46 10.33 27.54
30 13.76 29.55 12.37 27.42 10.62 27.45
40 12.50 28.97 12.34 27.08 10.35 27.32
Mean 12.54 30.41 11.97 27.72 10.40 27.52
LSD1% 0.17 0.03 0.22 0.15 0.18 0.02
Interactions1%:
(I) X (II) 0.26 0.07 0.64 0.01 0.09 0.12
(I) X (IV) 0.19 0.04 0.54 0.06 0.08 0.06
(II) X (IV) 0.38 0.02 0.37 0.06 0.09 0.02
(III) X (IV) 0.21 0.08 0.25 0.14 0.18 0.04
(I) X (III) 0.08 0.05 0.02
(II) X (III) 0.03 0.07 0.04

420. Glo. Adv. Res. J. Agric. Sci.
Figure 3: TDR device and probe with five sensors
Figure 4: Three dimension models and contour maps for soil moisture distribution patterns by using automatic control drip irrigation system under none slope and100% FC.
Concerning to (v/v %), the irrigation systems could put in
the following ascending orders 60% FC<80% FC<100% FC before and after irrigation both at when slope 5% conditions. Difference in (v/v %) between any two irrigation systems were significant at the 1 % level this may be due decreasing salt accumulation under 100% FC before irrigation in comparison with 80% FC and 60% FC.
Maximum and minimum values of moisture content (v/v %)were 12.56 % (30 cm) and 10.48 %(0 cm) under 80% FC and 60% FC, respectively before irrigation and 31.75 % (30 cm) and 27.27 % (40 cm) under 100% FC and 80% FC, respectively after irrigation when slope 0 % condition. But when slope 5 % conditions, the values of (v/v %) were 13.76 (30 cm) and 10.32 %(0 cm) for 100% FC and 60%
FC before irrigation and 31.54% (0 cm) and 27.08 % (40 cm) under 100% FC and 80% FC, respectively after irrigation.
Under automation control of drip irrigation system, no significant differences found between slopes 0 and 5%, so that he obtained of three dimension models and contour maps were explained about 0 and 5% slopes in the same time.
The obtained three dimension models and contour maps for soil moisture distribution when used 60 % field capacity under automation control drip irrigation system connection methods after and before irrigation when slopes (0 % and 5 %) conditions are shown in Figures. (3 and 4), respectively. These data agreed well with both of Filintas et al. (2007),

Mansour et al. 421
Figure 5: Three dimension models and contour maps for soil moisture distribution patterns by using automation control drip irrigation system under none slope and80 % FC.
Figure 6: Three dimension models and contour maps for soil moisture distribution patterns by using automation control drip irrigation system under none slope and 60 % FC.
Dioudis et al. (2008), Dioudis et al. (2003a) and Dioudis et al. (2003b).
Effect of different slopes and different field capacities under drip irrigation by automation controller system, on Mung bean yield, irrigation water used, and water productivity.
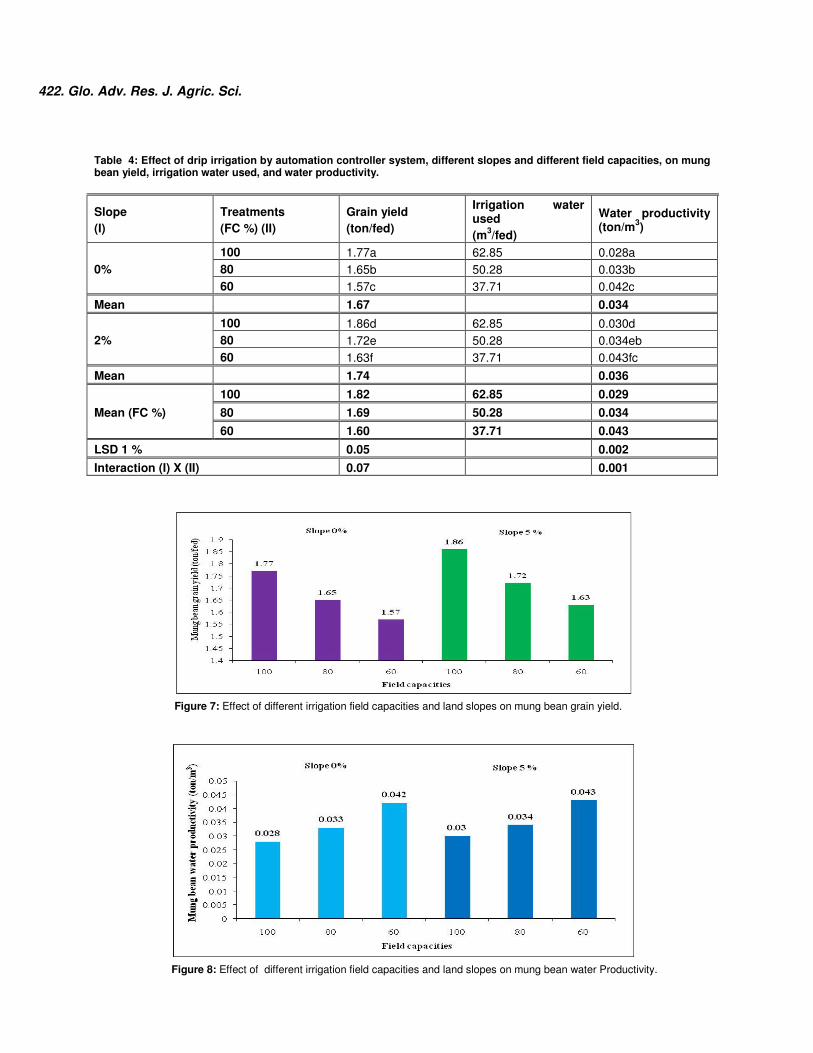
Data of Table (5) and Figures. (7 and 8) show the effect of different FC treatments and different slopes conditions on mung bean grain yield (ton/fed). It is important to
mention that, when slope 0% conditions the mean of mung bean grain yield (ton/fed) were 1.77, 1.65and 1.57(ton/fed) under 100% FC, 80% FC, and 60% FC, respectively. Whereas, with using slope 5% conditions they were 1.86, 1.72 and 1.63 (ton/fed)in the same sequence.
In respect to water productivity (ton/m3), the effect of
different FC treatments and different slopes conditions on water productivity (ton/m
3), under none slope conditions
the mean of mung bean water productivity were 0.028,
422. Glo. Adv. Res. J. Agric. Sci.
Figure 7: Effect of different irrigation field capacities and land slopes on mung bean grain yield.
Figure 8: Effect of different irrigation field capacities and land slopes on mung bean water Productivity.
Table 4: Effect of drip irrigation by automation controller system, different slopes and different field capacities, on mung bean yield, irrigation water used, and water productivity.
Slope
(I)
Treatments
(FC %) (II)
Grain yield
(ton/fed)
Irrigation water used
(m3/fed)
Water productivity (ton/m
3)
0%
100 1.77a 62.85 0.028a
80 1.65b 50.28 0.033b
60 1.57c 37.71 0.042c
Mean
1.67
0.034
2%
100 1.86d 62.85 0.030d
80 1.72e 50.28 0.034eb
60 1.63f 37.71 0.043fc
Mean 1.74 0.036
Mean (FC %)
100 1.82 62.85 0.029
80 1.69 50.28 0.034
60 1.60 37.71 0.043
LSD 1 % 0.05 0.002
Interaction (I) X (II) 0.07 0.001
Mansour et al. 423 0.033 and 0.042(ton/m
3) under 100% FC, 80% FC, and
60% FC, respectively. Whereas, when using slope 5% conditions they were 0.030, 0.034 and 0.043 (ton/m
3) in the
same sequence. There are significant differences between all means of grain yield and water productivity. For mung bean grain yield, interactions between treatments, in case none slope conditions, Maximum and minimum values recorded under 100 FC% X 0 % slope and 60 Fc% X 0% slope, respectively. In the other hand in case 5 % slope conditions, Maximum and minimum values recorded under 100 FC% X 5 % slope and 60 Fc% X 5% slope, respectively. Whereas, mung bean water productivity, Maximum and minimum values recorded under 60 FC% X 0 % slope and 100 Fc% X 0% slope, respectively. In the other hand in case 5 % slope conditions, Maximum and minimum values recorded under 60 FC% X 5 % slope and 100 Fc% X 5% slope, respectively. CONCLUSION Automation control drip irrigation system or high frequency irrigation system will often maintain low soil moisture suction (high moisture content) in a portion of the effective root zone. Observations revealed that soil distributions patterns were affected significantly by the different field capacities according to the following order: 100% FC > 80% FC > 60% FC. Whereas could be arrange the slopes order to 0 % < 5% and the effect on soil distributions patterns were not significant. The interactions of field capacities and slopes were significant. Mung bean grain yield (ton/fed) with none slope conditions, mean values were 1.77, 1.65 and 1.57(ton/fed) under 100% FC, 80% FC, and 60% FC, respectively. Whereas, with slope 5% conditions means were 1.86, 1.72 and 1.63 (ton/fed) in the same sequence. Water productivity (ton/m
3), under none
slope conditions the mean values were 0.028, 0.033 and 0.042(ton/m
3) under 100% FC, 80% FC, and 60% FC,
respectively. Whereas, in the case of slope 5%, mean values were 0.030, 0.034 and 0.043 (ton/m
3) in the same
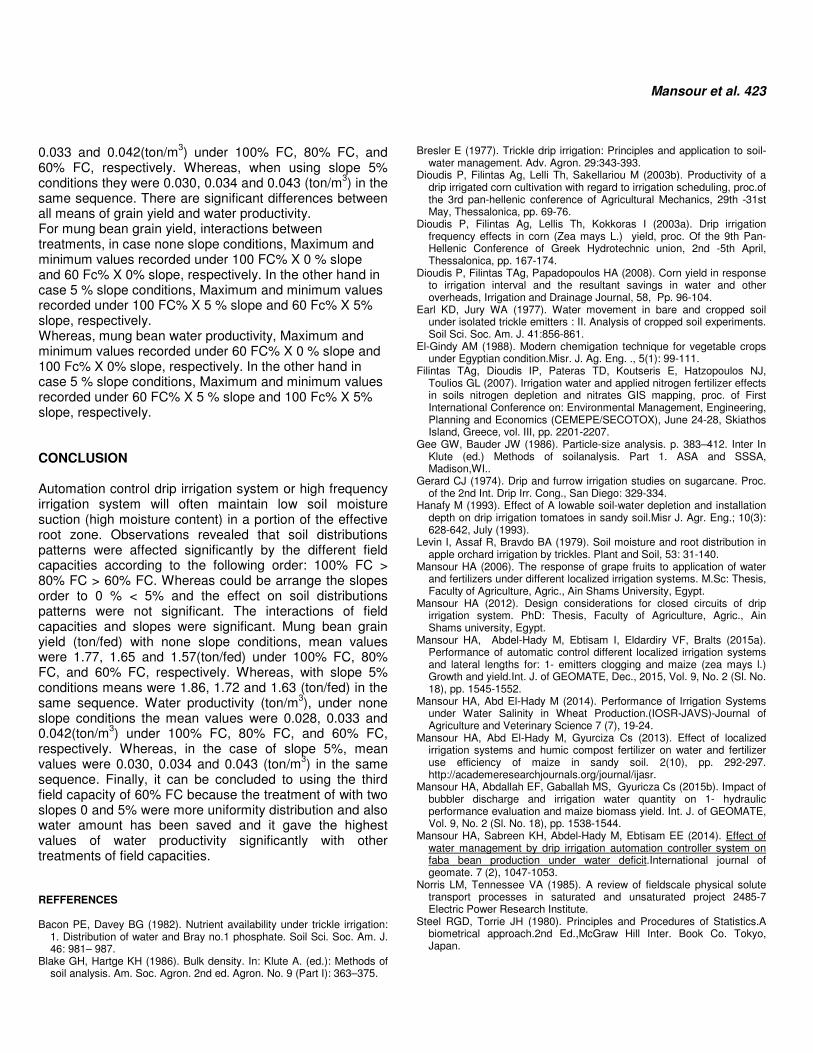
sequence. Finally, it can be concluded to using the third field capacity of 60% FC because the treatment of with two slopes 0 and 5% were more uniformity distribution and also water amount has been saved and it gave the highest values of water productivity significantly with other treatments of field capacities. REFFERENCES Bacon PE, Davey BG (1982). Nutrient availability under trickle irrigation:
1. Distribution of water and Bray no.1 phosphate. Soil Sci. Soc. Am. J. 46: 981– 987.
Blake GH, Hartge KH (1986). Bulk density. In: Klute A. (ed.): Methods of soil analysis. Am. Soc. Agron. 2nd ed. Agron. No. 9 (Part I): 363–375.
Bresler E (1977). Trickle drip irrigation: Principles and application to soil-water management. Adv. Agron. 29:343-393.
Dioudis P, Filintas Ag, Lelli Th, Sakellariou M (2003b). Productivity of a drip irrigated corn cultivation with regard to irrigation scheduling, proc.of the 3rd pan-hellenic conference of Agricultural Mechanics, 29th -31st May, Thessalonica, pp. 69-76.
Dioudis P, Filintas Ag, Lellis Th, Kokkoras I (2003a). Drip irrigation frequency effects in corn (Zea mays L.) yield, proc. Of the 9th Pan-Hellenic Conference of Greek Hydrotechnic union, 2nd -5th April, Thessalonica, pp. 167-174.
Dioudis P, Filintas TAg, Papadopoulos HA (2008). Corn yield in response to irrigation interval and the resultant savings in water and other overheads, Irrigation and Drainage Journal, 58, Pp. 96-104.
Earl KD, Jury WA (1977). Water movement in bare and cropped soil under isolated trickle emitters : II. Analysis of cropped soil experiments. Soil Sci. Soc. Am. J. 41:856-861.
El-Gindy AM (1988). Modern chemigation technique for vegetable crops under Egyptian condition.Misr. J. Ag. Eng. ., 5(1): 99-111.
Filintas TAg, Dioudis IP, Pateras TD, Koutseris E, Hatzopoulos NJ, Toulios GL (2007). Irrigation water and applied nitrogen fertilizer effects in soils nitrogen depletion and nitrates GIS mapping, proc. of First International Conference on: Environmental Management, Engineering, Planning and Economics (CEMEPE/SECOTOX), June 24-28, Skiathos Island, Greece, vol. III, pp. 2201-2207.
Gee GW, Bauder JW (1986). Particle-size analysis. p. 383–412. Inter In Klute (ed.) Methods of soilanalysis. Part 1. ASA and SSSA, Madison,WI..
Gerard CJ (1974). Drip and furrow irrigation studies on sugarcane. Proc. of the 2nd Int. Drip Irr. Cong., San Diego: 329-334.
Hanafy M (1993). Effect of A lowable soil-water depletion and installation depth on drip irrigation tomatoes in sandy soil.Misr J. Agr. Eng.; 10(3): 628-642, July (1993).
Levin I, Assaf R, Bravdo BA (1979). Soil moisture and root distribution in apple orchard irrigation by trickles. Plant and Soil, 53: 31-140.
Mansour HA (2006). The response of grape fruits to application of water and fertilizers under different localized irrigation systems. M.Sc: Thesis, Faculty of Agriculture, Agric., Ain Shams University, Egypt.
Mansour HA (2012). Design considerations for closed circuits of drip irrigation system. PhD: Thesis, Faculty of Agriculture, Agric., Ain Shams university, Egypt.
Mansour HA, Abdel-Hady M, Ebtisam I, Eldardiry VF, Bralts (2015a). Performance of automatic control different localized irrigation systems and lateral lengths for: 1- emitters clogging and maize (zea mays l.) Growth and yield.Int. J. of GEOMATE, Dec., 2015, Vol. 9, No. 2 (Sl. No. 18), pp. 1545-1552.
Mansour HA, Abd El-Hady M (2014). Performance of Irrigation Systems under Water Salinity in Wheat Production.(IOSR-JAVS)-Journal of Agriculture and Veterinary Science 7 (7), 19-24.
Mansour HA, Abd El-Hady M, Gyurciza Cs (2013). Effect of localized irrigation systems and humic compost fertilizer on water and fertilizer use efficiency of maize in sandy soil. 2(10), pp. 292-297. http://academeresearchjournals.org/journal/ijasr.
Mansour HA, Abdallah EF, Gaballah MS, Gyuricza Cs (2015b). Impact of bubbler discharge and irrigation water quantity on 1- hydraulic performance evaluation and maize biomass yield. Int. J. of GEOMATE, Vol. 9, No. 2 (Sl. No. 18), pp. 1538-1544.
Mansour HA, Sabreen KH, Abdel-Hady M, Ebtisam EE (2014). Effect of water management by drip irrigation automation controller system on faba bean production under water deficit.International journal of geomate. 7 (2), 1047-1053.
Norris LM, Tennessee VA (1985). A review of fieldscale physical solute transport processes in saturated and unsaturated project 2485-7 Electric Power Research Institute.
Steel RGD, Torrie JH (1980). Principles and Procedures of Statistics.A biometrical approach.2nd Ed.,McGraw Hill Inter. Book Co. Tokyo, Japan.

424. Glo. Adv. Res. J. Agric. Sci. Walter, Gardner H (1986).Water Content.In Methods of Soil Analysis Part
1.Physical and Mineralogical Methods.2 nd Edition.Klute, A, Campbell G. S, Jackson R. D, Mortland M. M and Nielsen D. R (eds).American Society of Agronomy, Madison, Wisconsin, U. S. A., pp. 493-541.