Performance Evaluation of the Portuguese Seaports Evaluation in the European Context
97
INSTITUTO SUPERIOR TÉCNICO Universidade Técnica de Lisboa Performance Evaluation of the Portuguese Seaports Evaluation in the European Context Manuel Luz Nunes Cantarino de Carvalho Dissertação para obtenção do Grau de Mestre em Engenharia Civil Júri Presidente: Prof. Joaquim Jorge da Costa Paulino Pereira Orientador: Prof. Rui Domingos Ribeiro da Cunha Marques Vogal: Prof. Carlos Alberto Pestana Barros Outubro 2007
Transcript of Performance Evaluation of the Portuguese Seaports Evaluation in the European Context

INSTITUTO SUPERIOR TÉCNICO Universidade Técnica de Lisboa
Performance Evaluation of the Portuguese Seaports
Evaluation in the European Context
Manuel Luz Nunes Cantarino de Carvalho
Dissertação para obtenção do Grau de Mestre em
Engenharia Civil
Júri
Presidente: Prof. Joaquim Jorge da Costa Paulino Pereira
Orientador: Prof. Rui Domingos Ribeiro da Cunha Marques
Vogal: Prof. Carlos Alberto Pestana Barros
Outubro 2007

ii

iii
Abstract
A global reform of the Portuguese port sector favoured the involvement of private operators in
the provision of port services. The port system comprises five major ports, each managed by an
independent Port Authority. These were set up as limited liability companies with all their shares
held by the State. Port services are gradually being passed on to private operators through
concession contracts. The Portuguese and three other countries port sectors were analysed in
terms of regulatory policy, governance model, institutional setting and scale and type of
operations. The analysed countries were Spain, because it is our main competitor, and the
Netherlands and the UK, whose ports had the top scores in the performance measurement
procedure carried out. In this procedure reliability and coherence were stressed in order to
achieve realistic and useful results. All the options in the performance analysis were thoroughly
discussed and justified. Forty one ports from eleven European countries were included in the
sample. The study relied on input oriented Data Envelopment Analysis (DEA) models, using as
inputs Operational Expenses (OPEX) and Capital Expenses (CAPEX); and as outputs
conventional general cargo, containerized cargo, roll on-roll off cargo, dry bulk cargo, liquid bulk
cargo and passengers. All the Portuguese ports had very low efficiency scores except Lisbon
which was deemed as efficient due to a very high volume of passenger traffic. The possible cost
reduction if the Portuguese seaports had performed efficiently was estimated about 64 million
euros in 2005.
Keywords:
Seaports; Regulation; DEA; Performance; Portugal.

iv
Resumo
A reforma do sector portuário promoveu uma maior participação dos operadores privados. Os
cinco maiores portos portugueses, a saber, Leixões, Aveiro, Lisboa, Setúbal e Sines são
geridos por Autoridades Portuárias independentes, constituídas como sociedades anónimas
em que todas a acções são propriedade do Estado. Além do português, os sectores portuários
de três outros países são analisados segundo diversas perspectivas, entre as quais, os
modelos de gestão portuária, a estrutura institucional, as políticas regulatórias e a escala e o
tipo de operações. Os países analisados foram a Holanda e o Reino Unido, que obtiveram os
melhores resultados em termos de desempenho, e a Espanha, o nosso competidor directo na
prestação de serviços portuários. Na avaliação de desempenho utilizaram-se modelos Data
Envelopment Analysis (DEA) com orientação para os inputs. A fiabilidade e a coerência foram
tomadas como aspectos cruciais pelo que todas as decisões tomadas na implementação do
algoritmo foram amplamente discutidas e justificadas. Os custos de operação e de capital
foram tomados como inputs e os volumes de carga geral convencional, contentorizada, roll on-
roll off, de granéis líquidos e sólidos e de passageiros como outputs. Quarenta e um portos de
onze países europeus foram incluídos na amostra. Os níveis de desempenho dos portos
portugueses são baixos excepto o do porto de Lisboa que foi tido como eficiente devido ao
volume muito elevado de passageiros. A redução de custos potencial, caso os portos nacionais
operassem de forma eficiente, foi estimada em 64 milhões de euros para 2005.
Palavras-chave:
Portos; Regulação; DEA; Desempenho; Portugal.

v
Acknowledgements
This study would not have been possible without the extraordinary commitment, drive and
knowledge of Professor Rui Cunha Marques. I would like to gratefully acknowledge the
enthusiastic supervision. His comments and suggestions were always outstanding. The best
advisor and teacher I could have wished for, he is actively involved in the work of all his
students, and clearly always has their best interest in mind. His efforts managed to make of this
journey a rewarding one both in the academic and personal fields.
To CESUR, for the opportunity to write this study. I am grateful to my office colleagues Ana
Brochado, Clara Landeiro, Isabel Ramos and Marta Gomes for the interesting and stimulating
environment. Patrícia, Carina and Vanessa Sobral deserve a special thank you for their
technical help, support and good humour that greatly contributed to make my stay at CESUR a
pleasant one. The support, good will and technical help of Alexandra, Ana, Pedro, Rita and
Rute with the most annoying copy machine in the world was greatly appreciated. Last but not
the least I am thankful to the almost permanently underperforming copy machine for constantly
reminding me why performance matters so much in the everyday life.
I thank the help in the very early stages of this study of Dr. Bruno Miguel da Cunha Marcelo of
the Lisbon Port Authority.
The informed insights provided by Dr. Duarte Lynce de Faria and Eng. Eduardo Bandeira, of the
Sines Port Authority, greatly influenced the final result of this study.
The interest and knowledge of someone who is in the port business for so long was very
important. I thank Eng. Carlos Figueiredo of LISCONT.
To Professor Carlos Pestana Barros, from ISEG, for his availability during the early stages of
this research, for the continuous flow of interesting papers and for his interest in my research.
To Professor Jose Tongzon for sharing his highly praised opinions about seaport performance
measurement.
This study benefited from conversations with several persons: Professor Ana Paixão Casaca,
Professor Teng-Fei Wang, Dr. Sheila Farrel, Professor Michiel Nijdam, Professor Larissa van
der Lugt and Professor Adolf NG.

vi
To Fundação para a Ciência e Tecnologia (FCT) for the grant of a scholarship that helped to
financially support part of my research and for the endowment of a travel grant for the
presentation of a paper in Athens.
To the Portuguese journalists Luís Filipe Duarte of the “Cargo” magazine , Rui Neves of “Jornal
de Negócios” newspaper and Luís Abrunhosa Branco of the “Camião” magazine for helping me
in an unconventional manner with a towed car.
I wish to thank my friends for helping me get through the difficult times, and for all the emotional
support, camaraderie, entertainment, and caring they provided.
Finally, and most importantly, I wish to thank my whole family. Especially to my parents, my
brother, my grandfather and grandmother. They bore me, raised me, supported me, taught me,
and loved me. To them I dedicate this dissertation.
Printed on 100% recycled paper

vii
INDEX
1. INTRODUCTION....................................................................................................................... 1
1.1 Maritime transport and the port sector ................................................................................ 1
1.2 Objectives ........................................................................................................................... 3
1.3 Methodology........................................................................................................................ 4
1.4 Structure.............................................................................................................................. 5
2. SEAPORT SECTOR ANALYSIS............................................................................................... 6
2.1 Introduction ......................................................................................................................... 6
2.2 Portugal............................................................................................................................... 6
2.2.1 General context ........................................................................................................... 6
2.2.2 Institutional framework and the structural reform ........................................................ 7
2.2.3 Governance model ...................................................................................................... 8
2.2.4 Concessions ................................................................................................................ 9
2.2.5 Tariffs......................................................................................................................... 12
2.2.6 Market structure......................................................................................................... 13
2.2.7 Market share.............................................................................................................. 14
2.2.8 Calling vessels........................................................................................................... 15
2.2.9 Financial context........................................................................................................ 15
2.2.10 Future ...................................................................................................................... 17
2.3 United Kingdom................................................................................................................. 18
2.3.1 General context ......................................................................................................... 18
2.3.2 Privatization process.................................................................................................. 19
2.3.3 Private ports............................................................................................................... 19
2.3.4 Trust ports.................................................................................................................. 20
2.3.5 Municipal ports........................................................................................................... 21
2.3.6 Policies and legislation .............................................................................................. 21
2.4 Netherlands....................................................................................................................... 23
2.4.1 General context ......................................................................................................... 23
2.4.2 Legislation and policies ............................................................................................. 24
2.4.3 Institutional setting ..................................................................................................... 25
2.4.5 Governance models................................................................................................... 26
2.4.6 Private ports............................................................................................................... 27
2.5 Spain ................................................................................................................................. 28
2.5.1 General context ......................................................................................................... 28
2.5.2 Institutional setting ..................................................................................................... 28
2.5.3 Service provision ....................................................................................................... 29
2.5.4 Financing model, tariffs and charges......................................................................... 29

viii
2.6 European Union ................................................................................................................ 31
2.6.1 General context ......................................................................................................... 31
2.6.2 Legislation and regulatory policies ............................................................................ 32
3. PERFORMANCE MEASUREMENT ....................................................................................... 34
3.1 Performance, productivity and efficiency .......................................................................... 34
3.2 Data Envelopment Analysis .............................................................................................. 38
3.3 State of the art................................................................................................................... 42
3.4 Model specification ........................................................................................................... 50
3.4.1 Outputs ...................................................................................................................... 51
3.4.2 Inputs ......................................................................................................................... 55
3.4.3 Models, Orientation and Data.................................................................................... 58
3.5 Results .............................................................................................................................. 60
3.5.1 Model results ............................................................................................................. 60
3.5.2 Aveiro......................................................................................................................... 63
3.5.3 Leixões ...................................................................................................................... 64
3.5.4 Setúbal....................................................................................................................... 64
3.5.5 Sines.......................................................................................................................... 66
3.5.6 Geographical analysis ............................................................................................... 66
3.5.7 OECD Purchase Power Parity................................................................................... 67
3.5.8 Aggregated general cargo ......................................................................................... 68
3.5.9 Variable sensitivity of efficient DMUs ........................................................................ 69
3.5.10 Super-Efficiency and peer count ............................................................................. 69
3.5.11 Is GDP related to port efficiency?............................................................................ 71
4 CONCLUSIONS ....................................................................................................................... 73
4.1 Concluding remarks .......................................................................................................... 73
4.2 Further research................................................................................................................ 77
5 REFERENCES......................................................................................................................... 78
ANNEX 1 – Portuguese Seaports throughputs and entered ships (2003-2005) ........................ 83
ANNEX 2 – Ranks and scores in the VRS and CRS models; scale efficiency........................... 84
ANNEX 3 – Efficient targets ........................................................................................................ 85
ANNEX 4 – Comparative VRS input oriented models: OECD PPP converted expenditures;
aggregated general cargo; Super Efficiency.................................................................. 86
ANNEX 5 – Scores of VRS input oriented models lacking each one of the variables ................ 87

ix
TABLE INDEX
Table 1 - Service provision in Portuguese ports ......................................................................... 11
Table 2 - Public service concessions in the Portuguese ports.................................................... 12
Table 3 - TPU-ship ...................................................................................................................... 13
Table 4 - Throughputs by cargo type of the Portuguese seaports in 2002-2005........................ 14
Table 5 - Throughputs by cargo type of the Portuguese main seaports in 2005 ........................ 15
Table 6 – Vessels calling in at Portuguese seaports (2002-2005).............................................. 15
Table 7 - Financial data of Portuguese main ports (year 2005).................................................. 17
Table 8 - Dutch seaports ............................................................................................................. 23
Table 9 - Investment and maintenance costs division in the Spanish port system..................... 30
Table 10 - Previous studies applying DEA to the port sector (1/2) ............................................. 44
Table 11 - Inputs and outputs used on previous studies ............................................................ 51
Table 12 - Input definition............................................................................................................ 56
Table 13 - Input and output Pearson’s correlation coefficients ................................................... 58
Table 14 – Variable statistics ...................................................................................................... 59
Table 15 - Descriptive statistics of the efficiency scores............................................................. 60
Table 16 - Efficient input and output targets under the VRS model............................................ 63
Table 17 – Peers and respective weights of the Portuguese seaports....................................... 66
Table 18 - VRS model results for Portuguese seaports (with exchange rate and OECD PPP
expenditures) ...................................................................................................................... 68
Table 19 - Target differences between the standard model and the aggregated general cargo
model .................................................................................................................................. 68
Table 20 - Variable sensitivity of efficient seaports ..................................................................... 69
Table 21 - Super efficiency scores and peer count of efficient DMUs ........................................ 70
Table 22- Sample statistics ......................................................................................................... 71
Table 23 – Mann-Whitney U and Kolmogorov-Smirnov tests ..................................................... 72

x
FIGURE INDEX
Figure 1 - Institutional framework of the Portuguese seaport sector ............................................ 8
Figure 2 - Financial evolution of the Portuguese port system (2002 - 2005) .............................. 16
Figure 3 - Cargo throughputs of the UK port system in 2005 ..................................................... 19
Figure 4 - Cargo throughputs of the Dutch port system in 2005 ................................................. 23
Figure 5 - Rotterdam and Amsterdam governance models ........................................................ 26
Figure 6 - Cargo throughputs of the Spanish port system in 2005 ............................................. 28
Figure 7 - Cargo volumes handled in European seaports by type in 2006................................. 31
Figure 8 - Chronogram of the regulation implementation in the maritime sector........................ 32
Figure 9 - Performance measures and organisational development .......................................... 34
Figure 10 - DMU, input and output concepts .............................................................................. 34
Figure 11 - Productivity frontier and inefficiency ......................................................................... 35
Figure 12 - Allocative and technical efficiency ............................................................................ 36
Figure 13 - Scale and pure technical efficiency .......................................................................... 37
Figure 14 - Efficiency decomposition .......................................................................................... 37
Figure 15 - Constant returns to scale efficiency frontier ............................................................. 39
Figure 16 - Variable returns to scale efficiency frontier............................................................... 39
Figure 17 - Slack and peer concepts .......................................................................................... 41
Figure 18 - Seaports with the highest passenger traffic.............................................................. 61
Figure 19 - CRS, VRS and SE scores ........................................................................................ 62
Figure 20 - Average efficiencies under VRS and CRS of European regions, countries and
insular ports ........................................................................................................................ 67
Figure 21 - Linear regression of the base model scores............................................................. 71
Figure 22 - Linear regression of the Super Efficiency scores .................................................... 72

1
1. INTRODUCTION 1.1 MARITIME TRANSPORT AND THE PORT SECTOR
The importance of maritime transportation for the global economy is paramount. In terms of
weight, about 96% of the world trade is carried by sea according to Rodrigue et al. (2006).
Maritime transportation is the only viable transport mode between a large number of the world’s
destinations. Even when alternative modes are available maritime is the one with the lowest
cost per ton km. Nowadays, sustainable development is seen as one of the main challenges of
our society and it is important to point out that sea shipping emits less CO2 than any other
transport mode.
Shipping was the first globalized industry in the world. This is proved by the fact that this activity
was the raison d’etre of the first international laws and conventions implemented in a global
scale. Moreover shipping constitutes the main pillar of globalization by daily transporting millions
of tons of all kinds of products between the five continents. A specialized world fleet is able to
cope with a wide variety of very different products and cargo types. In this fleet one can find
either giant bulk vessels carrying raw materials all around the world with significant economies
of scale or relatively small ultra-specialized reefer vessels transporting bananas and other
perishable products in a controlled atmosphere. The maturation process of certain fruits and
vegetables may be controlled by precisely adjusting temperature while at sea, allowing for these
to be delivered in perfect consumption conditions thousands of miles away from their plantation
sites.
Adam Smith, who is regarded as the father of modern economics, stated the access to water
transportation as an important catalyser of economic growth. In The Wealth of Nations1, his
most renowned work, he explains it in the following way:
“A broad-wheeled waggon, attended by two men, and drawn by eight horses, in about six weeks' time carries and brings back between London and Edinburgh near four ton weight of goods. In about the same time a ship navigated by six or eight men, and sailing between the ports of London and Leith, frequently carries and brings back two hundred ton weight of goods. Six or eight men, therefore, by the help of water-carriage, can carry and bring back in the same time the same quantity of goods between London and Edinburgh, as fifty broad-wheeled waggons, attended by a hundred men, and drawn by four hundred horses.[…] Since such, therefore, are the advantages of water-carriage, it is natural that the first improvements of art and industry should be made where this conveniency opens the whole world for a market to the produce of every sort of labour, and that they should always be much later in extending themselves into the inland parts of the country.”
Although written in the XVIII century these words remain valid as shipping continues to handle
the major stake of the world trade.
1 Smith (1776), Book I, Chapter 3, page 9.
2
The quality of the world’s ports and their performance is everything but uniform. There are vast
performance gaps between areas such as Northern Europe, where thousands of containers are
moved everyday, and some African ports where it is not uncommon for vessels to wait for
months before being allowed to moor. These differences are very significant in terms of
economic development as stated by the World Bank2:
“Excessive port costs or delays can prompt investors to locate production facilities in other countries or regions […] In many countries excessive port costs function like an additional import duty on all goods entering the country and a tax on exports.”
The relevance of global integrated transport chains has grown exponentially. Ports are one of
the fundamental elements in these chains, though the continuous escalation of cargo volumes
has greatly increased the pressure on them. More and more shippers are demanding not only a
swift cargo passage through seaports but also the lowest possible costs. Balancing between
these two aspects has led to an increasing interest of the scientific community in the
performance measurement of seaports. This research area focuses on finding the best
practices among seaports in order to spread them and allow for inefficient seaports to close the
gap that separates them from the top performing ones.
Performance measurement is seen as an essential tool towards the modernization and
competitiveness of all kinds of industries and organizations. By systematically comparing
organizations that provide the same type of services and measuring their performance one may
identify the best practices available and determine which role models the least performing
organizations should choose in order to improve. Measuring seaports performance is a complex
task because they provide a wide range of services and operate in significantly diverse contexts
however, Tongzon (1995) claims that the benchmarking of European seaports should be a
priority on the research agenda since, despite the clearly non-homogeneous nature of
European ports, they perform the same task and thus, may be compared for benchmarking
purposes.
An efficient and quality transport system is essential to provide the quality of life desired by most
of the developed countries. Nowadays the European Union suffers of chronic congestion in
some of its main road axis such as the Alps and the Pyrenees crossings. Besides, a significant
traffic growth is expectable according to forecasts. Congestion, environmental damages and
accidents are expected to increase appreciably if nothing is to be done, severely harming both
the users and the economy. Projections of 2010 congestion costs point to 1% of the European
Union GDP, according to the white paper for transport policy EU (2001). A modal shift was the
designated solution towards alleviating traffic pressure over the road infrastructures. The
promotion of Short Sea Shipping is seen as a way of achieving this modal shift. The sea is not
2 WB(2006); Port Reform Toolkit; page 273.

3
congested and it allows for the transportation of high volumes of goods in an environmentally
sustainable way at a relatively low cost.
Most of the analysed countries were reformed or under a reform processes aiming to increase
the participation of the private sector. Nevertheless, the form and the extent of private sector
participation varies widely from country to country. The European Union common policy
influence on the national policies towards the maritime sector has been gradually growing. In
the early days of the EU even a special derogation to the Rome Treaty was made in order to
exempt conference shipping from the competition rules. More and more these exemptions and
special differentiated treatment of the maritime sector are being phased out. European
environmental legislation has had a large impact on new port developments as most of the ports
are situated in estuarine areas which are especially sensitive areas. In addition the EU
significantly influences the development of new port projects since many of these, especially in
Southern Europe, are subject to European funding. Changes in the attribution criteria of
European funds may radically change investment patterns in port infrastructure.
The future enlargement of the Panama Canal will allow for the last generation of post-panamax
vessels to cross between the Pacific and the Atlantic Oceans. This will reinforce the importance
of the Trans-Atlantic route. Portugal, by means of its privileged geographical position, may take
advantage of this situation to greatly increase its cargo throughputs in the medium term.
Seaport infrastructures require lump investments and have a long life cycle, therefore it would
be advisable to establish, well in advance, a strategic planning and structural policy in order to
prepare our seaports to the predictable upcoming opportunities.
1.2 OBJECTIVES
This study has two major objectives. The first is to carry out a comparative analysis of the port
sectors of four European countries (Portugal, Spain, United Kingdom and the Netherlands). This
analysis intends to identify and understand the best practices available in order to improve
seaport performance and competitiveness. Several perspectives were considered and the
gathered facts and information should provide policy makers, port executives, researchers and
other readers with a solid background on aspects such as the regulatory policies, governance
models, legislation and cargo throughputs of each country and the European Union common
policies regarding this sector.
The second objective is to carry out a reliable performance evaluation of the Portuguese
seaports. Besides the evaluation results this study aims to establish a robust performance
measurement methodology standard. The ultimate achievement would be the use of the
developed methodology to perform periodical standardized analysis by Port Authorities or
regulators. In a more modest perspective, it would also be considered a success if this line of

4
research is continued in the academic field and more evaluations of this kind are produced with
comparable results.
1.3 METHODOLOGY
An holistic approach was undertaken in the implementation of the performance measurement
procedure. It is important to keep in mind the specific reality of the seaport’s activity and the
several relevant perspectives involved. It is often found that the operational aspects are not the
only causes of inefficiency or underperformance and that other factors do have a large
influence. Non-operational issues such as the legislatory framework and regulatory practices
may significantly affect the performance level of seaports. The consideration of the public
institutional setting and of the governance model is also relevant, since in most of the European
countries the State or the regional administrations have a high level of involvement in the port
sector. All these perspectives were considered in this study in order to provide an analysis as
relevant and realistic as possible.
A performance evaluation may be carried out through several alternative techniques. None is
clearly superior to the others but each one has its own particular advantages and
disadvantages. The choice of technique should be based on the objectives of the study and the
characteristics of the analysed activity. In previous studies of the seaport sector, the most
frequently used techniques were performance indicators and frontier models such as Stochastic
Frontier Analysis (SFA) and Data Envelopment Analysis (DEA). Performance indicators are
partial measures of productivity. Frontier models establish an efficient frontier and measure the
difference between what was actually produced and what could possibly have been produced if
performing efficiently or what was consumed and how much was effectively needed to be
consumed to produce the same of quantity goods or services. The difference between these
values constitutes the inefficiency. The most relevant characteristic of DEA in comparison with
other frontier methodologies is that it is a non-parametric deterministic model. The efficiency
frontier is determined through mathematical programming based solely on the analysed sample.
Thus, there is no the need to previously make any assumptions on the form of the efficiency
frontier which could bias the results. Stolp (1990) states that a non-parametric frontier model
lets the data ‘speak for itself’. In this study the emphasis is put on analysing data in a way as
reliable as possible avoiding any unnecessary hypothesis, assumptions and preconceived ideas
that may distort the final results. Following this rationale the DEA methodology was adopted on
the basis that it is able to cope with multiple outputs and inputs in an integrated way and that it
requires less subjective assumptions than the alternative methodologies.
In the implementation of the methodology the selection of variables is a critical issue. In this
study view, this specification is even more important than the choice of methodology or model
orientation since alternative variables may yield completely different results. If inconsistent

5
choices are made, and variables do not measure what they are supposed to, conclusions will be
unreliable and therefore useless. The adopted outputs and inputs were only defined after each
specific variable significance was thoroughly discussed and scrutinized in order to provide the
most realistic and useful results.
The analysed sample consisted of forty one seaports of Portugal and other ten European
countries. These countries were Spain, France, Belgium, United Kingdom, the Netherlands,
Denmark, Poland, Greece, Sweden and Norway, which is the only non-EU country included in
the group. In order to guarantee the maximum reliability, a great care was taken in collecting
data. Most of the data used in this study was collected directly from the annual reports and
statistical publications of the respective Port Authorities. However, in some, very few, cases, it
was necessary to withdraw figures from the EUROSTAT website when these where not found in
the Port Authorities publications.
The DEA results not only resulted in withdrawing efficiency scores, but also in matching each
Portuguese port with a ports that can serve as role models. These were determined based on
the peer concept. The potential cost reductions were computed, and it was investigated if scale
had significantly affected their performance.
1.4 STRUCTURE
This study is organized in the following way. Section 2 presents a general analysis of the
seaport sector focusing on important issues that may affect performance such as the
operational scale, public policies, regulatory practices and institutional settings in Portugal,
United Kingdom, the Netherlands and Spain. Finally the influence of the European Union
common policies affecting seaports and maritime transportation is analysed. Section 3 includes
the description of performance measurement concepts; an explanation of the DEA technique;
an analysis of the state of the art in terms of performance measurement of seaports; the
discussion of the implementation of the analysis in terms of variables, models and data and the
results presentation and discussion. In Section 4 conclusions from the present study are
withdrawn and further lines of research are established.
This study may be read in two different ways depending on one’s background and interests. If
the reader does not know the seaport sector or has a special interest in issues such as
regulation, privatization, legislation or governance models it is advisable to read this study in the
usual section order as Section 2 will help to understand the port concepts discussed in the next
section. On the other hand, if one has a good knowledge of the port sector, it is suitable to
proceed directly to Section 3, and then go back to read Section 2 case studies, already bearing
in mind the performance results of the analysed countries.

6
2. SEAPORT SECTOR ANALYSIS
2.1 INTRODUCTION
A performance analysis should never be carried out in a decontextualized way. It is crucial to
investigate and understand not only if certain context factors are influencing the analysis results
but also to which extent is their influence significant. This exercise requires a good knowledge
about the analysed organizations and their operating environment.
In this section the Portuguese seaport sector is thoroughly analysed and described in order to
favour an informed view of the analysis results. Several perspectives are integrated in the
analysis including regulatory policies, scale and type of operations, market structure,
institutional setting and investment policy among others which were found to be the most
relevant. Three other countries are analysed, the Netherlands, United Kingdom and Spain. The
first two were found to be the best overall performing countries in the performance evaluation
while Spain is Portugal’s main competitor in terms of port services. The European Union has
been gradually imposing important restrictions and policy orientations at a supra national level.
Therefore relevant common policies, directly or indirectly concerning the port sector, are also
analysed in this section.
2.2 PORTUGAL
2.2.1 General context
Portugal has a rich naval and maritime history and a favorable strategic geographic location,
close to the main sea trade routes. The continental port system comprises five major ports
namely, from North to South, Leixões, Aveiro, Lisbon, Setúbal and Sines; and four secondary
ports. The archipelagos of Azores and Madeira have their own autonomous port systems.
With the end of trade barriers in the European single market, Portuguese seaports have been
subject to higher levels of competition. Nowadays, it is indifferent to load or unload cargo in any
of the seaports inside the European Union. Besides, the external trade share with other
countries inside the EU has been growing, mainly with Spain, at the cost of extra-EU countries
trade share as evidenced by Afonso and Aguiar (2004). Trading more with closer countries
means that seaports now face fierce competition from other transport modes, mainly road
haulage.
Aiming at a higher competitiveness in a globalized market, a port sector reform was initiated
and has been gradually implemented. Monteiro (2003) establishes that the rationale behind this
reform was the belief that a competitive environment, with greater participation of private capital
in investment and in port related services provision, would decisively contribute to the
improvement of the seaports efficiency and competitiveness. Price reductions and significant
improvements of the service quality would contribute to a greater satisfaction of port users.

7
2.2.2 Institutional framework and the structural reform
In 1998, a governmental white paper entitled “Maritime and Port Policy towards the XXI century”
was published. The landlord port model was referred as the best method to induce private
sector participation. In this model a Port Authority owns the port infrastructure and fulfils
regulatory functions, while port services are provided by private operators who own assets
conforming to the port superstructure and the equipment required for service provision.
Port Authorities were set up as limited liability companies with all their shares held by the State,
allowing for a more business minded management. The five major seaports are now operating
with their own independent Port Authorities. These entities are in charge of promoting port
activities, attributing licenses or concessions in the areas under their jurisdiction and of
guaranteeing the public use of port services. It is their responsibility to ensure the regular
functioning of the port, with regard to its economic, financial and operational aspects. Security
and environmental protection, accident and pollution prevention at sea or inside the seaport fit
their attributions as well. Maintenance and development operations of access channels and
landside accessibilities inside the Port Authority’s jurisdiction area are under their direct
management. In a public utility basis they may expropriate and occupy lands needed for the
expansion or development of the port or related activities.
Port Authorities charge dues to the port users and receive rents from concessionaires.
Occasionally they also gather funds by renting assets under their jurisdiction for other purposes
rather than their core port business. For example, Lisbon Port Authority rents obsolete
warehouses to restaurants and bars on areas that are not deep enough to modern vessel
operations.
There are several public bodies with jurisdiction over the seaport areas besides Port Authorities.
Captainships ‘capitanias’ are delegations of the Portuguese Navy in each seaport with
attributions related to sovereignty, maritime and port security. The customs entity collects duties
related to goods shipped from outside the EU. The Borders and Immigration Service has
responsibilities related to migrants and asylum seekers. All animal origin products have to be
inspected by the Sanitary Authority. Finally, two police bodies, the Duty Brigade and the
Maritime Police have enforcement responsibilities in the port area as well.
The Port and Maritime Transport Institute (IPTM) was created by Decree-Law no. 257/2002. It
has juridical personality, administrative and financial autonomy and has its own patrimony. Its
functions include nationwide supervision, coordination and planning, strategic development,
standardization, regulation and fiscalization within maritime and port areas. Currently it works
under the government Secretary of State for Transportation supervision, which belongs to the
Ministry of Public Works, Transports and Communications. Administration of the secondary
continental ports and the navigability of the Douro River have also been delegated to the IPTM.

8
The National Council for Ports and Maritime Transport was created by Decree-Law no. 12/2003
of January 18th. It is a consultation body for the maritime and shipping affairs with
representatives of all the stakeholders (Port Authorities, government, worker’s unions and
industry). It was intended to provide technical and informed decision support in areas such as
the Port Authorities tariffs, the maritime sector policies, the articulation between ports and other
transport modes, the promotion of the Portuguese seaports and of the maritime transportation.
However, this council only effectively met during one year and it is now inactive.
As shown in Figure 1, this sector is currently supervised by the Ministry of Public Works,
Transportation and Communications (MOPTC) through the Secretary of State for Transportation
(SET). Both the Port Authorities and the IPTM are supervised at an arms length by the
Secretary of State for Transportation. Secondary ports are managed by the IPTM.
Ministry of Public
Works, Transportation
and Communications
(MOPTC)
Secretary of State for
Transportation
(SET)
Port and Maritime
Transport Institute
(IPTM)
Secondary Ports
Port Authorities:
Leixões, Aveiro, Lisbon,
Setúbal and Sines
Council for Ports
and Maritime
Transport
(inactive)
Figure 1 - Institutional framework of the Portuguese seaport sector
2.2.3 Governance model
Until the reform, Portuguese seaports roughly fitted in the tool port model, where the Port
Authority owned the infrastructure, the superstructure and the equipment as explained by
Bamford (2001). Private companies were limited to provide stevedoring labor.
Since those days several steps have been taken in order to increase private operators
participation in the Portuguese port sector. This has been carried out at various levels, including
operation, legislation and government policies. Nowadays the major share of cargo throughput
is handled by private operators on a concession basis. Legislation states that only in
exceptional situations may cargo handling services be provided in any other way than a

9
concession. However, some Port Authorities are still directly providing some of the cargo
handling services. In addition a port provides many other services besides cargo handling.
Several other activities are needed for a port to operate effectively (e.g. towage, mooring or
ancillary services) that account for a large share in the port overall performance. Most of these
other services are still directly provided by the Port Authorities instead of private operators.
Private sector participation is not an end by itself, but simply the way Portugal has chosen in its
search for more efficient and therefore more competitive seaports. Additionally, the State
divestiture in this public service creates higher requirements as far as regulation and
supervision efforts are concerned. Failure to provide a suitable economic regulatory framework
can be very costly in terms of inefficiency. In many countries, excessive port costs work as an
additional import duty on all goods entering the country and as a tax on exports.
Disproportionate port costs reduce the competitiveness of a nation’s products in world markets
and can stifle economic growth and development as stated by the World Bank (2006). In
Portugal, it is still rather unclear to know who detains regulatory functions due to a proliferation
of different organizations and entities with diverse attributions and sometimes conflicting or
overlapping responsibilities. Dias (2005) claims this has led to some disorientation by some of
the players in the seaport sector.
Nowadays service provision in ports is threefold: directly through Port Authority operational
resources, by private companies under short term license agreements or through concession
contracts where private operators perform under long term agreements.
2.2.4 Concessions
Private sector participation has been accomplished mainly through BOT (build, operate and
transfer) contracts. In this type of contract the operator compromises to invest in the
superstructure and sometimes in the infrastructure as well. In return it grants the right to operate
the service during a certain period. This period should be proportional to the required
investment. Usually, as the port industry has become a capital intensive one, contracts have
long time-spans of 20 or more years. At the end of the contract period both the infrastructure
and the superstructure should be transferred back to the Port Authority in perfect operating and
security conditions.
Already in 1993, with Decree-Law no. 298, the Portuguese legislation stated that concessions
should be the preferred way for the provision of cargo-handling services. Decree-Law 324/94
established the legal bases of public service cargo handling concessions in port areas.
Licensing is only allowed in cases where there is a serious probability that the tendering
process will have no participants or there is strategic national interest in the maintenance of this
situation. The former requires a ministerial official communication based on a previous

10
consultation to the stevedoring companies and the latter requires a specific resolution by the
Cabinet. Port Authorities are allowed to provide directly cargo handling in situations where the
service delivered by private companies has proved to be insufficient or to assure a minimum
level of intra-port competition. A concession contract maximum duration is thirty years and it
should be proportional to the operator’s investment. Port Authorities were endowed with the
responsibility of tendering, negotiating and supervising concession contracts procedures.
Cargo handling services in port areas are considered as a public service, therefore everyone
who requires them benefits from equal access conditions. Mooring priority is given to the first
vessel to present the documental request through its shipping agent. Dedicated terminals, i.e.,
terminal for the exclusive use of a liner service are not allowed. However, a private entity may
entail the exclusive use of a terminal for a specific industrial facility, under a private concession
use, if public interest is recognized by the Cabinet as stated by Dias (2005).
Awarding of a public service concession requires a public tendering process. A transitory
regime was established before the end of July 1995. It allowed for short term licenses to be
changed into concession of public service through direct negotiation between Port Authorities
and the incumbent.
Concession contracts establish both fixed and variable incomes due by the concessionaire to
the Port Authority. The fixed income refers to the infrastructures allocated to the concession,
calculated in terms of linear meter of quay, square meter of built and non built area. The
variable income is defined with regard to the volume of cargo handled. If the volume reaches
certain agreed levels, charges per extra handled unit are smaller. This scheme implies risk
sharing between both parts and is intended to promote efficiency. The annual rent setting
should obey the principle of indifference, i.e., the concession rent should be equivalent to the
operational result the Port Authority obtained prior to the concession as stated by Monteiro
(2003).
Further legislation, though not specific to the seaport sector, has introduced important new
regulation. Decree-Law no. 59/99 of March 2nd
, enlarges public work contracts juridical regime
to public service concessions. Thus a standardized public work tender process must be adopted
for public service concessions. In spite of the “Maritime and Port Policy towards the XXI century”
recommendation, a new base law specifically regulating port concessions has not yet been
produced. This way, the principal legislation concerning port concessions continues to be the
1994 Decree-Law. Port of Sines has had an exceptional treatment, as tailor made Decree-Laws
have been produced for each of its concessions.
Concerning other services besides cargo handling, only in 2001 was the possibility of licensing
or concession for other port services legally set through Decree-Law no. 75/2001 establishing

11
the juridical regime of tug services. These may be provided either through concession, licensing
or directly by the Port Authorities. Decree-Law no. 48/2002 does the same for the piloting
activity although it disregards licensing as a way of providing it.
Table 1 describes the way of provision of each type of port services.
Table 1 - Service provision in Portuguese ports
Service Provider
Cargo handling Private concessionaires and licensed operators or the Port Authority in exceptional situations
Pilotage Port Authority albeit concessions or licenses are established under legislation in force
Towage Port Authorities or concessionaires depending on the port
Mooring and Unmooring Port Authorities or concessionaires depending on the port
Fuel supply Concessionaires in general
Warehousing Concessionaires, licensed private enterprises and Port Authorities
Concessions of cargo handling, although being legally established for a long time, were not
common practice previously to the 1998 sector reform. Exceptional situations occurred where
previous operators claimed for public service concessions, under the transitory regime
mentioned above, which dismissed the public tender obligation. Table 2 lists public service
concessions in the Portuguese ports.

12
Table 2 - Public service concessions in the Portuguese ports
Port Terminal Cargo type Incumbent Timeframe
TCL (North and South container terminals)
Containers TCL, S.A. 25 year contract, eventually postponable for an extra 5 years period. Initiated in 2000.
Leixões
TCGL General cargo and dry bulk
TCGL, S.A. 25 year contract postponable for an extra 5 years period. Initiated in 2001.
Aveiro South Terminal General cargo SOCARPOR, S.A. 25 year contract postponable for an extra 5 years period. Initiated in 2001.
Alcântara Container Terminal
Containers LISCONT, S.A. 1985-2015
Santos Container Terminal
Containers TRANSINSULAR, S.A. 1995-2010
Santa Apolónia Container Terminal
Containers SOTAGUS, S.A. 2001-2021
Poço do Bispo Multipurpose
General cargo ETE, S.A. 2000-2020
Beato Multipurpose Terminal
General Cargo TMB, S.A. (consortium between Multiterminal, SPC and Sodiap)
2000-2020
Beato 1995-2025
Trafaria
Agribulk SILOPOR, S.A.
1995-2025
Palença Liquid bulk TAGOL, S.A. 1995-2025
Liquid bulk Barreiro
Liquid bulk LBC-Tanquipor, Ld.ª 1995-2025
Barreiro Conventional general cargo, liquid and dry bulk
ATLANPORT, S.A. 1995-2025
Lisbon
Seixal Dry bulk and general cargo
SNESGES, S.A. 1995-2025
Multipurpose-zone I
Dry bulk and general cargo
TERSADO, S.A. Initiated in 2004
Multipurpose Zone II
Dry bulk and general cargo
SADOPORT, S.A. Initiated in 2004
Setúbal
SAPEC Liquid bulk SAPEC
Multipurpose Terminal
General Cargo PORTSINES 25 years (initiated in 1992) Sines
Terminal XXI Containers PSA 30 years (initiated in 2004)
2.2.5 Tariffs
Port tariffs are established under the Decree-Law no. 273/2000 that sets out the Continental
Ports Tariff System. It stipulates the formulas for each and every tariff a Port Authority may
charge to cargo shippers and/or vessel owners. Based on these legally set formulas Port
Authorities annually define coefficients in order to calculate each tariff. These coefficients may
change depending on the cargo type (containers, conventional cargo, roll on-roll off, dry or liquid
bulk) and the ship type (tanker, containers, bulk ship, conventional cargo or roll on-roll off). The

13
legislation also defines the rebates that may be awarded to transshipment services, national
cabotage, regular lines, frequent users and oil tankers with green certification.
The tariff for port use is charged for the availability of access infra-structure and for the safety
and environmental protection measures. It encompasses two components. One applies to the
ships and vessels (henceforth referred to as TPU-Ship) while the other applies to cargo
(hereafter called TPU-Cargo).
According to the decree law referred above, TPU-Ship may be calculated in one of two ways as
shown in Table 3. The first relates to the gross tonnage of the ship and the ratio between the
weight of unloaded and loaded cargo. The second way refers to gross tonnage of the ship and
the length of stay. This tariff is charged to the ship owner.
Table 3 - TPU-ship
Tariff defined in ship gross tonnage and unloading to loading ratio
U1 × GT if R ≥ K U2 × GT + U3 × QT if R < K
GT - ship gross tonnage U1 - maximum rate per GT unit U2 - minimum rate per GT unit QT- handled cargo in tons U3 - rate per handled cargo R - ratio between unloaded and loaded cargo in tons K - set limit for R
Tariff defined in vessel gross tonnage and length of staying
GT × T
GT - vessel gross tonnage T - duration of vessel stay in port
TPU-cargo is computed on the basis of the amount of moved cargo measured in tons or units
depending on the type of cargo. Different tariffs may be set for loading and unloading
operations. This tariff is charged to the cargo shipper/receiver.
Other tariffs are defined for other services such as pilotage, tugs, mooring, storage and
supplies. Nevertheless, they only apply in the cases where the Port Authority directly supplies
those services. Concessionaires subject to public service contracts must submit tariffs to Port
Authority’s approval. However, they may freely offer rebates solely based on their commercial
policy.
2.2.6 Market structure
Portugal total throughput crossed the 60 million tons barrier in 2005 with a total throughput of
61 280 405 tons. Total throughput increased around 13 % between 2002 an 2005. The fastest
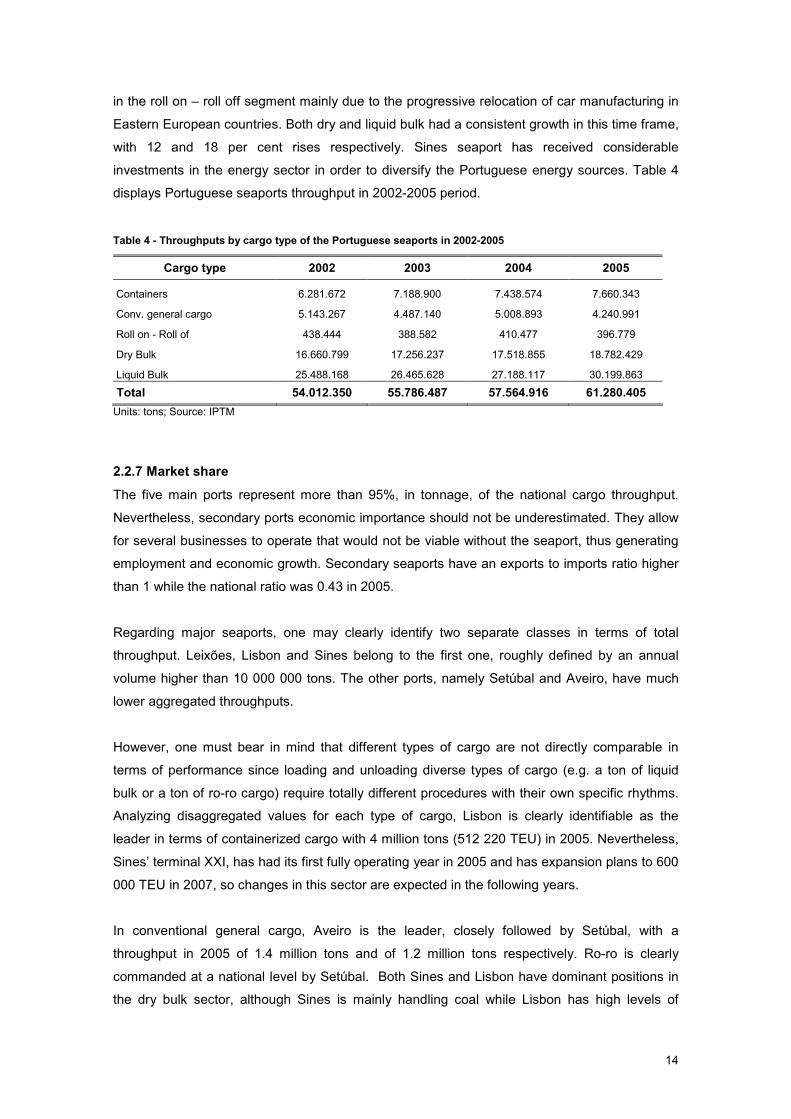
growing sector was containerized cargo, with an increase of 22%, while other unitized cargo
decreased, following the global shift towards containerization. There was a significant decrease
14
in the roll on – roll off segment mainly due to the progressive relocation of car manufacturing in
Eastern European countries. Both dry and liquid bulk had a consistent growth in this time frame,
with 12 and 18 per cent rises respectively. Sines seaport has received considerable
investments in the energy sector in order to diversify the Portuguese energy sources. Table 4
displays Portuguese seaports throughput in 2002-2005 period.
Table 4 - Throughputs by cargo type of the Portuguese seaports in 2002-2005
Cargo type 2002 2003 2004 2005
Containers 6.281.672 7.188.900 7.438.574 7.660.343
Conv. general cargo 5.143.267 4.487.140 5.008.893 4.240.991
Roll on - Roll of 438.444 388.582 410.477 396.779
Dry Bulk 16.660.799 17.256.237 17.518.855 18.782.429
Liquid Bulk 25.488.168 26.465.628 27.188.117 30.199.863
Total 54.012.350 55.786.487 57.564.916 61.280.405
Units: tons; Source: IPTM
2.2.7 Market share
The five main ports represent more than 95%, in tonnage, of the national cargo throughput.
Nevertheless, secondary ports economic importance should not be underestimated. They allow
for several businesses to operate that would not be viable without the seaport, thus generating
employment and economic growth. Secondary seaports have an exports to imports ratio higher
than 1 while the national ratio was 0.43 in 2005.
Regarding major seaports, one may clearly identify two separate classes in terms of total
throughput. Leixões, Lisbon and Sines belong to the first one, roughly defined by an annual
volume higher than 10 000 000 tons. The other ports, namely Setúbal and Aveiro, have much
lower aggregated throughputs.
However, one must bear in mind that different types of cargo are not directly comparable in
terms of performance since loading and unloading diverse types of cargo (e.g. a ton of liquid
bulk or a ton of ro-ro cargo) require totally different procedures with their own specific rhythms.
Analyzing disaggregated values for each type of cargo, Lisbon is clearly identifiable as the
leader in terms of containerized cargo with 4 million tons (512 220 TEU) in 2005. Nevertheless,
Sines’ terminal XXI, has had its first fully operating year in 2005 and has expansion plans to 600
000 TEU in 2007, so changes in this sector are expected in the following years.
In conventional general cargo, Aveiro is the leader, closely followed by Setúbal, with a
throughput in 2005 of 1.4 million tons and of 1.2 million tons respectively. Ro-ro is clearly
commanded at a national level by Setúbal. Both Sines and Lisbon have dominant positions in
the dry bulk sector, although Sines is mainly handling coal while Lisbon has high levels of

15
agribulk transshipment. Sines is the main energetic port, thus it has an overwhelming
advantage both regarding liquid bulk and total throughput. Disaggregated throughputs for the
main Portuguese seaports in 2005 are shown in Table 5.
Table 5 - Throughputs by cargo type of the Portuguese main seaports in 2005
Cargo type Leixões Aveiro Lisbon Setúbal Sines
Containerized 2.819.198
(352.001)*
4.040.127 (512.220)*
113.149 (13.145)*
546.287 (50.994)*
Other unitized cargo 487.152 1.376.328 438.812 1.212.426 28.771
Roll on - Roll off 9.108
(6.254)**
11.915 (6.686)**
375.756 (245.625)**
Dry Bulk 2.302.441 1.416.231 5.202.884 3.224.267 5.801.572
Liquid Bulk 7.713.004 536.257 1.608.827 1.716.538 18.552.681
TOTAL 13.330.903 3.328.816 11.302.565 6.642.136 24.929.311
Units: tons, *TEU, **vehicles; Source: 1 - IPTM, 2 - Port Authority of Setúbal
2.2.8 Calling vessels
There has been growth in the number, the total gross tonnage (GT) and the average gross
tonnage of the vessels calling in Portuguese seaports between 2002 and 2005. In 2003 and
2004 the number of vessels has decreased compared with the previous years, while the gross
tonnage has increased. This meant that fewer, but larger vessels were calling in. In 2005 both
the number of vessels and the average GT per ship increased. This illustrates the global trend
of shipping lines to deploy larger ships in order to exploit economies of scale, consequently
forcing seaports to invest in better (deeper) maritime accessibilities to remain competitive. The
evolution of vessel traffic in the period 2002-2005 is shown in Table 6.
Table 6 – Vessels calling in at Portuguese seaports (2002-2005)
Figures 2002 2003 2004 2005
Number of vessels 9.744 9.582 9.506 9.847
GT 90.913.324 93.330.458 94.010.931 101.266.904
Average vessel GT 9.330 9.740 9.890 10.284
Source: IPTM
2.2.9 Financial context
Facilities in the major seaports have been financed with public resources, including EU aids and
Port Authorities owned capitals and public resources, mainly EU funds. In some cases some
bank credit was also used, both from commercial banks and the European Investment Bank. In
the case of secondary ports, the investment was assigned to the extinct General Directorate for
Ports, Navigation and Maritime Transport, so they have benefited almost exclusively from public

16
financing (State budget and EU funds). Maintenance interventions in the main ports are
generally supported by the respective Port Authorities own capital. Exceptionally, sizeable
maintenance works in infrastructures necessary for the maritime accessibilities may be partially
funded by the State. Regarding secondary ports, when it involves substantial investments, the
government budget assures them through IPTM. Port Authorities have the competence to
approve their annual and pluriannual investment plans for port facilities as well as their
operational and annual investment budgets. Monteiro (2003) argues that, in practice, since
these companies are exclusively owned by public capitals, the State, through its representative
in the annual general meeting of each Port Authority, has the competence to approve the
proposed investments.
Nowadays, the main Port Authorities revenue sources are twofold: the tariffs directly charged to
the port users and the contractual rents with the concessionaires. However, some Port
Authorities have other revenue sources. Such is the case of the Port of Lisbon, where obsolete
warehouses have been rented to restaurants and bars. In Sines, a stone quarry situated inside
the port premises, originally intended to provide raw materials for the breakwater construction,
is now commercially exploited. Figure 2 portrays the financial evolution of the five main
continental ports in the 2002-2005 period.
-40
-20
0
20
40
60
80
100
120
140
160
180
2002 2003 2004 2005
(10
6 €
)
Costs before taxes Net Profit Investment
Figure 2 - Financial evolution of the Portuguese port system (2002 - 2005) (Unit: Euros; Sources: Leixões, Aveiro and Sines Port Authorities, Court of Auditors and National Statistic Institute)
As far as national performance is concerned, costs have been consistently decreasing.
Considering that throughput has been rising, it is acceptable to state that the reform has had a
positive overall effect in terms of performance improvement.
Large investments took place in 2002 with more than 90 million euros. The investment level by
Port Authorities has been largely reduced. In 2005 it was less than 25 % of the 2002 value. A
large share of port investment is now assured by private companies. This has had the positive
effect of allowing the State to use scarce public funds for other ends.

17
Results were negative during 2002 and 2003 and crossed the break even point in 2004.
Obtaining positive results is important in order to assure self-sustainability in the long term. It is
a prerequisite to ensure the user payer principle. European and national policies idealize about
achieving financial performance levels that generate enough revenue to sustain not only
running costs but also future investment needs. Even so, Portuguese ports are still far from
being able to support full investment costs without public funds aid.
All major ports achieved positive results in 2005 as shown in
Table 7. Lisbon and Leixões, the ones with higher container throughput obtained the highest
results. Investment levels were higher in Leixões, which invested heavily in improvements of its
maritime accessibilities. Setúbal and Aveiro have smaller private involvement in their ports,
which obliges their Port Authorities to allocate higher investment values.
Table 7 - Financial data of Portuguese main ports (year 2005)
Seaport Costs Results Investment
Leixões 37.449.718 4.179.000 7.376.000
Aveiro 12.004.449 1.401.000 6.500.000
Lisbon 46.865.553 5.833.000 4.267.000
Setúbal 20.581.747 762.000 6.930.000
Sines 34.806.114 1.311.000 3.658.000
Unit: Euros; Sources: Leixões, Aveiro and Sines Port Authorities, Court of Auditors and National Statistic Institute
2.2.10 Future
A governmental white paper was recently published under the title “Strategic Orientations for
the Maritime and Ports Sector”. The maintenance of port areas as public domain is
recommended in association with further implementation of the landlord port model. It
establishes the IPTM as the sole economic regulator at various levels: Port Authority tariffs and
operators’ tariffs. A gradual harmonization between ports tariffs will take place. Two secondary
ports with substantial commercial activity will have their own Port Authority, although all their
shares will be held by the closest major Port Authority. IPTM will also be responsible for the
maritime and seaport technical regulation and will assume an advisory role in strategic public
planning.

18
2.3 UNITED KINGDOM
2.3.1 General context
The United Kingdom is in the most advanced stage of port sector privatization worldwide. In
terms of economic regulation a laissez fair3 policy is pursued. Currently three models of port
governance coexist in the United Kingdom. Ports may be under private ownership, municipal
control, or managed by a trust. All of them are open to market forces, and are run independently
as stand-alone self-financing enterprises, free from Government support or subsidy, hence
relying solely on the dues charged to the port users. Commercial strategy and charging policies
are free from any governmental or regulatory interference though users may appeal against
them as stated in Modern Ports: A UK policy4:
“Government does not run the shipping industry or the ports industry. Government does
not decide the ports industry’s commercial strategy, or direct or fund its investment; nor
does it manage port operations. These are maters which Parliament has entrusted to local
statutory authorities, who fund their investment and operations from levies on users. In
general, port infrastructure can and should be commercially financed. Commercial funding
for development is unlikely to be a problem where a ports business is growing.
The Government and the devolved administrations retain powers to set dues when port
users appeal against them. This is because the public right to use a harbour depends
upon payment of dues. If they are not paid, the use is not by right. On the other hand, the
right could be practically extinguished if dues were unfair or unreasonable […] dues must
be fair and equitable. It is wrong for some users to have special treatment, and even to be
exempt from dues altogether, when their competitors are paying the going rate. […]
Harbour facilities cannot be maintained unless the user pays the going rate.”
Port charges should be set to cover not only the operational costs but also the lump costs
required for investments and maintenance. In contrast to the policies followed in other EU
countries the UK Government does not grant subsidies to ports.
In 2005 UK ports handled 426 million tons of external traffic and 127 million tons of cabotage.
Thus total throughput reached about 550 million tons. Total throughput has grown slowly in
recent years reflecting the economic trend towards lighter goods with higher added values.
Passenger traffic amounted to 31 million passengers in 2005 according to the Department for
Transport statistics. Figure 3 illustrates 2005 cargo throughputs in the UK.
3 Deregulation, non interference. 4 DfT (2000a); Modern Ports: A UK policy; 2.1.11 an 2.1.12

19
0
50
100
150
200
250
Liquid bulk Dry bulk Containerized Ro-ro Conventional
(million tonnes)
Figure 3 - Cargo throughputs of the UK port system in 2005
Source: Eurostat
2.3.2 Privatization process
During the last few decades, United Kingdom went through a generalized process of port
privatizations. Approximately 25% of the UK market, in tonnage, was publicly owned by the
British Transport Docks Board (BTDB) before 1983. In that year BTDB was converted into a
commercial company quoted on the London Stock Exchange with no Government shareholding.
The National Ports Council (NPC), an autonomous body that monitored the industry and had an
advisory role in applications to sizeable new port developments, was extinct.
In 1989 the ‘National Labour Dock Scheme’ (NLDS) was abolished. It compelled all dock
workers to have a permanent contract and to be subject to specific labour regulation. This was
leading to growing inefficiencies as new cargo types less demanding in terms of labour, namely
containerized cargo, were emerging. The UKMPG (2005) states that the NLDS abolishment led
to a dramatic improvement of port’s financial situation.
In 1990, legislation was enacted allowing for the privatization of trust ports. Seven former trust
ports were privatized, Clydeport, Dundee, Forth, Ipswich, Sherness, Teesport and Tilbury. Most
of them handle significant volumes of cargo. The government has the possibility to privatize a
trust Port Authority compulsorily, but it only exerted this prerogative on Ipswich in 1997. The
municipal port sector remains substantially unchanged except that Bristol was sold to a private
company.
2.3.3 Private ports
Private ports are owned by companies subject to private commercial law. The majority of
commercial ports are private comprising fourteen of the twenty largest UK ports in terms of
tonnage. Private ports with largest throughput are, according to official statistics of the DfT

20
(2006c), Grimsby & Immingham, Tees & Hartlepool and Southampton. Some of the more
relevant port companies are:
� ABP (Associated British Ports Holdings Ltd.), that withholds the former port assets of
the British Transport Dock Board (BTDB), is UK's leading ports group. ABP owns and
operates 21 ports all around the UK and handles approximately a quarter of the national
seaborne trade. Its ports are: Ayr, Barrow, Barry, Cardiff, Fleetwood, Garston, Goole,
Grimsby, Hull, Immingham, Ipswich, King's Lynn, Lowestoft, Newport, Plymouth, Port
Talbot, Silloth, Southampton, Swansea, Teignmouth and Troon. ABP is currently owned
by Admiral Acquisitions UK Ltd. quoted on the stock market of London;
� Hutchison Ports UK Ltd. which is a subsidiary company of Hutchison Whampoa Limited
quoted in the Hong Kong stock exchange. It operates Felixtowe, Harwich and
Thamesport;
� Forth Ports PLC is an independent company quoted in the London stock exchange. It
manages eight ports - Dundee on the Tay Estuary, Tilbury on the Thames and six on
the Forth Estuary - Leith, Grangemouth, Granton, Methil, Burntisland, Kirkcaldy and the
new Port of Rosyth.
This market structure reflects the advanced degree of liberalization of the British port sector,
with a dynamic market where mergers and acquisitions of port of companies or assets are
common.
As explained by the DfT (2000a) private ports are subject to the full freedoms and disciplines of
the commercial marketplace. Port companies may seek commercial funding borrowing on their
assets. As any other commercial company they are expected to generate dividends and to
increase share’s value over time. They are obliged to account to shareholders for their failures
as well as their successes. It is important to emphasize the fact that these private operators may
use their port assets as a guarantee for credit unlike in the rest of Europe.
2.3.4 Trust ports
Trust ports are unique to the UK as they have no shareholders or owners. Albeit not regarding
themselves as primarily profit driven, they nevertheless have to make a sufficient return on
capital to invest in new facilities and to compete with other ports. They are independent
statutory bodies, each governed by an independent board of trustees charged with acting in the
interest of all the stakeholders. As stated by the DfT (2000b) the stakeholders are all those
using the port, employees of the port, its users and all those individuals, organisations and
groups having an interest, not necessarily pecuniary, in the operation of the port.

21
Trust ports are very diverse, a few have significant commercial activities while others are only
dedicated to tourism and recreational purposes. Some trusts have a partial or total government
appointed board of trustees while others have their own selection procedures. London Port
Authority albeit having a trust status has all its terminals privatized while other trusts usually
provide their services directly. Under current legislation a trust has always the option to privatize
itself voluntarily.
The majority of UK commercial ports are trusts, though their total throughput is lower than the
one of private ports. Only a small number may be regarded as of national importance. A few are
important in specific markets. Dover handles almost 60 per cent of international sea borne
passenger traffic and 28 per cent of international road goods vehicles carried by ferry. Lerwick
and Milford Haven have major oil facilities. Five of the largest trust ports support the fishing
industry. Milford Haven and London are part of the 20 largest ports in terms of tonnage.
2.3.5 Municipal ports
There are around sixty municipal ports in England and Wales and over two hundred minor
facilities in the Scottish highlands and islands that are operated by a local authority and subject
to local government rules and financing requirements. A few are commercially significant.
Sullom Voe and Flotta appear in the top 20 by tonnage, both because of specialised oil
facilities. Portsmouth, Ramsgate, Sunderland, Weymouth and Workington also handle
considerable volumes of cargo. However the DfT (2006a) states that the municipal ports sector
is not large in traffic terms (only 14% of total traffic) and predominantly comprises small local
facilities.
2.3.6 Policies and legislation
United Kingdom legal system is sparing of legislative documents. The ‘Ports Act’ 1991
addresses the privatization of trust ports and the ‘National Port Marine Safety Code” of 2000
introduces a national standard for every aspect of port marine safety. New port developments
are subject to a number of approvals being the most relevant under the ‘Town and Country
Planning Act’ 1990. Authorization under the ‘Harbour Act’ 1964 or the ‘Transport and Roads Act’
1992 is required respectively if interference with navigation or the railway network is to take
place.
In terms of labour regulation there is no other regulation to port labour besides the one
applicable to the labour market in general. Each port has the ability to define its own labour
policies. Port Authorities are responsible for the enforcement of regulations concerning labour,
safety and environmental issues in the scope of the port state control conventions.
22
Conversely to legislative documents, there is some profusion of white and discussion papers
concerning the port sector. ‘Modern Ports: the UK Policy 2000’ determines the general
objectives of the government for the port sector. It assumes that it does not fit the government
to manage the industry neither to decide its commercial strategy or to guide or finance its
investments. It stimulates environmental best practices, safety improvements and enhanced
exploitation of existent infrastructures. ‘Modernizing Trust Ports: A Guide to good Governance
2000’ draws principles of modern management for the trust port administrations. It establishes
transparency and accountability standards with special focus on the board members duties and
selection procedure. ‘Opportunities for Ports in Local Authority Ownership 2006’ reviews the
situation of 61 municipal ports in England and Wales. Focusing in local populations as the
stakeholders of these ports guidelines concerning accountability, strategy, business planning
and finances are drawn. ‘Project Appraisal Framework for Ports 2003’ streamlines the appraisal
procedure for new port developments. The case by case approval procedure defined in this
report is currently under discussion. Some views claim the need for a national port development
policy after some major projects failed to meet environmental and landside transport system
congestion requirements, as shown in UKMPG (2005).

23
2.4 NETHERLANDS
2.4.1 General context
Historically the Netherlands have long been associated with the maritime trade. The
Netherlands coast lies in the middle of the Hamburg - Le Havre range where inter port
competition levels are very high. According to the ‘National Havenraad’ statistics in 2005 the
Dutch ports handled 471 million tons of cargo. Figure 4 illustrates 2005 cargo throughputs in the
Netherlands.
0
50
100
150
200
250
Liquid bulk Dry bulk Containerized Ro-ro Conventional
(million tonnes)
Figure 4 - Cargo throughputs of the Dutch port system in 2005
Source: National Havenraad
The Netherlands comprise four large port areas: Rijnmon en Maasmond, North Sea canal area,
Zeeland and Groningen. Outside these port areas there are some isolated ports: Scheveningen,
Harlingen and Den Helder. Table 8 shows Dutch seaports by area.
Table 8 - Dutch seaports
Seaport area Seaports
Rijnmon en Masmond
Rotterdam Schiedam
Vlaardingen Maassluis Dordrecht Moerdijk
North Sea Canal area
Amsterdam Zaandam Beverwlijk
Velsen/Ijmuiden
Zeeland Seaports Vlissingen Terneuzen
Groningen Delfzlijl
Eernshaven
Other seaports Scheveningen
Harlingen Den Helder

24
Belonging to the same port area does not imply being under the same port administration.
Rotterdam’s Port Authority ‘Havenbedrijf Rotterdam N.V.’ manages Vlaardingen and Schiedam
ports besides Rotterdam. Maassluis, Dordrecht and Moerdijk are not included and have their
own port administrations and regulations. Conversely all Groningen seaports are managed
through the Groningen Port Authority, directed by the ‘havenschap’ administration board where
Delfzijl and Eesmond municipalities and the Groningen province are represented.
The port of Rotterdam, with an annual throughput over 370 million tons, is by far the busiest
European port. Until the nineties it was the world’s largest port as well. Currently it ranks third
after Shangai and Singapore. Amsterdam port is the second largest Dutch port and ranks
fourteenth in Europe, according to the ESPO (2004). It has an annual throughput of 53 million
tons. Amsterdam and Rotterdam handle about 90% of the total cargo volume loaded and
unloaded in the Netherlands.
2.4.2 Legislation and policies
National port policy for the 2005-2010 period was established in the white paper ‘Seaports:
Anchors of the Economy’. It clearly states its focus on economic development while regarding
safety and human environment as restrictions that have to meet national and international
standards. It claims the need to reform government regulation over port traffic and
environmental and safety standards supervision but emphasizes the crucial importance of the
seaports sector for the national economy in terms of workplaces and revenues. Transit cargos,
which amount to 39 % of Dutch seaports throughput, are seen as positive for the economy on
the basis of providing significant scale economies. The rationale is that if logistical operators
cover their fixed costs partially or completely through transit cargos, they will be able to charge
less for national generated cargo and to offer a wider range of logistical services.
A stepwise decision procedure is established for port project public funding where national
interest is the main evaluation criteria. In case of a draw between two or more projects, projects
in the Port of Rotterdam have priority. Projects in the central economic areas of Amsterdam and
Zeeland have priority as well, except over the Port of Rotterdam area, if they meet the
supplementary criteria of real market interest.
As a result of the Manheim Treaty, that guarantees the free circulation in the Rhine River, the
Dutch state does not charge for the use of maritime accessibilities and interior navigation ways,
but it supports its maintenance costs.
The Central Government (Cabinet), the South Holland province, the Greater Rotterdam region
and the Rotterdam municipality formed the Rotterdam Mainport Managerial Conference ‘BOM’
in 1999. This conference met periodically in order to prepare the Development Project for the

25
Rotterdam Port. This plan was defined in four phases, the last one (phase 4) was defined in
2003. ‘BOM’ no longer exists has an institution but it contributed significantly towards an
integrated policy in the largest European port. In this plan economic, social, spatial planning and
cultural perspectives were considered in a long term perspective.
Relatively to the UK policy there is more State intervention by imposing some strategic options
over the market by conceding funding priority to certain port areas and managing most of the
major ports.
2.4.3 Institutional setting
The National Port Council ‘National Havenraad’ (NHR) congregates representatives of the
cabinet, regional administrations, fifteen Port Authorities, industry and port workers. It depends
on the Ministry of Transport. It plays a consultative role on government decisions in matters of
port policies and investments assuring coordination between the several undertakings.
Port Authorities are responsible for port spatial planning, safety and environmental protection
measures. They are also in charge of infrastructure maintenance and law and regulation
enforcement under the port state control.
Dutch public administration has three levels: central, regional and municipal. Most of the smaller
port administrations are integrated in the municipalities. Amsterdam port is managed through
an independent municipal company, the ‘Havenbedrijf’.
Municipalities may form partnerships between themselves and regions and jointly manage
seaports. These partnerships, ‘havenschappen’, are usually formed when the socio-economic
significance of the seaport largely expands over the municipality geographical borders. Three of
these arrangements manage several seaports:
� Groningen Seaports runs the ports of Delfzijl and Eemshaven
� Havenschap Moerdijk runs the port of Moerdijk
� Zeeland Seaports runs the ports of Vlissingen and Terneuzen.
Port of Rotterdam is managed by an independent company ‘Havenbedrijf Rotterdam N.V.’ since
2004. This company is not listed in any stock exchange. The Rotterdam municipality is the main
shareholder, while the State has a third of the shares.

26
2.4.5 Governance models
Dutch seaports follow the landlord port management model. Port Authorities lease port
infrastructure such as terminals and berths to private operators which directly supply services to
the port users. Though equipment is usually provided by the operators, a number of Port
Authorities own some equipment and rent it to the service providers. In some cases operators
partially or completely finance certain infra-structural developments though these are usually
supported by the Port Authorities. Typically Port Authorities also manage logistical and industrial
areas adjacent or near the port which they rent or lease to industries and logistical operators.
Figure 5 schematizes the two main Dutch seaports (Rotterdam and Amsterdam) governance
models.
Figure 5 - Rotterdam and Amsterdam governance models
Source: ISL (2006)
Port Authorities main sources of revenue are the dues paid by the port users and the leases of
port infrastructures and industrial and logistical sites. Their expenses consist basically of
personnel costs, goods and services expenditures, depreciation, interests and investment in
port infrastructure. The latter may be subject to public subsidies. Each Port Authority defines its
own regulations and has the power to define their own tariffs and leases.
The white paper asserts that the Dutch government, as well as other governments in the
Hamburg-le Havre range, is financially involved in major investments in basic infrastructure and
internal port infrastructure. These investments are mainly related to containerized cargo sector
which is expected to have a significant growth both in international and intra-European trade
routes.
27
Maintenance of maritime accessibilities, interior waterways and navigational aids outside port
areas are financially supported by the government. However, some Port Authorities, which
expanded (deepened) their maritime accessibilities, support the increased maintenance costs.
Maritime defences such as breakwaters are usually paid by the government.
A reference set of prices for each service is available but commercial operators are free to
negotiate going rates with their clients. Pilotage is exclusively provided by the National
Organization of Pilots, which detains a monopoly on the provision of this service. The rates
charged by this organization are defined by the Ministry of Transport. There are plans to
liberalize this service on the medium term.
Most terminal operators acquire port land through leases. However there are some situations
where the land has actually been bought. Usually the operator pays a fee proportional to the
occupied land area and the available quay length. This value will also depend on the land and
quay type and on the available water depth. According to ISL (2006) in theory these fees should
be set only on the basis of market prices but Port Authorities strategic planning typically has a
significant role on the fees definition. It is common practice for Port Authorities to define
differential fees for the same area depending on the company.
2.4.6 Private ports
There are some private ports in the Netherlands though to a much smaller extent than in the
United Kingdom. In Velsen/Ijmuiden area there is the metallurgical port of Hoogovens which is
completely private. In the same area another port is managed by the ‘Zeehaven Ijmuiden N.V’,
a commercial company where most of the shares are private while the Velsen/Ijmuiden
municipality and the North Holland province hold minor stakes ESPO (2005).
Some private companies do own port infrastructures with direct access to the navigational
channels. They have free maritime accessibilities and may be considered a kind of quasi-private
ports, though they do not have the rights and responsibilities usually associated with Port
Authorities. Some examples are the ferry company Stena Line’s terminal in Hoek van Holland
and the Total’s pier in the Scheld River estuary.

28
2.5 SPAIN
2.5.1 General context
Spain is the EU member state with the longest coastline. The Spanish port system comprises
44 ports of public interest in continental Spain, Canary and Balears archipelagos and overseas
territories of Ceuta and Mellilla. These are controlled through 28 Port Authorities.
Spanish ports annual throughput amounted to 374 million tons in 2005. The larger stakes of
handled cargo were liquid and dry bulks with volumes of 138 and 111 million tons respectively.
Containerized cargo followed closely with a throughput of 87 million tons. Figure 6 compares
2005 Spanish cargo handling volumes by cargo type.
0
20
40
60
80
100
120
140
160
Liquid bulk Dry bulk Containerized Ro-ro Conventional
(million tonnes)
Figure 6 - Cargo throughputs of the Spanish port system in 2005
Source: Eurostat
2.5.2 Institutional setting
The Spanish Constitution states that ports with international commercial services, with
hinterlands expanding over more than one Autonomous Regional Community or serving
industries of strategic national interest are of the exclusive competence of the National State.
‘Puertos del Estado’ is a public entity depending on the ‘Ministerio del Fomento’ (Ministry of
Economy). It is responsible for executing the government port policy and coordinating the entire
national port system, namely with the several state bodies which have jurisdiction over port
areas. Its competences also cover the harmonization of the maritime transport requirements
with other transport modes accessibilities and inter modal connections serving the port areas. It
has its own revenue sources and controls the ‘Fundo de Compensasion Interportuária’
(Interport Compensation Fund).

29
Port Authorities are autonomous public entities with legal ability and their own patrimony. They
manage one port or small group of nearby ports and are subject to coordination by “Puertos del
Estado”. The Autonomous Communities appoint the president of the Port Authority and the
majority of the board’s members. Port Authorities have responsibilities in the following fields:
� Management of the provision of port services through the attribution of authorizations,
licences and concessions;
� Definition of the port’s strategic policy;
� Establishing the port’s spatial planning, in coordination with the applicable legislation;
� Providing for the necessary safety and environment protection measures;
� Enforcing safety, health and work regulations and any other port state control
attributions;
� Establishing and collecting port users dues and concession, licence and authorization
fees.
2.5.3 Service provision
Spanish ports follow the landlord port model where Port Authorities regulate service provision
while private operators directly provide port services. The use of public port land for private
purposes is possible under license or concession agreements. Port service concessions have
legally set timeframe depending on the service they provide. For cargo handling services this
limitation is related with the concessionaire investment. 10 to 15 years if investments are only in
mobile equipment and 30 to 35 years if investments in infrastructure are to be made.
Spain allows pilotage services to be provided by private operators, though only one service
provider is allowed per port area. Concession agreements of pilotage services have a maximum
duration of 10 years.
Ancillary services such as water supply, bunkering and waste reception facilities are also
provided by private operators. These are required to have the authorization of both the Port
Authority and the environmental regulatory entity.
2.5.4 Financing model, tariffs and charges
Tariffs paid to the Port Authority for the provision of services are negotiable but they must not be
lower than the cost of providing the services. Services provided by private operators have
reference tariffs specified by the Port Authority. Private operators have freedom to establish
their own commercial policy offering rebates and discounts on these tariffs.
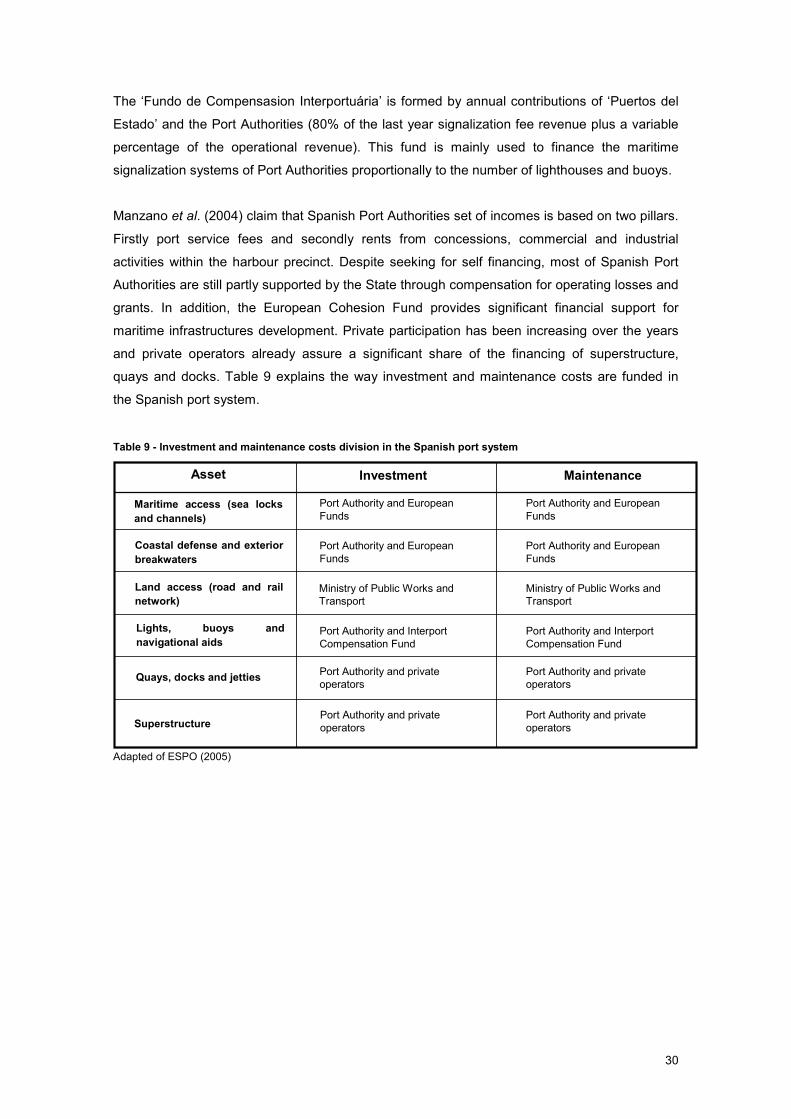
30
The ‘Fundo de Compensasion Interportuária’ is formed by annual contributions of ‘Puertos del
Estado’ and the Port Authorities (80% of the last year signalization fee revenue plus a variable
percentage of the operational revenue). This fund is mainly used to finance the maritime
signalization systems of Port Authorities proportionally to the number of lighthouses and buoys.
Manzano et al. (2004) claim that Spanish Port Authorities set of incomes is based on two pillars.
Firstly port service fees and secondly rents from concessions, commercial and industrial
activities within the harbour precinct. Despite seeking for self financing, most of Spanish Port
Authorities are still partly supported by the State through compensation for operating losses and
grants. In addition, the European Cohesion Fund provides significant financial support for
maritime infrastructures development. Private participation has been increasing over the years
and private operators already assure a significant share of the financing of superstructure,
quays and docks. Table 9 explains the way investment and maintenance costs are funded in
the Spanish port system.
Table 9 - Investment and maintenance costs division in the Spanish port system
Investment Maintenance
Maritime access (sea locks and channels)
Coastal defense and exterior breakwaters
Land access (road and rail network)
Lights, buoys and navigational aids
Quays, docks and jetties
Superstructure
Port Authority and European
Funds
Port Authority and European
Funds
Port Authority and European
Funds
Port Authority and European
Funds
Port Authority and Interport
Compensation Fund
Port Authority and Interport
Compensation Fund
Ministry of Public Works and
Transport
Ministry of Public Works and
Transport
Port Authority and private
operators
Port Authority and private
operators
Port Authority and private
operators
Port Authority and private
operators
Asset
Adapted of ESPO (2005)

31
2.6 EUROPEAN UNION
2.6.1 General context
About two thirds of Europe boundaries are facing the sea. The maritime area under its
jurisdiction is larger than its land area. Hundreds of seaports in its coast and interior waterways
have specialized facilities in almost every tradable product. European geography, abundant in
peninsulas and islands, favours the existence of a large amount of regular passenger lines and
ferry services. A rising cruising industry is giving place to several new facility projects and
developments all around the continent. About forty percent of the world’s fleet is European. 90%
of EU’s external trade and over 40 % of its internal trade is transported by sea and around 350
million passenger pass through European seaports according to the Green paper ‘Towards a
future maritime policy for the Union: A European vision for the oceans and the seas’, CEC
(2006). Europe imports large amounts of crude oil and petroleum products. Liquid bulks
constitute the larger share of the cargo handled in its ports as shown in Figure 7.
0
500
1000
1500
2000
2500
3000
3500
4000
4500
5000
Liquid bulk Dry bulk Containerized Ro-ro Conventional
(million tonnes)
Figure 7 - Cargo volumes handled in European seaports by type in 2006
Source: ESPO
There is fierce competition between seaports especially in the containerized cargo sector. This
is the best suited type of cargo for inter modal transportation allowing hinterlands to expand
internationally. A country imports or exports are no longer captive of their own seaports mainly
because of the improved communication ways within the EU. The ESPO (2007) reports that the
traditionally dominant ports in the Hamburg-Le Havre range are increasingly facing competition
from container ports in other European areas. There is a widening gap between container traffic
demand and terminal capacity in some ports, thus generating port congestion and delays in
some of the European major ports. In the coming years a further increase in available container
ship tonnage is expectable.

32
Despite the large efforts made towards modal shift, road haulage still largely surpasses railway
connections and inland waterways in terms of cargo volume. European policy is centred on the
need to accomplish this modal shift towards sustainable development. Intra European cargo
flows are expected to grow 50% until 2020 and the road system has already reached critical
congestion in some bottlenecks such as the Alps and the Pyrenees. Increasing efforts are being
made at the European level to stimulate Short Sea Shipping (SSS).
2.6.2 Legislation and regulatory policies
The Treaty of Rome 1958, that instituted the European Economic Community, stated that the
community shall have as its task establishing a common market and progressively
approximating the economic policies of Member Sates. This common market is based on the
four pillar freedoms, namely the free movement of persons, services, goods and capital. It
establishes a single economic area subject to free competition. The Treaty explicitly prohibited
restrictive agreements and state aids which may prevent, restrict or distort competition between
Member States. Additionally articles 70 to 80 formally institute the creation and development of
a common transport policy.
Albeit market competition for maritime service was theoretically established in the founding act
of the European Economic Community not much was done in order to put it into practice during
a long period of almost thirty years. Urrutia (2006) distinguishes, from an historical perspective,
four different periods in the implementation of common regulation and open market practices in
the European shipping industry as shown in Figure 8.
1958 1986 20021993 2007
Treaty rules barely applied
in the shipping sector.
Internal market and
competition rules applied to
shipping.
Setting up of a common
policy on safe seas.
2001 White paper;
Erika and Prestige
maritime safety
regulatory packages.
1958 1986 20021993 2007
Treaty rules barely applied
in the shipping sector.
Internal market and
competition rules applied to
shipping.
Setting up of a common
policy on safe seas.
2001 White paper;
Erika and Prestige
maritime safety
regulatory packages.
Figure 8 - Chronogram of the regulation implementation in the maritime sector
In 1986, regulation was introduced establishing the right of every European shipper or
passenger carrier to operate between every port of a Member State and ports of another
Member State or third country. This measure phased out restrictive market practices of some
countries regarding access to their ports. Protective measures towards anti-competitive
practices of third countries operators were also defined. Though, cabotage was still restricted to
the national fleet. In 1993 further regulation established the principle of freedom to provide

33
services of maritime transportation within Member States ports, although derogations were
granted along the coast and islands of Portugal, Spain, France and Greece.
Liner shipping conferences are groups of carriers that provide regular services, within specified
geographical limits, which agree to charge uniform rates. They were exempted from the Treaty
competition rules’ ban on restrictive business practices. The withdrawal of this exemption is
currently under discussion in the European Commission.
European Union took firm steps in protecting environmental values through regulatory action.
Directive 92/43 (Habitats Directive) and Directive 79/409 (Birds Directive) established special
areas of conservation (SAC) and special protection areas (SPA) respectively. Together SAC
and SPA form the ‘Natura 2000’ network, which aims at promoting the maintenance of
biodiversity. A significant number of seaports is surrounded or near those areas where new
developments are severely restricted. Projects are only permitted either if they guarantee no
adverse effects to the site or there are no alternatives and there are imperative reasons of
public interest. However compensation measures often severely increase the costs of new port
developments in these areas.
Vessel accidents involving large oil spills, such as the Erika in 1999 and the Prestige in 2002,
which required large and costly recovery actions, have concerned public opinion and pushed for
regulatory action. In order to improve vessel safety the EU reinforced port state control, which is
the inspection of foreign ships to verify that the condition of the ship, its equipments and its crew
comply with the requirements of international regulations.
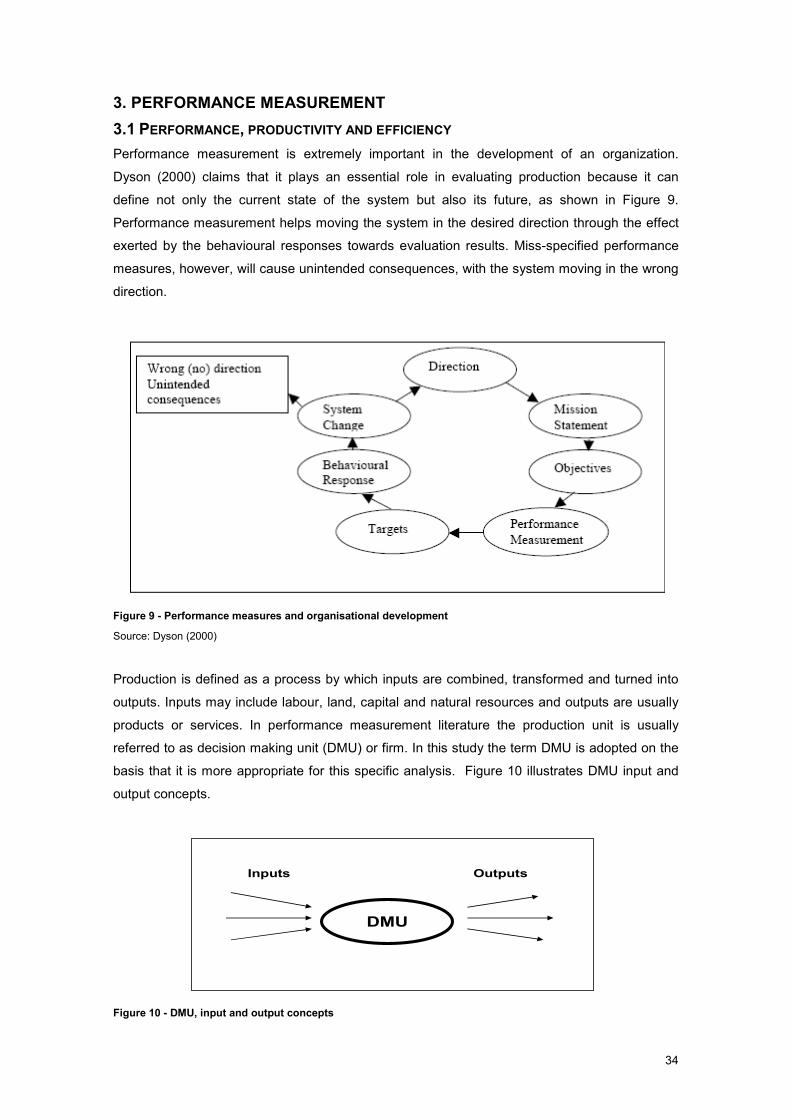
34
3. PERFORMANCE MEASUREMENT
3.1 PERFORMANCE, PRODUCTIVITY AND EFFICIENCY
Performance measurement is extremely important in the development of an organization.
Dyson (2000) claims that it plays an essential role in evaluating production because it can
define not only the current state of the system but also its future, as shown in Figure 9.
Performance measurement helps moving the system in the desired direction through the effect
exerted by the behavioural responses towards evaluation results. Miss-specified performance
measures, however, will cause unintended consequences, with the system moving in the wrong
direction.
Figure 9 - Performance measures and organisational development
Source: Dyson (2000)
Production is defined as a process by which inputs are combined, transformed and turned into
outputs. Inputs may include labour, land, capital and natural resources and outputs are usually
products or services. In performance measurement literature the production unit is usually
referred to as decision making unit (DMU) or firm. In this study the term DMU is adopted on the
basis that it is more appropriate for this specific analysis. Figure 10 illustrates DMU input and
output concepts.
DMU
Inputs Outputs
Figure 10 - DMU, input and output concepts

35
Performance analysis measures the relationship between input consumption and output
production. Usually similar DMUs are compared in search for the best practices. These are the
ones that provide maximum output production with minimum input consumption. Besides focus
on favourable characteristics towards this end such as operating scale and public or private
ownership is common in several applied research areas.
Wang et al. (2005) state that efficiency and productivity are the two most important concepts in
performance measurement. These two terms are frequently used interchangeably though there
is a slight difference between them. In a DMU with only one input and one output, productivity
may be computed as the ratio of output to input as represented in Figure 11. The curve f1
represents the production frontier in a determined point in time for this specific activity, also
known as the efficiency frontier. Technical efficiency is defined as the distance to the efficiency
frontier. This way DMUs B and C are efficient while DMU A is not. Note that the productivity
frontier may change with time, curve f2 represents the productivity frontier at another point in
time.
Input
Outp
ut
AB
C f1
f2
EDOInput
Outp
ut
AB
C f1
f2
EDO
Figure 11 - Productivity frontier and inefficiency
The output oriented technical efficiency of A can be computed by the ratio of productivity of
point A to that of point C as in equation 1. Output oriented efficiency evaluates the output
actually attained to that which is potentially attainable, given a fixed input level. Similarly, the
input oriented technical efficiency refers to the ratio between efficient use of inputs and the
current input utilization by the specific DMU while maintaining the same level of output
production. Input oriented efficiency of DMU A can be computed through equation 2.
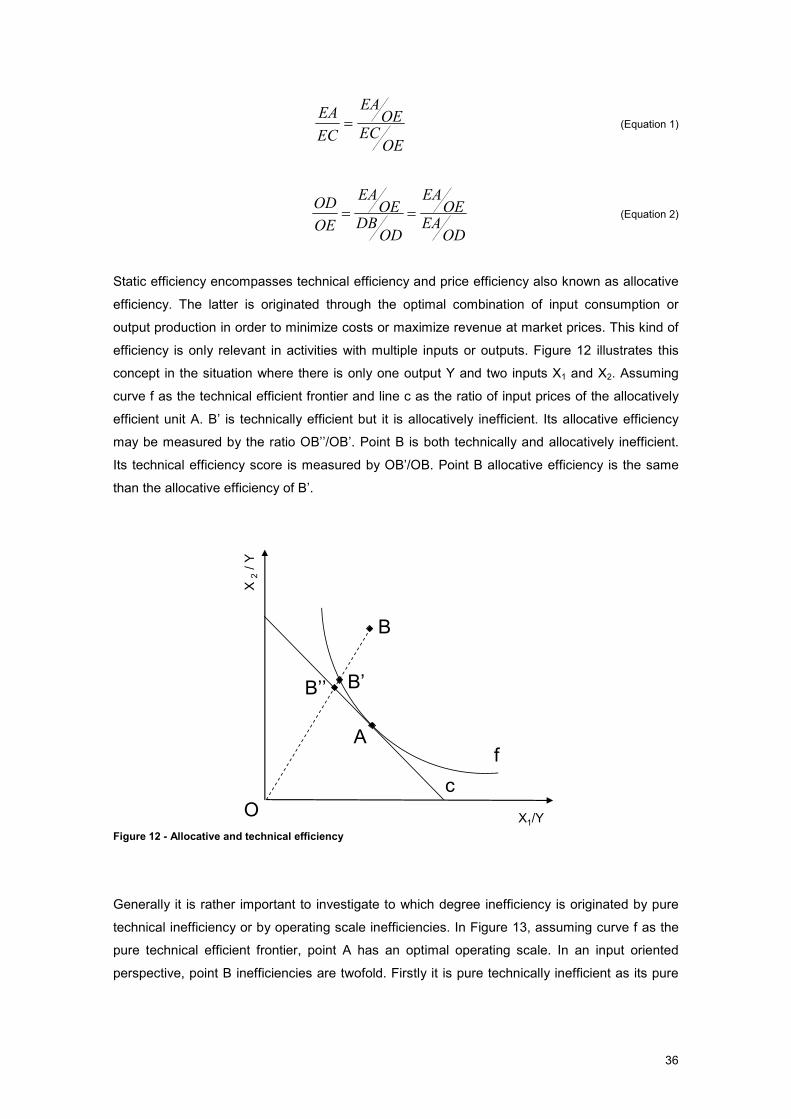
36
OEECOE
EA
EC
EA= (Equation 1)
ODEAOE
EA
ODDBOE
EA
OE
OD== (Equation 2)
Static efficiency encompasses technical efficiency and price efficiency also known as allocative
efficiency. The latter is originated through the optimal combination of input consumption or
output production in order to minimize costs or maximize revenue at market prices. This kind of
efficiency is only relevant in activities with multiple inputs or outputs. Figure 12 illustrates this
concept in the situation where there is only one output Y and two inputs X1 and X2. Assuming
curve f as the technical efficient frontier and line c as the ratio of input prices of the allocatively
efficient unit A. B’ is technically efficient but it is allocatively inefficient. Its allocative efficiency
may be measured by the ratio OB’’/OB’. Point B is both technically and allocatively inefficient.
Its technical efficiency score is measured by OB’/OB. Point B allocative efficiency is the same
than the allocative efficiency of B’.
X1/Y
X 2
/ Y
A
B’’
B
B’
f
c
O
Figure 12 - Allocative and technical efficiency
Generally it is rather important to investigate to which degree inefficiency is originated by pure
technical inefficiency or by operating scale inefficiencies. In Figure 13, assuming curve f as the
pure technical efficient frontier, point A has an optimal operating scale. In an input oriented
perspective, point B inefficiencies are twofold. Firstly it is pure technically inefficient as its pure

37
technical efficiency, computed by OB’/OB, is inferior to 1. Secondly it is scale inefficient and its
scale inefficiency is given by the ratio OB’’/OB’.
Input
Ou
tpu
t
Af
O Input
BB’
A
B’’
f
Input
Ou
tpu
t
Af
O Input
BB’
A
B’’
Input
Ou
tpu
t
Af
O Input
BB’
A
B’’
f
Figure 13 - Scale and pure technical efficiency
According to Zhu (2003), evidence of congestion is present when reductions in one ore more
inputs can be associated with increases in one or more outputs without worsening any other
input or output. He states the example of agriculture where too much fertilizer applied to a given
plot could reduce the overall output. Non-congestion efficiency measures pure technical
efficiency disregarding congestion effects while congestion efficiency measures the effect of
excess inputs. Figure 14 schematizes the several kinds of efficiency discussed above.
Production
Efficiency
Technical
Efficiency
Allocative
Efficiency
Scale
Efficiency
Pure Technical
Efficiency
Congestion
Efficiency
Non-congestion
Efficiency
Production
Efficiency
Technical
Efficiency
Allocative
Efficiency
Scale
Efficiency
Pure Technical
Efficiency
Congestion
Efficiency
Non-congestion
Efficiency
Figure 14 - Efficiency decomposition

38
3.2 DATA ENVELOPMENT ANALYSIS
The Data Envelopment Analysis (DEA) methodology was developed by Charnes, Cooper and
Rhodes (1978). In their model, which is usually referred by their initials CCR, efficiency is
defined as a weighted sum of outputs to a weighted sum of inputs, where the weights structure
is computed by means of mathematical programming. In this model constant returns to scale
(CRS) are assumed. Some year later Banker, Charnes and Cooper (1984) developed the BCC
model with variable returns to scale (VRS).
Since 1978 when the DEA technique was introduced until the end of 2001 more than 3200
publications were accounted by Tavares (2002). DEA has been widely applied worldwide and in
Portugal. Portuguese DEA studies encompass the areas of education by Castro (1993) and
Afonso e Santos (2005); banking by Portela (2003); mail by Vaz (1995); water and sewerage by
Marques (2005) and electricity by Morais (2000) and Boucinha et al. (2003). ERSE the
Portuguese energy regulator has effectively used DEA methodologies with practical effects on
its policies. The large number of published papers and its wide range of applications
demonstrate the potentialities and the flexibility of the DEA methodology.
DEA is a linear programming algorithm which handles multiple inputs and outputs and converts
them into a measurement of efficiency. DEA identifies efficient DMUs and builds a multi
dimensional efficient frontier. The non-efficient DMU efficiency scores are based on the distance
to this efficient frontier. It is important to emphasize that DEA does not assess absolute
efficiency but relative efficiency, because its results are always dependent of the analysed
sample. Wang et al. (2005) state that an important property of DEA is that there is no
requirement for any a priori views or information regarding the assessment of the efficiency of
DMUs. The weights for inputs and outputs are defined by the DEA algorithm, rather than being
inputted artificially as exogenous parameters. Stolp (1990) claims that by doing so the data is
more likely to ‘speak for itself’ and objectively reflect the ‘truth’ of the situation. The fact that this
method of selecting weights has not been frequently challenged is pointed out by Allen et al.
(1997).
Considering a hypothetical sample of ten DMUs (A to J), Figure 15 shows the efficient frontier
drawn under CRS. A is the only efficient DMU. The line from the origin and going through A
forms the efficient frontier. According to Wang et al. (2005) the term Data Envelopment Analysis
stems directly from the graphic description of the frontier with data points being enveloped by
the frontier.

39
Ou
tpu
t
InputO
A
F
B
D
G
C
E
IH J
Figure 15 - Constant returns to scale efficiency frontier
Considering the same sample, a VRS model would originate a piecewise frontier as shown in
Figure 16. DMUs A, B and H were deemed as efficient.
Input
Outp
ut
O
A
F
B
D
G
C
E
IH J
Figure 16 - Variable returns to scale efficiency frontier
Considering a set of DMUs where each DMUm (m=1,….,M) produces outputs yi (i=1,…,I) and
consumes inputs xj (j=1,…,J) the optimal weights would be computed through the following
fractional linear program.

40
∑
∑
=
==
J
j
jkj
I
i
iki
k
xb
ya
hMax
1
1 (Equation 3)
subject to:
Mkm
xb
ya
J
j
jmj
I
i
imi
,...,,...,11
1
1=≤
∑
∑
=
=
JjIiba ji ,...,1;,....,10, ==>
This formulation has infinite solutions and in order to avoid this less tractable situation another
formulation is proposed as shown below, known as the multiplier form.
∑=
=I
i
ikik yawMax1
: (Equation 4)
subject to:
∑=
=J
j
jkj xb1
1
MkmxbyaJ
j
jmj
I
i
imi ,...,,...,1011
=≤−∑∑==
JjIiba ji ,...,1;,....,10, ==>
Through the duality of linear programming it is possible to obtain the next envelopment form.
)(min11
∑∑==
+−J
j
j
I
i
ik ssh ε (Equation 5)
subject to:
01
=+−∑=
jkjkjm
M
m
m shxxλ
0syy iikjm
M
1mm =−−λ∑
=
Mkmm ,...,,...,10 =≥λ
JjIiss ji ,...,1;,....,10, ==>
where ε is non-Archimedean quantity. This is the well known CCR model referred. If we want
the model to encompass variable returns to scale (BCC model) we need to add a constraint of
the sum of λ equal 1, as pointed up by Banker et al. (1984).

41
Figure 17 illustrates the peer and slack concepts considering the sample A, B, C and D, two
inputs X1 and X2 and one output Y. As Coelli et al. (1998) explain the slack is related to the
sections of the piece-wise linear frontier which runs parallel to the axes. The C and D are two
efficient DMUs which define the frontier while A and B are inefficient. The Farrell measure of
technical inefficiency gives the efficiency of A and B as OA’/OA and OB’/OB, respectively.
However, it is questionable if point B’ is an efficient point since one could reduce the amount of
input X2 used (by the amount CB’) while still producing the same amount of outputs and
consuming the same amount of X1. This is known as input slack which is an additional measure
of inefficiency. Given A’ and B’ as the Farrell efficient projections of point A and B on the
frontier, D and C are peers of A with a weight proportional to CA’ and DA’ respectively. B has
only C as its peer with a weight equal to 1.
X1/Y
X 2
/ Y
O
f
A’
AB’
B
D
C
X1/Y
X 2
/ Y
O
f
A’
AB’
B
D
C
Figure 17 - Slack and peer concepts

42
3.3 STATE OF THE ART
Performance evaluations may be accomplished through several methodologies. Studies about
port efficiency and productivity measurement can be divided into three large groups. Firstly, the
ones using or suggesting performance indicators, such as Tongzon (1995) and the Australian
Productivity Commission, APC (1998). Secondly, parametric efficiency studies which include the
Stochastic Frontier analysis (SFA). Liu (1995) applies SFA to a sample of 28 ports and
investigates the relation between efficiency and ownership type while Cullinanne et al. (2002)
use SFA to analyse fifteen of the major Asian container terminals. Thirdly the non parametric
frontier efficiency measures such as Data Envelopment Analysis (DEA). Since this is the
methodology used in this investigation an intensive effort was made in order to exhaustively list
and analyse papers and studies applying it to the port sector. The most distinctive
characteristics about these studies are the DEA model, the inputs and the outputs measured
and the considered data set. Table 10 summarizes existing papers and their main
characteristics by chronological order.
While DEA has been extensively applied in efficiency measurement in several fields, it has been
scarcely used in the port sector. Only sixteen papers were found applying DEA to the port
sector. The first study was published by Roll and Hayuth (1993) but it should only be regarded
as a theoretical exploration of the applicability of DEA to the seaport sector since only
hypothetical data was used.
After this initial exploratory study, only six years later another paper was published. Martinez-
Budria et al. (1999) analysed 26 Spanish Port Authorities and separated them into three
categories, according to their complexity and size. After analysing them with BCC models they
concluded that larger ports presented higher efficiencies.
Tongzon (2001) analysed the efficiency of 4 Australian and 12 other ports with high throughput
levels of containerised cargos. Both DEA-Additive and CCR models were used. The latter
measures both technical and scale efficiencies while variable returns to scale are considered in
the former. The study considered two output and six input measures for the year of 1996. The
outputs were the total number of containers loaded and unloaded in TEU and the ship working
rate defined as the number of containers moved per working hour per ship. The author argues
that this last indicator is relevant in a quality of service perspective since the container handling
aspect of port operation is the largest component of ship turnaround time. Tongzon generalizes
port inputs as land, labour and capital. The former was introduced in the model as the terminal
area. Capital inputs were measured through the number of berths, cranes and tugs while Port
Authority employees were used as a proxy variable to the labour input since there was no
reliable data available about the number of stevedoring labourers. An extra variable portraying
service quality was employed. Delay time was defined as the difference between total berth
time plus waiting time to berth and the time between the start and finish of ship working.

43
Tongzon found out that the initial setup deemed too many ports as efficient. Pointing over
specification as the cause for this, he opted to drop the ship working rate input. With this new
formulation four ports were found to be inefficient under de DEA-Additive model. However six
other became inefficient only with the CCR model, therefore adding up to ten. Inefficient ports
had different characteristics regarding size and cargo origin (hub or feeder ports) consequently
it was pointed out that operational efficiency does not solely depend on its size or function.
Valentine and Gray (2001) applied a CCR model to 31 of the world’s top 100 container ports for
the year 1998. They used two inputs, total length of berths and container berth length, and two
outputs, the number of containers and the total tons of throughput. The relationship between
port efficiency and the type of ownership and organisational structure was investigated.
Itoh (2002) analysed the container operation of eight ports in Japan by means of a DEA
‘window’ application. Their efficiency was measured between 1990 and 1999. A single output
was employed, the amount of TEUs handled per year. Inputs were categorized as port
infrastructure, superstructure and labour. The first models were run with container terminal area
(m2), the number of container berths and the number of gantry cranes as inputs. However, he
recognized that the initially used inputs were not related to labour. Additional models were run
using an estimated value for container operations labour based on the total port labour and the
value relation between the share of container cargo and conventional cargo handled at each
port. While analysing results Itoh contextualizes them to single exceptional events such as the
Maersk terminal relocation, the earthquake in Kobe and the late 1990s Asian monetary crisis.
The scale efficiency is also analysed comparing the results of CCR and BCC models. Efficiency
measurements using the labour input were found to be consistently higher hence verifying the
fact that when one indicator is added to the DEA model, its discriminatory power decreases.

44
Table 10 - Previous studies applying DEA to the port sector (1/2)
Year Authors Data set Input Output Model
1993 Roll and Hayuth Hypothetical data for 20
ports
1) manpower 2) capital 3) cargo uniformity
1) cargo throughput 2) level of service 3) user’s satisfaction 4) ship calls
DEA-CCR
1999 Martinez- Budria et al.. 26 Spanish ports
1993 - 1997
1) labour expenditure 2) depreciation charges 3) other expenditures
1) total cargo moved through the docks 2) revenue obtained from the rent of port facilities
DEA-BCC
2001 Tongzon
4 Australian and 12 other international container ports
1996
1) cranes 2) number of container berths 3) number of tugs 4) terminal area 5) delay time 6) labour
1) cargo throughput 2) ship working rate
DEA-CCR
DEA-Additive
2001 Valentine and Gray
31 container ports out of the world’s top 100 container ports
1998
1) total length of berths 2) container berth length
1) number of containers 2) total tons of throughput
DEA-CCR
2002 Itoh 8 Japanese ports
1990 - 1999
1) terminal area 2) number of berths 3) number of cranes 4) number of employees
1) TEUs handled DEA-Window
2003 Serrano and Castellano 9 ports of Spain
1992 - 2000
1) berth length 2) terminal area 3) number of cranes
1)TEUs handled 2) total tons of throughput
DEA-BCC
2003a Barros 5 Portuguese seaports
1999 - 2000
Technical Efficiency 1) number of employees 2) book value of assets
Allocative Efficiency 1) price of labour - salaries and benefits divided by the number of employees 2) price of capital -expenditure on equipment and premises divided by the book value of physical assets
1) number of ships 2) movement of freight 3) gross tonnage of ships 4) market share 5) tons of break-bulk cargo 6) tons of containerised cargo 7) tons of ro-ro traffic 8) tons of dry bulk 9) tons of liquid bulk 10) net income
DEA-allocative and technical efficiency

45
Table 9 - Previous studies applying DEA to the port sector (2/2)
Year Authors Data set Input Output Model
2003b Barros 10 Portuguese seaports
1999 - 2000 1) number of employees 2) book value of assets
1) number of ships 2) tons of moved freight 3) tons of break bulk cargo 4) tons of containerised freight 5) tons of solid bulk 6) tons of liquid bulk
DEA-Malmquist
2004 Barros and Athanassiou 2 Greek and 4 Portuguese
seaports 1998 - 2000
1) number of employees 2) book value of assets
1) number of ships 2) tons of freight moved 3) tons of cargo handled 4) tons of containers handled
DEA-BCC
DEA-CCR
2004 Turner et al. 26 North American
container ports 1984 - 1997
1) berth size 2) terminal area 3) number of cranes
1) TEUs handled -
2004 Park and De 11 Korean seaports
1999
1) berthing capacity (number of ships) 2) cargo handling capacity (tons)
1) cargo throughput 2) number of ship calls 3) revenue 4) consumer satisfaction
DEA-BCC
DEA-CCR
2004 Cullinane et al.
25 of 30 largest container ports in the world
1992 - 1999
1) berth size 2) terminal area 3) number of berth cranes 4) number of yard cranes 5) number of straddle carriers
1) TEUs handled DEA-Window
(CCR and BCC)
2005 Wang et al.
25 of the 30 largest container ports plus 5
mainland China
1992 - 1999
1) terminal length 2) terminal area 3) quayside gantry cranes 4) yard gantry crane 5) straddle carriers
1) TEUs handled DEA-BCC
DEA-CCR
2006 Wang and Culliname 104 European container
terminals 2003
1) total berth length 2) terminal area 3) equipment costs
1) TEUs handled DEA-BCC
DEA-CCR
2006 Rios and Maçada
23 MERCOSUR container terminals
(15 Brazilian, 6 Argentinean and 2 Uruguayan)
2002 - 2004
1) number of cranes 2) number of berths 3) number of employees 4) terminal area 5) amount of yard equipment
1) TEUs handled 2) average number of container handled per hour per ship
DEA-BCC
2006 Barros
24 Italian Port Authorities
2002 - 2003
1) number of employees 2) investment 3) operating costs
1) liquid bulk 2) dry bulk 3) number of ships 4) number of passengers 5) number of containers with TEU 6) number of container with no TEU 7) total sales
DEA-CCR DEA-BCC
DEA-Cross efficiency
DEA-Super efficiency

46
Serrano and Castellano (2003) considered the seaport as a multi product industry by defining
two output variables for the different types of cargos, containerized freight and non
containerized freight. The first was measured in units and the second in tons. Nine major
Spanish container ports were analysed. Inputs were the length of berths in meters, the land
area in square meters including warehouses, buildings, roads, and even gardens. A proxy
variable for the number of cranes was defined as the average GT of container vessels. The
rationale was that ports serving larger vessels need to have larger and more specialized cranes.
Two models were computed. One considered vessel size as an input while the other did not.
Balanced panel data encompassed the period of 1992 to 2000. Average efficiencies were 70%
for the model with the extra input and 65% for the other one. From the empirical analysis
Serrano and Castellano concluded that Spanish ports had excessive investment in
infrastructure or that, because of the lumpiness in port investment, there was at the time excess
capacity. Moreover an inverse relationship between efficiency and port size was emphasized.
Turner et al. (2004) measured productivity trends on the top 26 continental U.S. and Canadian
container ports using a DEA approach. The influence of the industry structure, Port Authority
and carriers conduct were analysed with a Tobit regression. The specific analysed period, 1984
to 1997, lies between two major regulatory acts, the Shipping Act of 1984 and the Shipping
Reform Act of 1998. DEA model inputs were restricted to physical measures of container port
infrastructure. Disregarding long shore labour was justified on the basis that labour productivity
differences were minimal due to standardized gang sizes and related work rules across North
America’s ports. Therefore model’s inputs were defined as container terminal land (ha),
container berth length (m) and number of quayside gentry cranes. Total throughput in TEU was
the only output adopted. The DEA model results were only explicit in terms of aggregate results
for the West, East and Gulf coasts. All of them developed a positive trend during the studied
period but the West and Gulf coasts had clearly superior productivity averages than East
coast’s container port infrastructure. Finally this paper emphasized that “size matters” and
stated the relationship between a greater number of railroads and increased container port
productivity.
Park and De (2004) went beyond the traditional DEA approach and proposed a four stage
procedure were productivity, profitability, marketability and overall efficiency were separately
measured. Analysed variables encompassed berthing capacity, cargo handling capacity, cargo
throughput, number of ship calls, revenue and customer satisfaction. Each of these variables
was either considered as an input or an output, depending on the stage. Both CCR and BCC
models where used to compute the four stage approach for 11 Korean ports. Inferences about
increasing or decreasing returns to scale were taken. Results were somewhat mixed with some
ports presenting increasing returns to scale in some phases and decreasing returns to scale in
others. A factor specific efficiency analysis computed the single input/output potential
decrease/increase when all other inputs and outputs were kept at current levels. This analysis

47
was performed for the productivity, profitability and marketability stages. It was found that
marketability improvements should be prioritized by Korean Port Authorities and that six of the
eleven ports had significant input congestion.
Cullinane et al. (2004) applied a DEA-window analysis to 25 of the world’s top 30 container
ports, according to the ranking in 2001. This study was intended to analyse container terminals
separately though, due to data constraints, it was then decided to analyse container ports as a
whole instead. This is a common problem due to data scarcity and lack of detail. They stated
that the definition of efficiency variables should be based on ports objectives. For instance, if the
objective of a port is to maximise its profits, then labour should be deemed as an input. On the
other hand if the objective of a port is to increase employment, then labour may be accounted
as an output variable. Bearing this in mind, inputs were defined as the total quay length,
terminal area and number of quay gantry cranes. It was argued that there was a close
relationship between the number of employees and the number of gantry cranes in container
terminals. This relationship should be regarded with caution, since the fast pace of technology
frequently introduces new machineries that require no drivers and there is a different use of
labour in ports with different sizes and facilities. Container throughput was adopted as the only
output on the basis that it was the most appropriate and analytically tractable indicator of the
effectiveness of a container port. Cullinane et al. indicate two reasons why they chose an output
oriented model, a theoretic one and a pragmatic one. Firstly an output oriented model was
chosen on the basis that container ports must frequently review their capacity in order to stay
competitive. Secondly, under a more pragmatic view, an output oriented model facilitates the
results discussion when there is only one output. Both CCR and BCC models were applied,
within a three year window analysis period. Results showed that production scale was not the
main source of inefficiency for most container ports. In addition some world renowned ports
such as Rotterdam, Hamburg and Antwerp were found to be inefficient comparing to smaller
container ports that showed largely superior efficiency scores. However an in depth
contextualization analysis of these results shown that larger container ports had invested
heavily in capacity enlargement and new equipments. This caused a short term over capacity.
They hypothesize that competition and competitiveness might explain these empirical
inefficiency results, in opposition to the traditional economic theories.
An extensive analysis of European container terminals efficiency was accomplished by Wang
and Cullinane (2006). They were able to compile data at the terminal level. This had been
several times tried before, but always unsuccessfully, because data usually comes aggregated
at the port level. In this paper 104 European terminals across twenty nine countries were
analysed with CCR and BCC models. Considered inputs were the total quay length, terminal
area and aggregated annual expenditure with terminal equipment. As usual in previous studies,
a reliable source of labour data was not available. Following the established practice of
precedent studies which focused in containerized cargo efficiency, container throughput was the

48
only output considered. This study had an exceptional number of DMU relatively to former DEA
approaches. Thus average efficiency results were naturally expected to be lower, as they did,
since a larger sample allows for a higher discriminatory power among efficient DMUs. Anyhow,
even with this in mind, average efficiencies of European container terminals were found to be
quite low as the average efficiency score amounted only to 0,43 with the CCR model. A
preliminary result analysis suggested larger terminals to be more likely to have higher
performance levels than smaller ones. This was reinforced with a similar conclusion after a Tobit
regression analysis. A comparison between container terminals grouped by their location in
Europe revealed that the British Isles and Western European terminals had higher efficiency
scores while Eastern European and Scandinavian terminals performed least efficiently.
A MERCOSUR container terminal analysis was carried out by Rios and Maçada (2006) for the
period between 2002 and 2004. A model validation procedure relied on close contact with a
group of port executives. They were asked two times for suggestions during the implementation
of the analysis. Firstly in the initial stage of model implementation and secondly after an initial
model had been set up and preliminary results had been obtained. The latter led to the
consideration of an extra output in the final model. A BCC model was used with five inputs, the
number of cranes, the number of berths, the terminal area, the number of employees and the
number of yard equipment. Initially the only considered output was the container throughput in
TEU. Following the port executives suggestion a second output, the number of movements per
hour per ship, was included in the final model. Of 23 analysed terminals 14 were 100% efficient
during the 3 year period. However the number of efficient terminals decreased from 17 in 2002
to 14 in 2004. Five of the six large terminals were found to be efficient during the whole period.
A benchmark analysis of Italian seaports was accomplished by Barros (2006). Twenty four
Italian Port Authorities were analysed over the years of 2002 and 2003. Seven outputs were
considered: liquid bulk, dry bulk (including ro-ro cargo), number of ships, number of passengers,
number of containers with TEU, number of containers with no TEU and total sales. Measured
inputs included the number of employees, value of capital invested and size of operating costs.
Using output orientation both CCR and BCC efficiency scores were computed using average
values for the period. Only eight of the 24 Port Authorities were found to be inefficient with the
BCC model while the CCR model results showed sixteen inefficient units. Most of the Port
Authorities had decreasing returns to scale. Given the relatively high number of efficient units
DEA-Cross Efficiency and DEA-Super Efficiency models were used. Trapavi Port Authority
achieved the highest efficiency score with both of these models.
There are three papers focusing on Portuguese ports. Barros (2003a) analysed both technical
and allocative efficiency of the Portuguese Port Authorities. A large number of variables was
considered, two inputs and ten outputs. It was the paper with more variables. In order to
compute allocative efficiency the price of labour inputs was obtained by dividing the salaries and
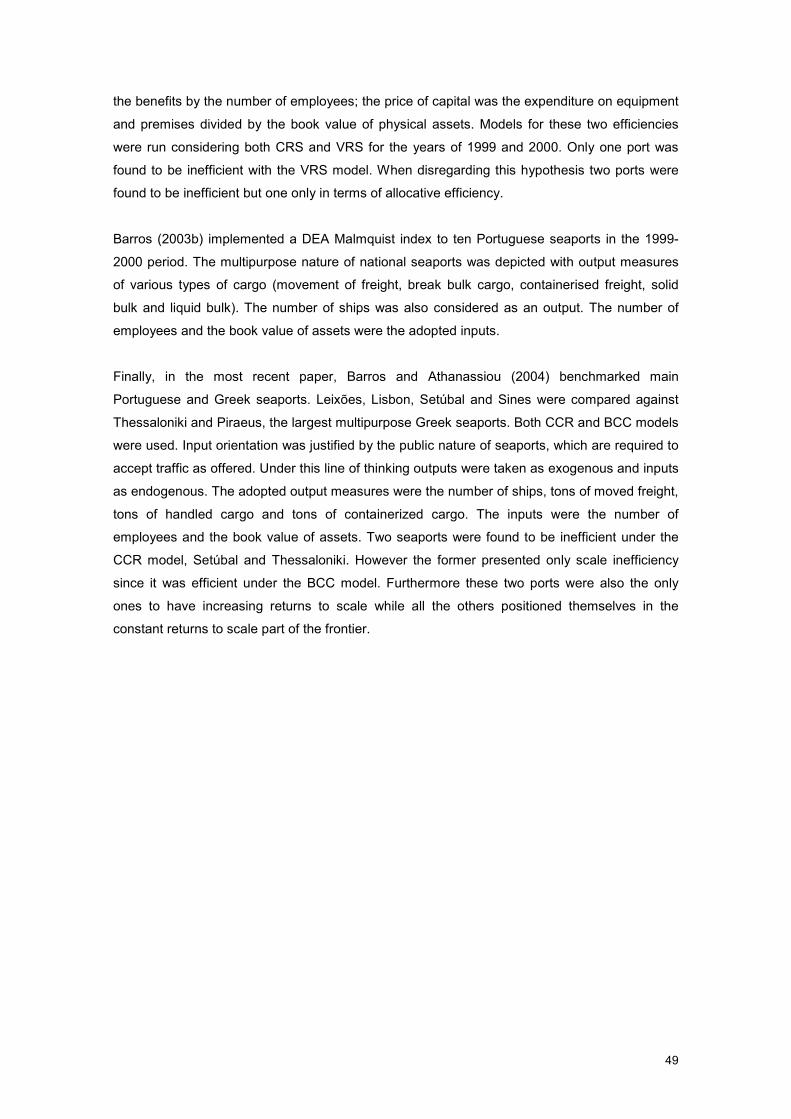
49
the benefits by the number of employees; the price of capital was the expenditure on equipment
and premises divided by the book value of physical assets. Models for these two efficiencies
were run considering both CRS and VRS for the years of 1999 and 2000. Only one port was
found to be inefficient with the VRS model. When disregarding this hypothesis two ports were
found to be inefficient but one only in terms of allocative efficiency.
Barros (2003b) implemented a DEA Malmquist index to ten Portuguese seaports in the 1999-
2000 period. The multipurpose nature of national seaports was depicted with output measures
of various types of cargo (movement of freight, break bulk cargo, containerised freight, solid
bulk and liquid bulk). The number of ships was also considered as an output. The number of
employees and the book value of assets were the adopted inputs.
Finally, in the most recent paper, Barros and Athanassiou (2004) benchmarked main
Portuguese and Greek seaports. Leixões, Lisbon, Setúbal and Sines were compared against
Thessaloniki and Piraeus, the largest multipurpose Greek seaports. Both CCR and BCC models
were used. Input orientation was justified by the public nature of seaports, which are required to
accept traffic as offered. Under this line of thinking outputs were taken as exogenous and inputs
as endogenous. The adopted output measures were the number of ships, tons of moved freight,
tons of handled cargo and tons of containerized cargo. The inputs were the number of
employees and the book value of assets. Two seaports were found to be inefficient under the
CCR model, Setúbal and Thessaloniki. However the former presented only scale inefficiency
since it was efficient under the BCC model. Furthermore these two ports were also the only
ones to have increasing returns to scale while all the others positioned themselves in the
constant returns to scale part of the frontier.

50
3.4 MODEL SPECIFICATION
The choice of inputs and outputs is a critical decision when performing an efficiency evaluation.
Different variables originate different results. One must ensure that the model results are
actually pointing in the right direction. An incorrect or less scrutinized choice of variables may
induce biased results. In this study this choice was especially difficult because the previous
literature is scarce. In addition, this literature focuses mainly on container terminals efficiency
and not on the port as a whole as this study does. There was a clear option to consider all cargo
types instead of only containerized cargo since most of the Portuguese ports are multipurpose
and some do not handle containerized cargo at all, such is the case of Aveiro.
Cullinane et al. (2004) state that the objectives of a port should be considered when defining
inputs and outputs. For instance, if the objective of a port is to maximize its profits, then the
number of employees can be an input variable. However, if the objective of a port is to increase
employment, then labour can be regarded as an output.
The analysed seaports have different objectives but, given that this study concerns the
performance measurement of the Portuguese seaports, it was established that variables should
be defined accordingly with the objective of the Portuguese seaports. It is assumed that given
the public nature of Portuguese seaport system, its objective is to support economic growth at
the national level. How can one measure the economic growth promoted by seaport
operations? It is not feasible to isolate the seaport contribution to GDP growth of all the other
factors that influence it. Following conventional economic wisdom it is assumed that the best
way a seaport can promote economic growth is by maximizing cargo and passenger traffic while
maintaining the lowest possible costs.
The following procedure was adopted in the variable selection in order to introduce as much
objectiveness as possible. Firstly, all inputs, outputs and the number of times they were found in
the literature review were listed. Table 11 resumes this step. Secondly, each of these possible
inputs and outputs was scrutinized and its significance thoroughly analysed in accordance with
the port objectives stated above. It was also defined the considered unit for each variable.
Thirdly, it was verified which ones of the pre-selected inputs and outputs where actually
obtainable in the available data sources.

51
Table 11 - Inputs and outputs used on previous studies
Inputs Frequency Outputs Frequency
Number of Cranes, berth cranes; yard cranes, straddle carriers
12 Cargo throughput 7
Terminal area 8 TEUs handled 7
Number of employees; manpower
8 Ship calls 6
Berth length; terminal length 6 Movement of freight 3
Book value of assets 3 Tons of containerized cargo 3
Number of berths 2 Tons of dry bulk cargo 3
Number of tugs 1 Tons of liquid bulk cargo 3
Container berth length 1 Tons of break bulk cargo 2
Number of container berths 1 Ship working rate 2
Berthing capacity (number of vessels)
1 Users satisfaction 2
Cargo handling capacity (tons)
1 Revenue 2
Delay time 1 Level of service 1
Cargo uniformity 1 Number of containers 1
Investment 1 Number of containers smaller than 20 feets
1
Equipment costs 1 Passengers 1
Operating costs 1 Market share 1
Labour expenditure 1 Ship gross tonnage GT 1
Depreciation charges 1 Net income 1
Other expenditures (besides labour expenditure and depreciations charges)
1 Revenue from the rent of port facilities
1
Capital 1
3.4.1 Outputs
Total cargo throughput is one of the two most frequent output measures. It was found seven
times on previous studies. Besides, it is consistent with the objective definition above. However
it has some drawbacks as well. Seaports handle several different types of cargos, usually
through different terminals. It is undoubtedly less costly to handle a ton of liquid bulk than a ton
of general conventional cargo. On a liquid bulk transfer, the ship is connected to shore through
a direct link to the pipeline and the cargo is loaded or unloaded through pumping at high ton per
hour rates. This process requires almost no human intervention. Conversely, conventional
general cargo requires high labour intensity and has slow rates of loading and unloading. An
evaluation considering total cargo throughput would inevitably deem ports specialized in liquid
bulks as very efficient while regarding the multipurpose ones as inefficient. This formulation

52
would encourage seaports to handle only the cargo types that are less costly to move, in order
to achieve higher efficiency scores. However, this would be highly undesirable as it hinders
economic activities that require other cargo types. Seaports should act in a demand responsive
way and this should be encouraged through efficiency measures pointing in the right direction.
Therefore it was established that the cargo output ought to be measured on a disaggregated
basis.
Having established this rationale it was necessary to define the detail level to which handled
cargo would be classified. This choice involves the following trade-off, a highly detailed level of
cargo classification would better reflect the diversity of cargos but it would originate a large
number of outputs. Some statistics classify cargos in more than 60 categories. Using this
amount of variables would be totally unfeasible due to DEA implementation restraints. Banker et
al. (1989) recommend, as a general rule of thumb in the implementation of DEA, that the
number of DMUs ought to be more than three times the number of input plus output variables.
Hence, a high number of variables would require a very large sample in order to have reliable
results. It was necessary to find an equilibrium point between the number of variables and the
feasibility of the DEA implementation. This equilibrium point was set by considering five types of
cargo – conventional general cargo, containerized cargo, ro-ro cargo, dry bulk and liquid bulk.
Containerized cargos are all cargos stowed inside ISO standard dimension containers. These
are generally 20 foot long (6.1 meters) or 40 foot long (12.2 meters). Containers are usually
transported in specialized container ships and efficiently handled in specialized container
terminals. Containerization greatly reduced cargo handling costs thus lowering total shipping
costs. Intermodal transportation relies heavily on containers as handling procedures between
transport modes are swift and inexpensive.
Conventional general cargos are unitized goods which are impossible or troublesome to
transport in containers. Typical cargos of this type are logs, coils and rocks. Containers smaller
than the ISO standards are usually loaded and unloaded at conventional general cargo facilities
and are accounted on this category.
Bulks are homogeneous non-unitized cargos which have no distinct form. Liquid bulk cargos
include crude, liquefied natural gas, chemical products and vegetable oils. These are usually
loaded and unloaded through pumping. Dry bulk products include cereals, iron ore, cement and
fertilizers and may be loaded and unloaded through cranes, conveyer belts and vacuum pumps.
Roll on – roll off (ro-ro) are wheeled cargos such as cars, lorries and trailers. These access the
vessel through a ramp that allows cargo to be rolled on and rolled off when in port.
Containerized cargo may be transported on trailers in a ro-ro ship. In these cases containers
were accounted as ro-ro cargo.

53
The points supporting the classification of cargos in five types are threefold. Firstly this
disaggregation level corresponds to the terminal disaggregation level. Usually there are specific
terminals to each one of these five cargo types and they are not usually handled together at the
same terminal although some exceptions exist. Some cargo terminals handle both conventional
and dry bulk cargo. Secondly there is a relatively low degree of substitution1 between them.
Thirdly, in a more pragmatic perspective, this cargo classification is rather common in European
seaport statistical reports which allowed the inclusion of a larger number of seaports in the
analysis.
Due to the frontier characteristics of DEA, a higher number of variables is associated with a
higher number of efficient DMUs. Hence, high number of variables diminishes the usefulness of
the DEA analysis. If too many variables are adopted in relation to the sample size, all the DMUs
may appear to be efficient in the analysis. This is highly undesirable as it makes the analysis to
be useless. Therefore it is advisable to consider as less variables as possible in order to avoid
too much DMUs to appear as efficient. One of the most direct ways of reducing variables would
be to consider only aggregated general cargo instead of containerized, ro-ro and conventional
general cargo. Reasons for this choice are that these cargos do have real marginal substitution
rates and it is technically possible to ship most of the transported goods in any of these cargo
types. For instance, a light vehicle is usually transported as ro-ro cargo, though it may be
transported as conventional general cargo or inside a container as containerized cargo. The
same occurs for a container which can be handled in through a conventional cargo crane or be
transported over a trailer in a ro-ro vessel. Although technically possible, in reality the
substitution margin of these types of cargos is usually very low because for each type of good
there is a certain cargo type that presents a considerably higher productivity level and therefore
much lower costs. A VRS input oriented model was run for comparative purposes using general
cargo as a single output instead of containerized, ro-ro and conventional general cargos. Its
results are presented and discussed in section 4.4.4.
Downstream of the output definition there was the need to decide how to measure each of
these variables. Firstly there was the possibility to either measure the real quantity of cargo
moved or the ships capacity calling in at the port as in some of the previous studies. Ships
capacity is usually measured in gross tonnage (GT) or dead weight tonnage (dwt). This study
measures the real quantities of cargo. Ships dimensions may be used as a proxy variable for
the quantities of cargo but it would be senseless to use a proxy variable when the variable itself
is available. It might be argued that a port would benefit of having large vessels calling in.
Nevertheless, in this study it was assumed that the port objective is to effectively handle cargo
and not to receive large vessels. Secondly it was necessary to define the units for each type of
1 Mankiew (2004) defines substitutes as two goods for which an increase in the price of one leads to an increase in the
demand for the other. In this case the concept is applied to services instead of goods.

54
cargo. Conventional general cargo, dry and liquid bulks are usually only stated in tons.
However, for containerized and ro-ro cargo, figures in TEU and units are frequently available.
TEU stands for twenty-foot equivalent unit and is defined as the volume equivalent to that
occupied by one ISO twenty-foot container. An advantage of TEU measurement is the fact that
it better reflects the operational requirements over the container terminals than tonnage since
some empty and half loaded containers have to be moved. A common productivity measure of
container terminal is the number of lifts per hour, but one may argue that a large share of
containers in our days are ISO forty-foot containers, equivalent to two TEU. Therefore, even
TEU measurement does not precisely reflect the number of lifts. Anyhow, this study uses
tonnage as containerized cargo measurement unit based on the following rationale. The port’s
objective is to move as much cargo as possible. If containerized cargo is measured in TEU it
would be the same for a port to move a full container or an empty one as both count as a TEU.
In this study view empty containers are a source of inefficiency that should be minimized. TEU
measurement does not distinguish empty from full containers and therefore would not provide
reliable results.
Ro-ro traffic was found to be measured in several different ways besides tonnage. Usually each
country has a specific way of measuring it. There are classifications by cargo nature, heavy or
light vehicles and trailers or self propelled units. Since tonnage statistics were available to all
ports they were clearly the most adequate.
Frequently seaports serve not only cargo but passengers as well. Depending on their location
seaports may receive a significant ferry or cruise passenger traffic. This involves the creation
and maintenance of infrastructure and services justifying the inclusion of passenger as an
output variable. Initially it was pondered whether to separate cruise passengers from the rest of
the passengers (ferries and scheduled lines). However data on this particular point is frequently
reported only at the aggregate level.
Ship calls was the third most frequent output on previous studies. However there is not a clear
relationship with the ports objectives. It is questionable if there is any benefit in a higher number
of ship calls if there is no throughput increase. Arguably the only advantage would be a more
reliable and frequent service. This potential advantage was not considered to be enough to add
another variable to the model as it would decrease results quality.
Quality of service indicators such as user satisfaction and ship working rate were not included.
In this study it is assumed that there is enough competition among European seaports so that in
the case of a port providing substandard service there is the possibility to use another port.
Under this assumption substandard ports would have their throughputs reduced and therefore
55
the lack of service quality would already be reflected by the results without the need to include
extra variables that would reduce the results quality.
Revenues, net income and market share were not adopted on the basis that conforming to the
public service perspective previously stated, focus should be on reducing costs instead of
increasing profits or revenues.
3.4.2 Inputs
Terminal area and the number of equipments such as berth cranes, yard cranes and straddle
carriers were the two most frequent inputs adopted in previous studies. This is due to the fact
that the majority of these studies focus only on container cargo. These variables are not so
relevant to other types of cargo or passengers. Terminal area is irrelevant in terms of liquid bulk
as liquid bulk facilities may consist of advanced platforms or piers which require negligible
areas. In addition only counting the number of equipments fails to capture important
characteristics of these inputs. Investing in state of the art equipment is significantly different in
terms of costs than buying used equipment. Even if only container traffic was analysed, as most
studies do, it would not be fair to admit that a port operating with two smaller cranes is less
efficient than other one which chose to invest in a larger crane two times more expensive.
Considering the number of cranes would benefit the latter. None of these variables was used in
this research.
The number of employees is also a very frequent variable. However existing data is usually
quite incomplete, usually only Port Authorities report their employees but most of the stevedore
work is usually provided by the concessionaires. Several proxy variables have been used to
estimate labour since available data is often incomplete, unreliable or inexistent. Considering
the number of employees while disregarding outsourcing costs would be unfair to ports with
lower outsourcing levels. Besides there is not enough standardization in the accountancy of port
employees in order to use it as a reliable variable.
Book value of assets is a very relevant measure and it would be highly advisable to use it as an
input if reliable data was available. Port assets are quite difficult to evaluate and procedures
vary from country to country and even at a national level. Some years ago Portuguese port
assets were re-evaluated and their book value of assets had a significant change. These factors
make it a very unreliable variable to consider.
Given the objective statement of reducing costs it was logical to deem costs as inputs. This
option has several advantages, being the most important that it correctly reflects several inputs
without favouring certain managerial options that are not directly related to performance. For
example, considering costs instead of labour or the number of cranes does not favour

56
outsourcing or using only one large yard crane instead of two or more smaller ones except if
these managerial options actually promote cost reductions.
If cost actually reflects land inputs is a more controversial question. In several of the previous
studies this input was directly measured through terminal area. Most of the terminals are
situated on reclamation areas from the sea or river beds which involved substantial
investments. Therefore, it is assumed that depreciation costs do reflect the land input.
Similarly to cargo throughput, also with the costs input was necessary to face a trade off
between detail and the number of input variables. It was chosen to aggregate costs in
operational expenses (OPEX) and capital expenses (CAPEX). Table 12 shows the items
included in OPEX and CAPEX. Albeit there are slight differences in accountancy reports from
country to country, the items included in each of the inputs were similar. This study did not
include taxes in any of the inputs as it was found that the different national taxation systems
would unfairly affect results.
Table 12 - Input definition
OPEX – Operational expenses CAPEX – Capital expenses
� Cost of goods sold and raw materials consumed;
� Supplies and external services � Personnel costs
� Depreciation; � Provisions; � Financial costs; � (does not include taxes).
Some ports were found to have significant extraordinary costs. In most of the accountancy
reports the detail level was not enough for a clear separation between extraordinary operational
and extraordinary capital expenditures. In these cases an extraordinary expenditure was
pondered and added to OPEX and CAPEX as shown in equation 3 and 4. OPEX’ and CAPEX’
are the final values introduced in the model and EXTRA is the total extraordinary expenditure.
EXTRACAPEXOPEX
OPEXOPEXOPEX *'
++= (Equation 6)
EXTRACAPEXOPEX
CAPEXCAPEXCAPEX *'
++= (Equation 7)

57
Using monetary variables as inputs created the need for a harmonization procedure between
countries. The annual reports of each port reported their expenditures in their own national
currency. The implementation of the DEA model required these currencies to be converted into
the same scale. In order to accomplish this, two optional procedures were considered. The first
was to convert all non euro costs into euros based on the going exchange rate. The second was
to ponder costs by the OECD Purchase Power Parity (PPP) national index. According to the
OECD – PPP website1:
“Purchasing Power Parities (PPPs) are currency conversion rates that both convert to a common currency and equalise the purchasing power of different currencies. […] PPP are both price deflators and currency converters, since they eliminate differences in price levels between countries in the process of conversion.”
PPP conversion rates are based on a basket of goods and services covered by the national
GDP. For these products market prices are registered in each country. Based on this
information a weighted average is computed in a way that a certain amount of converted
currency will buy the same amount of this basket of goods and services in any country.
Conversely the national currency needed to purchase a certain amount of goods and services
would equal the same amount when converted through PPP.
This index has several drawbacks when applied in the port context. The main one is that it
assumes that all expenditure is made on the internal national market. While that may be realistic
in terms of individuals it is dubious in terms of ports. Internal market prices may be reflected in
terms of labour costs but not in other significant expenditures such as machinery. It is perfectly
expectable for a seaport to buy machinery abroad if prices under exchange rate conversion are
cheaper.
Both exchange rates and PPP have advantages and drawbacks as seen above. In this study
European Central Bank bilateral exchange rates, of 30 December 2005, were used to convert
non euro currencies into euros. It is assumed this is not an uncontroversial option and a PPP
input converted model was run for comparison purposes. Results of this model are compared
with the exchange rates model in the Results section.
Correlation between input and output variables is a way of verifying to which extent input
consumptions do explain output levels and vice-versa. Pearson’s correlation values between
input and output were all positive. Containerized cargo has high correlation values (>0.8) for
both inputs. CAPEX is also highly correlated with dry and liquid bulk cargos. Passenger traffic
was the least correlated input with OPEX and CAPEX correlation coefficients of 0.2 of 0.023
respectively. Table 13 presents Pearson’s correlation coefficients of input and output variables.
1 OECD PPP website: http://www.oecd.org/searchResult/0,3400,en_2825_495691_1_1_1_1_1,00.html

58
Table 13 - Input and output Pearson’s correlation coefficients
Conventional Containerized Ro-ro Dry bulk
Liquid bulk
Passengers
OPEX 0.611 0.877 0.344 0.643 0.710 0.209
CAPEX 0.551 0.864 0.265 0.848 0.904 0.023
3.4.3 Models, Orientation and Data
Since the early days of DEA, with the CCR and BCC, many other models have been developed.
Usually these new models consider additional theoretical hypothesis or solve some
implementation issues but they are only applied a few number of times. The number of studies
and papers using the initial CCR and BCC is largely superior to the ones using any other of the
newest models. This study aims at developing a standardized methodology for seaport
performance evaluation. For this to be achieved the methodology should be as robust and
reliable as possible. Therefore the core analysis was performed using only the most validated
models, CCR which assumes Constant Returns to Scale (CRS) and BCC which assumes
Variable Returns to Scale (VRS). However in the results discussion a Super-Efficiency model
was used in order to provide a deeper insight. All models were run using the DEA Excel Solver
software, Zhu (2003).
As explained in section 3.1 efficiency can be measured either in an input or an output oriented
way. DEA allows for this orientation to be considered in the results. The port objective was
stated above to be the handling of the maximum cargo and passengers with the minimum
possible costs. If the input orientation is adopted the focus will be in cost reduction while if the
output orientation is considered then the focus will be in throughput maximization.
In this study view seaports are providing a public service. This means that seaports should
provide port services to whoever requires them with the required quality of service. Seaports
should act in a demand responsive way and not the opposite, this means that they should
provide for the existent and potential demand of port services instead of creating new
infrastructure in the hope to originate new demand by themselves. Henceforth it is assumed that
ports should focus in cost reduction. Based on this rationale an input orientation was chosen in
this analysis.
Forty one seaports from eleven European countries were analysed, all of them belonging to the
European Union except Norway. The UE countries were Portugal, Belgium, Denmark, France,
Greece, Poland, Spain, Sweden, the Netherlands and the United Kingdom.
This analysis evaluates the seaports performance during the year of 2005. In terms of data
collection a great care was put on gathering data as reliable as possible. Most of the data was
directly gathered from the annual reports of the respective Port Authorities. However for some

59
of the seaports it was not possible to find some of the required cargo or passenger figures. In
these few cases missing figures were withdrawn from EUROSTAT webpage. A previous data
comparison between Port Authorities publications and EUROSTAT showed that the latter was
reliable in the cases were the data was already available in the Port Authorities publications.
The statistics of each variable are shown in Table 14.
Table 14 – Variable statistics
OPEX CAPEX
Convent. general cargo
Contain. cargo
Ro-ro cargo
Dry bulk
Liquid bulk
Passengers
103 euros 10
3 euros 10
3 tons 10
3 tons 10
3 tons 10
3 tons 10
3 tons 10
3 pass.
Average 36435 15602 1927 7015 3247 8338 12036 2682
Median 20585 9246 509 658 894 3224 1729 285
Std. Dev. 45740 23038 3358 18425 6653 15765 27470 6068
Minimum 2820 1000 16 0 0 67 0 0
Maximum 222577 144331 17853 91090 36644 89446 171323 29929

60
3.5 RESULTS
3.5.1 Model results
As established above both input oriented constant returns to scale (CRS) and variable returns
to scale (VRS) models were used. From now on they will be stated by their abbreviation. In the
case that no specific model is stated then the results from the VRS model are being referred,
since VRS was deemed as the base model.
Usually previous studies such assumed that the VRS score measures pure technical efficiency
(PTE) while the CRS score measures technical efficiency TE. Scale efficiency could be obtained
by the ratio of TE to PTE. However in this study inputs were included as costs, therefore CRS
and VRS scores consider allocative efficiency besides TE and PTE. However it is still possible
to compute scale efficiency as shown in equation 8.
SEAEPTE
AESEPTE
AEPTE
AETE
VRS
CRS=
⋅
⋅⋅=
⋅
⋅= (Equation 8)
The VRS model highlights fourteen ports as efficient (Lisbon, Amsterdam, Antwerp, Calais,
Dover, Ferrol-San Cibrao, Larvik, London, Milford Haven, Piraeus, Rotterdam, Szczecin-
Swinoujscie, Valencia and Zeeland). The CRS model results show Amsterdam and Rotterdam
to be inefficient, therefore only the other 12 ports turned up to be efficient under this model.
Both the average and the median of the VRS scores are superior to the CRS ones as shown in
Table 15. This was expectable since CRS scores disregard scale efficiencies, otherwise it would
indicate inconsistent results. A small skewness and close mean and median values indicate an
approximate symmetrical distribution. There is a high linear association between both model
results, as the correlation coefficient is near 1, due to relatively high scale efficiencies.
Table 15 - Descriptive statistics of the efficiency scores
Statistics VRS CRS
Average 0.723 0.644
Median 0.765 0.641
Std. Deviation 0.261 0.287
Skewness -0.194 0.061
Minimum 0.244 0.216
Maximum 1.00 1.00
Pearson correlation 0.980
From the Portuguese ports only Lisbon was found to be efficient. The results discussion below
shows that this is mainly due to an exceptional high volume of passenger traffic going through it

61
as shown in Figure 18. Other ports with significant passenger traffic are Piraeus, Dover, Calais
and Stockholm.
0
5
10
15
20
25
30
35
Lisbon Piraeus Dover Calais Stockholm Balears Tenerife Goteborg Barcelona Roterdam
(106 passengers)
Figure 18 - Seaports with the highest passenger traffic
On the VRS analysis Aveiro was the second best Portuguese port with a score of 0.456 and
ranked 33rd
. Sines ranked 36th with 0.391. Leixões and Setúbal were 38
th and 40
th with scores of
0.385 and 0.364 respectively. The CRS model efficiency scores were lower. However all
Portuguese seaports climbed some positions in the ranking, except Aveiro that lowered to 36th
(0.336) ranking between Leixões 35th (0.341) and Setúbal 37
th (0.329). Sines had the greatest
increase ranking 31st with a CRS score of 0.360. Better positions in terms of CRS than VRS
show that scale is not a major cause for underperformance in the Portuguese port system. Only
Aveiro presented significant scale inefficiency with 0.737 scale efficiency score. All the
Portuguese seaports, except Lisbon, were in the lower ten places, both in the VRS as in the
CRS models.
Most of the seaports presented relatively high scale efficiencies. Vilagarcia (0.225), Marin
(0.409), Amsterdam (0.505) were the three ports most affected by scale. Figure 19 compares
CRS, VRS and scale efficiency (SE) scores of the 41 analysed seaports. Annex 2 lists their
values.

62
0.0 0.1 0.2 0.3 0.4 0.5 0.6 0.7 0.8 0.9 1.0
Zeeland
Vilagarcia
Vigo
Valencia
Thessaloniki
Tenerife
Tarragona
Szczecin-Swinoujscie
Stockholm
Santander
Roterdam
Piraeus
Passajes
Milford Haven
Marín
London
Las Palmas
Larvik
Huelva
Goteborg
Gijon
Ferrol-San Cibrao
Dover
Copenhagen Malmo
Castellon
Cartagena
Calais
Cadiz
Bilbao
Barcelona
Balears
Arhus
Antwerp
Amsterdam
Alicante
A Coruna
Sines
Setúbal
Lisbon
Leixões
Aveiro
CRS VRS SE
Figure 19 - CRS, VRS and SE scores

63
DEA provides efficient targets both for inputs and outputs. Targets for the Portuguese ports are
depicted in Table 16. It is important to mention that in the seaport sector output targets may look
like a theoretical abstraction since it is not the seaports role to generate cargo. However, it is in
their power to considerably cut costs if they focus on the best practices of their peers and
emulate them. Therefore this study considers the input efficient targets as primarily relevant. As
an efficient DMU, Lisbon port targets are the same than its actual values.
Table 16 - Efficient input and output targets under the VRS model
OPEX CAPEX Convent. general cargo
Contain. cargo
Ro-ro cargo
Dry bulk
Liquid bulk
Passengers
103 euros 10
3 euros 10
3 tons 10
3 tons 10
3 tons 10
3 tons 10
3 tons 10
3 pass.
Aveiro 3222 (7072)
1941 (4786)
1376 (1376)
527 (0)
739 (0)
2669 (1416)
2717 (536)
558 (0)
Leixões 9142 (23775)
5257 (13672)
2022 (487)
3539 (3539)
1259 (9)
4315 (2309)
7714 (7714)
465 (18)
Lisbon 29390 (29390)
16652 (16652)
438 (438)
4040 (4040)
11 (11)
5202 (5202)
1608 (1608)
29929 (29929)
Setúbal 5199 (14273)
2276 (6247)
1212 (1212)
570 (113)
716 (379)
3224 (3224)
1980 (1717)
1442 (1442)
Sines 7382 (18863)
6190 (15816)
4466 (29)
777 (658)
1886 (0)
11712 (5801)
18552 (18552)
255 (0)
Note: inside the parenthesis are the 2005 values
3.5.2 Aveiro
In order to reach the efficient frontier Aveiro would have to reduce its total expenditure from the
actual 11,858 thousand euros to 5,163 thousand euros. This is a cost reduction of about 56%.
Looking at disaggregated expenditures Aveiro should point to an optimal OPEX value of 3,222
thousand euros and a CAPEX of 1,941 thousand euros. In a more theoretical perspective it
could pursue efficiency through output increase to the levels shown in Table 16. However this
seaport does not have infrastructures for passenger and container traffic and creating new ones
would lead to a severe increase in costs.
The seaports used as benchmark for Aveiro were Larvik with a weight of 0.895 and Zeeland
with 0,105. Larvik had quite lower costs with an OPEX of 2,820 thousand euros and a CAPEX
of 1,000 thousand euros. It handled smaller volumes of conventional general cargo, liquid bulk
and dry bulk than Aveiro though it benefited from throughputs in containerized cargo (449
thousand tons), ro-ro cargo (455 thousand tons) and reasonable passenger traffic (623
thousand passengers). Aveiro did not provide any of the former throughputs. Conversely to
Larvik, Zeeland had almost the double of Aveiro’s CAPEX and a similar OPEX. Nonetheless it
handled largely superior volumes of cargo in all categories. Especially liquid bulk with an annual
throughput of 25 million tons, that is about 50 times superior to Aveiro’s throughput.

64
3.5.3 Leixões
The input efficient targets of Leixões are an OPEX of 9,142 thousand euros and a CAPEX of
5,257 thousand euros. The real input values were of 23,775 thousand euros and 13,672
thousand euros respectively. Thus if Leixões had performed efficiently it would have been able
to save about 23 million euros. With a focus on output maximization Leixões should aim for
throughput increases of 1535 thousand tons in conventional general cargo, 1250 thousand tons
in ro-ro cargo and 2013 thousand tons in dry bulk. It would also have to increase traffic in 447
thousand passengers to perform efficiently. Both containerized cargo and liquid bulk
throughputs were at efficient levels.
Leixões peers were Larvik (0.629), Zeeland (0.150), Valencia (0.120) and Milford Haven
(0.102). Larvik had much lower costs than Leixões. Although, the latter handles considerably
larger containerized cargo, dry and liquid bulk volumes. Zeeland total expenditure was less than
half of Leixões. OPEX was substantially low amounting only to 6,649 thousand euros. It handled
substantial throughputs of conventional general cargo (8,123 thousand tons), ro-ro cargo (3,158
thousand tons) and over 20 million tons of both dry and liquid bulk. Leixões surpassed it in
terms of passenger traffic and containerized cargo. Leixões container throughput and
passenger traffic are expected to rise in the short and medium term respectively. The former will
benefit of the enlargement of the draw bridge allowing panamax container vessels access to the
terminal. The latter will benefit from the projected new cruise terminal. Valencia had costs about
a third higher than Leixões though it handled much higher volumes of all cargo types except
liquid bulk. The throughput differential is especially significant in the containerized cargo as
Valencia handled about seven times the cargo volume of Leixões. Valencia served 335
thousand passengers against 18 thousand of Leixões. Milford Haven had a similar OPEX value
but a much lower CAPEX of 4,407 thousand euros. Regarding outputs it moved a very high
volume of liquid bulk, in absolute terms, and had a high level of passenger traffic relatively to
Leixões. Nevertheless it did not handle containerized cargo and had a much lower throughput of
conventional general cargo.
3.5.4 Setúbal
Setúbal had an OPEX efficient target of 5,199 thousand euros and CAPEX of 6,247 thousand
euros. This would imply a reduction of 9 million euros in OPEX and 4 million more in CAPEX.
Three outputs were at efficient levels, namely conventional general cargo, dry bulk and
passengers. Reaching the efficient frontier in terms of output would imply a containerized cargo
throughput of 570 thousand tons, against the actual value of 113. Ro-ro would have to almost
double to 716 thousand tons but liquid bulk would only have to increase about 200 thousand
ones to 1,980 thousand tons, which is approximately a 15% increase.
65
Setúbal peers were Larvik with a weight of 0.772, Ferrol-San Cibrao with 0.081, Zeeland with
0,070, Szczecin-Swinoujscie with 0.046 and Lisbon with 0.031. Regarding OPEX Ferrol-San
Cibrao, Larvik and Zeeland had much lower values than Setúbal while Lisbon and Szczecin-
Swinoujscie had about the double amount. Larvik had the lower OPEX with 2,820 thousand
euros while Setúbal had an OPEX of 14 million euro.
Concerning CAPEX Setúbal, with 6 million euros, was below Lisbon (16,652 thousand euros)
and Zeeland (9,962 thousand euros); and above Ferrol-San Cibrao (2,559 thousand euros),
Szczecin-Swinoujscie (1,914 thousand euros) and Larvik (1,000 thousand euros).
In terms of conventional general cargo Szczecin-Swinoujscie and Zeeland with throughputs of
2,863 and 8,123 thousand tons respectively largely doubled Setúbal’s 1,212 thousand tons.
Lisbon, Ferrol- San Cibrao and Larvik handled about half of Setúbal’s volume.
Lisbon’s containerized cargo throughput largely surpassed the volumes of all the other peers.
Only Ferrol-San Cibrao handled a lower volume of containerized cargo than Setúbal’s 113
thousand tons. This may change with time since Setúbal’s container operations have recently
started.
Setúbal handled 379 thousand tons of ro-ro cargo. It is the Portuguese leader in terms of ro-ro
cargo, but both Szczecin-Swinoujscie and Zeeland, with throughputs of 2,809 and 3,158
thousand tons respectively, handled significantly larger amounts. This may be due to the fact
that Setúbal handles mostly cars from the auto industry conglomerate nearby. Cars are a
relatively low density good and Setúbal would probably beneficiate if ro-ro cargo was accounted
in units instead of tonnage.
In terms of dry bulks all the other ports, except Larvik, handled much greater throughputs.
Zeeland with its 22,020 thousand tons had a significant edge over all the other peers. The new
concessions in the Port of Setúbal concern dry bulk cargo so it is expectable that this cargo type
throughputs will expand in the years to come.
Regarding liquid bulk, Setúbal had a higher throughput than all its peers except Zeeland which
moves more than ten times Setúbal’s throughput of 1,717 thousand tons. Setúbal does not have
any specific fuel or oil facility nearby. These are usually associated with high amounts of liquid
bulk throughputs.
Setúbal served 1,442 thousand passengers. It had more passenger traffic than all its peers
except Lisbon. However Lisbon has an exceptional high volume of passenger traffic.

66
3.5.5 Sines
Efficient performance would lead to a reduction of 11,481 thousand euros in OPEX and 9,626
reduction in CAPEX. Hence a total of 20 million euros would have been saved if Sines
performed efficiently during 2005. Looking at the outputs the target of conventional general
cargo throughput is 4,466 thousand tons. Containerized cargo would perform efficiently with a
777 tons cargo throughput. Thus, only a 15 % increase would be enough. This value was
largely exceeded in 2006 as Sines’ terminal XXI handled about 1,400 thousand tons of
containerized traffic. This increase was expectable since the container terminal started
operations during 2005. Other output efficient targets pointed towards 1,886 thousand tons of
ro-ro cargo, 11,712 tons of dry bulk cargo and 255 thousand passengers. The latter is not easily
attainable since there are no passenger infra-structures in Sines.
Sines had three peers, namely Zeeland with a weight of 0.525, Larvik with 0.333 and Milford
Haven with 0.525. All peers had significantly lower expenditures than Sines, except Milford
Haven which had a slightly superior OPEX. Zeeland although operating with lower costs has
higher outputs levels in all types of cargo and passengers. Therefore, Sines should focus in this
port as a role model since it exceeds it in every aspect. Larvik had the highest output level in
terms of conventional general cargo, ro-ro and passengers. However, dry and liquid bulk
throughputs of Sines were significantly superior. Milford Haven had an exceptionally high liquid
bulk throughput in absolute terms, about two times the one of Sines which was already
considerably high. In addition, Milford Haven handles a significant volume of ro-ro cargo, 534
thousand tons, and passenger traffic of 623 thousand passengers. Sines was superior in terms
of container and dry bulk cargo volume.
Table 17 summarizes the efficient peers of Portuguese seaports and their respective weights.
Both Larvik and Zeeland were peers of every seaport, except of Lisbon which was efficient.
Lisbon is a peer of Setúbal, although with a very small weight.
Table 17 – Peers and respective weights of the Portuguese seaports
Ferrol -
San Cibrao Larvik Lisbon
Milford Haven
Szczecin-Swinoujscie
Valencia Zeeland
Aveiro - 0.895 - - - - 0.105
Leixões - 0.629 - 0.102 - 0.120 0.150
Setúbal 0.081 0.772 0.031 - 0.046 - 0.070
Sines - 0.333 - 0.141 - - 0.525
3.5.6 Geographical analysis
Ports were grouped on the basis of their geographical location and average efficiencies were
computed. Based on these results it was verified that Southern European ports present average
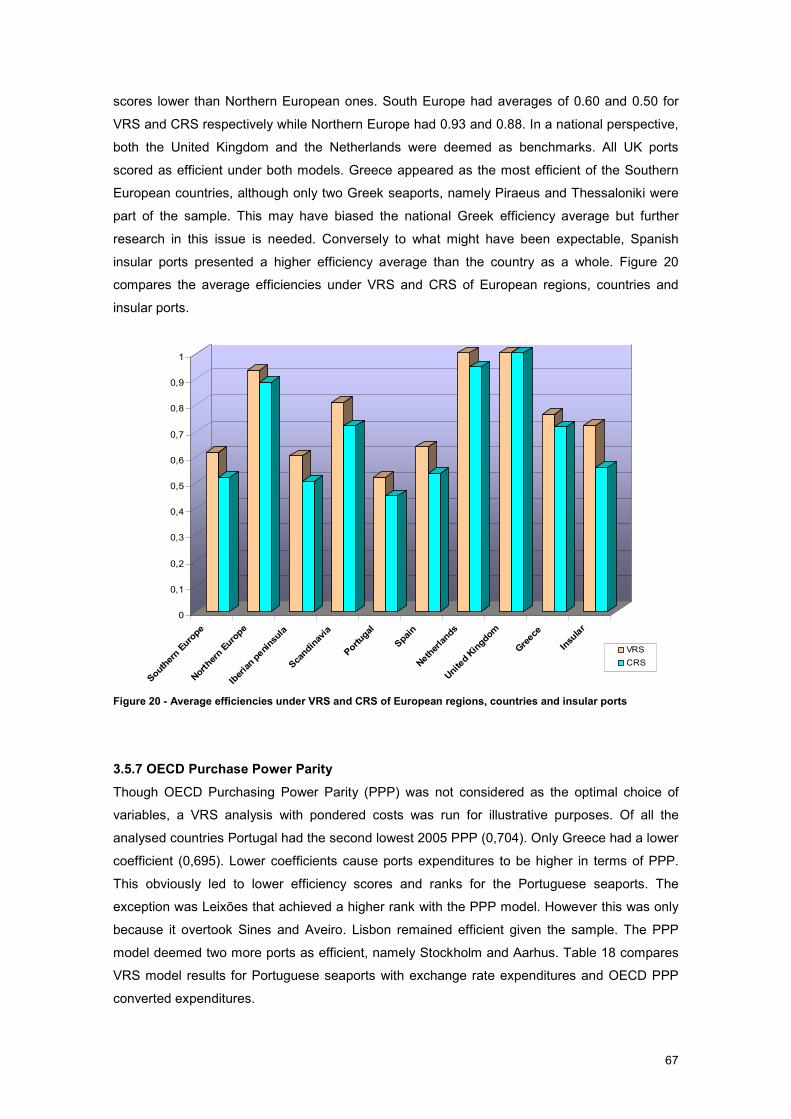
67
scores lower than Northern European ones. South Europe had averages of 0.60 and 0.50 for
VRS and CRS respectively while Northern Europe had 0.93 and 0.88. In a national perspective,
both the United Kingdom and the Netherlands were deemed as benchmarks. All UK ports
scored as efficient under both models. Greece appeared as the most efficient of the Southern
European countries, although only two Greek seaports, namely Piraeus and Thessaloniki were
part of the sample. This may have biased the national Greek efficiency average but further
research in this issue is needed. Conversely to what might have been expectable, Spanish
insular ports presented a higher efficiency average than the country as a whole. Figure 20
compares the average efficiencies under VRS and CRS of European regions, countries and
insular ports.
0
0,1
0,2
0,3
0,4
0,5
0,6
0,7
0,8
0,9
1
Southern Europe
Northern Europe
Iberian peninsula
Scandinavia
Portugal
Spain
Netherlands
United Kingdom
Greece
Insular
VRS
CRS
Figure 20 - Average efficiencies under VRS and CRS of European regions, countries and insular ports
3.5.7 OECD Purchase Power Parity
Though OECD Purchasing Power Parity (PPP) was not considered as the optimal choice of
variables, a VRS analysis with pondered costs was run for illustrative purposes. Of all the
analysed countries Portugal had the second lowest 2005 PPP (0,704). Only Greece had a lower
coefficient (0,695). Lower coefficients cause ports expenditures to be higher in terms of PPP.
This obviously led to lower efficiency scores and ranks for the Portuguese seaports. The
exception was Leixões that achieved a higher rank with the PPP model. However this was only
because it overtook Sines and Aveiro. Lisbon remained efficient given the sample. The PPP
model deemed two more ports as efficient, namely Stockholm and Aarhus. Table 18 compares
VRS model results for Portuguese seaports with exchange rate expenditures and OECD PPP
converted expenditures.

68
Table 18 - VRS model results for Portuguese seaports (with exchange rate and OECD PPP expenditures)
Base Model OECD PPP Seaport Efficiency Rank
Seaport Efficiency Rank
Lisbon Efficient - Lisbon Efficient -
Aveiro 0.456 33 Leixões 0.320 37
Sines 0.391 36 Aveiro 0.308 38
Leixões 0.385 38 Setúbal 0.306 39
Setúbal 0.364 40 Sines 0.305 40
3.5.8 Aggregated general cargo
Albeit having less two output variables than the base model, the aggregated general cargo
model deemed thirteen DMUs as efficient. From the initial fourteen efficient ports only Dover
was not deemed as efficient. Scores average and median were 0.67 and 0.58 respectively.
These were appreciably lower than the base model’s average of 0.72 and median of 0.77.
Looking at the Portuguese ports there were several changes both in ranks and efficiency levels.
Aveiro went three places up to 30th though its efficiency score was only of 0.42. Sines had the
same efficiency score than with the base model, 0.39, but beneficiated in terms of rank going up
to 32nd
. Setúbal ranked 33rd
with 0.36 efficiency. Leixões was the only Portuguese seaport to
lower both in efficiency, were it only scored 0.23, and rank where it stood as the least efficient
port. Lisbon remained in the efficient frontier under this model.
Peers of Aveiro and Sines remained the same. Leixões lost Valencia as a peer but added
London. Setúbal got one more peer, Milford Haven. Some of the Portuguese seaports targets
were different under this model. Aveiro target efficient costs decreased to 3,000 thousand euros
in OPEX and 1,421 thousand euros in CAPEX. Dry bulk was considered to be at an efficient
level while efficient level for liquid bulk decreased 1,476 thousand tons. Leixões efficient
expenditure level was severely lowered to 5,465 thousand euros of OPEX and 3,142 thousand
euros of CAPEX. For Setúbal only the liquid bulk efficient target had a significant reduction of
263 thousand tons. Sines targets were the same than before. Table 19 lists the differentials
between the base model targets and the aggregated general cargo model targets.
Table 19 - Target differences between the standard model and the aggregated general cargo model
OPEX CAPEX Dry bulk Liquid bulk Passengers Seaport
103 euros 10
3 euros 10
3 tons 10
3 tons 10
3 pass.
Aveiro 222 520 1253 1476 -36
Leixões 3677 2114 -852 0 -1
Lisbon 0 0 0 0 0
Setúbal 119 52 0 263 0
Sines 0 0 0 0 0

69
3.5.9 Variable sensitivity of efficient DMUs
The sensitivity of efficient ports to each one of the variables was tested by running models
without each one of the variables. For each of these models the efficient DMUs were checked
and compared with the ones of the base model. It was recorded if any of the efficient ports was
sensitive to a specific variable. Table 20 lists to which variables each efficient port is sensitive.
Only four of the efficient seaports were insensitive to all the variable drops: Antwerp, Larvik,
Rotterdam and Zeeland. Lisbon was deemed as inefficient when the passengers variable was
not included.
Table 20 - Variable sensitivity of efficient seaports
Seaport Variable
Lisbon Passengers
Amsterdam Dry bulk
Antwerp -
Calais Ro-ro
Dover CAPEX; Ro-ro; Passengers
Ferrol – San Cibrao OPEX; CAPEX; Dry bulk
Larvik -
London CAPEX
Milford Haven Liquid bulk
Piraeus CAPEX
Rotterdam -
Szczecin-Swinou. CAPEX
Valencia OPEX; Containerized
Zeeland -
3.5.10 Super-Efficiency and peer count
According to Anderson and Peterson (1993) a Super Efficiency analysis is performed when the
DMU under evaluation is not included in the reference set of the envelopment model. This
methodology allows for efficiency scores higher than 1 allowing for discriminate between the
performance of efficient DMUs. Besides, it is particularly useful to identify outliers. However as
the referred authors emphasizes that the efficient DMUs are not compared against the same
standard. Some efficient units may be infeasible to classify under Super Efficiency models.
A Super Efficiency VRS input oriented model was run. Four efficient DMUs were found to be
infeasible, namely Lisbon, Antwerp, Calais and Rotterdam. Zeeland scored exceptionally high
with 11.5 followed by Milford Haven with 4.6, London and Szczecin-Swinoujscie with 2.6. All
other efficient DMUs scored under 2.
Peer count indicates the number of times an efficient DMU was found to be efficient when
benchmarked against another DMU. As DEA builds the efficient frontier based on the analysed
sample, a DMU may be considered as efficient just because it is very different from all the
others analysed DMU. In a certain perspective one may say that an efficient DMU is as much
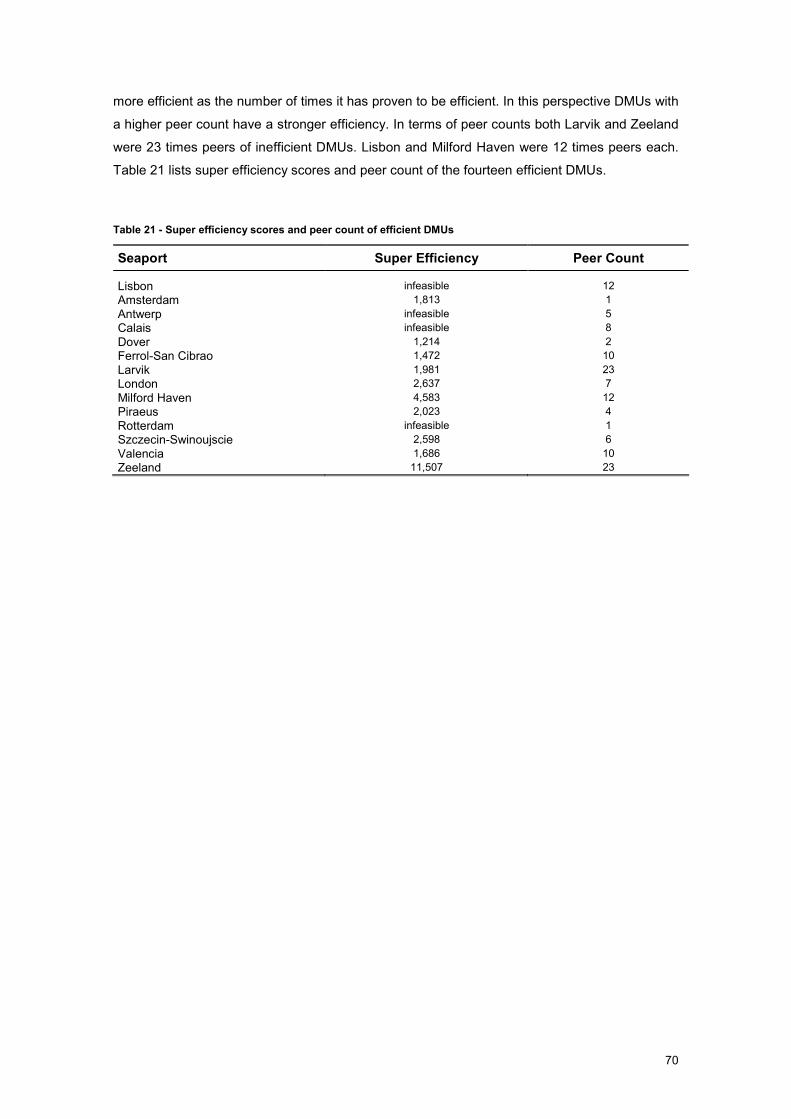
70
more efficient as the number of times it has proven to be efficient. In this perspective DMUs with
a higher peer count have a stronger efficiency. In terms of peer counts both Larvik and Zeeland
were 23 times peers of inefficient DMUs. Lisbon and Milford Haven were 12 times peers each.
Table 21 lists super efficiency scores and peer count of the fourteen efficient DMUs.
Table 21 - Super efficiency scores and peer count of efficient DMUs
Seaport Super Efficiency Peer Count
Lisbon infeasible 12
Amsterdam 1,813 1
Antwerp infeasible 5
Calais infeasible 8
Dover 1,214 2
Ferrol-San Cibrao 1,472 10
Larvik 1,981 23
London 2,637 7
Milford Haven 4,583 12
Piraeus 2,023 4
Rotterdam infeasible 1
Szczecin-Swinoujscie 2,598 6
Valencia 1,686 10
Zeeland 11,507 23

71
3.5.11 Is GDP related to port efficiency?
The relationship between national GDP per capita and seaport performance was investigated in
several ways. Both the base model and the Super Efficiency scores were used. The GDP per
capita of the analysed countries varied between 6,400 euros (Poland) and 52,500 euros
(Norway). There was a positive Pearson correlation between both model scores and GDP, but it
was higher with the base model scores. Table 22 shows the statistics of the considered sample.
The four seaports with infeasible scores (Lisbon, Antwerp, Calais and Rotterdam) were not
considered in the Super Efficiency model.
Table 22- Sample statistics
Statistics Base model GDP per capita Super Efficiency
Average 0.723 23,335 1.275
Median 0.766 20,900 0.677
Std. Deviation 0.262 8,148 1.936
Minimum 0.245 6,400 0.245
Maximum 1.000 52,500 11.507
Pearson correlation 0.403 0.266
A linear regression of the base model scores was found to have a positive slope, indicating that
higher efficiencies may be related with higher national GDPs. Figure 21 shows the linear
regression of the base model scores.
y = 12.564x + 14.249
R2 = 0.16260
10
20
30
40
50
60
0.00 0.10 0.20 0.30 0.40 0.50 0.60 0.70 0.80 0.90 1.00
Efficiency
(103 euros)
Figure 21 – Linear regression of the base model scores
The base model presented fourteen DMUs with scores equal to 1, the ones deemed as efficient.
In order to avoid these, another linear regression was made with the Super Efficiency scores,
since this model does not restrict efficient DMUs to have a score equal to 1. Again, there was a

72
positive slope but R2 was much lower. Figure 22 shows the linear regression of the Super
Efficiency scores.
y = 2.4988x + 20.426
R2 = 0.07120
10
20
30
40
50
60
0.00 2.00 4.00 6.00 8.00 10.00 12.00
Super Efficiency
(103 euros)
Figure 22 – Linear regression of the Super Efficiency scores
The Super Efficiency sample was divided in two groups. Seaports in countries with GDP per
capita higher and lower than 23 thousand euros. There were 27 seaports in the first group and
10 in the second group. The Mann-Whitney U and the Kolmogorov-Smirnov tests were used to
assess the hypothesis (H0), which was of the two groups having the same central tendency.
With a confidence interval of 95% the Mann-Whitney U test rejected the hypothesis while the
Kolmogorov-Smirnov accepted it. Table 23 shows the tests results and the procedures adopted.
Table 23 – Mann-Whitney U and Kolmogorov-Smirnov tests
Test Test Result Critical Value (5%) Decision
Mann-Whitney U -3.01 -1.96 Reject Ho
Kolmogorov-Smirnov 1.73 1.96 Accept Ho

73
4 CONCLUSIONS
4.1 CONCLUDING REMARKS
Aiming at the improvement of the seaports competitiveness a wide port sector reform was
initiated in the late nineties. After almost a decade since the beginning of the reform it is now
timely to evaluate its results. The rationale behind this reform was the belief that a competitive
environment, with greater participation of private capital in port investments and in port services
provision, would decisively contribute to the efficiency improvement and competitiveness of the
national port system. Port Authorities respecting each of the Portuguese main ports were
created with the nature of public companies and a national regulator (IPTM) was established.
Port Authorities are responsible for the attribution and monitoring of concessions in their
jurisdiction areas. Nowadays most of the cargo handling services are being provided through
concessions, however short term licences and direct provision by the Port Authorities are still
common. The opening to private operators of other port services besides cargo handling has
been slower. The pilotage service is still only provided by the Port Authorities although the
current legislation has already established the possibility of concession.
Portuguese seaports have been facing growing competition. The main reasons for the raise of
the competitive pressure are twofold. Firstly the opening of land borders inside the European
Union allows shippers to use any EU port independently of the final destination or origin of their
cargo. This created higher inter port competition. Secondly external trade origins and
destinations have changed. Nowadays Portugal trades mainly with continental European
countries instead of overseas ones. Maritime transportation, which was before the only possible
transport for the major share of the Portuguese external trade, is now competing with land
modes, primarily road haulage. In face of such competition performance measurement will
surely prove to be a priceless tool in the promotion of the Portuguese seaports modernization
and competitiveness.
The United Kingdom has the most privatized port system in the world. Most of its largest
commercial ports are completely privately owned and operated, however other port models
coexist such as trust ports and municipal ports. The UK pursues a deregulation policy where the
State does not control the seaports. They are managed as regular companies subject only to
the market forces. The government does not fund seaport infrastructure as most of the
continental European governments. UK seaport workers are only subject to the same
regulations than any other worker.
The Netherlands are part of the Hamburg – Le Havre range where most of the European major
ports are situated. Their overlapping hinterlands create a high competitive pressure in this area.
Rotterdam is the largest European port, moving more than five times the total throughput of the
Portuguese ports. The Netherlands have a high level of State intervention in the port sector.
The government directly funds infrastructural projects and gives funding priority to the

74
Rotterdam area over the rest of the country. Dutch Port Authorities usually manage vast areas
reserved for logistical and industrial purposes which are leased to private companies. All the
port services are provided by private operators except pilotage. There are some cases of
completely private ports but to a much smaller extent than in the United Kingdom.
Spain is Portugal’s only neighbouring country, therefore it is our main competitor in terms of port
services. In continental Spain there are 23 Port Authorities and the nation as a whole moved
about 374 million tons in 2005. This is of a completely different scale of operations than that of
Portugal with only five Port Authorities and an aggregated throughput of 60 million tons. Most of
the Spanish port developments were substantially funded by the EU Cohesion fund. Port
Authorities mainly fulfil the same functions as the Portuguese ones by managing the public port
assets and ensuring the provision of services through private operators. ‘Puertos del Estado’ is
the public body in charge of coordinating the local Port Authorities with the national seaport
policy. It manages the Inter Port Compensation Fund which is mainly formed by annual
contributions of the Port Authorities. It is used as a solidarity tool where the ports with higher
turnovers finance the ones with lower ones.
The EU has been gradually imposing policies and regulations which either directly or indirectly
affect seaports. Restrictive regulations concerning port and marine safety have been enforced
at a European level. These regulations are usually implemented by the Port Authorities in the
ambit of the Port state control. This places further strain on the Port Authorities and obliges
them to relevant investments and operational costs in order to effectively inspect certain pre
determined quotas of the vessels calling in at each European port. The EU policy on the
attribution of public funds has a significant influence on port developments. Most of the port
investments are dependent on the concession of European funding, especially in Southern
European countries. This implied that many of the new port developments were built not only
based on the perspectives of its commercial success but also on their attractiveness to EU
funding. Though not specifically aimed at seaports, relevant environmental regulations imposed
by the European Union such as the Birds and Habitats directives have had a major impact since
seaports are usually situated in environmentally sensitive areas. Stricter environmental
restrictions lead to higher port costs as the approval procedures to new port developments are
costlier and have a lower success rate. Besides, new port development approvals under current
EU legislation will also often require compensatory measures that increase the final investment
costs.
Performance measurement can be very effective in guiding an organization towards its
objectives, however a miss specified or incoherent performance methodology may point into
completely unintended directions. In order to avoid this, it is crucial to previously define the
organization objective in an unequivocal way and to guarantee that the performance
methodology is permanently coherent with this objective. In this study the ports objective was

75
defined as handling cargo and serving passengers with the lowest possible cost. Every option in
the implementation of the performance measurement was confronted with this objective.
Data Envelopment Analysis (DEA) has several advantages as a performance measurement
technique. It does not assume any predetermined form of the efficient frontier. The weights of
each variable are computed trough mathematical programming instead of being assumed. This
avoids subjectivity in the definition of the weights. DEA identifies peers for each of the inefficient
ports. Inefficient seaports should focus on these peers in the search for performance
improvement. The efficient targets provide measurable objectives such as cost reductions or
throughput increases.
Most of the previous literature applying DEA to the port sector focused only in containerized
traffic. This study undertook a broader perspective by considering all types of cargo plus
passengers. Forty one seaports of eleven European countries were analysed
It was found that monetary variables provide a more realistic approach towards input
measurement than other common input variables used in the previous literature. They are more
reliable because they are stated according to international accountancy norms by certified
accountants. Other variables lack this reliability and standardization. There is not a standardized
way of measuring terminal area. Some of the studies include buildings, internal roads and
railways in this area while others just measure the effective cargo storage area. Also, using
monetary variables avoids certain assumptions about managerial decisions. For example, if the
number of cranes is taken as an input it is assumed that operating with one large crane is more
efficient than operating with two smaller cranes even if one large crane costs the same than two
smaller ones. Two inputs were adopted, operational expenditure (OPEX) and capital
expenditure (CAPEX). Comparing between OECD PPP and exchange rate converted inputs it
was found that seaports in countries with lower PPP coefficients had lower efficiency results
with PPP converted expenditures. In this analysis exchange rate converted expenditures were
used.
In terms of outputs there was the need to balance between precision and the model results. A
large number of outputs would describe very precisely the different types of cargos and
passengers, however this would overload the model and provide unsatisfactory results. In
addition, too many variables would make the process of collecting data unfeasible, but if cargo
throughputs are not disaggregated then liquid bulk ports will be favoured because they handle
significantly superior tonnages. Six output variables were measured: conventional general
cargo, containerized cargo, roll on-roll off cargo (ro-ro), dry bulk, liquid bulk and passengers. A
model with the aggregated value of the first three outputs was run for comparative purposes. Its
average results were considerably lower.

76
Fourteen ports were found to perform efficiently: Lisbon, Amsterdam, Antwerp, Calais, Dover,
Ferrol-San Cibrao, Larvik, London, Milford Haven, Piraeus, Szczecin-Swinoujscie, Valencia and
Zeeland. Considering constant returns to scale (CRS) the same ports were taken as efficient
except Rotterdam and Amsterdam. The former still presented a relatively high efficiency and
rank but the latter was significantly scale inefficient.
Efficiency scores of the Portuguese seaports were all very low except for Lisbon. All the other
seaports were in the 10 least performing groups. Lisbon was deemed as efficient because of
the very high level of commuter passenger traffic. If performing efficiently, the major Portuguese
seaports would have saved about 64 million euros during 2005. Scale efficiency can not be
seen as a cause for inefficiency since most of the Portuguese seaports had relatively high scale
efficiencies. Only the port of Aveiro had a lower ranking under the constant returns to scale
model. The ports most often seen as efficient peers of the Portuguese ports were Larvik, Milford
Haven and Zeeland. They should be used as role models in the search for cost reductions and
improved competitiveness.
On a regional analysis Northern Europe was found to significantly outperform Southern Europe.
The Iberian Peninsula had relatively low performance results and Portugal was underperforming
in relation to Spain. In contradiction with previous studies, insular Spanish ports were found to
be more efficient than continental ones.
In terms of countries, the United Kingdom and the Netherlands were found to have the best
performing seaports. Both of them had an average of 1 under the variable returns to scale
model (VRS) since all of the analysed seaports in these countries were deemed as efficient.
This study therefore nominates the United Kingdom and the Netherlands as role models in
terms of national policies. These countries have significantly different degrees of private
involvement and direct government intervention in the port sector. In the Netherlands the
government directly funds port infrastructure and establishes it own funding priorities. The UK
has completely subsidy free port sector and pursuits a deregulatory policy. While the UK may
be taken as the example that private ports do perform efficiently, the Netherlands show that a
total port privatization is not necessarily a pre requisite to achieve high performance levels.
The relationship between GDP and port performance was investigated in several perspectives.
Albeit there were some indications relating higher performances with a higher GDP, it was not
found any definitive piece of evidence.

77
4.2 FURTHER RESEARCH
This study regards seaports as independent Decision Making Units (DMU). Country
performance results were computed as the mean of the seaports performance results in each
country. It would be interesting to consider the whole country as a DMU by using national public
spending in the seaport sector as input and the national annual throughputs and passenger
traffic as outputs. Public spending should encompass not only direct expenditure with Port
Authorities and infrastructure but also expenditure with public bodies with attributions related to
the seaport sector, such as regulators. This analysis would allow identify the best practices in
terms of public policies for the seaport sector, based on empirical evidence.
There is the need to further research in issues such as pricing policies, governance models and
the degree of private party participation in the provision of port services. No definitive piece of
evidence has been found respecting any of these issues and their relation to performance.
Several European countries have been competing for the large volumes of transhipment traffic.
The benefits of this type of traffic in terms of the national economy have not yet been positively
established. A significant share of port infrastructure developments is dependant on the
attribution of European funding. It is important to determine which criteria are being followed
when deciding to proceed with new developments, if the market is actually requesting these
new infrastructures or if they are only being built because of their eligibility for European
funding. The investigation of productivity change influenced by the safety, environmental
protection and funding policies of the European Union would provide relevant information in the
evaluation of collateral effects of these policies.
Cruising is rapidly expanding in Europe with significant impact in countries with tourism oriented
economies. Cruising is a relatively under researched topic since its growth is a relatively recent
trend. In the Portuguese perspective, a country with a long coastline but modest cruise traffic, it
is clearly necessary to promote further research on the main factors of cruise tourism
attractiveness.

78
5 REFERENCES
Afonso, A. and Santos, M. (2005): Students and Teachers: A DEA Approach to the Relative
Efficiency of Portuguese Public Universities. Working Paper, School of Economics and
Management (ISEG), Technical University of Lisbon, Lisbon, 32 p.
Afonso, O. and Aguiar, A. (2004): Comércio Externo e Crescimento da Economia Portuguesa
no Século XX. Working Paper, Economics School, University of Oporto, Oporto, 43 p.
Allen, R.; Athanassopoulos, A.; Dyson, R.G. and Thanassoulis, E. (1997): Weights Restrictions
and Value Judgements in Data Envelopment Analysis: Evolution, Development and
Future Directions. Annals of Operational Research, vol. 73, 13-34.
Andersen, P. and Petersen, N. (1993): A Procedure for Ranking Efficient Units in Data
Envelopment Analysis. Management Science, vol. 39, no. 10, 1261–1264.
APC (1998): International Benchmarking of the Australian Waterfront. Australian Productivity
Commission, Canberra, 285 p.
Bamford, C.G. (2001): Transport Economics. 3rd
edition, Heinemann, Oxford, 125 p.
Banker, R.D.; Charnes, A. and Cooper, W.W. (1984): Some Models for Estimating Technical
and Scale Inefficiencies in Data Envelopment Analysis. Management Science, vol. 30, no.
9, 1078-1092.
Banker, R.D.; Charnes, A.; Swarts, J.; Cooper, W.W. and Thomas, D. (1989): An Introduction to
Data Envelopment Analysis With Some of its Models and Their Uses. Research in
Governmental and Nonprofit Accounting, vol. 5, 125-163.
Barros, C.P. (2003a): Incentive Regulation and Efficiency of Portuguese Port Authorities.
Maritime Economics & Logistics, vol. 5, no. 1, 55-69.
Barros, C.P. (2003b): The Measurement of Efficiency of Portuguese Seaport Authorities with
DEA. International Journal of transport Economics, vol. 30, no. 3, 335-354.
Barros, C.P. and Athanassiou, M. (2004): Efficiency in European Seaports with DEA: Evidence
from Greece and Portugal. Maritime Economics & Logistics, vol. 6, no. 2, 122-140.
Barros, C.P. (2006): A benchmark Analysis of Italian Seaports Using Data Envelopment
Analysis. Maritime Economics & Logistics, vol. 8, no. 4, 347-365.

79
Boucinha, J.; Godinho, C.; Ignácio, C. and Weyman-Jones, T. (2003): DEA and Electricity
Distribution Networks in Portugal. In Workshop on Efficiency and Productivity Analysis,
Catholic University, Oporto.
Castro, R. (1993): O Método DEA – Aplicação à Avaliação da Eficiência Comparativa das
Escolas Secundárias do Distrito do Porto. Dissertation submitted for the concession of the
Master degree, Economics School, Oporto University, Oporto, 192 p.
CEC (2006): Towards a Future Maritime Policy for the Union: A European Vision for the Oceans
and the Seas. Green Paper, Commission of the European Communities, 49 p.
Charnes, A.; Cooper, W. and Rhodes, E. (1978): Measuring the Efficiency of Decision-Making
Units. European Journal of Operational Research, vol. 2, no. 6, 429-444.
Coelli, T.; Rao, D.S.P. and Battese G.E. (1998): An Introduction to Efficiency and Productivity
Analysis. Kluwer Academic Publishers, Boston, 296 p.
Cullinane, K.; Song, D.W. and Gray, R. (2002): A Stochastic Frontier Model of the Efficiency of
Major Container Terminals in Asia: assessing the Influence of Administrative and
Ownership Structures. Transportation Research, Part A, vol. 36, no. 8, 743-762.
Cullinane, K.; Song, D.W.; Ping, J. and Wang, T.F. (2004): An Application of DEA Windows
Analysis to Container Port Production Efficiency. Review of Network Economics, vol. 3, is.
2, 184-206.
DfT (2000a): Modern Ports: A UK Policy. Department for Transport, United Kingdom, 46 p.
DfT (2000b): Modernizing Trust Ports: A Guide to Good Governance. Department for
Transports, United Kingdom, 52 p.
DfT (2006c): Transport Statistics Report Maritime Statistics 2005. Department for Transport,
United Kingdom, 176 p.
Dias, J.C. (2005): Logística Global e Macrologística. Edições Sílabo, Lisbon, 586 p.
Dyson, R.G. (2000): Performance Measurement and Data Envelopment Analysis – Ranking
are Ranks!. OR Insight, vol. 13, no. 4, 3-8.
ESPO (2004): Factual Report on the European Port Sector. European Seaports Organization,
Brussels, 279 p.

80
ESPO (2007): A Market Report on the European Seaport Industry, ESPO Annual Report 2006-
2007, Brussels, 104 p.
EUROSTAT website: http://ec.europa.eu/eurostat
ISL (2006): Public Financing and Charging Practices of Seaports in the EU. Institute of Shipping
Economics and Logistics, Bremen, 472 p.
Itoh, H. (2002): Efficiency Changes at Major Container Ports in Japan: A Window Application of
Data Envelopment Analysis. Review of Urban and Regional Development Studies, vol.
14, no. 2, 133-152.
Liu, Z. (1995): The Comparative Performance of Public and Private Enterprise. The Case of
British Ports. Journal of Transport Economics and Policy, vol. 29, no. 3, 263-274.
Mankiew, N.G. (2004): Principles of Economics. 3rd
edition, Thomson South-Western, USA,
898 p.
Manzano, J.I.; Quijada, M.T. and Nuño, M.M. (2004): Economic Evaluation of the Spanish port
System Using the Promethee Multicriteria decision Method, Working Paper, Centro de
Estudios Andaluces, Seville, 30 p.
Marques, R. (2005): A Regulação de Serviços de Água e de Águas Residuais. Aplicação de
Técnicas Não Paramétricas de Benchmarking. Dissertation submitted for the concession
of the Phd. degree, Instituto Superior Técnico, Technical University of Lisbon, Lisbon,
432 p.
Martinez, B.E.; Diaz, A.R.; Navarro, I.M. and Ravelo, M.T. (1999): A Study of the Efficiency of
Spanish Port Authorities Using Data Envelopment Analisys. International Journal of
Transport Economics, vol. XXVI, no. 2, 237-253.
Monteiro, M.F. (2003): The Concession Process in the Portuguese Port Sector. Dissertation
submitted for the concession of the Master degree, Instituto Superior Técnico, Technical
University of Lisbon, Lisbon.
Morais, V. (2000): Eficiência e Produtividade na Distribuição de Energia Eléctrica. Dissertation
submitted for the concession of the Master degree, Instituto Superior de Economia e
Gestão, Technical University of Lisbon, Lisbon, 114 p.
81
MVW (2004): Seaports: Anchors of the Economy – National Seaports policy: 2005-2010. White
Paper, Ministerie van Verkeer en Waterstaat, The Hague, 104 p.
OECD PPP website:
http://www.oecd.org/searchResult/0,3400,en_2825_495691_1_1_1_1_1,00.html
Park, R.K. and De, P. (2004): An Alternative Approach to Efficiency Measurement of Seaports.
Maritime Economics & Logistics, vol. 6, no. 1, 53-69.
Portela, M.C. (2003): New Insights on Measuring Bank Branches Efficiency through DEA:
Transactional, Operational, and Profit Assessments. Ph.D. Thesis, Aston Business
School, Aston University, Birmingham, U.K..
Rios, L.R. and Maçada A. (2006): Analysing the Relative Efficiency of Container Terminals of
Mercosur using DEA. Maritime Economics & Logistics, vol. 8, no. 4, 331-346.
Roll, Y. and Hayuth, Y. (1993): Port Performance Comparison Applying Data Envelopment
Analysis (DEA). Maritime Policy and Management, vol. 20, is. 2, 153-161.
Serrano, M.G. and Castellano, L.T. (2003): Analisis de la Eficiencia de los Servicios de
Infraestructura en Espana: Una Aplicacion al Trafico de Contenedores. Proceedings of
the X Encuentro de Economia Publica, Tenerife, 18 p.
Smith, Adam (1786): An Inquiry into the Nature and Causes of the Wealth of Nations.
Bibliomania.com, 570 pages.
Available online at http://www.bibliomania.com/2/1/65/112/frameset.html
Stolp, C. (1990): Strenghts and Weaknesses of Data Envelopment Analysis: An Urban and
Regional Perspective. Computer, Environment and Urban Systems, vol. 14, no. 2, 103-
106.
Tavares, G. (2002): A Bibliography of Data Envelopment Analysis (1978-2001). Rutcor
Research Repot, New Jersey, 186 p.
Thanassoulis, E. (2003): Introduction to the Theory and Application of Data Envelopment
Analysis: a foundation text with integrated software. 2nd
edition, Kluwer Academic
Publishers, Norwell, 281 p.
Tongzon, J.L. (1995): Systematizing International Benchmarking for Ports. Maritime Policy and
Management, vol. 22, no. 2, 171-177.

82
Tongzon, J.L. (2001): Efficiency Measurement of Selected Australian and Other International
Ports Using Data Envelopment Analysis. Transportation Research Part A, vol. 35, no. 2,
107-122.
Turner, H.; Windle, R.; and Dresner, M. (2004): North American container port productivity:
1984-1997. Transportation Research Part E, vol. 40: 339-356.
UKMPG (2005): Government Involvement in Port Development. United Kingdom Major Ports
Group, London, 6 p.
Urrutia, B. (2006): The EU Regulatory Action in the Shipping Sector: A Historical Perspective,
Maritime Economics & Logistics, vol. 8, no. 2, 202-221.
Valentine, V.C. and Gray, R. (2001): The Measurement of Port Efficiency Using Data
Envelopment Analysis. Proceedings of the Ninth World Conference on Transportation
Research, Seoul.
Vaz, M. (1995): Eficiência Relativa e Output Potencial – uma Aplicação DEA. Dissertation
submitted for the concession of the Master degree, Economics School, Oporto University,
Oporto, 202 p.
Wang, T.F.; Cullinane, K. and Song, D.K. (2005): Container Port Production and Economic
Efficiency. 1st edition, Palgrave Macmillan, New York, 208 p.
Wang, T.F. and Cullinane, K. (2006): The Efficiency of European Container Terminals and
Implications to Supply Chain Management. Maritime Economics & Logistics, vol. 8, no. 1,
82-99.
WB (2006): Port Reform Toolkit. 2nd edition, World Bank, Washington, D.C, 375 p.
Zhu, J. (2003): Quantitative Models for Performance Evaluation and Benchmarking. 1st edition,
Kluwer Academic Publishers, Boston, 297 p.
Cover picture
Galeão “Santa Luzia”
Reproduction of oil painting of Alberto Cutileiro. Dimensions 9x12 cm.
Vessel of the XVII century armed with 30 pieces.

83
ANNEX 1 – Portuguese Seaports throughputs and entered ships (2003-2005)
TOTAL
2005 2004 2003 2005 2004 2003 2005 2004 2003 2005 2004 2003 2005 2004 2003 2005 2004 2003
Number 1,057 1,038 1,002 2,739 2,611 2,690 3,351 3,270 3,522 1,508 1,666 1,617 1,192 921 751 9,847 9,506 9,582
Gross Tonnage
(103 GT)
93,33018,305 13,155 101,267 94,01116,923 17,310 16,715 22,916
Sines
2,850 2,857 2,722 20,009 19,587 20,519 38,569 35,953 40,219
Entered shipsAveiro Leixões Lisbon Setúbal
TOTAL
2005 2004 2003 2005 2004 2003 2005 2004 2003 2005 2004 2003 2005 2004 2003 2005 2004 2003
Conventional 1,376 1,452 1,291 487 462 532 439 464 458 1,212 1,716 1,381 29 45 23 3,543 4,139 3,685
Containerized 0 0 0 2,819 2,834 2,527 4,040 4,148 4,550 113 141 85 546 208 0 7,519 7,330 7,163
Ro-ro 0 0 0 9 10 9 12 21 13 376 379 366 0 0 1 397 410 389
Sub-total 1,376 1,452 1,291 3,315 3,306 3,068 4,491 4,633 5,021 1,701 2,236 1,832 575 253 24 11,459 11,880 11,236
Dry bulk 1,416 1,071 1,067 2,302 2,378 2,226 5,203 4,761 4,790 3,224 3,065 2,883 5,802 5,416 5,396 17,947 16,691 16,363
Liquid bulk 536 604 606 7,713 7,299 7,471 1,609 1,276 1,452 1,717 1,133 1,323 18,553 16,765 15,443 30,127 27,077 26,296
TOTAL 3,329 3,128 2,964 13,331 12,983 12,766 11,303 10,670 11,263 6,642 6,434 6,039 24,929 22,434 20,863 59,534 55,648 53,895
SinesCargo type
LeixõesAveiro Lisbon Setúbal

84
ANNEX 2 – Ranks and scores in the VRS and CRS models; scale efficiency
Score Rank Score Rank
Aveiro 0.456 33 0.336 36 0.737
Leixões 0.385 38 0.341 35 0.887
Lisbon 1.000 1 1.000 1 1.000
Setúbal 0.364 40 0.329 37 0.904
Sines 0.391 36 0.360 31 0.921
A Coruna 0.503 29 0.352 33 0.700
Alicante 0.509 28 0.392 30 0.770
Amsterdam 1.000 1 0.505 24 0.505
Antwerp 1.000 1 1.000 1 1.000
Arhus 0.864 18 0.837 15 0.969
Balears 0.677 23 0.642 21 0.948
Barcelona 0.896 17 0.728 19 0.813
Bilbao 0.461 32 0.457 25 0.993
Cadiz 0.470 31 0.357 32 0.759
Calais 1.000 1 1.000 1 1.000
Cartagena 0.547 26 0.516 22 0.944
Castellon 0.862 19 0.752 17 0.872
Copenhagen Malmo 0.853 20 0.802 16 0.940
Dover 1.000 1 1.000 1 1.000
Ferrol-San Cibrao 1.000 1 1.000 1 1.000
Gijon 0.581 24 0.515 23 0.887
Goteborg 0.421 35 0.420 28 0.998
Huelva 0.486 30 0.428 27 0.881
Larvik 1.000 1 1.000 1 1.000
Las Palmas 0.766 21 0.750 18 0.980
London 1.000 1 1.000 1 1.000
Marín 0.555 25 0.227 39 0.409
Milford Haven 1.000 1 1.000 1 1.000
Passajes 0.383 39 0.342 34 0.891
Piraeus 1.000 1 1.000 1 1.000
Roterdam 1.000 1 0.838 14 0.838
Santander 0.245 41 0.216 41 0.884
Stockholm 0.915 16 0.873 13 0.954
Szczecin-Swinoujscie 1.000 1 1.000 1 1.000
Tarragona 0.430 34 0.416 29 0.968
Tenerife 0.721 22 0.697 20 0.967
Thessaloniki 0.529 27 0.447 26 0.844
Valencia 1.000 1 1.000 1 1.000
Vigo 0.386 37 0.321 38 0.831
Vilagarcia 0.996 15 0.225 40 0.225
Zeeland 1.000 1 1.000 1 1.000
Scale Efficiency
SeaportVRS CRS

85
ANNEX 3 – Efficient targets
OPEX CAPEX Conv. general cargo
Contain. cargo
Ro-ro Dry bulkLiquid bulk
Pass.
Aveiro 3222 1941 1376 527 739 2669 2717 558
Leixões 9142 5257 2022 3539 1259 4315 7714 465
Lisbon 29390 16652 438 4040 11 5202 1608 29929
Setúbal 5199 2276 1212 570 716 3224 1980 1442
Sines 7382 6190 4466 777 1886 11712 18552 255
A Coruna 4818 3451 2450 611 1140 5823 8533 450
Alicante 4125 1738 677 1037 487 1667 252 533
Amsterdam 48777 33134 4978 929 894 47163 20896 153
Antwerp 181907 48828 17853 74593 3647 26931 37030 5
Arhus 13531 4920 1236 3151 3313 2846 2613 1726
Balears 13938 8214 2525 913 6134 6645 6957 4667
Barcelona 42029 20076 7325 19929 3206 15997 16900 2208
Bilbao 12830 10824 5814 5429 2748 15013 19684 177
Cadiz 5094 3593 2172 889 1770 4949 5325 711
Calais 58335 25636 247 0 36644 900 143 11695
Cartagena 12513 4266 1599 390 1010 5080 20848 295
Castellon 5857 3708 2252 494 1037 7320 8950 305
Copenh. Malmo 36370 3059 2856 2346 4252 12032 6100 1285
Dover 62991 14729 164 4 20674 304 0 13500
Ferrol-S. Cibrao 4942 2559 566 1 170 8307 822 21
Gijon 10321 8254 6910 1001 2989 19681 20204 182
Goteborg 43082 11084 1943 6410 10198 6977 19674 2267
Huelva 6358 4374 2977 631 1345 7513 12927 376
Larvik 2820 1000 584 449 455 398 42 623
Las Palmas 19975 14219 4349 12654 2820 9980 8562 952
London 53461 5430 3298 6415 9003 14971 20156 13
Marín 2930 1256 799 470 532 1016 770 605
Milford Haven 20886 4407 19 0 534 67 36397 321
Passajes 5288 2646 2079 574 1103 5034 4591 541
Piraeus 121150 10672 194 18311 975 315 21 20388
Roterdam 222577 144331 8511 91090 9868 89446 171323 1518
Santander 4215 2700 1521 439 901 5139 3436 554
Stockholm 38112 5781 494 4579 2693 1022 1052 8415
Szczecin-Swin. 27429 1914 2863 357 2809 11709 883 994
Tarragona 8260 5954 3799 582 1586 11903 17907 141
Tenerife 13301 10327 4570 3236 3704 12348 13125 4558
Thessaloniki 16130 2600 1165 2917 1615 2643 3149 1247
Valencia 35521 22483 3651 25741 3731 6359 1380 335
Vigo 5403 3518 1725 1712 946 3684 3565 1281
Vilagarcia 2869 1114 680 458 489 672 365 615
Zeeland 6649 9962 8123 1194 3158 22020 25503 3
Efficient Input Target Efficient Output Target
Seaport

86
ANNEX 4 – Comparative VRS input oriented models: OECD PPP converted expenditures; aggregated general cargo; Super Efficiency
Score Ranking Score RankingAveiro 0.309 38 0.424 30 0.456
Leixões 0.320 37 0.230 41 0.385
Lisbon 1.000 1 1.000 1 infeasible
Setúbal 0.306 39 0.356 33 0.364
Sines 0.305 40 0.391 32 0.391
A Coruna 0.407 30 0.503 26 0.503
Alicante 0.411 28 0.395 31 0.509
Amsterdam 1.000 1 1.000 1 1.813
Antwerp 1.000 1 1.000 1 infeasible
Arhus 1.000 1 0.752 18 0.864
Balears 0.594 23 0.548 23 0.677
Barcelona 0.829 18 0.712 19 0.896
Bilbao 0.423 27 0.315 36 0.461
Cadiz 0.377 33 0.310 38 0.470
Calais 1.000 1 1.000 1 infeasible
Cartagena 0.467 26 0.539 24 0.547
Castellon 0.745 20 0.857 16 0.862
Copenhagen Malmo 0.936 17 0.705 20 0.853
Dover 1.000 1 0.983 15 1.214
Ferrol-San Cibrao 1.000 1 1.000 1 1.472
Gijon 0.526 24 0.581 21 0.581
Goteborg 0.468 25 0.339 34 0.421
Huelva 0.408 29 0.486 27 0.486
Larvik 1.000 1 1.000 1 1.981
Las Palmas 0.747 19 0.482 28 0.766
London 1.000 1 1.000 1 2.637
Marín 0.392 32 0.555 22 0.555
Milford Haven 1.000 1 1.000 1 4.583
Passajes 0.328 36 0.285 39 0.383
Piraeus 1.000 1 1.000 1 2.023
Roterdam 1.000 1 1.000 1 infeasible
Santander 0.209 41 0.233 40 0.245
Stockholm 1.000 1 0.799 17 0.915
Szczecin-Swinoujscie 1.000 1 1.000 1 2.598
Tarragona 0.375 34 0.430 29 0.430
Tenerife 0.673 22 0.512 25 0.721
Thessaloniki 0.401 31 0.336 35 0.529
Valencia 1.000 1 1.000 1 1.686
Vigo 0.328 35 0.315 37 0.386
Vilagarcia 0.699 21 0.996 14 0.996
Zeeland 1.000 1 1.000 1 11.507
OECD PPP converted
expenditure
Aggregated general
cargo Super Efficiency
Seaport

87
ANNEX 5 – Scores of VRS input oriented models lacking each one of the variables
OPEX CAPEX Conv. general cargo
Contain. cargo
Ro-ro Dry bulk Liquid bulk Pass.
Aveiro 0.279 0.456 0.424 0.456 0.456 0.456 0.456 0.456
Leixões 0.229 0.322 0.385 0.212 0.385 0.385 0.296 0.385
Lisbon 1.000 1.000 1.000 1.000 1.000 1.000 1.000 0.304
Setúbal 0.281 0.288 0.355 0.364 0.364 0.341 0.364 0.296
Sines 0.206 0.297 0.391 0.391 0.391 0.391 0.204 0.391
A Coruna 0.306 0.428 0.503 0.503 0.503 0.503 0.374 0.503
Alicante 0.418 0.461 0.509 0.387 0.509 0.445 0.509 0.509
Amsterdam 1.000 1.000 1.000 1.000 1.000 0.206 1.000 1.000
Antwerp 1.000 1.000 1.000 1.000 1.000 1.000 1.000 1.000
Arhus 0.525 0.666 0.864 0.612 0.652 0.843 0.864 0.823
Balears 0.368 0.677 0.668 0.677 0.373 0.677 0.677 0.553
Barcelona 0.503 0.896 0.714 0.325 0.896 0.896 0.896 0.826
Bilbao 0.247 0.413 0.461 0.276 0.461 0.461 0.369 0.460
Cadiz 0.209 0.440 0.470 0.440 0.338 0.470 0.470 0.470
Calais 1.000 1.000 1.000 1.000 0.269 1.000 1.000 1.000
Cartagena 0.431 0.260 0.547 0.539 0.547 0.515 0.249 0.547
Castellon 0.558 0.612 0.862 0.857 0.862 0.773 0.703 0.862
Copenhagen Malmo0.853 0.174 0.853 0.853 0.605 0.853 0.791 0.775
Dover 1.000 0.635 1.000 1.000 0.524 1.000 1.000 0.948
Ferrol-San Cibrao0.648 0.854 1.000 1.000 1.000 0.594 1.000 1.000
Gijon 0.573 0.351 0.581 0.581 0.581 0.170 0.581 0.581
Goteborg 0.313 0.252 0.421 0.330 0.274 0.421 0.370 0.416
Huelva 0.304 0.364 0.486 0.486 0.486 0.484 0.340 0.486
Larvik 1.000 1.000 1.000 1.000 1.000 1.000 1.000 1.000
Las Palmas 0.283 0.766 0.766 0.244 0.747 0.766 0.765 0.746
London 1.000 0.444 1.000 1.000 1.000 1.000 1.000 1.000
Marín 0.311 0.555 0.555 0.555 0.555 0.534 0.555 0.555
Milford Haven 1.000 1.000 1.000 1.000 1.000 1.000 0.234 1.000
Passajes 0.232 0.260 0.255 0.383 0.383 0.383 0.383 0.383
Piraeus 1.000 0.429 1.000 1.000 1.000 1.000 1.000 1.000
Roterdam 1.000 1.000 1.000 1.000 1.000 1.000 1.000 1.000
Santander 0.125 0.216 0.245 0.245 0.233 0.201 0.245 0.240
Stockholm 0.875 0.309 0.915 0.915 0.799 0.915 0.902 0.351
Szczecin-Swinoujscie1.000 0.242 1.000 1.000 1.000 1.000 1.000 1.000
Tarragona 0.319 0.287 0.430 0.430 0.430 0.405 0.319 0.430
Tenerife 0.336 0.721 0.721 0.591 0.574 0.721 0.720 0.564
Thessaloniki 0.529 0.159 0.515 0.251 0.529 0.528 0.529 0.529
Valencia 0.734 1.000 1.000 0.263 1.000 1.000 1.000 1.000
Vigo 0.195 0.386 0.386 0.291 0.357 0.386 0.386 0.344
Vilagarcia 0.882 0.996 0.996 0.996 0.996 0.996 0.991 0.996
Zeeland 1.000 1.000 1.000 1.000 1.000 1.000 1.000 1.000
Seaport
Lacking variable