
Performance-Based Financing Toolkit - World Bank Group
361
-
Upload
khangminh22 -
Category
Documents
-
view
0 -
download
0
Transcript of Performance-Based Financing Toolkit - World Bank Group


Performance-BasedFinancing Toolkit

György Bèla FritscheRobert SoetersBruno Meessen
with Cedric Ndizeye,Caryn Bredenkamp, andGodelieve van Heteren
THE WORLD BANKWashington, D.C.
Performance-BasedFinancing Toolkit
© 2014 International Bank for Reconstruction and Development / The World Bank1818 H Street NW, Washington DC 20433Telephone: 202-473-1000; Internet: www.worldbank.org
Some rights reserved1 2 3 4 17 16 15 14
This work is a product of the staff of The World Bank with external contributions. Note that The World Bank does not necessarily own each component of the content included in the work. The World Bank therefore does not warrant that the use of the content contained in the work will not infringe on the rights of third parties. The risk of claims resulting from such infringement rests solely with you.
The findings, interpretations, and conclusions expressed in this work do not necessarily reflect the views of The World Bank, its Board of Executive Directors, or the governments they represent. The World Bank does not guarantee the accuracy of the data included in this work. The boundaries, colors, denominations, and other information shown on any map in this work do not imply any judgment on the part of The World Bank concerning the legal status of any territory or the endorsement or acceptance of such boundaries.
Nothing herein shall constitute or be considered to be a limitation upon or waiver of the privileges and immunities of The World Bank, all of which are specifically reserved.
Rights and Permissions
This work is available under the Creative Commons Attribution 3.0 Unported license (CC BY 3.0)http://creativecommons.org/licenses/by/3.0. Under the Creative Commons Attribution license, you are free to copy, distribute, transmit, and adapt this work, including for commercial purposes, under the following conditions:
Attribution—Please cite the work as follows: Fritsche, György Bèla, Robert Soeters, and Bruno Meessen. 2014. Performance-Based Financing Toolkit. Washington, DC: World Bank. License:Creative Commons Attribution CC BY 3.0
Translations—If you create a translation of this work, please add the following disclaimer along withthe attribution: This translation was not created by The World Bank and should not be considered an offi cial World Bank translation. The World Bank shall not be liable for any content or error in this translation.
All queries on rights and licenses should be addressed to the Offi ce of the Publisher, The World Bank,1818 H Street NW, Washington, DC 20433, USA; fax: 202-522-2625; e-mail: [email protected].
ISBN (paper): 978-1-4648-0128-0ISBN (electronic): 978-1-4648-0129-7DOI: 10.1596/978-1-4648-0128-0
Cover design: Naylor Design, Inc.
Library of Congress Cataloging-in-Publication Data
Performance-based fi nancing toolkit / György Bèla Fritsche, Robert Soeters, Bruno Meessen.��p. ; cm.�Includes bibliographical references and index.�ISBN 978-1-4648-0128-0 (alk. paper) — ISBN 978-1-4648-0129-7�I. Soeters, Robert, author. II. Meessen, Bruno, 1969– author. III. World Bank, issuing body.�[DNLM: 1. Financial Management, Hospital—economics. 2. Health Facilities—economics.3. Quality Improvement—standards. 4. Reimbursement, Incentive. WX 157.1]�RA971.3�362.11068'1—dc23
2014002212
v
ContentsForeword xvAcknowledgments xviiAuthors and Contributors xixAbbreviations xxiii
Introduction 1
I.1 The Toolkit 1I.2 A Short History of PBF 4I.3 Results- Based Financing: A Profusion of Terms 6I.4 A Simplifi ed Example of PBF at a Health Facility 10Notes 12References 13
PART 1 HEALTH FACILITY– LEVEL DESIGN ISSUES 15
1. Buying a Quantity of Services 17
Main Messages 17Covered in This Chapter 171.1 How to Buy a Quantity of Services in PBF:
Four Points to Consider 181.2 How to Handle Important Design Issues
in Purchasing Services 191.3 How to Select Services: The Process in Practice 291.4 How to Handle Additional Requests for Inclusion of Services 381.5 Links to Files and Tools 40Notes 40References 41
2. Verifi cation of the Quantity of Services 43
Main Messages 43Covered in This Chapter 43
vi Contents
2.1 Introduction: Verifi cation Is a Cornerstone of PBF 442.2 PBF Verifi cation Systems 442.3 Ex Ante and Ex Post Verifi cation of Quantity of Services 452.4 Operational Challenges 472.5 Transitional Issues: Rigorous Implementation 532.6 Links to Files and Tools 54Notes 55Reference 55
3. Measuring and Verifying Quality 57
Main Messages 57Covered in This Chapter 573.1 Introduction 583.2 Diversifi cation of Quality Stimulation: The Carrot- and- Carrot
versus the Carrot- and- Stick Approach and Their Distinct Effects 603.3 Quality Tools: How Quality Is Paid for through PBF 693.4 Design Tips for the Quantifi ed Quality Checklist 723.5 Differing Contexts: Different Examples of Quality Checklists 753.6 Links to Files and Tools 83Notes 84References 84
4. Setting the Unit Price and Costing 87
Main Messages 87Covered in This Chapter 884.1 Introduction 884.2 Costing Background: PBF as a Health Reform Approach 884.3 The Importance of Balancing Health Facility Revenues
and Expenses 904.4 The Necessary Budget 914.5 Setting of Unit Fees to Stay within Budget 934.6 A Tested Example of Costing the Minimum Package
of Health Services 964.7 Strategic Purchasing 1084.8 Links to Files and Tools 109Notes 110References 110
5. Addressing Equity 113
Main Messages 113Covered in This Chapter 1135.1 Introduction: Why Worry About Equity? 114
Contents vii
5.2 PBF: An Innovative Approach to Enhancing Equity 1165.3 How to Make PBF Schemes More Pro- Poor 1175.4 Measuring and Monitoring Equity in PBF 130Recommended Resources 135Notes 136References 136
6. Health Facility Autonomy and Governance 139
Main Messages 139Covered in This Chapter 1396.1 Introduction: The Importance of Health Facility Autonomy 1406.2 Main Elements of Health Facility Autonomy 1416.3 Enhancing Autonomy: Improving Results 1416.4 Autonomy Demands Accountability 1446.5 Fee Setting and Drug Revolving Funds 146Note 147Reference 147
7. Health Facility Financial Management and the Indice Tool 149
Main Messages 149Covered in This Chapter 1507.1 Introduction 1507.2 General Sources of Cash Income of a Health Facility 1507.3 Verifi cation of the Amounts 1517.4 The Processing of Payments to Health Facilities 1537.5 The Indice Tool 1557.6 Links to Files and Tools 164
8. Performance Frameworks for Health Administration:
Incentivizing Regulatory Tasks 165
Main Messages 165Covered in This Chapter 1668.1 Introduction: The Reason for PBF Performance
Frameworks for Health Administration 1668.2 Performance Frameworks for Health Administration:
How They Work 1668.3 What Performance Frameworks Include
and Who Assesses Them 1678.4 How Much Money to Budget for PBF Performance
Frameworks 1718.5 Links to Files and Tools 172Note 172

viii Contents
PART 2 DESIGN STRUCTURE AND ISSUES 173
9. Investments to Help Start Health Facilities 175
Main Messages 175Covered in This Chapter 1759.1 Introduction 1769.2 The Investment Unit 1769.3 Why Investment Units Are Needed 1769.4 How Much Money Is Involved 1769.5 How Investment Units Work 178Reference 179
10. Improving Health Facility Management 181
Main Messages 181Covered in This Chapter 18110.1 Introduction 18210.2 The Three Management- Strengthening Tools 18210.3 Advanced Strategies for Improving Health Facility
Results: Learning from Good Practices 19010.4 Links to Files and Tools 200References 200
11. Governance Issues and Structures 201
Main Messages 201Covered in This Chapter 20111.1 Introduction 20211.2 Separation of Functions: Fostering Transparency, Voice,
and Accountability 20211.3 Governance Structures for PBF: Challenges and Types
of Purchasers 20511.4 PBF Contracts: PBF at Scale, Internal Market, Contracts,
and Governance 21111.5 Links to Files and Tools 215Note 215References 215
12. Data Gathering and Dissemination 217
Main Messages 217Covered in This Chapter 21712.1 Introduction: Data Gathering and Usage Are Crucial to PBF 21812.2 How Data Collection for PBF Is Different 218

Contents ix
12.3 How PBF Web- Enabled Application Works 22012.4 How to Arrive at a Functional Web- Enabled Application 22212.5 Links to Files and Tools 226Notes 226
13. Data Analysis and Learning 227
Main Messages 227Covered in This Chapter 22713.1 Introduction 22713.2 Comparison of Performance 22813.3 Strategies to Boost Data Analysis Capabilities 23613.4 Links to Files and Tools 238Note 238References 238
14 PBF Technical Assistance and Training 239
Main Messages 239Covered in This Chapter 23914.1 Introduction 24014.2 Types of Technical Assistance Necessary for PBF 24014.3 The Extended Team Mechanism 24514.4 Capacity Building, Training, and Working South– South 24914.5 Links to Files and Tools 254References 255
15. Designing and Updating a PBF Manual 257
Main Messages 257Covered in This Chapter 25715.1 Introduction 25815.2 Contents of a PBF Manual 25815.3 Regular Revision of the Tools 26015.4 Links to Files and Tools 261
16. Pilot Testing PBF 263
Main Messages 263Covered in This Chapter 26316.1 Introduction 26416.2 Why Do a PBF Pilot? 26416.3 How to Start a PBF Pilot: Gather Information
and Assess the Context 26516.4 How to Start a PBF Pilot: Adapt the Approach
to the Local Context 274
x Contents
16.5 Pilots: Stakeholder Information, Knowledge Sharing, and Training 275
16.6 Checklist for Implementers 27916.7 Links to Files and Tools 282Notes 283References 283
PART 3 EVIDENCE OF PBF SCHEMES 285
17. Evaluations of PBF and Frequently Asked Questions 287
Main Messages 287Covered in This Chapter 28717.1 Introduction 28817.2 Building Research Evidence for PBF Is a Work in Progress 28817.3 PBF Programs in LMIC and OECD Countries Have
Both Differences and Similarities 29817.4 PBF Programs Need Appropriate Design
and Implementation to Be Successful 30317.5 Frequently Asked Questions 308Notes 311References and Other Sources 311
Index 317
Boxes
I.1 PBF and Universal Health Coverage 2 I.2 Mayo- Ine Health Center, Nigeria 5 1.1 Paying for Performance in Senegal 20 1.2 Paying for Percentage Coverage in Haiti 21 1.3 Paying for Percentage Coverage in Liberia 21 1.4 How to Measure Whether Services Are PBF- SMART 24 1.5 What Health Workers Can Do to Infl uence the Quantity
of Services 24 1.6 Learning from Experience 30 1.7 Using the Modifi ed Delphi Technique 32 1.8 Use of the Modifi ed Delphi Technique in PBF Processes:
A Drill Down in Rwanda 36 2.1 Sample Techniques for PBF Community Client
Satisfaction Surveys 48 2.2 Verifi cation and Counterverifi cation Challenges 54 3.1 Nigerian Quantifi ed Quality Checklist 70 3.2 Important Message 74
Contents xi
3.3 Total Quality Management and Quality AssuranceIndicators for the Kyrgyz Republic PBF Approach 82
4.1 Decentralizing Human Resource Management to Health Facilities: The Case of Rwanda 93
4.2 Unit Fee Calculations 95 4.3 The Difference between Purchasing of Curative Care and
Strategic Purchasing Using PBF That Targets Preventive Care 109 5.1 Burundi: A Multipronged Approach to Equity in Financing
and Use 123 5.2 Selective Free Health Care Is Financed through PBF
in Burundi: A Personal Story from a Batwa Woman 127 6.1 Defi ning Human Resource Management 143 6.2 Community Participation and Voice Mechanisms in Burundi 145 7.1 Decentralized Decision Making on PBF Results in Nigeria 151 7.2 Payment for Performance in Burundi 153 7.3 Getting Money to Facilities 155 7.4 The Three Health Facility PBF Tools 156 8.1 The Need for Performance Frameworks: Learning
the Hard Way 168 8.2 A Second Scaling- up in Burundi: Applying Lessons
Learned from Rwanda 171 9.1 The Democratic Republic of Congo: Investment
Units Make More Sense 177 9.2 Using Investment Units for Fast Improvements
of Quality in a Nigerian PBF Project 179 10.1 Business Plans Differ from Action Plans 183 10.2 Developing the Individual Performance Evaluation Based
on the Expressed Needs of Health Facility Management 187 11.1 Civil Society Is Convincing the Ministry of Health
on Use of Community Client Satisfaction Surveys 204 12.1 Rwanda and Its PBF Data Center 223 12.2 Burundi and Its PBF Data Center 225 13.1 Forecasting Institutional Deliveries in Rwandese PBF 230 13.2 Proxy Indicators for Overall Performance and Effi ciency 232 13.3 Benchmarking Performance in Nigeria PBF 233 14.1 Calculating the Costs of PBF Technical Assistance in Rwanda 244 14.2 The Predictors of Success in the Rwandese PBF 245 15.1 The Rwandese and Burundi PBF User Manuals 259 16.1 The Ghost in the Tree 268 16.2 Adapting the PBF Approach: The Case of Nigeria 275 16.3 Scaling Up PBF: The Case of Sierra Leone 276
xixixi
xii Contents
17.1 Very Positive Trends in PBF Programs: The Case of FamilyPlanning Services in Rwanda 295
17.2 Different Ways to Enhance Health System Performance 303
Figures
I.1 The Structure of the Toolkit 3 I.2 Results- Based Financing: A Profusion of Terms 7 2.1 Separation of Functions 52 B3.2.1 Difference between Ex Ante and Ex Post Verifi cation
of the Quality in Burundi District Hospitals during 2011 74 4.1 Typical Target Curve for Number of PBF Services 103 4.2 With a Set Fee, Disbursements Begin Low, Experience
a Rapid Expansion, and Reach a Plateau, Lesotho PBF 103 5.1 Percentage of Use of Antenatal Care and Skilled Birth
Attendance by Poorest and Richest Quintiles 114 5.2 Afghanistan Health Sector Balanced Scorecard,
Provincial Results, 2004–06 125 5.3 Immunization Coverage in the Philippines, Quintile
Analysis and Concentration Index 132 B7.1.1 NSHIP PBF Administrative Model 152 11.1 The Separation of Functions and Its Governance Issues 203 11.2 Health Center PBF Administrative Model 206 B13.1.1 Total Number of Deliveries in Health Centers in 23 PBF
Districts in Rwanda, 2006– 08 230 13.1 Coverage for Deliveries in Five Health Centers
in Rwanda, 2006– 08 231B13.2.1 Example of Earnings as Proxy Indicator for Performance
and Effi ciency 232B13.3.1 PBF Performance in Select Districts in Nigeria,
December 2011– June 2012 233 13.2 Benchmarking Individual Health Facility Performance
for Institutional Deliveries in Nyaruguru District, Rwanda, January 2006– June 2008 234
13.3 Benchmarking Individual Health Facility Performance for Institutional Deliveries in Gicumbi District, Rwanda, January 2006– June 2008 235
13.4 A Dashboard Element for Burundi PBF 237 14.1 Technical Assistance Requirements Varied Over Time
in Rwanda 243 14.2 Trainer Development Cycle 251 B17.1.1 Average Number of Clients Using Modern FP Methods
in a PBF Health Facility, 2006–08 295

Contents xiii
Maps
I.1 Rapid Expansion of PBF Programs in Africa between 2006 and 2013 6
13.1 Coverage for New Consultations, Rwandese HealthCenters, 2007 236
Screenshots
B12.1.1 Monthly Invoice, Rwanda 224B12.2.1 Quarterly Report 225
Tables
I.1 RBF and Its Acronyms and Abbreviations 8 I.2 Simplifi ed Example of How Performance- Based Financing
Works in a Health Facility 11 1.1 Example of Column Headers Needed for a Curative
Care Register 22 B1.4.1 Example of a “Tick List”: An Inadequate Register 24 1.2 Examples of PBF Services for the Health Center/Community
Level and Their Implementation Experience 25 1.3 List of PBF Services Commonly Used at the First Referral
Hospital Level 27 1.4 Top 20 Services Purchased at Health Centers
in 16 PBF Projects 28 1.5 Example of PBF Service Scores 33 1.6 Example of MPA Service Scores 34 1.7 Example of Sorted Scores of MPA Services 34 1.8 Example of Weighted Scores of MPA Services 37 3.1 Scenario A: The Carrot-and-Carrot Approach 63 3.2 Scenario A: The Carrot-and-Stick Approach with Unit Prices
Infl ated, Assuming an Average of 60 Percent Quality 64 3.3 Scenario B: The Carrot-and-Carrot Approach 65 3.4 Scenario B: The Carrot-and-Stick Approach 66 3.5 Scenario C: The Carrot-and-Carrot Approach with 60 Percent
Cut-off Point for Paying Bonus 67 3.6 Scenario C: The Carrot-and-Stick Approach 68 3.7 Comparison of Scenarios A, B, and C 68 B3.1.1 Nigerian Quantifi ed Quality Checklist 70 B3.1.2 Example from the Outpatient Department Section,
Nigerian Quantifi ed Quality Checklist 71 B3.1.3 Example from the Essential Drugs Management Section,
Nigerian Quantifi ed Quality Checklist 71 B3.1.4 Example from the Tracer Drugs Section, Nigerian
Quantifi ed Quality Checklist 71

xiv Contents
4.1 Example of Services and Their Saturated MonthlyTargets for the MPA 98
4.2 Example of Baseline Coverage of Each Service in 2011 100 4.3 Example of Targets Set for 2012, 2013, and 2014 102 4.4 Example of Coverage Increases 104 4.5 Setting the Index Fee to Consume the Available Budget 106 4.6 Budget Per Service and Percentage of Total Budget
Available Per Service 107 5.1 PBF Design Elements and Their Anticipated Effect on Equity 118 6.1 Elements of Health Facility Autonomy 142 6.2 Enhancing Autonomy and Improving Results Step by Step 144 7.1 Example of Quarterly Financial Activities 157 7.2 Example of Past and Projected Income 159 7.3 Example of Past and Projected Expenses 160 7.4 Example of Budget for Employee Performance Bonuses 161 7.5 Example of Employee Indice Value 162 7.6 Consolidated Indice Values and Performance Evaluations
of Employees 163 8.1 Example of Performance Framework 169 B9.1.1 Investment Unit Approach in the Democratic Republic
of Congo, 2007–09 177 10.1 The General Content of a Business Plan 184 10.2 Example of Individual Performance Evaluation for Health Staff 188 10.3 Some Advanced Strategies for PBF 191 11.1 The Distinct Stakeholder Functions of PBF Key Players 205 11.2 Framework for Governance Issues and Structures 208 11.3 Examples of Private Purchaser and Quasi-Public
Purchaser Approaches 210 11.4 Distinctions between the Private Purchaser
and Quasi-Public Purchaser Approaches 211 11.5 PBF Contracts Used in Rwanda 212 11.6 PBF Contracts Used in Burundi 213 13.1 Analyzing Coverage for PBF Services in Rwanda, 2006–07 229 14.1 Technical Assistance Areas in PBF 241 B14.1.1 Overhead Costs as a Percentage of Total Costs 244 16.1 Checklist for PBF Implementers 279 17.1 Design and Implementation Characteristics Linked
to Improved Results 304 17.2 Possible Effects of Weak Design and Implementation 306 17.3 Frequently Asked Questions and Corresponding Answers 308
xv
Across the developing world, there has been encouraging but uneven prog-ress towards the Millennium Development Goals, a set of international tar-gets that come due in 2015. Even as daunting challenges remain, on health and other critical fronts, our immediate and post-2015 ambitions must be bold, refl ecting a fundamental shift towards solutions that make a diff erenceto our real clients—the millions of people in the developing world who still endure extreme poverty and are vulnerable to malnutrition, disease, and premature death.
The Health Results Innovative Trust Fund (HRITF) was set up in 2007 and funded by the governments of Norway and United Kingdom to supportcountries in the design, implementation, and evaluation of results-based fi -nancing programs aimed at accelerating progress towards the Millennium Development goals for women’s and children’s health. Programs in 31 coun-tries are currently supported by the HRITF. About US$400 million in HRITF grants are co-fi nancing US$1.6 billion in funding from the International De-velopment Association (IDA), the World Bank Group’s fund for the poorestcountries.
These programs focus on delivering better reproductive, maternal, andchild health, using an innovative set of approaches known as “results-basedfi nancing.” Pioneered in countries such as Cambodia, Rwanda, and Burundi to extremely good eff ect, several other countries have begun to experiment with this approach, including Zambia, Cameroon, Zimbabwe, and Nigeria. The World Bank Group is committed to advancing such approaches to helpensure that people get the aff ordable, quality health care necessary to live long, healthy, and productive lives. In September 2013, the World BankGroup—as part of its mission to eliminate extreme poverty and boost shared prosperity—pledged US$700 million in additional fi nancing through the end of 2015 to help developing countries reach the Millennium Development
Foreword
xvi Foreword
Goals for women’s and children’s health and survival. This new pledge will help governments to rapidly scale up successful pilot programs to the na-tional level.
At the front line—that is, at primary health centers and district hospitals—the results-based approach is known in many countries more specifi cally as “performance-based fi nancing.” With funds being paid to these health cen-ters and hospitals directly upon reaching specifi c measurable and verifi able targets, including the number of children immunized or the number of births taking place at health centers, performance-based fi nancing has been as good as its name, fostering results and injecting new life into run-down health facilities. But the approach isn’t just about fi nancing; it also repre-sents fundamental shifts in responsibility, transparency, and accountability. To help increase the focus on tangible results, this toolkit has been produced by practitioners for practitioners and embodies the rich experience of a cou-ple of decades of fi eld testing. While there is no cookie-cutter approach that works everywhere, much can be gained from studying various cases that add more to our understanding of what works and what doesn’t, putting the sci-ence of service delivery into practice. Delivering services to poor people is a science like any other, and it is important for us to push the frontier of knowl-edge continually forward.
As this toolkit demonstrates, performance-based strategies have evolved a great deal through testing and modifi cation. There is a huge wave of im-provement starting to break across Africa, Asia, and Latin America, enabling poor people to access quality health services and health facilities to motivate their staff and rebuild their dilapidated health infrastructure.
The World Bank Group is helping to shift funding and performance in-centives to where the actual work is being carried out. This is growing into a truly transformational exercise, not just because of new funding resources, but also because we are aiming, together with developing country govern-ments, to achieve value for money in health. Universal health coverage is possible if this transformation continues across the developing world.I hope that you fi nd this toolkit useful.
Timothy Grant EvansSector Director, Health, Nutrition, and Population Human Development NetworkThe World BankWashington, DC
xvii
The authors thank the thousands of health workers who have taught us somuch about performance-based fi nancing (PBF) and the members of the performance-based fi nancing community of practice, with whom we often interact and who work so hard at making PBF a journey of improvements and discoveries. Thanks also to the experts who have criticized PBF andwhose dialectic has helped us to improve the strategy of PBF approaches. We gratefully acknowledge funding from the Health Results Innovation Trust Fund, which fi nanced this toolkit.
The authors thank the members of the “PBF Expert Advisory Team” whocontributed to the review of the toolkit as it was drafted: Nicolas de Borman,Maud Juquois, Christophe Lemiere, Benjamin Loevinsohn, Shun Mabuchi, Ronald Mutasa, Jumana Qamruddin, Sunil Rajkumar, Claude Sekabaraga, Gaston Sorgho, Petra Vergeer, and Monique Vledder. Special thanks to Maud Juquois for translating some key Burundi documents. Also, many thanks toTrina Haque, Hadia Samaha, and Abdo Yazbeck, who were instrumental inmoving this product forward.
The authors gratefully acknowledge the internal and external reviewerswho spent considerable time reviewing the fi nal product: Nicolas de Bor-man, Jerry de la Forgia, Jumana Qamruddin, Louis Rusa, and Monique Vledder.
Acknowledgments

xix
About the Authors
György Bèla Fritsche is a medical doctor specializing in tropical medicine. He received a postgraduate degree in health policy, planning, and fi nancing from the London School of Hygiene and Tropical Medicine. For the past twenty years he has been living and working as a practitioner, public health manager, and advisor in Zambia, Senegal, Afghanistan, Kenya, South Sudan, and Rwanda. For the past ten years he has been closely involved in designing, implementing, and scaling up performance-based fi nancing (PBF) programs in Afghanistan, Rwanda, Burundi, Kyrgyzstan, Nigeria, Djibouti, Lesotho, the Democratic Republic of Congo, and the Republic of Congo. Since 2009 he has worked for the World Bank in Washington, DC as a senior health spe-cialist. He advises colleagues and governments in appropriate design and implementation issues related to results-based fi nancing programs.
Robert Soeters, an independent public health and health-fi nancing special-ist, is the director of SINA Health, a consultancy fi rm that organizes courses, conducts studies, and provides technical support mainly for performance-based health fi nancing programs. He conducted around 200 health-care-related missions since the mid 1980s for such organizations as the World Bank, the Dutch-based international NGO Cordaid, the European Union,several bilateral organisations, local governments, and the World Health Or-ganization. He has worked in more than thirty countries, mostly in Africa, Asia, and Eastern Europe. Soeters has a medical degree from the University of Amsterdam, a MPH degree from the Royal Tropical Institute in Amster-dam, and a PhD in public health and health economics from the University of Amsterdam. In 2013, he obtained a Dutch Royal Knighthood for his com-plete work.
Authors and Contributors

xx Authors and Contributors
Bruno Meessen holds a master of arts and a PhD in economics (UniversiténCatholique de Louvain, Belgium). He started his international career with Médecins Sans Frontières, where he served six years as an economist, mainly in sub-Saharan Africa and Asia. In 1999, he joined the Institute of Tropical Medicine, Antwerp, Belgium, where he is today a professor of health eco-nomics. As a researcher and policy adviser, he played a pioneer role in the design, implementation and evaluation of performance-based fi nancing schemes in Cambodia and Rwanda. His theoretical and empirical works contributed to the worldwide dissemination of the strategy. He is currently the lead facilitator of the performance-based fi nancing community of prac-tice, a group gathering more than 1,000 experts.
About the Contributors
Cedric Ndizeye holds an MD from the Catholic University of Bukavu, Dem-ocratic Republic of Congo, and an MPH from the Institute of Tropical Medi-cine, Antwerp, Belgium. He has been involved in performance-based fi nanc-ing since 2002, when he was the district director of health of Gakoma district in Rwanda, during one of the early PBF pilot schemes in that country. Since then he has worked as a technical advisor for HealthNet-TPO and for Man-agement Sciences for Health as a monitoring and evaluation specialist. He was closely involved in the scaling-up processes for PBF in Rwanda and Bu-rundi, and has provided technical advice on PBF in the Democratic Republic of Congo and Madagascar. He currently works for Management Sciences for Health as the principal technical advisor on performance-based health fi -nancing mechanisms.
Caryn Bredenkamp, PhD, specializes in health equity and fi nancial protec-tion, advising and training development professionals and government staff from countries around the world on how to measure equity and design pro-poor health policy. Attracted by the potential of results-based fi nancing to bring health services to the poor, she joined the World Bank’s results-based fi nancing team in 2008 and has worked on PBF in the Democratic Republic of Congo and Vietnam, among other countries. Caryn holds a master of arts (economics) from the University of Stellenbosch, Stellenbosch, South Africa, and a PhD in public policy (health economics) from the University of North Carolina–Chapel Hill. She started her working career as a university lec-turer in her native South Africa before moving to the World Bank’s Washing-ton offi ce to work on Albania and India in 2006. She is now the senior health economist for the Philippines, based in Manila.
Authors and Contributors xxi
Godelieve van Heteren is a physician, senior health systems reform spe-ncialist, and director of the Rotterdam Global Health Initiative, a global health innovation coalition, which involves Erasmus University institutes, several international NGOs specializing in health, the City of Rotterdam, and a num-ber of social entrepreneurs. She was trained in Leyden (medical school) andLondon (postgraduate studies at the Wellcome Institute/UCL). From 1988to 2002 she was a full-time university lecturer and comparative health sys-tems researcher at Nijmegen University medical school, before entering the Dutch Parliament. As a member of parliament she was spokesperson for health, biotechnology, innovation, and security, and chair of the standing committee on European aff airs. In 2008–09 Van Heteren was director of the international development agency Cordaid before moving to her current po-sition. Van Heteren’s present chief areas of interest are health policy and re-form processes, social sector innovation, transition management and how to build new institutions for the 21st century. She applies these interests to herwork as an international PBF consultant and trainer.

xxiii
AEDES European Agency for Development and Health
AFB+ acid-fast bacillus positive
AIDS acquired immune defi ciency syndrome
ANC antenatal care
ARV antiretroviral
BCG Bacillus Calmette–Guérin (vaccine)
BPL below poverty line
CAAC Cellule d’Appui a l’Approche Contractuelle
CB capacity building
CBO community-based organization
CCT conditional cash transfer
CHW community health worker
COD cash on delivery
COD-Aid cash on delivery–aid
CORDAID Catholic Organisation for Relief and Development Aid
COSA comité de santé (community health committee)
CPA complementary package of activities
CPVV Provincial Verifi cation and Validation Committee
CTB Coopération Technique Belge
DHO district health offi ce
DHS Demographic and Health Surveys
DLI disbursement-linked indicator
DOTS directly observed therapy for the treatment of tuberculosis
Abbreviations
xxiv Abbreviations
DPT3 diphtheria, pertussis, tetanus
FP family planning
GRO grassroots organization
HIS health information system
HIV human immunodefi ciency virus
HMIS health management information system
HNI-TPO Health Net International–Transcultural Psychosocial Organization
ICT information and communication technology
IT information technology
ITN insecticide-treated net
IPTp intermittent preventive treatment for malaria in pregnancy
IUD intrauterine device
JSY Janani Suraksha Yojana
LGA local government authority
LMIC lower- and middle-income countries
MDG Millennium Development Goal
MHIF Mandatory Health Insurance Fund
MICS Multiple Indicator Cluster Surveys
MMR Maternal Mortality Ratio (initial caps)
MoH ministry of health
MPA minimum package of activities
NCD noncommunicable disease
NGO nongovernmental organization
NSHIP Nigeria State Health Investment Project
OBA output-based aid
OCP oral contraceptive
OECD Organisation for Economic Co-operation and Development
OPD outpatient department
PBC performance-based contracting
PBF performance-based fi nancing
PBI performance-based incentives

Abbreviations xxv
PEPFAR U.S. President’s Emergency Plan for AIDS Relief
P4P Pay for Performance
PforR Program for Results
PHC primary health care
PHO provincial health offi ce
PIT provider-initiated testing for HIV
PMTCT prevention of mother-to-child transmission of HIV
PRP Provider Recognition Program
PTB pulmonary tuberculosis
RBF results-based fi nancing
SDC Swiss Agency for Development and Cooperation
SMART specifi c, measurable, achievable, realistic, and time-bound
SMOH state ministry of health
SP sulfadoxine/pyrimethamine
STD sexually transmitted disease
TA technical assistance
TB tuberculosis
TOT training of trainers
TT tetanus toxoid vaccination
TT2 second to the sixth tetanus toxoid vaccination
U-5 Under-5
U5MR Under-5 Mortality Rate
USAID United States Agency for International Development
VCT voluntary counseling and testing for HIV
VVF vesico-vaginal fi stula


1
Introduction
I.1 The Toolkit
What is performance- based fi nancing (PBF)? Why is this used to fi nancehealth services in lower- and lower- middle- income countries? If practitio-ners want to introduce PBF in their country, how shall they do it?
This toolkit addresses the questions what and why, while focusing on the answer to how it can be done. The toolkit is pervaded by answers to the fi rst question, while explaining the “how to”: the process, the planning, the de-sign, and the implementation of PBF schemes. It is written and reviewed by practitioners who have experimented with various methods and who have designed, implemented, witnessed, and evaluated its eff ects. Methods and approaches in PBF evolve continuously. Even though the toolkit providesguidance based on experience, the experience itself is based on trial and er-ror and constant testing, assessing, and reassessing. And this approach is why the toolkit is not meant as a fi nal product. It attempts to capture the current state of aff airs and best practices, while attempting to stay abreast by updating the methods, experiences, and tools used.

2 Performance-Based Financing Toolkit
Introducing PBF can be a daunting undertaking. For instance, the practi-tioner will need to complete the following tasks:
• Introduce autonomy• Introduce revolving drug funds• Introduce health facility management tools such as the indice tool, the
business plan, and individual performance evaluations• Design and write contracts• Set fees• Design quality checklists• Introduce community collaboration• Create steering committees at the district and national levels• Create information technology solutions.
How will the practitioner accomplish all of these tasks? This toolkit provides tools and explanations to help the practitioner do so.
This toolkit is meant to be a one- stop shop for the forms, tools, spread-sheets, contracts, terms of reference, performance frameworks, and so on that have been designed for successful PBF approaches in Asia and Africa.
This toolkit is written by implementers for implementers. It contains les-sons learned and experiential knowledge for starting PBF approaches and for scaling up these approaches nationwide. The toolkit contains what we, as implementers, would have liked to know when we fi rst started designing such approaches.
Methods and approaches in PBF continuously evolve. And this evolution is why the toolkit is meant not as a fi nal product but as a product that will be updated regularly. This toolkit is conceived as an organized and structured collection of tools and documents to implement PBF approaches in low- and lower- middle- income countries.
By using this toolkit, countries will be able to implement PBF approaches and to move rapidly in designing and implementing their schemes (box I.1).
As a tool for helping create better, more inclu-sive, and more accessible health services, PBFis an important component of achieving univer-sal health coverage (WHO 2010). There arethree broad areas in which PBF and universalhealth coverage intercept. These areas are (a)
defi ning the basic and complementary health package and delivering these packages, (b) ex-panding coverage of health services for the general population and especially for the poor-est, and (c) improving access to good- qualityhealth services.
BOX I.1
PBF and Universal Health Coverage
Introduction 3
Also, these tools may reduce the barrier to entry for governments and inter-national organizations willing to take on an implementing role in PBF.
This introduction includes a short history of PBF, a discussion of termi-nology, and a simplifi ed example of what PBF looks like for a health center.
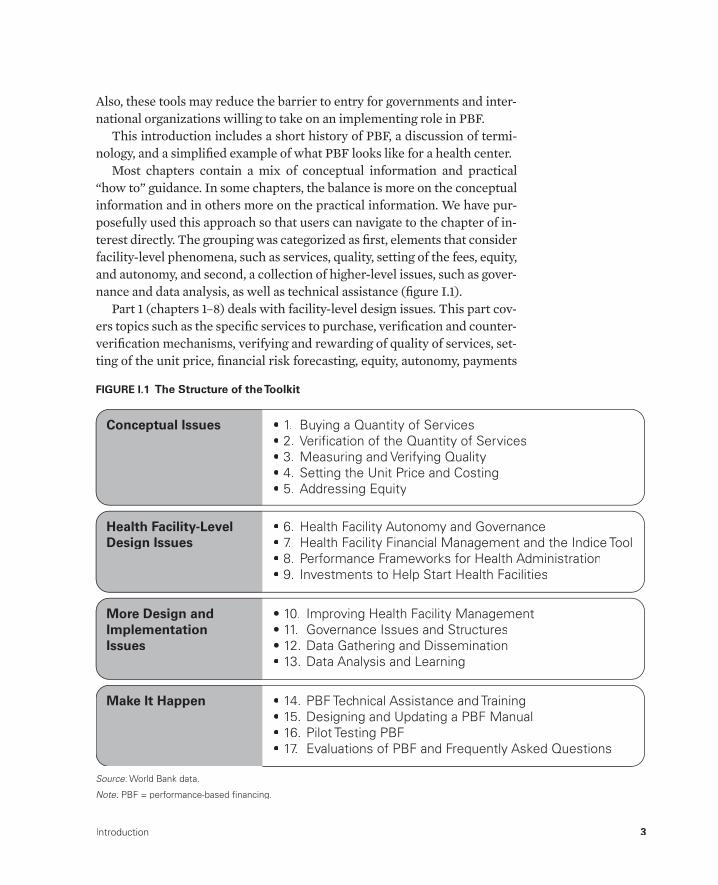
Most chapters contain a mix of conceptual information and practical “how to” guidance. In some chapters, the balance is more on the conceptualinformation and in others more on the practical information. We have pur-posefully used this approach so that users can navigate to the chapter of in-terest directly. The grouping was categorized as fi rst, elements that consider facility- level phenomena, such as services, quality, setting of the fees, equity, and autonomy, and second, a collection of higher- level issues, such as gover-nance and data analysis, as well as technical assistance (fi gure I.1).
Part 1 (chapters 1– 8) deals with facility- level design issues. This part cov-ers topics such as the specifi c services to purchase, verifi cation and counter-verifi cation mechanisms, verifying and rewarding of quality of services, set-ting of the unit price, fi nancial risk forecasting, equity, autonomy, payments
Source: World Bank data.:
Note: PBF = performance- based fi nancing.:
Conceptual Issues 1. 2. 3. 4. 5.
Buying a Quantity of ServicesVerification of the Quantity of ServicesMeasuring and Verifying QualitySetting the Unit Price and CostingAddressing Equity
Health Facility-Level Design Issues
6. 7. 8. 9.
Health Facility Autonomy and GovernanceHealth Facility Financial Management and the Indice ToolPerformance Frameworks for Health AdministrationInvestments to Help Start Health Facilities
More Design and Implementation Issues
10. 11. 12. 13.
Improving Health Facility ManagementGovernance Issues and StructuresData Gathering and DisseminationData Analysis and Learning
Make It Happen 14. 15. 16. 17.
PBF Technical Assistance and TrainingDesigning and Updating a PBF ManualPilot Testing PBFEvaluations of PBF and Frequently Asked Questions
FIGURE I.1 The Structure of the Toolkit

4 Performance-Based Financing Toolkit
and fi nancial management, and performance frameworks for the health administration.
Part 2 (chapters 9– 16) gives attention to design structures and issues rel-evant for implementation. This part covers topics such as investment units, health facility management and how to improve it, governance, data capture, data analysis, technical assistance requirements, design of a manual, and pi-lot testing.
Part 3 (chapter 17) addresses the current evidence on PBF schemes and contrasts the approaches in lower- and middle- income countries and Organ-isation for Economic Co- operation and Development (OECD) countries. Also, this part contains design tips and a table with frequently asked questions.
At the end of most chapters is a list of documents and tools, which can be accessed through web links (URLs) provided. The entire toolkit, as well as all of the documents and fi les referenced, can also be accessed at http://www.worldbank.org/health/pbftoolkit.
I.2 A Short History of PBF
Performance- based fi nancing in lower- and middle- income countries can be traced to early experimentation with the introduction of market forces in pri-mary health care. This experiment was in a publicly funded and publicly pro-vided health system, and its purpose was to cofi nance primary health care in Zambia’s Western Province in the late 1980s and early 1990s (Soeters and Nzala 1994).1 A further development was spurred in 1999, through Cambo-dia’s contracting of health services experience. In Cambodia, nongovernmen-tal organizations (NGOs) were contracted to provide either health services or management support to government- provided health services (Bhushan, Keller, and Schwartz 2002; Bhushan et al. 2007; Soeters and Griffi ths 2003).In Haiti, NGOs were contracted for service delivery (Eichler et al. 2009).
In both Cambodia and Haiti, these contracts were output- based or fi xed- price contracts with an element of award fees; this form of performance con-tracting was called performance- based contracting (PBC) (Loevinsohn 2008). In Afghanistan since 2003, PBC has been introduced as a national strategy for health service delivery (Arur et al. 2009; Loevinsohn and Sayed 2008; Palmer et al. 2006).
Since 2002, PBF has developed in its current form in Rwanda, where ac-tors who had been engaged in Cambodia brought their experience (Meessen et al. 2006; Meessen, Kashala, and Musango 2007; Soeters, Habineza, and Peerenboom 2006). A further boost came through development of similar approaches in the Democratic Republic of Congo (Soeters et al. 2011) and
Introduction 5
Burundi from 2006 onward. A small pilot started in Cameroon in 2008 andon Flores, Indonesia, in 2009. In 2009, the Central African Republic began a pilot in one prefecture, which has been expanded to six prefectures (January 2010 onward). Rwanda (in 2006), Burundi (in 2010), and Sierra Leone (in 2011) scaled up PBF approaches to function nationwide.
As of 2013, additional PBF projects and programs have been planned and implemented in a wide range of countries such as Afghanistan, Benin, Burkina Faso, Cameroon, Chad, Djibouti, The Gabon, Gambia, Kenya, the Kyrgyz Republic, Lao People’s Democratic Republic, Lesotho, Liberia, Mozambique, Nigeria, Senegal, South Sudan, Tajikistan, Tanzania, Vietnam, Zambia, Zanzibar (Tanzania), and Zimbabwe (see box I.2). More are certain to follow.
PBF approaches are undergoing a dynamic growth in terms of both par-ticipating countries and methodological issues (such as design, quality, eq-uity, demand- side interventions, and expansion in the secondary- care level).
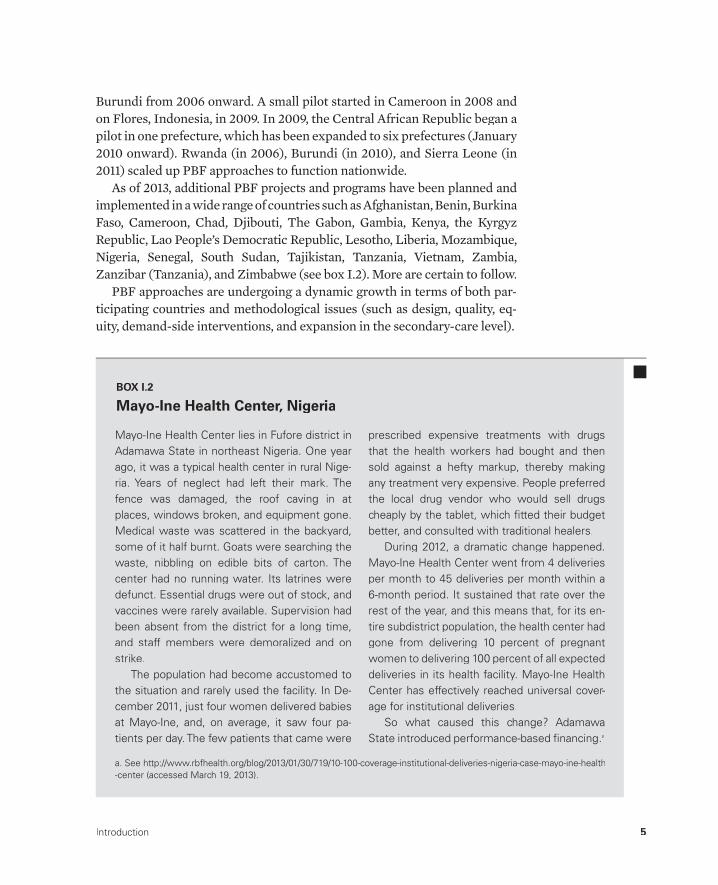
Mayo- Ine Health Center lies in Fufore district in Adamawa State in northeast Nigeria. One year ago, it was a typical health center in rural Nige-ria. Years of neglect had left their mark. Thefence was damaged, the roof caving in at places, windows broken, and equipment gone.Medical waste was scattered in the backyard, some of it half burnt. Goats were searching thewaste, nibbling on edible bits of carton. The center had no running water. Its latrines weredefunct. Essential drugs were out of stock, andvaccines were rarely available. Supervision had been absent from the district for a long time, and staff members were demoralized and on strike.
The population had become accustomed to the situation and rarely used the facility. In De-cember 2011, just four women delivered babiesat Mayo- Ine, and, on average, it saw four pa-tients per day. The few patients that came were
prescribed expensive treatments with drugs that the health workers had bought and then sold against a hefty markup, thereby making any treatment very expensive. People preferred the local drug vendor who would sell drugscheaply by the tablet, which fi tted their budget better, and consulted with traditional healers.
During 2012, a dramatic change happened.Mayo- Ine Health Center went from 4 deliveries per month to 45 deliveries per month within a 6- month period. It sustained that rate over the rest of the year, and this means that, for its en-tire subdistrict population, the health center hadgone from delivering 10 percent of pregnantwomen to delivering 100 percent of all expected deliveries in its health facility. Mayo- Ine HealthCenter has effectively reached universal cover-age for institutional deliveries.
So what caused this change? Adamawa State introduced performance- based fi nancing.a
BOX I.2
Mayo- Ine Health Center, Nigeria
a. See http://www.rbfhealth.org/blog/2013/01/30/719/10- 100- coverage- institutional- deliveries- nigeria- case- mayo- ine- health-center (accessed March 19, 2013).
6 Performance-Based Financing Toolkit
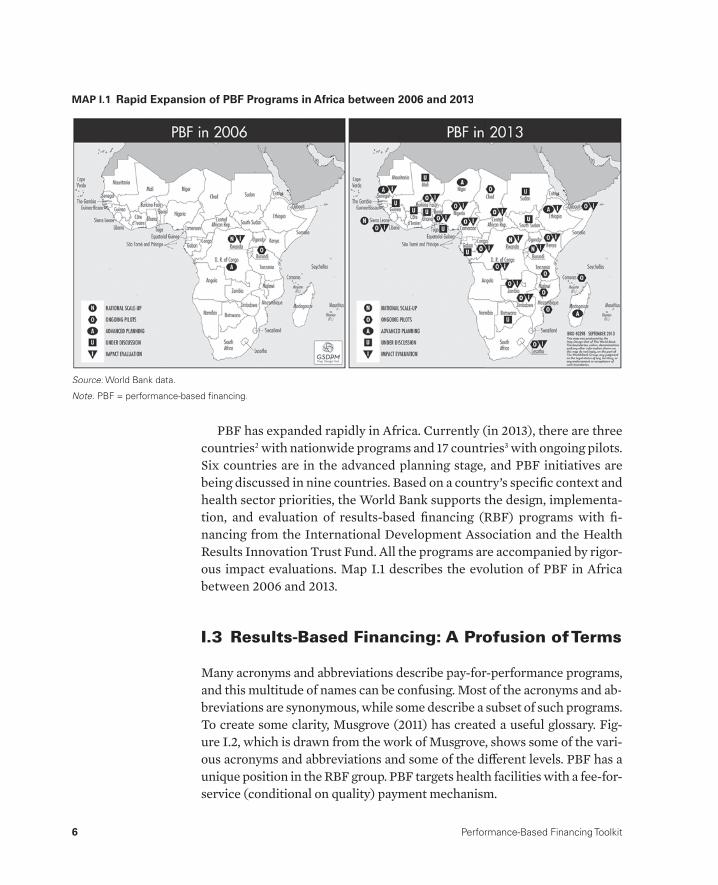
PBF has expanded rapidly in Africa. Currently (in 2013), there are three countries2 with nationwide programs and 17 countries3 with ongoing pilots.Six countries are in the advanced planning stage, and PBF initiatives are being discussed in nine countries. Based on a country’s specifi c context and health sector priorities, the World Bank supports the design, implementa-tion, and evaluation of results- based fi nancing (RBF) programs with fi -nancing from the International Development Association and the Health Results Innovation Trust Fund. All the programs are accompanied by rigor-ous impact evaluations. Map I.1 describes the evolution of PBF in Africa between 2006 and 2013.
I.3 Results- Based Financing: A Profusion of Terms
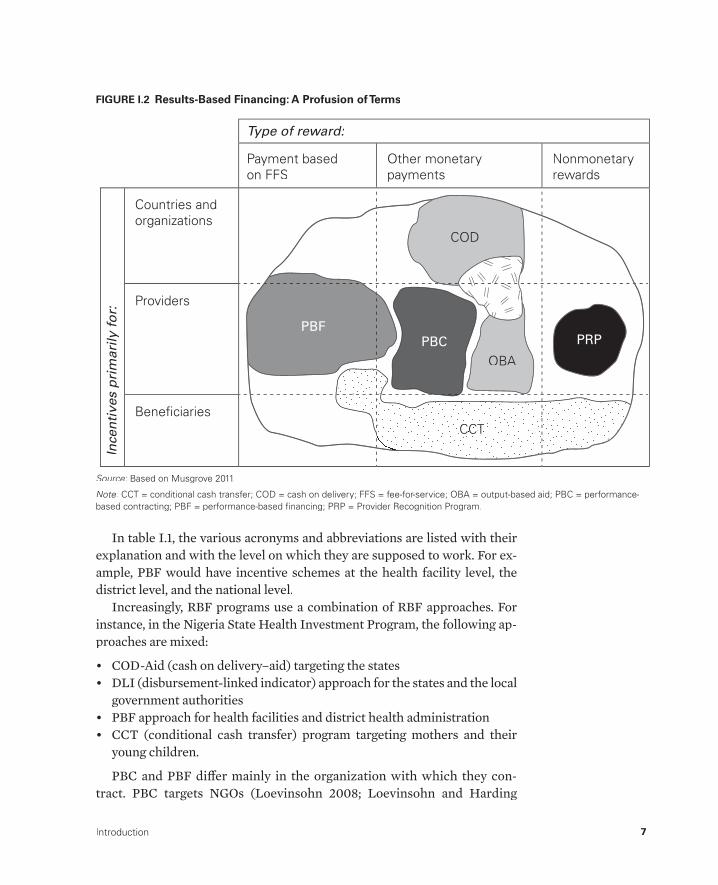
Many acronyms and abbreviations describe pay- for- performance programs, and this multitude of names can be confusing. Most of the acronyms and ab-breviations are synonymous, while some describe a subset of such programs. To create some clarity, Musgrove (2011) has created a useful glossary. Fig-ure I.2, which is drawn from the work of Musgrove, shows some of the vari-ous acronyms and abbreviations and some of the diff erent levels. PBF has a unique position in the RBF group. PBF targets health facilities with a fee- for- service (conditional on quality) payment mechanism.
MAP I.1 Rapid Expansion of PBF Programs in Africa between 2006 and 2013
Source: World Bank data.:
Note: PBF = performance-based fi nancing.:
Introduction 7
COD
PBFPBC
OBA
PRP
CCTTTCCCTC
Ince
nti
ves
pri
mar
ily f
or:
Type of reward:
Countries and organizations
Payment based on FFS
Other monetary payments
Nonmonetary rewards
Providers
Beneficiaries
FIGURE I.2 Results- Based Financing: A Profusion of Terms
Source: Based on Musgrove 2011.:
Note: CCT = conditional cash transfer; COD = cash on delivery; FFS = fee- for- service; OBA = output- based aid; PBC = performance- :based contracting; PBF = performance- based fi nancing; PRP = Provider Recognition Program.
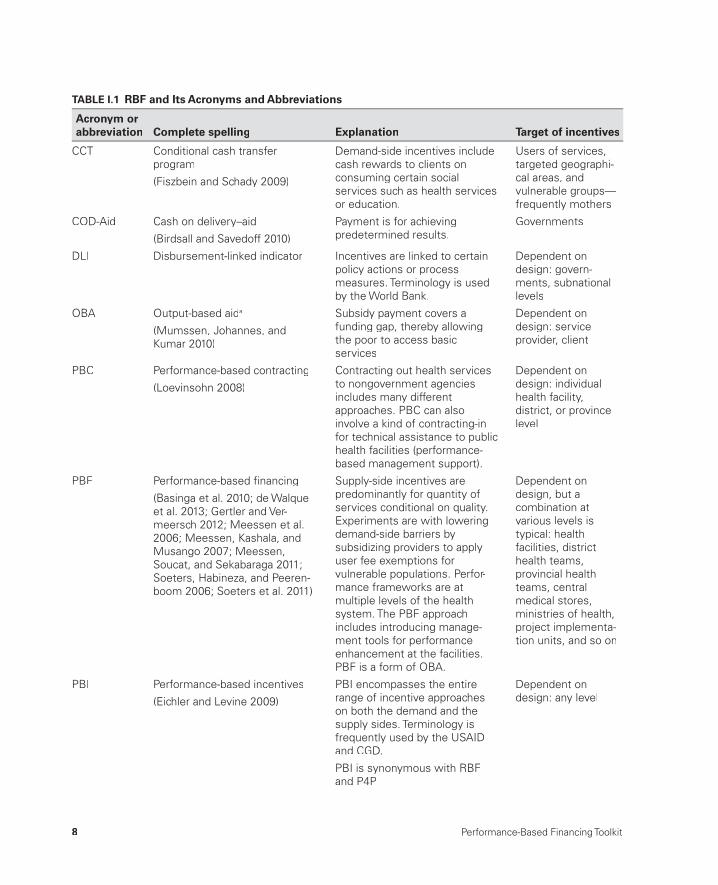
In table I.1, the various acronyms and abbreviations are listed with their explanation and with the level on which they are supposed to work. For ex-ample, PBF would have incentive schemes at the health facility level, the district level, and the national level.
Increasingly, RBF programs use a combination of RBF approaches. For instance, in the Nigeria State Health Investment Program, the following ap-proaches are mixed:
• COD- Aid (cash on delivery– aid) targeting the states• DLI (disbursement- linked indicator) approach for the states and the local
government authorities• PBF approach for health facilities and district health administration• CCT (conditional cash transfer) program targeting mothers and their
young children.
PBC and PBF diff er mainly in the organization with which they con-tract. PBC targets NGOs (Loevinsohn 2008; Loevinsohn and Harding
8 Performance-Based Financing Toolkit
TABLE I.1 RBF and Its Acronyms and Abbreviations
Acronym or abbreviation Complete spelling Explanation Target of incentives
CCT Conditional cash transferprogram
(Fiszbein and Schady 2009)
Demand- side incentives includecash rewards to clients on consuming certain socialservices such as health servicesor education.
Users of services,targeted geographi-cal areas, andvulnerable groups—frequently mothers
COD- Aid Cash on delivery– aid
(Birdsall and Savedoff 2010)
Payment is for achievingpredetermined results.
Governments
DLI Disbursement- linked indicator Incentives are linked to certainpolicy actions or processmeasures. Terminology is used by the World Bank.
Dependent ondesign: govern-ments, subnationallevels
OBA Output- based aida
(Mumssen, Johannes, andKumar 2010)
Subsidy payment covers a funding gap, thereby allowingthe poor to access basicservices
Dependent ondesign: serviceprovider, client
PBC Performance- based contracting
(Loevinsohn 2008)
Contracting out health servicesto nongovernment agencies includes many differentapproaches. PBC can alsoinvolve a kind of contracting-infor technical assistance to public health facilities (performance-based management support).
Dependent ondesign: individualhealth facility,district, or provincelevel
PBF Performance- based fi nancing
(Basinga et al. 2010; de Walqueet al. 2013; Gertler and Ver-meersch 2012; Meessen et al. 2006; Meessen, Kashala, and Musango 2007; Meessen,Soucat, and Sekabaraga 2011; Soeters, Habineza, and Peeren-boom 2006; Soeters et al. 2011)
Supply- side incentives are predominantly for quantity ofservices conditional on quality. Experiments are with lowering demand- side barriers bysubsidizing providers to applyuser fee exemptions for vulnerable populations. Perfor-mance frameworks are atmultiple levels of the health system. The PBF approachincludes introducing manage-ment tools for performanceenhancement at the facilities.PBF is a form of OBA.
Dependent ondesign, but acombination atvarious levels istypical: healthfacilities, districthealth teams,provincial healthteams, centralmedical stores,ministries of health,project implementa-tion units, and so on
PBI Performance- based incentives
(Eichler and Levine 2009)
PBI encompasses the entirerange of incentive approacheson both the demand and thesupply sides. Terminology isfrequently used by the USAID and CGD.
PBI is synonymous with RBFand P4P
Dependent ondesign: any level
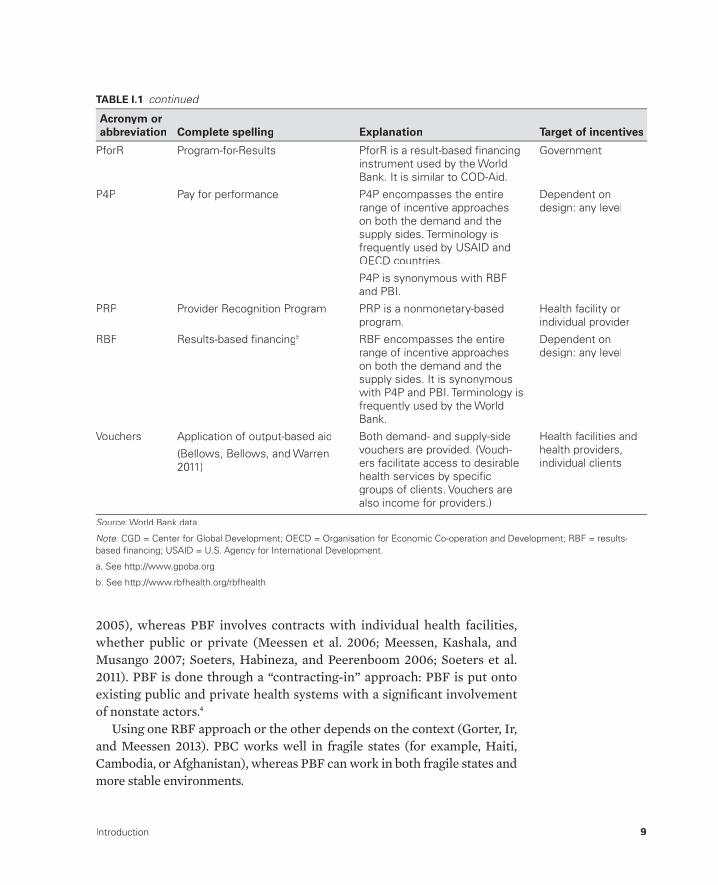
Introduction 9
2005), whereas PBF involves contracts with individual health facilities,whether public or private (Meessen et al. 2006; Meessen, Kashala, and Musango 2007; Soeters, Habineza, and Peerenboom 2006; Soeters et al. 2011). PBF is done through a “contracting- in” approach: PBF is put onto existing public and private health systems with a signifi cant involvement of nonstate actors.4
Using one RBF approach or the other depends on the context (Gorter, Ir, and Meessen 2013). PBC works well in fragile states (for example, Haiti, Cambodia, or Afghanistan), whereas PBF can work in both fragile states and more stable environments.
PforR Program- for- Results PforR is a result- based fi nancinginstrument used by the World Bank. It is similar to COD- Aid.
Government
P4P Pay for performance P4P encompasses the entirerange of incentive approacheson both the demand and thesupply sides. Terminology isfrequently used by USAID andOECD countries.
P4P is synonymous with RBFand PBI.
Dependent ondesign: any level
PRP Provider Recognition Program PRP is a nonmonetary- basedprogram.
Health facility orindividual provider
RBF Results- based fi nancingb RBF encompasses the entirerange of incentive approacheson both the demand and thesupply sides. It is synonymouswith P4P and PBI. Terminology isfrequently used by the WorldBank.
Dependent ondesign: any level
Vouchers Application of output- based aid
(Bellows, Bellows, and Warren 2011)
Both demand- and supply- sidevouchers are provided. (Vouch-ers facilitate access to desirablehealth services by specifi cgroups of clients. Vouchers are also income for providers.)
Health facilities andhealth providers,individual clients
Source: World Bank data.:
Note: CGD = Center for Global Development; OECD = Organisation for Economic Co- operation and Development; RBF = results-:based fi nancing; USAID = U.S. Agency for International Development.
a. See http://www.gpoba.org.
b. See http://www.rbfhealth.org/rbfhealth.
TABLE I.1 continued
Acronym or abbreviation Complete spelling Explanation Target of incentives
10 Performance-Based Financing Toolkit
This toolkit is primarily about PBF in the health sector of lower- and middle- income countries (LMIC). In many countries, this health sector comprises the public and faith- based- organization health facilities. In urban areas, the private for- profi t sector is becoming more important, and it is tar-geted in novel schemes such as the one in Douala, Cameroon.
There are several PBF approaches for health centers and hospitals in LMIC. For health centers, it is very common to use a fee- for- service for the minimum package of services and to pay conditional on the quality of the ser-vices. For hospitals, there is a mix of approaches: one uses a fee- for- service approach that is conditional on quality, and the other uses a balanced score-card that targets quality. The community PBF approach is being piloted.
The PBF approaches addressed in this toolkit have shown impressive re-sults through a rigorous impact evaluation (Basinga et al. 2010; de Walque et al. 2013; Gertler and Vermeersch 2012). The appeal of the PBF approach, notwithstanding the complexity and implementation challenges, is being validated through a nationwide scale- up in Burundi, which was completed in 2010, and through the application of this approach in a growing number of countries.
We are aware of the bewildering array of terms used to denote RBF ap-proaches. For this toolkit, we will be referring to performance- based fi nanc-ing, or PBF, when talking about the fee- for- service- conditional- on- quality RBF. The term PBF is used for two reasons. First, this term is used for this type of RBF in Africa, where it originated.5 Second, RBF designs, which arebeing introduced in many LMIC, are based on the fee- for- service- conditional- on- quality approaches (Gorter, Ir, and Meessen 2013).
I.4 A Simplifi ed Example of PBFat a Health Facility
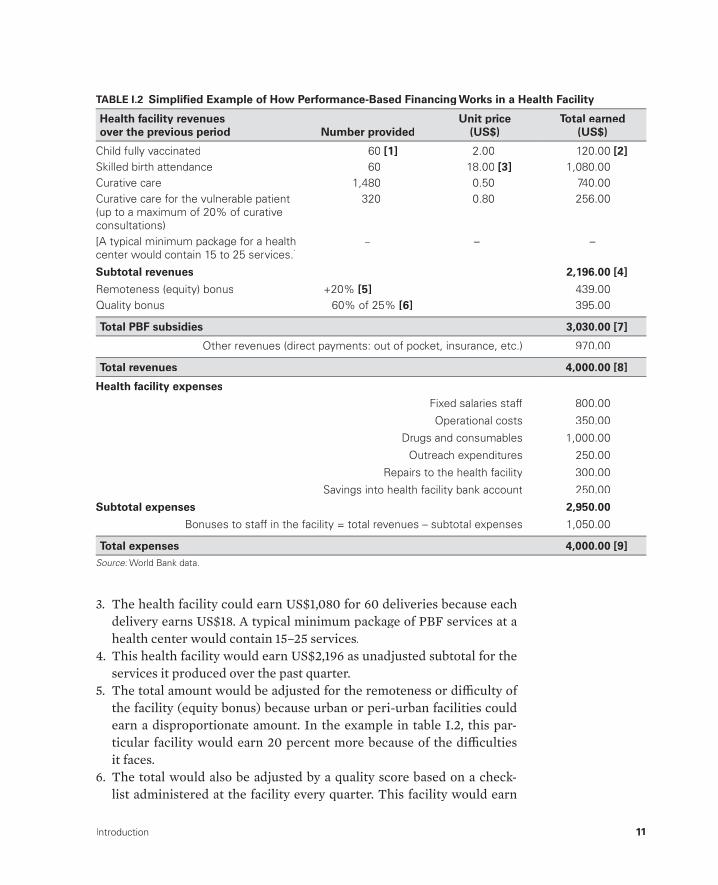
A simplifi ed example of PBF is provided in table I.2. The bulleted list with bracketed numbers that follows this paragraph shows how the performance of the health facility is fi nanced and how the health facility chooses to use the fi nancing. In this example, individual health facilities are provided funds based on the quantity and quality of services they produce as independently verifi ed. Each bracketed number refers to a fi eld in table I.2. For example, [1] refers to the number of children the health facility has fully immunized in the past quarter.
1. A health facility fully immunizes 60 children in a quarter.2. The health facility could earn US$120 (60 × US$2 per child fully
immunized).
Introduction 11
3. The health facility could earn US$1,080 for 60 deliveries because each delivery earns US$18. A typical minimum package of PBF services at a health center would contain 15– 25 services.
4. This health facility would earn US$2,196 as unadjusted subtotal for the services it produced over the past quarter.
5. The total amount would be adjusted for the remoteness or diffi culty of the facility (equity bonus) because urban or peri- urban facilities could earn a disproportionate amount. In the example in table I.2, this par-ticular facility would earn 20 percent more because of the diffi cultiesit faces.
6. The total would also be adjusted by a quality score based on a check-list administered at the facility every quarter. This facility would earn
TABLE I.2 Simplifi ed Example of How Performance- Based Financing Works in a Health Facility
Health facility revenues over the previous period Number provided
Unit price(US$)
Total earned (US$)
Child fully vaccinated 60 [1] 2.00 120.00 [2]Skilled birth attendance 60 18.00 [3] 1,080.00Curative care 1,480 0.50 740.00Curative care for the vulnerable patient(up to a maximum of 20% of curative consultations)
320 0.80 256.00
[A typical minimum package for a healthcenter would contain 15 to 25 services.]
– – –
Subtotal revenues 2,196.00 [4]
Remoteness (equity) bonus +20% [5] 439.00Quality bonus 60% of 25% [6] 395.00
Total PBF subsidies 3,030.00 [7]
Other revenues (direct payments: out of pocket, insurance, etc.) 970.00
Total revenues 4,000.00 [8]
Health facility expenses
Fixed salaries staff 800.00
Operational costs 350.00
Drugs and consumables 1,000.00
Outreach expenditures 250.00
Repairs to the health facility 300.00
Savings into health facility bank account 250.00
Subtotal expenses 2,950.00
Bonuses to staff in the facility = total revenues – subtotal expenses 1,050.00
Total expenses 4,000.00 [9]Source: World Bank data.:

12 Performance-Based Financing Toolkit
60 percent of what it would be entitled to because of the quality cor-rection. The quality correction is a maximum of 25 percent of earnings from the past quarter [6]. This facility thus earns 60 percent of the 25 percent for its quality.
7. The funds earned (US$3,030 in this example) are transferred to the bank account of the facility.
8. In this example, the health facility also has some other sources of cash revenue (US$970), and these are added to the PBF earnings.
9. The health facility had US$4,000 in income over the past quarter, and the expenses section illustrates how this could have been used. The in-come can be used for(a) health facility operational costs, such as drugs and consumables,
outreach expenses, and health facility maintenance and repair(b) performance bonuses for health workers (up to 50 percent) accord-
ing to defi ned criteria; this facility decided to spend 26 percent of its total income on performance bonuses (34 percent of its PBF earn-ings; however, because of other sources of cash income, such funds are managed integrally)
(c) savings; this health facility is saving not only to buy a motorcycle to facilitate community outreach but also to have a cash buff er.
Notes
1. See http://www.rbfh ealth.org/rbfh ealth/news/item/347/personal- story- seeking- roots- performance- based- fi nancing- pbf (accessed January 26, 2013).
2. Burundi, Rwanda, and Sierra Leone.3. Benin, Burkina Faso, Cameroon, the Comoros, the Central African Republic,
Chad, the Democratic Republic of Congo, the Republic of Congo, Kenya, Lesotho, Liberia, Malawi, Mozambique, Nigeria, Tanzania, Zambia, and Zimbabwe.
4. “Contracting- out” is also called a service delivery contract, and “contracting- in” is also called a management contract. In Cambodia where this terminology was used, contracting- in was reserved for those interventions whereby NGOsworked with and through the public sector. Contracting- in describes PBF systems best because there are many government– civil society structures withquite a few paid through public funds set up to enhance accountability andtransparency.
5. In francophone Africa where the approach gained currency (Burundi, the Democratic Republic of Congo, and Rwanda), it is referred to as fi nancement basé sur la performance (FBP), incentives pour la performance, or l’approchecontractuelle.
Introduction 13
References
Arur, A., D. Peters, P. Hansen, M. A. Mashkoor, L. C. Steinhardt, and G. Burnham. 2009. “Contracting for Health and Curative Care Use in Afghanistan between2004 and 2005.” Health Policy and Planning 25 (2): 135– 44.g
Basinga, P., P. Gertler, A. Binagwaho, A. Soucat, J. Sturdy, and C. Vermeersch. 2010.“Eff ect on Maternal and Child Health Services in Rwanda of Payment to Primary Health- Care Providers for Performance: An Impact Evaluation.” The Lancet 377t(9775): 1421– 28.
Bellows, N. M., B. W. Bellows, and C. Warren. 2011. “The Use of Vouchers for Reproductive Health Services in Developing Countries: Systematic Review.”Tropical Medicine and International Health 16 (1): 84– 96.
Bhushan, I., E. Bloom, D. Clingingsmith, R. Hong, E. King, M. Kremer, B. Loevin-sohn, and B. Schwartz. 2007. “Contracting for Health: Evidence from Cambodia.”Weatherhead School of Management, Case Western Reserve University, Cleveland, OH. http://faculty.weatherhead.case.edu/clingingsmith/cambodia13JUN07.pdf.
Bhushan, I., S. Keller, and B. Schwartz. 2002. “Achieving the Twin Objectives of Effi ciency and Equity: Contracting Health Services in Cambodia.” ERD Policy Brief No. 6, Asian Development Bank, Manila.
Birdsall, N., and W. Savedoff , eds. 2010. Cash on Delivery, A New Approach to ForeignAid. Washington, DC: Center for Global Development.
de Walque, D., P. J. Gertler, S. Bautista- Arredondo, A. Kwan, C. Vermeersch, J. deDieu Bizimana, A. Bingawaho, and J. Condo. 2013. “Using Provider Performance Incentives to Increase HIV Testing and Counseling Services in Rwanda.” Policy Research Working Paper 6364, World Bank, Washington, DC.
Eichler, R., P. Auxila, U. Antoine, and B. Desmangles. 2009. “Haiti: Going to Scalewith a Performance Incentive Model.” In Performance Incentives for Global Health: Potential and Pitfalls, edited by R. Eichler and R. Levine, 165– 88.Washington, DC: Center for Global Development.
Eichler, R., and R. Levine, eds. 2009. Performance Incentives for Global Health:Potential and Pitfalls. Washington, DC: Center for Global Development.
Fiszbein, A., and N. Schady. 2009. “Conditional Cash Transfers: Reducing Present and Future Poverty.” Policy Research Report, World Bank, Washington, DC.
Gertler, P., and C. Vermeersch. 2012. “Using Performance Incentives to ImproveHealth Outcomes.” Policy Research Working Paper WPS6100, World Bank, Washington, DC.
Gorter, A. C., P. Ir, and B. Meessen. 2013. “Evidence Review: Results- Based Financ-ing of Maternal and Neonatal Health Care in Low- and Lower- Middle- Income Countries.” Study, Deutsche Gesellschaft für Internationale Zusammenarbeit (GIZ), Eschborn, Germany.
Loevinsohn, B. 2008. Performance- Based Contracting for Health Services in Develop-ing Countries: A Toolkit. Health, Nutrition, and Population Series. Washington, DC: World Bank.

14 Performance-Based Financing Toolkit
Loevinsohn, B., and A. Harding. 2005. “Buying Results? Contracting for Health Service Delivery in Developing Countries.” The Lancet 366 (9486): 676– 81.t
Loevinsohn, B., and G. D. Sayed. 2008. “Lessons from the Health Sector in Afghani-stan: How Progress Can Be Made in Challenging Circumstances.” Journal of the American Medical Association 300 (6): 724– 26.
Meessen, B., J. P. Kashala, and L. Musango. 2007. “Output- based Payment to Boost Staff Productivity in Public Health Centres: Contracting in Kabutare District, Rwanda.” Bulletin of the World Health Organization 85 (2): 108– 15.
Meessen, B., L. Musango, J. P. Kashala, and J. Lemlin. 2006. “Reviewing Institutions of Rural Health Centres: The Performance Initiative in Butare, Rwanda.”Tropical Medicine and International Health 11 (8): 1303– 17.
Meessen, B., A. Soucat, and C. Sekabaraga. 2011. “Performance- Based Financing: Just a Donor Fad or a Catalyst Towards Comprehensive Health- Care Reform?” Bulletin of the World Health Organization 89 (2): 153– 56.
Mumssen, Y., L. Johannes, and G. Kumar. 2010. Output- Based Aid: Lessons Learned and Best Practices. Washington, DC: World Bank.
Musgrove, P. 2011. “Financial and Other Rewards for Good Performance or Results:A Guided Tour of Concepts and Terms and a Short Glossary.” World Bank, Washington, DC. http://www.rbfh ealth.org/system/fi les/RBF%20glossary%20long%20revised.pdf.
Palmer, N., L. Strong, A. Wali, and E. Sondorp. 2006. “Contracting Out HealthServices in Fragile States.” British Medical Journal 332 (7543): 718– 21.l
Soeters, R., and F. Griffi ths. 2003. “Improving Government Health Services through Contract Management: A Case from Cambodia.” Health Policy and Planning 18 g(1): 74– 83.
Soeters, R., C. Habineza, and P. B. Peerenboom. 2006. “Performance- Based Financ-ing and Changing the District Health System: Experience from Rwanda.” Bulletinof the World Health Organization 84 (11): 884– 89.
Soeters, R., and S. Nzala. 1994. “Primary Health Care Trading Companies forSustainable Development.” World Health Forum 15 (1): 51– 55.
Soeters, R., P. B. Peerenboom, P. Mushagalusa, and C. Kimanuka. 2011. “Performance- Based Financing Experiment Improved Health Care in the Democratic Republic of Congo.” Health Aff airs 30 (8): 1518– 27.
WHO (World Health Organization). 2010. World Health Report: Health Systems Financing— The Path to Universal Coverage. Geneva: WHO.

HEALTH FACILITY– LEVEL DESIGN ISSUES
PART 1

17
Buying a Quantity of Services
CHAPTER 1
MAIN MESSAGES
➜ When buying a quantity of services in PBF, give priority to those servicesthat have inadequate coverage but have a strong public health eff ect.
➜ Purchasing such services sends important signals to health workers about strategic choices.
➜ Some services are easier to purchase than others because of the ease with which they can be measured.
➜ PBF practitioners agree to a large extent on what services should be purchased.
➜ One can address pressure from lobbies to add more services by insisting that those advocates fi nd the additional resources to pay for the services.
COVERED IN THIS CHAPTER
1.1 How to buy a quantity of services in PBF: Four points to consider1.2 How to handle important design issues in purchasing services: Which
services are easy to purchase and which are not, and what services are commonly purchased?
18 Performance-Based Financing Toolkit
1.3 How to select services (the process in practice): How many services to buy and how to weigh quantitative services
1.4 How to handle any requests for inclusion of additional services: How to deal with services outside the PBF package
1.5 Links to fi les and tools
1.1 How to Buy a Quantity of Services in PBF:Four Points to Consider
It is sensible to pay for a particular quantity or volume of services. In high- income countries, this practice has been common for many years and is re-ferred to as a fee- for- service. When you buy health services, consider these four points:
• Buy services that are cost- eff ective. There is little point in buying ser-vices that are ineff ective or ineffi cient. Beginning with the World Develop-ment Report 1993: Investing in Health (World Bank 1993), consensus hasbeen emerging on which services or interventions provide good value for money. For example, child immunization, vitamin A supplementation, and skilled birth attendance are widely seen as eff ective and costing rela-tively little per life saved. Although some controversies remain over which services are the most cost- eff ective, the opinions of those imple-menting performance- based fi nancing (PBF) in real- world situations ap-pear to converge: there is a growing consensus about which services to buy (see table 1.3 later in this chapter).
• Be cautious in selecting services because your choices send an impor-tant signal to health workers about priorities. Governments or other purchasers often accord high priority to particular services. This prioriti-zation is an essential part of a good health sector strategy. When everything is a priority, nothing takes precedence! Thus, selecting a particular service does not mean that other services are without value. Instead, it means that in a given situation, some services will take precedence over others in terms of eff ort and resources. For example, in an epidemic of human immuno-defi ciency virus (HIV) concentrated in high- risk groups, one will select services concentrated among those populations that are most at risk. Vol-untary counseling and testing for HIV (VCT) services among the general population may be considered less of a priority than an increase in postna-tal care in high- risk circles.
• Be strategic in purchasing: Do not pay for volume if volume is not the problem. Where the coverage of specifi c services is low, PBF can help to

Buying a Quantity of Services 19
increase coverage. Where coverage of specifi c services is high, or where services are overproduced, paying for volume of services is not sensible. For example, if the level of skilled birth attendance is already 94 percentand has been for a few years, paying for volumes of skilled deliveries isineffi cient. In such circumstances, it would be more strategic to empha-size quality of care. This situation is not a theoretical concern. In the Kyr-gyz Republic, for example, nearly 100 percent of deliveries take place in hospitals. Thus, the government decided to focus on paying for improve-ments in the quality of care (see chapter 3).
• Be aware that preventive services really lag: Such services are oftenunderprovided and should be stimulated. In many countries, preven-tive and health promotion services are supposed to be “free of charge at the point of delivery.” In practice, this wording means that they are fi -nanced through input fi nancing, like drugs or medical consumables. Fre-quently, preventive services are underused by clients and underprovided by health workers. PBF has proven to be an eff ective way to subsidize such services and to increase health workers’ attention in providing them.1 This approach can result in a rapid increase in coverage of such highly eff ective but badly appreciated interventions.
1.2 How to Handle Important Design Issuesin Purchasing Services
Purchase Services Rather Than a Change in Indicators
Purchasing Health Outcomes Is ChallengingIt is challenging to purchase a decrease in indicators such as the Maternal Mortality Ratio (MMR) or the Under- 5 Mortality Rate (U5MR). Although an important goal of all health systems is to reduce maternal or child deaths, use of such indicators in PBF is usually not realistic for a number of reasons: (a) measurement, especially at the level of a catchment area of a health facil-ity, is very diffi cult; (b) the time between the delivery of a service and any visible eff ect at population level is so long that it interferes with providing any incentives to health workers or managers; and (c) any changes in those indicators are diffi cult to ascribe to specifi c actions of individual health workers because the indicators can be infl uenced by factors beyond the workers’ control. Although purchasing health outcomes is diffi cult, it is not impossible, and there may be situations where it can be tried. For example, one may be able to pay for nutritional outcomes, tuberculosis (TB) cures, or repair of cataracts.
20 Performance-Based Financing Toolkit
Purchasing Changes in Coverage Rates Does Not Appear to Work Well
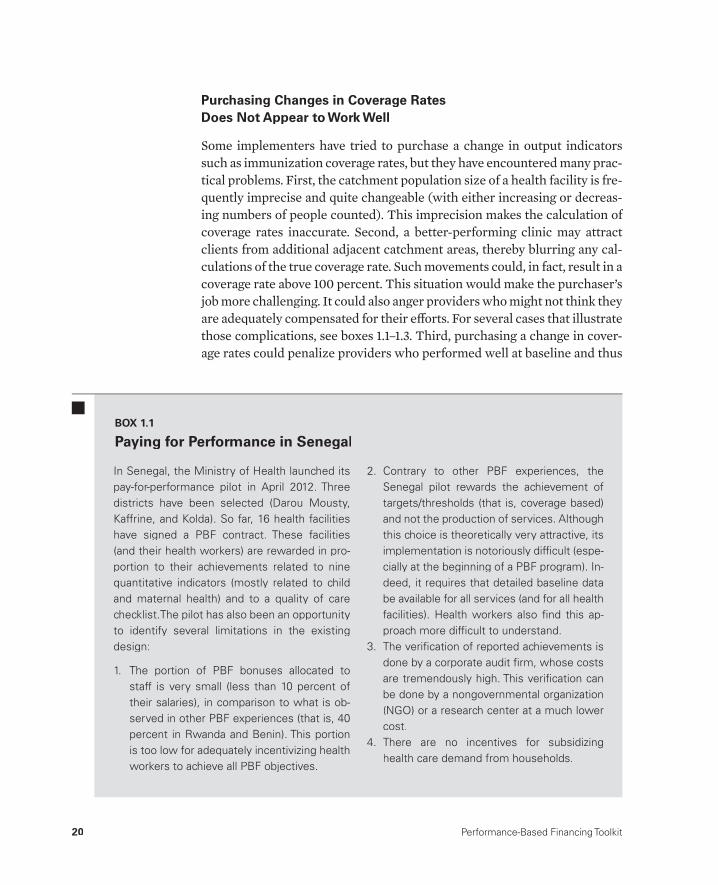
Some implementers have tried to purchase a change in output indicators such as immunization coverage rates, but they have encountered many prac-tical problems. First, the catchment population size of a health facility is fre-quently imprecise and quite changeable (with either increasing or decreas-ing numbers of people counted). This imprecision makes the calculation of coverage rates inaccurate. Second, a better- performing clinic may attract clients from additional adjacent catchment areas, thereby blurring any cal-culations of the true coverage rate. Such movements could, in fact, result in a coverage rate above 100 percent. This situation would make the purchaser’s job more challenging. It could also anger providers who might not think they are adequately compensated for their eff orts. For several cases that illustrate those complications, see boxes 1.1– 1.3. Third, purchasing a change in cover-age rates could penalize providers who performed well at baseline and thus
In Senegal, the Ministry of Health launched its pay- for- performance pilot in April 2012. Three districts have been selected (Darou Mousty, Kaffrine, and Kolda). So far, 16 health facilities have signed a PBF contract. These facilities (and their health workers) are rewarded in pro-portion to their achievements related to nine quantitative indicators (mostly related to child and maternal health) and to a quality of care checklist.The pilot has also been an opportunity to identify several limitations in the existing design:
1. The portion of PBF bonuses allocated to staff is very small (less than 10 percent of their salaries), in comparison to what is ob-served in other PBF experiences (that is, 40 percent in Rwanda and Benin). This portionis too low for adequately incentivizing health workers to achieve all PBF objectives.
2. Contrary to other PBF experiences, theSenegal pilot rewards the achievement oftargets/thresholds (that is, coverage based) and not the production of services. Althoughthis choice is theoretically very attractive, its implementation is notoriously diffi cult (espe-cially at the beginning of a PBF program). In-deed, it requires that detailed baseline databe available for all services (and for all healthfacilities). Health workers also fi nd this ap-proach more diffi cult to understand.
3. The verifi cation of reported achievements is done by a corporate audit fi rm, whose costsare tremendously high. This verifi cation canbe done by a nongovernmental organization (NGO) or a research center at a much lowercost.
4. There are no incentives for subsidizing health care demand from households.
BOX 1.1
Paying for Performance in Senegal
Buying a Quantity of Services 21
In Haiti, Management Sciences for Health, a U.S. Agency for International Development (USAID) contractor, has been managing a performance- based contracting program since 1998. Nongov-ernmental agencies were contracted to provide management support to health facilities, and
10 percent of the total budget was tied to cover-age increases for essential health services. The program struggled in its initial years to work around statistical validity of its surveys and had diffi culties paying for performance based on those survey results (Eichler, Auxila, and Pollock 2001).
BOX 1.2
Paying for Percentage Coverage in Haiti
In Liberia, performance- based contracting hasbeen implemented since 2009 through U.S.Agency for International Development funding. Nongovernmental agencies (NGOs) are con-tracted for management support to health facili-ties, and part of their budget (about 10 percent)is tied to percentage coverage increasesachieved by their facilities. Once per year, the NGO passed on the performance bonus earn-
ings to health facilities. There have been cases in which individual health facilities outper-formed, while others mostly underperformed, leading to the main contractor’s not paying the NGO performance bonuses for the high- performing facilities. The high- performing healthfacilities were disadvantaged and, therefore, discontent because they were not rewarded (World Bank 2011).
BOX 1.3
Paying for Percentage Coverage in Liberia
would fi nd it more diffi cult to further increase coverage. This change of ratescould also interfere with any additional eff orts to reach the poorest or most marginalized populations. This so- called step- function approach, as op-posed to constant incremental rewards, can also discourage providers be-cause it off ers strong incentives close to the threshold for the reward anddisincentives far above or below a threshold (Miller and Babiarz 2013).
Purchasing from the First Service versus Purchasing from Baseline Performance
To date, PBF schemes have purchased from the fi rst service— from the fi rstimmunization or the fi rst outpatient visit— and at the same value for each subsequent service provided. That approach has been sensible: it is simple tocalculate, and baseline performance is frequently unknown. The routine re-porting systems often perform poorly and are not verifi ed routinely or
22 Performance-Based Financing Toolkit
rigorously. As PBF evolves and can begin to rely on more robust baselines, it becomes possible to use other approaches that emphasize improvements from an agreed baseline.
Purchase Both Quantity and Quality of Services
In many settings worldwide, the quantity of health services provided is still far below optimal. Thus, PBF schemes are typically interested in increasing the quantity of services through a unit fee for each service delivered. How-ever, there is a legitimate concern that just paying for the volume of services will encourage providers to cut corners on the quality of care. Ensuring that the quality of care is not compromised and is substantially improved is a major challenge in PBF. The way to address quality of care is discussed in chapter 3.
Ensure Compatibility between Servicesand the Routine Information SystemWhen learning which services to buy under PBF, you should ensure that the defi nitions are compatible with the routine data collection forms in the health management information systems (HMISs). This is often not the case. For example, in many PBF schemes, “new family planning acceptor” is mentioned as a service that is purchased. Usually, this refers to “modern methods” of family planning (such as injections of Depo- Provera, oral con-traceptives, intrauterine devices, and implants). By contrast, the HMIS may track all methods, including traditional ones (for example, rhythm method) that are not used for PBF because they are diffi cult to verify objectively.
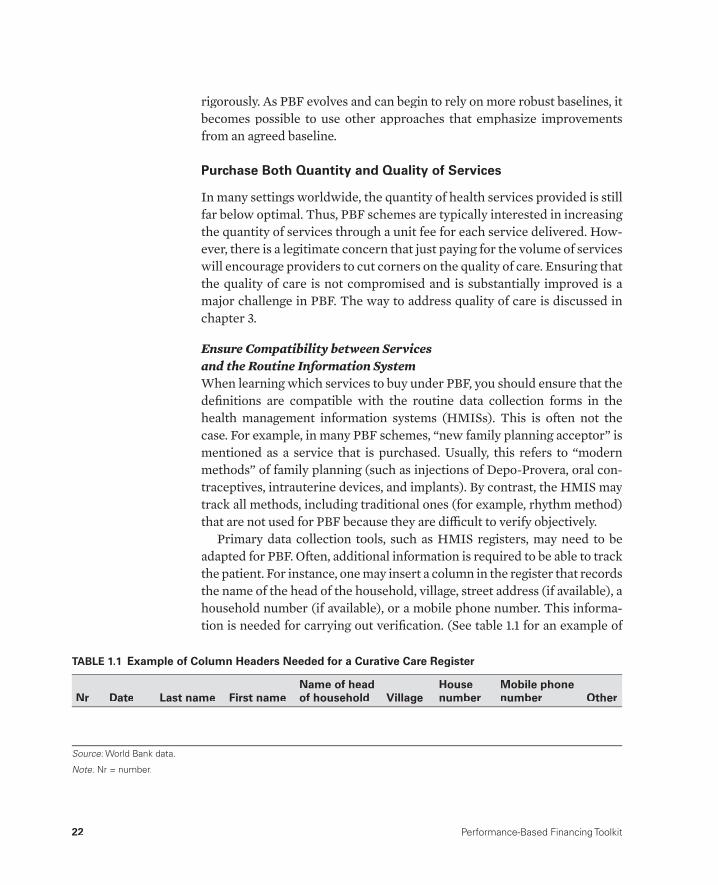
Primary data collection tools, such as HMIS registers, may need to be adapted for PBF. Often, additional information is required to be able to track the patient. For instance, one may insert a column in the register that records the name of the head of the household, village, street address (if available), a household number (if available), or a mobile phone number. This informa-tion is needed for carrying out verifi cation. (See table 1.1 for an example of
TABLE 1.1 Example of Column Headers Needed for a Curative Care Register
Nr Date Last name First nameName of headof household Village
Housenumber
Mobile phonenumber Other
Source: World Bank data. :
Note: Nr = number.:

Buying a Quantity of Services 23
the kind of information required. The necessity of improving record keeping is addressed in more detail in chapter 2.)
Be SMART in Selecting PBF Services
When choosing which services to purchase under PBF, you will fi nd a num-ber of practical considerations that can make the process challenging. Some SMART (specifi c, measurable, attributable, realistic/relevant, time bound) criteria that usually apply in such purchasing are listed. After explaining these criteria, we provide specifi c examples of services that have been pur-chased under diff erent PBF schemes and describe how they performed in the real world.
• Specifi c:S Any PBF service should have a clear operational defi nition that is easy to understand. For example, buying “antenatal care” is not suffi -ciently defi ned. Is it the fi rst antenatal visit that is meant or the fourth visit that will be purchased? What is the minimum content for a service to be considered a real antenatal visit?
Tip— Be careful about age groups: Paying for “consultations among chil-dren under 5 may be programmatically important but poses verifi cation nightmares in actual settings. Providers fi nd this service easy to manipulate by including older children, whose exact age can be diffi cult to verify.
• Measurable:MM To be viable, a PBF service needs to be easily measurable (see box 1.4). In practice, this means the following:➜ The date of an individual service can be easily extracted from a stan-
dardized register or patient fi le. This allows independent verifi cation of whether the service was actually delivered and when.
➜ The number of services provided can be easily counted from the regis-ter or patient fi les (counting is easier than calculating rates or ratios).
➜ Individual patients can be tracked so that a surveyor can verify: (a) whether the patient exists; (b) whether the patient received the service and when; and (c) whether the patient was satisfi ed with the service provided.
• Attributable: The service needs to be within the control of the provider to actually deliver. For example, tubal ligation or caesarean section would obviously not be an appropriate service to purchase from a health center. However, you need to be careful to avoid furnishing providers with anexcuse for not delivering services. Health centers have many ways tostrengthen service delivery (see box 1.5).
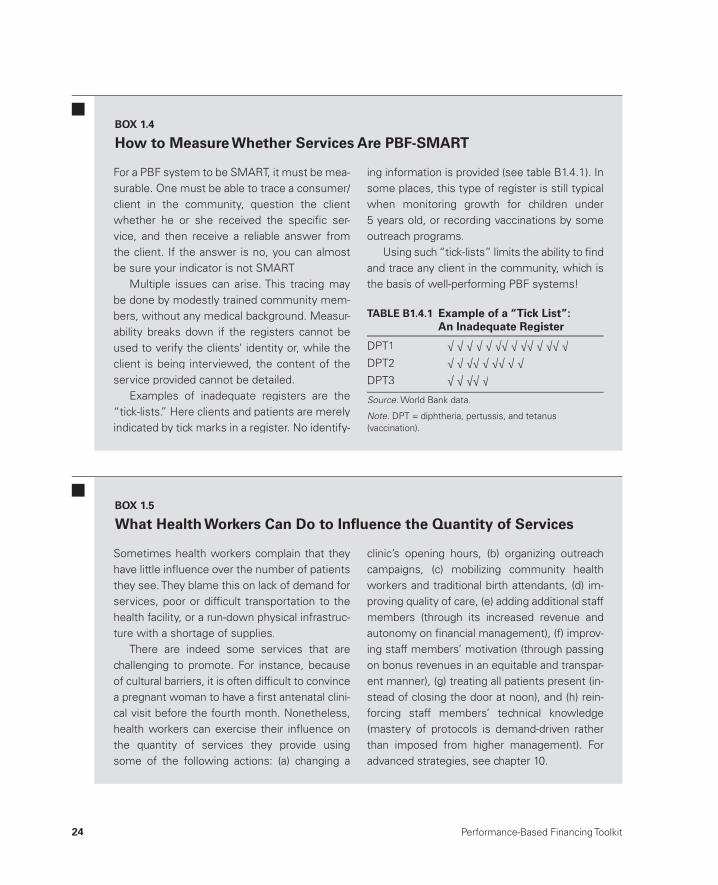
24 Performance-Based Financing Toolkit
For a PBF system to be SMART, it must be mea-surable. One must be able to trace a consumer/client in the community, question the client whether he or she received the specifi c ser-vice, and then receive a reliable answer fromthe client. If the answer is no, you can almost be sure your indicator is not SMART.
Multiple issues can arise. This tracing maybe done by modestly trained community mem-bers, without any medical background. Measur-ability breaks down if the registers cannot be used to verify the clients’ identity or, while the client is being interviewed, the content of the service provided cannot be detailed.
Examples of inadequate registers are the“tick- lists.” Here clients and patients are merely indicated by tick marks in a register. No identify-
ing information is provided (see table B1.4.1). In some places, this type of register is still typicalwhen monitoring growth for children under5 years old, or recording vaccinations by some outreach programs.
Using such “tick- lists” limits the ability to fi nd and trace any client in the community, which is the basis of well- performing PBF systems!
TABLE B1.4.1 Example of a “Tick List”:An Inadequate Register
DPT1 √ √ √ √ √ √√ √ √√ √ √√ √
DPT2 √ √ √√ √ √√ √ √
DPT3 √ √ √√ √
Source: World Bank data.:
Note: DPT = diphtheria, pertussis, and tetanus:(vaccination).
BOX 1.4
How to Measure Whether Services Are PBF- SMART
Sometimes health workers complain that theyhave little infl uence over the number of patients they see. They blame this on lack of demand for services, poor or diffi cult transportation to the health facility, or a run- down physical infrastruc-ture with a shortage of supplies.
There are indeed some services that are challenging to promote. For instance, because of cultural barriers, it is often diffi cult to convince a pregnant woman to have a fi rst antenatal clini-cal visit before the fourth month. Nonetheless, health workers can exercise their infl uence on the quantity of services they provide using some of the following actions: (a) changing a
clinic’s opening hours, (b) organizing outreach campaigns, (c) mobilizing community health workers and traditional birth attendants, (d) im-proving quality of care, (e) adding additional staff members (through its increased revenue and autonomy on fi nancial management), (f) improv-ing staff members’ motivation (through passing on bonus revenues in an equitable and transpar-ent manner), (g) treating all patients present (in-stead of closing the door at noon), and (h) rein-forcing staff members’ technical knowledge (mastery of protocols is demand-driven rather than imposed from higher management). For advanced strategies, see chapter 10.
BOX 1.5
What Health Workers Can Do to Infl uence the Quantity of Services

Buying a Quantity of Services 25
• Realistic/Relevant:➜ A realistic PBF service is already collected through the routine HMIS,
the service has its routine registers, and its defi nition poses no prob-lems with staff or with verifi ers.
➜ Overburdening the verifi ers with many services or services with diffi -cult composite indicators that need routine checking through multiple fi les and registers will push such verifi ers to cut corners. It is very im-portant to keep in mind the workload of many verifi ers. Be realistic with the choice of services and the time requirements involved in con-trolling the outputs. Field testing PBF tools such as registers is advis-able. This testing would include assessing the levels of eff ort by con-trollers and interobserver and intraobserver variability.
• Time bound: PBF payments should be made with regular intervals. Gen-erally, the longer the period between an action and the payment for that action, the less eff ective is the reward. A typical payment cycle is once per quarter, so the service you purchase needs to fi t within that time frame.
Consider the Practical Experience with Specifi c Services in Existing PBF Schemes
Table 1.2 lists a series of PBF services that have been used at the health cen-ter/community level and provides direct comments about how well these services have worked in the fi eld. Table 1.3 contains such PBF services for the fi rst- level referral hospital.
TABLE 1.2 Examples of PBF Services for the Health Center/Community Level and Their Implementation Experience
No.PBF service: Minimumpackage of activities Rating Comments on implementation
1 New outpatient consultation
Very good Easy to implement. Paying a subsidy for each curative carevisit opens the door for regulating the quality of thatconsultation. The purchaser can negotiate the out- of- pocketexpense downward. It also facilitates subsidizing of free health care.
13 Institutional delivery Very good Easy to implement. Paying a suffi cient fee will enable the facility to pay traditional birth attendants and community health workers a fee to bring women to deliver in a facility.In addition, it will enable the facility to wave formal or informal fees and to purchase gifts for the mother: theso- called welcome baby packages. For more details onhow this is done, see chapter 10, table 10.3, of this toolkit for advanced strategies.
(table continues on next page)
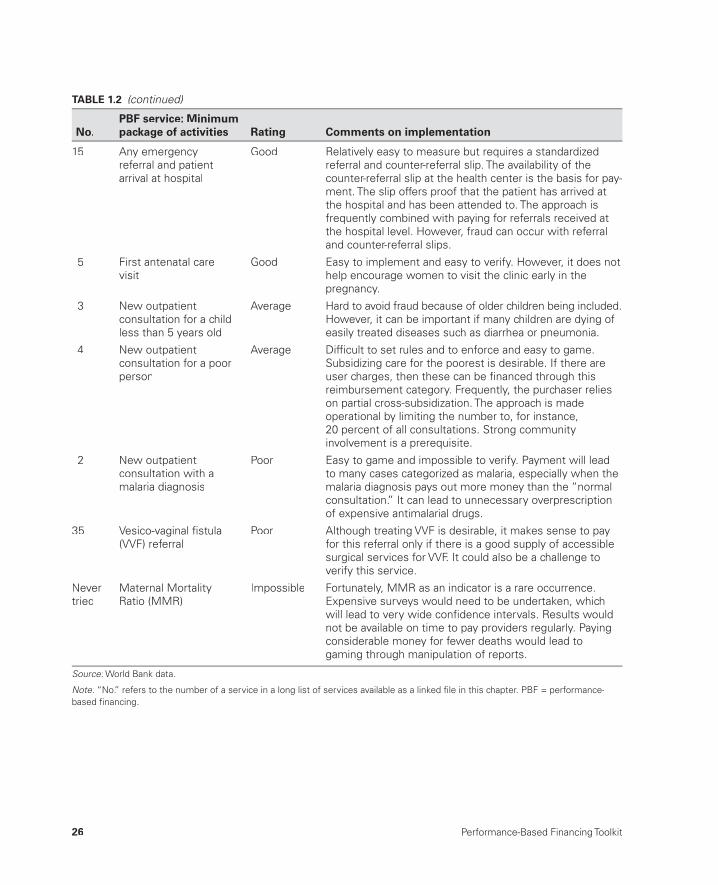
26 Performance-Based Financing Toolkit
15 Any emergencyreferral and patientarrival at hospital
Good Relatively easy to measure but requires a standardized referral and counter- referral slip. The availability of the counter- referral slip at the health center is the basis for pay-ment. The slip offers proof that the patient has arrived at the hospital and has been attended to. The approach isfrequently combined with paying for referrals received at the hospital level. However, fraud can occur with referral and counter- referral slips.
5 First antenatal carevisit
Good Easy to implement and easy to verify. However, it does nothelp encourage women to visit the clinic early in thepregnancy.
3 New outpatientconsultation for a childless than 5 years old
Average Hard to avoid fraud because of older children being included.However, it can be important if many children are dying ofeasily treated diseases such as diarrhea or pneumonia.
4 New outpatientconsultation for a poorperson
Average Diffi cult to set rules and to enforce and easy to game.Subsidizing care for the poorest is desirable. If there areuser charges, then these can be fi nanced through thisreimbursement category. Frequently, the purchaser relies on partial cross- subsidization. The approach is made operational by limiting the number to, for instance,20 percent of all consultations. Strong communityinvolvement is a prerequisite.
2 New outpatientconsultation with amalaria diagnosis
Poor Easy to game and impossible to verify. Payment will lead to many cases categorized as malaria, especially when themalaria diagnosis pays out more money than the “normal consultation.” It can lead to unnecessary overprescription of expensive antimalarial drugs.
35 Vesico- vaginal fi stula(VVF) referral
Poor Although treating VVF is desirable, it makes sense to pay for this referral only if there is a good supply of accessible surgical services for VVF. It could also be a challenge toverify this service.
Never tried
Maternal Mortality Ratio (MMR)
Impossible Fortunately, MMR as an indicator is a rare occurrence. Expensive surveys would need to be undertaken, whichwill lead to very wide confi dence intervals. Results would not be available on time to pay providers regularly. Paying considerable money for fewer deaths would lead togaming through manipulation of reports.
Source: World Bank data.:
Note: “No.” refers to the number of a service in a long list of services available as a linked fi le in this chapter. PBF = performance-:based fi nancing.
TABLE 1.2 (continued)
No.PBF service: Minimumpackage of activities Rating Comments on implementation

Buying a Quantity of Services 27
TABLE 1.3 List of PBF Services Commonly Used at the First Referral Hospital Level
No. PBF service Rating Comments on implementation
1 New outpatientconsultation by amedical doctor
Very good Easy to document and easy to verify. This is an incentive forreferred cases to be seen by a doctor, instead of bylesser- qualifi ed medical staff.
4 Minor surgery Very good Easy to document and easy to verify.
7 Complicated delivery Good Easy to document and more diffi cult to verify. If the fee for an assisted delivery is much higher than that for a normal delivery, misclassifi cation might easily occur.
8 Cesarean section(C- section)
Good Easy to document and easy to verify. If the fee for a C- section is very high, then too many C- sections may occur.However, in many areas, not nearly enough C- sections areperformed. It would be desirable to indicate a range or anupper limit for such C- sections.
10 Inpatient day for a poorperson
Average Diffi cult to set rules and diffi cult to enforce. However, subsidizing care for the poorest is necessary. If user charges occur, then these are fi nanced through this reimbursement category. Frequently, the purchaser relies on partial cross- subsidization. This approach is made operational by limiting the number to, for instance,20 percent of all inpatient days.
3 Counter- referral slip arrival at the health center
Average Diffi cult to verify. This system needs signed proof by thehospital that the health center has received the counter-referral slip written by the medical doctor. It is meant to reinforce the referral pathways between different levelsof care.
17 Documented death Poor Sometimes, national programs attempt to investigate maternal deaths. This is a very uncommon service toprocure. However, it might be a strategy to counterbalance underreporting of such deaths.
Source: World Bank data.:
Note: “No.” refers to the number of a service in a long list of services available as a linked fi le in this chapter. PBF = performance-:based fi nancing.
Table 1.2 lists examples of health center indicator/services that range from “very good,” PBF SMART, to “impossible.” Each service has a clear def-inition (an example of such defi nitions can be found in the links to fi les in this chapter, under the “service protocol reference guides”), although it can vary slightly, depending on the particular country context. For compiling such a list for all PBF services, you need very good primary data collection tools, such as registers and individual patient cards (see chapter 2). A longer list with services is available in the links to fi les in this chapter. The numbers in tables 1.2 and 1.3 refer to the numbers in this longer fi le.
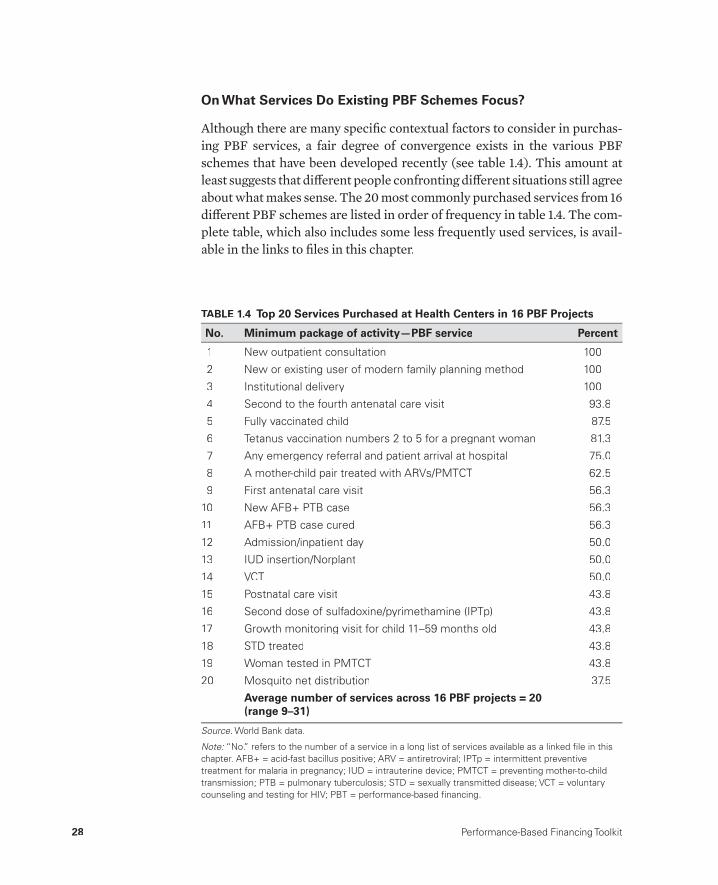
28 Performance-Based Financing Toolkit
On What Services Do Existing PBF Schemes Focus?
Although there are many specifi c contextual factors to consider in purchas-ing PBF services, a fair degree of convergence exists in the various PBF schemes that have been developed recently (see table 1.4). This amount at least suggests that diff erent people confronting diff erent situations still agree about what makes sense. The 20 most commonly purchased services from 16 diff erent PBF schemes are listed in order of frequency in table 1.4. The com-plete table, which also includes some less frequently used services, is avail-able in the links to fi les in this chapter.
TABLE 1.4 Top 20 Services Purchased at Health Centers in 16 PBF Projects
No. Minimum package of activity— PBF service Percent
1 New outpatient consultation 100
2 New or existing user of modern family planning method 100
3 Institutional delivery 100
4 Second to the fourth antenatal care visit 93.8
5 Fully vaccinated child 87.5
6 Tetanus vaccination numbers 2 to 5 for a pregnant woman 81.3
7 Any emergency referral and patient arrival at hospital 75.0
8 A mother- child pair treated with ARVs/PMTCT 62.5
9 First antenatal care visit 56.3
10 New AFB+ PTB case 56.3
11 AFB+ PTB case cured 56.3
12 Admission/inpatient day 50.0
13 IUD insertion/Norplant 50.0
14 VCT 50.0
15 Postnatal care visit 43.8
16 Second dose of sulfadoxine/pyrimethamine (IPTp) 43.8
17 Growth monitoring visit for child 11– 59 months old 43.8
18 STD treated 43.8
19 Woman tested in PMTCT 43.8
20 Mosquito net distribution 37.5
Average number of services across 16 PBF projects = 20 (range 9– 31)
Source: World Bank data.:
Note: “No.” refers to the number of a service in a long list of services available as a linked fi le in this :chapter. AFB+ = acid- fast bacillus positive; ARV = antiretroviral; IPTp = intermittent preventive treatment for malaria in pregnancy; IUD = intrauterine device; PMTCT = preventing mother- to- child transmission; PTB = pulmonary tuberculosis; STD = sexually transmitted disease; VCT = voluntary counseling and testing for HIV; PBT = performance- based fi nancing.
Buying a Quantity of Services 29
1.3 How to Select Services:The Process in Practice
General Issues
When you are about to select which services to purchase, the following questions should come to mind: (a) Which types of services are required? (b) How is the service package balanced in terms of which conditions or dis-eases are included? and (c) How many services should there be and what weight can you give to each service?
In some cases, you might only need to propose a balanced PBF package that has worked well in a similar environment to your own. With minor mod-ifi cations, such a package might be readily accepted. In other instances, how-ever, you will have to enter into painstaking negotiations over what type of services to include or omit. This can be a time- consuming process, which— if not managed well— could lead to stakeholders’ anger with each other.
“You do not like the services I’m proposing; therefore, you do not like me?”
In yet other settings, high- level persons may insist that certain services be included for political reasons (for instance, in the case of Rwanda when vesico- vaginal fi stulas were included). These choices may be not so SMART, but in the face of huge political pressure, technical arguments may not al-ways win. You could fi nd yourself confronted by supporters of a vertical dis-ease program, who are pushing for a disproportionate share of “their indica-tors” to be included in the PBF packages.
As a result, and because of time pressures, discussion might get bogged down and people might turn to a compromise package that resembles a “wil-debeest constructed by a committee” (in an African myth, the wildebeestwas the last creature that God created on earth from the remains of other animals). Therefore, considerable diplomatic skills may be needed to arrive at the most appropriate set of services to buy (see box 1.6). In the following paragraphs, we will discuss how to assess numbers and to weigh the impor-tance of services.
How Many Services Should One Buy?
How many PBF services should one buy? The following guidance is based on practical knowledge accumulated by PBF implementers. This knowledge is rapidly developing. In 16 PBF projects, the average is 20 services (with

30 Performance-Based Financing Toolkit
packages ranging from 9 to 31 services). See also table 1.3 in the links to fi les in this chapter.
Always keep in mind the following points. First, mind the balance: a bal-anced service package is necessary and represents what should be provided in a reasonable manner. What you do not buy could be in danger of being off ered less. Although there is no evidence of this, it would be wise to con-sider this possibility. Thus, opt for broad categories:
• “New curative consultation” captures all new outpatient consultations for any curative condition.
• “Fully vaccinated children” captures all obligatory childhood vaccina-tions before the age of 1 year.
• “ANC 2– 4” captures all recommended antenatal care (ANC) consulta-tions during a pregnancy, and it suggests that the fi rst one has occurred.
• “New and re- visit for a modern FP method” captures all family planning (FP) visits for modern methods (any new visit for a modern method and any re- visit for a three- month supply of additional oral contraceptives or a new injection).
Second, mind the context: context- specifi c problems and challenges arecrucial for implementing any package of services. What services are underprovided?
Managing policy processes in an inclusive man-ner can be diffi cult when dealing with a largenumber of stakeholders, such as in Rwanda in2005– 06. The intention was to keep the number of PBF services at the health-center level man-ageable (the system started with 30 services,and 14 of these were HIV related). Every en-counter between policy actors seemingly led to a “creep” in the number of services. This was partly due to the lack of knowledge related to purchasing HIV services by partner agencies. One year later, after a review of the system, much more experienced policy actors decidedto reduce the number of PBF services to 24 (14
services as a minimal package and 10 HIV- related services), cutting many services that were found to be either not practical or too dif-fi cult to verify objectively. Also, the actors had realized that each service had a transaction costand that any attempt to control a large numberof services led to skimping on the verifi cation processes. The reason for the large number of services in a country with an HIV prevalence of3 percent was that as a PEPFAR (U.S. Presi-dent’s Emergency Plan for AIDS Relief) focus- country, Rwanda had many HIV program imple-menting partners and considerable money topay for HIV services.
BOX 1.6
Learning from Experience

Buying a Quantity of Services 31
Third, mind the budget: much depends on your output budget (see chap-ter 4). With a larger output budget, you can off er higher fees and expandyour service package. You also have a trade- off between more services and higher fees per service.
Fourth, mind the transaction costs (time and money costs) of verifying and counterverifying the services you select (see chapter 2). Each service takes a certain time to verify in the health facility registers. Verifi cation can become more effi cient, but an excessive number of services will make the work of verifi ers more diffi cult.
In general, a package of between 15 and 25 services at each level (health center and hospital) is reasonable, although some experts advise increasing this to as many as 30 services. But as shown, much depends on the context, budget, and transaction costs. See also table 1.4, which illustrates the prac-tice in various PBF projects.
Use the Modifi ed Delphi Technique for Selecting PBF Services and Attributing Relative Weight
Resource allocation decisions are one of the great challenges in health care. Rational and transparent methods are needed to assist decision makers who often must consider multiple variables at the same time (Baltussen and Nies-sen 2006).
To select PBF services and allocate weight to each service, one can use a modifi ed Delphi technique. The Delphi method is a consensus- building tool that was originally developed after World War II to forecast the impact of technology on warfare. The method has evolved and is currently being used with group decision- making processes, especially those in which cer-tain groups tend to dominate. The method helps avoid the phenomenon of group thinking, which is so often the case when many political infl uences are present, time is short, and the stakes are high. Group thinking occurs in situations in which members of a group try to avoid confl ict and attempt to build consensus to such a degree that rational thinking and clear option ap-praisal suff er.
The modifi ed Delphi technique has been used in forecasting the impact of new technologies. It has aided multistakeholder approaches in participative policy making in developing countries, has assisted in policy making with interactive web- based tools (e- democracy),2 and has helped in program eval-uation (Wilson et al. 2010). PBF implementers can use this modifi ed Delphi technique to establish a list of indicators in a fair and conscientious manner.
Normally, the modifi ed Delphi technique can be applied during a one- day workshop. If, however, you combine this service selection process with the

32 Performance-Based Financing Toolkit
weighing of services and a fi nancial risk forecasting tool to determine draft fees, you will need about two days for the entire exercise.
Exercise: The Modifi ed Delphi Technique in Nine Steps
The modifi ed Delphi technique has been used in several African countries (see box 1.7). The materials required are as follows:
• Introductory Microsoft PowerPoint fi le• Microsoft Excel fi le of long list of services/indicators and template for
calculating scores• Basic costing tool example (see links to fi les in this chapter).
The Nine Steps to Apply the Modifi ed Delphi Technique
Step 1. Create a panel of experts who are mandated to decide on the PBF in-dicators. Before the workshop, think about and then discuss with decision makers the composition of the panel. In countries with PBF experience, the rule is to compose the panel with PBF experts only. This approach is pre-ferred because many discussions tend to have elements of desirability such as “this is an important service/indicator,” but such services are diffi cult to obtain through PBF techniques (measurement problems). Panel members with PBF experience understand such constraints better than those who do not have such experience. In any case, the panel should consist of public health specialists who have broad interest areas and know the local context. A panel should have about 7– 9 experts.
The modifi ed Delphi technique has been tested extensively in Rwanda. In February 2006, it was used in a workshop designing the national performance-based fi nancing (PBF) model (Rusa and Fritsche 2007) and later in determiningwhich indicators/services should be included in the HIV services package. During the secondhalf of 2007, the technique was used in consen-sus building for allocating weights to the vari-
ous components of the Rwanda PBF- quantifi ed quality checklist. From Rwanda, the use of the modifi ed Delphi technique has spread. In Sep-tember 2009, it was used in designing the basic and complementary PBF service packages forthe national PBF model in Burundi, and in June2010, it was applied during a national workshop in Benin to compose the list of PBF services tobe included in the basic service package.
BOX 1.7
Using the Modifi ed Delphi Technique
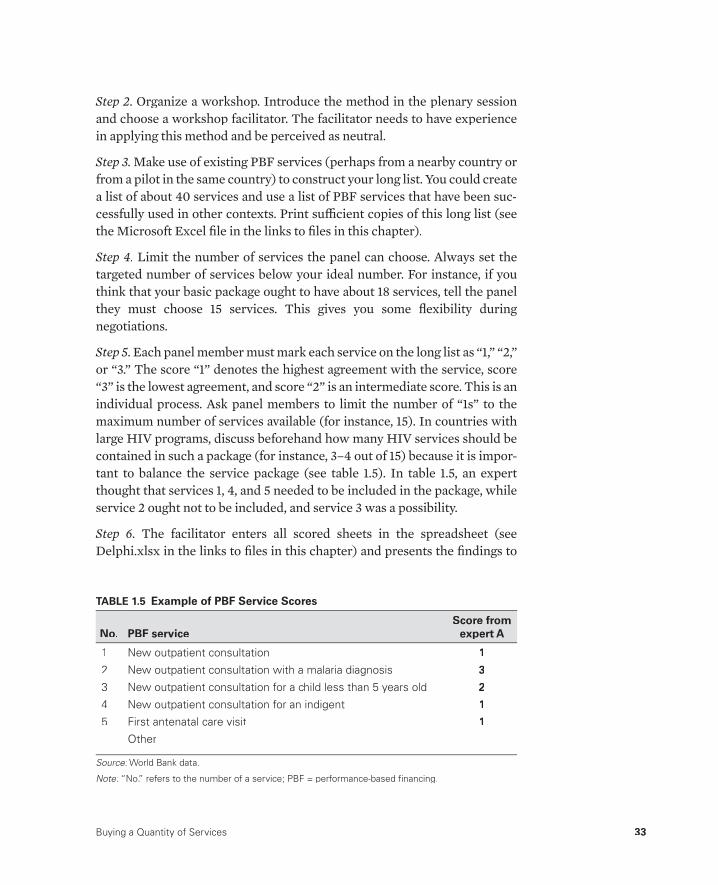
Buying a Quantity of Services 33
Step 2. Organize a workshop. Introduce the method in the plenary session and choose a workshop facilitator. The facilitator needs to have experience in applying this method and be perceived as neutral.
Step 3. Make use of existing PBF services (perhaps from a nearby country orfrom a pilot in the same country) to construct your long list. You could create a list of about 40 services and use a list of PBF services that have been suc-cessfully used in other contexts. Print suffi cient copies of this long list (see the Microsoft Excel fi le in the links to fi les in this chapter).
Step 4. Limit the number of services the panel can choose. Always set the targeted number of services below your ideal number. For instance, if youthink that your basic package ought to have about 18 services, tell the panel they must choose 15 services. This gives you some fl exibility during negotiations.
Step 5. Each panel member must mark each service on the long list as “1,” “2,” or “3.” The score “1” denotes the highest agreement with the service, score“3” is the lowest agreement, and score “2” is an intermediate score. This is an individual process. Ask panel members to limit the number of “1s” to the maximum number of services available (for instance, 15). In countries with large HIV programs, discuss beforehand how many HIV services should be contained in such a package (for instance, 3– 4 out of 15) because it is impor-tant to balance the service package (see table 1.5). In table 1.5, an expert thought that services 1, 4, and 5 needed to be included in the package, whileservice 2 ought not to be included, and service 3 was a possibility.
Step 6. The facilitator enters all scored sheets in the spreadsheet (seeDelphi.xlsx in the links to fi les in this chapter) and presents the fi ndings to
TABLE 1.5 Example of PBF Service Scores
No. PBF serviceScore from
expert A
1 New outpatient consultation 1
2 New outpatient consultation with a malaria diagnosis 3
3 New outpatient consultation for a child less than 5 years old 2
4 New outpatient consultation for an indigent 1
5 First antenatal care visit 1
Other
Source: World Bank data.:
Note: “No.” refers to the number of a service; PBF = performance- based fi nancing.:
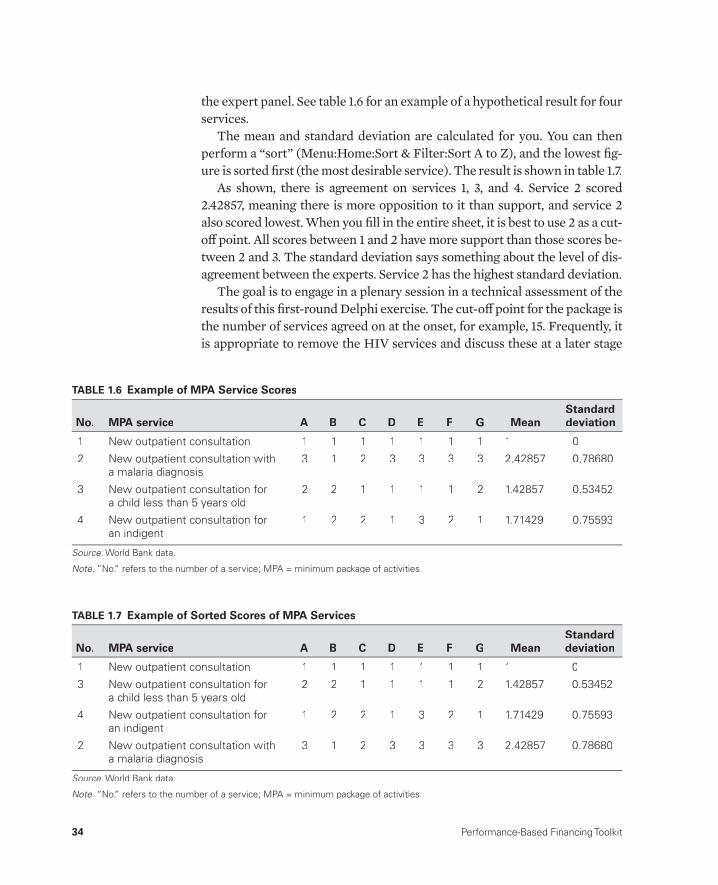
34 Performance-Based Financing Toolkit
the expert panel. See table 1.6 for an example of a hypothetical result for four services.
The mean and standard deviation are calculated for you. You can then perform a “sort” (Menu:Home:Sort & Filter:Sort A to Z), and the lowest fi g-ure is sorted fi rst (the most desirable service). The result is shown in table 1.7.
As shown, there is agreement on services 1, 3, and 4. Service 2 scored 2.42857, meaning there is more opposition to it than support, and service 2 also scored lowest. When you fi ll in the entire sheet, it is best to use 2 as a cut- off point. All scores between 1 and 2 have more support than those scores be-tween 2 and 3. The standard deviation says something about the level of dis-agreement between the experts. Service 2 has the highest standard deviation.
The goal is to engage in a plenary session in a technical assessment of the results of this fi rst- round Delphi exercise. The cut- off point for the package is the number of services agreed on at the onset, for example, 15. Frequently, it is appropriate to remove the HIV services and discuss these at a later stage
TABLE 1.6 Example of MPA Service Scores
No. MPA service A B C D E F G MeanStandard deviation
1 New outpatient consultation 1 1 1 1 1 1 1 1 0
2 New outpatient consultation with a malaria diagnosis
3 1 2 3 3 3 3 2.42857 0.78680
3 New outpatient consultation fora child less than 5 years old
2 2 1 1 1 1 2 1.42857 0.53452
4 New outpatient consultation foran indigent
1 2 2 1 3 2 1 1.71429 0.75593
Source: World Bank data.:
Note: “No.” refers to the number of a service; MPA = minimum package of activities.:
TABLE 1.7 Example of Sorted Scores of MPA Services
No. MPA service A B C D E F G MeanStandard deviation
1 New outpatient consultation 1 1 1 1 1 1 1 1 0
3 New outpatient consultation fora child less than 5 years old
2 2 1 1 1 1 2 1.42857 0.53452
4 New outpatient consultation foran indigent
1 2 2 1 3 2 1 1.71429 0.75593
2 New outpatient consultation with a malaria diagnosis
3 1 2 3 3 3 3 2.42857 0.78680
Source: World Bank data.:
Note: “No.” refers to the number of a service; MPA = minimum package of activities.:
Buying a Quantity of Services 35
(typically, experts tend to choose many more HIV services than the 3– 4 that have been agreed to at the outset). Such HIV services can then also be pro-posed with vertical donors who might be interested in buying into the scheme.
Important questions to address in the plenary discussion are the following:
• Is the package balanced?• How many services are there with a score between 1 and 2?• Are there any duplicate services or services that are implied or subsumed
in others?• Are there any technical reasons to remove or add services (importance,
cost- eff ectiveness, and so forth)?• Are we in agreement?
Step 7. If after these discussions the panel still disagrees on the number of services to include in the package (even after extending the package to, for instance, the 18 that the facilitator had in mind), a second round of Delphi can be done, by repeating steps 5– 7. Full consensus is normally reached by round three. But frequently, one round of Delphi suffi ces to get consensus(see box 1.8).
Step 8. Determine the weights for the individual services. The weights areused for the costing of the PBF services. The weight refl ects the relativevalue, importance, and desirability of a service as compared to other ser-vices. More information on how the weights are used for costing the PBF services is provided in chapter 4. The same modifi ed Delphi technique as used above can be used to determine the weights of PBF services:
a. Print copies of the sheet titled “weighting_MPA_Round1,” after copying the list of retained services. Print one or two copies per expert.
b. List the service “new outpatient consultation” as the fi rst service (as-suming that this service is retained, which is almost always the case),and give it an index of, for instance, 100. It is helpful to pitch this index value at about US$0.30 to US$0.40 worth of local currency units. The specifi cs on costing are addressed in chapter 4.
c. Let the experts weight each service as compared to this base index. Thenrepeat steps 5– 7. Table 1.8 provides an example of this approach. Rela-tive to the base index of 100, various experts attach diff erent weights to each chosen service. An average weight/index follows. The standard de-viation illustrates the level of agreement between the experts. A plenary discussion can lead to a fi nal index for which a column is created (“ple-nary”). For instance, in this imaginary example, the fi rst round of Delphi led to a suggestion that a delivery is valued at 10 times the base index,
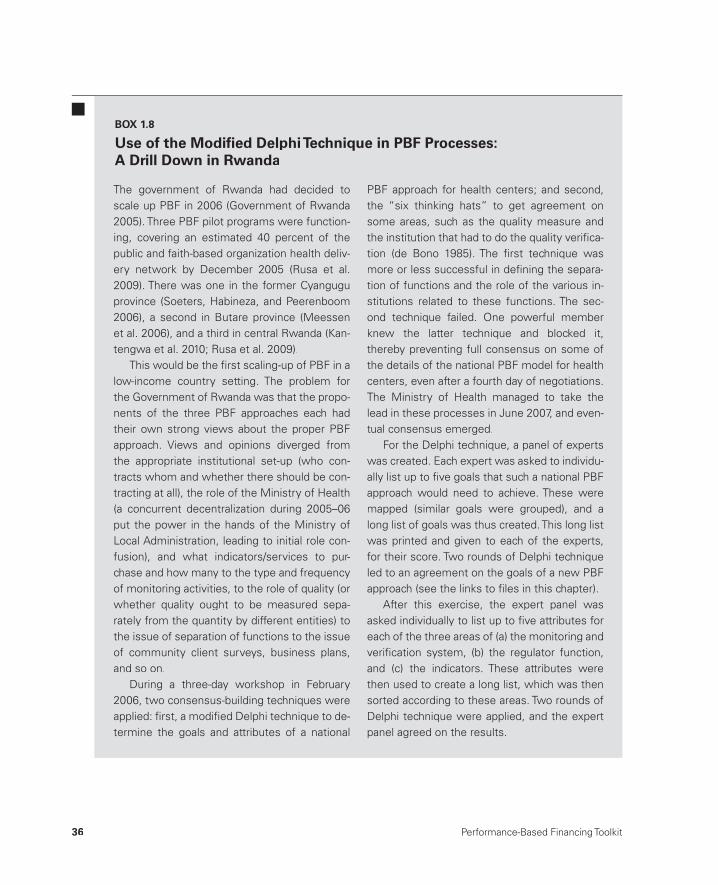
36 Performance-Based Financing Toolkit
The government of Rwanda had decided to scale up PBF in 2006 (Government of Rwanda 2005). Three PBF pilot programs were function-ing, covering an estimated 40 percent of the public and faith- based organization health deliv-ery network by December 2005 (Rusa et al. 2009). There was one in the former Cyangugu province (Soeters, Habineza, and Peerenboom 2006), a second in Butare province (Meessen et al. 2006), and a third in central Rwanda (Kan-tengwa et al. 2010; Rusa et al. 2009).
This would be the fi rst scaling- up of PBF in a low- income country setting. The problem for the Government of Rwanda was that the propo-nents of the three PBF approaches each hadtheir own strong views about the proper PBF approach. Views and opinions diverged fromthe appropriate institutional set- up (who con-tracts whom and whether there should be con-tracting at all), the role of the Ministry of Health (a concurrent decentralization during 2005– 06 put the power in the hands of the Ministry of Local Administration, leading to initial role con-fusion), and what indicators/services to pur-chase and how many to the type and frequency of monitoring activities, to the role of quality (or whether quality ought to be measured sepa-rately from the quantity by different entities) tothe issue of separation of functions to the issueof community client surveys, business plans,and so on.
During a three- day workshop in February 2006, two consensus- building techniques were applied: fi rst, a modifi ed Delphi technique to de-termine the goals and attributes of a national
PBF approach for health centers; and second, the “six thinking hats” to get agreement onsome areas, such as the quality measure and the institution that had to do the quality verifi ca-tion (de Bono 1985). The fi rst technique wasmore or less successful in defi ning the separa-tion of functions and the role of the various in-stitutions related to these functions. The sec-ond technique failed. One powerful memberknew the latter technique and blocked it, thereby preventing full consensus on some ofthe details of the national PBF model for health centers, even after a fourth day of negotiations. The Ministry of Health managed to take the lead in these processes in June 2007, and even-tual consensus emerged.
For the Delphi technique, a panel of experts was created. Each expert was asked to individu-ally list up to fi ve goals that such a national PBF approach would need to achieve. These weremapped (similar goals were grouped), and a long list of goals was thus created. This long list was printed and given to each of the experts, for their score. Two rounds of Delphi technique led to an agreement on the goals of a new PBFapproach (see the links to fi les in this chapter).
After this exercise, the expert panel was asked individually to list up to fi ve attributes foreach of the three areas of (a) the monitoring and verifi cation system, (b) the regulator function, and (c) the indicators. These attributes werethen used to create a long list, which was then sorted according to these areas. Two rounds of Delphi technique were applied, and the expertpanel agreed on the results.
BOX 1.8
Use of the Modifi ed Delphi Technique in PBF Processes:A Drill Down in Rwanda

Buying a Quantity of Services 37
TAB
LE 1
.8 E
xam
ple
of W
eig
hte
d S
core
s o
f M
PA S
ervi
ces
No.
MPA
ser
vice
Bas
e in
dex
AB
CD
EF
GA
vera
ge
ind
ex P
len
ary
Sta
nd
ard
dev
iati
on
1N
ew o
utpa
tient
co
nsul
tatio
n
100
100
100
100
100
100
100
100
100
0.00
2Fi
rst
ante
nata
l car
e vi
sit
5020
200
5075
2550
6761
.3
32–
5 te
tanu
s va
ccin
atio
n25
2550
3510
050
7551
27.6
4S
econ
d do
se o
f su
lfado
xine
/py
rimet
ham
ine
5075
2515
050
7525
6442
.9
5In
stitu
tiona
l del
iver
y50
01,
000
750
2,00
01,
500
500
750
1,00
055
9
6W
omen
tes
ted
inP
MTC
T20
025
030
025
050
060
015
032
116
5.4
7VC
T fo
r co
uple
s25
020
050
015
025
035
020
027
111
8.5
8N
ew A
FB+
PTB
cas
e8,
000
5,00
01,
500
5,00
02,
500
2,50
02,
000
3,78
62,
324.
8
9O
ther
Sour
ce: W
orld
Ban
k da
ta.
:
Not
e: “
No.
” re
fers
to
the
num
ber
of a
ser
vice
. AFB
+ =
aci
d- fa
st b
acill
us p
ositi
ve; P
MTC
T =
pre
vent
ing
mot
her- t
o- ch
ild t
rans
mis
sion
; PTB
= p
ulm
onar
y tu
berc
ulos
is; V
CT
=
:vo
lunt
ary
coun
selin
g an
d te
stin
g fo
r H
IV; M
PA =
min
imum
pac
kage
of
activ
ities
.

38 Performance-Based Financing Toolkit
whereas diagnosis of a new case of pulmonary tuberculosis would carry a weight of 37 times the base index.
d. Once you have arrived at a consensus, input such weights in the basic costing tool (see chapter 4).
Step 9. Input the weights into the basic costing tool (an example from Nigeria is provided in the links to fi les in this chapter):
a. Prepare the costing tool by inputting the basic coverage data, the popu-lation size, the available budget, and the assumptions related to the cov-erage rate increases under the PBF scheme.
b. You can use this draft costing tool in the second day of the workshop (allowing for time to set up the costing tool in the late afternoon of the fi rst day) to fi nalize the weights to gain agreement on the unit subsidies and underlying assumptions.
c. Frequently, public health specialists are surprised to see their resource allocation decisions translated into budget fi gures
d. Talk the expert panel through this approach, and allow them to take ownership of it. This approach ensures that after the second day of the workshop, you will have created momentum to take the work forward.
1.4 How to Handle Additional Requests for Inclusion of Services
How to Handle Additional Requests for Inclusion
As serious PBF implementer, be proactive in talking to potential donors about contributing components to the PBF package. For instance, services for HIV, tuberculosis, and sexually transmitted disease compose a package of 6– 7 services and could be funded by the Global Fund, the GAVI Alliance, or USAID/PEPFAR (U.S. Agency for International Development/U.S. Presi-dent’s Emergency Plan for AIDS Relief ). The information technology that drives PBF databases can handle various fund holders at the same time (see chapter 12). In addition, more donor involvement will lead to greater fi nan-cial sustainability and can promote better donor coordination.
In seeking donations, keep in mind the balance needed in the service package. This balance is important because PBF packages can become skewed by an excessive focus on HIV or other vertical programs, especially when donors bring money to the table.
The package of PBF services should be reviewed once a year. If you are not getting the results you want (too little of some, too much of others), you

Buying a Quantity of Services 39
can change unit fees (for strategic purchasing, see chapter 4). Sometimes, you may want to stop purchasing one service or add another. But beware of services infl ation when expanding the number of services, and keep a mean-ingful package with important unit subsidies off ered to providers. Infl ating the number of services while keeping the same budget will dilute other ser-vices. A package with too many services (more than 25– 30) will run the risk of too high transaction costs (verifi cation and counterverifi cation).
Thus, you may have to make tough resource allocation decisions. TheDelphi tool will help you in making these diffi cult choices.
What Happens to Nonincentivized Services and How Should They Be Handled?
Paying for some services and not for others can lead to the neglect of nonin-centivized services. Thus, for PBF, it is advisable (a) to use broad service cat-egories, (b) to choose between 15– 30 services, and (c) to choose a balancedpackage that refl ects the health priorities of the local community.
It is also important to continue monitoring the type of services received and the quantity of those services (see chapters 4 and 13).
Note that in many contexts, a package of 15– 30 services is much more than what local facilities have produced before. In any case, this is an area for future research.

40 Performance-Based Financing Toolkit
Notes
1. PBF targets health facilities, not health workers. However, it directs the attention of the managers and health workers to desired services.
2. http://en.wikipedia.org/wiki/Delphi_method (accessed December 18, 2013).
The following toolkit fi les can be accessed through this web link:http://www.worldbank.org/health/pbftoolkit/chapter01.
• Delphi.xlsx: Microsoft Excel spreadsheet for use with the modifi ed Delphi technique for PBF service selection
• Delphi.pptx: Microsoft PowerPoint fi le, which can be adapted as an introduction to the Delphi method
• Basic_Costing_Tool_Nigeria.xlsx: sample basic costing tool, which can be adapted to the local context (see also chapter 4)
• Link to fi les containing the indicators or services, including their unit fees or weights:– Three Rwandese PBF pilots (2002– 06)– DRC South Kivu PBF pilot (2005 to present)– Burundi PBF pilot (2006– 09)– Rwandese national PBF models for health centers and hospitals
(2006 to present)– Central African Republic PBF pilot (2008 to present)– Indonesia Flores PBF pilot (2008 to present)– Zambia Katete PBF pilot (2009 to present)– Burundi National PBF model (2010 to present)– Benin PBF pilot (2011 to present)– Cameroon PBF pilot (2011 to present)– Chad PBF pilot (2011 to present)– Nigeria PBF pilot (2011 to present)– Zimbabwe PBF pilot (2011 to present)– Afghanistan PBF pilot (2012 to present)– Republic of Congo PBF pilot (2012 to present)– Burkina Faso PBF pilot (2013 to present)
• Tables 1.2 and 1.3, extended versions
• Table 1.4, extended version.
1.5 Links to Files and Tools
Buying a Quantity of Services 41
References
Baltussen, R., and L. Niessen. 2006. “Priority Setting of Health Interventions: The Need for Multi- criteria Decision Analysis.” Cost Eff ectiveness and Resource Allocation 4: 14. doi:10.1186/1478- 7547- 4- 14.
de Bono, E. 1985. Six Thinking Hats. New York and Boston: Little, Brown.Eichler, R., P. Auxila, and J. Pollock. 2001. “Promoting Preventive Health Care:
Paying for Performance in Haiti.” In Contracting for Services: Output Based Aid and its Applications, edited by P. J. Brook and S. Smith, 65– 72. Washingotn, DC:World Bank.
Government of Rwanda. 2005. Health Sector Strategic Plan 2005– 2009. Kigali:Government of Rwanda.
Kantengwa, K., L. De Naeyer, C. Ndizeye, A. Uwayitu, J. Pollock, and M. Bryant. 2010. “PBF in Rwanda: What Happened after the BTC- Experience?” Tropical Medicine and International Health 15 (1): 148– 49.
Meessen, B., L. Musango, J. P. Kashala, and J. Lemlin. 2006. “Reviewing Institutions of Rural Health Centres: The Performance Initiative in Butare, Rwanda.”Tropical Medicine and International Health 11 (8): 1303– 17.
Miller, G., and K. S. Babiarz. 2013. “Pay- for- Performance Incentives in Low- and Middle- Income Country Health Programs.” NBER Working Paper 18932, National Bureau of Economic Research, Cambridge, MA.
Rusa, L., and G. Fritsche. 2007. “Rwanda: Performance- Based Financing in Health.” In Emerging Good Practice in Managing for Development Results: Sourcebook, 2nded., 105– 16. Washington, DC: World Bank.
Rusa, L., W. Janssen, S. van Bastelaere, D. Porignon, J. de Dieu Ngirabega, and W. Vandenbulcke. 2009. “Performance- Based Financing for Better Quality of Services in Rwandan Health Centres: 3- Year Experience.” Tropical Medicine and International Health 14 (7): 830– 37.
Rusa, L., M. Schneidman, G. Fritsche, and L. Musango. 2009. “Rwanda: Performance- Based Financing in the Public Sector.” In Performance Incentives for Global Health: Potentials and Pitfalls, edited by R. Eichler, R. Levine, andPerformance- Based Incentives Working Group, 189– 214. Washington, DC:Center for Global Development.
Soeters, R., C. Habineza, and P. B. Peerenboom. 2006. “Performance- Based Financ-ing and Changing the District Health System: Experience from Rwanda.” Bulletinof the World Health Organization 84 (11): 884– 89.
Wilson, D., J. Koziol- McLain, N. Garrett, and P. Sharma. 2010. “A Hospital- BasedChild Protection Programme Evaluation Instrument: A Modifi ed Delphi Study.” International Journal for Quality in Health Care 22 (4): 283– 93.
World Bank. 1993. “World Development Report 1993: Investing in Health.” Oxford University Press , New York.
———. 2011. “Aide Memoire: Technical Assistance Mission for Performance- Based Contracting, May 2– 13, 2011, Monrovia, Liberia.” World Bank, Washington, DC.


43
Verifi cation of the Quantity of Services
CHAPTER 2
MAIN MESSAGES
➜ Verifi cation is a cornerstone of PBF.➜ PBF verifi cation makes use of systematic data audits in health facility reg-
isters and client tracing in the community.➜ Before starting PBF, put in place a set of primary data collection tools for
verifi cation (registers and patient cards) with information through which one can trace the patient (address and telephone number).
➜ Verifi cation should be independently carried out: separation of functions is key, with a clear demarcation between purchasing, fund holding, provi-sion, and regulation and community voice.
COVERED IN THIS CHAPTER
2.1 Introduction: Verifi cation is a cornerstone of PBF2.2 PBF verifi cation systems2.3 Ex ante and ex post verifi cation of services2.4 Operational challenges: The importance of registers and the separation
of functions2.5 Transitional issues: Rigorous implementation2.6 Links to fi les and tools
44 Performance-Based Financing Toolkit
2.1 Introduction: Verifi cationIs a Cornerstone of PBF
Verifi cation is the cornerstone of any performance- based fi nancing (PBF) system. It is the key element of a PBF program that ensures that the services submitted for payment have been provided and have been delivered at good quality. For verifi cation of the quantities of PBF services and their proper delivery, a set of primary data collection tools (registers and patient cards) should be in place at each health facility. For PBF verifi cation to function properly, important prerequisites are the correct layout of registers; the availability of appropriate expertise in health facilities and with purchasers; and a solid separation of functions among purchasers, verifi ers, and provid-ers. This chapter deals with the various quantity verifi cation mechanisms, while chapter 3 treats the quality measures.
2.2 PBF Verifi cation Systems
PBF verifi cation systems must be rigorous. Evidence on what works best is gradually emerging. PBF verifi cation mechanisms are dense and multilay-ered and involve diff erent institutions. For a number of reasons, PBF quan-tity and quality verifi cation have been split:
• They each involve diff erent methodologies: quantity verifi cation is much more akin to an audit, whereas quality verifi cation entails more technical feedback.
• They both constitute a considerable workload: combining the two verifi -cation procedures could easily lead to an excessive amount of work, which could jeopardize careful procedures. PBF quality checklists are substantial and quite long, and they often involve multiple visits to a health facility over a certain period of time. Not taking this workload into account could lead to verifi ers cutting corners.1
• The split between quantity and quality verifi cation adds to governance and transparency. It allocates diff erent verifi cation tasks to diff erent insti-tutions, and the use of local agencies serves as an additional element in the desired separation of functions.
Most of the time, the purchasing agency2yy carries out PBF quantity verifi ca-tion. The agency uses systems to ensure that the services that have been re-corded and claimed for payment have actually been received by the clients. The agency also coordinates clients’ feedback on these services.
PBF quality verifi cation is usually delegated to the regulator, most fre-quently the district health team. The district health department is under a
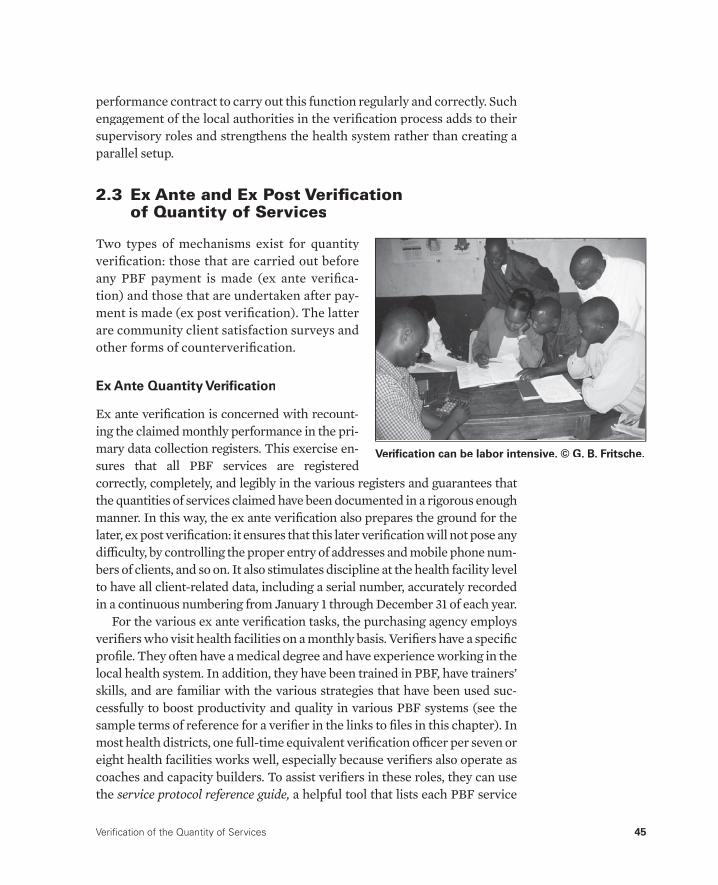
Verifi cation of the Quantity of Services 45
performance contract to carry out this function regularly and correctly. Such engagement of the local authorities in the verifi cation process adds to their supervisory roles and strengthens the health system rather than creating a parallel setup.
2.3 Ex Ante and Ex Post Verifi cation of Quantity of Services
Two types of mechanisms exist for quantity verifi cation: those that are carried out before any PBF payment is made (ex ante verifi ca-tion) and those that are undertaken after pay-ment is made (ex post verifi cation). The latter are community client satisfaction surveys and other forms of counterverifi cation.
Ex Ante Quantity Verifi cation
Ex ante verifi cation is concerned with recount-ing the claimed monthly performance in the pri-mary data collection registers. This exercise en-sures that all PBF services are registered correctly, completely, and legibly in the various registers and guarantees that the quantities of services claimed have been documented in a rigorous enoughmanner. In this way, the ex ante verifi cation also prepares the ground for the later, ex post verifi cation: it ensures that this later verifi cation will not pose any diffi culty, by controlling the proper entry of addresses and mobile phone num-bers of clients, and so on. It also stimulates discipline at the health facility level to have all client- related data, including a serial number, accurately recordedin a continuous numbering from January 1 through December 31 of each year.
For the various ex ante verifi cation tasks, the purchasing agency employs verifi ers who visit health facilities on a monthly basis. Verifi ers have a specifi c profi le. They often have a medical degree and have experience working in the local health system. In addition, they have been trained in PBF, have trainers’ skills, and are familiar with the various strategies that have been used suc-cessfully to boost productivity and quality in various PBF systems (see the sample terms of reference for a verifi er in the links to fi les in this chapter). In most health districts, one full- time equivalent verifi cation offi cer per seven or eight health facilities works well, especially because verifi ers also operate as coaches and capacity builders. To assist verifi ers in these roles, they can use the service protocol reference guide, a helpful tool that lists each PBF service
Verifi cation can be labor intensive. © G. B. Fritsche.

46 Performance-Based Financing Toolkit
with an elaborate defi nition and demonstrates the specifi c primary and sec-ondary data collection instruments (registers and individual patient cards).
Given the stringency of the PBF verifi cation requirements, the PBF veri-fi cation system generally does not rely on existing routine data collectiontsystems for its primary data. In nearly every conventional health manage-ment information system (HMIS), for instance, client address details— essential for PBF counterverifi cation— are insuffi ciently documented (see chapter 12). In fact, PBF verifi cation can be seen as the equivalent of a sys-tematic data- quality audit on all data elements. This is an intensive and time- consuming process. As a consequence, the types of services that are pur-chased through PBF are limited to 20– 30 for both the health center/community level and the fi rst- level referral hospital.
For the ex ante verifi cation, each health facility prepares a monthly provi-sional PBF invoice. In principle, the verifi cation process follows this monthly schedule, but in practice, it can also be done once every two or three months, depending on local circumstances such as travel distances and the general accessibility of the terrain. When starting PBF, one is advised to adhere as much as possible to a monthly verifi cation cycle to correct quickly any start- up problems that may occur with the new registers and such other PBF in-struments as the business plan and the indice tool. Intense coaching is often necessary during this start- up phase.
After the ex ante verifi cation has been completed, and data have been consolidated with the quality score (see chapter 3) and validated in the dis-trict PBF steering committee, health facilities can be paid for their perfor-mance. Most commonly, PBF payments occur on a quarterly basis. At the health facility level, the management tools— such as the indice tool (see chapter 7) and the individual performance evaluation tool (see chapter 10)— assist in converting the quarterly payment to monthly performance bo-nuses for staff . Health staff should be paid at acceptable intervals.
Ex Post Quantity Verifi cation
Ex post verifi cation refers to any verifi cation that is undertaken after therPBF payment has been made. Ex post quantity verifi cation aims to ascertain whether the services paid for have been received by real, as opposed to phantom, clients. In addition, it tries to gauge the level of client satisfaction with the services rendered. This particular type of ex post verifi cation is therefore frequently termed a community client satisfaction survey. Ex post verifi cations send two signals. On the one hand, they signal to providers that there is a strong chance that one will be caught if one cheats (by claiming phantom patients).3 On the other hand, providers, clients, and communities
Verifi cation of the Quantity of Services 47
are shown that in PBF, there is a serious desire to elicit feedback on the per-ceived quality of health service provision.
Details on the community client satisfaction surveys discussed below are drawn from Soeters (2013).
To carry out one of the main forms of ex post quantity verifi cation— the community client satisfaction survey— the purchaser selects a local grass-roots or nongovernmental organization (NGO) for each health center thatholds a principal PBF contract. Although there is a strong preference for or-ganizations with objectives linked to health, reproductive rights, or the fi ght against poverty, the organization could also be, for example, a local soccer club. The local organization must have been registered with the appropriategovernment authority for at least two years, must be known by the local au-thorities, and must carry a good reputation. It should have no close ties withthe health facility concerned. Members of such organizations with a suitable profi le are selected as interviewers and are trained to carry out the survey. They should be literate and understand the local languages. They should beavailable for about six days every three months to conduct the interviews. They should be capable and willing to reach households within two hours travelling distance by foot or by their own means of transport (by bicycle, for example). In addition, they should have the social skills to fulfi ll their tasksin a friendly manner and with commitment, discipline, honesty, and integ-rity. At least one woman should be available to audit family planning activi-ties, and she should be trained to counsel sensitive issues confi dentially.
The purchasing agency performs the random sampling in the health facil-ity registers and then passes on the identifying information (name and ad-dress) to the interviewers while retaining information related to the service provision, such as the exact date and type of service received. The interview-ers’ work is performance based: they are paid a fee for each fully completed questionnaire. The lump- sum payments vary by context and are usually be-tween US$5 and US$8 for each fully completed questionnaire.
2.4 Operational Challenges
The Challenge of Finding the Correct Sample Sizes
Implementers of PBF often become entangled in debates over the sample size that is necessary for community client satisfaction surveys. If one wished only to yield statistical analyses and relevance, such community client satisfaction surveys could quickly become a very expensive and time- consuming aff air. In practice, one must make a trade- off among statistical validity, costs, and the desired eff ects on the provider such as discouraging gaming) (see box 2.1).
48 Performance-Based Financing Toolkit
What sampling techniques have been used forthe PBF community client satisfaction surveys? A few examples from practice are as follows:
1. The Cordaid experience: Most Cordaid– PBF:projects take a random sample of 60– 80households per health center catchmentarea each quarter. Community- based organi-zations (CBOs) are selected in each of thecatchment areas and are coached by a com-munity verifi cation offi cer of the contracting/verifi cation agency. The CBO must be known by local authorities, must have a good repu-tation, and preferably should have been in existence for at least two years. The CBO should not have a close relationship with the designated health facility. The selection criteria for the interviewers may include thefollowinga:• Ability to read, write, and understand local
languages, with the knowledge of other main languages being an added advantage
• Availability for about six days every three months to conduct the interviews
• Capability and willingness to reach house-holds within two hours travelling distanceby foot or by their own means of transport (for example, by bike)
• Skills to fulfi ll the tasks in a friendly atmo-sphere, with commitment, discipline,honesty, and integrity
• At least one woman should be available for auditing family planning activities. She should be trained in counseling sensitive issues and maintaining confi dentiality
• Payment of US$8 may be given per inter-view for which standard questionnaires are used. The CBOs transfer the informa-
tion to the contracting and verifi cation agency, which in turn will use the informa-tion to provide feedback to the health fa-cilities. It may also infl uence the contractrenewal discussions.
2. The Rwandese national health center com-munity client satisfaction surveys:• Early method (2007– 10): After PBF was
scaled up for health centers in 2006, a protocol for community client satisfactionsurveys was tested and implemented in 2007. Each quarter, 15 of 500 health cen-ters were randomly selected. The proto-cols selected health facilities randomly and targeted the previous three months (or six months, depending on the interval) of production. They would sample six orseven services of the service package of about 25 (in principle, also randomly) andthen select 15 clients randomly from theselected register (using the register as thesampling matrix), using a defi ned sam-pling interval (total production over thedefi ned period/15) and a randomly chosen fi rst number to start the sampling. The ex post verifi cation verifi ed, among other is-sues, whether the ex ante registration had been done correctly.
• Later method (2011 to present): The early sampling method was revised during 2011. Because of the small sample size (only 15 patients per service and equiva-lent by service regardless of the average monthly “production”), the confi dence intervals for indicator “% of patients identifi ed in the community” were con-sidered very wide (and only slightly
BOX 2.1
Sample Techniques for PBF Community Client Satisfaction Surveys

Verifi cation of the Quantity of Services 49
meaningful when aggregated by healthcenter). It was quite likely that in a caseof fraud whereby one person in thehealth center is added at the end of theday or at the end of the week, extra pa-tients would be missed. Quality assur-ance sampling methodology was appliedto generate appropriate new samplesizes and decision rules. As a conse-quence, the new sampling methodologyinvolves a random selection of 15 health centers. Of the 25 PBF package services,three or four are randomly selected. Foreach of these services, 70 client- provider contacts are randomly selected from the primary registers. If fewer than 64 con-tacts are retrieved, the batch is rejected.Only when 64 or more patients for each service are traced— and have acknowl-edged use of the service concerned on aparticular day— is the site classifi ed as“good.” With this method, there is a6.0 percent chance of classifying an hon-est site as fraudulent and an 8.4 percentchance of classifying a fraudulent site as honest.b,c
3. The Burundi counterverifi cation mechanism (2010 to present): The Burundi system con-:sists of both a decentralized community client satisfaction survey performed by the provin-cial public purchaser (Provincial Verifi cation and Validation Committee, or CPVV) and an ex post counterverifi cation performed quarterly by an external agent. This third- party agent draws random samples of performance as-sessments at all levels of the health system (central technical support unit; provincial health department; and district health de-partment and health facilities). For the health facilities, it samples 4 of 17 districts. In each district, it samples 25 percent of the health centers (the district hospital is automatically included). The actual production over the pre-ceding three months is assessed and triangu-lated with the production as certifi ed by the CPVV. In each health center, the third- party agent samples six PBF services. Over the pre-ceding six months’ production, it samples 10 client- provider contacts. The third- party agent selects and recruits members from a suitable local grassroots organization, trains them, and has the clients traced in the communities.d
a. They should not be members of the health committee of the health facility nor providers at the same health facility, because sometimes the same people working at a health facility are active in different local associations.
b. There are many reasons for not being able to trace patients. For instance, there may be women who, for reasons of confi dentiality when using family planning services, give the incorrect name or address because their husbands may not know that they are using birth control. Likewise, patients may be seasonal workers, patients from neighboring counties, people who migrate to work on their pastures, and so on, and thus the results from the community- basedorganizations must be analyzed in depth to identify the real reasons for lack of traceability before concluding that fraudhas occurred.
c. A report detailing this method is available through the links to fi les in this chapter: “Report of Audit on: QuantityVerifi cation and Client Satisfaction, Quality Counter Verifi cation and Performance- Based Financing System and Procedures, period February– March 2011,” L. de Naeyer, J. B. Habaguhirwa, and C. Ndizeye.
d. A report detailing this method is available through the links to fi les in this chapter: “Synthese Globale de la ContreVerifi cation du FBP au Burundi (2011– 2012),” Republique du Burundi, Ministere de la Sante Publique et de la lutte contre le SIDA.
50 Performance-Based Financing Toolkit
Selecting the sample size for ex post quantity verifi cation in PBF is therefore fi rmly connected to an assessment of the other accountability mechanisms already in place in the country and district, such as the state of contracts, verifi cation mechanisms, and transparency and governance procedures. All such accountability mechanisms should be part and parcel of any well- designed and well- implemented PBF scheme. In fact, they can signifi cantly decrease the chances of fraud and thereby reduce the necessity to carry out extremely expensive ex post surveys.
After the clients for the surveys have been selected, they are contacted. In urban areas, verifi ers can use mobile phone numbers, which are system-atically requested upon registration of clients in health facilities. In rural areas, clients’ mobile phone numbers, household numbers, or exact house-hold address (village and name of the head of the household) are used. The increasing coverage of mobile phones in low-income countries/lower- and middle- income countries can decrease survey costs considerably. At this point, the local NGOs or grassroots organizations are approached and can start their work.
The Importance of Reliable Registers: Registers as the Cornerstone of PBF
Proper ex post verifi cation clearly depends to a large extent on registers into which detailed client contacts with the health facility have been entered. Only when such PBF registers are in order can a random selection of clients be drawn for ex post verifi cation.
Registers and their linked individual client cards are the cornerstone of PBF systems. When setting up a PBF system, implementers should give special care to ensure that primary and secondary data collection tools are available and up to standards. One should start with a thorough analysis of the existing HMIS. One nearly always fi nds severe defi ciencies in the rou-tine data collection systems. Clinics tend to be overburdened with a pleth-ora of routine data collection instruments and special control registers for every imaginable vertical disease program. Reporting upward is, at best, incomplete and, at worst, totally absent. Consolidated data rarely make it back to the health facility, let alone undergo analysis at the source of production.
Through its specifi c fi nancial incentives, PBF radically changes the rules of registration and data collection. When data are not completely and legibly registered, health facilities are simply not paid. Through specifi c PBF
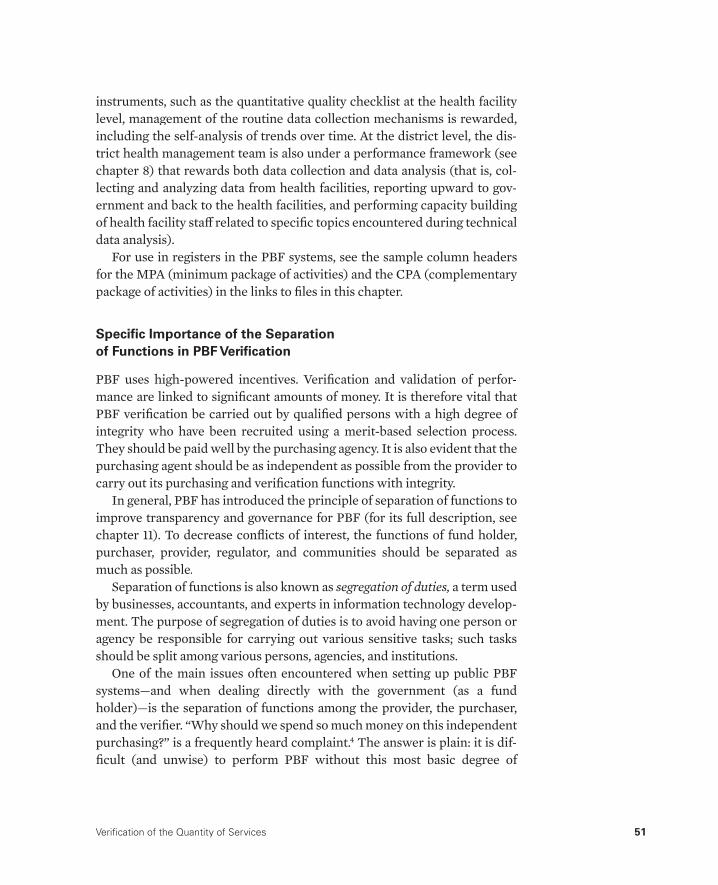
Verifi cation of the Quantity of Services 51
instruments, such as the quantitative quality checklist at the health facility level, management of the routine data collection mechanisms is rewarded, including the self- analysis of trends over time. At the district level, the dis-trict health management team is also under a performance framework (see chapter 8) that rewards both data collection and data analysis (that is, col-lecting and analyzing data from health facilities, reporting upward to gov-ernment and back to the health facilities, and performing capacity building of health facility staff related to specifi c topics encountered during technicaldata analysis).
For use in registers in the PBF systems, see the sample column headers for the MPA (minimum package of activities) and the CPA (complementary package of activities) in the links to fi les in this chapter.
Specifi c Importance of the Separation of Functions in PBF Verifi cation
PBF uses high- powered incentives. Verifi cation and validation of perfor-mance are linked to signifi cant amounts of money. It is therefore vital that PBF verifi cation be carried out by qualifi ed persons with a high degree of integrity who have been recruited using a merit- based selection process. They should be paid well by the purchasing agency. It is also evident that thepurchasing agent should be as independent as possible from the provider to carry out its purchasing and verifi cation functions with integrity.
In general, PBF has introduced the principle of separation of functions to improve transparency and governance for PBF (for its full description, see chapter 11). To decrease confl icts of interest, the functions of fund holder,purchaser, provider, regulator, and communities should be separated asmuch as possible.
Separation of functions is also known as segregation of duties, a term used by businesses, accountants, and experts in information technology develop-ment. The purpose of segregation of duties is to avoid having one person or agency be responsible for carrying out various sensitive tasks; such tasks should be split among various persons, agencies, and institutions.
One of the main issues often encountered when setting up public PBF systems— and when dealing directly with the government (as a fund holder)— is the separation of functions among the provider, the purchaser, and the verifi er. “Why should we spend so much money on this independentpurchasing?” is a frequently heard complaint.4 The answer is plain: it is dif-fi cult (and unwise) to perform PBF without this most basic degree of
52 Performance-Based Financing Toolkit
separation of functions. Nonseparation of functions is the most frequent PBF design error. Figure 2.1 represents a segregation of duties in the verifi ca-tion, authorization, recordkeeping, and reconciliation processes for PBF (for governance issues, see also chapter 11).
Verifier checks primary registers
and signs provisorymonthly invoice.
Verifier enters datain web-enabled
application and prints consolidated quarterly invoice (quantity and
quality).
District PBF steering committee meets each quarter and compares original invoices andquality checklist with
consolidated invoices and authorizes performance
payments.
Minutes of district PBF steering committee
and approved consolidated invoice
are sent to fund holder,who performs due
diligence.
Fund holder payshealth facilities each
quarter.
Source: World Bank data.:
FIGURE 2.1 Separation of Functions

Verifi cation of the Quantity of Services 53
2.5 Transitional Issues: Rigorous Implementation
PBF changes the rules of strategy. When PBF systems are correctly designed and implemented, health workers and their managers are quite devoted to making things work and moving toward getting results. In most countries, health workers are trained with a mission: to provide good health services to their population. Frequently, however, they fi nd their work frustrating be-cause they have no means to infl uence the quantity or the quality of theirwork and output. They are underpaid, they fi ght against many adverse con-ditions, and often they cannot devote all their time to servicing the public good. Well- designed PBF systems off er such health workers and their man-agers the opportunity to do what they were originally trained to do and tooff er higher- quality services to the patients in their area.
It is important to recall that while relying on health workers’ internal mo-tivation, PBF also introduces high- powered incentives. The system should be protected. Allowing even a few health workers and managers to get away with wholesale fraud would discourage the majority that are working hard to get results. Therefore, it is crucial to state unambiguously the rules of the system and to follow those rules.
First and foremost, it is important to explain the new rules of the system. Continuous support during the early stages of introducing PBF— when peo-ple are still grappling with understanding the new system— is vital (for de-tails on technical assistance, see chapter 14). One must learn to work with newly acquired autonomy, to work toward results, to manage resources and staff , and to respond to the new reporting requirements. These responsibili-ties all pose a variety of challenges. Many mistakes can easily be found in new PBF systems, mistakes often simply a result of lack of understanding of the system. Therefore, good technical support and coaching are no luxury.
In more mature systems, the focus can be switched to ensuring that there are disincentives for cheating the system and for fraud. Such focus demands the implementing of verifi cation and counterverifi cation mechanisms as de-signed and the taking of swift action when there are irregularities (box 2.2).
The message should be loud and clear: cheating is not permitted. If you cheat, you will be caught. When you are caught, you will likely lose your job (for instance, as the person in charge of the health center). At the same time, it will be made known publicly that you have cheated. Your health center will be pressured to repay the money that has been earned dishonestly, and your district management team will be pressured to act on the basis of the irrefut-able evidence that you have cheated. In short, implement PBF systems rigor-ously. Abide by the rules. Take action when fraud has been detected.

54 Performance-Based Financing Toolkit
Balancing the need to be seen as authoritative and trustworthy while being accountable for ob-vious cases of fraud is not easy, as shown in thefollowing examples:
• In Rwanda, during the scale- up of PBF 2006– 08, technical partners strongly ad-vised the Ministry of Health to include coun-terverifi cation measures in its PBF designs. Early evidence from pilot projects had dem-onstrated the need to do so. Community cli-ent satisfaction surveys were introduced in December 2008, after the fi rst such survey showed an acceptable— and low— 5 per-cent of services that could not be traced in the community. The ministry had been afraid that a larger percentage of clients would be untraceable, thereby undermining the approach.
• In Rwanda, unannounced visits to hospitals by a third party led to very different mea-sures for the quality checklists as obtained by the offi cial peer- evaluation visits. Clearly, the peers were too close to each other to remain objective in their scoring.
• In Burundi, a third party that had contracted to validate the verifi cations at all levels of the PBF systems found considerable differences in the quality assessments in health centers and hospitals as measured and reported by the health administration and by the peers. This fi nding led to stricter rules and penalties.
• In Burundi, to improve the routine data re-porting, the provincial verifi cation committeeintroduced a system of fi nancial penalties for health facilities that wrongly reported theirperformance.
BOX 2.2
Verifi cation and Counterverifi cation Challenges
The following toolkit fi les can be accessed through this web link:http://www.worldbank.org/health/pbftoolkit/chapter02.
• Sample PBF monthly provisory invoice
• Sample service protocol reference guides for the minimum package of activities and the complementary package of activities
• Sample reports on the Rwandese and Burundi community client sat-isfaction surveys (in French and English)
• Sample column headers for the MPA and the CPA
• Sample terms of reference for a verifi er
• Sample terms of reference for a counterverifi cation agent— Burundi
• Annual PBF reports 2010 and 2011— Burundi
2.6 Links to Files and Tools
Verifi cation of the Quantity of Services 55
Notes
1. If there is a suspicion of cheating, it is important to cross- check among services,such as tracing some sampled clients from the reception to the consultation tothe pharmacy via the lab to learn if the patient exists.
2. It is also called the contract management and verifi cation agency, because in many quasi- public purchasing arrangements, the government (central or local) is the purchaser but uses an agency to manage the contracts and to verify perfor-mance. In addition, the fund holding is separated in such instances from thispurchasing agency, leaving the agency with the core essential tasks of negotiat-ing and managing the contracts (on behalf of the government) and verifying performance.
3. Phantom claims are also a common occurrence in Organisation for EconomicCo- operation and Development health systems; in the United States, it has beenestimated that up to 10 percent of all Medicare expenditure is based on insur-ance fraud. In 2010, of an estimated US$528 billion in Medicare spending, anestimated US$47.9 billion was improper payments. The total U.S. healthexpenditure for 2010 was estimated at US$2.6 trillion. The Federal Bureau of Investigation estimates that for 2010, about 3 percent of total health expenditurewas due to insurance fraud.
4. Up to 30 percent of the PBF budget is spent for the purchasing, verifi cation,counterverifi cation, and coaching functions. The actual amounts depend on the PBF budget and the context (gross domestic product, geographical factors, and so on).
Reference
Soeters, R., ed. 2013. PBF in Action: Theory and Instruments— Course Guide, Performance- Based Financing. The Hague: Cordaid- SINA. http://www.sina- health.com/?page_id=585 (accessed April 23, 2013).

57
Measuring and Verifying Quality
CHAPTER 3
MAIN MESSAGES
➜ PBF purchases services conditional on the quality of those services: pro-viders who off er services with improved quality are paid more for thoseservices.
➜ PBF uses quantifi able quality checklists, and it measures and rewards specifi c components of quality. The checklist is context specifi c and can contain structural, process, and sometimes content- of- care measures.
➜ Update PBF quality checklists regularly to incorporate lessons learnedand set the quality standards progressively higher.
COVERED IN THIS CHAPTER?
3.1 Introduction3.2 Diversifi cation of quality stimulation: The carrot- and- carrot approach
versus the carrot- and- stick approach and their distinct eff ects3.3 Quality tools: How quality is paid for through PBF3.4 Design tips for the quantifi ed quality checklist3.5 Diff ering contexts: Diff erent examples of quality checklists3.6 Links to fi les and tools

58 Performance-Based Financing Toolkit
3.1 Introduction
In performance- based fi nancing (PBF), quality assessments tend to pro-voke heated debates. In many low- income countries, merely increasing the volume of desirable public health services is of great importance. But a larger volume of services should not be created at the expense of good quality. Good quality is a prerequisite for providing greater eff ectiveness of services.
Therefore, PBF purchases services conditional on the quality of those ser-lvices. PBF provides the incremental funding necessary to increase both the volume and the quality of services at the same time. This form of strategic dpurchasing is one of PBF’s hallmarks and sets PBF schemes apart from many other provider payment mechanisms.
Traditionally, many health systems analyzed quality in a fragmented manner— with little analysis, for example, by the district health teams. Verti-cal programs with their own quality schemes complicated matters and only added to the fragmentation (Soeters 2012).
PBF postulates that quality cannot be improved if managers close to the fi eld do not have certain powers to manage:
• Health facility managers should have the autonomy and fi nancial power to infl uence quality more directly. They should, for example, be able to recruit additional skilled staff if necessary, to buy new equipment and fur-niture, or to rehabilitate their health facility infrastructure when things fall apart.
• Health facility managers should have the instruments and skills to apply individual performance contracts to their health staff and thereby infl u-ence the staff ’s behavior.
In PBF, health facilities are reviewed regularly and are held to various standards:
• Local health authorities and peer review group members from other hos-pitals regularly review health facilities to monitor quality. To do so, they have at their disposal SMART (specifi c, measurable, achievable, realistic, and time bound), nationally agreed- upon composite quality indicators.
• When local health authorities and peer reviewers are conducting regu-lar quality reviews on local health facilities, they work systematically and make use of the composite indicators lists. One composite indicator may contain several elements, all of which must be satisfi ed to earn the quality points attached to that particular indicator. The weight of an indicator may vary between 1 and 5 points, depending on its importance. For ex-

Measuring and Verifying Quality 59
ample, to meet the composite indicator “cold chain fridge assured,” health facilities must fulfi ll the following criteria to obtain a point: (a) a thermom-eter is available, and regular control temperature is maintained; (b) a re-frigerator is present, and temperature form is available and is completed twice a day, including the visit day; (c) temperature remains between 2 and 8 degrees Celsius (°C) in register sheet; (d) supervisor verifi es functional-ity of thermometer; (e) temperature is between 2 and 8°C also according to thermometer; and (f ) temperature tag has not changed color.
• Based on the quality score, both positive and negative incentives can be mobilized to reward good quality and to discourage poor performance.
• The regulator and purchaser should not accept a below- standard qual-ity score of health facilities. The regulator should be able to close health facilities in the event their performance constitutes a health risk for the population.
• Purchasing agencies can give health facilities advance payments of their subsidies to speed up quality improvements. Investment units (for ex-ample, US$1,000 for health centers and US$5,000 for hospitals in local currency) may also be made available against the infrastructure or theequipment business plan. This money is released when the health facility has achieved progress in its improvements, which is normally verifi ed by an engineer. This demand- driven investment approach seems to be more effi cient than centralized planning (Soeters 2012).
Quality assurance has thus become a fundamental part of performance contracting. In PBF, you can fi nd heightened attention for quality in both demand- and supply- side decisions. The idea can be rephrased in economic terms. Increases in quality increase the quantity demanded. An increase in the quality also increases the cost of provision and that, in turn, decreases the quantity supplied. Thus, a new market equilibrium will occur with a new equilibrium price (Barnum and Kutzin 1993; Barnum, Kutzin, and Saxenian 1995).
To measure and reward quality, PBF uses a quantifi ed quality checklist. Clearly, however, quality is multidimensional and context specifi c. PBF ac-knowledges that some quality dimensions can be easily measured and re-warded, while others cannot. This discrepancy poses some restrictions onrewarding quality of care through PBF. That is why, in practice, PBF goes hand in hand with other strategies to improve quality, such as quality assur-ance, formative supervision, and continuous education.
PBF provides incentives for quality capacity strengthening at the district level (health authorities; see chapter 8), and at the same time, it measures thequality performance at the health center or hospital level (providers). This
60 Performance-Based Financing Toolkit
interplay often prompts specifi c requests for capacity building by the health workers, as a recent Rwandese PBF impact evaluation has documented well (Basinga et al. 2010).
3.2 Diversifi cation of Quality Stimulation: TheCarrot- and- Carrot versus the Carrot- and- StickApproach and Their Distinct Effects
Quality at All Levels
PBF operates through performance frameworks. Performance frameworks are sets of individually weighted, objectively verifi able criteria that add up to 100 percent of the desired performance. They typically include a set of pro-cess measures and target diff erent levels of the health system. Performance frameworks are found at the following levels:
• Health center• First- level referral hospital• District administration• District PBF steering committee• Semiautonomous public purchaser• Surveyors from the grassroots organizations carrying out the community
client satisfaction surveys• Community health worker cooperatives• Central- level technical support unit coordinating and steering the PBF
eff ort• Institution responsible for paying for performance• Sectors other than health (schools, and so on).
This chapter deals with the performance frameworks for the health center and the fi rst- level referral hospital. Other performance frameworks (for ex-ample, for the administration) are discussed in chapter 8.
Frameworks for Health Center and First- Level Hospital: Carrot- and- Carrot and Carrot- and- Stick Methods
For the health center, two slightly diff erent performance frameworks are used. Both can be framed as fee- for- service provider payments, con-ditional on quality. They are called the carrot- and- carrot and the carrot-and- stick methods. The carrot- and- carrot method consists of purchasing
Measuring and Verifying Quality 61
PBF services and adding a bonus (for example, up to 25 percent) for the quality performance. The carrot- and- stick method entails purchasing PBF services but detracting money in case of bad quality performance. Whenusing a carrot- and- stick method, one can infl ate the carrots a bit, thereby assuming a certain eff ect on the quality factor.
Behavioral science teaches that human beings are relatively more sensi-tive to the fear of losing money than to being off ered the prospect of earn-ing more. So theoretically, the carrot- and- stick approach should be the more powerful approach (Mehrotra, Sorbrero, and Damberg 2010; Thalerand Sunstein 2009). In practice, however, diff erent choices are being made. Afghanistan, Benin, Rwanda, and Zambia use the carrot- and- stick method,1
whereas Burundi, Cameroon, Chad, the Central African Republic, the Demo-cratic Republic of Congo, the Kyrgyz Republic, Nigeria, and Zimbabwe have opted for a carrot- and- carrot approach. Equally, nongovernmental organi-zation (NGO) PBF fund holders also seem to prefer the carrot- and- carrotmethod, as was the case in the following:
• Rwanda PBF pilot (2002– 05)• Burundi PBF pilot (2006– 10)• Central African Republic PBF pilot (2008 to present)• Cameroon PBF pilot (2009 to present)• Democratic Republic of Congo, South Kivu PBF Pilot (2006 to present)• Flores, Indonesia PBF pilot (2008– 11).
Whatever the exact eff ect, a remarkable feature of both performance frame-works is that they manage two actions at once: (a) to increase the quantity of health services and (b) to increase the quality of those services (Basinga et al. 2011).
Choosing Carrot and Carrot or Carrot and Stick
The main reasons for choosing one or the other method— apart from philo-sophical considerations and local preferences— are the level of deprivation of health facilities and the availability of alternative sources of cash income. A carrot- and- carrot method (quality as a bonus rather than as a risk) en-ables health facility managers to better forecast their income— income that in some situations derives predominantly from PBF. A carrot- and- carrot method is therefore advisable in settings in which alternative sources of cash income are limited. Such can be the case in environments with free or selective free health care and in settings in which cash subsidies from thecentral level are lacking, especially when this setting is aggravated by poor

62 Performance-Based Financing Toolkit
infrastructure, a lack of procedures, and the absence of equipment. In more mature systems— especially those with multiple sources of cash income— one can turn to a carrot- and- stick system.
Differing Effect: Different Scenarios with Carrot and Carrot versusCarrot and Stick
The two PBF approaches, carrot and carrot and the carrot and stick, have a diff erent eff ect on the earnings of health facilities. They send diff erent sig-nals to the provider. The following example may show how the quality cal-culus works in practice. Let’s start with the formulae for the two approaches, assuming both approaches use the same output budget.
Under the carrot- and- carrot approach, one counts
total payment to health facility = [total quantity payments due]+ [total quantity payments due * quality score * X%] (3.1)
where X% is 25%.Under the carrot- and- stick approach, one calculates
total payment to health facility = [total quantity payments due]* [quality score %]. (3.2)
In both cases, the quality score can range from 0 percent to 100 percent. Dif-ferent results occur under a carrot- and- carrot regime when compared with a carrot- and- stick method.
The quality will rarely be 100 percent. If one assumes that under the carrot- and- stick approach the average quality will be 60 percent, then one may infl ate unit fees accordingly if working with the same output budget. For the carrot- and- carrot approach, a cut- off point for quality is frequently applied below which a quality bonus is not paid. In the current example, this cut- off point is set at 60 percent.
To show the diff erent eff ects, three scenarios are demonstrated: Sce-nario A, in which the total quality scores are 100 percent (tables 3.1 and 3.2); Scenario B, in which the total quality score is 0 percent (tables 3.3 and 3.4); and Scenario C, in which the quality score is 59 percent (tables 3.5 and 3.6). Tables 3.1– 3.6 explain what diff erences may ensue between the carrot- and- carrot and carrot- and- stick approaches. Table 3.7 compares the approaches.

Measuring and Verifying Quality 63
TABLE 3.1 Scenario A: The Carrot-and-Carrot Approach
Health facility revenues over the previous period Number provided
Unit price(US$)
Total earned (US$)
Child fully vaccinated 60 2.00 120.00
Skilled birth attendance 60 18.00 1,080.00
Curative care 1,480 0.50 740.00
Curative care for the vulnerable patient(up to a maximum of 20% of curative consultations)
320 0.80 256.00
Subtotal revenues 2,196.00
Remoteness (equity) bonus +20% 439.00
Quality bonus 100% of 25% 594.00
Total PBF subsidies 3,184.00
Other revenues (direct payments: out of pocket, insurance, etc.) 970.00
Total revenues 4,154.00
Health facility expenses
Fixed salaries of staff 800.00
Operational costs 350.00
Drugs and consumables 1,000.00
Outreach expenditures 250.00
Repairs to the health facility 300.00
Savings into health facility bank account 250.00
Subtotal expenses 2,950.00
Staff bonuses = total revenues – subtotal of expenses 1,204.00
Total expenses 4,154.00Source: World Bank data.:
Scenario A: High Quality (100 percent)Tables 3.1 and 3.2 show the two approaches for Scenario A with the quality scores totaling 100 percent.
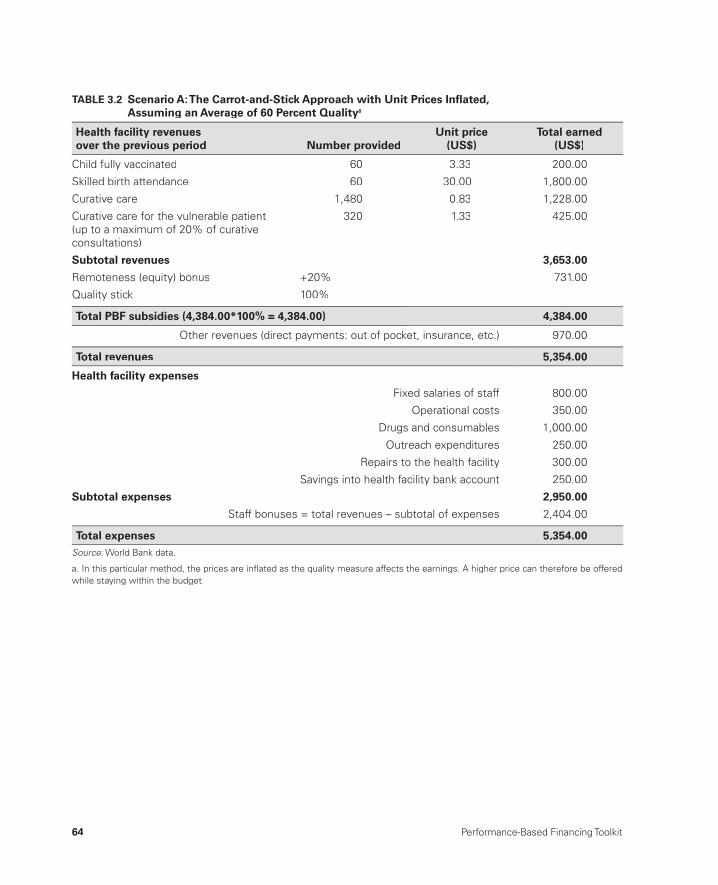
64 Performance-Based Financing Toolkit
TABLE 3.2 Scenario A: The Carrot-and-Stick Approach with Unit Prices Infl ated, Assuming an Average of 60 Percent Qualitya
Health facility revenues over the previous period Number provided
Unit price(US$)
Total earned (US$)
Child fully vaccinated 60 3.33 200.00
Skilled birth attendance 60 30.00 1,800.00
Curative care 1,480 0.83 1,228.00
Curative care for the vulnerable patient(up to a maximum of 20% of curative consultations)
320 1.33 425.00
Subtotal revenues 3,653.00
Remoteness (equity) bonus +20% 731.00
Quality stick 100%
Total PBF subsidies (4,384.00*100% = 4,384.00) 4,384.00
Other revenues (direct payments: out of pocket, insurance, etc.) 970.00
Total revenues 5,354.00
Health facility expenses
Fixed salaries of staff 800.00
Operational costs 350.00
Drugs and consumables 1,000.00
Outreach expenditures 250.00
Repairs to the health facility 300.00
Savings into health facility bank account 250.00
Subtotal expenses 2,950.00
Staff bonuses = total revenues – subtotal of expenses 2,404.00
Total expenses 5,354.00Source: World Bank data.:
a. In this particular method, the prices are infl ated as the quality measure affects the earnings. A higher price can therefore be offeredwhile staying within the budget.

Measuring and Verifying Quality 65
Scenario B: Very Low Quality (0 percent)A quality of 0 percent is a purely fi ctitious situation. However, depending on the context, a quality as low as 20 percent sometimes appears in practice (see tables 3.3 and 3.4). Most of the time, health facilities in such a state also have a very low volume of services. The two aspects— quantity and quality— tend to go hand in hand.
TABLE 3.3 Scenario B: The Carrot-and-Carrot Approach
Health facility revenues over the previous period Number provided
Unit price(US$)
Total earned (US$)
Child fully vaccinated 60 2.00 120.00
Skilled birth attendance 60 18.00 1,080.00
Curative care 1,480 0.50 740.00
Curative care for the vulnerable patient(up to a maximum of 20% of curative consultations)
320 0.80 256.00
Subtotal revenues 2,196.00
Remoteness (equity) bonus +20% 439.00
Quality bonus 0% 0.00
Total PBF subsidies 2,635.00
Other revenues (direct payments: out of pocket, insurance, etc.) 970.00
Total revenues 3,605.00
Health facility expenses
Fixed salaries of staff 800.00
Operational costs 350.00
Drugs and consumables 1,000.00
Outreach expenditures 250.00
Repairs to the health facility 300.00
Savings into health facility bank account 250.00
Subtotal expenses 2,950.00
Staff bonuses = total revenues – subtotal of expenses 655.00
Total expenses 3,605.00Source: World Bank data.:

66 Performance-Based Financing Toolkit
TABLE 3.4 Scenario B: The Carrot-and-Stick Approach
Health facility revenues over the previous period Number provided
Unit price(US$)
Total earned (US$)
Child fully vaccinated 60 3.33 200.00
Skilled birth attendance 60 30.00 1,800.00
Curative care 1,480 0.83 1,228.00
Curative care for the vulnerable patient(up to a maximum of 20% of curative consultations)
320 1.33 425.00
Subtotal revenues 3,653.00
Remoteness (equity) bonus +20% 731.00
Quality stick 0% 0.00
Total PBF subsidies (earnings * 0 = 0) 0.00
Other revenues (direct payments: out of pocket, insurance, etc.) 970.00
Total revenues 970.00
Health facility expenses
Fixed salaries of staff 800.00
Operational costs 0.00
Drugs and consumables 170.00
Outreach expenditures 0.00
Repairs to the health facility 0.00
Savings into health facility bank account 0.00
Subtotal expenses 970.00
Staff bonuses = total revenues – subtotal of expenses 0.00
Total expenses 970.00Source: World Bank data.:
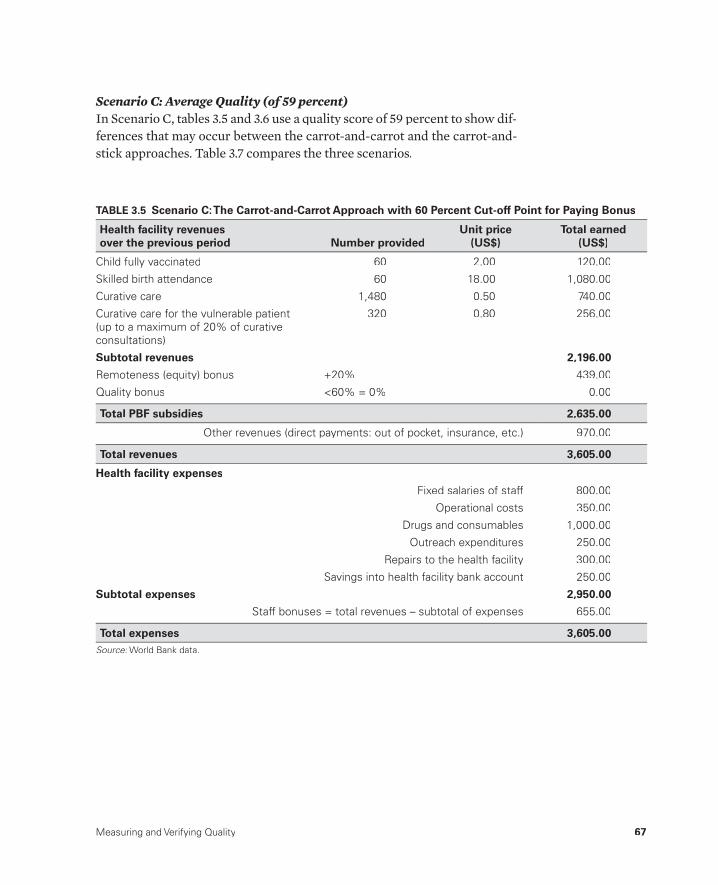
Measuring and Verifying Quality 67
Scenario C: Average Quality (of 59 percent)In Scenario C, tables 3.5 and 3.6 use a quality score of 59 percent to show dif-ferences that may occur between the carrot- and- carrot and the carrot- and- stick approaches. Table 3.7 compares the three scenarios.
TABLE 3.5 Scenario C: The Carrot-and-Carrot Approach with 60 Percent Cut-off Point for Paying Bonus
Health facility revenues over the previous period Number provided
Unit price(US$)
Total earned (US$)
Child fully vaccinated 60 2.00 120.00
Skilled birth attendance 60 18.00 1,080.00
Curative care 1,480 0.50 740.00
Curative care for the vulnerable patient(up to a maximum of 20% of curative consultations)
320 0.80 256.00
Subtotal revenues 2,196.00
Remoteness (equity) bonus +20% 439.00
Quality bonus <60% = 0% 0.00
Total PBF subsidies 2,635.00
Other revenues (direct payments: out of pocket, insurance, etc.) 970.00
Total revenues 3,605.00
Health facility expenses
Fixed salaries of staff 800.00
Operational costs 350.00
Drugs and consumables 1,000.00
Outreach expenditures 250.00
Repairs to the health facility 300.00
Savings into health facility bank account 250.00
Subtotal expenses 2,950.00
Staff bonuses = total revenues – subtotal of expenses 655.00
Total expenses 3,605.00Source: World Bank data.:
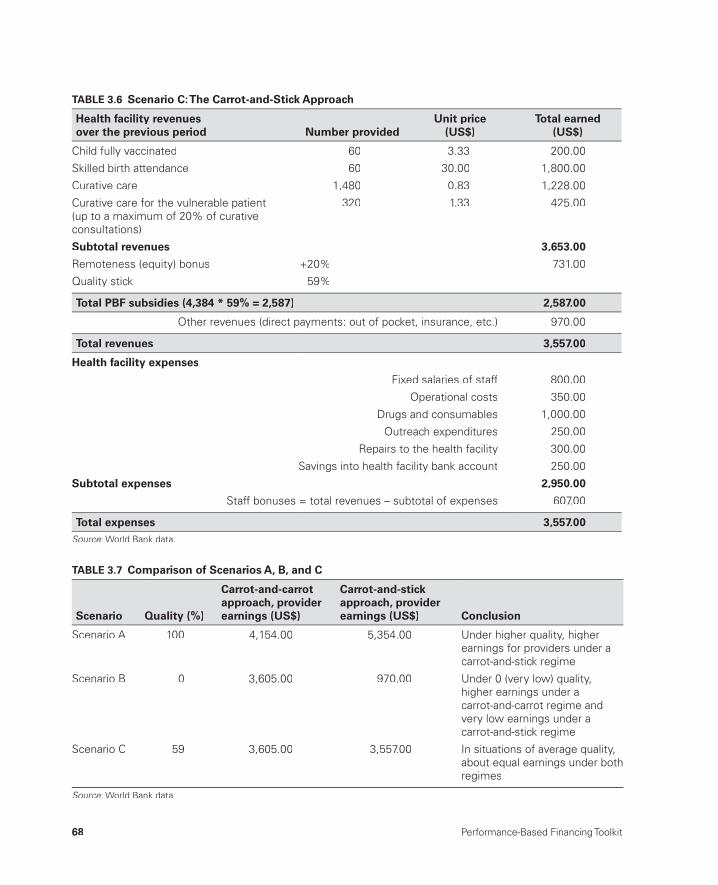
68 Performance-Based Financing Toolkit
TABLE 3.6 Scenario C: The Carrot-and-Stick Approach
Health facility revenues over the previous period Number provided
Unit price(US$)
Total earned (US$)
Child fully vaccinated 60 3.33 200.00
Skilled birth attendance 60 30.00 1,800.00
Curative care 1,480 0.83 1,228.00
Curative care for the vulnerable patient(up to a maximum of 20% of curative consultations)
320 1.33 425.00
Subtotal revenues 3,653.00
Remoteness (equity) bonus +20% 731.00
Quality stick 59%
Total PBF subsidies (4,384 * 59% = 2,587) 2,587.00
Other revenues (direct payments: out of pocket, insurance, etc.) 970.00
Total revenues 3,557.00
Health facility expenses
Fixed salaries of staff 800.00
Operational costs 350.00
Drugs and consumables 1,000.00
Outreach expenditures 250.00
Repairs to the health facility 300.00
Savings into health facility bank account 250.00
Subtotal expenses 2,950.00
Staff bonuses = total revenues – subtotal of expenses 607.00
Total expenses 3,557.00Source: World Bank data.:
TABLE 3.7 Comparison of Scenarios A, B, and C
Scenario Quality (%)
Carrot-and-carrot approach, provider earnings (US$)
Carrot-and-stickapproach, provider earnings (US$) Conclusion
Scenario A 100 4,154.00 5,354.00 Under higher quality, higherearnings for providers under acarrot-and-stick regime
Scenario B 0 3,605.00 970.00 Under 0 (very low) quality, higher earnings under acarrot-and-carrot regime andvery low earnings under a carrot-and-stick regime
Scenario C 59 3,605.00 3,557.00 In situations of average quality,about equal earnings under bothregimes
Source: World Bank data.:

Measuring and Verifying Quality 69
Conclusions and ImplicationsThree main conclusions can be drawn from those practical scenarios:
• In situations of very high quality, the carrot- and- stick method leads to more money for the best- performing health facilities.
• When quality levels are very low, the carrot- and- carrot method betterprotects basic health facilities’ income while penalizing low- quality, low- volume health facilities.
• When the quality level is average, both methods lead to similar incomelevels.
The fi ndings have important implications:
• When cash sources of income are diversifi ed and PBF is just one of sev-eral sources of cash income in a given health facility, the carrot- and- stick method might be preferable. PBF will leverage all other sources of cashincome, too, and direct them to maximizing quantity and quality of ser-vices. Such situations become more quality driven.
• When the only cash stems from PBF income, the carrot- and- carrot method might be preferable. It will protect the basic income of the facil-ity (by paying for the volume of services) and, at the same time, provide the additional resources to increase quantity and to fi ght low quality of services. Such situations are more quantity driven.
3.3 Quality Tools: How Quality Is Paid for through PBF
Tools Travel
PBF has distinct quality tools for the performance measures related to the minimum or basic package of health services in health centers, on the one hand, and for the complementary package of health services for fi rst- level referral hospitals on the other. The tools for the health centers have theirorigin in the NGO fund holder PBF approaches (see Soeters 2012). The qual-ity tools for the hospital can be traced to the quantifi ed quality checklists used by the Belgian Technical Cooperation PBF pilot in Rwanda (Rusa etal. 2009). In the incremental development of those tools, several phases of change can be distinguished. Tools appear to travel.
• The Kyrgyz rayon hospital’s quantifi ed quality checklist and balanced scorecard found its origin in the Rwandese district hospital checklist that included peer evaluation.

70 Performance-Based Financing Toolkit
• The Benin health center quality checklist drew inspiration from the Bu-rundi health center quality tools.
• The Burundi health center and hospital quality checklists drew their in-spiration from the Rwandese quality checklists.
• The Nigerian quality assessment tools are based on eclectic sources (NGO fund holder PBF approach and Rwandese and Burundi tools) adapted to the local context (box 3.1).
BOX 3.1
Nigerian Quantifi ed Quality Checklist
TABLE B3.1.1 Nigerian Quantifi ed Quality Checklist
No Service Points Weight %
1 General Management 11 4.4
2 Business Plan 9 3.6
3 Finance 10 4.0
4 Indigent Committee 7 2.8
5 Hygiene 25 10.0
6 OPD 34 13.7
7 Family Planning 22 8.8
8 Laboratory 10 4.0
9 Inpatient Wards 10 4.0
10 Essential Drugs Management 20 8.0
11 Tracer Drugs 30 12.0
12 Maternity 21 8.4
13 EPI 18 7.2
14 ANC 12 4.8
15 HIV/TB 249 100.0
Source: See the links to fi les in this chapter.:
Note: “No” refers to the number of a service. ANC = antenatal care; :EPI = expanded program on immunization; HIV = human immunodefi ciencyvirus; OPD = outpatient department; TB = tuberculosis.
The Nigerian quantifi ed quality checklist for health centers is used in the states of Adamawa, Nasarawa, and Ondo. It contains 15 services among which 249 points are allocated for 162 mostly composite indicators. Each indicator is weighted individually for a certain number of points. The summary scores are in table B3.1.1.
The Nigerian checklist has been sculpted to refl ect priority issues relevant to quality of care at the health center level in Nigeria. There is a large emphasis on management of essentialdrugs, minimal stock levels, and rational pre-scribing. A few examples of these indicators are shown in tables B3.1.2– B3.1.4.

Measuring and Verifying Quality 71
TABLE B3.1.2 Example from the Outpatient Department Section, Nigerian Quantifi edQuality Checklist
6.16 Proportion of outpatient visits treated with antibiotics <30%
4 06.16.1 See last 100 cases in register, check diagnosis and calculate the rate (< 30 cases).
Source: See the links to fi les in this chapter.:
TABLE B3.1.3 Example from the Essential Drugs Management Section, Nigerian Quantifi edQuality Checklist
10.3Main pharmacy store delivers drugs to health facility departmentsaccording to requisition
10 0
10.3.1 Supervisor verifi es whether quantity requisitioned equals quantity served.
10.3.2 Drugs to clients are uniquely dispensed through prescriptions. Prescrip-tions are stored and accessible.
10.3.3 Drugs and medical consumables prescribed are all in generic form.
Source: See the links to fi les in this chapter.:
TABLE B3.1.4 Example from the Tracer Drugs Section, Nigerian Quantifi ed Quality Checklist
11Tracer Drugs (min. stock = Monthly Av. Consumption/2) [max 30 points]
Available YES > MAC/2
Available NO < MAC/2
11.1 Paracetamol 500 mg tab 1 0
Source: See the links to fi les in this chapter.:
Tools Evolve
Initially, there were considerable disagreements between health reform ac-tors on how “quality” should be made operational. During the PBF scaling-up processes in Rwanda and Burundi, the fi ercest disagreements revolved around the quality measures. Although the quantifi ed quality checklist waspioneered in 2002, using it for a positive eff ect on PBF payments long re-mained a novelty in many places. The checklist’s evidence base, therefore, is still being built.
Despite this slow evolution, the applicability and appropriateness of checklists is being demonstrated by the mounting successful uses across many low- income and low- middle- income countries. The nationwide ap-plication of the tool in Rwanda from 2006 onward led to signifi cant positive results on quality documented in a rigorous impact evaluation. This fi nding
72 Performance-Based Financing Toolkit
has helped the quantifi ed quality checklist become an element of great im-portance in PBF design (Basinga et al. 2010; 2011). Similarly, clients have rec-ognized increases in structural quality of care, thus signifi cantly infl uenc-ing demand (Acharya and Cleland 2000). Rewarding poor country hospitals for adhering to treatment protocols decreased morbidity and mortality in Guinea- Bissau (Biai et al. 2007).
Thus, PBF quantifi ed quality checklists are not static instruments. They evolve. They originated in compilations of routine supervisory forms used in low- income district health systems. Various elements of the forms were gradually made to conform to SMART quality indicators and became objec-tively verifi able. They evolved by incorporating standard supervisory forms, for example, in the expanded program on immunization or family planning or in the maternal and child health services. They were made quantifi able, meaning that the variables could be counted in a nonarbitrary manner (pos-sibly with 0 or 1). In addition, variables received a weight, which quantifi ed the relative (subjective) importance from one set of variables to another. Ba-sic checklists were tested in practice for years, and valuable feedback was incorporated from end users.
In Rwanda, during the fi nal quarter of each year, a special working group (drawn from technicians from the extended team and mandated by the lat-ter; see chapter 14) incorporates feedback from end users and observations made by the technical teams in the fi eld. Then, in the fi rst quarter of every following year, a slightly modifi ed checklist is introduced. Generally, this modifi cation leads to a brief drop of the quality results across the country. Then, while people adjust to the new conditions, results increase over the course of the year, and the cycle begins again. Quality performance can con-stantly be improved. The fl exibility of the tool is considerable: it can include any important treatment protocol, norms, and standards as they become available. However, rewarding quality through quantifi ed checklists has its limitations. Checklists measure certain dimensions of quality quite reliably, such as inputs and accreditation. Other dimensions, however, cannot be cap-tured easily, because of nonverifi ability, lack of time, or fi nancial constraints. To foster quality in the system, the PBF tool should be complemented by other strategies.
3.4 Design Tips for the Quantifi edQuality Checklist
When choosing a checklist for your country, select one of the examples pro-vided in section 3.5, and use it as the starting point of a consultative process.
Measuring and Verifying Quality 73
Choosing Measures for the Quantifi ed Quality List
The type of measures that you include in the list depends on local circum-stances, such as the following:• What is the size of the health facility, the number and type of professional
staff members, and the number of services?• What is the level of sophistication of the service delivery network? Con-
sider the following types of protocols already in use:➜ In Benin, for instance, the Burundi quality checklist was adapted to
the Benin context. That checklist was less complex than the Rwandesechecklist.
➜ In Zambia, a modifi ed and much simplifi ed version of the Rwandese checklist was adapted to local realities.
• Is the health facility run down? If so, the primary focus should be on physi-cal infrastructure— water, electricity, latrines, and hygiene and equipment measures. The importance of improving basic elements can be fl aggedthrough the weighing mechanism. Later on, more sophisticated measurescan be added.
Nine Points to Consider
Consider the following nine points when choosing a checklist:
• Always keep in mind the end users of the quality checklists. They are district or hospital supervisors. Use appropriate, accessible language, and format the list for them. If designed well, the checklist will be quite educational.
• Ensure that the criteria are objectively verifi able. The checklist will gen-erate a single composite quality score that will be used to determine the performance rewards. Ensure that when a counterverifi cation takes place(that is, the verifi cation of the verifi ed results), the repeated score will be more or less the same as the original (see box 3.2).
• Remember that some clinically desirable quality variables may be quite useless as objectively verifi able PBF indicators; they are non- PBF SMART. The verifi cation methodology in PBF limits itself to the types of indicators or services that one can purchase eff ectively, effi ciently, and credibly.
• Do not oversimplify the checklist or make it too easy. Health staff mem-bers can appreciate being held to standards. You do not need to hold them to all standards at once, but at least make them accountable for those that matter the most.
• Remember that one of the systemic eff ects of the quantifi ed quality checklists is a signifi cantly increased exposure time between members of
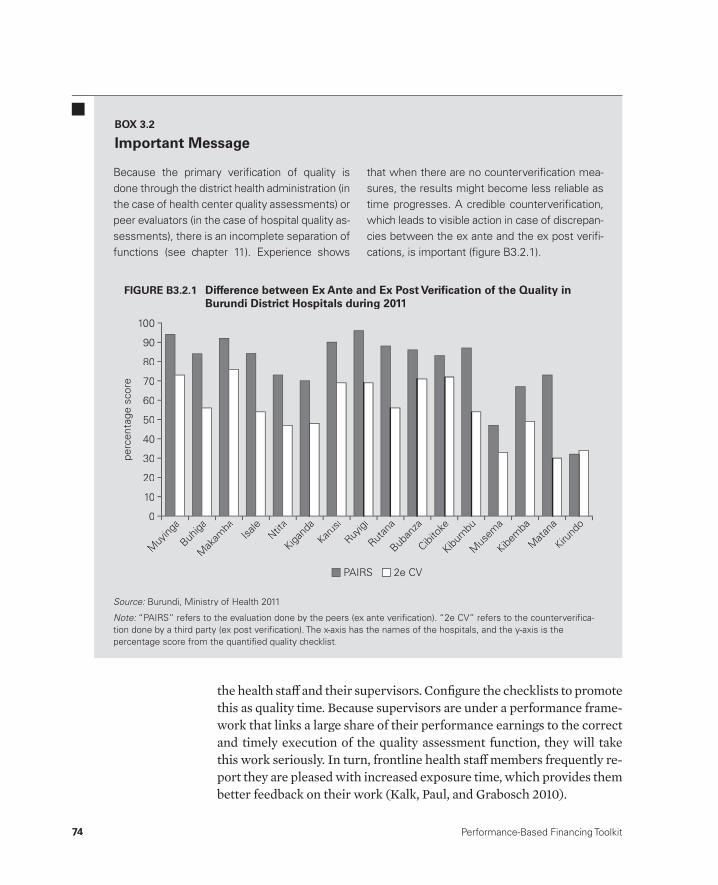
74 Performance-Based Financing Toolkit
the health staff and their supervisors. Confi gure the checklists to promote this as quality time. Because supervisors are under a performance frame-work that links a large share of their performance earnings to the correct and timely execution of the quality assessment function, they will take this work seriously. In turn, frontline health staff members frequently re-port they are pleased with increased exposure time, which provides them better feedback on their work (Kalk, Paul, and Grabosch 2010).
Because the primary verifi cation of quality is done through the district health administration (in the case of health center quality assessments) or peer evaluators (in the case of hospital quality as-sessments), there is an incomplete separation of functions (see chapter 11). Experience shows
that when there are no counterverifi cation mea-sures, the results might become less reliable as time progresses. A credible counterverifi cation, which leads to visible action in case of discrepan-cies between the ex ante and the ex post verifi -cations, is important (fi gure B3.2.1).
BOX 3.2
Important Message
Source: Burundi, Ministry of Health 2011.:
Note: “PAIRS” refers to the evaluation done by the peers (ex ante verifi cation). “2e CV” refers to the counterverifi ca-:tion done by a third party (ex post verifi cation). The x- axis has the names of the hospitals, and the y- axis is the percentage score from the quantifi ed quality checklist.
perc
enta
ge s
core
50
100
80
90
70
60
10
40
30
20
0
PAIRS 2e CV
Muy
inga
Buhiga
Mak
amba
Isale
Ntita
Kigand
a
Karusi
Ruyigi
Rutan
a
Buban
za
Cibito
ke
Kibum
bu
Mus
ema
Kibem
ba
Mata
na
Kirund
o
FIGURE B3.2.1 Difference between Ex Ante and Ex Post Verifi cation of the Quality inBurundi District Hospitals during 2011
Measuring and Verifying Quality 75
• Use the modifi ed Delphi technique (see chapter 1), for fi nalizing the design of the quality checklist. The technique will make designing thechecklist much easier, and it will maximize transparency in the decision-making process for allocating the general weights to the various compo-nents and subcomponents.
• Test the checklist to document interobserver and intraobserver reliability.• Pilot the checklist in a limited number of facilities to fi ne- tune it.• Update the checklists regularly (for example, once a year), and involve the
end users (technical assistants, district health staff members, and heads of facilities).
Counterverifi cation Is Necessary
Paying a considerable reward for quality performance has far- reaching im-plications. You will need to take into account separation of functions (see chapters 2 and 11). In reporting quality performances, you are wise to secure some counterverifi cation mechanisms. Lessons from the fi eld make it clearthat if you do not counterverify reported quality performance, the reportseasily become unreliable. To counterverify, use random elements of ran-domly selected checklists.
3.5 Differing Contexts: Different Examplesof Quality Checklists
The following quantifi ed quality checklists are provided as examples. They can be accessed in the web links to fi les in this chapter (see section 3.6). A multitude of performance measures exists, each with its own rationale. Here we present a short description of the various contexts in which the tools were designed and implemented.
• NGO fund holder PBF approach for health centers• Rwandese health center PBF approach• Rwandese district hospital PBF approach• Burundi health center PBF approach• Burundi district hospital PBF approach• Zambian health center PBF approach• Kyrgyz Republic rayon hospital PBF approach.
To understand an individual quality tool in detail, study its operations manu-als and talk extensively to the implementers (see chapters 14 and 15).
76 Performance-Based Financing Toolkit
NGO Fund Holder Health Center
The NGO fund holder PBF approach is a common form of the private pur-chaser PBF approach (see chapter 11).
• This quality tool is used in the NGO fund holder PBF approach at the level of the health center and minimum package of health services.
• The quality tool is contracted on a performance basis to the regulatory authority. Depending on the context, the regulatory authority can be the fi rst- level referral hospital or the district health management team. In principle, the regulatory authority must be a ministry of health (MoH) organization.
• The correct and timely execution of the quarterly checklist in all the health centers of a district health system is the main determinant of the performance payment to the MoH organization.
• The NGO fund holder PBF approach uses a carrot- and- carrot method. Each quarter, up to 25 percent of the total earnings of the past quarter can be earned as an extra bonus if the quality measure is 100 percent. This quality measure is typically weighted 50 percent for the result of the quarterly quality checklist and 50 percent for results based on a patient satisfaction index obtained through community client surveys.
The tool shows the 15 components of the quality questionnaire used in the Cordaid PBF pilot. See the links to fi les in this chapter.
Rwandese Health Center
The Rwandese health center’s quarterly quality checklist was constructed in early 2006 from the tool originally used in the NGO fund holder PBF ap-proach. The checklist has since been amended annually (changes for 2008– 11). In the links to fi les in this chapter, the 2008– 11 versions are provided. The 2008 version is the last version that was substantially edited. After 2008, it underwent only minor changes.
The Rwandese health center PBF model uses a carrot- and- stickmethod. Each quarter, a quality score is applied to the earnings of the pre-vious quarter. The earnings are discounted by the score. This method hasa strong and documented eff ect on the performance gap, the gap between what providers know is best practice and what they actually do (Gertler and Vermeersch 2012). Similarly, it aff ects the quality as measured through instruments at the health center level (Basinga et al. 2011). See the links tofi les in this chapter.

Measuring and Verifying Quality 77
Rwandese District Hospital
The Rwandese district hospital PBF approach was developed in July 2006 from a mix of previous experiences of the Rwanda PBF pilot projects. It drew on the Belgian Technical Cooperation tool, which was used earlier inhospital evaluations, and modifi ed the tool. The Rwandese approach used the peer evaluation concept that had been piloted by the NGO fund holderPBF approach (Rwanda and Ministry of Health 2006). The Rwandese ap-proach became well documented.
The two characteristic aspects of this particular PBF approach are (a) the weighting and fi nancing and (b) the peer evaluation concept.
WeightingIn the 2008/09 tool, the weighting amounted to allocating 20 percent to ad-ministration, 25 percent to supervision, and 55 percent to clinical activities. All available funds (Rwandese government, U.S. government, German Or-ganisation for Technical Cooperation, and so on) for the purchase of hospi-tal performance in Rwanda were virtually pooled. An allocation mechanismwas set up for each district hospital subject to various criteria. Subsequently, fund holders were identifi ed and a hospital performance purchaser thatwould agree to pay the performance invoice was identifi ed for each hospital.The fund holder would transfer the performance earnings based on the in-voice directly into the health facility’s bank account.
In this way, an internal market for the purchasing of hospital perfor-mance was created. Over the years, entry to and exit from this market have been smoothly coordinated by the central PBF technical support unit. The government has remained the largest purchaser of hospital performance. As was the case with the health center PBF internal market in Rwanda, agen-cies collaborating with the U.S. government were able to purchase perfor-mance on this internal market. This internal market has had tremendous im-plications for system strengthening, demonstrating how off - budget bilateral funding can be used for such purposes.
Performance budgets could represent up to 30 percent of the cash earn-ings of a hospital. Hence, they were a signifi cant source of new and addi-tional revenues. Through integrated and autonomous management of re-sources, PBF contributed to the signifi cant variable earnings of hospital staff .It also allowed hospitals to boost their number of doctors from one to two on average before the reforms (2005) to six to seven per hospital a few years thereafter. Doctors were drawn away not only from Rwanda’s capital city,Kigali, but also from labor markets in neighboring countries.

78 Performance-Based Financing Toolkit
For the 20 percent weighting for administration, the total “staff ” weight of staff members present in each hospital was added. (The staff weight is usually based on a certain weight given to a staff category as compared to a base weight).2
With regard to supervision staff , the number of health centers that a hos-pital supervised was taken as the allocation factor. In Rwanda, the supervi-sors of the health centers tend to be located in the district hospitals, and thus, a supervision “output budget” was allocated to each hospital. This forged an important link between the verifi cation mechanism for the quality perfor-mance of the health centers and those at the hospital level. The hospital is paid on a performance basis for the correct and timely execution of super-vising the health centers. The performance frameworks of the health center and the hospital are thus linked. This has turned out to be a very eff ective— and cost- eff ective— way of implementing PBF. It exemplifi es how PBF works as scaled up. A host of other measures related to the supportive function of the hospital toward the lower echelons of the health care system are also incentivized. Those include capacity building activities and the analysis and feedback of health management information system data.
For assessment of clinical activities, 17 clinical services were chosen. The total annual production of those services for the entire country was assessed and a weighting was applied. Matching this assessment with the available budget led to a unit value for each clinical service or activity.
In addition, there was a perceived need to “let the money follow the activ-ity.” Therefore, volume- driven performance measures were used for part of the quantifi ed quality checklist.
For each indicator in each category, a certain number of composite crite-ria were defi ned that would yield a certain number of performance points, frequently on an all- or- nothing basis. For supervision and administration, the total number of points was fi xed, although each hospital had its specifi c point value (because of diff ering global prospective performance budgets).
For the clinical activities portion, the volume of activities would drive the number of points to be earned. Yet here too, the points were conditioned on a long list of composite criteria on an all- or- nothing basis. In short, the earnings for the clinical activities were driven by a mix of quantity and qual-ity of services. Earnings could not be increased by boosting only the volume because the composite quality criteria had such a large eff ect on the perfor-mance earnings.
This Rwandese district hospital method is a carrot- and- stick method. (For further explanations, see the Rwandese district hospital PBF manual in the links to fi les in this chapter.)

Measuring and Verifying Quality 79
Peer Evaluation ConceptPeer evaluation was scaled up after an initial pilot phase. In short, each quar-ter, three core staff members from three hospitals reviewed a fourth hos-pital during a peer evaluation session. The core staff normally consisted of the medical director or deputy medical director, the chief nurse or deputy chief nurse, and the administrator or the senior accountant. The peer evalu-ations were coordinated by the central PBF technical support unit and were made operational by the extended- team mechanism (see chapter 14). Eachquarter, a representative from the central MoH and a donor technical agentjoined the peer evaluations as an observer.
Participation in peer evaluations (with the composite criteria of “com-pleteness” and “timeliness” on an all- or- nothing basis) was assessed in the performance evaluations of each hospital that participated in the evaluation and weighted. Participation turned out to be 100 percent. The peer evalua-tion teams tend to consist of about 10– 14 peers and observers. They take half a day once every quarter to evaluate one hospital. Normally, the group splits into three subgroups and works in parallel to assess performance measures.They reconvene toward the end of the evaluation and provide feedback ina plenary session to the hospital management and staff on the fi ndings and performance results.
As part of the performance measuring, the hospital staff does an auto- evaluation and follows the same checklist. For this performance measure, the score they fi nd would have to be within a certain range of the score thattheir peers noted.
Electronic forms were designed with Microsoft InfoPath, a software pro-gram that converted into a summary invoice to be sent to the fund holder. Because of the large amount of data (the Rwandese checklist containedabout 350 diff erent data elements), eff ective data analysis remained a majorchallenge. In addition, the criteria tended to change incrementally each year. A data collection platform developed for such purposes needed the fl exibil-ity to integrate such changes smoothly. Therefore, after 2009, the data com-pilation and analysis program was changed to Microsoft Excel.
The philosophy of the peer evaluation and checklist approaches is basedon the understanding that for a hospital to provide good quality care, its mi-crosystems must be fully operational. Systems such as management, hazard-ous waste disposal, hygiene, maintenance of equipment, and adherence to treatment protocols must be in place. External and internal drug and medi-cal consumable management, quality assurance mechanisms, data analysis, internal capacity building, and “learning by teaching” are also essential and must be functioning for the hospital to provide good quality care.

80 Performance-Based Financing Toolkit
The Rwandese peer evaluation mechanism includes aspects of accredi-tation and total quality management or continuous quality improvement mechanisms. It rewards process rather than results. It rewards the presence of a quality assurance team that assesses its own department’s performance; sets its own priorities; and follows up on its own identifi ed priorities, rather than outcomes, such as lower mortality rates. The Rwandese peer review philosophy is that medical professionals and managers are responsible for— and are rewarded for— introducing reviewing mechanisms and that the suc-cesses or failures of a system are a professional responsibility.
Interestingly, the peer reviews often boost coordination and communica-tion within departments and between departments and management. This is in line with current cutting- edge thinking on quality assurance processes in health care, the vital importance of communication among staff mem-bers, and interdepartmental coordination (Gawande 2010; Klopper- Kes et al. 2011; Wauben et al. 2011).
In sum, after a few years of undertaking peer review evaluations, one can observe the following:
• By and large, peer evaluation is perceived as useful by the end users.• Peer reviews have stimulated signifi cant positive changes in hospital per-
formance in relatively short periods of time.• At the hospital level, the quantifi ed quality checklist must be changed an-
nually as is done for the health center checklist. This will keep the evalu-ations dynamic.
• During performance of independent counterevaluations, signifi cant dis-crepancies have been observed sometimes between the reported and the counterverifi ed results. In conclusion, even with the use of relatively open and transparent verifi cation methods such as a peer evaluation mecha-nism, biases and active confl icts of interest can arise.
On the basis of this experience, introduce counterverifi cation mechanisms at the outset, stipulate sanctions against fraud clearly in the purchase con-tracts, and point out these strategies in the various trainings. Another possi-bility is to use unannounced evaluations instead of planned and programmed ones. See the links to fi les in this chapter.
Burundi Health Center
The Burundi health center quality checklist is based on the NGO fund holder PBF approach. A mandated task force modifi ed the checklist. Correct and timely execution of the quality assessment is included in the performance
Measuring and Verifying Quality 81
framework of the provincial and district health offi ces. The web- enabled da-tabase captures the subelements of the quality checklists and will therefore provide comprehensive comparative data on the various quality features.
The Burundi PBF system is a carrot- and- carrot system. The quality check-list is applied each quarter in each Burundi health center and constitutes 60 percent of the value of the quality bonus (the second carrot). Forty percent of the value of the quality bonus is determined by the quantifi ed results of patient perceptions obtained through the community client surveys. The maximum quality bonus is 25 percent of the earnings over the PBF quantity earnings of the preceding three months. The Benin PBF quality checklist is based on the Burundi health center quality checklist. As Benin began its PBF approach in 2011, it chose the Burundi checklist because that checklist seemed less sophisticated than the Rwandese checklist. Benin will be apply-ing a carrot- and- stick method. For the Burundi health center PBF approach, see the links to fi les in this chapter.
Burundi District Hospital
The Burundi district hospital quality checklist is based in part on the healthcenter quality checklist and in part on elements drawn from the Rwandese district hospital quality checklist. It is applied through a peer review mecha-nism, and a third- party counterverifi cation is built into this program (as for all performance frameworks throughout the entire PBF system in Burundi).The quality checklist works through a carrot- and- carrot method. The maxi-mum quality bonus is 25 percent over the PBF quantity earnings of the three preceding months (Burundi and Ministry of Health 2010). See the links to fi les in this chapter.
Zambian Health Center
The Zambian health center quality checklist has been created from the Rwandese health center quality checklist. However, it has been modifi ed and simplifi ed extensively. The Zambian health center, on average, has a lower number of qualifi ed staff members compared to the Rwandese healthcenter. The checklist was fi eld tested in the Katete district PBF before thepilot project began.
The Zambian quality checklist works through a carrot- and- stick method; the earnings from the preceding three months are discounted by the quality score obtained. The timely and correct application of this checklist has been contracted on a performance basis to the district hospital.
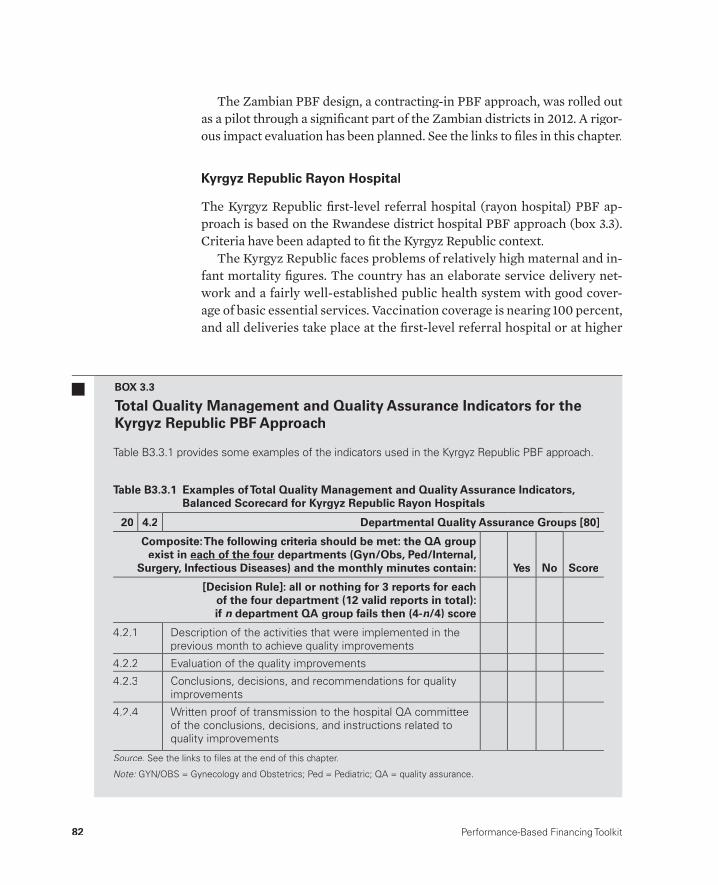
82 Performance-Based Financing Toolkit
The Zambian PBF design, a contracting- in PBF approach, was rolled out as a pilot through a signifi cant part of the Zambian districts in 2012. A rigor-ous impact evaluation has been planned. See the links to fi les in this chapter.
Kyrgyz Republic Rayon Hospital
The Kyrgyz Republic fi rst- level referral hospital (rayon hospital) PBF ap-proach is based on the Rwandese district hospital PBF approach (box 3.3). Criteria have been adapted to fi t the Kyrgyz Republic context.
The Kyrgyz Republic faces problems of relatively high maternal and in-fant mortality fi gures. The country has an elaborate service delivery net-work and a fairly well- established public health system with good cover-age of basic essential services. Vaccination coverage is nearing 100 percent,and all deliveries take place at the fi rst- level referral hospital or at higher
Table B3.3.1 provides some examples of the indicators used in the Kyrgyz Republic PBF approach.
BOX 3.3
Total Quality Management and Quality Assurance Indicators for the Kyrgyz Republic PBF Approach
Table B3.3.1 Examples of Total Quality Management and Quality Assurance Indicators, Balanced Scorecard for Kyrgyz Republic Rayon Hospitals
20 4.2 Departmental Quality Assurance Groups [80]
Composite: The following criteria should be met: the QA group exist in each of the four departments (Gyn/Obs, Ped/Internal,
Surgery, Infectious Diseases) and the monthly minutes contain: Yes No Score
[Decision Rule]: all or nothing for 3 reports for each of the four department (12 valid reports in total): if n department QA group fails then (4-n n/4) score
4.2.1 Description of the activities that were implemented in theprevious month to achieve quality improvements
4.2.2 Evaluation of the quality improvements
4.2.3 Conclusions, decisions, and recommendations for qualityimprovements
4.2.4 Written proof of transmission to the hospital QA committee of the conclusions, decisions, and instructions related toquality improvements
Source: See the links to fi les at the end of this chapter.:
Note: GYN/OBS = Gynecology and Obstetrics; Ped = Pediatric; QA = quality assurance.:
Measuring and Verifying Quality 83
levels of the echelon. Stakeholders agree that the relatively high maternal and infant mortality rates are due to low quality of care in the hospitals.These hospitals suff er from a lack of maintenance, poor access to blood, and a paucity of modern protocols and procedures. Informal payments are common in post– Soviet Union health systems (Aarva et al. 2009), and inthe Kyrgyz Republic, about 50 percent of clients are estimated to make in-formal payments to staff and for drugs (Kyrgyz Republic and Ministry of Health 2008, 31).
The PBF was scheduled to be fi eld tested in one district and then rolledout through a signifi cant part of the delivery network in 2013. A rigorousimpact evaluation is planned. It will use responses by civil society for a basis for capacity building and for transparency purposes. It will also use the peer evaluation mechanism.
In addition, the Kyrgyz Republic hospitals have a fair degree of auton-omy. About one- third of their cash revenues are driven by volume (paymentby the Mandatory Health Insurance Fund [MHIF] based on the number of treated cases and adjusted for the diagnosis- related group type and certain other variables). The PBF payments will be added to this payment mecha-nism through a carrot- and- carrot method. The MHIF quality department staff will also be closely involved in the peer evaluation mechanisms. See the links to fi les in this chapter.
The following toolkit fi les can be accessed through this web link:http://www.worldbank.org/health/pbftoolkit/chapter03.
• Quantifi ed quality checklists of the following– Rwandese district hospital PBF approach (2008, 2010)– Rwandese health center PBF approach (2008, 2009, 2010, 2011)– Burundi district hospital PBF approach (2010, 2011)– Burundi health center PBF approach (2010, 2011)– NGO fund holder PBF approach for health centers (2011)– Nigerian district hospital PBF approach (2011)– Nigerian health center PBF approach (2011)– Kyrgyz Republic rayon hospital PBF approach (2012)– Zambian health center PBF approach (2012).
• Rwandese district hospital PBF manual (2009).
3.6 Links to Files and Tools
84 Performance-Based Financing Toolkit
Notes
1. Zambia will be transitioning to a carrot- and- carrot approach.2. Allocating budget based on historic staffi ng patterns or number of beds is fraught
with problems. However, Rwanda already had signifi cant decentralizing of human resource policy. Thus, the health facilities had been made much more autonomous, and about one- half of all staff members were contract workers whowere paid from the hospital’s revenues. This initial staff benchmarking, based on 2007 staffi ng data for the 2008 PBF tool, was kept constant afterward, and managers could not infl uence their future expense budgets by increasing the numbers of their staff .
References
Aarva, P., I. Ilchenko, P. Gorobets, and A. Rogacheva. 2009. “Formal and InformalPayments in Health Care Facilities in Two Russian Cities, Tyumen and Lipetsk.”Health Policy and Planning 24 (5): 395– 405.g
Acharya, L. B., and J. Cleland. 2000. “Maternal and Child Health Services in RuralNepal: Does Access or Quality Matter More?” Health Policy and Planning 15 (2):g223– 29.
Barnum, H., and J. Kutzin, eds. 1993. Public Hospitals in Developing Countries:Resource Use, Cost, Financing. Baltimore: Johns Hopkins University Press.
Barnum, H., J. Kutzin, and H. Saxenian. 1995. “Incentives and Provider PaymentMethods.” International Journal of Health Planning and Management 10 (1):t23– 45.
Basinga, P., P. Gertler, A. Binagwaho, A. Soucat, J. Sturdy, and C. Vermeersch. 2010.“Paying Primary Health Care Centers for Performance in Rwanda.” Policy Research Working Paper 5190, World Bank, Washington, DC.
Basinga, P., P. Gertler, A. Binagwaho, A. Soucat, J. Sturdy, and C. Vermeersch. 2011.“Eff ect on Maternal and Child Health Services in Rwanda of Payment to Primary Health- Care Providers for Performance: An Impact Evaluation.” The Lancet 377 (9775): 1421– 28.
Biai, S., A. Rodrigues, M. Gomes, I. Ribeiro, M. Sodemann, F. Alves, and P. Aaby.2007. “Reduced In- Hospital Mortality after Improved Management of Children under 5 Years Admitted to Hospital with Malaria: Randomised Trial.” British Medical Journal 335 (7625): 862– 65.l
Burundi, Ministry of Health. 2010. Manuel des Procédures pour la mise en œuvre du fi nancement basée sur la performance au Burundi. Bujumbura: Ministry of Health.
———. 2011. Synthèse Globale de la Contre Verifi cation du FBP au Burundi (2011– i2012). Bujumbura: Ministry of Health.
Gawande, A. 2010. The Checklist Manifesto: How to Get Things Right. New York: Metropolitan Books Henry Holt.
Gertler, P., and C. Vermeersch. 2012. “Using Performance Incentives to ImproveHealth Outcomes.” Policy Research Working Paper WPS6100, World Bank, Washington, DC.
Measuring and Verifying Quality 85
Kalk, A., F. A. Paul, and E. Grabosch. 2010. “‘Paying for Performance’ in Rwanda: Does It Pay Off ?” Tropical Medicine and International Health 15 (2): 182– 90.
Klopper- Kes, A. H. J., N. Meerdink, C. P. M. Wilderom, and W. V. H. Harten. 2011. “Eff ective Cooperation Infl uencing Performance: A Study in Dutch Hospitals.”International Journal for Quality in Health Care 23 (1): 94– 99.
Kyrgyz Republic, Ministry of Health. 2008. “Mid- term Review Report: ManasTaalimi Health Sector Strategy.” Ministry of Health, Bishkek. http://www.un.org.kg/en/publications/article/5- Publications/3483- mid- term- review- report- manas- taalimi- health- sector- strategy (accessed April 23, 2013).
Mehrotra, A., M. Sorbrero, and C. Damberg. 2010. “Using the Lessons of Behavioral Economics to Design More Eff ective Pay- for- Performance Programs.” AmericanJournal of Managed Care 16 (7): 497– 503.
Rusa, L., W. Janssen, S. van Bastelaere, D. Porignon, J. de Dieu Ngirabega, and W. Vandenbulcke. 2009. “Performance- Based Financing for Better Quality of Services in Rwandan Health Centres: 3- Year Experience.” Tropical Medicine and International Health 14 (7): 830– 37.
Rwanda, Ministry of Health. 2006. Proceedings of a two- day workshop to create a national PBF model for district hospitals, Kigali, January.
Soeters, R. ed. 2012. PBF in Action: Theory and Instruments— PBF Course Guide. 4thed. The Hague: Cordaid-SINA.
Thaler, R. H., and C. R. Sunstein. 2009. Nudge: Improving Decisions About Health, Wealth, and Happiness. New York: Penguin Books.
Wauben, L. S. G. L., C. M. Dekker- van Doorn, J. D. van Wijngaarden, R. H. Goossens, R. Huijsman, J. Klein, and J. F. Lange. 2011. “Discrepant Perceptions of Commu-nication, Teamwork, and Situation Awareness among Surgical Team Members.” International Journal for Quality in Health Care 23 (2): 159– 66.

87
Setting the Unit Price and Costing
CHAPTER 4
MAIN MESSAGES
➜ PBF uses strategic purchasing. The goal is to realize the greatest amount of benefi t while eff ectively managing the costs. In PBF, the purchaser de-termines from whom to purchase services and for how much. The gov-ernment determines which services are available to purchase and sets the quality standards.
➜ For PBF to succeed, specifi c health reforms, such as increasing decisionrights on fi nancial and human resources, the ability to make a profi t, the possibility to pay performance bonuses, and a general strengthening of management, are very important.
➜ Using a solid output budget is crucial; more is better than less.➜ Fees are negotiable; the purchaser is able and allowed to renegotiate set
fees regularly.➜ PBF uses fee- for- service conditional on quality; this provider- payment
mechanism is open at the microlevel and closed at the macrolevel.
88 Performance-Based Financing Toolkit
COVERED IN THIS CHAPTER
4.1 Introduction4.2 Costing background: PBF as a health reform approach4.3 The importance of balancing health facility revenues and expenses4.4 The necessary budget4.5 Setting of unit fees to stay within budget4.6 A tested example of costing the minimum package of health services4.7 Strategic purchasing4.8 Links to fi les and tools
4.1 Introduction
How do you cost performance- based fi nancing (PBF) and set fees so that you do not go over your budget? That is the pivotal question around which this chapter revolves. This chapter focuses on the necessary preconditions for a successful PBF intervention, discusses the importance of balancing health facility revenues and expenses, and explains the necessary output budget. The fi nancial eff ect of quality will also be examined, because it is linked to the total quantity earnings of a health facility. Once the minimum and com-plementary package of services has been determined, the unit fees can be calculated. A practical example will illustrate the costing methodology.
PBF’s fee- for- service provider payment method leads to an increased de-sire for services. This puts pressure on available budgets. The chapter will, therefore, conclude with a discussion about how to handle these pressures and engage in strategic purchasing.
4.2 Costing Background: PBF asa Health Reform Approach
In PBF, we look at “the forest” before “the trees.” In analyzing PBF, consider the whole set of systemic interventions and system reengineering that to-gether generate particular eff ects (the forest), before the individual incen-tives or the provider payment mechanism (the trees). As many have empha-sized, system thinking is really necessary to understand PBF (de Savigny and Adam 2009; Meessen, Soucat, and Sekabaraga 2011; von Bertalanff y 1969), especially when related to costing.
Performance- based fi nancing is a health reform approach that intro-duces a specifi c kind of provider payment— fee- for- service conditional on
Setting the Unit Price and Costing 89
quality. This approach rewards health facilities for the quantity and quality of health services provided. However, this particular provider payment mechanism is only one dimension of PBF. The whole approach is far morecomprehensive and works with multiple performance frameworks at all levels in the health system— from the community client survey groups to the central technical unit in government that steers the implementationand coordination of all eff orts. This comprehensive approach entails thefollowing:
• Increasing health facility autonomy• Stimulating integrated management of funds at the health- facility level• Promoting autonomous human- resources management and effi cient pro-
curement of drugs and medical consumables• Aiming for strategic purchasing of essential services and continuously in-
creasing the standards for quality performance (see section 4.6 in this chapter).
• Fostering management by results and also providing the incremental funding needed to carry out these results (increasing service volume and quality of services)
• Introducing new forms of governance and accountability by involving community members and civil society in health facility boards and in dis-trict PBF steering committees, and by publishing quantity and quality performance of health facilities; gathering formal feedback on client sat-isfaction and informing public offi cials and health facilities on these per-ceptions are vital elements of a PBF system
• Strengthening the stewardship function of government by creating ca-pacity for data analysis at all levels of the health system and providing assistance
• Ensuring that the data on cost- eff ectiveness of health packages and the quantity and quality results assist policy makers in their allocation decisions.
The health systemic changes necessary to make PBF successful can be fun-damental and challenging. In reality, many reforms are initiated by working from experience, responding to pressures on the ground, and then discuss-ing the enabling environments for PBF. Often PBF starts with a pilot pro-gram. A successful PBF pilot program in designated districts or provinces accumulates data needed to promote the necessary changes for the system at large. Frontline health workers, managers, and district health offi cials of successful PBF pilot programs are often the most fervent proponents. They become the real PBF advocates and champions and turn PBF into an oppor-tunity that is diffi cult for decision makers to refuse.
90 Performance-Based Financing Toolkit
4.3 The Importance of Balancing HealthFacility Revenues and Expenses
In low- income countries, public health facilities, especially in the basic ech-elons of the system, rarely manage cash. Or if they do, such as fees for consul-tations or specifi c procedures, health facilities have to submit such revenues to a higher- level administrative agency. For example, drug revolving funds based on the Bamako Initiative have generated revenues that could be man-aged at the health- facility level. But in most of those cases, the facility’s deci-sion rights on these resources were put in the hands of higher- level adminis-trators who had to sign off on virtually all of the expenses.
PBF starts from the assumption that there is a fi nancing gap at thehealth- facilities level. This fi nancing gap is not always immediately visible. But there is a plethora of signs and symptoms hinting at its existence. They range from staff absenteeism, double practice, moonlighting, drug short-ages, drug pilfering, irrational prescribing, and polypharmacy (frequently linked to alternative- income- generating activities) to lack of hygiene, poorfacility maintenance, low volume of services in general, and low quality of care.
PBF systems attempt to address these problems by tackling the fi nancing gap. In essence, PBF intervention is defi ned as injecting performance- based cash into the facility while increasing local decision rights on all fi nancial and productive resources, and also strengthening local accountability and oversight mechanisms. In addition, enhanced formative supervision and intense moni-toring for quantity and quality results have become integral aspects of PBF. The main tools in PBF are, therefore, related to cash.
The key management support and coaching instruments are tools related to managing cash income and expenditure (indice tool, see chapter 6); strate-gies to increase quantity and quality of services (business plan, see chapter 10); and individual staff performance assessments (see chapter 10). Regular and rigorous external performance assessments of both the quantity and the quality of services follow, as does pay for staff performance.
In a PBF health facility, the combined amount of cash revenue from all diff erent sources needs to be suffi cient to keep increasing both quantity and quality of health services. Through PBF, health workers become stake-holders in their own health facilities and social entrepreneurs— they workon behalf of public health goals, yet have a stake in the fi nancial viability of their institution. If revenues are too low compared to expenditures, new sources of revenue should be found or expenses should be reduced. When aiming to achieve activities of higher quality standards, the health facility

Setting the Unit Price and Costing 91
requires more revenue. A balance between revenues and expenses is needed.
Another concern in trying to balance revenues and expenses arises if health facilities are forced to provide free or nominal health services when suffi cient third- party payments are not available to compensate for lost rev-enues. The total health facility revenues should be able to provide quality and equitable health services and to pay staff members remuneration suffi -cient to cover their basic needs (see also public choice theory and Maslow’s pyramid of needs [Maslow 1943]). This leads to two practical dictums: (a) staff members must be off ered an incentive package compelling enough for them to stay; and (b) any provider obligation dictated by politics, such as free health care, must be compensated to be sustainable.
4.4 The Necessary Budget
For a PBF output budget to be eff ective, the calculations must address thefi nancing gap. An output budget inaccurately confi gured may lead to insuf-fi cient eff ects and major disappointments.
One needs an accurate approximation of how much output budget is nec-essary to plug the fi nancing gap. For that, the earnings of the health facility must be considered. They include all cash for the recurrent and investmentcosts necessary for the facility to function. In addition, an estimate of how many additional resources would be needed for variable bonuses used to bring the take home salary of health workers to acceptable levels is also needed. Containing the health worker earnings gap is key: the approximateamount to be paid through performance results to health workers must be found. This earnings gap notion is a vague concept. It might be helpful in theearly design stages to commission studies to learn how much health workers actually earn from additional sources of income. Find out how much income would be necessary for health workers to sustain themselves in their specifi clocations.
The take- home salary of health workers is fundamental to the budget.The bonuses gained through PBF are the variable element of their remu-neration.1 The bonus percentage variable is very dependent on location. Get-ting this element approximately correct is of paramount importance. The following are a few examples:
• In Ghana, health workers earn fair salaries. The expert panel that was composed to propose a certain variable PBF bonus clearly took this situa-tion into account. The panel’s advice was to use a modest 15– 20 percent of

92 Performance-Based Financing Toolkit
variable income as compared to take- home earnings, while relatively more was planned as allocations to nonbonus recurrent budgets.
• In Rwanda, the size of the PBF bonuses represented 60– 100 percent of the base salary of health workers, and in Burundi, 100– 200 percent.
• In other locations, such as the Kyrgyz Republic, the bonus is infl uenced by perceptions of the amount the health system could aff ord to continue paying.2 In such cases, two scenarios may arise. On one hand, if staff bonuses decrease in response to perceived sustainability issues, the ef-fect of the PBF intervention could also potentially decrease. This wouldin turn decrease the sustainability of the intervention by another rout-ing because fewer eff ects of PBF would be documented, which could negatively infl uence decision makers and development partners. On the other hand, if interventions have shown signifi cant eff ects— and explicitlinks between performance budget and causal pathways for perfor-mance are made— this may lead to existing funds being reprogrammed into the performance- based budget and, consequently, enhance sustain-ability. Substantive performance budgets, backed by causal pathways, could indeed enhance sustainability. It is important to keep such con-siderations in mind.
Of course, the output budget is not solely for the payment of the variable bonus of staff workers. In the majority of PBF systems, about 50 percent of PBF earnings are commonly used for the staff performance payments while the remainder goes to nonsalary recurrent costs. It all depends onthe location and existing fi nancing arrangements. Moreover, fi nancial data have to be assessed from an integrated, systemic point of view. For instance, a rigid civil service with a fl awed allocation of human resources may need multiple reforms (see box 4.1) to make PBF function as designed. There are no fi xed guidelines on the appropriate size of an output budget. However, a useful rule of thumb in low- income countries is an overall output budget of US$3 per capita per year. Nevertheless, although subsidies for curative care services are part and parcel of PBF approaches, the US$3 per capita per year assumes that the larger part of curative care is paid from personalfunds or through a third party in addition to PBF.3 In middle- income coun-tries or countries with signifi cant infrastructural challenges, a much higher- output budget may be necessary.4 In practice, the system appears towork if from this amount, about two- thirds is set aside for the health cen-ter or community level and one- third for the fi rst- level referral hospital (Fritsche and Vergeer 2010; Soeters, Habineza, and Peerenboom 2006;Soeters et al. 2011).

Setting the Unit Price and Costing 93
4.5 Setting of Unit Fees to Stay within Budget
A key feature of PBF design is setting the unit fees for the quantity of ser-vices. Keeping expenses within the allocated output budget is an operational priority. In section 4.6, we provide a tested example of how to set unit fees.In section 4.7, we discuss the issue of how to engage in strategic purchasing and remain within the allocated budget.
In 2005, the Ministry of Health in Rwanda con-cluded that the central administration of govern-ment health facilities and health workers was in-effi cient. But at the same time, the government did not want to privatize government health facili-ties. In 2008, management of government health facilities was made autonomous whereby staff recruitment and salary payments became the re-sponsibility of the health facility management. Staff positions were tied to health facilities, and only the highest level of nursing staff (A0) was allocated by central levels. Management of all other human resources was given to the dis-tricts. About half of all health facility staff mem-bers were contract workers, and a ministerial in-struction defi ned the new rules, whereby health facility staff had to be paid according to the same rules and entitlements, independent from the funding source and independent from status asa civil servant or not. Staff who desired a transfer to another facility would have to apply for thisposition and could do so only when a position was available in the other facility. The district would also have to vet the transfer.
The government pays only a fi xed lump- sum subsidy to each health facility. In general, the
subsidy covers the basic salaries of governmenthealth staff. But the salaries of contractedhealth workers and the individual bonus pay-ments to health facility managers come from the variable subsidy payments (through PBF),income from the community- based health in-surance reimbursements, and cost- recoveryrevenues. This policy has had signifi cant effects on human resources for health facilities in avery short period of time. By 2008, qualifi ed staff in rural areas had increased by 90 percent as compared to 2005. The number of doctors increased by 151 percent, and the number of nurses increased by 32 percent. District hospi-tals on average had 8 medical doctors and 30 nurses by 2008. The numbers of doctors and nurses working for the civil service in the rural areas increased much faster as compared tothe capital. Although the number of doctors inthe capital increased from 24 to 27, the number of doctors in rural areas increased from 153 to285 during the same period. And although thenumber of nurses in the capital decreased from283 to 254, the number of nurses in the ruralareas increased from 3,481 to 4,543 during thesame period.
BOX 4.1
Decentralizing Human Resource Management to Health Facilities: The Case of Rwanda
Source: Additional inputs from Dr. Claude Sekabaraga, former Director of Policy and Planning, Rwanda, Ministry of Health.:
94 Performance-Based Financing Toolkit
Important General Characteristics of PBF Output Budgets and Unit Fees
The following are important general characteristics of PBF output budgets:
• A PBF output budget typically covers 3– 4 years.• The fee- for- service PBF provider payment mechanism is open at the
micro level. This means that within the parameters of the purchase con-tract and the agreed fees, facilities are paid for each contracted service. There is no cap. If facilities produce more services, they are paid for those services.
• The fee- for- service PBF provider payment mechanism is closed at the macrolevel. This means that the output budget for all PBF payments— combined over a given period— is a given.
• PBF output budgets are set at an average per capita basis.• Within this average, certain regions can be allocated a higher per capita
sum because of agreed- upon equity considerations, and other regions can be allocated a lower sum per capita.
• PBF fee setting results in an average agreed- upon set of fees for services. Within regions, certain facilities can be off ered a higher set of unit fees, because of rural hardship considerations, while other less disadvantaged regions can be off ered a lesser set of unit fees.
• Fees can be changed if necessary. Usually, PBF purchase contracts are written for one year with the specifi cation that fees can be renegotiated quarterly.
PBF as Leverage
The relationship between PBF unit fees and the cost of services is frequently misunderstood. In fact, the actual cost of health services that are provided in health facilities has little to do with a PBF unit fee. PBF works through lever-aging. PBF leverages all existing productive assets at a health facility: human resources, buildings, land, equipment, donated drugs and medical consum-ables, and income (if any exists). In this sense, PBF unit fees are frequently referred to as unit subsidies, because they are leverage instruments.
PBF increases the amount of cash available at the health facility, while promoting increased autonomy in the use of all available cash resources. PBF increases the cash revenue of the health facilities that springs from an incremental increase in the supply of these subsidized services. Soon after PBF is implemented, it increases substantially the volume of services pro-vided (see box 4.2 for a simplifi ed example). It also increases the quality of
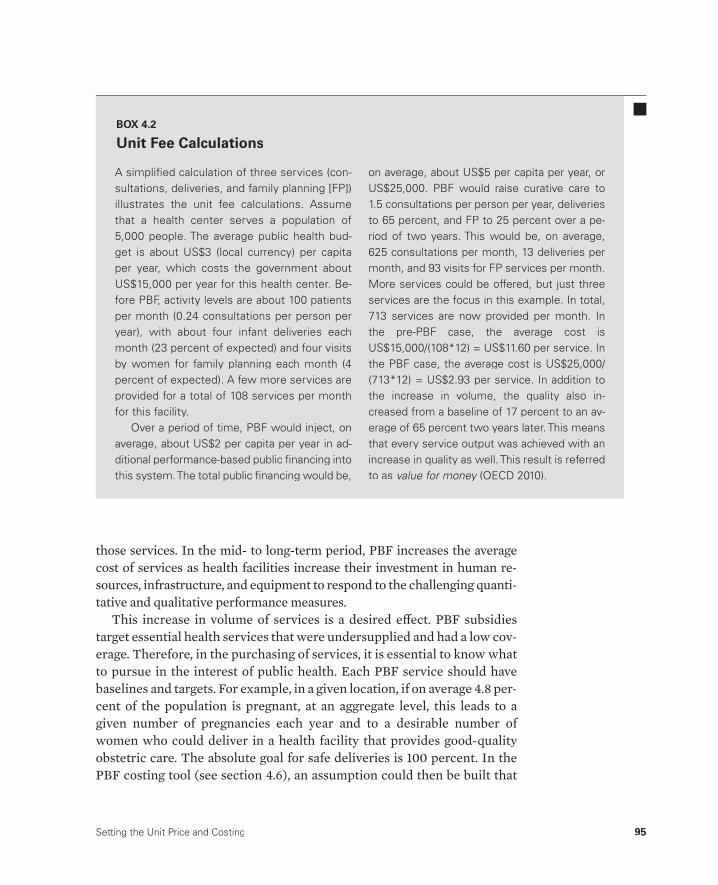
Setting the Unit Price and Costing 95
those services. In the mid- to long- term period, PBF increases the average cost of services as health facilities increase their investment in human re-sources, infrastructure, and equipment to respond to the challenging quanti-tative and qualitative performance measures.
This increase in volume of services is a desired eff ect. PBF subsidiestarget essential health services that were undersupplied and had a low cov-erage. Therefore, in the purchasing of services, it is essential to know what to pursue in the interest of public health. Each PBF service should havebaselines and targets. For example, in a given location, if on average 4.8 per-cent of the population is pregnant, at an aggregate level, this leads to a given number of pregnancies each year and to a desirable number of women who could deliver in a health facility that provides good- quality obstetric care. The absolute goal for safe deliveries is 100 percent. In the PBF costing tool (see section 4.6), an assumption could then be built that
A simplifi ed calculation of three services (con-sultations, deliveries, and family planning [FP]) illustrates the unit fee calculations. Assumethat a health center serves a population of5,000 people. The average public health bud-get is about US$3 (local currency) per capitaper year, which costs the government aboutUS$15,000 per year for this health center. Be-fore PBF, activity levels are about 100 patients per month (0.24 consultations per person peryear), with about four infant deliveries each month (23 percent of expected) and four visitsby women for family planning each month (4percent of expected). A few more services areprovided for a total of 108 services per month for this facility.
Over a period of time, PBF would inject, on average, about US$2 per capita per year in ad-ditional performance- based public fi nancing intothis system. The total public fi nancing would be,
on average, about US$5 per capita per year, orUS$25,000. PBF would raise curative care to 1.5 consultations per person per year, deliveries to 65 percent, and FP to 25 percent over a pe-riod of two years. This would be, on average, 625 consultations per month, 13 deliveries per month, and 93 visits for FP services per month. More services could be offered, but just three services are the focus in this example. In total,713 services are now provided per month. In the pre- PBF case, the average cost is US$15,000/(108*12) = US$11.60 per service. In the PBF case, the average cost is US$25,000/(713*12) = US$2.93 per service. In addition to the increase in volume, the quality also in-creased from a baseline of 17 percent to an av-erage of 65 percent two years later. This meansthat every service output was achieved with an increase in quality as well. This result is referred to as value for money (OECD 2010).
BOX 4.2
Unit Fee Calculations
96 Performance-Based Financing Toolkit
the share of women delivering in a health facility would have to increase from a low of 16 percent to a target of 65 percent over a three- year period.
Currently, coverage baselines are often compiled from existing data sources such as Demographic and Health Surveys and Multiple Indicator Cluster Surveys. In an ideal world, a specifi c health needs assessment would have to provide more accurate baselines for a given target population. In well- designed PBF pilot projects, such health needs assessments are carried out and provide accurate information for the purchaser as to the eff ect of its project. Although the primary intention of such household surveys is to ob-tain baseline data and to validate the coverage increases suggested by the purchased services, the surveys also function as a rich source of data for ad-ditional use as a time series of before- and- after data (Soeters and Kimanuka 2005; Soeters, Musango, and Meessen 2005; Soeters et al. 2011).
In short, setting a baseline and a set of coverage targets for each service and feeding these data into a model allow the purchaser to determine fees and forecast the fi nancial risk related to the fee- for- service provider pay-ment mechanism (see box 4.2). See the links to fi les in this chapter for vari-ous examples of costing for PBF. They include unit fee costing for Rwanda, Burundi, and Nigeria.
4.6 A Tested Example of Costing the Minimum Package of Health Services
Two cases are used to illustrate PBF costing and fi nancial- risk forecasting. The fi rst example, given in this section, displays the basic concepts. The sec-ond example, available through the links to fi les in this chapter (Basic Cost-ing Tool, Explanation of Basic Costing Tool), introduces the basic costing toolused by PBF designers to cost out its program. The second example includes costing of overheads related to administration, coaching, verifi cation, and counterverifi cation. The second example will be especially useful to pro-gram offi cers who design a PBF program and to donors who consider fi nanc-ing PBF schemes. The fi rst example draws on the case of Nigeria. The Mi-crosoft Excel fi le (Nigeria_Costing_Example1.xlsx) is available in the links to fi les in this chapter.
Nigerian Costing Example
This costing is based on the fee setting and fi nancial- risk forecasting that was used in a PBF pilot project in three districts across three Nigerian states. The main assumptions are stated in the worksheet titled “Key_assumptions,”

Setting the Unit Price and Costing 97
which is available in the Microsoft Excel fi le. The main assumptions include the following:
• In 2011, the population was 385,242.• The annual population growth rate is estimated at 3.2 percent.• There is US$1.80 per capita per year available for the minimum package
of activities.• There is US$0.90 per capita per year available for the complementary
package of activities.• The average quality over 2012 is assumed to reach 60 percent.• The quality bonus is 25 percent (if 50 percent or higher quality).• A carrot- and- carrot PBF mechanism is being applied: the amount of
money set aside for the quality bonus has been adjusted downward to ac-count for the average quality eff ect.
• The U.S. dollar (US)– Naira (((NNN) exchange rate is US$1.00 to)) NNN157.00.• The intervention runs for three years.
Prior to starting any costing exercise, you will have determined the following:
• Step 1. The services that you want to purchase (see chapter 1)• Step 2. The relative weights for your services (see chapter 1)
For this example, steps 1 and 2 have already been determined. Here, only the subsequent steps are discussed:
• Step 3. Determine the number of services to buy each month based onsaturated coverage.
• Step 4. Assess the baseline coverage of each service.• Step 5. Determine the amount of coverage you want to achieve for each
service.• Step 6. Parcel out service coverage increases between baseline and end line.• Step 7. Set the index fee, and adjust the indices to consume the available
budget.• Step 8. Review the budget allocation across services.
Step 3. Determine the Number of Services to Buy Each Month Based on Saturated Coverage• Open the second worksheet, titled “ControlPanel_MPA.”• In column B, the minimum package of activities (MPA) is listed. These
are services at the health center and community levels.• In column F, monthly targets are listed (see table 4.1).• For each of the services in column B, a monthly target is provided in column
F. These targets are location specifi c. In Nigeria, for instance, it is assumedthat each inhabitant would have to visit a health facility on average once per
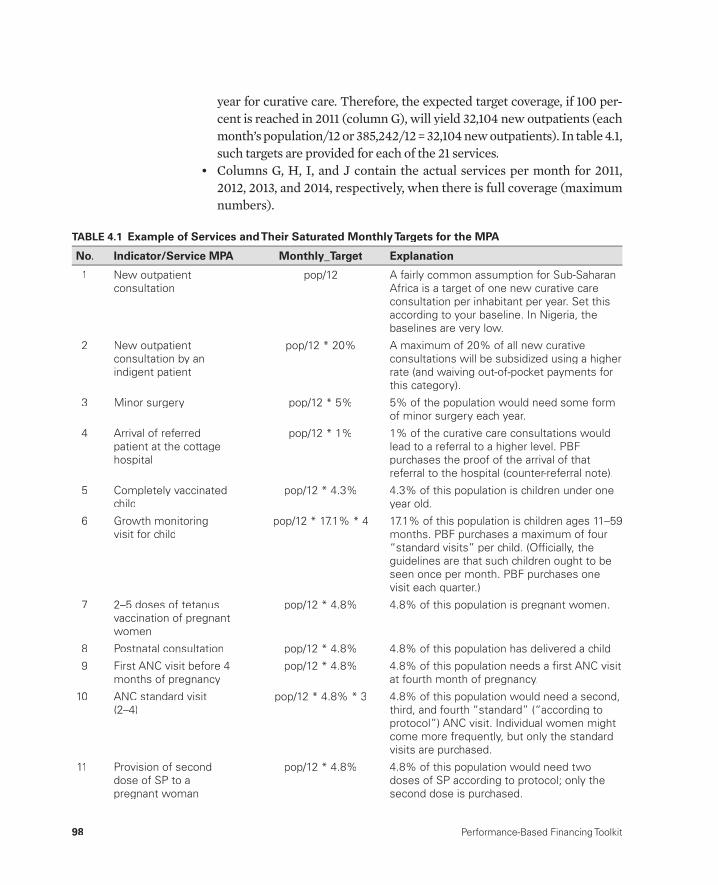
98 Performance-Based Financing Toolkit
year for curative care. Therefore, the expected target coverage, if 100 per-cent is reached in 2011 (column G), will yield 32,104 new outpatients (each month’s population/12 or 385,242/12 = 32,104 new outpatients). In table 4.1, such targets are provided for each of the 21 services.
• Columns G, H, I, and J contain the actual services per month for 2011, 2012, 2013, and 2014, respectively, when there is full coverage (maximum numbers).
TABLE 4.1 Example of Services and Their Saturated Monthly Targets for the MPA
No. Indicator/Service MPA Monthly_Target Explanation
1 New outpatient consultation
pop/12 A fairly common assumption for Sub-SaharanAfrica is a target of one new curative careconsultation per inhabitant per year. Set thisaccording to your baseline. In Nigeria, thebaselines are very low.
2 New outpatient consultation by anindigent patient
pop/12 * 20% A maximum of 20% of all new curative consultations will be subsidized using a higherrate (and waiving out-of-pocket payments forthis category).
3 Minor surgery pop/12 * 5% 5% of the population would need some formof minor surgery each year.
4 Arrival of referredpatient at the cottagehospital
pop/12 * 1% 1% of the curative care consultations wouldlead to a referral to a higher level. PBFpurchases the proof of the arrival of thatreferral to the hospital (counter-referral note).
5 Completely vaccinatedchild
pop/12 * 4.3% 4.3% of this population is children under oneyear old.
6 Growth monitoringvisit for child
pop/12 * 17.1% * 4 17.1% of this population is children ages 11–59 months. PBF purchases a maximum of four “standard visits” per child. (Offi cially, the guidelines are that such children ought to beseen once per month. PBF purchases onevisit each quarter.)
7 2–5 doses of tetanusvaccination of pregnantwomen
pop/12 * 4.8% 4.8% of this population is pregnant women.
8 Postnatal consultation pop/12 * 4.8% 4.8% of this population has delivered a child.
9 First ANC visit before 4months of pregnancy
pop/12 * 4.8% 4.8% of this population needs a fi rst ANC visitat fourth month of pregnancy.
10 ANC standard visit(2–4)
pop/12 * 4.8% * 3 4.8% of this population would need a second,third, and fourth “standard” (“according toprotocol”) ANC visit. Individual women mightcome more frequently, but only the standardvisits are purchased.
11 Provision of seconddose of SP to apregnant woman
pop/12 * 4.8% 4.8% of this population would need twodoses of SP according to protocol; only thesecond dose is purchased.

Setting the Unit Price and Costing 99
12 Normal delivery pop/12 * 4.8% * 80% 4.8% of this population would need to deliver in a health facility: 80% does so at thehealth-center level (10% at the hospital asnormal delivery, and 10% at the hospital as acomplicated delivery).
13 FP: total of new andexisting users of modern FP methods
pop * 22.5%/12 * 25%* 4 * 90%
22.5% of this population is women ofreproductive age (16–49 years); the unmetneed in this population is 25%; modern family planning methods are purchased (IUD;injection Depo-Provera); during each FP visit, a three-month supply/coverage is provided;90% will collect this at the health-center level and 10% at the hospital level. So “three-month coverage” is purchased.
14 FP: implants and IUDs pop * 22.5%/12 * 8% *90%
22.5% of this population is women ofreproductive age (16–49 years); the assump-tion is that 8% of women would seek animplant or IUD, of which 90% will be offeredat the health-center level and 10% at thehospital level.
15 VCT/PMTCT/PIT test pop/12 * 5% 7% of the population will be tested each year;5% will be tested at the health-center level.
16 PMTCT: HIV+ mothersand children treatedaccording to protocol
pop/12 * 4.8% * 5% *90%
5% of all pregnant women are HIV+ (in thispopulation; the exact target will vary between states), and the prevailing protocol is pur-chased; 90% will receive this at the health-center level and 10% at the hospital level.
17 STD treatment pop * 5%/12 * 70% 5% of this population is assumed to needtreatment for STDs each year, of which 70%is provided at the health-center level.
18 New AFB+ PTB patient pop/100,000 * 151 * 60%/12
PTB incidence is 151/100,000; 60% is assumed to be diagnosed at the health-centerlevel.
19 PTB patient: completedtreatment and cured
pop/100,000 * 151 * 60%/12
100% cure rate is the target, assuming that60% of new PTB patients are followed through the health-center and community levels.
20 ITN distribution pop/3/12/4.6 * 2 Each household would need at least two nets (national target); the average household is 4.6persons; one net lasts three years on average.
21 New family’s use of alatrine
pop/3/12/4.6 Each household would need one latrine;average household size is 4.6 persons; onelatrine lasts three years.
Source: World Bank data.:
Note: AFB+ = acid-fast bacillus positive; ANC = antenatal care; FP = family planning; HIV = human immunodefi ciency virus; ITN = :insecticide-treated net; IUD = intrauterine device; MPA = minimum package of activities; No. = number; pop = population; PIT = provider-initiated testing for HIV; PMTCT = prevention of mother-to-child transmission of HIV; PBF = performance-based fi nancing; PTB = pulmonary tuberculosis; SP = sulfadoxine/pyrimethamine; STD = sexually transmitted disease; VCT = voluntary counseling and testing for HIV.
TABLE 4.1 (continued)
No. Indicator/Service MPA Monthly_Target Explanation
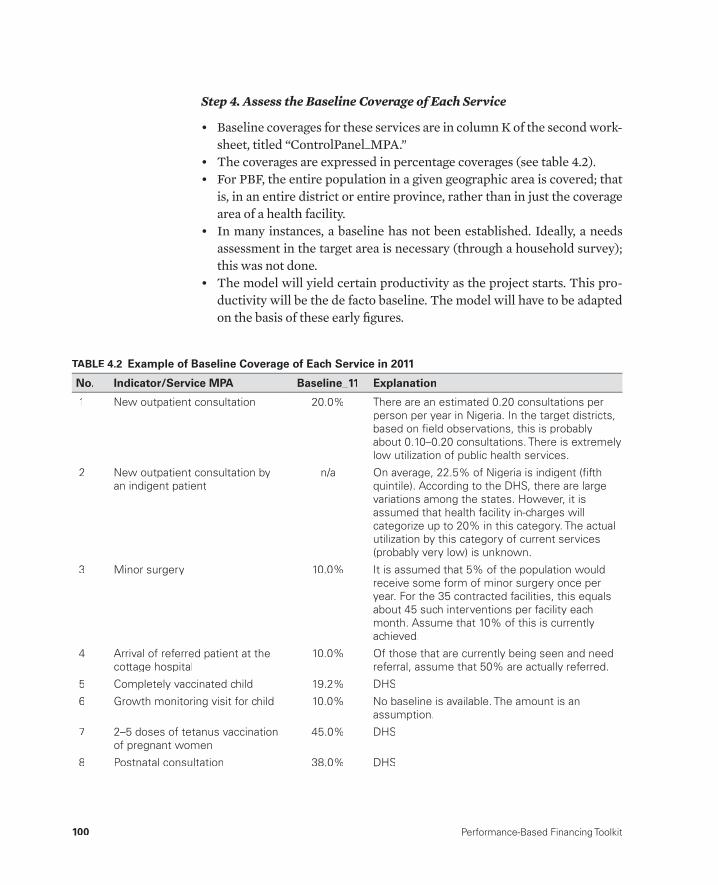
100 Performance-Based Financing Toolkit
Step 4. Assess the Baseline Coverage of Each Service
• Baseline coverages for these services are in column K of the second work-sheet, titled “ControlPanel_MPA.”
• The coverages are expressed in percentage coverages (see table 4.2).• For PBF, the entire population in a given geographic area is covered; that
is, in an entire district or entire province, rather than in just the coverage area of a health facility.
• In many instances, a baseline has not been established. Ideally, a needs assessment in the target area is necessary (through a household survey); this was not done.
• The model will yield certain productivity as the project starts. This pro-ductivity will be the de facto baseline. The model will have to be adapted on the basis of these early fi gures.
TABLE 4.2 Example of Baseline Coverage of Each Service in 2011
No. Indicator/Service MPA Baseline_11 Explanation
1 New outpatient consultation 20.0% There are an estimated 0.20 consultations per person per year in Nigeria. In the target districts,based on fi eld observations, this is probably about 0.10–0.20 consultations. There is extremely low utilization of public health services.
2 New outpatient consultation byan indigent patient
n/a On average, 22.5% of Nigeria is indigent (fi fth quintile). According to the DHS, there are largevariations among the states. However, it is assumed that health facility in-charges willcategorize up to 20% in this category. The actualutilization by this category of current services(probably very low) is unknown.
3 Minor surgery 10.0% It is assumed that 5% of the population wouldreceive some form of minor surgery once peryear. For the 35 contracted facilities, this equals about 45 such interventions per facility each month. Assume that 10% of this is currently achieved.
4 Arrival of referred patient at the cottage hospital
10.0% Of those that are currently being seen and needreferral, assume that 50% are actually referred.
5 Completely vaccinated child 19.2% DHS
6 Growth monitoring visit for child 10.0% No baseline is available. The amount is anassumption.
7 2–5 doses of tetanus vaccinationof pregnant women
45.0% DHS
8 Postnatal consultation 38.0% DHS
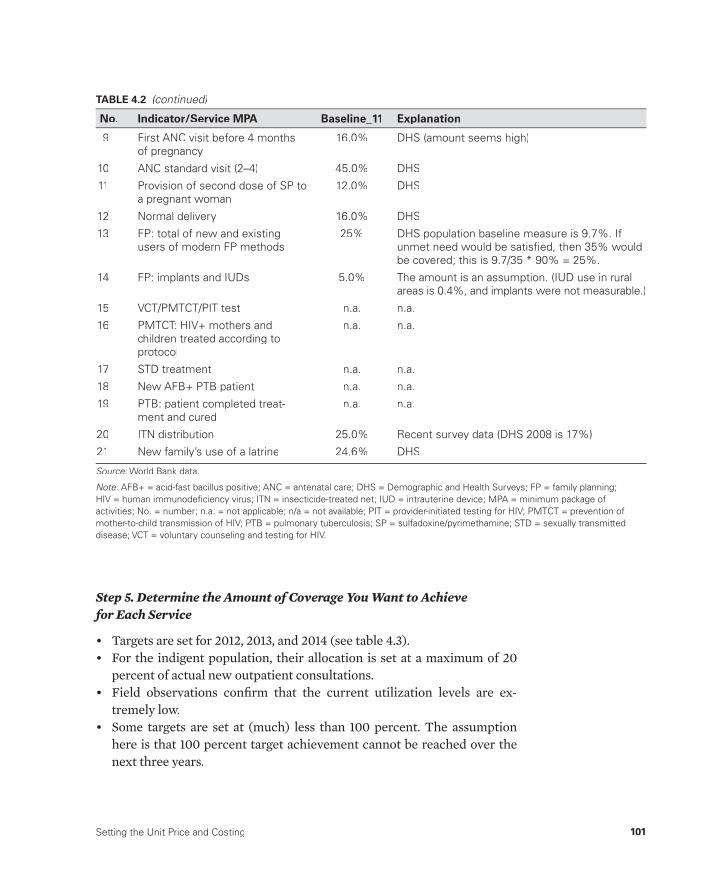
Setting the Unit Price and Costing 101
Step 5. Determine the Amount of Coverage You Want to Achieve for Each Service
• Targets are set for 2012, 2013, and 2014 (see table 4.3).• For the indigent population, their allocation is set at a maximum of 20
percent of actual new outpatient consultations.• Field observations confi rm that the current utilization levels are ex-
tremely low.• Some targets are set at (much) less than 100 percent. The assumption
here is that 100 percent target achievement cannot be reached over the next three years.
9 First ANC visit before 4 monthsof pregnancy
16.0% DHS (amount seems high)
10 ANC standard visit (2–4) 45.0% DHS
11 Provision of second dose of SP to a pregnant woman
12.0% DHS
12 Normal delivery 16.0% DHS
13 FP: total of new and existingusers of modern FP methods
25% DHS population baseline measure is 9.7%. Ifunmet need would be satisfi ed, then 35% wouldbe covered; this is 9.7/35 * 90% = 25%.
14 FP: implants and IUDs 5.0% The amount is an assumption. (IUD use in ruralareas is 0.4%, and implants were not measurable.)
15 VCT/PMTCT/PIT test n.a. n.a.
16 PMTCT: HIV+ mothers andchildren treated according toprotocol
n.a. n.a.
17 STD treatment n.a. n.a.
18 New AFB+ PTB patient n.a. n.a.
19 PTB: patient completed treat-ment and cured
n.a. n.a.
20 ITN distribution 25.0% Recent survey data (DHS 2008 is 17%)
21 New family’s use of a latrine 24.6% DHS
Source: World Bank data.:
Note: AFB+ = acid-fast bacillus positive; ANC = antenatal care; DHS = Demographic and Health Surveys; FP = family planning; :HIV = human immunodefi ciency virus; ITN = insecticide-treated net; IUD = intrauterine device; MPA = minimum package ofactivities; No. = number; n.a. = not applicable; n/a = not available; PIT = provider-initiated testing for HIV; PMTCT = prevention ofmother-to-child transmission of HIV; PTB = pulmonary tuberculosis; SP = sulfadoxine/pyrimethamine; STD = sexually transmitteddisease; VCT = voluntary counseling and testing for HIV.
TABLE 4.2 (continued)
No. Indicator/Service MPA Baseline_11 Explanation
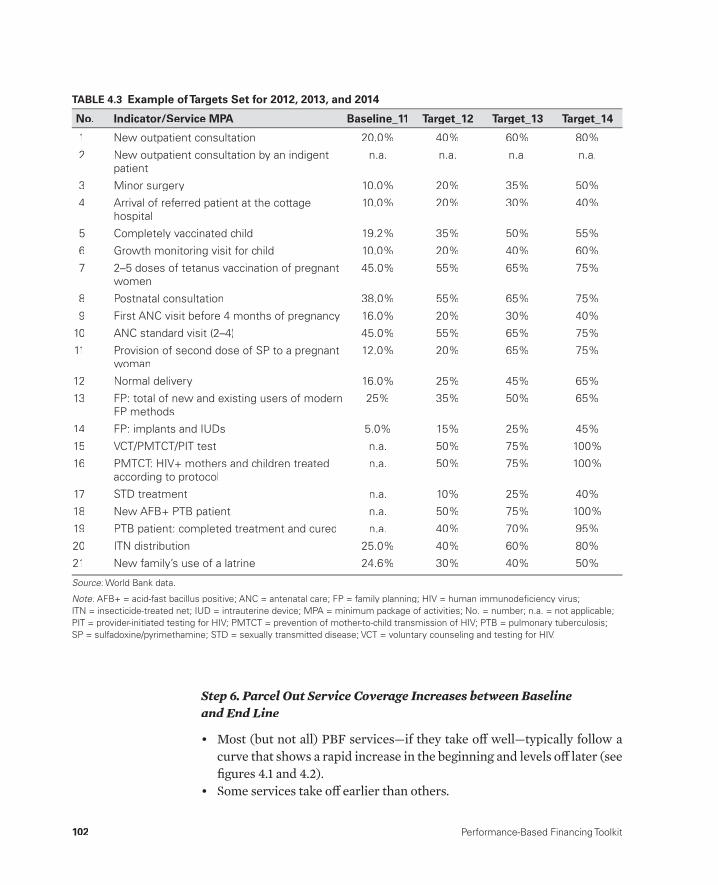
102 Performance-Based Financing Toolkit
TABLE 4.3 Example of Targets Set for 2012, 2013, and 2014
No. Indicator/Service MPA Baseline_11 Target_12 Target_13 Target_14
1 New outpatient consultation 20.0% 40% 60% 80%
2 New outpatient consultation by an indigentpatient
n.a. n.a. n.a. n.a.
3 Minor surgery 10.0% 20% 35% 50%
4 Arrival of referred patient at the cottage hospital
10.0% 20% 30% 40%
5 Completely vaccinated child 19.2% 35% 50% 55%
6 Growth monitoring visit for child 10.0% 20% 40% 60%
7 2–5 doses of tetanus vaccination of pregnantwomen
45.0% 55% 65% 75%
8 Postnatal consultation 38.0% 55% 65% 75%
9 First ANC visit before 4 months of pregnancy 16.0% 20% 30% 40%
10 ANC standard visit (2–4) 45.0% 55% 65% 75%
11 Provision of second dose of SP to a pregnant woman
12.0% 20% 65% 75%
12 Normal delivery 16.0% 25% 45% 65%
13 FP: total of new and existing users of modernFP methods
25% 35% 50% 65%
14 FP: implants and IUDs 5.0% 15% 25% 45%
15 VCT/PMTCT/PIT test n.a. 50% 75% 100%
16 PMTCT: HIV+ mothers and children treatedaccording to protocol
n.a. 50% 75% 100%
17 STD treatment n.a. 10% 25% 40%
18 New AFB+ PTB patient n.a. 50% 75% 100%
19 PTB patient: completed treatment and cured n.a. 40% 70% 95%
20 ITN distribution 25.0% 40% 60% 80%
21 New family’s use of a latrine 24.6% 30% 40% 50%
Source: World Bank data.:
Note: AFB+ = acid-fast bacillus positive; ANC = antenatal care; FP = family planning; HIV = human immunodefi ciency virus; :ITN = insecticide-treated net; IUD = intrauterine device; MPA = minimum package of activities; No. = number; n.a. = not applicable;PIT = provider-initiated testing for HIV; PMTCT = prevention of mother-to-child transmission of HIV; PTB = pulmonary tuberculosis;SP = sulfadoxine/pyrimethamine; STD = sexually transmitted disease; VCT = voluntary counseling and testing for HIV.
Step 6. Parcel Out Service Coverage Increases between Baseline and End Line
• Most (but not all) PBF services— if they take off well— typically follow a curve that shows a rapid increase in the beginning and levels off later (see fi gures 4.1 and 4.2).
• Some services take off earlier than others.
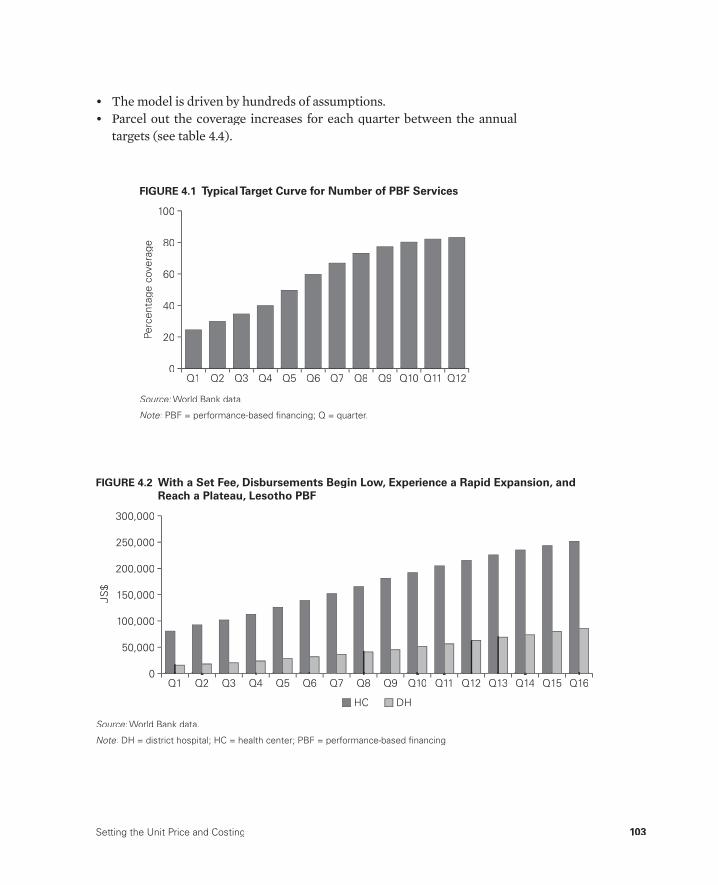
Setting the Unit Price and Costing 103
• The model is driven by hundreds of assumptions.• Parcel out the coverage increases for each quarter between the annual
targets (see table 4.4).Pe
rcen
tage
cov
erag
e
Q1 Q2 Q3 Q4 Q5 Q6 Q7 Q8 Q9 Q10 Q11 Q12
20
100
80
60
40
0
FIGURE 4.1 Typical Target Curve for Number of PBF Services
Source: World Bank data.:
Note: PBF = performance- based fi nancing; Q = quarter.:
US
$
50,000
300,000
200,000
250,000
150,000
100,000
0Q1 Q2 Q3 Q4 Q5 Q6 Q7 Q8 Q9 Q10 Q11 Q12 Q13 Q14 Q15 Q16
DHHC
FIGURE 4.2 With a Set Fee, Disbursements Begin Low, Experience a Rapid Expansion, and Reach a Plateau, Lesotho PBF
Source: World Bank data.:
Note: DH = district hospital; HC = health center; PBF = performance- based fi nancing.:

104 Performance-Based Financing Toolkit
TABLE 4.4 Example of Coverage Increases
No.Indicator/Service MPA Baseline_11 Target_12 1Q12 2Q12 3Q12 4Q12 Target_13 1Q13 2Q13 3Q13 4Q13 Target_14
1 New outpatientconsultation
20.0% 40% 25% 30% 35% 40% 60% 45% 50% 55% 60% 80%
2 New outpatientconsultation by an indigentpatient
—
3 Minor surgery 10.0% 20% 12% 15% 17% 20% 35% 24% 28% 32% 35% 50%
4 Arrival of referred patient at the cottagehospital
10.0% 20% 13% 15% 18% 20% 30% 23% 25% 28% 30% 40%
5 Completelyvaccinatedchild
19.2% 35% 23% 25% 30% 35% 50% 40% 43% 45% 50% 55%
6 Growthmonitoringvisit for child
10.0% 20% 12% 15% 17% 20% 40% 25% 30% 35% 40% 60%
7 2–5 doses oftetanus vaccination of pregnant women
45.0% 55% 47% 50% 52% 55% 65% 57% 60% 62% 65% 75%
8 Postnatal consultation
38.0% 55% 40% 45% 50% 55% 65% 57% 60% 62% 65% 75%
9 First ANC visitbefore 4 months ofpregnancy
16.0% 20% 17% 18% 19% 20% 30% 22% 25% 27% 30% 40%
10 ANC standardvisit (2–4)
45.0% 55% 47% 50% 52% 55% 65% 57% 60% 62% 65% 75%
11 Provision ofsecond dose of SP to apregnant woman
12.0% 20% 13% 15% 18% 20% 65% 30% 40% 50% 65% 75%
12 Normaldelivery
16.0% 25% 18% 20% 30% 35% 45% 40% 45% 50% 55% 65%
13 FP: total ofnew andexisting usersof modern FP methods
25.0% 35% 27% 30% 35% 40% 50% 45% 50% 55% 60% 65%
14 FP: implantsand IUDs
5.0% 15% 7% 10% 13% 15% 25% 17% 20% 23% 25% 45%
15 VCT/PMTCT/PIT test
— 50% 20% 30% 40% 50% 75% 60% 65% 70% 75% 100%
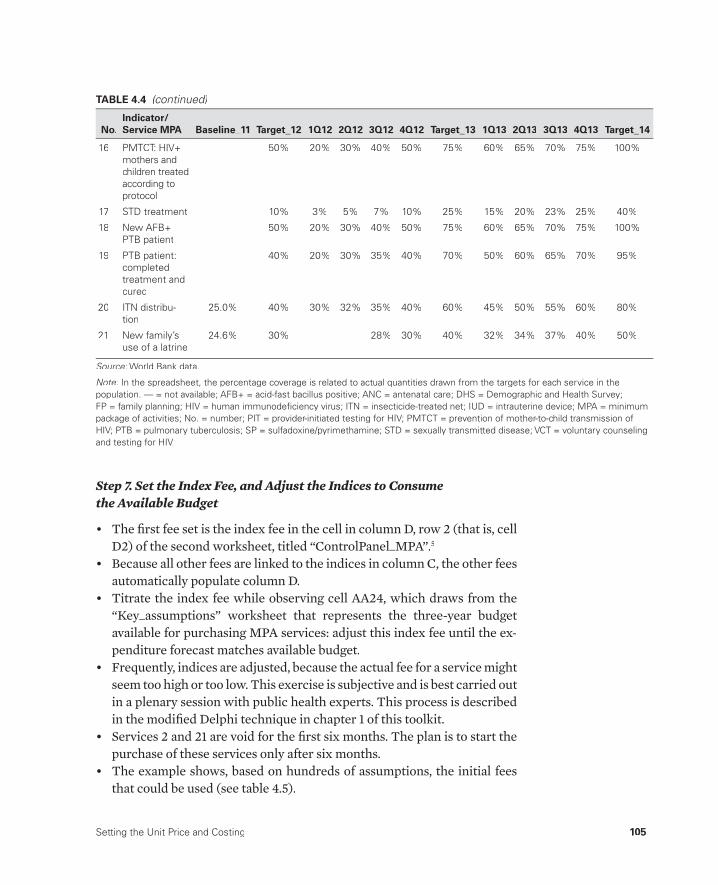
Setting the Unit Price and Costing 105
Step 7. Set the Index Fee, and Adjust the Indices to Consume the Available Budget
• The fi rst fee set is the index fee in the cell in column D, row 2 (that is, cellD2) of the second worksheet, titled “ControlPanel_MPA”.5
• Because all other fees are linked to the indices in column C, the other fees automatically populate column D.
• Titrate the index fee while observing cell AA24, which draws from the “Key_assumptions” worksheet that represents the three- year budget available for purchasing MPA services: adjust this index fee until the ex-penditure forecast matches available budget.
• Frequently, indices are adjusted, because the actual fee for a service might seem too high or too low. This exercise is subjective and is best carried out in a plenary session with public health experts. This process is described in the modifi ed Delphi technique in chapter 1 of this toolkit.
• Services 2 and 21 are void for the fi rst six months. The plan is to start the purchase of these services only after six months.
• The example shows, based on hundreds of assumptions, the initial fees that could be used (see table 4.5).
16 PMTCT: HIV+ mothers andchildren treatedaccording toprotocol
— 50% 20% 30% 40% 50% 75% 60% 65% 70% 75% 100%
17 STD treatment — 10% 3% 5% 7% 10% 25% 15% 20% 23% 25% 40%
18 New AFB+ PTB patient
— 50% 20% 30% 40% 50% 75% 60% 65% 70% 75% 100%
19 PTB patient: completed treatment andcured
— 40% 20% 30% 35% 40% 70% 50% 60% 65% 70% 95%
20 ITN distribu-tion
25.0% 40% 30% 32% 35% 40% 60% 45% 50% 55% 60% 80%
21 New family’s use of a latrine
24.6% 30% 28% 30% 40% 32% 34% 37% 40% 50%
Source: World Bank data.:
Note: In the spreadsheet, the percentage coverage is related to actual quantities drawn from the targets for each service in the :population. — = not available; AFB+ = acid-fast bacillus positive; ANC = antenatal care; DHS = Demographic and Health Survey;FP = family planning; HIV = human immunodefi ciency virus; ITN = insecticide-treated net; IUD = intrauterine device; MPA = minimumpackage of activities; No. = number; PIT = provider-initiated testing for HIV; PMTCT = prevention of mother-to-child transmission ofHIV; PTB = pulmonary tuberculosis; SP = sulfadoxine/pyrimethamine; STD = sexually transmitted disease; VCT = voluntary counselingand testing for HIV.
TABLE 4.4 (continued)
No.Indicator/Service MPA Baseline_11 Target_12 1Q12 2Q12 3Q12 4Q12 Target_13 1Q13 2Q13 3Q13 4Q13 Target_14
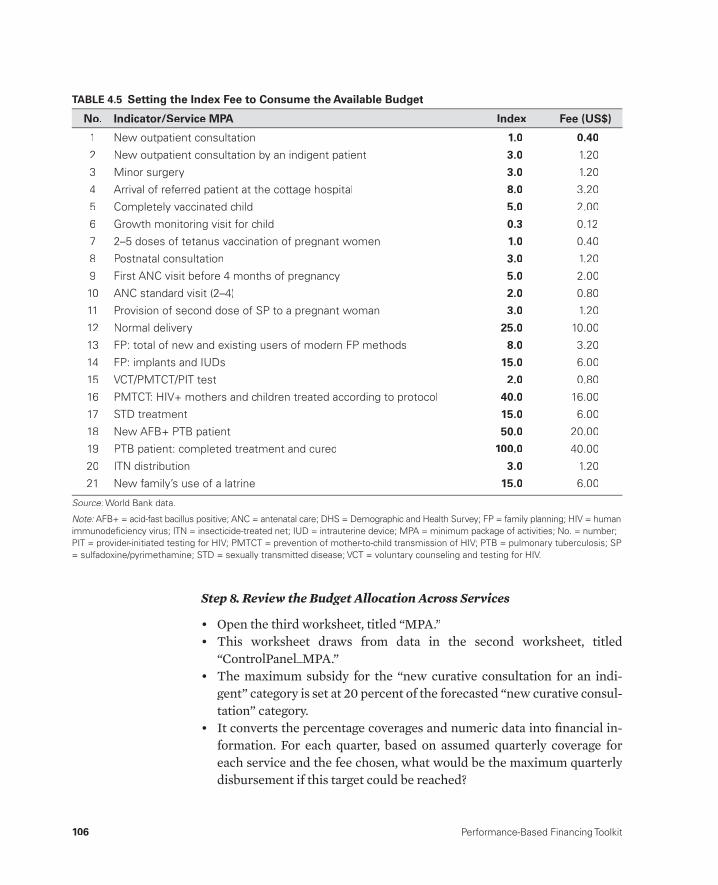
106 Performance-Based Financing Toolkit
Step 8. Review the Budget Allocation Across Services
• Open the third worksheet, titled “MPA.”• This worksheet draws from data in the second worksheet, titled
“ControlPanel_MPA.”• The maximum subsidy for the “new curative consultation for an indi-
gent” category is set at 20 percent of the forecasted “new curative consul-tation” category.
• It converts the percentage coverages and numeric data into fi nancial in-formation. For each quarter, based on assumed quarterly coverage for each service and the fee chosen, what would be the maximum quarterly disbursement if this target could be reached?
TABLE 4.5 Setting the Index Fee to Consume the Available Budget
No. Indicator/Service MPA Index Fee (US$)
1 New outpatient consultation 1.0 0.40
2 New outpatient consultation by an indigent patient 3.0 1.20
3 Minor surgery 3.0 1.20
4 Arrival of referred patient at the cottage hospital 8.0 3.20
5 Completely vaccinated child 5.0 2.00
6 Growth monitoring visit for child 0.3 0.12
7 2–5 doses of tetanus vaccination of pregnant women 1.0 0.40
8 Postnatal consultation 3.0 1.20
9 First ANC visit before 4 months of pregnancy 5.0 2.00
10 ANC standard visit (2–4) 2.0 0.80
11 Provision of second dose of SP to a pregnant woman 3.0 1.20
12 Normal delivery 25.0 10.00
13 FP: total of new and existing users of modern FP methods 8.0 3.20
14 FP: implants and IUDs 15.0 6.00
15 VCT/PMTCT/PIT test 2.0 0.80
16 PMTCT: HIV+ mothers and children treated according to protocol 40.0 16.00
17 STD treatment 15.0 6.00
18 New AFB+ PTB patient 50.0 20.00
19 PTB patient: completed treatment and cured 100.0 40.00
20 ITN distribution 3.0 1.20
21 New family’s use of a latrine 15.0 6.00
Source: World Bank data.:
Note: AFB+ = acid-fast bacillus positive; ANC = antenatal care; DHS = Demographic and Health Survey; FP = family planning; HIV = human :immunodefi ciency virus; ITN = insecticide-treated net; IUD = intrauterine device; MPA = minimum package of activities; No. = number; PIT = provider-initiated testing for HIV; PMTCT = prevention of mother-to-child transmission of HIV; PTB = pulmonary tuberculosis; SP= sulfadoxine/pyrimethamine; STD = sexually transmitted disease; VCT = voluntary counseling and testing for HIV.

Setting the Unit Price and Costing 107
• Scroll to column AN, where the actual budget for each service is shown. Column AO shows the corresponding percentage of the total budget. It is worthwhile to check whether the budgets allocated make sense.
• As shown in the worksheet, about 52.4 percent goes to maternal health and 13.9 percent to child health (see table 4.6).
TABLE 4.6 Budget Per Service and Percentage of Total Budget Available Per Service
Budget Total (US$) % Budget Indicator/Service MPA No.
$260,638 14.86% New outpatient consultation 1
$150,419 8.58% New outpatient consultation by an indigent patient 2
$21,627 1.23% Minor surgery 3
$10,426 0.59% Arrival of referred patient at the cottage hospital 4
$43,936 2.50% Completely vaccinated child 5
$35,418 2.02% Growth monitoring visit for child 6
$14,470 0.82% 2–5 doses of tetanus vaccination of pregnant women 7
$42,610 2.43% Postnatal consultation 8
$31,935 1.82% First ANC visit before 4 months of pregnancy 9
$77,779 4.43% ANC standard visit (2–4) 10
$32,025 1.83% Provision of second dose of SP to a pregnant woman 11
$223,900 12.77% Normal delivery 12
$319,062 18.19% FP: total of new and existing users of modern FPmethods
13
$28,256 1.61% FP: implants and IUDs 14
$32,310 1.84% VCT/PMTCT/PIT test 15
$25,008 1.43% PMTCT: HIV+ mothers and children treated accordingto protocol
16
$74,914 4.27% STD treatment 17
$14,637 0.83% New AFB+ PTB patient 18
$27,036 1.54% PTB patient: completed treatment and cured 19
$114,531 6.53% ITN distribution 20
$173,062 9.87% New family’s use of a latrine 21
$1,753,997 100.00%
$1,768,261 52.36% Maternal health
13.90% Child health
Source: World Bank data.:
Note: AFB+ = acid-fast bacillus positive; ANC = antenatal care; DHS = Demographic and Health Survey; FP = family planning; :HIV = human immunodefi ciency virus; ITN = insecticide-treated net; IUD = intrauterine device; MPA = minimum package ofactivities; No. = number; PIT = provider-initiated testing for HIV; PMTCT = prevention of mother-to-child transmission of HIV;PTB = pulmonary tuberculosis; SP = sulfadoxine/pyrimethamine; STD = sexually transmitted disease; VCT = voluntary counseling andtesting for HIV.

108 Performance-Based Financing Toolkit
The remaining worksheets apply the same methodology to the complemen-tary package of activities (CPA). The fees and the quarterly budget forecasts have been set in a web- enabled application, which will allow you to follow the service quantity, service quality, and budget disbursements. See chapter 12 for more details.
In the forecasting of fi nancial risk, calculations should be checked by at least one other person. Because of the many formulas, it is easy to make mistakes.
4.7 Strategic Purchasing
With all these instruments in place, you can now embark on strategic pur-chasing with PBF and actively determine what is bought, from whom, and for how much (Preker et al. 2007; WHO 2000). Strategic purchasing is vital but not easy. It is riddled with complications, even in developed countries’ health systems, as was well documented some years ago for European health reform experiences by Figueras, Robinson, and Jakubowski (2005).
Beginning in 2002, nongovernmental organizations (NGOs) engaged in piloting PBF have embarked on strategic purchasing. The small scale of the initial pilot projects allowed the purchasing agency managers to control the fees through Microsoft Excel spreadsheets. Scaled- up PBF systems, how-ever, such as in Rwanda and Burundi, necessitated other instruments. In Rwanda, PBF management reverted to information technology solutions that allowed national- level purchasing (beginning in 2007). In Burundi, a second- generation application of this same technology enabled regional- level purchasing (beginning in 2010).
These web- enabled applications provide comprehensive information on unit fees and disbursements in combination with quantity and quality re-sults, which allows the PBF purchaser to actively manage fees and results while remaining within a given output budget. They provide safeguards against overspending. They allow the purchaser to follow disbursements real- time, change fees, and issue amendments. High- volume services, such as curative care, are levers that— with only minor adjustments— can infl u-ence disbursements rapidly (see box 4.3). The unit fees and quarterly dis-bursement forecasts, extracted from Microsoft Excel models, such as the one discussed in section 4.6, are entered in this web- enabled application.
Through a dashboard of line graphs and bar charts, accurate information on the progress of PBF services can be obtained. Such information is essen-tial for monitoring of potential moral confl icts from the provider side, such as providers focusing only on easily achievable services to the detriment of
Setting the Unit Price and Costing 109
other services that may be equally important from a public health perspec-tive. The use of a business plan (see chapter 10), in which explicit strategiesare related to each of the PBF services, in combination with strategic purchasing— the ability to set fees for each facility and to issue quarterly amendments— enables the purchaser to act on such eventualities.
The various institutional arrangements for purchasing are covered inchapter 11 of this toolkit, and the information technology solution that en-ables strategic purchasing is discussed further in chapter 12.
There is a difference between purchasing of curative care conditions and strategic purchas-ing using PBF approaches. PBF, in principle,mostly targets preventive services. Such pre-ventive services have a certain maximum well-defi ned target in the population. For instance,in a certain population, there could be 4.5 per-cent who are children under one year of age totarget with vaccinations or 4.8 percent whoare pregnant women to convince to deliver in ahealth facility. Although one can be confronted with unexpectedly high expenditures if pur-
chasing curative care conditions (and espe-cially so when using a cost- reimbursement method), such is not the case with fi nancing preventive services using PBF. When a pur-chaser fi nances preventive services, there is a certain maximum that can be bought in the population, and knowing this maximum en-ables the purchaser to better forecast its risk. Excessive use of preventive services resulting from fee- for- service payment to providers has never been documented (Xingzhu and O’Dougherty 2004; see Davis et al. 1990).
BOX 4.3
The Difference between Purchasing of Curative Care and StrategicPurchasing Using PBF That Targets Preventive Care
The following toolkit fi les can be accessed through this web link:http://www.worldbank.org/health/pbftoolkit/chapter04.
• Basic Costing Tool (exercise fi le for Example 2)
• Burundi MPA and CPA costing
• Explanation of Basic Costing Tool
• Nigeria_Costing_Example1.xlsx (exercise fi le)
• Nigerian MPA and CPA costing
• Rwandese HIV costing
• Rwandese MPA costing.
4.8 Links to Files and Tools
110 Performance-Based Financing Toolkit
Notes
1. In autonomously managed health facilities with various sources of income, thevariable performance bonus paid to health workers might originate from theoverall profi t from the health facility, which is composed not only of PBF funds.In addition, and also important, the PBF earnings are used for nonbonusexpenses.
2. This perception is the reason that in PBF, fees should be negotiated by the healthfacilities to pay for the entire bill. Centrally set fees that do not help bridge this gap cannot assist the facility in closing the earnings gap.
3. An area of increasing interest is the issue of how to allocate this PBF budget. Inmost systems, this consists of a mix of free services or waivers for specifi ccategories of clients (for which the provider is reimbursed through PBF).
4. In the Nigerian example in section 4.5, a per capita output budget of US$2.70 was used. Nigeria is a lower- middle- income country, and this amount might be insuffi cient. However, because of low preexisting investment at the frontlines, this new PBF money represents a signifi cant additional investment. In addition, the Nigerian public health system has a host of systemic problems, such as a faltering central supply of drugs and severe misallocation of human resources. The idea is to see what US$2.70 per capita per year in additional PBF money willdo in conjunction with signifi cant other reforms (management strengthening program, coaching, and so on) and to alter the system as needed.
5. The “new outpatient consultation” service is chosen as the base index value for the ability to compare relative eff ort of any other activity relative to this common service.
References
Davis, K., R. Bialek, M. Parkinson, J. Smith, and C. Velozzi. 1990. “Reimbursement for Preventive Services: Can We Construct an Equitable System?” Journal of General International Medicine 5 (suppl 5): S93– 98.
de Savigny, D., and T. Adam, eds. 2009. Systems Thinking for Health Systems Strengthening. Geneva: World Health Organization.
Figueras, J., R. Robinson, and E. Jakubowski, eds. 2005. Purchasing to Improve Health Systems Performance. European Observatory on Health Systems and Policies Series. New York: World Health Organization on behalf of EuropeanObservatory on Health Systems and Policies.
Fritsche, G., and P. Vergeer. 2010. “Performance- Based Financing Drill Down.”Paper presented at a World Bank workshop, “Results- Based Financing,”Washington, DC.
Maslow, A. H. 1943. “A Theory of Human Motivation.” Psychological Review 50:370– 96.
Meessen, B., A. Soucat, and C. Sekabaraga. 2011. “Performance- Based Financing: Just a Donor Fad or a Catalyst towards Comprehensive Health Care Reform?” Bulletin of the World Health Organization 89 (2): 153– 56.

Setting the Unit Price and Costing 111
OECD (Organisation for Economic Co- operation and Development). 2010. Value forMoney in Health Spending. OECD Health Policy Studies. Paris: OECD.
Preker, A. L. Xingzhu, E. Velenyi, and E. Baria, eds. 2007. Public Ends Private Means:Strategic Purchasing of Health Services. Washington, DC: World Bank.
Soeters, R., C. Habineza, and P. B. Peerenboom. 2006. “Performance- Based Financ-ing and Changing the District Health System: Experience from Rwanda.” Bulletinof the World Health Organization 84 (11): 884– 89.
Soeters, R., and C. Kimanuka. 2005. “Enquete menage d’evaluation, du programmed’appui aux soins de sante de base dans la province de Cyangugu” [Householdsurvey of the program to support basic health care in the province of Cyangugu, Rwanda].
Soeters, R., L. Musango, and B. Meessen. 2005. “Comparison of Two Output Based Schemes in Butare and Cyangugu Provinces with Two Control Provinces inRwanda.” Report, Global Partnership on Output- Based Aid, Washington, DC, and Ministry of Health, Rwanda, Kigali.
Soeters, R., P. B. Peerenboom, P. Mushagalusa, and C. Kimanuka. 2011. “Performance- Based Financing Experiment Improved Health Care in the Democratic Republic of Congo.” Health Aff airs 30 (8): 1518– 27.
von Bertalanff y, L. 1969. General System Theory: Foundations, Development, Applica-tions. New York: George Braziller.
WHO (World Health Organization). 2000. The World Health Report 2000: HealthSystems— Improving Performance. Geneva: WHO.
Xingzhu, L., and S. O’Dougherty. 2004. “Purchasing Priority Public Health Ser-vices.” HNP Discussion Paper. Washington, DC, World Bank.


113
Addressing Equity
CHAPTER 5
MAIN MESSAGES
➜ Health care use by poor people lags those who are better off . Poor people risk being more deeply impoverished by the cost of seeking care.
➜ PBF provides incentives to health workers to increase the quantity and quality of services and focuses on improving equity in health care use.
➜ The likelihood of achieving this potential is greatly enhanced if PBF de-sign includes explicit pro- poor features, such as targeting resources at poor areas, pro- poor user fee policies, incentives for community healthworkers, and complementary demand- side incentives.
➜ PBF program managers must regularly monitor and evaluate the eff ect of the PBF program on equity. This approach requires knowledge of thenecessary analytical techniques for equity analysis and collection of the appropriate data.
COVERED IN THIS CHAPTER
5.1 Introduction: Why worry about equity?5.2 PBF: An innovative approach to enhancing equity5.3 How to make PBF schemes more pro- poor5.4 Measuring and monitoring equity in PBF
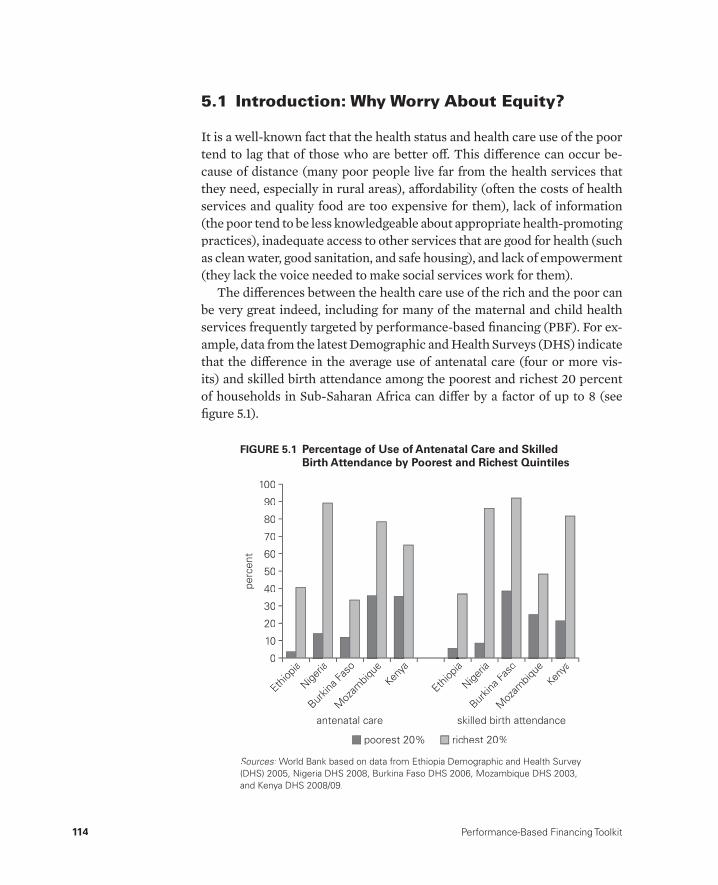
114 Performance-Based Financing Toolkit
5.1 Introduction: Why Worry About Equity?
It is a well- known fact that the health status and health care use of the poor tend to lag that of those who are better off . This diff erence can occur be-cause of distance (many poor people live far from the health services that they need, especially in rural areas), aff ordability (often the costs of health services and quality food are too expensive for them), lack of information (the poor tend to be less knowledgeable about appropriate health- promoting practices), inadequate access to other services that are good for health (such as clean water, good sanitation, and safe housing), and lack of empowerment (they lack the voice needed to make social services work for them).
The diff erences between the health care use of the rich and the poor can be very great indeed, including for many of the maternal and child health services frequently targeted by performance- based fi nancing (PBF). For ex-ample, data from the latest Demographic and Health Surveys (DHS) indicate that the diff erence in the average use of antenatal care (four or more vis-its) and skilled birth attendance among the poorest and richest 20 percent of households in Sub- Saharan Africa can diff er by a factor of up to 8 (see fi gure 5.1).
perc
ent
50
100
80
90
70
60
10
40
30
20
0
poorest 20% richest 20%
Ethiop
ia
Nigeria
Burkin
a Fas
o
Moz
ambiq
ueKen
ya
Ethiop
ia
Nigeria
Burkin
a Fas
o
Moz
ambiq
ueKen
ya
skilled birth attendanceantenatal care
Sources: World Bank based on data from Ethiopia Demographic and Health Survey (DHS) 2005, Nigeria DHS 2008, Burkina Faso DHS 2006, Mozambique DHS 2003,and Kenya DHS 2008/09.
FIGURE 5.1 Percentage of Use of Antenatal Care and Skilled Birth Attendance by Poorest and Richest Quintiles
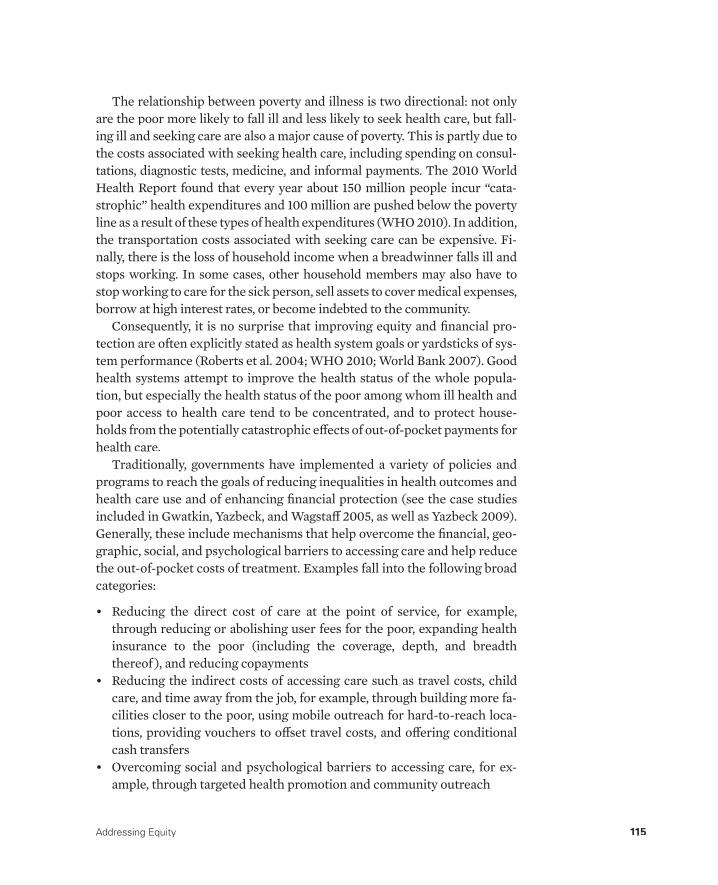
Addressing Equity 115
The relationship between poverty and illness is two directional: not only are the poor more likely to fall ill and less likely to seek health care, but fall-ing ill and seeking care are also a major cause of poverty. This is partly due to the costs associated with seeking health care, including spending on consul-tations, diagnostic tests, medicine, and informal payments. The 2010 World Health Report found that every year about 150 million people incur “cata-strophic” health expenditures and 100 million are pushed below the poverty line as a result of these types of health expenditures (WHO 2010). In addition, the transportation costs associated with seeking care can be expensive. Fi-nally, there is the loss of household income when a breadwinner falls ill and stops working. In some cases, other household members may also have to stop working to care for the sick person, sell assets to cover medical expenses, borrow at high interest rates, or become indebted to the community.
Consequently, it is no surprise that improving equity and fi nancial pro-tection are often explicitly stated as health system goals or yardsticks of sys-tem performance (Roberts et al. 2004; WHO 2010; World Bank 2007). Goodhealth systems attempt to improve the health status of the whole popula-tion, but especially the health status of the poor among whom ill health andpoor access to health care tend to be concentrated, and to protect house-holds from the potentially catastrophic eff ects of out- of- pocket payments for health care.
Traditionally, governments have implemented a variety of policies and programs to reach the goals of reducing inequalities in health outcomes and health care use and of enhancing fi nancial protection (see the case studies included in Gwatkin, Yazbeck, and Wagstaff 2005, as well as Yazbeck 2009). Generally, these include mechanisms that help overcome the fi nancial, geo-graphic, social, and psychological barriers to accessing care and help reduce the out- of- pocket costs of treatment. Examples fall into the following broad categories:
• Reducing the direct cost of care at the point of service, for example, through reducing or abolishing user fees for the poor, expanding healthinsurance to the poor (including the coverage, depth, and breadth thereof ), and reducing copayments
• Reducing the indirect costs of accessing care such as travel costs, child care, and time away from the job, for example, through building more fa-cilities closer to the poor, using mobile outreach for hard- to- reach loca-tions, providing vouchers to off set travel costs, and off ering conditional cash transfers
• Overcoming social and psychological barriers to accessing care, for ex-ample, through targeted health promotion and community outreach
116 Performance-Based Financing Toolkit
• Increasing the effi ciency of care to reduce the total amount of care that people use, for example, by limiting “irrational drug prescribing,” strengthening the referral system, and improving the quality of care pro-vided (especially at the lower levels)
• Strengthening the overall regulation and structure of both public and pri-vate health care markets.
5.2 PBF: An Innovative Approach to Enhancing Equity
PBF is a new, innovative strategy for reaching the poor. By supplying fi nan-cial incentives to providers to improve the quantity and quality of a set of targeted services and by monitoring that they do so, PBF shows excellent potential to increase the service use and health status of the poor.
PBF works in the following ways:
• PBF and equity in service use. When health workers are paid only on a salary basis (as is the case in many countries), there is very little fi nancial motivation to see additional patients, unless these patients off er to pay an additional under- the- table (informal) payment or are seen in the health worker’s private practice (so- called “moonlighting”).1 Even in countries where the poor are exempt from user fees, this provider payment struc-ture tends to bias service delivery in favor of the better- off patients who can more easily aff ord to make additional payments for care. In contrast, when a salary- based payment mechanism is complemented by a PBF payment mechanism, health workers have a fi nancial incentive to see the most patients possible, regardless of a patient’s ability to pay.
• PBF and fi nancial protection. By encouraging the use of care, and especially the preventive care included in the typical PBF package, PBF increases the likelihood that patients will seek care before their illness progresses to the point at which the costs of seeking care (and the fi nancial consequences of illness) are likely to be higher. Moreover, because PBF also off ers incen-tives to providers to improve the quality of the care that they give, the ef-fectiveness of treatment will likely improve, reducing the probability that patients return for additional care related to that illness episode, and thus reducing the total burden of out- of- pocket health expenditures.
Clearly, PBF has excellent potential to improve health equity and enhance fi nancial protection. As with any health care reform, however, there is no guarantee. There have also been very few rigorous studies of the eff ects of supply- side PBF (as defi ned in this toolkit) on the poor. The potential of

Addressing Equity 117
PBF to enhance equity and fi nancial protection is crucially dependent on the behavioral response of the provider/worker/facility to the PBF incen-tives. This, in turn, will depend on the broader institutional environment (for example, degree of autonomy of the provider over fees and staffi ng) and incentive structures (salary, informal payments, user fees, moonlighting op-portunities, and working conditions). Consequently, those who design, man-age, and evaluate PBF schemes should carefully consider the building blocks of their PBF; formulate hypotheses as to the likely eff ects on equity, given theinstitutional environment and incentive structure facing health workers (as well as the constraints facing patients); and refl ect on how the PBF scheme can be modifi ed to increase the likelihood that the program reaches the poor.As Gwatkin (2010, 1) warns:
Many plausible approaches are available for directing benefi ts toward the poor. . . . Even when such approaches are applied, however, predicting the eq-uity impact of any given [results-based fi naning (RBF)] strategy in any par-ticular setting remains more of an art than a science; and only after the fact, through careful monitoring, is it possible to assess an RBF project’s equity con-sequences with reasonable certainty.
In this chapter, we explore diff erent approaches that can be used to help en-sure that PBF schemes realize their potential of reaching the poor.
5.3 How to Make PBF Schemes More Pro- Poor
In its relatively short history, PBF has proven to be a very versatile approach that can be modifi ed in diff erent ways to make it more pro- poor. This section describes specifi c design elements of PBF that can be used to increase the extent to which PBF resources reach providers in destitute areas, services reach the poor, and any potential costs to the poor are mitigated. In practice, this often involves complementing PBF schemes with some of the more tra-ditional (frequently demand- side) mechanisms described above.
Table 5.1 summarizes the various PBF design elements that are consid-ered in this section, the expected eff ect on equity goals, and some country examples.
The country examples used for each of these design elements are cur-rently being, or have been, implemented within the context of PBF schemes. However, excellent examples of how to design and implement some of these elements, such as user fee exemption, in- kind demand- side incen-tives, vouchers schemes, and conditional cash transfer programs, can also befound outside of PBF schemes and have a longer history of implementation.
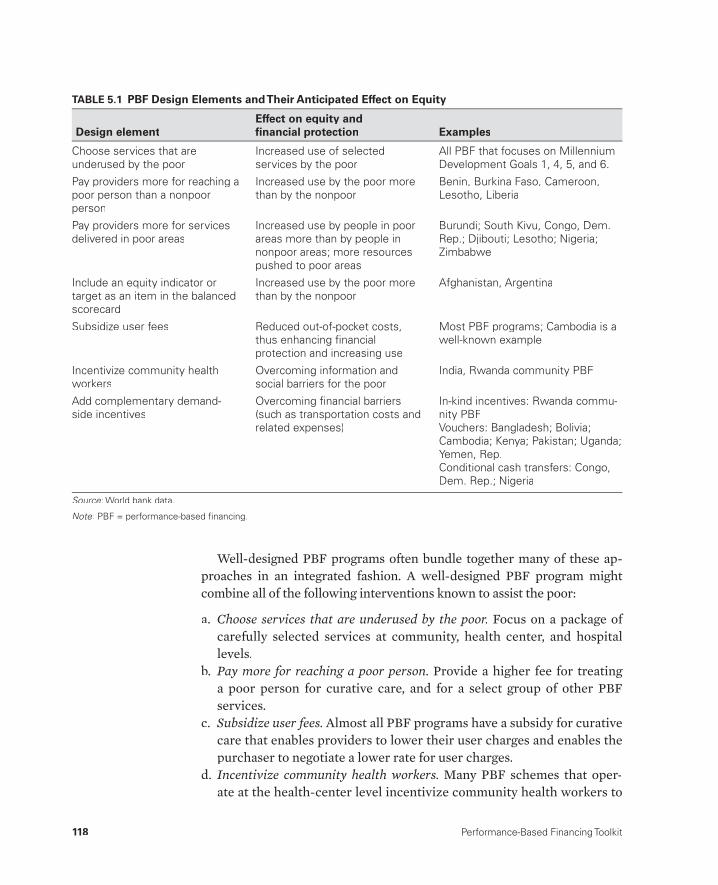
118 Performance-Based Financing Toolkit
Well- designed PBF programs often bundle together many of these ap-proaches in an integrated fashion. A well- designed PBF program might combine all of the following interventions known to assist the poor:
a. Choose services that are underused by the poor. Focus on a package of carefully selected services at community, health center, and hospital levels.
b. Pay more for reaching a poor person. Provide a higher fee for treating a poor person for curative care, and for a select group of other PBF services.
c. Subsidize user fees. Almost all PBF programs have a subsidy for curativecare that enables providers to lower their user charges and enables thepurchaser to negotiate a lower rate for user charges.
d. Incentivize community health workers. Many PBF schemes that oper-ate at the health- center level incentivize community health workers to
TABLE 5.1 PBF Design Elements and Their Anticipated Effect on Equity
Design elementEffect on equity andfi nancial protection Examples
Choose services that areunderused by the poor
Increased use of selectedservices by the poor
All PBF that focuses on MillenniumDevelopment Goals 1, 4, 5, and 6.
Pay providers more for reaching a poor person than a nonpoorperson
Increased use by the poor morethan by the nonpoor
Benin, Burkina Faso, Cameroon,Lesotho, Liberia
Pay providers more for servicesdelivered in poor areas
Increased use by people in poorareas more than by people innonpoor areas; more resourcespushed to poor areas
Burundi; South Kivu, Congo, Dem.Rep.; Djibouti; Lesotho; Nigeria; Zimbabwe
Include an equity indicator ortarget as an item in the balanced scorecard
Increased use by the poor morethan by the nonpoor
Afghanistan, Argentina
Subsidize user fees Reduced out-of-pocket costs,thus enhancing fi nancialprotection and increasing use
Most PBF programs; Cambodia is awell-known example
Incentivize community healthworkers
Overcoming information and social barriers for the poor
India, Rwanda community PBF
Add complementary demand-side incentives
Overcoming fi nancial barriers(such as transportation costs andrelated expenses)
In-kind incentives: Rwanda commu-nity PBFVouchers: Bangladesh; Bolivia; Cambodia; Kenya; Pakistan; Uganda; Yemen, Rep.Conditional cash transfers: Congo,Dem. Rep.; Nigeria
Source: World bank data.:
Note: PBF = performance-based fi nancing.:
Addressing Equity 119
reach more of their target population. They can, for instance, pay re-wards to community health workers and traditional birth attendants who bring women to deliver in health centers.
e. Add complementary demand- side incentives. Some PBF programs exper-iment with conditional in- kind incentive programs, such as providing a piece of cloth or an umbrella to mothers when they deliver in a healthfacility. Other programs may pay a cash reward.
Choose Services That Are Underused by the Poor
As noted in the introduction, there are large inequalities in the use of many types of services and a gap between the need for services and service cover-age. The extent of these inequalities varies by service type with the rich- poor gap in service use being much greater for certain services than for others. Where resources are scarce and only a limited range of services can be in-cluded in the PBF scheme, PBF program architects should consider target-ing those services that are the most underused by the poor.
In general, services related to maternal health (such as skilled birth atten-dance, antenatal care use, and bed- net use while pregnant) tend to be among those most inequitably distributed. Also, in general, if PBF schemes are fo-cused on the Millennium Development Goals (MDGs), they will tend to bepro- poor because most of the illnesses and health conditions encapsulatedby the MDGs are concentrated among the poor. One exception is human im-munodefi ciency virus (HIV), which, in most developing countries, is concen-trated among the better- off population. Also, although noncommunicable diseases (NCDs) are an emerging health problem and constitute a growing share of the overall disease burden even in the lowest- income countries,NCDs for the most part are still concentrated among the relatively wealthy rather than the relatively poor. As PBF programs increasingly expand in Asia and Southeast Asia (for example, the Kyrgyz Republic, the Lao People’s Democratic Republic, Tajikistan, Vietnam, and other countries), there will be more experimentation with purchasing services related to NCDs.
Inequalities in service delivery will be largely location specifi c because the barriers to accessing services may vary from one country to another and, within countries, from one region to another. Consequently, program archi-tects should inform themselves about the patterns of inequalities in health care use in the countries in which they will be working. Good sources of in-formation on country- specifi c inequalities in health service use include the World Bank’s Health Equity and Financial Protection country datasheets, the World Bank’s HealthStats database, and the MEASURE DHS Statcom-piler (see the list of recommended resources at the end of this chapter).
120 Performance-Based Financing Toolkit
A list of services used in PBF programs can be accessed through the linked fi les of chapter 1 (see section 1.5).
Pay More for Reaching a Poor Person Than a Nonpoor Person
A very direct way to encourage health workers to make an extra eff ort to reach the poor is to pay more for a service provided to a poor person than for one provided to a nonpoor person. In practice, this requires diff erentiating the PBF fee schedule according to the poverty status of the client/patient.
A good example is a PBF pilot in Benin. Of the 18 PBF services, the fi nan-cial reward associated with two services— antenatal care and institutional delivery— doubles when the benefi ciary is poor. Identifi cation of poor and nonpoor women is possible by means of a “poverty certifi cate” (which, in half the districts, has been replaced by a biometric card). These certifi cates have been issued to benefi ciaries of a health equity fund (put in place sev-eral years ago) after a process of community- based identifi cation of needy individuals.
Another example is an urban PBF program in Douala, Cameroon. The program systematically pays more for a poor person than for a wealthier cli-ent. Three of the 25 services (curative care, inpatient days, and minor sur-gery) off ered at the community/health center level have a premium fee for the poor.
The most diffi cult implementation challenge is to identify who is poor and who is not. Three main methods are commonly used to identify the poor for the purposes of inclusion into social programs:
• With means testing, a program offi cial directly assesses whether some-one should be considered poor based on direct verifi cation of income.This approach can be very accurate, but also typically requires high lev-els of literacy and is administratively demanding.
• Proxy means testing involves constructing a score for each householdgbased on a small number of easily observable characteristics or assets. This approach is easily verifi able, but it also requires reasonably high ad-ministrative capacity.
• Community targeting typically involves having a community leader or ggroup decide who in the community should be considered poor (for the purposes of a program). This approach, which might be the most feasible one for small- scale PBF programs, takes into consideration local knowl-edge of individual circumstances, allows for local defi nition of need, and transfers the costs of identifying benefi ciaries from the program to the community. However, local personnel may have other incentives,
Addressing Equity 121
besides accurately identifying program benefi ciaries, which could con-tinue or exacerbate patterns of social exclusion. Refer to Coady, Grosh,and Hoddinott (2004) for a more detailed discussion of these methods,their strengths and weaknesses, and examples of application to the health sector.
Even this brief discussion indicates that identifying the poor can be diffi cult and entail large administrative costs that will need to be balanced against the gains. Consequently, if individual targeting (paying more for reaching the poor) is going to be implemented within PBF, it should be used where anexisting social program has already identifi ed the poor and issued identifi ca-tion cards marking them as benefi ciaries, as in the case of Benin. If not, then the PBF scheme will have to establish its own targeting mechanism. Using existing targeting arrangements not only will reduce costs and complexity, but because the identifi cation of individuals is the outcome of a separatethird- party process, they also will minimize stigma and mitigate additional political risks.
There is extensive experience in targeting the poor through health equity funds, for instance in Cambodia (Annear 2010). In Cambodian Health Eq-uity Fund programs, both preidentifi cation and postidentifi cation work well, but preidentifi cation is the most eff ective and most cost- eff ective targeting method. In many PBF pilot programs, health facility managers have discre-tion in categorizing a share (for example, 10– 20 percent) of the curative care patients in the “poor” category (Soeters 2012). This approach is akin to the postidentifi cation targeting of the Cambodian Health Equity Fund schemes. More operational research is needed to determine how this can best be implemented.
Pay More for Services Delivered in Poor Areas— Equity Bonuses, Remoteness Bonuses, and Isolation BonusesThis strategy for reaching the poor involves adjusting the payment sched-ule so that providers in poor areas are paid higher amounts for each ser-vice delivered than providers in wealthier areas. This additional payment can be termed a remoteness bonus (for example, in Zimbabwe), an isolation bonus (for example, in parts of the Democratic Republic of Congo), or an equity bonus (for example, in Burundi). These bonuses are a form of geo-graphic targeting— a way to push more resources to underfunded facilities in remote, and typically poor, areas where health outcomes tend to be worse. This method increases the overall funding envelope for certain geographi-cal areas that are known to be disadvantaged. This approach allows scarce resources to be used more effi ciently and also avoids the need to design
122 Performance-Based Financing Toolkit
diffi cult and administratively expensive interventions that assess who is poor and who is nonpoor.
The fundamental idea behind this approach is to enable destitute facili-ties to have relatively more resources for paying the higher cost of provid-ing quality services to their population. Attracting and retaining good health care workers and paying for the higher cost of transportation are some of the reasons behind this approach.
A good example is the PBF scheme in Burundi (see box 5.1), where to-tal PBF payments to facilities are a combination of two types of payments: (a) interprovincial equity bonuses for disadvantaged provinces (the prov-ince’s poverty score is one of the indicators) and (b) intraprovincial equity bonuses for disadvantaged health facilities (the number of poor people in the catchment area and the characteristics of the health facility are two of the indicators).
In the Democratic Republic of Congo— in separate PBF schemes in South Kivu, Bas Congo, Kasai Oriental, Kasai Occidental, Province Oriental, North Kivu, and Bandundu provinces— health facilities in far- fl ung areas can earn a bonus up to 20 percent larger than those in urban facilities (Bredenkamp 2009).
The fi rst step in targeting PBF resources to poor areas is to decide at which level bonuses will be diff erentiated. Equity bonuses can vary across administrative subdivisions (such as states, provinces, or districts) or, as is more commonly the case in PBF, at the level of the catchment areas of providers (such as hospitals or health centers). In general, the smaller the geographic area at which the bonus is diff erentiated, the more specifi c and accurate will be the targeting of resources.
The second step is to determine which (health) areas are poor and which are not. There is extensive international experience with diff erent ap-proaches to geographic targeting2gg (see, for example, the excellent compila-tion of Coady, Grosh, and Hoddinott 2004, 62– 69). The simplest form of geo-graphic targeting involves the use of a single, easily available indicator that is strongly related to the objectives of the program:
• For example, the Honduran cash transfer program (Family Allowance Program, Programa de Asignación Familiar, or PRAF) used child nutri-tional status to target resources.
• Targeting can also be based principally on the judgment of program of-fi cials familiar with the fi eld conditions of facilities that serve poor ar-eas. Unfortunately, this approach is also less transparent, less formal, and more subjective.
Addressing Equity 123
In April 2010, the pilot PBF scheme in Burundi was scaled up to the national level. In 2006, to improve equity in use and enhancee fi nancial protection, a free health care policy was intro-duced, effectively eliminating all user fees for select vulnerable groups at the point of service.This selective free health care policy faced some implementation challenges, including re-imbursing providers in a timely manner and con-taining costs. Consequently, these funds were merged with the new national PBF scheme.
In addition, the Burundi PBF sought to im-prove equity in fi nancing across provinces. Ingthe Burundi PBF approach, the PBF subsidy ismoderated by two types of equity bonuses: (a) interprovincial equity bonuses for disadvan-taged provinces and (b) intraprovincial equity bonuses for disadvantaged health facilities.
The size of the interprovincial equity bonus depends on four indicators: the province’s pov-erty score, the isolation of the province, thepopulation of the province, and the number ofhealth facilities in the province. Based on these indicators, provinces are classifi ed into fi ve dif-ferent categories.
The size of the intraprovincial equity bonus, applied at the facility level, depends on six in-dicators: the population to be covered by each health facility; needs in terms of medical staff; needs in terms of small equipment; distance from the District Health Offi ce; geographic isolation; and the number of indigents sup-ported by a health facility. Based on these indi-
cators, facilities are classifi ed into fi ve differ-ent categories.
The overall fee- for- service amount for each service type is a function of the base fee, the province’s score on the interprovincial equity bo-nus, and the individual score on the interprovin-cial equity bonus. Combining these incentives, facilities can earn up to 40 percent over the base fee based on the interprovincial equity score and an additional 40 percent over the base fee based on the intraprovincial score such that the worst- scoring facilities in the worst- scoring provinces are eligible for a fee- for- service rate that is 80 per-cent higher than that of the best- scoring facilities in the best- scoring provinces.
The main motivation behind the equity bo-nuses in Burundi was to enhance equity in fi -nancing and mitigate the risk (under PBF) thatthe better- equipped facilities will be better ableto take advantage of the PBF incentives, andthus attract even more funding, while the less successful ones will continue to be relativelydisadvantaged. At the time of writing, programmanagers report that the interprovincial equity bonus is being implemented without diffi culty, and reduction of inequity in fi nancing across theprovinces is occurring. The intraprovincial equity bonus is being applied in some hospitals, butwith great diffi culty, and it is not yet being ap-plied at the health center level because of lackof funding. Consequently, at the time of writing, all health centers were still in the category withthe base rate (tied to the specifi c province).
BOX 5.1
Burundi: A Multipronged Approach to Equity in Financing and Use
• A more sophisticated version of geographical targeting uses statistical techniques (usually principal component analysis) to calculate a sum-mary poverty indicator for diff erent areas based on many diff erent indi-cators associated with poverty and usually based on data obtained from
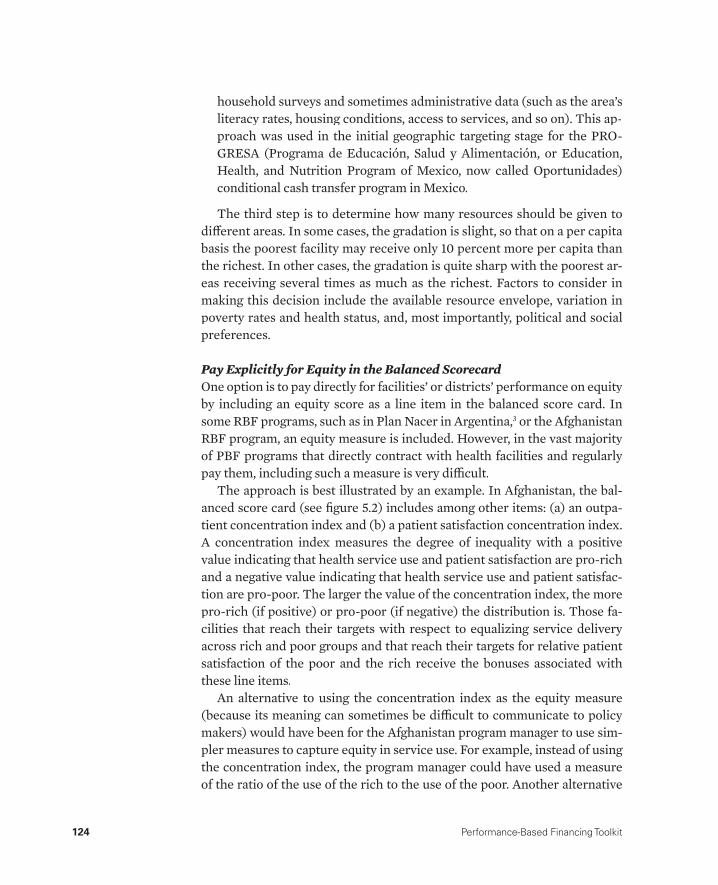
124 Performance-Based Financing Toolkit
household surveys and sometimes administrative data (such as the area’s literacy rates, housing conditions, access to services, and so on). This ap-proach was used in the initial geographic targeting stage for the PRO-GRESA (Programa de Educación, Salud y Alimentación, or Education, Health, and Nutrition Program of Mexico, now called Oportunidades) conditional cash transfer program in Mexico.
The third step is to determine how many resources should be given to diff erent areas. In some cases, the gradation is slight, so that on a per capita basis the poorest facility may receive only 10 percent more per capita than the richest. In other cases, the gradation is quite sharp with the poorest ar-eas receiving several times as much as the richest. Factors to consider in making this decision include the available resource envelope, variation in poverty rates and health status, and, most importantly, political and social preferences.
Pay Explicitly for Equity in the Balanced ScorecardOne option is to pay directly for facilities’ or districts’ performance on equity by including an equity score as a line item in the balanced score card. In some RBF programs, such as in Plan Nacer in Argentina,3 or the AfghanistanRBF program, an equity measure is included. However, in the vast majority of PBF programs that directly contract with health facilities and regularly pay them, including such a measure is very diffi cult.
The approach is best illustrated by an example. In Afghanistan, the bal-anced score card (see fi gure 5.2) includes among other items: (a) an outpa-tient concentration index and (b) a patient satisfaction concentration index. A concentration index measures the degree of inequality with a positive value indicating that health service use and patient satisfaction are pro- rich and a negative value indicating that health service use and patient satisfac-tion are pro- poor. The larger the value of the concentration index, the more pro- rich (if positive) or pro- poor (if negative) the distribution is. Those fa-cilities that reach their targets with respect to equalizing service delivery across rich and poor groups and that reach their targets for relative patient satisfaction of the poor and the rich receive the bonuses associated with these line items.
An alternative to using the concentration index as the equity measure (because its meaning can sometimes be diffi cult to communicate to policy makers) would have been for the Afghanistan program manager to use sim-pler measures to capture equity in service use. For example, instead of using the concentration index, the program manager could have used a measure of the ratio of the use of the rich to the use of the poor. Another alternative
FIGURE 5.2 Afghanistan Health Sector Balanced Scorecard, Provincial Results, 2004–06Benchmarks Badakhshan
Lower Upper 2004 2005 2006
A. Patients & Community
1 Overall Patient Satisfaction 66.4 90.9 86.4 94.2 86.8
2 Patient Perception of Quality Index 66.2 83.9 77.6 82.9 77.5
3 Written Shura-e-sehie activities in community 18.1 66.5 35.6 8.4 73.4B. Staff
4 Health Worker Satisfaction Index 56.1 67.9 63.5 64.8 70.6
5 Salary payments current 52.4 92.0 54.9 83.0 75.2C. Capacity for Service Provision
6 Equipment Functionality Index* 61.3 90.0 69.6 49.5 73.3
7 Drug Availability Index 53.3 81.8 52.9 81.5 74.0
8 Family Planning Availability Index 43.4 80.3 54.2 65.5 80.2
9 Laboratory Functionality Index (Hospitals & CHCs) 5.6 31.7 31.7 32.3 38.2
10 Staffi ng Index — Meeting minimum staff guidelines 10.1 54.0 38.0 37.2 66.3
11 Provider Knowledge Score 44.8 62.3 48.6 67.3 61.8
12 Staff received training in last year 30.1 56.3 68.9 87.3 53.7
13 HMIS Use Index 49.6 80.7 60.9 27.6 72.0
14 Clinical Guidelines Index 22.5 51.0 18.3 40.2 48.1
15 Infrastructure Index 49.3 63.2 63.2 35.5 38.9
16 Patient Record Index 56.1 92.5 51.5 51.4 66.4
17 Facilities having TB register 8.3 26.6 32.5 38.1 46.3D. Service Provision
18 Patient History and Physical Exam Index 55.1 83.5 54.2 67.7 72.6
19 Patient Counseling Index 23.3 48.9 23.3 31.1 35.0
20 Proper sharps disposal 34.1 85.0 64.4 34.4 75.6
21 Average new outpatient visit per month (BHC > 750 visits) 6.7 57.1 27.3 26.7 23.1
22 Time spent with patient (> 9 minutes) 3.5 31.2 21.0 12.0 23.1
23 BPHS facilities providing antenatal care 28.9 82.8 28.9 35.8 90.6
24 Delivery care according to BPHS 10.5 39.3 38.0 20.5 31.5E. Financial Systems
25 Facilities with user fee guidelines 80.3 100.0 94.8 84.4 70.7
26 Facilities with exemptions for poor patients 64.4 100.0 68.5 70.9 100.0F. Overall Vision
27 Females as % of new outpatients 46.5 59.7 46.9 52.4 54.6
28 Outpatient Visit Concentration Index 48.0 52.7 48.9 49.0 49.8
29 Patient Satisfaction Concentration Index 49.0 50.9 50.9 50.0 50.0Composite Scores
30 Upper Benchmarks Achieved 10.3 30.8 17.2 17.2 24.1
31 Lower Benchmarks Achieved 75.9 89.7 86.2 82.8 93.1
Mean scores across indicators 1 through 29 48.8 56.5 50.9 51.1 61.4
KEY
Score Above Upper Benchmark
Score Between Lower & Upper Benchmark
Score Below Lower Benchmark
*Benchmark set at 90%, though top quintile from 2004 was 74.1
Source: Afghanistan Ministry of Public Health, Johns Hopkins University, and IIHMR (Indian Institute of Health Management Research) 2006.:
Note: BHC = Basic Health Center; BPHS = Basic Package of Health Services; CHC = Comprehensive Health Center; HMIS = health management information system; TB = tuberculosis.
126 Performance-Based Financing Toolkit
would have been to simply set targets for use by the poor and vulnerable. In the Plan Nacer program in Argentina, one of the 10 tracer indicators on the basis of which fi nancing is transferred from the central Ministry of Health to the provincial ministries relates to the inclusion of indigenous populations (World Bank 2009).
Note that paying directly for equity in this manner still requires that fa-cilities are able to easily collect information on the socioeconomic status of those who use services. Even using a rich- poor ratio requires identifying the poor and the nonpoor, which, in turn, requires that the poor have a poverty card or other form of identifi cation.
Subsidize User Fees
Subsidizing user fees— possibly even fully so that the patient pays no for-mal charges to the provider— would remove one of the major barriers toaccessing health care and one of the major sources of destitution. Conse-quently, the removal or reduction of user fees is an important strategy for reaching the poor and can be implemented within a PBF scheme. Such a removal ought to go hand- in- hand with compensation to the provider of the income lost through this user fee removal, because a poorly planned or implemented user fee abolishment program leads to poor results in gen-eral (Hercot et al. 2011; Meessen, Gilson, and Tibouti 2011; Meesen et al. 2011; Orem et al. 2011). A reduction of user fees can be adopted in varying degrees of intensity: subsidizing fees across the board for all categories of patients; subsidizing fees only for particular categories of patients, such aspregnant women and children under six; or subsidizing fees only for the poor and vulnerable.
Fees for essential services such as deliveries can be quite high for vulner-able groups (Perkins et al. 2009) with the result that the eff ect of fi nancing such fees through PBF can be quite dramatic. This is illustrated by a personal story from Burundi (see box 5.2).
However, the removal of user fees can also have a number of adverse con-sequences. First, it can deprive facilities of an important source of revenue that is often needed for operating costs or for supplementing meager staff salaries. Second, it can lead to moral hazard and excess demand for services, overburdening staff and compromising quality. Third, when user fees are eliminated only for the poor (as is often the case), there is a risk of discrimi-nation by providers that have greater (fi nancial) incentives to serve the non-poor than the poor. Fourth, there is also the risk that the facility, in an eff ort to replace revenues, will simply start to charge informal (under- the- table) payments with little or no net benefi t for the patient.

Addressing Equity 127
Madame Esperance Kamurenzi tells of hergreat joy to be treated for free.
(Excerpt from an interview conducted with vulnerable groups of Batwaa in Mukoni, Muy-inga Province)
My name is Esperance Kamurenzi. I am a Mut-wakazi. I am 28 years old. With my fi rst husband, I had fi ve children, but all died! Now I’m with an-other man, and we have two children only!
During the crisis, I lived in refugee camps.Yes, it’s where I lived with other Batwa. In refu-gee camps, life was very hard. I did not go tothe health center: ISHWI DA!b = Never, ever did I attend the hospital! I’ve never been to see a doctor. Always I was afraid to go to the hospital without money. ISHWI DA! I could not go. Theothers would make fun of me!
I always gave birth at home. I did not even know what prenatal care was. I never brought my children for immunization. ISHWI DA! I also think that’s why my kids are dead [she seems to cry]! My husband also did not go to see the doctor! We all stayed at home. We were veryunhappy!
Today things have changed. First, I live in a beautiful house here in Mukoni! The state gave
us these beautiful houses covered with sheets.I no longer have the desire to always seek per-manent straw to cover the house. It is verygood [she smiles].
One day, I was walking around selling mypots and I stopped to listen to the radio. It saidthat pregnant women are not going to pay any-thing for consultation or childbirth. I asked if theBatwa were also involved. I then spoke to my husband. We danced. All night we danced. Even that one came to sensitize us to go to the health center.c He told us that now the questionof money is no longer an obstacle.
Today, I’m going to prenatal and for consul-tation and they cannot ask me anything. No time I was asked for money. I had a caesarean section every time. Nurses welcomed me very well. They do not treat me that I’m Mutwa. No, they do not hate me. After regaining some en-ergy, I hear their voices tell me, SPE,d get up and go home. Things went well! And I take my child. And we go home. Without paying any-thing! We are very happy. I extend my sincere thanks. Eh! MUNTUWEe I say this to the doc-tors: Esperance said, thank you! God even said thank you.
BOX 5.2
Selective Free Health Care Is Financed through PBF in Burundi: A Personal Story from a Batwa Woman
Source: MSPLS 2012.:
a. Batwa are an indigenous pygmy population in Burundi.b. Strong expression to express an emphatic “No!”c. She points at the person who has accompanied us to visit her.d. Elliptical word used to call her name (“Esperance” or “Hope”).e. A term used to shout at someone, to catch his or her attention.
When user fee removal is implemented within the context of PBF, someof these adverse consequences can be sharply mitigated, especially the fi rstconcern (revenue loss) and fourth concern (informal payments). In fact, where providers have the autonomy to determine the user fees charged by
128 Performance-Based Financing Toolkit
their facilities, the reduction of formal user fees is often a rational revenue- maximizing response by providers to the introduction of PBF: to increase the demand for their services, facilities might choose to lower their fees so that they receive a larger overall PBF subsidy (Soeters 2012). Those who wish to complement the introduction of PBF with user fee subsidies should educate providers that there is an opportunity for both large revenue gains and better access for more patients.
Health equity funds are a very particular type of PBF scheme that in-cludes the exemption of user fees for the poor (see Annear 2010 for a litera-ture review). In East Asia, health equity funds have been in place in Cambo-dia since 2000, and to a lesser extent also in Lao PDR and Vietnam. In Africa, they have been used in Benin. At the core of making exemptions eff ective is separation of the responsibility for assessment of exemption eligibility (non-governmental organizations [NGOs] or the state) from the provision of care (health facilities) and the compensation of providers for lost fee revenue (the fund). Providers off er care to poor patients free of charge, but are reim-bursed for service provision on a fee- for- service basis by the health equity fund. This model can easily be adopted by other existing PBF schemes.
There are two fi nal considerations on subsidizing user fees within the context of PBF. First, note that because user fees are only a part of the total cost of accessing care, subsidizing user fees may not be suffi cient to induce the desired level of care- seeking behavior, especially among poor house-holds. Each health care visit is also associated with other signifi cant fi nan-cial costs, including travel costs and various opportunity costs. Second, note that in health systems with the third- party (state to provider) fee- for- service reimbursement mechanism that characterizes PBF schemes, user fees (from patients) counter supplier- induced demand (that is, where providers supply more services than patients need out of fi nancial interest). Although remov-ing user fees within the context of a PBF scheme could potentially enhance equity, it could also deter effi ciency.
Add Conditional Financial In- Kind Incentives for Community Health Workers
Incentivizing community health workers is an important way to overcome the social, psychological, and informational barriers that the poor may face in accessing care.
When community health workers are formally or informally integrated into PBF programs, they are paid a fee or remunerated in- kind for bringing certain clients to health facilities or providing services directly to clients in the community itself. One example of a formal arrangement is the incentives paid
Addressing Equity 129
to community health workers (accredited social health activists, or ASHAs) in India’s Janani Suraksha Yojana (JSY) program for bringing women and chil-dren to government health centers for institutional deliveries, postnatal visits,and BCG (Bacillus Calmette– Guérin) vaccinations, as well as incentives to private sector providers for emergency caesarean- section deliveries (see, for example, Dagur, Senauer, and Switlock- Prose 2010). Another example is the incentives paid by the NGO BRAC to community health workers for super-vision of directly observed treatment, that is, short course directly observed therapy for the treatment of tuberculosis (DOTS) in tuberculosis patients in Bangladesh. The community health worker must supervise the treatment on a daily basis and is paid when the patient successfully completes DOTS.
Apart from these formal arrangements, providers involved in PBF schemes have been known to devise informal incentive- based arrangements with community health workers to encourage them to bring clients to the health facility. Such arrangements are much more common than the formal ones. Providers do this because they recognize that by paying a community health worker a small sum for identifying a pregnant woman, for example,and bringing her to the health facility, the facility- based workers may gain additional remuneration for the antenatal care visits and delivery- related services that will be used by this woman. Appropriate training can help make facility- based workers aware of the possibility and feasibility of imple-menting an informal arrangement such as this.
Add Demand- Side Financial or In- Kind Incentives for Patients
Many demand- side incentives are in the form of cash transfers, dependent on use of a particular service. They are designed to off set the fi nancial and opportunity costs of accessing care. An example is the demand- side fi nan-cial incentives paid to a pregnant woman for delivering in an accredited gov-ernment health institution as part of the India JSY program in which they are complementary to the supply- side payments to the community health workers discussed above. From an equity perspective, the program makesa special eff ort to reach the poor and overcome the barriers they may face in accessing care because the amount of cash provided varies by the profi le of the state (good- performing and worst- performing facilities), the urban- rural location of the facility, and the woman’s status of living “below poverty line” (BPL). Pregnant women also receive transportation vouchers.
Vouchers are a special type of fi nancial incentive that is provided tohouseholds to obtain free or highly subsidized health services, such as treat-ment of tuberculosis or sexually transmitted infections. Vouchers for safe motherhood services are fairly common. They are used in many countries in
130 Performance-Based Financing Toolkit
Africa, Asia, and Latin America, although mainly at a small scale and often with the support of NGOs (Bellows and Hamilton 2009; Bellows, Bellows, and Warren 2011; Bellows et al. 2013; Obare et al. 2013). The health facility retains these vouchers and is paid by the government or a private organiza-tion on the basis of the number of services provided. As with the pure condi-tional cash payments, because these incentives address both fi nancial barri-ers and informational barriers, by generating awareness of the importance of a service, they are expected to disproportionately benefi t the poor.
Smaller in- kind incentives tend to focus on making the consultation or patient- provider interaction more comfortable. They have been most com-monly used to promote use of reproductive health services, but they can be used for other types of services, too. For example, in Katete district in Zam-bia some facilities prepare “welcome baby packages,” including, for example, soap, napkins, second- hand baby clothes, and so on for women who deliver in facilities. In Rwanda, a formal national in- kind transfer program is now linked to the national PBF system. Women are off ered a package of gifts if they consume certain services (such as antenatal care, skilled delivery, and postnatal care). This nationwide scale- up was built on the experience of pi-lot schemes from 2002 to 2005 when individual health facilities successfully attracted clients by off ering mothers “welcome baby packages.”
Interestingly, although these conditional in- kind incentive programs could easily exist in the absence of PBF, PBF has often facilitated their im-plementation by creating a better administrative infrastructure. Through the increased autonomy introduced into facilities by PBF, as well as opening of facility bank accounts (often for the fi rst time) by PBF, government is able to transfer cash to the facility bank accounts and facilities are then able to procure these goods on the local market using their own purchase commit-tee (rather than using a centralized supply chain). Consequently, this is an excellent example of the complementary and synergistic eff ects of supply- side PBF and demand- side incentive programs for reaching the poor. The PBF scheme creates the supply- side preconditions (that is, autonomy, bank accounts, and the ability to respond to increased demand) for the implemen-tation of a demand- side incentive scheme that, in turn, contributes to the same service objectives as the PBF.
5.4 Measuring and Monitoring Equity in PBF
The eff ects of PBF on equity have not yet been well documented in the pub-lished literature. This is in large part due to the more general paucity of rigorous studies of PBF in developing countries. As the number of rigorous
Addressing Equity 131
studies of PBF expands, program managers, principal investigators, and data analysts will have the opportunity to contribute to the evidence base on the eff ects of PBF on equity. Doing so will require (a) that impact evaluationsand other studies collect the data necessary for the measurement of the ef-fects of PBF on equity and (b) that the PBF community is equipped with theanalytical tools needed to measure equity.
In the following sections, we provide a synopsis of items to consider when measuring and monitoring the eff ects of PBF on equity. However, note that many of the steps provided will require the help of people with specializedexperience if they are to be done properly.
Applying the Correct Analytical Techniques
In measuring and monitoring PBF’s eff ect on equity, one is likely to be con-cerned with three main types of questions.
Have Inequalities in Health Care Use and Health Status(Illness) Improved?This question can be answered using a few diff erent techniques. First, health outcomes can be disaggregated by quintile to show how health outcomes vary across wealth groups. Most commonly, outcomes are disaggregated by quintile (from the poorest 20 percent of the population to the wealthi-est 20 percent of the population) or by deciles (into tenths). The results are presented in a table or in a bar graph like that in fi gure 5.3, panel a. Al-though the results of this analysis are very easy to interpret with one periodof data, comparing multiple bar graphs over multiple time periods (whichone would want to do to assess the eff ect of PBF on equity) is more diffi cult to do accurately.
A second technique can provide a summary measure of inequality. In this technique, the relationship between the top quintile and the bottom quintilecan be expressed as a ratio to obtain a summary measure of inequality (for example, 88 percent in the richest quintile divided by 64 percent in the poor-est quintile gives a ratio of 1.4 in the case of fi gure 5.3).
A third technique, also a summary measure of inequality, is the concen-tration index. This has one major advantage over the quintile ratio measure, namely, that it takes into account inequalities across the entire income dis-tribution, rather than only the gap between the top quintile and the bottom quintile. The concentration index can range between – 1 and +1. A nega-tive value means that the indicator takes a higher value among the poor,while a positive index means that the indicator takes a higher value among the better- off population. The larger the index in absolute size, the more
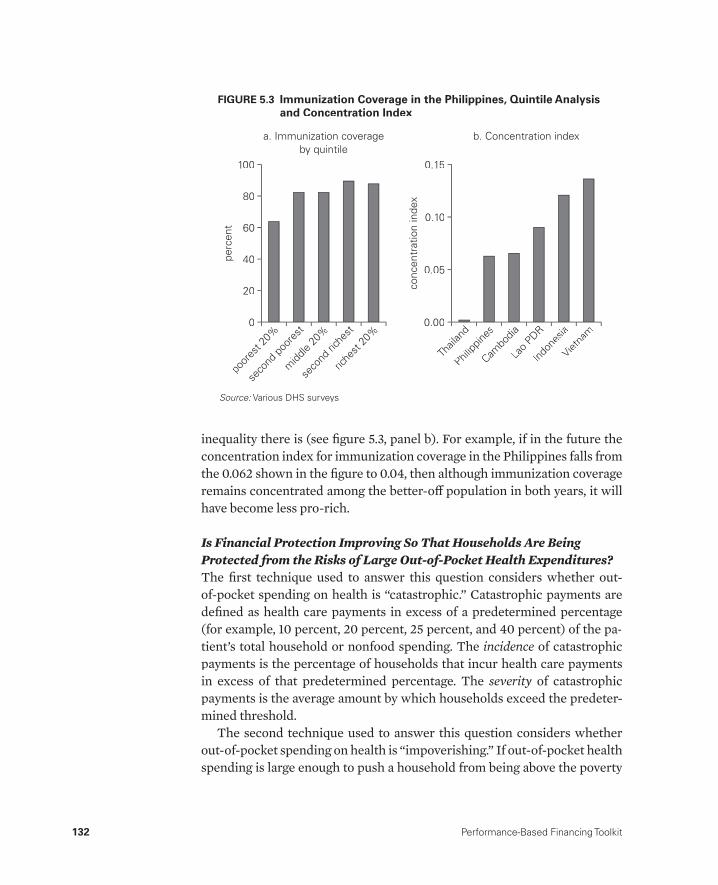
132 Performance-Based Financing Toolkit
inequality there is (see fi gure 5.3, panel b). For example, if in the future the concentration index for immunization coverage in the Philippines falls from the 0.062 shown in the fi gure to 0.04, then although immunization coverage remains concentrated among the better- off population in both years, it will have become less pro- rich.
Is Financial Protection Improving So That Households Are Being Protected from the Risks of Large Out- of- Pocket Health Expenditures?The fi rst technique used to answer this question considers whether out- of- pocket spending on health is “catastrophic.” Catastrophic payments are defi ned as health care payments in excess of a predetermined percentage (for example, 10 percent, 20 percent, 25 percent, and 40 percent) of the pa-tient’s total household or nonfood spending. The incidence of catastrophicpayments is the percentage of households that incur health care payments in excess of that predetermined percentage. The severity of catastrophicypayments is the average amount by which households exceed the predeter-mined threshold.
The second technique used to answer this question considers whether out- of- pocket spending on health is “impoverishing.” If out- of- pocket health spending is large enough to push a household from being above the poverty
b. Concentration index
conc
entr
atio
n in
dex
Thail
and
Philipp
ines
Cambo
dia
Lao P
DR
0.15
0.10
0.05
0.00
Indon
esia
Vietna
m
perc
ent
poor
est 2
0%
seco
nd po
ores
t
midd
le 20
%
seco
nd ric
hest
riche
st 20
%
20
100
80
60
40
0
a. Immunization coverageby quintile
FIGURE 5.3 Immunization Coverage in the Philippines, Quintile Analysisand Concentration Index
Source: Various DHS surveys.:

Addressing Equity 133
line before the health expenditure to being below the poverty line after the health expenditure, then the expenditure is classifi ed as impoverishing. The incidence of catastrophic payments is the percentage of households that in-cur health care payments that push them below the poverty line.
Is Government Spending on Health Becoming More or Less Pro- Poor?After a few years of implementation of PBF, especially if PBF has made a special eff ort to reach the poor, policy makers may want to know whether government spending on health is becoming more pro- poor. Whether this is the case depends on two factors: fi rst, how pro- poor the use of govern-ment health care services is; and second, the amount of money fl owing to the government- subsidized services that are used by the poor. PBF will po-tentially have an eff ect on both of these pathways. The technique used to assess the net eff ect of these two factors is called benefi t- incidence analysis. It answers the question whether, and by how much, government health ex-penditure disproportionately benefi ts the poor.
Applying these techniques will require knowledge of the methods and ac-cess to the software used to implement these techniques. Fortunately, many resources are available to provide assistance. To learn more about these tech-niques and the way to implement them using the free ADePT software, visit the ADePT Resource Center at http://www.worldbank.org/povertyandhealth to download software, manuals, training courses, and teaching materials. For an excellent resource to learn more about how to implement these techniques in STATA, see O’Donnell et al. (2008).
Collecting the Right Data
Only rarely can administrative data— data from the health information sys-tem (HIS)— be used to apply the techniques needed to assess equity. One lim-itation is that most HISs do not contain information on who is poor and who is not.4 A second, more important limitation is that the HIS only capturesdata on those people who actually use health services and not on the popula-tion as a whole. Consequently, the HIS cannot tell us how PBF has improved equity in health care use or fi nancial protection across the entire popula-tion. Therefore, for eff ective measuring and monitoring of equity, data from household surveys are needed. Obtaining the data involves selecting a rep-resentative sample of households or individuals from the population of the intervention area and administering a questionnaire to gather information on various characteristics of the household (such as income, location, and
134 Performance-Based Financing Toolkit
assets) and of individuals within that household (such as age, sex, education, illness, health care use, and health expenditure).
To measure equity in health care use and health status, one needs data on living standards (information on a household’s economic well- being or socioeconomic status that enables one to construct a continuous vari-able that ranks households from poorest to richest, such as data on assets, consumption, or expenditure), household size, illness variables, and health care use variables (information on the services that are targeted by PBF, forexample, antenatal care, skilled birth attendance, and immunization). The DHS provides a good model both for the construction of an asset index (as a measure of living standards) and for a method to measure the preven-tive care and maternal and child health– related services that are typically targeted by PBF.
To measure fi nancial protection, one needs data on household consump-tion or expenditure (assets are not suffi cient), household size, and out- of- pocket health expenditure. The household survey instrument contained in the World Bank’s RBF Impact Evaluation Toolkit is a good model for the collection of data on consumption and on health expenditure.5
To conduct benefi t- incidence analysis, one needs data on living standards (consumption, expenditure, or assets), data on use of health care, and, cru-cially, information on government health care expenditure on health facili-ties of diff erent types. Data on government health expenditure can be ob-tained from National Health Accounts reports or directly from ministries of health.
Using Equity Analysis to Inform Policy
The objective of equity analysis is to inform policy— policy that is directly related to PBF and policy that is complementary to PBF. Knowing how to conduct equity analysis and collecting the data needed to do so is just the fi rst step. It is essential that the results are used to monitor the eff ects of PBF programs over time and to provide input into the way PBF programs are designed and implemented. While any PBF program that improves average health care use should be considered a success, making a diff erence for the poorest population is an even more important concern. If the PBF program does not achieve this, then its design and implementation arrangements should be carefully examined to determine where changes could be made. Introducing some of the design elements discussed in this chapter would be a good fi rst step.

Addressing Equity 135
Recommended Resources
Section 1
For easily accessible statistical data on inequalities in health care use by country and region, see the following:
Health Equity and Financial Protection Country Datasheets, World Bank, Washington, DC, http://www.worldbank.org/povertyandhealth: country- specifi c factsheets on equity in health outcomes and service use, including data by quintile, and fi nancial protection.
HealthStats (database), World Bank, Washington, DC, http://datatopics.worldbank.org/hnp: select health indicators, including quintile data.
MEASURE DHS STATcompiler, ICF International, Calverton, MD, http://www.statcompiler.com: customizable country table on health outcomes, in-cluding by quintile and region, based on demographic and health surveys.
For case studies of health care interventions that were designed to re-duce inequalities and enhance fi nancial protection, see the following:
Gwatkin, D., A. Yazbeck, and A. Wagstaff , eds. 2005. Reaching the Poor withHealth, Nutrition, and Population Services: What Works, What Doesn’t, and Why. Washington, DC: World Bank.
Yazbeck, A. 2009. Attacking Inequality in the Health Sector: A Synthesis of Evidence and Tools. Washington, DC: World Bank.
Section 3
For theoretical and practical information on targeting health services at poor areas and poor people, see the following:
Coady, D., M. Grosh, and J. Hoddinott. 2004. Targeting of Transfers in Devel-oping Countries: Review of Experience and Lessons. Washington, DC: World Bank.
For examples of how PBF can be designed to be more pro- poor:
See the references cited in each part of section 3.
Join the online conversations of the PBF and Equity Working group at http://www.healthfi nancingafrica.org/join- our- cops.html: click “Results Based Fi-nancing,” click “sign in,” and then click “sign up.”

136 Performance-Based Financing Toolkit
Section 4
For more information on how to measure and monitor equity, see or visit the following:
Health Equity and Financial Protection, World Bank, Washington, DC, http://www.worldbank.org/povertyandhealth: ADePT Training Resource Center, including ADePT software, ADePT Health Manual, and online train-ing materials.
Impact Evaluation Toolkit. World Bank, Washington, DC, http://go.worldbank.org/IT69C5OGL0: information on implementation of surveys and a model survey instrument that includes the variables needed to measure equity.
MEASURE DHS, World Bank, Washington, DC, http://www.measuredhs.com: Demographic and Health Surveys (DHS) instruments as examples of good survey instruments for measuring living standards and access to care.
O’Donnell, O., E. van Doorslaer, A. Wagstaff , and M. Lindelow. 2008. Analyz-ing Health Equity Using Household Survey Data: A Guide to Techniques and Their Implementation. Washington, DC: World Bank (for guidance on statis-tical techniques and STATA do- fi les).
Notes
1. We are not suggesting that health workers are motivated only by money; weknow that they feel a strong moral obligation to serve all patients. We simply mean that beyond health workers’ moral motivation to serve their clients, thesalary system provides fairly little additional fi nancial motivation to provide lservices compared to other remuneration schemes.
2. The process of distinguishing between rich and poor areas is also sometimes referred to as poverty mapping.
3. A new nationwide follow- up program is called Plan Sumar. 4. There are some exceptions. In systems where poor households are identifi ed by
a poverty card (such as India’s BPL card) or a diff erent type of health insurance card (such as that in Indonesia’s Jamkesmas program), it would be possible to collect information on who is poor by using the health information system.
5. Visit http://www.worldbank.org/health/impactevaluationtoolkit.
References
Afghanistan Ministry of Public Health, Johns Hopkins University, and IIHMR (Indian Institute of Health Management Research). 2006. Afghanistan Health Sec-tor Balanced Score Card National and Provincial Results: Round Three 2006. Kabul:Afghanistan Ministry of Public Health, Johns Hopkins University, and IIHMR.
Addressing Equity 137
Annear, P. 2010. “A Comprehensive Review of the Literature on Health Equity Funds in Cambodia 2001– 2010 and Annotated Bibliography.” Health Policy and Health Finance Knowledge Hub Working Paper No. 9, Nossel Institute forGlobal Health, University of Melbourne, Melbourne.
Bellows, N. M., B. W. Bellows, and C. Warren. 2011. “The Use of Vouchers for Repro-ductive Health Services in Developing Countries: Systematic Review.” Tropical Medicine and International Health 16(1): 84– 96.
Bellows, B., and M. Hamilton. 2009. “Vouchers for Health: Increasing Use of Facility- Based STI and Safe Motherhood Services in Uganda.” Maternal and Child HealthP4P Case Study, Health Systems 20/20, Abt Associates Inc., Bethesda, MD.
Bellows, B., C. Kyobutungi, M. K. Mutua, C. Warren, and A. Ezeh. 2013. “Increasein Facility- Based Deliveries Associated with a Maternal Health Voucher Pro-gramme in Informal Settlements in Nairobi, Kenya.” Health Policy and Planning 28(2): 134– 42.
Bredenkamp, C. 2009. “The Puzzle of Isolation Bonuses for Health Workers.” RBF Technical Brief, World Bank, September. http://www.rbfh ealth.org/rbfh ealth/library/doc/214/puzzle- isolation- bonuses- health- workers.
Coady, D., M. Grosh, and J. Hoddinott. 2004. Targeting of Transfers in Developing Countries: Review of Experience and Lessons. Washington, DC: World Bank.
Dagur, V., K. Senauer, and K. Switlock- Prose. 2010. “Paying for Performance: The Ja-nani Suraksha Yojana Program in India.” P4P Case Study, Health Systems 20/20, Abt Associates Inc., Bethesda, MD. http://www.healthsystems2020.org/content/resource/detail/2609/.
Gwatkin, D. R. 2010. “Ensuring that the Poor Share Fully in the Benefi ts of Results- Based Financing Programs in Health.” RBF Working Paper, World Bank, Washing-ton, DC. http://www.rbfh ealth.org/system/fi les/RBF_Tech_Equity_03.pdf.
Gwatkin, D., A. Yazbeck, and A. Wagstaff , eds. 2005. Reaching the Poor with Health, Nutrition, and Population Services: What Works, What Doesn’t, and Why. Wash-ington, DC: World Bank.
Hercot, D., B. Meessen, V. Ridde, and L. Gilson. 2011. “Removing User Fees for Health Services in Low- Income Countries: A Multi- Country Review Frame-work for Assessing the Process of Policy Change.” Health Policy and Planning 26g(suppl 2): ii5– 15.
Meessen, B., L. Gilson, and A. Tibouti. 2011. “User Fee Removal in Low- IncomeCountries: Sharing Knowledge to Support Managed Implementation.” Health Policy and Planning 26 (suppl 2): ii1– 4.g
Meessen, B., D. Hercot, M. Noirhomme, V. Ridde, A. Tibouti, C. K. Tashobya, andL. Gilson. 2011. “Removing User Fees in the Health Sector: A Review of Policy Processes in Six Sub- Saharan African Countries.” Health Policy and Planning 26 g(suppl 2): ii6– 29.
MSPLS (Ministere de la sante publique et de la lutte contre le SIDA). 2012. Rapport annuel de mise en oeuvre du fi nancement basé sur la performance au Burundi.Bujumbura: MSPLS.
Obare, F., C. Warrren, R. Njuki, T. Abuya, J. Sunday, I. Askew, and B. Bellows. 2013. “Community- Level Impact of the Reproductive Health Vouchers Programme on Service Use in Kenya.” Health Policy and Planning 28 (2): 165– 75.

138 Performance-Based Financing Toolkit
O’Donnell, O., E. van Doorslaer, A. Wagstaff , and M. Lindelow. 2008. Analyzing Health Equity Using Household Survey Data: A Guide to Techniques and TheirImplementation. Washington, DC: World Bank.
Orem, J. N., F. Mugisha, C. Kirunga, J. Macq, and B. Criel. 2011. “Abolition of UserFees: The Uganda Paradox.” Health Policy and Planning 26 (suppl 2): ii41– 51.g
Perkins, M., E. Brazier, E. Themmen, B. Bassane, D. Diallo, A. Mutunga, T. Mwaka-jonga, and O. Ngobola. 2009. “Out- of- Pocket Costs for Facility- Based Maternity Care in Three African Countries.” Health Policy and Planning 24 (4): 289– 300.
Roberts, M. J., W. Hsiao, P. Berman, and M. Reich. 2004. Getting Health Reform Right: A Guide to Improving Performance and Equity. New York: Oxford Univer-sity Press.
Soeters, R., ed. 2012. PBF in Action: Theory and Instruments, Performance- Based Financing Course Guide. The Hague: Cordaid.
WHO (World Health Organization). 2010. World Health Report: Health Systems Financing— The Path to Universal Coverage. Geneva: WHO.
World Bank. 2007. Healthy Development: The World Bank Strategy for Health, Nutri-tion, and Population Results. Washington, DC: World Bank.
———. 2009. “Argentina: Provincial Maternal and Child Health Insurance: A Results- Based Financing Project at Work.” En Breve 150, World Bank, Washington, DC.
Yazbeck, A. 2009. Attacking Inequality in the Health Sector: A Synthesis of Evidenceand Tools. Washington, DC: World Bank.

139
Health Facility Autonomy and Governance
CHAPTER 6
MAIN MESSAGES
➜ Increasing health facility autonomy is vital for successful PBF.➜ Introducing PBF and health facility autonomy resembles creating a coop-
erative in which health workers become stakeholders.➜ PBF encourages health workers to act as social entrepreneurs.➜ Autonomy demands accountability and good governance structures.
COVERED IN THIS CHAPTER
6.1 Introduction: The importance of health facility autonomy6.2 Main elements of health facility autonomy6.3 Enhancing autonomy: Improving results6.4 Autonomy demands accountability6.5 Fee setting and drug revolving funds
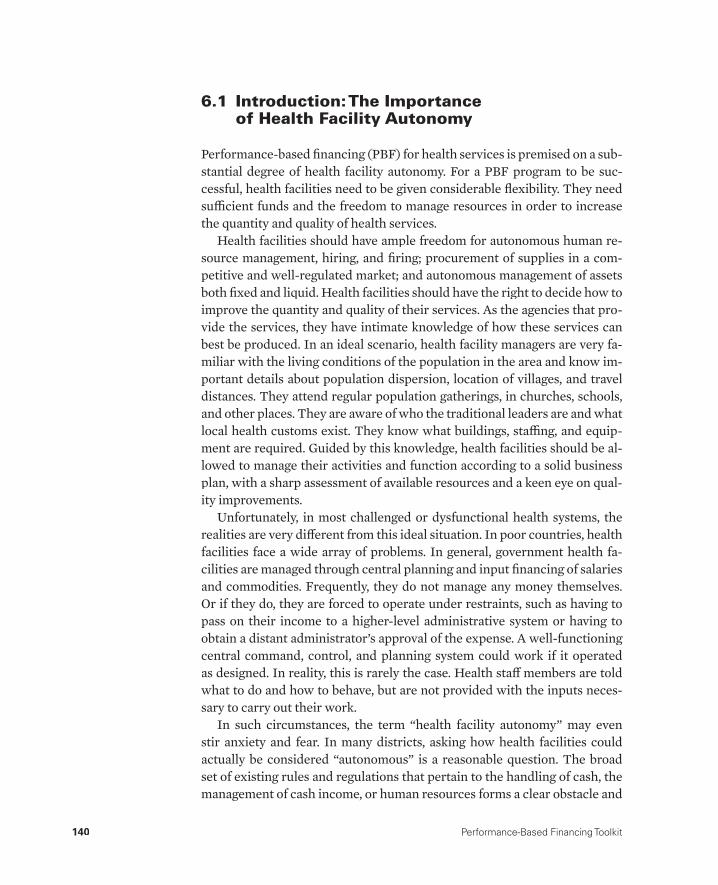
140 Performance-Based Financing Toolkit
6.1 Introduction: The Importanceof Health Facility Autonomy
Performance- based fi nancing (PBF) for health services is premised on a sub-stantial degree of health facility autonomy. For a PBF program to be suc-cessful, health facilities need to be given considerable fl exibility. They need suffi cient funds and the freedom to manage resources in order to increase the quantity and quality of health services.
Health facilities should have ample freedom for autonomous human re-source management, hiring, and fi ring; procurement of supplies in a com-petitive and well- regulated market; and autonomous management of assets both fi xed and liquid. Health facilities should have the right to decide how to improve the quantity and quality of their services. As the agencies that pro-vide the services, they have intimate knowledge of how these services can best be produced. In an ideal scenario, health facility managers are very fa-miliar with the living conditions of the population in the area and know im-portant details about population dispersion, location of villages, and travel distances. They attend regular population gatherings, in churches, schools, and other places. They are aware of who the traditional leaders are and what local health customs exist. They know what buildings, staffi ng, and equip-ment are required. Guided by this knowledge, health facilities should be al-lowed to manage their activities and function according to a solid business plan, with a sharp assessment of available resources and a keen eye on qual-ity improvements.
Unfortunately, in most challenged or dysfunctional health systems, the realities are very diff erent from this ideal situation. In poor countries, health facilities face a wide array of problems. In general, government health fa-cilities are managed through central planning and input fi nancing of salaries and commodities. Frequently, they do not manage any money themselves. Or if they do, they are forced to operate under restraints, such as having to pass on their income to a higher- level administrative system or having to obtain a distant administrator’s approval of the expense. A well- functioning central command, control, and planning system could work if it operated as designed. In reality, this is rarely the case. Health staff members are told what to do and how to behave, but are not provided with the inputs neces-sary to carry out their work.
In such circumstances, the term “health facility autonomy” may even stir anxiety and fear. In many districts, asking how health facilities could actually be considered “autonomous” is a reasonable question. The broad set of existing rules and regulations that pertain to the handling of cash, the management of cash income, or human resources forms a clear obstacle and

Health Facility Autonomy and Governance 141
blocks any sense of developing health facility autonomy. Some staff members and workers’ unions themselves may even resist autonomy in such situationsout of fear of the unpredictable eff ects such changes could bring to staff em-ployment and wages.
Nonetheless, PBF deems moving in the direction of health facility auton-omy vital for sustainable improvements. The concrete results of PBF in sev-eral more autonomous settings may validate the case. Over the past decades, PBF has fl ourished in rather heterogeneous environments. It has taken off inSouth Kivu, the Democratic Republic of Congo, where government is virtu-ally absent, salaries of health workers are not being paid, and health facili-ties are surviving through the user fees obtained from the population. PBF has boomed in Rwanda, where government reigns with a strong hand. PBF has succeeded in environments such as in Burundi, where the government is recovering from confl ict and trying to rebuild its authority. From the do- it- yourself attitude in the Democratic Republic of Congo to the strong gov-ernance of Rwanda or the initially weak governance structures of Burundi,1
one common variable stands out in all these settings. That variable explains in part why, in these three very diff erent contexts, PBF is still making strides.That variable is health facility autonomy.
6.2 Main Elements of Health Facility Autonomy
The elements that need to be introduced to facilitate autonomous manage-ment of a health facility are listed in table 6.1. The table may be a useful aidin discussing autonomy with government counterparts.
6.3 Enhancing Autonomy: Improving Results
The Path
Expanding health facility autonomy does not happen overnight. To change established ways of operating and overcome traditions of central command and control is hard work. The process of hiring and fi ring staff members can-not be changed immediately, nor can rigid or dysfunctional central medical procurement and supply systems be changed without considerable eff ort. And neither can the perception that “health staff cannot manage cash” be easily discarded. At the outset, resistance can be considerable. However, each of the transformations mentioned is necessary for PBF to work, and the various processes leading to change are, therefore, worth studying in depth.
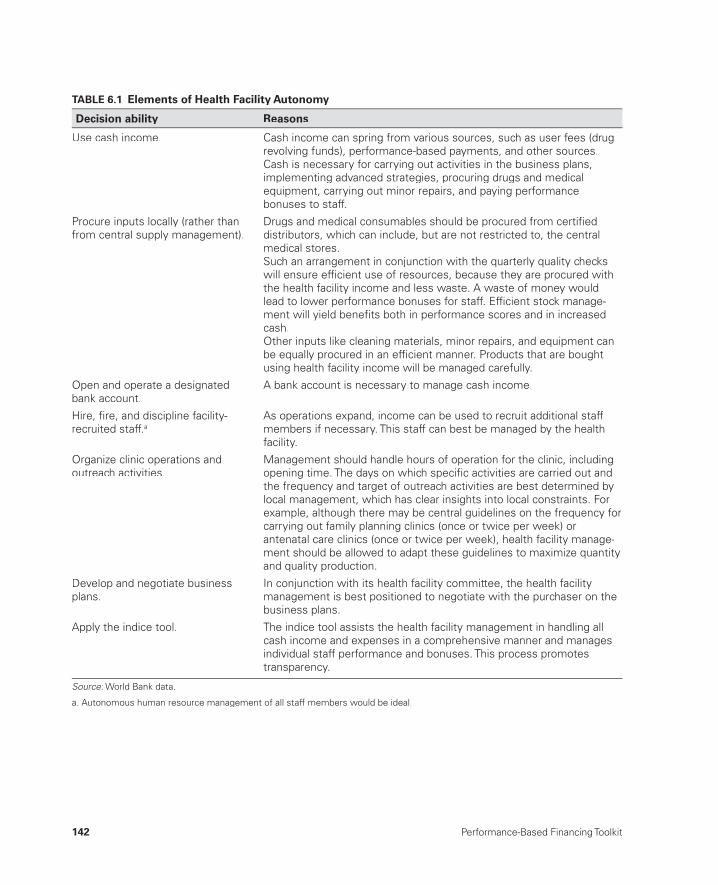
142 Performance-Based Financing Toolkit
TABLE 6.1 Elements of Health Facility Autonomy
Decision ability Reasons
Use cash income. Cash income can spring from various sources, such as user fees (drugrevolving funds), performance-based payments, and other sources.Cash is necessary for carrying out activities in the business plans,implementing advanced strategies, procuring drugs and medicalequipment, carrying out minor repairs, and paying performance bonuses to staff.
Procure inputs locally (rather than from central supply management).
Drugs and medical consumables should be procured from certifi ed distributors, which can include, but are not restricted to, the centralmedical stores.Such an arrangement in conjunction with the quarterly quality checkswill ensure effi cient use of resources, because they are procured with the health facility income and less waste. A waste of money wouldlead to lower performance bonuses for staff. Effi cient stock manage-ment will yield benefi ts both in performance scores and in increasedcash.Other inputs like cleaning materials, minor repairs, and equipment canbe equally procured in an effi cient manner. Products that are bought using health facility income will be managed carefully.
Open and operate a designatedbank account.
A bank account is necessary to manage cash income.
Hire, fi re, and discipline facility-recruited staff.a
As operations expand, income can be used to recruit additional staff members if necessary. This staff can best be managed by the health facility.
Organize clinic operations andoutreach activities.
Management should handle hours of operation for the clinic, includingopening time. The days on which specifi c activities are carried out andthe frequency and target of outreach activities are best determined bylocal management, which has clear insights into local constraints. Forexample, although there may be central guidelines on the frequency forcarrying out family planning clinics (once or twice per week) or antenatal care clinics (once or twice per week), health facility manage-ment should be allowed to adapt these guidelines to maximize quantity and quality production.
Develop and negotiate business plans.
In conjunction with its health facility committee, the health facility management is best positioned to negotiate with the purchaser on thebusiness plans.
Apply the indice tool. The indice tool assists the health facility management in handling allcash income and expenses in a comprehensive manner and managesindividual staff performance and bonuses. This process promotes transparency.
Source: World Bank data.:
a. Autonomous human resource management of all staff members would be ideal.
Health Facility Autonomy and Governance 143
PBF practice indicates that these contentious issues should be tackled early in the discussions with your PBF counterparts.
Implementers may be aided by the fact that many of the necessary trans-formations can be linked to broader, ongoing social or administrative re-forms. For example, the policies of hiring and fi ring may be connected to general civil service protocol. If a country decides to embark on civil service reforms (which was the case in Rwanda), this may facilitate the introductionof PBF health facility autonomy in staff recruitment as well (see box 6.1).Another example is a case in which health facility autonomy requires the existence of health facility bank accounts; this transformation is sometimes demanded in a country for reasons other than PBF as well.
In Rwanda, for instance, the government decided to decentralize human resource management to the district level and tied available civil servant positions to specifi c health facilities. In addition, it continued to invest— predominantly through available bilateral funding— into improving the per-formance of its central medical stores, which work through a “pull” system and a Bamako- type drug revolving fund. This approach met PBF require-ments. In Rwanda, about half of the health workers are contract workers who are employed directly by the health facility. In Burundi, this fi gure is about 10– 30 percent. Such developments can be catalyzed further, when PBF quantity and quality of health services increase and income, in turn, rises. This may encourage health facility managers to fi nd the most effi cient staffi ng patterns, fueling further powers of staffi ng management.
Step by Step
Table 6.2 provides a simplifi ed illustration of diff erent situations used to en-hance autonomy and results they are likely to produce. Going step by step from situations 1 to 5, one can see the progression from less autonomy to
Human resource management is defi ned as “adegree or level of freedom and discretion al-lowed to an employee over his or her job. As a general rule, jobs with high degree of autonomy
engender a sense of responsibility and greater job satisfaction in the employee(s). Not everyemployee, however, prefers a job with high de-gree of responsibility.”
BOX 6.1
Defi ning Human Resource Management
Source: BusinessDictionary.com, http://www.businessdictionary.com/defi nition/autonomy.html#ixzz1vhHGO0QC.:

144 Performance-Based Financing Toolkit
more autonomy. In situation 5, in which health staff members are told what to do, guided by the services and the quality norms, much discretion is given for how to go about achieving the objectives. In this situation, health staff members can participate. They are made stakeholders in their own health facility and can earn signifi cant performance- related bonus payments. This approach is quite the opposite of situation 1. In situation 5, health staff mem-bers are provided the cash necessary to deliver services and to improve qual-ity, and they earn more money by working harder and by delivering more good- quality results. In situation 5, health staff members are made autono-mous and responsible for their own results. Situation 5 approaches PBF.
6.4 Autonomy Demands Accountability
Greater autonomy requires accountability. PBF makes use of a whole range of instruments to ensure accountability: dealing with funds locally, at health facility level; regulating the income; dispensing staff bonuses; and ensuring that the cash entering the health facilities is spent in a transparent fashion.
Tools that help manage total health facility income in an integral man-ner, while allocating performance bonuses to individual health workers as a share of the income, are the indice tool (see chapter 7) and the individual performance evaluation (see chapter 10).
TABLE 6.2 Enhancing Autonomy and Improving Results Step by Step
SituationLevel of health facility autonomy and expected results
1 Tell the facility what to do and how to do it. Do not supply the drugs and equipment to do it.
Severely compromised autonomy and limited results
2 Tell the facility what to do and how to do it. Supply thedrugs and equipment to do it.
Compromised autonomy and limitedresults
3 Tell the facility what to do, but not how to do it. Provide abudget to do it.
Increased autonomy and improvedresults
4 Tell the facility what to do, but not how to do it. Pay thefacility on the basis of outputs and quality, but do not let the staff share in profi ts.
Enhanced autonomy and improvedresults
5 Tell the facility what to do, but not how to do it. Pay thefacility on the basis of outputs and quality, and let the staff share in the profi ts.
Enhanced autonomy and enhancedresults
Source: World Bank data.:
Note: This typology is meant for illustration only and does not necessarily refl ect reality, which is much more complex. It is a:simplifi cation of various existing situations.
Health Facility Autonomy and Governance 145
The Stimulus of Staff Bonuses
Staff bonuses are derived from the income of the health facility. Health facil-ity income is obtained from user fees, health insurance, PBF, and eventual other sources. Bonus payments are, therefore, not only derived from PBFpayments but also result from the holistic management of total health facil-ity income.
In most environments of enhanced autonomy and increased responsibil-ity for results, frequently there are certain spending rules related to bonus payments. Often, a cap is determined, setting a maximum amount that can be spent on bonus payments. For instance, 40– 60 percent of the income of a health facility can be spent on staff bonuses and salaries.
The How and Why of Health Facility Committees
Enhanced autonomy with regards to the use of public funds requires over-sight, which necessitates the creation of a health facility committee. Apart from the standard fi nancial management tools used for accounting purposes, such as the income and expense registers and the quarterly income and ex-pense statement that are auditable through the regular bureaucratic over-sight mechanisms, public oversight is achieved through creating a health facility management committee (see box 6.2).
What is the role of the community in managingits health services? In Burundi, qualitative re-search on the role of community health commit-tees (comités de santé, or COSAs) and community- based organizations (CBOs) was carried out. In general, COSAs in health facilities that were under PBF schemes functioned bet-ter than those that were not under PBF schemes; these COSAs were involved in devel-oping business plans, and community mem-bers were paid a sitting allowance as opposed
to COSAs in non- PBF facilities. However, over-all, the COSAs’ role was focused on supporting the health staff and not on representing the population. The role of the CBOs in PBF facili-ties was more promising: they were contracted by the nongovernmental organizations to verify whether patients had actually received servicesand to learn the patients’ opinions on those ser-vices. More analysis and experimentation isneeded to learn how to develop better account-ability mechanisms (Falisse et al. 2012).
BOX 6.2
Community Participation and Voice Mechanisms in Burundi
146 Performance-Based Financing Toolkit
Although fairly new, the experience with such health facility committees for PBF is promising, and increased experimentation is necessary to learn more about the ways in which these committees can become more eff ective in strengthening the community voice (Falisse et al. 2012).
The exact size and composition of such a committee varies according to location, but a few suggestions are as follows: (a) it should be small, and (b) it should have one or two members from the health facility partici-pate but without voting rights.
In many primary health care systems, various health facility committees, also named “neighborhood committees” or “ward development commit-tees,” exist. However, in nearly all cases, their membership is too large to be transplanted into the desired format, which requires a much smaller mem-bership. A good approach is to create a subcommittee from such a larger preexisting committee containing the essential persons (chair, treasurer, and others).
The chair of the health facility committee cosigns the purchase contract conjointly with the offi cial in charge of the health facility. One member of this health facility committee (its chair, or treasurer) could countersign checks. The functioning of the health facility committee is assessed each quarter using the quantifi ed quality checklist.
Frequently, health facility committee members asked to be paid. This is not advisable; if they are paid, they will lose their impartial nature. Minor expenses such as a sitting allowance or a travel per diem and food and drinks during the meetings can help compensate members for their time.
6.5 Fee Setting and Drug Revolving Funds
PBF uses public funds to subsidize services. PBF is concerned with bring-ing cash to health facilities. Whether the health facility raises cash through other sources (for example, user fees or drug fees for a drug revolving fund) is a decision for the health facility and its community. Community members, seated in the health facility management committee (the governing board), will form the interface between the community and the health facility and assist in setting such fees. Leveraging all other sources of cash (for instance, from user fees or drug revolving funds) and managing these holistically is an explicit aim of PBF. Public funds will be better managed (and targeted), as will all other sources of cash income.
PBF payments tend to focus predominantly on preventive services. It is best to focus a large part of the PBF fi nancing on services that are typically
Health Facility Autonomy and Governance 147
undersupplied by providers or underused by their patients. Of course, PBF funds also target curative care, which allows the purchaser to command quality related to content of care, such as rational prescribing of drugs and adherence to treatment protocols. Curative services are generally in high de-mand. Subsidizing curative care is a good strategy to lower fi nancial barriers to access to services. However, the ability to off er subsidies depends on the budget available. Very poor countries rarely have suffi cient public funds to pay for both curative and preventive care in any sustainable manner whilealso maintaining good quality and improving coverage.
A good strategy is to introduce a drug revolving fund and to explain tohealth staff members the relationship between lowering of the fi nancial cost to their patients (rational prescribing and limited mark- ups) and increased usage of services with the ability to increase total earnings by limiting missed opportunities (for vaccinations, antenatal care services, and family planning services). Such a strategy supports fi nancial sustainability (multiple sourcesof cash fi nancing, that is, not just from public funding) and opens the door to the introduction of risk- pooling arrangements (as a result of the cost signal for curative services).
Note
1. The nationwide successful scaling up of PBF in Burundi has created a case study in how to introduce good governance in a fragile state.
Reference
Falisse, J.- B., B. Meessen, J. Ndayishimiye, and M. Bossuyt. 2012. “Community Par-ticipation and Voice Mechanisms under Performance- Based Financing Schemesin Burundi.” Tropical Medicine and International Health 17 (5): 674– 82.


149
Health Facility Financial Management and the Indice Tool
CHAPTER 7
MAIN MESSAGES
➜ Cash income of health facilities can be from diff erent sources, including PBF. The indice tool helps the in- charge person of the health facility tomanage holistically all sources of cash income and expenses and to allo-cate a performance- based share of the profi ts to each health worker.
➜ PBF makes health workers shareholders in the fi nancial health of their health facility.
➜ Individual health- worker eff ort is rewarded each month. If you work harder, you receive a higher performance bonus. If you work less, thenyou receive a lower performance bonus.
Lack of money is the root of all evil.
— George Bernard Shaw

150 Performance-Based Financing Toolkit
COVERED IN THIS CHAPTER
7.1 Introduction7.2 General sources of cash income of a health facility7.3 Verifi cation of the amounts7.4 The processing of payments to health facilities7.5 The indice tool7.6 Links to fi les and tools
7.1 Introduction
Cash income of health facilities can originate from diff erent sources, includ-ing performance- based fi nancing (PBF). In PBF, building capacity to handle this cash at the facility level in an integrated and accountable manner is cru-cial. The indice tool helps the in- charge person of the health facility to man-age all sources of cash income and expenses and to allocate a performance- based share of the profi ts to each health worker.
Linking results to money requires good accountability structures to be in place:
• Produce good- quality results data to confi rm if the intended results have been achieved.
• Introduce accountability mechanisms for the governance of the public funds, which in turn promotes civil society and community involvement.
• Use budget disbursement as a proxy indicator for total performance, which can lead to good benchmarking of providers.
7.2 General Sources of Cash Incomeof a Health Facility
PBF is premised on cash being handled by health facilities. Possible sources of cash income for a health facility are (a) out- of- pocket payments; (b) fi xed cash support from government or aid agencies, for instance, to pay for ba-sic salaries or operational expenses; (c) income from health insurance pay-ments; and (d) payments of PBF subsidies or cash from other sources. The exact mix of cash income sources depends largely on context.
Especially in the PBF design phase, determine what existing cash sources are available and how much each of those sources contributes to the total income of a health facility. The possible scenarios range from cases in which no formal cash income reaches the facility to those in which the sources
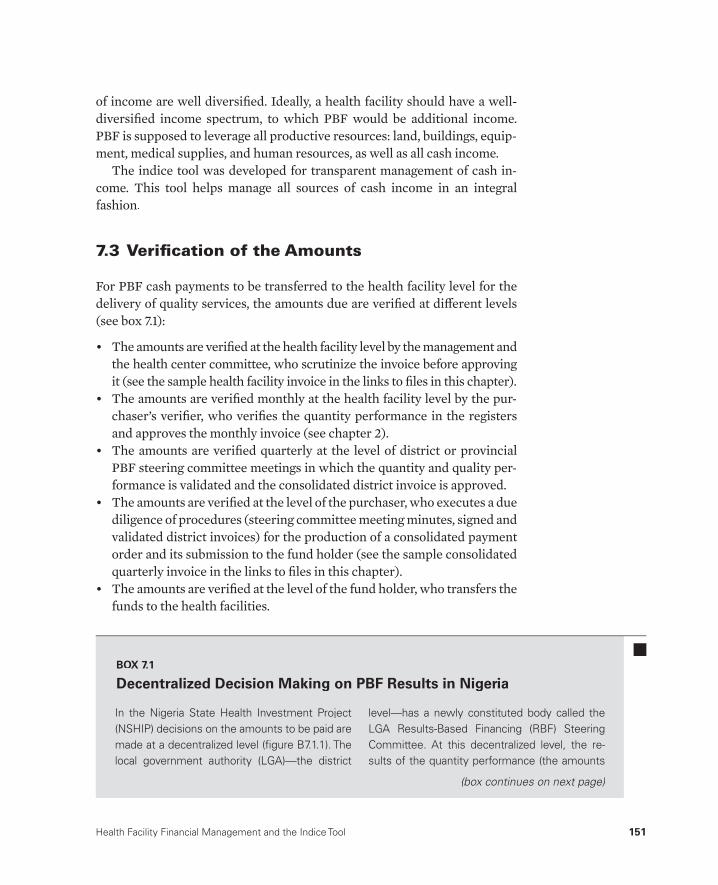
Health Facility Financial Management and the Indice Tool 151
of income are well diversifi ed. Ideally, a health facility should have a well- diversifi ed income spectrum, to which PBF would be additional income.PBF is supposed to leverage all productive resources: land, buildings, equip-ment, medical supplies, and human resources, as well as all cash income.
The indice tool was developed for transparent management of cash in-come. This tool helps manage all sources of cash income in an integral fashion.
7.3 Verifi cation of the Amounts
For PBF cash payments to be transferred to the health facility level for thedelivery of quality services, the amounts due are verifi ed at diff erent levels(see box 7.1):
• The amounts are verifi ed at the health facility level by the management and the health center committee, who scrutinize the invoice before approving it (see the sample health facility invoice in the links to fi les in this chapter).
• The amounts are verifi ed monthly at the health facility level by the pur-chaser’s verifi er, who verifi es the quantity performance in the registers and approves the monthly invoice (see chapter 2).
• The amounts are verifi ed quarterly at the level of district or provincial PBF steering committee meetings in which the quantity and quality per-formance is validated and the consolidated district invoice is approved.
• The amounts are verifi ed at the level of the purchaser, who executes a due diligence of procedures (steering committee meeting minutes, signed and validated district invoices) for the production of a consolidated payment order and its submission to the fund holder (see the sample consolidatedquarterly invoice in the links to fi les in this chapter).
• The amounts are verifi ed at the level of the fund holder, who transfers thefunds to the health facilities.
In the Nigeria State Health Investment Project(NSHIP) decisions on the amounts to be paid are made at a decentralized level (fi gure B7.1.1). Thelocal government authority (LGA)— the district
level— has a newly constituted body called the LGA Results- Based Financing (RBF) Steering Committee. At this decentralized level, the re-sults of the quantity performance (the amounts
BOX 7.1
Decentralized Decision Making on PBF Results in Nigeria
(box continues on next page)

152 Performance-Based Financing Toolkit
to be paid based on the volume of services) and the quality performance (the quality score deter-mined quarterly for each health facility) are scru-tinized. By use of a web- enabled application, a consolidated quarterly invoice is created for each district RBF steering committee. In the district steering committee meetings, the proof of ac-tual performance (the original monthly invoices and the results of the quarterly quality evalua-tions) is compared against the district invoices
printed from the database. The steering commit-tees are the governing boards for PBF. They in-clude the local government authority, the state ministry of health, the purchaser (the state pri-mary health care development agency), and civil society representatives.
In these decentralized meetings, perfor-mance is ratifi ed. Higher levels (the purchaser and the fund holder) carry out due diligenceonly on procedures.
SMOH/SPHCDA/
Partners
LGA RBF Steering Committee
Fund
Holder(s)
ServiceProvider:
HC/GeneralHospitals
Beneficiaries
SPHCDA PurchaserQuantity Evaluator
Follow-up and ClientSatisfactionSurveys
LGA PHC Dep.:
Quality Evaluator
Payment
AuthorizationSubmission of Results
PBC
Technical Support
FIGURE B7.1.1 NSHIP PBF Administrative Model
Source:Source: World Bank data.World Bank data::
Note: HC = health center; LGA = local government authority; NSHIP = Nigeria :State Health Investment Project; PBC = performance- based contracting; PHC = primary health care; PBF = performance- based fi nancing;RBF = results- based fi nancing; SMOH = state ministry of health;SPHCDA = state primary health care development agency.
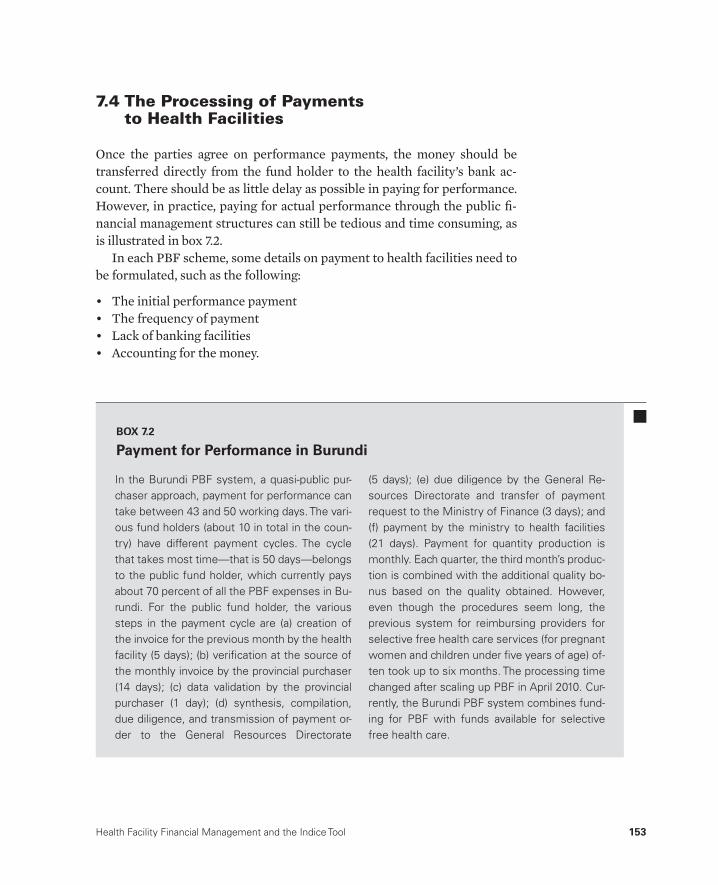
Health Facility Financial Management and the Indice Tool 153
7.4 The Processing of Payments to Health Facilities
Once the parties agree on performance payments, the money should be transferred directly from the fund holder to the health facility’s bank ac-count. There should be as little delay as possible in paying for performance. However, in practice, paying for actual performance through the public fi -nancial management structures can still be tedious and time consuming, as is illustrated in box 7.2.
In each PBF scheme, some details on payment to health facilities need to be formulated, such as the following:
• The initial performance payment• The frequency of payment• Lack of banking facilities• Accounting for the money.
In the Burundi PBF system, a quasi- public pur-chaser approach, payment for performance can take between 43 and 50 working days. The vari-ous fund holders (about 10 in total in the coun-try) have different payment cycles. The cycle that takes most time— that is 50 days— belongs to the public fund holder, which currently pays about 70 percent of all the PBF expenses in Bu-rundi. For the public fund holder, the various steps in the payment cycle are (a) creation ofthe invoice for the previous month by the healthfacility (5 days); (b) verifi cation at the source of the monthly invoice by the provincial purchaser(14 days); (c) data validation by the provincial purchaser (1 day); (d) synthesis, compilation,due diligence, and transmission of payment or-der to the General Resources Directorate
(5 days); (e) due diligence by the General Re-sources Directorate and transfer of payment request to the Ministry of Finance (3 days); and (f) payment by the ministry to health facilities (21 days). Payment for quantity production is monthly. Each quarter, the third month’s produc-tion is combined with the additional quality bo-nus based on the quality obtained. However,even though the procedures seem long, the previous system for reimbursing providers for selective free health care services (for pregnant women and children under fi ve years of age) of-ten took up to six months. The processing time changed after scaling up PBF in April 2010. Cur-rently, the Burundi PBF system combines fund-ing for PBF with funds available for selective free health care.
BOX 7.2
Payment for Performance in Burundi

154 Performance-Based Financing Toolkit
The Initial Performance Payment
Health staff may have a long wait for the fi rst performance payment. Con-sider this issue when scaling up PBF. Staff members may have heightened expectations: they have worked hard to make a diff erence, yet must wait two months after the end of the fi rst quarter to receive their fi rst payment (up to fi ve months into the program). This initial delay in rewards can create resentment. Two ways of dealing with this delay are (a) to introduce qual-ity improvement units and to fi nance the business plan (see chapter 9) and (b) to allow a lump- sum payment by the end of the second month into the next quarter of the PBF program (for the previous quarter’s performance). A lump sum will demonstrate to the staff that PBF is a reality, and it can help kick- start the quarterly payment cycle (because the payment for the fi rst quarter will arrive in month fi ve).
The Frequency of Payment
Payment is best made once a quarter. Although payment could be monthly, as in Burundi it is probably easier for the system to pay once per quarter. The indice tool not only helps the health facility manager distribute performance bonuses quarterly (by dividing the bonus portion over three months), but also assists in the fi nancial planning.
Lack of Banking Facilities
Some health facilities have no access to formal banking services. An absence of formal banks can be an obstacle for PBF, and creative thinking is often needed to fi nd a solution, as illustrated in box 7.3.
Accounting for the Money
Accounting for the money is part and parcel of PBF practice. For the funds they handle, health facilities use income and expense registers to document their daily cash fl ows. The quarterly income- expense statement, which is part of the PBF indice tool (see section 7.5) and the business plan (see chap-ter 10), is used by the health facility management committee, the purchasing agency, and the district health management. Health facility staff members are involved closely in deciding how much to spend on what. Their man-agement regularly informs them about their individual performance evalu-ations and performance bonus payments. Health facility staff members are also closely consulted when an investment must be made that would require

Health Facility Financial Management and the Indice Tool 155
forfeiting part or whole of their performance bonuses. Making staff mem-bers of a health facility stakeholders in the fi nancial health of their facility involves intense teamwork and a large degree of fi nancial transparency andshared decision making. Health facilities can be subject to routine fi nancial audits by the public administration.
7.5 The Indice Tool
The indice tool is a financial management tool that helps the manager (a) manage all cash income and expenses of the facility in a holistic and integrated manner; (b) provide a summary snapshot on the income and expense statements of the health facility and, therefore, is also a
In South Kivu province, the Democratic Repub-lic of Congo, Cordaid, a Dutch nongovernmentalorganization, has been managing a multisec-toral PBF project since 2007. In this far- away re-gion, health facilities could not open an account at a formal bank. The only bank branches were in the province’s capital, Bukavu. Cordaid de-cided to use agricultural cooperatives and mi-crocredit lenders. Although those institutionsare not banks, they are registered and legiti-mate entities. Shabunda did not have even anagricultural cooperative, which meant that Cor-daid initially had to use cash in an unsafe area. As a solution to this problem, the start- upcosts of a cooperative were fi nanced (whichamounted to less than US$20,000). Today,Shabunda has a bank that traders and the pur-chasing agent use. With these arrangements, there have been no problems transferring money from the purchasing agent to the healthfacilities.
In Chad, a World Bank– funded project em-ploys a performance- purchasing agency, the Eu-
ropean Agency for Development and Health(AEDES) to carry out the purchasing function onbehalf of the government. Chad has very low banking coverage. PBF is implemented in eight remote districts. For security reasons, AEDES was not willing to transport cash from a bank to the 120 contracted facilities. Initially, AEDES thought this lack of transportation would pose a major obstacle. In reality, there were manymore options on the ground than the agencyhad accounted for. Money transfer agencies,microcredit institutions, and church- based pay-ment systems were willing to step in. Ulti-mately, almost half the contracted facilities opened a bank account at an express union— a local money transfer agency that was ready to open a separate account for each facility. Theother half of the facilities used the services of a microcredit agency (such as caisses d’épargneet de retraite de Koumra, PARCEC, Moissala,and CECI Lai). Five health facilities (mostly hos-pitals) opted to open an account in an offi cial bank.
BOX 7.3
Getting Money to Facilities

156 Performance-Based Financing Toolkit
budget planning tool; and (c) allocate performance bonuses to individ-ual health workers in a transparent manner.
The indice tool exists in a paper form and in a Microsoft Excel form (see box 7.4). In this section, the paper form is presented. For guidance on using the Microsoft Excel form, see the document explaining its functionality in the links to fi les in this chapter. The Microsoft Excel form is typically used in larger facilities that have access to electricity and computers. The paper form is mostly used in smaller facilities such as health centers.
The Paper- Based Indice Tool
The indice tool exists in many variants. The example used here is from Ni-geria (see the links to fi les in this chapter). The Nigerian tool contains four sections:
a. Revenues and expenses for the past quarter: statement of quarterly fi -nancial activities
b. Revenues and expenses for the past month and proposed monthly rev-enues and expenses for the next quarter
c. Budget for performance bonuses; point value and monthly performance bonus
d. Individual indice value and bonus.
Revenues and Expenses for the Past Quarter: Statement of Quarterly Financial ActivitiesThis fi rst part of the indice tool lists the cash income that the health facility has received and specifi es the source of this cash over the previous quarter. It also itemizes the health facility expenditures in various categories over the same quarter, and it gives the bank balance. Table 7.1 is an example of the tool.
The indice tool forms part of the three PBF health facility tools: (a) the business plan, (b) theindice tool, and (c) the individual monthly healthworker performance evaluation. These tools
would best be presented together in chapter 10, titled “Improving Health Facility Manage-ment.” However, because of the nature of the indice tool, it is discussed in this chapter.
BOX 7.4
The Three Health Facility PBF Tools
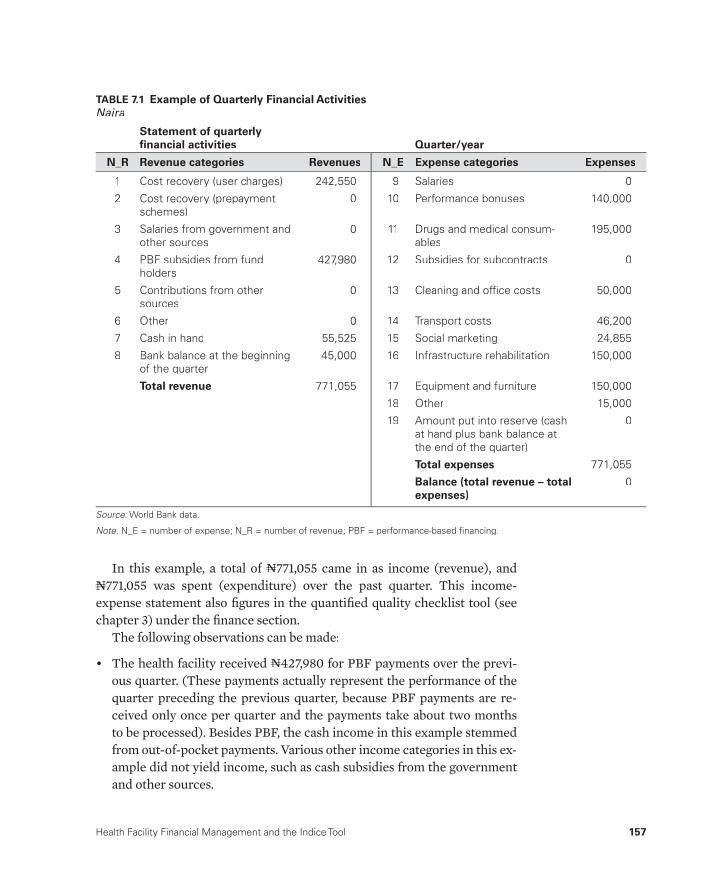
Health Facility Financial Management and the Indice Tool 157
In this example, a total of NNN771,055 came in as income (revenue), and NNN771,055 was spent (expenditure) over the past quarter. This income-expense statement also fi gures in the quantifi ed quality checklist tool (see chapter 3) under the fi nance section.
The following observations can be made:
• The health facility received NNN427,980 for PBF payments over the previ-ous quarter. (These payments actually represent the performance of thequarter preceding the previous quarter, because PBF payments are re-ceived only once per quarter and the payments take about two months to be processed). Besides PBF, the cash income in this example stemmedfrom out- of- pocket payments. Various other income categories in this ex-ample did not yield income, such as cash subsidies from the governmentand other sources.
TABLE 7.1 Example of Quarterly Financial ActivitiesNaira
Statement of quarterly fi nancial activities Quarter/year
N_R Revenue categories Revenues N_E Expense categories Expenses
1 Cost recovery (user charges) 242,550 9 Salaries 0
2 Cost recovery (prepayment schemes)
0 10 Performance bonuses 140,000
3 Salaries from government andother sources
0 11 Drugs and medical consum-ables
195,000
4 PBF subsidies from fundholders
427,980 12 Subsidies for subcontracts 0
5 Contributions from othersources
0 13 Cleaning and offi ce costs 50,000
6 Other 0 14 Transport costs 46,200
7 Cash in hand 55,525 15 Social marketing 24,855
8 Bank balance at the beginning of the quarter
45,000 16 Infrastructure rehabilitation 150,000
Total revenue 771,055 17 Equipment and furniture 150,000
18 Other 15,000
19 Amount put into reserve (cashat hand plus bank balance atthe end of the quarter)
0
Total expenses 771,055
Balance (total revenue – totalexpenses)
0
Source: World Bank data.:
Note: N_E = number of expense; N_R = number of revenue; PBF = performance-based fi nancing.:
158 Performance-Based Financing Toolkit
• Income from salaries is 0, because salaries were paid directly to the health workers and were not counted in this income- expense statement. If part or all of salaries would be paid in cash to the facility management, for instance, if human resources management were decentralized to the facilities, then the cash income for the salaries would be put under that particular income category on the indice sheet.
• On the expenditure side, only NNN140,000 was used for performance bo-nuses in this example. In Nigeria, the PBF system could allow up to 50 percent of the PBF income, that is, NNN213,990 (((NNN427,980/2), to be spenton performance bonuses. However, for some reason, the facility man-agement in this example decided to invest more in infrastructure reha-bilitation (((NNN150,000) and the acquisition of equipment and furniture (((NNN150,000).
• The facility’s income from out- of- pocket payments was NNN242,550, while spending on drugs and medical consumables was NNN195,000. The facility is probably operating a Bamako- type drug revolving fund. The health fa-cility staff would have been trained and would be coached systematically in understanding the link between rational prescribing of generic drugs (lower costs to the clients) and increased use (decreased fi nancial barri-ers to access to services) and increased income through PBF (targeting of predominantly preventive services).
• The “social marketing” category refl ects expenses for outreach activities (vaccinations; bed nets; latrine construction; information, education, and communication campaigns; and so on).
• In the “subsidies for subcontracts” category, the facility can pay any con-tractor. In this Nigerian example scheme, the main PBF contract holder is allowed to subcontract certain services to other health providers (ei-ther public or private), and it would then claim their production on its monthly invoice. The facility in this example, however, has not yet started subcontracting
• In this particular Nigerian PBF project, the quarterly income- expense statements, which are collected through the quarterly quality checklists, are entered in the web- enabled application. They will be used for sum-mary and comparative analyses.
Revenues and Expenses for the Past Month and Proposed Monthly Revenues and Expenses for the Next QuarterIn the second section of the indice tool, one can fi ll out the planned income and expenses for the next quarter. The section contains two tables: the fi rst for the income and the second for the expenses. The facility knows the quan-tity production of the previous three months (the monthly quantity invoices
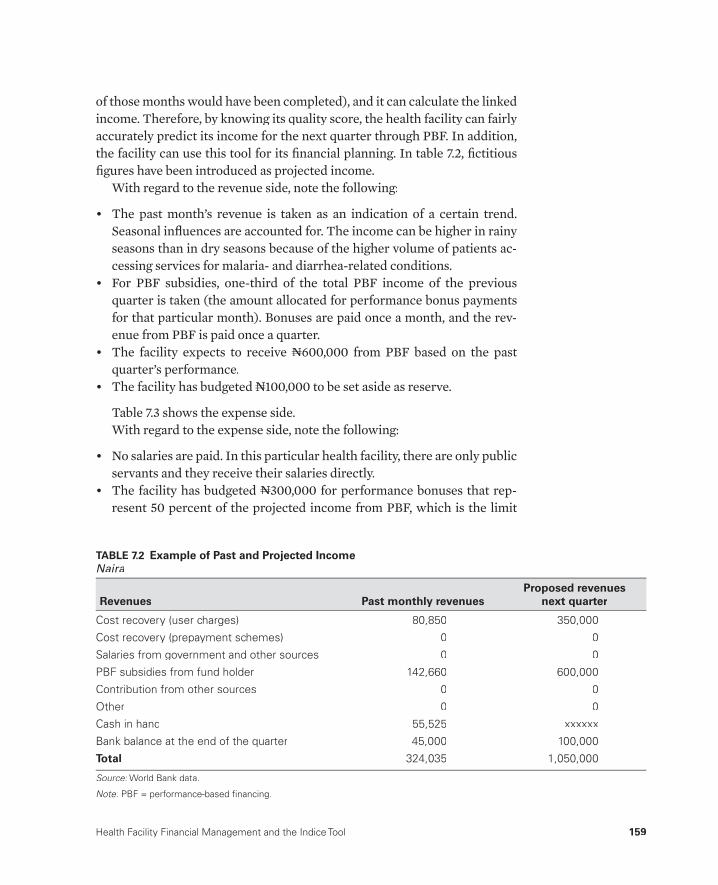
Health Facility Financial Management and the Indice Tool 159
of those months would have been completed), and it can calculate the linkedincome. Therefore, by knowing its quality score, the health facility can fairly accurately predict its income for the next quarter through PBF. In addition, the facility can use this tool for its fi nancial planning. In table 7.2, fi ctitious fi gures have been introduced as projected income.
With regard to the revenue side, note the following:
• The past month’s revenue is taken as an indication of a certain trend. Seasonal infl uences are accounted for. The income can be higher in rainy seasons than in dry seasons because of the higher volume of patients ac-cessing services for malaria- and diarrhea- related conditions.
• For PBF subsidies, one- third of the total PBF income of the previousquarter is taken (the amount allocated for performance bonus payments for that particular month). Bonuses are paid once a month, and the rev-enue from PBF is paid once a quarter.
• The facility expects to receive NNN600,000 from PBF based on the pastquarter’s performance.
• The facility has budgeted NNN100,000 to be set aside as reserve.
Table 7.3 shows the expense side.With regard to the expense side, note the following:
• No salaries are paid. In this particular health facility, there are only public servants and they receive their salaries directly.
• The facility has budgeted NNN300,000 for performance bonuses that rep-resent 50 percent of the projected income from PBF, which is the limit
TABLE 7.2 Example of Past and Projected IncomeNaira
Revenues Past monthly revenuesProposed revenues
next quarter
Cost recovery (user charges) 80,850 350,000
Cost recovery (prepayment schemes) 0 0
Salaries from government and other sources 0 0
PBF subsidies from fund holder 142,660 600,000
Contribution from other sources 0 0
Other 0 0
Cash in hand 55,525 xxxxxx
Bank balance at the end of the quarter 45,000 100,000
Total 324,035 1,050,000
Source: World Bank data.:
Note: PBF = performance-based fi nancing.:

160 Performance-Based Financing Toolkit
according to this specifi c Nigerian PBF scheme. The facility management can decide to spend less than 50 percent on performance bonuses— as it had in the previous quarter— but not more than 50 percent.
• The projected income is equal to the projected expense.
Budget for Performance Bonuses; Point Value and Monthly Performance BonusesIn the third section of this indice tool (see table 7.4), the manager must fi ll in the following information:
• In the fi rst row, the budget for performance bonuses for the next quarter is entered (this was NNN600,000). This component is called (a(( ).a
• In the second row, the number of indice points for all available staff for the past quarter is entered. This component is called (b(( ).b
• In the third row, the point value (pv(( ) for the coming quarter is calculatedvas (a(( )/(a b(( ). In this example, (bb pv(( ) = v NNN454. The point value is expressed in the local currency.
• In the fourth row, the maximum monthly point value (pm(( ) is provided:m(pv(( )/3 =v NNN151. This calculation means that for each month in the fol-lowing quarter, a point is worth NNN151. So, if a nurse or midwife works well and is assessed at 100 percent on his or her individual performance
TABLE 7.3 Example of Past and Projected ExpensesNaira
ExpensesPast monthly
expensesProposed expenses
next quarter
Salaries 0 0
Performance bonuses 47,000 300,000
Drugs and medical consumables 100,000 300,000
Subsidies for subcontracts 0 0
Cleaning and offi ce costs 35,000 60,000
Transport costs 30,000 65,000
Social marketing 17,000 50,000
Infrastructure rehabilitation 100,000 50,000
Equipment and furniture 75,000 100,000
Other 15,000 25,000
Amount put into reserve 0 100,000
Total 419,000 1,050,000
Source: World Bank data.:

Health Facility Financial Management and the Indice Tool 161
evaluation, then he or she is entitled to receive 90 (indice nurse) * 151 (pm(( ) =m NNN13,590 performance bonus for that month. (See chapter 10 for a discussion of the individual performance evaluations.) If that nurse or midwife would have scored 50 percent on the individual monthly perfor-mance evaluations, then he or she would have received 90 * 50% * 151 = NNN6,795.
• This method, therefore, not only allows spreading of the once- quarterly PBF payment to the facility over three months but also allows targeting of a performance- based share of that allocated performance bonus budgetto an individual health worker.
Assume that the facility staff in this example had 1,320 points. As shown in table 7.5, each health staff category has a certain indice value. The facil-ity’s in- charge person has a value of 100 points, indicating a more essential staff member, whereas a cleaner has a value of 10 points, indicating a less essential staff member. The total number of points for all staff members who were present during the past quarter (the numbers can fl uctuate) is 1,320 points. The individual indice values mean that from whatever amount, a share of 100/1,320 will accrue to the facility’s in- charge person and a share of 10/1,320 will accrue to a cleaner or security guard. These indices can be adapted according to the local situation. In table 7.5, there is a very large number of security guards and cleaners (20). Giving them a lower indice value allows more of the performance bonus points to be passed on to the more essential staff .
TABLE 7.4 Example of Budget for Employee Performance Bonuses
Budget componentNaira
or pointsNaira (NNN)or points
Budget for performance bonuses for nextquarter (a)
600,000 NNN
Number of points for all staff for the past quarter (b)
1,320 points
Point value (pv) coming quarter = (a)/(b) 454 NNN
Maximum point value per month (pm) = (pv)/3// 151 NNN
Individual monthly performance bonus = (% ofindividual performance score (p)) * (individualindice value (i)) * (pm)
NNN
Source: World Bank data.:
Note: pv = point value; pm = per month; p = % of individual performance score; i = individual indice:value.

162 Performance-Based Financing Toolkit
Individual Indice Value and BonusThe individual indice value is recorded in the motivation contract that each health worker signs with the health facility committee (see chapter 10). In the Nigerian PBF system, the rules are as follows:
• The indice tool uses (a) the maximum point value for each staff mem-ber from his or her motivation contract (see chapter 11), (b) the individ-ual performance evaluation for each staff member (see chapter 10), and (c) the point value for the following quarter obtained from the budget for employee performance bonuses (see table 7.4, row 3).
• Each month of the following quarter, staff members are assessed using the individual performance evaluation (see chapter 10). The score is re-corded in a specifi c register.
• Indice scores are discussed within the facility management team and pre-sented to the health facility committee.
• Each month before the middle of the following month and after vetting by the health facility committee, staff members receive their variable perfor-mance bonus.
• Staff members who are not employed at the facility during the month in which the bonus is paid (for example, if they have left the facility and are no longer employed) are not entitled to a performance bonus payment.
• Unspent bonus money is automatically placed in the reserve fund.
TABLE 7.5 Example of Employee Indice Value
No. Category of workerIndice value
for Samina HCSamina HC
staff no Points
1 In-charge person 100 1 100
2 Community health offi cer 80 2 160
3 Nurses and midwives 90 3 270
4 Community health extension worker 60 4 240
5 Technician 60 3 180
6 Junior community health extension worker 25 2 50
7 Ward aides and attendants 20 6 120
8 Security guards and cleaners 10 20 200
Total 1,320
Source: World Bank data.:
Note: HC = health center; No. = number.:

Health Facility Financial Management and the Indice Tool 163
• The facility management, in close collaboration with the facility health committee, reserves the right to invest in the facility infrastructure or equipment instead of paying the performance bonuses. Such a decision should be endorsed by the majority of the staff .
The indice tool ends with a list of all staff members and includes their indice values and individual monthly performance evaluations (see table 7.6).
TABLE 7.6 Consolidated Indice Values and Performance Evaluations of Employees
NoFamily name,
fi rst nameIndice
(i)
Monthly_Point_Value
(pm)
%_Perform_Eval(p)
Gross_Bonus(pb) = (i)*(p)*(pm)
Taxes(t)
Net_Bonus(pb) – (t)
1
2
3
4
5
6
7
8
9
10
11
12
13
14
15
16
17
18
19
20
21
Total (b)
Source: World Bank data.:
Note: i = individual indice value; No = number; p = % of individual performance score; pb = performance bonus; pm = point value per:month; t = tax.
164 Performance-Based Financing Toolkit
The following toolkit fi les can be accessed through this web link:http://www.worldbank.org/health/pbftoolkit/chapter07.
• Sample health facility monthly invoice
• Sample district PBF steering committee quarterly invoice
• Nigerian indice tool
• Microsoft Excel– based indice tool
• Document explaining the functionality of the Microsoft Excel– based indice tool.
7.6 Links to Files and Tools
165
Performance Frameworksfor Health Administration:Incentivizing Regulatory Tasks
CHAPTER 8
MAIN MESSAGES
➜ PBF administrators should work with performance frameworks.➜ Performance frameworks focus on core functions that are under the
health administration’s control and are important for reaching PBF re-sults at the health facility level: furnishing regular supportive supervision, applying the quality checklist quarterly, organizing capacity building on select topics, maintaining the vaccine supply facility, ensuring hygiene inother sectors such as hotels and markets, ensuring a well- functioning pharmaceutical sector, and functioning as the secretariat of the district PBF steering committee.
➜ The fi nancial rewards attached to the performance framework should be high enough to cover individual performance payment and recurrent cost elements.
166 Performance-Based Financing Toolkit
COVERED IN THIS CHAPTER
8.1 Introduction: The reason for PBF performance frameworks for health administration
8.2 Performance frameworks for health administration: How they work8.3 What performance frameworks include and who assesses them8.4 How much money to budget for PBF performance frameworks8.5 Links to fi les and tools
8.1 Introduction: The Reason for PBFPerformance Frameworks for HealthAdministration
Performance frameworks for the health administration are a vital ingredient of performance- based fi nancing (PBF). They facilitate the health adminis-tration’s regulatory engagement in PBF. Performance frameworks focus on core functions that are under the health administration’s control— such as supportive supervision, the quality checklist, and the secretariat for the PBF district steering committee— and are key in reaching PBF results at the health facility level. It is crucial that the fi nancial rewards attached to the performance framework are high enough to cover individual performance pay and recurrent cost elements.
This chapter deals with the background to these performance frame-works. It discusses how they should be designed and how much money should be used. The content of an average performance framework is illus-trated. Through the links to fi les in this chapter, you can access specifi c ex-amples from Burundi, Nigeria, Rwanda, and Zambia.
8.2 Performance Frameworks for HealthAdministration: How They Work
Purchasing agencies use performance frameworks to assess the level of per-formance of administrative entities. Administrative entities at the district, regional, or central level can be paid performance- based rewards if they carry out certain tasks well.1 Performance frameworks are set out in a con-tract (for contracts, see chapter 11) with money attached to results.
In early PBF pilots in Rwanda (2002– 05), performance frameworks were used to engage district health departments. The departments were paid ac-cording to the level of achievement of certain preagreed functions like
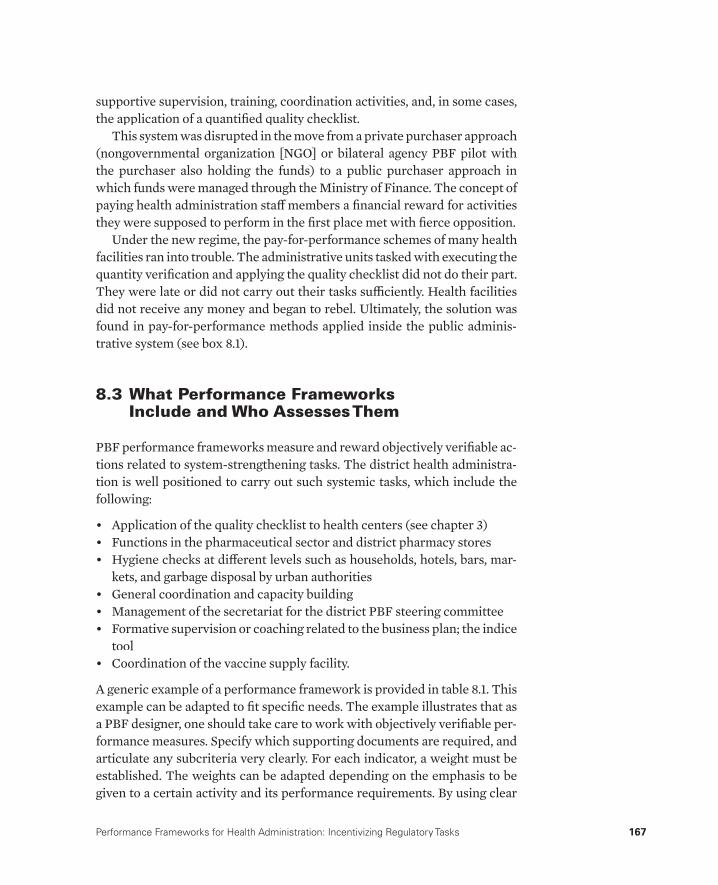
Performance Frameworks for Health Administration: Incentivizing Regulatory Tasks 167
supportive supervision, training, coordination activities, and, in some cases,the application of a quantifi ed quality checklist.
This system was disrupted in the move from a private purchaser approach (nongovernmental organization [NGO] or bilateral agency PBF pilot with the purchaser also holding the funds) to a public purchaser approach in which funds were managed through the Ministry of Finance. The concept of paying health administration staff members a fi nancial reward for activities they were supposed to perform in the fi rst place met with fi erce opposition.
Under the new regime, the pay- for- performance schemes of many healthfacilities ran into trouble. The administrative units tasked with executing the quantity verifi cation and applying the quality checklist did not do their part. They were late or did not carry out their tasks suffi ciently. Health facilities did not receive any money and began to rebel. Ultimately, the solution was found in pay- for- performance methods applied inside the public adminis-trative system (see box 8.1).
8.3 What Performance Frameworks Include and Who Assesses Them
PBF performance frameworks measure and reward objectively verifi able ac-tions related to system- strengthening tasks. The district health administra-tion is well positioned to carry out such systemic tasks, which include the following:
• Application of the quality checklist to health centers (see chapter 3)• Functions in the pharmaceutical sector and district pharmacy stores• Hygiene checks at diff erent levels such as households, hotels, bars, mar-
kets, and garbage disposal by urban authorities• General coordination and capacity building• Management of the secretariat for the district PBF steering committee• Formative supervision or coaching related to the business plan; the indice
tool• Coordination of the vaccine supply facility.
A generic example of a performance framework is provided in table 8.1. This example can be adapted to fi t specifi c needs. The example illustrates that as a PBF designer, one should take care to work with objectively verifi able per-formance measures. Specify which supporting documents are required, and articulate any subcriteria very clearly. For each indicator, a weight must be established. The weights can be adapted depending on the emphasis to be given to a certain activity and its performance requirements. By using clear
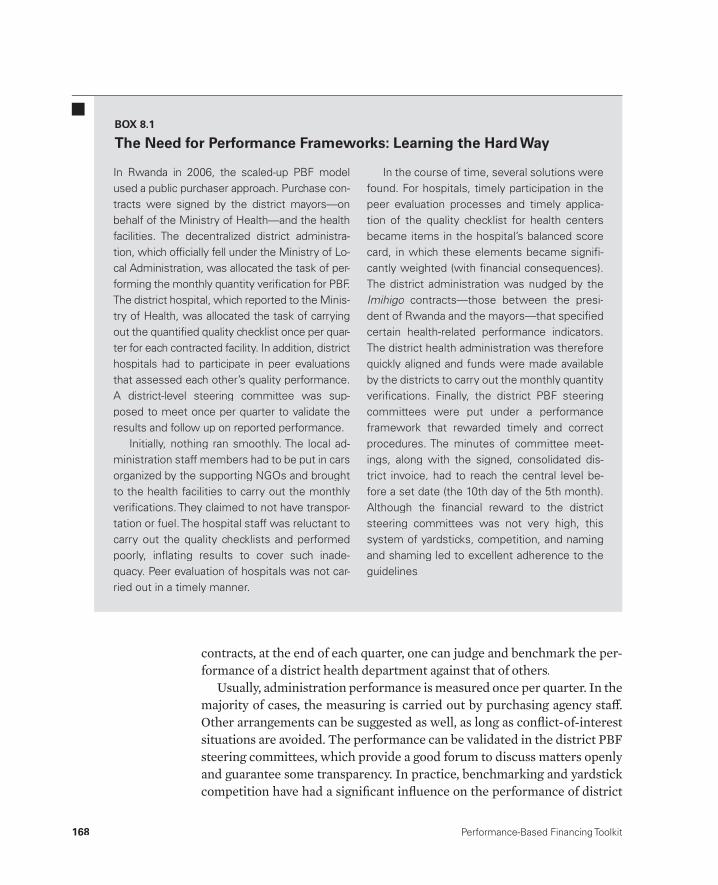
168 Performance-Based Financing Toolkit
In Rwanda in 2006, the scaled- up PBF model used a public purchaser approach. Purchase con-tracts were signed by the district mayors— on behalf of the Ministry of Health— and the health facilities. The decentralized district administra-tion, which offi cially fell under the Ministry of Lo-cal Administration, was allocated the task of per-forming the monthly quantity verifi cation for PBF.The district hospital, which reported to the Minis-try of Health, was allocated the task of carrying out the quantifi ed quality checklist once per quar-ter for each contracted facility. In addition, district hospitals had to participate in peer evaluations that assessed each other’s quality performance. A district- level steering committee was sup-posed to meet once per quarter to validate the results and follow up on reported performance.
Initially, nothing ran smoothly. The local ad-ministration staff members had to be put in cars organized by the supporting NGOs and broughtto the health facilities to carry out the monthlyverifi cations. They claimed to not have transpor-tation or fuel. The hospital staff was reluctant to carry out the quality checklists and performed poorly, infl ating results to cover such inade-quacy. Peer evaluation of hospitals was not car-ried out in a timely manner.
In the course of time, several solutions were found. For hospitals, timely participation in the peer evaluation processes and timely applica-tion of the quality checklist for health centers became items in the hospital’s balanced scorecard, in which these elements became signifi -cantly weighted (with fi nancial consequences).The district administration was nudged by the Imihigo contracts— those between the presi-odent of Rwanda and the mayors— that specifi ed certain health- related performance indicators.The district health administration was therefore quickly aligned and funds were made availableby the districts to carry out the monthly quantity verifi cations. Finally, the district PBF steering committees were put under a performance framework that rewarded timely and correct procedures. The minutes of committee meet-ings, along with the signed, consolidated dis-trict invoice, had to reach the central level be-fore a set date (the 10th day of the 5th month). Although the fi nancial reward to the district steering committees was not very high, thissystem of yardsticks, competition, and naming and shaming led to excellent adherence to the guidelines.
BOX 8.1
The Need for Performance Frameworks: Learning the Hard Way
contracts, at the end of each quarter, one can judge and benchmark the per-formance of a district health department against that of others.
Usually, administration performance is measured once per quarter. In the majority of cases, the measuring is carried out by purchasing agency staff . Other arrangements can be suggested as well, as long as confl ict- of- interest situations are avoided. The performance can be validated in the district PBF steering committees, which provide a good forum to discuss matters openly and guarantee some transparency. In practice, benchmarking and yardstick competition have had a signifi cant infl uence on the performance of district
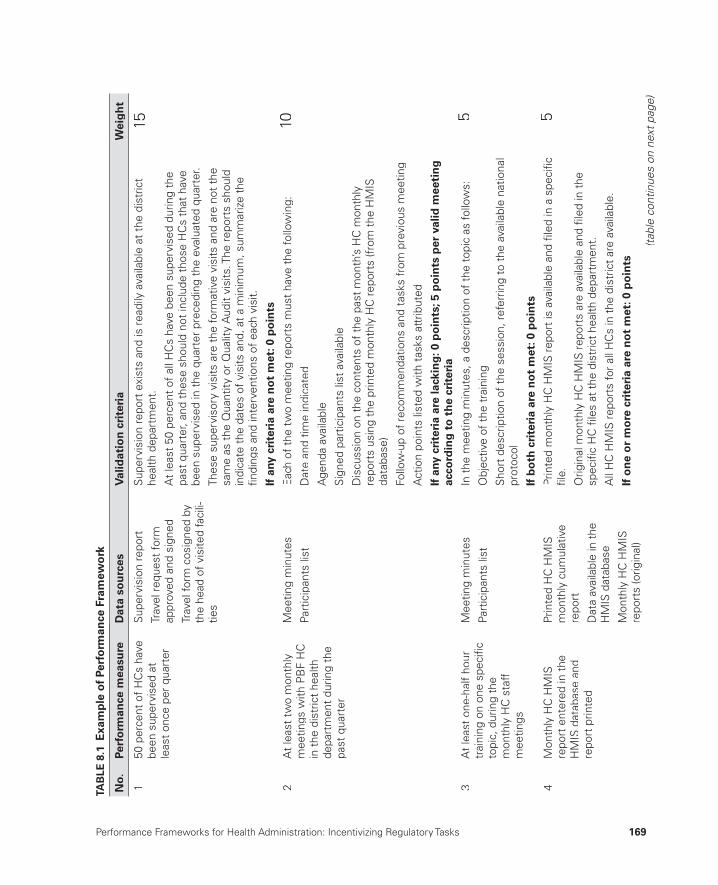
Performance Frameworks for Health Administration: Incentivizing Regulatory Tasks 169
TAB
LE 8
.1 E
xam
ple
of
Perf
orm
ance
Fra
mew
ork
No.
Perf
orm
ance
mea
sure
Dat
a so
urc
esV
alid
atio
n c
rite
ria
Wei
gh
t
150
per
cent
of
HC
s ha
ve
been
sup
ervi
sed
at
leas
t on
ce p
er q
uart
er
Sup
ervi
sion
rep
ort
Trav
el r
eque
st fo
rmap
prov
ed a
nd s
igne
d
Trav
el fo
rm c
osig
ned
byth
e he
ad o
f vis
ited
faci
li-tie
s
Sup
ervi
sion
rep
ort
exis
ts a
nd is
rea
dily
ava
ilabl
e at
the
dis
tric
t he
alth
dep
artm
ent.
At
leas
t 50
per
cent
of
all H
Cs
have
bee
n su
perv
ised
dur
ing
the
past
qua
rter
, and
the
se s
houl
d no
t in
clud
e th
ose
HC
s th
at h
ave
been
sup
ervi
sed
in t
he q
uart
er p
rece
ding
the
eva
luat
ed q
uart
er.
Thes
e su
perv
isor
y vi
sits
are
the
form
ativ
e vi
sits
and
are
not
the
sa
me
as t
he Q
uant
ity o
r Q
ualit
y A
udit
visi
ts. T
he r
epor
ts s
houl
din
dica
te t
he d
ates
of
visi
ts a
nd, a
t a
min
imum
, sum
mar
ize
the
fi ndi
ngs
and
inte
rven
tions
of
each
vis
it.
If a
ny c
rite
ria
are
no
t m
et: 0
po
ints
15
2A
t le
ast
two
mon
thly
m
eetin
gs w
ith P
BF
HC
in
the
dis
tric
t he
alth
de
part
men
t du
ring
the
past
qua
rter
Mee
ting
min
utes
Part
icip
ants
list
Eac
h of
the
tw
o m
eetin
g re
port
s m
ust
have
the
follo
win
g:
Dat
e an
d tim
e in
dica
ted
Age
nda
avai
labl
e
Sig
ned
part
icip
ants
list
ava
ilabl
e
Dis
cuss
ion
on t
he c
onte
nts
of t
he p
ast
mon
th’s
HC
mon
thly
repo
rts
usin
g th
e pr
inte
d m
onth
ly H
C r
epor
ts (f
rom
the
HM
ISda
taba
se)
Follo
w-u
p of
rec
omm
enda
tions
and
tas
ks f
rom
pre
viou
s m
eetin
g
Act
ion
poin
ts li
sted
with
tas
ks a
ttrib
uted
If a
ny c
rite
ria
are
lack
ing
: 0 p
oin
ts; 5
po
ints
per
val
id m
eeti
ng
ac
cord
ing
to
th
e cr
iter
ia
10
3A
t le
ast
one-
half
hour
tr
aini
ng o
n on
e sp
ecifi
cto
pic,
dur
ing
the
mon
thly
HC
sta
ff
mee
tings
Mee
ting
min
utes
Part
icip
ants
list
In t
he m
eetin
g m
inut
es, a
des
crip
tion
of t
he t
opic
as
follo
ws:
Obj
ectiv
e of
the
tra
inin
g
Sho
rt d
escr
iptio
n of
the
ses
sion
, ref
errin
g to
the
ava
ilabl
e na
tiona
l pr
otoc
ol
If b
oth
cri
teri
a ar
e n
ot
met
: 0 p
oin
ts
5
4M
onth
ly H
C H
MIS
re
port
ent
ered
in t
heH
MIS
dat
abas
e an
dre
port
prin
ted
Prin
ted
HC
HM
IS
mon
thly
cum
ulat
ive
repo
rt
Dat
a av
aila
ble
in t
heH
MIS
dat
abas
e
Mon
thly
HC
HM
IS
repo
rts
(orig
inal
)
Prin
ted
mon
thly
HC
HM
IS r
epor
t is
ava
ilabl
e an
d fi l
ed in
a s
peci
fi c
fi le.
Orig
inal
mon
thly
HC
HM
IS r
epor
ts a
re a
vaila
ble
and
fi led
in t
he
spec
ifi c
HC
fi le
s at
the
dis
tric
t he
alth
dep
artm
ent.
All
HC
HM
IS r
epor
ts fo
r al
l HC
s in
the
dis
tric
t ar
e av
aila
ble.
I f o
ne
or
mo
re c
rite
ria
are
no
t m
et: 0
po
ints
5
(tab
le c
ontin
ues
on n
ext p
age)
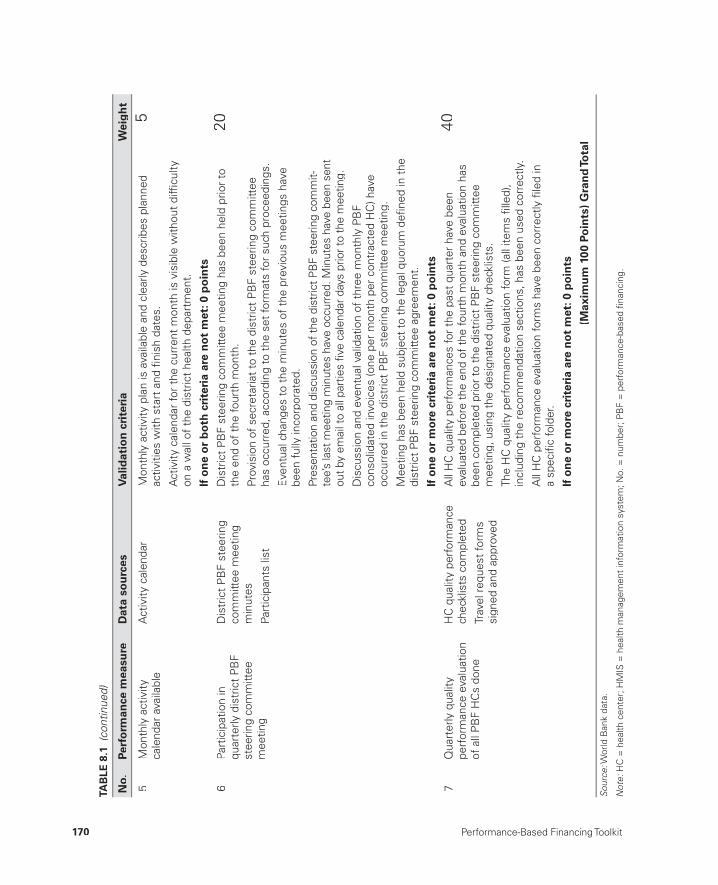
170 Performance-Based Financing Toolkit
5M
onth
ly a
ctiv
ity
cale
ndar
ava
ilabl
eA
ctiv
ity c
alen
dar
Mon
thly
act
ivity
pla
n is
ava
ilabl
e an
d cl
early
des
crib
es p
lann
edac
tiviti
es w
ith s
tart
and
fi ni
sh d
ates
.
Act
ivity
cal
enda
r fo
r th
e cu
rren
t m
onth
is v
isib
le w
ithou
t di
ffi cu
ltyon
a w
all o
f th
e di
stric
t he
alth
dep
artm
ent.
If o
ne
or
bo
th c
rite
ria
are
no
t m
et: 0
po
ints
5
6Pa
rtic
ipat
ion
inqu
arte
rly d
istr
ict
PB
Fst
eerin
g co
mm
ittee
mee
ting
Dis
tric
t P
BF
stee
ring
com
mitt
ee m
eetin
gm
inut
es
Part
icip
ants
list
Dis
tric
t P
BF
stee
ring
com
mitt
ee m
eetin
g ha
s be
en h
eld
prio
r to
th
e en
d of
the
four
th m
onth
.
Prov
isio
n of
sec
reta
riat
to t
he d
istr
ict
PB
F st
eerin
g co
mm
ittee
ha
s oc
curr
ed, a
ccor
ding
to
the
set
form
ats
for
such
pro
ceed
ings
.
Eve
ntua
l cha
nges
to
the
min
utes
of
the
prev
ious
mee
tings
hav
ebe
en f
ully
inco
rpor
ated
.
Pres
enta
tion
and
disc
ussi
on o
f the
dis
tric
t PB
F st
eerin
g co
mm
it-te
e’s
last
mee
ting
min
utes
hav
e oc
curr
ed. M
inut
es h
ave
been
sen
tou
t by
emai
l to
all p
artie
s fi v
e ca
lend
ar d
ays
prio
r to
the
mee
ting.
Dis
cuss
ion
and
even
tual
val
idat
ion
of t
hree
mon
thl y
PB
F co
nsol
idat
ed in
voic
es (o
ne p
er m
onth
per
con
trac
ted
HC
) hav
eoc
curr
ed in
the
dis
tric
t P
BF
stee
ring
com
mitt
ee m
eetin
g.
Mee
ting
has
been
hel
d su
bjec
t to
the
lega
l quo
rum
defi
ned
in t
he
dist
rict
PB
F st
eerin
g co
mm
ittee
agr
eem
ent.
If o
ne
or
mo
re c
rite
ria
are
no
t m
et: 0
po
ints
20
7Q
uart
erly
qua
lity
perf
orm
ance
eva
luat
ion
of a
ll P
BF
HC
s do
ne
HC
qua
lity
perf
orm
ance
chec
klis
ts c
ompl
eted
Trav
el r
eque
st fo
rms
sign
ed a
nd a
ppro
ved
All
HC
qua
lity
perf
orm
ance
s fo
r th
e pa
st q
uart
er h
ave
been
eval
uate
d be
fore
the
end
of
the
four
th m
onth
and
eva
luat
ion
has
been
com
plet
ed p
rior
to t
he d
istr
ict
PB
F st
eerin
g co
mm
ittee
m
eetin
g, u
sing
the
des
igna
ted
qual
ity c
heck
lists
.
The
HC
qua
lity
perf
orm
ance
eva
luat
ion
form
(all
item
s fi l
led)
,in
clud
ing
the
reco
mm
enda
tion
sect
ions
, has
bee
n us
ed c
orre
ctly
.
All
HC
per
form
ance
eva
luat
ion
form
s ha
ve b
een
corr
ectly
fi le
d in
a
spec
ifi c
fold
er.
I f o
ne
or
mo
re c
rite
ria
are
no
t m
et: 0
po
ints
40
(Max
imu
m 1
00 P
oin
ts)
Gra
nd
Tota
l
Sour
ce: W
orld
Ban
k da
ta.
:
Not
e: H
C =
hea
lth c
ente
r; H
MIS
= h
ealth
man
agem
ent
info
rmat
ion
syst
em; N
o. =
num
ber;
PB
F =
per
form
ance
-bas
ed fi
nanc
ing.
:
TAB
LE 8
.1 (
cont
inue
d)
No.
Perf
orm
ance
mea
sure
Dat
a so
urc
esV
alid
atio
n c
rite
ria
Wei
gh
t
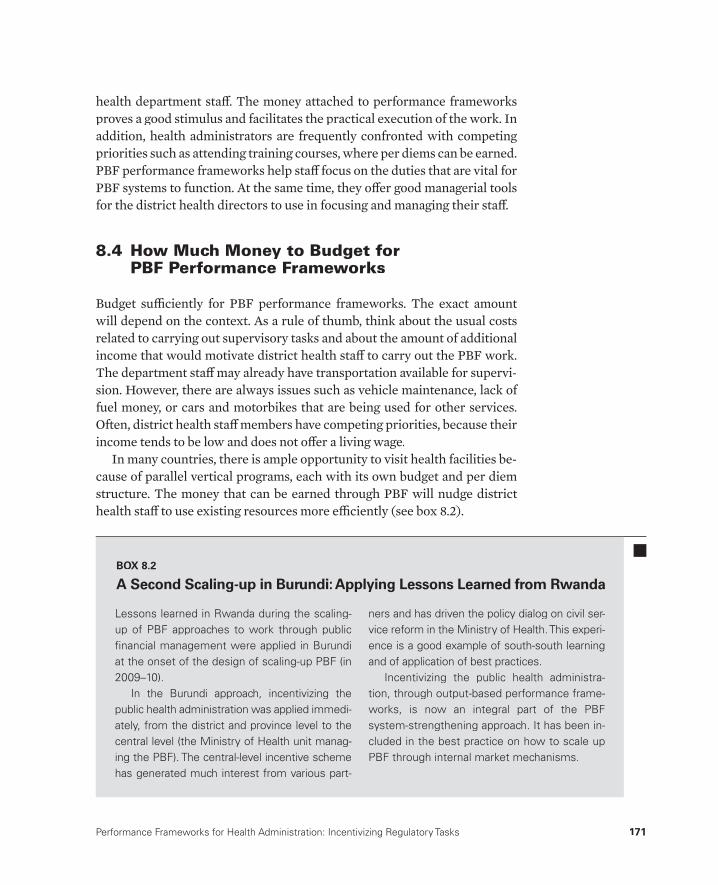
Performance Frameworks for Health Administration: Incentivizing Regulatory Tasks 171
health department staff . The money attached to performance frameworks proves a good stimulus and facilitates the practical execution of the work. In addition, health administrators are frequently confronted with competing priorities such as attending training courses, where per diems can be earned. PBF performance frameworks help staff focus on the duties that are vital forPBF systems to function. At the same time, they off er good managerial tools for the district health directors to use in focusing and managing their staff .
8.4 How Much Money to Budget forPBF Performance Frameworks
Budget suffi ciently for PBF performance frameworks. The exact amountwill depend on the context. As a rule of thumb, think about the usual costs related to carrying out supervisory tasks and about the amount of additional income that would motivate district health staff to carry out the PBF work. The department staff may already have transportation available for supervi-sion. However, there are always issues such as vehicle maintenance, lack of fuel money, or cars and motorbikes that are being used for other services.Often, district health staff members have competing priorities, because their income tends to be low and does not off er a living wage.
In many countries, there is ample opportunity to visit health facilities be-cause of parallel vertical programs, each with its own budget and per diem structure. The money that can be earned through PBF will nudge districthealth staff to use existing resources more effi ciently (see box 8.2).
Lessons learned in Rwanda during the scaling- up of PBF approaches to work through public fi nancial management were applied in Burundi at the onset of the design of scaling- up PBF (in2009– 10).
In the Burundi approach, incentivizing the public health administration was applied immedi-ately, from the district and province level to the central level (the Ministry of Health unit manag-ing the PBF). The central- level incentive schemehas generated much interest from various part-
ners and has driven the policy dialog on civil ser-vice reform in the Ministry of Health. This experi-ence is a good example of south- south learning and of application of best practices.
Incentivizing the public health administra-tion, through output- based performance frame-works, is now an integral part of the PBF system- strengthening approach. It has been in-cluded in the best practice on how to scale up PBF through internal market mechanisms.
BOX 8.2
A Second Scaling- up in Burundi: Applying Lessons Learned from Rwanda
172 Performance-Based Financing Toolkit
Note
1. Health administrations diff er among countries, such as prefectures in theCentral African Republic; districts in Anglophone countries; provinces in Burundi; and departments in the Republic of Congo.
Short case studies and examples of performance frameworks can be accessed through this web link: http://www.worldbank.org/health/pbftoolkit/chapter08.
• Rwanda:– Rwanda district PBF steering committee– Rwanda sector PBF steering committee– Rwanda central PBF support unit (Cellule d’Appui a l’Approche
Contractuelle, CAAC).
• Burundi:– Burundi central PBF technical support unit (CTN)– Burundi Provincial Verifi cation and Validation Committee (CPVV)– Burundi provincial health offi ce– Burundi district health offi ce.
• Zambia:– Zambia District Health Management Team.
• Nigeria:– Nigeria Local Government Authority Primary Health Care
Department.
8.5 Links to Files and Tools
DESIGN STRUCTUREAND ISSUES
PART 2

175
Investments to Help Start Health Facilities
CHAPTER 9
MAIN MESSAGES
➜ Health facilities respond faster to PBF when assisted by investments.➜ Investments are budgeted in investment units and are provided in cash.➜ The health facility management and community are told the amount of
money available to them and are invited to set their own priorities and plan accordingly. A business plan is created by the health facility manage-ment and negotiated with the purchaser.
COVERED IN THIS CHAPTER
9.1 Introduction9.2 The investment unit9.3 Why investment units are needed9.4 How much money is involved9.5 How investment units work
176 Performance-Based Financing Toolkit
9.1 Introduction
Health facilities respond faster to performance- based fi nancing (PBF) if there is room for targeted investments. In PBF, targeted investments can be provided through a negotiated business plan. Such investments should be provided in cash and hold the health facility accountable through a follow- up on their business plan.
9.2 The Investment Unit
The investment unit, also called a quality improvement unit, is a certain amount of money meant to assist the health facility in improving its service quality (Soeters 2013). Investment units are used for budgeting purposes by the purchaser. The purchaser can budget a certain sum for such activities and subsequently allocate “units,” or sums of money, to fi nance certain ac-tivities carried out by health facilities. For example, such a unit can be set at US$1,000 or US$2,500. These investment units are provided in cash.
9.3 Why Investment Units Are Needed
Investment units are often necessary because many health facilities are in poor shape after years of disinvestment or outright negligence. In many places, years of turbulence or poor maintenance have led to a dilapidated infrastructure, broken or absent equipment or furniture, and lack of access to water or sanitation. Establishing some basic preconditions for providing quality health services is a major focus of any health improvement program, including PBF.
9.4 How Much Money Is Involved
The amount of money needed for such basic investments depends largely on the context. One size does not fi t all. However, for illustration, for an average health facility with a catchment population of 10,000– 15,000 in a low- income country, one could budget about US$5,000 per year. In this spe-cifi c example, one could decide to work with investment units of US$1,000 (see box 9.1). This approach allows for targeting more (small unit) invest-ments to the most destitute areas or to health facilities that are in need of
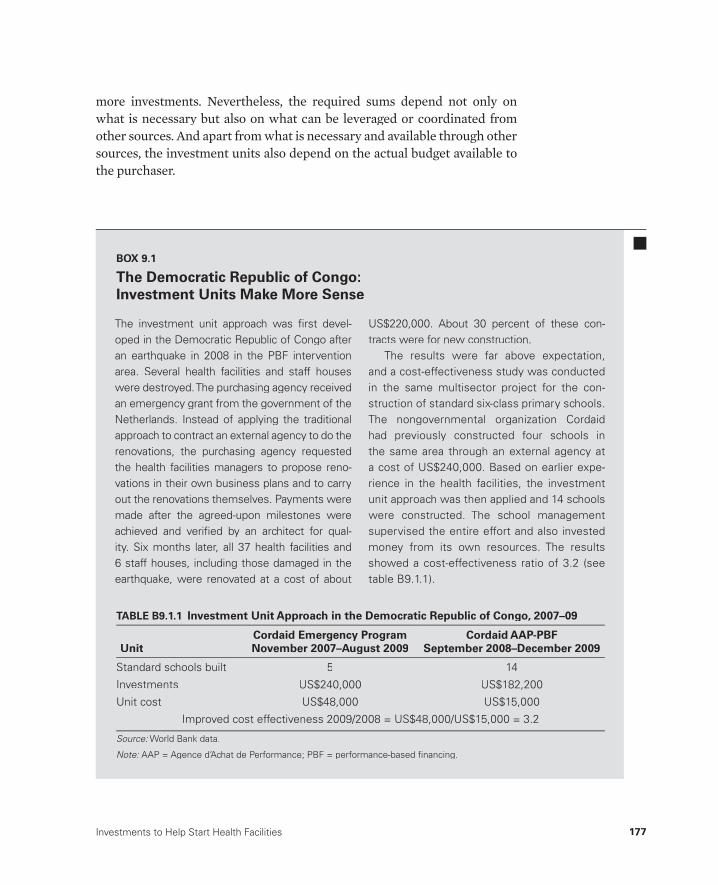
Investments to Help Start Health Facilities 177
more investments. Nevertheless, the required sums depend not only onwhat is necessary but also on what can be leveraged or coordinated from other sources. And apart from what is necessary and available through othersources, the investment units also depend on the actual budget available to the purchaser.
The investment unit approach was fi rst devel-oped in the Democratic Republic of Congo after an earthquake in 2008 in the PBF interventionarea. Several health facilities and staff houses were destroyed. The purchasing agency receivedan emergency grant from the government of theNetherlands. Instead of applying the traditionalapproach to contract an external agency to do therenovations, the purchasing agency requested the health facilities managers to propose reno-vations in their own business plans and to carry out the renovations themselves. Payments weremade after the agreed- upon milestones were achieved and verifi ed by an architect for qual-ity. Six months later, all 37 health facilities and 6 staff houses, including those damaged in the earthquake, were renovated at a cost of about
US$220,000. About 30 percent of these con-tracts were for new construction.
The results were far above expectation, and a cost- effectiveness study was conducted in the same multisector project for the con-struction of standard six- class primary schools. The nongovernmental organization Cordaid had previously constructed four schools in the same area through an external agency at a cost of US$240,000. Based on earlier expe-rience in the health facilities, the investment unit approach was then applied and 14 schools were constructed. The school management supervised the entire effort and also invested money from its own resources. The results showed a cost- effectiveness ratio of 3.2 (see table B9.1.1).
BOX 9.1
The Democratic Republic of Congo:Investment Units Make More Sense
TABLE B9.1.1 Investment Unit Approach in the Democratic Republic of Congo, 2007–09
UnitCordaid Emergency Program November 2007–August 2009
Cordaid AAP-PBF September 2008–December 2009
Standard schools built 5 14
Investments US$240,000 US$182,200
Unit cost US$48,000 US$15,000
Improved cost effectiveness 2009/2008 = US$48,000/US$15,000 = 3.2
Source: World Bank data.:
Note: AAP = Agence d’Achat de Performance; PBF = performance-based fi nancing.:
178 Performance-Based Financing Toolkit
9.5 How Investment Units Work
Investment units are negotiated through the business plans that are drawn up by the health facility and its community. They work through a decentral-ized priority setting by an autonomous health facility management.
Making health facilities and their communities responsible, and provid-ing them with the autonomy to use the money for certain intended invest-ment purposes, is a win- win situation. The health facility and its community win because they can work toward fi xing their own problems, and the pur-chaser wins because the approach is a more effi cient solution to building in-frastructure. Investment units are provided in cash because this is a more ef-fi cient solution than attempting to micromanage reconstruction and deliver inputs to the health facility through central planning and input fi nancing.
Providing cash and autonomy to health facility management will be a new development in many contexts. A certain degree of trial and error will cer-tainly occur. The quantifi ed quality checklist (see chapter 3) has proved to be very handy in this new situation. The health facility management can be guided through an initial planning process of how to invest a certain amount of money to upgrade its facility and how to respond best to the new qual-ity standards. Setting quality standards is demanding, and choosing between competing priorities can be challenging. It is best to leave the priority setting to the health facility management itself. Health facility staff often knows best what is needed and what level of eff ort can be provided. This decentralized approach makes the health facility management and its community respon-sible for the upkeep of their health services and allows them to create local solutions to diffi cult problems (see box 9.2).
Health facilities know what drugs and medical consumables are out of stock and also possibly where to obtain such items of good quality and price locally. Equally, they will be aware of where to obtain minor equipment such as blood pressure gauges, weighing scales, and items necessary for a deliv-ery kit. For repairing furniture or making new furniture and for repairing a leaking roof, a broken door, and so on, the health facility and its community might have ready cost- eff ective solutions. Making such choices in an open fashion, through a business plan, allows negotiation and agreement with the health facility management on these activities. The business plan is an important tool for the purchaser and the health facility alike and forms an integral part of the purchasing contract (for more details, see chapter 10).
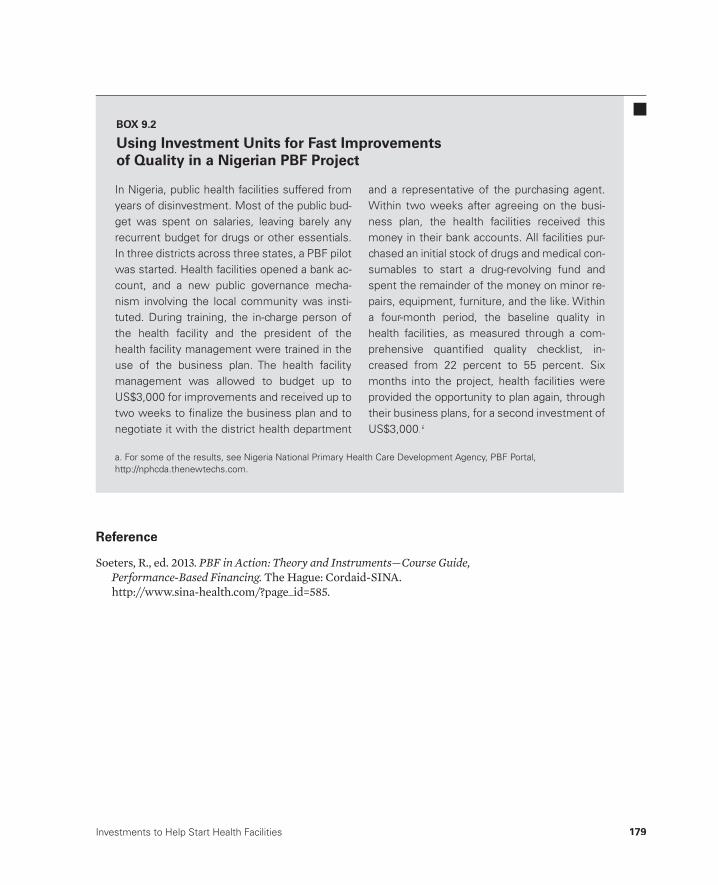
Investments to Help Start Health Facilities 179
Reference
Soeters, R., ed. 2013. PBF in Action: Theory and Instruments—Course Guide, Performance-Based Financing. The Hague: Cordaid-SINA.http://www.sina-health.com/?page_id=585.
In Nigeria, public health facilities suffered fromyears of disinvestment. Most of the public bud-get was spent on salaries, leaving barely anyrecurrent budget for drugs or other essentials. In three districts across three states, a PBF pilot was started. Health facilities opened a bank ac-count, and a new public governance mecha-nism involving the local community was insti-tuted. During training, the in- charge person of the health facility and the president of thehealth facility management were trained in theuse of the business plan. The health facilitymanagement was allowed to budget up to US$3,000 for improvements and received up to two weeks to fi nalize the business plan and to negotiate it with the district health department
and a representative of the purchasing agent. Within two weeks after agreeing on the busi-ness plan, the health facilities received this money in their bank accounts. All facilities pur-chased an initial stock of drugs and medical con-sumables to start a drug- revolving fund and spent the remainder of the money on minor re-pairs, equipment, furniture, and the like. Withina four- month period, the baseline quality in health facilities, as measured through a com-prehensive quantifi ed quality checklist, in-creased from 22 percent to 55 percent. Sixmonths into the project, health facilities were provided the opportunity to plan again, through their business plans, for a second investment ofUS$3,000.a
BOX 9.2
Using Investment Units for Fast Improvements of Quality in a Nigerian PBF Project
a. For some of the results, see Nigeria National Primary Health Care Development Agency, PBF Portal, http://nphcda.thenewtechs.com.

181
Improving HealthFacility Management
CHAPTER 10
MAIN MESSAGES
➜ PBF must be accompanied by improvement in health facility management.
➜ PBF introduces three important management- strengthening tools at the health facility level: (a) the business plan, (b) the individual performance evaluation, and (c) the indice tool.
➜ PBF embraces advanced strategies to improve health facility results.
COVERED IN THIS CHAPTER
10.1 Introduction10.2 The three PBF management- strengthening tools10.3 Advanced strategies for improving health facility results: Learning
from good practices10.4 Links to fi les and tools

182 Performance-Based Financing Toolkit
10.1 Introduction
Performance- based fi nancing (PBF) contributes to and benefi ts from good health facility management. Already at the outset, PBF can improve health facility management considerably by using three basic management- strengthening tools and by exposing management to strategies that have worked to deliver good results elsewhere.
10.2 The Three Management- Strengthening Tools
Three basic management- strengthening tools that greatly help advance management in PBF are (a) the PBF business plan, (b) the individual performance evaluation, and (c) the indice tool. These tools assist the health facility manage-ment in carrying out its planning processes, in managing individual staff performance, and in allocating performance bonuses. Two of the
tools, the business plan and the individual performance evaluation, are dis-cussed in this chapter. The third one, the indice tool, is discussed in chapter 4 (titled “Setting the Unit Price and Costing”) of this toolkit, because it is of great importance in balancing the budget and in allocating performance bonuses.
Main Management Tool Number One: The PBF Business Plan
The business plan is a planning document created by the management of a health facility. It is negotiated with the purchaser and approved by the health facility management. The business plan describes the baseline situation for a given facility and indicates the results that can be expected. It also proposes clear strategies to achieve those goals. A business plan helps the purchaser engage in strategic purchasing (see chapter 4).
Most health facility staff members know their catchment population but are not used to planning and measuring activities according to actual targets. Even in situations in which targets are used for planning, a follow- up on the results is often rare. Moreover, when targets have a high visibility, such as the case with vaccination targets (Murray et al. 2003), overreporting is common. A business plan helps health facility staff members delineate where they
Three PBF management strengthening tools:
1. Business plan2. Individual performance evaluation3. Indice tool
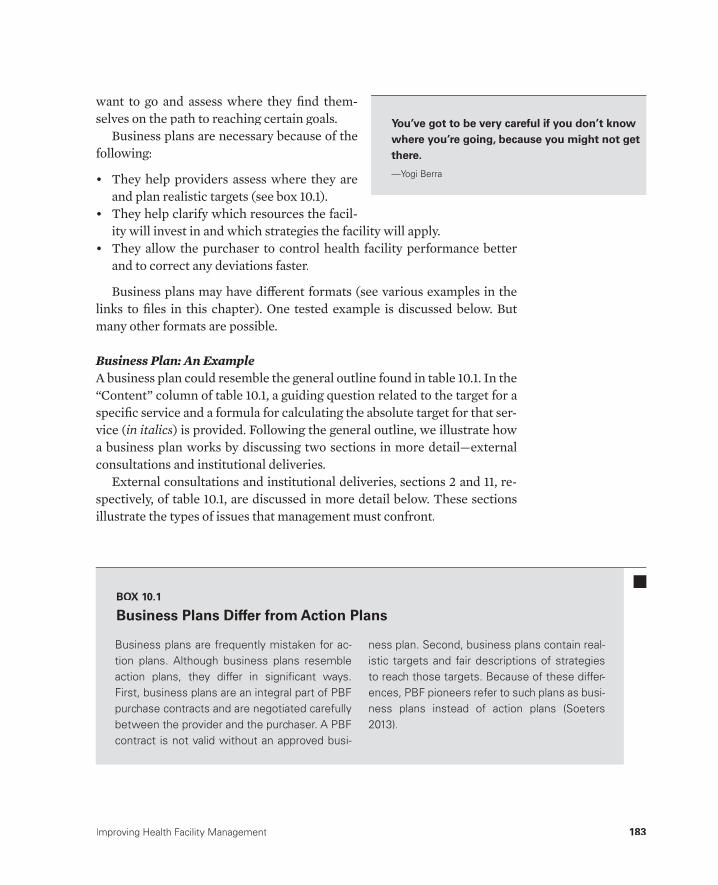
Improving Health Facility Management 183
want to go and assess where they fi nd them-selves on the path to reaching certain goals.
Business plans are necessary because of the following:
• They help providers assess where they areand plan realistic targets (see box 10.1).
• They help clarify which resources the facil-ity will invest in and which strategies the facility will apply.
• They allow the purchaser to control health facility performance better and to correct any deviations faster.
Business plans may have diff erent formats (see various examples in the links to fi les in this chapter). One tested example is discussed below. But many other formats are possible.
Business Plan: An ExampleA business plan could resemble the general outline found in table 10.1. In the “Content” column of table 10.1, a guiding question related to the target for a specifi c service and a formula for calculating the absolute target for that ser-vice (in italics) is provided. Following the general outline, we illustrate how sa business plan works by discussing two sections in more detail— external consultations and institutional deliveries.
External consultations and institutional deliveries, sections 2 and 11, re-spectively, of table 10.1, are discussed in more detail below. These sectionsillustrate the types of issues that management must confront.
You’ve got to be very careful if you don’t know where you’re going, because you might not get there.
— Yogi Berra
Business plans are frequently mistaken for ac-tion plans. Although business plans resembleaction plans, they differ in signifi cant ways.First, business plans are an integral part of PBFpurchase contracts and are negotiated carefullybetween the provider and the purchaser. A PBF contract is not valid without an approved busi-
ness plan. Second, business plans contain real-istic targets and fair descriptions of strategies to reach those targets. Because of these differ-ences, PBF pioneers refer to such plans as busi-ness plans instead of action plans (Soeters2013).
BOX 10.1
Business Plans Differ from Action Plans

184 Performance-Based Financing Toolkit
TABLE 10.1 The General Content of a Business Plan
No. Section Content
1 General information • Administrative region• Population• Staff (qualifi ed and support staff)• Eventual subcontracted facilities• Summary health facility statistics, such as those for select reproductive
and child health services, outpatient services, and admission days
2 External consultations • What is your monthly target population?(Total population in your catchment area/12)(The number of new curative consultations in this example is one per person per year.)
3 Referral of patients • What is the monthly target for referral of seriously ill patients in your catchment area?
(Population/12 × 5%)(The number of seriously ill patients in this example is 5%.)
4 Vitamin A distribution(children between 6and 59 months)
Preschool consulta-tions (children between 12 and 59 months)
• What is the number of children between the age of 6 and 59 months who should receive each month a vitamin A capsule in your catchment area?
(Population × 18%/12 × 2 caps)• What is the number of children each month who should fi nish six standard
visits for preschool consultations between the age of 12 and 59 months?(Population × 16%/12 × 6)
5 Vaccinations • Calculations related to fi ve vaccination targets are required:• BCG• DPT3• Measles• Fully immunized children• Fully immunized pregnant women (TT2+)(The target group of children less than 1 year of age is [4.3%] of the population of the catchment area. The number of pregnancies in the catchment area is estimated at [4.8%].)
6 Distribution of bednets
• What is the monthly bed net distribution in your catchment area if thetarget is 100%? (The area of health population/5 years/12 months/1.5people. One bed net has a life span of 5 years and is used by 1.5 personson average [child with mother—couple].)
• What was the bed net coverage rate in the previous quarter?(Number of nets distributed during the past quarter/catchment area population/4 quarters/5 years/1.5 persons)
7 Tuberculosis • What are the monthly targets for TB detection (population/100,000 × 150/12) and the TB treatment) (population/100,000 × 150/12) in your)catchment area? (The incidence for AFB+ PTB in this example is assumedto be 150 new cases of AFB+ PTB per 100,000 population per year.)
8 New family using a latrine
• What is the monthly target for new families using latrines in your catchment area?
(Population/4.6 persons per household/12 months/3 years)(The average household in this example has 4.6 persons and one latrine perhousehold, and the average latrine lasts three years.)

Improving Health Facility Management 185
9 Family planning Calculate the number of couples (women) who should use oral and injectableFP methods in your catchment area each month if 22.5% is the target.(New + existing users = population × 25%/12 × 22.5% × 4)(In this example, 22.5% of the population is women of childbearing age,while the unmet need is estimated at 25%. Only modern contraceptives arecounted, and those are counted in three-month cycles. Modern contracep-tives are injectable contraceptives, implants, IUDs, and OCPs.)a
10 Antenatal care • What is the target for the number of new antenatal care consultations permonth?
(Population × 4.8%/12)• What is the target for the number of antenatal consultancies per month to
achieve the target for pregnant women who visit during their pregnancy atleast three times?
(Population × 4.8%/12 × 3) 11 Delivery care and
abortions• What is the coverage for deliveries that took place in the health facility in
the past quarter?(Number of realized births during the past quarter/population × 4.8% x 3)• What is the monthly target for institutional deliveries for your catchment area?(Population × 4.8%/12 months)
12 Human resourcemanagement
• What remuneration does the health facility pay to staff from differentrevenues (from government sources, own sources, and so on)?
13 Other resources • Drugs and medical consumables• Medical equipment• Furniture and offi ce supplies• Infrastructure
14 Financial planning • Financial planning—forecasted quarterly income and expenses• Income-expense statement from the past quarter
Source: World Bank data.:
Note: AFB+ = acid-fast bacillus positive; BCG = Bacillus Calmette-Guérin; DPT3 = diphtheria, pertussis, tetanus; FP = family planning;:IUD = intrauterine device; No. = number; OCP = oral contraceptive; PTB = pulmonary tuberculosis; TB = tuberculosis; TT2+ = secondto the sixth tetanus toxoid vaccination.
a. Implants and IUDs are paid separately and against a higher fee as their protection spans several years.
External Consultations• What is the monthly target for outpatient department (OPD) consulta-
tions in your ward?
(Total population in the ward catchment area /12.)• What are the problems concerning OPD consultations attending your
health center?
Analyze the possible factors such as (a) purchasing power of the population to pay fees, (b) fee payment per act or fi xed fees, (c) competition with other health
TABLE 10.1 (continued)
No. Section Content

186 Performance-Based Financing Toolkit
facilities, (d) lack of medicines, (e) remote villages, ( f ) lack of qualifi ed person-nel, and (g) staff motivation. Are there any other problems?
• What strategies are proposed to solve those problems?
Consider (a) increasing qualifi ed staff , (b) adding outreach strategies, (c) pro-posing new subcontracts with health posts and private clinics, (d) decreasing fees, (e) providing pricing for fl at fees or per activity, ( f ) discussing with un-trained practitioners how they will stop practicing, and (g) involving the local health authorities.
Institutional Deliveries
• What is the coverage of deliveries in the health facility in the past quarter?
(Number of realized births during the past quarter/population × 4.8% × 3.)
• What is the monthly target for institutional deliveries for your catchment area?
(Population × 4.8%/12 months.)
• What problems are encountered in your catchment area?
Analyze the following: (a) availability of qualifi ed staff with permanent duty ros-ter, (b) clean delivery room, (c) confi dentially assured, (d) equipment (delivery kit, sterile delivery boxes, vacuum extractors, and sutures), (e) sterilization pro-cedures (gloves, plastic apron, and disinfection), ( f ) conditions of hospitalization (space, ventilation, bed net), and (g) existence of partogram and correct use.
• What strategies do you propose in consideration of the above factors?
Examine the following: (a) increase qualifi ed staff , (b) buy equipment, (c) change hygiene and sterilization procedures, (d) rehabilitate infrastructure, (e) train staff , and (e) open a new maternity ward.
• What problems concerning unsafe abortions are in your catchment area?• Consider the following: (a) maternal deaths after illegal abortions,
(b) cases of pregnancy after rape, and (c) lack of access to safe abortions.• What strategies do you propose to solve the above problems?
Main Management Tool Number Two: The Individual Monthly Performance Evaluation
Individual staff performance is assessed monthly through a performance evaluation tool (table 10.2). The staff is assessed by its facility management. The individual performance bonus depends on the performance assessment.
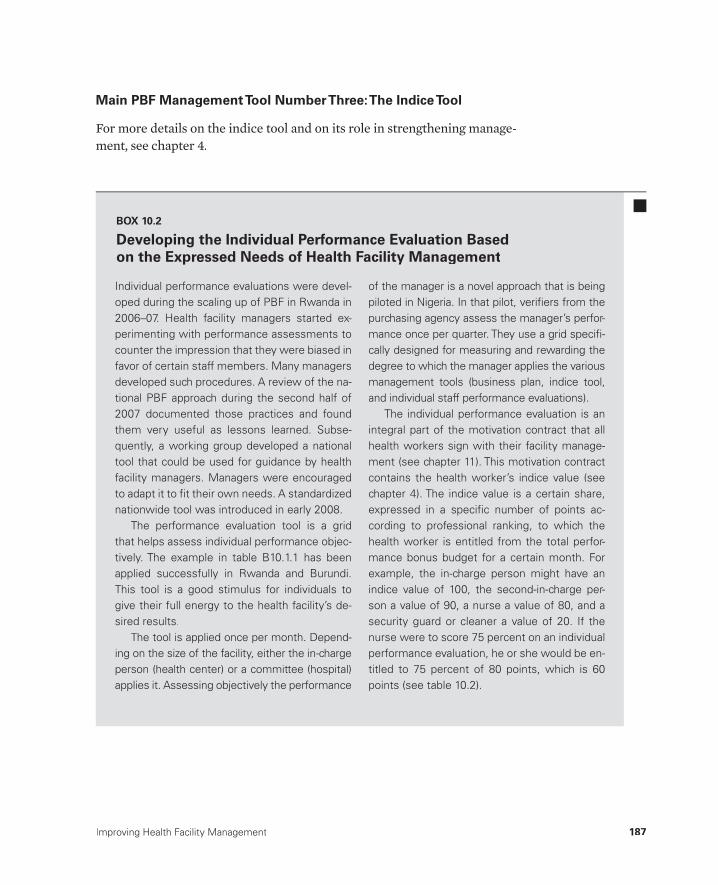
Improving Health Facility Management 187
Individual performance evaluations were devel-oped during the scaling up of PBF in Rwanda in 2006– 07. Health facility managers started ex-perimenting with performance assessments tocounter the impression that they were biased in favor of certain staff members. Many managers developed such procedures. A review of the na-tional PBF approach during the second half of 2007 documented those practices and found them very useful as lessons learned. Subse-quently, a working group developed a nationaltool that could be used for guidance by healthfacility managers. Managers were encouraged to adapt it to fi t their own needs. A standardizednationwide tool was introduced in early 2008.
The performance evaluation tool is a grid that helps assess individual performance objec-tively. The example in table B10.1.1 has beenapplied successfully in Rwanda and Burundi.This tool is a good stimulus for individuals to give their full energy to the health facility’s de-sired results.
The tool is applied once per month. Depend-ing on the size of the facility, either the in- charge person (health center) or a committee (hospital)applies it. Assessing objectively the performance
of the manager is a novel approach that is being piloted in Nigeria. In that pilot, verifi ers from the purchasing agency assess the manager’s perfor-mance once per quarter. They use a grid specifi -cally designed for measuring and rewarding the degree to which the manager applies the various management tools (business plan, indice tool, and individual staff performance evaluations).
The individual performance evaluation is an integral part of the motivation contract that allhealth workers sign with their facility manage-ment (see chapter 11). This motivation contract contains the health worker’s indice value (seechapter 4). The indice value is a certain share, expressed in a specifi c number of points ac-cording to professional ranking, to which thehealth worker is entitled from the total perfor-mance bonus budget for a certain month. Forexample, the in- charge person might have an indice value of 100, the second- in- charge per-son a value of 90, a nurse a value of 80, and asecurity guard or cleaner a value of 20. If thenurse were to score 75 percent on an individualperformance evaluation, he or she would be en-titled to 75 percent of 80 points, which is 60 points (see table 10.2).
BOX 10.2
Developing the Individual Performance Evaluation Basedon the Expressed Needs of Health Facility Management
Main PBF Management Tool Number Three: The Indice Tool
For more details on the indice tool and on its role in strengthening manage-ment, see chapter 4.
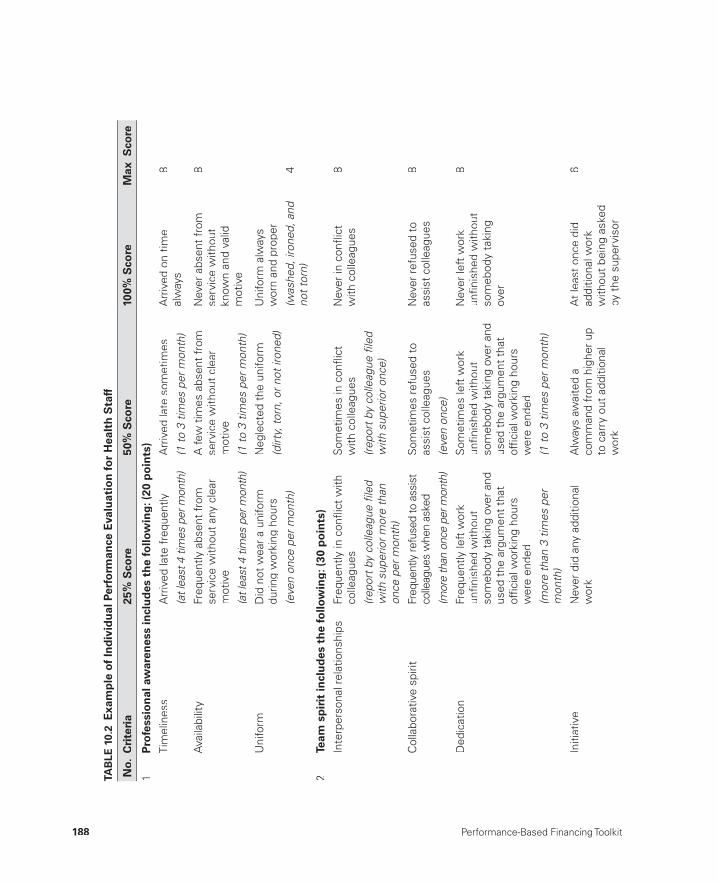
188 Performance-Based Financing Toolkit
TAB
LE 1
0.2
Exa
mp
le o
f In
div
idu
al P
erfo
rman
ce E
valu
atio
n fo
r H
ealt
h S
taff
No.
Cri
teri
a25
% S
core
50%
Sco
re10
0% S
core
Max
Sco
re
1P
rofe
ssio
nal
aw
aren
ess
incl
ud
es t
he
follo
win
g: (
20 p
oin
ts)
Tim
elin
ess
Arr
ived
late
fre
quen
tly
(at l
east
4 ti
mes
per
mon
th)
Arr
ived
late
som
etim
es
(1 to
3 ti
mes
per
mon
th)
Arr
ived
on
time
alw
ays
8
Ava
ilabi
lity
Freq
uent
ly a
bsen
t fr
om
serv
ice
with
out
any
clea
r m
otiv
e
(at l
east
4 ti
mes
per
mon
th)
A fe
w t
imes
abs
ent
from
se
rvic
e w
ithou
t cl
ear
mot
ive
(1 to
3 ti
mes
per
mon
th)
Nev
er a
bsen
t fr
omse
rvic
e w
ithou
tkn
own
and
valid
mot
ive
8
Uni
form
Did
not
wea
r a
unifo
rmdu
ring
wor
king
hou
rs
Neg
lect
ed t
he u
nifo
rm
(dirt
y, to
rn, o
r not
iron
ed)
Uni
form
alw
ays
wor
n an
d pr
oper
(was
hed ,
iron
ed, a
nd
not t
orn)
(e
ven
once
per
mon
th)
4
2Te
am s
pir
it in
clu
des
th
e fo
llow
ing
: (30
po
ints
)
Inte
rper
sona
l rel
atio
nshi
psFr
eque
ntly
in c
onfl i
ct w
ithco
lleag
ues
Som
etim
es in
con
fl ict
w
ith c
olle
ague
s
(repo
rt b
y co
lleag
ue fi
led
with
sup
erio
r onc
e)
Nev
er in
con
fl ict
w
ith c
olle
ague
s8
(repo
rt b
y co
lleag
ue fi
led
with
sup
erio
r mor
e th
an
once
per
mon
th)
Col
labo
rativ
e sp
irit
Freq
uent
ly re
fuse
d to
ass
ist
colle
ague
s w
hen
aske
d
(mor
e th
an o
nce
per m
onth
)
Som
etim
es r
efus
ed t
o as
sist
col
leag
ues
(eve
n on
ce)
Nev
er r
efus
ed t
o as
sist
col
leag
ues
8
Ded
icat
ion
Freq
uent
ly le
ft w
ork
unfi n
ishe
d w
ithou
t so
meb
ody
taki
ng o
ver
and
used
the
arg
umen
t th
at
offi c
ial w
orki
ng h
ours
w
ere
ende
d
(mor
e th
an 3
tim
es p
er
mon
th)
Som
etim
es le
ft w
ork
unfi n
ishe
d w
ithou
t so
meb
ody
taki
ng o
ver
and
used
the
arg
umen
t th
at
offi c
ial w
orki
ng h
ours
w
ere
ende
d
(1 to
3 ti
mes
per
mon
th)
Nev
er le
ft w
ork
unfi n
ishe
d w
ithou
t so
meb
ody
taki
ng
over
8
Initi
ativ
eN
ever
did
any
add
ition
alw
ork
Alw
ays
awai
ted
a co
mm
and
from
hig
her
upto
car
ry o
ut a
dditi
onal
w
ork
At
leas
t on
ce d
id
addi
tiona
l wor
k w
ithou
t be
ing
aske
dby
the
sup
ervi
sor
6
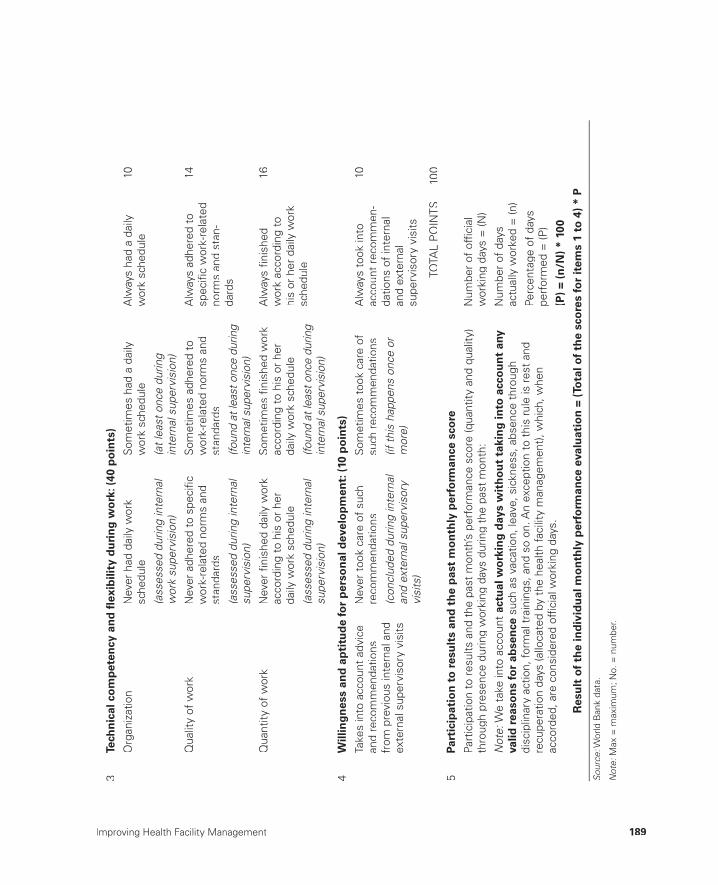
Improving Health Facility Management 189
3Te
chn
ical
co
mp
eten
cy a
nd
fl ex
ibili
ty d
uri
ng
wo
rk: (
40 p
oin
ts)
Org
aniz
atio
nN
ever
had
dai
ly w
ork
sche
dule
(ass
esse
d du
ring
inte
rnal
w
ork
supe
rvis
ion)
Som
etim
es h
ad a
dai
lyw
ork
sche
dule
(at l
east
onc
e du
ring
inte
rnal
sup
ervi
sion
)
Alw
ays
had
a da
ily
wor
k sc
hedu
le
10
Qua
lity
of w
ork
Nev
er a
dher
ed t
o sp
ecifi
cw
ork-
rela
ted
norm
s an
dst
anda
rds
(ass
esse
d du
ring
inte
rnal
su
perv
isio
n)
Som
etim
es a
dher
ed t
ow
ork-
rela
ted
norm
s an
dst
anda
rds
(foun
d at
leas
t onc
e du
ring
inte
rnal
sup
ervi
sion
)
Alw
ays
adhe
red
to
spec
ifi c
wor
k-re
late
d no
rms
and
stan
-da
rds
14
Qua
ntity
of
wor
k N
ever
fi ni
shed
dai
ly w
ork
acco
rdin
g to
his
or
her
daily
wor
k sc
hedu
le
(ass
esse
d du
ring
inte
rnal
su
perv
isio
n)
Som
etim
es fi
nish
ed w
ork
acco
rdin
g to
his
or
her
daily
wor
k sc
hedu
le
(foun
d at
leas
t onc
e du
ring
inte
rnal
sup
ervi
sion
)
Alw
ays
fi nis
hed
wor
k ac
cord
ing
to
his
or h
er d
aily
wor
ksc
hedu
le
16
4W
illin
gn
ess
and
ap
titu
de
for
per
son
al d
evel
op
men
t: (
10 p
oin
ts)
Take
s in
to a
ccou
nt a
dvic
ean
d re
com
men
datio
ns
from
pre
viou
s in
tern
al a
ndex
tern
al s
uper
viso
ry v
isits
Nev
er t
ook
care
of
such
re
com
men
datio
ns
(con
clud
ed d
urin
g in
tern
al
and
exte
rnal
sup
ervi
sory
vi
sits
)
Som
etim
es t
ook
care
of
such
rec
omm
enda
tions
(if th
is h
appe
ns o
nce
or
mor
e)
Alw
ays
took
into
ac
coun
t re
com
men
-da
tions
of
inte
rnal
and
exte
rnal
su
perv
isor
y vi
sits
10
TOTA
L P
OIN
TS
100
5Pa
rtic
ipat
ion
to
res
ult
s an
d t
he
pas
t m
on
thly
per
form
ance
sco
re
Part
icip
atio
n to
res
ults
and
the
pas
t m
onth
’s p
erfo
rman
ce s
core
(qua
ntity
and
qua
lity)
thro
ugh
pres
ence
dur
ing
wor
king
day
s du
ring
the
past
mon
th:
Num
ber
of o
ffi ci
al
wor
king
day
s =
(N)
Not
e: W
e ta
ke in
to a
ccou
ntac
tual
wo
rkin
g d
ays
wit
ho
ut
taki
ng
into
acc
ou
nt
any
valid
rea
son
s fo
r ab
sen
ce s
uch
as v
acat
ion,
leav
e, s
ickn
ess,
abs
ence
thr
ough
disc
iplin
ary
actio
n, fo
rmal
tra
inin
gs, a
nd s
o on
. An
exce
ptio
n to
thi
s ru
le is
res
t an
d re
cupe
ratio
n da
ys (a
lloca
ted
by t
he h
ealth
faci
lity
man
agem
ent)
, whi
ch, w
hen
acco
rded
, are
con
side
red
offi c
ial w
orki
ng d
ays.
Num
ber
of d
ays
actu
ally
wor
ked
= (n
)
Perc
enta
ge o
f da
yspe
rfor
med
= (P
)
(P)
= (n
/N)
* 10
0
Res
ult
of
the
ind
ivid
ual
mo
nth
ly p
erfo
rman
ce e
valu
atio
n =
(To
tal o
f th
e sc
ore
s fo
r it
ems
1 to
4)
* P
Sour
ce: W
orld
Ban
k da
ta.
:
Not
e: M
ax =
max
imum
; No.
= n
umbe
r.:
190 Performance-Based Financing Toolkit
10.3 Advanced Strategies for Improving Health Facility Results: Learning from Good Practices
In addition to application of the basic PBF management tools, a wide array of advanced strategies has been developed to improve results, both through demand- side and supply- side interventions. Advanced strategies have been developed by successful PBF health facilities in various countries and thus have been tested in various contexts.
It is useful to share such experiences to avoid reinventing the wheel. Ex-amples of such advanced strategies are as follows:
• Supply- side strategies:➜ Increasing clinic opening times➜ Decreasing staff absenteeism➜ Enhancing staff attitudes➜ Increasing the number of qualifi ed staff members➜ Enhancing infrastructure, equipment, and drugs➜ Increasing collaboration with community health workers➜ Increasing outreach➜ Subcontracting secondary facilities, including the private sector.
• Demand- side strategies:➜ Lowering fees for curative care➜ Lowering or abolishing fees for family planning➜ Off ering a baby- welcome package to pregnant women➜ Paying traditional birth attendants a fee for bringing pregnant women
to the health facility➜ Paying community health workers a fee for following up on tuberculo-
sis patients➜ Enhancing quality in general➜ Enhancing staff attitudes.
Advanced strategies that have been proven to work in a particular situation can be shared with health facilities that are just beginning PBF. PBF involves new ways of working for the health staff . Sharing lessons learned in other contexts is often highly appreciated by health providers. Avoid inventing ad-vanced strategies that already have been discovered by others (learn from those): invent original ones. Table 10.3 lists a range of advanced strategies.
Advanced strategies such as the ones listed in table 10.3 will serve the fa-cility in improving its results. This improvement has been shown in practice. Many of the strategies are simply common sense, and some strategies are

Improving Health Facility Management 191
TAB
LE 1
0.3
So
me
Ad
van
ced
Str
ateg
ies
for
PB
F
No.
Ser
vice
Ad
van
ced
st
rate
gyTo
do’
sE
xpla
nat
ion
0
Gen
eral
man
agem
ent
Use
PB
F to
ols.
• P
BF
equa
ls r
ecor
d ke
epin
g. K
eep
100%
of
your
reco
rds,
and
get
pai
d 10
0% fo
r yo
ur p
erfo
r-m
ance
.
• R
ecor
d ke
epin
g sh
ould
be
done
acc
ordi
ng t
o a
PB
F re
port
sta
ndar
d, b
e co
mpl
ete
and
legi
ble,
and
incl
ude
a m
obile
pho
ne n
umbe
r an
d ho
useh
old
num
ber.
• U
se t
he q
ualit
y ch
eckl
ist
to id
entif
y w
eak
poin
tsin
the
per
form
ance
.
• Pr
ovid
e ch
eckl
ist
item
s fo
r ea
ch s
ervi
ce (q
uant
ity
and
qual
ity).
• Tr
ain
your
sta
ff a
nd P
BF
com
mitt
ee in
PB
F.
• A
pply
the
mon
thly
indi
vidu
al p
erfo
rman
ceev
alua
tion,
and
dis
cuss
it w
ith t
he s
taff
mem
ber.
• A
pply
the
indi
ce t
ool e
ach
quar
ter,
and
disc
uss
resu
lts w
ith y
our
staf
f.
• E
ach
mon
th, s
elec
t an
em
ploy
ee o
f th
e m
onth
.
• E
ach
wee
k, h
ave
gene
ral s
taff
mee
tings
and
di
scus
s pe
rfor
man
ce.
• S
hare
per
form
ance
res
ults
with
you
r st
aff,
incl
udin
g re
sults
fro
m t
he in
dice
too
l and
fi nan
cial
man
agem
ent
deci
sion
s.
• E
ach
mon
th, h
ave
at le
ast
one
man
agem
ent
team
mee
ting.
• E
ach
mon
th, h
ave
a m
eetin
g w
ith t
he P
BF
faci
lity
com
mitt
ee.
• D
eleg
ate
to y
our
seni
or m
anag
emen
t: d
o no
t m
icro
man
age.
• B
e fa
ir to
you
r st
aff.
• E
nsur
e go
od t
eam
wor
k.
• D
o ac
tiviti
es t
oget
her
outs
ide
wor
k.
• B
ette
r us
e of
PB
F in
stru
men
ts le
ads
to
bett
er r
esul
ts, a
nd b
ette
r re
sults
lead
to
mor
e sa
tisfa
ctio
n am
ong
the
staf
fan
d th
e co
mm
unity
.•
Bet
ter
resu
lts le
ad t
o m
ore
inco
me
for
heal
th fa
cilit
y an
d st
aff
bonu
ses.
• G
ood
man
agem
ent
lead
s to
a b
ette
r m
otiv
ated
sta
ff, w
hich
lead
s to
a b
ette
r pe
rfor
man
ce.
• G
ood
team
wor
k w
ill le
ad t
o be
tter
re
sults
and
mor
e sa
tisfa
ctio
n am
ong
staf
f.•
Bet
ter
team
wor
k an
d so
cial
rel
atio
ns
betw
een
staf
f w
ill le
ad t
o be
tter
pe
rfor
man
ce.
• A
lway
s le
arn
from
oth
ers
who
hav
e be
en s
ucce
ssfu
l.•
Act
ivel
y se
ek m
anag
emen
t su
ppor
t fo
r P
BF
blac
k bo
x to
olsa
and
data
man
agem
ent.
(tab
le c
ontin
ues
on n
ext p
age)
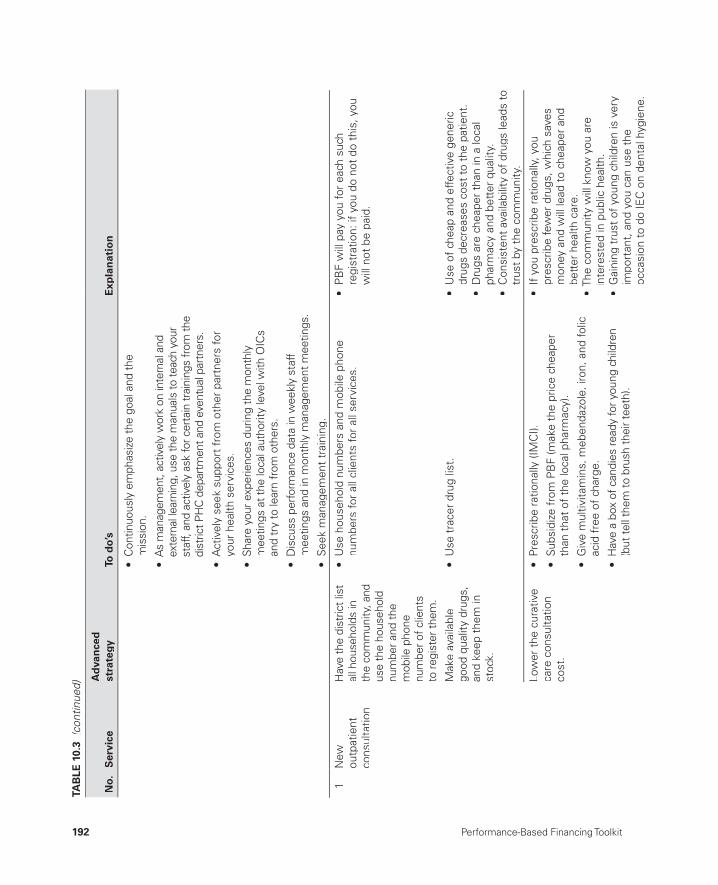
192 Performance-Based Financing Toolkit
• C
ontin
uous
ly e
mph
asiz
e th
e go
al a
nd th
e m
issi
on.
• A
s m
anag
emen
t, ac
tivel
y w
ork
on in
tern
al a
nd
exte
rnal
lear
ning
, use
the
man
uals
to te
ach
your
st
aff,
and
activ
ely
ask
for c
erta
in tr
aini
ngs
from
the
dist
rict P
HC
dep
artm
ent a
nd e
vent
ual p
artn
ers.
• A
ctiv
ely
seek
sup
port
fro
m o
ther
par
tner
s fo
r yo
ur h
ealth
ser
vice
s.
• Sh
are
your
exp
erie
nces
dur
ing
the
mon
thly
mee
tings
at t
he lo
cal a
utho
rity
leve
l with
OIC
san
d tr
y to
lear
n fr
om o
ther
s.
• D
iscu
ss p
erfo
rman
ce d
ata
in w
eekl
y st
aff
mee
tings
and
in m
onth
ly m
anag
emen
t mee
tings
.
• S
eek
man
a gem
ent
trai
ning
.
1
New
outp
atie
ntco
nsul
tatio
n
Hav
e th
e di
stric
t lis
t al
l hou
seho
lds
in
the
com
mun
ity, a
ndus
e th
e ho
useh
old
num
ber a
nd th
em
obile
pho
nenu
mbe
r of c
lient
sto
regi
ster
them
.
• U
se h
ouse
hold
num
bers
and
mob
ile p
hone
nu
mbe
rs fo
r al
l clie
nts
for
all s
ervi
ces.
• P
BF
will
pay
you
for
each
suc
hre
gist
ratio
n: if
you
do
not
do t
his,
you
w
ill n
ot b
e pa
id.
Mak
e av
aila
ble
good
qua
lity
drug
s,an
d ke
ep t
hem
in
stoc
k.
• U
se t
race
r dr
ug li
st.
• U
se o
f ch
eap
and
effe
ctiv
e ge
neric
dr
ugs
decr
ease
s co
st t
o th
e pa
tient
.•
Dru
gs a
re c
heap
er t
han
in a
loca
l ph
arm
acy
and
bett
er q
ualit
y.•
Con
sist
ent
avai
labi
lity
of d
rugs
lead
s to
tr
ust
by t
he c
omm
unity
.
Low
er t
he c
urat
ive
care
con
sulta
tion
cost
.
• Pr
escr
ibe
ratio
nally
(IM
CI).
• S
ubsi
dize
fro
m P
BF
(mak
e th
e pr
ice
chea
per
than
tha
t of
the
loca
l pha
rmac
y).
• G
ive
mul
tivita
min
s, m
eben
dazo
le, i
ron,
and
folic
ac
id f
ree
of c
harg
e.
• H
ave
a bo
x of
can
dies
read
y fo
r you
ng c
hild
ren
(but
tell
them
to b
rush
thei
r tee
th).
• If
you
pre
scrib
e ra
tiona
lly, y
oupr
escr
ibe
few
er d
rugs
, whi
ch s
aves
m
oney
and
will
lead
to
chea
per
and
bett
er h
ealth
car
e.•
The
com
mun
ity w
ill k
now
you
are
in
tere
sted
in p
ublic
hea
lth.
• G
aini
ng t
rust
of
youn
g ch
ildre
n is
ver
y im
port
ant,
and
you
can
use
the
oc
casi
on t
o do
IEC
on
dent
al h
ygie
ne.
TAB
LE 1
0.3
(con
tinue
d)
No.
Ser
vice
Ad
van
ced
st
rate
gyTo
do’
sE
xpla
nat
ion
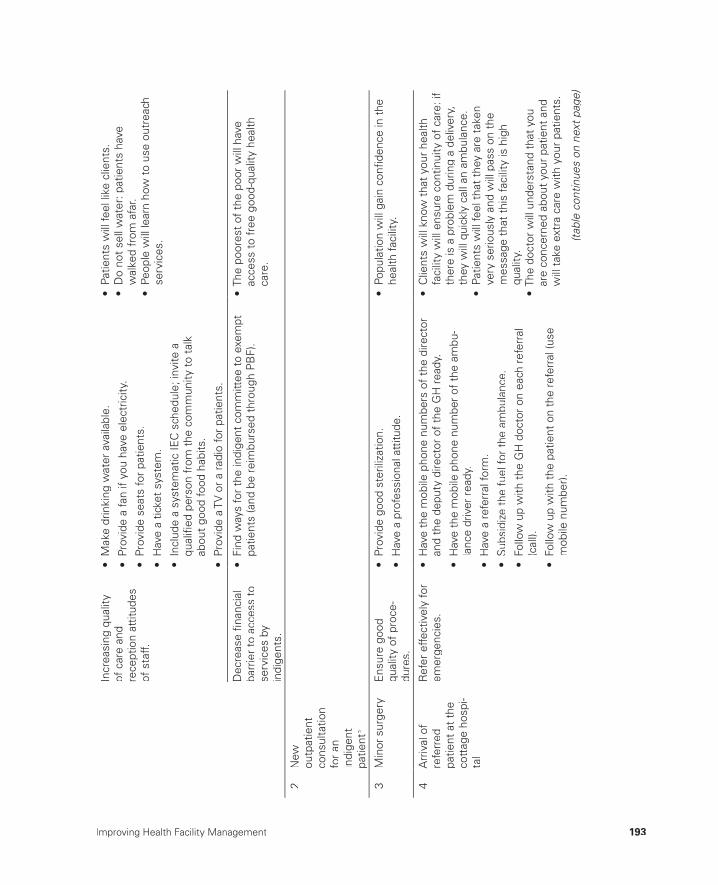
Improving Health Facility Management 193
Incr
easi
ng q
ualit
yof
car
e an
d re
cept
ion
attit
udes
of
sta
ff.
• M
ake
drin
king
wat
er a
vaila
ble.
• Pr
ovid
e a
fan
if yo
u ha
ve e
lect
ricity
.
• Pr
ovid
e se
ats
for
patie
nts .
• H
ave
a tic
ket
syst
em.
• In
clud
e a
syst
emat
ic IE
C s
ched
ule;
invi
te a
qual
ifi ed
per
son
from
the
com
mun
ity t
o ta
lk
abou
t go
od fo
od h
abits
.
• Pr
ovid
e a
TV o
r a
radi
o fo
r pa
tient
s .
• Pa
tient
s w
ill fe
el li
ke c
lient
s.•
Do
not
sell
wat
er: p
atie
nts
have
w
alke
d fr
om a
far.
• Pe
ople
will
lear
n ho
w t
o us
e ou
trea
chse
rvic
es.
Dec
reas
e fi n
anci
al
barr
ier
to a
cces
s to
se
rvic
es b
yin
dige
nts.
• Fi
nd w
ays
for
the
indi
gent
com
mitt
ee t
o ex
empt
patie
nts
(and
be
reim
burs
ed t
hrou
gh P
BF)
.•
The
poor
est
of t
he p
oor
will
hav
eac
cess
to
free
goo
d-qu
ality
hea
lth
care
.
2
New
outp
atie
ntco
nsul
tatio
nfo
r an
in
dige
ntpa
tient
b
3
Min
or s
urge
ryE
nsur
e go
od
qual
ity o
f pr
oce-
dure
s.
• Pr
ovid
e go
od s
teril
izat
ion.
• H
ave
a pr
ofes
sion
al a
ttitu
de.
• Po
pula
tion
will
gai
n co
nfi d
ence
in t
hehe
alth
faci
lity.
4
Arr
ival
of
refe
rred
pa
tient
at
the
cott
age
hosp
i-ta
l
Ref
er e
ffect
ivel
y fo
rem
erge
ncie
s.•
Hav
e th
e m
obile
pho
ne n
umbe
rs o
f th
e di
rect
oran
d th
e de
puty
dire
ctor
of
the
GH
rea
dy.
• H
ave
the
mob
ile p
hone
num
ber
of t
he a
mbu
-la
nce
driv
er r
eady
.
• H
ave
a re
ferr
al fo
rm.
• S
ubsi
dize
the
fue
l for
the
am
bula
nce.
• Fo
llow
up
with
the
GH
doc
tor
on e
ach
refe
rral
(c
all).
• Fo
llow
up
with
the
pat
ient
on
the
refe
rral
(use
mob
ile n
umbe
r).
• C
lient
s w
ill k
now
tha
t yo
ur h
ealth
fa
cilit
y w
ill e
nsur
e co
ntin
uity
of
care
: if
ther
e is
a p
robl
em d
urin
g a
deliv
ery,
they
will
qui
ckly
cal
l an
ambu
lanc
e.•
Patie
nts
will
feel
tha
t th
ey a
re t
aken
very
ser
ious
ly a
nd w
ill p
ass
on t
he
mes
sage
tha
t th
is fa
cilit
y is
hig
hqu
ality
.•
The
doct
or w
ill u
nder
stan
d th
at y
ou
are
conc
erne
d ab
out
your
pat
ient
and
w
ill t
ake
extr
a ca
re w
ith y
our
patie
nts.
(tab
le c
ontin
ues
on n
ext p
age)
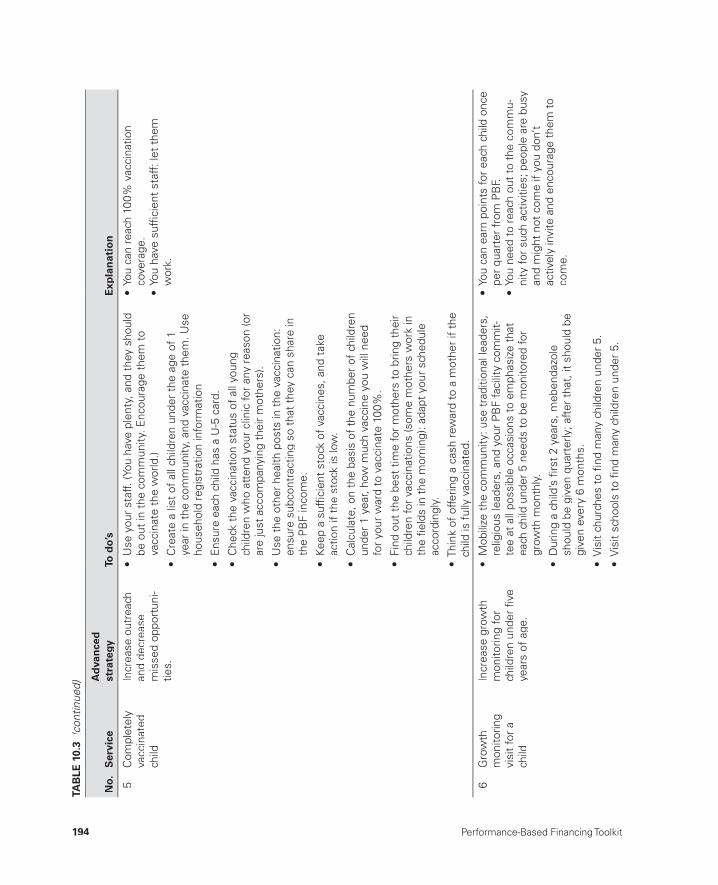
194 Performance-Based Financing Toolkit
5
Com
plet
ely
vacc
inat
edch
ild
Incr
ease
out
reac
han
d de
crea
sem
isse
d op
port
uni-
ties.
• U
se y
our
staf
f. (Y
ou h
ave
plen
ty, a
nd t
hey
shou
ld
be o
ut in
the
com
mun
ity. E
ncou
rage
the
m t
ova
ccin
ate
the
wor
ld.)
• C
reat
e a
list
of a
ll ch
ildre
n un
der
the
age
of 1
year
in t
he c
omm
unity
, and
vac
cina
te t
hem
. Use
hous
ehol
d re
gist
ratio
n in
form
atio
n
• E
n sur
e ea
ch c
hild
has
a U
-5 c
ard.
• C
heck
the
vac
cina
tion
stat
us o
f al
l you
ng
child
ren
who
att
end
your
clin
ic fo
r an
y re
ason
(or
are
just
acc
ompa
nyin
g th
eir
mot
hers
).
• U
se t
he o
ther
hea
lth p
osts
in t
he v
acci
natio
n:en
sure
sub
cont
ract
ing
so t
hat
they
can
sha
re in
the
PB
F in
com
e.
• Ke
ep a
suf
fi cie
nt s
tock
of
vacc
ines
, and
tak
e ac
tion
if th
e st
ock
is lo
w.
• C
alcu
late
, on
the
basi
s of
the
num
ber
of c
hild
ren
unde
r 1
year
, how
muc
h va
ccin
e yo
u w
ill n
eed
for
your
war
d to
vac
cina
te 1
00%
.
• Fi
nd o
ut t
he b
est
time
for
mot
hers
to
brin
g th
eir
child
ren
for
vacc
inat
ions
(som
e m
othe
rs w
ork
in
the
fi eld
s in
the
mor
ning
): ad
apt
your
sch
edul
eac
cord
ingl
y.
• Th
ink
of o
fferin
g a
cash
rew
ard
to a
mot
her
if th
e ch
ild is
ful
ly v
acci
nate
d.
• Yo
u ca
n re
ach
100%
vac
cina
tion
cove
rage
.•
You
have
suf
fi cie
nt s
taff
: let
the
mw
ork.
6
Gro
wth
mon
itorin
g vi
sit
for
ach
ild
Incr
ease
gro
wth
m
onito
ring
for
child
ren
unde
r fi v
e ye
ars
of a
ge.
• M
obili
ze t
he c
omm
unity
: use
tra
ditio
nal l
eade
rs,
relig
ious
lead
ers,
and
you
r P
BF
faci
lity
com
mit-
tee
at a
ll po
ssib
le o
ccas
ions
to
emph
asiz
e th
at
each
chi
ld u
nder
5 n
eeds
to
be m
onito
red
for
grow
th m
onth
ly.
• D
urin
g a
child
’s fi
rst
2 ye
ars,
meb
enda
zole
shou
ld b
e gi
ven
quar
terly
; aft
er t
hat,
it s
houl
d be
give
n ev
ery
6 m
onth
s.
• V
isit
chur
ches
to
fi nd
man
y ch
ildre
n un
der
5.
• Yo
u ca
n ea
rn p
oint
s fo
r ea
ch c
hild
onc
e pe
r qu
arte
r fr
om P
BF.
• Yo
u ne
ed t
o re
ach
out
to t
he c
omm
u-ni
ty fo
r su
ch a
ctiv
ities
; peo
ple
are
busy
an
d m
ight
not
com
e if
you
don’
t ac
tivel
y in
vite
and
enc
oura
ge t
hem
to
com
e.
• V
isit
scho
ols
to fi
nd m
any
child
ren
unde
r 5.
TAB
LE 1
0.3
(con
tinue
d)
No.
Ser
vice
Ad
van
ced
st
rate
gyTo
do’
sE
xpla
nat
ion

Improving Health Facility Management 195
• A
part
fro
m w
eigh
ing
and
mea
surin
g th
e ch
ildan
d pr
ovid
ing
meb
enda
zole
, ens
ure
good
qua
lity
IEC
for
pers
onal
hyg
iene
and
food
pre
para
tion.
• O
ffer
a pi
ece
of c
andy
or
a bi
scui
t fo
r ea
ch
grow
th-m
onito
red
child
(and
use
IEC
to
emph
a-si
ze im
port
ance
of
brus
hing
tee
th).
Com
bine
gro
wth
-m
onito
ring
activ
ities
with
fam
ily p
lann
ing
asm
uch
as p
ossi
ble.
• A
lway
s co
mbi
ne IE
C fo
r gr
owth
mon
itorin
g w
ith
IEC
for
fam
ily p
lann
ing.
• I f
wom
en w
ant
a ce
rtai
n m
etho
d, e
nsur
e th
at
they
can
hav
e ac
cess
to
it.
• M
any
wom
en h
esita
te t
o us
e FP
at
the
faci
lity
leve
l bec
ause
of
stig
ma.
7
2–5
teta
nus
vacc
inat
ions
of p
regn
ant
wom
an
Dec
reas
e m
isse
d op
port
uniti
es.
• Sy
stem
atic
ally
che
ck T
T st
atus
for
all p
regn
ant
wom
en.
• Fo
llow
the
imm
uniz
atio
n ca
lend
ar fo
r pr
egna
nt
wom
en: d
o no
t ca
tego
rize
as T
T-1
each
TT.
• En
sure
goo
d pl
anni
ng fo
r suf
fi cie
nt v
acci
ne s
tock
.
8
Post
nata
l con
-su
ltatio
nIn
crea
se P
NC
rat
e.•
Incr
ease
the
num
ber
of w
omen
del
iver
ing
in
your
faci
lity.
• Ke
ep a
clo
se w
atch
on
all p
regn
ant
wom
en
unde
r yo
ur c
are,
and
cal
l the
m a
roun
d th
eir
ED
D(m
obile
out
reac
h) t
o en
sure
tha
t th
ey d
eliv
er
with
you
; if
they
did
not
, fol
low
up
to e
nsur
eth
ey c
ome
for
PN
C.
• Pr
ovid
e a
gift
for w
omen
who
del
iver
in y
our
faci
lity
and
who
com
e ba
ck fo
r the
ir PN
C (y
ou c
an
com
bine
the
gift
for t
hose
tw
o oc
casi
ons)
:pr
ovid
e th
e ba
by-w
elco
me
pack
age
(soa
p an
d, fo
r ex
ampl
e, s
econ
d-ha
nd b
aby
clot
hing
) dur
ing
PNC
.
• P
NC
is v
ery
impo
rtan
t fo
r th
e he
alth
of
the
mot
her
(eve
ntua
l inf
ectio
ns, a
nd
so o
n) a
nd fo
r a
chec
k of
the
neo
nate
.
9
Firs
t AN
C
cons
ulta
tion
befo
re fo
urth
mon
th o
fpr
egna
ncy
Get
pre
gnan
tw
omen
to
com
e as
ea
rly a
s po
ssib
le.
• Fi
nd o
ut if
you
can
giv
e ad
vice
dur
ing
wed
ding
sor
suc
h ev
ents
.
• U
se A
NC
vis
its in
gen
eral
to
emph
asiz
e th
at
com
ing
befo
re t
he fo
urth
mon
th is
impo
rtan
t.
• D
urin
g ea
ch c
onta
ct w
ith t
he c
omm
unity
, em
phas
ize
early
AN
C v
isits
.
• O
ffer
a gi
ft t
o a
wom
an w
ho c
omes
ear
ly a
ndco
mpl
etes
all
4 A
NC
vis
its a
ccor
ding
to
the
cale
ndar
.
• Pr
ovid
e fr
ee p
regn
ancy
tes
ts.
• If
the
y co
me
befo
re 4
mon
ths,
you
can
do t
he 4
sta
ndar
d A
NC
vis
its.
• If
you
pro
pose
thi
s in
the
bus
ines
s pl
an, y
ou c
an g
et fi
nanc
ing
for
the
test
s ki
ts.
• Yo
u ca
n pr
opos
e co
nditi
onal
in-k
ind
gift
s (u
mbr
ella
s, c
loth
s, s
oap,
and
so
on) i
n yo
ur b
usin
ess
plan
s.
(tab
le c
ontin
ues
on n
ext p
age)
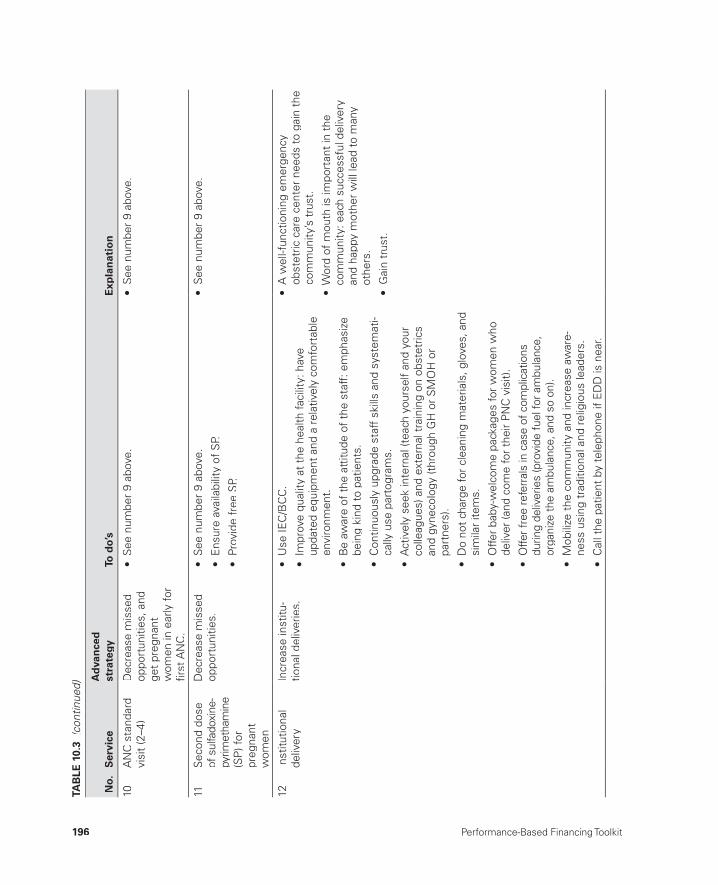
196 Performance-Based Financing Toolkit
10A
NC
sta
ndar
d vi
sit
(2–4
)D
ecre
ase
mis
sed
oppo
rtun
ities
, and
get
preg
nant
wom
en in
ear
ly fo
rfi r
st A
NC
.
• S
ee n
umbe
r 9
abov
e.•
See
num
ber
9 ab
ove.
11S
econ
d do
seof
sul
fado
xine
-py
rimet
ham
ine
(SP
) for
pr
egna
nt
wom
en
Dec
reas
e m
isse
d op
port
uniti
es.
• S
ee n
umbe
r 9
abov
e.
• E
nsur
e av
aila
bilit
y of
SP.
• Pr
ovid
e fr
ee S
P.
• S
ee n
umbe
r 9
abov
e.
12In
stitu
tiona
lde
liver
yIn
crea
se in
stitu
-tio
nal d
eliv
erie
s.•
Use
IEC
/BC
C.
• Im
prov
e qu
ality
at
the
heal
th fa
cilit
y: h
ave
upda
ted
equi
pmen
t an
d a
rela
tivel
y co
mfo
rtab
leen
viro
nmen
t.
• B
e aw
are
of t
he a
ttitu
de o
f th
e st
aff:
em
phas
ize
bein
g ki
nd t
o pa
tient
s.
• C
ontin
uous
ly u
pgra
de s
taff
ski
lls a
nd s
yste
mat
i-ca
lly u
se p
arto
gram
s.
• A
ctiv
ely
seek
inte
rnal
(tea
ch y
ours
elf
and
your
co
lleag
ues)
and
ext
erna
l tra
inin
g on
obs
tetr
ics
and
gyne
colo
gy (t
hrou
gh G
H o
r S
MO
H o
rpa
rtne
rs).
• D
o no
t ch
arge
for
clea
ning
mat
eria
ls, g
love
s, a
ndsi
mila
r ite
ms.
• A
wel
l-fun
ctio
ning
em
erge
ncy
obst
etric
car
e ce
nter
nee
ds t
o ga
in t
heco
mm
unity
’s t
rust
.
• W
ord
of m
outh
is im
port
ant
in t
he
com
mun
ity: e
ach
succ
essf
ul d
eliv
ery
and
happ
y m
othe
r w
ill le
ad t
o m
any
othe
rs.
• G
ain
trus
t.
• O
ffer
baby
-wel
com
e pa
ckag
es fo
r w
omen
who
deliv
er (a
nd c
ome
for
thei
r P
NC
vis
it).
• O
ffer f
ree
refe
rral
s in
cas
e of
com
plic
atio
nsdu
ring
deliv
erie
s (p
rovi
de fu
el fo
r am
bula
nce,
orga
nize
the
ambu
lanc
e, a
nd s
o on
).
• M
obili
ze t
he c
omm
unity
and
incr
ease
aw
are-
ness
usi
ng t
radi
tiona
l and
rel
igio
us le
ader
s.
• C
all t
he p
atie
nt b
y te
leph
one
if E
DD
is n
ear.
TAB
LE 1
0.3
(con
tinue
d)
No.
Ser
vice
Ad
van
ced
st
rate
gyTo
do’
sE
xpla
nat
ion

Improving Health Facility Management 197
13Fa
mily
plan
ning
(m
oder
n FP
met
hods
)
Incr
ease
the
FP
cove
rage
for
thos
e w
omen
who
wan
tch
ild s
paci
ng.
• E
nsur
e av
aila
bilit
y of
con
dom
s, p
ills,
inje
ctio
ns,
impl
ants
, and
IUD
s.
• E
nsur
e co
n fi d
entia
lity
and
resp
ect,
and
do
not
be ju
dgm
enta
l. B
e ki
nd a
nd p
atie
nt, a
nd o
ffer
afr
ee c
hoic
e of
pro
duct
s.
• O
ffer
the
serv
ices
for
free
(you
rec
eive
sub
sidi
esto
pay
for
the
prod
ucts
).
• A
ctiv
ely
seek
tra
inin
g fo
r IU
Ds
and
impl
ants
.
• O
ffer
FP s
ervi
ces
each
day
of
the
wee
k: b
e fl e
xibl
e an
d re
ady
to o
ffer
advi
ce a
t an
y m
omen
t.
• D
ecre
ase
mis
sed
oppo
rtun
ities
by
mak
ing
info
rmat
ion
avai
labl
e at
eac
h IE
C/B
CC
, eac
h A
NC
visi
t, a
nd e
ach
cura
tive
care
con
sulta
tion
for
any
reas
on b
y a
wom
an o
f ch
ild-b
earin
g ag
e.
• IE
C/B
CC
sho
uld
be d
one
by e
ach
clin
ical
sta
ffm
embe
r.
• In
tegr
ate
FP w
ith n
utrit
iona
l and
out
reac
hac
tiviti
es.
• E
xpla
in a
nd m
anag
e w
ell t
he e
vent
ual s
econ
dary
ef
fect
s or
sid
e ef
fect
s.
• U
se r
egis
ters
to
rem
ind
clie
nts
of r
evis
its(m
obile
pho
nes)
.
• Pr
ovid
e cl
ient
s w
ith t
heir
FP c
ard
regi
stra
tion
num
bers
(lea
ve m
ain
card
s at
the
hea
lth fa
cilit
y,
but
give
reg
istr
atio
n ca
rds
to c
lient
s).
• M
any
wom
en w
ant
FP b
ut d
o no
t kn
ow w
hat
it is
or
whe
re t
o ge
t it.
• Fo
r m
any,
FP
is v
ery
expe
nsiv
e.•
Inve
stin
g in
exp
lain
ing
the
met
hods
,ad
vant
ages
, and
dis
adva
ntag
es w
ill
help
you
gai
n th
e tr
ust
of t
he c
omm
u-ni
ty.
• O
f al
l wom
en o
f ch
ild-b
earin
g ag
e (W
CB
A a
re 2
6% o
f th
e ca
tchm
ent
popu
latio
n), 2
5% d
o no
t w
ant
mor
e ch
ildre
n or
wan
t to
spa
ce t
heir
birt
hs.
14FP
: im
plan
ts
and
IUD
sS
ee n
umbe
r 13
abov
e.•
See
num
ber
13 a
bove
.•
See
num
ber
13 a
bove
.
(tab
le c
ontin
ues
on n
ext p
age)
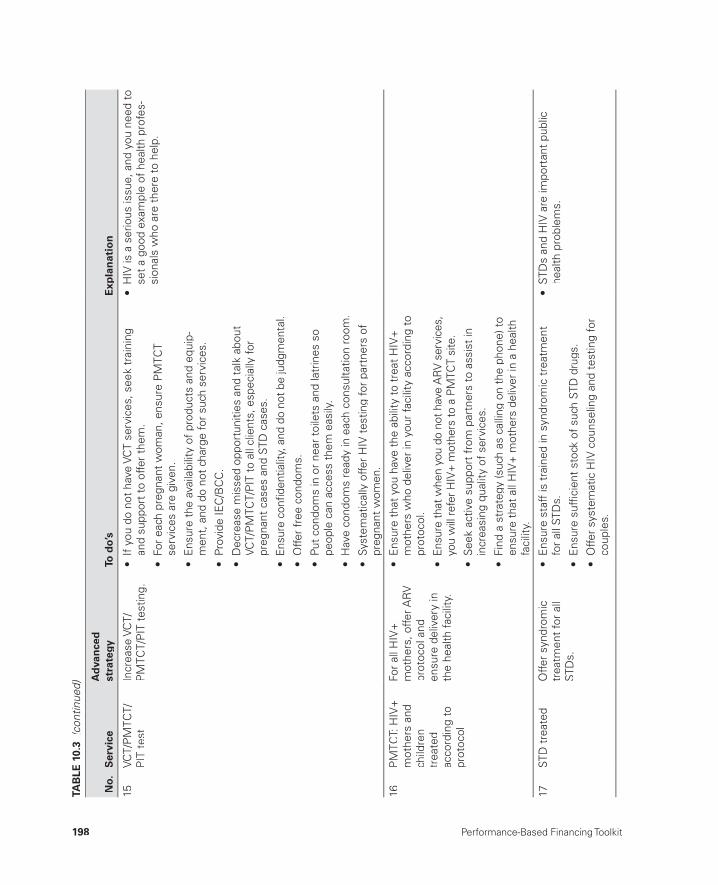
198 Performance-Based Financing Toolkit
15VC
T/P
MTC
T/P
IT t
est
Incr
ease
VC
T/P
MTC
T/P
IT t
estin
g.•
If y
ou d
o no
t ha
ve V
CT
serv
ices
, see
k tr
aini
ng
and
supp
ort
to o
ffer
them
.
• Fo
r ea
ch p
regn
ant
wom
an, e
nsur
e P
MTC
Tse
rvic
es a
re g
iven
.
• E
nsur
e th
e av
aila
bilit
y of
pro
duct
s an
d eq
uip-
men
t, a
nd d
o no
t ch
arge
for
such
ser
vice
s.
• Pr
ovid
e IE
C/B
CC
.
• D
ecre
ase
mis
sed
oppo
rtun
ities
and
tal
k ab
out
VCT/
PM
TCT/
PIT
to
all c
lient
s, e
spec
ially
for
preg
nant
cas
es a
nd S
TD c
ases
.
• En
sure
con
fi den
tialit
y, a
nd d
o no
t be
judg
men
tal.
• O
ffer
free
con
dom
s.
• Pu
t co
ndom
s in
or
near
toi
lets
and
latr
ines
so
peop
le c
an a
cces
s th
em e
asily
.
• H
ave
cond
oms
read
y in
eac
h co
nsul
tatio
n ro
om.
• Sy
stem
atic
ally
offe
r H
IV t
estin
g fo
r pa
rtne
rs o
fpr
egna
nt w
omen
.
• H
IV is
a s
erio
us is
sue,
and
you
nee
d to
set
a go
od e
xam
ple
of h
ealth
pro
fes-
sion
als
who
are
the
re t
o he
lp.
16P
MTC
T: H
IV+
mot
hers
and
child
ren
trea
ted
acco
rdin
g to
pr
otoc
ol
For
all H
IV+
mot
hers
, offe
r AR
Vpr
otoc
ol a
nd
ensu
re d
eliv
ery
inth
e he
alth
faci
lity.
• E
nsur
e th
at y
ou h
ave
the
abili
ty t
o tr
eat
HIV
+m
othe
rs w
ho d
eliv
er in
you
r fa
cilit
y ac
cord
ing
to
prot
ocol
.
• En
sure
that
whe
n yo
u do
not
hav
e A
RV
serv
ices
, yo
u w
ill re
fer H
IV+
mot
hers
to a
PM
TCT
site
.
• S
eek
activ
e su
ppor
t fr
om p
artn
ers
to a
ssis
t in
in
crea
sing
qua
lity
of s
ervi
ces.
• Fi
nd a
str
ateg
y (s
uch
as c
allin
g on
the
pho
ne) t
o en
sure
tha
t al
l HIV
+ m
othe
rs d
eliv
er in
a h
ealth
fa
cilit
y.
17ST
D t
reat
edO
ffer
synd
rom
ic
trea
tmen
t fo
r al
l ST
Ds.
• E
nsur
e st
aff
is t
rain
ed in
syn
drom
ic t
reat
men
t fo
r al
l STD
s.
• E
nsur
e su
ffi ci
ent
stoc
k of
suc
h ST
D d
rugs
.
• O
ffer
syst
emat
ic H
IV c
ouns
elin
g an
d te
stin
g fo
r co
uple
s.
• ST
Ds
and
HIV
are
impo
rtan
t pu
blic
he
alth
pro
blem
s.
TAB
LE 1
0.3
(con
tinue
d)
No.
Ser
vice
Ad
van
ced
st
rate
gyTo
do’
sE
xpla
nat
ion
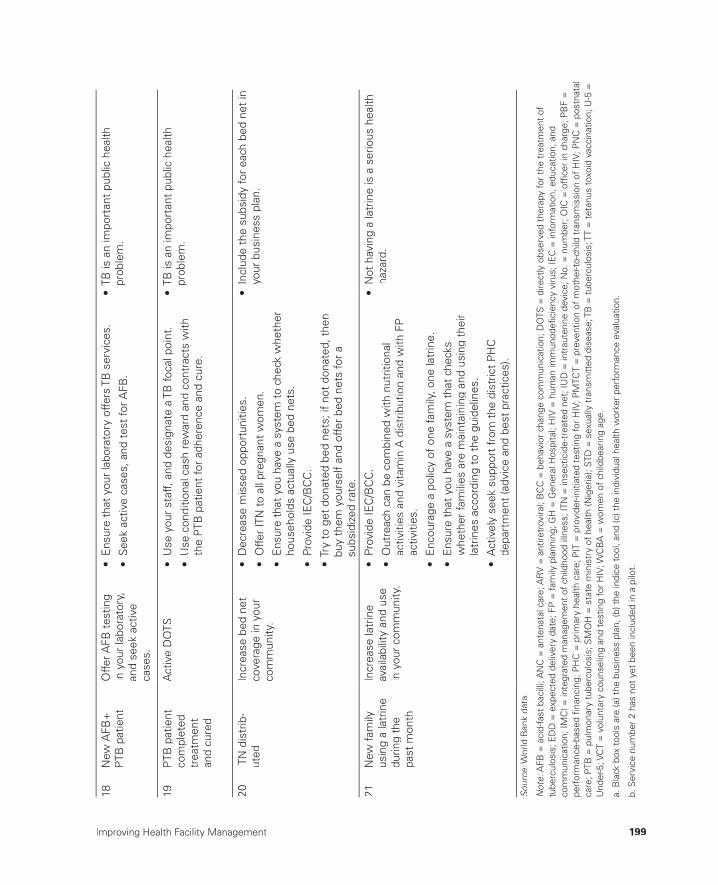
Improving Health Facility Management 199
18N
ew A
FB+
P
TB p
atie
ntO
ffer A
FB t
estin
g in
you
r la
bora
tory
, an
d se
ek a
ctiv
eca
ses.
• E
nsur
e th
at y
our
labo
rato
ry o
ffers
TB
ser
vice
s.
• S
eek
activ
e ca
ses,
and
tes
t fo
r AFB
.
• TB
is a
n im
port
ant
publ
ic h
ealth
pr
oble
m.
19P
TB p
atie
ntco
mpl
eted
tr
eatm
ent
and
cure
d
Act
ive
DO
TS•
Use
you
r st
aff,
and
desi
gnat
e a
TB fo
cal p
oint
.
• U
se c
ondi
tiona
l cas
h re
war
d an
d co
ntra
cts
with
the
PTB
pat
ient
for
adhe
renc
e an
d cu
re.
• TB
is a
n im
port
ant
publ
ic h
ealth
pr
oble
m.
20IT
N d
istr
ib-
uted
Incr
ease
bed
net
co
vera
ge in
you
r co
mm
unity
.
• D
ecre
ase
mis
sed
oppo
rtun
ities
.
• O
ffer
ITN
to
all p
regn
ant
wom
en.
• E
nsur
e th
at y
ou h
ave
a sy
stem
to
chec
k w
heth
er
hous
ehol
ds a
ctua
lly u
se b
ed n
ets.
• Pr
ovid
e IE
C/B
CC
.
• Tr
y to
get
don
ated
bed
net
s; if
not
don
ated
, the
nbu
y th
em y
ours
elf
and
offe
r be
d ne
ts fo
r a
subs
idiz
ed r
ate.
• In
clud
e th
e su
bsid
y fo
r ea
ch b
ed n
et in
yo
ur b
usin
ess
plan
.
21N
ew fa
mily
usin
g a
latr
ine
durin
g th
e pa
st m
onth
Incr
ease
latr
ine
avai
labi
lity
and
use
in y
our
com
mun
ity.
• Pr
ovid
e IE
C/B
CC
.
• O
utre
ach
can
be c
ombi
ned
with
nut
ritio
nal
activ
ities
and
vita
min
A d
istr
ibut
ion
and
with
FP
ac
tiviti
es.
• E
ncou
rage
a p
olic
y of
one
fam
ily, o
ne la
trin
e.
• E
nsur
e th
at y
ou h
ave
a sy
stem
tha
t ch
ecks
w
heth
er fa
mili
es a
re m
aint
aini
ng a
nd u
sing
the
irla
trin
es a
ccor
ding
to
the
guid
elin
es.
• A
ctiv
ely
seek
sup
port
fro
m t
he d
istr
ict
PH
C
depa
rtm
ent
(adv
ice
and
best
pra
ctic
es).
• N
ot h
avin
g a
latr
ine
is a
ser
ious
hea
lthha
zard
.
Sour
ce: W
orld
Ban
k da
ta.
:
Not
e: A
FB =
aci
d-fa
st b
acill
i; A
NC
= a
nten
atal
car
e; A
RV
= a
ntire
trov
iral;
BC
C =
beh
avio
r ch
ange
com
mun
icat
ion;
DO
TS =
dire
ctly
obs
erve
d th
erap
y fo
r th
e tr
eatm
ent
of:
tube
rcul
osis
; ED
D =
exp
ecte
d de
liver
y da
te; F
P =
fam
ily p
lann
ing;
GH
= G
ener
al H
ospi
tal;
HIV
= h
uman
imm
unod
efi c
ienc
y vi
rus;
IEC
= in
form
atio
n, e
duca
tion,
and
com
mun
icat
ion;
IMC
I = in
tegr
ated
man
agem
ent
of c
hild
hood
illn
ess;
ITN
= in
sect
icid
e-tr
eate
d ne
t; IU
D =
intr
aute
rine
devi
ce; N
o. =
num
ber;
OIC
= o
ffi ce
r in
cha
rge;
PB
F =
pe
rfor
man
ce-b
ased
fi na
ncin
g; P
HC
= p
rimar
y he
alth
car
e; P
IT =
pro
vide
r-ini
tiate
d te
stin
g fo
r H
IV; P
MTC
T =
pre
vent
ion
of m
othe
r-to-
child
tra
nsm
issi
on o
f H
IV; P
NC
= p
ostn
atal
care
; PTB
= p
ulm
onar
y tu
berc
ulos
is; S
MO
H =
sta
te m
inis
try
of h
ealth
(Nig
eria
); ST
D =
sex
ually
tra
nsm
itted
dis
ease
; TB
= tu
berc
ulos
is; T
T =
tet
anus
tox
oid
vacc
inat
ion;
U-5
=U
nder
-5; V
CT
= v
olun
tary
cou
nsel
ing
and
test
ing
for
HIV
; WC
BA
= w
omen
of
child
bear
ing
age.
a. B
lack
box
too
ls a
re (a
) the
bus
ines
s pl
an, (
b) t
he in
dice
too
l, an
d (c
) the
indi
vidu
al h
ealth
wor
ker
perf
orm
ance
eva
luat
ion.
b. S
ervi
ce n
umbe
r 2
has
not
yet
been
incl
uded
in a
pilo
t.

200 Performance-Based Financing Toolkit
References
Murray, C. J., B. Shengelia, N. Gupta, S. Moussavi, A. Tando, and M. Thieren. 2003. “Validity of Reported Vaccination Coverage in 45 Countries.” The Lancet 362 (9389): 1022– 27.
Soeters, R. 2013. PBF in Action: Theory and Instruments— Course Guide, Performance- Based Financing. The Hague: Cordaid- SINA. http://www.sina- health.com/?page_id=585.
found in non- PBF facilities, too. However, health workers will be more likely to carry out such advanced strategies if, in addition to improving the results, using the strategies also improves their income. Here, PBF diff ers from tra-ditional input- based approaches.
The following toolkit fi les can be accessed through this web link:http://www.worldbank.org/health/pbftoolkit/chapter10.
• Business plan for a Nigerian health center (2011)
• Business plan for a Nigerian district hospital (2011).
10.4 Links to Files and Tools
201
Governance Issues and Structures
CHAPTER 11
MAIN MESSAGES
➜ Introducing separation of functions is a key governance element in PBF that poses major challenges.
➜ Involving communities and nonstate actors in decision making at all lev-els strengthens good governance in PBF.
➜ PBF contracts assist in clarifying the new rules of the game.
COVERED IN THIS CHAPTER
11.1 Introduction11.2 Separation of functions: Fostering transparency, voice, and
accountability11.3 Governance structures for PBF: Challenges and types of purchasers11.4 PBF contracts: PBF at scale, internal market, contracts, and
governance11.5 Links to fi les and tools
202 Performance-Based Financing Toolkit
11.1 Introduction
All over the world, intense debates rage over “good governance” and what that term actually entails. The World Bank has adopted a defi nition of good governance that underscores the importance of (a) sound public sector management (effi ciency, eff ectiveness, and economy); (b) accountability; (c) exchange and free fl ow of information (transparency); and (d) a legal framework that enhances development, justice, and respect for human rights and liberties. Other international agencies have echoed this defi ni-tion by describing good governance as addressing four major components: (a) legitimacy (those who govern should have the consent of those gov-erned), (b) accountability (ensuring transparency, being answerable for one’s actions), (c) competence (eff ective policy making, implementation, and service delivery), and (d) respect for the law and protection of human rights (see ECOSOC 2006).
In performance-based fi nancing (PBF), these notions of good governance have been translated into a number of clear practices. The separation of functions and the enhancing of transparency, voice, and accountability for results are key.
In other chapters of this toolkit, a number of individual governance struc-tures are discussed in more detail. For the community and community client satisfaction surveys, see chapter 2. For the community health facility com-mittee, see chapter 6. More on purchasing and fund holding can be learned in this chapter and chapter 12 (web-enabled application). Highlighted here is the separation of functions as one of the major governance challenges and, in particular, the purchaser-provider split. The chapter concludes with il-lustrations of how governance issues should be clearly defi ned in the various PBF contracts.
11.2 Separation of Functions: Fostering Transparency, Voice, and Accountability
In many walks of life, the principle of separation of functions is central to improving governance. Its purpose is to decrease confl ict-of-interest situa-tions (see chapter 2). In PBF too, it is best practice to strive for a full sepa-ration of functions between the chief players in the health care arena: the fund holder, the purchaser, the provider, the community, the community health facility committees, the local PBF steering committees, and the na-tional PBF coordination mechanisms (fi gure 11.1). Separation of functions creates a clear division of labor between those players and contributes to
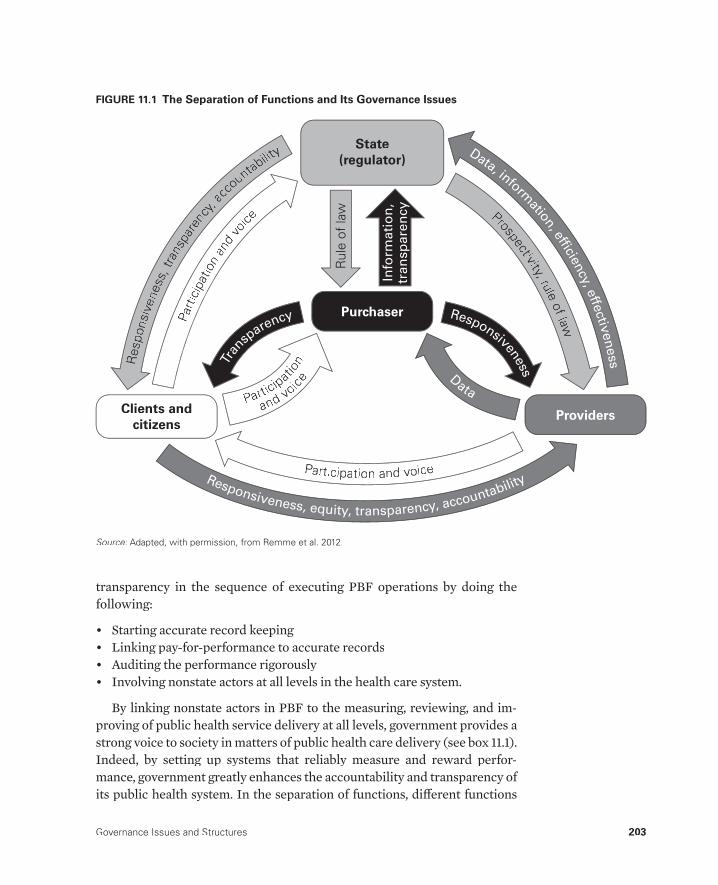
Governance Issues and Structures 203
transparency in the sequence of executing PBF operations by doing the following:
• Starting accurate record keeping• Linking pay-for-performance to accurate records• Auditing the performance rigorously• Involving nonstate actors at all levels in the health care system.
By linking nonstate actors in PBF to the measuring, reviewing, and im-proving of public health service delivery at all levels, government provides a strong voice to society in matters of public health care delivery (see box 11.1). Indeed, by setting up systems that reliably measure and reward perfor-mance, government greatly enhances the accountability and transparency of its public health system. In the separation of functions, diff erent functions
Participat
ion
and voice
Tran
sparency
Data
Responsiveness
Prospectivity,yy ruleof law
Data, informatio
n, effi
ciency, e
ffectiv
en
ess
State(regulator)
Providers
Purchaser
Clients and citizens
Rul
e of
law
Info
rmati
on
,tr
an
sp
are
ncy
Participation and voiceResponsiveness, equity, transparency, accountability
Res
pons
iven
ess,
trans
pare
ncy,yy
acco
untability
Parti
cipa
tion
and
voice
FIGURE 11.1 The Separation of Functions and Its Governance Issues
Source: Adapted, with permission, from Remme et al. 2012.:
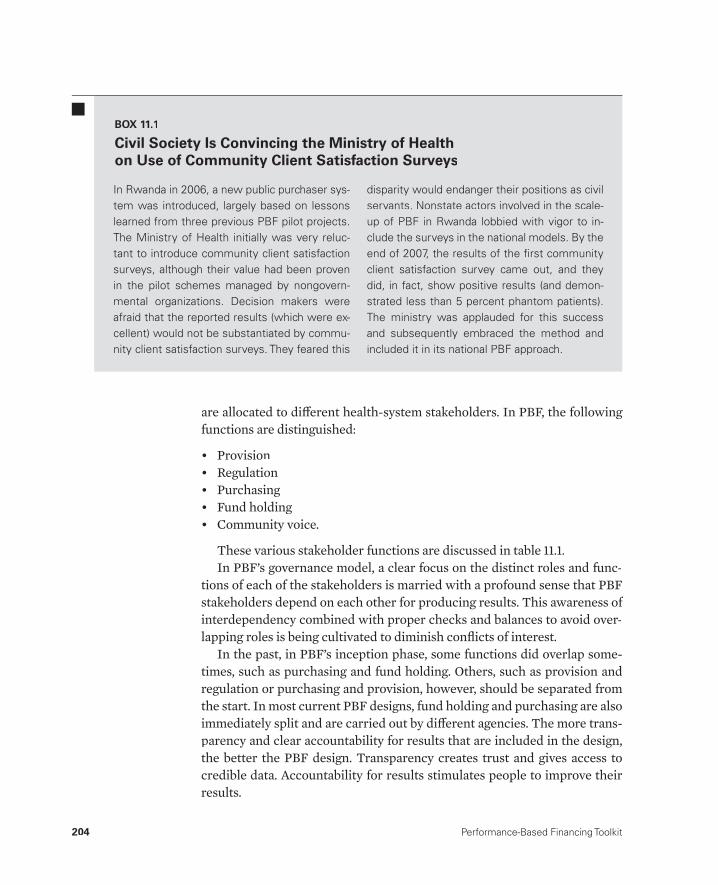
204 Performance-Based Financing Toolkit
are allocated to diff erent health-system stakeholders. In PBF, the following functions are distinguished:
• Provision• Regulation• Purchasing• Fund holding• Community voice.
These various stakeholder functions are discussed in table 11.1.In PBF’s governance model, a clear focus on the distinct roles and func-
tions of each of the stakeholders is married with a profound sense that PBF stakeholders depend on each other for producing results. This awareness of interdependency combined with proper checks and balances to avoid over-lapping roles is being cultivated to diminish confl icts of interest.
In the past, in PBF’s inception phase, some functions did overlap some-times, such as purchasing and fund holding. Others, such as provision and regulation or purchasing and provision, however, should be separated from the start. In most current PBF designs, fund holding and purchasing are also immediately split and are carried out by diff erent agencies. The more trans-parency and clear accountability for results that are included in the design, the better the PBF design. Transparency creates trust and gives access to credible data. Accountability for results stimulates people to improve their results.
In Rwanda in 2006, a new public purchaser sys-tem was introduced, largely based on lessons learned from three previous PBF pilot projects.The Ministry of Health initially was very reluc-tant to introduce community client satisfaction surveys, although their value had been proven in the pilot schemes managed by nongovern-mental organizations. Decision makers were afraid that the reported results (which were ex-cellent) would not be substantiated by commu-nity client satisfaction surveys. They feared this
disparity would endanger their positions as civil servants. Nonstate actors involved in the scale-up of PBF in Rwanda lobbied with vigor to in-clude the surveys in the national models. By theend of 2007, the results of the fi rst communityclient satisfaction survey came out, and theydid, in fact, show positive results (and demon-strated less than 5 percent phantom patients).The ministry was applauded for this success and subsequently embraced the method andincluded it in its national PBF approach.
BOX 11.1
Civil Society Is Convincing the Ministry of Healthon Use of Community Client Satisfaction Surveys
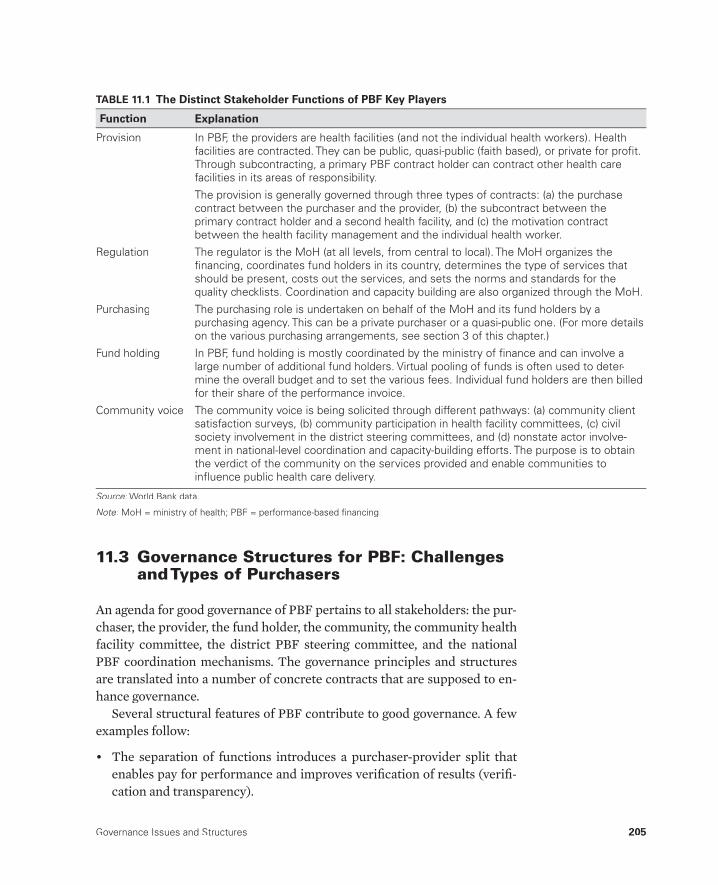
Governance Issues and Structures 205
11.3 Governance Structures for PBF: Challenges and Types of Purchasers
An agenda for good governance of PBF pertains to all stakeholders: the pur-chaser, the provider, the fund holder, the community, the community healthfacility committee, the district PBF steering committee, and the national PBF coordination mechanisms. The governance principles and structures are translated into a number of concrete contracts that are supposed to en-hance governance.
Several structural features of PBF contribute to good governance. A fewexamples follow:
• The separation of functions introduces a purchaser-provider split thatenables pay for performance and improves verifi cation of results (verifi -cation and transparency).
TABLE 11.1 The Distinct Stakeholder Functions of PBF Key Players
Function Explanation
Provision In PBF, the providers are health facilities (and not the individual health workers). Healthfacilities are contracted. They can be public, quasi-public (faith based), or private for profi t.Through subcontracting, a primary PBF contract holder can contract other health care facilities in its areas of responsibility.
The provision is generally governed through three types of contracts: (a) the purchase contract between the purchaser and the provider, (b) the subcontract between theprimary contract holder and a second health facility, and (c) the motivation contract between the health facility management and the individual health worker.
Regulation The regulator is the MoH (at all levels, from central to local). The MoH organizes the fi nancing, coordinates fund holders in its country, determines the type of services that should be present, costs out the services, and sets the norms and standards for thequality checklists. Coordination and capacity building are also organized through the MoH.
Purchasing The purchasing role is undertaken on behalf of the MoH and its fund holders by apurchasing agency. This can be a private purchaser or a quasi-public one. (For more details on the various purchasing arrangements, see section 3 of this chapter.)
Fund holding In PBF, fund holding is mostly coordinated by the ministry of fi nance and can involve alarge number of additional fund holders. Virtual pooling of funds is often used to deter-mine the overall budget and to set the various fees. Individual fund holders are then billedfor their share of the performance invoice.
Community voice The community voice is being solicited through different pathways: (a) community client satisfaction surveys, (b) community participation in health facility committees, (c) civil society involvement in the district steering committees, and (d) nonstate actor involve-ment in national-level coordination and capacity-building efforts. The purpose is to obtainthe verdict of the community on the services provided and enable communities toinfl uence public health care delivery.
Source: World Bank data.:
Note: MoH = ministry of health; PBF = performance-based fi nancing.:
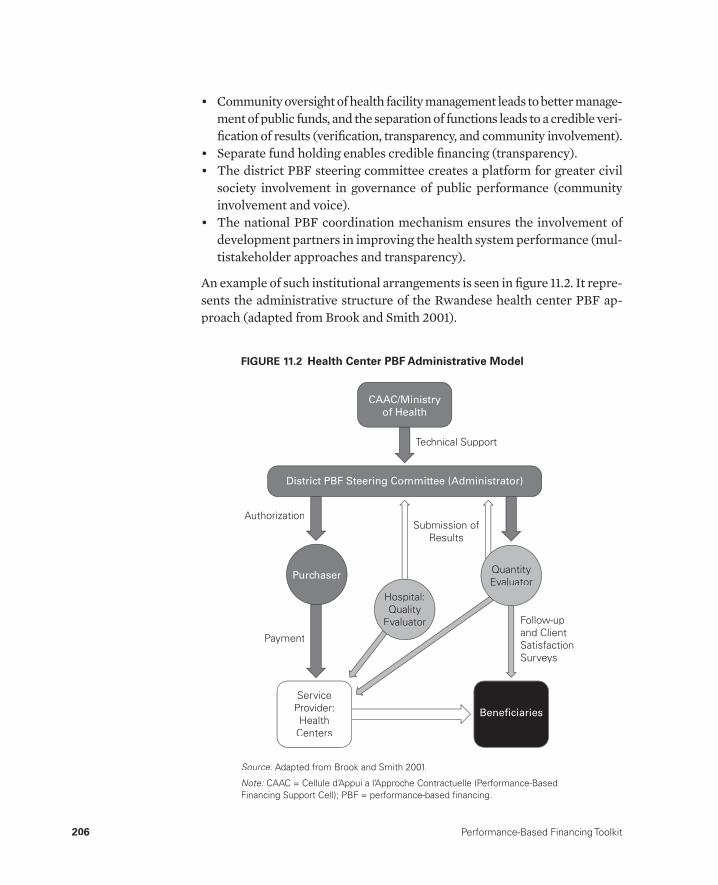
206 Performance-Based Financing Toolkit
• Community oversight of health facility management leads to better manage-ment of public funds, and the separation of functions leads to a credible veri-fi cation of results (verifi cation, transparency, and community involvement).
• Separate fund holding enables credible fi nancing (transparency).• The district PBF steering committee creates a platform for greater civil
society involvement in governance of public performance (community involvement and voice).
• The national PBF coordination mechanism ensures the involvement of development partners in improving the health system performance (mul-tistakeholder approaches and transparency).
An example of such institutional arrangements is seen in fi gure 11.2. It repre-sents the administrative structure of the Rwandese health center PBF ap-proach (adapted from Brook and Smith 2001).
CAAC/Ministry
of Health
District PBF Steering Committee (Administrator)
Purchaser
ServiceProvider:Health
Centers
Beneficiaries
Quantity Evaluator
Follow-up and ClientSatisfactionSurveys
Hospital:Quality
Evaluator
Payment
AuthorizationSubmission of
Results
Technical Support
FIGURE 11.2 Health Center PBF Administrative Model
Source: Adapted from Brook and Smith 2001.:
Note: CAAC = Cellule d’Appui a l’Approche Contractuelle (Performance-Based:Financing Support Cell); PBF = performance-based fi nancing.
Governance Issues and Structures 207
Governance Challenges
In table 11.2, a series of governance issues, gov-ernance structures, and characteristic inter-ventions in PBF systems are listed. The table also lists the particular challenges that may be faced when such governance measures are im-plemented. Good governance is hard work.
Two Types of Purchaser Arrangementswith Implications for Governance
In this section, we delve a bit deeper into one specifi c topic: the purchaser. More specifi cally, we point out the relationship between the separation of functions and the purchaser. We will discuss purchasing arrangements and the implications for the separation of functions.
In current PBF programs, we can fi nd two predominant types of purchas-ing arrangements: (a) the private purchaser and (b) the quasi-public pur-chaser. In the private purchaser approach, a private agency carries out therole of the purchaser, while in the approach of the quasi-public purchaser,that function is embedded in government. In the fi eld, the following pur-chasing arrangements have been observed:
• A private purchaser approach funded through bilateral funds• A private purchaser approach funded through government sources• A public purchaser approach funded through a mix of bilateral and gov-
ernment funds• A quasi-public purchaser approach funded through a mix of bilateral and
government funds.
The fi rst arrangement is typical in PBF pilots (Meessen et al. 2006; Meessen, Kashala, and Musango 2007; Rusa et al. 2009; Soeters, Habineza, and Peerenboom 2006). A nongovernmental agency is engaged to do the pur-chasing, verifi cation, and coaching. Fund holding rests typically with thisnongovernmental agency (Soeters et al. 2011), although diff erent variations exist, such as contracting a separate entity to do the fund holding, as is the case in the Cordaid Zambia PBF pilot (2011 to present).
In the second arrangement, a private purchaser is contracted by the gov-ernment to carry out the purchasing, verifi cation, and coaching activities. Fund holding will typically be in the hands of the ministry of fi nance. An example of this type of arrangement is the PBF pilot in Zimbabwe (2011 topresent).
Well then, says I, what’s the use you learningto do right when it’s troublesome to do rightand ain’t no trouble to do wrong, and the wages is just the same?
—Mark Twain, Adventures of Huckleberry Finn, 1884
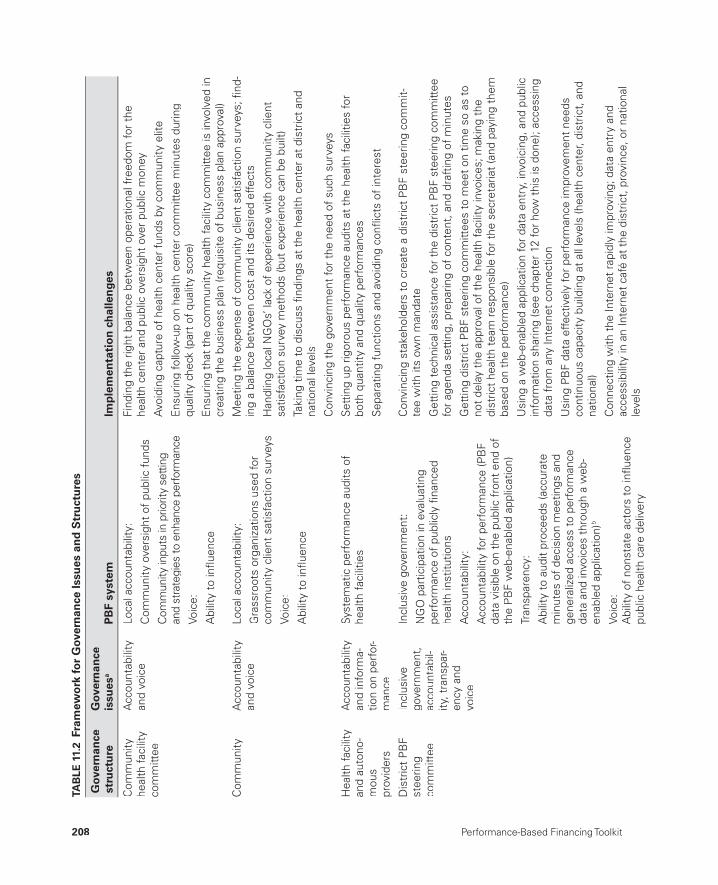
208 Performance-Based Financing Toolkit
TAB
LE 1
1.2
Fram
ewo
rk fo
r G
over
nan
ce Is
sues
an
d S
tru
ctu
res
Gov
ern
ance
st
ruct
ure
Gov
ern
ance
is
sues
aP
BF
syst
emIm
ple
men
tati
on
ch
alle
nge
s
Com
mun
ityhe
alth
faci
lity
com
mitt
ee
Acc
ount
abili
tyan
d vo
ice
Loca
l acc
ount
abili
ty:
Com
mun
ity o
vers
ight
of
publ
ic f
unds
Com
mun
ity in
puts
in p
riorit
y se
tting
and
stra
tegi
es to
enh
ance
per
form
ance
V oic
e:
Abi
lity
to in
fl uen
ce
Find
ing
the
right
bal
ance
bet
wee
n op
erat
iona
l fre
edom
for
the
heal
th c
ente
r an
d pu
blic
ove
rsig
ht o
ver
publ
ic m
oney
Avo
idin
g ca
ptur
e of
hea
lth c
ente
r fu
nds
by c
omm
unity
elit
e
Ens
urin
g fo
llow
-up
on h
ealth
cen
ter
com
mitt
ee m
inut
es d
urin
g qu
ality
che
ck (p
art
of q
ualit
y sc
ore)
Ens
urin
g th
at t
he c
omm
unity
hea
lth fa
cilit
y co
mm
ittee
is in
volv
ed in
cr
eatin
g th
e bu
sine
ss p
lan
(req
uisi
te o
f bu
sine
ss p
lan
appr
oval
)
Com
mun
ityA
ccou
ntab
ility
and
voic
eLo
cal a
ccou
ntab
ility
:
Gra
ssro
ots
orga
niza
tions
use
d fo
r co
mm
unity
clie
nt s
atis
fact
ion
surv
eys
Voic
e:
Abi
lity
to in
fl uen
ce
Mee
ting
the
expe
nse
of c
omm
unity
clie
nt s
atis
fact
ion
surv
eys;
fi nd
-in
g a
bala
nce
betw
een
cost
and
its
desi
red
effe
cts
Han
dlin
g lo
cal N
GO
s’ la
ck o
f ex
perie
nce
with
com
mun
ity c
lient
sa
tisfa
ctio
n su
rvey
met
hods
(but
exp
erie
nce
can
be b
uilt)
Taki
n g t
ime
to d
iscu
ss fi
ndin
gs a
t th
e he
alth
cen
ter
at d
istr
ict
and
natio
nal l
evel
s
Con
vinc
ing
the
gove
rnm
ent
for
the
need
of
such
sur
veys
Hea
lth fa
cilit
y an
d au
tono
-m
ous
prov
ider
s
Acc
ount
abili
tyan
d in
form
a-tio
n on
per
for-
man
ce
Syst
emat
ic p
erfo
rman
ce a
udits
of
heal
th fa
cilit
ies
Set
ting
up r
igor
ous
perf
orm
ance
aud
its a
t th
e he
alth
faci
litie
s fo
r bo
th q
uant
ity a
nd q
ualit
y pe
rfor
man
ces
Sep
arat
ing
func
tions
and
avo
idin
g co
nfl ic
ts o
f in
tere
st
Dis
tric
t P
BF
stee
ring
com
mitt
ee
Incl
usiv
e go
vern
men
t,ac
coun
tabi
l-ity
, tra
nspa
r-en
cy a
ndvo
ice
Incl
usiv
e go
vern
men
t:
NG
O p
artic
ipat
ion
in e
valu
atin
g pe
rfor
man
ce o
f pu
blic
ly fi
nanc
ed
heal
th in
stitu
tions
Acc
ount
abili
ty:
Acc
ount
abili
ty fo
r pe
rfor
man
ce (P
BF
data
vis
ible
on
the
publ
ic f
ront
end
of
the
PB
F w
eb-e
nabl
ed a
pplic
atio
n)
Tran
spar
ency
:
Abi
lity
to a
udit
proc
eeds
(acc
urat
em
inut
es o
f de
cisi
on m
eetin
gs a
nd
gene
raliz
ed a
cces
s to
per
form
ance
data
and
invo
ices
thr
ough
a w
eb-
enab
led
appl
icat
ion)
b
Voic
e:A
bilit
y of
non
stat
e ac
tors
to
infl u
ence
pu
blic
hea
lth c
are
deliv
ery
Con
vinc
ing
stak
ehol
ders
to
crea
te a
dis
tric
t P
BF
stee
ring
com
mit-
tee
with
its
own
man
date
Get
ting
tech
nica
l ass
ista
nce
for
the
dist
rict
PB
F st
eerin
g co
mm
ittee
for
agen
da s
ettin
g, p
repa
ring
of c
onte
nt, a
nd d
raft
ing
of m
inut
es
Get
ting
dist
rict
PB
F st
eerin
g co
mm
ittee
s to
mee
t on
tim
e so
as
to
not
dela
y th
e ap
prov
al o
f th
e he
alth
faci
lity
invo
ices
; mak
ing
the
dist
rict
heal
th t
eam
res
pons
ible
for
the
secr
etar
iat
(and
pay
ing
them
ba
sed
on t
he p
erfo
rman
ce)
Usi
ng a
web
-ena
bled
app
licat
ion
for
data
ent
ry, i
nvoi
cing
, and
pub
licin
form
atio
n sh
arin
g (s
ee c
hapt
er 1
2 fo
r ho
w t
his
is d
one)
; acc
essi
ngda
ta f
rom
any
Inte
rnet
con
nect
ion
Usi
ng P
BF
data
effe
ctiv
ely
for
perf
orm
ance
impr
ovem
ent
need
s co
ntin
uous
cap
acity
bui
ldin
g at
all
leve
ls (h
ealth
cen
ter,
dist
rict,
and
na
tiona
l)
Con
nect
ing
with
the
Inte
rnet
rap
idly
impr
ovin
g; d
ata
entr
y an
d ac
cess
ibili
ty in
an
Inte
rnet
caf
é at
the
dis
tric
t, p
rovi
nce,
or
natio
nal
leve
ls

Governance Issues and Structures 209
Nat
iona
l lev
el:
Min
istr
y of
H
ealth
,na
tiona
lst
eerin
g co
mm
ittee
, ex
tend
ed
team
m
echa
nism
Rul
e of
law
, in
clus
ive
gove
rnm
ent
and
voic
e,
effi c
ienc
y an
d ef
fect
iven
ess,
tr
ansp
aren
cy,
acco
unta
bilit
y
Rul
e of
law
:A
ssur
ance
tha
t th
e ne
w ru
les
are
follo
wed
Incl
usiv
e go
vern
men
t an
d vo
ice:
Str
ong
invo
lvem
ent
of n
onst
ate
acto
rs
in v
erifi
catio
n, c
oach
ing,
coo
rdin
atio
n,
and
capa
city
bui
ldin
g ta
sks
Invo
lvem
ent
of n
onst
ate
acto
rs in
ov
ersi
ght
on a
nd t
arge
ting
of p
ublic
and
dono
r P
BF
mon
ey
Effi
cien
cy a
nd e
ffect
iven
ess:
Att
empt
to
enha
nce
cove
rage
for
good
qua
lity,
cos
t-ef
fect
ive
serv
ices
Tran
spar
ency
:
Web
-ena
bled
app
licat
ion
that
offe
rs
easy
acc
ess
to in
form
atio
n on
res
ults
an
d pa
ymen
ts
Acc
ount
abili
ty:
Publ
ic in
form
atio
n on
res
ults
,pa
ymen
ts, a
nd c
omm
unity
clie
ntsa
tisfa
ctio
n su
rvey
s th
roug
h w
ebsi
te
Cre
atin
g ef
fect
ive
inst
itutio
nal s
truc
ture
s th
at c
oord
inat
e w
ell;
revi
ewin
g pr
ogre
ss s
yste
mat
ical
ly; t
akin
g ac
tion
whe
n ne
cess
ary
(the
ext
ende
d te
am m
echa
nism
to
assi
st t
he g
over
nmen
t in
ensu
ring
that
the
new
rule
s ar
e fo
llow
ed; s
ee c
hapt
er 1
4)
Cre
atin
g ef
fect
ive
coor
dina
tion
mec
hani
sms
that
co-
opt
nons
tate
ac
tors
to
wor
k w
ith g
over
nmen
t to
coo
rdin
ate
and
stee
r th
e P
BF
appr
oach
(see
“ex
tend
ed t
eam
mec
hani
sm”
in c
hapt
er 1
4)
Cre
atin
g ef
fect
ive
dash
boar
ds; h
avin
g go
od-q
ualit
y da
ta a
naly
sis
capa
bilit
y to
ana
lyze
tre
nds
in s
ervi
ce p
rovi
sion
and
exp
endi
ture
s
Effe
ctiv
ely
lobb
ying
dec
isio
n m
aker
s, b
ased
on
PB
F da
ta, f
or m
ore
fund
ing
and
also
bal
ance
d fu
ndin
g (h
ealth
cen
ters
ver
sus
dist
rict
hosp
itals
ver
sus
natio
nal h
ospi
tals
)
Effe
ctiv
ely
lobb
ying
dev
elop
men
t pa
rtne
rs t
o in
crea
se t
heir
supp
ort
for
PB
F sy
stem
s
Impl
emen
ting
deep
er r
e for
ms
such
as
hum
an r
esou
rces
for
heal
th
refo
rms
Invo
lvin
g no
nsta
te a
ctor
s at
all
leve
ls o
f th
e P
BF
syst
em:
The
com
mun
ity le
vel f
or c
omm
unity
-clie
nt s
atis
fact
ion
surv
eys
The
dist
rict
leve
l (di
stric
t P
BF
stee
ring
com
mitt
ees)
for
deci
sion
s on
pa
y fo
r pe
rfor
man
ce
The
natio
nal l
evel
in c
oord
inat
ion
bodi
es a
nd t
echn
ical
wor
king
gr
oups
to
refi n
e th
e P
BF
appr
oach
bas
ed o
n le
sson
s le
arne
d
Con
vinc
ing
gove
rnm
ent
on t
he a
dvan
tage
and
impo
rtan
ce o
f tr
ansp
aren
cy v
ersu
s th
e kn
ee-je
rk r
eact
ion
of n
ot s
harin
g da
ta
Mai
ntai
ning
and
con
tinuo
usly
dev
elop
ing
the
web
-ena
bled
app
lica-
tion
and
its w
ebsi
te (h
ostin
g, s
ubco
mm
ittee
s)
Sour
ce: W
orld
Ban
k da
ta.
:
Not
e: N
GO
= n
ongo
vern
men
tal o
rgan
izat
ion;
PB
F =
per
form
ance
-bas
ed fi
nanc
ing.
:
a. S
ee L
ewis
(200
6).
b. F
or e
xam
ple,
see
the
Nig
eria
Nat
iona
l Prim
ary
Hea
lth C
are
Dev
elop
men
t Age
ncy,
PB
F Po
rtal
, htt
ps://
nphc
da.t
hene
wte
chs.
com
.
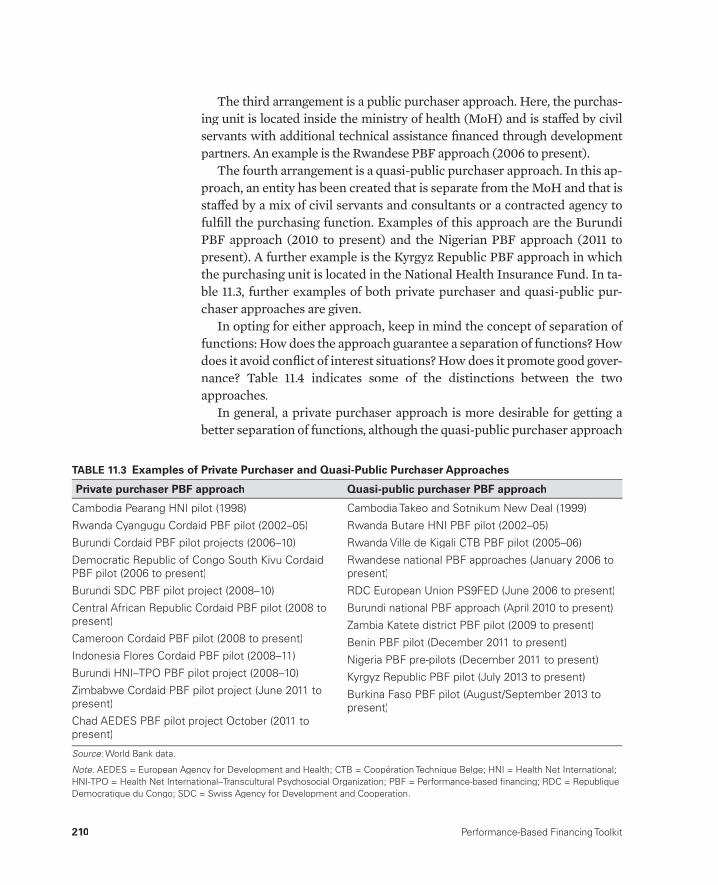
210 Performance-Based Financing Toolkit
The third arrangement is a public purchaser approach. Here, the purchas-ing unit is located inside the ministry of health (MoH) and is staff ed by civil servants with additional technical assistance fi nanced through development partners. An example is the Rwandese PBF approach (2006 to present).
The fourth arrangement is a quasi-public purchaser approach. In this ap-proach, an entity has been created that is separate from the MoH and that is staff ed by a mix of civil servants and consultants or a contracted agency to fulfi ll the purchasing function. Examples of this approach are the Burundi PBF approach (2010 to present) and the Nigerian PBF approach (2011 to present). A further example is the Kyrgyz Republic PBF approach in which the purchasing unit is located in the National Health Insurance Fund. In ta-ble 11.3, further examples of both private purchaser and quasi-public pur-chaser approaches are given.
In opting for either approach, keep in mind the concept of separation of functions: How does the approach guarantee a separation of functions? How does it avoid confl ict of interest situations? How does it promote good gover-nance? Table 11.4 indicates some of the distinctions between the two approaches.
In general, a private purchaser approach is more desirable for getting a better separation of functions, although the quasi-public purchaser approach
TABLE 11.3 Examples of Private Purchaser and Quasi-Public Purchaser Approaches
Private purchaser PBF approach Quasi-public purchaser PBF approach
Cambodia Pearang HNI pilot (1998)
Rwanda Cyangugu Cordaid PBF pilot (2002–05)
Burundi Cordaid PBF pilot projects (2006–10)
Democratic Republic of Congo South Kivu CordaidPBF pilot (2006 to present)
Burundi SDC PBF pilot project (2008–10)
Central African Republic Cordaid PBF pilot (2008 topresent)
Cameroon Cordaid PBF pilot (2008 to present)
Indonesia Flores Cordaid PBF pilot (2008–11)
Burundi HNI–TPO PBF pilot project (2008–10)
Zimbabwe Cordaid PBF pilot project (June 2011 to present)
Chad AEDES PBF pilot project October (2011 to present)
Cambodia Takeo and Sotnikum New Deal (1999)
Rwanda Butare HNI PBF pilot (2002–05)
Rwanda Ville de Kigali CTB PBF pilot (2005–06)
Rwandese national PBF approaches (January 2006 topresent)
RDC European Union PS9FED (June 2006 to present)
Burundi national PBF approach (April 2010 to present)
Zambia Katete district PBF pilot (2009 to present)
Benin PBF pilot (December 2011 to present)
Nigeria PBF pre-pilots (December 2011 to present)
Kyrgyz Republic PBF pilot (July 2013 to present)
Burkina Faso PBF pilot (August/September 2013 to present)
Source: World Bank data.:
Note: AEDES = European Agency for Development and Health; CTB = Coopération Technique Belge; HNI = Health Net International;:HNI-TPO = Health Net International–Transcultural Psychosocial Organization; PBF = Performance-based fi nancing; RDC = RepubliqueDemocratique du Congo; SDC = Swiss Agency for Development and Cooperation.

Governance Issues and Structures 211
is more attractive to many governments because of a greater sense of owner-ship. Sometimes, colleagues evoke the argument of “sustainability” or “cost”when expressing their interest in the quasi-public purchaser approach. However, the quasi-public purchaser approach is not necessarily cheaperthan the private purchaser approach (Uwimpuhwe 2011). For more details,see chapter 14.
11.4 PBF Contracts: PBF at Scale, Internal Market, Contracts, and Governance
Contracts Embody Governance Rules
Contracts are used in PBF systems to clarify the new rules of the game. Even at the microlevel, contracts are important governance instruments. They embody the new roles of the health system stakeholders, the PBF services,and its fees, and they stipulate the rules for verifying and paying for perfor-mance. PBF works through an internal market mechanism created to pur-chase performance from a country’s health system.
There are many types of contracts, ranging from health facilities contract-ing to deliver services to health workers signing motivation contracts that specify what is expected of them and make explicit the share they are enti-tled to from the performance bonus of the facility earnings. Or, some
TABLE 11.4 Distinctions between the Private Purchaser and Quasi-Public Purchaser Approaches
CriteriaPrivate purchaser
approachQuasi-public purchaser
approach
Acceptability for MoH Diffi cult High
Contracting By choice of the best By appointment
Flexibility for innovation Likely Diffi cult
Competition for contracts Feasible Diffi cult
Limited duration of contract(for example, 2 years)
Applicable Once appointed, contractcancellation not easy
Potential of mixing roles, inparticular with regulatory role
Less likely More likely
Identity of fund holder Different organization Different organization
During start-up of PBF pilot Highly recommendable Diffi cult to organize
During scale-up of PBF Politically less feasible Politically more feasible
Source: World Bank data.:
Note: MoH = ministry of health; PBF = performance-based fi nancing.:

212 Performance-Based Financing Toolkit
contracts require district PBF steering committee members to sign agree-ments that describe their new roles and responsibilities.
The number of contracts also vary considerably. For example, in the Rwandese PBF system three contracts are used for the health center PBF approach, two more for the community PBF approach, and an additional two for the hospital PBF approach. In Burundi, nine diff erent contracts de-lineate the newly created institutional structures.
PBF contracting is frequently framed as a memorandum of understand-ing or a service agreement. This method is quite diff erent from detailed le-galistic frames found in many standard contracts used by development agen-cies. The chief purpose of internal contracts in PBF is to clarify the new “rules of the game” (North 1990). In fact, those contracts are frequently a summary of the PBF approach detailing in plain language the rights and ob-ligations of each party.1 In tables 11.5 and 11.6, the various types of contractsused in Rwanda and Burundi are described. To access the actual documents, see the links to fi les in this chapter.
TABLE 11.5 PBF Contracts Used in Rwanda
No. Public purchaser or contract Signatories
1 District PBF steering committee The multilateral contract is between the district mayor and thedistrict PBF parties (nine signatories including the Ministry of LocalAdministration, Ministry of Health; representatives of providers; and civil society).
2 Purchase contract for the health center
The contract is between the Ministry of Local Administration and the health center and is signed by the representative of the mayor (on behalf of the mayor) at the sector level (subdistrict) with thepresident of the health center management team (the board) (twosignatories).
3 Motivation contract The contract is signed by the health facility management teamrepresentative and the individual health worker (two signatories).
4 Purchase contract for the district hospital
The contract is signed by the minister of health, the hospital director,and the president of the governing board (three signatories).
5 Sector PBF steering committee The contract is between the mayor and the sector PBF steeringcommittee and is signed by the sector executive secretary (onbehalf of the mayor) the in-charge person of the health center, thehealth center CHW cooperative supervisor, the president of theCHW cooperative, and a local community representative (fi vesignatories).
6. Purchase contract with the CHW cooperative
The contract is between the sector administration and the commu-nity health worker cooperative and is signed by the sector adminis-tration representative, the in-charge person of the health center, andthe president of the CHW cooperative (three signatories).
Source: World Bank data.:
Note: CHW = community health worker; No. = number; PBF = performance-based fi nancing.:
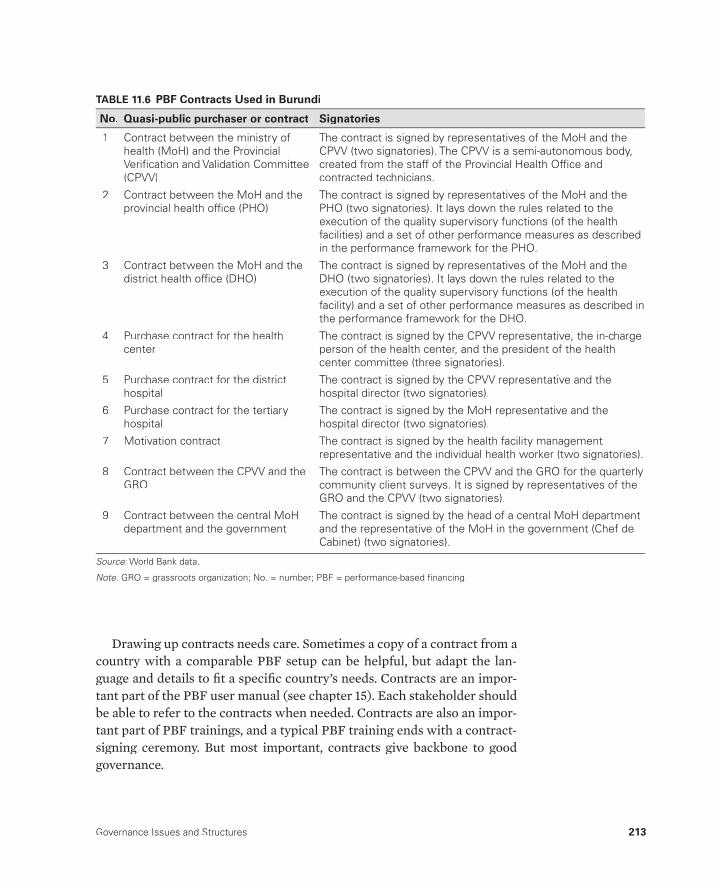
Governance Issues and Structures 213
Drawing up contracts needs care. Sometimes a copy of a contract from a country with a comparable PBF setup can be helpful, but adapt the lan-guage and details to fi t a specifi c country’s needs. Contracts are an impor-tant part of the PBF user manual (see chapter 15). Each stakeholder should be able to refer to the contracts when needed. Contracts are also an impor-tant part of PBF trainings, and a typical PBF training ends with a contract-signing ceremony. But most important, contracts give backbone to good governance.
TABLE 11.6 PBF Contracts Used in Burundi
No. Quasi-public purchaser or contract Signatories
1 Contract between the ministry ofhealth (MoH) and the ProvincialVerifi cation and Validation Committee(CPVV)
The contract is signed by representatives of the MoH and the CPVV (two signatories). The CPVV is a semi-autonomous body,created from the staff of the Provincial Health Offi ce and contracted technicians.
2 Contract between the MoH and theprovincial health offi ce (PHO)
The contract is signed by representatives of the MoH and the PHO (two signatories). It lays down the rules related to the execution of the quality supervisory functions (of the health facilities) and a set of other performance measures as described in the performance framework for the PHO.
3 Contract between the MoH and thedistrict health offi ce (DHO)
The contract is signed by representatives of the MoH and the DHO (two signatories). It lays down the rules related to the execution of the quality supervisory functions (of the health facility) and a set of other performance measures as described in the performance framework for the DHO.
4 Purchase contract for the health center
The contract is signed by the CPVV representative, the in-charge person of the health center, and the president of the healthcenter committee (three signatories).
5 Purchase contract for the district hospital
The contract is signed by the CPVV representative and thehospital director (two signatories).
6 Purchase contract for the tertiaryhospital
The contract is signed by the MoH representative and thehospital director (two signatories).
7 Motivation contract The contract is signed by the health facility management representative and the individual health worker (two signatories).
8 Contract between the CPVV and theGRO
The contract is between the CPVV and the GRO for the quarterlycommunity client surveys. It is signed by representatives of theGRO and the CPVV (two signatories).
9 Contract between the central MoHdepartment and the government
The contract is signed by the head of a central MoH departmentand the representative of the MoH in the government (Chef deCabinet) (two signatories).
Source: World Bank data.:
Note: GRO = grassroots organization; No. = number; PBF = performance-based fi nancing.:

214 Performance-Based Financing Toolkit
PBF at Scale: Market, Contracting, and Governance
PBF at scale works through a regulated internal market mechanism. Internal markets or quasi-markets were introduced in health care in the 1990s in countries such as New Zealand and the United Kingdom. Those countries intended to introduce some market forces into the rigid national healthsystem–type public health systems (Enthoven 1991; Grand 2003; Walsh 1995). Regulated markets as a policy model were further elaborated in Euro-pean countries like the Netherlands.
The terms internal market or t quasi-market are appropriate to describe how tPBF works at scale. It does so through introducing an internal market for the purchase of performance. PBF approaches introduce a purchaser-provider split in which diff erent functions are allocated transparently to diff erent bod-ies. Price signals are introduced in rigid public health systems, and social en-trepreneurship of health facility managers and providers is stimulated. Even in rural settings in low-income countries where there are often very few com-peting providers for public health, PBF facilities that off er better services might draw clients from the catchment population of facilities that off er lower-quality services. Even in such settings, it has become clear that PBF stimulates “voting with the feet” and “money following the patient.”
In the context of PBF internal market developments, the terms contract-ing in and contracting out are used. Contracting in was fi rst used to describe tthe contracting experience in Cambodia in the late 1990s (Bhushan et al. 2007; Loevinsohn and Harding 2005). The term referred to nonstate actors who were contracted in to assist the government to improve health service delivery. Contracting in was adopted to contrast with contracting out, which meant that health service delivery was allocated by contract to nonstate ac-tors. In both approaches, of course, public money is being used.
One could argue that PBF originated in Cambodia through a contracting-in experience (Soeters and Griffi ths 2003). Nonstate actors set up methods that assisted the Cambodian government’s public health system to improve its per-formance (Meessen et al. 2006; Meessen, Soucat, and Sekabaraga 2011).
Conceptually, PBF projects are close to contracting-in methods. This in-sight is important because it has design implications for the role of technical assistance in PBF systems (see also chapter 14).
Many governments are not used to working with nongovernmental orga-nizations (NGOs). Governments often resist working with NGOs, especially when the NGO sector is large such as in complex emergencies. However, governments need to realize the consequences of the health system strength-ening activities through PBF. Nonstate actors are not only essential for a good separation of functions, but also important in assisting the government to improve the performance of its health system.

Governance Issues and Structures 215
Note
1. Contacting a lawyer for advice on the way to introduce these contracts is your choice. However, because these contracts are internal agreements and because plain language is used, an uninitiated lawyer might object to the form and thecontent.
References
Bhushan, I., E. Bloom, D. Clingingsmith, R. Hong, E. King, M. Kremer, B. Loevin-sohn, and B. Schwartz. 2007. “Contracting for Health: Evidence from Cambodia.”Weatherhead School of Management, Case Western Reserve University, Cleveland, OH. http://faculty.weatherhead.case.edu/clingingsmith/cambodia13JUN07.pdf.
Brook, P., and S. Smith, eds. 2001. Contracting for Public Services: Output-Based Aid and Its Applications. Washington, DC: World Bank.
ECOSOC (United Nations Economic and Social Council). 2006. “Defi nition of BasicConcepts and Terminologies in Governance and Public Administration.”
The following toolkit fi les can be accessed through this web link: http://www.worldbank.org/health/pbftoolkit/chapter11.
• Rwanda:– District PBF steering committee contract– Purchase contract for the health center– Motivation contract– Purchase contract for the district hospital– Sector PBF steering committee– Purchase contract with the community health worker (CHW)
cooperative.
• Burundi:– Contract between the Ministry of Health (MoH) and the Provincial
Verifi cation and Validation Committee (CPVV)– Contract between the MoH and the provincial health offi ce (PHO)– Contract between the MoH and the district health offi ce (DHO)– Purchase contract for the health center– Purchase contract for the district hospital– Purchase contract for the tertiary hospital– Motivation contract– Contract between the CPVV and the grassroots organization (GRO)– Contract between the central MoH department and the
government.
11.5 Links to Files and Tools
216 Performance-Based Financing Toolkit
E/C.16/2006/4, Committee on Experts on Public Administration, ECOSOC, New York. http://unpan1.un.org/intradoc/groups/public/documents/un/un-pan022332.pdf.
Enthoven, A. C. 1991. “Internal Market Reform of the British National Health Service.” Health Aff airs 10 (3): 60–70.
Grand, J. L. 2003. Motivation, Agency, and Public Policy. London: Oxford University Press.
Lewis, M. 2006. “Governance and Corruption in Public Health Care Systems.”Center for Global Development Working Paper 78, World Bank, Washington, DC.
Loevinsohn, B., and A. Harding. 2005. “Buying Results? Contracting for Health Service Delivery in Developing Countries.” The Lancet 366 (9486): 676–81.t
Meessen, B., J.-P. Kashala, and L. Musango. 2007. “Output-based Payment to Boost Staff Productivity in Public Health Centres: Contracting in Kabutare District, Rwanda.” Bulletin of the World Health Organization 85 (2): 108–15.
Meessen, B., L. Musango, J. P. Kashala, and J. Lemlin. 2006. “Reviewing Institutions of Rural Health Centres: The Performance Initiative in Butare, Rwanda.” Tropical Medicine and International Health 11 (8): 1303–17.
Meessen, B., A. Soucat, and C. Sekabaraga. 2011. “Performance-Based Financing: Just a Donor Fad or a Catalyst Towards Comprehensive Health-Care Reform?” Bulletin of the World Health Organization 89 (2): 153–56.
North, D. C. 1990. Institutions, Institutional Change, and Economic Performance.Cambridge, UK: Cambridge University Press.
Remme, M., P. B. Peerenboom, P.-M. Douzima, D. M. Batubenga, M. I. Inoussa, and J. van de Weerd. 2012. “Le Financement basé sur la Performance et la BonneGouvernance: Leçons apprises in République Centrafricaine.” PBF CoP Working Paper Series WP8, African Performance-Based Financing Community of Practice, World Bank, Washington, DC. http://www.hha-online.org/hso/system/fi les/wp8fb penrca.pdf.
Rusa, L., W. Janssen, S. van Bastelaere, D. Porignon, J. de Dieu Ngirabega, and W. Vandenbulcke. 2009. “Performance-Based Financing for Better Quality of Services in Rwandan Health Centres: 3-Year Experience.” Tropical Medicine and International Health 14 (7): 830–37.
Soeters, R., and F. Griffi ths. 2003. “Improving Government Health Services through Contract Management: A Case from Cambodia.” Health Policy and Planning 18 g(1): 74–83.
Soeters, R., C. Habineza, and P. B. Peerenboom. 2006. “Performance-Based Financ-ing and Changing the District Health System: Experience from Rwanda.” Bulletinof the World Health Organization 84 (11): 884–89.
Soeters, R., P. B. Peerenboom, P. Mushagalusa, and C. Kimanuka. 2011. “Perfor-mance-Based Financing Experiment Improved Health Care in the Democratic Republic of Congo.” Health Aff airs 30 (8): 1518–27.
Uwimpuhwe, S. 2011. “Cost Analysis of the Performance-Based Financing Scheme in Rwanda.” School of Public Health, National University of Rwanda, Kigali.
Walsh, K. 1995. Public Services and Market Mechanisms. Competition, Contracting,and the New Public Management. London: Macmillan Press.

217
Data Gathering and Dissemination
CHAPTER 12
MAIN MESSAGES
➜ Linking data to money and accountability and implementing an auditing process force positive changes in the way data are managed.
➜ The PBF web- enabled application is the backbone of any mature PBF ad-ministrative system.
➜ PBF web- enabled applications link service delivery and invoicing and en-able good governance (accountability for results and transparency).
COVERED IN THIS CHAPTER
12.1 Introduction: Data gathering and usage are crucial to PBF12.2 How data collection for PBF is diff erent12.3 How a PBF web- enabled application works12.4 How to arrive at functional PBF web- enabled applications12.5 Links to fi les and tools

218 Performance-Based Financing Toolkit
12.1 Introduction: Data Gathering and Usage Are Crucial to PBF
Data gathering and usage are a central part of performance- based fi nanc-ing (PBF) systems. If well applied, PBF leads to better quality data and bet-ter availability of data at all levels— from the smallest health center to the health ministry. Linking data to payment changes the way data are man-aged. Web- based information technology solutions have been developed and form the backbone of PBF administrative systems. At the same time, better- quality data and more data- driven systems require enhancing data analysis capabilities at all levels. In this chapter, we discuss how to achieve these requirements.
12.2 How Data Collection for PBF Is Different
PBF leads to better data and better usage of data. PBF payment systems re-quire and stimulate more eff ective data management and data availability at all levels. PBF drives better usage of data precisely because the data are linked to payments. In practice, 100 percent data availability is being achieved because health facilities or agencies must report data or forfeit per-formance incentive payments. In addition, data quality is also enhanced be-cause data must be checked at health facility, district, and national levels before any payment is disbursed. If data are not available at any of these three levels, payment cannot proceed. These specifi c procedures for paying for performance ensure that providers deliver data that are complete and available at all levels of the system.
Linking data to payments and to accountability and auditing data changes the way data are managed. Data become the equivalent of earnings. And both earnings and data are audited at all levels: community, health center, district, and national. For PBF, if the quantity and quality of services pro-duced determine how much money is earned— and both are under heavy scrutiny at all levels— the importance of data collection increases substan-tially from “data collection as usual.”
Data are scrutinized at health facility, local (district/varies per country), and national levels. At the health facility level, data are tallied from the reg-isters. At the district level, quantity and quality data are verifi ed and ap-proved. At the national level, a consolidated payment order is produced and quantity and quality data for the entire country are compiled. At all three levels, relative performance is analyzed (for the type of analysis used in such exercises, see chapter 13).

Data Gathering and Dissemination 219
The Differences
In general, PBF data systems diff er from routine health management infor-mation systems (HMISs):
• For PBF, a limited data set is collected.• In PBF, there is rigorous data verifi cation of all data at the source and the
data are triangulated at various levels.• In PBF, all data are tied to an automated invoicing and payment module.
The PBF administrative system is primarily set up to provide solutions forinvoicing and payment for performance. But a welcome side eff ect of having data tied to payment is that the system also leads to valuable performance information.
Limited Data Set CollectedIn PBF systems, a more limited set of data is tracked. In a typical PBF system, about 20 services are purchased at each level (health center and district hos-pital) and lead to a total of about 40 services. The data are collected monthly and are not disaggregated for personal information such as name, age, gen-der, and address. Personal information remains in the registers at the healthfacilities, and only summary quantity data are entered in the database. In addition to the quantitative data, summary quality data are entered (consoli-dated scores, but not the full set) for about 15 services. This approach is doneonce every three months. In terms of workload, it reduces monthly data ele-ments, which in a typical MHIS are many and, as an example, totaled about 10,000 in the pre- 2012 Rwandese HMIS.
Data Rigorously Verifi ed at the SourcePBF data verifi cation is rigorous and is double- checked against routine data at the source. At the health facility level, specially designated primary data col-lection tools (registers and individual patient cards) are used. Each month, all services purchased are verifi ed at the source. These data are double- checked against similar data of the HMIS. The PBF data quality verifi cation process can result in improvements to HMIS data reliability too (see chapter 2).
Data Tied to Automatic Invoicing and Payment Module for PBFInvoicing and payment are core functions of PBF data management systems. Such functions are usually not included in an ordinary HMIS. PBF quantity data and quality data are entered in the web- enabled application. Once per quarter, a consolidated district invoice is printed from the system and pre-sented to the district steering committee for approval. After the invoice goes through validation procedures and receives approval at the higher level, a
220 Performance-Based Financing Toolkit
payment order is printed. This payment order is approved and sent to the fund holder(s). A fl exible PBF system can manage diff erent purchasers and fund holders. It can easily be adapted to fi t contextual needs.
12.3 How PBF Web- Enabled Application Works
Two Components
Web- based information technology for PBF generally consists of two com-ponents: (a) a database that is accessible through the Internet (web- enabled) at all times and (b) a public website through which PBF tools and results are actively shared.
Web- Enabled DatabaseThe web- enabled database is the information technology solution for scaled- up PBF systems that at one time used spreadsheets or off - line databases for data management. This database system enables users to enter PBF perfor-mance data, maintain PBF system parameters (such as which data elements are purchased and at what tariff s), calculate PBF payments, and print pay-ment orders. The system also links to other analysis tools such as Microsoft Excel or geographic information software to enable district- and national- level staff to analyze service performance.
The data management and validation system, which includes the web- enabled database, currently forms the administrative backbone of two scaled- up PBF systems (Rwanda and Burundi). Interest in using this solu-tion is rapidly growing in PBF systems in Benin, Burkina Faso, Cameroon, Congo- Brazzaville, Chad, the Democratic Republic of Congo, Lesotho, Nige-ria, Senegal, and Zambia, among others.
This solution has many advantages:
• Issues with unreliable virus- prone personal computers in areas lacking routine maintenance and technical expertise for information technology hardware and software are circumvented; any functioning Internet ac-cess will suffi ce.
• A platform for a multidirectional information exchange is provided; all participants at all levels have access to the same information.
• The need for all paper- based health facility invoices to be sent to the cen-tral level is avoided; only consolidated district invoices are sent.
• A repository is provided for very reliable health information that can be used to monitor and evaluate health sector performance data over time and to verify each service has been accounted for and paid for.
Data Gathering and Dissemination 221
• Effi cient and reliable invoicing and strategic purchasing are facilitated.• Virtual pooling of all funds for PBF is possible; up to 10 diff erent fund
holders are managed through the Rwandese and Burundi scaled- up systems.
The overall majority of countries have opted to use software that is freeware or shareware and can be adapted by programmers. An advantage of using freeware or shareware is that no licensing fees must be paid. A mix of free software (PHP) and open source software (Joomla, WordPress, MySQL, and PostgreSQL) is applied. MySQL and PostgreSQL are popular open source databases,1 Joomla and WordPress are free open source content manage-ment systems,2 and PHP is a widely used programming language that was originally designed for web development to produce dynamic web pages but is now used predominantly for server- side scripting.3
These information and communication technology (ICT) solutions are the backbone of PBF systems. Without them, obtaining timely, accurate, andcomplete datasets for use in paying providers on time and for enabling good governance (accountability for results and transparency; see chapter 11) would be diffi cult.
The Public WebsiteThe public website contains news, pictures, a calendar of PBF- related events, and information on the PBF facility’s performance and earnings (hence the “public front end”).
There are also opportunities to build on existing data collection systems to develop a hybrid PBF solution. This type of solution can have the advan-tages of reducing duplication of data entry through a parallel PBF data cap-ture system and enhancing the use of HMIS data generally. In this case, the data are gathered through the routine HMIS system and passed to the PBF system for analysis, validation, and invoice processing. New web- based plat-forms for HMIS, such as the District Health Information Software 2(DHIS 2), have application program interfaces that enable data to be ex-changed in real time with other systems.
Data Analysis: Capacity Building Required
Data- driven systems require a higher level of data analysis capability. Focus-ing more on data in PBF exposes the fact that data analysis capabilities can be rather weak at many levels of the health systems. The best techniques for data analysis and the diff erent strategies to enhance such capabilities are dis-cussed further in chapter 13.
222 Performance-Based Financing Toolkit
12.4 How to Arrive at a Functional Web- EnabledApplication
General Considerations
To establish a functional PBF web- enabled application, seek assistance from a consultant, but be very clear about the application requirements. In addi-tion, defi ne how you wish to train the end users and discuss maintenance and security. Take the following steps:
• Defi ne your PBF system requirements (data fl ows, type of data to be col-lected, payment methods, fund holders, system users, and so on).
• Get technical ICT support from a systems developer or programmer to do the following:➜ Match your requirements to existing PBF applications, and decide
whether you will need to develop software or can adapt an existing system.
➜ Confi gure the system to local requirements.➜ Develop custom reports.
• Train the end users.• Plan for maintenance, security, and continuous development.
Find a Consultant for Software DevelopmentExperience with PBF web- enabled application is fairly recent, and therefore limited, albeit growing. In each country, a local information technology pro-grammer is trained to maintain and further develop the web- enabled appli-cation, so expertise is increasing. An off - the- shelf product, which can be adapted by any programmer with some experience in MySQL and PHP, is available. In the links to fi les in this chapter, you will fi nd the generic terms of reference for such an information technology consultant.
Train the End UsersEnd users will need training in using this web- enabled application. Training should target district- level administrative and health authorities, technical assistants, and ministry of health staff working at the national level. Training is frequently started by reviewing the general level of computer literacy in a given situation: the basics of Internet use, security issues related to accounts and passwords, and information about working on public computers. Two- to- three day training programs seem to be appropriate. District staff can use real performance data to practice data entry. Trainings like this were given in Rwanda for its 2006 performance data and in Burundi during the fi rst six months of its 2010 performance data.

Data Gathering and Dissemination 223
In addition, training a local PHP (software) technician in script, website management through Joomla or WordPress, and maintenance of the data-base (including its back- up procedures) is helpful.
Plan for Maintenance, Security, and Continuous DevelopmentThe database can be located on a server in the capital of the country or based in the cloud overseas. Using a server within the country has various advan-tages: it enhances the sense of ownership, and, frequently, the access speed is better. However, the server can be located anywhere, especially if access isthrough a satellite connection. Around- the- clock guaranteed server func-tion, data back- up possibilities, and professional storage (power back- up and climate control) are essential.
In searching for a suitable server in the capital, select an experienced in-formation technology technician who knows about installing and maintain-ing servers. Analyze two or three Internet service providers. Choose the most reliable one. Purchase the server(s), write a contract with the Internet service provider of your choice, and install the software on the server. Then you are ready to begin.
An example of a contract with an Internet service provider can be found in the links to fi les in this chapter.
Finally, set up a website editorial committee and a database management committee. The editorial committee manages quality control and oversight of information published on the website and also manages access to the reg-istered portion. The database management committee oversees database se-curity and access, back- up related issues, ongoing development of the web application, and issues related to the ability to analyze performance data. Examples of terms of reference for a website editorial committee and data-base management committee can be found in the links to fi les in this chapter. For information on the PBF data centers of Rwanda and Burundi, see boxes12.1 and 12.2, respectively.
The Rwandese PBF approach for health centers at the national level and for those at the com-munity level relies on a web- enabled databaseas the backbone of the PBF administrative sys-tem. The centralized system uses one set of
unit fees for the quantity indicators, which are set at the national level. Composite measures from the quantifi ed quality checklist are also en-tered in this database.
BOX 12.1
Rwanda and Its PBF Data Center
(box continues on next page)

224 Performance-Based Financing Toolkit
Fourteen measures are related to the ser-vices in the quality checklist. Each composite measure contains multiple subcomposite mea-sures and many data elements. The paper- based information on all subcomposite measures and data elements remains at the decentralized level and is not entered in the database. Its purpose is to enable targeted managerial action at a decen-tralized level. The idea was that this decentralized approach would allow changing the underlying quality criteria and data elements regularly (put-ting the quality performance barrier incremen-tally higher), without having to change the soft-ware and its interface each year.
The interface creates consolidated quarterly invoices (consolidating the quantity data with
the quality measure) for the minimum package of health services and human immunodefi -ciency virus (HIV) services. It also contains a menu of graphs, which compare trend linesamong indicators.
Screenshot B12.1.1 shows the monthly in-voice for the minimum package of services of one health center. These data correspond to the verifi ed paper invoice, which is retained in the district administrative offi ce, with a validatedcopy left in the health center. The quantities can be verifi ed in the registers, and thus the clients can be traced to their communities by third- party counterverifi cation agents.
SCREENSHOT B12.1.1 Monthly Invoice, Rwanda
Source: Rwanda, Ministry of Health, Performance- Based Financing database.:
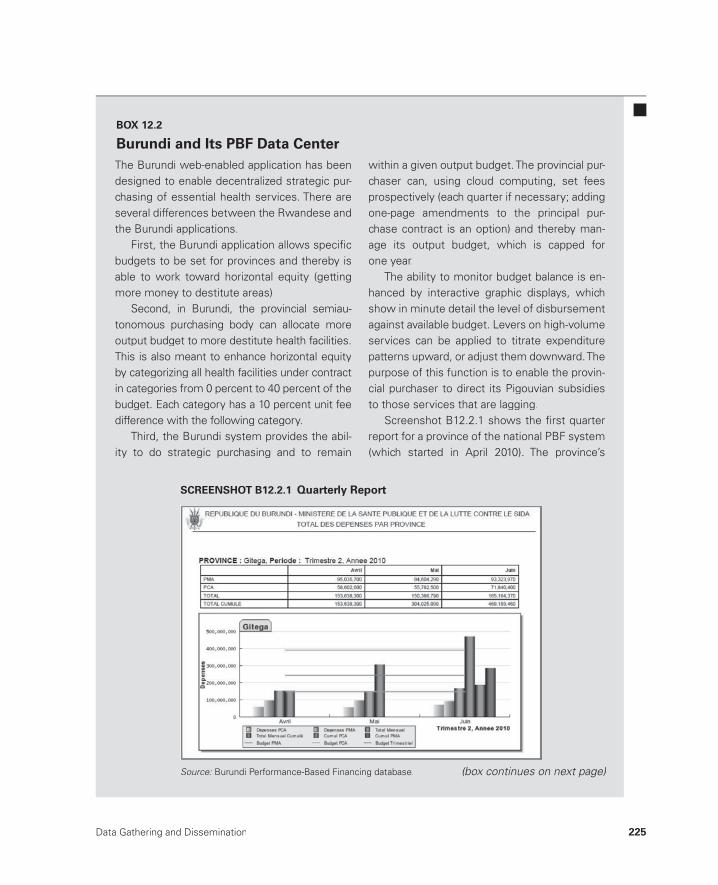
Data Gathering and Dissemination 225
The Burundi web- enabled application has been designed to enable decentralized strategic pur-chasing of essential health services. There are several differences between the Rwandese and the Burundi applications.
First, the Burundi application allows specifi cbudgets to be set for provinces and thereby isable to work toward horizontal equity (gettingmore money to destitute areas).
Second, in Burundi, the provincial semiau-tonomous purchasing body can allocate moreoutput budget to more destitute health facilities.This is also meant to enhance horizontal equity by categorizing all health facilities under contract in categories from 0 percent to 40 percent of the budget. Each category has a 10 percent unit feedifference with the following category.
Third, the Burundi system provides the abil-ity to do strategic purchasing and to remain
within a given output budget. The provincial pur-chaser can, using cloud computing, set fees prospectively (each quarter if necessary; adding one- page amendments to the principal pur-chase contract is an option) and thereby man-age its output budget, which is capped for one year.
The ability to monitor budget balance is en-hanced by interactive graphic displays, whichshow in minute detail the level of disbursement against available budget. Levers on high- volume services can be applied to titrate expenditurepatterns upward, or adjust them downward. Thepurpose of this function is to enable the provin-cial purchaser to direct its Pigouvian subsidiesto those services that are lagging.
Screenshot B12.2.1 shows the fi rst quarter report for a province of the national PBF system(which started in April 2010). The province’s
BOX 12.2
Burundi and Its PBF Data Center
(box continues on next page)
SCREENSHOT B12.2.1 Quarterly Report
Source: Burundi Performance- Based Financing database.:
226 Performance-Based Financing Toolkit
Notes
1. MySQL, http://www.mysql.com/products/enterprise/database/, andPostgreSQL, http://www.postgresql.org.
2. Joomla, http://www.joomla.org/, and WordPress, http://wordpress.org. 3. PHP, http://en.wikipedia.org/wiki/PHP.
The following toolkit fi les can be accessed through this web link:http://www.worldbank.org/health/pbftoolkit/chapter12.
• Sample terms of reference for a PHP programmer
• Sample contract with an Internet service provider
• Terms of reference for a website editorial committee
• Terms of reference for a database management committee.
12.5 Links to Files and Tools
actual expenses for the minimum package ofactivities (PMA), its complementary package of activities (PCA), and its quarterly budget are
shown. The data show slight overspending,which can be corrected easily by slightly adjust-ing one or two levers.
227
Data Analysis and Learning
CHAPTER 13
MAIN MESSAGES
➜ The key analytical methods in PBF are analyzing an increase from base-line, analyzing trends over time, analyzing coverage, and performing benchmarking.
➜ Data analysis capabilities are urgently needed at all levels.
COVERED IN THIS CHAPTER
13.1 Introduction13.2 Comparison of performance13.3 Strategies to boost data analysis capabilities13.4 Links to fi les and tools
13.1 Introduction
Much can be learned from performance- based fi nancing (PBF) data. Data analysis and learning are essential parts of PBF systems. Comparing perfor-mance trends, looking at the percentages of population coverage obtained, and benchmarking are the three most important analytical methods.
228 Performance-Based Financing Toolkit
Comparing performance may leave stakeholders with a sense of urgency about those that underperform. Comparing performance and rewarding performance are linked in PBF, which is defi nitely an asset.
Given the rapid international developments around data management, stakeholders at all levels need to boost their capabilities for analyzing data. Data analysis capabilities can be strengthened through automated dash-boards, but also through familiarization with Microsoft Excel PivotTable analysis. This chapter discusses how to perform capacity building.
13.2 Comparison of Performance
Data analysis and learning are essential in PBF. A clearer focus on results can change and improve systems considerably. Focusing on outputs and quality spurs actions that are diff erent from those that occur when concentrating only on inputs. Focusing on results rapidly reveals how much can actually be achieved by even relatively small amounts of additional fi nancing. When systems focus on results, they tend to become more effi cient and eff ective while also casting light on what may still be needed to reach the desired lev-els of performance.
As there are many ways to Rome, there are also many ways to produce results. Therefore, comparing diff erent methods for reaching results and comparing the relative cost- eff ectiveness of one approach to another is im-portant (Maynard 2012).
The most commonly used data analysis methods in PBF are (a) analyzing an increase from baseline, (b) analyzing trends over time, (c) analyzing cov-erage, and (d) performing benchmarking.
Analyzing an Increase from Baseline and Trends Over Time
Analyzing an increase from a baseline typically uses line graphs with a monthly breakdown. The longer the time frame, the more meaningful the line graph becomes. A trend line can be created that provides the slope for this line graph— the trend line provides the middle- to long- term- expected per-formance. Such a trend line can be used for forecasting, and it becomes more reliable when the data series are longer. See box 13.1 later in this chapter.
Analyzing Coverage
Analyzing coverage is derived from calculating the percentage population covered of a certain PBF service and works as follows. Each PBF service has a saturated target. For example, a common target for the number of curative

Data Analysis and Learning 229
care consultations per person is one per year. And the target for fully vacci-nated children is the total number of children under one year of age. The coverage for curative care is 50 percent when there is 0.5 consultation perperson per year (as the target in this example), and the coverage for fully vac-cinated children is 75 percent if 75 percent of the children under the age of one have been fully immunized (see also chapter 4).
In table 13.1, the coverage for institutional deliveries in 23 Rwandese dis-tricts over a 24- month period is shown. Those deliveries occurred in health centers; the deliveries in hospitals were omitted in this table. The average coverage for deliveries was 23.8 percent in January 2006 and 38.2 percent inDecember 2007. This change represents a 60 percent increase from baseline
TABLE 13.1 Analyzing Coverage for PBF Services in Rwanda, 2006–07
District
Deliveriestarget,2006
Deliveries,January
2006
Coverage, January
2006
Deliveriestarget,2007
Deliveries, December
2007
Coverage, December
2007
Change in 24 months
(%)
Nyarugenge 10,796 49 0.05 11,077 82 0.09 63.1
Gasabo 14,601 238 0.20 14,981 336 0.27 37.6
Gisagara 11,941 319 0.32 12,252 321 0.31 1.9
Rusizi 15,122 373 0.30 15,515 411 0.32 7.4
Gicumbi 16,387 317 0.23 16,813 452 0.32 39.0
Nyanza 10,260 191 0.22 10,526 294 0.34 50.0
Nyaruguru 10,546 153 0.17 10,820 316 0.35 101.3
Rubavu 13,332 210 0.19 13,679 411 0.36 90.8
Gatsibo 12,913 135 0.13 13,249 409 0.37 195.3
Nyamasheke 14,807 357 0.29 15,192 470 0.37 28.3
Ngororero 12,858 274 0.26 13,192 413 0.38 46.9
Kickiro 9,467 207 0.26 9,713 309 0.38 45.5
Rulindo 11,447 307 0.32 11,744 385 0.39 22.2
Ruhango 11,199 353 0.38 11,490 383 0.40 5.8
Burera 14,612 465 0.38 14,992 517 0.41 8.4
Huye 12,093 180 0.18 12,407 432 0.42 133.9
Rutsiro 12,043 230 0.23 12,356 437 0.42 85.2
Ngoma 10,711 107 0.12 10,989 392 0.43 257.1
Gakenke 14,671 180 0.15 15,052 540 0.43 192.4
Bugesera 12,153 349 0.34 12,469 455 0.44 27.1
Kayonza 9,554 140 0.18 9,802 368 0.45 156.2
Muhanga 13,084 423 0.39 13,425 550 0.49 26.7
Rwamagana 10,045 92 0.11 10,306 624 0.73 561.1
Total/Average 284,642 5,649 0.2382 292,043 9,307 0.3824 60.6
Source: Rwanda, Ministry of Health, Performance-Based Financing database.:
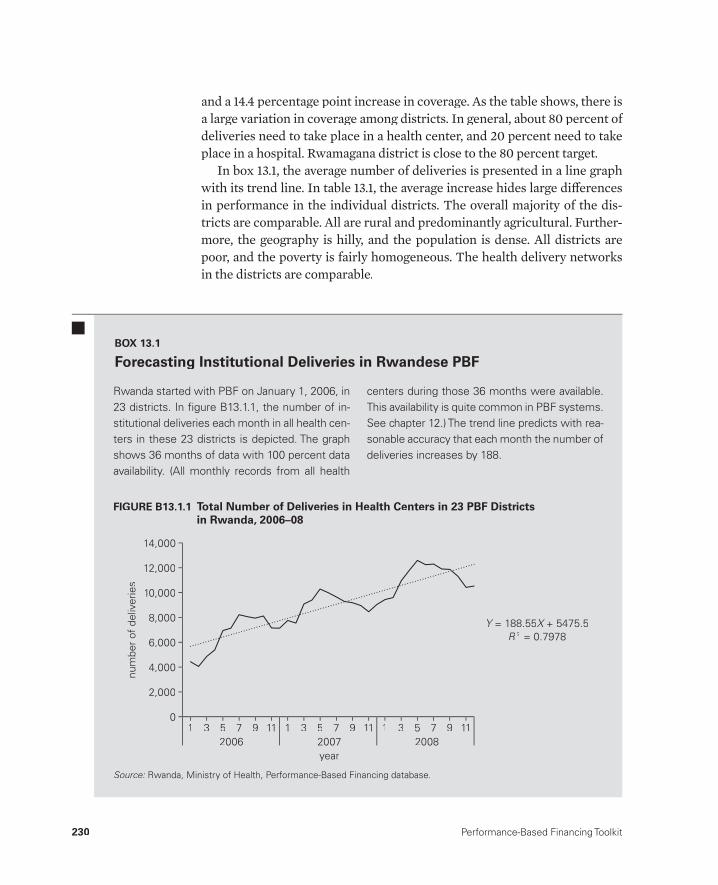
230 Performance-Based Financing Toolkit
and a 14.4 percentage point increase in coverage. As the table shows, there is a large variation in coverage among districts. In general, about 80 percent of deliveries need to take place in a health center, and 20 percent need to take place in a hospital. Rwamagana district is close to the 80 percent target.
In box 13.1, the average number of deliveries is presented in a line graph with its trend line. In table 13.1, the average increase hides large diff erences in performance in the individual districts. The overall majority of the dis-tricts are comparable. All are rural and predominantly agricultural. Further-more, the geography is hilly, and the population is dense. All districts are poor, and the poverty is fairly homogeneous. The health delivery networks in the districts are comparable.
Rwanda started with PBF on January 1, 2006, in 23 districts. In fi gure B13.1.1, the number of in-stitutional deliveries each month in all health cen-ters in these 23 districts is depicted. The graph shows 36 months of data with 100 percent data availability. (All monthly records from all health
centers during those 36 months were available. This availability is quite common in PBF systems. See chapter 12.) The trend line predicts with rea-sonable accuracy that each month the number of deliveries increases by 188.
BOX 13.1
Forecasting Institutional Deliveries in Rwandese PBF
num
ber
of d
eliv
erie
s
4,000
14,000
10,000
12,000
8,000
6,000
2,000
0
2006year2007 2008
1 3 5 7 9 11 1 3 5 7 9 11 1 3 5 7 9 11
Y = 188.55Y X + 5475.5XR 2 = 0.7978
FIGURE B13.1.1 Total Number of Deliveries in Health Centers in 23 PBF Districtsin Rwanda, 2006– 08,
Source:S Rwanda, Ministry of Health, Performance- Based Financing database.R d Mi i t f H lth P f B d Fi i d t b:
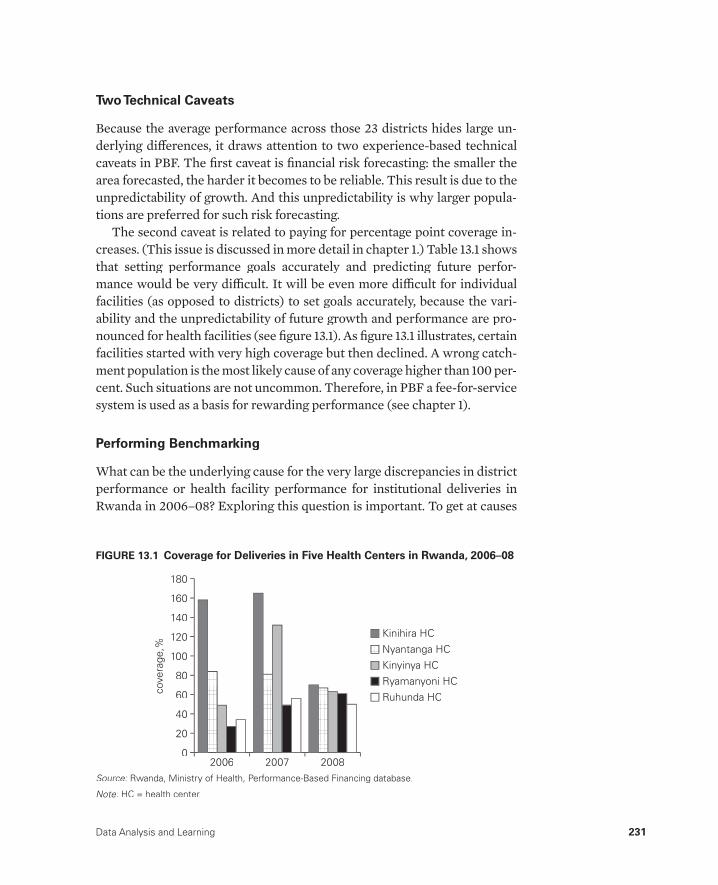
Data Analysis and Learning 231
Two Technical Caveats
Because the average performance across those 23 districts hides large un-derlying diff erences, it draws attention to two experience- based technical caveats in PBF. The fi rst caveat is fi nancial risk forecasting: the smaller the area forecasted, the harder it becomes to be reliable. This result is due to the unpredictability of growth. And this unpredictability is why larger popula-tions are preferred for such risk forecasting.
The second caveat is related to paying for percentage point coverage in-creases. (This issue is discussed in more detail in chapter 1.) Table 13.1 shows that setting performance goals accurately and predicting future perfor-mance would be very diffi cult. It will be even more diffi cult for individual facilities (as opposed to districts) to set goals accurately, because the vari-ability and the unpredictability of future growth and performance are pro-nounced for health facilities (see fi gure 13.1). As fi gure 13.1 illustrates, certainfacilities started with very high coverage but then declined. A wrong catch-ment population is the most likely cause of any coverage higher than 100 per-cent. Such situations are not uncommon. Therefore, in PBF a fee- for- service system is used as a basis for rewarding performance (see chapter 1).
Performing Benchmarking
What can be the underlying cause for the very large discrepancies in district performance or health facility performance for institutional deliveries in Rwanda in 2006– 08? Exploring this question is important. To get at causes
cove
rage
,%
80
180
140
160
120
100
60
40
20
0
Kinihira HCNyantanga HC
Ruhunda HCRyamanyoni HCKinyinya HC
2006 2007 2008
FIGURE 13.1 Coverage for Deliveries in Five Health Centers in Rwanda, 2006– 08
Source: Rwanda, Ministry of Health, Performance- Based Financing database.:
Note: HC = health center.:
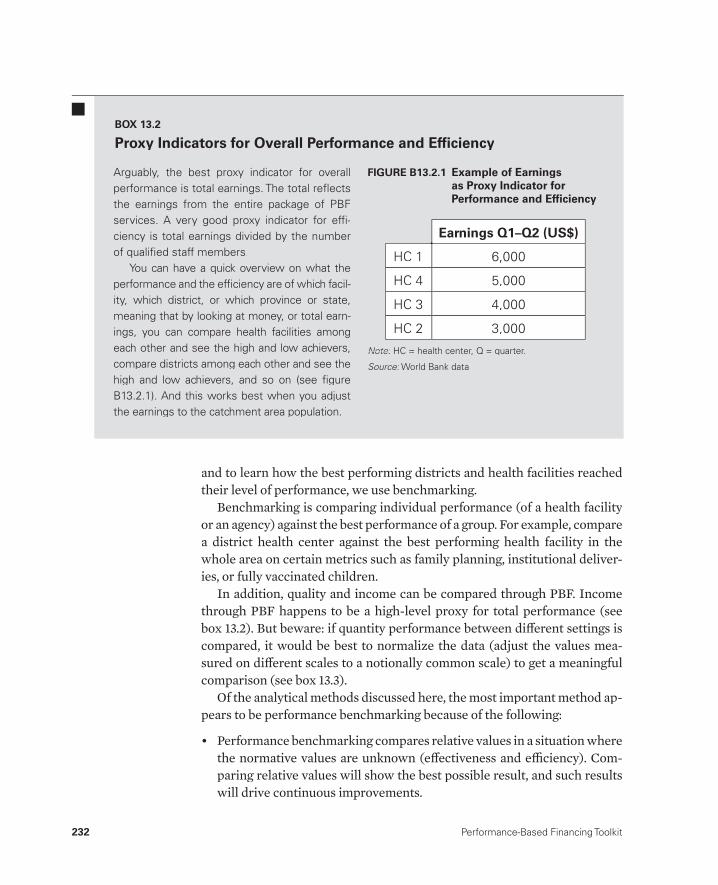
232 Performance-Based Financing Toolkit
and to learn how the best performing districts and health facilities reached their level of performance, we use benchmarking.
Benchmarking is comparing individual performance (of a health facility or an agency) against the best performance of a group. For example, compare a district health center against the best performing health facility in the whole area on certain metrics such as family planning, institutional deliver-ies, or fully vaccinated children.
In addition, quality and income can be compared through PBF. Income through PBF happens to be a high- level proxy for total performance (see box 13.2). But beware: if quantity performance between diff erent settings is compared, it would be best to normalize the data (adjust the values mea-sured on diff erent scales to a notionally common scale) to get a meaningful comparison (see box 13.3).
Of the analytical methods discussed here, the most important method ap-pears to be performance benchmarking because of the following:
• Performance benchmarking compares relative values in a situation where the normative values are unknown (eff ectiveness and effi ciency). Com-paring relative values will show the best possible result, and such results will drive continuous improvements.
Arguably, the best proxy indicator for overallperformance is total earnings. The total refl ectsthe earnings from the entire package of PBFservices. A very good proxy indicator for effi -ciency is total earnings divided by the numberof qualifi ed staff members.
You can have a quick overview on what theperformance and the effi ciency are of which facil-ity, which district, or which province or state,meaning that by looking at money, or total earn-ings, you can compare health facilities amongeach other and see the high and low achievers,compare districts among each other and see thehigh and low achievers, and so on (see fi gureB13.2.1). And this works best when you adjustthe earnings to the catchment area population.
BOX 13.2
Proxy Indicators for Overall Performance and Effi ciency
HC 1
HC 4
HC 3
HC 2
6,000
5,000
4,000
3,000
Earnings Q1–Q2 (US$)
FIGURE B13.2.1 Example of Earningsas Proxy Indicator forPerformance and Effi ciency
Note:Note: HC = health center, Q = quarter.HC = health center Q = quarter::
Source: World Bank data.:
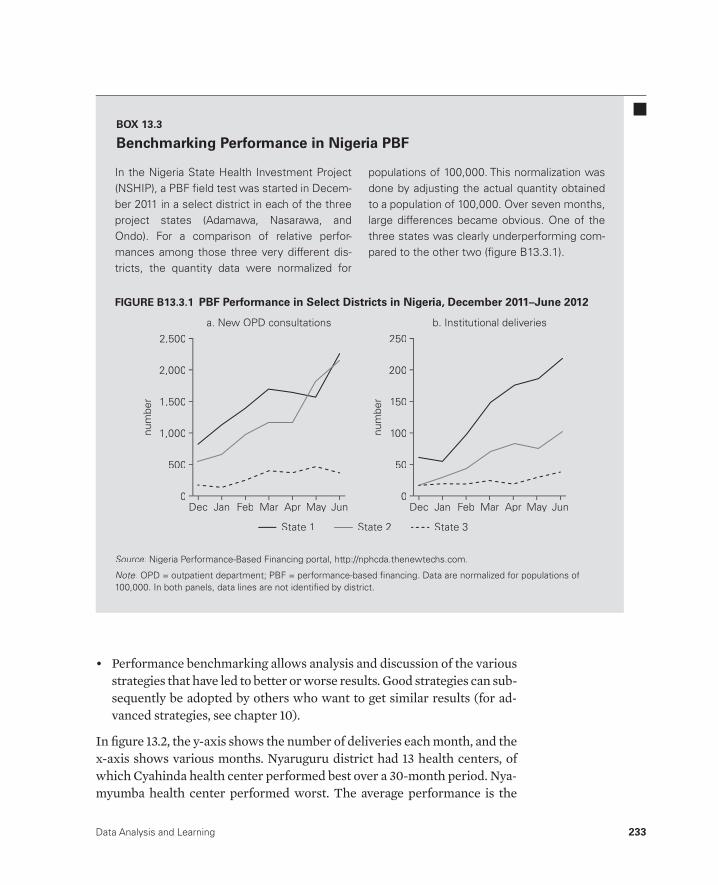
Data Analysis and Learning 233
• Performance benchmarking allows analysis and discussion of the variousstrategies that have led to better or worse results. Good strategies can sub-sequently be adopted by others who want to get similar results (for ad-vanced strategies, see chapter 10).
In fi gure 13.2, the y- axis shows the number of deliveries each month, and the x- axis shows various months. Nyaruguru district had 13 health centers, of which Cyahinda health center performed best over a 30- month period. Nya-myumba health center performed worst. The average performance is the
In the Nigeria State Health Investment Project (NSHIP), a PBF fi eld test was started in Decem-ber 2011 in a select district in each of the three project states (Adamawa, Nasarawa, andOndo). For a comparison of relative perfor-mances among those three very different dis-tricts, the quantity data were normalized for
populations of 100,000. This normalization was done by adjusting the actual quantity obtainedto a population of 100,000. Over seven months,large differences became obvious. One of the three states was clearly underperforming com-pared to the other two (fi gure B13.3.1).
BOX 13.3
Benchmarking Performance in Nigeria PBF
b. Institutional deliveries
num
ber
500
2,500
2,000
1,500
1,000
0
a. New OPD consultations
Dec Jan Feb Mar Apr May Jun
num
ber
50
250
200
150
100
0Dec Jan Feb Mar Apr May Jun
State 1 State 2 State 3
FIGURE B13.3.1 GURE B13.3.1 PBF Performance in Select Districts in Nigeria December 2011–June 2012 PBF Performance in Select Districts in Nigeria, December 2011– June 2012
Source: Nigeria Performance- Based Financing portal, http://nphcda.thenewtechs.com.:
Note: OPD = outpatient department; PBF = performance- based fi nancing. Data are normalized for populations of:100,000. In both panels, data lines are not identifi ed by district.
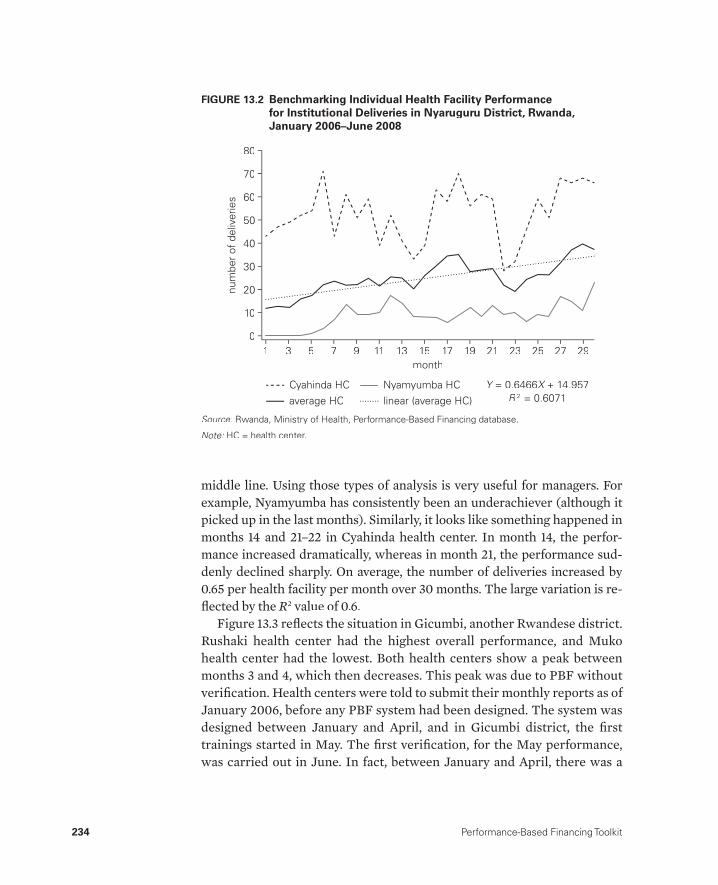
234 Performance-Based Financing Toolkit
middle line. Using those types of analysis is very useful for managers. For example, Nyamyumba has consistently been an underachiever (although it picked up in the last months). Similarly, it looks like something happened in months 14 and 21– 22 in Cyahinda health center. In month 14, the perfor-mance increased dramatically, whereas in month 21, the performance sud-denly declined sharply. On average, the number of deliveries increased by 0.65 per health facility per month over 30 months. The large variation is re-fl ected by the R2 value of 0.6.
Figure 13.3 refl ects the situation in Gicumbi, another Rwandese district.Rushaki health center had the highest overall performance, and Muko health center had the lowest. Both health centers show a peak between months 3 and 4, which then decreases. This peak was due to PBF without verifi cation. Health centers were told to submit their monthly reports as of January 2006, before any PBF system had been designed. The system was designed between January and April, and in Gicumbi district, the fi rsttrainings started in May. The fi rst verifi cation, for the May performance, was carried out in June. In fact, between January and April, there was a
FIGURE 13.2 Benchmarking Individual Health Facility Performancefor Institutional Deliveries in Nyaruguru District, Rwanda,January 2006– June 2008
num
ber
of d
eliv
erie
s
1 3 5 7 9 11month
13 15 17 19 21 23 25 27 29
10
80
60
70
40
30
20
0
Y = 0.6466Y X + 14.957XR 2 = 0.6071
Cyahinda HC Nyamyumba HCaverage HC linear (average HC)
50
Source: Rwanda, Ministry of Health, Performance- Based Financing database.:
Note: HC = health center.:
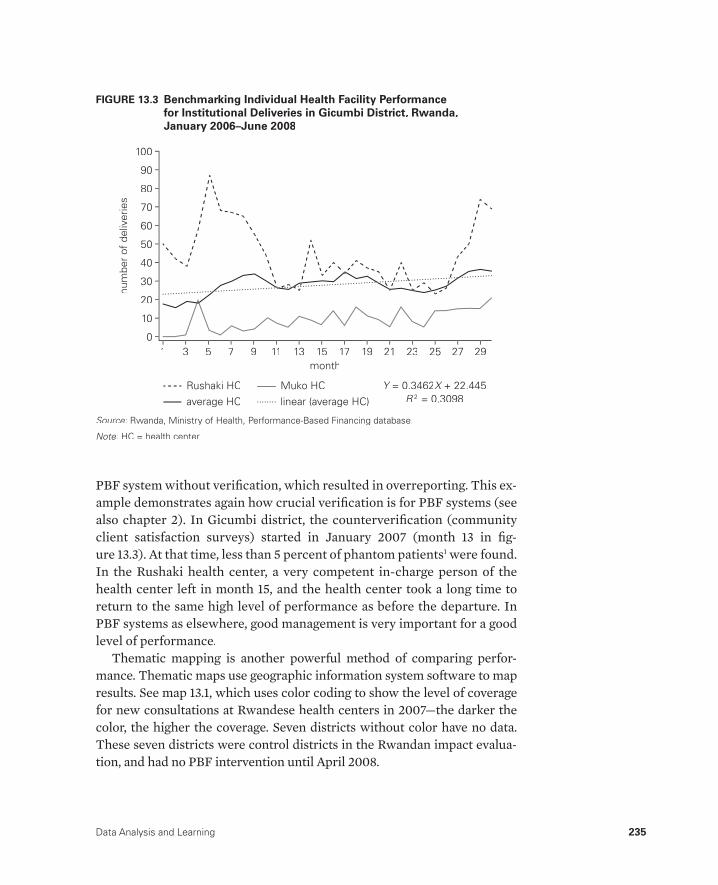
Data Analysis and Learning 235
PBF system without verifi cation, which resulted in overreporting. This ex-ample demonstrates again how crucial verifi cation is for PBF systems (seealso chapter 2). In Gicumbi district, the counterverifi cation (community client satisfaction surveys) started in January 2007 (month 13 in fi g-ure 13.3). At that time, less than 5 percent of phantom patients1 were found.In the Rushaki health center, a very competent in- charge person of the health center left in month 15, and the health center took a long time toreturn to the same high level of performance as before the departure. In PBF systems as elsewhere, good management is very important for a good level of performance.
Thematic mapping is another powerful method of comparing perfor-mance. Thematic maps use geographic information system software to map results. See map 13.1, which uses color coding to show the level of coveragefor new consultations at Rwandese health centers in 2007— the darker the color, the higher the coverage. Seven districts without color have no data.These seven districts were control districts in the Rwandan impact evalua-tion, and had no PBF intervention until April 2008.
num
ber
of d
eliv
erie
s
1 3 5 7 9 11month
13 15 17 19 21 23 25 27 29
10
100
60
70
80
90
40
30
20
0
Y = 0.3462Y X + 22.445XR 2 = 0.3098
Rushaki HC Muko HCaverage HC linear (average HC)
50
FIGURE 13.3 Benchmarking Individual Health Facility Performancefor Institutional Deliveries in Gicumbi District, Rwanda,January 2006– June 2008
Source: Rwanda, Ministry of Health, Performance- Based Financing database.:
Note: HC = health center.:

236 Performance-Based Financing Toolkit
13.3 Strategies to Boost Data AnalysisCapabilities
Given the importance of solid, reliable data management, stakeholders at all levels in PBF need to strengthen their data analysis capabilities. In many health care systems, general data analysis capabilities are lacking among many staff members, even though such capabilities are crucial for analyzing and improving performance.
Data analysis capabilities are not fully developed because previously, many systems were not driven by results. Data were collected routinely without too many consequences if they were incomplete or faulty. Inaccu-rate data are the scourge of many routine reporting systems in low- and middle- income countries (Murray et al. 2003). Because of a renewed focus on results and the concomitant need for data analysis capabilities, the gaps in data analysis capabilities have become blatant.
Source: Rwanda, Ministry of Health, Performance- Based Financing database.:
Note: Coverage/C/Yr = coverage per capita per year.:
MAP 13.1 Coverage for New Consultations, Rwandese Health Centers, 2007

Data Analysis and Learning 237
Each level in the health system has diff erent data analysis needs that re-quire distinct capabilities to analyze. At the health center and community level, analysts need to know actual and desirable coverage of services, be-cause those data are necessary for planning and for drawing up a business plan. At this level, obtaining accurate coverage estimates is always a prob-lem. One confounding factor at this level is the often- problematic demarca-tion of a health center’s formal catchment area. Although the issue is chal-lenging, agreement on some formal demarcation for catchment areas is important.
At the district level, fi gures for the actual coverage for all health centers, the trends over time, and the benchmarking of performance are important. Here, relative performance and strategies to reach a higher level of perfor-mance are discussed. At the national level, the various types of coverage are important as is the benchmarking of districts for their relative performance. Higher- level benchmarking can inform strategies to assist lower- performing districts to increase their achievements. Districts may lag because of a wide array of reasons, ranging from a lack of district health leadership to geo-graphical challenges and diffi cult terrain. Trends over time of indicators can be used to inform fi nancial risk forecasting models that are necessary to set the fees.
Some tools may help. Automated dashboards, for instance, track key performance indicatorsand are automatically updated to show the most recent results available. They enable key indica-tors to be followed with a minimum amount of ef-fort and provide a quick overview of how the sys-tem is performing in relation to those key indicators. Figure 13.4 provides an example of such a dashboard element. In Burundi, managers can follow disbursements and determine whether or not they are overspending. As fi gure 13.4 shows, by January 15, 2011, 77 percent of the 2010 PBF budget was spent.
A Microsoft Excel PivotTable analysis allows managers to customize an analysis through tables or graphs of any of the performance indicators present in their database. The tool is versatile, but managers need specifi c, more advanced training to create and analyze these data. Because of the rela-tive diffi culty of the method, refresher trainings might also be necessary.
Budget Total Annuel (PMA+PCA)Budget Total: 1,681,546,000 FBU
Total Depense: 1,294,466,950 FBUPourcentage: 77%
Samedi, 15 Janvier 2011.
PROVINCE: GitegaAnnee 2010
0 100
25
50
75
FIGURE 13.4 A Dashboard Element for Burundi PBF
Source: Burundi Performance- Based Financing database.:
Note: FBU = Burundi Franc; PCA = package of complemen-:tary activities; PMA = package of minimum activities.
Note
1. Phantom patients are those who are claimed to have been served by the health center and are recorded in its register so as to claim the service fee. But then, after a community client satisfaction survey has been carried out, the patients cannot be traced in the community or can be traced but claim not to have received that service. Hence, the term phantom patient.
References
Maynard, A. 2012. “The Powers and Pitfalls of Payment for Performance.” HealthEconomics 21 (1): 3– 12.
Murray, C. J., B. Shengelia, N. Gupta, S. Moussavi, A. Tandon, and M. Thieren. 2003. “Validity of Reported Vaccination Coverage in 45 Countries.” The Lancet 362 t(9389): 1022– 27.
238 Performance-Based Financing Toolkit
The following toolkit fi les can be accessed through this web link:http://www.worldbank.org/health/pbftoolkit/chapter13.
• Training reports for two Microsoft Excel PivotTable trainings showing methodology and content
13.4 Links to Files and Tools

239
PBF Technical Assistance and Training
CHAPTER 14
MAIN MESSAGES
➜ PBF requires targeted technical assistance and regular training.➜ Technical assistance is very important, especially for PBF functions such
as good governance and independent verifi cation.➜ Civil society involvement is essential and enhances good governance.➜ The promotion of South– South technical assistance is vital because such
assistance more rapidly creates local ownership for PBF.
COVERED IN THIS CHAPTER
14.1 Introduction14.2 Types of technical assistance necessary for PBF14.3 The extended team mechanism14.4 Capacity building, training, and working South– South14.5 Links to fi les and tools
240 Performance-Based Financing Toolkit
14.1 Introduction
Performance- based fi nance (PBF) requires intense technical assistance. External expertise is often necessary for diff erent functions, but the type of assistance varies over time, while the intensity of assistance declines. The technical assistance functions can be manifold. They span the entire techni-cal fi eld of PBF. Nonstate actors fi gure prominently in governance for PBF and have distinct importance, for instance, in the separation of functions. Certain roles should not be executed by the government. Coordination of technical assistance for PBF is mostly organized through the extended team mechanism. Signifi cant emphasis is put on capacity building of local tech-nicians and researchers, and increasingly technical assistance is provided South– South (cooperation or the sharing of technology and knowledge be-tween developing countries). This exchange enhances ownership.
14.2 Types of Technical Assistance Necessary for PBF
In most settings, PBF requires initial intensive technical assistance. For many countries, PBF involves novel ways of fi nancing health services and of strengthening the health system. It introduces fi nancing of health services based on outputs, a method that is conditional on the quality of those ser-vices, instead of fi nancing based on inputs, and a method that most countries tended to use before PBF. In addition, PBF insists on considerable autonomy at the health facility level and involves cash management that frequently was absent prior to PBF. PBF strengthens the health system because it increases the quantity and quality of health services while boosting the transparency and accountability of the health system through institutionalizing civil soci-ety roles in the governance of PBF. All those shifts constitute major transi-tions, in which some technical assistance may be welcome.
Functions, for which external support may be needed, especially at the outset, include the following:
• Counterverifi cation• Coordination• Financing• Database development and maintenance• Capacity building of stakeholders• Participation in governance• Training (which is treated later in this chapter).
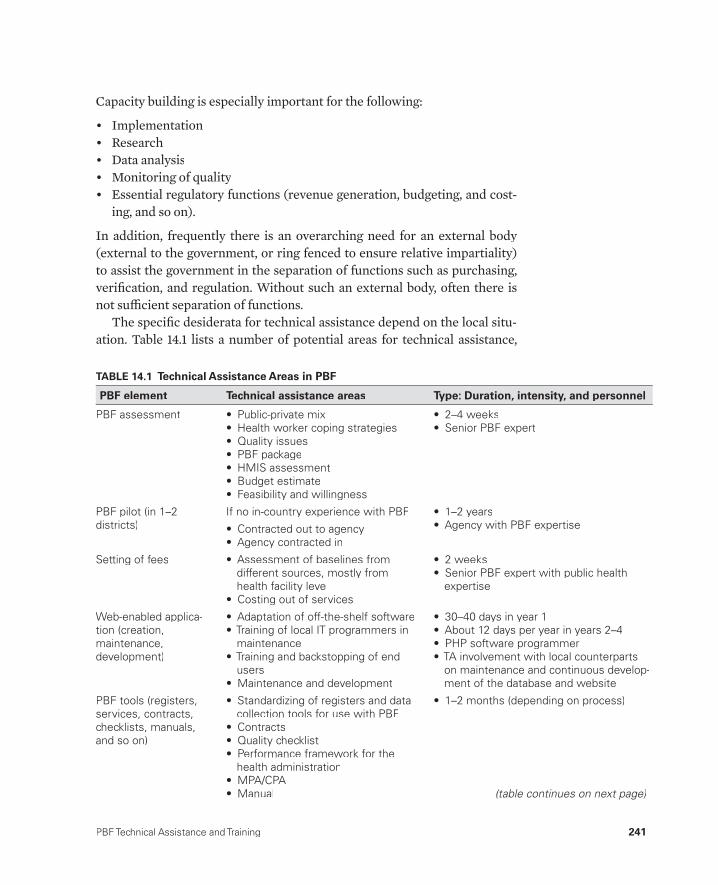
PBF Technical Assistance and Training 241
Capacity building is especially important for the following:
• Implementation• Research• Data analysis• Monitoring of quality• Essential regulatory functions (revenue generation, budgeting, and cost-
ing, and so on).
In addition, frequently there is an overarching need for an external body (external to the government, or ring fenced to ensure relative impartiality) to assist the government in the separation of functions such as purchasing, verifi cation, and regulation. Without such an external body, often there is not suffi cient separation of functions.
The specifi c desiderata for technical assistance depend on the local situ-ation. Table 14.1 lists a number of potential areas for technical assistance,
TABLE 14.1 Technical Assistance Areas in PBF
PBF element Technical assistance areas Type: Duration, intensity, and personnel
PBF assessment • Public-private mix• Health worker coping strategies• Quality issues• PBF package• HMIS assessment• Budget estimate• Feasibility and willingness
• 2–4 weeks• Senior PBF expert
PBF pilot (in 1–2districts)
If no in-country experience with PBF
• Contracted out to agency• Agency contracted in
• 1–2 years• Agency with PBF expertise
Setting of fees • Assessment of baselines from different sources, mostly fromhealth facility level
• Costing out of services
• 2 weeks• Senior PBF expert with public health
expertise
Web-enabled applica-tion (creation,maintenance,development)
• Adaptation of off-the-shelf software• Training of local IT programmers in
maintenance• Training and backstopping of end
users• Maintenance and development
• 30–40 days in year 1• About 12 days per year in years 2–4• PHP software programmer• TA involvement with local counterparts
on maintenance and continuous develop-ment of the database and website
PBF tools (registers,services, contracts,checklists, manuals, and so on)
• Standardizing of registers and data collection tools for use with PBF
• Contracts• Quality checklist• Performance framework for the
health administration• MPA/CPA• Manual
• 1–2 months (depending on process)
(table continues on next page)
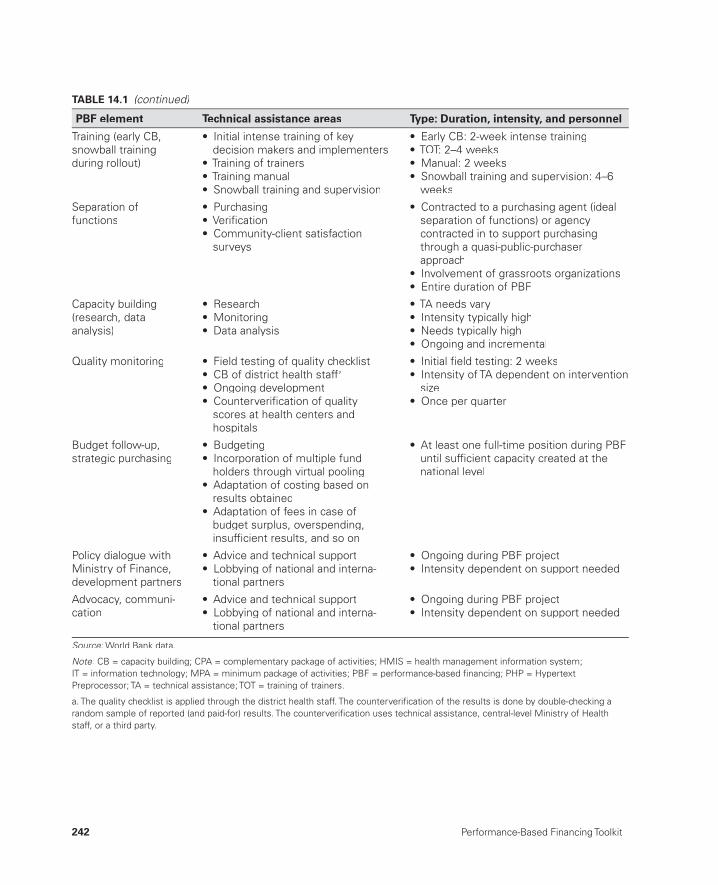
242 Performance-Based Financing Toolkit
Training (early CB,snowball trainingduring rollout)
• Initial intense training of keydecision makers and implementers
• Training of trainers• Training manual• Snowball training and supervision
• Early CB: 2-week intense training• TOT: 2–4 weeks• Manual: 2 weeks• Snowball training and supervision: 4–6
weeks
Separation offunctions
• Purchasing• Verifi cation• Community-client satisfaction
surveys
• Contracted to a purchasing agent (ideal separation of functions) or agencycontracted in to support purchasingthrough a quasi-public-purchaserapproach
• Involvement of grassroots organizations• Entire duration of PBF
Capacity building(research, data analysis)
• Research• Monitoring• Data analysis
• TA needs vary• Intensity typically high• Needs typically high• Ongoing and incremental
Quality monitoring • Field testing of quality checklist• CB of district health staffa
• Ongoing development• Counterverifi cation of quality
scores at health centers andhospitals
• Initial fi eld testing: 2 weeks• Intensity of TA dependent on intervention
size• Once per quarter
Budget follow-up, strategic purchasing
• Budgeting• Incorporation of multiple fund
holders through virtual pooling• Adaptation of costing based on
results obtained• Adaptation of fees in case of
budget surplus, overspending,insuffi cient results, and so on
• At least one full-time position during PBF until suffi cient capacity created at thenational level
Policy dialogue withMinistry of Finance,development partners
• Advice and technical support• Lobbying of national and interna-
tional partners
• Ongoing during PBF project• Intensity dependent on support needed
Advocacy, communi-cation
• Advice and technical support• Lobbying of national and interna-
tional partners
• Ongoing during PBF project• Intensity dependent on support needed
Source: World Bank data.:
Note: CB = capacity building; CPA = complementary package of activities; HMIS = health management information system;:IT = information technology; MPA = minimum package of activities; PBF = performance-based fi nancing; PHP = Hypertext Preprocessor; TA = technical assistance; TOT = training of trainers.
a. The quality checklist is applied through the district health staff. The counterverifi cation of the results is done by double-checking a random sample of reported (and paid-for) results. The counterverifi cation uses technical assistance, central-level Ministry of Healthstaff, or a third party.
TABLE 14.1 (continued)
PBF element Technical assistance areas Type: Duration, intensity, and personnel
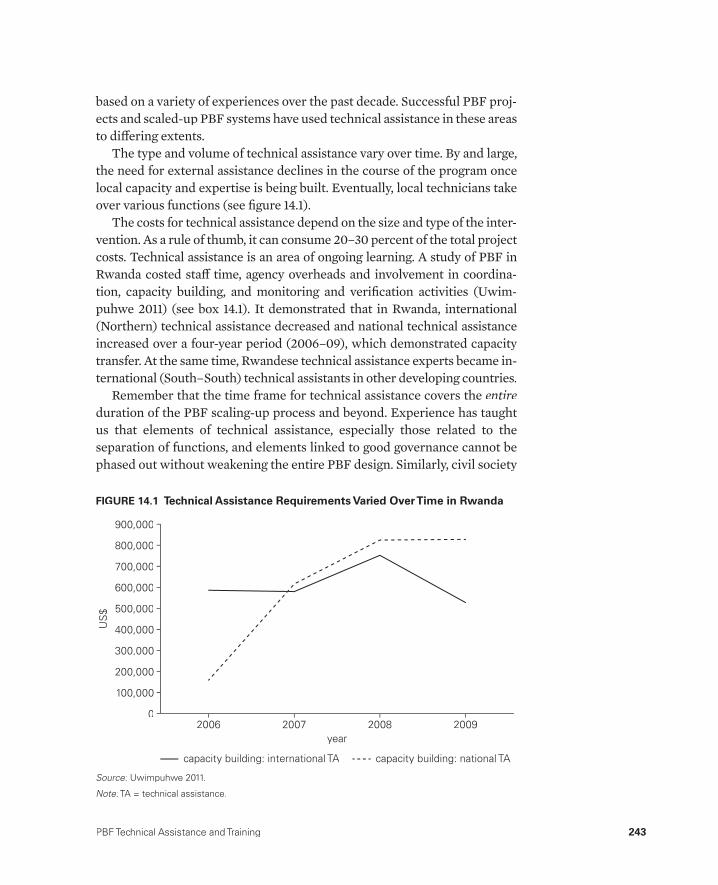
PBF Technical Assistance and Training 243
based on a variety of experiences over the past decade. Successful PBF proj-ects and scaled- up PBF systems have used technical assistance in these areas to diff ering extents.
The type and volume of technical assistance vary over time. By and large,the need for external assistance declines in the course of the program oncelocal capacity and expertise is being built. Eventually, local technicians take over various functions (see fi gure 14.1).
The costs for technical assistance depend on the size and type of the inter-vention. As a rule of thumb, it can consume 20– 30 percent of the total project costs. Technical assistance is an area of ongoing learning. A study of PBF in Rwanda costed staff time, agency overheads and involvement in coordina-tion, capacity building, and monitoring and verifi cation activities (Uwim-puhwe 2011) (see box 14.1). It demonstrated that in Rwanda, international (Northern) technical assistance decreased and national technical assistance increased over a four- year period (2006– 09), which demonstrated capacity transfer. At the same time, Rwandese technical assistance experts became in-ternational (South– South) technical assistants in other developing countries.
Remember that the time frame for technical assistance covers the entireduration of the PBF scaling- up process and beyond. Experience has taught us that elements of technical assistance, especially those related to the separation of functions, and elements linked to good governance cannot bephased out without weakening the entire PBF design. Similarly, civil society
US
$
2006 2007year
2008 2009
200,000
100,000
900,000
700,000
800,000
500,000
400,000
300,000
0
capacity building: international TA capacity building: national TA
600,000
FIGURE 14.1 Technical Assistance Requirements Varied Over Time in Rwanda
Source: Uwimpuhwe 2011.:
Note: TA = technical assistance.:
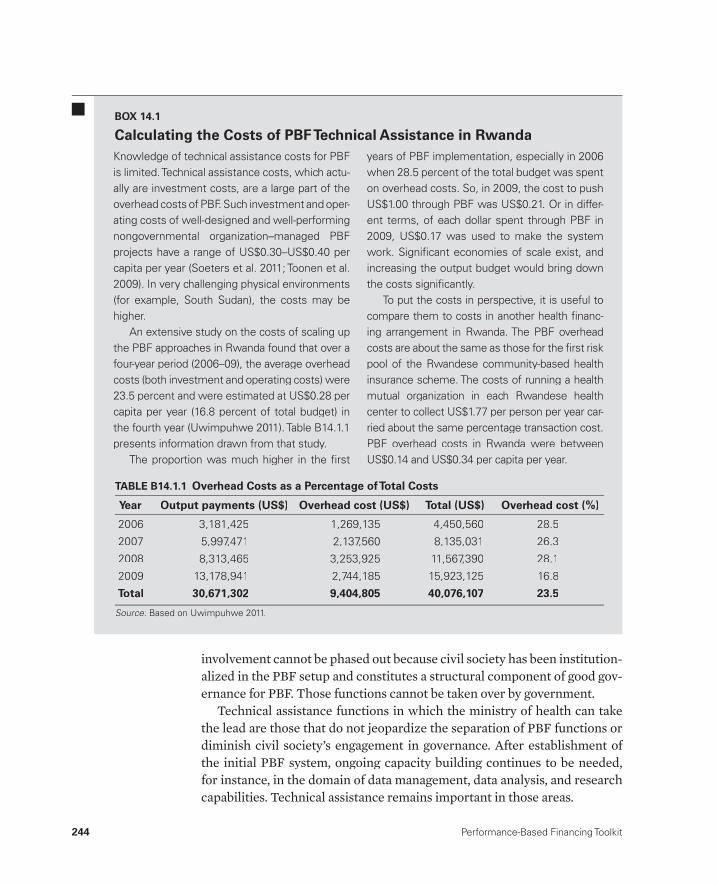
244 Performance-Based Financing Toolkit
involvement cannot be phased out because civil society has been institution-alized in the PBF setup and constitutes a structural component of good gov-ernance for PBF. Those functions cannot be taken over by government.
Technical assistance functions in which the ministry of health can take the lead are those that do not jeopardize the separation of PBF functions or diminish civil society’s engagement in governance. After establishment of the initial PBF system, ongoing capacity building continues to be needed, for instance, in the domain of data management, data analysis, and research capabilities. Technical assistance remains important in those areas.
Knowledge of technical assistance costs for PBF is limited. Technical assistance costs, which actu-ally are investment costs, are a large part of the overhead costs of PBF. Such investment and oper-ating costs of well- designed and well- performing nongovernmental organization– managed PBF projects have a range of US$0.30– US$0.40 per capita per year (Soeters et al. 2011; Toonen et al. 2009). In very challenging physical environments (for example, South Sudan), the costs may be higher.
An extensive study on the costs of scaling up the PBF approaches in Rwanda found that over a four- year period (2006– 09), the average overhead costs (both investment and operating costs) were 23.5 percent and were estimated at US$0.28 per capita per year (16.8 percent of total budget) in the fourth year (Uwimpuhwe 2011). Table B14.1.1 presents information drawn from that study.
The proportion was much higher in the fi rst
years of PBF implementation, especially in 2006 when 28.5 percent of the total budget was spent on overhead costs. So, in 2009, the cost to push US$1.00 through PBF was US$0.21. Or in differ-ent terms, of each dollar spent through PBF in 2009, US$0.17 was used to make the system work. Signifi cant economies of scale exist, and increasing the output budget would bring down the costs signifi cantly.
To put the costs in perspective, it is useful to compare them to costs in another health fi nanc-ing arrangement in Rwanda. The PBF overhead costs are about the same as those for the fi rst risk pool of the Rwandese community- based health insurance scheme. The costs of running a health mutual organization in each Rwandese health center to collect US$1.77 per person per year car-ried about the same percentage transaction cost. PBF overhead costs in Rwanda were between US$0.14 and US$0.34 per capita per year.
BOX 14.1
Calculating the Costs of PBF Technical Assistance in Rwanda
TABLE B14.1.1 Overhead Costs as a Percentage of Total Costs
Year Output payments (US$) Overhead cost (US$) Total (US$) Overhead cost (%)
2006 3,181,425 1,269,135 4,450,560 28.5
2007 5,997,471 2,137,560 8,135,031 26.3
2008 8,313,465 3,253,925 11,567,390 28.1
2009 13,178,941 2,744,185 15,923,125 16.8
Total 30,671,302 9,404,805 40,076,107 23.5
Source: Based on Uwimpuhwe 2011.:

PBF Technical Assistance and Training 245
14.3 The Extended Team Mechanism
Implementing and sustaining a PBF health reform program, especially dur-ing the scale- up, is arduous. We will analyze some implementation chal-lenges and focus on one key prerequisite for good implementation— good information and coordination.
We examine the case of the scale- up of PBF in Rwanda in 2006, analyzing how the coordination and communication were handled and how diff erent fund holders and technical agents were mobilized. This latter aspect of thescale- up seems crucial (see box 14.2). The Ministry of Health would not have been able to exercise its leadership nor eff ectively run the program had it not received the technical assistance to do so.
Hogwood and Gunn’s (1984) Perfect Implemen-tation Model lists 10 preconditions for the suc-cessful implementation of a top- down policy(Hogwood and Gunn 1984):
1. Circumstances external to the imple-menting agency do not impose cripplingconstraints.
2. Adequate time and suffi cient resources are made available to the program.
3. The required combination of resources is actually available.
4. The policy to be implemented is based on a valid theory of cause and effect.
5. The relationship between cause and ef-fect is direct, and there are few, if any, intervening links.
6. The dependency relationship is minimal.7. There is understanding of and agree-
ment on objectives.8. Tasks are fully specifi ed in correct
sequence.9. There is perfect communication and
coordination.10. Those in authority can demand and ob-
tain perfect compliance.
This Perfect Implementation Model can be used to assess a proposed policy in the likelihood that it gets implemented. It can also be used after the fact to assess what went wrong or what might explain any current situation. This model was used retrospectively to assess the Rwandese national scale- up of PBF in 2006– 09. A very mixed picture emerged of conditions that predicted failure and conditions that predicted success.
The positive factors were in the majority, and three of the fi ve negative factors were bal-anced by some positive features. It was remark-able that (a) resources were abundant, includ-ing the proper mix of resources (resources for output payments and resources for technical assistance), and (b) tasks were fully specifi ed in correct sequence— perfect communication and coordination existed, and those in authority could demand and obtain perfect compliance. Although there were weak points, hallmarks of successful implementation were (a) available re-sources, including the proper mix of resources; (b) strong leadership from the Ministry of Health, especially from the second half of 2007 onward; and (c) good communication and coordination.
BOX 14.2
The Predictors of Success in the Rwandese PBF
246 Performance-Based Financing Toolkit
Rwandese Case: Two Consecutive Teams— Technical WorkingGroup Followed by Extended Team Mechanism
In Rwanda, two types of formal groups and meeting grounds were steer-ing the development of the PBF system. The fi rst was the technical work-ing group, and the second, introduced in April 2007, was the extended team mechanism.
• Technical working group meetings were national- level meetings on pol-icy and strategy. They constituted a forum for the Rwandese Ministry of Health (MoH) in which technical assistants and heads of agencies could discuss broad details of the PBF approach. The meetings involved ap-proving tools, manuals, and so on. The group was presided over by the PBF coordinator of the MoH and received secretarial support through a technical agency
• Extended team meetings were national- level meetings that assembled technicians and built an implementation- oriented coordination mecha-nism. The meetings involved technical assistants from three MoH de-partments and eight development partners who were mostly working in a number of specifi c districts. The meetings were chaired by an MoH technician with secretarial support through a technical agency.
In the fi rst phase— design— 18 intensive, well- documented technical work-ing group meetings were held between February and August 2006. Then, the working group met six more times up to April 2007. After April, the work-ing group meetings stopped. The extended team meetings began in April 2007, amounting to 23 sessions until July 2009. In short, an implementation- oriented coordination team took over from the technical working group.
The Extended Team Mechanism as aSystem- Strengthening Instrument
The Rwandese extended team was meant to coordinate the provision of technical assistance to the decentralized district PBF steering committees. It was also intended to bridge the gap between policy and implementation. Staff members from three MoH departments and eight development agen-cies were assembled, totaling more than 40 technical assistants. Meetings were scheduled from 9 a.m. to 1 p.m. on the last Thursday of the month, and the agenda was carefully prepared. Minutes were distributed quickly and, af-ter approval, were posted on the documentation section of the PBF website.
The extended team became the focus of most capacity building activities. The team was targeted to grow into master trainers in PBF and in advanced
PBF Technical Assistance and Training 247
trainers in data analysis. All of those eff orts were supported by team- building activities.
What were the main strategies used to build this extended team that turned it into such an eff ective system- strengthening tool? Four important features of this process are as follows:
• Mapping stakeholders to assess who is interested• Mobilizing support from the government and key development partners• Using a bottom- up approach to obtain buy- in• Setting agendas, documenting meetings, and running the program.
Mapping Stakeholders to Assess Who Is InterestedThe extended team mapped stakeholders for their experience with PBF andtheir areas of interest. The team listed organizations that were already pay-ing for performance (MoH, Management Sciences for Health [MSH], andthe Belgian Development Agency) and agencies that had been managing the PBF pilot programs but had stopped paying for performance (International aid agencies Cordaid and Health Net International– Transcultural Psychoso-cial Organization [HNI- TPO]). The names of technical staff members from those agencies were noted. Because MSH purchased human immunodefi -ciency virus (HIV) preventive and curative services performance from about 100 health facilities that were supported by fi ve U.S. government collaborat-ing agencies, those agencies were also mapped. The MoH contacted the U.S. government collaborating agencies to nominate technical staff members to become their PBF technicians.
Mobilizing Support from the Government and Key Development PartnersThe extended team contacted the United States Agency for InternationalDevelopment (USAID) and informed the agency of the purpose of coordi-nation. The Belgian embassy in Rwanda was also mobilized to participate. USAID convened a meeting between the MoH and the U.S. government col-laborating agencies. The USAID health offi cer requested that the heads of the collaborating agencies provide PBF support to the MoH. One strategy to boost involvement of the collaborating agencies consisted of parceling out 100 purchase contracts among the fi ve agencies, thereby eff ectively ty-ing them into the system. The collaborating agencies would have to take the national system seriously. This acceptance was to their own interest: they would otherwise not be able to endorse the veracity of the HIV performancedata that they had paid for so far. In fact, the HIV/AIDS (acquired immune defi ciency syndrome) treatment and care agencies were urged to take an
248 Performance-Based Financing Toolkit
interest in the general health services, because the general quality measures were aff ecting the HIV payments. Any disturbances in the non- HIV services would undermine the credibility of the HIV measures, too. All of those ser-vices were measured through the same mechanism— the same local admin-istration verifi er and the same hospital supervisory team.
With this procedure, the U.S. government– funded HIV/AIDS technical agencies had been eff ectively co- opted into taking an integral interest in the entire health system.
Using a Bottom- Up Approach to Obtain Buy- InA bottom- up approach was used to determine the actual scope of work of the new coordination mechanism. The idea was to create a horizontal coordina-tion mechanism in which stakeholder participation would arise more from a sense of common purpose and common objectives and less from a sense of command and control.
The fi rst two meetings of the extended team were a few days apart. In the initial meeting, the participants separated into small groups to draft a list of tasks that (a) the extended team ought to perform (its scope of work) and (b) the individual members of the team, the so- called district PBF focal points, would have to carry out. The small groups presented their work in a plenary session, and common elements were compiled. This eff ort led to a fi rst draft of the scope of work of the extended team and a draft terms of reference for the PBF focal points. In the second meeting, the documents were submitted, discussed, amended, fi nalized, and adopted. District PBF focal points were mapped to specifi c districts, mostly coinciding with the geographical interest area of each technician’s organization. Technicians who were full- time PBF specialists were given multiple districts to support; other technicians were assigned to one district only. The extended team was created.
In the links to fi les of this chapter, fi nd the agenda for the fi rst extended team meeting, the terms of reference for the extended team, and the terms of reference for the district PBF focal point.
Setting Agendas, Documenting Meetings, and Running the ProgramCareful agenda setting, accurate minutes keeping, and fast dissemination of documentation were the hallmarks of both the technical working group and the extended team meetings. For the remainder of their activities, their modus operandi was diff erent. Members of the extended team were troubleshooting in dysfunctional district PBF steering committees. They were called in to deal with accountability mechanisms for the district hos-pital peer- evaluation mechanisms. They helped to address counterverifi ca-tion mechanisms for the quality measures in the health centers and led the
PBF Technical Assistance and Training 249
review of the various PBF tools in the last quarter of each year. The team members also worked extensively as trainers for PBF.
Representatives of the MoH chaired both groups. The extended team meetings allowed for easy operation of the PBF system by the MoH.
The Rwandese case is a good example of what may be required to opti-mize technical assistance in a given situation.
14.4 Capacity Building, Training,and Working South– South
PBF always emphasizes using local technicians and researchers. Ultimately, local experts are best positioned to help transform their health systems and carry those systems through the many necessary transitions. PBF systems are new and need evidence- based adaptations to local circumstances. Local ex-perts can easily become the champions who will help manage and change the system with messages of couleur locale (local color) rather than with messagesfrom abroad. Local experts possess fi ne- tuned knowledge of how to commu-nicate most eff ectively the various transformations required. In short, techni-cal assistance from as close to a local setting as possible is preferred for PBF. There is a rapidly growing number of southern technicians who are closer to the many local realities and closer to the local know-how at the health facility level. Training such key technicians should be taken on from the beginning.
Training of Trainers
When starting PBF, disseminate and make understood the new rules to all frontline health workers in all health centers and hospitals, the district ad-ministrative and health staff , and the political leaders in the country. Scaling up PBF through an entire country demands a well- planned, thorough train-ing strategy. This section and the next recommend how to do so.
A key component of the scaling- up strategy of PBF is the development of a pool of persons capable of the following:
• Transferring PBF knowledge and skills to others through technical as-sistance, training, supervision, and coaching
• Supporting the various partners who are assisting the health sector in thecountry as it transforms fi nancing into PBF.
The basic idea is to train trainers who will subsequently (a) execute the train-ing of the health center management and the district health staff , (b) remainthe resource persons for the staff during the start- up and the implementation

phases, and (c) become the de facto PBF specialists for the country. Data use, analysis and interpretation, dissemination of good practices, and a diff erent and more eff ective way of working will come to the fore after PBF is intro-duced. Permanent education is needed for ongoing capacity building to do PBF better.
The national- level trainers and technical assistants will assist the MoH in building PBF capacity through technical assistance, training, management, and evaluation skills at the central, district, health facility, and community levels. The trainers and assistants will demonstrate a high level of knowledge about PBF tools and how and when to use them. They will also understand the roles of the various PBF actors and the process of data management.
The extended team is the natural source for such training of trainers. Avail-able human resources for PBF have been identifi ed in various organizations. Focus on their capacity development. Often, a substantial number of the na-tion’s high- capacity individuals have been contracted by bilateral agencies that fund vertical programs. For example, the group of HIV/AIDS imple-menters in Sub- Saharan Africa and similar agencies form a natural pool from which to select staff members for capacity building. We assume that you have already identifi ed these agencies and invited them to join your extended team.
Finding a Master Trainer
PBF is a paradigm shift. For trainers to really grasp the depth of PBF pro-gramming, to learn from each other, and to become enthusiastic proponents, they need to be guided through a learning process.
A very good master trainer is needed to do this teaching. Such processes take about two weeks of full- time engagement of the trainers, about one week of preparatory work before the training of trainers, and one to two weeks after training to compile the training manual. This process of about fi ve weeks also requires time to supervise the actual trainings. The master trainer, who is unlikely to know much about PBF, will need very close and full- time technical support by the senior PBF specialist.
Training Development Process
This particular capacity- building strategy aims to develop a cadre of train-ers at all levels with a solid understanding of PBF principles, tools, and pro-cesses. In some cases, trainees show the interest and aptitude to become master trainers themselves, and they should receive additional coaching that will enable them to develop or adapt training curricula to meet the needs of a particular level of the health system. The PBF training of trainer programs
250 Performance-Based Financing Toolkit
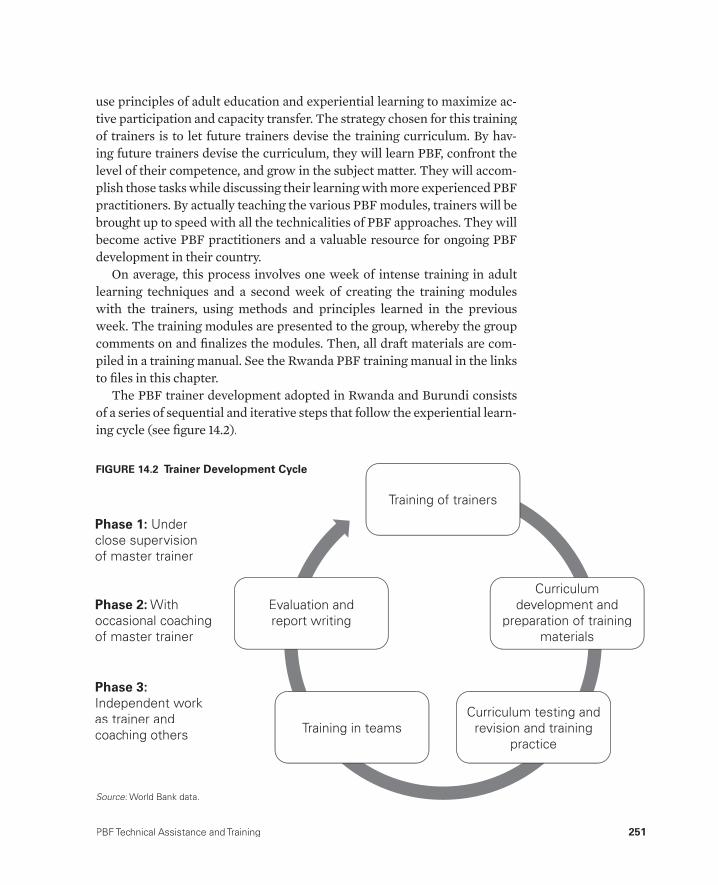
PBF Technical Assistance and Training 251
use principles of adult education and experiential learning to maximize ac-tive participation and capacity transfer. The strategy chosen for this training of trainers is to let future trainers devise the training curriculum. By hav-ing future trainers devise the curriculum, they will learn PBF, confront the level of their competence, and grow in the subject matter. They will accom-plish those tasks while discussing their learning with more experienced PBF practitioners. By actually teaching the various PBF modules, trainers will be brought up to speed with all the technicalities of PBF approaches. They will become active PBF practitioners and a valuable resource for ongoing PBF development in their country.
On average, this process involves one week of intense training in adult learning techniques and a second week of creating the training modules with the trainers, using methods and principles learned in the previous week. The training modules are presented to the group, whereby the group comments on and fi nalizes the modules. Then, all draft materials are com-piled in a training manual. See the Rwanda PBF training manual in the links to fi les in this chapter.
The PBF trainer development adopted in Rwanda and Burundi consistsof a series of sequential and iterative steps that follow the experiential learn-ing cycle (see fi gure 14.2).
Phase 1: Under close supervision of master trainer
Phase 2: With occasional coaching of master trainer
Phase 3:Independent work as trainer and coaching others
Curriculum development and
preparation of training materials
Curriculum testing and revision and training
practiceTraining in teams
Evaluation and report writing
Training of trainers
FIGURE 14.2 Trainer Development Cycle
Source: World Bank data.:

252 Performance-Based Financing Toolkit
At the national level, the steps are as follows:
1. Selection of target group (at national level by identifi cation of nationaltrainers)
2. Mid- level training of trainers (TOT), including a module on how to de-velop training curricula
3. Curriculum development and training design in PBF for identifi ed tar-get groups at diff erent levels by trainers having completed the TOT withcoaching by the master trainer
4. Co- training practice with the master trainer to test curriculum and practice training skills with daily self- assessment and feedback
5. Curriculum redesign and modifi cation based on testing6. Co- training of target groups in teams of three to four national- level PBF
trainers with coaching by the master trainer to practice training skills with daily self- assessments and feedback
7. Co- training in teams of two to three national- level PBF trainers inde-pendent of the master trainer (repeated several times to scale up PBFand reinforce learning)
8. Identifi cation of national team members who have achieved the level of master trainer.
At the provincial and district levels, the steps are as follows:
1. Selection of target group (sector and health center level)2. Preparation of the training3. Co- training in teams of three to four people with coaching from master
trainers (repeated several times to scale up PBF and reinforce learning).
Terms of Reference for Master Trainer
Sample terms of reference for a master trainer can be found in the links to fi les in this chapter.
Example of Training ManualsTwo examples of training manuals can be found in the links to fi les in this chapter. Although the manuals are in French, the layout and content will be more or less understandable. The manuals have been created in such a fashion that the individual sessions can be extracted from the Adobe fi le and used as stand- alone modules.
Start planning for the actual trainings well in advance. Printing the PBF user manuals and fi nalizing and printing the PBF training manuals might take quite some time. In low- and middle- income countries, delays in
PBF Technical Assistance and Training 253
preparing the training materials need to be factored in to the process: they are bottlenecks.
Training for Rollout
How do you plan and execute training for all health staff in an entire coun-try? From our experience, it is very challenging work. But it is doable. And itis extremely rewarding if you are successful. This training is hands- on: get involved.
The basic strategy is incremental training: begin small, and build upward. You will have already identifi ed and trained your trainers. You will have fi -nalized your PBF manual. You will have done your training of trainers. Andyou will have fi nalized your PBF training manual.
Typically, you will have two types of target groups for trainings: (a) the health center management (the health center in- charge person and the pres-ident of the health center management committee) and (b) the district PBFsteering committee members, the quantity verifi ers, and the quality verifi ers.
• Health center management. Four days of training is typical. About 30– 40participants (less is better) and 2– 3 PBF trainers per training session are needed. The idea is for the health center management to explain the PBFsystem to their health center staff . The training ends with a ceremony in which the purchase contracts are signed. This approach nicely formalizes the end of training and the start of the new PBF system. The PBF trainersshould be those who are mapped to that particular district and who will provide hands- on support during the implementation of PBF.
• District PBF steering committee. Three to four days of training is typical.About 30– 40 participants (less is better) and 2– 3 PBF trainers per train-ing session are needed. The training ends with the signing of the multilat-eral contract and, hence, formalizes the district PBF steering committee. The multilateral contract is signed by the head of the district administra-tion (commissioner or mayor) and by various parties, including the dis-trict health director and civil society.
Planning for Further Training
The planning for the larger- scale training is done during the closing days of the TOT. Plans are drawn up, allocating various districts to various agencies and technical assistants. Here, the importance of the extended team arises; the various agencies in this team have a combined operational capacity that far surpasses the capacity of any of them individually.

254 Performance-Based Financing Toolkit
Planning and executing one high- quality, decentralized four- day training for 40 fi eld staff members is not easy. Now, imagine organizing such training for 500 health centers and 40 district hospitals and their management com-mittees: that eff ort involves training 1,000 people in all parts of the country in groups of 30– 40. At the least, you will have to organize 25– 30 four- day trainings throughout the country. In addition, those trainings will have to be done within a reasonable time because the PBF system must start func-tioning by a set date. Assuming that you have 30 districts in a given country, then you will have to organize a further 20– 30 trainings for the district PBF steering committees.
Your task is to organize 50– 60 high- quality, three- to four- day trainings for a total of about 1,500– 2,000 people within about eight weeks. This objective
Terms of reference and other documents for a PBF technical expert (fi eld work) can be accessed through this web link: http://www.worldbank.org/health/pbftoolkit/chapter14.
• Terms of reference for a PBF technical expert (national- level work)
• Examples of terms of reference for a PBF technical assistance agency– Burundi– Cameroon– Lesotho– Nigeria– Zimbabwe.
• Agenda for the fi rst Rwandese extended team meeting
• Terms of reference for the Rwandese extended team
• Terms of reference for the district PBF focal point
• Minutes of the Rwandese extended team meetings (2007– 09)
• Rwanda PBF training manual for health centers and hospitals
• Rwanda PBF training manual for community PBF
• Schedule of the Rwandese 2008 health center and district hospital trainings (nationwide scaling- up)
• Schedule of the Rwandese 2009 Community PBF trainings here (na-tionwide scaling- up)
• Schedule of the Burundi 2009/2010 PBF trainings (nationwide scaling- up)
• Terms of reference for a master trainer.
14.5 Links to Files and Tools
PBF Technical Assistance and Training 255
would be diffi cult enough if it were just a fi nancial issue— an estimated US$6,000 per training that totals US$300,000– US$360,000 is needed. But that is not the full story. It is physically impossible for one agency to organize all the trainings and to carry out simultaneous training sessions in all parts of the country. Therefore, you need to request heads of agencies to chip in,not so much for funding (although requesting them to fund this would be a demonstration of their commitment) as for expertise in organization and logistics. They need to help with informing districts and the health facilities; organizing the training sites; and handling all the detailed work of logistics, accommodations, and so on.
We have applied this methodology successfully in the trainings for scal-ing up PBF in two countries. Trained during the scale- up in the fi rst coun-try, two very competent trainers became the master trainers in the secondcountry. The latter is an excellent example of South– South capacity transfer.
References
Hogwood, B., and L. Gunn, eds. 1984. Policy Analysis for the Real World. Oxford: Oxford University Press.
Soeters, R., P. B. Peerenboom, P. Mushagalusa, and C. Kimanuka. 2011. “Performance- Based Financing Experiment Improved Health Care in the Demo-cratic Republic of Congo.” Health Aff airs 30 (8): 1518– 27.
Toonen, J., A. Cananvan, P. Vergeer, and R. Elovainio. 2009. Performance- Based Fi-nancing for Health: Lessons from Sub- Saharan Africa. Amsterdam: Royal TropicalInstitute (KIT).
Uwimpuhwe, S. 2011. “Cost Analysis of the Performance- Based Financing Scheme in Rwanda.” School of Public Health, National University of Rwanda, Kigali.


257
Designing and Updating a PBF Manual
CHAPTER 15
MAIN MESSAGES
➜ A PBF project needs a concise manual, written in plain language.➜ The PBF manual is primarily meant for frontline health workers and their
managers.➜ Tools and checklists described in the manual need to be tested and up-
dated regularly.
COVERED IN THIS CHAPTER
15.1 Introduction15.2 Contents of a PBF manual15.3 Regular revision of the tools15.4 Links to fi les and tools
258 Performance-Based Financing Toolkit
15.1 Introduction
A performance- based fi nancing (PBF) project needs a manual. At a mini-mum, the manual should contain the following:
• Description of the institutional arrangements, such as the separation of functions
• Roles of the diff erent actors• Monitoring and verifi cation mechanisms• List of PBF services• Contracts• Checklists.
The manual should be written in plain language because it is meant for frontline health workers and their managers. Creating ownership by devel-oping the manual in close collaboration with the PBF counterparts is very important. Regular revision of the manual is advisable; once per year is recommended.
15.2 Contents of a PBF Manual
A PBF project needs a well- organized and concisely written manual, because PBF is a new and diff erent way of doing business. The various rules need to be spelled out clearly to avoid any ambiguities. Especially when practices diverge from current procedures, it is important to introduce these changes very clearly. One can demonstrate, for instance, how health services will be documented and in which registers, how money will be managed, and how performance of individual health workers will be assessed and rewarded.
In practice, the three most important changes from usual procedures to which implementers refer are (a) the level of detail and accuracy related to routine data recording; (b) the fact that services are paid for and, hence, staff members are evaluated and paid on the basis of their performance; and (c) the high level of quality required, which is measured regularly. Most of the new rules pertain to aspects of these changes and are described in detail in the various contracts that come with PBF.
A PBF manual has certain standard features. It contains a description of the PBF approach and its main principles. For instance, the manual de-scribes the separation of functions as a governance requirement and illus-trates what this means for the roles and responsibilities of all PBF actors. It describes the monitoring and verifi cation mechanisms and the possible sanctions related to fraud. It details the PBF services, the unit fees, and the
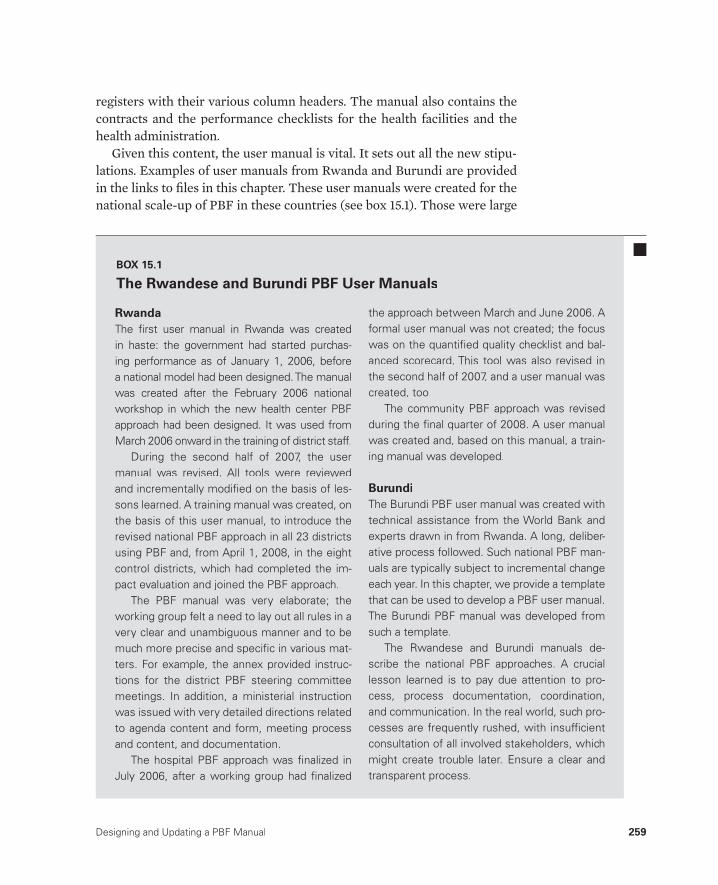
Designing and Updating a PBF Manual 259
registers with their various column headers. The manual also contains the contracts and the performance checklists for the health facilities and the health administration.
Given this content, the user manual is vital. It sets out all the new stipu-lations. Examples of user manuals from Rwanda and Burundi are provided in the links to fi les in this chapter. These user manuals were created for the national scale- up of PBF in these countries (see box 15.1). Those were large
RwandaThe fi rst user manual in Rwanda was created in haste: the government had started purchas-ing performance as of January 1, 2006, before a national model had been designed. The manual was created after the February 2006 national workshop in which the new health center PBF approach had been designed. It was used from March 2006 onward in the training of district staff.
During the second half of 2007, the usermanual was revised. All tools were reviewedand incrementally modifi ed on the basis of les-sons learned. A training manual was created, onthe basis of this user manual, to introduce therevised national PBF approach in all 23 districts using PBF and, from April 1, 2008, in the eight control districts, which had completed the im-pact evaluation and joined the PBF approach.
The PBF manual was very elaborate; the working group felt a need to lay out all rules in a very clear and unambiguous manner and to be much more precise and specifi c in various mat-ters. For example, the annex provided instruc-tions for the district PBF steering committee meetings. In addition, a ministerial instruction was issued with very detailed directions related to agenda content and form, meeting process and content, and documentation.
The hospital PBF approach was fi nalized in July 2006, after a working group had fi nalized
the approach between March and June 2006. Aformal user manual was not created; the focus was on the quantifi ed quality checklist and bal-anced scorecard. This tool was also revised inthe second half of 2007, and a user manual was created, too.
The community PBF approach was revised during the fi nal quarter of 2008. A user manual was created and, based on this manual, a train-ing manual was developed.
BurundiThe Burundi PBF user manual was created with technical assistance from the World Bank and experts drawn in from Rwanda. A long, deliber-ative process followed. Such national PBF man-uals are typically subject to incremental changeeach year. In this chapter, we provide a template that can be used to develop a PBF user manual.The Burundi PBF manual was developed from such a template.
The Rwandese and Burundi manuals de-scribe the national PBF approaches. A cruciallesson learned is to pay due attention to pro-cess, process documentation, coordination,and communication. In the real world, such pro-cesses are frequently rushed, with insuffi cient consultation of all involved stakeholders, whichmight create trouble later. Ensure a clear andtransparent process.
BOX 15.1
The Rwandese and Burundi PBF User Manuals
260 Performance-Based Financing Toolkit
operations. But even for a pilot project, standard practice is to develop a user manual.
A PBF user manual contains the collection of all tools used in the PBF scheme. The following is an example of a table of contents:
• Introduction• Background of and rationale for PBF• Description of the institutional setup (separation of functions; roles and
responsibilities)• Listing and description of the PBF indicators and their data collection
tools (listing of registers in annex)• Description of the quantifi ed quality checklist (tool in annex)• Description of the verifi cation process• Description of the counterverifi cation process• Description of the contractual relationships (contracts in annex)• Description of the business plan• Description of the indice tool• Description of the community client satisfaction surveys• Description of the coordination mechanisms• Description of the role of technical assistance and civil society• Description of the web- enabled database• Annexes: all contracts, checks lists, column headers of the registers used,
and so on• Date of the manual.
The links to fi les in this chapter provide a template, which can be adapted to context. The template is not complete, but it contains some sections that are illustrative and meant to provide a head start. For instance, fi ve contracts are in this template. They demonstrate how contracts permeate the entire health system and include the public health administration at various levels.
Keep the manual as short and concise as possible. If the document is too long, too diffi cult to understand, or too bureaucratic, then health workers and their managers might be confused or intimidated, which would defeat the purpose.
15.3 Regular Revision of the Tools
Creating ownership through close collaboration with counterparts is im-portant. The many tools and instruments need careful discussion and ad-aptation to the local context. Avoid taking a manual from another context and merely copying and pasting the contents. Essential tools such as PBF
Designing and Updating a PBF Manual 261
registers and patient fi les may diff er signifi cantly between contexts, and more important, the quality checklists may need fi ne- tuning to local norms, local realities, and local infrastructure. For example, the Rwandese health center quality checklist could not be transferred to the Zambian context but had to be adapted thoroughly to serve any purpose in Zambia because,among other diff erences, Zambian health centers were much smaller andhad a much smaller staff .
If starting a pilot in a country that lacks experience with PBF projects, be proactive. Propose to test a certain approach, using a particular manual,with the explicit understanding that the manual will most likely be revised in a year or so. Certain elements of the manual, such as the quality checklist, may need fi eld testing and adaptation. Create suffi cient room to make these revisions.
In any new context, the various tools will need to be tested:
• Quantity verifi cation procedures. Note the time taken because you willneed to train staff to follow these procedures; you need to ensure thatregisters and column headers are standardized, to assist in thinking through the best schedules for the entity that has been tasked with thisactivity, and so on. You, as a health planner, would typically be involved in this stage.
• Quantifi ed quality checklist. The checklist must be tested. Note the timetaken because you will need to train staff to follow these procedures; you need to assist in thinking through the best schedules for the entity that has been tasked with this activity, which includes an important ele-ment of monitoring the intraobserver and interobserver reliability, and so on. There are diff erences between the health centers and the hospitals
The following fi les can be accessed through this web link: http://www.worldbank.org/health/pbftoolkit/chapter15
• Rwandese health center PBF user manual (2008)
• Rwandese District Hospital PBF user manual (2009)
• Rwandese community health worker PBF user manual (2009)
• Burundi PBF user manual (2010)
• Nigerian PBF user manual (2011)
• Generic template for a PBF user manual.
15.4 Links to Files and Tools
262 Performance-Based Financing Toolkit
that infl uence decisions. Here too, you, as the health planner, would be involved.
Regular revision of the manual is wise. Stakeholders must have the chance to review to what extent the system works and to adapt the approach where needed. It is essential to regularly update the quality checklist to incorpo-rate lessons learned and to introduce new criteria with new developments. Manual revisions are best done once per year. Stay dynamic in improving the quality of the system.

263
Pilot Testing PBF
CHAPTER 16
MAIN MESSAGES
➜ Carry out a small- scale pilot before attempting PBF at scale in a country without PBF experience.
➜ A small- scale pilot is less threatening to decision makers and creates local capacity to implement PBF.
➜ Adapt the approach to the local context.
COVERED IN THIS CHAPTER
16.1 Introduction16.2 Why do a PBF pilot?16.3 How to start a PBF pilot: Gather information and assess the context16.4 How to start a PBF pilot: Adapt the approach to the local context16.5 Pilots: Stakeholder information, knowledge sharing, and training16.6 Checklist for implementers16.7 Links to fi les and tools

264 Performance-Based Financing Toolkit
16.1 Introduction
Before attempting performance- based fi nancing (PBF) on a larger scale in a country without PBF experience, carry out a small- scale pilot. A pilot is less threatening to decision makers and creates local capacity to imple-ment PBF. Before conducting a PBF pilot, inform stakeholders about the ap-proach and assess the context. It is important to adapt the approach— that is, budget, services, checklists, technical assistance, and general institutional arrangements— to the local setting. A well- designed and well- implemented PBF pilot will generate interest among decision makers because it will be seen as a homegrown program.
A checklist for implementers is provided at the end of this chapter. It lists in chronological order the steps to be completed when starting a PBF pilot.
16.2 Why Do a PBF Pilot?
A pilot1 is desirable because PBF involves some profound health- systemchanges. Considerable resistance to such large transformations can occur, especially if the country has no experience with the substance of PBF or the way to implement it. A country that lacks experience with PBF means that it lacks local experts who can design and scale up the approach, advocate for PBF, or explain the benefi ts of the reform. Starting PBF in a small area has many advantages. Necessary changes can be introduced while building local experience and know- how. Starting small makes a lot of sense.
The following changes tend to be the most visible or contentious in intro-ducing PBF:
• The change toward autonomy and cash management in health facilities• The change toward health facilities purchasing inputs directly (as op-
posed to receiving inputs from the central level)• The separation of functions• The involvement of civil society in governance• The dominant focus on results and the increased need to analyze the
results.
Some changes generate more friction than others. Over the past decade, the separation of functions has caused the most resistance. In addition, some contexts do not allow health workers to benefi t from PBF income while other contexts have stirred debates about cash management by health facilities.
Resistance to change occurs predominantly at the central level. The de-centralized levels of health systems— the health facility staff members, their
Pilot Testing PBF 265
managers, and the district- level health offi cers— in general appreciate the changes that PBF proposes. However, for a system that is habitually planned, fi nanced, and managed from above through central- input fi nancing, PBF transformations such as increasing health facility autonomy may be per-ceived as a loss of control over resources by central planners. Hence, their resistance to such change can be fi erce.
A pilot off ers the opportunity to experiment with the larger changes with-out jeopardizing the whole system. You can propose that decision makers try the desired changes in only a tiny part of the health system, an approach that is less threatening. Hiring an external agency or consultants as implement-ers automatically introduces a separation of functions, if the consultants or the agency will be put in charge of the contracting, verifi cation, and counter-verifi cation. Visiting successful demonstration sites with decision makers is a very practical way to see PBF in action.
If PBF pilots are well designed and well implemented, tangible improve-ments in both quality and volume of care plus mounting staff enthusiasm can often be shown in a very short period of time. Dramatic improvements, es-pecially in situations with lower baselines for quality and volume of services, can help to convince decision makers to attempt to scale up PBF.
16.3 How to Start a PBF Pilot: Gather Information and Assess the Context
Starting a PBF pilot requires in- depth understanding of the health system, its performance, the existing incentives, the constraints, and the opportu-nities. Here, we assume a context in which there is little or no experience with PBF.
First, assess the context before designing the PBF program. Each context is unique. Simply copying and pasting a PBF approach from one country toanother is asking for trouble. In addition to assessing the context, do the following:
• Gather intelligence.• Assess demand- and supply- side constraints to service delivery.• Identify PBF champions and windows of opportunity.• Assess the degrees of autonomy of health facilities.• Assess the existing degree of management of user fees.• Assess the market for drugs.• Assess the human resources for health.• Consider the wider health reforms necessary for PBF to work better, and
inform the stakeholders (see section 16.5 of this chapter).
266 Performance-Based Financing Toolkit
Gather Intelligence
Collect and analyze specifi c information related to the specifi c context of the pilot. Often, such information is dispersed and of poor quality. Therefore, do fi eld work and carry out targeted studies to obtain the relevant PBF in-formation. The importance of gathering this information is threefold. First, essential health intelligence is needed to make the case for PBF, which will include a comparison of these data with international benchmarks, country- specifi c Millennium Development Goals, and peer countries. Second, base-lines for fi nancial risk forecasting are needed. And third, become familiar with the country’s experience with other results- based fi nancing programs (for example, voucher schemes and conditional in- cash or in- kind transfer programs) or existing PBF schemes.
For a PBF assessment, gather more detailed information on the following:
• The level of autonomy of health facilities— whether they have bank ac-counts; how they manage their cash fl ows, if any; and whether they have decision rights related to their income (from clients’ out- of- pocket pay-ments, drug sales, and so on)
• The cash income and expenditure of the health centers and fi rst- level re-ferral hospitals
• Whether clients are charged for services (formally or informally) and whether free health services exist for certain groups (for example, preg-nant women and children under fi ve years of age)
• The staffi ng patterns of health facilities, including the staff members’ take- home salaries
• The way the health workers are paid and employed (through a basic sal-ary with allowances, through employment by the health facility with a possible bonus system, and so on)
• The way the health facility is fi nanced (salaries and inputs, output fi nanc-ing, out- of- pocket payments by clients, or a mix of these)
• The type of salaries health workers would need to earn to make a dif-ference in their socioeconomic status, which would be important for a health facility in- charge person in order to attract qualifi ed staff
• The organization of the drug supply (a Bamako- type revolving drug fund, central medical stores, and so on), and the way it functions in practice
• The additional fi nancial resources that would be necessary, in addition to the budget implied by the assessment of the earnings gap, to make a diff er-ence in the health facility’s capacity to deliver good quality health services.
Most of the above information can be obtained through interviews with key informants (ministry of health technicians, donor technical agency staff members, multilateral agency technical staff members, district- level health
Pilot Testing PBF 267
managers, and health facility staff members). A stakeholder analysis can be useful to explore a complex health system in which many actors havediverging opinions on a proposal such as introducing PBF. It is crucial to visit health facilities— both health centers and fi rst- level referral hospitals— and study the district- level administrative arrangements that are related toplanning, supervision, capacity building, and potential roles in the supply of drugs and vaccines. In some instances, in Rwanda for example, the dis-trict administration is responsible for those functions, while the Ministry of Health manages the district hospitals. In Burundi, the Ministry of Health is nominally in charge of both public health and hospital services.2
To obtain practical information and impressions on the issue of auton-omy, out- of- pocket payments, income and expenses, drugs, and human re-sources, visit health facilities. If you lack PBF experience, this is one of the steps where a public health expert with PBF experience would be very help-ful. Although valuable documentation on such systems can always be ob-tained, fi eld visits are mandatory to assess the district health system in prac-tice. Field visits are expensive and time consuming, and results obtained are sometimes confusing. A visit to a health facility can benefi t from the use of structured interview guides. The information obtained on fi eld visits needs to be double checked at various levels. This can be done during a formal de-briefi ng with fi eld practitioners and health managers.
Collecting such a large amount of health information can be tedious, es-pecially when further research on some aspects of the health system such as human resources or the pharmaceutical sector is desired. Balance the searchfor information with other time constraints. Here again, it is better to be ap-proximately right than precisely wrong after exhaustive eff orts to look at all the details.
Intelligence Gathering: Example of Assessing the Necessary Output BudgetIntelligence gathering is especially important in determining the output budget. Elaborate studies can be commissioned to gain more knowledge onthe exact incentive environment and all the multifarious motives of health workers. But that knowledge may become an obstacle for serious action (seealso chapter 4).
It is important to note that the output budget used by PBF is not meant solely for paying the variable bonuses for health workers. The output bud-get ought to help bridge the earnings gap by providing the approximate amount of money— to be paid through performance bonuses necessary for improving quantity and quality performance. The output budget is meant to achieve this adjustment through a mix of interventions (accountability,

268 Performance-Based Financing Toolkit
transparency, targeted demand- driven technical assistance, much enhanced monitoring arrangements, adequate cash resources for nonbonus recurrent expenditures, much enhanced performance- based earnings of health work-ers, and so on). For details, see chapter 4.
Assess Demand- and Supply- Side Constraints to Service Delivery
For each context you will work in, it is crucial to have a clear idea of the demand- and supply- side constraints to health service use and delivery.
Demand- side barriers can be as follows:
• Geographical• Financial• Cultural (see box 16.1)• A combination (Ensor and Cooper 2004).
Supply- side constraints relate to the following:
• Ineffi ciencies• Low quality of service in health facilities• Absence of services.
A remarkable story from Cambodia explains the potential force of supply- side solutionsto demand- side problems. According to es-tablished anthropological knowledge, Khmer women would not give birth in a health facility. They believed that ancestral spirits would not allow deliveries to take place far from the house where the deceased grandparents had lived.And indeed, two years (1999– 2000) into the contracting program, the institutional deliveryrate remained at a dismal 2– 3 percent irrespec-tive of the subsidies. However, the health facil-ity’s subsidy for each delivery was increased about every six months to ever higher levels.
Then in 2001, in a Khmer health center, one doctor achieved 50 percent institutional deliv-
ery coverage in his community. This achieve-ment was spectacular. When asked how he didthis, he said that during the Pol Pot regime, the health center location had been a killing fi eldand that people believed that bad spirits lived in the trees around the health center. This belief stopped women from agreeing to stay at the health center through the night. The doctor was unhappy to lose the PBF subsidies. After con-sulting with local authorities, he cut down the trees. From that moment on, women started to come to the health center to give birth. Based on his success, chiefs in the surrounding health centers took similar measures such as chas-ing spirits or paying demand- side incentives to benefi ciaries.
BOX 16.1
The Ghost in the Tree

Pilot Testing PBF 269
Interventions on both the supply and the demand sides can have a power-ful infl uence on use of essential health services. Much of the increase in use is through suppliers infl uencing the demand side, such as the following:
• Qualitative improvements will lead to a higher demand.• Much improved attitudes of staff versus their clients will lead to a higher
demand.• Through the systematic proposal of preventative services, lost opportuni-
ties for family planning, voluntary counseling and testing, or vaccinationswill be minimized.
• Health facility managers frequently use demand- side incentives to attract clients, such as in the case of certain health facilities in Rwanda that off erbaby- welcome packages. The package consists of a piece of soap, a cloth, and some baby clothes that the mother will receive when delivering at thehealth facility.
More specifi c demand- side interventions could relate to the following:
• Obligatory community based– health insurance schemes (as in the case of Rwanda) decrease signifi cantly the fi nancial barriers to access to services and protect largely against catastrophic health expenditures.
• Health equity funds, in the case of high out- of- pocket expenditures, could be an important tool to protect the poorest of the poor (Annear 2010; Har-deman et al. 2004).
Most of the time, low use of health services has complex origins, often in-volving supply- side issues as well as demand- side issues. This complexity becomes obvious in cases such as one involving a conditional cash transfer program for pregnant women to deliver in health facilities. In Ghana, ex-perts discovered that women incur considerable costs to deliver in a health facility, although nominally, deliveries are free of charge. It is convenient to think that cultural barriers were mostly to blame for the low use of delivery room services. Yet the reality was diff erent. When the value of the items that women had to bring for their delivery, the objects that were taken from them by the staff and not returned, and the cost of travel and other expenses were totaled, women needed US$25 per delivery. This amount completely out-stripped the budget available for the conditional cash transfer program (an estimated US$11 per delivery). This example suggests that focusing only on the demand side is improper when there are obvious supply- side problems. For demand- side interventions to maximize their eff ect, health systems needreasonably well- functioning delivery systems. Well- designed interventions on both the supply side and the demand side should work synchronously.
270 Performance-Based Financing Toolkit
Tackling the supply side through incentives for quantity and quality of health services means frequently dealing with seemingly intangible quality is-sues. Those issues include the reception of patients and a phenomenon called the “performance gap” or the “know– do gap”— the gap between what provid-ers know and what they do. This gap is well documented. Providers do less than what they know should be done (Gertler and Vermeersch 2012). In any case, assess what exists for incentivizing supply- or demand- side activities.
Identify PBF Champions and Windows of Opportunity
When conducting a pilot of complex health reforms such as the introduction of PBF, the following well- known phenomena are worth considering:
• Champions or change agents (Walt 1994)• Window of opportunity (Kingdon 1995)• Path dependency (Gómez 2011).
Champions or change agents are vital to introduce and sustain an attitudeof change toward PBF. The most powerful change agents are national staff members, senior technicians, and high- level ministry of health offi cials. When entering a new context without any experience in PBF, identify any such champions. A minister, a deputy minister or permanent secretary, di-rectors of policy and planning, or other high- level technical staff members at the ministry of health may be potential champions and should be lobbied. Sometimes, lobbying other ministries, such as the ministry of fi nance, can be a strategic approach, too. Combining the support of these parties with a successful PBF pilot may be a particularly eff ective way to gain broad- based buy- in from the government for PBF (Loevinsohn 2008, 21).
Window of opportunity refers to a certain opening through which the ex-yisting system is more prone to change. This can be, for example, the appoint-ment of a new minister who makes innovation a policy or who is favorable to PBF. The Millennium Development Goals, when fi rst championed, off ered such a window of opportunity for health reformers. But such windows can, alas, be closed.
Finally, path dependency refers to the particular history of a country thatyhas shaped its health institutions and, to some extent, determines how peo-ple respond. For instance, a strong socialist background with central com-mand and control— such as health systems built according to the type of classic national health system organization— could be very resistant to the introduction of PBF3 because of the perceived imbalance in civil servant re-muneration and the perception that health facilities ought not to manage a

Pilot Testing PBF 271
cash budget. An example of path dependency is the diffi culty experienced by the Obama administration with introducing national health insurance in the United States. Diff erent stakeholders thought they would lose out because of the reforms and therefore opposed any of the changes.
Assess the Degree of Autonomy of Health Facilities
PBF for health services is premised on the autonomy of health facilities, andPBF projects will not be successful without suffi cient autonomy in those facilities. In the ideal situation, such autonomy would consist of (a) au-tonomous human resource management (hire and fi re), (b) autonomousprocurement of supplies on a competitive and well- regulated market, and (c) autonomous management of assets (both fi xed and liquid). In the world of dysfunctional health systems in poor countries, the reality is far from this ideal situation.
Autonomy is required to improve the quantity and quality of health ser-vices through PBF. The health facility manager needs freedom (and suf-fi cient funds) to manage resources to increase the quantity and quality of health services.
One cannot quickly or easily deal with human resource issues such as hiring and fi ring, with a rigid and dysfunctional central medical procure-ment and supply system, or even with the perception that the health staff cannot manage cash. However, each one of those three points is worth studying in depth and pointing out in early discussions with government counterparts, too.
For autonomy, there are immediate prerequisites such as bank accountsand enough decision rights on spending and on hiring additional staff , if necessary. Decision rights are important for establishing PBF, but they will require deeper reforms such as civil service reforms (like in the case of Rwanda). See also chapter 6.
Assess the Existing Degree of Management of User Fees
Managers need cash to fi x infrastructure, to purchase and maintain equip-ment, to procure drugs and medical consumables, to hire additional staff ,and to pay performance bonuses. In many countries, frontline health man-agers receive no direct government cash contributions to pay for the afore-mentioned items that are necessary for providing quality health services.
User fees can be an important source of cash at the health facility level.In an assessment of a health facility, the level of income and expenditure

272 Performance-Based Financing Toolkit
is always analyzed. Some systems attempt to work without formal cash fl ows. In other systems, cash collected is sent upward into the system to be used for general budgeting. In such systems, coping strategies that will appear include retaining cash income and modifying health information system data to fi t the reported cash. Allowing health facilities to earn in-come through user fees is also an eff ective technique to formalize informal payments.
In situations of selective free health care, cash- starved systems with un-derpaid staff members, a lack of budgeting for recurrent costs, and Bamako- type revolving drug funds, health staff will use coping mechanisms such as under- the- table payments and drug pilferage. However, in situations with some form of revolving drug fund, where there is a price signal for drugs and, therefore, a value to a service, adding PBF can be a good fi t.
User fees can be a lever through which the health facility manager can balance the budget. Ideally, those fees ought to be negotiated with the local community and approved by the ministry of health. In situations of selective free health care declarations that are nonnegotiable, the shortfall needs to be fi nanced through PBF funding and, consequently, the PBF budget needs to be larger. Unfortunately, an absence of a direct price signal makes the intro-duction of a health insurance unlikely.
However, those PBF systems need additional safe guards, such as health equity funds (Annear 2010; Hardeman et al. 2004), to protect the poorest of the poor.
Assess the Market for Drugs
Analyzing the drug procurement and supply system at the health facility level is an important part of any initial PBF assessment.
Drugs and medical consumables make up a sizeable proportion of the costs at the health facility level.4 How those are fi nanced will determine not only the size of this portion but also the way the drugs are managed and dis-pensed by the health facility.
In an ideal world, central procurement and timely and complete sup-ply through a pull system— a system based on customer demand— ought to work. In the real world, such systems lead too often to a delayed and incom-plete supply, corruption, and mismanagement of stock and waste (Soeters et al. 2011).
PBF systems off er the opportunity for health facilities to decentralize drug procurement. Integrated budget management (managing funds from

Pilot Testing PBF 273
diff erent sources in an integrated manner as opposed to a vertical manner) allows the health facility manager to access drugs with certifi ed suppliers at a good price. The medical stores can be suppliers if they provide quality drugs at reasonable cost and at the time required.
The regulator, that is, the ministry of health can be incentivized to carry out its regulatory role related to the certifi ed suppliers and to regularly apply the quantifi ed quality checklist that is integral to PBF systems. Such qual-ity checklists have an important eff ect on the performance measure (that is, the performance payments). The checklists typically include an exhaustivesection on pharmaceuticals management and availability as well as process and content measures of quality of care (for example, the adherence to well- established clinical treatment algorithms).
Client perceptions of quality of care, including drug availability, are rou-tinely sought through community client satisfaction surveys. Survey results can be quantifi ed and included in the performance payments, such as in Burundi.
Assess the Human Resources for Health
Analyzing human resources during the initial assessment is important. Background documents to the health work force are useful. More impor-tant, however, go into the fi eld and assess the human resource situation fi rst-hand in a good selection of health facilities. Basic information relates to the following:
• Function and title of staff , civil servant versus contract worker, and numbers
• Remuneration, in terms of base salary and take- home salary (taxes, allow-ances, bonuses), and whether salaries are paid regularly
• Information on cost of living for the health staff members• Any private practice in the vicinity of the health facility (and average in-
come of the health staff involved)• Ratio of qualifi ed staff linked to population in the catchment area (could
be a staff shortage mainly in rural areas and an abundance of staff in urban settings, which makes the health facilities very diffi cult to assess)
• Open discussion with key informants, which can be through a focus group, on job satisfaction, remuneration, the issues staff members face in delivering quality health services, and so on5
• Use of available contingent valuation studies (studies that describe thewage levels) (Serneels et al. 2006).
16.4 How to Start a PBF Pilot: Adapt the Approach to the Local Context
Each context is diff erent. Adapting the PBF approach to the local circum-stances is important. Even minor diff erences can call for adapting the approach.
Some contexts such as the following are more favorable to PBF than others:
• Contexts with a Bamako- type revolving drug fund with good community participation or with some existing cash management because of user charges managed at the facility level
• Contexts with cash budgets provided by government or fi nancing partners
• Situations where a large part of the workforce are contract workers (man-aged by the facility and fi nanced through health facility income)
• Settings with relatively low salaries and relatively signifi cant perfor-mance bonuses.
Some specifi c examples in which the PBF approach was adapted to meet context- specifi c challenges include the following:
• Benin: a health insurance program for the poorest was linked to fi nancing through PBF (providing services to the poorest is fi nanced by a higher fee through PBF).
• Burundi: a selective free health care program for vulnerable groups was linked to fi nancing through PBF (providing curative services to children under fi ve and pregnant women are fi nanced by a higher fee through PBF).
• Nigeria (see box 16.2): management benchmarking was introduced to strengthen human resource management and to put pressure on health facility managers to manage available resources better.
• Zambia: a separate district PBF steering committee was not acceptable; hence it was subsumed as a subcommittee in the existing district health management team structure.
• Zimbabwe: no performance bonuses were allowed.
Adaptations may aff ect the budget, the services provided, checklists, technical assistance needs, and general institutional arrangements. For bud-gets, see chapter 4 of this toolkit; for services, see chapters 1 and 3; for check-lists, see chapters 3 and 8; and for general institutional arrangements, see chapter 11.
274 Performance-Based Financing Toolkit
Pilot Testing PBF 275
16.5 Pilots: Stakeholder Information,Knowledge Sharing, and Training
PBF usually generates considerable interest from government and develop-ment partners. Frequently, ministry of health technicians and donor techni-cal agency specialists already agree that business as usual in the health sector does not lead to the desired results. Yet the desirability of PBF as an alterna-tive strategy is often put under the microscope as well. PBF may appear to be a lot of work or complicated. Offi cials may argue that PBF eff orts would disrupt other planned activities. Some may be convinced that PBF would not work in poor countries. Those and other misconceptions underscore the need to inform the stakeholders upfront. There are various ways to com-municate with decision makers: organize a workshop or PBF courses, direct
Nigeria started PBF with three prepilot districts in three states (Adamawa, Nasarawa, and Ondo) in December 2011. The Nigerian PBF approach pur-chases a basic and a complementary package of services in rural areas in mostly public facilities with a single faith- based institution among the 35 contracted facilities. The situation analysis showed a combination of extremely low produc-tivity (as low as 0.1 patient per qualifi ed nurse perday), very poor quality of services, and overstaff-ing (predominantly among nonqualifi ed staff, but also with qualifi ed staff). Medical staff was paid relatively well (as compared to the Sub- Saharan Africa average). The population was clearly not us-ing public services, but instead was using the pri-vate sector (pharmacies) to purchase drugs over the counter. Public facilities were out of stock for drugs or nurses ran informal revolving drug funds with a very high cost to the population.
The PBF approach was adapted by intro-ducing (a) a formal revolving drug fund (withgeneric drugs and a focus on rational prescrib-
ing), (b) incentives aiming at preventive services and quality, (c) benchmarking of health facilitymanagers with a specifi c instrument (focus onapplication of business plans, individual perfor-mance evaluations, and indice tool), and (d) a rigorous benchmarking of district and facilityperformance across the PBF states. The outputbudget, although set relatively high at US$2.70per capita per year, was meaningless to health facility staff members who had become ac-customed to working very little. Therefore, in addition to PBF, a management benchmarking and strengthening program had to be intro-duced for better managing available resources(money and staff). Nonperforming health facil-ity managers were replaced. The Nigerian PBF approach emphasizes the systemic nature ofPBF: apart from introducing health facility au-tonomy, coaching of health facility managersand strengthened supervision, more profoundhuman resources for health reforms are neededto tackle Nigeria’s public health problems.
BOX 16.2
Adapting the PBF Approach: The Case of Nigeria

276 Performance-Based Financing Toolkit
bilateral meetings with decision makers, or stimulate exchange visits or study tours.6 Further ways to access and exchange information are through reading, inviting consultants, or joining the growing number of web- based communities of practice, such as the African PBF community of practice.
Conference for Sharing Information and Pilot Experience
Sharing experiences from pilots at conferences can be very useful, but like for any conference, careful preparation is everything. The following are several examples of conferences in which results- based fi nancing (RBF) approaches were presented with links to the agendas and to the Microsoft PowerPoint presentations. One example— Kigali in January 2006— is meant to show the in- country experience with three diff erent PBF pilot programs and to pres-ent the set up of the national PBF- design workshop in February 2006. The other examples are conferences and workshops held in Abuja, Jaipur, Bu-jumbura, and Washington, D.C. The March 2009 Bujumbura workshop can be seen as an information- sharing and consensus- building workshop that set the stage for the emergence of a national PBF model. The Jaipur, Abuja, and Washington, D.C., conferences were meant for information sharing.
Just as with any golden rules, exceptions exist such as in the case of Sierra Leone. The country scaled up a public PBF purchaser approach dur-ing 2011 without any PBF experience. The Sierra Leoneans, however, did receive implementa-tion support from an experienced PBF expert, and the scaling- up benefi ted from a uniquelyhigh degree of political support and leader-ship from the Ministry of Health. Nonetheless, Sierra Leone’s approach lacks several designfeatures that are common in other successfully scaled- up systems. For instance, its separationof functions is weak. The system lacks civil so-ciety involvement at any level of governance. It offers no technical assistance for the technical support functions. The system does not havea web- enabled application with a public front
end. It has no third- party counterverifi cationmechanism. In addition, the PBF budget (topay for performance) is very low. A study visit by a Sierra Leone delegation to Burundi high-lighted the absence of those features, and thedelegation expressed its desire to include those elements in the Sierra Leone design soon. The Sierra Leone case shows that countries can at-tempt to implement PBF without a range of es-sential design elements. However, the absence of some of those elements will lead to a lesssuccessful result later. Without any rigorous evaluation of the Sierra Leone scaling- up, it will be diffi cult to draw lessons regarding the effec-tiveness of this approach and to compare theapproach to other PBF approaches or non- PBFinterventions.
BOX 16.3
Scaling Up PBF: The Case of Sierra Leone
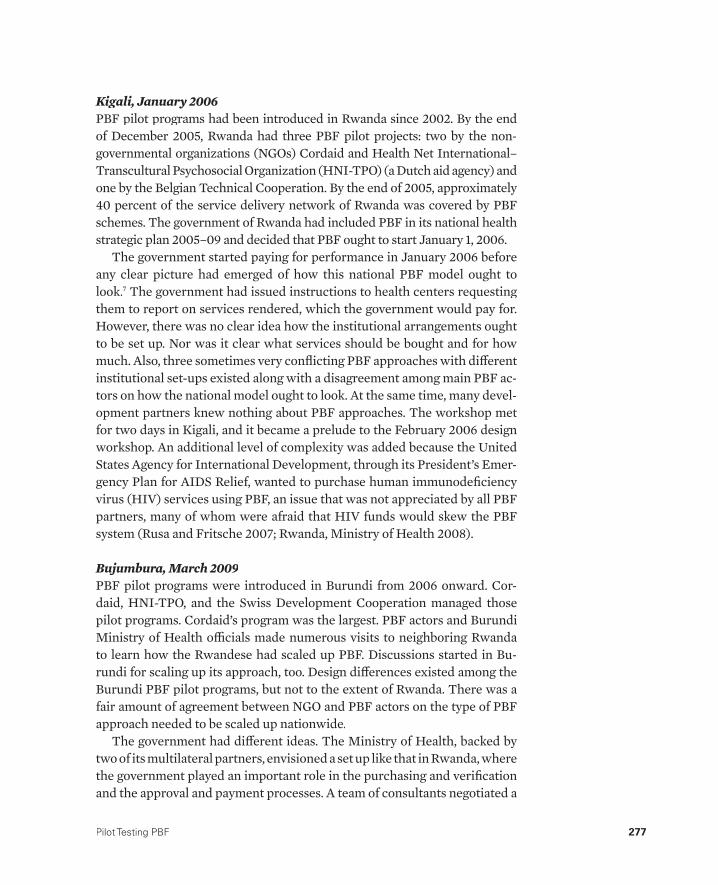
Pilot Testing PBF 277
Kigali, January 2006PBF pilot programs had been introduced in Rwanda since 2002. By the end of December 2005, Rwanda had three PBF pilot projects: two by the non-governmental organizations (NGOs) Cordaid and Health Net International–Transcultural Psychosocial Organization (HNI- TPO) (a Dutch aid agency) andone by the Belgian Technical Cooperation. By the end of 2005, approximately 40 percent of the service delivery network of Rwanda was covered by PBFschemes. The government of Rwanda had included PBF in its national health strategic plan 2005– 09 and decided that PBF ought to start January 1, 2006.
The government started paying for performance in January 2006 beforeany clear picture had emerged of how this national PBF model ought to look.7 The government had issued instructions to health centers requesting them to report on services rendered, which the government would pay for.However, there was no clear idea how the institutional arrangements oughtto be set up. Nor was it clear what services should be bought and for howmuch. Also, three sometimes very confl icting PBF approaches with diff erentinstitutional set- ups existed along with a disagreement among main PBF ac-tors on how the national model ought to look. At the same time, many devel-opment partners knew nothing about PBF approaches. The workshop met for two days in Kigali, and it became a prelude to the February 2006 design workshop. An additional level of complexity was added because the UnitedStates Agency for International Development, through its President’s Emer-gency Plan for AIDS Relief, wanted to purchase human immunodefi ciency virus (HIV) services using PBF, an issue that was not appreciated by all PBF partners, many of whom were afraid that HIV funds would skew the PBF system (Rusa and Fritsche 2007; Rwanda, Ministry of Health 2008).
Bujumbura, March 2009PBF pilot programs were introduced in Burundi from 2006 onward. Cor-daid, HNI- TPO, and the Swiss Development Cooperation managed those pilot programs. Cordaid’s program was the largest. PBF actors and Burundi Ministry of Health offi cials made numerous visits to neighboring Rwanda to learn how the Rwandese had scaled up PBF. Discussions started in Bu-rundi for scaling up its approach, too. Design diff erences existed among the Burundi PBF pilot programs, but not to the extent of Rwanda. There was a fair amount of agreement between NGO and PBF actors on the type of PBF approach needed to be scaled up nationwide.
The government had diff erent ideas. The Ministry of Health, backed by two of its multilateral partners, envisioned a set up like that in Rwanda, where the government played an important role in the purchasing and verifi cation and the approval and payment processes. A team of consultants negotiated a
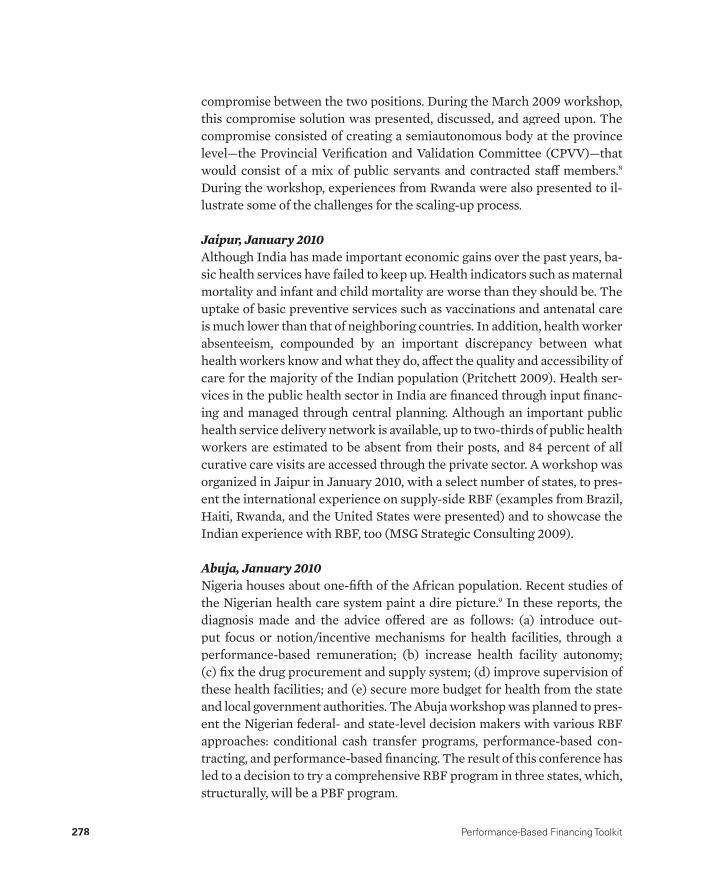
278 Performance-Based Financing Toolkit
compromise between the two positions. During the March 2009 workshop, this compromise solution was presented, discussed, and agreed upon. The compromise consisted of creating a semiautonomous body at the province level— the Provincial Verifi cation and Validation Committee (CPVV)— that would consist of a mix of public servants and contracted staff members.8
During the workshop, experiences from Rwanda were also presented to il-lustrate some of the challenges for the scaling- up process.
Jaipur, January 2010Although India has made important economic gains over the past years, ba-sic health services have failed to keep up. Health indicators such as maternal mortality and infant and child mortality are worse than they should be. The uptake of basic preventive services such as vaccinations and antenatal care is much lower than that of neighboring countries. In addition, health worker absenteeism, compounded by an important discrepancy between what health workers know and what they do, aff ect the quality and accessibility of care for the majority of the Indian population (Pritchett 2009). Health ser-vices in the public health sector in India are fi nanced through input fi nanc-ing and managed through central planning. Although an important public health service delivery network is available, up to two- thirds of public health workers are estimated to be absent from their posts, and 84 percent of all curative care visits are accessed through the private sector. A workshop was organized in Jaipur in January 2010, with a select number of states, to pres-ent the international experience on supply- side RBF (examples from Brazil, Haiti, Rwanda, and the United States were presented) and to showcase the Indian experience with RBF, too (MSG Strategic Consulting 2009).
Abuja, January 2010Nigeria houses about one- fi fth of the African population. Recent studies of the Nigerian health care system paint a dire picture.9 In these reports, thediagnosis made and the advice off ered are as follows: (a) introduce out-put focus or notion/incentive mechanisms for health facilities, through a performance- based remuneration; (b) increase health facility autonomy; (c) fi x the drug procurement and supply system; (d) improve supervision of these health facilities; and (e) secure more budget for health from the state and local government authorities. The Abuja workshop was planned to pres-ent the Nigerian federal- and state- level decision makers with various RBF approaches: conditional cash transfer programs, performance- based con-tracting, and performance- based fi nancing. The result of this conference has led to a decision to try a comprehensive RBF program in three states, which, structurally, will be a PBF program.
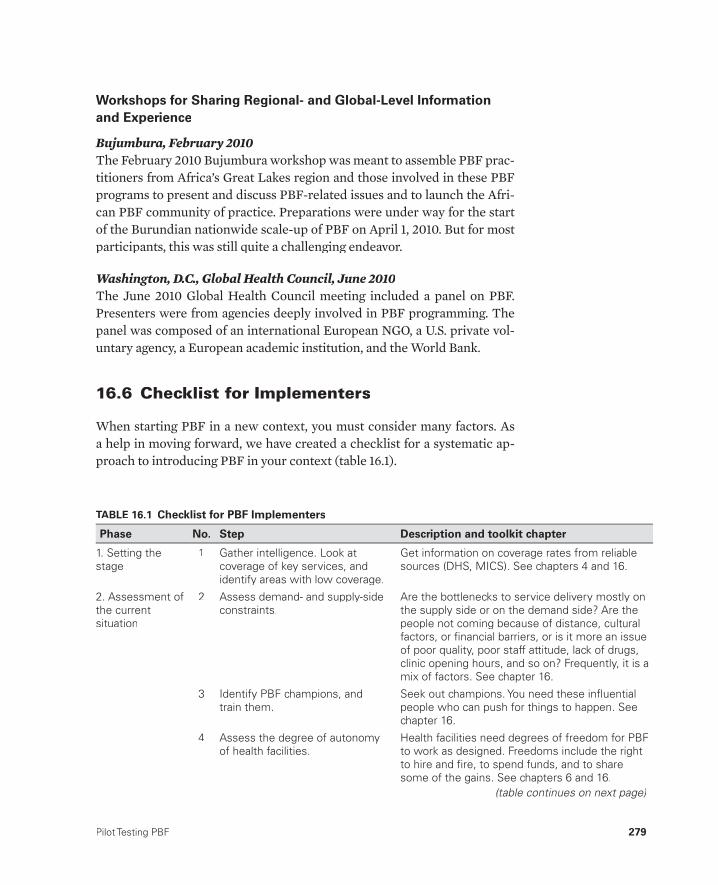
Pilot Testing PBF 279
Workshops for Sharing Regional- and Global- Level Informationand Experience
Bujumbura, February 2010The February 2010 Bujumbura workshop was meant to assemble PBF prac-titioners from Africa’s Great Lakes region and those involved in these PBF programs to present and discuss PBF- related issues and to launch the Afri-can PBF community of practice. Preparations were under way for the start of the Burundian nationwide scale- up of PBF on April 1, 2010. But for most participants, this was still quite a challenging endeavor.
Washington, D.C., Global Health Council, June 2010The June 2010 Global Health Council meeting included a panel on PBF. Presenters were from agencies deeply involved in PBF programming. The panel was composed of an international European NGO, a U.S. private vol-untary agency, a European academic institution, and the World Bank.
16.6 Checklist for Implementers
When starting PBF in a new context, you must consider many factors. As a help in moving forward, we have created a checklist for a systematic ap-proach to introducing PBF in your context (table 16.1).
TABLE 16.1 Checklist for PBF Implementers
Phase No. Step Description and toolkit chapter
1. Setting the stage
1 Gather intelligence. Look atcoverage of key services, andidentify areas with low coverage.
Get information on coverage rates from reliable sources (DHS, MICS). See chapters 4 and 16.
2. Assessment of the currentsituation
2 Assess demand- and supply-sideconstraints.
Are the bottlenecks to service delivery mostly onthe supply side or on the demand side? Are thepeople not coming because of distance, culturalfactors, or fi nancial barriers, or is it more an issue of poor quality, poor staff attitude, lack of drugs, clinic opening hours, and so on? Frequently, it is amix of factors. See chapter 16.
3 Identify PBF champions, andtrain them.
Seek out champions. You need these infl uential people who can push for things to happen. Seechapter 16.
4 Assess the degree of autonomyof health facilities.
Health facilities need degrees of freedom for PBFto work as designed. Freedoms include the rightto hire and fi re, to spend funds, and to sharesome of the gains. See chapters 6 and 16.
(table continues on next page)

280 Performance-Based Financing Toolkit
5 Assess existing cash manage-ment.
What revenue sources are available for the healthfacilities? (And how much?) How does the health facility currently manage cash resources (if any)?What is the state of the banking sector in ruralareas? How do funds fl ow within the govern-ment? See chapters 4 and 16.
6 Assess the market for drugs. Where are the drugs coming from? Is therea reliable supply from the central level? Are there other potential sources for drugs? Seechapter 16.
7 Assess the human resources for health.
How many and what type of health workers are available? Where are they located? How much do they earn? See chapters 4 and 16.
8 Assess the HMIS. What registers are available at the health facilities?How are they kept? What is the exact layout ofthese registers? See chapters 2, 12, and 16.
9 Assess the private sector. How will the private sector be involved? Which private providers will be involved? Consider part ofthe initial assessment of the delivery network andthe public-private mix. See chapter 16.
10 Identify institutions and NGOsthat can carry out verifi cation activities.
Consider the institutional setup; the separation offunctions; and the eventual agencies or institu-tions that could do contract management andverifi cation functions. See chapter 11.
11 Examine governance at thehealth facility level, and considergovernance for PBF in general.
Look at local accountability mechanisms: Is the community involved? When introducing autono-my, think of local checks and balances. Think of district-level governance mechanisms, too. Seechapter 11.
12 Keep in mind wider health reforms, and inform thestakeholder.
More profound health reforms are necessary tomake PBF function better. PBF is a clothes hangerfor other reforms such as human resources for health reforms, reforms in the way drugs areprocured, and eventually reforms in health insurance arrangements. See chapters 16 and 17.
3. Design 13 Plan for a small-scale pilot. Always start with a small-scale pilot; even onedistrict will do. See chapter 16.
14 Identify the different types oftechnical assistance required.
TA will likely be needed for implementation of the PBF pilot. There also may be a need for technicalsupport to health facilities to strengthen theirmanagement. See chapters 14 and 16.
15 Assess the available budget. Suffi cient money is needed to do PBF. See chapter 4.
16 Create bank accounts for eachhealth facility, and establish cashmanagement procedures.
Plan for one bank account per health facility andalso an income and an expense register. Seechapter 7.
17 Defi ne the services, and createthe service packages.
Get agreement on services to purchase. If there isno in-country experience on what to purchase,then propose a list. See chapter 1.
TABLE 16.1 (continued)
Phase No. Step Description and toolkit chapter

Pilot Testing PBF 281
(table continues on next page)
TABLE 16.1 (continued)
Phase No. Step Description and toolkit chapter
18 Weight the individual services. Each service has a relative value as compared tothe other services. See chapter 4.
19 Perform fi nancial risk forecasting.
Set the prices, and calculate the geographicequity adjustments. See chapter 4.
20 Create the quality checklists forhealth centers and hospitals,and test the checklists.
These quantifi ed quality checklists can be borrowed from other contexts and adjusted to fi t local realities. Test them fi rst. See chapter 3.
21 Create the performanceframeworks for the health administration.
Performance frameworks are needed for the health administration, and sometimes for otherinstitutions also. See chapter 8.
22 Create the web-enabledapplication.
A web-enabled application forms the backbone ofa PBF system. It typically has a public interfaceand is important for good governance. See chapters 11, 12, and 13.
23 Create the business plan. Create a business plan template, which can beborrowed from other contexts. See chapter 10.
24 Create the indice tool. Create an indice tool: a paper-based one for healthcenters and an electronic one for hospitals.Borrow from other contexts as needed. Seechapter 7.
25 Create the contracts. Design the contracts. Borrow from other contextsas needed. See chapter 11.
26 Write a PBF user manual. Draft a PBF user manual, meant for use by healthworkers, managers, district health staff members, and technical assistants. See chapter 15.
27 Plan for training. Depending on the scale of the training, it can be achallenging exercise. Plan well ahead for thetraining capacity, the training manual, and logistic and administrative issues. See chapter 14.
4. Implementation 28 Train health staff community and health administration, and signcontracts.
Good-quality training is essential. The variouscontracts are signed at the end of the trainings.See chapter 14.
29 Negotiate the business plans,and pay the investment units.
Business plans are explained during the trainings,and health managers have a certain amount of time to create their business plans. The business plans will be negotiated. Investment units willhave to be paid, too. See chapters 9 and 10.
30 Carry out coaching. Coaching health facility managers in enhancingperformance of their health facility is crucial,especially in the early days of PBF. See chapters10 (mainly), 12, 13, and 14.
31 Perform the quantity verifi cation. Monthly verifi cation of the quantity, in the healthfacilities, is especially important in the fi rst 6 to 12 months of the PBF scheme. See chapters 1 and 2.
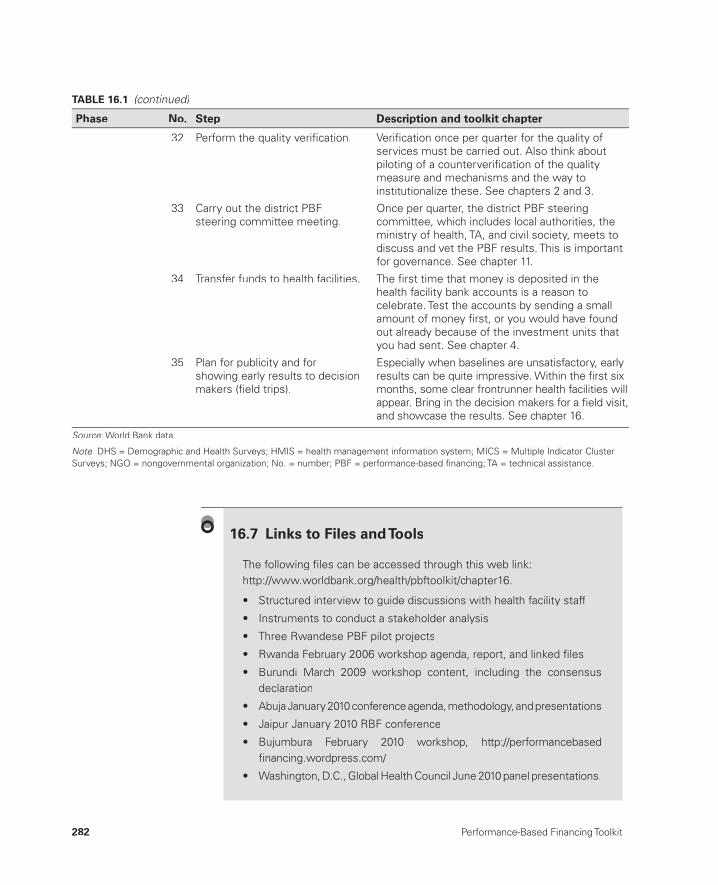
282 Performance-Based Financing Toolkit
32 Perform the quality verifi cation. Verifi cation once per quarter for the quality ofservices must be carried out. Also think aboutpiloting of a counterverifi cation of the quality measure and mechanisms and the way toinstitutionalize these. See chapters 2 and 3.
33 Carry out the district PBFsteering committee meeting.
Once per quarter, the district PBF steeringcommittee, which includes local authorities, theministry of health, TA, and civil society, meets todiscuss and vet the PBF results. This is important for governance. See chapter 11.
34 Transfer funds to health facilities. The fi rst time that money is deposited in thehealth facility bank accounts is a reason tocelebrate. Test the accounts by sending a small amount of money fi rst, or you would have foundout already because of the investment units that you had sent. See chapter 4.
35 Plan for publicity and forshowing early results to decisionmakers (fi eld trips).
Especially when baselines are unsatisfactory, early results can be quite impressive. Within the fi rst sixmonths, some clear frontrunner health facilities will appear. Bring in the decision makers for a fi eld visit, and showcase the results. See chapter 16.
Source: World Bank data.:
Note: DHS = Demographic and Health Surveys; HMIS = health management information system; MICS = Multiple Indicator Cluster :Surveys; NGO = nongovernmental organization; No. = number; PBF = performance-based fi nancing; TA = technical assistance.
TABLE 16.1 (continued)
Phase No. Step Description and toolkit chapter
The following fi les can be accessed through this web link: http://www.worldbank.org/health/pbftoolkit/chapter16.
• Structured interview to guide discussions with health facility staff
• Instruments to conduct a stakeholder analysis
• Three Rwandese PBF pilot projects
• Rwanda February 2006 workshop agenda, report, and linked fi les
• Burundi March 2009 workshop content, including the consensus declaration
• Abuja January 2010 conference agenda, methodology, and presentations
• Jaipur January 2010 RBF conference
• Bujumbura February 2010 workshop, http://performancebasedfi nancing.wordpress.com/
• Washington, D.C., Global Health Council June 2010 panel presentations.
16.7 Links to Files and Tools

Pilot Testing PBF 283
Notes
1. In some countries such as Zambia, a PBF pilot consists of a pilot covering morethan half the country’s health system. Such pilots were mostly preceded by a so- called PBF prepilot in one or two districts. The purpose of such prepilots, or fi eld tests, was the same: to introduce the concept on a small scale and to gainexperience before attempting a larger intervention.
2. In Burundi, 40 percent of hospitals are managed by faith- based organizations.3. Sometimes the reverse could happen in such situations. Some actors become so
frustrated that they are ready for change.4. According to studies using the indice tool, drugs and medical consumables make
up approximately 15– 25 percent of the costs at this level.5. It is crucial to review which proportion of PBF subsidies should be paid in per-
formance bonuses to create a situation where the staff is satisfi ed. However, theidea is not to then impose the fi ndings but to simply have an average that guidesthe costing. This costing is not an exact science, and such information needs to be double checked at various levels.
6. Bilateral meetings for explanations of PBF to ministers and director generals are very eff ective, and those sessions usually take place before a conference.
7. In fact, there was an important period not well known by many: the Butare andCyangugu Provinces were identifi ed as the two pilot provinces for the Ministry of Finance. Having two pilots required harmonization between the two schemes (at least for relative prices). This coordination was a major step toward a na-tional model.
8. In the compromise solution, the idea was that the CPVV would be a body gather-ing diff erent stakeholders, including civil society and local government. Enoughchecks and balances would exist while acknowledging the concern of the gov-ernment to keep some control.
9. See Das Gupta, Gauri, and Khemani (2003); McKinsey and Company (2009); and World Bank (2008).
References
Annear, P. 2010. “A Comprehensive Review of the Literature on Health Equity Funds in Cambodia 2001– 2010 and Annotated Bibliography.” Health Policy and Health Finance Knowledge Hub Working Paper No. 9, Nossel Institute forGlobal Health, University of Melbourne, Melbourne.
Das Gupta, M., V. Gauri, and S. Khemani. 2003. “Decentralized Delivery of Primary Health Services in Nigeria: Survey Evidence from the States of Lagos and Kogi.” African Region Human Development Working Paper Series No. 70, World Bank, Washington, DC.
Ensor, T., and S. Cooper. 2004. “Overcoming Barriers to Health Service Access: Infl uencing the Demand Side.” Health Policy and Planning 19 (2): 69– 79.g
Gertler, P., and C. Vermeersch. 2012. “Using Performance Incentives to ImproveHealth Outcomes.” Policy Research Working Paper 6100, World Bank, Washing-ton, DC.

284 Performance-Based Financing Toolkit
Gómez, E. 2011. “An Alternative Approach to Evaluating, Measuring, and Compar-ing Domestic and International Health Institutions: Insights from Social ScienceTheories.” Health Policy 101 (3): 209– 19.
Hardeman, W., W. Van Damme, M. Van Pelt, I. Por, H. Kimvan, and B. Meessen. 2004. “Access to Health Care for All? User Fees Plus a Health Equity Fund in Sotnikum, Cambodia.” Health Policy and Planning 19 (1): 22– 32.g
Kingdon, J. 1995. Agendas, Alternatives and Public Policies. New York: Longman.Loevinsohn, B. 2008. Performance- Based Contracting for Health Services in Develop-
ing Countries: A Toolkit. Health, Nutrition, and Population Series. Washington, DC: World Bank.
McKinsey and Company. 2009. “Scaling Up Primary Health Care in Nigeria, InitialFindings.” Discussion document, McKinsey and Company, Washington, DC.
MSG Strategic Consulting. 2009. “Results- Based Financing in Public Health Sectorin India.” Draft report for the World Bank. MSG Strategic Consulting, Delhi.
Pritchett, L. 2009. “Is India a Flailing State? Detours on the Four Lane Highway to Modernization.” HKS Working Paper No. RWO09- 013, Harvard Kennedy Schoolof Government, Harvard University, Cambridge, MA.
Rusa, L., and G. Fritsche. 2007. “Rwanda: Performance- Based Financing in Health.” In Emerging Good Practice in Managing for Development Results: Sourcebook, 2nd edition, 105– 16. Washington, DC: World Bank.
Rwanda, Ministry of Health. 2008. “Annual Report 2007: Performance- Based Fi-nancing in the Rwandan Health Sector.” CAAC/Ministry of Health, Kigali.
Serneels, P., M. Lindelow, J. G. Montalvo, and A. Barr. 2006. “For Public Service or Money: Understanding Geographical Imbalances in the Health Workforce.” Health Policy and Planning 22 (3): 128– 38.g
Soeters, R., P. B. Peerenboom, P. Mushagalusa, and C. Kimanuka. 2011. “Performance- Based Financing Experiment Improved Health Care in the Democratic Republicof Congo.” Health Aff airs 30 (8): 1518– 27.
Walt, G. 1994. Health Policy: An Introduction to Process and Power. London: ZedBooks.
World Bank. 2008. “Nigeria, Improving Primary Health Care Delivery: Evidence from Four States.” Report No. 44041– NG, World Bank, Washington, DC.

EVIDENCE OFPBF SCHEMES
PART 3

287
Evaluations of PBF andFrequently Asked Questions
CHAPTER 17
MAIN MESSAGES
➜ PBF in LMIC is relatively new and so are serious evaluations of well- designed and well- implemented programs.
➜ Be aware of simple analogies between PBF programs in LMIC and OECD countries, because contexts diff er more than they resemble each other.
➜ “Evidence” for PBF is built gradually in many ways. So far, in practicethere is a wide variety of programs and designs.
➜ Policy makers in LMIC should be selective in copying lessons learned from PBF schemes in OECD countries.
COVERED IN THIS CHAPTER
17.1 Introduction17.2 Building research evidence for PBF is a work in progress17.3 PBF programs in LMIC and OECD countries have both diff erences
and similarities17.4 PBF programs need appropriate design and implementation to be
successful17.5 Frequently asked questions
288 Performance-Based Financing Toolkit
17.1 Introduction
Performance- based fi nancing (PBF) in lower- and middle- income coun-tries (LMIC) is relatively new. Only recently, people have started to engage in serious evaluations of well- designed and well- implemented programs. Although PBF evaluations in LMIC are still in a developmental stage, there are a number of similarities and diff erences between PBF programs in LMIC and Organisation for Economic Co- operation and Development (OECD) countries. OECD countries have extensive knowledge on pay- for- performance schemes and health reforms, which can be used to inform PBF reforms in LMIC. Although similarities exist between PBF programs in LMIC and OECD countries, remember that contexts diff er signifi cantly. In fact, the diff erences between these contexts are greater than the similari-ties. Policy makers in LMIC should, therefore, be selective in copying lessons from OECD countries.
Despite the scarcity of well- evaluated, well- designed, and well- implemented PBF programs in LMIC, there are practical signs that such programs show promising results. Research evidence shows that functional design and solid implementation of PBF programs are prerequisites for at-taining useful evaluation results.
In the chapter’s discussion about building research evidence, a range of programs that exist in practice and off er incentives to health facilities is cov-ered. There are programs on the supply side and on the demand side. On the supply side, various results- based fi nancing (RBF) programs are high-lighted. Because PBF is a very specifi c type of RBF— distinguishable from other RBF approaches (Musgrove 2011)— PBF programs will be denoted as “PBF.” Demand- side incentive schemes, which off er incentives to clients for certain health actions, are not discussed here. For a comprehensive review on demand- side incentives, see Fiszbein and Schady (2009).
17.2 Building Research Evidencefor PBF Is a Work in Progress
Building a solid evaluation practice for PBF programs in LMIC is a work in progress. Currently, the results of PBF on health outputs and outcomes are still inconclusive (Miller and Babiarz 2013). A lack of research during the pioneering years and the subsequent weak research designs that did not take into account a counterfactual are partly to blame. Well- designed PBF programs in LMIC are generally complex to research because of their comprehensive and systemic nature (Meessen et al. 2012). Moreover, many
Evaluations of PBF and Frequently Asked Questions 289
existing PBF programs diff er signifi cantly in design. This variation makes it hazardous to apply results too quickly from a particular program evaluation to another context. Besides evaluation of the quantity and quality of outputs,other dimensions of PBF warrant serious research because well- designedPBF programs in LMIC are real health reforms that may change various di-mensions and various levels of a health system all at once (Meessen, Soucat, and Sekabaraga 2011). Examples are as follows:
• Changes at the health facility level can simultaneously aff ect the availabil-ity of resources to deliver services and the motivation of health workers. In addition, there can be an increase in the autonomy of the health facility and a demand for better health facility management. Also, a change in thepattern of service delivery can occur with more preventive services of-fered against better quality. Public health facilities will function more like cooperatives with staff behaving more like shareholders. Private facili-ties can become better regulated and will off er more preventive services while being held accountable for delivering quality services. The commu-nity near the health facility will formally engage in providing oversight over fi nances and strategies. Community client satisfaction surveys will lead to knowledge about community perceptions on the quality and avail-ability of services.
• Changes at the district level include a strengthening of the public health administration in supervisory, coordination, and regulatory roles. The public health administration will be nudged through an incentive scheme to deliver results while its performance is being benchmarked. In paral-lel, the creation of a governing board for PBF that includes community representation alongside that of government institutions will enhance transparency and accountability. Such changes lead to improved and more inclusive governance and a strengthened public health administration.
• Changes brought about by the PBF purchasing arrangements involve a separation of functions among the purchaser, the public and private pro-viders, the regulator, and the community. Accountability mechanisms canthereby change profoundly.
• Changes at the national level include a refocusing of the ministry of health (MoH) on its stewardship role, a promotion of intense collaboration with development partners, a shift of additional fi nancing to cost- eff ective cu-rative and preventive services, a change in planning mechanisms, and a shift of focus to results and to an intensifi ed use of data for performance management.
In building of solid evidence for PBF, two lines of reasoning apply. First, to be meaningful, research eff orts should focus on well- designed and
290 Performance-Based Financing Toolkit
well- implemented PBF programs. Second, research eff orts should not be confi ned to rigorous randomized trials, but should include quantitative re-search techniques and complement these with good qualitative research. Broadening the methodological scope is pertinent to capturing the wide range of systemic changes brought about by well- designed PBF schemes (Alexander and Hearld 2012; Meessen et al. 2012).
The following topics are discussed in the next section:
• How evidence on PBF in LMIC varies• How the evidence on PBF in OECD countries compares• How to deal with the problem of overall weak evaluation designs• How to deal with the fact that rigorous impact evaluations are often dif-
fi cult in practice• Why PBF programs are diffi cult to research.
How Evidence on PBF in LMIC Varies
The combined evidence on PBF in LMIC has been inconclusive according to Witter et al. (2012) in a Cochrane review from 2012. However, their evidence for this statement was drawn from evaluations of PBF programs that greatly varied in design and implementation characteristics.
Witter et al. (2012) applied one rigorous assessment framework to evalu-ation studies as divergent as program evaluations of various— and diff erent— country programs of a nongovernmental organization (Toonen et al. 2009) to a quasi- experimental randomized controlled trial of a nationwide scale- up (Basinga et al. 2011). Moreover, both the type of evaluation methodology and the type of PBF intervention studied varied signifi cantly.
The Witter et al. (2012) review concluded— perhaps a little too categorically— that there was a lack of rigorous evidence for PBF in LMIC. The report correctly pointed out, however, that more comprehensive re-search was needed. Importantly, the report underscored that the eff ect of PBF depended on design and implementation.
Although there is indeed a paucity of good- quality research data, two re-cent well- designed randomized controlled trials of PBF programs in LMIC settings showed opposing evaluation results. Although one evaluation— of a well- designed PBF intervention in Rwanda— pointed at signifi cant results, the other evaluation— of a poorly designed PBF intervention in Uganda— demonstrated no results. We tentatively conclude that good design and implementation of PBF are preconditions for getting positive evaluation results. When embarking on a rigorous evaluation, make sure the PBF pro-gram to be evaluated is properly designed and implemented carefully too.
Evaluations of PBF and Frequently Asked Questions 291
The following well- designed impact evaluations are discussed in moredetail. Both evaluations are randomized controlled trials of PBF programs, one in Rwanda and the other in Uganda.1
The Rwandese Impact Evaluation Showed Signifi cant ResultsThe Rwandese impact evaluation showed good results for quantity and qual-ity of services as compared to a control (Basinga et al. 2011; de Walque et al. 2013; Gertler and Vermeersch 2012). Not only did the quantity and quality of services increase signifi cantly, but also a signifi cant eff ect occurred on the size and weight of children under fi ve years of age living in the catchment areas of PBF facilities (Gertler and Vermeersch 2012). The impact evalua-tion was built into a nationwide scaling- up of PBF from 2006 to 2008. This impact evaluation is unique in that health facilities in the control district re-ceived exactly the same amount of cash as those in the treatment districts. By providing the same amount of cash to both treatment and control sites, researchers could isolate the incentive eff ect from the eff ect of increasing resources alone. The study is cited as being exemplary because this rigorous approach has not even been seen in OECD countries (OECD 2010).
Well- designed PBF pilot projects from 2002 to 2005 preceded the Rwan-dese scaling- up and showed positive results (Meessen et al. 2006; Mees-sen, Kashala, and Musango 2007; Rusa et al. 2009a; Soeters, Habineza, and Peerenboom 2006; Soeters, Musango, and Meessen 2005). In fact, it wasthese results that convinced the government to embark on the scale up of PBF in the country (Logie, Rowson, and Ndagije 2008; Meessen, Soucat, and Sekabaraga 2011; Rusa and Fritsche 2007; Rusa et al. 2009b; Sekabaraga, Diop, and Soucat 2011).
Despite the study’s positive eff ect on policy makers, there were critics as well. They criticized the evaluations for having a before- and- after design, for not having a control group, for having been carried out by PBF advo-cates, and for suff ering from publication bias (Elridge and Palmer 2009; Ire-land, Paul, and Dujardin 2011; Kalk, Paul, and Grabosch 2010; Oxman andFretheim 2009; Witter et al. 2012).
In South Kivu, the Democratic Republic of Congo, a well- designed PBFproject showed positive results compared to areas that received traditional program support (Soeters et al. 2011). The study had a before- and- after design. With regard to design, this project was similar to the scaled- up ap-proach in Rwanda.
The Ugandan Impact Evaluation Showed No ResultsIn Uganda, an impact evaluation was carried out on a performance- based contracting project from 2003 to 2006 (Lundberg, Marek, and Okwero
292 Performance-Based Financing Toolkit
2007; Morgan 2010; Ssengooba, McPake, and Palmer 2012). This evaluation showed no diff erence between districts with PBF and the control districts. In relation to the program design and implementation, the researchers con-cluded as follows:
What emerges . . . is that the main reasons for the failure . . . were unrealis-tic design of the intervention, ill- considered adaptations made hastily as the inadequacies of the design revealed themselves, and poor anticipation of the responses of institutions and individuals both inside and outside the change process. Key factors were the under fi nancing of the initiative, the underesti-mation of the technical and institutional capacity requirements for successful implementation, the overloading of the implementation team with additional research activities and the failure to consider important actors who infl uence outcomes but are not directly included in the change process. (Ssengooba, McPake, and Palmer 2012, 382)
In ShortAlthough there is a plethora of PBF program designs in LMIC settings, there is a scarcity of rigorous evaluations. However, two randomized controlled trials of PBF in LMIC settings show contradictory evaluation results. One evaluation of a well- designed PBF intervention in Rwanda showed signifi -cant results, while the other evaluation of a poorly designed PBF interven-tion in Uganda showed no results. The way in which PBF programs are de-signed and implemented appears to be crucial for getting positive evaluation results. This is further discussed below.
How the Evidence on PBF in OECD Countries Compares
The evidence for PBF deriving from evaluations in OECD countries is very mixed. Initially, there was a similar lack of evaluations as in LMIC. However, the research on PBF program evaluations in OECD countries grew very rap-idly over the past decades. In broad terms, two categories of research ex-ist: studies related to PBF (often called “pay- for- performance”) programs in which provider payments are closely tied to quality of care and studies in which provider payments are not associated with quality of care.
To date, paying providers for improving the quality of care has mixed re-sults in OECD countries. However, data are emerging that indicate the im-portance of design and implementation for achieving results. Paying provid-ers for service outputs does lead to a higher service provision. An incomplete description of the various contexts in which this occurs prohibits easy ap-plication of such information elsewhere.2

Evaluations of PBF and Frequently Asked Questions 293
Provider Payment Mechanisms Tied to Quality of CareThe fi rst category of research is related to provider payment mechanismsthat are tied to quality of care, that is, PBF programs. PBF programs in OECD countries have been evaluated frequently, and the number of evaluations is still increasing (Van Herck et al. 2010). Unfortunately, many of these types of evaluations either (a) measure diff erence between before and after or (b) provide monitoring or process information. Such evaluations do not provide convincing evidence to direct policy (Gertler et al. 2011). In addition, a focus on eff ectiveness alone will not answer the question about the relative cost- eff ectiveness (Maynard 2012).
A systematic review (up to July 2009) of 128 evaluation studies of PBF programs in OECD countries produced a large body of evidence concerning clinical eff ectiveness and equity (Van Herck et al. 2010). Less evidence was found for the eff ect on coordination, continuity, patient- centeredness, andcost- eff ectiveness. In addition, the extent of the eff ect varied according to design choices and the context in which the program was introduced. In this review, only nine of 128 studies used a randomized design. The review high-lighted the relationship between evaluation fi ndings and PBF design choices and context. The following tips were recommended to obtain better results (Van Herck et al. 2010):
• Select and defi ne PBF targets according to baseline room for improvement.
• Use process and intermediary outcome indicators as target measures.• Involve stakeholders, and communicate program information thoroughly
and directly.• Implement a uniform PBF design across payers.• Focus on both quality improvement and achievement.• Distribute incentives to individuals and at the team level.
Mixed evaluation results (Petersen et al. 2006; Rosenthal and Frank 2006; Rosenthal et al. 2007) might be the product of suboptimally designed PBFprograms (Werner et al. 2011). In a study of 126 Premier, Inc., hospitals in the United States, it was found that in hospitals that faced less competition and in those that were better fi nanced the extent of the eff ect was larger with a larger incentive. So for design purposes, tailor incentives to the context: off er higherincentives in settings where the predicted eff ect is smaller (Werner et al. 2011).
Provider Payment Mechanisms Not Tied to Quality of CareA second, quite substantial body of research is related to provider payment mechanisms that are not tied to quality of care, that is, those mechanisms
294 Performance-Based Financing Toolkit
that describe the relationship between the way the provider is paid and the amount (quantity, length, frequency, or type) of services that are rendered. A recent Cochrane review examined the eff ectiveness of fi nancial incen-tives on provider behavior (Flodgren et al. 2011). In this study of provider payment mechanisms in high- income countries, fi nancial incentives were grouped in fi ve categories:
• Payment for work during a specifi ed time period• Payment for each service, episode, or visit• Payment for provision of care for a patient or specifi c population• Payment for provision of a prespecifi ed level or of a change in activity or
quality of care• Mixed methods.
Payment for work during a specifi ed period (salary) was generally not eff ec-tive. All other incentive mechanisms showed positive eff ects, while mixed methods showed mixed results.
Financial incentives were generally eff ective for the following:
• Improving processes of care• Improving referrals and admissions• Improving prescribing costs outcomes.
Financial incentives were generally ineff ective for the following:
• Improving compliance with guidelines outcomes.
The review states: “For a majority of studies, the comparison intervention was not clearly stated, compromising a reader’s ability to understand the context within which the study was conducted and therefore how it might translate to another setting” (Flodgren et al. 2011, 11).
In ShortPaying providers on the basis of outputs leads to a higher volume of services rendered. Sharper documentation of the context in which such provider payment mechanisms are evaluated is important for using evaluation fi nd-ings in other settings.
How to Deal With the Problem of Overall Weak Evaluation Designs
Weak evaluation designs combined with a general lack of evaluations in LMIC lead to a lack of strong evidence on PBF program eff ectiveness. Program eval-uations are generally of two types: monitoring and evaluation (see box 17.1).
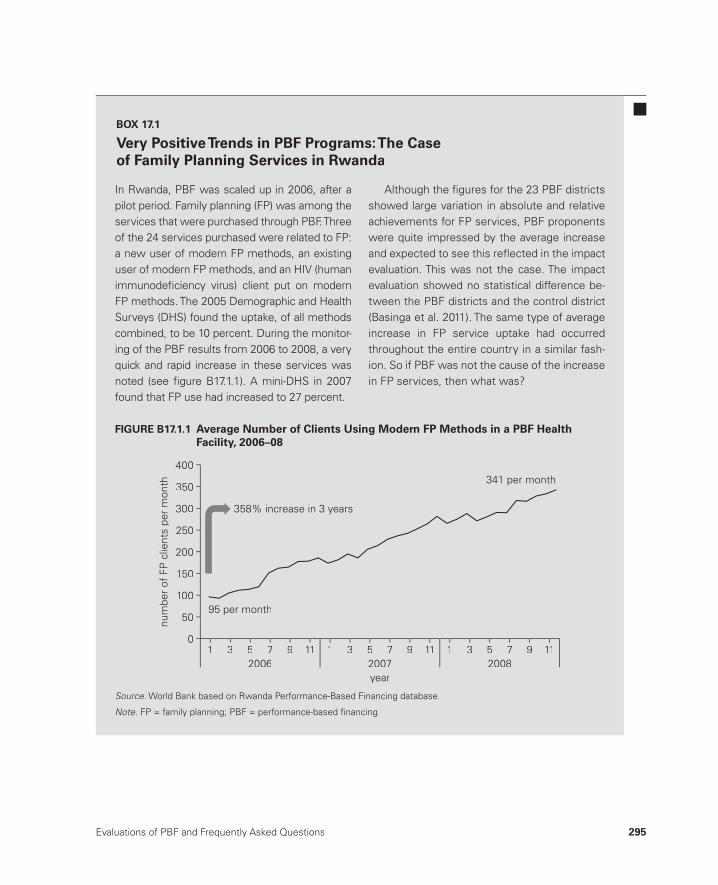
Evaluations of PBF and Frequently Asked Questions 295
In Rwanda, PBF was scaled up in 2006, after a pilot period. Family planning (FP) was among theservices that were purchased through PBF. Three of the 24 services purchased were related to FP:a new user of modern FP methods, an existing user of modern FP methods, and an HIV (humanimmunodefi ciency virus) client put on modernFP methods. The 2005 Demographic and HealthSurveys (DHS) found the uptake, of all methods combined, to be 10 percent. During the monitor-ing of the PBF results from 2006 to 2008, a veryquick and rapid increase in these services was noted (see fi gure B17.1.1). A mini- DHS in 2007found that FP use had increased to 27 percent.
Although the fi gures for the 23 PBF districtsshowed large variation in absolute and relative achievements for FP services, PBF proponents were quite impressed by the average increase and expected to see this refl ected in the impact evaluation. This was not the case. The impact evaluation showed no statistical difference be-tween the PBF districts and the control district (Basinga et al. 2011). The same type of average increase in FP service uptake had occurredthroughout the entire country in a similar fash-ion. So if PBF was not the cause of the increasein FP services, then what was?
BOX 17.1
Very Positive Trends in PBF Programs: The Case of Family Planning Services in Rwanda
num
ber
of F
P c
lient
s pe
r m
onth
150
400
300
350
250
200
100
50
0
2006year2007 2008
1 3 5 7 9 111 3 5 7 9 11 1 3 5 7 9 11
341 per month
95 per month
358% increase in 3 years
FIGURE B17.1.1 Average Number of Clients Using Modern FP Methods in a PBF HealthFacility, 2006–08y,
Source:: World Bank based on Rwanda Performance- Based Financing database.World Bank based on Rwanda Performance Based Financing database::
Note: FP = family planning; PBF = performance- based fi nancing.:

296 Performance-Based Financing Toolkit
Evaluations can be divided into three types (Gertler et al. 2011; Imas and Rist 2009):
• Monitoring➜ The monitoring of results tracks inputs, outputs, and results of a proj-
ect or program.• Evaluations
➜ Descriptive questions are used to assess what is taking place and what are the organizational processes and to describe the processes through stakeholder interviews.
➜ Normative questions are used to analyze what is actually taking place, compare this against what is supposed to take place, and assess whether the targets are accomplished.
➜ Cause and eff ect questions are used to examine outcomes. These also try to assess what diff erence the intervention makes to outcomes. Im-pact evaluations fall in this category.
The story on family planning in Rwanda in box 17.1 demonstrates that re-liance on monitoring information from PBF districts alone might have led to a conclusion that PBF was the cause of this strong increase. However, the impact evaluation showed no diff erence between the increases of the con-traceptive prevalence rate in the treatment and the control districts. PBF appeared to have had no eff ect on increasing the uptake of family planning services during its scaling- up phase in Rwanda. Does this fi nding mean that PBF should not be used for family planning services (because it apparently had no eff ect according to the Rwandese impact evaluation)? And should this “wisdom” be applied to other contexts? Not really.
Other types of evaluations might have revealed that at that time, in- charge persons of health facilities in both treatment and control districts were un-der pressure by the district mayors to deliver family planning results. While the district mayors were under pressure by the president to deliver on fam-ily planning in addition to 80 other development targets across all sectors, the in- charge persons were under pressure by their district mayor to deliver on family planning. Many stories circulate about in- charge persons in con-trol districts who called their colleagues in the treatment districts and asked about the tools they were using to measure performance and to direct per-formance to individual health workers. The nonconditional cash payments received each quarter by the control facilities were therefore also condi-tioned on reaching performance results.3 Qualitative research using focusgroup discussions would have informed the impact evaluation results and would have provided more contextual information on why some methods worked, while others, seemingly, did not. For this reason, there are a large
Evaluations of PBF and Frequently Asked Questions 297
number of rigorous impact evaluations fi nanced through the Health ResultsInnovation Trust fund; by 2013, there were 15 such impact evaluations, and their number is growing. These impact evaluations will add signifi cantly tothe body of evidence on such approaches through a mix of diff erent evalu-ations: alongside quantitative methods, there are also qualitative methods, process evaluations, and so on.
In ShortUsing mixed methods, that is, a mix of quantitative techniques (for example, impact evaluations) and qualitative techniques (for example, focus group discussions) would have explained why there was no diff erence in Rwanda between the treatment and control groups for family planning services(Tashakkori and Teddlie 2003).
How to Deal with the Fact That Rigorous ImpactEvaluations Are Often Diffi cult in Practice
Rigorous impact evaluations are diffi cult to carry out. Signifi cant techni-cal and fi nancial resources are required. In a recent book, Gertler et al. (2011) describe impact evaluations in more detail. The impact evaluation toolkit, which the World Bank has recently published, provides useful tips and tools.4
Why PBF Programs Are Diffi cult Research
PBF programs are systemic interventions (de Savigny and Adam 2009; von Bertalanff y 1969). Their systemic reform character necessitates applying a wide range of monitoring and evaluation techniques that use a mix of quan-titative and qualitative methods (Alexander and Hearld 2012; Meessen et al. 2012). In systematic interventions, many variables operate at the same time. They work together in reaching a range of desirable eff ects, and many of these variables are not easy to research.
Intervention actions may also interfere with each other. Consider, forexample, the Rwandese family planning case discussed above. The infl u-ence of the performance agreements of the president on the behavior of the in- charge persons of health facilities in control districts during theimpact evaluation was not foreseen. So is it correct to conclude— on the basis of lack of eff ect of PBF on family planning services in Rwanda during 2006– 08— that this result will be the same in other countries? No. In fact, quite a number of other evaluations indicate that PBF does have an eff ect on family planning services.
298 Performance-Based Financing Toolkit
17.3 PBF Programs in LMIC and OECD CountriesHave Both Differences and Similarities
Although PBF programs in LMIC diff er from those in OECD countries in important ways, there are also similarities. Evaluation results, however, can-not be extrapolated from OECD to LMIC countries. The following sections discuss how LMIC and OECD programs diff er, how they are similar, and what LMIC can learn from OECD country approaches to PBF.
Differences Between PBF Programs in LMIC and OECD Countries
PBF programs in LMIC and OECD countries diff er in the following respects:
• Coverage for essential health services• Baseline quality of services• Health worker coping strategies• Size of output budget• Type of PBF program• Institutional arrangements.
Coverage for Essential Health ServicesEssential health services have much poorer coverage in low- income coun-tries compared to OECD countries. In a low- income country, a person vis-its a health provider on average once in two years, but in OECD countries, a person visits a doctor on average 6.5 times per year (OECD 2011). A further example is institutional deliveries. In Sub- Saharan Africa, 40 percent of the women deliver with a qualifi ed provider, while in OECD countries the rate is close to 100 percent. So while there is underconsumption of health services in low- income countries, there is overconsumption in OECD countries. This is one of the main reasons that PBF programs in LMIC incentivize service pro-vision (OECD 2010). Stimulating service provision for preventive services— a key element of PBF approaches in LMIC— is also a common feature of many health programs in OECD countries (Xingzhu and O’Dougherty 2004).
Baseline Quality of ServicesThe quality of health services in LMIC is very low compared to OECD countries. LMIC face both poor coverage and low quality of health services (Berendes et al. 2011; Das 2011). Quality of care is considered a challenge in OECD countries, too (IOM 2001; Kohn, Corrigan, and Donaldson 2000). However, the worst health institution in any OECD country would probably still score better than most best health facilities in LMIC.

Evaluations of PBF and Frequently Asked Questions 299
Quality baselines diff er, and the problems facing LMIC health facilities are diff erent. For instance, LMIC health facilities often lack basic equip-ment, struggle with defi cient infrastructure, have problems with water and sanitation, and lack basic products to ensure adequate hygiene. All such ba-sic inputs are commonly available in OECD country health facilities.
Consequently, the quality problems that confront LMIC and OECDhealth systems are in diff erent categories and are diffi cult to compare, a phe-nomenon known as the “category problem” (Ryle 1949). Therefore, PBF pro-grams in LMIC use diff erent measures as compared to those in OECD coun-tries. These unique instruments incentivize diff erent dimensions of quality (Donabedian 2005). For instance, the dimensions in LMIC emphasize the structural aspects of quality and those elements of patient- provider interac-tions that can be captured in various documents.
Health Worker Coping StrategiesIn addition to poor coverage and quality problems, LMIC must deal withhealth workers who have low salaries and compensate with coping mech-anisms to pay for daily living expenses. Health worker coping strategies in LMIC are sizable and pervasive, and they are a type and form that is uncommon in OECD countries. Coping mechanisms such as absentee-ism, moonlighting, double- practice, acceptance of informal payments orgifts, and drug pilfering pervade LMIC health systems (Van Lerberghe et al. 2002). This situation is diff erent from OECD countries where health workers do not face such challenges to their most basic needs. Many the-ories support the observation that insuffi cient pay to meet basic needs leads to less work eff ort— from Maslow’s (1943) pyramid of needs to Ak-erlof’s (1982) wage fairness theory and Herzberg’s (1968) motivation- hygiene theory.
Size of Output BudgetWith respect to percentage, the size of the PBF output budget is large com-pared to similar programs in OECD countries. Correcting the need for health worker coping strategies requires a relatively large PBF budget. Whereas inOECD countries a pay- for- performance program could be equivalent to a maximum of 5 percent of additional fi nancing (OECD 2010),5 in LMIC this could be closer to 30– 40 percent. PBF programs in LMIC attempt to fi nance a large gap composed of signifi cant health worker bonuses and a consider-able sum to procure basic equipment and missing drugs, repair basic sanita-tion, and so on. The size of the incentives is known to be positively corre-lated with results (Miller and Babiarz 2013).

300 Performance-Based Financing Toolkit
Type of PBF ProgramPBF programs in LMIC diff er from those in OECD countries in basic aims. First, delivering more cash into health facilities to pay health worker bo-nuses and to fi nance infrastructure, equipment, and drugs is a core aim of PBF systems in LMIC.6 In contrast, OECD countries have a diff erent aim.Pay- for- performance programs in OECD countries are focused on quality and have cost- containment objectives (Maynard 2012). Second, in OECD countries a wide variety of PBF approaches are found under the title “Pay for Performance,” or P4P, schemes. By contrast, PBF programs in LMIC are primarily comparable to one another: they increase the volume of services (through a fee- for- service mechanism) and the quality (through a balanced scorecard with the level of quality aff ecting on the payment). Meanwhile, PBF programs in OECD countries increase the quality (through diff erent means) while hoping that this will lead to cost containment and savings in the mid- term.7
In ShortPBF programs diff er signifi cantly between LMIC and OECD countries. Such diff erences render evaluation results drawn from OECD country PBF pro-grams not directly applicable to LMIC.
Similarities
Besides signifi cant diff erences between PBF programs in LMIC and OECD countries, there are also a number of similarities. Such similarities are par-ticularly clear if an analogy is drawn between PBF programs in LMIC and provider payment mechanisms and health reforms in OECD countries. The following elements of OECD health systems have parallels to PBF programs in LMIC.
Fee- for- ServicePaying providers a fee- for- service leads to more services. Paying providers a fee for each service clearly leads to an increase in those services (Averill et al. 2010; Chaix- Couturier et al. 2000; Flodgren et al. 2011; Jegers et al. 2002; Langenbrunner, Cashin, and O’Dougherty 2009). This phenomenon is also described in LMIC (Lagarde and Palmer 2008). In other words, output- based payments (such as fee- for- service, case- based payments, and diagnosis- related groups) have the potential to increase service provision. This is similar to PBF systems in LMIC in which providers are paid a fee- for- service conditional on quality (Basinga et al. 2011; de Walque et al. 2013; Gertler and Vermeersch 2012).

Evaluations of PBF and Frequently Asked Questions 301
Purchaser- Provider SplitA purchaser- provider split in OECD countries and former Soviet republics is similar to PBF separation of functions in LMIC. The purchaser pays provid-ers a fee- for- service. A purchaser- provider split creates a market for healthservices whereby the purchaser is split from the provider (Langenbrunner, Cashin, and O’Dougherty 2009). Such purchaser- provider splits have been a cornerstone of health reforms in OECD countries and former Soviet repub-lics (Busse et al. 2005). Similarly, PBF health reforms introduce a separationof functions by splitting the purchasing of services from the provision and regulation of services (see chapter 2) (Bertone and Meessen 2010).
Health Reforms and Market ReformsPBF health reforms are similar to internal market or quasi- market reforms in OECD country health systems. PBF health reforms introduce market forces in centrally managed LMIC health systems (Meessen, Soucat, and Sekabaraga 2011). Such reforms are similar to those introduced in the United Kingdom and New Zealand under the New Public Management thinking (Le Grand 2003; Le Grand and Bartlett 1993). A better distribution of health care while improving effi ciency was a stated goal of internal market reforms (Busse et al. 2005; Enthoven 1991). Just like in OECD countries, PBF health reforms in LMIC attempt to enhance allocation effi ciency— by channeling existing resources from the macrolevel to the lower levels of the health care pyramid— and to improve technical effi ciency at the health facility level.
Strategic PurchasingPurchasing of well- defi ned basic and complementary health packages through PBF in LMIC is conceptually similar to strategic purchasing inOECD countries. Purchasing a service requires the service to be defi ned, a fee to be attached to it, and the service package to be made explicit. Whereaspassive purchasing refers to just paying the bill that providers send, strategic purchasing refers to actively determining what to buy, from whom, and for how much (WHO 2000). PBF systems in LMIC defi ne clearly the type of services and the amount to be paid for each service. Also, such PBF systems allow the purchasing process (how much is purchased from whom) to bemonitored and enable purchasers to change the service fee regularly based on budget realities or strategic choices.
Path DependencyPath dependency, a well- known phenomenon in health reforms in OECD countries, also applies to PBF reforms in LMIC. Path dependency means that what has been done in the past will determine what will likely be done

302 Performance-Based Financing Toolkit
in the future. How health services have been organized, fi nanced, and deliv-ered in the past determine to a very large degree the preference of that coun-try’s health system (Walt 1994). This phenomenon, which is well known in the OECD country health reform literature (Busse et al. 2005; Figueras, Rob-inson, and Jakubowski 2005), explains why in some countries PBF health reforms catch on easily and in others the reforms seem to fail or have dif-fi culties catching on. In addition to such preferences for a certain way of doing things, some powerful stakeholders have entrenched interests, and it is very diffi cult to go against their interest (for instance, Obama care). In fact, path dependency is the reason that it is important to introduce such PBF re-forms through a well- designed and well- implemented pilot fi rst, before at-tempting to scale up PBF (see chapter 16). A PBF pilot allows local advocates to stand up, to learn PBF, to adapt it to their context, and to show results to policy makers. Infl uencing path dependency is a key aspect of PBF reforms.
In ShortAlthough there are signifi cant diff erences between LMIC and OECD coun-try PBF systems, there are also similarities. These similarities are in inter-nal market reforms, path dependency, purchaser- provider splits, strategic purchasing, and the infl uence of fee- for- service on provider behavior. Policy makers in LMIC countries should take into account such similarities when designing their PBF systems.
What LMIC Can Learn from OECD Countries
OECD country PBF systems can inform PBF systems in LMIC in two areas. These areas are noncommunicable diseases and verifi cation based on health information systems.
LMIC face an increasing burden of noncommunicable diseases and, in some instances, a double burden of infectious diseases and a developing bur-den of noncommunicable diseases (WHO 2011). Because treatment options for cardiovascular conditions are limited (due to the cost of medical technol-ogy), the focus will be on prevention. Including noncommunicable disease– related measures in PBF, on both the quantity and the quality aspects, could benefi t LMIC systems. The “how- to” could be gleaned from more advanced systems such as the United Kingdom’s Quality and Outcomes Framework, in which a few years of experimentation has led to valuable experience in this domain.
The second area in which LMIC can learn from OECD countries involves information and communication technology (ICT) solutions. Advanced PBF systems in LMIC use web- enabled data systems and increasingly also
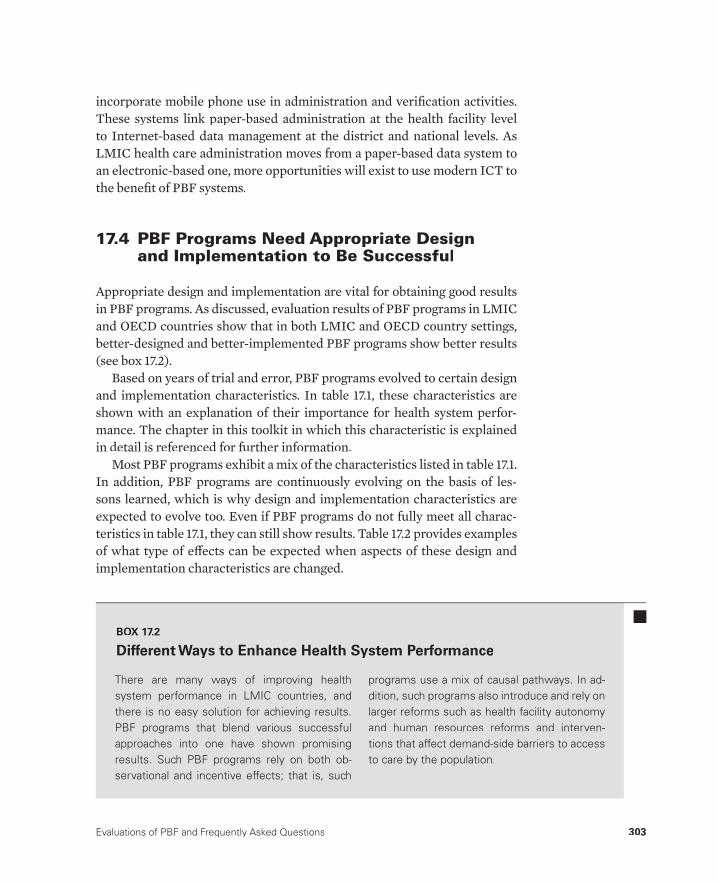
Evaluations of PBF and Frequently Asked Questions 303
incorporate mobile phone use in administration and verifi cation activities. These systems link paper- based administration at the health facility level to Internet- based data management at the district and national levels. AsLMIC health care administration moves from a paper- based data system toan electronic- based one, more opportunities will exist to use modern ICT to the benefi t of PBF systems.
17.4 PBF Programs Need Appropriate Designand Implementation to Be Successful
Appropriate design and implementation are vital for obtaining good resultsin PBF programs. As discussed, evaluation results of PBF programs in LMIC and OECD countries show that in both LMIC and OECD country settings,better- designed and better- implemented PBF programs show better results (see box 17.2).
Based on years of trial and error, PBF programs evolved to certain design and implementation characteristics. In table 17.1, these characteristics are shown with an explanation of their importance for health system perfor-mance. The chapter in this toolkit in which this characteristic is explained in detail is referenced for further information.
Most PBF programs exhibit a mix of the characteristics listed in table 17.1.In addition, PBF programs are continuously evolving on the basis of les-sons learned, which is why design and implementation characteristics are expected to evolve too. Even if PBF programs do not fully meet all charac-teristics in table 17.1, they can still show results. Table 17.2 provides examples of what type of eff ects can be expected when aspects of these design and implementation characteristics are changed.
There are many ways of improving health system performance in LMIC countries, and there is no easy solution for achieving results. PBF programs that blend various successfulapproaches into one have shown promisingresults. Such PBF programs rely on both ob-servational and incentive effects; that is, such
programs use a mix of causal pathways. In ad-dition, such programs also introduce and rely onlarger reforms such as health facility autonomyand human resources reforms and interven-tions that affect demand- side barriers to access to care by the population.
BOX 17.2
Different Ways to Enhance Health System Performance
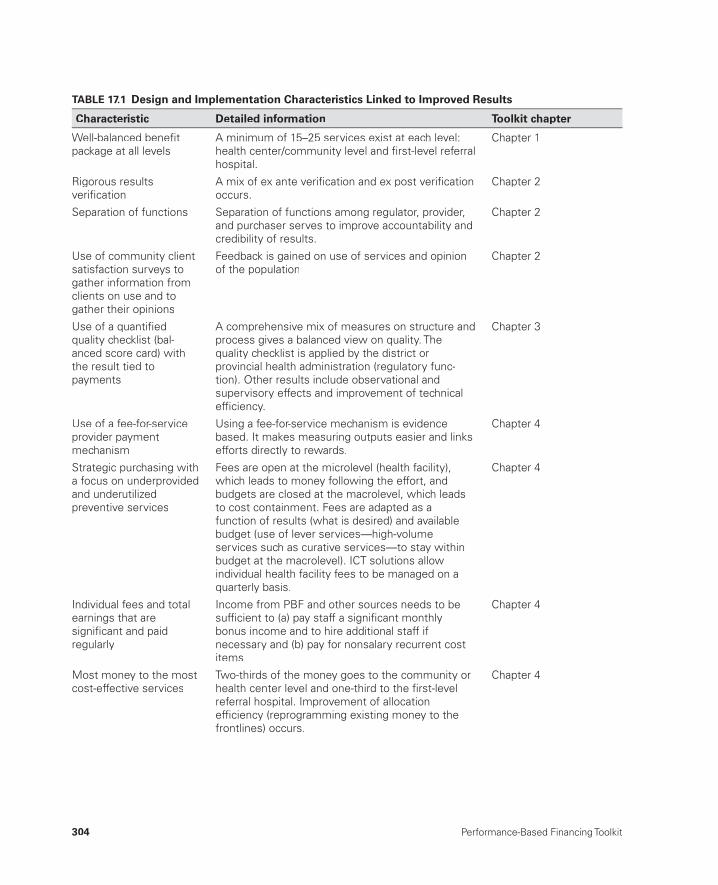
304 Performance-Based Financing Toolkit
TABLE 17.1 Design and Implementation Characteristics Linked to Improved Results
Characteristic Detailed information Toolkit chapter
Well-balanced benefi tpackage at all levels
A minimum of 15–25 services exist at each level: health center/community level and fi rst-level referral hospital.
Chapter 1
Rigorous resultsverifi cation
A mix of ex ante verifi cation and ex post verifi cationoccurs.
Chapter 2
Separation of functions Separation of functions among regulator, provider, and purchaser serves to improve accountability and credibility of results.
Chapter 2
Use of community clientsatisfaction surveys to gather information fromclients on use and togather their opinions
Feedback is gained on use of services and opinionof the population
Chapter 2
Use of a quantifi edquality checklist (bal-anced score card) withthe result tied topayments
A comprehensive mix of measures on structure andprocess gives a balanced view on quality. Thequality checklist is applied by the district orprovincial health administration (regulatory func-tion). Other results include observational andsupervisory effects and improvement of technicaleffi ciency.
Chapter 3
Use of a fee-for-service provider paymentmechanism
Using a fee-for-service mechanism is evidencebased. It makes measuring outputs easier and linksefforts directly to rewards.
Chapter 4
Strategic purchasing witha focus on underprovidedand underutilizedpreventive services
Fees are open at the microlevel (health facility), which leads to money following the effort, andbudgets are closed at the macrolevel, which leadsto cost containment. Fees are adapted as afunction of results (what is desired) and available budget (use of lever services—high-volume services such as curative services—to stay within budget at the macrolevel). ICT solutions allow individual health facility fees to be managed on aquarterly basis.
Chapter 4
Individual fees and totalearnings that aresignifi cant and paidregularly
Income from PBF and other sources needs to besuffi cient to (a) pay staff a signifi cant monthlybonus income and to hire additional staff if necessary and (b) pay for nonsalary recurrent costitems.
Chapter 4
Most money to the mostcost-effective services
Two-thirds of the money goes to the community orhealth center level and one-third to the fi rst-levelreferral hospital. Improvement of allocationeffi ciency (reprogramming existing money to thefrontlines) occurs.
Chapter 4
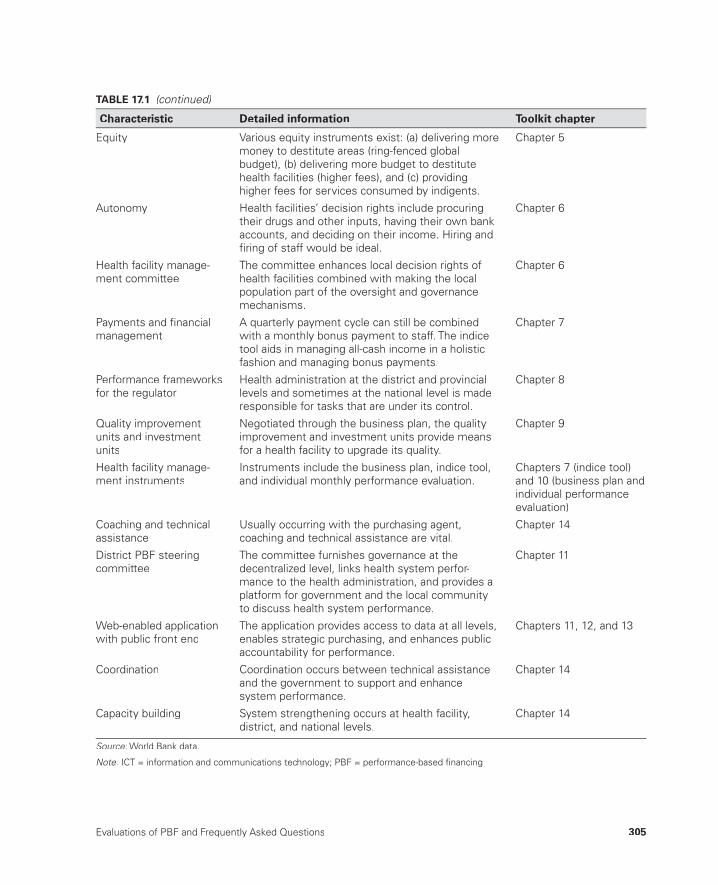
Evaluations of PBF and Frequently Asked Questions 305
Equity Various equity instruments exist: (a) delivering more money to destitute areas (ring-fenced globalbudget), (b) delivering more budget to destitute health facilities (higher fees), and (c) providinghigher fees for services consumed by indigents.
Chapter 5
Autonomy Health facilities’ decision rights include procuringtheir drugs and other inputs, having their own bankaccounts, and deciding on their income. Hiring andfi ring of staff would be ideal.
Chapter 6
Health facility manage-ment committee
The committee enhances local decision rights ofhealth facilities combined with making the localpopulation part of the oversight and governancemechanisms.
Chapter 6
Payments and fi nancialmanagement
A quarterly payment cycle can still be combinedwith a monthly bonus payment to staff. The indice tool aids in managing all-cash income in a holisticfashion and managing bonus payments.
Chapter 7
Performance frameworksfor the regulator
Health administration at the district and provinciallevels and sometimes at the national level is maderesponsible for tasks that are under its control.
Chapter 8
Quality improvement units and investment units
Negotiated through the business plan, the quality improvement and investment units provide meansfor a health facility to upgrade its quality.
Chapter 9
Health facility manage-ment instruments
Instruments include the business plan, indice tool,and individual monthly performance evaluation.
Chapters 7 (indice tool)and 10 (business plan andindividual performanceevaluation)
Coaching and technicalassistance
Usually occurring with the purchasing agent,coaching and technical assistance are vital.
Chapter 14
District PBF steeringcommittee
The committee furnishes governance at the decentralized level, links health system perfor-mance to the health administration, and provides aplatform for government and the local communityto discuss health system performance.
Chapter 11
Web-enabled application with public front end
The application provides access to data at all levels,enables strategic purchasing, and enhances publicaccountability for performance.
Chapters 11, 12, and 13
Coordination Coordination occurs between technical assistance and the government to support and enhance system performance.
Chapter 14
Capacity building System strengthening occurs at health facility,district, and national levels.
Chapter 14
Source: World Bank data.:
Note: ICT = information and communications technology; PBF = performance-based fi nancing.:
TABLE 17.1 (continued)
Characteristic Detailed information Toolkit chapter
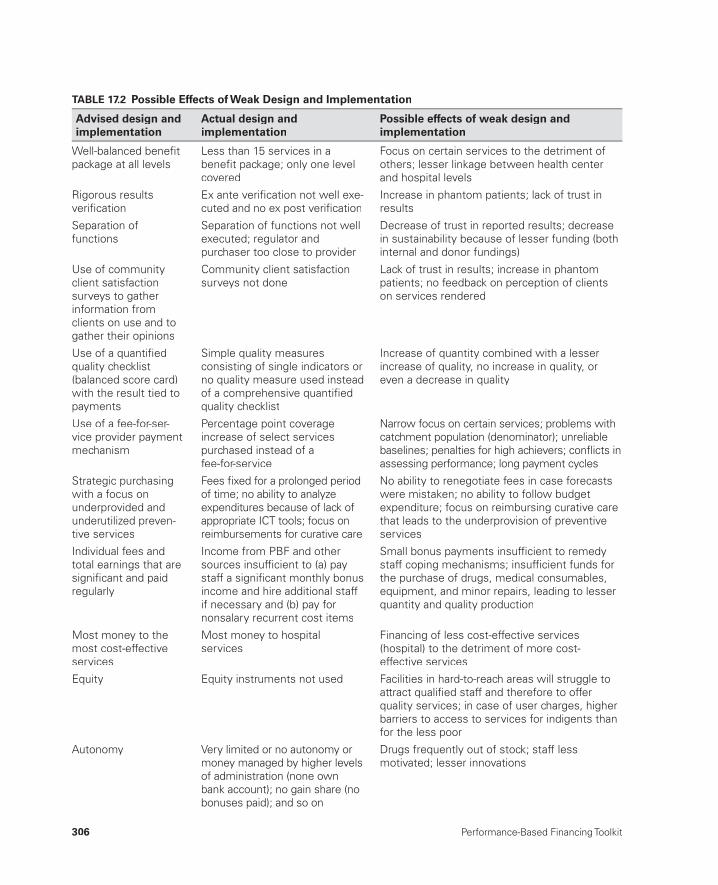
306 Performance-Based Financing Toolkit
TABLE 17.2 Possible Effects of Weak Design and Implementation
Advised design and implementation
Actual design andimplementation
Possible effects of weak design and implementation
Well-balanced benefi tpackage at all levels
Less than 15 services in a benefi t package; only one level covered
Focus on certain services to the detriment of others; lesser linkage between health center and hospital levels
Rigorous resultsverifi cation
Ex ante verifi cation not well exe-cuted and no ex post verifi cation
Increase in phantom patients; lack of trust inresults
Separation offunctions
Separation of functions not wellexecuted; regulator and purchaser too close to provider
Decrease of trust in reported results; decreasein sustainability because of lesser funding (bothinternal and donor fundings)
Use of community client satisfactionsurveys to gather information fromclients on use and togather their opinions
Community client satisfactionsurveys not done
Lack of trust in results; increase in phantompatients; no feedback on perception of clientson services rendered
Use of a quantifi edquality checklist(balanced score card)with the result tied topayments
Simple quality measuresconsisting of single indicators orno quality measure used insteadof a comprehensive quantifi edquality checklist
Increase of quantity combined with a lesserincrease of quality, no increase in quality, oreven a decrease in quality
Use of a fee-for-ser-vice provider paymentmechanism
Percentage point coverage increase of select servicespurchased instead of afee-for-service
Narrow focus on certain services; problems withcatchment population (denominator); unreliablebaselines; penalties for high achievers; confl icts in assessing performance; long payment cycles
Strategic purchasingwith a focus onunderprovided andunderutilized preven-tive services
Fees fi xed for a prolonged periodof time; no ability to analyze expenditures because of lack ofappropriate ICT tools; focus onreimbursements for curative care
No ability to renegotiate fees in case forecastswere mistaken; no ability to follow budgetexpenditure; focus on reimbursing curative carethat leads to the underprovision of preventive services
Individual fees andtotal earnings that aresignifi cant and paidregularly
Income from PBF and othersources insuffi cient to (a) pay staff a signifi cant monthly bonus income and hire additional staffif necessary and (b) pay for nonsalary recurrent cost items
Small bonus payments insuffi cient to remedy staff coping mechanisms; insuffi cient funds for the purchase of drugs, medical consumables,equipment, and minor repairs, leading to lesserquantity and quality production
Most money to themost cost-effective services
Most money to hospitalservices
Financing of less cost-effective services(hospital) to the detriment of more cost-effective services
Equity Equity instruments not used Facilities in hard-to-reach areas will struggle toattract qualifi ed staff and therefore to offerquality services; in case of user charges, higherbarriers to access to services for indigents thanfor the less poor
Autonomy Very limited or no autonomy ormoney managed by higher levelsof administration (none ownbank account); no gain share (no bonuses paid); and so on
Drugs frequently out of stock; staff less motivated; lesser innovations
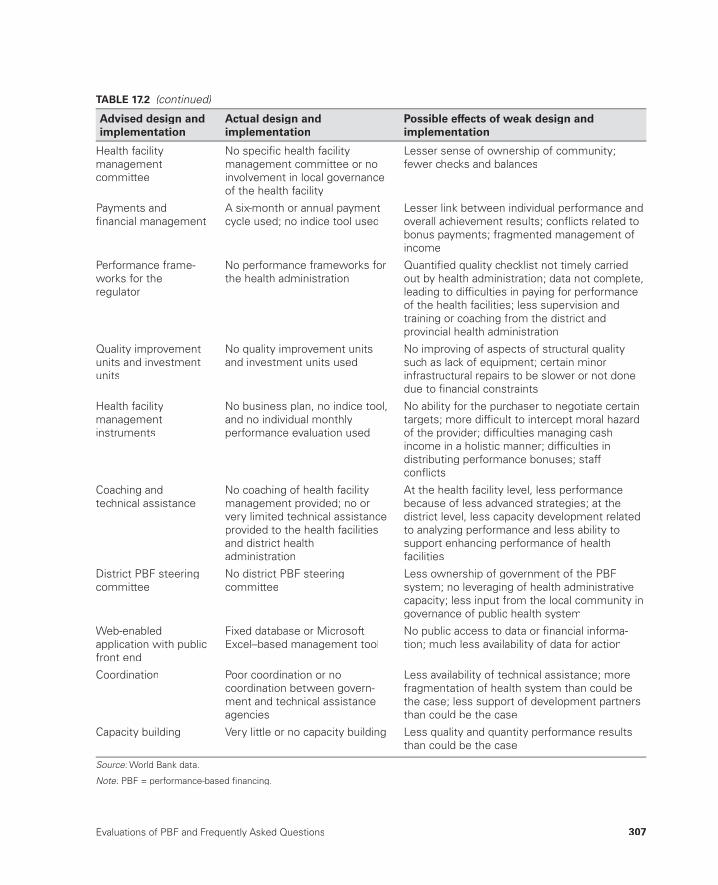
Evaluations of PBF and Frequently Asked Questions 307
Health facility managementcommittee
No specifi c health facility management committee or noinvolvement in local governanceof the health facility
Lesser sense of ownership of community;fewer checks and balances
Payments andfi nancial management
A six-month or annual paymentcycle used; no indice tool used
Lesser link between individual performance andoverall achievement results; confl icts related tobonus payments; fragmented management ofincome
Performance frame-works for theregulator
No performance frameworks for the health administration
Quantifi ed quality checklist not timely carriedout by health administration; data not complete,leading to diffi culties in paying for performance of the health facilities; less supervision andtraining or coaching from the district andprovincial health administration
Quality improvement units and investment units
No quality improvement unitsand investment units used
No improving of aspects of structural quality such as lack of equipment; certain minorinfrastructural repairs to be slower or not done due to fi nancial constraints
Health facility managementinstruments
No business plan, no indice tool,and no individual monthlyperformance evaluation used
No ability for the purchaser to negotiate certaintargets; more diffi cult to intercept moral hazard of the provider; diffi culties managing cash income in a holistic manner; diffi culties indistributing performance bonuses; staffconfl icts
Coaching andtechnical assistance
No coaching of health facility management provided; no orvery limited technical assistanceprovided to the health facilitiesand district healthadministration
At the health facility level, less performance because of less advanced strategies; at thedistrict level, less capacity development related to analyzing performance and less ability tosupport enhancing performance of healthfacilities
District PBF steeringcommittee
No district PBF steeringcommittee
Less ownership of government of the PBFsystem; no leveraging of health administrativecapacity; less input from the local community ingovernance of public health system
Web-enabled application with publicfront end
Fixed database or Microsoft Excel–based management tool
No public access to data or fi nancial informa-tion; much less availability of data for action
Coordination Poor coordination or nocoordination between govern-ment and technical assistanceagencies
Less availability of technical assistance; more fragmentation of health system than could bethe case; less support of development partnersthan could be the case
Capacity building Very little or no capacity building Less quality and quantity performance resultsthan could be the case
Source: World Bank data.:
Note: PBF = performance-based fi nancing.:
TABLE 17.2 (continued)
Advised design and implementation
Actual design andimplementation
Possible effects of weak design and implementation

308 Performance-Based Financing Toolkit
17.5 Frequently Asked Questions
PBF is new to many governments and amounts to a diff erent way of doing business. Reaching results through output fi nancing is diff erent from fi nanc-ing through inputs (salaries, equipment, training, and so on). Questions that are frequently asked in the transition to PBF, and their answers, are provided in table 17.3.
TABLE 17.3 Frequently Asked Questions and Corresponding Answers
Question Answer
1 Are PBF and other incentive-based approaches effective?
PBF leads to more and better quality health services if it is well designedand well implemented. When PBF is not well designed or well imple-mented, it may lead to a lesser (or no) effect or to wrong results, such as the overproduction of certain services and the underproduction ofothers. More evidence is needed to document PBF effects, and suchresearch is increasingly being carried out. See chapter 17.
2 Even if PBF is effective, is itreally cost-effective? Couldthe same or better results bemore easily achieved byusing the additional money inother ways (like raisinghealth workers’ salaries orproviding better supplies)?
Well-designed research in Rwanda indicates that PBF leads to more andbetter quality health services as compared to just providing more money. This research also shows that children living near PBF facilities have a better nutritional status than children living near non-PBF health facilities.The PBF effect is so strong that it affects child health status. For the same amount of payment, the intervention group delivered higherresults. See chapter 17. More research is needed about the cost-effec-tiveness of PBF as compared to other system-strengthening approaches.A large amount of research on this subject is being planned.
3 Can PBF actually make inequality worse becausericher areas capture most ofthe money?
This could indeed be a real danger if the PBF is not well designed, which is why PBF pays higher fees to health facilities that are in more destitute areas: health facilities located in the worst areas will be paid the highestfees for their services and receive relatively more income through PBF. These facilities can then recruit more staff. See chapter 5.
4 Does PBF lead to gaming ofthe system by (a) outrightfraud and cheating, (b)reducing of quality of care soas to maximize volumes, and(c) providers’ focusing on theeasiest services and theeasiest-to-reach populations?
Gaming is a real danger in PBF:
(a) Rigorous verifi cation and counterverifi cation are done to certify thequantity and quality of services. In well-designed PBF, less than 5percent of clients cannot be traced back in the community.
(b) PBF payments are conditional based on the quality of services.Making fee-for-service payments conditional on quality leads to an increase in the quality of these services at the same time as thevolume increases.
(c) PBF closely monitors the size of the fees and the relative value ofeach fee as compared to the other. PBF also rigorously monitors theamount and type of services that are produced. Such monitoringwould intercept the underproduction of certain services. Moreover, providers in the most destitute areas are paid the highest fees fortheir services, and there is increasing experimentation with payinghigher fees for indigents. See chapters 2, 3, 4, and 5.

Evaluations of PBF and Frequently Asked Questions 309
(table continues on next page)
5 Does PBF destroy intrinsicmotivation, so that healthworkers work only when given incentives, which results in reducedprofessionalism?
Research on this subject is mostly from OECD countries and resultingarguments are ambiguous and cannot be directly applied to LMIC. PBFuses a systemic approach that not only works with relatively highincentives (because take-home salaries are very low), but also providesautonomy on the use of funds and strong management support.Research from Rwanda shows that health providers did much better under PBF. Providers under PBF stayed more within their area of expertise than did those that were not under PBF; PBF providers were more professional. Most health workers and their managers prefer PBFto previous systems. See chapter 17.
6 Does PBF distort healthsystems so that nonincentiv-ized services deteriorate?
Nonincentivized services could deteriorate, which is a real danger if PBFis not well designed or implemented. Thus, PBF purchases a balancedpackage of services at all levels of the health system. PBF also strength-ens the role of the district health administration to ensure that monitor-ing and quality supervision are carried out regularly. These tactics helpavoid such health system distortions. See chapters 1 and 4.
7 Is PBF just a way of privatiz-ing health services?
PBF introduces market forces in rigid public health systems by creatingan internal market. This is not the same as privatizing health services, and in the case of public health facilities, ownership remains with thegovernment. However, health facilities and their communities are given more autonomy (and much more money) to better manage their healthservices. Health workers are made stakeholders in their own facilities, which is quite similar to the idea of a cooperative. In addition, private not-for-profi t or for-profi t facilities are also targeted by PBF (because PBFattempts to cover the entire health network and not just the publicsystem). See chapter 6.
8 Is PBF just another way of introducing or perpetuatinguser fees?
On the contrary, PBF pays providers signifi cant fees to enable theseproviders to offer more services of better quality. If the fees are high enough (when the PBF budget is high enough), then PBF can alsosubsidize partly or fully the out-of-pocket expenses of patients. In thelatter case, user fees could be decreased or abolished. Unfortunately, public budgets are insuffi cient to fi nance all health care costs. See chapter 4.
9 Is PBF just a modest reformthat perpetuates theineffective, ineffi cient, and inequitable systems currentlyin place?
PBF involves signifi cant reforms, which is why PBF is often diffi cult to implement. PBF calls for major reforms exactly because many healthsystems are ineffective, ineffi cient, and inequitable. For PBF to work well, signifi cant reforms are required in (a) autonomy, (b) human resources management, (c) drug and medical consumables supply, and(d) fi nancial barriers to access to services. Currently, two country health systems (Rwanda and Burundi) showcase the effects of such successful reforms. See chapter 17.
10 How can PBF create anypositive effect before thehuman resources, physical infrastructure, and suppliesof the health facilities arestrengthened?
These factors are indeed important, which is why PBF works (a) on increasing autonomy, including hiring and fi ring practices, and (b) with investment units so that health facilities can start fi xing infrastructure, procure missing equipment, and purchase supplies quickly. Greatlyincreased income through PBF enables health facilities to hire additionalstaff, too. See chapters 6 and 9.
TABLE 17.3 (continued)
Question Answer
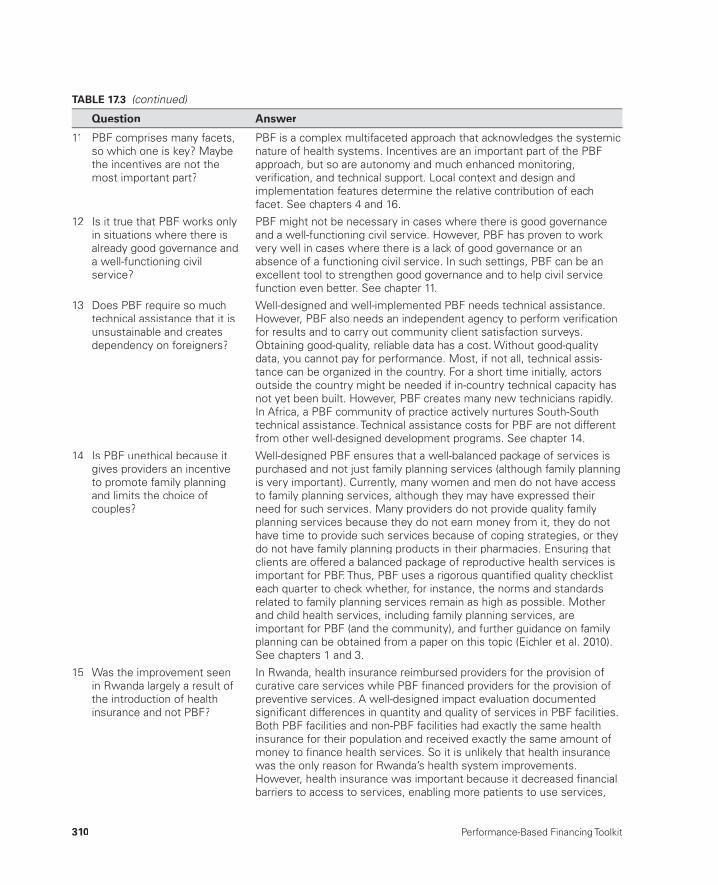
310 Performance-Based Financing Toolkit
11 PBF comprises many facets,so which one is key? Maybethe incentives are not themost important part?
PBF is a complex multifaceted approach that acknowledges the systemicnature of health systems. Incentives are an important part of the PBFapproach, but so are autonomy and much enhanced monitoring, verifi cation, and technical support. Local context and design andimplementation features determine the relative contribution of eachfacet. See chapters 4 and 16.
12 Is it true that PBF works onlyin situations where there isalready good governance and a well-functioning civilservice?
PBF might not be necessary in cases where there is good governanceand a well-functioning civil service. However, PBF has proven to workvery well in cases where there is a lack of good governance or anabsence of a functioning civil service. In such settings, PBF can be anexcellent tool to strengthen good governance and to help civil service function even better. See chapter 11.
13 Does PBF require so much technical assistance that it isunsustainable and createsdependency on foreigners?
Well-designed and well-implemented PBF needs technical assistance.However, PBF also needs an independent agency to perform verifi cationfor results and to carry out community client satisfaction surveys.Obtaining good-quality, reliable data has a cost. Without good-quality data, you cannot pay for performance. Most, if not all, technical assis-tance can be organized in the country. For a short time initially, actorsoutside the country might be needed if in-country technical capacity hasnot yet been built. However, PBF creates many new technicians rapidly.In Africa, a PBF community of practice actively nurtures South-Southtechnical assistance. Technical assistance costs for PBF are not different from other well-designed development programs. See chapter 14.
14 Is PBF unethical because itgives providers an incentive to promote family planningand limits the choice ofcouples?
Well-designed PBF ensures that a well-balanced package of services ispurchased and not just family planning services (although family planningis very important). Currently, many women and men do not have accessto family planning services, although they may have expressed their need for such services. Many providers do not provide quality familyplanning services because they do not earn money from it, they do nothave time to provide such services because of coping strategies, or theydo not have family planning products in their pharmacies. Ensuring that clients are offered a balanced package of reproductive health services isimportant for PBF. Thus, PBF uses a rigorous quantifi ed quality checklisteach quarter to check whether, for instance, the norms and standardsrelated to family planning services remain as high as possible. Motherand child health services, including family planning services, areimportant for PBF (and the community), and further guidance on familyplanning can be obtained from a paper on this topic (Eichler et al. 2010).See chapters 1 and 3.
15 Was the improvement seenin Rwanda largely a result ofthe introduction of healthinsurance and not PBF?
In Rwanda, health insurance reimbursed providers for the provision ofcurative care services while PBF fi nanced providers for the provision ofpreventive services. A well-designed impact evaluation documentedsignifi cant differences in quantity and quality of services in PBF facilities.Both PBF facilities and non-PBF facilities had exactly the same health insurance for their population and received exactly the same amount ofmoney to fi nance health services. So it is unlikely that health insurancewas the only reason for Rwanda’s health system improvements. However, health insurance was important because it decreased fi nancial barriers to access to services, enabling more patients to use services,
TABLE 17.3 (continued)
Question Answer
Evaluations of PBF and Frequently Asked Questions 311
TABLE 17.3 (continued)
Question Answer
including preventive services. PBF ensured that the much increased demand for services was met with an enhanced supply of servicesagainst a higher quality. A further reason for the improvements wereconcomitant human resources for health reforms, which led to a muchbetter distribution of health workers and a redistribution of healthworkers from the capital to rural areas.
Source: World Bank data.:
Note: LMIC = lower- and middle-income countries; OECD = Organisation for Economic Co-operation and Development; :PBF = performance-based fi nancing.
Notes
1. Two other well- designed PBF program evaluations showed good results: one inthe Philippines (Peabody et al. 2011) and one in Indonesia (Olken, Onishi, andWong 2012). However, because of very diff erent contexts (Sub- Saharan Africa versus the Philippines and Indonesia) and PBF design characteristics— in the Philippines, Peabody et al. (2011) measured and rewarded doctors’ knowledge and practice using vignettes, and in Indonesia, Olken, Onishi, and Wong (2012) rewarded villages if the health providers performed better— these are notdiscussed.
2. Every case is diff erent from the other in terms of contexts and institutional ar-rangements. Pay- for- performance programs in OECD are introduced in settings where there is already a lot of output- based payment.
3. In fact, the impact evaluation of PBF in the health sector was hurt by anotherPBF scheme (in the control districts), inspired by the PBF scheme in the treat-ment districts.
4. The web- accessible impact evaluation toolkit contains a host of instruments andtools to plan, design, and implement an impact evaluation: http://go.worldbank.org/IT69C5OGL0.
5. But most of their revenue is already linked to outputs such as diagnosis- related groups, fee- for- service, and so on.
6. But there is also a large heterogeneity among PBF programs in LMIC, such as inHaiti, Pakistan, and so on.
7. There is one large exemption to this general tendency: in the United Kingdom’sQuality and Outcomes Framework, one of the initial goals was to signifi cantly increase a general practitioner’s income.
References and Other Sources
Akerlof, G. 1982. “Labor Contracts as Partial Gift Exchange.” Quarterly Journal of Economics 97: 543– 69.
Alexander, J. A., and L. R. Hearld. 2012. “Methods and Metrics Challenges of Delivery- System Research.” Implementation Science 7: 15.
312 Performance-Based Financing Toolkit
Averill, R. F., N. I. Goldfi eld, J. C. Vertrees, E. C McCollough, R. L. Fuller, and J. Eisejhandler. 2010. “Achieving Cost Control, Care Coordination, and Quality Improvement through Incremental Payment System Reform.” Journal of Ambu-latory Care Management 33 (1): 2– 23.t
Basinga, P., P. Gertler, A. Binagwaho, A. Soucat, J. Sturdy, and C. Vermeersch. 2011.“Eff ect on Maternal and Child Health Services in Rwanda of Payment to Primary Health- Care Providers for Performance: An Impact Evaluation.” Lancet 377 t(9775): 1421– 28.
Berendes, S., P. Heywood, S. Oliver, and P. Garner. 2011. “Quality of Private and Pub-lic Ambulatory Health Care in Low and Middle Income Countries: Systematic Review of Comparative Studies.” PLoS Medicine 8 (4): e1000433.
Bertone, M. P., and B. Meessen. 2010. “Splitting Functions in a Local Health System: Early Lessons from Bubanza and Ngozi Projects in Burundi.” Report, Cordaid, The Hague.
Busse, R., J. Figueras, R. Robinson, and E. Jakubowski. 2005. “Strategic Purchasing to Improve Health Systems Performance: Key Issues and International Trends.”HealthcarePapers 8 (Special issue): 62– 76.
Chaix- Couturier, C., I. Durand- Zaleski, D. Jolly, and P. Durieux. 2000. “Eff ects of Financial Incentives on Medical Practice: Results from a Systematic Review of the Literature and Methodological Issues.” International Journal for Quality in Health Care 12 (2): 133– 42.
Das, J. 2011. “The Quality of Medical Care in Low- Income Countries: From Provid-ers to Markets.” PLoS Medicine 8 (4): e1000432.
de Savigny, D., and T. Adam. 2009. Systems Thinking for Health Systems Strengthen-ing. Geneva: World Health Organization.
de Walque, D., P. J. Gertler, S. Bautista- Arredondo, A. Kwan, C. Vermeersch,J. de Dieu Bizimana, A. Bingawaho, and J. Condo. 2013. “Using Provider Perfor-mance Incentives to Increase HIV Testing and Counseling Services in Rwanda.” Policy Research Working Paper 6364, World Bank, Washington, DC.
Donabedian, A. 2005. “Evaluating the Quality of Medical Care.” Milbank Quarterly83 (4): 691– 729.
Eichler, R., B. Seligman, A. Beith, and J. Wright. 2010. “Performance- Based Incen-tives: Ensuring Voluntarism in Family Planning Initiatives.” Bethesda, MD:Health Systems 20/20 project, Abt Associates Inc. http://www.healthsystems2020.org/content/resource/detail/2686/.
Elridge, C., and N. Palmer. 2009. “Performance- Based Payment: Some Refl ectionson the Discourse, Evidence, and Unanswered Questions.” Health Policy and Plan-ning 24 (3): 160– 66.g
Enthoven, A. C. 1991. “Internal Market Reform of the British National Health Ser-vice.” Health Aff airs 10 (3): 60– 70.
Figueras, J., R. Robinson, and E. Jakubowski, eds. 2005. Purchasing to Improve Health Systems Performance. European Observatory on Health Systems and Policies Series. New York: World Health Organization on behalf of EuropeanObservatory on Health Systems and Policies.

Evaluations of PBF and Frequently Asked Questions 313
Fiszbein, A., and N. Schady. 2009. “Conditional Cash Transfers: Reducing Presentand Future Poverty.” Policy Research Report, World Bank, Washington, DC.
Flodgren, G., M. Eccles, S. Shepperd, A. Scott, E. Parmelli, and F. R. Beyer. 2011. “An Overview of Reviews Evaluating the Eff ectiveness of Financial Incentives inChanging Healthcare Professional Behaviours and Patient Outcomes.” CochraneDatabase of Systematic Reviews (7).
Gertler, P., S. Martinez, P. Premand, L. B. Rawlings, and C. M. J. Vermeersch. 2011.Impact Evaluation in Practice. Washington, DC: World Bank.
Gertler, P., and C. Vermeersch. 2012. “Using Performance Incentives to ImproveHealth Outcomes.” Policy Research Working Paper WPS6100, World Bank, Washington, DC.
Herzberg, F. 1968. “One More Time: How Do You Motivate Employees?” Harvard Business Review 46 (1): 53– 62.
Imas, L. G. M., and R. C. Rist. 2009. The Road to Results: Designing and Conducting Eff ective Development Evaluations. Washington, DC: World Bank.
IOM (Institute of Medicine), ed. 2001. Crossing the Quality Chasm: A New Health System for the 21st Century. Washington, DC: National Academy Press.
Ireland, M., E. Paul, and B. Dujardin. 2011. “Can Performance- Based Financing Be Used to Reform Health Systems in Developing Countries?” Bulletin of the World Health Organization 89 (9): 695– 98.
Jegers, M., K. Kesteloot, D. De Graeve, and W. Gilles. 2002. “A Typology for Provider Payment Systems in Health Care.” Health Policy 60 (3): 255– 73.y
Kalk, A., F. A. Paul, and E. Grabosch. 2010. “‘Paying for Performance’ in Rwanda: Does It Pay Off ?.” Tropical Medicine and International Health 15 (2): 182– 90.
Kohn, L. T., J. M. Corrigan, and M. S. Donaldson, eds. 2000. To Err Is Human: Build-ing a Safer Health System. Washington, DC: Institute of Medicine.
Lagarde, M., and N. Palmer. 2008. “The Impact of User Fees on Health Service Uti-lization in Low- and Middle- Income Countries: How Strong Is the Evidence?” Bulletin of the World Health Organization 86 (11): 839– 48.
Langenbrunner, J. C., C. Cashin, and S. O’Dougherty, eds. 2009. Designing and Implementing Health Care Provider Payment Systems: How- to Manuals. Wash-ington, DC: World Bank and U.S. Agency for International Development.
Le Grand, J. 2003. Motivation, Agency, and Public Policy. London: Oxford University Press.
Le Grand, J., and W. Bartlett, eds. 1993. Quasi- Markets and Social Policy. London: Macmillan.
Logie, D., M. Rowson, and F. Ndagije. 2008. “Innovations in Rwanda’s Health Sys-tem: Looking to the Future.” The Lancet 372 (9634): 256– 61.t
Lundberg, M., T. Marek, and P. Okwero. 2007. “Contracting Health Services inUganda.” Unpublished report, World Bank, Washington, DC.
Maslow, A. H. 1943. “A Theory of Human Motivation.” Psychological Review 5 (4):370– 96.
Maynard, A. 2012. “The Powers and Pitfalls of Payment for Performance.” HealthEconomics 21 (1): 3– 12.
314 Performance-Based Financing Toolkit
Meessen, B., J. P. Kashala, and L. Musango. 2007. “Output- Based Payment to Boost Staff Productivity in Public Health Centers: Contracting in Kabutare District, Rwanda.” Bulletin of the World Health Organization 85 (2): 108– 15.
Meessen, B., L. Musango, J. P. Kashala, and J. Lemlin. 2006. “Reviewing Institutions of Rural Health Centres: The Performance Initiative in Butare, Rwanda.” Tropi-cal Medicine and International Health 11 (8): 1303– 17.
Meessen, B., A. Soucat, and C. Sekabaraga. 2011. “Performance- Based Financing: Just a Donor Fad or a Catalyst Towards Comprehensive Health Care Reform?” Bulletin of the World Health Organization 89 (2): 153– 56.
Meessen, B., G. van Heteren, R. Soeters, G. Fritsche, and W. van Damme. 2012. “Time for Innovative Dialogue on Health Systems Research.” Bulletin of the World Health Organization 90 (10): 715– 715A.
Miller, G., and K. S. Babiarz. 2013. “Pay- for- Performance Incentives in Low- and Middle- Income Country Health Programs.” NBER Working Paper 18932, Na-tional Bureau of Economic Research, Cambridge, MA.
Morgan, L. 2010. “Some Days Are Better than Others: Lessons Learned fromUganda’s First Results- Based Financing Pilot.” World Bank, Washington, DC. http://www.rbfh ealth.org/news/item/296/some- days- are- better- others- lessons- learned- uganda%E2%80%99s- fi rst- results- based- fi nancing- pil //rbfh ealth.org.
Musgrove, P. 2011. “Financial and Other Rewards for Good Performance or Results:A Guided Tour of Concepts and Terms and a Glossary of RBF.” World Bank, Washington, DC. http://www.rbfh ealth.org/library/doc/381/fi nancial- and- other- rewards- good- performance- or- results- guided- tour- concepts- and- ter.
OECD (Organisation for Economic Co- operation and Development). 2010. Value forMoney in Health Spending. OECD Health Policy Studies. Paris: OECD.
— — — . 2011. Health at a Glance: OECD Indicators. Paris: OECD. http://www.oecd.org/health/health- systems/49105858.pdf.
Olken, B. A., J. Onishi, and S. Wong. 2012. “Should AID Reward Performance? Evi-dence from a Field Experiment on Health and Education in Indonesia.” NBER Working Paper 17892, National Bureau of Economic Research, Cambridge, MA.
Oxman, A. D., and A. Fretheim. 2009. “Can Paying for Results Help to Achieve theMillennium Development Goals? Overview of the Eff ectiveness of Results- Based Financing.” Journal of Evidence- Based Medicine 2 (2): 70– 83.
Peabody, J., R. Shimkhada, S. Quimbo, J. Florentino, M. Bacate, C. E. McCulloch, andO. Solon. 2011. “Financial Incentives and Measurement Improved Physicians’Quality of Care in the Philippines.” Health Aff airs 30 (4): 773– 81.
Petersen, L., D. LeChauncy, L. Woodard, T. Urech, C. Daw, and S. Sookanan. 2006. “Does Pay- for- Performance Improve the Quality of Health Care?” Annals of Internal Medicine 145 (4): 265– 72.
Rosenthal, M., and R. Frank. 2006. “What Is the Empirical Basis for Paying for Qual-ity in Health Care?.” Medical Care Research and Review 63 (2): 135– 57.
Rosenthal, M. B., B. E. Landon, K. Howitt, H. R. Song, and A. M. Epstein. 2007.“Climbing Up the Pay- for- Performance Learning Curve: Where Are the Early Adopters Now?” Health Aff airs 26 (6): 1674– 82.
Evaluations of PBF and Frequently Asked Questions 315
Rusa, L., and G. Fritsche. 2007. “Rwanda: Performance- Based Financing In Health.” In Emerging Good Practice in Managing for Development Results: Sourcebook, 2nded., 105– 16. Washington, DC: World Bank.
Rusa, L., W. Janssen, S. van Bastelaere, D. Porignon, J. de Dieu Ngirabega, and W. Vandenbulcke. 2009a. “Performance- Based Financing for Better Quality of Services in Rwandan Health Centers: 3- year Experience.” Tropical Medicine and International Health 14 (7): 830– 37.
Rusa, L., M. Schneidman, G. Fritsche, and L. Musango. 2009b. “Rwanda: Performance- Based Financing in the Public Sector.” In Performance Incentives for Global Health: Potentials and Pitfalls, edited by R. Eichler, R. Levine, andPerformance- Based Incentives Working Group, 189– 214. Washington, DC: Cen-ter for Global Development.
Ryle, G. 1949. The Concept of Mind. Middlesex: Penguin Books.Sekabaraga, C., F. Diop, and A. Soucat. 2011. “Can Innovative Health Financing Poli-
cies Increase Access to MDG- Related Services? Evidence from Rwanda.” Health Policy and Planning 26 (supp 2): 52– 62.g
Soeters, R., C. Habineza, and P. B. Peerenboom. 2006. “Performance- Based Financ-ing and Changing the District Health System: Experience from Rwanda.” Bulletinof the World Health Organization 84 (11): 884– 89.
Soeters, R., L. Musango, and B. Meessen. 2005. “Comparison of Two Output Based Schemes in Butare and Cyangugu Provinces in Rwanda.” Report, Global Partner-ship on Output- Based Aid, Washington, DC, and Ministry of Health, Rwanda, Kigali.
Soeters, R., P.- B. Peerenboom, P. Mushagalusa, and C. Kimanuka. 2011. “Performance- Based Health Financing Experiment Improved Health Care in the Democratic Republic of Congo.” Health Aff airs 30 (8): 1518– 27.
Ssengooba, F., B. McPake, and N. Palmer. 2012. “Why Performance- Based Contract-ing Failed in Uganda— An ‘Open- Box’ Evaluation of a Complex Health System Intervention.” Social Science & Medicine 75 (2): 377– 83.
Tashakkori, A., and C. Teddlie. 2003. Handbook of Mixed Methods in Social and Behavioural Research. Thousand Oaks, CA: Sage.
Toonen, J., A. Canavan, P. Vergeer, and R. Elovainio. 2009. Performance- Based Fi-nancing for Health: Lessons from Sub- Saharan Africa. Amsterdam: Royal TropicalInstitute (KIT).
Van Herck, P., D. De Smedt, L. Annemans, R. Remmen, M. B. Rosenthal, andW. Sermeus. 2010. “Systematic Review: Eff ects, Design Choices, and Context of Pay- for- Performance in Health Care.” BMC Health Services Research 10: 247.
Van Lerberghe, W., C. Conceicao, W. Van Damme, and P. Ferrinho. 2002. “When Staff Is Underpaid: Dealing with the Individual Coping Strategies of Health Per-sonnel.” Bulletin of the World Health Organization 80 (7): 581– 84.
von Bertalanffl y, L. 1969. General System Theory: Foundations, Development, Applica-tions. New York: George Braziller.
Walt, G. 1994. Health Policy: An Introduction to Process and Power. London: ZedBooks.
316 Performance-Based Financing Toolkit
Werner, R. M., J. T. Kolstad, E. A. Stuart, and D. Polsky. 2011. “The Eff ect of Pay- for-Performance in Hospitals: Lessons For Quality Improvement.” Health Aff airs 30(4): 690– 98.
WHO (World Health Organization). 2000. The World Health Report 2000: HealthSystems— Improving Performance. Geneva: WHO.
———. 2011. Global Status Report on Noncommunicable Diseases 2010. Geneva: WHO.
Witter, S., A. Fretheim, F. L. Kessy, and A. K. Lindahl. 2012. “Paying for Performance to Improve the Delivery of Health Interventions in Low- and Middle- IncomeCountries (Review).” The Cochrane Database of Systematic Reviews (2).
Xingzhu, L., and S. O’Dougherty. 2004. “Purchasing Priority Public Health Ser-vices.” HNP Discussion Paper, Washington, DC, World Bank.
317
INDEX
AAbuja workshop (January 2010), 278accountability, 89, 139, 144–46, 150,
202–5, 240, 289acronyms and abbreviations list, 8–9tadapting approach to local context, 264,
274–75, 275bADePT software, 133advance payment from purchasing
agencies, 59AEDES (European Agency for
Development and Health), 155bAfghanistan
carrot-and-stick approach in, 61performance-based contracting for
health service delivery in, 4RBF program in, 124
Africa. See also specifi c countriesfrancophone Africa, 12n5health equity funds in, 128PBF programs in, 4–6, 6m
age issues, 23AIDS. See HIV/AIDSanalysis of data. See data analysisantenatal care and institutional deliveries
benchmarking performance, 232–35, 233b, 234–35f5
business plan and, 186costs of institutional deliveries to
women, 269
decline in coverage, 231, 231f1fee schedules and identifi cation of
poor, 120, 126forecasting institutional deliveries,
229–30, 230bpersonal story of woman receiving
free health care, 127bpoorest and richest quintiles’ use
of, 114f4thematic mapping for institutional
deliveries, 235, 236mvouchers, use of, 129–30
Argentina’s Plan Nacer, 124, 126automated dashboards, use of, 237, 237f7autonomy. See health facility autonomy
Bbalanced scorecard, used to achieve
equity of services to the poor, 124–26,125f5
Bamako Initiative, 90, 143banking facilities, lack of access to, 154Belgian Technical Cooperation, 69, 77benchmarking performance, 231–35,
233b, 234–35f,5 237fbenefi t-incidence analysis, 133Benin
carrot-and-stick approach in, 61, 81health equity funds in, 128local context challenges in, 274
Boxes, fi gures, maps, notes, and tables are indicated by b, f, m, n, and t following the pagenumbers.
318 Index
equity approach to fi nancing in, 123bhealth facility administration in,
267, 283n2health facility autonomy in, 141lessons from Rwanda applied
in, 171blocal context challenges in, 274modifi ed Delphi technique, use
in, 32bPBF data center in, 225–26bPBF pilot in, 5, 10PBF user manual in, 259bperformance framework in, 171bprocessing of payments in, 153bquality checklists in
based on Rwanda checklist, 70Benin checklist based on, 70,
73, 81disagreements over, 71district hospital, 75, 81health center, 75, 80–81
quasi-public purchaser approach in,210, 210t, 213t
scaling-up in, 147n1, 171btrainer development in, 251web-enabled database in, 220
business plan, 182–86compared to action plan, 183bexample of, 183–85, 184–85t
buy-in, obtaining through bottom-upapproach, 248
CCambodia
contracting-in, use in, 12n4, 214Health Equity Fund programs in, 121health equity funds in, 128performance-based contracting for
health services in, 4supply-side solutions to demand-
side problems in, 268bCameroon
carrot-and-carrot approach in, 61PBF pilot in, 4, 10poor patients, premium free for, 120
capacity building of stakeholders, 240–41, 244, 246–47, 249. See also training
modifi ed Delphi technique, use in, 32b
quality checklist in, 70, 73, 81targeting the poor in, 120, 121
bonuses for health workersbudgeting for, 91–92, 110n1
indice tool and, 144, 161teff ectiveness in increasing health
services in rural areas, 93bequity bonuses, remoteness bonuses,
and isolation bonuses, 121–24individual indice value and bonus,
162–63tpayment for performance,
processing of, 153–54, 153bstimulus of, 145subsidies used to fund, 283n5
bottom-up approach to obtain buy-in, 248
budgetinggathering information on, 266output budget, 91–92, 94,
267–68, 299for performance frameworks, 150,
171–72for Rwanda health facilities, 84n2selecting services and, 31setting unit fees to stay within
budget, 93–96for verifi cation and
counterverifi cation, 55n4Bujumbura workshops
March 2009, 277–78February 2010, 279
Burundiautomated dashboard used in,
237, 237f7bonuses and salaries of health
workers in, 92equity bonuses for providers to
the poor, 121–22, 123bcarrot-and-carrot approach in, 61, 81community participation and voice
in, 145bcontracts used in, 212, 213tcounterverifi cation mechanism in,
49b, 54b, 74b
Index 319
community involvement in health facility boards and committees, 89, 145–46,145b, 206, 206f,6 208f t
community targeting, 120–21compatibility between services and
routine information system, 22–23, 22tcompensation of health workers. See
bonuses for health workers; salary of health workers
concentration index, use as equity measure, 124–26, 125f,5 131–32, 132f f2
conditional cash transfer (CCT), 8tconditional fi nancial in-kind incentives
for community health workers, 128–29conferences for sharing information and
pilot experience, 276–78Congo, Democratic Republic of
carrot-and-carrot approach in, 61getting money to facilities in, 155bhealth facility autonomy in, 141impact evaluation in, 291investment unit approach in, 177bisolation bonuses for providers in,
121, 122PBF use in, 4
consultants. See also technical assistanceexternal consultations, in business
plan, 185–86lawyers, use of, 215n1software development
consultants, 222contracting-in
Cambodian public health systemusing, 12n4, 214
defi ned, 12n4PBF projects similar to, 214
contracting-out, 12n4, 214contract management
governance and, 211–13, 212–13tlawyers, use of, 215n1verifi cation agencies and, 55n2
coordination, 240, 245. See also technicalassistance
Cordaid, 155b, 177b, 207, 277cost-eff ective services, 18, 89, 116, 293, 308tcounterverifi cation mechanism, 49b, 54b,
74b, 75, 240, 248
carrot-and-carrot vs. carrot-and-stick approach, 60–69. See also specifi c countries
NGO fund holder PBF approachand, 76
Scenario A (high quality), 62, 63–64t, 68t
Scenario B (high quality), 62, 65–66t, 68t
Scenario C (average quality), 62, 67–68t
cash income, 149–51gathering information on, 266verifi cation of amounts, 151–52
cash on delivery-aid (COD-Aid), 8tcash transfer programs, 122, 124catastrophic payments, 132–33Central African Republic
carrot-and-carrot approach in, 61PBF pilot in, 5
Chadcarrot-and-carrot approach in, 61getting money to facilities in, 155b
champions on local scene, 249, 270–71cheating. See fraudchecklists
pilot project implementationchecklist, 279, 279–82t
quality checklists, 59data collection and, 51described, 70bdesign tips, 72–75drug availability, 273examples of, 71t, 75–83investment units and, 178sharing of checklists, 69–72unannounced visits vs. offi cial
visits to hospitals and, 54brevision on regular basis, 261
childbirth. See antenatal care andinstitutional deliveries
Coady, D., 121COD-Aid (cash on delivery-aid), 8tcommunity-based organizations (CBOs),
48b, 145bcommunity client satisfaction surveys,
46–47, 48–49b, 204b, 289
320 Index
reliable registers, importance of,50–51
web-enabled application, 217, 220–21consultant for software
development, 222general considerations, 222how to create, 222–26maintenance, security, and
continuous development, 223–26
training end users, 222–23deliveries. See antenatal care and
institutional deliveriesDelphi method. See modifi ed Delphi
technique, use ofdemand side
constraints to service delivery,268–70
fi nancial or in-kind incentives forpatients, 119, 129–30
strategies to improve health facility results, 189
Democratic Republic of Congo. SeeCongo, Democratic Republic of
Demographic and Health Surveys (DHS),96, 114, 134, 295b
development partners and national PBF coordination, 206, 247–48
disbursement-linked indicator (DLI), 8tdissemination of information. See data
gathering and disseminationdistrict PBF steering committees
community involvement in, 89, 151–52b
governance framework with, 208tquality framework for, 60training of, 253
diversifi cation of quality stimulation,60–69
drug supplyassessment of, 266, 272–73revolving funds, 90, 143, 146–47, 272
Eequity, 113–38
bonuses for providers to the poor, 121–24, 123b
data collection on, 133–34
CPVV (Provincial Verifi cation andValidation Committee), 49b, 54b,278, 283n8
curative careclassifying curative care patients as
“poor,” 121preventive care purchasing vs., 109bsubsidizing, 147
Ddata analysis, 227–38
automated dashboards, use of, 237, 237f7
benchmarking performance, 231–35, 232–33b, 234–35f,5 237f
comparison of performance, 228–36coverage analysis, 228–30, 229tincrease from baseline and
trends over time, 228,230b, 237
technical caveats, 231formal demarcation for catchment
areas, 237importance of, 227–28links to fi les and tools, 238proxy indicators for overall
performance and effi ciency,232, 232b
strategies to boost, 236–38types of, 227
data gathering and dissemination, 217–26data analysis and capacity building,
221. See also data analysisdatabase development, 240on equity, 133–34importance of, 218links to fi les and tools, 226PBF data centers, described, 223–26bPBF special requirements for, 218–20
automatic invoicing and payment module, 219–20
diff erences from routine HMIS, 219
limited data set collected, 219public website on performance
and earnings, 221verifi cation at source, 219
peer review, 79
Index 321
running the program, 248–49setting agendas, 248–49
external consultations, in business plan, 185–86
Ffamily planning, 22, 295b, 296, 297fee-for-service, 87, 88, 94, 123b, 128,
231, 300fi eld visits, 54b, 266, 267Figueras, J., 108fi nancement basé sur la performance, 12n5fi nancial management. See health facility
fi nancial managementfi nancing gap, 90, 91fi rst-level referral hospitals
how to select services, 27tquality checklists, 75, 82–83, 82bquality frameworks, 60–61staff performance payments, 92visiting, 266
forecasting, 228, 230b, 231, 231f1fragile states, 9francophone Africa, 12n5fraud, 53, 55n1, 55n3, 308tfree health services, 91, 110n3, 127, 127b,
129–30, 266, 272freeware, 221frequently asked questions, 308, 308–11t
GGAVI Alliance, 38geographic information software, 220geographic targeting, 121–24Gertler, P., 297Ghana
bonus and salaries of health workersin, 91–92
costs of institutional deliveriesin, 269
Global Fund, 38Global Health Council (Washington,
D.C., June 2010), 279governance issues and structure, 201–16.
See also health facility autonomychallenges, 207community involvement, 206, 206f.6
See also community involvement
gap in health care use betweenpoorest and richest, 114–15, 114f4
health care issue, 114–16, 309tinnovative approach to enhancing,
116–17, 118tmeasuring and monitoring, 113,
130–34OECD countries’ clinical
eff ectiveness and, 293policy informed by equity
analysis, 134pro-poor schemes, 113, 117–30. See
also pro-poor schemesrecommended resources, 135–36
European Agency for Development andHealth (AEDES), 155b
evaluations, 287–316design and implementation
requirements for success, 303–4t,303–7, 303b
diffi culty of research, 297impact evaluations, 291–92LMIC vs. OECD countries, 288,
292–94, 298–303overview, 288provider payment mechanisms not
tied to quality of care, 293–94provider payment mechanisms tied
to quality of care, 293research evidence, development of,
288–97weak evaluation designs, 294–97,
306–7tex ante verifi cation
of quality of services, 74bof quantity of services, 45–46
ex post verifi cationof quality of services, 74bof quantity of services, 46–47
extended team approach, 245–49buy-in, obtaining through bottom-up
approach, 248documenting meetings, 248–49mapping stakeholders to assess
interest, 247mobilizing support from government
and key development partners,247–48

322 Index
health facility autonomy, 139–47. See alsogovernance issues and structure
accountability and, 144–46, 208tassessing for pilot project, 271bonuses. See bonuses for health
workerselements of, 141, 142tenhancing and improving results,
141–42, 144tfee setting and drug revolving funds,
146–47gathering information on, 266importance of, 53, 89, 140–41research needed on, 289
health facility boards and committees.See also district PBF steering committees
community involvement in, 89, 145–46, 145b, 206, 206f6
health facility fi nancial management,149–64. See also unit price and costing
accounting for the money, 154–55cash income, 149–51fi nancing gap, 90, 91frequency of payment, 154general sources of cash income,
150–51getting money to facilities, 155bindice tool, 155–64. See also
indice toolinitial performance payment, 154lack of banking facilities, 154links to fi les and tools, 164in low-income countries, 90overview, 150processing payments, 153–55verifi cation of cash amounts, 151–52
health facility management, 181–200advanced strategies to improve
results, 190, 191–99texternal consultations, 185–86fi nancial management. See health
facility fi nancial managementhealth workers as stakeholders in,
90–91, 139institutional deliveries, 186links to fi les and tools, 200
in health facility boards andcommittees
contracts and governance rules,211–13, 212–13t
framework for, 208–9tfunction of PBF key players, 205tinternal market for purchasing,
214–15links to fi les and tools, 215overview, 202PBF at scale, 214–15private purchaser approach, 207–8,
210–11tpublic purchaser approach, 207,
210, 212tquasi-public purchaser approach,
207, 210–11, 210–11t, 213tseparation of functions, 202–5,
203f,3 205f ttransparency, voice, and
accountability, 202–6types of purchaser arrangements,
207–11Grosh, M., 121group thinking, 31Guinea-Bissau, treatment protocols
reducing morbidity and mortality in, 72
Gunn, B., 245bGwatkin, D., 117
HHaiti, performance-based contracting in,
4, 21bhealth centers. See also headings starting
with “health facility”how to select services, 25–26tMayo-Ine Health Center
(Nigeria), 5boutput budget and subsidies for, 92quality checklists for, 75–76, 80–82quality frameworks for, 60–61unit fees. See unit price and costingvisiting, 266, 267
Health Equity and Financial Protectioncountry datasheets (World Bank), 119
health equity funds, 121, 128, 272
Index 323
incentives. See also bonuses for healthworkers
conditional fi nancial in-kindincentives for community healthworkers, 118–19, 128–29
demand-side fi nancial or in-kind incentives for patients, 129–30
PBF’s use of, 53, 309–10tperformance-based incentives
(PBI), 8tresults-based fi nancing, 7f7for staff to stay, 91, 121–24
IndiaBPL card in, 136n4Janani Suraksha Yojana program
in, 129workshop on pilot program in, 278
indice tool, 142t, 155–64, 187benefi ts of use of, 144, 155–56budget for performance bonuses,
160–62, 161tindividual indice value and bonus,
162–63, 162–63tlinks to fi les and tools, 164paper-based, 156past month and proposed monthly
revenues and expenses, 158–60, 159–60t
as PBF health facility tool, 156bstatement of quarterly fi nancial
activities, 156–58, 157tindividual performance evaluation, 144,
186, 187bexample of, 188–89tindividual indice value and bonus,
162, 162–63tIndonesia
carrot-and-carrot approach in, 61Jamkesmas program in, 136n4PBF pilot in, 5program evaluation in, 311n1
information. See data analysis; data gathering and dissemination;stakeholder analysis
information and communicationtechnology (ICT), 219–21, 302–3
in-kind incentives, 130
management-strengthening tools, 182–89
business plan, 182–86, 183b,184–85t
indice tool, 187. See also indicetool
individual performanceevaluation, 144, 186, 187b
overview, 182research needed on, 289training of, 253
health information systems (HISs),133–34
health management information systems(HMISs), 22–23, 22t, 25, 46, 50, 219
Health Net International-TransculturalPsychosocial Organization (HNI-TPO), 277
health reforms and market reforms, 301Health Results Innovation Trust Fund,
6, 297HealthStats database (World Bank), 119health workers
acting as entrepreneurs, 139bonuses. See bonuses for health
workerscontract health workers, 143coping strategies of, 299incentives for, 91, 136n1
conditional fi nancial in-kindincentives for, 118–19, 128–29
salary. See salary of health workersas stakeholders, 90–91, 139
HISs (health information systems),133–34
HIV/AIDS, 30b, 32b, 38, 119, 247–48, 277HMISs (health management information
systems), 22–23, 22t, 25, 46, 50, 219Hoddinott, J., 121Hogwood, B., 245bHonduran cash transfer program, 122human resource management, 93b,
143b, 273
IICT (information and communication
technology), 219–21, 302–3
324 Index
local health authorities, quality reviews by, 58–59
lower- and middle-income countries (LMIC), 10, 288–92
compared to OECD countries, 292–302
learning from OECD countries, 302–3
weak evaluation designs in, 294–97
Mmanagement. See health facility
managementmanagement by results, 89Mandatory Health Insurance Fund
(MHIF, Kyrgyz Republic), 83manuals. See training; user manualsMaslow’s pyramid of needs, 91, 299Maternal Mortality Ratio (MMR), 19Mayo-Ine Health Center (Nigeria), 5bMDGs (Millennium Development Goals),
119, 266, 270means testing, 120MEASURE DHS Statcompiler, 119Medicare fraud, 55n3Mexico’s PROGRESA (now called
Oportunidades) program, 124Microsoft tools used, 79, 108, 156,
220, 237Millennium Development Goals (MDGs),
119, 266, 270minimum package of health services,
costing of, 96–108ministry of health
governance role of, 209t, 210, 267mobilizing support from government
and key development partners,247–48
quality checklists and drug availability, 273
refocusing of role of, 289technical assistance for, 245, 246. See
also technical assistanceMMR (Maternal Mortality Ratio), 19modifi ed Delphi technique, use of, 31–38,
32b, 33–34t, 36b, 37t, 75Multiple Indicator Cluster Surveys, 96Musgrove, P., 6
International Development Association, 6investments in health facility startups,
175–79how much money is involved,
176–77, 177binvestment units, 176
for fast quality improvements, 179b
how they work, 178overview, 176
invoicingPBF special requirements for, 219–21sample monthly invoice, 224b
isolation bonuses, 121–24
JJaipur workshop (January 2010), 278Jakubowski, E., 108
KKigali workshop (January 2006), 276, 277Kyrgyz Republic
birth deliveries in, 19bonuses and salaries of health
workers in, 92carrot-and-carrot approach in, 61quality checklists in
adoption of Rwanda checklist,69, 82
rayon (fi rst-level referral) hospital, 69, 75, 82–83, 82b
quasi-public purchaser approach in,210, 210t
LLao PDR, health equity funds in, 128lessons learned
advanced strategies for improving health facility results, 190, 191–99t
data analysis providing. See data analysis
LMIC learning from OECDcountries, 302–3
Rwanda lessons applied inBurundi, 171b
leveraging, 94–96Liberia, performance-based contracting
in, 21b

Index 325
PBC, use of, 21bPBF, use of, 4strategic purchasing by, 108vouchers, use of, 129–30
nonincentivized services, 40
OOECD countries, evidence from, 288,
292–94compared to LMIC countries
baseline quality of services, 298–99
essential health services, 298fee-for-service, 300health reforms and market
reforms, 301health worker coping
strategies, 299output budget, 299path dependency, 301–2purchaser-provider split, 301similarities, 300–302strategic purchasing, 301type of PBF program, 300
open source software, 221output-based aid (OBA), 8toutput budgets. See budgeting
Ppath dependency, 270–71, 301–2pay for performance (P4P), 9t, 20b, 167,
168b, 292, 300, 311n2PBC (performance-based contracting),
4, 7, 8t, 9PBF. See performance-based fi nancingPBI (performance-based incentives), 8tpeer reviews, 58, 79–80, 248PEPFAR (U.S. President’s Emergency
Plan for AIDS Relief ), 30b, 38, 277Perfect Implementation Model
(Hogwood & Gunn), 245bperformance-based contracting (PBC),
4, 7, 8t, 9performance-based fi nancing (PBF)
bonus systems. See bonuses forhealth workers
buying services in, 18–19. See alsoservices, purchasing of
NNational Health Insurance Fund (Kyrgyz
Republic), 210NCDs (noncommunicable diseases),
119, 302negotiable fees, 87, 94, 110n2New Zealand, regulated internal market
in, 214NGOs. See nongovernmental
organizationsNigeria
benchmarking performance in, 233bcarrot-and-carrot approach in, 61decentralized decision making in,
151–52bindice tool in, 156–64. See also
indice toolinvestment units to improve PBF
project quality in, 179bLGA Results-Based Financing (RBF)
Steering Committee in, 151–52blocal context challenges in, 274, 275bMayo-Ine Health Center, 5bminimum package of health services,
costing of, 96–108, 98–99t, 110n4mix of fi nancing approaches used for
State Health Investment Program in, 7–9
quantifi ed quality checklist, 70,70b, 71t
quasi-public purchaser approach in,210, 210t
State Health Investment Project in, 151–52b, 233b
workshop on pilot program in, 278noncommunicable diseases (NCDs),
119, 302nongovernmental organizations (NGOs)
carrot-and-carrot approach preferred by, 61
community client satisfactionsurvey, role in, 47
contracting-in, use of, 12n4, 214fund holder health center, quality
tool, 76, 80payment for patient successful
completion of treatment programby, 129

326 Index
example of, 169–70thow they work, 165–67links to fi les and tools, 172reasons for, 166, 168bwhat frameworks to include, 167–71who makes assessments, 167–71
performance gap, 270phantom claims, 55n3, 238n1Philippines
immunization coverage in, 132, 132bprogram evaluation in, 311n1
pilot projects, 263–84adapting approach to local context,
264, 274–75, 275bfi eld visits, 267implementation checklist, 279,
279–82tknowledge sharing, 276–78links to fi les and tools, 282overview, 264prepilots, 283n1prior to starting, 265–73
assessment of autonomy of health facilities, 271
assessment of context, 96, 267assessment of demand- and
supply-side constraints,268–70
assessment of drugs market,272–73
assessment of humanresources, 273
assessment of output budget,267–68
assessment of user feesmanagement, 271–72
fi eld visits, 267identifi cation of champions or
change agents, 270–71identifi cation of windows of
opportunity, 270–71information gathering, 266–73
private purchaser approach in, 207reasons for doing, 89, 263, 264–65resistance to change and, 264–65stakeholder information, 275–76strategic purchasing in, 108
political reasons for selection of services, 29
community client satisfactionsurveys, 46–47, 48–49b, 204b, 289
data. See data analysis; data gathering and dissemination
equity and, 116–17, 118t. See alsoequity
evaluations, 287–316. See alsoevaluations
expansion of programs in Africa, 6mexplained, 8textended team approach, 245–49fi nancial management and.
See health facility fi nancialmanagement
frequently asked questions, 308,308–11t
governance. See governance issuesand structure; health facility autonomy
health coverage and, 2b, 7as health reform approach, 88–89history of, 4–6investments in startups. See
investments in health facility startups
management and. See health facility management
manuals, 257–62. See also training;user manuals
PBC compared to, 7–9performance frameworks for. See
performance frameworkspilot testing of, 263–84. See also pilot
projectspro-poor schemes, 113, 117–30purchasing of services. See services,
purchasing ofquality assessments. See quality
measurement and verifi cationquantity verifi cation. See verifi cation
of quantity of servicessimplifi ed example of health facility,
10–12, 11tperformance-based incentives (PBI), 8tperformance benchmarking. See
benchmarking performanceperformance frameworks, 165–72
budgeting for, 171–72in contracts, 166, 168b
Index 327
carrot-and-carrot vs. carrot-and-stick approach, 60–69, 63–68t
diversifi cation of quality stimulation,60–69
frameworks for health center and fi rst-level hospitals, 60–61
links to fi les and tools, 83overview, 58–60paying for quality through PBF tools,
22, 69–72quantifi ed quality checklists, 59,
69–71, 70b, 71t, 72–75. See alsochecklists
drug availability, 273examples of, 75–83revision on regular basis, 261testing of, 261–62
separation from quantity verifi cation, 44–45
quantity of services, 22–23, 29–31health workers’ infl uence on, 24bverifi cation of, 43–55. See also
verifi cation of quantity of servicesquarterly reports
indice tool’s statement of quarterly fi nancial activities, 156–58, 157t
sample, in web-enabledapplication, 225b
quasi-public purchaser approach, 207, 210–11, 210–11t, 213t
RRBF. See results-based fi nancingRBF Impact Evaluation Toolkit (World
Bank), 134, 297realistic PBF services, 25registers as cornerstone of PBF, 50–51remoteness and isolation bonuses, 121–24reproductive health services, 130, 295b.
See also antenatal care and institutional deliveries; family planning
results-based fi nancing (RBF), 6–10diagram of, 7f7equity measure included in, 124explained, 9tincentives for, 7f7supply side, 288types of awards, 7f7
revolving funds. See drug supply
the poor. See pro-poor schemespoverty cards, use of, 136n4poverty mapping, 136n2preventive care purchasing
compared to curative care, 109bPBF focus on, 146underprovided and need to
stimulate, 19, 147primary health care, PBF use in, 4private purchaser approach, 207–8,
210–11tprivatization, 309tprogram-for-results, 9tPROGRESA (Mexico), 124pro-poor schemes, 113, 117–30
balanced scorecard, used to achieve equity of services to the poor, 124–26, 125f5
concentration index, use as equity measure, 124–26, 125f,5 131–32, 132f f2
conditional fi nancial in-kindincentives for community healthworkers, 118–19, 128–29
demand-side fi nancial or in-kind incentives for patients, 129–30
design elements in, 2b, 117–19, 118tpaying more to reach poor than
nonpoor, 118, 120–26subsidizing user fees, 118, 126–28underused services, selection of, 118,
119–20provider recognition program (PRP), 9tProvincial Verifi cation and Validation
Committee (CPVV), 49b, 54b,278, 283n8
proxy indicators for overall performanceand effi ciency, 232b
proxy means testing, 120public purchaser approach, 207,
210, 212tpurchaser-provider split, 301purchasing of services. See services,
purchasing of; unit price and costing
Qquality measurement and verifi cation,
57–83access to quality health services, 2baverage quality scenario, 67

328 Index
quality checklists inannual review and modifi cation,
72, 261disagreements over, 71district hospital, 75, 77–78health center, 75, 76Kyrgyz Republic adoption of,
69, 82performance frameworks
and, 167unannounced visits vs. offi cial
visits to hospitals and, 54bZambia adoption of, 73, 81, 261
reproductive health services and in-kind payments in, 130
services included in, 29technical assistance requirements in,
243, 243f,3 244f b, 246–49thematic mapping for institutional
deliveries in, 235, 236mtrainer development in, 251web-enabled database in, 220workshops on pilot projects in,
276–79
Ssalary of health workers, 91–92, 93b, 266scaling-up processes, 71–72, 108, 147n1,
171b, 245, 276b, 295bsegregation of duties. See separation of
functionsSenegal, pay for performance in, 20bseparation of functions
governance issues and structure,202–5, 203f,3 205f t
nonstate actors and, 240, 241research needed on, 289verifi cation of quantity of services,
44–45, 51–52, 52f2service protocol reference guide,
45–46services, purchasing of, 17–41
advance payment from purchasing agencies, 59
compatibility between servicesand routine information system, 22–23, 22t
cost-eff ective services, 18
Robinson, R., 108rural services, 93b, 121–24. See also pro-
poor schemesRwanda
benchmarking performance forinstitutional deliveries in, 232–35,234–35f5
bonus and salaries of health workersin, 92, 93b
budget of health facilities in, 84n2calculating costs of technical
assistance in, 244bcarrot-and-carrot approach in, 61carrot-and-stick approach in, 61, 78civil service reforms in, 143community client satisfaction
surveys in, 48–49bcontract health employees in, 143contracts used in, 212, 212tcounterverifi cation mechanism
in, 54bcoverage analysis for PBF services
in, 229–30, 229textended team approach in, 246–49family planning services in, 295b,
296, 297forecasting institutional deliveries
in, 230, 230b, 231f1health facility administration in, 206,
206f,6 267fhealth facility autonomy in, 141human resource management in
health facilities in, 93bimpact evaluation in, 290, 291individual performance evaluations
in, 187blessons learned from, 30b, 171bmodifi ed Delphi technique, use in,
32b, 36bPBF data center in, 223–24bPBF development in, 4, 5, 223–24bPBF user manual in, 259bpeer evaluation mechanism in, 79–80performance frameworks in, 166–
67, 168bpredictors of success in, 245b, 310tpublic purchaser approach in,
210, 212t
Index 329
sexually transmitted diseases, treatmentof, 129
shareware, 221Sierra Leone
PBF pilot in, 5scaling-up in, 276b
SMART (specifi c, measurable, attributal,realistic/relevant, time bound) criteria, 23–25, 24b, 58, 72, 73
Soeters, R., 47South-South learning, 171b, 239, 240, 243,
249–55staffi ng. See health workers; human
resource managementstakeholder analysis, 266, 275–76stewardship of government, 89strategic purchasing
curative care vs. preventivecare, 109b
LMIC compared to OECDcountries, 301
unit price and costing, 87, 89, 108–9volume purchasing, 18–19
subsidiesfor curative care, 147government paying lump-sum
subsidy to health facilities, 93bunit subsidies to providers, 39, 94user fees, 118, 126–28
supply sideconstraints to service delivery, 189RBF programs, 288strategies to improve health facility
results, 189Swiss Development Cooperation, 277
Tteam approach. See extended team
approachtechnical assistance, 239–55
bottom-up approach to obtain buy-in, 248
capacity building, training, andworking south-south, 239, 249–55
costs of, 243, 244bextended team mechanism, 245–47importance of, 53, 239, 310tlinks to fi les and tools, 254
coverage rates, 20–21design issues in, 19–28diffi culty in accuracy of coverage
rates, 20–21from fi rst service vs. from baseline
performance, 21–22handling additional requests for
inclusion, 38–40health outcomes, challenges in
purchasing, 19how to select, 18, 29–38
balance and, 30, 33budget and, 31context and, 30fi rst referral hospital level, 27tgeneral issues, 29health center/community level,
25–26tlearning from experience,
25–27, 30bmodifi ed Delphi technique, use
of, 31–38, 32b, 33–34t, 36b, 37tpolitical reasons for
selection, 29quantity to buy, 29–31. See also
verifi cation of quantity of services
transaction costs and, 31links to fi les and tools, 39most commonly purchased services,
28, 28tnonincentivized services, 40in PBF, 18–19quality of services, 22–23. See
also quality measurement andverifi cation
quantity of services, 22–23, 29–31. See also verifi cation of quantity of services
health workers’ infl uence on, 24b
SMART (specifi c, measurable,attributal, realistic/relevant, timebound) criteria for purchasing,23–25, 24b, 58, 72, 73
step-function approach, 21strategic purchasing of volume,
18–19
330 Index
baselines and targets, 95–96, 100–102t,100–105, 103f3
budgeting expenses, 87, 91–92allocating across services, 106–8,
107t, 110n3coverage increases, example of,
104–5tcurative care vs. preventive care
purchasing, 109bindex fee, 105, 106tleveraging, 94–96links to fi les and tools, 109minimum package of health services,
costing of, 96–108, 98–102t, 103f,3104–5t
overview, 88PBF as health reform approach,
88–89setting unit fees to stay within
budget, 93–96fee calculations, 95b
strategic purchasing, 87, 89, 108–9universal health coverage, 2bU.S. President’s Emergency Plan for
AIDS Relief (PEPFAR), 30b, 38, 277USAID (United States Agency for
International Development), 21b, 38, 247, 277
user fees, 118, 126–28, 146–47, 271–72, 309tuser manuals, 257–62
contents, 258–60examples of, 259blinks to fi les and tools, 261need for, 258revision on regular basis, 260–62sample table of contents, 260
Vvalue for money, 95bverifi cation of cash amounts, 151–52verifi cation of quantity of services, 43–55
budget for, 55n4challenges, 54bcounterverifi cation mechanism, 49b,
54b, 74b, 75ex ante verifi cation, 45–46ex post verifi cation, 46–47learning from experience, 30b
local sources of, 249overview, 240planning for further training, 253–55setting agendas, documenting
meetings, and running theprogram, 248–49
technical working group, 246types of, 240–44, 241–42t
timeliness of payments, 25Toolkit
overview, 1–2structure of, 3–4, 3f3use of, 2–3
training. See also technical assistancecontract signing at end of, 213of district PBF steering
committees, 253of health center management, 253links to fi les and tools, 254master trainer, 250, 252in Microsoft tools, 237planning for further training, 253–55for rollout, 253team members as trainers, 249training development process and
cycle, 250–52, 251f1training manuals, 252–53training of trainers, 249–50of verifi ers, 45of web-enabled application end
users, 222–23transaction costs and selection of
services, 31transparency, 50, 202–6, 240tuberculosis treatment, 129
UUganda, impact evaluation in, 290,
291–92Under-5 Mortality Rate (U5MR), 19United Kingdom
Quality and Outcomes Frameworkin, 302, 311n7
regulated internal market in, 214unit price and costing, 87–111. See also
health facility fi nancial managementbalancing health facility revenues
and expenses, 90–91
Index 331
World Bankdefi nition of good governance, 202Health Equity and Financial
Protection country datasheets, 119HealthStats database, 119RBF Impact Evaluation Toolkit,
134, 297World Development Report 1993:
Investing in Health, 18World Health Report (2010), 115
ZZambia
carrot-and-carrot approach in, 84n1carrot-and-stick approach in, 61fund holding by separate entity in, 207local context challenges in, 274PBF use for primary health care in, 4quality checklists in
adoption of Rwanda checklist,73, 81, 261
health center, 75, 81–82reproductive health services and in-
kind payments in, 130scope of pilot project in, 283n1
Zimbabwecarrot-and-carrot approach in, 61local context challenges in, 274private purchaser approach funded
through ministry of fi nance in,207, 210t
remoteness bonuses for providers tothe poor in, 121
links to fi les and tools, 54operational challenges, 47–52purchasing agency handling, 44,
47, 55n2reliable registers, 50–51role in PBF, 44sample sizes, 47–50, 48–49bseparation from quality verifi cation,
44–45separation of functions in, 51–52, 52f2systems of, 44–45testing of procedures, 261training of verifi ers, 45transitional issues, 53–54
voice, 145–46, 145b, 202–5volume purchasing, 18–19vouchers, 9t, 129–30
WWashington, D.C., Global Health Council
(June 2010), 279web-enabled database, 217, 220–21
consultant for software development, 222
general considerations, 222how to create, 222–26maintenance, security, and
continuous development, 223–26training end users, 222–23
windows of opportunity, 270–71Witter, S. A., 290workshops for sharing information and
pilot experience, 276–78

ECO-AUDIT
Environmental Benefits Statement
The World Bank is committed to preserving
endangered forests and natural resources. Per-formance-Based Financing Toolkit is printedton recycled paper with 50 percent postcon-
sumer fiber in accordance with the recom-
mended standards for paper usage set by the
Green Press Initiative, a nonprofit program
supporting publishers in using fiber that is not
sourced from endangered forests. For more
information, visit www.greenpressinitiative
.org.
Saved:
• 20 trees
• 9 million BTUs of
total energy
• 1,722 pounds of net
greenhouse gases
• 9,339 gallons of waste
water
• 625 pounds of solid
waste