
Performance Audit of CEO/Office of Information Technology
108
Office of the Performance Audit Director TASKS III-V REPORT: Review of CEO/IT Operational Readiness, Performance Measurement, and Communications June 9, 2010 Performance Audit of CEO/Office of Information Technology Final Report
-
Upload
khangminh22 -
Category
Documents
-
view
4 -
download
0
Transcript of Performance Audit of CEO/Office of Information Technology
Office of the
Performance Audit Director
TTAASSKKSS IIIIII--VV RREEPPOORRTT::
RReevviieeww ooff CCEEOO//IITT OOppeerraattiioonnaall RReeaaddiinneessss,, PPeerrffoorrmmaannccee MMeeaassuurreemmeenntt,,
aanndd CCoommmmuunniiccaattiioonnss
June 9, 2010
Performance Audit of
CEO/Office of Information Technology
Final Report
PERFORMANCE AUDIT OF CEO/IT – TASKS III - V REPORT Final Report
Table of Contents
Executive Summary ...................................................................................................................... i
Introduction .................................................................................................................................. 1
Scope and Objectives ................................................................................................................... 2
Audit Methodology ..................................................................................................................... 3
Background Information ............................................................................................................. 4
Findings and Recommendations ............................................................................................... 7
Task III: Review CEO/IT Operational Readiness ............................................................... 8
A. Roles and Responsibilities ........................................................................................ 8
B. Organizational Structure ........................................................................................ 11
C. Processes and Procedures ....................................................................................... 16
Task IV: Review CEO/IT Performance Measurement ..................................................... 56
A. Countywide IT Oversight ....................................................................................... 56
B. CEO/IT Performance Measurement ...................................................................... 57
C. Research and Benchmarking .................................................................................. 65
Task V: Evaluate CEO/IT Communications ...................................................................... 66
A. CEO/IT Communication with the Board of Supervisors ................................... 66
B. CEO/IT Communication with Agencies/Departments ...................................... 68
C. CEO/IT Communication with the Public ............................................................. 70
D. Communication within CEO/IT ............................................................................ 71
Appendices ................................................................................................................................ A1
Appendix A: Customer Survey Results ....................................................................... A1
Appendix B: Memo to the Board of Supervisors on IT Sourcing .............................. B1
Appendix C: CEO/IT-NPS Cost Recovery ....................................................................C1
Appendix D: IT Performance Metrics .......................................................................... D1
Appendix E: Documents Reviewed .............................................................................. E1
i
PERFORMANCE AUDIT OF CEO/IT – TASKS III - V REPORT Final Report
Executive Summary
Introduction
On June 2, 2009, the Board of Supervisors (Board) approved the scope of work for the
Performance Audit of the County Executive Office/Office of Information Technology
(CEO/IT). To successfully manage the audit and ensure more frequent receipt of
information, the Board divided the audit into five tasks:
Task I: Document and Verify Current IT Resource Allocations
Task II: Review CEO/IT Proposed Business Model (IT Strategic Plan)
Task III: Review CEO/IT Operational Readiness
Task IV: Review CEO/IT Performance Measurement
Task V: Evaluate CEO/IT Communications
The Task I and II reports have been completed by the Office of the Performance Audit
Director (Office) and submitted via the public agenda to the Board. This report
combines Tasks III – V into one final document.
Preface
Over the past nine months, the Office and its IT consultant (AEF Systems Consulting,
Inc.) have comprehensively examined the operations and activities of CEO/IT. In our
first report (Task I), the primary conclusion of the audit was that IT at the County of
Orange is a significant budgetary expense (including considerable sole source contracts)
that requires increased scrutiny and a more robust framework for tracking and
reporting costs. In our second report (Task II), the primary conclusion was that the IT
Strategic Plan developed by CEO/IT for the County of Orange does not achieve its
intended purpose of serving as an actionable roadmap for Countywide IT operations
and investments over the next five years.
In this report (Tasks III – V), there are two primary conclusions:
1. The IT infrastructure services that are most valued by agencies/departments (e.g.,
network, security, telephone) are generally well provided by CEO/IT. This is
quite an accomplishment in an organization with the size and complexity of
Orange County, and it is a testament to the skill and work ethic of many CEO/IT
employees.
ii
PERFORMANCE AUDIT OF CEO/IT – TASKS III - V REPORT Final Report
2. There remain, however, many critical opportunities for improvement within
CEO/IT. Given the scale of these challenges, meaningful progress cannot be
made without a strong commitment from CEO/IT leadership to adjust its
approaches to Countywide IT strategic planning, IT project/portfolio
management, performance measurement, and external/internal communications.
These conclusions are based on the audit team’s comprehensive review of CEO/IT
documents, financial information, research of industry best practices, a customer survey
of agency/department executives and IT managers, and a body of consistent testimonial
evidence from 83 interviews with agency/department executives, agency/department IT
managers, Board of Supervisors’ staff, and CEO/IT and CEO staff at all levels of the
organization. As such, this audit report is a compilation of direct observations, factual
documentation, and informed opinions of the County’s business and IT technical
leaders (both within CEO/IT and agencies/departments) about the management and
performance of CEO/IT.
Background
A consideration of past events is vital to understanding the present condition of
CEO/IT. In many ways, the current County IT environment has evolved as a reaction to
the actions of the previous County Information Officer (CIO), as confirmed during
numerous interviews with County executives. The previous CIO attempted, against the
collective desire of agencies/departments, to further centralize control of Countywide IT
operations under CEO/IT. As a result of this approach and other issues, a change in
leadership was made. Thus, at the time the current CIO was hired in February 2006, the
majority of agencies/departments made it clear that they preferred the continuation of a
decentralized County IT system. In response, the CIO has maintained a decentralized
system and revamped the Countywide IT Governance structure in an effort to increase
agency/department participation. The success of these endeavors and other operational
aspects of CEO/IT are addressed within this audit report.
Summary Findings
CEO/IT Strengths:
Overall, in light of CEO/IT’s commitment to retain a largely decentralized IT model (i.e.,
Federated model), many agencies/departments view the current CEO/IT organization as
iii
PERFORMANCE AUDIT OF CEO/IT – TASKS III - V REPORT Final Report
an improvement over the past. A sample of specific positive features of CEO/IT that
were identified throughout the course of this audit is listed below:
Strengths
Several IT staff and managers within CEO/IT (including its contractors) have
earned praiseworthy reputations for their responsiveness to customer issues and
for their work to improve technical operations.
Many technical CEO/IT staff members (primarily contract employees) have
worked in the County’s IT environment for many years. These individuals
understand the history and intricacies of County IT systems and have stable
working relationships with agency/department IT staff.
Data Center operations have enabled the County to provide a well-functioning IT
infrastructure. Specific examples of accomplishments include: the implementation
of a rigorous planning process for infrastructure-related projects, the enhancement
of data storage capacity, and the upgrade and further securing of the Wide Area
Network. (pages 37-39)
CEO/IT has established an IT Project Review Board which includes CEO/IT,
CEO/Budget, and agency/department IT managers that reviews annual budget
requests for IT projects costing more than $150K. (page 24)
CEO/IT has coordinated the provision of IT Project Management training for
hundreds of County IT professionals. (pages 25)
The billing of agencies/departments for services provided by CEO/IT has
improved over the past few years, with greater detail available and more precise
tracking of services rendered. (page 50)
Areas for CEO/IT Improvement:
Notwithstanding these accomplishments, CEO/IT customers and stakeholders (County
agencies/departments, Board of Supervisors) have several significant concerns. All of
these issues have been thoroughly validated by interviews, survey responses, and the
audit team’s research of internal operations. The following bullet points represent the
most significant improvement opportunities identified, though there are many others
contained in the body of this report.

iv
PERFORMANCE AUDIT OF CEO/IT – TASKS III - V REPORT Final Report
Areas for Improvement
Long-standing strategic deficiencies have not been sufficiently addressed by
CEO/IT, the more significant of which include: clarifying CEO/IT roles and
responsibilities relative to agency/department IT operations, understanding
agency/department business and technology issues, and oversight of Countywide
IT spending. (pages 8-11, 16-18)
CEO/IT has not prioritized its spending based on customer values/needs. CEO/IT
has spent millions of dollars ($1.1M of ISF 289 Retained Earnings in FY 08/09;
$1.3M projected in FY 09/10 and $1.4M projected in FY 10/11) of
agency/department money to pursue projects that agencies/departments view as
lower priority (e.g., eGov, Single Sign-On) at the expense of core infrastructure
needs and services (e.g., network security, telephone services), which
agencies/departments view as higher priority. (pages 44-45, 52)
There are problematic levels of disclosure in how CEO/IT allocates, spends and
reports spending in Internal Service Fund (ISF) 289 and General Fund Agency 038
(Data Systems Development Projects). This includes: (1) funding the operations
and maintenance of non-infrastructure initiatives and projects out of ISF 289
Retained Earnings without informing agencies/departments, (2) including cost
elements in the administrative overhead of ISF 289 without adequately informing
agencies/departments (e.g., Clarity project, the FY 10/11 proposed movement of the
CEO/IT Project Management Office from Agency 017 to ISF 289), and (3)
reallocating money between IT projects without notifying the Board. (pages 43-46,
50-55)
CEO/IT has established an unworkable number (14) of discrete, specialized
organizational units based upon the inappropriate application of the ‚Centers of
Excellence‛ concept. This has resulted in staff confusion over responsibilities, set
unreasonable expectations for attaining operational excellence in all 14
organizational units and made it difficult to accomplish organizational goals and
objectives. (pages 11-14)
Many high-profile CEO/IT-driven projects have faced implementation challenges
due to a variety of issues. Examples include: eGovernment ($5.8M), Clarity
($643K), OCid ($286K), and 3-1-1 Customer Service Center ($450K). Furthermore,
CEO/IT did not first establish adequate management processes to prepare its
organization to take on these and other initiatives. (pages 26-34)

v
PERFORMANCE AUDIT OF CEO/IT – TASKS III - V REPORT Final Report
The IT Governance structure was established for the purpose of ensuring
agency/department participation in important funding decisions and Countywide
IT initiatives/projects. However, the governance system as a whole is struggling
due to (1) CEO/IT’s decision to wholly or partially bypass the Governance structure
on several important IT issues and funding decisions (e.g., initial Sourcing efforts,
use of ISF 289 money), (2) an infrequent meeting schedule for County executives,
(3) inconsistent attendance, (4) an inefficient number of groups (which includes
separate governance structures for some major IT initiatives/projects), and (5) a
confusing line of authority and flow of information up the decision making chain.
(pages 18-21)
Verbal communications from CEO/IT to the Board tend to be unnecessarily
technical, heavy on jargon, and unsuccessful in informing the audience. In
addition, several forms of written communication (e.g., Agenda Staff Reports, IT
Quarterly Reports, memoranda) have failed to provide sufficient and/or accurate
information to allow the Board to make informed decisions. (pages 66-71)
Based on multiple interviews and observations, there are several opportunities to
improve internal communications within CEO/IT. A prime example is the CIO’s
decision not to provide the County Technology Officer (one of his two direct
reports) with a copy of the preliminary draft of this audit report for review prior to
the factual review meeting. Another example cited by many CEO/IT staff is their
reluctance to offer differing viewpoints from those of the CIO. (pages 71-73)
As the central organization for Countywide IT efforts, CEO/IT should be
establishing performance measurement standards, templates, and targets for
agencies/departments and gathering data on the performance of Countywide IT; to
date, CEO/IT has not made substantive progress in this area. (pages 56-57)
CEO/IT does not have sufficient metrics in place to measure its own performance in
many areas. For example, CEO/IT does not measure IT project performance
beyond schedule and budget metrics, and there is minimal or no tracking of actual
staff resource hours against planned allocations. (pages 48-49, 58-61)
CEO/IT and its primary contractor (ACS) have not conducted ACS performance
surveys as required by the contract since FY 06/07. Consequently, for over two
years, ACS went without a performance incentive bonus/penalty; CEO/IT went
without a quantitative measure of its primary contractor’s performance; and the
Board of Supervisors has been without a formal performance assessment of the
County’s largest IT contractor. (pages 63-65)

vi
PERFORMANCE AUDIT OF CEO/IT – TASKS III - V REPORT Final Report
Collectively, the aforementioned deficiencies have had a significant negative impact on
the management of a major County cost center. Positive progress in addressing these
deficiencies can only be achieved if there is a clear acknowledgement of their existence
on the part of the CEO and CEO/IT leadership.
Summary Recommendations
The audit team has provided the following key recommendations to address Tasks III –
V findings.
1. Establish specific roles and responsibilities for CEO/IT vis-à-vis
agencies/departments; begin by confirming Board and agency/department
expectations. It would be most efficient for CEO/IT to resolve this issue prior to the
release of the IT Sourcing RFP (Note: this was also a recommendation in the Task II
audit report).
2. Streamline the existing organizational structure, and identify a small number of
topical (not organizational) areas that can be developed as ‚Centers of Excellence‛
(e.g. Project Management).
3. Simplify the IT Governance structure by consolidating groups, ensuring that
Countywide IT issues/initiatives/projects (and the associated business case analyses)
are thoroughly vetted, understood, and have broad stakeholder buy-in before they
are implemented.
4. Focus CEO/IT resources on core, mission-critical infrastructure services for
agency/department customers before pursuing other less essential initiatives.
5. Develop a policy for the use of ISF 289 Retained Earnings; include, as a requirement,
the disclosure to and approval of a majority of agencies/departments leadership via
the IT Governance structure.
6. Improve the planning stages for IT projects by ensuring that all proposed solutions
undergo a rigorous business case analysis, which includes a discussion of how the
solution addresses a compelling and necessary agency/department business need
and establishes clear project outcomes.
7. Develop meaningful key performance metrics and reporting mechanisms that track
and evaluate important decision-making information to the Board, the public, and
County executives.
vii
PERFORMANCE AUDIT OF CEO/IT – TASKS III - V REPORT Final Report
8. Improve communications with the Board of Supervisors and agencies/departments
by ensuring that all documents/presentations are complete, accurate, timely, and
clearly articulated for a non-technical audience. In addition, all stakeholders need to
be brought into the discussion as early as possible for IT projects/initiatives that
have significant operational and cost implications.
The audit team would like to thank County agency/department staff for their
cooperation and candor during this performance audit. We would also like to express
our appreciation to CEO/IT staff members who spent many hours collecting
information and documentation to assist in the successful completion of this lengthy
audit.
1
PERFORMANCE AUDIT OF CEO/IT – TASKS III - V REPORT Final Report
Introduction
Board Chair Bates and Vice-Chair Nguyen, in response to the Board of Supervisors’
(Board) postponement of the approval of the Countywide Information Technology
Strategic Plan in March 2009, requested that the Office of the Performance Audit
Director (Office) audit the efforts and activities of the County Executive Office/Office of
Information Technology (CEO/IT) and the former Information Technology Working
Group. On June 2, 2009, the Board approved the scope of work for the Performance
Audit of CEO/IT.
The specific goals of the Performance Audit are to:
1. Ensure that a major Countywide expense category (i.e., information technology) is
efficiently and effectively managed, especially in the current fiscal climate.
2. Ensure that CEO/IT has an information technology business model that provides
clarity to the Board and agencies/departments in long term information technology
planning efforts and in daily information technology decision making. Identify
successful governmental information technology business models and practices.
Clearly define the areas of responsibility and authority assigned to CEO/IT.
3. Identify opportunities to improve CEO/IT’s management of information technology
operations and projects.
4. Provide recommendations to improve CEO/IT communication to the Board, County
agencies/departments, and the public.
In order to effectively manage the significant scope of work for this performance audit,
the Board approved the following phased approach:
Task I: Document and Verify Current IT Resource Allocations
Task II: Review CEO/IT Proposed Business Model (IT Strategic Plan)
Task III: Review CEO/IT Operational Readiness
Task IV: Review CEO/IT Performance Measurement
Task V: Evaluate CEO/IT Communications
Given the operational overlap between several of the topics covered in Tasks III – V, the
audit team chose to combine these final three Tasks into one report.
2
PERFORMANCE AUDIT OF CEO/IT – TASKS III - V REPORT Final Report
Scope and Objectives
This report addresses the following activities and questions, as approved by the Board
of Supervisors:
Task III: Review CEO/IT Operational Readiness
Does the current CEO/IT organizational structure support or detract from
accomplishing the Information Technology Strategic Plan and Countywide mission
and goals?
Are established CEO/IT processes and procedures and CEO/IT’s staff knowledge of
agency/department business processes adequate to: (1) influence or control
agency/department information technology expenditures, (2) assist with project
management and implementation, and (3) ensure that project reviews are done in a
timely manner?
Is there a formal process in place for assessing risk on a project-by-project basis?
Task IV: Review of CEO/IT Performance Measurement
Are there sufficient metrics and monitoring procedures in place to track actual
versus expected performance of CEO/IT contributing to: (1) Countywide
information technology productivity, (2) efficiency of agency/department
operations, and (3) effectiveness of agency/department operations?
Is there an effective process in place for post-implementation reviews to: (1) validate
expected costs and benefits of information technology projects and (2) document
and disseminate lessons learned?
Is there an effective process in place to assess the practices and procedures used by
CEO/IT to monitor and report on contractor performance (e.g., ACS)?
Does CEO/IT have a process for continual benchmarking against organizations in
the public and private sectors with respect to cost, speed, productivity, and quality
of outputs/outcomes?
What is the role and performance history of CEO/IT in large information technology
projects with Countywide implications (e.g., CAPS+, ATS)?

3
PERFORMANCE AUDIT OF CEO/IT – TASKS III - V REPORT Final Report
What is CEO/IT’s process for determining the need for sole source
contracts/agreements vs. competitively bid services?
Does CEO/IT have a process that involves the County Financial Officer, or other
corporate official, to develop and maintain full and accurate accounting of
information technology-related expenditures and results?
Task V: Evaluate CEO/IT Communications
Review all processes for communicating the information listed above to the Board,
County agencies/departments, and the public.
Does CEO/IT have a separate annual report that describes progress in achieving its
goals? If so, does it provide the depth of information preferred by the Board?
Audit Methodology
This audit report is organized around the Tasks III – V subject matter areas: CEO/IT
Operational Readiness, CEO/IT Performance Measurement, and CEO/IT
Communications. Each subject area is further parsed in order to answer the
aforementioned questions posed by the Board of Supervisors.
The audit team, with the assistance of its IT consultant, AEF Systems Consulting, Inc.,
performed the following audit activities:
1. Revisited the working documents of the Task I and II performance audit reports
(e.g., financial and staffing data sets, Countywide IT Strategic Plan).
2. Conducted comprehensive IT research, including but not limited to,
organizational structure, performance metrics, management processes, project
management, and industry best practices. (see Appendix E)
3. Distributed an online Customer Survey to County agency/department executives
and IT managers to measure the quality of CEO/IT performance in Task III – V
areas. (see Appendix A)
4
PERFORMANCE AUDIT OF CEO/IT – TASKS III - V REPORT Final Report
4. Interviewed CEO/IT management staff, the County Executive Officer and Chief
Information Officer, staff from each Board of Supervisors Office, former CEO/IT
management employees, and executive and IT staff from 22 County
agencies/departments. In total, 83 interviews were conducted.
5. Conducted detailed review of CEO/IT documents including: Operating Plan,
project planning documents, project management methodology,
consultant/vendor contracts, policies and procedures, IT Governance charters
and minutes, strategic planning documents, Resource Plans, internal CEO/IT
analyses and consultant reports, annual budget and actual expense data, and IT
Agenda Staff Reports.
Background Information
Technology and the business of local government are inseparable. At the County of
Orange, in order to meet the public service requirements of its 3.1 million citizens, every
agency/department utilizes technological resources during the course of its day-to-day
operations. To illustrate, consider these examples:
The Social Services Agency, Probation Department, District Attorney, Health
Care Agency, and Sheriff-Coroner Department all have electronic case
management files.
The Assessor’s Department stores its property value assessment and subsequent
property tax billing information electronically.
The County Clerk records the exchange of real property in the County and
maintains vital personal information such as birth, marriage, and death records
electronically.
The Orange County Waste & Recycling department tracks every ton of trash
disposed in the County’s landfills electronically.
The Orange County Library system maintains and provides its citizens an
electronic catalogue of media and resources.
The OC Public Works Department electronically tracks road conditions and
traffic signal operations for 321 miles of Orange County’s roadways.
5
PERFORMANCE AUDIT OF CEO/IT – TASKS III - V REPORT Final Report
The Auditor-Controller electronically records information pertaining to the
receipt and dispersal of monies.
The Clerk of the Board of Supervisors electronically prepares the Board’s public
agenda and maintains a historical record of all Board decisions.
The Registrar of Voters electronically records, processes, and presents the results
of the votes cast by Orange County citizens during elections.
To understand the current IT environment at the County of Orange, it is vital to first
consider past technology and leadership events.
In the 1990s, IT systems environments transitioned from centralized mainframe
computing to dispersed client servers and open systems. As a result, most County
agencies/departments became increasingly autonomous, gaining control over their own
local area networks, help desk operations, and server maintenance staff. For some
common Enterprise (Countywide) IT functions, however, it continued to make sense to
provide some services via the County’s central IT organization (CEO/IT) — services
such as a wide-area network, the management of the remaining mainframe computers
and servers, and the provision of first-line network security for the County. In addition,
CEO/IT also continues to provide services to smaller agencies/departments that do not
have their own IT operations. This balance of centralization/decentralization at the
County of Orange is referred to as a ‚Federated model.‛ Though there are inherent
economic inefficiencies from decentralizing IT operations, from an operational
perspective, the ability for agencies/departments to control their own resources and
maintain closer linkages between business needs and technology decisions has
sustained the County’s adherence to the Federated model.
Given the pervasive use and average annual cost (~$150 million) of technology services
in the sixth largest County in the United States, the Board has made the monitoring and
evaluation of County IT operations a priority. Some of the actions taken by the Board
to improve IT management at the County include:
In June 2005, following the controversial purchase of a $6 million computer
mainframe and increased concerns from agencies/departments regarding the
lack of transparency in IT service rates, the Board created the ‚Information
Technology Working Group (ITWG),‛ as an oversight body. Two Board Offices
were voting members of and actively participated in the ITWG for the past five
years.
6
PERFORMANCE AUDIT OF CEO/IT – TASKS III - V REPORT Final Report
The County Executive Office, in response to a Board request, instituted an IT
quarterly reporting process (May 2005) and an IT cost study (November 2005) to
provide the Board with additional insight into IT operations at the County.
In March 2009, the Board postponed the approval of the IT Strategic Plan and
subsequently authorized the Office to conduct a performance audit of CEO/IT
activities and operations.
There have also been several changes in CEO/IT leadership, with four County
Information Officers (CIOs) over the past ten years. At the time the current CIO was
hired in February 2006, there were numerous identified concerns to be addressed1:
Unclear roles and responsibilities for CEO/IT vis-à-vis agencies/departments, as
well as the lack of discussion regarding the appropriate balance between IT
centralization/decentralization
Poor communication between CEO/IT and agency/department IT operations and
the resulting lack of trust
Lack of billing transparency from CEO/IT to agencies/departments
Lack of CEO/IT knowledge of agency/department IT operations
Lack of sufficient planning for major IT initiatives
Lack of active contract management for CEO/IT vendors
In many ways, the current County IT environment has evolved in reaction to these
issues and the actions of the previous CIO, as confirmed during interviews with County
executives. The previous CIO attempted, against the collective desire of
agencies/departments, to further centralize control over Countywide IT operations
under CEO/IT. As a result of this approach and other issues, a change in leadership
was made. Thus, at the time the current CIO was hired, the majority of
agencies/departments made it clear that they preferred the continuation of the
decentralized County IT system. In response, the CIO has maintained a decentralized
system and revamped the Countywide IT Governance structure in an effort to increase
agency/department participation. The success of these endeavors and other operational
aspects of CEO/IT are addressed within this audit report.
1 Identified in CEO/IT strategic and organizational planning documents (2006) and numerous audit interviews

7
PERFORMANCE AUDIT OF CEO/IT – TASKS III - V REPORT Final Report
(page intentionally left blank)

8
PERFORMANCE AUDIT OF CEO/IT – TASKS III - V REPORT Final Report
Findings and Recommendations
Task III: Review CEO/IT Operational Readiness
The audit team’s review of CEO/IT’s operational readiness includes (A) an evaluation of
its roles and responsibilities relative to those of agencies/departments, (B) the
efficiency/effectiveness of CEO/IT’s organizational structure, and (C) its formal
management processes and procedures.
A. Roles and Responsibilities
The discussion of CEO/IT roles and responsibilities includes an examination of the
Countywide IT system and CEO/IT’s understanding of customer IT business needs and
issues.
Decentralization and the Federated Model
As previously noted, the County of Orange manages its IT operations under a
‚Federated‛ model. In a Federated system, agencies/departments retain autonomy over
program-specific IT processes, applications, and systems. CEO/IT’s overall role in the
current Orange County system is to provide leadership in Countywide strategic IT
initiatives and shared IT services. This leadership should be provided in the context of
a formal governance structure, which includes agencies/departments as participating
stakeholders.
Finding 1: The specific roles and responsibilities of CEO/IT (e.g., IT oversight,
performance management, identification of consolidation
opportunities) vis-a-vis agency/department IT operations continue to be
vaguely defined.
The lack of clearly defined roles and responsibilities for CEO/IT has been a source of
concern for several years. The following examples illustrate this consistent challenge:
An August 2005 report by CEO consultant, Performance Management Partners,
stated that the role of CEO/IT in the evolving technology environment is a
strategic issue that should be addressed.
9
PERFORMANCE AUDIT OF CEO/IT – TASKS III - V REPORT Final Report
At a CEO/IT management offsite meeting in November 2005, the ‚lack of a clear
definition of CEO/IT roles and responsibilities‛ was identified as a significant
issue hampering Countywide IT operations.
In a series of interviews with agencies/departments conducted by CEO/IT and its
consultant between June and July 2006, one of the ‚Major Concerns with
CEO/IT‛ was the need for better clarity regarding the role of CEO/IT.
In October 2007, a consultant hired by CEO/IT conducted a series of interviews to
analyze CEO/IT business processes. In these interviews, one of the ‚Top Agency
Complaints‛ identified was a ‚Lack of understanding of CEO/IT role (perceived
role not aligned with what the agencies need from CEO/IT).‛
More recent assessments of this problem indicate that little or no progress has been
made in rectifying this concern. For example:
Clearly defined CEO/IT roles (e.g., IT oversight, performance management,
identification of consolidation opportunities) vis-a-vis agencies/departments are
not delineated in the Countywide IT Strategic Plan or the CEO/IT Operational
Plan.
In a majority of interviews with agency/department executives and IT managers
(conducted as part of this Tasks III-V audit between February 2010 and April
2010), the lack of clearly defined roles between CEO/IT and agency/department
IT staff was an issue that was consistently cited as problematic.
Several members of the CEO/IT management team indicated that it is critical to
resolve this long-standing issue, which has constrained progress in Countywide
IT service delivery for many years.
In the survey instrument utilized in the Task II audit report, when
agency/department respondents were asked, ‚How would you rate the clarity of
the [IT Strategic] Plan regarding the roles and responsibilities of CEO/IT
compared to the IT functions of agencies/departments,‛ the average score was
2.7 out of 5, with 1 being ‘Very Unclear’ and 5 being ‘Very Clear.’ This Strategic
Plan was created during 2007 and 2008.

10
PERFORMANCE AUDIT OF CEO/IT – TASKS III - V REPORT Final Report
Recommendation 1: Implement Task II audit report recommendation #5: “Working
with County agencies/departments, define roles and responsibilities for CEO/IT and
agency/department IT operations, seek approval of these roles from the Board of
Supervisors, and clearly communicate these roles to all IT stakeholders.” It would be
most efficient for CEO/IT to resolve this issue prior to the release of the IT Sourcing
RFP.
CEO/IT Knowledge of Agency/Department IT Operations
Before an organization defines its roles and responsibilities, it is important to first
understand customer needs and issues. In CEO/IT’s case, its primary customers are
agencies/departments.
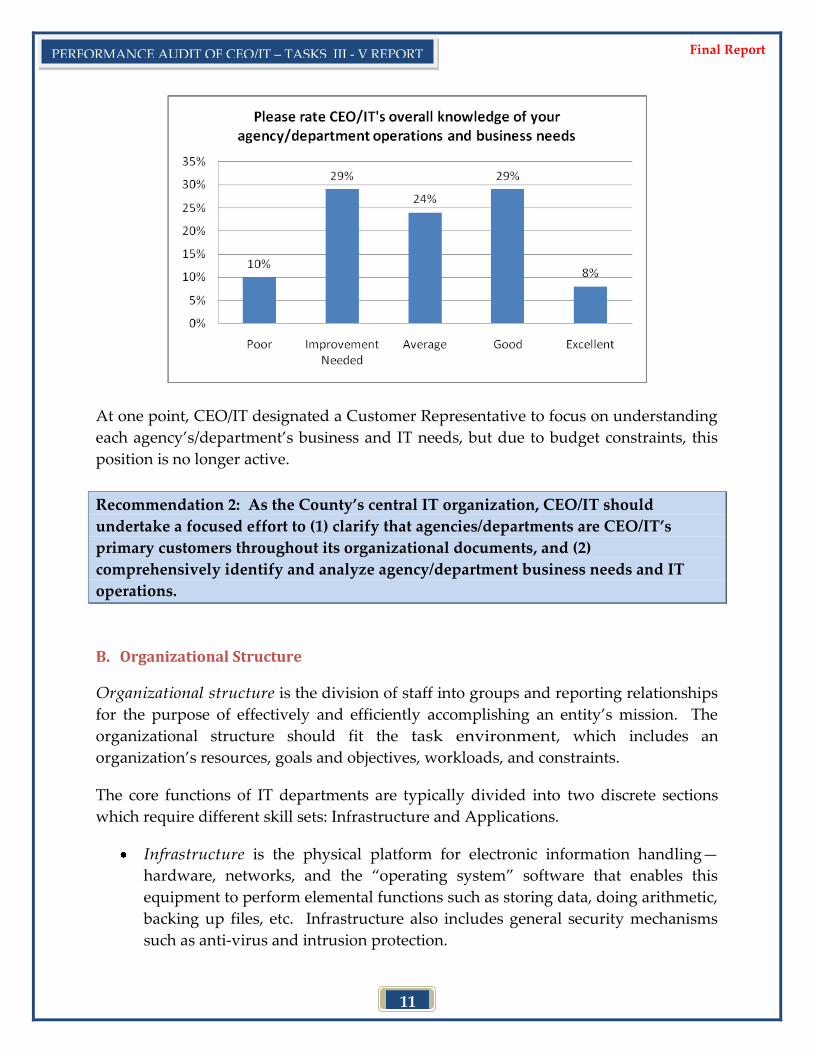
Finding 2: CEO/IT’s knowledge of agencies’/departments’ IT business issues and
activities continues to require improvement.
CEO/IT’s understanding of Countywide IT business activities is important for at least
two reasons: (1) the Board expects CEO/IT to have specific knowledge of Countywide
IT activities so it can provide expert advice on Agenda Staff Report items and annual
budget requests, and (2) so that expensive Enterprise IT initiatives/projects pursued by
CEO/IT are of practical value to agencies/departments.
Unfortunately, CEO/IT’s understanding of agency/department operations has been a
long-standing concern. Some smaller agencies/departments do not view CEO/IT as
understanding, or having the desire to understand, its business needs. This is in
contrast to some agencies/departments with major IT initiatives, who generally perceive
CEO/IT as having adequate knowledge of their business needs. The Customer Survey
conducted as part of this audit confirms these average results, as shown on the
following page.
11
PERFORMANCE AUDIT OF CEO/IT – TASKS III - V REPORT Final Report
At one point, CEO/IT designated a Customer Representative to focus on understanding
each agency’s/department’s business and IT needs, but due to budget constraints, this
position is no longer active.
Recommendation 2: As the County’s central IT organization, CEO/IT should
undertake a focused effort to (1) clarify that agencies/departments are CEO/IT’s
primary customers throughout its organizational documents, and (2)
comprehensively identify and analyze agency/department business needs and IT
operations.
B. Organizational Structure
Organizational structure is the division of staff into groups and reporting relationships
for the purpose of effectively and efficiently accomplishing an entity’s mission. The
organizational structure should fit the task environment, which includes an
organization’s resources, goals and objectives, workloads, and constraints.
The core functions of IT departments are typically divided into two discrete sections
which require different skill sets: Infrastructure and Applications.
Infrastructure is the physical platform for electronic information handling—
hardware, networks, and the ‚operating system‛ software that enables this
equipment to perform elemental functions such as storing data, doing arithmetic,
backing up files, etc. Infrastructure also includes general security mechanisms
such as anti-virus and intrusion protection.
12
PERFORMANCE AUDIT OF CEO/IT – TASKS III - V REPORT Final Report
Applications define the particular pieces of information to be created and used,
and the particular forms, transactions, workflows, and business rules for
processing that information. The application function also includes software
tools for the general user (email, word processing, spreadsheets, etc.), as well as
tools for programmers to develop custom applications to meet business
requirements.
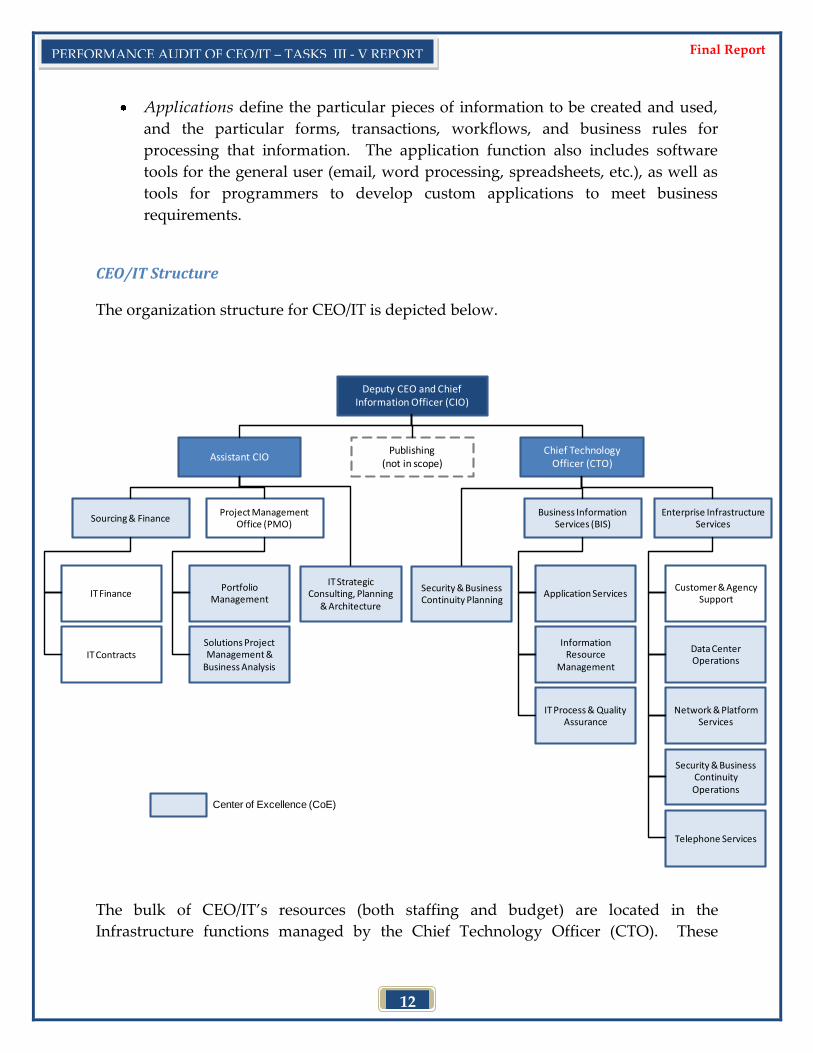
CEO/IT Structure
The organization structure for CEO/IT is depicted below.
The bulk of CEO/IT’s resources (both staffing and budget) are located in the
Infrastructure functions managed by the Chief Technology Officer (CTO). These
Deputy CEO and Chief Information Officer (CIO)
Assistant CIOPublishing
(not in scope)Chief Technology
Officer (CTO)
Sourcing & FinanceProject Management
Office (PMO)Business Information
Services (BIS)Enterprise Infrastructure
Services
IT FinancePortfolio
Management
IT Strategic Consulting, Planning
& Architecture
Customer & Agency Support
IT ContractsSolutions Project Management &
Business Analysis
Security & Business Continuity Planning
Application Services
Information Resource
Management
IT Process & Quality Assurance
Data Center Operations
Network & Platform Services
Security & Business Continuity Operations
Telephone Services
Center of Excellence (CoE)
13
PERFORMANCE AUDIT OF CEO/IT – TASKS III - V REPORT Final Report
functions are the core services for Countywide IT and they include the operations and
maintenance of a mainframe, servers, a wide-area network, and a telephone system.
Infrastructure activities are funded out of Internal Service Fund (ISF) 289.
The Application function is primarily the responsibility of County
agencies/departments that use particular applications, although CEO/IT has taken on
some projects that entail developing and maintaining applications with Countywide
implications (e.g., eGov, OCid). Application project management and support services
are dispersed among several sections of CEO/IT, with some applications project
management staff reporting to the Project Management Office (PMO) Manager and
some applications project management and support staff reporting to the CTO.
Arrangement of Organizational Units
Finding 3: CEO/IT has improperly used the “Centers of Excellence” (CoE) concept
to establish an unworkable number (14) of discrete, specialized
organizational units.
As identified on the organizational chart on the previous page, CEO/IT calls its key
organizational units ‚Centers of Excellence‛ (CoE). A CoE is commonly defined as a
cross-functional body that brings together a group of people to focus on a single process
area, business activity, or capability2. A CoE is typically an overlay to an organization
which can be formal or informal, but should not be substituted for, or made
synonymous with, organizational units, as CEO/IT has done. In CEO/IT’s case, they
have identified 14 CoE which constitute its organizational structure. While the stated
intent of this approach was to develop specialists in each of the 14 CoE, it has resulted
in a fragmented organizational structure with several inefficiencies:
For an organization the size of CEO/IT (200 FTEs and shrinking), developing 14
‚Centers of Excellence‛ promotes an unrealistic goal that operational excellence
can be developed in all 14 distinct areas, with its current staffing contingent.
Planning and Security functions are dispersed among multiple organizational
units. There are three separate organizational units for Planning activities: IT
Strategic Consulting, Planning & Architecture; IT Process & Quality Assurance;
and Strategic & Business Continuity. Likewise, there are two separate
2 8 Reasons to Consider a Center of Excellence, Digital Landfill, March 2010; Establishing a Center of Excellence; Jonathan G. Geiger;
Information Management Magazine, August 2006.

14
PERFORMANCE AUDIT OF CEO/IT – TASKS III - V REPORT Final Report
organizational units for Security: Security & Business Continuity Planning and
Security & Business Continuity Operations.
Two CoE have no staff assigned to them (IT Strategic Consulting, Planning &
Architecture and IT Process & Quality Assurance)
CEO/IT has applied an inconsistent method for identifying CoE within its
structure. For example, as shown in the organizational chart, some CoE are
actually subcomponents of other broader CoE.
In order to achieve coordination among 14 operational units, each composed of
specialists, a greater number of staff must be involved to address issues or
plan/execute projects. Agencies/departments have criticized this practice,
stating: ‚When we call a meeting, ten CEO/IT staff members attend and we get
charged for it.‛
Recommendation 3: (a) Streamline the existing organizational structure, and (b)
identify a small number of topical (not organizational) areas that can be developed as
“Centers of Excellence” (e.g., Project Management, Vendor Management).
Finding 4: The individual fulfilling the role of Chief Information Security Officer
(CISO) reports to the CIO for security-related activities and to the Chief
Technology Officer (CTO) for technical project work; this situation has
the potential for conflicts of interest.
An organization’s CISO is typically a senior level manager or executive responsible for
establishing and maintaining the enterprise strategy to ensure information assets are
adequately protected. The CISO (1) works with staff to identify, develop, and
implement processes across the organization that reduce information technology (IT)
risks, and (2) establishes appropriate standards and controls. The CISO is also typically
responsible for security compliance. According to a 2009 Gartner research publication,
the role of the CISO is becoming ‚increasingly more strategic, with relatively less day-
to-day responsibility for operational tasks, and a commensurately larger responsibility
for enterprise coordination of security management activities, and promulgation of the
IT risk management agenda3.‛
3 Top-Five Issues and Research Agenda, 2009-2010: The Chief Information Security Officer; Gartner; 26 March 2009.
15
PERFORMANCE AUDIT OF CEO/IT – TASKS III - V REPORT Final Report
Over the past decade, there has been much industry discussion regarding the
appropriate organizational level/location of a CISO. The appropriate choice depends
upon many factors such as an organization’s size, level of external connectivity, the type
of confidential information stored, and its dependence on information technology.
Some experts believe that the CISO should be at the same level as the Chief Information
Officer (CIO). In some organizations that have chosen this structure, CISO reporting
varies from reporting directly to the CEO, the CFO, the Risk Management Office, or the
Internal Audit Department.
At the County of Orange, from May 2009 to April 2010, the CTO had oversight over
projects that were under the CISO; however, the CISO continued to report to the CIO in
matters of information security. This dual reporting relationship has the potential to
influence the CISO in security matters. In April 2010, CISO responsibilities transferred
to the Enterprise Infrastructure Services Manager who, as of the writing of this report,
also has a dual reporting relationship to both the CIO and the CTO.
Recommendation 4: The CISO should report exclusively to the CIO.
Organizational Change (Turnover and Growth)
Finding 5: Since the hiring of a new CIO in February 2006, the CEO/IT
organization has undergone significant turnover, especially in the
administrative management ranks.
The primary personnel statistics used to measure organizational turnover are
separations (either voluntary or involuntary) and transfers out of CEO/IT into other
agencies/departments. From December 1992 through February 2006 (a period of 13
years), CEO/IT experienced 81 separations or transfers, which averages out to
approximately 0.5 such personnel actions per month. Of those 81 separations, 19 or 23%
were in the administrative management ranks. From March 2006 through January 2010
(a period of almost four years), CEO/IT experienced 53 separations or transfers out of
the department, which averages out to approximately 1.1 such personnel actions per
month. Of the 53 separations or transfers out occurring during this period, 18 or 34%
were in the administrative management ranks.
As noted in the Task I Audit Report, CEO/IT has also seen significant growth in the
administrative management ranks. In FY 2005/06, there were 16 Executive or
Administrative Manager (AM) positions throughout CEO/IT (8 AM I, 4 AM II, and 4
16
PERFORMANCE AUDIT OF CEO/IT – TASKS III - V REPORT Final Report
AM III or AM III Special), excluding the CIO. As of the writing of this report, there are
29 Executive or AM positions throughout CEO/IT (9 AM1, 11 AM2, 7AM3 or AM3
Special, and 2 Executives). Of these 29 positions, 22 of the individuals have been hired
into or transferred into their position from elsewhere in the County since September
2006.
Recommendation 5: (a) Ensure formal knowledge transfer procedures are in place
and followed for personnel separations/transfers, (b) Initiate a separation/transfer
interview process for any future separations/transfers, to be conducted by the Human
Resources Department, in order to capture any common challenges/issues, and (c)
Ensure that agency/department customers are always formally notified of relevant
staffing changes (both County and contractor) in a timely fashion.
C. Processes and Procedures
This section evaluates CEO/IT’s formal processes and procedures for managing IT
operations.
Management and Oversight of Countywide IT Activities
As the IT leader in the County, it is expected that CEO/IT has some degree of
management and oversight of Countywide IT activities. The audit team evaluated
CEO/IT’s role as an IT leader in the following three areas:
Control and Oversight of Countywide IT Expenditures
IT Governance
Countywide IT Strategic Planning
Control and Oversight of Countywide IT Expenditures
CEO/IT has budget authority over all projects funded out of Agency 038/Data Systems
Development, which includes both agency/department and CEO/IT-driven projects.
Though CEO/IT does not have formal authority to control spending on
agency/department-funded projects, there is a Board expectation that CEO/IT provides
oversight of Countywide IT expenditures.
17
PERFORMANCE AUDIT OF CEO/IT – TASKS III - V REPORT Final Report
Finding 6: CEO/IT exercises minimal oversight over agency/department IT
spending.
CEO/IT currently oversees agency/department-funded IT project spending through two
mechanisms, one formal and one informal. The first method is the formal review of
agency/department IT projects estimated to cost more than $150K. As part of the
annual budget process, the IT Project Review Board (composed of two CEO/IT staff, the
CEO Budget Director, and four agency/department IT managers) scores all
agency/department IT projects that exceed the $150K threshold that are included in the
agency/department’s budget for the upcoming fiscal year. The IT Project Review Board
scores these projects according to a set of criteria, including risk, return on investment,
and whether the project is mandated. While this process is formally conducted every
year, the results do not directly impact funding for the project, as long as the
agency/department intends to pay for the project out of their own budget. To date,
these scoring results have not been formally reported to the Board of Supervisors or the
public.
The second method of oversight exercised by CEO/IT over agency/department IT
spending is via the submittal of agenda items for approval by the Board of Supervisors.
The CIO and his staff review IT-related items that come before the Board, and their
input contributes to the ultimate concurrence or non-concurrence by the CEO on the
item. The CIO stated that his role in the review of all ASRs is as follows:
Review all ASRs for IT implications
Review all ASRs for impact and the possibility of leveraging the contract
Provide feedback on ASRs that the CIO disagrees with, e.g., Sheriff’s contract for
platform support
Look for opportunities to leverage master contracts, where possible
The CIO does not look at ASRs from the perspective of ‚CEO/IT can provide it‛
As illustrated by the statements above, the CIO’s review is focused more on the
contractual elements of ASR items and less on Countywide operational efficiency or
efficacy of ASR items. As noted elsewhere in this report, this somewhat laissez-faire
approach to agency/department IT spending oversight is driven by the CIO’s
interpretation of his role in a decentralized, Federated IT model. Multiple interviews
confirm that this interpretation does not always match the Board’s expectation for
CEO/IT’s level of review.
Overall, as mentioned in the audit’s Task I report, CEO/IT should take a greater role in
the tracking and reporting of Countywide IT expenditures on a regular basis.
18
PERFORMANCE AUDIT OF CEO/IT – TASKS III - V REPORT Final Report
Recommendation 6: (a) Formalize and seek Board support for CEO/IT’s role in the
oversight of Countywide IT activities, which includes the important task of
understanding and opining on agency/department IT spending prior to ASRs being
heard by the Board, and (b) Report IT Project Review Board scoring to the Board of
Supervisors as part of the annual budget process.
IT Governance
Most large local governments oversee their IT investments and initiatives through
interdepartmental participation in ‚governance‛ committees. According to a relevant
article from the IT Governance Institute, IT Governance should enable policymakers to:
Allow the CIO and the IT organization to return business value
Ensure that the CIO and IT organization does not squander the capital that
[policymakers] provide or invest in bad projects
Control the CIO and the IT organization
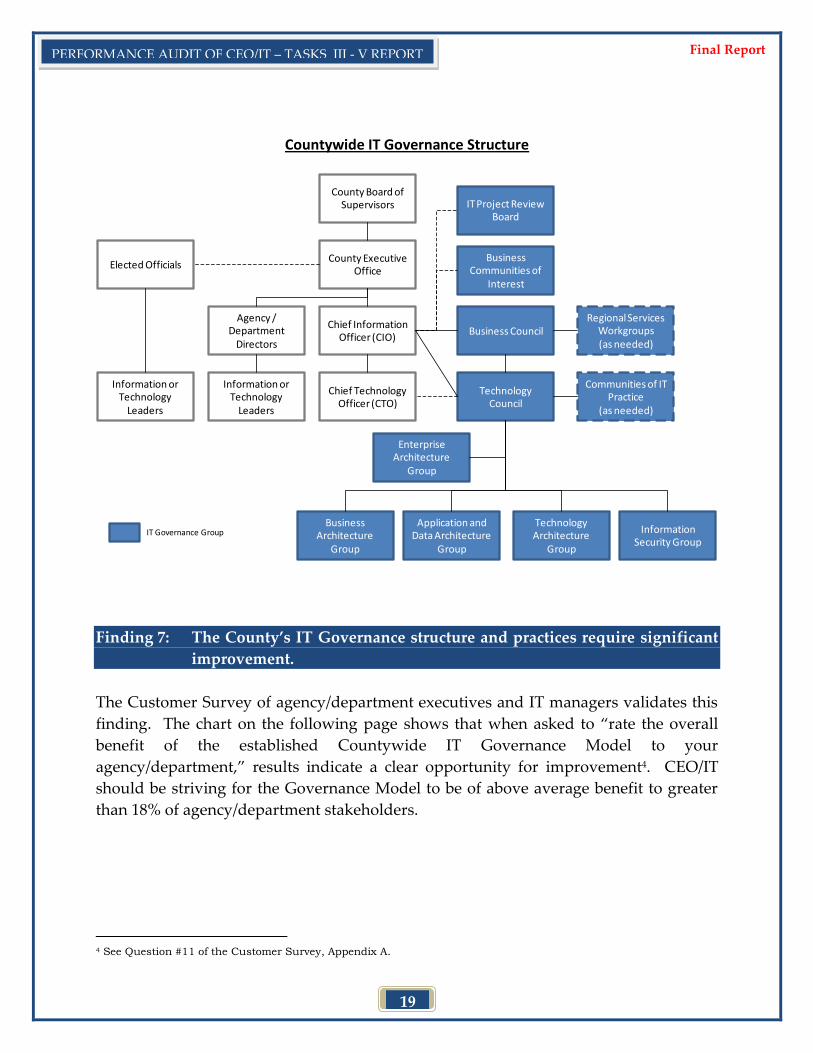
The County’s IT governance structure was established for the purpose of ensuring
agencies/departments a formal mechanism to collaborate and jointly make decisions
regarding Countywide IT issues. As depicted on the following page, governance
groups consist of a number of different stakeholders. The Business Council is made up
of Department Heads or their delegates; the Technology Council is made up of IT
Managers from agencies/departments; and the Technical Groups (e.g., Technical
Advisory Group, Security Working Group) consist of IT Managers and IT subject matter
experts.
19
PERFORMANCE AUDIT OF CEO/IT – TASKS III - V REPORT Final Report
Countywide IT Governance Structure
County Board of Supervisors
County Executive Office
Chief Information Officer (CIO)
Chief Technology Officer (CTO)
Agency / Department
Directors
Information or Technology
Leaders
Elected Officials
Information or Technology
Leaders
IT Project Review Board
Business Communities of
Interest
Technology Council
Business Council
Communities of IT Practice
(as needed)
Regional Services Workgroups (as needed)
Enterprise Architecture
Group
Application and Data Architecture
Group
Business Architecture
Group
Technology Architecture
Group
Information Security Group
IT Governance Group
Finding 7: The County’s IT Governance structure and practices require significant
improvement.
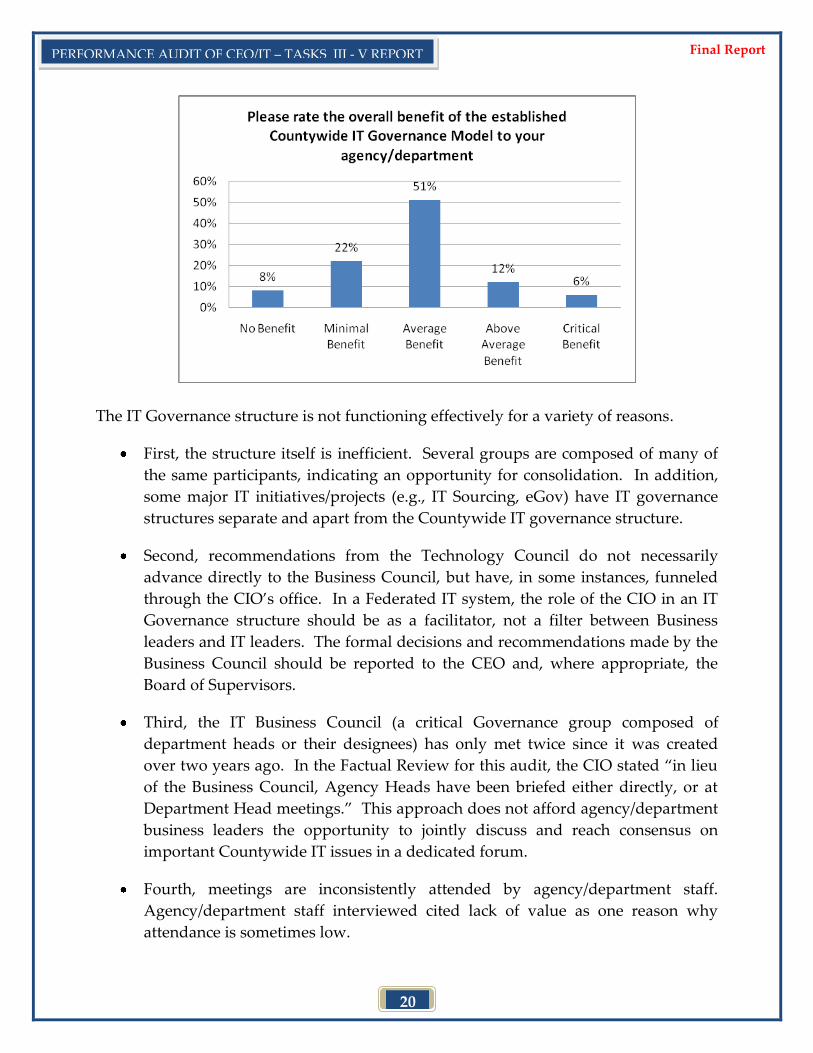
The Customer Survey of agency/department executives and IT managers validates this
finding. The chart on the following page shows that when asked to ‚rate the overall
benefit of the established Countywide IT Governance Model to your
agency/department,‛ results indicate a clear opportunity for improvement4. CEO/IT
should be striving for the Governance Model to be of above average benefit to greater
than 18% of agency/department stakeholders.
4 See Question #11 of the Customer Survey, Appendix A.
20
PERFORMANCE AUDIT OF CEO/IT – TASKS III - V REPORT Final Report
The IT Governance structure is not functioning effectively for a variety of reasons.
First, the structure itself is inefficient. Several groups are composed of many of
the same participants, indicating an opportunity for consolidation. In addition,
some major IT initiatives/projects (e.g., IT Sourcing, eGov) have IT governance
structures separate and apart from the Countywide IT governance structure.
Second, recommendations from the Technology Council do not necessarily
advance directly to the Business Council, but have, in some instances, funneled
through the CIO’s office. In a Federated IT system, the role of the CIO in an IT
Governance structure should be as a facilitator, not a filter between Business
leaders and IT leaders. The formal decisions and recommendations made by the
Business Council should be reported to the CEO and, where appropriate, the
Board of Supervisors.
Third, the IT Business Council (a critical Governance group composed of
department heads or their designees) has only met twice since it was created
over two years ago. In the Factual Review for this audit, the CIO stated ‚in lieu
of the Business Council, Agency Heads have been briefed either directly, or at
Department Head meetings.‛ This approach does not afford agency/department
business leaders the opportunity to jointly discuss and reach consensus on
important Countywide IT issues in a dedicated forum.
Fourth, meetings are inconsistently attended by agency/department staff.
Agency/department staff interviewed cited lack of value as one reason why
attendance is sometimes low.
21
PERFORMANCE AUDIT OF CEO/IT – TASKS III - V REPORT Final Report
Finally, and most concerning, the IT Governance structure has been wholly or
partially bypassed by CEO/IT on several important funding decisions and
Enterprise IT initiatives/projects (e.g., initial Sourcing efforts, use of ISF 289
Retained Earnings) which defeats the purpose of having a Governance structure.
Unfortunately, in the Factual Review for this audit, the CIO stated that use of ISF
289 Retained Earnings (generated from charges to agencies/departments) is not a
Governance issue.
When asked about some of the aforementioned challenges, the CIO acknowledged that
the Governance structure remains ‚embryonic.‛
Recommendation 7: Revise the IT Governance structure to (1) establish a “dotted
line relationship” between the CIO and the Technology Council and between the
CIO and the Business Council, (2) consolidate groups with redundant participants,
(3) ensure that the establishment of any separate IT governance groups for individual
IT initiatives/projects are for subject matter needs and that these groups link up with
the Countywide IT Governance structure, and (4) ensure that all Countywide IT
funding and initiatives/projects are thoroughly vetted and agreed upon through the
Governance decision-making chain.
Countywide IT Strategic Planning
Among CEO/IT’s responsibilities is Countywide IT Strategic Planning. The Task II
audit report evaluated the content of the proposed IT Strategic Plan; this section
evaluates CEO/IT’s ability to perform effective IT strategic planning.
Finding 8: CEO/IT’s strategic planning responsibilities and activities are dispersed
and not well-coordinated within the organization. Furthermore, there
are missed opportunities to provide value to agencies/departments as a
Countywide IT leader.
The Center of Excellence/organizational unit that is responsible for strategic planning
reports to the Assistant CIO but contains no assigned staff resources. Instead, strategic
planning activities are dispersed throughout the organization. For example, the
development of Countywide IT policies, guidelines, and standards is a strategic
planning activity that, at times, is handled by either a Program Manager in the PMO,
the Chief Information Security Officer, or the Chief Technology Officer. This dispersion
of responsibility for the development of IT policies, guidelines, and standards has the
following negative consequences:
22
PERFORMANCE AUDIT OF CEO/IT – TASKS III - V REPORT Final Report
There is no individual or group with explicit responsibility for enforcing policy
mandates or auditing against guidelines. The lack of clearly defined roles and
responsibilities for CEO/IT vis-à-vis agencies/departments is likely one of the
major reasons CEO/IT has not historically monitored compliance.
Without an identified individual or group with direct responsibility for strategic
planning, existing policies, guidelines, and standards are not updated over time.
For example, the most recent Email Domain Policy available was created in 2005
and the most recent Cell Phone Guidelines document is from 2004, despite major
changes in the IT environment.
Furthermore, agencies/departments also indicated that they expect CEO/IT to be
a leader in specific areas of Countywide strategic planning. For example, as part
of their own strategic planning, agencies/departments will plan for upgrades of
systems and technology. CEO/IT should have an understanding of
agencies/departments plans for their upgrades and provide the option for
agencies/departments to coordinate with the rest of the County — an effort that
would likely help agencies/departments achieve cost savings by pooling the
procurement of IT goods and services.
As the central IT organization at the County, CEO/IT should work toward providing
more consistent value to agencies/departments in this area.
Recommendation 8: Clearly identify and localize strategic planning roles within
CEO/IT. Work with agencies/departments to ensure that CEO/IT strategic planning
activities are valuable to and consistent with agencies’/departments’ own strategic
planning efforts.
Project and Portfolio Management
Another key management process that is the responsibility of CEO/IT as the central IT
organization in the County is Enterprise (Countywide) IT project management. This
includes managing projects related to Countywide upgrades of IT infrastructure (e.g.,
Wide Area Network, Telephone), as well as leading projects that either have a
Countywide scope (e.g., Disaster Recovery) or are not owned by any particular
agency/department (e.g., emergency mass notification system). CEO/IT also offers
project management services through its Project Management Office (PMO) to County
agencies/departments, as requested.
23
PERFORMANCE AUDIT OF CEO/IT – TASKS III - V REPORT Final Report
The following sections discuss and evaluate CEO/IT’s portfolio and project
management operations.
CEO/IT Portfolio and Project Management Office (PMO)
The PMO was established by CEO/IT in 2004. At that time, the PMO’s primary
objectives were to develop and adopt a formal IT Project Management Methodology
(based on the standards set by the Project Management Institute5) and to build a more
disciplined project management culture in the County. One positive result of this effort
was the development of an IT Project Management Methodology Handbook, with 22
sets of supporting guidelines covering specific project management topics and 16
supporting templates.
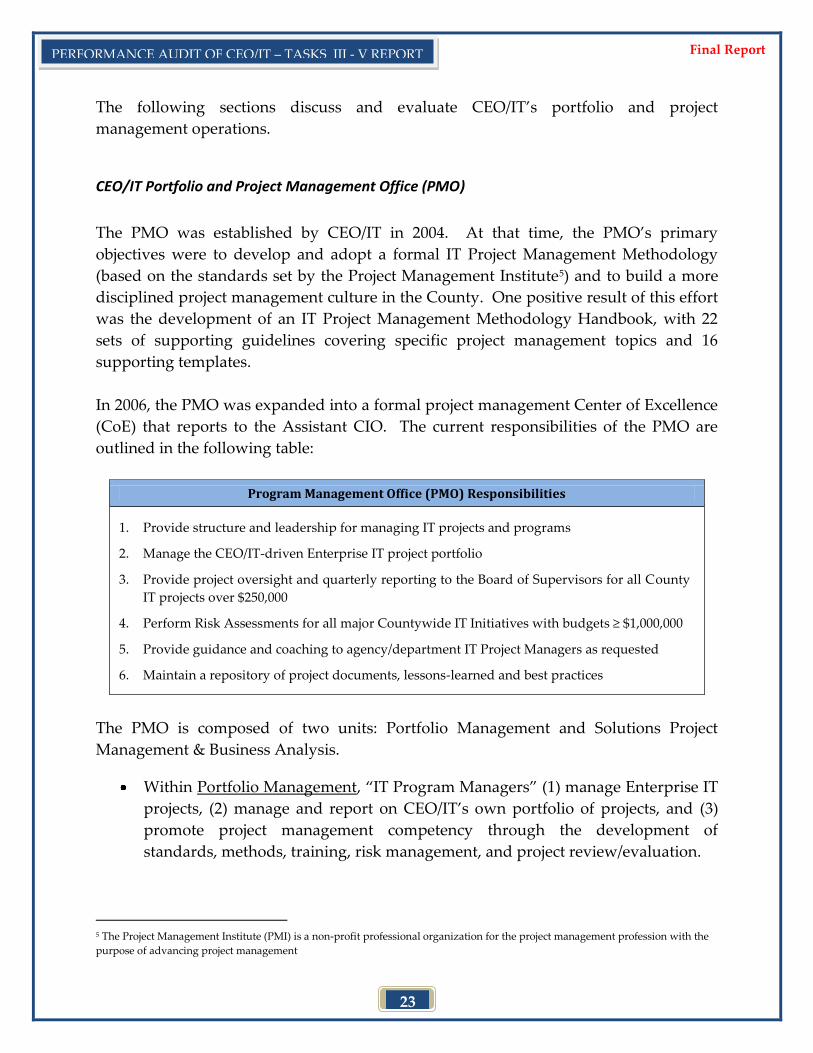
In 2006, the PMO was expanded into a formal project management Center of Excellence
(CoE) that reports to the Assistant CIO. The current responsibilities of the PMO are
outlined in the following table:
Program Management Office (PMO) Responsibilities
1. Provide structure and leadership for managing IT projects and programs
2. Manage the CEO/IT-driven Enterprise IT project portfolio
3. Provide project oversight and quarterly reporting to the Board of Supervisors for all County
IT projects over $250,000
4. Perform Risk Assessments for all major Countywide IT Initiatives with budgets ≥ $1,000,000
5. Provide guidance and coaching to agency/department IT Project Managers as requested
6. Maintain a repository of project documents, lessons-learned and best practices
The PMO is composed of two units: Portfolio Management and Solutions Project
Management & Business Analysis.
Within Portfolio Management, ‚IT Program Managers‛ (1) manage Enterprise IT
projects, (2) manage and report on CEO/IT’s own portfolio of projects, and (3)
promote project management competency through the development of
standards, methods, training, risk management, and project review/evaluation.
5 The Project Management Institute (PMI) is a non-profit professional organization for the project management profession with the
purpose of advancing project management
24
PERFORMANCE AUDIT OF CEO/IT – TASKS III - V REPORT Final Report
Solutions Project Management & Business Analysis is composed of ‚Solutions
Project Managers‛ who manage agency/department-driven IT projects and
CEO/IT-driven projects, and ‚Business Analysts‛ who identify business
requirements for IT projects.
Outside the PMO, there are also CEO/IT employees who serve as technical leads/project
managers for infrastructure-related projects at the Data Center that require less than 500
hours of staff time (note: while these individuals manage projects as part of their role,
these managers are not considered formal Project Managers). In addition, managers
within the Business Information Services group (which reports to the CTO) plan,
organize, manage and monitor Information Systems projects for custom-developed
applications as well as the integration and implementation of commercial-off-the-shelf
systems6.
CEO/IT Project Management
This section evaluates the performance of CEO/IT in several important categories:
Project Management leadership and oversight
IT Portfolio Management
CEO/IT-driven Enterprise projects
Agency/Department-driven IT projects
CEO/IT-driven Technical operations projects
Post-implementation project reviews
Project Management Leadership and Oversight
Over the past four years, the PMO has achieved success in promoting a more
disciplined project management culture in the following ways:
The PMO maintains the County of Orange IT Project Management Methodology
guidelines and templates. Some agencies/departments have found the templates
useful for their own IT project management efforts.
The PMO Manager leads the IT Project Review Board, which reviews all project
requests for Agency 038 funds and recommends projects for funding based on
many factors such as cost, benefits, and alignment with strategic goals. The
6 CEO/IT Business Information Services Profile, August 18, 2009.
25
PERFORMANCE AUDIT OF CEO/IT – TASKS III - V REPORT Final Report
review board was established in 2009 and includes representatives from
agencies/departments and CEO/Budget.
The PMO is responsible for reporting the status of all County IT projects costing
≥ $250,000 (or that are highly visible and require additional oversight) to the
Board of Supervisors via IT Quarterly Reports. In this capacity, CEO/IT has
knowledge of some agency/department IT projects that are not funded via
General Fund Agency 038. It should be noted that as part of this process the
PMO validates project status/progress updates provided by
agencies/departments.
The PMO performs Risk Assessments for all County IT projects with a budget of
≥ $1 million, or those that are deemed to require additional oversight. This
process includes a review of the project schedule, budget, expenditures, status,
and evaluation of risks. Risk Assessments are presented the Board of
Supervisors along with the IT Quarterly Reports.
The PMO coordinates IT project management training for County staff. Between
2004 and 2008, when the County funded formal project management training
through UC Irvine Extension, 330 County employees completed at least one
training course. Of those, 74 employees received formal certification by
completing the six required courses. Due to budget constraints, these
certification courses are no longer offered, but in 2009 the PMO began
conducting its own basic project management training sessions with Child
Support Services. Based on positive feedback, the PMO intends to continue
offering this training to interested agencies/departments.
Countywide IT Portfolio Management
IT Portfolio Management is typically addressed with a two-pronged approach:
Project Portfolio – IT Project Portfolio Management is the analysis and collective
management of a group of current or proposed projects. The fundamental
objective is to determine the optimal mix and sequencing of proposed projects to
achieve the organization's overall goals (e.g., economic goals, business strategy
goals, or technical goals) within constraints such as budget, scarcity of staff
resources, and schedule.
Application Portfolio – Application Portfolio Management examines spending on
IT applications based upon their relative value to the organization, including an
26
PERFORMANCE AUDIT OF CEO/IT – TASKS III - V REPORT Final Report
examination of the financial benefits of each application in comparison to the
costs of the application's maintenance and operations.
Finding 9: Application Portfolio Management is not performed.
CEO/IT began the discussion of managing a portfolio of all County IT applications as
part of the Countywide IT Strategic Plan and Business Continuity/Disaster Recovery
initiative. In FY 09/10, CEO/IT assembled a complete central inventory of IT
Applications Countywide; however, this portfolio is not currently managed by CEO/IT.
Recommendation 9: Develop an Action Plan for managing the Countywide IT
Application Portfolio within the context of the County’s Federated IT system.
CEO/IT-Driven Enterprise Projects
As noted, the PMO assigns staff to a number of CEO/IT-driven projects that have
Enterprise benefit or implications. In 2006, CEO/IT received $5.6 million of General
Fund money for such projects. Enterprise projects that were funded included many of
what CEO/IT calls ‚Strategic IT Initiatives‛ in its proposed IT Strategic Plan (e.g.,
eGovernment, 3-1-1 Service Center, Regional Wireless).
The PMO has had some notable successes in implementing Enterprise solutions.
Among the more successful projects are those that were prompted by a Board request
or Grand Jury report, or those that were not already in place at agencies/departments.
One example is the Business Continuity/Disaster Recovery project that was initiated
following a 2005 Grand Jury report that found that the County’s business continuity
plans were incomplete. The resulting Disaster Recovery project commenced in FY 06/07
and is now nearly complete. Another example is the AlertOC project, which
implemented a new emergency mass notification system.
Despite these successes, there have been several fundamental mistakes made by CEO/IT
relative to Enterprise IT projects.
Finding 10: CEO/IT did not adequately prepare internal management processes,
documents, methods and tools prior to taking on a significant increase
in the number of Enterprise IT projects/initiatives.
The Task I audit report highlighted the significant increase in the number of Key IT
Projects over the last several years. In FY 06/07, there were 16 such projects, and in FY
27
PERFORMANCE AUDIT OF CEO/IT – TASKS III - V REPORT Final Report
07/08, there were 14 such projects, compared to only four in FY 05/06. Though CEO/IT
did add a number of management personnel, CEO/IT was ill-prepared for this drastic
influx of IT projects, as there were many internal management processes not yet in place
or substantively implemented. For example:
The IT Strategic Plan had not yet been developed. Without an established
strategic direction, investments in IT projects and initiatives were not clearly
prioritized or aligned with IT strategic goals.
The IT Project Review Board had not yet been established, and therefore,
investments in IT projects/initiatives did not undergo a rigorous business case
analysis (e.g., assessment of costs, benefits, alignment with strategic goals), aside
from one-off feasibility studies. This is confirmed by the audit team’s review of
many Enterprise IT project planning documents.
A comprehensive tool to both plan and manage the allocation of resources to
these new projects was not yet available. Though a project to implement a
resource planning tool (Clarity) was initiated in FY 07/08, it was not until FY
09/10 that Clarity was even partially functional for resource management. The
only means for resource planning that existed prior to FY 09/10 was a large Excel
spreadsheet, which was updated quarterly and is referred to by CEO/IT as the FY
07/08 and FY 08/09 ‚Operating Plans.‛
ITIL, a process management framework that outlines industry best practices, had
not yet been implemented; substantive progress in implementing the ITIL
framework was not made until FY 08/097.
The effects of pursuing such a high number of IT projects and initiatives simultaneously
without first focusing on internal improvements led to a number of major deficiencies:
1. Frequent changes in project focus/priority
2. Unrealistic workload demands on staff
3. Poorly executed projects
Recommendation 10: CEO/IT should take additional steps to build a sufficient
strategic framework and solid organizational foundation in order to achieve
successful management of future IT projects/initiatives
7 According to a 2009 ACS review of CEO/IT organizational alignment, ‚Different functions of ITIL have been adopted at various
degrees of maturity within CEO/IT. However, it seems that ITIL framework and lifecycle is currently something most of the staff
and managers pay attention to ‘when time permits’ or on the sidelines.‛
28
PERFORMANCE AUDIT OF CEO/IT – TASKS III - V REPORT Final Report
Finding 11: Many high profile CEO/IT-driven Enterprise projects have not been
implemented successfully due to a variety of project planning issues.
A number of Strategic IT Initiatives and other Enterprise IT projects pursued by CEO/IT
have encountered significant challenges from a project management standpoint. Audit
interviews and a thorough review of pertinent documents provided several examples
(shown below as case studies) where CEO/IT has launched many of its projects without
satisfactory planning.
Case Studies
3-1-1 Customer Service Center
eGovernment
Clarity IT Portfolio Management
OCid
IT Sourcing
3-1-1 Customer Service Center:
The 3-1-1 Customer Service Center project proposed to implement a shared,
Countywide public contact center to manage customer communications. Specific
planning deficiencies related to this project included (1) a problematic approach for its
business case analysis and (2) a lack of sufficient stakeholder buy-in.
In March 2008, CEO/IT requested Board approval for a contract with EMA, Inc. for 3-1-1
Customer Service Center services in the amount of $1.3 million. The first phase of this
project was for EMA to conduct a detailed business case analysis to determine the
feasibility of implementing 3-1-1 at the County. If the study recommended—and the
Board approved—implementation, EMA would be the vendor utilized for the
subsequent phases of the project. While in some cases it is acceptable practice to engage
the same vendor for both the analysis and implementation phases of an IT project, in
the case of the 3-1-1 Customer Service Center project, where the recommendation of the
business case analysis was essentially a ‘go/no-go’ decision (in this case, a ‘go’), there is
a potential risk of insufficient independence and objectivity on the part of the vendor
conducting the business case analysis.
29
PERFORMANCE AUDIT OF CEO/IT – TASKS III - V REPORT Final Report
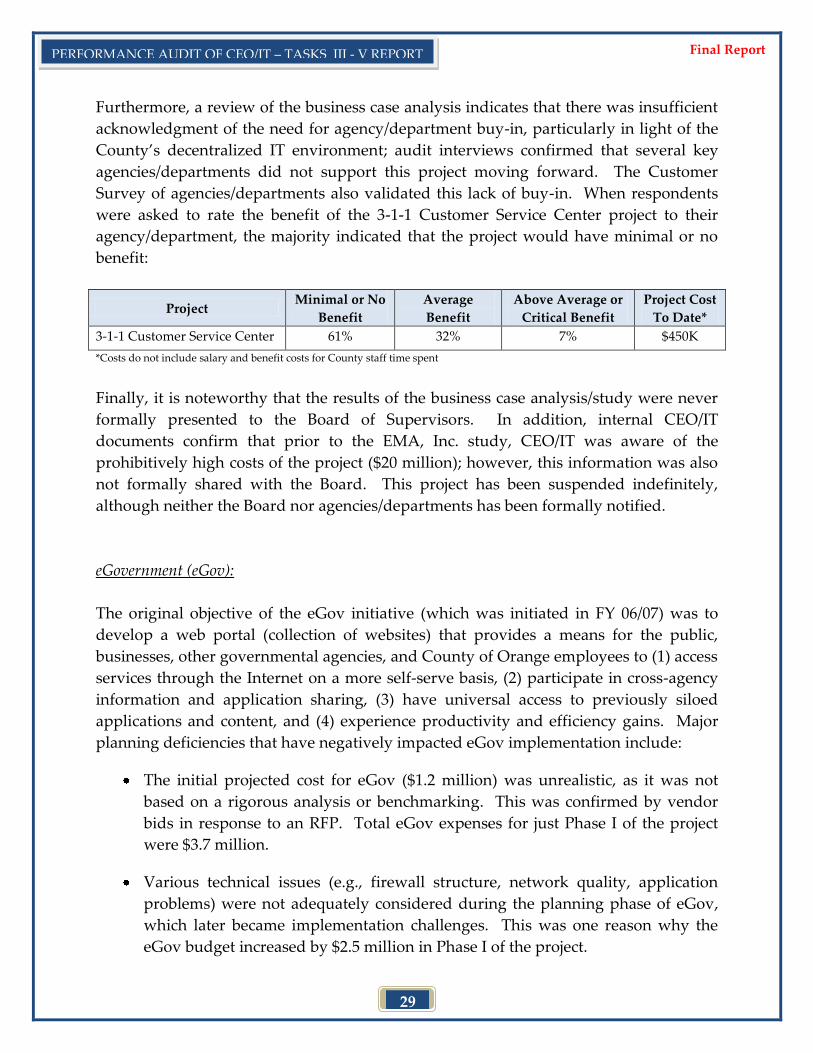
Furthermore, a review of the business case analysis indicates that there was insufficient
acknowledgment of the need for agency/department buy-in, particularly in light of the
County’s decentralized IT environment; audit interviews confirmed that several key
agencies/departments did not support this project moving forward. The Customer
Survey of agencies/departments also validated this lack of buy-in. When respondents
were asked to rate the benefit of the 3-1-1 Customer Service Center project to their
agency/department, the majority indicated that the project would have minimal or no
benefit:
Project Minimal or No
Benefit
Average
Benefit
Above Average or
Critical Benefit
Project Cost
To Date*
3-1-1 Customer Service Center 61% 32% 7% $450K
*Costs do not include salary and benefit costs for County staff time spent
Finally, it is noteworthy that the results of the business case analysis/study were never
formally presented to the Board of Supervisors. In addition, internal CEO/IT
documents confirm that prior to the EMA, Inc. study, CEO/IT was aware of the
prohibitively high costs of the project ($20 million); however, this information was also
not formally shared with the Board. This project has been suspended indefinitely,
although neither the Board nor agencies/departments has been formally notified.
eGovernment (eGov):
The original objective of the eGov initiative (which was initiated in FY 06/07) was to
develop a web portal (collection of websites) that provides a means for the public,
businesses, other governmental agencies, and County of Orange employees to (1) access
services through the Internet on a more self-serve basis, (2) participate in cross-agency
information and application sharing, (3) have universal access to previously siloed
applications and content, and (4) experience productivity and efficiency gains. Major
planning deficiencies that have negatively impacted eGov implementation include:
The initial projected cost for eGov ($1.2 million) was unrealistic, as it was not
based on a rigorous analysis or benchmarking. This was confirmed by vendor
bids in response to an RFP. Total eGov expenses for just Phase I of the project
were $3.7 million.
Various technical issues (e.g., firewall structure, network quality, application
problems) were not adequately considered during the planning phase of eGov,
which later became implementation challenges. This was one reason why the
eGov budget increased by $2.5 million in Phase I of the project.
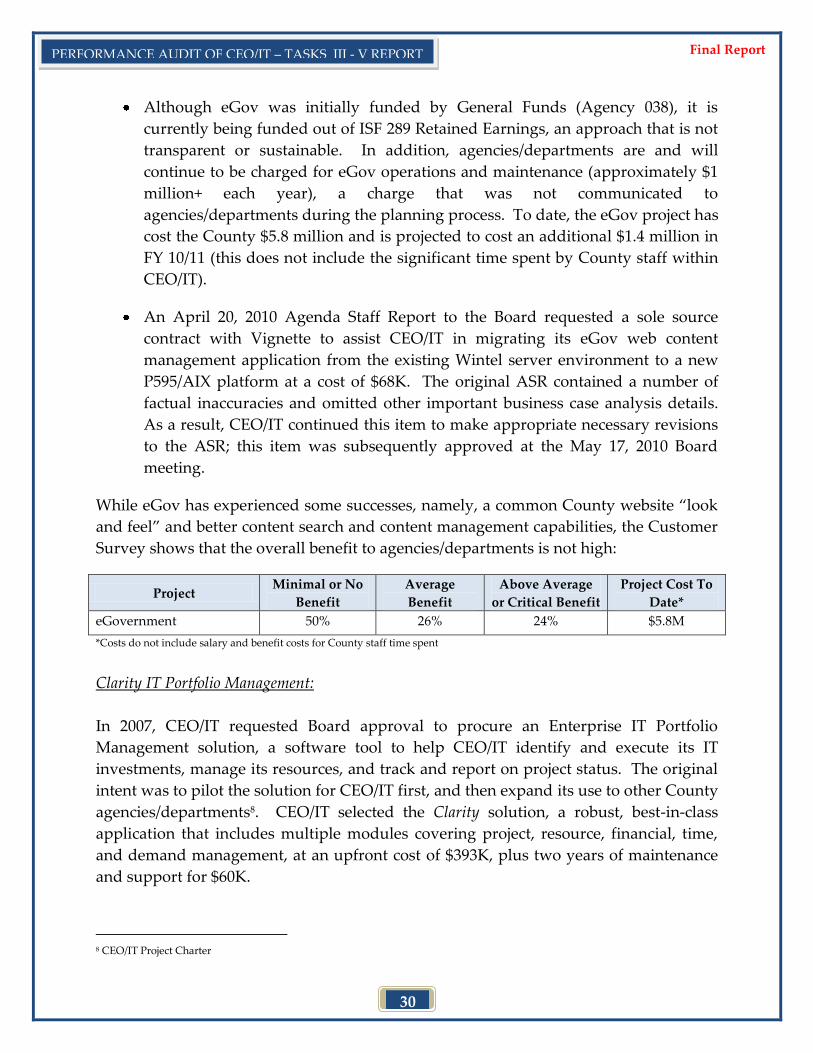
30
PERFORMANCE AUDIT OF CEO/IT – TASKS III - V REPORT Final Report
Although eGov was initially funded by General Funds (Agency 038), it is
currently being funded out of ISF 289 Retained Earnings, an approach that is not
transparent or sustainable. In addition, agencies/departments are and will
continue to be charged for eGov operations and maintenance (approximately $1
million+ each year), a charge that was not communicated to
agencies/departments during the planning process. To date, the eGov project has
cost the County $5.8 million and is projected to cost an additional $1.4 million in
FY 10/11 (this does not include the significant time spent by County staff within
CEO/IT).
An April 20, 2010 Agenda Staff Report to the Board requested a sole source
contract with Vignette to assist CEO/IT in migrating its eGov web content
management application from the existing Wintel server environment to a new
P595/AIX platform at a cost of $68K. The original ASR contained a number of
factual inaccuracies and omitted other important business case analysis details.
As a result, CEO/IT continued this item to make appropriate necessary revisions
to the ASR; this item was subsequently approved at the May 17, 2010 Board
meeting.
While eGov has experienced some successes, namely, a common County website ‚look
and feel‛ and better content search and content management capabilities, the Customer
Survey shows that the overall benefit to agencies/departments is not high:
Project Minimal or No
Benefit
Average
Benefit
Above Average
or Critical Benefit
Project Cost To
Date*
eGovernment 50% 26% 24% $5.8M
*Costs do not include salary and benefit costs for County staff time spent
Clarity IT Portfolio Management:
In 2007, CEO/IT requested Board approval to procure an Enterprise IT Portfolio
Management solution, a software tool to help CEO/IT identify and execute its IT
investments, manage its resources, and track and report on project status. The original
intent was to pilot the solution for CEO/IT first, and then expand its use to other County
agencies/departments8. CEO/IT selected the Clarity solution, a robust, best-in-class
application that includes multiple modules covering project, resource, financial, time,
and demand management, at an upfront cost of $393K, plus two years of maintenance
and support for $60K.
8 CEO/IT Project Charter
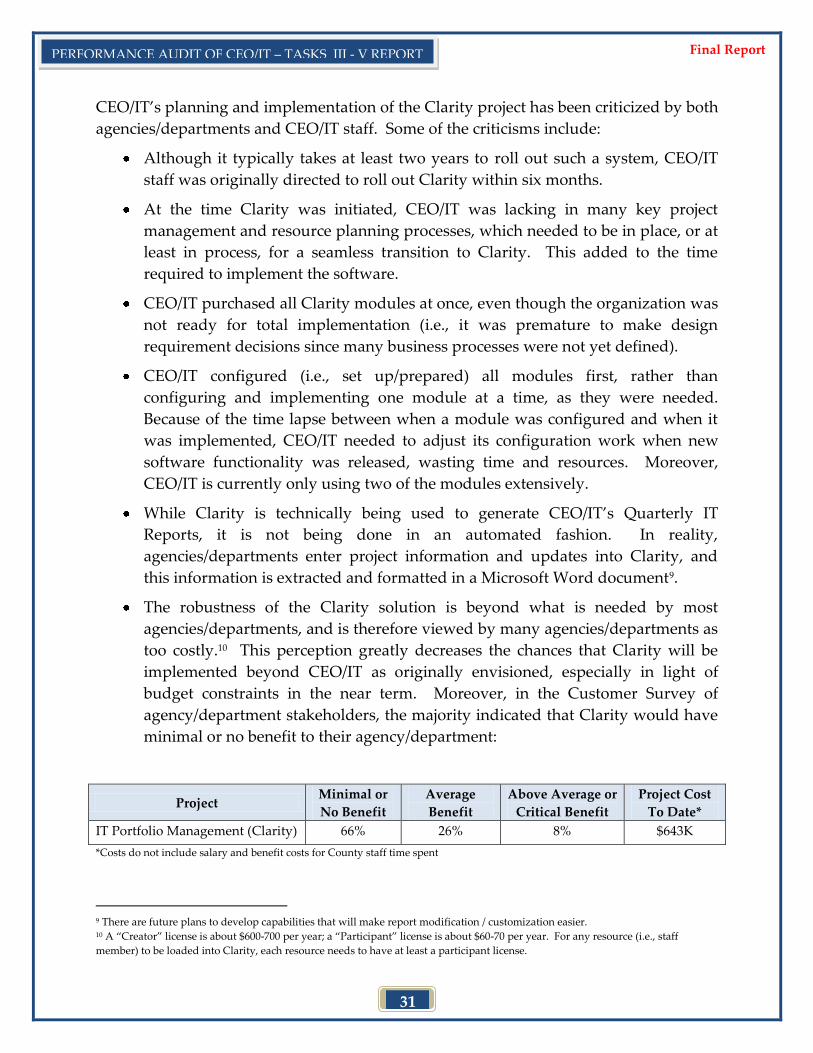
31
PERFORMANCE AUDIT OF CEO/IT – TASKS III - V REPORT Final Report
CEO/IT’s planning and implementation of the Clarity project has been criticized by both
agencies/departments and CEO/IT staff. Some of the criticisms include:
Although it typically takes at least two years to roll out such a system, CEO/IT
staff was originally directed to roll out Clarity within six months.
At the time Clarity was initiated, CEO/IT was lacking in many key project
management and resource planning processes, which needed to be in place, or at
least in process, for a seamless transition to Clarity. This added to the time
required to implement the software.
CEO/IT purchased all Clarity modules at once, even though the organization was
not ready for total implementation (i.e., it was premature to make design
requirement decisions since many business processes were not yet defined).
CEO/IT configured (i.e., set up/prepared) all modules first, rather than
configuring and implementing one module at a time, as they were needed.
Because of the time lapse between when a module was configured and when it
was implemented, CEO/IT needed to adjust its configuration work when new
software functionality was released, wasting time and resources. Moreover,
CEO/IT is currently only using two of the modules extensively.
While Clarity is technically being used to generate CEO/IT’s Quarterly IT
Reports, it is not being done in an automated fashion. In reality,
agencies/departments enter project information and updates into Clarity, and
this information is extracted and formatted in a Microsoft Word document9.
The robustness of the Clarity solution is beyond what is needed by most
agencies/departments, and is therefore viewed by many agencies/departments as
too costly.10 This perception greatly decreases the chances that Clarity will be
implemented beyond CEO/IT as originally envisioned, especially in light of
budget constraints in the near term. Moreover, in the Customer Survey of
agency/department stakeholders, the majority indicated that Clarity would have
minimal or no benefit to their agency/department:
Project Minimal or
No Benefit
Average
Benefit
Above Average or
Critical Benefit
Project Cost
To Date*
IT Portfolio Management (Clarity) 66% 26% 8% $643K
*Costs do not include salary and benefit costs for County staff time spent
9 There are future plans to develop capabilities that will make report modification / customization easier. 10 A ‚Creator‛ license is about $600-700 per year; a ‚Participant‛ license is about $60-70 per year. For any resource (i.e., staff
member) to be loaded into Clarity, each resource needs to have at least a participant license.
32
PERFORMANCE AUDIT OF CEO/IT – TASKS III - V REPORT Final Report
OCid:
This project was first initiated during the FY 08/09 budget cycle and experienced
multiple changes during its planning phase. For example, OCid was first envisioned to
be implemented Countywide to allow for single sign-on (i.e., one password and access
point for all County applications) and identity management capabilities (i.e., a
consolidated database of County employee identification information). The first major
application that CEO/IT attempted to synchronize with OCid was the CAPS+ financial
and purchasing system. When the CAPS+ project team decided not to pilot OCid, the
Property Tax Management System (PTMS) project was asked to consider implementing
OCid. PTMS agreed initially, but ultimately decided to abandon the integration after
unsuccessful efforts to ‚make it work.‛ PTMS management stated that this failed effort
has cost the PTMS project both significant time and money. Subsequently, the plan for
OCid changed again to a pilot implementation with CEO/IT and the Health Care
Agency (HCA). However, in December 2009, CEO/IT and the Human Resources
Department saw an opportunity to use OCid to roll out a new IT Usage Policy to all
County employees, which again required a Countywide roll out to all
agencies/departments. The OCid team was then given just 60 days to plan and
implement the application Countywide.
Not surprisingly, this aggressive timetable, combined with haphazard planning and
unrealistic expectations, resulted in a number of critical implementation flaws, such as:
(1) instances of OCid system overload due to its rapid Countywide roll-out, (2) incorrect
information in employee profiles, (3) employees being assigned to the wrong
agency/department, and (4) managers given access to information of employees in other
agencies/departments. CEO/IT would have benefited from a slower, phased rollout of
OCid when the scope was expanded, as is industry best practice. During project
planning, CEO/IT also failed to properly engage agency/department stakeholders.
Agencies/departments were not apprised of important details and plans related to
OCid, which should have been communicated through the IT Governance structure.
Rather than having all critical stakeholders in the same room, CEO/IT chose to speak
with agency/department IT and Human Resources Department stakeholders separately,
which led to misunderstandings and poor coordination. To date, the cost of the OCid
project is $286K (not including salary and benefit costs for County staff).
IT Sourcing:
The IT Sourcing initiative is arguably the most critical IT project/initiative currently in
process. In this complex undertaking, CEO/IT is proposing to go out to bid to replace

33
PERFORMANCE AUDIT OF CEO/IT – TASKS III - V REPORT Final Report
its current 11-year, $266 million Staff Augmentation contract with ACS with a Managed
Services outsourcing contract. A Managed Services outsourcing model differs from a
Staff Augmentation model in that (1) vendor performance/quality is measured solely
against contractual Service Levels (i.e., minimum standards of performance), (2)
management of contractors is the responsibility of the vendor rather than the County,
and (3) infrastructure services are procured for a fixed per-unit-supported (e.g., per
server) fee at a agreed upon Service Level, rather than on a per hour basis for contract
staff time.
In September 2009, the consultant engaged by CEO/IT to conduct a sourcing analysis
(Avasant) began meeting with agencies/departments to gather information, with the
goal of developing a recommendation on the type of sourcing model (e.g., Staff
Augmentation, Managed Services) that would be in the best interest of the County.
Unfortunately, during this process, (1) many agencies/departments were left with the
impression that a decision to move to a Managed Services model, which would have
outsourced many existing Countywide IT positions, was predetermined without their
input, and (2) the impact on agency/department operations, as well as the identification
and consideration of important logistical aspects (i.e., meet and confer obligations,
legal) had not been sufficiently considered and resolved.
CEO/IT also proposed a highly aggressive timeline which would have rushed
important communication with and analysis for agencies/departments and the Board.
Initially, CEO/IT planned to agendize the approval of a conceptual sourcing strategy for
a November/December 2009 Board meeting, before resolution of the issues noted above
and without sufficient discussion with agencies/departments or the Board. Once
informed of the significant impact of CEO/IT’s sourcing initiative on County operations,
the Board of Supervisors directed the audit team and CEO/IT to discuss the timeline for
both the audit and the sourcing effort and also directed the audit team to identify issues
that the Board should consider before hearing the item and to recommend
improvements to CEO/IT’s approach.
As a result, CEO/IT re-engaged agency/department stakeholders through a governance
process (separate from the County IT Governance structure) before bringing the item to
the Board. Following governance discussions, the scope of the IT sourcing initiative
was scaled back from a Countywide proposal to the current scope of the ACS contract
(Data Center services only). A recommendation was also made for CEO/IT to proceed
with one Request for Proposal (RFP) for IT Sourcing and Voice over Internet Protocol
(VoIP), rather than two separate RFPs. These changes were approved by the Board at
its February 2, 2010 meeting.
34
PERFORMANCE AUDIT OF CEO/IT – TASKS III - V REPORT Final Report
Recommendation 11: Improve the initial stages of IT Project Management (project
initiation and planning, business case analysis) to ensure that proposed solutions (1)
address clear business needs for all stakeholders, and (2) include agency/department
buy-in before proceeding with project implementation.
Agency/Department-Driven IT Projects
In addition to CEO/IT-driven projects, CEO/IT Project Managers (typically ‚Solutions
Project Managers‛) support periodic agency/department projects, as requested. Since
FY 05/06, CEO/IT Project Managers have supported 11 major agency/department
projects11 (e.g., ePages, SECURE Electronic Recording Delivery System) totaling
approximately $9 million (compared to 13 major Enterprise projects, such as Disaster
Recovery and eGov, totaling approximately $12 million).
Some agencies/departments who have utilized CEO/IT project management services
have provided positive feedback about their experience. However, CEO/IT faces
multiple on-going challenges in providing project management services to
agencies/departments Countywide.
Finding 12: The project management services offered by the PMO are viewed as
having little value to many agencies/departments.
According to results of the Customer Survey of agency/department executives and IT
managers, only 14% of respondents indicated that use of CEO/IT project management
resources to assist them with IT projects was of ‘Above Average’ or of ‘Critical
Importance/Value’; as opposed to the 47% who said that project management services
were of ‘Minimal’ or ‘No Importance/Value’12.
There are several reasons given by agencies/departments to explain these results:
Many agencies/departments have and prefer to use their own IT staff for project
management and simply need a point of contact at the Data Center to assist with
the infrastructure component of their projects. For example, none of the three
major system upgrades currently in process (i.e., CAPS+, PTMS, ATS) relies on
CEO/IT as their primary project manager, as they have their own PMOs.
11 Agency/Department IT projects budgeted to cost ≥ $250,000 (e.g., ePages, SECURE Electronic Recording Delivery System) 12 See Question #7 of the Customer Survey in Appendix A
35
PERFORMANCE AUDIT OF CEO/IT – TASKS III - V REPORT Final Report
There is a decreased demand for project management services due to the current
and near-term budget constraints.
Of those agencies/departments that have experience with CEO/IT’s project
planning and implementation services, several believe there is improvement
needed. For example, in the Customer Survey, when asked to rate the quality of
the PMO’s IT Project Planning services to agencies/departments, of the 12
individuals who responded to this question, six indicated that it was ‘Poor’ or
‘Needs Improvement’ (vs. four indicating that it was ‘Average’ and two
indicating that it was ‘Good’ or ‘Excellent’). Similarly, when asked to rate the
quality of the PMO’s IT Project Implementation services to agencies/departments,
of the 12 individuals who responded to this question, five indicated that it was
‘Poor’ or ‘Needs Improvement’ (vs. five indicating ‘Average’ and two indicating
that it was ‘Good’ or ‘Excellent’)13.
Agencies/departments perceive CEO/IT’s project management services to be too
costly. When asked in the Customer Survey to compare the cost of CEO/IT’s
project management services with IT industry standards, of the 13 individuals
who responded to the question, 12 indicated that CEO/IT was more costly14.
For agencies/departments that do utilize PMO services, there is a stated need to more
clearly define project expectations between CEO/IT and the agency/department.
Currently, there is not a consistently utilized agreement between the two parties as to
expected hours, bill rates, and detailed responsibilities15. This is important because
individual agencies/departments have different needs from the PMO. While some need
a PMO resource to serve as just a technical liaison, others may need more traditional
project management support (e.g., managing vendors). (Note: CEO/IT does not
currently bill agencies/departments for CEO/IT Project Manager time but plans to
establish charge rates for all project managers beginning next fiscal year. Other services
offered by CEO/IT, such as Help Desk support and network operations, do have
Memoranda of Understanding and service level expectations).
Recommendation 12: Reexamine PMO project management services to develop a
clear service catalog that matches the needs of agencies/departments. Consider the
use of contractors for intermittent increases in demand, as well as staff reallocation if
agency/department demand for these services is not planned to increase in the near
term.
13 See Question #5 of the Customer Survey in Appendix A 14 See Question #6 of the Customer Survey in Appendix A 15 Roles and responsibilities included in project charters are sometimes high level
36
PERFORMANCE AUDIT OF CEO/IT – TASKS III - V REPORT Final Report
It should also be noted that CEO/IT has played and continues to play a varying role in
major system upgrades with Countywide implications (e.g., CAPS+, PTMS, ATS). For
the CAPS+ project, the CIO is a member of the CAPS+ Steering Committee; for the
PTMS project, staff from CEO/IT PMO is playing an independent verification and
validation (IV&V) role; and for the ATS project, CEO/IT technical staff is supporting the
infrastructure needs for the new system.
CEO/IT-Driven Technical Operations Projects
As mentioned previously, there are also technical managers who report to the Chief
Technology Officer who manage technical, infrastructure-related IT projects (e.g.,
security, operations or network-related projects) that require less than 500 hours of staff
time. Some of these projects are initiated by agency/department requests (e.g., creating
a CAPS+ payment authorization report for Public Administrator/Public Guardian).
Other projects are related to upgrades of the County IT network, refreshes to security
hardware, upgrades to Data Center equipment, or process improvements to operations.
Post-Implementation Project Reviews
CEO/IT’s Project Management Methodology calls for post-implementation reviews
(project ‚Closing‛). As part of these reviews, Project Managers are responsible for
completing the following tasks:
Obtain a sign-off on Project Acceptance by project sponsor
Identify Lessons Learned with team
Complete Customer and PMO Appraisals
Close project in Clarity application and ensure all project documentation is
stored in the project collaboration folder for future reference
Although CEO/IT’s own Project Management Methodology calls for post-
implementation reviews, according to CEO/IT staff, these reviews have not been
completed consistently and/or thoroughly. For example, Lessons Learned documents
have not been completed for all projects, and PMO Appraisals have not yet been
formalized. As a result, CEO/IT has not benefited from positive and negative lessons
learned for a number of high dollar projects.
37
PERFORMANCE AUDIT OF CEO/IT – TASKS III - V REPORT Final Report
A proper post-implementation review should also include measuring the success of a
project, particularly realized benefits (e.g., actual cost savings achieved). This aspect of
a post-implementation review will be discussed in more detail in the ‚Performance
Measurement‛ section of this report (see page 55).
Technical Operations
The Technical Operations of CEO/IT are overseen by the Chief Technology Officer
(CTO) and include activities such as Network/Platform Services, Mainframe
Operations, Network Security, Telephone Services, and Business Information Services
(BIS), which consists primarily of Application Development. The costs for these
technical services are billed to County agencies/departments via Internal Service Fund
(ISF) 289.
All agencies/departments at the County purchase, at a minimum, two types of services
from CEO/IT: (1) access to the Wide Area Network (WAN)/the Internet and (2)
Telephone services via the OCTNET system16. As noted in our Task I report, these two
service charges comprised approximately 37% of all ISF 289 Charges in FY 08/09. Based
on the multitude of interviews with agency/department IT management and
executive/administrative management, the Customer Survey conducted as part of this
audit, and a review of historical ACS Customer Service Survey results, on average,
County customers have been and are currently satisfied with the level of technical
service that they receive in these two primary areas.
The current CTO has made some significant improvements over the last 12-18 months.
CEO/IT has pursued in earnest an organizational ‚re-alignment‛ of its
Network/Platform Services unit, in conjunction with a broader initiative to implement
the Information Technology Infrastructure Library (ITIL) framework throughout its
technical operations. ITIL is a collection of concepts, checklists, and procedures that
reflect industry best practices for information technology service management. To date
the key positive results from this initiative are as follows:
The documentation of over 280 Standard Operating Procedures (SOPs) for
CEO/IT employees/contract staff to refer to as they complete tasks; these SOPs
have all been reviewed and approved by either County or ACS management and
are scheduled to be refreshed on an periodic basis. These procedures are
available via an internal collaboration website (using SharePoint) to all CEO/IT
16 Agencies/departments that have their own Voice over Internet Protocol systems use OCTNET to connect to the rest of the County
38
PERFORMANCE AUDIT OF CEO/IT – TASKS III - V REPORT Final Report
employees. This is a critical first step toward making IT processes at the Data
Center more repeatable.
The assignment of key staff resources in order to cover the three primary phases
of all technical tasks (Plan, Design/Build, and Operate/Maintain).
The implementation of formal Service Design Packages (SDPs) to guide the
design and execution of any new Network/Platform/Mainframe/AIX services
requested by agencies/departments or CEO/IT for new projects/initiatives. SDPs
provide a thorough, methodical approach to defining requirements, clarifying
costs and performance expectations, and ensuring that all operational areas of
CEO/IT are working from the same playbook as projects/initiatives proceed.
Telephone Services has initiated an online, automated change request system
that allows for improved tracking and more efficient processing of customer
requests.
Improved tracking and reporting on various workload and performance
measures (see the Performance Measurement section of this report for more
details).
Other non-ITIL related initiatives/projects have been successful as well.
In the area of Network Security, prior to November 2009 the audit team has
confirmed that the only intrusion detection mechanisms in place after normal
business hours (M-F, 9-5) in the County Network were some obsolete pieces of
monitoring equipment. In response to this escalating risk, in November 2009
CEO/IT Executive Management decided to purchase and implement an intrusion
protection/detection system (IPS/IDS) from IBM for an upfront hardware cost of
$377K and an ongoing service cost of $200K per year.
In the area of Data Center (OCDC) Operations, there was a successful upgrade of
the Uninterruptible Power Supply, a revamp of the fire suppression system, as
well as the establishment of a formal OCDC access review process.
The Mainframe Services group continues to provide solid reliable support for
applications remaining on the Mainframe. In addition, Mainframe Services has
successfully implemented, from a hardware standpoint, two new IBM P595
servers with AIX environments: one which is currently supporting the CAPS+
Finance and Purchasing System and one which will support the CAPS+ HR &
39
PERFORMANCE AUDIT OF CEO/IT – TASKS III - V REPORT Final Report
Payroll System, the eGov content management application, and possibly serve a
disaster recovery role to the CAPS+ Finance and Purchasing system.
From a broader perspective, multiple interviews and documents also confirm that the
current CTO has made noticeable progress in establishing priorities and plans for
resource allocation in CEO/IT Technical Operations over the last 12-18 months. Prior to
his arrival, the operational side of CEO/IT did not have formal direction or a framework
for prioritizing among the cascade of implementation and maintenance projects
pursued by the CIO and agencies/departments, especially during the timeframe FY
06/07 through FY 08/09. Consequently, during this time period, the modus operandi for
the Data Center became crisis management or ‚fire-fighting.‛ While this issue did not
lead to a significant degradation of overall service quality, the net impacts were
increased operational risk and inefficiency, as well as CEO/IT staff frustration. It is
important to note that ACS has played a key role in the success of many of these recent
initiatives, including the ITIL implementation.
Alongside these positive findings, the audit team also identified some areas of concern
and opportunities for improvement in the following functional units of CEO/IT’s
technical operations:
Business Information Services (BIS)
Network & Platform Services (NPS)
Security
Business Information Services (BIS)
Finding 13: Agencies’/departments’ demand for Application Development work has
decreased drastically over the last three years, such that this operation of
CEO/IT is no longer financially viable as currently structured.
Demand from agencies/departments for Business Information Services (BIS) (i.e.,
application development, application database design, etc.) has drastically decreased
over the last three years. In FY 07/08, CEO/IT spent approximately $13.7M on these
services, but in FY 09/10 expects to only spend $4.8M, a reduction of 65% over this time
period. While a portion of these reductions are the result of flagging budgets for IT
application projects, there are a number of other drivers that impact the viability of BIS
as a standalone business unit in CEO/IT.
40
PERFORMANCE AUDIT OF CEO/IT – TASKS III - V REPORT Final Report
A significant portion of this reduction was caused by the removal of approximately 30
applications contract (ACS) staff who worked on the ATS Reengineering project.
During FY 08/09, the Assessor, CEO/IT, and ACS agreed to have ACS and the Assessor
negotiate a unique arrangement rather than utilize the standard ACS-CEO/IT contract.
All parties agreed that it was inefficient for the Assessor to pay CEO/IT a 12% margin
on top of ACS costs for general overhead, as the Assessor was managing these
contractors on a day-to-day basis.
The rationale for moving the ACS resources working on the ATS project into a direct
relationship with the Assessor is applicable to the majority of ACS resources working in
the Application Development group of BIS. Over time, agencies/departments have
moved away from utilizing CEO/IT to manage the planning, building and
implementation of business-specific IT applications and instead, have either (1)
embedded ACS resources in their department that they manage themselves or (2)
utilized their own application development contractors (other than ACS). For example,
both Probation and SSA have embedded ACS resources that they manage themselves
on a day-to-day basis, yet they pay a 12% administrative overhead margin to CEO/IT.
Both of these agencies also utilize outside contractors for application development
work. As another example, the PTMS Project is currently contracting directly with Tata
Consultancy for its application development needs.
The Auditor-Controller’s CAPS+ Program Office also utilizes an ACS subcontractor
(GCAP) for the CAPS+ upgrade and pays CEO/IT the 12% administrative overhead
margin, despite the fact that these resources are managed day-to-day by the CAPS+
Program Office. In this case, ACS agreed to reduce its own overhead from the
contractual 20.9% to 7.25% because of the minimal management responsibility for these
subcontractors; however, CEO/IT made no such reduction in its 12% overhead charge.
The CAPS+ Program Office also had a contract with ACS (via CEO/IT) to perform
application development work related to the CAPS+ Reports and Interfaces. This was
one instance where the CAPS+ Program Office expected CEO/IT to directly manage
ACS resources to achieve the successful completion of these critical application
elements. However, through a variety of miscues, these efforts failed, significant time
and resources were wasted, the schedule was delayed, and the application development
work was shifted to a different contractor.
It should be noted that there are two recent exceptions to this trend: the Electronic
Fictitious Business Name (EFBN) project and the Electronic Recording Delivery System
(or SECURE) project, both of which were funded by the Clerk-Recorder’s Office. In
both instances, BIS managed ACS application development resources successfully to the
satisfaction of the Clerk-Recorder’s Office.
41
PERFORMANCE AUDIT OF CEO/IT – TASKS III - V REPORT Final Report
In addition to the overall reduction in demand for Application Development services,
the BIS unit has historically under-recovered its costs, placing further cost pressures on
other service units of ISF 289, such as Network/Platform Services. For example, as
noted above, BIS spent approximately $13.7M in FY 07/08, yet only recovered $12.0M in
revenue, creating an operating deficit of approximately $1.7M. Similarly, in FY 08/09
BIS spent $10.9M, but collected only $9.4M in revenues from agencies/departments,
creating an operating deficit of $1.4M. The reasons for this under-recovery of costs
include (1) volatility of agency/department demand for services (outside of CEO/IT’s
control), (2) a lag in the reduction of contract resources commensurate with declining
demand (within CEO/IT’s control), (3) fixed administrative costs that have not declined
commensurate with demand for services, and (4) inadequate control over ACS costs
relative to ISF charge rates.
To manage this situation, BIS could be playing a more proactive role in conducting
strategic application planning and business analysis of the Countywide portfolio of
applications to identify application development opportunities that would benefit
multiple agencies/departments. While there is a forum for such discussions in some IT
Governance groups (e.g., Application and Data Architecture Group), to date, CEO/IT
has not put forward any formal proposals in this regard. The audit team confirmed that
historically ACS played a more active role in communicating with and marketing
application services to agencies/departments. However, several years ago, CEO/IT
made the decision to bring this responsibility ‚in-house‛ and required that ACS
communicate with agencies/departments only via CEO/IT management. Unfortunately,
subsequent to that decision, CEO/IT has not developed a marketing or strategic
application plan for application development needs Countywide, despite BIS’
continuing under-recovery of costs.
Taken together, all the aforementioned trends have diminished the need for a BIS
Service Unit. Unless CEO/IT intends to develop a strategic application and marketing
plan to revive demand for this service, all ACS resources should contract directly with
agencies/departments, without paying for CEO/IT administrative overhead.
Recommendation 13: Merge BIS management into the PMO and BIS/Information
Resource Management staff into Network & Platform Services. BIS/IT Process &
Quality Assurance responsibilities should be assumed by the PMO.
42
PERFORMANCE AUDIT OF CEO/IT – TASKS III - V REPORT Final Report
Network & Platform Services (NPS)
The NPS unit of CEO/IT provides five major services to agencies/departments: (1)
access to the Wide Area Network (WAN)/Internet, (2) Network Security, (3) Server
Maintenance (SLA), (4) Storage Area Network (SAN) capacity, and (5) technical support
for agency/department server-related projects. The first two cost centers are charged to
all agencies/departments on a per email per month basis (with the exception of the
Sheriff’s Department exception noted below), and there is little volatility in the demand
for these services. The other three cost centers, however, are charged only to
agencies/departments that avail themselves of the service.
With respect to Server Maintenance, CEO/IT has nine major customers, who
house a total of approximately 232 servers at the Data Center. The largest of
these customers are Assessor, Auditor-Controller, CAPS+, Clerk-Recorder,
Probation, SSA, Treasurer-Tax Collector, and the PTMS project. These customers
rely on CEO/IT to provide a general level of monitoring and maintenance for the
servers, and in exchange, customers pay CEO/IT approximately $647 per server
per month.
The storage capacity in the CEO/IT SAN is available to agencies/departments on
a per gigabyte per month basis. The largest users of this service are Assessor,
CAPS+, and SSA.
Lastly, the technical support for server-related projects is available to
agencies/departments at approximately $90 per hour.
In FY 08/09, CEO/IT implemented an entirely new service rate structure and as a result,
does not have consistent/comparable historical records of service demand. Thus,
demand can only be measured beginning in FY 08/09. This short timeframe
notwithstanding, the trends in customer demand for the three customer-driven service
areas (SAN, Server Maintenance, and Server Project Technical Support) are as follows:
Demand for technical support for server-related projects declined significantly
from FY 08/09 to FY 09/10 (by approximately 35% or 6,900 hours), and a further
decline is expected from FY 09/10 to FY 10/11 (approximately 15%). The
associated revenues from these services dropped from $1.8M in FY 08/09 to a
projected $1.1M in FY 09/10.
Demand for storage capacity in the CEO/IT SAN increased drastically from FY
08/09 to FY 09/10 (nearly 100%), and a slight increase is projected from FY 09/10
43
PERFORMANCE AUDIT OF CEO/IT – TASKS III - V REPORT Final Report
to FY 10/11 to accommodate the CAPS+ Financial, Clerk-Recorder ERDS, and
ATS systems. The associated revenues from these services increased from $331K
in FY 08/09 to a projected $690K in FY 09/10.
Demand for Server Maintenance at the Data Center increased from FY 08/09 to
FY 09/10 (by approximately 21%), driven largely by the build-up of open system
environments associated with large data system projects (i.e. CAPS+, ATS,
PTMS) and the SECURE project from the Clerk-Recorder. Despite this ramp up,
there is a 15% decline projected from FY 09/10 to FY 10/11 as customers such as
PTMS and Clerk-Recorder scale back the level of monitoring/maintenance on a
number of non-critical servers in order to save costs. The associated revenues
with this service increased from $1.7M in FY 08/09 to a projected $1.9M in FY
09/10.
For details regarding cost recovery of different business lines of CEO/IT-NPS, please
refer to Appendix C.
Finding 14: The Network and Platform Services unit of CEO/IT, a core, mission-
critical service for agencies/departments, has been forced to reduce
resources to problematic levels, largely due to operational and charging
anomalies that have developed in other areas of CEO/IT over the last
three years.
The positive progress in technical operations within CEO/IT during the last 12-18
months, noted earlier in this report, has been counteracted by finance-related challenges
that have put pressure on the entire ISF 289. These challenges, detailed below, can be
attributed to both endogenous forces (i.e., broader budgetary constraints), as well as
internal decisions made by CEO/IT Executive Management:
Charging Methodology: Going into FY 08/09, CEO/IT Executive Management
decided to change the charging methodology for recovering costs pertaining to
Network Services (i.e. access to the Wide Area Network/Internet). Historically,
CEO/IT charged based on the number of Internet Protocol (IP) addresses within a
particular agency/department. After performing benchmarking and research,
CEO/IT decided to instead charge based on the number of email addresses
within a particular agency/department. For agencies/departments that had a
number of personnel with email addresses, but without assigned one-to-one
personal computers or laptops (e.g., the Sheriff-Coroner Department) this meant
a significant increase in monthly costs for access to the County Network. To
illustrate the impact of such a change, the Sheriff-Coroner Department/Agency

44
PERFORMANCE AUDIT OF CEO/IT – TASKS III - V REPORT Final Report
060 (OCSD) went from paying $462K in FY 07/08 to paying $1.4M in FY 08/09.
As a result, OCSD in particular protested the change during FY 08/09 and
requested that CEO/IT only charge them for email addresses of the
approximately 232 administrative personnel that utilize many of the County
internal systems (e.g. VTI, CAPS+, ERMI), rather than for all 3,300+ personnel in
OCSD. The CEO’s office did not make the adjustment for the remaining portion
of FY 08/09, but did agree to make a change in FY 09/10. Thus, in FY 09/10,
OCSD has been charged only for those approximately 232 emails that pertain to
administrative personnel, and consequently their costs have decreased
significantly (projected to be only $108K for the entire fiscal year). The resulting
drastic reduction in revenue caused CEO/IT to (1) increase the rate for County
Network Services charged to other agencies/departments from $34.47 per email
address per month to $38.82 per email address per month (a 12.6% increase), and
(2) to cut approximately $700K out of its Network/Platform Services budget for
FY 09/10. In spite of these impacts, CEO/IT has stated that they believe this is the
appropriate method for charging the Sheriff’s Department for Network Services
for several reasons, including: (1) OCSD maintains its own separate network that
includes all of its own internal systems, (2) most OCSD staff do not use VTI for
timekeeping, but instead use an OCSD-specific system.
Use of Retained Earnings: As noted in the Task I report of this audit, as well as
in other sections of this report, CEO/IT began a practice in FY 08/09 of paying for
select non-infrastructure-related projects out of the Retained Earnings from ISF
289. These earnings come from fiscal year-end operating surpluses (i.e., revenues
collected from agencies/departments exceed CEO/IT’s costs) in the ISF. In FY
08/09, CEO/IT spent $1.5M of Retained Earnings on four projects, the most
expensive of which was the eGov project, at just over $1M. In FY 09/10, CEO/IT
is projecting that it will spend $2.2M on ‚Retained Earnings Projects,‛ with eGov
again being the most expensive at $1.2M. Finally, as proposed in the FY 10/11
budget, CEO/IT plans to spend nearly $3M on such projects, with eGov ($1.4M)
and IT Sourcing Transition ($1.1M) constituting the bulk of the costs. Rather
than using these Retained Earnings to help reduce rates or defray costs for core,
mission-critical service areas (such as Network/Platform Services) or invest in
necessary infrastructure (telephone upgrade), CEO/IT has primarily used these
scarce resources in a fashion opaque to its customers (i.e., agencies/departments)
to fund the ongoing operations and maintenance of the eGov system. Not only is
this practice unsustainable, but it runs contrary to the message given to
agencies/departments by CEO/IT from the outset of the eGov project, which is
that agencies/departments are not paying for eGov.
45
PERFORMANCE AUDIT OF CEO/IT – TASKS III - V REPORT Final Report
The aforementioned idiosyncrasies have negatively impacted ISF 289 financial
resources, which, in turn, has negatively impacted NPS service levels and exposed this
mission-critical component of Countywide IT to greater operating risks as described
below.
While NPS has been achieving greater efficiency as a result of better internal
organization and standardization over the last 12-18 months, a review of all relevant
documentation and CEO/IT management and staff interviews confirm that NPS has
been required to cut critical elements of its operation and is delaying important
activities indefinitely. For example:
As a cost cutting measure in FY 07/08, CEO/IT disbanded the Network
Operations Center (NOC), which was the central monitoring entity for the entire
County network, across a variety of the NPS disciplines (WAN, Security, Server
Monitoring). As a consequence of this action, NPS has been forced to become
more reactive and uncoordinated when dealing with network problems.
NPS management conducted a labor analysis (as of June 2009), which
demonstrated that the workload for NPS was equivalent to almost 40 FTE
positions, but funding for only 38 existed. This labor analysis also showed a
backlog of ‚Outstanding/Deferred Operations & Maintenance‛ tasks in NPS,
totaling over 34,000 hours of work (or 16+ FTEs). Since June 2009, NPS resources
have been cut even further, primarily in the form of a reduction in ACS contract
staff. For the 12 months ending June 30, 2009, the average ACS FTEs per month
in NPS was 35.2. For the first 8 months of FY 09/10, the average ACS FTEs per
month in NPS was 27.3, a reduction of almost 8 FTEs.
CEO/IT management demonstrated to the audit team that the Security element of
NPS is understaffed by at least one FTE, relative to the current workload. With
the recent implementation of an intrusion protection/detection service, staff
workload has increased as the number of protection/detection alerts to respond
to has increased.
In sum, the financial decisions made by CEO/IT Executive Management have had
significant opportunity costs to a core infrastructure service (NPS), forcing it to operate
with fewer staff resources, which has created a higher degree of operational risk, while
ISF Retained Earnings are being used for projects/initiatives that agencies/departments
do not consider critical.

46
PERFORMANCE AUDIT OF CEO/IT – TASKS III - V REPORT Final Report
Recommendation 14: Focus resources on securing adequate core, mission-critical
services for agencies/departments, such as Network Platform Services, before
pursuing other non-core activities.
Security
Finding 15: The County Information Security Officer (CISO) has the ability to
conduct individual investigations without the express written
authorization from a Human Resources or Departmental Manager.
In speaking with CEO/IT security personnel, the audit team confirmed that there is no
formal requirement for the CISO to obtain written authorization from either Human
Resources or Departmental management prior to initiating an investigation of an
individual’s information technology behaviors or usage. Although there is an
unwritten and in-practice rule that no such investigation should occur without HR
authorization, there should be a formal control in place that protects all parties from
frivolous or groundless investigations.
Recommendation 15: Create a formal policy mandating that the CISO obtain HR or
Departmental authority prior to initiating any investigation of County personnel.
Resource Planning
Another key management process is the planning and monitoring of staff resources
across a variety of project and operations/maintenance activities. When done
effectively, resource planning helps management allocate scarce staff resources in a
manner that accomplishes the highest priority tasks and minimizes internal
inefficiencies/redundancies. Resource monitoring is also an important tool for
managers to ensure a balanced workload with sufficient coverage for all important
assignments.
In 2007, CEO/IT purchased Clarity, an IT Portfolio Management application/software
tool that includes resource management functionality. However, as previously
discussed in the PMO section of this report, many of the foundational management
processes were not in place to make effective use of this tool. To illustrate, as noted,
prior to the arrival of the current CTO and the implementation of the Clarity resource
management tool, CEO/IT did quarterly resource planning on large MS Excel
spreadsheets. In addition, some CEO/IT staff used MS Project to plan for upcoming

47
PERFORMANCE AUDIT OF CEO/IT – TASKS III - V REPORT Final Report
tasks and operational responsibilities. This approach did not afford a timely, aggregate
view of resource needs and allocations.
In response, in FY 09/10, CEO/IT took several steps to address this issue:
The PMO Manager and the CTO began conducting biweekly resource planning
meetings to review planned staff allocations to various IT projects
CEO/IT loaded all projects and Maintenance & Operations activities into the
Clarity tool
The CTO established project priorities to guide the allocation of scarce resources
Alongside these recent improvements to formalize Resource Planning, there are also
some opportunities to improve both the planning and tracking of staff time.
Finding 16: CEO/IT has not yet documented formal resource planning procedures
and has not refreshed critical resource planning documents, such as the
Operating Plan.
The recently established resource planning meetings and associated resource planning
screens in Clarity are a step in the right direction. However, these meetings are focused
primarily on project-related activities, in large measure to ascertain and monitor the
significant number of ongoing, concurrent projects that have infrastructure
implications. Consequently, there is still some confusion among ACS contract staff
about how to balance project-related responsibilities with day-to-day O&M tasks,
especially for those staff that have both project and O&M responsibilities. In a related
issue, CEO/IT is still undecided as to whether to use Clarity across the CEO/IT
organization or to use other tools. Some managers prefer the Clarity tool and others
prefer to extract information from Clarity and manipulate data in MS Excel or other
applications.
Another area of concern is that the Operating Plan, the foundational document for
resource planning, needs to be a living document and refreshed prior to the budget
process to reflect any planned operational changes and needs.
48
PERFORMANCE AUDIT OF CEO/IT – TASKS III - V REPORT Final Report
Recommendation 16: (a) Refresh the Operating Plan at least once a year prior to the
budget process. (b) Maximize the efficiency and effectiveness of resource planning
meetings by discussing and documenting a set of formal procedures that drive the
preparation for and execution of resource planning within CEO/IT. Examples of
procedural questions that should be explicitly addressed in the documentation
include:
- Who are the necessary participants in resource planning meetings?
- What information/dashboards need to be reviewed at each meeting?
- How should this group interact with the Operating Plan document and how often
does the document need to be refreshed?
CEO/IT may also want to use the existing governance process or informal discussions
with agencies/departments to collaborate on effective resource planning
tools/strategies.
Finding 17: Most CEO/IT managers do not track actual staff resource hours against
planned allocations, and in some instances, County staff utilization is
not tracked at all.
It is important for any organization to track and retroactively examine how staff time
has been spent relative to what was planned. Currently CEO/IT has two different tools
for tracking staff time: (1) County staff in CEO/IT bill their time to specific job numbers
that are established in the County’s timekeeping system (VTI), and (2) ACS contractors
bill their time to specific work requests that are established in a CEO/IT standalone
system called the Electronic Labor Verification Information System (ELVIS). However,
because many CEO/IT staff code their time to generic, catch-all job numbers, these
reports would not necessarily be helpful in assessing true workload and utilization.
Rather than fixing these business process/workflow issues (i.e., establishing and
requiring all CEO/IT staff to code their time to more detailed job codes by specific
projects/activities in VTI, and extracting/summarizing utilization data from ELVIS),
CEO/IT has been incorrectly focusing on only the modifications to the Clarity system
that create interfaces between VTI and ELVIS in order automate the workload and
utilization analysis; it is more critical for CEO/IT to fix the timekeeping procedures first,
then focus on systems to automate the process.
The primary impact of this approach is that, to date, with the exception of the
Application Services Unit (which does track utilization for all ACS resources), CEO/IT
49
PERFORMANCE AUDIT OF CEO/IT – TASKS III - V REPORT Final Report
has not been tracking, analyzing, and reporting on County staff workload in any formal
way. Though there is a pilot effort to track actual hours for 15 operational activities
(e.g., Security Operations & Maintenance, LAN/WAN Maintenance Support), and an
effort is planned for FY 10/11 to add job codes to the VTI time tracking system, CEO/IT
does not currently have an accurate understanding of how its staff resources’ time is
actually spent. The problems that arise from the inadequate tracking of actual hours are
as follows:
CEO/IT does not have the data necessary to inform and substantiate staffing
increases or decreases.
To meet budget reduction requirements, CEO/IT might reduce (or may have
reduced) staff resources in the wrong areas, negatively affecting operations.
Bill rates for IT services to agencies/departments may not reflect the true cost of
providing the service, resulting in agencies/departments being over or
undercharged for services.
Some staff resources may be under or over-utilized.
On another front, the IT Sourcing effort currently in process will change the staffing
resource landscape in 2011. Going to the proposed Managed Services contract will
mean that CEO/IT will no longer have responsibility for the allocation of contractor
resources, which comprises the overwhelming majority of CEO/IT’s staff. Without
responsibility for managing contractor staff, CEO/IT may no longer need to use Clarity
to the extent that is currently envisioned. Also, as part of the Sourcing effort, CEO/IT
will be determining its ‚retained organization,‛ which is the structure and County staff
resources that will remain following the transition to the new Managed Services
outsourcing model. To help CEO/IT understand its County staffing needs under this
new model, CEO/IT should immediately begin tracking actual utilization for County
staff, forgoing the use of Clarity if need be (note: the ability to track actual resource
utilization in Clarity is not currently functional, and job codes have not yet been
established in VTI).
Recommendation 17: Immediately begin tracking actual utilization for County staff,
using manual tracking mechanisms (e.g., excel spreadsheets), if needed, and establish
simple reports that assist management with workload and resource analysis.
50
PERFORMANCE AUDIT OF CEO/IT – TASKS III - V REPORT Final Report
Administrative and Financial Operations
Similar to its operational functions, the administrative and financial management
processes of CEO/IT have made significant progress in some respects, but there are also
notable opportunities for improvement, especially in the area of disclosure.
Multiple agency/department interviewees noted that the billing for services provided
by CEO/IT has improved over the last few years, with greater detail available and more
precise tracking of services rendered. To this end, CEO/IT has implemented a detailed
planning and monitoring process to ascertain service demand from the different
agencies/department. Prior to each fiscal year, CEO/IT Finance staff meets with IT
Managers and Directors of Administration from the eleven largest County
agencies/departments to obtain planned usage for the upcoming year across the suite of
CEO/IT services (telephones, application development, network access, server
maintenance, storage capacity, etc.). Specific planned service units (e.g. hours,
gigabytes, number of servers per month) are recorded and monitored for all County
agencies/departments throughout the year. CEO/IT Finance then revisits the eleven
largest agencies/departments midway through the year to see if their demand is
expected to change significantly during the second half of the year.
In conjunction with improved service demand planning and tracking, CEO/IT Finance
also conducts monthly meetings with CEO/IT management in order to review in detail
the budget to actual progress for each service unit within CEO/IT. This monitoring
practice has been especially critical during the last two fiscal years, as
agency/department demand for service has fluctuated significantly with the County’s
budgetary constraints.
These improvements notwithstanding, a problematic level of disclosure remains in how
CEO/IT allocates, spends, and reports spending in ISF 289 and Agency 038 (Data
Systems Development Projects). The following is a brief overview of ISF 289 and
Agency 038:
Internal Service Fund 289 – This Fund is used by CEO/IT to provide and charge for
a variety of IT services to County agencies/departments, such as: Internet access,
telephone services, hosting of hardware at the County Data Center, staff
augmentation by contractors for IT services, and IT project management. Unlike
General Fund operations, whose unspent/unencumbered allocations typically
flow back into the General Fund as Fund Balance Available, Internal Service
Funds accumulate a separate ‚Retained Earnings‛ reserve to be used in future
years. It should be noted that ISF’s are funds set up for the purpose of providing

51
PERFORMANCE AUDIT OF CEO/IT – TASKS III - V REPORT Final Report
services to other County agencies/departments. As such, the controlling agency
(in this case CEO/IT), has a fiduciary responsibility to manage fund resources in
a transparent and accountable manner.
Fund 100/General Fund, Agency 038 (Data Systems Development) – This Agency was
formed to fund the planning and implementation phases of large systems
development projects. Once these projects are implemented, they shift into the
operations and maintenance phase, and project budgets are moved to specific
agency/department operating funds for management.
Finding 18a: For ISF 289, CEO/IT has charged agencies/departments for
infrastructure related services, assuming a certain level of
capital/infrastructure spending, but has historically under-spent this
budget by a significant margin.
For the three fiscal years 06/07 - 08/09, CEO/IT ISF 289 budgeted $3.4M, $5.1M, and
$3.6M, respectively, for Maintenance of Equipment (Object 1300) and Equipment (Object
4000). ISF 289 charges agencies/departments directly for anticipated equipment
maintenance costs (Object 1300), and though agencies/departments are not charged
directly for most planned equipment purchases (Object 4000) for the upcoming fiscal
year, they are charged a depreciation amount, which is meant to be aggregated and
used when new equipment is needed. For example, during the three fiscal years 06/07-
08/09, ISF 289 customers were charged $2.4M, $2.1M, and $2.3M, respectively, for
depreciation. A review of actual spending illustrates that CEO/IT spent or encumbered
$2.4M, $2.5M, and $1.4M in each fiscal year, respectively. In aggregate, over the three
year period, while $12.1M was budgeted and $9.8M was charged to
agencies/departments, only $6.2M was spent on capital infrastructure (maintenance or
equipment).
One key business area that has routinely under-spent its capital budget is Telephone
Services (OCTNET). For the three fiscal years 06/07 through 08/09, CEO/IT budgeted a
total of $4.1M for Telephone Equipment (expenditure object 4000) and Maintenance of
Equipment (expenditure object 1300). Agencies/departments were charged a total of
$4.5M. Yet, in actuality, CEO/IT only encumbered/expended $793K in these
expenditure objects.
Any fiscal year-end surplus revenue was used by CEO/IT in one of two ways: (1) to
fund other non-capital costs in the same fiscal year or (2) to further build the ISF 289
Retained Earnings balance.

52
PERFORMANCE AUDIT OF CEO/IT – TASKS III - V REPORT Final Report
Finding 18b: CEO/IT has funded the operations and maintenance of ongoing non-
infrastructure initiatives and projects out of ISF 289 Retained Earnings
without informing agencies/departments.
Although CEO/IT has budgeted and collected significant sums of money for
infrastructure equipment and maintenance spending in each of the fiscal years FY 06/07
– FY 08/09, CEO/IT staff confirmed that there was a conscious decision made by
Executive Management several years ago to cease any significant telephone-related
infrastructure refresh or replacement spending. This decision is troubling from at least
two standpoints: (1) the current PBX telephone system used by the County has been at
the end of its useful life for a number of years, as has the current voice mail system,
both of which are identified in the detailed capital refresh and replacement plan and (2)
despite having no plans to make any major telephone replacements, CEO/IT has
continued to over-recover its costs from its customers for the past several years.
Another important issue is the current shortage of funds to pay for the telephone
upgrade (Voice over Internet Protocol) proposed for implementation in FY 10/11. One
would expect that in light of the lack of capital spending during the previous three
fiscal years, as well as the over-recovery on costs, there would be available funds within
ISF 289 (rather than using General Fund Agency 038) to pay for telephone infrastructure
refresh or replacement projects, or alternatively to jumpstart the VoIP initiative.
However, the audit team has confirmed that going into FY 10/11, there are minimal
(<$1M) remaining reserves set aside to fund either of the aforementioned alternatives.
As has been previously noted in both the Task I and this Tasks III-V audit report, much
of the Retained Earnings (approximately $3.6M) has already been or will be spent on
the eGov project (between FY 08/09 and FY 10/11). These financial decisions have not
been discussed with agencies/departments (the paying customers) or the Board.
Recommendation 18: Establish a formal policy that requires consultation with and
approval from the IT Governance structure prior to the use of ISF 289 Retained
Earnings.

53
PERFORMANCE AUDIT OF CEO/IT – TASKS III - V REPORT Final Report
Finding 19: The components of indirect overhead charged by CEO/IT to
agencies/departments in ISF 289 have not been proactively and clearly
disclosed to agencies/departments.
In addition to the use of ISF 289 Retained Earnings for projects that have not been
communicated with and/or supported by agencies/departments, CEO/IT has similarly
included cost elements in the indirect overhead charged to agencies/departments that
apply primarily to CEO/IT-driven projects. As a result, there is general confusion and
frustration among agencies/departments about the justification for CEO/IT’s 12%
overhead charge. One such overhead component is the ongoing costs related to the
Clarity portfolio management tool. Though the upfront $393K cost for the purchase of
the software was properly paid for through Agency 038 in FY 06/07, the subsequent
efforts to make Clarity more usable within CEO/IT (at an estimated cost of at least
$500K from FY 08/09 projected through FY 10/11) have been paid for out of the
administrative overhead pool in ISF 289 charged to agencies/departments. To date,
only CEO/IT is actively using the Clarity tool to help manage its IT operations17. To
complicate matters, CEO/IT has only just begun to see some resource planning benefits
within the last 12 months, and significant and costly application modifications are still
in process.
Another example of problematic disclosure is the current proposal by CEO to move
CEO/IT’s Project Management Office (PMO) from General Fund Agency 017 (Unit 3050)
to ISF 289, beginning in FY 10/11. Although CEO/IT expects that a portion of the
associated staff time/salaries & benefits will be offset by charges (either back to the
CIO’s office, to Agency 038, or directly to agencies/departments), there is still
approximately $500K of cost that will have to be absorbed by the Overhead Cost Pool of
ISF 289. Prior to this action, CEO Budget instructed agencies/departments to build their
budgets assuming an 11% indirect overhead charge. However, due to this recent
change, agencies/departments will be charged 12% for FY 10/11. In essence
agencies/departments will be collectively paying $500,000 of additional non-billable
staff costs over the course of FY 10/11 as a result of this change. This change was not
discussed via the IT Governance process; the lone means for notifying
agencies/departments of the justification for this change was a reference made by
CEO/IT at the April 2010 Financial Managers Forum. Agencies/departments were
notified that it will be necessary to adjust their budgets as part of the 1st Quarterly
Budget Report in order to account for this change.
17 The extent of agencies/departments use of Clarity is updating project information for the IT Quarterly Report. Clerk-Recorder is
also looking into using Clarity for its SECURE Electronic Recording Delivery System (ERDS).

54
PERFORMANCE AUDIT OF CEO/IT – TASKS III - V REPORT Final Report
Recommendation 19: Develop a formal, annual review session of ISF 289
Administrative Overhead costs with agencies/departments.
Finding 20: CEO/IT has reallocated money between Agency 038 (Data Systems
Development) projects without notifying or seeking approval from the
Board of Supervisors.
General Fund Agency 038 (Data Systems Development) is a budgetary mechanism that
was established to fund the planning and design phases of specific Enterprise IT system
projects. Once project implementation occurs, those projects with Countywide benefit
and ongoing operations/maintenance costs should transition to and become funded via
ISF 289 either through building onto existing charges or through the creation of a new
charge to users of the service. There are no staff positions assigned to Agency 038. The
authority for allocating monetary resources in Agency 038 rests with the CIO.
As part of the Information System Request portion of the Annual Budget Process, the
Board of Supervisors approves a slate of projects to be funded at specific dollar
amounts during the upcoming fiscal year. Some of these projects are managed by
agencies/departments (ATS, PTMS), while others are managed by CEO/IT (Disaster
Recovery, eGov – Phase I, Regional Wireless). Prior to FY 06/07, monies in Agency 038
were used primarily for a few large, critical IT systems (ATS, PTMS, CAPS Legacy).
However, beginning in FY 07/08, CEO/IT began to fund many more projects out of
Agency 038 (noted in Task I audit report). Agency 038, like all agencies/departments, is
currently permitted to make budgetary transfers between Budget Units (formerly
‚Orgs‛) per existing accounting policies set forth by the Auditor-Controller, and such
actions should be accompanied by appropriate documentation and official budget
transfers in order to ensure transparency and proper disclosure.
Prior to FY 07/08, CEO/IT was responsible for executing budget adjustments within
Agency 038; however, the audit team has confirmed with CEO/Budget that because of
CEO/IT’s improper accrual practices (which artificially inflated the funds available in
the following fiscal year), CEO/Budget took control of the budget management
responsibility for Agency 038 beginning in FY 07/08. In addition, though CEO/IT
submits budget transfer documents for all transfers within Agency 038, these transfers
have not always been vetted with impacted agencies/departments or the Board of
Supervisors, prior to the decision. Without this notification there is no method by
which the Board will know that money approved for specific projects during the annual
budget process is actually spent as directed.
55
PERFORMANCE AUDIT OF CEO/IT – TASKS III - V REPORT Final Report
In one instance, the ePages project managed by the Public Administrator/Public
Guardian (PA/PG) Office, which was originally funded at $500K in FY 07/08 and $500K
in FY 08/09 (total of $1M), had its overall project funding cut by $250K between the 2nd
and 3rd Quarters of FY 07/08. The audit team confirmed that this action was taken by
CEO/IT without discussing the project implications with PA/PG. In addition, no budget
transfer document exists for this reduction. In another example, a review of budget
transfer documents in Agency 038 demonstrates that between January 31st and February
14th 2008, two Agency 038 projects (an IT Security Audit & Threat Assessment and the
Enterprise Architecture project) had over $728,000 of funding redirected to support the
escalating costs of the eGov-Phase I Project. Not only was the Board not formally
notified of the reduction to these two projects prior to the transfer, but the Board was
also not notified of the significant increased costs of the eGov project until February 26
(via the IT Quarterly Report), after the transfers had already taken place. In the budget
transfer document from the Enterprise Architecture project, no explanation was
provided by CEO/IT, and in the transfer from the IT Security Threat Assessment, the
only explanation provided was, ‚Transfer funds between projects as required to meet
business objectives.‛
In light of the fact that the Board of Supervisors approves specific dollar amounts for
particular IT projects in Agency 038 during the annual budget process , it is important
that the Board and agencies/departments are not only made aware, but are also
supportive of any significant transfer of money between projects. Both the unique
nature of Agency 038 (as a collection of pre-approved IT projects) and the recent history
of these significant transfers calls for additional monitoring and scrutiny.
Recommendation 20: CEO/IT and CEO/Budget should implement a policy specific to
Agency 038 which presents criteria and dollar thresholds for notifying or obtaining
approval from the Board of Supervisors regarding proposed budget transfers
between Agency 038 projects.
56
PERFORMANCE AUDIT OF CEO/IT – TASKS III - V REPORT Final Report
Task IV: Review CEO/IT Performance Measurement
As a major County cost center (over $150 million annually), information technology
demands significant scrutiny and oversight. Key to ensuring that public resources are
used effectively and efficiently is the County’s ability to measure its IT performance. A
strong IT performance measurement program allows County leaders to align IT
activities with business needs and highlight areas of improvement.
In this Task, the audit team reviews and evaluates CEO/IT’s performance measurement
activities in several areas:
A. CEO/IT oversight of Countywide IT activities
B. CEO/IT performance (including the ACS contract)
C. CEO/IT’s best practice research and benchmarking efforts
A. Countywide IT Oversight
One of the primary value-added services provided by any organization’s central IT
group is the continual assessment of operational effectiveness and efficiency in IT.
Though CEO/IT does not directly manage agency/department IT operations in the
County’s decentralized IT environment, there is still a clear oversight role to play with
respect to performance measurement and assessment. In a previous section of this
report, the audit team discussed the fiscal oversight exercised by CEO/IT over
agency/department IT expenditures. This section evaluates whether CEO/IT has
sufficient metrics and monitoring procedures in place to oversee (1) Countywide IT
productivity and (2) the efficiency and effectiveness of agency/department IT
operations.
Finding 21: As the central organization for Countywide IT efforts, CEO/IT should
be establishing performance measurement standards, templates, and
targets for agencies/departments and gathering data on the performance
of Countywide IT; to date, CEO/IT has not made any substantive
progress in this area.
In an effective performance measurement program, an organization must establish a set
of metrics and the procedures for gathering relevant data. CEO/IT has indicated that its
reluctance in this area has been driven by its sensitivity to infringing on
agency/department operations. However, the facilitation and collection of performance
57
PERFORMANCE AUDIT OF CEO/IT – TASKS III - V REPORT Final Report
metrics would not equate to telling agencies/department how to run their operations.
Moreover, the move to a more robust, comprehensive performance measurement
system is a Countywide initiative (the Balanced Scorecard) being spearheaded by the
CEO’s office. As such, it is entirely consistent for the CIO to assume a more proactive
role in establishing IT performance metrics throughout the County, as well as in
aggregating, assessing, and reporting the results. A prime opportunity to establish
these metrics was the Countywide IT Strategic Plan; however, as noted in the Task II
audit report, the proposed Plan document did not set out any performance metrics for
assessing the success of the Countywide IT goals and strategies.
An insufficient knowledge of agency/department IT operations, as well as a lack of
Countywide IT performance measure inhibits CEO/IT’s ability to provide meaningful
review and evaluation of agency/department requests for Board approval of IT resource
allocations, and underutilizes CEO/IT’s strategic position in the organization as the
clearinghouse for all major IT decisions.
Recommendation 21: CEO/IT should use the IT Governance structure to
collaboratively develop a set of Countywide IT performance metrics and a
method/means for aggregating and reporting the results.
As a corollary to performance measures, CEO/IT could also be conducting IT
performance audits/assessments of agency/department IT operations to provide
suggestions for aligning these operations with industry best practices. For a short
period, CEO/IT offered this service to agency/departments for the purpose of providing
‚continuous improvement‛ opportunities; however, CEO/IT no longer provides these
services. This assessment or ‚audit‛ function is a valuable service that would result in
several mutual benefits: (1) CEO/IT would learn agency/department IT operations in
more detail, (2) a joint effort builds collaborative momentum, (3) CEO/IT can gather and
aggregate important decision-making information, (4) CEO/IT can identify and share
Countywide IT best practices and functional expertise, and (5) existing variations in
quality and performance can be brought up to a Countywide standard.
B. CEO/IT Performance Measurement
CEO/IT has initiated some soft performance measurement activities for its own
organization. For example, during 2009 CEO/IT management went through a self-
assessment process, rating each of the 120+ Key Result Areas (KRA) identified in
CEO/IT’s Operating Plan (e.g., Board of Supervisor Communication, HR Recruiting and
58
PERFORMANCE AUDIT OF CEO/IT – TASKS III - V REPORT Final Report
Planning, IT Research and Development) based on the Capability Maturity Model
Integration (CMMI)18 approach’s five stages of maturity (1-Initial, 2-Managed, 3-
Defined, 4-Quantitatively Managed, 5-Optimizing). Although the CEO’s office
spearheaded the Countywide Balanced Scorecard initiative and CEO/IT led the
implementation of a performance scorecard software system to support the initiative,
the CEO’s office ironically (including CEO/IT) has not implemented the Balanced
Scorecard or used the software19. This is concerning because CEO/IT—by the nature of
its business and access to data and technology—should lead by example and be at the
forefront of performance measurement.
The following sections examine CEO/IT performance measurement in more detail
regarding its Project Management Office, Technical Operations, and ACS contractors.
Project Management Office (PMO)
IT Project Performance
The primary project performance measures utilized for CEO/IT-driven projects are
budget and schedule metrics. Budgets and schedules for all CEO/IT-driven projects, as
well as agency/department-driven projects costing more than $250,000, are tracked
using the Clarity portfolio management application. The status of all projects
Countywide costing more than $250,000 are reported to the Board of Supervisors via the
IT Quarterly Report.
Finding 22: CEO/IT does not measure IT project performance beyond schedule and
budget metrics. Specifically, CEO/IT does not measure actual vs.
projected benefits anticipated from project business case analyses.
For all projects requesting General Fund Agency 038 monies, the Information Systems
Request (ISR) process is utilized, requiring the submitting agency/department to
provide a business case for the request. This includes providing the background of the
project, the expected business benefits, the expected costs of the project, possible risk,
Return on Investment (ROI), and payback period. In addition, regardless of funding
18 CMMI a trademarked process improvement approach that provides organizations with the essential elements for effective process
improvement 19 Agencies/departments that have implemented the Balanced Scorecard software include: Probation, Treasurer-Tax Collector, OC
Parks, OC Community Resources, OC Public Works, and OC Waste & Recycling (nearly complete). Agencies/departments that plan
to implement that software in the near future are Registrar of Voters and Child Support Services.
59
PERFORMANCE AUDIT OF CEO/IT – TASKS III - V REPORT Final Report
type, all CEO/IT-driven projects that are estimated to take 500 or more work hours
require the completion of a business case and project plan.
It is important from both a project performance and a learning perspective that CEO/IT
compares the business case and project plan against actual results. By conducting this
validation and tracking actual savings or benefits, CEO/IT can better estimate the costs
and benefits of future projects and measure the actual success of its projects and
initiatives. To date, however, most projects that are completed are not compared
against the original business case, including those measurements that are most useful:
actual ROI and quantifiable benefits (e.g., actual cost savings). As noted earlier in this
report, post-implementation reviews have not been consistently and/or thoroughly
conducted. Given that IT is a major County cost center, this evaluation process should
be standard operating procedure and is a critical deficiency for CEO/IT. Without these
metrics, it is difficult for stakeholders to adequately measure the success and value of an
IT project, whether resources are used effectively, and whether additional money
should continue to be expended on individual projects.
Recommendation 22: Develop a more rigorous project performance measurement
process that includes the tracking of actual vs. projected benefits (e.g., cost savings
and process improvements) in an effort to measure the actual Return on Investment
of a project.
PMO Staff Performance
In total, since FY 05/06, the PMO has been engaged by agencies/departments to support
a total of $9M in Key IT Projects.
In FY 08/09, the PMO began measuring the performance of its Program/Project
Managers engaged to support agency/department-driven projects. At the end of each
project, agencies/departments are asked by CEO/IT to complete a Customer Appraisal
Form. To date, five Customer Appraisal Forms have been completed for the following
projects:
Electronic Fictitious Business Name (Clerk-Recorder) - $372K
BidSync Implementation (Purchasing) - $30K
Court Calendar Implementation (Child Support Services) - $172K
Standard Data Record (SDR) Hardware Refresh (Assessor) - $22K
60
PERFORMANCE AUDIT OF CEO/IT – TASKS III - V REPORT Final Report
SECURE Electronic Recording Data System (Clerk-Recorder) - $768K (total of
$3M for all four application owner counties)
With the exception of one appraisal, the performance of PMO staff based on these
appraisals has met or exceeded customer expectations.
Finding 23: While CEO/IT does measure the performance of its project management
staff on agency/department projects, there is no measurement of staff
performance on Enterprise IT projects driven by CEO/IT.
In addition to the $9M of agency/department-driven Key IT Projects, the
Project/Program Managers in the PMO have also managed $12M of major CEO/IT-
driven Enterprise projects. Given that these Project/Program Managers spend the bulk
of their time on high-dollar CEO/IT-driven Enterprise projects that involve many
different County stakeholders, CEO/IT should complete customer appraisals for these
projects as well.
Recommendation 23: Expand the use of post-implementation Customer Appraisals
for Enterprise IT projects.
Technical Operations
In conjunction with the many process improvements that CEO/IT has made in the
Technical Operations side of the organization, a number of performance metrics are
currently being collected at the Data Center, especially in the Service Desk and Network
Platform Services groups. In fact, a vital component of ITIL (the management
framework being implemented in the Technical Operations of CEO/IT) is the
measurement of Key Performance Indicators (KPIs). Some of these metrics are collected
and reported in a user-friendly fashion, while others are only available for managers to
view on an as-needed basis.
Two of the areas in CEO/IT Technical Operations where performance measurement is
used extensively are Capacity Management (i.e., IT infrastructure is provided at the
right time, in the right volume, and at the right price) and Availability Management
(i.e., IT infrastructure is available for the provision of IT services). Since May 2009, the
CTO has tasked ACS with assembling an Availability Report and a Capacity
Management Report on a monthly basis. The groups of infrastructure that are covered
in each of these reports include: Wide Area Network, Security, Storage, Email, Virtual
61
PERFORMANCE AUDIT OF CEO/IT – TASKS III - V REPORT Final Report
Environment, P595 Systems, Mainframe, Data Center Power, Data Center Space, and
Telephone Services. These reports are presented to CEO/IT Executive Management and
are available for viewing on an internal CEO/IT website. Aside from data charts that
show metrics over time, the reports also provide contextual analysis and discussion to
further inform the reader. Though the bulk of information on these reports is currently
gathered manually, the creation and review of these reports is a positive step for
CEO/IT Technical Operations.
An additional bright spot with respect to performance measurement is Telephone
Services. AT&T, the primary subcontractor for these services, provides a monthly
‚Performance Summary,‛ which includes a variety of year-to-date workload and
performance achievement data within Telephone Services.
Some areas for improvement in Technical Operations performance measures include:
Finding 24: CEO/IT does not have a robust performance measurement system in
place in the area of Server hosting.
An area in need of improved performance measurement is NPS/Service Level
Agreement (SLA) services (server hosting). Currently, agencies/departments have three
SLA choices when they house a server at the Data Center:
SLA1 = includes just providing power and floor space for the server
SLA2 = includes SLA1 plus the installation of any major operating system-type
patches (e.g. MS Windows)
SLA3 = includes 24/7 monitoring/maintenance of the server by NPS staff. Within
SLA 3, which is the SLA typically chosen by most agencies/departments that host
servers at the Data Center, there are a number of service level tasks and
associated metrics (30+)
Unfortunately, not all of these service level tasks are measured and reported on a
regular basis, either to CEO/IT management or to the agency/department customers
who are paying for these services. This performance reporting is an opportunity for
CEO/IT Technical Operations to demonstrate the value it is providing for the price
agencies/departments are paying. Historically, large agencies/departments have been
reticent to relocate their servers to the OCDC because of performance, control, and cost
concerns. A robust performance measurement system in this area would be a positive
step toward demonstrating that performance issues should no longer be an impediment
to the consolidation of servers at the Data Center.
62
PERFORMANCE AUDIT OF CEO/IT – TASKS III - V REPORT Final Report
Even in the areas of strong measurement and reporting, there are opportunities to
improve the usability of the information. For example, one of the strongest areas of
NPS/SLA, in terms of measurement, is incident recording via the OCDC Service Desk.
When an agency has a problem associated with a hosted server under SLA3, then a
customer calls into the Service Desk. Currently, there are a number of incident-related
reports for NPS that are available on the Data Center Help Desk Intranet site. However,
though the collection and reporting of this data is positive, much of the data either does
not tie to specific SLA metrics that are established in the MOUs with
agencies/departments or has not been aggregated and reported in a format that allows
for trend analysis. Such analysis is vital to tracking and demonstrating performance
over time, as well as establishing benchmarks going forward.
Recommendation 24: Review all existing performance metrics in the area of NPS-
SLA services, add/consolidate where appropriate, and refine the reporting
mechanisms for this data. (see Appendix D for examples)
Finding 25: There is no central repository for CEO/IT Technical Operations
performance data.
Currently, much of the performance data collected within CEO/IT Technical Operations
is scattered in a number of different locations, on both the County Intranet
(‚Management Information Systems Reports‛) and the ‚CTO portal,‛ which is a newly
established website for internal use by CEO/IT Technical Operations. This situation
makes it difficult for managers to track performance and aggregate comprehensive,
organization-wide reports, which is a very time-intensive process. In addition, because
some of the web pages with performance data have overlapping information with other
web pages, there is greater chance for errors as information is being compiled. Lastly,
much of this performance information, including the new Availability and Capacity
reports, are not shared with agencies/departments in a proactive way. Given that these
reports touch on Countywide IT infrastructure, such as the Wide Area Network and the
Telephone Systems, it is important that agencies/departments receive this data.
Recommendation 25: Migrate all performance information pertaining to CEO/IT,
including Technical Operations, to a “CEO/IT Performance” webpage, consolidate
the existing number of CEO/IT performance-related web pages on the County
Intranet, and share all relevant CEO/IT performance data with County
agencies/departments.
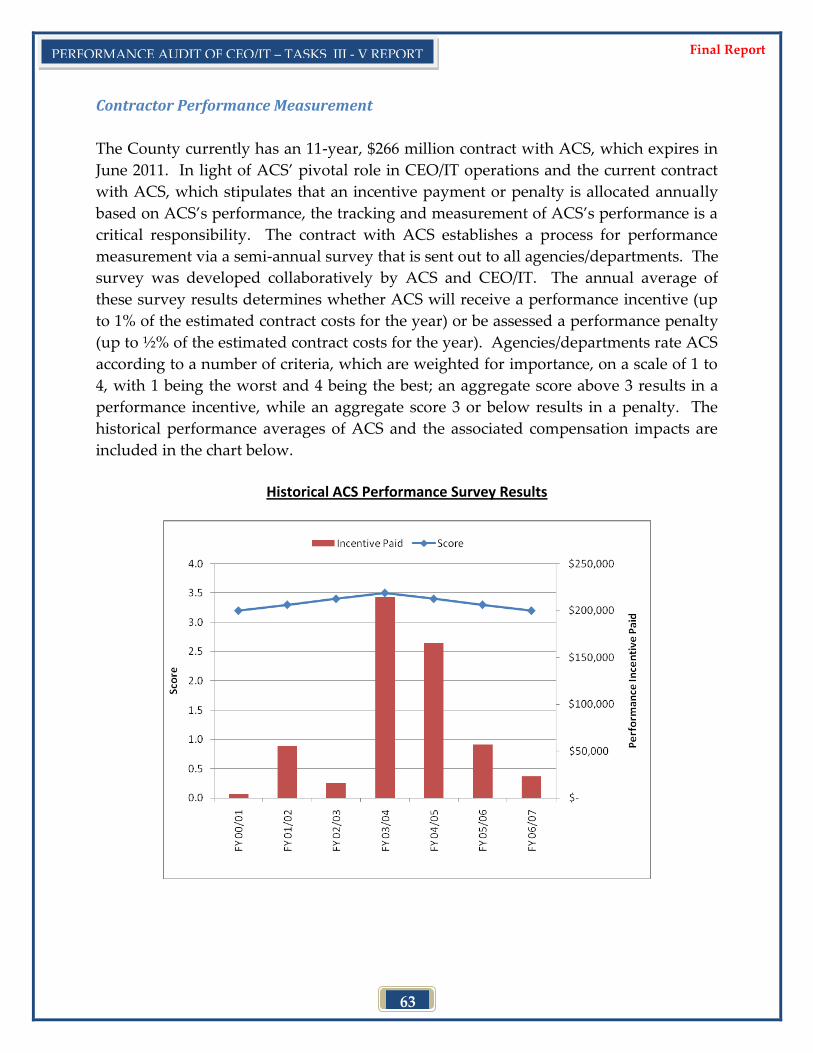
63
PERFORMANCE AUDIT OF CEO/IT – TASKS III - V REPORT Final Report
Contractor Performance Measurement
The County currently has an 11-year, $266 million contract with ACS, which expires in
June 2011. In light of ACS’ pivotal role in CEO/IT operations and the current contract
with ACS, which stipulates that an incentive payment or penalty is allocated annually
based on ACS’s performance, the tracking and measurement of ACS’s performance is a
critical responsibility. The contract with ACS establishes a process for performance
measurement via a semi-annual survey that is sent out to all agencies/departments. The
survey was developed collaboratively by ACS and CEO/IT. The annual average of
these survey results determines whether ACS will receive a performance incentive (up
to 1% of the estimated contract costs for the year) or be assessed a performance penalty
(up to ½% of the estimated contract costs for the year). Agencies/departments rate ACS
according to a number of criteria, which are weighted for importance, on a scale of 1 to
4, with 1 being the worst and 4 being the best; an aggregate score above 3 results in a
performance incentive, while an aggregate score 3 or below results in a penalty. The
historical performance averages of ACS and the associated compensation impacts are
included in the chart below.
Historical ACS Performance Survey Results
64
PERFORMANCE AUDIT OF CEO/IT – TASKS III - V REPORT Final Report
Finding 26: CEO/IT and ACS have not conducted performance surveys as required
by the contract since FY 06/07.
For the first seven years of the contract, CEO/IT and ACS worked collaboratively to
refine the survey instrument and to identify responsibility for any problems noted in
the survey responses. Though the contract states that ACS is responsible for the
distribution of the surveys, CEO/IT and ACS had agreed that it was more appropriate
for CEO/IT to send out the survey and aggregate the results in order to ensure proper
independence controls. Midway through FY 07/08 (year 8 of the contract), CEO/IT
decided to adhere to the specific language of the contract and instructed ACS to
distribute the surveys going forward. However, in FY 07/08, no survey was distributed
to agencies/departments. CEO/IT documentation demonstrates that throughout this
fiscal year they communicated frequently with ACS about his problem, and yet no
survey was ever sent out. Then, for the first half of FY 08/09, ACS did distribute a
survey, but the survey had a number of problems, including a lack of consistency with
the prior year’s questions and an incorrect scoring scale. For the second half of FY
08/09, again, there was no survey distributed to agencies/departments. Consequently,
ACS went for two years without a performance incentive bonus/penalty, and the
CEO/IT went without a quantitative measure of its primary IT contractor’s
performance. Additionally, the Board of Supervisors has been without a formal
performance assessment of the County’s largest IT contractor for over two years. It is
unclear why CEO/IT was unable to resolve this issue with ACS, despite the fact that
both sides were actively involved. Clearly, the process was followed for the first seven
years of the contract with CEO/IT taking the lead on survey distribution and results
aggregation.
This situation is particularly troubling as some members of the CEO/IT Executive Team
have expressed dissatisfaction with ACS over the last several years, in which case there
is a real incentive on the part of the County to collect the survey results in order to
substantiate and document any poor performance and assign the appropriate level of
financial penalty. Yet, it was not until FY 09/10 that CEO/IT and ACS succeeded in
collaborating to distribute a refreshed customer survey. The results of this survey are
still being compiled as of the writing of this report. Other than this survey, there are no
other means established for the formal performance measurement of ACS. The need for
such measures will become even more compelling as CEO/IT and the County pursues a
Managed Services outsourcing approach to the Data Center as well as a converged
Voice/Data Network.
65
PERFORMANCE AUDIT OF CEO/IT – TASKS III - V REPORT Final Report
Recommendation 26: (a) Conduct benchmarking surveys against other organizations
(private and public), to establish a robust set of performance metrics for all major
contractors, especially those with critical roles in the delivery of core IT services, and
(b) Report the results of these performance measurements to the Board of
Supervisors and on the “CEO/IT Performance” web page on at least an annual basis,
and incorporate the results into a broader Annual CEO/IT Report.
C. Research and Benchmarking
Over the past year, the Chief Technology Officer (CTO) has proactively undertaken
efforts to research and benchmark CEO/IT’s infrastructure as a step toward improving
Data Center performance. In July 2009, consultant Hewlett-Packard (HP) was engaged
to conduct a gap analysis of CEO/IT’s infrastructure, using HP’s Adaptive
Infrastructure Maturity Model (AIMM), which consists of five maturity stages20. The
study rated the County against both the Public Sector industry and the desired maturity
level. HP examined CEO/IT’s infrastructure in four domains (Technology &
Architecture, Management Tools & Processes, Culture & Staff, and Demand, Supply &
IT Governance), finding that the County is currently in Stage 2 maturity
(‚Standardized‛) for most elements of the four domains. While the target or desired
stage for the County of Orange is Stage 4 (‚Automated Service Oriented‛), HP
recommended that the County first work toward moving from Stage 2 maturity to
Stage 3 maturity (‚Optimized‛) in the near term, aspiring to reach Stage 4 in the longer
term.
In addition to the HP benchmarking study, the CTO recently procured Gartner IT Key
Metrics Data, which allows CEO/IT to benchmark key spending, staffing, performance,
and operational measures. An analysis of CEO/IT’s performance against these
benchmarks is currently beginning.
For Enterprise strategic initiatives and projects, research and benchmarking is
conducted on a project-by-project basis. For example, in conducting business cases and
analyses related to the 3-1-1 Customer Service Center and Regional Wireless initiatives,
CEO/IT staff and consultants researched other cities and counties that had undertaken
similar initiatives to understand costs and feasibility. Similarly, a consultant was hired
to conduct a gap analysis as part of the ITIL implementation.
20 Stage 1: Compartmentalized, Stage 2: Standardized, Stage 3: Optimized, Stage 4: Automated Service Oriented, Stage 5: Adaptively
Sourced Infrastructure
66
PERFORMANCE AUDIT OF CEO/IT – TASKS III - V REPORT Final Report
Task V: Evaluate CEO/IT Communications
A major part of the scope of work for Tasks III-V is to evaluate the quality of CEO/IT
communication with the Board of Supervisors, agencies/departments, the public, and
within its own organization.
Finding 27a: The quality of communication between CEO/IT and its internal/external
customers has improved but still requires immediate management
attention.
A. CEO/IT Communication with the Board of Supervisors
CEO/IT utilizes multiple mechanisms for communication with the Board. Examples
include: monthly Board Executive Assistant briefings, IT Project Quarterly Reports,
Board Meetings via Agenda Staff Reports (ASRs), memoranda, and ad-hoc
meetings/briefings. The audit team interviewed staff from each of the five Board
Offices regarding their perception of the quality of communication between their
Offices and CEO/IT. Perceptions were consistent across a majority of Board Offices.
The following is a summary of the opportunities for improvement that were expressed:
Communications from CEO/IT to the Board tend to be unnecessarily technical,
heavy on jargon, and unsuccessful in informing the audience.
On several important IT initiatives/projects presented to the Board for approval,
requests are presented as urgent, without a proper foundation laid in advance.
Information that is provided sometimes lacks sufficient business context to help
the Board make informed resource allocation decisions.
CEO/IT has, at times, reacted in a defensive manner to input from the Board
which was confirmed by leadership within the County Executive Office and
within CEO/IT.
CEO/IT should communicate how proposed IT initiatives/projects are aligned
and/or linked with the Strategic Financial Plan and the Annual Budget process to
ensure that each initiative/project is financially accounted for and reviewed.
67
PERFORMANCE AUDIT OF CEO/IT – TASKS III - V REPORT Final Report
The audit team evaluated two major mechanisms for CEO/IT communication with the
Board: IT Quarterly Reports and Agenda Staff Reports.
IT Quarterly Reports
IT Quarterly Reports were initiated in 2005 at the request of Supervisor Campbell.
Positive communication aspects of these reports include:
The reports provide the Board with a snapshot of the current status of IT projects
costing ≥$250,000.
CEO/IT has been responsive to requested changes in report format and content by
the Board.
Identified opportunities for improvement include:
After examining multiple examples of CEO/IT-driven projects that have been poorly
planned and/or executed (eGovernment, Clarity, OCid), as detailed in the Project
Management portion of this audit report, it is evident that the IT Quarterly Reports,
in many cases, fail to give the Board an adequate picture of individual project status.
As validated in the Task I audit report, not all project costs are reported in IT
Quarterly reports. For example, on-going operations and maintenance costs, as well
as County staff-time costs, are not reported.
The delay between the reporting period and its presentation to the Board (CEO/IT
targets 6-8 weeks, but sometimes it has been 2-3 months) has resulted in project
status information being stale at the time of Board presentation. Recent examples
are both the October – December 2009 quarterly report, agendized on the March 2,
2010 Board meeting, and the January – March 2010 quarterly report, agendized on
the May 4, 2010 Board meeting, which state that the OCid project is ‚on-time and
on-budget,‛ when it has, in fact, experienced major setbacks.
IT projects are not numbered and, at times, project names are changed. As a result,
it is difficult for the Board to track changes in project scope, schedule or costs.
Additionally, all project phases are not always reported or appropriately
communicated (e.g., eGov).
68
PERFORMANCE AUDIT OF CEO/IT – TASKS III - V REPORT Final Report
Agenda Staff Reports and Board Presentations
Agenda Staff Reports (ASRs) and Board presentations are utilized by CEO/IT to inform
the Board about its most important activities and to provide the Board with the
information it needs to make important resource allocation decisions. Unfortunately,
CEO/IT has struggled with effectively writing and presenting ASRs. Recent examples
include:
CEO/IT ASRs do not always disclose all relevant information required for the Board
to make informed policy and resource allocation decisions. Examples include the
initial efforts by CEO/IT for Board approval of an IT Sourcing strategy that were
postponed due to a lack of sufficient information provided to the Board; and the
original April 20, 2010 ASR regarding a sole source contract with Vignette to migrate
the eGovernment delivery system a new (P595) platform that was continued due to
insufficient and inaccurate information.
The March 2, 2010 Board meeting discussion regarding a Regional Wireless grant
application demonstrated CEO/IT’s lack of awareness regarding the specifics of this
item.
The March 30, 2010 Board meeting discussion regarding a proposed Countywide
Social Media policy illustrated CEO/IT’s inability to allay Board concerns and
address specific details of the policy, resulting in the item’s continuance.
Audit team interviews with CEO/IT staff at all levels also support the view that
improvement needs to be made in the quality of CEO/IT communication with the
Board.
B. CEO/IT Communication with Agencies/Departments
CEO/IT management uses a variety of methods to communicate with
agencies/departments, some of which include: meetings with the CIO, meetings with
other CEO/IT executives (e.g., CTO), memoranda, the IT Project Review Board, and the
IT Governance structure.
Audit research indicates that CEO/IT communication with agencies/departments has
been a long-standing concern:
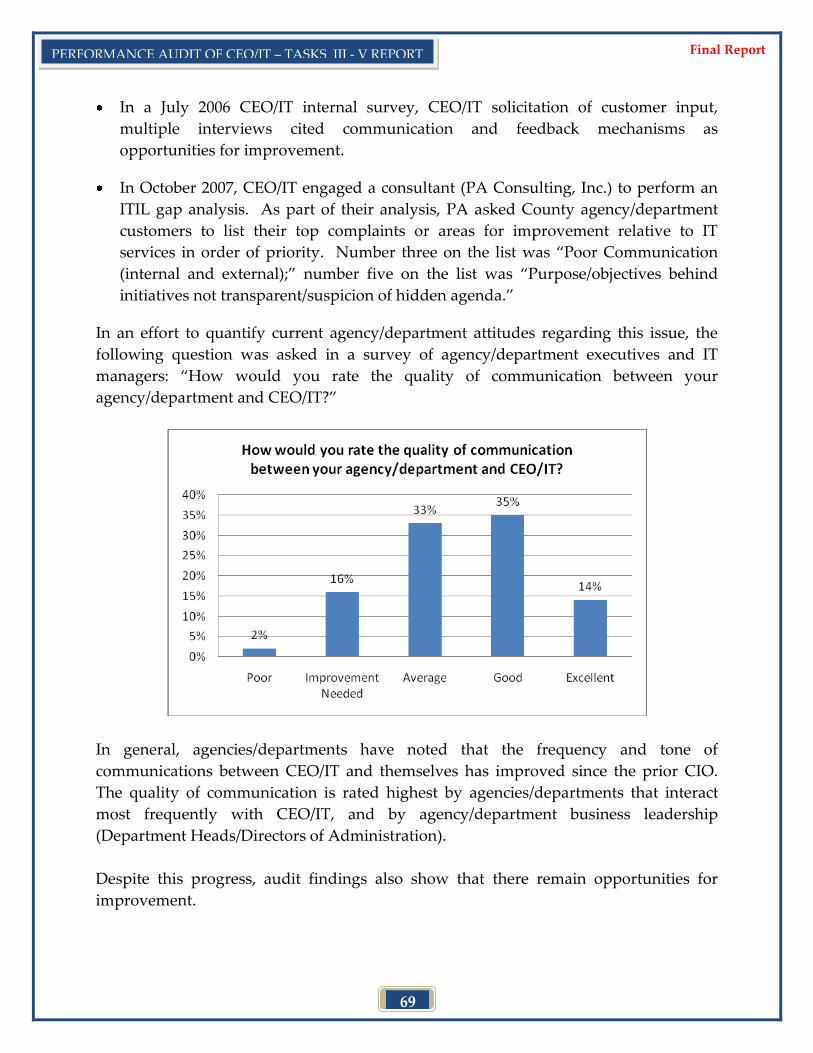
69
PERFORMANCE AUDIT OF CEO/IT – TASKS III - V REPORT Final Report
In a July 2006 CEO/IT internal survey, CEO/IT solicitation of customer input,
multiple interviews cited communication and feedback mechanisms as
opportunities for improvement.
In October 2007, CEO/IT engaged a consultant (PA Consulting, Inc.) to perform an
ITIL gap analysis. As part of their analysis, PA asked County agency/department
customers to list their top complaints or areas for improvement relative to IT
services in order of priority. Number three on the list was ‚Poor Communication
(internal and external);‛ number five on the list was ‚Purpose/objectives behind
initiatives not transparent/suspicion of hidden agenda.‛
In an effort to quantify current agency/department attitudes regarding this issue, the
following question was asked in a survey of agency/department executives and IT
managers: ‚How would you rate the quality of communication between your
agency/department and CEO/IT?‛
In general, agencies/departments have noted that the frequency and tone of
communications between CEO/IT and themselves has improved since the prior CIO.
The quality of communication is rated highest by agencies/departments that interact
most frequently with CEO/IT, and by agency/department business leadership
(Department Heads/Directors of Administration).
Despite this progress, audit findings also show that there remain opportunities for
improvement.
70
PERFORMANCE AUDIT OF CEO/IT – TASKS III - V REPORT Final Report
First, the IT Governance structure and its individual groups were intended to serve as a
forum for agency/department collaboration. However, as previously discussed in the
IT Governance portion of this report there are a variety of obstacles that inhibit
meaningful communication/collaboration.
Second, communication with agencies/departments was the most cited area for
improvement by CEO/IT staff. Examples of specific CEO/IT employee comments
include:
Communication is the weakest part of CEO/IT; it’s not the best part of what we do
We keep shooting ourselves with a lack of transparency
We send out ill-crafted messages and expect good results
We need to provide a compelling reason for agencies/departments to listen to us; we
owe them explanations and transparency
Third, interviews with and survey results from agency/department executive and IT
management staff raised several improvement opportunities, such as:
Some forms of communication, especially emails to agency/department executives
and IT professionals regarding the implementation of new enterprise IT
initiatives/projects are often presented in a heavy-handed fashion (already decided),
and/or are confusing due to a lack of context.
Proposals with a significant impact to agencies/departments are presented in a
rushed, last-second manner with incomplete details or business analysis.
C. CEO/IT Communication with the Public
Like all public entities, CEO/IT is ultimately responsible to the public, which includes
transparency in its use of public funds. The general method of CEO/IT communication
with the public, in addition to items presented to the Board via the public agenda, is
through its website on OCgov.com.
The audit team reviewed this website and found that while the site does provide the
public with a high-level understanding of the role of the Chief Information Officer and
the key initiatives of CEO/IT, the content on the site has not been kept up-to-date. For
example, the ‚Key Strategic Initiatives‛ area of the site has not been updated since 2008
and inaccurately includes the 311 Service Center as a current initiative (note: 311
71
PERFORMANCE AUDIT OF CEO/IT – TASKS III - V REPORT Final Report
Service Center was an initiative that was discontinued after the feasibility analysis
stage). As the central IT organization in the County and the champion of the eGov
initiative, it is unfortunate that information on CEO/IT’s own website is stale.
Finding 27b: CEO/IT does not prepare an Annual Report.
A specific question posed by the Board of Supervisors in the scope of this audit was
whether or not CEO/IT has ‚<a separate Annual Report that describes progress in
achieving its goals.‛ The audit team has confirmed that no separate Annual Report is
prepared although CEO/IT does contribute to the overall CEO Business Plan and does
prepare a document that lists its key accomplishments.
D. Communication within CEO/IT
In regard to CEO/IT’s internal communications, there were mixed results. It was
generally acknowledged that communication in technical operational areas has
improved noticeably with the implementation of the ITIL framework. Alternatively,
CEO/IT staff also provided the audit team with several examples of dysfunctional
internal communication practices, which is summarized below:
Several concerns were raised regarding communication between the CIO and the
rest of the CEO/IT organization. A sampling of interview comments included:
o Typically, the CIO’s decision to pursue certain IT projects is already made and
the resulting request for staff input is perfunctory.
o Many CEO/IT staff are hesitant to disagree with the CIO in internal meetings.
o It is very difficult for the CIO to admit or communicate mistakes.
The CIO did not provide the CTO (one of his two direct reports) a copy of the
preliminary draft report during the factual review phase of the audit (two weeks).
During the factual review meeting, the CIO confirmed that this was the case and
subsequently provided the CTO a copy of the report.
The current organizational structure, built around the ‚14 Centers of Excellence‛,
has resulted in a more specialized workforce. As a result, some staff have perceived
an increase in inefficiency due to a greater number of staff involved in any one
project, leading to excessive amounts of internal communication and coordination,
greatly expanding project timeframes and cost.
72
PERFORMANCE AUDIT OF CEO/IT – TASKS III - V REPORT Final Report
E. Communication Impacts from Other Tasks III-V Audit Findings
Ineffective communication continues to hamper CEO/IT’s operations and performance.
A cumulative examination of audit findings clearly demonstrates that this deficiency
has evolved into a culture where important IT information/activities are not disclosed
by CEO/IT to its customers. The findings below, which are found in other sections of
this audit report, have communication elements:
The use of the IT Governance structure to collaborate on Countywide IT activities
has been wholly or partially bypassed on several occasions.
Several formal CEO/IT communications to the Board (e.g., ASRs, Quarterly Reports,
memoranda) fail to provide sufficient and/or inaccurate information to allow the
Board to make informed decisions.
CEO/IT leadership priorities are unclearly communicated and frequently change.
As a result, organizational objectives are vague and individual project priorities are
in a constant state of flux.
The results of many important CEO/IT initiated consultant and project feasibility
studies authorized by the Board have not been subsequently provided to the Board.
Examples include: 311 Customer Service Center study, PA Consulting Review of
the ACS contract, and the Plan Net of the County telephone system.
CEO/IT billing rates have become more transparent, but overhead components and
the use of ISF 289 Retained Earnings are still not proactively and clearly disclosed to
agencies/departments.
These communication deficiencies have negatively impacted CEO/IT in the following
manner:
Working relationships between CEO/IT and the Board, as well as between CEO/IT
and agencies/departments, continue to be strained. In some cases, the
communication missteps of CEO/IT have created even more friction.
From an efficiency standpoint, the impact of communication deficiencies leads to
hours of unnecessary Board and County staff time spent working through poorly
explained initiatives and projects.
Operational decisions are pursued against the recommendations of staff and have
subsequently resulted in avoidable project failures.
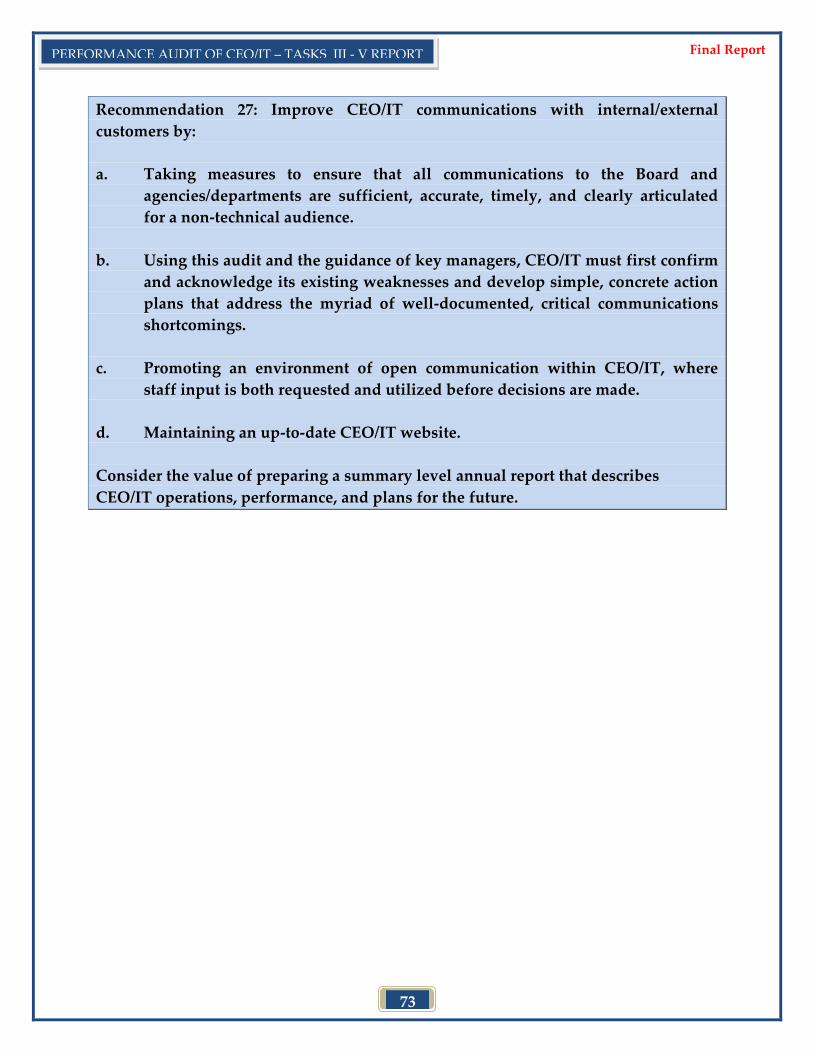
73
PERFORMANCE AUDIT OF CEO/IT – TASKS III - V REPORT Final Report
Recommendation 27: Improve CEO/IT communications with internal/external
customers by:
a. Taking measures to ensure that all communications to the Board and
agencies/departments are sufficient, accurate, timely, and clearly articulated
for a non-technical audience.
b. Using this audit and the guidance of key managers, CEO/IT must first confirm
and acknowledge its existing weaknesses and develop simple, concrete action
plans that address the myriad of well-documented, critical communications
shortcomings.
c. Promoting an environment of open communication within CEO/IT, where
staff input is both requested and utilized before decisions are made.
d. Maintaining an up-to-date CEO/IT website.
Consider the value of preparing a summary level annual report that describes
CEO/IT operations, performance, and plans for the future.
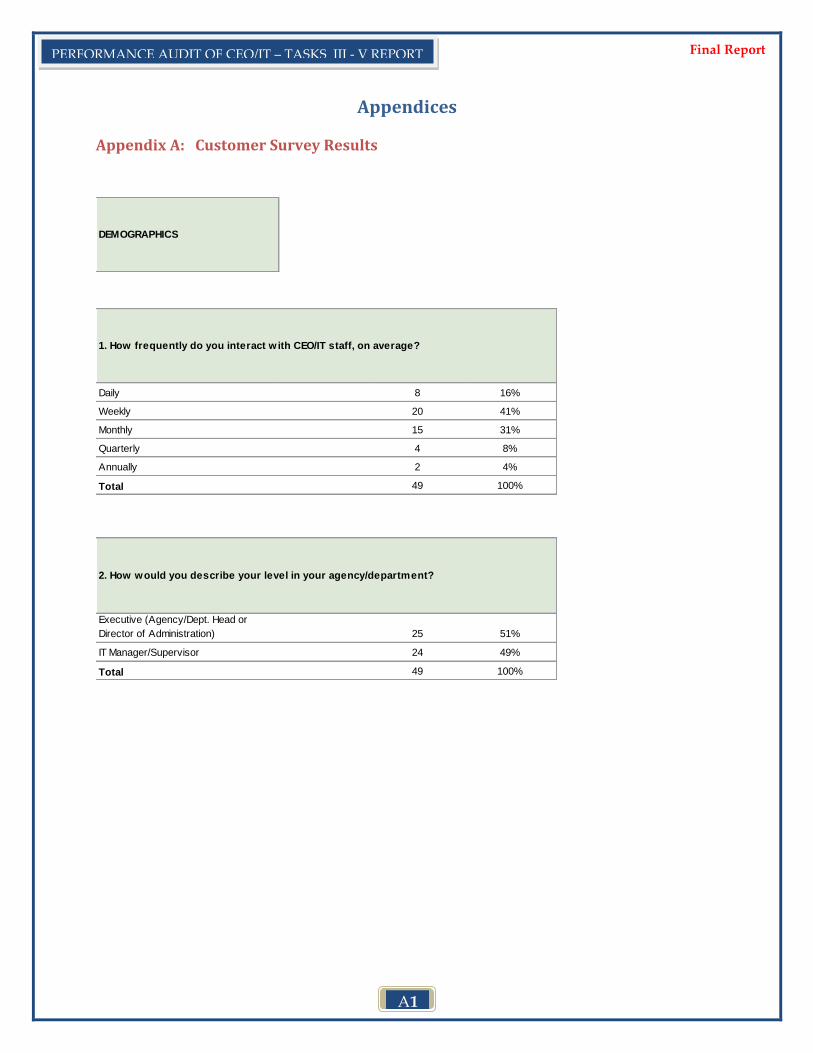
A1
PERFORMANCE AUDIT OF CEO/IT – TASKS III - V REPORT Final Report
Appendices
Appendix A: Customer Survey Results
DEMOGRAPHICS
Daily 8 16%
Weekly 20 41%
Monthly 15 31%
Quarterly 4 8%
Annually 2 4%
49 100%
1. How frequently do you interact w ith CEO/IT staff, on average?
Total
Executive (Agency/Dept. Head or
Director of Administration) 25 51%
IT Manager/Supervisor 24 49%
49 100%
2. How would you describe your level in your agency/department?
Total
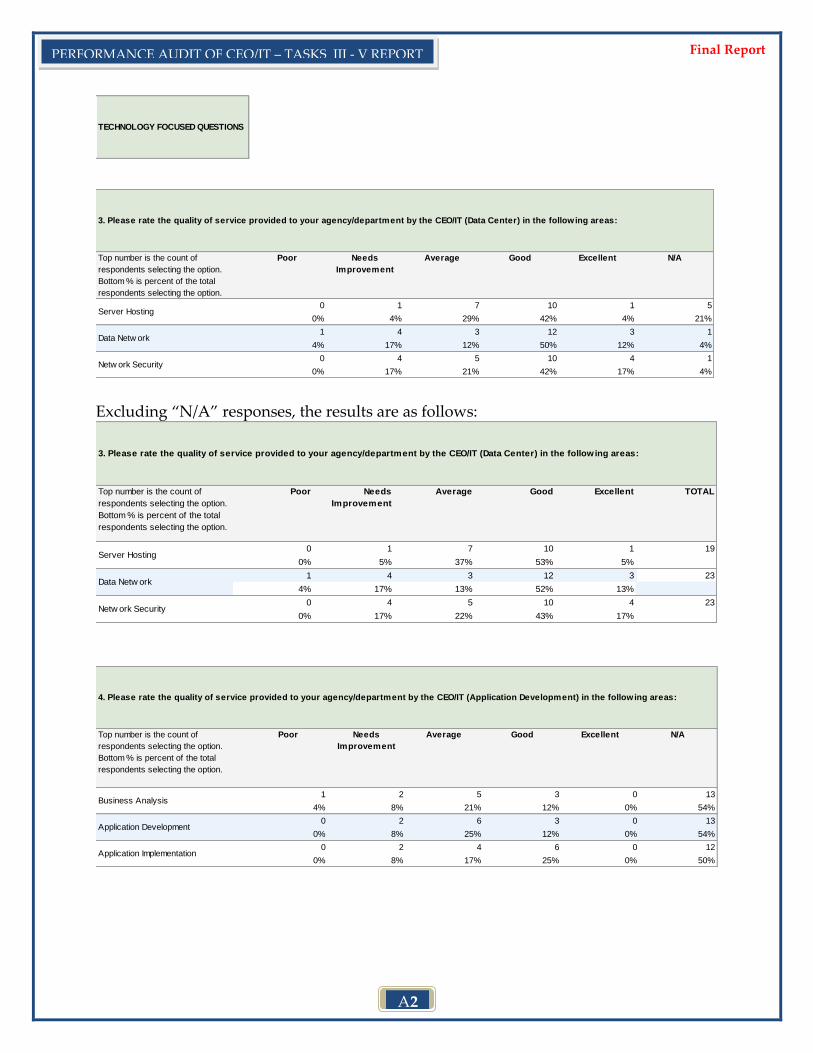
A2
PERFORMANCE AUDIT OF CEO/IT – TASKS III - V REPORT Final Report
TECHNOLOGY FOCUSED QUESTIONS
Top number is the count of
respondents selecting the option.
Bottom % is percent of the total
respondents selecting the option.
Poor Needs
Improvement
Average Good Excellent N/A
0 1 7 10 1 5
0% 4% 29% 42% 4% 21%
1 4 3 12 3 1
4% 17% 12% 50% 12% 4%
0 4 5 10 4 1
0% 17% 21% 42% 17% 4%
Server Hosting
3. Please rate the quality of service provided to your agency/department by the CEO/IT (Data Center) in the following areas:
Data Netw ork
Netw ork Security
Excluding ‚N/A‛ responses, the results are as follows:
Top number is the count of
respondents selecting the option.
Bottom % is percent of the total
respondents selecting the option.
Poor Needs
Improvement
Average Good Excellent TOTAL
0 1 7 10 1 19
0% 5% 37% 53% 5%
1 4 3 12 3 23
4% 17% 13% 52% 13%
0 4 5 10 4 23
0% 17% 22% 43% 17%
Server Hosting
3. Please rate the quality of service provided to your agency/department by the CEO/IT (Data Center) in the following areas:
Data Netw ork
Netw ork Security
Top number is the count of
respondents selecting the option.
Bottom % is percent of the total
respondents selecting the option.
Poor Needs
Improvement
Average Good Excellent N/A
1 2 5 3 0 13
4% 8% 21% 12% 0% 54%
0 2 6 3 0 13
0% 8% 25% 12% 0% 54%
0 2 4 6 0 12
0% 8% 17% 25% 0% 50%
4. Please rate the quality of service provided to your agency/department by the CEO/IT (Application Development) in the following areas:
Business Analysis
Application Development
Application Implementation
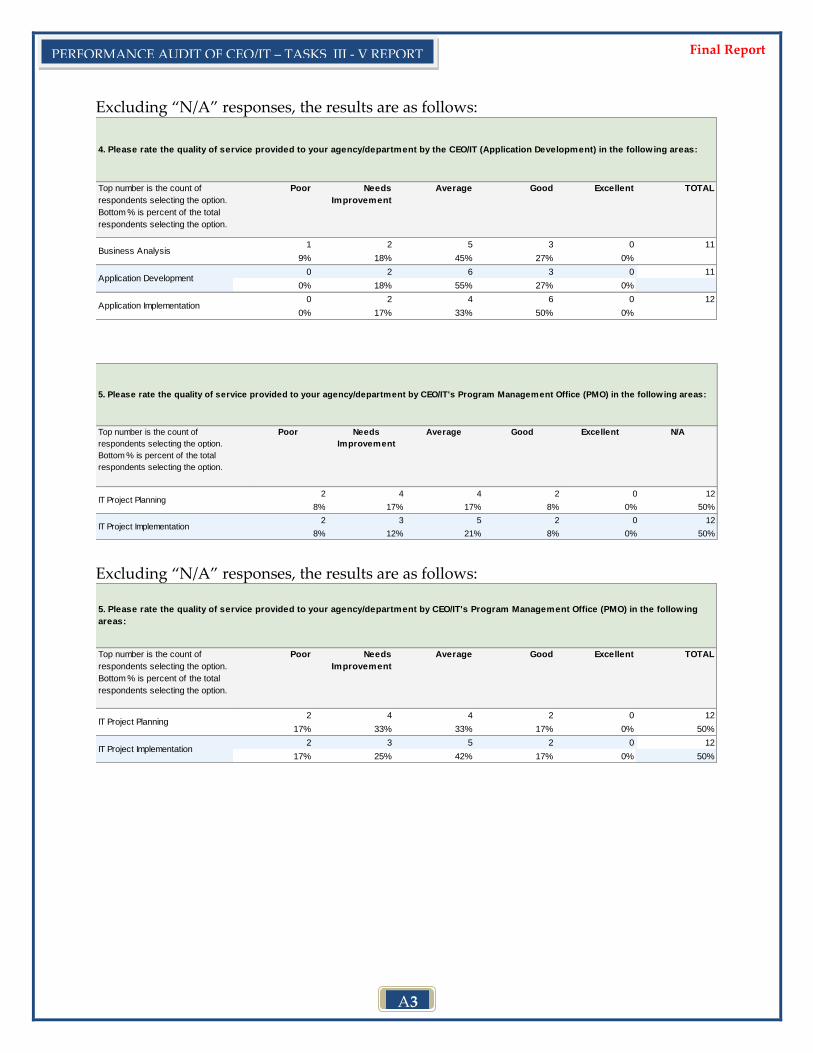
A3
PERFORMANCE AUDIT OF CEO/IT – TASKS III - V REPORT Final Report
Excluding ‚N/A‛ responses, the results are as follows:
Top number is the count of
respondents selecting the option.
Bottom % is percent of the total
respondents selecting the option.
Poor Needs
Improvement
Average Good Excellent TOTAL
1 2 5 3 0 11
9% 18% 45% 27% 0%
0 2 6 3 0 11
0% 18% 55% 27% 0%
0 2 4 6 0 12
0% 17% 33% 50% 0%
4. Please rate the quality of service provided to your agency/department by the CEO/IT (Application Development) in the following areas:
Business Analysis
Application Development
Application Implementation
Top number is the count of
respondents selecting the option.
Bottom % is percent of the total
respondents selecting the option.
Poor Needs
Improvement
Average Good Excellent N/A
2 4 4 2 0 12
8% 17% 17% 8% 0% 50%
2 3 5 2 0 12
8% 12% 21% 8% 0% 50%
5. Please rate the quality of service provided to your agency/department by CEO/IT's Program Management Office (PMO) in the following areas:
IT Project Planning
IT Project Implementation
Excluding ‚N/A‛ responses, the results are as follows:
Top number is the count of
respondents selecting the option.
Bottom % is percent of the total
respondents selecting the option.
Poor Needs
Improvement
Average Good Excellent TOTAL
2 4 4 2 0 12
17% 33% 33% 17% 0% 50%
2 3 5 2 0 12
17% 25% 42% 17% 0% 50%
5. Please rate the quality of service provided to your agency/department by CEO/IT's Program Management Office (PMO) in the following
areas:
IT Project Planning
IT Project Implementation
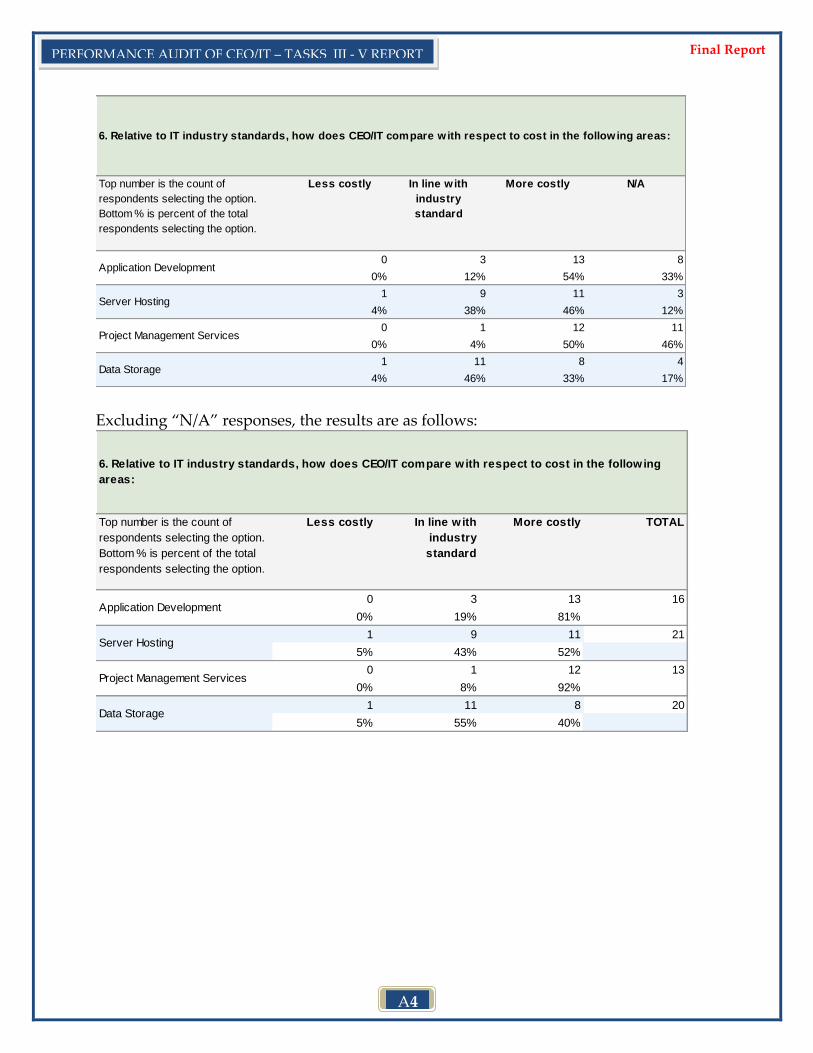
A4
PERFORMANCE AUDIT OF CEO/IT – TASKS III - V REPORT Final Report
Top number is the count of
respondents selecting the option.
Bottom % is percent of the total
respondents selecting the option.
Less costly In line with
industry
standard
More costly N/A
0 3 13 8
0% 12% 54% 33%
1 9 11 3
4% 38% 46% 12%
0 1 12 11
0% 4% 50% 46%
1 11 8 4
4% 46% 33% 17%
Server Hosting
6. Relative to IT industry standards, how does CEO/IT compare with respect to cost in the following areas:
Application Development
Project Management Services
Data Storage
Excluding ‚N/A‛ responses, the results are as follows:
Top number is the count of
respondents selecting the option.
Bottom % is percent of the total
respondents selecting the option.
Less costly In line w ith
industry
standard
More costly TOTAL
0 3 13 16
0% 19% 81%
1 9 11 21
5% 43% 52%
0 1 12 13
0% 8% 92%
1 11 8 20
5% 55% 40%
Server Hosting
6. Relative to IT industry standards, how does CEO/IT compare with respect to cost in the following
areas:
Application Development
Project Management Services
Data Storage
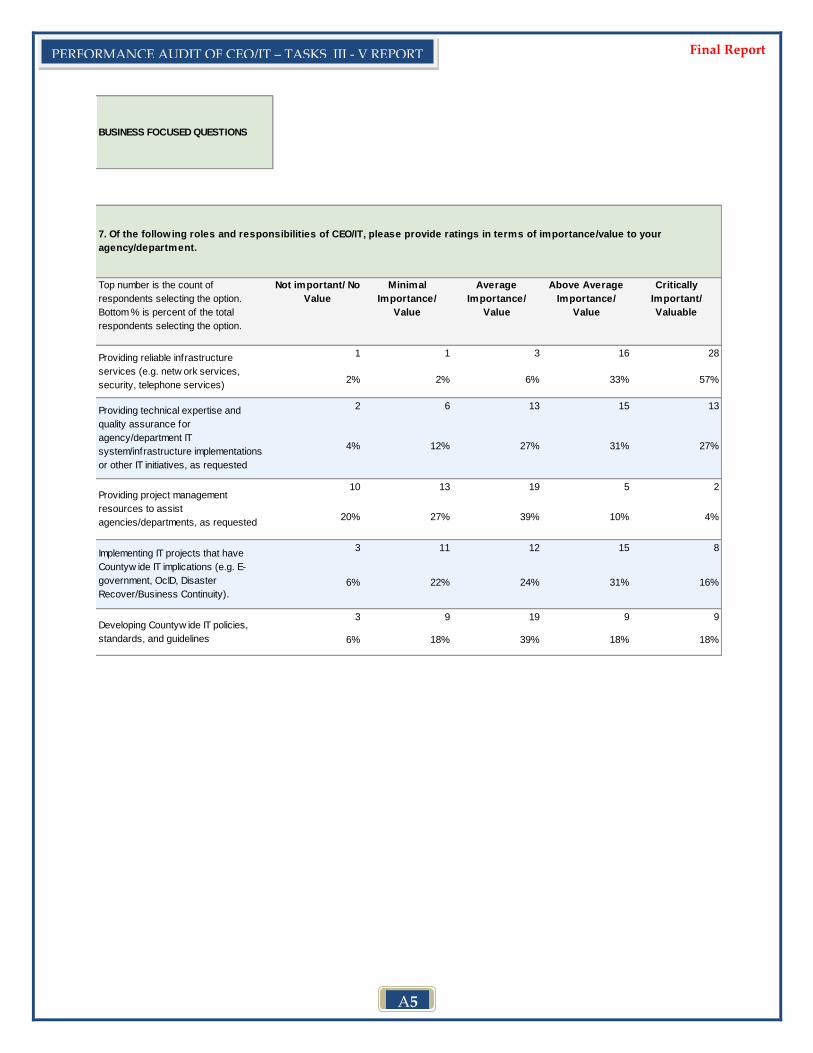
A5
PERFORMANCE AUDIT OF CEO/IT – TASKS III - V REPORT Final Report
BUSINESS FOCUSED QUESTIONS
Top number is the count of
respondents selecting the option.
Bottom % is percent of the total
respondents selecting the option.
Not important/ No
Value
Minimal
Importance/
Value
Average
Importance/
Value
Above Average
Importance/
Value
Critically
Important/
Valuable
1 1 3 16 28
2% 2% 6% 33% 57%
2 6 13 15 13
4% 12% 27% 31% 27%
10 13 19 5 2
20% 27% 39% 10% 4%
3 11 12 15 8
6% 22% 24% 31% 16%
3 9 19 9 9
6% 18% 39% 18% 18%
7. Of the following roles and responsibilities of CEO/IT, please provide ratings in terms of importance/value to your
agency/department.
Providing reliable infrastructure
services (e.g. netw ork services,
security, telephone services)
Providing technical expertise and
quality assurance for
agency/department IT
system/infrastructure implementations
or other IT initiatives, as requested
Providing project management
resources to assist
agencies/departments, as requested
Implementing IT projects that have
Countyw ide IT implications (e.g. E-
government, OcID, Disaster
Recover/Business Continuity).
Developing Countyw ide IT policies,
standards, and guidelines
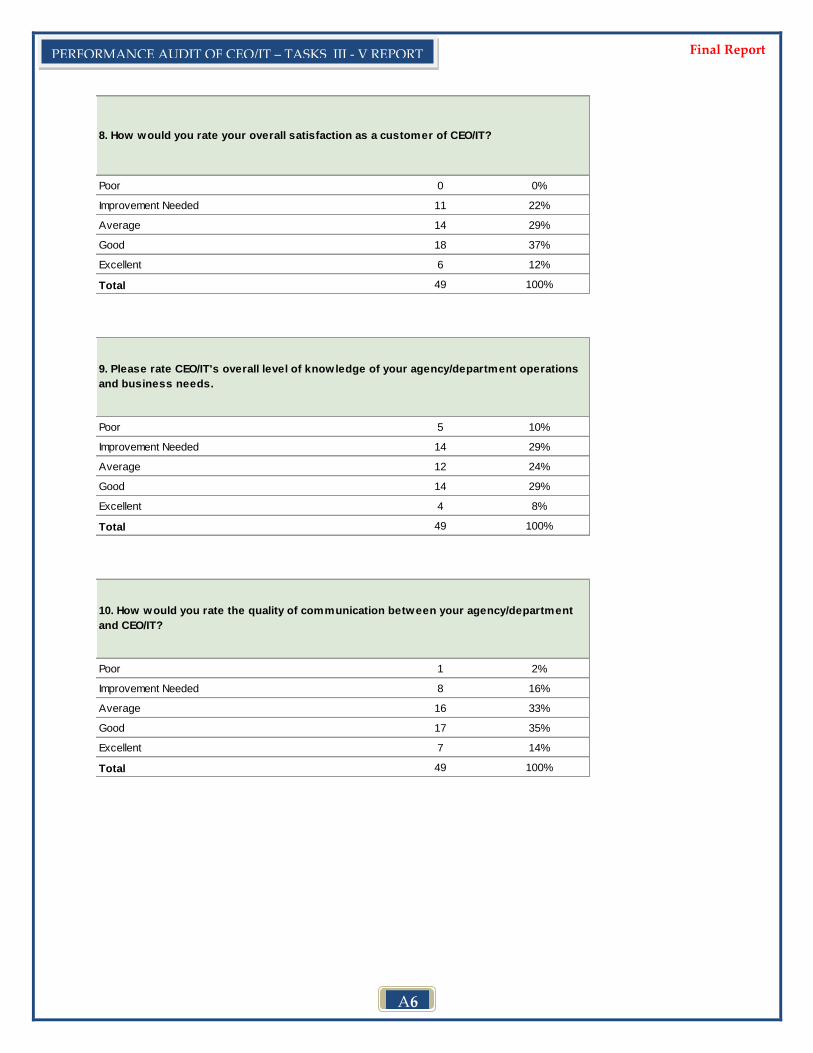
A6
PERFORMANCE AUDIT OF CEO/IT – TASKS III - V REPORT Final Report
Poor 0 0%
Improvement Needed 11 22%
Average 14 29%
Good 18 37%
Excellent 6 12%
49 100%
8. How would you rate your overall satisfaction as a customer of CEO/IT?
Total
Poor 5 10%
Improvement Needed 14 29%
Average 12 24%
Good 14 29%
Excellent 4 8%
49 100%Total
9. Please rate CEO/IT's overall level of knowledge of your agency/department operations
and business needs.
Poor 1 2%
Improvement Needed 8 16%
Average 16 33%
Good 17 35%
Excellent 7 14%
49 100%
10. How would you rate the quality of communication between your agency/department
and CEO/IT?
Total
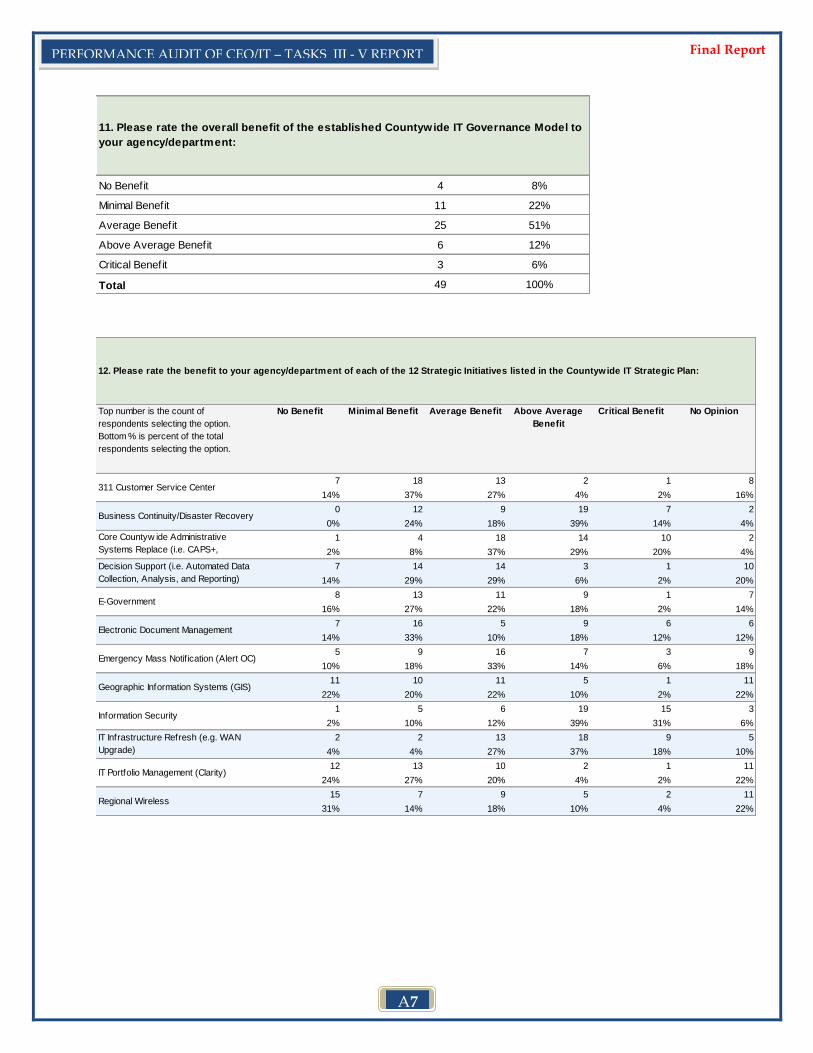
A7
PERFORMANCE AUDIT OF CEO/IT – TASKS III - V REPORT Final Report
No Benefit 4 8%
Minimal Benefit 11 22%
Average Benefit 25 51%
Above Average Benefit 6 12%
Critical Benefit 3 6%
49 100%
11. Please rate the overall benefit of the established Countywide IT Governance Model to
your agency/department:
Total
Top number is the count of
respondents selecting the option.
Bottom % is percent of the total
respondents selecting the option.
No Benefit Minimal Benefit Average Benefit Above Average
Benefit
Critical Benefit No Opinion
7 18 13 2 1 8
14% 37% 27% 4% 2% 16%
0 12 9 19 7 2
0% 24% 18% 39% 14% 4%
1 4 18 14 10 2
2% 8% 37% 29% 20% 4%
7 14 14 3 1 10
14% 29% 29% 6% 2% 20%
8 13 11 9 1 7
16% 27% 22% 18% 2% 14%
7 16 5 9 6 6
14% 33% 10% 18% 12% 12%
5 9 16 7 3 9
10% 18% 33% 14% 6% 18%
11 10 11 5 1 11
22% 20% 22% 10% 2% 22%
1 5 6 19 15 3
2% 10% 12% 39% 31% 6%
2 2 13 18 9 5
4% 4% 27% 37% 18% 10%
12 13 10 2 1 11
24% 27% 20% 4% 2% 22%
15 7 9 5 2 11
31% 14% 18% 10% 4% 22%
Emergency Mass Notif ication (Alert OC)
12. Please rate the benefit to your agency/department of each of the 12 Strategic Initiatives listed in the Countywide IT Strategic Plan:
311 Customer Service Center
Business Continuity/Disaster Recovery
Core Countyw ide Administrative
Systems Replace (i.e. CAPS+,
ATS/PTMS)Decision Support (i.e. Automated Data
Collection, Analysis, and Reporting)
E-Government
Electronic Document Management
Geographic Information Systems (GIS)
Information Security
IT Infrastructure Refresh (e.g. WAN
Upgrade)
IT Portfolio Management (Clarity)
Regional Wireless

A8
PERFORMANCE AUDIT OF CEO/IT – TASKS III - V REPORT Final Report
Excluding ‚No Opinion‛ responses, the results are as follows:
Top number is the count of
respondents selecting the option.
Bottom % is percent of the total
respondents selecting the option.
No Benefit Minimal Benefit Average Benefit Above Average
Benefit
Critical Benefit TOTAL
7 18 13 2 1 41
17% 44% 32% 5% 2%
0 12 9 19 7 47
0% 26% 19% 40% 15%
1 4 18 14 10 47
2% 9% 38% 30% 21%
7 14 14 3 1 39
18% 36% 36% 8% 3%
8 13 11 9 1 42
19% 31% 26% 21% 2%
7 16 5 9 6 43
16% 37% 12% 21% 14%
5 9 16 7 3 40
13% 23% 40% 18% 8%
11 10 11 5 1 38
29% 26% 29% 13% 3%
1 5 6 19 15 46
2% 11% 13% 41% 33%
2 2 13 18 9 44
5% 5% 30% 41% 20%
12 13 10 2 1 38
32% 34% 26% 5% 3%
15 7 9 5 2 38
39% 18% 24% 13% 5%
Emergency Mass Notif ication
(Alert OC)
12. Please rate the benefit to your agency/department of each of the 12 Strategic Initiatives listed in the Countywide IT Strategic Plan:
311 Customer Service Center
Business Continuity/Disaster
Recovery
Core Countyw ide Administrative
Systems Replace (i.e. CAPS+,
ATS/PTMS)Decision Support (i.e. Automated
Data Collection, Analysis, and
Reporting)
E-Government
Electronic Document Management
Geographic Information Systems
(GIS)
Information Security
IT Infrastructure Refresh (e.g.
WAN Upgrade)
IT Portfolio Management (Clarity)
Regional Wireless
49 Responses
13. Please provide any additional customer service-related comments or feedback that
you think would be helpful for our audit of CEO/IT.
Comments (excludes comments that can be attributed to a particular
agency/department):
Need to improve on communication with other agencies.
Would like to see: More complete billing statements & better breakdown in services. Less
internal security where it makes sense(less firewalls, rules, etc).

A9
PERFORMANCE AUDIT OF CEO/IT – TASKS III - V REPORT Final Report
Identify total cost of ownership (including on-going support) for all projects.
I believe that CEO-IT is getting better, but still have trouble thinking outside the box. Reviews
department's Plan without optional suggestions/ideas when they are the "experts." Should have
better knowledge of departments' business requirements and needs.
CEOIT is doing better and better.
When rolling out new systems, e.g. OCid, it is very important to include all stakeholders at the
onset of the project and keep the communication lines open all the way through the project.
Keeping the communication lines open can result in efficiencies, confidence with the integrity of
the data, better working relationships and good results.
Plan/Pilot with a large and small agency to ensure you meet the needs of both. CEO IT focuses
on the small agencies for pilot, when they try to implement the setup with a large agency we
encounter their inability to accommodate, we must pay for custom programming to make it work
for us, or a response the system doesn't work that way. If a system will be mandated by the BOS
that all agencies use the system then the BOS should mandate any system must work for the
largest agency down to the smallest agency. This ensures funds are spent wisely for systems
that are mandated by the BOS that all agencies use the system.
More open communication on rates and fees is definitely an area for improvement. Additionally,
there needs to be more of a focus on department operational needs for IT funding in addition to
the Countywide projects.
CEO/IT needs to improve communication, clearly define roles and responsibilities, provide
improved customer service and reduce costs.
CEO/IT typically provides excellent responses to requests for service.
The CEO's Office of Project Management has never engaged our department to support our
projects.
CEO should consider their customer's needs before they expend resources on their own projects
Too many initiatives without Department input. Also seems that CEOIT already has an agenda
prior to our input. CEOIT has limited expertise and will frequently use Dept. staff resources.
They do a fantastic job considering the circumstances

A10
PERFORMANCE AUDIT OF CEO/IT – TASKS III - V REPORT Final Report
The most important service provided by CEO/IT is policy and best practice promulgation to
ensure uniformity throughout the County to the greatest extent possible.
Mr. Ajmani and his staff have made a concerted effort to reach out to our agency in the past
several months to improve communication and provide service.
B1
PERFORMANCE AUDIT OF CEO/IT – TASKS III - V REPORT Final Report
Appendix B: Memo to the Board of Supervisors on IT Sourcing
OOffffiiccee ooff tthhee PPeerrffoorrmmaannccee AAuuddiitt DDiirreeccttoorr
Memorandum
October 16, 2009
To: Chairman Patricia Bates
Vice-Chair Janet Nguyen
Members, Board of Supervisors
From: Performance Audit Director
Subject: Office of the Performance Audit Director Follow-up Memo on
Performance Audit of CEO/IT and the Avasant Contract Discussions
At the September 15, 2009 Board meeting, Supervisor Bates directed CEO/IT and the
Office of the Performance Audit Director (OPAD) to meet and review the scopes of
work for both the CEO/IT Sourcing Advisor (Avasant) and the Performance Audit of
CEO/IT in order to mitigate any unnecessary duplication of effort. Each of your Offices
has received our October 16, 2009 joint memo on this subject.
During those discussions, OPAD raised an additional concern that the Board will be
asked to vote on a Sourcing Strategy and the release of an IT Sourcing RFP before
important and pertinent elements of the CEO/IT Performance Audit are complete. My
office met with CEO/IT and Avasant to discuss our additional concern. In an effort to
inform your Board of current IT activities and plans, the following is a summary of the
items that were discussed and their implications. In addition, following that summary,
we have provided recommendations for your Board to consider.
Discussion Items
CEO Proposed Board Presentation of a New IT Sourcing Strategy
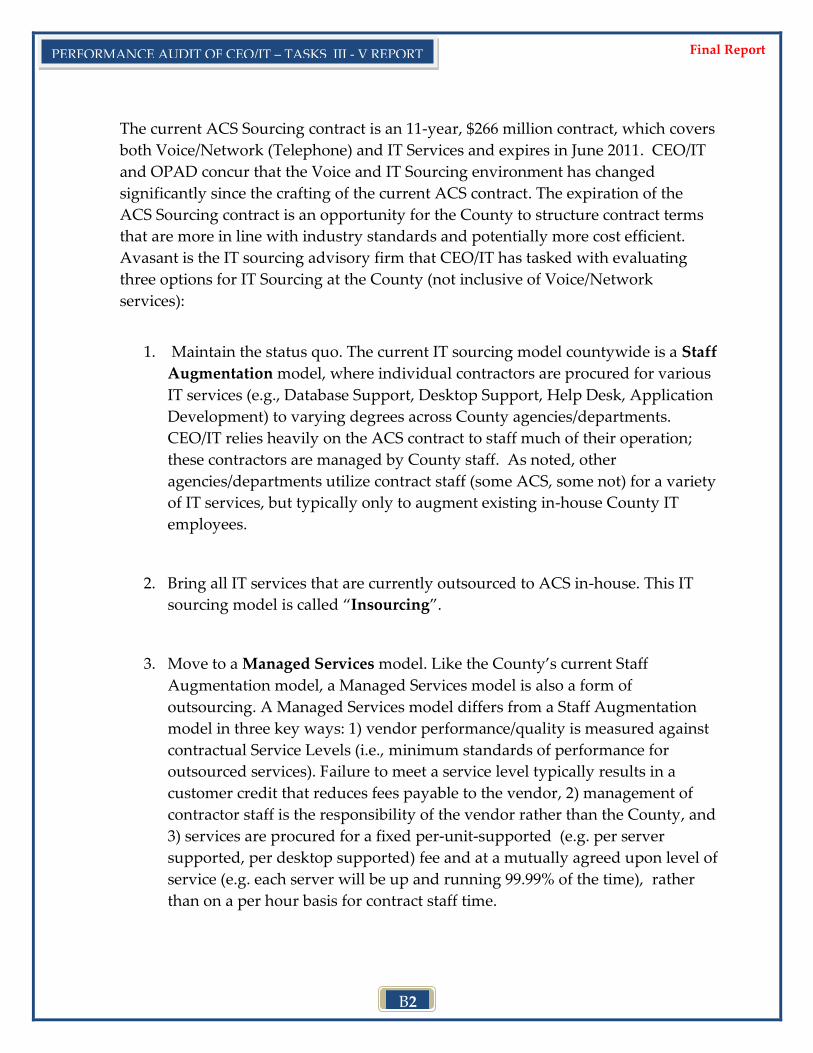
B2
PERFORMANCE AUDIT OF CEO/IT – TASKS III - V REPORT Final Report
The current ACS Sourcing contract is an 11-year, $266 million contract, which covers
both Voice/Network (Telephone) and IT Services and expires in June 2011. CEO/IT
and OPAD concur that the Voice and IT Sourcing environment has changed
significantly since the crafting of the current ACS contract. The expiration of the
ACS Sourcing contract is an opportunity for the County to structure contract terms
that are more in line with industry standards and potentially more cost efficient.
Avasant is the IT sourcing advisory firm that CEO/IT has tasked with evaluating
three options for IT Sourcing at the County (not inclusive of Voice/Network
services):
1. Maintain the status quo. The current IT sourcing model countywide is a Staff
Augmentation model, where individual contractors are procured for various
IT services (e.g., Database Support, Desktop Support, Help Desk, Application
Development) to varying degrees across County agencies/departments.
CEO/IT relies heavily on the ACS contract to staff much of their operation;
these contractors are managed by County staff. As noted, other
agencies/departments utilize contract staff (some ACS, some not) for a variety
of IT services, but typically only to augment existing in-house County IT
employees.
2. Bring all IT services that are currently outsourced to ACS in-house. This IT
sourcing model is called ‚Insourcing‛.
3. Move to a Managed Services model. Like the County’s current Staff
Augmentation model, a Managed Services model is also a form of
outsourcing. A Managed Services model differs from a Staff Augmentation
model in three key ways: 1) vendor performance/quality is measured against
contractual Service Levels (i.e., minimum standards of performance for
outsourced services). Failure to meet a service level typically results in a
customer credit that reduces fees payable to the vendor, 2) management of
contractor staff is the responsibility of the vendor rather than the County, and
3) services are procured for a fixed per-unit-supported (e.g. per server
supported, per desktop supported) fee and at a mutually agreed upon level of
service (e.g. each server will be up and running 99.99% of the time), rather
than on a per hour basis for contract staff time.
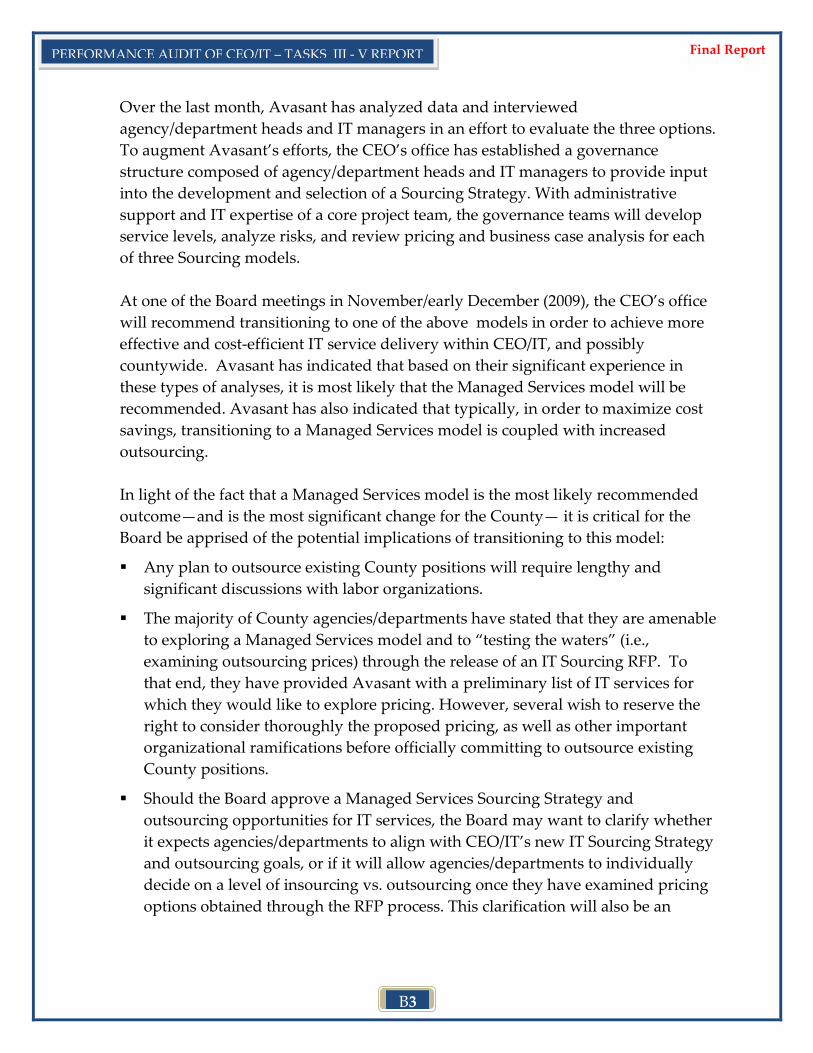
B3
PERFORMANCE AUDIT OF CEO/IT – TASKS III - V REPORT Final Report
Over the last month, Avasant has analyzed data and interviewed
agency/department heads and IT managers in an effort to evaluate the three options.
To augment Avasant’s efforts, the CEO’s office has established a governance
structure composed of agency/department heads and IT managers to provide input
into the development and selection of a Sourcing Strategy. With administrative
support and IT expertise of a core project team, the governance teams will develop
service levels, analyze risks, and review pricing and business case analysis for each
of three Sourcing models.
At one of the Board meetings in November/early December (2009), the CEO’s office
will recommend transitioning to one of the above models in order to achieve more
effective and cost-efficient IT service delivery within CEO/IT, and possibly
countywide. Avasant has indicated that based on their significant experience in
these types of analyses, it is most likely that the Managed Services model will be
recommended. Avasant has also indicated that typically, in order to maximize cost
savings, transitioning to a Managed Services model is coupled with increased
outsourcing.
In light of the fact that a Managed Services model is the most likely recommended
outcome—and is the most significant change for the County— it is critical for the
Board be apprised of the potential implications of transitioning to this model:
Any plan to outsource existing County positions will require lengthy and
significant discussions with labor organizations.
The majority of County agencies/departments have stated that they are amenable
to exploring a Managed Services model and to ‚testing the waters‛ (i.e.,
examining outsourcing prices) through the release of an IT Sourcing RFP. To
that end, they have provided Avasant with a preliminary list of IT services for
which they would like to explore pricing. However, several wish to reserve the
right to consider thoroughly the proposed pricing, as well as other important
organizational ramifications before officially committing to outsource existing
County positions.
Should the Board approve a Managed Services Sourcing Strategy and
outsourcing opportunities for IT services, the Board may want to clarify whether
it expects agencies/departments to align with CEO/IT’s new IT Sourcing Strategy
and outsourcing goals, or if it will allow agencies/departments to individually
decide on a level of insourcing vs. outsourcing once they have examined pricing
options obtained through the RFP process. This clarification will also be an
B4
PERFORMANCE AUDIT OF CEO/IT – TASKS III - V REPORT Final Report
opportunity for the Board to have a policy discussion regarding the current
County ‚federated (decentralized) IT system‛.
IT Sourcing Strategy Request for Proposal (RFP)
As part of the execution of CEO/IT’s proposed IT Sourcing Strategy, CEO/IT plans
on releasing two RFPs (essentially bifurcating the scope of work that is currently
under the ACS contract).
The first is an expedited RFP for Voice/Network (Telephone) services (specifically,
for Voice over Internet Protocol or ‚VoIP‛), which is proposed to be released in
November 2009, with the intent of having a Telephone/Network vendor in place by
March 2010. Fast-tracking this RFP will likely allow the County to realize significant
cost-savings. In fact, several agencies/departments have VoIP in place or have, for
some time, expressed their desire to move to the less-costly VoIP technology. In
moving forward, it is, however, important to note that with VoIP technology, voice
and data may share the same communications medium at some points in the
communications network. Therefore, any decisions regarding new VoIP technology
should accommodate and not preclude future networking, functionality and
capacity requirements that would be identified and proposed in the IT Sourcing
process.
CEO/IT proposes to release a second RFP for IT Services (e.g., Data Center
operations, Desktop Support, Help Desk) in March 2010. The development and
release of this RFP will follow Board approval of the CEO-recommended IT
Sourcing Strategy. OPAD believes that CEO/IT should ensure that this RFP and the
subsequent vendor negotiations reflect any value-added findings/recommendations
from CEO/IT Performance Audit Task I (Document and Verify Current IT Resource
Allocations scheduled to be completed in October 2009), Task II (Review of CEO/IT
Proposed Business Model scheduled to be completed in January 2010), and Task III
(Review of CEO/IT Operational Readiness scheduled to be completed in April 2010).
The possibility of waiting to release the second RFP until after the completion of
Tasks I-III of the Performance Audit was discussed in detail. During those
discussions, it became clear that CEO/IT has concerns about significantly delaying
the release of the second RFP. CEO/IT has stated that such a delay in soliciting for
and selecting an IT Sourcing vendor will consequently delay potential cost savings
to the County in the short-term. OPAD believes that the opportunity cost of waiting
is outweighed by the long-term benefit of having an RFP that incorporates the
B5
PERFORMANCE AUDIT OF CEO/IT – TASKS III - V REPORT Final Report
results of the Performance Audit. Moreover, OPAD believes that because the new
IT Sourcing contract will be a multi-year, multi-million dollar contract, it is critically
important from a long-term financial, operational and risk perspective to ensure that
the RFP and selection process is as thorough as possible and consistent with
countywide IT requirements.
Recommendations to the Board
1. Proceed with Voice/Network (Telephone) RFP release to expedite cost saving.
However, ensure that this RFP does not inhibit future IT Sourcing options.
2. Direct OPAD to review and comment to the CEO and Board on any IT Sourcing
Strategy proposal, in-concept or in detail, made by CEO/IT, prior to formal Board
consideration on the public agenda.
If you have any questions or wish to discuss this matter in more detail, please contact
me at your convenience.
_____________________________
Steve Danley
cc: Tom Mauk, CEO
Satish Ajmani, CIO
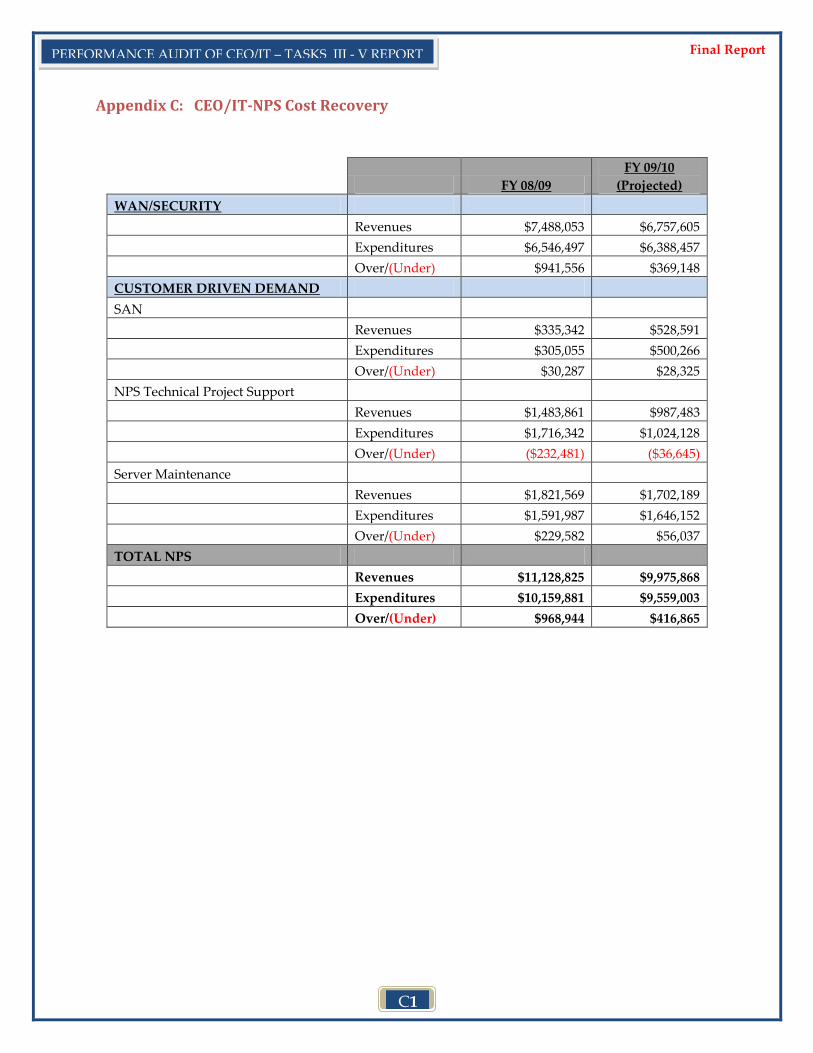
C1
PERFORMANCE AUDIT OF CEO/IT – TASKS III - V REPORT Final Report
Appendix C: CEO/IT-NPS Cost Recovery
FY 08/09
FY 09/10
(Projected)
WAN/SECURITY
Revenues $7,488,053 $6,757,605
Expenditures $6,546,497 $6,388,457
Over/(Under) $941,556 $369,148
CUSTOMER DRIVEN DEMAND
SAN
Revenues $335,342 $528,591
Expenditures $305,055 $500,266
Over/(Under) $30,287 $28,325
NPS Technical Project Support
Revenues $1,483,861 $987,483
Expenditures $1,716,342 $1,024,128
Over/(Under) ($232,481) ($36,645)
Server Maintenance
Revenues $1,821,569 $1,702,189
Expenditures $1,591,987 $1,646,152
Over/(Under) $229,582 $56,037
TOTAL NPS
Revenues $11,128,825 $9,975,868
Expenditures $10,159,881 $9,559,003
Over/(Under) $968,944 $416,865
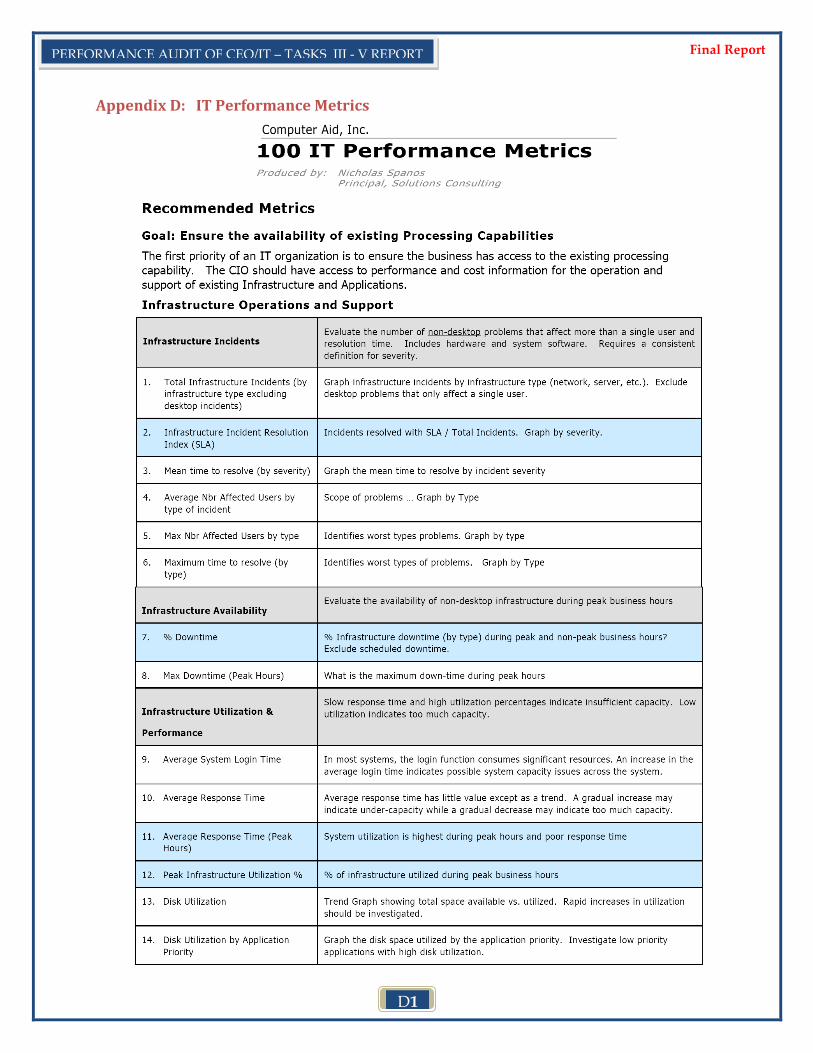
D1
PERFORMANCE AUDIT OF CEO/IT – TASKS III - V REPORT Final Report
Appendix D: IT Performance Metrics
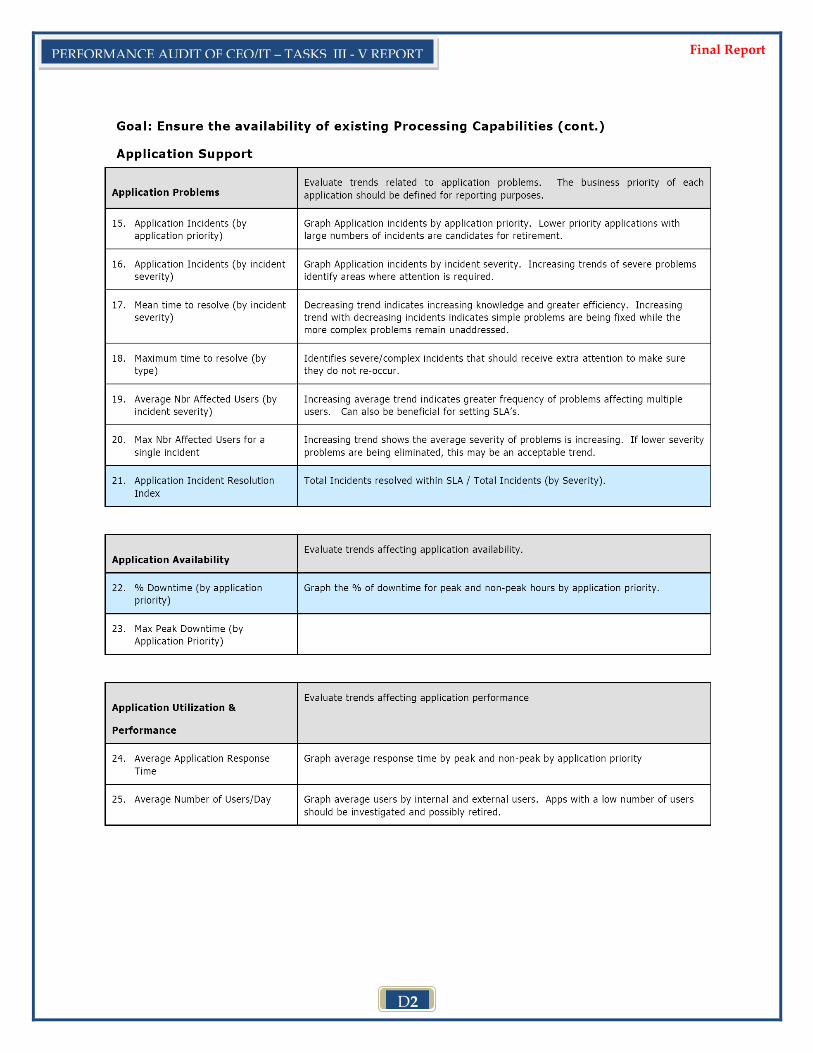
D2
PERFORMANCE AUDIT OF CEO/IT – TASKS III - V REPORT Final Report
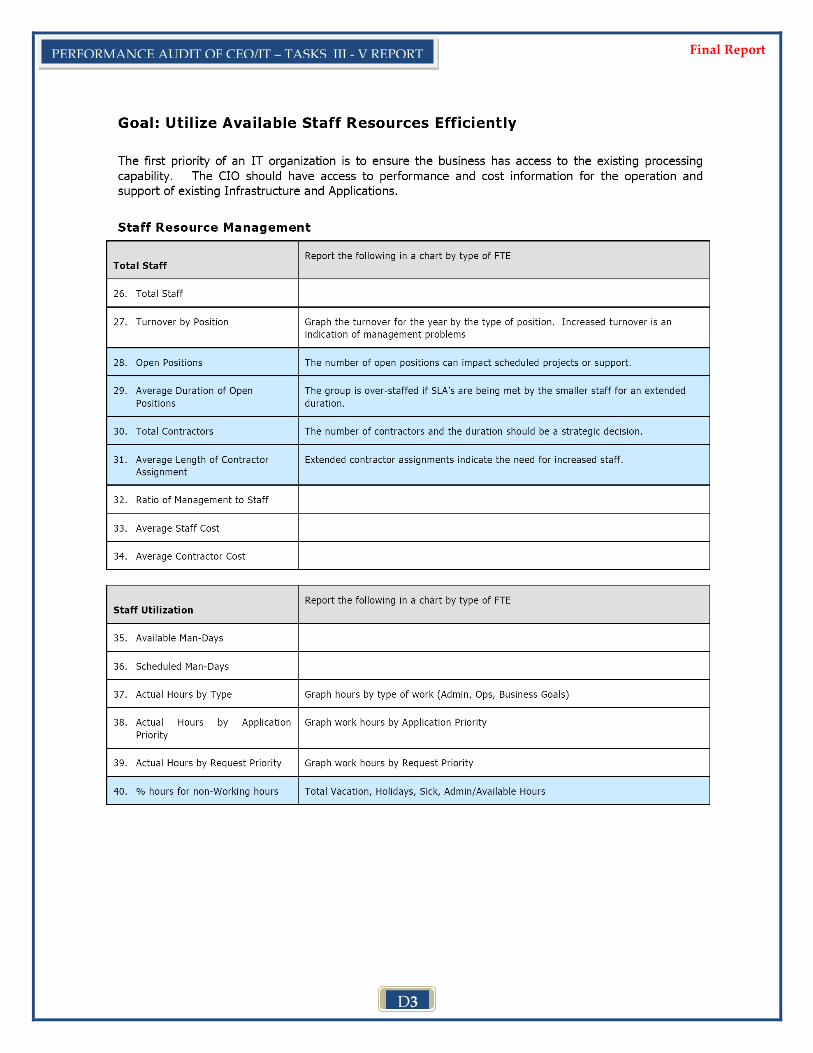
D3
PERFORMANCE AUDIT OF CEO/IT – TASKS III - V REPORT Final Report
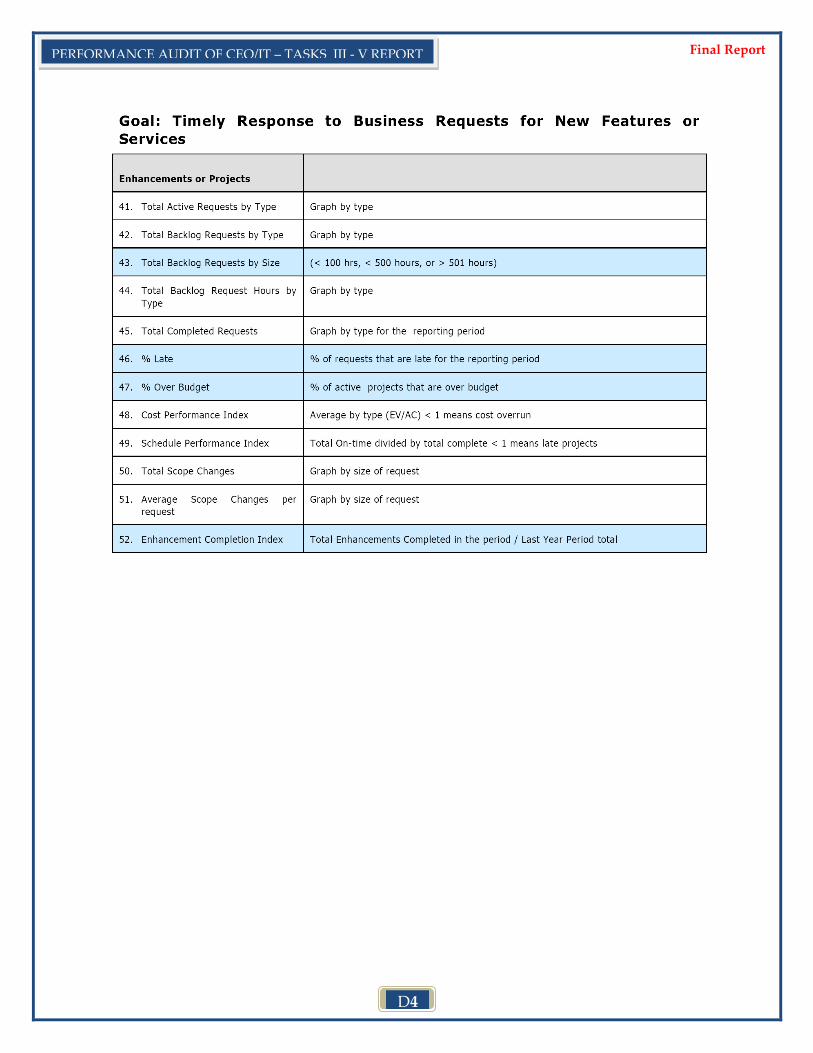
D4
PERFORMANCE AUDIT OF CEO/IT – TASKS III - V REPORT Final Report
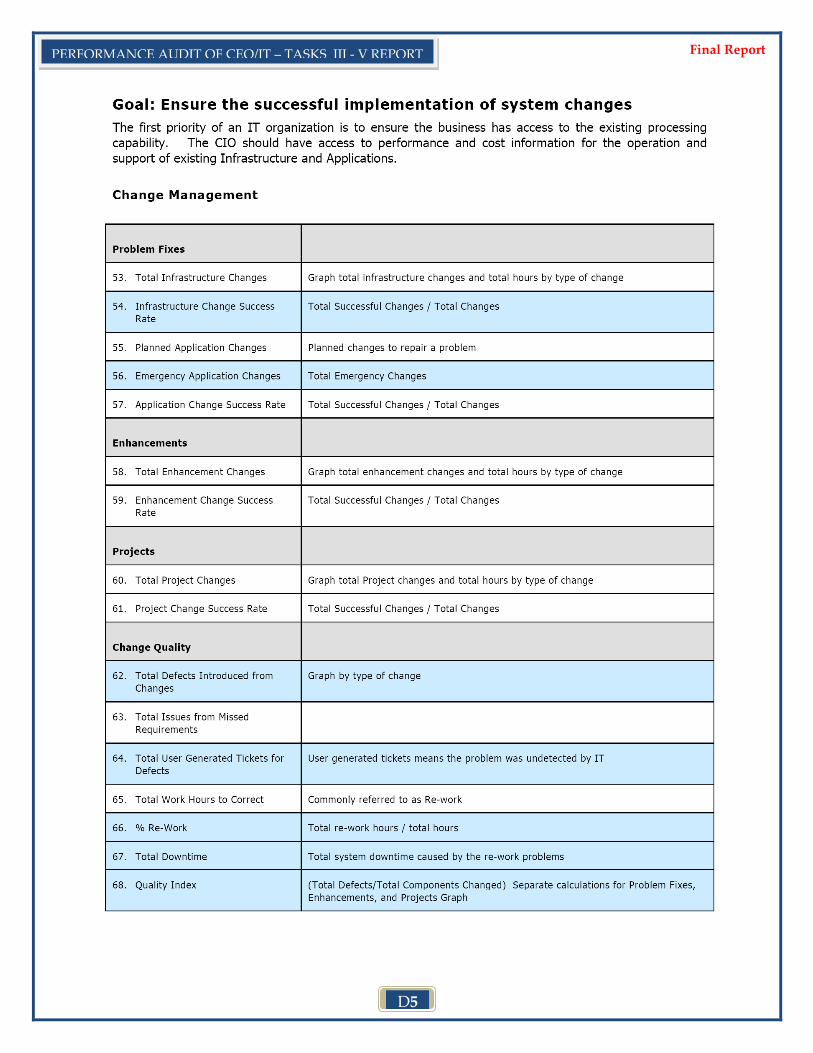
D5
PERFORMANCE AUDIT OF CEO/IT – TASKS III - V REPORT Final Report

D6
PERFORMANCE AUDIT OF CEO/IT – TASKS III - V REPORT Final Report
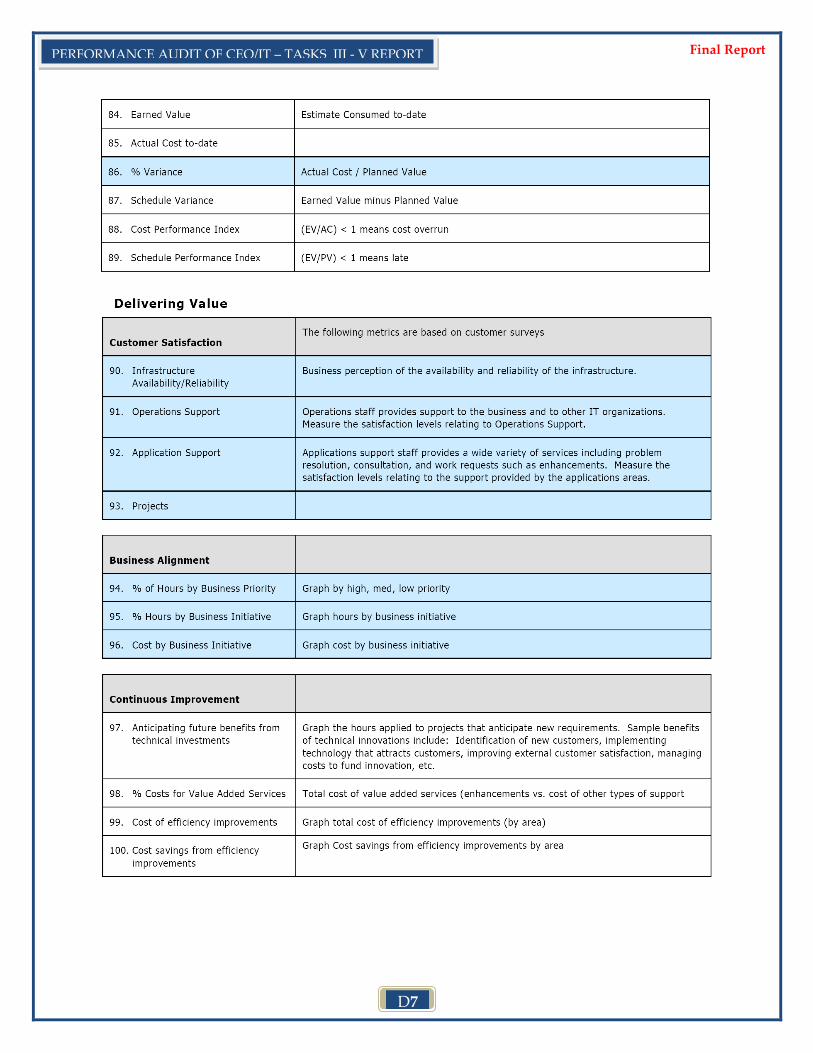
D7
PERFORMANCE AUDIT OF CEO/IT – TASKS III - V REPORT Final Report
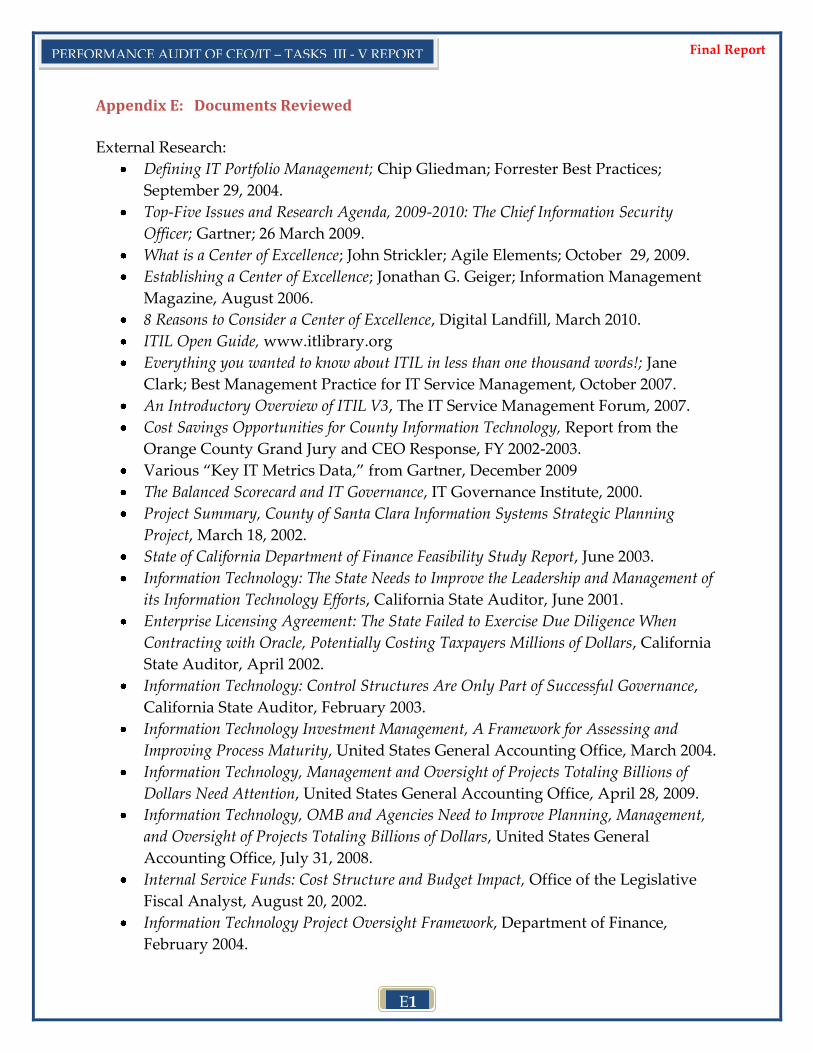
E1
PERFORMANCE AUDIT OF CEO/IT – TASKS III - V REPORT Final Report
Appendix E: Documents Reviewed
External Research:
Defining IT Portfolio Management; Chip Gliedman; Forrester Best Practices;
September 29, 2004.
Top-Five Issues and Research Agenda, 2009-2010: The Chief Information Security
Officer; Gartner; 26 March 2009.
What is a Center of Excellence; John Strickler; Agile Elements; October 29, 2009.
Establishing a Center of Excellence; Jonathan G. Geiger; Information Management
Magazine, August 2006.
8 Reasons to Consider a Center of Excellence, Digital Landfill, March 2010.
ITIL Open Guide, www.itlibrary.org
Everything you wanted to know about ITIL in less than one thousand words!; Jane
Clark; Best Management Practice for IT Service Management, October 2007.
An Introductory Overview of ITIL V3, The IT Service Management Forum, 2007.
Cost Savings Opportunities for County Information Technology, Report from the
Orange County Grand Jury and CEO Response, FY 2002-2003.
Various ‚Key IT Metrics Data,‛ from Gartner, December 2009
The Balanced Scorecard and IT Governance, IT Governance Institute, 2000.
Project Summary, County of Santa Clara Information Systems Strategic Planning
Project, March 18, 2002.
State of California Department of Finance Feasibility Study Report, June 2003.
Information Technology: The State Needs to Improve the Leadership and Management of
its Information Technology Efforts, California State Auditor, June 2001.
Enterprise Licensing Agreement: The State Failed to Exercise Due Diligence When
Contracting with Oracle, Potentially Costing Taxpayers Millions of Dollars, California
State Auditor, April 2002.
Information Technology: Control Structures Are Only Part of Successful Governance,
California State Auditor, February 2003.
Information Technology Investment Management, A Framework for Assessing and
Improving Process Maturity, United States General Accounting Office, March 2004.
Information Technology, Management and Oversight of Projects Totaling Billions of
Dollars Need Attention, United States General Accounting Office, April 28, 2009.
Information Technology, OMB and Agencies Need to Improve Planning, Management,
and Oversight of Projects Totaling Billions of Dollars, United States General
Accounting Office, July 31, 2008.
Internal Service Funds: Cost Structure and Budget Impact, Office of the Legislative
Fiscal Analyst, August 20, 2002.
Information Technology Project Oversight Framework, Department of Finance,
February 2004.
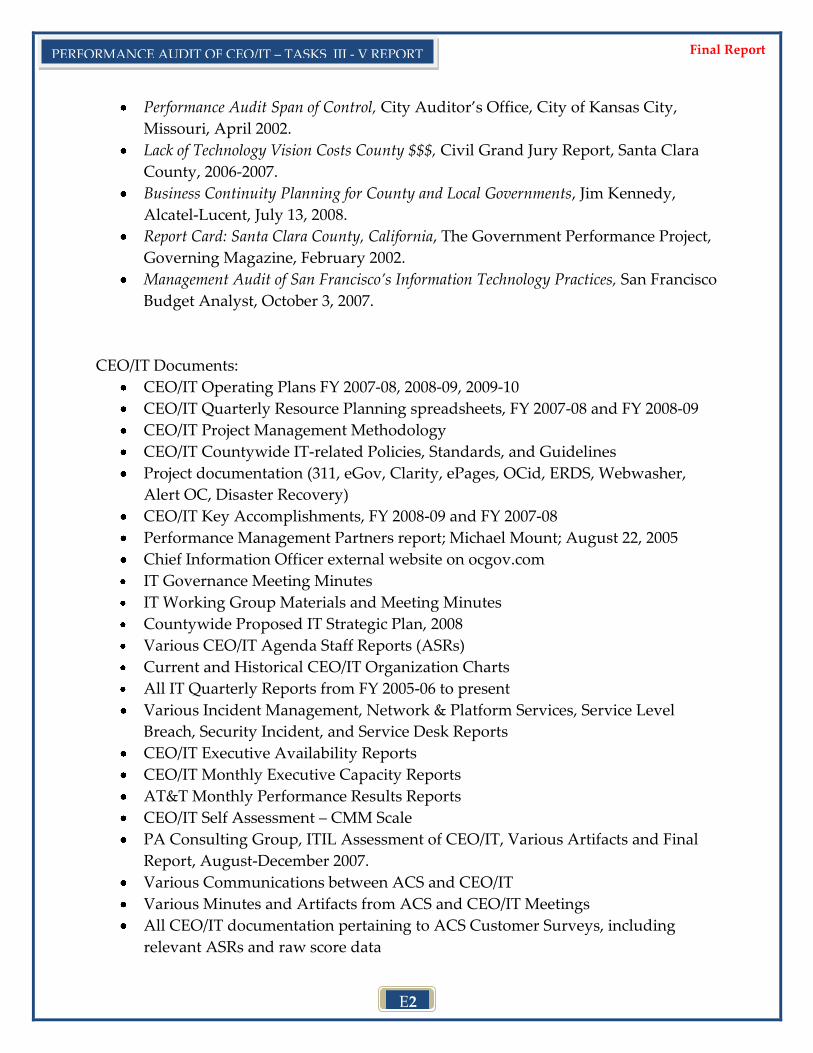
E2
PERFORMANCE AUDIT OF CEO/IT – TASKS III - V REPORT Final Report
Performance Audit Span of Control, City Auditor’s Office, City of Kansas City,
Missouri, April 2002.
Lack of Technology Vision Costs County $$$, Civil Grand Jury Report, Santa Clara
County, 2006-2007.
Business Continuity Planning for County and Local Governments, Jim Kennedy,
Alcatel-Lucent, July 13, 2008.
Report Card: Santa Clara County, California, The Government Performance Project,
Governing Magazine, February 2002.
Management Audit of San Francisco’s Information Technology Practices, San Francisco
Budget Analyst, October 3, 2007.
CEO/IT Documents:
CEO/IT Operating Plans FY 2007-08, 2008-09, 2009-10
CEO/IT Quarterly Resource Planning spreadsheets, FY 2007-08 and FY 2008-09
CEO/IT Project Management Methodology
CEO/IT Countywide IT-related Policies, Standards, and Guidelines
Project documentation (311, eGov, Clarity, ePages, OCid, ERDS, Webwasher,
Alert OC, Disaster Recovery)
CEO/IT Key Accomplishments, FY 2008-09 and FY 2007-08
Performance Management Partners report; Michael Mount; August 22, 2005
Chief Information Officer external website on ocgov.com
IT Governance Meeting Minutes
IT Working Group Materials and Meeting Minutes
Countywide Proposed IT Strategic Plan, 2008
Various CEO/IT Agenda Staff Reports (ASRs)
Current and Historical CEO/IT Organization Charts
All IT Quarterly Reports from FY 2005-06 to present
Various Incident Management, Network & Platform Services, Service Level
Breach, Security Incident, and Service Desk Reports
CEO/IT Executive Availability Reports
CEO/IT Monthly Executive Capacity Reports
AT&T Monthly Performance Results Reports
CEO/IT Self Assessment – CMM Scale
PA Consulting Group, ITIL Assessment of CEO/IT, Various Artifacts and Final
Report, August-December 2007.
Various Communications between ACS and CEO/IT
Various Minutes and Artifacts from ACS and CEO/IT Meetings
All CEO/IT documentation pertaining to ACS Customer Surveys, including
relevant ASRs and raw score data
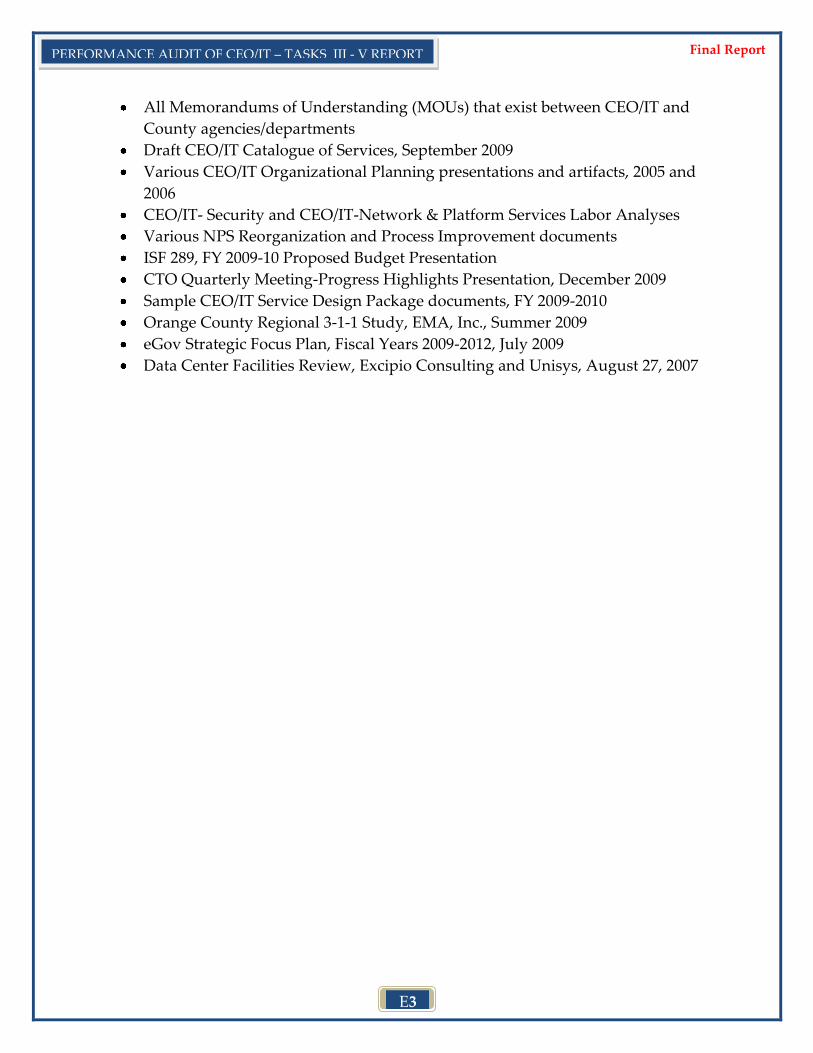
E3
PERFORMANCE AUDIT OF CEO/IT – TASKS III - V REPORT Final Report
All Memorandums of Understanding (MOUs) that exist between CEO/IT and
County agencies/departments
Draft CEO/IT Catalogue of Services, September 2009
Various CEO/IT Organizational Planning presentations and artifacts, 2005 and
2006
CEO/IT- Security and CEO/IT-Network & Platform Services Labor Analyses
Various NPS Reorganization and Process Improvement documents
ISF 289, FY 2009-10 Proposed Budget Presentation
CTO Quarterly Meeting-Progress Highlights Presentation, December 2009
Sample CEO/IT Service Design Package documents, FY 2009-2010
Orange County Regional 3-1-1 Study, EMA, Inc., Summer 2009
eGov Strategic Focus Plan, Fiscal Years 2009-2012, July 2009
Data Center Facilities Review, Excipio Consulting and Unisys, August 27, 2007