
Performance Analysis of PEMFC Based Grid - Research Square
30
Performance Analysis of PEMFC Based Grid- connected Distributed Generation System Alper Nabi AKPOLAT ( [email protected] ) Department of Electrical-Electronics Engineering, Faculty of Technology, Marmara University, 34722, Istanbul, Turkey https://orcid.org/0000-0002-6972-2509 Erkan Dursun Marmara University Original article Keywords: Distributed generation (DG), Fuel cell, Wind turbine, Photovoltaic (PV), Performance analysis Posted Date: October 23rd, 2020 DOI: https://doi.org/10.21203/rs.3.rs-95537/v1 License: This work is licensed under a Creative Commons Attribution 4.0 International License. Read Full License
-
Upload
khangminh22 -
Category
Documents
-
view
3 -
download
0
Transcript of Performance Analysis of PEMFC Based Grid - Research Square

Performance Analysis of PEMFC Based Grid-connected Distributed Generation SystemAlper Nabi AKPOLAT ( [email protected] )
Department of Electrical-Electronics Engineering, Faculty of Technology, Marmara University, 34722,Istanbul, Turkey https://orcid.org/0000-0002-6972-2509Erkan Dursun
Marmara University
Original article
Keywords: Distributed generation (DG), Fuel cell, Wind turbine, Photovoltaic (PV), Performance analysis
Posted Date: October 23rd, 2020
DOI: https://doi.org/10.21203/rs.3.rs-95537/v1
License: This work is licensed under a Creative Commons Attribution 4.0 International License. Read Full License

Performance analysis of PEMFC based grid-connected distributed generation system
Alper Nabi Akpolat*, Erkan Dursun
1Department of Electrical-Electronics Engineering, Faculty of Technology,
Marmara University, 34722, Istanbul, Turkey
[email protected], [email protected]
*Corresponding Author
Abstract
Background: Less energy consumption and more efficient use of fossil-fueled technologies are among
the sustainable energy targets of modern societies. The essential activities to be achieved under these
objectives are to increase the distributed generation structures and increase their applicability. The
distributed generation (DG) is a small-scale version of the traditional power grid, which is supported by
micro turbines, hydrogen fuel cells, wind turbines, photovoltaic (PV) modules, combine heat and power
systems, and energy storage units.
Methods: The aim of this research is to detail performance analyze and unit sizing of proton-exchange
membrane fuel cell (PEMFC)-based grid-connected distributed generation system with the help of
empirical calculations. To this end, we tried to establish the system and analyze the performance of
reliable operation of the system with experimental verifications.
Results and Conclusions: The results demonstrate the situation of annual production about how much
rated power can be generated through the real meteorological data to dispatch the power to the constant
variable loads. While, 53.56% of the total energy demand is met by the utility grid, 46.44% of the demand
is met by the produced energy i.e., from microgrid. The PEMFC based hybrid microgrid at Marmara
University, Faculty of Technology was analyzed in detail in this study. According to the results of the
performance analysis, the important points that will be highlighted and will help the researchers working
in this field are as follows. Our results are encouraging and can be validated by a larger sample size with
the fine weather conditions in terms of the percentage of procurement of energy.
Keywords: Distributed generation (DG), Fuel cell, Wind turbine, Photovoltaic (PV), Performance
analysis
1. Introduction
All technological developments have emerged in line with specific needs. Since the history of humanity,
scientists, researchers, engineers, and inventors have been looking for solutions to the problems
encountered while working on meeting the needs of people. In response to the problems faced by
traditional grids, researchers and scientists have agreed on the need for modernization of the traditional
grid. The main problems encountered in traditional grids are transmission losses and energy security due
to the transfer of the generated energy to loads that are kilometers away. According to the U.S. Department
of Energy, modular, small-scale, on-grid, or off-grid systems, consisting of wind turbines, photovoltaic
(PV) modules, hydrogen fuel cells, and energy storage units that provide near-load installation, are called
distributed generation (DG) [1]. DG systems are able to continue operating during blackouts, which
allows flexible and efficient electrical energy distribution with an integration of renewable energy. DGs
are designed for small and medium sized electric power grid to provide energy for dynamic load groups
such as organized industrial site, Research & Development centers, university campuses, and technoparks
[2].
A lot of definitions are used about DG in the literature. The definition of the nominal values of each
distributed power station also differs country wise. Due to the variations when defining DG, the following
parameters must be determined: the power location area, the capacity of distributed generation, the used
technology, and the operation mode. DG requires efficient and cost-effective integration with the existing

grid [3]. It can be presumed that the distributed generation is flexible energy generation system that can
operate either connected or independent from the grid, providing installation close to the load groups.
This is operated conveniently for flexible and dynamic load groups such as university campuses,
educational institutions, and research-development centers.
Although DGs provide flexibility in energy management, the energy production capacities of the wind
turbine and PV modules depends largely on meteorological conditions. Therefore, in the absence of
sufficient wind and sun, a third support energy generation system is needed. In this study, the hydrogen
fuel cell stack was used as a back-up power generation system. The hydrogen used by the fuel cell is
produced by the electrolyser operating with the energy produced by using renewable energy sources. This
ensures a completely clean and sustainable energy conversion [4]. In this study, unit sizing and
performance analysis of the PEMFC based grid-connected distributed generation system at Marmara
University, Faculty of Technology, is performed, and analyzed. The rest of the paper is organized as
follows: DG Case Studies in World Universities are given briefly. The next section handles the factors
need to be set-up for DG system design as Overview of Hybrid Microgrid System. In this Section, each
component is examined in detail, their effectiveness is evaluated. For the next one that gives some
discussion points about the DG system design, challenges, summarizes regarding operation results. The
main points of conclusions remarks are presented in the last section.
2. DG Case Studies at World Universities
One of the best examples of establishing the DG systems on university campuses in the University of
California, San Diego (UCSD). The system has installed capacity of 42 MW, and meets 92 % of its annual
electricity demands of the UCSD [5].
Fig. 1. The PV modules in UCSD [5].
Another example is the DG system at the Illinois Institute of Technology (IIT). This system includes 4
MW gas turbine, wind turbines, and PV modules [5]. The DG system consists of a 15 MW gas turbine
and a 4.5 MW PV plant [6-7].

Fig. 2. Gas-fueled CHP plant in Princeton University.
The DG system installed at Westlakes Campus of Central Lancashire University in England consists of a
5kW wind turbine, a 20 kW PV system, a 21.6 kW heat pump, and a 6 kW solar thermal power system
[8]. In addition to these universities, Hangzhou Dianzi University in China, Genoa University in Italy,
The University of Nottingham in the UK, Chiang Mai Rajabhat University in Thailand, Technical
University of Denmark, and New York University in the USA have small and medium scale capacity
DGs [7-12] as can be seen in Fig.1, 2 and 3.
Fig. 3. PV modules and a Micro Turbine in the Genoa University, Savona Campus [10].
3. Overview of Hybrid Microgrid System
The DG system, which is the subject of this study, was established in Marmara University, Faculty of
Technology. With this system, university researchers and academicians will be supported in the fields of
fuel cell technologies, renewable energy systems, power electronics, sustainable energy management, and
hybrid power systems.
Components of the DG system is stated as follows;
• PV modules, 1000 W
• The wind turbine, 400 W
• Hydrogen PEM fuel cell stack, 1200 W
• The hybrid inverter, 2400 W
• The battery bank, 600 Ah, 14.4 kWh
• Fuel cell start-up battery, 2x12V, 120 Ah
• Hydrogen generator (electrolyser), 60sl / h
• Low-pressure hydrogen tank, 1500 sl
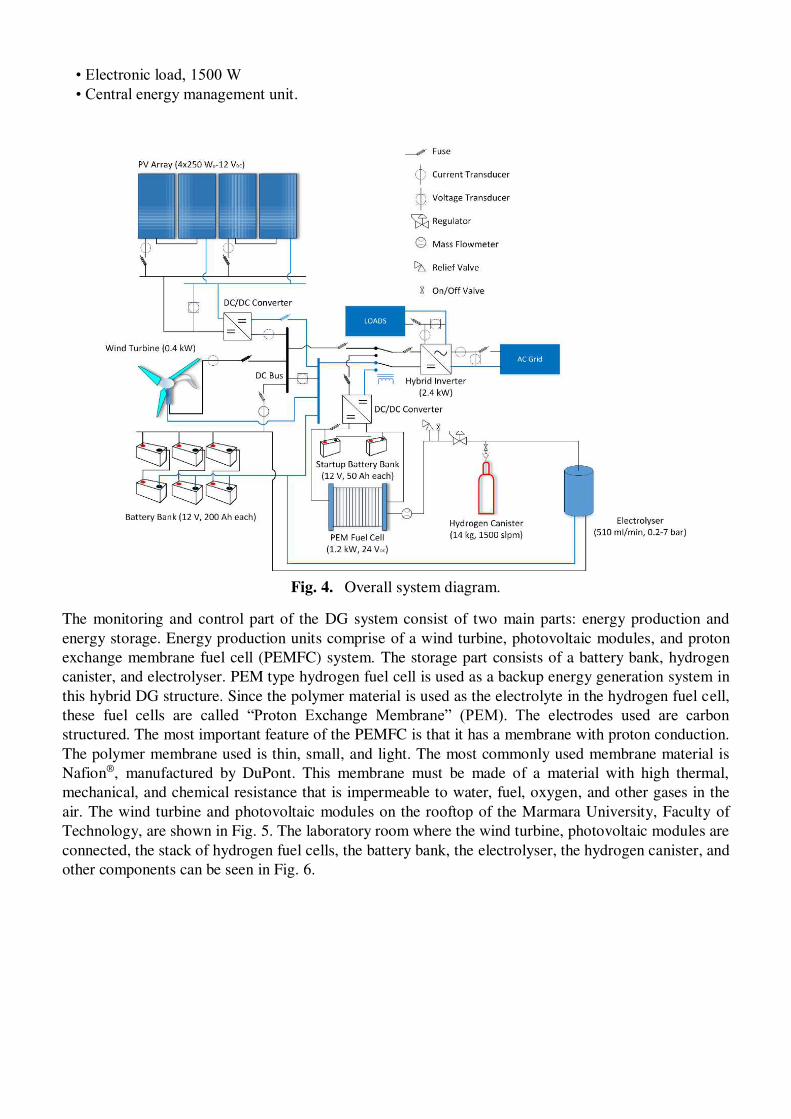
• Electronic load, 1500 W
• Central energy management unit.
Fig. 4. Overall system diagram.
The monitoring and control part of the DG system consist of two main parts: energy production and
energy storage. Energy production units comprise of a wind turbine, photovoltaic modules, and proton
exchange membrane fuel cell (PEMFC) system. The storage part consists of a battery bank, hydrogen
canister, and electrolyser. PEM type hydrogen fuel cell is used as a backup energy generation system in
this hybrid DG structure. Since the polymer material is used as the electrolyte in the hydrogen fuel cell,
these fuel cells are called “Proton Exchange Membrane” (PEM). The electrodes used are carbon structured. The most important feature of the PEMFC is that it has a membrane with proton conduction.
The polymer membrane used is thin, small, and light. The most commonly used membrane material is
Nafion®, manufactured by DuPont. This membrane must be made of a material with high thermal,
mechanical, and chemical resistance that is impermeable to water, fuel, oxygen, and other gases in the
air. The wind turbine and photovoltaic modules on the rooftop of the Marmara University, Faculty of
Technology, are shown in Fig. 5. The laboratory room where the wind turbine, photovoltaic modules are
connected, the stack of hydrogen fuel cells, the battery bank, the electrolyser, the hydrogen canister, and
other components can be seen in Fig. 6.

Fig. 5. Wind turbine and photovoltaic modules on the rooftop of the faculty building.
Fig. 6. The DG system components.
Beginning from the wind turbine, the performance analysis of the system components is performed.
Also, the wind turbine specifications exist in Table 1.
Table 1. Wind Turbine Specifications.
Specifications Unit
Nominal Power 400 W
Swept Area 1.07 m2
Cut-in wind speed 3.58 m/s
Cut-off wind speed 49.2 m/s
Rotor diameter 1.17 m
Alternator Permanent Magnet Brushless

The Weibull probability density function is usually used to calculate the energy generated from the wind
turbine depending on the momentarily variable wind.
𝑓(𝑣) = 𝑘𝑐 (𝑣𝑐)𝑘−1 𝑒𝑥𝑝 [− (𝑣𝑐)𝑘] (1)
Where; 𝑘 is called the shape parameter, and 𝑐 is called the scale parameter. In those cases, too much
detail is known about the wind regime in a region, the 𝑘 shape parameter can be set to 2. In that case, the
Weibull probability density function is called the Rayleigh probability density function [13-14].
𝑓(𝑣) = 2𝑣𝑐2 𝑒𝑥𝑝 [− (𝑣𝑐)2] (2)
𝑓(𝑣) = 𝜋𝑣2�̅�2 𝑒𝑥𝑝 [− 𝜋4 (𝑣�̅�)2] (3)
�̅� =Average wind speed (m/s) =4.78 m/s
Fig. 7. Power curve of wind turbine.
According to the Weibull calculations, the wind turbine power curve can be expressed in Fig. 7. The total
annual obtained energy from the wind turbine is calculated as 228.493 kWh as seen in Table 2.
Table 2. Rayleigh probability density functions and wind turbine calculations.
Wind
Speed
[m/s]
Power
[W] 𝒇(𝒗) Hours/year at 𝒗
Energy
[Wh/year]
1.06 0 0.065 569.4 0
2.02 0 0.1194 1045.944 0
2.99 0 0.1512 1324.512 0
3.58 1 0.1581 1384.956 1620.39852
5.00 14 0.1453 1272.828 17921.41824
5.99 31 0.1196 1047.696 32499.52992
6.97 51 0.0893 782.268 39848.73192
8.00 83 0.0609 533.484 44311.18104
9.00 120 0.0382 334.632 40232.80536
10.00 146 0.0221 193.596 28357.94208
11.00 149 0.0118 103.368 15372.88896
11.99 120 0.00585 51.246 6140.80818
0
20
40
60
80
100
120
140
160
0.00 2.00 4.00 6.00 8.00 10.00 12.00 14.00 16.00 18.00
Po
we
r [W
]
Wind Speed [m/s]

13.01 70 0.00268 23.4768 1643.376
13.97 43 0.00114 9.9864 427.817376
14.99 25 0.000452 3.95952 97.4833824
15.97 9 0.000166 1.45416 13.5091464
17.00 10 0.0000569 0.498444 4.8847512
18.00 2 0.000018 0.15768 0.3169368
Total 228493.0918
Table 3. PV module (polycrystalline cells) specifications.
Features Values (UOM)
Module Efficiency (%) 15.71
Cell Efficiency (%) 17.9
Peak Power 250 Wp
Max Power Voltage (Vmp) 30.6V
Max Power Current (Imp) 8.17A
Open Circuit Voltage (Voc) 38 V
Short Circuit Current (Isc) 8.71A
Number of Cell 60
Dimensions 1640x990x35 mm
The parameters of the PV module are reported in Table 3. With regards to geographic location, the
coordinates of the aforementioned the system are on 40°59′ North Latitude, 29°3′ East Longitude.
𝛿 = 23.45 sin [360365 (𝑛 − 81)] (4)
𝛽𝐴 = 90 − 𝐿 + 𝛿 (5)
𝑃𝑉𝑡𝑖𝑙𝑡 = 90 − 𝛽𝐴 (6)
Where; 𝛿 is solar declination angle, 𝛽𝐴 is an altitude angle, the altitude angle is the angle between the sun
and the local horizon directly beneath the sun. Besides, 𝑃𝑉𝑡𝑖𝑙𝑡 is optimum PV module tilt angle= 30º fixed,
L is the latitude of the site and n is number of day.
𝐼𝑡𝑜𝑡𝑎𝑙 = 𝐼𝑏𝑒𝑎𝑚 + 𝐼𝑑𝑖𝑓𝑓𝑢𝑠𝑒 + 𝐼𝑟𝑒𝑓𝑙𝑒𝑐𝑡𝑒𝑑 (7)
𝐼𝑏𝑒𝑎𝑚 = 𝐼𝐵𝐻𝑅𝐵 (8)
𝐼𝐵𝐻 = 𝐼𝐻 − 𝐼𝐷𝐻 (9)
𝑅𝐵 = cos(𝐿−𝑃𝑉𝑡𝑖𝑙𝑡) cos 𝛿 sin 𝐻𝑆𝑅𝐶+𝐻𝑆𝑅𝐶 sin(𝐿−𝑃𝑉𝑡𝑖𝑙𝑡) sin 𝛿cos 𝐿 cos 𝛿 sin 𝐻𝑆𝑅+𝐻𝑆𝑅 sin 𝐿 sin 𝛿 (10)
𝐻𝑆𝑅 = cos−1(− tan 𝐿 tan 𝛿) (11)
𝐻𝑆𝑅𝐶 = 𝑚𝑖𝑛{cos−1(− tan 𝐿 tan 𝛿), cos−1[− tan(𝐿 − 𝑃𝑉𝑡𝑖𝑙𝑡) tan 𝛿]} (12)

𝐶 = 𝐼𝐻𝐼𝑂 (13)
𝐼𝐷𝐻𝐼𝐻 = 1.390 − 4.207𝐶 + 5.531𝐶2 − 3.108𝐶3 (14)
𝐼𝑑𝑖𝑓𝑓𝑢𝑠𝑒 = 𝐼𝐷𝐻 (1+cos(𝑃𝑉𝑡𝑖𝑙𝑡)2 ) (15)
𝐼𝑂 = (24𝜋 ) 𝑆𝐶 [1 + 0.034 cos (360𝑛365 )] (cos 𝐿 cos 𝛿 sin 𝐻𝑆𝑅 + 𝐻𝑆𝑅 sin 𝐿 sin 𝛿) (16)
𝐼𝑟𝑒𝑓𝑙𝑒𝑐𝑡𝑒𝑑 = 𝜌𝐼𝐻 (1−cos(𝑃𝑉𝑡𝑖𝑙𝑡)2 ) (17)
Where; 𝐼𝑡𝑜𝑡𝑎𝑙 is total daily solar irradiance on the PV module, 𝐼𝑏𝑒𝑎𝑚 is beam solar irradiance on the PV
module, 𝐼𝑑𝑖𝑓𝑓𝑢𝑠𝑒 is diffuse solar irradiance on the PV module, 𝐼𝑟𝑒𝑓𝑙𝑒𝑐𝑡𝑒𝑑 is reflected solar radiation on the
PV module, 𝐼𝐻 is total average daily horizontal solar irradiance, 𝐼𝐵𝐻 is beam irradiance on the horizontal
surface, 𝑅𝐵 is beam tilt factor, 𝐻𝑆𝑅𝐶 is the sunrise hour angle for the collector (when the sun first strikes
the collector face, θ = 90o). And 𝐻𝑆𝑅 is the sunrise hour angle (in radians), 𝐶 is clearness index, 𝐼𝑂 is
extraterrestrial insolation on a horizontal surface the site, 𝐼𝐻is insolation on a horizontal surface, lastly 𝜌
is ground reflectivity. The total solar irradiance profile can be stated in Fig. 8.
Fig. 8. Monthly solar irradiance.
The 3DSun-Path program has been used to assist in comparing solar altitude, azimuth angles, and zenith
angles. The program interface is shown in Fig. 9.
0
50
100
150
200
250
Jan Feb Mar Apr May Jun Jul Aug Sep Oct Nov Dec
To
tal S
ola
r Ir
rad
ian
ce [k
Wh
/m2
]

Fig. 9. Geographic location of the faculty building and solar positions [15] 𝐸𝑡𝑜𝑡𝑎𝑙 = 𝐴𝑚𝑜𝑑𝑢𝑙𝑒 . 𝜂𝑚𝑜𝑑𝑢𝑙𝑒 . 𝐼𝑡𝑜𝑡𝑎𝑙 . 𝑃𝑅 (18)
𝐸𝑡𝑜𝑡𝑎𝑙 is produced Total PV output energy (kWh), 𝑃𝑅 is performance ratio (0.5~0.9), 𝐴𝑚𝑜𝑑𝑢𝑙𝑒 is module
area (m2), and 𝜂𝑚𝑜𝑑𝑢𝑙𝑒 is module efficiency (%).
Fig. 10. Produced PV total output energy.
Equation (18) expresses total annual produced PV energy. By this calculation, the annual average
produced energy profile is plotted and illustrated in Fig. 10, also annual total PV energy corresponds
1335.05 kWh. Fig. 11 depicts the hourly total produced PV output energy. It can be extracted that
generation is higher at noon times than the other times when the energy extracts.
0
20
40
60
80
100
120
140
160
180
Jan Feb Mar Apr May Jun Jul Aug Sep Oct Nov Dec
En
erg
y [
kW
h]
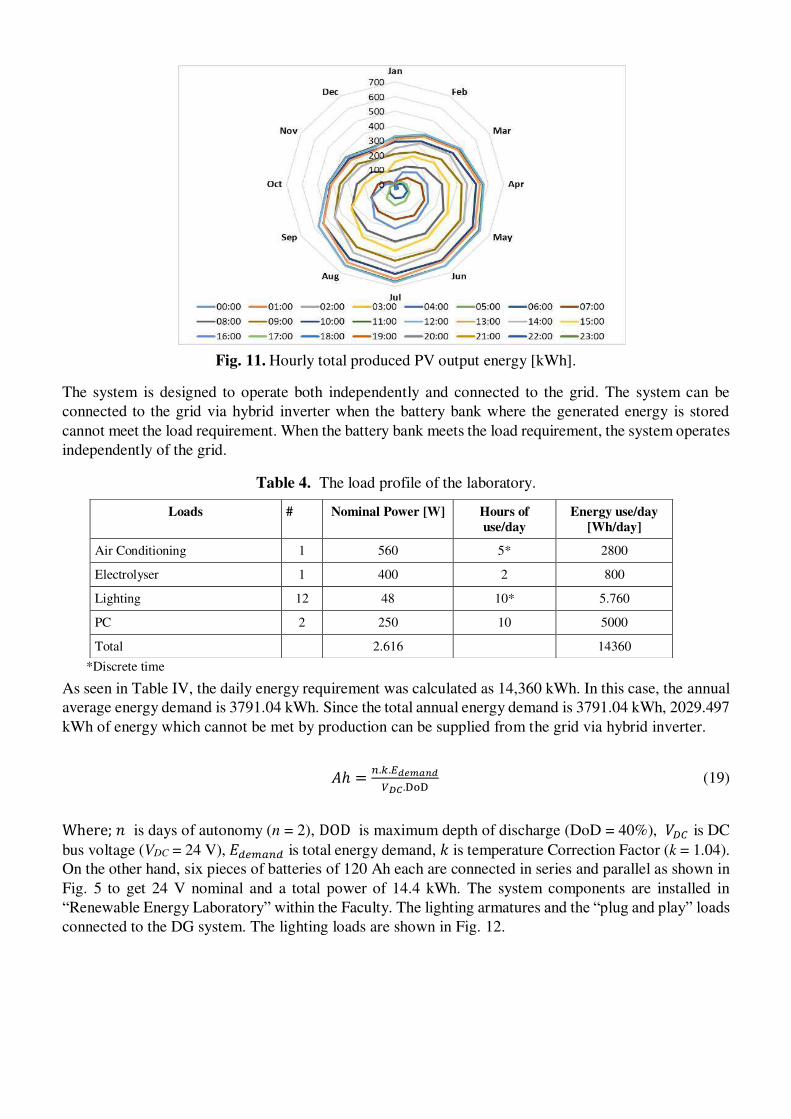
Fig. 11. Hourly total produced PV output energy [kWh].
The system is designed to operate both independently and connected to the grid. The system can be
connected to the grid via hybrid inverter when the battery bank where the generated energy is stored
cannot meet the load requirement. When the battery bank meets the load requirement, the system operates
independently of the grid.
Table 4. The load profile of the laboratory.
*Discrete time
As seen in Table IV, the daily energy requirement was calculated as 14,360 kWh. In this case, the annual
average energy demand is 3791.04 kWh. Since the total annual energy demand is 3791.04 kWh, 2029.497
kWh of energy which cannot be met by production can be supplied from the grid via hybrid inverter.
𝐴ℎ = 𝑛.𝑘.𝐸𝑑𝑒𝑚𝑎𝑛𝑑𝑉𝐷𝐶.DoD (19)
Where; 𝑛 is days of autonomy (n = 2), DOD is maximum depth of discharge (DoD = 40%), 𝑉𝐷𝐶 is DC
bus voltage (VDC = 24 V), 𝐸𝑑𝑒𝑚𝑎𝑛𝑑 is total energy demand, 𝑘 is temperature Correction Factor (k = 1.04).
On the other hand, six pieces of batteries of 120 Ah each are connected in series and parallel as shown in
Fig. 5 to get 24 V nominal and a total power of 14.4 kWh. The system components are installed in
“Renewable Energy Laboratory” within the Faculty. The lighting armatures and the “plug and play” loads connected to the DG system. The lighting loads are shown in Fig. 12.
Loads # Nominal Power [W] Hours of
use/day
Energy use/day
[Wh/day]
Air Conditioning 1 560 5* 2800
Electrolyser 1 400 2 800
Lighting 12 48 10* 5.760
PC 2 250 10 5000
Total 2.616 14360

Fig. 12. The lighting loads in the laboratory.
The annual average energy produced from wind turbine and photovoltaic modules is 1563.543 kWh. The
PEMFC can generate 198 kWh of energy per year when we estimate that it produces 3 hours of average
power per day. In this case, the total energy produced from the hybrid micro grid is 1761.543 kWh. By
means of the electrolyser in the system, the hydrogen demand of the hydrogen fuel cell stack can be met.
The hydrogen produced by the electrolyser is stored in the metal hydride canister. The charge pressure of
the metal hydride canister is 5 bar and the discharge pressure is between 2-5 bar. Weight is 14 kg and
capacity is 1500 lt. The empty canister can be fully filled in 50 hours. PEM type hydrogen fuel cell stack
is used in the system. The stack in the system can run for 8 hours with a full hydrogen canister at 250 W
average. In order for the hydrogen fuel cell stack to operate at a maximum power of 1200 W, it should be
supplied with 13 liters of hydrogen per minute. The output flow of the electrolyser used in the system is
510 ml per minute. Therefore, the produced hydrogen should be stored in order for the heap to operate at
a power of 300 W.
A Graphical User Interface (GUI) is used for the hydrogen fuel cell stack used in the system, as shown in
Fig. 13. With the help of this interface, all inputs and outputs of the system can be monitored and
controlled in real time.
Fig. 13. GUI PEMFC Stack,components and sankey diagram
Additionally, polarization curves of fuel cells for different load characteristics, determination of charge-
discharge characteristics of batteries, energy conversion and efficiency analysis, wind turbine and
photovoltaic module data were obtained. The input power of the system, the powers used and the energy
losses are shown in a Sankey diagram. This diagram also shows the state of charge of the start-up batteries
of the fuel cell stack as can be seen in Fig. 13. The most important parameter of a hydrogen fuel cell is
the polarization curve. The polarization curve is a graph showing the change in current of a fuel cell or

stack depending on voltage or power. This curve determines the performance of the cell. Through the
GUI it is possible to monitor the instantaneous polarization curve of PEMFC Stack can be shown in Fig.
14.
Fig. 14. The Polarization Curves of The PEMFC.
The GUI of the PEMFC monetarizes and also facilitates data acquisition relevant to all variables are also
seen in Fig. 15.
Fig. 15. Data acquisition screen.

a) b)
c)
Fig. 16. a) PEMFC stack voltage, b) PEMFC stack current, c) PEMFC stack temperature [C°].
Fig. 16 shows the voltage, current, power and temperature curves of the collected PEMFC stack for
approximately one hour (4000 seconds). Besides, the data for the SoC level of the start-up battery and
PEMFC’s DC/DC converter output voltages, were drawn by collecting in Fig.17.
a) b)
Fig. 17. a) Start-up battery state of charge (SoC) levels, b) PEMFC’s DC/DC converter output voltages
4. Operation Results
The PEMFC based grid-connected DG system at Marmara University, Faculty of Technology was
analyzed in detail in this study. 53.53% of the total energy demand is met by the utility grid, while 46.47%
of the demand is met by the DG system as can be seen in Fig. 18.
20.00
25.00
30.00
35.00
40.00
0 1000 2000 3000 4000
PE
MF
C S
tack
Vo
lta
ge
[V
]
0.00
1.00
2.00
3.00
4.00
5.00
6.00
0 1000 2000 3000 4000
PE
MF
C S
tack
Cu
rre
nt
[A]
20.00
22.00
24.00
26.00
28.00
30.00
32.00
0 1000 2000 3000 4000
PE
MF
C S
tack
Te
mp
era
ture
[C
°]
0
5
10
15
20
25
30
0 1000 2000 3000 4000
Sta
rt-u
p B
att
ery
So
C [
%]
0
5
10
15
20
25
30
0 1000 2000 3000 4000
PE
MF
C D
C/D
C C
on
ve
rte
r
Ou
tpu
t [V
]

Fig. 18. Grid support and DG energy produce.
Energy supplied from the utility grid, production of DG systems and energy demands for the system
are given in Table 5. With respect to the energy values of DGs as kWh, most of the demands are met
by PV as 35.22% of total produce i.e., nearly 76% among DGs as can be seen in Fig. 19. The
contribution of the wind and PEMFC i.e., the rest of PV (nearly 24% among DGs) has almost close
percentages as 6.02% and 5.23%, respectively.
Fig. 19. The pie chart of power generation and grid support rates of the microgrid for a defined
operation.
Table 5. The distributed generation and energy demands [kWh]. 𝐄𝐖𝐢𝐧𝐝 𝐄𝐏𝐕 𝐄𝐏𝐄𝐌𝐅𝐂 𝐄𝐝𝐞𝐦𝐚𝐧𝐝 𝐄𝐠𝐫𝐢𝐝
228.493 1335.05 198 3791.04 2029.497
5. Conclusion
According to the results of the performance analysis, the important points that will be highlighted and
will help the researchers working in this field are as follows. First of all, it can be extracted that the PV
modules are more useful and efficient in urban applications than wind turbines. For example, we can
hardly see 160 W of a wind turbine with a nominal 400 W of power used in this system. The most
important reason for this is that the wind turbines installed in places where there are many buildings
cannot catch the necessary wind due to the dynamic nature of the wind. Another important consequence
of the DG system is that the hydrogen required by the fuel cell is supplied by the electrolyser which is
supplied from renewable energy instead of ready hydrogen tanks. However, the PEM type fuel cell stack
is not suitable for continuous operation if the electrolyser has a low hydrogen producing capacity.
Although the nominal power of the fuel cell is 1200 W, it is operated with 250 W output power. The
energy required for the operation of electrolyser is produced entirely from renewable energy. With the
increase of the power and size of the electrolyser, PEMFC's support for the DG system will increase even
more.
E_WIND
6,02%
E_PV
35,22%
E_PEMFC
5,23%
E_GRID
53,53%
1 2 3 4

The key components of the system are power switching and power electronics components. The
frequency of the power switching elements of the inverter used in the system during connection and
disconnection from the grid affects the loads in the system. This particularly affects fluorescent
luminaires, which operate with a gas discharge.
Acknowledgement
This study was supported by grant from Scientific Research Projects Unit (BAPKO) project number:
FEN-E-120314-0069.
Authors’ contributions
ANA and ED wrote the manuscript. ED performed the experimental design of this microgrid and data
acquisition. ANA operated the system. ANA and ED gathered and evaluated the results. ANA and ED
reviewed the manuscript. All authors read and approved the final manuscript.
Funding
This research did not receive any specific grant from funding agencies in the public, commercial, or not-
for-profit sectors.
Availability of data and materials
Not applicable.
Ethics approval and consent to participate
Not applicable.
Consent for publication
Not applicable.
Competing interests
The authors declare that they have no competing interests.
Author details
1Department of Electrical-Electronics Engineering, Faculty of Technology, Marmara University,
Istanbul, Turkey
References
[1] About Microgrids, Microgrids at Berkeley Lab. https://building-microgrid.lbl.gov/about-microgrids,
[accessed 15 May 2020].
[2] Unamuno E, Barrena JA. Hybrid AC/DC microgrids—Part I: Review and classification of topologies.
Renew Sust Energ Rev 2015;52:1251-1259. https://doi.org/10.1016/j.rser.2015.07.194.
[3] U.S. Department of Energy. Distributed Energy. Retrieved from http://energy.gov/oe/technology-
development/smart-grid/distributed-energy [accessed 16 May 2020].
[4] Leto S, Sun C. A novel joint bidding technique for fuel cell wind turbine photovoltaic storage unit
and demand response considering prediction models analysis Effect's. Int J Hydrog Energy 2020;
45:6823-6837. https://doi.org/10.1016/j.ijhydene.2019.12.210
[5] Han Y, Chen W, Li Q, Yang H, Zare F, Zheng Y. Two-level energy management strategy for PV-
Fuel cell-battery-based DC microgrid. Int J Hydrog Energy 2019;44:19395-19404.
https://doi.org/10.1016/j.ijhydene.2018.04.013
[6] Washom B, Dilliot J, Weil D, Kleissl J, Balac N, Torre W, Richter C. Ivory Tower of Power:
Microgrid Implementation at the University of California, San Diego. IEEE Power Energy M
2013;11:28-32. https://doi.org/10.1109/MPE.2013.2258278
[7] Liang C, Shahidehpour M, DC Microgrids: Economic Operation and Enhancement of Resilience by
Hierarchical Control. IEEE T Smart Grid 2014;5:2517–2526.

[8] Case study: Microgrid at Princeton University, Consulting-Specifying Engineer, 2015.
http://www.csemag.com/single-article/case-study-microgrid-at-princeton
university/a852c6c36420f738c8ecf66de7aa3dd1.html [accessed 20 May 2020].
[9] The University of Central Lancashire (UCLAN)
http://www.uclan.ac.uk/courses/msc_pgdip_renewable_energy_engineering.php [accessed 20 May
2020].
[10] The Microgrids Group at Berkeley Lab, “Examples of Microgrids”, Berkeley Lab., 2019.
https://building-microgrid.lbl.gov/examples-microgrids [accessed 20 May 2020].
[11] Bracco S, Delfino F, Pampararo F, Robba M, Rossi M. Planning and management of sustainable
microgrids: The test-bed facilities at the University of Genoa. 2013 Africon, Pointe-Aux-Piments,
2013:1-5. https://doi.org/10.1109/AFRCON.2013.6757862
[12] Davies R, Sumner M, Christopher E. Energy storage control for a small community microgrid. 7th
IET International Conference on Power Electronics, Machines and Drives (PEMD 2014),
Manchester, 2014:1-6. https://doi.org/10.1049/cp.2014.0508
[13] Setthapun W, Srikaew S, Rakwichian J, Tantranont N, Rakwichian W, Singh R. The integration and
transition to a DC based community: A case study of the Smart Community in Chiang Mai World
Green City. 2015 IEEE First International Conference on DC Microgrids (ICDCM), Atlanta, GA,
2015:205-209. https://doi.org/10.1109/ICDCM.2015.7152039
[14] Masters GM. Renewable and Efficient Electric Power Systems, IEEE Press and Wiley; 2014.
[15] Mihet-Popa L, Groza V, Isleifsson F. Experimental testing for stability analysis of distributed energy
resources components with storage devices and loads. 2012 IEEE International Instrumentation and
Measurement Technology Conference Proceedings, Graz, 2012:588-593.
[16] Dr. Andrew Marsh, 3D Sun-Path, https://drajmarsh.bitbucket.io/sunpath3d.html [accessed 01 June
2020].

Figures
Figure 1
The PV modules in UCSD [5].

Figure 2
Gas-fueled CHP plant in Princeton University.
Figure 3
PV modules and a Micro Turbine in the Genoa University, Savona Campus [10].

Figure 4
Overall system diagram.

Figure 5
Wind turbine and photovoltaic modules on the rooftop of the faculty building.

Figure 6
The DG system components.
Figure 7
Power curve of wind turbine.

Figure 8
Monthly solar irradiance.
Figure 9
Geographic location of the faculty building and solar positions [15]

Figure 10
Produced PV total output energy.

Figure 11
Hourly total produced PV output energy [kWh].

Figure 12
The lighting loads in the laboratory.
Figure 13
GUI PEMFC Stack,components and sankey diagram

Figure 14
The Polarization Curves of The PEMFC.

Figure 15
Data acquisition screen.

Figure 16
a) PEMFC stack voltage, b) PEMFC stack current, c) PEMFC stack temperature [C°].
Figure 17
a) Start-up battery state of charge (SoC) levels, b) PEMFC’s DC/DC converter output voltages
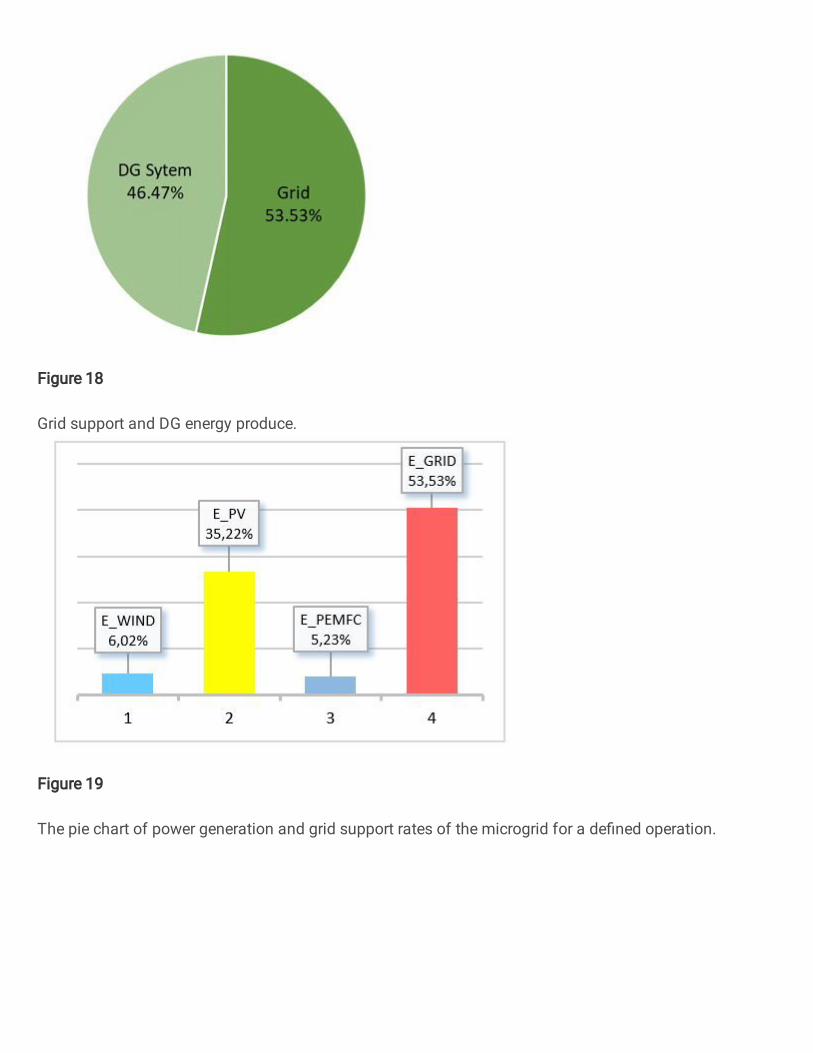
Figure 18
Grid support and DG energy produce.
Figure 19
The pie chart of power generation and grid support rates of the microgrid for a de�ned operation.