
Corporate Governance Practices and Competitive Advantage ...
Upload
khangminh22Category
view
0download
0
Resources, Autonomy and Strategy: Perceptions of Competitive Advantage in the UK Automotive Components Industry
A thesis submitted in fulfilment of the requirements of De Montfort University for the Degree of Doctor of Philosophy
by
Brahim Herbane
2001
School of Business Faculty of Business and Law
De Montfort University

ABSTRACT
Theory building in strategic management has traditionally suffered from strong
demarcation lines. The case of the resource-based view of firm (RBV) which has
emerged as an alternative approach to industry-based explanations of how
organisations develop and sustain competitive advantage, particularly
demonstrates this divide. Since then, these alternative views of competitive
advantage have often been portrayed as mutually exclusive antagonists.
This study sets out to examine the perceptions of strategic managers in the UK
automotive components industry in relation to these two competing schools of
thought which advocate advantage through resources (RBV) or advantage through
residence (industry approaches). This industry has been chosen due to the clear
potential for industry structure and internal competencies to influence competitive
advantage. Using quantitative techniques, data from senior managers is analysed
in order to establish the extent to which the views of industry practitioners
converge or diverge with the theoretical or anecdotal offerings of the strategy
literature.
The findings of this thesis suggest that a complex hybrid of perceptions tends to
prevail among respondents from the industry. This can be attributed to historical,
operational and supply chain factors. Furthermore, the study finds that the lexicon
of competitive advantage and the priorities of resources advocated in the literature
are not shared by strategists in the industry. Accordingly, the study finds, strategic
management theory in relation to the resource-based view requires further
research using the methodology developed in this thesis as a foundation.

Acknowledgements
There are many people without the assistance and advice from whom this project
would never have been completed.
Professor Paul Foley, Dr Dominic Elliott and Professor Colin Egan have come to
form a rewarding supervisory team, with each bringing to the study their
individual and respected expertise. Each of them also have a role to play in setting
out the journey that is partly completed in this the form of this thesis; Paul by
offering me the opportunity and funding to pursue the research; Dominic for
suggesting that I familiarise myself with the work of Mintzberg, thereby fuelling
my curiosity for controversy in the field of strategic management, and Colin, for
expressing scepticism about the resource-based view - something that has
propelled the purpose of this study in providing a meaningful and scholarly
contribution to our field of study.
During the course of this Doctoral project, Dr Michael Rouse joined the Faculty
of Business and Law at De Montfort University. Since then he has provided an
enormous amount of advice and support in matter relating to strategic
management and the resource-based view. In addition, collaboration with him in
writing projects have undoubtedly assisted me in thinking more critically about
my field of study, profession and industries in which I work.
Special thanks must also go to two members of the School of Business. John
Rendall has provided valuable critical comment on the use of factor analysis and
multivariate methods, and Chris Vaughan-Jones has offered useful advice on
questionnaire design and matters of survey research design. I hope that this work
provides some satisfaction of the value that you add to your institution and
colleagues.
Support during the course of this research has not come solely from respected
experts. Family and friends have provided a role in maintaining the momentum
that has culminated in this thesis. In particular, Ricardo Herbane has provided
valuable comments and support throughout the process.
Finally, without my parents, there would have been less impetus for the
completion of this study having continuously reminded that work in progress is
simply that and of the importance of completing work.
11
Table of Contents
CHAPTER 1 - INTRODUCTION ................................................................................................... I
1.1 INTRODUCTION TO THE STUDy ................................................................................................ 1 1. 1.1 Research Domain ........................................................................................................... 2 1.1.2 Structure of the Thesis .................................................................................................... 3
CHAPTER 2 - SETTING THE RESEARCH AGENDA ................................................................. 7
2.1 INTRODUCTION ....................................................................................................................... 7 2.1.1 Origins of Strategy ......................................................................................................... 7
2.1.2 Strategy Formulation: The Existentialists............................................................ I () 2.1.3 Strategy Formation: The Emasculation of Formulation ........................................... 13 2.1.4 Implementation and Formulation .... ............................................................................. 19
2.2 RESOURCES AND ADVANTAGE .............................................................................................. 22 2.2.1 Resources and Assets ..................................................................................... ............... 23 2.2.2 Processes ...................................................................................................................... 24 2.2.3 Competitive Advantage ...................................................... ........................................... 24
2.3 PERCEPTIONS AND STRATEGIC DECISIONS ............................................................................. 25 2.4 CHAPTER SUMMARY ............................................................................................................. 29
CHAPTER 3 - THE INDUSTRY CONTEXT ............................................................................... 30
3.1. INTRODUCTION .................................................................................................................... 30 3.1.1 Definitions ............................................................................................................... ..... 30 3.1.2 The Scale and Scope of the UK Automotive Industry ................................................... 31
3.2. THE AUTOMOTIVE INDUSTRY .............................................................................................. 33 3.2.1 Changing Names. Places and W~s ............................................................................. 33 3.2.2 The Case 0/ Europe and the Changing Supply Chain .................................................. 37
3.3. INCREASED OUTSOURCrNG ................................................................................................... 38 3.3.1 To Make or Buy? .......................................................................................................... 38 3.3.2 An Industry Perspective ............................................................................ .................... 46
3.4. THE CONDUCT OF BUYER-SUPPLIER RELATIONSHIPS .......................................................... 50 3.4.1 The Adversarial Nature o/Supply Relationships .......................................................... 50 3.4.2 Alternatives to Sole and Multiple Sourcing .................................................................. 52 3.4.3 Lean Supply ........... ....................................................................................................... 54 3.4.4 Supplier Performance. Behaviour and Perceptions ..................................................... 59 3.4.5 Current and Forthcoming Factors in the Components Sector ..................................... 61
3.5. CHAPTER SUMMARY ............................................................................................................ 64
CHAPTER 4: RESIDENCE OR RESOURCES? - VIEWS OF COMPETITIVE ADV ANTAGE67
4.1. INTRODUCTION .................................................................................................................... 67 4.2. THE DISREGARD OF ORGANISATIONAL HETEROGENEITY: A TRILOGy ................................ 69
4.2.1 The Lure of Scale .............................................................. ........................................... 69 4.2.2 The Relativity of Analysis ............................................................................................. 74 4.2.3 Thefatalism of industry context ............................................................ ........................ 79
4.3. THE NOTION OF HETEROGENEITY: A RESOURCE-BASED VIEW ............................................ 84 4.3.1 Basic Concepts .. ........................................................................................................... 84 4.3.2 Resource Accumulation ................................................................................................ 89 4.3.3 The Notion of Portfolios ........................................................................................... 105 4.3.4 Managing Resources .................................................................................................. 113 4.3.5 ClassifYing Resources .................................................................................. ............... 122
4.4. BALANCrNG PERSPECTIVES ................................................................................................ 133 4.4. 1 RB V and Industrial Organisation ............................................................................... 133 4.4.2 Implications: Residence or Resources? ...................................................................... 138
4.5. SUMMARy .......................................................................................................................... 139
111

CHAPTER 5 - METHODOLOGy ............................................................................................... 140
5. I INTRODUCTION ................................................................................................................... 140
5.2 THE RESEARCH PROCESS .................................................................................................... 141
5.2.1 Research Traditions in Strategic Management ........................................................ 143 5.2.2 Research Questions/Problem Definition .............. , ........................... , ......... ....... 147 5.2.3 Attitudes and Perceptions........................................................................ ..148
5.3 RESEARCH DESIGN .............................................................................................................. 148 5.3.1 Data Collection and Analysis Process............................................................ . .. 148 5.3.2 Choice of Data Collection Instrument ..................................................................... 152 5.3.3 Choice of Respondents and Unit of Analysis.......................... . ......................... 153 5.3.4 Sampling Issues .......................................................................................................... 153 5.3.5 Database Development ................................. .............................................................. 154 5.3.6 Non-response and Response Rate Target ................................................................... 160
5.4 QUESTIONNAIRE DEVELOPMENT AND DEPLOYMENT .......................................................... 161
5.4.1 Content Analysis ................................ ................................................................ " ....... 162 5.4.2 Comparative Focus Groups Pre-testing...................................................... . 164 5.4.3 'Delphi' Testing of Questionnaire Design and Completion Process .................. ....... 173 5.4.4 Final Questionnaire Design ...................................................................................... 174 5.4.5 Administration of the Questionnaire .................................................................. , ....... 178
5.5 SUMMARy ........................................................................................................................... 179
CHAPTER 6 - CHARACTERISTICS OF RESPONDENTS ...................................................... 180
6.1 INTRODUCTION ................................................................................................................... 180
6.2 RESPONSES ......................................................................................................................... 181 6.2.1 Response Rate and Non-response Bias ...................................................................... 181 6.2.2 Non-respondents - Refusals ..................................................................... , .............. 183 6.2.3 Non-respondents - Systematically Dijferent? .......................................... , ...... , .. , ...... . 184 6.2.4 Non-respondents - Anecdotal Insights ......................................................... , ........... . 185
6.3 RESPONDENT ORGANISATIONS ............................................................. , .... , ................ , ........ 187
6.3.1 Number of Employees .............................................................................. .................. 187 6.3.2 Turnover ............................................................................................................ , ........ 189 6.3.3 Component Types ....................................................................................................... 191 6.3.4 Tier in the Supply Chain ........................................................................ ..................... 193 6.3.5 Headquarter Location .. .............................................................................................. 196 6.3.6 Customers ............................................................ ......... , .. , ........... , .... , ......................... 197 6.3. 7 Involvement in Alliances ......................... .......... .......................................................... 200 6.3.8 R&D Responsibi/ity ................................................................................. . ............... 202 6.3.9 Observations about the Respondent Organisations .................................................... 203
6.4 RESPONDENTS MANAGERS ................................................................................................. 204
6.4.1 Formal Position of Respondents ................................................................................. 204 6.4.2 Background ................................................................................................................ 205 6.4.3 Experience in the Automotive Industry ....................................................................... 207 6.4.4 Observations about Respondents ........................................................................ ........ 208
6.5. SUITABILITY OF SAMPLE SIZE AND SAMPLING ADEQUACy ............................................... 208
6.5. I Suitability of Sample Size .......................................................................................... 208 6.5.2 Sampling Adequacy and Data Factorability ............................................................. 209
6.6. CHAPTER SUMMARy .......................................................................................................... 209
CHAPTER 7 - RESEARCH RESULTS AND ANALYSIS ........................................................ 211
7.1 INTRODUCTION ................................................................................................................... 211
7.1. I Addressing the Research Questions ............................................................................ 211 7 .2 FACTOR ANALYSIS OF COMPETITIVE ADV ANT AGE STATEMENTS ....................................... 213
7.2. I Factor I - Organisational Transparency .................................................................. 215 7.2.2 Factor 2 - Management Advantage ........................................................................... 222 7.2.3 Factor 3 - Relationship Uniqueness ............... ........................................................... 226 7.2.4 Factor 4 - Platform Advantage .................................................................................. 231 7.2.5 Factor 5 -Scale ..................................................................... ..................................... 235
lV

7.2.6 Factor 6 - Market Power ................................................................................. ...238 7.2.7 Factor 7 - Resource Accumulation ............................................................................ 241 7.2.8 Factor 8 -Immediacy o/Superiority ...................................................................... 243 7.2.9 Factor 9 - Historical Advantage ................................................................................ 246
7.3 PRIORITIES AND LANGUAGE ................................................................................................ 250 7.3. I Terminology of Resources .......................................................................................... 250 7.3.2 Strategic Priorities ..................................................................................................... 252
7.4 RESEARCH QUESTIONS REVISITED ...................................................................................... 255 7.4.1 Research question one - Principal Research Question.............. ................... ...255 7.4.2 Research question two .................................................... ............................................ 262 7.4.3 Research question three ................................................................................ .............. 263 7.4.4 Research questionfour .............................................................. ................................. 265 7.4.5 Research questionfive .................................................. .............................................. 267
7.5 CHAPTER SUMMARY ........................................................................................................... 268
CHAPTER 8 - CONCLUSIONS AND IMPLICATIONS ........................................................... 272
8.1 INTRODUCTION ................................................................................................................... 272 8.2 CONSEQUENCES OF THE FINDINGS ...................................................................................... 272
8.2.1 The Mixed Personality of Competitive Advantage ...................................................... 272 8.2.2 Similarities in Individual Theoretical Concepts ........................................................ 275 8.2.3 Key Issues in the Perceptions of Managers ................................................................ 275 8.2.4 The Lexicon of Competitive Advantage ...................................................................... 279
8.3 IMPLICATIONS FOR THE AUTOMOTIVE COMPONENTS INDUSTRY ......................................... 281 8.4 REFLECTIONS ON METHODOLOGy ...................................................................................... 283
8.4.1 Single Industry Focus ................................................................................................. 283 8.4.2 Careful Sampling ...................................................................... .................................. 284 8.4.3 Pretesting Versus Piloting ............................................................... ........................... 285 8.4.4 The Relevance and Value o/Factor Analysis ............................................................. 286 8.4.5 Limitations and Modifications to the Research Strategy ............................................ 287
8.5 DIRECTIONS FOR FUTURE RESEARCH .................................................................................. 287 8.5.1 Buildings on the Foundations ............................................................ ........................ 287 8.5.2 New Research Questions ............................................................................................ 290
8.6 CONCLUDING COMMENTS ................................................................................................... 292
BIBLIOGRAPHY ......................................................................................................................... 296
APPENDICES .............................................................................................................................. 330
ApPENDIX I: PRODUCT PLATFORMS IN THE EUROPEAN AUTOMOTIVE INDUSTRy .................... 331 ApPENDIX 2: TECHNICAL ApPENDIX - FACTOR ANALYSIS PROCEDURES .................................. 332
Choice of Factor analysis technique ................................................................................... 332 Number offactors ............................................................... ................................................. 332 Rotation ............................................................................................................................... 333 Factor Loadings .................................................................................................................. 334 Selection of Final Structure and Trial Extractions ............... ............................................... 334
ApPENDIX 3: COMPANIES EXCLUDED FOR AUTOMOTIVE DATABASE ....................................... 338 ApPENDIX 4: LIST OF ORIGINAL STATEMENTS .......................................................................... 341 ApPENDIX 5: PRE-TEST GROUP TRAITS (GENERAL MANAGER GROUP) ................................... 344 ApPENDIX 6: PRE-TEST PRO-FORMA .......................................................................................... 345 ApPENDIX 7: SECOND PROTOTYPE QUESTIONNAIRE ................................................................. 347 ApPENDIX 8: FINAL QUESTIONNAIRE ........................................................................................ 353 ApPENDIX 9: COVERING LEITER .............................................................................................. 358 ApPENDIX 10: ANOVA - VRIO AND TERMINOLOGy .............................................................. 359 ApPENDIX 11: RELIABILITY OF SCALES .................................................................................... 360 ApPENDIX 12: OBLIQUE ROTATED SOLUTION ........................................................................... 361
v

List of Tables Table 3.1: UKIEU Motor Vehicle Production and UK Registrations 1988-1998.32 Table 3.2: Vehicle Production in UK-based Plants (1998) .................................... 33 Table 3.3: Structure and Ownership of the European Volume Assemblers (1997)
....................................................................................................................... 36 Table 3.4: Leading Automotive Component Companies located in the UK ........ .49 Table 3.5: Global Nomenclature of Supply Chain Tiering .................................... 55 Table 3.6: Product Gaps in the UK Components Manufacturing Base ................. 64 Table 3.7: Market vs Partnership Relationships .................................................... 64 Table 4.1: Proposals for Competitive Advantage .................................................. 98 Table 4.2: Factors Affecting the Process of Resource Accumulation ................. 104 Table 4.3: 'VRIO' Reflected in the Wider Body of Literature ............................ 132 Table 5.1: SIC Codes Relevant to Automotive Component Manufacturers ........ 156 Table 5.2: Deleted Statements and Rationale for Exclusion ............................... 164 Table 5.3: Pre-test results of Comparative Focus Groups ................................... 171 Table 5.4: Profile of Experts used in 'Delphi' Testing of Second Prototype ...... 174 Table 5.5: Question Types used in Final Questionnaire ...................................... 176 Table 6.1: Component Types and Number of Suppliers ...................................... 191 Table 6.2: Representation of Miscellaneous Component .................................... 192 Table 6.3: Turnover per Tier ................................................................................ 195 Table 6.4: Employees per Tier ............................................................................. 195 Table 6.5: Respondents' Customers - UK and Continental Europe .................... 199 Table 6.6: Additional Assemblers Supplied by Respondent Companies ............ 200 Table 6.7: Supplier Alliances according to Supply Chain Tier ........................... 201 Table 6.8: R&D Involvement According to Supply Chain Tier .......................... 203 Table 6.9: Formal Job Descriptions of Respondent Managers ............................ 205 Table 6.10: Backgrounds of Respondent Managers ............................................ 206 Table 6.11: Experience of Respondent Managers (n=284) ................................. 207 Table 7.1: Rotated Factor Solution ...................................................................... 215 Table 7.2: Factor Structure - Organisational Transparency ................................ 216 Table 7.3: Factor Structure - Management Advantage ....................................... 222 Table 7.4: Factor Structure - Relationship Uniqueness ....................................... 227 Table 7.5: Factor Structure - Platform Advantage .............................................. 232 Table 7.6: Factor Structure - Scale ...................................................................... 235 Table 7.7: Factor Structure - Market Power ........................................................ 238 Table 7.8: Factor Structure - Resource Accumulation ........................................ 241 Table 7.9: Factor Structure - Immediacy of Superiority ..................................... 244 Table 7.10: Factor Structure - Historical Advantage .......................................... 247 Table 7.11: Ranking of Resource Terminology (n=284) ..................................... 25I Table 7.12: Ranking of Resource Terminology by Tier (n=284) ........................ 251 Table 7.l3: Importance of Resources (n=284) .................................................... 252 Table 7.14: Importance of Resources by Tier (n=284) ........................................ 253 Table 7.15: Summary of Research Questions and Responses ............................. 270
Vl

List of Figures Figure 4.1: Advantage through Position and Advantage through Resources ........ 68 Figure 4.2: A Model ofIndustrial Organisation Analysis ..................................... 80 Figure 4.3: Resources - Bundled, Linked and Used ............................................ 112 Figure 4.4: Framework of Competitive Advantage ............................................. 124 Figure 4.5: VRIO Applied to Resources .............................................................. 128 Figure 5.1: The Research Process ........................................................................ 142 Figure 5.2: Data Collection and Analysis Process ............................................... 149 Figure 5.3: Visual Summary of the Research Design .......................................... 179 Figure 6.1 : Rate of Responses over the Mailing Period ...................................... 182 Figure 6.2: Respondent Group Size - Number of Employees ............................. 188 Figure 6.3: Respondent Organisations' Position in the Supply Chain ................. 193 Figure 6.4: Headquarter Location of Respondent Organisations ......................... 197 Figure 6.5: Alliance Involvement with other Suppliers ....................................... 201 Figure 6.6: R&D Involvement of the Respondent Group .................................... 202 Figure 7.1: The Cartography of Competitive Advantage .................................... 257
Vll

Chapter I.' Introduction
Chapter 1 - Introduction
1.1 INTRODUCTION TO THE STUDY
In the 100 years since the birth of the automotive industry the transatlantic axis of
production has now become a global concern, with the assembly of vehicles
located in South America, Australia and the Indian subcontinent, in addition to the
well known triad of the US, Europe and South-east Asia. Since its infancy, this
industry has been a risky one. Mergers, acquisitions, corporate failures and
strategic alliances have been present throughout as the demand for vehicles has
grown. In 1903, global demand totalled approximately 100,000 vehicles. By 1996
global demand had reached nearly 52,000,000 vehicles (Bessel, 1990; Willings,
1998).1
From the outset, this industry has been characterised by high levels of competition
and wherever organisations have found that their offerings have been challenged
by those of other organisations, the notion of competitive or comparative
advantage has formed an important part of future planning and
production/marketing considerations. The notion of competition is inextricably
linked to the concept of firms developing a relative advantage in order to improve
performance.
This study deals with differing Vlews of competitive advantage and the
perceptions of managers towards such views. In particular, the study examines
whether the 'resource-based view' of the firm (RBV) is reflected in the way that
managers perceive the potential sources of competitive advantage that can be
exploited either implicitly or explicitly by an organisation in its strategy.
The title of the thesis - Resources, Autonomy and Strategy: Perceptions of
Competitive Advantage in the UK Automotive Components Industry - reflects
three issues that are central to this thesis:
• 'Resources' refers to the body of theory that is to be subjected to investigation,
namely the resource-based view;
I Bessel (1990) notes that ofthe 220 UK-based car manufacturers that had existed at the tum of the century, around 80 of these had ceased trading by 1905.
1

Chapter 1: Introduction
• 'Autonomy' refers to the question of whether automotive component suppliers
remain strategically independent in a highly coordinated supply chain that is
dominated by the final assembler of vehicles; and
• 'Strategy' reflects the influence of managers' perceptions upon their decisions.
1.1.1 RESEARCH DOMAIN
To provide a context for the study, the automotive components industry has been
chosen to examine the research questions proposed later in the study. Other
studies have chosen multi-industry samples (for instance, Miller and Friesen,
1986; Robinson and Pearce, 1988; Carter et al., 1994). This is deemed
inappropriate since many industry-specific issues may alter the sources of
competitive advantage. The inevitable trade off between generalisability among
different industries and representativeness and relevance must take into
consideration the subject matter to be studied. In this case, the study deals with
unique capabilities whose essence, nature and composition can only be clearly
understood in conjunction with the contingency and competitive variables which
face organisations within the same industry. It also allows the verisimilitudes of
the industry to provide a foundation of understanding, rather than a source of
variance in the findings.
Furthermore, the choice of the automotive components industry as the domain for
the study has been informed by the impact it has had on national economies and
other sectors. Product complexity and the tight coupling of the supply chain have
provided conditions in which many different corporate strategies have been
observed, including, partnership collaboration, merger, acquisition and strategic
alliance. The specific industry conditions which are pertinent to this study are
considered in Chapter 3.
The problem which this study seeks to address is one which has plagued the
academic study of organisations and their environment. Many theories and models
have been developed by academics within the strategic management field and
intended for use by practising managers. In use however, such theories and
models may have been transformed, either as a result of thoughtful re
interpretation but also as a result of misinterpretation. The latter, it is argued, is a
2

Chapter I: Introduction
less satisfactory outcome smce it reduces the credibility of the academic
contribution to organisational improvement, a goal which is sought by
management research.
The aims of this study are two-fold. First it indicates if and how RBV concepts are
reflected in managers' thinking, therefore having some impact on the strategic
management process. A secondary (and supplementary) aim is to use the findings
of this study to propose where future work in the RBV could most beneficially be
directed (Chapter 8).
There is some irony that RBV thinking could be construed as an about tum in the
way in which competitive advantage is interpreted. The notion of competition led
to the 'competitive advantage gestalt' and the emphasis on external factors as
determinants of such advantage. An understanding of the industry and the
environment allowed planners to identify whether a skill or resource deployed in
one organisation was more effective than in another. A wide variety of techniques
have been developed in order to undertake an analytical study of the external
environment. The 'relativity approach' is also reflected in many internal audit
models used prior to the development of RBV approaches (Chapter 4). However,
since the RBV is predicated on organisational and resource uniqueness, there is
the implication that no comparison to rivals or the environment is necessary other
than to determine that the resource, skill or asset is possessed by any other firm.
Consequently, the RBV approach to competitive advantage suggests that the only
external variable that matters is the customer, since they will ultimately judge the
value of the unique competency by paying premium prices, manifesting buyer
loyalty or switching to the product.
1.1.2 STRUCTURE OF THE THESIS
Chapter 2 sets out the macro-theoretical context (strategic management) and
clarifies terminology that will be used throughout subsequent chapters. The
chapter considers the evolution of strategic management as a practitioner and
academic discipline whilst recognising the critique offered by advocates of
strategy formation. In continuation of this, the relationship between managers'
perceptions and their subsequent decisions is observed, leading to the research
3

Chapter i: introduction
stimulus of the study - To examine managers' perceptions of competitive
advantage.
Chapter 3 introduces the industry context (the automotive components industry)
and its parent industry, automotive assembly. In addition, it explores some of the
important historical developments in the buyer-supplier relationship and current
trends and factors influencing the automotive components sector. The chapter
ends by proposing the principal research question:
Do managers perceive competitive advantage to be based on bundles of
heterogenous resources which facilitate differentiation and
diversification rather than external factors such as industry structure
and macro-environmental factors of
The micro-theoretical context is introduced in Chapter 4, where the resource
based view of the firm, a view of advantage through resources, is contrasted with
its antecedent, a view of advantage through residence. The resource-based view is
disaggregated into four components, and four additional research questions for
study are generated:
Research question 2: Do managers perceive resource accumulation to be part of the RBV construct?
Research question 3: Do managers associate portfolios of resources with product platforms, families and technology convergence?
Research question 4: Do managers recognise the importance of resource management?
Research question 5: Do managers make a distinction between resources in terms of their strategic significance and do they use terminology indiscriminately?
Chapter 5 examines the methodological parameters for the study. It begins with an
examination of methodological issues pertaining to strategic management and
those which apply generally to social science research. Following this, the
research strategy is introduced and justified, followed by an explanation of the
2 Hereafter referred to as Research Question I.
4

Chapter I: Introduction
data-analysis techniques to be used, consisting mainly of principal components
analysis. Important aspects of the research strategy such as the development of an
original database and the pre-testing of the data collection instrument are fully
detailed.
In Chapter 6, the thesis shifts from the precursors to the study and the research
results to the primary research phase. The chapter provides a detailed insight into
the respondent organisations and respondent managers. In so doing, the study can
be confident that the data is derived from senior managers (strategists) from the
UK automotive components industry. Following a brief discussion of non
response issues, where no significant differences are reported, the chapter focuses
upon the salient characteristics of suppliers in terms of their origin, size, products,
human resources, turnover, supply chain position, research and development
approaches, and strategic alliance involvement. The chapter continues with an
examination of the respondent managers' backgrounds and length of tenure,
ending with a consideration of sampling adequacy and data factorability.
Having confirmed the suitability of the data set to be subjected to principal
components analysis, Chapter 7 presents the empirical analysis of data which
deals with the five research questions developed in earlier chapters. Principal
components analysis reveals a nine-factor structure which portrays the perceptions
of industry strategists in relation to theories of competitive advantage based on
residence and resources. Each of the factors is examined in detail and interpreted
through the lens of the industry conditions, practices and developments introduced
in Chapter 4. Following this, analysis of variance (ANOV A) is used to examine
the language and priorities of managers.
The discussion of the findings in chapter seven continues with the presentation of
a cartography of competitive advantage designed to visualise the perceptions of
the respondent managers. This is used to address the principal research question.
Subsequent to this, research questions 2 to 5 are addressed. The chapter explains
how the perceptions of managers neither reflect a resource-based view nor a
residence-based view of competitive advantage. Instead, a hybrid set of
perceptions can be said to prevail among managers in the industry. These findings
5

Chapter i: introduction
are considered alongside the prevailing literature considered in Chapter 4.
Furthermore, the chapter examines the differing priorities of managers in relation
to the strategic significance of resources and the favoured terminologies to
describe such resources.
The thesis concludes, in Chapter 8, with an appraisal of the contributions of the
study to the wider field of strategic management. It begins with a discussion of
the consequences emanating from the primary research findings and the
implications of the study for the automotive components industry. Next follows a
reflection on the methodology used and its strengths and weaknesses following its
deployment. Possibilities for further study using the methodology as the first step
in a multi-stage methodology and new research questions arising from the
analysis and discussion of the findings are then identified. The chapter ends by
contemplating the position of this study within the wider field of strategic
management.
6

Chapter 2: Setting the Research Agenda
Chapter 2 - Setting the Research Agenda
2.1 INTRODUCTION
The elevation of strategy within organisations and classrooms in recent decades is
without doubt. Connoting rigour, clarity and foresight, the interpretation of
strategy itself has often lacked these characteristics. Indeed, controversy and
division have been at its side. In this chapter, the study examines the nature, role
and application of strategy and strategic management. Its purpose is to provide a
foundation upon which to position the study in terms of the management/business
literature and to clarify concepts that will be necessary in the empirical analysis
developed in subsequent chapters.
2.1.1 ORIGINS OF STRATEGY
The origins of the word strategy can be found in the Greek words stratas (army)
and ego (I am).3 These components form strategos meaning the art of military
command. Between the times of the Greek empire and the present time, strategy
in a general sense has come to signify the means by which to attain predetermined
goals through a detailed consideration of assets available and operating
conditions.
In the twentieth century, strategic, corporate, or long range planning and strategic
management can most clearly be traced back to two events. The first was the
introduction of a 'business policy' course at the Harvard Business School in 1912
(Arben, 1997).4 The second, and more influential (in organisational terms), was
the efforts of professional managers during the 1920s to deal with the growth and
control of multi-business, multi-national organisations. The practitioner
development of strategy originates from the turn of the century when a number of
American firms found themselves in a privileged yet precarious position.
Companies such as General Motors, Ford and Dupont had become the first
J The strict etymology of the word strategos is stralos and ego ("I am the army"). However, many writers (for instance Bracker, 1980; Evered, 1983; Whittington, 1993; Grant, 1995; McMillan and Tampoe, 2000) have suggested a different etymology derived from stratos and ag or agein (to lead).
4 It should be noted that many other writers have attributed the Ford Foundation Report (Gordon and Howell, 1959) as the impetus for the introduction of business policy into the university business degree curriculum.
7

Chapter 2: Setting the Research ARenda
multinationals with operations and sales beyond US geographical limits
(Whittington, 1993). For example, the Ford Motor company opened its first
overseas factory in Manchester, England in October 1911 (although mass
production through moving track assembly only followed in 1914). The challenge
for senior management at the time was to develop methods by which such a large
and complex organisation could be co-ordinated, controlled and developed in a
systematic manner. In the early 1920s and 1930s, General Motors faced the
challenge of organisational complexity and the effects of the 1929 Stock Market
crash which sent many industrialised nations into economic downturn. Alfred
Sloan, Chainnan and Chief Executive Officer (CEO) of General Motors during
this period called for a "factual approach to business judgement" (1963:xxvii) in
contrast to the "seat of the pants" (1963:52), more instinctive approaches taken by
the senior managers who had preceded him in the company. This led to the
introduction of methodical approaches to business analysis and strategic options
which then came under the umbrella tenn 'business policy'.
Subsequently, structured policy and planning approaches developed and played a
major part in many industrial organisations making a rapid switch from civilian to
military production during World War II. Companies such as Ford and General
Motors produced a variety of military equipment - personnel carriers, machine
guns and aircraft components. In pre-war Japan, Toyota had been predominantly a
manufacturer of looms and textile manufacturing equipment. With Government
help, the company began its first large scale vehicle production during the war.
By the mid 1950s, American finns faced unprecedented challenges from
companies and countries that found themselves in the midst of economic and
industry reconstruction following World War II. The approach to policy
development which incorporated production planning with long tenn financial
budgeting could no longer deal sufficiently well with the dynamic changes to
industries, technologies and markets.
8

Chapter 2: Setting the Research Agenda
By the 1960s, formal planning techniques based on private sector organisations
were introduced into the public sector. At the time, the US Department of Defence
introduced the Planning-Programming-Budgeting System (PPBS). Hailed as a
panacea for public sector planning, it adopted an approach in which objectives
would be met through the analysis and subsequent choice of plans which would
create a positive benefit in relation to cost. The objective of PPBS was to use
profit creation principles to ensure that government budgets could yield maximum
benefit, rather than simply spending budget allocations. PPBS never fully
succeeded in its goals because of the resistance generated by the large changes
which the new system demanded. Without continuity of leadership to marshal
constant support for the controversial PPBS. a return to previous approaches to
planning soon followed (Mintzberg, 1994). In spite of the failure of PPBS, it
marked the period in which policy and planning became highly formalised and
analytical.
Despite the transfer of strategy from the military domain to the civilian and
commercial one, the combative tone and terminology of its origins still remain,
particularly given the increasingly competitive and international nature of
business. In this regard, Evered cites Lenin who said that "the soundest strategy in
war is to postpone operations until the moral disintegration of the enemy renders
the delivery of a mortal blow both possible and easy" (1983:64). The commercial
equivalent to this maxim is the rise to prominence of Japanese manufacturers on
the world stage. In their case, the mortal blow was dealt by gaining a command
over higher priced market segments after having dominated lower priced segment
for many years (allowing them to further improve their experience curve and gain
economies of scale and scope - Chapter 4). The relative decline of consumer
electronics and automobile industries based in Europe and the USA in the face of
Japanese competition are further testimonies to this. The claims of unfair
competition, Trojan horses and double standards in east-west trading relations
confirms a suspicion that civilian strategy has borrowed more than merely
structure from its military origins, but indeed part of its philosophY. As Evered
describes:
9

Chapter 2: Setting the Research Agenda
The history of strategy ... is a saga built on bluff, feint, distraction, camouflage, ruse, surprise, guile, illusion, trickery, traps, bait, decoy, ambush, disguise, misinformation and secrecy (1983:64).
Indeed, a commonly used term is that of 'the marketplace is a battlefield', a term
which originates from ancient China. Sun Tzu's (400BC) and Machiavelli's (1521)
'The Art of War', and Von Clausewitz' 'On War' (1832) have been widely used in
the business context and highlight the importance of the military to strategy
philosophies (Cleary, 1991; Hou, 1994; Chen, 1995).
Endemic throughout the history of strategy is a mismatch between the
understanding of what strategy is and what is should be used for. The latter is well
known; to enable the growth of the organisation in the face of competition and a
changing operating environment. What strategy is has been more problematic,
with as many definitions of strategy as there are authors on the subject and
practitioners of the discipline.5 This question has been compounded by the debate
between the 'existentialists', advocating a process of strategy formulation, and the
'emasculators' which emphasise the formation of strategies. This debate is
important within the ambit of this study since the way in which strategies develop
is an important factor in normative theories of strategy.
2.1.2 STRATEGY FORMULATION: THE EXISTENTIALISTS
The most popular view of strategy is that it is the outcome of strategic
management (or planning) which is a predetermined process of planning and
analysis which is rational and systematic. Rational signifies that the information
used to both inform and form the basis of decisions arises from data collection
which is not influenced by speculation, inaccuracy, judgements and intuition.
Such information is balanced and taken from a wide variety of sources in order to
provide a consistent and thorough understanding in which the user of the
information can have confidence. The process is systematic because information
is taken through a series of pre-defined, well-established and inter-related stages
5 The economist Joan Robinson remarked that "there is no advantage (and much error) in making definitions of words more precise than the subject matter they refer to" (1956:361).
10

Chapter 2: Setting the Research Agenda
of analysis to arrlve at an integrated understanding of complex themes and
actions. Accordingly, strategy is formulated and is a conscious and deliberate
choice made by managers:
The determination of the basic, long-term goals and objectives of an enterprise, and the adoption of courses of action and the allocation of resources necessary for carrying out those goals (Chandler, 1963: 13).
Corporate strategy is the pattern of decisions in a company that determines and reveals its objectives, purposes or goals, produces the principal policies and plans for achieving those goals and defines the range of business to pursue, the kinds of economic and human organisation it is or intends to be, and the nature of the economic contribution it intends to make to its shareholders, employees, customers and communities (Andrews. 1980:8).
The pattern or plan that integrates an organisations major goals, policies, and action sequences into a cohesive whole (Quinn, 1980:7).
Common within each of these definitions is the explicit chronology of activities
that should be undertaken; goal setting followed by the choice of strategy and
continued by its implementation. Before a choice of strategy can be made, an
analysis is undertaken to determine the feasible strategic options. Consequently,
the traditional strategy formulation approach involves three distinct stages;
analysis, choice and implementation.6 The strategy formulation process has. at its
heart, the notion that managers deliberately think about the organisation,
environment and rivals. Clearly, in this context, managers' perceptions of which
strategies are most expedient may not be derived from the most rational analysis.
Managers set out to think deliberately but this should not be confused with
rationality (Section 2.3).
The strategy formulation approach has been shaken by the forced entry of
uncertainty and discontinuities into planning paradigms. Consequently, the
approach's proclaimed efficacy in dealing with unforeseen eventualities has been
6 This approach (or caricature of the process) can be seen in the 1970s (e.g. Cohen and Cyer!, 1973; Vancil. 1976) and remains the case today (Hunger and Wheelen, 1992; Hill and Jones, 1995, Johnson and Scholes. 1997).
11

Chapter 2: Setting the Research Agenda
challenged. Mintzberg (1994:299) suggests that "creativity by its very nature creates
categories or rearranges established ones ... that is why formal planning can neither
provide creativity nor deal with it when it emerges by other means". Even one of
stalwarts of the formulation approach, Porter (1987), recognises that tradition and
inertia have set in:
Corporate strategy ... is both the darling and the step-child of contemporary management practice - the darling because CEOs have been obsessed with diversification since the early 1960s, the step-child because almost no consensus exists about what corporate strategy is, much less about how a company should formulate it (1987:42).
Porter (1987) found in his study of the diversified companies' corporate strategies
a greater number of acquired companies had been divested rather than had been
retained as part of the overall organisation, denoting a failure of the corporate
strategy, be this in the choice itself or in the understanding of prevailing
competitive conditions. Whittington (1993) argues (based on the premise that
CEOs or senior management are the organisational incumbents responsible for
strategic choices) that diversification as a popular growth mechanism arose from
the distinction of ownership from control. As a result of this, the professional
manager, who in attempt to gain recognition for his success (in the cause of his
own self-interest) would chose diversification as a way to attain greater
recognition in a shorter period of time. In other words, formulation is not a by
word for success and strategies are often impeded by the incumbents and the act
of implementation. Furthermore, implicit within this suggestion is the notion of a
manager's perception (diversification leads to greater recognition) leading to a
decision (Section 2.3).
A further problem with the formulation approach is that no explicit contingency is
made for crises and disasters. A growing literature dealing with this issue has
shown that organisations face business interruptions due to or in spite of strategic
planning. The impact of an interruption will vary according to a wide variety of
organisational characteristics and decisions (Pauchant and Mitroff, 1988; 1992)
12

Chapter 2: Setting the Research ARenda
with often unpredictable consequences.7 Strategy formulation, however much its
advocates would suggest or desire it to be, cannot provide the comprehensive
provision of long-term organisational development. Instances may arise where
strategies may emerge from beyond the strategic planners' ambit.
2.1.3 STRATEGY FORMATION: THE EMASCULATION OF FORMULATION
The evolution of organisations in the absence of formal planning has long been
recognised. Alchian (1950:211) observed that "adaptive, imitative and trial and
error in the pursuit of ... profits is utilized rather than its sharp contrast, the
pursuit of 'maximized' profits [based around certainty and full information]".
Honda's entry into the US market (Pascale, 1984; Benjamin, 1993; Mintzberg,
1996) and Sun Microsystems's development of the Java language (Alsop, 1997) are
stark illustrations of company success which has occurred despite the failure of the
deliberate strategy chosen by the organisation. Honda's failed intended strategy was
to launch a motorcycle to rival Harley Davidson's products. Instead, the Honda
Supercub, never intended for the US market, was enormously successful. Sun
Microsystems' Java was originally intended for set-top television decoder boxes.
When the company withdrew from the market, the internet provided an opportunity
for the technology to be applied within internet browsers.
Whilst there is agreement that 'strategic' includes reference to policies, plans and
actions which are long-term in nature and company-wide in influence, there is less
agreement about whether or not a strategy is always the conscious product of
strategy formulation. Often it is assumed that strategy is synonymous with
planning and that planning is therefore associated with success. Mintzherg, the
arch-critic of orthodox planning systems, contends that planned strategies can only
find a degree of success in an environment that is stable and predictable. In practical
planning environments, strategy is irrevocably trapped between the potentially
restrictive deliberate type and the potentially chaotic emergent type (Mintzberg,
7 For instance, assumptions about small car design, an alleged media conspiracy and poor media management led to the delayed launch of the Mercedes A class car in autumn 1997. The company lost an estimated £ 100 million, delayed re-Iaunch for twelve months and negatively affected its parent company's stock price by 32% (Prowse, 1998).
13

Chapter 2: Setting the Research Agenda
1990). "We seem to have to choose between 'extinction by instinct' and 'paralysis
by analysis'" suggests Mintzberg (1994:390).
Organisations may choose strategies which subsequently fail or lead to other
unforeseen possibilities. Such outcomes of strategy formulation are no less
'strategic' since they have company-wide effects over a long period of time. This
is a view of strategy as something which occurs in spite of planning. Additionally,
luck, unexpected events and even errors may conspire to move an organisation in
a very different direction than originally intended, known as 'strategy formation'.
The term originates from Lindblom (1959) who described how public sector
managers discovered new methods of administration in what he termed 'muddling
through'. Hedberg and Jonsson (1977) propose that the strategy formulation was
punctuated by an emotional dimension (myth, fantasy, will and creativity),
thereby influencing behaviour and the outcome of the strategy process. In Quinn
(1977), the author suggested that managers should adopt an approach to strategy
implementation in a logically incremental manner, since:
Unlike the preparation of a fine banquet, it is virtually impossible for the manager to orchestrate the internal decisions, external environmental events, behavioural and power relationships, technical and informational need, and actions and intelligent opponents so that they come together at any precise moment (1977: 17).
Quinn also acknowledged the possibility of strategies emerging in his definition
of strategy as "the pattern or plan that integrates an organisation's major goals,
policies, and action sequences into a cohesive whole" (Quinn, 1980:7). The use of
the concept of pattern in the definition of strategy reflects this. Many decisions,
actions and events that are seemingly unrelated conspire to change the course of
an organisation in spite of an intended strategy developed through a formal
strategic management process.
Johnson (1988) took the notion of readjustment and environmental change, and
called it 'strategic drift'. Mintzberg (1973; 1977; 1978; 1983) suggested that
organisations' strategies could arise from other than a predetermined and
formalised planning process, and Van Cauwenbergh and Cool (1982) attributed
14

Chapter 2: Setting the Research Agenda
strategy formation to the less systematised approaches to planning employed
within Japanese corporations.
The pivot between obscurity and notoriety is undoubtedly the seminal work on
strategy formation by Mintzberg and Waters (1985) who labelled the phenomena
'emergent strategies'. Emergent strategies are the amalgamation of strategy as a
plan (the traditionally held view of strategy being a vehicle by which the company
reaches a desired and intended future state) and strategy as a "pattern in a stream
of decisions" (Mintzberg and Waters, 1985 :257). 8 This view challenges the
traditional assumption that strategic ideas and options are the sole preserve of
senior managers and planning departments. Indeed, emergent strategies
emasculate those responsible for organisational strategy. Mintzberg and Waters
(1985) argue that new and unforeseen opportunities can emerge at any level in the
organisation and beyond it. A salesperson's idea for a new customer segment, an
engineer's idea to modify the design of a product or an accounts clerk's idea to
offer a different finance package to customers or suppliers could form the basis of
an entirely new, yet equally successful, alternative to the strategies formally
developed at the most senior level in the organisation. Acknowledging the
emergent nature of strategy does not mean the abandonment of formal strategic
management. Rather, it calls for a balance between the sometimes rigid direction,
analysis and control of deliberate strategies, and the flexibility and responsiveness
of emergent strategies.
Emergent strategies are the manifestation of a transcendence from strategy as a
plan, the traditionally held view of strategy being a vehicle by which the company
reaches a desired and intended future state, to a less predictable and controllable
source of organisational opportunities. It is proposed that the dichotomy between
direction, analysis and control of deliberate strategies on one hand, and the
flexibility and responsiveness of emergent strategies on the other should be
reconciled in order that "strategy formation walks on two feet, one deliberate, the
other emergent" (Mintzberg and Waters, 1985:271). This allows for an awareness
of turbulence in the business environment and in doing so, encourages strategic
8 A similar definition of an emergent strategy can be found in Miller and Mintzberg (1974).
15

Chapter 2: Setting the Research Agenda
learning which permits the strategy (and indeed the process) to be moulded
according to the specific needs of the company at a given moment.
In the 1980s, organisations fabled for their large strategic planning departments,
such as Royal Dutch/Shell and General Electric, began to reduce the scale of their
strategic planning activities. In 1983 Jack Welch, Chairman of General Electric,
virtually eliminated the planning department (which at one time had as many as
30,000 planners) in favour of a few strategists, recognising that the company had
far exceeded the point of diminishing returns in terms of planning department
size. Nonetheless, Welch's view of strategy, however, remained the same, "trying
to understand where we will sit in tomorrow's world, and not where we hope to
sit, assessing where we can be, and then deciding where we want to be" (Ansoff
and McDonnell, 1990:35).
The notion of emergent strategies has been met with a mixed reception. Ansoff
(1991) interprets strategy formation as an endorsement "a world free of explicit
strategy formulation and free of strategic managers" (1991 :454) and "advocating
trial and error in diversification programmes" (1991 :456) which he suggests is
questionable given that an organisation taking such an approach would increase its
exposure to risk in the face of competitors which had systematically planned.
However, he does offer some limited support for the notion of strategy formation:
It is possible to show that the 'emerging strategy' model is a valid prescription for success in incremented environments, a valid description of poorly performing firms in discontinuous environments, and a valid description of the behaviour of a majority of not-for-profit organisations (1991 :460 emphasis added).
In response, Mintzberg (1991) suggests that the view of planning as strategy and
learning as an unnecessary adjunct has been promoted through the two dominant
factors;The assumption of rationality and rigour:
We think that we are so awfully smart. We can work it out all in advance, so cleverly, we "rational" human beings, products of the "age of enlightenment." We can predict the future, identify the non-starters, impose our minds on all that matters (1991 :465).
16

Chapter 2: Setting the Research Agenda
And the teaching of the subject in the classroom :
The danger of the [strategy formulation approach] may be in providing a seductive model whose superficial "rationality" in the classroom can so easily get promoted into the executive suite (1991 :465).
Goold (1992) supports the formulation approach by suggesting that the
unstructured experimentation advocated by the notion of 'emergent' strategies
essentially suggests the abandonment of formalised planning approaches. Instead,
he suggests, planners should be willing to refine their formulated strategies as
conditions change in the planning process, in order that the final strategy reflects
prevailing competitive and organisational conditions more accurately. Kenyon and
Marthur (1993) position emergent strategies within the implementation phase of a
formulated strategic management approach rather than ascribe credence to the
idea that an entirely novel strategy appears from somewhere other than the
boardroom or the planning department. They also add that emergent strategies are
not strategies since they are not deliberate and often subconscious. Furthermore,
they can only be identified ex post.
Problematic among many rejections of emergent strategies are two main
assumptions. The first is that where a strategy emerges from an unexpected
source, it cannot be labelled as such or credited with existence or importance. This
is similar to rejecting any new scientific discovery.9 The second is the comparison
of an emergent strategy against the traditional view of strategy characterised by
rationality, predetermination, rigour and procedure, with its military origins
largely responsible for this.
The deliberate-emergent debate still remains within strategic management. Inkpen
and Choudhury (1995) proposed that the 'absence' of strategy in organisations,
rather than the study of unexpected strategies is a relatively under-researched area
of research within the field. A strategy of absence could be explained as a failure
of managers to undertake any systematic process of strategic planning, as a period
9 The discovery of penicillin is one such example. where the decay of organic matter can indeed produce something that is useful for counteracting illnesses.
17

Chapter 2: Setting the Research Agenda
of transition between strategies and necessary in developing industries (such as
information technology), or as a 'virtue' where managers deliberately avoid
conscious planning in order to stimulate the emergence of strategies from other
sources. This suggestion of anything other than strategic planning being
undertaken by organisation still generated a reaction. Bauerschmidt (1996:667)
argues that a strategy of absence cannot be a strategy since "the strategic paradigm
- any strategic paradigm - depends on the presence of strategy". Strategy should
be seen as the property of the organisation and must therefore be recognisable as
such. Emergent strategies only become strategies in retrospection. In response,
Inkpen (1996:670) argues that "a firm may start with an intended strategy that is
very conscious. If that strategy is displaced, an emergent strategy may take its
place".
At the very heart of the debate lies one preconception of what strategy is. If it is a
predetermined, systematic vehicle for achieving long-term organisation-wide
growth, then the notions of emergent strategies or strategies of absence (when
associated with high performance) are an anathema. If one's view of strategy is
broader, and less dependent upon a deliberate process, these notions become more
acceptable, especially since strategy has been adopted for use in wider range of
contexts than commerce and conflict.
Fundamentally, all writers engaging in this debate are attempting to explain the
differences between organisational performance, between means and ends, and
between emancipation and existentialism. It could be suggested, however, that
whilst a valuable debate, the incumbents have themselves been 'boxed-in'. In
whatever way organisations grow, develop and improve their performance (or
otherwise), they each gather, exploit and deploy resources. It is perhaps these
resources, as much as the strategy involved which determines organisational
performance and competitive advantage.
18

Chapter 2: Setting the Research Agenda
2.1.4 IMPLEMENTATION AND FORMULATION
A formulated approach to strategy implies that the rigour of antecedent planning
activities lead to unproblematic implementation. However, one of the difficulties
for theorists and practitioners alike has been the placing of the strategy into effect
- implementation. As Giles (1990) succinctly describes:
If it were possible for an entire organisation to sing the same song from the same song sheet and face in the same direction at the same time, that would be a powerful force. If the song were good, the direction true and the timing right, it would be a serious threat to competitors (1991 :75).
This analogy reflects the orthodox VIew of strategic formulation and
implementation. But taking into account the notion of strategy formulation, on
returning to Giles' choral analogy we find a number of unanswered questions.
First we have a query about the origins of the song and who wrote it. It is naive,
indeed dangerous to believe that CEOs, given their self-interests and subjectivity
(Anderson and Payne, 1975; Ireland et aI, 1997), and outside planners with little
tacit knowledge of the firm and using almost universally applicable analytical
techniques and models (Capon et aI, 1980) can have total domination over the
planning process. What may be required is a hierarchical synthesis of the process
in order that the feasibility and implementability of the strategy can be gauged.
Mintzberg comments that "the classic view of the manager as planner is not in
accord with reality. If the manager does indeed plan, it is not by locking his door,
puffing his pipe and thinking great thoughts" (1994:99). A corollary of this is
developed in Section 2.3.
Next we find that improvisation has not been considered, a process that can be as
healthy in strategic planning as it can be for musical arrangement. It allows fine
tuning to take place according to the relative strengths of the group (or
organisation) within the bounds of needs, abilities and aspirations of members.
Improvisation emanates in an emergent fashion when errors are identified and
possibilities are considered and scrutinised. It is once this process takes place that
the choir or organisation can take the same song (agreed and feasible), knowing
that alternative versions (differing agendas) have been eliminated or minimised,
19

Chapter 2: Setting the Research Agenda
then face the same direction with the timing (knowledge and intent) that will
indeed pose a threat to competitors. It is better for a reasonable strategy to be
implemented fully and collectively than for an idealistic strategy to fail, either due
to the unreasonableness of its demands or the failure of implementation.
Mintzberg (1994) expounds the thesis that plans can arise without planners and
planning, planning can take place without planners and without producing a plan,
and that planners can exist without producing plans and without indulging in
formal planning. He contends that while plans are often made to include
flexibility, the process governing planning can be inflexible. In this regard he
points to the climate of planning, noting how Henri Fayol saw planning as a way
to constrict flexibility in order to specify a predetermined path towards which
resources could then be accurately directed. Mintzberg argues that the explicit
articulation of strategies also form the roots of inflexibility given that managers
and planners want their strategies to be successful and assume that they are
perfect. Any subsequent changes that may be needed as a result of externalities
will face stiff resistance because of the effect of undermining the
manager/planner's competence, however justified the changes may be. It is ironic
that the aversion to change that is so often to blame for the failure of
implementation may be present in the people who formulate the strategies at risk.
Another source of inflexibility is to be found in the conservatism of the process
itself (and which inspired Jelinek and Amar's (1983: 1) comment about "corporate
strategy by laundry list"). Mintzberg considers formally planned change to be
incremental (marginal and limited) in contrast with quantum change which may
entail an upheaval in the organisation. It is also generic in form, often based on the
structure of the organisation (Strategic Business Units). Difficulties then occur
because of the inextricable link between structure and strategy so that when the
company requires a rapid strategic response to discontinuities in the environment,
both strategy and structure are subjected to changes which, as have been noted,
provoke resistance. The dichotomy between internal stability and external
volatility becomes paradoxical as planning processes (and the planners
themselves) strive for an easily understood and passive environment in which
20

Chapter 2: Setting the Research Agenda
their well structured company with its 'grand plan' can position itself and gain
superiority.
In addition to the changes identified by Mintzberg in the classical planning
approaches is the disposition of managers who tend to opt for predetermined
strategies, thus bypassing the option of creating new strategies. The pertinent
causes of this are the previously mentioned conservatism of organisations and the
desire to engage in operationalisation rapidly. The 'off the shelf strategies to
which he refers fall into what he calls the 'positioning school' (Generic Strategies
and Portfolio Management are two cases in point). This approach to strategic
management has undoubtedly been successful to varying degrees but has come
under increasing scrutiny recently because of the negative effects it has on
managers to engage in strategic creativity (Snyder and Ebeling, 1993; Foss, 1996;
Finlay, 1998). It could be argued that this could lead to a choice of strategy that
has been well proven in particular industries but does not fulfil the requirements
or indeed take into account the idiosyncrasies of the industry in which it is to be
implemented. Prahalad and Hamel further this line of criticism:
It is not very comforting to think that the essence of western strategic thought can be reduced to eight rules for excellence, seven S's, five competitive forces, four product life-cycle stages, three generic strategies and innumerable two-by-two matrices (1989: 71 ).
Whereas Mintzberg's (1994) criticisms are aimed (at first sight) at the theorists,
Prahalad and Hamel's comments are directed to those responsible for planning in
companies because it is they who have the tacit knowledge of the organisation and
its environment, from which they can tailor the strategy to their needs. The
detailed exploration of the failure of strategic planning forwarded by Mintzberg
does, upon closer inspection, follows the view that planners are ultimately
responsible for the failure to plan effectively (besides all the problems of
implementation) because of their lack of creativity in such matters. He concludes
that two types of planners exist, one right-handed and the other left-handed. The
right handed planner is analytical and participates in strategic programming,
suiting categorisation as a classical strategic planner. Conversely, the left handed
21

Chapter 2: Setting the Research Agenda
planner (with dominant right sided neural motors influencing cognitive processes)
pursues synthesis planning in the knowledge that analysis should not preclude
synthesis as elaborate and thorough analyses are incapable of detecting
discontinuities.
It is precisely because analysis is not synthesis that Mintzberg proposes that
strategic planning is not strategic formulation, leading him to suggest that the term
"strategic planning" is an oxymoron. This is the basis upon which he calls the
process "a grand fallacy" (1994:321). A little reactionary perhaps but it is
interesting to note Whittington's observation that there is no equivalent to the
term 'Corporate Strategy' in the Japanese language (1993 :30), partly because of
the connotations of the word strategy. While in western culture strategy is seen as
a manner in which to achieve a future desired state, enshrined in eastern
philosophy is the belief that the arrival at a future state arises from a combination
of both luck and fate, forces beyond the control of mortal beings.
Irrespective of the differences between advocates of formation or formulation,
strategy necessarily implies the deployment of an organisation's resources. In the
next section, the study establishes what is understood to be meant by the term
resource, since this will become increasingly important as research questions are
developed in subsequent chapters. Furthermore, the links between resources,
process and competitive advantage are briefly considered.
2.2 RESOURCES AND ADVANTAGE
Central to this study are the following themes and concepts:
• Resources and assets
• Processes
• Competitive advantage
Their importance throughout this study makes it expedient to provide some
elaboration in order to avoid confusion and ambiguity.
22

Chapter 2: Setting the Research Agenda
2.2.1 RESOURCES AND ASSETS
Two terms are generally used to describe the property or possessions of an
organisation; assets and resources. Assets are "all the things accountants like to
write on the balance sheet" (Hay and Williamson, 1991: 11) and differ in terms of
whether they are fixed (to be used in the business and not designed to be resold
immediately) and current (short life and designed to be converted into cash).
Assets, from an accounting perspective, are characterised by their tangibility and
liquidity. Tangible assets normally include land, buildings, plant, machinery,
trading stock, fixtures, debtors, and cash/investments.
Resources can be considered to include all assets, capital equipment, raw
materials, organisational processes and attributes, information, and various kinds
of expertise, skills or knowledge that are controlled by the organisation
(Wernerfelt, 1984).
Resources are also seen to encompass "all assets, capabilities, organisational
processes, firm attributes, information, knowledge, etc. controlled by a firm that
enable the firm to conceive oland implement strategies that improve its efficiency
and effectiveness." (Barney, 1991: 10 1 emphasis added). Barney further suggests
three categories of resources with examples:
(a) Physical capital resources; technology, machinery, location, factor input
access.
(b) Human capital resources; "training, experience, judgment, intelligence,
relationship, and insights of individual managers and workers in a firm"
(1991:101).
(c) Organisational capital resources; stakeholder relations, planning and
decision making systems, control and reporting systems.
For the purposes of this study resource will be the term which refers to
organisational possession of value, unless a distinction is required or where
another writer has used the term asset. 10
10 'Possession' is used to imply ownership and to ensure a distinction, where necessary, between resources and intellectual property, i.e. through licensing.
23

Chapter 2: Setting the Research Agenda
2.2.2 PROCESSES
A process is a series of inter-related activities in which inputs are converted into
outputs. Essentially, the term process refers to activities which lead to the
transformation of resources. For instance, in the manufacture of a vehicle body
panel, the activities of melting, shaping, soldering and painting constitute the
process in which steel is transformed from ingots into the finished subassembly
(the door). In a service sector organisation such as a tour operator, the process of
combining flights, accommodation, insurance, transfers and excursions transforms
these individual inputs (some in-house, others from external suppliers) into the
product of a packaged holiday. Indeed, the strategic management 'process'
accords with this definition. In the classical sense, strategic management involves
certain inputs from internal and external evaluations which leads to a choice of
strategy and its subsequent implementation. The knowledge from these strategic
evaluations is transformed into a decision.
2.2.3 COMPETITIVE ADVANTAGE
Competitive advantage is a commonly used term which describes an
organisation's position of superiority relative to its rivals. It is not, however, a
static term. Rather, the dimensions of time and space determine its adequacy as a
descriptor of an organisation's prevalence within its competitive domain.
Consequently, sustainable competitive advantage is seen when a firm is
"implementing a value creating strategy not simultaneously being implemented by
any current or potential competitors and when these other firms are unable to
duplicate the benefits of this strategy." (Barney 1991: 102: original emphasis).
Rouse and Daellenbach (1999) have proposed that competitive advantage is
inferred from sustained periods of above-normal performance.
The identification of whom those rivals are against which an organisation's
advantage is given its relativity can be identified in a number of ways:
• Incumbent rivals in the industry's structure (Porter, 1980),
• Organisations within the same strategic group (McGee and Thomas, 1986)
• According to the cross elasticity of demand (Herbane and Rouse, 2000)
24

Chapter 2: Setting the Research Agenda
The degree (or outcome) of competitive advantage is a multifarious concept. It
could be measured in many ways including, inter alia, financial performance,
market share, brand loyalty, revenue growth, intellectual property rights, and the
inimitability of resources. Whilst performance is clearly a function of both
performance relative to rivals and the use of resources by managers, competitive
advantage suggests that there is an optimal use to which resources can be put in
the most attractive and profitable markets (Porter, 1980). Such an optimal use of
resources suggests the ability to identify and use those resources on the part of
managers responsible for strategic management (i.e. the top management team). In
turn, this presupposes rationality in the strategy formulation (although it is
recognised that strategy formation often lacks rationality by virtue of the absence
of a strategic decision). Next the literature surrounding managerial perceptions
and cognitive limitations is considered, leading subsequently to the stimulus for
this research study.
2.3 PERCEPTIONS AND STRATEGIC DECISIONS
Characteristic of strategic decisions is the uncertainty of outcome (Schwenk,
1984). Despite the systematic nature of a strategy formulation process, the fact
that no two strategies are precisely the same and their outcome cannot be known
ex ante, combined with the complexity of the organisation and its environment,
render the analysis and choice of a strategy an ambiguous, if not, problematic
process for senior managers (Mintzberg, et al., 1976). Anderson and Payne
(1975:814) summarise the problem as follows: "In strategy formulation the
critical area is not uncertainty per se but the processing of accurate information to
deal with uncertainty". However, the decision making problem resides principally
in that the accuracy of the information may be compromised by human actions
and intentions, and the subsequent use of the information is also constrained by
the individual's ability to make value of it (i.e., arrive at an optimal decision).
The notions of rationality in managerial behaviour and decision making have been
challenged since the early work of Simon (1957) and the behavioural theory of the
firm from the Carnegie School (March and Simon, 1958; Cyert and March, 1963)
through the notion of bounded rationality. This is where the individual (or a
25

Chapter 2: Setting the Research Agenda
collective) is cognitively impeded due to the inability to process infinite amounts
of information in a limited period of time, compounded by the differing
perspectives that individuals may have of a situation or environment. Festinger
(1957) proposed that 'cognitive dissonance' could be said to exist where an
individual seeks consistency in their beliefs by interpreting information or
external stimuli in such a way that existing beliefs are supported whilst conflicting
information is effectively (though subconsciously) disregarded. Although this
should not be taken to suggest that managers act irrationally in strategic decision
making, limited rationality presents what Eisenhart and Zbaracki (1992:22) term a
"heuristic perspective", whereby aspects of the decision making process can be
rational whilst others cannot. Indeed, early works in the field of policy and
planning suggested that the perception of the environment was as important as the
objective assessment of it (Weick, 1969).
The perceptions of managers and their influences on strategic decision making
have been the focus of much attention in the management literature, and latterly in
the strategic management literature. Studies by Child (1972) and Miles et ai.,
(1974) have both suggested that managers' perceptions of the environment
influence the choice of strategies designed to meet with changes which take place
beyond the organisation's boundaries. More recently, the view that perceptions
influence behaviour (i.e., decisions and actions) has been refined to include a
consideration of experiential influences, values and beliefs, and the filtering of
information in the development of managers' perceptions (Hambrick, 1984; Day
and Lord, 1992; Finkelstein and Hambrick, 1996). Others have examined the links
between managers' perceptions of the environment and organisational
performance (Dutton and Dukerich, 1991; Thomas, Clark and Gioia, 1993),
suggesting that there is a clear link between how managers perceive their
organisation and environment and how they subsequently act to achieve
predetermined goals. It has also been suggested that external influences have a
greater impact on manager's perceptions than functional experience and
conditioning (Chattophadhyay et al., 1999).11 Furthermore, the link between
II Nonetheless, associations between functional conditioning/experience and cognitive bias have been reported (Walsh, 1988; Hogkinson and Johnson, 1994), as have the impact of functional differences upon the perceptions of issues arising in a planning context (Barnes, 1984; Norburn. 1986; Ireland et aI., 1987).
26

Chapter 2: Setting the Research Agenda
managers perceptions and their relationship to specific strategies such as
diversification and new service development has been examined (Song, 1982;
Bantel and Jackson, 1989).
Furthermore, several studies have indicated that attempts to simplify the
complexity of planning activities leads to cognitive simplification which generates
perceptions that subsequently lead to decision making. For instance, Huff (1982)
suggests that the actions or decisions of rivals may lead senior managers to
'reformulate' their strategy because of strategic concepts borrowed from industry
experience, i.e. how other firms solved problems. In addition, concepts and ideas
may be transferred from past analogous experience and may also emanate from
the wider business environment (e.g. business press and industry associations).
The proposition of 'borrowed experience' is that the industry context influences
the manager's perceptions of strategic opportunities, ideas and concepts.
Schwenk (1984) proposed that cognitive simplification is observable in a variety
of ways; denying trade-offs, single-outcome calculation, reasoning by analogy,
representativeness, the illusion of control, prior hypothesis bias and escalating
commitment. The supporting work of Roll (1986), Tang (1988), Porac et ai ..
(1995) and Sellers (1997) indicate that when manager's perceptions of
competitive strategy are simplified through cognitive simplification or bias,
subsequent decisions or actions can lead to discernible shortcomings in
performance vis a vis the intended or existing strategy of the organisation
(Chapter 4).
It is axiomatic that the perceptions of managers and the priorities which they hold
will have an influence upon the strategic decisions they take (Knight et ai., 1999)
and the impact of such perceptions will be determined by the extent to which the
individual is subjected to cognitive distortion in group-decision making
environments and the degree of control over the strategic decision that she or he
can exert (Miller et al., 1998).
Moreover, the importance of the understanding that researchers have of managers'
perceptions has far reaching consequences for both normative and positive
theories in the management field. As Sutcliffe and Huber (1998) suggest:
27

Chapter 2: Setting the Research Agenda
Given that organisational actions are based in part on top managers' perceptions of their organization's environment, our ability to analyze, understand, and predict organizational actions and performances may be seriously constrained unless we recognise and account for differences in these perceptions (1998:794).
Perceptions of the external environment will reflect the manager's view of the
nature and degree of competition which the company faces, combined with a
perception of the resources with which the organisation must compete. This
suggests that managers will not only perceive both the internal and external
environments individually but may also have a specific perception of competitive
advantage - how an organisation can successfully achieve its goals using its
resources in the face of competition. Accordingly, such a perception of
competitive advantage will, it is suggested by the antecedent literature, have an
influence on the choice of strategies adopted by the organisation.
Bearing in mind that the understanding of managers' perceptions is an important
precursor to the evaluation of decisions and actions taken by them on behalf of the
organisation, we have, in essence, given rise to the major question that this study
sets out to address - how do managers perceive competitive advantage? Those
theories of competitive advantage that are the focus of this study, a residence
based view and a resource-based view, are reviewed in Chapter 3. Meanwhile, the
industry environment which, it is also argued, may influence perceptions of
competitive advantage is discussed in the next chapter. The choice of a single
industry as the domain for this study is clearly important to provide the
opportunity to capture, identify and explore industry-level factors which may
explain the perceptions of managers since not only will they influence their
perceptions, they may have given rise to them in the first instance.
It is no coincidence that there should be a study of perceptions of competitive
advantage that examines the resource-based view (RBV) of the firm. Well
regarded as one of the founders of the RBV, Penrose (1960:22-23) made the
observation that the rate and method of growth (i.e., strategies) of a firm are
constrained by the knowledge and experience (coloured by the perceptions) of its
28

Chapter 2: Setting the Research Agenda
managers. Although her observation has not been reported in other RBV studies,
it is with this in mind that the study is fomented.
However, for the purposes of this study, actual performance is not a central issue,
since the focus resides in the perceptions of managers about the sources (and
theories) of competitive advantage, rather than its outcome.
2.4 CHAPTER SUMMARY
Strategic management is concerned with the use of resources to achieve
predetermined goals achieved through a process of strategy formulation to achieve
competitive advantage. Terms within this definition have been examined and
clarified since they will be used frequently during the progression of this thesis.
Although advocates and observers of strategy formation suggest that important
strategies may emerge, the suggestion is not that formal planning should be
abandoned but rather that planning activities are, by their very nature, limited by
the managers involved. Indeed, it has been suggested that the perceptions of
managers influence not only the analytical activities of the planning process but
also the choice of strategy that the organisation may subsequently follow.
Accordingly, the research stimulus for this study is:
To examine managers' perceptions of competitive advantage.
In the next and following chapters, the research stimulus is developed into a series
of testable research questions. In the next chapter we examine the industry context
in which the study is domiciled.
29

Chapter 3: The Industry Context
Chapter 3 - The Industry Context
3.1. INTRODUCTION
This chapter examines the specific nature of the automotive industry given that it
is the industry within which the study is domiciled. Combined with the micro
theoretical context (Chapter 4) a basis is formed for the development of the
research strategy, data collection and analysis. Furthermore, this chapter provides
a foundation for the interpretation of data in Chapters 6 and 7.
The automotive industry, and specifically the automotive components sector, has
been chosen due to the significant changes that have taken place in the last one
hundred years. Important for this study is that this industry provides a research
setting where changes in industry structure (through consolidation, strategic
alliances and changing buyer-supplier relationships) have clearly been undertaken
in the search for further sources of competitive advantage through position or
residence. Equally, the way in which organisations use their resources (whether
focussed in terms of final assembly or in a broad manner with integrated supply
chains) has also changed. Accordingly, this chapter leads to the development of
the principal research question which addresses the impact of industry structure
upon competitive advantage and the use of resources to gain competitive
advantage.
This chapter commences with by a historical overview of the automotive industry,
theories of outsourcing and market exchanges, and developments in the buyer
supplier relationship which have become a model of best practice employed in
other industrial sectors.
3.1.1 DEFINITIONS
The 'automotive industry' is a term of such clarity and ambiguity that it could be
defined in terms of all organisations involved in the production, distribution and
supply of motorised vehicles. For the purposes of this study, there is a need to
distinguish between differences in motor vehicles and differences among those
30

Chapter 3: The Industry ('on/ext
organisations with the supply chain and between original equipment and
aftermarket components.
Broadly speaking, two markets exist within the automotive industry; cars and car
based light vans represents the first with commercial vehicles such as buses,
articulated lorries, rigid trucks and non car-based vans within the second (Trade
and Industry Committee, 1985). However, this nomenclature exists alongside
others which distinguish between passenger cars, light commercial vehicles
(LCY) and heavy goods vehicles (HGY). LCYs cover car-derived vans (less than
1.8 tonnes) and vans (between 1.8 tonnes and 3.5 tonnes). The HGV market
includes vehicles over 3.5 tonnes, such as fixed and articulated trucks, buses and
coaches but excludes military and agricultural vehicles (SMMT, 1999).
The House of Commons Select Committee Report (1987: 1) defined the motor
components industry as subcontractors and suppliers of "components forming part
of or fitted as standard to on-road vehicles powered by internal combustion
engines12, but excluding in-vehicle entertainment, accessories and liquids".
Original equipment (OE) refers to components which are fitted to the vehicle at
the time of manufacture, whereas aftermarket (AM) components are replacements,
often non-durable and, in some cases, may not be produced by the same
manufacturer of original equipment.
3.1.2 THE SCALE AND SCOPE OF THE UK AUTOMOTIVE INDUSTRY
Of the 10,000 to 15,000 components in a passenger car, around 70 per cent of its
value is represented by the cost of components (Womack et al., 1990). In 1998,
UK based car production stood at 1,748,305 units in proportion to the 2,247,402
vehicles registered (Table 3.1 ).13 This level of production represented over 12 per
cent of total EU production. In general automotive terms, the UK has some 40
12 This term refers to power generated through the combustion of petroleum liquid and air. Such engines can take four forms; two-stroke, four-stroke, diesel and rotary (Wankel). 131n the UK market sales are based on registrations, i.e. the number of new vehicles whose ownership has been transferred from the assembler via the Driver and Vehicle Licensing Agency (DVLA). This does not always equate to sales to the consumer or the fleet buyer as many motor vehicle dealerships 'pre-register' the vehicle and store the 'registered' vehicle until its sale. However, the number of pre-registered vehicles is not measured.
31

Chapter 3: The Industry ('on/ext
assemblers of cars, vans, trucks and buses (SMMT, 1999).14 The Society of Motor
Manufacturers and Traders (SMMT) estimates that 330,000 people work directly
in the assembly or supply stages of the industry in the UK, with another 460,000
employed in retail, wholesale and distribution. Combined with automotive
assembly, the motor industry has a turnover of around £40bn per annum,
representing over 5 per cent of UK gross domestic product, comparing favourably
to the EU average of 1.6 per cent (SMMT, 1999). It has been estimated that there
are 7,000 automotive component manufacturers employing 150,000 people, with a
combined turnover of £12bn (Auto Industry, 1999).15 In 1995, exports of UK
manufacturing components were valued at £6.2bn from its level in 1993 of
£4.8bn. In spite of this, the trade deficit has widened with little amelioration
associated with favourable exchange rates in the mid-late 1990s.
Year UK Registrations UK Production EU Production 1988 2,215,574 1,226,835 1989 2,300,944 1,299,082 1990 2,008,934 1,295,611 1991 1,592,326 1,236,900 1992 1,593,601 1,291,880 1993 1,778,426 1,375,524 1994 1,910,933 1,466,823 1995 1,945,366 1,532,084 12,636,067 1996 2,025,450 1,696,134 13,061,348 1997 2,170,725 1,698,015 13,451,272 1998 2,247,402 1,748,305 14,510,472
Table 3.1: UK/EU Motor Vehicle Production and UK Registrations 1988-1998
Sources: Society of Motor Manufacturers and Traders (SMMT) European Automobile Manufacturers Association (ACEA)
Among the UK volume producers, capacity utilisation (i. e. the proportion of
production capacity actually used at a given point in time) varied between 47 and
96 per cent in 1997 (Table 3.2). Notably, greenfield plants account for some of the
best capacity utilisation figures (75-96%), although it should be noted that this is
in part due to the lower number of models produced in the plant, which tends to
reduce the variability of demand.
14 The seven major volume manufacturers are Ford, Nissan, Vauxhall (General Motors), Honda, Toyota, MG Rover, and Peugeot (PSA). 15 The number of automotive component suppliers is difficult to determine accurately. Chapter five, however. addresses this issue and its implications for sampling.
32
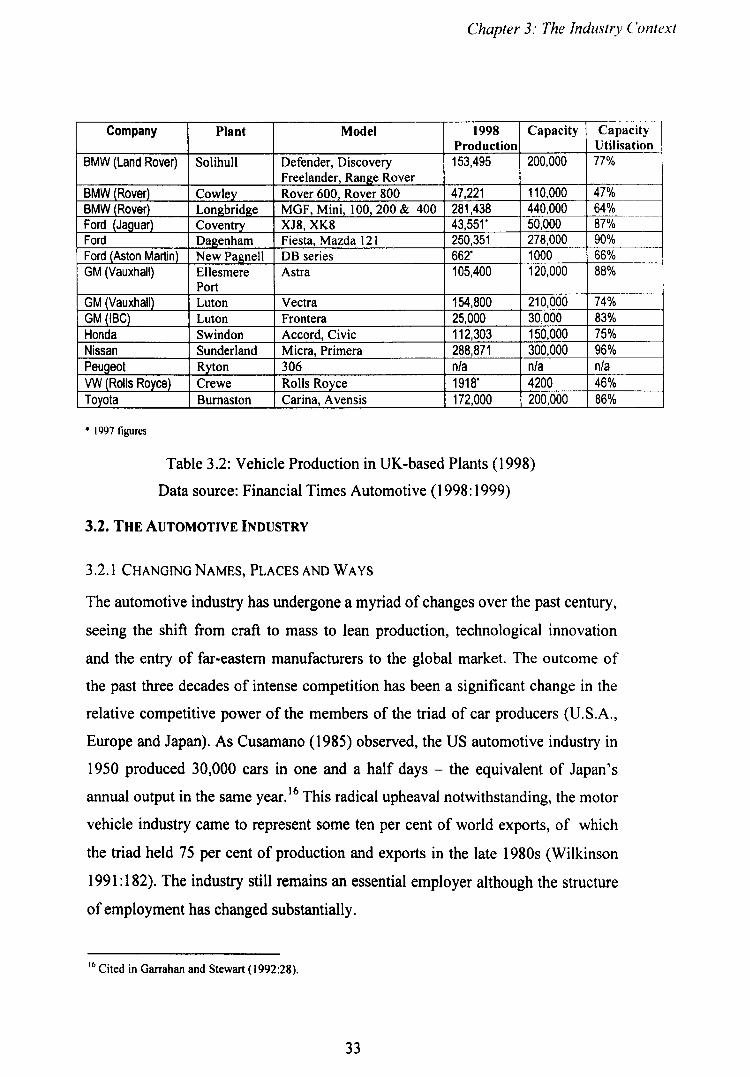
Chapter 3: The Industry ('ontext
Company Plant Model 1998 Capacity Production
BMW (Land Rover) Solihull Defender, Discovery 153,495 200,000 Freelander, Range Rover
BMW (Rover) Cowley Rover 600, Rover 800 47,221 110,000 BMW (Rover) Longbridge MGF, Mini, 100,200 & 400 281,438 440,000 Ford (Jaguar) Coventry XJ8, XK8 43,551' 50,000 Ford Dagenham Fiesta, Mazda 121 250,351 278,000 Ford (Aston Martin) New Pagnell DB series 662' 1000 GM (Vauxhall) Ellesmere Astra 105,400 120,000
Port GM(Vauxhall) Luton Vectra 154,800 210,000 GM (IBC) Luton Frontera 25,000 30,000 Honda Swindon Accord, Civic 112,303 150,000 Nissan Sunderland Micra, Primera 288,871 300,000 Peugeot Ryton 306 nfa nfa VW (Rolls Royce) Crewe Rolls Royce 1918' 4200 Toyota Bumaston Carina, A vensis 172,000 200,000
• 1997 figures
Table 3,2: Vehicle Production in UK-based Plants (1998)
Data source: Financial Times Automotive (1998: 1999)
3.2. THE AUTOMOTIVE INDUSTRY
3.2.1 CHANGING NAMES, PLACES AND WAYS
Capacity Utilisation 77%
47% 64% 87% 90% 66% 88%
74% 83% 75% 96% nfa 46% 86%
The automotive industry has undergone a myriad of changes over the past century,
seeing the shift from craft to mass to lean production, technological innovation
and the entry of far-eastern manufacturers to the global market. The outcome of
the past three decades of intense competition has been a significant change in the
relative competitive power of the members of the triad of car producers (U.S.A.,
Europe and Japan), As Cusamano (1985) observed, the US automotive industry in
1950 produced 30,000 cars in one and a half days - the equivalent of Japan's
annual output in the same year, 16 This radical upheaval notwithstanding, the motor
vehicle industry came to represent some ten per cent of world exports, of which
the triad held 75 per cent of production and exports in the late 19808 (Wilkinson
1991: 182), The industry still remains an essential employer although the structure
of employment has changed substantially,
16 Cited in Garrahan and Stewart (1992:28).
33

Chapter 3: The Industry Context
The reasons for the relative changes of power within the triad (and the emerging
'Asian Tiger' nations) have frequently been attributed to low wages, workaholic
employees, a "mysterious culture' and a competitive currency, but increasingly
there has emerged the realisation that these explanations have been too simplistic
at best and naive at worst. The relative changes have come about because of
different strategies between incumbents in the east and west. As Samson
succinctly describes:
Japanese strategy was (and is) simple and rather straightforward: First the Japanese came to the United States to study techniques, make contacts, become aware of marketing problems and uncover weaknesses. The second stage involved returning home to train workforces in foreign ways while adapting native Japanese practices to the new technologies and simultaneously enter into licensing agreements with the Americans. During this period Japan's government would erect import barriers to foreign competitors. The third stage involved Japanese firms uniting, under MITI's direction, to attack the American market. The product was sold underpriced with the aim of conquering a large market share as soon as possible. During the fourth phase, the Japanese would upgrade their product to take over higher priced segments (1993:60).
However, in November 1980 the U.S. International Trade Commission concluded
that the US automotive industry was not being affected simply by Japanese
imports per se, but that it had brought upon itself demise through not altering its
production to smaller cars when the demand for such vehicles was in fact rising.
The loss of market share to the Japanese resulted when the latter provided
products to fill the gap (Wilkinson 1991: 186). In addition to this, Japanese
assemblers' greenfield based plants integrating lean manufacturing and flexible
manufacturing systems (the ability to produce different models using essentially
the same machinery and tooling arrangements) allowed them to efficiently
produce a differing range of products such as Multi-Purpose Vehicles (MPVs),
Four Wheel Drive vehicles (4WD), sports cars and city cars, each appealing to
different niches in the market as and when they appeared. The Japanese
manufacturers' view of the car market pays scant regard for the view that the car
industry is mature. Indeed, it reflects the views of Hamel and Prahalad who note:
34

Chapter 3: The Industry Context
What most executives mean when they label a business mature is that sales growth has stagnated in their current geographical markets for existing product sold through existing channels. In such cases it is not the industry that is mature but the executives' conception of the industry (1989:73).
More recently the industry has experienced a spate of strategic alliances and
mergers, as a result of which American and European assemblers have become
more competitive in the short term, General Motors (G.M.)/Toyota and the now
defunct HondaIRover alliances are cases in point. In the former alliance GM
improved dramatically as a result of a temporary alliance and started 'afresh' with
the Saturn subsidiary manufacturer based on a greenfield site in Nashville,
Tennessee. It now produces a sub-compact (hatchback) sized car that rivals
Japanese equivalents in both price and quality. In the late 1990s, Daimler and
Chrysler merged (1998) and Ford acquired Volvo and Land Rover (1999 and
2000 respectively).
The full effects of the industry'S upheaval are not fully clear but American motor
managers are finally re-assessing the reasons for their previously indomitable self
confidence. It is clear however that the producer of the twenty-first century now
requires well established J.I.T. (Just-in-time) delivery and lean manufacturing
systems, a flexible and highly skilled workforce and far reaching ties with
component suppliers in order to facilitate a rapid response to changing customer
requirements (increasingly seen through 'lean retailing'). The principle of high
volume production will be replaced by shorter production runs as a result of more
frequent product changes. The core skills of the Japanese automobile industry are
succinctly described by Carr and Truesdale (1992):
Japan's car industry is highly competitive. The car assemblers take only 17 hours to assemble a car compared with 25 hours for US assemblers and 37 hours for European assemblers. New car models take an average of only 43 months to develop compared with 62 in the U.S.A. and 63 in Europe. 17 (1992:49)
17 R&D lead time is often measured from 'styling freezc' (the dccision to proceed with a givcn design of vehicle) to 'job I' (production). Measures of R&D include time, cost, percentage of 'carry-over' parts from other or previous models, and R&D man hours.
35

Chapter 3: The Industry Context
Table 3.3 shows the structure and ownership of the European automotive
assembly industry in the late 1990s, denoting a degree of consolidation which has
implications for suppliers (Section 4.6). Further, it indicates that seven 'parent'
assemblers account for the ownership of 25 of the 29 volume produces located in
Europe. Renault and the Japanese producers are the exception with Renault
ranking fourth in tenns of units produced. By virtue of the lack of
merger/acquisition activity and the relative brevity of their presence in Europe,
Honda, Nissan, Toyota and Suzuki occupy positions nine to twelve. Unlike their
dominance globally, Ford and General Motors occupy rankings four and SIX,
behind the European leader, Volkswagen AG and PSA.
Parent Rank Production (1997) SubsidiarylDivision of: Alfa Romeo Fiat Aston Martin Ford Audi Volkswagen BMW ./ 7 1,120,450 Chrysler Benz ./ 8 908,773 Citroen PSA Ferrari Fiat Fiat ./ 5 1,542,610 Ford ./ 3 1.780,079 General Motors (GM) ./ 6 1,440.794 Honda ./ 10 108,097 Jaguar Ford Land Rover Ford Magna Steyr Puch GM Maserati Fiat Mercedes Benz Daimler Benz Nedcar 197,000 Mitsubishi!Dutch State! Volvo Nissan ./ 9 357,430 Renault (36.8% stake 1999)
Opel GM PSA ./ 2 1,897,643 Renault 4 1,632,382 Rolls Royce Volkswagen Rover BMW Saab GM Seat Volkswagen Skoda Volkswagen Suzuki ./ 12 92,256 Toyota 11 104,615 Vauxhall GM Volkswagen ./ 1 2,449,754 Volvo Ford
Table 3.3: Structure and Ownership of the European Volume Assemblers (1997)
Source: Production data: FT Automotive (1998) Author's analysis
36

Chapter 3: The Industry Context
3.2.2 THE CASE OF EUROPE AND THE CHANGING SUPPLY CHAIN
Before the mid-1980's, the European market for assemblers could have been
described as 'insular' with indigenous assemblers commanding a great proportion
of the home market-share (Austin Rover in the UK, Renault in France, Fiat in
Italy and Seat in Spain). In 1986, however, the status quo was shattered by the
opening of Nissan's Sunderland plant, a move prompted by the Japanese
manufacturers' need to circumvent tariff barriers for non-EC produced cars
(Garrahan and Stewart, 1992). The choice of country was, in part, influenced by
lower relative wage costs, weakened trade unions and a pro free-market
government that welcomed overseas investment.
Other factors such as the high value of the Yen and lower overseas production
rates played their part in this type of growth/market penetration strategy, also
assisting in the hedging of currency and economic risk. In the following years,
Honda (having collaborated with Rover since 1979), Toyota and IBC moved to
Britain. By 1997, Honda, Nissan and Toyota accounted for 27.4 per cent of UK
passenger vehicle production, comprising of 484,416 units of production (FT,
1998a).
Nevertheless, fears regarding local parts content (the value of the vehicle on
completion less overseas input elements) and the possibility of the Japanese
quickly gaining market share at the expense of indigenous assemblers, were
voiced. Consequently the Japanese assemblers agreed to self limitation in addition
to mandatory market share restrictions (the same concept but known as the
Voluntary Export Restraint had been self imposed by the Japanese in the case of
the US market).18 The European Commission ruled in 1991 that the European
market would gradually be opened to the Japanese, from 11 per cent to 16 per cent
in 1999.
18 Many arguments in respect of parts content and the location of value-added creation mirror those associated with transfer pricing (Cravens, 1997).
37

Chapter 3: The Industry Context
There are problems arising from the dichotomy of views of the pro-Japanese and
anti-Japanese nations (for reasons of the aforementioned 'insularity'), the most
vociferous of the latter coming from France and Italy. Further to this is the
question of the nationality of cars produced in 'transplant' factories. The
European Commission has been evasive in the clarification of this grey area but it
appears that any excessive (or threatening?) transplant production will be offset
against Japanese imports to the European Union. The parts content debate has
always aimed to appeal to partisan feelings but oncemore, the Japanese have
learnt from their US experience and have initiated production with parts content
values of between 60 and 83% (the Nissan Micra), far above the initial levels in
the US.
3.3. INCREASED OUTSOURCING
3.3.1 To MAKE OR BUY?
Before examining the increased level of outsourcing, it is appropriate to consider a
broader theoretical discussion of why organisations within the automotive
industry choose to develop in-house or outsourced operations for the provision of
inputs such as components, parts and raw materials.
Coase (1937) proposed that the existence of firms was predicated on the ability to
reduce the costs of economic coordination. When the benefits of using market
coordination (i.e. third party buyers and suppliers) rose above those incurred by
in-house operations, the latter would be chosen. However, the limits of growth,
Coase argued, would arise when marginal bureaucratic costs - the costs of
coordinating an ever larger organisation - exceeded the benefits achieved from
growth and internalised resource and activity coordination.
Since Coase's propositions, the degree to which an organisation should pursue
integration along its supply chain (vertical-forward or vertical-backward) has been
informed by a number of different perspectives, including transaction costs, asset
specificity, and the differential between market and transfer prices. Clearly, an
organisation must have requisite resources to do so, but the factors noted above
38

Chapter 3: The Industry Context
have been deemed worthy indicators of the value and feasibility of vertical
integration.
Since all organisations carry out transactions, whether internally through its value
chain, or externally in buyer-seller exchanges there must be costs associated with
carrying out such exchanges other than those directly linked to the unit cost of
production. The importance placed on the choice of vertical integration in the
context of transaction costs originates from the work of Williamson (1975) who,
in a development of Coase's work, proposed that efficiency could be maximised
by the governance mechanism which minimised the cost of exchanges (or
transaction costs) of the firm. This 'transaction costs' approach posits a choice
between a market relationship with upstream and downstream firms, characterised
by the possibility of opportunism and power-dependency levels, or incur the
immediate costs of vertical integration (hierarchies) followed by the costs of
increasing the size and structure of the organisation. The assumption of 'markets'
as a governance mechanism is that such exchange relations are governed by
irrationality and self-interest seeking with guile connoting that loyal behaviour
cannot always be elicited from suppliers or buyers compared with internal
'hierarchies'. In addition to the supposed risk of external exchange relations,
Williamson suggests that several types of costs are associated with a contractual
relationship with an external organisation upstream or downstream:
1. search and information costs (for initially selecting suppliers or buyers)
ii. drafting, bargaining and decision costs
111. costs of safeguarding an agreement (legal expenses)
IV. monitoring and enforcement costs
v. bonding costs (learning about the supplier)
Vl. maladaptation costs (Williamson, 1979).
These costs combine to constitute transaction costs. A co-operative and ongoing
relationship with organisations is necessary to reduce the impact of the six costs
identified above. Initiatives such as supplier development programmes, 'open
book accounting' (where a buyer is entitled to view the supplier's detailed
39

Chapter 3: The Industry ('on/e.'a
accounting information) and 'cost transparency' (where a buyer is able to
scrutinise the supplier's costs of manufacture) have indirectly contributed to the
lowering of transaction costs (Lamming, 1993). Furthermore, organisations may
find that they must also invest in relationship-specific assets in order for a trading
relation to commence and progress. These could take the form of specialised plant
and equipment, proprietary software or dedicated logistics systems. Such 'asset
specificity' (Riordan and Williamson, 1985) arises where some of the assets and
resources of an organisation are uniquely associated with servicing a specific
supply relationship with another firm and could not be put to alternative use
without significant modification and cost. The traditional notion of asset
specificity signified assets specifically designed for use in exchanges with a single
buyer organisation. The supplier bought and owned the asset thereby presenting
the risk that the owner of the assets may face opportunistic acts from a buyer or
supplier in the appropriation of further revenue due to shifts in the power
dependence relationship. A development of this can be seen in the automotive
industry where a car assembler may pay for the tooling costs and owns the
equipment used by a supplier of components situated in a dedicated production
cell. Whilst the tooling could be adapted for use with other variants for other
assemblers this is practically impossible. Ownership of the tooling assets by the
buyer allows it to repatriate the equipment from the supplier's factory in
exceptional circumstances. In this case, idiosyncratic assets are owned by both the
supplier (the production cell) and the buyer (the tooling). 19
From a supply chain perspective, transaction costs suggest that managers within
organisations trading goods and services will not only face bounded rationality
but will act on the basis of foresight, self-interest and opportunity - they will seek
to achieve the best outcome in terms of the reduction of transaction costs
underpinned, wherever possible, by transaction specific assets. The motives of the
human actors concerned, coupled with the transaction as the basis notion of
analysis are important considerations in the transaction costs approach. So, whilst
this would seem to advocate the pursuance of selfish and extortionate
relationships with firms in the supply chain, where transaction costs are lower in-
19 Based on an interview with a UK plastic mOUldings company supplying to the car industry.
40

Chapter 3: The Industry Context
house such integration should be sought since "governance is a means by which to
infuse order in a relation where potential conflict threatens to undo or upset
opportunities to realise mutual gains" (Williamson, 1999: 1090 original emphasis).
The decision to integrate activities within an organisation or to outsource them to
external parties is commonly known as the 'make or buy' decision. Amongst the
factors under consideration are the proprietary value of activities, the availability
and capability of external sources of supply, the strategic impact of the activity in
the context of the organisation's operations and the differential between transfer
prices and market prices. Market prices are based on the actual (or forecast) prices
charged by supplier and include overheads and a 'mark-up' In contrast, transfer
prices are internal prices charged within the divisions of an organisation as
throughputs pass along the internalised supply chain. Where the transfer price of a
component or product is less than the market price, vertical integration can be
justified in terms of direct financial benefit. Transfer prices are normally found in
organisations with divisionalised structures which operate a profit centre approach
to internal financial control. Generally, there are two ways in which transfer prices
are determined. In the first, prices are determined on the basis of market prices.
Here divisions simply trade throughputs between themselves, charging prices to
the receiving division which reflect external prices for equivalent throughputs.
The problem surrounding this method is that whilst creating a relatively uniform
and well understood approach to setting prices, it achieves little to encourage
improved linkages between divisions. The second method, using cost based
accounting measures, enables managers to measure the actual cost of throughputs
traded between divisions in the internalised supply chain, identify areas in which
inefficient practices and activities are located, and thereafter initiate improvement
measures.
Standard costing methods also ensure that an upstream division does not inflate its
transfer price in order to create the impression that it adds greater value than other
parts of the internal supply chain. In particular, those divisions which are located
downstream would face the predicament of receiving parts from upstream which
already has an inaccurate and inflated transfer price. Do they set their own transfer
price incorporating the already inflated transfer price charged to them upon receipt
41
Chapter 3: The Industry Context
of goods from upstream? If so, this would maintain their contribution to the
transformation process but exacerbate the problem as they subsequently charge a
transfer price to a downstream division receiving its outputs. Alternatively, they
could set their transfer price at a level which reflects the true value of the goods
produced thus far within the internal supply chain (if they knew the amount by
which their upstream division had inflated its prices by). In so doing, this would
lower the apparent 'contribution' made by this division within the context of the
overall transformation process. Such divisional behaviour could lead to inaccurate
reporting and comparisons between divisions, with an augmented potential for
conflict. The strategic importance of transfer prices can be seen in terms of the
way in which an organisation grants autonomy to divisions that are still reliant on
the acquisition of inputs and the dispersal of outputs within the larger company
structure, enabling each division to develop a true picture of its performance
relative to other divisions and rivals within its industry (Hay and Williamson,
1991).
Beyond the boundaries of an organisation, transfer pricing systems have
ramifications for stakeholders and are subject to macro-environmental influence.
For instance, transfer pricing has been used by multinational organisations as a
method by which a higher proportion of added value is retained in the country of
origin, simultaneously reducing some of the resistance to FDI in other countries
and the corporate tax burden in overseas locations with higher fiscal rates than in
the home country. This is achieved by raising the transfer price at the point at
which goods are sold to the overseas division located in a high tax country. Whilst
fiscal objectives remain a predominant driver of transfer pricing, it is suggested
that it encourages division or subsidiary managers to seek internal sources of
supply rather than external sources and provides a partial hedge against currency
fluctuations for multinationals companies. Finally, it allows organisations to
sustain operations in countries facing economic difficulties by lowering the
transfer price to the country concerned, reducing the impact of the poor economic
conditions and retaining operations in order to maintain good relationships with
local governments and employees (Cravens, 1997).
42

Chapter 3: The Industry ('on/ext
Agreed upon motives for vertical integration include strategic considerations,
output/input price discrepancies and uncertainties about costs/prices (Mahoney,
1992). Strategic considerations include creating barriers to entry and the ability to
control supply to smaller rivals in an industry. A reduction in the number of
suppliers could also lead to an increase in the prices faced by rivals that have not
pursued vertical integration. Vertical integration eliminates the need to pay the
prices set by a supplier, which may be exacerbated if the supplier enjoys a
commanding position within the market (monopoly, duopoly, etc.). Vertical
integration also appeals to those organisations which seek to reduce uncertainty in
terms of price and quantity of supply, which can affect production scheduling and
price setting to downstream organisations. It has been suggested elsewhere that
the cost of securing supply in the form of backward integration should be
considered a proxy insurance premium (Adelman, 1949). Vertical integration is
also argued to reduce uncertainty concerning the quality of components, products,
and retailing, and reduces the unexpected expropriation of technical know-how.
It has been proposed that five main advantages of vertical integration exist: profit,
co-ordination and control, audit and resource control, motivation and
communication (Mahoney, 1992). Senior managers have the authority to control
and organise the behaviour of managers within the organisation. Beyond its
boundaries, senior managers have to rely on good relations at best and litigation at
worst. Vertical integration enables the organisation to make resource allocations
with more complete information about activities since one firm's senior manager
has no automatic legal right to audit the activities of another. It is suggested that
as vertical integration increases so too does the number of intra-organisational
exchanges, generating a greater sense of collective benefit and security. Finally,
the use of standardised and established communications (LT. and financial
systems) within an organisation is preferable to the link between two
organisations with incompatible systems. Were a supplier to have compatible
systems, a transaction cost approach would argue that the risk of opportunism
would favour the choice of vertical integration.
Three major areas of cost disadvantages may accrue to vertically integrated
organisations; structural, strategic and production. Vertical integration,
43

Chapter 3: The Industry ('ontext
particularly where this is through acquisition or merger which accelerates the
speed of change, inevitably increases the size of an organisation's structure. In so
doing, vertical integration raises the costs of control and co-ordination. Vertical
integration requires the management of a wider variety of tasks. A lack of
familiarity with these tasks and a dilution of managerial skill sets may also raise
costs in terms of lower effectiveness relative to the pre-integration structure. In
removing the competitive market pressures which previously drove areas of the
business to continuously improve, the creation of a secure market for a supply
division may lead to complacency which erodes the advantage of market prices.
The 54-day long strike at General Motors in June-July 1998 was provoked by the
decision of senior managers to reduce internal supply division costs which were
comparatively higher that those from external suppliers, otherwise outsourcing
would occur. Taken together, the suggestion is that internal costs may be higher
than those available from third parties and may lead to an outsourcing decision.
One solution (albeit a partial one) is tapered vertical integration, whereby an
organisation has simultaneous in-house and an external sources of supply (Porter,
1980)?O
Exit barriers (Harrigan, 1980) and costs may rise as an organisation increases its
strategic, financial and operating commitment to specific industries, markets or
products. This will depend on the degree to which the vertical integration is
focussed on few or many products. Vertical integration may also lower an
organisation's access to valuable tacit information from independent buyers and
suppliers who may well also transact with the organisation'S direct rivals. The
investment in idiosyncratic assets may also depress financial performance.
The resources directed toward vertical integration could be more usefully
deployed in creating process improvements elsewhere in the organisations core
processes. Furthermore, if production capacity is under-utilised, the over-capacity
is spread across a longer series of processes compared with a less integrated
organisation which can simply reduce the quantity of supplies it requires to meet
20 Albeit advocated originally by Porter as a way of strategically managing a manufacturing capacity deficit or signalling that an organisation poses a credible threat of integration to shift bargaining power ( 1980:319-20).
44

Chapter 3: The Industry Contexl
downstream demand. It has been estimated that over-capacity In the global
automotive industry stood at between 25-30 per cent in 1998, with Europe facing
30 per cent overcapacity in the same period (Brown, 1999).
The lessons to be learnt from a high level of in-house production have been
available since the early years of the automobile industry. Abernathy and Wayne
(1974) recount the development of the Ford Motor Company and its River Rouge
plant in their longitudinal study to derive the 'limit' of the learning curve (which
they contend is the point at which a new product introduction is made). The
excessive degree with which Ford sought to develop economies of scale and
production based learning so as to steepen its experience curve created
manufacturing and production inflexibility. The Model T was first produced in
1907 and retained its original chassis and engine compartment throughout its life
whilst peripheral improvements were made as a result of increased buyer
education and an improved road network.
By this stage however, the Model T had become a technologically outdated
product and in May 1927, the River Rouge Plant was closed for an entire year in
order to re-organise and re-tool production facilities, a period in which market
leadership was conceded to General Motors (Abernathy and Wayne, 1974: 115).
This is a harsh and early lesson of growth based on extensive vertical integration.
There are many compelling reasons to engage in the outsourcing of activities.
Some are more beneficial in a strategic (i.e., long-term and organisation-wide)
way. As a method by which managers can reduce wage costs, industrial disputes
and higher productivity, outsourcing is only a short term-solution. Outsourcing
based upon a focus on expertise and technology is, perhaps, more beneficial than
the former.
45

Chapter 3: The lnduslry COn/exl
3.3.2 AN INDUSTRY PERSPECTIVE
The transaction costs perspective (section 3.3.1) suggests that in the absence of
lower 'hierarchy' costs, transactions should be undertaken using the 'market' as a
governance mechanism.21 In the latter, exchanges can be thought to resemble a
form of collaborative self-interest, where asset specificity and repeated exchanges
suggest collaboration/commitment but where the self interest of the human actors
(i.e. senior managers) may become manifest as they seek to achieve their own
organisation's objectives.
The 1980s and 1990s were characterised by sweeping changes in the automobile
industry on a global scale. By this time, components from outside suppliers had
come to constitute between 50 and 70 per cent of the production costs of a vehicle
(the former applicable to non-Japanese assemblers and the latter to Japanese
assemblers. Bertodo, 1991a). Despite this however, core and high added-value
components such as major engine components, chassis and body panels have
remained a strictly in-house activity.22 Component costs have, during much of this
time, been far from the controlling grip of the assemblers but with the
overcapacity crisis in the developed world's car market becoming ever greater
(Brown, 1999), most car manufacturers have placed greater importance upon re
evaluating the relationship between themselves and their suppliers. This process
has been underway in the US since the early 1980s and by 1990 the shakeout in
the US sector has reduced the number of players by a third to 2000.
Throughout the global automotive industry, purchasing operations have become a
target for reducing and shifting the cost burden of assemblers. Among the
suppliers, many of them have found themselves facing the dilemma that in order
to secure long term contracts with assemblers they must cut prices, show an
earlier commitment toward product development and finance the R&D for
21 Further expositions of the transaction costs approach include: Williamson, 1979; Williamson, 1983; Williamson, 1985; Hill and Kim, 1988; Williamson, 1988; Walker and Poppo, 1991; Alvesson and Lindkvist, 1993; Zajac and Olsen, 1993 and Williamson, 1999.
22 What is generally understood to be a 'chassis' in a motor vehicle (the subframe onto which major mechanical components as fitted) is currently referred to as the 'automotive underbody'.
46

Chapter 3: The Industry Contexl
appropriate components. This change from in-house production to outsourcing
during the 1980's is well documented (Bertodo, 1991a-f, Lamming, 1993).
Additionally, there have been increasing pressures from suppliers to introduce
commonality of components for extensive use across model ranges and the new
demands for modular production whereby the component forms part of an
integrated system or 'sub-assembly' (e.g. Fuel Injection and Anti-lock Braking
systems).23 Suppliers have also felt the demands for improved component quality
given the importance placed on defect and 'hospital bay' rate reductions by the
US and European assemblers that have placed great priority on this as it has
become one of the Japanese assemblers' key sources of competitive advantage
(Womack et al., 1990).
A significant and polemic figure in the automotive industry in recent years is Jose
Ignacio Lopez de Arriortua, the former worldwide parts purchasing chief at
General Motors who in 1993 left the Detroit-based car giant for a similar position
at Volkswagen. His 'defection' is neither anecdotal nor trivial. He is the
embodiment of the new emphasis being placed on component manufacturers in
order to improve quality, costs and overall competitiveness. After the automation
debacle at G.M. in the late 1980's (in which G.M. invested heavily in automation
in the view that it was the key to competitiveness), the assembler learnt, partly as
a result of their joint venture with Toyota (NUMMI), that new relationships with
suppliers would be beneficial to company health and competitiveness. Lopez set
out to secure price cuts for components of around 20 per cent, in return for which
the supplier would be rewarded long-term supply contracts. Within a year, the
Spaniard's new policy had saved G.M. over a billion dollars.24 However, these
effects were as counterproductive as they were short-lasting. Jones (1998)
comments that "the Lopez shock tactics approach may have woken up lots of
suppliers but did not lead to sustained improvements" (1998: 1 0). Supplier
development and relationship models such as those used by Toyota and Nissan
23 Prior to Ford's introduction of rolling track assembly in 1914, cars were unique in that parts where not interchangeable between the same model due to the lack of absolute uniformity and tolerance of components. The uniformity of replacement components actually arose in the ordnance and munitions industry in the midnineteenth century, when the mass production of bullets and shells began in earnest. 24 Comprehensive coverage (beyond the remit of this study) of the incident of alleged industrial espionage can be found in Elkind (1997).
47

Chapter 3: The Industry ('on/ex/
have been found to be far more beneficial for the parties concerned over extended
period of time.
No longer does it seem appropriate or wise to maintain the adversarial nature of
relations between component suppliers and assemblers. Whilst in the past,
assemblers would often rely on their bargaining power to select the lowest cost
supplier, the advent of Just-in-Time management and manufacturing, and quality
and flexibility requirements have created a need for a modem, strategic
relationship, with the resultant outcome being sole-sourcing. Here, a supplier
exclusively provides components for the entire production life of the model. The
difficulty for suppliers in Europe has been to balance the demands of the shared
destiny relationship such as FMS, CAD/CAM, EDI (Electronic Data Interchange),
SPC (Statistical Process Control), FMEA (Failure Mode Effect Analysis),
logistics development and organisational change costs, with the effort to reduce
the productivity gap with Japanese component manufacturers.
Despite higher wage costs, Carr (1992) found that in the mid 1980's, German
component manufacturers had productivity levels twice that of the British.
Notwithstanding this, he asserted that British productivity had improved
substantially but not enough to reduce the differential. Confirmation of this view
is provided in the research reporting a 2: I productivity gap between British and
Japanese component manufacturers in productivity and a 100: 1 gap in quality.
Following the full implementation of lean manufacturing, productivity could rise
by 10 to 15 per cent a year (Oliver et ai., 1994).
The finding of Carr's research (1992) suggests that attention should not be paid to
differentials between Britain and Germany but between British and Japanese
component manufacturers: "One automotive battery producer suggested that
whilst the most efficient battery plants in Western Europe were now generally up
to six or seven batteries per man hour, Japanese manufacturers were producing
ten" (1992b:82).
The situation for suppliers in Europe is similar but not identical to that of the US.
One fundamental difference, however, is that the Japanese manufacturers have set
up complementary component manufacturing facilities in the US in order to
48

Chapter 3: The Industry ('ontext
circumvent the requirements of local parts content regulations. In Europe
however, the Japanese have found that there exists an established, innovative and
high quality components sector upon which to rely (as well as having had
relatively easy access).
The innovative element of the European sector has in part come from large
companies (such as Siemens, Bosch, Magnetti Marelli and Mannesmann) utilising
their key strengths in automotive applications. Additionally, there has been a spate
of acquisition activity leading to increased economies of scale and scope (T & N' s
purchase of Goetze, the German piston ring producer is one example). In 1990,25
of Europe's component manufacturers had related sales of over $1 bn, of which six
were British (GKN, Lucas, BTR, Pilkington, T&N, BBA.) However, the
European market in the 1990s remained highly fragmented with over 10,000
suppliers, among which only 250 had 500 employees or more (Bertodo 1991 a).
More recently, GKN, Lucas (now Lucas-Varity) and T&N have retained their
position of flagship suppliers in both a UK and European context (Table 3.4).
Company Turnover 1995-1996 US$ OOOs
GKN Pic 5,666,208 Lucas Varity Pic 4,282,144 T&N Pic 3,321,278 UGC Ltd 1.716,673 Unipart Limited 1,384,061 Michelin Tyre Pic 1,194,521 European Motor Holdings Pic 635,504 Automotive Products Group Ltd 552,188 Echlin Europe Ltd 459,145 TRW UK Ltd 378,244 Johnson Controls Automotive Ltd 325,326 Brown Brothers Ltd 342,781 Allied Signal Ltd 297,628 Automotive Products Pic 312,940 Aeroquip·Vickers Ltd 296,750 Quinton Hazell Pc 254,355 Calsonic International (Europe) Ltd 258,945 Arvin International (UK) Pic 263,352 Carclo Engineering Group Ltd 238,217 Eaton Ltd 225,716 Meritor Light Vehicle Systems Ltd 168,526 Quinton Hazell Automotive Systems Ltd 161,960
Table 3.4: Leading Automotive Component Companies located in the UK
Source: FT Automotive (1998b),
49

Chapter 3: The Industry Context
3.4. THE CONDUCT OF BUYER-SUPPLIER RELATIONSHIPS
3.4.1 THE ADVERSARIAL NATURE OF SUPPLY RELATIONSHIPS
Frey and Schlosser (1993) provide a clear discussion of the limitations of the
traditional competitive bidding process in the automotive industry. They argue
that competitive bidding is an effective mechanism for receiving low price bids
from suppliers at any given moment. However, the process fails to stimulate
innovation (instead, incremental improvements occur) because of the risk of
recovering R&D investments. Hence, established designs find their life-cycle
extended and innovations are pursued by assemblers (though it is a costly
activity). However, problems arise because assemblers know that many
homogenous components and many substitutes. Accordingly, it is suggested that
in the case of product development three situations may arise:
(l) The component supplier gambles on bidding low for a project
requiring development but is unsuccessful, creating difficulties and delays
for the parties.
(2) The component supplier provides an appropriate component within
the price bid but revised specifications are necessary for the completion of
the project. In this case the supplier may not benefit from the innovation as
extra costs have negated such benefits, or
(3) The component supplier provides an appropriate component within
the price bid and original specifications. In this case both parties share the
benefits of the development and the process can be said to work.
This competitive bidding process provided a way to achieve low cost components
at a time when quality was seen to be something that would be assured by end of
production line inspections. Richardson recounts how during the 1980's, US car
assemblers began to convert their supplier relations towards "a form of quasi
vertical integration, the relationships ... [of which were] ... characterised by
longevity, closeness and exclusivity" (1993:340) in the knowledge that quality
50

Chapter 3: The Industry ('on/ext
components from upstream activities contributed more to quality than a mass of
operatives correcting defects in 'hospital bays'.
Womack et al., (1990) describe the mass production supply system as one in
which suppliers would be involved in a purely economic exchange characterised
by much dis-information and dis-loyalty. Being involved late in the vehicle design
process, suppliers would be given proprietary designs for a given component and
asked to bid for a supply contract on the basis of a specified production volume.
Whilst these contracts may have been of less than a year in length, in this so
called 'market-based bidding' system (akin to Frey and Sclosser's 'competitive
bidding') it seemed to appear wise to bid below unit cost in order to win the
contract. This was deemed a suitable approach as experience/learning curve
saving would inevitably follow, assemblers would accept inflation-based price
increases, and there would be a point at which switching costs would be
prohibitive for the vehicle manufacturer thus allowing them to make opportunist
price rises in any case. Thus emerged a system in which:
Quoting a lower price per part is absolutely essential to a winning bid. However, the suppliers are also aware that follow-on business for a new model can often extend over ten years. Then there's the market for replacement parts, which may be considerably longer. So, in reality, they are not bidding on a one-year contract but potentially, on a stream of business running for twenty years. (Womack et al., 1990: 141).
Central to this bidding process is the ability of the supplier to remam as
mysterious as possible with regard to operations and cost structure. As Womack el
al., (1990) observed, the price bid per part would often be the only information
concession made to assemblers. This would consequently hinder any 'in
production' changes caused by manufacturability, reliability or functionality. This
attitude forms almost the organisational equivalent to demarcation lines, which at
the individual level have the source of many of western industries industrial
relations woes in the past (Bain, 1990).
By adapting a policy of outsourcing single components rather than sub-assemblies
or modules, not only were the transaction costs of coordinating between 2000 and
2500 suppliers substantial (Womack et al., 1990: 157), the assemblers would still
51

Chapter 3: The Industry Context
face a quality problem inherent to the large number of parties involved in the
manufacture of one component:
[U]ntil recently, General Motors built practically all its own seats by ordering about twenty-five parts per seat from many suppliers. When the parts were finally put together in the finished seat, it was not surprising that a piece wouldn't fit or that two abutting materials would prove incompatible. For example, they might rattle or squeak in cold weather because of different expansion coefficients (Womack et al., 1990: 142).
The make or buy approach taken by vehicle manufacturers has, in fact, turned full
circle. Abernathy and Wayne (1974), Womack et al .. (1990), and Lamming
(1993) note that when the automotive industry began over a century ago, many
components where purchased from small engineering companies. Since then we
have witnessed massive integration and deintergration, with the second round of
outsourcing taking on a far different complexion.
The following section examines new approaches to the sourcing of automotive
components in recent years and then explores the 'lean supply' model.
3.4.2 ALTERNATIVES TO SOLE AND MULTIPLE SOURCING
The detailed nature of buyer-supplier relationships has been sketchy, vague and
disparate. It has been widely held that Japanese manufacturers relied on sole
sourcing but Richardson's (1993) work on the Japanese automobile industry
suggests a new framework for buyer-supplier relationships which dispels this
interorganisational preconception and seeks to obtain some of the benefits of the
competitive bidding process while retaining the simplification brought to
production processes by sole sourcing.
The 'universal' use of sole sourcing by Japanese assemblers could be misleading
for another reason. Most new plants commence with the production of a single
model. There is, therefore, no rationale (based on a transaction costs approach) for
the assembler to have two suppliers of alternators or two suppliers of fuel pumps.
Consequently, sole sourcing is believed to be the model pursued by Japanese
assemblers. However, the introduction of new models in addition to existing ones
52

Chapter 3: The Industry Context
in the same facility will often lead to the use of more than one suppler of the same
type of component (e.g. alternators and fuel pumps).
Richardson proposes that a hybrid form of sourcing known as parallel sourcing is
that which is actually used by Japanese assemblers because previous studies have
looked at a particular point in time to identify the sourcing system in use. He adds:
A closer look would reveal that there are several firms in the supplier group who are qualified to produce a component. Some are currently producing similar components for different models while others have done so in the past. Thus the term parallel sourcing. The distinctive feature of parallel sourcing is that two or more suppliers with similar capabilities are concurrently sole sourcing suppliers for very similar components. While using a sole source for a component, the assembler establishes parallel sources to provide performance comparisons and competitive bidders for the next product cycle (1993:342).
Richardson finds two types of suppliers in existence - Design Supplied (OS) and
Design Approved (DA). DS suppliers are provided with component designs from
the assembler who seeks to ensure quality from the suppliers who tend to be in the
lower tier of the supplier hierarchy?5 OS suppliers have weaker relationships with
assemblers but they still receive technological and managerial assistance in order
that they may become more competitive and eventually receive DA status. DA
suppliers occupy the first tier of the supplier hierarchy (Section 3.4.3 below) and
number only a few hundred. DA suppliers design and manufacture components
according to assemblers requirements and, accordingly, have a closer relationship
with the assembler. The assembler tends to take a slightly lower interest in DA
suppliers' cost structures than in the case of DS suppliers, thus conferring to them
a greater degree of bargaining power. The risk for DA suppliers is that they may
not be compensated for the costs involved in component development but they are
more likely to secure numerous supply contracts.
2S Clark and Fujimoto (1991) note that the Japanese equivalent of design supplied is known as Taiyo-;:u. In the UK it is known as 'build to print'.
53

Chapter 3: The Industry Con/exl
3.4.3 LEAN SUPPLY
The 'lean supply' system originates, and is to be found in its 'ideal type' form in
Japan, differing from the market-based bidding adversarial approach in the six key
areas of; supplier selection and price setting, the nature and approach to falling
unit costs, mode of delivery, constancy of production, quality philosophy, and,
problem solving and relationship maintenance.
In lean supply, the vehicle manufacturer coordinates a supply structure of around
300 suppliers which are designated the assembly and supply of an entire sub
assembly. This requires the tiering of the supply chain. In order to reduce the
number of interfaces between buyer and supply (i.e., one per supplier), a small
number of key suppliers (less than 300) are nominated to take responsibility for
the supply of a sub-assembly (also known as a 'module') directly to the assembly.
This contributes to a major reduction in transaction, bureaucratic and parts costS. 26
These first tier suppliers buy components from a second tier of suppliers who in
turn purchase their components, raw materials and commodity items from a third
tier of suppliers. In some instance, a company may act as both a third tier supply
and a direct supplier to the assembler, but for different products, such as a
chemicals company which suppliers polymer products to tier 2 companies and
supplies paints directly to the vehicle assembler. Tiering has its problems,
however. A component manufacturer occupying a tier 2 position within the supply
chain must provide quotes for tier 1 companies that may have not won the supply
contract from the tier one supplier. In addition they must work well within the
lead time that the tier 1 supplier has to provide a quote for the assembler. The
problem is compounded with tier 3 suppliers quoting to tier 2 suppliers.
The notion of tiering has been extended to recognise the global nature of the
automotive industry and the importance of raw material suppliers. The new tiers
are presented in Table 3.5.
26 An infonnal discussion between the author and a manager for a fonner Rover supplier revealed that the yearly administration costs of one part number (i.e., a specific component) can be as high as £ 1 0,000 for the assembler.
54

Chapter 3: The Industry ('ontext
Tier Role Global Tier 1 Supply value-added systems Local Tier 1 Supply value-added subassemblies Local Tier 2 Supply component parts Global Tier 3 Supply major raw materials Local Tier 3 Machine shops and components
Table 3,5: Global Nomenclature of Supply Chain Tiering
Source: Based on Auto Industry (1999)
Whilst important to the reduction of transaction and bureaucratic costs, the
outsourcing of subassemblies can add greater complexity and logistical costs to
the process since a third party has to be integrated into the manufacturing process,
in which stocks are minimised through just-in-time manufacture and delivery,
Nissan, for instance, assembles facia subassemblies (a cycle time of two minutes)
adjacent to the production line and has the same employee fit them to the vehicle
within the normal track time (FT Automotive, 1999).
Lean supply requires the involvement of these so called 'first-tier' suppliers early
in the design process, and for them to liase directly with others suppliers which
produce parts for the assembly. Early involvement removes the need for costly
changes or improvements to components once production has commenced. Prices
are determined on the basis of 'market price minus' in which:
the lean assembler establishes a target price for the car ... and then, with the suppliers, works backwards, figuring how the vehicle can be made for this price while allowing for a reasonable profit for both the assembler and the suppliers (Womack et al., 1990: 148).
The nature of falling costs differs substantially in the lean system. It is not an
expectation of lean assemblers that their suppliers should increase their prices
under any circumstances, even in the advent of inflation. This is because of the
belief in, and success with, the kaizen continuous improvement process.27 Whilst
this may appear to be a harsh dictat from vehicle producers, the use of value
analysis and engineering with the assistance of the assembler where required, does
27 Kaizen combines two kanji symbols - Kai (modifY) and Zen (goodness),
55

Chapter 3: The Industry Context
yield falling costs. These costs savings are shared if they were derived jointly, or
retained entirely by the supplier if it was solely responsible for the cost saving.
The mode of delivery is that of just-in-time delivery rather than the materials
requirement planning or economic order quantity approach using large
warehousing facilities. JIT uses kanban visible records in supply windows of
hours rather than days. Constancy of production (or heijunka) is far more evident
in the lean supply chain because JIT relies upon it. If suppliers face uncertainty,
they have no option but to maintain high stocks of product in order to conform to
delivery requirements (a vital performance criteria when assessing suppliers for
future contracts). These stocks of course, incur storage costs for the assembler. As
Womack et al., note, "these kind of [unexpected] shifts are very difficult to
accommodate in a system in which employees, because of job guarantees, are a
fixed cost (1990: 151). This is not unique to Japan. In the UK assemblers tend to
over-produce than reduce output, and place workers on short time because of the
threat of industrial action.
With little or no stock to buffer the assembler against interruptions in supply, poor
quality can exacerbate the problem as they do not have the luxury of a one for one
replacement of faulty parts. Consequently demands such as zero defects (which
Womack et al., (1990:152) note is "a goal rather than a reality") are crucial to the
constancy of operations.28 Quality is seen to a function of lean supply and
manufacturing, having been built into the system instead of being added onto the
system, as is the case with many European and US organisations.
The approach to problem solving and relationship maintenance IS starkly
illustrated in the following example from Womack et aI., (1990) in which a
supplier development team visits a supplier (a rare occurrence in the adversarial
system) with a component defect problem. The team uses the "five why's"
approach (originating from Toyota):
28 The Japanese quality issue has been dealt with exhaustively elsewhere and is not a major focus for this study (see Ohno 1978, 1988; Ashley, 1992; Goldman, 1992; Sako, 1992).
56

Chapter 3: The Industry Context
First, they discover that the defective part has been caused by a machine that cannot hold a proper tolerance. But the machine isn't the ultimate cause. So the team asks: "Why can't this machine hold tolerance?" The supplier's personnel report that it's because the machine operators cannot be adequately trained. The team members ask, "Why?" The supplier answers that it's because these employees keep quitting to look for other work, which means the operators are novices. "Why do workers keep quitting?" team members then ask. The answer: "Because the work is monotonous, noisy, and unchallenging." The ultimate resolution: to rethink the work process in order to reduce turnover. This, at last, is the ultimate cause - almost always an organisational problem (1990: 152).
It is this ability to create a mutually collaborative relationship that enables the two
parties to understand the soft organisational components that are the underlying
cause of a given problem or impediment to improvement.
Supplier development is critical to the success of a collaborative relationship.
Nissan's supplier development approach, known as the 'Nissan Way', is based on
practices long established in Japan and emphasises:
• Mutual dependence
• Long term relationships
• Supplier development of parts and subassemblies
• Suppliers and Nissan using similar quality methodologies
In order to achieve this, Nissan UK began its supplier selection and development
in mid-1985 with the intention of establishing a supplier family of between 150
and 200 companies with common aims and aspirations, long term relationships,
clearly established responsibilities, and shared technical/quality knowledge
underpinned by kaizen. By 1992, Nissan had 195 suppliers; 130 based in the UK,
28 in Germany and the balance spread amongst other European countries. Having
said this, however, after seven years of production, the company found that only
39 UK suppliers could compete with their Japanese equivalents in the
performance measures of quality, cost, timely delivery, development ability and
management (Lawther, 1999). The 'Nissan Way' is conveyed in its supplier
quality statement:
57

Chapter 3: The Industry Context
The Nissan Quality Philosophy is one of commitment to customer satisfaction through continuous improvement in quality, safety and reliability. The supplier has total responsibility for the delivery of zero defect products and will, establish quality systems accordingly. These systems will include the continual review and development of management, product design, material specification and manufacturing processes. The development of mutual trust and cooperation will bring about quality and productivity improvements to the shared benefit of both supplier and Nissan (Lawther, 1999).
Carr and Truesdale (1992) document the establishment of relations between
Nissan and its prospective suppliers. Nissan's Supplier Development Teams
(SDTs) spent time with the suppliers to advise them on quality and the continuous
improvement philosophy, lust-In-Time delivery requirements, training
programmes and even on problems with components destined for rival
assemblers. This process of consultation lasted for four years until the first
delivery of components was received.
More recently supplier development has enabled Nissan's new models to been
developed 25 per cent more quickly than existing models. The company achieved
this short lead time through 'Project Cogent' which, in January 1996, brought
together 80 suppliers in a series of workshops designed to evaluate performance
in the expected areas of quality and cost. In addition, areas such as design
(drawings), prototype/test parts and testing have been included given that have an
impact not only on the cost of research and development (around five per cent)
but also have an impact on the production costs of the vehicle (seventy to eighty
per cent). As Nissan's deputy R&D director explained:
If products are badly designed they will be intrinsically expensive, no matter how many are made or how hard your purchasing department puts the squeeze on you. If a designer makes a product that is hard to assemble, quality will inevitable suffer. Yes, you can add retrospective Japanese 'poka yoke' countermeasures but this increases cost and reduces plant capacity. (Beecham, 1998: 15).29
29 Poka yoke refers to a fool-proofing device used in defect prevention. Poka yoke was first used at the end of the late l800s at the Toyoda Loom Works, where looms were designed to halt if a thread broke. Otherwise. were the loom to continue, it would produce an entire roll of fabric with a 'pull' which would render it unsuitable for sale. The technique was formally developed in the 1950s by Shingeo Shingo (an industrial engineer at Toyota).
58

Chapter 3: The Industry Context
Cogent has reduced the number of post launch design changes by 80 per cent,
thereby reducing rectification problems in production. Furthermore, Nissan has
split its procurements activities into three areas, according to the component's
scope within the assembler's plants across the world:
• Global, single supplier parts which account for 13 per cent of total component
purchases by value and include anti-lock braking systems and airbags
• Regional suppliers for components which may differ according to regional
tastes such as plastic (resin) interior/exterior trim (bumpers, etc.)
• Per-factory suppliers for specific national markets (optional extras such as
sunroofs).
This echoes the changing nature of tiering to reflect the global sourcing of
components (Table 3.5). Furthermore, the use of supplier development teams and
lean supply methods illustrate a 'voice' type of buyer-seller relationship (Helper,
1987; 1990) where communications, the sharing of knowledge and long-term
commitment reduce the likelihood of the threat of switching compared with a
traditional 'exit' approach, wherein low levels of commitment and shared goals
lead to a higher likelihood of buyer switching.
3.4.4 SUPPLIER PERFORMANCE, BEHAVIOUR AND PERCEPTIONS
Richardson (1993) provides a useful schematic framework for clarifying the
nature, quality and quantity of buyer-supplier relations. Of particular use is his
definition of supplier performance as "quality, timeliness, responsiveness to
changes in quantity, innovativeness and other non-price aspects of the exchange"
1993 :342) From a number of cost viewpoints; transaction, switching, trading,
competitiveness and set-up, he suggests that higher supplier performance results
from the use of parallel sourcing.
One of the greater implications in Richardson's study is that increasingly, when
assemblers want to create firmer links with suppliers, they place greater
importance in having in-depth knowledge of suppliers operations reflecting, in
many ways, the lean supply model.
59

Chapter 3: The Industry Context
Leverick and Cooper (1998) have recently found that UK buyer-supplier
relationships have changed toward a partnership sourcing approach but still bear
many of the facets of the pure market exchange approach. The mean length of
relationship with the component supplier's main customer was nearly 21 years
and accounted for an average of 28.1 per cent of revenues. This indicates that
long-term relationships have existed within the components industry far before the
entry of the Japanese manufacturers in the mid-1980s. Whether, however, these
relationships were long term due to collaboration or necessity, is unclear, but one
could suggest that an organisation such as GKN, the dominant supplier of
constant velocity joints in the UK would have long standing relationships with
indigenous suppliers.
The research by Leverick and Cooper (1998) also captures information which
could be used as a proxy measure for loyalty. Based on the highest mean
likelihood, suppliers thought that failure to satisfy a customer (assembler) would
lead to assistance rather that the loss of current, future or large contracts.
Component producers are clearly becoming far more involved in product
development, not only in terms of design and prototyping, but also in the
management of the project in a proactive manner. The degree of collaboration (in
contrast to adversarial interaction) was also reflected in price setting. Suppliers
ranked negotiation as the most influential factor, followed by target vehicle
price30, competitor's bids, its previous price and production costs. In the light of
such changes towards the Japanese model of supplier relations, respondents found
the wider level of inter-company activity to have diluted the clarity of
responsibility and communications between partner. In addition, 43 per cent of
respondents were unable to identify Japanese-based competitors compared to their
European (22 per cent) and US (39 per cent) rivals. This could indicate several
perceptions of rivals. The distance between rivals is an indicator of the level of
threat that they pose, and that it is not necessary to identify and benchmark against
30 This reflects 'market price-minus' pricing as opposed to 'cost plus'. In the first, the assembly establishes the price at which the vehicle will be sold. The assembler, working with suppliers, undertakes the task of designing. manufacturing and marketing the vehicle without exceeded the market price yet generating profit. In the cost plus approach. the assembler sets prices based on the costs of production plus a margin. Factors such as the elasticity of demand, rivals prices, efficiency and factor market instability are often too dynamic to ensure price stability based on cost-plus principles.
60

Chapter 3: The Industry Context
rivals due to the assistance offered by the assembler, which ultimately assists and
determines the existence of a supply relationship. Yet, despite the increasing
duration of supply relationships, the UK sector still lags somewhat behind those
of Japanese vehicle assemblers, where 68 per cent of suppliers has never changed
(or been forced to change) assembler (McMillan, 1990).
3.4.5 CURRENT AND FORTHCOMING FACTORS IN THE COMPONENTS SECTOR
Beyond the competitive, ecological and social challenges facing the automotive
industry in general, several emerging factors seem likely to have an impact upon
UK automotive components suppliers in the next few years:
• New materials and technologies
• New entrants
• Location of suppliers
• Greater consolidation
• Changes in the UK vehicle registration system
• Product' gaps'
The Mercedes A-Class is the first production vehicle to use glass reinforced pedal
brackets rather than aluminium or steel (FT Automotive 1999:9). The implications
of such a development is twofold. First, it enables further penetration of chemical
producers into the sector (in this case it involves the use of DuPont's Zytel
material) and, second, it signifies the drive toward, weight saving, recyclability
and enhanced performance characteristics in terms of noise, vibration and
durability. In addition, all assemblers are currently embarking on research to
enable the changeover from 12-24 volts to a new 36-43 volt standard which will
enable a larger number of more powerful electronic and electrical components
such as lighting, whilst enabling a reduction in the size and weight of batteries.
New entrants are likely to enter high added-value areas of the market which are
resistant to imitation by incumbent through patent and copyright protection. For
instance, Bayer has entered the automotive sector with the production of plastics
used as an alternative to conventional steel and aluminium bodies. Its automotive
division, Auto Creative Group, sees itself not only as a raw materials supplier but
61

Chapter 3: The Industry ('ontext
as a 'development partner' involved in finding applications for the new material
with partners such as Audi (FT Automotive, 1999:8). Furthermore, Hewlett
Packard announced its entry into the automotive components sector in mid-1998
with the development of computer modules (ibid).
One of Ignacio Lopez's supplier innovations at both GM and VW was to begin to
change the nature of the location of suppliers adjacent to plants or within them.
The suppliers would manufacture a subassembly and have its own employees fit
the sub-assembly into the vehicle within the assembler's plant. This has been
adopted at GM plants in Brazil, and at Skoda, with limited trials at Mercedes
Smart-city car plants, and may slowly develop in geographical areas with existing
automotive component and assembly infrastructure, rather than greenfield sites.
GM's main UK plant, based in Ellesmere Port, has adopted Supply In-Line
Sequence (SILS), a process designed to reduce the distances and costs of
transportation and enable improvements in productivity. Important components
from external suppliers are manufactured within the complex and transported on
small trains to the point of assembly. Components are designed to ensure greater
ease of assembly, thereby reducing the complexity and duration of the assembly
process. Companies such as Plastic Omnium Automotive (bumpers, tanks and
fillers) and Mackie Automotive Systems (interior trim and cooling systems),
along with Vauxhall's in-house components division, Delphi Automotive, are
located within the supply and assembly park (FT Automotive, 1997). Mercedes
Benz has also 'outsourced' the paint shop within its Rastatt (Germany) plant to
the paint producer DfuT in the production of the A class vehicle (Kochan, 1999a).
Mergers and acquisitions between medium and high volume producers invariably
affect the locus of revenues within the supply chains as newly merged or acquired
concerns seek to consolidate purchasing operations and reduce the number of
similar components delivered by different suppliers. For instance, Daimler
Chrysler estimates that $l.4bn savings will be realised through shared
components, logistic and purchasing power (FT Automotive Components Analyst,
1998a). Following the acquisition of a 36.8% stake in Nissan by Renault in early
62

Chapter 3: The Industry Context
1999, the two companies intend to consolidate their 30 current product platforms
into 10 by 2010 (Edmondson and Thornton, 1999; Sliwa, 1999)? 1
At a European level, in the early 1970s, around 10,000 companies supplied
directly to assembler, falling to 3,000 in 1994. This is expected to continue, with
further consolidation and merger/acquisition activity leading to less than 1,000 in
the year 2000. The Lucas-Varity and Federal Mogul-Lucas acquisitions are recent
cases in point. Bursa et al., (1997) have predicted that consolidation will lead to
'super-suppliers' with turnovers of $3 billion per annum that will characterise the
global industry in the coming decade (Bursa et al., 1997). A foreshadowing of the
critical mass required for super-supplier scale could be seen in the major industry
mergers and acquisitions of 1996 and 1997, in which nine companies accounted
for the consolidation of some $16.4 billion of company assets from merged or
acquired assets (Wells and Nieuwenhuis, 1998:31). Furthermore, Virag and
Mount (1998) have recently reported high levels of strategic alliance activity
between suppliers, partially in a defence against acquisition threats and to develop
procurement, R&D and production economies.
Changes in the UK vehicle registration system will have an impact upon
production scheduling and cyclicality. The annual registration system began in
January 1963 and moved to August 1 st in 1967. The impact of the yearly
registration systems was to create a major peak in the sales of vehicles in August,
accounting for 22.5 per cent of total annual sales in 1998 (SMMT, 1999). Whilst a
useful ploy to stimulate the replacement market and create the consumer cult of
the 'latest registration', the impact of the system upon the industry was negative in
comparison with consumers.
The artificial seasonality of the registration system disrupts capacity utilisation
among assemblers and suppliers alike and forces a great degree of variability
between master production schedules. Consequently the ability to achieve just-in
time production (the ability to product and deliver the required good at the time at
which they are needed and in the precise quantity) is reduced, since fundamental
31 Product platforms and their application in the automotive industry are discussed in Chapter 4.
63

Chapter 3: The Industry Context
to the implementation of just-in-time is heijunka (production smoothing). The
annual registration plate system will be replaced in September 2001.
Pickemell (l998a) has identified several areas in which the UK automotive
components industry is in a weak position to supply, either through a lack of local
suppliers or due to the R&D intensity needed for successful entry. The lack of
intellectual property in these areas may prove a further (and related) limiting
factor. The product 'gaps' are presented in Table 3.6.
Fuel injection systems High value electronic systems
Large plastic components and materials Automatic transmissions and gearboxes
Small meters and sensors Dampers/ suspension assemblies and oil seals
Gas struts (boots and tailgates) Mirror assemblies and glass
Remote control systems Anti-lock brakes (ABS)
Aluminium pressure castings and small castings Large exterior pressing (body panels)
Air conditioning units Pressed petrol tanks
Table 3.6: Product Gaps in the UK Components Manufacturing Base
3.5. CHAPTER SUMMARY
Buyer-supplier relationships have undergone a major change in form and action
since the 1970s. These are summarised in Table 3.7.
Factor Market relationship Partnership relationship (adversaria/) (collaborative)
Number of suppliers >1200 ~350
Supplier relationship Transaction cost driven Co-producer Contract duration Short term Long term Supplier interface Purchasing department Purchasing, R&D, manufacturing Supplier involvement Late in the R&D process Throughout the R&D process SuPpJy chain Decoupled Integrated and synchronous Approach to quality Incoming inspection TQM and kaizen Nature of service Product only Product and value added Supplier's objective Minimise price Minimise supply chain cost
Table 3.7: Market vs Partnership Relationships
Source: Adapted from Bertodo (1991a:261)
64

Chapter 3: The Industry ('on/ext
Based on Table 3.7 above and based on the observations made in previous
sections, a caricature of partnership supply chain relationships has the following
salient features.
• Tiering • Emphasis on cost, quality and timeliness of delivery
• Long-term relationships
• Preferred suppliers and global sourcing
• Reduction in part numbers and platforms
• Greater delegation to suppliers in terms of R&D (innovativeness, speed, cost)
• Interdependence and functional integration
It is all too easy to admire the ideal type which is the Japanese automotive
components industry. However, as such it represents an alternative and, arguably,
superior model of supply-chain relations to its predecessor. Ironically, with the
exception of Nissan's Sunderland plant, Japanese assemblers have still found
significant differentials in quality and cost in overseas plants compared to their
indigenous facilities (Taylor, 1997).32 The inimitable differential may lie in a
multifarious mix of economic, geographical, geophysical, cultural and historical
factors (Nishiguchi, 1985; Sako, 1992; Nishiguchi and Brookfield, 1997).
Commercial and strategic selfishness appear (for the most part) to have
surrendered to commercial and strategic interdependence. Trust is simply a
positive externality of such a relationship in the realisation that suppliers and
buyers do (and indeed always have) relied upon each other. Globalisation and
consolidation have added to the imperative of survival, growth and success. Power
and dependence still exist, but seemingly exist in a bilateral form rather than in the
unilateral and coercive form of the past.
This point in the thesis provides an opportunity to begin with the development of
research questions in the context of the research stimulus identified in Chapter 2
(which the reader will recall was based on the suggestion that perceptions
influence the decision and actions of managers).
12 Chapter 4 discusses causal ambiguity, which provides elaboration upon why this may be the case.
65

Chapter 3: The Industry Context
It would appear, given the preceding discussion within this chapter, that unique
resources in terms of products, processes and people appear to make a
contribution to suppliers' success vis a vis assemblers but that de-integration,
alliance, merger and acquisition activities have changed the structure of the
industry along with the tiering of the supply chain. Accordingly, the automotive
industry not only presents evidence of competitive advantage through unique
resources - it also offers indications of the role that industry structure has in the
development of competitive advantage. Bearing the research stimulus in mind, the
principal research question (research question I) arising from the overview of the
chosen industry in this chapter is structured as follows:
Do managers perceive competitive advantage to be based on bundles
of heterogenous resources which facilitate differentiation and
diversification rather than external factors such as industry structure
and macro-environmental factors?
In the next chapter, the study considers theories of competitive advantage which
relate to resources and residence. From this review, further research questions are
developed and operationalised prior to the development of an appropriate research
strategy in Chapter 5.
66

Chapter 4: Residence or Resources? - Views of Competitive Advantage
Chapter 4: Residence or Resources? - Views of
Competitive Advantage
4.1. INTRODUCTION
Previous chapters have identified the research stimulus and the main research
question for this study. The principal research question asks whether, given that
perceptions influence actions and decisions, managers perceive competitive
advantage in terms of residence (position within an industry) or in terms of the
unique use of resources. The automotive components industry has been chosen as
the industry domain for the study since it offers the potential for both sources of
competitive advantage to be examined (Chapter 3).
This chapter reviews the development and impact of the resource-based view
(RBV) of the firm in the literature of strategic management. Central to this chapter
is the differentiation between advantage through residence and advantage through
resources. In so doing, the study can highlight the salient features of these two
competing (and often antagonistic) views of competitive advantage and develop
further research questions that are articulated at the point in the chapter where the
review of literature has given rise to these questions. However, in advance of the
these developments, the reader should note that research questions 2 to 5 are
structured as follows:
Research question 2: Do managers perceive resource accumulation to be
part of the RBV construct?
Research question 3: Do managers associate portfolios of resources with
product platforms, families and technology convergence?
Research question 4: Do managers recognise the importance of resource
management?
Research question 5: Do managers make a distinction between resources in
terms of their strategic significance and do they use terminology
indiscriminately?
67

Chapter 4: Residence or Resources? - Views ojCompelitive Advantage
The choice of the two competing views of competitive advantage reflects the
development of strategic management since its inception. This chapter examines
both viewpoints. Firstly, advantage through position refers to the disregard of
heterogeneity, with section 4.2 addressing why organisational heterogeneity has
been met with little attention or interest prior to the 1980s and 1990s, when its
roots can be traced to several decades earlier. The author proposes a ' trilogy of
homogeneity' as an explanation of why this has arisen. Secondly, section 4.3
introduces the notion of heterogeneity and how this is intimately linked to
advantage through resources, embodied in the resource-based view, consisting of
four main facets. Figure 4.1 portrays the differences between advantage through
residence and advantage through resources and provides a framework for the
review of the literature in this chapter.
THE DISREGARD OF HETEROGENEITY
THE LURE OF SCALE
THE FATALISM OF INDUSTRY CONTEXT
RELATIVITY OF ANALYSIS
THE NOTION OF HETEROGENEITY
RESOURCE UNIQUENESS AND ACCUMULA TIO?'-'N.!--___ -. ADVANTAGE
MANAGING RESOURCES
RESOURCE BASED VIEW
PORTFOLIOS
Figure 4.1: Advantage through Position and Advantage through Resources
68

Chapter 4: Residence or Resources? - Views ojCompetitive Advantage
A further purpose of the chapter is to clearly operationalise these concepts of
competitive advantage through a review of the extant literature. This will assist in
determining the most appropriate development of data collection instruments and
measures, set out in Chapter 5, and provide a basis for discussing the contribution
of a single industry study to the development of theory in Chapters 7 and 8. This
chapter concludes by precisely framing the research questions for this study.
4.2. THE DISREGARD OF ORGANISATIONAL HETEROGENEITY: A TRILOGY
Organisations are not simply economic and financial entities; their historical and
social dimensions account for many of the differences between organisations
(Nelson and Winter, 1982; Huber, 1991; Walsh and Ungson, 1991). Indeed, the
motor car can be said to have historical, social, economic and financial
dimensions. Put simply, all organisations are unique. No two organisations have
the same access to resources nor do they carry out their processes and sell their
outputs in precisely the same manner. Whilst organisations have, prima jacie,
many homogenous characteristics, as can be observed through the 'caricatures' of
organisational structure (Herbane and Rouse, 2000), their heterogeneity has often
been disregarded in favour of far simpler explanations of organisational
advantage. One explanation for why heterogeneity was relegated in the past could
be termed the 'trilogy of homogeneity', which comprises of the lure of scale, the
relativity of analysis, and the fatalism of industry context.
4.2.1 THE LURE OF SCALE
Alone, or in combination, competition, globalisation and new competitors have
long proved to be a fillip for seeking production cost reductions. Central to many
aspects of management theory has been the reduction of unit costs of production
based around the pursuit of large production runs. This has led to what is termed
here as the 'lure of scale', within which four central theories should be addressed;
economies of scale, economies of scope, the experience curve and the learning
curve.
69

Chapter 4: Residence or Resources? - Views o/Competitive Advantage
Ford (1988 [1926]:147) records how, in the early 1920s, 500 men produced over
half a million headlamp units per month in a single Ford Motor Co. factory under
the supervision of two managers who represented the entire 'management' level
of the plant. This is one (albeit extreme) example of the span of control,
commonly used as a descriptor of organisational structure denoting the number of
persons who are overseen by a manager or supervisor. This concept was
influenced by the principles of labour/task division which predominated at the
tum of the twentieth century under scientific management, which originally took
its lead from the propositions advanced by Smith (1776).
In addition to scientific management and work study (Taylor, 1947), one could
reasonably interpret human relations approaches (Maslow, 1943; 1954) and
corporate culture (Schwartz and Davis, 1981; Schein, 1985; Barney, 1986;
Denison, 1990) as attempts to increase the productivity of the individual employee
in the context of overall organisational performance. Each of these approaches
recognises that organisations are socio-technical systems, whereby physical
processes and human input interact to carry out the conversion and transformation
process of inputs into output. Where they differ, however, is in their view of how
the human facet of the organisation should be managed in order to improve
performance.
Within whichever philosophy of management has prevailed in organisations,
consistent has been the belief that as output rises, long-run average costs fall.
Overheads are spread over a larger number of units produced, set-up times for
plant and equipment fall, and bulk purchasing discounts from suppliers increase,
thereby reducing the unit cost of item produced. Essentially, the causal
relationship has come to be known as economies of scale (Teece, 1982; George,
Joll and Lynk, 1991).
With the additional benefits which accrue to those organisations which share
resources among different business units, known as economies of scope (Teece,
1980), both of these phenomenon affecting unit costs point toward a reward for
becoming a high volume producer. High volume production, therefore, became
central to many popular strategic options based on low cost (Porter, 1980).
70

Chapter 4: Residence or Resources? - Views o/Competitive Advanta~e
In Wright's (1936) study of aircraft production costs, the observation of labour
input declining as production doubled was termed 'the learning curve'.
Subsequently the concept of the learning curve was introduced into the
management literature, proposing that as employees repeated a process or
technique, they would become more efficient, thus reducing unit labour costs. In
essence, the concept examined economies of scale from a labour perspective
without exploring too deeply the cognitive processes in action.
Two decades later, Abernathy and Wayne (1974) published the results of a
longitudinal study of the motor vehicle manufacturer Ford, in which they
expounded the thesis that rising fixed costs, diminished innovation and limited
specialisation in work groups (low flexibility) resulted from the pious application
of cost reduction strategies using the learning curve as its basis. From the lessons
of Ford, Douglas Aircraft, IBM, and colour television production they contend
that managers should trade-off "the hoped-for advantages from varying degrees of
cost reduction against a consequent loss in flexibility and ability to innovate"
(1974: 112). Yelle (1979) suggests that the importance of the learning curve is not
the fall in labour costs in itself, but the ability to forecast such reductions and
incorporate this understanding into bids for new business and the evaluation of
supplier price quotations.
Originating in the empirical work of the Boston Consulting Group (1968), the
experience curve proposes that unit costs decrease by a given percentage with the
doubling of accumulated output.)) The amount of decrease tends to be production
process specific varying between 10 and 30 per cent. These economies of
persistence, whereupon the longer a product is manufactured the lower the unit
cost proved as superficially attractive as they were unproductive for strategy
development. In addition to discouraging product replacement, the pursuit of
experience curve effects requires sufficient additional production capacity to
double cumulative output.
33 In experience curve calculations, total unit costs are measured compared with labour costs along in learning curve measurements.
71

Chapter 4: Residence or Resources? - Views of Competitive Advantage
Three elements contribute to the experience curve; economIes of scale, the
learning curve, and the falling cost of capital relative to competitors, enabling a
manufacturer to introduce new products at an unprofitable level (in order to gain
market share quickly) in the knowledge that at a given level of accumulated
production (experience) profits will be generated while having a large proportion
of the market.
Furthermore, order of entry in a market is a critical determinant of which
organisation among a group of rivals has the lowest unit cost of production, since
early entrants will have the best opportunity to double their cumulative volumes
of production more quickly than those which enter later (unless later entrants have
a cost advantage through newer, more efficient processes or are able to capture
large amounts of market share quickly).
Product life-cycles are a further consideration, since these will influence the
duration over which cumulative production volume will double. If a market is in
the embryonic stage of the product life-cycle, it may take only six months for
cumulative volume to double. In maturity it could take ten years for volume to
double. Indeed the whole concept of the product life cycle has been called into
question (Dhalla and Yuspeh, 1976), where cigarettes, toilet tissue, cosmetics and
cereals exhibited life cycle patterns which did not conform to the archetypal curve
presented in basic marketing texts.
By the mid 1980s, a more critical eye was cast on the applicability and usefulness
of the experience curve concept. An important omission in the many of the
preceding explanations and exhortations of the experience curve was the explicit
recognition that many of the costs of production are incurred through the cost of
bought in materials and components. The notion of the experience curve as a
purely internally driven cost reduction phenomenon did not hold true (Sallenave,
1988).
A problem in attempting to use experience curves as a method of evaluating
relative cost advantages between rivals is that many utilise the same production
technology and are exposed to the same increases in costs. However, companies
attempt to disrupt the homogeneity of these factors through product
72

Chapter 4: Residence or Resources? - Views o/Competitive Advantage
differentiation, technical and manufacturing improvements, and better sourced
capital and labour.
Whilst the limitations of the expenence curve have been clearly identified,
outright rejection of the concept within the sphere of competitive advantage has
not occurred. Abernathy and Wayne's (1974) study of how Ford's pursuit of cost
reduction through long production runs led to a one year plant closure in 1927 and
the loss of market leadership has also been used to show how the application of
the concept has been problematic as much as its stature and interpretation.
Failure in this and similar cases may arise from a focus on numerical analysis
which clouds a deeper understanding of why and how the concept functions
(Ghemewat, 1985). The inter-firm variations in experience curve slopes can be
attributed to two factors. First, falling costs are the result of a company-wide
effort and are often complemented with reward and recognition schemes, owing
as much to the ability and volition of senior managers to offer such incentives as
to the social climate (culture) of the organisation. Second, and similar to
Sallenave's observations, there are varying degrees to which costs can be reduced
according to the products and manufacturing processes involved.
Alberts' (1989) renunciation of the experience curve highlights the questionable
foundation of cost management upon which it is based. It is suggested that the
experience curve serves only to combine three elements into a convenient form;
the experience hypothesis (improvement by repetition), historical cost-volume
curves (cumulative volume related cost reductions), and the strategic imperative
(increasing market share). His analysis of the many interpretations of the
experience curve identify causation whereby "CV [cumulative volume] not only
correlates with decreases in C· [inflation adjusted average total costs], but also
cause them" (1989:38). This, he continues, is a relationship in the business world
that both academics and managers have been aware of for many years but has
been subsumed into management theory.
73

Chapter 4: Residence or Resources? - Views o/Competitive Advantage
Hence, the lure of scale is predicated upon the strategic imperative of increasing
market share to achieve scale thereby facilitating economies of scope, learning
and experience curve effects, preferably to the point of leadership within a market
or segment. However, Woo and Cooper (1982) found that low market share did
not lead to low profitability (pre-tax return on investment). Instead, profitable low
share businesses enjoyed high levels of financial performance in conditions of low
growth, low product change, high standardisation, and with a high frequency of
purchase.
The implications of the lure of scale for this study are:
1. The proposition that scale advantages are central to competitive advantage has
become widely accepted, yet may not hold true in all cases.
2. It promotes a view that organisations are homogenous, or at least have the
ability to be, given sufficient investment in plant, equipment and labour.
3. Market share position predominates as a symbol of success in place of other
measures of performance such as Return on Net Assets, Return on Investment,
Value Added, and Dividend per Share.
4.2.2 THE RELATIVITY OF ANALYSIS
Relativity of analysis articulates the proposition that strategic analysis is a process
of comparison between organisations. From this, an understanding of the
differences should lead to the choice of strategy. This factor is considered to
embody the concept of advantage through position since it suggests that an
organisation's size and market position will be one of the most important
attributes that it can use in pursuance or sustenance of competitive advantage.
Learned et al., (1965: 178) commented that "the strengths of a company which
constitute a resource for growth and diversification accrue primarily through
experience in making and marketing a product line", reflecting the lure of scale
which had preceded the development of business policy as a formal functional and
academic discipline.34 Moreover, the relativity of analysis presumes rationality and
J4 The widespread introduction of 'business policy' into the US university curriculum arose in the early 1960s following the Gordon Howell report in the USA (Gordon and Howell. 1959).
74

Chapter 4: Residence or Resources? - Views o/Competitive Advantage
full information in the process of strategic competitor analysis. No more so are
these assumptions carried that in the concepts of 'best fit' and 'SWOT' analysis,
which suggest perfect entropy.
Typical of early approaches to internal analysis were functional orientation,
(involving an evaluation of each of the department within an organisation such as
marketing, operations, etc.), financial analysis, life cycle analysis, and R&D
analysis (Buchele, 1962). However, the recognisable term 'strength', soon found
itself as one quarter of the now classical SWOT analysis (c/, Ansoff, 1965;
Andrews, 1971; Hofer and Schendel, 1978). As a technique found in many
company meeting rooms and virtually every strategic management textbook
produced over the last decade, the technique embodied the strategic axiom of 'best
fit' (Learned et al., 1965), where organisations, having identified their internal
strengths and weaknesses, seize or create opportunities by capitalising on their
strengths, minimising threats, and avoiding their weaknesses or finding a way to
convert weakness into strength or neutrality. An almost exact exposition of
SWOT analysis can be observed in Aharoni (1993:32).
Hence, organisations do not operate in isolation - their choice of strategy is not
(or should not be) made in isolation - so accordingly the importance of resources
cannot be evaluated in isolation (Collis and Montgomery, 1995). Such
comparisons require organisations to have similar resources and for full
information to be available about the equivalent resources possessed by rivals.
Confusion quickly reigned in the terminology designed to describe areas of
aptitude that should from the basis of competitive advantage. Indeed Learned et
ai., (1985) used terminology identical to Selznick (1957) to denote 'strengths' or
"unique internal capability" (1965: 181):
The "distinctive competence" [ej Selznick 1957] of an organisation is more than what it can do; it is what it can do particularly well. ... To identify the less obvious or by-product strengths of an organisation, which may well be transferable to some more profitable opportunity, one may well begin by examining the organisation's current product line and by defining the functions it serves in its markets (1965: 179).
75

Chapter 4: Residence or Resources? - Views o/Competitive Advantage
Stevenson (1976) suggests that strengths enable organisations to carry out
activities in better manner than others whilst weaknesses are impediments to the
achievement of organisational goals. However, attempts to arrive at a generic lists
of factors which should come to form a competitive analysis have been
problematic. For instance, Stevenson's (1976) research suggested twenty-two
'attributes' which fell into five general categories of organisation, personnel,
technical, finance and marketing. Surprisingly, finance attributes were the least
considered by the respondents in the assessment of firm's strengths. Further
aspects of the research suggested that managers at different levels of the
organisation held differing views on organisational strengths. Influences attributed
to this variance include the individual respondent's background, length of service,
level of responsibility and hierarchical position, the organisation's history,
operating environment, and operations. Ireland et al., (1987) also found
significant differences in perceptions according to managerial level.
Stevenson also suggests that managers involved in the strategic audit of the firm
would also employ different considerations in the assessment of a strength and a
weakness. Consideration of the company's history was the most important in the
assessment of strengths, followed by 'competitive' considerations. 'Normative'
considerations were used least. This included "Consultant's Opinions .. .
Management's Understanding of Management Literature ... Rules of Thumb .. .
[and] Opinion" (1976:62). The emphasis placed on considerations was the
antithesis in the assessment of weaknesses. Stevenson offers the following
explanation:
The nature of the criteria determines whether they will be used for judging strengths or weaknesses. The utilization of the historical criteria for judging strengths occurs because managers are constantly searching for improvements in problem areas which they have previously identified. The base from which these improvements are made then becomes the standard by which the current attributes are judged. The converse is true with respect to weaknesses. The organisation's current position is only a step on the way to where the managers wish it were. The gap is then measured between the current position and the goal which reflects a normative judgement of what ought to be (1976:63).
76

Chapter 4: Residence or Resources? - Views of Competitive Advantage
Common to both Stevenson (1976) and Learned et aI., (1965) (and reflecting a
broader constituency besides) is the view, either explicitly or implicitly, that
strengths should be unique, distinctive and less than obvious (to rivals). Whilst
these are laudable virtues, the relativity of analysis achieved through best fit has
been more problematic, in no small part due to its practical application - the
SWOT analysis.
With an easily recognisable acronym the intuitive simplicity of SWOT analysis
and its acceptance as a formal analytical technique has made it ubiquitous
(Glaister and Falshaw, 1999). However, there remain several problems with the
technique, with implications for the study of competitive advantage.
SWOT analysis is portrayed as an analytical technique (see for instance; Hunger
and Wheelen, 1992; De Wit and Meyer, 1994; Wright et al., 1994; Johnson and
Scholes, 1997) but lacks process and methodology. Accordingly, it is presented as
an application which takes the form of structured brainstorming, whereby
participants in the so-called 'analysis' have a framework of four factors in which
to categorise issues. Once this has been accomplished, strengths are matched to
opportunities and so on, according to the notion of best-fit.
The ordering of factors within the acronym raises questions about the analysis
which arises. Taking the first two letters, S and W, the suggestion is that internal
factors should be identified first, following which external factors (Opportunities
and Threats) are identified. An important omission is relativity. Strength and
weakness can only be known if the analysts concerned are aware of, and
understand, the degree of proficiency of rival organisations in the area in question.
Without such knowledge, the attribution of a factor as a strength may be
disingenuous at best and misleading at worse. In reality, bounded rationality
(Simon, 1957). cognitive and heuristics bias (Tversky and Kahneman, 1974;
Schweiger and Finger, 1984; Barnes, 1984) and commercial secrecy conspire to
prevent one organisation knowing as much about a rival as it knows about its
own. This should not excuse a misapplication of SWOT as a technique, but
perhaps the expectation that surrounds it is not justified for something that is
structured brainstorming. Even if an organisation is able to accurately designate a
77

Chapter 4: Residence or Resources? - Views o/Competitive Advantaxe
factor according to the four SWOT criteria, a number of questions still remain.
For instance, having arrived at a list of SWOT factors, do planners know what the
priority or ranking of threats is and the degree of difference between them? This
applies equally to the list of strengths that has been developed. Also lacking is a
consideration of how strengths may link together to generate further strengths.
Further chain reaction relationships could extend to the external analysis where
the realisation of a threat in the environment may generate additional threats, or
dilute a strength, or exacerbate a weakness. Finally, the assumption that the
findings apply generically leads to the question of whether a strength, for
example, is always a strength, and in all circumstances? (Herbane and Rouse,
2000).
The major criticism of SWOT relates to how it is used by organisations and
consultants. Hill and Westbrook (1997) reported several problems with the use of
SWOT analyses by managers and consultants. For instance, it was assumed that
the four factors applied in all situations. Furthermore, where a SWOT analysis had
been conducted by different persons within the same organisations, the lists
differed and little or no attempt was made to verify the points identified nor any
reconciliation of the differences and contradictions presented. The analyses
remained lists of points perceived by the participant to have a strategic importance
in relation to the firm and its competitive environment, although this reflected
limited attempts to prioritise or group related points together to establish the
complex relationships between systems and resources, and with external variables.
Finally, Hill and Westbrook (1997) found that the SWOT analyses carried out in
their respondent organisations did not make a contribution to formal strategic
planning activities and did not link into implementation efforts for existing
strategies.
The implications of relativity of analysis for this study are the following:
1. The concept of best fit has given rise to SWOT analysis - a form of simple
analysis which may not provide a full understanding of where competitive
advantage resides in an organisation and where it could be exploited.
78

Chapter 4: Residence or Resources? - Views o/Competitive Advantage
2. It suggests that competitive advantage can be identified through a comparison
with other organisations which, more often than is not, are immediate rivals.
3. It proposes that competitive advantages arise from superiority among a
common set of factors rather than firm-specific and inimitable ones.
4. It ignores the difficulty of ascertaining information for the purposes of
comparability (between organisations).35
The relativity of analysis, often manifest through SWOT analysis has tended to
disregard heterogeneity in favour of the tangible, comparable features of
organisations operating in close competitive proximity to each other. This, in turn,
leads to the impact of industry as a factor which assumes homogeneity among
competing firms.
4.2.3 THE FATALISM OF INDUSTRY CONTEXT
A third factor which has contributed to the disregard of heterogeneity is the
fatalism of industry context, encapsulated by the Industry Organisation (10)
branch of economics. A view is taken that industry structure is the main influence
upon an organisation's performance (in financial terms) and the attainment of
associated goals. The essence of industrial organisation can be seen in the view
taken by Bain (1959):
I am concerned with environmental setting within which enterprises operate and in how they behave in these settings as producers, sellers and buyers. By contrast, I do not take an internal approach ... such as ... how enterprises do and should behave in ordering their internal operations. My primary unit of analysis is the industry of competing groups of firms, rather than the individual firm or the company wide aggregate of enterprises (Bain 1959: vii-viii).
Industrial Organisation places overriding importance upon the effect of industry
structure on individual organisations. Accordingly, it is those organisations that
are most able to change in relation to external forces that will survive, reflecting
the evolutionist perspective forwarded by Whittington (1993). Mason (1939) and
35 Indeed, implicit within such models is the notion of unbounded rationality and complete information for decision makers. In the light of litigation between organisations, corporate espionage and executive 'poaching', one doubts whether complete information could be obtained on a rivals activities and processes.
79

Chapter 4: Residence or Resources? - Views of Competitive Advantage
Bain (1959) suggested that the structure of an industry affects the conduct of firms
within the industry and consequently their performance. Known as the Structure
Conduct-Performance (SCP) hypothesis, it is proposed that success is determined
by ensuring that organisations not only understand the impact of industry structure
on performance, but attempt to change industry structure to one which is more
favourable. Conduct (i.e. behaviour) in this sense represents the activities of an
organisation which are influenced by strategic decisions taken by senior managers
(Mc Williams and Smart, 1995). The SCP hypothesis suggests that little, if any,
contribution is made by firms whose capabilities do not allow them to influence
the industry in which they operate. Porter asserts that 10 and SCP lie at the "the
heart" (1981 :617) of the strategy field. However, this view presents a paradox due
to the fact that favourable changes to industry structure will favour similar
organisations. since SCP influences the behaviour of all organisations within it.
Accordingly, the assumption of heterogeneity in the SCP paradigm has been
revised with the concept of strategic groups and mobility barriers (Caves and
Porter, 1977; McGee and Thomas, 1986). Furthermore, Teece (1984) has
suggested that Porter's (1980) five forces industry model is a re-presentation of
the model of industrial organisation analysis (Figure 4.2).
: . . ...
Supply: Raw materials Technology Unionisation Product durability Value/weight Business altitudes Public policies
Demand: Price elasticity SubstKutes Rate of growth Cyclical and seasonal characte Purchase method Marketing type
Structure Number of sellers and buyers
Product differentiation Barriers to entry Cost StructunlS
Vertical integration Con Iomeraleness
Conduct
Pricing behaviour Product strategy and advertising
Research and innovation Plant Investment
Product and al/ocalive efllciency Progress
Full employment E ul
. ..'
Figure 4.2: A Model of Industrial Organisation Analysis
Source: Teece (1984:95)
80

Chapter 4: Residence or Resources? - Views o/Competitive Advantage
The 10 view of industry distortion (whereby above nonnal profits can only be
achieved in a long-run equilibrium of favourable industry structure), behaviour and
perfonnance must have the notion of perfect competition as its starting point. The
neoclassical state of equilibrium in the market occurs when these factors are found in
conjunction, whereupon the price at which the quantity supplied equals the quantity
demanded. These finns, seeking to maximise profits, earn zero economic profits
when operating in such environments and according to this neoclassical perspective,
it is only when a finn is an imperfect competitor that it can eam supranonnal profits.
This is the reward for finns that manipulate market imperfections that restrict
completion. In essence, the only way to eam supranonnal profits is by altering the
forces influencing the efficiency of the market at a particular point in time. This runs
contrary to contemporary strategy research as Jacobson (1992) suggests, in that
strategic management places emphasis on imperfectly competitive markets to
reduce competition whilst 10 focuses on the enhancement of competitive
behaviour within markets.
10 does not take into account the effects of innovation which provides a finn with
lead-time over its competitors (Liebennan and Montgomery, 1988; Stalk, 1988;
Das, 1991; Tunc and Gupta, 1993). The resultant effect is one of disequilibrium,
change and uncertainty. In their discussion of the sources of sustainable
competitive advantage, Lado et al., (1992) move away from the Industrial
Organisation (10) view that external elements (detennining the finn's position
relative to rivals in an industry) are decisive factors in the competitive advantage
construct. They argue that the inability of 10 to acknowledge limits on rationality,
technological uncertainty, constraints on factor mobility and dishonest or foolish
behaviour of the finn's key actors furthers the need to consider more than just the
industry within strategic analysis.
Mahoney and Pandian (1992) highlight a further distinction between 10 and
internal analysis. Industrial organisation considers a 'representative' finn whilst a
resource-based approach adopts a view of the organisation in which finn-specific
resources lead to a portfolio of skills and competitive advantage. They continue by
noting some of the major omissions made by the neo-classical view of the firm
(the theory which underpins much of the 10 approach) which include "transaction
81

Chapter 4: Residence or Resources? - Views of Competitive AdvanlaKe
costs; limits on rationality; technological uncertainty; consumer or producer
learning and prices as signals of quality" (Mahoney and Pandian, 1992:369).
Taken at face value, 10 suggests that competition and profitability in markets can
be explained on the basis of external, market structure-based factors. 36 Since the
locus of competition lies for organisations within industries, industry analysis
techniques emerged in the 1980s, notably that of Porter (1980). McWilliams and
Smart (1993 :65) observe that "evidence of the influence of the SCP paradigm is
apparent in research and prescriptions pertaining to generic strategies and business
typologies, strategic groups, diversification mergers and acquisitions and strategic
planning". However, they argue that SCP is limited in its applicability to strategy
research due to the level of analysis which presumes homogeneity, a reliance on
static analysis and the assumption that barriers to entry are a priority for
managers.
Perhaps deeper seated reasons lie behind the popularity of the industry context.
The first is the attribution of blame, whereby senior managers can apportion the
failure of a strategy to external and largely uncontrollable factors. The second is
that the stability of a market leader is most often challenged by a new (often
unexpected) entrant Which, in an attempt to gain market share quickly to
overcome scale-based disadvantages, revolutionises the product, servIce or
delivery (e.g., Dyson, Canon, Microsoft, Sony, Toyota). Third, the long standing
theoretical and empirical elegance of economics is highly persuasive.
However, a more balanced view that explains the influence of industrial
organisation economics in explaining competitive advantage is that external
analysis provides only half of the overall view that is needed for strategic analysis.
The external environment generates opportunities and threats which an
organisation must be aware of before selecting a new strategy. The other half of
the analysis consists of the internal analysis of the organisation's strengths and
weaknesses relative to other firms in the environment. The 'best fit' between
J6 Indeed, Porter (1980) makes no explicit reference to internal analysis is his seminal work 'Competitive Strategy', Of 16 chapters, some fifteen discuss how organisations should develop strategy according to the structure, age or size of an industry. The remaining chapter (2) introduces the now (in)famous generic strategies.
82

Chapter 4: Residence or Resources? - Views of Competitive Advantage
strengths, weaknesses, opportunities and threats arising from both internal and
external strategic analysis provides the most balanced perspective from which to
generate strategic options.
Strategies designed to conserve or alter industry structure are prolific. Horizontal
merger and acquisition, vertical integration and strategic alliances each foreclose or
reduce the level of competition within an industry and alter its structure.3?
The implications of such fatalism for this study are:
1. Competitive advantage arises from the industry environment. It exists in its
context and determines the degree of sustainability for a particular source of
competitive advantage. The characteristics of the industry in question -
automotive components - are particularly pertinent in this regard (Chapter 3).
2. The assumption of homogeneity is at its apotheosis with 10. It would follow
that the unique skills are less important (if important at all) than the ability of
a company to influence the structure of the industry (the five competitive
forces).
3. Techniques and theories such as critical success factors (Lei decker and Bruno,
1984; Jenster 1987) and business-level strategies (Porter, 1980) have
emphasised the impact of conditions at the industry level.
4. Managers may share or 'borrow' experiences of strategic concepts and sources
of competitive advantage from the same industry (Huff, 1982) leading to
commonality in strategic decisions through the presumed homogeneity of
organisations suggested by SCP.
Accordingly, whilst SCP has offered a degree of explanatory power at the
theoretical level, do such paradigms prevail in the minds of managers within a
single industry? The principal research question (Chapter 3) sets out to address this
matter directly.
)7 Lobbying, whereby organisations attempt to influence economic/competition policies. may also be predicated upon the preservation or recourse to favourable industry structure conditions.
83

Chapter 4: Residence or Resources? - Views o/Competitive Advantage
4.3. THE NOTION OF HETEROGENEITY: A RESOURCE-BASED VIEW
4.3.1 BASIC CONCEPTS
The resource-based view has developed into one of the most influential
developments in strategic management in the 1990s. An ever-inquisitive
readership of academics and practitioners have turned to this supposedly new
school of thought in order to understand how competitive advantage is generated,
sustained and enhanced. Its origins can be traced back to economists working
decades earlier.
Non-price methods of competition had effectively been airbrushed out of the
economists' theories of competition prior to the tum of the twentieth century.
Interest turned to how organisations could vary prices according to their
uniqueness or advantage over rivals. Sraffa (1926) suggested the ownership of
unique natural resources and legal privileges (including patents) led to increasing
returns to those organisations in imperfect markets. Robinson (1933) proposed
advertising and product differentiation38 as further vehicles for generating
imperfect competition, which for our purposes simply denotes the notion of
superiority and inferiority among a group of rival organisations within an industry
or strategic group (McGee and Thomas, 1986; 1992). To these factors,
Chamberlin (1950) added all forms of intellectual property, buyer loyalty and
geographical advantages. The salient relationship in the economist's views of
imperfect competition seen above is that between product and price, denoting a
product-based view of imperfect competition. A step forward was the suggested
relationship between productive resources, the finished product and price.
Widely regarded as one of the pioneers of the resource based view, Penrose
addressed this relationship. Central to her 'Theory of the Growth of the Firm'
(1959; 1960) was the view that organisations were not merely administrative
entities but also "a collection of productive resources" (1959:24). The view of an
organisation as an amalgam of resources had implications for the manner in which
competitive advantage could be explained. By describing organisations as holding
38 The earliest use of the term in a business context found by the author.
84

Chapter 4: Residence or Resources? - Views o.fCompetilive Advantage
bundles of resources which varied from others, the way in which these bundles
were developed and managed determined their ability to create value and
diversify:
It is the heterogeneity and not the homogeneity of the productive services available or potentially available from its resources that gives each firm its unique character. Not only can the personnel of a firm render a heterogenous variety of unique services, but also the material resources of the firm can be used in different ways which means they can provide different kinds of services (1959:75).
Resource heterogeneity is one of the two pillars of the resource-based view
(Barney, 1997). Prima facie, it suggests that all organisations are different and
whilst this is hardly a revelation in itself, it begs the question - why organisations
are unique (heterogenous)? It follows that the way in which resources are acquired
by organisations and the way in which they are managed and used will determine
their productive output. Irvin and Michaels (1989) point out the need for new
approaches to organisational advantage due to three sets of factors. First are
changes in structural, scale, technology and regulatory barriers around industries.
Secondly, the dawn of what they call "the era of 'human capital'" (10). Thirdly,
they note the homogeneity of strategic offerings and approaches in many
industries in which almost every company within it pursues largely the same
strategy (airlines expanding business class travel, for instance).
Resource immobility, the second pillar of the RBV, proposes that resources may be
inelastic in supply or are costly to imitate or acquire.39 The heterogeneity and
immobility of valuable resources provides the basis for a sustainable competitive
advantage.
Teece's (1982) 'Theory of the Multi-product Firm' is another early modern RBV
work which has been influenced by the Penrose paradigm. The firm is viewed as
possessing a capability in the early stages of the value creation/transformation of
inputs process which occasions a "generalisable capability which might well find
a variety of final product applications" (1982:45). This in turn influences the
39 This is akin to the notion of Ricardian rent (Eklund and Hebert, 1990).
85

Chapter 4: Residence or Resources? - Views o/Competitive Advantage
perception of the firm, with the writer gIvmg such examples as information
processing rather than computers, dairy products rather than milk and cheese,
farm machinery rather than tractors and harvesters, and time measurement rather
than clocks and watches. It may argued that this is simply another attempt to
define the business in a similar way to that espoused by Levitt (1960). However,
the former differs in the sense that the capabilities and configurations that
characterise the firm are already in place and are manifest in a variety of outputs.
The latter is merely are redefinition of an organisation's purpose, which may
prove to be beneficial in the setting of an organisation direction with regard to
products and markets.
Teece (1982) suggests that the view of the firm presented in much of the orthodox
literature de-emphasises (or ignores altogether) the importance of tacit knowledge
in determining the growth options and product offerings available to an
organisation. 'Knowledge' as a resource is difficult to transfer or sell since it often
resides among groups within an organisation.4o Therefore, the full value of such
knowledge (and therefore the rationale for the decision to pursue its acquisition) is
only known upon possessing that knowledge. The knowledge may be the
manifestation of cumulative group-member know-how, which can only be
appropriated from the firm as a whole (assuming the group is reconvened in an
environment that powers the existing group dynamics).
Whilst this issue is of less concern from a positive approach (i.e. describing what
is), for subsequent research with a normative flavour (i.e. prescribing what
should), debate has centred on the ability of firms to acquire and develop
resources and capabilities (Barney 1986, Dierickx and Cool 1989). Teece's
contribution is to highlight, once more, the importance of upstream capabilities
within an organisation'S transformation processes and the value and immobility of
intangible resources such as knowledge.
Responsible for coining the term Resource-based View of the Firm, Wemerfelt
(1984) offers a further reason for the disregard of heterogeneity. Due to the
40 In the case of intellectual property, sale of the 'knowledge' resource is facilitated through the licensing process.
86

Chapter 4: Residence or Resources? - Views of Competitive Advantage
problem of identification and measurement, economists had been glacially slow in
formally studying the impact of intangible resources and economies of scope,
which were only formally modelled in the early 1980s. Resources are defined as
"those (tangible and intangible) assets which are tied semipermanently to the firm ....
Examples of resources are: brand names, in-house knowledge of technology,
employment of skilled personnel, trade contacts, machinery, efficient procedures,
capital, etc" (1984: 172).
The need to consider both product and resource perspectives together was
introduced by Wernerfelt (1984: 171) when he suggested that "most products
require the services of several resources and several resources can be used in
several products". The latter part of the comment forms a crucial element of RBV
thinking, that a given resource may be evident in a wide variety of product in the
organisation's portfolio (Section 4.3.3). Acquisition and merger activity is viewed
as a manner in which the firm can purchase and incorporate 'resource bundles'
which are either supplementary or complementary to the bundle already present in
the firm. Hamel (1991) echoes the view of the firm in terms of a portfolio of core
competencies (or 'resource endowments') and the shift of competition from being
inter-product to inter-firm, that is to say that firms compete with their resource
bundles rather than their products. To this Hamel adds that competitive strategy
approaches (e.g. Porter, 1980) represent only a short-term approach to the
development of competitive advantage and offers few insights into how
(historically) skills and knowledge have been developed, diffused and deployed in
an organisation's activities.
Wemerfelt (1984) also introduced the resource-product matrix, where the
contribution of a organisational resource to a product (or range of products) is
identified. Derivations of this have been found in Prahalad and Hamel (1990),
Snyder and Ebeling (1992) and Herbane and Rouse (2000).
By using a resource-product matrix approach, Wernerfelt suggest that
diversification can be achieved through one of three resource development
strategies. The first, sequential entry. entails the use of single resources in a
number of markets, whereas exploit and develop. involves the use of resources
87

Chapter 4: Residence or Resources? - Views of Competitive Advantage
and skills to develop others in the 'resource portfolio' in order to generate greater
value.
The third resource strategy is that of stepping stones, where the major
consideration is the ability of the resource to generate further growth potential. In
the case of Honda, with its skills in engine design and manufacture, the company
sought to exploit the skills in applications far wider than motorcycle manufacture,
leading to presences in markets such a lawnmowers, boat engines, motor-cars and
portable generators (Mintzberg, Quinn and Ghoshal, 1998).
Wemerfelt's paper is as much a positioning paper as it is a call to action. Calling it
"a first cut at a huge can of worms" (1984: 180), he anticipated the difficulties of
identifying and measuring resources. Such problems are perhaps more attributable
to the researcher than the manager given that the increase in technology-based
advantages and cross functional activities may mask the sources of advantage to
the outside observer.
According to Conner (1991), a central tenet of the resource-based view is the
maintenance of product/service distinctiveness or low cost capability without the
need for investments which would dissipate any such returns. It is in this sense that
RBV marks a departure from the "neoclassical view of the firm as input-combiner"
in that "it does not include the accompanying neoclassical assumptions of a freely
available and perfectly specifiable production algorithm, as well as costly resource
mobility across uses and infinite input divisibility." (1991: 132). Therefore, the firm
is a "seeker of unique, or otherwise costly-to-copy, inputs." (1991: 133) In an
accompanying end-note, Conner adds that assets are said to be unique when they are
"infinitely costly to copy" (1991: 149).
Synthesis of the basic concepts
The resource-based view proposes that organisations are unIque due to the
possession of bundles of productive resources which may be heterogenous and
immobile, and lead to differentiation, diversification and competitive advantage.
Clearly, however, the possession of resources must be preceded by their
acquisition which, for the purposes of this study, is termed resource accumulation.
88

Chapter 4: Residence or Resources? - Views of Competitive Advantage
4.3.2 RESOURCE ACCUMULATION
The ability, or otherwise, and manner in which an organisation acquires resources
will determine the constituency of its resource bundles and consequently the
ability to combine these into portfolios of resources which find their ways into
finished products and services (section 4.3.3). Resources which do not reside in
one organisation normally reside in another commercial organisation, in nature
itself, or elsewhere in the public domain (society and public institutions). Each of
these are resource domains.
Barney (1986b) uses the term 'strategic factor market' to describe a 'virtual'
market in which an organisation acquires many of its resources. The resource
domains noted above can all be considered strategic factor markets in this context.
Design skills, low cost manufacturing competence, marketing capabilities and
market share can all be acquired through strategic factor markets. Those
organisations who successfully exploit such markets do so either because the have
a unique understanding of a given resource's future revenue generating potential,
or due to serendipity. This echoes Lieberman and Montgomery's (1988) pre
emption of scarce assets, whereby an organisation realises the strategic value of
resources prior to its rivals, thereby foreclosing access to the resource for its rivals
some time later. Examples of resources which can be pre-empted include
production capacity, domain names, raw material supply and real estate. So, it is
proposed that all productive resources are, in some way, available to organisations
through factor markets. However, organisations may differ in their behaviour and
success in strategic factor markets due to expectations, lack of separation,
uniqueness and lack of entry.
Expectations refer to the anticipated return to be generated through the acquisition
and subsequent deployment of the resource. Assuming that more than one firm
requires a given resource, bids in the strategic factor market may raise the factor
price to the point at which higher returns fall to normal returns, therefore creating
the following situation in which:

Chapter 4: Residence or Resources? - Views of Competitive Advantage
[I]n the long run, firms with more accurate expectations will usually be able to avoid economic losses associated with buying overpriced strategic resources. Firms that do not require these overpriced resources suffer from the "winner's curse," i.e., the fact that they successfully acquire the resources in question suggests that they overbid (Barney 1986b:1233).
The automotive components industry provides a stark example of how bidding in
factor markets has tended to fail. The uncertainty of the traditional arms-length
contractual relationship has been replaced by a more collaborative framework in
which many of the factors such as quality, design and manufacturing skills have
been acquired simply through the mechanism of the collaborative interface,
ostensibly at no direct cost to the organisation (Chapter 3). It could be argued that
limited concessions granted now will be repaid through future business and firm
survival.
Whilst it may seem prudent to suggest pessimism when bidding in factor markets,
one must consider that having shown intention to acquire, failure to do so could
lead to the possible demise of a chosen strategy where there is a dependence on
the resource for implementation. It is therefore incumbent upon the firm's
decision makers to be accurate about anticipated returns in order to optimise
returns in the long run due to the uncertainty/inaccuracy of rival firms'
expectations. Barney (1996b) uses the term lack of separation to describe
circumstances in which one firm may already have in its possession the resources
required for the implementation of a strategy. An example could be a high street
bank which has a highly developed information systems infrastructure and enters
the telephone banking market without having to enter the strategic factor market
for banking software and hardware. Once again, this anticipation of resources may
have come from good managerial foresight, but equally from pure luck.
Uniqueness occurs when only one firm can pursue a given strategy. This will have
occurred due to historical factors. For instance GKN's dominance in the Constant
Velocity Joint (CV) market can be attributed to the company having acquired
patents for CV joints (fitted to front-wheel drive (FWD) cars) when rear-wheel
drive cars were the dominant design (Lamming, 1993). Once more, good foresight
or luck are cited as reasons for such outcomes. The GKN example combines the
90

Chapter 4: Residence or Resources? - Views of Competitive Advantage
two, the careful approach towards protecting technological developments, and the
fortuitous development of FWD cars to serve the European and South-east Asian
markets.
Imperfect competition in strategic factor markets may also occur when not all
firms who require a resource enter the market for it. This may be due to a failure
to understand the return-generating potential of a strategy, where firms lack the
financial strength to acquire the resource, and thus never enter into bidding for it,
and where there is a lack of understanding of what opportunities (and therefore
returns) may be created by a strategy.
The acquisition of resources is clearly contingent upon the resources which an
organisation currently possesses in order to generate an exchange. Predominant
among these means of exchange is financial resources for the simple purchase of the
resource. However, it could also involve the exchange of resources with a partner in
a strategic alliance (Gerlach, 1987; Lorange and Roos 1993; Gulati, et ai, 1994;
Faulkner, 1995) or the choice of merger or acquisition (Meeks, 1977; Guyon, 1998).
Organisations with "informational advantages" (Barney, 1986b: 1238) about the
importance and value (actual and potential) of resources available in factor
markets will allow decision makers to make appropriate bids for resources based
on well informed expectations. It is from where such informational advantages
can be derived that is more problematic. Expectations, lack of separation,
uniqueness and lack of entry may account for differences between organisations in
the way in which they successfully acquire resources (or to the contrary).
Barney's view of strategic factor markets is only a starting point in the
understanding of the resource accumulation process; it does not fully address why
organisations may not understand precisely which resources are important, why
they are important and from where they can be obtained.
Dierickx and Cool (1989) propose an alternative to strategic factor markets and
offer a different explanation for the differences between the accumulation of
resources among organisations. Through the protection of resources from
imitation and substitution, organisations accumulate resources to reach a
"privileged asset position" (1989: 1507). So, here, competitive advantage IS
91

Chapter 4: Residence or Resources? - Views of Competitive Advantage
generated from "a bundle of assets, rather than the particular product market
combination chosen for its deployment" (1989: 1504) mirroring the resource and
process perspective found to be a basic proposition of the resource-based view.
Unlike Barney (1986b), which purports to the existence of strategic factor markets
for all resources, Dierickx and Cool reject the tradeability of assets such as
reputation, trust, reliability or knowledge in factor markets (and therefore between
organisations). Such markets could not always provide the precise type of
resources that are required for strategy implementation as "firms do not employ
'generic labour', but people endowed with firm specific skills and values"
(1989: 1505). Consequently, firms are endowed with resources which may not be
acquired by rival firms and should thus be used in the firm's strategies. The
resource may have been developed in such a way that it is "the cumulative result
of adhering to a set of consistent policies over a period of time" (1989: 1506),
connoting the historic dimension of an organisation's resource bundles.
A development from the previous literature is the extension of asset advantage
from merely referring to superiority of an organisation's resource bundles arising
from informational advantages and success in strategic factor markets, to
developing resource stocks which cannot be traded, imitated or substituted.41
These three criteria of tradeability, inimitability and substitutability determine the
degree to which they may be considered (and subsequently exploited) as strategic
resources.
Substitution can quickly remove the ability of assets to confer competitive
advantage. Dierickx and Cool suggest that the substitution of Xerox's extensive
service network by Canon's lower servicing functionality in the market for
photocopiers made the former resource obsolete and less able to generate value
for its owners.
Inimitability is a function of the asset's method of collection. Five main factors
influence the resource accumulation process:
41 Dierickx and Cool (1989) use the term 'asset stock'. Reference to 'resource stock' is used for the purposes of clarity and consistency rather than to connote a difference between the original source and its representation here.
92

Chapter 4: Residence or Resources? - Views of Competitive Advanla~e
• time compression diseconomies
• asset mass efficiencies
• interconnectedness of asset stocks
• asset erosion
• causal ambiguity.
Time compression diseconomies could simply be considered the cumulative effect
of time on the ability of others to imitate an asset. This could be due to the pre
emption of scarce assets (Lieberman and Montgomery 1988), fortuity, prudence,
or the law of diminishing returns:
In the case of R&D, the presence of time compression diseconomies implies that maintaining a given rate of R&D spending over a particular time interval produces a larger increment to the stock of R&D know-how than maintaining twice this rate of R&D spending over half the time interval (Dierickx and Cool 1989: 1507).
Time compression diseconomies highlight the importance of resource
development over time. R&D is a case in point. It may also be the case that some
resources simply cannot be reproduced at all because the resource will always be
older than any alternative that is produced (such as older employee's experience,
as opposed to their knowledge).
Asset mass efficiencies occur when an additional flow of asset creates further
value, growth and strategic opportunities. The implications for follower firms are
similar to those with low cumulative sales when competing in scale/experience
dependent industries (Abernathy and Wayne 1974). Certain types of resources or
capabilities attract more resources or enhance capabilities. Organisations with a
history in, and an accumulation of, know-how in R&D are generally in a better
position to make new breakthroughs (Mansfield and Wagner, 1975; Helfat, 1997).
Organisations that have developed extended networks of relationships will have
capabilities for information collection or environmental scanning that are not
93

Chapter 4: Residence or Resources? - Views a/Competitive Advantage
available to firms with fewer year's involvement in such activities.42 Corporate
and business reputations, and the efficiencies arising from established distribution
channels also constitutive asset mass efficiencies.
The interconnectedness of asset stocks may determine that the accumulation of
one stock is dependent upon the existence of another, with particular
characteristics. The example given is that of product development based on
consumer feedback that has been facilitated by a wide service network. Firms that
cannot innovate and therefore cannot build new capabilities except by virtue of
imitating others will be disadvantaged. The problem for such firms is not the low
level or non-existence of a certain asset, but the lack of its complement.
Asset erosion refers to the diminution in the value and contribution of resources
unless they are continually maintained. A research and development resource will
only maintain its contribution if the appropriate financial, human and physical
resources enable R&D to pursue the development of the latest technologies.
Equally, brand reputation can erode as the market demographics to which that
reputation is linked changes. Since resources require constant maintenance, being
more efficient in asset accumulation in the preceding areas prevents the
deterioration of assets at the same rate as less efficient, experienced or insightful
firms.
Lastly, causal ambiguity arises when managers and employees are unable to
emulate a process or skill from another part of their own organisation because
they are unable to understand the process or skill entirely accurately. The
ambiguity between cause and effect leads to the inaccurate reproduction of
something which has been successful elsewhere in the organisation:
The stochastic nature of the accumulation process may stem from our inability to identify some of the relevant variables as well as our inability to control them. Indeed, for some asset stocks it may be impossible to fully specify which factors play a role in their accumulation process, even for firms who already own those stocks (Dierickx and Cool 1989:1509 emphasis added).
42 One could suggest that such infonnation could be 'bought in' to overcome a lack of asset mass efficiencies. However, whether the infonnation would match the detail, context and relevance of the infonnation and knowledge possessed by the organisation with the advantage is doubtful.
94

Chapter 4: Residence or Resources? - Views of Competitive Advantage
Organisations which face the problems of imperfect best practice transfer between
sites do so because of causal ambiguity, such in the case of Toyota, where it has
been unable to reach the same levels of efficiency in its overseas plants compared
to those located in Japan (Taylor, 1997). The tacitness, specificity and complexity
of processes (Reed and DeFillippi, 1990) may further compound the problem.
Causal ambiguity is the intra-organisational equivalent of the inter-organisational
problem of uncertain imitability. For other organisations which aim to match the
advantage developed by a market leader or pioneer, the challenge is to understand
fully a rival's competencies in order to imitate the rival's success. Whilst it may
be superficially possible to identify where the source of competitive advantage
lies, such as in good customer service, lighter products, better features or lower
cost, the means by which such ends are achieved may prove more difficult to
identify. Reverse engineering can provide some insights into product design, but
this cannot show how the Research and Development process was organised in
order to produce a novel design. Neither can it provide a substantive indication of
the manufacturing processes which are used in the creation of the product.
The problem of firms being unable to accurately emulate the capabilities and
skills of rivals has been termed 'uncertain imitability' (Lippman and Rumelt,
1982). Causal ambiguity and uncertain imitability each affect different individuals
and groups. Lippman and Rumelt (1982) describe uncertain imitability as follows:
The conventional view is that competition and free entry will eliminate such differences, so their persistence may be taken to indicate the presence of market power or impeded entry. However, if the original uncertainty stems from a basic ambiguity concerning the nature of the causal connections between actions and results, the factors responsible for performance differentials will resist precise identification. Under such conditions the uncertainty attached to entry and imitative attempts persists and complete homogeneity is unattainable. Thus, persistent differentials in profitability may be consistent with free entry and fully competitive behaviour (1982:418).
Organisations seeking to either replicate their own processes elsewhere face
causal ambiguity and those seeking to imitate the process of a rival face uncertain
95

Chapter 4: Residence or Resources? - Views of Competitive AdvantaKe
imitability.43 Notwithstanding their differences, both these phenomena are
predicated upon the need for full information in order to accurately replicate a
given process. Their implications for resource accumulation are clear. Not only
may the accumulation of resources be imperfect, so may the identification of
necessary resources which precedes it.
The contribution made by the resource stock framework is complementary to
strategic factor markets. The former focuses on sustainability, which is an inverse
function of imitability, tradeability and substitutability. This differs from the
traditional view of sustainable in the context of competitive advantage meaning
long-term in nature. Here the temporal nature of competitive advantage is
determined by the ability of a rival to identify and subsequently imitate or acquire
the necessary resources.
In a development of Lippman and Rumelt's (1982) work, Reed and DeFiIlippi
(1990) contextualise their work within "an emerging trend in strategy to formulate
models based on assumptions of disequilibria, rather than static efficiency"
(1990: 10 1). They centre their discussion of sustainable competitive advantage
(SCA) upon the interaction of causal ambiguity and barriers to imitation, noting
that the RBV literature has two congruent and widespread themes; that
competency is always generated within the firm, and that competency has an
essential internal skills component. Reed and DeFillippi also observe a common
theme within the RBV literature regarding the application and returns from
resources in which resource integration leads to product proliferation and higher
value-added.
Nonetheless, SCA does not simply equate to competence, since luck and
exogenous factors may provide opportunities not conferred by the firm's
resources. Reed and DeFillippi (1990) note that the position of competitive
advantage has not always been clear in the strategy literature, having been
considered previously as a factor in an organisation's strategy, and latterly as the
outcome of a strategy or series of strategies. Advantage and ambiguity of
43 With causal ambiguity and uncertain imitability, the organisation (and its managers) may only realise that their strategic decision to buy a resource was inappropriate only once the resource is in their possession. This enduring problem of information asymmetry has come to be known as the 'lemon' problem (Akerlof. 1970).
96

Chapter 4: Residence or Resources? - Views of Competitive Advanta~e
resources is presented as the interaction of three factors; tacitness, complexity and
specificity.
Tacitness, seen as "the inability of even a skilled performer to codify the decision
rules and protocols that underlie performance" (1990:91) assists causal ambiguity
in raising a barrier to imitation. Complexity protects competencies in making the
knowledge set surrounding the organisational skill too difficult for an individual
to understand and therefore protecting it from expropriation. For rivals looking at
the organisation, complexity ensures that they cannot fully discern the linkages
between organisational assets. Specificity is concerned with the manner in which
the organisation's assets are associated and deployed predominantly or
exclusively in the pursuance of a given transactionlrelationship.44 These
'relationships' may add further to the ambiguity of the resource's contribution to
SCA. In a link to the first factor, they add that "human asset specificity is highly
correlated with tacitness" (1990:93). Possession of knowledge and an
understanding of its significance can often be widely separated.
Causal ambiguity is itself a component in a relationship which determines
competitive advantage. The balancing factors are the level of competition and
barriers to imitation. The latter is viewed as an obstacle or restraint to imitation.
Barriers can be sustained by internal managerial action such as the leverage of
tacit knowledge, tighter security around operations and increasing asset
specificity. Tacitness, complexity and specificity contribute to causal ambiguity,
which in tum raises barriers to imitation and influences the decay or sustainability
of a competitive advantage. These proposed relationships are summarised in
Table 4.1.
44 Asset specificity originates in the work of Williamson (1975; 1979; 1983).
97

Chapter 4: Residence or Resources? - Views o/Competitive Advantage
Theme Proposition Causal Ambiguity Ambiguity may be derived from tacitness in skill-based
competencies. Ambiguity may be derivedfrom the complexity of skills andlor resource interaction within competencies and from interaction between competencies Ambiguity m~ be derived jjom skill and resource specificity
Barriers to imitation interaction effects of tacitness. complexity. and specificity serve to heighten ambiguity effects and barriers to imitation Barrier height is afunction of the level of competition. A given amount of ambiguity in a highly competitive environment results in a lower barrier than the equivalent ambiguity in a less competitive environment Barriers to imitation are dependent on the ambiguity in a firm's competency-based advantage. and the potential barrier height is moderated by the firm 's value-added
Decay and Regardless of the level of competition or the degree of Sustainability of ambiguity. decay in the barriers to imitation remains a Advantage temporally relatedJ!henomenon
For a given level of competition. the rate of decay will be proportional to the amount of ambiguity. For a given level of ambiguity, the rate of decay will be proportional to the amount of competition Sustainability of competency-based competitive advantage is dependent upon reinvestment in causally ambiguous competency characteristics of tacitness. complexity. and specificity
Table 4.1: Proposals for Competitive Advantage
Compiled from Reed and DeFillippi (1990:93-98).
As with Dierickx and Cool (1989), Grant (1991) also suggests that not all
resources can be purchased in open markets and in the case that they are,
acquisition can often be hampered. Reasons forwarded are geographical
immobility (plant equipment and human resources), imperfect information
(regarding market value and rate of return), firm specific resources (where value
creation is truly unique to the 'mother' firm, such as the Saab name before the
OM equity purchase), and capability immobility, where teams of resources and
human capital are interwoven so as to make capabilities difficult to identify and
emulate. Replicability denotes the extent to which imitators are able to develop a
resource or capability endogenously. Multifarious routines are, once again, more
defensible against imitation. For instance, Grant suggests that lIT and Quality
Circles are more difficult to emulate than would first appear because their success
is predicated as much on attitudinal change and the physical changes to work
process and routines.
98

Chapter 4: Residence or Resources? - Views of Competitive AdvantaKe
Resources develop, often incrementally, due to imperfect factor markets,
inimitability and rarity. Uncertainty, complexity and conflict may also arise to
produce a planning environment in which "strategy partly becomes a shot in the
dark and partly an exercise in heuristic creativity aimed at overcoming biases and
blind spots" (Amit and Schoemaker 1993:43). Accordingly, they suggest, the
examination of firm uniqueness yields an outcome in which "resources ... stem
from imperfect and hard to predict decisions by boundedly rational managers
facing high uncertainty, complexity, and interfirm conflict" (1993:44). The impact
of distortion upon human cognition has long been recognised in the form of
bounded rationality (Simon, 1957), Groupthink (Janis, 1982), cognitive bias
Tversky and Kahneman, 1974; Schweiger and Finger, 1984; Barnes, 1984) and
conflict (Cameron, 1986). In combination with a lack of informational advantages,
these may conspire to reduce the effective identification, choice and acquisition of
resources, much before the availability of resources become an impediment.
Peteraf (1993) presents a model of competitive advantage which combines not
only resource heterogeneity, but imperfect mobility and ex post and ex ante
constraints on competition. The rationale for the four factor model is a distinction
made between heterogeneity per se and long run competitive advantage. Whilst
heterogeneity is an essential component of this construct, it is does not constitute
the whole. The framework serves to promote greater insights into the restriction of
resource supply, which underpins firms' ability to resist imitation and resource
appropriation. Heterogeneity is said to occur when the supply of "superior
productive factors" (1993: 180) is limited in terms of the total available for
incorporation in all firms' value creation processes. This supply may also be
"quasi-fixed" (1993: 180) subsequent to which there are time delays in the creation
of new sources of supply for the superior productive factors. Such restrictions
alleviate scenarios in which many firms compete away their margins having
entered because of the high profitability of the domain at a previous point in time.
Peteraf (1993) uses the market power/monopoly framework to identify other
sources of heterogeneity. Here, endogenous restrictions prevail, rewarding the
firm with returns which stem from scale-based or first mover advantages.
99

Chapter 4: Residence or Resources? - Views of Competitive Advantage
Having generated a firm-specific advantage, managers must seek to sustain the
advantage over planning horizons, particularly when capital outlays may have
been substantial (in the case of acquiring resources from factor markets, as
opposed to 'lucky' spending). Consequently, the second component of Peterafs
model is that of generating ex-post limits to competition. These she describes as
"subsequent to a firm's [sic] gaining a superior position and earning rents, there
must be forces which limit competition for those rents" (1993: 182 original
emphasis). Included are imperfect imitability/causal ambiguity, imperfect
substitutability and endogenously generated entry barriers.
The mobility of resources constitutes the third component. Resources may be
perfectly immobile, i.e. impossible to transact in open markets, or imperfectly
mobile, in which case they can be traded between organisations but may not
create more value for the previous owner than for the new one. This could be due
to their use in conjunction with other assets, or because they are the result of
relationship-specific investments (Peteraf 1993). Hence, Peteraf maintains, such
asymmetries assist in creating the time-lag to imitation that is so imperative in the
sustenance of competitive advantage. However, she comments in a footnote that
negative externalities (technology or environmental change) may occur from
mobility issues, similar to Leonard-Barton's concept of 'Core Rigidities' (1992).
The fourth element recognises the need to prevent all players in a market making
a simultaneous move for a particular resource gathering position which will
consequently devalue its value adding potential. Peteraf names these 'ex-ante
limits to competition' and points to Barney's (1986a) work on imperfect factor
markets and the concept of luck. Additionally, uncertain imitability (Lippman and
Rumelt, 1982) suggests that not all firms know which resources are important,
have the resources to successfully pursue and acquire the resource, and at the
same point in time.
Peteraf suggests that her model can be used for analysing resources without the
'generic-ness' levelled at some of the 'design school' models (discussed in
Mintzberg, 1990; Whittington, 1993). The model encompasses a method by which
managers can recognise and distinguish the "specific resource endowment"
100

Chapter 4: Residence or Resources? - Views o/Competitive Advan{a~e
(1993: 186) of the firm and the strategic opportunities that it may bring, adding
that "application of the model will not increase competition for available rents.
This will only ensure that each firm optimizes the use of its own specialised
resources" (1993: 187).
The RBV, it could be suggested, assists in the accreditation of those resources
which make an obvious and direct contribution to a sustainable competitive
advantage. Peteraf illustrates this with the case of a firm which may have a Nobel
scientist amidst its personnel. Whilst the scientist may be unique, high mobility
means that he or she cannot be considered to a sustainable source of competitive
advantage. However, if the scientist's skills are dependent on specialist teams,
skilful managers and organisational culture, the threat and impact of the scientist's
mobility are reduced.
The model may also inform 'make or buy' decisions. Peteraf (1993) suggests that
if the technology is imperfectly mobile, in-house production should be retained.
However, if this is not the case, licensing would still provide limited returns. An
understanding of imitability and mobility may also enrichen strategies to prevent
technology imitation, through the pre-emption of future capabilities coupled with
the technology. In considering a development project which involves the
exploitation of a firm-specific capability, the in-house choice is superior because
skills are developed in the context of current operations and are therefore
customised as opposed to generic. In addition, the development of the capability
as much as the capability itself offers the organisation an important opportunity to
learn and leverage associated skills within different projects in the future whilst
generating skills that are less transferable between organisations, thereby
increasing resistance to imitation.
Resources are considered by Conner (1991) to have limitations placed upon their
rent-generating (value-adding) potency and such limitations may have both
exogenous and endogenous sources. External limitations may stem from market
demand, public policy limitations and competitive substitution. Here also, luck
may playa part in determining the value of a firm's resources. Internal limitations
on rent-generation emanate, in part, from the consequences of linking assets (c.f
101

Chapter 4: Residence or Resources? - Views o/Competitive AdvantaKe
asset mass efficiencies). Here, the emphasis in not placed on the uniqueness of the
assets themselves, but the ways in which they are combined with other firm
resources. Asset specificity occurs when "the value of A ... increases in the
presence of B, but the value of C is independent of either A or B ... [therefore] ".
grows in value when it is teamed with B, but C does not" (1991: 135). Hence,
another level of resource-based analysis lies at the point at which firms generate
different quantities and rates of value according to asset bundling relative to firms
with similar and equivalent assets. This notion of asset specificity combines
Dierickx and Cool's time compression diseconomies with asset mass
efficiencies.45
Another factor which may determine the longevity of a specific input is the
contract governing the possession of the asset/resource within the firm. Connor
(1991) illustrates the contractual enforcement of asset preservation using the case
of having purchased an iron ore mine in the past at a lower price. In this case,
providing that supplies do not become exhausted. there is no cost involved in
preserving the 'possession' of the asset. Conversely, in the case of an expiring
lease for a valuable retail location, the firm may quickly become vulnerable,
particularly if the premises were central to the asset specificity of the organisation.
Finally, a firm which is highly dependent upon the creations of a gifted scientist is
vulnerable to the financial demands of the scientist, and to the possibility that
he/she may leave for another firm or start up a rival organisation.
Synthesis of resource accumulation
The manner in which organisations accumulate resources directly influences the
composition of their resource bundles. The literature considered above posits a
multitude of factors which affect the resource accumulation process among
organisation. Several themes are replicated between studies (such as immobility
45 The use of the term asset specificity differs from the original (above). The original meaning refers to where assets and resources of an organisation are uniquely associated with servicing a specific supply relationship with another firm and could not be put to alternative use without significant modification and cost. These idiosyncratic assets have the highest level of specificity. Locations can be asset specific. such as in the case of a supplier that situates its factory next to a buyer's warehouse to reduce transportation costs. Human resources could also be asset specific. where an employee has been trained exclusively to meet the needs of a single client or customer such as in marketing and corporate finance companies. Differing levels of asset specificity affect the choice of effective governance structure which control the series of transactions in buyer-seller relations. Generally. vertical integration may offer a more cost-effective approach in cases of repeated transactions with high levels of asset specificity (Chapter 3).
102

Chapter 4: Residence or Resources? - Views of Competitive Advantage
and ambiguity). Upon closer inspection, many of the themes bear a great deal of
similarity. Indeed, seven categories of themes have been found among the studies:
1. Causality - where organisations are unable to clearly understand or replicate
resources due to ambiguity in the cause-effect relationship. Consequently they
may not accumulate precisely the same resource as another.
2. Information - where organisations are unable to identify or discern the value
of a resource due to limited information. Consequently they may fail to
accumulate a resource which is of strategic importance.
3. Organisational behaviour - where the decision making process relating to
resource acquisition is hampered. The results are similar to the information
factor.
4. Serendipity - organisations may accumulate valuable resources through luck
rather than a conscious strategic decision to do so.
5. Linkages - where resources are difficult or impossible to acquire because they
are linked to other resources in a dependent way, in some cases over a long
duration. As such, they cannot be disentangled and acquired separately.
6. Immobility - where resources cannot be accumulated because the they cannot
be moved from one organisation to another, either physically or in some other
way, such as contractually (legal and commercial).
7. Availability - where resources cannot be accumulated by virtue of the fact that
no exact alternative exists, markets cannot be entered, or where alternatives
are discernibly inferior.
The relationship between the seven factors identified above and the literature
surrounding resource accumulation is presented in Table 4.2 overleaf. A resource
based view proposes that the resource accumulation process is hampered by
causality, information, organisational behaviour, serendipity, linkages, immobility
and availability.
103

Chapter 4: Residence or Resources? - Views of Competitive Advuntuge
Accordingly, the second research question ofthis study is structured as follows:
RESEARCH QUESTION 2
Do managers perceive resource accumulation to be part of the RBV
construct?
Organisational heterogeneity begins with the heterogeneity of the resource
accumulation process but is directly manifest by the way in which resources are
used by organisations. It is to this that we now turn by examining the notion of
portfolios of resources.
Category Factor Source
Causality Uncertain imitability Lippman and Rumelt (1982) Causal ambiguity Dierickx and Cool (1989) Imperfect imitability Peteraf( 1993)_ Perfect mobility with lower value creation Peteraf (1993)
Information Informational advantages Barney (1986) Imperfect information Grant (1991 ) Uncertainty Amit and Schoemaker (1993)
Organisational behaviour E~ectations Barney (1986) Conflict Amit and Schoemaker (\993)
Serendipity Luck Barney (\986)
Linkages Lack of separation Barney (1986) Time compression diseconomies Dierickx and Cool (1989) Interconnectedness of asset stocks Dierickx and Cool ( 1989) Asset erosion Dierickx and Cool (1989) Asset mass efficiencies Dierickx and Cool (1989) Complexity Reed and Defillippi (1990) Asset bundling Connor (1991) Complexity Amit and Schoemaker (\993)
Immobility Specificity Reed and Defillippi (1990) Geographical immobility Grant (1991) Firm specific resources Grant (1991) Capability immobility Grant (1991) Replicability Grant (1991) Asset specifici!y Connor (1991) Contractual provisions Connor (1991) Quasi-fixed resources Peteraf (1993)
A vailabUity Tradability Dierickx and Cool (1989) Substitutability Dierickx and Cool (1989) Lack of entry Barney (1986) Tacitness Reed and Defillippi (1990) Endogenous restrictions Peteraf (1993) Imj>erfect substitutability Peteraf (1993) Entry barriers Peteraf (1993)
Table 4.2: Factors Affecting the Process of Resource Accumulation
104

Chapter 4: Residence or Resources? - Views o/Competitive Advantage
4.3.3 THE NOTION OF PORTFOLIOS
Earlier we saw that the resource-based view centralises upon the bundling of
resources within organisations. Such bundling refers directly to the portfolios of
resources found within transformation processes which lead to final product of
service. Accordingly, these portfolios of resources may be evident in the
organisation's outputs. It is opportune now to consider how the notion of
portfolios can be observed.
Prahalad and Hamel (1990) popularised the RBV concept and introduced the term
'core competence' into the managerial vemacular.46 In so doing, the notion of
resource portfolios was advanced as the most effective way to generate a long
term competitive advantage, unlike the short-term gains that can be made from the
price and performance characteristics of a company's products in market domains.
It was proposed that firms must be seen as a "portfolio of competencies ... [rather
than] a portfolio of businesses" (1990:81) echoing the basic concepts of RBV
thinking. Core competencies are "the collective learning of the organisation,
especially how to coordinate diverse production skills and integrate multiple
streams of technologies" (1990:83). Doz (1993) notes the RBV grounding in the
economics literature, and acknowledges the absence of "a solid empirical base and
a microtheoretical foundation" (1993: 1). Such competencies are defined as "the
underlying process routines that allow to combine resources, systems, assets and
values, to result in predictable high-level performance of task, which yield
advantage over competitors, and provide valued functionalities for customers"
(1993:3).
These organisational resources called core competencies, unlike their more
tangible counterparts, develop and strengthen over time through use and
application (echoing asset erosion). They provide the potential for new products,
markets and applications development, and create synergy among different parts
of the company. Core competencies, Prahalad and Hamel (1990) suggest, cannot
46 Seimick (1957) adjectivised the word competence when referring to management skills to become 'distinctive competence', many years prior to its adjectivisation as 'core competence'.
105

Chapter 4: Residence or Resources? - Views of Competitive AdvunluKe
be developed simply by ploughing vast funds into research and development
(echoing time compression diseconomies).
Whilst clearly many of the ideas proposed by Prahalad and Hamel merely
reflected the content of the antecedent literature, the departure arose in three ways;
the term 'core competence' itself, criteria by which to evaluate whether the
combination of resources constitute a core competence, and practical example of
organisations with core competencies. Core competencies bear three vital
characteristics; potential application in a variety of markets, perceived use value47,
and inimitability. The latter they suggest "will be difficult if it is a complex
harmonisation of individual technologies and production skills" (1990:83-84).
Core competencies may be the result of numerous years of development whose
physical manifestations are the end products called 'core products'. The loss of
core competencies cannot be predicted because of the subtle way in which they
develop via continuous improvement and will therefore have severe consequences
for companies competing in the markets of the future. As Prahalad and Hamel
suggest, "it is difficult to get off the train, walk to the next station, and then
reboard." (1990:85). By their very nature, firms must have only a few
competencies which find themselves in core products which are then central to the
firm's end offerings. This is counter-intuitive to the approach portrayed in the
orthodox strategy approach which suggests that firms should develop as many
strengths as possible to counteract weaknesses and threats and to capitalise on
opportunities in the operating environment. Aaker (1989) found that firms listed
(on average) 4.65 attributes as sustainable competitive advantage factors. leading
him to assert that "multiple strengths are needed in order to compete successfully
and that assets and skills are defined at a more specific and detailed level".
(1989:96)
Prahalad and Hamel (1990) suggest that to vlew the firm in terms of its
competencies allows product development that may not have been conceivable
within the traditional SBU structure because of the fusion of inter-functional
47 Term used by Bowman (1991; 1992a; 1992b) to denote the satisfaction in use derived by the customer relative to the price paid for the product or service.
106

Chapter 4: Residence or Resources? - Views of Competitive Advantage
technology and expertise. Prahalad and Hamel's analysis of Canon's three core
competencies shows that through precision mechanic, fine optics and micro
electronics, the company has developed twenty three products ranges (which in
turn have multiple models), each of them utilising at least one competence.
An organisation's core competencies may be manifest in rivals' products, since it
may be the original equipment manufacturer of high added value proprietary
components which are the industry standard. For example, by the late 1980s,
Matsushita had a 45% market share in VCR components in comparison with its
20% share of final product demand. Similarly, Canon held 84% of global share for
laser printer engines despite its low market share for finished printers. (Prahalad
and Hamel, 1990:85). 48
The decision to outsource components, thereby eroding the R&D and production
resources of an organisation have major implication for core competencies. Whilst
outsourcing could yield cost savings due to lower market prices (Williamson,
1985) compared to internal transfer prices (Mahoney, 1992; Cravens, 1997), it
does little to expand the capability and application of the organisation's skills
base. It also relinquishes any control over products and markets that lie
downstream. Sony and Philips' upstream competence in basic laser and disc
technology has allowed them to greatly influence the development on multi-media
and mini-disc.
In the automotive industry, outsourcing has become widespread, but in the main,
strategic (and high value-added) components that give the car its identity and
character, namely, engine, chassis and bodywork have remained the only true
manufacturing activities for many automotive assemblers who outsource the many
of the ten thousand or so 'anonymous' parts in a completed car. For automotive
component manufacturers, the tiering of the supply chain has signified the
development of a first tier of suppliers who will supply whole assemblies for
transmission, suspension, brakes, etc, (Chapter 3). In doing so, the supplier is
faced with a choice of which activities to outsource to second tier suppliers.
48 Philips and Sony's laser diode patent and Sony's production oftloppy disk drives. diskettes and VCR tape are further examples.
107

Chapter 4: Residence or Resources? - Views o/Competitive Advantage
The harmonization and convergence of resources into portfolios has become
popular in many manufacturing industries and are commonly known by the
collective term 'product platforms'. Meyer and Utterback (1993) suggest that core
competencies should be used within 'product families' and 'product platforms'.
Product families represent a different approach to portfolio and product
management in the sense that resource and component sharing enable more
effective product development, the growth of proprietary knowledge, and more
responsive and effective marketing. Because products are clearly related in their
technologies, any product or component improvement is incorporated into the
entire product range. A product family refers to a group of products which each
utilise the same product platform. In tum, product platforms are the skeleton of a
product, to which additional components are added in order to differentiate them
among other products using the same platform according to variations in market
segments. Meyer and Utterback illustrate the concept of product platforms (and
the flexibility that they offer) with the case of the Sony Walkman in which
between 1980 and 1990, 160 versions of the Walkman were launched, based
around four key technologies (in-ear headphones, mini-flat motors, rechargeable
batteries, and disk drive mechanics). Similarly, Black and Decker adopted a
product family approach in its power tools business after realising that the vast
array of motors and switches was incurring unnecessary costs. The new approach
involved the development of multi-purpose motors, housing and switches to
correspond with each product family. These changes are yielded production
saving of fifty per cent and the new approach is attributed to company' substantial
presence in the power tools market.
Television set design and manufacture also relies on the use of product platforms.
Different television sets produced by the same company may contain the same
'chassis' (which contains the cathode ray tube and signal tuner). The manufacturer
subsequently differentiates the chassis using different casings and features such as
teletext, stereo sound and greater connectivity. In 1998, Sony UK had a TV
product range of 37 models, including 15 new models based on a less than a
dozen platforms. A product platform approach can also be observed in less
tangible products, such as computer software. Most complex software packages
108

Chapter 4: Residence or Resources? - Views o/Competitive AdvantaKe
and operating systems are based on small programme modules which come to
form the entire programme (Cusumano, 1997).
Core capability should ultimately manifest itself in the form of profitability,
product proliferation and/or employee satisfaction according to Meyer and
Utterback (1993). The writers also reflect the theme of asset erosion, adding that
organisations need to sustain and enhance the potency of competencies. Their
research found four main impediments to competence development. These can be
described as impatience, blindness, overconfidence, and prematureness.
Capability may be stifled or destroyed when organisations place impractical and
unreasonably short time limits on project development. An additional effect of
impatience may be the limits placed in terms of the penetration and positioning of
the product in the market. Early withdrawal eliminates any future revenue streams
that may have been increasingly easier to realise. Blindness connotes the inability
of some organisations to recognise technological discontinuities and the
occasional influence of the 'Icarus' effect (Miller, 1990). Such events may render
the capabilities (upon which the firm relied for sustainable competitive advantage)
useless.
Meyer and Utterback also argue that "planned renewal of product platforms
combined with sustained development of core capabilities is a defence against
technological surprises and obsolescence" (1993 :44), much in the same vein as
the supply side approach to strategy espoused by Hay and Williamson (1991). The
synthesis of this with the 'creative destruction' event, may assist in the
understanding of a particular irony. When a firm innovates and introduces a
product onto the market, the replacement process of old for new is effectively a
destructive one in the sense that future revenue streams from the old product are
removed. However, this is not problematic for a given firm if an existing product
is 'destroyed' by a product of the same firm which, ceteris paribus, should yield
similar, if not superior, future returns. It is when a firm's product is 'destroyed' by
the new product introduction of a rival firm that the consequences are severe if the
firm is unable to react rapidly to the rivals product launch. Meyer and Utterback
109

Chapter 4: Residence or Resources? - Views o/Competitive Advanla~e
(1993 :46) allude to this when they note that "winning companies retire their own
products rather than let competitors do it for them".
Clearly, there are many risks associated with policies of planned obsolescence,
particularly where product platforms are involved. However, many organisations
'carryover' parts from previous models to ensure a longer return on R&D
investments.49
For product families to have an opportunity to develop and make an impact on
their respective markets, new management approaches may be required. In
particular, product planning should become planning with the unit of analysis at
the platform level. Additionally, resource allocation should also be made on the
basis of product platforms, and must adopt longer time horizons. Consequently,
Meyer and Utterback would suggest that the firm will find itself in a situation in
which process and technology improvements improve the wider portfolio of
products sharing the same platform.
Product platforms are a relatively recent development which involves a greater
degree of integration between R&D, production, purchasing and marketing,
reflecting the integration of multiple streams of technologies in a number of
products. However, organisations may integrate their technologies without the
direct need for product platforms. The improvement and convergence of
technology over time is often represented in the products developed by
organisations such as Sony (Jolly, 1997).
Although the bundling of resources has been suggested (albeit anecdotally) in
respect of individual technologies, know how, etc., Robins and Wiersema (1995)
found that relationships between business units involving the sharing of product
oriented resources (in addition to the sharing of resources in the search for
economies of scope) led to higher levels of performance that those organisations
with business units that had little or no levels of relatedness.
49 This is a double-edged sword, however. Japanese producers tend to carry over fewer components from previous models (18%) whereas European producers carry over 29% of components and US producers used over 45% of parts from existing models. This suggests that Japanese producers are able to design a greater number of components in a shorter period of time, leading to a more technologically integrated and advanced product (Clark and Fujimoto, 1989:54).
110

Chapter 4: Residence or Resources? - Views o/Competitive Advantage
The concept of bundling resources in the form of product platforms is not
confined to the consumer electronics industry. Increasingly it is becoming the
bedrock of product strategies in the automotive sector (Chapter 3). A vehicle
manufacturer which uses the same chassis (automotive underbody/floorpan) and
rolling stock or drivetrain (suspension. gearbox, etc.) along with associated
electronics components and driver controls in a variety of models is said to be
using a product platform. Three European examples of this are the case of the
Saab 9-5, which shares the same platform as the Vauxhall (GM) Vectra, the VW
Sharan, Seat Alhambra and Ford Galaxy which share the same MPV (Multi
purpose vehicle) platform and the Ford Puma and Fiesta, which are mechanically
identical but highly distinct in their exterior bodywork and interior trim. Appendix
1 provides further detail about the extent of automotive platform use within and
across automotive groups in Europe. For upstream organisations in the supply
chain, the consequences of platform strategies are clear. In the past, several
components will have been supplied to an assembler within a model range. Now,
the same component will form part of a platform used across models and brand
portfolios.
In addition to the trend toward platform strategies, a concept known as
modularisation may soon become a feature of automotive assembler and,
therefore, sourcing strategies. Already, suppliers (particularly at tier 1) are
responsible for the development and delivery of a subassembly such as a braking
system, seating, driver controls and transmission, In such cases, the constituent
components are combined from third party and in-house supplier parts to provide
the assembler with a fully finished unit ready for incorporation into the vehicle
platform. Modularisation takes a further step in the combination of individual
parts which come to form an independent unit. Vehicle interiors, comprising seats,
instrumentation, airbags and belts, headliners and parcel shelves, door modules,
door trim, carpets, steering and air conditioning, could be offered by a single
supplier - a systems integrator - to the assembler. Warburton (1999) has argued
that the race to become an interior module system integrator has offered a
rationale for 14 mergers and acquisitions in the period 1996 and 1999 in Europe
alone.
111

Chapter 4: Residence or Resources? - Views ojCompetilive Advantage
Synthesis of the notion of portfolios
The notion of portfolios extends beyond the collection of resources held by an
organisation in order to undertake its productive activities. Portfolios are also
manifest in finished product through product platforms and families, and through
technology convergence. Accordingly, resources should be bundled, linked and
used (Figure 4.3).
BUNDLED UNKED USED , ~ •
/
, )f ••
-- .. . ~-- AND AND
~ .. . I ~,
I ,
Figure 4.3: Resources - Bundled, Linked and Used.
Source: Herbane and Rouse (2000:255)
Organisations, it is suggested, should bring together (bundle) resources, combine
(link) them to form a product platform and exploit (use) them within product
families. In so doing there is a greater likelihood that the complexity of the
product, combined with problems of resource accumulation and proprietary
protection will increase the inimitability of a given product or service.
Accordingly, the third research question of this study is structured as follows:
RESEARCH QUESTION 3
Do managers associate portfolios of resources with product platforms,
families and technology convergence?
However, it is obvious that resources do not bundle together by themselves. It is
in this respect that the resource-based view offers approaches to how resources
should be managed. It is to this that the study now turns to generate a further
research question.
112

Chapter 4: Residence or Resources? - Views of Competitive Advantage
4.3.4 MANAGING RESOURCES
Since resources reside as bundles within organisations and are suggested to be
manifested in the form of product platforms and technology convergence,
resources must be managed. Without resource management, resources will not
find their way effectively into the implementation of organisations' strategies.
Irvin and Michaels (1989) propose that core resources manifest themselves at the
organisational level rather than merely at the functional level. A successful 'core
skill' should synthesise physical assets with human capital and associated
mechanisms such as training programmes. To build such resources, Irvin and
Michaels propose five approaches to the successful implementation of core
resources. These include (i) Integrating strategy with the resources, i.e. building
and exploiting them; (ii) Having few, yet specific resources (they suggest between
two and five); (iii) Ensuring that those employees central to the 'core skill' know
of their importance in maintaining it; (iv) Sustaining commitment through driving
and enduring leadership attention; and (v) Developing better methods of
organisational learning. These should assist firms in developing resources which
may enhance competitive advantage even in the absence of barriers to imitation
and unique assets. This approach assumes a degree of tangibility, mobility and
casual clarity of core resources, and makes little association between resources,
products and processes.
However, of interest here is the notion that senior management (leadership)
should be familiar with those focussed, yet strategically significant resources that
the organisation has at its disposal (although resource accumulation should
recognise this awareness if senior managers proceed to successfully acquire those
resources). It follows that in the light of more tangible elements of an organisation
- products and processes - within which resources are contained, we might expect
resource management to be a lesser priority than the more observable aspects of
the firm. This question, however is not explicitly addressed in the literature and
this provides the foundation for the research question relevant to the management
of resources (developed in this section).
113

Chapter 4: Residence or Resources? - Views o/Competitive Advantage
Doz (1993) proposes a disaggregration of organisational competencies in order to
develop managerial understanding and development. The managerial theory of
competencies proposed by Doz addresses a number of key 'dilemmas' facing the
development and dispersion of such organisational capabilities. Five key
managerial processes are proposed, each of which may take an organic/natural
path, or which may be managed formally within the organisation.
First, managers have to determine the extent to which they will formally pursue
competence formulation activities as opposed allowing them to form beyond the
ambit of their control. As Doz points out, certain aspects of the competence may
simply be too cryptic, subtle, or tacit to identify and then control. In describing
competencies as often representing "know-how in action" (Doz, 1993:7),
development occurs through repetition and the speed of repetition will determine,
or at least have a major influence upon, the rate of development of the proficiency
in question. Total Quality Management, for instance, provides one approach to the
enhancing the speed of learning since it provides "a framework, a language, a
systematic approach, and a set of procedures for the explication and the
improvement of know-how" (Doz, 1993 :7).
Furthermore, these structured approaches to learning and improvement may
engender a greater understanding of the immediate and ultimate sources of
improvements. There are however, problems in occasIOnmg change 10
competencies since they may be locked into traditional routines. Antecedent
routines have a number of effects on competence development in the sense that
they represent a "dominant process logic being applied to dominant product
design" (1993 :8). They will also portray what is seen as best practice and may
consequently influence future resource deployments. Competencies may also
represent the configuration of the firm in relation to stakeholders.
A second dilemma arises in the choice between trapping the competence in its
current form and exploiting it, or allowing it to develop and capture learning
within the firm which may lead to new applications and innovations. Leaming
should of course be encouraged but the point at which something is routinised is a
difficult point to ascertain:
114

Chapter 4: Residence or Resources? - Views of Competitive Advantage
The current vogue for 'best practice' transfers reflect this difficulty ... uniformity of format allows easier connection between various parts of an organisation, while freedom of content, and differentiation of culture, allow innovation and selective evolution (1993:10).50
However, Doz adds that the above may only be applicable where the knowledge
can be made explicit and therefore amenable to transfer and storage. Another
influence on the transfer of competencies lies in the location of knowledge
storage. This may occur at the individual, group or organisational level. Diffusion
amongst these groups may vary, as might the transfer of competence-embedded
knowledge between different levels in the organisation. Doz also highlights the
need for commitment as "competence diffusion and institutionalisation work only
insofar as individuals who have resources are willing to share them, and those
who benefit from the learning stay with the company" (1993: 13). An internal
labour market approach acknowledges the need to retain and spread competencies
and associated learning.
Thirdly, management must determine the scope of the competence and its
potential in both specialist and general applications. The question of "specificity
vs. aggregation" (1993: 13) deals with the inimitable mix/combination of
capabilities and assets to generate product attributes that are intrinsically valued
by customers. Managers, planners and employees alike should therefore pursue
the new "combination and blending of discrete elements of competencies that
provide for opportunity creation and competitive advantage" (1993: 13). Although
a major factor against imitation, competence building should not be based simply
on technology mixing. As Doz explains, product development using the classical
functional demarcations, may provide resource outcomes compared with multi
functional approaches. Honda's 'T-shaped' engineers (with their great depth of
knowledge but with sufficient breadth of knowledge to integrate with other areas)
and project management approaches enhance competence integration.
so One could question how much an organisation can benefit from a best practice study of another given the problems of uncertain imitability and resource accumulation. The implications of this observation are considered in Chapter 8.
115

Chapter 4: Residence or Resources? - Views o/Competitive AdvantaKe
A fourth managerial task is the leverage of competencies and the chosen emphasis
between existing and forthcoming uses. Calling it "an exercise in both external
imagination and in internal flexibility" (1991: 16), Doz proposes a number of
approaches that managers can adopt in order to leverage current and future
competencies. Firms must not set its product-market domain too rigidly and
should share competencies among SBUs to generate new applications/
developments. Additionally, firms should not take a technology pull/demand side
stance on product improvement or replacement. Doz asserts that this requires a
movement away from a pre-eminence of a portfolio management perspective
towards an understanding of buyer values and new opportunities.
Product development necessarily embraces an element of risk and the "fear of
failure" may obstruct the activity and its outcome. Here, Doz suggests cheaper
prototype testing or simulation to reduce the capital outlay required for product
testing. These may include "core platforms and variations, modularity, faster and
less costly product development, more flexible manufacturing, decreasing
economies of scale, and faster production ramp-ups" (1993: 16). Failure, he adds,
should be "seen as a collective tuition cost for finding new applications, not the
fault of a specific individual" (1993: 16). Equally precarious to the limited
definition of business scope is the over-expansive definition which may lead to
wasted resources in an attempt to exploit inappropriate competencies.
Finally, the renewal of core competencies present both discontinuous and
incremental alternatives. Because the dominant design may change and assets may
deteriorate managers have to acknowledge and engage in competence renewal
activity, although such renewal competencies "are even more difficult to pin
down, for analytical and managerial purposes" (1993: 18), because of their
difficulty in quantification. However, Doz does forward some thoughts as to why
firms cannot or will not develop and create new ideas and organisational
directions. First, the reasons for past successes may not be fully understood.
Second, renewal may challenge the status quo and may stimulate a reaction (third)
in which all associated activities are sidelined "into new ventures or 'skunk
works' the legitimacy of which remains vulnerable to corporate politics and
financial fortunes." (1993: 19) A further difficulty lies in the decision as to which
116

Chapter 4: Residence or Resources? - Views o/Competitive Advantllge
renewal competencies should be developed, if indeed it is possible. It may be the
case that the bundle of competencies possessed by the organisation is simply
inappropriate for current competitive and innovative conditions. Whilst the RBV
perspective is relatively new, Doz's approach to competence development
considers a competence life-cycle approach and adopts a normative stance on
competence diffusion and enhancement.
Mahoney and Pandian (1992) concur with the view that strategy is an activity in
which organisations seek to generate rents, taking as its basis the holistic view of the
firm and a long-term orientation. Such rents can occur because a resource is
restricted (monopoly rents), rare (Ricardian rents) or deployed in an unforeseen
manner (entrepreneurial rents). In considering the rent generating potential of
resources in the possession of a firm, managers can discern which of these can be
labelled 'strengths' and thus be managed in future strategies, for it is those
"differences among firms in terms of information, luck, and/or capabilities [that]
enable the firm to generate rents" (1992:365).
When senior managers consider diversification options, Mahoney and Pandian
(1992) suggest that the RBV perspective can illuminate the validity of such
product/market considerations in four areas, namely limitations, motivations,
directions and contributions. Limitations to internal growth may occur when
demands exceed existing resource endowments. Managers may be motivated
toward the diversification option where there are unlunder-used resources which
may be matched with external opportunities, or simply because a core skill or
capability finds its way into more products. Furthermore, idiosyncratic resources
may have a strong influence upon the direction taken, given that they may offer
possibilities for diversification which may emerge and evolve as do technologies,
processes and applications.
From this arises the suggestion that the management of resources is a precursor
and/or complement to the processes and products that will lead to a diversification
away from current product/market domains. As a precursor to this relationship,
the management of resources appears to assume high importance. Whether
managers do accord the management of resources with as high an importance as
117

Chapter 4: Residence or Resources? - Views ojCompetitive Advantage
products and processes still remains, and will be addressed directly with research
question 4.
Insights are also gained as to the contributions of related diversification to overall
corporate performance. Unrelated diversification is seen to confer lower returns
than the divergence of existing resources which do contribute to economies of
scope and synergies. Teece describes economies of scope as a situation in which
"for all outputs yl and y2, the cost of joint production is less than the cost of
producing each output separately (1980:224). Where the sum of the whole is
greater than the sum of the parts, the term synergy has become synonymous. The
sharing of resources, as much as their combination requires the management of
those resources, in the absence of an ability to combine products and processes.
Whilst Ansoff (1987) suggested that analysis of the phenomenon should be made
at a functional level, Mahoney and Pandian (1992) suggest that synergies can be
differentiated due to the way in which some synergies may be intertwined with an
organisation's competencies, making them difficult to expropriate unless the
organisation is acquired. This they call "idiosyncratic bilateral synergy", unlike
"contestable synergy" which can be easily emulated through the acquisition of
resources in open markets (1992:389).
As we have seen, uncertain imitability occurs when, in the attempt to imitate the
sources of competitive advantage, a rival fails to isolate the resources which
contribute to it. It is therefore incumbent upon firms to gain knowledge of this
cause-effect relationship through such vehicles as executive 'poaching' or detailed
competitor analysis. Paradoxically, in order for the advantage to be preserved,
those competitively advantaged firms may benefit from not overtly knowing of
the causal link between resources and advantage, because once consciously and
formally identified, it is far easier to appropriate. This suggests that were
managers to perceive resource management to be less important than product or
process management, this might generate positive benefits in the sustenance of a
causally ambiguous resource advantage. Once again however, it prompts this
study to consider how the management of products, processes, and resources are
perceived in terms of their importance. Imperfect imitability is also enhanced due
to the 'social complexity' of resources. Here, corporate culture, managerial
118

Chapter 4: Residence or Resources? - Views o/Competitive Advanta~e
coherence and good buyer-supplier relations are examples where there is strong
causal ambiguity and where the difficulty of identification may render the
management of such resources more difficult.
A component of Amit and Schoemaker's (1993) discussion of strategic resources
is the consideration of what they term 'Behavioural Decision Theory'. Here, they
note that in any consideration of the use of strategic assets in the future, managers
must first visualise the future deployment of such assets, identify competitive
linkages with the aforementioned option, and eliminate the behavioural
impediments that create organisational inertia (similar to Lieberman and
Montgomery's (1986) 'incumbent inertia'). Cognitive biases (Chapter 2) may also
illuminate our understanding of how future strategic asset deployments are sub
optimal. They identify uncertainty, complexity and conflict as three main
influences on the managerial process in question. Once again, the assertion is that
the intangibility of resources may provide a deterrent against or increase the
difficulty of managing resources, rather than the products and processes to which
they contribute.
Uncertainty manifests itself in the form of different expectations of
macroeconomic and market factors, and risk aversion, which may be the product
of managers being uncertain of the probabilities of an expected outcome. Levels
of risk aversion may be determined by the character, background and experience
of the individual manager. Amit and Schoemaker also suggest that bounded
rationality51 may lead managers to place too much importance on past products
and processes. It is suggested that those firms that are not trapped by this
retrospective bias will have greater scope to generate future options "more
flexibly and imaginatively" (1993 :41). This echoes the notion of leveraging ideas
(and aspirations) that is so central to Prahalad and Hamel's (1989) precursory
work to core competencies.
Because of the interaction of so many variables in the process of understanding
the organisation, the environment and their interaction, managers will often
51 The limited ability of an individual to gather, store, prioritise. analyse and interpret information (Simon, 1957).
119

Chapter 4: Residence or Resources? - Views ofCompelitive Advantage
simplify relationships in order to make speedier decisions. However, as Amit and
Schoemaker point out, this can also lead to dysfunctional and inconsistent
decisions:
Specifically, [simplification] frames may (1) bound out important futures, competitors, or new technologies; (2) dictate the reference point relative to which SA [strategic assets] are measured (e.g., Chrysler comparing its quality control capability to OM's rather than to Japan's Honda; and, (3) specify the yardstick or metric used (e.g., measuring quality in terms of defective parts per thousand vs. number and type of customer complaints) (1993:41).
Managers may use their 'instinct' which, in the absence of formalised
investigation, may lead to the misinterpretation of important resources. The
complexity of the organisation, its encumbrance and history, may be such that
managers are not aware of the real sources of the company's success, virtually
akin to the emergent strategy process (Mintzberg and Waters, 1985). Conflict may
hinder decisions regarding the future deployment and management of resources in
the sense that redeployment may involve their removal from one function or
business unit to another. Instinctively, this will lead to an adverse reaction that
may jeopardise collaboration between functions and the complementarity that led
to the development of a capability in the first place.
In their exploration of competing theories of the firm, Seth and Thomas (1994)
ascribe the most important task of theory to the determination of business and
competition. Here, the RBV is understood involve the deployment of resources in
such a way as to create tangible and non-tangible assets which lead to competitive
advantage. One important benefit is to encourage an improved use of current
resources, arguably in different combinations, to prevent under-utilisation and
enhance competitive advantage. Embracing Lipmann and Rumelt's (1982) and
Barney's (1986a) work, they add that whilst firms may enhance the size, shape
and deployment of their resource-base, this activity may be the manifestation of
both "purposeful strategic behaviour and stochastic processes" (1994: 177). This
offers the possibility, at least theoretically, that in spite of underestimating the
need to manage resources strategically, organisations' resources find productive
120

Chapter 4: Residence or Resources? - Views o/Competitive AdvanlaRe
uses, in an emergent manner similar to that suggested by Amit and Schoemaker
(1989) above.
Synthesis of Managing Resources
The leverage of core competencies has been articulated as an effective basis for a
strategy to attain a sustainable competitive advantage, and provides an important
underpinning of the resource-based view.
However, for this to be the case, resources need to be managed since, otherwise,
they will not be exploited in the most effective way. Imperative in the
management of resources are systematic approaches to organisational learning,
the incorporation of resources into routines, the storage and diffusion of
competencies, and the renewal and sustenance of competencies.
More fundamentally, and absent from the RBV literature, is evidence which
supports the notion that the management of resources should obtain equal
precedence to that of managing products and processes. If strategic managers do
not perceive a high important with respect to the management of resources which
contribute to products and processes, there is the possibility that resources may go
under-utilised. This absence in the literature leads to the fourth research question:
RESEARCH QUESTION 4
Do managers recognise the importance of resource management?
All of these issues are, however, aided or encumbered by the way in which
managers identify and classify resources. Since everything within an organisation
could be considered a resource, a resource-based view could be consider a free
for-all analysis of anything which is suspected to yield a sustainable competitive
advantage. Several techniques exist for the classification of resources, these being
the next subject of attention.
121

Chapter 4: Residence or Resources? - Views ofCompelitive Advantage
4.3.5 CLASSIFYING RESOURCES
Without a clear framework for classification, the resource-based view of the firm
is rendered merely tautologous. After all, everything in an organisation is a
resource, be it tangible or otherwise. Should an organisation consider its superior
ratio of stapling machines per employee relative to its rivals as a strength or a core
competence? It is the former in the strictest sense that one organisation has a
greater amount of a resource than the other. It cannot, as will be suggested in this
section, be considered to be the latter (a core competence). Whichever way this
resource superiority is perceived, it is highly unlikely that it is or would ever be or
become a strategically significant resource. This subsection examines ways in
which the differences between resources can be identified (although this chapter
has already briefly introduced two approaches; the product-process matrix
approach, and Prahalad and Hamel's (1990) three criteria for core competencies).
Barney (1986a, 1986b, 1991) argues that a linear sequence of criteria can be
applied to resources in order to ascertain their strategic significance. Firm
resources should therefore be valuable, rare, imperfectly imitable and non
substitutable in order to resist/deflect imitation.
Resources are valuable when they can be seen to contribute to the organisation's
strategy. In other words, they are strategic in nature, adding value in their
deployment. This necessarily implies that the value of a resource is determined by
the value placed on the resource according to market conditions (i. e. the
requirement for the resource and the supply of the resource). Later in this section,
the concept of value is addressed further. Next, rarity can be accorded to a
resource when few, if any, other firms are in possession of it. Non-substitutability
exists when there is no other strategically equivalent resource available. Imperfect
imitability describes the way in which resources are difficult to imitate (in contrast
to substitution, in which the market forces or introduces an alternative that reduces
the value earning potential of a resource). Unique historical conditions such as
managerial succession and critical incidents influence the requirement, selection
and acquisition of resources.
122

Chapter 4: Residence or Resources? - Views o/Competitive AdvanluRe
The framework forwarded by Barney (1991) presented in Figure 4.4 below is an
attempt to qualitatively determine the contribution of firm resources to
competitive advantage. However, Barney comments that "firms cannot expect to
"purchase" sustained competitive advantages on open markets .... Rather, such
advantages must be found in the rare, imperfectly imitable, and non-substitutable
resources already controlled by a firm" (1991: 117). In stating this, he is conceding
that the strategic factor market framework (Barney 1986a) is limited in its
explanatory capability with regard to unique firm resources required for
successful implementation. This reflects the critical exchanges in Barney (1989a)
and Dierickx & Cool (1989b). Secondly, the framework for identifying firm
resources above could eliminate the causal ambiguity that allows these very same
resources to be a source of sustainable competitive advantage in the first place.
Grant (1991) argues that the RBV as a basis for strategy formulation is inherently
more prudent as it is founded on generally stable internal capabilities rather than
turbulent and unpredictable environmental forces. The differentiation between
resources and capabilities is one which allows a parsimonious approach to
undertaking the early stages of the resource analysis:
Resources are inputs into the production process - they are the basic units of analysis. ... But, on their own, few resources are productive. Productive activity requires the cooperation and coordination of teams of resources. A capability is the capacity for a team of resources to perform some task or activity. While resources are the source of a firm's capabilities, capabilities are the main sources of its competitive advantage (1991 : 119).
Capabilities are held in group or teams and are then deployed in "regular and
predictable patterns of activity" (1991:122) which necessarily require the
management of these resources. As a development of Barney's work (1991),
Grant suggests that for resources to generate capabilities durability, transparency,
transferability and replicability are requisite traits.
123

Chapter 4: Residence or Resources? - Views ofCompetilive Advantage
VALUE
FIRM RESOURCE RARITY
HETEROGENEITY 110 IMPERFECT IMIT ABILlT' ... ,. ,. - HISTORY
FIRM RESOURCE DEPENDENT
MOBILITY - CAUSAL AMBIGUITY
- SOCIAL
COMPLEXITY
SUBSTITUTABILITY
Figure 4.4: Framework of Competitive Advantage
Source: Barney (1991: 112)
SUSTAINED
COMPETITIVE
ADVANTAGE
Durability is a function of the speed at which the resources that are routinised
become outdated. Technology may be destroyed in a Schumpeterian fashion
(Schumpeter, 1934) while brand loyalty and corporate image may have their value
slowly eroded. Equally possible, however, is the opposite scenario. Transparency
corresponds to the time that elapses before rivals successfully copy a strategy
(which subsequently places demands upon resources and routines). Grant (1991)
notes two challenges facing the imitator. First, the task of identifying that a rival
has a competitive advantage and the way in which it is being attained. Secondly,
determining the capabilities that support the strategy. This echoes Lippman and
Rumelt's uncertain imitability (1982), which he succinctly depicts as "the greater
the uncertainty within a market over how successful companies 'do it', the more
inhibited are potential entrants, and the higher the level of profit that established
firms can maintain within that market" (Grant 1991: 125). Transferability refers to
the efforts made by rivals to acquire the resources necessary to imitate a strategy.
Similarly, Collis and Montgomery (1995) argue that the most strategically
significant resources are those which are inimitable and durable and cannot be
substituted or appropriated.
124

Chapter 4: Residence or Resources? - Views ofCompetilive Advantage
Amit and Schoemaker (1993) portray capabilities as:
[A] firm's capacity to deploy Resources, usually in combination, using organisational processes, to effect the desired end. They are information-based, tangible or intangible processes that are firmspecific and are developed over time through complex interactions among the firm's Resources they can abstractly be thought of as 'intermediate goods' generated by the firm to provide enhanced productivity of its Resources, as well as strategic flexibility and protection for its final product or service. Unlike Resources, Capabilities are based on developing, carrying and exchanging information through the firm's human capital (1993:35 original emphasis).
When a firm's resources and capabilities contribute to competitive advantage and
are "difficult to trade and imitate, scarce, appropriable and specialised", Amit and
Schoemaker (1993:37) call them 'strategic assets'. Examples of such strategic
assets cited by the authors include faster R&D processes, brands, channel and
supply management, service structure and reputation.
Both implicit and explicit in the RBV is the connotation that all resources are
positive and beneficial in their nature, irrespective of their strategic significance.
The belief, thus far, is of the absence of externalities arising from the development
and deployment of such resource based capabilities in the search for sustainable
competitive advantage. One writer that does however offer a useful exploration of
these 'side effects' is Leonard-Barton (1992). Core rigidities are the antithesis of
core capability, defining the latter as "the knowledge set that distinguishes and
provides a competitive advantage." (1992: 113) As "an interrelated, interdependent
knowledge system", core capabilities consist (in part or entirely of) four elements,
the skills and knowledge base, technical systems, managerial systems, and values
and norms (Schein, 1988; 1991). This latter element is seen to permeate the
former three. Knowledge and skills are seen to include idiosyncratic throughput
and design knowledge, tacit knowledge that is synergistic at firm level, and formal
knowledge development and control systems which add to knowledge stocks.
Values and norms influence the selection, installation and dissemination of
knowledge such that the four elements are representation of the organisation's
past history and accomplishments. Capabilities therefore become heterogeneous
125

Chapter 4: Residence or Resources? - Views (~lC()mpetitive Advantage
and highly inimitable. Miyazaki (1991) defines core technology and competence
as the underlying technologies which span several businesses and products.
Competencies are said to differ from capabilities since the former enable the latter
to be merged and exploited in a 'radical' manner.
Prahalad (1993) elaborates further on the concept of core competence. In what he
calls the process of 'creative bundling' organisations fuse together "multiple
technologies and customer knowledge and intuition" (1993:45). It is not simply
technological distinctiveness that constitutes a core competence but rather the
ability of firms to contextualise such technologies within the uses that they may
be put to. Technology may exist in stand-alone form, in which the contribution of
functional departments is limited and all input knowledge is explicitly codifiable.
Similar to Miyazaki (1991), Prahalad (1993) distinguishes between competence
and capability but demotes the importance of capabilities further. Capabilities, he
suggests, are the equivalent of order-qualifying criteria (i.e. no advantage is
gained) whereas competencies are order-winning criteria that generate an
advantage.
The process of harmonisation that is pivotal to the cultivation of competencies is
further developed with the representation of competence as being the sum of
Technology x Governance Process x Collective Learning. If an organisation
adopts a parochial SBU approach, it will fail to generate any substantial
proficiency in the Governance Process which represents the "quality of
relationships across functions, across business units" (1993:45). Consequently,
despite a high competence in technology and learning, the organisation will
always score low according to the formula due to the deficit in the ability to
coordinate, develop, promote and encourage inter-function collaboration.
Tampoe (1994) defines a competence as "a technical or management subsystem
which integrates diverse technologies, processes, resources and know-how to
deliver products and services which confer sustainable and unique competitive
advantage and added vale to an organization" (1994:69). In being central to
organisations, Tampoe outlines several criteria which all competencies should
bear:
126

Chapter 4: Residence or Resources? - Views ojCompelitive AdwlnlaRe
• Essential to corporate survival in the long and short term
• Invisible to competitors
• Difficult to imitate
• Unique to the corporation
• A mix of skills, resources and processes
• A capability which the organisation can sustain over time
• Greater than the competence of an individual
• Essential to the development of core products and eventually to end products
• Essential to the implementation of the strategic vision of the corporation
• Essential to the strategic decisions of the corporation, i.e. on diversification,
downsizing, rationalizing, making alliances, and joint ventures
• Marketable and commercially valuable
• Few in number (1994:68-69)
Competence analysis is hampered by the failure of managers to understand or
acknowledge (by accident or design) the competencies which exist. Thus, Tampoe
(1994) suggest that to work backwards from the product or service and henceforth
to the 'sub-assemblies' from which the product and service is derived provides a
suitable approach. In this way, non-core products do not dilute or mislead the
analysis. This reflects both an activity-based analysis approach (Herbane and
Rouse 2000).
In development of his earlier work (Barney 1991), Barney offers the VRIO
framework to operationalise the notions of resource heterogeneity and immobility
and to evaluate the strategic importance of resources according to a series of
questions (Barney, 1997; Herbane and Rouse, 2000):
• The Question of Value - Do an organisation's resources enable it to create value?
• The Question of Rarity - How many other organisations within the industry already possess the valuable resources?
• The Question of Inimitability - Can firms without a resource or capability obtain it, and do so without facing a cost disadvantage?
127

Chapter 4: Residence or Resources? - Views o/Competitive Advantage
• The Question of Organisation - Is a firm organised to exploit the full competitive potential of its resources and capabilities?
The VRIO framework is designed to facilitate an evaluation of the strategically
significant resources that should be used to underpin a strategy to develop a
sustainable competitive advantage. In essence it is a series of questions (which
should be asked in sequence) about resources which we have identified as
potential capabilities. The degree to which a resource meets each of these criteria
in turn will determine the strategic significance of the resource as the foundation
of a strategy. Herbane and Rouse (2000) suggest that three categories of resources
exist:
• Skill sets based upon valuable resources - which confer competitive parity since they are not rare and can be imitated
• Capabilities based upon valuable and rare resources - which confer a competitive advantage but can still be imitated
• Core competencies based upon valuable, rare, inimitable and organised resources - which confer a sustainable competitive advantage
These are portrayed in Figure 4.5.
Sustainable _ ..... ~ Competitive
Advantage
ompetitive Advantage
_ .. ~~ Competitive Parity
Figure 4.5: VRIO Applied to Resources
Source: (Herbane and Rouse, 2000:261)
128

•
Chapter 4: Residence or Resources? - Views of Competitive Advanlal{c
Ettlie and Ward (1997) have suggested that an application of VRIO criteria
explains the sustainable competitive advantage achieved by NBIC's mass
customisation capability in Japan. However, this along with other studies that
have applied the VRIO criteria (see for example Herbane and Rouse, 2000) are
largely anecdotal. Furthermore, such expositions, whilst intuitively attractive, may
have candidature for the criticism of Williamson who suggests "show me a
success story and I will show you (uncover) a core competence or show me a
failure and I will show you (uncover) a missing competence" (1999: 1093-1094).
Elements of the VRIO criteria have also found their way into strategy consulting
(Coyne, Hall and Clifford, 1997) with value and rarity argued to be hallmarks of a
core competence within McKinsey's strategy division.
Snyder and Ebeling (1992) present a managerial perspective on the identification
and exploitation of core competencies. When, by virtue of their totality, activities
outperform rival's equivalents, the term 'core competency' may be used to denote
the possession of a unique value-adding talent possessed by the firm, not simply
carried out by it. In what they suggest is a disturbing tendency they point to the
attribution of competence to such outcomes as reputation and quality, when in fact
they should be viewed as "the result of performing discrete activities well"
(1992:27). Firms should at each stage in the production and provision cycle,
determine the sources of added value and build relative share in them, rather than
taking a portfolio based approach which focuses on relative market share. This
latter approach could lead to erroneous divestment decisions, and is illustrated
with the case of a firm which produces a number of goods, of one is an electric
carving knife, which is labelled as a dog under BeG terminology. Divestment
would in fact hamper the development of the rest of the firm's product because it
would impede scale economies and experience based learning. Value-added may
be measured in a number of ways:
Value added is often defined as the selling price less the cost of all purchased inputs. Under this definition, when selling price cannot be determined because a market for intermediate goods does not exist, the total cost of the activity is used as a proxy for value added, with profit shown as a separate value element. But cost is not always the most accurate measure of value added. Consider a quality control function that saves millions of dollars without
129

Chapter 4: Residence or Resources? - Views olCompetitive Advantage
incurring much cost. In this case, value added represents the cost of not performing the activity (Snyder and Ebeling, 1992:32 original emphasis).
The very way in which the firm is viewed as an activity system instead of a
product portfolio determines and assists in the development of competitive
advantage in mUltiple product-market domains. As they note, "had Honda
determined that its core competency was in supplying motorcycles ... lawn mower
manufacturers ... might be a lot better off today" (1992:29). The management of
competencies involves strict definition and agreement on the sources of
competence, and the ability to extend competencies within and beyond the
boundaries of the organisation. Strict definition of core competence in terms of
quantity and source provides a focus for managerial action. Consensus building
between senior managers limits functional parochialism and may be achieved
through activity based benchmarking, asset and employee distribution analysis,
and 'what if scenario bUilding. Snyder and Ebeling (1992) conclude that the role
of senior management should centre upon the identification of suitable
competencies and to prompt employees to coalesce around them.
Synthesis of Classifying Resources
For a strategy to be effective, it must be underpinned by resources which lead to a
sustainable competitive advantage. If resources are used which are easy to imitate
or are such that all rivals have those resources in similar (or equal) proportion and
quality little, if any, advantage will be gained. Thus, the time, cost and effort
involved in planning for and putting into place a new strategy will yield little
return.
Prior to any consideration of which factors affect the strategic significance of
resources, a problem arises with the differing terms used by RBV writers. 52 Snow
and Hrebiniak (1980), Prahalad and Hamel (1990), Miyazaki (1991), Tampoe
(1994) and Snyder and Ebeling (1993) use the term core competency to denote the
most strategic significant resource, whereas Grant (1991), Leonard-Barton (1992)
and Amit and Shoemaker (1993) make reference solely to 'capabilities'. Only
52 It could be suggested that writers are vying for their own term to become prototypical within the literature. rather than any discernible differentiation between the terms.
130
Chapter 4: Residence or Resources? - Views o/Competitive Advanta~e
Hamel (1992) and Herbane and Rouse (2000) make reference to both capabilities
and competencies, yet the perception differs. with the former viewing a capability
as merely an order qualifying criteria and the latter classifying valuable and rare
resources as 'capabilities'.
However, the ambiguities, differences and disagreements surrounding
classifications of resources within the literature should generate some concern. Is
the eclecticism of the terminology a necessary attribute of an emerging body of
theory and do managers make distinctions in the terminology of resources and the
hierarchy of resources in the same manner as in the literature?
Despite the variations in the terminology closer inspection reveals that many of
the preceding works considered in this section echo the VRIO criteria forwarded
by Barney (1997). These similarities are shown in Table 4.3 (overleaf), where the
similarities between the VRIO (value, rarity, inimitability and organisation)
criteria and other works are highlighted. Furthermore it suggests that VRIO
sufficiently embraces the characteristics for the strategic significance of resources
held more widely in the RBV literature.
Accordingly, it is suggested that VRIO offers the simplest yet effective way to
distinguish between resources. However, a problem remains, that of whether
managers perceive the strategic significance of resources in the same way as
theorists (albeit arising from practical observation). This combined with the
differing terminologies for resources (core competency, competence, capability
and strength) stimulate the fifth research question:
RESEARCH QUESTION 5
Do managers make a distinction between resources in terms of their
strategic significance and do they use terminology indiscriminately?
131

Chapter 4: Residence or Resources? ~- Views oj'Compelilive AdvanlaKe
Source Factors V R I 0 Barney (1991) Valuable • Rare • Non-substitutable • Imperfect imitability • Grant (1991) Routinisation • Imperfect imitability • Non-substitutability • Miyazaki (1991) Affect multiple businesses • Based on know-how • Change generating capacity • Leonard-Barton (1992) Skills and knowledge • Technical systems • Management systems • Values and norms • Amit and Schoemaker (1993) Low tradeability • Limited substitutability • Specialised assets • Inimitability • Prahalad and Hamel (1993) Ability to add value • Potential for diversification • Inimitability • Snyder and Ebeling (1993) Unique • Value addina • Tampoe (1994) Essential to long and short term survival • Invisible to competitors • Difficult to imitate • Unique to the corporation • A mix of skills. resources and processes • A sustainable capability • Greater than competence of individuals • Essential to core and end products • Essential to the strategic vision • Essential to strategic decisions • Marketable and commercially valuable • Few in number • Collis and Montgomery (1995) Inlmitability • Durability • Substitutability • Approprlability • Coyne Clifford & Hall (1997) Value • Rarity •
Table 4.3: 'VRIO' Reflected in the Wider Body of Literature.
132

Chapter 4: Residence or Resources?- Views o/Competitive Advanta~e
4.4. BALANCING PERSPECTIVES
4.4.1 RBV AND INDUSTRIAL ORGANISATION
Having disaggregated the resource-based view of the firm into its constituent
elements, it is now appropriate to return to a comparison between the RBV and
Industrial Organisation, (10) the preceding dominant paradigm in strategic
management. Following this, the chapter concludes with an exposition of the
research questions that have been developed.
Lado, Boyd and Wright (1992) move away from the 10 view that external
elements (determining the firm's position relative to rivals in an industry) are the
deciding factor in the competitive advantage construct. The failure of 10 to
acknowledge "limits on rationality, technological uncertainty, constraints on
factor mobility ... and dishonest or foolish behaviour of the firm' key actors"
(1992:79) furthers the need to adopt a new perspective, in this case what they call
"strategic selection". Unlike strategic choice which is limited in terms of
alternative, strategic selection, involves the creation and adoption of opportunities
that are internally or externally generated leading to a combination of resources
that are firm specific and tacit i.e. "non-codifiable and non-explicitly replicable"
(1992:82). The linkages between information and asset flows between managerial,
resource, transformation and output based competencies should mitigate against
the effects of imitation and protect competitive advantage where it exists.
Managerial competencies are the provision of an ordered strategic direction and
the ability to assimilate information that identifies problems and experiences to
reveal strategic opportunities. Though it would appear that this element is the
basis of any cognitive model, Lado el al., (1992) dedicate little of their discussion
to this. Resource-based competencies are considered to be "the core human and
non-human assets both tangible and intangible, that allow the firm to outperform
rival firms over a sustained period of time" (1992:84). For these competencies to
remain effective and resistant to imitation, they must appear ambiguous to
outsiders. However, their discussion of Schumpeter's notion of 'creative
destruction' removes the emphasis on achieving adequate time-lags in relation to
competitors 'snapping at their heels'. Notwithstanding, they usefully emphasise
133

Chapter 4: Residence or Resources?- Views (~rCompelitive Advantage
the potency of a 'sidestep' strategy by the use of resources in ways that have not
previously been considered by the industry and its major players. The well
documented strategies of Canon versus Xerox and Japanese car producers vs
Detroit are cases in point (Prahalad and Hamel, 1990; Womack et ai, 1990).
Innovation and culture provide the basis of transformation-based competencies by
adapting existing technologies, products and processes within a culture that is
"valuable, rare and difficult to imitate" (Lado el al., 1992:86).
The RBV is in contradistinction to the 10 view that learning, labour/capital
substitution, and economies of scale and scope secure competitive advantage,
arguing that the ability of competitors to harness the same benefits effectively
nullifies any potential competitive advantage. Consequently, emphasis must be
placed on the discovery and use of the unique managerial and cultural facets of
the organisation to catalyse the evolution of these competencies. The creation of
buyer value, not in just in the physical attributes of the product but its intangible
components such as quality, service, brand name and reputation. These may allow
the firm to command price premiums in the positive phase of the Schumpeterian
cycle 0. e prior to imitation) and allow the firm to construct the basis for future
buyer loyalty.
Lado et aI's (1992) competency-based model provides a basis upon which the
attainment of competitive advantage utilises the individual traits of an
organisation in contrast to the misleading path along which 10 has led much of
modem strategic thinking. They conclude that "firms should continually invest in
skills and capabilities that are causally ambiguous and are not easily tradeable in
the market for strategic factors" (1992:88).
The differing analytical perspectives taken by external analysts and managers may
point to the persistence and emergence respectively of the industry analysis
approach and the resource based approach. Amit and Schoemaker (1993) call the
former "models [which] may, ex post, point to a limited set of resources and
capabilities that explain some of the firm's past performance" (1993: 33) although
it is of limited use in providing managers with approaches to identifying future
sources of competitive advantage and revenue streams. Industry analysis fails to
134

Chapter 4: Residence or Resources? ... Views (~lCompelilive A"\'al1la~e
consider idiosyncratic factors which increase sustainable asymmetry which may
be influenced by "mobility barriers, organisational inertia, heterogenous
expectations, [and] failures in resource markets" (1993:34).
The RBV is said by Amit and Schoemaker to "focus on factor, imperfections and
highlights the heterogeneity of firms, their varying degrees of specialisation, and
the limited transferability of corporate resources" (1993:35), whereas:
Industry analysis excels in assessing the profit potential of various industry participants by focusing on the external competitive forces and barriers that prevail in different product/market segments. Further, it is essential in deriving a set of Strategic Industry Factors. It is incomplete, however, in that it treats the firm largely as a black box (Le., a faceless, unitary actor), while de-emphasizing the role of managerial discretion. Assuming high rationality and substitutability of executive talent, industry analysis logically deduces the end-game consequences in participants' initial condition [sic] (1993:42).
However, although 10 and RBV are presented as antagonistic theories in relation
to the source and sustenance of a competitive advantage, the RBV may be
presented as a complementary perspective which may illuminate organisational
analysis and strategy, particularly in the area of diversification. Since strategy
concerns itself with the organisation, the environment and their interface,
Mahoney and Pandian (1992) espouse the merits of the RBV in conjunction with
10 and organisational economics approaches:
While a morality lay [sic] of the virtuous resource-based theorists doing battle against the misguided strategic group theorists may provide a crusading faith for the young and naive, a more balanced view, in our estimation, is needed. Intellectual isolating mechanisms which artificially reduce the trading of ideas are not best for the strategy field as a whole (1992:374).
This is a clearly compelling exigency for further research and raises the possibility
that managers may not perceive competitive advantage as dependent on residence
(10) or resources (RBV) alone. This, as the reader will recall, is the principal
research question posed for this study (Chapter 3).
Strategy research provides an interface between theory and practitioner
application. The RBV perspective acknowledges firm heterogeneity as a
135

Chapter 4: Residence or Resources?- Views (~rCOmpelilive Advanla~e
cornerstone component of competitive advantage and this is an aspect of the
strategic audit that organisational managers can pursue with rigour and relevance.
The 'black box', homogenous firm approach (previously noted as a 'paradox' by
Mahoney and Pandian 1993) detaches firm-specific advantages from strategy
formulation. Whilst providing undoubtedly useful insights into other aspects of
competition, it is the RBV which concentrates on the internal, inimitable and core
facets of the organisations. This view has received substantially less emphasis in
the economics/strategy literature and the recent surge in RBV writing reflects this
much needed expansion.
Although many distinctions between 10 and RBV has been advanced, Connor
(1991) suggests that the portrayal of Industrial Organisation as the antithetical
forefather of the resource-based view obscures several shared assumptions,
including:
• the firm as a combiner of inputs
• external forces determining the value of activities
• external forces determining the success of strategies
• the possibility of persistent above-normal returns
• the importance of efficiency and size
• the role of asset specificity in governing economic exchanges.
Thus, in a manner similar to Mahoney and Pandian (1992), the RBV may perhaps
not offer a replacement to 10 in explaining competitive advantage, but offer a new
(albeit not mature) theory of the firm.
Teece, Pisano and Shuen (1994) argue that there are three approaches to
developing competitive advantage for organisation. The first two approaches are
the labelled 'competitive forces' and 'strategic conflict', which view competitive
advantages the result of "privileged product market position" (1994: 1). The third,
labelled the 'efficiency approach' generates competitive advantage as a result of
firm-based advantages. Within this, the RBV perspective is most prominent. From
this, they propose an extension called the 'capabilities approach'.
Teece at al., (1994) point out that the view of competitive advantage which stems
from firm level capabilities was given consideration in early seminal strategy texts
136

Chapter 4: Residence or Resources? -- Views (~(Compelilive Advantage
(Learned et al., 1965) but suggest that "unfortunately, the academic literature
stalled for a couple of decades" (1994:9) due to the rise to prominence of
analytical techniques based on 10 economics (competitive forces) which appealed
in terms of their apparent rigour and scientific content. Teece at aI., (1994)
highlight how a view of residence or resources could affect an entry strategy
decision. A residence-based approach would entail the selection of an industry
based on its profitability, an entry strategy based on "conjectures about
competitors' rational strategies" (1994:9) and a subsequent attempt to acquire the
necessary resources for entry. In contrast, a resource-based approach to market
entry would commence with an analysis of a firm's unique resources. a choice of
an industry based on where the resource would generate the best performance and
entry based on linking the resources in current markets to resources in the future
( new) market.
It is the multiple application, preservation, linking and development of firm
specific assets in the RBV that both distinguishes it from the 10 approach wherein
all incumbent firms could use assets in a not dissimilar way. Barney (1991) has
also noted some of the apparent differences between the 110 and RBv
perspectives:
These [10] researchers seldom argue that firms do not vary in terms of their unique histories, but rather that these unique histories are not relevant to the understanding of a firm's performance (Porter, 1980). The resource-based view of competitive advantage developed here relaxes this assumption. Indeed, this approach asserts that not only are firms intrinsically historical and social entities, but that their ability to acquire and exploit some resources depends on their place in space and time (1991 : 107).
However, such differences may not be as stark as first suggested. Here, it is
acknowledged that the RBV approach is not antithetical to the 10 perspective but
centred upon a different focal point. The former may generate insights into
sustainable competitive traits which may then be tracked in an industrial and
competitive context. Indeed, structural and relational issues may determine the
way and rate in which firms acquire resources in factor markets.
137

Chapter 4: Residence or Resources? - Views of Competitive AJmnlage
4.4.2 IMPLICATIONS: RESIDENCE OR RESOURCES?
The impact of industry and the macro-environment upon an organisation's
strategies cannot be doubted. However, these sources of strategic influence do not
capture the entire dynamics of competitive advantage. They are simply one set of
factors which organisations should take into account when attempting to devise
strategies at a corporate, business-unit or functional level. Residence within an
industry with beneficial structural and competitive dynamics characteristics has
long been held to explain differences in performance through the persistence of
macro-economic theory, industry theory and strategic group theory. Many
problems still remain with such a view as the sole determinant of competitive
advantage. Industry structure manipulation, market share priorities, and entry
barrier augmentation are implicit strategies when such a perspective is relied upon
within a decision making framework. Despite the attempts of many organisations
to protect and enhance their performance and presence in their markets, there are
enumerate examples of organisations which have entered, challenged existing
incumbent, and succeeded in markets in spite of the strategies of incumbents to
protect their residence.
A resource-based view of competitive advantage is offered as both a rival and a
complement to the externally derived view of competitive advantage. Resources
are the basic building blocks of any organisations activity. It is the manner in
which, and the differences between, how organisations deploy their resources
which may also explain the sources of sustainable competitive advantage.
Fundamentally, although the debate outlined in this section has tended to focus
upon an 'either-or' choice between two competing schools of thought, there are
indications from theorists that the two approaches are not and should not be
considered to be mutually exclusive. Indeed, this section has identified
concessions in the literature where similarity and complementarity between the
two bodies of literature have been suggested. This has raised the possibility that in
addressing the principal research question, neither residence or resources will
prevail alone in managers' perceptions of competitive advantage.
138

Chapter 4: Residence or Resources? -- Views ojCompelitive Advantage
A long tradition of research in the macro-economics field has consolidated the
pertinence and prowess of 10 within strategic management. A resource-based
view of the firm has yet to move beyond anecdotal, yet intensely appealing
explanations. It should not be dismissed out of hand. Rather, its largely theoretical
status makes it suitable for a practical enquiry of this kind.
4.5. SUMMARY
In addition to the principal research question53, four addition research questions
have been developed from the literature are based on the propositions of the
resource-based view:
Research question 2: Do managers perceive resource accumulation to be
part o/the RBV construct?
Research question 3: Do managers associate portfolios 0/ resources with
product plat!orms,/amilies and technology convergence?
Research question 4: Do managers recognise the importance 0/ resource
management?
Research question 5: Do managers make a distinction between resources
in terms 0/ their strategic significance and do they use terminology
indiscriminately
Having developed the five research questions, the next chapter addresses the
methodological issues pertaining to the study.
SJ "Do managers perceive competitive advantage to be based on bundles of heterogenous resources which facilitate differentiation and diversification rather than external factors such as industry structure and macroenvironmental factors?"
139

('hapler 5: Melhod%}Zv
Chapter 5 - Methodology
5.1 INTRODUCTION
Theories of competitive advantage have often been presented as antagonists -
alternatives, counterpoints and contradictions. Are theories such as 10 and RBV
merely protagonists posted in the foothills of strategic management theory?
Moreover, does the protagonism or antagonism of these theories reflect the views
of those charged with taking strategic decisions? This latter question is central to
this study. This chapter explains the research strategy chosen and deployed by the
researcher in response to the research questions developed in the preceding
chapters. It begins by examining the fundamentals of social-science research and
how the research process is portrayed. In continuation, it examines some of the
controversies which have accompanied the research activity within the field of
study - strategic management, and how these debates have influenced the research
design in this study. Having reiterated the research problem and questions.
Section three deals with the practical matters of the research design, sample,
sampling, the research instrument and response rate targets. For this study, the
sample frame has taken the form of a database devised and developed specifically
by the researcher.
Section four details the process of research instrument development - from
prototyping stages, through to pre-testing and final deployment. Focus groups and
a modified 'Delphi' approach to pre-testing are introduced to the study in order to
address issues of validity and reliability. Finally, the chapter details the systematic
deployment of the research instrument, summarises the research design and sets
down criteria for its evaluation following the analysis and discussion in the
following chapters.
140

Chapter 5: Methodology
5.2 THE RESEARCH PROCESS
Research has been defined as "the process of systematically obtaining accurate
answers to significant and pertinent questions by use of the scientific method of
gathering and interpreting information" (Clover and Balsley 1979: 1). The inquiry
that is central to any research took its modern form with the emergence of the
physical sciences which sought to establish the truth of the physical world.
Replaced was the authority of religion and philosophy in explaining 'truth' with
the application of science, whose authority was derived from interpretation based
on systematic methods, accuracy and significance.
Truth, in itself, is highly polemic in terms of its realism and constancy. If the truth
is believed to reside in the real world, can we be sure that the real world is that
which we observe in the research inquiry? Instead, the inquiry may only capture a
representative realism, whereby "all perception is a result of inner representations
of the external world" (Warburton, 1999: 101). The result is that indirect
observation may present the only course for the researcher, bounded by the limits
of their cognition and resources. Secondly, the constancy of truth has been
challenged by falsificationism (Popper, 1959), in which it is suggested than only
through a process of conjecture and its subsequent refutation can theory develop
(albeit in an imperfectly true and potentially falsifiable manner). Implicit in this
view is that the pace of theoretical development is constrained by the desire,
ability and speed of the researcher in seeking to refute extant theory. 54 In contrast,
the well known treatise of Kuhn (1975) suggests that paradigm shifts punctuate
the history of scientific progression and challenge preceding assumptions,
methods and interpretations.
The social sciences take as their emphasis the study of individuals and their
collective forms within environments. 55 In so doing, the research inquiry must not
~4 Warburton (1999) notes the long delay in the proven falsification of Newton's theories of gravity and their final acceptance as a rejection of the theory which it sought to reject. Similarly, Lakatos (1968) found that the scientist Prout had (in I 81S) proposed a hypothesis which he knew, a priori, could be refuted for reasons and with methods with which he was already familiar. 55 This should not suggest that physical sciences do not have a social dimension. Their outcomes are interpreted and implemented (or otherwise) in a social context. For instance. research in the 1950s and 1960s suggesting the negative health effects of tobacco could be claimed as systematic, pertinent and signiticant. and could have led to changed human behaviour and organisational policy. This case suggests that society. and not only science. is often unwilling to change in the light of scientific discovery.
141

hapter 5: Methodology
aspire to achieve the same generic goals of science but also recogmse its
adjectivisation. Social science research has to contend with an understanding of
social construction of theory and behaviour, but also deal with the possibility of
socially destructed inquiries. Gould (1996) recounts the ugly history of
intelligence testing in biological determinism and hereditarianism. Such notable
controversies show that the researcher must set out, not only to identify and
pursue relevant and novel research, but a priori recognise the need for nobility .
The nobility of the researcher connotes that he or she has been methodical and
considered in pursuit of answers. In turn this connotes methodology.
The research process used in this study reflects Sekaran's (1992) eight stage
process (Figure 5.1), albeit with the distinction that this study does not set out to
test hypotheses but proposes to examine research questions. It includes a further
flowchart (Figure 5.2) which indicates the detailed research desi gn and data
collection process, considered in further detail in Sections 5.3 and 5.4.
2. PRELIMINARY DATA GATHERING Interviewing
L~erature survey
1. OBSERVATION Broad area of research
interest defined
6. SCIENTIFIC RESEARCH DESIGN
7. DATA COLLECTION
8. DEDUCTION Research uestlons answered
Figure 5.1: The Research Process
Source: Adapted from Sekaran (1992:93)
142

Chapter 5: Methodology
Each of these stages are examined explicitly or implicitly in the following
sections. First, however, we tum to a discussion of methodological traditions
within the field of strategic management and its implications for this study.
5.2.1 RESEARCH TRADITIONS IN STRATEGIC MANAGEMENT
As a piece of doctoral research in the field of strategic management it is important
not only to consider broad social science based methodological issues, but also the
considerable methodological debate taking place among active scholars in the
discipline.
Research traditions in strategic management have echoed the schism in strategic
management as a discipline. Chapter 2 addressed the deliberate-emergent debate
and Chapter 4 identified the two competing views of competitive advantage,
based on heterogeneity or homogeneity. These have, in part, determined how and
why strategy research is undertaken. For instance, those concerned with strategy
content and process (Chandler, 1962, Mintzberg, 1973, Harrigan, 1983) have used
case-based research. Case study-based research, whilst forming the basis of
normative theories, has been (wrongly) labelled as anecdotal and as lacking in
generalisability. S6
Equally, statistical research has been perceived to lack a grounded organisational
context and to be positivistic in its orientation. The case study embraces the
selection of subjects of study which would be considered 'outliers', on the basis of
their uniqueness, rarity, interest or manifestation of best practice. A lack of
similarity is often sought. Harrigan (1983) includes these within 'fine grained
methodologies' in which the researcher focuses upon issues which influence and
describe the complexity of strategy formulation.
Whilst lacking in the traits such as the ability to test hypotheses. generalisability
and statistical summarisation, case studies facilitate "meticulous attentions [sic] to
detail, relevance to business practice, and access to multiple viewpoints"
(Harrigan, 1983:399).
56 Despite this. the pedagogical narrative that is the case study is widely used in the teaching of the field at both undergraduate and postgraduate level.
143

Chapter 5: Method%K)!
Those concerned with the observation of general patterns, or more specifically,
the generalisability of results have used statistical studies. The statistical study
views outliers as discrepancies which limit the ability of the research to generalise
about the population in which the sample resides. Thomas and Pruett (1993:5)
suggest that "many analysts wrestle endlessly with such discrepancies under the
assumption that failing to find perfect convergence indicates a flaw in its design or
an error in the analyses". Hayek noted that "one of the reasons why economists
are increasingly apt to forget about the constant changes which make up the whole
economic picture is probably their growing preoccupation with statistical
aggregates, which show a very much greater stability than the movements of the
detail" (1945:523-524). Harrigan (1983) regards statistical studies as 'coarse
grained methodologies' within her continuum of research methods. In extremis,
many studies have relied upon financial databases such as PIMS and
COMPUST AT from which relationships between contingency variables could be
studied (e.g. Galbraith and Schendel, 1983; Hambrick, 1983; Miller and Friesen,
1986).
Despite the use of a coarse grain methodology in this study, the research strategy
is best achieved through the selection of a single industry rather than a multi
industry ambit. Chapter 4 showed that both theories of competitive advantage in
this study (resources and residence) either explicitly or implicitly recognise that
industries offer specific conditions and circumstances that are not (or less)
available to firms outside industry boundaries. Furthermore, the notion of industry
recipes and critical success factors (Chapters 3 and 4), imperfectly heterogenous
decision making across industry participants (Huff, 1982), shared factor markets
(Chapter 4) and organisational cultures (Rouse and Daellenbach. 1999) evidence
the importance of taking into account and isolating industry as a independent
variable in the study. Furthermore, in relation to the research stimulus and
questions particular to this study, Chapter 2 has suggested that industry conditions
may affect the perceptions of managers and therefore the decisions and actions
that are subsequently taken.
Clearly, a weakness of a single industry study is the inability to capture and reflect
the variety of linkages and diversification across and between industries. For
144

('hapler 5: MethodoloRY
instance, diversification from or into aerospace can be observed in relation to the
automotive industry, as can linkages with financial services and military hardware
(Chapter 2). However. since the study is concerned with managers' perceptions
which may be influenced by industry events and conditions, an 'interpretative
context' is sought to facilitate the subsequent analysis of data and clarity of
meaning (if this is found to transpire). Nevertheless, reservations about large
sample statistical studies remain.
This study adopts a coarse methodology in its application of factor analysis to
questionnaire derived primary data. This is dealt with in later sections, but it is
worthy of note that the data analysis method chosen can be used without prejudice
to outliers and may lead to classifications which require narrative for
interpretation.
Bettis (1991) calls for the release of strategic management research from "the
straightjacket". The methodologically restrictive garment to which this editorial
refers comprises of two parts; first, the fact that paradigms (perceptive constructs),
frameworks (procedural guides) and models (microcosms of behaviour,
movement, time and relation) are largely ethnocentric and antiquated. Secondly,
he notes a strong bias (or as to paraphrase Mintzberg, a bias toward objectivity) in
favour of "large sample multivariate statistical studies" (1991 :316). He adds that
he is "sometimes left with the impression that a kind of Gresham's law is at work.
Is the bad money of statistical methodology driving out the good money of
strategic substance?" (1991 :26).
Summer et al., (1990) assign the role of strategic management to the amelioration
of "survival and growth of those organisations that through their outputs have
distinctive competencies, compared to other competing organisations, to produce
outputs that serve society" (1990:364). However, as in many cases the unit of
analysis is the organisation in its operating environment they argue that "those in
the field cannot easily assume that "x causes y" ceteris paribus, for the simple
reason that in the world of action, all other variables are not equal" (1990:363).
This sentiment was articulated earlier by Mintzberg (1979):
145

Chapter 5: Method%R)'
Organisations intermingle a great many elements in their functioning. Researchers who focus on two variables at a time -who catch what someone has called the "economists' plague"; holding all other things constant - seem to cloud issues as often as they clarify them .... We live in a world of dynamic systems. (A colleague of mine claims that everything in the world correlates with everything else at 0.3) (1979:588).
The push toward quantitative research is clearly evidenced in prevalent strategic
management journals whilst it should be recognised that many of the discipline's
classical writing have been derived from longitudinal methodologies, particularly
the work of Chandler (1963), Mintzberg (1973), Porter (1980) and more recently,
Prahalad and Hamel (1990). In the consideration of sample size, for the sake of
validity and generalisability, many previous studies in the field have relied on
Fortune 500 or Times 1000 rankings as sample frames, yet arguably, strategies
ought to be firm specific and non-imitable. Mintzberg asks "What, for example, is
wrong with samples of one? Why should researchers have to apologize for them?"
(1979:583). His reply is as follows:
Given that we have one hundred people each prepared to do a year of research, we should ask ourselves whether we are better off to have to study 100 organisations, giving us superficial data on ten thousand, or each study one, giving us in-depth data on one hundred. The choice obviously depends on what is to be studied. But it should not preclude the small sample, which has often proved superior. (1979:584)
Why this push towards methodologies that may not yield the insights required for
practitioner use? Bettis (1991) connotes the relative security of quantification in
asserting that "there is a tendency to do second-class economics research instead
of using economics to do first-class strategic management research" (1991 :316).
Mintzberg adds that "the more deeply we probe into this field of organisations, the
more complex we find it to be, and the more we need to fall back on so-called
exploratory, as opposed to, "rigorous", research methodologies" (1979:584). In
this respect, the inverse function of exploration and rigour can be turned positive
with a suitably planned and executed methodology. As with strategic
management, the research process requires the logical, feasible and appropriate
coupling of planning and implementation.
146

Chapter 5: MethodoloR)J
It is in the light of the methodological criticisms at a disciplinary level that we
tum to the consideration of the research strategy relevant to this study. First,
however, it is important to reiterate the research questions of this study (since the
research strategy will be necessarily informed by their purpose and nature) and
make a minor point about the word 'perception'.
5.2.2 RESEARCH QUESTIONS/PROBLEM DEFINITION
Following the research stimulus indicated in Chapter 2, the following chapters
developed the principal research question, supplemented by four further research
questions devised in Chapter 4:
Research question 1 (Principal research question): Do managers perceive
competitive advantage to be based on bundles of heterogenous resources
which facilitate differentiation and diversification rather than external
factors such as industry structure and macro-environmentalfactors?
Research question 2: Do managers perceive resource accumulation to be
part of the RBV construct?
Research question 3: Do managers associate por(folios of resources with
product platforms, families and technology convergence?
Research question 4: Do managers recognise the importance of resource
management?
Research question 5: Do managers make a distinction between resources
in terms of their strategic significance and do they use lermin%K)!
indiscriminately
In their broadest sense these questions seek to establish whether managers
perceive competitive advantage to be based on advantage through residence,
advantage through resources or a combination thereof. 57 The precise examination
of these research questions is considered prior to the empirical analysis of data in
Chapter 7.
S7 This represent stages four and five of the Sekaran (1992) process.
147

Chapter 5: Melhod%R)'
5.2.3 ATTITUDES AND PERCEPTIONS
Throughout this and the preceding chapters, the term perception has been used in
its 'lay' meaning of the individual's interpretation of an external stimulus or
sensory information. These interpretations, it is posited, may influence behaviour
such as strategic decision making (Chapter 2). However, it is now appropriate to
consider the concept of perception alongside that of attitudes since the latter has
also been suggested to influence behaviour. 58 The attitude-behaviour dyad can be
seen in Allport's definition of an attitude being a "mental and neural state of
readiness, organised through experience. exerting a directive or dynamic influence
upon the individual's response to all objects and situations with which it is
related" (1989:8). Rice adds that "[attitudes] represent our basic orientation
toward a given stimulus and as such form an important part of the way in which
people perceive and react to their environment" (1993: 176 emphasis added).
Thus, attitudes represent a foundation upon which the primary senses combine to
provide a general perception.
Given that it is highly unlikely, though not inconceivable that the physical senses
may alter an individual's perception(s) of competitive advantage, it is argued that
for the purposes of this study that the terms perception and attitude are
interchangeable. In further and partial support of this assertion of semantic
similarity, the technique derived from perception testing, the Repertory Grid
(Kelly, 1955) is also associated with attitude measurement strategies (for example
Oppenheim. 1976).
5.3 RESEARCH DESIGN
5.3.1 DATA COLLECTION AND ANALYSIS PROCESS
Given that this study is not concerned with strategy content but rather the
antecedent perceptions which may influence the priorities and choices made by
senior managers (Chapter 2), the choice of data collection tool, data type and data
analysis technique are informed by the research questions generated in the
58 Attitude and behaviour have a bilateral relationship. since an attitude may be derived from an individual's behaviour. The decision to take actiony rather than the (preferred) action x may lead to a change in attitude if action y is found to have produced a more desirable outcome.
148

hapler 5: Methodology
previous chapter. Indeed relatively few studies have examined managers
perceptions (within the field of strategic management) using quantitative methods.
More relevant to this study, none have examined managers ' perceptions of the
RBV, which begs the question, is this 'view' held by managers (leading to
resource-based strategies)? Instead, there has been a tendency to focus upon the
choice and outcome of strategy. In Sekaran's terms (1992) this constitutes the
identification of the broad areas of research interest. In addition, the study should
considered exploratory since little is known about the research domain.
Figure 5.2 shows the data collection and analysis process for this study. It should
be highlighted that whilst it portrays a chronology and linearity toward the arrival
at results and data analysis, the process has been designed on the basi that the end
(data analysis and testing) should inform the means by which this objective is
attained.
MAINTAIN RECORD OF: 'INELIGIBLE COMPANIES ·COMPLETED RETURNS ·INCOMPLETE RETURNS
'DELPHI' TESTING WITH GROUP OF EXPERTS
COMPARATIVE FOCUS GROUPS
DATABASE PREPARATION
·CHECK FOR M&A ACTIVITY -CHECK FOR NAME CHANGES -CROSS REFERENCE WITH IAElWDA -CHECK FIELD CONSISTENCY -TRIAL MAll !-1ERGES
Figure 5.2: Data Collection and Analysis Process
149

Chapter 5: Methodology
Factor analysis was chosen as the primary method of analysis following
consideration of the techniques available for multivariate analysis, the aims of the
study, and the type of data to be collected. Multivariate analysis is a term which is
generally applied to statistical procedures which simultaneously analyse more
than two variables. From the outset of this study, it was clear that more than two
variables would be necessary to measure differences and similarities between
respondents' perceptions within the automotive components industry.
Whilst a number of multivariate techniques are available to the analyst (for
instance, conjoint analysis, multiple discriminant analysis, cluster analysis and
multi-dimensional scaling) factor analysis offers the researcher an
interdependence technique (i.e., where variables are not designated as dependent
or independent) which enables the analysis of metric data. 59 Although cluster
analysis can be used under these circumstances the procedure requires the
selection of variables from which groups will be developed, presupposing that
given variables can lead to associations between the subjects, thereby leading to
the development of clusters (Hair el al., 1987). Since the mutual exclusivity of
groups is a central goal of the cluster analysis technique it is inappropriate given
that the study focuses on the perceptions of managers, which in turn may be
multifarious in their nature.
Next, the nature of the study has also informed the choice of factor analysis given
that the technique allows the researcher to examine whether concepts are
considered to be distinct by respondents and provides a structured approach to the
reduction of the data set to a more manageable size, where the researcher can
attempt to interpret its complexity (Bryman and Cramer, 1997). The use of factor
analysis provides an opportunity to evaluate the underlying structures of
managers' perceptions and how it may, indeed, be the case that an individual
manager's perception of competitive advantage is a hybrid construct or otherwise.
~9 Although Hair et aI., (1987) discount the use of ordinal (i.e .. non-metric) data for usc in factor analysis. many studies. including Bowman, 1991; Mueller. 1995; Elliott, 1998; Chattopadhyay et al., 1999; and Kaufman et al .• 2000 have used ordinal (Likert scale derived) data. Indeed, it has been argued that Likert. semantic differential, itemised rating and Stapel scales should be treated "as if they were interval" (Diamantopolous and Schlegelmilch. 1997) and one of the readings used to illustrate the use of factor analysis within Hair et al., (1987) used a five point Likert scale (Deshpande, 1982). Since an ordinal scale has the characteristics of equivalence and order. by ensuring that there is equal distance between the points along the scale. the salient features of an interval scale are met.
150

Chapter 5: Melhod%R.v
As a data reduction technique, factor analysis seeks the correlations 'behind'
correlations of large matrices of data. Developed in a social context (lQ testing
and theories of hereditarianism) the technique has attracted as many critics as
advocates. A popular adjective in descriptions of factor analysis is 'underlying'. If
something is 'underlying' can it be real? This so-called 'error of reification'
(Gould, 1997) can arise through the researcher attempt to generate convincing
results. Specifically, this means a factor(s) with strong loadings.60 However, the
purpose of this study is not to examine organisation's tangible processes or
activities nor to create classify tangible resources into a new nomenclature.
Instead, its purpose is to examine the attitudinal and cognitive priorities of
managers within a given industry. As a data analysis procedure, factor analysis
offers the ability to construct a score for something that is not directly observable,
the ability to generate a small number of scores to describe a larger number of
scores, and the ability to manage a necessarily large amount of data (SPSS, 1997).
A further consideration which informed the choice of factor analysis was the use
of the technique in studies which have sought to achieve similar objectives. albeit
using different theories and with differing research questions and outcomes.
Factor analysis of this type has a long tradition in the measurement of attitudes
and perceptions, particularly in the fields of marketing (Hair et al., 1987) and
psychology (Kline, 1994; Gould, 1997). Bowman's study of managerial
perceptions of Porter's generic strategies (1991) used multivariate analysis using a
multi-industry sample. Mueller (1995) used factor analysis in a study of critical
success factors in the process plant contracting process. Elliott (1998) also used
exploratory factor analysis in the application of a research instrument in the field
of crisis management.
For the purposes of presentation, only discussion of specific routines within the
factor analysis procedure are included in the main text. However, for the purposes
of completeness, Appendix 2 provides a further amplification of the factor
analysis technique including considerations surrounding the choice of extraction,
60 A factor is not a variable. In multivariate analysis. the term refers to a grouping of interrelationships between variables.
151

Chapter 5: Method%K}'
the number of factors, rotation, and factor loadings. Next, the chapter considers
individual stages of the research process.
5.3.2 CHOICE OF DATA COLLECTION INSTRUMENT
The study uses a survey-based data collection instrument to ascertain the priority
of factors which senior managers (those responsible for strategic decision making)
attribute to an organisation's competitive advantage. In this way, the study can
evaluate whether a resource-based or position-based view predominates
managers' perceptions. This instrument prevents a contrived research setting and
minimises researcher interference. Furthermore, it enables a larger sample
(discussed below) of respondents to examine the research questions.
Of the field methods available (Snow and Thomas, 1994) the postal questionnaire
enables the most appropriate capture of required data than its alternatives. Direct
and participant observation would reveal the outcomes of the perceptions rather
than isolating the perceptions per se. Archival analysis would only reveal how the
perceptions informed language used by respondents and decisions taken. Once
again, the perceptions could not be isolated in order to explore research questions.
Interviews could yield an insight into the perceptions of managers, fewer subjects
could be undertaken within a given timescale and resource constraints, and the
qualitative analysis of transcripts using domain analysis (either by hand or using
NUD*IST) could problematise the testing of research questions. 61 Furthermore,
the inconsistency of data across respondents' organisations could be heightened
using these methods.
The use of a postal questionnaire creates a number of trade-offs. Advantages
include allowing the respondent time to give thoughtful answers, the provision of
pre-coded results, enhanced reliability and the reduced costs. Disadvantages
include the need to use closed questioned, restriction and frustration, the
possibility of intentionally incorrect answers, answers based on consultation and
the possibility of creating a new paradigm for the respondent.
61 Based on previous experience (see for example Berhane. et al. 1997; Elliott. Berbane and Swartz. 2000).
152

Chapter 5: Meth()d()I()~y
However, the postal questionnaire was chosen because the respondents are known
to be literate and are easy to identify. In addition, the use of closed questions
relating to attitudes and perceptions are suited to this type of data collection
instrument and provide a systematic data set. The cross-sectional time horizon of
the postal questionnaire instrument favours this study. Given that perceptions and
attitudes are often formed and reformed according to events, it would prove to be
counterproductive to survey managers at differing points in time and could affect
the confidence of inferences derived from the data analysis, since events and
context would be difficult to associate with responses.
5.3.3 CHOICE OF RESPONDENTS AND UNIT OF ANALYSIS
The final questionnaire would be sent to senior managers of companies in the
sample frame (Section 5.3.3). The unit of analysis within the population to be
studied is the individual senior manager.62 This is attuned with studies such as
Burgeois (1985), Dess (1987) and Sutcliffe and Huber (1998) which include both
CEOs and senior managers from functional areas (i.e. directors). At the apex of
the hierarchy, managing directors combine operational involvement and are
considered to be best able to respond to a questionnaire for this study, since it is
they who have either a major involvement in the development of a new strategy,
or are responsible for approving a strategy devised by a formal strategic planning
department. Questionnaires were not sent to strategic planning departments
because the degree of control over the choice of strategy and their existence
within organisations could vary greatly (often according to size). The choice of
potential respondent is an important consideration since it would influence minor
aspects of the sample frame's development and questionnaire design.
5.3.4 SAMPLING ISSUES
Representativeness has been described as "the degree of similarity between the
characteristics of the sample and the characteristics of the universe [population]
from which the sample was drawn" (Clover and Balsley 1979:234). However, it is
62 This study is not concerned with group decision making, since this would require 100% participation from the decision making group and would assume that perceptions remain constant under such conditions. Senior managers are Managing Directors, Chairmen, Presidents and Chief Executive Officers.
153

Chapter 5: Me t 11OtiO/OR) ,
rarely the case that the population will share precisely the same characteristics as
the sample. Under such as reality, Sekaran suggests that it is incumbent on the
researcher "to choose the sample in such a way that it is representative of the
population it is expected to characterise" (1992:228). This has been achieved by
evaluating (in the next section) the definition of 'car component producers' in its
most modem context, using a multi-source approach to sample frame construction
(which acknowledges the limitations of their compilation) and an understanding
of those types of organisations (elements) that are not included (small firms and
new entrants) to which the research results cannot be generalised. Fowler Jr
(1993:12) adds that "a sample can only be representative of the sample frame -
that is, the population that actually had a chance to be selected".
A further consideration for the sample frame is the minimum number of responses
required for validity in factor analysis. The implications of sample size and
validity are discussed in Section 5.4, but are clearly influenced by the initial
sample frame.
5.3.5 DATABASE DEVELOPMENT
The first problem in the development of the sample frame was the identification of
an accurate population size (UK automotive component manufacturers),
highlighted in Chapter 3. Clarification of this was essential in establishing both
the population and generalisability of findings. It should be noted that
generalisability is used in the strict methodological sense. It should .lli!! be
construed as an attempt to generalise about uniqueness 0. e. a large scale study of
organisational competencies) which, in so doing, would undermine the entire
study.
The Society of Motor Manufacturers and Traders (SMMT, 1999) estimates that
there are 7,000 component suppliers based in the UK (without providing the
parameters for such an estimate) in contrast with The Commission of the European
Communities' (1992) identification of 3250 companies across the European
Community, a figure used by Boston Consulting Group and Touche Ross (Hawkins,
NO:ll). Pickemell's study of the automotive components industry used a sample of
191 components suppliers, which he noted was "broadly representative of the
154

Chapter 5: Method%R)'
population" (1998b: 169), as had other studies such as Sleight (1988), whilst
Leverick and Cooper (1998) mailed questionnaires to 450 component suppliers,
identified from industry directories, annual reports and SMMT membership lists.63
Whilst the major objective of the study was not to identify an accurate number of
component suppliers operating in the UK, a bespoke database became
increasingly necessary and proved to be the most effective way to manage the
sampling elements of this study. Moreover, a definitive list of UK component
suppliers could not be compiled due to continuous changes in the sector (new
entrants, mergers/acquisitions, divestments), ambiguity surrounding classification,
and a lack of publicly available and comprehensive lists of suppliers.
The Parliamentary Select Committee (1985) encountered similar problems and
provided its own definition to include companies who produce "components
forming part of or fitted as standard equipment to on-road vehicles powered by
internal combustion engines, but excluding in-vehicle entertainment. accessories
and liquids" (1985:1). The Standard Industrial Classification Codes (SIC) were
criticised by the select committee for their exclusion of any component that was
not "manufactured wholly or mainly of metal" (1985: 1), which excluded
components which were forged, cast or electronic in nature.
However, the SIC grouping have more far reaching consequences than those
proposed by the select committee in that they are somewhat imprecise in assisting
the identification of component suppliers. As Table 5.1 shows, whilst group 34.3
could be considered the most appropriate for the selection of automotive
component suppliers, several others could include suppliers with significant
involvement in the provision of components to the automotive industry. Equally,
however, these additional categories will also include many organisations that do
not have any involvement in automotive component manufacture. A similar
situation can be found in Robins and Wiersema (1995:281) who noted that the
SIC system has "created categorizations that may place close substitutes ... into
different groupings while combining very different goods and services in common
63 With a response rate of 20 per cent (88 returns). The thesis returns to how this study's response rate compare with other studies in Chapter 6.
155

Chapter 5: Metholi%Xy
categories" and gave rise to sample frame impediments in their study of inter
relationships within multi-business firms.
SIC code Description Automotive tq!j!Jication 17.1 Preparation of spinning of textile Seating and interior trim
fibres 20.2 Manufacture of veneer sheets .. , Dashboard fascias
other panels and boards 25.1 Manufacture of rubber products Seals. hoses and gaskets
26.1 Manufacturer of glass and glass Glazing products
27.l to 27.5 Manufacture of basic metals Tubing. aluminium products. castings
28.1,28.4, Manufacture of fabricated metal Forgings, pressing and stampings
28.5,28.7 products
31.1 Manufacture of insulated wire Wiring looms and connectors and cable
31.5 Manufacture of lighting Vehicle lighting equipment and electric lamps
31.6 Manufacture of electrical Instrumentation equipment not elsewhere classified
34.3 Manufacture of parts and All remaining automotive accessories for motor vehicles components. but possibly and their engines including supplies of the
components listed above
Table 5.1: SIC Codes Relevant to Automotive Component Manufacturers
Compiled from: Office for National Statistics
There is ongoing evidence of the need for a definition of elements within a sample
frame within the automotive components sector:
Companies which are principally involved in accessories and replacement component manufacturers [sic], bodywork and trim manufacturers, braking system component manufacturers, engine component manufacturers, electrical ... , general component and other ... , steering, suspension and axle ... , and transmission and transmission component manufacturers (ICC, 1995:4).
This offers a wider definition than that used by the Select Committee through its
inclusion of non-factory fit accessones (such as roof-racks) and
replacement/aftermarket components. Accordingly, the definition of a car
component manufacturer used in this study is a derivative of the former, thereby
including UK-based (though not necessarily owned) companies which
manufacture components which form part of or fitted as standard equipment to
156

('hapter 5: MethodoloRY
passenger cars powered by internal combustion engines, but excluding in-vehicle
entertainment, after-market accessories and liquids. This is the database entry
criteria subsequently used.
A further problem arose with the degree to which an organisation is involved in
the automotive components sector and ascertaining such information from
consolidated accounts. In the absence of a clear definition of the automotive
components sector, arbitrary approaches have been adopted in other studies. For
instance, ICC (1998) derived its sample of components manufacturers based on
the following criteria:
1. The company generated more than 50 per cent of its revenue from automotive
activities, or
2. The company generated less that 50 per cent of its revenue from automotive
activities but was included "by virtue of its size, significan[ce] within the
industry" (1998:5)
The virtues by which organisations were included despite their lower involvement
in the sector were not made explicit, however. Whilst only containing a sample of
140 companies, it highlights the problem of establishing suitable boundaries for
what constitutes a component supplier. Furthermore, such a classification depends
greatly upon the degree to which organisations are forthcoming with information
about the proportion of output directed to specific markets.64
Consequently, a new database was constructed, using:
• Trade directories6s
• SIC codes cross referencing
• Industry specific documents (specialist reports, etc.)
• Government publications, and
• Visits to industrial parks in the locality of assembler's plants (to identify smaller
firms that may not have been included in directories or identified from other
sources).
64 Indeed. generic components (e.g. electronic) may be supplied to a variety of industries. thereby obfuscating industry boundaries. 6S These include Dun and Bradstreet (1998), Reed (I 998a) and Reed ( I 998b ).
157

('hap/er 5: Alerhoc/%gy
Company details were entered into a computer database to enable a mail merge
letter to be produced. Companies were asked for general information about their
operations in order to ascertain their fit within the automotive industry. The
majority kindly returned company accounts and brochures which enabled the
researcher to commence the building of the supplier database. Of the 765
companies identified in the preliminary search of the sources identified above,
658 were found to have operations matching the database criteria. A further 107
companies responded with information upon which their profile could be
evaluated. In these case, their operations were beyond the criteria and therefore
excluded (Appendix 3). It is a noteworthy illustration of the inaccuracy of
classifications used by secondary sources and the segmentation of the components
sector (cars, commercial vehicles, distribution, aftermarket, etc.).
The supplier database was enhanced by entries from three additional sources that
were manually cross-referenced against this new database. The American Institute
of Automotive Engineers (IAE, 1999) database identified 625 UK-based suppliers
and the Welsh Development Agency (WDA, 1999) database included 71 suppliers
located in Wales. Finally, the SMMT industry directory (SMMT, 2000) offered a
small number of further entries.66 Together, these sources identified a further 380
suppliers making a total of 1038 known component suppliers. The database (based
in MS Access 97 SR-l) enabled direct merge facilities to produce stationary and
correspondence. The triangulation of sources has enabled the researcher to
overcome the problems inherent to the use of single sources (Foley, 1983) and the
official nomenclature of automotive component suppliers.
Having regard to Womack et al., (1990), this database compares favourably to the
estimation of 300 'major' and 1500 'minor' UK component suppliers,
constituting 58 per cent of the total number cited (1990: 165), although the
definition of 'minor' is unclear. Since then, it is likely that further consolidation
has taken place in the industry. More recently, however, it has been suggested that
1,265 companies have operations officially classed as automotive component
66 The SMMT director does not include all component suppliers and includes a wide variety organisations operating at the periphery of automotive manufacturing, offering services such as media. finance. insurance, training and shipping.
158

Chapter 5: Methodology
manufacture within SIC 34.3 (ONS, 2000a), although a greater number are
expected to be operating in other SIC groups (Table 5.1 ).67 Furthermore, and by
way of an international comparison, Mudambi and Helper (1998) identified 1227
tier 1 suppliers operating in the US alone compared with similar figures cited in
the UK but across several tiers.
Irrespective of the changes to the database, the study's sample frame has the
following strengths:
• It considers a realistic definition of 'component' manufacturers in the light of
recent changes in materials and technologies (Chapter 3).
• It excludes firms that produce solely after-market or heavy goods vehicle
components. Their inclusion would distort the sampling frame and
consequently the results yielded from other respondents.
• Firms are excluded where they may have previously been classified as
component producers yet have no UK production facilities. The international
dimension is not within the remit of this research. To include such firms
would be to further distort the sample frame.
• There are cases where overseas firms may be involved in car component
production yet their UK production is not directed to this market.
• Non-response can be provisionally investigated (further strategies are
discussed later), using a comparison of respondents data fields in the database
and those of non-respondents.
Some of the secondary sources utilised for the compilation of the sample frame
may not provide comprehensive coverage of smaller sized organisations. This is
partially due to trade directories being based on voluntary entries and others being
based on the 'top' 50,000 UK companies.68 Whilst the sample frame is current, it
67 Parenthetically it should be noted that the Office for National Statistics considers an 'enterprise' to comprise of one or more legal units. Therefore, a large component supplier that has a number of subsidiaries may be considered to be only one company. Consequently, the number of suppliers quoted here should be considered conservative given the SIC code problematic, enterprise definition and evidence provided in Chapter 6, where it is found that discrepancies between official turnover figures for 'the sector' are significantly lower than those reported in this study. 68 For instance, one company which responded to the survey had not been identified in publicly available directories but was identified due to a television news report during the Rover crisis of spring 2000, in which the managing director was asked to comment publicly.
159

Chapter 5: Methodo/OKY
can not be claimed to be comprehensive. Fluxes will occur due to the clements'
(i.e. a single component of the population) insolvencies, acquisitions, or changes
of address. Indeed, over the period of its development, a number of organisations
changed status, with implications for the sample frame size and, therefore,
response rates.
As such, the database serves as the sample frame, that is the collection of
organisations which have an opportunity to respond. Given the identification and
selection process described earlier, the sample frame cannot be said to be
representative of the total population. Whilst not equal to the population it can be
considered suitable for use given the problems identified above. The sample frame.
however, is the known population.
5.3.6 NON-RESPONSE AND RESPONSE RATE TARGET
Non-response is an important consideration in all survey research methods.
particularly if the researcher is dependant upon a specific number of complete
responses in order to subject data to analytical techniques. Fowler Jr (1993)
defines non-response bias as "the extent to which those not responding are biased
- that is, systematically different from the whole population" (1993: 40). In the
case of postal questionnaires he adds:
Bias attributable to non-response can be studied by comparing those who respond immediately with those who respond after follow-up steps are taken. One generalisation that seems to hold up ... is that people who have a particular interest in the subject matter of the research itself are more likely to return the postal questionnaire than those who are less interested. This means that mail surveys with low response rates may be biased significantly in ways that are related directly to the purposes of the research. (1993:41)
In order to ensure that the study would not include design elements or factors
which could prejudice response rates, the meta-analysis of response rate
determinants (Diamantopolous and Schlegelmilch, 1996) was implemented where
permissible.
The required number of responses for the study would be determined by the form
of analysis. Exponents of factor analysis have widely differing views of minimum
160
('hapta 5: MethodoloKY
response sizes. Generally, such views fall into two categories. In the first, the
minimum number of responses is stated. For instance. Guilford (1956) suggests
200 subjects, whilst Kline (1996) and Hair et ai., (1987) suggest 100 subjects. In
the second, the number of items/variables determines the minimum number of
subjects. Sekaran (1992) suggests that for validity in multivariate analysis, the
number of responses should be up to ten times greater than the number of
variables measured in the questionnaire. To a lesser extent, Coakes and Steed
(1999) and Tinsley and Tinsley (1987) suggest a minimum of 5 subjects per
variable. Irrespective of which approach is taken data can only be subjected to
factor analysis once its 'factorability' has been established (Chapter 6).
Ultimately, therefore, it is the factorability of the data matrix and the strength of
the factor loadings extracted rather than the sample size that determine confidence
in results.
For this study it was decided that subject to factorability a minimum of 200
responses would be appropriate. This number would meet all the
recommendations noted above with the exception of Sekaran (1992), which would
require 320 responses. In order to achieve this response it was decided that all
organisations in the sample frame should be chosen to form the sample. Chapter 6
discusses the actual number of responses received (284), comparative response
rates, and the profile of respondents.
5.4 QUESTIONNAIRE DEVELOPMENT AND DEPLOYMENT
As noted earlier, the data collection instrument was chosen in order to
systematically gather data from a large number of senior managers which could
subsequently be subjected to statistical analysis (using data reduction techniques).
In order to arrive at a final questionnaire to be administered to automotive
component manufacturers in the database, three tasks were undertaken to deal
with validity and reliability;
• Content analysis
• Comparative focus group pre-testing
• Delphi testing of questionnaire design and completion process
161

Chapter 5: Methodology
The combination of these three activities represent an attempt to refine the data
collection instrument in a manner which is directly associated with the nature of
the study, rather than the application of generic piloting methods. As such its
represents an opportunity not only to improve research quality, but to introduce
innovative and experimental, yet effective, dimensions to the methodology.
Clearly, before the pre-testing could begin, a prototype questionnaire was
developed. In this form, the questionnaire contained two sections - company
profile questions (size, products, customers, tier, etc) and statements referring to
competitive advantage accompanied by a five point likert scale. The content of the
questionnaire was derived from the review of the literature relating to supply
chain management in the automotive components sector, advantage through
resources and advantage through position approaches to competitive advantage
(Chapters 3 and 4). From this review (and the propositions developed), a total of
47 statements were originally developed (Appendix 4). In order to arrive at a
refined list of statements, a pre-test was conducted which sought to achieve three
objectives. The first was to ensure that there would be a balance in the number of
statements. To have more statements relating to a resource-based view would
generate the potential for distortion in the subsequent data analysis. The second
objective was to identify overlap errors and redundancies. The final objective was
to test for reliability of the statements which remained.
5.4.1 CONTENT ANALYSIS
A simple content analysis was used to highlight potential duplication (where
different measures deal with the same thing) and item overlap (where a measure
could mean more than the researcher intended) which could affect the confidence
of inferences derived from the data.69 This was achieved by taking the list of
statements and using the replace function in Microsoft Word. Spaces were
replaced with paragraph marks and the list of statements was ordered
alphabetically to highlight the occurrence of each word. Where duplicate verbs,
nouns and adjectives were identified, the list of statements was checked to ensure
69 Although item overlap errors are considered by 8agozzi (1994). the implementation of the content analysis was chosen as a simple way to consider duplication and overlap at its most simple level of disaggregation -the single word.
162

('hapter 5: Methodology
that statements did not appear to be similar. In general, this approach proved to be
unsatisfactory in that the repetition of a word would rarely reveal duplication and
reflects the lack of confidence with 'face' validity. It did, however, confirm that
the statements referring to the terminology of resources (40-43 in Appendix 4)
bore too much similarity to one another and would require clearer rubric and a
semantic differential scale to be effective. Such changes were deployed to produce
question 14 in the final questionnaire.
In addition, the content analysis explicated the repetitive nature of statements 44-
47 (hierarchy of resources) and the difficulty in arriving at a suitable rubric which
would apply to these and remaining statements. Hence, this led to the removal of
these statements and the use of a new format (question 14 in the final
questionnaire). The changes to statements 40 to 47 not only reduced the number
of statements but also allowed greater flexibility in dealing with 'backfire' effects
in the ordering of questions (Section 4.4).
The 39 remaining statements were further examined in order to reduce their
number, ensure balance and eliminate duplication/overlap. To provide a
framework within which to consider these issues, a limit was placed on the
number of statements and the number of categories into which each statement
could be linked. A total of eight categories (classes) were developed:
1. Company size
2. Industry structure
3. Strengths and Weaknesses
4. Relationships with customer
5. Uniqueness and competitive advantage
6. Access to resources
7. Managing resources
8. Combining resources
Classes one to four relate to a residence view of competitive advantage (division
A), whereas classes five to eight contain statements regarding advantage through
resources (division B). Each class would contain four statements, making a total
of 32 statements to ensure a balance in the number of statements based on each
163

Chapter 5: Metlwd(}I(}~y
competing 'perspective' of competitive advantage. Table 5.2 indicates the
statements (from Appendix 4) and the rationale underscoring their removal.
Deleted Statement Reason for Removal 25. The links between new and existing Similar to statement 21 - The ability to understand resources are not known at first the cause-effect relationship between resource.l· and
competitive advantage differs between organisations - potential overlap error
26. Resources are difficult to acquire Could be difficult to interpret the word' move'. since because they cannot be moved it may connote a physical asset, rather than
intangibles. 27. Resources cannot be accumulated Similar rationale to statement 26. On this occasion, because they cannot be purchased the statement implies that all resources must be
purchased (rather than developed organicall~J 28. We lookfor ways of using our This statement is highly similar to statement 32 We resources in new areas and products purposefully plan for the use of resources in our
future strategies - unnecessary duplication 33. Organisations are collections of Could be confused with statement 17 which refers to products and services "bundles" 34. Organisations are collections of Replicates question 17 - Organisations are bundles resources o{resources .... 36. Product platforms reflect final This is an ambiguous statement which could be demand for products interpreted in a number of ways, e.g. are influenced
by final demand. Also, customers are (generally) not aware of platform usage.
Table 5.2: Deleted Statements and Rationale for Exclusion
The amended item pool, comprising of 32 statements, was evaluated agaIn to
ensure that, where possible, the clearest (and shortest) description could be used.
The revised statement list was then subjected to third party pre-testing in order to
ensure reliability.
5.4.2 COMPARATIVE Focus GROUPS PRE-TESTING
The purpose of the pre-test was to evaluate the extent to which third parties would
categorise the statements according to the eight classes developed by the
researcher. In this way, the reliability and validity of the items could be
determined. This exercise would also indicate the degree to which the statements
could be interpreted correctly, thereby highlighting the need for changes to
ambiguous (i.e., non-categorisable statements).
164

Chapter 5: Merhou%Kl'
Reliability is an essential consideration In questionnaire design. fowler Jr
(1993:80) describes reliability as "the extent to which [respondents I In
comparable situations will answer questions in similar ways". Alternatively it is
"the amount of agreement between independent attempts to measure the same
theoretical concept" (Bagozzi, 1994: 17). Despite their differences, both are
concerned with the consistency of measures among different respondents or
groups of respondents.
Both reliability and validity (discussed later in this section) are important concepts
within the broader construct of measurement error where, due to random or
systematic error, observed scores differ from 'true scores' by virtue of the degree
to which the researcher can reduce measurement error whilst recognising that no
data collection instrument is perfect. This raises the question of whether the 'true'
score can been known ex-ante. This is particularly problematic when applied to
this study since it deals with respondents' perceptions and whether a perception
has equivalence with the truth, and also because the exploratory nature of the
study infers a lack of prior knowledge about what these perceptions might be.
Even were a perception to be considered equivalent to 'truth', the absence of
knowledge (known criterion groups) problematises the determination of what the
true score is. As Oppenheim (1976) noted, the assumption behind tests such as co
efficient alpha (Cronbach, 1951) is that attitudes are both true and stable.
However, pre-testing was undertaken to ensure that measurement quality was
maximised by reducing systematic error, although random error cannot be
controlled for and is argued to be self-compensating (Diamantopolous and
Schlegelmilch, 1997) as the sample size grows and becomes more representative
of the population.
Reliability has several facets, many of which were addressed in the pre-test. These
include stability (consistency after time), equivalence (consistency between sets of
respondents), and generalisability (applicability in different settings and
methodologies). Given that the data collection instrument is entirely new,
reliability testing approaches, such as test-retest were not used due to the problem
of 'practice effects' which can arise within short time periods (Litwin, 1995).
165

Chapter 5: Methodology
Alternate-form reliability would also prove to be problematic since its
prerequisite, alternative wording, could give rise to alternative meaning which, as
Oppenheim (1976:73) argues "will no longer be the same question".
Despite the problems of using co-efficient alpha, an adapted approach to internal
consistency reliability is fundamental to the design of the pre-test. Given the item
pool of 32 statements are focussed on specific variables (the classes) one could
develop a surrogate measure of how successfully the different statements measure
the same (relevant) variable. That is to say, could the respondent readily associate
the statement with the pre-determined class? By using the focus groups, elements
of interrater reliability were also adopted.
The design of the pre-test meant that sensitivity could not addressed. However,
the choice of a five-point Likert scale used in the final questionnaire design
(Section 5.4.4) is based on previous studies using multivariate analysis in the
study of perceptions (Bowman, 1991; Elliott, 1998; Knight et al. 1999; Kaufman
et ai, 2000), prevailing consensus in this regard (for example, Bagozzi. 1994) and
Elmore and Beggs (1975) who found that seven or even nine points did not
improve reliability. Likert scales are considered to enhance reliability because of
the range of answers available to respondent, precision of response and the ability
to include statements "whose manifest content is not obviously related to the
attitude in question, so that the subtler and deeper ramifications ... can be
explored" (Oppenheim, 1976: 141). The choice of measurement scale is a critical
consideration in validity, where the concern is with the suitability of the measure
in serving to measure that which is intended to be measured.
Next we turn to validity, that is, "the extent to which the answer given is a true
measure and means what the researcher wants or expects it to mean" (Fowler Jr
1993 :80). Validity cannot be inferred using complex statistical methods from the
pre-test since it has not used the five point likert scale that will be used to measure
the ordered relationship of the statement against the priorities of respondents.
There is a further problem attendant with validity evaluation in this study. As
DeVellis (1991:43) commented "the issue [of validity] is more subtle when
measuring attributes, such as beliefs, attitudes or dispositions, because it is
166

('hapter 5: Method%l{y
difficult to determine exactly what the range of potential items is and when a
sample of items is representative".
However, the ability of the comparative focus groups to classify the statement
correctly (discussed shortly) would suggest that validity could be achieved since it
echoes Bagozzi's view of "a group [the classes] of interrelated ideas [statements]
whose totality captures the essence of the phenomenon under consideration
[perceptions of competitive advantage]" (1994: 18). Furthermore, the matter of
validity is a central consideration in the choice of principal components analysis
and the need to ensure that value biases are not introduced by the researcher
(Connor and Becker, 1977), although the need to capture those of the respondent
may be an objective which is established in advance of data collection.
The content analysis represented the simplest and least credible form of validity -
face validity. Of the commonly used alternatives, only content validity could he
used. The approach involves 'judges' who are asked to evaluate the items. In this
pre-test, respondents were asked to classify the statements within the item pool.
Whilst this is not normally accompanied by scientific or numerical measures. the
pre-test described shortly does attempt to evaluate the rigour of the survey
instrument's validity. Concurrent, predictive and construct validity could not be
established due to the original and exploratory nature of the study. the item pool
and (by implication) the lack of established criterion with which to compare items.
The subjects for the pre-test comprised of two groups - a group of ('general')
managers from a variety of industries/industry sectors and another consisting of
managers within an automotive company.70 Each group would bring different
characteristics to bear upon the pre-test, thereby accounting for the term
'comparative focus group'. The 'general' managers would provide a broad insight
into the reliability of the statements and highlight terminology that would be
difficult to interpret. The 'automotive' managers would provide further insight
into the reliability of statements which had a specific industry focus. Taken
together, the pre-test respondents would furnish an understanding of the
equivalence reliability.
70 The term 'general' refers to these managers' professional domain rather than their operating activity.
167

('hapter 5: Methodology
The 'general' manager group comprised of 25 managers attending one of the
researcher's strategic management modules. The group had a mean managerial
experience of 8.6 years and contained managers from manufacturing, services and
the public sector. All major functional backgrounds (production, marketing,
finance, etc) were represented. Appendix 5 provides further information on the
'general group' to substantiate their suitability for the pre-test. The pre-test was
scheduled to take place prior to the respondents having studied external analysis
or internal analysis elements of the taught course to ensure that the content did not
distort the pre-testing exercise and to attenuate the effects of respondents having
being taught about different approaches to competitive advantage (since it is
presumed that a number of industry respondents will not have undertaken formal
business education).
The 'automotive' manager group comprised of 16 managers attending a company
management development programme on two occasions in which the researcher
was involved. 71 The module content was based around operational, logistical and
retailing issues, thereby having no effect in distorting respondents' efforts in the
pre-test. By virtue of their attendance on the management development
programme, this group included respondents of sufficient experience of the
automotive industry test the reliability of the questionnaire.
Both groups were informed of the purpose behind the pre-test and were given a
proforma (Appendix 6) which contained the list of 32 statements (randomised)
and the eight categories. They were instructed to consider each statement and to
write in the box (adjacent to each statement) the number of the category (1-8) they
believed the statement should be classified within. The reader will recall that the 8
classes (categories) were highlighted earlier in this section. In addition, they were
asked to annotate the proforma in instances where they found a statement to be
confusing, ambiguous or erroneous. In both cases, the groups required between 15
and 20 minutes to complete the exercise.
71 VW Group Management Development Programme (Wadenhoe Consultancy). The group comprised of managers from Volkswagen. Audi. and Seat.
168

Chapter 5: Methodology
Since the eight classes represent a category nominal scale, subsequent data
analysis was limited to enumeration rather than calculations based around the
arithmetic mean. Since each of the classes is a factor within a larger construct, the
purpose was to examine the degree to which respondents could recognise the
association of a statement with a category (class). This echoes the Likert's
assertion that the item poollbattery should seek to measure "the attitudes of
members of the [respondent] group, not those of the experimenter" (1967:93).
In the light of these quantitative limitations, criteria were devised in order to
examine the degree to which a statement could be considered reliable in terms of
its recognisable association with one of the classes.72 The expected distribution of
statements to classes should be uniform (four statements in each class). Assuming
that each outcome is likely, the probability of a pre-test respondent choosing the
correct class is 1/8 (i.e. 12.5%). The criterion had to recognise the possibility of
inadvertently 'correct' guesses within the results.
The first criteria was that the reliability of a statement would be accepted if the
number of correct respondents in the 'general' group was greater than 63.5%. This
figure was derived from 51 % (representing a majority) and 12.5% (the probability
of guessing the correct class). Therefore, if 63.5% of the 'general' managers
correctly associated the statement and its predetermined class the statement was
accepted (criteria A). Were the 51 % level to have been used, it could be argued
that some 49% of respondents could have scored incorrectly to no avail in the
questionable acceptance of the statement. Moreover, the acceptance criteria
represents a near two-thirds majority. Thus, a high 'correct' score indicates the
relevance and appropriateness of the statement/item to the class, i.e., content
validity. Next, when a statement failed to reach the acceptance criteria within the
'general' group, the scores for the 'automotive' managers were used. If the
72 Several criteria were developed in order to deal with the problem of using category nominal scales. but were rejected. These included, the number of alternative classes used, the number and percentage of position classes used, the number and percentage of RBV classes used, the second choice as a percentage of the first choice and a 'class test' - where the number of correct classes (i.e. RBV if the statement was RBV related) subtracted from the number of incorrect classes used. None of these criteria offered any further refinement to those finally used in this study.
169

Chapter 5: Met/7odo/OKY
acceptance criteria of 63.5% failed to be reached, the statement would be rejected
outright (criteria B).
The combination of both pre-test datasets was considered and rejected since it
would obscure the degree to which the 32 statements had a clearer meaning
among managers operating in the automotive industry (the domain of the study)
rather among a variety of industries. 73 The results of the pre-test led to the
acceptance of 11 statements from the 'general' group, shown in Table 5.3 where
accepted statements are indicated by a shaded score. For no statement was an
incorrect class the most popular.
Table 5.3 shows that the level of disagreement with the classes did not reach
above 20% for an accepted statement or 36% for a statement which did not meet
the criteria A. These latter statements were subjected to criteria B, where 21
statements successfully met the threshold of 63.5%, with a minimum score of
75% and with the second highest (yet incorrect class) score reaching no higher
than 19%.
The pre-test indicates that the statements, whilst meaningful for managers from a
variety of industries, are highly meaningful and reliable for managers in an
automotive industry context. The research instrument, whilst reliable in terms of
stability and equivalence, cannot be said to be generalisable without further
refinement. This not unexpected since the 32 statements have been devised with
the industry context (Chapter 3) in mind.
A further benefit from the pre-test is that it provides further assurance in terms of
the reliability of attitudinal questions/items:
By using sets of questions, provided they all relate to the same attitude, we maximise the more stable components while reducing the instability due to particular items, emphasis, mood changes and so on (Oppenheim, 1976:74).
7) Indeed, all of the statements would have been accepted using the combined data sets. Furthennore, by combining the datasets, the researcher would not have been able to examine the concept of 'equivalence' in the context of reliability.
170

hapter 5: Methodology
'General' Managers n=25 ' Automotive' Managers n=16 Statement Correct % correct % in 2nd % correct % in 2nd
class 1. 1 56 24 7S It)
2. 1 60 12 100 0 3. 2 68 12 6S 32 4. 1 48 28 82 IS 5. 4 52 20 88 12 6. 5 64 12 94 6 7. 1 60 12 75 1" .' 8. 2 60 16 82 12 9. 3 68 20 88 12 10. 4 80 12 94 6 II. 2 76 16 7S 25 12. 6 68 16 69 \J 13. 8 64 24 69 25 14. 2 60 24 94 6 15. 3 72 12 82 18 16. 4 44 12 100 0 17. 6 48 12 88 12 18. 6 68 20 88 7 19. 5 44 20 75 13 20. 5 52 36 88 12 21. 5 60 28 7S 18 22. 8 56 20 88 12 23 . 8 56 20 94 <> 24. 6 52 20 88 (,
25. 7 48 12 82 13 26. 3 64 28 82 13 27. 7 56 16 88 6 28. 3 56 20 88 12 29. 8 56 8 94 6 30. 4 56 16 82 6 31. 7 72 20 75 25 32. 7 52 12 82 18
Table 5.3: Pre-test results of Comparative Focus Groups
Bearing in mind that no research instrument is perfect, the pre-test sought to
ensure validity through content validity and reliability through internal
consistency.
171

Chapter 5: Methodology
The next stage in the questionnaire development was to enhance content validity.
Despite the request to the pre-test groups for annotations to the proforma where
necessary, none were made, with the exception of where a respondent
reconsidered the category into which they thought a statement should be
classified. This provided further confirmation of the unproblematic nature of the
32 statements.
Despite the success of the pre-test, it was not the intention to suggest that that the
statements and classes are mutually exclusive. By the very nature of the
statements, classes and divisions, mutual exclusivity cannot be asserted nor
guaranteed. For instance, a statement relating to size could also be considered to
relate to the ability of an organisation to successfully manage relationships with
customers and industry structure, whereby entry barriers have limited the entry
and growth of newer entrants (Porter, 1980). The RBV statements are considered
to be associated in their role as constituents of a perspective relating to
competitive advantage. However, since the statements were devised in order to
capture data relating to the differing perspectives on competitive advantage, the
pre-test served to confirm that the construction of the statements were as reliable
as possible, rather than their isolation from others in the data collection
instrument. 74 The pre-test has examined the reliability of the research instrument
through internal consistency reliability and inter-rater reliability (internal
reliability), and validity through face validity (content analysis) and content
validity (comparative focus groups testing).
The next stage in the questionnaire design process involved the development of a
second prototype (Appendix 7) incorporating the 32 pre-tested statements and
expert opinion about further aspects of design, layout, rubric and completion.
14 Subsequent to the pre-test activity and analysis it has been found that a study published in the Strategic Management Journal used a similar approach to pre-testing as that used in this study. SutclitTe and Huber (2000) used a group of22 industry executives - a smaller number than that used in this study.
172

Chapter 5: Metlwdo/uKY
5.4.3 'DELPHI' TESTING OF QUESTIONNAIRE DESIGN AND COMPLETION PROCESS
Further refinements were sought from experts in the field of market research and
strategic management. However, rather than seeking feedback and making
changes in a sequential fashion one by one, it was decided that feedback should be
sought simultaneously, considered and incorporated into the questionnaire design.
Its was expected that each expert would offer different, and in some cases
contradictory advice, which would hamper sequential consultation. Consequently,
aspects of the Delphi forecasting technique (Delbecq et al., 1975) were adopted
for this final development stage of the research instrument. These include the
selection of individuals who are experts in the field of study and limited contact
between the experts. For this 'Delphi'-type test, six experts were given a copy of
the questionnaire. They were asked to consider:
• The clarity of the rubric used
• The time taken to complete the questionnaire
• Issues of ambiguity, controversy or irrelevance in the questions
• Layout
• Miscellaneous issues
A meeting with each took place within a week of receipt of the questionnaire. The
profile of the experts in terms of the expertise which was sought is shown in Table
5.4 (overleaf). From this exercise. several useful amendments were made to the
questionnaire. Experts A and B suggested the inclusion of a glossary to guide the
respondent through themes such as resources and platforms. although no other
experts made this suggestion. However. since these themes were contained within
the pre-tested statements there would be the danger of colouring respondents
perceptions through the inclusion of such material. Experts A and C suggested
amendments to the geographical origin question which could have created the
impression of political bias.
Differences in opinion relating to the ordering of questions also arose. Expert A
suggested that the profile questions (turnover, customers, etc.,) should be
positioned at the end of the questionnaire. It was argued that the most valuable
173

('hllpler 5: Melhot/%.l!.Y
information (i.e., the attitudinal statements) would be captured first and a sense of
escalating commitment would arise. In contrast, experts, D and F suggested that
these questions should occupy less page space but remain at the start of the
questionnaire. It was decided that to move these questions to the end (particularly
about turnover) might appear suspicious and therefore jeopardise confidence in
the researcher, although Denscombe (1998) does suggest that
contentious/sensitive questions should appear later in the questionnaire. All
agreed that it would take not more than 15 minutes to complete and that the size
and layout of the questionnaire was unproblematic.
Taken together, there were few substantive changes upon which major differences
between the revisions suggested by the experts. Most suggested clarification of
rubric which referred to "statements", "terms" and "criteria". This was achieved
through the use of arrows and amendment to the original rubric.
-Expert Profession Industry Strategic Market
A
B C
D E F
knowledge management research knowledge knowledge
Senior lecturer in strategic ./
management Business professor ./
Senior lecturer in strategic ./ ./
management Senior research manager .; .;
Senior lecturer in marketing ./
Senior lecturer in marketing. ./
MRS Chief examiner
Table 5.4: Profile of Experts used in 'Delphi' Testing of Second Prototype.
5.4.4 FINAL QUESTIONNAIRE DESIGN
The changes suggested by the Delphi testing of the second prototype were
incorporated into the final design of the questionnaire (Appendix 8). Bearing the
same dimensions as its predecessor, the folded A3 questionnaire comprised of five
parts:
174
--

Chapter 5: Method()lo~y
1. Profile questions about the company (questions 1 to 8)
2. Questions about the background and experience of the respondent (questions 9
to 12)
3. Questions about the terminology used by the respondent (question 13)
4. Questions about the importance of resources (question 14)
5. Statements about competitive advantage (questions 15 to 46)
The final page included the researcher's address and telephone for use in the event
that the questionnaire was accidentally separated from the covering letter and
return envelope. In addition, a small box was included in order to include a code
to identify the respondent in a discrete manner whilst maintaining anonymity and
confidentiality. In this way, were the questionnaire to have been lost. a third party
could not associate the responses within a given questionnaire with the senior
manager that had responded.
Questions 1 to 12 (parts one and two) provide data by which to assess the nature
of the respondent organisations and the respondents themselves. The structure of
these questions varies according to the data sought, but where possible.
established classifications have been used in order to enable comparisons with
other studies. The turnover question (question 2) was retained in its original
position since such a question could not be considered polemic and, if the
question was perceived in this way, the respondent would simply ignore it. If the
question were to be ignored, turnover figures could be obtained from publicly
available sources. A different position for this question could not guarantee a
higher rate of response. As Table 5.5 shows, questions I, 3 and 4 are derived from
well established sources. Scale types include nominal and category nominal,
although several questions rely on direct quantification and determinant choice
where appropriate.
175

Chapter 5: Methodology
Question Purpose Basis of question structure --,-----
1 Profile respondents according to DTI definitions of company size (Bank number of employees. of England, 20001 Cate~~ nominal.
2 Additional profile data. None - direct quantification used. 3 Determine products manufactured by Product groupings based on Bosch
respondent's company. (1996) using checklist format. 'Other' categories added for exceptions.
4 Ascertain respondent company's tier Definitions of tiers 1,2 and 3 are well in the supply chain. established in the industry, although
short descriptions were provided. Category nominal.
5 Establish the degree of coverage Complied from top 15 passenger vehicle among the main volume assemblers. manufacturers using checklist format.
'Other' categories added for exc~tions. 6 Determine current ownership/origin Four (non-political/economic)
of the respondent company. geographical areas plus two further 'other' category nominal categories for exceptions.
7 Determine alliance linkages in the None - dichotomous format plus 'don't supply chain. know' cat~~ --_ ..
S Determine R&D linkages with Three category nominal statements customers. developed.
9 Determine functional background of Determinant choice plus one 'other' respondents. category. No category nominal since
question refers to 'main' background 10 Determine experience within the None - direct quantification used.
automotive industry II Determine experience as a senior None - direct quantification used.
manager 12 Establish differences in role at senior None - open ended question
level
Table 5.5: Question Types used in Final Questionnaire
The remaining questions (parts 3 to 5) rely on interval scales to generate metric
data. Parts three and four of the questionnaire were developed as a result of two
factors. First, the content analysis (Section 4.1) led to the removal of statement 40
to 43 and 44 to 47 (parts three and four respectively) because their retention in the
original prototype would have compromised the effectiveness of the rubric, the
statements bore too much similarity, and would necessitate a semantic differential
scale to be effective. Secondly, it was considered important to capture data about
managers perceptions about the hierarchy of resources and the language that they
use to describe competitive advantage prior any consideration of the competitive
advantage statements in part 5. This is known as a backfire effect, where "prior
176

Chapter 5: Methodology
items can also determine what is seen by the respondent as worth saying and what
is seen as redundant" (Tourangeau and Rasinski. 1988:302).75
Question order is an important consideration given that the study is concerned
with capturing the mindset within the data set. rather than influencing the mindset
which leads to the empirical precursors. In avoiding any backfire effects, it was
hoped that that parts 3 and 4 would perform better in eliciting managers' views in
relation to the question since they require less consideration that those in part 5,
and it has been argued that often, the answer which is given most quickly is the
one that is more likely to reflect the truth, thereby improving validity
(Oppenheim, 1976). 8agozzi (1994:41) suggests that questions with similar
content should be grouped together in order to maintain the focus of the
respondent and Denscombe (1998) advises the commencement of a questionnaire
with simple and undemanding questions to encourage the respondent to proceed.
Finally, parts were designed and ordered in such a way that the earlier ones could
be completed quickly to give the respondent the impression that they were making
satisfactory progress. The risk of respondent fatigue during the completion of the
questionnaire could threaten the quality of data collected. Semantic differential
scales are used for parts 3 and 4 (bipolar adjectives, exact opposite, no indication
of intensity).
Part five of the questionnaire contained the 32 statements which successfully
completed the content analysis and comparative focus group pre-test, along with
the rubric amended in line with comments suggested by the expert group. As
discussed earlier in this chapter, the choice of measurement scale was that of a
Likert-style, with associated measures of intensity in order to differentiate
respondents on the magnitude of difference on each of the statements.76
The questionnaire was professionally printed using paper of the same off-white
tone as the University's headed notepaper and numbered individuaIly to match a
7~ It should be noted that the avoidance of 'backfire' effects is not straightforward. Its mirror image is the 'carryover' effect, whereby preceding questions may influence the interpretation of items found later in the survey instrument. 76 On the labelling of points on such 8 measurement scale. Likert (1967 :91) commented that "so far as the measurement of an attitude is concerned, it is quite immaterial what the extremes of the attitude continuum are called; the important fact is that persons do differ quantitatively in their attitudes, some being more toward one extreme, some more toward the other".
177

Chapter 5: Methodology
general reference list used to monitor non-response and to ensure that the correct
organisations would receive a second mailing. The covering letter (Appendix 9)
was drafted in accordance with the structure suggested by Dillman (1978) and
made reference to the study's adherence to the Market Research Society code of
conduct. 77
Other than the use of official University stationary, survey sponsorship was
considered and rejected. Although this could have been sought from a
manufacturer and one of the largest UK suppliers, such sponsorship may have
been seen to jeopardise assurances of anonymity and confidentially, and could
equally be perceived by potential respondents as a method by which a rival or
customer could enrich their knowledge. 78 Moreover, there is evidence that
commercial sponsorship may not improve response rates (Baumgartner and
Heberlein, 1984). Faria and Dickinson (1992) and Diamantopolous and
Schlegelmilch (1996) reported evidence indicating that managers show a
preference toward the completion of questionnaires from academic institutions.
5.4.5 ADMINISTRATION OF THE QUESTIONNAIRE
The supplier database was used to generate a customised mailshot of letters and
envelope labels. Each numbered questionnaire was accompanied by a printed, first
class pre-paid return envelope and a hand-signed letter. All questionnaires were
mailed simultaneously in order to gauge the speed of response at weekly
increments. This data is reported along with the actual response rates achieved
early in Chapter 6. The researcher kept records of organisations that had
responded, refused to participate. were ineligible, or had ceased trading. The
known status of organisation was included in a new field in the supplier database
which could be used to sort records and generate a follow up mailing. A second
mailing was planned and executed exactly four weeks after the first. Only if the
number of responses failed to reach 200 (as discussed earlier) would a telephone
and fax follow up be used.
77 This was suggested by one of the experts during the Delphi interview. who also resides as chief examiner of the Market Research Society. 78 Of course, the questionnaire deals with perceptions rather than the content of strategy. but the respondent would see the endorsement first rather than the full content of the questionnaire.
178

Chapter 5: MethoC/olo!{v
Once the satisfactory response was achieved, non-response could be considered.
This is reported in Chapter 6 where, given the public availability of financial data.
systematic non-response is considered by using employee and sales figures for a
equal sample of respondents and non-respondents.
5.5 SUMMARY
Figure 5.3 provides a summary of the research design. In a single sentence. the
design could be described as 'an exploratory and cross-sectional study to establish
relationships in a non-contrived environment using a minimal interference
questionnaire instrument containing a mixture of measures administered to
individuals within a sample frame based on the known population '.
Purpose of study Type of Extent of Study setting Measurement invMtIoatlon In ~urQ!
Mix 01: Exploration Establish
Minimal Non-contnved Nominal scales relationships Category nomina
Interval scales If)
I VI >-
~ -<: ... -<:
Data-collection a Unit of analysis Sampling design Time horizon
method
Individuals Known population is sample frame Cross-sectional Questionnaire
Figure 5.3: Visual Summary of the Research Design
This chapter has set out the methodology chosen in light of the research questions
and methodological debates within the field of strategic management and beyond.
Since the nature of the study is experimental, item development required a
similarly experimental, yet considered approach. The pre-testing process sought to
ensure reliability and validity within the limitations of the quantification available.
The next chapter examines the outcome of the data collection strategy which this
chapter has discussed. In particular, it considers the achieved response rate,
respondent profiles, non-response issues and the sampling adequacy, thereby
providing a foundation for the discussion of competitive advantage perceptions in
Chapter 7.
179

Chapter 6: Characteristics o/'Respondel1ts
Chapter 6 - Characteristics of Respondents
6.1 INTRODUCTION
Previous chapters have dealt with the theoretical and developmental background
to the study. The last chapter discussed the research design and pre-deployment
activities undertaken by the researcher in order to gather primary data, marking
the pivot between the theoretical framework and practical enquiry. This chapter
reports on the outcome of the chosen strategy in terms of data collection and the
respondents which have contributed to the data set which is the subject of further
scrutiny and empirical analysis in Chapter 7.
Prior to the analysis of data in the next chapter, this chapter sets out to address
three important questions. First, is the number of respondents sufficient to
facilitate adequate multivariate analysis? Second, does the response rate and
characteristics of respondent companies allow the researcher to make inferences
about automotive component manufacturers? Third, can the respondents from
these organisation be considered to be strategic decision makers in terms of their
position and experience?
Overall, the purpose of this chapter is to establish the extent to which the data
collection process has been successful in terms of data analysis requirements and
in comparison with previous studies. In section 6.2, non-response issues are
considered using statistical analysis and insights gathered from follow-up
telephone interviews. Sections 6.3 and 6.4 portray the salient characteristics of the
respondents and their organisations in order to accurately 're-frame' the study,
that is to say precisely describe about whom and what (in professional and
organisational terms) the study refers, given the data collected. Section 5
addresses the issues of sample size and factorability of the data matrix for the
purposes of factor analysis.
180

Chapter 6: ('haracteristics l~lRespondents
This chapter marks the first occasion in which specific reference will be made in
the text to an organisation which has provided first-hand, or primary data, for the
study. The reference number used to track responses will be used in the remaining
text as an anonymous identifier for companies and will follow the convention
'#number' (e.g. #479).
6.2 RESPONSES
6.2.1 RESPONSE RATE AND NON-RESPONSE BIAS
Following the inclusion of a unique identification number, all the postal
questionnaires were dispatched by first class post at the same time in order to
ensure that the follow-up mailing could be undertaken with the certainty that few,
if any, very late responses would be received. The mailing phase represented an
eight week period, punctuated at the mid-way point by a follow up for
organisations for which a reason for non-response was not known. As expected.
the highest number of responses was received soon after the mailings with a slow
down in response with the passage of time. Figure 6.1 indicates the number of
responses received per week over the mailing period, with the final number of
responses reaching 284. The peak in week five is accounted for by returns from
the follow-up mailing. A further questionnaire was returned but found to be
ineligible for the study since the respondent was making reference to distribution,
rather than manufacturing operations.
In addition to the receipt of completed questionnaires, a number of envelopes
were returned undelivered with a postal service return sticker indicating "gone
away" status. Clarification of how "gone away" is defined was sought from the
Royal Mail, but it was found that this description indicates that whilst the address
was correct, the company no longer occupied the premises. The reasons for this
could include closure of the business, a change in business name or a move to
alternative premises. Accordingly, it cannot be inferred with any degree of
certainty that these companies have ceased to exist, but rather that they are
unreachable. In total, 145 companies (14% of the sample frame) were unreachable
due to the return of the envelope. A further 28 companies contacted the researcher
181

hapter 6: haracteristics of Respondents
to indicate their ineligibility for the study due to the fact that the company did not
operate in the automotive passenger vehicle components industry. These
companies were involved in the heavy goods vehicle (HGV) sector or no longer
considered themselves to be automotive component suppliers due to low or
infrequent production of components.
140 -
120 -
~ I/) c 0 Q.
~ .. -0 .. 60 Q) .0
E ::s 40 z
20
0 1 2 3 4 5 6 7 8
Week
Figure 6.1: Rate of Responses over the Mailing Period.
Having identified ineligible and unreachable organisations the final response rate
for the study can be reported. DeVaus (1991) suggested that response rates should
exclude ineligibles and unreachables, therefore the size of the revised ample
frame is 865 leading to a response rate of 32.9 per cent.
The number of responses (n=284) and response rate (32.9 per cent) achieved in
this study compares favourably with other studies in the automotive component
sector and studies in strategic management using postal questionnaires. In the ca e
of the former type of study, Pickernell (l998b) received 98 responses from a
sample frame of 191 (51 per cent) and Leverick and Cooper (1998) received 88
182

Chapter 6: Characteristics olResl'ondents
returns from a sample frame of 450 (20 per cent). As was noted in Chapter 5,
these studies derived their comparatively smaller sample frames from similar
sources to those used in this study, yet were deemed by the authors concerned
suitable to generalise about the population that is automotive component
suppliers. Also noted in the previous chapter is the definitional uncertainty
surrounding the boundaries of the popUlation.
Although differing in their objectives, two studies recently published in the
Strategic Management Journal are similar in terms of sample frame size (n= 1 000),
respondent type (senior management), and theoretical domain (strategic
management). Simonin (1999) achieved a lower response rate of 19.2 per cent
producing a data set subjected to confirmatory factor analysis whilst Slater and
Olson (2000) succeeded in achieving a response rate of 28 per cent from a sample
of 1000 organisations in a study focussed at senior executives. Similarly, McEvily
and Zaheer (1999) achieved a slightly higher response of 38 per cent (309
responses). Not only is this study a useful benchmark due to its similarity with
respect to the traits noted above and the use of the data-set in a similar manner to
Simonin (1999), it also reports a higher number of ineligible companies (17.8 per
cent of the original sample frame) than that encountered in this study.
It can, therefore, be proposed that this study has achieved a similar, and in some
cases superior, response to studies that are equivalent in terms of industry.
respondent, sample frame, and theoretical domain. Whilst a satisfactory response
rate and no evident non-response bias are positive attributes for any primary
study, they are insufficient conditions alone for empirical analysis. A further test -
the factorability of the data set - is discussed in Section 6.5.
6.2.2 NON-RESPONDENTS - REFUSALS
A small number of companies contacted the researcher by post and e-mail to
indicate their non-participation in the study. (These companies are included within
the sample frame given their eligibility, reachability and ability to respond). A
total of seven companies returned their questionnaire without completion, two of
which (#289 and #935) stated insufficient time for completion. Another company,
a small forgings manufacturer (#935), stated that the restructuring of the company,
183

Chapter 6: Characteristics (~(Respon"ents
coupled with economic pressures such as the high value of sterling. meant that the
Managing Director's "priorities [were] focussed elsewhere".79 A further three
organisations (#206, #595 and #672) made reference to their company policy of
not completing questionnaires due to the large number of requests which they
receive. Two companies (#287 and #671) returned the questionnaire stating the
desire not to participate but without providing any reasons.
6.2.3 NON-RESPONDENTS - SYSTEMATICALLY DIFFERENT?
Despite a high number of responses from the mailed questionnaire, there still
remained the possibility that non-respondents could be systematically different
from respondent organisations. Two variables were selected for this purpose -
turnover and employees, since these are organisational traits that are tangible.
publicly available and have been used in other recent and comparable studies to
examine non-response bias (McEvily and Zaheer, 1999; Simonin. 1999). A random
sample of 50 non-respondent companies was selected from the supplier database and
turnover and employee figures were taken from the FAME database (FAME, 2000).
An equal and random sample of respondents' turnover data was taken from the data
entry file and subjected to a Kolmogorov-Smirnov Two Sample test, designed to
compare the turnover and employees in the respondent and non-respondent groups
(Bryman and Duncan, 1997).
The p-values for turnover and employees were 0.178 and 0.711 respectively. Since
these p-values are greater than 0.05 they should be considered insignificant,
suggesting that both the respondent groups and non-respondents come for the same
population. We can, therefore assume, ceteris paribus, that the respondent group is
representative of the sample frame, although the problem of the population versus
known population of automotive component suppliers (Chapter 5) remains.
79 This quotation is taken directly from correspondence received from the Managing Director of the company.
184

Chapter 6: Characteristics (?lRespondcnts
6.2.4 NON-RESPONDENTS- ANECDOTAL INSIGHTS
Following the data collection phase, the researcher spoke by telephone with the
Managing Directors of two non-respondent companies in order to explore the
reasons for non-participation in the study. With their consent, it provided an
opportunity to examine some of the issues relating to the research design in
further detail.
The Managing Director (MD) of company #103 explained that his medium sized
plastic components company had decided to diversify away from the original
equipment components industry like "many other similar companies" due to three
main problems encountered by smaller suppliers. First, the continuous price cuts
demanded by the assembler no-longer enabled the company to retain historical
levels of profitability, despite the assistance from some assemblers in cost
reduction programmes. One US-based assembler was identified as the worst client
in terms of demanding price cuts without assistance, reflecting the impact of
Ignacio Lopez's sourcing policies developed at GM and now known within the
industry as reine preisdiktat or 'price is the only concern' (Bursa el al., 1997:34).
A second problem offered by the MD was that of resident engineers having an
adverse impact on the supplier, becoming a surrogate director imposed by the
assembler. Eventually, he added, the resident engineer would "take over" and
"become god-like". The perception of resident engineers offered by the MD is in
stark contrast to their portrayal in the literature (Chapter 3) as a positive and
beneficial facet of the new supply chain paradigm.80 A third problem faced by the
company was low cost competition from the far east (especially China) which. the
MD alleged, use inferior (and cheaper) technology for products such as wheel
covers, where solvents are used instead of water-based technology. In response to
these problems faced in the automotive sector, the company had diversified into
niche markets, such as travel storage boxes, composite doors and other non
automotive plastics applications.
80 With further exploration. future studies should examine the perception of the resident engineer from the suppliers' perspective. thereby provides further insights into the bargaining power of the assemblers.
185

Chapter 6: Characteristics of Respondents
The conversation with the MD of company # 103 addressed a further issue with
the research design - the lack of endorsement from the Society of Motor
Manufacturers and Traders (SMMT). He commented that the SMMT was
perceived to lack support for component manufacturers, particularly those with
smaller operations. Indeed, his recent experience suggested that there was little to
gained from membership of the society. One illustration of this was that of having
cancelled the company's membership, the company was still invited by the
SMMT to attend a funded industry conference in Frankfurt, Germany. This, he
suggested indicated the inconsistency of the industry association, and contributed
to a less than satisfactory regard for it.
Although, he added, that the extent to which these views were widely held could
not be asserted nor supported, it is possible that such views could also have been
directed toward the study, thereby diminishing the response to it. Such comments,
although anecdotal, support the decision not to seek endorsement beyond that of
the University as detailed in Chapter 5.
Although less revealing, a similar situation was encountered by company #303,
the Managing director of which explained in the follow-up discussion that his
small (10 person) company had diversified away from the fabrication of
aluminium castings for the automotive industry to new markets such as food
preparation equipment. Although anecdotal, the insights derived from the
Managing Directors of company #103 and, to a lesser extend #303, provide
further evidence to support the reduction in the sample frame due to unreachable
companIes.
These anecdotal insights further addresses the issue of how compames were
defined and included within the sample frame. The need to diversify for the
purposes of survival meant that companies may no longer consider themselves to
be solely automotive components suppliers, despite their historical legacy in the
industry. Companies might, therefore, consider themselves to be a 'plastics',
'metal' or 'rubber' manufacturers competing in several markets and therefore
consider themselves no longer eligible to respond to a request for participation to
an automotive-related survey.
186

Chapter 6: Characteristics (~lRe.\J)()ndent.\'
6.3 RESPONDENT ORGANISATIONS
This section considers the question of whether the organisations that have
respondented are sufficiently representative of the known population in order for
the researcher to make inferences about that wider population. The focus of
discussion here is the data provided by the profile questions in part 1 of the
questionnaire. Where relevant, the discussion will consider the differences
between respondents from different tiers in the supply chain (Chapter 3) in order
to examine how the characteristics change according to the suppliers' proximity to
the assembler.
6.3.1 NUMBER OF EMPLOYEES
Company size was measured using the recognised classification by number of
employees used by the DTI (Bank of England, 2000) where, in addition to the
small, medium and large taxonomy, a micro firm (less than 9 employees) is
added. When such classifications are compared with the respondent data set,
medium and large firms predominate in their representation (Figure 6.2).
Together, large and medium firms account for 83.8 per cent of participating
companies (40.1 per cent and 43.7 per cent respectively).
Two factors can be said to account for the smaller proportion of micro and small
sized firms represented in this study. First, consolidation within the component
sector in the past decade has affected the structure in the industry in this context.
Mergers and acquisitions will also have reduced the number of smaller firms,
generating a proportionately higher number of medium to large sized
organisations. Although there is no comparable historical data on the structure of
the components sector, it is likely that for high volume component manufacture
and delivery, such operations would require at least 50 employees. In only a few
cases of components which are not standard fitments (e.g. leather good, wooden
veneer, etc.) would micro and small firms have sufficient production volume to
meet final assembly demand, although such companies might reside at tiers two
and three of the supply chain (Section 6.3.4).
187

Chapter 6: Characteristics olReslwm/ents
50~-----------------------------------------'
c: ~
40
30
20
10
.... ~ oL~ ••• _
0-9
Number of employees
10-49 50-249 250+
Figure 6.2: Respondent Group Size - Number of Employees
A second reason which might account for the distribution of respondent
companies by size toward higher number of employees is the increasing
specialisation of companies that is connoted by the tiering of the supply chain,
whereby smaller companies supply commodity products (fasteners, hoses. runner
products, electrical parts, etc). It is, therefore, possible that a number of companies
did not respond because the addressee did not perceive the company to be an
automotive component manufacturer by virtue of the general application of the
component produced rather than the level of output supplied to the industry. 81
Furthermore, the lower number of micro and small firms may also be influenced
by the industry trend of subsystem/module delivery. First and second tier
suppliers are now responsible for seeking their own component suppliers and the
status quo may not be preserved with these suppliers seeking new component
suppliers in order to meet delivery unit prices determined in negotiation with (but
often dictated by) the assemblers.
81 The 'non-automotive'-automotive supplier has been addressed in Chapter 4 and Section 6.2.4. ofthis chapter.
188

Chapter 6: Characteristics (~(Re.\'p()ndenl.\·
The respondent profile should not be taken to suggest that there are very few
small (and micro) firms operating in the industry. Companies of this type arc
increasingly more difficult to identify, having diversified away from a dependence
on the sector (Section 6.2.4 above) and may no longer perceive their operations to
be dominated by the automotive sector. The trend toward consolidation that is
taking place downstream can also have been seen to have taken effect upstream.
6.3.2 TURNOVER
The positioning of questions was addressed in the previous chapter and reference
was made to the possibility that respondents might not be willing to complete the
question relating to company turnover for automotive related operations. In
conclusion to this discussion, the turnover question was retained at the start of the
questionnaire (as question number two). The outcome of this question reveals that
90.5 per cent (n=257) of respondents completed this question, offering support to
the choice of question position and its non-polemic nature.
The turnover figures for respondents reflects the broad nature of sample in terms
of its size, with minimum and maximum turnovers of £300.000 and
£2,000,000,000 respectively. The mean turnover figure was £51,538.911. The
total turnover accounted for by the sample is £13,245,500,000.
The total revenue figure reported by the respondents suggests that prevIous
estimates of the sector's contribution has been underestimated. For instance.
Autoindustry (1999) offers £ 12 billion as the value of turnover from the sector in
1998, when this study (albeit using 1999 data) exceeds the turnover by nearly
£ 1.25 billion and comprises of only one-third of the known suppliers operating in
the UK.
A further, and more significant, indication of the how the sample compares with
known features of the UK automotive component industry can, in part, be
discerned by turnover figures from SIC groups. However, Chapter 5 noted that
organisations producing parts and components for passenger vehicles could be
included in a wide variety of SIC codes which did not indicate the direct usage of
the product concerned but that the SIC would include many companies with no
automotive sector involvement. Accordingly, the aggregation of data from
189

Chapter 6: Characteristics l~lResp(}ndents
different SIC groups is a potential dangerous undertaking. Since one SIC code has
been designated specifically for automotive component manufacturers (SIC 34.4)
official statistics provide some benchmark comparisons (albeit conservative ones
given the caveats noted above). ONS (2000c) reports that the turnover/sales from
manufacturers of parts and accessories for motor vehicles and their engines (i. e ..
SIC 34.3) totalled £7.963 billion in 1997. Although comparable figures for 1998
are not currently available, an estimated index of turnover (ONS 2000d) indicates
that turnover will have risen in this group by approximately 0.810/0, suggesting
that turnover in 1999 will have been at the level of approximately £8.027 billion.
This figure represents a shortfall of £5.218 billion compared with the turnover
figures of the respondent group.
A single fiscal/calendar year and the inability to desegregate OE and AM revenue
does not account for what is clearly a major underestimation of the value of
automotive component manufacture in terms of the UK's trade balance, GDP and
economic growth. The diffusion of component suppliers across SIC groups
appears to account for the diminished measurement of the sector's direct
contribution to the UK economy in contributing to others, according to official
statistics. R2
Whilst the highest turnover recorded in the study (£2 billion) may appear to be
reasonably high, it reveals the potential for further consolidation in the UK
components base. Although subsidiaries of seven of the world's top 25 suppliers
(Bursa el al.. 1997) are represented in the study, none of the remaining
organisations in the study currently meet the 'super-supplier' criteria (i.e. > $3bn
per annum).83 Further consolidation, through merger or acquisition to either
defend their current operating position or to achieve global (i.e .. super-supplier)
status seems likely in the near future. Although turnover alone does not constitute
a rationale for merger or acquisition (strategic and operational considerations and
synergies are further points of scrutiny prior to the pursuance of such a strategy) a
82 A further reason for the high level ofturnover reported could be the respondents' inclusion of group and non-automotive turnover, despite being asked explicitly to include automotive OEM business only. 83 SBUs of the top 25 global suppliers represented in this study include companies #316. #326. #546. #56]. #6]5. #814 and #982.
190

Chapter 6: Characteristics olResfJondents
turnover level of $1 billion (c.£640 million84) has been suggested as the minimum
than can be expected of tier one suppliers. As Bursa et al., (1997:98) note,
otherwise "they will be squeezed out, one way or another", reflected in a move to
tier two or three, or exit from the sector altogether. This issue is addressed furthl!f
in Section 6.3.4 which examines the tier representation of respondent companies
and how turnover differs accordingly.
6.3.3 COMPONENT TYPES
The respondent organisations produce a wide variety of automotive components,
with a minimum of five companies (in the case of tyres and wheels) within each
component category. Table 6.1 details the number of respondent companies in
each component category and shows that internal engine components, interior trim
and metal stampings and pressings have the highest representations.
Component type Number of suppliers %
of total Braking systems 27 9.5 Engine - internal components 39 13.8 Engine cooling 23 8.1 Exterior trim 23 8.1 Fuel supply 34 11.9 Gearbox/clutch components 33 11.6 Glazing products 9 3.2 Heating and ventilation 31 10.9 Hydraulics 14 4.9 Ignition/engine management 26 9.2 Instrumentation 21 7.4 Intake air/exhaust systems 23 8.1 Interior trim 49 17.3 Lighting 17 5.9 Seating 28 9.8 Stampingslpressing 36 12.6 Starting systems 17 5.9 Steering systems 27 9.5 Suspension 31 10.9 Vehicle body parts 21 7.4 Wheels/tyres 5 1.7
Table 6.1: Component Types and Number of Suppliers
114 Exchange rates based on average QI and Q2 $1£ rates (CBI. 2000).
191

Chapter 6: Characteristics (~(Resp()ndenIS
It is also clear that several organisations are multi-product manufacturers due to
their presence in more than one category. However. this is more noticeable among
the large companies than in the smaller companies, where there is a focus on a
single product or component of a secondary nature (stampings which form part of
a larger subassembly). Not only should diversification and related product
development be attributed to the multiple responses found in Table 6.1. the
convergence of technologies and modularisation of components (Warburton.
1999) could also be advanced to account for this finding. Although the data
collection instrument sought to find the most effective component classification
(based on Bosch, 1996), respondents were given the opportunity to include
components not formally specified in questionnaire. A further 165 entries were
made (Table 6.2), although some of these could have already been specified in the
questionnaire, such as stamping and pressing. A number of the miscellaneous
entries could be categorised within existing ones. Some examples of these include
electric motor cores (starting systems), speed control systems (ignition/engine
management) and fuel senders (fuel supply). The components listed in Table 6.3
indicate that some of the product gaps identified by Pickemell (1998a) have been
removed.
Acoustic parts/insulation Adhesives Airbags Batteries Bearings Body panels Coatings Control and regulator cables Doorlock sensors Drive belts Engine mounts Fasteners Gear shifters Gyroscopes Headlamp cleaning Hose assemblies Hose clamps Injection mOUldings Interior hinges Leather trim Moulded foam
Occupant safety components Oil sumps Paint Pneumatics Polymers Rubber mOUldings Sealing products Seals and gaskets Seat belts Seatbelt retractors Security components Springs Sunroofs Timing belts Vibration isolation components Wheel hubs Wheel weights Window regulators Windowlboot linkages Wipers Wiring harnesses/connectors
Table 6.2: Representation of Miscellaneous Component
192

hapter 6: haracteristi s oj Respondents
6.3.4 TIER IN THE SUPPLY CHAIN
Companies from all tiers of the supply chain (Chapter 3) were targeted for
participation. Responses were received from companies from each tier, though in
greater proportion according to their proximity to the assembler. The final dataset
comprised of 152 tier one suppliers, 98 tier two suppliers and 34 tier three
suppliers. Figure 6.3 shows the distribution of companies in percentage terms and
the higher participation of the upper two tiers.
One could offer several reasons for this skewed distribution. First, the
identification of tier three companies was problematised by SI c\as ification
and multi-industry involvement, both of which are themes discussed extensively
in the previous chapter. Secondly, smaller firms have a higher likelihood f
business failure (Dunne and Hughes, 1992), and may therefore n t be in a po iti n
to respond or be identified as a potential respondent. Thirdly, the original database
would simply have replicated the lack of third tier suppliers due to its
triangulation of disparate sources.
Tier 2 35%
Tier 3 12%
Tier 1 53%
Figure 6.3: Respondent Organisations' Position in the upply hain
It has already been established that representativeness cannot be addressed
because the population cannot be ascertained accurately. However, an observation
can be made in respect of the form of the supply chain. The concept of tiering
193

Chapter 6: Characteristics (?l Respontiel1lS
(Womack et al., 1990; Bertodo, 1991; Lamming, 1993; Saunders, 1994) has
portrayed the number of organisations within a given tier diminishing with the
proximity of the tier to the final assembler. Indeed, Bertodo (1991a) used a
triangular representation in which the apex of around 300 first tier suppliers would
be supplied by some 2000 second tier suppliers who in turn would receive their
inputs from approximately 7000 third tier subcontractors. In contrast (and noting
the caveats above), the form of the supply chain found in this study indicates the
predominance of the first two tiers.
Since the hiatus of literature about supply chain tiering in the late 1980s and earl y
1990s, greater consolidation has taken place and a specific third tier in which
suppliers produce the majority of their output for tier two component
manufacturers no longer exists to the same extent as a decade or more ago.8~
Given the relationship, importance and value-added ability of higher tier
suppliers, one would expect this to be reflected in measures of company size -
turnover and employees. These are presented in Tables 6.3 and 6.4. The highest
turnover per tier was reported from tier 1, although the highest mean turnover and
maximum turnover was found in tier two. Moreover, three companies in tier two
(#192,#285 and #565) reported higher turnover than the £700 million per annum
reported by the highest turnover company in tier 1 and accounted for 74% of
revenue in tier 2. Thus, the mean turnover per tier should be treated with caution.
Nonetheless, as expected (due to its lower representation and volume) tier three
has both the lowest total turnover and mean turnover.
The small differential between tiers 1 and 2 can also be attributed to the higher
number of strategic business units and subsidiaries within tier 1. Since the
turnover is SBU specific rather than group turnover, in the case of most tier 2
companies, the turnover at the highest tier could be considered to be somewhat
conservative.
as Although not central to this study, the current status of tier three suppliers requires further investigation. and is considered in Chapter 8.
194

Chapter 6: Characteristics (~lResp(}ndents
Tier 1 Tier 2 Tier 3 All Tiers ._-Number of companies 8 138 86 33 257
Turnover Total turnover (£) 7,220,950,000 5,182,900,000 841,650,000 13,245,500,000
~eanturnover(£) 52,325,725 60,226,279 25,504,545 51,538,910
~inimum turnover (£) 300,000 500,000 600,000 300,000
~aximum turnover (£) 700,000,000 2,000,000,000 35,000,000 2,000,000,000
a Companies that have provided turnover data
Table 6.3: Turnover per Tier
A clearer picture of the differentials between the tiers in the supply chain can be
seen in the use of the number employees as a measure of size. Table 6.4 shows the
absolute number in each category per tier and the associated percentile.
First tier companies are mostly large and medium sized, although the requirement
for specialised components for high performance model variants has meant that 13
small and micro-sized companies had first tier status in the respondent group.86
The second tier is dominated by medium sized firms and has equal numbers of
large and small/micro firms, whilst the lowest tier has a relatively even
distribution of firms across the large, medium and small/micro categories. The
distributions presented here are those which, a priori, would be expected given
that the individual company volume per model rises significantly per tier as the
relationships increasingly become confined to a few suppliers only. Consequently,
the labour force will reflect the level of output in a manufacturing context.
Emp/oyeesQ Tier 1 Tier 2 Tier 3 Number % Number % Number %
~icro (0-9 employees) 1 0.7 4 4.1 2 5.9 Small(1 0-49 employees) 12 7.9 18 18.4 9 26.5 ~edium (50-249 employees) 58 38.2 54 55.1 12 35.3 Large (250+ employees) 81 53.2 22 22.4 11 32.3 Total per tier 152 98 34 8 n=284
Table 6.4: Employees per Tier
86 Such companies are first tier by virtue of their direct supply relationship with the assembler rather than as a supplier of modules/subassemblies, a role which requires extensive R&D and coordination skills.
195

Chapter 6: Characteristics olRespont/t'nls
The caricature of supply chain tiers and company size are reflected in the
respondent group, although only partial support is provided by turnover figures
due to the inclusion of three companies with disproportionately high revenues
relative to their tier. The data provides stronger support for the understanding that
small firms tend to reside at tier 3 and the largest firms at tier 1.
6.3.5 HEADQUARTER LOCATION
Unsurprisingiy, the respondent group is mainly comprised of companies which
have their headquarters based in the UK and continental Europe (Figure 6.4).
Although 'ownership' of many of these companies is difficult to determine due to
their public listing status, the geographical bias partly reflects the indigenous
supply base within the UK and regional sourcing policies (i.e., the European
automotive industry will source most of its components from within Europe due
to logistics costs). UK based companies accounted for 60.2 per cent of
respondents with Europe and US companies constituting 21.1 per cent and 13 per
cent of respondents respectively. All Pacific Rim respondent companies were
based in Japan and albeit fewer in number compared with Europe and US
geographical areas (5.3 per cent of the total), their representation is slightly higher
than the proportion within the known population.87 Only one respondent used the
'other' category, which in this case was to describe its HQ location in South
Africa.
However, the use of headquarter location as a measure of geographical origin
should be treated with caution. Differences in the organisational structure of
respondent organisations may have led to a distortion in the responses to this
question. To evidence this, two US companies (#328 and #563) have geographical
organisational structures with a global HQ based in the US and a regional HQ
(Europe, North America, Asia, etc.). The respondents of these organisations
identified their headquarter location as Europe, suggesting that in the absence of a
simple structure (subsidiary to HQ), respondents may have used the immediate
reporting line as a surrogate for the ultimate headquarter location.
17 Willings (1998: 18S-187) has identified 39 Japanese component manufacturers in the UK. which represents 3.8 per cent of the known population (n=1038).
196

hapter 6: haraeteri lies of Respondents
UK • Europe I
15 1
60 171
o North America
o Pacific Rim II
• Other
Figure 6.4: Headquarter Location of Respondent Organisation
6.3.6 CUSTOMERS
Respondents were asked to identify the immediate or indirect cu tomers for their
components/materials to provide an indication of respondent set coverage of the
major volume assemblers. The phrasing of the question would ensure that second
and third tier suppliers would not merely include other component suppliers
downstream in the supply chain. With the exception of Mazda, which has neither
UK nor continental European production, all the major European volume
assemblers were supplied by at least 23 per cent of respondent organisation
(Table 6.5). The low number of respondents reporting supply relationship with
Mazda provides further corroboration of the proximity/logistics dimension in
sourcing policies noted earlier in the chapter.
Furthermore, there is evidence of significant export activities t continental
Europe given that five of the volume assemblers have no high volume assembly
presence in the UK (Daimler-Chrysler, Fiat aab, VW and Volv ) although
between 23 and 37 per cent of suppliers had component supply relationships with
these assemblers. Indeed, this could rise to six (Renault) despite the difficulty in
establishing whether the component sourcing that was part of the alliance with
Nissan announced in April 1999 is manifestly reflected (and is omitted from this
assertion). Moreover, with the popularity of platform usage (Chapters 3 and 4;
197

Chapter 6: Characteristics ofRe.\pondents
Appendix 1), a UK manufactured component for the Volkswagen Golf/Bora
would form part of the platform used in the Audi TT and A3 (Hungary). Skoda
Octavia (Czech Republic) and Seat Leon (Spain).
Three medium volume assemblers, Daewoo, Hyundai and Suzuki were not
supplied by any of the respondent organisations. The FDI investment and
geographical position of Suzuki's plants in Iberia have reduced new business
opportunities for UK-based suppliers. Equally, Daewoo's five central and eastern
European plants (Poland x2 Romania, Czech Republic and Uzbekistan) were
scheduled to produce 600,000 units (which includes commercial vehicles) in
1998, based around licensed GM technology and emerging new models (AEM.
1997).88 Hyundai has no European plants and along with Daewoo, are noted for
their sourcing of components from Korea and within their own Chaebols (Bursa et
al., 1997:43).
Information about the number of suppliers per assembler is very rare, but two
studies indicate that the respondent group includes many of the suppliers of
individual assemblers. For example, Bursa et al., (1997) states that Nissan has 131
suppliers based in the UK compared with the 119 companies in this study. In
another study in which the author has been involved (Foley et al., 1996) identified
80 UK suppliers compared with 128 in the respondent group (the larger number
reflecting the higher plant volume and model variety since the start of production).
The respondent group also supplied to a number of specialist, low volume or
alliance assemblers (Table 6.6). Eight respondents indicated that they supplied
General Motor's US operations and one other respondent supplied Daihatsu's
production in South East Asia suggesting a small amount of component export
outside western, central and eastern Europe. The low number of Nedcar suppliers
will have been influenced by the joint platform development of Volvo (Ford) and
Mitsubishi for the CharismalS40N 40 models, including a high number of
Japanese sourced carry over parts from previous models. The small number of
Rolls Royce suppliers is not unexpected due to the high proportion of in-house
88 By way of comparison, in the same period (1999), VW's Wolfsburg plant produced 604,OH Golfs and a further 255,298 units (FT Automotive, \999).
198

Chapter 6: Characteristics (~(Rt'.\'p()ndt'n1s
component production for current models, although some integration with VW
component sources will arise in the future alongside the trend toward multi model
component sharing and platform usage within the industry.
Assembler Respondent 0/0 total UK Non-UK European suppliers respondents Plants Plants r
BMW 125 44.01 ./ Germany
Daimler-Chrysler 91 32.04 x Austria. France. Germany, Spain
PSA Group 81 28.52 ./ France. Portugal . Spain
Belarus, Belgium, Germany.
Ford 202 71.13 ./ Netherlands Poland. Portugal.
Spain, Sweden" Turkey
Fiat 65 22.89 JC France, Italy, Poland, Turkey
Honda 147 51.76 ./ Turkey
Jaguar 170 59.86 ./ lC
Mazda 28 9.86 lC lC
Nissan 119 41.90 ./ France
Rover/Land Rover 214 75.35 ./ x
Renault b 82 28.87 ./ Belgium, France, Portugal,
Slovenia, Spain. Turkey
Saab C 85 29.93 x Sweden
Toyota 128 45.07 ./ France
Vauxhall (GM) 136 47.89 ./ Belgium, Germany, Hungary, Poland.
Portugal, Russia. Turkey Belarus, Belgium
Volkswagen Groupd Czech Rep., Germany
106 37.32 JC Hungary. Poland. Portugal, Russia, Spain, Slovakia
Volvo (specific) 90 3] .69 x Sweden
• Volvo operations; b Equity alliance with Renault; C GM Group; d Includes Seat, Skoda, Audi (excludes Rolls Royce), • Excludes alliances with Central and Eastern European alliances for rebadged models
Table 6.5: Respondents' Customers - UK and Continental Europe
Sources: Author's own data, Automotive Emerging Markets (September 1997; June 1998), and Brown (1999)
199

Chapter 6: Characteristics (~lRe.\'p()ndents
The downstream and final assembler relationships of the respondent group are
broadly in accordance with the plant locations of major volume producers in the
UK and continental Europe. As expected, there is clear evidence of export activity
of components and geography still remains an important factor in the sourcing
policies of the assemblers, evidenced by the low number of supply relationships
outside Europe.
Company Suppliers Parent Plant location(s) Aston Martin 4 Ford UK Daihatsu 1 Independent S.E. Asia GM (US) 8 nla U.S.A. Lotus 5 Proton (Malasii!l UK Morgan 1 Independent UK Nedcar 3 Volvo-Mitsubishi Born, Netherlands
--~~-
---- -
Porsche 2 Indel'endent Zuffenhausen.German~
Reliant 1 Independent UK --Rolls Royce 7 VolkswagenlBMWII'I New UK plant announced (2000)
TVR 2 Independent UK -------
Table 6.6: Additional Assemblers Supplied by Respondent Companies
6.3.7 INVOLVEMENT IN ALLIANCES
Collaboration between suppliers and assemblers has been a major feature in the
change in supply chain relationships within the sector for over twenty years. with
the adoption of the 'Japanese' model of supplier development (Chapter 3).
Recently, there has been evidence to suggest that alliances have now become a
feature upstream in the US-based automotive component sector where suppliers
have attempted to absorb some of the advantages inherent within kieretsu
structures (Virag and Mount, 1998).
In their study of 131 suppliers, Virag and Mount (1998) discovered that 54 per
cent of respondents had entered into a strategic alliance with another supplier with
45 per cent having chosen not to pursue such inter-organisational linkages (I per
cent replied 'not applicable').
19 The final arrangements for BMW and Volkswagen following the takeover of Rolls Royce are as followsthe Rolls Royce company is split into two with Volkswagen retaining the Crewe factory, Bentley brand and the right to manufacture Rolls Royce Cars until 2001 at which time BMW will obtain the Rolls Royce brand.
200

hapler 6: hara lerislics of Re pond nl
In this study (n=284), a smaller percentage of companies (44 per cent) had entered
into strategic alliances with other component m~ufacturers (Figure 6.5). Not
known is the degree to which these alliances are voluntary or hostile, where in the
latter it is the assemblers which require two or more suppliers to work together to
develop and bid for a component supply contract. However, prima facie, the UK
based sector bears only minor differences to its US counterpart and indicates the . degree of interconnectedness and interdependence among organisations upstream
of the final assembler.
Yes 44%
Don't know 1%
No 55%
Figure 6.5: Alliance Involvement with other Suppliers
Alliance involvement varies slightly according to the tier of the respondent in the
supply chain (Table 6.7). Around one third of tier two and three companies were
involved in formal alliances with other suppliers. However, over half (55 per c nt)
of tier one companies did have formal collaborative arrangements in place. The
need for, or requirement to form, alliances is stronger with the proximity of the
supplier to the assembly, predicated by the need to supply systems and module
which require a greater range of design manufacturing and technical expertise.
Alliances with suppliers Tier 1 Tier 2 Tier 3
Count % Count % -Count % No 68 44.7 65 66.3 21 61.8 Yes 83 54.6 32 32.7 11 32.4 Don't know 1 0.7 1 1.0 2 5.9
Table 6.7: Supplier Alliances according to Supply Chain Tier.
201

hapler 6: haracleri 'lies of Respond nls
6,3 .8 R&D RESPONSIBILITY
Evidence of the formal linkages with assemblers can be examined through the
extent to which collaboration is a central pillar of research and development. ver
half of the respondent group was primarily involved in joint R&D with the
assembler with fewer than a quarter of companies ' building to print' (u ing the
customer's designs) or developing components on their own (Figure 6.6),
Own designs
24% Build to print
20%
Joint R&D 56%
Figure 6.6: R&D Involvement of the Respondent Group
Between the three tiers, few salient differences were observed in the appr ach to
R&D used by the respondents (Table 6.8). Clearly dominant is a joint R&
approach across the tiers. Tier one suppliers rely least on customer designs (15.1
per cent) whereas tier two companies have the highest rate of build t print
involvement. This suggests that these tier two companies are working to th
designs developed by the tier one supplier and assembler.
The tier three suppliers are still involved in joint R&D with their cu t mers ti r
two suppliers) but have the highest rate of sole R&D involvement of the tier
(26.5 per cent). This could be, in part, due to the c mrnodity nature f the pr duct
(fasteners, plastics, basic materials, etc.). However, this i not an anomaly - all
three tiers still have levels of sole R&D which cannot be ignored. Between on
fifth and one quarter of all companies in each tier have taken this approach. These
companies need or believe research and development to be central to their strategy
and/or their competitive advantage. A joint R&D approach clearly has advantages
202

Chapter 6: Characteristics (4'Respontients
in tenns of cost, time, learning and commitment (Chapter 3). but companies are
seeking to forgo these in favour of competitive differentiation and advantage -
ultimately their survival. This clearly indicates the importance of further research
within the automotive components industry in relation to why organisations still
choose (or are forced to adopt) sole R&D approaches. The study returns to this
theme in Chapter 8.
R&D Involvement Tier 1 Tier 2 Tier 3
Count % Count % Count % Build to print 23 15.1 26 26.5 7 20.6 Joint R&D 91 59.9 51 52.0 18 52.9 Own designs 38 25.0 21 21.4 9 26.5 --
Table 6.8: R&D Involvement According to Supply Chain Tier
6.3 .9 OBSERVATIONS ABOUT THE RESPONDENT ORGANISATIONS
The set of respondent organisations for this study illustrate the variety of
companies which operate within the UK automotive components sector. Although
predominantly UK or European-based, the presence of US and Japanese
companies denotes their technological capabilities and associations with
assemblers of similar origins with operations in the UK and Europe. Indeed, a
high level of export activity can be observed from the respondent organisations.
predominantly into mainland Europe but with a small amount of production
exported to farther afield. Although the automotive industry can be considered to
be global in manufacturing, logistics and operations, it is an industry that has
finnly rooted regional infrastructures and systems.
The number of companies and their size according to the tier in the supply chain
as found in this study bear the hallmarks of the sectoral structure indicated in
preceding studies although turnover data suggests a high degree of similarity
between companies in the first and second tier. Equally, respondents' involvement
in supplier alliances suggests congruence of the respondent group with preceding
studies. In tenns of products and customers, the respondent group can be said to
produce all major components and assemblies to all major assemblers. Indeed. the
203

Chapter 6: Characteristics (~l Respondents
group includes companies that also supply to smaller volume vehicle assemblers
and supply specialised components in addition to their high volume component
portfolio. Furthermore, the multi-product nature of the group demonstrates the
technological convergence that will become increasingly important as
modularisation becomes the norm in vehicle design, component sourcing and final
assembly.
The respondent group is unlikely to remain untouched in the next few years.
Consolidation strategies are likely to affect those organisations that are not already
SBUs or subsidiaries of larger automotive concerns, and few of the respondents
presently have reached the turnover threshold for super supplier status. However,
the respondent group is sufficiently well comprised to constitute a suitable
foundation for an analysis which purports to examine the UK automotive
components sector.
6.4 RESPONDENTS MANAGERS
Next the chapter considers the managers that have supplied data for the
investigation. In particular, this section examines the respondent's credentials for
assignation as 'senior' managers and the success of the researcher in achieving
responses from this relevant group. Without the correct type of manager as
participants in the study, no inferences can be made about strategic decision
makers. The principal foci are the managers' positions, background, automotive
experience and tenure as a senior manager.
6.4.1 FORMAL POSITION OF RESPONDENTS
The target respondents within the organisations ('respondent managers') within
the sample frame were senior managers, given their direct involvement in
strategic decision making. The questionnaire asked the respondents to state their
formal job title in the expectation that there would be some minor variations and
to ensure that the person who had completed the questionnaire could be deemed
eligible for a study about senior managers. All respondents were found to be
eligible according to their job title (Table 6.9).
204

Chapter 6: Characteristics (~lRe.\'p()nd('nt.\'
The overwhelming majorIty (96.4 per cent) of respondent managers were
Directors or Managing Directors, the latter of which is a term frequently replaced
by Chief Executive Officer. Directors are regarded to be the highest level manager
with a direct managerial and budgetary remit for a specific functional area
(finance, marketing, production etc.,) and generally occupy a company board
position, thereby providing the Director with a direct influence upon strategic
decisions. In addition, functional (business level) strategic plans are the
responsibility of a given director and should be aligned with the corporate level
strategy. The Managing Director is considered to be the highest ranking manager
responsible for day-to-day operations within an organisation. He or she will
normally report to the Company ChairmanlPresident.
Title Number of respondents Percenta~e
Chief Executive Officer 10 3.5 Chairman 4 1.4 Director 116 40.8 Managing Director 148 52.1 President 3 1.1 Vice President 3 1.1 TOTAL 284 100.0
Table 6.9: Formal Job Descriptions of Respondent Managers
Accordingly, the respondent managers are clearly senior managers which (at least
in authority) are responsible for their organisations' strategic initiatives. On this
basis, where subsequent chapters make reference to strategists and strategy
makers, they do so through a known and explicit understanding of the hierarchical
position of respondents.
6.4.2 BACKGROUND
The background of the manager was included in the questionnaire since this might
have an influence upon a manager's perceptions of competitive advantage.
Indeed, the notion of functional bias is well established within the literature
(Anderson and Paine, 1975; Barnes, 1984; Norbum, 1986; Ireland el ai., 1987).
Such data was necessary not only to provide further depth into the characteristics
205

Chapter 6: Characteristics (~lRespondent.\'
of the respondent manager group, but to provide further information for
interpretation in the next chapter. Correspondingly, respondents were asked to
identify their main background in terms of training and experience. The word
'main' was used to avoid split-decision responses where a respondent might tick
two or more boxes in the questionnaire and render the response of little use for
analysis given that no weighting would be supplied.
Given the nature of the industry, one would expect a functional bias in the
respondent manager group toward production and this was found to the case
(Table 6.10).
Back2round Number of respondents Percentage Production 119 41.9 Sales 23 8.1 Marketing 59 20.8 Research and Development 19 6.7 --Purchasing 7 2.5 Finance 24 8.5 Other 33 11.6 TOTAL 284 100.0
Table 6.10: Backgrounds of Respondent Managers.
A production background was found to be the most common, with 42 per cent of
managers having their formal training as experience. Marketing backgrounds were
the second most common among the respondent managers whilst sales, R&D,
purchasing and finance reaching only single figure percentages in the respondent
manager group. The 'other' category was ticked by 33 managers although the
request to specify the type of background was inconsistent. Several indicated
engineering backgrounds (which in certain cases could be considered to form part
of production) and a smaller number still had backgrounds in logistics (which,
again, could be considered to form part of purchasing, or vice-versa). Although
there was the expectation that some of the senior managers might have
background in Information Technology or Law, with explicit provision for this in
the questionnaire, no respondent managers indicated backgrounds in these two
areas.
206

Chapter 6: ('haracteristics ojRt!spondents
6.4.3 EXPERIENCE IN THE AUTOMOTIVE INDUSTRY
Respondents were asked to provide information about their experience within the
automotive industry and experience in their present position i. e., length of current
tenure as a senior manager (Table 6.11).
Experience Mean S.D. Industry 19.91 10.73 Tenure 6.48 6.68
Table 6.11: Experience of Respondent Managers (n=284)
Whilst we would not expect industry experience to exceed tenure, the respondent
manager group has lengthy experience within the industry (mean =19.91 years)
with only a small number of managers with experiences less that ten years
(SO=10.73). By way of comparison, Mudambi and Helper's (1998) study of
senior managers in the US automotive components industry reported an average
industry experience of 18 years. From the study'S perspective and for the purposes
of interpretation of findings, it can be posited that most of the managers within the
respondent group have experienced the transition of the UK automotive
components sector since the influx of Japanese assembly foreign direct investment
in the late 1980s.
Equally, Table 6.11 above presents the respondent manager group as holding
sufficiently long tenures to constitute at least medium term (1-7 years) insights
into strategic decision making and the outcomes of previous strategic decisions.
They should not, except for in only a few extreme cases (SO=6.68), be considered
novice managers in their respective senior positions. It could also be assumed that
many of the senior managers mayor will have occupied another senior position,
particularly in the case of Managing Directors (52.1 per cent of respondents) who
will have occupied a functional directorship (Director of Finance, Director of
Production, elc.) prior to promotion to their current position.
207

Chapter 6: Characteristics (~lResp()ndf!nts
6.4.4 OBSERVATIONS ABOUT RESPONDENTS
The data set has been constructed with the contributions of strategic managers.
This statement is supported by the overwhelming number of Managing Directors
and Directors in the study, with the balance occupied by non-operational senior
managers (Chairmen and Presidents). Moreover, these managers have adequate
levels of industry experience and positional tenure for the researcher not only to
be certain that these managers have sufficient experience to be involved in
strategic decision-making, but that they do so with a thorough understanding of
the impact of industry context on business strategies.
6.S. SUITABILITY OF SAMPLE SIZE AND SAMPLING ADEQlJACY
This chapter has addressed the suitability of the respondents in respect of the
organisations' characteristics and the seniority of managers such that we can
consider the data to have been contributed by strategic managers in the UK
automotive components industry. In addition, statistical analysis has revealed no
significant differences between non-respondents and respondents. However, prior
to the undertaking of the empirical analysis of data, two final issues require
attention - the suitability ofthe sample size and the factorability of the data matrix
generated from responses.
6.5.1 SUITABILITY OF SAMPLE SIZE
Prior to any undertaking of factor analysis, two important considerations must be
overcome. These are sample size and sampling adequacy. In Chapter 5 it was
observed that there is some disagreement among statistical experts as to the
sample sized required for factor analysis. Sample size is important because of its
influence upon the reliability of factors The achieved number of responses
(n=284) means that the criteria of 5 subjects per variable90 and a minimum
response of either 100 or 200 (Guilford, 1956; Hair el al., J 987; Tinsley, 1987;
Kline 1992; Coakes and Steed, 1999) have been met with a high margin of
comfort. Only the strictest criterion set by Sekaran (1992), that would have
90 The reader will recall that there are 32 statements in the questionnaire. On this basis. the threshold of IbO has been met.
208

Chapter 6: Characteristics o.lRespondents
required 320 responses has not been achieved, although by a margin of 36 returns.
On the consideration of sample size, the data set provided by the respondent group
is apt for factor analysis.
6.5.2 SAMPLING ADEQUACY AND DATA FACTORABILITY
However, as the previous chapter noted, factorability of the data sct is an
important consideration prior to analysis since data matrices can have one of two
characteristics - functional and identity. A functional matrix (necessary for factor
analysis) contains underlying relationships between variables which cannot be
identified prima facie. An identity matrix would only tell us that what is factored
is exactly the same as that which is already known (Rendall, 2000a).
Sampling adequacy/factorability of the entire data matrix can be tested in two
ways, through the Bartlett's test of sphericity and the Kaiser-Meycr-Olkin (KMO)
measure of sampling adequacy. Applied to the data set, Barlett's test is large at
1620.921 with a small significance level (Sig = .000) indicating that factorability
can be achieved, and the KMO measure of sampling is above O.S (MSA = 0.717).
The MSA criteria of 0.717 would be classified as 'middling' by Stewart (1981). A
functional matrix has been achieved, and data reduction techniques can be
suitably applied to the data to derive further insights.
6.6. CHAPTER SUMMARY
This chapter has examined the response to the research strategy and design
developed in the previous chapter. A primary consideration was to audit the
respondents and data set in order to ensure that the study could reasonably purport
to be that which it set out to be.
There is clear evidence to establish that the respondent organisation group is not
significantly different to the known population. The response rate compares
favourably with previous studies and the respondent group reflects the known
characteristics of component suppliers developed in previous studies.
Additionally, the chapter has clearly shown that respondent managers are
sufficiently vocationally and industrially experienced to provide a clear indication
of a wider group of managers' attitudes toward theories of competitive advantage.
209

Chapter 6: Characteristics (~rResfJ()ndent.\·
Finally, the data matrix derived from the respondents has been tested for its
suitability for data reduction techniques. In this respect, testing has shown the
potential for further insights to be derived from the contributions of respondents.
The data, and therefore the inferences and outcomes of the analysis are derived
from a suitable sample of strategic managers in the UK automotive components
industry. The next chapter examines the responses of respondent managers and
the inferences that can be made through the empirical analysis of the data.
210

Chapter 7: Research Results and Analysis
Chapter 7 - Research Results and Analysis
7.1 INTRODUCTION
Having established the nature and composition of the respondent organisations
and managers in the previous chapter, the principal objective of this chapter is to
provide a detailed discussion of the empirical findings and their contribution in
relation to the research questions for this study.
The chapter begins with a reiteration of the research questions, noting in each case
how the empirical analysis will be used to derive answers and conclusions.
Following this, the chapter continues with a detailed examination of the factor
analytic solution which is used to address the research questions, complemented
with further statistical techniques used to explore differences in the data.
The chapter concludes with an explicit consideration of how the research
questions have been resolved and observations about the industry, respondents
and strategic management theory are made in order to form the basis for the final
chapter, which examines the contribution and implications of the study to the
industry and its theoretical domain.
7.1.1 ADDRESSING THE RESEARCH QUESTIONS
Prior to embarking upon the analysis of the data collected from the respondent
organisations and managers profiled in Chapter 6, it is appropriate to reiterate both
the research questions and how each will be addressed using the chosen data
analysis procedures.
i. Do managers perceive competitive advantage to be based on bundles ol
heterogenous resources which facilitate differentiation and divers(/icalion
rather than external Jactors such as industry structure and macro
environmental Jactors?
211

Chapter 7: Research Results and Analysis
Were one to observe such a clear loading structure for one of the views of
competitive advantage (position or resources) with an ambiguous structure
explaining the remaining variables, such a question could be answered in the
affirmative - that managers perceive competitive advantage in a clear way,
reflecting the preceding discussion of the literature (Chapters 3 and 4). Thus, for
instance, were factor analysis to present a component matrix in which the relevant
four factors clearly loading the variables of company size, industry structure,
strengths and weaknesses, and supply chain relationships, in contrast to a number
of ambiguous, weak, or un-interpretable factors (by virtue of the variance
explained), one could support the view that a perception based on competitive
advantage based upon position was held by the responded managers.'J1
ii. Do managers perceive resource accumulation to be pari (~r the RBV
construct?
The second research question can be considered through an inspection of how the
resource accumulation statements load (either together or separately) in the
component matrix. A priori, the four 'access to resources' statements will load
together onto the same factor.
iii. Do managers associate portfolios of resources with product platforms,
families and technology convergence?
Similarly, for support to be given to the move from the abstract notion of resource
bundles into the perceptions of strategists one would expect to find that the four
statements relating to combining resources load in the component matrix. A
priori, the four statements will load together onto the same factor. Accordingly
91 The reader will recall that the resource-based items in the survey instrument fall into four classes -Uniqueness and competitive advantage, access to resources, managing resources, and combining resourc~s. The position based classes are size, industry structure, strengths and weaknesses. and relationships.
212

Chapter 7: Research Results and AtUl~vsis
loadings on different factors would suggest that the cogency of the concept is
limited, if non-existent.
IV. Do managers recognise the importance o/resource management?
For the importance of resource management to be supported, one would expect
that the statements referring to resource management loads onto a factor for which
a specific management interpretation can be made (such as managing resources,
as had given rise to the four items in Chapter 4).
v. Do managers make a distinction between resources in terms of their
strategic significance and do they use terminology indiscriminately?
Here, one would expect that support for the proposition of a hierarchy of
resources would be offered by the means scores for questions 14a to 14d
(referring to valuable, rare, inimitable and organised respectively). The mean
scores for each of these statements in order would have to increase to provide
support for the VRIO framework. Equally, the spread of scores for the
terminology used by the respondent in questions 13a to 13d (referring to strength,
capability, competence and core competence respectively) would suggest that
managers use individual, rather than a variety of, terms, the latter indicating a
higher degree of indiscrimination between the terms.
7 .2 FACTOR ANALYSIS OF COMPETITIVE Aov ANT AGE STATEMENTS
A principal component analysis using orthogonal solution reveals a simple
structure comprising of nine factors with eigenvalues over 1.1 which explain 52.6
per cent of the variation in responses (Table 7.1).92 The balance of variance still to
be explained and the number of factors provides some indication of complexity
92 The final structure was chosen following a trial rotation procedure detaile~ in Appendix 2.
213

Chapter 7: Research Results and Analys;s
within the data-set, despite having achieved simple structure. The nine factors
consist of two doublet factors, four triplet factors and three factors on which five
or more items load (Thurstone, 1949). Two of the nine factors (8 and 9) are
bipolar indicating negative relationships between items within these factors.
Given that the number of factors exceeds the number of classes (8) from which
the statements were derived, one can already discern that there is not a precise
resemblance of the factor structure to that proposed from the antecedent literature.
The nine factors identified in the factor structure in Table 7.1 have been labelled
as follows:
Factor 1 - Organisational Transparency
Factor 2 - Management Advantage
Factor 3 - Relationship Uniqueness
Factor 4 - Platform Advantage
Factor 5 - Scale
Factor 6 - Market Power
Factor 7 - Resource Accumulation
Factor 8 - Immediacy of Superiority
Factor 9 - Historical Advantage
The remaining parts of this section examine the individual composition of each of
the factors, how they differ from the expectations suggested in the strategic
management literature and how an interpretation (and label) can be developed in
the context of the UK automotive components industry. The individual
interpretation of the factors provides the basis for addressing several of the
research questions as indicated in Section 7 .1.1 (overleaf). Taken as a whole, and
following the individual interpretation of the factors, the factor matrix provides
the foundation for a response to the principal research question "Do managers
perceive competitive advantage to be based on bundles of heterogenous resources
which facilitate differentiation and diversification rather than external factors such
as industry structure and macro-environmental factors?",
214

s23
s35 s34 s27
hapter 7: Research Re ults and A nol is
Factor Factor Factor Factor Factor Factor Factor Factor Factor 123 4 5 6 7 8 9
0.15 0.74 0.58 0.53 0.39
0.71 0.65 0.5'~
0.52 0.46
0.61 O.SS O.SS 0.49 0.43 0.41
.....
0.7S 0.6 0.52
0.81 0.68
0.6 0.6S O.3~
Table 7.1: Rotated Factor Solution
7.2.1 FACTOR 1 - ORGANISATIONAL TRANSPARENCy93
Factor one - organisational transparency - accounts for the most variance in the
rotated factor matrix and can be considered to be the strongest strategic concept.
93 For the convenience of the reader, the final page of this thesis takes the form ofa pull-out flap containing the full list of statements referred to in this chapter. Hence "s23" in the text is used as a short notation for statement 23 .
215

hapter 7: Re 'earch Re u/ls and Analysis
Three of the four items originally designated to connote the relativity f analy i
(Chapter 4.2.3) load on this factor (s23, s40 and s42) and this factor can be
interpreted as the respondent managers' beliefs about whether he or he can easily
identify competitive advantages through analysis rather than the whether the
advantage, once gained, can be sustained or imitated (Table 7.2). The factor label
connotes a clear ' vista' of strategic issues, strategic analysis, and competiti e
advantages between organisations. It implies that there is a relatively ea y
diffusion of knowledge, which in this industry could be attributable to upply
chain management, resident engineers and tiering.
The loading of statements 42 and 31 reflect the belief that a strategic c mpetit r
analysis can reveal the hidden sources of competitive advantage albeit under
conditions of uncertain imitability. In particular, our attention should be drawn t
our interpretation of statement 31 (originally a RBV stat ment) in the context of
this factor, where respondent managers do not perceive resource advantage to be
hidden or mysterious. Were this to be the case otherwise, s27 s34 and s35 would
have been expected to load on the same factor.
Factor number
Statement number
23
42
31
40
33
II IIV II
4.32
, ". Rot ~ed Orilinal .emeDt text IOldlnl! elass A rival's strengths and weaknesse .749 3 can be evaluated obieclively. A company can col/ecI enough .737 3 information about rivals to enable comparisons of strengths and weaknesses. The relationship between resources .584 6 and competitive advantage can be clearlv IInderslood A SWOT analysis enables managers .526 3 to effectively analyse rivals' strengths and weaknesses. The differences between .392 5 companies' resources account for differences in competitive advantage.
Table 7.2: Factor Structure - Organisational Transparency
216
Orlilnal division
Position
Posit ion
Re ourc
POSili n
Resour e

Chapter 7: Research Results and Analysis
Accordingly, factor one is about the analysis of advantage which is perceived to
be transparent which is confirmed by the loading of s40, which provides explicit
recognition of using simple techniques to compare organisations. The corollary of
the analysis - implementation of the advantage and perceptions about whether
imitation can succeed or innovation be sustained - are central themes exhibited in
factors three and four.
Statement 33 loads at .392 (i.e. <.40) and despite its original purpose to convey
some of the basic notions of the resource-based view. the statement loads onto this
factor since, whatever the interpretation of 'resources', the statement conveys the
idea of differentials (c.f. s40). It should be noted that this statement suggests asset
mass efficiencies (Dierrickx and Cool, 1989) whereupon there are instances in
which planning per se does not account for the differences between organisations
even though such differences can be identified.
Statements s23 and s42 have very strong loadings, suggesting a positive
relationship between information collected and objective analysis. In other words,
rationality of decision making and analysis is presumed, despite the insights of
bounded rationality, groupthink and cognitive biases in respect of decision
processes. To further advance the understanding of this factor as referring to
analysis is the failure of the remaining SWOT item to load onto this factor (s29).
Closer inspection of the wording of the statement ("companies always exploit
their strengths to gain a competitive advantage") reveals that respondents have
distinguished between the identification (analysis) and deployment
(implementation) of resources which are perceived to be superior to those of rivals
(i.e., a strength). Accordingly, it is not the analysis per se that generates the
advantage - it merely highlights the potential to do so. Managers appear to echo
the classical approach to strategy formulation. i.e. analysis. choice and
implementation examined in Chapter 2 (Ansoff, 1965; Learned el al., 1965,
Andrews, 1971). The ability to use a resource deemed to be superior is central to
factor two (below).
217

Chapter 7: Research Results and Anarrsis
The first factor gives rise to a number of important implications. First there is an
estimation of the perceived difficulty of strategic analysis, which among the
respondent managers is perceived to be relatively easy on account of
organisational transparency. Secondly the importance of resources or strengths are
determined by their ability to generate value and advantage in the context of the
external competitive environment. Third there is confirmation of the intuitive
attraction of the SWOT concept. Fourth, a preliminary indication is presented (to
be supported by later factors) to indicate that managers do not make a clear
distinction between residence or resources as portrayed in the literature.
Whether the perceived transparency of analysis has implications remains to be
seen. However, this transparency could reflect a lack of true insight into
competitive and strategic issues. Consequently, if competitive advantage does not
arise from planning (the search for new opportunities), one would expect
advantages to accrue from other sources such as technology, organisational size,
history, management and relationships. Indeed, subsequent factors appear to
reflect these sources of competitive advantage.
The organisational transparency factor reveals much about the assumptions and
perceptions of managers within this industry. Absent from the loaded items is
uncertainty, whereby the dynamics of the business environment, human cognition
limitations, the ambiguity of planning techniques and inter and intra
organisational politics conspire together to reduce the efficacy of strategic
planning activities (Chapter 2). Organisational transparency presupposes the
senior manager's ability to identify, understand and influence the context in which
he or she is planning (Camillus and Datta, 1991). In essence, organisational
transparency is underpinned by the notion that management is. in part, about
control, not only of the factors of production but also those forces which influence
the productive ability of those factors and the future circumstances and
configuration of resources in which those resources will be deployed (i. e.. the
organisation's strategy).
Strategy formulation is a clear pillar of organisational transparency. To an extent,
the loading of items which resonate deliberate and predetermined processes of
218

Chapter 7: Research Results and Analysis
strategic analysis and strategic choice are unsurprising, but nonetheless revealing.
since the respondent managers' remit is widely considered to be as strategic
architects. However, since the factor does not load items which refer to intra
organisational relationships, functional involvement or size-based items (for
which several statements are available in the item pool of the survey instrument)
one can infer that high level strategic activities are commensurate with the
hierarchical level of managers directly involved. In other words, factor one reveals
that managers perceive strategic planning activities to be the sole preserve of
equivalent peers, rather than the calls for subordinate involvement in those same
activities (for instance Mintzberg, 1977) or a combination thereof (Petroni, 1983;
Moyer, 1996).
The notion of rivalry is strong in organisational transparency. where one finds that
three of the five statements contain the word 'rival' load the factor. Not only is an
understanding of who rivals are an absolute necessity in order to carry out a
comparison between two organisations, rivalry connotes the immediacy of
industry competition, that is to say, all those organisations among which there is a
potential for cross elasticity of demand already resides in the industry. Hence. the
planner's concern should be with those organisations, rather than those who,
subject to the attractiveness and strategic benefits of the industry, seek to enter
only to face entry barriers (Caves and Porter, 1977~ Dixit, 1980~ Milgrom and
Roberts, 1982; Breshnan and Reiss, 1987) such as capital requirements (physical
plant and equipment), customer access (given the longer term nature of supply
contracts than in the past) and technology issues Goint R&D forming the basis of
platform strategies). Such an observation can be made due to the non-loading of
statements referring to entry barriers (s25) and the number of rivals (s 17). Despite
the often compelling message from the literature that senior managers should pay
as much attention to those organisations that are currently not part of the industry
but have the potential to do so (Porter, 1980; Prahalad and Hamel, 1991).
comparative approaches (i.e., SWOT oriented) to analysis are based around
existing rivals rather than potential entrants or diversifiers.
What could account for such a view to be taken by the respondents in this study -
or more accurately, for the views to be reflected in this factor? Clearly, unlike so-
219

Chapter 7: Research Results and Analysis
called newer industries such as consumer electronics, personal computing and
biotechnology, competitive shifts have been characterised by punctuated stability.
where shifts in the extent of in-house component production by the assemblers
and their technology, cost, logistics and quality priorities.94 So. why would a UK
radiator/cooling system manufacturer have considered a Japanese supplier of
equivalent components to have been a rival until such a company's entry was
precipitated by the commencement of UK production for a Japanese assembler in
the 1980s?95 Plant location decisions could not be influenced by the indigenous
supplier and, accordingly, agency over the selection of suppliers and their entry
could not be controlled.
Next, it could be argued that the existing rivals or (industry resident) potential
rivals are known relatively easily. Managers will be acutely aware of who rivals
are since componentry can be identified from a simple under-bonnet search.
company publicity and previous bidding activities (where rival bidders may have
been identified by the assembler), Such historical knowledge of rivals and the
assumptions of stability in rival clusters (i.e. strategic groups) would merely
confinn that comparative strategic analysis is best served, achieved and
enlightened through a focus on those existing rivals. If. in addition to this, and
hitherto argued in Chapter 3, lower transaction costs, higher asset specificity (due
to joint R&D), and higher switching costs (due to shared resources) may
contribute to longer contract lengths (as the basis and reward for collaborative
behaviour), it could be suggested that the dynamics of buyer-supplier switching
are more stable than in the past (when short-tenn price orientations reigned
supreme).
Although industry context may explicate why rivalry is perceived to be a direct
presence in the industry at a given point in time alone, there is a danger that
potential rivals from other industries or geographical locations are ignored such
that strategic analysis becomes a benchmarking exercise against known rivals
rather than a wider (albeit more problematically investigative) search for new
904 The world's first petrol driven motor car was launched into the German market by Gottlieb Daimler in 1885 (Bessel, 1990). 91 Garrahan and Steward (1993: 16) note than in a ten year period (1981-1991) some three hundred Japanese components suppliers began production in the USA.
220

Chapter 7: Research Results and Analysis
demand threats. Accordingly, organisational transparency reflects these
strategists' view of the competitive world seen through a fixed telescope, used to
focus on those known elements from a single angle of view such that rivalry is
limited by both perceptive and assumptions of certainty, rather than the
kaleidoscopic or holographic perspectives implicit in those arguing a chaotic or
hyper-competitive view of competitive dynamics (Stacey, 1993; Levy, 1994;
Beinhocker, 1997; Lengnick-Hall and Wolff, 1999) which challenges both the
notions of stability and repeated planning using similar techniques. Further, the
simplification of reference points against which a company's resources are
evaluated may lead to incorrect conclusions in respect of the source of strategic
threats (Amit and Schoemaker, 1993).
It is not lethargy or lack of experience which necessarily accounts for a limited
conception, and thereafter analysis, of rivals, but rather the industry conditions
which set the context and priorities for planning and analysis events.
Consequently, one can already discern from our first factor that industry has, not
unexpectedly, an influence on the perceptions which drive the analysis and
understanding of strategic options and possibilities, as postulated by Huff (1982)
and termed 'borrowed experience'.
In summary, the organisational transparency factor reveals a strong perception in
respect of a formulated top-management activity of planning and analysis based
on a clear vista of the competitive landscape and known rivals. Hence, despite the
articulations of resource-based writers that competitive advantage is internally
derived (Lado et ai, 1992; Mahoney and Pandian, 1992; Amit and Schoemaker.
1993), underlying of the resources at the organisation's disposal and to be
considered more widely than industry boundaries, managers perceive a more
limited view - that the comparison of the organisations' aptitudes is relative to
immediate rivals which are clearly understood. The notion of 'best-fit' (Learned et
ai, 1965) rather than 'stretch' (Prahalad and Hamel, 1993) reverberates this factor.
221

hapler 7: Re earch Results and A nal sis
7.2.2 FACTOR 2 - MANAGEMENT ADVANTAGE
On factor two - management advantage - all four ' managing resource item
load strongly (Table 7.3). This meets the expectations of the salient strategic
concept of 'managing resources' derived from the review of the RBV literature in
Chapter 4. Accordingly, the central tenet of the second strongest factor is that
competitive advantage is delivered through the management of throughput
outputs and activities. Luck does not playa part in this construct since statement
26 (acquisition of resources due to luck) does not load on this factor. An
important observation to make about this factor is that the statements refer t
senior managers' involvement in the management of the different (but nonetheless
related) building blocks of an organisation's activities (products, processes and
resources). The factor reveals the degree to which senior manager ascrib
importance to the management of these different building block , in additi n t
their formal duties as Managing Directors, functional director EO tc.
, -.' , ·~or Fador Factor name Elacn alu vartane number elPlalned 2 Manal!ement advanlal!e 2.29 7.4%
Statement Statement tot , Rotated Orlllnl' Orlalna'
number loldlnir clan division 41 Process management is an ,710 7 Resourc s
important senior mana$!ement role 39 Product management is an .646 7 Resource
important senior management role 45 Resource management is an .574 7 Re ources
important senior mana$!ement role 46 An important senior management .5 18 7 Resource
role is to look for new opportunities for current platforms and technolo$!les
19 Geographical proximity to .461 4 Po ilion customers (assemblers) is a source of competitive advantage
Table 7.3: Factor Structure - Management Advantage
Once again, one can observe that the nature of the industry has a di cemible
impact upon the perceptions of respondent managers. For instance, process
management (s41) has the highest loading, which is unsurprising given the
222

Chapter 7: Research Results and Analysis
industry priorities of price/cost, quality and the reliability of delivery. Although
these are generic competitive attributes that are important in many other
industries, each of these are contingent on the ability of senior management to
manage key associated processes.
Product management (s39) has the second highest loading. Since the development
and evolution of components/subassemblies/modules is a necessity (Chapter 3),
often driven by the assemblers requirements (or downstream suppliers), the
ongoing management of the product rather than its initial development is
important for the ongoing sustenance of the advantage which the supplier holds
given its current contract with the buyer (assembler).
Albeit important, by virtue of its strong loading (.518), statement 46 reflects the
priority given to initial development. This does not mean that R&D is disregarded
but rather that it is perceived that once an organisation has an advantage the
management priority resides with sustaining and enhancing the advantage. rather
than developing new ones immediately. Moreover, the pertinence of process
management (s41) suggests that once a supply contract is won, the emphasis
changes to ongoing cost reduction and improvements in quality, provisions for
which are often included in contracts with assemblers. In other words, the
improvement of performance is considered to be a precursor to the next supply
contract so that, in effect, an objective of process management appears to be the
building of 'next contract prerequisites'. This is especially relevant to the
automotive components industry given that supply contracts are awarded or
renewed at intervals similar to the life of a vehicle model (i.e. 3-5 years) and are
contingent on past performance or the potential ability to supersede the
performance of an existing supplier of a component.
Resource management (s45) also loads strongly on this factor, although it would
have been unsurprising were this statement to have loaded elsewhere given the
loading structure - particularly factor seven which has been interpreted as
resource accumulation. Notwithstanding, the loading of this statement augments
the management advantage interpretation chosen. Statement 46, which refers to
the strategic management of technology and product platforms could have loaded
223

Chapter 7: Research Results and Analysis
with related statements from the same class (combining resources). Instead it has
loaded on factor two since respondent managers appear to perceive a relationship
between the management of resources and the planning for new technology
applications. The fact that the statement refers to "new opportunities" clearly
ascribes priority to the need to widen subassembly usage across suppliers,
particularly as industry consolidation downstream may threaten continuity of
business upstream given the convergence of platforms across assembler or newly
merged assembly concerns.
Statement 19 is the only item that has loaded onto this factor but that does not
originate from class 7 (managing resources). However, its loading on the
management advantage factor suggests that geographical proximity to the
assembler is considered to be an important condition for the successful
management of the relationship, further to the locational benefits of collaboration,
logistics savings and process integration that are common to Keiretsu structures
(Miyashita and Russell, 1994) and a rationale underpinning supplier parks
(Chapter 3).
One should also note that the statements refer to senior management and thus a
high level of agreement from the group of respondent managers is unsurprising.
However, the reader will recall from Chapter 6 that 51.1 per cent of respondent
managers had production, R&D or procurement backgrounds. Senior managers
might, therefore, consider 'hands-on' operational expertise and involvement to be
an imperative given that ultimately it is the component supplied and the manner in
which it is supplied that manifests the advantage (or otherwise) of the supplier.
This will further enhance the (semi) permanency of the relationship with
downstream parties. So, management's role is not merely to plan for advantage.
but to contribute to it in ways other than simply through planning activities.
Returning to the propositions offered by the resource-based view (Chapter 4), it is
suggested that the management of resources is necessary to bring alive the
resource endowments of an organisation to generate a sustainable competitive
advantage. It is clear that since only one factor (organisational transparency)
precedes the management advantage factor in terms of accounting for the largest
224

Chapter 7: Research Results und Analysis
amount of variance in the data-set, factor 2 is a strong strategic concept in relation
to views about competitive advantage and can be said to reflect RBV thinking.
Accordingly, the interpretation of this factor is that managers' abilities to
successfully manage different levels of organisational resources (from product to
process to resource) is considered to be, at the very least, a prerequisite for
success in the automotive industry.
Seemingly, the predisposition of the respondent group to a multi-level
management of organisations' resources seems to match the conditions suggested
by Doz (1993) where the leverage and renewal of competencies can only take
place with the development, diffusion and integration of key skills and assets.
Since products are the outcomes of processes (which in tum are the socio
technical manifestation of the organisations resources bundled together) the
loading together of statements making reference to products, processes and
resources appears to suggests some coherence in managers' understanding of
these vital linkages. Indeed, knowing that close linkages with downstream parties
are important within the industry context, geographical proximity otTers enhanced
opportunities to strategically manage shared products, processes and resources in
a superior manner.
Moreover, the senior management involvement in their management suggests that
a strategic overview of the management of these processes is imperative to ensure
(for the pragmatic competitive reasons discussed above) that an organisation can
meet customer expectations. The loading of s46 further evidences the close
perceived relationship between current resources and their use, and the
further/future deployment of resources by the organisation, central to which is the
involvement of senior management. So, whilst the automotive industry is
technology driven (either to reduce costs, improve quality or add value
downstream), respondents clearly attribute the leverage of current
technologies/platforms as an integral part of achieving an advantage through
management.
The search for new opportunities suggests that, whether due to formal planning or
otherwise, the search for entrepreneurial rents through future deployments of
225

Chapter 7: Research Results and Analysis
resources is important, albeit underpinned by the necessary precursors of product.
process, and resource management (Mahoney and Pandian, 1992; Amit and
Schoemaker, 1993). Given the nature of the organisational transparency factor. it
can be suggested that respondent managers may trade-off the sophistication of
isolated planning activities in place of direct managerial influence on those
organisational attributes than will generate or sustain competitive advantage. This
is particularly important given the nature of the next factor, which deals with
relationships along the supply chain, where competitive battles are won and lost.
Accordingly, competitive advantage arises through decisions and actions, whether
premeditated or not which lead to a better use of resources in meeting objectives
and customer's expectations than rivals. In this sense, the perceptions of managers
in this study is not dissimilar to Seth and Thomas' (1994: 177) view of competitive
advantage derived from "purposeful strategic behaviour [doing rather than
planning] and stochastic processes [which are observed outside the planning
environment]" .
As with the interpretation of all factors, caution should be exercised. An
alternative view of this factor is that the loadings reflect managerial hubris (Roll,
1986). If this is to be the case, however, the danger of overestimation of abilities
by managers themselves is well documented to have an adverse impact on the
choice and outcome of corporate strategies (Leontiades and Tezel, 1980; Leonard
Barton, 1992; Hartley, 1994),
7 .2.3 FACTOR 3 - RELATIONSHIP UNIQUENESS
The relationship uniqueness factor comprises three position and three resource
based items, providing further evidence (as with organisational transparency) that
two competing views of competitive advantage are mutually inclusive when
interpreted by the respondent group.
Factor three is an unexpected hybrid of classes 4 (relationships) and 5 (uniqueness
and competitive advantage) with items from classes 2 and 8. Together, however,
the factor can be interpreted as relationship uniqueness, whereby the behaviour of
the supplier toward downstream buyers is perceived to generate competitive
advantages (Table 7.4). The development of unique, value-adding and long term
226

Chapter 7: Research Results and Anal sis
relationships (in contrast with variants based simply on economic exchange)
concurs with the industry literature, particularly at tier 1. However, tier position
(s22) per se does not contribute to this factor (in fact it loads on factor 8) and thus
it can be suggested that the perception of relationship uniqueness does not appear
to be affected by supply chain position. Indeed, the devolution of responsibility up
the supply chain designed to introduce hitherto under-exploited benefits from the
tiering approach (Chapter 3) supports this.
The long term nature of the relationship (s24) is a critical bedrock of this factor.
So, although time is argued for the most part to confer a competitive advantage
when it is shortened (cycle time, lead time, delivery time, etc.), here it is the
passage of time that is essential to competitive advantage. Parties in the
relationship have a prolonged opportunity to collaborate, learn, evolve adapt and
improve. This is critical to the development of a value-adding partner hip, from
which other statements which load on this factor can build. In essence duration
rather than speed is assigned importance in relation to time.
Fador %or
number 'actor name Elaenvalue variance explained
3 Relationship uniqueness 2.09 6.8%
Statement .' .,' ":'0/0" • '" "':~~~<'; '-;""'. :' I;;" :Rbtl~ . 'Orlp I Orillnal number . .mBtement to t , loadlni clan diviSion
24 Long-term (i. e. vehicle life or .608 4 Position longer) relationships with customers are a source of advantage
30 R&D involvement with assemblers .555 4 Position is a source of compet itive advantage
28 The ability to change quickly due to .546 2 Position the demands of assemblers is a source of competitive advantaf[e
35 Intangible resources such as skills, .487 5 Resourc s patents, and processes influence competitive advantage.
34 Resources which are difficult or .429 5 Resource impossible to acquire lead to competitive advantage
27 The combination of resources .411 8 Resourc s through product platforms/new technologies increases value added
Table 7.4: Factor Structure - Relationship Uniqueness
227

Chapter 7: Research Results and Ana~v.\'i.\'
Shorter, and the shortening of, time spans are embraced within s30 and s28 where
the supplier's contribution to the reduction of R&D lead time (possibly using
simultaneous engineering) and the ability to change quickly according to the
needs of assembler are of central importance to meeting downstream demand
conditions. Both of these statements indicate that the ability to exhibit flexibility
in responses required downstream offer behavioural evidence to enhance the
longer term relationship (Asanuma, 1988). It is in this light that factor two's
emphasis on advantage through management is further delineated.96
In the light of the loading of statement 30 onto this factor, there is a clear rationale
for statement 27 doing so. This latter statement, with regard to combining
technologies, demonstrates the integration of suppliers (especially those at tier
one) into assemblers' R&D structures and the trend toward modules.
subassemblies and platforms. Here one can understand that long term
relationships and high R&D involvement (noting that 56 per cent of the
respondent organisations are involved in joint R&D with buyers - see Chapter 6)
provide an opportunity to develop new component inputs which not only enhance
the relationship, but also provide the supplier with occasion to capture greater
value added (via margin) on account of their ability to contribute more than
simply the manufacture of taiyo-zu (build to print) parts.
The inclusion of statements referring to the uniqueness of resources (s34 and s35)
indicates that relationship uniqueness is enhanced where inimitable and
inaccessible resources are used in prolonged transactions between upstream and
downstream organisations. Thus, resource uniqueness necessarily augments the
causal ambiguity and uncertain imitability (Lippman and Rumelt, 1982~ Reed and
DeFillippi, 1990) which can protect the advantages upon which the longevity of
the relationship is predicated. Further corroboration of this can be seen in Chapter
6 (sections 6.7 and 6.8) where R&D and alliance activity increases as proximity to
the assembler draws closer, reflecting the commensurate value-added and de
commoditisation of goods supplied.
96 It is noted that the orthogonal rotation offers no insight into the relatedness of factors. Here the point is being made that factor two is highly important due to the variance explained relative to other factors.
228

Chapter 7: Research Results and Analysis
A relationship statement that did not load this factor was s 19 (geographical
proximity). It has already been seen that this item loaded on factor 2 and so one
can infer that geographical proximity is not perceived to be a central contributor to
relationship uniqueness. Albeit important in assisting with managing the
relationship, capital investment requirements, assemblers' production location
shifts and so-called global sourcing introduce a degree of uncertainty to its
contribution to relationship uniqueness. So, whilst geographical proximity is
beneficial to the management of the relationship, technology and resource issues
obtain precedence.
Similarly, statement 44, which refers to superior logistics does not load on this
factor, although one might have expected it to do so, given that it represents the
nexus operation between buyer and supplier. Its loading on another factor
suggests that logistics is no longer considered to be a source of advantage which
contributes to bipartisan relationship longevity and success. Logistics. it seems.
has been relegated to a prerequisite capability given that logistical performance
terms (delivery windows, percentage of late deliveries, etc.,) now come to form
provisions within the supply contract.
Once again, industry conditions are important in explaining this factor. Not only is
there a well established body of literature in the field of supply chain management
which affirms the need to engage in collaborative value-adding supply
relationships (Asanuma, 1985a, 1985b; Clark el a/. , 1987; Cusumano and
Takeishi, 1991). the assemblers themselves have clearly made efforts to develop
new supply chain relationships underpinned by supplier development programmes
and rewards for performing suppliers (Chapter 3). Nonetheless, the relationship
uniqueness factor is not simply a reflection of these industry drivers. The threat of
buyer switching still remains and it is clear from the loading of tactors which refer
to unique resources held by the component supplier (s34 and s35) that unique
resources not only consolidate the relationship, thereby aiding its longevity. but
also put into place conditions which mitigate against supplier switching. If the
supplier is able to develop a relationship in which the assembler depends on the
unique resources held by the supplier, the relationship involving design.
manufacture and delivery becomes imperfectly imitable. Accordingly, switching
229

Chapter 7: Research Results and A nulys;,\'
costs for the assembler are raised and the power-dependence relationship is less
one sided than under conditions where such unique or rare resources arc not
possessed (or indeed used in the relationship) by the component supplier.
The ordering of statements in the factor and their original classes give rise to
another observation (Table 7.4). The position-based statements rank one to three
whilst the resource-based statement rank four to six in this factor's structure. From
this one could suggest that the supply relationship is more important than the
unique attributes which support its longevity, at least in the initial stages. Only
once a supply relationship is in place can the supplier influence the relationship to
the extent noted above to reduce the risk of losing the revenue stream at the end of
a given model's life. Although, such an inference could not be regarded as
remarkable, the respondent managers' perceptions would likely influence the
differing approaches to winning new contracts and subsequent collaborative
behaviour. This suggested order of priorities arising from this factor has
implications for the strategies of both new entrants and incumbents. For either,
suppliers need to embark upon a strategy to achieving residence (i. e. win the
supply contract where, as sole supplier, a small advantage is gained) and then
solidify the relationship using rare or unique resources to develop advantages
which reduce the threat of rivals and raise switching costs. At this time, the supply
relationship can develop into a form of 'extrapreneurship', whereby new ideas are
developed along the supply chain and thereby reflected in the form of component
modules, product platforms and unique resources.
However, the incumbent already has, prima facie, an advantage over new/newer
entrants in that it may be the current supplier of the component to the assembler.
Accordingly, the incumbent has an advantage not only in that it has no entry
barriers to overcome, but it is likely to develop relationship uniqueness more
quickly than the new entrant based on its prior or current experience in
embellishing a supply relationship with traits which are likely to preserve the
stream of income from the customer. In so doing, inadvertent entry deterrence is
achieved, whereby the nature of post-entry competition is altered by virtue of the
investments made by the supplier to continuously improve relationships with
downstream parties.
230

Chapter 7: Research Results and Analysis
There are pragmatic reasons why a logic for a strategy of residence advantage
followed by resource advantage should be followed. The development, scope and
uniqueness of a given supply relationship cannot be ascertained accurately by any
party in advance of its commencement. Instead, the prevailing criterion of price,
delivery and quality, for which measurable targets and contractual arrangements
can be made in advance of a new trading relationship (with an existing supplier or
new one). The minimum conditions for performance are set, aligned with the
sourcing priorities of the customer. Despite the overtures of the component
suppliers in the pre-supply contract period in respect of the value that they can
bring to the assembler, such supra value-added benefits cannot be assured. Only
the existing presence and the reputation arising from the supplier's presence in the
industry can manifest latter intentions and behaviour. So, to a further extent. the
incumbent has a further advantage (unless they are considered by the customer to
have performed to a lesser degree than was expected).
7.2.4 FACTOR 4 - PLATFORM ADVANTAGE
There is little to doubt the interpretation of factor four as referring to a platform
advantage. Three of the four statements devised for the representation of
combining resources offered by the resource-based view of competitive advantage
load very strongly. This 'triplet' factor is solely comprised of three items from the
same class, suggesting congruence with the expectations of perceptions developed
in Chapter 4 (Table 7.5). The remaining item from this class (s27) has been found
to load on the relationship uniqueness factor and a rationale for it having done so
has been offered in the previous section. Nonetheless, one can observe from this
factor that a sequence of relationships is observable in this cogent perception held
by the respondent managers. Since product platforms (or the more common
subassembly, module or subsystem found at the supplier level) are a manifestation
of design, technical and manufacturing advantages (Warburton, 1999), the ability
to achieve such an advantage requires superior abilities in the coordination of
these aforementioned functional areas. This is not only a functional management
responsibility but also a senior management priority, given the need to ensure that
coordination is achieved. Functional managers' priorities reside in sustaining and
developing the individual function's contribution to the platfonnlmodule. Further
231

Chapter 7: Research Results and A nal sis
support for this observation can be derived from factor 2 which ha been
interpreted as an explicit advantage from management perceived by resp ndent .
Fador %ot
number 'adorname Eigenvalue variance explained
4 Platform advantage 1.63 5.8%
Statement Statement te t Rotated Orilinal Original number loadlnll elass division
37 Product platforms/technologies .754 8 Resources reflect a company's competitive advantage
36 The ability to develop/supply a .649 8 Resources product platform requires superior coordination & management skills
43 Product platforms, modules or new .522 8 Resour e technologies reduce the threat of imitation
Table 7.5: Factor Structure - Platform Advantage
The reward for the achievement of advantage through resource combinations is
also very clear from this factor, given that the reduction in the threat of imitati n
is equidistant to the erosion of a platform advantage (which in turn is central to the
supply relationship - factor 3). Further, by developing components jointly or
solely on behalf of the customer, there is an amelioration in the threat of switching
due to the component specificity which is intrinsic to the uniqueness of the
subassembly. Although the sharing of proprietary knowledge could be seen as a
threat to competitive advantage (Lei, 1993), the shared processes leading to the
physical innovation will reduce the threat of imitation arising since a proces
cannot be reverse engineering in the same manner as a physical product
(Mansfield, 1985; 1988; Lieberman and Montgomery, 1988).
Although this factor represents a lower percentage of the variance than it
predecessors, the need to manifest capability in the form of advanced subsy terns
or modules is clearly a coherent strategic concept for managers within the
industry, particularly given the trend toward the involvement of suppliers in the
final assembly of the vehicle (Kochan 1 999a). Although such demands may be
driven by the needs of assemblers themselves, the factor would seem to confirm
232

Chapter 7: Research Results and Analysis
the notion within the resource-based view that the ability to integrate technologies
(c.f. Chapter 4) requires a multifunctional, stretch oriented approach to
management, products and technologies. The outcome of this is increased buyer
value and the closure of entry points for imitators, which form two of Prahalad
and Hamel's (1990) three criteria for core competence.
The appearance of such a factor would be expected in an industry which is driven
by and is strategically dependent upon complex subsystems of components in the
assembly of the finished product. This, in itself, generates a conundrum in the
implications of this factor. Does the factor reflect industry conditions and
practices, or does it reflect a resource-based perception held by the managers.
manifest through the loading together of statements relating to product platforms?
Although such a question is mildly circular, what clearly emanates from this
factor is that the respondent managers' agreement and coherent understanding of
the importance in combining resources to generate competitive advantage.
Accordingly, the strategies considered and chosen by the these managers may be
driven by the imperative and need to exploit their organisations' resource
combinations, manifest through product platforms.
The importance of this factor in respect of the resource-based view is that
Chapters 3 and 4 suggested that product platforms and families practically reflect
the notion of bundling resources both in the automotive industry and beyond.
Although this forms only one way in which an organisation's resources (skills.
processes, tangible and intangible assets) can be combined - indeed, relationship
uniqueness represents another bundled resource - product platforms have become
popular due to the transaction, manufacturing and research and development costs
associated with them. Platforms are clearly perceived to be a cornerstone in the
development and sustenance of competitive advantage
The platform advantage factor seemingly reveals further associations made about
product platforms by the respondent managers. Platforms/resource combinations
require superior coordination and management skills to be fully successful. They
are not simply about constituent technologies. Rather it is the ability to add value
by seeking new technologies and materials, developing needs in line with
233

Chapter 7: Research Result", and Ana~\'.\'i.\'
customers' R&D programmes (Clark, 1989), and renewing the platforms as new
vehicle models are planned, which enable the supplier to leverage resource
combinations, In so doing, a competitive advantage can be gained, since the
resource combination (component) for a customer's platform will, in effect, be the
equivalent of a component supplied to several different modules, given the
proliferation of platforms and platform strategies (Appendix I). Furthermore, the
resource combination of the platform itself, combined with the development of
unique supply relationships (inferred from the management roles which are
central to factor 2) would seem to reduce the threat of imitation and position the
current supplier in a superior position for the future in respect of maintaining
supply contracts with assemblers. This resonates the suggestion by Meyer and
Utterback (1993) that the renewal of core competencies is as important as their
initial development. This renewal is best achieved intra-relationship rather than
extra-relationship.
Whilst the respondent group is taken as a whole in deriving and explaining this
factor, what would account for the consensus shared between senior managers of
suppliers at different stages/tiers of the supply chain, given that it is known that
the prevalence of the resource combination (subassembly, module, etc.) is more
prevalent downstream in the supply chain, normally at tier I? One possible
explanation is that suppliers at tiers 2 and 3 clearly make a contribution to the
final system delivered to the assembler and, in some cases, are involved in the
black box development of parts delegated upstream by the tier 1 supplier.
Accordingly tier 2 and 3 companies not only contribute their resource bundles to
the bundled resource that is the final subassembly, but their resources are
intrinsically important to its assembly and delivery. So, the materials, components
or processes of these upstream suppliers not only contribute to the platform
advantage, but also 'lock-in' that supplier to its delivery and supply. Despite their
lower involvement in terms of value added, senior managers of the non-tier 1
suppliers seem to perceive platform advantage as offering a win-win scenario in
which they can secure future revenues (with the assembler's platform strategies
and the use of carry-over parts) and expand current production output. Indeed,
further support for this is offered in the next factor - scale.
234

Chapter 7: Research Results and Analy is
In summary, managers recognise the association between the advantage ari sing
from a platform and the important skills require to design and deliver a resource
combination. This perception is found to concur with a resource-based view of
combining resources (Chapter 4).
7.2.5 FACTOR 5 - SCALE
Factor five clearly represents scale as a strategic concept considered to be
important and salient in the perceptions of the respondent group (Table 7.6).
Furthermore, in a similar manner as factors 2, 3 and 4, it reflects the current status
and structure of the automotive industry. Both items in this ' doublet factor ' (a
factor involved in the variance of two statements) originate from the cIa of
statements labelled ' company size' and statement 15 has the highest I ading in the
entire factor structure (.814).97
1: %o( Factor 'Factor name Eleenvalue variance number explained 5 Scale 1.49 5.6
Statement S~temeat text R4)~~ed Ol'!atnl Orilin 1
number . loadlnl! claa divISion 15 High production volume generates .814 1 Position
a competitive advantage 16 Process improvements (due to long .678 1 Position
production runs) lead to competitive advanta$!e
Table 7.6: Factor Structure - Scale
One would expect that scale would be an important factor in a volume industry
such as the automotive industry. However, the scale factor is not merely
concerned with size per se, but rather with the ability to generate volume related
savings such as economies of scale and improvements (with downward cost
connotations) derived from learning and experience curve phenomena ( hapter
3). So, not only does high volume enable the spread of fixed investment and costs
over a greater number of units produced, it offers repeated occasions in which
97 Irrespective of variations in the trails extractions (section 7.1.2). this factor remained intact and omnipresent, with the only deviation being in its order in the factor rotation .
235

Chapter 7: Research Results and Analysis
process improvements can be sought, identified and implemented (Robinson,
1991). Further to this, without high volume, R&D cost amortisation would be
impeded given the high level of R&D involvement across all tiers on behalf of the
assembler (80% of respondent organisations involved in sole or joint R&D).
Well established also is the relationship between scale and learning and
experience curve concepts. From a supply chain perspective, where supply
contracts are awarded periodically (i.e. every 3-5 years), knowledge of the
relationship between scale and cumulative volume related savings are an
important consideration in bidding for future contracts and in the evaluation of
bids from suppliers upstream. Whether or not the respondent managers in this
study have transferred their clear awareness and perception of the importance of
scale into such considerations cannot be discerned from the data. Nonetheless, it is
sufficient to state that without scale being such a priority, one would unlikely find
such considerations to materialise in a practical planning context.
In contrast to competitive advantage achieved through unique resource
combinations and relationships (factors 2 and 4), scale offers a more fundamental
source of advantage, although one could present scale as a reflection of advantage
derived in other ways rewarded through large order volumes and contract
longevity. In turn, the repeated transactions through scale offer further scope to
improve in-house activities and inter-organisational relations.
The scale factor recognises a relationship between output growth and productivity
growth necessary to derive a competitive bidding advantage (Yelle, 1979). In
addition to this, the scale of the organisation's operations will not only determine
proximity to the minimum efficient scale of operations but also determines the
extent to which a new entrant faces scale based disadvantages and/or the degree to
which the new entrant must invest in high levels of capacity utilisation (Besanko
e/ aI, 1996). Given the high level of overcapacity in the industry (Brown, 1999),
scale clearly offers both a credible deterrent (reflecting the game theoretic
development of Dixit, 1980) and a precursor to superior capacity utilisation within
the supplier's plant(s).
236

Chapter 7: Research Results and Analysis
In the previous section it was noted that assemblers' platform strategies offer the
potential for higher volume production of single components against which fixed
costs can be distributed. For those suppliers which succeed in winning a contract
for the supply of components central to a product platform, a potentially winning
position is created. Equally, no longer is the loss of a supply contract for a given
component linked to a single vehicle model. Increasingly, the loss of the contract
implicates the loss of component demand across a large proportion of a
company's models and, in the most severe of cases, the loss of component
demand across assembler groups (e.g. VW Group, GM group, Ford Group).
Consequently there is a logic to suggest why relationship uniqueness.
management advantage and platforms precede this factor in explaining higher
percentages of variance in the respondent manager data-set - without them, scale
will not be achieved.
Finally, in a continually cost driven industry, scale should confer component
suppliers a greater degree of bargaining power in negotiating the costs of their
own inputs. However, such 'procurement economies' (Alberts, 1989) would only
lead to parity since any cost savings arising from the greater scale would be
expected to be shared with the assembler in the form of component price
reductions given contractual provisions and open bookJcost transparency
accounting practices in the automotive supply chain (Lamming, 1993).
Given the prominence of the factor in terms of items loadings and origins, it is
surprising to find that two company size related statements did not load onto this
factor (s 17 and s 18). However, it seems that managers are acutely aware of a
distinction between the size of output (pertaining to this factor) and the size of the
organisation (with implications for market share and the degree of power that it is
bestowed with). Accordingly, s 17 and s 18 load on the sixth factor - market
power. Moreover, the measurement of scale is internally relative, based on the
factor-cost function whereas market power (factor 6) is externally relative where
the denominator is the size of the market and incumbent rivals. It is to this
externally relative factor that is considered next.
237

hapter 7: Research Result and A nalysi
7.2.6 FACTOR 6 - MARKET POWER
Factor six - market power - comprises those company size items (s 17 and s 18)
that did not load onto factor 5 (scale). This triplet factor (a factor involved in the
variance of 3 statements) is completed with the loading of statement 21 , originally
developed to convey the notion of bargaining power (porter, 1980). It should be
noted that s21 loads at .372 which, although lower than 0.4 chosen earlier in this
chapter is acceptable since it exceeds the minimum threshold of 0.3 (Table 7.7) .98
Fador %01
number Factor n"me Ellenvalu variance , .elplalned
6 Markel power 1.41 5.2%
Statement ", ,. Rotated Orilioll Orilinal number Statement text loadbta clan division
17 A low number of direct rivals is an .687 I Position indication of a company 's competitive advanta~e
18 Organisations with high market .649 I Po it ion shares have a competitive advantage
21 A company's power over its .372 2 Position suppliers (due to its size) is a source of competitive advantage
Table 7.7: Factor Structure - Market Power
The highest loading item (s17), where a low number of direct rivals indicates
competitive advantage, may be determined by a multitude of influences such as
entry barriers (s25 which did not load), isolating mechanisms (Rumelt 1979), etc.
An outcome of a small number of direct rivals is that the denominator upon wluch
market share is based is favourable given that the total share is spread aero
smaller number of firms. Correspondingly, the correlation of item sl8 (market
share) is unsurprising given this explicit relationship and the origins of the tw
statements in terms of their class ('industry structure'). In addition, the lower th
number of alternative sources of supply, the higher are the switching costs for the
assembler, unless the latter decides to integrate backwards to overcome switching
costs and potentially higher market prices. The trend toward de-integration and
98 The decision to retain this item was supported and informed by the consi stenlioading of the item during trial extractions (Appendix 2) .
238

Chapter 7: Research Results and Ana(vsis
the need to secure lower market prices bestow suppliers with few direct rivals
since the dependence on their outputs on the part of the assembler is heightened.
There is an additional implication of a low number of direct rivals. Since this not
only determines comparative company size, it also indicates that concentration (a
small number of large companies) is considered to be more amenable to the
development of competitive advantage. It simplifies the growth in market share
through acquisition because market share shifts (with its attendant effects upon
scale based savings) can be achieved through the acquisition of fewer, but larger.
companies. Thus, a low number of direct rivals enables companies to develop
advantages which it can deploy to achieve improved performance in relationships
downstream and, as a result, increase market share. Market share would also
confer advantages which the supplier could exploit upstream since the supplier's
market share determines its input requirements, affecting order quantities placed
with upstream suppliers. So, whilst a second or third tier supplier could benefit
from the market share gains of a tier one supplier, it correspondingly becomes
more dependent on that tier one supplier as an important single revenue source.
Such an interpretation for the achievement of advantage vis a vis upstream
companies through market power is made with the support derived from the
loading ofs21 which, despite its weaker loading, suggests the possible presence of
motive for such an approach under conditions where a supplier has achieved
market power.
Once more, this factor reflects industry conditions (i. e., the suggestion that
managers are influenced by their industries) and represents the way in which
respondent managers perceive the method by which they should achieve growth
and stability. Related issues in respect of the interpretation of this market power
factor include the imperative to achieve super-supplier status (Chapter 3) which
can only be achieved through share building strategies, which in turn promulgate
acquisitive or merger activity. Next, the continuous consolidation which is taking
place downstream in the automotive industry necessitates greater organisational
size in order to ensure that the supplier is capable of meeting demand for the
increasingly large (but decreasing number) of assemblers in terms of design.
manufacture and logistics.
239

Chapter 7: Research Results and Analysis
Not only is market power necessary to achieve the scale necessary to compete
effectively on cost, it also offers a protection of the organisation's advantage
through the acquisition of potential threats to its product. The coherence of the
market power factor would appear to suggest that the market imperative is clearly
understood by managers, as is its relationship to bargaining power and the extent
of immediate rivalry.
For the respondent managers, the market imperative of share building is clearly
strong. In an industry cognisant of concepts such as 'best practice' and 'world
class', the symbolism of market leadership is not only tonal, but is also clearly
attributed to competitive advantage through technology, performance, quality or
price (or combination thereof) and thereafter financial performance. In addition.
the loading of statement 21 suggests that managers perceive organisational size to
be commensurate with the degree of control that the organisation can exert in the
supply chain. The consequence of this is that although respondents perceive
collaborative behaviour to be a source of competitive advantage (factor 3), this is
does not represent a sacrifice or abandonment of a view in favour of, or efforts
directed toward, the use of market power as the basis for exerting influence on
other organisations. Whilst commercial pragmatism may explain this perception,
it is sufficient to propose that a mindset of collaboration does coexist alongside a
mindset of competition among strategic managers within the automotive
components industry.
A danger with such the perception of market power is that since market share is a
relative term, managers may be limited in their view of what constitutes the
market. As the market for components is becoming increasingly transnational, the
composition of rivals may change significantly. Consequently, a component
supplier based in mainland Europe may not be perceived to be a direct rival given
its geographical location compared with rivals based in the UK and the lack of a
supply contract with a UK based assembler.
However, a wider view of rivals might reveal that the small number of rivals that
are perceived to exist represent only the leading edge of a rather larger body of
240

Chapter 7: Research Results and Analysis
rivals located close by in what is, from a sourcing and logistics perspective, if not
from a geographical one, a shrinking world.99
7.2.7 FACTOR 7 - RESOURCE ACCUMULATION
The seventh factor in the matrix can be interpreted as resource accumulation since
it is loaded by two statements designated with the 'access to resource' cIa
(Table 7.8). Statement 31 has loaded on factor one and has been interpreted as
transparency related rather than (the originally anticipated) relationship to the
understanding of linkages between strategically significant resources as a
precursor to strategies for their acquisition or accumulation. Equally, statement 32
did not load onto this factor, although as the reader will find with the next factor
this statement's loading offers intriguing possibilities for interpretation.
Factor ... %of
number .. 'aetorname Ellenvllue varlanc
_explained 7 Resource accumulation 1.26 5.1
Statement Statement telt Rotated Or1alnal Orllinal number loadlu elass dlVlslon
26 The acquisition of important .722 6 Resourc s resources is often due to luck
38 Senior managers differ in their view .627 6 Resources of which resources are important
Table 7.8: Factor Structure - Resource Accumulation
The resource accumulation factor comprises items which suggest that the resource
endowments of organisations vary due to luck (s26) and due to the variability f
senior managers with regard to the identification and selection of resource . The
expected non-loading statements enable us to discount the role of formal planning
as a contributory factor to such variations (s31) and to not consider the ability r
otherwise to acquire resources subsequent to this (s32). Accordingly th
underlying construct of this factor suggests that differences in managerial
perceptions of those resources which are important may lead to variations in the
success in acquisition and success of newly obtained resources. One can envisage
virtuous or vicious cycles in which the lucky (i.e. non-planned) acquisition of
99 The reader will recall that this problem was found to be evident among UK automotive component suppliers in Chapter 3 following the work of Leverick and Cooper (1998).
241

Chapter 7: Research Results and Analysis
strategically important resources confirms to incumbents the lesser importance of
formal planning for resource acquisition, whereupon the successful (albeit lucky)
behaviour is repeated.
Notable about this factor is that it marks a departure from its predecessors. Here
one finds that conscious, predetermined and systematic strategic management
activities are not always perceived to contribute to the development of an
advantage. Indeed, the variability and disregard for resource analysis, needs
requirements and the managers involved may have little impact (given the items
that did not load) on emergent strategies of resource accumulation. whereby luck
or unexpected events transpire to present the organisation with a strategic choice,
lacking in any preceding analysis, of whether to acquire a resource or otherwise
(Barney, 1986b).
A possible explanation for this perception is the frequent use of alliances and
partnership arrangements within the automotive industry. Since it has been
suggested that the evolution of an alliance brings with it opportunities to develop
new skills, products and processes (Faulkner. 1995), resource accumulation
opportunities cannot be accurately forecast in advance since these will evolve and
present themselves as alliances and partnership arrangements flourish and mature.
Accordingly, the nature and strength of factors 2 (management advantage) and 3
(relationship uniqueness) are necessary to propagate the conditions for resource
accumulation to arise within an inter-organisational collaboration.
The resource accumulation factor found in this study is more limited than that
derived from the literature in Chapter 4. Luck and disagreement are associated
with (imperfect) resource accumulation where luck and causality are related, since
the understanding of causality would determine the extent to which resource
accumulation is a deliberate action. Disagreement among managers may be
influenced by limited information or may destroy potential informational
advantages where senior managers fail to reach agreement about those resources
which should be acquired. In part, this might be due to differences in functional
background, where the knowledge of how important particular resources are
might only be known to those operating within a specialist area. Furthermore,
242

Chapter 7: Research Results and Analysis
knowledge about resources may be tacit and therefore unlikely to be subjected to
'scientific' or financial analysis. Accordingly, for a manager to persuade peers in
a group decision making situation that the given resource should be sought and
acquired may prove to be difficult in the absence of tangible evidence to this
effect. The respondent managers have not, however, associated linkages,
immobility and availability as issues which affect the decisions about, and
processes of, resource accumulation.
The strong loading of statement 26, which makes reference to luck in the process
of resource accumulation, may not be altogether unexpected in the automotive
industry, given the increased use of collaborative forms of behaviour between
organisations wherein opportunities for resource accumulation are presented to the
parties concerned as has been noted above. In addition, where an organisation
desires to increase scale and market power through acquisition, such a strategy
may be decided prior to the identification of acquisition targets. Therefore,
although a company has decided to grow through acquisition, the precise nature of
the bundle of resources that it will acquire will vary from company to company
given that organisation's resource endowments are unique, i.e. a central tenet of
the resource-based view.
Although partial support is offered by this factor for the notion of resource
accumulation, in the minds of our respondent managers, it is less multifarious than
that suggested in the literature and does not resonate the deliberate informational
advantages which offer managers the opportunity to pre-empt the strategic
importance of resources and subsequently acquire them. As factor 2 suggests,
management advantage of current resources, processes, products and relationships
are a clearer priority for managers within this industry.
7.2.8 FACTOR 8 - IMMEDIACY OF SUPERIORITY
The factor structure ends with two triplet bipolar factors (factors involved in the
variance of three statements with both positive and negative loadings). The first of
these is factor 8, which can be interpreted as immediacy of superiority. Three
items (s22, s29 and s32) load on this factor despite having originated from
different classes. The negative loading of statement 32 (-.745) means that access
243

Chapter 7: Research Results and Analysi
to resources is negatively related to other items loading on this factor (Table 7.9).
It transpires that for the respondent managers, the acquisition of resources does
not necessarily lead to an advantage, nor does the position of the company in the
supply chain (in terms of tier) influence the ability of organisations to identify and
acquire resources. This echoes the interpretation of the previous factor, where the
planning for resource accumulation per se is not perceived to generate or present
opportunities. Instead, it is the relationship with other organisations in the
operating environment which facilitate this. Although orthogonally derived factors
must be interpreted alone, one can observe complementarity rather than
contradiction in factors 7 and 8.
'. %of Faetor Factor name Eigenvalue variance number exol.lned 8 Immediacy oj superiority 1.22 5.0%
Statement Statement text Rotated Original OrielDal number loadlna class division
32 Some organisations are better able -.745 6 Resources to identify and acquire useful resources than others
29 Companies always fully exploit .608 3 Position their strengths to gain a competitive advantage.
22 Position (tier 1,2, 3) within the .510 2 Position supply chain is an indication of a company 's competitive advanta~e
Table 7.9: Factor Structure - Immediacy of Superiority
Factor 8 is labelled the 'immediacy of superiority' since as resource accumulation
is not perceived to be immediately relevant to the competitive position of the
organisation in its supply chain. It appears that respondent managers perceive that
competitive advantage is due to the ability to use current resources (rather than
those that would be available post-resource accumulation) and due to a supplier's
current position within the supply chain. Therefore, the immediacy of the resource
advantage, rather than the currently inaccessible potential for it, is construed to be
important.
244

Chapter 7: Research Results and Analysis
Seemingly, the immediacy of superiority factor reveals a short-term orientation in
the development of strategically significant resources. The nature of the industry,
however, can once more inform us of the rationale which may underpin the
perception of immediacy of superiority. Since the tight coupling of the supply
chain implies a sense of shared destiny, that destiny can be better secured more
effectively through strategies designed to demonstrate capability and commitment
until the end of a vehicle model's life, whereupon negotiations for new supply
contracts will be undertaken. In the interim, incumbents develop new advantages
jointly with supply chain partners, through continuous improvement processes,
joint R&D, and the expansion of alliances and partnerships designed to augment
the final product. These developments and initiatives are shared and are outside
the total and direct control of component suppliers and are driven, for the most
part, by the assemblers' or downstream partners' product and technology
objectives.
So, although a short term, or more accurately a current, view of how organisations
achieve superiority is reflected in this factor, factors elsewhere suggest that a
longer-term orientation toward the development of competitive advantage is
prevalent among senior managers in this industry. However, this would seemingly
produce a contradiction between short-termist and long-termist orientations from
the same managers. A transactional view of the industry may provide some
insights. Since it has already been seen that managers perceive relationship
building and enhancement using unique resources and platform advantages to be
highly important and conspicuous concepts, these relationships mark a vehicle in
which continuous (often daily) transactions take place between buyer and
supplier. In each of these transactions there is an opportunity to demonstrate
partnership capabilities, logistics and product advantage, and increase scale and
market share. Accordingly, the short-term orientation is complementary and
supplemental to building long-term relationships. It is clear from the other factors
that actions speak louder that words (or bids) in sustaining and winning new
supply contracts.
245

Chapter 7: Research Results and Analysis
Not only is a sense of immediacy resonated in this factor, so too is a sense of
inevitability in the conditions for competitive advantage because of the negative
loading of s32. One can infer that position in the supply chain has an influence
upon the organisation's ability to acquire resources and that the strengths
exploited by companies within their strategies are determined by position rather
than unique or advanced resource accumulation skills on the part of senior
managers within these companies. This might, in part, be a reflection of the
increased size and turnover of organisations as they near tier I status and may be
enhanced by their transnational reach and ownership status (for instance, whether
they are publicly listed). In addition, Chapter 6 has highlighted higher rates of
collaborative R&D and intra-supplier strategic alliances among tier 1 companies
in the sample.
Combined with an immediate interface with the assembler, tier 1 suppliers will
have a greater exposure to, and therefore opportunity to acquire useful tangible
and, especially, intangible resources such as know how and technical skills.
Consequently, the immediacy of superiority clearly conveys ideas about a
positional view of competitive advantage rather than a resource based view of
imperfect resource accumulation, heterogeneous superiority and causally
ambiguous planning processes.
7.2.9 FACTOR 9 - HISTORICAL ADV ANT AGE
The final factor has the same structure as the penultimate (bipolar and triplet) and
appears to represent a perception of historical factors contributing to competitive
advantage (Table 7.10). In this, the historical advantage factor, entry barriers
(s25) are deemed to render new or recent entrants with a comparative
disadvantage due to the cost and difficulty of entry. Having done so, the new
entrant will face scale-based disadvantages and will have to compete from scratch
for supply contracts having little or no 'track record' in the industry. Cost
advantage independent of scale and a lack of asset mass efficiencies (Dierickx and
Cool, 1989) merely compound their problems in relation to delivering equivalence
of cost/price downstream compared with incumbents. The notion of asset mass
efficiencies is communicated by the loading of statement 20 on this factor, where
246

Chapter 7: Research Results and Analysis
an organisation's stock or bundle of resources collected in the past has a bearing
on its ability to generate value and advantage. Since this is not intimately related
to scale (factor 5), this current factor bears more resemblance to resource-based
notions of advantage than positional perspectives. One must, however, be
circumspect with this factor given that the two items' loadings are marginally
below the .4 threshold.
··i 0/. of Factor Faetor riame Efaenvalue variance number explained 9 Historical advantage 1.11 4.2%
Statement Statement text Rotated Orlalnal Original number loadlne class division
25 New entrants to an industry face a .540 2 Position competitive disadvantage
20 Organisations are 'bundles ' of .393 5 Resources resources which influence competitive advantage
44 Superior logistics and delivery are -.382 4 Position a source of competitive advantage
Table 7.10: Factor Structure - Historical Advantage
Historical advantage is an unexpected factor since the development of divisions
and classes led to the development of a 'uniqueness and competitive advantage'
category (Chapter 5). Although it infers a historical development of advantage it
was not expected that historical dimensions would present themselves in the factor
matrix without the loading of most, if not all, of the class 5 statements onto the
same factor. Instead, the converse is observed to have occurred. One such
statement does, however, load (s20). Accordingly, it appears that managers
perceive the passage of time or the duration of presence of an organisation within
an industry to be a striking strategic competitive concept, but few items load to
improve this factor's conceptual clarity despite having seen the time dimension is
critical to the relationship uniqueness factor.
Notwithstanding this, supporting evidence from the industry context suggests that
the incumbent still retains advantages (Chapter 3). For instance, the vehicle for
industry entry is increasingly costly - scale is clearly imperative (factor 5) and
organic growth (i.e., internal investment in a new subsidiary) represents a costly,
247

Chapter 7: Research Results and Analysis
and possibly prohibitive, mode of entry. Acquisition is increasingly costly since,
as has been seen earlier, the need for scale (driven by downward price pressure)
has conspired to stimulate consolidation, thereby making acquisition a costlier
option than in the past (since incumbent's acquisition targets will also be larger
than in the past). Strategic alliances may offer a further alternative, predicated on
the basis that the level of investment and risk is reduced through the sharing and
pooling of resources (although subsequent returns may be reduced). Once more, a
potential entrant may face a disadvantage due to the its lack of industry
experience, expertise and involvement, making it a less attractive alliance partner.
In few circumstances, where the new entrant can achieve entry through the
diversification of its core technologies into automotive applications to effect
substitution for incumbents products, does the credible threat of entry rise. Such a
threat does not originate solely through the availability of alternative sources of
supply, but more importantly with the threat of technology substitution (Chapter
3).
Statement 44 loads negatively onto this factor and marginally below the threshold.
It appears that respondent managers no longer perceive superior logistics to
represent a source of competitive advantage and, specifically in the case of this
factor, that the logistics function no longer yields advantage, irrespective of the
historical development of capabilities in this area. 100 In contrast, the rigidity of
logistics capabilities are deemed insufficiently flexible to deal with the changing
locations of production (i.e., the North-west and South-east no longer dominant as
geographical clusters of assemblers in the UK) and delivery protocols (JIT,
modular delivery, SILS etc,). The skills of 'moving materials' in and of
themselves will not generate excessive value. Instead, overcoming logistics
problems through proximity has become a priority in the relationship uniqueness
factor. Location is to be considered the revision to logistics competence,
particularly given the threat arising from the location of a rival or new entrant
closer to the assembler (which at a fundamental level could signify lower total
costs in a cost driven industry).
100 Logistics in this context is defined as the movement and transportation of materials and components from one location to another, whether in-house or along the supply chain.
248
Chapter 7: Research Results and Analysis
The development of supplier parks, SILS, and the location of suppliers within the
plant complex boundary as a tenant, such as Ikeda Hoover and Nissan Yarnoto at
the Nissan plant in Sunderland offer further corroboration (Garrahan and Stewart,
1993; FT Automotive Components Analyst, 1997) to suggest that resource
differentials such as geographical immobility (Grant, 1991), with their
implications for resource accumulation, have a role in influencing competitive
advantage
The relationship of this factor to the antecedent literature is a fascinating one.
First, the notion of bundles of resources has a weak position in the factor
structure, possible reflecting the fact that it is an abstract idea that is rarely
considered by the managers (at least consciously) in planning and strategic
activities. In contrast, a more practical manifestation of resource bundling,
platforms has been found to resonate strongly with respondents. Accordingly,
although managers do not think in the (often) abstract terms of the resource-based
view, their perceptions of competitive advantage appear to reflect the practical
applications of such concepts.
Secondly, the historical advantage factor is a hybrid of residence items and
resource-based items. Once again, it can be suggested that the two competing
views of competitive advantage do not present an 'either-or' perspective in the
minds of our strategic managers. Instead, a concern for the durability of resource
prominence, underpinned by a stable industry structure where an advantage
already exists seems to be a concern for managers in this industry.
Finally, given the understanding of resource accumulation, organisational
transparency and relationship uniqueness, respondent managers seek to preserve
and enhance advantages embedded within supply relationships to a greater extent
than the ability to prevent new entrants. In part, this may be due to an inability to
prevent entry, but also due to the more immediate impact on competitive
advantage that can be derived from building for the future rather than building
barriers to entry. This is not only beyond the abilities of the single supplier (unless
intellectual property and scale enable the supplier to do so), but also cannot
249

Chapter 7: Research Results and Analysis
guarantee future revenue streams. IOI Given the managers' concern for control, the
former resides to a greater degree within the remit of industry respondents (factor
6).
7.3 PRIORITIES AND LANGUAGE
The chapter now turns to the analysis of data which relates to the terminology and
language used in the strategic management literature to distinguish between the
type and significance of resources. The reader will recall that Chapter 4 identified
four terms used to describe types of resources - strength, capability, competence
and core competence and four criterion by which to evaluate their strategic
significance, based around Barney's (1997) value, rarity, inimitability and
organisation. The concern for these issues in the context of this study is that given
the perceptions of competitive advantage held by the respondent managers, do the
terms and resource trait priorities mirror those expressed in the literature?
7.3.1 TERMINOLOGY OF RESOURCES
Respondents were asked to indicate the degree of frequency with which they used
four terms (strength, capability, competence and core competence) to describe
important company resources which are prevalent in the strategic management
literature. Were a resource-based view to predominate the use of such
terminology, one might expect 'competence' or 'core competence' to have higher
mean values than 'strength' or 'capability'.
Instead, the term capability is the most frequently used term by respondents
(Table 7.11) followed by competence, strength and core competence. Thus, the
term that is most particular to (and descriptive of) the RBV - core competence -
represents the least used term. However, this observation is marginal due to the
narrow range of scores observed in the data (3.32 to 3.9io2) and tends to suggest
that despite the differences inferred from the data, managers distinguish little
101 Indeed a positioning approach to strategy, whereby the strategist chooses a position for the company in the marketplace and consolidates the position by influencing the erection of entry barriers could be described as a 'bunker mentality' approach to strategy, i.e .. choose a position perceived to be safe and protect the position. 102 This could also be expressed as a 13% differential along the measurement scale.
250

Chapter 7: Research Results and Analysis
between the tenns and, accordingly, use them to a similar extent and for similar
purposes.
Term Mean S.D Capability 3.97 .897 Com~etence 3.62 1.023 Strength 3.49 1.117 Core Competence 3.32 1.280
Table 7.11: Ranking of Resource Tenninology (n=284)
The perceived homogeneity of the resource tenninology is resonated at all levels
of the supply chain. One-way Analysis of Variance (ANOV A) was used to
examine whether significant differences existed between groups of respondent
organisations according to supply chain tier, with no significant differences found
at the I % level (Appendix 10). Indeed, the rank order of the four tenns change
only in case of tier 3 suppliers, where' strength' and 'competence' change in their
position of relative importance.
Tier 1 Mean Rank Tier 2 Mean Rank Tier 3 Mean Rank Capability 4.03 1 Capability 3.96 1 Capabi1itr 3.76 1 Competence 3.64 2 Competence 3.69 2 Competence 3.35 r.1J';'~ 3 Strength 3.53 3 Strength 3.33 3 Strength 3.74 L~2 Core 3.45 4 Core 3.33 4 Core 2.74 4 competence competence com~etence
Table 7.12: Ranking of Resource Tenninology by Tier (n=284)
Consequently, although all the tenns are used by the managers in the study, no
single tenn appears to dominate the lexicon of competitive advantage. The
respondents do not discern, nor presumably feel the need to make, a distinction
between the tenns despite what is known about the respondents from the factor
structure examined in the previous section, where managers have recognised that
251

Chapter 7: Research Results and Analysis
some resource bundles such as relationships and platforms are clearly important in
the context of achieving competitive parity or advantage within the automotive
components industry. Although it cannot be established from the data the extent to
which the respondent managers have been exposed to academic literature
surrounding the theories of competitive advantage which form the basis of this
study, the finding here is not that managers fail to recognise the differences
between competencies or strengths (and so forth), but rather that the terms would
have the propensity to be used interchangeably, irrespective of the strategic
significance of the resources. Hence the burgeoning literature of the resource
based view would appear to have not made an impact upon the differences in the
terminology, despite evidence that newer terms such as competence and core
competence are used frequently by managers.
7.3.2 STRATEGIC PRIORITIES
Respondents were asked to indicate the degree of importance attached to the
'valuable, rare, inimitable and organised' criteria examined in Chapter 4. These
terms were used due to their commonality in the literature and the supposition that
the degree to which resources meet each of the VRIO criteria in turn determines
the strategic significance of the resource. Once again, scores for the four
individual criteria were similar in their position at just above the mid-way point
on a five point scale (Table 7.13) although the ability of a resource to generate
value represented the highest score (mean = 4.67) followed by organisation, rarity
and inimitability (means = 3.54, 3.36 and 3.13 respectively). Thus in reverse
order, IROV appears to the order of criteria for strategic significance perceived by
respondent strategic managers rather than VRIO.
Term Mean SD Value 4.68 .55 Organisation 3.54 1.02 Rarity 3.36 1.04 Inimitability 3.13 .98
Table 7.13: Importance of Resources (n=284)
252

Chapter 7: Research Results and Analysis
In a similar manner to the examination of terminology presented above, only at
tier 3 was the perceived importance of criteria found to differ from IROV, where
rarity and organisation trade places in the hierarchy of criteria importance (Table
7.13) although ANOVA revealed no significant differences between respondent
organisations according to tier.
Tier 1 Mean Rank Tier 2 Mean Rank Tier 3 Mean Rank Value 4.69 1 Value 4.65 1 Value 4.68 1 Organisation 3.64 2 Organisation 3.42 2 Organisation 3.44 3 Rarity 3.36 3 Rarity 3.28 3 Rarity 3.59 2 Inimitability 3.16 4 Inimitability 3.05 4 Inimitability 3.21 4
Table 7.14: Importance of Resources by Tier (n=284)
The differences between VRIO and IROV can be explained by industry conditions
and the findings of the nine-factor solution discussed earlier in this chapter. The
high importance given to 'value' reflects the cost-driven nature of the industry and
the continuous need to add value in the activities undertaken by the supplier in
order to fulfil its obligations to customers (other suppliers downstream or the final
assembler). The leverage or synergy of activities across an organisation (i.e.,
' organisation') ranks second and can be understood from the perspective of the
nodes of collaboration between buyer and supplier. R&D, logistics, production
and quality are common areas/functions from which collaborative activities will
be undertaken downstream, upstream and, increasingly given the use of alliances
with other suppliers, horizontally at the same point in the supply chain.
Consequently, skills and resources that are relevant to the support of collaboration
(and the ability to generate value in the relationship) are considered important for
leverage across these aforementioned areas (and others besides) in a manner akin
to the organisation in the VRIO framework. Further support to this can be found
in the strength and coherence of the relationship uniqueness factor identified
earlier in this chapter.
253

Chapter 7: Research Results and Analysis
Whilst important to the respondent managers, rarity and inimitability have lower
scores than value and organisation. Since one would expect rarity or inimitability
to enhance value rather than be separate to and less important than it, these lower
score must resonate the perceptions of competitive advantage held by the
respondent managers. Here, three factors may help to explain why this lesser
perceived importance has been found in the data - organisational transparency,
relationship uniqueness and resource accumulation. Organisational transparency
(factor 1) conveys the sense that the strategic managers in the sample do not
perceive the analysis and understanding of other organisation's competitive
advantage to be a difficult task. Absent are notions of causal ambiguity,
uncertainty imitability, and bounded rationality. Instead, the clear understanding
of rival's operations inferred from this factor suggests that the identification of
rare and inimitable resources can be known. However, since the acquisition of
resources is perceived to be a relatively stochastic process (factor 7 - resource
accumulation) the inability to accumulate resources in response to rivals' rare or
inimitable resources might prove to be a disincentive, particular, where
collaboration (factor 3 - relationship uniqueness) offers a known opportunity to
generate and enhance value alongside greater leverage from company resources.
Furthermore, the lower priorities assigned to rarity and inimitability reflect a
belief that inimitability cannot be assured, given the risk of diffusion of technical
know-how through technical communications, employees, reverse engineering
and the 'engineering-around' of patents (Lieberman and Montgomery, 1988).
This interpretation of IROV is further enriched by the profile data of respondent
companies presented in Chapter 6, where it was found that there were many
companies operating in each component type area. Although detailed component
knowledge could not be collected and the possibility that companies within each
component group may produce smaller components that come to form the
subassembly, there is partial evidence to support the limitations of inimitability
given the multiple representation in component areas, especially since the dual
sourcing policies of assemblers (in essence, a supply chain continuity provision)
necessitates the presence of an alternative source of supply for every outsourced
component.
254

Chapter 7: Research Results and Analysis
Although VRIO has an implicit logic, particularly in that inimitability is superior
to rarity (in terms of the supply of a resource), such a logic cannot be discerned
from the IROV sequence of priorities. Indeed, rather than a sequence of criterion
to be met in tum for the evaluation of strategically significant resources, the
findings here should be presented as a ranking of priorities, since rarity cannot
logically be superior to inimitability nor, importantly, be a precursor to it (where a
single firm is in possession of a strategically significant resource). Perhaps,
however, the respondent managers consider inimitability to be both difficult to
achieve and lacking in commensurate rewards for its achievement.
Hence, managers do make a distinction between resources in terms of strategic
significance, but not in the manner expected or suggested by the literature.
Instead, VRIO is replaced by IROV. Indeed, it could be suggested that a definition
of strategy inferred from, and appropriate to, the strategic managers in this study
is that it is the use of resources to achieve a leveraged value-added advantage.
Finally, it should be noted that no correlations were found between the VRIO
terms and the terms used to describe the importance of resources. Accordingly,
despite the support in the literature, the proposed hierarchy of resources presented
in Chapter 4 (Figure 4.5) remains purely hypothetical given the empirical analysis
undertaken for this study.
7.4 RESEARCH QUESTIONS REVISITED
Following the empirical analysis of the data collected from respondents, it is now
appropriate to address the research questions posited in this study.
7.4.1 RESEARCH QUESTION ONE- PRINCIPAL RESEARCH QUESTION
The first question sought to address the two competing views of competitive
advantage - position (residence) and a resource-based view (resources) - and to
establish the extent to which the two competing schools of thought could be
identified within the perceptions of managers within an industry. The research
question was framed as follows:
255

Chapter 7: Research Results and Analysis
Do managers perceive competitive advantage to be based on bundles of
heterogenous resources which facilitate differentiation and diversification
rather than external factors such as industry structure and macro
environmental factors?
The rotated factor structure in section 7.7.2 identified nine factors; five of these
were hybrids of position and resource statements, two factors could be considered
to represent resource-based concepts and a further two factors conveyed
residence-based concepts. However, no single factor comprised of the four items
originally designated within each division or class.
Alone, the factors reveal little. Only with interpretation and an understanding of
the context in which the factors emerge as underlying constructs can one make
sense of this empirical outcome. The interpretations offered for each factor are
based on the specific industry context as well as institutional context (Oliver,
1997). Moreover, if the interpretation of the factors is dependent on knowledge of
the industry, then it cannot be denied that industry context also would appear to be
a moderating influence on the perceptions of managers operating within it. The
need for studies about the resource-based view to be located within a single
industry to examine and take account of its effects has gone largely unnoticed
from a methodological and interpretative perspective (Rouse and Daellenbach
(1999). In part, this study has made a contribution to this debate in showing that
interpretation is context-dependent.
Senior managers in the automotive components industry - the strategic decision
makers and strategists - do not perceive competitive advantage to arise from
resource or residence alone. Instead, their perceptions of competitive advantage
are a hybrid of these two so-called competing schools of thought. The limitations
of human cognition, the limited field of vision, and the desire for organisational
growth and size are clearly prevalent within the factor structure.
Research question one cannot be answered in yes/no terms. A response to the
question can be presented in graphical form, where the perceptions, constructs and
their composition are portrayed as a cartography of competitive advantage (Figure
7.1 overleaf).
256

Pure Concepts ~ .
~ \2!7
6. ).forti I 1'0Wl#l'
Residence
Chapter 7: Research Results and AnalY' i
Hybrid Concepts + ................................................................. +
/ . Or,onl,,,"orlOl rralf.pun ncy
9. J/lIIOrlCO( Ad vo lllagr
Figure 7.1: The Cartography of Competitive Advantage
Pure Concepts
~ .
~ \:Y
1 Huotf,.uA«"","/" UfJ"
Resource
The figure positions each of the nine factors in a virtual space where coordinates
are determined by the eigenvalue of each factor (which determines vertical
position) and the extent to which the factor bears resemblance to a residence view
of competitive advantage or a resource-based view of competitive advantage. At
the outermost (left and right) points are where the pure factors are positioned
comprising solely of items from the same division (residence or resources). The
horizontal positions of the hybrid concepts are determined by the proportion of the
residence or resource items that have been found to load on each factor. The
circular representations of each factor comprise shaded segments to denote their
composition in terms of the number of statements, and the origins of the statement
in terms of the residence (dark shading) or resources (light shading). Hence, for
257

Chapter 7: Research Results and Analysis
instance, the vertical position of factor 1 (Organisational Transparency) is
determined by having the highest eigenvalue among the nine factors. Its
horizontal position is due to being the hybrid factor that has the highest proportion
of 'residence' items within it. The only factors that are further to the left on the
horizontal axis are those which are purely comprised of 'residence' items.
Visually, the cartography of competitive advantage suggests that a
positional/residential view of competitive advantage is slightly more dominant in
the perceptions held by respondents although neither could purport to offer
conceptual clarity. Equally, however, factors comprising mainly or solely of
resource-based items have higher eigenvalues.
To an extent, this attempt to visualise factors in terms of their theoretical purity
and strength (eigenvalue) leads to positions for the factors in Fig 7.1 which could
be deemed to be subjective in nature. However, the figure is designed to denote
differences between factors in terms of purity and importance rather than to derive
immediate comparisons of relativity between them (i. e. precise measures of
distance). Had oblique rotation provided a solution in which factors had strong
correlations (Appendixes 2 and 12), metric axes rather than the non-metric variety
presented here would provide further detail to prevent any visual distortion
leading to misinterpretation. A metric for the horizontal axis in which the
percentage of the dominant division were to dictate the horizontal coordinate,
would also carry a subjective dimension. 103 However, were similar figures to be
derived from replications of this study in different industries, vertical coordinates
would be important to highlight the dominance (or otherwise) of factors in the
cartography.
Taking these limitations into account, the cartography of competitive advantage
represents the mindset of strategists within the automotive components industry.
103 For instance, factor 'A' comprises of three items, two of which are position items and one is a resource item and factor '8' has the same composition of items (2 x position and I x resource). In factor 'A' the two position items have the strongest loadings followed by the resource item, whereas in factor '8' the resource item loads strongest, followed by a position item and with the final position item possessing a negative loading. In terms of eigenvalue and purity, the factors would have the same coordinate, but in terms of their composition they are clearly different. However, we could not allocate different positions to the two factors since the composition ofthe factors is a reflection of correlations of the items within each factor. They are not external measures per se. In other words, Figure 7.1 should be considered a 'visualisation' rather than a model.
258

Chapter 7: Research Results and Analysis
As a collection of perceptions, they can be said to represent aspirations as much as
precursors to decision or actions (Chapter 2). For instance, the ease of strategic
analysis (organisational transparency), rational management (management
advantage - factor 2) and size based advantages (scale and market power - factors
5 and 6) are optimal conditions for organisational success which might apply to
all organisations. Yet despite information to the contrary, such as the impediments
to rational decision making and the negative implications of scale identified in
Chapter 4, such ideals in the form of the factors identified in the data are strong.
salient concepts in the mind of managers.
Nevertheless, the mindset of managers within this industry can also be considered
pragmatic through the clear presence of factors which suggest that not every
aspect of an organisation is within the immediate grasp and control of its senior
managers. The resource accumulation factor (factor 7) suggests a perceived lack
of control over the acquisition of resources. Furthermore, the uncertainty that
managers have about the longevity of supply relationships downstream is
reflected in relationship uniqueness (factor 3), where managers seek to enhance
partnership arrangements to ensure (once more for pragmatic reasons) the
continuation of income streams. The tight coupling of the supply chain since the
widespread introduction of the lean supply model (Chapter 3) underpins the
importance of certainty over its antithesis, i. e. better the devil you know or have to
know than the uncertainty of where a future supply contract may be domiciled.
The cartography of competitive advantage reflects a volume industry. Factors
such as scale (factor 5). market power (factor 6) and immediacy of superiority
(factor· 8) are intimately associated with the ability to sustain a supplier's
competitive position. Clearly, scale is volume dependent and market power is a
function of the size of the market. The immediacy of superiority is also important
since the global nature of sources of supply. the high number of alternative
suppliers for many components (given the need for dual sourcing) and the
substitution of technologies and materials means that component suppliers must
be able to manifest an advantage at any given point in time to win new business
and sustain existing relationships. Without such immediacy of advantage, the risk
exists that switching will occur.
259

Chapter 7: Research Results and Analysis
Furthermore, the mindset portrayed in the cartography of competitive advantage
reflects the dynamics of the automotive industry in general, where consolidation
downstream may threaten aggregate demand for components (given that merger
and acquisition activity is predicated principally on brand access, platform sharing
and overcapacity reduction). The extraction of three concepts (factors) manifest
the cognisance of managers in this regard; the ability to mitigate competitive
threats through relationship uniqueness (factor 3), platform advantages (factor 5)
and historical advantages (factor 9) which have led to the accumulation of
important resources (for instance, intellectual property, R&D skills, and process
capabilities). However, as noted earlier, nothing can be certain, as demonstrated
by the appearance of the resource accumulation factor (factor 7).
Despite changes and uncertainties in the industry, the strategists in this study
would appear to walk with the two feet in the context of strategy (one deliberate -
one emergent) suggested by Mintzberg (1985). A formulation approach to guiding
the organisation into the future can be observed in the organisational transparency,
management advantage, platform advantage (R&D), scale, and market power
factors. Each of these factors connote a deliberate approach on the part of the
respondent managers to ensure continuity of current supply relationships and the
seeking of new ones. This does not mean that all of the respondents plan and plan
well within their respective organisations, but that the cognitive propensity to do
so resides within the perceptions of these senior managers. However, despite the
rapid changes taking place in the industry as a whole, the strategists seem to
favour seeking stability in order to build for the future, particularly through
'extrapreneurship' to develop relationship-specific technological advantages and
the building of 'next contract prerequisites' (factor 2).
Equally, the composition of the factors examined earlier in this chapter offers the
possibility that the respondent managers are accommodating toward the adaptive
and imitative behaviour that is central to emergent strategies. Although
organisational transparency (factor 1) communicates the belief that planning is a
transparent and problem-free process, factors such as relationship uniqueness
(factor 3), resource accumulation (factor 7) and historical advantage (factor 9)
260

Chapter 7: Research Results and Analysis
each suggest that the development of an advantage is time dependent and the
outcome may not be predicted accurately.
Relationship uniqueness (factor 3) will not be an instant characteristic of a
relationship with a party downstream in the supply chain but, nonetheless, for any
durability in the relationship to emerge, the supplier will have to exhibit sufficient
flexibility and commitment to the relationship for it to be anything other than a
low-added value market-based transaction. Moreover, the tight coupling of the
supply chain and the technically elaborate nature of the product signifies the need
for suppliers to be able to adapt to customers' (especially assemblers) future
product development plans.
Resource accumulation (factor 7) is recognised by the respondent managers to be
a process influenced more by luck than clear intention. Rather more characteristic
of ambiguous intent, managers may not realise or agree upon, ex ante, those
resources that could be pre-empted on every occasion that such a decision
requirement is presented (Lieberman and Montgomery, 1988). Furthermore, as
partnership relations with downstream companies or horizontal alliances (Chapter
6) develop, unplanned (i.e., emergent) resource accumulation opportunities may
present themselves to senior managers (or indeed to managers elsewhere in the
organisation).
From the preceding factor analysis, interpretation and the cartography presented in
Figure 7.1 three observations can be made in respect of the findings:
Perceptions of competitive advantage are complex, comprising pure and hybrid concepts and interpretations.
Neither the resource-based view nor a position-based view of competitive advantage can be said to predominate in the thinking of practising strategic managers.
The perceptions of the strategists in this study suggest that the resourcebased view and a position-based view of competitive advantage are not mutually exclusive, despite their portrayal in the literature. Managers do not perceive them to be antagonists.
261

Chapter 7: Research Results and Analysis
7.4.2 RESEARCH QUESTION TWO
Without resource accumulation (and impediments to this process), differences in
the resource endowments of organisations would not exist. Accordingly, the
resource-based view places a great deal of attention upon resource accumulation,
portraying the process as one in which historical, mobility and inseparability
factors (among other) impede access to value-adding resources. Moreover,
managers' skills and organisational politics will often account for differentials in
resource accumulation on account of the inability or incapacity to identify
important resources, their source and a manner by which to take possession of
them. Hence, the study proposed a second research question to examine the
degree to which managers perceived, understood and rated the concept of resource
accumulation:
Do managers perceive resource accumulation to be part of the RB V
construct?
Although a resource accumulation factor was interpreted in the factor structure
(factor 7 in section 7.2.7), the resemblance of the factor with the antecedent
literature is somewhat limited. Resource accumulation is hampered by
disagreement but aided by luck. albeit beyond the control of the managers
concerned. However, the perception of organisational transparency (factor 1) finds
that managers within the industry perceive the identification of resources and the
attributes of other organisations to be an unproblematic process and that the
importance of existing supply chains (factor 3), underpinned by platform
advantage (factor 4), scale (factor 5) and market power (factor 6) confirms that
senior managers understand the supply chain and the relationships undertaken
within it to offer the resources necessary to develop, enhance and exploit
competitive advantage.
Factor 7 - resource accumulation - suggests that informational advantages
(Barney 1986b) may only arise during the course of an alliance or partnership
arrangement. In addition, the lack of entry suggested in the process of resource
accumulation (Barney 1986b) is not reflected in the factor extract earlier in this
chapter. Instead, it is consumed within the historical advantage factor (factor 9).
262

Chapter 7: Research Results and Analysis
Section 7.3.2 identified the resource priorities of the respondent managers to be
IROV (inimitability, rarity, organisation and value in ascending order of
importance) rather than VRIO. This reveals that if managers consider inimitability
and rarity to be of lesser importance for a resource, this means that they would not
consider inimitability, tradeability and substitutability (Dierickx and Cool, 1989)
to be important criteria in the selection and acquisition of a resource.
Furthermore, resource accumulation is perceived to be one problematised by
causal ambiguity which may reduce the replicability of resource accumulation
efforts by organisations as suggested by Grant (1991). Absent from this factor are
statements originally intended to convey concepts from the RBV in relation to the
understanding of links between resources and advantage (s31) and the superiority
of firms in resource accumulation (s32). Thus, the perception of resource
accumulation by the managers in this study is a narrower concept than that
proposed by the RBV, reflecting the limitations of managers and planning (in
spite of the perception that is central to factor 1). Nonetheless, resource
accumulation is a pure concept, devoid of non-RBV items and can be therefore by
said to represent a modified version of that which can be identified in the
literature.
Consequently, and in response to the research question, one would be surprised to
find that the identification of rare or inimitable resources (as suggested in the
literature) constitutes a formal planning activity:
Accordingly, the perceptions of respondents can only partially be said to
concur with the propositions of the resource-based view.
7.4.3 RESEARCH QUESTION THREE
It was thought, a priori. and detailed in Chapter 3 that the concept of product
platforms might reflect the more abstract notion of bundling resources proposed
by the resource-based view. Correspondingly, the following research question was
presented:
Do managers associate portfolios of resources with product platforms.
families and technology convergence?
263

Chapter 7: Research Results and Analysis
A positive response to this question can be offered following the detailed
examination of the platform advantage factor (factor 4) in section 7.2.4 of this
chapter. Not only does the notion of resource bundles clearly resonate in the
interpretation of factor 4 (platform advantage) which in tum reflects R&D and
procurement practices that are increasingly becoming the norm within the
industry, one also finds that the combination of tangible and intangible resources
that lead to relationship uniqueness (factor 3) also echo the combination of
resources which lead to competitive advantage.
Suggested here is that managers' perceptions mirror the articulations of the
resource-based view in respect of bundling resources rather than a resource-based
view having influenced these perceptions (which cannot be established from the
methodology used). However, as a reflection of how practising managers think
about competitive advantage, the outcome of the data analysis proposes the
following:
The bundling of resources advocated by the RB V would represent one of
the more recognisable concepts for managers arising from this school of
thought.
Platform advantage is the strongest and least ambiguous competitive advantage
concept held by the managers in this study. In the cartography of competitive
advantage (Figure 7.1), it is the factor with the highest number of items from the
same division (3 x RBV items) in relation to its eigenvalue. Such a strong
concept is likely to represent an important strategic priority in the activities and
planning undertaken by senior managers.
The discussion in section 7.2.4 also suggested that product platforms could be
considered not only a manifestation of technological competence, but also a
strategic insurance policy to ensure production volumes in the face of industry
consolidation and overcapacity.
However, the identification of this factor and subsequent discussion of research
question three raises two questions. First, would such a perception (factor) be
found in a study located in an industry where product platforms were less
264

Chapter 7: Research Results and Analysis
prevalent or non-existent?104 Only upon replication of the study in a different
industry could such a question be addressed. It is sufficient to say, nonetheless,
that the importance of industry context in the interpretation of the platform
advantage factor, leads one to hypothesise that industry, operating and product
differences would affect the extent to which such a factor could be observed
among incumbent strategic managers. Secondly, is the existence of such a strong
strategic concept among the senior managers of automotive component suppliers
an organic priority (where it is the suppliers' managers themselves that have
decided that platform advantage is highly important) or a priority primarily
influenced by the assembler that has driven changes to the design and assembly of
components?
7.4.4 RESEARCH QUESTION FOUR
A recurrent theme in the literature review (Chapter 4) which gave rise to the
research question four was the management of resources. Without this, it is
obvious that the productive potential of an organisation's resources may not be
fully exploited (although equally resources could be mismanaged to diminish their
potential). Important for this study was to make a distinction between products,
processes and resources to determine the extent to which managers perceive
resource management to be a formal process that is additional, though
nonetheless, related, to the management of the outcome of resources - products
and processes.
Consequently, the following research question was presented:
Do managers recognise the importance of resource management?
The factor analysis of the data suggests that the question should be answered in
the affirmative given the discussion of the management advantage factor in
section 7.2.2. The management advantage factor clearly indicates that managers
perceive resource management to be correlated with the management of products
and processes, but the loading structure of this factor suggests that resource
management does not predominate. Instead, product and process management
104 For instance, petro-chemicals, hosiery and publishing would appear to offer a lower utilisation of shared components/inputs.
265

Chapter 7: Research Results and Analysis
have stronger correlations (albeit minor differences) but this, in part, is due to the
more tangible nature of products and processes, and their direct impact on the
need to secure ongoing supply relationships with assemblers or downstream
component assemblers that are so vital to competitive advantage and survival in
the sector. In addition, given that the 'managing resources' statements loaded
together on the same factor, which is the second strongest in terms of its
eigenvalue and accountability for variance, leads one to propose that the
perception of managing resources among the respondents bears a high level of
similarity to that offered in the RBV literature (Chapter 4), and the management
advantage factor more than coincides with factors reliant on resource
management, such as relationships and platforms which are represented
coherently in the factor structure.
The management of resources is an integral part of managing (often) more
tangible elements of an organisation such as product, processes and technologies.
Ostensibly, the respondent managers associate resource management with these
other manageable elements and understand that resources underlie each of them.
This notion is evident within the RBV literature (Chapter 2). Irvin and Michaels
(1989) suggested that managers should be familiar with strategically significant
resources, and Mahoney and Pandian (1992) argue that without an understanding
of how resources contribute to processes, products and services, insights into
diversification and new product options will not arise in a planned manner.
Otherwise resources will, from a resource-based view, remain under-utilised (Seth
and Thomas, 1994).
The understanding of resources and their contributory role across the organisation
is evident in the work of writers that have argued that core competencies reside in
the resources which contribute to a wide range of product in the form of core
technologies (Prahalad and Hamel, 1990) or product families (Meyer and
Utterback, 1993). Further afield, the concept of economies of scope (Teece,
1982) can only be realised where managers understand the linkages between
resources, product and processes.
266

Chapter 7: Research Results and Analysis
The management theme extends beyond factor 2 (management advantage).
Sections 7.2.3 and 7.2.4 highlighted the role of management in the interpretation
of the relationship uniqueness and platform advantage factors.
Therefore, it can be stated that:
Resource management is considered by strategic managers to be
intimately linked to products and process and an important role for
senior managers as well as their subordinates.
7.4.5 RESEARCH QUESTION FIVE
The lexicon of the resource-based view is, to say the least, varied and fragmented.
Disagreements and differences among key writers with regard to terms used to
describe the positive resource and attributes of an organisation, combined with
similar differences in views of those characteristics which distinguish between the
importance of resources led to the following question:
Do managers make a distinction between resources in terms of their
strategic significance and do they use terminology indiscriminately?
Following the analysis of data in section 7.3.1 it was found that the senior
managers in this study tend to use the general terms of 'capability' and
'competence', which have an easily recognisable meaning beyond the lexicon of
management, to a greater degree than the more specialised term of 'core
competence' that is imbued with connotations of the resource-based view. In this
respect, at least, the resource-based view is not reflected in the terms used by
managers. Moreover, whilst minor differences can be observed in the extent to
which the various terms are used, no single term can be said to dominate. The data
reveals indifference toward the differing terms at the very least or confusion about
the differences in such terms at worst. Given that no correlations could be found
with the terms and the criterion of valuable, rare, inimitable and organised,
respondent managers clearly do not discern the terms to have different meanings.
The managers merely use the term in varying amounts. The findings show, at the
very least, that managers are likely to use the terms interchangeably since they are
267

Chapter 7: Research Results and Analysis
less cognisant of any semantic and practical differentials that theorists tend to
highlight.
It could be suggested that were a resource-based view to predominate, we might
expect the terms 'competence' and 'core competence' to predominate also.
Indeed, the findings in response to question 5 reflect the hybridisation of
competitive advantage concepts and theories.
Following this, the empirical analysis presented in section 7.3.2 clearly indicated
that the theoretical (and albeit rational) sequence of criterion proposed by the
VRIO criteria is not shared by senior managers in the automotive components
industry. Instead, and once again reflecting competitive priorities, value is
considered to be most important trait for a resource, followed by the ability to
organise (leverage) resource. Rarity and imitability are considered to be of lesser
importance, in contrast to the literature which suggests that rarity and inimitability
are important precursors to core competence status.
Hence:
Practising strategists differ from theorists in respect of those traits which
determine the strategic significance of resources whilst making little
distinction in terms used to describe important resources.
However, the findings in relation to this comment are not conclusive. It indicates,
prima facie that data collection is not always equal to insight. However,
improvements in relation to addressing this question are considered in Chapter 8.
7.S CHAPTER SUMMARY
This chapter began by explaining how each of the research questions developed in
earlier chapters would be addressed. Following this, the final factor analysis
structure was presented and justified. This structure sought to achieve a simple
structure and judicious consideration of the number of factors to extract by
running a series of trial extractions. The factor structure can be considered to be
robust for the purposes of interpretation in relation to the research questions, the
nature of the industry and the theoretical domain in which the study is domiciled.
268

Chapter 7: Research Results and Analysis
The chapter continued by presenting the factor analysis of the competitive
advantage statements from the 284 completed questionnaires. Nine factors were
found, each of which were interpreted in turn, bearing in mind the industry
context. The analysis of each factor indicated that industry conditions can be
considered to have an impact upon the perceptions of managers as found in the
empirical analysis. However, the number of factors extracted exceeded the
number of classes originally developed (nine and eight respectively) indicating
that the perceptions or concepts that are prevalent in the minds of the strategists
taking part in this study did not precisely match the expectations developed from
the review of the literature.
Individually, the nine factors were; organisational transparency, management
advantage, relationship uniqueness, platform advantage, scale, market power,
resource accumulation, immediacy of superiority, and historical advantage. These
factors indicate that the perceptions of competitive advantage held by managers
within the UK automotive components industry are complex, hybrid in their
reflection of strategic management theory, and boundedly rational (Chapter 2).
Accordingly, the strategic decisions considered and taken by such managers are
likely to reflect the cognitive cartography of competitive advantage presented in
the chapter.
Further, the language and priorities held by the respondent managers did not echo
those offered by the literature. Managers did not indicate that VRIO (value, rarity,
inimitability and organisation) was their favoured ascending criteria for the
strategic significance of resource. Instead, the senior managers almost reversed
this order of significance by indicating that value was the most important criteria
for resource, followed by organisation, rarity and inimitability. In the same order
of significance as VRIO, the managers' priorities are IROV. Similarly, variation
in the terminology used by managers to describe strategically significant resources
varied from expectation in the literature. The term 'core competence', emblematic
of the resource-based view, was the least used term. It was surmised that the
impact of the resource-based view's terminology (i.e. core 'competence' and
'competence') appears not to have been extensive in replacing the terms
'capability' and 'strength' in the lexicon of competitive advantage.
269

Chapter 7: Research Results and Analysis
Following the discussion of priorities and language, and in the light of the
preceding analysis, the chapter returned to address the research questions. The
research questions have been answered, although in several instances the answer
has proved to be less than straightforward. In the case of each question, a
proposition or response to the question was made to summarise how the question
was answered. These are presented in Table 7.15.
RESEARCH QUESTION PROPOSITION/RESPONSE
Research question J (Principal Perceptions of competitive advantage are
Research question): complex, comprising pure and hybrid concepts and interpretations.
Do managers perceive competitive Neither the resource-based view nor a position-based view 0/ competitive advantage can be said
advantage to be based on bundles to predominate in the thinking 0/ practising of heterogenous resources which strategic managers. facilitate differentiation and diversification rather than external The perceptions of the strategists in this study
factors such as industry structure suggest that the resource-based view and a
and macro-environmental factors? position-based view of competitive advantage are not mutually exclusive, despite their portrayal in the literature. Managers do not perceive them to be antagonists.
Research question 2 Accordingly, the perceptions of respondents can
Do managers perceive resource only partially be said to concur with the propositions of the resource-based view.
accumulation to be part of the RBV construct? Research question 3 The bundling o/resources advocated by the RBV
Do managers associate portfolios represents one of the more recognisable concepts for managers arising from this school of
of resources with product thought. platforms, families and technology convergence? Research question 4 Resource management Is considered by strategic
Do managers recognise the managers to be intimately linked to products and process and an important role for senior
importance of resource managers as well as their subordinates. manaKement? Research question 5 Practising strategists differ from theorists in
Do managers make a distinction respect of those traits which determine the strategic significance of resources whilst making
between resources in terms of their little distinction in terms used to describe strategic significance and do they important resources. use terminology indiscriminately?
Table 7.15: Summary of Research Questions and Responses
270

Chapter 7: Research Results and Analysis
This chapter also introduced a cartography of competitive advantage (Figure 7.1).
The cartography is intended to visually represent the composition of the factors
found in the data analysis and differences in terms of eigenvalues and their
theoretical purity. In essence, it summarises the findings in response to the
principal research question, but it may also offer a way of developing the testing
of theory and comparisons between studies. These implications are considered in
the next chapter.
Having completed the analysis of data and the development of linkages to the
research questions, the next chapter considers this study in the wider context of
strategic management theory, management practice, management education and
methodological development.
271

Chapter 8: Conclusions and Implications
Chapter 8 - Conclusions and Implications
8.1 INTRODUCTION
In the previous chapter, each of the research questions were addressed, alongside
the presentation of a cartography of competitive advantage. In this chapter, the
researcher adopts a wider perspective of the issues arising from the results of this
study. In particular, it focuses on the impact of the study in methodological,
practitioner and strategic management terms.
The chapter begins with an exposition of the consequences of the findings
followed by some of the implications of the study for the automotive components
industry. Next, the chapter reflects on the methodology used and examines how
this methodology could be used as a foundation for more a complex research
design in the field of strategic management. In addition, a number of research
questions are proposed arising from the analysis and discussion developed in
previous chapters. The chapter, and the thesis, concludes with comments which
reflect on the contribution of the study to the wider field of study.
8.2 CONSEQUENCES OF THE FINDINGS
8.2.1 THE MIXED PERSONALITY OF COMPETITIVE ADVANTAGE
In Chapter 7, the empirical analysis of the data from respondent managers led to
the discussion of the research questions. These questions were developed from the
research stimulus which led the study to examine managers' perceptions of
competitive advantage. A nine factor solution from principal components analysis
was interpreted to suggest that managers do not share the same perceptions as
those that are inferred from the literature, where residence and resource are
portrayed as distinct (often competing), theories of competitive advantage.
The resource-based view has attracted a great deal of interest from within the field
of strategic management. Equally, however, concerns have been expressed about
it tautology and circularity (Porter, 1991) and of the problem of observing the
unobservable (Godfrey and Hill, 1995) from a theoretical and methodological
perspective. Furthermore, the criticisms of this relatively new body of theory in
272

Chapter 8: Conclusions and Implications
strategic management (although notable antecedents were identified in Chapter 4)
have been forwarded in practitioner oriented developments of RBV theory
(Higgins, 1996; Petts, 1997) where disquiet has revolved around the anecdotal and
problematic communication ofRBV theory to managers.
Whichever the direction of such criticism, the debate has run before it has walked.
Anecdotal insights into core competencies and the RBV represent the equivalent
of a baby's first steps; sporadic, without precise intention, limited to a short
duration and yet exciting to observers. From the outset of this theory's
development, and its subsequent comparison to the industrial-organisation
approach to strategic analysis and choice (Chapter 4), there has been an
assumption among theorists that practitioners would share the same
compartmentalised views as theirs.
Although RBV and 10 approaches have attempted to isolate the performance of
organisations to a number of variables that accord with the theory in question (e.g.
10 focuses on market structure, behaviour and performance whereas the RBV
focuses on the value, use and isolation of resources), it is assumed that managers
will think in those same compartmentalised terms. This notion has been called
into question by Sutcliffe and Huber (1998 who argue that:
Given that organizational actions are based in part on top managers' perceptions, ... our ability to analyze, understand and predict organizational actions and performance may be seriously constrained unless we recognise and account for . . . these perceptions" (1998:794).
Hence, this study has taken a deliberate step backwards in order to take a useful
step forwards in the development of RBV theory and practice. This study has
found that the "split personality" (Sanchez and Heene, 1997:304) between
residence and resources that is evident in the literature cannot be supported from
the viewpoint of how managers perceive competitive advantage. Instead, the
cognitive cartography of competitive advantage indicates that managers have a
mixed personality insofar as the factors which determine competitive advantage
within a specific industry - automotive components - and such perceptions can be
attributed to prevailing industry conditions and practices (Chapter 7).
273

Chapter 8: Conclusions and Implications
The suggestion that competing theories of competitive advantage "compounded
the confusion about strategy that now besets managers" (Collis and Montgomery,
1995) could also be questioned. The findings of this study is that managers have
their own mental models of the priorities that assist in the achievement of
competitive advantage. Although these do not necessarily concur with the austere
black and white portrayal of competitive advantage in the literature, the colour
palette considered by managers may be industry and experience dependent. This
necessarily implies the replication of the methodology used in this thesis in other
sectors (Section 8.5).
Evident from the perceptions of mangers is that they have a strong belief in their
own ability to influence the competitive position of the firm. This is hardly
unexpected, but the strongest factors found in the empirical analysis
(organisational transparency, management advantage, relationship uniqueness and
platform advantage) do not embrace the idea that matters are beyond manager's
control. They can plan for the future, leverage their management skills, develop
unique supply chain relationships and lead the R&D process. Few of the concepts
(factors) perceived by managers suggest a recognition of an incapacity to control
the immediate destiny of the organisation, nor build for its future (resource
accumulation and historical advantage). Managers purposefully believe that the
possibility resides for the creation of an asymmetrical position for their
organisation in respect of their rivals within the industry. However, intention,
action and success are different, though nonetheless related. So, whilst this study
does not purport to track the decisions of the managers and subsequent
performance (a matter which is considered in section 8.5 below), the cartography
represents an informed view of how managers perceive competitive advantage in
the industry that is the focus of the study.
274

Chapter 8: Conclusions and Implications
8.2.2 SIMILARITIES IN INDIVIDUAL THEORETICAL CONCEPTS
The individual components of the resource-based view (RBV) formed a major
theme in this study. Chapter 4 examined the prevailing literature in the domain of
the RBV and found that four major elements could be identified: resource
accumulation, uniqueness and competitive advantage, portfolios, and managing
resources.
In the factor analysis of the competitive advantage statements, the results
indicated that the concepts of 'managing resources', 'portfolios' and 'resource
accumulation' could be observed in the composition of factors, albeit to varying
degrees. For instance, managing resources was echoed in the management
advantage factor (which also emphasised the role of geographical proximity). The
concept of bundling resources into portfolios of resources which are used in
several applications was evident in the platform advantage factor which directly
reflects the nature of vehicle design and assembly. In the case of this factor, three
statements developed to convey the theoretical concept loaded very strongly
together. The concept of resource accumulation was also perceived as a cogent
concept by respondents. However, in this case, the process of resource
accumulation was found to be one characterised more by fortuity that design.
The existence of these factors in the analysis lead to an affirmative (albeit to
varying degrees) response to research questions 2, 3, and 4, indicating that
managers do concur with the abstract concepts of the resource-based view
Question 5, which considered the terminology and priorities for managers within
the automotive components industry, was considered using less elaborate
statistical techniques. In the case of this question, the results deviated substantially
from the expectations that were developed from the literature.
8.2.3 KEy ISSUES IN THE PERCEPTIONS OF MANAGERS
The careful examination and interpretation of the factors in Chapter 7 can be used
to highlight a number of important issues within the perceptions of managers. In
essence they describe the managers' attitudes toward strategic and competitive
issues in the automotive components sector. In an irrational world, managers still
believe that they can be rational in their decision making and analysis in the light
275

Chapter 8: Conclusions and Implications
of organisational transparency. This suggests that rational models of strategic
planning will be accepted by such managers and employed in the development of
future plans.
The management of supply chain relations (especially downstream) is an
imperative for managers. Not only is a senior management role that which is
involved in the development of new opportunities, process management is
perceived to be an integral part of systematically managing products and other
organisational resources (know how, etc.). Hence, senior management is
perceived by these managers to be 'hands-on' as well as the conventional strategic
role.
Competitive advantage, according to the respondent senior managers of
automotive component suppliers, can be achieved through the development of
unique relationships with downstream organisations. In this way, the company
becomes 'locked' into the final production processes of the vehicle assembler,
thereby raising switching costs. The duration of the relationship is critically
important since it offers the opportunity to engage in organisational learning with
partners, and to manifest the positive and collaborative behaviour that will lead to
a higher likelihood of success in bidding for new business once the vehicle
model's life has ended.
The ability to achieve a competitive advantage through combinations of resources
in the form of a platform or complex subassembly is an evident priority for
managers in this industry. Not only do platforms offer the potential to capture
greater value from the transformation process in the supply chain, they enable
suppliers to increase the volume of production of a given component given the
tendency toward automotive platform usage within and across assemblers' ranges
and brands. Furthermore, the high rates of joint R&D (Chapter 6) confirm that a
form of 'extrapreneurship' is necessary to augment the uniqueness of a buyer
supplier relationship.
Managers make a distinction between scale and market position (power). Scale is
concerned with the size of output relative to production capacity. In a volume
industry such as this, the ability to maximise capacity utilisation in order to
276

Chapter 8: Conclusions and Implications
deliver year-on-year pnce reductions to buyers is a competitive necessity.
Similarly, yet distinctively, market power is perceived to be the size of the
organisation relative to rivals. Once more, with the advent of new competition
from beyond trading zones (EU, ASEAN, NAFTA, etc.) organisations located
within the UK may find themselves in a weaker competitive position by virtue of
a shrinking demand for components (as overcapacity downstream is reduced) and
a shrinking world in terms of the source and location of rivals.
Although managers believe that they can plan effectively given the transparency
of rivalry, competition and industry conditions, they nonetheless recognise that
the future cannot be predicted with certainty. This is especially true in the case of
resource accumulation, but also in the case of developing unique relationships
with suppliers where the commitments made by the supplier may not be
reciprocated by the assembler. For instance, an automotive component supplier
that had committed a large amount of time and resources to the development of
unique relationship with Vauxhall (GM) would find themselves in an uncertain
position following the announcement that Luton-based passenger vehicle
operations are due to cease in 2001 and be transferred to plants in continental
Europe. Although, the supplier would still be contracted to supply components to
these overseas plants until the end of the model's life (specifically the Vectra
model), renewal of the supply contract (assuming no carry-over parts) would not
be a certainty, and might be hampered by locational and currency disadvantages
faced by the UK-based assembler. Even were the supplier to be a subsidiary or
division of a large multinational, the company would still be faced with the
dilemma of whether to locate component production more closely to the customer
to improve renewal possibilities. Contrast this, however, with a supplier that has
invested similar resources in a unique relationship with Toyota, an assembler
which in January 2001 announced a 30 per cent increase in production levels to
220,000 units per annum at its Burnaston (UK) plant.
In the light of the uncertainty noted above, the immediacy of superiority is critical
to senior managers in the automotive components industry. This is not a case of
impatience but of pragmatism. A rapid response to assemblers' requirements
combined with the ability to continuously manifest the supplier's competitive
277

Chapter 8: Conclusions and Implications
advantage(s) is necessary. However, managers in this study recogmse that
competitive advantage will develop over the course of time, whether this be
through unique relationships, technical and design excellence, reputation or
superior management experience. More importantly in the context of this study's
aims - to examine managers' perceptions of competitive advantage - is that
position within the industry as much as the unique resources at the disposal of the
company are considered critical in the search for competitive advantage. This
balance between residence and resources is visualised in the cartography of
competitive advantage (Figure 7.1).
In Williamson's defence of transaction costs theory (1999) he advanced a major
criticism of the resource-based view - a lack of operationalisation. 1os Such a
criticism should be reconsidered in the light of this study. The hybrid perceptions
of competitive advantage and the industry-specific cartography that has
subsequently been developed is an initial stepping stone to further study which
should examine both the impact of perceptions upon actions and decisions, and
the performance accruing from those actions. Only with such an initial stepping
stone having been identified can large scale studies be pursued. So, whilst the
RBV may have developed on the basis of an assumption that the plural of
anecdote is data, there has been a call for the RBV to "show its hand"
(Williamson, 1999: 1093) since it is a theory of the firm which connotes high(er)
performance. Instead, it is the decisions (or lack of them) of managers to use the
organisation's resources in the context of a competitive environment which
determine performance. Since these decisions are informed by factors other than a
strategic analysis, such as background, training and, critically in the case of this
study, the perceptions that managers have of competitive advantage, the finding
that a hybrid of competitive constructs rather than pure reflections of theories of
the firm prevailing in the minds of managers leads to a slightly differing outcome.
The pursuance of pure theory development is a necessary precursor to
management education and economic policy, but when it is found that reality
refracts, absorbs and fuses rather than reflects such developments, theorists,
lOS By operationalisation, Williamson is referring to a position whereby RBV theory can be used for the purposes of prediction. In addition, he denounces the anecdotal nature ofRBV work.
278

Chapter 8: Conclusions and Implication.\"
practitioners and educators should seek a balance between the ideal model of
competitive advantage resident on the printed page and the imperfect reality
which can be observed in the competitive environs. The difference is that of
dendrology compared with biology.
8.2.4 THE LEXICON OF COMPETITIVE ADVANTAGE
One of the main aims of this study was to assess the extent to which the nouns
used to describe a competitive advantage (strength, capability, competence, and
core competence) were used by managers. A corollary of this was to examine the
order of importance associated with certain characteristics of a resource (value,
rarity, inimitability and organisation) given the association made by RBV writers
between core competencies and many of these characteristics. These issues were
embraced within research question 5. As Sanchez and Heene (1997:308) add, "a
central concern of competence theory is developing better insights into the ways
managers conceptualise and communicate about new possibilities for competing
and cooperating".
Williamson has raised a further concern about the resource-based view - the
"often tautological definitions" (1999:1093). Although such a criticism was not
originally sought to be addressed, this study can provide a response. Following the
analysis in Chapter 7, this study concurs with the view that tautological
definitions do exist in the minds of strategic managers within the automotive
industry. They make little distinction between terms such as strength, capability,
competence and core competence. Whilst not all of these terms are directly
attributable to the RBV, the addition of terms used by writers in this field have
certainly not provided further clarification in the lexicon used to describe and
differentiate between resources of differing strategic significance. Thus we would
expect no more of a differentiation between resources that that provided by the
simple adjectivisation of a term. For instance, does the phrase "this is a core
competence" offer any greater insight for a manager to state "this is a very
important resource"?
279

Chapter 8: Conclusions and Implications
Seemingly, the results of this study would indicate that the managing strategists
participating in this study do not make distinctions between the terms referring to
a hierarchy of resources. This does not mean that they will not discern the fact that
resources differ in their strategic importance but that practising managers are less
concerned (or entirely unconcerned) with such semantic distinctions than their
academic counterparts.
The differences in precision and priority between academic and practitioner
terminologies have a further implication noted by Petts (1997:551) who argues
that the RBV "does not provide an easily assimilated conceptual framework for
managers", adding that "if this new paradigmatic viewpoint is going to be adopted
by ... business, there needs to be a straightforward way of explaining it to the
uninitiated". In the light of this study we can discern that the ambiguity of
concepts may present a problem in itself, but this is may be exacerbated by
differences in precision and priority. There are no easy solutions to the problem of
variable terminology. However, if the RBV is to have a wider and longer lasting
audience from the practitioner community (beyond curiosity toward the
anecdotal), a convergence in the lexicon of competitive advantage will be
required, since the potential distortion in the message from the academic when
received by the practitioner will devalue the potency and usefulness of the original
message.
Furthermore, there are consequences for intrusive research methodologies (Rouse
and Daellenbach, 1999) where the objective of the researcher is to examine RBV
issues within single organisations using multiple respondents and employing
open-ended or semi-structured questions. The findings of this study propose that
the researcher should examine, prior or during data collection, whether
respondents make a discernible distinction between types of resources. Otherwise,
the researcher may be led to identify distinctions where they do not exist or to
miss distinctions where they do. This is particularly important if the purpose of
the research is to develop normative theories of competitive advantage and ensure
reliability in the triangulation of data sets from the same organisation (lick, 1979).
280

Chapter 8: Conclusions and Implications
However, the propensity for managers to misinterpret the importance of resources
and deploy them in the fulfilment of a strategy on the basis of their mistaken
importance may still remain. This is especially pertinent given the connotations of
'organisational transparency' found in the study of managers' perceptions. In this
respect, further research is required to establish whether the mistaken
identification of something that is a core competence (a resource that is, at least
theoretically, valuable, rare, inimitable and organised) when in fact it is a less
strategically significant resource leads to a lower performance for the organisation
than might have been the case.
8.3 IMPLICATIONS FOR THE AUTOMOTIVE COMPONENTS INDUSTRY
Chapter 6 provided an exposition of the respondent organisations and managers,
providing the basis from which to argue with certitude that the study and its
findings were located precisely within the definition of an automotive component
supplier in the UK. The non-respondent analysis used at the start of Chapter 7
indicated that the respondent group was not significantly different from a sample
of non-respondents.
Consolidation is clearly evident in the size of organisation prevalent within the
sample. Moreover, the sample suggests that there is a small proportion of small
and micro sized firms within the UK sector. Accordingly, the image of clusters of
small machine shops servicing the industry does not necessarily hold true.
Increasingly, volume production requirements, international sourcing and cost
pressures will reduce the number of small suppliers, leaving only those specialist
manufacturers producing low volumes for non-standard parts within the sector. In
spite of this, however, the majority of suppliers in this study (60 per cent) can still
be considered to originate from the UK.
The study has also found an indication that the contribution of the automotive
components sector may be seriously underestimated (Chapter 6). There is a
shortfall of £S .2bn between the revenue data gathered in this study and those
provided by official statistics. Furthermore, the data collected for this study
represents less than one-third of companies recognised to operate within the UK
automotive components sector. This study highlights, once again, the problems
281

Chapter 8: Conclusions and Implications
arising with industry statistics based upon standard industry classifications. Such
statistics could impair policy making at a national level. In addition, the view that
tier 1 suppliers are necessarily larger than tier 2 counterparts has also been
questioned in this study as measured by turnover.
An assessment of the component types produced in the UK indicates that the
component supplier-base can be considered 'full-range' in terms of the major
outsourced component types required for final assembly. The product gaps
identified in a previous study (Pickemell, 1998a) have been, in part, filled
according to the findings of this research. However, despite the supply capability
and variety of the UK components industry (given the long history of assembly in
the UK) the location of the supplier in relation to the assembler would appear to
remain important. The study has found that a lower percentage of suppliers supply
overseas that to UK-based assemblers. Further evidence, if this was needed, is
provided to support the knock-on effect of assembly plant closures and overseas
re-Iocations (OM and Ford are two recent examples), Foreign direct investment
(FOI) initiatives by government should also reflect the impact of FOI assembler
investments and their impact on local and regional economies (see Foley et aI.,
1996). The combination of underestimated contributions and the impact of
assembly plant losses should provide a compelling case for the promotion of the
UK automotive industry's role in national wealth creation.
Interorganisational collaboration still remains strong within the industry, despite
the threat of a slight move back toward price/cost dominated economic exchanges
or 'reine preisdiktat' (Chapter 3). Joint research and development is predominant
across all tiers of the supply chain and a substantial number of suppliers have
entered into strategic alliances with other suppliers (44 per cent of respondent
organisations ).
The analysis of perceptions of competitive advantage highlighted that supply
chain relationships and product platforms are paramount within this industry.
Senior managers, therefore, reflect current competitive issues in the industry and
their consequences. These managers also recognise that capacity utilisation is a
critical issue in the light of consolidated capacity at the end of the supply chain.
282

Chapter 8: Conclusions and Implications
8.4 REFLECTIONS ON METHODOLOGY
The nature of the research questions led to the selection of a research strategy that
was based around empirical methods. Although empirical works have come to
dominate studies in strategic management in recent years, it was the resemblance
of this study to attitudinal testing which informed the choice of the research
strategy (Chapter 5). A mixed methodology was not adopted since the purpose of
the research study was to examine perceptions of managers across an industry,
rather than to link empirical findings to case studies or other forms of qualitative
data collection and analysis. The emphasis of this study lies in its focus on
examining the foundations of senior managers' strategic decisions - their
perceptions of competitive advantage. Without such foundations, it is argued here,
neither qualitative nor longitudinal methodologies can be entirely rigorous given
that the researcher would not know whether, for instance, how a firm's current
resources (in the instance of case-based research) had been influenced by
managers or how changing conditions had affected an organisation's competitive
advantage (given the changing perceptions of managers across the time period in
question). Hence, rather than being all things to all people, this study has chosen
to focus as an aid to rigour. In so doing, the study offers a solid, credible platform
both methodologically and in its findings for the subsequent replication of the
study to be undertaken (Section 8.5). Replication and extension of research studies
plays an important role in the development of theories, yet there is a tendency to
pursue exploratory and 'new' research. 106
8.4.1 SINGLE INDUSTRY Focus
The use of a single industry as the focus of study has enabled the interpretation of
data that, prima facie, could be considered largely abstract. However, as Rouse
and Daellenbach (1999) argue, research in the resource-based view may
potentially benefit from a single industry focus since firms within the same may
bear similarities in terms of strategic decisions, strategic factor markets and
organisational cultures. This study demonstrates that their suggestion of shared
106 Hubbard et al., (1998) found that only between 5 and 10 per cent of journal articles in the management field are replications and extensions of previous studies.
283

Chapter 8: Conclusions and Implications
factor markets and industry characteristics having a bearing on the outcome of
RBV -oriented studies can be upheld. Furthermore, in knowing that the strategists
in the industry have a long experience and tenure (Chapter 6) the mindsets of
incumbents will have been shaped by such influences.
Whilst the choice of a single industry enables the researcher to interpret more
specifically the finding which he or she develops in the course of data analysis,
such a decision necessarily forces the researcher to consider precisely how an
industry is defined and how the sampling should be undertaken. For this study,
definitions of the automotive components industry varied to such an extent that
firms not considered to be competitors might be labelled as such. For instance, a
HOV braking component supplier with no passenger car business and a passenger
car braking component supplier would be considered to be rivals on account of
their component type. The cross-elasticity of demand does not exist and rivalry, it
follows, does not exist between these two suppliers.
8.4.2 CAREFUL SAMPLING
A study which claims to focus on a single industry cannot purport to do so unless
judicious consideration has been given to how the industry is defined, whether the
definition is suitable and how incumbent organisations are identified. This
necessarily adds to the work of the researcher, but without this, claims of an
industry focus are unwarranted. In pursuance of such a claim, this study set out to
develop a database of component suppliers that met the definition of an original
equipment component supplier to the high volume assemblers of passenger
vehicles. A multi-source approach was used to identify organisations that met the
criteria developed in Chapter 4, because Standard Industry Classification codes
both included and excluded relevant firms. The experience of the researcher based
on the conduct of this study would lead to the suggestion that how samples are
chosen need increasing scrutiny where SIC codes alone are used. In this respect,
the omission of important potential respondents in respect of their quantity and
type arising from SIC codes has been avoided in this study and can be said to
concur with the recommendations of Rouse and Daellenbach (1999) for RBV
284

Chapter 8: Conclusions and Implications
methodologies. 107 Careful sampling is an important precursor to the relevance of
responses.
Bespoke database development has its benefits despite the work involved in their
development where large number of responses are required. The ability to
generate mail merges and to manage responses ensures that follow up activities
are as effective in targeting actual non-respondents. Furthermore, the database is
valuable insofar as non-response bias has been shown to be insignificant.
Although the postal survey approach can be considered an impersonal form of
contact between the researcher and the subject, the ability to personalise
correspondence using database software partially offsets this effect. An additional
benefit for the researcher is that he or she has an indication of how the database
and the sample subsequently derived from it compares with publicly available
information and provides a basis for comparison with similar studies within the
industry (as discussed in Chapter 6).
8.4.3 PRETESTING VERSUS PILOTING
Although the pre-testing of statements in the manner used in this study is not new,
it offers further evidence that the careful development of statements with the
target audience as the central consideration offers the opportunity to examine the
data collection instrument in a more detailed manner than would be the case of a
typical pilot phase involving the distribution of a small number of surveys to
participants. The use of focus groups enables the researcher to gather more
feedback and to examine problems and potential solutions with persons similar to
the subsequent recipients of the questionnaire. Furthermore, the pre-testing of the
data collection instrument with a group of general managers, as employed in this
study, also ensures that respondents which may have a lesser experience of the
industry and its associated terminologies will have an equal opportunity to
respond appropriately to questions. This approach also indicates the extent to
which surveys and their content may be used across industries as well as the
industry which is the concern of the study. In essence, the researcher is thinking
about the applicability and obsolescence of the survey.
107 Rouse and Daellenbach (1999) recommend on this refinement, albeit theoretically.
285
Chapter 8: Conclusions and Implications
8.4.4 THE RELEVANCE AND VALUE OF FACTOR ANALYSIS
Finally, in respect of the methodological dimensions of this study, the primary
data analysis technique - factor analysis - has proved to be a success. lOS Such an
assertion is support by a number of outcomes arising from the previous chapter.
First, the technique offers a manner by which to deal with a large data set (9088
data items were collected for the 32 statements alone) and reduce the data into a
manageable format (i.e. nine factors). Secondly, the trial extractions (Chapter 7)
used in this study required the researcher to think about how the data was best
interpreted in the context of the research questions and research context.
Indeed, this trial extraction process indicated that the first (apparent) answer was
not the best one. Such an approach involves the exploration of the data for
underlying patterns by the researcher as much as the factor analysis has sought to
achieve mathematically. 109 The software package is blind to the research questions
and research context. The researcher is responsible for finding the most
appropriate answers. Third, the use of factor analysis in this study has once again
shown that the interpretation of factors is critically dependent on an understanding
of the context in which the data was collected. Abstract data can be given life
through logical and thoughtful interpretation. Although exploratory factor analysis
was chosen due to its relevance in theory building, future studies of this type may
use a confirmatory factor analytical approach (LISREL-based) for the purposes of
predicted hypotheses developed by the researcher.
101 It is worth noting that prior to this study, the researcher's experience had largely been one of explanatory. exploratory and descriptive qualitative studies (e.g. Herbane, 1994; Swartz et ai, 1995; Herbane et al .• 1997; Elliott et af, 1999). Fitness for purpose, methodologically speaking, should be criteria for the selection of the research strategy rather than any predilection toward a favoured methodology. 109 This echoes the 'grounded' approach to theory development (Glaser and Strauss, 1967).
286

Chapter 8: Conclusions and Implications
8.4.5 LIMITATIONS AND MODIFICATIONS TO THE RESEARCH STRATEGY
Whilst the research strategy and data collection can be considered to have been
successful for the most part, the deployment of the research strategy has
highlighted a number of areas which could generate further or more refined data.
Although findings in relation to question 5 could be interpreted in the industry
context, it has clearly shown the limitations of dealing with questions of
terminology and the importance of resources through the use of interval scales
given the proximity of scores and the lack of correlations. A repertory grid
approach (Kelly, 1955) using the terminology as constructs and using
combinations of the VRIO criteria as 'objects' could be incorporated into the
survey instrument. Although this would yield insights into whether (and if so,
how) terms were associated with certain characteristics of advantage, a danger
might be to slow down the completion of the questionnaire and endanger its
completion. However, with the survey instrument completed and successfully
deployed, piloting to examine the effects of this modification could be undertaken.
Additional profile data would be useful to enable further examination of the data
derived from the factor analysis. For instance, information about the nationality
and educational background of respondent managers would allow inferences to be
made about relationships between tenure, education, experience and nationality,
and the perceptions of managers.
8.S DIRECTIONS FOR FUTURE RESEARCH
8.5.1 BUILDINGS ON THE FOUNDATIONS
This study has successfully shown the value in testing theories within strategic
management using methodologies akin to personality/attitude testing. It has been
found that hybrid interpretations of theories can be observed among a group of
managers within the same industry. Earlier in this chapter it was argued that the
study of how managers' attitudes reflect prevailing or emerging theories was a
necessary precursor to the study of how organisations' performances reflect
strategic decisions based on or reflective of these theories given that perceptions
will influence actions (Chapter 2). This section is concerned with how this study
287

Chapter 8: Conclusions and Implications
can form a basis for future research, how the study could be refined for replication
and how the research has generated further research questions.
From the outset of the study, some uncertainty existed in respect of the size of the
questionnaire, presenting in turn a trade-off that needed to be reconciled against
other considerations. An ideal situation would be one in which the researcher
could include as many items/statements as she or he wished without jeopardising
respondents' willingness to complete the questionnaire. As the previous section
indicated some 9088 data items were compiled from the respondents. In no single
case did a respondent omit to provide a response to an individual statement. This
completeness of data suggests that the data collection instrument was suitably
structured and adequate in its length. The addition of further statements would
enable the researcher to examine more detailed, complex and interconnected
issues than the 32 statements used in this study could provide. In this instance
consultation with pre-test focus groups and limited piloting would help the
researcher to discern whether the increased number of statements would lead to
respondent fatigue.
The main direction for future research could be to incorporate the research
strategy used in this study to form part of a multi-stage methodology which seeks
to address competitive advantage within an industry and the perception, decision
and performance relationship. Such a methodology would comprise of three
stages. In the first, the research would replicate this study's methodology to
examine the perceptions of managers within an industry. The second stage would
involve the use of intrusive measures such as semi-structured interviews, archival
research and content analysis, action research and case study approaches to
identify how the perceptions held by managers would have an influence on the
decisions taken by that manager, both individually and within group decision
making (Eisenhardt, 1989; Yin, 1989; Leonard-Barton, 1990; Hamel et al., 1993).
Bibliometric and patent analysis (Chapter 4) would usefully supplement this
qualitative data. Thirdly, the methodology would attempt to isolate the linkage
between the strategic decision and organisation performance. The measurement of
financial performance is by no means a straightforward and agreed upon activity.
Perhaps, however, measures of superior performance such as the ability to
288

Chapter 8: Conclusions and Implications
premium price relative to alternative products and services, and a measure such as
return on premium price might prove to be a useful staring point. llo A wide
variety of measures of organisational performance are available, although many
remain problematical. III These include stakeholder approaches (Mitchell et aI.,
1997), accounting measures such as leverage, profitability and liquidity (bearing
in mind some of the problems in the use of such measures; see Zimmerman, 1983;
Watts and Zimmerman, 1990; Smith, 1996), and present value measures for
public companies (Copeland and Weston, 1993). Market measures would clearly
be included within a consideration of performance, as would measure of HR
measures (turnover and tenure/experience of employees) and technology measures
such as R&D expenditure, lead-time, carry over parts and intellectual property
applications (Trademarks and Patents).
Once completed in a single industry, the three stage methodology could be
employed across industry boundaries to examine how differences in strategists'
perceptions differ by industry and subsequent decisions and performances. Such
an approach would show the synergies and insights that can potentially arise from
the use of mixed methods. The mapping of factors using an approach similar to
the cartography of competitive advantage presented in Chapter 7 could be used to
highlight the salient differences between perceptions of managers between
industries, where they exist. Accordingly, although this study is quantitative in its
nature, it by no means eschews the possibilities for a qualitative synthesis.
The proposal of a three stage research strategy such as that proposed above
suggests that the operationalisation of RBV research can be achieved, contingent
on the acknowledgement of a number of caveats. Although it may appear that
such an approach would seek to generalise, more appropriate is that RBV research
should seek to identify patterns and re-occurrences which can be used to advise
managers to change practices, resources and decisions to improve organisational
performance, rather than devise rules and prescriptions that, necessarily by virtue
110 Return on premium price is calculated as follows: Premium price (difference between company' price and average industry prices) divided by industry average prices (lAP). Thus, for instance, where lAP for the ~roduct is £10 and company A's selling price is £12, return on premium price is (2+1O)xlOO = 20%. II See: Wood and Laforge, 1979; Rhyne, 1986; Ramanujam et al., 1986; Pearce et al., 1987; Cool and
Schendel, 1988; Boyd, 1991; Veliyath and Shortell, 1993; Brown and Laverick, 1994.
289
Chapter 8: Conclusions and Implications
of the historical and social dimension of many resources, are rendered ineffectual
(for instance, the study of the organisation of research and development in
isolation). Furthermore as Chapter 4 indicates causal ambiguity and uncertain
imitability will always be the enemy of generalisation but the ally of uniqueness.
In respect of the exigency to study the RBV empirically, this is actually needed to
overcome the charge of 'anecdotism' that accompanies much of the work already
carried out (Chapter 4). However, anecdote and abstract empiricism are two sides
of the same coin of the "trivia" currency which both dilute interpretation. Needed,
instead, is a balance between strong empirical foundations coupled with the
richness of detail so that empirical evidence coupled with rich supporting material
will lead to a compelling, coherent and competent body of theory.
8.5.2 NEW RESEARCH QUESTIONS
During the course of this study, the discussion and analysis has itself generated
further research questions. Several research themes/questions warrant further
investigation and this section develops research questions for further study.
Chapter 4 raised the issue of whether organisations can really benefit from a best
practice study (for instance Oliver et al., 1994) given the problems of uncertain
imitability and resource accumulation. The question of whether organisations can
truly learn from publicly available studies of others requires further investigation
if researchers and consultants are to understand the impact that best
practice/benchmarking research has on the practitioner community. The following
research question is proposed:
Research question A: Do best practice studies enable organisations to
successfully emulate best practices?
Such a research question would be most effectively examined through qualitative
methods such as the case study, in which the role of an organisation's process
transformation is considered alongside the information and advice at their disposal
(in the form of a best practice study).
290

Chapter 8: Conclusions and Implications
The concept of the tier three supplier would, from the attempts in this study to
identify them, be an elusive one. Further research is required to focus on who
these tier three suppliers are, their characteristics (size, age, turnover) and their
dependence on the automotive sector. The following research question is
proposed:
Research question B: Can a large third tier of suppliers be identified in
the UK automotive components sector?
The 98 known tier 2 suppliers could be used to assist in the identification of
additional tier 3 suppliers to the 34 known in this study. A revised survey
instrument, using parts 1-3 of the questionnaire used in this study could be used to
specifically examine the issues which led to the proposal of research question B.
The anecdotal insight recounted in Chapter 6 (Section 6.2.4) generated the
possibility that 'resident' or 'guest' engineers working within component
suppliers may not be perceived as positively as portrayed in the literature (Chapter
3). Here it would be worthy to ask whether seconded personnel from assemblers
are perceived generally as a 'friendly foe' and the reasons underpinning the
responses. The following research question is proposed:
Research question C: Is the Resident Engineer perceived to be a
collaborative asset or a hindrance to the supplier?
Although the source of technical plans in the R&D (Research and Development)
process are known (built to print, joint or sole), additional questions which
examine the R&D process (rather than the trigger) would offer further insights
into this technology driven industry. The following research question is proposed:
Research question D: How is the organisation of R&D related to the
source of component plans?
Such a question could apply to suppliers across all tiers and could be examined
through a short questionnaire designed to identify which R&D approach is used
(for instance simultaneous, sequential, or e-build approaches) and to examine
responsibilities for decision making associated with product development and
291

Chapter 8: Conclusions and Implications
project management. Thus the researcher could discern whether suppliers control
the R&D process or whether it is the assemblers that drive it.
A further question raised in Chapter 6 related to why organisations choose (or are
forced to) adopt sole R&D approaches and whether companies might be trading
off the benefits of shared R&D in favour of competitive advantage in other ways.
Consequently, the following research question is proposed:
Research question E: Why do companies use a sole approach to R&D?
This research question would need to addressed through a series of statements
designed to examine the motives and pressures for such an approach.
Although these new research questions may appear to fragmented in their nature,
questions C, D and E have an underlying themes - R&D. It is clear that the
strategic management of R&D among UK automotive components suppliers is a
clear domain for future study.
8.6 CONCLUDING COMMENTS
In bringing this study to a conclusion, it is now opportune to summarise the
theoretical. practical and methodological contributions and conclusions of this
study.
In theoretical terms, the study has made a contribution in being the first to
examine the managers' perceptions of competitive advantage in the context of two
'competing' theories in strategic management. In so doing, the study has
discovered a hybrid of perceptions that questions the strategy formulation
literature and makes a contribution to the literature in relation to the "Perception
~ Decision ~ Action relationship". Insights into the lexicon of competitive
advantage have been drawn together to challenge the extant literature (important
in the communications between academics and practitioners) and a cartography of
competitive advantage has been developed to provide an alternative presentation
of factor analysis.
In practical terms. the study questions whether managers have full knowledge and
have perfect entropy in spite of their perceptions. In terms of behaviour in the
292

Chapter 8: Conclusions and Implications
supply chain, the study has found that managers recognise the importance of
relationship management by competitive collaboration and that 'next-contract
requisites' are important in the development of long-term success. Furthermore,
the study suggests that competence development is better achieved within a
collaborate relationship. Alliances between the suppliers themselves has not been
studied in the UK context but it is clear from this study that such alliances are not
a rarity. Finally, in practical terms, the UK automotive components sector is more
important than we might previously have thought. Problems and ambiguities with
SIC codes and a shortfall in sector turnover in official statistics (£5.2 bn)
compared with the findings of this study cloud the contribution of the sector to the
national economy and export activity.
Several methodological contributions and conclusions can be made. First, the
study has sampled a larger number of companies than any known UK study by
virtue of a bespoke database. The survey instrument has been successfully refined
and deployed by using pretesting and use of comparative focus group testing, and
Delphi-testing. The high response rate and completeness of the data-set are
testament to this success.
Strategic management has, for the most part, developed from the fusion of many
separate disciplinary fields (economics, organisational theory, finance,
international business. marketing). Together, they have sought to explain how and
why organisations should make choices which generate the best use of resources
in relation to predetermined goals. It is at this point where, naturally in the case of
a developing discipline, disagreement has emerged.
Most business researchers, as indeed all industry managers, are keenly interested
in how organisational performance can be improved. The assumption of pure
rationality may prove to be a useful starting point in explaining pure theories of
optimal returns in the use of resources under conditions of complete information,
stability and certainty. However, any departure from these conditions necessarily
requires us to think about how political, coercive, and irrational dimensions lead
to the management of organisations.
293

Chapter 8: Conclusions and Implications
Since no two organisations are the same, one cannot anticipate that the
prescriptions of theories undeniably reflect the behaviour of managers within
those organisations. Seeking the best in an imperfect world rather that the seeking
of what is best in a perfect world should be the intention of strategic management
researchers - strategy formation and the cognitive limitations of decision makers
are testimony to this. A lack of this recognition has meant that research in
strategic management, particularly in the examination of competition theory and
competitive advantage, has run the risk of being empirically impenetrable or
anecdotally alien. At either extreme, research in strategic management has been
guilty of generating "intellectual isolating mechanisms" (Mahoney and Pandian,
1992) which hamper theory development and, potentially, the impact of normative
approaches to strategic management.
This study has found that theories of competitive advantage are not centrifuges.
The perceptions of managers indicate that they are clearly not pulled in one
direction toward a single theory. Furthermore, the study proposes that in terms of
the sources of competitive advantage, managers are 'thinking out of the box' of
rigid competitive paradigms. Indeed, they seem to be thinking without boxes.
The investigation has shown that that the variety of terminology on offer by
strategic management to describe strategically significant resources is confusing
or meaningless. In this respect, Joan Robinson's remark that "there is no
advantage (and much error) in making definitions of words more precise than the
subject matter they refer to" (1956:361) should be considered with some regard.
Several contributions have been made by this study. This is the first known study
to examine managers' perceptions of two competing theories within strategic
management. In so doing, the findings of this study can be used as a foundation
for a re-evaluation of theory development in strategic management since it
indicates that theories are not perceived in the same way by managers as the
academics which gave rise to them. This is not to say that such theories are wrong,
but rather that it is wise to evaluate how strategic management theories match
with practitioners' perceptions on a periodic basis if strategic management is to
294

Chapter 8: Conclusions and Implications
excel in both positive and normative roles. Necessary readjustments may be
required, as have been proposed in this study.
Furthermore, this study has developed and deployed a robust methodology,
capable of replication and extension into a multi-stage research design (Section
8.5.1). The use of factor analysis and subsequent interpretation of data has offered
an appropriate manner by which to address the research questions. The
development of a bespoke database to assist with sample frame management has
enhanced the insights and confidence in the results, and has provided the
opportunity to re-evaluate some of the characteristics of automotive component
suppliers evident in the antecedent literature. And, the use of a graphical approach
to the presentation of a cognitive cartography has been forwarded as a way in
which to communicate the salient characteristics of managers' perceptions within
an industry.
Finally, this thesis has shown that a great deal of work is still required in order to
fully understand the contribution of the resource-based view to managers'
thinking and decision making. Although neither residence nor resources
predominate in the minds of managers, the industry context - despite its reduced
importance advocated by the resource-based view - still remains an important
variable in the choice and outcome of strategies, and the interpretation of data in
the study of strategic management.
295

Bibliography
Bibliography
Aaker, D.A. (1989) Managing Assets and Skills: The Key to Sustainable
Competitive Advantage, California Management Review, Winter, pp. 91-
106.
Abernathy, W.J. and Wayne, K. (1974), 'Limits of the Leaming Curve', Harvard
Business Review, Sept-Oct, pp. 109-119.
Adelman, M. A. (1949), 'Integration and Anti-trust Policy', Harvard Law Review,
63, pp. 626-655
AEM (1997) Overcrowding at home drives car makers west, Automotive
Emerging Markets, September 1997, p.25-26
Aharoni. Y. (1993) In Search for the Unique: Can Firm-Specific Advantage be
Evaluated?, Journal of Management Studies, 30 (1), pp. 31-49.
Akerlof, G.A. (1970) The Market for "Lemons": Quality Uncertainty and the
Market Mechanism, Quarterly Journal of Economics, 84, pp. 488-500.
Alberts, W.W. (1989) The Experience Curve Doctrine Reconsidered, Journal of
Marketing, 52, July, pp. 36-49.
Alchian, A.A. (1950) Uncertainty. Evolution and Economic Theory, Journal of
Political Economy, 58. pp. 211-221.
Allport, O.W. (1989) The historical background of modern social psychology, in
The Handbook of Social Psychology, Wokingham, Addison Wesley
Alsop, S. (1997) 'Sun's Java: What's Hype, What's Real', Fortune, July 7th, pp.
83-84.
Alvesson, M. and Lindkvist, L. (1993) Transaction Costs, Clans and Corporate
Culture, Journal of Management Studies, 30 (3), pp. 427-452.
296

Amit, R., and Schoemaker, J. P. H. (1993), 'Strategic Assets and Organisational
Rent', Strategic Management Journal. 14, pp. 33-46.
Anderson, c.R. and Paine, F.T (1975) Managerial Perceptions and Strategic
Behaviour, Academy 0/ Management Journal, 18 (4), pp. 811-823.
Appendices
Anderson, E. and Gatignon, H. (1986) Models of Foreign Entry: A Transaction
Costs Analysis and Propositions, Journal 0/ International Business Studies,
17,pp.I-26.
Andrews, K. R. (1971), The Concept o/Corporate Strategy. Dow Jones Irwin,
Howood, IL., USA.
Andrews, K.R. (1980), The Concept o/Corporate Strategy, Irwin, Homewood, IL,
USA.
Ansoff, H.I. (1965) Corporate Strategy: An Analytic Approach to Business Policy
for Growth and Expansion, New York, McGraw Hill.
Ansoff, H.I. (1987), Corporate Strategy, Revised Edition, London, Penguin
Business.
Ansoff, H.I. (1991) Critique of Henry Mintzberg's 'The Design School:
Reconsidering the Premises of Strategic Management', Strategic
Management Journal, 12, pp. 449-461.
Ansoff, H.I. and McDonnell, E. (1990), Implanting Strategic Management, Prentice
Hall, Hemel Hempstead.
Arben, P.D. (1997) The Integrating Course in the Business School Curriculum, or,
whatever happened to Business Policy?, Business Horizons, March-April,
pp.65-70.
Asanuma, B. (1985a) The Contractual Framework for Parts Supply in the Japanese
Automotive Industry, Japanese Economic Studies, 15, pp. 54-78.
Asanuma, B. (1985b) The Organisation of Parts Supply in the Japanese Automotive
Industry, Japanese Economic Studies, 15, pp. 32-53.
297

Appendices
Asanuma, B. (1988) Manufacturer Supplier Relationships in Japan and the Concept
of Relation Specific Skill, Journal of the Japanese and International
Economics, 3, March, pp. 1-30.
Ashley, S. (1992) Applying Taguchi's Quality Engineering to Technology
Development, Mechanical Engineering, July, pp. 58-61.
Auto Industry (1999), The automotive components industry [Online]. Available
from: http://www.autoindustry.co.uklservices/services_3.html [accessed
03/08/99].
Bagozzi, R.P. (ed) (1994) Principles of Marketing Research, Oxford, Blackwell
Business.
Bain, G.S. (1990) Industrial Relations in Britain, Oxford, Basil Blackwell.
Bain, J. (1959), Industrial Organisation, John Wiley and Son, New York, USA.
Bank. of England (2000) Quarterly Report on Small Business Statistics, London,
Domestic Finance Division, Bank. of England.
Bantel, K.A. and Jackson, S.E (1989) Top management and innovations in
banking. Does the composition of the team make a difference?, Strategic
Management Journal, 10, Special Issue, pp. 107-124.
Barnes, J.H. (1984) Cognitive Biases and their Impact on Strategic Planning,
Strategic Management Journal, 5, pp. 129-137.
Barney, J. (1986a), 'Organisational culture: Can it be a source of sustained
competitive advantage?' Academy of Management Review, 11, pp. 656-
665.
Barney, J. (1991),'Firm resources and sustained competitive advantage.' Journal
of Management, 17, pp. 99-120.
Barney, J. (1997), Gaining and Sustaining Competitive Advantage. Addison
Wesley Publishing, Harlow.
Barney, lB. (1986b) Strategic Factor Markets: Expectations, Luck and Business
Strategy, Management Science, 42, pp. 1231-1241.
298

Bamey, J.B. (1989) Asset Stocks and Sustained Competitive Advantage: A
Comment, Management Science, 35 (12), December, pp. 1511-1513.
Appendices
Bauerschmidt, A. (1996) Speaking of Strategy, Strategic Management Journal, 17,
pp. 665-667.
Baumgartner, R.M. and Heberlein, T.A. (1984) Recent research on mailed
questionnaire response rates in Lockhart, D.C. (ed) Making effective used
of mailed questionnaires, San Francisco, Jossey-Bass.
Beecham, M. (1998) Suppliers pass the Cogent test, FT Automotive Components
Analyst, September, p. 15.
Beinhocker, E.D. (1997) Strategy at the Edge of Chaos, The McKinsey Quarterly, 1,
pp.24-39.
Benjamin, C. (1993) Honda and the Art of Competitive Manoeuvre, Long Range
Planning, 26 (4), pp22-31.
Bertodo, R.O. (1991a) Alignment of Automotive Suppliers to a Strategic Vision,
International Journal of Vehicle Design, 12 (3), pp. 255-267.
Bertodo, R.O. (1991b) Co-Production: Basis ofa New Supplier Relationship,
Society of Motor Manufacturers and Traders 5th Annual Quality
Conference, Binningham, March 20.
Bertodo, R.O. (1991c) Interlinking: A Post Teamworking Automotive Deployment
Strategy, Proc. 1 Mech. E., 205, Part D, pp. 211-219.
Bertodo, R.O. (1991d) Reconciliation of Technology and Market Forces,
Automotive Technology International, pp. 75-78.
Bertodo, R.O. (1991e) The Role of Suppliers in Implementing Strategic Vision,
Long Range Planning, 24 (3), pp. 40-48.
Bertodo, R.O. (1991f), 'The Role of Suppliers in Implementing Strategic Vision',
Long Range Planning, 24 (3), pp. 40-48.
Besanko, D., Dranove, D. and Shanley, M. (1996), Economics o/Strategy,
London, John Wiley and Son.
299

Appendices
Bessel, R. (1990) Transport, in Chant, C. (ed) Science, Technology and Everyday
Life 1870-1950, London, Routledge.
Bettis, R.A. (1991) Strategic Management and the Straightjacket: An Editorial
Essay, Organisational Science. 2 (3), pp. 315-319.
Bosch (1996) Automotive Handbook, Fourth Edition, Stuttgart, Robert Bosch
GMBH.
Boston Consulting Group (1968) Perspectives on Experience, Boston MA, Boston
Consulting Group Inc.
Boston Consulting GrouplPRS (1980) The European Vehicle Components Industry,
London, Boston Consulting Group.
Bourgeois, LJ. (1985) Strategic goals, perceived uncertainty and economic
performance in volatile environments, Academy of Management Journal,
28, pp. 548-573.
Bowman, C. (1991) Perceptions of Competitive Strategy: Realised Strategy.
Concensus and Performance, PhD Thesis, Cranfield School of
Management.
Bowman, C. (1992a), 'Interpreting competitive strategy,' In Faulkner, D. and
Johnson, G., The Challenge of Strategic Management, London, Kogan
Page, pp. 64-83.
Bowman, C. (1992a), 'Interpreting competitive strategy,' In Faulkner, D. and
Johnson, G., The Challenge o/Strategic Management, London, Kogan
Page, pp. 64-83.
Boyd, B.K. (1991) Strategic Planning and Financial Performance: A Meta
Analytic Approach, Journal 0/ Management Studies, 28 (4), pp. 353-374.
Bracker, J. (1980) The historical development of the strategic management
concept, Academy of Management Review, 5 (2), pp. 219-224.
Bresnahan, I.F. and Reiss, P.C. (1987) Do Entry Conditions Vary across Markets?,
Brookings Papers on Economic Activity, 3, pp. 833-871.
300

Brown, M.D. and Laverick, S. (1994) Measuring Corporate Performance, Long
Range Planning, 27 (4), pp. 88-98.
Brown, S. (1999) Europe's automotive future: Challenges for the new
millennium, London, FT Automotive
Bryman, A. and Cramer, D. (1997) Qualitative Data Analysis with SPSS for
Windows, London, Routledge.
Buchele, R.B. (1962) How to Evaluate a Firm, California Management Review,
Fall, pp. 5.
Appendices
Burgeois, L. J. (1985) Strategic goals, perceived uncertainty and economic
performance in volatile environments, Academy of Management Journal,
28, pp. 548-573.
Bursa, M., Hunston, H., Lewis, A. and Wright, C. (1997) The Automotive Supply
Chain - New strategies for a new world order, London, Informa
Publishing Group.
Cameron, K. (1986) Effectiveness as a Paradox: Consensus and Conflicts in
Perceptions of Organisational Effectiveness, Management Science, 32, pp.
539-533.
Camilus, J.C. and Datta, D.K. (1991), 'Managing Strategic Issues in a Turbulent
Environment', Long Range Planning, 24 (2), pp. 67-74.
Capon, N., Farley, J.U., and Hulbert, J. (1980) International diffusion of corporate
and strategic planning practices, Columbia Journal of World Business, 15
(3), pp. 5-13.
Carr, C.H. (1992b), 'Productivity and Skills in Vehicle Component Manufacturers
in Britain, Germany, the U.S.A. and Japan', National Institute Economic
Review, 139, pp. 79-87.
Carr, C.H. and Truesdale, A. (1992), 'Lessons from Nissan's British Suppliers',
International Journal of Operations and Production Management, 12 (2),
pp.49-57.
301

Appendices
Carter, N.M., Steams, T.M., Reynolds, P.O. and Miller, B.A. (1994)New venture
strategies: Theory development with an empirical base, Strategic
Management Journal, 15 (1), pp. 21-41.
Cattell, R.B. (1978) The scientific use of factor analysis in behavioural and life
sciences, London, Plenum Press.
Caves, R. and Porter, M.E. (1977) From entry barriers to mobility barriers:
conjectural decisions and contrived deterrence to new competition,
Quarterly Journal of Economics, 26, pp. 241-262.
CBI (2000) Economic Bulletin, September 2000, London, Confederation of
British Industry
Chamberlin, E.H. (1950) Product Heterogeneity and Public Policy, American
Economic Review, 40, My, pp. 85-92.
Chandler, A.D. (1962), Strategy and Structure: Chapters in the History of the
Industrial Enterprise, MIT Press, Cambridge, MA, USA.
Chattopadhyay, P., Glick, W.H., Chet Miller, C. and Huber, G.P. (1999)
Determinants of Executive Beliefs: Comparing Functional Conditioning
and Social Influence, Strategic Management Journal, 20, pp. 763-789.
Chen, M. (1995) Asian Management Systems: Chinese, Japanese and Korean Styles
of Business, London, Routledge.
Child, J. (1972) Organization, Structure , Environment and Performance - The
Role of Strategic Choice, Sociology, 6, pp. 1-22.
Clark, K. B. and Fujimoto, T. (1989), 'Lead Time in Automobile Product
Development: Explaining the Japanese Advantage', Journal of
Engineering and Technology Management, 6, pp. 25-58.
Clark, K.B. (1989) Project Scope and Project Performance: The Effect of Parts
Strategy and Supplier Involvement on Product Development, Management
Science, 35 (10), pp. 1247-1263.
302

Clark, K.B., Chew, W.B. and Fujimoto, T. (1987) Product Development in the
World Auto Industry, Brookings Papers on Economic Activity, 3, pp.729-
771.
Cleary, T. (1991) The Japanese Art of War, Shambala, London
Appendices
Clover, V.T. and Balsey, H.L. (1979) Business Research Methods, Grid Publishing
Inc, Columbus Ohio.
Coakes, S.J. and Steed, L.G. (1999) SPSS - Analysis without Anguish, John
Wiley & Sons, Brisbane.
Coase, R.H. (1937) The Nature of the Firm, Economica, November, pp. 386-405.
Coase, R.H. (1937) The Nature of the Finn, Economica, November, pp. 386-405.
Cohen, KJ. and Cyert, R.M. (1973) Strategy: Fonnulation, Implementation and
Monitoring, Journal of Business, July, pp. 349-367.
Collis, DJ. and Montgomery, C.A. (1995) Competing on Resources; Strategy in the
1990s, Harvard Business Review, July-August, pp. 118-127.
Commission Of The European Communities (1992) The European Motor Vehicle
Industry: Situation, Issues at Stake. and Proposals for Action.
Communication from the Commission to the Council, the European
Parliament and the Economic and Social Committee, Brussels.
Conner, R.M. (1991) A Historical Comparison of Resource-Based Theory and
Five Schools of Thought within Industrial Organisation Economics: Do
we have a New Theory of the Firm, Journal of Management, 17 (1), pp.
121-154.
Connor, P.E. and Becker, B.W. (1977) Value Biases in Organisational Research,
Academy of Management Review, July, pp. 421-430.
Cool, K. and Schendel, D. (1988), Performance Differences Among Strategic
Group Members, Strategic Management Journal, 9, pp. 207-223.
Copeland, T. E., and Weston, J. F. (1993), Financial Theory and Corporate
Policy. Addision-Wesley, Reading, MA, USA.
303

Cortina, 1.M. (1993) What is Coefficient Alpha? An Examination of Theory and
Applications, Journal of Applied Psychology, 78 (1), pp. 98-104.
Coyne, K.P., Hall, SJ.D. and Clifford, P.D. (1997) Is your core competence a
mirage?, The McKinsey Quarterly, 1, pp. 40-54.
Cravens, K.S. (1997), 'Examining the Role of Transfer Pricing for Multinational
Firms', International Business Review, 6 (2), pp. 127-145.
Cronbach, LJ. (1951) Coefficient Alpha and the Internal Structure of Tests,
Psychometrika, 16 (3), pp. 297-334.
Cusumano, M.A (1991) The Japanese Automobile Industry: Technology and
Management at Nissan and Toyota, London, Harvard University Press.
Appendices
Cusumano, M.A. (1997), 'How Microsoft Make Large Teams Work Like Small
Teams', Sloan Management Review, Fall, pp. 9-20.
Cusumano, M.A and Takeishi, A (1991) Supplier Relations and Management: A
Survey of Japanese, Japanese Transplant, and U.S. Auto Plants, Strategic
Management Journal, 12, pp. 563-588.
Cyert, R.R. and March, lG. (1963) A Behavioural Theory of the Firm.
Englewood Cliffs, N.J.: Pentice Hall.
Das, T.K. (1991) Time: The Hidden Dimension in Strategic Planning, Long Range
Planning, 24 (3) pp. 49-57.
Day, D.V. and Lord, R.G. (1992) Expertise and problem categorization - The role
of expert processing in organiszational sense making, Journal of
Management Studies, 29, pp. 35-47.
De Wit, B. and Meyer, R. (eds) (1994) Strategy: Process, Content, Context: An
International Perspective, Minneapolis, West Publishing.
Delbecq, AL., Van de Ven, AH. and Gustafson, D.H. (1975) Group Techniques
for Program Planning: A Guide to Nominal Group and Delphi Processes,
Glenview Ill, Foresman.
Denison, D. R. (1990). Corporate Culture and Organizational Effectiveness. John
Wiley & Sons, New York, NY, USA
304

Appendices
Denscombe, M. (1998) The Good Research GUidefor small-scale social research
projects, Buckingham, Open University Press.
Deshpande, R. (1982) The organizational context of market research use, Journal
of Marketing, 46, Fall, pp. 91-101.
Dess, G.G. (1987) Consensus on strategy formulation and organisational
performance: Competitors in a fragmented industry, Strategic
Management Journal, 8 (3), pp. 259-277.
De Vaus, D.A. (1991) Surveys in Social Research, Third Edition, London, Allen
and Unwin.
De Vellis, R.F. (1991) Scale Development - Theory and Applications, London,
Sage.
Dhalla, N. K. and Yuspeh, S. (1976), 'Forget the Product-Life Cycle Concept!',
Harvard Business Review, January-February, pp. 102-110.
Diamantopolous, A. and Schlegelmilch, B.B. (1996) Determinants of Industrial
Mail Survey Response - A Survey-on-Surveys Analysis of Researchers'
and Managers' Views, Journal of Marketing Management, 12, pp. 505-
531.
Diamantopolous, A. and Schlegelmilch, B.B. (1997) Taking the fear out of data
analysis, The Dryden Press, London.
Dierickx, I. and Cool, K. (1989), 'Asset Stock Accumulation and Sustainability
of Competitive Advantage: Reply', Management Science, 35 (12), p. 1514.
Dierickx, I. and Cool, K. (1989), 'Asset Stock Accumulation and Sustainability
of Competitive Advantage', Management Science, 35 (12). pp. 1504-1511.
Dillman, D.A. (1978) Mail and Telephone Surveys - A Total Design Method, New
York. Wiley.
Dixit, A. (1980), 'The Role ofInvestment in Entry Deterrence', Economic
Journal, 90, pp. 95-106.
305

Appendices
Doz, Y. (1993) Managing core-competency for corporate renewal: Towards a
managerial theory of core competencies, INSEAD Working Papers series
94/23/SM, INSEAD, Fontanbleau.
Dun and Bradstreet (1998) Key British Enterprises, High Wycombe, Dun and
Bradstreet Ltd.
Dunne, P. and Hughes, A. (1992) Age, size, growth and survival revisited,
Working Paper 23, Small Business Research Centre, University of
Cambridge, September.
Dutton, J.E. and Dukerich, J.K. (1991) Keeping an eye on the mirror: The role of
image and identity in organization adaptation, Academy of Management
Journal, 34, pp. 517-554.
Economist (1991) Automotive components, 6th JUly.
Edmondson, G. and Thornton, E. (1999) He revved Up Renault. Will Nissan be
next?, Business Week, April 12, p. 23.
Eisenhardt, K.M. (1989) Building Theories from Case Study Research, Academy of
Management Review, 14 (4), pp. 532-550.
Eisenhardt, K.M. and Zbaracki, MJ. (1992) Strategic Decision Making, Strategic
Management Journal, 13, pp. 17-37.
Eklund Jr, R.B. and Hebert, R.F. (1990) A History of Economic Theory and
Method, London, McGraw Hill.
Elkind, P. (1997) Blood Feud, Fortune, 135 (7), pp. 24-33
Elliott, D. P (1998) Organisationallearningfrom crisis: An examination of the
UKfootball industry 1945-1997, PhD Thesis, University of Durham.
Elliott, D., Herbane, B. and Swartz, E. (2000) Business Continuity Management:
A Test of Continuity between Economic Sectors, Risk Management, 2 (1),
pp.27-28.
Elliott, D., Swartz, E. and Herbane, B. (1999), Just Waiting for the Next Big Bang:
business continuity planning in the UK finance sector, Journal of Applied
Management Studies, Vol 8, No 1, pp. 43-60.
306

Elmore, P.E. and Beggs, D.L. (1975) Salience of concepts and commitments to
extreme judgements in response patterns of teachers, Education, 95 (4),
pp. 325-334.
Ettlie, J. and Ward, P.T. (1997) US Manufacturing in the Early 1990s: The Chase
and the Challenge, Business Strategy Review, 8 (4), pp. 53-59.
Evered, R. (1983) So What is Strategy?, Long Range Planning, 16 (3), pp. 57-72.
FAME (2000) Financial Analysis Made Easy [Online], database located at
http://fame.bvdep.com.
Faria, AJ. and Dickinson, J.R. (1992) Mail survey response, speed and cost,
Industrial Marketing Management, 21, pp. 51-60.
Appendices
Faulkner, D. (1995), International Strategic Alliances: Cooperating to Compete,
London, McGraw Hill.
Festinger, L. (1957), A Theory of Cognitive Dissonance. Stanford University
Press, Alto CA, USA.
Finkelstein, S. and Hambrick, D. C. (1996) Strategic leadership; Top Executives
and their Effects on Organizations, St Paul, West Publishing.
Foley, P. (1983) A comparison offour industrial sources, in Healey, M. (1979)
Urban and regional Industrial Research, Norwich, Geobooks, pp. 91-104.
Foley, P., Hutchinson, J., Herbane, B. and Tait, G. (1996), 'The Impact of Toyota
on Derbyshire's Local Economy and Labour Market', Tijdschrift voor
Economische en Sociale Geographie, 87 (l), pp. 19-31.
Ford, H. (1988 [1926]), Today and Tomorrow, Productivity Press, Cambridge, MA.
Fowler Jr, FJ. (1993) Survey Research Methods, Sage, London.
Frey Jr, S.C. and Schlosser, M.M. (1993) ABB and Ford: Creating Value Through
Cooperation, Sloan Management Review, Autumn, pp. 65-72.
FT Automotive (1998b) World Automotive Manufacturing, 1, May 1998,
Financial Times Business Limited, London.
307

FT Automotive (1998a) FT Automotive Components Analyst, Financial Times
Automotive, 51, May.
FT Automotive, (1999) FT World Automotive Manufacturing, Financial Times
Automotive, 12, April.
Galbraith, C. and Schendel, D. (1983) An empirical analysis of strategy types,
Strategic Management Journal, 4 (2), pp. 153-173.
Garrahan, P. and Stewart, P. (1992) The Nissan Enigma: Flexibility at work in a
Local Economy, Mansell.
George, K. D., Joll, C. and Lynk, E. L. (1991), Industrial Organisation:
Competition, Growth and Structural Change, London, Routledge.
Gerlach, M. (1987) Business Alliances and the Strategy of the Japanese Firm,
California Management ReView, 30, pp. 126-142.
Ghemawat, P. (1985) Building Strategy on the Experience Curve, Harvard
Business Review, March-April, pp. 143-149.
Appendices
Giles, W.D. (1991) Making Strategy Work, Long Range Planning, 24 (5), pp. 75-
91.
Glaister, W. and Falshaw, R.J. (1999) Strategic planning: still going strong?, Long
Range Planning, 32 (1). pp. 107-115.
Glaser, B. and Strauss, A. (1967) The Discovery of Grounded Theory, Chicago, IL,
Aidine.
Goldman, A. (1992) Japanese Managerial Psychology: An Analysis of Cultural and
Organisational Features of "Total Quality Control". Journal 0/ Managerial
Psychology, 7 (1), pp. 17-20.
Goold, M. (1992) Design, Learning and Planning: A Further Observation on the
Design School Debate. Strategic Management Journal, 13, pp. 169-170.
Gordon. R.A. and Howell. J.E. (1959) Higher Education/or Business. New York,
Columbia University Press.
Gould, SJ. (1996) The Mismeasure of Man, London, Penguin.
308

Appendices
Grant, R.M. (1991) The Resource-Based Theory of Competitive Advantage,
California Management Review, 33 (3), pp. 114-135.
Grant, R.M. (1995) Contemporary Strategy Analysis, Oxford, Blackwell Business.
Guilford, J.P. (1956) Psychometric Methods, New York, McGraw Hill.
Gulati, R., Kharina, T. and Nohria, N. (1994) Unilateral Commitments and the
Importance of Process in Alliances, Sloan Management Review, Spring, pp.
61-69.
Guyon,1. (1998), 'Voulex-vous merger avec moi, ce soir?', Fortune, 138 (4), p.
31.
Hair Jr, 1.F., Anderson, R.E. and Tatham, T.L. (1987) Multivariate Data Analysis
with Readings, Collier Macmillan, London.
Hambrick, D. and Mason, P.A. (1984) Upper echelons: The organisation as a
relfection of its top managers, Academy of Management Review, 9 (2), pp.
193-206.
Hambrick, D.C (1983) High profit strategies in mature capital goods industries: A
contingency approach, Academy of Management Journal, 26 (4), pp. 477-
500.
Hamel, G. (1991) Competition for competence and inter-partner learning within
international strategic alliances, Strategic Management Journal, 12, pp.
83-103.
Hamel, G. (1992) Competition for Competence and Inter-Partner Learning within
International Strategic Alliances, Strategic Management Journal, 12, pp.
83-103.
Hamel, 1., Dufour, S. and Fortin, D. (1993) Case Study Methods, Quantitative
Research Methods Series 32, London, Sage
Harrigan, K.R. (1983) Research Methodologies for Contingency Approaches to
Business Strategy, Academy of Management Review, 8 (3), pp. 398-405.
Harrigan, K.R. (1980) The Effects of Exit Barriers Upon Strategic Flexibility,
Strategic Management Journal, 1, pp. 165-176.
309

Harrigan, K.R. (1985) Strategic Flexibility - A Management Guide for Changing
Times, Lexington, Lexington Books.
Appendices
Hartley, R.F. (1994) Management Mistakes and Successes, Chichester, John Wiley.
Hawkins, S. (ND) The Automotive Industry, Touche Ross & Co, London.
Hay, M. and Williamson, P. (1991) The Strategy Handbook, Oxford, Basil
Blackwell.
Hayek, F.A. (1945) The Use of Knowledge in Society, American Economic Review,
35, September, pp. 519-530.
Hedberg, B. and Jonsson, S. (1977) Strategy Fonnulation as a Discontinuous
Process, International Studies of Management and Organisation, 7 (2), pp.
88-109.
Helfat, C.E. (1997) Know-how and asset complementarity and dynamic capability
accumulation: The case of R&D, Strategic Management Journal, 18 (5),
pp. 339-360.
Helper, S. (1987) Supplier relations and technical change: Theory and
application to the US auto industry, PhD Thesis, Harvard University.
Helper, S. (1990) Cooperative supplier relations in the U.S. and Japanese Auto
Industries: An ExitIV oice Approach, Business and Economic History,
Second Series, 19, pp. 153-162.
Herbane, B. (1994) Integrated Strategic/Crisis Management Case Study: The
Baltic Exchange and Bishopsgate Bombings, Unpublished Case Study, De
Montfort University, Leicester
Herbane, B. and Rouse, MJ. (2000) Strategic Management: An Active Learning
Approach, First Edition, Blackwell, London. (ISBN 0631216421)
Herbane, B., Swartz, E, and Elliott, D (1997) Contingency and Continua:
Achieving Excellence through Business Continuity Planning, Business
Horizons, November-December, pp. 19-25.
Hill, C. W. L, and Jones, G.R. (1995), Strategic Management: An Integrated
Approach,3rd edition., Houghton Mifflin Company, Boston, MA, USA.
310

Appendices
Hill, C. W.L. and Kim, W.c. (1988) Searching for a Dynamic Theory of the
Multinational Enterprise: A Transaction Cost Model, Strategic Management
Journal, 9, pp. 93-104
Hill, T. (1985), Manufacturing Strategy: The Strategic Management of the
Manufacturing Function. MacMillan, London.
Hill, T. and Westbrrok, R. (1997) SWOT Analysis: It's Time for a Product Recall,
Long Range Planning, 30 (1), pp. 46-52.
Hitt, M.A. and Ireland, R.D. (1985) Corporate Distinctive Competence, Strategy,
Industry and Performance, Strategic Management Journal, 6, pp. 273-293.
Hofer, C. W. and Schendel, D. (1978), Strategy formulation: analytical Concepts.
West, St . Paul, MN, USA.
Hogkinson, G.P. and Johnson, G. (1994) Exploring the mental models of
competitive strategists: The case for a processual approach, Journal of
Management Studies, 31, pp. 525-551.
Hou, W.C. (1994) Sun Tzu's Art of War: Selected Applications to Strategic
Thinking and Business Practices, International Review of Strategic
Management,S, pp. 83-109.
House Of Commons Select Committee (1987), Third Report: The UK Components
Industry, London, HMSO.
Hubbard, R., Vetter, D.E. and Little, E.L. (1998) Replication in strategic
management: Scientific testing for validity, generalizability, and usefulness,
Strategic Management Journal, 19, pp. 243-254.
Huber, G.P. (1991) Organisational learning: The contributing processes and
literature, Organization Science, 2, pp. 88-115.
Huff, A.S. (1982), Industry Influences on Strategy Reformulation, Strategic
Management Journal, 3, pp. 119-131.
Hunger, D.l and Wheelen, T.L. (1992) Strategic Management and Business Policy,
Addison Wesley Publishing Co Inc.
311

IAE (1999) Worldwide Automotive Supplier Directory [Online], Available from:
http://www.sae.orglwwsdltmp/16f689101.html
ICC (1995) Motor Components and Accessory Manufacturers, Hampton, ICC
Infonnation Group.
ICC (1998) Motor Components and Accessory Manufacturers, Hampton, ICC
Infonnation Group.
Inkpen, A. and Choudry, N. (1995) The Seeking of Strategy Where it is Not:
Appendices
Towards a Theory of Strategy Absence, Strategic Management Journal, 16,
pp. 313-323.
Inkpen, A.C. (1996) The Seeking of Strategy where it is not: Towards a Theory of
Strategy Absence: A Reply to Bauerschmidt, Strategic Management
Journal, 17, pp. 669-670.
Ireland, RD., Hitt, M.A., Bettis, RA. and Deporras, D.A. (1987) Strategy
Fonnulation Processes: Differences in Perceptions of Strengths and
Weaknesses and Environmental Uncertainty by Managerial Level, Strategic
Management Journal, Vol 8, pp. 469-489.
Irvin, RA. and Michaels III, E.G. (1989) Core Skills: Doing the Right Things
Right. The McKinsey Quarterly, Summer, pp. 4-19.
Jacobson, R. (1992) The 'Austrian' School of Strategic Management, Academy of
Management Review, 17 (4), pp. 782-807.
Janis, I.L. (1982), Victims of Group think, 2nd edition. Houghton Mifflin, Boston,
MA, USA.
lelenik, M. and Amar, D. (1983) Implementing Corporate Strategy: Theory and
Reality, Thrid Annual Conference of the Strategy Management Society,
Paris.
lenster, P.V. (1987) Using Critical Success Factors in Planning, Long Range
Planning, 20 (4), pp. 102-109.
lick, T.D. (1979) Qualitative and Quantitative Methods: Triangulation in Action,
Administrative Science Quarterly, 24, December, pp. 602-611.
312

Appendices
Johnson, G. (1988) 'Rethinking Incrementalism' Strategic Management Journal,
9(1), pp. 75-91.
Johnson, G. & Scholes, K. (1997), Exploring Corporate Strategy: Text and Cases,
4th edition. Prentice Hall, London.
Jolly, V. K. (1997), Commercialising New Technologies: Gettingfrom Mind to
Market, Boston M.A., Harvard Business School Press.
Jones, D.T. (1998) Making cars - the agenda for the next decade, FT World
Automotive Manufacturing, May, pp. 8-10.
Kaufman, A., Wood, C.H. and Theyel, G. (2000) Collaboration and technology
linkages: A strategic supplier typology, Strategic Management Journal,
21, pp. 649-663.
Kelly, G.A. (1955) The Psychology of Personal Constructs, New York, W.W.
Norton.
Kenyon, A. and Marthur, A.A. (1993) The Meaning of 'Strategy': The 'Designed'
versus 'Emergent' Dispute, European Management Journal, 11 (3), pp.
357-360.
Kline, P. (1994) An Easy Guide to Factor Analysis, London, Routledge.
Knight, D., Pearce, C.L., Smith, K.G., OHan, J.D., Sims, H.P., Smith, K.A., and
Flood, P. (1999) Top Management Team Diversity, Group Process, and
Strategic Consensus, Strategic Management Journal, 20, pp. 445-465.
Kochan, A. (I 999a) Jaguar uses knowledge-based tools to reduce model
development times, Assembly Automation, 19 (2), pp. 114-117.
Kochan, A. (I 999b) Rover's E-Build process assembles cars in the virtual world,
AssemblyAutomation, 19 (2), pp. 118-120.
Kochan, A. (1999c) Automotive industry looks for lean production, Assembly
Automation, 18 (2), pp. 132-137.
Krafcik, J.F. (1988) Triumph of the Lean Production System, Sloan Management
Review, 30 (1) Fall, pp. 41-52.
313

Appendices
Kuhn, T S (1975) 'The Structure o/Scientific Revolutions', Chicago, University of
Chicago Press, 2nd edition
Lado, A, Boyd, N.G. and Wright, P. (1992), 'A Competency-Based Model of
Sustainable Competitive Advantage: Toward a Conceptual Integration',
Journalo/Management, 18 (1), pp. 77-81.
Lakatos, I. (1968) Criticism and the Methodology of Scientific Research
Programmes, Proceedings 0/ the Aristotelian Society, 69, pp. 149-186.
Lamming, R. (1993) Beyond Partnership: Strategies for Innovation and Lean
Supply, Prentice Hall, London.
Lawther, C. (1999) Customer-Supplier Relationship: The Nissan Way [Online].
Available from: http://www.autoindustry .orglBPIIBPl.html [accessed
28/07/99].
Learned, E.P., Christensen, c.R., Andrews, K.R. and Guth, W.D. (1965) Business
Policy: Text and Cases, Homewood Illinois, Irwin.
Lei, D. (1993), Offensive and Defensive uses of Alliances, Long Range Planning,
26 (4), 1993, pp. 32-41.
Leidecker, J.K. and Bruno, AV. (1984) Identifying and Using Critical Success
Factors, Long Range Planning, 17 (1), pp. 23-32.
Lengnick-Hall, C.A. and Wolff, J.A (1999) Similarities and Contradictions in the
Core Logic of Three Strategy Research Themes, Strategic Management
Journal, 20, pp. 1109-1132.
Leonard-Barton, D. (1990) A Dual Methodology for Case Studies: Synergistic Use
of a Longitudinal Single Site with Replicated Multiple Sites, Organisation
Science, 1 (3), pp. 248-266.
Leonard-Barton, D. (1992) Core Capabilities and Core Rigidities: A Paradox in
Managing New Product Development, Strategic Management Journal, 13,
pp. 111-125.
Leontiades, M. and Tezel, A (1980) Planning Perceptions and Planning Results,
Strategic Management Journal, 1, pp. 65-79.
314

Appendices
Leverick, F. and Cooper, R. (1998) Partnerships in the Motor Industry:
Opportunities and Risks for Suppliers, Long Range Planning, 31 (1), pp. 72-
81.
Levitt, T. (1975) Marketing Myopia, Harvard Business Review, Sept-Oct, pp.
Levy, D. (1994) Chaos Theory and Strategy: Theory, Application and Managerial
Implications, Strategic Management Journal, 15, pp. 167-178.
Liebennan, M. and Montgomery, D. (1988), 'First Mover Advantages', Strategic
Management Journal, 9, pp. 41-58.
Likert, R. (1967) The Method of Constructing an Attitude Scale, in Fishbein, M.
(1967) Readings in Attitude Theory and Measurement, New York, John
Wiley & Sons Inc., pp. 90-95.
Lindblom, C.E. (1959) The Science of 'Muddling Through' , Public
Administration Review, 19 (2), pp.
Lippman, S. A. and Rumelt, R. P. (1982), 'Uncertain imitability: An analysis of
interfirm differences in efficiency under competition.' The Bell Journal of
Economics, 13, pp. 418-438.
Litwin, M.S. (1995) How to measure survey reliability and validity, London, Sage
Lorange, P. and Roos, 1. (1993) Strategic Alliances: Formulation, Implementation
and Evolution, Oxford, Blackwell Business.
Machiavelli, N. (1995) The Art o/War, London, Penguin
MacMillan, H. and Tampoe, M. (2000) Strategic Management, Oxford, Oxford
University Press.
Mahoney, 1. T. (1992), 'The Choice of Organisational Form: Vertical Financial
Ownership Versus Other Methods of Integration' , Strategic Management
Journal, 13 (8), pp. 559-584.
Mahoney, 1.T. and Pandian, lR. (1992), 'The Resource-Based View Within the
Conversation of Strategic Management', Strategic Management Journal,
13, pp. 363-380.
315

Mansfield, A. and Wagner, S. (1975) Organisational and Strategic Factors
Associated with Probabilities of Success in Industrial R&D, Journal of
Business, 48 (2), pp. 179-198.
Appendices
Mansfield, E. (1988) Industrial Innovation in Japan and the United States, Science,
241,pp.1769-1774.
Mansfield, E. (1985) How rapidly does new industrial technology leak out?, The
Journal of Industrial Economics, 34 (2), December, pp. 217-223.
March, J.G. and Simon, H.A. (1958) Organizations, New York, Wiley.
Maslow, A. H. (1943), 'A theory of human motivation,' Psychological Review,
50, pp. 370-396.
Mason, E.S. (1939), 'Price and production policies oflarge-scale enterprises',
American Economic Review, 39, March, pp. 61-74.
McEvily, B. and Zaheer, A. (1999) Bridging Ties: A Source of finn heterogeneity
in competitive capabilities, Strategic Management Journal, 20, pp. 1133-
1156.
McGee, J. and Thomas, H. (1986), 'Strategic Groups: Theory, Research and
Taxonomy', Strategic Management Journal, 7, pp. 141-160.
McGee, J. and Thomas, H. (1992) 'Strategic Groups and Intra-Industry
Competition', International Review of Strategic Management, 3, pp. 77-
98.
McMillan, J. (1990) Managing suppliers - Incentive systems in Japanese and
United States industry, California Management Review, 82, pp. 38-55.
McWilliams, A. and Smart, D.L. (1993) Efficiency v. Structure-Conduct
Performance: Implications for Strategy Research and Practice, Journal of
Management, 19 (1), pp. 63-78.
McWilliams, A. and Smart, D.L. (1995) The Resource-based View of the Finn:
Does it go far enough in shedding the assumptions of the SCP paradigm?,
Journal of Management Enquiry, pp. 4 (4), pp. 309-316.
316

Meeks, G. (1977) Disappointing Marriage: A Study of the Gainsfrom Mergers,
Cambridge University Press.
Appendices
Meyer, M. H. and Utterback, J. M. (1993), 'The Product Family and the
Dynamics of Core Capability', Sloan Management Review, 34 (3), Spring,
pp.29-47.
Miles, R.E., Snow, C.C. and Pfeffer, J. (1974) Organization-Environment
Concepts and Issues, Industrial Relations, 13, pp. 244-264.
Miller, C. and Minzberg, H. (1974) Strategy Formulation in Context, Working
Paper, Montreal, McGill University.
Miller, C., Burke, L.M. and Glick, W.H. (1998) Cognitive diversity among upper
echelon executives: Implications for strategic decision processes, Strategic
Management Journal, 19, pp. 39-58.
Miller, D. (1990) The Icarus Pardox, New York, Harper Business.
Miller, D. and Friesen, P.H. (1986) Porter's (1980) generic strategies and
performance: An empirical examination with American data. Part 1:
Testing Porter, Organisation Studies, 7 (1), pp. 37-55.
Mintzberg, H. (1973) Strategy Making in Three Modes, California Management
Review, 16 (2), pp. 44-53.
Mintzberg, H. (1973) The Nature of Managerial Work. New York: Harper and
Row.
Mintzberg, H. (1977) Policy as a Field of Management Theory, Academy of
Management Review, January, pp. 88-103.
Mintzberg, H. (1978) Patterns in Strategy Formulation, Management Science, 24
(9), pp. 479-498.
Mintzberg, H. (1979) An Emerging Strategy of "Direct" Research, Administrative
Science Quarterly, 24, December, pp. 582-589.
Mintzberg, H. (1990) The Design School: Reconsidering the Basic Premises of
Strategic Management, Strategic Management Journal, pp. 171-195.
317

Mintzberg, H. (1994), The Rise and Fall of Strategic Planning, Prentice Hall,
London.
Mintzberg, H. (1996) The "Honda effect" revisited, California Management
Review, 38 (4), pp. 78-79.
Mintzberg, H. and Waters, J.A. (1985), 'Of Strategies Deliberate and Emergent',
Strategic Management Journal, 6, pp. 257-272.
Mintzberg, H., Raisinghani, P., and Theoret, A. (1976) The structure of
'unstructured' decision processes, Administrative Science Quarterly, 21,
pp. 246-275.
Appendices
Mintzberg, H; Quinn, J B and Ghoshal, S (1998) 'The Strategy Process: Revised
European Edition', London, Prentice Hall
Mitchell, R. K., Agle, B. R. and Wood, D. J. (1997), 'Toward a theory of
stakeholder identification and salience: Defining the principle of who and
what really counts,' Academy of Management Review, 22, pp. 853-886.
Miyashita, K. and Russell, D. (1994), Keiretsu: Inside the Hidden Japanese
Conglomerates. McGraw Hill, London.
Miyazaki, K. (1991), 'Core Competence: Optoelectronics-related Competence
Building in Japanese and European Firms', Research Evaluation, 1 (2), pp.
89-96.
Moyer, K. (1996) 'Scenario Planning at British Airways- A Case Study', Long
Range Planning, 29 (2), pp. 172-181.
Mudambi, R. and Helper, S. (1998) The 'close but adversarial' model of supplier
relations in the U.S. auto industry, Strategic Management Journal, 19, pp.
775-792.
Mueller, J.D. (1995) Process plant contracting in the former Soviet Union and
CentrallEastern Europe, PhD Thesis, De Montfort University.
Nelson, R.P. and Winter, S.G. (1982) An Evolutionary Theory of Economic
Change. Cambridge, MA: Harvard University Press.
318

Nishiguchi, T. (1985) Strategic Dualism: An Alternative in Industrial Societies,
Unpublished PhD Thesis, Nuffield College, Oxford University.
Appendices
Nishiguchi, T. and Brookfield, J. (1997) The Evolution of Japanese Subcontracting,
Sloan Management Review, Fall, pp. 89-101.
Norbum, D. (1986) Gogos, Yoyos and Dodos: Company Directors and Industrial
Performance, Strategic Management Journal, 7, pp. 101-117.
Norusis, MJ. (1994) SPSS 6.1,' Guide to data analysis, Englewood Cliffs,
Prentice Hall.
Nunally, J. (1978) Psychometric Theory, New York, McGraw Hill.
Ohno, T. (1978) Toyota siesan hashiki, Tokyo, Diamond Inc.
Ohno, T. (1988) Toyota Production System - Beyond Large Scale Production,
Cambridge MA, Productivity Press.
Oliver, C. (1997) Sustainable Competitive Advantage: Combining Institutional and
Resource-based Views, Strategic Management Journal, 18 (9), pp. 697-713.
Oliver, N., Jones, D.T., Delbridge, R., Lowe, J., Roberts, P. and Thayer, B. (1994)
The Second Lean Enterprise Report, London. Anderson Consulting.
ONS (2000a) Number of Enterprises by Size, London, Office for National
Statistics.
ONS (2000b) Annual Sample Survey of Production Industries, London, Office
for National Statistics.
ONS (2000c) Output, Sales and Prices, London, Office for National Statistics.
ONS (2000d) Business Research and Development, London, Office for National
Statistics.
Oppenheim, A.N. (1976) Questionnaire Design and Attitude Measurement,
London, Heinemann.
Pascale, R.T. (1984) Perspectives on Strategy: The Real Story behind Honda's
Success, California Management Review, 24 (3), pp. 47-72.
319

Appendices
Pauchant, T and Mitroff, I (1992) 'The Crisis-prone Organisation', San Francisco,
California, Jossey-Bass
Pearce III, J.A., Freeman, E.B. and Robinson Jr, R.B. (1987) The Tenuous Link
Between Formal Strategic Planning and Functional Performance, Academy
of Management Review, 12 (4), pp. 658-675.
Penrose, E. (1995 [1959]), Theory of the Growth of the Firm, 3rd edition. Oxford
University Press, Oxford.
Penrose, E.T. (1960) The Growth of the Firm. A Case Study: The Hercules Powder
Company, Business History Review, 34 (1), pp. 1-23.
Peteraf, M. (1993), 'The cornerstones of competitive advantage: A resource-based
view.' Strategic Management Journal, 14, pp. 179-191.
Peterson, R.A. (1994) A Meta-Analysis ofCronbach's Coefficient Alpha, Journal
of Consumer Research, 21, September, pp. 381-39l.
Petroni, G. (1983) The Strategic Management of R&D Part II - Organising for
Integration, Long Range Planning, 16 (2), pp. 51-64.
Pickernell, D. (1998a) FDI in the Uk Car Component Industry: Recent causes and
Consequences, Tijdschrift voor Economische en Sociale Geographie, 89 (3),
pp. 239-252.
Pickernell, D. (I 998b) Structural Change and the Single Market Programme: The
Case of the UK Automotive Components Industry, European Planning
Studies, 6 (2), pp. 165-186.
Popper, K. (1959) The logic of scientific discovery, New York, Basic Books.
Porac, J.F., Thomas, H., Wilson, F., Paton, D. and Kanfer, A. (1995), 'Rivalry
and the Industry Model of Scottish Knitwear Producers,' Administrative
Science Quarterly 40(2), pp. 203-227.
Porter, M.E. (1980). Competitive Strategy. Free Press, New York, NY, USA.
Porter, M.E. (1981), 'The Contribution of Industrial Organisation to Strategic
Management',AcademyofManagement Review, 6 (4), pp. 609-620.
Porter, M.E. (1985) 'Competitive Advantage', New York, The Free Press
320

Porter, M.E. (1987), 'From Competitive Advantage to Corporate Strategy',
Harvard Business Review, 65 (3), pp. 43-59.
Prahalad, C. K. (1993), 'The role of core competencies in the corporation.'
Research and Technology Management, 36 (6), pp. 40-47.
Appendices
Prahalad, C. K. and Hamel, G. (1990), 'The core competence of the corporation.'
Harvard Business Review, May-June, pp. 79-91.
Prahalad, C.K. and Bettis, R.A. (1986) The Dominant Logic, Strategic Management
Journal, 7, pp. 485-501.
Prahalad, C.K. and Hamel, G. (1989) Strategic Intent, Harvard Business Review,
May-June, pp. 63-79.
Prahalad, C.K. and Hamel, G. (1990) The Core Competence of the Corporation,
Harvard Business Review, May-June, pp. 79-93.
Prahalad, C.K. and Hamel, G. (1993) Strategy as Stretch and Leverage, Harvard
Business Review, March-April, pp. 75-84.
Prowse, R. (1998) A legal moose on the loose?, Motor Industry Management,
October, p.17
Quinn, lB. (1977) Strategic Change: "Logical Incrementalism", Sloan
Management Review, Fall, pp. 7-21.
Quinn, J .B. (1980), Strategies for Change: Logical Incrementalism, Irwin,
Homewood IL, USA.
Ramanujam, V., Vekatraman, N. and Camillus, J.C. (1986) Multi-objective
assessment of Effectiveness of Strategic Planning: A Discriminant
Analysis Approach, Academy of Management Journal, 29 (2), pp. 347-
372.
Reed (1998a) Kompass Company Information Register, Reed Business
Information, East Grinstead, Reed Elsevier.
Reed (1998b) Kelly's Industry Directory, Reed Business Information, East
Grinstead, Reed Elsevier.
321

Reed, R. and DeFillippi, R. J. (1990), 'Causal Ambiguity, Barriers to Imitation
and Sustainable Competitive Advantage', Academy of Management
Review, 15 (1), pp. 88-102.
Rendall, J. (2000a) Private communication, 19th September 2000.
Rendall, J. (2000b) Private communication, 5th October 2000.
Rhyne, L.C. (1986) The Relationship of Strategic Planning to Financial
Performance, Strategic Management Journal, 7, pp. 423-436.
Ricardo, D. (1817), Principles of Political Economy and Taxation. 1. Murray,
London.
Rice, C. (1993) Consumer Behaviour - Behavioural Aspects of Marketing,
London, Butterworth-Heinemann.
Appendices
Richardson, J. (1993), 'Parallel Sourcing and Supplier Performance In the Japanese
Automobile Industry', Strategic Management Journal, 14, pp. 339-350.
Riordan, M.H. and Williamson, O.E. (1985) Asset Specificity and Economic
Organisation, International Journal of Industrial Organisation. 3, pp. 365-
378.
Robins, J. and Wiersema (1995) A Resource-based Approach to the Multibusiness
Firm: Empirical Analysis of Portfolio Interrelationships and Corporate
Financial Performance, Strategic Management Journal, 16, pp. 277-299.
Robinson, A. (1991) (ed) Continuous Improvements in Operations: A Systematic
Approach to Waste Reduction, Cambridge, Massachusetts, Productivity
Press.
Robinson, J. (1933) The Economics of Imperfect Competition, London,
Macmillan.
Robinson, J. (1956) The Industry and the Market, Economic Journal, Vol LXVI,
No 262 (June), p361.
Robinson, R.B. and Pearce, J.A. (1988) Planned patterns of strategic behaviour
and their relationship to business-unit performance, Strategic Management
Journal, 9 (1), pp. 43-60.
322

Roll, R (1986) 'The Hubris Hypothesis of Corporate Takeovers', Journal of
Business, 59, pp. 197-216.
Roll, R (1986), 'The Hubris Hypothesis of Corporate Takeovers', Journal of
Business, 59, pp. 197-216.
Appendices
Rouse, M. 1. and Daellenbach, U. (1999), 'Re-thinking research methods from the
resource-based perspective: Isolating sources of sustainable competitive
advantage,' Strategic Management Journal, 20, pp. 487-494 ..
Rumelt, RP. (1979) Evaluation of Strategy: Theory and Models, in Schendel,
D.E. and Hofer, C. (eds) Strategic Management, Boston, Brown, pp. 196-
212.
Rumelt, RP. (1991) How much does industry matter?, Strategic Management
Journal, 12, pp. 167-185.
Sako, M. (1992) Prices, Quality and Trust: How British and Japanese Companies
Manage thie Buyer-Supplier Relationships, Cambridge, Cambridge
University Press.
Sallenave, J.P. (1985) The Uses and Abuses of Experience Curves, Long Range
Planning, Vol 18, No 1, pp. 64-72.
Samson, R (1993) Competing with the Japanese - Strategies for European
Business, Long Range Planning, 26 (4), pp. 59-65.
Saunders, M. (1994) Strategic Purchasing and Supply Chain Management, London,
Pitman.
Schein, E. H. (1991) Organizational Culture and Leadership: A Dynamic View.
Jossey-Bass, Oxford.
Schein, E.H. (1988) Organisational Socialization and the Profession of
Management, Sloan Management Review, Fall, pp. 53-65 (Reprint).
Schumpeter, J.A. (1934) The Theory of Economic Development. Cambridge, MA:
Harvard Press.
Schwartz, H., and Davis, S. (1981). 'Matching corporate culture and business
strategy.' Organizational Dynamics, 10(1), pp. 30-38.
323

Schweiger, D. M. and Finger, P.A. (1984) 'The Comparative Effectiveness of
Dialectical Inquiry and Devil's Advocacy,' Strategic Management
Journal, 5, pp. 335-350.
Schwenk, C.R. (1984) Cognitive Simplification Processes in Strategic Decsion
Making, Strategic Management Journal, 5, pp. 111-128.
Sekaran, U. (1992) Research Methods for Business: A Skill Building Approach,
John Wiley and Sons, Chichester.
Appendices
Sellers, P. (1997), 'First: Why Pepsi needs to become more like Coke', Fortune,
4 March 3, pp. 18 -19.
Selznick, P. (1959) Leadership in Administration: A Sociological Perspective.
New York: Harper and Row.
Seth, A. and Thomas, H. (1994) Theories of the Firm: Implications for Strategy
Research, Journal of Management Studies, 31 (2), pp. 165-191.
Simon, H.A. (1957), Administrative Behaviour, 2nd Edition, MacMillan, New
York,
Simonin, B.L. (1999) Ambiguity and the process of knowledge transfer in
strategic alliances, Strategic Management Journal, 20, pp. 595-623.
Slater, S.F. and Olson, E.M. (2000) Strategy Type and Performance: The
Influence of Sales Force Management, Strategic Management Journal, pp.
813-829.
Sleigh, P .A.C. (1988) The UK automotive components industry: an assessment of
its structural changes, foreign participation, product areas, sales
performance and prospects, Motor Business Special Report Number 10,
Economist Intelligence Unit, London
Sliwa, B. (1999) A risky but synergistic alliance, FT World Automotive
Manufacturing, 12, April, pp. 1-2.
Sloan, A.P. (1963) My Years with General Motors, London, Sedgewick and
Jackson.
324

Smith, T. (1996), Accountingfor Growth: Stripping the Camojlage from
Company Accounts, Century Business, London.
SMMT (1999) UK Motor Industry Facts 1999, London, Society of Motor
Manufacturers and Traders.
SMMT (2000) The UK Motor Industry Directory, London, Society of Motor
Manufacturers and Traders Ltd.
Snow, c.c. and Hrebiniak, L.G. (1980) Strategy, Distinctive Competence and
Organisational Performance, Administrative Science Quarterly, 25, pp.
317-335.
Snow, C.c. and Thomas, J.B. (1994) Field Research Methods in Strategic
Management: Contributions to Theory Building and Testing, Journal of
Management Studies, 31 (4), pp. 457-479.
Snyder, A. V. and Ebeling Jr, H. W. (1992), 'Targeting a Company's Real Core
Competencies', Journal of Business Strategy, 13 (6), pp. 26-32.
Appendices
Song, J. (1982) Diversification strategies and the experience of top executives of
large firms, Strategic Management Journal, 3, pp. 377·380.
SPSS (1997) SPSS Base 7.5 Applications Guide, SPSS Inc, Chicago, IL
Sraffa, P. (1926) The Law of Returns under Competitive Conditions, Economic
Journal, 36, December, pp. 535·550.
Stacy, R.D. (1993) Strategic Management and Organisational Dynamics, London,
Pitman.
Stalk Jr., G. (1988), 'Time: The Next Source of Competitive Advantage'. Harvard
Business Review, July·August, pp. 41-51.
Stevenson, H.H. (1976) Defining Corporate Strengths and Weaknesses, Sloan
Management Review, 17 (3), pp. 51·68.
Stewart, D.W. (1981) The application and misapplication of factor analysis in
marketing research, Journal of Marketing Research, 18, pp. 51.62.
325

Appendices
Swnmer, C.E., Bettis, R.A., Duhaime, I.R., Grany, J.H., Hambrick, D.C., Snow,
c.c. and Zeithaml, C.P. (1990) Doctoral Education in the Field of Business
Policy and Strategy, Journal of Management, 16 (2), pp. 361-398.
Sutcliffe, K.M. and Huber, G.P. (1998) Firm and industry as determinants of
executive perceptions of the environment, Strategic Management Journal,
19, pp. 793-807.
Swartz, E., Elliott, D. and Herbane, B. (1995) Out of Sight, Out of Mind. The
Limitations of Traditional Information Systems Planning, Facilities, 13
(9/10), pp. 15-22.
Tampoe, M. (1994) Exploiting the Core Competencies of your Organisation, Long
Range Planning, 27 (4), pp. 66-77.
Tang, M. 1. (1988) 'An Economic Perspective on Escalating Commitment,'
Strategic Management Journal, 9: 79-92.
Taylor, A. (1997), 'How Toyota defies Gravity', Fortune, 136 (11), December 8th
pp.38-44.
Taylor, F.W. (1947) Scientific Management. New York: Harper.
Teece, Dol. (1980) Economies of Scope and the Scope of the Enterprise, Journal of
Economic Behaviour and Organisation, 1, pp. 223-247.
Teece, Dol. (1982) Toward an economic theory of the multiproduct firm. Journal of
Economic Behaviour and Organisation, 3, pp. 29-63.
Teece, OJ. (1984) Economic Analysis and Strategic Management, California
Management Review, 26 (3), pp. 87-110.
Teece, OJ., Pisano, G. and Shuen, A. (1994) DynamiC Capabilities and Strategic
Management, CCC Working Paper No 94-9.
Thomas, H. and Pruett, M. (1993) Perspectives on Theory Building in Strategic
Management, Journal of Management Studies, 30 (1), pp. 3-11.
Thomas, J.B., Clark, S.M. and Gioia, D.A. (1993) Strategic sense-making and
organizational performance - Linkages among scanning, interpretation,
action and outcomes, Academy of Management Journal, 36, pp.239-270.
326

Appendices
Thurstone, L.L. (1949) Multiple-factor analysis: A development and expansion of
'The Vectors of Mind', Second Impression, Cambridge, Cambridge
University Press.
Tinsley, H.E.A. and Tinsley, OJ. (1987) Uses of Factor Analysis in Counseling
Psychology Research, Journal of Counseling Psychology, 34, pp. 414-424.
Tirole, J. (1988), The Theory of Industrial Organization. MIT Press, Cambridge,
MA,USA.
Tourangeau, R. and Rasinki, K.A. (1988) Cognitive processes underlying context
effects in attitude measurement, Psychological Bulletin, 103, pp.299-314.
Trade and Industry Committee (1985) Memorandum submitted to the Department
o/Trade and Industry (M22), Wednesday 27 November, Her Majesty's
Stationary Office, London.
Tunc, E.A. and Gupta, J.N.D. (1993) Is Time a Competitive Weapon among
Manufacturing Finns?, International Journal of Operations and Production
Management, 13 (3), pp. 4-12.
Tversky, A. and Kahneman, D. (1974), 'Judgement under Uncertainty: Heuristics
and Biases', Science, 185, pp. 1124-1131.
Van Cauwenbergh, A. and Cool, K. (1982) Strategic Management in a New
Framework, Strategic Management Journal, 3, pp. 245-265.
Vancil, R.F. (1976) Strategy Fonnulation in Complex Organisations, Sloan
Management Review, Winter, pp.I-18
Veliyath, R. and Shortell, S.M. (1993) Strategic Orientation: Strategic Planning
System Characteristics and Perfonnance, Journal of Management Studies,
30 (3), pp. 359-381
Virag, D. and Mount, E. (1998) Automotive Supplier Partnering: Making
Partnerships Work, Financial Times Automotive, London.
Von Clausewitz, C. (1832 [1993]) On War, Translated by Howard, M. and Paret,
P., London, Everyman's Library.
327

Walker, G. and Poppo, L. (1991) Profit Centres, Single Source Suppliers and
Transaction Costs, Administrative Science Quarterly, 36, pp. 66-87.
Walsh, J.P. (1988) Selectivity and selective perception: An investigation of
manageral belief structures and information processing, Academy of
Management Journal, 31, pp. 873-896.
Walsh, J.P. and Ungson, G.R. (1991) Organizational memory, Academy of
Management Review, 16, pp. 57-91.
Warburton, M. (1999) The challenges of modularisation, World Automotive
Manufacturing, 19, November, pp. 14-18.
Warburton, N (1999) Philosophy, London, Routledge.
Watts, R. L. and Zimmerman, J. L. (1990), 'Positive accounting theory: A ten
year perspective,' Accounting Theory, 65, pp. 131-156.
WDA (1999) Industry Directory [Online], Available from:
http://www.autoline.orglWDAldatasheetsll-l.html [accessed 8/3199]
Appendices
Weick, K.E.(1969) The Social Psychology of Organizing, Reading (US), Addision
Wesley.
Wells, P. and Nieuwenhuis, P. (1998) Automotive Materials: The Challenge of
Globalisation and Technological Change, Financial Times Automotive,
London.
Wernerfelt, B. (1984), 'A resource-based view of the firm' Strategic
Management Journal,S, pp. 171-180.
Whittington, R.(1993), What is Strategy and does it matter?, Routledge, London.
Wilkinson, E. (1991) Japan Versus the West: Image and Reality, London, Penguin.
Williamson, O. E. (1975), Markets and Hierarchies: Analysis and Antitrust
Implications, New York, Free PressIMacMillan.
Williamson, O.E. (1979) Transaction Cost Economics: The Governance of
Contractual Relations, The Journal of Law and Economics, October, pp.
233-261.
328

Williamson, O.E. (1983) Credible Commitments: Using Hostages to Support
Exchange, American Economic Review, 73 (4) pp. 519-540.
Williamson, O.E. (1985) The Economic Institutions of Capitalism, New York,
Free Press.
Williamson, O.E. (1988) The Logic of Economic Organisation, Journal of Law,
Economics and Organisation, 4, Spring, pp. 65-94.
Williamson, O.E. (1999) Strategy Research: Governance and Competence
Perspectives, Strategic Management Journal, 20, pp. 1087-1108.
Willings, R. (1998) The Japanese Automotive Industry in Europe, Financial
Times Automotive, London.
Womack J.P., Jones, D.T. and Roos, D. (1990), The Machine That Changed the
World, Rawson Associates, Maxwell MacMillan International, Oxford.
Woo, C.Y. and Cooper, A.C. (1992) The Surprising Case for Low Market Share,
Harvard Business Review, 60 (6), pp. 106-113.
Appendices
Wood, D.R. and Laforge, R.L. (1979) The Impact of Comprehensive Planning on
Financial Performance, Academy of Management Journal, 22 (3), pp. 516-
526.
Wright, P., Pringle, C.D. and Kroll, MJ. (1994) Strategic Management: Text and
Cases (2nd ed), Allyn and Bacon.
Wright, T.P. (1937) Factors affecting the cost of aeroplanes, Journal of
Aeronautical Sciences, 3 (4), pp. 122-128.
Yelle, L.E. (1979) The Learning Curve: Historical Review and Comprehensive
Survey, Decision Sciences, 10, pp. 302-328.
Yin, R K (1989) Case Study Research: Design and Method, Sage, London
Zajac, EJ. and Olsen, C.P. (1993) From Transaction Cost to Transaction Value
Analysis: Implications for the Study of Interorganisational Strategy, Journal
of Management Studies, 30 (1), pp. 130-145.
Zimmerman, J. L. (1983), 'Taxes and firm size,' Journal of Accounting and
Economics, 5(2), pp. 119-149.
329

Appendices
Appendices
330

Appendices
ApPENDIX 1: PRODUCT PLATFORMS IN THE EUROPEAN AUTOMOTIVE INDUSTRY
Platform code Assembler Vehicle model B-VX62 Seat Alhambra B-VX62 Ford Galaxy B-VX62 VW Sharan
TypeB Fiat Punto TypeB Fiat Uno TypeB Lancia Y
TypeCID Fiat Brava Type CID Fiat Bravo TypeCID Fiat Marea TypeCID Fiat Tempra Type CID AlfaRomeo Alfa 145/146 TypeCID AlfaRomeo Alfa 155/156 Type CID Lancia Dedra TypeCID Lancia Delta
XK8 Jaguar XK8 XK8 I Aston Martin DB7
BE9l Ford Fiesta BE91 Ford Puma BE91 Mazda 121
106 Peugeot 106 106 Citroen Saxo
N3 Peu2eot 306 N3 Citroen ZX
X65 Renault Clio X65 Renault MeKane
X54 I Renault Laguna X54 Renault Safrane
A Audi A3 A Seat Toledo A VW Golf A VW Bora A VW Vento
B Audi A4 B Audi A6 B VW Passat
AO Scat Ibiza AO Seat Inca AO VW Polo AO Seat Arosa
GM2900 Saab 9-S GM2900 Vauxhall/Opel IVectra
Automotive Platform Usage (European Passenger Vehicle Assembly plants) 1998/1999
Source: Compiled from World Automotive Manufacturing (1998;1999)
331

Appendices
ApPENDIX 2: TECHNICAL ApPENDIX - FACTOR ANALYSIS PROCEDURES
CHOICE OF FACTOR ANALYSIS TECHNIQUE
Although many factor analysis procedures are available to the researcher, two
appear to be most relevant to the analysis of data for this study, PCA (Principal
components analysis or component analysis) and PAF (Principal axis factoring or
common factor analysis). Where these two techniques differ, inter alia, is in the
way in which they deal with variance (Bryman and Cramer 1997:280). Total
variance is understood to be the sum of common variance, specific variance and
error variance. Common variance is the variance/variation shared by the scores of
people on three or more variables, whereas specific variance refers to variation
which is specific/unique to a variable and not shared by another variable. Finally,
error variance will occur due to inevitable fluctuations which occur in measuring
something repeatedly or in short succession.
Hair et al., (1987) suggest that the selection of peA or P AF is dependent on the
objective of the analysis and the amount of prior knowledge about variance. For
example, PCA (also known as component analysis) should be used when there is
prior knowledge of variance, when the objective is prediction and when the
number of factors is determined in advance, hence the use of PCA in this study.
NUMBER OF FACTORS
A further consideration prior to statistic analysis is number of factors that the
researcher decides, a priori, to extract or the statistical method through which the
number of factors is produced. Two approaches are commonly used, the latent
root criterion (eigenvalue) or scree plot criterion. The eigenvalue is the amount of
the total test variance that is accounted for by a particular factor and in the latent
root approach, factors with eigenvalues over 1 are retained for rotation. Kaiser's
criterion proposes that factors with an eigenvalue greater than 1 are retained when
the number of variables is less than 30, average communality is greater than 0.70
or when the sample is greater than 250 with an average communality greater than
0.60 (Bryman and Cramer, 1997:283). Kaizer's criterion can, therefore be used for
332

Appendices
the data set, given its sample size. The scree plot criterion produces a graphical
representation of eigenvalues for each factor extracted in succession. It differs
from the pure eigenvalue approach by providing an additional cut-off for factor
(other than eigenvalue > 1). This cut-off point is that where the plotted line of
eigenvalues changes slope.
So, therefore, how do the two approaches differ? Hair et al., (1987:247) suggest
that "the eigenvalue is probably most reliable when the number of variables is
between 20 and 50" and that the scree plot approach will often produce more
seemingly significant factors that eigenvalue criterion (often two or three more
factors). Ultimately, the choice is one determined by the interpretability of the
factor structure produced rather than differences between the techniques per se.
ROTATION
Rotation is used to maximise relationships between variables and factors, to
reduce ambiguities, to prevent the first factor including too many items and to
increase the interpretability of factors. The most compelling argument for rotation
is to improve the ease of factor interpretation, although it understandable that this
stage in the process could be construed to be further, unnecessary manipulation of
already distilled data. The aim of rotation is not to change the number of factors
but to arrive, instead, at a 'simple structure' (Thurstone, 1947), where, in essence,
each factor has a few, high loadings. The advantages of achieving a simple
structure is ease of interpretation since factor loadings are high, and ease of
replication (Cattell, 1978).
Although rotation is an accepted step in factor analysis, the choice of alternative
forms of rotation has problematised the process. The correct form of rotation is
necessary for achieving a simple structure. Broadly speaking two types of rotation
can be used - orthogonal and oblique.
Orthogonal rotation produces factors which are uncorrelated with each other. An
advantage is that factors do not contain redundant information yet factors may be
forced to be unrelated, whereas in real life they could be related.
333

Appendices
Oblique rotation constructs the factor matrix in such a manner that correlations
between the factors are computed, thus overcoming the problems of redundant
information forcibly included within other factors and their subsequent
unrelatedness. Hair et ai., (1987) suggest that no single oblique rotational method
solution is superior to another when applied (i.e Oblimin, the default oblique
solution should be used). Hence Oblimin oblique rotation is often used since, "if
the ultimate goal of the factor analysis is to obtain several theoretically
meaningful factors or constructs, an oblique solution is appropriate" (Hair et a/. ,
1987:238).
FACTOR LOADINGS
Prior to interpretation, the researcher should be familiar with the meaning of
factor loadings. Whilst high loadings account for the most important correlations
there are some differences in the level at which a loading can be high or
significant. Both Kline (1994) and Hair et al., (1987) agree upon a minimum
loading +/-0.3. Kline only distinguishes between this loading (moderately high)
and loadings greater than +/-0.6 (high). Hair et al., (1987) use the divisions of +/
.30 (significant), +/- .40 (important) and +/- .50 (very significant). However, such
matters will depend on the size of the data set and item pool (variables). As the
number of variables rises, so the acceptable level of loadings decreases and ''the
larger the sample size, the smaller the loading to be considered significant; the
larger the number of variables being analysed, the smaller the loadings to be
considered significant; the larger the number of factors. the larger the size of the
loading on later factors to be considered significant for interpretation" (Hair et al .•
1987:250).
SELECTION OF FINAL STRUCTURE AND TRIAL EXTRACTIONS
Equally important to the procedure of factor analysis is the interpretability of
extracted factors. In order to arrive at a rotated solution to the factor analysis that
would offer the best potential for interpretation in relation to the research
questions, a number of trial extractions were undertaken. The trial extractions
were precipitated by the need to achieve simple structure subsequent to rotation
(Thurstone, 1947; Cattell, 1978) which eases interpretability by improving factor
334

Appendices
loadings and the replicability of factor structures. Furthermore, early factor
analyses of the data-set which yielded eleven factor solutions containing a small
number of unique factors (a factor which is involved in the variance of only one
variable) with eigenvalues close to one. These proved to be unsatisfactory for
interpretation. Since the interpretation of factor structures containing unique
variables is not recommended (Kline, 1994) the data was extracted and rotated in
the same way with differences made only to the number of factors extracted which
varied between five and eleven.
Trial extractions of this nature necessarily mark a decision to select from available
criteria for the number of factors to be extracted. Bearing the need for
interpretability and structure in mind, the latent root criterion (> 1) and scree-test
criterion (Cattell. 1978, Hair el ai., 1987) produced eleven and thirteen factors
respectively. but with many factorial indistinctions. The percentage of variance
criterion is imprecise given the exploratory nature of the study. What remains is
the use of a priori criterion. which in this case are the simple structure and
interpretability indicated.
Accordingly. following each trial extractions. each factor structure was examined
and initial interpretations and factor labels were developed. Indeed, several factors
were extracted with a degree of regularity. although their degree of importance in
explaining variance differed. In other words. underlying structure could be
observed within the data-set - simple structure was sought to complement this.
The trial extractions offered an opportunity to observe the frequency of non
loading items and to inform the decision relating to the final item pool to SUbject
to extraction and rotation. A general observation arising from this was that the
lower the number of factors extracted. the higher would be the number of items
which did not load. However, non-loading factors were not consistent and, as would be expected. the adoption of the .30 level for factor loading (discussed
further below) enabled all factors to load onto at least one factor. Primajacie, all
32 competitive advantage statements appeared suitable for factoring given their
ability to load a factor across a variety of extractions. although further
confirmation was sought.
335

Appendices
Reliability analysis could not be undertaken in the pre-test phase of the study
(Chapter 5). However. the primary data set could now be subjected to tests of
internal consistency using coefficient alpha (Cronbach, 1951; Cortina, 1993).
Although, there is some variation between authors with regard to the minimum
level of accepted alpha. between .70 and .80 are considered acceptable or
respectable (Nunally, 1978; DeVellis, 1991). Item reliability for the 32 statements
in this study falls between the levels given above (a=.7376) with negligible
improvement to be gained from the removal of individual scale items (Appendix
11 ).112 Although objections have been raised about the alpha coefficient and noted
in Chapter 5, the alpha is reported to enable the reader to derive comparisons with
studies using similar methodological and analytical procedures.
The trial extractions also provided an opportunity to consider the threshold for
factor loadings to be used in the adopted structure for interpretation. Once more,
variations can be observed in the theoretical and applied literature. Whilst .30 is
the minimum level recommended in multivariate analysis texts (e.g., Hair et al ..
1987; Kline, 1994; 8ryman and Cramer, 1997; Coakes and Steed, 1999), factor
analytic studies have used higher levels such as .40 and .50, where it is suggested
or inferred that the higher threshold introduces greater rigour. 113 Although the
number of subjects and the measures of sampling adequacy should have an
influence upon the threshold, whereby sample inadequacy should lead to a higher
threshold for the importance of loadings (that is if the data matrix should be factor
analysed in the first instance), higher thresholds ignore lower, but nonetheless,
important loadings. Equally, to ignore loadings that lie only marginally below a
threshold is unwise (Kline, 1994). Thus, for this study, a loading level of 0.4 has
been accepted with the condition that marginally lower loadings are considered
where simple and interpretable structure can be retained. This level of loading
III Although based on marketing-related publications, Peterson's (1994) meta-analysis of alpha coefficients reported a mean of. 77 from a sample of 4,286 studies - similar to the alpha produced from the data set in this study. 113 These observations were derived from a comparison of Bowman, 1991; Mueller, 1995; Elliott, 1998; Chattopadhyay et 01., 1999; and Kaufman et 01., 2000. Each study was examined for the minimum loading used, number of factors extracted, percentage of variance explained, original number of items, number of retained items and, the minimum and maximum item to factor loading.
336

Appendices
salience represents a balance between the implications noted above and provided
further scrutiny to potential non-loading items.
Since it is recommended that the researcher should perform and compare
orthogonal and oblique rotations of the same data-set prior to interpretation,
especially in the case of the exploratory research (Stewart, 1981; Rendall, 2000a)
this task was undertaken next. Rotation was used to maximise the relationships
between variables and factors thereby reducing ambiguities and whilst many
techniques exist, their objective is to retain the same number of factors whilst
achieving the best structure for interpretation. Varimax and Direct Oblimin were
employed and the two loading structures were compared. This revealed three
issues which ultimately led to the selection of the orthogonal rotation as most
suitable for interpretation. First, an oblique solution nine factor structure bore a
high degree of resemblance to the factors extracted in the orthogonal solution, the
latter of which has a tendency to force items to load onto factors than the former
(Norusis, 1994). Six factors were the same and three were hybrids of the
remaining items. Second, the component correlation matrix generated from
oblique rotation revealed no correlations of merit between the variables (the
highest was .189). Third, the oblique structure matrix produced several
inseparable variables compared with orthogonal rotation. Subsequently,
orthogonal rotation was deemed superior for the purposes of developing simple
structure, i.e. where each factor has a few high loadings, and adopted for
interpretation. The oblique solution output is retained for reference in Appendix
12. Whether using an orthogonal or oblique rotation, the factor structure produced
did not match that which one might expect to encounter were the eight classes to
be considered equal or near equal in the respondent's perceptions of competitive
advantage.
337

App ndic >
ApPENDIX 3: COMPANIES EXCLUDED FOR AUTOMOTIVE DATABA E
Listed below are companies that have been categorised as automotive component suppliers according to SIC classifications (Chapter 4). However, requests for data led to the exclusion of the companies for a variety of reasons, including:
AM - Aftermarket-only production HGV - Operations only in the Heavy Goods Vehicle market Not MVI - Company has no direct involvement in the automotive industry
Company Name Acorn Chemicals Aeroquip Aiden Cabs Allied Signal Alvis
-Autc:la C..?m"p0nents
Reason for Exclusion Aftermarket (AM) only Heavy Goods Vehicle (HGV) only HGV HGV HGV AM HGV Avonride
Bainbridge Silencers Beason Cooke
-----_�_
Beldam Lascar Blowspeed Bpw Ltd Brockhouse Brockhouse Ma~u~~ring ___ _
,Br_oughton Group_ Brymar Electrics Burton Delingpole Bus Engineers C H Industrials Cam Profiles Cannon Rubber Caradon ElIiott
Gon~ ~wa~ Gone away Not MVI Refused to provide information HGV -NotMVI NotMYI HGV Receivership Not MVI Gone away Liquidation Not MYI - -AM ONLY NotMVI ------1-----
Channel Holdings --~-----------
Clarks Crankshaft Crossland Filters David Brown Deans Dom Nemef Corbin Douglas Tugmasters Duncan Cabs Eastfiel~Engineering _ Eberspacher Brochenhurst (Hants) Ltd Electricars Em Exhausts Englass
- -- -
Ernest Derricott
t anuc
AM ONLY NotMYI Gone away HGV NotMYI NotMYI Specialist vehicles
. - -HGV NotMVI HGV Gone away
' Receivership Not MVI
_ ~ea~ed trading Robotics
338

First Line Flexible Lamps Fossit And Thorne G E Lighting Gabriel Gap Gordon Lamb Gpg Pic Gretsch Unitas Hatcher Hendrickson Europe Hi-Ton International Hindle Group Huco Interglass Invertec John R. Boone Jost Julius Koch Kab Seating Kenlowe Knorr Bremse Lab Craft Laird Group Lay stall M&F Components Majorsell Majorsell Ltd Midland Radiator Midway Mollard Universal Joints Motaquip Multi-Stroke Handbrake Controls Nelson Burgess Ntn Distribution Only ames Faulkner Paddy Hopkirk Partco Pesco Premier Hazard Raydydot Ltd Raydyot Raydyot Ltd Resort Ltd Reynolds Boughton Ltd Ringshare Ringspan Ror Rockwell Sachs Automotive
Distribution HGV Retailer NotMVI NotMVI Refused info Refused info Gone away NotMVI Signs HGV Gone away .NotMVI NotMVI Not MVI HGV NotMVI HGV NotMVI HGV
.t\M only
.HGV HGVonly No UK production Development company AM only Gone away HGV . Gone away In receivership NotMVI Distributor Not MVI Not MVI NotMVI NotMVI AM
i Distribution 'HGV HGV Refused information Refused information HGV
Voluntary liquidation Very little in automotive involvement Gone away HGV HGV Distributor
339
Appendices

Schwitzer Turbos
Sears Shaftfield Fabrications
Silver Shield
Smc
Sp Stromag Transmissions
Suitpull T. Harrison And Co
Tecalemit Systems Ltd
Thos. Winnard
Tilt Measurement
Transport Seating
Tyzack
Unipower
Voith
W.H. Tildesley
Wichita
Williams
HGV
HGV
Not MVI
AM only
Automation equipment
Refused information
Not MVI
Gone away Gone away
NotMVI
HGV
HGV
; Gone away
Very little in automotive involvement HGV
HGV
,NotMVI
NotMVI
NotMVI
340
Appendices

Appendices
ApPENDIX 4: LIST OF ORIGINAL STATEMENTS
Company size
1. High production scale leads to lower costs which create price competitiveness
2. Improvements based on long production runs leads to improvements in processes
3. Organisations with high market shares have a competitive advantage
4. A long product life cycle is important for cost reduction and profitability
Industry Structure
5. Position within the supply chain reflects competitive advantage
6. Changes in the industry structure influence competitive advantage
7. New entrants to an industry always face competitive disadvantage
8. Changes within the supply chain affect all organisations equally
Strengths and weaknesses
9. Companies with strengths relative to their competitors have a competitive advantage
10. Competitors strengths are easy to recognise
11. We can compare our activities to those of our rivals
12. We understand where we are stronger than our rivals
Relationships with customer
13. Geographical proximity to customers (assemblers) is a source of competitive advantage
14. Long-term (i.e. vehicle life or longer) relationships with customers are a source of advantage
15. R&D involvement with assemblers is a source of competitive advantage
16. Superior logistics and delivery are a source of competitive advantage
341

Appendices
Uniqueness and competitive advantage
17. Organisations are bundles of resources which influence competitive advantage
18. Competitive advantage occurs due to an organisation having resources which are different to those of rivals
19. Companies with resources which are difficult or impossible to acquire have a competitive advantage
20. Knowledge (employee skills, patents, trademarks, and processes) lead to competitive advantage
Access to resources
21. The ability to understand the cause-effect relationship between resources and competitive advantage differs between organisations
22. Some organisations are better able to identify and acquire useful resources
23. Decision makers may disagree on which important resources they should acquire
24. The acquisition of important resources is a matter of luck
25. The links between new and existing resources are not known at first
26. Resources are difficult to acquire because they cannot be moved
27. Resources cannot be accumulated because they cannot be purchased
Managing Resources
28. We look for ways of using our resources in new areas and products
29. Managers are responsible for managing products
30. Managers are responsible for managing processes
31 . Managers are responsible for managing resources
32. We purposefully plan for the use of resources in our future strategies
Combining resources
33. Organisations are collections of products and services
34. Organisations are collections of resources
342

Appendices
35. Product platfonns reflect an advantage in resources
36. Product platfonns reflect final demand for products
37. The combination of resources enables higher value added
38. The combination of resources reduces the threat of imitation
39. Platfonns reflect the linking of resources together
Terminology
40. Strength is a tenn used to note the superiority of a company over its rivals
41. Capability is a tenn used to note the superiority of a company over its rivals
42. Competence is a tenn used to note the superiority of a company over its rivals
43. Core competence is a tenn used to note the superiority of a company over its rivals
Hierarchy of Resources
44. The ability to generate value-added from resources is most important to competitive advantage
45. The rarity of the resource is most important to competitive advantage
46. The inimitability of the resource is most important to competitive advantage
47. The flexibility of the resource is most important to competitive advantage
343

Appendices
ApPENDIX 5: PRE-TEST GROUP TRAITS (GENERAL MANAGER GROUP)
Respondent # I 2 3 456 789 10 II 12 13 14 15 16 17 18 19 20 21 22 23 24 2S
Experience (years) 21 6 10 14 3 7 12 8 8 15 16 12 3 6 3 4 10 10 6 6 5 6 8 7 9 Total
1 Background ~
Production: 1 1 1 1 1 111 1 9 Sales: 1 1 1 1 1 1 1 7 Marketing/sales: 1 1 1 1 1 5 R&D: 1 1 1 3 Purchasing: 1 1 1 1 1 5 Finance: 1 1 1 1 1 5 Legal: 0 Administration: 1 1 1 1 1 1 1 1 1 9 IT: 1 1 2 Other: 1 1 1 1 4
Industry Sector: Manufacturing: 1 1 1 1 1 1 1 1 1 1 1 I I Service: 1 1 1 1 1 1 1 1 1 1 10 Public: 1 1 1 1 4
Mean experience 8.6 (vears)
344

Appendices
ApPENDIX 6: PRE-TEST PRO-FORMA
Category High production volume generates a competitive 1. Company size
advantage Process improvements (due to long production runs)
2. Industry structure
lead to competitive advantage 3. Strengths and A low number of direct rivals is an indication of a competitive advantage Weaknesses
Organisations with high market shares have a competitive advantage Geographical proximity to customers (assemblers) is a
4. Relationships with
customer source of competitive advantage Organisations are bundles of resources which influence
5. Uniqueness &
competitive advantage competitive A company's power over its suppliers (due to its size) is a source of competitive advantage advantage
Position (tier 1,2,3) within the supply chain is an 6. Access to resources indication of a company's competitive advantage A rival's strengths and weaknesses can be evaluated 7. Managing resources objectively Long-term (i.e. vehicle life or longer) relationships with 8. Combining resources
customers are a source of advantage New entrants to an industry always face a competitive disadvantage The acquisition of important resources is often due of
. luck The combination of resources through product platforms/new technologies increases value added The ability to change quickly due to the demands of assemblers is a source of competitive advantage Companies always fully exploit their strengths to gain a competitive advantage R&D involvement with assemblers is a source of competitive advantage
345

Category
The relationship between resources and competitive advantage can be clearly understood Some organisations are better able to identify and acquire useful resources than others The differences between companies' resources account for differences in competitive advantage Resources which are difficult or impossible to acquire lead to competitive advantage Intangible resources such as skills, patents, and processes influence competitive advantage The ability to develop/supply a product platform requires superior coordination & management skills Product platforms/technologies reflect a company's competitive advantage Senior managers differ in their view of which resources are important Product management is an important senior management role A SWOT analysis enables managers to effectively analyse rivals' strengths and weaknesses Process management is an important senior management role A company has enough information about rivals to enable comparisons of strengths and weaknesses Product platforms, modules or new technologies reduce the threat of imitation Superior logistics and delivery are a source of competitive advantaae Resource management is an important senior management role An important senior management role is to look for new opportunities for current platforms and technologies
Work experience: __ (Years)
Operating Areas: Production: Sales: Marketing/sales: R&D: Purchasing: Finance: Legal: Administration: IT: Other:
Industry Sedor: Manufacturing: Service: Public:
346
Appendices
1. Company size
2. Industry structure
3. Strengths and
Weaknesses
4. Relationships with
customer
5. Uniqueness &
competitive advantage
6. Access to resources
7. Managing resources
8. Combining resources
D

ApPENDIX 7: SECOND PROTOTYPE QUESTIONNAIRE
Competitive Advantage in the Automotive Components Industry Survey of Senior Managers' Views
Part 1: About your company
1. Company name:
2. Division or business unit (if appropriate):
3. Turnover per year: £, __________ _
4. Number of employees: Please tick ./
aI-50 b 51-250 c 250+
5. Products.
Please indicate the components manufactured by your company:
Appendices
- --~---
Please tick as appropriate ,/ Please tick as appropriate y" --
a Braking systems m Interior trim b Engine - internal components n Lighting c Engine cooling 0 Seating --d Exterior trim p Stampings/ pressing
- --~.
e Fuel supply q Starting systems f Gearbox/ clutch components r Steering systems
---g Glazing products s Suspension h Heating and ventilation t Vehicle body parts
.-~ ..
i Hydraulics u Wheels/ tyres -.-.--
Ignition/ engine management j v Other .-- ---"-- ,----k Instrumentation w Other - - -- "' <- •• ~
I Intake air/exhaust systems x Other ._-- ~~.-
347

Appendices
6. Tier in the supply chain.
Which tier in the supply chain does your company occupy for the majority of its supply relationships?
Please tick one only
o Tier 1 - we supply modules/ subassemblies directly to the assembler. 0 Tier 2 - we supply to a tier 1 component manufacturer. 0 Tier 3 - we supply to a tier 2 component manufacturer. 0
7. Who are your immediate or indirect customers at present?
Please tick as ./ Please tick as ./ Please tick as appropriate a})propriate appropriate
a BMW g Jaguar m Toyota
b I>aimler-<:hrysler h Mazda n Vauxhall c PSAGroup i Nissan 0 Volkswagen d Ford j Rover p Volvo e Fiat k Renault q Other: f Honda I Saab r Other:
8. What is the geographical origin of your company?
Please tick one only ./
a British b European Union c North America d Pacific Rim e Other (please state)
9. Is your company involved in alliances or partnerships with other component suppliers?
Please tick one only ~ Yes []
No 0
348
./

Appendices
10. Which of the following statements best describes your company's responsibility for Research and Development?
Please tick one only
~ We "build to print" /"work to customers' drawings". 0 We are involved in joint R&D with customers. 0 Components are generally our own designs. 0
Part 2: About you
11. What is your main background in terms of training and experience?
Please tick one only ./ Please tick one only ./
a Production f Finance b Sales g Legal
--
--c Marketing/ sales h IT
--~~-.-
d R&D 1 Other e Purchasing j Other
.--
12. How long have you worked in the automotive industry? _____ Years
13. How long have you occupied your present position?
13a. What is the formal title of your present position?
Part 3: Terms that you use
_____ years
14. Please indicate the degree to which you use the following terms to describe tile source of competitive advantage:
Please circle Littlel Very often Never
a) "Strength" 1 2 3 4 5
b) "Capability" 1 2 3 4 5
c) "Competence" 1 2 3 4 5
d) "Core competence" 1 2 3 4 5
349
-

Appendices
Part 4: The importance of resources
15. How important are the following criteria when you are evaluating a resoli ree?
Please circle
Not Important Very Important
a) The ability to generate value. 1 2 3 4 5
b) The rarity of the resource. 1 2 3 4 5
c) The inimitability of the resource. 1 2 3 4 5
d) The potential to use the resource 1 2 3 4 5 elsewhere in the company.
Part 5: Your views on competitive advantage
Please indicate the extent to which you agree of disagree with the following
statements:
Please circle one I onlY
Strongly Disagree
16 High production volume generates a 1 2 3 competitive advantage.
17 Process improvements (due to long 1 2 3 production runs) lead to competitive advantage.
18 A low number of direct rivals is an indication I 2 3 of the competitive advantage of a company.
19 Organisations with high market shares have 1 2 3 a competitive advantage.
20 Geographical proximity to customers 1 2 3 (assemblers) is a source of competitive advantage.
21 Organisations are 'bundles' of resources 1 2 3 which influence competitive advantage.
22 A company's power over its suppliers (due to 1 2 3 its size) is a source of competitive advantage.
23 Position (tier 1,2,3) within the supply chain 1 2 3 reflects a company's competitive advantage.
350
4
4
4
4
-- --4
4
4
4
Stron Agi
gly ree 5
.---
5
--
5 -.----~-
'--"-"'--'''-
5 -. __ .,0'-.
__ ~,w_,~, __
5
. .. ,,--
5
5
- ~
5
- --

Appendices
-_._----_. __ ., -
24 A rival's strengths and weaknesses can be 1 2 3 4 5 evaluated objectively.
-.-.~ .. -- .... ------... -- - '-'".- .-.--~-.-".~ .-
25 Long-term (i.e. vehicle life or longer) 1 2 3 4 5 relationships with customers are a source of advantage.
-.-.--.-".-~--
~--------
26 New entrants to an industry always face a 1 2 3 4 5 competitive disadvantage.
-27 The acquisition of important resources is 1 2 3 4 5
often due of luck. ---~--.-
----~~
28 The combination of resources through 1 2 3 4 5 product platforms/new technologies increases value added.
"- -_.-_-"- ~.
~--- -29 The ability to change quickly due to the 1 2 3 4 5
demands of assemblers is a source of com~etitive advantage.
--
30 Companies with strengths compared with 1 2 3 4 5 their competitors have a competitive advantage.
"-- . __ .•.. -- -'~ .---~-
31 R&D involvement with assemblers is a 1 2 3 4 5 source of competitive advantage. ._---
32 The relationship between resources and 1 2 .-----
3 4 5 competitive advantage can be clearly understood.
33 Some organisations are better able to identify 1 2 -- .-..
3 4 5 and acquire useful resources than others. ._-
34 The differences between companies' 1 2 .. -
3 4 5 resources account for differences in competitive advanta.&e.
~-"'
35 Companies with resources which are difficult 1 2 '~-.-.
3 4 5 or impossible to acquire have a competitive advantage.
"--36 Intangible resources such as skills, patents, 1 2 "--3 4 5
and processes influence competitive advantaKe.
.~-~ -37 The ability to develop/supply a product 1 2
.-~-.,,-~
3 4 5 platform requires superior coordination & management skills.
--.
38 Product platforms/ technologies reflect a 1 2 --3 4 5
company's competitive advantage.
39 Senior managers differ in their view of which 1 2 3 4 -.
5 resources are important. -
40 Product management is an important senior 1 2 3 4 5 management role.
351

Appendices
-.---- _ .. ---- -_._--"_ ..
41 A SWOT analysis enables managers to 1 2 3 4 5 effectively analyse rivals' strengths and weaknesses. ---,
--.-
42 Process management is an important senior 1 2 3 4 5 management role. - -- .---- -.. - - ""-
43 A company has enough information about 1 2 3 4 rivals to enable comparisons of strengths and weaknesses ..
-- •.
44 The combination of resources in product 1 2 3 4 5 platforms/new technologies reduces the threat of imitation.
.. ..-
45 Superior logistics and delivery are a source of 1 2 3 4 5 competitive advantage.
... ----- -46 Resource management is an important senior 1 2 3 4 5
management role.
47 An important senior management role is to 1 2 3 4 5 look for new opportunities for current platforms and technologies ---- -------_ ..
Thank you for your cooperation in the completion of this questionnaire.
If you have any queries, please contact Brahim Herbane on (0116) 2577263.
Contact and address details to which summary findings should be sent:
352

Appendices
ApPENDIX 8: FINAL QUESTIONNAIRE
Overleaf is a copy of the final questionnaire distributed to senior managers in the
supplier database, the development of which was discussed in Chapter 5. The
questionnaire was printed as a single A3 folded sheet to improve the presentation.
353

Competitive Advantage in the Automotive Components Industry: Survey of Senior Managers' Views
Part 1: About your company
1. Number of employees (UK Operations):
PLEASE TICK ONE ONLY./ a 0-9 b 10-49 c 50-249 d More than 250
2. What is your approximate automotive (OEM) turnover per annum? £_-------
3. Please indicate the components manufactured by your company:
PLEASE TICK AS MANY AS APPROPRIATE ./ a Braking systems i Hydraulics -q Starting systems
b Engine - internal components j Ignition/engine management r Steering systems
c Engine cooling k Instrumentation s Suspension
d Exterior trim 1 Intake air/exhaust systems t Vehide body parts
e Fuel supply m Interior trim u Wheels/lyres
f GearboX/clutch components n Lighting v Other: (specify)
g Glazing products 0 Seating w Other: (specify)
h Heating and ventilation p Stampings/presslng x Other: (specify)
4. Which tier in the supply chain does your company occupy for the majority of its supply relationships?
PLEASETICKONEONLY ~ Tier 1- we supply modules/subassemblies directly to the assembler. 0 Tier 2 - we supply to a tier 1 component manufacturer. 0 Tier 3 - we supply to a tier 2 component manufacturer. 0
5. Who are your immediate or indirect customers at present?
PLEASE TICK AS MANY AS APPROPRIATE .,/ a BMW g Jaguar m Toyota b Daimler-Chrysler h Mazda n Vauxhall c PSA Group i Nlssan 0 Volkswagen d Ford i Rover p Volvo e Fiat k Renault Q Other: (apedIy)
f Honda I Saab r Other: (specify)
6. Where is your company headquarters based?
PLEASE TICK ONE ONLY ./ a United Kingdom d PacifIC Rim I b Europe e Other: (specify)
c North America f Other: (specify)
354

7. Is your company involved in alliances or partnerships with other component supplias?
PLEASE TICK ONE ONLY ~ Yes o No 0 Don'tKnow 0
8. Which of the following statements best describes your company's responsibility for Research and Development?
PLEASE TICK ONE ONLY ~ We only "build to print" I "work to customers' drawings". 0 We are involved in joint R&D with customers. 0 Components are generally our own designs. 0
Part 2: About you
9. What is your main background in tenns of training and experience?
PLEASE TICK ONE ONLYv' a Production g R&D m Legal b Sales h Purchasing n IT c Marketing i Finance 0 Other: (specify)
10. How long have you worked in the automotive industry? _____ Years
11. How long have you occupied your present position? -----Years
I I
12. What is the fonnal title of your present position? ________________ .
Part 3: Terms that you use
13. Please indicate the frequency with which you use each of the follOWing tenns to describe the source of competitive advantage in your company. (PLEASE CIRCLE ONE NUMBER FOR EACH TERM ONLy)
Terms: Infrequently Frequently
a) "Strength" 1 2 3 4 5 b) "Capability" 1 2 3 4 5 c) "Competence" 1 2 3 4 5 d) "Core competence" 1 2 3 4 5
Part 4: The im;eortance of resources
14. How important or unimportant are each of the following criteria when you are evaluating a resource? (PLEASE CIRCLE ONE NUMBER ONLY FOR EACH CRITERIA)
Criteria: Unimportant
a) The ability to generate value 1 b) The rarity of the resource 1 c) The low imitability of the resource 1 d) The potential to use the resource 1 elsewhere in the company
355
2 2 2 2
3 3 3 3
4 4 4 4
Important
5 5 5 5
Don't know
0 0 0 0
Don't know
o o o o

Part 5: Your views on competitive advantage
Using just Q!!£ of the terms shown, please indicate the extent to which you agree or disagree
with each of the following statements:
I Statements I Terms PLEASE CIRCLE ONE NUMBER ONI.Y PER STATEMENT
~ Very I Fairly \ F aIl1y-r-V8rY
strongly strongly Neutral strongly strongl disaaree disaaree aa ree__ __8Jl1'!e_
y
15 High production volume generates a competitive 1 2 3 4 5 advantage. - .-~--.-- .~- ..
- >._-- -._-- .... ~.-.--
16 Process improvements (due to long production runs) 1 2 3 4 5 lead to competitive advantage.
-.- -_._- -- ,-_ ..... - _. 17 A low number of direct rivals is an indication of a 1 2 3 4 5
company'scompetitiveadvantage. - . ---- ._--
-."--.-~ ....
18 Organisations with high market shares have a 1 2 3 4 5 competitive advantage. ---..... --_. --_ ...
... _._- ------ -- .... __ ... _-
19 Geographical proximity to customers (assemblers) is 1 2 3 4 5 a source of competitive advantage.
--•• __ •• __ 0- •• _. ~ __ •
---.-~-- . _._,-, .-"
120 Organisations are 'bundles' of resources which 1 2 3 4 5
influence competitive advantage. -_ .. _---- -..
21 A company's power over its suppliers (due to its 1 2 3 4 5 size) is a source of competitive advantage.
~.-~.- . - _. _ .•. _-.'+-
22 Position (tier 1,2,3) within the supply chain is an 1 2 3 4 5 indication of a company's competitive advantage. -.--_. -.--_.- ....
----.~-~-
23 A rival's strengths and weaknesses can be evaluated 1 2 3 4 5 o_bjectively.
24 Long-term (i.e. vehicle life or longer) relationships 1 2 3 4 5 with customers are a source of advantage.
25 New entrants to an industry face a competitive 1 2 3 4 5 disadvantage. ---------
26 The acquisition of important resources is often due --- --. __ .
1 2 3 4 5 to luck.
- ----~-
-.--~-
27 The combination of resources through product 1 2 3 4 5 platforms/new technologies increases value added.
<-~-------28 The ability to change quickly due to the demands of 1 2 3 4 5
assemblers is a source of competitive advantage. - --~----.- ---
129 Companies always fully exploit their strengths to
.- , .. +._ .. - -.--.-
1 2 3 4 5 I gain a competitive advantage. I
-. ---
1
30 R&D involvement with assemblers is a source of 1 2 3 4 competitive advantage.
5
- - -<--
Please turn over .....
356

I Statements I Terms ~ .. " "
PER S1.ATEME
TL .... 'j"
Very I Fairly I Fairly Very
~ strongly strongly Neutral s:~~~y _ s~~:y disagree disagree
~ PLEASE CIRCl E ONI' NUMllrR ONI Y
131 The relationship between resources and competitive 1 2 3 4 5
advantage can be clearly understood. - - .- --'-' . .. ...
32 Some organisations are better able to identify and 1 2 ~ 4 5 acquire useful resources than others. -. ----_ .. - . - - -
-, - .. ~-- -- ..
33 The differences between companies' resources 1 2 3 4 5 account for differences in competitive advantage. ------.-.----.- --'
--" .. _-- - -~- ._"
34 Resources which are difficult or impossible to 1 2 3 4 5 acquire lead to competitive advantage.
- '-"-'--~ ~ .. -.--.. --~-,--.---- -_.
35 Intangible resources such as skills, patents, and 1 2 3 4 5 processes influence competitive advantage.
~ • o. ~ _ .. , .. "_. - _ ... _ .. _-
36 The ability to develop/supply a product platform I 2 3 4 5 requires superior coordination & management skills.
~-- -'~-'-. -----_.-.---_ ..
37 Product platforms/ technologies reflect a company's 1 2 3 4 5 com£etitive advantage. ---- .- .. ~-~,. -.•..
~~-.... ,.--- --38 Senior managers differ in their view of which 1 2 3 4 5
resources are important. •. ~- .. _.,--
39 Product management is an important senior I 2 3 4 5 management role.
-~'---'-'--
. --- '"'. .~- - _ .. 40 A SWOT analysis enables managers to effectively 1 2 3 4 5
analyse rivals' strengths and weaknesses. ," ... -.. ----~.-. ----_ .. _ ..
41 Process management is an important senior 1 2 3 4 5 management role. -_. __ .. __ .. -
•. _--_. 42 A company can collect enough information about rivals 1 2 3 4 5
to enable comparisons of strengths and weaknesses. - ~- -
- - --43 Product platforms, modules or new technolOgies I 2 3 4 5
reduce the threat of imitation. -
44 Superior logistics and delivery are a source of 1 2 3 4 5 competitive advanta...&e.
45 Resource management is an important senior 1 2 3 4 5 management role. ----_._.-_._- .. -- - ~-""~ ... -'-,--An important senior management role is to look for ,46 1 2 3 4 5
I new opportunities for current platforms and technologies --- .. ~.---
Thank you for your cooperation in the completion of this questionnaire.
If you have any queries, please contact Brahim Herbane on (0116) 2577263 or at Leicester Business School, De Montfort University, The Gateway, Leicester LEI 9BH,
357

ApPENDIX 9: COVERING LETTER
«Senior_Manager» «ID _Company_Name» «Address 1» «Address 2» «Address 3» «Address_ 4» «Postal Code»
Dear Sir,
Appendic(.'s
«Date»
Excellence in manufacturing and supply chain management are well understood in the automotive industry but the competitive priorities of suppliers less so. I am carrying out a unique industry-wide research study about the ways in which competitive advantage is created in the automotive components industry. The study is central to the completion of my Doctoral degree.
As the strategic decision maker within your company, you are in a position to provide the study with an insight into current competitive priorities. Clearly. the study has consequences for policy decisions at company, industry and government levels. As such, all major component producers in the UK have been included in this study.
Enclosed is a questionnaire which should take about ten minutes to complete. It asks about your company in general terms, your background and your views on competitive advantage. None of the questions should be of a commercially sensitive or controversial nature and your responses will be kept strictly confidential. Individual responses will remain anonymous and only aggregate and anonymous results will be produced. This study follows the Market Research Society Code of Conduct (www.mrs.org.uk).
As a gesture of appreciation for your participation, I will be pleased to send a copy of the exclusive research report to you in due course. It will report the differences among automotive component suppliers in relation to their competitive advantage priorities.
Please return the questionnaire using the enclosed stamped, addressed envelope. If you have any questions you wish to ask or there is anything you would like to discuss, please do not hesitate to contact me at the University on 0116 2577263 or bye-mail ([email protected]).
Thank you in advance of your participation.
Yours sincerely,
Brahim Herbane Senior Lecturer Department of Corporate Strategy
358

API'l!lIciil'CS
ApPENDIX 10: ANOV A - VRIO AND TERMINOLOGV
Sum of df Mean F Sig. Squares Square
Value Between 0.085 2 0.042 0.142 0.868 Groups Within Groups 84.112 281 0.299 Total 84.197 283
Rarity Between 2.471 2 1.235 1.124 0.326 Groups Within Groups 308.895 281 1.099 Total 311.366 283
Inimitability Between 0.988 2 0.494 0.516 0.598 Groups Within Groups 269.192 281 0.958 Total 270.180 283
Organisation Between 3.448 2 1.724 1.676\ 0.18Q Groups Within Groups 289.045 281 1.029 Total 292.493 283
Strength Between 4.939 2 2.470 1.994\ 0.138 Groups Within Groups 348.004 281 1.238 Total 352.944 283
Capability Between 1.926 2 0.963 1.1
981 0.303 Groups Within Groups 225.849 281 0.804 Total 227.775 283
Competence Between 3.007 2 1.503 1.439\ 0.239 Groups Within Groups 293.680 281 1.045 Total 296.687 283
Core Between 14.351 2 7.175 4.482\ 0.011 competence Groups
Within Groups 449.846 281 1.601 Total 464.197 283
359

ApPENDIX 11: RELIABILITY OF S CALES
R ELI A B I LIT Y A N A L Y SIS seA L E (A L P H A)
Item-total Statistics
Scale Scale Corrected Mean Variance Item- Alph
if Item if Item Total i I m Deleted Deleted Correia ion Dele
Q15 113 . 2148 72 . 5509 . 1126 . 7411 Q16 112 . 8099 72 . 5503 . 1368 . 7384 Q17 113 . 6408 71.2557 .1995 . 7347 Q18 113.2535 71.7235 . 1972 . 7344 Q19 112.9824 72 . 0456 . 202 4 . 7 38 Q20 113.1197 71.0174 . 2955 . 7285 Q21 113.0352 70 . 3026 . 2911 . 7284 Q22 113 . 9577 71 . 3268 . 194 4 . 7 Sl Q23 113 . 1937 70.941 2 . 2658 . 7301 Q24 112 . 4859 71. 7136 . 2532 . 730 Q25 113 . 1197 73 . 15 17 . 0964 . 7410 Q26 114.1514 74.1431 .0 336 . 7450 Q27 112 . 8204 71.6744 . 3188 . 7283 Q28 112.2465 71. 5857 . 3357 . 7277 Q29 113 . 9683 70 . 4972 . 2036 . 7355 Q30 112 . 4859 71. 8620 . 2659 . 7304 Q31 113.4014 70 . 9973 . 3132 . 7277 Q32 112 . 6655 73.6792 .17 82 .734 7 Q33 113 . 1796 71.4 341 . 2496 . 7310 Q34 113.1514 70.3198 . 2947 . 7282 Q35 112 . 5423 72 . 1855 . 277 0 . 7303 Q36 112 . 6690 71 . 0279 . 341 8 . 72 7 Q37 113.0387 70.3200 . 3797 . 72 44 Q38 112 . 9190 74.6 259 .0 166 . 7444 Q39 112 . 5986 71.5698 . 3109 . 7284 040 113.0810 70 . 6259 . 3031 . 7279 Q41 112 . 6127 71 . 192 2 . 3346 . 7272 042 113 . 2535 69 . 2500 . 3773 . 7231 043 113 . 4120 70.038 2 . 335 4 . 7259 Q44 112.5669 70.8188 . 327 9 . 726 045 112 . 5810 71. 3185 . 3429 . 7271 Q46 112 . 3627 71.0588 . 3773 . 7257
Reliabili ty Coefficients
N of Cases 284.0 N of Items - 32
Alpha = . 7376
360

Appendices
ApPENDIX 12: OBLIQUE ROTATED SOLUTION
Structure Matrix Component
2 3 4 5 6 7 8 9
Q41 .723 Q39 .653 .310 Q45 .540 .358 Q46 .506 .358 Q19 .503 Q26 -.722 Q38 -.625 Q15 .799 Q16 .695 Q25 -.530 Q44 -.318 .470 Q17 -.688 Q18 -.657 Q21 .328 .304 -.396 Q23 .750 Q42 .749 Q31 .301 .604 .326 Q40 -.310 .559 Q33 .407 Q32 -.734 Q29 .346 .629 Q22 .322 .527 Q37 .776 Q36 .398 .679 Q43 .569 .316 Q24 .639 Q30 .427 .572 Q28 -.399 .570 Q35 -.318 .495 Q27 .322 .437 Q34 -.341 .351 -.333 .414 Q20 -.307 -.393 .409
Extraction Method: Principal Component Analysis. Rotation Method: Oblimin with Kaiser Normalization.
361

List of Competitive Advantage Statements for Reference in Chapter 7
15 High production volume generates a competitive advantage. 16 Process improvements (due to long production runs) lead to competitive advantage. 17 A low number of direct rivals is an indication of a company's competitive advantage. 18 Organisations with high market shares have a competitive advantage. 19 Geographical proximity to customers (assemblers) is a source of competitive advantage. 20 Organisations are 'bundles' of resources which influence competitive advantage. 21 A company's power over its suppliers (due to its size) is a source of competitive advantage. 22 Position (tier 1,2,3) within the supply chain is an indication of a company's competitive advantage 23 A rival's strengths and weaknesses can be evaluated objectively. 24 Long-term (i.e. vehicle life or longer) relationships with customers are a source of advantage. 25 New entrants to an industry face a competitive disadvantage. 26 The acquisition of important resources is often due to luck. 27 The combination of resources through product platforms/new technologies increases value added. 28 The ability to change quickly due to the demands of assemblers is a source of competitive advantage. 29 Companies always fully exploit their strengths to gain a competitive advantage. 30 R&D involvement with assemblers is a source of competitive advantage. 31 The relationship between resources and competitive advantage can be clearly understood. 32 Some organisations are better able to identify and acquire useful resources than others. 33 The differences between companies' resources account for differences in competitive advantage. 34 Resources which are difficult or impossible to acquire lead to competitive advantage. 35 Intangible resources such as skills, patents, and processes influence competitive advantage. 36 The ability to develop/supply a product platform requires superior coordination & management skills. 37 Product platforms/technologies reflect a company's competitive advantage. 38 Senior managers differ in their view of which resources are important. 39 Product management is an important senior management role. 40 A SWOT analysis enables managers to effectively analyse rivals' strengths and weaknesses. 41 Process management is an important senior management role. 42 A company can collect enough information about rivals to enable comparisons of strengths and weaknesses. 43 Product platforms, modules or new technologies reduce the threat of imitation. 44 Superior logistics and delivery are a source of competitive advantage. 45 Resource management is an important senior management role. 46 An important senior management role is to look for new opportunities for current platforms and technologies
Copyright © 2022 FDOKUMEN