Perception of Wine Labels by Hong Kong Chinese Consumers
38
Elsevier Editorial System(tm) for Wine Economics and Policy Manuscript Draft Manuscript Number: WEP-D-14-00025R1 Title: Perception of Wine Labels by Hong Kong Chinese Consumers Article Type: Full Length Article Keywords: Hong Kong wine market, Chinese wine consumers, wine label, extrinsic wine attributes Corresponding Author: Dr. Anat Tchetchik, Ph.D Corresponding Author's Institution: Ben-Gurion University of the Negev First Author: Vicky Chi Man TANG , MBA Order of Authors: Vicky Chi Man TANG , MBA; Anat Tchetchik, Ph.D; Eli Cohen, Professor Abstract: Despite Hong Kong's growing wine consumption and the abundance of retail brands available there, the demanding choice task faced by its wine consumers, who are more subject to a mix of Chinese and Western cultural influences than consumers in other South Asian countries, has not been studied until now. This exploratory study aims to delve into the importance of wine label attributes for Hong Kong Chinese wine consumers, and to shed light on the ways in which their perceptions affect their choice of wine. Employing an online survey, the results suggest that Hong Kong Chinese wine consumers look for the top three most searched attributes: wine origin, grape variety, and food and wine pairing. A simple means differences test indicated that a traditional label design is favored over modern and contemporary wine labels, and that yellow is the most preferred color. However, a data- driven segmentation analysis reveals that about 95% of young Hong Kong Chinese wine consumers prefer "elegant contemporary" labels with red as the dominant color. These findings could be useful for wineries entering this market and for wine label designers who wish to better understand how Hong Kong wine consumers assess alternatives when choosing a bottle of wine. Response to Reviewers: Reviewers' comments: Reviewer #1: The manuscript reported a study on wine label perception in Hong Kong wine consumers. It provides some new information on label preference in Hong Kong market comparing with that in mainland China and other wine countries, which is valuable not only for wine promotion for Hong Kong market, but also could be a reference for the future development of China mainland wine and label preference. However, as the authors indicated in their discussion, there is a few shortage of this study, such as the relatively small number of the respondents and so on. Revision is required before the manuscript can be accepted. My suggestions and comments go as follows: 1. Page 2 line 23-28, I think the authors need to up-date the wine market expectation data, will China and Russia realize the expect wine consumption increment in 2014?
Transcript of Perception of Wine Labels by Hong Kong Chinese Consumers
Elsevier Editorial System(tm) for Wine Economics and Policy Manuscript Draft Manuscript Number: WEP-D-14-00025R1 Title: Perception of Wine Labels by Hong Kong Chinese Consumers Article Type: Full Length Article Keywords: Hong Kong wine market, Chinese wine consumers, wine label, extrinsic wine attributes Corresponding Author: Dr. Anat Tchetchik, Ph.D Corresponding Author's Institution: Ben-Gurion University of the Negev First Author: Vicky Chi Man TANG , MBA Order of Authors: Vicky Chi Man TANG , MBA; Anat Tchetchik, Ph.D; Eli Cohen, Professor Abstract: Despite Hong Kong's growing wine consumption and the abundance of retail brands available there, the demanding choice task faced by its wine consumers, who are more subject to a mix of Chinese and Western cultural influences than consumers in other South Asian countries, has not been studied until now. This exploratory study aims to delve into the importance of wine label attributes for Hong Kong Chinese wine consumers, and to shed light on the ways in which their perceptions affect their choice of wine. Employing an online survey, the results suggest that Hong Kong Chinese wine consumers look for the top three most searched attributes: wine origin, grape variety, and food and wine pairing. A simple means differences test indicated that a traditional label design is favored over modern and contemporary wine labels, and that yellow is the most preferred color. However, a data-driven segmentation analysis reveals that about 95% of young Hong Kong Chinese wine consumers prefer "elegant contemporary" labels with red as the dominant color. These findings could be useful for wineries entering this market and for wine label designers who wish to better understand how Hong Kong wine consumers assess alternatives when choosing a bottle of wine. Response to Reviewers: Reviewers' comments: Reviewer #1: The manuscript reported a study on wine label perception in Hong Kong wine consumers. It provides some new information on label preference in Hong Kong market comparing with that in mainland China and other wine countries, which is valuable not only for wine promotion for Hong Kong market, but also could be a reference for the future development of China mainland wine and label preference. However, as the authors indicated in their discussion, there is a few shortage of this study, such as the relatively small number of the respondents and so on. Revision is required before the manuscript can be accepted. My suggestions and comments go as follows: 1. Page 2 line 23-28, I think the authors need to up-date the wine market expectation data, will China and Russia realize the expect wine consumption increment in 2014?
Re: Agreed. We have revised the second paragraph on p.2 and the first paragraph on p.3 regarding wine consumption in the countries mentioned to include the most updated data available. Updated data records do not exist yet for 2013. 2. To get more reliable results on perception of label color and label style, specifically designed 'for test use' labels are suggested. When all the other attributes are unique, the preference of the target attribute style will be better evaluated. In this study it could better if the authors can avoid the possible bias caused by different grape variety (When I read appendix 1, the second wine label looks like a Sauvignon, the fourth is a Pinot noir). The authors need to explain how the labels used in the test are 'representative' in the market. Re: We understand the reviewer’s concern. Yet, during the survey, which was conducted via monkey survey software, the respondents were asked to focus on the design (we now stress this point better in the manuscript at the bottom of p.10). Given the short time span allowed, they were not able to focus on the text on the label, which in very few cases included information on grape variety or COO. Regarding the choice of the label designs, they are not a representative sample of the Hong Kong market. The market in Hong Kong is flooded by wines from different sources, resulting in hundreds of label types. It would be very difficult to verify the representativeness level of the labels used. 3. For appendix 2, the label color study has the same problem. Label design could have a strong influence on the overall color preference results. I doubt why yellow color label won the highest score while in the actual market yellow dominant labels take a small share. The yellow label which the authors used in the study looks like the Yellow Label of Wolf Blass, if it is true, then its win out could because of its higher recognition and familiarity in the respondents rather than the color itself. The up-mentioned issues need to be addressed the discussion. Re: As mentioned in the previous answer, during the survey respondents were asked to focus on the label’s color only (we now stress this point better in the manuscript in the first paragraph of p.11). See also Appendix 2, which shows that the colors are a very dominant feature of the labels. Regarding the Wolf Blass, indeed a label of this winery exists in this color, and for consumers familiar with the Australian wine market, a Wolf Blass brand association may arise. Yet, on the label used in this study, the Wolf Blass brand name did not appear. We expanded the analyses of label color and implemented segmentation analysis for color only. Results show that although the simple mean comparison of the label color showed that red was the least preferred color, the latent segmentation analysis showed the opposite, i.e., red was the color preferred by 35% of the respondents, while the other colors were preferred by 20–23% of the respondents. A paragraph with the analysis and discussion was added to the manuscript (p. 18, two last paragraphs – p. 19 up to section 5). 4. A new part to investigate a representative wine shop in Hong Kong on brief statistics of different wine label colors and styles could support and validate the results gained from respondents and strengthen the discussion part. Re: We agree that in principle, such an investigation would be useful in validating the results, yet Honk Kong is characterized by multiple wine shops, usually independent and not chain-affiliated, which would pose a challenge in identifying a representative wine-shop. Also, since Hong Kong wine consumers’ preferences have not yet been studied, and since there are many combinations of COO, label design and color, wine and food pairing, and so on, and different weights are placed on each element, the display on retail shelves may not be very meaningful. 5. Page 9, line 18-30. Re: method. The results of 'just after purchasing' kind of on-site investigation could be different from that done by long after purchasing questionnaire results. For some occasional consumers they could forget the brand name when they were asked to fill-in an on-line questionnaire, but brand name could have a more important effect in decision making when the consumers make their purchasing. This point should be discussed.
Re: The first part of the on-site investigation was conducted as a preliminary stage with the objective of obtaining data for the design of the second-stage on-line questionnaire. The participants were completely different in these two stages and so were the questions they were asked. 6. Page 9 line 59- page 10 line 2, why the authors selected a Canadian wine label other than Australian or Chilean, Argentina wine label, I guess the Canadian wine share in Hong Kong is quite small. Re: There are many Canadian Chinese in Hong Kong. Wine traders import many niche products, such as Canadian wines. Such wines in Hong Kong are gaining more popularity than others. Having said that, the COO was not mentioned on the label and the respondents were not able to identify the country of origin of the wine that is represented by the label. 7. Page 10 line 50-53, in 5 Likert-type scale, score 2.5 or so should be considered of any strong influence? How to explain the importance of food wine matching attribute? Re: The average values obtained by the Likert-type scale indicate the relative importance of each attribute. ‘Food and wine pairing’ was found to be as important as brand name and vintage year, as no significant differences were observed among these three attributes’ means (see Table 2). On p.20 we provide a possible explanation for the growing importance of ‘food and wine pairing.’ Reviewer #2: Reviewer Feedback for Hong Kong Label Article Good article. Clear methodology. Interesting results. Should be published with the following revisions made to each section below: INTRODUCTION Update statistics to at least 2013 - 2014. It is now 2015 and many of the statistics on the Hong Kong market are too old, e.g. 2010 International Monetary Fund, etc. Re: Agreed. We have added the most updated data available in the second paragraph of p.2 and the first paragraph of p.3 regarding wine consumption in the countries mentioned. Updated data records do not exist yet for 2013. Is "Hongkonger" a real word? Be consistent in phrasing. Sometimes you say "Hong Kong Chinese wine consumers, and other times a different term. Make them the same. Re: Done, changed to “Hong Kong Chinese” rather than "Hongkonger" Grammar - the whole paper needs to be proofread by a native English speaker. Some of the grammar is not correct. Re: The paper was edited by a professional editor who is a native English speaker (American). There has been at least one other article published on this topic, but the authors state theirs is the first. Not true. Please look athttp://faculty.washington.edu/karyiu/confer/beijing06/papers/zhuo-li-hu.pdf. This should be added to references and mentioned in lit review Re: This reference is now included in subsection 2.1.2: Perception of Country of Origin. LITERATURE REVIEW # 2 should read "Review of the Literature, rather than "Wine Perception and Evaluation". It would also be helpful if the authors added a paragraph describing the relevant literature they will be reviewing, and then move Wine Perception and Evaluation to 2.1. Do the same with the other sub-topics of the lit review. Re: Done
The authors need to do a more thorough lit review on the wine labels. They are missing a few studies - most published in the International Journal of Wine Marketing/International Journal of Wine Business Research. There are studies that address the issues of classic verses modern labels, and the inclusion of a "chateau," which are relevant to this paper. Re: A more thorough lit review on wine label designs is now included in subsection 2.1 Wine Perception and Evaluation, [e.g. Berber, Almanza and Donovan (2006), Elliot and Barth (2012) and Charters, Lockshin & Unwin, 1999]. Also, this study discusses the importance of appellation on the label, and should be mentioned in the lit review.http://www.emeraldinsight.com/doi/abs/10.1108/17511061011035198 Re: This reference was added to subsection 2.1.2 Perceptions of COO. Also, the large multi-author, multi-nation study headed by Goodman, regarding how consumers around the world select wine should be included here. The authors can then compare the Hong Kong consumer to others around the world. Re: We thank the reviewer for bringing up this paper. The multi-author, multi-nation study by Goodman et al. (2008) was added to the manuscript and used to compare Hong Kong results with other counties in the world. See subsection 4.1 Importance of Attributes for the elaborated discussion. We also add the study below. See p. 16 in the revised manuscript. http://blogs.adelaide.edu.au/wine-future/2014/01/08/mapping-the-influencers-of-consumer-choice-for-wine-selection-on-and-off-premise-in-key-export-markets/http://blogs.adelaide.edu.au/wine-future/2014/01/08/mapping-the-influencers-of-consumer-choice-for-wine-selection-on-and-off-premise-in-key-export-markets/ METHODOLOGY Add a paragraph explaining how you analyzed the data, the tools you used: SPSS, Excel, types of statistical analysis, qualitative, etc Re: Done. See page p.11 above section 4 in the revised manuscript. RESULTS Move socio-demographics (last paragraph of methodology section) to the results section where they belong. Re: Done CONCLUSIONS & IMPLICATIONS Should add the #5 to this Title and change heading to read “Discussion, Implications & Conclusions” Re: Done Add a list of bullet points, or a table highlighting key recommendations for wine marketers. Re: Done (before section 5.1) Also, need to address the issue of “white vs yellow” labels. Your abstract states that yellow labels are the preferred color, but in the discussion section you state that white is the preferred color. Which is correct? Please fix. Also, if white is preferred, how can you explain the issue of white color meaning death in Chinese culture? Re: We are sorry for the misunderstanding on our side and thank the reviewer for commenting on it. The abstract was changed and now matches the findings of the study. The yellow color was ranked high in a simple means test based on Likert-scale based data. However, a data-driven segmentation
analysis revealed that the preferences for wine label color among Hong Kong Chinese are differently distributed among different consumer segments, with the largest segment preferring labels with white as the dominant color. This is also mentioned in the revised manuscript on p.20.

February 15, 2015
Dear Editor,
Attached please find the revised manuscript "Perception of Wine Labels by Hong Kong Chinese
Consumers" to be considered for publication in the Journal of Wine Economics and Policy.
We have addressed each of the reviewers’ concerns and requests. We also performed, based on a
comment of the second reviewer, an additional segmentation analysis which better clarifies the
results regarding color preferences. We believe that all the above mentioned have improved the
manuscript to a great extent.
We would like to thank both reviewers for their insightful comments on the paper as these
comments led us to an improvement of the work.
We hope to hear from you soon.
Sincerely,
Anat Tchetchik
Ben-Gurion University of the Negev
Cover Letter
Perception of Wine Labels by Hong Kong
Chinese Consumers
Vicky Chi Man Tang
Anat Tchetchik
Eli Cohen
Vicky Chi Man TANG holds a Wine and Spirit MBA from the Kedge Business School,
Bordeaux and HKU Space, Hong Kong. This paper is based on her MA thesis.
Anat Tchetchik is a faculty member of the Department of Business Administration at Ben-
Gurion University of the Negev, Beer-Sheva, Israel.
Eli Cohen is a faculty member of the Department of Management at Ben-Gurion University
of the Negev, Beer-Sheva, Israel and an adjunct senior research fellow at the School of
Marketing, The University of South Australia.
*Title Page
1 2 3 4 5 6 7 8 9 10 11 12 13 14 15 16 17 18 19 20 21 22 23 24 25 26 27 28 29 30 31 32 33 34 35 36 37 38 39 40 41 42 43 44 45 46 47 48 49 50 51 52 53 54 55 56 57 58 59 60 61 62 63 64 65
Perception of Wine Labels by Hong Kong
Chinese Consumers
Abstract
Despite Hong Kong‟s growing wine consumption and the abundance of retail
brands available there, the demanding choice task faced by its wine consumers, who are more
subject to a mix of Chinese and Western cultural influences than consumers in other South
Asian countries, has not been studied until now. This exploratory study aims to delve into the
importance of wine label attributes for Hong Kong Chinese wine consumers, and to shed
light on the ways in which their perceptions affect their choice of wine. Employing an online
survey, the results suggest that Hong Kong Chinese wine consumers look for the top three
most searched attributes: wine origin, grape variety, and food and wine pairing. A simple
means differences test indicated that a traditional label design is favored over modern and
contemporary wine labels, and that yellow is the most preferred color. However, a data-
driven segmentation analysis reveals that about 95% of young Hong Kong Chinese wine
consumers prefer "elegant contemporary" labels with red as the dominant color. These
findings could be useful for wineries entering this market and for wine label designers who
wish to better understand how Hong Kong wine consumers assess alternatives when choosing
a bottle of wine.
Key words: Hong Kong wine market, Chinese wine consumers, wine label, extrinsic wine
attributes
Paper type: Full-length article
Manuscript
1 2 3 4 5 6 7 8 9 10 11 12 13 14 15 16 17 18 19 20 21 22 23 24 25 26 27 28 29 30 31 32 33 34 35 36 37 38 39 40 41 42 43 44 45 46 47 48 49 50 51 52 53 54 55 56 57 58 59 60 61 62 63 64 65
1. Introduction
Wine consumption and culture were established over the course of many centuries,
and date back to ancient times, when wine spread from its places of origin to different parts
of the world through commerce and wars. Recently, with changes in the global economic
arena that have led to the globalization of wine, its consumption has been revolutionized. The
global economic picture is also being reshaped, with a shift in economic power from mature
markets to emerging ones. The growing magnitude of the economies of emerging markets,
such as that of China, has encouraged developed nations to seek out their share. As measured
by the total GDP, by 2013 China was already the world‟s second largest economy after the
USA (Knox, Agnew and McCarthy, 2014). It is estimated that BRICS (Brazil, Russia, India,
China, and South Africa) will be one of the major players in the world economy in the next
30 years. The cumulative GDP of BRICS will overtake that of the USA by 2018, and is
expected to surpass that of the G7 countries by 2030 (Basu, Barik & Arokiasamy 2013).
Over the last several years, the global wine industry has faced a number of challenges,
among them global recession, a rise in health consciousness regarding the consumption of
alcoholic drinks, concerns about the sustainability of conventional grape growing, changes in
global trade, and regulations that limit its growth potential. While wine consumption across
Europe is declining (Dewald, 2003), between 2011 and 2016 world red wine consumption is
expected to grow by 9.1%, driven in particular by China, while white wine consumption
should increase by only 2.75% over the same period (Vinexpo, 2013). Other countries whose
wine consumption is expected to grow are the USA and Russia. The Russian wine sector is
growing and has significant growth potential driven by a new generation of young wine
drinkers with high levels of disposable income. Between 2012 and 2013, Russia‟s wine
imports increased by 16% (UDSA, 2014), whereas by 2016 Americans are expected to drink
18% more red wine than they did in 2012.
1 2 3 4 5 6 7 8 9 10 11 12 13 14 15 16 17 18 19 20 21 22 23 24 25 26 27 28 29 30 31 32 33 34 35 36 37 38 39 40 41 42 43 44 45 46 47 48 49 50 51 52 53 54 55 56 57 58 59 60 61 62 63 64 65
Lifestyle changes, coupled with the 2008 duty exemption on wine granted by the
Hong Kong government, which was aimed at facilitating Hong Kong‟s transformation as a
wine hub, led to an increase of 54% in wine consumption from 2008 to 2012. Between 2013
and 2017, it should grow by a further 17.4% (Vinexpo, 2014). With an average annual per
capita consumption of 5.4 liters in 2012, Hong Kong ranks first in Asian‟s per capita
consumption, before Japan (3 liters) and China (1.3 liters). With a provisional population
estimate of 7.184 million by mid-2013 (Census and Statistics Department, 2013), Hong Kong
is the third largest wine-consuming market in Asia, following China and Japan. Hong Kong
inhabitants and their many tourist guests spent HK$3.4 billion on wine (US$440 million) in
2012 (Vinexpo, 2014).
Hong Kong, as a former British colony, is more exposed to a mix of Chinese and
Western cultural influences than other South Asian countries, and a large number of
Westerners reside there. In fact, Hong Kong leads the Globalization Index, ranking first
among the 60 largest economies in the world for three consecutive years (2010, 2011, 2012),
according to Ernst &Young‟s annual report on globalization (Ernst &Young, 2012). Notably,
the Index is based on five main pillars, including openness to trade, exchange of technology
and ideas, labor movements, and cultural integration. Nonetheless, the majority of the
population is still of Chinese origin, with strong roots in Chinese culture, despite exposure to
Western lifestyle and culture. The population is 93% Chinese, about 1% European, 0.2%
American, 0.2% Australian, and 5.6% other Asian (Census and Statistics Department, 2013).
While Hong Kong Chinese consumers are very open to Western and non-Chinese
cultures, the wine market is a complex one. With the many accreditations on the origin side, it
would be unlikely for an average Hong Kong Chinese wine consumer to have the necessary
knowledge to choose a bottle of wine unless he or she has had some wine education. Yet,
despite growing appreciation for wine in Hong Kong, the percentage of consumers who are
educated about wine is not large, partly because the wine drinking tradition in Hong Kong is
still in its infancy. For the average consumer, it is difficult to read and interpret the cues

1 2 3 4 5 6 7 8 9 10 11 12 13 14 15 16 17 18 19 20 21 22 23 24 25 26 27 28 29 30 31 32 33 34 35 36 37 38 39 40 41 42 43 44 45 46 47 48 49 50 51 52 53 54 55 56 57 58 59 60 61 62 63 64 65
presented on a bottle of wine and come to a final purchasing decision. While Hong Kong has
a Chinese cultural background, we assume that its exposure to Western culture affects the
wine evaluation process of consumers, the attributes they consider most important, and the
types of information they are looking for on the label.
Most of the studies on wine consumption and purchasing behavior were conducted in
European wine markets such as France and Italy, where wine consumption is part of the
consumer‟s lifestyle, or in the US. With the economic shift toward Asian countries, several
studies were carried out in large Chinese cities such as Beijing (Yu et al., 2009) and Shanghai
(Balestrini and Gamble, 2006; Hu et al., 2008).
Despite the overloading of the Hong Kong market with a multitude of wines of all
origins, until now there has been no research on Hong Kong consumer‟s wine evaluation
process and decision making. Apparently, due to its currently small market size, only limited
studies have been examining wine consumption in Hong Kong (e.g., Dewald, 2003; Pettigrew
and Charters, 2010).
The purpose of this study is to explore how Hong Kong Chinese consumers perceive
the information on wine labels and to examine their preferences for label color and design,
including preferences toward Old vs. New World labels, and other wine attributes when
choosing a bottle of wine. It is crucial for wine marketing practitioners and label designers to
understand which attributes Hong Kong Chinese consumers consider before purchasing wine
and to gain insight into how they perceive the information presented on wine labels.
2. Review of the Literature
Contemporary wine consumers are faced with a puzzling assortment of brands and a
wide range of information, yet in most cases it is not possible to taste the wine prior to
purchase. Therefore, given their lack of expertise, consumers are obliged to make their
decisions based on packaging and the information available on the label. Labels presents a
1 2 3 4 5 6 7 8 9 10 11 12 13 14 15 16 17 18 19 20 21 22 23 24 25 26 27 28 29 30 31 32 33 34 35 36 37 38 39 40 41 42 43 44 45 46 47 48 49 50 51 52 53 54 55 56 57 58 59 60 61 62 63 64 65
large amount of information that includes both intrinsic and extrinsic cues (Thomas and
Pickering, 2003; Lockshin et al. 2006; Goodman et al. 2006) that the consumer responds to
and believes to represent the truth regarding origin, grape variety, and so on when making
purchase decisions (Tootelian and Ross, 2000).
Numerous studies have been conducted on the impact of wine cues on consumers‟
wine purchasing behavior (e.g., Goodman et al., 2006; Olsen et al., 2003; Sherman and Tuten,
2011). Based on data collected in Germany, Mueller and Szolnoki (2010) reported that
packaging and brand evaluation were the strongest drivers for consumers‟ wine preferences
and that their purchase intent was mainly influenced by informed liking and price evaluation.
In Australia, it was demonstrated that when faced with a wide selection of wines within a
limited time, consumers use implicit logical sequences of cues, i.e., they enter into a “search”
for information to uncover the hidden “experience” and “credence” aspects to reduce any
perceived purchasing risk (Mueller et al., 2009).
Sherman and Tuten (2011) explored the influence of two label variables (design genre
and brand name) on the perception of wine and the wine choice of US respondents. The
results showed that design and brand name only mattered during gift purchase, and that
consumers prefer traditional label designs and names over novel ones for gifts. For general
consumption, studies indicated that New World wines gained a remarkable share of the
European market (Steiner, 2004). Several studies conducted in Mainland China reveal that
Chinese consumers do not perceive wine as a “drink” as do consumers in many European
countries, but rather as something to be purchased and consumed on social occasions (Yu et
al., 2009). Liu and Murphy (2007) found that in China, French wines were considered of
higher quality and were better known than Australian wines.
However, these studies may not be applicable to mixed cultures such as that of Hong
Kong. Only limited knowledge has been accumulated on wine consumption in Hong Kong,
including Dewald‟s (2003) findings that wine is consumed mainly in restaurants and is
usually drunk during a meal. In addition, Pettigrew and Charters (2010) reported that the
1 2 3 4 5 6 7 8 9 10 11 12 13 14 15 16 17 18 19 20 21 22 23 24 25 26 27 28 29 30 31 32 33 34 35 36 37 38 39 40 41 42 43 44 45 46 47 48 49 50 51 52 53 54 55 56 57 58 59 60 61 62 63 64 65
reason for wine drinking in Hong Kong was its image, which conveyed desirable symbolic
meanings such as intellectuality, success, affluence, and sophistication.
2.1 Wine Perception and Evaluation
2.1.1. Perception of Wine Labeling Design
Several studies have been conducted on the effect of wine labeling design and
confirmed that specific visual codes are associated with different product categories. Celhay
and Passebois (2011) claim that visual codes recorded and stored in our memory become part
of “cognitive categories” that are ranked according to the degree of perceived typicality that
represents a given category in our minds. Berber, Almanza, and Donovan (2006) argued that
for customers intimidated by the number of brands, label designs, information, and bottle
packaging available, the label design and information provided on it can offer reassurance
that the wine will provide value for money in terms of performance and quality. Two
important classifications of wine label designs are “traditional” and “modern/contemporary”
(Batt and Dean, 2000). Elliot and Barth (2006) noted that in the US, modern, innovative, and
distinctive labels are more attractive to the younger market than to the older market, which
prefers more traditional styles, whereas French consumers, whether young or old, novice or
expert, still prefer wine with traditional labels in order to reduce perceived risk (Celhay and
Trinquecoste, 2008). No study has yet been conducted on Hong Kong wine consumers‟
preferences in this regard. Since the front label is the first line of communication to entice the
consumer (Charters, Lockshin & Unwin, 1999), the efforts to design a good wine label are
never a waste, in light of the reliance of consumers on the specific aspects of label design,
notably imagery, and layout to assess the quality of the bottle (Elliot and Barth, 2012).
Yet, most wine labels that are exported and sold in Hong Kong are designed by
foreign people with limited understanding of the local culture. Given the lack of adequate
research on the perceptions of Chinese consumers in general, and Hong Kong Chinese in
1 2 3 4 5 6 7 8 9 10 11 12 13 14 15 16 17 18 19 20 21 22 23 24 25 26 27 28 29 30 31 32 33 34 35 36 37 38 39 40 41 42 43 44 45 46 47 48 49 50 51 52 53 54 55 56 57 58 59 60 61 62 63 64 65
particular, of label design, including text, wine label designers are unable to target these
consumers‟ tastes and preferences. This study strives to bridge this gap of knowledge by
conducting a study in Hong Kong.
2.1.2. Perception of Country of Origin
Country of origin (COO) is considered an extrinsic cue that relates to the product
itself (Quester and Smart 1998). The importance of the COO effect is well documented (e.g.,
Batt & Dean, 2000). In particular, COO can be an indicator of quality when it is difficult to
assess by other objective means (Elliot & Cameron, 1994). The importance of appellation
information in the minds of consumers compared to geographic entities such as county or
state has also been addressed. In French wines, visual codes of the wines‟ specific region are
visible and perceived by consumers as typical of the regions (Celhay and Passebois, 2011).
Atkin and Johnson (2010) have explored whether consumers utilize appellation information
to the same extent that they use information relating to larger geopolitical regions, such as
state or country. They found that simpler place-of-origin information based on larger
geographical areas is more heavily utilized by consumers than appellation information.
Studies on Chinese wine consumers showed that they attach high importance to COO when
making purchasing decisions. The studies of Balestrini and Gamble (2006) and Hu et al.
(2008) on the importance of COO for wine buyers in supermarkets and malls, respectively, in
Shanghai indicated that COO information was a significant factor in wine evaluation and a
significantly more important cue for quality than price (which was also found as a sign of
quality). Li, Hu, and Zhuo (2006) also indicated that COO is the most important factor in
their wine evaluation when a single-cue approach is applied. The applicability of these
findings to the case of Hong Kong cannot be determined, since Hong Kong consumers are
more exposed to Western labels and have more wine knowledge than most consumers in
Mainland China. The current research aims to investigate this issue.
1 2 3 4 5 6 7 8 9 10 11 12 13 14 15 16 17 18 19 20 21 22 23 24 25 26 27 28 29 30 31 32 33 34 35 36 37 38 39 40 41 42 43 44 45 46 47 48 49 50 51 52 53 54 55 56 57 58 59 60 61 62 63 64 65
2.1.3. Perception of Color
Color is considered an extrinsic cue that can be altered without changing the product
in terms of price, packaging, or brand name (Quester and Smart 1998). Numerous studies
have explored the effect of colors on consumers‟ feelings, physiological responses,
perceptions, attitudes, and choice behavior. Madden, Hewett & Roth (2000) emphasized that
color is an integral part of products, packaging, and logos. Colors can serve as an effective
tool in creating and sustaining brand and corporate images in the minds of customers if they
are used wisely and effectively in different cultural contexts, as it has been well established
that they bear different meanings in different cultures. It has been recognized that global
marketing of standardized products in terms of color design would be a mistake, and an
investigation of how colors and their combinations are perceived in the target market is
necessary to avoid failure (Madden et al., 2000).
Several studies have addressed the effects of colors in South Asian culture.
Kommonen (2011) found that a prudent approach to local meanings of color is essential.
Yellow, for example, represents gold and thus richness, while green represents vital force, but
in some situations may indicate unfaithfulness of a woman to her husband. Red is related to
happiness, “luck,” and celebration and not, as might be assumed, communism. Liu and
Murphy (2007) noted that in China white is an “unlucky” color, associated with funerals. In
Hong Kong, Gunnerod (1991) found that with regard to flowers, consumers prefers shades of
red, pink, yellow, and white, while Madden et al. (2000) found that purple is considered close
to brown, and, since brown is close to black, is associated with sadness.
Nevertheless, color preference does not exist in a vacuum; a number of studies
suggest that consumers may prefer certain colors over others in different product categories.
A study conducted by Pantone (1992) found that black is the color worn most for dressy
occasions. Blue, gray, red, white, and black are the preferred colors for automobiles, while
beige is favored for carpeting (Mundell, 1993).
1 2 3 4 5 6 7 8 9 10 11 12 13 14 15 16 17 18 19 20 21 22 23 24 25 26 27 28 29 30 31 32 33 34 35 36 37 38 39 40 41 42 43 44 45 46 47 48 49 50 51 52 53 54 55 56 57 58 59 60 61 62 63 64 65
Studies on the impact of the colors of wine labels on consumers‟ choices have also
been conducted. Boudreaux and Palmer (2007) studied the effects of three elements of wine
label design, including color, on US consumers‟ perceptions of brand personality. They found
that color had significant effects on most dependent variables (e.g., successful, cheerful,
excitement, daring, spirited, etc.). Nevertheless, no such study has been conducted in Hong
Kong. Considering Hong Kong‟s peculiarities compared to other South Asian markets and the
rapid growth in its wine consumption, a study investigating wine label color preferences and
perceptions is required.
3. Methodology
The methodology used in this paper consisted of two stages. The first included
interviews with actual wine buyers in order to expose in real time the factors and attributes
that influence their decision-making processes. The second stage was a structured
questionnaire that employed the attributes exposed in the first stage in order to investigate
their importance when choosing a wine and shed light on customers‟ preferences regarding
wine label design and color.
3.1 Target population
The target population of this study consisted of Hong Kong citizens of Chinese origin,
of legal drinking age (18 years old or above), who had purchased at least one bottle of wine
in the past three months.
For the first stage of this research, we obtained permission to interview customers in
the wine section of a leading supermarket chain store with a large number of branches in all
parts of Hong Kong. This stage included a face-to-face interview intended to identify
patterns, themes, and features of a wider perspective that would be employed in the second
stage. Twenty respondents were interviewed as soon as they made a purchase of at least one
1 2 3 4 5 6 7 8 9 10 11 12 13 14 15 16 17 18 19 20 21 22 23 24 25 26 27 28 29 30 31 32 33 34 35 36 37 38 39 40 41 42 43 44 45 46 47 48 49 50 51 52 53 54 55 56 57 58 59 60 61 62 63 64 65
bottle of wine.
The interviews were conducted on two consecutive days over the weekend, a
Saturday afternoon and a Sunday morning, when a high rate of purchase was expected. The
chosen branches are located in two large malls in residential districts, one on Festival Walk,
an upmarket major landmark in Kowloon Tong, and one in East Point City, a large private
housing estate and shopping mall in Tseung Kwan O. The subjects were asked about the
reasons they chose the particular wine they had purchased (e.g., price, past experience,
recommended by family or friends, perceived quality, brand name, vintage, country of origin,
and promotion). The second question concerned the information they were looking for on the
label (brand name, vintage year, varietal, château image, and so on). It appears that
respondents consider the information on the label very useful.
The second stage was a structured questionnaire that was designed based on the
information gathered in the first stage. This questionnaire was conducted through an online
survey. The questionnaire was translated from English to Chinese and vice versa to ensure
accuracy. Next, it was pre-tested using a convenience sample of ten respondents to ensure
smoothness and consistency in the questionnaire setting. It was then distributed by email to a
convenience sample of thirty-five people, who were then requested to send it to their friends
and relatives. The criterion for participation in the survey was that the respondent had bought
wine in the past three months. One hundred and eighty questionnaires were distributed in
early February 2013, before the Chinese New Year, and then launched online and collected
from mid-May to the end of August 2013 and during January 2014. Only 136 questionnaires
were valid. Of these, 118 (87%) were filled out by Hong Kong Chinese and 18 (13%) by
respondents of other origins. The latter were not included in the analysis.
Respondents were asked about the importance of seven attributes (brand, grape
varietal, vintage year, origin of the wine, alcohol content, label color, and label design) and
their preferences for wine label design and color. The seven attributes selected for the online
survey were drawn from the face-to-face interviews conducted in the first stage and from the
1 2 3 4 5 6 7 8 9 10 11 12 13 14 15 16 17 18 19 20 21 22 23 24 25 26 27 28 29 30 31 32 33 34 35 36 37 38 39 40 41 42 43 44 45 46 47 48 49 50 51 52 53 54 55 56 57 58 59 60 61 62 63 64 65
literature, including a study conducted in China (Yu et al., 2009).
The designs chosen for the wine labels in this study were similar to those used by
Boudreaux and Palmer (2007) and reflected the same styles. Accordingly, five combinations
of wine label designs in the form of pictures were shown to respondents: traditional with
châteaux, modern classic, modern vibrant, modern contemporary, and elegant contemporary
(see Appendix 1 for illustrations). Respondents were asked to rate their preferences for each
label design on a five-point Likert-type scale. In order to avoid bias as much as possible,
respondents were asked to ignore all other information and focus only on the label design. In
addition, four labels, in the form of pictures, were selected, each with a single dominant
color, including red, yellow, black, and white (see Appendix 2 for illustration). The colors
chosen were ranked among the top five liking ratings in Hong Kong (Madden et al., 2000).
Respondents were asked to rate their label color preferences on a Likert-type scale. Again,
respondents were asked to refer to the color as the sole attribute for ranking. The data was
analyzed using Excel© spreadsheet and IBM SPSS. Segmentation was performed applying
Latent Gold 4.0 software.
4. Results and discussion
Table 1 provides a socio-demographic profile of the Hong Kong Chinese respondents
who participated in the survey. Of the 118 valid responses from Hong Kong Chinese, women
represent 51% (n=60) of the sample and men 49% (n=58). Most of the respondents were
from the age group of 18–34 years (46%), with the next important age group 35–44 years
(30%), and finally 45 years and older (24%). Sixty-nine percent of the respondents had
academic degrees and 31% had secondary school diplomas.
-Table 1 about here-
1 2 3 4 5 6 7 8 9 10 11 12 13 14 15 16 17 18 19 20 21 22 23 24 25 26 27 28 29 30 31 32 33 34 35 36 37 38 39 40 41 42 43 44 45 46 47 48 49 50 51 52 53 54 55 56 57 58 59 60 61 62 63 64 65
4.1 Importance of Attributes
Respondents were asked to indicate the importance of seven attributes in their wine
purchase, on a Likert-type scale, from “extremely important” to “not at all important,” by
indicating one score for each attribute. The results, depicted in Table 2, show that the mean
scores of the top three attributes of importance to Hong Kong Chinese respondents were
“origin of wine” (mean=3.07), “grape variety” (mean=2.77), and “brand name” (mean=2.53),
followed by “food and wine pairing” (mean=2.52). “Origin of wine” was significantly
different from “grape variety” (p<0.05). “Grape variety” was significantly different from
“brand name”. However “brand name,” “food and wine pairing,” and “vintage year” were not
significantly different from each other. The results demonstrate that most of the respondents
consider “origin of wine” more important than the other attributes. In comparison, Goodman
et al. (2008) found that “origin of wine” was ranked second in France, third in Austria, China,
Italy, and the UK, and fourth in Australia, Germany, Taiwan, and the US. “Alcohol content”
is the least important attribute for respondents. These results are in line with findings from
most of the countries studied in Goodman et al., (2008) (Austria, China, France, Germany,
Israel, New Zealand, Taiwan, the UK, and the USA).
Regarding “grape variety,” while ranked second in this study, it was ranked first in
Austria, second in New Zealand, third in the US and Australia, fourth in France, fifth in
Germany and Israel, sixth in Italy and Brazil, and seventh in Taiwan, China, and the UK
(Goodman et al., 2008). Finally, “matching with food” (equivalent to “food and wine
pairing”), which was ranked third in the current study, was ranked first in France, second in
Italy and Israel, third in Brazil and Germany, and fourth in Austria. However, it was ranked
low in New Zealand, Taiwan, the UK, and the USA, and in China it was rated last in
importance. This contrasting finding between China and Hong Kong regarding “matching
with food” can be explained by the fact that while Chinese consumers do not usually drink
wine with food, so that “matching with food” is of little importance to them, Hong Kong is
1 2 3 4 5 6 7 8 9 10 11 12 13 14 15 16 17 18 19 20 21 22 23 24 25 26 27 28 29 30 31 32 33 34 35 36 37 38 39 40 41 42 43 44 45 46 47 48 49 50 51 52 53 54 55 56 57 58 59 60 61 62 63 64 65
developing a reputation of being a “gourmet paradise,” where wine and food are closely
associated with one another.
-Table 2 about here-
“Brand name” was also found to rank third in importance, a result that differs from
findings in Australia, where brand was found to be one of the strongest drivers for informed
liking (Mueller and Szolnoki, 2010), and where brand name acts as a surrogate for a number
of attributes, including quality (Lockshin et al, 2000). This result also differs from findings in
China and Brazil, where “brand name” was found to be of great importance when choosing a
bottle of wine (Goodman et al., 2007, 2008).
In sum, the differences between our results and those collected from the Chinese
population may be due largely to the fact that the latter studies were conducted in Mainland
China, while this research focused on Hong Kong Chinese, who are more exposed to Western
culture than their mainland counterparts.
4.2 Label Design
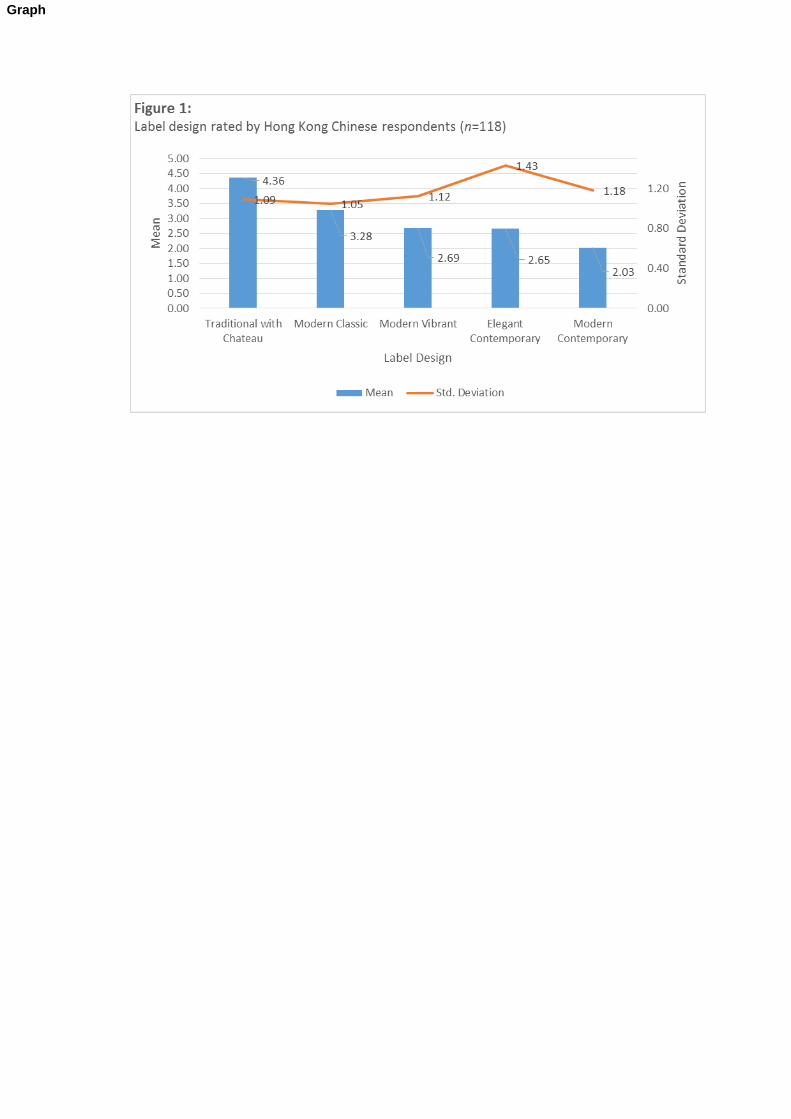
Significant differences in terms of customer preference for label design (p<0.001)
were found. The results, summarized in Figure 1, show that the label design “traditional with
château” has the highest and most significant mean (4.36), with a standard deviation of 1.09.
Preferences for the other label designs were as follows: “modern classic” (mean=3.28),
“modern vibrant” (mean=2.69), and “elegant contemporary” (mean=2.65). These findings are
in accordance with findings in the USA and France, where traditional label designs,
regardless of brand names, had the highest mean scores and an advantage over modern ones
(Boudreaux and Palmer, 2007; Sherman and Tuten, 2011). These results are also in line with
a study conducted in France that involved Bordeaux wine labels with different designs, but
identical information (Celhay and Passebois, 2011), where respondents indicated strong
1 2 3 4 5 6 7 8 9 10 11 12 13 14 15 16 17 18 19 20 21 22 23 24 25 26 27 28 29 30 31 32 33 34 35 36 37 38 39 40 41 42 43 44 45 46 47 48 49 50 51 52 53 54 55 56 57 58 59 60 61 62 63 64 65
preference for the most typical label.
-Figure 1 about here-
4.3 Label Color
Color culture in the Chinese context is complex. For the Chinese, colors express
cultural values, beliefs, and emotions. In terms of label color dominance, the participants in
this study demonstrate a clear preference for the color yellow (Table 3), significantly
different from the other label colors (p<0.001). In China, the color yellow has been found to
be associated with optimism, hope, and happiness (Akcay et al., 2011). Surprisingly, labels in
which the colors black and white dominate rank second and third (no significant difference)
in the list of preferences, while labels in which the color red is dominant rank last on the
preferred list (mean=2.15, SD=1.20) and their rank is significantly different from that of the
black or white labels (p=0.05), despite the fact that red is associated with passion, energy, and
love in China (Akcay et al., 2011). These findings are in partial contradiction to the usual
Chinese color preferences (Akcay et al., 2011; Kommonen, 2011; Liu and Murphy, 2007),
where white is considered unlucky, red is considered lucky, and black is associated most
closely with death, mystery, and fear. These findings also contradict those of Madden et al.
(2000), who conducted a study of color meanings and preferences in different cultures,
including Hong Kong, where white was the first on the list of preferences, followed by blue,
black, red, and then yellow. In light of these surprising findings, we conducted data-driven
segmentation analysis, discussed in the next section, in an effort to resolve this issue.
-Table 3 about here-
4.4 Segmentation
A-priori segmentation based on gender showed no significant differences regarding
1 2 3 4 5 6 7 8 9 10 11 12 13 14 15 16 17 18 19 20 21 22 23 24 25 26 27 28 29 30 31 32 33 34 35 36 37 38 39 40 41 42 43 44 45 46 47 48 49 50 51 52 53 54 55 56 57 58 59 60 61 62 63 64 65
the rating of wine attributes. Concerning label design, women rate the “elegant
contemporary” label higher (p<0.05) and the “modern vibrant” design lower than men do
(p<0.05). In terms of age groups, respondents 45 years old and older tend to prefer “modern
classic” label designs significantly more than younger respondents (p<0.05). The younger
generation, from 18 to 34 years old, is more inclined to prefer “modern contemporary” labels.
As Goodman (2014) noted, segmentation using attributes that had an influence on
consumer choice is likely to assist wine marketers in selecting and designing their approach
to a particular market. Hence, further analyses were conducted to examine whether latent
clusters (segments) exist among all subjects, using Latent GOLD software, Version 4.0
(Vermunt and Magidson, 2005). Latent cluster analysis (LCA) aims to extract relatively
homogeneous groups of respondents from heterogeneous data. Segmentation is then based on
how well each cluster predicts the choices made based on the importance weights. The wine
attributes did not contribute to discrimination among the latent clusters, but label design and
label color improved the segmentation. We estimated models ranging from two to four
clusters. The log likelihood function of the Bayesian Information Criterion (BICLL) was used
to identify the best cluster model, as measured by the lowest BIC value (decreasing BIC and
increasing LL indicate improving fit). The four-cluster solution had the lowest BIC and the
strongest loadings on each cluster, with a limited number of cross-loadings. All eight features
are significantly different between the clusters (p-values<0.05), which implies that these
attributes are important in segmenting the clusters. The four-cluster solution is presented in
Table 4.
Since significant differences were observed among the clusters (Table 4), we
suspected that a latent behavior existed between these clusters, and therefore respondents
were classified into different groups. Each cluster represents a different core of attributes:
Cluster 1 is labeled "traditional," since its subjects mainly focus on traditional labels with
châteaux. The color red is significantly (p<0.01) considered negative by members of Cluster
1, while the color white is the only one considered favorable (P<0.01) by them. All three of
1 2 3 4 5 6 7 8 9 10 11 12 13 14 15 16 17 18 19 20 21 22 23 24 25 26 27 28 29 30 31 32 33 34 35 36 37 38 39 40 41 42 43 44 45 46 47 48 49 50 51 52 53 54 55 56 57 58 59 60 61 62 63 64 65
the other clusters considered red positive. Cluster 2 is labeled "modern classic," red or yellow
label, Cluster 3 as “elegant contemporary,” and Cluster 4 “black label,” as the members of
this cluster prefer black and modern labels and have a negative preference for traditional
châteaux.
-Table 4 about here-
Cluster 1 is the largest, with 40.7% of the respondents, while Clusters 2, 3, and 4 contain
30.5%, 16.1%, and 12.7% respectively. The majority of Cluster 3 consists of young
respondents (18–34 years) who prefer „elegant contemporary‟ labels with red as the dominant
color. All other clusters contain respondents from all the age groups. Cluster 1 is interesting,
as its members prefer traditional labels with châteaux and white as the dominant color.
However, with the exception of age, we could not find any core of demographic characteristic
that differentiated the clusters. The composition of the clusters is presented in Table 5.
-Table 5 about here-
As mentioned above in subsection 4.3, it was surprising that the red color was less
preferred by the respondents. Hence, we isolated the label design in the segmentation analysis
and applied latent cluster analysis (Latent GOLD software, Version 4.0, Vermunt and
Magidson, 2005) to the label color data only. The results of the analysis suggested four
clusters (BIC on the log-likelihood was used to identify the best cluster model) with no cross-
loadings. Each cluster represents a single label color.
All four label colors are significantly different between the clusters (p-values< 0.01),
which implies that these attributes are important in segmenting the clusters. The four-cluster
solution is presented in Table 6. Since significant differences were observed among the
clusters, we suggest that a latent behavior existed between these clusters, and therefore
respondents were classified into different groups. Each cluster represents a different color
preference. Cluster 4 is the largest cluster and the respondents focus on the red label color.
1 2 3 4 5 6 7 8 9 10 11 12 13 14 15 16 17 18 19 20 21 22 23 24 25 26 27 28 29 30 31 32 33 34 35 36 37 38 39 40 41 42 43 44 45 46 47 48 49 50 51 52 53 54 55 56 57 58 59 60 61 62 63 64 65
Results show (Table 6) that the segment of respondents who prefer red labels consists
of 35% of the respondents in our sample, making red the most preferred color. This segment
is much larger than the segments of respondents that prefer the other colors. These findings
are with agreement with the standard Chinese preferences of colors (Akcay et al., 2011;
Kommonen, 2011; Liu and Murphy, 2007), where red is considered a lucky color. In
conclusion, more in-depth analysis is required to confirm the perception of color by Hong
Kong Chinese consumers.
5. Discussion, Implications, and Conclusions
This study aimed to explore Hong Kong Chinese consumer‟s wine preferences in order to
determine what information they look for on wine labels and how this information and other
label attributes affect their purchasing decisions. The results confirm that, similar to
consumers from other cultures (see e.g., Lockshin and Cohen‟s 2009 study of 11 countries),
Hong Kong Chinese consumers in our study are assisted in their wine purchasing decision by
extrinsic and intrinsic cues on the wine label. Among these are wine origin, grape variety,
brand name, and food and wine pairing, as well as label design and color. However, they
differ from their mainland Chinese counterparts and from Westerners in attaching the highest
importance to the origin of the wine and to food and wine pairing, and in their preferred label
color. Nevertheless, their preference for label design resembles that of consumers in Western
countries such as the US and France.
An upcoming trend among Hong Kong Chinese wine consumers is a preference for
food and wine pairing information to be present on the wine label. This factor was not of
importance in the past few years, and was barely mentioned in past studies (Yu et al., 2009),
but with the popularity of wine appreciation courses and wine-tasting events, and in an
atmosphere in which Hong Kong enjoys the reputation of being a “gourmet paradise,” wine
and food have come to be closely associated with one another. This research reveals that there
1 2 3 4 5 6 7 8 9 10 11 12 13 14 15 16 17 18 19 20 21 22 23 24 25 26 27 28 29 30 31 32 33 34 35 36 37 38 39 40 41 42 43 44 45 46 47 48 49 50 51 52 53 54 55 56 57 58 59 60 61 62 63 64 65
is a demand for such information, which should not be ignored by wine label designers,
marketers, or winery owners. For inexperienced wine consumers looking for a new taste or
wine enthusiasts with little or rudimentary wine knowledge, such information could be of
great value in guiding their selection and could lead to repeat purchases and
recommendations to friends and relatives by word of mouth.
In addition, attractive and easy to understand wine label design would make the
information search easier. Combinations of elements of wine label designs and colors should
be used according to the product‟s target audience and take into account the timing of the
purchase and different consumer groups. As mentioned above, preferences for wine label
color among Hong Kong Chinese are differently distributed among different consumer
segments with, according to the second segmentation analysis, the largest segment preferring
labels with red as the dominant color. Notably, the segmentation results demonstrate that a
simple means comparison test based on Likert-scale based data can be misleading if not
followed by more advanced methods, such as data-driven segmentation analysis.
Being a former British colony, Hong Kong is influenced by both Chinese and Western
culture. However, the findings of this study are in line with those of Hu et al. (2008),
revealing that some salient features of Hong Kong Chinese wine consumers‟ buying behavior
are associated with the Chinese culture, particularly the “face value,” which is reflected in the
selection of wine origin. This information is valuable to French wineries and wine companies
as well as to wine label designers, who may choose to include a French element in the wine
label to attract consumers‟ attention.
One major element in the successful marketing of wine is the importance of
thoroughly understanding the targeted market and its consumers. Each market and each
consumer segment differs in its wine perceptions and preferences. Knowledge of the key
factors that influence their wine purchases can assist wineries, brand owners, and marketers
in achieving successful sales results and sustaining them in the long term.
1 2 3 4 5 6 7 8 9 10 11 12 13 14 15 16 17 18 19 20 21 22 23 24 25 26 27 28 29 30 31 32 33 34 35 36 37 38 39 40 41 42 43 44 45 46 47 48 49 50 51 52 53 54 55 56 57 58 59 60 61 62 63 64 65
This study on the Hong Kong Chinese population is of particular importance to
wineries, wine companies, wine label designers, and wine marketers due to the distinctive
features of this population and its rising per capita consumption of wine. Accordingly, some
key recommendations for wine marketers, including wine label designers can be drawn:
Information on the origin of the wine, which could include country of origin and
region, must be conveyed directly.
Information regarding grape variety and food and wine pairing should be given
high priority by wine label designers.
Combinations of elements of wine label designs and colors should be used
according to the product‟s target audience: specifically, young people prefer
„elegant contemporary‟ labels with red as the dominant color, whereas older people
prefer traditional labels with châteaux and white as the dominant color.
5.1 Limitations and Future Research
The present study has several limitations and should be followed by further studies.
First, future research with a larger sample size and longer time frame is recommended to
prevent a limited representation of the sample population and to make the results more
generalizable to the Hong Kong population. Second, the selections of labels for the questions
related to label design and label color dominance are limiting and might not result in the most
precise interpretation possible. This should remain for future studies.
One last important point to mention is that the list of attributes selected poses some
limitations that may have restricted the respondents in their ranking. Attributes such as
vineyard, percentage of blend, and cellaring information, to name a few, could be considered
in future studies. Future studies should take into account how other possible factors, such as
level of wine knowledge and interest in wine, influence consumers‟ perceptions. Future
studies may also place more emphasis on the distinctive characteristics of the bottle of wine
in relation to purchase intent, enabling marketing practitioners and wine label designers to
1 2 3 4 5 6 7 8 9 10 11 12 13 14 15 16 17 18 19 20 21 22 23 24 25 26 27 28 29 30 31 32 33 34 35 36 37 38 39 40 41 42 43 44 45 46 47 48 49 50 51 52 53 54 55 56 57 58 59 60 61 62 63 64 65
appeal to values such as sense of quality, loyalty, satisfaction, and so on when designing wine
labels. Future research could investigate variables of importance in the course of the purchase
decision-making process, such as other information sources (the Internet, for example).
In the current study, a-priori segmentation based on demographic characteristics of the
respondents did not show significant preferences or trends of wine characteristics, label
design, and color. However, latent class segmentation shows different clusters in terms of
using wine labels and colors. A larger-scale study is recommended to explore the
characteristics of consumers in such segments.
Finally, while a comparative study embracing the three major territories of Hong
Kong (Hong Kong Island, Kowloon, and the New Territories) was not possible due to the
small sample size, such a study would be of interest in order to determine consumers‟
behavior with the aim of improving product placement, sales, and marketability within Hong
Kong.
1 2 3 4 5 6 7 8 9 10 11 12 13 14 15 16 17 18 19 20 21 22 23 24 25 26 27 28 29 30 31 32 33 34 35 36 37 38 39 40 41 42 43 44 45 46 47 48 49 50 51 52 53 54 55 56 57 58 59 60 61 62 63 64 65
REFERENCES
Accidental Travel Writer. Hong Kong: Wine Consumption Soars 200% in Five Years! 2012.
http://www.accidentaltravelwriter.net/accidental-travel-writer/2012/03/hong-kong-wine-
consumption-soars-200-in-five-years-.html (accessed 1 April, 2012)
Ahearn, R.J., 2011. Rising economic powers and the global economy: Trends and issues for
Congress. Congress Research Service. August 22, 2011.
Akcay, O., Dalgin, M.H., Bhatnagar, S., 2011. Perception of color in product choice among
college students: A cross-national analysis of USA, India, China and Turkey.
International Journal of Business and Social Science 2(21) [Special Issue–November
2011].
Atkin, T. Johnson, R. 2010. Appellation as an indicator of quality. International Journal of
Wine Business Research, 22(1), 42 – 61.
Balestrini, P., Gamble, P., 2006. Country-of-origin effects on Chinese wine consumers.
British Food Journal, 108(5), 396–412.Barber, N., Almanza, B. A., Donovan, J. R.,
2006. Motivational factors of gender, income and age on selecting a bottle of wine.
International Journal of Wine Marketing, 18(3), 218-232.
Basu, T., Barik, D., Arokiasamy, P., 2013. Demographic determinants of economic growth in
BRICS and selected Developed Countries, Presented in XXVII IUSSP International
Population Conference, 26-31st August 2013 at BEXCO, Busan, Republic of Korea.
http://iussp.org/sites/default/files/event_call_for_papers/Demographic%20Determinants
%20of%20Economic%20Growth%20in%20BRICS%20and%20selected%20Develope
d%20Countries.pdf (accessed 14 Feb 2015).
Batt, P.J., Dean, A., 2000. Factors influencing the consumer‟s decision to purchase wine from
a retail liquor store in Perth, Western Australia, Australian and New Zealand Wine
Industry Journal, 15(4), 34–41.
Boudreaux, C.A., Palmer, S.E., 2007. A charming little Cabernet: Effects of wine label design
on purchase intent and brand personality. International Journal of Wine Business
Research, 19(3), 170–186.
Celhay, F., Passebois, J., 2011. Wine labelling: is it time to break with tradition? A study of
the moderating role of perceived risk. International Journal of Wine Business Research,
23(4), 318–337.
Census and Statistics Department (C&SD). The Government of the Hong Kong Special
Administration Region.
http://www.censtatd.gov.hk/hong_kong_statistics/statistics_by_subject/index.jsp?subject
ID=1&charsetID=1&displayMode=T (accessed November 2 2013)
Chaney, I.M., 2000. External search effort for wine. International Journal of Wine Marketing,
12(2), 5–21.
Charters, S., Lockshin, L., Unwin, T., 1999. Consumer responses to wine bottle back labels.
1 2 3 4 5 6 7 8 9 10 11 12 13 14 15 16 17 18 19 20 21 22 23 24 25 26 27 28 29 30 31 32 33 34 35 36 37 38 39 40 41 42 43 44 45 46 47 48 49 50 51 52 53 54 55 56 57 58 59 60 61 62 63 64 65
Journal of Wine Research, 10(3), 183-195.
Cohen, E., 2009. Applying best-worst scaling to wine marketing. International Journal of
Wine Business Research, Vol. 21(1), 8–23.
Crummy, M., 2012. Top 10 wine consuming countries. The Drink Business. Available:
www.thedrinksbusiness.com/2012/04/wine-consuming-countries-2014/ (accessed on
16/04/2014)
Dewald, B.W.A., 2003. Wine consumption in Hong Kong. International Journal of Wine
Marketing, 15(1), 54–68.
Elliot, G., Cameron, R., 1994. Consumer perception of product quality and the country-of-
origin effect. Journal of International Marketing 2, 49-62.
Elliot, S., Barth, J. E., 2012. Wine label design and personality preferences of millennials.
Journal of Product & Brand Management, 21(3), 183-191.
Ernst &Young‟s Annual Globalization Report. 2012.
http://www.ey.com/GL/en/Issues/Driving-growth/Globalization---Looking-beyond-the-
obvious---2012-Index (accessed on 15 Feb 2015)
Goodman, S., Lockshin, L., Cohen, E., 2006. What influences consumer selection in the retail
store? The Australian & New Zealand Grapegrower & Winemaker, December, 61–63.
Goodman, S., Lockshin, L., Cohen, E., 2007. Influencers of consumer choice – comparing
international markets. Wine Industry Journal. 22(3) May/June.
Goodman, S, Lockshin, L, Cohen, E, Fensterseifer, J, Ma, H, D'Hauteville, F, Siriex, L, Orth,
U, Casini, L, Corsi, A, Jaeger, S, Danaher, P, Brodie, R, Olsen, J and Thach, L 2008.
International Comparison of Consumer Choice for Wine: A Twelve Country
Comparison. Proceedings of the 4th International Conference for the Academy of Wine
Business Research, Sienna, Italy, July 2008.
Goodman, S., 2014. Mapping the Influencers of Consumer Choice for Wine Selection (On
and Off-Premise) in Key export markets http://blogs.adelaide.edu.au/wine-
future/2014/01/08/mapping-the-influencers-of-consumer-choice-for-wine-selection-on-
and-off-premise-in-key-export-markets/http://blogs.adelaide.edu.au/wine-
future/2014/01/08/mapping-the-influencers-of-consumer-choice-for-wine-selection-on-
and-off-premise-in-key-export-markets/ (accessed on 15 Feb 2015)
Gunnerod, P.K., 1991. Marketing cut flowers in Japan and Hong Kong. International Trade
Forum, 3, p. 28, Business Source Complete, EBSCOhost, accessed??? .
HKTDC 2013. Wine Industry in Hong Kong (2013). Hong Kong Trade and Development
Council. http://hong-kong-economy-research.hktdc.com/business-news/vp-
article/en/1/1X07WNW7.htm (accessed on 22 June 2013)
Hu, X., Li, L., Xie, C., Zhou J., 2008. The effects of country-of-origin on Chinese consumers'
wine purchasing behavior. Journal of Technology Management in China, 3(3), 292–306.
Knox, P.J., Agnew, A. & McCarthy, L. 2014. The geography of the world economy.
Routledge.
Kommonen, K., 2011. Narratives on Chinese color culture in business contexts: The Yin
1 2 3 4 5 6 7 8 9 10 11 12 13 14 15 16 17 18 19 20 21 22 23 24 25 26 27 28 29 30 31 32 33 34 35 36 37 38 39 40 41 42 43 44 45 46 47 48 49 50 51 52 53 54 55 56 57 58 59 60 61 62 63 64 65
Yang Wu Xing of Chinese values. Cross Cultural Management, 18(3), 366–383.
Li, L. Hu, X., Zhuo J. 2006. Do Chinese Consumer Prefer to buy Imported Wine? The effect
of country of origin. Conference paper, WTO, China, and the Asian Economies, IV:
Economic Integration and Economic Development, University of International Business
and Economics, Beijing, China, June 24-25.
Liu, F., Li, J., Murphy, J., 2008. The effect of language on brand attitude – A wine label test
in China. In Rodgers, S. (Ed.), Proceedings of the 2008 Conference of the American
Academy of Advertising.
Liu, F., Murphy, J., 2007. A qualitative study of Chinese wine consumption and purchasing:
Implications for Australian wines. International Journal of Wine Business Research,
19(2), 98–113.
Lockshin, L., Jarvis, W., d‟Hauteville, F., Perrouty, J.-P., 2006. Using simulations from
discrete choice experiments to measure consumer sensitivity to brand, region, price, and
awards in wine choice. Food Quality and Preference, 17(3–4), 166–178.
Lockshin, L. and Cohen, E. 2011. Using product and retail choice attributes for cross-national
segmentation. European Journal of Marketing, 45(7/8), 1236-1252.
Lockshin, L., Rasmussen, M., Cleary, F., 2000. The nature and roles of a wine brand.
Australia and New Zealand Wine Industry Journal, 15 (4), 17–24.
Madden, T., Hewett, K., Roth, M., 2000. Managing images in different cultures: A cross-
national study of color meanings and preferences. Journal of International Marketing,
8(4), 90–107.
Mueller, S., Lockshin, L., Louviere, J., Francis, L., Ozidacz, P. (2009). How does shelf
information influence consumers' wine choices? The Australian and New Zealand Wine
Industry Journal, 50–56.
Mueller, S., Szolnoki, G., 2010. The relative influence of packaging, labeling, branding and
sensory attributes on liking and purchase intent: Consumers differ in their
responsiveness. Food Quality and Preference, 21, 774–783.
Mundell, H., 1993. How the color mafia chooses your clothes. American Demographics, 21-
23.
Olsen, J.E., Thompson, K.J., Clarke, T.K., 2003. Consumer Self-Confidence in Wine
Purchases. International Journal of Wine Marketing, 15(3), 40–51.
Pantone, 1992. Pantone Color Preference Study, Pantone Inc.
Pettigrew, S., Charters, S., 2010. Alcohol consumption motivations and behaviors in Hong
Kong. Asia Pacific Journal of Marketing and Logistics, 22(2), 210–221.
Rocchi, B., Stefani, G., 2005. Consumers‟ perception of wine packaging: a case study.
International Journal of Wine Marketing, 18(1), 33–44.
Sherman, S., Tuten, T., 2011. Message on a bottle: The wine label's influence. International
Journal of Wine Business Research, 23(3), 221–234.
Somogyi, S., Li, E., Johnson, T., Bruwer, J., Bastian, S., 2011. The underlying motivations of
Chinese wine consumer behavior. Asia Pacific Journal of Marketing and Logistics,
1 2 3 4 5 6 7 8 9 10 11 12 13 14 15 16 17 18 19 20 21 22 23 24 25 26 27 28 29 30 31 32 33 34 35 36 37 38 39 40 41 42 43 44 45 46 47 48 49 50 51 52 53 54 55 56 57 58 59 60 61 62 63 64 65
23(4), 473–485.
Szolnoki, G., Herrmann, R., Hoffmann, D., 2010. Origin, grape variety or packaging?
Analyzing the buying decision for wine with a conjoint experiment. American
Association of Wine Economics, Working paper No. 72 (available: http://www.wine-
economics.org/list-of-aawe-working-papers/ (Accessed 19 April 2014).
Thomas, A., Pickering, G. (2003). The importance of wine label information. International
Journal of Wine Marketing, 15(2), 58–74.
Tootelian, D.H., Ross, K., 2000. Product label: What information do consumers want, and
will they believe it? Journal of Food Products Marketing, 6(1), 25–38.
USDA, Global Agricultural Information Network (GAIN), 2014. Report number: RSATO08.
US Wine Exports to Russia Are on the Rise.
http://www.calwinexport.com/files/US%20Wine%20Exports%20to%20Russia%20Are
%20on%20the%20Rise_Moscow%20ATO_Russian%20Federation_4-1-2014.pdf
(accessed on 12 Feb 2015)
Vermunt, J.K. Magidson, J. 2005. Technical Guide for Latent GOLD 4.0: Basic and
Advanced. Belmont Massachusetts: Statistical Innovations Inc.
Vinexpo, 2013. The world wine and spirits market with a look forward to 2016.
http://www.infowine.com/docs/document144.pdf (accessed on 12 Feb 2015)
Vinexpo, 2014. The Wine and spirits market in Hong Kong with prospects until 2017.
http://www.vinexpo.com/media/cms_page_media/437/IWSR%20-
%20Hong%20Kong%20-%20ANG.pdf (accessed on 12 Feb 2015).
Wine Institute, 2010a. Per Capita Wine Consumption by Country.
http://www.wineinstitute.org/resources/worldstatistics/article44 (accessed on 1 April
2012)
Wine Institute., 2010b. World Wine Consumption by Volume.
http://www.wineinstitute.org/resources/worldstatistics/article127 (accessed on 1 April
2012)
Yu, Y., Sun, H., Goodman, S., Chen, S., Ma, H., 2009. Chinese choices: A survey of wine
consumers in Beijing. International Journal of Wine Business Research, 21(2), 155–168.
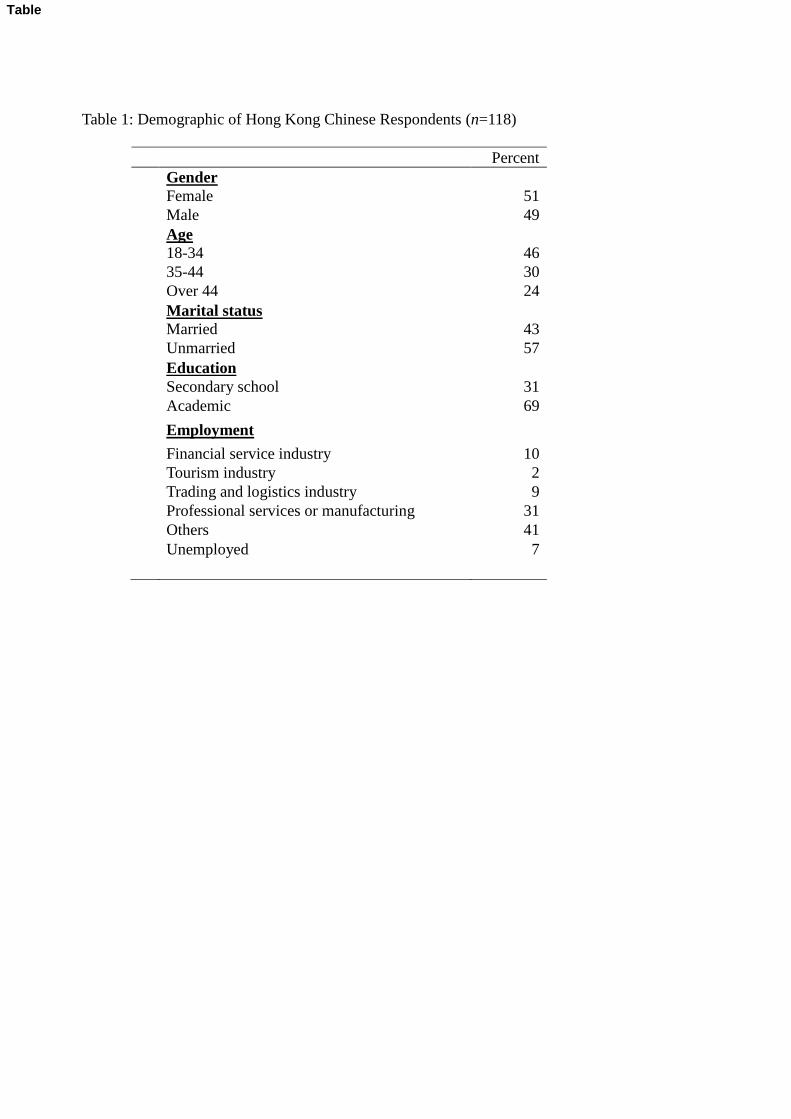
Table 1: Demographic of Hong Kong Chinese Respondents (n=118)
Percent
Gender
Female 51
Male 49
Age
18-34 46
35-44 30
Over 44 24
Marital status
Married 43
Unmarried 57
Education
Secondary school 31
Academic 69
Employment
Financial service industry 10
Tourism industry 2
Trading and logistics industry 9
Professional services or manufacturing 31
Others 41
Unemployed 7
Table
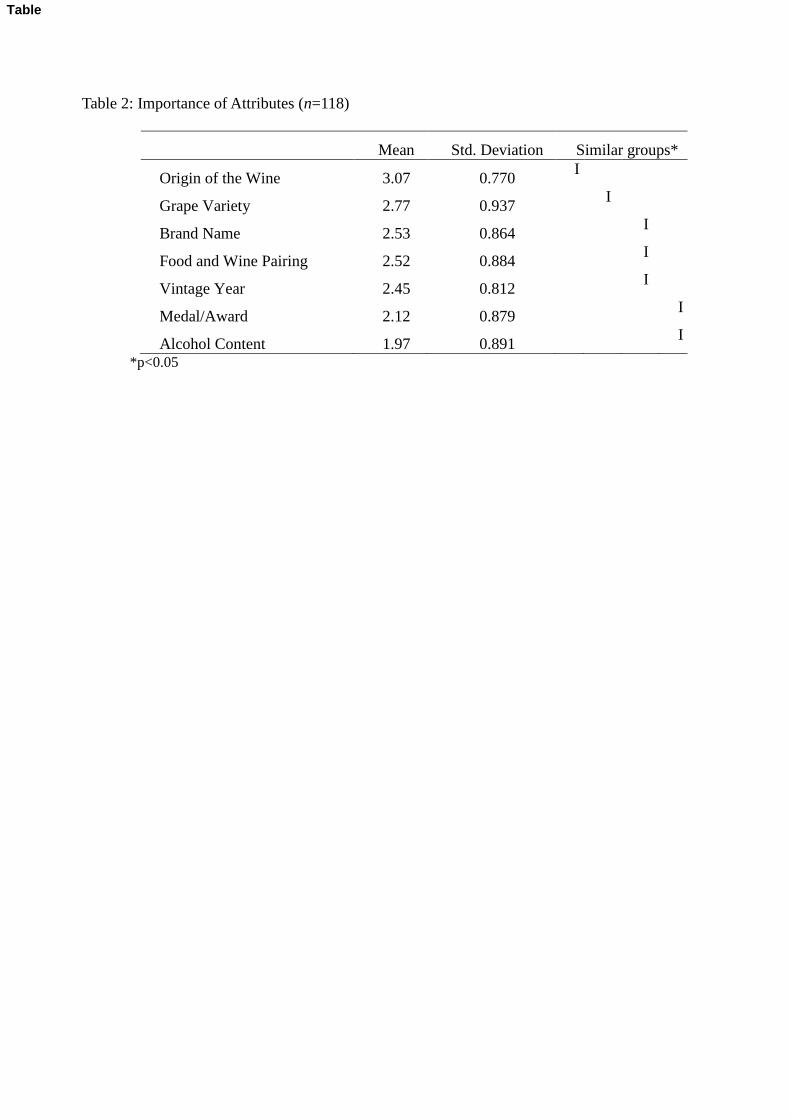
Table 2: Importance of Attributes (n=118)
Mean Std. Deviation Similar groups*
Origin of the Wine 3.07 0.770 I
Grape Variety 2.77 0.937 I
Brand Name 2.53 0.864 I
Food and Wine Pairing 2.52 0.884 I
Vintage Year 2.45 0.812 I
Medal/Award 2.12 0.879 I
Alcohol Content 1.97 0.891 I
*p<0.05
Table
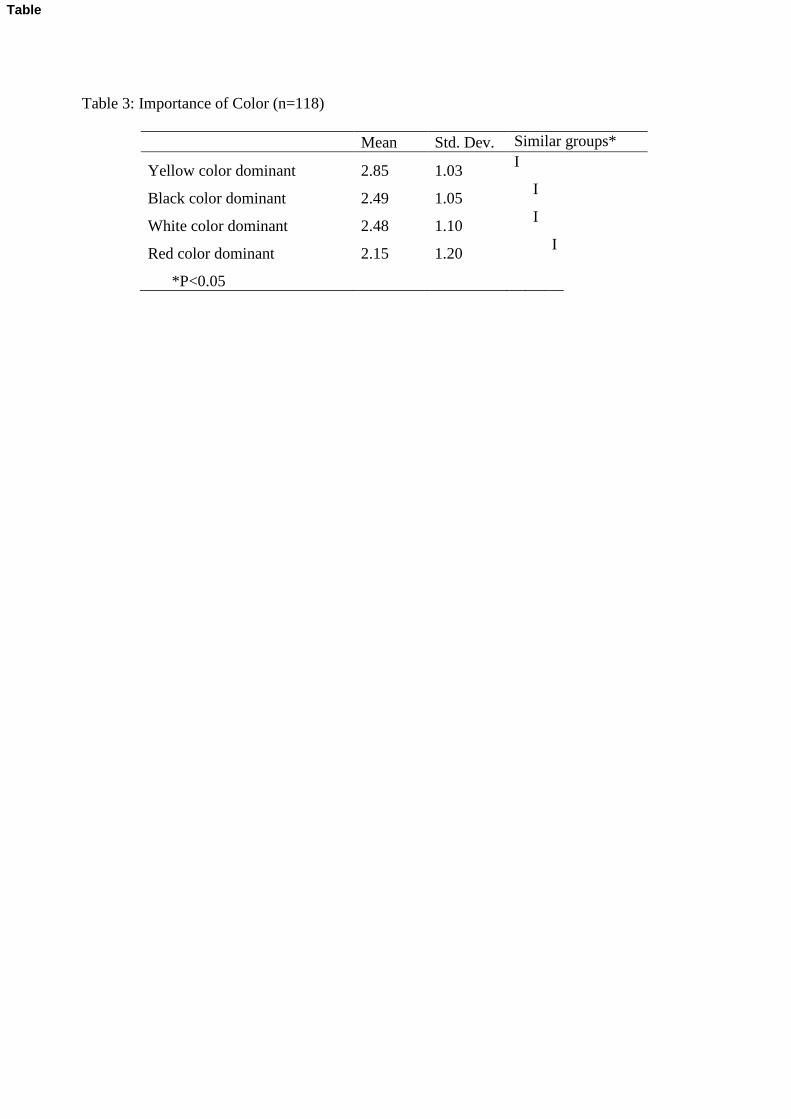
Table 3: Importance of Color (n=118)
Mean Std. Dev. Similar groups*
Yellow color dominant 2.85 1.03 I
Black color dominant 2.49 1.05 I
White color dominant 2.48 1.10 I
Red color dominant 2.15 1.20 I
*P<0.05
Table
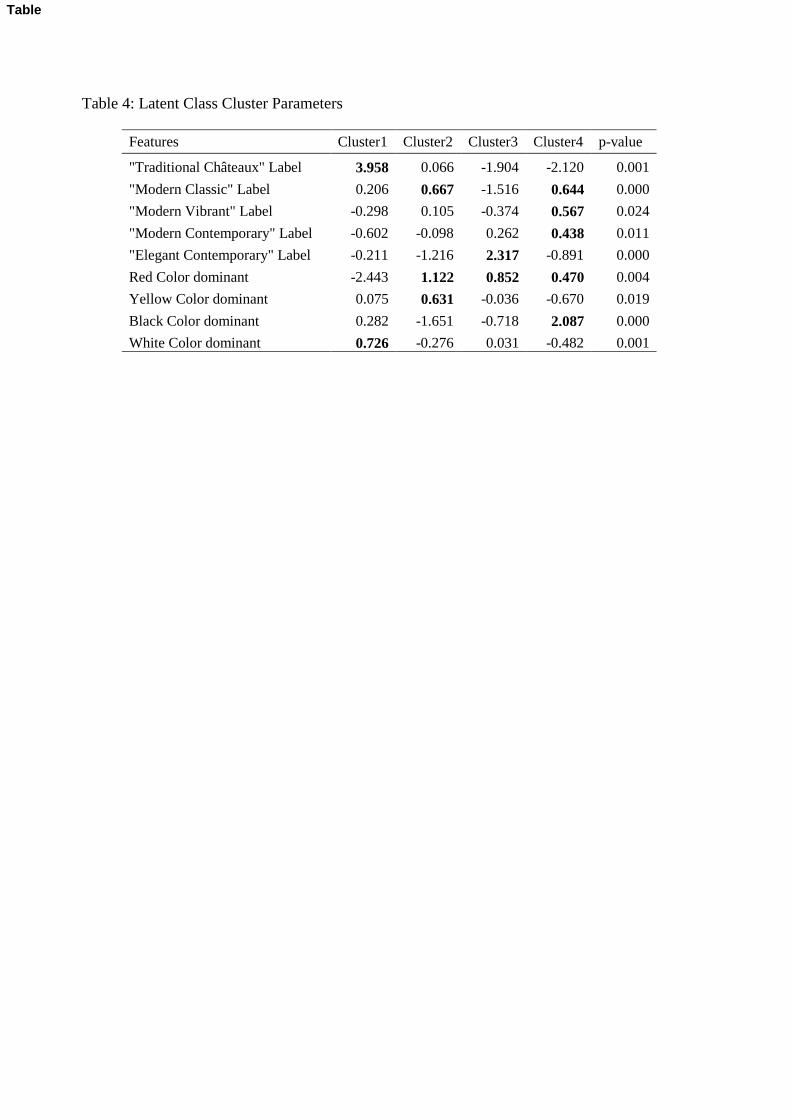
Table 4: Latent Class Cluster Parameters
Features Cluster1 Cluster2 Cluster3 Cluster4 p-value
"Traditional Châteaux" Label 3.958 0.066 -1.904 -2.120 0.001
"Modern Classic" Label 0.206 0.667 -1.516 0.644 0.000
"Modern Vibrant" Label -0.298 0.105 -0.374 0.567 0.024
"Modern Contemporary" Label -0.602 -0.098 0.262 0.438 0.011
"Elegant Contemporary" Label -0.211 -1.216 2.317 -0.891 0.000
Red Color dominant -2.443 1.122 0.852 0.470 0.004
Yellow Color dominant 0.075 0.631 -0.036 -0.670 0.019
Black Color dominant 0.282 -1.651 -0.718 2.087 0.000
White Color dominant 0.726 -0.276 0.031 -0.482 0.001
Table
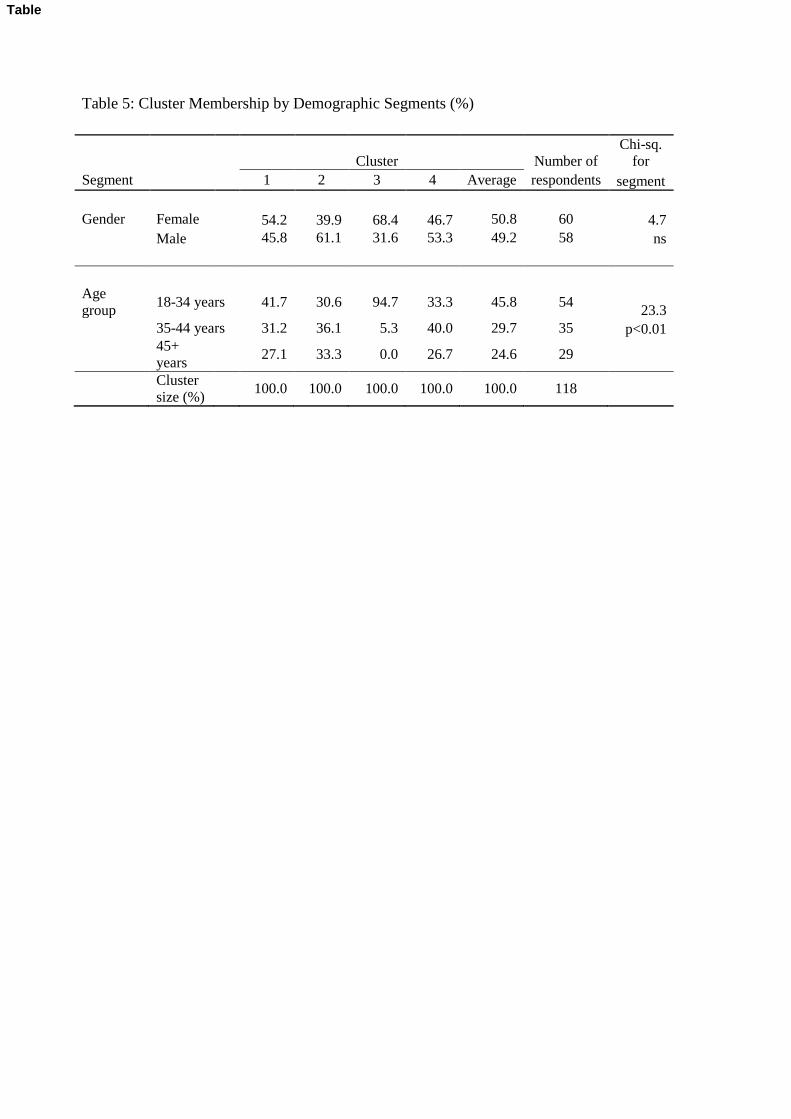
Table 5: Cluster Membership by Demographic Segments (%)
Cluster Number of
Chi-sq.
for
Segment 1 2 3 4 Average respondents segment
Gender Female
54.2 39.9 68.4 46.7 50.8 60 4.7
Male
45.8 61.1 31.6 53.3 49.2 58 ns
Age
group 18-34 years 41.7 30.6 94.7 33.3 45.8 54
23.3
35-44 years 31.2 36.1 5.3 40.0 29.7 35 p<0.01
45+
years 27.1 33.3 0.0 26.7 24.6 29
Cluster
size (%) 100.0 100.0 100.0 100.0 100.0 118
Table
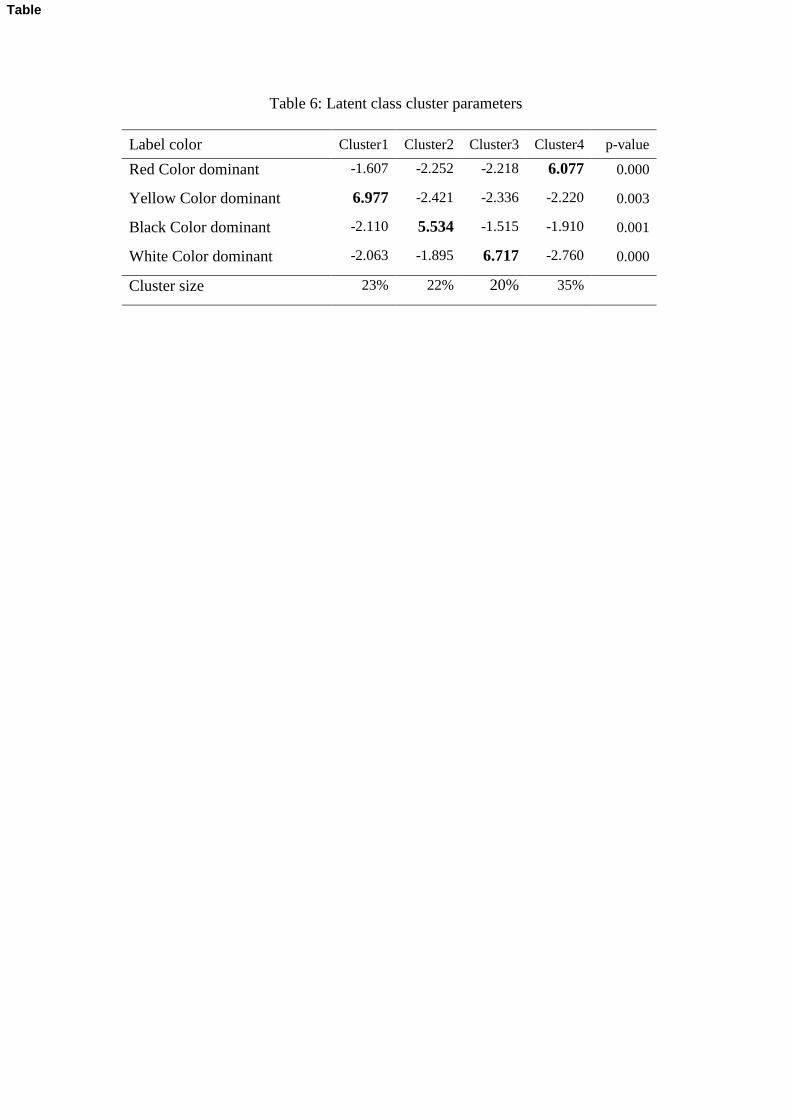
Table 6: Latent class cluster parameters
Label color Cluster1 Cluster2 Cluster3 Cluster4 p-value
Red Color dominant -1.607 -2.252 -2.218 6.077 0.000
Yellow Color dominant 6.977 -2.421 -2.336 -2.220 0.003
Black Color dominant -2.110 5.534 -1.515 -1.910 0.001
White Color dominant -2.063 -1.895 6.717 -2.760 0.000
Cluster size 23% 22% 20% 35%
Table
Graph