Perception of pitch location within a speaker’s F0 range
8
Perception of pitch location within a speaker’s F0 range a) Douglas N. Honorof b) and D. H. Whalen Haskins Laboratories, 270 Crown Street, New Haven, Connecticut 06511 ~Received 24 March 2004; revision received 2 November 2004; accepted 5 November 2004! Fundamental frequency ~F0! is used for many purposes in speech, but its linguistic significance is based on its relation to the speaker’s range, not its absolute value. While it may be that listeners can gauge a specific pitch relative to a speaker’s range by recognizing it from experience, whether they can do the same for an unfamiliar voice is an open question. The present experiment explored that question. Twenty native speakers of English ~10 male, 10 female! produced the vowel /Ä/ with a spoken ~not sung! voice quality at varying pitches within their own ranges. Listeners then judged, without familiarization or context, where each isolated F0 lay within each speaker’s range. Correlations were high both for the entire range ~0.721! and for the range minus the extremes ~0.609!. Correlations were somewhat higher when the F0s were related to the range of all the speakers, either separated by sex ~0.830! or pooled ~0.848!, but several factors discussed here may help account for this pattern. Regardless, the present data provide strong support for the hypothesis that listeners are able to locate an F0 reliably within a range without external context or prior exposure to a speaker’s voice. © 2005 Acoustical Society of America. @DOI: 10.1121/1.1841751# PACS numbers: 43.71.An, 43.71.Bp, 43.71.Es @PFA#. Pages: 2193–2200 I. INTRODUCTION Fundamental frequency ~F0! carries information about many different linguistic and paralinguistic aspects of the speech signal, but it does so in a speaker-dependent way. A pitch-accent system like that of Japanese, for example, dis- tinguishes words on the basis of which mora bears a shift in relative F0. However, F0 height is not specified by the lan- guage in general; rather, what counts as high or low varies by speaker ~Leather, 1983; Moore and Jongman, 1997!. Irre- spective of which parameters require F0 manipulation in a given phonology, the most obvious source of difference in pitch is speaker sex. Peterson and Barney ~1952! found a difference of approximately three-quarters of an octave be- tween adult males and adult females in average F0s of citation-form monosyllables across vowels, and approxi- mately a full octave’s difference when comparing analogous F0 measures for adult males and children. It appears, then, that ‘‘high pitch’’ cannot be specified as a particular F0 value, because any value ~if attainable! could be high for some speakers and low for others. How, then, do listeners gauge where within the speaker’s range a particular pitch lies? One possibility, of course, is that direct exposure to a voice over time allows a listener to learn the range of pitches that a speaker can and does pro- duce. If so, the perception of linguistic pitch targets may become possible as a function of exposure to a speaker’s voice. Indeed, there is evidence that familiarity with a voice is a factor in speech perception. For example, words spoken by familiar voices are easier to recognize ~Palmeri et al., 1993! and identify in noise ~Nygaard and Pisoni, 1998!. Such effects of familiarity in perception are not surprising given that linguistic and sociophonetic features are intertwined with speaker-indexical information in the speech signal ~Ladefoged and Broadbent, 1957; Fellowes et al., 1997; Re- mez et al., 1997! and in word memory ~Goldinger, 1996!. It may be that listeners perform ‘‘speaker normalization’’ in order to strip away linguistically extraneous information from the linguistic message, but it is at least as likely, as recent findings suggest, that listeners use a normalization strategy in order to disentangle invariant phonological infor- mation and invariant speaker information from each other without necessarily forgetting the latter ~see Sheffert and Fowler, 1995!. There may remain much that we do not yet understand about how speaker normalization is accom- plished by human listeners ~e.g., Johnson and Mullennix, 1997!, but we should be careful not to assume that percep- tion always entails a computational process of normalization. Clearly, listeners successfully perceive the speech of unfa- miliar voices—voices not stored in memory. In such cases, no exposure-based normalization strategy is available to the listener. It is unclear whether previous exposure to a voice is required for accurate pitch perception. When a sentential context is given, listeners can estimate the location of a pitch within a speaker’s range ~Wong and Diehl, 2003!. Other studies suggest success with contexts even shorter than a sentence. For example, in some languages, there are utter- ances as short as a single syllable that span a large region of the speaking range as in the case of the falling tone of stan- dard Mandarin, in which case exposure to a single utterance of a single tone might, conceivably, provide enough informa- tion about a speaker’s range to allow listeners to normalize F0. Indeed, a study by Moore and Jongman ~1997! indicates that perception of a Mandarin tone having an F0 turning point or change in F0 does not depend on context, thus dy- namic F0 is presumably calibrated syllable internally. If prior exposure to a short contour is required for the listener to succeed at normalizing pitch, logically, the listener should a! Portions of this work were presented at the 146th Meeting of the Acousti- cal Society of America, Austin, Texas, November 2003. b! Electronic mail: [email protected] 2193 J. Acoust. Soc. Am. 117 (4), Pt. 1, April 2005 0001-4966/2005/117(4)/2193/8/$22.50 © 2005 Acoustical Society of America Downloaded 30 Nov 2010 to 128.36.47.101. Redistribution subject to ASA license or copyright; see http://asadl.org/journals/doc/ASALIB-home/info/terms.jsp
-
Upload
independent -
Category
Documents
-
view
1 -
download
0
Transcript of Perception of pitch location within a speaker’s F0 range
Downloade
Perception of pitch location within a speaker’s F0 rangea)
Douglas N. Honorofb) and D. H. WhalenHaskins Laboratories, 270 Crown Street, New Haven, Connecticut 06511
~Received 24 March 2004; revision received 2 November 2004; accepted 5 November 2004!
Fundamental frequency~F0! is used for many purposes in speech, but its linguistic significance isbased on its relation to the speaker’s range, not its absolute value. While it may be that listeners cangauge a specific pitch relative to a speaker’s range by recognizing it from experience, whether theycan do the same for an unfamiliar voice is an open question. The present experiment explored thatquestion. Twenty native speakers of English~10 male, 10 female! produced the vowel /Ä/ with aspoken~not sung! voice quality at varying pitches within their own ranges. Listeners then judged,without familiarization or context, where each isolated F0 lay within each speaker’s range.Correlations were high both for the entire range~0.721! and for the range minus the extremes~0.609!. Correlations were somewhat higher when the F0s were related to the range of all thespeakers, either separated by sex~0.830! or pooled~0.848!, but several factors discussed here mayhelp account for this pattern. Regardless, the present data provide strong support for the hypothesisthat listeners are able to locate an F0 reliably within a range without external context or priorexposure to a speaker’s voice. ©2005 Acoustical Society of America.@DOI: 10.1121/1.1841751#
PACS numbers: 43.71.An, 43.71.Bp, 43.71.Es@PFA#. Pages: 2193–2200
theydftn
s b
ni
b
xu
he0
er, ir tpaye
icek
ne
al
innastionor-her
etom-,ep-on.nfa-es,the
istial
itch
an atter-n of
tan-ncea-
lize
ingdy-orto
uld
st
I. INTRODUCTION
Fundamental frequency~F0! carries information aboumany different linguistic and paralinguistic aspects of tspeech signal, but it does so in a speaker-dependent wapitch-accent system like that of Japanese, for example,tinguishes words on the basis of which mora bears a shirelative F0. However, F0 height is not specified by the laguage in general; rather, what counts as high or low variespeaker~Leather, 1983; Moore and Jongman, 1997!. Irre-spective of which parameters require F0 manipulation igiven phonology, the most obvious source of differencepitch is speaker sex. Peterson and Barney~1952! found adifference of approximately three-quarters of an octavetween adult males and adult females in average F0scitation-form monosyllables across vowels, and appromately a full octave’s difference when comparing analogoF0 measures for adult males and children. It appears, tthat ‘‘high pitch’’ cannot be specified as a particular Fvalue, because any value~if attainable! could be high forsome speakers and low for others.
How, then, do listeners gauge where within the speakrange a particular pitch lies? One possibility, of coursethat direct exposure to a voice over time allows a listenelearn the range of pitches that a speaker can and doesduce. If so, the perception of linguistic pitch targets mbecome possible as a function of exposure to a speakvoice. Indeed, there is evidence that familiarity with a vois a factor in speech perception. For example, words spoby familiar voices are easier to recognize~Palmeri et al.,1993! and identify in noise~Nygaard and Pisoni, 1998!. Sucheffects of familiarity in perception are not surprising givethat linguistic and sociophonetic features are intertwin
a!Portions of this work were presented at the 146th Meeting of the Acoucal Society of America, Austin, Texas, November 2003.
b!Electronic mail: [email protected]
J. Acoust. Soc. Am. 117 (4), Pt. 1, April 2005 0001-4966/2005/117(4)/2
d 30 Nov 2010 to 128.36.47.101. Redistribution subject to ASA license or
. Ais-in-y
an
e-ofi-sn,
’ssoro-
r’s
en
d
with speaker-indexical information in the speech sign~Ladefoged and Broadbent, 1957; Felloweset al., 1997; Re-mezet al., 1997! and in word memory~Goldinger, 1996!. Itmay be that listeners perform ‘‘speaker normalization’’order to strip away linguistically extraneous informatiofrom the linguistic message, but it is at least as likely,recent findings suggest, that listeners use a normalizastrategy in order to disentangle invariant phonological infmation and invariant speaker information from each otwithout necessarily forgetting the latter~see Sheffert andFowler, 1995!. There may remain much that we do not yunderstand about how speaker normalization is accplished by human listeners~e.g., Johnson and Mullennix1997!, but we should be careful not to assume that perction always entails a computational process of normalizatiClearly, listeners successfully perceive the speech of umiliar voices—voices not stored in memory. In such casno exposure-based normalization strategy is available tolistener.
It is unclear whether previous exposure to a voicerequired for accurate pitch perception. When a sentencontext is given, listeners can estimate the location of a pwithin a speaker’s range~Wong and Diehl, 2003!. Otherstudies suggest success with contexts even shorter thsentence. For example, in some languages, there are uances as short as a single syllable that span a large regiothe speaking range as in the case of the falling tone of sdard Mandarin, in which case exposure to a single utteraof a single tone might, conceivably, provide enough informtion about a speaker’s range to allow listeners to normaF0. Indeed, a study by Moore and Jongman~1997! indicatesthat perception of a Mandarin tone having an F0 turnpoint or change in F0 does not depend on context, thusnamic F0 is presumably calibrated syllable internally. If priexposure to a short contour is required for the listenersucceed at normalizing pitch, logically, the listener sho
i-
2193193/8/$22.50 © 2005 Acoustical Society of America
copyright; see http://asadl.org/journals/doc/ASALIB-home/info/terms.jsp
nlycaitcfed
olloerd
in
ao
tuere
ently
tblaseatorthulicoe
veuik-eoer
vaiv
esswex
eri-
ln,
storyof ao-20via aetricetricor
nal
totercific
the
con-tedker.
dalis-theoneme/t akertheieds,d, orungn
glis-
ioncip-eri-the
F0useri-the
ingus-
is
Downloade
not be able to normalize pitch correctly if presented owith steadyF0s. It remains to be seen whether listenerscorrectly assess the location of F0 within the spoken prange~tessiture! of an unfamiliar individual on the basis oisolatednatural utterances without first having been exposto F0 contours within the speaker’s range.
If perception of steady F0 does not require prior expsure to the speaker’s range, we must determine how thetener is able to accomplish the task. One basis for pitchcation within an F0 range might be voice quality. Thliterature has produced a number of differing claims regaing the nature of dependencies between voice quality~asreflected in glottal pulse characteristics! and F0. Commonmeasures of glottal pulse characteristics include overalltensity, the open quotient of the voice source~that is, therelative time during which the glottis remains open duringpitch period!, skewness of the glottal pulse, the strengththe relationship between the amplitudes of F0 and F0*2 ~thatis, H2–H1!, etc. Swerts and Veldhuis~2001! review this lit-erature and present the results of a highly constrained sof their own aimed at exploring the proposal that listen‘‘might be able to locate an utterance in a speaker’s sperange on the basis of voice quality~298!.’’ They concludethat there is some evidence that the perception of F0 depon voice quality, but do not go so far as to explore directhe ramifications of such a finding for perception~see alsoFant et al., 1985; Klatt and Klatt, 1990; Gobl and Nı´ Cha-saide, 1992!. Di Paolo and Faber~1990! have reported thavoice quality~breathy versus creaky phonation as indexedF1–F0! can be used by listeners to distinguish tense fromvowels. Taken as a whole, these studies make direct asment of voice quality a possible means for the immedinormalization of an individual speaker’s pitch without priexposure to a broad range of productions by the voice ofindividual. Therefore, we hypothesize that listeners shobe able to use immediately available information about voquality to locate where within a speaker’s range the pitcha vowel lies, even when presented with unfamiliar voicand virtually no context for their judgments.
If listeners are unable to perform this task, we will hato conclude that the perception of pitch does indeed reqcontextualization or familiarization with a particular speaer’s pitch range. If, on the other hand, as predicted, listenare able to successfully identify the relative location of islated steady pitches without prior exposure to a speakvoice ~and thus to a speaker’s tessiture!, we will have evi-dence that acoustic parameters of some sort must co-with F0 so as to make an immediate identification of relatF0 possible.
II. METHODS
A. Materials
1. Speakers
Twenty native speakers of North American English~10men, 10 women! participated in the production phase of thexperiment. Ages ranged from 20 to 78. Each speaker paa prescreening administered by questionnaire. The ansof those who participated in the production phase of the
2194 J. Acoust. Soc. Am., Vol. 117, No. 4, Pt. 1, April 2005
d 30 Nov 2010 to 128.36.47.101. Redistribution subject to ASA license or
nh
-is--
-
-
f
dysch
ds
yxss-e
edefs
re
rs-’s
rye
eders-
periment indicated that they had neither training nor expence as a vocal soloist, that they were nonsmokers~for atleast the preceding five years!, that they were in good vocahealth ~including the absence of symptoms of congestiocoughing, post-nasal drip, or fatigue on the day of the te!,that they were not prone to severe or chronic respiratallergies, and that they had never received the diagnosiscommunication disorder, vocal-fold pathology, or neuromtor impairment. Furthermore, on the day of the test, allspeakers passed manual binaural audiometric screeningBeltone 110 in a sound-attenuated chamber. The audiomtests demonstrated hearing-threshold levels at audiom~pulsed! frequencies between 0.125 and 1 kHz at 25 dBlower—well below the average amplitude of conversatiospeech.
2. Stimulus generation
In order to determine which F0s we should attemptelicit from a given speaker and in order to allow us, at a ladate, to calculate where those F0s lay within speaker-spevoice ranges, we elicited spoken tessitures~vocal ranges!from each speaker. In a double-isolated sound booth,speaker was instructed to speak, not sing~Titze, 1995!, /Ä/glissandos as though they were saying the words at aversational ‘‘loudness’’ to the experimenter, who was seain the booth approximately one meter away from the speaThe speaker spoke an /Ä/ by beginning at a comfortable~self-determined! habitual pitch~see Fairbanks, 1960!, then in-creasing fundamental frequency continuously until mophonation could no longer be sustained. Multiple rising glsandos of this type were elicited from each speaker untilexperimenter was satisfied that he had recordedsmoothly rising, nonsung glissando that included the extrehigh end of the speaker’s range. Next, a set of fallingÄ/glissandos was elicited in a similar manner beginning aspeaker-specific habitual pitch and falling until the speawas no longer able to sustain phonation at the low end ofrange. The number of attempts was typically three but varfrom two to eight. During elicitation of spoken glissandothe speaker was asked to begin again if he or she sensethe experimenter judged, that the voice had taken on a squality or if the audio signal was clipped or if a vowel tokewas produced noticeably more quietly than other tokens.
Speaker-specific ranges were calculated from thesesandos using autocorrelation in Praat v4.1~range545–900Hz; 15 maximum candidates!, in particular, to provide infor-mation about the high end of the tessiture. Autocorrelatwas supplemented by interactive measurement of the rerocal of the arithmetic mean of three successive pitch pods. The floor of the spoken tessiture was defined asbasal pitch, specifically, the frequency at which periodicwas no longer analyzable by autocorrelation or, in dubiocases, identified by direct measurement of three pitch pods. The ceiling of the spoken tessiture was defined asfrequency of the first falsetto break extracted from the risglissando during which nonfalsetto voice quality was stained at the highest frequency. In clinical practice, falsettooften included in a normative voice range profile~VRP, alsocalled the ‘‘F02SPLmin voice profile,’’ ‘‘F0 /SPL profile,’’
D. N. Honorof and D. H. Whalen: F0 within speaker range
copyright; see http://asadl.org/journals/doc/ASALIB-home/info/terms.jsp
h
no
ernktadnc
e
nthpse
dpsohgeifi-
nean
akek
m
ure
ThithHa
owe
isth
wecoexaen
sd tooneder.ed ain a
on-
ellals.
theor-the
re--
and
eadyf there-
F0ove
thens,ith
-.1.
theeirtheingchk-d di-re-ntericited
k-ally,
/ale
rep-ey
Downloade
‘‘voice field,’’ ‘‘voice area,’’ or ‘‘phonetogram’’! in an at-tempt to assess voice disorders~especially of singers!, inwhich case the falsetto break is often seen as a small notcintensity ~,5 dB! on the loud side of the~normally! ovalshape of the profile~Schutte and Seidner, 1983; Heyleet al., 2002!. Although falsetto may be used in speech, njust in singing, we excluded falsetto from our speakspecific ranges in order to increase the difficulty of the raing task for the listeners~see later!. Because we were nointerested in the margins of the F0 range, no effort was mto control for variations in extrema within speakers as a fution of time of day~see Gelfer, 1989!, beyond the collectionof multiple ranges from each speaker.
Once speaker-specific ranges had been established,speaker was asked to sustain a spoken /Ä/ on at least eightdistinct notes spaced roughly evenly within his or her nofalsetto spoken F0 range. The instruction to speak rathersing /Ä/ was met with surprisingly little resistance, perhabecause nonsingers had been recruited by design, somwhom having expressed relief that they were not expectesing. As was the case with the glissandos, occasional lainto a sung voice quality also occurred in the productionsteady tones, and sung tokens were replaced. In order tothese nonsingers space notes out within their own ranthey were provided with sinusoidal audio stimuli. Speccally, they heard four 300 ms pure tones per octave~notes c,e, g, and a from 49 to 524 Hz! in which a linear ramp func-tion was applied to the amplitude over the first 100 ms aover the last 100 ms. The experimenters selected at leight such auditory stimuli within the speaker’s tessiture apresented them over a harman/kardon multimedia spesystem with adjustable output levels. Output was always wabove measured auditory threshold levels for the speaThe talker was asked to respond to each stimulus by atteing to match the pitch of the tone while speaking /Ä/ at aconversational ‘‘loudness.’’ In order to help the speaker fther, we used a Kay Visipitch II running in DOS to providreal-time visual feedback on success of pitch-matching.participant saw a trace of his or her own pitch along whorizontal guide lines placed at 10 Hz above and 10below the target pitch. Speakers were asked to hold etone for four to five seconds, then to inspire~to encourageresetting of the glottis! and to produce at least another twvowels, also separated by a breath. Vowels so producedalso digitized as 44.1 kHz, 16-bit NSP sound files usingnear-measurement-quality microphone~Earthworks QTC1!routed to the Visipitch via a hardware high-pass filter~Fo-cusrite ISA220, cutoff530 Hz, 18 dB/octave rolloff! underspeaker-independent input gain. We excluded tokens wnoticeable F0 or intensity excursions, as seen in acouanalysis displays. For each speaker, the eight tokenswere best spread out throughout the speaker’s rangethen selected. For each item selected, the first 500 mstaining no noticeable F0 or intensity excursions weretracted from the longer vowel. A linear amplitude ramp wapplied to the first and last 100 ms of this extracted segm
J. Acoust. Soc. Am., Vol. 117, No. 4, Pt. 1, April 2005
d 30 Nov 2010 to 128.36.47.101. Redistribution subject to ASA license or
in
t--
e-
ach
-an
oftoesfelps,
dst
derller.pt-
-
e
zch
rea
thticatren--
st.
B. Listeners
Twelve native speakers of North American English~6men, 6 women! participated in the listening task. Ageranged from 20 to 58. Each listener was asked to respona prescreening questionnaire. Answers indicated that nhad ever been diagnosed with a communication disorFurthermore, on the day of the test, all 12 listeners passmanual binaural audiometric screening via a Beltone 110sound-attenuated chamber. The audiometric tests demstrated hearing threshold levels at audiometric~pulsed! fre-quencies between 0.125 and 1 kHz at 30 dB or lower, wbelow the lowest amplitude present in the stimulus materi
C. Procedures
For each stimulus we had recorded, we calculatedachieved F0—not the target F0—as a percentage of the cresponding speaker-specific nonfalsetto tessiture usingformula in Eq. ~1!, where F0ratio is the percentage of theindividual speaker’s tessiture with which we aimed to corlate listener rankings, F0ach is the fundamental frequency location actually achieved by the speaker,Tbase is the lowestsustainable F0 within the speaker’s spoken tessiture,Trange is the tessiture itself.
F0ratio5F0ach2Tbase
Trange•0.01. ~1!
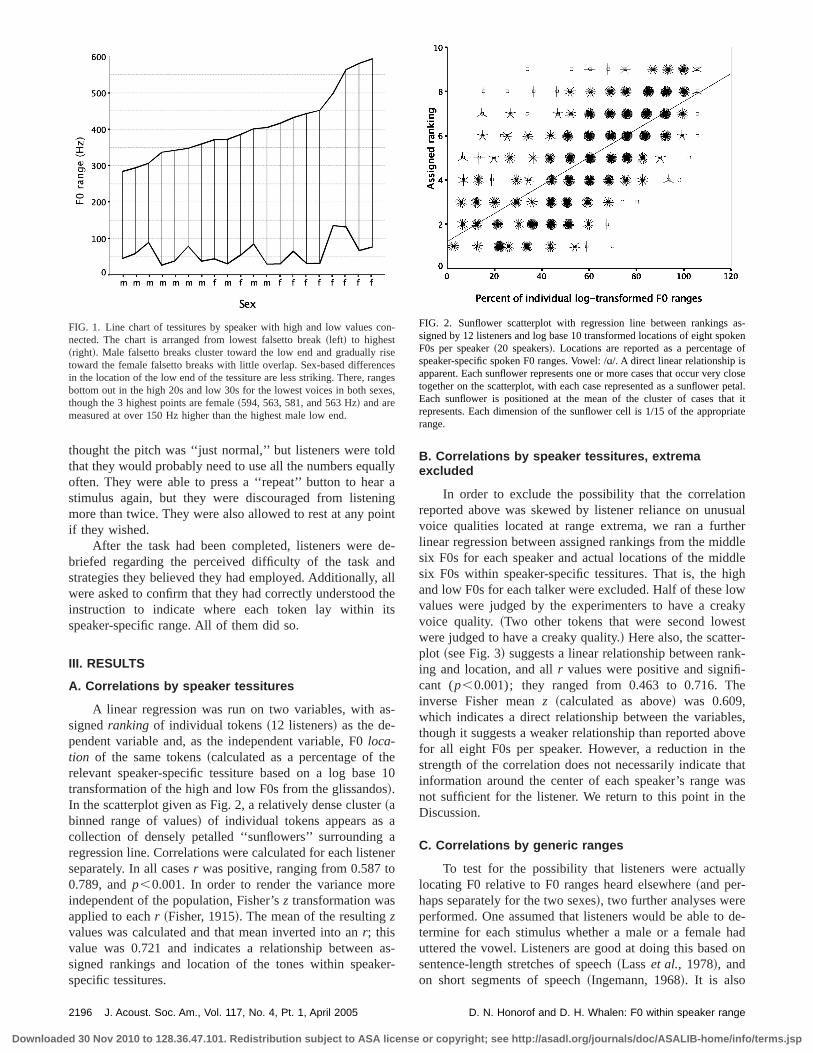
Tessitures were based on spoken glissandos, not stF0s, but highest speakable steady F0s and the top end ononfalsetto spoken glissando ranges differed slightly, asported elsewhere~Reich et al., 1990, but see Zraicket al.,2000!. Therefore, for two female speakers, the highestvalues lay above the speaker’s tessiture, 3% and 14% abfor one speaker, and 5% above for the other. Half oflowest male tokens and half of the lowest female tokethough they fell within the tessiture, were produced whighly periodic glottal fry. Two instances of the second lowest tones~one male, one female! were also produced with fryTessitures for each speaker appear coded by sex in Fig.
Listeners were warned that they would be hearingvoices of different speakers using different parts of thspeaking ranges, and asked to identify where withinspeaker’s range each token fell. The list of stimuli, consistof one token of each of eight F0s collected from easpeaker~83205160 stimuli!, was randomized across speaers and tokens separately for each listener and presenteotically one at a time over headphones. Stimuli were psented at a comfortable output level set by the experimeand kept constant across listeners. Responses were solvia a custom MATLAB graphical user interface~GUI! on aflat-panel display. The GUI window accepted input via clicable buttons numbered sequentially and arranged verticwith the word ‘‘high’’ at the top and ‘‘low’’ at the bottom.Listeners used these buttons to indicate the location of anÄ/token within a speaker’s pitch range on a nine-point scnumbered ‘‘1’’~‘‘just about as low as they could go’’! to ‘‘9’’~‘‘just about as high as they could go’’!. A nine-point scalewas used so that the eight F0 levels would not be underresented. Listeners were instructed to choose ‘‘5’’ if th
2195D. N. Honorof and D. H. Whalen: F0 within speaker range
copyright; see http://asadl.org/journals/doc/ASALIB-home/info/terms.jsp
ldalrinin
dndath
its
s
heesraan
ore
ae
nsualherddledleighowakyst-k-
-e
les,ove
thethatwase
lly
de-had
on
on
risc
ngxe
as-okenof
closepetal.at itriate
Downloade
thought the pitch was ‘‘just normal,’’ but listeners were tothat they would probably need to use all the numbers equoften. They were able to press a ‘‘repeat’’ button to heastimulus again, but they were discouraged from listenmore than twice. They were also allowed to rest at any poif they wished.
After the task had been completed, listeners werebriefed regarding the perceived difficulty of the task astrategies they believed they had employed. Additionally,were asked to confirm that they had correctly understoodinstruction to indicate where each token lay withinspeaker-specific range. All of them did so.
III. RESULTS
A. Correlations by speaker tessitures
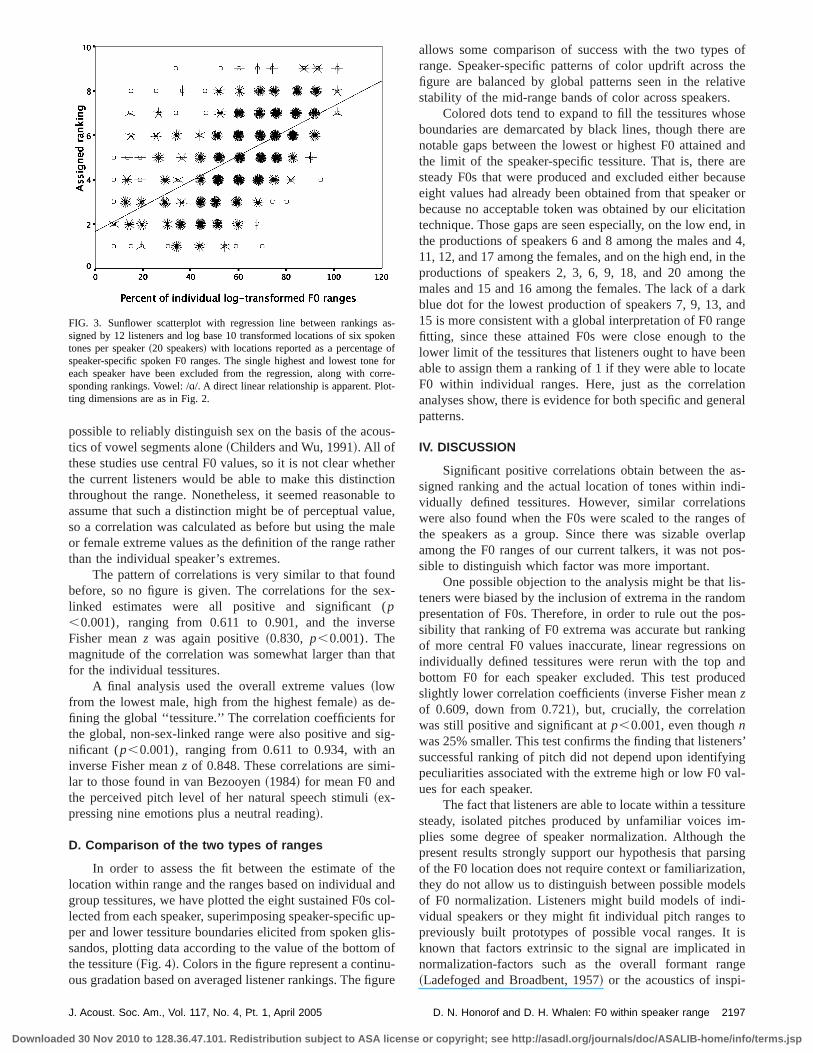
A linear regression was run on two variables, with asignedranking of individual tokens~12 listeners! as the de-pendent variable and, as the independent variable, F0loca-tion of the same tokens~calculated as a percentage of trelevant speaker-specific tessiture based on a log bastransformation of the high and low F0s from the glissando!.In the scatterplot given as Fig. 2, a relatively dense cluste~abinned range of values! of individual tokens appears ascollection of densely petalled ‘‘sunflowers’’ surroundingregression line. Correlations were calculated for each listeseparately. In all casesr was positive, ranging from 0.587 t0.789, andp,0.001. In order to render the variance moindependent of the population, Fisher’sz transformation wasapplied to eachr ~Fisher, 1915!. The mean of the resultingzvalues was calculated and that mean inverted into anr; thisvalue was 0.721 and indicates a relationship betweensigned rankings and location of the tones within speakspecific tessitures.
FIG. 1. Line chart of tessitures by speaker with high and low values cnected. The chart is arranged from lowest falsetto break~left! to highest~right!. Male falsetto breaks cluster toward the low end and graduallytoward the female falsetto breaks with little overlap. Sex-based differenin the location of the low end of the tessiture are less striking. There, rabottom out in the high 20s and low 30s for the lowest voices in both sethough the 3 highest points are female~594, 563, 581, and 563 Hz! and aremeasured at over 150 Hz higher than the highest male low end.
2196 J. Acoust. Soc. Am., Vol. 117, No. 4, Pt. 1, April 2005
d 30 Nov 2010 to 128.36.47.101. Redistribution subject to ASA license or
lyagt
e-
lle
-
10
er
s-r-
B. Correlations by speaker tessitures, extremaexcluded
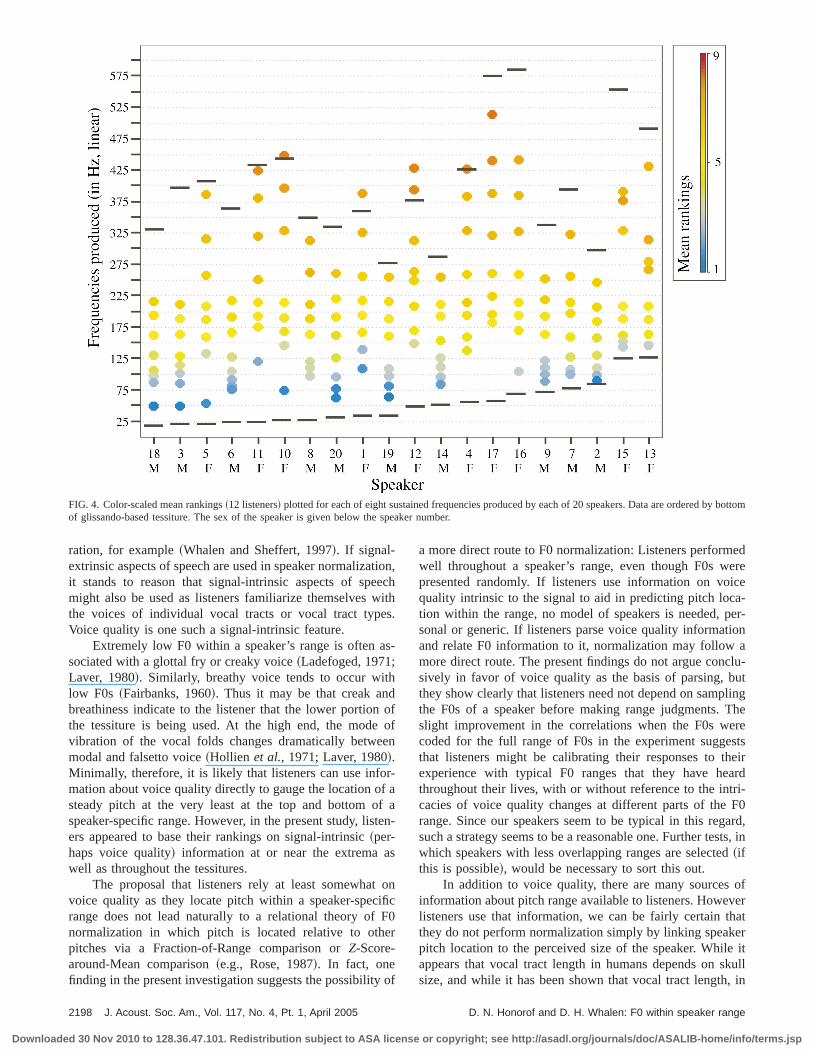
In order to exclude the possibility that the correlatioreported above was skewed by listener reliance on unuvoice qualities located at range extrema, we ran a furtlinear regression between assigned rankings from the misix F0s for each speaker and actual locations of the midsix F0s within speaker-specific tessitures. That is, the hand low F0s for each talker were excluded. Half of these lvalues were judged by the experimenters to have a crevoice quality. ~Two other tokens that were second lowewere judged to have a creaky quality.! Here also, the scatterplot ~see Fig. 3! suggests a linear relationship between raning and location, and allr values were positive and significant (p,0.001); they ranged from 0.463 to 0.716. Thinverse Fisher meanz ~calculated as above! was 0.609,which indicates a direct relationship between the variabthough it suggests a weaker relationship than reported abfor all eight F0s per speaker. However, a reduction instrength of the correlation does not necessarily indicateinformation around the center of each speaker’s rangenot sufficient for the listener. We return to this point in thDiscussion.
C. Correlations by generic ranges
To test for the possibility that listeners were actualocating F0 relative to F0 ranges heard elsewhere~and per-haps separately for the two sexes!, two further analyses wereperformed. One assumed that listeners would be able totermine for each stimulus whether a male or a femaleuttered the vowel. Listeners are good at doing this basedsentence-length stretches of speech~Lasset al., 1978!, andon short segments of speech~Ingemann, 1968!. It is also
-
eesess,
FIG. 2. Sunflower scatterplot with regression line between rankingssigned by 12 listeners and log base 10 transformed locations of eight spF0s per speaker~20 speakers!. Locations are reported as a percentagespeaker-specific spoken F0 ranges. Vowel: /Ä/. A direct linear relationship isapparent. Each sunflower represents one or more cases that occur verytogether on the scatterplot, with each case represented as a sunflowerEach sunflower is positioned at the mean of the cluster of cases threpresents. Each dimension of the sunflower cell is 1/15 of the approprange.
D. N. Honorof and D. H. Whalen: F0 within speaker range
copyright; see http://asadl.org/journals/doc/ASALIB-home/info/terms.jsp
u
thiolelua
th
ndex(rs
th
rsini-
thanc
c uli
u-gu
ofthetive.seareandareauser ortiond, ind 4,thethearkndgetheen
ateoneral
as-di-nss ofrlapos-
lis-omos-ing
onndced
rs’ngal-
ureim-thesingn,elsi-toisinge
aokofeort-
Downloade
possible to reliably distinguish sex on the basis of the acotics of vowel segments alone~Childers and Wu, 1991!. All ofthese studies use central F0 values, so it is not clear whethe current listeners would be able to make this distinctthroughout the range. Nonetheless, it seemed reasonabassume that such a distinction might be of perceptual vaso a correlation was calculated as before but using the mor female extreme values as the definition of the range rathan the individual speaker’s extremes.
The pattern of correlations is very similar to that foubefore, so no figure is given. The correlations for the slinked estimates were all positive and significantp,0.001), ranging from 0.611 to 0.901, and the inveFisher meanz was again positive~0.830, p,0.001). Themagnitude of the correlation was somewhat larger thanfor the individual tessitures.
A final analysis used the overall extreme values~lowfrom the lowest male, high from the highest female! as de-fining the global ‘‘tessiture.’’ The correlation coefficients fothe global, non-sex-linked range were also positive andnificant (p,0.001), ranging from 0.611 to 0.934, with ainverse Fisher meanz of 0.848. These correlations are simlar to those found in van Bezooyen~1984! for mean F0 andthe perceived pitch level of her natural speech stimuli~ex-pressing nine emotions plus a neutral reading!.
D. Comparison of the two types of ranges
In order to assess the fit between the estimate oflocation within range and the ranges based on individualgroup tessitures, we have plotted the eight sustained F0slected from each speaker, superimposing speaker-specifiper and lower tessiture boundaries elicited from spoken gsandos, plotting data according to the value of the bottomthe tessiture~Fig. 4!. Colors in the figure represent a continous gradation based on averaged listener rankings. The fi
FIG. 3. Sunflower scatterplot with regression line between rankingssigned by 12 listeners and log base 10 transformed locations of six sptones per speaker~20 speakers! with locations reported as a percentagespeaker-specific spoken F0 ranges. The single highest and lowest toneach speaker have been excluded from the regression, along with csponding rankings. Vowel: /Ä/. A direct linear relationship is apparent. Ploting dimensions are as in Fig. 2.
J. Acoust. Soc. Am., Vol. 117, No. 4, Pt. 1, April 2005
d 30 Nov 2010 to 128.36.47.101. Redistribution subject to ASA license or
s-
ern
toe,leer
-
e
at
g-
edol-p-
s-of
re
allows some comparison of success with the two typesrange. Speaker-specific patterns of color updrift acrossfigure are balanced by global patterns seen in the relastability of the mid-range bands of color across speakers
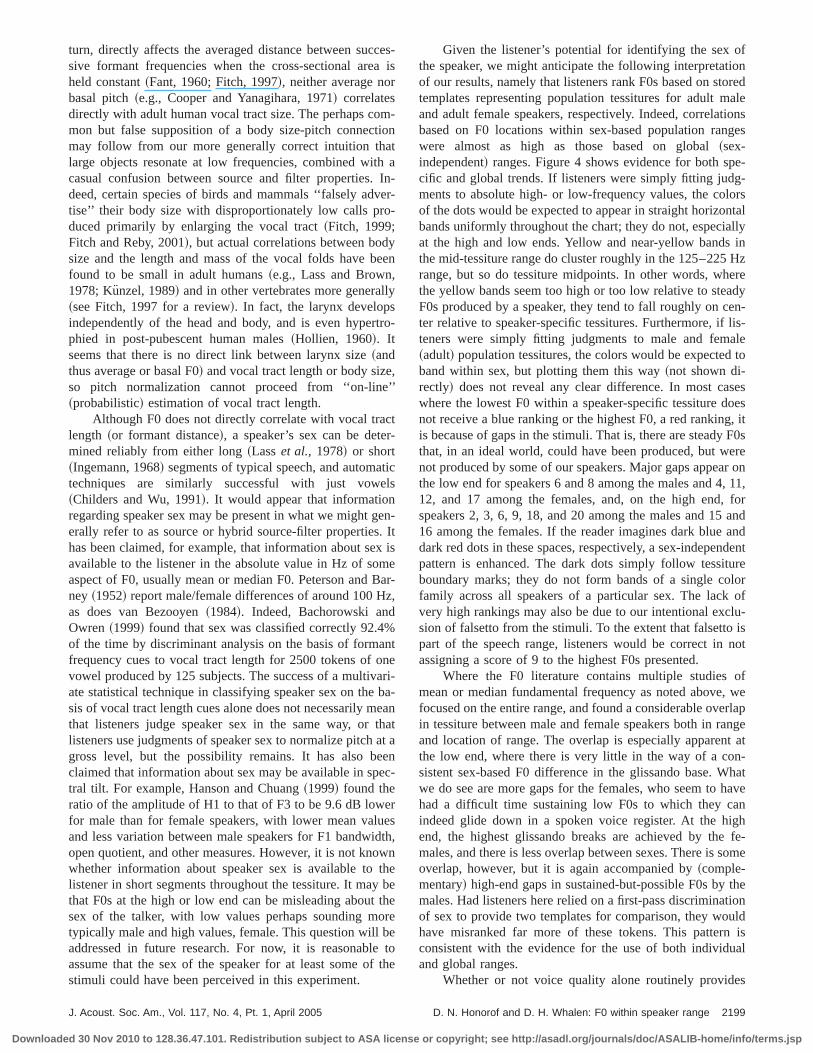
Colored dots tend to expand to fill the tessitures whoboundaries are demarcated by black lines, though therenotable gaps between the lowest or highest F0 attainedthe limit of the speaker-specific tessiture. That is, theresteady F0s that were produced and excluded either beceight values had already been obtained from that speakebecause no acceptable token was obtained by our elicitatechnique. Those gaps are seen especially, on the low enthe productions of speakers 6 and 8 among the males an11, 12, and 17 among the females, and on the high end, inproductions of speakers 2, 3, 6, 9, 18, and 20 amongmales and 15 and 16 among the females. The lack of a dblue dot for the lowest production of speakers 7, 9, 13, a15 is more consistent with a global interpretation of F0 ranfitting, since these attained F0s were close enough tolower limit of the tessitures that listeners ought to have beable to assign them a ranking of 1 if they were able to locF0 within individual ranges. Here, just as the correlatianalyses show, there is evidence for both specific and genpatterns.
IV. DISCUSSION
Significant positive correlations obtain between thesigned ranking and the actual location of tones within invidually defined tessitures. However, similar correlatiowere also found when the F0s were scaled to the rangethe speakers as a group. Since there was sizable oveamong the F0 ranges of our current talkers, it was not psible to distinguish which factor was more important.
One possible objection to the analysis might be thatteners were biased by the inclusion of extrema in the randpresentation of F0s. Therefore, in order to rule out the psibility that ranking of F0 extrema was accurate but rankof more central F0 values inaccurate, linear regressionsindividually defined tessitures were rerun with the top abottom F0 for each speaker excluded. This test produslightly lower correlation coefficients~inverse Fisher meanzof 0.609, down from 0.721!, but, crucially, the correlationwas still positive and significant atp,0.001, even thoughnwas 25% smaller. This test confirms the finding that listenesuccessful ranking of pitch did not depend upon identifyipeculiarities associated with the extreme high or low F0 vues for each speaker.
The fact that listeners are able to locate within a tessitsteady, isolated pitches produced by unfamiliar voicesplies some degree of speaker normalization. Althoughpresent results strongly support our hypothesis that parof the F0 location does not require context or familiarizatiothey do not allow us to distinguish between possible modof F0 normalization. Listeners might build models of indvidual speakers or they might fit individual pitch rangespreviously built prototypes of possible vocal ranges. Itknown that factors extrinsic to the signal are implicatednormalization-factors such as the overall formant ran~Ladefoged and Broadbent, 1957! or the acoustics of inspi-
s-en
forre-
2197D. N. Honorof and D. H. Whalen: F0 within speaker range
copyright; see http://asadl.org/journals/doc/ASALIB-home/info/terms.jsp
y bottom
Downloade
FIG. 4. Color-scaled mean rankings~12 listeners! plotted for each of eight sustained frequencies produced by each of 20 speakers. Data are ordered bof glissando-based tessiture. The sex of the speaker is given below the speaker number.
tieis
s
hd
o
e
r-f afte
s
oifiFer
o
edereice-er-
onaclu-utlingTheerestseirardri-F0ard,sts, ind
ofverhater
itkull, in
ration, for example~Whalen and Sheffert, 1997!. If signal-extrinsic aspects of speech are used in speaker normalizait stands to reason that signal-intrinsic aspects of spemight also be used as listeners familiarize themselves wthe voices of individual vocal tracts or vocal tract typeVoice quality is one such a signal-intrinsic feature.
Extremely low F0 within a speaker’s range is often asociated with a glottal fry or creaky voice~Ladefoged, 1971;Laver, 1980!. Similarly, breathy voice tends to occur witlow F0s ~Fairbanks, 1960!. Thus it may be that creak anbreathiness indicate to the listener that the lower portionthe tessiture is being used. At the high end, the modevibration of the vocal folds changes dramatically betwemodal and falsetto voice~Hollien et al., 1971; Laver, 1980!.Minimally, therefore, it is likely that listeners can use infomation about voice quality directly to gauge the location osteady pitch at the very least at the top and bottom ospeaker-specific range. However, in the present study, lisers appeared to base their rankings on signal-intrinsic~per-haps voice quality! information at or near the extrema awell as throughout the tessitures.
The proposal that listeners rely at least somewhatvoice quality as they locate pitch within a speaker-specrange does not lead naturally to a relational theory ofnormalization in which pitch is located relative to othpitches via a Fraction-of-Range comparison orZ-Score-around-Mean comparison~e.g., Rose, 1987!. In fact, onefinding in the present investigation suggests the possibility
2198 J. Acoust. Soc. Am., Vol. 117, No. 4, Pt. 1, April 2005
d 30 Nov 2010 to 128.36.47.101. Redistribution subject to ASA license or
on,chth.
-
fofn
an-
nc0
f
a more direct route to F0 normalization: Listeners performwell throughout a speaker’s range, even though F0s wpresented randomly. If listeners use information on voquality intrinsic to the signal to aid in predicting pitch location within the range, no model of speakers is needed, psonal or generic. If listeners parse voice quality informatiand relate F0 information to it, normalization may followmore direct route. The present findings do not argue consively in favor of voice quality as the basis of parsing, bthey show clearly that listeners need not depend on sampthe F0s of a speaker before making range judgments.slight improvement in the correlations when the F0s wcoded for the full range of F0s in the experiment suggethat listeners might be calibrating their responses to thexperience with typical F0 ranges that they have hethroughout their lives, with or without reference to the intcacies of voice quality changes at different parts of therange. Since our speakers seem to be typical in this regsuch a strategy seems to be a reasonable one. Further tewhich speakers with less overlapping ranges are selecte~ifthis is possible!, would be necessary to sort this out.
In addition to voice quality, there are many sourcesinformation about pitch range available to listeners. Howelisteners use that information, we can be fairly certain tthey do not perform normalization simply by linking speakpitch location to the perceived size of the speaker. Whileappears that vocal tract length in humans depends on ssize, and while it has been shown that vocal tract length
D. N. Honorof and D. H. Whalen: F0 within speaker range
copyright; see http://asadl.org/journals/doc/ASALIB-home/info/terms.jsp
cear
mioatth
Ive-
ye,lly
tr
,’’
ctr-
tils
ge.xmBz
%annabethaee
erueidwthyth
orbeef t
ofionoredale
ionsges
e-g-orsntalllyinHzeredyen-lis-
aleto
sesoes, itF0serer on, 11,forand
anddent
urelorof
lu-isnot
of, werlapnget atn-hat
haven
ghfe-
some
thetionldis
al
s
Downloade
turn, directly affects the averaged distance between sucsive formant frequencies when the cross-sectional areheld constant~Fant, 1960; Fitch, 1997!, neither average nobasal pitch~e.g., Cooper and Yanagihara, 1971! correlatesdirectly with adult human vocal tract size. The perhaps comon but false supposition of a body size-pitch connectmay follow from our more generally correct intuition thlarge objects resonate at low frequencies, combined wicasual confusion between source and filter properties.deed, certain species of birds and mammals ‘‘falsely adtise’’ their body size with disproportionately low calls produced primarily by enlarging the vocal tract~Fitch, 1999;Fitch and Reby, 2001!, but actual correlations between bodsize and the length and mass of the vocal folds have bfound to be small in adult humans~e.g., Lass and Brown1978; Kunzel, 1989! and in other vertebrates more genera~see Fitch, 1997 for a review!. In fact, the larynx developsindependently of the head and body, and is even hyperphied in post-pubescent human males~Hollien, 1960!. Itseems that there is no direct link between larynx size~andthus average or basal F0! and vocal tract length or body sizeso pitch normalization cannot proceed from ‘‘on-line~probabilistic! estimation of vocal tract length.
Although F0 does not directly correlate with vocal tralength ~or formant distance!, a speaker’s sex can be detemined reliably from either long~Lasset al., 1978! or short~Ingemann, 1968! segments of typical speech, and automatechniques are similarly successful with just vowe~Childers and Wu, 1991!. It would appear that informationregarding speaker sex may be present in what we mighterally refer to as source or hybrid source-filter propertieshas been claimed, for example, that information about seavailable to the listener in the absolute value in Hz of soaspect of F0, usually mean or median F0. Peterson andney ~1952! report male/female differences of around 100 Has does van Bezooyen~1984!. Indeed, Bachorowski andOwren ~1999! found that sex was classified correctly 92.4of the time by discriminant analysis on the basis of formfrequency cues to vocal tract length for 2500 tokens of ovowel produced by 125 subjects. The success of a multivate statistical technique in classifying speaker sex on thesis of vocal tract length cues alone does not necessarily mthat listeners judge speaker sex in the same way, orlisteners use judgments of speaker sex to normalize pitchgross level, but the possibility remains. It has also beclaimed that information about sex may be available in sptral tilt. For example, Hanson and Chuang~1999! found theratio of the amplitude of H1 to that of F3 to be 9.6 dB lowfor male than for female speakers, with lower mean valand less variation between male speakers for F1 bandwopen quotient, and other measures. However, it is not knowhether information about speaker sex is available tolistener in short segments throughout the tessiture. It mathat F0s at the high or low end can be misleading aboutsex of the talker, with low values perhaps sounding mtypically male and high values, female. This question willaddressed in future research. For now, it is reasonablassume that the sex of the speaker for at least some ostimuli could have been perceived in this experiment.
J. Acoust. Soc. Am., Vol. 117, No. 4, Pt. 1, April 2005
d 30 Nov 2010 to 128.36.47.101. Redistribution subject to ASA license or
s-is
-n
an-r-
en
o-
c
n-Itisear-,
teri-a-anatt anc-
sth,ne
beee
tohe
Given the listener’s potential for identifying the sexthe speaker, we might anticipate the following interpretatof our results, namely that listeners rank F0s based on sttemplates representing population tessitures for adult mand adult female speakers, respectively. Indeed, correlatbased on F0 locations within sex-based population ranwere almost as high as those based on global~sex-independent! ranges. Figure 4 shows evidence for both spcific and global trends. If listeners were simply fitting judments to absolute high- or low-frequency values, the colof the dots would be expected to appear in straight horizobands uniformly throughout the chart; they do not, especiaat the high and low ends. Yellow and near-yellow bandsthe mid-tessiture range do cluster roughly in the 125–225range, but so do tessiture midpoints. In other words, whthe yellow bands seem too high or too low relative to steaF0s produced by a speaker, they tend to fall roughly on cter relative to speaker-specific tessitures. Furthermore, ifteners were simply fitting judgments to male and fem~adult! population tessitures, the colors would be expectedband within sex, but plotting them this way~not shown di-rectly! does not reveal any clear difference. In most cawhere the lowest F0 within a speaker-specific tessiture dnot receive a blue ranking or the highest F0, a red rankingis because of gaps in the stimuli. That is, there are steadythat, in an ideal world, could have been produced, but wnot produced by some of our speakers. Major gaps appeathe low end for speakers 6 and 8 among the males and 412, and 17 among the females, and, on the high end,speakers 2, 3, 6, 9, 18, and 20 among the males and 1516 among the females. If the reader imagines dark bluedark red dots in these spaces, respectively, a sex-indepenpattern is enhanced. The dark dots simply follow tessitboundary marks; they do not form bands of a single cofamily across all speakers of a particular sex. The lackvery high rankings may also be due to our intentional excsion of falsetto from the stimuli. To the extent that falsettopart of the speech range, listeners would be correct inassigning a score of 9 to the highest F0s presented.
Where the F0 literature contains multiple studiesmean or median fundamental frequency as noted abovefocused on the entire range, and found a considerable ovein tessiture between male and female speakers both in raand location of range. The overlap is especially apparenthe low end, where there is very little in the way of a cosistent sex-based F0 difference in the glissando base. Wwe do see are more gaps for the females, who seem tohad a difficult time sustaining low F0s to which they caindeed glide down in a spoken voice register. At the hiend, the highest glissando breaks are achieved by themales, and there is less overlap between sexes. There isoverlap, however, but it is again accompanied by~comple-mentary! high-end gaps in sustained-but-possible F0s bymales. Had listeners here relied on a first-pass discriminaof sex to provide two templates for comparison, they wouhave misranked far more of these tokens. This patternconsistent with the evidence for the use of both individuand global ranges.
Whether or not voice quality alone routinely provide
2199D. N. Honorof and D. H. Whalen: F0 within speaker range
copyright; see http://asadl.org/journals/doc/ASALIB-home/info/terms.jsp
ittcwlisose
Fsrsat
ernr
msthrt2th
e
rt
,’’
ic
an
o
nka
n
al
y
-
rdm
’’ J.
, P.s-
h
o-
s
foc.
r-
’uen-
eech
.
-
xp.
in
er-
tal
nt/
-
ng.
cy
Downloade
listeners with sufficient information for F0 normalization,is clear that listeners are sensitive to the location of piwithin a speaker’s range, even for isolated utterances. Ittake further experimentation to isolate the features thatteners are sensitive to and to explain why listeners are gbut not perfect at the task. For example, it would prove uful to test whether varying synthetic voice quality acrossrange of F0s confounds the listeners’ attempts to trackvalues. Another avenue of research suggested by the prestudy would involve a replication in which the experimenteselected speakers with tessitures located high and low insolute frequency and with less overlap than seen amongpresent speakers, if such speakers can be found.
ACKNOWLEDGMENTS
We thank Jeff Weihing for assistance withMATLAB pro-gramming and Brook Swainson and Paul De Decker for thassistance with stimulus extraction. We also thank CaFowler, Gordon Ramsay, and Yi Xu for their comments aBob Ladd for a helpful discussion of the data reported heDuring the review process, this paper also benefited fronumber of insights offered by the Peter Assmann, TecumFitch and an anonymous reviewer. Any shortcomings inpresent research remain our own. This work was suppoby NIH Grant No. DC-02717 and NIH Grant No. DC-0378to Haskins Laboratories and by an equipment loan fromInstitute for Voice and Speech.
Bachorowski, J.-A., and Owren, M. J.~1999!. ‘‘Acoustic correlates of talkersex and individual talker identity are present in a short vowel segmproduced in running speech,’’ J. Acoust. Soc. Am.106, 1054–1063.
Childers, D. G., and Wu, K.~1991!. ‘‘Gender recognition from speech. PaII: Fine analysis,’’ J. Acoust. Soc. Am.90, 1841–1856.
Cooper, M., and Yanagihara, N.~1971!. ‘‘A study of the basal pitch levelvariations found in the normal speaking voices of males and femalesCommun. Disord.3, 261–266.
Di Paolo, M., and Faber, A.~1990!. ‘‘Phonation differences and the phonetcontent of the tense-lax contrast in Utah English,’’ Lang. Var. Change2,155–204.
Fairbanks, G.~1960!. Voice and Articulation Drillbook~Harper and Row,New York!.
Fant, G. ~1960!. Acoustic Theory of Speech Production~Mouton, TheHague!.
Fant, G., Liljencrants, J., and Lin, Q.~1985!. ‘‘A four-parameter model ofglottal flow,’’ Speech Transmission Laboratory—Quarterly ProgressStatus Report, Royal Institute of Technology, Stockholm 4, pp. 1–13.
Fellowes, J. M., Remez, R. E., and Rubin, P. E.~1997!. ‘‘Perceiving the sexand identity of a talker without natural vocal timbre,’’ Percept. Psychphys.59, 839–849.
Fisher, R. A.~1915!. ‘‘Frequency distribution of the values of the correlatiocoefficient in samples from an indefinitely large population,’’ Biometri10, 507–521.
Fitch, W. T. ~1997!. ‘‘Vocal tract length and formant frequency dispersiocorrelate with body size in rhesus macaques,’’ J. Acoust. Soc. Am.102,1213–1222.
Fitch, W. T. ~1999!. ‘‘Acoustic exaggeration of size in birds via tracheelongation: Comparative and theoretical analyses,’’ J. Zool.248, 31–48.
Fitch, W. T., and Reby, D.~2001!. ‘‘The descended larynx is not uniquelhuman,’’ Proc. R. Soc. London, Ser. B268, 1669–1675.
Gelfer, M. P.~1989!. ‘‘Stability in phonational frequency range,’’ J. Commun. Disord.22, 181–192.
Gobl, C., and Nı´ Chasaide, A.~1992!. ‘‘Acoustic characteristics of voicequality,’’ Speech Commun.11, 481–490.
Goldinger, S. D.~1996!. ‘‘Words and voices: Episodic traces in spoken woidentification and recognition memory,’’ J. Exp. Psychol. Learn. MeCogn.22, 1166–1183.
2200 J. Acoust. Soc. Am., Vol. 117, No. 4, Pt. 1, April 2005
d 30 Nov 2010 to 128.36.47.101. Redistribution subject to ASA license or
hill-
od-
a0ent
b-he
irolde.a
eheed
e
nt
J.
d
-
.
Hanson, H. M., and Chuang, E. S.~1999!. ‘‘Glottal characteristics of malespeakers: Acoustic correlates and comparison with female data,Acoust. Soc. Am.106, 1064–1077.
Heylen, L., Wuyts, F. L., Mertens, F., De Bodt, M., and Van de HeyningH. ~2002!. ‘‘Normative voice range profiles of male and female profesional voice users,’’ J. Voice16, 1–7.
Hollien, H. ~1960!. ‘‘Some laryngeal correlates of vocal pitch,’’ J. SpeecHear. Res.3, 52–58.
Hollien, H., Brown, W. S., and Hollien, K.~1971!. ‘‘Vocal fold length asso-ciated with modal, falsetto, and varying intensity phonation,’’ Folia Phniatr. 23, 66–78.
Ingemann, F.~1968!. ‘‘Identification of the speaker’s sex from voicelesfricatives,’’ J. Acoust. Soc. Am.44, 1142–1144.
Johnson, K., and Mullennix, J. W.~ed.!. ~1997!. Talker Variability in SpeechProcessing~Academic, San Diego, CA!.
Klatt, D. H., and Klatt, L. C.~1990!. ‘‘Analysis, synthesis, and perception ovoice quality variations among female and male talkers,’’ J. Acoust. SAm. 87, 820–857.
Kunzel, H. J.~1989!. ‘‘How well does average fundamental frequency corelate with speaker height and weight?,’’ Phonetica46, 117–125.
Ladefoged, P.~1971!. Elements of Acoustic Phonetics~University of Chi-cago Press, Chicago!.
Ladefoged, P., and Broadbent, D. E.~1957!. ‘‘Information conveyed byvowels,’’ J. Acoust. Soc. Am.29, 98–104.
Lass, N. J., and Brown, W. S.~1978!. ‘‘A correlational study of speakersheights, weights, body surface areas, and speaking fundamental freqcies,’’ J. Acoust. Soc. Am.63, 1218–1220.
Lass, N. J., Mertz, P. J., and Kimmel, K. L.~1978!. ‘‘Effect of temporalspeech alterations on speaker race and sex identifications,’’ Lang Sp21, 279–290.
Laver, J. ~1980!. The Phonetic Description of Voice Quality~CambridgeUniversity Press, Cambridge!.
Leather, J.~1983!. ‘‘Speaker normalization in perception of lexical tone,’’ JPhonetics11, 373–382.
Moore, C. B., and Jongman, A.~1997!. ‘‘Speaker normalization in the perception of Mandarin Chinese tones,’’ J. Acoust. Soc. Am.102, 1864–1877.
Nygaard, L. C., and Pisoni, D. B.~1998!. ‘‘Talker-specific learning in speechperception,’’ Percept. Psychophys.60, 355–376.
Palmeri, T. J., Goldinger, S. D., and Pisoni, D. B.~1993!. ‘‘Episodic encod-ing of voice attributes and recognition memory for spoken words,’’ J. EPsychol. Learn. Mem. Cogn.19, 309–328.
Peterson, G. E., and Barney, H. L.~1952!. ‘‘Control methods used in a studyof the vowels,’’ J. Acoust. Soc. Am.24, 175–184.
Reich, A. R., Frederickson, R. R., Mason, J. A., and Schlauch, R. S.~1990!.‘‘Methodological variables affecting phonational frequency rangeadults,’’ J. Spinal Disord.55, 124–131.
Remez, R. E., Fellowes, J. M., and Rubin, P. E.~1997!. ‘‘Talker identifica-tion based on phonetic information,’’ J. Exp. Psychol. Hum. Percept. Pform. 23, 651–666.
Rose, P.~1987!. ‘‘Considerations in the normalisation of the fundamenfrequency of linguistic tone,’’ Speech Commun.6, 343–351.
Schutte, H. K., and Seidner, W.~1983!. ‘‘Recommendation by the Union ofEuropean Phoniatricians~UEP!: Standardizing voice area measuremephonetography,’’ Folia Phoniatr.35, 286–288.
Sheffert, S. M., and Fowler, C. A.~1995!. ‘‘The effects of voice and visiblespeaker change on memory for spoken words,’’ J. Mem. Lang.34, 665–685.
Swerts, M., and Veldhuis, R.~2001!. ‘‘The effect of speech melody on voicequality,’’ Speech Commun.33, 297–303.
Titze, I. ~1995!. ‘‘Speaking vowels versus singing vowels,’’ J. Singing52,41–42.
van Bezooyen, R.~1984!. Characteristics and Recognizability of Vocal Expressions of Emotion~Foris Publications, Dordrecht!.
Whalen, D. H., and Sheffert, S. M.~1997!. ‘‘Normalization of vowels bybreath sounds,’’ inTalker Variability in Speech Processing, edited by K.Johnson and J. W. Mullennix~Academic Press, San Diego!, pp. 133–144.
Wong, P. C. M., and Diehl, R. L.~2003!. ‘‘Perceptual normalization forinter- and intratalker variation in Cantonese level tones,’’ J. Speech LaHear. Res.46, 413–421.
Zraick, R. I., Nelson, J. L., Montague, J. C., and Monoson, P. K.~2000!.‘‘The effect of task on determination of maximum phonational frequenrange,’’ J. Voice14, 154–160.
D. N. Honorof and D. H. Whalen: F0 within speaker range
copyright; see http://asadl.org/journals/doc/ASALIB-home/info/terms.jsp