Perceived Neighborhood Environment and Walking for Specific Purposes Among Elderly Japanese
10
Original Article Perceived Neighborhood Environment and Walking for Specific Purposes Among Elderly Japanese Shigeru Inoue 1 , Yumiko Ohya 1 , Yuko Odagiri 1 , Tomoko Takamiya 1 , Masamitsu Kamada 2 , Shinpei Okada 3 , Kohichiro Oka 4 , Yoshinori Kitabatake 5 , Tomoki Nakaya 6 , James F Sallis 7 , and Teruichi Shimomitsu 1 1 Department of Preventive Medicine and Public Health, Tokyo Medical University, Tokyo, Japan 2 Physical Education and Medicine Research Center Unnan, Unnan, Japan 3 Physical Education and Medicine Research Foundation, Tomi, Japan 4 Faculty of Sport Sciences, Waseda University, Tokorozawa, Japan 5 Meiji Yasuda Life Foundation of Health and Welfare, Hachio-ji, Japan 6 Department of Geography, College of Letters, Ritsumeikan University, Kyoto, Japan 7 Department of Psychology, San Diego State University, USA Received April 22, 2011; accepted July 12, 2011; released online October 15, 2011 ABSTRACT Background: Recent research has revealed the importance of neighborhood environment as a determinant of physical activity. However, evidence among elderly adults is limited. This study examined the association between perceived neighborhood environment and walking for specific purposes among Japanese elderly adults. Methods: This population-based, cross-sectional study enrolled 1921 participants (age: 65–74 years, men: 51.9%). Neighborhood environment (International Physical Activity Questionnaire Environmental Module) and walking for specific purposes (ie, transportation or recreation) were assessed by self-report. Multilevel logistic regression analyses with individuals at level 1 and neighborhoods at level 2 were conducted to examine the association between environment and walking, after adjustment for potential confounders. Results: Access to exercise facilities, social environment, and aesthetics were associated with total neighborhood walking. Odds ratios (95% CI) were 1.23 (1.00–1.51), 1.39 (1.14–1.71), and 1.48 (1.21–1.81), respectively. Regarding walking for specific purposes, social environment and aesthetics were consistent correlates of both transportation walking and recreational walking. Environmental correlates differed by specific types of walking and by sex. Transportation walking significantly correlated with a greater variety of environmental attributes. Sex differences were observed, especially for transportation walking. Bicycle lanes, crime safety, traffic safety, aesthetics, and household motor vehicles were significant correlates among men, while access to shops, access to exercise facilities, and social environment were important among women. Conclusions: Specific environment–walking associations differed by walking purpose and sex among elderly adults. Social environment and aesthetics were consistent correlates of both transportation walking and recreational walking. Improving these environmental features might be effective in promoting physical activity among elderly Japanese. Key words: physical activity; transportation; recreation; policy INTRODUCTION The health benefits of physical activity have been well documented in previous studies. A physically active lifestyle reduces the risk of all-cause mortality, cardiovascular diseases, diabetes, and some cancers. 1–4 In addition, it plays an im- portant role in maintaining functional ability and indepe- ndence among elderly adults. 5–8 However, a large proportion of the population in developed countries remains physically inactive. 9 In Japan, during the years 1999–2009, mean daily steps decreased from 7962 to 7214 among men and from 7226 to 6352 among women. The trend is similar among elderly Japanese. 10,11 To establish effective intervention strategies, evidence of physical activity correlates is needed. Various sociodemo- graphic and psychological factors have been recognized as Address for correspondence. Shigeru Inoue, Department of Preventive Medicine and Public Health, Tokyo Medical University, 6-1-1 Shinjuku, Shinjuku-ku, Tokyo 160-8402, Japan (e-mail: [email protected]). Copyright © 2011 by the Japan Epidemiological Association J Epidemiol 2011;21(6):481-490 doi:10.2188/jea.JE20110044 481
Transcript of Perceived Neighborhood Environment and Walking for Specific Purposes Among Elderly Japanese
Original Article
Perceived Neighborhood Environment and Walkingfor Specific Purposes Among Elderly JapaneseShigeru Inoue1, Yumiko Ohya1, Yuko Odagiri1, Tomoko Takamiya1, Masamitsu Kamada2,Shinpei Okada3, Kohichiro Oka4, Yoshinori Kitabatake5, Tomoki Nakaya6,James F Sallis7, and Teruichi Shimomitsu1
1Department of Preventive Medicine and Public Health, Tokyo Medical University, Tokyo, Japan2Physical Education and Medicine Research Center Unnan, Unnan, Japan3Physical Education and Medicine Research Foundation, Tomi, Japan4Faculty of Sport Sciences, Waseda University, Tokorozawa, Japan5Meiji Yasuda Life Foundation of Health and Welfare, Hachio-ji, Japan6Department of Geography, College of Letters, Ritsumeikan University, Kyoto, Japan7Department of Psychology, San Diego State University, USA
Received April 22, 2011; accepted July 12, 2011; released online October 15, 2011
ABSTRACT
Background: Recent research has revealed the importance of neighborhood environment as a determinant ofphysical activity. However, evidence among elderly adults is limited. This study examined the association betweenperceived neighborhood environment and walking for specific purposes among Japanese elderly adults.Methods: This population-based, cross-sectional study enrolled 1921 participants (age: 65–74 years, men: 51.9%).Neighborhood environment (International Physical Activity Questionnaire Environmental Module) and walking forspecific purposes (ie, transportation or recreation) were assessed by self-report. Multilevel logistic regression analyseswith individuals at level 1 and neighborhoods at level 2 were conducted to examine the association betweenenvironment and walking, after adjustment for potential confounders.Results: Access to exercise facilities, social environment, and aesthetics were associated with total neighborhoodwalking. Odds ratios (95% CI) were 1.23 (1.00–1.51), 1.39 (1.14–1.71), and 1.48 (1.21–1.81), respectively.Regarding walking for specific purposes, social environment and aesthetics were consistent correlates of bothtransportation walking and recreational walking. Environmental correlates differed by specific types of walking andby sex. Transportation walking significantly correlated with a greater variety of environmental attributes. Sexdifferences were observed, especially for transportation walking. Bicycle lanes, crime safety, traffic safety, aesthetics,and household motor vehicles were significant correlates among men, while access to shops, access to exercisefacilities, and social environment were important among women.Conclusions: Specific environment–walking associations differed by walking purpose and sex among elderlyadults. Social environment and aesthetics were consistent correlates of both transportation walking and recreationalwalking. Improving these environmental features might be effective in promoting physical activity among elderlyJapanese.
Key words: physical activity; transportation; recreation; policy
INTRODUCTION
The health benefits of physical activity have been welldocumented in previous studies. A physically active lifestylereduces the risk of all-cause mortality, cardiovascular diseases,diabetes, and some cancers.1–4 In addition, it plays an im-portant role in maintaining functional ability and indepe-ndence among elderly adults.5–8 However, a large proportion
of the population in developed countries remains physicallyinactive.9 In Japan, during the years 1999–2009, mean dailysteps decreased from 7962 to 7214 among men and from 7226to 6352 among women. The trend is similar among elderlyJapanese.10,11
To establish effective intervention strategies, evidence ofphysical activity correlates is needed. Various sociodemo-graphic and psychological factors have been recognized as
Address for correspondence. Shigeru Inoue, Department of Preventive Medicine and Public Health, Tokyo Medical University, 6-1-1 Shinjuku, Shinjuku-ku,Tokyo 160-8402, Japan (e-mail: [email protected]).Copyright © 2011 by the Japan Epidemiological Association
J Epidemiol 2011;21(6):481-490doi:10.2188/jea.JE20110044
481

determinants of physical activity.12 In addition, recent studieshave identified neighborhood environmental characteristicsthat are consistently related to physical activity,13–19 includingresidential density, access to destinations, sidewalks,aesthetics, and access to exercise facilities. Interventionsregarding these factors are expected to have a substantiallong-term impact on population physical activity levels,which could complement the usually short-term effects ofindividually targeted interventions.
Studies have revealed that the relationships betweenenvironmental factors and physical activity differ withregard to the purpose of physical activity (eg, transportationvs recreational walking), population group (eg, men vswomen), and cultural setting (eg, Western vs Eastern).15,20
Age has been shown to be an important modifier ofenvironment–physical activity relationships.21 Elderly adultsoften have different roles in society (eg, retired from work,fewer childcare obligations), different physical activitypatterns, and lower fitness levels as compared with young ormiddle-aged adults. These differences may modify physicalactivity–environment relationships. Thus, investigation of therelation of physical activity to neighborhood environmentamong elderly adults is important and of great interest.However, data on elderly adults are not sufficient.21–23
Furthermore, to our knowledge, there has been no publishedstudy of these relations among elderly Japanese.
In this study, the associations between various perceivedneighborhood environmental attributes and walking forspecific purposes were examined in a cross-sectional studyusing randomly selected community samples of elderlyJapanese.
METHODS
Participants and data collectionThis cross-sectional study was conducted from February
through March 2010. A total of 2700 residents aged 65 to 74years and living in 3 cities in Japan (Bunkyo ward in Tokyo,Fuchu in Tokyo, and Oyama in Shizuoka prefecture) wererandomly selected from registries of residential addressesand stratified by sex, age (65–69, 70–74 years), city, andneighborhood. In this study, neighborhood was defined ascho-cho, the smallest administrative unit for area in Japan.There were 68 cho-cho in Bunkyo, 146 in Fuchu, and 45 inOyama. First, 15 neighborhoods were randomly selected fromeach city, and 60 subjects from each neighborhood wererandomly selected and stratified by sex and age. As a result,45 neighborhoods (15 neighborhoods from each city) wereselected, and the sample of 2700 older adults included 1350residents of each sex, 1350 residents of each age category,and 900 subjects from each city. To encompass a large varietyof environmental characteristics and walking behaviors,we designed the study to include neighborhoods in urban,suburban, and rural areas. The locations, areas, populationsizes, and population densities of each city are shown inthe Figure. Bunkyo is in central Tokyo (area: 11.3 km2,population: 191 463). Fuchu is a suburban city located about20 km west of the center of Tokyo (area: 29.3 km2, population:244 834). It is in the Tokyo Metropolitan Area and withincommuting distance from central Tokyo. Oyama is a smallrural city located about 80 km west of Tokyo (area: 136.1 km2,population: 20 783).For data collection, questionnaires were sent to and
collected from participants via post. To obtain a betterresponse rate, invitation letters that described the content ofthe study were sent to all 2700 subjects 2 weeks before thesurvey. As an incentive for participation, a 500-yen (about 6US dollars in 2011) book voucher was offered. During thesurvey, a call center was set up to respond to survey inquiriesfrom the subjects. Additional requests to complete the surveywere mailed twice to nonrespondents. If the survey wasincomplete, we asked the participant to redo the survey. As a
BunkyoA: 11.3 km2
P: 191,463D: 16,943/km2
FuchuA: 29.3 km2
P: 244,834D: 8356/km2
OyamaA: 136.1 km2
P: 20,783D: 152/km2
Abbreviations: A, area; P, population; D, population density
Figure. Location and characteristics of the 3 studied cities
Neighborhood Environment and Walking Among Elderly Adults482
J Epidemiol 2011;21(6):481-490
result, of the 2700 subjects, 2046 responded to the survey.After data cleaning, 1966 subjects had valid data, which wereincluded in the present analyses (response rate: 72.8%). Dueto disabilities that prevented walking, the 45 participants whoanswered, “could not do physical activities,” to the question,“During the past 4 weeks, how much did physical healthproblems limit your usual physical activities (such as walkingor climbing stairs)?,” were excluded from this study. Thisquestion was an item from the 8-item Short-Form HealthSurvey (SF8).24 Ultimately, data from 1921 residents wereincluded in the analyses. Participants signed an informedconsent document before answering the questionnaire.This study received prior approval from the Tokyo MedicalUniversity Ethics Committee.
Assessment of perceived neighborhood environ-mentTo measure perceived neighborhood environmental char-acteristics, the International Physical Activity QuestionnaireEnvironmental Module (IPAQ-E) was used.25–27 The surveyhas demonstrated test-retest reliability25 and concurrentvalidity,25,27 and several items were related to physicalactivity in an 11-country study.26 Questions regardingneighborhood environment attributes were taken or adaptedfrom previous measures developed in the United States.28,29
The IPAQ-E consists of 17 questions: 7 core items, 4recommended items, and 6 optional items. In this study, weused core and recommended items that assess residentialdensity, access to shops, public transport, sidewalks, bicyclelanes, access to exercise facilities, crime safety, traffic safety,social environment (seeing people being active), aesthetics(the aesthetic and pleasing qualities of a neighborhood forwalking), and ownership of household motor vehicles. Thesequestions refer to a neighborhood environment where theperson could walk within 10 to 15 minutes from theirresidence. Nine of 11 items (residential density and householdmotor vehicles excluded) are statements that describeneighborhood features believed to be related to physicalactivity, followed by 4 response choices: strongly disagree,somewhat disagree, somewhat agree, and strongly agree. Forexample, the statement regarding sidewalks is, “There aresidewalks on most of the streets in my neighborhood.”The residential density item asks about the main typesof houses in neighborhoods (eg, detached single-familyresidences, multifamily condos, apartments). The questionon motor vehicles concerns the number of motor vehiclesin the participant’s household. The translation process,description of each item, and reliability of this scale werereported in a previous study.25
Assessment of neighborhood walkingParticipants were asked about their frequency of walking(days/week) and average walking duration each day (min/day)for 5 specific purposes: transportation walking for daily
activity, recreational walking, walking for commuting towork, walking during work, and walking for other purposes.A walking questionnaire, whose validity was previouslyreported,30 was modified for this study. The formerquestionnaire included 6 types of walking, includingwalking for commuting to school. However, in this studypopulation, few persons were likely to commute to school.Thus, the question on commuting to school was deleted andthis type of walking was included in walking for otherpurposes. The questionnaire instructed participants to reportcontinuous walking done for 5 or more minutes. Walking time(min/week) was calculated as the product of frequency andduration. In this study, we followed the same analytic methodsof a previous study30 and focused on types of walking that areexpected to occur in the participant’s neighborhood. These are(1) transportation walking for daily activity (min/week), (2)recreational walking (min/week), and (3) total neighborhoodwalking (sum of the time of 3 types of walking: transportationwalking for daily activity, recreational walking, and walkingfor commuting to work, min/week). Although walking forcommuting to work is also expected to occur, at least in part,in the neighborhood, we excluded this type of walking fromthe specific analyses because the present sample included only331 participants (17.2%) who worked regularly.
Sociodemographic and other variablesSex, age, and city of residence were obtained from the registryof residential addresses of each city. Educational attainment(years of education), employment status (working hours),living with family or other cohabitants, and self-rated healthwere obtained from self-reports. Body mass index (BMI) wascalculated from self-reported height and weight. Self-ratedhealth was measured with a single item from SF-8 that askedparticipants to rate their health. Participants chose the mostsuitable response from a 6-point scale: excellent, very good,good, fair, poor and very poor, to the question, “Overall, howwould you rate your health during the past 4 weeks?”.24
Statistical analysesTo examine the association between neighborhood envi-ronment as the independent variable and walking as thedependent variable, odds ratios (ORs) and 95% CIs for activewalkers were calculated using multilevel logistic regressionmodels with individuals at level 1 and neighborhood atlevel 2. In other words, we used a generalized linear mixedmodel with each environmental variable and control covariateas fixed effects, with a random intercept term at theneighborhood level. City of residence was included in themodel as a dummy variable. This approach was chosento account for the nested data structure. For the analyses,responses to 11 environmental variables were converted intodichotomous variables by means of a method used in previousstudies.25,26,31 For residential density, the choice of “detachedsingle-family residences” formed a category indicating low
Inoue S, et al. 483
J Epidemiol 2011;21(6):481-490

residential density, while others were included in anothercategory, indicating high residential density. As for thenumber of household motor vehicles, responses werecategorized as none and 1 or more. For the other 9environmental variables, responses were classified into 2categories: agreement (strongly agree and somewhat agree)and disagreement (somewhat disagree and strongly disagree).For walking variables, participants were classified into 2groups. First, we analyzed relationships between totalneighborhood walking and environmental variables.Participants were classified as an active neighborhoodwalker if they walked 150 minutes/week or more, consistentwith current physical activity guidelines.5 Then, 2 specifictypes of walking—transportation walking for daily activityand recreational walking—were analyzed. For these variables,participants were divided into 2 groups by using the median:less than 60 minutes or 60 minutes or more per week fortransportation walking for daily activity and less than 30 or 30minutes or more per week for recreational walking. Tocalculate ORs, the references were set as environmentalfactors expected to be associated with lower levels of walking(low for residential density, owning household motor vehicles,and poor for the other 9 variables), meaning that an ORgreater than 1.00 indicates an expected association between anactivity-supportive environmental characteristic and activewalking. ORs were adjusted by age, sex, employment status(working for 35+ hours per week vs less, including no work),educational level (13+ years vs <13 years), BMI (25+ kg/m2
vs <25 kg/m2), and self-rated health (good: excellent, verygood, good vs fair or poor: fair, poor, very poor). A P valueless than 0.05 was considered to indicate statisticalsignificance. Analyses were conducted with IBM SPSSStatistics version 19 (SPSS Inc., Tokyo, Japan), fordescriptive analyses, and lme4 (ver. 0.999375-39), a mixedmodeling package for R (ver. 2.12.1), which is a free softwareenvironment for statistical computing for multilevel analyses.
RESULTS
Table 1 shows the characteristics of the participants. Menaccounted for 50.9% of this sample. The mean age (SD) was69.5 (2.9) years. The city of residence was Bunkyo for 31.4%of participants, Fuchu for 34.3%, and Oyama for 34.3%.Overall, 17.2% of participants worked 35 hours/week orlonger, and 10.6% were living alone. As for walking time,the median time (25th percentile, 75th percentile) was 165(45, 350) minutes/week for total neighborhood walking, 60(0, 140) minutes/week for transportation walking for dailyactivity, and 30 (0, 180) minutes/week for recreationalwalking.
Table 2 shows the results of analyses of total neighborhoodwalking. Access to exercise facilities (OR 1.23, 95% CI1.00–1.51), social environment (1.39, 1.14–1.71), andaesthetics (1.48, 1.21–1.81) were significantly associated
with total neighborhood walking. Aesthetics was a con-sistent correlate of total walking among men and women.Social environment was related to total walking only amongmen, and access to shops was significant only among women.Results of analyses of the 2 specific purposes of
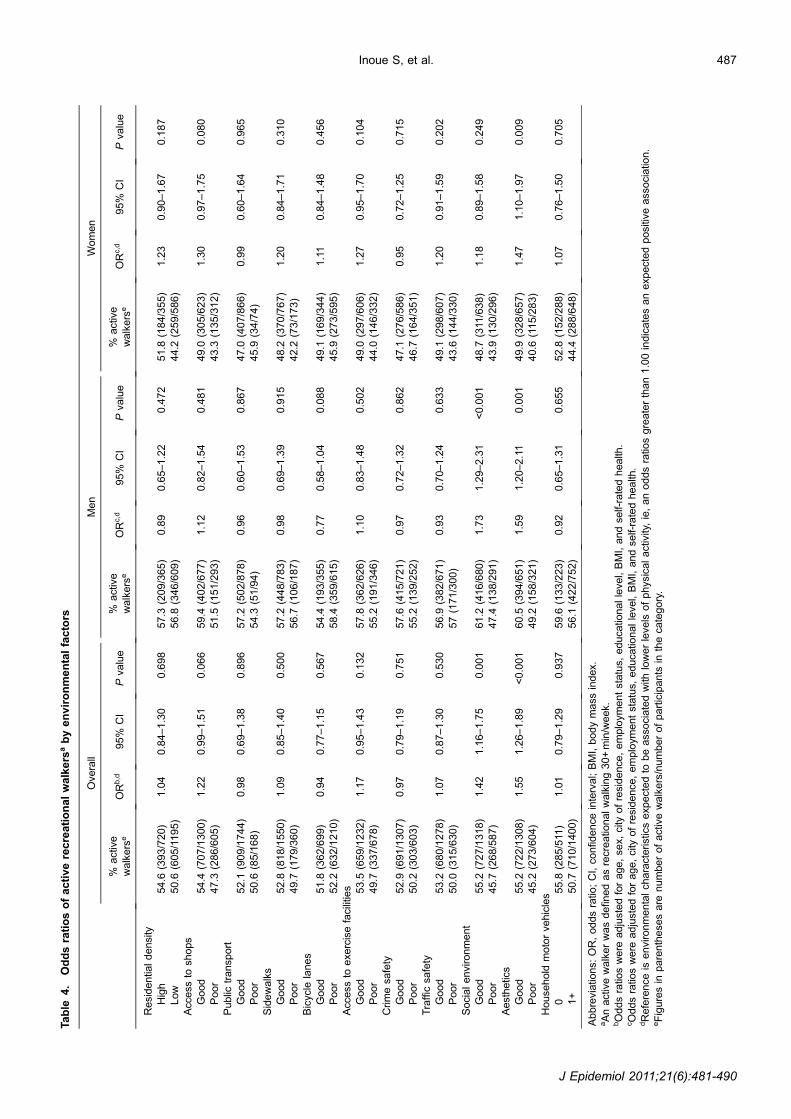
walking are shown in Tables 3 and 4. Among the overallsample, 2 environmental attributes—social environment andaesthetics—were consistent correlates of these 2 types ofwalking. In addition, bicycle lanes, access to exercisefacilities, and household motor vehicles were significantlyassociated with transportation walking. Sex differences wereobserved, especially in the analyses of transportation walking.
Table 1. Characteristics of participants
Overalln = 1921
Menn = 977
Womenn = 944
n % n % n %
Age, years65–69 956 49.8 488 49.9 468 49.670–74 965 50.2 489 50.1 476 50.4mean ± SD 69.5 ± 2.9 69.5 ± 3.0 69.6 ± 2.9
City of residenceBunkyo 604 31.4 311 31.8 293 31.0Fuchu 658 34.3 335 34.3 323 34.2Oyama 659 34.3 331 33.9 328 34.7
Education, years<13 1254 65.3 565 57.8 689 73.013+ 667 34.7 412 42.2 255 27.0
Employment status35+hours/week 331 17.2 248 25.4 83 8.8no workor <35hours/week
1590 82.8 729 74.6 861 91.2
Living with family or other cohabitantsYes 1718 89.4 888 90.9 830 87.9No 203 10.6 89 9.1 114 12.1
BMI, kg/m2
<25 1526 79.4 751 76.9 775 82.125+ 395 20.6 226 23.1 169 17.9Mean ± SD 22.8 ± 3.0 23.2 ± 2.7 22.3 ± 3.3
Self-rated healthExcellent 57 3.0 31 3.2 26 2.8Very good 432 22.5 231 23.6 201 21.3Good 1092 56.8 559 57.2 533 56.5Fair 265 13.8 120 12.3 145 15.4Poor 59 3.1 26 2.7 33 3.5Very poor 16 0.8 10 1.0 6 0.6
Total neighborhood walking, min/week<150 874 45.8 442 45.5 432 46.1150+ 1035 54.2 530 54.5 505 53.9Median(25%tile, 75%tile)
165 (45, 350) 178 (45, 370) 160 (47, 320)
Transportation walking for daily activity, min/week<60 945 49.4 560 57.5 385 41.060+ 967 50.6 414 42.5 553 59.0Median(25%tile, 75%tile)
60 (0, 140) 30 (0, 120) 80 (0, 160)
Recreation walking, min/week<30 921 48.0 421 43.1 500 53.030+ 999 52.0 555 56.9 444 47.0Median(25%tile, 75%tile)
30 (0, 180) 60 (0, 200) 5 (0, 120)
Abbreviation: BMI, body mass index.
Neighborhood Environment and Walking Among Elderly Adults484
J Epidemiol 2011;21(6):481-490

Table
2.
Oddsratiosofactiveneighborhoodwalkers
abyenvironmentalfactors
Ove
rall
Men
Women
%active
walkerse
OR
b,d
95%
CI
Pva
lue
%active
walkers
eOR
c,d
95%
CI
Pva
lue
%active
walkerse
OR
c,d
95%
CI
Pva
lue
Residentia
ldensity
High
59.7
(427/715
)1.01
0.81–
1.25
0.937
57.9(210/363)
0.93
0.69–1.26
0.650
61.6
(217/352)
1.09
0.80–
1.49
0.578
Low
51.0
(606/1189)
52.7(320/607)
49.1
(286/582)
Access
tosh
ops
Good
57.8
(747/129
2)
1.23
0.99–
1.52
0.061
57.1(385/674)
1.02
0.75–1.39
0.913
58.6
(362/618)
1.44
1.07–
1.94
0.017
Poor
46.7
(281/602
)48.6(142/292)
44.8
(139/310)
Public
transp
ort
Good
55.0
(955/173
5)
0.99
0.71–
1.40
0.976
55.1(482/875)
0.94
0.59–1.49
0.799
55.0
(473/860)
1.08
0.65–
1.80
0.776
Poor
46.4
(77/166)
48.4(45/93)
43.8
(32/73)
Sidewalks
Good
56.4
(868/154
0)
1.26
0.98–
1.61
0.067
56.2(438/779)
1.22
0.87–1.72
0.255
56.5
(430/761)
1.30
0.91–
1.85
0.152
Poor
45.4
(163/359
)47.6(89/187)
43.0
(74/172)
Bicycle
lanes
Good
58.1
(403/694
)1.08
0.88–
1.32
0.480
56.7(200/353)
0.98
0.74–1.31
0.904
59.5
(203/341)
1.18
0.88–
1.57
0.271
Poor
52.2
(628/120
4)
53.3(327/613)
50.9
(301/591)
Access
toexe
rcisefacilities
Good
57.2
(700/122
4)
1.23
1.00–
1.51
0.047
56.9(354/622)
1.19
0.90–1.59
0.221
57.5
(346/602)
1.31
0.98–
1.76
0.072
Poor
49.2
(332/675
)50.3(174/346)
48.0
(158/329)
Crim
esa
fety
Good
55.1
(717/130
2)
0.96
0.79–
1.18
0.715
54.0(388/719)
0.78
0.57–1.05
0.106
56.4
(329/583)
1.16
0.87–
1.53
0.308
Poor
52.8
(315/597
)56.4(141/250)
50.1
(174/347)
Trafficsa
fety
Good
56.1
(715/127
5)
1.15
0.94–
1.40
0.168
55.5(372/670)
1.08
0.81–1.43
0.606
56.7
(343/605)
1.24
0.94–
1.65
0.130
Poor
51.1
(318/622
)52.5(156/297)
49.8
(162/325)
Sociale
nvironment
Good
57.4
(752/130
9)
1.39
1.14–
1.71
0.001
58.3(395/677)
1.57
1.18–2.09
0.002
56.5
(357/632)
1.24
0.93–
1.66
0.145
Poor
47.7
(279/585
)46.2(134/290)
49.2
(145/295)
Aesthe
tics
Good
57.2
(743/129
9)
1.48
1.21–
1.81
<0.001
58.1(376/647)
1.56
1.18–2.07
0.002
56.3
(367/652)
1.38
1.03–
1.85
0.030
Poor
48.2
(290/602
)47.7(153/321)
48.8
(137/281)
House
holdmotorve
hicles
064.0
(326/509
)1.21
0.95–
1.55
0.126
63.1(140/222)
1.19
0.84–1.69
0.324
64.8
(186/287)
1.18
0.83–
1.66
0.361
1+
50.8
(706/139
1)
52.1(390/749)
49.2
(316/642)
Abbreviatio
ns:OR,oddsratio
;CI,co
nfidence
interval;BMI,bodymass
index
.a A
nactiveneighborhoodwalker
wasdefi
nedastotaln
eighb
orhoodwalkingof150+min/week.
b Oddsratio
swere
adjustedforage,se
x,city
ofresidence
,employm
entstatus,
educa
tionalleve
l,BMI,andse
lf-ratedhea
lth.
c Oddsratio
swere
adjusted
forage,city
ofresidence
,employm
ent
status,
educa
tional
leve
l,BMI,andse
lf-ratedhealth
.d R
eference
isenvironmentalc
haracteristicsexp
ectedto
beassociatedwith
alowerleve
lofphys
ical
activity,ie,anodd
sratio
greaterthan1.00indicatesanexp
ectedpos
itive
ass
ociatio
n.
e Figuresin
parenthese
sare
numbe
rofactivewalkers/number
ofparticipants
intheca
tegory.
Inoue S, et al. 485
J Epidemiol 2011;21(6):481-490

Table
3.
Oddsratiosofactivetransportationwalkers
abyenvironmentalfactors
Ove
rall
Men
Women
%active
walkers
eOR
b,d
95%
CI
Pva
lue
%active
walkers
eOR
c,d
95%
CI
Pva
lue
%active
walkers
eOR
c,d
95%
CI
Pva
lue
Reside
ntia
ldensity
High
56.8
(407/717)
1.03
0.83–1.28
0.815
48.1(175/364)
1.17
0.87–1.58
0.299
65.7(232/353)
0.87
0.62–1.20
0.395
Low
47.0
(559/11
90)
39.3(239/608)
55.0(320/582)
Access
tosh
ops
Good
54.1
(701/1295)
1.22
0.98–1.51
0.076
44.1(298/676)
0.95
0.69–1.30
0.747
65.1(403/619)
1.57
1.16–2.13
0.004
Poor
43.5
(262/602)
39.0(114/292)
47.7(148/310)
Public
transp
ort
Good
51.6
(896/1738)
1.03
0.73–1.46
0.856
42.9(376/877)
0.98
0.61–1.57
0.933
60.4(520/861)
1.15
0.67–1.96
0.607
Poor
41.0
(68/166)
38.7(36/93)
43.8(32/73)
Sidewalks
Good
52.6
(811
/1543
)1.19
0.92–1.53
0.180
43.8(342/781)
1.20
0.84–1.70
0.317
61.5(469/762)
1.20
0.83–1.73
0.333
Poor
42.3
(152/359)
37.4(70/187)
47.7(82/172)
Bicycle
lanes
Good
56.8
(395/695)
1.26
1.03–1.54
0.026
49.2(174/354)
1.41
1.06–1.87
0.019
64.8(221/341)
1.14
0.85–1.54
0.385
Poor
47.2
(569/1206)
38.8(238/614)
55.9(331/592)
Access
toexe
rcisefacilities
Good
53.7
(658/1225)
1.26
1.03–1.55
0.027
44.3(276/623)
1.16
0.87–1.54
0.319
63.5(382/602)
1.39
1.03–1.88
0.033
Poor
45.1
(305/677)
39.5(137/347)
50.9(168/330)
Crim
esa
fety
Good
49.9
(650/1302)
0.88
0.72–1.09
0.240
41.0(295/719)
0.69
0.51–0.94
0.017
60.9(355/583)
1.07
0.80–1.42
0.665
Poor
52.3
(314/600)
47.2(119/252)
56.0(195/348)
Trafficsa
fety
Good
50.0
(637/1275)
0.90
0.74–1.10
0.321
40.1(269/670)
0.71
0.53–0.94
0.017
60.8(368/605)
1.15
0.86–1.54
0.353
Poor
52.3
(327/625)
48.2(144/299)
56.1(183/326)
Sociale
nvironment
Good
53.0
(695/1311
)1.31
1.06–1.61
0.011
44.1(299/678)
1.20
0.90–1.60
0.223
62.6(396/633)
1.42
1.06–1.92
0.021
Poor
45.7
(268/586)
39.5(115/291)
51.9(153/295)
Aesthe
tics
Good
52.7
(685/1301)
1.31
1.07–1.61
0.009
44.8(290/648)
1.33
1.00–1.76
0.047
60.5(395/653)
1.28
0.95–1.74
0.107
Poor
46.4
(280/603)
38.5(124/322)
55.5(156/281)
Hous
ehold
motorve
hicles
064.7
(330/510)
1.43
1.12–1.83
0.004
55.4(123/222)
1.54
1.10–2.17
0.012
71.9(207/288)
1.32
0.92–1.92
0.135
1+
45.4
(633/1393)
38.7(291/751)
53.3(342/642)
Abbreviatio
ns:OR,oddsratio
;CI,co
nfidence
interval;BMI,bodymass
index
.a A
nactivetransp
ortatio
nwalker
wasdefi
ned
astransp
ortatio
nwalkingforadaily
activity
of60+
min/week.
b Oddsratio
swere
adjustedforage,se
x,city
ofresidence
,employm
entstatus,
educa
tionalleve
l,BMI,andse
lf-ratedhea
lth.
c Oddsratio
swere
adjusted
forage,city
ofresidence
,employm
ent
status,
educa
tional
leve
l,BMI,andse
lf-ratedhealth
.d R
eference
isenvironmentalc
haracteristicsexp
ectedto
beassociatedwith
lower
leve
lsofphys
icala
ctivity,ie,anoddsratio
sgreaterthan1.00indicatesanexp
ectedpos
itive
ass
ociatio
n.
e Figuresin
parenthese
sare
numbe
rofactivewalkers/number
ofparticipants
intheca
tegory.
Neighborhood Environment and Walking Among Elderly Adults486
J Epidemiol 2011;21(6):481-490
Table
4.
Oddsratiosofactiverecreationalwalkers
abyenvironmentalfactors
Ove
rall
Men
Women
%active
walkers
eOR
b,d
95%
CI
Pva
lue
%active
walkers
eOR
c,d
95%
CI
Pva
lue
%active
walkers
eOR
c,d
95%
CI
Pva
lue
Residentia
ldensity
High
54.6
(393/720)
1.04
0.84–
1.30
0.698
57.3
(209/365
)0.89
0.65–
1.22
0.472
51.8(184/355)
1.23
0.90–1.67
0.187
Low
50.6
(605/1195)
56.8
(346/609
)44.2(259/586)
Access
tosh
ops
Good
54.4
(707/1300
)1.22
0.99–
1.51
0.066
59.4
(402/677
)1.12
0.82–
1.54
0.481
49.0(305/623)
1.30
0.97–1.75
0.080
Poor
47.3
(286/605)
51.5
(151/293
)43.3(135/312)
Pub
lictransp
ort
Good
52.1
(909/1744
)0.98
0.69–
1.38
0.896
57.2
(502/878
)0.96
0.60–
1.53
0.867
47.0(407/866)
0.99
0.60–1.64
0.965
Poor
50.6
(85/168)
54.3
(51/94)
45.9(34/74)
Sidewalks
Good
52.8
(818/1550
)1.09
0.85–
1.40
0.500
57.2
(448/783
)0.98
0.69–
1.39
0.915
48.2(370/767)
1.20
0.84–1.71
0.310
Poor
49.7
(179/360)
56.7
(106/187
)42.2(73/173)
Bicycle
lanes
Good
51.8
(362/699)
0.94
0.77–
1.15
0.567
54.4
(193/355
)0.77
0.58–
1.04
0.088
49.1(169/344)
1.11
0.84–1.48
0.456
Poor
52.2
(632/1210
)58.4
(359/615
)45.9(273/595)
Access
toexe
rcisefacilities
Good
53.5
(659/1232
)1.17
0.95–
1.43
0.132
57.8
(362/626
)1.10
0.83–
1.48
0.502
49.0(297/606)
1.27
0.95–1.70
0.104
Poor
49.7
(337/678)
55.2
(191/346
)44.0(146/332)
Crim
esa
fety
Good
52.9
(691/1307
)0.97
0.79–
1.19
0.751
57.6
(415/721
)0.97
0.72–
1.32
0.862
47.1(276/586)
0.95
0.72–1.25
0.715
Poor
50.2
(303/603)
55.2
(139/252
)46.7(164/351)
Trafficsa
fety
Good
53.2
(680/1278
)1.07
0.87–
1.30
0.530
56.9
(382/671
)0.93
0.70–
1.24
0.633
49.1(298/607)
1.20
0.91–1.59
0.202
Poor
50.0
(315/630)
57(171/300)
43.6(144/330)
Soc
iale
nvironment
Good
55.2
(727/1318
)1.42
1.16–
1.75
0.001
61.2
(416/680
)1.73
1.29–
2.31
<0.001
48.7(311
/638)
1.18
0.89–1.58
0.249
Poor
45.7
(268/587)
47.4
(138/291
)43.9(130/296)
Aes
thetics
Good
55.2
(722/1308
)1.55
1.26–
1.89
<0.001
60.5
(394/651
)1.59
1.20–
2.11
0.001
49.9(328/657)
1.47
1.10–1.97
0.009
Poor
45.2
(273/604)
49.2
(158/321
)40.6(115/283)
House
holdmotorve
hicles
055.8
(285/511
)1.01
0.79–
1.29
0.937
59.6
(133/223
)0.92
0.65–
1.31
0.655
52.8(152/288)
1.07
0.76–1.50
0.705
1+
50.7
(710/1400
)56.1
(422/752
)44.4(288/648)
Abbreviatio
ns:OR,oddsratio
;CI,co
nfidence
interval;BMI,bodymass
index
.a A
nactivewalkerwasdefi
nedasrecreatio
nalw
alking30+min/week
.b O
ddsratio
swere
adjustedforage,se
x,city
ofresidence
,employm
entstatus,
educa
tionalleve
l,BMI,andse
lf-ratedhea
lth.
c Oddsratio
swere
adjusted
forage,city
ofresidence
,employm
ent
status,
educa
tional
leve
l,BMI,andse
lf-ratedhealth
.d R
eference
isenvironmentalc
haracteristicsexp
ectedto
beassociatedwith
lower
leve
lsofphys
icala
ctivity,ie,anoddsratio
sgreaterthan1.00indicatesanexp
ectedpos
itive
ass
ociatio
n.
e Figuresin
parenthese
sare
numbe
rofactivewalkers/number
ofparticipants
intheca
tegory.
Inoue S, et al. 487
J Epidemiol 2011;21(6):481-490

Among men, significant correlates of this type of walkingwere bicycle lanes, crime safety, traffic safety, aesthetics, andhousehold motor vehicles. Among women, access to shops,access to exercise facilities, and social environment wererelated to this type of walking. The ORs for the majority ofsignificant relationships were greater than 1.00, ie, in theexpected direction of correlations, except crime safety andtraffic safety in the analyses of transportation walking amongmen. Most variance estimates of error terms at level 2 wereclose to 0, so estimated coefficients of fixed effects werealmost identical to those in conventional single-level logisticregression.
DISCUSSION
This cross-sectional study revealed that neighborhoodenvironmental characteristics were associated with walking,and that these associations varied by purpose, among elderlyJapanese. Social environment (viewing people being active)and aesthetics were consistently associated with transportationwalking and recreational walking. In addition, among theoverall sample, transportation walking was related to 3 otherenvironmental characteristics: bike lanes, access to exercisefacilities, and household motor vehicles.
A position statement by the Heart Foundation’s NationalPhysical Activity Advisory Committee in Australiasummarized recent studies of neighborhood environmentalcharacteristics and walking in adults.32 The statementhighlighted 4 characteristics that were consistent correlatesof transportation walking—population density, proximity ofdestinations (including shops and public transport), mixedland-use planning, and street connectivity (the “walkabilityindex” often comprises these attributes)—as well as 3 char-acteristics that were correlates of recreational walking—accessto exercise facilities, pedestrian infrastructure, and aesthetics.The results of our previous study of a Japanese adult samplewere consistent with the Committee’s statement.30 However,the results of the present study of a sample of elderly adultsslightly differed from these previous findings. Residentialdensity and access to public transport have been frequentlyreported as correlates of transportation walking, but they werenot associated with any type of walking in the present study.Access to shops—a consistent and strong correlate oftransportation walking in previous studies of adults—wassignificantly associated with transportation walking onlyamong women. Thus, the present results suggest a relativelyweaker association between transportation walking and“walkability”-related environmental features, especiallyamong older men, as compared with young and middle-agedpopulations. On the other hand, sidewalks, access to exercisefacilities, and aesthetics, which were previously reportedas correlates of recreational walking, were significantlyassociated with transportation walking in the present study.These results indicate that transportation walking among
elderly adults might have similar characteristics to recreationalwalking. One possibility is that, as Shigematsu et al21
discussed in a previous report, elderly adults might combinetransportation walking with recreational walking in 1 trip. Forexample, someone goes to a park for a recreational walk and,on the way home, goes shopping. Thus, the differentiationbetween the 2 types of walking may be less clear amongelderly adults. Another possibility is that elderly people havefewer obligations than do younger people with regard todaily activities such as commuting and shopping; thus,transportation walking is not a requirement for them. Theymight walk for transport only when they live in enjoyable andattractive environments that support recreational walkingamong younger adults.Before the present analyses, we speculated that elderly
people may be vulnerable to unfavorable environments,meaning that the association between environment andphysical activity might be stronger among this population.Contrary to expectations, the odds ratios were relatively lowin this study, although there is no criterion with which toassess strong versus weak associations. A previous study thatexamined age differences in the relationship of perceivedneighborhood environment to walking reported somewhatsimilar results, ie, there were a smaller number of envi-ronmental features that were significantly associated withwalking among older adults as compared with youngeradults.21 One possible explanation for different and weakerassociations among elderly adults is that many elderly peoplehave multiple physical and social limitations, which can leadto complicated associations between environment andphysical activity and thus weaken observed associations. Forexample, patterns of associations may differ by physicalfitness level, having or not having a social role, the presenceof family members, etc. Further studies are needed to examineif elderly people are vulnerable to neighborhood envi-ronmental attributes and if physical and social conditionsmodify these relationships.Sex differences were observed in the present study,
especially in transportation walking for daily activity.Among men, environmental attributes that were significantlyassociated with walking for daily activity were bike lanes,traffic safety, crime safety, aesthetics, and household motorvehicles; among women, the associated attributes were accessto shops, access to exercise facilities, and social environment.Patterns of associations in women were similar to those notedin Western studies, ie, access to shops and exercise facilitieswere important for transportation walking.21,23 It is plausiblethat access to shops is more important for women, who oftenhave more obligations with regard to household duties. Accessto exercise facilities was associated with transportationwalking but not with recreational walking. This may seemsurprising, but was also reported in a previous study.21 Itmay be that adults walk for transport to exercise facilities,take a child to the facilities, including parks, and combine
Neighborhood Environment and Walking Among Elderly Adults488
J Epidemiol 2011;21(6):481-490

transportation walking and recreational walking. Regardingolder men, the relationship between household motor vehicleaccess and transportation walking suggests a car-dependentlifestyle among this population: those with cars walked less.We observed unexpected negative associations of crime safetyand traffic safety with transportation walking among men. Wehypothesized that safety was an important issue among elderlyadults. However, considering these results, the young old (age65–74 years) may be sufficiently physically fit and not overlyconcerned by safety issues. Also, variation in crime safety inJapan might be too low to yield associations, as the country isgenerally considered safe. Instead, walkers perceived moresafety concerns than did sedentary persons. Perhaps walkersare more likely to encounter threats or are more familiar withsigns of disorder in their neighborhoods. This is a limitation ofa perceived measure and the present cross-sectional design.Because the results of previous studies of safety concernswere inconsistent,22,33,34 further studies of elderly samples areneeded.
There are several limitations of this study. First, this studyhad a cross-sectional design, which does not allow us toaddress the direction of causality. Longitudinal or inter-vention studies are needed in future research. Second, bothenvironmental and walking measures were based on self-reporting. Although self-reporting can assess walking fordifferent purposes and a wide range of environmentalcharacteristics, we must consider the possibility of adiscrepancy between perception and reality, even though themeasures have been validated. Thus, studies using objectivemeasures, such as accelerometers for physical activity and ageographic information system for environmental evaluation,are needed in the future, although both objective andperceived measures are useful. Third, this study examinedelderly adults aged 65 to 74 years. The results could differamong older age groups. We must be careful to consider thegeneralizability of the results.
Despite these limitations, studies of the physicalactivity environment for elderly adults are limited, especiallyamong Japanese populations. The present results indicate thatseveral environmental factors are related to walking forspecific purposes among elderly Japanese. Improving theseenvironmental features in neighborhoods might be aneffective strategy to promote physical activity among thispopulation.
ACKNOWLEDGMENTS
The authors gratefully thank Dr. Tsuyoshi Hamano, ShimaneUniversity for his technical input on statistical methods. Thisstudy was supported by a Grant-in-Aid for Scientific Research(C): 20500604 from the Japan Ministry of Education, Culture,Sports, Science and Technology and by a Grant-in-Aidfrom the Ministry of Health, Labour and Welfare of Japan(Comprehensive Research on Prevention of Cardiovascular
Diseases and Other Lifestyle-Related Diseases: H20-Junkankitou-Ippan-001).Conflicts of interest: The authors have no other conflicts of
interest, including related directorships, stock holdings, orcontracts.
REFERENCES
1. Haskell WL, Lee IM, Pate RR, Powell KE, Blair SN,Franklin BA, et al. Physical activity and public health: updatedrecommendation for adults from the American College of SportsMedicine and the American Heart Association. Circulation.2007;116:1081–93.
2. Physical Activity Guidelines for Americans: Be Active, Healthy,and Happy! Washigton DC: U.S. Department of Health andHuman Services; 2008 [cited 2011 April 15]. Available from:http://www.health.gov/paguidelines/guidelines/default.aspx.
3. Hayasaka S, Shibata Y, Ishikawa S, Kayaba K, Gotoh T, NodaT, et al. Physical activity and all-cause mortality in Japan:the Jichi Medical School (JMS) Cohort Study. J Epidemiol.2009;19:24–7.
4. Fujita K, Takahashi H, Miura C, Ohkubo T, Sato Y, Ugajin T,et al. Walking and mortality in Japan: the Miyagi Cohort Study.J Epidemiol. 2004;14 Suppl 1:S26–32.
5. Nelson ME, Rejeski WJ, Blair SN, Duncan PW, Judge JO, KingAC, et al. Physical activity and public health in older adults.Recommendation from the American College of SportsMedicine and the American Heart Association. Circulation.2007;116:1094–105.
6. Brach JS, FitzGerald S, Newman AB, Kelsey S, Kuller L,VanSwearingen JM, et al. Physical activity and functional statusin community-dwelling older women: a 14-year prospectivestudy. Arch Intern Med. 2003;163:2565–71.
7. DiPietro L. The epidemiology of physical activity and physicalfunction in older people. Med Sci Sports Exerc. 1996;28:596–600.
8. LaCroix AZ, Guralnik JM, Berkman LF, Wallace RB, SatterfieldS. Maintaining mobility in late life. II. Smoking, alcoholconsumption, physical activity, and body mass index. Am JEpidemiol. 1993;137:858–69.
9. The world health report 2002, Reducing risks, promoting healthylife. Geneva: World Health Organization; 2002 [cited 2011April 15]. Available from: http://www.who.int/whr/2002/en/index.html.
10. The National Health and Nutrition Survey. Tokyo: The Ministryof Health, Labour and Welfare of Japan [cited 2011 April 15].Available from: http://www.mhlw.go.jp/bunya/kenkou/kenkou_eiyou_chousa.html.
11. Inoue S, Ohya Y, Tudor-Locke C, Tanaka S, Yoshiike N,Shimomitsu T. Time trends for step-determined physical activityamong Japanese adults. Med Sci Sports Exerc. 2011 (in press).
12. Trost SG, Owen N, Bauman AE, Sallis JF, Brown W. Correlatesof adults’ participation in physical activity: review and update.Med Sci Sports Exerc. 2002;34:1996–2001.
13. Sallis JF, Owen N. Ecological models of health behavior. In:Glanz, K, Rimer, BK, Lewis, FM, editors. Health behavior andhealth education. 3rd ed. San Francisco: Jossey-Bass; 2002.p. 462–84.
Inoue S, et al. 489
J Epidemiol 2011;21(6):481-490

14. Hill JO, Wyatt HR, Reed GW, Peters JC. Obesity and theenvironment: where do we go from here? Science. 2003;299:853–5.
15. Owen N, Humpel N, Leslie E, Bauman A, Sallis JF.Understanding environmental influences on walking; Reviewand research agenda. Am J Prev Med. 2004;27:67–76.
16. Saelens BE, Handy SL. Built environment correlates of walking:a review. Med Sci Sports Exerc. 2008;40(7 Suppl):S550–66.
17. Wendel-Vos W, Droomers M, Kremers S, Brug J, van Lenthe F.Potential environmental determinants of physical activity inadults: a systematic review. Obes Rev. 2007;8:425–40.
18. Gebel K, Bauman AE, Petticrew M. The physical environmentand physical activity: a critical appraisal of review articles. Am JPrev Med. 2007;32:361–9.
19. Heath G, Brownson R, Kruger J, Miles R, Powell KE, RamseyLT; the Task Force on Community Preventive Services. Theeffectiveness of urban design and land use and transport policiesand practices to increase physical activity: A systematic review.J Phys Act Health. 2006;3 suppl.1:S55–76.
20. Inoue S. Physical activity and public health (4): physical activityand environment. Nippon Koshu Eisei Zasshi. 2008;55:403–6(in Japanese).
21. Shigematsu R, Sallis JF, Conway TL, Saelens BE, Frank LD,Cain KL, et al. Age differences in the relation of perceivedneighborhood environment to walking. Med Sci Sports Exerc.2009;41:314–21.
22. Sallis JF, Kerr J. Physical activity and the built environment,President’s Council on Physical Fitness and Sports ResearchDigest. 2006; Series 7, No. 4:1–8 [cited 2011 April 15].Available from: http://www.fitness.gov/publications/digests/december2006digest.pdf.
23. Berke EM, Koepsell TD, Moudon AV, Hoskins RE, Larson EB.Association of the built environment with physical activity andobesity in older persons. Am J Public Health. 2007;97:486–92.
24. Fukuhara S, Suzukamo Y. Manual of the SF-8 Japanese version.Institute for Health Outcomes & Process Evaluation Research,Kyoto, 2004.
25. Inoue S, Murase N, Shimomitsu T, Ohya Y, Odagiri Y,
Takamiya T, et al. Association of physical activity andneighborhood environment among Japanese Adults. Prev Med.2009;48:321–5.
26. Sallis JF, Bowles HR, Bauman A, Ainsworth BE, Bull FC, CraigCL, et al. Neighborhood environments and physical activityamong adults in 11 countries. Am J Prev Med. 2009;36:484–90.
27. Sallis JF, Kerr J, Carlson JA, Norman GJ, Saelens BE, Durant N,et al. Evaluating a brief self-report measure of neighborhoodenvironments for physical activity research and surveillance:Physical Activity Neighborhood Environment Scale (PANES).J Phys Act Health. 2010;7:533–40.
28. Addy CL, Wilson DK, Kirtland KA, Ainsworth BE, Sharpe P,Kimsey D. Association of perceived social and physicalenvironmental supports with physical activity and walkingbehavior. Am J Public Health. 2004;94:440–3.
29. Saelens BE, Sallis JF, Black JB, Chen D. Neighborhood-baseddifferences in physical activity: an environment scale evaluation.Am J Public Health. 2003;93:1552–8.
30. Inoue S, Ohya Y, Odagiri Y, Takamiya T, Ishii K, KitabayashiM, et al. Association between perceived neighborhoodenvironment and walking among adults in 4 cities in Japan.J Epidemiol. 2010;20:277–86.
31. Kamada M, Kitayuguchi J, Inoue S, Kamioka H, Mutoh Y,Shiwaku K. Environmental correlates of physical activity indriving and non-driving rural Japanese women. Prev Med.2009;49:490–6.
32. The Heart Foundation’s National Physical Activity AdvisoryCommittee. Position statement: The built environmentand walking [cited 2011 April 15]. Available from:http://www.heartfoundation.org.au/SiteCollectionDocuments/Built_environment_position_statement_FINAL_LR%20for%20web.pdf.
33. Humpel N, Owen N, Leslie E. Environmental factors associatedwith adults’ participation in physical activity: a review. Am JPrev Med. 2002;22:188–99.
34. Duncan MJ, Spence JC, Mummery WK. Perceived environmentand physical activity: a meta-analysis of selected environmentalcharacteristics. Int J Behav Nutr Phys Act. 2005;2:11.
Neighborhood Environment and Walking Among Elderly Adults490
J Epidemiol 2011;21(6):481-490