PEACE STUDIES PAPERS FOURTH SERIES - CORE
63
CICS WORKING PAPERS Working Paper 2: SPENDING TO SAVE: Retrospective Case Studies Malcolm Chalmers April 2005 DEPARTMENT OF PEACE STUDIES 1 CORE Metadata, citation and similar papers at core.ac.uk Provided by Bradford Scholars
-
Upload
khangminh22 -
Category
Documents
-
view
3 -
download
0
Transcript of PEACE STUDIES PAPERS FOURTH SERIES - CORE

CICS WORKING PAPERS
Working Paper 2:
SPENDING TO SAVE: Retrospective Case Studies
Malcolm Chalmers
April 2005
DEPARTMENT OF PEACE STUDIES
1
CORE Metadata, citation and similar papers at core.ac.uk
Provided by Bradford Scholars
CICS Working Papers CICS Working Papers are published alongside the Department of Peace Studies’ Peace Studies Papers, and are intended to provide reports on research conducted by the Centre for International Cooperation and Security (CICS). About CICS CICS is a centre for research and training in international and transnational issues, in the fields of conflict, co-operation and governance, particularly in relation to violence, security, development, democracy, crime and environment. Based within the University of Bradford’s Department of Peace Studies, CICS researchers have a range of interests and expertise, who, together with an international network of experts and partners, enable CICS to produce a wide array of research reports, seminars, policy workshops, conferences and training courses with a large and growing number of clients and partners in Europe and internationally. CICS’s Core Activities are organised around:
Research and Analysis – Working with a wide range of partners, CICS is a centre for cutting edge research and policy analysis/support, combining academic and practitioner understanding and experience;
Training – CICS provides tailored training which enables participants and
organisations to develop their understanding and effectiveness in relation to conflict, security, development and governance issues. CICS can develop and deliver in-house training courses, seminars and distance learning to suit the needs of most organisations within its areas of expertise;
Consultancy – CICS undertakes contract-based work for numerous national,
regional and international agencies, working on projects covering a wide range of issues in its areas of competence.
The Centre for International Co-operation and Security Department of Peace Studies University of Bradford Richmond Road Bradford West Yorkshire BD7 1DP UK Director: Dr. Owen Greene Contact: Andy Brunt, Programme Manager Tel: +44 (0)1274 233825 Fax: +44 (0)1274 235296 email: [email protected] Web: www.bradford.ac.uk/cics
CONTENTS Acknowledgements About the Author 1.0 THE BALKANS 1989 - 2003 by Malcolm Chalmers and
Susan Willett 6
1.1 Executive Summary 7 1.2 Introduction 8 1.3 Peace and Conflict Scenarios 8 The Balkan Conflict at a Glance 9/10 1.4 Additional Annual Costs of the Conflict Scenario 11 Table 1 – Costs of war damage to directly affected territories 11 Table 2 – Costs to states of former Yugoslavia at ($bn 2004) prices 13 Table 3 – Loss of national income to neighbouring states
at ($bn 2004) prices 14
Table 4 – Cost of humanitarian assistance programmes at ($bn. 2004) prices
15
Table 5 – Cost of post-conflict reconstruction and development assistance at ($m 2004 prices)
16
Table 6 – Cost of UN/NATO military forces in Balkans ($m. 2004 prices)
18
Table 7 – Total costs of Balkans conflict to international community (2004 prices)
18
1.5 Probability of the Conflict without Conflict Prevention Packages 18 1.6 Conflict Prevention Packages 18 Table 8 – Additional Costs of CP Package 1 ($m. 2004 prices) 20 Table 9 – Additional Costs of CP Package 2 ($m 2004 prices) 21 1.7 Probability of Conflict with Conflict Prevention Packages 22 1.8 Net Present Value and Assessment 22 2.0 AFGHANISTAN 1989 – 2003 By Malcolm Chalmers and
Hooman Peimani 24
2.1 Executive Summary 25 2.2 Introduction 26 2.3 Peace and Conflict Scenarios 26 2.4 Additional Annual Costs of the Conflict Scenario 29 Table 1 – Annual loss of national income a result of conflict
(US$bn. 2004 prices) 30
Table 2 – Annual cost for Iran and Pakistan of housing refugees as a result of conflict ($bn. 2004 prices)
31
Table 3 – Costs to international community in providing emergency assistance and coping with other costs of conflict
34
3
($bn. 2004 prices) Table 4 – Costs for international community in stopping conflict
($bn. 2004 prices) 35
2.5 Probability of the Conflict without Conflict Prevention Packages 35 2.6 Conflict Prevention Packages 35 Table 5 – Cost of conflict prevention package 1 ($bn 2004 prices) 37 Table 6 – Cost of conflict prevention package21 ($bn. 2004 prices) 39 2.7 Probability of Conflict with Conflict Prevention Packages 39 2.8 Net Present Value and Assessment 41 3.0 RWANDA 1989 – 2003 by Saskia Van Hoyweghen, Jeremy
McKenna and Stefaan Smis 42
3.1 Executive Summary 43 3.2 Introduction 45 3.3 Peace and Conflict Scenarios 45 3.4 Additional Annual Costs of the Conflict Scenario 47 Table 1 – Environmental, infrastructural and socio-economic damage
in $m 48
Table 2 – Increase in military expenditure in $m 48 Table 3 – Increase in military expenditure in $m 1994 – 1997 49 Table 4 – Loss of GNP ($m 2004 prices) 50 Table 5 – Public expenditure 51 Table 6 – Summary of costs to Rwanda ($m 2004 prices) 51 Table 7 – Human Development in Rwanda 1980 – 2001 52 Table 8 – Summary of total cost to neighbouring countries ($m) 53 Table 9 – Humanitarian assistance costs of OECD members ($m) 53 Table 10 – Humanitarian cost related to refugee crisis ($m) 54 Table 11 – Military assistance and evacuation of compatriots ($m) 55 Table 12 – Reconstruction cost to the International Community in
Rwanda ($m) 55
Table 13 – Summary of costs of conflict to the International Community ($m 2004 prices
56
Table 14 – Support for the peace process ($m) 57 3.5 Probability of the conflict without Conflict Prevention Packages 57 3.6 Conflict Prevention Packages 57 Table 15 – Estimated cost of CP1 to the International Community ($m
at 2004 prices) 59
Table 16 – Estimated cost of CP2 to the international community ($m. 2004 prices)
61
3.7 Probability of conflict with Conflict Prevention Packages 61 3.8 Net Present Value and Assessment 62
4
Acknowledgements The author would like to acknowledge the assistance of Jeremy McKenna, Hooman Peimani, Stefaan Smis, Saskia Van Hoyweghen and Susan Willett in writing the case studies contained in this volume. We gratefully acknowledge the funding from the UK Department for International Development that made this research possible. About the editor Malcolm Chalmers is Professor of International Politics in the Department of Peace Studies, University of Bradford. His areas of research expertise include UK defence and security policy, security sector reform, defence economics and budgeting and the control of the arms trade.
5

The Balkans 1989 - 2003
Malcolm Chalmers and Susan Willett
6
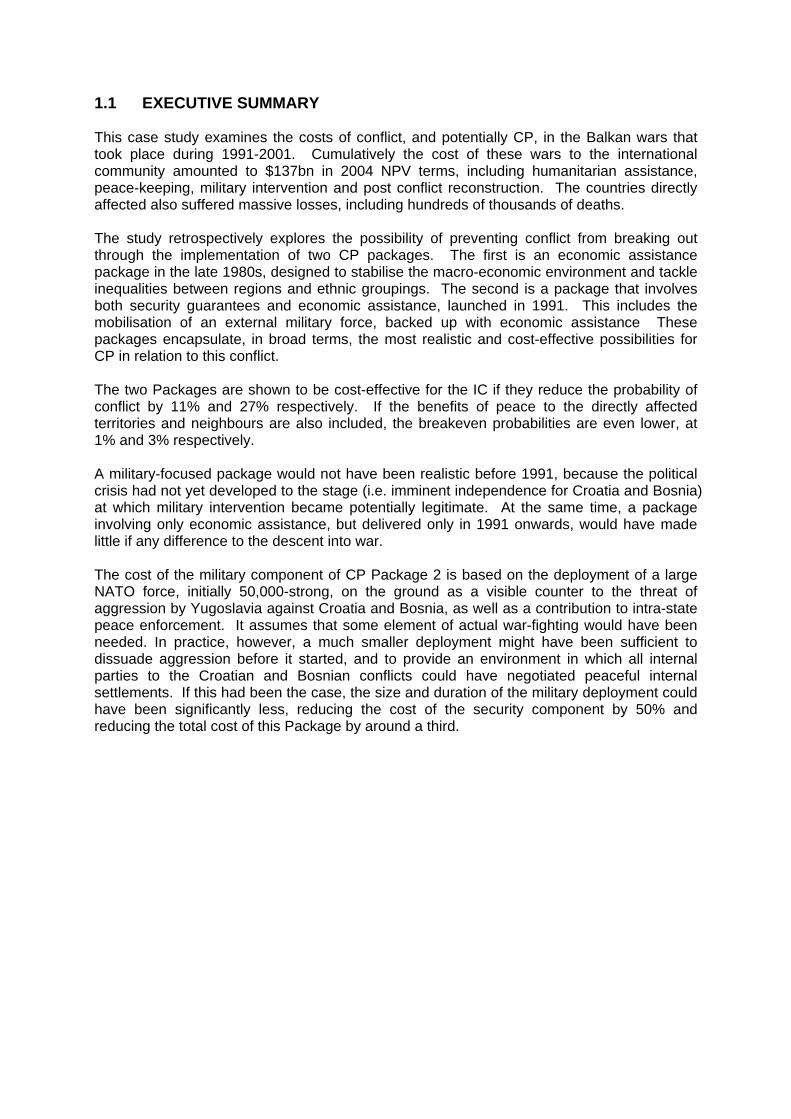
1.1 EXECUTIVE SUMMARY This case study examines the costs of conflict, and potentially CP, in the Balkan wars that took place during 1991-2001. Cumulatively the cost of these wars to the international community amounted to $137bn in 2004 NPV terms, including humanitarian assistance, peace-keeping, military intervention and post conflict reconstruction. The countries directly affected also suffered massive losses, including hundreds of thousands of deaths. The study retrospectively explores the possibility of preventing conflict from breaking out through the implementation of two CP packages. The first is an economic assistance package in the late 1980s, designed to stabilise the macro-economic environment and tackle inequalities between regions and ethnic groupings. The second is a package that involves both security guarantees and economic assistance, launched in 1991. This includes the mobilisation of an external military force, backed up with economic assistance These packages encapsulate, in broad terms, the most realistic and cost-effective possibilities for CP in relation to this conflict. The two Packages are shown to be cost-effective for the IC if they reduce the probability of conflict by 11% and 27% respectively. If the benefits of peace to the directly affected territories and neighbours are also included, the breakeven probabilities are even lower, at 1% and 3% respectively. A military-focused package would not have been realistic before 1991, because the political crisis had not yet developed to the stage (i.e. imminent independence for Croatia and Bosnia) at which military intervention became potentially legitimate. At the same time, a package involving only economic assistance, but delivered only in 1991 onwards, would have made little if any difference to the descent into war. The cost of the military component of CP Package 2 is based on the deployment of a large NATO force, initially 50,000-strong, on the ground as a visible counter to the threat of aggression by Yugoslavia against Croatia and Bosnia, as well as a contribution to intra-state peace enforcement. It assumes that some element of actual war-fighting would have been needed. In practice, however, a much smaller deployment might have been sufficient to dissuade aggression before it started, and to provide an environment in which all internal parties to the Croatian and Bosnian conflicts could have negotiated peaceful internal settlements. If this had been the case, the size and duration of the military deployment could have been significantly less, reducing the cost of the security component by 50% and reducing the total cost of this Package by around a third.
1.2 INTRODUCTION The key questions to be addressed in this study are:
• with the benefit of hindsight, what conflict prevention ‘packages’ could the international community have designed in order to minimise the probability of the conflicts that actually took place?
• how much would have been saved if these packages had been implemented, given
reasonable estimates about their costs, compared with the actual cost of conflict and post-conflict intervention.
The first section provides a background to the conflicts. This is followed by an assessment of the levels of resources that the international community has committed to the Western Balkans since 1991. The third part of the study provides two hypothetical scenarios for CP interventions that might have restrained conflict from breaking out. These CP packages are then costed and an assessment of their probability of success is made. 1.3 PEACE AND CONFLICT SCENARIOS Conflict Scenario In the 1980s Yugoslavia faced a severe economic crisis, characterised by hyperinflation, growing inter-regional inequalities, and widespread industrial unrest. This in turn hastened the process of political fragmentation, the rise of nationalism and the descent into conflict. By 1991, the combination of financial crisis and nationalist protests became too much. Following unilateral secessions by Slovenia, Croatia, Bosnia and Macedonia, war erupted, resulting in the worst humanitarian crisis that Europe had witnessed since the Nazi era. Millions of refugees sought sanctuary in Western Europe, sparking a major crisis for EU asylum and immigration policies. In the initial stages of the conflicts in Croatia and Bosnia, the violence was organised by politically ambitious thugs and paramilitary groups led by self-appointed warlords, backed by hard-line nationalists in Belgrade, that were fighting beleaguered ethnic leaders of equal nationalist fervour. This mix of belligerents rendered traditional approaches to diplomatic peace-making efforts redundant. The preventative toolbox of sanctions, diplomatic negotiations and ‘traditional’ peacekeeping operations (UNPROFOR) was rendered impotent by political actors who preferred to seek their political objectives through military means. The UN dispatched a 38,000 strong peace-keeping force (UNPROFOR) in 1992, but it failed to give the force either the mandate or capability for robust peace enforcement and several key military powers, including the US and Germany, failed to take part. Largely as a consequence, the next three years saw a continuation of the conflict, with international action only able to reduce the extent of the suffering. NATO finally took decisive military action in 1995 which brought an end to the war. The Dayton Peace Agreement was signed in November 1995 and a 60,000-strong NATO led Implementation Force (IFOR) was created, which was succeeded by SFOR. It soon became apparent that early withdrawal would result in a resumption of violence and NATO troops remain in Bosnia to this day.
8
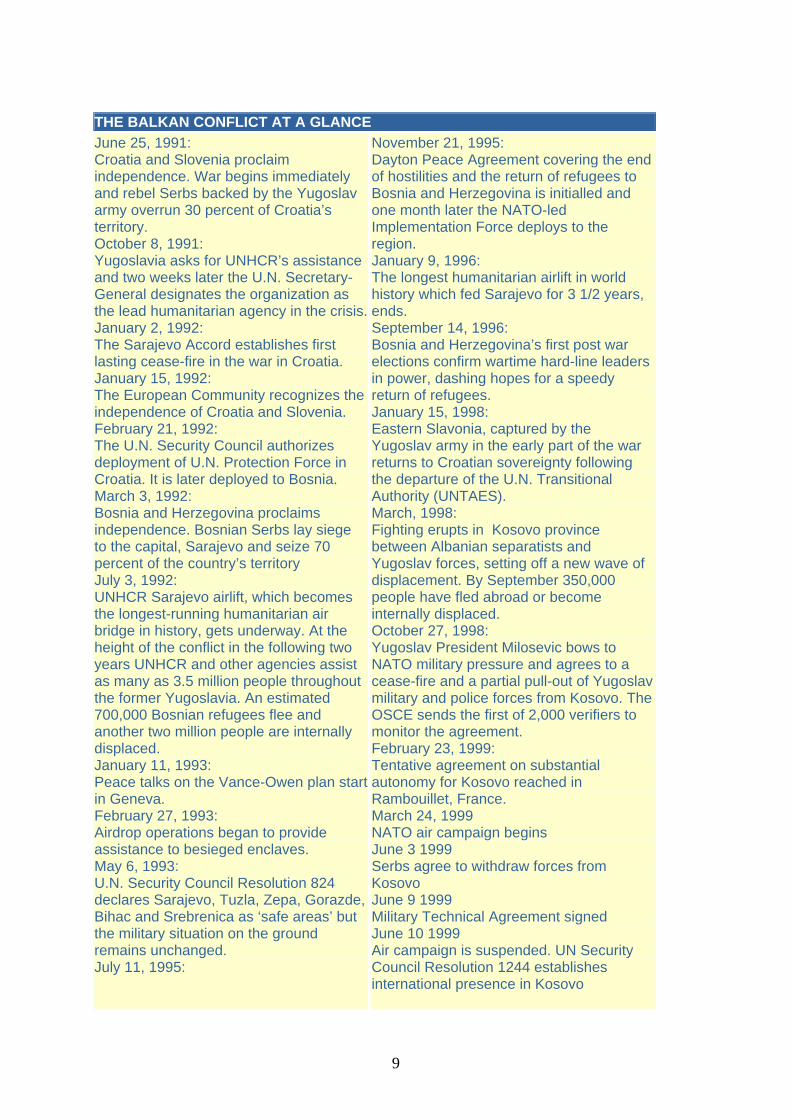
THE BALKAN CONFLICT AT A GLANCEJune 25, 1991: Croatia and Slovenia proclaim independence. War begins immediately and rebel Serbs backed by the Yugoslav army overrun 30 percent of Croatia’s territory. October 8, 1991: Yugoslavia asks for UNHCR’s assistance and two weeks later the U.N. Secretary-General designates the organization as the lead humanitarian agency in the crisis.January 2, 1992: The Sarajevo Accord establishes first lasting cease-fire in the war in Croatia. January 15, 1992: The European Community recognizes the independence of Croatia and Slovenia. February 21, 1992: The U.N. Security Council authorizes deployment of U.N. Protection Force in Croatia. It is later deployed to Bosnia. March 3, 1992: Bosnia and Herzegovina proclaims independence. Bosnian Serbs lay siege to the capital, Sarajevo and seize 70 percent of the country’s territory July 3, 1992: UNHCR Sarajevo airlift, which becomes the longest-running humanitarian air bridge in history, gets underway. At the height of the conflict in the following two years UNHCR and other agencies assist as many as 3.5 million people throughout the former Yugoslavia. An estimated 700,000 Bosnian refugees flee and another two million people are internally displaced. January 11, 1993: Peace talks on the Vance-Owen plan start in Geneva. February 27, 1993: Airdrop operations began to provide assistance to besieged enclaves. May 6, 1993: U.N. Security Council Resolution 824 declares Sarajevo, Tuzla, Zepa, Gorazde, Bihac and Srebrenica as ‘safe areas’ but the military situation on the ground remains unchanged. July 11, 1995:
November 21, 1995: Dayton Peace Agreement covering the end of hostilities and the return of refugees to Bosnia and Herzegovina is initialled and one month later the NATO-led Implementation Force deploys to the region. January 9, 1996: The longest humanitarian airlift in world history which fed Sarajevo for 3 1/2 years, ends. September 14, 1996: Bosnia and Herzegovina’s first post war elections confirm wartime hard-line leaders in power, dashing hopes for a speedy return of refugees. January 15, 1998: Eastern Slavonia, captured by the Yugoslav army in the early part of the war returns to Croatian sovereignty following the departure of the U.N. Transitional Authority (UNTAES). March, 1998: Fighting erupts in Kosovo province between Albanian separatists and Yugoslav forces, setting off a new wave of displacement. By September 350,000 people have fled abroad or become internally displaced. October 27, 1998: Yugoslav President Milosevic bows to NATO military pressure and agrees to a cease-fire and a partial pull-out of Yugoslav military and police forces from Kosovo. The OSCE sends the first of 2,000 verifiers to monitor the agreement. February 23, 1999: Tentative agreement on substantial autonomy for Kosovo reached in Rambouillet, France. March 24, 1999 NATO air campaign begins June 3 1999 Serbs agree to withdraw forces from Kosovo June 9 1999 Military Technical Agreement signed June 10 1999 Air campaign is suspended. UN Security Council Resolution 1244 establishes international presence in Kosovo
9
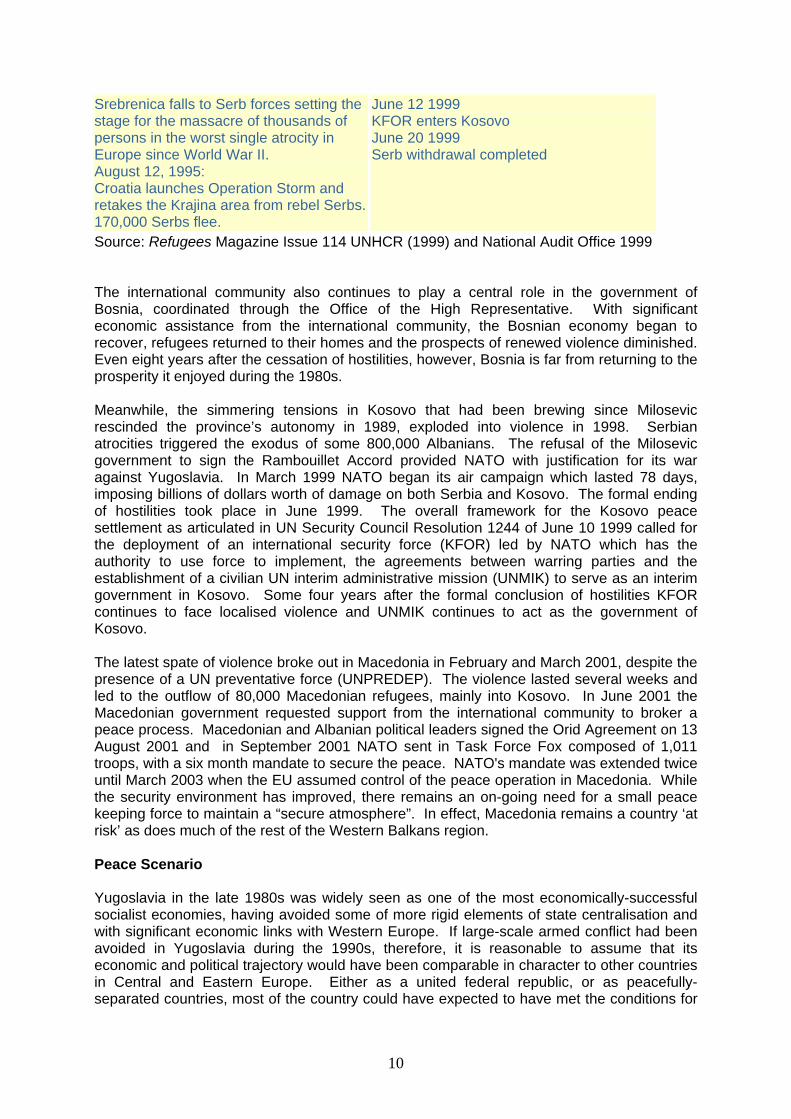
Srebrenica falls to Serb forces setting the stage for the massacre of thousands of persons in the worst single atrocity in Europe since World War II. August 12, 1995: Croatia launches Operation Storm and retakes the Krajina area from rebel Serbs. 170,000 Serbs flee.
June 12 1999 KFOR enters Kosovo June 20 1999 Serb withdrawal completed
Source: Refugees Magazine Issue 114 UNHCR (1999) and National Audit Office 1999 The international community also continues to play a central role in the government of Bosnia, coordinated through the Office of the High Representative. With significant economic assistance from the international community, the Bosnian economy began to recover, refugees returned to their homes and the prospects of renewed violence diminished. Even eight years after the cessation of hostilities, however, Bosnia is far from returning to the prosperity it enjoyed during the 1980s. Meanwhile, the simmering tensions in Kosovo that had been brewing since Milosevic rescinded the province’s autonomy in 1989, exploded into violence in 1998. Serbian atrocities triggered the exodus of some 800,000 Albanians. The refusal of the Milosevic government to sign the Rambouillet Accord provided NATO with justification for its war against Yugoslavia. In March 1999 NATO began its air campaign which lasted 78 days, imposing billions of dollars worth of damage on both Serbia and Kosovo. The formal ending of hostilities took place in June 1999. The overall framework for the Kosovo peace settlement as articulated in UN Security Council Resolution 1244 of June 10 1999 called for the deployment of an international security force (KFOR) led by NATO which has the authority to use force to implement, the agreements between warring parties and the establishment of a civilian UN interim administrative mission (UNMIK) to serve as an interim government in Kosovo. Some four years after the formal conclusion of hostilities KFOR continues to face localised violence and UNMIK continues to act as the government of Kosovo. The latest spate of violence broke out in Macedonia in February and March 2001, despite the presence of a UN preventative force (UNPREDEP). The violence lasted several weeks and led to the outflow of 80,000 Macedonian refugees, mainly into Kosovo. In June 2001 the Macedonian government requested support from the international community to broker a peace process. Macedonian and Albanian political leaders signed the Orid Agreement on 13 August 2001 and in September 2001 NATO sent in Task Force Fox composed of 1,011 troops, with a six month mandate to secure the peace. NATO's mandate was extended twice until March 2003 when the EU assumed control of the peace operation in Macedonia. While the security environment has improved, there remains an on-going need for a small peace keeping force to maintain a “secure atmosphere”. In effect, Macedonia remains a country ‘at risk’ as does much of the rest of the Western Balkans region. Peace Scenario Yugoslavia in the late 1980s was widely seen as one of the most economically-successful socialist economies, having avoided some of more rigid elements of state centralisation and with significant economic links with Western Europe. If large-scale armed conflict had been avoided in Yugoslavia during the 1990s, therefore, it is reasonable to assume that its economic and political trajectory would have been comparable in character to other countries in Central and Eastern Europe. Either as a united federal republic, or as peacefully-separated countries, most of the country could have expected to have met the conditions for
10
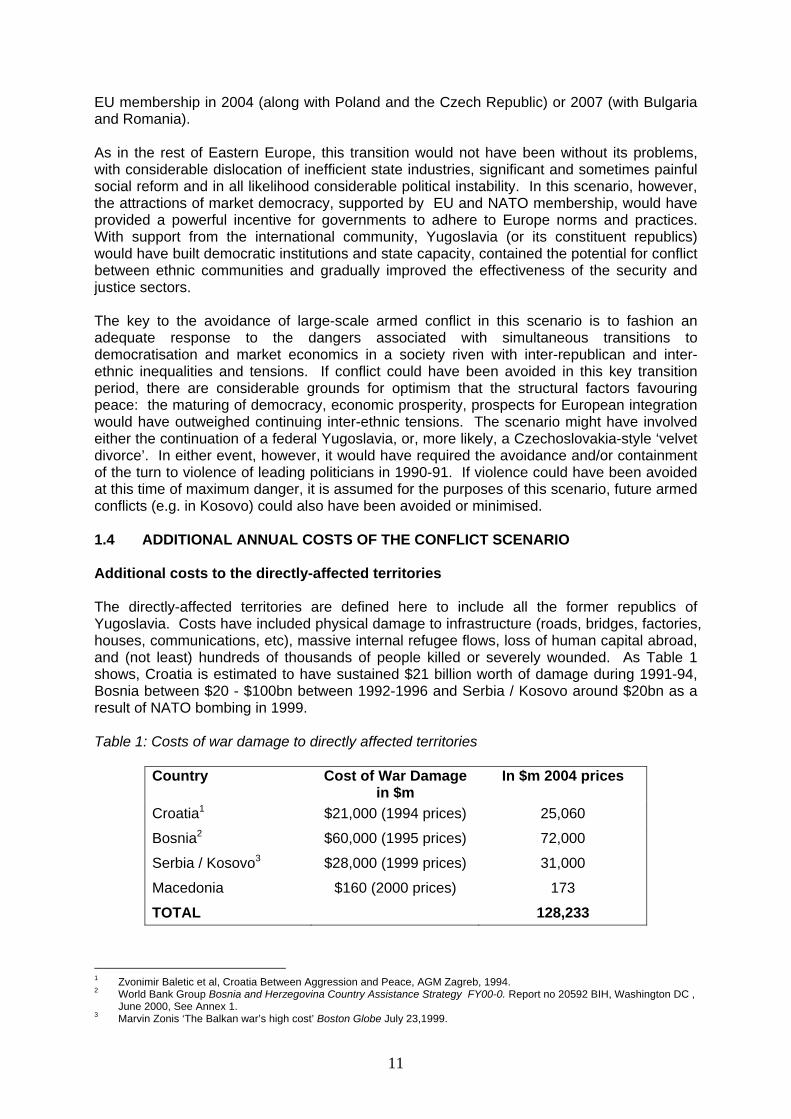
EU membership in 2004 (along with Poland and the Czech Republic) or 2007 (with Bulgaria and Romania). As in the rest of Eastern Europe, this transition would not have been without its problems, with considerable dislocation of inefficient state industries, significant and sometimes painful social reform and in all likelihood considerable political instability. In this scenario, however, the attractions of market democracy, supported by EU and NATO membership, would have provided a powerful incentive for governments to adhere to Europe norms and practices. With support from the international community, Yugoslavia (or its constituent republics) would have built democratic institutions and state capacity, contained the potential for conflict between ethnic communities and gradually improved the effectiveness of the security and justice sectors. The key to the avoidance of large-scale armed conflict in this scenario is to fashion an adequate response to the dangers associated with simultaneous transitions to democratisation and market economics in a society riven with inter-republican and inter-ethnic inequalities and tensions. If conflict could have been avoided in this key transition period, there are considerable grounds for optimism that the structural factors favouring peace: the maturing of democracy, economic prosperity, prospects for European integration would have outweighed continuing inter-ethnic tensions. The scenario might have involved either the continuation of a federal Yugoslavia, or, more likely, a Czechoslovakia-style ‘velvet divorce’. In either event, however, it would have required the avoidance and/or containment of the turn to violence of leading politicians in 1990-91. If violence could have been avoided at this time of maximum danger, it is assumed for the purposes of this scenario, future armed conflicts (e.g. in Kosovo) could also have been avoided or minimised. 1.4 ADDITIONAL ANNUAL COSTS OF THE CONFLICT SCENARIO Additional costs to the directly-affected territories The directly-affected territories are defined here to include all the former republics of Yugoslavia. Costs have included physical damage to infrastructure (roads, bridges, factories, houses, communications, etc), massive internal refugee flows, loss of human capital abroad, and (not least) hundreds of thousands of people killed or severely wounded. As Table 1 shows, Croatia is estimated to have sustained $21 billion worth of damage during 1991-94, Bosnia between $20 - $100bn between 1992-1996 and Serbia / Kosovo around $20bn as a result of NATO bombing in 1999. Table 1: Costs of war damage to directly affected territories
Country Cost of War Damage in $m
In $m 2004 prices
Croatia1 $21,000 (1994 prices) 25,060
Bosnia2 $60,000 (1995 prices) 72,000
Serbia / Kosovo3 $28,000 (1999 prices) 31,000
Macedonia $160 (2000 prices) 173
TOTAL 128,233
1 Zvonimir Baletic et al, Croatia Between Aggression and Peace, AGM Zagreb, 1994. 2 World Bank Group Bosnia and Herzegovina Country Assistance Strategy FY00-0. Report no 20592 BIH, Washington DC ,
June 2000, See Annex 1. 3 Marvin Zonis ‘The Balkan war’s high cost’ Boston Globe July 23,1999.
11
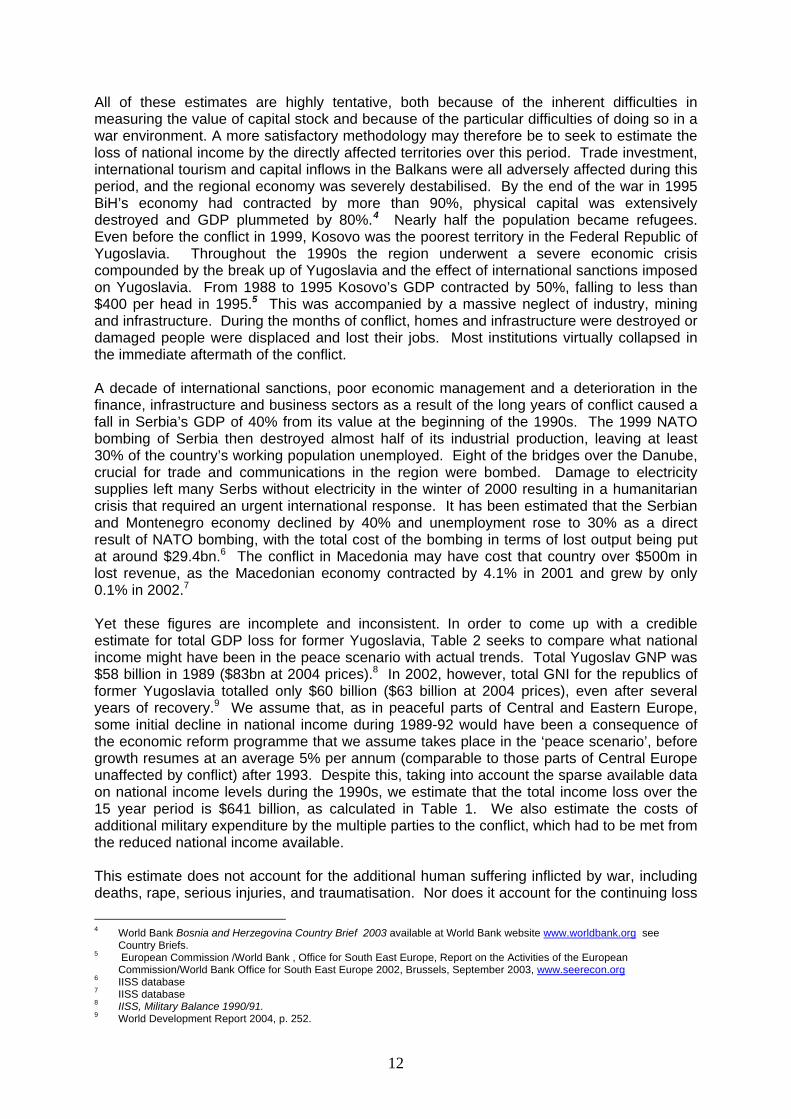
All of these estimates are highly tentative, both because of the inherent difficulties in measuring the value of capital stock and because of the particular difficulties of doing so in a war environment. A more satisfactory methodology may therefore be to seek to estimate the loss of national income by the directly affected territories over this period. Trade investment, international tourism and capital inflows in the Balkans were all adversely affected during this period, and the regional economy was severely destabilised. By the end of the war in 1995 BiH’s economy had contracted by more than 90%, physical capital was extensively destroyed and GDP plummeted by 80%.4 Nearly half the population became refugees. Even before the conflict in 1999, Kosovo was the poorest territory in the Federal Republic of Yugoslavia. Throughout the 1990s the region underwent a severe economic crisis compounded by the break up of Yugoslavia and the effect of international sanctions imposed on Yugoslavia. From 1988 to 1995 Kosovo’s GDP contracted by 50%, falling to less than $400 per head in 1995.5 This was accompanied by a massive neglect of industry, mining and infrastructure. During the months of conflict, homes and infrastructure were destroyed or damaged people were displaced and lost their jobs. Most institutions virtually collapsed in the immediate aftermath of the conflict. A decade of international sanctions, poor economic management and a deterioration in the finance, infrastructure and business sectors as a result of the long years of conflict caused a fall in Serbia’s GDP of 40% from its value at the beginning of the 1990s. The 1999 NATO bombing of Serbia then destroyed almost half of its industrial production, leaving at least 30% of the country’s working population unemployed. Eight of the bridges over the Danube, crucial for trade and communications in the region were bombed. Damage to electricity supplies left many Serbs without electricity in the winter of 2000 resulting in a humanitarian crisis that required an urgent international response. It has been estimated that the Serbian and Montenegro economy declined by 40% and unemployment rose to 30% as a direct result of NATO bombing, with the total cost of the bombing in terms of lost output being put at around $29.4bn.6 The conflict in Macedonia may have cost that country over $500m in lost revenue, as the Macedonian economy contracted by 4.1% in 2001 and grew by only 0.1% in 2002.7 Yet these figures are incomplete and inconsistent. In order to come up with a credible estimate for total GDP loss for former Yugoslavia, Table 2 seeks to compare what national income might have been in the peace scenario with actual trends. Total Yugoslav GNP was $58 billion in 1989 ($83bn at 2004 prices).8 In 2002, however, total GNI for the republics of former Yugoslavia totalled only $60 billion ($63 billion at 2004 prices), even after several years of recovery.9 We assume that, as in peaceful parts of Central and Eastern Europe, some initial decline in national income during 1989-92 would have been a consequence of the economic reform programme that we assume takes place in the ‘peace scenario’, before growth resumes at an average 5% per annum (comparable to those parts of Central Europe unaffected by conflict) after 1993. Despite this, taking into account the sparse available data on national income levels during the 1990s, we estimate that the total income loss over the 15 year period is $641 billion, as calculated in Table 1. We also estimate the costs of additional military expenditure by the multiple parties to the conflict, which had to be met from the reduced national income available. This estimate does not account for the additional human suffering inflicted by war, including deaths, rape, serious injuries, and traumatisation. Nor does it account for the continuing loss
4 World Bank Bosnia and Herzegovina Country Brief 2003 available at World Bank website www.worldbank.org see
Country Briefs. 5 European Commission /World Bank , Office for South East Europe, Report on the Activities of the European
Commission/World Bank Office for South East Europe 2002, Brussels, September 2003, www.seerecon.org 6 IISS database 7 IISS database 8 IISS, Military Balance 1990/91. 9 World Development Report 2004, p. 252.
12
of potential national income after 2003, as a result of the loss of productive capital and people during the conflict. It excludes the additional costs of military expenditure during this period. Table 2: Costs to states of former Yugoslavia (at $bn 2004 prices)
Year Actual national income
Projected national
income in peace
scenario
Resulting loss of
national income
Additional military
expenditure (by all
parties) 1989 83 83 - - 1990 75 77 2 2 1991 45 70 25 10 1992 35 68 33 10 1993 25 70 45 8 1994 25 74 49 8 1995 25 77 52 8 1996 35 81 46 6 1997 45 85 40 6 1998 50 89 39 6 1999 40 94 54 8 2000 48 98 50 1 2001 54 103 49 - 2002 57 109 52 - 2003 63 114 51 - Total 587 73
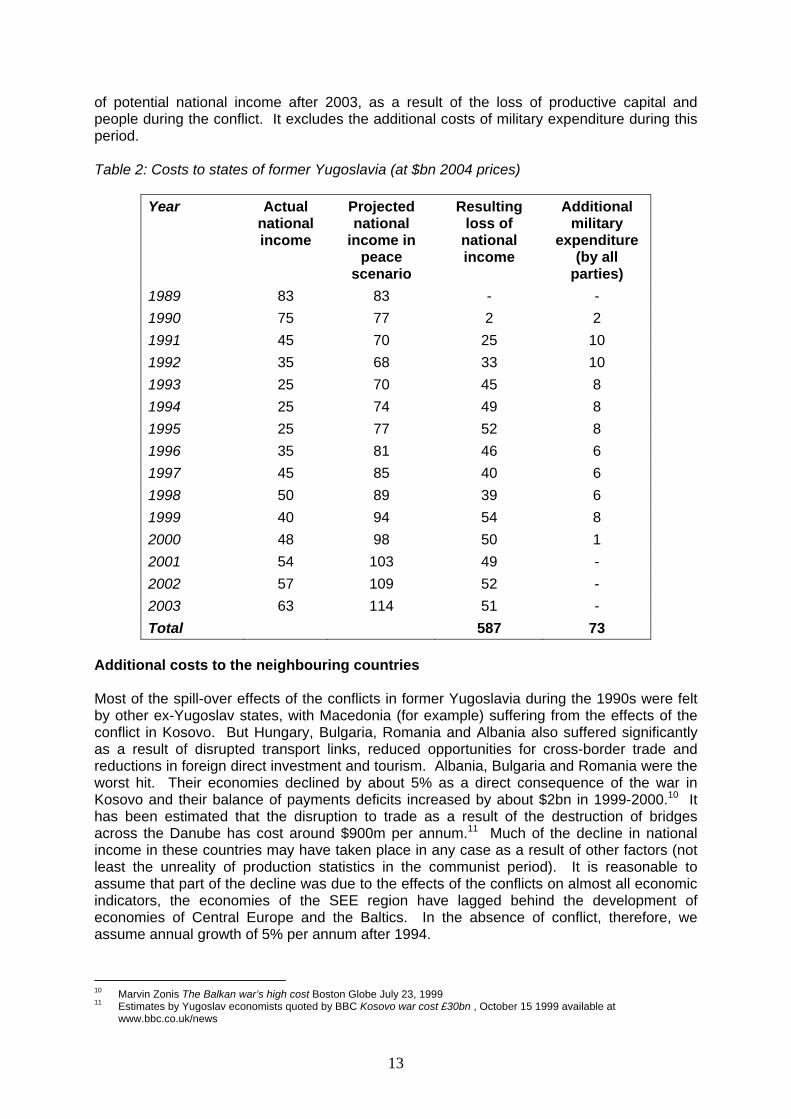
Additional costs to the neighbouring countries Most of the spill-over effects of the conflicts in former Yugoslavia during the 1990s were felt by other ex-Yugoslav states, with Macedonia (for example) suffering from the effects of the conflict in Kosovo. But Hungary, Bulgaria, Romania and Albania also suffered significantly as a result of disrupted transport links, reduced opportunities for cross-border trade and reductions in foreign direct investment and tourism. Albania, Bulgaria and Romania were the worst hit. Their economies declined by about 5% as a direct consequence of the war in Kosovo and their balance of payments deficits increased by about $2bn in 1999-2000.10 It has been estimated that the disruption to trade as a result of the destruction of bridges across the Danube has cost around $900m per annum.11 Much of the decline in national income in these countries may have taken place in any case as a result of other factors (not least the unreality of production statistics in the communist period). It is reasonable to assume that part of the decline was due to the effects of the conflicts on almost all economic indicators, the economies of the SEE region have lagged behind the development of economies of Central Europe and the Baltics. In the absence of conflict, therefore, we assume annual growth of 5% per annum after 1994.
10 Marvin Zonis The Balkan war’s high cost Boston Globe July 23, 1999 11 Estimates by Yugoslav economists quoted by BBC Kosovo war cost £30bn , October 15 1999 available at
www.bbc.co.uk/news
13
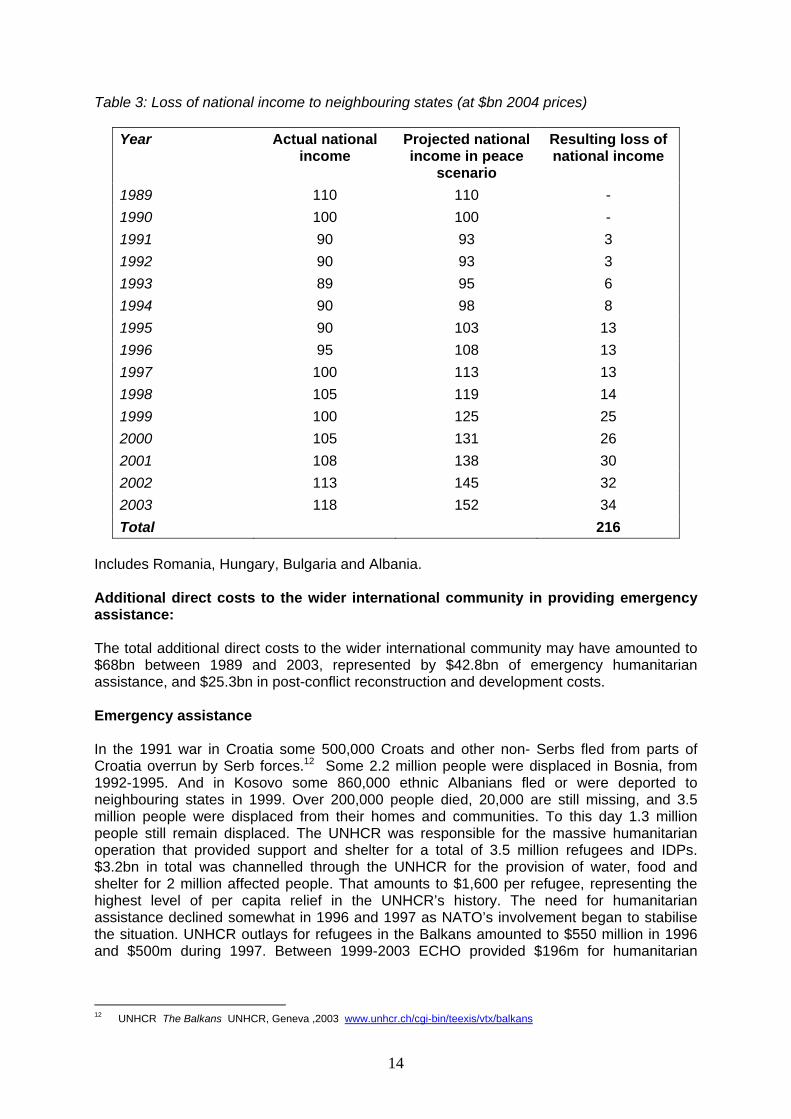
Table 3: Loss of national income to neighbouring states (at $bn 2004 prices)
Year Actual national income
Projected national income in peace
scenario
Resulting loss of national income
1989 110 110 - 1990 100 100 - 1991 90 93 3 1992 90 93 3 1993 89 95 6 1994 90 98 8 1995 90 103 13 1996 95 108 13 1997 100 113 13 1998 105 119 14 1999 100 125 25 2000 105 131 26 2001 108 138 30 2002 113 145 32 2003 118 152 34 Total 216
Includes Romania, Hungary, Bulgaria and Albania. Additional direct costs to the wider international community in providing emergency assistance: The total additional direct costs to the wider international community may have amounted to $68bn between 1989 and 2003, represented by $42.8bn of emergency humanitarian assistance, and $25.3bn in post-conflict reconstruction and development costs. Emergency assistance In the 1991 war in Croatia some 500,000 Croats and other non- Serbs fled from parts of Croatia overrun by Serb forces.12 Some 2.2 million people were displaced in Bosnia, from 1992-1995. And in Kosovo some 860,000 ethnic Albanians fled or were deported to neighbouring states in 1999. Over 200,000 people died, 20,000 are still missing, and 3.5 million people were displaced from their homes and communities. To this day 1.3 million people still remain displaced. The UNHCR was responsible for the massive humanitarian operation that provided support and shelter for a total of 3.5 million refugees and IDPs. $3.2bn in total was channelled through the UNHCR for the provision of water, food and shelter for 2 million affected people. That amounts to $1,600 per refugee, representing the highest level of per capita relief in the UNHCR’s history. The need for humanitarian assistance declined somewhat in 1996 and 1997 as NATO’s involvement began to stabilise the situation. UNHCR outlays for refugees in the Balkans amounted to $550 million in 1996 and $500m during 1997. Between 1999-2003 ECHO provided $196m for humanitarian
12 UNHCR The Balkans UNHCR, Geneva ,2003 www.unhcr.ch/cgi-bin/teexis/vtx/balkans
14
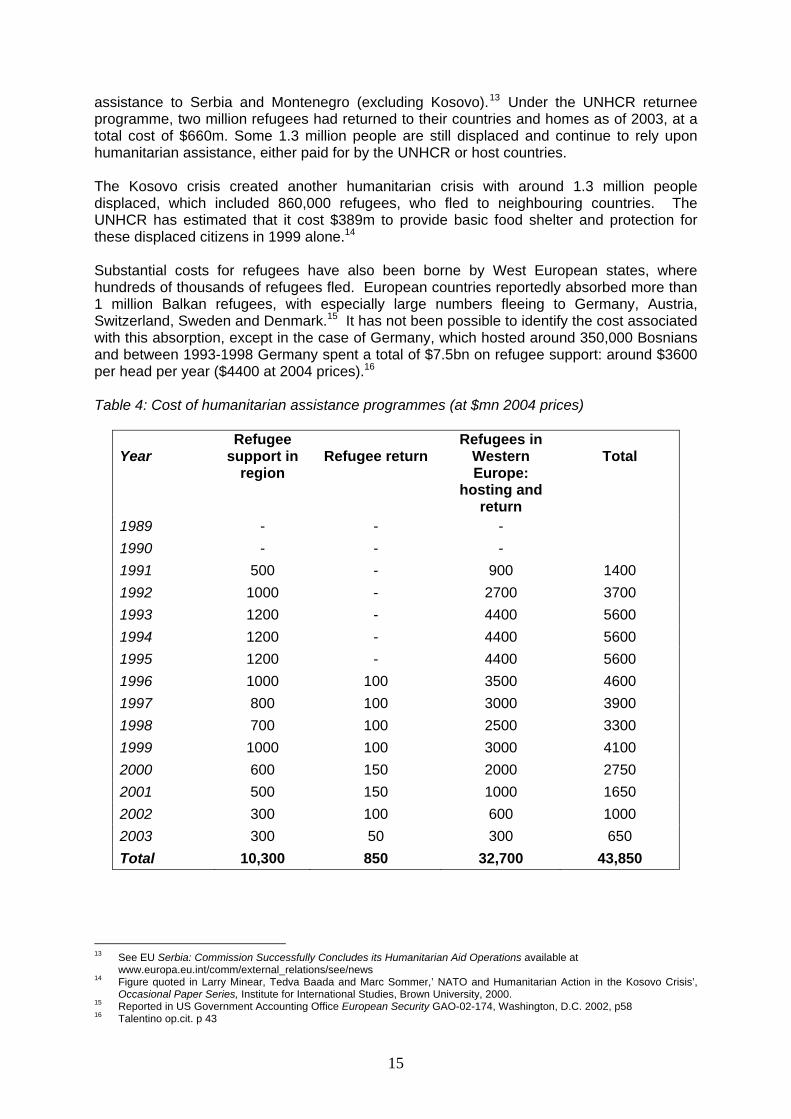
assistance to Serbia and Montenegro (excluding Kosovo).13 Under the UNHCR returnee programme, two million refugees had returned to their countries and homes as of 2003, at a total cost of $660m. Some 1.3 million people are still displaced and continue to rely upon humanitarian assistance, either paid for by the UNHCR or host countries. The Kosovo crisis created another humanitarian crisis with around 1.3 million people displaced, which included 860,000 refugees, who fled to neighbouring countries. The UNHCR has estimated that it cost $389m to provide basic food shelter and protection for these displaced citizens in 1999 alone.14 Substantial costs for refugees have also been borne by West European states, where hundreds of thousands of refugees fled. European countries reportedly absorbed more than 1 million Balkan refugees, with especially large numbers fleeing to Germany, Austria, Switzerland, Sweden and Denmark.15 It has not been possible to identify the cost associated with this absorption, except in the case of Germany, which hosted around 350,000 Bosnians and between 1993-1998 Germany spent a total of $7.5bn on refugee support: around $3600 per head per year ($4400 at 2004 prices).16 Table 4: Cost of humanitarian assistance programmes (at $mn 2004 prices)
Year
Refugee support in
region
Refugee return
Refugees in Western Europe:
hosting and return
Total
1989 - - - 1990 - - - 1991 500 - 900 1400 1992 1000 - 2700 3700 1993 1200 - 4400 5600 1994 1200 - 4400 5600 1995 1200 - 4400 5600 1996 1000 100 3500 4600 1997 800 100 3000 3900 1998 700 100 2500 3300 1999 1000 100 3000 4100 2000 600 150 2000 2750 2001 500 150 1000 1650 2002 300 100 600 1000 2003 300 50 300 650 Total 10,300 850 32,700 43,850
13 See EU Serbia: Commission Successfully Concludes its Humanitarian Aid Operations available at
www.europa.eu.int/comm/external_relations/see/news 14 Figure quoted in Larry Minear, Tedva Baada and Marc Sommer,’ NATO and Humanitarian Action in the Kosovo Crisis’,
Occasional Paper Series, Institute for International Studies, Brown University, 2000. 15 Reported in US Government Accounting Office European Security GAO-02-174, Washington, D.C. 2002, p58 16 Talentino op.cit. p 43
15
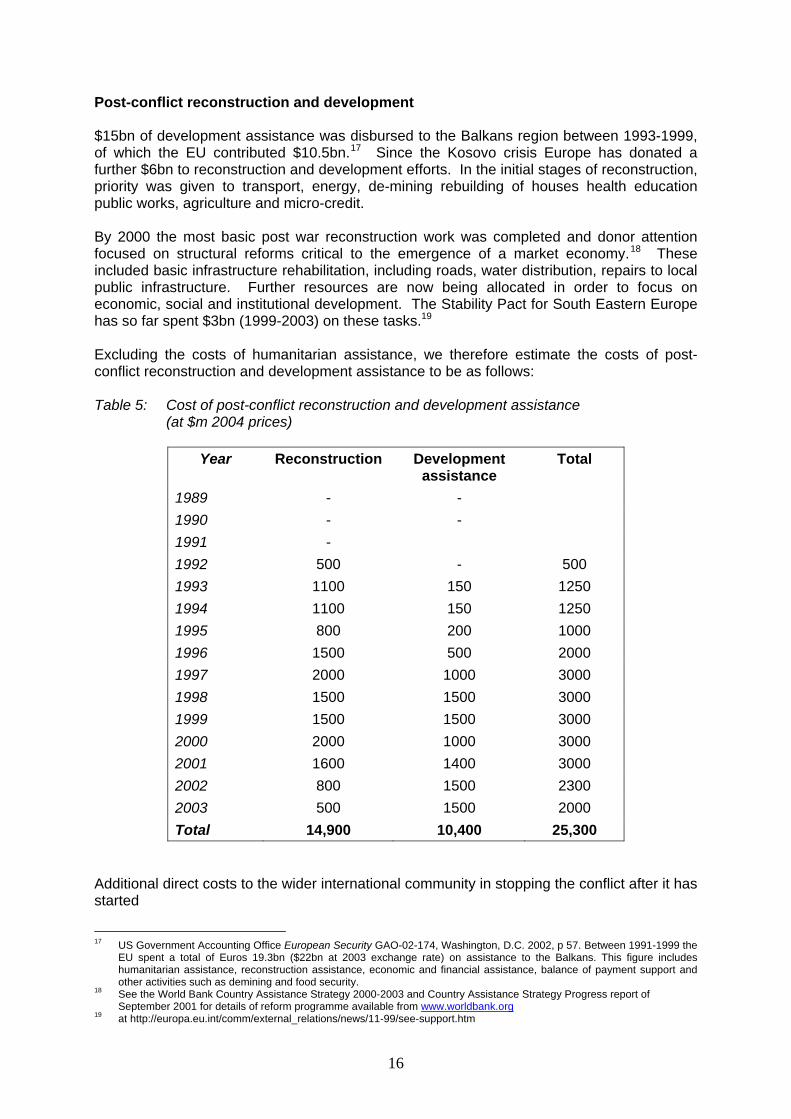
Post-conflict reconstruction and development $15bn of development assistance was disbursed to the Balkans region between 1993-1999, of which the EU contributed $10.5bn.17 Since the Kosovo crisis Europe has donated a further $6bn to reconstruction and development efforts. In the initial stages of reconstruction, priority was given to transport, energy, de-mining rebuilding of houses health education public works, agriculture and micro-credit. By 2000 the most basic post war reconstruction work was completed and donor attention focused on structural reforms critical to the emergence of a market economy.18 These included basic infrastructure rehabilitation, including roads, water distribution, repairs to local public infrastructure. Further resources are now being allocated in order to focus on economic, social and institutional development. The Stability Pact for South Eastern Europe has so far spent $3bn (1999-2003) on these tasks.19 Excluding the costs of humanitarian assistance, we therefore estimate the costs of post-conflict reconstruction and development assistance to be as follows: Table 5: Cost of post-conflict reconstruction and development assistance (at $m 2004 prices)
Year Reconstruction Development assistance
Total
1989 - - 1990 - - 1991 - 1992 500 - 500 1993 1100 150 1250 1994 1100 150 1250 1995 800 200 1000 1996 1500 500 2000 1997 2000 1000 3000 1998 1500 1500 3000 1999 1500 1500 3000 2000 2000 1000 3000 2001 1600 1400 3000 2002 800 1500 2300 2003 500 1500 2000 Total 14,900 10,400 25,300
Additional direct costs to the wider international community in stopping the conflict after it has started
17 US Government Accounting Office European Security GAO-02-174, Washington, D.C. 2002, p 57. Between 1991-1999 the
EU spent a total of Euros 19.3bn ($22bn at 2003 exchange rate) on assistance to the Balkans. This figure includes humanitarian assistance, reconstruction assistance, economic and financial assistance, balance of payment support and other activities such as demining and food security.
18 See the World Bank Country Assistance Strategy 2000-2003 and Country Assistance Strategy Progress report of September 2001 for details of reform programme available from www.worldbank.org
19 at http://europa.eu.int/comm/external_relations/news/11-99/see-support.htm
16
The total cost of military operations intended to stop the conflicts in the Balkans amounts to $42.1bn, of which almost half ($20.47bn) was spent on SFOR and over a quarter (12.5bn) on KFOR. The UNPROFOR mission included 38,599 military personnel and cumulatively cost the international community $4.6bn for the duration of its mandate between February 1992 and March 1995. UNPROFOR was replaced in Bosnia by the NATO Implementation Force (IFOR) which fielded 60,000 troops in the region between December 1995 to December 1996. IFOR’s primary mission was to implement the Military Aspects of the Dayton Peace Agreement. IFOR cost $5bn during its twelve month existence. Its successor, SFOR, cost $4bn in 1997 and $4bn in 1998. The size of SFOR has declined from 32,000 in 1997 to 19,000 in 1998 and 12,000 in 2003. The cumulative cost of IFOR/SFOR amounted to $15bn between 1995-1999.20 On-going expenditures on SFOR for the period 2000-2003 cost an estimated $5.47bn.21 In addition to the NATO led forces three UN missions that had previously operated under the UNPROFOR mandate continued to operate independently of the NATO led operation. The United Nations Preventive Deployment Force (UNPREDEP) which came into existence in March 1995 monitored the border regions of the Former Yugoslav Republic of Macedonia (FYROM) Its mandate ended in February 1999 and cumulatively cost $149.5 million.22 The United Nations Transitional Administration for Eastern Slavonia, Baranja and Western Sirmium (UNTAES) was mandated to ensure security and stability in the South Eastern region of Croatia. The UNTAES mission was terminated on 15 January 1998, with a cumulative costs for the period June 1996- June 1998 at $415.3 million.23. The additional cost of NATO’s military campaign in Kosovo is estimated to have been around $2.5bn.24 In total there were 60,000 NATO troops engaged in the Kosovo campaign in 1999, declining to 45,700 in 2000. Allied forces contributed 38,000 troops to the Kosovo campaign, at a cost of $4bn between 1999 and 2000.25 Since 2000 KFOR troop levels have been reduced. As of August 2003 there were just over 22,100 KFOR troops reducing the annualised costs of KFOR’s presence to just over $1bn per annum in 2003. NATO’s operations in Macedonia, Task force Fox and Allied Harmony, were funded through the KFOR budget.
20 Figure supplied in Andrea Talentino, ‘Bosnia’ in M. E. Brown and R. N. Rosecrance ‘The Case for Conflict Prevention’ in
Michael E. Brown and Richard N Rosecrance (eds), The Costs of Conflict: Prevention and Cure in the Global Arena, Carnegie Commission on Preventing Deadly Conflict, 1999, p27.
21 This was calculated by using figures for US DoD incremental costs of its Balkans operations in US Government Accounting Office Balkans Regional Security and Projected Factor Affecting Regional Stability: Briefing Report to Chairman, Committee Armed Services, House of Representatives, April 2000 GAO/NSIAD-00-125BR, Government Printing Office, Washington DC, April 2000,and by calculating an annualised unit cost for SFOR forces other than the US troops by using UK figures supplied in NAO report by the Comptroller and Auditor General Kosovo The Financial Management of Military Operations, HC 530 1999-2000 London, The Stationary Office, 5 June 2000 p13.
22 Annualised figures provided in UN Department Public Information UNPREDEP Mission Profile Un New York, 16 March 1999 available at www.un.org/Depts/dpkp/dpko/co_mission/unpred_p.htm
23 Annualised figures provided in UN Department for Public Information Croatia –UNTAES available at www.un.org/Dept/DPKO/Mission/untaes_b.htm
24 BBC News Online, 15 October 1999. 25 A unit cost derived from UK estimates of incremental costs to the MoD’s contributions to the SFOR operation has been
used as an approximation of the unit cost of SFOR. A unit cost of $53,000 per annum was arrived at by dividing the force level of 10,500 into the MoD’s incremental level of expenditure in 1999 of £342m and adjusting this figure to 2003 levels. This unit cost was then used to calculate the costs of the non-US force component of SFOR.
17
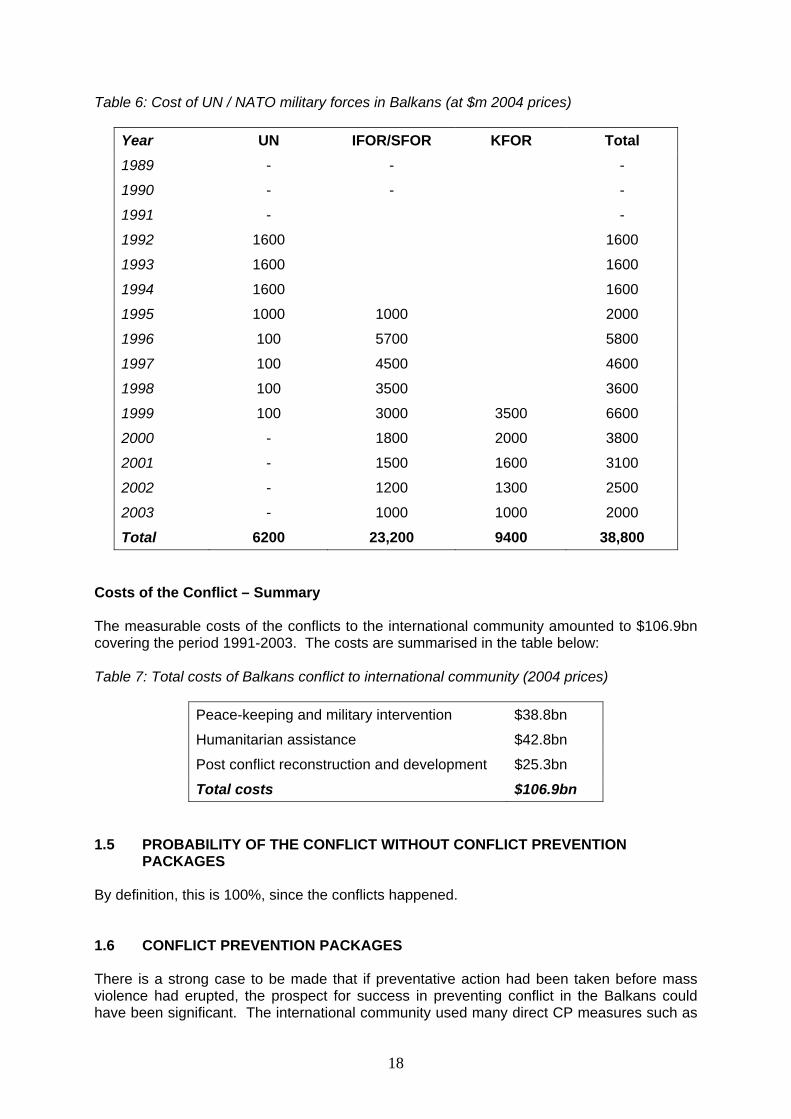
Table 6: Cost of UN / NATO military forces in Balkans (at $m 2004 prices)
Year UN IFOR/SFOR KFOR Total 1989 - - -
1990 - - -
1991 - -
1992 1600 1600
1993 1600 1600
1994 1600 1600
1995 1000 1000 2000
1996 100 5700 5800
1997 100 4500 4600
1998 100 3500 3600
1999 100 3000 3500 6600
2000 - 1800 2000 3800
2001 - 1500 1600 3100
2002 - 1200 1300 2500
2003 - 1000 1000 2000
Total 6200 23,200 9400 38,800 Costs of the Conflict – Summary The measurable costs of the conflicts to the international community amounted to $106.9bn covering the period 1991-2003. The costs are summarised in the table below: Table 7: Total costs of Balkans conflict to international community (2004 prices)
Peace-keeping and military intervention $38.8bn
Humanitarian assistance $42.8bn
Post conflict reconstruction and development $25.3bn
Total costs $106.9bn 1.5 PROBABILITY OF THE CONFLICT WITHOUT CONFLICT PREVENTION PACKAGES By definition, this is 100%, since the conflicts happened. 1.6 CONFLICT PREVENTION PACKAGES There is a strong case to be made that if preventative action had been taken before mass violence had erupted, the prospect for success in preventing conflict in the Balkans could have been significant. The international community used many direct CP measures such as
18
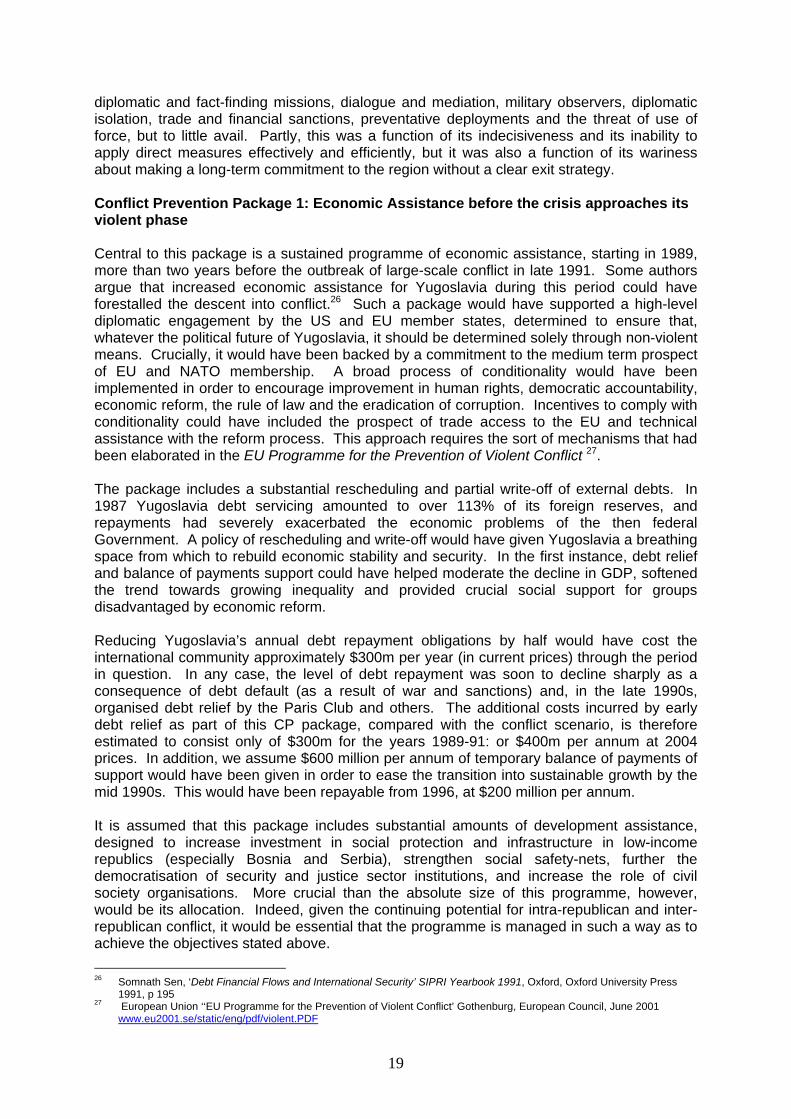
diplomatic and fact-finding missions, dialogue and mediation, military observers, diplomatic isolation, trade and financial sanctions, preventative deployments and the threat of use of force, but to little avail. Partly, this was a function of its indecisiveness and its inability to apply direct measures effectively and efficiently, but it was also a function of its wariness about making a long-term commitment to the region without a clear exit strategy. Conflict Prevention Package 1: Economic Assistance before the crisis approaches its violent phase Central to this package is a sustained programme of economic assistance, starting in 1989, more than two years before the outbreak of large-scale conflict in late 1991. Some authors argue that increased economic assistance for Yugoslavia during this period could have forestalled the descent into conflict.26 Such a package would have supported a high-level diplomatic engagement by the US and EU member states, determined to ensure that, whatever the political future of Yugoslavia, it should be determined solely through non-violent means. Crucially, it would have been backed by a commitment to the medium term prospect of EU and NATO membership. A broad process of conditionality would have been implemented in order to encourage improvement in human rights, democratic accountability, economic reform, the rule of law and the eradication of corruption. Incentives to comply with conditionality could have included the prospect of trade access to the EU and technical assistance with the reform process. This approach requires the sort of mechanisms that had been elaborated in the EU Programme for the Prevention of Violent Conflict 27. The package includes a substantial rescheduling and partial write-off of external debts. In 1987 Yugoslavia debt servicing amounted to over 113% of its foreign reserves, and repayments had severely exacerbated the economic problems of the then federal Government. A policy of rescheduling and write-off would have given Yugoslavia a breathing space from which to rebuild economic stability and security. In the first instance, debt relief and balance of payments support could have helped moderate the decline in GDP, softened the trend towards growing inequality and provided crucial social support for groups disadvantaged by economic reform. Reducing Yugoslavia’s annual debt repayment obligations by half would have cost the international community approximately $300m per year (in current prices) through the period in question. In any case, the level of debt repayment was soon to decline sharply as a consequence of debt default (as a result of war and sanctions) and, in the late 1990s, organised debt relief by the Paris Club and others. The additional costs incurred by early debt relief as part of this CP package, compared with the conflict scenario, is therefore estimated to consist only of $300m for the years 1989-91: or $400m per annum at 2004 prices. In addition, we assume $600 million per annum of temporary balance of payments of support would have been given in order to ease the transition into sustainable growth by the mid 1990s. This would have been repayable from 1996, at $200 million per annum. It is assumed that this package includes substantial amounts of development assistance, designed to increase investment in social protection and infrastructure in low-income republics (especially Bosnia and Serbia), strengthen social safety-nets, further the democratisation of security and justice sector institutions, and increase the role of civil society organisations. More crucial than the absolute size of this programme, however, would be its allocation. Indeed, given the continuing potential for intra-republican and inter-republican conflict, it would be essential that the programme is managed in such a way as to achieve the objectives stated above. 26 Somnath Sen, ‘Debt Financial Flows and International Security’ SIPRI Yearbook 1991, Oxford, Oxford University Press
1991, p 195 27 European Union ‘‘EU Programme for the Prevention of Violent Conflict’ Gothenburg, European Council, June 2001
www.eu2001.se/static/eng/pdf/violent.PDF
19
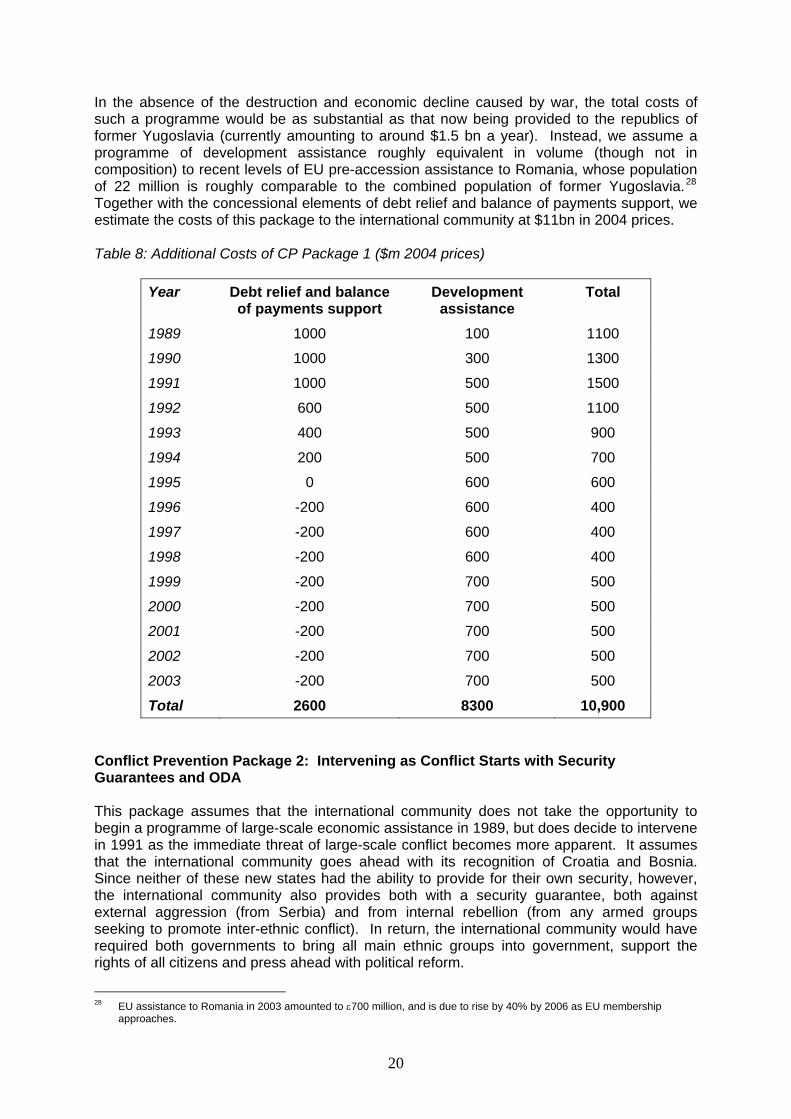
In the absence of the destruction and economic decline caused by war, the total costs of such a programme would be as substantial as that now being provided to the republics of former Yugoslavia (currently amounting to around $1.5 bn a year). Instead, we assume a programme of development assistance roughly equivalent in volume (though not in composition) to recent levels of EU pre-accession assistance to Romania, whose population of 22 million is roughly comparable to the combined population of former Yugoslavia.28 Together with the concessional elements of debt relief and balance of payments support, we estimate the costs of this package to the international community at $11bn in 2004 prices. Table 8: Additional Costs of CP Package 1 ($m 2004 prices)
Year Debt relief and balance of payments support
Development assistance
Total
1989 1000 100 1100
1990 1000 300 1300
1991 1000 500 1500
1992 600 500 1100
1993 400 500 900
1994 200 500 700
1995 0 600 600
1996 -200 600 400
1997 -200 600 400
1998 -200 600 400
1999 -200 700 500
2000 -200 700 500
2001 -200 700 500
2002 -200 700 500
2003 -200 700 500
Total 2600 8300 10,900 Conflict Prevention Package 2: Intervening as Conflict Starts with Security Guarantees and ODA This package assumes that the international community does not take the opportunity to begin a programme of large-scale economic assistance in 1989, but does decide to intervene in 1991 as the immediate threat of large-scale conflict becomes more apparent. It assumes that the international community goes ahead with its recognition of Croatia and Bosnia. Since neither of these new states had the ability to provide for their own security, however, the international community also provides both with a security guarantee, both against external aggression (from Serbia) and from internal rebellion (from any armed groups seeking to promote inter-ethnic conflict). In return, the international community would have required both governments to bring all main ethnic groups into government, support the rights of all citizens and press ahead with political reform.
28 EU assistance to Romania in 2003 amounted to ε700 million, and is due to rise by 40% by 2006 as EU membership
approaches.
20
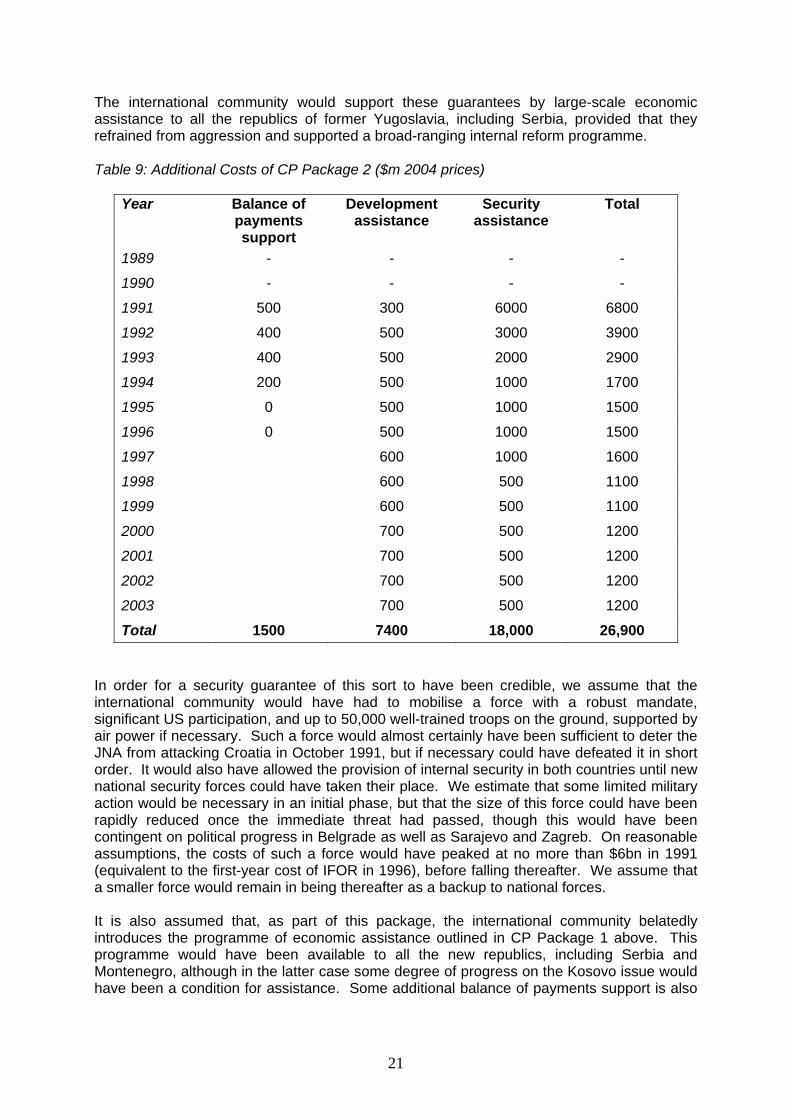
The international community would support these guarantees by large-scale economic assistance to all the republics of former Yugoslavia, including Serbia, provided that they refrained from aggression and supported a broad-ranging internal reform programme. Table 9: Additional Costs of CP Package 2 ($m 2004 prices)
Year Balance of payments support
Development assistance
Security assistance
Total
1989 - - - -
1990 - - - -
1991 500 300 6000 6800
1992 400 500 3000 3900
1993 400 500 2000 2900
1994 200 500 1000 1700
1995 0 500 1000 1500
1996 0 500 1000 1500
1997 600 1000 1600
1998 600 500 1100
1999 600 500 1100
2000 700 500 1200
2001 700 500 1200
2002 700 500 1200
2003 700 500 1200
Total 1500 7400 18,000 26,900 In order for a security guarantee of this sort to have been credible, we assume that the international community would have had to mobilise a force with a robust mandate, significant US participation, and up to 50,000 well-trained troops on the ground, supported by air power if necessary. Such a force would almost certainly have been sufficient to deter the JNA from attacking Croatia in October 1991, but if necessary could have defeated it in short order. It would also have allowed the provision of internal security in both countries until new national security forces could have taken their place. We estimate that some limited military action would be necessary in an initial phase, but that the size of this force could have been rapidly reduced once the immediate threat had passed, though this would have been contingent on political progress in Belgrade as well as Sarajevo and Zagreb. On reasonable assumptions, the costs of such a force would have peaked at no more than $6bn in 1991 (equivalent to the first-year cost of IFOR in 1996), before falling thereafter. We assume that a smaller force would remain in being thereafter as a backup to national forces. It is also assumed that, as part of this package, the international community belatedly introduces the programme of economic assistance outlined in CP Package 1 above. This programme would have been available to all the new republics, including Serbia and Montenegro, although in the latter case some degree of progress on the Kosovo issue would have been a condition for assistance. Some additional balance of payments support is also
21
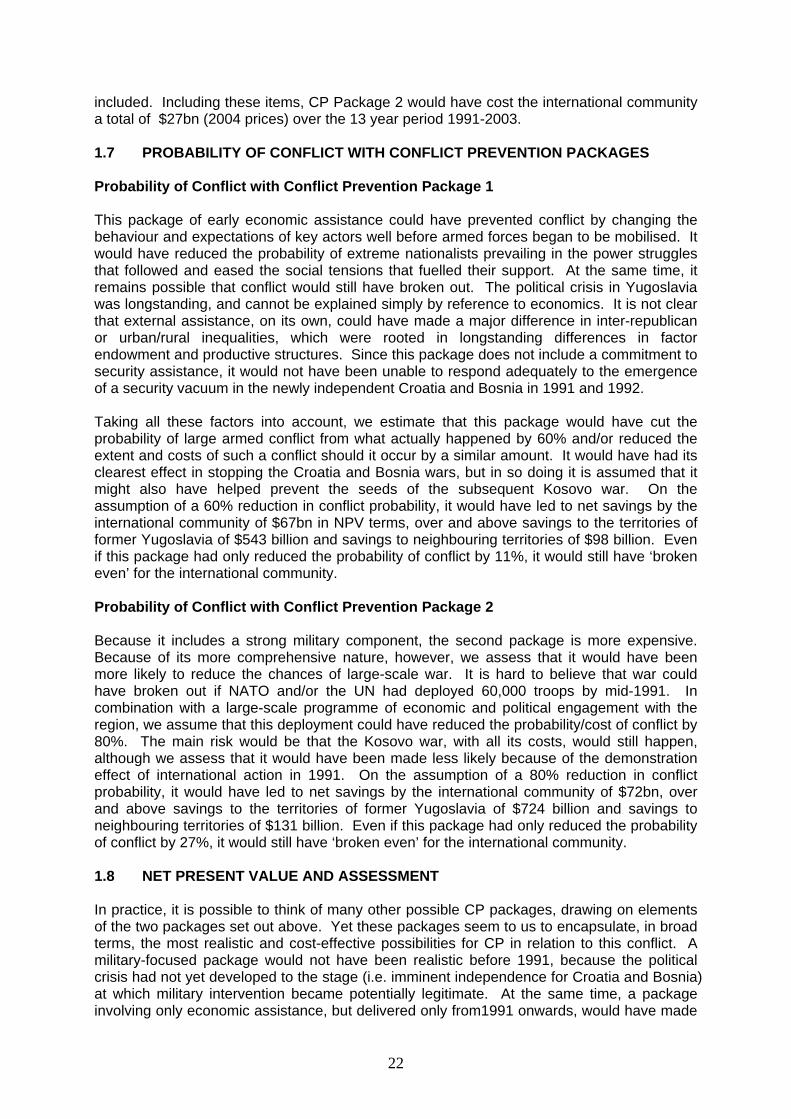
included. Including these items, CP Package 2 would have cost the international community a total of $27bn (2004 prices) over the 13 year period 1991-2003. 1.7 PROBABILITY OF CONFLICT WITH CONFLICT PREVENTION PACKAGES Probability of Conflict with Conflict Prevention Package 1 This package of early economic assistance could have prevented conflict by changing the behaviour and expectations of key actors well before armed forces began to be mobilised. It would have reduced the probability of extreme nationalists prevailing in the power struggles that followed and eased the social tensions that fuelled their support. At the same time, it remains possible that conflict would still have broken out. The political crisis in Yugoslavia was longstanding, and cannot be explained simply by reference to economics. It is not clear that external assistance, on its own, could have made a major difference in inter-republican or urban/rural inequalities, which were rooted in longstanding differences in factor endowment and productive structures. Since this package does not include a commitment to security assistance, it would not have been unable to respond adequately to the emergence of a security vacuum in the newly independent Croatia and Bosnia in 1991 and 1992. Taking all these factors into account, we estimate that this package would have cut the probability of large armed conflict from what actually happened by 60% and/or reduced the extent and costs of such a conflict should it occur by a similar amount. It would have had its clearest effect in stopping the Croatia and Bosnia wars, but in so doing it is assumed that it might also have helped prevent the seeds of the subsequent Kosovo war. On the assumption of a 60% reduction in conflict probability, it would have led to net savings by the international community of $67bn in NPV terms, over and above savings to the territories of former Yugoslavia of $543 billion and savings to neighbouring territories of $98 billion. Even if this package had only reduced the probability of conflict by 11%, it would still have ‘broken even’ for the international community. Probability of Conflict with Conflict Prevention Package 2 Because it includes a strong military component, the second package is more expensive. Because of its more comprehensive nature, however, we assess that it would have been more likely to reduce the chances of large-scale war. It is hard to believe that war could have broken out if NATO and/or the UN had deployed 60,000 troops by mid-1991. In combination with a large-scale programme of economic and political engagement with the region, we assume that this deployment could have reduced the probability/cost of conflict by 80%. The main risk would be that the Kosovo war, with all its costs, would still happen, although we assess that it would have been made less likely because of the demonstration effect of international action in 1991. On the assumption of a 80% reduction in conflict probability, it would have led to net savings by the international community of $72bn, over and above savings to the territories of former Yugoslavia of $724 billion and savings to neighbouring territories of $131 billion. Even if this package had only reduced the probability of conflict by 27%, it would still have ‘broken even’ for the international community. 1.8 NET PRESENT VALUE AND ASSESSMENT In practice, it is possible to think of many other possible CP packages, drawing on elements of the two packages set out above. Yet these packages seem to us to encapsulate, in broad terms, the most realistic and cost-effective possibilities for CP in relation to this conflict. A military-focused package would not have been realistic before 1991, because the political crisis had not yet developed to the stage (i.e. imminent independence for Croatia and Bosnia) at which military intervention became potentially legitimate. At the same time, a package involving only economic assistance, but delivered only from1991 onwards, would have made
22
little if any difference to the descent into war. A more robust military-led package in 1992 or 1993 would have been better than delaying robust intervention until 1995, but it would have had no clear advantages, and many clear disadvantages, compared with the 1991 intervention examined in Package 2. The two Packages are shown to be cost-effective for the IC if they reduce the probability of conflict by 11% and 27% respectively. If the benefits of peace to the directly affected territories and neighbours are also included, the breakeven probabilities are even lower, at 1% and 3% respectively. The cost of the military component of CP Package 2 is based on the deployment of a large NATO force, initially 50,000-strong, on the ground as a visible counter to the threat of aggression by Yugoslavia against Croatia and Bosnia, as well as a contribution to intra-state peace enforcement. It assumes that some element of actual war-fighting would have been needed. In practice, however, a much smaller deployment might have been sufficient to dissuade aggression before it started, and to provide an environment in which all internal parties to the Croatian and Bosnian conflicts could have negotiated peaceful internal settlements. If this had been the case, the size and duration of the military deployment could have been significantly less, reducing the cost of the security component by 50%, and reducing the total cost of this Package by around a third.
23
Afghanistan 1989 - 2003
Malcolm Chalmers and Hooman Peimani
24
2.1 EXECUTIVE SUMMARY This case study looks at possible packages for the prevention of the prolonged conflicts in Afghanistan between 1989 and 2003. It thus encompasses the departure of Soviet troops in February 1989, the post-Soviet Najibullah government that lasted until June 1992, the subsequent civil war that led to the dominance of the Taliban, the Taliban’s fall in November 2001, and the subsequent post-civil war era, including the creation of an Afghan central government, up until December 2003. The study makes estimates of the costs of these multiple conflicts, to the international community, neighbouring Iran and Pakistan and Afghanistan itself. By far the biggest component of these costs relates to the impact that the ongoing Afghan war had on the global drugs market and on international terrorism, culminating in the 9/11 attacks. The study examines two possible CP packages, both of which involve support for a hypothetical peace accord between the Afghan regime and the Mujahedin groups in 1989-90. The first is a financial assistance package, totalling $15 billion (in 2004 prices) over 15 years. The second includes both UN military forces and an enhanced financial assistance programme, and costs $100 billion in total. The main reason for the relatively high level of expense of both packages is that Afghanistan had already experienced a decade of civil war, had been heavily armed (on both sides) by foreign powers and was facing considerable obstacles to a negotiated peace. The retrospective case for the cost-effectiveness of CP in Afghanistan rests heavily on the assumption that Afghanistan’s war had a significant effect on the scale of international terrorism (including the 9/11 attacks) and/or the global drugs problem. If such a relationship did exist, making even modest inroads into the costs of these global problems would have made CP worthwhile. In this study, we assume that the creation of a peaceful Afghanistan in the 1990s would have reduced the probability of 9/11 by 50%, reduced the total costs of dealing with international terrorism by 20%, and reduced the total costs incurred as a result of the international drugs trade by 5%. On these assumptions, both CP Packages would have been worthwhile to the IC at relatively low breakeven probabilities of success (7% and 50% respectively). If these global costs are excluded, the retrospective cost-effectiveness of the packages to the IC is very low indeed and CP would not have been cheaper (for the IC) than letting the conflict continue. Finally, if the indirect costs to the IC are excluded, but account is taken of the high costs of conflict to Afghanistan and its neighbours, the first CP Package generates a modest positive return, but the second does not. In the latter case, the sheer scale of the projected Package (involving an initial deployment of 30,000 troops, and the provision of a level of ODA larger in absolute terms than that provided to any other aid recipient) means that its projected costs would have exceeded the combined benefits to the IC, directly-affected territory and neighbours.
2.2 INTRODUCTION This case study looks at conflict in Afghanistan between 1989 and 2003. It thus encompasses the period from the departure of Soviet troops in February 1989, the post-Soviet Najibullah government that lasted until June 1992 and the civil war in the post-Najibullah era leading to the rise of the Taliban and its control over most of the country. Finally, it includes the Taliban’s fall in November 2001 and the subsequent period of the post-civil war era, including the creation of an Afghan central government up until December 2003. The study makes estimates of the costs of these multiple conflicts to the international community, to neighbouring Iran and Pakistan and to Afghanistan itself. It then examines two possible CP packages, both of which involve support for a hypothetical peace accord between the Najibullah regime and the armed Mujahedin groups. The first is an economic assistance package, totalling around $15 billion over 15 years. The second also includes the provision of UN military forces and a much- enhanced economic assistance programme. The study estimates the reduction in the probability of conflict as a result of each of these packages and thus whether either of the packages could have prevented the resumption of civil war. Before 1989, there was significant international engagement in Afghanistan, both through large-scale military support to the Government by the Soviet Union, and by major Western countries, who assisted the anti-Soviet armed struggle of the Mujahedin groups. Military aid accounted for the bulk of Western engagement, with humanitarian assistance for the operation of the Afghan refugee camps in Pakistan. Extensive military aid from both sides stopped in February 1989 when the Soviet troops left Afghanistan, although small-scale Western military assistance continued until 1992, when the Mujahedin groups overthrew the Kabul Communist regime. Humanitarian assistance continued on an on-and-off basis until the Taliban's fall. At the very end of the period, the Western countries directly intervened in Afghanistan in the aftermath of the September 2001 terrorist attacks on the United States. 2.3 PEACE AND CONFLICT SCENARIOS Conflict Scenario: what actually happened The period from 1989 to 2003 was one of almost continuous warfare in Afghanistan. The Mujahedin war against the Soviet forces and the pro-Soviet Kabul government (which had begun in the early 1980's) lasted until June 1992. This civil war took the form of war against the Soviet forces until 1989, when they finally withdrew from Afghanistan. The Soviet withdrawal did not end the war, which changed its focus to one fought between the Mujahedin and the weakened Kabul regime. The regime was further weakened in December 1991 when the Soviet Union's collapse cut its only source of military and financial assistance. In June 1992, the Mujahedin forces captured Kabul, but the subsequent establishment of an Islamic regime ended the civil war only for a short while. A coalition government consisting of the major Mujahedin groups representing rival ethnic groups failed to overcome conflicts over shares of government. Civil war resumed late in 1992 and lasted until the Taliban's fall. The new round of civil war further devastated Afghanistan and created widespread hardship. The territories controlled by different groups expanded and contracted frequently because of constant fighting between and among them. Unsurprisingly, there was a growing desire for an end to the Mujahedin era among the Afghans. This popular demand for a strong central government coincided with those of countries (notably Pakistan) interested in a strong, but sympathetic, Afghan government.
26
The, primarily Pashtun, Taliban movement came to the political scene in 1994 with a promise to end the civil war, but its emergence intensified it as they sought to subjugate all other rival groups. After two years of fighting, they captured Kabul in 1996 and pushed out the mainly non-Pashtun groups. By that time, over half the country was under their control, but the territory to the north and west of Kabul was still controlled by Tajik, Hazara and Uzbek groups. Then, in early 1999, the Taliban invaded northern Afghanistan, pushing its opponents into the 10 percent of the country dominated by Uzbeks and Tajiks, now formed into the Northern Alliance. Iran and Russia became its main supporters, with backing also from India, Tajikistan and Uzbekistan. In the aftermath of the September 11 attacks, the Northern Alliance, now reinforced by Iran and Russia and enjoying military assistance from the United States, recaptured most of the country, excluding the southern and south-eastern territories dominated by Pashtun tribes who, with American assistance, rose against the Taliban regime in their territories a few weeks before its demise in November 2001. Since that time, various Western countries have contributed military assets to the coalition forces fighting the remnants of the Taliban and Al-Qaeda. The Western countries also helped the creation of a peacekeeping force, the International Security Assistance Force (ISAF). The 5,500-strong force has been a major factor in enabling the Afghan government to function in Kabul. NATO took charge of the force in August 2003. By February 2004, in addition, twelve ‘provincial reconstruction’ units had been deployed in centres beyond Kabul and a further four teams (led by UK, Italy, Turkey and Norway) are due to deploy by summer 2004. NATO and allied countries have also undertaken to train and arm the Afghan National Army (ANA) and the Afghan police force. Non-military engagement has been reflected in efforts to establish a functional Afghan central government supported by all the interested influential parties. Those efforts included the Berlin conference of December 2001, the negotiations between and among the anti-Taliban groups and their main supporters (Iran and Russia) and also among Afghanistan's neighbours (Iran, Pakistan, Tajikistan, Turkmenistan and Uzbekistan). They led to the convention of the Loya Jirga (grand assembly of influential Afghan figures) and to the setting up the constitutional Loya Jirga of December 2003, which adopted a constitution on 5 January 2004. Gathered in the Tokyo donor conference of January 2002, Western (EU, USA and Japan) and non-Western (Iran, Saudi Arabia, India, Pakistan and South Korea) donors committed themselves to provide $4.5bn over a five-year period (2002-6) towards Afghanistan's reconstruction.29 A fraction of the 2003 approved budget of $87 billion for the operation of the US military in Iraq and Afghanistan was dedicated to Afghanistan, of which, according to unconfirmed reports, about $1.6 billion will be spent on development projects.30
Despite these efforts, Afghanistan remains riven with conflict. The Government has not yet achieved control over much of its territory. Al Qaeda and Taliban forces remain active in much of the country, and disputes between local warlords still frequently escalate into large-scale armed conflict. There is little doubt that a rapid withdrawal of international forces would again plunge Afghanistan into civil war. Even with those forces in place, the prospects for avoiding conflict remain uncertain (as we explore in the prospective Afghanistan case study).
29 Council of Foreign Relations, "How Much Will Humanitarian Aid for Afghanistan cost?" Terrorism: Questions and Answers,
2004, Accessed: 16 January 2004. 30 Anne Carlin, " How to Spend Wisely in Afghanistan," The New York Times, 26 January 2004.
27
Peace Scenario This scenario outlines what could possibly have happened had the international community chosen to engage in Afghanistan during the period immediately after the Soviet withdrawal but before the capture of Kabul by the Mujahedin. It assumes that unified pressure from the international community, supported by a package of incentives, would have led to a ceasefire between most if not all of the major parties to the conflict. The reluctance of the Soviet Union and the Western countries to finance their respective allies after the withdrawal of Soviet troops, together with growing dissatisfaction at the costs of war by economically-exhausted regional mentors (Iran and Pakistan) could have provided an opportunity for such an initiative. Moreover, since the two sides were unable to eliminate each other in the foreseeable future, incentives for settlement increase further. Although both sides violate the agreed ceasefire frequently, negotiations continue between 1989 and 1991, leading to a peace accord and the creation of a government of national reconciliation in 1991. Under United Nations auspices, it provided for a power-sharing arrangement, for a general amnesty for both sides' supporters and fighters, for the release of their prisoners, for the demobilisation of most of their troops and the integration of the rest into a national military force and for elections in 1992. The peace scenario assumes that both the wider international community and Afghanistan's neighbours (Iran and Pakistan) are committed to using their political influence and economic means to persuade the parties to the conflict to end their hostility in favour of a peaceful negotiated settlement. The scenario does not assume a total absence of hostility in the post-peace accord era, and it is to be expected that some elements on both sides resort to arms to achieve their political, personal or criminal objectives. The availability of a large number of small weapons, the dissatisfaction of many demobilised ex-fighters, poverty and high unemployment resulted in many small-scale politically or criminally motivated armed clashes. While some of these armed clashes develop into significant local conflicts, none of them escalate to the level of a large-scale civil war. This scenario assumes that, in parallel with the departure of Soviet troops from Afghanistan in 1989, a strong international CP effort (see below for more details) helps persuade the Mujahedin to accept negotiations with the Kabul Communist regime and to find a peaceful settlement. While proven to be a force to reckon with, in 1989 the Mujahedin were years away from overthrowing the Kabul regime. The two sides were both exhausted and concerned about the loss of foreign support as the Soviet withdrawal from Afghanistan deprived both sides of most of the material and financial support of their respective foreign supporters (in the Soviet Union and in Pakistan/ the US). Afghanistan was economically exhausted, it had lost most of its limited and inadequate infrastructural, industrial and agricultural capabilities due to 11 years of heavy fighting, and there had been massive forcible displacement of the rural population of whom most lived in Iran and Pakistan as refugees. Given the right political circumstances, a strong coalition of domestic interests could have been mobilised in support of a restoration of peace. A united commitment to a peace settlement by the international community is crucial to the plausibility of this scenario. For the purposes of this exercise, therefore, it is assumed that, concerned about its enormous domestic problems and the gradual loss of its Warsaw Pact allies, Moscow would have backed the agreement. It is also assumed that it would have the blessing of the Mujahedin's Western backers, who would have seen no merit in the civil war's continuity once their Cold War enemy was falling apart. Finally, Iran and Pakistan would have blessed the agreement to end instability in their neighbouring country and to ease its heavy economic burden on them, including the cost of housing millions of Afghan refugees. Their respective Afghan protégés' participation in the emerging Afghan reconciliation government would have assured them of the latter's favourable policy towards them.
28
Finally, the peace scenario assumes the creation of a new national political system (probably involving some form of elections) that is broadly acceptable to the former enemies and that helps to initiate a progressive process of stabilisation during the period from 1992 to 2003. It is assumed that a reconstruction programme begins to build a basic infrastructure, to rehabilitate agriculture to a significant extent and to establish a small industrial sector. As discussed below, substantial international support would have been a key determinant of the success of such a programme. 2.4 ADDITIONAL ANNUAL COSTS OF THE CONFLICT SCENARIO Additional costs to the directly-affected territory The human and psychological costs of years of devastating war are not directly quantifiable, but it is possible to estimate the annual loss for Afghanistan of national income as a result of the conflict scenario, compared with the peace scenario, during the period 1989-2003. The World Bank estimates Afghanistan's GDP, presumably that of its formal economy, to be about $3.5 billion (at 2003 prices) in 1981.31 During the 1980s, its average annual growth rate was -2 percent, which rose to 4.6 percent during the period 1990-1998. The end of the civil war and subsequent reconstruction activities pushed the growth rate to 30 percent in 2002.32 For 2000, another source estimates the GDP to be about $4 billion, which is consistent with the mentioned pattern of growth.33 Given this situation, it is assumed that Afghanistan's annual income was $3.3 billion in 1989, which gradually grew, including five years of 0 percent annual growth, to about $4.0 billion in 2000 and 2001. It then grew by 30 percent in 2002 and by another 30 percent in 2003. In the case of the peace scenario, however, it can be assumed that national income would have grown rapidly in the period of immediate post-conflict reconstruction, not least because peace would likely have been accompanied by the return of between four and five million of its nationals, including most of its highly educated ones, who left the country during the conflict era. Thus we assume $3.6 billion of national income for 1989 is increased by 10 percent in 1990 and another 10 percent in 1991. As confidence in stability begins to build, more refugees return and reconstruction gains momentum. It rises by 25 percent in 1992. The successful elections in that year then encourages three consecutive 20 percent increases in 1993, 1994 and 1995, helped both by larger foreign assistance packages and the better performance of the Afghan economy. From 1996 to 2003, the national income grew by a steady 5 percent annual increase, as the economy becomes fully functional. In the absence of reliable statistics on the government and the armed opposition spending during the period 1988 to 2003, it is assumed that the government and the anti-government forces spent at least $1 billion annually on defence: i.e. at least one-third of national income. By comparison, the estimated annual military expenditure of the Afghan government alone in 2002 was $525.2 million, despite its heavy reliance on the US-led coalition force for its security.34 We assume that military expenditure could have fallen somewhat in the latter years of the peace scenario, consequent upon consolidation of rival factions.
31 World Bank, Afghanistan at a Glance, 9 September 2003. 32 Ibid. 33 Government of Canada. 34 "Afghanistan: Military," AllRefer.com, 2004, accessed: 25 January 2004.
29
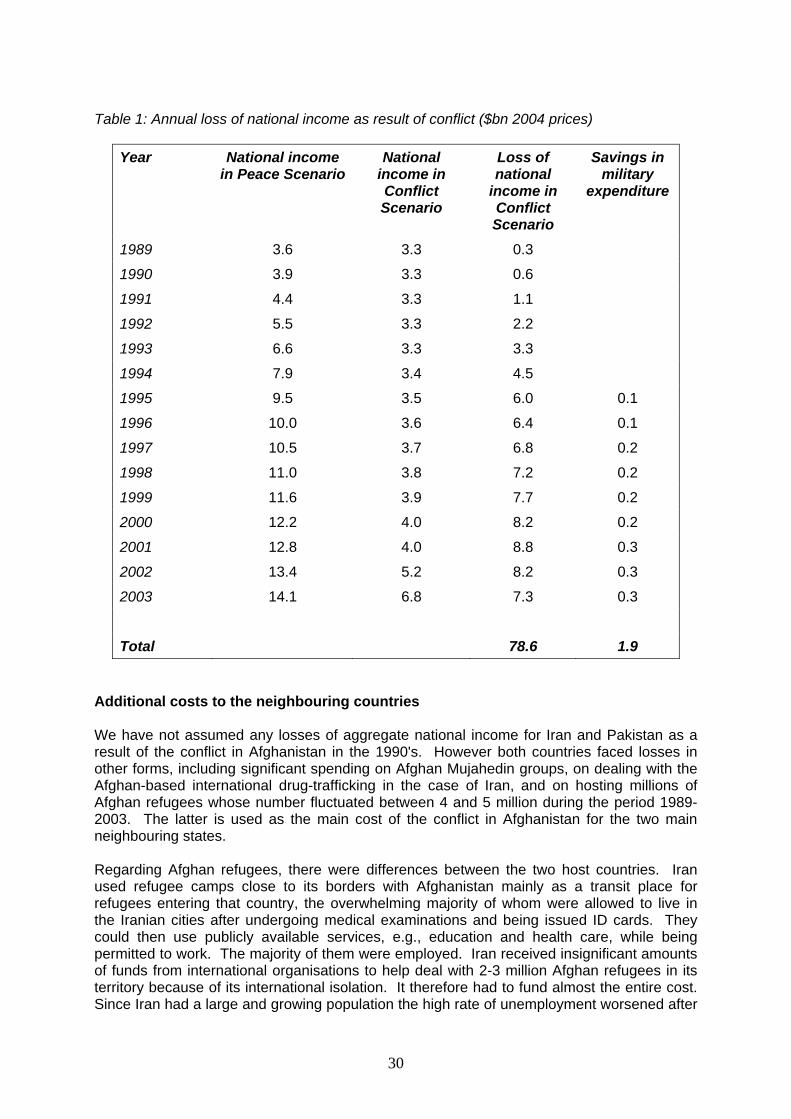
Table 1: Annual loss of national income as result of conflict ($bn 2004 prices)
Year National income in Peace Scenario
National income in Conflict Scenario
Loss of national
income in Conflict Scenario
Savings in military
expenditure
1989 3.6 3.3 0.3
1990 3.9 3.3 0.6
1991 4.4 3.3 1.1
1992 5.5 3.3 2.2
1993 6.6 3.3 3.3
1994 7.9 3.4 4.5
1995 9.5 3.5 6.0 0.1
1996 10.0 3.6 6.4 0.1
1997 10.5 3.7 6.8 0.2
1998 11.0 3.8 7.2 0.2
1999 11.6 3.9 7.7 0.2
2000 12.2 4.0 8.2 0.2
2001 12.8 4.0 8.8 0.3
2002 13.4 5.2 8.2 0.3
2003 14.1 6.8 7.3 0.3
Total 78.6 1.9 Additional costs to the neighbouring countries We have not assumed any losses of aggregate national income for Iran and Pakistan as a result of the conflict in Afghanistan in the 1990's. However both countries faced losses in other forms, including significant spending on Afghan Mujahedin groups, on dealing with the Afghan-based international drug-trafficking in the case of Iran, and on hosting millions of Afghan refugees whose number fluctuated between 4 and 5 million during the period 1989-2003. The latter is used as the main cost of the conflict in Afghanistan for the two main neighbouring states. Regarding Afghan refugees, there were differences between the two host countries. Iran used refugee camps close to its borders with Afghanistan mainly as a transit place for refugees entering that country, the overwhelming majority of whom were allowed to live in the Iranian cities after undergoing medical examinations and being issued ID cards. They could then use publicly available services, e.g., education and health care, while being permitted to work. The majority of them were employed. Iran received insignificant amounts of funds from international organisations to help deal with 2-3 million Afghan refugees in its territory because of its international isolation. It therefore had to fund almost the entire cost. Since Iran had a large and growing population the high rate of unemployment worsened after
30
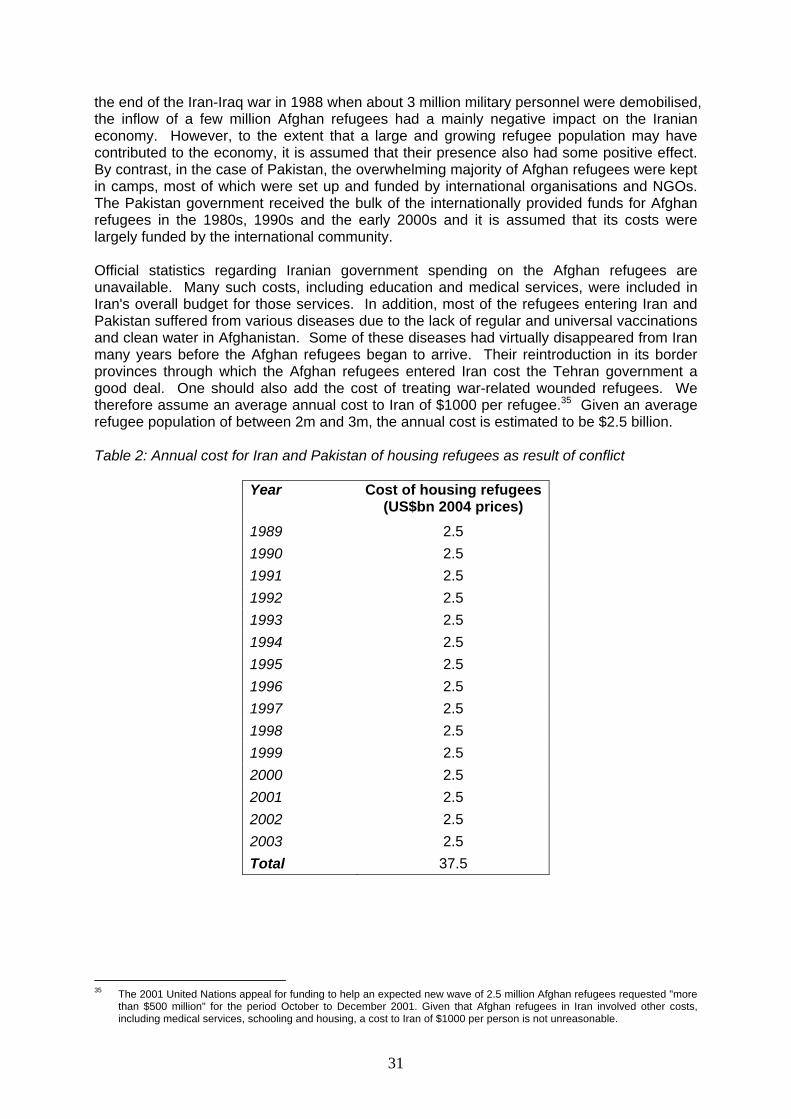
the end of the Iran-Iraq war in 1988 when about 3 million military personnel were demobilised, the inflow of a few million Afghan refugees had a mainly negative impact on the Iranian economy. However, to the extent that a large and growing refugee population may have contributed to the economy, it is assumed that their presence also had some positive effect. By contrast, in the case of Pakistan, the overwhelming majority of Afghan refugees were kept in camps, most of which were set up and funded by international organisations and NGOs. The Pakistan government received the bulk of the internationally provided funds for Afghan refugees in the 1980s, 1990s and the early 2000s and it is assumed that its costs were largely funded by the international community. Official statistics regarding Iranian government spending on the Afghan refugees are unavailable. Many such costs, including education and medical services, were included in Iran's overall budget for those services. In addition, most of the refugees entering Iran and Pakistan suffered from various diseases due to the lack of regular and universal vaccinations and clean water in Afghanistan. Some of these diseases had virtually disappeared from Iran many years before the Afghan refugees began to arrive. Their reintroduction in its border provinces through which the Afghan refugees entered Iran cost the Tehran government a good deal. One should also add the cost of treating war-related wounded refugees. We therefore assume an average annual cost to Iran of $1000 per refugee.35 Given an average refugee population of between 2m and 3m, the annual cost is estimated to be $2.5 billion. Table 2: Annual cost for Iran and Pakistan of housing refugees as result of conflict
Year Cost of housing refugees (US$bn 2004 prices)
1989 2.5 1990 2.5 1991 2.5 1992 2.5 1993 2.5 1994 2.5 1995 2.5 1996 2.5 1997 2.5 1998 2.5 1999 2.5 2000 2.5 2001 2.5 2002 2.5 2003 2.5 Total 37.5
35 The 2001 United Nations appeal for funding to help an expected new wave of 2.5 million Afghan refugees requested "more
than $500 million" for the period October to December 2001. Given that Afghan refugees in Iran involved other costs, including medical services, schooling and housing, a cost to Iran of $1000 per person is not unreasonable.
31
Additional direct costs to the wider international community in providing emergency assistance and in coping with other costs from the conflict For most of the period, costs to the international community from the conflict in Afghanistan were relatively modest, reflecting the lack of international engagement with the country. Estimates for 1989-2000 are based on available statistics on OECD countries' ODA to Afghanistan. 36 In addition, we include UNHCR costs of supporting around 2.5 million refugees in Pakistan estimated at $50 million per annum. During 2002, the international community spent $700m on humanitarian and relief efforts in Afghanistan and its neighbours, including supporting refugee return. It was less successful in meeting its other commitments. In addition, $420mn was spent on reconstruction and $200mn for direct budget support to the Government.37 The pace of spending continued to be restricted by the poor security situation. We also attribute some of the additional costs to the IC of international terrorism and the narcotics trade to the conflict in Afghanistan, given the latter’s role as a safe haven for Al Qaeda through the 1990s and its dominance of global opium production. With regard to international terrorism, a series of incidents during the 1990s were directly related to Al Qa’eda, beginning with the failed attack on the World Trade Centre in 1993, the attacks on US embassies in Kenya and Tanzania in 1998 and the crippling of USS Cole in 2000. As UK Foreign Secretary Jack Straw recently argued:
‘What the international community should have done is to heed the earlier warnings about the nature of Al-Qa’eda and to have taken earlier action to deal with Al-Qa’eda and the failing state which was harbouring it, which was Afghanistan. Had we done that, we might have avoided September 11 and everything that followed.’38
The direct costs of the destruction in New York on September 11 2001 amounted to around $40 billion.39 These events might still have taken place in the absence of the protracted Afghan wars of the 1990s. However, it is reasonable to suggest that the availability of Afghanistan as a centre for recruitment and training of large numbers of terrorist operatives, as well as a safe haven for Al Qa’eda leaders and associates involved in planning international terrorism, may have made the organisation of the events of 9/11 easier than it might otherwise have been. Certainly, this is an assumption that most governments have now accepted and which was the main basis upon which the subsequent intervention in Afghanistan has been justified. On the other hand, given that the socio-political and ideological causes of 9/11 were not primarily a result of events in Afghanistan, it would be simplistic to rule out the possibility of 9/11 even after a stable Afghan peace. On balance, therefore, we assume that the risk of 9/11 would have been reduced by 50% in the event of successful CP in Afghanistan. We can therefore estimate the additional direct costs to the US as being $20 billion spread evenly between 2001, 2002 and 2003.
36 OECD and World Bank, ‘Aid Charts for Recipient Countries and Territories – Afghanistan’, OECD, 2003. Many estimates of
assistance allocated since 2001 do not make a distinction between military and non-military components, between pledged amounts and actual transfers, and between amounts spent on projects in Afghanistan and those allocated to include the operational cost of aid delivering agencies, NGOs, UN, and the EU in Afghanistan, including the hefty salaries of their foreign employees. Unless otherwise stated, figures apply to all mentioned amounts.
37 World Bank, Afghanistan Transitional Support Strategy, March 2003, p. 6; Barnett Rubin and Humayun Hamidzada, Afghanistan Reconstruction, Center for International Cooperation, 2003.
38 ‘ We should have hit al-Qa’eda sooner’, Daily Telegraph, 20 March 2004. 39 Robert Looney, Strategic Insights, Volume I, Issue 6 (August 2002).
32
In addition, a number of recent studies have estimated the global cost of countering international terrorism (including inefficiencies in trade, security costs) at around 0.3% of global GDP, equivalent to $90 billion per year.40 We do not include other wider economic costs incurred as a result of September 11, though it would be possible to do so. In the event of the peace scenario in Afghanistan, we assume these costs could have been reduced by 20% during the period 1995-2003: a saving of $18 billion per year by the end of this period. The saving is less in earlier years, reflecting the lower levels of security precautions at that time. The sensitivity analysis at the end of this paper will explore the implications of varying this assumption. From small beginnings, opium poppy production in Afghanistan grew fast during the wars of 1980-2000.41 By the mid 1990s, it dominated the supply to world markets, accounting for three quarters of heroin reaching Western Europe. In the peace scenario, we assume that this level of production decreases significantly as Government control of its territory expands and alternative economic opportunities are created. If this reduction in supply had resulted in a significant reduction in total availability in global markets, the benefits would have been considerable. In neighbouring Iran, Pakistan and Central Asia, as well as further afield in Afghanistan, Europe and the US, increased consumption of heroin and other narcotics played a key role in both large-scale organised crime and small-scale criminality. In the UK (90% of whose heroin originates in opium from Afghanistan), drug use has been a key factor in the rapid growth in prison population over the last decade. Reducing global access to heroin might, therefore, have had significant social and economic benefits. The causal relationships are too complex and under-explored to discuss in this paper. For the purposes of our calculation, however, we assume that the total global costs of narcotic misuse are at least $200 billion and that these costs would have been reduced by 5% if supply from Afghanistan were to be reduced to a fraction of its current level without full transfer of production elsewhere.42 These savings, it is assumed, would be progressively realised from 1992 onwards in the peace scenario for Afghanistan.
40 The IMF estimated that the loss of US output resulting from terrorism related costs could be as high as 0.75% of US GDP.
A 2002 CBO study estimated terrorism directly cost the US about 0.3% of non-farm GDP, and reduced total factor productivity by around 0.3%. Robert Keleher, ‘The Economic Costs of Terrorism’, Joint Economic Committee, US Congress, May 2002, and Geoff Raby, DFAT Australia, ‘The Costs of Terrorism and the benefits of cooperating to combat terrorism’, 24 February 2003 provide useful surveys of the literature, including these results.
41 Draft Technical Annex 2 to Chapter 1 of World Bank et al , Securing Afghanistan’s Future, 2004. 42 This estimate takes into account drug control budgets ($33 billion in the US alone), cocaine and heroin consumer spending
($80 billion in the US and Europe), as well as spending on prisons, crime, personal security.
33
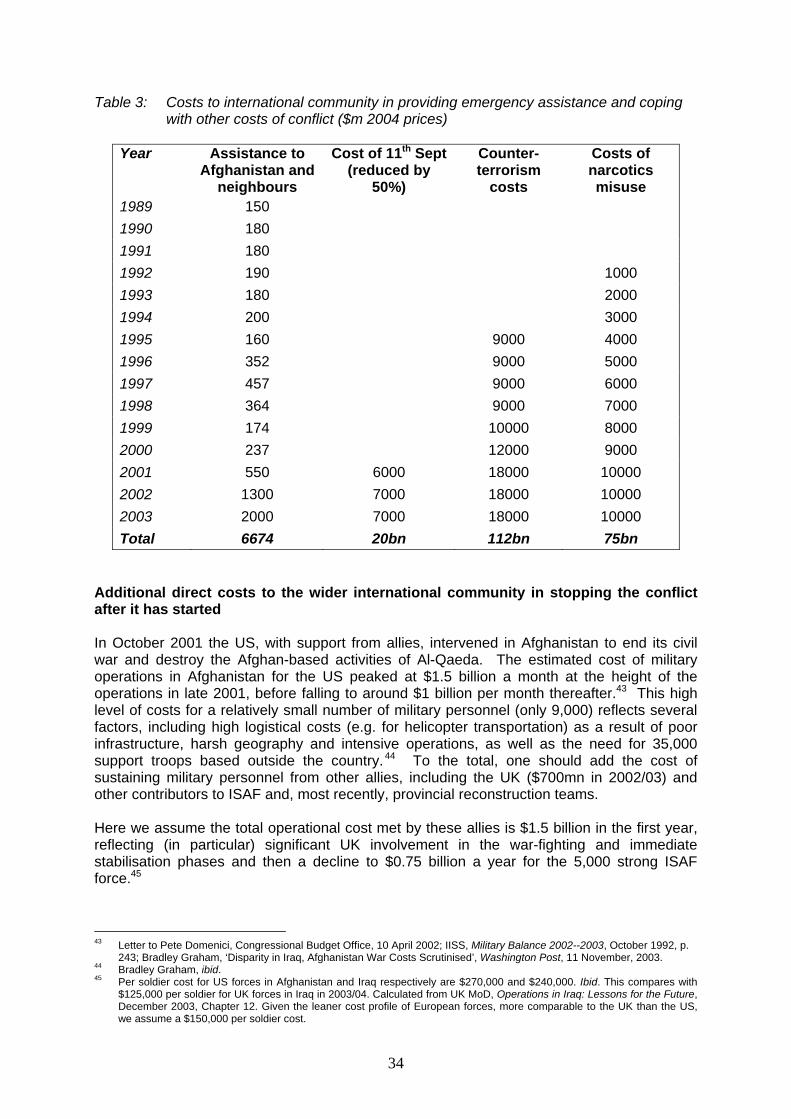
Table 3: Costs to international community in providing emergency assistance and coping with other costs of conflict ($m 2004 prices)
Year Assistance to
Afghanistan and neighbours
Cost of 11th Sept (reduced by
50%)
Counter-terrorism
costs
Costs of narcotics misuse
1989 150 1990 180 1991 180 1992 190 1000 1993 180 2000 1994 200 3000 1995 160 9000 4000 1996 352 9000 5000 1997 457 9000 6000 1998 364 9000 7000 1999 174 10000 8000 2000 237 12000 9000 2001 550 6000 18000 10000 2002 1300 7000 18000 10000 2003 2000 7000 18000 10000 Total 6674 20bn 112bn 75bn
Additional direct costs to the wider international community in stopping the conflict after it has started In October 2001 the US, with support from allies, intervened in Afghanistan to end its civil war and destroy the Afghan-based activities of Al-Qaeda. The estimated cost of military operations in Afghanistan for the US peaked at $1.5 billion a month at the height of the operations in late 2001, before falling to around $1 billion per month thereafter.43 This high level of costs for a relatively small number of military personnel (only 9,000) reflects several factors, including high logistical costs (e.g. for helicopter transportation) as a result of poor infrastructure, harsh geography and intensive operations, as well as the need for 35,000 support troops based outside the country.44 To the total, one should add the cost of sustaining military personnel from other allies, including the UK ($700mn in 2002/03) and other contributors to ISAF and, most recently, provincial reconstruction teams. Here we assume the total operational cost met by these allies is $1.5 billion in the first year, reflecting (in particular) significant UK involvement in the war-fighting and immediate stabilisation phases and then a decline to $0.75 billion a year for the 5,000 strong ISAF force.45
43 Letter to Pete Domenici, Congressional Budget Office, 10 April 2002; IISS, Military Balance 2002--2003, October 1992, p.
243; Bradley Graham, ‘Disparity in Iraq, Afghanistan War Costs Scrutinised’, Washington Post, 11 November, 2003. 44 Bradley Graham, ibid. 45 Per soldier cost for US forces in Afghanistan and Iraq respectively are $270,000 and $240,000. Ibid. This compares with
$125,000 per soldier for UK forces in Iraq in 2003/04. Calculated from UK MoD, Operations in Iraq: Lessons for the Future, December 2003, Chapter 12. Given the leaner cost profile of European forces, more comparable to the UK than the US, we assume a $150,000 per soldier cost.
34
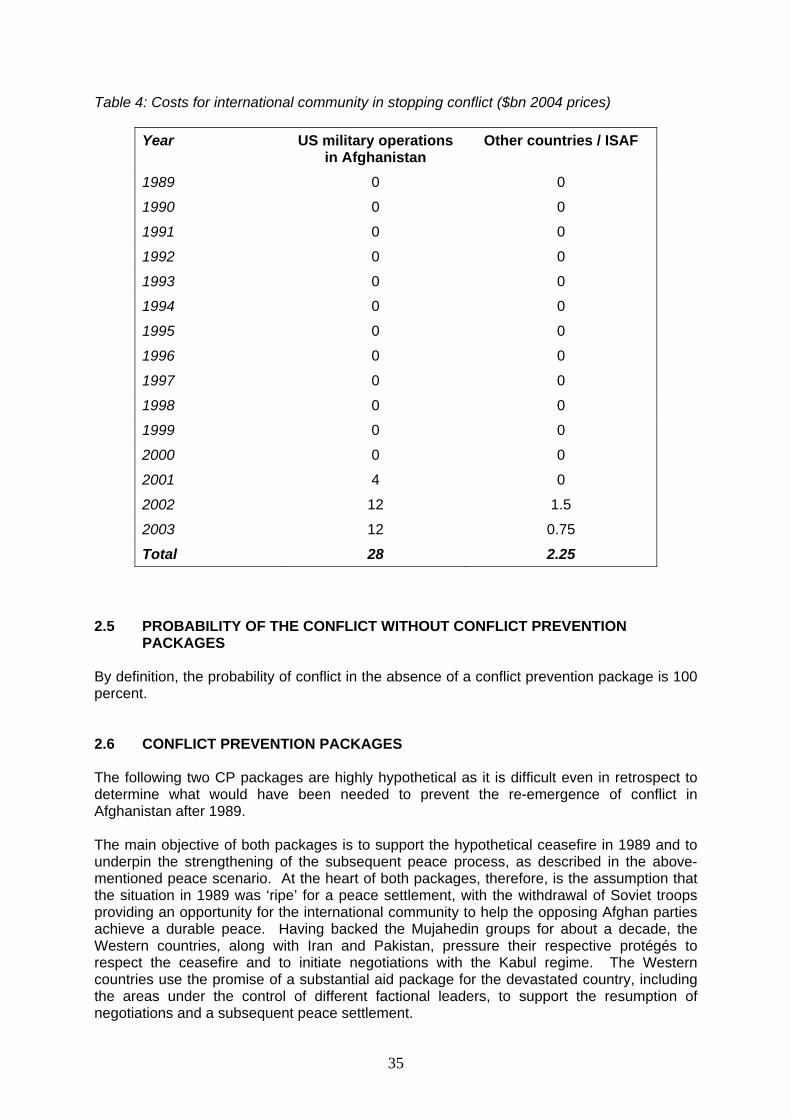
Table 4: Costs for international community in stopping conflict ($bn 2004 prices)
Year US military operations in Afghanistan
Other countries / ISAF
1989 0 0
1990 0 0
1991 0 0
1992 0 0
1993 0 0
1994 0 0
1995 0 0
1996 0 0
1997 0 0
1998 0 0
1999 0 0
2000 0 0
2001 4 0
2002 12 1.5
2003 12 0.75
Total 28 2.25 2.5 PROBABILITY OF THE CONFLICT WITHOUT CONFLICT PREVENTION PACKAGES By definition, the probability of conflict in the absence of a conflict prevention package is 100 percent. 2.6 CONFLICT PREVENTION PACKAGES The following two CP packages are highly hypothetical as it is difficult even in retrospect to determine what would have been needed to prevent the re-emergence of conflict in Afghanistan after 1989. The main objective of both packages is to support the hypothetical ceasefire in 1989 and to underpin the strengthening of the subsequent peace process, as described in the above-mentioned peace scenario. At the heart of both packages, therefore, is the assumption that the situation in 1989 was ‘ripe’ for a peace settlement, with the withdrawal of Soviet troops providing an opportunity for the international community to help the opposing Afghan parties achieve a durable peace. Having backed the Mujahedin groups for about a decade, the Western countries, along with Iran and Pakistan, pressure their respective protégés to respect the ceasefire and to initiate negotiations with the Kabul regime. The Western countries use the promise of a substantial aid package for the devastated country, including the areas under the control of different factional leaders, to support the resumption of negotiations and a subsequent peace settlement.
35
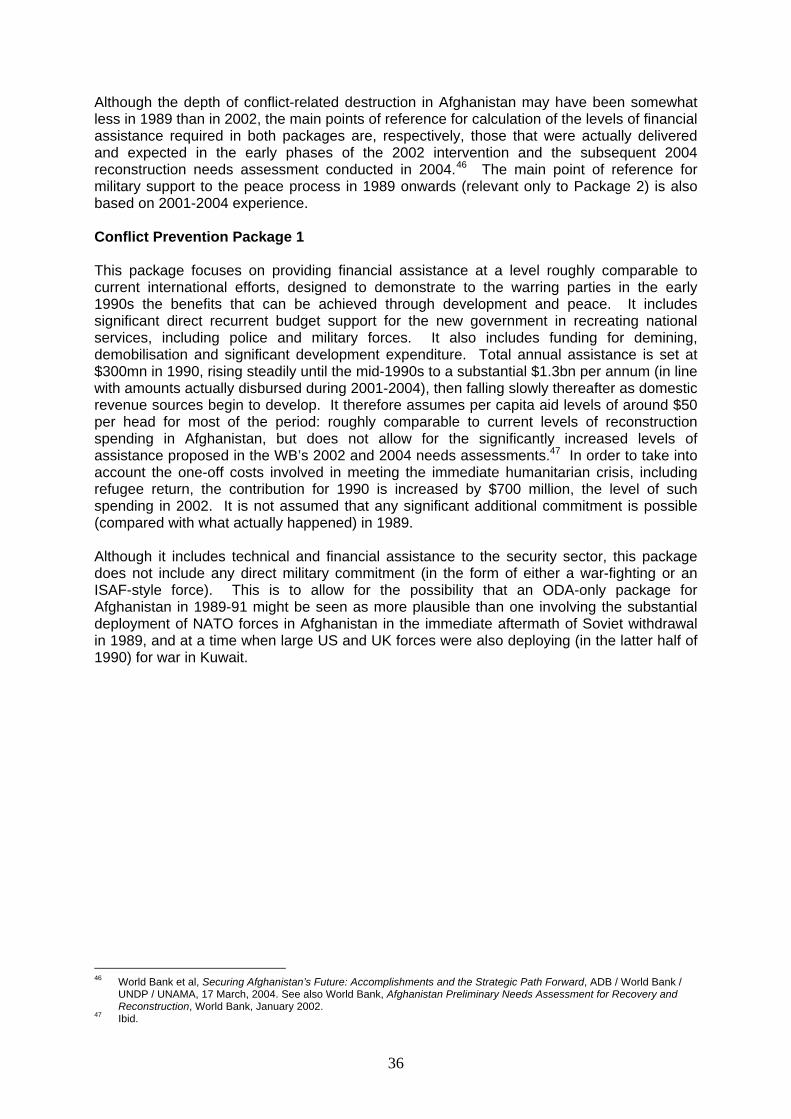
Although the depth of conflict-related destruction in Afghanistan may have been somewhat less in 1989 than in 2002, the main points of reference for calculation of the levels of financial assistance required in both packages are, respectively, those that were actually delivered and expected in the early phases of the 2002 intervention and the subsequent 2004 reconstruction needs assessment conducted in 2004.46 The main point of reference for military support to the peace process in 1989 onwards (relevant only to Package 2) is also based on 2001-2004 experience. Conflict Prevention Package 1 This package focuses on providing financial assistance at a level roughly comparable to current international efforts, designed to demonstrate to the warring parties in the early 1990s the benefits that can be achieved through development and peace. It includes significant direct recurrent budget support for the new government in recreating national services, including police and military forces. It also includes funding for demining, demobilisation and significant development expenditure. Total annual assistance is set at $300mn in 1990, rising steadily until the mid-1990s to a substantial $1.3bn per annum (in line with amounts actually disbursed during 2001-2004), then falling slowly thereafter as domestic revenue sources begin to develop. It therefore assumes per capita aid levels of around $50 per head for most of the period: roughly comparable to current levels of reconstruction spending in Afghanistan, but does not allow for the significantly increased levels of assistance proposed in the WB’s 2002 and 2004 needs assessments.47 In order to take into account the one-off costs involved in meeting the immediate humanitarian crisis, including refugee return, the contribution for 1990 is increased by $700 million, the level of such spending in 2002. It is not assumed that any significant additional commitment is possible (compared with what actually happened) in 1989. Although it includes technical and financial assistance to the security sector, this package does not include any direct military commitment (in the form of either a war-fighting or an ISAF-style force). This is to allow for the possibility that an ODA-only package for Afghanistan in 1989-91 might be seen as more plausible than one involving the substantial deployment of NATO forces in Afghanistan in the immediate aftermath of Soviet withdrawal in 1989, and at a time when large US and UK forces were also deploying (in the latter half of 1990) for war in Kuwait.
46 World Bank et al, Securing Afghanistan’s Future: Accomplishments and the Strategic Path Forward, ADB / World Bank /
UNDP / UNAMA, 17 March, 2004. See also World Bank, Afghanistan Preliminary Needs Assessment for Recovery and Reconstruction, World Bank, January 2002.
47 Ibid.
36
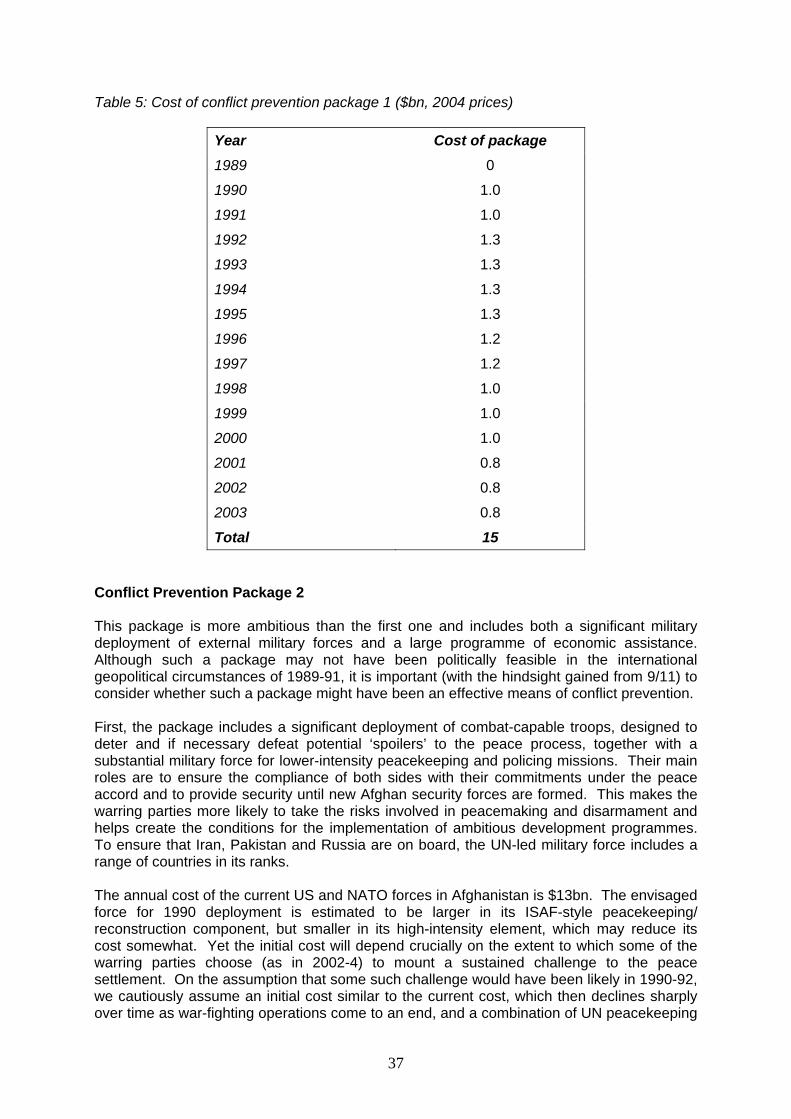
Table 5: Cost of conflict prevention package 1 ($bn, 2004 prices)
Year Cost of package 1989 0
1990 1.0
1991 1.0
1992 1.3
1993 1.3
1994 1.3
1995 1.3
1996 1.2
1997 1.2
1998 1.0
1999 1.0
2000 1.0
2001 0.8
2002 0.8
2003 0.8
Total 15 Conflict Prevention Package 2 This package is more ambitious than the first one and includes both a significant military deployment of external military forces and a large programme of economic assistance. Although such a package may not have been politically feasible in the international geopolitical circumstances of 1989-91, it is important (with the hindsight gained from 9/11) to consider whether such a package might have been an effective means of conflict prevention. First, the package includes a significant deployment of combat-capable troops, designed to deter and if necessary defeat potential ‘spoilers’ to the peace process, together with a substantial military force for lower-intensity peacekeeping and policing missions. Their main roles are to ensure the compliance of both sides with their commitments under the peace accord and to provide security until new Afghan security forces are formed. This makes the warring parties more likely to take the risks involved in peacemaking and disarmament and helps create the conditions for the implementation of ambitious development programmes. To ensure that Iran, Pakistan and Russia are on board, the UN-led military force includes a range of countries in its ranks. The annual cost of the current US and NATO forces in Afghanistan is $13bn. The envisaged force for 1990 deployment is estimated to be larger in its ISAF-style peacekeeping/ reconstruction component, but smaller in its high-intensity element, which may reduce its cost somewhat. Yet the initial cost will depend crucially on the extent to which some of the warring parties choose (as in 2002-4) to mount a sustained challenge to the peace settlement. On the assumption that some such challenge would have been likely in 1990-92, we cautiously assume an initial cost similar to the current cost, which then declines sharply over time as war-fighting operations come to an end, and a combination of UN peacekeeping
37
and Afghan forces progressively takes over. Initially, the total external force might include around 30,000 troops on the ground, along with 20,000 support troops based elsewhere. Although this level is progressively reduced, we assume that a UN force remains in place until 1998, by which time national Afghan security forces are fully able to take their place. Second, this CP Package involves a package of financial assistance that is markedly more generous than that envisaged in the first CP package. This is based on the detailed needs assessment by the Afghan Government and international organisations, published in 2004, and reflects the assumption that the provision of a safer security environment by an external UN force allows Afghanistan to absorb much higher levels of assistance than in the first Package. It would have allowed the new Government to achieve significant progress in infrastructure building (roads, water, electricity, telecommunications and fuel networks), education and health services, security (police and military), demining, DDR, ending opium cultivation and investment in agriculture and industry. Since it takes time to build up a programme of this magnitude, we assume spending levels rise from $2bn in 1990 to $4bn in 1993, then stabilising before falling in the late 1990s when greater mobilisation of domestic revenue sources becomes possible. As in CP1, we include $700m in 1990 for humanitarian assistance. By 1994, this level of assistance equates to around $160 per head, lower than the per capita level in immediately post-war Bosnia ($273 in 1996), but otherwise one of the highest in the world at that time.48 It would probably have made Afghanistan the world’s biggest ODA recipient: comparable with the 1994 receipts of China ($3.9bn), and dwarfing those of high-population (and more politically stable) countries such as Egypt ($3.0bn), India ($2.6bn) and Bangladesh ($2.1bn).49
48 World Development Indicators; World Development Report 2004. 49 World Development Indicators 1997, Table 6.10. Converted into 2004 prices.
38
Table 6: Cost of conflict prevention package 2 ($bn 2004 prices)
Year Financial Assistance
Military forces Total Cost
1989 0 0 0
1990 2 13 15
1991 3 8 11
1992 3 7 10
1993 4 6 10
1994 4 5 9
1995 4 4 8
1996 4 4 8
1997 4 3 7
1998 4 2 6
1999 4 0 4
2000 3 0 3
2001 3 0 3
2002 3 0 3
2003 3 0 3
Total 48 52 100 2.7 PROBABILITY OF CONFLICT WITH CONFLICT PREVENTION PACKAGES Probability of Conflict with Conflict Prevention Package 1 Given the devastation of the country, this package would have provided the opposing sides with a significant incentive to refrain from resorting to arms in the short term, not least because of the reluctance of foreign powers to fund a new round of hostility. Small-scale operations, while likely, would not have escalated to a major conflict. In the medium-term, however, it is possible that the relatively small level of foreign assistance on offer would not have been enough to provide a sufficiently strong stake in peace for the parties to the conflict. Depending on priorities within the available aid, it might have proven impossible to simultaneously fund full demobilisation of ex-fighters, basic infrastructural investment and significant improvements in provision of employment and education opportunities for ex-combatants. Consequently, remaining loyal to their armed political groups, including the warlords, might have been the best option for many soldiers. The competing attractions of involvement in the Afghan-based international drug trade might have further undermined the viability of the aid package. Yet it is probably the absence of a credible security guarantee that would undermine this package most severely. Neither side would have felt secure in agreeing to implement its ceasefire commitments, without an impartial force to oblige the other side to follow suit. As a consequence, conflicts among the rival warlords and their affiliated political groups would have been likely to re-emerge. Even if there were an initial period of peace as a result of a UN-brokered settlement, the absence of a significant UN military presence would have
39
increased the chances of major military conflicts emerging within 1-3 years of a ceasefire, as all sides sought to press home temporary military advantages before the creation of strong national armed forces could be consolidated. Fear of such a shift in the balance of power in favour of a Mujahedin group/alliance with affiliations with Iran or Pakistan could in turn have provoked the other country to act to prevent such a scenario, increasing the chances of escalation to a new round of civil war in 1992 / 1993. The possibility that the Pashtun-dominated Kabul regime, deprived of its Soviet sponsor, might now ally with pro-Pakistani Pashtun groups could have been another trigger for large-scale conflict. In the absence of a realistic possibility for a significant change in Afghanistan's economic situation, the unstable political situation would have also provided grounds for intervention by neighbours. Their probable incentives could have been to end the chaos to prevent its possible spill-over into their countries, to help their protégés establish a government or to end drug-trafficking. Although CP1 might well have delayed the return to civil war, therefore, we estimate that the probability of a return to large-scale armed conflict, on a scale comparable to that actually experienced in the 1990s, would have been very high during the period 1989-2003. We estimate the probability of avoiding a return to large-scale conflict, as a result of CP1, as being only 20%. Probability of Conflict with Conflict Prevention Package 2 This Package would have had a significantly greater chance of success in preventing large-scale armed conflict in the medium and long term. The combination of an unprecedently large economic assistance package and security guarantees backed by significant military deployments would have reduced the probability of civil war to relatively low levels. Some risk would remain that internal spoilers (rebellious warlords and dissatisfied Afghans) and/or hostile neighbours (especially those opposed to the extension of US power in the region) might have sought to undermine a new settlement. Their chances of success would have been considerably reduced, however, by the sheer scale of the economic and military commitment assumed here. The heavy security presence would likely have been sufficient to allow for the reconstruction of a viable Afghan state and the high level of economic assistance could have further strengthened the chances of peace. Even so, the possibility of the re-emergence of conflict in later years cannot be ruled out, even in this scenario. First, although the sizeable aid package envisaged would have benefited large sections of Afghan society, the distribution of these benefits would likely have been uneven, favouring urban areas compared with rural ones and some ethnic groups and regions over others. Increased horizontal inequality of this sort might in turn have helped to increase the possibility that a relatively fragile government in Kabul would disintegrate on factional / ethnic lines. Second, massive increases in aid flows, together with increased drug-related income, might have risked providing increased incentives for competition for control of national and local political power, as well as providing resources for financing armed groups that sought to take part in such a competition. The mere assumption of increased levels of aid is not sufficient. Without appropriately-structured (and ‘conflict-sensitive’) aid, there is a real risk that aid could fuel conflict rather than dampen it. Third, but not least, the gradual withdrawal of foreign military forces assumed in this Package might itself have been a cause of instability, as different factions manoeuvred to take advantage of a post-UN environment. The unknown willingness of the contributing countries to the peacekeeping force to engage in a further major military conflict would have made such a conflict more likely. Fourth, the package assumes that the international community, including Afghanistan’s neighbours, remains united in its support for the central Afghan government.
40
The greater the failure to curb the power of regional leaders, however, the greater the risk that this unity would have been fractured, opening up the possibility of external sponsorship of rival factions. Taking all these factors into account, we do not rule out the possibility of a relatively stable peace being achieved. The chances of such a peace continuing would likely have grown if the central government could have consolidated its power in the early 1990s and if large-scale economic reconstruction and development could have begun. Even with a massive external commitment (much greater, for example, than that in the Balkans in the same period), the project of political consolidation could have failed as a result of some or all the factors outlined above. On balance, therefore, we assess that the probability of civil war would still have been 40 percent over the whole period 1989-2003, with probably the greatest risk being in the mid 1990s. 2.8 NET PRESENT VALUE AND ASSESSMENT Neither of the CP Packages under discussion in this paper were ever likely to happen and our calculations go some way to explaining why this was the case. Both packages involve very high levels of investment, yet (in our assessment) might have delivered only partial reductions in the probability of conflict. The main reason for the relatively high level of expense of CP in this case study is that Afghanistan had already experienced a decade of civil war, had been heavily armed (on both sides) by foreign powers and was facing considerable obstacles to a negotiated peace, not least because of this preceding conflict. Almost all (99%) of the costs of the Afghan conflict to the IC relate either to its estimated deleterious effects on international terrorism and the global narcotics trade, or to the costs of the September 11th attacks on the US, and the subsequent US-led intervention in Afghanistan. The retrospective case for the cost-effectiveness of CP in Afghanistan, therefore, rests on the assumption that Afghanistan’s war had a significant effect on the scale of international terrorism and/or the global drugs problem. If such a relationship did exist, making even modest inroads into the costs of these global problems would have made CP worthwhile. In this study, we have assumed that the creation of a peaceful and stable Afghanistan in the 1990s would have reduced the probability of 9/11 by 50%, reduced the total costs of dealing with international terrorism by 20% and reduced the total costs incurred as a result of the international drugs trade by 5%. On these assumptions, both CP Packages would have been worthwhile to the IC at relatively low breakeven probabilities of success (7% and 50% respectively). If these costs are excluded, the retrospective cost-effectiveness of CP in Afghanistan to the IC is very low indeed. On this assumption, Afghanistan would be the exception that proves the rule about CP being cheaper than cure. Alternatively, if the indirect costs to the IC are excluded, but account is taken of the high costs of conflict to Afghanistan and its neighbours, the first CP Package generates a modest positive return, but the second does not. In the latter case, the sheer scale of the projected CP Package (involving an initial deployment of 30,000 troops, and the provision of a level of ODA larger in absolute terms than that provided to any other aid recipient) means that its projected costs would have exceeded the combined benefits to the IC, directly affected territory and neighbours.
41
Rwanda 1989-2003
Saskia Van Hoyweghen Jeremy McKenna
Stefaan Smis
42
3.1 EXECUTIVE SUMMARY In this paper we discuss the possibilities for prevention of the Rwandan conflicts of the early 1990s, their costs and the costs of conflict that might have been saved. The events taken into account are strictly related to Rwanda’s civil war, which broke out in 1990 and the genocide in 1994. They include, besides the war and the genocide, the refugee crisis and the first Congo war (1996-1997). The purpose of the latter was to free the refugees from the grip of the genocidal former government and to guarantee the security of Rwanda’s borders from former extremist fighters. It was therefore a direct consequence of the previous Rwanda conflict. By contrast, we do not take into account the cost of later phases of the Congo war, since their causal relationship with the Rwandan war and genocide is much more questionable. This study focuses on two windows of opportunity for outside intervention during 1989-2003. The most realistic options were chosen, even though other preventive measures could have been taken further in the past. The first possibility for outside intervention (Conflict Prevention Package 1) would have been in 1990-1991 when the civil war was still in a very early and limited stage. An early international engagement in the form of support for peace negotiations, together with a commitment to a peacekeeping force to oversee the implementation of any agreement, would have increased the chances that the outcome of such agreement would have been implemented. This Package also involves economic support. Due to the deep economic crisis it had experienced since the late 1980s, Rwanda in 1990 had gone through a period of considerable economic and political instability. A significant reallocation of aid budgets during this period could have softened the impact of the structural adjustment programme and its related costs. It could also have built in disincentives for the radicalising government, which in reality was spending much of its income on the war effort. This combined package would not have fully solved Rwanda’s instability, but it had a 50% chance of stopping the war before it escalated and caused significant damage. More importantly, if the civil war had not happened, the much greater costs of the genocide would also have been avoided. A second opportunity was missed in 1994. While the international community had known since 1993 that large scale violence was to be expected in Rwanda, it undertook little action. Knowing that the genocide consisted of two phases (physical elimination of opposition in Kigali and countrywide ethnic killings afterwards) and was carefully planned by a small group of people, a relatively limited military intervention (Conflict Prevention Package 2) would have been sufficient to stop the killings in Kigali and thus prevent the spread of the genocide to the rest of the country. Such an intervention would not have solved the root causes of the instability, and further monitoring of the situation for a few more years would have been necessary in order to support a return to stability. Nevertheless, the chance that the genocide would have occurred with this package is estimated at only 1%. It would not only have saved massive costs, but also hundreds of thousands of lives. We conclude that both CP packages studied would have had to reduce the probability of conflict by around 15% in order to be cost-effective for the IC. If the costs to Rwanda itself are also taken into account, the breakeven probability would have been much lower, at around 3%. In both calculations, therefore, conflict prevention statistically stood a very good chance of saving money. If one were to try to make a choice between the two packages under study many other factors would need to be taken into account. Package 1 which essentially argues for early international engagement at the very onset of conflict (in contrast to Package 2 which supposes robust military intervention when conflict threatens to escalate to unacceptably high levels) seems to be the obvious choice, in terms of cost effectiveness, the expectation of an overall higher success rate, and (last but not least) the human costs of the civil war.
However, we equally have to realise that in 1990 no-one would have expected the initial RPF incursion into Rwanda to have the wider ramifications it eventually did. No-one could have predicted the genocide at that point, let alone the refugee saga and the first Congo war. Moreover, since in 1990-91 it would have been difficult to predict the further evolvement of the actual conflict scenario, it would have been more difficult for external actors to get a grip on the situation. As a result, we estimate that there would still have remained a 50% chance of the civil war happening despite the implementation of the suggested CP package. These handicaps have to be taken into account when evaluating it. CP Package 2 is a more straightforward package since the conflict had evolved to the extent that it became more predictable that decisive action at the right moment stood a very high chance of stopping the genocide and all its related costs. However, this would imply that Rwanda had already suffered from the war for several years. While the economic costs of the war are low, the social and political cost of the war on Rwanda’s future stability should not be underestimated, even though they have not been taken into account here. Reconciliation would be harder than in the case of Package 1 and so would the formation of a coalition government acceptable to all. It can be argued that a Rwandan government formed after implementation of Package 2 would have had the added bonus of the RPF weighing more heavily on the macro-economic management of Rwanda and having a positive effect on trying to solve some of Rwanda’s structural economic problems, which had remained unaddressed until then. However, once again, we should not only look at economic indicators. The RPF is an elite minority that dominates policy and has a poor human rights record both within Rwanda and in neighbouring Congo. Hence, in terms of national and regional political stability, it might have been better to have had a Rwandan government resulting from an implementation of Package 1 which would have given the RPF a much smaller share in power (because it would not have had the time to prove itself on the battle field). Such a coalition would have been more acceptable to the Rwandan political establishment of the time and could therefore have prevented the radicalisation within circles of the Rwandan political elite. The conclusions reached here are not substantially influenced by varying the costs of the Packages. Even if the economic support costs included in Package 1 are doubled, it would still have been cost-effective to the IC at a breakeven probability of success of 24%. Similarly, a trebling of the costs of the military force included in Package 2 would have increased the breakeven probability of cost-effectiveness to the IC to 46%: still well below the near-certainty of success which the study suggests would have been achieved with a smaller force. In both cases, the breakeven probability is much lower once the costs of the conflict and genocide to the Rwandan people is taken into account.
44
3.2 INTRODUCTION In this paper, we discuss the possibilities for external intervention in the Rwandan conflict, their related costs and the costs of conflict that might have been saved. In order to do this, first of all we need a clear understanding of what is meant by the Rwandan conflict. The Great Lakes Region of East-Central Africa has witnessed many violent conflicts over the past fifteen years, including the civil war in Rwanda (1990-1994), the Rwandan genocide in 1994, the war in Northern Uganda, the Burundi conflict and the two Congo wars (1996-1997 and the second war starting in 1998). The civil war that started in Rwanda in October 1990 and the genocide that occurred from April 1994 are generally understood as events that have negatively affected the stability of the whole Great Lakes Region. Indeed, since the outbreak of the Rwandan conflict, the situation in Burundi has further deteriorated, the conflict in Northern Uganda has exploded and the Democratic Republic of the Congo has experienced two wars. Despite the fact that the genocide in Rwanda is generally seen as the trigger for much of the instability in the region, the linkages between these different conflicts are not always straightforward. It is thus unjustified for the purpose of this study to study all these events as part of one conflict. Instead, we limit ourselves to the civil war (1990-1994), the genocide (1994) and its immediate aftermath, and the first Congo war (1996-1997). Much of the violence witnessed thereafter in this region can not be directly related back to these events. We will discuss the possibility of intervention in Rwanda at two specific points. There would have been other, including earlier, interventions possible than the ones discussed here. However, we have chosen the most realistic options within the historical time frame given. First of all, there was the option of an early intervention in 1990 when the civil war was still in a very early stage with limited negative effects. The possible outcomes and cost of an early international diplomatic engagement to prevent escalation will be calculated. As part of the same prevention package, the economic policies towards Rwanda are altered, as there is ground to argue that these increased the levels of destabilisation and violence that took place in 1992 – 1993. A second possible intervention would have been in the weeks and even days running up to the start of the genocide in Kigali in April 1994. It is now commonly accepted that, if UNAMIR had been given the mandate and manpower to intervene, the massacres could have been contained in Kigali instead of turning into a country wide genocide, with massive loss of life, huge numbers of refugees and a near totally destroyed territory. 3.3 PEACE AND CONFLICT SCENARIOS Conflict Scenario In October 1990, the RPF (Rwandan Patriotic Front) invaded Rwanda from Uganda. The RPF consisted of Rwandan Tutsi who had lived in exile in Uganda since the 1960s and had fought alongside Museveni in the National Resistance Army. The Rwandan army was taken by surprise and only managed to deflect the RPF attack with the help of French and Zairean elite troops. However, from 1991 both sides started to re-arm and increase their troops dramatically so that subsequent military confrontations increasingly resulted in larger displacement and physical destruction. A Peace Accord (the ‘Arusha Accord’) was brokered with the help of Tanzania and the OAU in 1993 and included the deployment of a UN peacekeeping force (UNAMIR). By this stage, however, sections within the Rwandan government had radicalised so much that they now found the peace agreement unacceptable. Even though Arusha was a technically sophisticated process, its timing was too late.
45
This had to do mainly with the fact that the RPF had secured itself an important share in the proposed transition government and army on the basis of its military success. A range of other factors also had a destabilising effect on Rwanda during this period. Since the late 1980s Rwanda had entered a deep economic crisis due to drastically shrinking export revenues, which in turn had forced it to accept a Structural Adjustment Programme (SAP) in 1990. There is much controversy about the actual impact of the SAP, which was never fully implemented. Nevertheless, it is clear that worsening economic conditions led to general discontent, thereby contributing to the radicalisation of society. Ethnic militia and gangs found it easier to recruit youth who had fewer alternative opportunities open to them. The pressure to ‘democratise’ in the middle of a war further increased political tensions. These combined factors created a fertile breeding ground for ethnic scape-goating and popular discontent in general. As a last resort to avoid the implementation of the Arusha Accord, an extremist circle within the Rwandan government started in April 1994 the elimination of all potential opposition. The genocide was initially a well planned execution of political opposition and only weeks later turned into countrywide killings with an ethnic character. While a combination of many contextual factors can explain the militarisation of Rwandan society and the rise of extremist groups in the period leading up to the genocide, it is of crucial importance to distinguish between ethnic violence and genocide. The difference between both is not just a question of scale. The genocide was not a popular outburst of discontent but was imagined, organised and set in motion by a well defined group of actors. Its prevention therefore was, as will be argued, relatively straightforward. In response to the genocide, the RPF broke the cease fire and resumed the civil war, achieving a rapid military victory and coming to power in July 1994. The extremist interim government fled south and eventually into Zaire, taking about 2 million Rwandans with it on its flight, confronting the humanitarian community with one of the biggest refugee crises and humanitarian emergencies ever. During this period of exile, the former government and army planned a re-invasion of Rwanda and, for this purpose, organised military training, incursions into Rwanda (killing local officials and genocide survivors) and purchased military equipment. In mid 1996, the new RPF dominated government in Kigali intervened and ‘closed down’ the camps, forcing the majority of refugees to return home. At the same time, Rwanda and Uganda started a war to dispose of Mobutu as leader of Zaire in the hope of installing a new regime that would guarantee the security of its borders. This war came to an end when Kabila became Zaire’s, now the Democratic Republic of Congo, new President in March 1997. Peace Scenarios Within the Rwandan conflict, we identify two separate peace scenarios, related to the timing of the two CP packages. In the first scenario, the civil war is stopped in its tracks shortly after it starts in October 1990, i.e. before significant destruction and killing has taken place. In fact labelling the incursion at that stage a true civil war is a bit of an overstatement. This peace scenario therefore means the continuation of political tension, but without actual military confrontation, violence and its related costs. The avoidance of civil war in this scenario, it is assumed, would also have prevented the genocide four years later, although it was difficult to foresee at the time. This hypothetical peace scenario would be one where an early Arusha Peace Accord, in some version, was successfully implemented. As pointed out in the conflict scenario, Arusha was a good process but it came too late. An early peace agreement would have meant a smaller share in power for the RPF, which would have been more acceptable to the Rwandan political establishment. Since Rwanda was already going through a multi-faceted crisis as described above, these tensions would most likely remain unresolved and thus a risk of some renewed violence remains not unlikely. However, this peace scenario assumes that this does not take the form of large-scale armed violence
46
during the period until 2003. For the purposes of this assessment, we assume that the development policies subsequently adopted by a coalition government would have been similar to those of the RPF-dominated government that eventually came to power (though see comments below on human development). The second peace scenario involves the avoidance of the genocide, but not the preceding civil war. This would have meant a prevention of escalation into massive scale killing, destruction and human displacement. However the root causes of the previously existing instability would not have been addressed and thus ‘peace’ in this case would have meant the return to a period of instability and most likely some low intensity conflict in the immediate aftermath of the prevented genocide. In this scenario, we also assume that Arusha would eventually be implemented and that the economic crisis gets addressed. So we can eventually expect to see a slow but gradual return to stability. This case study is confined to those events that can be considered as direct results of the Rwanda conflict, i.e. the civil war and the genocide. The prevention of the Rwandan civil war and/or the genocide would have had a very uncertain effect, for example, on the future direction of the conflict in Burundi. As for the second Congo war, it is our assessment that Rwanda and Uganda invaded Congo mainly for economic reasons and that the question of security was only of relative importance. In other words, the second Congo war might have happened regardless of previous events in Rwanda and the costs and benefits which were incurred by it can therefore hardly be seen as a result of the Rwandan conflict. In comparing the costs of the peace and conflict scenarios in this case study, therefore, we do not include an assessment of either the massive costs of the second Congo war to Congo or the significant economic gains made by Rwanda. 3.4 ADDITIONAL ANNUAL COSTS OF THE CONFLICT SCENARIO In this section, we will describe the actual costs of the conflict as it happened and as it is described above. As a baseline for comparison we take the year 1989 to calculate costs incurred. Since the Rwanda conflict consists of two main events, the civil war and the genocide, and the suggested CP packages are each destined at one of those events, the discussion of the costs is split between these two periods. Additional costs to the directly-affected territory The civil war in 1990 and 1991 was rather limited in scale. This is reflected in the estimated costs. The RPF attack displaced about 65,000 people in the Northern part of Rwanda and the war affected a comparatively small part of the territory. Yet from 1991 both sides started to expand their fighting force dramatically and invest heavily in arms, so that a second RPF offensive in 1991 resulted in a bigger military confrontation, eventually with more pronounced negative results.50
50 The Government of Rwanda estimated the cost of reconstructing the war ravaged North at $20m in 1992. This included
damages to forestry resources, the Akagera National Par, general infrastructure and housing of 65 000 IDPs. Cf. Republique du Rwanda, October 1991, Reconstruction des zones endommagées et la réinstallation des populations déplacés, Kigali. Since the number of IDPs had increased more than tenfold in 1993, it is not unreasonable to multiply the damages by at least five, especially with regard to socio-economic damage
47
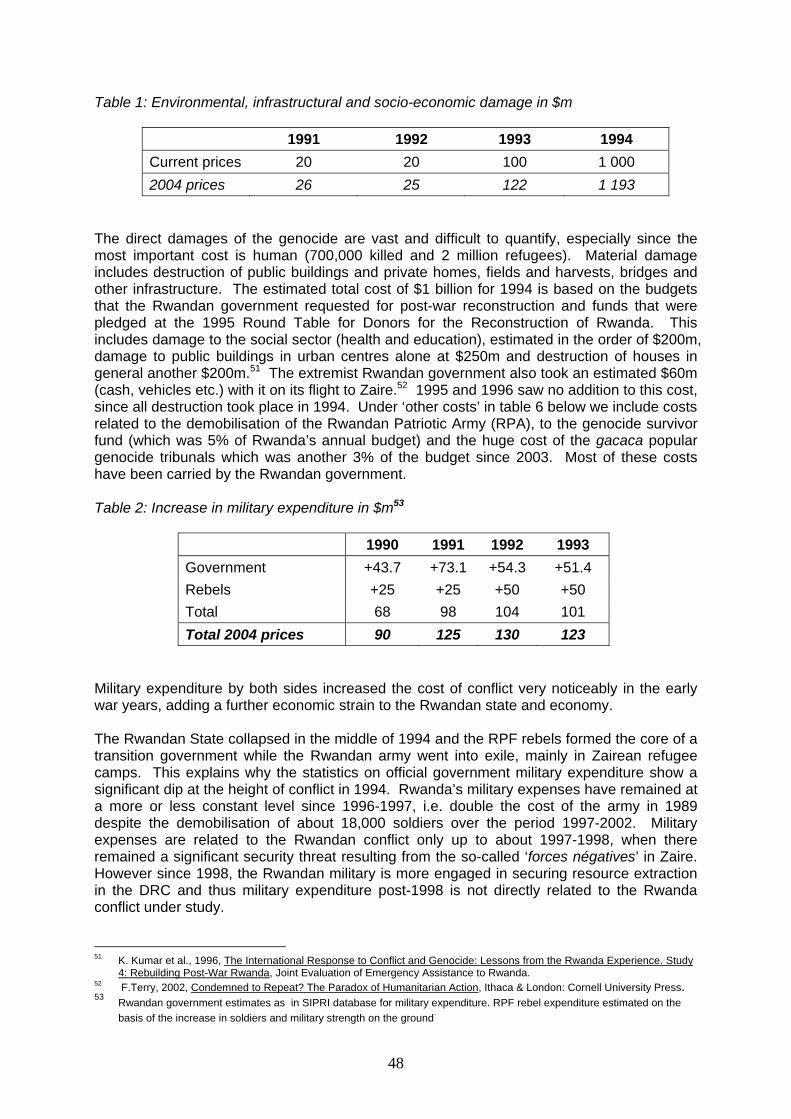
Table 1: Environmental, infrastructural and socio-economic damage in $m
1991 1992 1993 1994 Current prices 20 20 100 1 000 2004 prices 26 25 122 1 193
The direct damages of the genocide are vast and difficult to quantify, especially since the most important cost is human (700,000 killed and 2 million refugees). Material damage includes destruction of public buildings and private homes, fields and harvests, bridges and other infrastructure. The estimated total cost of $1 billion for 1994 is based on the budgets that the Rwandan government requested for post-war reconstruction and funds that were pledged at the 1995 Round Table for Donors for the Reconstruction of Rwanda. This includes damage to the social sector (health and education), estimated in the order of $200m, damage to public buildings in urban centres alone at $250m and destruction of houses in general another $200m.51 The extremist Rwandan government also took an estimated $60m (cash, vehicles etc.) with it on its flight to Zaire.52 1995 and 1996 saw no addition to this cost, since all destruction took place in 1994. Under ‘other costs’ in table 6 below we include costs related to the demobilisation of the Rwandan Patriotic Army (RPA), to the genocide survivor fund (which was 5% of Rwanda’s annual budget) and the huge cost of the gacaca popular genocide tribunals which was another 3% of the budget since 2003. Most of these costs have been carried by the Rwandan government. Table 2: Increase in military expenditure in $m53
1990 1991 1992 1993 Government +43.7 +73.1 +54.3 +51.4 Rebels +25 +25 +50 +50 Total 68 98 104 101 Total 2004 prices 90 125 130 123
Military expenditure by both sides increased the cost of conflict very noticeably in the early war years, adding a further economic strain to the Rwandan state and economy. The Rwandan State collapsed in the middle of 1994 and the RPF rebels formed the core of a transition government while the Rwandan army went into exile, mainly in Zairean refugee camps. This explains why the statistics on official government military expenditure show a significant dip at the height of conflict in 1994. Rwanda’s military expenses have remained at a more or less constant level since 1996-1997, i.e. double the cost of the army in 1989 despite the demobilisation of about 18,000 soldiers over the period 1997-2002. Military expenses are related to the Rwandan conflict only up to about 1997-1998, when there remained a significant security threat resulting from the so-called ‘forces négatives’ in Zaire. However since 1998, the Rwandan military is more engaged in securing resource extraction in the DRC and thus military expenditure post-1998 is not directly related to the Rwanda conflict under study.
51 K. Kumar et al., 1996, The International Response to Conflict and Genocide: Lessons from the Rwanda Experience. Study
4: Rebuilding Post-War Rwanda, Joint Evaluation of Emergency Assistance to Rwanda. 52 F.Terry, 2002, Condemned to Repeat? The Paradox of Humanitarian Action, Ithaca & London: Cornell University Press. 53 Rwandan government estimates as in SIPRI database for military expenditure. RPF rebel expenditure estimated on the
basis of the increase in soldiers and military strength on the ground.
48
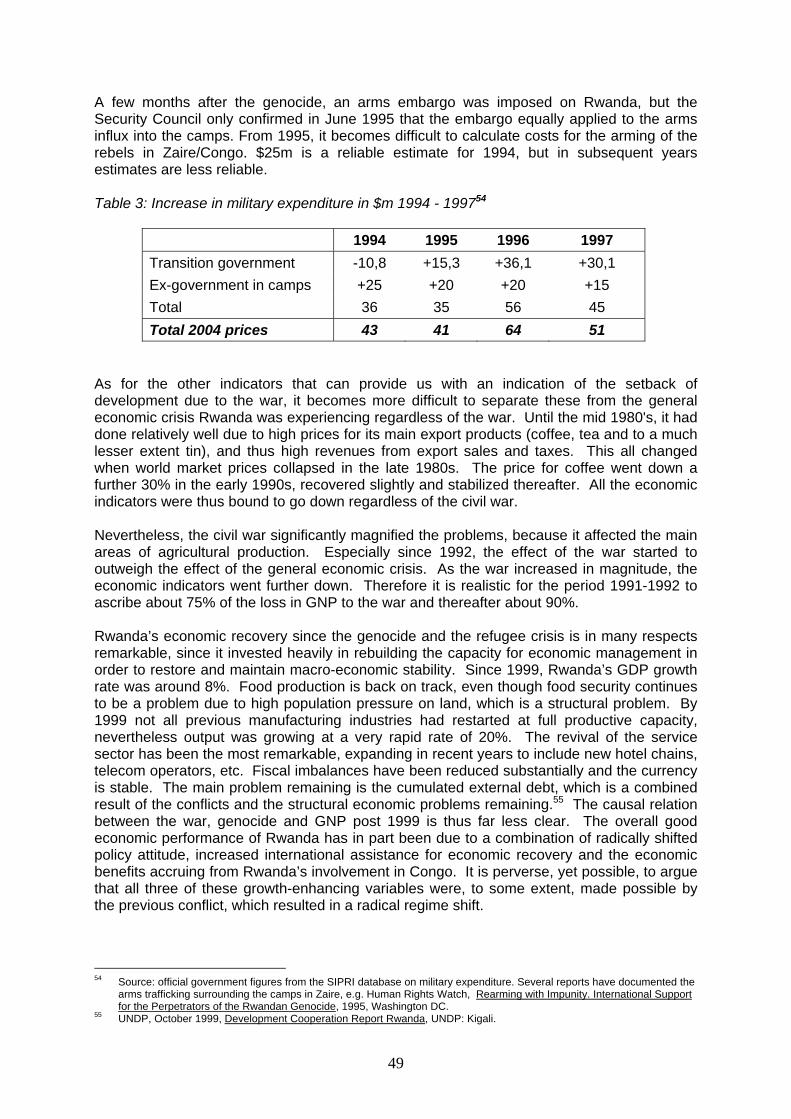
A few months after the genocide, an arms embargo was imposed on Rwanda, but the Security Council only confirmed in June 1995 that the embargo equally applied to the arms influx into the camps. From 1995, it becomes difficult to calculate costs for the arming of the rebels in Zaire/Congo. $25m is a reliable estimate for 1994, but in subsequent years estimates are less reliable. Table 3: Increase in military expenditure in $m 1994 - 199754
1994 1995 1996 1997 Transition government -10,8 +15,3 +36,1 +30,1 Ex-government in camps +25 +20 +20 +15 Total 36 35 56 45 Total 2004 prices 43 41 64 51
As for the other indicators that can provide us with an indication of the setback of development due to the war, it becomes more difficult to separate these from the general economic crisis Rwanda was experiencing regardless of the war. Until the mid 1980's, it had done relatively well due to high prices for its main export products (coffee, tea and to a much lesser extent tin), and thus high revenues from export sales and taxes. This all changed when world market prices collapsed in the late 1980s. The price for coffee went down a further 30% in the early 1990s, recovered slightly and stabilized thereafter. All the economic indicators were thus bound to go down regardless of the civil war. Nevertheless, the civil war significantly magnified the problems, because it affected the main areas of agricultural production. Especially since 1992, the effect of the war started to outweigh the effect of the general economic crisis. As the war increased in magnitude, the economic indicators went further down. Therefore it is realistic for the period 1991-1992 to ascribe about 75% of the loss in GNP to the war and thereafter about 90%. Rwanda’s economic recovery since the genocide and the refugee crisis is in many respects remarkable, since it invested heavily in rebuilding the capacity for economic management in order to restore and maintain macro-economic stability. Since 1999, Rwanda’s GDP growth rate was around 8%. Food production is back on track, even though food security continues to be a problem due to high population pressure on land, which is a structural problem. By 1999 not all previous manufacturing industries had restarted at full productive capacity, nevertheless output was growing at a very rapid rate of 20%. The revival of the service sector has been the most remarkable, expanding in recent years to include new hotel chains, telecom operators, etc. Fiscal imbalances have been reduced substantially and the currency is stable. The main problem remaining is the cumulated external debt, which is a combined result of the conflicts and the structural economic problems remaining.55 The causal relation between the war, genocide and GNP post 1999 is thus far less clear. The overall good economic performance of Rwanda has in part been due to a combination of radically shifted policy attitude, increased international assistance for economic recovery and the economic benefits accruing from Rwanda’s involvement in Congo. It is perverse, yet possible, to argue that all three of these growth-enhancing variables were, to some extent, made possible by the previous conflict, which resulted in a radical regime shift.
54 Source: official government figures from the SIPRI database on military expenditure. Several reports have documented the
arms trafficking surrounding the camps in Zaire, e.g. Human Rights Watch, Rearming with Impunity. International Support for the Perpetrators of the Rwandan Genocide, 1995, Washington DC.
55 UNDP, October 1999, Development Cooperation Report Rwanda, UNDP: Kigali.
49
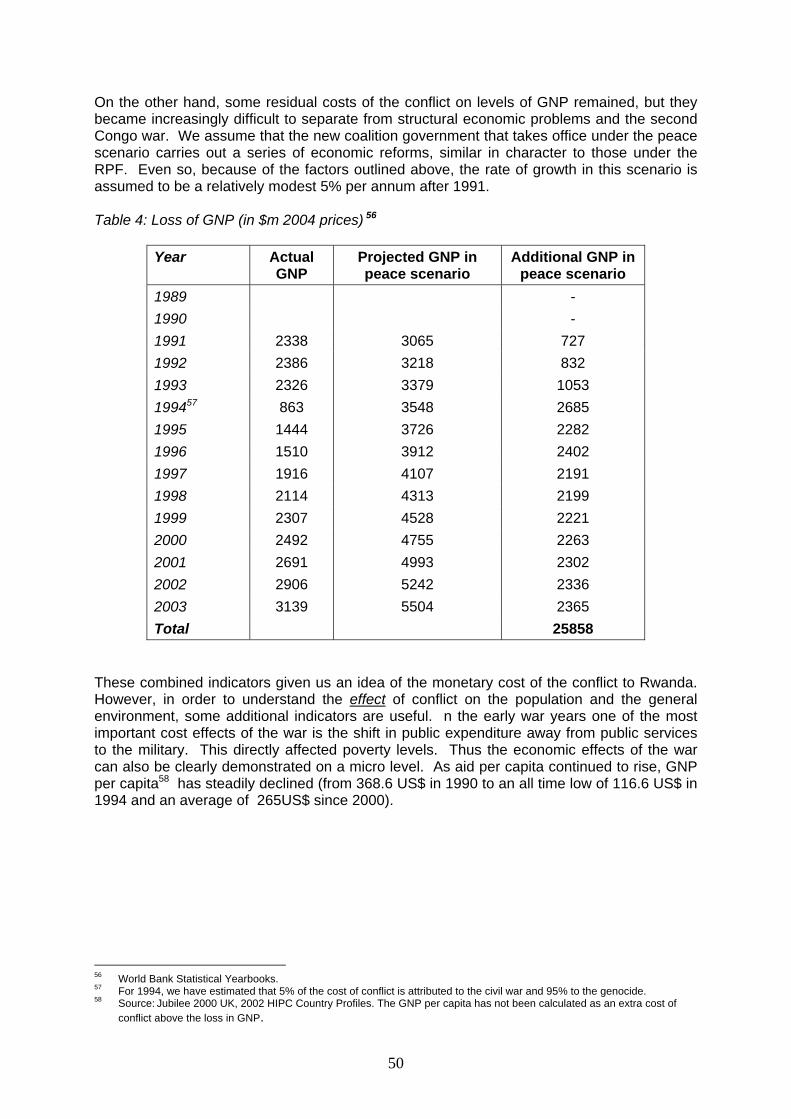
On the other hand, some residual costs of the conflict on levels of GNP remained, but they became increasingly difficult to separate from structural economic problems and the second Congo war. We assume that the new coalition government that takes office under the peace scenario carries out a series of economic reforms, similar in character to those under the RPF. Even so, because of the factors outlined above, the rate of growth in this scenario is assumed to be a relatively modest 5% per annum after 1991. Table 4: Loss of GNP (in $m 2004 prices) 56
Year Actual
GNP Projected GNP in peace scenario
Additional GNP in peace scenario
1989 - 1990 - 1991 2338 3065 727 1992 2386 3218 832 1993 2326 3379 1053 199457 863 3548 2685 1995 1444 3726 2282 1996 1510 3912 2402 1997 1916 4107 2191 1998 2114 4313 2199 1999 2307 4528 2221 2000 2492 4755 2263 2001 2691 4993 2302 2002 2906 5242 2336 2003 3139 5504 2365 Total 25858
These combined indicators given us an idea of the monetary cost of the conflict to Rwanda. However, in order to understand the effect of conflict on the population and the general environment, some additional indicators are useful. n the early war years one of the most important cost effects of the war is the shift in public expenditure away from public services to the military. This directly affected poverty levels. Thus the economic effects of the war can also be clearly demonstrated on a micro level. As aid per capita continued to rise, GNP per capita58 has steadily declined (from 368.6 US$ in 1990 to an all time low of 116.6 US$ in 1994 and an average of 265US$ since 2000).
56 World Bank Statistical Yearbooks. 57 For 1994, we have estimated that 5% of the cost of conflict is attributed to the civil war and 95% to the genocide. 58 Source: Jubilee 2000 UK, 2002 HIPC Country Profiles. The GNP per capita has not been calculated as an extra cost of
conflict above the loss in GNP.
50
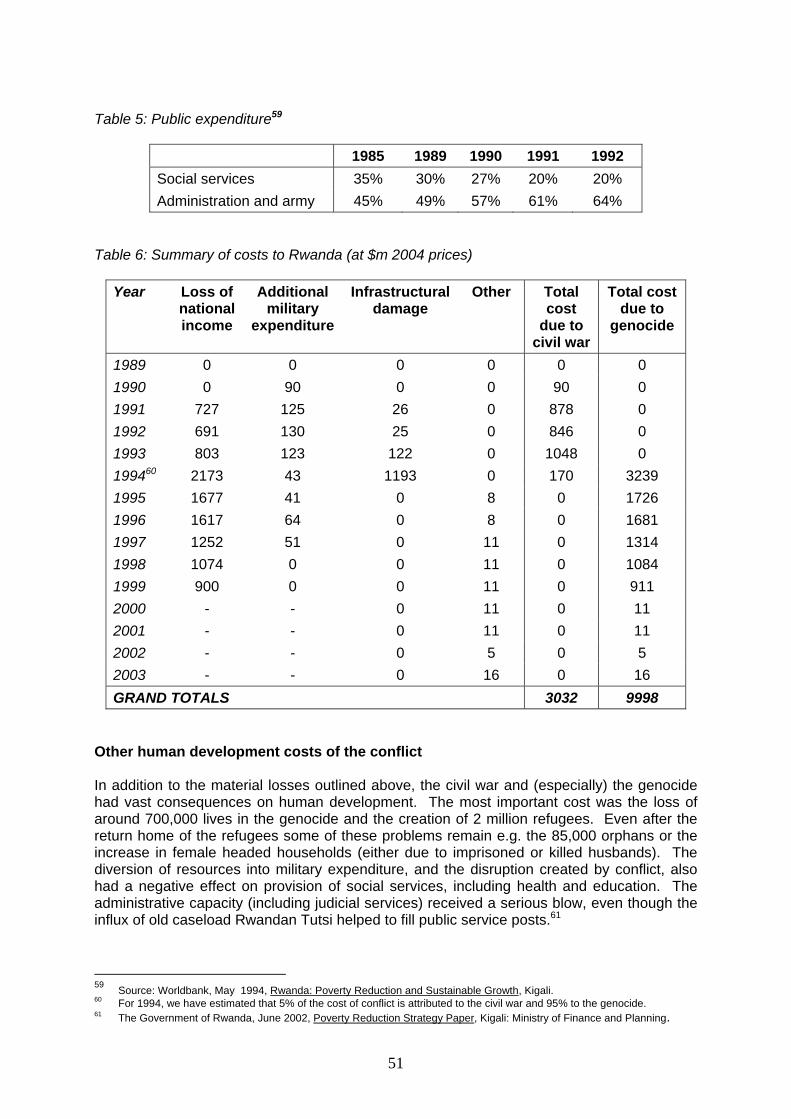
Table 5: Public expenditure59
1985 1989 1990 1991 1992 Social services 35% 30% 27% 20% 20% Administration and army 45% 49% 57% 61% 64%
Table 6: Summary of costs to Rwanda (at $m 2004 prices)
Year Loss of national income
Additional military
expenditure
Infrastructural damage
Other Total cost
due to civil war
Total cost due to
genocide
1989 0 0 0 0 0 0 1990 0 90 0 0 90 0 1991 727 125 26 0 878 0 1992 691 130 25 0 846 0 1993 803 123 122 0 1048 0 199460 2173 43 1193 0 170 3239 1995 1677 41 0 8 0 1726 1996 1617 64 0 8 0 1681 1997 1252 51 0 11 0 1314 1998 1074 0 0 11 0 1084 1999 900 0 0 11 0 911 2000 - - 0 11 0 11 2001 - - 0 11 0 11 2002 - - 0 5 0 5 2003 - - 0 16 0 16 GRAND TOTALS 3032 9998
Other human development costs of the conflict In addition to the material losses outlined above, the civil war and (especially) the genocide had vast consequences on human development. The most important cost was the loss of around 700,000 lives in the genocide and the creation of 2 million refugees. Even after the return home of the refugees some of these problems remain e.g. the 85,000 orphans or the increase in female headed households (either due to imprisoned or killed husbands). The diversion of resources into military expenditure, and the disruption created by conflict, also had a negative effect on provision of social services, including health and education. The administrative capacity (including judicial services) received a serious blow, even though the influx of old caseload Rwandan Tutsi helped to fill public service posts.61 59 Source: Worldbank, May 1994, Rwanda: Poverty Reduction and Sustainable Growth, Kigali. 60 For 1994, we have estimated that 5% of the cost of conflict is attributed to the civil war and 95% to the genocide. 61 The Government of Rwanda, June 2002, Poverty Reduction Strategy Paper, Kigali: Ministry of Finance and Planning.
51
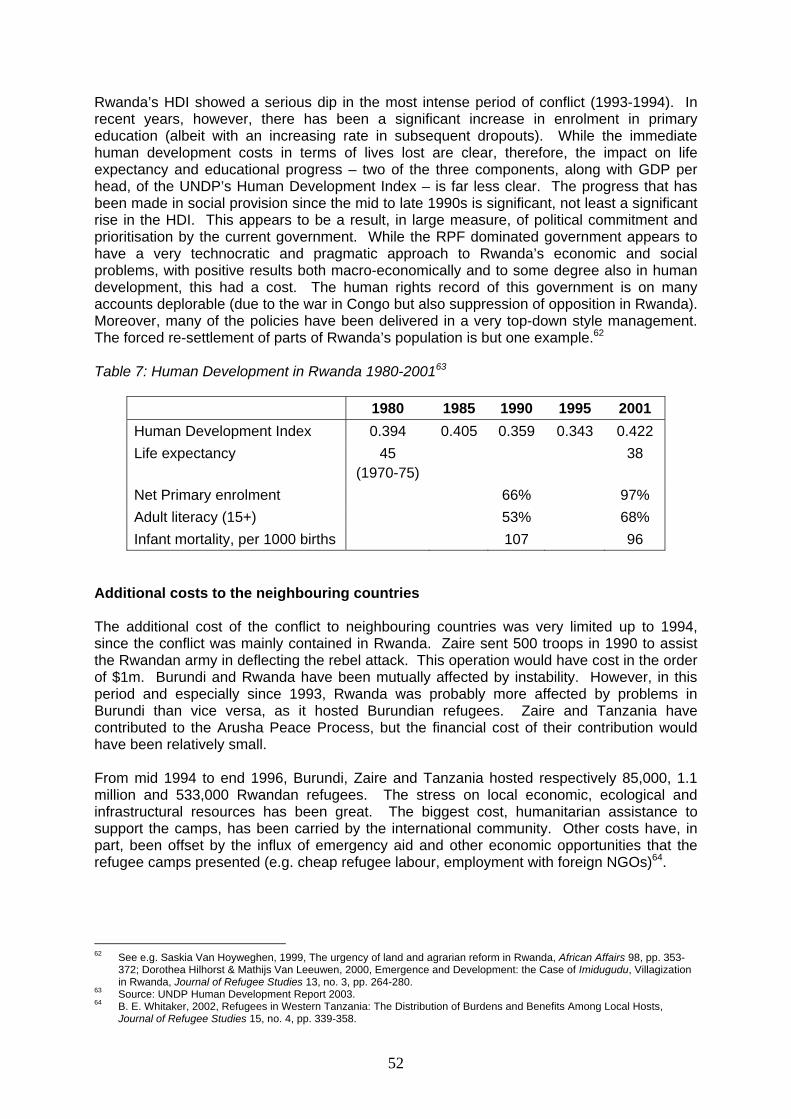
Rwanda’s HDI showed a serious dip in the most intense period of conflict (1993-1994). In recent years, however, there has been a significant increase in enrolment in primary education (albeit with an increasing rate in subsequent dropouts). While the immediate human development costs in terms of lives lost are clear, therefore, the impact on life expectancy and educational progress – two of the three components, along with GDP per head, of the UNDP’s Human Development Index – is far less clear. The progress that has been made in social provision since the mid to late 1990s is significant, not least a significant rise in the HDI. This appears to be a result, in large measure, of political commitment and prioritisation by the current government. While the RPF dominated government appears to have a very technocratic and pragmatic approach to Rwanda’s economic and social problems, with positive results both macro-economically and to some degree also in human development, this had a cost. The human rights record of this government is on many accounts deplorable (due to the war in Congo but also suppression of opposition in Rwanda). Moreover, many of the policies have been delivered in a very top-down style management. The forced re-settlement of parts of Rwanda’s population is but one example.62 Table 7: Human Development in Rwanda 1980-200163
1980 1985 1990 1995 2001 Human Development Index 0.394 0.405 0.359 0.343 0.422 Life expectancy 45
(1970-75) 38
Net Primary enrolment 66% 97% Adult literacy (15+) 53% 68% Infant mortality, per 1000 births 107 96
Additional costs to the neighbouring countries The additional cost of the conflict to neighbouring countries was very limited up to 1994, since the conflict was mainly contained in Rwanda. Zaire sent 500 troops in 1990 to assist the Rwandan army in deflecting the rebel attack. This operation would have cost in the order of $1m. Burundi and Rwanda have been mutually affected by instability. However, in this period and especially since 1993, Rwanda was probably more affected by problems in Burundi than vice versa, as it hosted Burundian refugees. Zaire and Tanzania have contributed to the Arusha Peace Process, but the financial cost of their contribution would have been relatively small. From mid 1994 to end 1996, Burundi, Zaire and Tanzania hosted respectively 85,000, 1.1 million and 533,000 Rwandan refugees. The stress on local economic, ecological and infrastructural resources has been great. The biggest cost, humanitarian assistance to support the camps, has been carried by the international community. Other costs have, in part, been offset by the influx of emergency aid and other economic opportunities that the refugee camps presented (e.g. cheap refugee labour, employment with foreign NGOs)64.
62 See e.g. Saskia Van Hoyweghen, 1999, The urgency of land and agrarian reform in Rwanda, African Affairs 98, pp. 353-
372; Dorothea Hilhorst & Mathijs Van Leeuwen, 2000, Emergence and Development: the Case of Imidugudu, Villagization in Rwanda, Journal of Refugee Studies 13, no. 3, pp. 264-280.
63 Source: UNDP Human Development Report 2003. 64 B. E. Whitaker, 2002, Refugees in Western Tanzania: The Distribution of Burdens and Benefits Among Local Hosts,
Journal of Refugee Studies 15, no. 4, pp. 339-358.
52
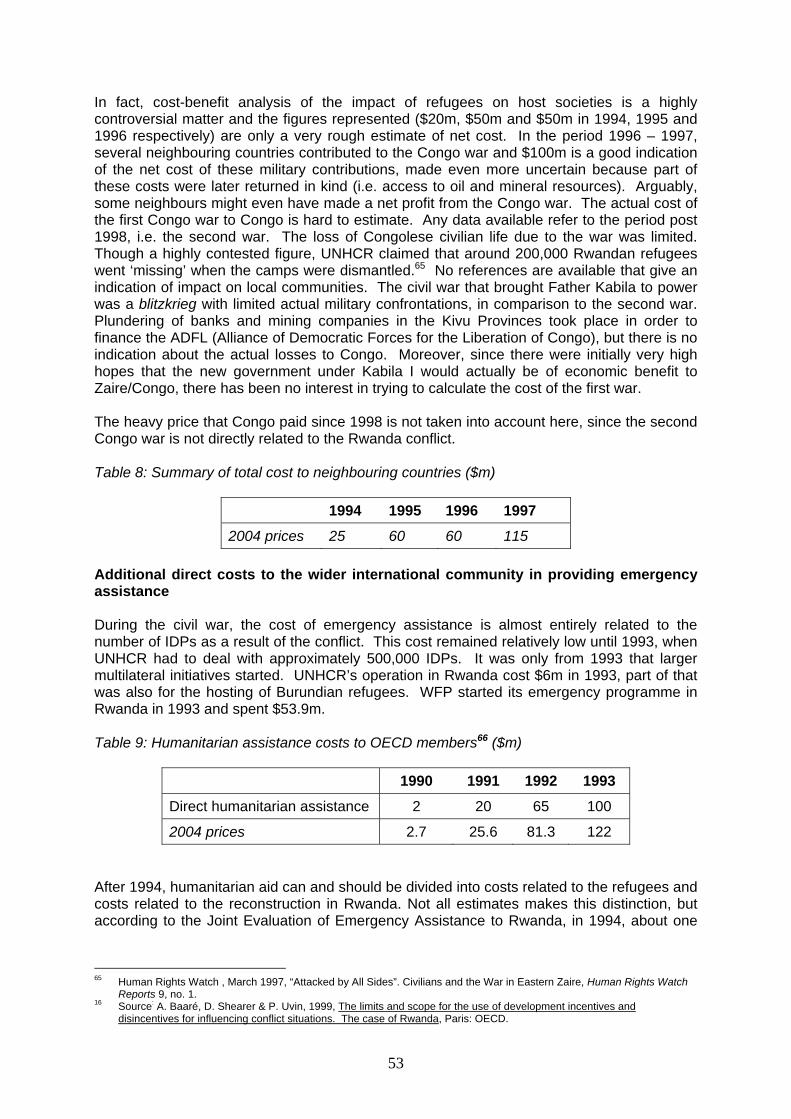
In fact, cost-benefit analysis of the impact of refugees on host societies is a highly controversial matter and the figures represented ($20m, $50m and $50m in 1994, 1995 and 1996 respectively) are only a very rough estimate of net cost. In the period 1996 – 1997, several neighbouring countries contributed to the Congo war and $100m is a good indication of the net cost of these military contributions, made even more uncertain because part of these costs were later returned in kind (i.e. access to oil and mineral resources). Arguably, some neighbours might even have made a net profit from the Congo war. The actual cost of the first Congo war to Congo is hard to estimate. Any data available refer to the period post 1998, i.e. the second war. The loss of Congolese civilian life due to the war was limited. Though a highly contested figure, UNHCR claimed that around 200,000 Rwandan refugees went ‘missing’ when the camps were dismantled.65 No references are available that give an indication of impact on local communities. The civil war that brought Father Kabila to power was a blitzkrieg with limited actual military confrontations, in comparison to the second war. Plundering of banks and mining companies in the Kivu Provinces took place in order to finance the ADFL (Alliance of Democratic Forces for the Liberation of Congo), but there is no indication about the actual losses to Congo. Moreover, since there were initially very high hopes that the new government under Kabila I would actually be of economic benefit to Zaire/Congo, there has been no interest in trying to calculate the cost of the first war. The heavy price that Congo paid since 1998 is not taken into account here, since the second Congo war is not directly related to the Rwanda conflict. Table 8: Summary of total cost to neighbouring countries ($m)
1994 1995 1996 1997
2004 prices 25 60 60 115 Additional direct costs to the wider international community in providing emergency assistance During the civil war, the cost of emergency assistance is almost entirely related to the number of IDPs as a result of the conflict. This cost remained relatively low until 1993, when UNHCR had to deal with approximately 500,000 IDPs. It was only from 1993 that larger multilateral initiatives started. UNHCR’s operation in Rwanda cost $6m in 1993, part of that was also for the hosting of Burundian refugees. WFP started its emergency programme in Rwanda in 1993 and spent $53.9m. Table 9: Humanitarian assistance costs to OECD members66 ($m)
1990 1991 1992 1993
Direct humanitarian assistance 2 20 65 100
2004 prices 2.7 25.6 81.3 122 After 1994, humanitarian aid can and should be divided into costs related to the refugees and costs related to the reconstruction in Rwanda. Not all estimates makes this distinction, but according to the Joint Evaluation of Emergency Assistance to Rwanda, in 1994, about one
65 Human Rights Watch , March 1997, “Attacked by All Sides”. Civilians and the War in Eastern Zaire, Human Rights Watch
Reports 9, no. 1. 16 Source: A. Baaré, D. Shearer & P. Uvin, 1999, The limits and scope for the use of development incentives and
disincentives for influencing conflict situations. The case of Rwanda, Paris: OECD.
53
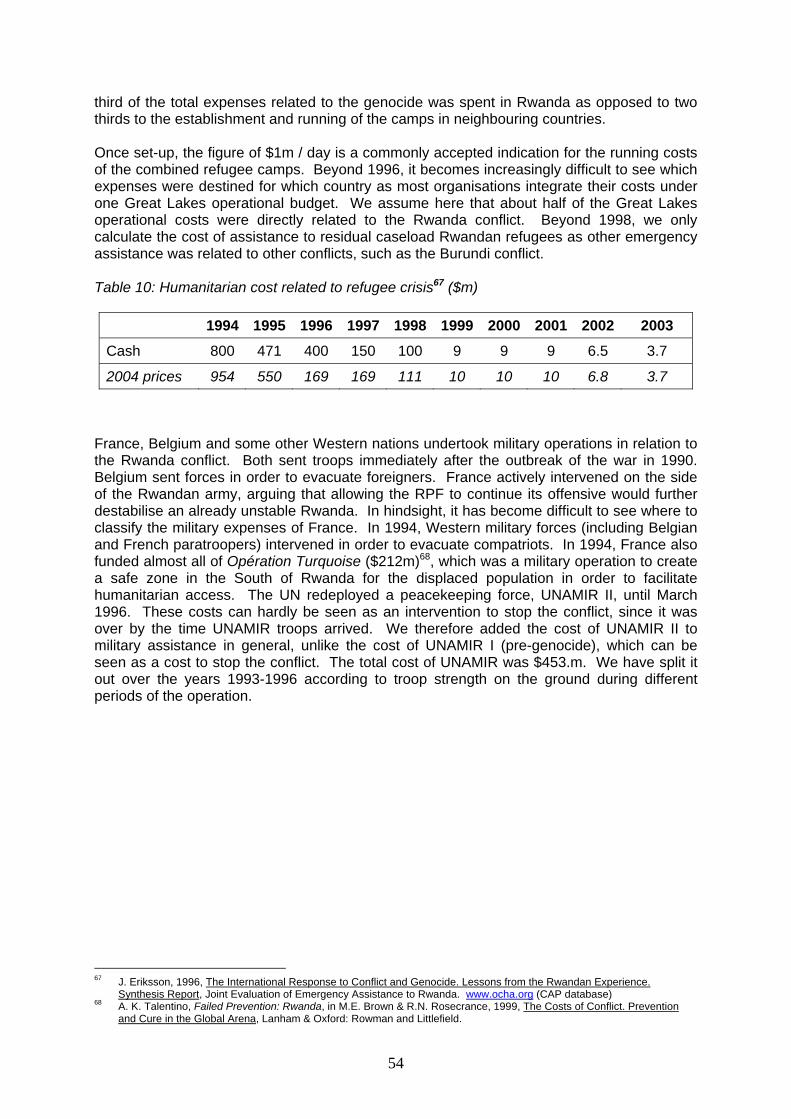
third of the total expenses related to the genocide was spent in Rwanda as opposed to two thirds to the establishment and running of the camps in neighbouring countries. Once set-up, the figure of $1m / day is a commonly accepted indication for the running costs of the combined refugee camps. Beyond 1996, it becomes increasingly difficult to see which expenses were destined for which country as most organisations integrate their costs under one Great Lakes operational budget. We assume here that about half of the Great Lakes operational costs were directly related to the Rwanda conflict. Beyond 1998, we only calculate the cost of assistance to residual caseload Rwandan refugees as other emergency assistance was related to other conflicts, such as the Burundi conflict. Table 10: Humanitarian cost related to refugee crisis67 ($m)
1994 1995 1996 1997 1998 1999 2000 2001 2002 2003
Cash 800 471 400 150 100 9 9 9 6.5 3.7
2004 prices 954 550 169 169 111 10 10 10 6.8 3.7
France, Belgium and some other Western nations undertook military operations in relation to the Rwanda conflict. Both sent troops immediately after the outbreak of the war in 1990. Belgium sent forces in order to evacuate foreigners. France actively intervened on the side of the Rwandan army, arguing that allowing the RPF to continue its offensive would further destabilise an already unstable Rwanda. In hindsight, it has become difficult to see where to classify the military expenses of France. In 1994, Western military forces (including Belgian and French paratroopers) intervened in order to evacuate compatriots. In 1994, France also funded almost all of Opération Turquoise ($212m)68, which was a military operation to create a safe zone in the South of Rwanda for the displaced population in order to facilitate humanitarian access. The UN redeployed a peacekeeping force, UNAMIR II, until March 1996. These costs can hardly be seen as an intervention to stop the conflict, since it was over by the time UNAMIR troops arrived. We therefore added the cost of UNAMIR II to military assistance in general, unlike the cost of UNAMIR I (pre-genocide), which can be seen as a cost to stop the conflict. The total cost of UNAMIR was $453.m. We have split it out over the years 1993-1996 according to troop strength on the ground during different periods of the operation.
67 J. Eriksson, 1996, The International Response to Conflict and Genocide. Lessons from the Rwandan Experience.
Synthesis Report, Joint Evaluation of Emergency Assistance to Rwanda. www.ocha.org (CAP database) 68 A. K. Talentino, Failed Prevention: Rwanda, in M.E. Brown & R.N. Rosecrance, 1999, The Costs of Conflict. Prevention
and Cure in the Global Arena, Lanham & Oxford: Rowman and Littlefield.
54
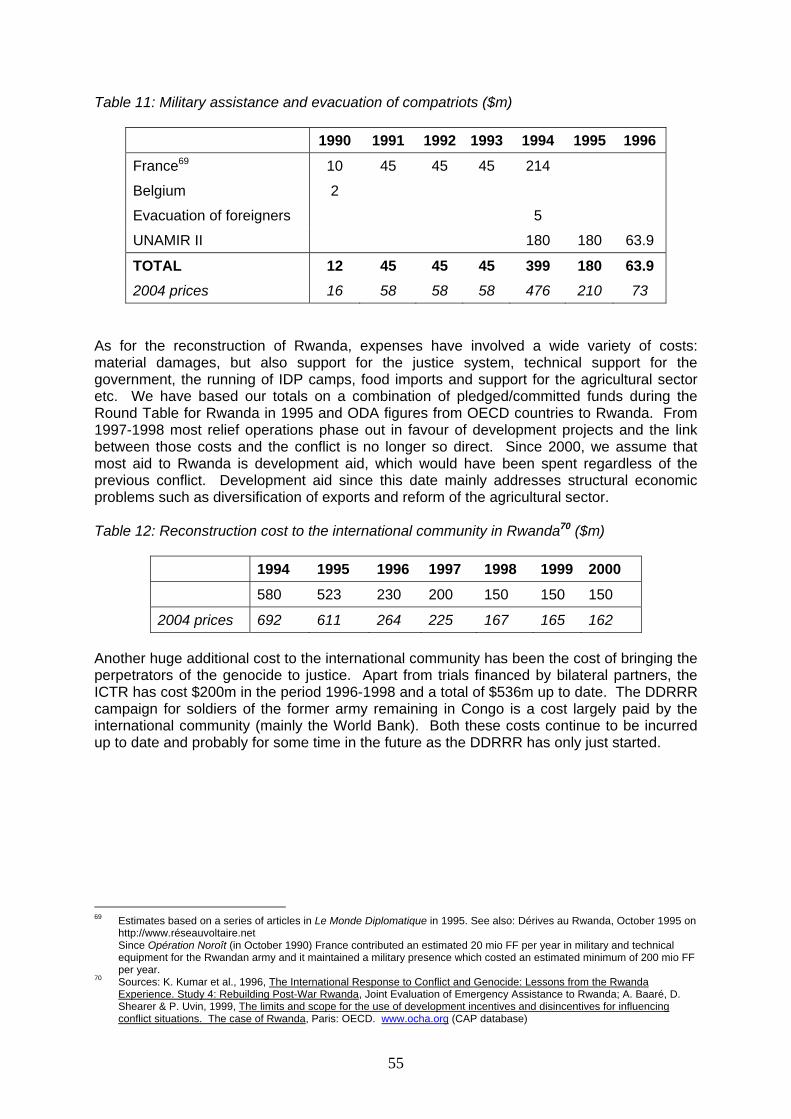
Table 11: Military assistance and evacuation of compatriots ($m)
1990 1991 1992 1993 1994 1995 1996
France69 10 45 45 45 214
Belgium 2
Evacuation of foreigners 5
UNAMIR II 180 180 63.9
TOTAL 12 45 45 45 399 180 63.9 2004 prices 16 58 58 58 476 210 73
As for the reconstruction of Rwanda, expenses have involved a wide variety of costs: material damages, but also support for the justice system, technical support for the government, the running of IDP camps, food imports and support for the agricultural sector etc. We have based our totals on a combination of pledged/committed funds during the Round Table for Rwanda in 1995 and ODA figures from OECD countries to Rwanda. From 1997-1998 most relief operations phase out in favour of development projects and the link between those costs and the conflict is no longer so direct. Since 2000, we assume that most aid to Rwanda is development aid, which would have been spent regardless of the previous conflict. Development aid since this date mainly addresses structural economic problems such as diversification of exports and reform of the agricultural sector. Table 12: Reconstruction cost to the international community in Rwanda70 ($m)
1994 1995 1996 1997 1998 1999 2000
580 523 230 200 150 150 150
2004 prices 692 611 264 225 167 165 162 Another huge additional cost to the international community has been the cost of bringing the perpetrators of the genocide to justice. Apart from trials financed by bilateral partners, the ICTR has cost $200m in the period 1996-1998 and a total of $536m up to date. The DDRRR campaign for soldiers of the former army remaining in Congo is a cost largely paid by the international community (mainly the World Bank). Both these costs continue to be incurred up to date and probably for some time in the future as the DDRRR has only just started.
69 Estimates based on a series of articles in Le Monde Diplomatique in 1995. See also: Dérives au Rwanda, October 1995 on
http://www.réseauvoltaire.net Since Opération Noroît (in October 1990) France contributed an estimated 20 mio FF per year in military and technical
equipment for the Rwandan army and it maintained a military presence which costed an estimated minimum of 200 mio FF per year.
70 Sources: K. Kumar et al., 1996, The International Response to Conflict and Genocide: Lessons from the Rwanda Experience. Study 4: Rebuilding Post-War Rwanda, Joint Evaluation of Emergency Assistance to Rwanda; A. Baaré, D. Shearer & P. Uvin, 1999, The limits and scope for the use of development incentives and disincentives for influencing conflict situations. The case of Rwanda, Paris: OECD. www.ocha.org (CAP database)
55
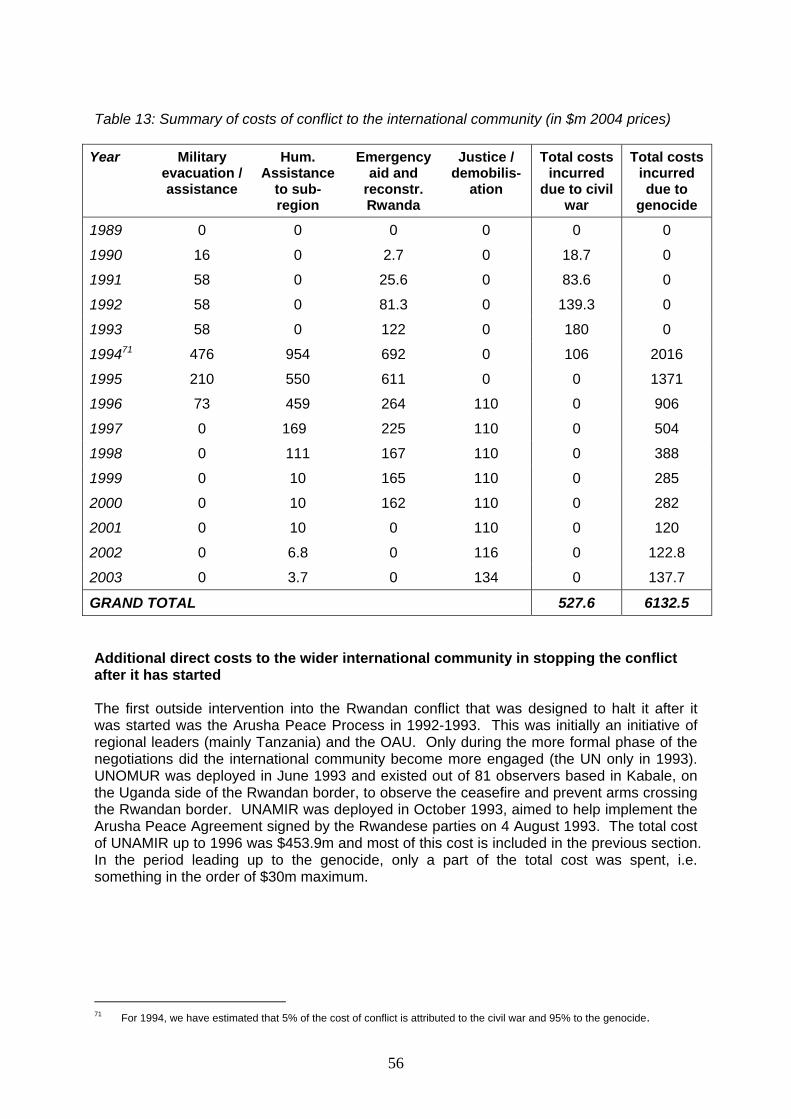
Table 13: Summary of costs of conflict to the international community (in $m 2004 prices)
Year Military evacuation / assistance
Hum. Assistance
to sub-region
Emergency aid and
reconstr. Rwanda
Justice / demobilis-
ation
Total costs incurred
due to civil war
Total costs incurred due to
genocide
1989 0 0 0 0 0 0
1990 16 0 2.7 0 18.7 0
1991 58 0 25.6 0 83.6 0
1992 58 0 81.3 0 139.3 0
1993 58 0 122 0 180 0
199471 476 954 692 0 106 2016
1995 210 550 611 0 0 1371
1996 73 459 264 110 0 906
1997 0 169 225 110 0 504
1998 0 111 167 110 0 388
1999 0 10 165 110 0 285
2000 0 10 162 110 0 282
2001 0 10 0 110 0 120
2002 0 6.8 0 116 0 122.8
2003 0 3.7 0 134 0 137.7
GRAND TOTAL 527.6 6132.5 Additional direct costs to the wider international community in stopping the conflict after it has started The first outside intervention into the Rwandan conflict that was designed to halt it after it was started was the Arusha Peace Process in 1992-1993. This was initially an initiative of regional leaders (mainly Tanzania) and the OAU. Only during the more formal phase of the negotiations did the international community become more engaged (the UN only in 1993). UNOMUR was deployed in June 1993 and existed out of 81 observers based in Kabale, on the Uganda side of the Rwandan border, to observe the ceasefire and prevent arms crossing the Rwandan border. UNAMIR was deployed in October 1993, aimed to help implement the Arusha Peace Agreement signed by the Rwandese parties on 4 August 1993. The total cost of UNAMIR up to 1996 was $453.9m and most of this cost is included in the previous section. In the period leading up to the genocide, only a part of the total cost was spent, i.e. something in the order of $30m maximum.
71 For 1994, we have estimated that 5% of the cost of conflict is attributed to the civil war and 95% to the genocide.
56
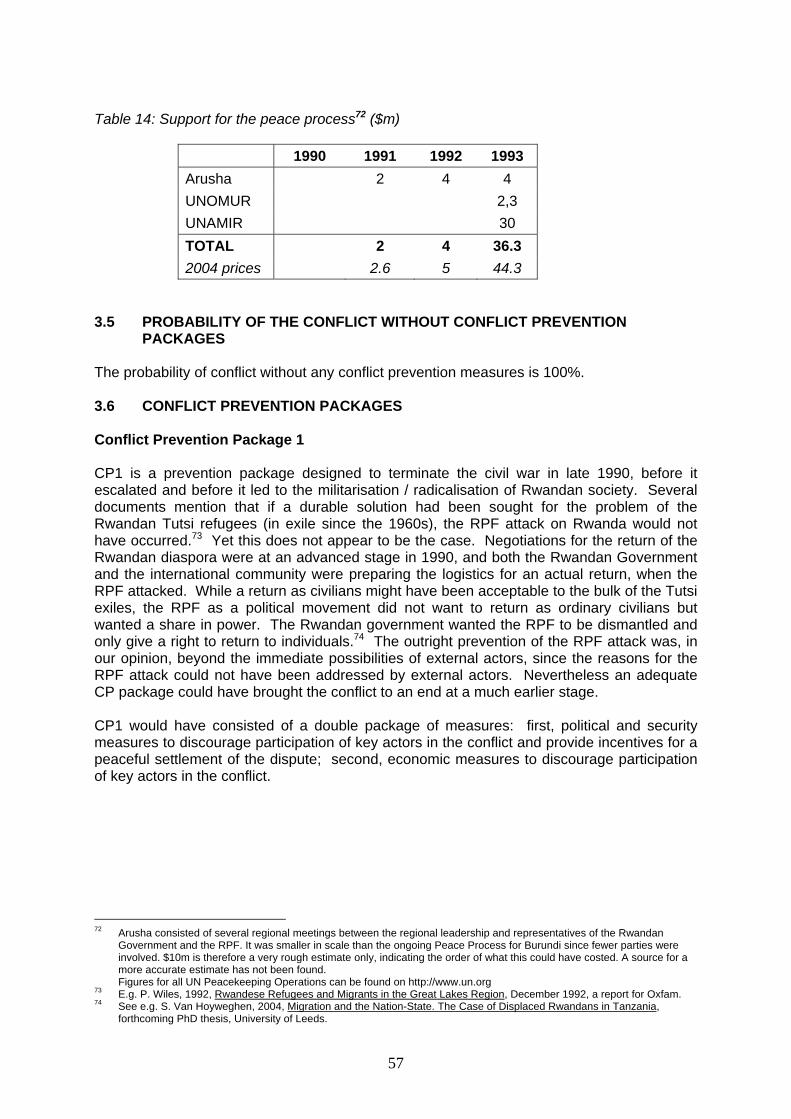
Table 14: Support for the peace process72 ($m)
1990 1991 1992 1993 Arusha 2 4 4 UNOMUR 2,3 UNAMIR 30 TOTAL 2 4 36.3 2004 prices 2.6 5 44.3
3.5 PROBABILITY OF THE CONFLICT WITHOUT CONFLICT PREVENTION PACKAGES The probability of conflict without any conflict prevention measures is 100%. 3.6 CONFLICT PREVENTION PACKAGES Conflict Prevention Package 1 CP1 is a prevention package designed to terminate the civil war in late 1990, before it escalated and before it led to the militarisation / radicalisation of Rwandan society. Several documents mention that if a durable solution had been sought for the problem of the Rwandan Tutsi refugees (in exile since the 1960s), the RPF attack on Rwanda would not have occurred.73 Yet this does not appear to be the case. Negotiations for the return of the Rwandan diaspora were at an advanced stage in 1990, and both the Rwandan Government and the international community were preparing the logistics for an actual return, when the RPF attacked. While a return as civilians might have been acceptable to the bulk of the Tutsi exiles, the RPF as a political movement did not want to return as ordinary civilians but wanted a share in power. The Rwandan government wanted the RPF to be dismantled and only give a right to return to individuals.74 The outright prevention of the RPF attack was, in our opinion, beyond the immediate possibilities of external actors, since the reasons for the RPF attack could not have been addressed by external actors. Nevertheless an adequate CP package could have brought the conflict to an end at a much earlier stage. CP1 would have consisted of a double package of measures: first, political and security measures to discourage participation of key actors in the conflict and provide incentives for a peaceful settlement of the dispute; second, economic measures to discourage participation of key actors in the conflict.
72 Arusha consisted of several regional meetings between the regional leadership and representatives of the Rwandan
Government and the RPF. It was smaller in scale than the ongoing Peace Process for Burundi since fewer parties were involved. $10m is therefore a very rough estimate only, indicating the order of what this could have costed. A source for a more accurate estimate has not been found.
Figures for all UN Peacekeeping Operations can be found on http://www.un.org 73 E.g. P. Wiles, 1992, Rwandese Refugees and Migrants in the Great Lakes Region, December 1992, a report for Oxfam. 74 See e.g. S. Van Hoyweghen, 2004, Migration and the Nation-State. The Case of Displaced Rwandans in Tanzania,
forthcoming PhD thesis, University of Leeds.
57

Political and security measures: The key to this CP Package is the active involvement of the international community in an Arusha-style peace process in late 1990 or early 1991, immediately after the RPF attack. The cost of support for peace negotiations can be based on the estimated cost of Arusha, increased a bit since more Western involvement is presumed. This political initiative would be backed by an arms embargo, which could have prevented both the militarisation of the conflict and the negative effect of military expenditure on general poverty levels, including France’s provision of military assistance to the Rwandan Government. It would also have been supported by the early deployment of a peacekeeping force in order to control the embargo, oversee the peace process and guarantee its implementation. We are suggesting a robust peace keeping force presuming that early negotiations had a higher chance of resulting in an effective cease fire. In addition, the international community would deploy civilian personnel to monitor the general human rights situation, thus helping to provide essential feed-back to all external actors involved so that policies could have been adjusted in time. An actual field office of the HCHR would probably not be necessary at this point to carry out a minimal monitoring and facilitation function. We have therefore estimated the cost of involvement of HCHR on the basis of the cost of a similar involvement in Sierra Leone in 1999, which was an average of $0.6m for a 6 month period.75 The cost of the deployment of a peacekeeping force similar in strength (around 5,000 troops) to that planned for UNAMIR over a period of 3 years, can be based on what UNAMIR eventually cost, though it would probably have cost less. UNAMIR cost $453.9m (October 1993 – March 1996) but was never deployed at full strength as planned. A current UN peace keeping operation with similar troop strength is UNMISET in East Timor (annual budget $193.34m, 2004 prices). Their mandate is slightly more robust than would have been needed in Rwanda in 1991 and the cost is higher because of the involvement of Western troops. The mandate includes security and law enforcement, border control and general stability and justice measures. Finally, in the light of the widespread (retrospective) realisation that active promotion of democratisation was a destabilizing factor in Rwanda, the package would involve a reining-back of international community demands in this area. Economic measures: The aid business in Rwanda continued to operate in 1990-94 as if the war did not exist. This package assumes that donors altered their economic policies towards Rwanda with the potential for conflict much more firmly in their minds. It includes a small increase in aid, designed to soften the social impact of the SAP package, and the devaluation in particular, and also to absorb the shock of falling coffee prices. A number of conditionalities, incentives and disincentives would have been built in to prevent the use of aid for the strengthening of a radicalising regime and to prevent the use of aid for increased military expenditures (as occurred in practice). It is difficult to assess the cost for these measures, since it was not the lack of aid that was necessarily the problem but more the way that it was spent. An increase of about $50m per annum (1990 prices) would be sufficient to cover the measures proposed, although this amount is slightly increased towards the end of the peace keeping presence in order to act as an incentive for continued moderation.
75 Source: OHCHR Annual Report 2000, Geneva.
58
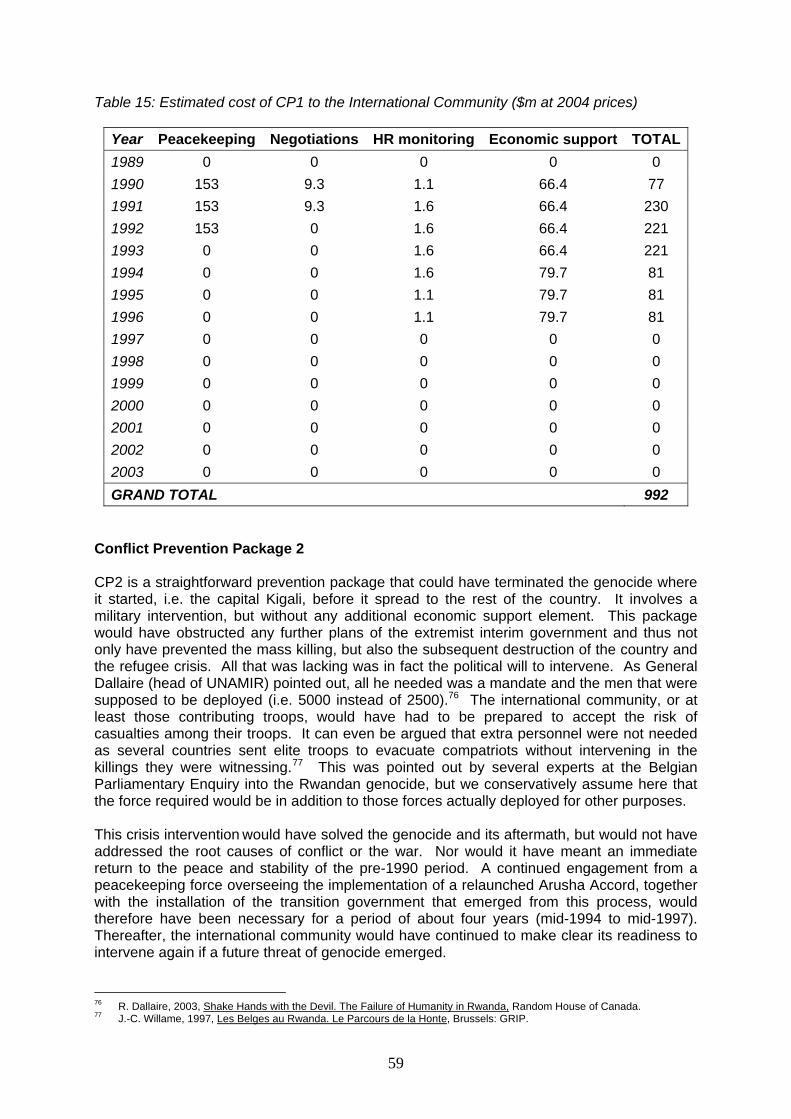
Table 15: Estimated cost of CP1 to the International Community ($m at 2004 prices)
Year Peacekeeping Negotiations HR monitoring Economic support TOTAL1989 0 0 0 0 0 1990 153 9.3 1.1 66.4 77 1991 153 9.3 1.6 66.4 230 1992 153 0 1.6 66.4 221 1993 0 0 1.6 66.4 221 1994 0 0 1.6 79.7 81 1995 0 0 1.1 79.7 81 1996 0 0 1.1 79.7 81 1997 0 0 0 0 0 1998 0 0 0 0 0 1999 0 0 0 0 0 2000 0 0 0 0 0 2001 0 0 0 0 0 2002 0 0 0 0 0 2003 0 0 0 0 0 GRAND TOTAL 992
Conflict Prevention Package 2 CP2 is a straightforward prevention package that could have terminated the genocide where it started, i.e. the capital Kigali, before it spread to the rest of the country. It involves a military intervention, but without any additional economic support element. This package would have obstructed any further plans of the extremist interim government and thus not only have prevented the mass killing, but also the subsequent destruction of the country and the refugee crisis. All that was lacking was in fact the political will to intervene. As General Dallaire (head of UNAMIR) pointed out, all he needed was a mandate and the men that were supposed to be deployed (i.e. 5000 instead of 2500).76 The international community, or at least those contributing troops, would have had to be prepared to accept the risk of casualties among their troops. It can even be argued that extra personnel were not needed as several countries sent elite troops to evacuate compatriots without intervening in the killings they were witnessing.77 This was pointed out by several experts at the Belgian Parliamentary Enquiry into the Rwandan genocide, but we conservatively assume here that the force required would be in addition to those forces actually deployed for other purposes. This crisis intervention would have solved the genocide and its aftermath, but would not have addressed the root causes of conflict or the war. Nor would it have meant an immediate return to the peace and stability of the pre-1990 period. A continued engagement from a peacekeeping force overseeing the implementation of a relaunched Arusha Accord, together with the installation of the transition government that emerged from this process, would therefore have been necessary for a period of about four years (mid-1994 to mid-1997). Thereafter, the international community would have continued to make clear its readiness to intervene again if a future threat of genocide emerged. 76 R. Dallaire, 2003, Shake Hands with the Devil. The Failure of Humanity in Rwanda, Random House of Canada. 77 J.-C. Willame, 1997, Les Belges au Rwanda. Le Parcours de la Honte, Brussels: GRIP.
59
The forces on standby for ONUMOZ, i.e. the UN Operation in Mozambique (December 1992- December 1994), provides a good basis for estimating the cost of a similar operation in Rwanda, since the mandate and troop strength were similar to what would have been needed in Rwanda. A peace keeping force in Rwanda would have equally needed to separate and disarm fighting forces, locate and destroy weapons. They would equally needed to have safeguarded access for humanitarian actors, provided and co-ordinated technical assistance and overseen the implementation of the peace agreement and the installation of a new government. We are therefore looking at a total cost of $850m (1994 prices) spread over a period of 4 years. This is in the same order as Renner’s estimate. He estimated that a 6 month peacekeeping force in 1994 at a cost of ‘just’ $115m could have prevented the genocide.78 Talentino arrives at a CP package of $4,500m, i.e. well above our estimate.79 She estimates the cost of the military force higher because of the need to engage in combat in 1994. However, we believe no high tech weaponry was needed and that this cost would have disappeared in the following years. Her peace scenario also differs in the sense that she proposes a very extensive humanitarian and economic aid package in order to arrive at a situation of relative peace and stability. This is a question of perspective. By looking at the period 1990-1993 and its related cost, it is clear that the staggering increase in the cost of conflict after 1994 is directly attributable to the acts of genocide and not the general context of instability and civil war. A mere military intervention plus extended peacekeeping force would have prevented the great majority of these costs. Given the particular context of instability, the installation of a field office of the HCHR could supplement the peace force. The cost of the HCHR field office in Burundi ($2,3m in 1999) is relevant for comparison since the context and tasks are very similar to what would have been needed in Rwanda in 1994. The field office could be maintained in place for a longer period than the peace-keeping force as a close monitoring agent.
78 M.Renner, November 1994, Budgeting for Disarmament: The Costs of War and Peace, Worldwatch Paper no. 122.,
Washington: Worldwatch Institute. 79 A. K. Talentino, Failed Prevention: Rwanda, in M.E. Brown & R.N. Rosecrance, 1999, The Costs of Conflict. Prevention
and Cure in the Global Arena, Lanham & Oxford: Rowman and Littlefield.
60

Table 16: Estimated cost of CP2 to the international community ($m at 2004 prices)
Year Peace enforcing / keeping HR monitoring TOTAL 1989 0 0 0 1990 0 0 0 1991 0 0 0 1992 0 0 0 1993 0 0 0 1994 268.4 1.5 269.9 1995 298.3 2.5 300.8 1996 298.3 2.5 300.8 1997 149.1 2.5 151.6 1998 0 1.5 1.5 1999 0 1.5 1.5 2000 0 0 0 2001 0 0 0 2002 0 0 0 2003 0 0 0 GRAND TOTAL 1026.1
3.7 PROBABILITY OF CONFLICT WITH CONFLICT PREVENTION PACKAGES Probability of Conflict with Conflict Prevention Package 1 There is general agreement that the 1992-1993 Arusha Peace Process was technically sophisticated and that little more could have been done to make it work. However, it came in many respects too late, and as a result it was never accepted by all the parties to the conflict. After considerable military advances during 1991 and 1992, the RPF used its military strength on the ground as a negotiating chip for getting the most out of the Arusha process. This threat was considered unacceptable by a growing proportion of those in government and no agreement was reached. The effect of CP1 on the likelihood of avoiding this escalation is difficult to estimate since several scenarios are possible. It is possible that less military support for the Rwandan army in October 1990 might have led to an outright capture of Kigali by the RPF in 1990, with unpredictable consequences. Nevertheless, such an outcome is not certain. Taking into account the pre-existing general instability in Rwanda (economic crisis, democratisation process, etc.) it is quite possible that some level of renewed violence would have broken out regardless in subsequent years. The economic initiatives suggested in the package could have reduced this probability but not eliminated it. As a consequence of these various factors, we estimate that CP1 would only have reduced the likelihood of a 1990-1993 scale civil war taking place, sometime before 2003, to about 50%. However we estimate that this package would have had a much greater impact on the risk of a genocide taking place, which we estimate would only have been 10% with this package. Of the total costs of the Rwandan conflict, 82% is attributable to the genocide (which accounts for 92% of the costs to the international community, 100% of those to neighbours and 77% to Rwanda itself).
61
As a consequence, the reduction in probability of conflict (weighted by the relative costs of the various parts of that conflict to the international community, neighbours and Rwanda combined) is estimated to be 83%. Probability of Conflict with Conflict Prevention Package 2 CP2 would have been a relatively straightforward intervention, isolating the already known masterminds of the genocide and keeping militia in check in the capital. Given the necessary resources, the likelihood that the genocide could have been prevented would have been very high. In the short term, and as long as a sizeable international force was present, we assess the probability of success as 95%. Provided that a credible threat of re-intervention remained even after UN forces departed in 1998, moreover, the chances of genocide taking place in subsequent years would have remained low. If CP2 had been implemented, the cumulative probability of genocide taking place during 1994-2003 is therefore assessed at only 5%. In this scenario, the costs of the civil war would not have been prevented. However, since these costs constitute only 18% of the total costs of the Rwanda conflict (only 8% of costs to the international community, practically 0% of those incurred by neighbouring countries and 23% of costs to Rwanda), the reduction in probability of conflict (weighted by the relative costs of various parts of that conflict to the international community, neighbours and Rwanda combined) would be 78%. 3.8 NET PRESENT VALUE AND ASSESSMENT We conclude that both CP packages studied would have had to reduce the probability of conflict by around 15% in order to be cost-effective for the IC. If the costs to Rwanda itself are also taken into account, the breakeven probability would have been much lower, at around 3%. In both calculations, therefore, conflict prevention statistically stood a very good chance of saving money. If one were to try to make a choice between the two packages under study many other factors would need to be taken into account. Package 1 which essentially argues for early international engagement at the very onset of conflict (in contrast to Package 2 which supposes robust military intervention when conflict threatens to escalate to unacceptably high levels) seems to be the obvious choice, in terms of cost effectiveness, the expectation of an overall higher success rate and (last but not least) the human costs of the civil war. However, we equally have to realise that in 1990 no-one would have expected the initial RPF incursion into Rwanda to have the wider ramifications it eventually did. No-one could have predicted the genocide at that point, let alone the refugee saga and the first Congo war. Moreover, since in 1990-91 it would have been difficult to predict the further evolvement of the actual conflict scenario, it would have been more difficult for external actors to get a grip on the situation. As a result, we estimate that there would still have remained a 50% chance of the civil war happening despite the implementation of the suggested CP package. These handicaps have to be taken into account when evaluating it. CP Package 2 is a more straightforward package since the conflict had evolved to the extent that it became more predictable to external actors so that decisive action at the right moment stood a very high chance of stopping the genocide and all its related costs. However, this would imply that Rwanda had already suffered from the war for several years. While the economic costs of the war are low, the social and political cost of the war on Rwanda’s future stability should not be underestimated, even though they have not been taken into account here. Reconciliation would be harder than in the case of Package 1, and so would the formation of a coalition government acceptable to all. It can be argued that a Rwandan government formed after implementation of Package 2 would have had the added bonus of
62
the RPF weighing more heavily on the macro-economic management of Rwanda and having a positive effect on trying to solve some of Rwanda’s structural economic problems, which had remained unaddressed until then. However, once again, we should not only look at economic indicators. The RPF is an elite minority that dominates policy and has a poor human rights record both within Rwanda and in neighbouring Congo. Hence, in terms of national and regional political stability, it might have been better to have had a Rwandan government resulting from an implementation of Package 1 which would have given the RPF a much smaller share in power (because it would not have had the time to prove itself on the battle field). Such a coalition would have been more acceptable to the Rwandan political establishment of the time and could therefore have prevented the radicalisation within circles of the Rwandan political elite. The broad conclusions reached here are not substantially influenced by varying the costs of the two Packages. Even if the costs of additional economic support included in Package 1 are doubled (which we do not think would have been necessary), this Package would still have been cost-effective to the IC at a breakeven probability of success of 24%. Similarly, a larger military force might plausibly have been required in Package 2 in order to follow through on the immediate task of halting the genocide in Kigali. If the costs of such a force had been three times those included above, for example, the breakeven probability of cost-effectiveness to the IC would have been 46%: still well below the near-certainty of success which the study suggests would have been achieved with a smaller force. In both cases, the breakeven probability is much lower once the costs of the conflict and genocide to the Rwandan people is taken into account.
63