pdf - Igor V. Florinsky
403
-
Upload
khangminh22 -
Category
Documents
-
view
0 -
download
0
Transcript of pdf - Igor V. Florinsky


EARTH SCIENCES IN THE 21ST CENTURY SERIES
MAN AND THE GEOSPHERE


EARTH SCIENCES IN THE 21ST CENTURY SERIES
Man and the Geosphere Igor V. Florinsky (Editor)
2010. ISBN: 978-1-60876-387-0


EARTH SCIENCES IN THE 21ST CENTURY SERIES
MAN AND THE GEOSPHERE
IGOR V. FLORINSKY EDITOR
Nova Science Publishers, Inc. New York
Copyright © 2010 by Nova Science Publishers, Inc. All rights reserved. No part of this book may be reproduced, stored in a retrieval system or transmitted in any form or by any means: electronic, electrostatic, magnetic, tape, mechanical photocopying, recording or otherwise without the written permission of the Publisher. For permission to use material from this book please contact us: Telephone 631-231-7269; Fax 631-231-8175 Web Site: http://www.novapublishers.com
NOTICE TO THE READER The Publisher has taken reasonable care in the preparation of this book, but makes no expressed or implied warranty of any kind and assumes no responsibility for any errors or omissions. No liability is assumed for incidental or consequential damages in connection with or arising out of information contained in this book. The Publisher shall not be liable for any special, consequential, or exemplary damages resulting, in whole or in part, from the readers’ use of, or reliance upon, this material. Any parts of this book based on government reports are so indicated and copyright is claimed for those parts to the extent applicable to compilations of such works. Independent verification should be sought for any data, advice or recommendations contained in this book. In addition, no responsibility is assumed by the publisher for any injury and/or damage to persons or property arising from any methods, products, instructions, ideas or otherwise contained in this publication. This publication is designed to provide accurate and authoritative information with regard to the subject matter covered herein. It is sold with the clear understanding that the Publisher is not engaged in rendering legal or any other professional services. If legal or any other expert assistance is required, the services of a competent person should be sought. FROM A DECLARATION OF PARTICIPANTS JOINTLY ADOPTED BY A COMMITTEE OF THE AMERICAN BAR ASSOCIATION AND A COMMITTEE OF PUBLISHERS. LIBRARY OF CONGRESS CATALOGING-IN-PUBLICATION DATA Man and the geosphere / editor, Igor V. Florinsky. p. cm. Includes index. ISBN 978-1-60876-387-0 (hardcover) 1. Biosphere. 2. Hydrocarbons. 3. Amino acids. 4. Nucleic acids. I. Florinsky, Igor V. QH343.4.M36 2009 304.2--dc22 2009037450
Published by Nova Science Publishers, Inc. New York
The cover shows the painting "On the Heights (Tumo)" by Nicholas Roerich (1936) from the collection of the Latvian National Museum of Art, Riga, Latvia.
CONTENTS
Preface vii Acknowledgments xiii Part I. Geo and Bio: Key Relationships 1 Chapter 1 Fluid Evolution of the Earth and Origin of the Biosphere 3
Alexey A. Marakushev and Sergey A. Marakushev Chapter 2 Role of Isotopes in the Biosphere 33
Emlen V. Sobotovich, Igor V. Florinsky, Olga B. Lysenko and Dmitry M. Grodzinsky
Chapter 3 Geochemical Anomalies: Sickness and Health 69 Iosif F. Volfson, Wolfgang Paul and Igor G. Pechenkin
Chapter 4 Geopsychology: Geophysical Matrix and Human Behavior 115 Bryce P. Mulligan, Lynn Suess Cloes, Quoc Hao Mach and Michael A. Persinger
Part II. Crossing a Range of Spatial Scales 143 Chapter 5 Intraspecific Variability of Plants: The Impact of Active Local
Faults 145 Irina G. Boyarskikh and Alexander V. Shitov
Chapter 6 Pathogenic Effect of Fault Zones in the Urban Environment 169 Vyacheslav A. Rudnik and Evgeny K. Melnikov
Chapter 7 Health of People Living in a Seismically Active Region 185 Alexander V. Shitov
Chapter 8 Sacred Places and Geophysical Activity 215 Igor V. Florinsky
Chapter 9 Tectonic and Climatic Rhythms and the Development of Society 257 Vladimir G. Trifonov

Contents vi
Chapter 10 Hydrogen Degassing of the Earth: Natural Disasters and the Biosphere 307 Vladimir L. Syvorotkin
List of Contributors 349 Index 351

PREFACE In the early 1970s, UNESCO had launched the international ecological program “Man
and the Biosphere” to establish biosphere reserves and to protect genetic resources (Di Castri et al., 1981). The program has been initiated due to the public and scientific concerns about the growing impact of modern civilization on the environment. Indeed, by the mid-20th century, the human impact on the planet had reached such a level, that Vernadsky (1945) stated: ‘man becomes a large-scale geological force’. Subsequent advances in nuclear and space technologies have strengthened an illusion about the might of mankind. It overshadowed the obvious fact that ‘civilization exists by geological consent’1.
Indeed, humanity is under the permanent influence of the geosphere2. Roles of some geological biotropic factors are obvious and have been well studied. A list of such factors includes:
• Catastrophic manifestations of the geodynamics (i.e., volcanic explosions, strong earthquakes, tsunamis, and seismically triggered landslides); and
• Geochemical anomalies responsible for the occurrence of both endemic diseases and deposits of therapeutic mineral resources.
However, little is known about biotropic effects of other geogenic factors. Among these are geomagnetic activity, magnetic anomalies, natural background radiation, isotopic fractionation, fluid migration and gas emission within fault zones, mild seismicity causing local variations of geophysical and geochemical parameters, the Earth’s deep degassing modulating biologically important atmospheric characteristics, cyclicity of tectonic and climatic processes, gravity, solid tides, etc. Biological effects of these factors are not well known in the broad scientific community.
This book is the first attempt to close the gap, synthesizing the knowledge on all known geogenic factors influencing humans, society, and civilization. With this aim in mind, a group of scholars has been assembled from a wide variety of disciplines – geology, geochemistry, biophysics, biochemistry, psychology, neurophysiology, botany, and mathematical modeling – to examine the problem from an interdisciplinary perspective.
The book is divided into two parts. Part I represents the state-of-the-art in the field of geo-bio-interactions. Part II introduces particular examples of direct and indirect influences of the geological environment on the bio- and anthroposphere.
1 Anonymous (frequently attributed to W. Durant – Hirst, 2006). 2 We take the word geosphere to mean the entire interior of the Earth.

I. V. Florinsky viii
Part I comprises four chapters. Chapter 1 conceptually outlines a hydrogen-hydrocarbon-organic evolutionary direction,
which is mutually connected with processes encompassing the entire interior of the Earth. The endogenous evolution of our planet is controlled by impulses of fluid degassing of the liquid outer core. Each pulse begins with extension of the crust and mantle and terminates with their compression. Geomagnetic activity is inversely related to the endogenous activity: the higher the fluid degassing rate, the lower the geomagnetic reversal rate. Released from the Earth’s liquid core, fluids lose hydrogen during the extension phase. However the compression regime, impeding the hydrogen migration from fluids, promotes the development of hydrocarbons in magma chambers within the crust and mantle. Upward migration of hydrocarbons from magma chambers leads to their accumulation in the Earth’s crust as gas and oil deposits. Cooling of uprising hydrocarbon fluids and their interaction with the hydrosphere provides the abiogenic generation of organic compounds using nitrogen-hydrocarbon precursors. Complexes of life came into existence during interactions of these abiogenic substances. All of this naturally produces a chemical basis for the subsequent embedding of genetic instructions that makes life possible. Thus the chapter, for the first time, demonstrates relationships between the global fluid degassing and the origin of oil, life, and the biosphere.
Stable and radioactive isotopes play a key role in the formation of chemical and physical properties of a chemical element. Isotopes, being subsystems of the element, allow nature to create biosystems, which are marked by a wide range of adaptive properties, at various hierarchical levels. Chapter 2 mainly looks at stable isotope fractionation in the human organism. The authors consider isotopic composition of body tissues and dependence of human isotope fractionation on diet, geographical context, the state of health, and age. It is proposed that a living organism and each of its systems can be characterized by a typical composition of natural isotopes, “an isotopic card”, whose content is mutually connected with the environment. In the signature, typical isotope ratios may fluctuate supporting the state of isotopic homeostasis, an integral part of the general homeostasis of the organism. The authors also review a role of natural radioisotopes in speciation and biological evolution. It is demonstrated that natural background radiation is important for vital activity of living beings, whereas dramatic periods of speciation have regularly occurred in periods of high radioactivity of the environment. Possible mutagenic effects of the cosmic radiation increased during geomagnetic reversals and excursions are also discussed.
Chapter 3 looks at natural geochemical anomalies, which can influence the balance of trace elements in the human organism, causing both adverse and positive impact on human health. The authors show that fluid degassing via faults is the main factor responsible for the development of geochemical anomalies. As a result, a major portion of both endemic-disease areas and balneological resorts are located within geodynamically active regions. The authors comprehensively review health effects of natural abnormal concentrations of trace elements and gases in the environment, as well as healing effects of natural geological products including mineral waters, muds, moor, sands, and some minerals.
The geomagnetic field – generated in the liquid outer core, maintained by the geodynamo, and modulated by solar activity – permanently influences all living beings. Chapter 4 investigates the potential of geopsychology, which studies the impact of geophysical and geochemical variables on human behavior. The authors’ emphasis is on the effects of geomagnetic activity on vascular events and brain function. Capabilities of the

Preface ix
geopsyche concept are exemplified by two field-scale case studies. The authors argue that the optimal creativity and adaptability of populations may require determination of the empirical congruence between the person’s neurocognitive profile and the geophysical environment.
Part II consists of six chapters. Each chapter describes biotropic effects of geogenic factors associated with a particular spatial scale. A sequence of chapters is arranged according to a range of scales: “field – city – region – continent – globe”.
Plant domestication has given a strong impetus to the development of early agricultural societies. It is well known that such societies have commonly been located in regions of genetic and phenotypic intra- and interspecific variability of plants. Chapter 5 considers the impact of active faults on plant intrapopulation variability exemplified by blue honeysuckle. The authors found that the diversity of fruit shape and the occurrence of bitter-free fruits (a recessive trait important for domestication) are sharply increased within fault zones. These effects are probably associated with the influence of local seismicity (a chronic stressor), and a seismically induced groundwater-driven release of geochemical mutagenic agents within fault zones.
Chapter 6 probes into geological and geophysical factors influencing human health in the urban environment. The authors established statistically significant relationships between spatial distribution of cancer incidence rates in apartment buildings and zones of enhanced permeability of the crust, which comprise faults and areas of increased rock fracturing. Mechanisms of such adverse effects on human health may be connected with a disturbance of mitosis and cell development due to geomagnetic fluctuations within fault zones and a specific gaseous and geochemical regime associated with the deep-fluid degassing via faults.
Chapter 7 considers the impact of geological environment on the health of people living in seismically active regions. The author demonstrates that distinct geogenic agents influence human health at different temporal scales. At a long-term scale, prevalence rates of some diseases depend on the level of terrestrial γ radiation and the occurrence of intrusions, magnetic anomalies, and active faults. At a medium-term scale, an earthquake preparation process begins to influence incidence rates of certain nosologies 2–3 years ahead of the main shock. This effect is connected with a gradual change of a dynamic stress field, which results in increased fracturing, the rise of radon emission, and changes in the regional hydrogeological situation. At a short-term scale, an earthquake preparation process triggers geomagnetic fluctuations, which lead to an increase in emergency calls before the earthquake and during aftershocks.
Altered states of consciousness are a phenomenon, which have influenced and continue to influence the development of personality, culture, and civilization. Chapter 8 investigates the role of geophysical activity in the occurrence of mystical experience in particular places on the Earth’s surface and subsequent sacralization of such places. It is suggested that the following complex of geogenic factors is necessary for place sacralization: regional and local active faults, local lithospheric magnetic anomalies, regional and local lithospheric stresses, and regional seismic activity. The author assumes the following cause and effect chain: There is increased permeability of the crust along faults. This creates conditions conducive to the occurrence of ore concentrations and magmatic bodies generating local magnetic anomalies. Geomagnetic storms modulate the intensity of the geomagnetic field at these anomalies. Before an earthquake, the rise of regional lithospheric stresses leads to electric currents. Propagating along faults, they also modulate the intensity of magnetic anomalies. Local fluctuations of the geomagnetic field influence the human brain and can lead to a mystical

I. V. Florinsky x
experience. An analysis of the statistically representative regional sample of sacred places and geological and geophysical data lends credence to this hypothesis.
It is well known that natural processes – biological, climatic, and geological – are marked by cyclicity with periods ranging from seconds, minutes, and hours (e.g., physiological cycles) to hundreds, thousands, and millions of years (e.g., Milankovitch cycles). Interference between biological, climatic, and geological cycles may lead to regular results in the sociosphere. Chapter 9 examines this problem from a regional and continental perspective. The author presents a broad picture of the historical development of societies within the vast territory of the Alpine-Himalayan orogenic belt and the East European Platform during the Middle and Late Holocene. At a centennial scale, multiple-of-11-yr cyclicity is the most important among the short-period fluctuations of climatic and tectonic activity. These cycles influence the economic activity of the society. At a millennial scale, historical development – including the five key historical crises – displays a periodicity, which is largely in synchrony with the 1,200-yr cycle of climatic and endogenous activity. The author argues that although the crises were marked by social unrest, mass migrations, and political perturbations, they maintained the “sociodynamo”, offering new forms of economic and political relations. Such a conclusion is consistent with the Molchanov law: During the course of evolution, the ability to “survive” is unique to oscillating systems. “Stable” inflexible systems turn into inert parts of the environment, whereas unstable systems collapse (Molchanov, 1967). Synchronism of climatic and tectonic events in both short- and medium-term oscillations is possibly caused by the difference in the rotational velocity of the liquid outer core and the mantle, periodic changes in the Earth’s orbital parameters, and solar activity. Multiple-of-11-yr cycles correlate with the periodic changes in solar activity, whereas the 1,200-yr cycle is associated with the precession of the geomagnetic axis around the Earth’s rotational axis.
Finally, Chapter 10 discusses multiple impacts of the deep hydrogen degassing of the Earth on the bio- and anthroposphere. The process of inner core crystallization leads to the release of hydrogen, which is accumulated at the boundary of the liquid outer core and the mantle, and then diffuses outward to the Earth’s surface via rift and fault zones. The author demonstrates that the gas flow causes intensification of seismic and volcanic activity, decline of aerobic biota in the oceans, and ozone layer depletion. A surplus flux of ultraviolet-B, adversely affecting biota, reaches the Earth’s surface through the negative ozone anomalies. They also pass a surplus flux of infrared energy that leads to abnormal heating of local parts of the Earth’s surface. This increases frequency of regional extreme meteorological events, causes El Niño and general destabilization of the atmosphere and ocean. The author argues that the list of geological driving forces for speciation includes topographic barriers, millennial-scale climatic fluctuations caused by the precession of the geomagnetic axis, geomagnetic reversals and excursions, geochemical anomalies, seismicity, radon emission via faults, and ultraviolet radiation over the degassing centers.
The scientific intrigue of the book resides in the fact that most geogenic biotropic factors (except for gravity and radiation) are functions or manifestations of two “meta-agents”: the deep degassing of the Earth and the geomagnetic field. The deep degassing is responsible for seismic and volcanic activity, fluid migration and gas emission within fault zones, the occurrence of geochemical anomalies, and key atmospheric and climatic processes. The geomagnetic field manifests in lithospheric magnetic anomalies, geomagnetic storms, reversals, and excursions, and the precession of the geomagnetic axis. Both meta-agents are

Preface xi
generated by processes in the liquid outer core. These processes are probably mutually related to each other, and this problem invites further investigation.
This book demonstrates that the life of individuals, societies, and all of humanity is essentially regulated by geological forces in wide ranges of spatial and temporal scales. It is irrational to ignore this fact. I hope that this book will provide ‘a further basis by disposing of certain inner obstacles which prevent many people from seeing themselves as part of the universe’ (Lorenz, 1966, p. xiii).
REFERENCES
Di Castri, F., Hadley, M. and Damlamian, J. (1981). MAB: The Man and the Biosphere Program as an evolving system. Ambio, 10, 52–57.
Hirst, K.K. (2006). Will Durant on geological consent. In About.com: Archaeology, http://archaeology.about.com/od/quotations/qt/quote84.htm
Lorenz, K. (1966). On aggression. London, UK: Methuen. Molchanov, A.M. (1967). Possible role of oscillating processes in evolution. In G.M. Frank
(Ed.), Oscillating processes in biological and chemical systems (pp. 274–288). Moscow, USSR: Nauka (in Russian).
Vernadsky, V.I. (1945). The biosphere and the noösphere. American Scientist, 33, 1–12. I. V. Florinsky Pushchino – Kiev, June 2009


ACKNOWLEDGMENTS Each chapter of this book was peer-reviewed by at least two internationally recognized
experts. The editor thanks the following people who have served as reviewers: P.W. Abrahams (Institute of Geography and Earth Sciences, Aberystwyth University, UK), S.N. Ayrapetyan (UNESCO Chair – Life Sciences International Postgraduate Educational Center, Yerevan, Armenia), V.N. Binhi (Prokhorov General Physics Institute, Russian Academy of Sciences, Moscow, Russia), R. Bol (North Wyke Research, Biotechnology and Biological Sciences Research Council, Okehampton, UK), M.L. Carapezza (Istituto Nazionale di Geofisica e Vulcanologia, Roma, Italy), S. Dimitrova (Solar-Terrestrial Influences Institute, Bulgarian Academy of Sciences, Sofia, Bulgaria), A.U. Dogan (Department of Chemical and Biochemical Engineering, University of Iowa, USA), R.B. Firestone (Lawrence Berkeley National Laboratory, USA), E.R. Force (Department of Geosciences, University of Arizona, Tucson, USA), F. Freund (NASA Ames Research Center, Moffett Field, USA), N. Friesen (Botanical Garden, University of Osnabrück, Germany), A. Gilat (Geological Survey of Israel (ret.), Jerusalem, Israel), M. Heads (Buffalo Museum of Science, Buffalo, USA), C. Heriot-Maitland (Oxford Doctoral Course in Clinical Psychology, University of Oxford, UK), A.A. Ivlev (Faculty of Soil Science, Agricultural Chemistry, and Ecology, Russian State Agrarian University – Timiryazev Moscow Agricultural Academy, Moscow, Russia), K. Kamoi (Center of Diabetes and Endocrine & Metabolism Disease, Nagaoka Red Cross Hospital, Japan), N. Laulainen (Pacific Northwest National Laboratory, Richland, USA), A.E. Lukin (Institute of Geological Sciences, National Academy of Sciences of Ukraine, Kiev, Ukraine), J.L. Meshalkina (Faculty of Soil Science, Lomonosov Moscow State University, Russia), M. Mikulecký (Department of Statistics and Biometry, Neuroendocrinology Letters, Stockholm, Sweden & Bratislava, Slovakia), I.M. Pepe (Faculty of Medicine, University of Genoa, Italy), E. Şalcioğlu (Section of Trauma Studies, Institute of Psychiatry, King’s College London, UK), M. Sintubin (Department of Earth and Environmental Sciences, Katholieke Universiteit Leuven, Belgium), V.Y. Smorodin (Climate Change Institute, University of Maine, Orono, USA), E. Stoupel (Division of Cardiology, Rabin Medical Center, Petah Tiqwa, Israel), C. Tatu (Department of Biology, University of Medicine and Pharmacy, Timişoara, Romania), M. Thorne (Mike Thorne and Associates Limited, Halifax, UK), and L. Vergani (Department of Biology, University of Genoa, Italy).
The editor also appreciates useful suggestions by D.L. Abel (The Gene Emergence Project, The Origin of Life Science Foundation, Inc., Greenbelt, USA), G. Barbujani (Department of Biology, University of Ferrara, Italy), B. Bogin (Department of Human Sciences, Loughborough University, UK), A.S. Issar (Zuckerberg Institute for Water

Igor V. Florinsky xiv
Research, Ben-Gurion University of the Negev, Sede Boqer, Israel), F. Manni (Eco-Anthropology Group, National Museum of Natural History, Musée de l’Homme, Paris, France), and J.T. Trevors (Department of Environmental Biology, University of Guelph, Canada).
Finally, the editor thanks E.K. Vershinina (Tetra Pak, Kiev, Ukraine) for technical help, V.G. Karpova (Lundbeck, Kiev, Ukraine) and S.S. Zakharova (Institute of Mathematical Problems of Biology, Russian Academy of Sciences, Pushchino, Russia) for librarian assistance, as well as A. Dowd (Rockefeller College of Public Affairs and Policy, State University of New York University at Albany, USA), B. Holley (Georgia Institute of Technology, Atlanta, USA), B.P. Mulligan (Neuroscience Research Group, Laurentian University, Sudbury, Canada), and H. Paul (Miner’s Christian Mission, Celifodina, Spokane, USA) for linguistic help.

PART I. GEO AND BIO: KEY RELATIONSHIPS


In: Man and the Geosphere ISBN 978-1-60876-387-0 Editor: Igor V. Florinsky, pp. 3-31 © 2010 Nova Science Publishers, Inc.
Chapter 1
FLUID EVOLUTION OF THE EARTH AND ORIGIN OF THE BIOSPHERE
Alexey A. Marakushev and Sergey A. Marakushev
ABSTRACT
The endogenous evolution of the Earth, controlled by impulses of fluid degassing from the liquid core, is responsible for a special evolutionary direction, which may be called “hydrogen–hydrocarbon–organic”. It starts with the appearance of hydrocarbon features of deep-seated magma chambers, the evolution of which is combined with the formation of the Earth’s crust depressions. Such features result from the development of alkali trends in the magmatism as indicated by hydrocarbon inclusions in early-generation minerals of alkali rocks. Their formation is controlled by the disproportionation reactions in fluids accompanying magmatism. Upward migration of hydrocarbons from magma chambers causes their access to the surface and accumulation in the Earth’s crust including gas and oil deposits in sedimentary basins on the continental frames of the oceans and marginal seas. Oxidizing environments of near-surface structures provide separation of water from them, and the formation of their types depleted in hydrogen: acetylene, benzene, and their derivates.
Reactions of the formation and transformation of hydrocarbons are accompanied by dehydration, which is an endothermic endogenous process. With cooling, there is not enough energy for its proceeding. This results in the development of the opposite processes of hydration and oxidation of hydrocarbon leading to abiogenic generation of organic compounds. Organic compounds and hydrocarbons are correlated by their hydrogen numbers illustrating their common origin. The differences in oxygen concentration reflect the distribution of organic compounds by oxidizing facies. The main regularity of the entrance of organic compounds in the C–H–O system is illustrated by their position on crossing of connodes connecting the compositions of primitive compounds with each other and hydrocarbons. This reflects their mutual relations, because their compositions are formed and duplicated by successive joining of reaction products to the earlier formed matter with the formation of polymers. They outline reactions between the components of fluids, successive joining of which produces multi-carbonic organic compounds. Thus, the formation of ethylene glycol results from the combination of the reactions of ethane oxidation and benzene (acetylene) hydration. The systems of organic substance generation differ in the type of components acting on the
Alexey A. Marakushev and Sergey A. Marakushev 4
hydrocarbon compounds: oxygen (C–H–O), nitrogen (C–H–N), oxygen–nitrogen (C–H–O–N), and water and phosphoric (C–HN–H2O–P2O5). There are also concepts on prebiological peptide nucleic acids. This suggests that qualitatively new “complexes of life” may appear during interaction of abiotic inorganic precursors with organic nucleic acids and peptides (nucleotides and amino acids). This allows us to pay special attention to it considering the problem of origin and evolution of the biosphere, which, in our opinion, was formed and developed because of the influence of uprising hydrocarbon–organic plumes on the hydrosphere.
Keywords: fluids; magmatism; hydrocarbons; oil generation; amino acids; nucleic acids.
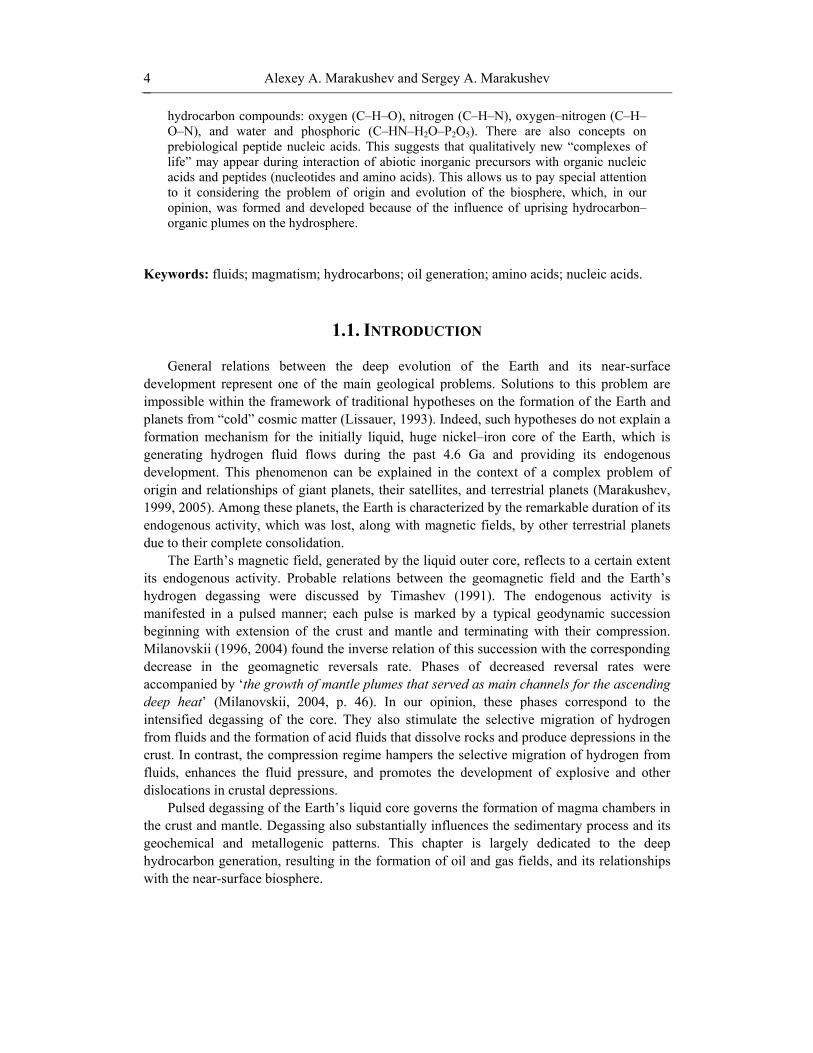
1.1. INTRODUCTION General relations between the deep evolution of the Earth and its near-surface
development represent one of the main geological problems. Solutions to this problem are impossible within the framework of traditional hypotheses on the formation of the Earth and planets from “cold” cosmic matter (Lissauer, 1993). Indeed, such hypotheses do not explain a formation mechanism for the initially liquid, huge nickel–iron core of the Earth, which is generating hydrogen fluid flows during the past 4.6 Ga and providing its endogenous development. This phenomenon can be explained in the context of a complex problem of origin and relationships of giant planets, their satellites, and terrestrial planets (Marakushev, 1999, 2005). Among these planets, the Earth is characterized by the remarkable duration of its endogenous activity, which was lost, along with magnetic fields, by other terrestrial planets due to their complete consolidation.
The Earth’s magnetic field, generated by the liquid outer core, reflects to a certain extent its endogenous activity. Probable relations between the geomagnetic field and the Earth’s hydrogen degassing were discussed by Timashev (1991). The endogenous activity is manifested in a pulsed manner; each pulse is marked by a typical geodynamic succession beginning with extension of the crust and mantle and terminating with their compression. Milanovskii (1996, 2004) found the inverse relation of this succession with the corresponding decrease in the geomagnetic reversals rate. Phases of decreased reversal rates were accompanied by ‘the growth of mantle plumes that served as main channels for the ascending deep heat’ (Milanovskii, 2004, p. 46). In our opinion, these phases correspond to the intensified degassing of the core. They also stimulate the selective migration of hydrogen from fluids and the formation of acid fluids that dissolve rocks and produce depressions in the crust. In contrast, the compression regime hampers the selective migration of hydrogen from fluids, enhances the fluid pressure, and promotes the development of explosive and other dislocations in crustal depressions.
Pulsed degassing of the Earth’s liquid core governs the formation of magma chambers in the crust and mantle. Degassing also substantially influences the sedimentary process and its geochemical and metallogenic patterns. This chapter is largely dedicated to the deep hydrocarbon generation, resulting in the formation of oil and gas fields, and its relationships with the near-surface biosphere.
Fluid Evolution of the Earth and Origin of the Biosphere 5
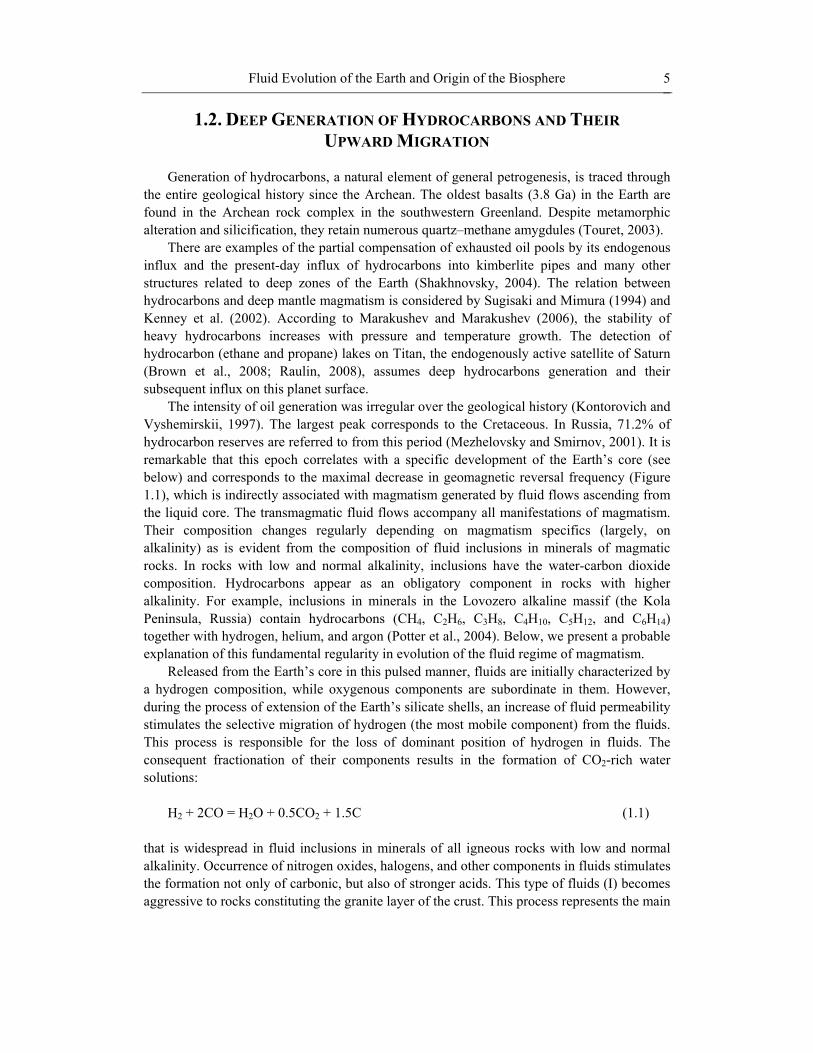
1.2. DEEP GENERATION OF HYDROCARBONS AND THEIR UPWARD MIGRATION
Generation of hydrocarbons, a natural element of general petrogenesis, is traced through
the entire geological history since the Archean. The oldest basalts (3.8 Ga) in the Earth are found in the Archean rock complex in the southwestern Greenland. Despite metamorphic alteration and silicification, they retain numerous quartz–methane amygdules (Touret, 2003).
There are examples of the partial compensation of exhausted oil pools by its endogenous influx and the present-day influx of hydrocarbons into kimberlite pipes and many other structures related to deep zones of the Earth (Shakhnovsky, 2004). The relation between hydrocarbons and deep mantle magmatism is considered by Sugisaki and Mimura (1994) and Kenney et al. (2002). According to Marakushev and Marakushev (2006), the stability of heavy hydrocarbons increases with pressure and temperature growth. The detection of hydrocarbon (ethane and propane) lakes on Titan, the endogenously active satellite of Saturn (Brown et al., 2008; Raulin, 2008), assumes deep hydrocarbons generation and their subsequent influx on this planet surface.
The intensity of oil generation was irregular over the geological history (Kontorovich and Vyshemirskii, 1997). The largest peak corresponds to the Cretaceous. In Russia, 71.2% of hydrocarbon reserves are referred to from this period (Mezhelovsky and Smirnov, 2001). It is remarkable that this epoch correlates with a specific development of the Earth’s core (see below) and corresponds to the maximal decrease in geomagnetic reversal frequency (Figure 1.1), which is indirectly associated with magmatism generated by fluid flows ascending from the liquid core. The transmagmatic fluid flows accompany all manifestations of magmatism. Their composition changes regularly depending on magmatism specifics (largely, on alkalinity) as is evident from the composition of fluid inclusions in minerals of magmatic rocks. In rocks with low and normal alkalinity, inclusions have the water-carbon dioxide composition. Hydrocarbons appear as an obligatory component in rocks with higher alkalinity. For example, inclusions in minerals in the Lovozero alkaline massif (the Kola Peninsula, Russia) contain hydrocarbons (CH4, C2H6, C3H8, C4H10, C5H12, and C6H14) together with hydrogen, helium, and argon (Potter et al., 2004). Below, we present a probable explanation of this fundamental regularity in evolution of the fluid regime of magmatism.
Released from the Earth’s core in this pulsed manner, fluids are initially characterized by a hydrogen composition, while oxygenous components are subordinate in them. However, during the process of extension of the Earth’s silicate shells, an increase of fluid permeability stimulates the selective migration of hydrogen (the most mobile component) from the fluids. This process is responsible for the loss of dominant position of hydrogen in fluids. The consequent fractionation of their components results in the formation of CO2-rich water solutions:
H2 + 2CO = H2O + 0.5CO2 + 1.5C (1.1)
that is widespread in fluid inclusions in minerals of all igneous rocks with low and normal alkalinity. Occurrence of nitrogen oxides, halogens, and other components in fluids stimulates the formation not only of carbonic, but also of stronger acids. This type of fluids (I) becomes aggressive to rocks constituting the granite layer of the crust. This process represents the main

Alexey A. Marakushev and Sergey A. Marakushev 6
factor responsible for the formation of depressions in the crust that are subsequently filled with sedimentary and volcanogenic materials.
The transition to the compression regime, noted by dislocations, impedes the migration of hydrogen from fluids stimulating the generation of hydrocarbons in them:
3H2 + CO = H2O + CH4, (1.2) 5H2 + 2CO = 2H2O + C2H6, etc. (1.3) Under the influence of hydrogen, acidic components of these fluids (II) are decomposed: 4H2 + H2CO3 = 3H2O + CH4, (1.4)
which determines the alkaline affinity of magmatism.
Figure 1.1. Geomagnetic polarity time scale (Hoffman, 1988). Dark (light) areas denote periods of normal (reversed) polarity.
Fluid Evolution of the Earth and Origin of the Biosphere 7
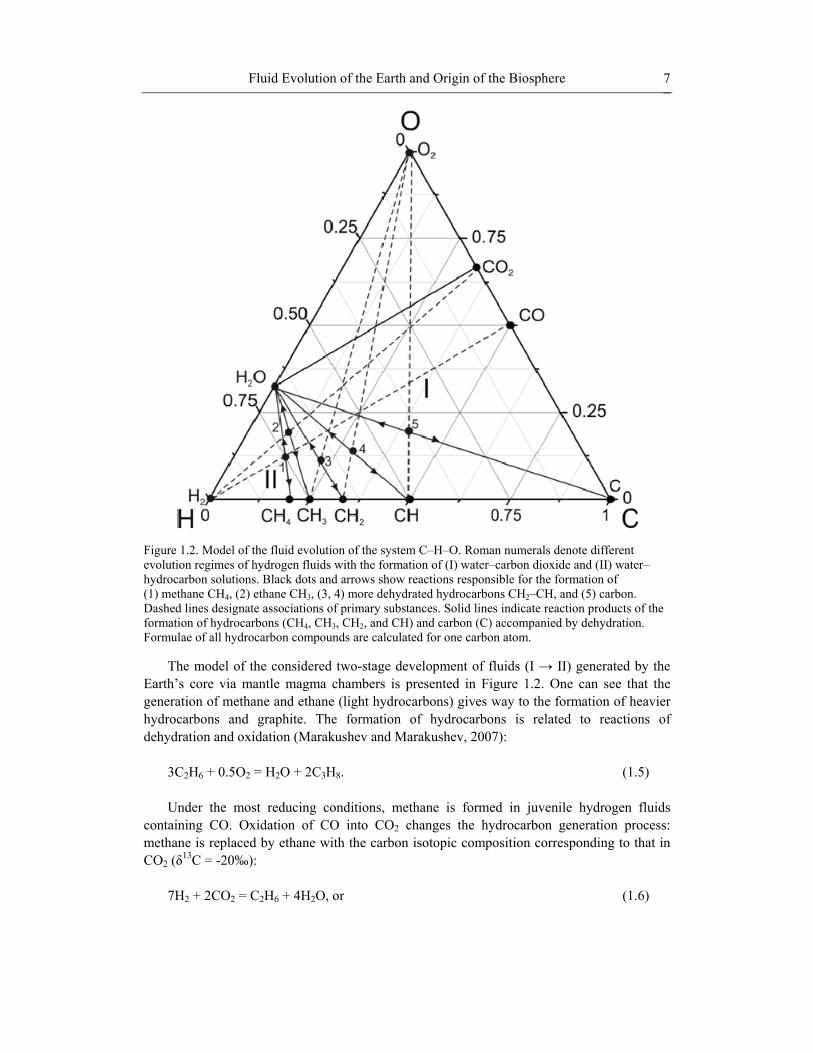
Figure 1.2. Model of the fluid evolution of the system C–H–O. Roman numerals denote different evolution regimes of hydrogen fluids with the formation of (I) water–carbon dioxide and (II) water–hydrocarbon solutions. Black dots and arrows show reactions responsible for the formation of (1) methane CH4, (2) ethane CH3, (3, 4) more dehydrated hydrocarbons CH2–CH, and (5) carbon. Dashed lines designate associations of primary substances. Solid lines indicate reaction products of the formation of hydrocarbons (CH4, CH3, CH2, and CH) and carbon (C) accompanied by dehydration. Formulae of all hydrocarbon compounds are calculated for one carbon atom.
The model of the considered two-stage development of fluids (I → II) generated by the Earth’s core via mantle magma chambers is presented in Figure 1.2. One can see that the generation of methane and ethane (light hydrocarbons) gives way to the formation of heavier hydrocarbons and graphite. The formation of hydrocarbons is related to reactions of dehydration and oxidation (Marakushev and Marakushev, 2007):
3C2H6 + 0.5O2 = H2O + 2C3H8. (1.5) Under the most reducing conditions, methane is formed in juvenile hydrogen fluids
containing CO. Oxidation of CO into CO2 changes the hydrocarbon generation process: methane is replaced by ethane with the carbon isotopic composition corresponding to that in CO2 (δ13C = -20‰):
7H2 + 2CO2 = C2H6 + 4H2O, or (1.6)
Alexey A. Marakushev and Sergey A. Marakushev 8
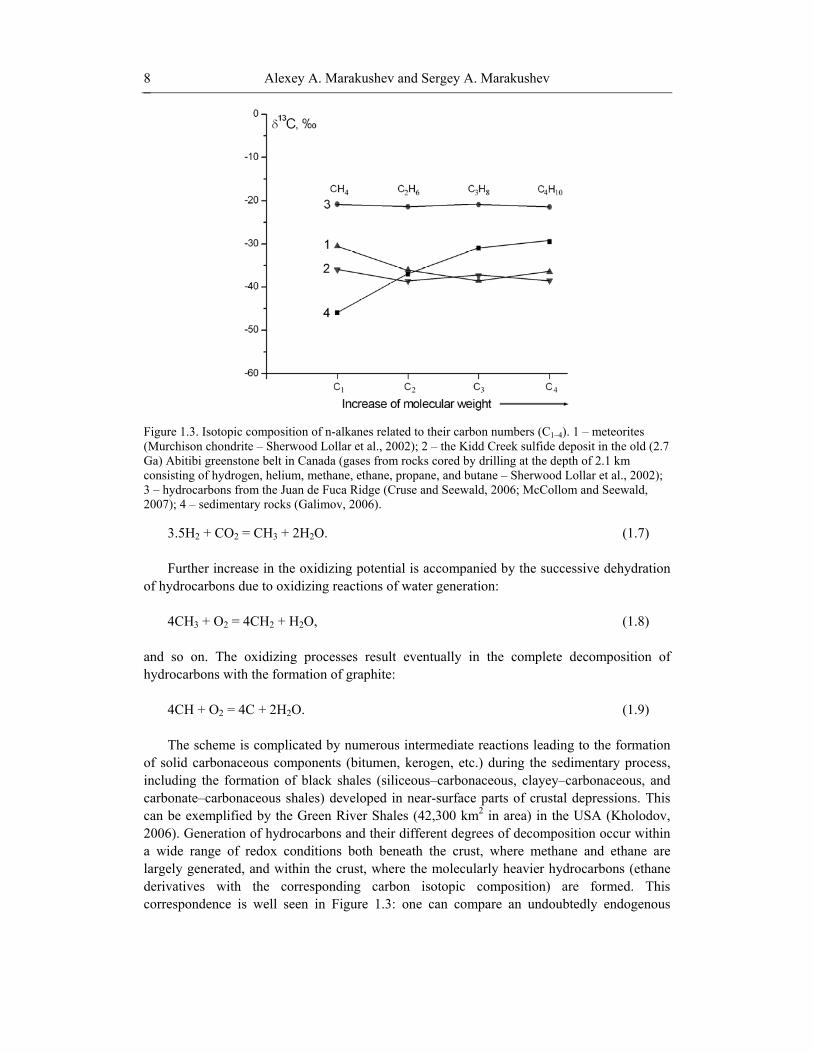
Figure 1.3. Isotopic composition of n-alkanes related to their carbon numbers (C1–4). 1 – meteorites (Murchison chondrite – Sherwood Lollar et al., 2002); 2 – the Kidd Creek sulfide deposit in the old (2.7 Ga) Abitibi greenstone belt in Canada (gases from rocks cored by drilling at the depth of 2.1 km consisting of hydrogen, helium, methane, ethane, propane, and butane – Sherwood Lollar et al., 2002); 3 – hydrocarbons from the Juan de Fuca Ridge (Cruse and Seewald, 2006; McCollom and Seewald, 2007); 4 – sedimentary rocks (Galimov, 2006).
3.5H2 + CO2 = CH3 + 2H2O. (1.7) Further increase in the oxidizing potential is accompanied by the successive dehydration
of hydrocarbons due to oxidizing reactions of water generation: 4CH3 + O2 = 4CH2 + H2O, (1.8)
and so on. The oxidizing processes result eventually in the complete decomposition of hydrocarbons with the formation of graphite:
4CH + O2 = 4C + 2H2O. (1.9) The scheme is complicated by numerous intermediate reactions leading to the formation
of solid carbonaceous components (bitumen, kerogen, etc.) during the sedimentary process, including the formation of black shales (siliceous–carbonaceous, clayey–carbonaceous, and carbonate–carbonaceous shales) developed in near-surface parts of crustal depressions. This can be exemplified by the Green River Shales (42,300 km2 in area) in the USA (Kholodov, 2006). Generation of hydrocarbons and their different degrees of decomposition occur within a wide range of redox conditions both beneath the crust, where methane and ethane are largely generated, and within the crust, where the molecularly heavier hydrocarbons (ethane derivatives with the corresponding carbon isotopic composition) are formed. This correspondence is well seen in Figure 1.3: one can compare an undoubtedly endogenous

Fluid Evolution of the Earth and Origin of the Biosphere 9
hydrocarbon (Murchison chondrite) as well as the oldest (Archean Abitibi formation, Canada) and recent (oceanic ridges) massive sulfide deposits with hydrocarbons in sedimentary rocks.
The Rainbow hydrothermal field of the Mid-Atlantic Ridge contains heavy saturated hydrocarbons C16H34 – C29H60 (CH2.125 – CH2.069) (Holm and Charlou, 2001; Charlou et al., 2002). The ascending migration of hydrocarbons is traced in hydrogen rich alkaline fluids, for example, ultramafic-hosted Lost City hydrothermal fields of the Mid-Atlantic Ridge (Proskurowski et al., 2008; Konn et al., 2009), whose endogenous nature is proved by a high enough content of heavy carbon isotope. In the hydrothermal field of the Juan de Fuca Ridge (northeastern Pacific), hydrocarbons associated with methane are represented by gaseous alkanes, such as ethane, C2H6, propane, C3H8, and butane, C4H10, as well as alkenes, such as ethylene, C2H4, propylene, C3H8, benzol, C6H6, and toluene, C7H8 (Cruse and Seewald, 2006). The input of mainly light hydrocarbons into sedimentary sequences from deep zones was also emphasized by Scott et al. (2004), who attributed the origin of heavier hydrocarbons in oil pools to the oxidation of methane.
The carbon isotopic composition of endogenous hydrocarbons correlates with ethane (C2 = Cn) rather than with methane. Therefore, ethane should be considered as their predecessor. The inertness of methane in hydrocarbon occurrences is explained by tighter bonds of carbon with hydrogen (bond energy is 425.0 kJ/mol) as compared with other hydrocarbons. Consequently, in natural processes methane behaves similarly to molecular hydrogen (bond energy is 431.9 kJ/mol). Therefore, the molecularly heavy endogenous hydrocarbons (Cn > C2) represent derivatives of ethane rather than methane. Ethane and its molecularly heavier derivatives differ from hydrocarbons of sedimentary rocks (Figure 1.3), in which carbon becomes gradually heavier with the increase of the molecular weight (C1 < Cn). In terms of this parameter, hydrocarbons from sedimentary rocks different from their endogenous counterparts with the relatively constant carbon isotopic composition (C2 = Cn). In terms of variations in the carbon isotopic composition, hydrocarbons from sedimentary rocks are similar to the so-called thermogenic hydrocarbons (Sherwood Lollar et al., 2002) that are generated by a biomass (plants and, largely, microorganisms) buried in sedimentary rocks at high temperatures (thermal anomalies). Thermogenic hydrocarbons may also be related to the influx of endogenous hydrocarbons into sedimentary sequences by hydrothermal solutions that ascend from deep magma chambers and form thermal anomalies. Combinations of these hydrocarbon types with different isotopic variations are governed by the heterogeneity of hydrocarbon pools in sedimentary sequences. The difference between isotopic data on thermogenic and endogenous hydrocarbons is explained by their formation in closed and open thermodynamic systems, respectively (Taran et al., 2007). Using C1–C4 isotopic data, Sherwood Lollar et al. (2002) considered hydrocarbons from gas fields in southwestern Ontario as thermogenic products, but their mixing with endogenous hydrocarbons is not ruled out. These authors also assume the subordinate role of endogenous hydrocarbons in the formation of hydrocarbon pools in the sedimentary sequence. An opposite opinion is presented by Scott et al. (2004): ‘petroleum originates chiefly through abiogenic processes’.
A comparison of different standpoints shows that the long-term discussion about the origin of oils remains a pressing issue. Weighty arguments in favor of endogenous oil origin are represented by the abundant outflows of hydrocarbons onto the ocean floor along the global system of rift zones (Figure 10.1) without any connection with sediments. Formation levels of the carbon isotopic composition of the molecularly heavy hydrocarbons are

Alexey A. Marakushev and Sergey A. Marakushev 10
determined apparently by ethane, whereas the thermogenic carbon becomes heavier in succession C1–Cn.
High concentrations of metals in oils (sometimes of commercial significance) represent an additional feature indicating their endogenous nature. “Vanadium” oils are particularly productive: ‘in the United States, two thirds of vanadium production is provided by its extraction from oil’ (Avdonin et al., 2005, p. 87). In such oils, the vanadium content is as high as 0.2–130 ppm, which is twice as high as that of Ni (0.2–60 ppm) (Hodgson, 1954; Mezhelovsky and Smirnov, 2001). Degassing of oil is accompanied by the formation of bitumens (asphaltite, asphalt, etc.), in which the V and Ni contents increase up to 4,500 and 520 ppm, respectively. The elevated content of these metals in oil is explained by its enrichment with sulfur: V and Ni concentrations are 550–1,400 and 120–195 ppm, respectively, in sulfur-bearing heavy oils and malthas (Mezhelovsky and Smirnov, 2001). The sulfur-bearing oil is found in the unique Minas Ragra vanadium deposit (Peru) in the Cretaceous rocks. The deposit is represented by an asphaltite body (1 km long and 8–12 m thick) with the vanadium content of about 6%.
V, Ni, and Zn make up a specific (“petroleum”) association in oils. Based on the prevalence of one of these metals, oils are divided into different geochemical (vanadium, nickel, and zinc) types in oil fields and provinces (Mezhelovsky and Smirnov, 2001). Association of these metals in geodes, druses, and veins is established in bitumens from diamond-bearing kimberlite pipes in platforms. According to Gottikh et al. (2004), geodes of the Udachnaya diamond-bearing pipe in the Siberian Platform contain asphaltite with a light (“petroleum”) carbon isotopic composition (δ13C = -34.6‰) in contrast with the heavy carbon in the coexisting calcite (δ13C = +24.5‰). The vanadium content in asphaltite is substantially higher as compared with other trace elements. This is explained by the extreme chemical affinity of vanadium with hydrocarbons and its efficient concentration during all the stages of hydrocarbon generation.
In the geochemical and metallogenic aspects, the vanadium oil correlates with black shales, in which the average vanadium content (205 ppm) is almost twice as high as that in carbon-depleted sedimentary rocks (110 ppm). Sometimes, the vanadium content increases to abnormally high values (a few kilograms per ton) and impart metallogenic significance to the black shales. ‘The vanadium-concentrating function of the living matter could not create vanadium anomalies in black shales’ (Yudovich and Ketris, 1994, p. 76). These anomalies are determined by the input of vanadium from deep zones and indicate direct relation between the formation of black shales and oils. This fact is emphasized by occurrence of the oil shales. However, in contrast to oil pools located largely in deep zones under significant pressures, oil shales arose at shallow depths reflecting the ascent of oil to near-surface beds of sedimentary basins. Moreover, low pressure promoted the selective migration of hydrogen from oil and the formation of heavy carbonaceous substances (including shungite – Buseck et al., 1997) typical of black shales.
The remarkable geochemical similarity between black shales and vanadium oils, which are enriched in many metals, is traced over the geological history: the most efficient vanadium average content (~590 ppm) is recorded in the Cretaceous black shales (Yudovich and Ketris, 1994). This phenomenon correlates with the maximum oil generation mentioned above: 71% of oil reserves in Russia are represented by the Cretaceous variety (Mezhelovsky and Smirnov, 2001). This reflects the relation between oil generation and evolution of the Earth’s core. The Cretaceous Age was characterized by a remarkable decrease in the

Fluid Evolution of the Earth and Origin of the Biosphere 11
geomagnetic reversal rate (Figure 1.1). This phenomenon was related to an intense degassing of the core in the course of its interaction with the mantle substrate. As was mentioned above, geodynamic extension of the mantle substrate, which stimulates the core degassing and selective migration of hydrogen from fluids, is accompanied by magmatism with low and normal alkalinity associated with the destruction of the continental crust. The extension regime was replaced by a compression that prevents the selective migration of hydrogen. This regime promoted the concentration of hydrocarbons in fluids and the development of alkaline magmatism.
The alternation of regimes is reflected in the development of the crust. Extension regime I (Figure 1.2) fosters the formation of volcanosedimentary and sedimentary depressions, whereas the compression regime II (Figure 1.2) provokes their dislocations (including explosive ones) that are responsible for reversed faulting in the crystalline basement of depressions. The complete cycle in the formation of depressions is recorded in trap formations by basaltic flows at their bases (regime I) and overlying sequences (regime II) that are usually composed of carbonaceous sediments and subalkaline–alkaline rocks at the top of the cycle. The evolution (I → II) is traced in the composition of fluid inclusions in minerals of igneous rocks in trap formations and reflects the increasing role of hydrocarbons in inclusions during the growth of rock alkalinity:
(H2O – CO2) → (H2O – CH4). (1.10) Similar trends are also observed in intrusive rocks of trap depressions that are confined to
the sedimentary sequences between the lower basaltic and upper alkaline volcanic rocks (Makarenko, 1997). Such a distinct tendency is related to the fact that igneous rocks are formed in the crust due to the replacement of their crustal counterparts accompanied by the removal of a significant share of the excess (relative to the magmatic eutectics) components by fluids. In the case of mafic–ultramafic magmatism, the accompanying fluids are chemically aggressive to the sialic rocks (sandy–clayey units in trap formations). Their leaching under the influence of such fluids promotes the emplacement of intrusions. For example, the sedimentary sequence (the Zhdanov formation) between the lower tholeiitic basalt and upper alkali basalt flows in the Precambrian Pechenga ring trap formation (the Kola Peninsula) is only 1.5 km thick, although this sequence encloses more than 300 mafic–ultramafic intrusions, including bodies with sulfide Cu–Ni mineralization.
According to the sedimentary migration (thermogenic) hypothesis of the origin of oil and gas pools, black shales (Wignall, 1994) are considered as oil source rocks: ‘carbonate-rich source rocks give away vanadium to oils much more readily than the clayey varieties’ (Yudovich and Ketris, 1994, p. 103). It is traditionally believed that ‘upon subsidence to deeper zones, where the temperature reaches 70–100° C, black shales produce huge quantities of oil and hydrocarbon gases’ (Yudovich and Ketris, 1994, p. 33). This assumption is inconsistent with the geological constraints of oil pools that are controlled by dislocations in sedimentary basins, and are largely confined to their basal parts or the upthrown crystalline basement (Areshev, 2004).
The scales of pools indicate undoubtedly the hydrocarbon influx from deep zones and their geological settings rule out the existence of “producing” sedimentary sequences beneath these pools. Pools largely confined to anticlinal dome-shaped structures are exemplified by the Rhourde El Baghel oil field in Algeria. The giant oil pool of this field replaced 340 m of

Alexey A. Marakushev and Sergey A. Marakushev 12
the sedimentary section located above the upthrown crystalline basement of the depression. ‘The presence of asphalt inclusions in its weathering crust indicates the concentration of oil in rocks of the basement and confirms the probable vertical migration of deep fluids’ (Shakhnovsky, 2004, p. 33). The role of the vertical migration, which actually governed the localization of oil and gas fields in sedimentary depressions, was also emphasized by Koudriavtsev (1973) and Kropotkin (1985). A giant oil pool has recently been discovered by drilling at a depth of 11 km in the Gulf of Mexico – a major deep-water well that may contain more than 4 billion barrels of crude oil (Gismatullin, 2009).
In oceanic ridges, deep fluids are recorded as hydrocarbon-rich hydrothermal vents and liquid hydrocarbon seeps on the seafloor (Holm and Charlou, 2001; Charlou et al., 2002). Hydrocarbons accompany the formation of a sedimentary depression along the Juan de Fuca Ridge (Cruse and Seewald, 2006). Thus, they model the initial stage of black shale formation. Judging from the occurrence of oil hydrocarbons (alkanes and alkyl benzols) in hydrothermal vents on the ridge, oil can also be generated within the ridge. However, the oil is likely confined to the deep sedimentary sequence of the depression, where the fluid pressure prevents the loss of hydrogen. In this respect, oceanic-margin ridges of the Juan de Fuca type occupy an intermediate position between the classical mid-ocean ridges, which are not accompanied by depressions, and the shelf–continental margins of oceans and seas, where sedimentary sequences serve as the main reservoirs for oil pools (Khain and Polyakova, 2004).
Localization of oil and gas pools in sedimentary basins is traditionally attributed to various structural and lithological traps. However, the significance of such concepts faded after the discovery of giant oil pools, which pose the problem of space for their formation. This issue is similar to the problem of space for intrusions, which was solved by the discovery of magmatic replacements of intruded rocks and large-scale removal of the crustal material by fluids. As is shown above, removal of the crustal material also governs the formation of depressions under the influence of fluids that leach the crustal granite layer and promote its replacement by sedimentary rocks. Subsequently, processes of leaching also embrace sedimentary rocks of depressions and their basement. These processes correlate with various dislocations. In oil-productive depressions, hydrocarbon accumulation is preceded by the hydrothermal acidic leaching that promotes the decompaction of rocks and provides the subsequent localization of oil pools therein (Marakushev and Marakushev, 2008a, 2009). Due to leaching, quartz grains acquire the spherical shape that gives an impression of their roundness.
The role of deep leaching is evident from the localization of oil pools in upthrown blocks of the basement in sedimentary depressions (Areshev, 2004). Deposits in the shelf zone of southern Vietnam exemplify this fact. The crystalline basement beneath the Oligocene–Pleistocene Hue Depression of the Cuu Long Basin is represented by granites. Their upthrown blocks control the localization of numerous oil and gas pools. They occur commonly in sedimentary rocks and locally in the upthrown granite blocks. Oil generation in the upthrown basement of the depression reaches large scales incomparable with its limited accumulations in sedimentary rocks of the White Tiger field on the shelf of southern Vietnam. It is unique in this respect. Its giant oil pools are largely confined to the multiple-stage granite blocks traced down to a depth of 1.5 km (Areshev, 2004). Only some part of oil occurs in the surrounding and overlying stratified sequences.

Fluid Evolution of the Earth and Origin of the Biosphere 13
Figure 1.4. Schematic diagram illustrating fluid degassing of the liquid core. Solid lines are modern core-mantle plumes; dashed lines are inferred ancient plumes. In magma chambers (dots), deep fluids attain hydrocarbon features due to the development of alkali trends in the magmatism. Consequent upward migration of hydrocarbon fluids leads to the formation of oil basins (1 – Namibe basin, 2 – Lofoten basin). Helices denote convective motions in the liquid outer core producing the geomagnetic field. Global profile of the Earth crossing longitudes 15° E and 165° W.
This incomplete review of hydrocarbon distribution in near-surface structures of the crust demonstrates their close combination with petrogenesis and ore formation, i.e., modern sulfide formation on the sea floor. We should also mention the formation of gaseous hydrates (clathrates) participating in oceanic sedimentation. The Hg admixture in gaseous hydrates provides evidence for their endogenous nature. Mentioned events open the way to the radical transformation of being cooled hydrocarbon solutions (oxidation and hydration) accompanied by generation of organic compounds during their upward migration (Figure 1.4).
1.3. ABIOGENIC FORMATION OF ORGANIC SUBSTANCES The increase of oxygen potential and cooling are the factors of radical transformation of
uprising deep hydrocarbon fluids. At first approximation, the composition of the main types of hydrocarbons and organic compounds in comparison with primitive matter is characterized in Figure 1.5, based on formal oxidation levels of carbon and number of carbon–carbon bonds (Weber, 2002). Figure 1.6 shows regular entrance of organic compounds to the three-component Н–С–О system that is controlled by their position exclusively on crossing of connodes connecting the compositions of primitive compounds with each other (Н2–CO, Н2–CO2) and with hydrocarbon compositions (СН4–О2, СН3–О2, СН2–О2, СН–О2, СН2–Н2О, CH–Н2О).

Alexey A. Marakushev and Sergey A. Marakushev 14
Figure 1.5. Carbon compounds in the С–Н–О system different by the number of carbon mutual bonds and formal oxidation degree (Weber, 2002). Oxygen (О) in organic compounds may be replaced by heteroatoms, such as nitrogen and sulfur.
Figure 1.6. Н–С–О system presented by primitive matter (1), hydrocarbons (2), and organic compounds (3). Black rhomb (4) denotes an average composition of organic matter (Voitkevich et al., 1977). I–V indicate oxidizing facies.

Fluid Evolution of the Earth and Origin of the Biosphere 15
Each organic compound is located on the crossing point of three connodes that provides evidence for the nature of organic compounds: each of them may be synthesized because of, at least, three independent reactions. Their successive joining results in the formation of more massive organic compounds, i.e., polymers of considered initial organic compounds. The example of stoichiometric formaldehyde polymers (H2CO)n, where n = 2, 3, 4, …, allows us to consider arbitrarily the successive joining of reactions. Formaldehyde is formed at n = 1:
CO + H2 = H2CO, (1.11)
hexoses are formed at n = 6:
6CO + 6H2 = (H2CO)6, (1.12)
whereas other organic compounds are formed in an intermediate interval:
• acetic acid, CO2 + СH4 = (H2CO)2, • lactic acid, 3СH2 + 1,5O2 = (H2CO)3, • tetroses, 4СН + 2Н2О2 = (Н2СО)4, • pentoses, 5С + 5Н2О = (Н2СО)5, and so on. Structural systematics of organic molecules allows us to suggest a number of possible
types of the C–H–O system of organic compounds as groups with typical chemical and thermodynamic properties controlled by the group additivity approach (Mavrovouniotis, 1991; Amend and Helgeson, 1997). The composition of these organic compounds is correlated with hydrocarbons by hydrogen numbers that provides evidence for mutual relations between them. This allows us to broaden the impulsivity of hydrocarbon formation in the geological history of the Earth on organic materials. However, they principally differ by redox conditions of the formation, as demonstrated in Figure 1.6, where several organic compounds transitional to hydrocarbons are presented. Facies I is characterized by strong reducing conditions favorable for hydrocarbon formation. The increase of oxygen chemical potential results in the generation of organic compounds of the systems H2–CO and H2–CO2. Facies IV presents the most oxidizing conditions. Geologically, it may be named as a facies of interaction between uprising hydrocarbon fluids and the hydrosphere. The formation regime of gaseous hydrates (clathrates), endogenous nature of which is proved by detection of light He and Hg occurring in sedimentary deposits of the oceanic floor, is the analogue of such environments nowadays.
Abiogenic generation of organic substances was partly considered in the works by Marakushev and Marakushev (2006, 2007, 2008a, 2008b). We concluded that this process is linked to the origin of hydrocarbons as part of the general pulsive hydrocarbon/organic evolution of the Earth. This conclusion is also valid for the organic substances forming complex molecules of amino acids and nucleic acids paragenetically subdivided into ribonucleic (RNA) and deoxyribonucleic (DNA) acids. The systems of their generation differed in the type of components acting on the hydrocarbon compounds: oxygen (C–H–O), nitrogen (C–H–N), oxygen–nitrogen (C–H–O–N), and water and phosphoric (C–HN–H2O–P2O5). The organic substances related to groups of “common origin” appear in each mentioned system (Tables 1.1 and 1.2).

Table 1.1. Simple carbon and hydrocarbon substances and reaction of formation of nucleic acids (I – monosaccharides, II – nitrogen base) and proteins (III – amino acids) organic substances
Chemical groups
Carbon-hydrocarbon substances Organic substances
HCH+
Formulae Names and symbols Regressive reactions (hydratation) NC
N+
I 0 С5 Ribose (Rib) 5С + 5Н2О = C5H10O5 0 0.29 С5Н2 Deoxyribose (dRib) С5Н2 + 4Н2О = C5H10O4 0
II
0 С4 Uracil (Ura) (4С + N2) + 2Н2О = C4H4N2O2 0.33 0.29 С5Н2 Thymine (Thy) (С5Н2 + N2) + 2Н2О = C5H6N2O2 0.29 0.38 С5Н3 Guanine (Gua) (C5H3 + 2.5N2) + H2O = C5H5N5O 0.50 0.43 С4Н3 Cytosine (Cyt) (C4H3 + 1.5N2) + H2O = C4H5N3O 0.43 0.50 (СН)5 Adenine (Ade) (C5H5 + 2.5N2) = C5H5N5 0.50
III
0 С4 Aspartate (Asp) (4С + 0.5N2 + 0.5О2) + 3.5Н2О = C4H7NO4 0.20 0.17 C5H Glutamate (Glu) (C5H + 0.5N2) + 4H2O = C5H9NO4 0.17 0.18 С9H2 Tyrosine (Tyr) (С9H2 + 0.5N2) + 3H2O = С9H11NO3 0.10 0.25 C3H Serine (Ser) (C3H + 0.5N2) + 3H2O = C3H7NO3 0.25 0.33 C2H Glycine (Gly) (C2H + 0.5N2) + 2H2O = C2H5NO2 0.33 0.33 (C2H)2 Asparagine (Asn) (C4H2 + N2) + 3H2O = C4H8N2O3 0.33 0.42 C11H8 Tryptophan (Trp) (C11H8 + N2) + 2H2O = C11H12N2O2 0.15 0.43 C4H3 Threonine (Thr) (C4H3 + 0.5N2) + 3H2O = C4H9NO3 0.20 0.44 С9H7 Phenylalanine (Phe) (С9H7 + 0.5N2) + 2H2O = С9H11NO2 0.10 0.44 C5H4 Glutamin (Gln) (C5H4 + N2) + 3H2O = C5H10N2O3 0.29 0.45 C6H5 Histidine (His) (C6H5 + 1.5N2) + 2H2O = С6H9N3O2 0.33 0.50 (СH)3 Alanine (Ala) (С3Н3 + 0.5N2) + 2Н2О = С3H7NO2 0.25 0.50 (CH)3 Cysteine (Cys) (С3Н3 + 0.5N2 + 0.5S2) + 2H2O = C3H7NO2S 0.25 0.50 (CH)5 Proline (Pro) (C5H5 + 0.5N2) + 2H2O = C5H9NO2 0.17 0.58 С5Н7 Valine (Val) (C5H7 + 0.5N2) + 2H2O = С5Н11NO2 0.17
0.58 С5H7 Methionine (Met) (С5H7 + 0.5N2 + 0.5S2) + 2H2O = С5H11NO2S 0.17 0.60 (С2Н3)3 Leucine (Leu) (С6Н9 + 0.5N2) + 2H2O = С6Н13NO2 0.14 0.60 (С2Н3)3 Isoleucine (Ile) (С6Н9 + 0.5N2) + 2H2O = С6Н13NO2 0.14 0.63 (C3H5)2 Lysine (Lys) (С6H10 + N2) + 2H2O = С6H14N2O2 0.25 0.63 (C3H5)2 Arginine (Arg) (C6H10 + 2N2) + 2H2O = C6H14N4O2 0.40

Table 1.2. Reactions of nucleoside and their monophosphate (MP) substance formation. Reactions are divided to redox facies ribose and deoxyribose
Facies NCN+
Names and symbols Progressive reactions (dehydratation)
Carbon-hydrocarbon substances
HCH+
Formulae
Ribose (Rib) C5H10O5
0.18 Uridine (U) C4H4N2O2(Ura) + C5H10O5 = C9H12N2O6 + H2O 0 (С)9 Phosphate (UMP) C9H12N2O6(U) + HPO3 = C9H13N2O9Р
0.25 Cytidine (C) C4H5N3O(Cyt) + C5H10O5 = C9H13N3O5 + H2O 0.25 (С3Н)3 Phosphate (CMP) C9H13N3O5(C) + HPO3 = C9H14N3O8P
0.33 Guanosine (G) C5H5N5O(Gua) + C5H10O5 = C10H13N5O5 + H2O 0.23 C10H3 Phosphate (GMP) C10H13N5O5(G) + HPO3 = C10H14N5O8P
0.33 Adenosine (A) C5H5N5(Ade) + C5H10O5 = C10H13N5O4 + H2O 0.23 C10H3 Phosphate (AMP) C10H13N5O4(A) + HPO3 = С10H14N5O7P
Deoxyribose (dRib) C5H10O4
0.17 Deoxythymidine (dT) C5H6N2O2 (Thy) + C5H10O4 = C10H14N2O5 + H2O 0.29 (C5H2)2 Phosphate (dTMP) C10H14N2O5 + HPO3 = C10H15N2O8P
0.25 Deoxycytidine (dC) C4H5N3O + C5H10O4 = C9H13N3O4 + H2O 0.36 C9H5 Phosphate (dCMP) C9H13N3O4 + HPO3 = C9H14N3O7P
0.33 Deoxyguanosine (dG) C5H5N5O (Gua) + C5H10O4 = C10H13N5O4 + H2O 0.23 C10H3 Phosphate (dGMP) C10H13N5O4 (dG) + HPO3 = C10H14N5O7P
0.33 Deoxyadenosine (dA) C5H5N5 (Ade) + C5H10O4 = C10H13N5O3 + H2O 0.23 C10H3 Phosphate (dAMP) C10H13N5O3 (dA) + HPO3 = С10H14N5O6P

Alexey A. Marakushev and Sergey A. Marakushev 18
The simplest of the aforementioned substances are monosaccharides and adenine, which are related to the hydrocarbon–oxygen and hydrocarbon–nitrogen systems, respectively. All other substances are related to the more complex hydrocarbon–oxygen–nitrogen and hydrocarbon–oxygen–nitrogen–phosphoric systems.
Monosaccharides forming nucleic acids are related to the C–H–O system, which includes a lot of hydrocarbon–oxygen (organic) substances. They are generated in the reactions between simple substances and hydrocarbons. These reactions may duplicate the compositions of the organic substances and their sequential binding to substances formed earlier. This results in the formation of massive substances (polymers), which form polymer series.
The increase in the molecular weight of substances is the essence of the C–H–O system, which mainly serves for accumulation of abiogenic organic substance. It contributes to the mass of living matter, whose average content is C = 18.0, H = 10.5, O = 70.0, and N = 0.3 weight percent (Voitkevich et al., 1977, p. 60). This indicates its relation to the C–H–O system. Among all organic substances of this system, nucleic acids contain only monosaccharides ribose (Rib) and deoxyribose (dRib), which may be mutually transformed in the reaction
2Rib = 2dRib + O2, (1.13)
with reactions of the nitrogen bases of the nucleic acids, such as adenine (Ade), guanine (Gua), and cytosine (Cyt). The approximate system of redox facies in the diagram
2Oμ vs.
temperature (Figure 1.7) is determined by the reactions. In this diagram, the equilibrium Rib = dRib separates the areas of stability (facies) of substances related to RNA and DNA and formed of different monosaccharides. DNA belongs to a more reduced facies (it contains DR) and reflects the adenine–guanine equilibrium
2Ade + O2 = 2Gua, (1.14)
which, under standard conditions, corresponds to a low chemical potential of oxygen (below the pyrite–pyrrhotite–magnetite equilibrium shown in the diagram). In contrast to DNA, RNA belongs to a relatively oxidized facies (it includes monosaccharide Rib, which is richer in oxygen). Nevertheless, like DNA, RNA corresponds to the adenine–guanine equilibrium (it includes the paragenesis Ade + Gua). This means that the adenine–guanine equilibrium belongs to two redox facies, Rib and dRib, as it is shown in Figure 1.7 as an intersection of its lines with the line of monosaccharide equilibrium with an increase in temperature. According to this plot, RNA differs from DNA not only in more oxidized conditions of formation, but also in a higher temperature of formation. Different temperature modes of the formation of DNA and RNA are determined by their separation by a wide facies of cytosine. In general, the temperature of the formation of nucleic acids do not exceed 120° C, limiting the area of existence of living matter (Kashefi and Lovley, 2003). Figure 1.7 shows the relationship of the formation of nucleic acids determined by the reactions of their bases (Ade and Gua) with monosaccharides Rib (in RNA) and dRib (in DNA). As a result, the paragenesis Ade + Gua is separated into the parageneses Ade + Rib and Gua + Rib (in RNA) and Ade + dRib and

Fluid Evolution of the Earth and Origin of the Biosphere 19
Gua + dRib (in DNA), which, at different temperatures, correspond to considerably different chemical potentials of oxygen.
Figure 1.7. The scheme of redox and temperature facies of nucleic acids with their separation to RNA and DNA. Dashed arrows show dissociation of the isopotential paragenesis Ade + Gua into the parageneses Ade + Rib (dRib) + Cyt ↔ Gua + Rib (dRib) + Cyt corresponding to different oxygen potentials. The dot–dash line shows the buffer equilibrium “pyrite (FeS2) – pyrrhotite (FeS) – magnetite (Fe3O4)”.
This is due to the formation of cytosine shifting the adenine–guanine equilibrium. This is followed by the formation of low- and high-potential parageneses: Ade + dRib (Rib) and Gua + dRib (Rib), respectively (Figure 1.7, dotted arrows). This determines the sequences of the formation of nucleotides, which correspond to a decrease in the chemical potential of oxygen:
Gua + dRib (Rib) → Cyt → Ade + dRib (Rib) (1.15)
and its increase:
Ade + dRib (Rib) → Cyt → Gua + dRib (Rib). (1.16) Their repeatability generates a “respiration” during the formation of nucleic acids. It is
determined by a systematic decrease in the chemical potential of oxygen in the fluids due to oxygen consumption by oxygen-accumulating parageneses 3Gua + dRib (Rib) and Ade + dRib (Rib) followed by the recovery of its steady-state level determined by fluid infiltration. Thus, the system of nucleic acids is developed in self-oscillatory processes

Alexey A. Marakushev and Sergey A. Marakushev 20
(concentration self-oscillations – Zhabotinsky, 1974) characterized by repeated combinations of nucleotides corresponding to different chemical potentials of oxygen.
These relationships may more clearly be presented in the diagrams of chemical potentials of oxygen and nitrogen (Figure 1.8), which characterize variations of parageneses of substances in the systems of nucleic acids under the conditions of free inflow/outflow of these components.
Figure 1.8. Chemical potentials of oxygen and nitrogen of the binary system H–C as applied to DNA. The difference in the chemical potentials of oxygen of the parageneses Gua + dRib and Ade + dRib is characterized by its oscillations during alternations of the parageneses during formation. The alternations of Cyt and Thy reflect variations in the chemical potential of nitrogen. The dot–dash line shows the pyrite–pyrrhotite–magnetite buffer as in Figure 1.7.

Fluid Evolution of the Earth and Origin of the Biosphere 21
These diagrams (for DNA and RNA) show that, in addition to the oxygen variation of parageneses considered here, the changes in the parageneses were caused by variability in the nitrogen potential. According to the diagrams for DNA (Figure 1.8), cytosine corresponds to a high potential of nitrogen, in contrast to nitrogen-poor bases, such as thymine (Thy) and uracil (Ura), appurtenant to DNA and RNA, respectively. This means that the formation of cytosine is accompanied by a decrease in the nitrogen potential, which promotes the formation of thymine or uracil. Thymine and uracil differ only in the hydrocarbon component
Ura + CH2 = Thy. (1.17) An increase in the complexity of the parageneses of purines, pyrimidines, and
monosaccharides, that is, the formation of nucleosides, nucleoside phosphates, and polynucleotides, is accompanied by their dehydration:
C5H5N5 (Ade) + (H2CO)5 (Rib) = C10H13N5O4 (A) + H2O, (1.18) C4H5N3O (Cyt) + (H2CO)5 (Rib) = C9H13N3O5 (C) + H2O, (1.19)
where A is adenosine, C is cytidine. Their further dehydration results in the formation of the structural order of the three-component hydrocarbon–nitrogen system, which includes a binary two-component subsystem C–(HN) consisting of
• adenine, C5(HN)5, • cytosine, C4(HN)3 + H2O, • ribose, C + 5H2O, • adenosine, C10(HN)5 + 4H2O, and • cytidine, C9(HN)3 + 5H2O. The binding of phosphates to nucleosides results in the formation of nucleoside
phosphates belonging to the same subsystem: C10H14N5O7P (AMP) = C10(HN)5 + 4.5H2O + 0.5P2O5, (1.20) C9H14N3O8P (CMP) = C9(HN)3 + 5.5H2O + 0.5P2O5, (1.21) C10H15N5O10P2 (ADP) = C10(HN)5 + 5H2O + P2O5, etc., (1.22)
where AMP is adenosine monophosphate, CMP is cytidine monophosphate, and ADP is adenosine diphosphate. The belonging of the substances to this subsystem determines the stability of their parageneses with nucleotide phosphates whose factors of formation include, in addition to the parameters pressure (P), and temperature (T), the chemical potentials of water and phosphorus (P2O5). This is exemplified in Figure 1.9 by two equilibriums’ isopotential with respect to water:
6C10H13N5O4 (A) + H2O = 3C5H5N5 (Ade) + 5C9H13N3O5 (C), (1.23)

Figure 1.9. The facies of aqueous adenosine phosphates (AMP, ADP, ATP), cytidine phosphates (CMP, CDP, CTP), nitrogen bases, and nucleosides in the diagram of the chemical potentials of phosphorus (P2O5) and water (under standard temperature and pressure using constants from (LaRowe and Helgeson, 2006)). The linear diagrams of the parageneses of substances applies to the binary subsystem C–NH (H2O) of the system C–H–N.

Fluid Evolution of the Earth and Origin of the Biosphere 23
3C5H5N5 (Ade) + C9H13N3O5 (C) + H2O = 6C4H5N3O (Cyt). (1.24) An increase in the chemical potentials of phosphorus and water mainly results in the
formation of CMP, which determines further development of the binary system C–HN in different parageneses with cytosine, adenine, and adenosine. An increase in the chemical potential of water along X-axis is correlated with a decrease in temperature (in the corresponding P, T diagram). Hence, the diagram (Figure 1.9) shows high-temperature formation of AMP and ADP as a result of phosphate binding, hydration of adenosine and AMP, and the transformation of the paragenesis
CMP + Ade → AMP (ADP). (1.25) The facies A, AMP, and ADP are high-temperature, whereas the Cyt facies corresponds
to a low temperature area (the right lower part of Figure 1.9), where an increase in the potential of phosphorus results in the formation of the parageneses CMP + Ade, CDP + Ade, and CTP + Ade, where CTP is cytidine triphosphate. Adenosine triphosphate (ATP) and CTP are formed at almost similar potentials of phosphorus and water. However, this negligible difference results in the transformation of the low temperature paragenesis CTP + Ade into paragenesis CTP + ATP, and completion of the development of the system considered.
Thus, Figure 1.9 shows a model of the physicochemical abiogenic formation of organic phosphates that are important for prebiological evolution in the hydrothermal phosphorus solutions. The system considered is crowned by the facies ATP in the paragenesis with CTP, which corresponds to the highest chemical potentials of phosphorus and water. ATP could be a “key molecule of life evolution” (Galimov, 2004), the primary phosphorylating agent in living cells coupled with synthesis of peptide and nucleotide chains (the formation of proteins, RNA, and DNA). Abiotic synthesis of ATP was studied in a number of experimental works (Yamagata, 1999; Julian and Beauchamp, 2003). However, we are the first to consider its paragenetic relationships with nitrogen bases, nucleosides, and nucleotides. The nitrogen–hydrocarbon and phosphorus specificities were geologically combined in phosphorite sediments, which periodically appeared in the sedimentary envelope of the Earth during all the geological history due to the pulsive development of alkaline magmatism.
1.4. ORIGIN OF THE BIOSPHERE Phosphoric formations developing in oceans in combination with hydrocarbon sources
were, presumably, unique structures in life’s origin, because phosphates are necessary for complex processes in the formation of ATP, RNA, and DNA. In this chapter, we do not consider all substances directly associated with the problem of life’s origin. Nevertheless, even they differ strikingly in composition and origin, because they belong to different hydrocarbon systems: oxygen C–H–O, nitrogen C–H–N, and phosphoric C–H–P. This diversity was noted long ago and provided skepticism about the possibility of a spontaneous origin of life. For instance, there is a well-known analogy with a complex clock mechanism, which cannot spontaneously form itself from a set of its details. However, in contrast to these
Alexey A. Marakushev and Sergey A. Marakushev 24
details, the substances of nucleic acids and proteins have a strong mutual chemical affinity, which determined their natural selection from the vast diversity of abiotic organic substances.
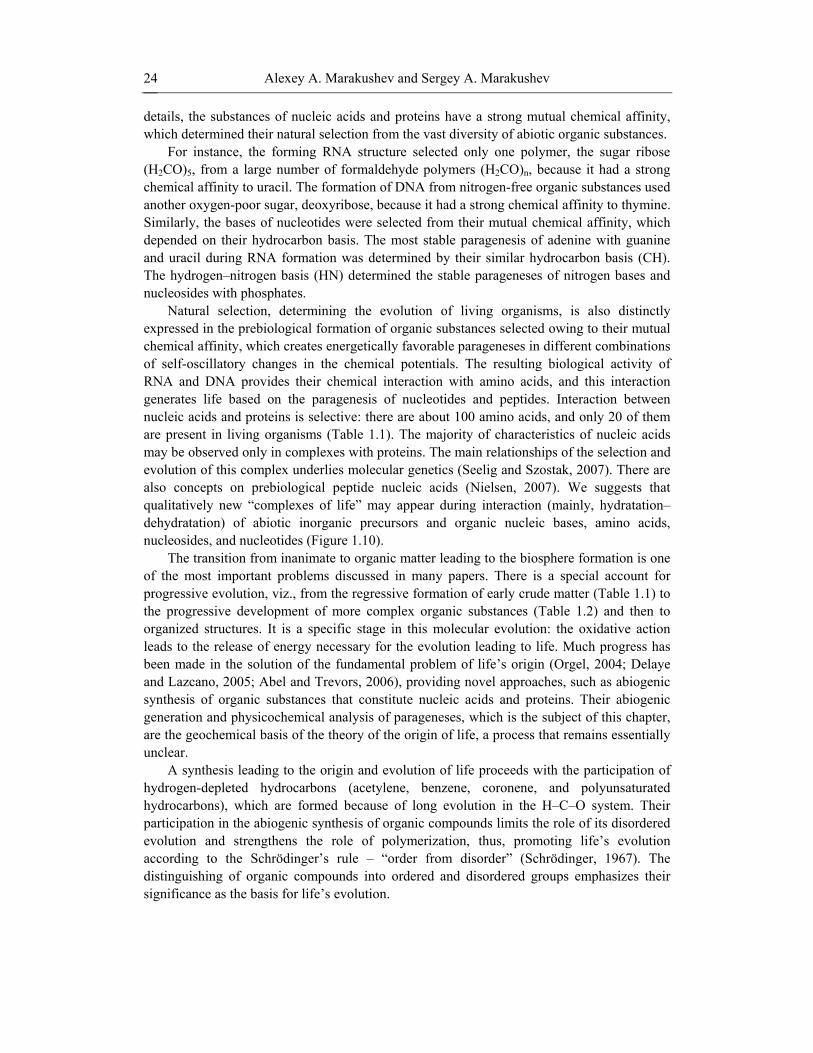
For instance, the forming RNA structure selected only one polymer, the sugar ribose (H2CO)5, from a large number of formaldehyde polymers (H2CO)n, because it had a strong chemical affinity to uracil. The formation of DNA from nitrogen-free organic substances used another oxygen-poor sugar, deoxyribose, because it had a strong chemical affinity to thymine. Similarly, the bases of nucleotides were selected from their mutual chemical affinity, which depended on their hydrocarbon basis. The most stable paragenesis of adenine with guanine and uracil during RNA formation was determined by their similar hydrocarbon basis (CH). The hydrogen–nitrogen basis (HN) determined the stable parageneses of nitrogen bases and nucleosides with phosphates.
Natural selection, determining the evolution of living organisms, is also distinctly expressed in the prebiological formation of organic substances selected owing to their mutual chemical affinity, which creates energetically favorable parageneses in different combinations of self-oscillatory changes in the chemical potentials. The resulting biological activity of RNA and DNA provides their chemical interaction with amino acids, and this interaction generates life based on the paragenesis of nucleotides and peptides. Interaction between nucleic acids and proteins is selective: there are about 100 amino acids, and only 20 of them are present in living organisms (Table 1.1). The majority of characteristics of nucleic acids may be observed only in complexes with proteins. The main relationships of the selection and evolution of this complex underlies molecular genetics (Seelig and Szostak, 2007). There are also concepts on prebiological peptide nucleic acids (Nielsen, 2007). We suggests that qualitatively new “complexes of life” may appear during interaction (mainly, hydratation–dehydratation) of abiotic inorganic precursors and organic nucleic bases, amino acids, nucleosides, and nucleotides (Figure 1.10).
The transition from inanimate to organic matter leading to the biosphere formation is one of the most important problems discussed in many papers. There is a special account for progressive evolution, viz., from the regressive formation of early crude matter (Table 1.1) to the progressive development of more complex organic substances (Table 1.2) and then to organized structures. It is a specific stage in this molecular evolution: the oxidative action leads to the release of energy necessary for the evolution leading to life. Much progress has been made in the solution of the fundamental problem of life’s origin (Orgel, 2004; Delaye and Lazcano, 2005; Abel and Trevors, 2006), providing novel approaches, such as abiogenic synthesis of organic substances that constitute nucleic acids and proteins. Their abiogenic generation and physicochemical analysis of parageneses, which is the subject of this chapter, are the geochemical basis of the theory of the origin of life, a process that remains essentially unclear.
A synthesis leading to the origin and evolution of life proceeds with the participation of hydrogen-depleted hydrocarbons (acetylene, benzene, coronene, and polyunsaturated hydrocarbons), which are formed because of long evolution in the Н–С–О system. Their participation in the abiogenic synthesis of organic compounds limits the role of its disordered evolution and strengthens the role of polymerization, thus, promoting life’s evolution according to the Schrödinger’s rule – “order from disorder” (Schrödinger, 1967). The distinguishing of organic compounds into ordered and disordered groups emphasizes their significance as the basis for life’s evolution.

Fluid Evolution of the Earth and Origin of the Biosphere 25
Figure 1.10. “The complex of life”, which combines the main groups of “common origin” uniting organic substances of nucleinic acids and proteins: 1 – monosaccharides, 2 – the nitrogen bases, 3 – nucleosides and nucleotides, 4 – amino acids; and their inorganic nitrogen-hydrocarbon precursors (the open corresponding signs 1, 2, 3, and 4). For symbols of substances and nitric numbers N/(C + N) see Tables 1.1 and 1.2.
The biosphere itself is considered in various extents. It is often limited by a sedimentary envelope of the Earth (Kholodov, 2006). In other studies, the biosphere is limited only by the thermal survival of bacteria. It spreads up to a temperature of 121° С (Kashefi and Lovley, 2003), which can be reached in the Earth’s crust at a depth of 4–5 km according to the geothermal gradient. A depth close to that determines the lower boundary of the terrestrial biosphere, according to the concept of the so-called deep, hot biosphere: ‘microbial life exists in all the locations where microbes can survive’ (Gold, 1992). According to this concept, there are no areas on the Earth safe from bacterial “infection” during long periods of geological time. The cited paper contains data on deep drilling providing evidence for the presence of anaerobic thermophilic bacteria below a depth of 4 km. Analogous data is discussed by Pedersen (2000), who pays special attention to the distribution of microbial life deep below the sedimentary envelope and substantiates a model of intraterrestrial microbial life. For example, in the borehole Gravberg 1 (Siljan Ring, Sweden) drilled in granitic rocks,

Alexey A. Marakushev and Sergey A. Marakushev 26
thermophilic bacteria were enriched and isolated from a depth of 5,278 m where the temperature ranged from 65° to 75° C (Szewzyk et al., 1994). This finding in the Fennoscandian Shield demonstrates the role of crystalline rock enrichment with hydrogen, methane, and carbon dioxide as a factor promoting the spreading of bacterial life to the depth. A model of а hydrogen-driven biosphere in deep igneous rock was suggested by Pedersen (2000). Probably, the origin of the biosphere results from deep processes of the origin of hydrocarbon-organic systems related to impulses of oil formation.
The results of our study of impulsive hydrocarbon-organic systems confirm molecular evolution. Due to their specific composition, they draw near the “life” level relatively early in quite simple С–Н–О systems. They comprise the main types of organic compounds and their various combinations divided into abiogenic being formed by the irregular joining of atomic groups and structurally ordered biogenic ones. The latter results from the oxidation and hydration of hydrogen-poor hydrocarbons (acetylene, benzene, coronene, polyynes, or, for example, natural polymer crystals of hydrocarbons – Yushkin, 1996) different from other hydrocarbons by order of atomic structure. Their participation results in low-entropic polymerization of organic compounds promoting “asymmetric synthesis” by organic matter.
Hydrocarbon-organic evolution are typical not only for the Earth, but also for interstellar nebulas, planets, their satellites, and comets (McKeegan et al., 2006; Sandford et al., 2006). However, this evolution is limited by abiogenic synthesis of organic compounds in the Solar system outside the Earth. The origin of life requires a hydrosphere that is typical only for the Earth. The stratospheric ozone layer and the hydrosphere are the unique features of the Earth in the Solar system, where the origin and evolution of life is possible (Marakushev, 2000). The progress in astronomy resulted in the finds of small stars similar to the Sun and surrounded by large fluid planets, compared to Jupiter in size (Charbonneau, 2003). Later, surroundings of stars by small near-stellar planets, similar to the Earth in size, were also revealed in the stellar analogues of the Solar system (Doyle et al., 2000). This allows us to hope for discoveries of Earth’s analogues among them located within a continuously habitable zone, a region of space around a star where a planet can sustain a hydrosphere necessary for the origin and evolution of life.
1.5. CONCLUSION An understanding of the role of the core in crustal processes changes the concept of the
tectonosphere: ‘all spheres of the Earth from the crust to the core located at a depth of 2,900 km should be referred to the tectonosphere’ (Pushcharovsky, 2005).
The considered hydrocarbon-organic model is capable of explaining the possible pathways to the prebiotic synthesis of reactive mononucleotides, the oligomerization or polymerization of reactive monomers, the possibility of spontaneous emergence of catalytic RNAs synthesized under plausible geochemical conditions, and the possibility of the spontaneous emergence of a catalytic network capable of sustaining a life-like system. However, the whole area of the origin of supramolecular genetic polymers containing an informational sequence of nucleotides has remained not solved. In this Chapter, progress was made toward the solution of the problem of prebiotic development of organic matter from it’s

Fluid Evolution of the Earth and Origin of the Biosphere 27
regressive origin (Table 1.1) to progressive generation (Table 1.2), which is uniquely the Earth’s.
Since the time of Charles Darwin and his ‘warm little pond’ (Darwin, 1887, p. 18), scientists have been wrestling with the challenge of formulating a plausible scenario for the origin and early evolution of life. How did a self-replicating assembly of molecules emerge on the early Earth and give rise to cellular life? From this perspective, even the simplest free-living bacteria in contemporary biology are of staggering complexity. The fossil record of life appears to go back 2.6 billion years. Yet, some of the oldest fossils resemble modern cyanobacteria, providing few clues as to how the earliest life differed from that of today. However, the study of prebiotic chemistry provides key insights into the plausibility of a given in this work scenario, but it cannot hope to recreate a scenario de novo. We believe the main challenges confronting the emergence of life field are in further clarifying the nature of the specific geochemical processes.
ACKNOWLEDGMENTS The work was supported by the Presidium of Russian Academy of Sciences (the program
of fundamental researches No. 15, subprogram 1 “Origin of the biosphere and evolution of geo-biological systems”).
REFERENCES
Abel, D.L. and Trevors, J.T. (2006). Self-organization vs. self-ordering events in life-origin models. Physics of Life Reviews, 3, 211–228.
Amend, J.P. and Helgeson, H.C. (1997). Group additivity equations of state for calculating the standard molal thermodynamic properties of aqueous organic species at elevated temperatures and pressures. Geochimica et Cosmochimica Acta, 61, 11–46.
Areshev, E.G. (2004). Petroleum basins of the Pacific mobile belt. Moscow, Russia: Avanti (in Russian).
Avdonin, V.V., Boitsov, V.E., Grigoriev, V.M., Seminsky, Z.V., Solodov, I.A. and Starostin, V.I. (2005). Metallic mineral deposits. Moscow, Russia: Academic Project, Triksta (in Russian).
Brown, R.H., Soderblom, L.A., Soderblom, J.M., Clark, R.N., Jaumann, R., Barnes, J.W., Sotin, C., Buratti, B., Baines, K.H. and Nicholson, P.D. (2008). The identification of liquid ethane in Titan’s Ontario Lacus. Nature, 454, 607–610.
Buseck, P.R., Galdobina, L.P., Kovalevski, V.V., Rozhkova, N.N., Valley, J.W. and Zaidenberg, A.Z. (1997). Shungites – the C-rich rocks of Karelia, Russia. Canadian Mineralogist, 35, 1363–1378.
Charbonneau, D. (2003). Atmosphere out of that world. Nature, 422, 124–125. Charlou, J.L., Donval, J.P., Fouquet, Y., Jean-Baptiste, P. and Holm, N. (2002).
Geochemistry of high H2 and CH4 vent fluids issuing from ultramafic rocks at the Rainbow hydrothermal field (36°14' N, MAR). Chemical Geology, 191, 345–359.

Alexey A. Marakushev and Sergey A. Marakushev 28
Cruse, A.M. and Seewald, J.S. (2006). Geochemistry of low-molecular weight hydrocarbons in hydrothermal fluids from Middle Valley, northern Juan de Fuca Ridge. Geochimica et Cosmochimica Acta, 70, 2073–2092.
Darwin, F. (Ed.) (1887). The life and letters of Charles Darwin, including an autobiographical chapter, Vol. 3. London, UK: John Murray.
Delaye, L. and Lazcano, A. (2005). Prebiological evolution and the physics of the origin of life. Physics of Life Reviews, 2, 47–64.
Doyle, L.R., Deeg, H.J. and Brown, T.M. (2000). Searching for shadow of other Earths. Scientific American, 283(3), 38–45.
Galimov, E.M. (2004). Phenomenon of life: between equilibrium and non-linearity. Origins of Life and Evolution of the Biosphere, 34, 599–613.
Galimov, E.M. (2006). Organic geochemistry of isotopes. Vestnik Rossiiskoi Akademii Nauk, 76, 978–988 (in Russian).
Gismatullin, E. (2009). BP makes ‘giant’ oil discovery in Gulf of Mexico. In Bloomberg.com, Sept. 2, 2009, http://www.bloomberg.com/apps/news?pid=20601087&sid=a.x9.b7YSclI
Gold, T., (1992). The deep, hot biosphere. Proceedings of the National Academy of Sciences, 89, 6045–6049.
Gottikh, R.P., Pisotskii, B.I. and Zhuravlev, D.Z. (2004). Trace element distribution in the kimberlite–bitumen and basalt–bitumen systems in diatremes of the Siberian Craton. Doklady Earth Sciences, 399A, 1222–1226.
Hodgson, G.W. (1954). Vanadium, nickel, and iron trace metals in crude oils of Western Canada. American Association of Petroleum Geologists Bulletin, 38, 2537–2554.
Hoffman, K.A. (1988). Ancient magnetic reversals: clues to the geodynamo. Scientific American, 258(5), 76–83.
Holm, N.G. and Charlou, J.L. (2001). Initial indications of abiotic formation of hydrocarbons in the Rainbow ultramafic hydrothermal system, Mid-Atlantic Ridge. Earth and Planetary Science Letters, 191, 1–8.
Julian, R.R. and Beauchamp, J.L. (2003). Abiotic synthesis of ATP from AMP in the gas phase: implications for the origin of biologically important molecules from small molecular clusters. International Journal of Mass Spectrometry, 227, 147–159.
Kashefi, K. and Lovley, D.R. (2003). Extending the upper temperature limit for life. Science, 301, 934.
Kenney, J.F., Kutcherov, V.A., Bendeliani, N.A. and Alekseev, V.A. (2002). The evolution of multicomponent systems at high pressures: VI. The thermodynamic stability of the hydrogen–carbon system: The genesis of hydrocarbons and the origin of petroleum. Proceedings of the National Academy of Sciences, 99, 10976–10981.
Khain, V.E. and Polyakova, I.D. (2004). Oil and gas potential of deep-and ultradeep-water zones of continental margins. Lithology and Mineral Resources, 39, 530–540.
Kholodov, V.N. (2006). Geochemistry of sedimentary process. Moscow, Russia: Geos (in Russian).
Konn, C., Charlou, J.L., Donval, J.P. Holm, N.G., Dehairs, F. and Bouillon, S. (2009). Hydrocarbons and oxidized organic compounds in hydrothermal fluids from Rainbow and Lost City ultramafic-hosted vents. Chemical Geology, 258, 299–314.
Kontorovich, A.E. and Vyshemirskii, V.S. (1997). Irregularity of oil formation in the Earth’s history resulting from the cyclic evolution of the Earth’s crust. Transactions (Doklady) of the Russian Academy of Sciences. Earth Science Sections, 357, 1154–1157.

Fluid Evolution of the Earth and Origin of the Biosphere 29
Koudriavtsev, N.A. (1973). Genesis of oil and gas. Leningrad, USSR: Nedra (in Russian). Kropotkin, P.N. (1985). Degassing of the Earth and the origin of hydrocarbons. International
Geology Review, 27, 1261–1275. LaRowe, D.E. and Helgeson, H.C. (2006). Biomolecules in hydrothermal systems:
calculation of the standard molal thermodynamic properties of nucleic-acid bases, nucleosides, and nucleotides at elevated temperatures and pressures. Geochimica et Cosmochimica Acta, 70, 4680–4724.
Lissauer, J.J. (1993). Planet formation. Annual Review of Astronomy and Astrophysics, 31, 129–174.
Makarenko, G.F. (1997). Periodicity of basalts, biocrises, structural symmetry of the Earth. Moscow, Russia: Geoinformmark (in Russian).
Marakushev, A.A. (1999). Origin of the Earth and nature of its endogenous activity. Moscow, Russia: Nauka (in Russian).
Marakushev, A.A. (2000). Astrobiology – an illusory science. Vestnik Rossiiskoi Akademii Nauk, 70, 223–226 (in Russian).
Marakushev, A.A. (2005). Cosmic petrology and the planetary evolution of the Solar system. Astronomical and Astrophysical Transactions, 24, 507–519.
Marakushev, A.A. and Marakushev, S.A. (2006). PT facies of elementary, hydrocarbon, and organic substances in the C–H–O system. Doklady Earth Sciences, 406, 141–147.
Marakushev, A.A. and Marakushev, S.A. (2007). Redox facies of hydrocarbons and the formation of oil. Doklady Earth Sciences, 414, 561–566.
Marakushev, A.A. and Marakushev, S.A. (2008a). Formation of oil and gas fields. Lithology and Mineral Resources, 43, 454–469.
Marakushev, A.A. and Marakushev, S.A. (2008b). Hydrogen breathing of Earth (origin and geological and biological consequence). International Scientific Journal for Alternative Energy and Ecology, 57, 156–174.
Marakushev, A.A. and Marakushev, S.A. (2009). Formation of oil and gas fields. Exploration and Production, 7(1), 35–39.
Mavrovouniotis, M.L. (1991). Estimation of standard Gibbs energy changes of biotransformation. Journal of Biological Chemistry, 266, 14440–14445.
McCollom, T.M. and Seewald, J.S. (2007). Abiotic synthesis of organic compounds in deep-sea hydrothermal environments. Chemical Reviews, 107, 382–401.
McKeegan, K.D., Aléon, J, Bradley, J., Brownlee, D., Busemann, H., Butterworth, A., Chaussidon, M., Fallon, S., Floss, C., Gilmour, J., Gounelle, M., Graham, G., Guan, Y., Heck, P.R., Hoppe, P., Hutcheon, I.D., Huth, J., Ishii, H., Ito, M., Jacobsen, S.B., Kearsley, A., Leshin, L.A., Liu, M.-C., Lyon, I., Marhas, K., Marty, B., Matrajt, G., Meibom, A., Messenger, S., Mostefaoui, S., Mukhopadhyay, S., Nakamura-Messenger, K., Nittler, L., Palma, R., Pepin, R.O., Papanastassiou, D.A., Robert, F., Schlutter, D., Snead, C.J., Stadermann, F.J., Stroud, R., Tsou, P., Westphal, A., Young, E.D., Ziegler, K., Zimmermann, L. and Zinner, E. (2006). Isotopic compositions of cometary matter returned by stardust. Science, 314, 1724–1728.
Mezhelovsky, N.V. and Smirnov, A.A. (Eds.) (2001). Depths of Russia, Vol. 1, No. 2: Mineral resources. Saint Petersburg, Russia: Nauka (in Russian).
Milanovskii, Y.Y. (1996). Pulsation of the Earth. Geotectonics, 29, 359–378.
Alexey A. Marakushev and Sergey A. Marakushev 30
Milanovskii, Y.Y. (2004). Geopulsation in the Earth’s evolution. In L.I. Krasny, O.V. Petrov and B.A. Blyuman (Eds.), The planet Earth: Tectonics and geodynamics (pp. 41–55). Saint Petersburg, Russia: Karpinsky Russian Geological Research Institute (in Russian).
Nielsen, P.E. (2007). Question 1: peptide nucleic acids and the origin and homochirality of life. Origins of Life and Evolution of the Biosphere, 37, 323–328.
Orgel, L.E. (2004). Prebiotic chemistry and the origin of the RNA world. Critical Reviews in Biochemistry and Molecular Biology, 39, 99–123.
Pedersen, K. (2000). Exploration of deep intraterrestrial microbial life: current perspectives. FEMS Microbiology Letters, 185, 9–16.
Potter, J., Rankin, A.H. and Treloar, P.J. (2004). Abiogenic Fischer–Tropsch synthesis of hydrocarbons in alkaline igneous rocks; fluid inclusion, textural and isotopic evidence from the Lovozero complex, N.W. Russia. Lithos, 75, 311–330.
Proskurowski, G., Lilley, M.D., Seewald, J.S. Früh-Green, G.L., Olson, E.J., Lupton, J.E., Sylva, S.P. and Kelley, D.S. (2008). Abiogenic hydrocarbon production at Lost City hydrothermal field. Science, 319, 604–607.
Pushcharovsky, Y.M. (2005). Structure, energetics, and tectonics of the Earth’s mantle. Vestnik Rossiiskoi Akademii Nauk, 75, 1115–1122 (in Russian).
Raulin, F. (2008). Organic lakes on Titan. Nature, 454, 587–589. Sandford, S.A., Aléon, J., Alexander, C.M.O’D., Araki, T., Bajt, S., Baratta, G.A., Borg, J.,
Bradley, J.P., Brownlee, D.E., Brucato, J.R., Burchell, M.J., Busemann, H., Butterworth, A., Clemett, S.J., Cody, G., Colangeli, L., Cooper, G., D’Hendecourt, L., Djouadi, Z., Dworkin, J.P., Ferrini, G., Fleckenstein, H., Flynn, G.J., Franchi, I.A., Fries, M., Gilles, M.K., Glavin, D.P., Gounelle, M., Grossemy, F., Jacobsen, C., Keller, L.P., Kilcoyne, A.L.D., Leitner, J., Matrajt, G., Meibom, A., Mennella, V., Mostefaoui, S., Nittler, L.R., Palumbo, M.E., Papanastassiou, D.A., Robert, F., Rotundi, A., Snead, C.J., Spencer, M.K., Stadermann, F.J., Steele, A., Stephan, T., Tsou, P., Tyliszczak, T., Westphal, A.J., Wirick, S., Wopenka, B., Yabuta, H., Zare, R.N. and Zolensky, M.E. (2006). Organics captured from comet 81P/Wild 2 by the stardust spacecraft. Science, 314, 1720–1724.
Schrödinger, E. (1967). What is life? The physical aspect of the living cell and Mind and matter. Cambridge, UK: Cambridge University Press.
Scott, H.P., Hemley, R.J., Mao, H.-k., Herschbach, D.R., Fried, L.E., Howard, W.M. and Bastea, S. (2004). Generation of methane in the Earth's mantle: in situ high pressure–temperature measurements of carbonate reduction. Proceedings of the National Academy of Sciences, 101, 14023–14026.
Seelig, B. and Szostak, J.W. (2007). Selection and evolution of enzymes from a partially randomized non-catalytic scaffold. Nature, 448, 828–831.
Shakhnovsky, I.M. (2004). Origin of oil hydrocarbons (2nd ed.). Moscow, Russia: All-Russian Scientific Research Institute of Organization, Management, and Economics of Oil and Gas Industry (in Russian).
Sherwood Lollar, B., Wastgate, T.D., Ward, J.A., Slater, G.F. and Lacrampe-Couloume, G. (2002). Abiogenic formation of alkanes in the Earth’s crust as a minor source for global hydrocarbon reservoirs. Nature, 416, 522–524.
Sugisaki, R. and Mimura, K. (1994). Mantle hydrocarbons: abiotic or biotic. Geochimica et Cosmochimica Acta, 58, 2527–2542.

Fluid Evolution of the Earth and Origin of the Biosphere 31
Szewzyk, U., Szewzyk, R. and Stenström, T.-A. (1994). Thermophilic, anaerobic bacteria isolated from a deep borehole in granite in Sweden. Proceedings of the National Academy of Sciences, 91, 1810–1813.
Taran, Y.A., Kliger, G.A. and Sevastianov, V.S. (2007). Carbon isotope effects in the open-system Fischer-Tropsch synthesis. Geochimica et Cosmochimica Acta, 71, 4474–4487.
Timashev, S.F. (1991). The role of chemical factors in the evolution of natural systems (chemistry and ecology). Russian Chemical Reviews, 60, 1183–1204.
Touret, J.L.R. (2003). Remnants of early Archaean hydrothermal methane and brines in pillow-breccia from the Isua Greenstone Belt, West Greenland. Precambrian Research, 126, 219–233.
Voitkevich, G.V., Miroshnikov, D.E., Povarennych, A.S. and Prochorov, V.G. (1977). Brief guidebook on geochemistry (2nd rev. enl. ed.). Moscow, USSR: Nedra (in Russian).
Weber, A.L. (2002). Chemical constraints governing the origin of metabolism: the thermodynamic landscape of carbon group transformations under mild aqueous conditions. Origins of Life and Evolution of the Biosphere, 32, 333–357.
Wignall, P.B. (1994). Black shales. New York, NY: Oxford University Press. Yamagata, Y. (1999). Prebiotic formation of ADP and ATP from AMP, calcium phosphates
and cyanate in aqueous solution. Origins of Life and Evolution of the Biosphere, 29, 511–520.
Yudovich, Y.E. and Ketris, M.P. (1994). Trace elements in the black shales. Ekaterinburg, Russia: Nauka (in Russian).
Yushkin, N.P. (1996). Natural polymer crystals of hydrocarbons as models of prebiological organisms. Journal of Crystal Growth, 167, 237–247.
Zhabotinsky, A.M. (1974). Concentration autooscillations. Moscow, USSR: Nauka (in Russian).


In: Man and the Geosphere ISBN 978-1-60876-387-0 Editor: Igor V. Florinsky, pp. 33-68 © 2010 Nova Science Publishers, Inc.
Chapter 2
ROLE OF ISOTOPES IN THE BIOSPHERE
Emlen V. Sobotovich, Igor V. Florinsky, Olga B. Lysenko and Dmitry M. Grodzinsky
ABSTRACT
This chapter consists of two main parts. The first deals with the phenomenon of biological fractionation of stable isotopes as a contribution to isotopic fractionation in geological processes. The second deals with biological roles of natural radioisotopes.
We briefly address kinetic, thermodynamic, and magnetic isotope effects. Fractionation of stable isotopes of some biogenic elements (H, C, O, N, Mg, S, K, Ca, Fe, Cu, and Zn) in the human body is discussed. In particular, we consider (a) the natural isotopic composition of human tissues, fluids, and gases including the temporal dynamics of those isotopic compositions; (b) impacts of diet and geographical peculiarities on human isotopic composition; and (c) dependence of human isotope ratios on the state of health and age. We suppose that each living organism and each of its systems can be characterized by a typical isotopic composition, “an isotopic signature”, which is related to the environment. In the signature, typical isotope ratios may fluctuate supporting the state of isotopic homeostasis, a part of the general homeostasis of the organism. There are also sharp changes in typical isotope ratios exceeding the ranges of such fluctuations. Sharp isotope shifts may be used as natural internal markers of pathological processes.
Finally, we address biological effects of natural radioisotopes and their role in speciation and biological evolution. Experimental studies testify that natural background radiation is an important factor for the vital activity of organisms. Paleontological data suggest that dramatic periods of speciation and diversification have regularly occurred in periods of high natural radioactivity of the environment associated with the deposition of uranium-rich sediments. Within the East African Rift, a combined impact of regional geological processes has formed a zone of increased natural radiation that is suggested to have played a principal role in the origin of Homo sapiens. Possible mutagenic effects of the cosmic radiation increased during geomagnetic reversals and excursions are also discussed. We suggest that natural low dose ionizing radiation may be deleterious to individuals but beneficial for the population being one of the key factors generating variations that are acted upon by natural selection.

Emlen V. Sobotovich, Igor V. Florinsky, Olga B. Lysenko et al. 34
Keywords: isotopic fractionation; isotope effects; isotopic shift; biogenic element; natural radiation; radon; speciation.
2.1. INTRODUCTION The biosphere is integrated into the course of all geological processes (Vernadsky, 1929b,
2001). Biological fractionation of isotopes – preferential use of one stable isotope over other(s) during processes in living organisms – is a contribution to isotopic fractionation in geological processes (Galimov, 1985).
A concept of the biological fractionation of isotopes of biogenic elements (Tables 2.1 and 2.2) was initially based on the fact that living organisms and abiotic compounds have dissimilar isotopic compositions. For example, the carbon of living organisms is enriched in 12С as compared with abiotic sources (Degens, 1969). This has usually been explained by the kinetic isotope effect (Section 2.2).
It was later proposed that distinctions in isotopic fractionation in different biosystems may be explained by peculiarities of exchange processes (Degens, 1969). Abelson and Hoering (1961) proved an influence of a medium on the isotopic composition of an organism. Studies of the impact of heavy water on biological processes suggested that a biological system responds to both the isotopic composition of a medium and its divergence from the isotopic composition of the biosystem (Roginskii and Shnol’, 1965).
Adaptation to unfavorable conditions, accompanied by resource mobilization, may modulate biological isotopic fractionation. It was proposed that (a) such changes may be used as an integral parameter characterizing the state of biochemical processes in the organism, and (b) the intramolecular distribution of isotopes may be sensitive to any deviations of biosynthesis from the norm. However, in vivo, such deviations cannot be explained by isotopic effects only: their influences are modulated by interferences of the metabolic conditions (Roginskii and Shnol’, 1965; Schmidt, 2003).
Galimov (1985) suggested that a consistent distribution of isotopes between and within biomolecules is an intrinsic property of all biochemical reactions in living organisms. He proposed that biological isotopic fractionation is characterized by differences in the isotopic composition between an organism and a medium, between biochemical fractions, between individual compounds in such fractions, and between biomolecules. This author also suggested that biological isotopic fractionation takes place at a cellular level, while substance transport and intercellular exchange play a lesser role in this process.
The influence of environmental media on the isotopic composition of living organisms can be generalized in geographical terms. There is spatial variability in isotopic ratios typical of particular tissues of plants, animals, and humans (Nakamura et al., 1982; Rubenstein and Hobson, 2004; Bai et al., 2008; Ehleringer et al., 2008; West et al., 2008). The variability depends on climatic conditions, the isotopic composition of meteoric water, chemical properties of bedrocks, soils, and groundwater, topographic position as a control on insolation and the gravity-driven redistribution of water and nutrients in the landscape, proportion of C3 and C4 vegetation, and geographically dependent chemical characteristics of food (Figure 2.1).

Role of Isotopes in the Biosphere 35
Table 2.1. Biogenic classification of chemical elements (Bgatov, 1999)
Type Group Elements Description B
ioge
nic
Protoelements H, C, O, N Basic elements of organic molecules originated in the Precambrian. Components of most of amino acids.
P, S Obligatory components of protein molecules, DNA, and RNA. Creators of proto-life, precellular life.
Macroelements K, Na, Ca, Mg, Cl, Si The elements of buffer system of first unicellular organisms and cell potential. First elements of skeletal system of protists.
Essential microelements
Fe, Cu, Zn, Mn, Cr, Se, Mo, I, Co, F
The elements integrated in metabolism with the advent of the blood system. Participants of redox reactions. Components of coenzymes.
Conventionally essential microelements
As, Br, Li, Ni, V, Cd, Pb Narrow-specialized elements “used” by some species only. Sometimes, components of coenzymes.
Brain elements Au, Sn, Tl, Te, Ge, Ga Probably, the elements take part in brain signaling in mammals. They were possible integrated in metabolism in the Quaternary Period.
Abi
ogen
ic
Neutral Al, Ti, Rb Despite of a wide abundance in the lithosphere, the elements were not integrated in metabolism of animals due to weak reactive ability.
Competitors B, Sr, Cs The elements were integrated in metabolism of marine species. This resulted in their further competition with other elements (e.g., Ca) in metabolism of land species leading to pathologies.
Aggressive Hg, Be, Os, Bi The elements of late volcanic activity. Thus, they were not integrated in metabolism. Dangerous in low doses.
Lysenko and Sobotovich (2006) proposed a concept of isotopic zonality, that is, well-
ordered spatial distribution of stable isotopes in the biosphere. Isotopic zonality, controlled by the geological environment, generates background conditions for biological isotopic fractionation.
The phenomenon of biological isotopic fractionation has been much studied for hydrogen (Thomson, 1963), carbon (Ivlev, 2001), oxygen (Barbour, 2007), nitrogen (Handley and Raven, 1992), magnesium (Black et al., 2008), silicon (Street-Perrott and Barker, 2008), sulfur (Johnston et al., 2005), calcium (DePaolo, 2004), iron (Beard et al., 2003), copper (Zhu et al., 2002), zinc (Cloquet et al., 2008), and selenium (Johnson, 2004). Results of numerous studies (see bibliographies in reviews cited) strongly supported a hypothesis by Vernadsky (1929a) that living organisms selectively utilize specific isotopes. However, a number of problems remain to be solved.

Emlen V. Sobotovich, Igor V. Florinsky, Olga B. Lysenko et al. 36
Table 2.2. Abundance and some nuclear characteristics of selected elements and their isotopes discussed in this chapter and section 3.3
El
emen
t Abundance, weight % (Vernadsky, 2001)
Isot
ope
Isotope-abundance variation, % (De Laeter et al., 2003)
Nuclear characteristics* (Stone, 2005)
Spin, ħ Magnetic dipole moment, nm
Electric quadrupole moment, b Crust Biota,
fresh weight
1H 1.00 70.00 1Н 99.99 1/2 +2.79284734 2Н 0.01 1 +0.857438228 +0.0028
3Li 0.005 10-5 6Li 7.59 1 +0.8220473 -0.00082 7Li 92.41 3/2 +3.256427 -0.0406
6C 0.35 18.00 12C 98.93 0 13C 1.07 1/2 +0.7024118
7N 0.04 0.30 14N 99.64 1 15N 0.36 1/2 -0.28318884
8О 49.13 10.50
16O 99.76 0 17O 0.04 5/2 -1.89379 -0.02578 18O 0.20 0
9F 0.08 5·10-4 19F 100 1/2 +2.628868
12Mg 2.35 0.04
24Mg 78.99 0 25Mg 10.00 5/2 -0.85545 +0.199 26Mg 11.01 0
14Si 26.00 0.20
28Si 92.22 0 29Si 4.69 1/2 -0.55529 30Si 3.09 0
16S 0.10 0.05
32S 94.99 0 33S 0.75 3/2 +0.6438212 -0.678 34S 4.25 0 35S 0.01 3/2 +1.07 +0.0471
19K 2.35 0.30
39K 93.26 3/2 +0.39147 +0.585 40K 0.01 4 -1.298100 -0.073 41K 6.73 3/2 +0.2148701 +0.0711
20Ca 3.25 0.50
40Ca 96.94 0 42Ca 0.65 0 43Ca 0.14 7/2 -1.3173 -0.055 44Ca 2.09 0 46Ca 0.004 0 48Ca 0.19 0
26Fe 4.20 0.01
54Fe 5.85 0 56Fe 91.75 0 57Fe 2.12 1/2 +0.09062300 0.11 58Fe 0.28 0
27Co 0.002 2·10-5 59Co 100 7/2 +4.627 +0.35
29Cu 0.01 2·10-4 63Cu 69.15 3/2 2.227206 -0.211 65Cu 30.85 3/2 2.3816 -0.195

Role of Isotopes in the Biosphere 37
Elem
ent
Abundance, weight % (Vernadsky, 2001)
Isot
ope
Isotope-abundance variation, % (De Laeter et al., 2003)
Nuclear characteristics* (Stone, 2005)
Crust Biota, fresh weight Spin, ħ
Magnetic dipole moment, nm
Electric quadrupole moment, b
30Zn 0.02 5·10-4
64Zn 48.27 0 66Zn 27.98 0 67Zn 4.10 5/2 +0.8752049 +0.150 68Zn 19.02 0 70Zn 0.63 0
33As 5·10-4 3·10-5 75As 100 3/2 +1.43948 0.314
34Se 8·10-5 10-6
74Se 0.89 0 76Se 9.37 0 77Se 7.63 1/2 +0.5350422 1.1 78Se 23.77 0 80Se 49.61 0 82Se 8.73 0
38Sr 0.04 2·10-3
84Sr 0.56 0 86Sr 9.86 0 87Sr 7.00 9/2 -1.0928 +0.33 88Sr 82.58 0
53I 10-4 10-5 127I 100 5/2 +2.81327
82Pb 0.002 5·10-5
204Pb 1.40 0 206Pb 24.10 0 207Pb 22.10 1/2 +0.592583 0.51 208Pb 52.40 0
92U 4·10-4 10-6
234U 0.005 0 235U 0.72 7/2 -0.38 4.936 238U 99.27 0
* Related to the ground state. In particular, Vernadsky (1931) proposed that distinct isotopes of an element may
differently influence biota. As far as we know, this issue has been much studied in two contexts only: unnatural conditions (e.g., cultivation of organisms in heavy water – Katz and Crespi, 1966) (Section 2.3.4) and effects of radionuclides (UNSCEAR, 2001, 2008). Although the impact of diet on the isotopic composition of an organism has been generally characterized (Section 2.3.2), a poorly understood issue is the response of biological isotopic fractionation to aging and stress factors (e.g., physical load and disease – Section 2.3.3). This issue has been mainly studied in the context of nutritional stressors (McCue and Pollock, 2008).
This chapter consists of two main parts. The first deals with the phenomenon of biological fractionation of stable isotopes. We discuss fractionation of stable isotopes of some biogenic elements (H, C, O, N, Mg, S, K, Ca, Fe, Cu, and Zn) in humans. We consider (a) the isotopic composition of human tissues, fluids, and gases including the temporal dynamics of those isotopic compositions; (b) impacts of diet and geographical peculiarities on the isotopic composition of humans; and (c) dependence of human isotopic fractionation on both state of health and age. In the second part, we address biological effects of natural radioisotopes and their role in speciation and biological evolution.

Emlen V. Sobotovich, Igor V. Florinsky, Olga B. Lysenko et al. 38
Figure 2.1. Global distribution of modeled values of mean annual values of leaf water δ18O and δD. Means were derived from monthly model predictions that utilized input grids of annual average precipitation isotope ratios as plant source water, elevation (for barometric pressure), and modified monthly climate grids for temperature and humidity. Grid cells where monthly temperature averages were never above freezing resulted in blank cells shown as gray (after West et al., 2008; © West et al., 2008, courtesy of PloS ONE).
2.2. ISOTOPE EFFECTS
Isotopic fractionation, leading to differences between the isotopic composition of a
reaction product and that of the initial compound, is a result of the physico-chemical nonequivalence of isotopes. Below we outline three types of isotopic effects: kinetic, thermodynamic (equilibrium), and magnetic.
A kinetic isotope effect (Melander, 1960; Collins and Bowman, 1971; Roginskii and Shnol’, 1965) is caused by distinct rates of chemical reactions for different isotopic forms –

Role of Isotopes in the Biosphere 39
compounds having similar composition and structure, but including dissimilar isotopes of an element in one or several positions. In a system of interactive particles, lighter particles possess higher velocities. Thus, molecules containing a lighter isotope are more mobile than those containing a heavier one. Chemical bonds formed by a heavy isotope are more durable than those formed by a light isotope. The activation energy of a reaction involving an isotopically heavy form is higher than that involving an isotopically light form. The kinetic isotope effect of a chemical reaction is quantitatively estimated as the ratio of reaction rate constants for the two isotopic forms. It depends on the difference in activation energies, but does not depend on the absolute value of the activation energy. Reaction products are usually enriched in a light isotope if the ratio of reaction rate constants is >1. In this case, a heavy isotope is accumulated in an unreacted residue.
An isotopically heavy form possesses less free energy than an isotopically light form. In the general case, the minimal free energy of a system can be achieved with different isotopic compositions of its components. A thermodynamic isotope effect corresponds to the resultant distinction in isotopic compositions of the components. Redistribution of an isotope between system components can be expressed as an isotopic exchange reaction. The equilibrium constant of the reaction can be determined using concentrations of initial reagents and products, or by the change of free energy in the reaction. Thermodynamic isotope effects determine an overall tendency for isotopic fractionation in biosystems, but there are also variations associated with peculiarities of biosynthesis, metabolism, and organism evolution (Galimov, 1985; Schmidt, 2003).
Some chemical and biochemical processes are associated with a change of the total electronic spin of the reactive system (e.g., triplet–singlet transformation). The probability of such a transformation differs for nuclei possessing different spin values. The magnetic isotope effect results in fractionation of odd, magnetic isotopes and even, nonmagnetic isotopes in chemical and biochemical processes (Buchachenko, 2000, 2009) according to their nuclear spin values and magnetic moments (Table 2.2). Unlike kinetic isotope effects, magnetic isotope effect depends on the intensity of the external magnetic field (Salikhov, 1996; Buchachenko, 2000). Currently, the magnetic isotope effect is established for H, C, O, Mg, Si, S, Ge, Sn, Hg, and U (Buchachenko, 2009).
From a biological point of view, it is important that a synthesis rate of adenosine triphosphate (ATP) – a source of chemical energy within cells – depends on the nuclear spin and magnetic moment of Mg2+ in creatine kinase and ATPase. The higher the portion of the magnetic isotope 25Mg in the magnesium isotopic composition of the enzymes, the higher the ATP synthesis rate (Buchachenko et al., 2006; Buchachenko and Kouznetsov, 2008).
Isotopes of a heavy element have relatively small differences in masses (Firestone et al., 1996). The magnetic isotope effect can be effective in this case, changing the theoretical ranges of variations in the isotopic ratios of heavy elements. The ranges may be broader than those estimated for fractionation based solely on differences in the atomic mass. It is important to note that the main rock-forming elements (О, Si, Mg, Ca, and Fe) have isotopes with different spins (Table 2.2). In the context of the magnetic isotope effect, studies of isotopic ratios of heavy elements can open a way to better understand both biogeochemical mechanisms of ore formation and biochemical reactions in living organisms.
Emlen V. Sobotovich, Igor V. Florinsky, Olga B. Lysenko et al. 40
2.3. ISOTOPIC FRACTIONATION OF BIOGENIC ELEMENTS IN THE HUMAN BODY
Compared with investigations of plants and animals, processes of isotopic fractionation in
the human body are still little understood. In this context, H, C, O, and N are the most extensively studied biogenic elements. Some limited data are available on the isotopic fractionation of S, Fe, Mg, Zn, K, Ca, and Cu in the human body. In this respect, other biogenic elements (Table 2.1) having stable isotopes have not been studied.
Investigations has been conducted in the following areas: 1. Isotopic composition of tissues, fluids, and gases including the temporal dynamics of
isotopic ratios; 2. Relations between the isotopic composition of human tissues, diets, and geographical
peculiarities; 3. Dependence of human isotopic fractionation on the state of health and age; 4. Influence of stable isotopes on the human organism. See Appendix 2.A for a description of the δ isotope ratio notation for elements discussed
below.
2.3.1. Isotopic Composition of the Human Body It seems likely that Lasnitzki and Brewer (1942) pioneered the description of the isotopic
composition of human tissues. They found an enrichment of bone including marrow in 41K (δ41K = 10.28–21.91‰). Some tissues were enriched in 39K: liver δ41K ranged from 0‰ to -3.19‰, brain δ41K was -1.79‰, kidney δ41K ranged from 0‰ to -5.98‰, and heart δ41K was -5.28‰. The potassium isotopic composition of lung, spleen, and skeletal muscle did not vary from that of a standard material (KCl). However, Mullins and Zerahn (1948) have argued that all these findings were erroneous, because of inaccuracies and artifacts in the method used by Lasnitzki and Brewer (1941). As far as we know, since then nobody has tried to estimate potassium isotope ratios in the human body. We should stress that the main argument of Mullins and Zerahn (1948) – that potassium isotopes are not fractionated in biota due to their large atomic mass – cannot be accepted, since it has been established that isotopes of heavier elements (e.g., Fe, Zn, and Se) fractionate in living organisms (Beard et al., 2003; Johnson, 2004; Cloquet et al., 2008).
Lyon and Baxter (1978) presented the first comprehensive data set on the carbon isotopic composition of various tissues of the human body (Table 2.3). One can see that different human tissues are characterized by dissimilar carbon isotope ratios: blood is the most enriched in 13C, whereas the thymus is the most depleted (the difference is about 7‰). Bone carbonate is enriched in 13C by about 10‰ relative to soft tissues.
It should be realized that the isotopic ratio in a particular tissue is not a constant value. There is temporal variability of such ratios manifested at various temporal scales. This variability can be associated with biorhythms, endo- and exogenous processes in the organism (some of them being governed by dietary peculiarities, inter-regional movement, aging, and

Role of Isotopes in the Biosphere 41
disease – Sections 2.3.2 and 2.3.3). Different tissues are characterized by distinct dynamics of isotopic ratios because of different rates of metabolism, regeneration, and remodeling typical of those tissues.
Table 2.3. δ13C variation in human tissues from a single individual
(Lyon and Baxter, 1978) Organs and tissues δ13C, ‰ Pancreas -25.3 Thyroid -22.7 Thymus -25.6 Kidney -24.0 Heart -22.8 Muscle -23.6 Spleen -22.2 Liver -22.7 Brain -21.1 Lung -22.4 Testes -22.3 Blood -18.2 Blood plasma -18.7 For example, Ivlev et al. (1992) observed slow oscillations with a period of 20–30 days
and variable amplitude in the carbon isotopic composition of humans hairs. The maximum deviation from a mean level was 6‰. Different individuals had dissimilar oscillation patterns. They were associated with biorhythms accompanied by oscillations in the energetic and biosynthetic demands of epidermic cells that determined the degree of pyruvate pool depletion associated with ATP and keratin syntheses.
Later, Ivlev et al. (1994) found relationships between daily rhythms in the human organism and variations of the carbon isotopic composition of expired CO2. There are two phases in the daily variation of δ13C corresponding to day- and nighttime types of metabolism. The daytime phase consists of altering maxima and minima of δ13C in expired CO2 associated with periodicity in feeding and movement activity. The nighttime phase is marked by continuous enrichment of expired CO2 in 12C. More detailed examination of diurnal variations in the carbon isotopic composition of expired CO2 allowed Ivlev et al. (1996b) to detect short-term oscillations with periods of 2–3 h. The period is little dependent on the functional state of the organism. This phenomenon can be connected with the periodic filling/depletion of the cytoplasmic pool of CO2 (Ivlev, 2001) in the cells of organs that are most active in a particular functional state of the organism.
Metges and Petzke (1997) presented data on δ15N of thirteen plasma-free amino acids in humans (Table 2.4). Phenylalanine and threonine were the most depleted in 15N. There were small differences in the nitrogen isotopic composition of alanine, leucine, proline, and ornithine: their δ15N values ranged from 10 to 15‰. The metabolically related phenylalanine and tyrosine differed in their nitrogen isotopic composition by ~15‰. Later, Petzke et al. (2005) measured δ15N and δ13C in fourteen amino acids of human hair (Table 2.4). The difference between the lowest and highest δ13C values of the individual amino acids (leucine

Emlen V. Sobotovich, Igor V. Florinsky, Olga B. Lysenko et al. 42
and glycine) was ~30‰, whereas the difference between the lowest and highest δ15N values (for threonine and proline) was ~25‰. Fuller et al. (2005) proved that δ15N values in human tissues are influenced by deviations in nitrogen homeostasis: a catabolic state leads to an increase in δ15N, whereas an anabolic state results in a decrease in δ15N of the body.
Demikhov (2005) studied the hydrogen isotopic composition of human tissues and fluids. The water of human blood, saliva, sweat, and urine is characterized by a similar hydrogen isotopic composition within limits of the measurement accuracy (Table 2.5). These fluids are deuterium enriched by ~30‰ relative to local drinking water (its δD was -74‰). The increase of δD in human blood, saliva, sweat, and urine relatively to local drinking water should be compensated by secretion of hydrogen with low δD from the human organism in other ways. A probable way is sebaceous gland activities: human cerumen has a very light hydrogen isotopic composition (Table 2.5).
Table 2.4. Average values of δ15N and δ13C (‰) in amino acids of human blood plasma
and hair (Metges and Petzke, 1997; Petzke et al., 2005)
Amino acids Blood plasma Hair δ15N δ15N δ13C Histidine 1.64 3.7 -20.1 Isoleucine no data 9.8 -25.6 Leucine 11.4 10.5 -30.4 Lysine 2.94 2.5 -27.0 Phenylalanine -10.89 2.0 -27.5 Threonine -5.43 -9.7 -26.2 Valine 8.34 13.3 -25.3 Alanine 9.86 9.2 -16.5 Aspartic acid no data 9.0 -15.6 Glutamic acid 8.41 14.4 -17.7 Glycine 6.08 6.4 -0.1 Proline 13.87 15.7 -20.7 Serine 7.12 8.7 -22.2 Tyrosine 6.08 4.1 -16.5 Ornithine 10.1 no data
Table 2.5. δD variation in human fluids and tissues (Demikhov, 2005)
Fluid and tissue δD, ‰ Breathed-out moisture -83 Saliva -49 Blood -48 Sweat -45 Urine -44.5 Hairs -78 Nails -82 Earwax (cerumen) -161

Role of Isotopes in the Biosphere 43
Analyzing δD, δ13C, δ15N, and δ18O of scalp hair and fingernail samples every two weeks for eight months, Fraser et al. (2006) found relatively small fluctuations in δ13C and δ15N of hair (-20.59 ± 0.59‰ and 9.90 ± 0.71‰, respectively) and nails (-21.14 ± 0.56‰ and 10.06 ± 1.04‰, respectively). Larger fluctuations were found for δD and δ18O values of hair (-66.2 ± 4.1‰ and 14.7 ± 1.7‰, respectively) and nails (-60.7 ± 7.6‰ and 13.1 ± 1.5‰, respectively). O’Connell et al. (2001) found that (a) bone collagen is enriched relative to hair keratin by 1.4‰ in δ13C and 0.86‰ in δ15N; (b) no significant difference exists between hair and nail keratin in δ13C; and (c) nail keratin is enriched relative to hair keratin by 0.65‰ in δ15N. It was proposed that the δ13C differences may be caused by differences in amino acid composition between hair keratin and bone collagen.
Walczyk and von Blanckenburg (2002, 2005) demonstrated that the human intestines preferentially absorb the lightest iron isotope. They found that human blood and muscle tissue have similar iron isotopic compositions (mean δ56Fe are -2.74‰ and -2.58‰, respectively); hair is enriched in 54Fe (δ56Fe = -3.8‰), whereas the liver is enriched in 56Fe (mean δ56Fe is -1.37‰). The mean δ57Fe of human blood was estimated as -3.8‰ (Walczyk and von Blanckenburg, 2002). Ohno et al. (2004) determined δ56Fe and δ57Fe of human erythrocytes as about -3‰ and -4.5‰, respectively. There were no seasonal changes in these ratios over a period of one year, probably due to the slow turnover of body iron. The trend of enrichment of the human blood in 54Fe and depletion in 56Fe and 57Fe was supported by observations of Stenberg et al. (2005).
Maréchal et al. (1999) pioneered estimation of copper fractionation in humans: δ65Cu = 0.30‰ for the human blood. There is also evidence for zinc fractionation in the human body. Maréchal et al. (1999) reported the δ66Zn value of the human blood as 0.41‰. Stenberg et al. (2004) measured δ66Zn values of human hair and whole blood as -0.60‰ and 0.56‰, respectively. Ohno et al. (2005) estimated δ66Zn and δ68Zn of human hair as -0.16‰ and -0.31‰, respectively, whereas δ66Zn and δ68Zn of human erythrocytes were 0.43‰ and 0.83‰, respectively. These authors found no seasonal fluctuations in these values.
Among vertebrates, bone δ44Ca is ~1.3‰ lower than dietary δ44Ca and dissolved soft tissue δ44Ca. This difference is associated with fractionation during bone formation, whereas bone resorption does not fractionate Ca isotopes. Thus, if dietary δ44Ca is constant and the rates of bone formation and resorption are equal, the difference in δ44Ca between bone and soft tissue should be constant. It was found that urinary δ44Ca responds to changes in bone mineral balance in less than a month (Skulan et al., 2007).
There is limited evidence on gender differences in stable isotope fractionation. For example, the blood δ56Fe and δ57Fe of males is lower by ~0.3‰ than that of females (Walczyk and von Blanckenburg, 2002, 2005). Ohno et al. (2004) also reported that female erythrocytes are more enriched in 56Fe and 57Fe than male ones: δ56Fe values were -2.55‰ for females and -3‰ for males; δ57Fe values were -3.77‰ for females and -4.4‰ for males. Prowse et al. (2005) demonstrated that bone collagen of females is more depleted in 13C than that of males (δ13C values were -19‰ and -18.7‰, respectively), and bone collagen δ15N values are consistently lower among females than males. Although these effects are still poorly known, one can presume that they are associated with gender differences in metabolism.

Emlen V. Sobotovich, Igor V. Florinsky, Olga B. Lysenko et al. 44
2.3.2. Dependence of Isotopic Composition of the Body on Diet and Geography
Plants from different climatic zones have different carbon isotopic compositions due to
distinct rates of metabolism (Craig, 1954). DeNiro and Epstein (1978, 1981) were the first to study a dependence of isotopic composition of animal bodies on diet. Later, it was established that isotopic ratios of C, N, O, H, and S in human tissues can retain information on the dietary and environmental conditions that prevailed during tissue formation. Since different tissues have dissimilar rates of regeneration or remodeling (some tissues are not remodeled after formation, such as tooth enamel), isotopic ratios of a particular set of tissues may reflect the life circumstances of a person during distinct periods of his or her life.
The influence of diets and geographical peculiarities on the isotopic composition of human hair, fingernails, teeth, and bones is the best-understood issue of the isotopic composition of the human body. Most of these studies are connected with research in archaeology (Ambrose and DeNiro, 1986; Dupras and Schwarcz, 2001; Wilson et al., 2007) and forensics (Bol et al., 2007; Meier-Augenstein and Fraser, 2008; Mützel Rauch et al., 2009). In archaeology, intrinsic isotope ratios in human tissues are analyzed to reconstruct paleodiets and migration routes. In forensics, such isotope analyses may be used to identify mutilated bodies, to reconstruct the life circumstances of a person, and to verify the origin of migrants.
C4 plants (e.g., maize), using the Hatch–Slack photosynthetic cycle, fractionate carbon differently from C3 plants (most grasses, trees, roots, and tubers), using the Calvin cycle (Hatch and Slack, 1970). Variations in δ13C of human tissues may distinguish C3 from C4 food diets including grass- or corn-fed animal products (Nakamura et al., 1982). In particular, North Americans usually have higher δ13C values in human tissues as compared with Europeans. For example, hemoglobin δ13C values are -24.4‰ and -18.7‰ (Apostol et al., 2001), and hair δ13C values are -20.5‰ and -18.2‰ (Bol et al., 2007), respectively. These differences reflect a higher proportion of C4 food in North American diets.
δ15N values in human tissues may be used to distinguish plant from animal protein diets. Higher δ15N values of human hair relate to omnivorous and ovo-lacto-vegetarian diets, whereas lower δ15N values relate to more vegetarian diets (O’Connell and Hedges, 1999). However, there are significant differences in δ15N values of fingernails sampled from vegetarians living in different regions (Nardoto et al., 2006). High δ15N values are typical for persons with a marine diet (Schoeninger et al., 1983; Prowse et al., 2005; Buchardt et al., 2007).
Meteoric water is marked by spatial variability of δ18O and δD values due to Rayleigh distillation in the global rainfall cycle (Bowen, 1991). In particular, precipitation at higher latitudes is δ18O and δD depleted compared with lower latitudes (Figure 2.1). Thus, δ18O and δD values of human tissues may provide information on the geographical location where a person consumed food and water (Sharp et al., 2003; O’Brien and Wooler, 2007; Daux et al., 2008; Ehleringer et al., 2008).
δ34S values in human tissues can be used to discriminate between terrestrial and marine diets (Richards et al., 2001; Bol et al., 2007; Buchardt et al., 2007).
In general, the 13C and 15N enrichment of tissues increases along food chains (Minagawa and Wada, 1984; Bump et al. 2007). For animals, DeNiro and Epstein (1978, 1981) established that tissues are usually enriched in 13C by ~1‰ and in 15N by ~3‰ relative to the

Role of Isotopes in the Biosphere 45
diet. For humans, Ivlev et al. (1996a) found 12C enrichment of the expired CO2 by 3–6‰ relative to diet. The isotopic balance is maintained by 13C enrichment of urine urea by 3–5‰. Human blood and tissues are enriched in 54Fe as compared with the diet: the blood δ56Fe value is lower by ~2.6‰ than the dietary δ56Fe (Walczyk and von Blanckenburg, 2002, 2005).
Human breast milk is enriched in 18O relative to the water imbibed by a lactating mother, due to the preferential expiration of H2
16O (Wright and Schwarcz, 1998). Roberts et al. (1988) showed that urine δ18O values of breastfed infants are higher than those of bottle-fed infants by 1.85‰, whereas the urine δ18O values of bottle-fed infants are higher than those of local meteoric water by 2.6‰. Fuller et al. (2006) found that fingernails and hair of breastfed infants are enriched in 13C (~1‰) and 15N (2–3‰) compared with those of mothers during the lactation period, whereas bottle-fed infants have no increase in δ13C or δ15N values.
Aside from the spatial (geographical) variability in the dietary control of human isotopic composition, there is temporal variability in these dependences, which are manifested at various temporal scales. For example, Lacroix et al. (1973) demonstrated that oral administration of glucose naturally enriched in 13C resulted in a marked rise in δ13C in the expired CO2. δ13C reached its maximum at 4 h and then declined. Urine δD and δ18O quickly respond to a travel-related change in drinking water (Horvitz and Schoeller, 2001; O’Brien and Wooler, 2007). Hair δD and δ18O are more stable: changes were observed about 4 weeks after moving (Nakamura et al., 1982; Ehleringer et al., 2008).
Slatkin et al. (1985) demonstrated that a difference in δ13C of cerebellar neuronal deoxyribonucleic acid (DNA) and cerebellar white matter is ontogenetically controlled. δ13C of the cerebellar neuronal DNA is stable corresponding to the maternal diet during fetal development, because nearly all neurons are formed during maturation of the fetal brain and do not remodel thereafter. δ13C of the cerebellar white matter is changeable, reflecting the predominant diet of a person, because white matter tissue turns over rapidly.
Human tissues can provide records of dietary history. For example, enamel of teeth developed at older ages is more enriched in 13C and more depleted in 18O than that developed at younger ages. Such an isotopic shift can be caused by the shift to solid foods from lipid-rich milk (Wright and Schwarcz, 1998). Long hairs can include an “isotopic memory” of seasonal dietary variations as fluctuations of δD, δ15N, and δ13C values along a hair (Sharp et al., 2003).
In this context, it is appropriate to mention two abiogenic elements, lead and strontium. 206Pb/204Pb, 207Pb/204Pb, 208Pb/204Pb, and 87Sr/86Sr ratios are usually considered as “signatures” of the local geological situation. It is commonly assumed that both lead and strontium are hardly fractionated in biological processes due to very small differences in isotopic masses (Capo et al., 1998; Blum and Erel, 2003). These assumptions allow one to use the Pb and Sr isotope ratios in human teeth and bones to reconstruct migration patterns: the ratios in tooth enamel reflecting the geographical origin of food and water consumed in childhood may be used as a birthplace marker, whereas the ratios in bone tissues formed in different periods of life can reflect migration routes (Price et al., 2002; Bower et al., 2005; Montgomery et al., 2005). However, we note that actual 87Sr/86Sr ratios in plant and human tissues slightly differ from those of local bedrocks (Price et al., 2002). This is in conflict with the theoretical assumption that biota does not fractionate strontium. Although 86Sr and 87Sr have very small differences in masses, they have different spin values (Table 2.2). Therefore, biological

Emlen V. Sobotovich, Igor V. Florinsky, Olga B. Lysenko et al. 46
fractionation of these isotopes may be possible due to the magnetic isotope effect (Section 2.2).
2.3.3. Shifts in Human Isotope Ratios Depending on the State of Health and Age
Lasnitzki and Brewer (1942) found that tumor tissues (primary carcinomas of liver, lung,
stomach, rectum, kidney, and colon, as well as liver metastasis) are enriched in 39K (δ41K ranged from -12.2‰ to -7.37‰) as compared with normal tissues (Section 2.3.1). Although Lyon and Baxter (1978) did not observe clear shifts in carbon isotopic composition of healthy and cancerous tissues, there was a methodical drawback in that study: the authors compared the δ13C range of all available healthy tissues (i.e., adrenals, brain, bone collagen, gall-bladder, heart, kidney, liver, lungs, muscle, pancreas, prostate, skin, spleen, testes, and thyroid) with the δ13C range of all available cancerous tissues (i.e., breast, colon, prostate, stomach, and rectal muscle). A close look at the only paired data, which were for prostate, shows that cancerous prostate tissue is enriched in 13C by 2.5‰.
Kaznacheev et al. (1987) found that normal aortic walls and eye lens are gradually depleted in 13C with age. δ13C values of normal tissues decreased from -21.3 to -23.9‰ as the age increased from 1 month to 70 years. They observed that atherosclerotic aortic walls and cataract lens are depleted in 13C relative to normal tissues. The more severe were the atherosclerotic manifestations (adipose strip, fibrous plaques, and atheromatous plaques with ulceration), the higher the 13C depletion found: δ13C decreased by ~1‰, 1.5‰, and 3‰, respectively, relative to the normal aorta. Such shifts in δ13C were observed for all age groups. For cataract lenses, δ13C values decreased by 0.8–1.7‰ depending on age.
Katzenberg and Lovell (1999) found that collagen of some pathological bones is enriched in 13C as compared to norm (δ13C = -19.6 – -20.5‰): δ13C values ranged from -13.8‰ to -14.4‰ for post-paralytic atrophy and from -17‰ to -17.9‰ for osteomyelitis, whereas a healing fracture was slightly depleted in 13C by 0.4‰. Compared with δ15N values of normal collagen (8.9–11.4‰), there was depletion in 15N by ~2‰ for post-paralytic atrophy and enrichment in 15N by ~1.5‰ for osteomyelitis, whereas a healing fracture was marked by a similar nitrogen isotopic composition to normal tissue. Prowse et al. (2005) demonstrated that there is a trend of enrichment of bone collagen in 15N and 13C with age. On the other hand, there is a trend of depletion of bone apatite in 13C with age.
Studying the dynamics of hair carbon isotopic composition, Ivlev (1992) recorded a temporal substantial enrichment of hair in 13C by 20‰ relative to a mean δ13C level for a person experiencing a temporal acute worsening of his state of health. The sharp increase in δ13C began one day before a crisis peak; the highest δ13C was estimated as 0.4‰ on the day after the peak; then a gradual decrease in δ13C values to their mean level was observed over a period of three days.
Ivlev and Goncharov (1993) studied the carbon isotopic composition of the blood plasma of patients suffering from diabetes mellitus, obesity, hyper- and hypothyreosis, and Cushing’s disease. Blood plasma carbon of the diabetics was depleted in 13C (δ13C varied from -23‰ to -24.5‰) relative to that of obese patients (δ13C varied from -20.5‰ to -21.99‰). Patients with hypo- and hyperthyreosis and Cushing’s disease had a wider range of δ13C values, probably associated with biorhythms and heterogeneity of Cushing’s disease. There were
Role of Isotopes in the Biosphere 47
clear isotopic differences in the blood sera of adults and children for all diseases. This may testify to changes in cellular metabolism in the ontogenesis.
Ivlev et al. (1994) studied daily variations in δ13C values of expired CO2 in insulin-dependent diabetes and obesity. Unlike healthy persons (Section 2.3.1) and obesity patients, diabetic patients have a stable level of δ13C during the night. Obese patients had daily δ13C variability similar to that of healthy persons, but more smoothly varying. Studying daily average δ13C values of expired CO2 and urine urea sampled from patients in different hormonal metabolic states (i.e., nanism, thyroiditis, hypothyreosis, diabetes mellitus, and obesity), Ivlev et al. (1996a) found well-marked variations in these characteristics relative to those of healthy persons. However, daily average δ13C values of expired CO2 or urine urea cannot be considered as a specific index of a particular pathology or functional state of the organism, because these values change in any situation when a new functional state influences the energetic exchange in cells.
Demikhov (2005) studied the influence of age on the hydrogen isotopic composition of human urine. The urine δD of 60 year old humans differed significantly from that of 16 year old humans (-39‰ and -48‰, respectively). The increase of urine δD with age can be explained by the change of urine chemical composition, for example, due to an increase of the protein content.
To test a relation between bone mineral balance and soft tissue δ44Ca, Skulan et al. (2007) measured δ44Ca of urine from participants in a study in which extended bed rest (17 weeks) was used to induce bone loss. They found a depletion of urine calcium in 44Ca for the experimental group: the urine δ44Ca values were -0.48‰ and 0.12‰ for the experimental and control groups, respectively.
Krayenbuehl et al. (2005) studied iron fractionation under hemochromatosis conditions, a disorder characterized by progressive iron overload of tissues due to ineffective control of intestinal iron absorption associated with mutations in the HFE gene. Blood of hemochromatosic patients is marked by a higher δ56Fe values (-2.11‰) than blood of healthy persons (from -2.72‰ to -2.58‰). Blood δ56Fe values of hemochromatosic patients correlate with severity of the disease (e.g., prevalence of liver disease, arthropathy of metacarpophalangeal joints). These conclusions were in general agreement with results by Stenberg et al. (2005). They found that the blood of hemochromatosic patients is enriched in 56Fe and 57Fe by ~0.40‰, but depleted in 66Zn, 67Zn, and 68Zn by ~0.10‰.
Sobotovich et al. (2007) examined δ13C values of blood erythrocytes in 72 persons of various ages in different states of health: 27 healthy persons, 30 persons suffering from diseases of different etiology (e.g., hypertension, ischemic cardiac disease, and peptic ulcer), 5 leukemia patients, and 10 radiation disease patients. We found that erythrocyte δ13C values of healthy persons ranged from -23‰ to -24‰ for all age groups (Figure 2.2). On the other hand, erythrocyte δ13C values of persons suffering from diseases of different etiology had age-dependent shifts relative to those of healthy persons (Figure 2.2). The clearest shift of the carbon isotope ratio was found for erythrocytes of radiation disease patients: δ13C values ranged from -20‰ to -22‰ (Figure 2.2). It is clear that the erythrocyte carbon of all the types of sick persons studied was enriched in 13С relative to the control group.
Data presented in this section demonstrate that changes of the state of health due to sickness and aging influence isotopic ratios of human tissues. However, there is no an unambiguous trend in such shifts (which can be temporary in cases of short-term mild disorders or acute but reversible diseases).

Emlen V. Sobotovich, Igor V. Florinsky, Olga B. Lysenko et al. 48
Figure 2.2. Carbon isotopic composition of blood erythrocytes for healthy and sick people.
For different tissues, one can observe enrichment of the isotopic composition in both heavier and lighter isotopes under different disease conditions or with age. Therefore, the facts are in conflict with a hypothesis by Shchepinov (2007) postulating that processes of aging are accompanied by depletion of human tissues in heavier isotopes.
2.3.4. Isotopic Composition of the Human Body as a Natural Internal Marker
Various stable isotopes are widely used as tracers in vivo in biochemical and
pharmacological studies as well as in clinical practice for diagnostic purposes and monitoring of the state of health (Bier, 1997; Koletzko et al., 1997; Rennie, 1999; Abramson, 2001; Patterson and Veillon, 2001). Compared with radioisotope tracers, stable isotopes have many well-known advantages (Roginskii and Shnol’, 1965; Bier, 1997). It is generally believed that ‘the doses of stable isotope tracer substances that are used for clinical diagnostic and research purposes appear safe and without any adverse effects’ (Koletzko et al., 1997). With rare exceptions, the effects of stable isotopes of an element on the human organism are poorly known.
A distinct response of living organisms to different isotopes was first found in research on the biological effects of heavy water (Kritchevsky, 1960; Lobyshev and Kalinichenko, 1978). On the one hand, there were successful attempts to cultivate deuterated organisms

Role of Isotopes in the Biosphere 49
(Katz and Crespi, 1966). On the other, it was found that D2O is toxic to many living organisms (Thomson, 1963). Replacement of ordinary water with D2O may lead to inhibition of mitosis and other physiological processes. This effect was used in experiments to suppress human tumor cells growing using heavy water (Hartmann et al., 2005). However, deuterium-depleted water also possesses anticancer properties (Somlyai et al., 1993; Krempels et al., 2008). The similar anticancer effects of both heavy and light waters may testify that a restricted range of deuterium content in tissues is essential for the normal functioning of living organisms.
Distinct responses of living organisms to different isotopes were also observed in the context of bipolar disorder treatment. Studying the membrane transport of 6Li and 7Li by human erythrocytes, Lieberman et al. (1979) found that 6Li is taken up in preference to 7Li. Stoll et al. (2001) demonstrated that effects of 6Li on polyuria and polydipsia were greater than those of 7Li. Kidneys from 6LiCl-treated rats were marked by more frequent severe lesions in renal tubules than those from 7LiCl-treated rats.
Medical side effects apart, what is the level of scientific rigor of stable-isotope-tracer methods? Roginskii and Shnol’ (1965) emphasized that an “ideal tracer” for biochemical research should not influence a process under study; it must be an indicator rather than a reagent. Conventional stable isotope tracers, injected into an organism or separated tissue, cannot be considered as ideal tracers because mass and spin variation of isotopes of an element can cause isotopic effects, which may lead to artifacts.
On the other hand, the human organism can be characterized by an intrinsic complex of isotopic ratios of its tissues, fluids, and gases varying between normal and pathological states (Section 2.3.3). Shifts in intrinsic isotope ratios of human tissues can serve as a natural internal marker for medical diagnostics and monitoring of the state of health (Ivlev, 1992; Sobotovich and Lysenko, 2001). Shifts in intrinsic isotope ratios of tissues may probably be used for early diagnostics because the isotopic composition of a living organism is more sensitive to some stressors than other biochemical systems (Shaw-Allen et al., 2005).
At an intramolecular level, the isotopic composition may retain aspects of the physiological history of the organism (Brenna, 2001): each stereochemically unique position in each molecule has an isotopic ratio reflecting processes of synthesis and degradation. If this hypothesis is valid, an analysis of the intramolecular isotopic composition will be appropriate to detect the origins of chronic diseases.
Hatch et al. (2006) analyzed intrinsic shifts in hair δ15N and δ13C values to develop diagnostic criteria for two nutritional disorders, anorexia and bulimia. Results of the study demonstrated that isotopic ratios of the two elements are not sufficiently informative to achieve a correct discrimination between these disorders. We believe that to develop criteria for monitoring of the state of health and medical diagnostics based on isotopic ratios of the human organism, there is a need to analyze isotopic ratios of a representative set of biogenic elements possessing multiple stable isotopes, such as H, B, C, O, N, Mg, Si, S, Cl, K, Ca, V, Fe, Ni, Cu, Zn, and Mo. Materials presented in this chapter testify that fractionation of Mg, S, K, Ca, Fe, Cu, and Zn isotopes in the human body is scantily known, whereas the isotopic fractionation of other biogenic elements (Table 2.1) has not been studied. Therefore, apart the development of methods for intrinsic-isotope-ratio diagnostics, further investigations should include two lines: (a) comprehensive research into fractionation of all biogenic elements in the human body; and (b) development of precise instrumental methods to analyze isotopic fractionation in biological samples.

Emlen V. Sobotovich, Igor V. Florinsky, Olga B. Lysenko et al. 50
2.4. NATURAL RADIOISOTOPES AND LIVING MATTER There are over 60 naturally occurring radionuclides (Firestone et al., 1996) classified
under two groups: 1. Primordial radionuclides and their decay products contained in materials of the
planet since its creation (e.g., isotopes of U and Th families, 40K, 48Ca, and 87Rb). 2. Cosmogenic radionuclides forming by interactions of cosmic rays with atoms of
some elements (e.g., 14C and 3H). All biotic and abiotic components of the environment are radioactive, since they contain
natural radioactive elements (Grodzinsky, 1965; Pertsov, 1967; Eisenbud and Gesell, 1997; UNSCEAR, 2000b). The natural terrestrial radiation is generally associated with rocks containing K, U, Th, and members of their families. Together with secondary cosmic rays, these are the main source of external irradiation of biota. Each living creature contains some amount of radioisotopes of biogenic elements (e.g., 14C and 40K) incorporated into cells. These radioisotopes are the main source of internal irradiation of living organisms. Additional sources of internal irradiation are radioisotopes of Pb, Pu, Ra, Th, and U. In particular, they are easily incorporated into bone crystals (Tandon et al., 1998).
These environmentally distributed radionuclides cause permanent exposure of all living beings to ionizing radiation. In most cases, the dose rate is very low because the natural radioactivity content is low. In the biosphere, the average dose rate is ~10 cGy/yr, varying over a broad range depending on local concentrations of radionuclides in the environment. Specifically, the rate can be higher in terrains with an increased concentration of natural radionuclides in soil and rocks. This content, as a rule, reflects peculiarities of ancient biogeochemical processes.
In the 1920s, two seminal ideas were generated. First, a concept of radiation hormesis was proposed: results of physiological experiments allowed Zwaardemaker (1924, p. 349) to state that ‘energy of bio-radioactivity may have a decisive influence on the living system… Applied in heavy doses radium destroys the tissues, but applied… in microdoses radioactivity may cause a revival’. Second, it was hypothesized that the natural terrestrial radiation is one of the possible reasons for speciation and biological evolution (Olson and Lewis, 1928; Babcock and Collins, 1929).
2.4.1. Radiation Hormesis Experimental attempts to find an impact of the natural background radiation on biological
systems encounter large difficulties. This is because experiments of this sort should be designed considering two factors. First, studies should be carried out in deep mines to isolate experimental organisms from the action of cosmic rays (Babcock and Collins, 1929). Besides, mines should be excavated in rocks with a very low intrinsic radionuclide content. Second, the diet should contain potassium without the 40K radioisotope. These difficult design requirements led to conflicting experimental results.
Role of Isotopes in the Biosphere 51
For example, Vinogradov (1957) did not observe any influence of the replacement of potassium of natural isotopic composition with 40K-free potassium on the growth and development of Aspergillus niger. Moore and Sastry (1982) proposed that low-energy Auger and Coster-Kronig electrons, emitted after the electron capture decay of 40K, may have highly localized radiochemical effects on the genetic material dependent on the intercellular location of 40K. However, the expected number of electron capture disintegrations was estimated as 3 × 10⁻¹⁰ per cell per day, a value below the observed spontaneous mutation rate (Gevertz et al., 1985). These authors did not find clear effects of 40K in media on the spontaneous mutation rate in several strains of Escherichia coli.
On the other hand, numerous physiological experiments by Zwaardemaker (1920, 1924) demonstrated that isolated hearts of Petromyzon, eel, and frog can beat if one replaces K in the Ringer solution with Ra, Th, U, or Rb. Moreover, revival of the isolated frog heart occurred using external irradiation if the radiation level due to such radioactive source was close to the natural radioactivity of 40K contained in the blood. These results have later been reproduced by Verkhovskaya and Arutyunova (1953) and Hoitink and Westhoff (1956). They have used 32P, 238U, and 24Na as external radioactive sources. Roginskii and Shnol’ (1965) proposed that such extremely low doses of radiation serve as a trigger for the rhythmic activity of heart.
Planel et al. (1969) demonstrated an influence of decreasing intensity of background radiation on Protozoa. Chambers with lead walls were located at a depth of 200 m in a salt mine. Although total inactivation of the cell population was not observed, a negative impact of decreasing background radiation on the vitality of paramecium was found. Experiments with various cultures and organisms showed that an artificially depleted natural radiation environment may cause general suppression of vital functions, whereas low doses of γ radiation may trigger enzyme activity and culture growth (Croute et al., 1982; Conter et al., 1983, 1986; Planel et al., 1987).
Epidemiological research testified that various territories with an enhanced level of the natural terrestrial radiation are marked by decreased rates of cancer morbidity (Nambi and Soman, 1987; Haynes, 1988; Mifune et al., 1992; Cohen, 1995).
As results of such laboratory and epidemiological studies (for bibliography see Luckey, 1991), the concept of radiation hormesis was developed (Luckey, 1991; Macklis and Beresford, 1991; Calabrese, 1994; Vaiserman, 2008). The concept states that (a) only relatively high doses of radiation (more than five times higher than natural background radiation) can cause a damage in biological systems; and (b) low doses of natural ionizing radiation are necessary for living organisms, since they stimulate certain vital functions of an organism, in particular, the immune system (Safwat, 2008).
To explain the health beneficial effects of low dose radiation, several mechanisms have been proposed, such as changes in gene expression, stimulation of DNA repair, detoxication of free radicals, production of stress proteins, activation of membrane receptors and release of growth factors, and compensatory cell proliferation (Macklis and Beresford, 1991; Feinendegen, 2005). Kuzin (1997) proposed that absorption of a quantum of radiation by a biopolymer molecule within a cell leads to forming a polariton, a persistent exciton. Degradation of polaritons is accompanied by the emission of low-intensity light (this is reminiscent of a concept of mitogenic rays – Gurwitsch, 1932). These rays stimulate cell division and growth of the cell population in prokaryotic and eukaryotic organisms. However, the energy absorbed by cells from the natural background radiation is very low. Thus, it is

Emlen V. Sobotovich, Igor V. Florinsky, Olga B. Lysenko et al. 52
unlikely that effects of the background radiation on the vital activity have an energetic nature. Rather it is suggested that they are mediated through information transfer processes.
We should stress that there is no consensus among researchers as to low dose effects (Mossman, 2001; Cohen, 2002; Bonner, 2003; Brenner et al., 2003; Kadhim et al., 2004). Numerous data suggest that low-dose ionizing radiation adversely affect human health (UNSCEAR, 2000a, 2001, 2008). The contradiction between these observations and the concept of radiation hormesis can naturally be exemplified by well-known cancerogenic effects of radon gas exposure (Cothern and Smith, 1987) and therapeutic effects of radon bath treatment (Erickson, 2007) (Section 3.3.10).
2.4.2. Speciation and Natural Ionizing Radiation There are two adaptive strategies to stress impacts in living organisms: ontogenetic and
phylogenetic adaptations (Grodzinsky, 2006). In the case of ionizing radiation, the first strategy is expressed as radioadaptation and results in an augmentation of radioresistance after irradiation at low doses. The mechanism of ontogenetic adaptation consists in induction of the synthesis of enzymes concerned with DNA repair. Most likely the ontogenetic adaptive strategy operates as a basis for ensuring the sustainability of organisms in modified environmental conditions marked by an increase in genotoxicity. Widening the diversification of organisms over generations is achieved by means of the genomic instability induced in response to irradiation at low doses. It is reasonably safe to suggest that many responses of organisms to low-level chronic irradiation may be considered as consequences of the active reactions of living organisms associated with realization of such adaptive strategies. The second – phylogenetic – adaptive strategy increases the frequency of genetic diversification, which enlarges the possibilities for active natural selection.
2.4.2.1. Effects of the Terrestrial Radiation
During precellular biochemical evolution (Chapter 1), the level of natural radioactivity was higher than it is now. Ionizing radiation was no doubt a powerful factor in the early steps in the origin of organic substances. In the continental crust, one of the most important radioactive sources was the production and accumulation of Rn within the crust porosity (Garzón and Garzón, 2001). Synthesis of low molecular weight organic compounds in gases of the primary atmosphere, polymerization of monomers leading to formation of protein-like molecules, and other radiation chemistry processes formed a basis for the precellular evolution of life. Later, the presence of an eternal field of ionizing radiation due to the natural radioactivity in the environment could be a precondition for spontaneous mutagenesis in populations of any species.
Neruchev (1976) argued that there were periods in the geological past of the Earth when the level of the natural radioactivity in local regions of the Earth’s crust increased manifold because of the geochemical transport and accumulation of uranium. Durations of these radioactive periods varied from one to several million years. Paleontological studies carried out in various stratigraphic groups disclosed direct relations between the level of radioactivity in the environment and speciation processes (Figure 2.3).

Figure 2.3. Relationships between epochs of high natural radioactivity and changes in rates of species extinction and origination. K– is the extinction coefficient,
K+ is the origination coefficient; 100n
nK
t
m ⋅=∑∑
−, 100
n
nK
t
n ⋅=∑∑
+, where nm is a number of extinct species, nn is a number of new species, and nt is a number
of surviving species for a particular stratigraphic level (after Neruchev, 1976, figure 3, © Allerton Press, 1976; reproduced with kind permission of Allerton Press, Inc.).`

Emlen V. Sobotovich, Igor V. Florinsky, Olga B. Lysenko et al. 54
Neruchev (1976, 2007) presented examples of drastic modifications in flora and fauna during periods of high natural radioactivity in the environment. For instance, a rapid transformation of algae occurred in the radioactive epoch between the Lower and Middle Cambrian. Many new taxons of sponges and bryozoans appeared in the Late Jurassic when the terrestrial radioactivity was very high. The first vertebrates (Ostracodermi) appeared in the radioactive period of the Early Ordovician. The first terrestrial tetrapods (Ichthyostega) came into being in the radioactive epoch between the Late Devonian and Carboniferous. The first reptiles have emerged in the Pennsylvanian, during an intensive sedimentation of uranium-enriched deposits. Rather similar mutations of front limbs of different animal groups, which allowed them to fly, were developed during radioactive epochs: The first flying animals, Pterosaurs, emerged in the radioactive epoch between the Late Permian and Triassic. The first birds emerged in the other radioactive epoch between the Late Jurassic and Cretaceous. The first flying mammals, microbats, originated in the Eocene radioactive epoch.
Matyushin (1974, 1982) proposed a hypothesis for the origin of Homo sapiens in the context of geological peculiarities of the East African Rift, “the homeland of humanity” (Section 10.3.2.1). He demonstrated that biological changes of local anthropoids, resulting in the origin of the human species, occurred due to ancient activization of regional geological processes connected with riftogenesis. In particular, high tectonic activity led to the exposure of uranium deposits and formation of Oklo natural reactors (Gauthier-Lafaye et al., 1996). An increase of volcanic activity caused effusion of radioactive magma. The combined impact of these geological factors, forming zones of increased natural radiation in East Africa, played a key role in numerous mutations of the local anthropoids and, as a result, in the origin of Homo sapiens (Matyushin, 1974, 1982).
Lenz (1979) proposed a closely related hypothesis. It is well-known that there is an increased release of Rn through active faults prior to earthquakes (Osika, 1981; King et al., 1996, 2006). Lenz (1979) suggested that Rn and its decay products (Section 3.3.10), dissolved in groundwater, could act as a mutagenic agent for hominid groups in East Africa and other seismically active regions in India, China, and Java. Persistent ingestion of radon-enriched water could lead to the increase in the frequency of mutations in the populations. These mutations could affect the rate genes resulting in a rapid morphological and physiological changes of hominids, such as increase in brain size, reduction in body hair, changes of glands, loss of estrus, an increase of the pregnancy term, a decrease in the maturity of the infant at birth, an increase of a period of infant dependency, etc.
2.4.2.2. Possible Effects of the Cosmic Radiation during Geomagnetic Reversals and Excursions
Thomas (1936) suggested that the large variety of species and high number of endemics often found in high mountains may be results of mutations due to irradiation by cosmic rays. In the 1960s, it has been observed that there were correlations between species extinction and geomagnetic reversals (Watkins and Goodell, 1967; Hays, 1971). It was proposed that during geomagnetic reversals, when the intensity of the geomagnetic field is drastically reduced (Vogt et al., 2009), living organisms were bombarded by increased cosmic radiation causing enhanced mutation rates and mass extinctions (Uffen, 1963; Simpson, 1966). However, it was shown that the cosmic radiation-induced increase in the mutation rate would be too small to cause mass extinctions (Waddington, 1967; Harrison and Prospero, 1974).
Role of Isotopes in the Biosphere 55
Several hypotheses were proposed to explain correlated periodicities of mass extinctions and geomagnetic reversals. In particular, it was suggested that extinctions were caused by the strong decrease of the geomagnetic field per se during reversals (Crain, 1971; Kopper and Papamarinopoulos, 1978) (see biotropic effects of the depleted geomagnetic field elsewhere – Kopanev and Shakula, 1985). Valkovic (1977) hypothesized that the decline of geomagnetic intensity could disturb intake and metabolism of essential trace elements in living organisms. Kopper and Papamarinopoulos (1978) suggested that geomagnetic reversals could drastically increase the mutagenic potential of the ultraviolet-B radiation (Section 10.3.2.3). Loper et al. (1988) proposed that geomagnetic reversals, being connected with cycles of the endogenous activity in the core and mantle, are just indicators of its intensification (cf. Milanovskii, 1996). The rise of the endogenous activity increases volcanic activity leading to the release of large amounts of CO2 and sulfates, which have a pronounced effect on biota. We can add that the intensification of the endogenous activity can also enhance the deep hydrogen degassing and seismicity, which are powerful biotropic factors (Section 10.3.2.3).
An interest in the possible biological effects of geomagnetic reversals was rejuvenated by Kuznetsov and Kuznetsova (2004). They argued that several turning points of human evolution that happened in Africa correlate with geomagnetic reversals and excursions in the Late Cenozoic (see a geomagnetic polarity time scale elsewhere – Mankinen and Wentworth, 2003). For example, the human brain expansion and origin of Homo erectus (Hawks et al., 2000) were preceded by two key mutations during the Gauss-Matuyama reversal (~2.58 Ma ago): the genes encoding CMP-N-acetylneuraminic acid hydroxylase and the predominant myosin heavy chain were inactivated ~2.7 Ma (Chou et al., 2002) and ~2.4 Ma ago (Stedman et al., 2004), respectively. The most recent common ancestors of modern human mitochondrial DNA and Y chromosome are ~230 ka and ~100 ka old, respectively (Cavalli-Sforza and Feldman, 2003). These dates correlate with the Jamaica and Blake excursions, respectively. One of the variants of Microcephalin gene, regulating brain size, that arose in modern humans ~37 ka ago (Evans et al., 2005) correlates with the Mungo excursion (Kopper and Papamarinopoulos, 1978).
Kuznetsov and Kuznetsova (2004) explained such a correlation by a drastically enhanced cosmic radiation over Africa (and Europe) during the reversals. The geomagnetic field was presumably 10 times weaker in Africa than in other regions in those periods due to two features: (a) a specific trajectory of the virtual geomagnetic pole motion (Kuznetsov, 1999); and (b) the absence of large magnetic anomalies in Africa, like Brazilian, Canadian, and Siberian ones, which have maintained a remanent field in the Americas and Asia. Regardless of which agent caused the mutations during the reversal – an enhanced cosmic radiation or other geogenic factors mentioned above – this issue calls for further investigations. The Kuznetsovs’ study may be complimentary to the Matyushin hypothesis described in the previous section.
2.5. CONCLUSION In dynamic equilibrium, energy, information, and properties of a natural system are
interconnected so closely that miniscule changes of one of these parameters can cause some nonlinear functional and structural, quantitative and qualitative changes of the entire system.

Emlen V. Sobotovich, Igor V. Florinsky, Olga B. Lysenko et al. 56
We suppose that isotopes, being subsystems of the element, provide it with an additional adaptive feasibility. “Isotopic adaptation”, governed by a set of physical and chemical properties of isotopes, allows the element (a) to retain its status as a building block of nature; (b) to exhibit nuances in its properties; and (c) to extend its capacity in creation of abiotic and biotic systems reflecting the finest features of biochemical processes in living organisms.
Each living organism and biosystem can be characterized by a typical isotopic composition, “an isotopic signature”, which closely related to the environment including the geosphere. In the signature, typical isotope ratios may fluctuate to a limited degree supporting the state of isotopic homeostasis, an integral part of the general homeostasis of the organism. There are also sharp changes in typical isotope ratios exceeding the ranges of such fluctuations. Sharp isotope shifts may be used as internal markers of pathological processes.
Future studies should be focused on (1) development of precise instrumental methods to analyze isotopic fractionation in biological samples; (2) comprehensive research on isotopic fractionation of all biogenic elements possessing multiple stable isotopes and present in the human body; and (3) development of methods for intrinsic-isotope-ratio diagnostics. Attention should be centered on (a) the possibility of occurrence of not only mass-dependent (kinetic and thermodynamic) isotope effects, but also spin-dependent (magnetic) isotope effects (especially for elements heavier than S), and (b) metabolic mechanisms of such isotope effects.
Paleontological, anthropological, and geological data suggest that natural radiation was of primary importance in micro- and macroevolution. This coincides with thoughts of Timoféeff-Ressovsky et al. (1935) on the role of gene mutations in evolution. The main mechanisms of speciation due to radiation effects may be related to an increase in the frequency of recombination in genetic structures, augmentation of the intensity of error-prone DNA repair, and induction of genomic instability. Thus, natural ionizing radiation may be deleterious for individuals, but have a beneficial effect for entire populations being one of the key factors in natural selection.
ACKNOWLEDGMENTS We would like to thank Y.N. Demikhov and N.A. Skulsky (Institute of Environmental
Geochemistry, National Academy of Sciences of Ukraine, Kiev, Ukraine) for fruitful discussions and technical support. Authors are grateful to four anonymous reviewers for helpful criticism, N.J. Stone (Clarendon Laboratory, Oxford University, Oxford, UK) for a useful remark, and V.Y. Smorodin (Climate Change Institute, University of Maine, Orono, USA) for librarian help.
APPENDIX 2.A. THE δ NOTATION Sample isotopic composition is commonly described relative to a standard in parts per
thousand (‰) using the δ notation:
( ) 10001RR standardsample ×−=δ , (2.A.1)

Role of Isotopes in the Biosphere 57
where R is the ratio abundance of a heavier to the lightest isotope of a particular element in a sample or in a standard reference material.
As a standard reference material, the standard mean ocean water (SMOW) is used for D and 18O determination; Pee Dee Belemnite (PDB) limestone standard is used for 13C determination; atmospheric nitrogen gas is used for 15N determination; calcium carbonate reference material NIST-SRM 915a is used for Ca isotope determination; Canyon Diablo troilite (CDT), a meteoritic sulfide is used for S isotope determination; Fe isotopes are reported relative to the reference material IRMM-014; Cu isotopes can be reported relative to the reference material NIST SRM 976 (De Laeter et al., 2003). An internationally certified Zn isotope standard reference material does not exist. Data are reported relative to a material from the Lyon-CNRS laboratory, a Johnson Matthey (JMC) Zn standard solution (Cloquet et al., 2008).
Negative and positive δ values indicate depletion and enrichment of a heavy isotope, respectively.
REFERENCES
Abelson, P.H. and Hoering, T.C. (1961). Carbon isotope fractionation in formation of amino acids by photosynthetic organisms. Proceedings of the National Academy of Sciences, 47, 623–632.
Abramson, F.P. (2001). The use of stable isotopes in drug metabolism studies. Seminars in Perinatology, 25, 133–138.
Ambrose, S.H. and DeNiro, M.J. (1986). Reconstruction of African human diet using bone collagen carbon and nitrogen isotope. Nature, 319, 321–324.
Apostol, I., Brooks, P.D. and Mathews, A.J. (2001). Application of high-precision isotope ratio monitoring mass spectrometry to identify the biosynthetic origins of proteins. Protein Science, 10, 1466–1469.
Babcock, E.B. and Collins, J.L. (1929). Does natural ionizing radiation control rate of mutation? Proceedings of the National Academy of Sciences, 15, 623–628.
Bai, E., Boutton, T.W., Liu, F., Wu, X.B. and Archer, S.R. (2008). Variation in woody plant δ13C along a topoedaphic gradient in a subtropical savanna parkland. Oecologia, 156, 479–489.
Barbour, M.M. (2007). Stable oxygen isotopic composition of plant tissue: a review. Functional Plant Biology, 34, 83–94.
Beard, B.L., Johnson, C.M., Skulan, J.L., Nealson, K.H., Cox, L. and Sun, H. (2003). Application of Fe isotopes to tracing the geochemical and biological cycling of Fe. Chemical Geology, 195, 87–117.
Bgatov, A.V. (1999). Biogenic classification of chemical elements. Philosophia Nauki, 2(6), 80–89 (in Russian).
Bier, D.M. (1997). Stable isotopes in biosciences, their measurement and models for amino acid metabolism. European Journal of Pediatrics, 156, S2–S8.
Black, J.R., Epstein, E., Rains, W.D., Yin, Q.-z. and Casey, W.H. (2008). Magnesium-isotope fractionation during plant growth. Environmental Science and Technology, 42, 7831–7836.
Emlen V. Sobotovich, Igor V. Florinsky, Olga B. Lysenko et al. 58
Blum, J.D. and Erel, Y. (2003). Radiogenic isotopes in weathering and hydrology. In J.I. Drever (Ed.), Treatise on geochemistry, Vol. 5 (pp. 365–392). Amsterdam, Netherlands: Elsevier.
Bol, R., Marsh, J. and Heaton, T.H.E. (2007). Multiple stable isotope (18O, 13C, 15N and 34S) analysis of human hair to identify the recent migrants in a rural community in SW England. Rapid Communications in Mass Spectrometry, 21, 2951–2954.
Bonner, W.M. (2003). Low-dose radiation: thresholds, bystander effects, and adaptive responses. Proceedings of the National Academy of Sciences, 100, 4973–4975.
Bowen, R. (1991). Isotopes and climates. Barking, UK: Elsevier. Bower, N.W., Getty, S.R., Smith, C.P., Simpson, Z.R. and Hoffman, J.M. (2005). Lead
isotope analysis of intra-skeletal variation in a 19th century mental asylum cemetery: diagenesis versus migration. International Journal of Osteoarchaeology, 15, 360–370.
Brenna, J.T. (2001). Natural intramolecular isotope measurements in physiology: elements of the case for an effort toward high-precision position-specific isotope analysis. Rapid Communications in Mass Spectrometry, 15, 1252–1262.
Brenner, D.J., Doll, R., Goodhead, D.T., Hall, E.J., Land, C.E., Little, J.B., Lubin, J.H., Preston, D.L., Preston, R.J., Puskin, J.S., Ron, E., Sachs, R.K., Samet, J.M., Setlow, R.B. and Zaider, M. (2003). Cancer risks attributable to low doses of ionizing radiation: assessing what we really know. Proceedings of the National Academy of Sciences, 100, 13761–13766.
Buchachenko, A.L. (2000). Recent advances in spin chemistry. Pure and Applied Chemistry, 72, 2243–2258.
Buchachenko, A.L. (2009). Magnetic isotope effects in chemistry and biochemistry. New York, NY: Wiley.
Buchachenko, A.L. and Kouznetsov, D.A. (2008). Efficiency of ATP synthase as a molecular machine. Biophysics, 53, 219–222.
Buchachenko, A.L., Kouznetsov, D.A. and Berdinsky, V.L. (2006). New mechanisms of biological effects of electromagnetic fields. Biophysics, 51, 489–496.
Buchardt, B., Bunch, V. and Helin, P. (2007). Fingernails and diet: stable isotope signatures of a marine hunting community from modern Uummannaq, North Greenland. Chemical Geology, 244, 316–329.
Bump, J.K., Fox-Dobbs, K., Bada, J.L., Koch, P.L., Peterson, R.O. and Vucetich, J.A. (2007). Stable isotopes, ecological integration and environmental change: wolves record atmospheric carbon isotope trend better than tree rings. Proceedings of the Royal Society, Series B, 274, 2471–2480.
Calabrese, E.J. (Ed.) (1994). Biological effects of low level exposures: Dose-response relationships. Boca Raton, FL: CRC Press.
Capo, R.C., Stewart, B.W. and Chadwick, O.A. (1998). Strontium isotopes as tracers of ecosystem processes: theory and methods. Geoderma, 82, 197–225.
Cavalli-Sforza, L.L. and Feldman, M.W. (2003). The application of molecular genetic approaches to the study of human evolution. Nature Genetics, 33, 266–275.
Chou, H.H., Hayakawa, T., Diaz, S., Krings, M., Indriati, E., Leakey, M., Paabo, S., Satta, Y., Takahata, N. and Varki, A. (2002). Inactivation of CMP-N-acetylneuraminic acid hydroxylase occurred prior to brain expansion during human evolution. Proceedings of the National Academy of Sciences, 99, 11736-11741.
Role of Isotopes in the Biosphere 59
Cloquet, C., Carignan, J., Lehmann, M.F. and Vanhaecke, F. (2008). Variation in the isotopic composition of zinc in the natural environment and the use of zinc isotopes in biogeosciences: a review. Analytical and Bioanalytical Chemistry, 390, 451–463.
Cohen, B.L. (1995). Test of the linear-no threshold theory of radiation carcinogenesis for inhaled radon decay products. Health Physics, 68, 157–174.
Cohen, B.L. (2002). Cancer risk from low-level radiation. American Journal of Roentgenology, 179, 1137–1143.
Collins, C.J. and Bowman, N.S. (Eds.) (1971). Isotope effects in chemical reactions. New York, NY: Van Nostrand Reinhold.
Conter, A., Dupouy, D. and Planel, H. (1983). Demonstration of a biological effect of natural ionizing radiations. International Journal of Radiation Biology, 43, 421–432.
Conter, A., Dupouy, D., Delteil, C. and Planel, H. (1986). Influence of very low doses of ionizing radiation on Synechococcus lividus metabolism during the initial growth phase. Archives of Microbiology, 144, 286–290.
Cothern, C.R. and Smith, J.E. (Eds.) (1987). Environmental radon. New York, NY: Plenum Press.
Craig, H. (1954). Carbon-13 in plants and the relationships between carbon-13 and carbon-14 variations in nature. Journal of Geology, 62, 115–149.
Crain, I.K (1971) Possible direct causal relation between geomagnetic reversals and biological extinctions. Bulletin of the Geological Society of America, 82, 2603–2606.
Croute, F., Soleilhavoup, J.P., Vidal, S., Dupouy, D. and Planel, H. (1982). Paramecium tetraurelia growth stimulation under low-level chronic irradiation: investigations on a possible mechanism. Radiation Research, 92, 560–567.
Daux, V., Lécuyer, C., Héran, M.-A., Amiot, R., Simon, L., Fourel, F., Martineau, F., Lynnerup, N., Reychler, H. and Escarguel, G. (2008). Oxygen isotope fractionation between human phosphate and water revisited. Journal of Human Evolution, 55, 1138–1147.
De Laeter, J.R., Böhlke, J.K., de Bièvre, P., Hidaka, H., Peiser, H.S., Rosman, K.J.R. and Taylor, P.D.P. (2003). Atomic weights of the elements: review 2000. Pure and Applied Chemistry, 75, 683–800.
Degens, E.T. (1969). Biogeochemistry of stable carbon isotopes. In G. Eglinton and M.T.J. Murphy (Eds.), Organic geochemistry: Methods and results (pp. 304–329). New York, NY: Springer.
Demikhov, Y.N. (2005). Separation of hydrogen isotopes in the human organism. Dopovidi Natsionalnoi Academii Nauk Ukrainy, No. 11, 165–169 (in Russian, with English abstract).
DeNiro, M.J. and Epstein, S. (1978). Influence of diet on the distribution of carbon isotopes in animals. Geochimica et Cosmochimica Acta, 42, 495–506.
DeNiro, M.J. and Epstein, S. (1981). Influence of diet on the distribution of nitrogen isotopes in animals. Geochimica et Cosmochimica Acta, 45, 341–351.
DePaolo, D.J. (2004). Calcium isotopic variations produced by biological, kinetic, radiogenic and nucleosynthetic processes. Reviews in Mineralogy and Geochemistry, 55, 255–288.
Dupras, T.L. and Schwarcz, H.P. (2001). Strangers in a strange land: stable isotope evidence for human migration in the Dakhleh Oasis, Egypt. Journal of Archaeological Science, 28, 1199–1208.

Emlen V. Sobotovich, Igor V. Florinsky, Olga B. Lysenko et al. 60
Ehleringer, J.R., Bowen, G.J., Chesson, L.A., West, A.G., Podlesak, D.W. and Cerling, T.E. (2008). Hydrogen and oxygen isotope ratios in human hair are related to geography. Proceedings of the National Academy of Sciences, 105, 2788–2793.
Eisenbud, M. and Gesell, T.F. (1997). Environmental radioactivity: From natural, industrial, and military sources (4th ed.). London, UK: Academic Press.
Erickson, B.E. (2007). The therapeutic use of radon: a biomedical treatment in Europe; an “alternative” remedy in the United States. Dose-Response, 5, 48–62.
Evans, P.D., Gilbert, S.L., Mekel-Bobrov, N. Vallender, E.J., Anderson, J.R., Vaez-Azizi, L.M., Tishkoff, S.A., Hudson, R.R. and Lahn, B.T. (2005). Microcephalin, a gene regulating brain size, continues to evolve adaptively in humans. Science, 309, 1717–1720.
Feinendegen, L.E. (2005). Evidence for beneficial low level radiation effects and radiation hormesis. British Journal of Radiology, 78, 3–7.
Firestone, R.B., Shirley, V.S., Baglin, C.M., Chu, S.Y.F. and Zipkin, J. (Eds.) (1996). Table of isotopes, 2 vols. (8th ed.), New York, NY: Wiley.
Fraser, I., Meier-Augenstein, W. and Kalin, R.M. (2006). The role of stable isotopes in human identification: a longitudinal study into the variability of isotopic signals in human hair and nails. Rapid Communications in Mass Spectrometry, 20, 1109–1116.
Fuller, B.T., Fuller, J.L., Harris, D.A. and Hedges, R.E.M. (2006). Detection of breastfeeding and weaning in modern human infants with carbon and nitrogen stable isotope ratios. American Journal of Physical Anthropology, 129, 279–293.
Fuller, B.T., Fuller, J.L., Sage, N.E., Harris, D.A., O’Connell, T.C. and Hedges, R.E.M. (2005). Nitrogen balance and 15N: why you’re not what you eat during nutritional stress. Rapid Communications in Mass Spectrometry, 19, 2497–2506.
Galimov, E.M. (1985). Biological fractionation of isotopes. Orlando, FL: Academic Press. Garzón, L. and Garzón, M.L. (2001). Radioactivity as a significant energy source in prebiotic
synthesis. Origins of Life and Evolution of the Biosphere, 31, 3–13. Gauthier-Lafaye, F., Holliger, P. and Blanc, P.-L. (1996). Natural fission reactors in the
Franceville basin, Gabon: a review of the conditions and results of a “critical event” in a geologic system. Geochimica et Cosmochimica Acta, 60, 4831–4852.
Gevertz, D., Friedman, A.M., Katz, J.J. and Kubitchek, H.E. (1985). Biological effects of background radiation: mutagenicity of 40K. Proceedings of the National Academy of Sciences, 82, 8602–8605.
Grodzinsky, D.M. (1965). Natural radioactivity of plants and soils. Kiev, USSR: Naukova Dumka (in Russian).
Grodzinsky, D.M. (2006). Reflections of the Chernobyl catastrophe on the plant world: special and general biological aspects. In C.C. Busby and A.V. Yablokov (Eds.), Chernobyl 20 years on: The health effects of the Chernobyl accident (pp. 117–134). Aberystwyth, UK: European Committee on Radiation Risk, Green Audit Press.
Gurwitsch, A. (1932). Die mitogenetische Strahlung, zugleich zweiter Band der “Probleme der Zellteilung”. Berlin, Germany: Springer.
Handley, L.L. and Raven, J.A. (1992). The use of natural abundance of nitrogen isotopes in plant physiology and ecology. Plant, Cell and Environment, 15, 965–985.
Harrison, C.G.A. and Prospero, J.M. (1974). Reversals of the Earth's magnetic field and climatic changes. Nature, 250, 563–565.

Role of Isotopes in the Biosphere 61
Hartmann, J., Bader, Y., Horvath, Z., Saiko, P., Grusch, M., Illmer, C., Madlener, S., Fritzer-Szekeres, M., Heller, N., Alken, R.-G. and Szekeres, T. (2005). Effects of heavy water (D2O) on human pancreatic tumor cells. Anticancer Research, 25, 3407–3411.
Hatch, K.A., Crawford, M.A., Kunz, A.W., Thomsen, S.R., Eggett, D.L., Nelson, S.T. and Roeder, B.L. (2006). An objective means of diagnosing anorexia nervosa and bulimia nervosa using 15N/14N and 13C/12C ratios in hair. Rapid Communications in Mass Spectrometry, 20, 3367–3373.
Hatch, M.D. and Slack, C.R. (1970). Photosynthetic CO2-fixation pathways. Annual Review of Plant Physiology, 21, 141–162.
Hawks, J., Hunley, K., Lee, S.-H. and Wolpoff, M. (2000). Population bottlenecks and pleistocene human evolution. Molecular Biology and Evolution, 17, 2–22.
Haynes, R.M. (1988). The distribution of domestic radon concentrations and lung cancer mortality in England and Wales. Radiation Protection Dosimetry, 25, 93–96.
Hays, J.D. (1971). Faunal extinctions and reversals of the Earth’s magnetic field. Bulletin of the Geological Society of America, 82, 2433–2447.
Hoitink, A.W. and Westhoff, J.M. (1956). Experiments with radioactive perfusion (24Na) of the isolated frog’s heart. Acta Physiologica et Pharmacologica Neerlandica, 5, 208–209.
Horvitz, M.A. and Schoeller, D.A. (2001). Natural abundance deuterium and 18-oxygen effects on the precision of the doubly labeled water method. American Journal of Physiology – Endocrinology and Metabolism, 280, E965–E972.
Ivlev, A.A. (1992). Link between the isotopic composition of the carbon of hair and the functional state of man. Biophysics, 37, 985–988.
Ivlev, A.A. (2001). Carbon isotope effects (13C/12C) in biological systems. Separation Science and Technology, 36, 1819–1914.
Ivlev, A.A. and Goncharov, N.P. (1993). Isotopic composition of blood plasma carbon in patients with endocrine diseases. Problemy Endocrinologii, 39(1), 36–40 (in Russian, with English abstract).
Ivlev, A.A., Knyazev, Y.A. and Logachev, M.F. (1996a). Daily average values of the isotopic composition of carbon of CO2 of the expired air and urinary urea in humans in normal conditions and in certain endocrinal pathologies. Biophysics, 41, 505–513.
Ivlev, A.A., Knyazev, Y.A. and Logachev, M.F. (1996b). Short-period variations in the isotopic composition of carbon of CO2 of the expired air in different functional states of humans. Biophysics, 41, 499–504.
Ivlev, A.A., Panteleyev, N.Y. and Glukhov, A.A. (1992). Variability of some isotope characteristics of carbon in humans. Biophysics, 37, 989–994.
Ivlev, A.A., Panteleyev, N.Y., Knyazev, Y.A., Logachev, M.V. and Miller, Y.M. (1994). Daily variations in the isotopic composition of the carbon of the CO2 of the expired air in humans in the presence of certain metabolic disturbances. Biophysics, 39, 377–383.
Johnson, T.M. (2004). A review of mass-dependent fractionation of selenium isotopes and implications for other heavy stable isotopes. Chemical Geology, 204, 201–214.
Johnston, D.T., Farquhar, J., Wing, B.A., Kaufman, A.J., Canfield, D.E. and Habicht, K.S. (2005). Multiple sulfur isotope fractionations in biological systems: a case study with sulfate reducers and sulfur disproportionators. American Journal of Science, 305, 645–660.

Emlen V. Sobotovich, Igor V. Florinsky, Olga B. Lysenko et al. 62
Kadhim, M.A., Moore, S.R. and Goodwin, E.H. (2004). Interrelationships amongst radiation-induced genomic instability, bystander effects, and the adaptive response. Mutation Research, 568, 21–32.
Katz, J.J. and Crespi, H.L. (1966). Deuterated organisms: cultivation and uses. Science, 151, 1187–1194.
Katzenberg, M.A. and Lovell, N.C. (1999). Stable isotope variation in pathological bone. International Journal of Osteoarchaeology, 9, 316–324.
Kaznacheev, V.P., Doil’nitsyn, E.F., Gabuda, S.P., Rzhavin, A.F. and Malikov, N.G. (1987). Carbon isotope fractionation in atherosclerotic human tissue. Bulletin of Experimental Biology and Medicine, 104, 1218–1220.
King, C.-Y., King, B.-S., Evans, W.C. and Zhang, W. (1996). Spatial radon anomalies on active faults in California. Applied Geochemistry, 11, 497–510.
King, C.-Y., Zhang, W. and Zhang, Z. (2006). Earthquake-induced groundwater and gas changes. Pure and Applied Geophysics, 163, 633–645.
Koletzko, B., Sauerwald, T. and Demmelmair, H. (1997). Safety of stable isotope use. European Journal of Pediatrics, 156, S12–S17.
Kopanev, V.I. and Shakula, A.V. (1985). Influence of the hypogeomagnetic field on biological objects. Leningrad, USSR: Nauka (in Russian).
Kopper, J.S. and Papamarinopoulos, S. (1978). Human evolution and geomagnetism. Journal of Field Archaeology, 5, 443–452.
Krayenbuehl, P.-A., Walczyk, T., Schoenberg, R., von Blanckenburg, F. and Schulthess, G. (2005). Hereditary hemochromatosis is reflected in the iron isotope composition of blood. Blood, 105, 3812–3816.
Krempels, K., Somlyai, I. and Somlyai, G. (2008). A retrospective evaluation of the effects of deuterium depleted water consumption on 4 patients with brain metastases from lung cancer. Integrative Cancer Therapies, 7, 172–181.
Kritchevsky, D. (Ed.) (1960). Deuterium isotope effects in chemistry and biology. Annals of the New York Academy of Sciences, 84, 573–781.
Kuzin, A.M. (1997). Natural atomic radiation and the phenomenon of life. Bulletin of Experimental Biology and Medicine, 123, 313–315.
Kuznetsov, V.V. (1999). A model of virtual geomagnetic pole motion during reversals. Physics of the Earth and Planetary Interiors, 115, 173–179.
Kuznetsov, V.V. and Kuznetsova, N.D. (2004). Impact of the cosmic radiation and long-term variations of the geomagnetic field on the climate and life’s evolution on the Earth. In B.M. Shevtsov (Ed.), Solar-terrestrial bonds and electromagnetic precursors of earthquakes: Proceedings of the 3rd International conference, Paratunka, Russia, Aug. 16–21, 2004, Vol. 2 (pp. 82–104). Petropavlovsk-Kamchatsky, Russia: Institute of Cosmophysical Research and Radio Wave Propagation, Russian Academy of Sciences (in Russian, with English abstract).
Lacroix, M., Mosora, F., Pontus, M., Lefebvre, P., Luyckx, A. and Lopez-Habib, G. (1973). Glucose naturally labeled with carbon-13: use for metabolic studies in man. Science, 181, 445–446.
Lasnitzki, A. and Brewer, A.K. (1941). A study of the isotopic constitution of potassium in various rat tissues. Biochemical Journal, 35, 144–151.
Lasnitzki, A. and Brewer, A.K. (1942). The isotopic constitution of potassium in normal tissue and cancer from human subjects. Cancer Research, 2, 494–496.

Role of Isotopes in the Biosphere 63
Lenz, W.J. (1979). Radon: A factor in human evolution. M.A. Thesis. Stony Brook, NY: State University of New York at Stony Brook.
Lieberman, K.W., Stokes, P.E. and Kocsis, J. (1979). Characteristics of the uptake of lithium isotopes into erythrocytes. Biological Psychiatry, 14, 845–849.
Lobyshev, V.I. and Kalinichenko, L.P. (1978). Isotope effects of D2O in biological systems. Moscow, USSR: Nauka (in Russian).
Loper, D.E., McCartney, K. and Buzyna, G. (1988). A model of correlated episodicity in magnetic-field reversals, climate, and mass extinctions. Journal of Geology, 96, 1–15.
Luckey, T.D. (1991). Radiation hormesis. Boca Raton, FL: CRC Press. Lyon, T.D.B. and Baxter, M.S. (1978). Stable carbon isotopes in human tissues. Nature, 273,
750–751. Lysenko, O.B. and Sobotovich, E.V. (2006). Isotopic metabolism in biosystems. Transactions
of the Institute of Environmental Geochemistry, 13, 102–107 (in Russian, with English abstract).
Macklis, R.M. and Beresford, B. (1991). Radiation hormesis. Journal of Nuclear Medicine, 32, 350–359.
Mankinen, E.A. and Wentworth, C.M. (2003). Preliminary paleomagnetic results from the Coyote Creek Outdoor Classroom drill hole, Santa Clara Valley, California: USGS Open-File Report 03-187. Menlo Park, CA: U.S. Geological Survey.
Maréchal, C.N., Télouk, P. and Albarède, F. (1999). Precise analysis of copper and zinc isotopic compositions by plasma-source mass spectrometry. Chemical Geology, 156, 251–273.
Matyushin, G.N. (1974). Role of ionizing radiation in anthropogenesis. In N.N. Kramarenko and A.L. Chepalyga (Eds.), Space and evolution of organisms: Proceedings of the All-Union meeting ‘Space factors and evolution of the organic world’, Moscow, USSR, Feb. 26 – Mar. 1, 1974 (pp. 276–292). Moscow, USSR: Palaeontological Institute, Academy of Sciences of the USSR (in Russian).
Matyushin, G.N. (1982). The dawn of mankind. Moscow, USSR: Mysl (in Russian, with English summary).
McCue, M.D. and Pollock, E.D. (2008). Stable isotopes may provide evidence for starvation in reptiles. Rapid Communications in Mass Spectrometry, 22, 2307–2314.
Meier-Augenstein, W. and Fraser, I. (2008). Forensic isotope analysis leads to identification of a mutilated murder victim. Science and Justice, 48, 153–159.
Melander, L. (1960). Isotope effects on reaction rates. New York, NY: Ronald Press. Metges, C.C. and Petzke, K.J. (1997). Measurement of 15N/14N isotopic composition in
individual plasma free amino acids of human adults at natural abundance by gas chromatography–combustion isotope ratio mass spectrometry. Analytical Biochemistry, 247, 158–164.
Mifune, M., Sobue, T., Arimoto, H., Komoto, Y., Kondo, S. and Tanooka, H. (1992). Cancer mortality survey in a spa area (Misasa, Japan) with a high radon background. Cancer Science, 83, 1–5.
Milanovskii, Y.Y. (1996). Pulsation of the Earth. Geotectonics, 29, 359–378. Minagawa, M. and Wada, E. (1984). Stepwise enrichment of 15N along food chains: further
evidence and the relation between δ15N and animal age. Geochimica et Cosmochimica Acta, 48, 1135–1140.

Emlen V. Sobotovich, Igor V. Florinsky, Olga B. Lysenko et al. 64
Montgomery, J., Evans, J.A., Powlesland, D. and Roberts, C.A. (2005). Continuity or colonization in Anglo-Saxon England? Isotope evidence for mobility, subsistence practice, and status at West Heslerton. American Journal of Physical Anthropology, 126, 123–138.
Moore, F.D. and Sastry, K.S. (1982). Intracellular potassium: 40K as a primordial gene irradiator. Proceedings of the National Academy of Sciences, 79, 3556–3559.
Mossman, K.L. (2001). Deconstructing radiation hormesis. Health Physics, 80, 263–269. Mullins, L.J. and Zerahn, K. (1948). The distribution of potassium isotopes in biological
material. Journal of Biological Chemistry, 174, 107–113. Mützel Rauch, E., Lehn, C., Peschel, O., Hölzl, S. and Roßmann, A. (2009). Assignment of
unknown persons to their geographical origin by determination of stable isotopes in hair samples. International Journal of Legal Medicine, 123, 35–40.
Nakamura, K., Schoeller, D.A., Winkler, F.J. and Schmidt, H.L. (1982). Geographical variations in the carbon isotope composition of the diet and hair in contemporary man. Biomedical Mass Spectrometry, 9, 390–394.
Nambi, K.S.V. and Soman, S.D. (1987). Environmental radiation and cancer in India. Health Physics, 52, 653–657.
Nardoto, G.B., Silva, S., Kendall, C., Ehleringer, J.R., Chesson, L.A., Ferraz, E.S.B., Moreira, M.Z., Ometto, J.P.H.B. and Martinelli, L.A. (2006). Geographical patterns of human diet derived from stable-isotope analysis of fingernails. American Journal of Physical Anthropology, 131, 137–146.
Neruchev, S.G. (1976). Effects of radioactive epochs on the evolution of the biosphere. Soviet Geology and Geophysics, 17, 1–9.
Neruchev, S.G. (2007). Uranium and life in the history of the Earth (2nd ed.). Saint Petersburg, Russia: All-Russian Oil Research Prospecting Institute (in Russian).
O’Brien, D.M. and Wooler, M.J. (2007). Tracking human travel using stable oxygen and hydrogen isotope analyses of hair and urine. Rapid Communications in Mass Spectrometry, 21, 2422–2430.
O’Connell, T.C. and Hedges, R.E.M. (1999). Investigations into the effect of diet on modern human hair isotopic values. American Journal of Physical Anthropology, 108, 409–425.
O’Connell, T.C., Hedges, R.E.M., Healey, M.A. and Simpson, A.H.R.W. (2001). Isotopic comparison of hair, nail and bone: modern analyses. Journal of Archaeological Science, 28, 1247–1255.
Ohno, T., Shinohara, A., Chiba, M. and Hirata, T. (2005). Precise Zn isotope ratio measurements of human red blood cell and hair samples by multiple collector-ICP-mass spectrometry. Analytical Sciences, 21, 425–428.
Ohno, T., Shinohara, A., Kohge, I., Chiba, M. and Hirata, T. (2004). Isotopic analysis of Fe in human red blood cells by multiple collector-ICP-mass spectrometry. Analytical Sciences, 20, 617–621.
Olson, A.R. and Lewis, G.N. (1928). Natural radioactivity and the origin of species. Nature, 121, 673–674.
Osika, D.G. (1981). The fluid regime of the seismically active regions. Moscow, USSR: Nauka (in Russian).
Patterson, K.Y. and Veillon, C. (2001). Stable isotopes of minerals as metabolic tracers in human nutrition research. Experimental Biology and Medicine, 226, 271–282.

Role of Isotopes in the Biosphere 65
Pertsov, L.A. (1967). The natural radioactivity of the biosphere. Jerusalem, Israel: Israel Program for Scientific Translations.
Petzke, K.J., Boeing, H., Klaus, S. and Metges, C.C. (2005). Carbon and nitrogen stable isotopic composition of hair protein and amino acids can be used as biomarkers for animal-derived dietary protein intake in humans. Journal of Nutrition, 135, 1515–1520.
Planel, H., Soleilhavoup, J.-P., Cottin, F., Tixador, R. and Richoilley, G. (1969). Recherches sur l’action biologique de l’irradiation naturelle: étude de la croissance de Paramecium aurelia et Paramecium caudatum en laboratoire souterrain. Comptes Rendus Hebdomadaires des Séances de l’Académie des Sciences, Série D, 269, 1697–1700.
Planel, H., Soleilhavoup, J.P., Tixador, R., Richoilley, G., Conter, A., Croute, F., Caratero, C. and Gaubin, Y. (1987). Influence on cell proliferation of background radiation or exposure to very low, chronic gamma radiation. Health Physics, 52, 571–578.
Price, T.D., Burton, J.H. and Bentley, R.A. (2002). The characterization of biologically available strontium isotope ratios for the study of prehistoric migration. Archaeometry, 44, 117–135.
Prowse, T.L., Schwarcz, H.P., Saunders, S.R., Macchiarelli, R. and Bondioli, L. (2005). Isotopic evidence for age-related variation in diet from Isola Sacra, Italy. American Journal of Physical Anthropology, 128, 2–13.
Rennie, M.J. (1999). An introduction to the use of tracers in nutrition and metabolism. Proceedings of the Nutrition Society, 58, 935–944.
Richards, M.P., Fuller, B.T. and Hedges, R.E.M. (2001). Sulphur isotopic variation in ancient bone collagen from Europe: implications for human palaeodiet, residence mobility, and modern pollutant studies. Earth and Planetary Science Letters, 191, 185–190.
Roberts, S.B., Coward, W.A., Ewing, G., Savage, J., Cole, T.J. and Lucas, A. (1988). Effect of weaning on accuracy of doubly labeled water method in infants. American Journal of Physiology – Regulatory, Integrative and Comparative Physiology, 254, R622–R627.
Roginskii, S.Z. and Shnol’, S.E. (1965). Isotopes in biochemistry: Theory, problems, results. Jerusalem, Israel: Program for Scientific Translations.
Rubenstein, D.R. and Hobson, K.A. (2004). From birds to butterflies: animal movement patterns and stable isotopes. Trends in Ecology and Evolution, 19, 256–263.
Safwat, A. (2008). Clinical applications of low-dose whole body irradiation hormesis In E. Le Bourg and S.I.S. Rattan (Eds.), Mild stress and healthy aging: Applying hormesis in aging research and interventions (pp. 157–170). Amsterdam, Netherlands: Springer.
Salikhov, K.M. (1996). Magnetic isotope effect in radical reactions. Wien, Austria: Springer. Schmidt, H.-L. (2003). Fundamentals and systematics of the non-statistical distributions of
isotopes in natural compounds. Naturwissenschaften, 90, 537–552. Schoeninger, M.J., DeNiro, M.J. and Tauber, H. (1983). Stable nitrogen isotope ratios of bone
collagen reflect marine and terrestrial components of prehistoric human diet. Science, 220, 1381–1383.
Sharp, Z.D., Atudorei, V., Panarello, H.O., Fernández, J. and Douthitt, C. (2003). Hydrogen isotope systematics of hair: archeological and forensic applications. Journal of Archaeological Science, 30, 1709–1716.
Shaw-Allen, P.L., Romanek, C.S., Bryan, A.L. Jr. and Jagoe, C.H. (2005). Shifts in relative tissue δ15N values in snowy egret nestlings with dietary mercury exposure: a marker for increased protein degradation. Environmental Science and Technology, 39, 4226–4233.
Shchepinov, M.S. (2007). Do “heavy” eaters live longer? BioEssays, 29, 1247–1256.

Emlen V. Sobotovich, Igor V. Florinsky, Olga B. Lysenko et al. 66
Simpson, J.F. (1966). Evolutionary pulsations and geomagnetic polarity. Bulletin of the Geological Society of America, 77, 197–204.
Skulan, J., Bullen, T., Anbar, A.D., Puzas, J.E., Shackelford, L., LeBlanc, A. and Smith, S.M. (2007). Natural calcium isotopic composition of urine as a marker of bone mineral balance. Clinical Chemistry, 53, 1155–1158.
Slatkin, D.N., Friedman, L., Irsa, A.P. and Micca, P.L. (1985). The stability of DNA in human cerebellar neurons. Science, 228, 1002–1004.
Sobotovich, E.V. and Lysenko, O.B. (2001). Isotopic shifts in biological processes. Dopovidi Natsionalnoi Academii Nauk Ukrainy, No. 4, 114–119 (in Russian, with English abstract).
Sobotovich, E.V., Lysenko, O.B. and Shatilo, V.B. (2007). Carbon isotope shift in erythrocytes of human blood as a possible index of its functional activity. In E.F. Konoplya (Ed.), Radiation and Chernobyl: Nearest and remote consequences (pp. 130–135). Gomel, Belarus: Institute of Radiology (in Russian, with English abstract).
Somlyai, G., Jancsó, G., Jákli, G., Vass, K., Barna, B., Lakics, V. and Gaal, T. (1993). Naturally occurring deuterium is essential for the normal growth rate of cells. FEBS Letters, 317, 1–4.
Stedman, H.H., Kozyak, B.W., Nelson, A., Thesier, D.M., Su, L.T., Low, D.W., Bridges, C.R., Shrager, J.B., Minugh-Purvis, N. and Mitchell, M.A. (2004). Myosin gene mutation correlates with anatomical changes in the human lineage. Nature, 428, 415–418.
Stenberg, A., Andrén, H., Malinovsky, D., Engström, L.-M., Rodushkin, I. and Baxter, D.C (2004). Isotopic variations of Zn in biological materials. Analytical Chemistry, 76, 3971–3978.
Stenberg, A., Malinovsky, D., Öhlander, B., Andrén, H., Forsling, W., Engström, L.-M., Wahlin, A., Engström, E., Rodushkin, I. and Baxter, D.C. (2005). Measurement of iron and zinc isotopes in human whole blood: preliminary application to the study of HFE genotypes. Journal of Trace Elements in Medicine and Biology, 19, 55–60.
Stoll, P.M., Stokes, P.E. and Okamoto, M. (2001). Lithium isotopes: differential effects on renal function and histology. Bipolar Disorders, 3, 174–180.
Stone, N.J. (2005). Table of nuclear magnetic dipole and electric quadrupole moments. Atomic Data and Nuclear Data Tables, 90, 75–176.
Street-Perrott, F.A. and Barker, P.A. (2008). Biogenic silica: a neglected component of the coupled global continental biogeochemical cycles of carbon and silicon. Earth Surface Processes and Landforms, 33, 1436–1457.
Tandon, L., Iyengar, G.V. and Parr, R.M. (1998). A review of radiologically important trace elements in human bones. Applied Radiation and Isotopes, 49, 903–910.
Thomas, H.H. (1936). Cosmic rays and the origin of species. Nature, 137, 359–359. Thomson, J.F. (1963). Biological effects of deuterium. New York, NY: Pergamon Press. Timoféeff-Ressovsky, N.W., Zimmer, K.G. and Delbrück, M. (1935). Über die Natur der
Genmutation und der Genstruktur. Nachrichten der Biologischen Gesellschaft für Wissenschaft, 1, 189–245.
Uffen, R.J. (1963). Influence of the Earth’s core on the origin and evolution of life. Nature, 198, 143–144.
UNSCEAR (2000a). DNA repair and mutagenesis. In United Nations Scientific Committee on the Effects of Atomic Radiation, Sources and effects of ionizing radiation: UNSCEAR

Role of Isotopes in the Biosphere 67
2000 report to the General Assembly, with scientific annexes, Vol. 2: Effects (pp. 1–72). New York, NY: United Nations.
UNSCEAR (2000b). Exposures from natural radiation sources. In United Nations Scientific Committee on the Effects of Atomic Radiation, Sources and effects of ionizing radiation: UNSCEAR 2000 report to the General Assembly, with scientific annexes, Vol. 1: Sources (pp. 83–156). New York, NY: United Nations.
UNSCEAR (2001). Hereditary effects of radiation: UNSCEAR 2001 report to the General Assembly, with scientific annex. New York, NY: United Nations.
UNSCEAR (2008). Effects of ionizing radiation: UNSCEAR 2006 report to the General Assembly, with scientific annexes, Vol. 1. New York, NY: United Nations.
Vaiserman, A.M. (2008). Irradiation and hormesis. In E. Le Bourg and S.I.S. Rattan (Eds.), Mild stress and healthy aging: Applying hormesis in aging research and interventions (pp. 21–41). Amsterdam, Netherlands: Springer.
Valkovic, V. (1977). A possible mechanism for the influence of geomagnetic field on the evolution of life. Origins of Life, 8, 7–11.
Verkhovskaya, I.N. and Arutyunova, M.B. (1953). Effect of radiation of radioactive substances on function of the isolated frog heart. Izvestiya Akademii Nauk SSSR, Series Biological, No. 6, 98–110 (in Russian).
Vernadsky, V.I. (1929a). Isotopes and living matter. Comptes Rendus de l’Académie des Sciences de l’URSS, Series A, No. 12, 215–218 (in Russian).
Vernadsky, V.I. (1929b). La biosphère. Paris, France: Alcan. Vernadsky, V.I. (1931). About an influence of living organisms on isotopic mixture of
chemical elements. Comptes Rendus de l’Académie des Sciences de l’URSS, Series A, No. 6, 141–147 (in Russian).
Vernadsky, V.I. (2001). The chemical composition of the Earth’s biosphere and its environment (3rd ed.). Moscow, Russia: Nauka (in Russian).
Vinogradov, A.P. (1957). Biological role of potassium-40. Nature, 180, 507–508. Vogt, J., Sinnhuber, M. and Kallenrode, M.-B. (2009). Effects of geomagnetic variations on
System Earth. In K.-H. Glaβmeier, H. Soffel and J.F.W. Negendank (Eds.), Geomagnetic field variations (pp. 159–208). Berlin, Germany: Springer.
Waddington, C.J. (1967). Paleomagnetic field reversals and cosmic radiation. Science, 158, 913–915.
Walczyk, T. and von Blanckenburg, F. (2002). Natural iron isotope variations in human blood. Science, 295, 2065–2066.
Walczyk, T. and von Blanckenburg, F. (2005). Deciphering the iron isotope message of the human body. International Journal of Mass Spectrometry, 242, 117–134.
Watkins, N.D. and Goodell, H.G. (1967). Geomagnetic polarity change and faunal extinction in the Southern Ocean. Science, 156, 1083–1087.
West, J.B., Sobek, A. and Ehleringer, J.R. (2008). A simplified GIS approach to modeling global leaf water isoscapes. PLoS ONE, 3, e2447, doi:10.1371/journal.pone.0002447.
Wilson, A.S., Taylor, T., Ceruti, M.C., Chavez, J.A., Reinhard, J., Grimes, V., Meier-Augenstein, W., Cartmell, L., Stern, B., Richards, M.P., Worobey, M., Barnes, I. and Gilbert, M.T.P. (2007). Stable isotope and DNA evidence for ritual sequences in Inca child sacrifice. Proceedings of the National Academy of Sciences, 104, 16456–16461.

Emlen V. Sobotovich, Igor V. Florinsky, Olga B. Lysenko et al. 68
Wright, L.E. and Schwarcz, H.P. (1998). Stable carbon and oxygen isotopes in human tooth enamel: identifying breastfeeding and weaning in prehistory. American Journal of Physical Anthropology, 106, 1–18.
Zhu, X.K., Guo, Y., Williams, R.J.P., O’Nions, R.K., Matthews, A., Belshaw, N.S., Canters, G.W., de Waal, E.C., Weser, U., Burgess, B.K. and Salvato, B. (2002). Mass fractionation processes of transition metal isotopes. Earth and Planetary Science Letters, 200, 47–62.
Zwaardemaker, H. (1920). On physiological radio-activity. Journal of Physiology, 53, 273–289.
Zwaardemaker, H. (1924). Bio-radioactivity and humoral environment. Quarterly Journal of Experimental Physiology, 14, 339–350.

In: Man and the Geosphere ISBN 978-1-60876-387-0 Editor: Igor V. Florinsky, pp. 69-113 © 2010 Nova Science Publishers, Inc.
Chapter 3
GEOCHEMICAL ANOMALIES: SICKNESS AND HEALTH
Iosif F. Volfson, Wolfgang Paul and Igor G. Pechenkin
ABSTRACT
Natural geochemical anomalies can both adversely and positively affect human health influencing the balance of trace elements in the organism. It is obvious that content of trace elements in a particular terrain is controlled by a combination of various climatic and landscape characteristics, which, in turn, depend on the geological, mineralogical, and geochemical features of bedrocks, as well as endogenous and exogenous geological processes. Endemic diseases usually exemplify links between human health and geological processes. On the other hand, humans have used geological products for healing since time immemorial. A major portion of both endemic-disease areas and balneological resorts are located within geodynamically active regions.
This chapter consists of three parts. In the first part, we present a model for the development of geochemical halos in geodynamically active regions. We distinguished three interrelated ore-forming systems playing a crucial role in the epigenesis: catagenetic, exfiltration, and infiltration. Fluid degassing via faults is the main factor responsible for the concentration of elements, mineralization, and formation of ore deposits. In the second part, we review health effects of natural abnormal concentrations of trace elements (i.e., F, Si, Co, Zn, As, Se, Sr, I, and U), Rn, and volcanic gases in the environment. In the third part, we address healing effects of natural geological products, such as mineral and thermal waters, clays, muds, moor, sapropel, sands, flints, shungite, salt, and shilajit.
An assessment of health risks or benefits caused by geological materials should be started with the study of geological settings responsible for the concentration of trace elements and their geochemical features. It is important to map territories in terms of both epidemiological and balneological states, and to model their spatio-temporal dynamics under distinct environmental scenarios.
Keywords: geochemical halo; endemic disease; trace element; mineral water; pelotherapy; spa.

Iosif F. Volfson, Wolfgang Paul and Igor G. Pechenkin 70
3.1. INTRODUCTION Numerous epidemiological and environmental studies demonstrate links between human
health and various geochemical parameters, such as concentration of elements in bedrocks and soils, hydro- and geochemical characteristics of ground- and surface waters, and elemental, gaseous, and mineral composition of the air, air dust, and aerosols (Vinogradov, 1938; Avtsyn, 1972; Underwood, 1979; Låg, 1990; Abrahams, 2002; Komatina, 2004; Selinus et al., 2005; Plumlee et al., 2006; Hough, 2007; Skinner, 2007). Geological environment influences the occurrence of congenital malformations (Aggett and Rose, 1987), neoplasms (Peeters, 1987), cardiovascular (Masironi, 1987), infectious (Weinberg, 1987), and mental (Persinger, 1987) diseases. Endemic diseases are observed against a background of abnormally low or high concentrations of chemical elements in soils, bedrocks, and groundwater, which are natural geochemical anomalies.
On the other hand, humans have used various geological products for healing (e.g., in balneotherapy and pelotherapy) since time immemorial (Tsarfis, 1985; Parish and Lotti, 1996; Koenig, 2005). Among these are mineral waters (Petraccia et al., 2006), muds (Veniale et al., 2007), clays (Carretero et al., 2006), and other minerals (Scholten, 1993; Murthy, 2003). These products are successfully used to treat diseases of the gastrointestinal, musculoskeletal, dermatological, nervous, genitourinary, and respiratory systems. As a rule, sources of such geological products are also associated with natural geochemical anomalies.
A major portion of endemic-disease areas and balneological resorts are located within geodynamically active regions. This chapter consists of three parts. In the first part, we present a three-component model for the development of geochemical halos in geodynamically active regions. In the second part, we review health effects of natural abnormal concentrations of various trace elements (i.e., F, Si, Co, Zn, As, Se, Sr, I, and U), Rn, and volcanic gases in the environment. In the third part, we address healing effects of geological products, such as mineral and thermal waters, clays, muds, moor, sapropel, sands, flints, shungite, salt, and shilajit.
3.2. GEODYNAMIC ACTIVITY AND GEOCHEMICAL ANOMALIES Geodynamic situations leading to high concentrations of natural toxic substances may be
used to model and map hazardous areas for human residency, according to the manifestation of geological features and factors affecting human health. Indeed, some regions demonstrate obvious health consequences of the exposure to toxic elements and compounds (U, Se, Mo, F, As, Tl, Cd, Hg, CH4, etc.), which are naturally transported from the depth of the Earth to the land surface. Among these regions are India, Bangladesh, Thailand, Chile, China, Mexico, Serbia, and others (Figure 3.1), which are subjected to the impact of natural toxicants responsible for a wide range of diseases.
Most of the regions are located within active tectonic belts, such as the Alpine-Himalayan, Andean, and Mongolian belts, as well as other territories marked by seismic activity, processes of collision of the continental and oceanic plates, and active faulting (cf. Figures 3.1 and 3.2).

Figure 3.1. Global distribution of endemic diseases associated with geological factors. The map was compiled using on data from several sources (Avtsyn, 1972; Allison et al., 1996; Admakin, 1999; Revich, 2001; Selinus et al., 2005).

Figure 3.2. A schematic map of the global tectonic activity of the past 1 million years (DTAM Team, 1998; courtesy of NASA).

Geochemical Anomalies: Sickness and Health 73
Over the course of geological history, fluid degassing via faults has been, and continues to be one of the main factors responsible for the element concentration in rocks, mineralization, and formation of mineral deposits in geodynamically active regions (Kasimov et al., 1978; Kropotkin, 1985; Kerrich, 1986; Sibson, 1987; Pechenkin and Pechenkin, 2004; Marakushev and Marakushev, 2008) (Section 1.2).
3.2.1. A Model for the Development of Geochemical Halos Studies of interrelations between the recent ore-forming systems (OFSs) in Central Asia
within large crustal blocks (Pechenkin and Pechenkin, 1996; Pechenkin and Pechenkin, 2005) enabled us to distinguish a number of geostructural settings with the hydrogenous ore formation. We considered: (a) an impact of epigenetic processes on the transformation of rocks of the sedimentary cover and gaseous-liquid fluids therein; and (b) regularities of this process dominated by tectonic factor due to the movement of lithospheric plates. As a result, we distinguished three interrelated OFSs playing a crucial role in the epigenetic ore formation (Grushevoy and Pechenkin, 2003; Pechenkin et al., 2005): catagenetic (stadial), exfiltration, and infiltration OFS. Each system forms specific geochemical and, hence, both epidemiological and balneological setting.
A model of the catagenetic OFS is elaborated for a region representing an inherited (residual) oceanic basin and its mountainous framing (zone of upthrusts and overthrusts of the foreland), e.g. the West Turkmen basin and its northern flank. In the early evolution, the metalliferous gaseous-liquid fluid was formed due to catagenesis in the Mesozoic reservoirs. The catagenetic OFS represents a hydrodynamically closed system and is characterized by the formation of liquid and gaseous mineral resources, such as oil, hydromineral, and gaseous (CH4) pools. Their formation is intimately associated with the catagenetic transformation of rocks during their sinking to depths corresponding to the development of the principal phase of oil or gas formation. This process can be accelerated due to intensification of stress during orogenesis. The spatial distribution of mineral deposits is essentially governed by geofluid discharge zones, where ore deposits of Mo, As, Pb, Zn, Cu, Fe, Mn, Sc, Hf, and rare elements are subjected to various changes.
The catagenetic OFS also serves as a preparatory system for the exfiltration OFS. This is manifested by the generation of various components in gaseous-liquid fluids, such as acid hot brines and compounds of Al, Si, F, Pb, Cu, Zn, Sr, Li, and Cs (Figure 3.3).
Processes in the exfiltration OFS are related to the opening of hydrodynamic system, beginning of manifestation of the geochemical potential of solutions formed at the catagenetic stage, and development of metalliferous and non-metalliferous occurrences and deposits of various scales. These processes lead to irreversible alterations of geofluids with a gradual destruction of the united multicomponent system. Metalliferous brines, as well as metalliferous (e.g., Fe, Ag, and Cu) and non-metalliferous occurrences and deposits are observed at the boundaries of currently active zones of geofluid discharge. They are accompanied by high concentrations of toxic elements (e.g., Cd, Tl, As, and Pb) and marked by the presence of rare elements, Hf, W, and Sb. Concentrations of precious metals, such as Au and Pt, are also observed. The deepest areas of the trough served as the principal zones for the accumulation of geofluids enriched in gaseous and liquid phases.
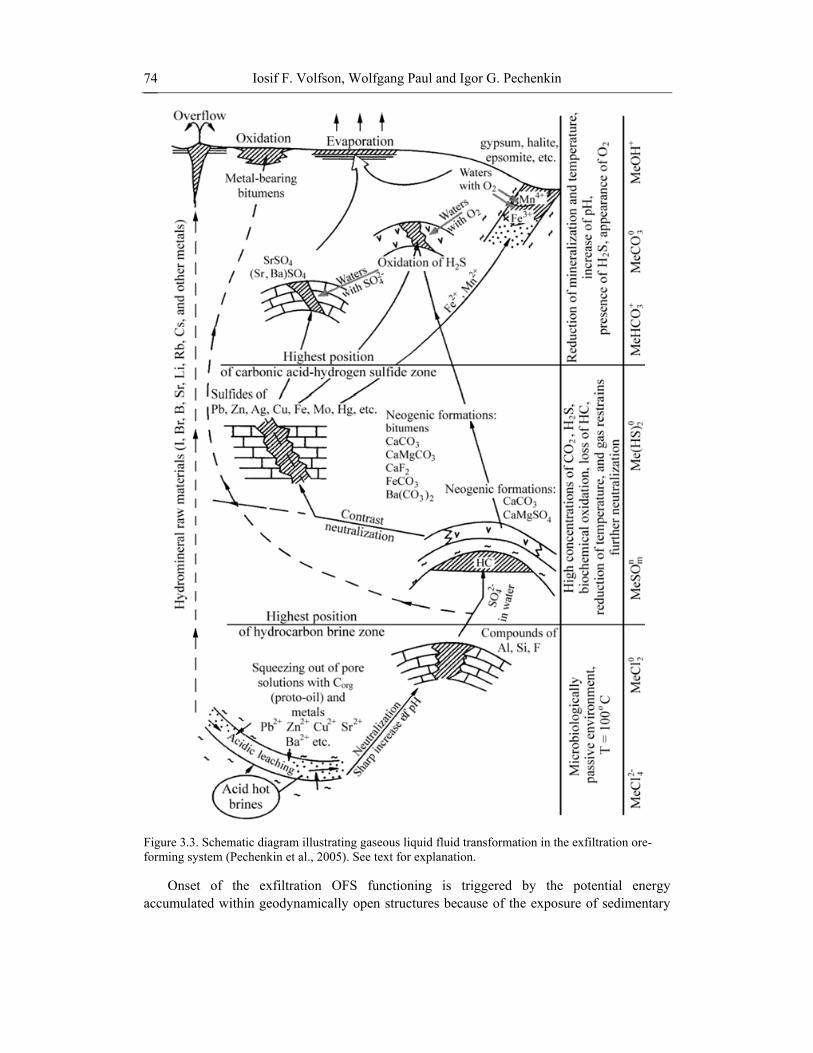
Iosif F. Volfson, Wolfgang Paul and Igor G. Pechenkin 74
Figure 3.3. Schematic diagram illustrating gaseous liquid fluid transformation in the exfiltration ore-forming system (Pechenkin et al., 2005). See text for explanation.
Onset of the exfiltration OFS functioning is triggered by the potential energy accumulated within geodynamically open structures because of the exposure of sedimentary

Geochemical Anomalies: Sickness and Health 75
formations. Fluid degassing provokes a shift of equilibrium in the solution and its differentiation due to an abrupt drop of intrabed pressures and temperatures. Mineral deposits can be combined into several groups depending on the degree of fluid transformation, such as hydromineral raw resources (e.g., I, Br, B, Sr, Li, Cs), sulfides of Pb, Cu, Zn, Fe, Ag, Mo, and Hg, neogenic formations (e.g., bitumens, CaCO3, CaMgCO3, CaF2, FeCO3, Ba(CO3)2, CaMgSO4), deposits of gypsum, halite, epsomite, etc. (Figure 3.3).
The infiltration OFS begins to act in reservoirs of stratabound and underground regimes of subsurface waters after the complete decompression in collectors. Folded rocks of the mountain framing are recharge zones, whereas rocks filling large basins and intermontane depressions are host rocks for mineralization. The location of regional and local discharge zones govern the directed movement of stratabound waters. These waters are oxygenated and enriched in several elements, such as U, Se, Mo, Re, Cu, V, and Sc. They form epigenetic zonality of the oxidative series and the stratabound oxidation zones. The stratal, roll, or other morphologically similar ore lodes, are formed at the reductive (both syngenetic and epigenetic) geochemical barriers. The infiltration OFS predominates during the formation of polymineral uranium ores of the sandstone type.
3.2.2. Geodynamics and Endemies A complex of pathogenic factors provokes endemic diseases within geofluid discharge
zones. For example, urological endemic diseases (e.g., Balkan endemic nephropathy, kidney cancer, and heavy forms of urolithiasis) are typical for the population of Serbia, Montenegro, Romania, and some regions of the USA (e.g., the Powder Basin, Colorado) living in territories of Pliocene lignite exposures (Figure 3.1). Affected areas relate to water supply sources that are polluted by natural polycyclic aromatic hydrocarbons, As, B, Br, Cl, Cr, F, Li, Na, P, Rb, Se, Sr, W, sulfur compounds, CH4, bitumen, and oil. These substances are discharged via active faults and fractures. Concourses of bacteria and fungi were also revealed in those water supplies. They generate a biogeochemical barrier, where toxic elements and compounds, as well as nutrients, such as PO4 and NH3, are precipitated. The environment of such zones is favorable for the active duplication of fungi (e.g., Zygomycetes, Coelomycetes, Penicillium, and Aspergillus), which are producers of toxic compounds (Bunnell et al., 2006; Orem et al., 2007).
The other example of an endemic disease, which depends on geodynamic activity, is coccidioidomycosis (Figure 3.1), a pulmonary or hematogenous fungal disease caused by soil fungi Coccidioides immitis and C. posadasii (Hector and Laniado-Laborin, 2005). Earthquakes and seismically triggered landslides provoke a sharp increase in the number of fungi in the atmospheric air. Simultaneously, the morbidity rate of coccidioidomycosis increases (Abrahams, 2002). The scale of this effect is aggravated by dust storms accompanying earthquakes (Weinberg, 1987; Hough, 2007). The influence of seismic activity on human health is comprehensively discussed in Chapter 7.
Endemic diseases caused by exposures to geological factors can also be developed within cratons and relatively stable aseismic structures. The presence of coal deposits and hydrocarbon fields within the East European Platform indicates a geodynamic activity and permeability of the Earth’s crust due to deep fault zones (Pronin et al., 1997; Tikhonov et al., 2005). Such zones can be qualified as hazardous territories in terms of possible impacts of the

Iosif F. Volfson, Wolfgang Paul and Igor G. Pechenkin 76
geological environment on biota (Melnikov et al., 1994) (Chapter 6). In this situation, the most hazardous factors are radon emission via faults (Section 3.3.10) and organic compounds (e.g., polycyclic aromatic hydrocarbons, phenol, and CH4) contained in coal deposits and oil-bearing collectors. These components can freely circulate in the fractured space of the Earth’s interior and reach sources of the drinking water supply. Besides, toxic elements associated with hydrocarbons – Hg, Pb, Zn, Tl, Cd, Se, and V – can adversely affect human health.
3.3. TRACE ELEMENTS AND GASES: HEALTH EFFECTS The greatest part of the human body consists of a few chemical elements. Twelve of them
– H, C, N, O, Na, Mg, S, P, Cl, K, Ca, and Fe – make up 99.9% of the body. The remainder 0.1% contains trace elements (Reinhold, 1975; Mertz, 1981; Aggett, 1985). About one-third of the naturally occurring 90 elements are known to be essential to life (Table 2.1). The list of trace elements considered as essential for human health includes Li, B, F, Al, Si, V, Cr, Mn, Co, Ni, Cu, Zn, Ge, As, Se, Br, Rb, Mo, Sn, and I (Bogden and Klevay, 2000).
Trace elements enter the human body through the digestive, respiration, and skin systems with food, water, and air. Trace elements are involved in all major metabolic pathways. In particular, trace elements serve catalytic, structural, and regulatory activities, interacting with enzymes, hormones, and biological membranes. This determines the importance of trace elements for the organism.
A deficiency or excess of trace elements and disruption of biological equilibrium between them may lead to functional or structural abnormalities (Mertz, 1981; Aggett, 1985). Microelementoses – diseases induced by either deficiency or excess of trace elements in the organism (Avtsyn et al., 1991; Skalny, 1999) – can be associated with both endogenous and exogenous causes. Among endogenous microelementoses are genetic, congenital, or acquired metabolic disorders (e.g., Wilson’s disease – Ala et al., 2007). Exogenous microelementoses are connected with the environmental impacts.
In this section, we briefly review health effects of abnormal concentrations of some trace elements (F, Si, Co, Cu, Zn, As, Se, Sr, Cd, I, and U), Rn, and volcanic gases in natural conditions only. Technogenic geochemical anomalies (environmental pollution), industrial and occupational effects are not considered. For the abundance of the selected trace elements in the crust and biosphere as well as isotope-abundance variation see Table 2.2. Detailed information on the function of trace elements in living organisms, symptoms due to trace element excess or deficiency, reference values for trace elements in the human tissues and fluids, and nutritional requirements can be found elsewhere (Underwood, 1979; Versieck, 1985; Mertz, 1986–1987; Bogden and Klevay, 2000; Paul and Paul, 2002).
3.3.1. Fluorine Fluorine is a highly reactive, poisonous, yellowish brown gas. Volcanoes emit HF gas
interacting with the ash particles and meteoric water. These aerosols adhering to tephra particles form F-bearing compounds (Cronin et al., 2003). Fluorine mainly occurs as fluorite, CaF2 (Perkins, 2002).

Geochemical Anomalies: Sickness and Health 77
The adult body contains about 2.6 g of fluorine. It is especially concentrated in teeth as a component of fluorapatite, Ca5F(PO4)3. The enamel of healthy teeth has an average fluorine content of 0.0111%. Recommended dietary intake of F ranges from 1.5 to 4 mg/day (Mertz, 1981).
Fluorine deficiency in the human body leads to dental caries and possibly to osteoporosis (Reinhold, 1975; Nielsen, 2000). Fluorine deficiency is attributed to a low fluorine content in drinking water (<0.7 mg/L). It is well known that small concentrations of F (below 1.5 ppm) are helpful for the prevention of dental caries. However, fluoride dose above 1.5 ppm increases the severity of tooth mottling and provokes the risk of osteoporosis and collapsed vertebrae. Long-term ingestion of drinking water with a fluorine content >1.5 ppm leads to dental and skeletal fluorosis, as well as nonskeletal health problems, such as brachycardia, low blood pressure, skin irritation, keratolysis, and disturbance of metabolism of fat and carbohydrates (Edmunds and Smedley, 2005).
Endemic fluorosis is an acute public health problem in India, China, Lithuania, Russia, and other countries (Avtsyn, 1972) (Figure 3.1). Around 25 million people living in India are affected by this disease. Among various minerals responsible for the high fluoride concentration in Indian groundwater, one can mention fluorapatite and fluorite, which are leached from metamorphic rocks mainly represented by the Proterozoic hornblende gneiss (Teotia et al., 1981).
High fluoride contents in drinking water (1.5–5 mg/L) are also typical for western Lithuania. Local fluorine halos are correlated with a deep artesian reservoir in Devonian and Permian formations (Klimas and Mališauskas, 2008). Fluorine discharge occurs via a deep fault system. About 90,000 people are exposed to an excess of fluorine content in drinking water, a reason for a higher prevalence rate of dental fluorosis. In the eastern and southeastern parts of Lithuania, drinking water has low fluoride contents; the incidence rate of dental caries is higher than in the western parts of the country (Narbutaite et al., 2007).
3.3.2. Silicon Pure silicon crystals are rarely found in volcanic exhalations. This metalloid usually
occurs as minerals consisting of SiO2 in different crystalline forms (e.g., quartz, flint, amethyst, agate, rock crystal, jasper, etc.). Silicon also occurs as silicate minerals, such as feldspars (KAlSi3O8 – NaAlSi3O8 – CaAl2Si2O8), pyroxenes (XY(Si,Al)2O6, where X is Ca, Na, Fe2+, Mg, Zn, Mn, Li; Y is Cr, Al, Fe3+, Mg, Sc, Ti, V), amphiboles (e.g., actinolite, Ca2(Mg,Fe)5Si8O22(OH)2), and mica (X2Y4-6Z8O20(OH,F)4, where X is K, Na, Ca, Ba, Rb, Cs; Y is Al, Mg, Fe, Mn, Cr, Ti, Li; and Z is Si, Al, Fe3+, Ti) (Perkins, 2002). Various forms of silica are found in subterranean and surface water (Bogomolov et al., 1966).
The adult body contains about 1 g of silicon. High silicon content is recorded in connective tissues, such as walls of the aorta, tracheas, ligament, bones, epidermis, hair, and lymph nodes (Schwarz, 1978). Typical dietary intake of Si ranges from 10 to 50 mg/day (Nielsen, 2000).
The silicon element influences the formation of connective and bone tissue. The silicon content in the aorta gradually decreases with age, indirectly suggesting an essential status of Si in pathogenesis of atherosclerosis (King and Belt, 1938; Schwarz, 1978).
Iosif F. Volfson, Wolfgang Paul and Igor G. Pechenkin 78
Silicon deficiency in the human organism can be caused by an insufficient supply in food and escalated removal, as the result of accelerated growth and physical overloading. It was suggested that silicon deficiency is manifested as a weakness of connective tissues (bronchi-pulmonary system, ligaments, and cartilage), weakness of bone tissues (osteoporosis), hair thinning and fragility, cholesterinemia, and early development of atherosclerosis (see review and bibliography in Nielsen, 2000).
The silicon excess in the human organism can be caused by the epactal intake of this element and the disturbance in silicon metabolism. These disorders are manifested as lung fibrosis, urolithiasis, and malignancies of the pleura and abdominal cavity. The silicon excess is typical for people living in terrains with abundance of siliceous rocks and silicate minerals, such as opoka, tripoli, diatomites, flints, zeolites, and zeolite-bearing clays (e.g., regions of the East European Platform dominated by Cretaceous siliceous rocks and mineral formations, Cretaceous silica-rich troughs of England and France). Systematic inhalation of air dust with a high content of free silica provokes silicosis, pneumoconiosis, tuberculosis (Snider, 1978; Xu et al., 1993; Derbyshire, 2003), and even endemic silicosis (Bar-Ziv and Goldberg, 1974; Mathur and Choudhary, 1997) and ophthalmosilicosis (Alieva et al., 1988).
However, epidemiological studies in the center of the European part of Russia demonstrated that the tuberculosis morbidity rate is decreased in areas, where siliceous rocks and minerals are common. A strong negative correlation (r = -0.7) was found between the tuberculosis morbidity rate and silicon content in groundwater (Akuginova et al., 1998). This testifies that Si incorporated into connective lung tissues plays a protective role in lung diseases.
This apparent controversy of the silicon excess demonstrates a key importance of the entering path of a trace element into the human body: negative effects (silicoses) are associated with the respiration path (silica-enriched dust inhalation), whereas positive effects (strengthening of the lungs) – with the digestive path (silica-enriched water drinking).
3.3.3. Cobalt Cobalt is a hard, lustrous, bluish-gray metal. It occurs as cobaltite, CoAsS, carrollite,
CuCo2S4, linneite, Co3S4, skutterudite, CoAs3, cattierite, CoS2, and some other minerals (Perkins, 2002).
The adult body contains about 1.5 mg of cobalt. Most cobalt is in the liver, skeletal muscles, bones, hair, and fat fiber. Average dietary intake of Co is about 20 µg (Barceloux, 1979).
Cobalt is a component of the vitamin B12 (cobalamin) molecule. In this compound, Co exists in the solid trivalent state and accounts for about 4.5%. Vitamin B12 is of primary importance in the formation of blood as well as the functioning of the brain and nervous system. Cobalamin is involved in the metabolism of all cells of the body (Markle and Greenway, 1996).
Cobalt deficiency can be caused by its insufficient intake due to a solely vegetarian diet, reduced acidity of gastric juice, reduction of pancreas functioning, and vitamin B12 deficiency. The vitamin B12 deficiency is most notable in hemopoietic tissues of bone marrow and neural tissues. A disturbance of the menstrual cycle can take place in the female organism. Pernicious anemia is the most evident manifestation of cobalt deficiency.

Geochemical Anomalies: Sickness and Health 79
Degenerative changes in spinal marrow and neural symptoms were recorded in many patients. Hyperpigmentation of skin may also be observed at the cobalamin deficiency (Markle and Greenway, 1996).
Geochemical provinces marked by the cobalt deficiency are endemic areas of enzootic marasmus. This cobalt nutritional deficiency disease is recorded in cattle grazing on pastures notably depleted in Co. This is particularly valid for Australia, New Zealand, Wales, and some regions of Russia (Mills, 1979). The disease occurs if the cobalt content in soil is less than 4 mg/kg. Lack of this element is suggested by several symptoms, such as acceleration in the heart action, difficult breathing, reduction of milk production, and loss of body weight. This disease is also responsible for numerous deaths of calves (6 to 18 months old) and cows after calving or their unfitness to calve.
To our knowledge, only one case of cobalt deficiency has been reported for humans: a 16-month-old girl, a persistent dirt eater living on an isolated Welsh hill farm, suffered from anemia and behavioral problems. Cattle on the farm were treated for cobalt deficiency, and the child recovered after the oral administration of cobalt chloride (Shuttleworth et al., 1961).
3.3.4. Zinc This white metal occurs naturally as sphalerite, (Zn,Fe)S, as well as smithsonite, ZnCO3,
hemimorphite, Zn2SiO4, and hydrozincite, Zn5(CO3)2(OH)6 (Perkins, 2002). The adult body contains about 2–4 g of zinc. Zinc is located relatively evenly throughout
the human organism (Rink and Gabriel, 2000; Hambidge and Krebs, 2007). Recommended dietary intake of Zn for adults is about 15 mg/day (Mertz, 1981).
Zinc is a cofactor of about 300 enzymes. Zinc metalloenzymes and zinc-dependent enzymes take part in nucleic acid metabolism, as well as proliferation, differentiation, and growth of cells. Zinc plays a regulatory role in apoptosis suppressing pathways leading to programmed cell death. Zinc modulates cellular signal recognition, and activities of protein kinase and protein phosphatase. Zinc is an essential element for the immune and endocrine systems (Chan et al., 1998; Rink and Gabriel, 2000; Kaji, 2001; Hambidge and Krebs, 2007).
Zinc deficiency is caused by poor food choice, loss of blood and gastrointestinal diseases (e.g., malabsorption and inflammation). Clinical manifestations related to a zinc deficiency are as follows: low appetite, anemia, fatigue, allergic diseases, hyperactivity, body mass deficit, hair loss, bad vision, development delay, immune suppression, dermatitis, weakening of neuropsychological functions, behavior disorders, and dementia. In the case of pregnancy, zinc deficiency increases the risk of premature delivery, low birth weight, and infant and maternal mortality (Prasad, 2003; Hambidge and Krebs, 2007).
A possible influence of zinc geochemical anomalies on human health is still poorly understood. Nevertheless, some pilot studies reported statistically significant relationships between the development of childhood onset diabetes and a low zinc content in groundwater used as drinking water supply (Haglund et al., 1996; Zhao et al., 2001).

Iosif F. Volfson, Wolfgang Paul and Igor G. Pechenkin 80
3.3.5. Arsenic Arsenic is a poisonous metalloid having several allotropic forms. Three metalloidal forms
are found free in nature, such as native arsenic, arsenolamprite, and pararsenolamprite. Arsenic occurs as arsenopyrite, FeAsS, arsenides (e.g., cobaltite, CoAsS, skutterudite, CoAs3, and lollingite, FeAs2), sulfides (e.g., orpiment, As2S3 and realgar, α-As4S4), and arsenates (e.g., mimetite, Pb5(AsO4)3Cl and erythrite, Co3(AsO4)2·8H2O) (Perkins, 2002; Mandal and Suzuki, 2002).
The adult body contains about 3–4 mg of arsenic. The element occurs in hair, nails, teeth, and the liver (Mandal and Suzuki, 2002). A typical dietary intake of As ranges from 12 to 25 μg/day (Nielsen, 2000).
The arsenic toxicity is manifested as various pathological conditions, such as black foot disease, arsenical keratosis, skin cancer, cardiovascular and peripheral vascular diseases, developmental anomalies, neurological and neurobehavioral disorders, diabetes, hearing loss, portal fibrosis, anemia, leukopenia, eosinophilia, and carcinoma. Most cases of arsenic-induced diseases are associated with exposure to inorganic As3+, which is 2–10 times more toxic than As5+. A common toxic mode is the inactivation of enzyme systems serving as a biological catalyst. In vivo, As5+ reduces to As3+, which interferes with enzymes by bonding to –SH and –OH groups. The inhibitory action is based on inactivation of pyruvate dehydrogenase by complexation with As3+. This prevents the generation of adenosine triphosphate (ATP) and energy production (Mandal and Suzuki, 2002; Tchounwou et al., 2003).
Large populations are exposed to high arsenic concentrations in drinking water (more than 1 mg/L) in Chile, West Bengal, Bangladesh, Thailand, Inner Mongolia, Taiwan, China, Mexico, Argentina, Finland, and Hungary (Figure 3.1). For example, in the city of Antofagasta, Chile, 80% of inhabitants have skin lesions (Table 3.1). Arsenic is thrown out of volcanoes during eruption and gets into the drinking water via the Toconce River with an average arsenic concentration of 800 μg/L. A complex of arsenic-induced diseases is observed in this region, including mental retardation and physical disorders in children, skin lesions (hyperpigmentation, keratosis, arsenicosis, etc.), disorders of the pulmonary system, cardiovascular diseases, and cancers (Allison et al., 1996; Tchounwou et al., 2003; Marshall et al., 2007). It is important to note that this region has a long history of arsenic poisoning of the local population: mummies of the Inca period from local cemeteries had lesions on the skin or a high arsenic concentration in their body (Figueroa et al., 1988; M.J. Allison, 2009, personal communication).
High arsenic concentrations are typical for coal-bearing sedimentary basins of China in the provinces of Guangxi, Guizhou, Hunan, and Shaanxi, where As is accumulated mainly in sulfides (1 kg/t) and organic material of coal. The arsenic-polluted coal is used for heating and cooking in these provinces (Finkelman et al., 1999).
Studies in West Bengal and Bangladesh demonstrated that local endemic diseases are related to high arsenic concentrations in schists and coals. As is leached by groundwaters from sulfides scattered in coal seams and host-schists during changes in the groundwater level because of active vertical displacements of lithospheric blocks, periodic drying and oxidation of the arsenic sulfides, and their transportation in the easily dissolved form to the sources of water supply. An arsenic concentration in local waters exceeds 50 µg/L and reaches up to 3,400 µg/L (Mandal and Suzuki, 2002; Tchounwou et al., 2003; Mashkovtsev et al., 2004).
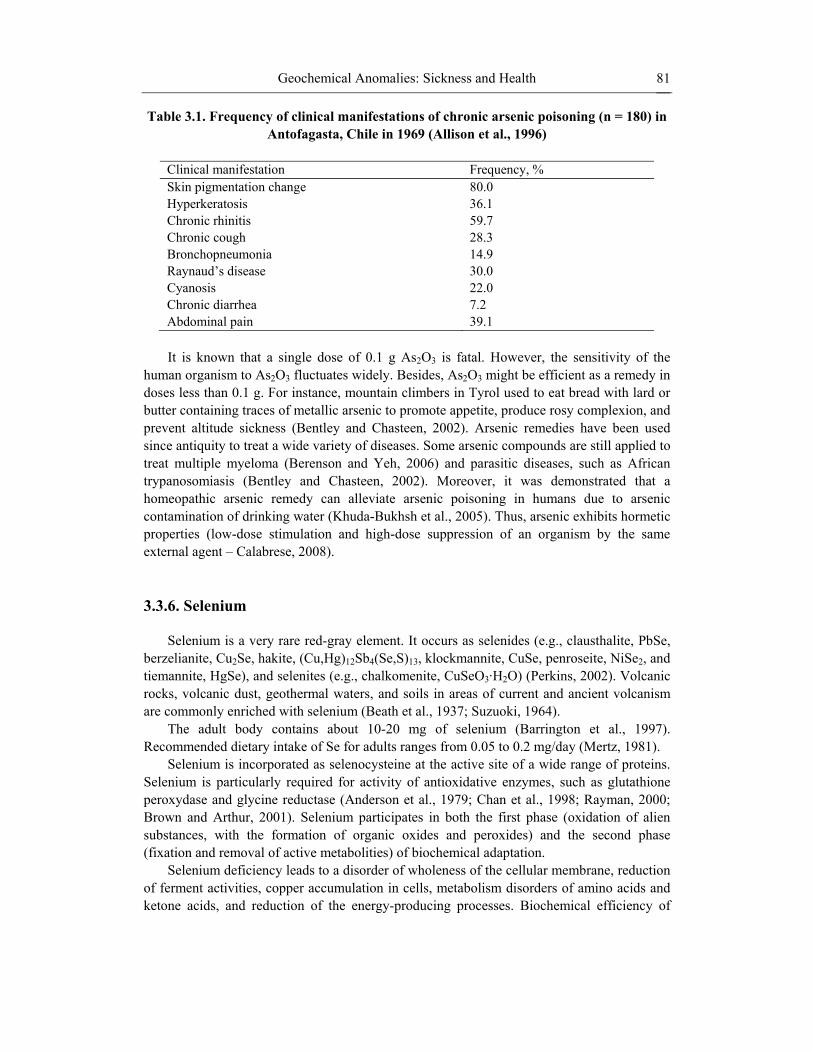
Geochemical Anomalies: Sickness and Health 81
Table 3.1. Frequency of clinical manifestations of chronic arsenic poisoning (n = 180) in Antofagasta, Chile in 1969 (Allison et al., 1996)
Clinical manifestation Frequency, % Skin pigmentation change 80.0 Hyperkeratosis 36.1 Chronic rhinitis 59.7 Chronic cough 28.3 Bronchopneumonia 14.9 Raynaud’s disease 30.0 Cyanosis 22.0 Chronic diarrhea 7.2 Abdominal pain 39.1 It is known that a single dose of 0.1 g As2O3 is fatal. However, the sensitivity of the
human organism to As2O3 fluctuates widely. Besides, As2O3 might be efficient as a remedy in doses less than 0.1 g. For instance, mountain climbers in Tyrol used to eat bread with lard or butter containing traces of metallic arsenic to promote appetite, produce rosy complexion, and prevent altitude sickness (Bentley and Chasteen, 2002). Arsenic remedies have been used since antiquity to treat a wide variety of diseases. Some arsenic compounds are still applied to treat multiple myeloma (Berenson and Yeh, 2006) and parasitic diseases, such as African trypanosomiasis (Bentley and Chasteen, 2002). Moreover, it was demonstrated that a homeopathic arsenic remedy can alleviate arsenic poisoning in humans due to arsenic contamination of drinking water (Khuda-Bukhsh et al., 2005). Thus, arsenic exhibits hormetic properties (low-dose stimulation and high-dose suppression of an organism by the same external agent – Calabrese, 2008).
3.3.6. Selenium Selenium is a very rare red-gray element. It occurs as selenides (e.g., clausthalite, PbSe,
berzelianite, Cu2Se, hakite, (Cu,Hg)12Sb4(Se,S)13, klockmannite, CuSe, penroseite, NiSe2, and tiemannite, HgSe), and selenites (e.g., chalkomenite, CuSeO3·Н2О) (Perkins, 2002). Volcanic rocks, volcanic dust, geothermal waters, and soils in areas of current and ancient volcanism are commonly enriched with selenium (Beath et al., 1937; Suzuoki, 1964).
The adult body contains about 10-20 mg of selenium (Barrington et al., 1997). Recommended dietary intake of Se for adults ranges from 0.05 to 0.2 mg/day (Mertz, 1981).
Selenium is incorporated as selenocysteine at the active site of a wide range of proteins. Selenium is particularly required for activity of antioxidative enzymes, such as glutathione peroxydase and glycine reductase (Anderson et al., 1979; Chan et al., 1998; Rayman, 2000; Brown and Arthur, 2001). Selenium participates in both the first phase (oxidation of alien substances, with the formation of organic oxides and peroxides) and the second phase (fixation and removal of active metabolities) of biochemical adaptation.
Selenium deficiency leads to a disorder of wholeness of the cellular membrane, reduction of ferment activities, copper accumulation in cells, metabolism disorders of amino acids and ketone acids, and reduction of the energy-producing processes. Biochemical efficiency of

Iosif F. Volfson, Wolfgang Paul and Igor G. Pechenkin 82
calcium, phosphorus, and iodine depends on Se. There is a relation between selenium deficiency and cancers of the stomach, prostate, large intestine, and mammary gland (Rayman, 2000; Brown and Arthur, 2001; Fordyce, 2005).
There are selenium-deficient regions in China, sub-Saharan Africa, New Zealand, and Western Europe including Holland, Denmark, and Germany (Figure 3.1). In Russia, such areas are located in the Northwest and Siberia, such as Yakutia and Transbaikalia (e.g., the Urov River basin – Ermakov, 1992). Both Keshan disease (degeneration of the heart muscle and chronic cardiomyopathy) and Kashin-Beck disease (degenerative osteoarthrosis of joints and the spine) are caused by low selenium contents in food chains (Chen et al., 1980; Masironi, 1987; Allander, 1994; Frankenberger and Benson, 1994; Fordyce, 2005). According to current concepts, the development of Kashin-Beck disease is provoked by a decrease of phosphorus content in the bones and calcium leaching from the bones under selenium deficiency (Chen et al., 1980; Selinus and Frank, 2000). For animals, a selenium deficiency leads to white muscle disease particularly characterized by the muscular dystrophy and liver necrosis (Muth, 1963).
There is a progressive decrease in selenium levels in the human body under an acquired immune deficiency syndrome (AIDS) (Dworkin, 1994). This is connected with the fact, that the human immunodeficiency virus (HIV) produces selenoproteins, which are involved in the viral replication, using Se of the host (Patrick, 1999). Since selenium is important for immune modulation and antioxidative protection, the HIV-induced selenium depletion leads to the suppression of these vital functions. The HIV-induced selenium depletion can be more dangerous against a background of the geologically caused selenium deficiency. Thus, Foster (2004) proposed that populations of selenium-deficient regions are high-risk groups for AIDS. Indeed, soils of much of sub-Saharan Africa are low in selenium, excluding Senegal. This country has a lower morbidity rate of AIDS than the rest of sub-Saharan Africa.
High selenium contents in soil are observed over a large territory of Australia, USA, and in some regions of Russia, such as Yakutia, Tuva, and the southern Urals (Ermakov, 1992; Fordyce, 2005). Events of selenium toxicosis, observed in animal and human populations, are caused by the excessive uptake of this element together with plants (e.g., Astragalus and Happlopappus) serving as selenium concentrators (James et al., 1989). Such selenium toxicosis is manifested as the “alkaline disease”. In the Hubei province, China, events of the poisoning by natural environmental selenium (3–7 mg per day) were documented. The main manifestations of selenium excess are as follows: instable emotional conditions, garlic scent from mouth and skin (due to the formation of dimethyl selenide), nausea and retching, abnormalities of the function of the liver, erythema of the skin, rhinitis, bronchoalveolitis and edema of the lungs (due to breathing the selenium vapor), hair loss, and nail fragility (Fordyce, 2005).
3.3.7. Strontium Strontium is a soft, extremely reactive silver-white or yellowish metal. It naturally as
strontianite, SrCO3, celestite, SrSO4, and tausonite, SrTiO3 (Perkins, 2002). The adult body contains about 320 mg of strontium. About 99% of this element is
deposited in bone and connective tissue. Recommended dietary intake of Sr for adults is about 2 mg/day (Nielsen, 2004).

Geochemical Anomalies: Sickness and Health 83
There are no data on an effect of the strontium deficiency on human health. In rats, the strontium deficiency leads to growth inhibition, bone damages, and teeth calcification resulting in a higher frequency of caries (Nielsen, 2004).
Bgatov (1999) assigned Sr to a group of elements called “abiogenic competitors” (Table 2.1). These elements have been used in metabolic processes of ancient marine species. During the course of evolution, nature “replaced” them with the lighter and more reactive Ca. However, abiogenic competitors remain an ability to substitute Ca in metabolism of land species leading to pathologies. The strontium ions, substituting calcium ions in hydroxylapatite, Ca5(PO4)3(OH), the main constituents of the mineral matter of bones, can lead to strontium rickets accompanied with the disturbance of calcium metabolism and the phosphorus-calcium balance in the body as well as increased bone fragility (Cabrera et al., 1999; Nielsen, 2004). The most peculiar feature of such diseases is the development of a retrograde change of bone-joint system during the growth and development of the organism, e.g., symmetrically deforming osteoporosis because of a delay in the growth of bones on the part of metaepiphyseal cartilages.
There are regional differences in the strontium content of human bones depending on the strontium content in local bedrocks and groundwater (Turekian and Kulp, 1956). Increased strontium contents and Sr/Ca ratios in bedrocks, soils, and water supplies may lead to the development of bone diseases in local populations. For example, human chondrodystrophy and rickets and animal osteoporosis were observed in some regions of Tajikistan with high Sr/Ca ratios of bedrocks (Kovalsky, 1974, pp. 188–189). Yudakhin and Malov (2008) reported an increased incidence rate of osteoporosis in some areas of the Arkhangelsk Region, Russia. There are increased strontium contents (up to 50 mg/L) in local ground- and surface waters due to high strontium contents in local Upper Permian rocks (up to 2.4 g/kg).
In the present view, Kashin-Beck disease – endemic degenerative osteoarthrosis – is caused by selenium deficiency (see historical review and bibliography in Allander, 1994) (Section 3.3.6). However, it was proposed that Kashin-Beck disease is mainly associated with the replacement of Ca2+ of bone tissue by Sr2+ (Vinogradov, 1939; Avtsyn, 1972). In the Urov River basin, soils indeed are depleted in Ca and enriched in Sr: compared to chernozemic soils, the Urov soils are marked by 36 times higher Sr/Ca ratio, 21 times lower content of Ca, and 3–4 times higher content of Sr (Kovalsky, 1974, pp. 193–194). We suppose that both selenium and strontium hypotheses of the origin of Kashin-Beck disease calls for further investigations.
3.3.8. Iodine Iodine is a grayish-black nonmetallic element. It as iodates, iodides, and other combined
forms. Iodine compounds are constituents in seawater, brines, and minerals of the Chilean nitrate deposits. Seawater contains about 0.05 ppm of iodine. Some gas-field brines contain from 30 to 1,300 ppm of iodine. The Chilean nitrate deposits in the Atacama Desert contain the following iodine minerals: lautarite, Ca(IO3)2, dietzeite, Ca2(IO3)2·(CrO4), and bruggenite, Ca(IO3)2·H2O (Krukowski and Johnson, 2006).
The adult body contains about 20 mg of iodine. Of this, about 15 mg are stored in the thyroid gland. About two-thirds of this content resides in the thyroxin (Delange, 1994). Recommended dietary intake of iodine for adults is about 0.15 mg/day (Mertz, 1981).

Iosif F. Volfson, Wolfgang Paul and Igor G. Pechenkin 84
The excess of the iodine content can be related to its surplus intake with food and metabolic disorders. The iodine excess can be manifested as follows: development of the goiter, hyperthyrosis, thyrotoxicosis, headache, weariness, fatigue, depression, numbness and skin tingling, rash, acne, the aseptic inflammation of mucus in the iodine-rich places, such as the respiratory tract, salivary glands, and perirhinal sinuses (Fuge, 2005).
About 1 billion of the world’s population suffers from iodine deficiency (Figure 3.1). Communities in upland areas are commonly afflicted by iodine deficiency, because this element is easily leached from thin upper soils in exposed areas during high rainfall. The main reason for iodine deficiency in the human body is an insufficient level of this element in food and water. This induces the iodine-deficiency diseases (endemic goiter, hypothyroidism, dysthyreosis, cretinism), which are accompanied by functional and structured disorders. Main manifestations of iodine deficiency are as follows: high production rates of thyroid gland hormones, goiter formation, sleepiness, edema of the face, limbs, and trunk, high cholesterol levels, brachycardia, constipations, skeletal deformation, hearing loss, palsies, reduction of fertility, still birth, innate anomalies of the development, high rate of prenatal death, and a reduction of the intellectual level (Avtsyn, 1972; Stanbury and Hetzel, 1980; Aggett and Rose, 1987; Delange, 1994; Fuge, 2005).
Interrelationships between natural and technogenic geochemical anomalies can lead to distinctive consequences. For example, there are iodine-depleted soils in Polesie, the vast swampy area surrounding the Chernobyl Nuclear Power Plant in Ukraine and Belarus. During the Chernobyl accident on April 26, 1986, more than half of the radioactive iodine in the reactor was released into the atmosphere. Endemically, thyroids of persons that lived in Polesie have been in hypothyroid conditions. Thus, thyroids have intensively begun to accumulate iodine radioisotopes. It was found that a combined effect of the endemic iodine deficiency and internal ionizing radiation, induced by iodine radionuclides, accumulated in thyroids during the accident, increase the incidence rate of thyroid diseases including cancer (Sivachenko et al., 2003).
3.3.9. Uranium Uranium is a silvery-white metal. Its low levels can be found within all rocks, soils, and
waters. The main uranium sources are granites and their acid volcanic analogues (felsites and rhyolites). The uranium content in natural water is as much as 5 µg/L in some territories, and reaches 25 µg/L in Thuringia, Germany. Uranium particularly occurs as uraninite, UO2–U3O8, carnotite, K2(UO2)2(VO4)2·3H2O, autunite, Ca(UO2)2(PO4)2·10–12H2O, and coffinite, U(SiO4)1–x(OH)4x (Dahlkamp, 2009).
The adult body contains about 22 mg of uranium. Main uranium depots are spleen, kidneys, skeleton, and liver. A daily intake of U varies from 1 to 5 mg (Taylor and Taylor, 1997; Anke et al., 2009). After ingestion, most uranium is excreted within a few days. A small fraction (0.2–5%) is deposited in the bones and kidneys. Uranium deposited in bones can remain there for years (Figure 3.4).

Geochemical Anomalies: Sickness and Health 85
Figure 3.4. Uranium oxide globules (shown by arrows) on dental tissue (Volfson and Bakhur, 2007). Uranium was reduced and impregnated in the bacteria-inhabited dental calculus of a mineralogist with 40-yr-long service period. Scanning electron microscopy image x15,000 by V.T. Dubinchuck (Fedorovsky All-Russian Research Institute for Mineral Resources, Moscow, Russia; reproduced with kind permission of the author).
Exposure to high uranium concentrations has both chemical and radiological risks. The chemical risk is associated with the binding of U with biomolecules (Craft et al., 2004; Brugge et al., 2005). The radiological risk is serious for lungs and bones (UNSCEAR, 2000), since U deposited in bone can lead to bone cancer because of the persistent irradiation (half-excretion time of U from bone is ~300 days).
Danger arising from the chemical toxicity of uranium is generally more widespread than the risks from its radioactivity (Craft et al., 2004; Brugge et al., 2005). Upon entering the human organism, U affects all organs and tissues, because it is a constitutional cell poison. Symptoms of uranium poisoning are mainly manifested as damage of the kidneys (the appearance of protein and saccharides in urine and the subsequent extrarenal oliguria). Gastrointestinal tract and liver are also affected. Chronic uranium intoxication can provoke the disturbance of hematosis and the nervous system. Cancer is the most remarkable effect of uranium toxicity.
There are no data on endemic diseases related to uranium. An epidemic situation might be worse at outcrops of uranium-bearing rocks because of an immune suppression due to a uranium intoxication and irradiation. This supposition may be confirmed by data on the health of uranium miners and the population living next to uranium mining operations (Brugge and Goble, 2002; Tatz et al., 2006). However, some epidemiological studies testify to decreased rates of morbidity in territories with an enhanced level of the natural terrestrial radiation (Nambi and Soman, 1987). According to a concept of radiation hormesis, low doses of natural ionizing radiation are necessary for living beings, since they stimulate vital functions of an organism, particularly, the immune system (Luckey, 1991) (Section 2.4.1). Thus, this issue calls for further investigations.

Iosif F. Volfson, Wolfgang Paul and Igor G. Pechenkin 86
3.3.10. Radon Radon, the result of radium decay, is a heavy colorless odorless gas. It accumulates in
underground cavities, mines, basements, and poorly ventilated houses constructed from materials with an increased natural radioactivity, such as granites enriched with U (Section 3.3.9). After exposure on the Earth’s surface, Rn is dissipated in the atmospheric air.
Radon is one of the most striking examples for the dependence of geological biotropic factors on geodynamical activity. Although radon release occurs in any point of the land surface, increased levels of soil radon can be usually observed along active faults and fracture zones (Moussa and El Arabi, 2003). Besides, radon emission via active faults increases prior to earthquakes (Osika, 1981; King et al., 1996). Soil radon levels are modulated by luni-solar tides (Crockett et al., 2006).
The most stable isotope of radon is 222Rn with a half-life of 3.825 days. Radon decays with α-radiation and forms a series of decay products with α- and β-radiation: 218Po, 214Pb, 214Bi, and 214Po. The health hazard from radon comes from these radionuclides, especially 218Po and 214Po, possessing high energies. 218Po and 214Po may attach to the inner lining tissues of lungs or gastrointestinal tract after radon inhalation or ingestion of radon-enriched water. The radionuclides continue to decay with α-radiation. It can damage cells in the tissues, create free radicals, and induce DNA damage leading to mutations (Cothern and Smith, 1987; UNSCEAR, 2000; Appleton, 2005).
It is believed that Rn accounts for a 40% dose of the irradiation received by the population from natural sources of radiation. This gas allegedly represents the second most important risk factor for lung cancer, next to smoking. The mortality rate for lung cancer induced by radon irradiation is 13,000 people in the USA, around 3,000 in England, and more than 20,000 in India. On the other hand, epidemiological research testified that some territories with enhanced levels of soil radon gas are marked by decreased rates of cancer morbidity (Cohen, 1995). There are also contradictory data concerning geochemical triggers of multiple sclerosis: Warren (1963) presented evidence that a prevalence rate of multiple sclerosis increases in areas with lead-enriched bedrocks and soils, whereas Bølviken et al. (2003) established links between the morbidity rate of this disease and the indoor radon content in Norway.
Despite this controversy, Rn is used in medical practice (Tsarfis, 1991; Franke et al., 2000; Falkenbach et al., 2005; Erickson, 2007). Natural mineral waters containing Rn are used in spas for bathing (Table 3.2). Such waters are divided into four groups based on radon activity: very weak (0.75 kBq/L), weak (1.5 kBq/L), medium (7.5 kBq/L), and high (above 7.5 kBq/L). Radon is also applied by inhalation in caves with natural radon concentrations in air of 30–160 kBq/m3. The famous radon spas are Tskhaltubo (Georgia), Jalalabad (Kyrgyzstan), Baranovichi (Belarus), Baden-Baden (Germany), Karlovy Vary and Jáchymov (Czech Republic), and Belokurikha (Russia).
Radon baths are used to treat diseases of the musculoskeletal, dermatological, and nervous systems, cardiovascular and gynecological diseases, and thyroid overactivity. Transcutaneous resorption or inhalation of radon may be enhanced by heat or CO2. Most of the incorporated radon is discharged by exhalation. The remainder is effective in body tissues through radon decay.

Table 3.2. Main types of radon mineral waters in Russia and Kyrgyzstan (Tsarfis, 1991)
Location Rn content, kBq/L
Chemical composition, mg/L Temperature, °C pH
H2SiO3 CO2 Cl– HCO3– SO4
2– F– Na+ + K+ Ca2+ Mg2+
Pyatigorsk, the Caucasus 4.2 63 41 30 27 67 25 20 6.6
Uvildy, the Urals 4.3–6.7 32 56 46 36 5.8 6.9
Lipovka, the Urals 0.75 5 93 19 55 29 5 16.5
Belokurikha, Altai 0.01 52 23 34 52 95 3 42 9.2
Balyrinka, Transbaikalia 0.3 79 56 14 60 29 21 45 9.5
Molokovo, Transbaikalia 1.0 49 1,100 87 49 63 21 1 5.6
Ust-Kut, East Siberia 0.37 95 5 94 4 7 7.2
Jety-Oguz, Kyrgyzstan 1.75 94 6 52 48 39 7.4

Iosif F. Volfson, Wolfgang Paul and Igor G. Pechenkin 88
For medical purposes, of particular interest are the short-life products of radon decay, such as 218Po, 214Pb, and 214Bi with half-lifes of 3.05 min, 26.8 min, and 19.07 min, respectively. Together with minerals and salts, these radionuclides induce intrinsic transmutation in the organism of a sick person. The so-called active pellicle, formed on the human body during a radon bath, acts for around 3 h, rendering a beneficial effect on the human organism.
The apparent contradiction between negative and positive health effects of Rn exemplifies the concept of radiation hormesis (Luckey, 1991): low doses of ionizing radiation stimulate living beings, whereas high doses suppress them (Section 2.4.1).
3.3.11. Volcanic Gases Volcanic activity is clearly associated with degassing of the Earth (Section 10.4) and
geodynamical activity (Figure 3.2). Products of volcanic and geothermal activity – various gases (e.g., H2S, SO2, HF, HCl – Symonds et al., 1994), lava, bombs, lapilli, ash, and tephra – are sources of the environmental risk. These products can be hazardous for biota due to an influence of suspended minerals, toxic elements, gases, and acids on organs and tissues of living organisms as well as a mechanical impact on biota. They also pose short- and long-term problems for human health, creating a potential for endemic diseases, such as dental and skeletal fluoroses, respiratory diseases (mucus affection, acute and chronic silicosis, asthma, and pulmonary edema), eye diseases (keratitis, blepharitis, conjunctivitis, ophthalmosilicosis, and cataract), and death from asphyxia and intoxication (Cronin et al., 2003; Weinstein and Cook, 2005).
Consequences for human health pertaining to products of volcanic activity depend on various factors. Among these are the nature, type, and duration of eruption, as well as chemical and physical parameters of the volcanic products: size, morphology, crystallochemical and physical properties of ash particles, valence state of elements, chemical composition of the toxic ions, concentration of elements and their solubility, pH and Eh values of ground- and surface water solutions (Carapezza et al., 2003; Weinstein and Cook, 2005; Durand and Wilson, 2006; Amaral et al., 2008).
In terms of the hazard level of volcanic products, the leading role belongs to volcanic gases and gaseous substances (gases, vapor, aerosols, fumes, and smokes). These gases can easily react with the water vapor and other chemical materials producing acids and volatile compounds. They also transport various metals (including the toxic ones, such as Hg, As, U, etc.) formed during eruptions.
Volcanic gases clearly possess almost unavoidable irritating effects on the human skin, eye, and respiratory organs. Even a special defensive uniform of volcanologists does not protect them from the influence of some gases (e.g., HCl and HF). In small doses, their influence is expressed as irritation of the eye and throat. Higher doses can provoke the ulcerous disease of mucous membrane and respiratory tract with the probability of even lethal outcome because of pulmonary edema and laryngospasm.
CO2 and H2S are the most dangerous gaseous products of volcanic activity (Carapezza et al., 2003). They both pertain to a group of asphyxiating gases heavier than air. They can become concentrated near the Earth’s surface and lead to death of people and animals from asphyxia. CO2 is concentrated in potentially hazardous volcanic areas. In this case, the soil

Geochemical Anomalies: Sickness and Health 89
and plants are subjected to its detrimental effect. For example, the slope of Mammoth Mountain, California was subjected to deforestation because of the concentration of CO2 emitting from the depth along faults (Cook et al., 2001). Examination of morbidity data on the city of Rotorua, New Zealand located on the geothermal field revealed possible health impacts of gas emissions (Bates et al., 1998; Durand and Wilson, 2006).
However, a carbon dioxide deficiency in the organism leads to spasticity causing various diseases. Thus, dry carbon dioxide baths are indicated in ischemic heart disease, hypertonic disease, and asthma (Zhirov, 1983; Barashkova et al., 1989). Dry carbon dioxide baths are performed in an isolated sitting box with CO2 content of 15–25% and temperature of 35–40° C; a patient’s head is placed out of the box. For example, such treatment of patients with myocardial infarction normalizes hemodynamic parameters of cardiac output, reduces rhythm, and decreases systolic and diastolic arterial pressure (Barashkova et al., 1989). For the use of naturally carbonated and hydrogen sulfide mineral waters see Section 3.4.1.
Products of volcanic emission include several asphyxiating gases (e.g., CO, CH4, NO2, and CS2). Even a small concentration of CO is potentially lethal, because it easily enters into hematopoietic glands and damages the blood and vascular systems in the human organism. Together with CO and CO2, CH4 sharply decreases the essential oxygen concentration in the atmosphere. NO2 has a harmful influence on the respiratory system expressed as asthma and damage of the lower parts of the lungs. CS2 heavily affects the muscular system, causing headache and delirium. NH3, a water-soluble gas, causes irritation of the eye, skin, upper respiratory tract, and nasal and oral mucosa (Weinstein and Cook, 2005).
Products of volcanic eruption include ions of U easily reacting with the hydrofluoric acid forming uranium fluoride. It can possess a multifunctional toxic effect. Internal organs, such as the gastrointestinal tract, kidneys, lungs, reproductive organs, and bones, are strongly damaged by this acid. Products of volcanic emissions also contain other metals and metalloids, such as Pb, Sn, Ni, Pt, Sb, Na, and Ca, which may form ionic links with fluoride characterized by unpredictable effects on human health.
Acid rain is formed due to the emission of HCl and sulfur compounds into the atmosphere together with other volcanic products. Damage to human health is expressed in lesion of the skin integument, affectation of lung tissue, asthma, pneusis, and pulmonary edema. The situation is aggravated by the extensive spreading of the compounds and a consequent damage of the environment. First of all, soil and water sources are affected. Bioavailability of trace elements in soil can be altered. This can lead to disturbance of the human internal balance of trace elements, leading to various forms of microelementoses.
High concentrations of trace elements in the scalp hair are recorded for people living in volcanic regions. For example, population of the Azores exposed to volcanic emissions showed relatively high concentrations of Cd (96.9 ppb), Cu (16.2 ppm), Pb (3,417.6 ppb), Rb (216.3 ppb), and Zn (242.8 ppm). Strong correlations were also found for Cd–Rb and Pb–Rb pairs in the exposed population (Amaral et al., 2008). It is suggested that this type of exposure may be as harmful as living close to industrial facilities. The radius of a halo of high metal concentration formed during volcanic activity is variable. The most severe consequences for human health exist in the proximal zone (10–15 km) of the volcanic apparatus.

Iosif F. Volfson, Wolfgang Paul and Igor G. Pechenkin 90
3.4. Geological Products in Therapy Empirical data of many generations concerning medical properties of various geological
products have been embodied in systems of traditional medicines, such as Ayurveda (Murthy, 2003). Minerals are used in homeopathic formulations (Scholten, 1993). In the 19th–20th centuries, many of the traditional medical practices using geological products were found valid by evidence-based medicine and introduced to the practice of physicians in European countries.
In this section, we address healing effects of mineral and thermal waters, clays, muds, moor, sapropel, sands, flints, shungite, and salt. Like endemic-disease areas, a major portion of balneological resorts is located within geodynamically active regions (cf. Figures 3.5 and 3.2).
3.4.1. Mineral and Thermal Waters Mineral waters are waters enriched with naturally dissolved minerals and gases. The
formation of mineral waters depends on hydrogeological and geological settings, as well as climatic peculiarities of a region. The chemical composition of mineral water is defined by a complex of geological and geochemical processes, physico-chemical factors (e.g., chemical composition of the water source, types of aquiferous rocks, and concentration of dissolved salts), as well as deep magmatic and thermal-metamorphic processes responsible for temperature, ionic and gaseous content of the water, e.g., the generation and accumulation of CO2 in the water (Tsarfis, 1991; May et al., 1996).
In terms of total dissolved solids (TDS), mineral waters are categorized into five groups: low mineralized waters with TDS = 2–5 g/L, medium mineralized waters with TDS = 5–15 g/L, high mineralized waters with TDS = 15–35 g/L, brine waters with TDS = 35–150 g/L, and high brine waters with TDS > 150 g/L. The chemical content of mineral water usually includes various ions and trace elements (Pongü Text and Design, 1996–2009). However, the ionic composition of a mineral water is mainly defined by three anions (Cl–, SO4
2–, and HCO3
–) and three cations (Na+, Mg2+, and Ca2+). Thus, a common classification of mineral waters is based on their predominant ionic composition: bicarbonate, sulfate, sulfurous waters, etc. If more than one ion dominates, one can distinguish sodium-chloride, bicarbonate-sulfate waters, etc. (Tsarfis, 1985; Petraccia et al., 2006). Mineral waters can also be classified according to their enrichment in gases, such as CO2, H2S, Rn, and CH4. Finally, mineral waters can be categorized according to the temperature in a spring: very cool (0–4° C), cool (4–20° C), low thermal (20–35° C), thermal (35–42° C), hot (42–100° C), and very hot (more than 100° C).
In balneotherapy, mineral waters are used for drinking, bathing, inhalation, and drainage. Low and medium mineralized waters are commonly applied for drinking therapy, whereas high mineralized waters and brines are given for external use only. Low thermal and thermal waters are directly used, whereas waters of other temperatures are heated or cooled.
The therapeutic action of mineral water is associated with its ionic and gaseous content, temperature, as well as time and speed of administration.

Figure 3.5. Global distribution of balneological resorts and thermal waters. The map was compiled using on data from several sources (Tsarfis, 1991; Wikipedia contributors, 2009a, 2009b).

Iosif F. Volfson, Wolfgang Paul and Igor G. Pechenkin 92
In oral administration, there are three steps of the water action: (1) a local action of water on mucous membranes; (2) a reflexive and humoral action on various systems of the human organism via the digestive system; and (3) an alteration of the internal media and metabolism after the redistribution of the mineral water in the organism. In inhalations, a mineral water acts locally on the reparative system causing antispastic, antiinflammatory, and antiallergenic effects.
In bathing, the human body is exposed to thermal, chemical, and mechanical factors. Water influences the skin, a complex receptor organ, by a complex of neuroreflexive, capillaric, and humoral mechanisms. This stimulates the generation of mediators (e.g., serotonin, bradykinin, histamine, and acetylcholine) and causes functional, metabolic, and immune responses. Ions and gases of the mineral water easily penetrate the skin. Then, they influence particular organs, tissues, and the entire organism through the blood (Tsarfis, 1985, 1991).
Diseases of various nosologies are treated by mineral waters (Tables 3.3 and 3.4) (Tsarfis, 1985; Petraccia et al., 2006). For example, bathing with naturally carbonated mineral waters (contain >0.75 g/L of CO2) redistributes the blood, expanses skin capillaries, reduces arterial pressure, and increases the tonus of the parasympathetic nervous system. Naturally carbonated waters are used in baths to treat heart diseases and peripheral vasculopathies. Bathing with hydrogen sulfide mineral waters (contain >10 mg/L of H2S) regulates the blood circulation and the functional state of the nervous system, as well as produces antiinflammatory action and desensibilization. Bathing with hydrogen sulfide waters are indicated to treat vascular, musculoskeletal, nervous, dermatological, and gynecological diseases (Tsarfis, 1985).
Table 3.3. Medical effects and indications of drinking mineral waters according to their
predominant ionic composition (Tsarfis, 1991; Petraccia et al., 2006)
Predominant ions Indications and effects HCO3
– Indicated in hydrochloric-peptic hypersecretion and gastro-esophageal reflux disease. Neutralize acid secretion, accelerate gastric empting, and provoke the release of gastric peptides. Neutralize metabolic acidosis in decompensated diabetes.
SO42– Indicated in chronic constipation. Stimulate intestinal motility.
Facilitate cholecystokinin release. SO4
2– – HCO3– Indicated in gall bladder hypokinesis, biliary sand, and post-
cholecystectomy syndrome. SO3
2– Indicated in diabetes. Decrease glycemia, polydipsia, and polyuria. Na+ – Cl– Indicated in constipation, irritable colon, and biliary pathology.
Stimulate intestinal peristalsis, intestinal secretion of water and electrolytes, biliary secretion, and bile inflow into duodenum.
Mg2+ Facilitate the hepato-biliary functions through choleretic, cholagogue, and cholecysto-kinetic effects. Indicated in premenstrual syndrome, climacterium, and post-menopausal osteoporosis.
Ca2+ Indicated in calcium deficiencies (children, pregnant women, menopause, old age, osteoporosis).
Fe2+ Indicated in sideropenic anemia and hyperthyroidism.

Geochemical Anomalies: Sickness and Health 93
Table 3.4. Health benefits of hot spring bathing (after Finkelman, 2008)*
Type of spring Disease susceptible to treatment
Sim
ple
hot
Chl
orid
e
Hyd
roge
n ca
rbon
ate
Sulfa
te
Car
bon
diox
ide
Iron
Sulfu
r
Aci
d
Rad
on
Neuralgia + + + + + + + + + Muscular pain + + + + + + + + + Movement paralysis + + + + + + + + + Frozen shoulder + + + + + + + + + Joint diseases + + + + + + + + + Bruise + + + + + + + + + Chronic digestive diseases + + + + + + + + + Hemorrhoids + + + + + + + + + Catarrhal diseases + + + + + + + + + Skin cracks + + + + + Skin burns + + + + Chronic skin disease + + + + + Gynecological diseases + + + Arteriosclerosis + + + + Hypertension + + + Menstrual disorders + Diabetes + Gout + Chronic cholecystitis + Cholelithiasis +
* © Finkelman, 2008; reproduced with kind permission of the author; additional credits to M. Takeuchi, National Institute for Advanced Industrial Science and Technology, Japan
Waters produced by volcanic activity are also used in balneology. Fumarolic waters
contain free H2SO4, HCl, Cl–, SO42–, and complex cations (Fe and Al dominate). They are
characterized by a prominent acid reaction (pH < 3) and various degrees of mineralization (up to 25 g/L). The acid thermal springs are enriched in Fe (150–250 mg/L), Al (100–130 mg/L), and H2SiO3 (300–400 mg/L). Such waters are used in “Acid Spring”, a spa on Kunashir Island, Russia (Tsarfis, 1991).
For information on radon mineral waters see Section 3.3.10. Deposits of carbonate water are known in Russia (Transbaikalia and the Far East), the
Pamir region, and Central Asia. Sulfide water deposits occur in the Kola Peninsula and North Caucasus, Russia. Chloride-sodium mineral waters are typical for the Crimea and the northern Black Sea Coast area. Deposits of thermal water are located in the areas of modern volcanism and young orogeny in the Alps, Balkans, Iceland, Italy, Russia (Kamchatka, Kuril Islands, and Caucasus), Japan, etc. (Figure 3.5).

Iosif F. Volfson, Wolfgang Paul and Igor G. Pechenkin 94
3.4.2. Clays Clay minerals, plastic under wet condition and hard when dry, are hydrous aluminum
phyllosilicates, including variable amounts of Fe, Mg, alkali metals, and other cations (Velde, 1977).
Geophagia, the eating of clay, has long been viewed as pathological behavior. It has been claimed to be a cause and a consequence of anemia (Halsted, 1968). However, clay consumption may also be considered as an intuitive adaptive behavior due to antidiarrheal, detoxification, and mineral supplementation potentials of clay minerals (Reid, 1992).
Indeed, clays are used in pharmacology. Clay minerals are utilized in pharmaceutical formulations of orally administered gastrointestinal protectors, laxatives, and antidiarrhoeaics, as well as topical applications (dermatological protectors and cosmetics). Clays are also applied to clean and moisturize the skin and to treat lipodystrophy, acne, and cellulite. In pharmacology, clays are used as active principles and excipients, since clay minerals are marked by a high specific area, high sorptive capacity, chemical inertness, and low or null toxicity (Carretero et al., 2006).
Palygorskite and kaolinite – (Mg,Al)2Si4O10(OH)·4(H2O) and Al2Si2O5(OH)4, respectively – are used as gastrointestinal protectors adhering to the gastric and intestinal mucous membrane and absorbing toxins and bacteria. Laxatives based on smectites, ((Mg0.33Al1.67)2(OH)2(Si2O5)2)·Na0.33(H2O)4, act by osmosis, irritation of the small bowel, colon, and rectum. Palygorskite and kaolinite are also used as antidiarrhoeaics due to high capacity of water absorption. Kaolinite, smectites, and talc, Mg3Si4O10(OH)2 are used as dermatological protectors (powders, creams, and ointments): these minerals adhere to the skin forming a layer, which protects it against external agents (Carretero et al., 2006).
Clays are widely used in spas. For example, treatment of rheumatism and arthritis with hydrothermal clayish mud is practiced in Hveragerði, Iceland (Kristmannsdóttir and Geptner, 2008). Clayish matter is mined from sedimentary beds formed by the washing and sedimentation of hydrothermally altered hyaloclastites. The clay minerals are mainly represented by dioctahedral smectites. The composition of petrogenic elements is similar for most of the hydrothermally altered hyaloclastites and sediments, whereas the contents of some trace elements (Au, As, Se, Sb, and Hg) differ notably from one site to another. Increase in some elements in the sediments is attributed to an active influence of bacteria and fungi.
In the Theistareykir and Námafjall geothermal fields, Iceland, the major clay minerals are kaolinite and smectite in areas of the present-day fumarolic activity, whereas the redeposited talus-proluvium sediments are mainly composed of smectites. Increased contents of some trace elements in the hydrothermally altered sedimentary deposits can be related not only to the water-rock interaction, but also to the bacterial metabolism and local biochemical enrichment in Se, As, Sb, Br, I, Au, and Ag. In Theistareykir, this is confirmed by the association of Ag, C, and remnants of mineralized bacteria in smectites and iron hydroxides (Kristmannsdóttir and Geptner, 2008).
3.4.3. Muds Muds (peloids) are pastes produced by natural mixing of clayey materials with the sea,
salt-lake, or mineral waters, accompanied by organic materials produced by microorganisms

Geochemical Anomalies: Sickness and Health 95
during the maturation process (Tsarfis, 1985; Veniale et al., 2007). Maturation implies modification of the water-clay environment (pH, Eh, temperature, light exposure, and hydrologic regime) and development of the new growth of microorganisms (i.e., diatoms, cyanophyceae, bacteria, and protozoa) and their metabolic products. The thermophylic microorganisms, colonizing the maturing mud, concentrate within its several upper centimeters. Their type and density particularly depend on the lasting time and sunlight exposure (Veniale et al., 2004). In natural conditions, muds are usually produced at pools in geothermal areas as well as salt lakes or lagoons, e.g., Lakes Moinaki, Saki, and Aji Gol in the Crimea.
Peloids include three main components: mud solution, coarsely dispersed component, and finely dispersed component (a colloidal complex). The mud solution contains dissolved salts, organic matter, and gases. TDS of solution varies from 0.01 to 400 g/L, depending on the mud type. Most of dissolved salts consists of three anions (Cl–, SO4
2–, HCO2–) and three
cations (Na+, Mg2+, Ca2+). The coarsely dispersed component includes particles of size from 0.001 to 0.01 mm. These are salt crystals, gypsum pieces, former plant substances, and organic substances. The finely dispersed component includes particles (<0.001 mm) of organic and mineral compounds (iron sulfide, silica, etc.). The colloidal content varies from 4% to 20% (Tsarfis, 1985).
Organic and mineral components of peloids exist in the solid, liquid, and gaseous states. The organic matter occurs as the solid colloidal component. It includes humic substances, fat acids, bitumen, amino acids, and asphaltogenic substances. The mineral component consists of hardly soluble minerals and salts. It includes siliceous and calcareous substances, compounds of Fe, S, Mn, P, and N, as well as trace elements (e.g., I, Br, Pb, and Mo). Gases (H2S, CO2, N2, and O2) exist in the free and soluble states. They are produced by biological and chemical reactions.
Peloids render therapeutic effects due to their thermophysical properties, the presence of organic and mineral matter and biologically active elements (e.g., Fe, Cu, Al, and Co), amino acids, hydrocarbons, H2S, as well as hormone-, antibiotic-, and vitamin-like substances. Peloids have a stimulatory, antiphlogistic, and analgesic action, as well as antibacterial and bacteriostatic properties. Pelotherapy consists in the local or generalized application of peloids for the treatment of chronic rheumatic processes, degenerative osteoarthrosis, dysendocrine arthropathies, myalgias, neuralgias, fractures, disorders following vasculopathies, psoriasis, and some other diseases (Tsarfis, 1985; Veniale et al., 2007). There are many pelotherapeutic resorts around the world. Among these are Rotorua (New Zealand), Vale das Furnas (Azores Archipelago), Eupatoria, Saki, Theodosia (Crimea), and others.
3.4.4. Moor The moor is a complex substance produced from plant tissues. First, plant tissues are
transformed into peat. Then it is transformed into a relatively little altered fibrous material, which is mainly composed of the water-insoluble part of the plant, e.g., lignin, cellulose, etc. The microbial transformation of this substance yields the final product called dopplerite, an alkaline humate. Along with a complex of humic acids and amino acids, the moor contains alkali salts, aluminum hydrates, sexual hormone substances, ferrous and ferric salts, fats, fat

Iosif F. Volfson, Wolfgang Paul and Igor G. Pechenkin 96
acids, penicillia, trace elements (e.g., B, Br, Cr, Cu, Ti, V, Zr, and Sr), vitamins, starch, and nitrogen compounds (Paul, 1970; Summa and Tateo, 1999).
The moor is used for both external and internal treatments. The moor-suspension bath (a suspension of peat in blackwater) is utilized to treat chronic gynecological diseases, chronic rheumatic diseases, neuritis, arthritis, arthrosis, prostatitis, skin diseases, exhaustion, and metabolic disorders. The moor drink is generally used to treat gastric and intestinal disorders (e.g. ulcers, gastritis, and duodenitis), activation of the liver, kidney, and gall bladder, and a general systematic improvement. One of the most famous moor deposits is located at Neydharting in Austria (Paul, 1970).
Scientific proofs of the usefulness of the moor therapy are still limited. Kübler (1991) demonstrated that humic acids extracted from the air-dried moor peat have the inhibitory effect on the intrinsic coagulation system. She proposed that excessive fibrin production, induced by activated coagulation factors of the intrinsic system, may be interrupted with humic acids. Thus, if postoperative adhesion is induced by an enhanced production of fibrin, the adhesion may be prevented by the moor therapy.
Peat is used in pharmaceutical formulations as active principles, since peat extracts have antiulcerogenic, antiradical, and antitoxic effects. Peat medicaments are particularly indicated for treatment of keratitis, chorioretinitis, and vascular and degenerative processes in the retina (Schepetkin et al., 2002).
3.4.5. Sapropel Sapropel, freshwater lake silt, is a bottom lacustrine deposit originating from residues of
water plants and animals, fragments of higher plant tissue, pollen, sand, clay, and various minerals. A mineral part of sapropel consists of clay and sand transformed during oxidizing and reductive reactions. The organic part resulted from anaerobic biochemical decomposition of the biomass and its re-synthesis by microorganisms. Sapropel contains not less than 15% of organic substances (e.g., lignin–humus complex, carbohydrates, and bitumen) in the dry residue (Tsarfis, 1991; Schepetkin et al., 2002).
Like muds and moor, sapropel is used in pelotherapy in suspension baths and applications to treat diseases of the musculoskeletal, dermatological, and nervous systems (Serov and Tereshin, 1985; Ivanova et al., 1997; Samutin, 1997). Therapeutic properties of sapropel are similar to those of fulvic and humic acids (Section 3.4.4) including antibacterial, antitoxic, antiradical, antiulcerogenic, antiarthritic, immunomodulatory, and antiinflammatory effects. Sapropels are used in pharmaceutical formulations as active principles, which are particularly indicated to treat chronic radiculites, plexitises, neuralgia, rheumatoid arthritis, arthroses, paranasal sinuses, and rhinitis (Schepetkin et al., 2002).
3.4.6. Sands Sands are composed of mineral particles ranging in diameter from 0.0625 to 2 mm. Most
beach sands consist of quartz, SiO2. Heavy mineral (black) sands contain various minerals, such as rutile, TiO2, zircon, ZrSiO4, monazite, (Ce,La,Pr,Nd,Th,Y)PO4, etc. (Rao, 1957; El-Hinnawi, 1964; Moss, 1966).

Geochemical Anomalies: Sickness and Health 97
Sands are used for sand bathing (ammotherapy) in various regions of the world, particularly in Grado, Italy and Safaga and Aswan, Egypt. Sand bathing can be effective in therapy of acute and chronic arthritis, rheumatism, psoriasis, and skin inflammations (Soldati et al., 1968; Dilixat et al., 2001; Zunnunov et al., 2007). In Safaga region (the Red Sea coast), black sands are collected from the top surface of shore sediments. They are dried and mixed with beach sands. Patients’ bodies are covered with a sand layer and exposed to the sun for about 4 h per day. This daily treatment is carried out for about a month depending on the case (El-Arabi, 2005).
The healing effect of the local black sands is attributed to a complex of microclimatic and geochemical factors, including an increased natural radiation of the sands. They contain U, Th, and 40K. Thorium and uranium are mainly presented as secondary components of monazite, zircon, and xenotime, YPO4, whereas potassium is presented as feldspar, KAlSi3O8, and mica (El-Arabi, 2005). For therapeutic sands, the absorbed dose rate of gamma radiation ranges from 32.9 to 63.4 nGy/h in Aswan and Safaga, respectively. Average activity concentration of 238U, 232Th, and 40K were estimated as 10.4, 18.5, and 1,086 Bq/kg in Safaga as well as 28.5, 9.1, and 340 Bq/kg in Aswan (El-Bahi et al., 2005).
3.4.7. Flints Flints – hard, usually dark stones with glassy appearance – are sedimentary
cryptocrystalline forms of quartz generally occurring as nodules in sedimentary rocks (McBride, 1979).
Application of flints for the biological activation of water reduces the time of therapy and raises the efficiency of the treatment of various diseases. It was particularly proved that water infusions of flints possess a dramatic effect of protection against ionizing radiation (Zhavrid et al., 1998). Prolong use of water infusions from flints by healthy animals before the total γ-irradiation (6–8 Gr) increased resistivity of their organisms and considerably reduced effects from the ionizing radiation.
We studied mineralogical, geochemical, crystallochemical, and microbiological properties of flints from sedimentary formations of the East European Platform (Volfson et al., 2008). Clumps of fossilized bacteria were recorded in flints. The number of bacteria depends on the crystallochemical properties of mineral polymorphs of the fine-grained silica. Existence of areas of the structured polymorphs of silica, on the one hand, and increased amounts of fossilized bacteria, on the other, were suggested by high concentrations of some trace elements (e.g., Cu, Ni, Co, and U) in the studied flints (Volfson, 2004; Volfson and Zenova, 2004).
Examination of the biological activity of various mineral species of flints demonstrated that this is an effect of the antimicrobial activity of actinomycetes, inhabitants of chalcedony flints, producing biologically active substances (e.g., antibiotics). Staphylococcus aureus stock (UV-2 mutant stock) was used as a test organism in experiments with antimicrobial activities of actinomycetes. Antagonism to this stock was most clearly shown by streptomycetes of Cinereus section, Violaceus series from a chalcedony flint sample of parental Upper Cretaceous rocks. The lyses zone of S. aureus (a zone of the absence of the growing test organism) was equal to 20 mm around a block of the growing actinomycete.

Iosif F. Volfson, Wolfgang Paul and Igor G. Pechenkin 98
Mycetin, one of the first antibiotics, has been extracted from actinomycetes Streptomyces violaceus by Krassilnikov and Koreniako (1939). This suggests that actinomycetes grown on flint materials may be used to produce a new type of antibiotics and other biologically active materials. A probable reactivation of biological activity of bacteria in the flint water infusion with healing properties remains to be investigated.
3.4.8. Shungite Shungite is a group of black Precambrian rocks containing a poorly crystalline carbon
(30%), silicates (70%), and a group of trace elements (e.g., Fe, Ti, V, Ni, Cu, and Zn) (Buseck et al., 1997; Kovalevski et al., 2001).
The only shungite deposit is located on the bank of Lake Onega near the city of Petrozavodsk, Russia. The first Russian spa, “Marcial Waters”, was established there in the 18th century by Peter the Great, who empirically defined medical characteristic of groundwater contacting with or passing through shungite rocks. The shungite water can be classified as ferric mineral water with the average content of Fe+3 of about 76 mg/L (up to 2,600 mg/L). It also includes rather high concentrations of Al, Cu, Ni, and Zn: up to 220, 20, 48, and 230 mg/L, respectively (Tsarfis, 1991; Charykova et al., 2006).
Shungite water is recommended for the prophylaxis and treatment of diseases of the gastrointestinal tract, locomotor apparatus, and liver, nervous and reproductive system, as well as for curing allergy, asthma, and diabetes. The medical effect of shungite is associated with the presence of the fullerene component in its structure. During contact with water, fullerenes together with C and trace elements pass into the water in minor doses (Rysyev, 2001). Antibacterial properties of the shungite water can be connected with the high concentrations of heavy metals (Charykova et al., 2006).
Shungite by itself is used in pharmaceutical formulations to treat skin lesions, cosmetics, and water filters (Rysyev, 2001).
3.4.9. Salt Table salt (halite, NaCl) plays an important role in digestion and metabolism. In
particular, it is necessary for the replenishment of HCl in gastric juice. Usually, a human consumes 7-9 kg of salt annually. Salt is a complex mineral system. Besides 90–97% of halite, it includes tens of soluble and least soluble minerals, such as sylvite, KCl, carnallite, KMgCl3·6H2O, bischofite, MgCl2·6H2O, anhydrite, CaSO4, gypsum, CaSO4·2H2O, calcite, CaCO3, etc. (Yushkin, 2003). Thus, table salt is one of the main sources of trace elements for the human being.
A healing factor of speleotherapy – a complex of procedures based on the use of salt as a healing component – is related to a specific microclimate in a speleological infirmary (Chervinskaya and Zilber, 1995; Alföldy et al., 2002). The air temperature is 18–22° C, the air humidity is about 75%, the air is flowing, and there is a high concentration of light ions in the salt mine atmosphere: about 760–960 light negatively charged ions per 1 cm3 of the salt

Geochemical Anomalies: Sickness and Health 99
mine air, in contrast to 115–160 air ions per 1 cm3 of the atmospheric air. An important factor defining the therapeutic effect of salt caves is the absence of microbes and allergens in the air.
Speleotherapy is used for the treatment of chronic lung diseases, which accompany disorders of secretion and excretion of phlegm, acute chronic bronchitis, asthmatic bronchitis, inflammation of nasopharynx and upper respiratory tract, immune deficit in children, and allergic skin diseases. The main effects of speleotherapy consist in the promotion of anti-inflammatory, broncholytic, and mucolytic actions, immune correction, sedation, normalization of functioning of the central nervous system, blood pressure reduction, and metabolic stimulation (Chervinskaya and Zilber, 1995).
Cave resorts are widespread in Europe. The most famous ones are located in the Permian salt formations of Poland, Ukraine, and Russia. Salt chambers are also popular (Hedman et al., 2006). The walls, ceilings, floors, and decorative elements of such rooms are usually made from sylvinite, a natural mixture of halite, sylvite, and some other salts of Na, K, Mg, and Ca.
3.4.10. Shilajit Shilajit, also known as mumie and brag zhun, is a semihard, blackish-brown resin-like
water-soluble substance with a distinctive camphor-like smell and bitter taste (Ghosal, 2006). It is usually collected from rock faces in mountain regions (e.g., the Himalayas, Hindu Kush, Altai, Urals, Sayan, and Caucasus), at elevations between 2,000 and 5,000 m. Shilajit is usually found in karstic and tectonic caves, cracks, and other cavities in fault zones with cataclastic and mylonitized rocks (Khasanov, 2006).
Shilajit is a complex natural mixture of organic (60–80%) and inorganic (20–40%) compounds. It is composed of more than twenty groups of biologically active substances (Frolova and Kiseleva, 1996). Among these are humus substances (e.g., humic and fulvic acids), dibenzo-α-pyrones (Ghosal, 1990; Schepetkin et al., 2002, 2003), essential oils, waxes, as well as organic, fatty, and amino acids. The total fatty acid content ranges from 0.37 to 3.90 mg/g. Myristic and lauric acids dominate: they range from 25% to 50% and from 4.9% to 37.0%, respectively, of all fatty acids (Kiseleva et al., 1996). The total free amino acid content ranges from 0.03% to 3.55% dry weight. Glycine and glutamin dominate: they range from 24.3% to 83.64% and from 3.24% to 23.91%, respectively, of all amino acids (Kiseleva et al., 1998). The mineral part includes the following elements: C (31.80–54.04%), H (2.14–6.20%), N (5.00–7.18%), S (0.20–3.84%), O (33.03–58.80%), K (9.13–18.93%), Ca (2.20–7.29%), Mg (5.5–7.0%), Si (1.53–4.03%), Al (1.34–1.54%), Mn (0.16–0.30%), P (0.04–0.10%), Sr (0.06–0.07%), and Ba (0.04–0.07%). Shilajit also includes up to forty trace elements: Cu, Ni, Co, Cr, Rb, Be, Li, Mo, Zn, W, Cd, In, Sn, Ti, Hg, Sb, Pb, B, Br (~25 mg/kg), As, Ag, V, Te, Ga, Gd, Zr (>5 mg/kg), Au, Ir, Bi, Sc, Se, Cs, Hf, Y, Yb, and Eu (Khasanov, 2006).
Such complex chemical content of shilajit is the determined factor of its unique medical properties. Shilajit has been used in Asian traditional medicines for about 3,000 years. It is a strong immunomodulator, antioxidant, antiinflammatory, and adaptogenic agent protecting the human organism against various stressors and improving recovery after diseases. Shilajit possesses the antimicrobial activity against staphylococci, streptococci, enterococci, and Proteus. It is used as a rejuvenator, tonic, aphrodisiac, antiseptic, diuretic, and as lithontriptic

Iosif F. Volfson, Wolfgang Paul and Igor G. Pechenkin 100
medicament. Shilajit is highly effective for regeneration, e.g., in the treatment of bone fractures. It is prescribed against gastrointestinal, genitourinary, and nervous diseases, diabetes, tuberculosis, chronic bronchitis, asthma, anemia, eczema, anorexia, osteoporosis, etc. (Schepetkin et al., 2002; Ghosal, 2006). Some pharmaceutical companies produce shilajit extract (Schepetkin et al., 2002).
There are several hypotheses of the shilajit origin. It has been proposed that shilajit is formed due to the long-term humification of either some alpine plants or excrements of alpine rodents. An idea of the marine origin of shilajit was put forward, which defines this substance as a paleohumus produced from marine invertebrate fossils (Ghosal, 2006). However, Savinykh (2003) established that origin of shilajit is associated with processes of the hydrogen degassing of the Earth (Section 1.2).
Long-standing research of shilajit deposits in the Mountain Altai, Russia, demonstrated that shilajit is a water-soluble bitumen generated from hydrocarbon fluids migrating via faults and fractures (Figure 3.6) (Savinykh, 2003, 2006; Savinykh et al., 2008).
Figure 3.6. Shilajit deposits of the Sarlyk dome, the Mountain Altai, Russia (after Savinykh, 2003, © Savinykh, 2003; reproduced with kind permission of the author).

Geochemical Anomalies: Sickness and Health 101
Fluid sources are domes of potassium-rich granitoids located at a depth of more than 30 km in rift and paleorift zones. Fluids sublimate into yellow-brownish powders. They are oxidized and washed off by meteoric water, and next congeal to resin-like forms on arches, walls, and bottoms of dry cavities. Then, microbiota and animals may transform primary shilajit ores.
Shilajit samples from different mountain regions have close average values of δ13C (-24.7‰) that support their similar origin (Khasanov, 2006). Deep-fluid origin of shilajit is evidenced by the following facts (Savinykh, 2003; Savinykh et al., 2008): (1) shilajit is marked by the high content of benzol bitumoid (up to 10%) and potassium (up to 12% of arcanite, K2SO4); (2) shilajit deposits are commonly located nearby occurrences of oil-like substances, such as hatchettite, asphalt, and ozokerite; (3) shilajit is commonly accompanied by films of chalk, gypsum, and fluorapatite; (4) cubic silicon carbide binding with graphite and diamond was observed in shilajit; and (5) caves and cavities with shilajit deposits are usually located at fault zones (Figure 3.6).
3.5. CONCLUSION There is a diversity of geochemical provinces and geochemical anomalies, viz., areas
marked by distinct contents of chemical elements and compounds in the environment, which influence vital functions of biota. The importance of the geochemical mosaic in the biological evolution cannot be overstated (Vinogradov, 1964). Abnormal concentrations of chemical elements in bedrocks, soils, and waters are persistently acting stress factors for living organisms. The stressors induce adaptive reactions of biota, including mutations, which progressive accumulation leads to the origination of new species. Thus, geochemical anomalies are one of the geological driving forces of speciation (Section 10.3.2.3).
Most of the territories affected by endemic diseases and areas with deposits of healing geological products are located within geodynamically active regions marked by active faulting, seismicity, and volcanic and geothermal activity. Fluid degassing via faults is one of the main factors responsible for the formation of geochemical provinces and anomalies.
The human body represents a complex “geochemical anomaly”, including nearly all chemical elements. Elements concentrated in natural geochemical anomalies can both adversely and positively affect human health influencing the balance of trace elements in the human organism. One of the key problems of medical geological research is to define the origin and source of elements concentrated within geochemical halos, groundwaters, gases, and aerosols. An assessment of health risks or benefits caused by geological materials should be started with the study of geological settings responsible for the concentration of trace elements and their geochemical features. It is important to map territories in terms of both epidemiological and balneological states as well as to model their spatio-temporal dynamics under distinct environmental scenarios (Kovalsky, 1979; Bølviken and Bjørklund, 1990; May et al., 1996; Golovin et al., 2004; Volfson et al., 2006).

Iosif F. Volfson, Wolfgang Paul and Igor G. Pechenkin 102
ACKNOWLEDGMENTS The authors thank M.J. Allison (Medical College of Virginia Campus, Virginia
Commonwealth University, Richmond, USA), A.F.S. Amaral (Spanish National Cancer Research Center, Madrid, Spain), J.E. Bunnell (US Geological Survey, Reston, USA), R.B. Finkelman (Department of Geosciences, University of Texas at Dallas, Richardson, USA), M.I. Savinykh (Sibdalmumie, Novokuznetsk, Russia), O. Selinus (Geological Survey of Sweden, Uppsala, Sweden), and H.C.W. Skinner (Departments of Geology and Geophysics and Orthopaedics and Rehabilitation, Yale University, New Haven, USA) for fruitful discussions and materials, two anonymous reviewers for helpful criticism, E.V. Sobotovich (Institute of Environmental Geochemistry, National Academy of Sciences of Ukraine, Kiev, Ukraine) for a useful suggestion, A. Oderova (Fedorovsky All-Russian Research Institute for Mineral Resources, Moscow, Russia) for mapping, H. Paul (Miner’s Christian Mission, Celifodina, Spokane, USA) for linguistic editing, as well as N.A. Serper and I.E. Lyubimova (Fedorovsky All-Russian Research Institute for Mineral Resources, Moscow, Russia) for librarian assistance.
REFERENCES
Abrahams, P.W. (2002). Soils: their implications to human health. Science of the Total Environment, 291, 1–32.
Admakin, O.I. (1999). Stomatological morbidity of people living in various climatic geographical regions of Russia. Ph.D. Thesis. Moscow, Russia: Moscow State Medical Stomatological Institute (in Russian).
Aggett, P.J. (1985). Physiology and metabolism of essential trace elements: an outline. Clinics in Endocrinology and Metabolism, 14, 513–543.
Aggett, P.J. and Rose, S. (1987). Soil and congenital malformations. Experientia, 43, 104–108.
Akuginova, Z.D., Suslikov, V.L. and Kuyukiniva, G.E. (1998). Silicon and tuberculosis. In L.P. Kurakov (Ed.). Study and use of silica rocks of Chuvashia (pp. 76–100). Cheboksary, Russia: Chuvashian University Press (in Russian).
Ala, A., Walker, A.P., Ashkan, K., Dooley, J.S. and Schilsky, M.L. (2007). Wilson’s disease. Lancet, 369, 397–408.
Alföldy, B., Török, S., Balásházy, I., Hofmann, W. and Winkler-Heil, R. (2002). EPMA and XRF characterization of therapeutic cave aerosol particles and their deposition in the respiratory system. X-Ray Spectrometry, 31, 363–367.
Alieva, Z.A., Nesterov, A.P. and Skripnichenko, Z.M. (1988). Occupational pathology of the organ of vision. Moscow, USSR: Medicina (in Russian).
Allander, E. (1994). Kashin-Beck disease: an analysis of research and public health activities based on a bibliography 1849–1992. Scandinavian Journal of Rheumatology, 23(S99), 1–36.
Allison, M.J., Figueroa, L., Razmilic, B. and González, M. (1996). Arcenisimo crónico en el Norte Grando Chileno. Dialogo Andino, 14/15, 159–168.

Geochemical Anomalies: Sickness and Health 103
Amaral, A.F.S., Arruda, M., Cabral, S. and Rodrigues A.S. (2008). Essential and non-essential trace metals in scalp hair of men chronically exposed to volcanogenic metals in the Azores, Portugal. Environment International, 34, 1104–1108.
Anderson, P.H., Berrett, S. and Patterson, D.S. (1979). The biological selenium status of livestock in Britain as indicated by sheep erythrocyte glutathione peroxidase activity. Veterinary Record, 104, 235–238.
Anke, M., Seeber, O., Müller, R., Schäfer, U. and Zerull, J. (2009). Uranium transfer in the food chain from soil to plants, animals and man. Chemie der Erde – Geochemistry, 69(Suppl. 2), 75–90.
Appleton, J.D. (2005). Radon in air and water. In O. Selinus, B. Alloway, J.A. Centeno, R.B. Finkelman, R. Fuge, U. Lindh and P. Smedley (Eds.), Essentials of medical geology: Impacts of the natural environment on public health (pp. 227–262). Amsterdam, Netherlands: Elsevier.
Avtsyn, A.P. (1972). Introduction to geographical pathology. Moscow, USSR: Medicina (in Russian).
Avtsyn, A.P., Zhavoronkov, A.A., Rish, M.A. and Strochkova, L.S. (1991). Human microelementoses: Etiology, classification, organopathology. Moscow, USSR: Medicina (in Russian).
Bar-Ziv, J. and Goldberg, G.M. (1974). Simple siliceous pneumoconiosis in Negev Bedouins. Archives of Environmental Health, 29, 121–126.
Barashkova, N.L., Kartamysheva, N.L., Krasnova, V.P., Kryuchkova, L.N., Myasoedova, E.S., Sakharova, N.A. and Burtsev, V.I. (1989). “Dry” carbon dioxide baths in treating patients with myocardial infarction at the sanatorium stage of rehabilitation. Klinicheskaya Meditsina, 67(5), 38–41 (in Russian).
Barceloux, D.G. (1999). Cobalt. Clinical Toxicology, 37, 201–216. Barrington, J.W., Taylor, M., Smith, S. and Simpkins, P.B. (1997). Selenium and recurrent
miscarriage. Journal of Obstetrics and Gynaecology, 17, 199–200. Bates, M.N., Garrett, N., Graham, B. and Read, D. (1998). Cancer incidence, morbidity and
geothermal air pollution in Rotorua, New Zealand. International Journal of Epidemiology, 27, 10–14.
Beath, O.A., Gilbert, C.S. and Eppson, H.F. (1937). Selenium in soils and vegetation associated with rocks of Permian and Triassic age. American Journal of Botany, 24, 96–101.
Bentley, R. and Chasteen, T.G. (2002). Arsenic curiosa and humanity. Chemical Educator, 7, 51–60.
Berenson, J.R. and Yeh, H.S. (2006). Arsenic compounds in the treatment of multiple myeloma: a new role for a historical remedy. Clinical Lymphoma and Myeloma, 7, 192–198.
Bgatov, A.V. (1999). Biogenic classification of chemical elements. Philosophia Nauki, 2(6), 80–89 (in Russian).
Bogden, J.D. and Klevay, L.M. (Eds.) (2000). Clinical nutrition of the essential trace elements and minerals: The guide for health professionals. Totowa, NJ: Humana Press.
Bogomolov, G.V., Plotnikova, G.N. and Titova, E.A. (1966). Silica in the subterranean waters of certain regions of the USSR and other countries. Hydrological Sciences Journal, 11, 24–33.

Iosif F. Volfson, Wolfgang Paul and Igor G. Pechenkin 104
Bølviken, B. and Bjørklund, A. (1990). Geochemical maps as a basis for geomedical investigations. In J. Låg (Ed.), Geomedicine (pp. 75–106). Boca Raton, FL: CRC Press.
Bølviken, B., Celius, E.G., Nilsen, R. and Strand, T. (2003). Radon: a possible risk factor in multiple sclerosis. Neuroepidemiology, 22, 87–94.
Brown, K.M. and Arthur, J.R. (2001). Selenium, selenoproteins and human health: a review. Public Health Nutrition, 4, 593–599.
Brugge, D., de Lemos, J.L. and Oldmixon, B. (2005). Exposure pathways and health effects associated with chemical and radiological toxicity of natural uranium: a review. Reviews on Environmental Health, 20, 177–193.
Brugge, D. and Goble, R. (2002). The history of uranium mining and the Navajo people. American Journal of Public Health, 92, 1410–1419.
Bunnell, J.E., Tatu, C.A., Bushon, R.N., Stoeckel, D.M., Brady, A.M.G., Beck, M., Lerch, H.E., McGee, B., Hanson, B.C., Shi, R. and Orem, W.H. (2006). Possible linkages between lignite aquifers, pathogenic microbes, and renal pelvic cancer in northwestern Louisiana, U.S.A. Environmental Geochemistry and Health, 28, 577–587.
Buseck, P.R., Galdobina, L.P., Kovalevski, V.V., Rozhkova, N.N., Valley, J.W. and Zaidenberg, A.Z. (1997). Shungites – the C-rich rocks of Karelia, Russia. Canadian Mineralogist, 35, 1363–1378.
Cabrera, W.E., Schrooten, I., Debroe, M.E. and D’Haese, P.C. (1999). Strontium and bone. Journal of Bone and Mineral Research, 14, 661–668.
Calabrese, E.J. (2008). What is hormesis? In E. Le Bourg and S.I.S. Rattan (Eds.), Mild stress and healthy aging: Applying hormesis in aging research and interventions (pp. 5–19). Amsterdam, Netherlands: Springer.
Carapezza, M.L., Badalamenti, B., Cavarra, L. and Scalzo, A. (2003). Gas hazard assessment in a densely inhabited area of Colli Albani Volcano (Cava dei Selci, Roma). Journal of Volcanology and Geothermal Research, 123, 81–94.
Carretero, M.I., Gomes, C.S.F. and Tateo, F. (2006). Clays and human health. Developments in Clay Science, 1, 717–741.
Chan, S., Gerson, B. and Subramaniam, S. (1998). The role of copper, molybdenum, selenium, and zinc in nutrition and health. Clinics in Laboratory Medicine, 18, 673–685.
Charykova, M.V., Bornyakova, I.I., Polekhovskii, Y.S., Charykov, N.A., Kustova, E.V. and Arapov, O.V. (2006). Chemical composition of extracts from shungite and “shungite water”. Russian Journal of Applied Chemistry, 79, 29–33.
Chen, X., Yang, G., Chen, J., Chen, X., Wen, Z. and Ge, K. (1980). Studies on the relations of selenium and Keshan disease. Biological Trace Element Research, 2, 91–107.
Chervinskaya, A.V. and Zilber N.A. (1995). Halotherapy for treatment of respiratory diseases. Journal of Aerosol Medicine, 8, 221–232.
Cohen, B.L. (1995). Test of the linear-no threshold theory of radiation carcinogenesis for inhaled radon decay products. Health Physics, 68, 157–174.
Cook, A.C., Hainsworth, L.J., Sorey, M.L., Evans, W.C. and Southon, J.R. (2001). Radiocarbon studies of plant leaves and tree rings from Mammoth Mountain, CA: a long-term record of magmatic CO2 release. Chemical Geology, 177, 117–131.
Cothern, C.R. and Smith, J.E. (Eds.) (1987). Environmental radon. New York, NY: Plenum Press.

Geochemical Anomalies: Sickness and Health 105
Craft, E.S., Abu-Qare, A.W., Flaherty, M.M., Garofolo, M.C., Rincavage, H.L. and Abou-Donia, M.B. (2004). Depleted and natural uranium: chemistry and toxicological effects. Journal of Toxicology and Environmental Health, Part B, 7, 297–317.
Crockett, R.G.M., Gillmore, G.K., Phillips, P.S., Denman, A.R. and Groves-Kirkby, C.J. (2006). Tidal synchronicity of built-environment radon levels in the UK. Geophysical Research Letters, 33, L05308 doi:10.1029/2005GL024950.
Cronin, S.J., Neall, V.E., Lecointre, J.A., Hedley, M.J. and Loganathan, P. (2003). Environmental hazards of fluoride in volcanic ash: A case study from Ruapehu volcano, New Zealand. Journal of Volcanology and Geothermal Research, 121, 271–291.
Dahlkamp, F.J. (Ed.) (2009). Uranium deposits of the world, 4 vols. New York, NY: Springer.
Delange, F. (1994). The disorders induced by iodine deficiency. Thyroid, 4, 107–128. Derbyshire, E. (2003). Natural dust and pneumoconiosis in High Asia. In H.C.W. Skinner and
A.R. Berger (Eds.), Geology and health. Closing the gap (pp. 15–18). New York, NY: Oxford University Press.
Dilixat, Y., Aytulun, S., Mayiram, S., Arkin, S., Ibadet, R., Sekine, M. and Kagamimori, S. (2001). Use of sand bathing for the treatment of arthritis and other conditions. Alternative Therapies in Health and Medicine, 7(6), 24.
DTAM Team (1998). Global tectonic activity map (GTAM). In DTAM Team, Digital tectonic activity map, Global tectonic datasets: Schematic view. Greenbelt, MD: NASA Goddard Space Flight Center, http://denali.gsfc.nasa.gov/dtam/
Durand, M. and Wilson, J.G. (2006). Spatial analysis of respiratory disease on an urbanized geothermal field. Environmental Research, 101, 238–245.
Dworkin, B.M. (1994). Selenium deficiency in HIV infection and the acquired immunodeficiency syndrome (AIDS). Chemico Biological Interactions, 91, 181–186.
Edmunds, M. and Smedley, P. (2005). Fluoride in natural waters. In O. Selinus, B. Alloway, J.A. Centeno, R.B. Finkelman, R. Fuge, U. Lindh and P. Smedley (Eds.), Essentials of medical geology: Impacts of the natural environment on public health (pp. 301–329). Amsterdam, Netherlands: Elsevier.
El-Arabi, A.M. (2005). Natural radioactivity in sand used in thermal therapy at the Red Sea Coast. Journal of Environmental Radioactivity, 81, 11–19.
El-Bahi, S.M., El-Dine, N.W., Ahmed, F., Sroor, A. and Abdl Salaam, M.M.A. (2005). Natural radioactivity levels for selected kinds of Egyptian sand. Isotopes in Environmental and Health Studies, 41, 161–168.
El-Hinnawi, E.E. (1964). Mineralogical and geochemical studies on Egyptian (U.A.R.) black sands. Contributions to Mineralogy and Petrology, 9, 519–532
Erickson, B.E. (2007). The therapeutic use of radon: a biomedical treatment in Europe; an “alternative” remedy in the United States. Dose-Response, 5, 48–62.
Ermakov, V.V. (1992). Biogeochemical regioning problems and the biogeochemical selenium provinces in the former USSR. Biological Trace Element Research, 33, 171–185.
Falkenbach, A., Kovacs, J., Franke, A., Jörgens, K. and Ammer, K. (2005). Radon therapy for the treatment of rheumatic diseases – review and meta-analysis of controlled clinical trials. Rheumatology International, 25, 205–210.
Figueroa, L., Razmilic, B., Allison, M. and González, M. (1988). Evidencia de arsenicismo crónico en momias del valle Camarones. Región Tarapacá, Chile. Chungará, 21, 33–42.
Iosif F. Volfson, Wolfgang Paul and Igor G. Pechenkin 106
Finkelman, R.B. (2008). Health benefits of geological materials and geologic processes. In International Medical Geology Association, Short course on medical geology, the 33rd International geological congress, Oslo, Norway, Aug. 10, 2008. (CD-ROM).
Finkelman, R.B., Belkin, H.E. and Zheng, B. (1999). Health impacts of domestic coal use in China. Proceedings of the National Academy of Sciences, 96, 3427–3431.
Fordyce, F. (2005). Selenium deficiency and toxicity in the environment. In O. Selinus, B. Alloway, J.A. Centeno, R.B. Finkelman, R. Fuge, U. Lindh and P. Smedley (Eds.), Essentials of medical geology: Impacts of the natural environment on public health (pp. 373–415). Amsterdam, Netherlands: Elsevier.
Foster, H.D. (2004). Halting the AIDS pandemic. In D.G. Janelle, B. Warf and K. Hansen (Eds.), WorldMinds: Geographical perspectives on 100 problems (pp. 69–73). Dordrecht, Netherlands: Kluwer.
Franke, A., Reiner, L., Pratzel, H.G., Franke, T. and Resch, K.L. (2000). Long-term efficacy of radon spa therapy in rheumatoid arthritis – a randomized, sham-controlled study and follow-up. Rheumatology, 39, 894–902.
Frankenberger, W.T. and Benson, S. (Eds.) (1994). Selenium in the environment. New York, NY: Marcel Dekker.
Frolova, L.N. and Kiseleva, T.L. (1996). Chemical composition of mumijo and methods for determining its authenticity and quality (a review). Pharmaceutical Chemistry Journal, 30, 543–547.
Fuge, R. (2005). Soils and iodine deficiency. In O. Selinus, B. Alloway, J.A. Centeno, R.B. Finkelman, R. Fuge, U. Lindh and P. Smedley (Eds.), Essentials of medical geology: Impacts of the natural environment on public health (pp. 417–433). Amsterdam, Netherlands: Elsevier.
Ghosal, S. (1990). Chemistry of shilajit, an immunomodulatory Ayurvedic rasayan. Pure and Applied Chemistry, 62, 1285–1288.
Ghosal, S. (2006). Shilajit in perspective. Oxford, UK: Alpha Science International. Golovin, A.A., Krinochkin, L.A. and Pevzner, V.S. (2004). Geochemical specialization of
bedrock and soil as indicator of regional geochemical endemicity. Geologija, 48, 22–28. Grushevoy, G.V. and Pechenkin, I.G. (2003). Metallogeny of uranium-bearing sedimentary
basins of the Central Asia. Moscow, Russia: Fedorovsky All-Russian Research Institute for Mineral Resources (in Russian, with English abstract).
Haglund, B., Ryckenberg, K., Selinus, O. and Dahlquist, G. (1996). Evidence of a relationship between childhood-onset type I diabetes and low groundwater concentration of zinc. Diabetes Care, 19, 873–875.
Halsted, J.A. (1968). Geophagia in man: its nature and nutritional effects. American Journal of Clinical Nutrition, 21, 1384–1393.
Hambidge, K.M. and Krebs, N.F. (2007). Zinc deficiency: a special challenge. Journal of Nutrition, 137, 1101–1105.
Hector, R.F. and Laniado-Laborin, R. (2005). Coccidioidomycosis – a fungal disease of the Americas. PLoS Medicine, 2, e2, doi:10.1371/journal.pmed.0020002.
Hedman, J., Hugg, T., Sandell, J. and Haahtela, T. (2006). The effect of salt chamber treatment on bronchial hyperresponsiveness in asthmatics. Allergy, 61, 605–610.
Hough, R.L. (2007). Soil and human health: an epidemiological review. European Journal of Soil Science, 58, 1200–1212.

Geochemical Anomalies: Sickness and Health 107
Ivanova, T.G., Tronova, T.M., Kapilevich, L.V., Andreiko, L.N., Kilina, E.S., Karelina, O.A., Levitsky, E.F. and Knipenberg, E.V. (1997). The use of sapropels in osteoarthritis in participants in the cleanup of the aftermath of the accident at the Chernobyl Atomic Electric Power Station. Voprosy Kurortologii, Fizioterapii, i Lechebnoy Fizicheskoy Kultury, No. 3, 23–25 (in Russian, with English abstract).
James, L.F., Panter, K.E., Mayland, H.F., Miller, M.R. and Baker, D.C. (1989). Selenium poisoning in livestock: a review and progress. In L.W. Jacobs (Ed.), Selenium in agriculture and the environment (pp. 123–131). Madison, WI: Soil Science Society of America.
Kaji, M. (2001). Zinc in endocrinology. International Pediatrics, 16, 131–137. Kasimov, N.S., Kovin, M.I., Proskuryakov, Y.V. and Shmelkova, N.A. (1978). Geochemistry
of the soils of fault zones (exemplified by Kazakhstan). Soviet Soil Science, 10, 397–406. Kerrich, R. (1986). Fluid transport in lineaments. Philosophical Transactions of the Royal
Society of London, Series A, 317, 219–251. Khasanov, A.K. (2006). New data on the carbon isotopic composition and genesis of mumie.
Doklady Earth Sciences, 410, 1080–1082. Khuda-Bukhsh, A.R., Pathak, S., Guha, B., Karmakar, S.R., Das, J.K., Banerjee, P., Biswas,
S.J., Mukherjee, P., Bhattacharjee, N., Choudhury, S.C., Banerjee, A., Bhadra, S., Mallick, P., Chakrabarti, J. and Mandal, B. (2005). Can homeopathic arsenic remedy combat arsenic poisoning in humans exposed to groundwater arsenic contamination?: A preliminary report on first human trial. Evidence-Based Complementary and Alternative Medicine, 2, 537–548.
King, C.-Y., King, B.-S., Evans, W.C. and Zhang, W. (1996). Spatial radon anomalies on active faults in California. Applied Geochemistry, 11, 497–510.
King, E.J. and Belt, T.H. (1938). Physiological and pathological aspects of silica. Physiological Reviews, 18, 329–365.
Kiseleva, T.L., Frolova, L.N., Baratova, L.A. and Yus’kovich, A.K. (1996). HPLC study of fatty-acid components of dry mumijo extract. Pharmaceutical Chemistry Journal, 30, 421–423.
Kiseleva, T.L., Frolova, L.N., Baratova, L.A., Baibakova, G.V. and Ksenofontov, A.L. (1998). Study of the amino acid fraction of dry mumijo extract. Pharmaceutical Chemistry Journal, 32, 103–108.
Klimas, A. and Mališauskas, A. (2008). Boron, fluoride, strontium and lithium anomalies in fresh groundwater of Lithuania. Geologija, 50, 114–124.
Koenig, C. (2005). Specialized hydro-, balneo- and medicinal bath therapy. Lincoln, NE: iUniverse.
Komatina, M.M. (2004). Medical geology: Effects of geological environments on human health. Amsterdam, Netherlands: Elsevier.
Kovalevski, V.V., Buseck, P.R. and Cowley, J.M. (2001). Comparison of carbon in shungite rocks to other natural carbons: an X-ray and TEM study. Carbon, 39, 243–256.
Kovalsky, V.V. (1974). Geochemical ecology. Moscow, USSR: Nauka (in Russian). Kovalsky, V.V. (1979). Geochemical ecology and problems of health. Philosophical
Transactions of the Royal Society of London. Series B, Biological Sciences, 288, 185–191.
Krassilnikov, N.A. and Koreniako, A.I. (1939). The bactericidal substance of the actinomycetes. Microbiologia, 8, 673–685 (in Russian with English abstract).
Iosif F. Volfson, Wolfgang Paul and Igor G. Pechenkin 108
Kristmannsdóttir, H. and Geptner, A. (2008). Hydrothermal medicative clays – mud formentation cure in Iceland. In Proceedings of the 33rd International geological congress, Oslo, Norway, Aug. 6–14, 2008. X-CD Technologies (CD-ROM).
Kropotkin, P.N. (1985). Degassing of the Earth and the origin of hydrocarbons. International Geology Review, 27, 1261–1275.
Krukowski, S.T. and Johnson, K.S. (2006). Iodine. In J.E. Kogel, N.C. Trivedi, J.M. Barker and S.T. Krukowski (Eds.), Industrial minerals and rocks: Commodities, markets, and uses (7th ed.) (pp. 541–551). Littleton, CO: Society for Mining, Metallurgy and Exploration.
Kübler, H. (1991). Differential inhibitory effects of humic acids on coagulation systems of human blood. In B. Allard, H. Borén and A. Grimvall (Eds.), Humic substances in the aquatic and terrestrial environment (pp. 429–436). Berlin, Germany: Springer.
Låg, J. (Ed.) (1990). Geomedicine. Boca Raton, FL: CRC Press. Luckey, T.D. (1991). Radiation hormesis. Boca Raton, FL: CRC Press. Mandal, B.K. and Suzuki, K.T. (2002). Arsenic round the world: a review. Talanta, 58, 201–
235. Marakushev, A.A. and Marakushev, S.A. (2008). Formation of oil and gas fields. Lithology
and Mineral Resources, 43, 454–469. Markle, H.V. and Greenway, D.C. (1996). Cobalamin. Critical Reviews in Clinical
Laboratory Sciences, 33, 247–356. Marshall, G., Ferreccio, C., Yuan, Y., Bates, M.N., Steinmaus, C., Selvin, S., Liaw, J. and
Smith, A.H. (2007). Fifty-Year study of lung and bladder cancer mortality in Chile related to arsenic in drinking water. Journal of the National Cancer Institute, 99, 920–928.
Mashkovtsev, I.L., Narajan Deb, S. and Zakir, H. (2004). Arsenic water pollution in Bangladesh and in India – the result of geological peculiarities of near-boarder coal basins. Ugol, No. 5, 58–59 (in Russian).
Masironi, R. (1987). Geochemistry, soils and cardiovascular diseases. Experientia, 43, 68–74. Mathur, M.L. and Choudhary, R.C. (1997). Desert Lung Syndrome, in rural dwellers of the
Thar Desert, India. Journal of Arid Environments, 35, 559–562. May, F., Hoernes, S. and Neugebauer, H.J. (1996). Genesis and distribution of mineral waters
as a consequence of recent lithospheric dynamics: the Rhenish Massif, Central Europe. Geologische Rundschau, 85, 782–799.
McBride, E.F. (Ed.) (1979). Silica in sediments: Nodular and bedded chert. Tulsa, OK: Society of Economic Paleontologists and Mineralogists.
Melnikov, E.K., Rudnik, V.A., Musiychuk, Y.I. and Rymarev, V.I. (1994). Pathogenic influence of active fault zones in Saint Petersburg area. Geoecologia, No. 4, 50–69 (in Russian).
Mertz, W. (1981). The essential trace elements. Science, 213, 1332–1338. Mertz, W. (Ed.). (1986–1987). Trace elements in human and animal nutrition, 2 vols. (5th rev.
ed.). Orlando, FL: Academic Press. Mills, C.F. (1979). Trace elements in animals. Philosophical Transactions of the Royal
Society of London, Series B, Biological Sciences, 288, 51–63. Moss, A.J. (1966). Origin, shaping and significance of quartz sand grains. Australian Journal
of Earth Sciences, 13, 97–136.

Geochemical Anomalies: Sickness and Health 109
Moussa, M.M. and El Arabi, A.G.M. (2003). Soil radon survey for tracing active fault: a case study along Qena-Safaga road, Eastern Desert, Egypt. Radiation Measurements, 37, 211–216.
Murthy, S.R.N. (2003). Minerals of the Indian systems of medicine: Ayurveda and Siddha. Bangalore, India: Prasad Narasimha.
Muth, O.H. (1963). White muscle disease, a selenium-responsive myopathy. Journal of the American Veterinary Medical Association, 142, 272–277.
Nambi, K.S.V. and Soman, S.D. (1987). Environmental radiation and cancer in India. Health Physics, 52, 653–657.
Narbutaite, J., Vehkalahti, M.M. and Milčiuviene, S. (2007). Dental fluorosis and dental caries among 12-yr-old children from high- and low-fluoride areas in Lithuania. European Journal of Oral Sciences, 115, 137–142.
Nielsen, F.H. (2000). Possibly essential trace elements. In J.D. Bogden and L.M. Klevay (Eds.) Clinical nutrition of the essential trace elements and minerals: The guide for health professionals (pp. 11–36). Totowa, NJ: Humana Press.
Nielsen, S.P. (2004). The biological role of strontium. Bone, 35, 583–588. Orem, W., Tatu, C., Pavlovic, N., Bunnell, J., Lerch, H., Paunescu, V., Ordodi, V., Flores, D.,
Corum, M. and Bates, A. (2007). Health effects of toxic organic substances from coal: toward “panendemic” nephropathy. Ambio, 36, 98–102.
Osika, D.G. (1981). The fluid regime of the seismically active regions. Moscow, USSR: Nauka (in Russian).
Parish, L.C. and Lotti, T.M. (Eds.) (1996). Balneology and the spa: the use of water in dermatology. Clinics in Dermatology, 14, 547–692.
Patrick, L. (1999). Nutrients and HIV: part one – beta carotene and selenium. Alternative Medicine Review, 4, 403–413.
Paul, W. (1970). Healing Earth: Moor – Its role in science and medicine: Health treasures from an Austrian spa; “The Neydharting Moor-Bouquet”; The quintessence of Otto Stöber’s works on moor. Portland, OR: Metropolitan Press.
Paul, W. and Paul, H. (2002). Mineralogical and bio-geo-chemical research works 1949–1959 (A contribution to mining engineering and health research). Spokane, WA: Miner’s Christian Mission, Celifodina Publisher.
Pechenkin, I.G. and Pechenkin, V.G. (1996). Metallogeny of the Turan Plate sedimentary cover. Lithology and Mineral Resources, 31, 325–332.
Pechenkin, I.G. and Pechenkin, V.G. (2004). Destruction of deposits is one of mankind’s development factor. In V. Gavrilenko and E. Panova (Eds.), Proceedings of the 2nd International Symposium "Bio-inert interaction: Life and stone", Saint Petersburg, Russia, 23–25 June, 2004 (pp. 76–78). Saint Petersburg: Saint Petersburg University Press (in Russian, with English abstract).
Pechenkin, I.G., Volfson, I.F., Sysoev, A.N., Pechenkin, V.G. and Grushevoy, G.V. (2005). Metallogeny of the uranium-bearing sedimentary basins. In J. Mao and F.P. Bierlein (Eds.), Mineral deposit research: Meeting the global challenge (pp. 307–310). Berlin, Germany: Springer.
Pechenkin, V.G. and Pechenkin, I.G. (2005). Exfiltrative mineralization in the Bukantau ore district (Central Kyzyl Kum Region, Uzbekistan). Lithology and Mineral Resources, 40, 462–471.

Iosif F. Volfson, Wolfgang Paul and Igor G. Pechenkin 110
Peeters, E.-G. (1987). The possible influence of the components of the soil and the lithosphere on the development and growth of neoplasms. Experientia, 43, 74–81.
Perkins, D. (2002). Mineralogy (2nd ed.). Upper Saddle River, NJ: Prentice Hall. Persinger, M.A. (1987). Geopsychology and geopsychopathology: mental processes and
disorders associated with geochemical and geophysical factors. Experientia, 43, 92–104. Petraccia, L., Liberati, G., Masciullo, S.G., Grassi, M. and Fraioli, A. (2006). Water, mineral
waters and health. Clinical Nutrition, 25, 377–385. Plumlee, G.S., Morman, S.A. and Ziegler, T.L. (2006). The toxicological geochemistry of
earth materials: an overview of processes and the interdisciplinary methods used to understand them. Reviews in Mineralogy and Geochemistry, 64, pp. 5–57.
Pongü Text and Design (1996–2009). Mineral waters of the world. Meilen, Switzerland: Pongü Text and Design GmbH, http://www.pmgeiser.ch/mineral/index.php
Prasad, A.S. (2003). Zinc deficiency. British Medical Journal, 326, 409–410. Pronin, A.P., Bashorin, V.N. and Zvonilkin, B.D. (1997). Geological features and fluid
activity of the Kaluga ring structure. Transactions of the Russian Academy of Sciences – Earth Science Sections, 356, 960–964.
Rao, C.B. (1957). Beach erosion and concentration of heavy mineral sands. Journal of Sedimentary Research, 27, 143–147.
Rayman, M.P. (2000). The importance of selenium to human health. Lancet, 356, 233–241. Reid, R.M. (1992). Cultural and medical perspectives on geophagia. Medical Anthropology,
13, 337–351. Reinhold, J.G. (1975). Trace elements – a selective survey. Clinical Chemistry, 21, 476–500. Revich, B.A. (2001). Environmental pollution and human health. Introduction to
environmental epidemiology. Moscow, Russia: MNEPU (in Russian, with English contents).
Rink, L. and Gabriel, P. (2000). Zinc and the immune system. Proceedings of the Nutrition Society, 59, 541–552.
Rysyev, O.A. (2001). Shungite – The stone of health. Saint Petersburg, Russia: Tessa (in Russian).
Samutin, N.M. (1997). Experience in using sapropel mud in combination with a magnetic field in treating cervical osteochondrosis. Voprosy Kurortologii, Fizioterapii, i Lechebnoy Fizicheskoy Kultury, No. 5, 25–26 (in Russian, with English abstract).
Savinykh, M.I. (2003). Shilajit in the Mountain Altai: Regularities of location, conditions of generation, classification, and forecast of resources. Ph.D. Thesis. Moscow, Russia: Ordzhonikidze Moscow State University of Mineral Exploration (in Russian).
Savinykh, M.I. (2006). Classification of shilajit ore deposits. Izvestiya Vuzov, Geologia i Razvedka, No. 5, 39–41 (in Russian, with English abstract).
Savinykh, M.I., Kozlova, G.G., Ladygin, M.V., Chernykh, B.P. and Kudryashov, N.S. (2008). Shilajit – a product of the Earth degassing. In A.N. Dmitrievsky and B.M. Valyaev (Eds.), Earth degassing: Geodynamics, deep fluids, oil, gas, and their parageneses: Proceedings of the All-Russian conference, Moscow, Russia, Apr. 22–25, 2008 (pp. 434–436). Moscow, Russia: Geos (in Russian, with English abstract).
Schepetkin, I., Khlebnikov, A. and Kwon, B.S (2002). Medical drugs from humus matter: focus on mumie. Drug Development Research, 57, 140–159.

Geochemical Anomalies: Sickness and Health 111
Schepetkin, I.A., Khlebnikov, A.I., Ah, S.Y., Woo, S.B., Jeong, C.-S., Klubachuk, O.N. and Kwon, B.S. (2003). Characterization and biological activities of humic substances from mumie. Journal of Agricultural and Food Chemistry, 51, 5245–5254.
Scholten, J. (1993). Homeopathy and minerals. Utrecht, Netherlands: Stichting Alonnissos. Schwarz, K. (1978). Significance and functions of silicon in warm-blooded animals: review
and outlook. In G. Bendz and I. Lindqvist (Eds.), Biochemistry of silicon and related problems: Proceedings of the 40th Nobel Symposium, Lidigö, Sweden, 1977 (pp. 207–230). New York, NY: Plenum Press.
Selinus, O., Alloway, B., Centeno, J.A., Finkelman, R.B., Fuge, R., Lindh, U. and Smedley, P. (Eds.) (2005). Essentials of medical geology: Impacts of the natural environment on public health. Amsterdam, Netherlands: Elsevier.
Selinus, O. and Frank, A. (2000). Medical geology. In L. Möeller (Ed.), Environmental medicine (pp. 164–183). Stockholm, Sweden: ArbSkNämnden.
Serov, S.I. and Tereshin, S.Y. (1985). Effect of sapropel from Lake Moltai and its components on the functions of nervous and muscle tissues (experimental study). Voprosy Kurortologii, Fizioterapii, i Lechebnoy Fizicheskoy Kultury, No. 1, 52–53 (in Russian).
Shuttleworth, V.S., Cameron, R.S., Alderman, G. and Davies, H.T. (1961). A case of cobalt deficiency in a child presenting as “earth eating”. Practitioner, 186, 760–764.
Sibson, R.H. (1987). Earthquake rupturing as a mineralizing agent in hydrothermal systems. Geology, 15, 701-704.
Sivachenko, T.P., Bebeshko, V.G., Elagin, V.V., Nikiforova, N.V. and Chykalova, I.G. (2003). Radiation effect after Chernobyl: thyroid pathology in children who suffered from combined effect of radiation exposure and iodine deficiency. Ukrainian Medical Journal, 1(33), 60–64 (in Ukrainian, with English abstract).
Skalny, A.V. (1999). Human microelementoses (Diagnosis and therapy). Moscow, Russia: KMK Press (in Russian).
Skinner, H.C.W. (2007). The Earth, source of health and hazards: an introduction to medical geology. Annual Review of Earth and Planetary Sciences, 35, 177–213.
Snider, D.E. (1978). The relationship between tuberculosis and silicosis. American Review of Respiratory Disease, 118, 455–460.
Soldati, R., Pinat, F. and de Leon Suarez, J. (1968). Modern psammotherapy (sand baths). (Methods, mechanism of action, clinical indications). Friuli Medico, 23, 569–578 (in Italian).
Stanbury, J.B. and Hetzel, B.S. (Eds.) (1980). Endemic goiter and endemic cretinism: Iodine nutrition in health and disease. New York, NY: Wiley.
Summa, V. and Tateo, F. (1999). Geochemistry of two peats suitable for medical uses and their behaviour during leaching. Applied Clay Science, 15, 477–489.
Suzuoki, T. (1964). A geochemical study of selenium in volcanic exhalation and sulfur deposits. Bulletin of the Chemical Society of Japan, 37, 1200–1206.
Symonds, R.B., Rose, W.I., Bluth, G.J.S. and Gerlach, T.M. (1994). Volcanic-gas studies: methods, results, and applications. Reviews in Mineralogy and Geochemistry, 30, 1–66.
Tatz, C., Cass, A., Condon, J. and Tippett, G. (2006). Aborigines and uranium: Monitoring the health hazards. Canberra, Australia: Australian Institute of Aboriginal and Torres Strait Islander Studies.

Iosif F. Volfson, Wolfgang Paul and Igor G. Pechenkin 112
Taylor, D.M. and Taylor, S.K. (1997). Environmental uranium and human health. Reviews on Environmental Health, 12, 147–157.
Tchounwou, P.B., Patlolla, A.K. and Centeno, J.A. (2003). Carcinogenic and systemic health effects associated with arsenic exposure – a critical review. Toxicologic Patology, 31, 575–588.
Teotia, S.P.S., Teotia, M. and Singh, R.K. (1981). Hydro-geochemical aspects of endemic skeletal fluorosis in India – an epidemiologic study. Fluoride, 14, 69–74.
Tikhonov, A.I., Pavlov, P.P. and Sidorov, A.V. (2005). Accumulation of heavy metals in soils at the sites of deep water inflow. Geochemistry International, 43, 724–730.
Tsarfis, P.G. (1985). Nature and health: Treatment and rehabilitation by natural factors. Moscow, USSR: Mir Publishers.
Tsarfis, P.G. (Ed.) (1991). Resorts, 2 vols. Moscow, USSR: Profizdat (in Russian). Turekian, K.K. and Kulp, J.L. (1956). Strontium content of human bones. Science, 124, 405–
407. Underwood, E.J. (1979). Trace elements and health: an overview. Philosophical Transactions
of the Royal Society of London, Series B, Biological Sciences, 288, 5–14. UNSCEAR (2000). Exposures from natural radiation sources. In United Nations Scientific
Committee on the Effects of Atomic Radiation, Sources and effects of ionizing radiation: UNSCEAR 2000 report to the General Assembly, with scientific annexes, Vol. 1: Sources (pp. 83–156). New York, NY: United Nations.
Velde, B. (1977). Clays and clay minerals in natural and synthetic systems. Amsterdam, Netherlands: Elsevier.
Veniale, F., Barberis, E., Carcangiu, G., Morandi, N., Setti, M., Tamanini, M. and Tessier, D. (2004). Formulation of muds for pelotherapy: effects of “maturation” by different mineral waters. Applied Clay Science, 25, 135–148.
Veniale, F., Bettero, A., Jobstraibizer, P.G. and Setti, M. (2007). Thermal muds: perspectives of innovations. Applied Clay Science, 36, 141–147.
Versieck, J. (1985). Trace elements in human body fluids and tissues. Critical Reviews in Clinical Laboratory Sciences, 22, 97–184.
Vinogradov, A.P. (1938). Biogeochemical provinces and endemies. Comptes Rendus de l’Académie des Sciences de l’URSS, 18, 283–286 (in Russian).
Vinogradov, A.P. (1939). Geochemical studies in the Urov endemic area. Comptes Rendus de l’Académie des Sciences de l’URSS, 23, 64–67 (in Russian).
Vinogradov, A.P. (1964). Provinces biogéochimiques et leur rôle dans l’évolution organique. In U. Colombo and G.D Hobson (Eds.), Advances in organic geochemistry: Proceedings of the International meeting, Milan, Italy, 1962 (pp. 317–338). New York, NY: Macmillan.
Volfson, I.F. (2004). Medical and biological aspects of the study and application of biologically active flints of the Russian Platform. In V. Gavrilenko and E. Panova (Eds.), Proceedings of the 2d International symposium “Bio-inert interaction: Life and stone”, Saint Petersburg, Russia, June 23–25, 2004 (pp. 157–160). Saint Petersburg, Russia: Saint Petersburg University Press (in Russian, with English abstract).
Volfson, I.F. and Bakhur, A.E. (2007). Medical radiogeology. ANRI, 48, 25–33 (in Russian). Volfson, I.F., Pechenkin, I.G. and Kremkova, E.V. (2006). Medical geology of today: targets
and the ways of their realization. In E.G. Panova and V.V. Gavrilenko (Eds.), Bio-inert

Geochemical Anomalies: Sickness and Health 113
interactions: Life and stone (pp. 107–123). Saint Petersburg, Russia: Saint Petersburg University Press (in Russian).
Volfson, I., Pechenkin, I., Sidorenko, G., Zenova, G. and Shelekhova, E. (2008). Medical and mineralogical aspects of the study of flints. In Proceedings of the 33rd International geological congress, Oslo, Norway, Aug. 6–14, 2008. X-CD Technologies (CD-ROM).
Volfson, I.F. and Zenova, G.M. (2004). Bacterial factor in formation of biologically active flints of the Russian Platform. In V. Gavrilenko and E. Panova (Eds.), Proceedings of the 2d International symposium “Bio-inert interaction: Life and stone”, Saint Petersburg, Russia, June 23–25, 2004 (pp. 100–103). Saint Petersburg, Russia: Saint Petersburg University Press (in Russian, with English abstract).
Warren, H.V. (1963). Trace elements and epidemiology. Journal of the College of General Practitioners, 6, 517–531.
Weinberg, E.D. (1987). The influence of soil on infectious disease. Experientia, 43, 81–87. Weinstein, P. and Cook, A. (2005). Volcanic emissions and health. In O. Selinus, B. Alloway,
J.A. Centeno, R.B. Finkelman, R. Fuge, U. Lindh and P. Smedley (Eds.), Essentials of medical geology: Impacts of the natural environment on public health (pp. 203–226). Amsterdam, Netherlands: Elsevier.
Wikipedia contributors (2009a). List of hot springs. In Wikipedia, the free encyclopedia, http://en.wikipedia.org/wiki/Hot_springs_around_the_world
Wikipedia contributors (2009b). List of spa towns. In Wikipedia, the free encyclopedia, http://en.wikipedia.org/wiki/List_of_spa_towns
Xu X.Z., Cai X.G., Men X.S., Yang P.Y., Yang J.F., Jing S.L., He J.H. and Si W.Y. (1993). A study of siliceous pneumoconiosis in a Desert Area of Sunan County, Gansu Province, China. Biomedical and Environmental Sciences, 6, 217–222.
Yudakhin, F. and Malov, A. (2008). Natural strontium in drinking water of the Arkhangelsk region. In Proceedings of the 33rd International geological congress, Oslo, Norway, Aug. 6–14, 2008. X-CD Technologies (CD-ROM).
Yushkin, N.P. (2003). Human health effects of “table” minerals. In N. Kamata (Ed.), Proceedings, 1st International symposium of the Kanazawa University 21st century COE program, Kanazawa, Japan, Mar. 17–18, 2003, Vol. 1 (pp. 261–265). Kanazawa, Japan: Kanazawa University.
Zhao, H.X., Mold, M.D., Stenhouse, E.A., Bird, S.C., Wright, D.E., Demaine, A.G. and Millward, B.A. (2001). Drinking water composition and childhood-onset Type 1 diabetes mellitus in Devon and Cornwall, England. Diabetic Medicine, 18, 709–717.
Zhavrid, E.A., Istomin, Y.P., Alexandrova, E.N., Prokhorova, V.I., Lappo, S.V. and Tsyrus, T.P. (1998). Experimental studies of peculiarities of the water activated by flint. In E.A. Korotkevich (Ed.), Urgent problems of oncology and medical radiology (pp. 418–426). Lesnoi, Belarus: Scientific Research Institute on Oncology and Medical Radiology (in Russian).
Zhirov, V.P. (1983). Effect of “dry” carbon dioxide baths on external respiratory function in patients with chronic nonspecific lung diseases and bronchospastic syndrome. Voprosy Kurortologii, Fizioterapii, i Lechebnoy Fizicheskoy Kultury, No. 2, 20–23 (in Russian).
Zunnunov, Z.R., Ibragimova, S.N., Zunnunova, S.Z. and Shomurodov, N.V. (2007). Ammotherapy of rheumatoid arthritis. Voprosy Kurortologii, Fizioterapii, i Lechebnoy Fizicheskoy Kultury, No. 6, 25–27 (in Russian, with English abstract).


In: Man and the Geosphere ISBN 978-1-60876-387-0 Editor: Igor V. Florinsky, pp. 115-141 © 2010 Nova Science Publishers, Inc.
Chapter 4
GEOPSYCHOLOGY: GEOPHYSICAL MATRIX AND HUMAN BEHAVIOR
Bryce P. Mulligan, Lynn Suess Cloes, Quoc Hao Mach and Michael A. Persinger
ABSTRACT
The sophistication of modern technology and statistical analyses is sufficient to fully explore the potential of geopsychology or “the geopsyche”. It is defined as the relationship between the complex matrix of static and time-varying geophysical and geochemical variables within a locality and human behavior. Geomagnetic variations, sufficient to explain about 10% of the variance, have been reliably associated with cardiovascular stability and the brain’s cerebral sensitivity. There is strong correlational evidence that long-term geophysical fluctuations may shift a population’s cognitive style and its responses to environmental crises. Two sites within Ontario, Canada are considered proofs of concept. In one site, associated with marked mineralization and strong local gradients in the geomagnetic field, there is an aggregation of creative individuals who report that “the place” is responsible for their elevated productivity. In another site, the apparent interaction between tectonic strain, hydrological loading within a magnetite mine, and the construction of a cell phone communication tower produced unusual brain-frequency magnetic fields that have been associated with an epidemic of intuitive and “spiritual” experiences within tens of thousands of visitors. We suggest that the optimal creativity and adaptability of future populations may require determination of the empirical congruence between the person’s neurocognitive profile and the geophysical environment.
Keywords: geomagnetic field; psychology; behavior; brain; consciousness; nervous system.
4.1. INTRODUCTION Geopsychology, geoneuroscience, and environmental psychophysiology are various
names for the study of the complex relationships between the geophysical environment and

Bryce P. Mulligan, Lynn Suess Cloes, Quoc Hao Mach et al. 116
human behavior. More or less stable components of the geophysical environment include the elements and minerals within the soil, the local geomagnetic field, and the structural alterations produced by human activities. Phasic components of this environment include geomagnetic activity, passage of weather systems, and the multiple stimuli that precede earthquakes. These transient stimuli can interact with the static components of the geophysical milieu to produce synergistic complexes of stimuli that can essentially affect different subpopulations whose cerebral activities and biological structures enhance their sensitivity.
This chapter is divided into two parts. The first involves a general review of the types of behaviors that have been correlated or shown to be affected by experimental stimulation with various components of the geophysical environment. Information published since the review by Persinger (1987) will be emphasized. It is also recommended that the reader consult a thorough review by Cherry (2002) concerning the Schumann resonances (Schumann, 1952; Sentman, 1995) as a possible biophysical mechanism of the biological effects of solar/geomagnetic activity.
The second part of the chapter involves the application of the concepts of geopsychology to two specific locations. The first is the Bancroft area of North Hastings in Ontario, Canada, and is a quintessential example of how the complexities of the geophysical environment may interact with subpopulations of people to produce unique and varying behaviors. The Bancroft area has been designated as the “most talented town” in the province because of a preponderance of artists who have elected to live there. The region is replete with geomagnetic anomalies, magnetite deposits, uranium, and exotic natural topography.
The second area is located near Marmora, Ontario. The general region has a history of being a “sacred site” according to aboriginal sources. The small area, about 100 by 100 m, is adjacent to a magnetite mine that has been accumulating about 57 million L of water per month for over a decade. During the period between 1992 and 1997, epicenters for local earthquakes moved significantly closer to this site. Thousands of people reported “spiritual”, creative, and inspirational experiences within the area.
4.2. A SELECTIVE REVIEW OF THE LITERATURE
4.2.1. The Static or Steady-State Magnetic Field According to present views, the geomagnetic field is induced and maintained by the
convection of molten iron within the liquid outer core (Merrill et al., 1998). The strength of the geomagnetic field is often presented as about 50 μT. Although there is the expected (approximately 30% of the intensity) difference between the polar and equatorial regions, the major source of variance is the intricate variations from local depositions of conductive ore bodies (Korhonen et al., 2007). An idealized approach to geomagnetic values obscures the real variability with which specific behaviors are most associated.
The complex matrix of intensity and directional variations of the local geomagnetic field within which a person lives has not been quantified. The gradients of change range from a few nT to several hundred nT per meter. Both the polarity and direction can produce a plethora of configurations. However, Rocard (1964) demonstrated that many people are

Geopsychology 117
sensitive to gradients of between 200 nT/m and 300 nT/m. The threshold for discerning the presence of subsurface activity (such as running water) producing these fields for most sensitive human beings is about 10 nT/m. Like all human potentials and aptitudes, the sophistication and sensitivity of the discernment of intensity gradients appear to be normally distributed.
According to Harvalik (1978), the regions within the human body that are sensitive to these gradients are within the vicinity of the renal and suprarenal (adrenal) glands and within the brain, specifically the pineal organ. Sensitivity is diminished during episodes of kidney dysfunction. Slow time-varying changes in the direction of static magnetic fields are now well documented to reduce melatonin synthesis within the pineal organ. The largest amount of melatonin is produced primarily by the gastrointestinal system (Bubenik, 2002).
Reduction of the geomagnetic field around the head to simulate the reduced values experienced within space stations, or near local surface anomalies attenuated by mineralization, was reported by Del Seppia et al. (2006) to alter skin conductance to highly emotional pictures after 1.5 hr of exposure. These changes were interpreted as a marked enhancement of autonomic responses to emotional stimuli due to the brief reduced field exposure.
Attenuation of the local static magnetic field can produce analgesia in mice. Prato et al. (2005) found that only a few daily 1 hr exposures of mice to mu-metal cages produced analgesia that was comparable to an injection of 5 mg/kg of morphine. The local field within the mu-metal cages was reduced to less than 1 μT compared to the surrounding 50 μT. The variability of the intensity of the static magnetic field within domestic settings around metal bed or door frames can approach these values.
Even the simplest equations for ratios for detection of change of stimulus magnitude depend upon the absolute value of the reference point. For example, Weber’s law states that for classical sensory modalities, the just-noticeable difference for a change in a stimulus compared to the absolute reference point is a constant. As the magnitude of the steady-state value changes, the amount of change in the magnitude of the stimulus to be detected must also alter.
The detection of static magnetic gradients can be modulated by the simultaneous application of complex magnetic fields. McKay and Persinger (2005) exposed rats to a theta-burst (4–7 Hz) magnetic field (about 300 nT peak-to-peak amplitude) with an interstimulus interval (4 s) similar to that which produces analgesia equivalent to 5 mg/kg of morphine (Martin et al., 2004). These rats, but not those exposed to other interstimulus intervals, discerned an intramaze “cue” of 180 μT (75 μT/cm). The theta-burst pattern magnetic field had been selected because when applied as electrical current it facilitates long term potentiation (LTP) in hippocampal slices. This structure is essential for memory within spatial contexts. We have found that applications of even 1 μT LTP-patterned magnetic fields across the temporal lobes for about 30 min can increase the recall of semantic memory (Richards et al., 1996).
That application of a weak magnetic field can alter the intrinsic rhythm of a system has been shown with cells. Martynuk (1995) demonstrated that exposure to an 8 Hz, 30 μT field altered the dynamics of leukocyte activity. As reported by Ahmed and Wieraszko (2008), the application of appropriately-patterned magnetic fields could couple different hippocampal networks, which could then resonate differently with applied magnetic fields. The resultant interference patterns have been considered a means of representing information and even memory within the space occupied by the magnetic fields (Persinger, 2008).

Bryce P. Mulligan, Lynn Suess Cloes, Quoc Hao Mach et al. 118
The interaction between man-made time-varying electromagnetic fields and the static geomagnetic field is the basis for Larmor (resonance) models of magnetobiological interactions (Binhi, 2002). They generally state that the values required to affect a specific ion may be much less than normal if the applied frequency matches the product of the static field strength and the charge divided by the ion’s mass. Although most theorists employ the 50 μT average static field strength to obtain solutions for optimal ion resonance at the man-made power frequencies of 50 Hz or 60 Hz, the actual range of static field strength in real very local (within 10 m2) space can vary at least two orders of magnitude.
This means that during casual movement through geomagnetic space, depending upon the velocity of the person and how long he or she remains within different static intensities, ranges in ambient frequencies would preferentially affect different ions. Those most likely affected would be Ca2+, Mg2+, Na+, K+, Li+, and even some of the heavier metals. The magnetic isotope effect (Buchachenko, 2009) (Section 2.2) may also contribute to biological effects of magnetobiological interactions (Buchachenko et al., 2006). Perhaps the only occasion wherein protracted exposure to a given static intensity would be constant for more than 30 minutes, to allow specific ions to be influenced, would be during the immobility of sleep. This duration (30 min) was selected because it is within the range of the minimum time required for most weak (1 μT) power-frequency or time-varying magnetic fields to produce discernable changes in molecular signaling pathways.
Interactions with these frequencies may be important geopsychological factors. Tyasto et al. (1995) found a tangible decrease in 1 mHz to 10 Hz ambient fields within the nT to μT range on Saturdays and Sundays in Saint Petersburg, Russia. This weekend effect was also associated with a 70% decrease in myocardial infarctions. This range of frequencies, employed experimentally, is associated with depression and fatigue. Åkerstedt et al. (1999) showed that sleeping in a 1 μT, 50 Hz field reduced total sleep time as well as the duration of slow wave sleep.
These everyday sources of power, particularly within a habitat in a region rich in radon gas emissions from local rock, can affect the distribution of this natural radioactivity. Henshaw et al. (1996) collected graphic evidence that 222Rn daughter nuclei, particularly 214Po and 218Po, concentrated around house wiring in a manner similar to the attraction of iron filings to a magnet. The subsequently charged aerosols oscillated within the 50 Hz field.
4.2.2. Geomagnetic Activity and Vascular Events There have been consistent reports and convergent mechanisms for the relationship
between increased geomagnetic activity and cardiovascular parameters. The direct relevance of geocardiovascular responses to this chapter lays in their demonstration of the internal consistency of the effects once the non-linearity and individual sensitivities of human subpopulations are accommodated. In addition, the subtle vascular alterations, leading to more dramatic results, have the potential to affect daily behavior through altering the optimal functioning of cerebral activity and hence thought.
Average daily global geomagnetic variations over about 50 nT (with similar local values) or a total of the 8 daily 3-hr K-index (Menvielle and Berthelier, 1991) values exceeding 35 were associated with about a 10% increase in systolic and diastolic blood pressure (Ghione et al., 1998; Dimitrova, 2006) as well as myocardial infarction (Villoresi, 1995). Chibisov et al.

Geopsychology 119
(1995) and Breus et al. (2002) found more destruction and degradation of mitochondria in cardiomyoctes of rabbits during geomagnetic storms (Bardasano et al., 1989). These changes in ultrastructure were analogous to those observed by electron microscopy in the pineal organ in rats killed during a geomagnetic storm. There was also a concomitant drop in blood oxygenation and a basic (more alkaline) shift in blood pH in the rabbits.
In human beings, worsening of indices of capillary blood flow was noted in 72% of the patients with myocardial infarction on the day of geomagnetic storms (Gurfinkel et al., 1995). Between 3-hr K-index values of 0 and 4 (about 50 nT variation) rabbits showed less variability in heart rate (Gmitrov and Gmitrova, 2004). During a geomagnetic storm, cosmonauts showed a 30% decrease in standard deviation (SD) in heart rate (Breus et al., 2002). An even larger decrease in SD was shown for Soyuz cosmonauts by Baevsky et al. (1998). Impaired heart rate variability can be a predictor of mortality in patients with vascular diseases.
Detailed multivariate analyses by Felgin et al. (1997) showed a 14% to 20% increase in stroke with large fluctuations in solar activity and geomagnetic activity, respectively, the day before the event. Low solar activity on the day of the stroke added linearly to the effect. Similar instability the day after a geomagnetic storm (K = 5) was reported by Chernouss et al. (2002) within the Arctic and Antarctic. As aptly shown by Stoupel (2002), the association between geomagnetic activity and deaths from cerebrovascular dysfunction is related to the increment of the intensity and the age range of the patients.
4.2.3. Natural Electromagnetic Activity and Headaches Less immediately life-threatening, but more chronic and intermittent vascular transients
are associated with migraine headaches. Stoupel (2002) reported almost twice the number of migraine headaches during days with A-index values between 30 and 50, which correspond to amplitudes of between 70 and 120 nT. The actual correlation for numbers of migraines across the spectrum of geomagnetic activity and severe pain was about 0.95. Investigating the approximately 30% of the population who are weather sensitive, Kuritzky et al. (1987) found that the percentage of severe headaches occurring in a population of migraine patients was 6% during geomagnetic quiet periods. The percentages for unsettled, active, and stormy geomagnetic (global daily average >40 nT) conditions were 29%, 30%, and 35%, respectively. The association was replicated by De Matteis et al. (1994).
Because sensitivity to meteorological changes is reported by 30% to 78% of headache patients, Walach et al. (2001) measured the association between these aversive experiences and the electromagnetic pulses (sferics) associated with weather processes. Sferics occur as short bursts of about 0.5 ms (that is also the duration of the action potentials of many axons). These approximately 10 kHz electromagnetic waves display pulse rates between 1 and 100 Hz. Typical intensities are below 100 nT. The frequency and amplitude of sferics and numbers of headaches on the same day were weakly correlated (r = 0.20). Vaitl et al. (2001) showed a comparable correlation (r = 0.33) between the occurrence of sferics and the occurrence of migraines during the autumn months in Germany. That the sferics were responsible for the experience has been demonstrated by experimental production of sferics within the laboratory.

Bryce P. Mulligan, Lynn Suess Cloes, Quoc Hao Mach et al. 120
4.2.4. Geomagnetic Activity and Brain Function Considering the classical interactive relationships in the brain between the vasculature
and the neurons and glial cells for various classes of migraine headaches, the correlations between geomagnetic activity and more intense electrical events should be expected. Rajaram and Mitra (1981) reported direct correlations of about 0.50 between monthly incidence of epileptic convulsions and (monthly) geomagnetic activity. Comparable strength correlations between daily geomagnetic activity and limbic seizures in rats have been repeated several times (Bureau and Persinger, 1992; Persinger, 1995). The experimental simulation of geomagnetic activity-evoked seizures in epileptic rats was the same effect size (amount of variance explained) as the correlation studies (Michon and Persinger, 1997).
From the perspective of geopsychology, these associations are relevant because they suggest a much larger and stronger incidence of associations with more subtle and complex behaviors. Stoupel et al. (1991) reiterated the complex association between solar and geomagnetic activity and patients reporting seizures and dizziness. Persinger and Richards (1995) showed that vestibular experiences in partial sensory deprivation, a setting that often promotes creativity, was enhanced when the global daily geomagnetic activity exceeded 15–20 nT at the time of the experience and during the previous night (between 0200 and 0400 local time).
Within this setting and during applications of weak (100 nT to 1 μT) magnetic fields over the right hemisphere to simulate conditions of creativity (right hemispheric dominance), the occurrence of a sensed presence was correlated with the local geomagnetic variations as measured by a magnetometer situated in the laboratory. Sensed presences were reported when the rate of change in the geomagnetic field was about 1 pT per second for at least 10 minutes, until a cumulative change of about 15 to 20 nT had occurred (Booth et al., 2005).
The pT range may be a prominent band within which fundamental neuroelectromagnetic functions operate. The sensed presence (Persinger and Makarec, 1992), which is often identified as a Sentient Being, is the likely prototype for a variety of entities to which creativity and insight have been attributed. The names vary from culture to culture. The ancient Greeks called these experiences “Muses”, whereas creative, primarily right hemispheric individuals from other cultures have called these experiences “spirit guides”, “visitors”, or some variant of “the other”. The experiences are often associated with information or knowledge not easily predictable from the person’s reinforcement history or cultural context.
Right hemispheric dominance, including the chemistry associated with right hemispheric functions, has been associated with “spirituality”. This term is applied more in the context of insight, innovation, and intuition rather than a religious indicator. The sensitivity of the right hemisphere (particularly the temporal lobe) compared to the left to alterations in geomagnetic activity can be inferred by concomitant shifts in visual thresholds within the upper left visual fields. In fact, very weak magnetic fields applied in the laboratory over the right hemisphere are known to facilitate the occurrence of the sensed presence and many other experiences similar to those evoked surgically by weak electrical stimulation of the temporal lobes or its mesiobasal structures the hippocampal formation and amygdala (St-Pierre and Persinger, 2006). Amplification of “insights” and experiencing “connections” or associations between thoughts or environmental events previously not perceived or acknowledged are also reported.

Geopsychology 121
The effects of weak, natural, slow variations upon the biological chemistry that modulates brain function are becoming clear. Geomagnetic disturbances above daily averages of about 25 nT are associated with essential reductions in nocturnal melatonin levels (Burch et al., 1999). Melatonin is an important antioxidant that also displays oncostatic (cancer slowing) as well as electrical dampening properties. Injected melatonin decreases the probability of neuroelectrical seizures, whereas reduction of melatonin, even from exposure during the nocturnal period to low luminescence (a few lux), increases electrical activity. Not surprisingly, just before the onset of the dream (rapid eye movement) phase of sleeping, there is a decrease in melatonin levels.
Periods of increased geomagnetic activity have been significantly correlated with spontaneous visual experiences described as hallucinatory by some and “paranormal” by others (Randall and Randall, 1991). The less pejorative description would be: “intense dream-like experiences with which creativity is strongly correlated”. They may also be labeled as hypnopompic or hypnagogic imagery.
The analyses of a large sample of cases of “post-mortem” or bereavement apparitions indicated they occurred during periods of increased global daily geomagnetic activity (above about 25 to 30 nT) compared to the days before or after the experiences. The diurnal distribution (a peak between 0200 and 0400 local time) and characteristics of the experiences were compatible with temporal lobe electrical lability secondary to melatonin suppression-induced changes in nocturnal brain activity (Persinger, 1988).
Increased geomagnetic activity is associated with a generally negative affect (“emotional tone”) for most individuals. Whether this relates to the consequences of mildly disrupted circadian rhythms (or sleep disturbances the previous night) has not been discerned. However, the likely consequences of disturbed sleep, such as increased incidence of accidents within industrial and traffic settings, have been consistently reported. The typical increase compared to the local baseline is between 10% and 20% (Ptitsyna et al., 1995).
In addition to disturbed geomagnetic conditions, periods of quiet geomagnetic activity, which could be facilitated in particular places with specific geophysical parameters, contribute to psychological phenomena. Conesa (1995) reported that the incidence of sleep-paralysis increased when geomagnetic activity was quiet. These periods are also associated with people feeling more “connected” with significant others, particularly if they are experiencing emotional distress or crisis (Arango and Persinger, 1988). Low geomagnetic activity is also associated with increased heart electrical instability, a major correlate of dream sleep in individuals with cardiovascular anomalies (Stoupel et al., 1994).
The most recent technology, particularly quantitative electroencephalography (QEEG), has been demonstrated to be a useful tool to show direct effects of geomagnetic activity on brain function. Babayev and Allahverdiyeva (2007) measured increased bursts of activity within the alpha and theta range. They were prevalent over the right hemisphere during days with severe, as opposed to quiet or moderate, geomagnetic activity. They also showed how employing the full range of geomagnetic activity for correlation analyses obscured associations. On the days of moderate geomagnetic storms, the tone of the sympathetic nervous system dominated. During periods of severe geomagnetic disturbances the tone of the parasympathetic nervous system dominated.
We have also found similar real-time QEEG associations between indices of atmospheric power and output over the right hemisphere of normal young volunteers. However, unlike the Babayev and Allahverdiyeva (2007) results, we found regions of the brains and frequency

Bryce P. Mulligan, Lynn Suess Cloes, Quoc Hao Mach et al. 122
bands were differentially correlated. Atmospheric power reflects the power flux carried by aurora-producing particles (protons and electrons) in the atmosphere. Direct measurements of power flux are made using polar-orbiting satellites. Data obtained from a single polar-pass of one of these satellites is used to generate an estimate of total atmospheric power (reported in gigawatts) for the entire planet. Like geomagnetic storms, planetary auroral activity is related to intrusions of high-energy solar wind particles (Meyer-Vernet, 2007). Only theta activity (4 Hz to 7 Hz) in the right prefrontal region was negatively correlated with increased atmospheric power. The right temporal lobe showed peak increases within the beta (14 Hz to 25 Hz) and gamma range (40 Hz to 50 Hz) that were directly correlated to atmospheric power. Because the range of K-index values was between 0 and 4 during our study, that is, there were no extreme geomagnetic conditions, the varied, but reliable configuration of the atmospheric-electroencephalographic changes might be considered representative of the complexity by which this interaction is manifested.
4.2.5. Large Scale Geopsychology The contribution of the most conspicuous periodicity in geomagnetic activity, the solar-
related cycles of 10 to 11 yr and 21 to 22 yr, involves large populations and hence social and political events (Chapter 9). The most well-known example of these geopsychological and heliobiological associations is the correlation between social conflicts (wars) and the solar cycle. They were first reported by Tchijevsky (1938) and replicated by Mikulecký (2007). Social revolutions have culminated near solar maxima. Even religious motivation has been shown to be strongly correlated with a 21-yr (Hale) cycle, which is considered the full polarity component of the 10.5-yr (Schwabe) cycle (Starbuck et al., 2002).
There are also reports of diminished levels of immunoglobulins, particularly IgM and possibly IgG, during the maximum rates of change in solar activity (Stoupel et al., 1995). IgG composes about 70% of the serum antibodies and is responsible for responses against viruses, toxins, and pyrogenic bacteria. IgM responses are elicited by antigens of gram-negative bacteria. Such long-cycle variations affect the populations’ vulnerability to epidemics. That the changes in the geomagnetic environment associated with the solar cycle can affect genetic expression, as inferred by chromosome aberration, has been clearly shown in one study by Stoupel et al. (2005).
The occurrences of major social changes have been attributed to solar-geophysical variations. Vladimirskii and Kislovskii (1995) reported that all major creative achievements in theoretical physics in the course of a century occurred at the maxima of solar activity. They argue that these periodicities reflect the populations’ dominant (cerebral) hemispheric style. Domination of the left hemispheric style of thought is associated with pragmatism, interest in the future, optimism, constructiveness, openness of social systems, democratism, and the reliance upon the laws of reason. Its behavioral manifestations include search for truth in dialogue. On the other hand, the right hemispheric style emphasizes an interest in the past, sympathy towards romantic self-will, and pessimism. The behavioral manifestations are introversion, separatism, and authoritarian rule with a low prestige for knowledge.
Vladimirskii and Kislovskii (1995) estimated the periods occur every 50 to 60 years. The reasoning corresponds with the observations of Páles and Mikulecký (2004) that the periodic emergence of great poets displayed a 500-yr cycle in Arabia, Persia, China, and Japan.

Geopsychology 123
Correlational evidence of the link between solar-geomagnetic cycles and manifestations of functional asymmetry of the human brain was published by Volchek (1995). She found that the period of oscillations for left hemispheric and right hemispheric dominance was equivalent to a generation, approximately 20 to 25 yr. The most important modulator of the person’s propensity for left or right hemispheric cognitive style was the interplanetary magnetic field during the month of conception.
That perinatal geomagnetic conditions are associated with adult behaviors has been supported independently by canonical correlations (Hodge and Persinger, 1991). Increases in the aggregate of global geomagnetic activity around birth accommodated about 10% of the variance in the increased temporal lobe lability, as inferred by standardized self-report questionnaires, in young males. A similar strength association was found between increased perinatal geomagnetic activity and adult scores for inferences of anxiety (Persinger and Janes, 1975). This association was replicated for women by Ossenkopp and Nobrega (1979).
Experimental manipulation of perinatal magnetic fields (Mulligan and Persinger, 1998) for rats resulted in clear alterations in neuronal numbers within sexual dimorphic structures (preoptic nucleus) within the adult hypothalamus. Our more recent research has shown that perinatal exposures to 5 nT variation, 7 Hz, or 0.5 Hz magnetic fields within the laboratory alter neuronal density within regions of the hypothalamus involved with appetite, sexual reproduction, and social dominance.
4.2.6. Gravity and Geopsychology Except for the obvious fact that life evolved within a gravitation field, the impact of
gravity on life was rarely studied until the Space Age. Daily or monthly gravitational changes were considered too minute to be effective even though tidal influences are well known. This too has changed. Small differences in orthostatic reactions in human subjects have been correlated with the lunar semidiurnal tidal wave of force of gravity (Raibshtein et al., 1995). Garib et al. (1995) reported that dynamics of expression of receptors on the surface of T-lymphocytes was coupled to the heterogeneity of tidal changes in the force of gravity.
There is a widely propagated, ancient cultural stereotype that the Moon phases influence the human psychical state and behavior such as aggression, emotional disturbance, suicide and homicide frequency, traffic accidents, psychiatric emergency room visits, lunacy, etc. It is well known that gravitational interaction in the “Sun–Moon–Earth” system (lunisolar tides) affects the hydrosphere, atmosphere, magnetosphere, and the solid Earth (Wilhelm et al., 1997). Thus, it is hardly surprising that there were attempts to explain a possible biotropic influence of lunar phases by the tidal modulation of geomagnetic activity, atmospheric circulation, extremely low frequency electromagnetic waves, and even direct gravitational influence on the human body (see reviews, polemics, and bibliographies elsewhere – Culver et al., 1988). However, numerous medical statistical studies yielded contradictory results. Some works have supported the hypothesis demonstrating statistically significant cyclic detriments to the state of health correlated with full and/or new moon phases, that is, periods of increased levels of solid tides. Other works did not demonstrate any statistical relation (see reviews and bibliographies elsewhere – Dubrov, 1996; Culver et al., 1988; Zimecki, 2006).
Geomagnetic and gravitational interactions and synergisms must exist within a physical context. Mikulecky et al. (1996) found that the association between epileptic seizures and

Bryce P. Mulligan, Lynn Suess Cloes, Quoc Hao Mach et al. 124
geomagnetic activity was abolished when tidal gravitational effects were first removed from the analyses. The experimental demonstration of this effect was reported by Persinger (1971). He found that the ambulatory behavior of dozens of litters of rats that had been prenatally exposed to a 0.5 Hz rotating magnetic field (a frequency that approaches the resonance value for the Earth–Moon system) was correlated 0.80 with lunar distance at the time of birth. This relationship was not apparent for rats exposed to sham field conditions.
4.2.7. Geochemistry and Behavior Any thorough review of geopsychology should require a succinct summary of the local
geochemical situation. It determines the trace elements within the soil from which local plants, animals, and human beings obtain water and food either directly or indirectly (Section 3.3). Examples of the importance of local indigenous mineralization and their contribution to pathology have been presented previously (Persinger, 1987). That anomalous concentrations of trace elements, such as Cu, Fe, Ca, Zn, or Mg, are correlated with specific pathologies is clearly acknowledged.
These elements are vital components of dynamic proteins (enzymes) within the body. For example, Zn is contained within carbonic anhydrase (which catalyzes the removal of metabolites of oxidative metabolism), glutamate dehydrogenase (a key component for maintaining neuronal stability), and lactic acid dehydrogenase (Section 3.3.4). Copper is contained in cytochrome c oxidase whose normal activity forms the phospholipids that constitute the cell membrane. Cytochrome c oxidase limits the serial processing rate of electrons from oxygen donors to once every approximately 20 ms, the duration of time known to be associated with the recursive electromagnetic correlates of consciousness. Elements are also integral to structural proteins, such as hemoglobin and insulin. The sensitivity of the fetus to small alterations in ingested elements or minerals is extraordinary and is amplified by the accelerated metabolism and rate of cell division that defines this stage of ontogeny.
However, future geopsychology must also closely examine the more subtle variations in geochemistry. For example, levels of nickel within the water supply might be considered “normal” by authorities for the region because of the high content in local rocks that cannot be easily removed. The new technologies in molecular biology have revealed that such very subtle alterations affect the subtypes of ion channels within neurons that determine their stability. T-type calcium channels, which promote the burst-firing of neurons strongly correlated with both memory and the electrical lability coupled to creativity, can be preferentially blocked by low concentrations of nickel (Su et al., 2002).
4.3. CASE STUDIES
4.3.1. Bancroft: The Most Talented Town in Ontario Bancroft, the commercial and service center of North Hastings County in Eastern Ontario
(Figure 4.1), was selected as the first example of the application of geopsychology. This region was identified as “the most talented town in Ontario” by Television Ontario due to its

Geopsychology 125
exceptionally high population density of artistic, creative, and eccentric individuals who live within the confines of the territory. According to the full biographical data collected for a sample of 41 people who lived within this area, most of the individuals felt “most at peace” within the region compared to other places they had lived. Some inhabitants had simply been driving through the area when they felt “this was the place to live”.
Figure 4.1. Geographical location of the study sites: B – the Bancroft area, M – the Marmora site.
4.3.1.1. Geological and Geophysical Data
Bancroft is built on the granite rock of the Grenville Province of the Canadian Shield. The rock types include metamorphosed sediments, volcanic rock and ash flows, deposits of plutonic rocks, and skarn. Remaining magma intrusions are due to plate subduction that resulted in the formation of a vast mountain range about one billion years ago. The tectonic activity along the shear (fault) zones has been the focus of multiple studies (Lumbers, 1967; Divi and Fyson, 1973). Bancroft is known as “the Mineral Capital of Canada” due to the exceptional variety of minerals found there (Sabina, 1982; Millis, 1999). This “reservoir” includes 1,600 species of minerals in more than 10,000 identified deposits. In the 1960s, uranium mining became widespread within the area (Little, 1969). Other materials included iron, gold, lead, copper, nickel, and arsenic.
The region we investigated measures about 42 by 55 km (between 44.75° to 45.25° N and between 77.50° to 78.00° W). A westwardly adjacent area of identical size (between 44.75° to 45.25° N and between 78.00° to 78.50° W) in Peterborough and Haliburton Counties was used as the reference (control) area. Most of the geological/geophysical information has been documented by the Geological Survey of Canada. Aeromagnetic coverage of the area is relatively complete and aeromagnetic maps are available (Geological Survey of Canada, 1957).
The numbers of magnetic anomalies, defined as peaks and troughs of aeromagnetic contours (Figures 4.2 and 4.3), were counted manually and gradients of magnetic anomalies (nT/m) were estimated. Spatial gradients were designated as negative if the magnetic intensity decreased as the focus of a depression was approached; they were considered as positive if the intensity increased.
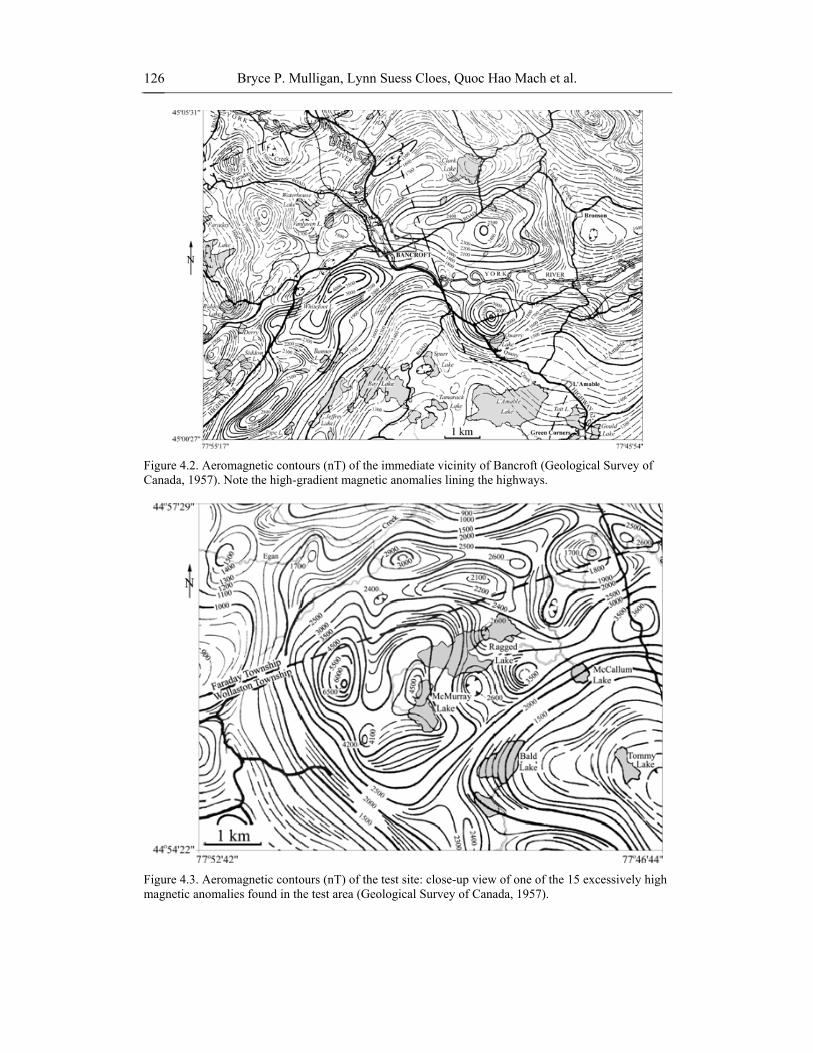
Bryce P. Mulligan, Lynn Suess Cloes, Quoc Hao Mach et al. 126
Figure 4.2. Aeromagnetic contours (nT) of the immediate vicinity of Bancroft (Geological Survey of Canada, 1957). Note the high-gradient magnetic anomalies lining the highways.
Figure 4.3. Aeromagnetic contours (nT) of the test site: close-up view of one of the 15 excessively high magnetic anomalies found in the test area (Geological Survey of Canada, 1957).

Geopsychology 127
Overall means and SD (in parentheses) of intensities from the aeromagnetic maps refer to values above or below the average for the area that was surveyed. They were 1,791 (552) nT for the highs and -1,235 (251) nT for the lows. Values for peaks and troughs, respectively, within the test area were 1,860 (710) nT and -1,235 (303) nT. Within the adjacent reference area of equal size, the means and SD for the peaks were 1,597 (316) nT and for the troughs were -1,235 (202) nT. There were a total of 407 troughs and 573 peaks in both areas combined. The average width of the troughs and peaks was about 0.5 km. Analysis of variance indicated that peak anomalies in the North Hastings area displayed significantly higher magnetic field intensities compared to the reference area (F(1, 572) = 34.19, p < 0.0001), whereas the mean magnetic field intensity associated with trough anomalies did not differ between the two areas.
The overall means and SD (in parentheses) for the gradients surrounding the peaks and troughs were 0.50 (0.68) nT/m and -0.28 (0.35) nT/m, respectively. In the study area these values were 0.63 (0.87) nT/m and -0.31 (0.44) nT/m, respectively. Within the reference area the means and SD of the gradients for the peaks and troughs were 0.39 (0.41) nT/m and -0.25 (0.27) nT/m. Analysis of variance revealed that gradients associated with peak anomalies were significantly elevated in the test area relative to the reference area (F(1, 572) = 17.81, p < 0.0001). There was no discrepancy between sites for the gradient values associated with trough anomalies.
Assuming a base-intensity of 45,000 nT, this means that the average actual gradients within both the trough and peak anomalies within the reference area would be below 10 nT/m. The trough anomalies within the Bancroft area would also be below this threshold. However, the peak anomalies within the Bancroft area would be about 25 nT/m. This is above the threshold required to detect activity and information from natural magnetic fields during casual ambulation according to Rocard (1964). Assuming the typical coefficient of variation is about 30%, this means that most of the gradients within the Bancroft region have the potential to directly affect the awareness of sensitive inhabitants.
The highest measure for deviation of the magnetic field was 3,300 nT above the average value in the reference area, whereas this measure was 6,500 nT above the average value within the Bancroft (test) area (Figure 4.3). There were 15 peak anomalies with intensities above 3,300 nT within the test area (Figures 4.2 and 4.3) and no peaks with magnitudes above this value in the reference area. The magnetic field intensities, associated with these 15 peak anomalies in the Bancroft (test) area, were significantly (F(1, 572) = 641.67, p < 0.001) higher than all other peak intensity values combined.
The average intensity associated with the 15 areas was 4,100 nT compared to the average of all other (n = 558) anomalies which was 1,700 nT. The equivalent gradients for these unexpectedly high intensity peak anomalies would be about 100 to 200 nT/m over substantial areas. This range was considered optimal “detection” levels by Rocard (1964).
4.3.1.2. Demographic Data, Autobiographical Data, and Standardized Testing
The second author interviewed each of the 41 subjects individually. The following data were obtained: birthdate, birthplace, handedness, numbers of siblings, numbers of children, educational level, occupation, medical history, hobbies, talents, duration of time living in the area, and the reasons for moving to the area. The subjects were selected from the records of the local Community Futures network base.

Bryce P. Mulligan, Lynn Suess Cloes, Quoc Hao Mach et al. 128
The Myers-Briggs Type Indicator (MBTI), which is a standardized inventory by which cognitive style is inferred, was administered to each person. The items are constructed to yield four dichotomous scales: extroverted (E) vs. introverted (I), sensing (S) vs. intuitive (N), thinking (T) vs. feeling (F), and judging (J) vs. perceiving (P). Each person was assigned a four-letter code. For example, “ESTJ” denotes an individual who is extroverted, sensing, thinking, and judging. It is possible for an individual to show equivalent tendencies for both extremes of one or more of the four factors. In this case, the interviewer must ask further questions to break the tie. The MBTI manual described characteristics for the possible combinations (Myers and McCaulley, 1985).
Complex Partial Epileptic-like Signs (CPES) inventory (Roberts, 1993) was also administered. This scale contains 36 items (each item, reflecting frequency, scored between 0 and 6) referring to experiences often reported by individuals who display complex partial epilepsy. The items have been employed to operationally define the epileptic spectrum disorder. Extreme scores, within the upper 5% of the population, are often obtained from patients who display verifiable complex partial seizures. Traditionally they have been diagnosed as temporal lobe, nocturnal, and limbic epilepsies.
However, creative individuals such as artists, musicians, and writers score within the intermediate range above the average and below the extreme (Persinger and Makarec, 1993). The detailed personality characteristics of these individuals based upon standardized and norm-referenced personality inventories for normal people have been published elsewhere (Persinger and Makarec, 1993). Individuals who display above average complex partial epileptic-like experiences are above normal on scales by which eccentric thinking and energetic behavior are inferred from the Minnesota Multiphasic Personality Inventory (Butcher et al., 2004).
4.3.1.3. Behavioral Results
All but one of the 41 subjects reported important historical incidents that could have produced reorganizations of their neuromatrices. We employ the term “neuromatrix” to describe the intricate spatial patterns of the dendritic spines, axonal connections, and gap junctions within cerebral space that support the electromagnetic patterns associated with behavior, including consciousness. These “reorganizing events” included direct mechanical impact (e.g., motor vehicle incident, physical abuse or forceps’ birth), electrical shock, hypoxia, and high fever.
The single factor distributions of the MBTI for the people living within the Bancroft area are shown in Table 4.1. This shows the numbers of people who showed equal balance or either dominance of one or the other component of the scale for judging–perceiving, extroverted–introverted, sensing–intuitive, and thinking–feeling. Chi-squared analyses indicated no significant discrepancy between the expected distribution based upon the normal population and the people living in and around Bancroft for judging-perceiving and extroversion-introversion. However, Bancroft-area inhabitants displayed disproportionably more intuitive styles than sensing styles (χ2(2) = 85.81, p < 0.001) and more feeling cognitive styles than thinking styles (χ2(2) = 14.281, p < 0.01).
Because of the sample size, a thorough analysis of all possible two-letter MBTI types was not possible. However, it was apparent that only 2 of the 41 subjects showed a SP (sensing-perceiving) profile. The sensing-perceiving cognitive style is the second most abundant in the normal population and is typical of artists. Instead, 29 of 41 subjects displayed NF (intuitive-feeling) cognitive styles.

Geopsychology 129
Table 4.1. Frequency of MBTI single-factor distributions for the Bancroft-area sample and the expected frequencies for the normal population. There was a disproportionately high number of intuitive styles versus sensing styles (χ2(2) = 85.81, p < 0.001) and more
feeling cognitive styles as opposed to thinking ones (χ2(2) = 14.281, p < 0.01) Preference Observed Expected
Equal 5 3
Judging 19 19
Perceiving 17 19
Equal 5 2
Extroverted 21 30
Introverted 15 9
Equal 5 2
Sensing 4 30
Intuition 32 9
Equal 4 3
Thinking 7 19
Feeling 30 19
Table 4.2. Frequency of actual and expected (normal population) distributions of the 16 possible personality types as classified by the MBTI after breaking ties. Significant
disconcordance was found between expected and actual values (χ2(15)= 267.08, p < 0.001)
Four-factor type Observed Expected ESTJ 1 5.4 ESTP 0 5.4 ESFJ 0 5.4 ESFP 1 5.4 ENTP 1 2.0 ENTJ 3 2.0 ENFJ 3 2.0 ENFP 11 2.0 ISTJ 0 2.5 ISTP 0 2.0 ISFJ 1 2.5 ISFP 1 2.0 INTJ 2 0.5 INTP 2 0.5 INFJ 8 0.5 INFP 7 0.5
Bryce P. Mulligan, Lynn Suess Cloes, Quoc Hao Mach et al. 130
This suggests that the process used by Bancroft-area residents to create art may differ from that used by the conventional artist. While non-right-handed, non-NF types had inhabited the Bancroft area longer than any other group (F(3, 37) = 3.19, p < 0.05; ω2 = 0.21), non-right-handed NF types showed increased CPES (F(3, 37) = 3.69, p < 0.03; ω2 = 0.23) relative to all other groups (ω2 is the estimate of the variance explained in the population by a predictor variable).
Table 4.2 displays the distribution of the observed versus expected occurrence of the 16 possible four-factor personality types within the sample from the Bancroft area. Chi-squared analyses demonstrated a strong disconcordance (χ2(15) = 267.08, p < 0.001). MBTI types INFJ, INFP, and ENFP were 16, 14, and 5 times, respectively, more common in the sample than expected from the normal population. According to the manual (Myers and McCaulley, 1985), individuals who display the INFJ profile succeed by perseverance, originality, and desire to do whatever is needed or wanted. They are quietly forceful, conscientious, and concerned for others. Socially, they are respected for their firm principles. The major vocations dominated by these profiles include religious practitioners (e.g., monks, priests, clergy) and teachers of art, drama, and music.
INFP persons are characterized by enthusiasms and loyalties. They care about learning, ideas, and independent projects of their own. Major vocations dominated by these individuals include writers, artists, entertainers, journalists, as well as religious educators of all denominations. If there is a type of person that understands psychic phenomena, it would be INFP (Myers and McCaulley, 1985). ENFP individuals are warmly enthusiastic, high-spirited, ingenious, and imaginative. They are able to do almost anything that interests them. These individuals often rely on their ability to improvise instead of preparing in advance. Top vocations include journalists, teachers of art, music, and drama, and writers, artists, musicians, and composers.
Among ENFP profiles only, there was a significant discrepancy for people who were either: (a) born and raised in the Bancroft region of North Hastings, (b) chose to live permanently in the area, or (c) visited or lived there occasionally (φ = 0.59). The permanent dwellers were predominantly ENFP profiles. Those respondents who grew up in the area also showed a marginal, but statistically significant enhancement of complex partial epileptic-like experiences compared to those who had moved there as adults.
The disproportionate predominance of these three cognitive styles within the “mineral capital” of Canada was conspicuous. They are living within an area containing a rich spatial density of geomagnetic gradients that are above the threshold for “detection” by sensitive individuals (Rocard, 1964). Their presence also supports the claims of local leaders of commerce that the area may facilitate or attract individuals with specific talents, particularly those defined by insight and creativity.
The average score on the Complex Partial Epileptic Experience Scale for the 41 people sampled from the Bancroft area was 36.5 (SD = 28). Compared to our normative data, this score is about 1 SD above the mean. The left-hand dominant subjects displayed significantly (F(2, 38) = 5.84, p < 0.01; ω2= 0.24) higher CPES scores (M = 62, SEM = 15) than those who were ambidextrous (M = 37, SEM = 8) or right-handed (M = 27, SEM = 3). Left-handed INFP types obtained the highest CPES scores (F(11, 29) = 5.59, p < 0.0002; ω2 = 0.68) as compared to all other handedness/personality type groups. This mild elevation in complex partial epileptic experiences, that does not indicate epilepsy, is correlated with creativity.

Geopsychology 131
Handedness also showed a marked deviation from normal expectations for the area. The numbers of subjects who preferred their right hand (22), left hand (8), or both hands (11) exhibited proportions that were significantly (χ2(2) = 106.15, p < 0.001) disconcordant from expectancy. The expected values were as follows: right-handed – 36, left-handed – 4, and ambidextrous – 1.
Left-handed and ambidextrous individuals are more likely to display right hemispheric characteristics and to employ more integrative activity within both cerebral hemispheres during problem solving. The right hemisphere of the human brain is more sensitive to geomagnetic variations following solar storms or the Earth’s passage through a sector of the interplanetary magnetic field (Babayev and Allahverdiyeva, 2007). Consequently, these individuals would be expected to show clear alterations in mood and productivity as a function of geomagnetic activity.
4.3.1.4. Geopsychological Relationships
The addresses of the 41 subjects were used to generate geographical coordinates (including altitude) that were plotted on the aeromagnetic map. A circular area defined by a radius of 1 km was used to assess each dwelling site for the number and magnitude of peaks and depressions, the maximum magnetic gradient, and the presence or absence of lake water. The geographic coordinates for the 15 unexpectedly elevated magnetic anomalies were used along with the coordinates of the subjects’ dwellings to calculate the mean distance in kilometers between each of the subjects and the 15 magnetic anomalies.
Most subjects lived in isolated outlying areas surrounding the town of Bancroft. Bancroft itself is the service and commercial center of North Hastings. It was found that both main highways leaving Bancroft from the southwest and southeast (Highways 28 and 62, respectively) were lined by 2 of the 15 excessively high magnetic peaks with gradients of about 100 nT/m (Figure 4.2). Most subjects traveled along these roads on a weekly basis and so regardless of their choice of living site would be exposed to these high gradients at least transiently.
During the interviews subjects were asked why they chose to live where they did. Most responded that “it felt right” or they “liked the area”. One subject in particular (an ambidextrous INFP) who cited psychic ability as her foremost talent claimed her home, a location characterized by shallow magnetic gradients and an absence of peaks or depressions, was a “happy, healthy place”. The same subject reported “psychic attacks from dark entities” at a nearby location. This second site contained excessively high magnetic peaks and steep magnetic gradients. The subject had vowed to stay away from this area. Another subject, this one a right-handed ENFP reporting a history of malfunctioning electronic devices in her presence, suggested that the interviewer investigate a certain highway intersection where the subject had consistently felt “confused and troubled”. This intersection also displayed anomalously high magnetic peaks and steep positive gradients (Figure 4.3).
Geopsychology predicts that neurostructural characteristics predispose individuals to geophysical sensitivities. Ambidextrous subjects had significantly higher maximum magnetic field intensities within a 1 km radius of their houses than did right- or left-handed subjects (F(2, 37) = 5.27, p < 0.02; ω2 = 0.23). The dwelling sites of right-handed INFPs had more magnetic depressions (sample minimum was 0, sample maximum was 2) than the dwelling sights of most other groups (F(7, 30) = 2.38, p < 0.05; ω2 = 0.36). This implies that neurostructural characteristics may influence an individual’s selection of a housing site.

Bryce P. Mulligan, Lynn Suess Cloes, Quoc Hao Mach et al. 132
It is likely that, unlike classical sense organ-based perception, geopsychological phenomena involve direct physical interactions between the brain and environment. Hence, the behavioral result of these interactions would depend on the “geopsychological locus” within the brain. Overall, there was a significant positive correlation between CPES score and the minimum magnetic field intensity found within 1 km of a subject’s home (r = 0.29, p < 0.04). When right-handers were compared to non-right-handers (left-handed and ambidextrous subjects combined), there was a negative relationship between CPES scores and the maximum magnetic field intensity found within 1 km of the subject’s dwelling for right-handers only (r = -0.39, p < 0.04).
The association between CPES scores (i.e., creative thinking) and ambient magnetic field intensity implies the involvement of the temporal lobes, known to be sensitive to environmental intensity magnetic fields and associated with creativity (Persinger, 2001). Individual differences in neurostructure, in this case inferred from hand dominance, would alter the locus and nature of brain-geophysical interactions.
The length of time that subjects inhabited the Bancroft area varied from 0 (seasonal visitors) to 46 yr. The mean and SD was 11.1 and 10.3 yr, respectively. When the subjects were divided into four equally-sized groups based on residential duration (0 to 2, 3 to 8, 9 to 17, and 18 to 46 yr), it was found that INFPs who had lived in the area for less than 2 or more than 18 yr had significantly elevated CPES scores (F(13, 27) = 3.98, p < 0.002; ω2 = 0.66) relative to all other groups.
4.3.2. The Marmora Phenomena
4.3.2.1. The Site Most of the phenomena occurred within the boundaries of a farm located between
Marmora (44.3° N, 77.7° W) and Deloro, Ontario (Figure 4.1) (Suess and Persinger, 2001). Within 10 km of the farm is an old gold mine from which large quantities of arsenic were extracted to be used for pesticides. The mine, which was considered the most contaminated in the province, was later filled with radioactive refuse from a nuclear plant before it was sealed and capped. Crowe Lake and several dams are within 4 km of the farm.
About 17 km west of the farm is Petroglyphs Provincial Park (Wainwright et al., 1988). The park contains hundreds of symbolic shapes and figures carved upon flat expanses of marble. Their estimated age is between 500 and 1,000 years. The petroglyphs are considered a sacred site by the Ojibwe Anishinabe natives who call this area “the rocks that teach” although the alternative translation is “the rocks that talk”.
The Marmora magnetite deposit (Wahl and Lake, 1957) is within a belt of Grenville metasediments composed of crystalline limestone, amphibolites, granite-gneiss, and quartzite gneiss (Easton et al., 1987). Aeromagnetic surveys revealed an anomalous zone, located about 2 km southeast of the village of Marmora, with a major strike (axis) north to northwest with a dip of 60° W. Mining of the magnetite deposit (35% magnetite) began in 1952 and continued until water fill became excessive in 1978. The estimated accumulation is about 1,600 liters per minute. The asymptote of 23 × 106 L of water in the open pit is predicted to occur in 2009 (Figure 4.4).

Geopsychology 133
Figure 4.4. The Marmora site: (a) an aerial photograph of the Marmoraton magnetite mine in 1978, photo by Clive Nickerson; (b) the same mine filled with water in 2009, photo by Laurel Suess-Kinastowski.
The property of the farm is immediately adjacent to the magnetite mine. The phenomena, which were given religious overtones, began in the year 1990 on a small hill shortly after a commercial microwave (cellular phone) tower was erected on an adjacent hill. Direct measurement with a power frequency meter by the second author revealed surprisingly intense extremely low frequency electromagnetic field strengths between 10 and 950 nT that occurred as slow continuous variations between 1 and 7 s. Because there were no power

Bryce P. Mulligan, Lynn Suess Cloes, Quoc Hao Mach et al. 134
sources in the immediate vicinity, both the presence and the intensity of these magnetic fields were unexpected and suggested an anomalous amplification from either power sources of the nearby communication tower or very powerful telluric currents.
The static geomagnetic field within the area along the path was inferred to contain marked gradients within the range of 200 to 300 nT/m. The magnetite within surface rocks in some places is sufficient to attract medallions and small trinkets composed of iron alloys. Tingling sensations on the skin beneath conductors, such as silver or gold ornaments, have also been reported.
The occurrence of approximately 1 μT, time-varying fields within the site could have profound effects on experients. Specific burst-firing fields with the same intensity applied across the temporal lobes effectively improve depression secondary to a closed head injury in patients after three to four weeks of weekly, one hour exposures (Baker-Price and Persinger, 1996, 2003). Experimental application of the same intensity fields to rats produces a robust analgesia that is equivalent to about 5 mg/kg of morphine (Martin et al., 2004). Such experiences in human beings would increase the reward attributed to a specific area as well as the occurrence of thoughts generated by the release of endogenous opiates.
Between 1992 and 1995, tens of thousands of people walked through the various stations of the small hill that was considered “the focus” of the phenomena. They included seeing glows around the rocks, “auditory messages”, the sense of a presence, and altered visual experiences. Unusually colored clouds, such as pinkish green or greenish-yellow, have been reported before electrical storms. Between 1990 and 1997, the numbers of discernable seismic events near Marmora significantly increased until one occurred within 46 km of the site in 1997 (Suess and Persinger, 2001).
4.3.2.2. Geomagnetic and Seismic Correlations
Detailed analyses of experiences from three women, who reported at least five different episodes of intense “creative” or spiritual experiences while slowly walking through the site, showed a relationship between the occurrence of their experiences and global geomagnetic activity. The geomagnetic activity during days in which experiences occurred was significantly less than the days before or after the experiences (Suess and Persinger, 2001). The occurrence of the experiences during periods of diminished geomagnetic activity suggests a similarity to types of emotional experiences, often attributed to paranormal sources, likely coupled to brain-geophysical interactions.
Lag/lead time series analyses indicated that 61% of the variances in total numbers of experiences per month reported on the site could be accommodated by the occurrence of an earthquake within 200 km during the previous month and a proportional decrease in geomagnetic activity two months previously. On the other hand, the reports of unusual lights and the “detection” of visual stimuli, including “apparitions”, occurred during the weeks before the occurrence of local seismic activity and during peaks of geomagnetic activity. This enhancement is consistent with clusters of occurrences in other areas, such as in the Uinta Basin (Persinger and Derr, 1985), associated with increases in geomagnetic activity (Persinger, 1988).

Geopsychology 135
4.4. CONCLUSION The importance of geopsychology within the twenty-first century for predicting the
spatial variability of human potentials and characteristics will become evident as databases increase and the sophistication of statistical analyses improves. With the growing interest in maintaining behavioral registries for classes of normal behaviors, rather than only those defined as pathological or deviations from the mores of the society, the relationships between local earth and human thinking will become more apparent.
However, the effects are subtle at the level of the individual or the daily increment of analysis and, like most epidemiological phenomena, will be optimally observed at the level of the group over longer durations of time. Most of the effect sizes for the temporal correlations between geomagnetic variables and both physiological and behavioral changes in human populations have explained no more than about 10% to 20% of the variance (Khabarova and Dimitrova, 2008). However, this small effect, when applied to hundreds of thousands of sensitive individuals with specific neurocognitive properties, would be expected to produce quantitative changes in routine behaviors that result in qualitatively different and emergent phenomena.
REFERENCES
Ahmed, Z. and Wieraszko, A. (2008). The mechanism of magnetic field-induced increase of excitability in hippocampal neurons. Brain Research, 1221, 30–40.
Åkerstedt, T., Arnetz, B., Ficca, G., Paulsson, L.-E. and Kallner, A. (1999). A 50-Hz electromagnetic field impairs sleep. Journal of Sleep Research, 8, 77–81.
Arango, M.A. and Persinger, M.A. (1988). Geophysical variables and behavior: LII. Decreased geomagnetic activity and spontaneous telepathic experiences from the Sidgwick collection. Perceptual and Motor Skills, 67, 907–910.
Babayev, E.S. and Allahverdiyeva, A.A. (2007). Effects of geomagnetic activity variations on the physiological and psychological state of functionally healthy humans: some results of Azerbaijani studies. Advances in Space Research, 40, 1941–1951.
Baevsky, R.M., Petrov, V.M. and Chernikova, A.G. (1998). Regulation of autonomic nervous system in space and magnetic storms. Advances in Space Research, 22, 227–234.
Baker-Price, L.A. and Persinger, M.A. (1996). Weak, but complex pulsed magnetic fields may reduce depression following traumatic brain injury. Perceptual and Motor Skills, 83, 491–498.
Baker-Price, L.A. and Persinger, M.A. (2003). Intermittent burst-firing weak (1 microTesla) magnetic fields reduce psychometric depression in patients who sustained closed head injuries: a replication and electroencephalographic validation. Perceptual and Motor Skills, 96, 965–974 .
Bardasano, J.L., Cos, S. and Picazo, M.L. (1989). Veränderungen der Anzahl synaptischer Bänder in der Pinealdrüse der Ratte an Geomagnetischen Ruhetagen und Gewittertagen. Journal für Hirnforschung, 30, 639–643.
Binhi, V.N. (2002). Magnetobiology: Underlying physical problems. San Diego, CA: Academic Press.

Bryce P. Mulligan, Lynn Suess Cloes, Quoc Hao Mach et al. 136
Booth, J.N., Koren, S.A. and Persinger, M.A. (2005). Increased feelings of the sensed presence and increased geomagnetic activity at the time of the experience during exposures to transcerebral weak complex magnetic fields. International Journal of Neuroscience, 115, 1053–1079.
Breus, T.K., Pimenov, K.Y., Cornélissen, G., Halberg, F., Syutkina, E.V., Baevsky, R.M., Petrov, V.M., Orth-Gomér, K., Åkerstedt, T., Otsuka, K., Watanabe, Y. and Chibisov, S.M. (2002). The biological effects of solar activity. Biomedicine and Pharmacotherapy, 56, 273s–283s.
Bubenik, G.A. (2002). Gastrointestinal melatonin: localization, function, and clinical relevance. Digestive Diseases and Sciences, 47, 2336–2348.
Buchachenko, A.L. (2009). Magnetic isotope effects in chemistry and biochemistry. New York, NY: Wiley.
Buchachenko, A.L., Kouznetsov, D.A. and Berdinsky, V.L. (2006). New mechanisms of biological effects of electromagnetic fields. Biophysics, 51, 489–496.
Burch, J.B., Reif, J.S. and Yost, M.G. (1999). Geomagnetic disturbances are associated with reduced nocturnal excretion of a melatonin metabolite in humans. Neuroscience Letters, 266, 209–212.
Bureau, Y.R.J. and Persinger, M.A. (1992). Geomagnetic activity and enhanced mortality in rats with acute (epileptic) limbic lability. International Journal of Biometeorology, 36, 226–232.
Butcher, J.N., Atlis, M.M. and Hahn, J. (2004). The Minnesota Multiphasic Personality Inventory-2 (MMPI-2). In M.J. Hilsenroth and D.L. Segal (Eds.), Comprehensive handbook of psychological assessment, Vol. 2: Personality assessment (pp. 30–38). Hoboken, NJ: Wiley.
Chernouss, S., Antonenko, O., Ilyin, V., Milinevsky, G., Moiseenko, Y. and Bogomolets, A.A. (2002). Heart rate variability parameters variations at geomagnetic disturbances in Arctic and Antarctic regions. In A.G. Yakhnin, N.V. Semenova and V.V. Shabalin (Eds.), Physics of auroral phenomena: Proceedings of the XXV Annual seminar, Apatity, Russia, Feb. 26 – Mar. 1, 2002 (pp. 157–160). Apatity, Russia: Polar Geophysical Institute, Russian Academy of Sciences.
Cherry, N. (2002). Schumann resonances, a plausible biophysical mechanism for the human health effects of solar/geomagnetic activity. Natural Hazards, 26, 279–331.
Chibisov, S.M., Breus, T.K., Levitin, A.Y. and Drogova, G.M. (1995). Biological effects of a planetary magnetic storm. Biophysics, 40, 957–966.
Conesa, J. (1995). Relationship between isolated sleep paralysis and geomagnetic influences: a case study. Perceptual and Motor Skills, 80, 1263–1273.
Culver, R., Rotton, J. and Kelly, I.W. (1988). Geophysical variables and behavior: XLIX. Moon mechanisms and myths: a critical appraisal of explanations of purported lunar effects on human behavior. Psychological Reports, 62, 683–710.
De Matteis, G., Vellante, M., Marrelli, A., Villante, U., Santalucia, P., Tuzi, P. and Prencipe, M. (1994). Geomagnetic activity, humidity, temperature and headache: is, there any correlation? Headache, 34, 41–43.
Del Seppia, C., Mezzasalma, L., Messerotti, M., Cordelli, A. and Ghione, S. (2006). Simulation of the geomagnetic field experienced by the International Space Station in its revolution around the Earth: effects on psychophysiological responses to affective picture viewing. Neuroscience Letters, 400, 197–202.

Geopsychology 137
Dimitrova, S. (2006). Relationship between human physiological parameters and geomagnetic variations of solar origin. Advances in Space Research, 37, 1251–1257.
Divi, R.R. and Fyson, W.K. (1973). Folds and strain in Grenville metamorphic rocks, Bancroft, Ontario, Canada. Bulletin of the Geological Society of America, 84, 1607–1618.
Dubrov, A.P. (1996). Human biorhythms and the Moon. New York, NY: Nova Science Publishers.
Easton, R.M., Carter, T.R. and Bartlett, J.R. (1987). Supracrustal rocks of the Central Metasedimentary Belt of the Grenville Province, Madoc–Marmora–Havelock area, Ontario. In Centennial field guide, Vol. 5: Northeastern section of the Geological society of America (pp. 333–336). Boulder, CO: Geological Society of America.
Felgin, V.L., Nikitin, Y.P. and Vinogradova, T.E. (1997). Solar and geomagnetic activities: are there associations with stroke occurrence? A population-based study in Siberia, Russia (1982–1992). Cerebrovascular Diseases, 7, 345–348.
Garib, F.Y., Bortnikova, G.I., Rizopulu, A.P. and Tashpulatov, K.A. (1995). Effect of tidal changes in the force of gravity on the periodicity of expression of T-lymphocyte receptors in vitro. Biophysics, 40, 823–827.
Geological Survey of Canada (1957). Magnetic survey of Hastings, Peterborough and Haliburton Counties, Ontario [map]. 1 : 63,360. Aeromagnetic series. Ottawa, ON: Geological Survey of Canada.
Ghione, S., Mezzasalma, L., Del Seppia, C. and Papi, F. (1998). Do geomagnetic disturbances of solar origin affect arterial blood pressure? Journal of Human Hypertension, 12, 749–754.
Gmitrov, J. and Gmitrova, A. (2004). Geomagnetic field effect on cardiovascular regulation. Bioelectromagnetics, 25, 92–101.
Gurfinkel, Y.I., Lyubimov, V.V., Orayevskii, V.N., Parfenova, L.M. and Yur’ev, A.S. (1995). Effect of geomagnetic disturbances on capillary blood flow in patients suffering from ischaemic disease of the heart. Biophysics, 40, 777–783.
Harvalik, Z.V. (1978). Anatomical localization of human detection of weak electromagnetic radiation: experiments with dowsers. Physiological Chemistry and Physics, 10, 525–534.
Henshaw, D.L., Ross, A.N., Fews, A.P. and Preece, A.W. (1996). Enhanced deposition of radon daughter nuclei in the vicinity of power frequency electromagnetic fields. International Journal of Radiation Biology, 69, 25–38.
Hodge, K.A. and Persinger, M.A. (1991). Quantitative increases in temporal lobe symptoms in human males are proportional to postnatal geomagnetic activity: verification by canonical correlation. Neuroscience Letters, 125, 205–208.
Khabarova, O.V. and Dimitrova, S. (2008). Some proves of integrated influence of geomagnetic activity and weather changes on human health. In Fundamental space research: Recent development in geoecology monitoring of the Black Sea area and their prospects: Proceedings of the International conference, Sunny Beach, Bulgaria, Sept. 21–28, 2008 (pp. 306–309). Sofia, Bulgaria: Space Research Institute.
Korhonen, J.V., Fairhead, J.D., Hamoudi, M., Hemant, K., Lesur, V., Mandea, M., Maus, S., Purucker, M., Ravat, D., Sazonova, T. and Thébault, E. (2007). Magnetic anomaly map of the world, scale 1 : 50,000,000. Paris, France: Commission for the Geological Map of the World.
Kuritzky, A., Zoldan, Y., Hering, R. and Stoupel, E. (1987). Geomagnetic activity and the severity of the migraine attack. Headache, 27, 87–89.

Bryce P. Mulligan, Lynn Suess Cloes, Quoc Hao Mach et al. 138
Little, H.W. (1969). Anhydrite-pegmatite uranium ore at Bancroft, Ontario. Economic geology, 64, 691–693.
Lumbers, S.B. (1967). Geology and mineral deposits of the Bancroft–Madoc area. In S.E. Jenness (Ed.), Geology of parts of eastern Ontario and western Quebec (pp. 13–19). Kingston, ON: Geological Association of Canada.
Martin, L.J., Koren, S.A. and Persinger, M.A. (2004). Thermal analgesic effects from weak, complex magnetic fields and pharmacological interactions. Pharmacology, Biochemistry and Behavior, 78, 217–227.
Martynuk, V.S. (1995). Temporal organization of living organisms and the problem of the reproducibility of the results in magnetobiological research. Biophysics, 40, 925–927.
McKay, B.E. and Persinger, M.A. (2005). Complex magnetic fields enable static magnetic field cue use for rats in radial maze tasks. International Journal of Neuroscience, 115, 625–648.
Menvielle, M. and Berthelier, A. (1991). The K-derived planetary indices: description and availability. Reviews of Geophysics, 29, 415–432.
Merrill, R.T., McElhinny, M.W. and McFadden, P.L. (1998). The magnetic field of the Earth: Paleomagnetism, the core, and the deep mantle (2nd ed.). London, UK: Academic Press.
Meyer-Vernet, N. (2007). Basics of the solar wind. Cambridge, UK: Cambridge University Press.
Michon, A.L. and Persinger, M.A. (1997). Experimental simulation of the effects of increased geomagnetic activity upon nocturnal seizures in epileptic rats. Neuroscience Letters, 224, 53–56.
Mikulecký, M. (2007). Solar activity, revolutions and cultural prime in the history of mankind. Neuroendocrinology Letters, 28, 749–756.
Mikulecky, M., Moravcikova, G. and Czanner, S. (1996). Lunisolar tidal waves, geomagnetic activity and epilepsy in the light of multivariate coherence. Brazilian Journal of Medical and Biological Research, 29, 1069–1972.
Millis, D. (1999). Rock collecting near Bancroft, Ontario. Friendsville, PA: Rock Doc. Mulligan, S. and Persinger, M.A. (1998). Perinatal exposures to rotating magnetic fields
‘demasculinize’ neuronal density in the medial preoptic nucleus of male rats. Neuroscience Letters, 253, 29–32.
Myers, I.B. and McCaulley, M.H. (1985). MBTI manual: A guide to the development and use of the Myers-Briggs Type Indicator (2nd ed.). Palo Alto, CA: Consulting Psychologists Press.
Ossenkopp, K.-P. and Nobrega, J.N. (1979). Significant relationship between perinatal geomagnetic field activity and anxiety levels in females. Archives für Meteorologie, Geophysik und Bioklimatologie, Series B, 27, 75–90.
Páles, E. and Mikulecký, M. (2004). Periodic emergence of great poets in the history of Arabia and Persia, China and Japan. Neuroendocrinology Letters, 25, 169–172.
Persinger, M.A. (1971). Prenatal exposure to an ELF rotating magnetic field, ambulatory behavior, and lunar distance at birth: a correlation. Psychological Reports, 28, 435–438.
Persinger, M.A. (1987). Geopsychology and geopsychopathology: mental processes and disorders associated with geochemical and geophysical factors. Experientia, 43, 92–104.
Persinger, M.A. (1988). Increased geomagnetic activity and the occurrence of bereavement hallucinations: evidence for melatonin-mediated microseizuring in the temporal lobe? Neuroscience Letters, 88, 271–274.

Geopsychology 139
Persinger, M.A. (1995). Sudden unexpected death in epileptics following sudden, intense increases in geomagnetic activity: prevalence of effect and potential mechanisms. International Journal of Biometeorology, 38, 180–187.
Persinger, M.A. (2001). The neuropsychiatry of paranormal experiences. Journal of Neuropsychiatry and Clinical Neuroscience, 13, 515–524.
Persinger, M.A. (2008). On the possible representation of the electromagnetic equivalents of all adult memory within the Earth’s magnetic field: implications for theoretical biology. Theoretical Biology Insights, 1, 3–11.
Persinger, M.A. and Derr, J.S. (1985). Geophysical variables and behavior. XXIII: Relations between UFO reports within the Uinta basin and local seismicity. Perceptual and Motor Skills, 60, 143–152.
Persinger, M.A. and Janes, J.T. (1975). Significant correlations between human anxiety scores and perinatal geomagnetic activity. International Journal of Biometeorology, 19, 126s.
Persinger, M.A. and Makarec, K. (1992). The feeling of a presence and verbal meaningfulness in context of temporal lobe function: factor analytic verification of the Muses? Brain and Cognition, 20, 217–226.
Persinger, M.A. and Makarec, K. (1993). Complex partial epileptic signs as a continuum from normals to epileptics: normative data and clinical populations. Journal of Clinical Psychology, 49, 33–45.
Persinger, M.A. and Richards, P.M. (1995). Vestibular experiences of humans during brief periods of partial sensory deprivation are enhanced when daily geomagnetic activity exceeds 15–20 nT. Neuroscience Letters, 194, 69–72.
Prato, F.S., Robertson, J.A., Desjardins, D., Hensel, J. and Thomas, A.W. (2005). Daily repeated magnetic field shielding induces analgesia in CD-1 mice. Bioelectromagnetics, 26, 109–117.
Ptitsyna, N.G., Villoresi, G., Tyasto, M.I., Iucci, N. and Dorman, L.I. (1995). Possible effect of geomagnetic disturbances on the incidence of traffic accidents (St. Petersburg 1987–1989). Physica Medica, 11, 93–101.
Randall, W. and Randall, S. (1991). The solar wind and hallucinations – a possible relation due to magnetic disturbances. Bioelectromagnetics, 12, 67–70.
Raibshtein, V.A. Kudryashev, V.E., Tarasov, S.I. and Chepasov, V.I. (1995). Role of tidal variations of the force of gravity in the regulation of the systems response of blood circulation and respiration to orthostasis. Biophysics, 40, 791–798.
Rajaram, M. and Mitra, S. (1981). Correlation between convulsive seizure and geomagnetic activity. Neuroscience Letters, 24, 187–191.
Richards, P.M., Persinger, M.A. and Koren, S.A. (1996). Modification of semantic memory in normal subjects by application across the temporal lobes of a weak (1 microT) magnetic field structure that promotes long-term potentiation in hippocampal slices. Electro- and Magnetobiology, 15, 141–148.
Roberts, R.J. (1993). Positive associations among dichotic listening errors, complex partial epileptic-like signs, and paranormal beliefs. Journal of Nervous and Mental Disease, 181, 668–671.
Rocard, Y. (1964). Actions of a very weak magnetic gradient: the reflex of the dowser. In M.F. Barnothy (Ed.), Biological effects of magnetic fields, Vol. 1 (pp. 279–286). New York, NY: Plenum Press.

Bryce P. Mulligan, Lynn Suess Cloes, Quoc Hao Mach et al. 140
Sabina, A. (1982). Some rare minerals of the Bancroft area. Mineralogical Record, 13, 223–228.
Schumann, W.O. (1952). Über die strahlungslosen Eigenschwingungen einer leitenden Kugel, die von einer Luftschicht und einer Ionosphärenhülle umgeben ist. Zeitschrift und Naturfirschung, 7a, 149–154.
Sentman, D.D. (1995). Schumann resonances. In H. Volland (Ed.), Handbook of atmospheric electrodynamics, Vol. 1 (pp. 267–296). Boca Raton, FL: CRC Press.
St-Pierre, L.S. and Persinger, M.A. (2006). Experimental facilitation of the sensed presence is predicted by the specific patterns of the applied magnetic fields, not by suggestibility: re-analyses of 19 experiments. International Journal of Neuroscience, 116, 1079–1096.
Starbuck, S., Cornélissen, G. and Halberg, F. (2002). Is motivation influenced by geomagnetic activity? Biomedicine and Pharmacotherapy, 56, 289s–297s.
Stoupel, E. (2002). The effect of geomagnetic activity on cardiovascular parameters. Biomedicine and Pharmacotherapy, 56, 247s–256s.
Stoupel, E.G., Abramson, E., Gabbay, U. and Pick, A.I. (1995). Relationship between immunoglobulin levels and extremes of solar activity. International Journal of Biometeorology, 38, 89–91.
Stoupel, E.G., Frimer, H., Appelman, Z., Ben-Neriah, Z., Dar, H., Fejgin, M.D., Gershoni-Baruch, R., Manor, E., Barkai, G., Shalev, S., Gelman-Kohan, Z., Reish, O., Lev, D., Davidov, B., Goldman, B. and Shohat, M. (2005). Chromosome aberration and environmental physical activity: down syndrome and solar and cosmic ray activity, Israel, 1990–2000. International Journal of Biometeorology, 50, 1–5.
Stoupel, E., Martfel, J. and Rotenberg, Z. (1991). Admissions of patients with epileptic seizures (E) and dizziness (D) related to geomagnetic and solar activity levels: differences in female and male patients. Medical Hypotheses, 36, 384–388.
Stoupel, E., Martfel, J.N. and Rotenberg, Z. (1994). Paroxysmal atrial fibrillation and stroke (cerebrovascular accidents) in males and females above and below age 65 on days of different geomagnetic activity levels. Journal of Basic and Clinical Physiology and Pharmacology, 5, 315–329.
Su, H., Sochivko, D., Becker, A., Chen, J., Jiang, Y., Yaari, Y. and Beck, H. (2002). Upregulation of a T-type Ca2+ channel causes a long-lasting modification of neuronal firing mode after status epilepticus. Journal of Neuroscience, 22, 3645–3655.
Suess, L.A. and Persinger, M.A. (2001). Geophysical variables and behavior. XCVI: “Experiences” attributed to Christ and Mary at Marmora, Ontario, Canada may have been consequences of environmental electromagnetic stimulation: implications for religious movements. Perceptual and Motor Skills, 93, 435–450.
Tchijevsky, A.L. (1938). Les épidemies et les perturbations électromagnetiques du milieu exterieur. Paris, France: Hippocrate.
Tyasto, M.I., Ptitsyna, N.G., Kopytenko, Y.A., Voronov, P.M., Kopytenko, Y.A., Villoresi, G. and Iucci, N. (1995). Influence of man-made and natural electromagnetic fields on the incidence of different pathologies in St Petersburg. Biophysics, 40, 829–837.
Vaitl, D., Propson, N., Stark, R., Walter, B. and Schienle, A. (2001). Headache and sferics. Headache, 41, 845–853.
Villoresi, G., Breus, T.K., Dorman, L.I., Iucci, N. and Rapoport, S.I. (1995). Effect of interplanetary and geomagnetic disturbances on the rise in the number of clinically severe medical pathologies (myocardial infarction and stroke). Biophysics, 40, 983–993.

Geopsychology 141
Vladimirskii, B.M. and Kislovskii, L.D. (1995). Cosmophysical periods in European history. Biophysics, 40, 849–852.
Volchek, O.D. (1995). Influence of the cyclicity of the environment on the manifestations of functional asymmetry of the human brain. Biophysics, 40, 1015–1022.
Wahl, W.G. and Lake, S. (1957). Airborne magnetometer survey discovers Marmora magnetite deposit. In: J.P. de Wet (Ed.), Methods and case histories in mining geophysics: Proceedings of the 6th Commonwealth mining and metallurgical congress, Canada, 1957 (pp. 155-162). Montreal, QC: Mercury Press.
Wainwright, I.N.M., Michalski, S., Young, G.S., Sears, H. and Laver, M.E. (1988). The rock art of the Petroglyphs Provincial Park: Conservation and recording. Ottawa, ON: Canadian Conservation Institute.
Walach, H., Betz, H.-D. and Schweickhardt, A. (2001). Sferics and headache: a prospective study. Cephalalgia, 21, 685–690.
Wilhelm, H., Zurn, W. and Wenzel, H.G. (Eds.) (1997). Tidal phenomena. Berlin, Germany: Springer.
Zimecki, M. (2006). The lunar cycle: effects on human and animal behavior and physiology. Postępy Higieny i Medycyny Doświadczalnej, 60, 1–7.


PART II. CROSSING A RANGE OF SPATIAL SCALES


In: Man and the Geosphere ISBN 978-1-60876-387-0 Editor: Igor V. Florinsky, pp. 145-167 © 2010 Nova Science Publishers, Inc.
Chapter 5
INTRASPECIFIC VARIABILITY OF PLANTS: THE IMPACT OF ACTIVE LOCAL FAULTS
Irina G. Boyarskikh and Alexander V. Shitov
ABSTRACT
Plant domestication has given a strong impetus to the development of early agricultural societies. Such societies have commonly been located in regions of genetic and phenotypic intra- and interspecific variability of plants. In this chapter, we study a possible impact of active local faults on plant intrapopulation variability exemplified by Lonicera caerulea L. (blue honeysuckle).
We carried out a combined geophysical (magnetometric) and botanical survey in the Ak-Turu Valley, Mountain Altai, Russia. Statistical analyses demonstrated that within fault zones (a) the expression of L. caerulea recessive trait – bitter-free fruits – is sharply increased; (b) the smallest fruits are observed; and (c) diversity of fruit shape is increased. It is known that many species display the highest level of plant-to-plant intrapopulation variability when they occur in the least favorable environmental conditions. This can be connected with a mutagenicity of a chronic stress and a direct influence of local geochemical mutagenic agents. The decrease in fruit weight and the increase in variability of morphometric and taste traits indicate that fault zones may effect plant development in both these ways. This can be associated with local seismicity as a permanent stressor, as well as a seismically induced increase in the groundwater-driven release of some mutagenic substances and radon emanation along the faults and adjacent fractures.
Our results suggest that geochemical and geophysical anomalies as well as an enhanced degassing level within fault zones, especially during regional seismic activization, may mutagenically affect plants.
Keywords: seismicity; magnetic field; fault; Lonicera caerulea L.; mutation; speciation.

Irina G. Boyarskikh and Alexander V. Shitov 146
5.1. INTRODUCTION It is trivial that any exposure to an environmental factor, higher than some threshold,
causes the response of a biological system. These relations are well understood, for example, in the context of biotropic effects of local climatic parameters, such as solar radiation, air and soil temperature, air pressure, precipitation, and humidity on humans, animals, and plants (Andronova et al., 1982; Romanova et al., 1983; Weiss et al., 1988; Mackey and Lindenmayer, 2001). Biotropic effects of local topographic variability are also well known. Controlling insolation and gravity-driven lateral redistribution of water and nutrition in soils, relief influences activity of soil microorganisms (Florinsky et al., 2004), distribution of vegetation cover (Kruckeberg, 2004), and some plant properties, such as grain and seed yield (Pennock et al., 2001; Si and Farrell, 2004) and grain protein and oil content (Kravchenko and Bullock, 2002). At a local (field) scale, bedrock and soil geochemical impact on plants is known in sufficient detail (Mitchell and Burridge, 1979; Brooks, 1983; Kovalevsky, 1987; Busacca and Meinert, 2003; Kruckeberg, 2004). On the other hand, effects of local geological structures and processes and geophysical activity on biota have not yet been well examined.
Plants, especially trees and shrubs living for dozens of years in the same place, are the best record for effects of geological heterogeneities on biota. Indeed, there are abrupt changes in the plant cover along fault zones, particularly, due to increased rock fracturing that provides conditions for a discharge of groundwater (Vinogradov, 1955; Miroshnichenko, 1958; Kasimov et al., 1978; Ringrose et al., 1998). Thus, tectonics provides conditions for the emergence of azonal biocenosis and vegetation (Myalo and Goryainova, 1972; Bgatov and Lizalek, 1992). In fault zones, an increased rock fracturing facilitates migration of mineralized groundwater and gas emanation leading to an increase of contents of various chemical elements (Kasimov et al., 1978; Trifonov and Karakhanian, 2004a; King et al., 2006). Contents of trace elements (e.g., Fe, Mn, As, Zr, and Nb) in tissues of plants growing within a fault zone can be nearly twice as large as those outside the fault zone (Lukina et al., 1992).
Since geochemical anomalies including toxic elements can adversely affect living entities (Section 3.3), deformed and forked trees (as a case of dichotomous branching) can occur there with an increased frequency (Melnikov et al., 1994; Nash et al., 2003; Trifonov and Karakhanian, 2004a) (Section 6.4.2). Fruit shrubs and vegetable plants are highly responsive to geological heterogeneities: they can have reduced growth, yield, and germination, and produce a lot of misshapen fruits (Melnikov et al., 1994). For Astragalus penduliflorus growing at a seismoactive fault, the activity of phenylalanine ammonia-lyase (a key enzyme in pathogen defense and stress response – Ryals et al., 1996) increased by two times after a strong earthquake (Trifonov and Karakhanian, 2004b, p. 156). A release of hydrothermic or magmatic gases via faults and fractures can provoke vegetation stress, damage (e.g., changes in chlorophyll content – Nash et al., 2003), and even mortality (Cook et al., 2001; Farrar et al., 2002; Nash et al., 2003).
On the other hand, geodynamic activity and geochemical anomalies may have been one of the reasons for speciation. Vavilov (1926, 1992) has determined seven main centers of the greatest diversity of cultural plants (Section 10.3.2.3). These centers are typically located within the geodynamically active regions (Trifonov and Karakhanian, 2004a). Such interpretation is particularly supported by the abundance of endemic species in Armenia: most

Intraspecific Variability of Plants 147
of them are distributed along active faults or their vicinity (Trifonov and Karakhanian, 2004a). Lateral displacements along faults also contribute to plant speciation (Heads, 1998, 2008).
In this chapter, we examine an intrapopulation variability of Lonicera caerulea L. (Blue honeysuckle) in terms of taste, size, and shape of its fruits. We hypothesized that variability of these traits, particularly the expression of the recessive trait – the lack of bitterness – in many plants of the same population is associated with an influence of active tectonics.
5.2. BLUE HONEYSUCKLE: GENERAL INFORMATION The Lonicera subsection Caeruleae Rehd. is comprised of two species, L. caerulea L.
and L. iliensis Pojark., which together are sometimes referred to Blue honeysuckle (Skvortsov and Kuklina, 2002). These shrubs are circumpolar boreal species of the temperate regions of the Northern hemisphere. The largest area of their habitat is located in Asia. They typically occur in the taiga zone and occasionally in the Arctic zone. In mountains, they occur from middle forest to alpine vegetation altitudinal zones. Ecological optimum for L. caerulea L. falls in the range of 1,400–1,900 m above sea level.
Almost wherever they grow, the Caeruleae plants bear bitter and inedible fruits. The bitter taste of the blue honeysuckle fruit is a dominant trait (Plekhanova, 1987). However, populations with a lesser share of bitter-fruited plants have been reported in some locations, such as the Kamchatka Peninsula, Kuril Islands, Sakhalin Island, coast of the Sea of Okhotsk, Amur Krai, and Zabaykalsky Krai (Kuklina, 1987; Plekhanova and Rostova, 1994). In the Mountain Altai, Caeruleae fruits, harvested from specimens of different populations, taste differently. Our preliminary studies demonstrated that, in the most of populations, plants bearing bitter-free fruits made up 0–30% of each population. There were also regions with micropopulations marked by an essentially higher portion of plants bearing sweet and acid-sweet fruits. The same micropopulations were noted for increased variability for some morphological traits, such as fruit size and shape.
Wild blue honeysuckle is a popular berry plant in the Far East, East Siberia, and Sayan and Altai Mountains. Blue honeysuckle fruits (Figure 5.1) are important sources of vitamins and biologically active substances in early summer. Content of saccharides varies from 4% to 9%, and content of acids varies from 2% to 4%. Ascorbic acid content ranges from 40 to 170 mg per 100 g fresh weight. Content of flavonoids ranges up to 1,500 mg per 100 g fresh weight. They include rutin, leucoanthocyanins, and chlorogenic and caffetannic acids. Fruits and products of their processing have general strengthening, antisclerotic, blood-forming, and capillary-strengthening effects. Fruits stimulate digestion. Bark, leaf, and flower tea is externally used for antiinflammation treatment of throat and eye diseases. Blue honeysuckle fruits are a source for preparation of a natural food dye with an intensively dark red color (Plekhanova, 1994). In introduction, L. caerulea is considered as a commercially valuable berry culture (Plekhanova, 2000; Hummer, 2006; Svarcova et al., 2007). This dictates the importance of research of its taste trait variability.

Irina G. Boyarskikh and Alexander V. Shitov 148
Figure 5.1. Blue honeysuckle fruits from the Fault site 1. Graph paper is used for size reference (the grid size of 0.5 cm).
5.3. STUDY AREA
A study area was situated in the south of Western Siberia within the Mountain Altai (the
Hercynian portion of the Altai mountain country), in the Altai Republic, Russia (Figure 5.2). The study area was located at the foothill of the northern macroslope of the North Chuya Range, on the southwestern margin of the Kurai intermountain basin, in the Ak-Turu River valley (50° 07' N, 87° 49' E). Elevation ranges from 1,650 to 2,100 m above sea level. The study area occupies about 10 km2 (Figure 5.3).

Intraspecific Variability of Plants 149
Figure 5.2. Geographical location of the study area and other blue honeysuckle sites in the Altai Republic (Table 5.2).
The study area is situated within the extreme continental climate zone with cold prolonged (more than 7 months) winters and chilly dry summers. According to data from the nearest Ak-Turu weather station, located 4 km southward from the study area, mean annual temperature is -4.5° С, mean January temperature is -18.9° С, and mean July temperature is 15° С. Mean annual precipitation is about 490 mm including 396 mm of rainfall and 94 mm of snowfall. The mean length of the frost-free period is 68 days. The mean length of the growing season is 130 days (Modina, 1997).
Underlying rocks consist of the Devonian volcanogenic sedimentary deposits, Dayan suite dissected by southeast-striking faults (Boyarskikh and Shitov, 2008). There are mountain gray forest and sod podzolic soils developed on chlorite and clayey schists. The study area was located within the mixed coniferous forest altitudinal zone (Table 5.1). L. caerulea subsp. altaica L. is the only subspecies of blue honeysuckle within the study area.

Irina G. Boyarskikh and Alexander V. Shitov 150
Figure 5.3. The study area.
5.4. MATERIALS AND METHODS
We conducted a combined geophysical and botanical survey in summer 2007.
5.4.1. Geophysical Survey First, we performed a magnetometric survey using an MMP-303 hand-held quantum
magnetometer (Rudgeofizika, 1982). The survey was carried out by a standard approach (Nikitsky and Glebovsky, 1980) using both regular grid and transects with 20 m intervals. A reference station and a network were established to correct measurements for diurnal drift. All measurements were georeferenced with a Garmin eTrex H GPS navigator.
Results of the magnetometric survey demonstrated that the territory is mainly characterized by a weak intensity of the geomagnetic field reflecting rocks of the Dayan suite having a weak magnetic susceptibility. However, there are three zones marked by an elevated geomagnetic field: two northeast-striking abnormal zones and a local anomaly associated with the Kokorya dacitic-rhyolitic subvolcanic complex (Figure 5.4).

Intraspecific Variability of Plants 151
Table 5.1. Botanical description of the study sites (party based on published data – Lashchinsky, 1959)
Sites Botanical description Fault sites 1 and 2, Reference sites 1 and 4
Mixed coniferous forest consists of Pinus sibirica Du Tour (Siberian cedar), Picea obovata Ledeb. (Siberian spruce), and Larix sibirica Ledeb. (Siberian larch). Understory shrub cover is short and relative dense. It includes L. caerulea subsp. altaica (Pall.) Plekhanova, Cotoneaster melanocarpus Fisch. ex. Blytt, Cotoneaster uniflora Lodd., Pentaphylloides fruticosa (L.) O. Schwarz, Rosa acicularis Lindl., Caragana arborescens Lam., Spiraea media Franz Schmidt, and Spiraea chamaedrifolia L. Understory herbs include Helictotrichon pubescens Huds., Geranium pseudosibiricum J. Mayer, Carex macroura Meinsh, Poa annua L., Bupleurum multinerve DC, Bupleurum aureum Fisch., Galium boreale L., Artemisia macrantha Ledeb., and Artemisia sericea Web. ex Stechm., etc. (some 35 species). Moss cover: Rhytidium rucosum dominates. Hylocomium proliferum and Hypnun sp. are less common.
Kokorya site, Reference sites 2, 3, and 5
Mixed coniferous forest consists of Larix sibirica Ledeb. and Pinus sibirica Du Tour. Understory shrubs: Betula rotundifolia Spach. and L. caerulea subsp. altaica (Pall.) Plekhanova dominate. There are also individual Cotoneaster uniflora Lodd., Pentaphylloides fruticosa (L.) O. Schwarz, Rosa acicularis Lindl., Caragana arborescens Lam., Spiraea media Franz Schmidt, and Salix reticulata L.. Understory herb cover is not dense and includes Vaccinium vitis-idaea L., Cerastium lithosperumifolium Fisch., Aegopodium alpestre Ledeb., Equisetum hyemale L., Viola altaica Ker.-Gawl., Festuca altaica Trin., and Empetrum androgynum V. Vassil. Bergenia crassifolia (L.) Fritsch. is observed on rocks. Moss and lichen cover is a thick (7–10 cm), dense, and continuous. It consists of Hylocomium proliferum, Pleurozium schreberi, Cladonia alpestris, Peltigera (Sp), and Cladonia silvatica.
Fault sites 3 and 4 Mixed coniferous forest consists of Pinus sibirica Du Tour and Larix sibirica Ledeb. Understory shrub cover is sparse. L. caerulea subsp. altaica (Pall.) Plekhanova, Betula rotundifolia Spach., and Pentaphylloides fruticosa (L.) O. Schwarz dominate. There are also Salix reticulata L., Cotoneaster uniflora Lodd., Spiraea media Franz Schmidt, and Ribes nigrum L. there. Understory herb cover is heterogeneous including both boreal species (Vaccinium vitis-idaea L. and a small touch of Pyrola rotundifolia L. and Galium boreale L.) and steppe species, such as Koeleria gracilis Pers., Artemisia gmelinii Web. ex Stechm. Moss cover is thick, dense, and continuous. It consists of Hylocomium proliferum and Rhytidium rucosum.

Irina G. Boyarskikh and Alexander V. Shitov 152
Figure 5.4. The magnetometric profile across the study area.
Second, we carried out a detailed magnetometric survey of the area including northeast-striking abnormal zones. Results suggested that they represent weakened fractured zones associated with northwest-striking faults (Figures 5.3 and 5.4). We suppose that they are associated with the Baratal dextral strike-slip fault (Gusev, 2004) (Figure 7.2a). The geomagnetic field gradient was about 50 nT within the fault zone. We also performed a series of additional magnetometric surveys on the right side of the Ak-Turu River confirming the northeast striking of the fault (Boyarskikh and Shitov, 2008). Faults are perpendicular to the valley.
5.4.2. Botanical Survey First, we selected five sites within magnetic anomalies (Figure 5.3): four sites at
anomalies associated with faults (Fault sites 1–4), and a site at the anomaly associated with the Kokorya dacitic-rhyolitic subvolcanic complex (Kokorya site). We also selected five Reference sites beyond magnetic anomalies located at various distances from them (Figure 5.3). All the sites were situated on northeastern slopes at various elevations (Table 5.2: # 1–10). The Fault site 1 and all Reference sites measure 500 m2, the Fault site 2 measures 1,000 m2, whereas the Kokorya site and Fault sites 3 and 4 measures 300 m2.
Ecologically, all sites were generally similar (Table 5.1). However, there are some differences due to their topographic positions. The Fault sites 1 and 2, Kokorya site, and Reference sites 2 and 3 are marked by more similar ecological conditions: they are located along a path in the valley forest, 100–400 m wide and 4.5 km long, on the elevated side of the Ak-Turu River. The Reference sites 1 and 4 are situated on other forest paths. The Reference site 1 is characterized by wetter conditions as there is a marshy brook there. The Reference site 4 is located in a narrow hollow constraining insolation. The Reference site 5 is altitudinally beyond a zone of ecological optimum for blue honeysuckle (Section 5.2). The Reference site 4, Fault sites 3 and 4, located 400 m, 1 km, and 2 km from the river, respectively, are marked by drier conditions than those sites located nearby the river.
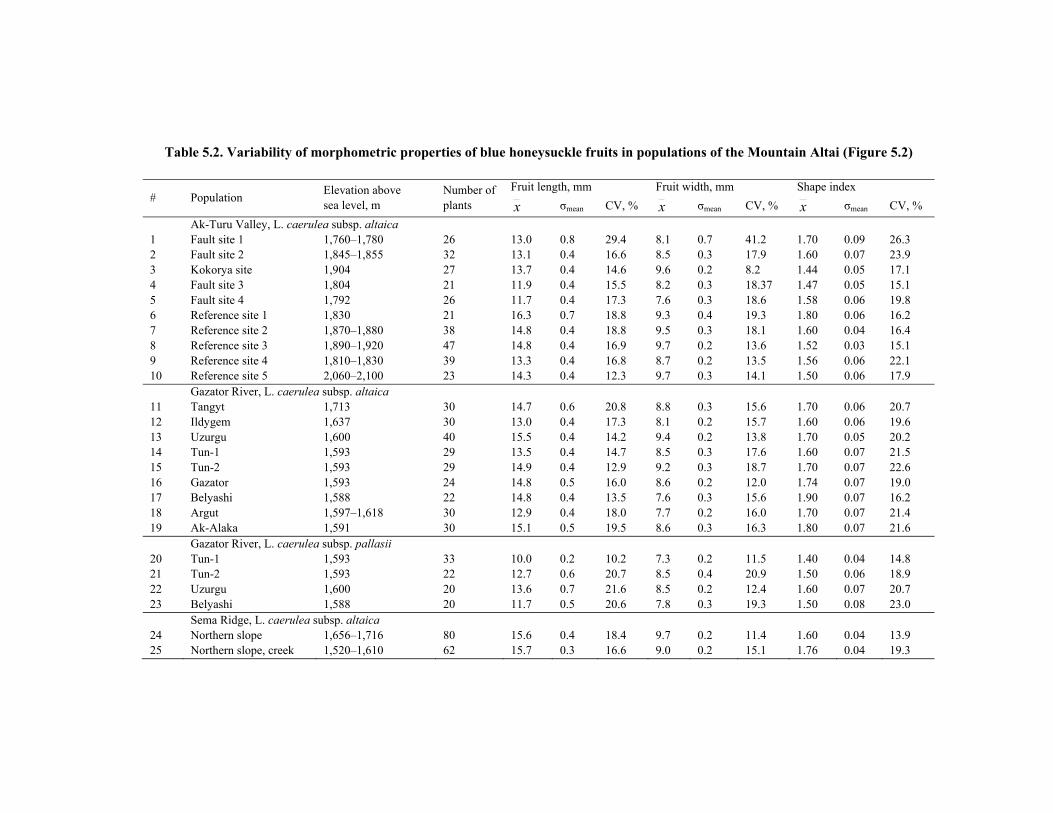
Table 5.2. Variability of morphometric properties of blue honeysuckle fruits in populations of the Mountain Altai (Figure 5.2)
# Population Elevation above sea level, m
Number of plants
Fruit length, mm Fruit width, mm Shape index
x σmean CV, % x σmean CV, % x σmean CV, % Ak-Turu Valley, L. caerulea subsp. altaica 1 Fault site 1 1,760–1,780 26 13.0 0.8 29.4 8.1 0.7 41.2 1.70 0.09 26.3 2 Fault site 2 1,845–1,855 32 13.1 0.4 16.6 8.5 0.3 17.9 1.60 0.07 23.9 3 Kokorya site 1,904 27 13.7 0.4 14.6 9.6 0.2 8.2 1.44 0.05 17.1 4 Fault site 3 1,804 21 11.9 0.4 15.5 8.2 0.3 18.37 1.47 0.05 15.1 5 Fault site 4 1,792 26 11.7 0.4 17.3 7.6 0.3 18.6 1.58 0.06 19.8 6 Reference site 1 1,830 21 16.3 0.7 18.8 9.3 0.4 19.3 1.80 0.06 16.2 7 Reference site 2 1,870–1,880 38 14.8 0.4 18.8 9.5 0.3 18.1 1.60 0.04 16.4 8 Reference site 3 1,890–1,920 47 14.8 0.4 16.9 9.7 0.2 13.6 1.52 0.03 15.1 9 Reference site 4 1,810–1,830 39 13.3 0.4 16.8 8.7 0.2 13.5 1.56 0.06 22.1 10 Reference site 5 2,060–2,100 23 14.3 0.4 12.3 9.7 0.3 14.1 1.50 0.06 17.9 Gazator River, L. caerulea subsp. altaica 11 Tangyt 1,713 30 14.7 0.6 20.8 8.8 0.3 15.6 1.70 0.06 20.7 12 Ildygem 1,637 30 13.0 0.4 17.3 8.1 0.2 15.7 1.60 0.06 19.6 13 Uzurgu 1,600 40 15.5 0.4 14.2 9.4 0.2 13.8 1.70 0.05 20.2 14 Tun-1 1,593 29 13.5 0.4 14.7 8.5 0.3 17.6 1.60 0.07 21.5 15 Tun-2 1,593 29 14.9 0.4 12.9 9.2 0.3 18.7 1.70 0.07 22.6 16 Gazator 1,593 24 14.8 0.5 16.0 8.6 0.2 12.0 1.74 0.07 19.0 17 Belyashi 1,588 22 14.8 0.4 13.5 7.6 0.3 15.6 1.90 0.07 16.2 18 Argut 1,597–1,618 30 12.9 0.4 18.0 7.7 0.2 16.0 1.70 0.07 21.4 19 Ak-Alaka 1,591 30 15.1 0.5 19.5 8.6 0.3 16.3 1.80 0.07 21.6 Gazator River, L. caerulea subsp. pallasii 20 Tun-1 1,593 33 10.0 0.2 10.2 7.3 0.2 11.5 1.40 0.04 14.8 21 Tun-2 1,593 22 12.7 0.6 20.7 8.5 0.4 20.9 1.50 0.06 18.9 22 Uzurgu 1,600 20 13.6 0.7 21.6 8.5 0.2 12.4 1.60 0.07 20.7 23 Belyashi 1,588 20 11.7 0.5 20.6 7.8 0.3 19.3 1.50 0.08 23.0 Sema Ridge, L. caerulea subsp. altaica 24 Northern slope 1,656–1,716 80 15.6 0.4 18.4 9.7 0.2 11.4 1.60 0.04 13.9 25 Northern slope, creek 1,520–1,610 62 15.7 0.3 16.6 9.0 0.2 15.1 1.76 0.04 19.3

Table 2. (Continued)
# Population Elevation above sea level, m
Number of plants
Fruit length, mm Fruit width, mm Shape index
x σmean CV, % x σmean CV, % x σmean CV, % 26 Northeastern slope 1,610–1,700 40 14.6 0.4 15.6 9.1 0.3 17.7 1.60 0.04 15.5 27 Creek 1,550 20 14.8 0.4 12.1 9.2 0.4 19.5 1.65 0.07 18.0 Terekta Ridge, L. caerulea subsp. altaica 28 Karakol 1,286 21 14.0 0.3 9.0 9.0 0.3 15.2 1.59 0.07 20.0 29 Karakol 1,603 20 12.1 0.4 14.0 8.3 0.3 14.0 1.47 0.05 16.0 30 Karakol 1,986 20 12.7 0.6 21.0 8.5 0.4 19.0 1.53 0.07 21.0 31 Talovaya 1,900–2,000 13 11.0 0.6 19.0 7.8 0.5 25.0 1.49 0.13 32.0 32 Chernaya Terekta 1,850 18 13.0 0.6 18.0 9.0 0.2 8.0 1.50 0.06 17.0 33 Terekta Ridge 1,830 14 13.0 0.6 17.0 8.0 0.3 14.0 2.40 0.04 6.0 Ulagan District, L. caerulea subsp. altaica 34 Uzynkel 2,078 18 13.2 0.5 16.9 6.5 0.3 23.2 2.09 0.10 20.4 35 Ulagan-Altash 1,936 11 13.1 0.7 18.5 7.2 0.2 10.5 1.84 0.11 19.9 36 Chibitka 1,707 10 15.1 0.9 18.3 7.6 0.6 25.7 2.08 0.18 27.6 37 Bashkaus, slope 1,249–1,309 20 16.6 0.5 14.7 9.6 0.5 23.3 1.83 0.12 28.9 38 Bashkaus, valley 1,230 20 16.7 0.5 13.8 9.1 0.4 21.0 1.89 0.08 18.0 Katun Ridge, L. caerulea subsp. altaica 39 Osinovka 1,560 10 13.8 0.7 16.7 8.8 0.4 15.0 1.59 0.08 16.8 40 Kucherla 1,148 10 15.2 0.8 16.6 9.4 0.5 15.2 1.63 0.08 16.3 41 Kuragan 1,088 11 15.5 0.7 15.0 9.0 0.4 14.8 1.75 0.09 16.4 Kurai Ridge, L. caerulea subsp. altaica 42 Kuektonar, lake 2,110 20 12.1 0.5 18.0 6.8 0.3 20.0 1.80 0.10 24.0 43 Kuektonar 2,000 20 14.3 0.5 17.0 8.1 0.3 17.0 1.80 0.08 20.0 44 Kuektonar, river head 1,793 18 14.6 0.6 17.0 8.4 0.4 21.0 1.85 0.10 23.0 Chikhachev Ridge, L. caerulea subsp. altaica 45 Lake Kindyktykul 2,528 17 10.9 0.6 21.0 7.1 0.4 22.0 1.57 0.07 18.0 46 Bar-Burgazy, slope 2,089 19 11.6 0.5 19.0 7.6 0.4 20.0 1.60 0.11 31.0 47 Bar-Burgazy, valley 2,064 20 13.2 0.5 17.0 9.3 0.3 14.0 1.46 0.08 25.0
x – mean, σmean – standard deviation of mean.

Intraspecific Variability of Plants 155
Second, we sampled blue honeysuckle fruits. It is clear that there is a variability s1 between fruits for each plant. There is also a variability s2 between fruits on different plants within a site. Finally, there is a variability s3 between fruits on plants growing at different sites. We shall to prove that s3 >> s2 + s1. However, an analysis of plant trait variability is often hindered because s1 can be too high. For blue honeysuckle, this is associated with several peculiarities of the species: Blue honeysuckle has a long florescence period and non-concurrent ripening of fruits. A fall in temperature or very hot weather may cause a massive formation of defective, deformed, and unripe fruits. In this situation, simple random sampling cannot reflect an actual picture of genotypic variability of fruit traits in the population. Therefore, we sampled only ripe, formed, and largest fruits implying that they had completely achieved their genetic potential. In this case, s1 can be minimized. This methodology allowed us to estimate actual morphometric, biochemical, and taste properties of fruits (Gidsyuk, 1981; Shemberg, 1984; Plekhanova, 1989; Skvortsov and Kuklina, 2002).
Twenty to forty specimens of blue honeysuckle were randomly sampled from each site (Table 5.2: # 1–10). 30 fruit samples were collected from each specimen.
5.4.3. Sample Analysis First, we carried out a test of the fruit bitterness. The bitter taste of the blue honeysuckle
fruit is governed by thirteen compounds, such as an iridoid glycoside 7-ketologanin, dibutyl malate, 4-butyl 1-methyl malate, 1-butyl methyl malate, etc. (Anikina et al., 1988; Vereshchagin et al., 1989). As we were not equipped to handle an analysis for these compounds, we used a taste test. Fruits were rated for the bitterness level using a five-point taste scale, from the least bitter (1 point) to the most bitter (5 points). To make the diagram easier to read, we rearranged the scale into a three-point scale by merging 1- and 2-pointers into a single left column and 4- and 5-pointers into a single right column. Coefficient of variation (CV) of the bitterness level was estimated for each site.
Second, we estimated variability of fruit size (length and width) and shape. Fruit shape was described in both qualitative and quantitative terms. Qualitatively, we used the following shape types: round, oval, long-oval, egg, inverse egg, bell, drop, ascidium, cylinder, and spindle (Figure 5.5). Quantitatively, we calculated a shape index, a ratio of length to width. Means and CV were estimated for each morphometric trait at each site.
Variability of fruit traits was qualitatively assessed using a universal scale developed by Mamaev (1973). In this scale, the range is rated in terms of CV. The range is rated as very low at CV ≤ 7%, low at CV = 8–12%, medium at CV = 13–20%, high at CV = 21–40%, and very high at CV ≥ 40%.
Finally, we applied χ2 and t tests (Glantz, 2002) to check statistical differences between mean and CV values of each fruit trait at magnetic anomalies and reference sites. χ2 test was applied to check variability of rank indices (i.e., fruit bitterness and shape), whereas t test was used to check variability of quantitative morphometric traits (i.e., fruit length, width, and shape index).
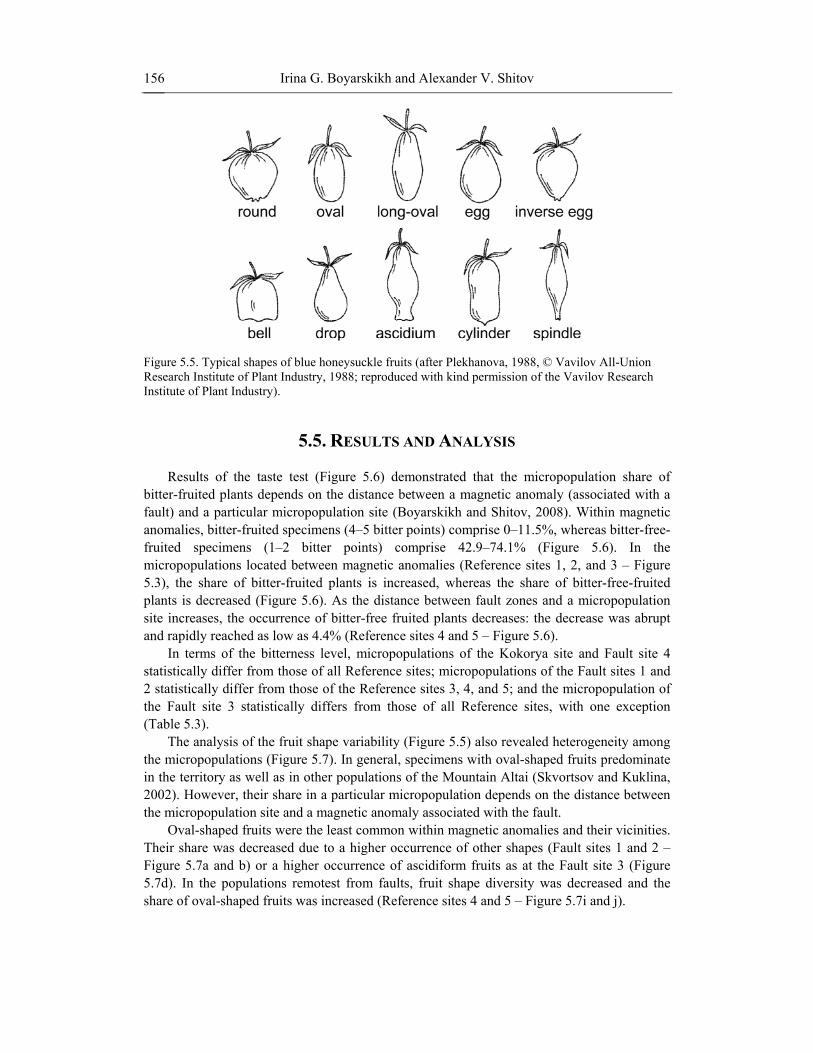
Irina G. Boyarskikh and Alexander V. Shitov 156
Figure 5.5. Typical shapes of blue honeysuckle fruits (after Plekhanova, 1988, © Vavilov All-Union Research Institute of Plant Industry, 1988; reproduced with kind permission of the Vavilov Research Institute of Plant Industry).
5.5. RESULTS AND ANALYSIS
Results of the taste test (Figure 5.6) demonstrated that the micropopulation share of
bitter-fruited plants depends on the distance between a magnetic anomaly (associated with a fault) and a particular micropopulation site (Boyarskikh and Shitov, 2008). Within magnetic anomalies, bitter-fruited specimens (4–5 bitter points) comprise 0–11.5%, whereas bitter-free-fruited specimens (1–2 bitter points) comprise 42.9–74.1% (Figure 5.6). In the micropopulations located between magnetic anomalies (Reference sites 1, 2, and 3 – Figure 5.3), the share of bitter-fruited plants is increased, whereas the share of bitter-free-fruited plants is decreased (Figure 5.6). As the distance between fault zones and a micropopulation site increases, the occurrence of bitter-free fruited plants decreases: the decrease was abrupt and rapidly reached as low as 4.4% (Reference sites 4 and 5 – Figure 5.6).
In terms of the bitterness level, micropopulations of the Kokorya site and Fault site 4 statistically differ from those of all Reference sites; micropopulations of the Fault sites 1 and 2 statistically differ from those of the Reference sites 3, 4, and 5; and the micropopulation of the Fault site 3 statistically differs from those of all Reference sites, with one exception (Table 5.3).
The analysis of the fruit shape variability (Figure 5.5) also revealed heterogeneity among the micropopulations (Figure 5.7). In general, specimens with oval-shaped fruits predominate in the territory as well as in other populations of the Mountain Altai (Skvortsov and Kuklina, 2002). However, their share in a particular micropopulation depends on the distance between the micropopulation site and a magnetic anomaly associated with the fault.
Oval-shaped fruits were the least common within magnetic anomalies and their vicinities. Their share was decreased due to a higher occurrence of other shapes (Fault sites 1 and 2 – Figure 5.7a and b) or a higher occurrence of ascidiform fruits as at the Fault site 3 (Figure 5.7d). In the populations remotest from faults, fruit shape diversity was decreased and the share of oval-shaped fruits was increased (Reference sites 4 and 5 – Figure 5.7i and j).

Intraspecific Variability of Plants 157
Figure 5.6. Fruit taste variation at different sites.
Figure 5.7. Fruit shape variation at different sites: (a) Fault site 1; (b) Fault site 2; (c) Kokorya site; (d) Fault site 3; (e) Fault site 4; (f)–(j) Reference sites 1–5, respectively.

Irina G. Boyarskikh and Alexander V. Shitov 158
Figure 5.8. CV of the fruit shape at different sites.
Table 5.3. χ2-values characterizing differences in the fruit bitterness level at magnetic
anomalies and reference sites
Sites Reference sites
1 2 3 4 5 Fault site 1 – – 10.1 56.4 82.9 Fault site 2 – – 12.7 59.8 89.1 Kokorya site 26.9 24.6 39.6 96.7 127.4 Fault site 3 – 19.8 14.4 38.8 89.3 Fault site 4 25.9 24.3 38.6 94.7 126.3
Significant differences with p ≤ 0.01; dashes are non-significant differences. In terms of the fruit shape (Figure 5.8), micropopulations of the Fault sites 2 and 3
statistically differ from those of all Reference sites, micropopulations of the Fault sites 1 and 4 statistically differ from those of the Reference sites 2, 3, and 4, whereas there were no significant differences between the micropopulation of the Kokorya site and those of all Reference sites (Table 5.4). The high variability of the fruit shape at the Reference site 5 is probably associated with more severe conditions (the site is located on the upper border of the ecological optimum for blue honeysuckle – Section 5.4.2). As the Reference site 1 is located between two faults (Figure 5.3), they probably influence plants at the site. This is reflected by the absence or decrease of significant differences in the fruit shape variability between micropopulations of this site and those of the Fault sites 1 and 2 (Table 5.4).

Intraspecific Variability of Plants 159
Table 5.4. χ2-values characterizing differences in the fruit shape at magnetic anomalies and reference sites
Sites Reference sites
1 2 3 4 5 Fault site 1 – 19.5 16.6 19.9 – Fault site 2 4.3 27.3 24.1 27.8 6.1 Kokorya site – – – – – Fault site 3 4.7 28.2 24.9 28.7 6.5 Fault site 4 – 6.1 4.4 6.3 –
Bold indicate significant differences with p ≤ 0.01; others are those with 0.01 < p ≤ 0.05; dashes are non-significant differences.
Table 5.5. t-values characterizing differences in mean (upper) and CV (lower) values of fruit morphometric traits at magnetic anomalies and selected reference sites
Parameter Sites Reference sites
2 3 5 Fruit length Fault site 1 2.1 2.1 –
2.4 2.8 3.7 Fault site 2 2.9 3.1 2.1
– – 1.7 Kokorya site 1.9 – –
– – – Fruit width Fault site 1 2 2.4 2
3.7 4.6 4.3 Fault site 2 2.6 3.6 3
– 1.9 – Kokorya site – – –
4.2 3.0 2.4 Shape index Fault site 1 – 1.9 1.9
2.4 2.8 1.8 Fault site 2 – – –
2.2 2.7 1.7 Kokorya site 2.3 1.7 –
– – – Bold indicate significant differences with p ≤ 0.01; others are those with 0.01 < p ≤ 0.1; dashes are non-
significant differences. According to previous studies, as the altitude above sea level is increased in mountain
regions, the average weight of blue honeysuckle fruit is decreased. For example, it is 0.33 g at 1,800 m above sea level and 0.15 g at 2,200–2,400 m at the Kurai Ridge, the Mountain Altai. A similar decreasing pattern was observed in the Tien Shan (Skvortsov and Kuklina, 2002). However, an analysis of our data obtained in the Ak-Turu valley revealed that this rule might not always be the case (Table 5.2, # 1–10).

Irina G. Boyarskikh and Alexander V. Shitov 160
Indeed, the smallest fruits were observed in the Fault site 1 at about 1,760 m above sea level. The fruits were also the most variable for length and width there (their variability levels were rated as high and very high). The fruits of the micropopulation in the Fault site 2 at about 1,855 m above sea level were also typically small but less variable. Specimens at the Kokorya site had small fruits, which were more spheroid in shape (with the lowest value for the shape index). The variability level was low, even though that micropopulation was small. Plants growing on the reference sites beyond fractured zones bear larger fruits. As elevation is increased to 2,100 m above sea level, the fruits become somewhat lesser and less variable in size.
In terms of the fruit length, the Fault site 2 statistically differs from all Reference sites (Table 5.5). The Fault site 1 also statistically differs from all Reference sites except the Reference site 5. The regular decrease of the fruit size is caused by the deterioration of ecological conditions with the increase of altitude (Section 5.4.2). In terms of the fruit width, the Fault sites 1 and 2 statistically differ from all Reference sites (Table 5.5). From the morphometric point of view, there are no significant differences between plants growing at the Kokorya site and all Reference sites (Table 5.5).
In terms of all morphometric traits, the Fault site 1 is marked by a statistically higher variability as compared to all Reference sites (Tables 5.2 and 5.5). In terms of CV of the shape index, the Fault site 2 statistically differs from the closest Reference sites. In terms of the fruit width, the Kokorya site is characterized by the statistically lowest variability (Tables 5.2 and 5.5).
Thus, the analysis demonstrated that around active fault zones L. caerulea populations are marked by the increased frequency of occurrence of bitter-free fruits, the smallest fruits, and the diversity of fruit shape.
5.6. DISCUSSION Based on long-standing studies in population ecology of wood plants, Mamaev and
Makhnev (1982) established regularities for transformations of the level of intrapopulation variability in ecological and geographic ranges of species. These authors divided all plant traits into relatively stable and labile ones according to their ability for transformation during the progress of a temporal adaptation to environmental conditions. For “labile” traits, one can observe an increase of the variability amplitude in extreme conditions, on the northern and southern borders of the distribution, and near the upper limit of high-mountain populations. For “stable” traits, an increase in the intrapopulation variability is more often observed in zones of probable introgressive hybridization and, sporadically, in various parts of the areal.
In three populations of blue honeysuckle in the Krasnoyarsk Krai (the taiga ecozone), Shemberg and Shemberg (1994) set off fruit sizes as the most stable traits from thirteen morphological and chemical traits. The intrapopulation variability of fruit length and width was minor: CV were in ranges of 9.8–14.0% and 8.8–10.4%. For the taiga ecozone, Teplyuk et al. (2003) also found that fruit length and width of blue honeysuckle are marked by very low and low levels of variability: CV were in ranges of 5.6–12.9% and 4.1–8.6% at ecologically different sites. They concluded that these traits do not depend on ecological and geographic conditions of areals.

Intraspecific Variability of Plants 161
As the first approximation, let us assume that fruit length and width of blue honeysuckle are “stable” traits. In this case, the increase in their intrapopulation variability (Table 5.2) cannot be associated with introgressive hybridization because only one subspecies – L. caerulea subsp. altaica L. – occurs within the study area (Table 5.1). Sporadic manifestation of the variability can be caused by some powerful external factor including a recombination mechanism.
However, size and form of blue honeysuckle fruits are relatively stable for an individual shrub, but essentially vary within a population in the Mountain Altai (Skvortsov and Kuklina, 2002). Our five-year study of blue honeysuckle in various areas of this region (Figure 5.2 and Table 5.2) demonstrated that the intrapopulation variability of fruit length and width is generally medium (CV = 12–20%). Moreover, it reaches up to 32% in some micropopulations. One can see an increase in the variability near the upper limit of specific distribution (Table 5.2).
Thus, there is discordance between blue honeysuckle fruit variability in the Mountain Altai (Skvortsov and Kuklina, 2002) (Table 5.2) and the Krasnoyarsk taiga (Shemberg and Shemberg, 1994; Teplyuk et al., 2003). This can be connected with the fact that ecological conditions are more homogenous in the taiga ecozone than in mountain regions. This leads to lower variability between and within plant populations in taiga than in mountains.
Considering these data, we can assume that blue honeysuckle fruit sizes are “labile” traits. Thus, one can use them as marks of extreme conditions.
It is known that many species display the highest level of plant-to-plant intrapopulation variability when they occur in the least favorable environmental conditions (Mamaev, 1973). This can be connected with (a) a mutagenicity of a chronic stress (Belyaev and Borodin, 1982; Badyaev, 2005) and a development of long-term adaptation to stressors (Lichtenthaler, 1996); and (b) a direct influence of local geochemical mutagenic agents. Thus, the decrease in fruit weight and the increase in variability of morphometric and taste traits indicate that fault zones may effect plant development in both these ways.
With respect to the first, seismically active regions are considered as areas favorable to speciation as seismicity is a stress factor for biota (Vorontsov and Lyapunova, 1984; Trifonov and Karakhanian, 2004a). Second, it is known that active faults zones are channels for fluid migration and emanation of gases including radon. These processes form narrow geochemical anomalies or halos along fault and fracture lines (Kasimov et al., 1978; Trifonov and Karakhanian, 2004a; King et al., 2006). Some of these anomalies can be associated with various chemical elements, whose increased contents adversely and/or mutagenically affect biota (Section 3.3). Radon mutagenicity is well known (UNSCEAR, 2000) (Section 3.3.10). Lenz (1979) suggested that radon, released through active faults prior earthquakes and dissolved in groundwater, might act as a mutagenic agent produced rapid morphological changes in some species living in seismically active terrains (Section 2.4.2). Thus, active faults in seismically active regions can be considered as potential geological factors in natural selection (Section 10.3.2.3).
The Mountain Altai is an active seismic area: the most recent evidence of regional seismic activity was the 2003 Chuya earthquake (Gol’din et al., 2004) (Section 7.2.5.1). In 2003–2004, most of seismic shocks were observed along the northern macroslope of the North Chuya Range within the Baratal fault zone (Gusev, 2004). Its northern portion is nearest the epicentral area of the 2003 Chuya earthquake and its aftershocks (Figure 7.2a). The 2003 Chuya earthquake led to activization of geological processes throughout the

Irina G. Boyarskikh and Alexander V. Shitov 162
Mountain Altai. In particular, elevated content of SO42– and other ions in ground- and surface
waters were observed in 2003–2004 (Kats, 2005; Shitov, 2006) (Section 7.2.5.2). Intensification of ground icing was also reported (Dostavalova, 2005). This process reflected an enhanced seepage of deep salt groundwater through faults and fractures.
Recall that the study area is located the northern macroslope of the North Chuya Range (Section 5.3). We attributed local faults of the study area to the Baratal fault system (Section 5.4.1). Thus, we suppose that increased variability of L. caerulea fruit size and shape as well as the expression of its recessive trait (bitter-free fruits) in many specimens growing within local fault zones was caused by a seismically induced increase in the groundwater-driven release of some mutagenic substances as well as radon emanation along these faults and adjacent fractures.
The recessive trait of L. caerulea is rather stable. In 2004, twenty bitter-free-fruited specimens were sampled in the Ak-Turu valley and planted in the city of Novosibirsk. In 2005–2007, we have carried out taste tests revealed the lack of bitterness in all fruiting specimens, that is, the recessive trait had not been lost through introduction. This fact is essential to create introduced populations and to preserve the genetic diversity of Lonicera caerulea L.
5.7. CONCLUSION Study of L. caerulea variability demonstrated that within fault zones: • The expression of its recessive trait – bitter-free fruits – is sharply increased; • The smallest fruits are observed; and • Diversity of fruit shape is increased. The increase in variability of morphometric and qualitative traits as well as reduce of fruit
sizes and weights within zones of active faults are indications of geochemical and/or geophysical factors suppressing development of plants. Our preliminary analysis show an essential increase in the content of Ti, Cr, Mn, Sr, Mo, Ba, Mg, and S in L. caerulea leaves sampled within fault zones. In particular, the Sr content in leaves is nearly twice as large as that outside fault zones, whereas the Rb content in leaves is essentially reduced within fault zones.
Our results suggest that geochemical and geophysical anomalies as well as an enhanced degassing level within fault zones, especially during regional seismic activization, may mutagenically affect plants. In the case of L. caerulea, this leads to the massive phenotypic occurrence of the recessive trait. Preliminary spectrometric measurements of the flavonol content in L. caerulea leaves sampled within the Fault site 1, and Reference sites 4 and 5 showed that the total content of flavonols within the fault zone is 1.5 times higher than that at the Reference sites. This may be indicative of a possible biochemical rebuilding in affected plants. It is known that a flavonol accumulation in a plant is a response to unfavorable or unusual environmental conditions (Zaprometov, 1996). Further studies of a composition of phenolic compounds by more accurate techniques will allow us to explain biochemical mechanisms of plant adaptation to active geodynamical processes.

Intraspecific Variability of Plants 163
In our studies of the population variability of L. caerulea, we found that plants response to local geological processes in some other areas of the Mountain Altai (the South Chuya and Kurai Ridges). However, this response is dissimilarly manifested at different sites, probably, due to different levels of seismic activity and/or different sets of geoenvironmental factors affecting plants. To reveal general regularities in plant responses to local geological processes, there is a need to carry out further research of geochemical and geophysical influence on biological systems.
Key principles of the Vavilov’s theory of origin of cultivated plants are based on the correlation between regions of genetic and phenotypic intra- and interspecific variability with areas of early agricultural civilizations often located in mountain countries (Vavilov, 1926, 1992). Polymorphism of cultivated plants in these regions was usually associated with a decay of natural selection after bringing a wild plant into cultivation, as well as a poor level of artificial selection in primitive agriculture. Tectonically driven factors could also play roles of mutagenic agents causing the intraspecific variability in mountain regions (Section 10.3.2.3). Together with topographic isolation, they could assist the natural revealing and accumulation of recessive traits. Thus, local geological structures and processes and geophysical activity have contributed to the development of plants suitable for cultivation and implicitly influenced the development of society.
ACKNOWLEDGMENTS Authors thank three anonymous reviewer for helpful criticism and useful remarks.
REFERENCES
Andronova, T.I., Deryapa, I.R. and Solomatin, A.P. (1982). Heliometeotropic reactions of healthy and sick people. Leningrad, USSR: Medicina (in Russian).
Anikina, E.V., Syrchina, A.I., Vereshchagin, A.L., Larin, M.F. and Semenov, A.A. (1988). Bitter iridoid glucoside from the fruit of Lonicera caerulea. Chemistry of Natural Compounds, 24, 512–513.
Badyaev, A.V. (2005). Stress-induced variation in evolution: from behavioural plasticity to genetic assimilation. Proceedings of the Royal Society B: Biological Sciences, 272, 877–886.
Belyaev, D.K. and Borodin, P.M. (1982). The influence of stress on variation and its role in evolution. Biologisches Zentralblatt, 100, 705–714.
Bgatov, V.I. and Lizalek, N.A. (Eds.) (1992). Studies of azonal ecological and geological systems exemplified by platform terrains in Siberia. Novosibirsk, Russia: Siberian Research Institute of Geology, Geophysics, and Mineral Resources (in Russian).
Boyarskikh, I.G. and Shitov, A.V. (2008). Features of intrapopulation variability of Lonicera caerulea L. – Blue honeysuckle under active geodynamic processes of the Mountain Altai. In S.V. Dolgovykh (Ed.), Biodiversity and ecological issues of the Mountain Altai and adjacent regions: Present, past, and future: Proceedings of the International

Irina G. Boyarskikh and Alexander V. Shitov 164
conference, Gorno-Altaysk, Russia, Sept. 22-26, 2008, Pt. 2 (pp. 19–25). Gorno-Altaysk, Russia: Gorno-Altaysk University Press (in Russian, with English abstract).
Brooks, R.R. (1983). Biological methods of prospecting for minerals. New York, NY: Wiley. Busacca, A.J. and Meinert, L.D. (2003). Vine and geology – the terroir of Washington State.
In T.W. Swanson (Ed.), Western Cordillera and adjacent areas (pp. 69–85). Boulder, CO: Geological Society of America.
Cook, A.C., Hainsworth, L.J., Sorey, M.L., Evans, W.C. and Southon, J.R. (2001). Radiocarbon studies of plant leaves and tree rings from Mammoth Mountain, CA: a long-term record of magmatic CO2 release. Chemical Geology, 177, 117–131.
Dostavalova, M.S. (2005). Peculiarities of ground icing development in winter 2003–2004 in the epicentral area of the Chuya earthquake. In V.I. Krupchatnikov (Ed.), Natural resources of the Mountain Altai, No. 2 (pp. 61–66). Gorno-Altaysk, Russia: Gorno-Altaysk Typography (in Russian).
Farrar, C.D., Sorey, M.L., Evens, W.C., Howle, J.F., Kerr, B.D., Kennedy, B.M., King, C.-Y. and Southon, J.R. (2002). Forest-killing diffuse CO2 emissions at Mammoth Mountain as a sign of magmatic unrest. Nature, 376, 675–678.
Florinsky, I.V., McMahon, S. and Burton, D.L. (2004). Topographic control of soil microbial activity: a case study of denitrifiers. Geoderma, 119, 33–53.
Gidsyuk, I.K. (1981). Honeysuckle with edible fruits. Tomsk, USSR: Tomsk University Press (in Russian).
Glantz, S.A. (2002). Primer of biostatistics (5th ed.). New York, NY: McGraw-Hill. Gol’din, S.V., Seleznev, V.S., Emanov, A.F., Filina, A.G., Emanov, А.А., Novikov, I.S.,
Vysotskii, Е.М., Fateev, А.V., Kolesnikov, Y.I., Podkorytova, V.G., Leskova, Е.V. and Yarygina, М.А. (2004). Chuya earthquake and its aftershocks. Doklady Earth Sciences, 395A, 394–396.
Gusev, N.I. (Ed.) (2004). Regional geological, hydrogeological, and geoecological study of territories of the Altai Krai and Altai Republic. Geological setting and mineral deposits of the Altai Republic. Saint Petersburg, Russia: Karpinsky Russian Geological Research Institute (in Russian).
Heads, M. (1998). Biogeographic disjunction along the Alpine fault, New Zealand. Botanical Journal of the Linnean Society, 63, 161–176.
Heads, M. (2008). Biological disjunction along the West Caledonian fault, New Caledonia: a synthesis of molecular phylogenetics and panbiogeography. Botanical Journal of the Linnean Society, 158, 470–488.
Hummer, K.E. (2006). Blue Honeysuckle: a new berry crop for North America. Journal of the American Pomological Society, 60, 3–8.
Kasimov, N.S., Kovin, M.I., Proskuryakov, Y.V. and Shmelkova, N.A. (1978). Geochemistry of the soils of fault zones (exemplified by Kazakhstan). Soviet Soil Science, 10, 397–406.
Kats, V.E. (2005). Hydrogeological peculiarities of the groundwater condition in Altai Republic in 2004 (after the Chuya earthquake). In V.I. Krupchatnikov (Ed.), Natural resources of the Mountain Altai, No. 2 (pp. 61–65). Gorno-Altaysk, Russia: Gorno-Altaysk Typography (in Russian).
King, C.-Y., Zhang, W. and Zhang, Z. (2006). Earthquake-induced groundwater and gas changes. Pure and Applied Geophysics, 163, 633–645.
Kovalevsky, A.L. (1987). Biogeochemical exploration for mineral deposits (2nd ed. rev. enl.). Utrecht, Netherlands: VNU Science Press.

Intraspecific Variability of Plants 165
Kravchenko, A.N. and Bullock, D.G. (2002). Spatial variability of soybean quality data as a function of field topography: I. Spatial data analysis. Crop Science, 42, 804–815.
Kruckeberg, A.R. (2004). Geology and plant life: The effects of landforms and rock types on plants. Seattle, WA: University of Washington Press.
Kuklina, A.G. (1987). Ecological and geographic variation in blue honeysuckle in the context of introduction. Ph.D. Thesis. Moscow, USSR: Main Botanical Garden (in Russian).
Lashchinsky, N.N. (1959). Forest types in the Mountain Altai. Lesnoe Khozyaistvo, No. 6, 7–11 (in Russian).
Lenz, W.J. (1979). Radon: A factor in human evolution. M.A. Thesis. Stony Brook, NY: State University of New York at Stony Brook.
Lichtenthaler, H.K. (1996). Vegetation stress: an introduction to the stress concept in plants. Journal of Plant Physiology, 148, 4–14.
Lukina, N.V., Lyal’ko, V.I., Makarov, V.I., Skobolev, S.F., Spiridonov, K., Chekhtova, Y. and Chervenyashka, M. (1992). Preliminary results of a spectrometric study of the Faisabad test area (Tian-Shan – Intercosmos 88 International Aerospace Experiment). Soviet Journal of Remote Sensing, 9, 1022–1037.
Mackey, B.G. and Lindenmayer, D.B. (2001). Towards a hierarchical framework for modelling the spatial distribution of animals. Journal of Biogeography, 28, 1147–1166.
Mamaev, S.A. (1973). Forms of intraspecific variability in ligneous plants. Moscow, USSR: Nauka (in Russian).
Mamaev, S.A. and Makhnev, A.K. (1982). Study of population structure of wood plants by the method of morpho-physical markers. In A.V. Yablokov (Ed.), Phenetics of populations: Proceedings of the 2nd All-Union meeting, Moscow, USSR, 1979 (pp. 140–150). Moscow, USSR: Nauka (in Russian).
Melnikov, E.K., Rudnik, V.A., Musiychuk, Y.I. and Rymarev, V.I. (1994). Pathogenic influence of active fault zones in Saint Petersburg area. Geoecologia, No. 4, 50–69 (in Russian).
Miroshnichenko, V.P. (1958). Disjunctive expressions of recent tectonic motions in the southwest Turkmenistan and their investigations by air methods. Trudy Laboratorii Aerometodov, 6, 3–21 (in Russian).
Mitchell, R.L. and Burridge, J.C. (1979). Trace elements in soils and crops. Philosophical Transactions of the Royal Society of London, Series B, Biological Sciences, 288, 15–24.
Modina, T.D. (1997). Climates of the Altai Republic. Novosibirsk, Russia: Novosibirsk Pedagogical University (in Russian).
Myalo, E.G. and Goryainova, I.N. (1972). Peculiarities in manifestation of groundwater discharge connected with faults. Izvestiya Akademii Nauk, Series Geographical, No. 5, 81–86 (in Russian).
Nash, G.D., Moore, J.N. and Sperry, T. (2003). Vegetal-spectral anomaly detection at the Cove Fort-Sulphurdale thermal anomaly, Utah, USA: implications for use in geothermal exploration. Geothermics, 32, 109–130.
Nikitsky, V.E. and Glebovsky, Y.S. (Eds.) (1980). Magnetic exploration. Moscow, USSR: Nedra (in Russian).
Pennock, D., Walley, F., Solohub, M., Si, B. and Hnatowich, G. (2001). Topographically controlled yield response of canola to nitrogen fertilizer. Soil Science Society of America Journal, 65, 1838–1845.

Irina G. Boyarskikh and Alexander V. Shitov 166
Plekhanova, M.N. (1987). Potential and perspectives of honeysuckle hybridization. In: M.I. Boldyrev (Ed.), Selection and study of sorts of berry cultures (pp. 162–167). Michurinsk, USSR: All-Union Scientific Research Institute of Horticulture (in Russian).
Plekhanova, M.N. (1988). Classificator of genus Lonicera L. subsection Caeruleae Rehd. (honeysuckle). Leningrad, USSR: Vavilov All-Union Institute of Plant Industry (in Russian).
Plekhanova, M.N. (1989). Variability of Lonicera kamtschatica (Sevast.) Pojark. in the Kamchatka River basin. Nauchno-Tekhnichesky Bulleten Vsesoyuznogo Instituta Rastenievodstva, 194, 45–49 (in Russian, with English abstract).
Plekhanova, M.N. (1994). Honeysuckle. In E.P. Kuminov, Unconventional horticultures (pp. 99–149). Michurinsk, USSR: All-Union Scientific Research Institute of Horticulture (in Russian).
Plekhanova, M.N. (2000). Blue honeysuckle (Lonicera caerulea L.) – a new commercial berry crop for temperate climate: genetic resources and breeding. Acta Horticulturae, 538, 159–164.
Plekhanova, M.N. and Rostova, N.S. (1994). The analysis of variability of morphological, anatomical and biochemical characters of Lonicera in subsection Caeruleae (Caprifoliaceae) with the help of the method of principal components. Botanichesky Zhurnal, 79(2), 45–64 (in Russian, with English abstract).
Ringrose, S., Vanderpost, C. and Matheson, W. (1998). Evaluation of vegetative criteria for near-surface groundwater detection using multispectral mapping and GIS techniques in semi-arid Botswana. Applied Geography, 18, 331–354.
Romanova, E.N., Mosolova, G.I. and Beresneva, I.A. (1983). Microclimatology and its importance for agriculture. Leningrad, USSR: Hydrometeoizdat (in Russian).
Rudgeofizika (1982). Hand-held quantum magnetometer MMP-303. Technical description and user guide. Leningrad, USSR: Rudgeofizika (in Russian).
Ryals, J.A., Neuenschwander, U.H., Willits, M.G., Molina, A., Steiner, H.Y. and Hunt, M.D. (1996). Systemic acquired resistance. Plant Cell, 8, 1809–1819.
Shemberg, E.N. (1984). Using leaf traits in diagnostics of blue honeysuckles. In L.K. Pozdnyakov (Ed.), Variability and introduction of wood plants of Siberia (pp. 116–124). Krasnoyarsk, USSR: Sukachev Institute of Forest and Timber, Russian Academy of Sciences (in Russian).
Shemberg, M.A. and Shemberg, E.N. (1994). Variability and population structure of Lonicera pallasii Ledeb. in the Central Siberia. Rastitelnye Resursy, 30(4), 29–35 (in Russian).
Shitov, A.V. (2006). Ecological consequences of activization of geodynamic processes in the Mountain Altai. Vestnik Tomskogo Universiteta, Bulletin Operativnoi Nauchnoi Informatsii, 72, 118–135 (in Russian, with English abstract).
Si, B.C. and Farrell, R.E. (2004). Scale-dependent relationship between wheat yield and topographic indices: a wavelet approach. Soil Science Society of America Journal, 68, 577–587.
Skvortsov, A.K. and Kuklina, A.G. (2002). Blue honeysuckle: Botanical studies and its prospects in the central Russia. Moscow, Russia: Nauka (in Russian).
Svarcova, I., Heinrich, J. and Valentova, K. (2007). Berry fruits as a source of biologically active compounds: the case of Lonicera caerulea. Biomedical Papers of the Medical Faculty, Palacky University, 151, 163–174.

Intraspecific Variability of Plants 167
Teplyuk, N.Y., Evtukhova, O.M. and Shemberg, M.A. (2003). Individual variability of morphological and chemical traits of blue honeysuckle in the Krasnoyarsk Krai. Khimia Rastitelnogo Syrya, 7(1), 87–91 (in Russian).
Trifonov, V.G. and Karakhanian, A.S. (2004a). Active faulting and human environment. Tectonophysics, 380, 287–294.
Trifonov, V.G. and Karakhanian, A.S. (2004b). Geodynamics and the history of civilization. Moscow, Russia: Nauka (in Russian, with English contents, extended summary, and figure captions).
UNSCEAR (2000). DNA repair and mutagenesis. In United Nations Scientific Committee on the Effects of Atomic Radiation, Sources and effects of ionizing radiation: UNSCEAR 2000 report to the General Assembly, with scientific annexes, Vol. 2: Effects (pp. 1–72). New York, NY: United Nations.
Vavilov, N.I. (1926). Studies on the origin of cultivated plants. Bulletin of Applied Botany and Plant Breeding, 16(2), 1–248 (in Russian, with English summary).
Vavilov, N.I. (1992). Origin and geography of cultivated plants. Cambridge, UK: Cambridge University Press.
Vereshchagin, A.L., Anikina, E.V., Syrchina, A.I., Lapin, M.F., Azin, L.A. and Semenov, A.A. (1989). Chemical investigation of the bitter substances of the fruit of Lonicera caerulea. Chemistry of Natural Compounds, 25, 289–292.
Vinogradov, B.V. (1955). Examples of relationships between vegetation, soils, and neotectonics. Journal Botanique de l'URSS, 40, 837–844 (in Russian).
Vorontsov, N.N. and Lyapunova, E.A. (1984). Explosive chromosomal speciation in seismic active region. Chromosomes Today, 8, 289–294.
Weiss, S.B., Murphy, D.D. and White, R.R. (1988). Sun, slope, and butterflies: topographic determinants of habitat quality for Euphydryas editha. Ecology, 69, 1486–1496.
Zaprometov, M.N. (1996). Phenolic compounds and their role in a plant life. Moscow, USSR: Nauka (in Russian).


In: Man and the Geosphere ISBN 978-1-60876-387-0 Editor: Igor V. Florinsky, pp. 169-183 © 2010 Nova Science Publishers, Inc.
Chapter 6
PATHOGENIC EFFECT OF FAULT ZONES IN THE URBAN ENVIRONMENT
Vyacheslav A. Rudnik and Evgeny K. Melnikov
ABSTRACT
The authors discuss geological and geophysical factors which can influence human health in the urban environment. In the city of Saint Petersburg, Russia, and in settlements of the Saint Petersburg Region, combined medical and geological investigations have established a strong relationship between spatial distribution of cancer incidence rate in apartment buildings and zones of enhanced permeability of the crust (ZEPC), comprising faults, associated underground watercourses, and areas of increased rock fracturing. Compared to ZEPC, soil and air anthropogenic pollution seems to have only a secondary role in causing cancers. Indeed, the cancer incidence rate was 2.8 and 4.1 times higher in apartment buildings located within ZEPC and their intersections, respectively, than outside them, regardless of a level of total soil pollution with heavy metals. On the other hand, the cancer incidence rate was a mere 1.3 and 1.5 times higher in buildings at areas marked by moderate- and high level of soil pollution with heavy metals, respectively, than at low-polluted areas, regardless of their position relative to ZEPC. The cancer incidence rate was 1.8 and 2 times higher in settlements located within ZEPC and their intersections, respectively, than outside them, regardless of a level of total air pollution. On the other hand, the cancer incidence rate was only 1.2 higher in settlements with a high level of total air pollution than in low-polluted settlements, regardless of their position relative to ZEPC.
Mechanisms of the adverse effect of ZEPC on human health may be connected with a disturbance of mitosis and cell development due to three factors: (a) fluctuation of geomagnetic gradients within fault zones; (b) a specific air ion regime connected with tectonic movements along faults; and (c) a specific gaseous and geochemical regime associated with the fluid degassing via faults. City building design principles should consider the pathogenic influence of ZEPC.
Keywords: fault; morbidity; fracturing; cancer; dowsing; plant morphoses.

Vyacheslav A. Rudnik and Evgeny K. Melnikov 170
6.1. INTRODUCTION One of the key problems of geoenvironmental studies is classification and segmentation
of a territory according to the rate of biological comfort. This includes recognition of areas favorable and unfavorable for human habitation (Astorri et al., 2002; Beaubien et al., 2003; Carapezza et al., 2003; Durand and Scott, 2005; Horwell et al., 2005). Within unfavorable areas, human beings experience a stressogenic exposure leading to various functional disorders and diseases. These areas can be of both anthropogenic and natural origin.
Anthropogenic zones of biological discomfort are connected with human activities. In particular, they refer to areas of environmental disasters attributable, for example, to accidents associated with nuclear power stations or chemical/metallurgical plants. There is the increased pollution of soil, water, and air by heavy metals, radionuclides, pesticides, etc. within anthropogenic zones of biological discomfort.
Natural zones of biological discomfort are associated with local geological peculiarities. Some of these zones relate to natural geochemical anomalies. For example, biota can be adversely affected by a misbalance of some trace elements in soils and groundwaters, such as F, I, Hg, As, Sr, natural radionuclides, etc. (Section 3.3). Other types of natural areas of biological discomfort are usually associated with zones of enhanced permeability of the crust (ZEPC) including active faults, fault intersections or junctions, buried paleovalleys and underground watercourses, increased rock fracturing, karst cavities, and some other geological features. Adverse effects of ZEPC on the urban environment allow one to describe them as zones of geological risk (Osipov, 1994; Kostryukova and Kostryukov, 2002). Geophysical and geochemical anomalies are often associated with ZEPC. Emanation of gases (e.g., Rn, CH4, H2S, and CO2) within fault zones and fractures can adversely influence human health (Henshaw et al., 1990; Bates et al., 1998; Gilman and Knox, 1998; Baxter et al., 1999; Annunziatellis et al., 2003; Bølviken et al., 2003; Durand and Wilson, 2006; Appleton, 2005).
Adverse effects of “bad places” on biota (including human beings) have been well known since antiquity. Thus, attention has been concentrated on the selection of a place for dwelling houses in former times. An increased sensitivity of some domestic animals and dowsers has been traditionally used to reveal “bad places”. However, rules of thumb to select a place for habitation have gradually declined as the human population and number of cities have increased. As a result, areas of habitation have emerged where one can observe repetitive cases of cancer, leukemia, multiple sclerosis, and some other hard diseases and dysfunctions across the generations. Currently, such “bad places” are often lumped together as geopathic or geopathogenic zones (GPZ).
Although most researchers of GPZ have not clearly explained their nature, they have noted a spatial relation of the zones to some geological features, such as underground watercourses (Fritsch, 1955; Freiherr von Pohl, 1987; Bachler, 1989), which are often associated with buried faults and zones of increased rock fracturing. However, most of these conclusions were based on information provided by dowsers, and are not supported by geological and geophysical surveys. Moreover, in many cases medical data were not statistically representative since small population samples were used. There are also numerous speculations about regular “networks” of “earth beams” adversely affecting human beings (Curry, 1978; Hartmann, 1982). However, this issue is still a subject of scientific

Pathogenic Effect of Fault Zones in the Urban Environment 171
discussion (Hacker et al., 2005; Leitgeb and Lukas, 2008), and we do not concern the Curry and Hartman networks in this chapter.
In the early 1990s, the authors initiated the first rigorous study of relationships between GPZ, properties of geological media, and responses of biota including humans in several administrative districts of the city of Saint Petersburg, Russia (Melnikov et al., 1993, 1994). In the project, we have studied GPZ that are spatially correlated with established geological features, and in this chapter we briefly describe the most important results (exemplified by the Kalininsky District of the city) and their interpretation.
6.2. STUDY AREA Geological setting of the Saint Petersburg Region is governed by its position at a
tectonically stressed junction of the Baltic Shield and East European Platform. The depth of the Early Precambrian crystalline basement increases in a southward direction along a dense system of predominantly northwest- and northeast-striking faults (Melnikov et al., 1993, 1994). The city is crossed by the system of near-east-, northwest-, and near-north-striking regional and transregional faults (Figure 6.1).
The fault network generally controls the main coast elements of the Gulf of Finland, the modern drainage network, preglacial and interglacial paleodrainage networks, as well as the spatial distribution of uranium deposits located in the Vendian sandstones at depths of 200–350 m. These faults are partially reflected by anomalies of the geomagnetic and gravity fields indicating heterogeneities in the composition of the crystalline basement caused by displacements of its blocks along these faults in the Early Precambrian time. There were small displacements along these faults (up to several tens of meters) during the Phanerozoic time. As a result, the faults can be recognized as escarpments of the Pre-Quaternary deposits using data from a dense network of bore holes. These faults are badly recognized in the Phanerozoic sand and clay deposits, whereas they may be revealed by a drastic increase of fractureness and karstification in carbonate rock horizons.
Figure 6.1. Regional faults for the city of Saint Petersburg and adjacent territories.

Vyacheslav A. Rudnik and Evgeny K. Melnikov 172
At the top of the Proterozoic basement deposits, unconformably overlying dislocated features of the crystalline basement, the faults concerned are marked by radioactive anomalies associated with diffusion halos of uranium in the Vendian sediments. Several poorly developed uranium deposits are spatially correlated with fault intersections. In the Quaternary deposits, the faults are partially manifested by preglacial and interglacial paleovalleys (Melnikov et al., 1993, 1994).
According to vertical deformations of reference points in tunnels of the Saint Petersburg subway, vertical movements along faults crossing the city have alternating signs and range from 0.5 to 20 mm per year. At fault intersections, vertical movements range from 30 to 50 mm per year.
6.3. MATERIALS AND METHODS For the Kalininsky District of Saint Petersburg (Figure 6.2), we used the following data
set: • Materials of geological and geophysical (electrical and gas emanation) surveys from
archives of GGP Nevskgeologia and some other geological organizations of the city, including data obtained during subway construction.
• Materials of geochemical soil survey conducted by GGP Nevskgeologia. A survey grid of 200 m by 200 m was used.
• Materials of motorized dowsing surveys carried out by several independent dowsers. • Population of each apartment building. Data were obtained from the District
Administration. The total sample comprised 330,358 persons. Age group distribution was as follows: 0–14 ages – 12%, 15–19 ages – 8.5%, 20–39 ages – 29%, 40–59 ages – 29.5%, and 60+ ages – 21%. Male and female populations comprised about 45% and 55%, respectively. Proportions of male and female adults who are daily smokers were about 58% and 12%, respectively. Since the Kalininsky District is a typical municipal area without retirement homes, one can assume that such distributions are, on average, true for all apartment buildings surveyed.
• Data on cancer incidence rates for each apartment building for the years of 1990 and 1991. Data were obtained from the Saint Petersburg Municipal Clinical Oncology Center. We used the total incidence rate of cancer, that is, we did not separate cancers of a specific site/type.
• Data on traffic accidents that happened in the Kalininsky District over 2 years (1990–1991). A sample included about 3,500 traffic accidents excluding drunk drivers and pedestrians. Data were obtained from the Kalininsky District Road Police Service.
• Statistical data on morphoses of trees in several parks, particularly, in the Piskarevsky Park and the park of the Saint Petersburg Forest Technical Academy (Figure 6.2). The sample size was about 5,000 trees.
Using these materials, we produced four maps (scales of 1:25,000) (Figure 6.2):

Pathogenic Effect of Fault Zones in the Urban Environment 173
• A map of ZEPC based on geological and geophysical data; • A map of soil pollution with heavy metals based on materials of geochemical soil
survey; • A map cancer incidence rate based on medical statistical data; and • A map of GPZ based on dowsing survey. A comparative and statistical analyses of data was carried out.
Figure 6.2. Portion of the Kalininsky District of Saint Petersburg: cancer incidence rate (per 1,000 population) in the years 1991–1992, ZEPC, and areas marked by a high level of soil pollution with heavy metals.
6.4. RESULTS AND DISCUSSION
6.4.1. “Biolocation Anomalies” and Zones of Enhanced Crustal Permeability Dowsing has been practiced for several millennia (Ellis, 1917; Burridge, 1955), although
this art and craft of “biolocation” is a subject of great controversy (Deming, 2002; Chow, 2005; Dym, 2008). Nevertheless, dowsing is used for water and mineral prospecting and geological mapping including detection of faults (Sochevanov et al., 1984; Betz, 1995) as well as for revealing hidden defects in constructions (Boltunov and Boltunov, 1997). A basis for dowsing is probably an ideomotor effect, a reflexive response of human organism to subtle gradients of natural electromagnetic fields associated with underground features (Rocard, 1964; Bakirov, 1992; Betz, 1995).

Vyacheslav A. Rudnik and Evgeny K. Melnikov 174
For the study area, several independent dowsers revealed linear “biolocation anomalies” several kilometers long and 50–200 m wide. A comparison of the map of GPZ based on dowsing survey with the map of ZEPC based on geological and geophysical materials (Figure 6.2) demonstrated that 86% of “biolocation anomalies” relate to ZEPCs associated with two fault systems. Indeed, the Kalininsky District is crossed by a near-north-striking fault as well as a near-west-northwest-striking fault system (Figure 6.1).
Figure 6.3. Relationship between traffic accidents and ZEPC in the Kalininsky District of Saint Petersburg.
This result testifies that (a) biolocation can be used as an additional method to reveal ZEPCs; and (b) there is an ideomotor effect that happens when crossing geodynamically active zones, which is probably associated with anomalies of geophysical fields related to ZEPCs. It is notable that the number of traffic accidents was 30–300% higher within ZEPCs than outside them (Figure 6.3). This phenomenon may be connected with the influence of local geomagnetic gradients on human behavior (Rocard, 1964) (Section 4.3.1) when drivers cross ZEPCs. It seems that dowsers and “sensitive” drivers manifest the same ideomotor effect, which activates the dowser’s rod or frame and disturbs driver’s attention.
6.4.2. Humans and Zones of Enhanced Crustal Permeability
The southern part of the Kalininsky District was mainly developed in the 19th century,
and there are many big factories and industrial plants that are located here. One can observe large halos of soil pollution characterized by high concentrations of Pb, Zn, As, etc. (ZC > 32 – Table 6.1). The ZEPC density (total length of ZEPCs per area) is about 1.5 km per km2

Pathogenic Effect of Fault Zones in the Urban Environment 175
(Figure 6.2). The northern part of the Kalininsky District was developed in the 1970s. It predominantly includes apartment buildings (5–15 floors). This area is located 3–7 km from the industrial factories and industrial plants of the southern part of the district. Most of this northern area is associated with rather low levels of soil pollution with heavy metals (ZC < 16 – Table 6.1). However, the area is characterized by a high density of ZEPC (about 2.8 km per km2 – Figure 6.2).
The analysis of data on ZEPC and cancer incidence rate demonstrated that the latter was 2.8 and 4.1 times higher in apartment buildings located within ZEPC and their intersections, respectively, than outside them, regardless of the level of soil pollution (Table 6.1).
Table 6.1. Relationships between cancer incidence rate (per 1,000 population) and
position of apartment buildings relating to ZEPC and levels of the total soil pollution by heavy metals (ZC) in the Kalininsky District of Saint Petersburg (Melnikov et al., 1993)
Level of the total soils pollution by heavy metals*
Population and incidence rate
Position of buildings Outside ZEPC
Partially within ZEPC
Completely within ZEPC
At ZEPC intersections
Low (ZC < 16) Population 125,076 76,279 97,872 31,131
Incidence rate 1.60 3.63 4.50 6.47
Moderate (ZC = 16–32)
Population 18,146 12,219 26,135 8,189
Incidence rate 2.07 4.66 4.44 8.91
High (ZC > 32) Population 6,639 6,910 5,384 –
Incidence rate 2.56 4.56 7.06 – * The index ZC is a sum of coefficients of pollutant concentrations in soil (Ministry of Health, 1999):
( )11
−−=∑=
nKZn
iCiC , where i = 1, … n, n is number of pollutants, КC is a concentration
coefficient of a particular pollutant: КC = СS / СB, where СS is a concentration of a heavy metal in soil, СB is a regional background concentration of a heavy metal in soil. There was zero cancer incidence rate in 60% of buildings located outside ZEPC, 20% of
buildings located within ZEPC, and 10% of buildings situated at ZEPC intersections. From another perspective, the cancer incidence rate of 8 per 1,000 population was typical for 3% of buildings located outside ZEPC, 21% of buildings located within ZEPC, and ~46% of buildings situated at their intersections. Eighteen per cent of apartment buildings were associated with an occupant cancer incidence rate of 15-50 at ZEPC intersection sites.
The analysis of data on cancer incidence rate and soil pollution with heavy metals demonstrated that this factor of anthropogenic pollution plays a secondary role compared with ZEPC. Indeed, the cancer incidence rate was only 1.3 and 1.5 times higher at moderate- and high-pollution areas, respectively, than at low-polluted areas, regardless of their position relative to ZEPC (Table 6.1). Analysis of variance shows a statistical relation between cancer incidence rate and ZEPC at a higher level of significance than that determined between cancer incidence rate and soil pollution with heavy metals (Table 6.2). However, there was the highest statistical relation between cancer incidence rate and a combination of ZEPC and soil
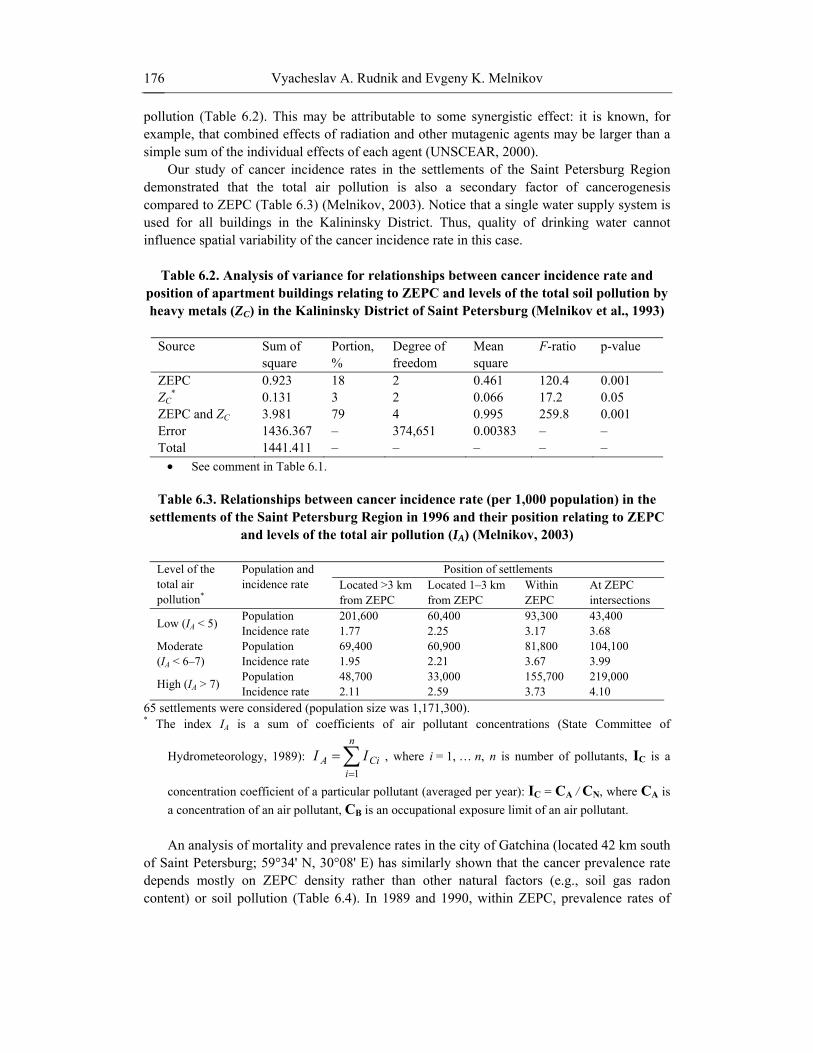
Vyacheslav A. Rudnik and Evgeny K. Melnikov 176
pollution (Table 6.2). This may be attributable to some synergistic effect: it is known, for example, that combined effects of radiation and other mutagenic agents may be larger than a simple sum of the individual effects of each agent (UNSCEAR, 2000).
Our study of cancer incidence rates in the settlements of the Saint Petersburg Region demonstrated that the total air pollution is also a secondary factor of cancerogenesis compared to ZEPC (Table 6.3) (Melnikov, 2003). Notice that a single water supply system is used for all buildings in the Kalininsky District. Thus, quality of drinking water cannot influence spatial variability of the cancer incidence rate in this case.
Table 6.2. Analysis of variance for relationships between cancer incidence rate and
position of apartment buildings relating to ZEPC and levels of the total soil pollution by heavy metals (ZC) in the Kalininsky District of Saint Petersburg (Melnikov et al., 1993)
Source Sum of
square Portion, %
Degree of freedom
Mean square
F-ratio p-value
ZEPC 0.923 18 2 0.461 120.4 0.001 ZC
* 0.131 3 2 0.066 17.2 0.05 ZEPC and ZC 3.981 79 4 0.995 259.8 0.001 Error 1436.367 – 374,651 0.00383 – – Total 1441.411 – – – – – • See comment in Table 6.1.
Table 6.3. Relationships between cancer incidence rate (per 1,000 population) in the settlements of the Saint Petersburg Region in 1996 and their position relating to ZEPC
and levels of the total air pollution (IA) (Melnikov, 2003)
Level of the total air pollution*
Population and incidence rate
Position of settlements Located >3 km from ZEPC
Located 1–3 km from ZEPC
Within ZEPC
At ZEPC intersections
Low (IA < 5) Population 201,600 60,400 93,300 43,400 Incidence rate 1.77 2.25 3.17 3.68
Moderate (IA < 6–7)
Population 69,400 60,900 81,800 104,100 Incidence rate 1.95 2.21 3.67 3.99
High (IA > 7) Population 48,700 33,000 155,700 219,000 Incidence rate 2.11 2.59 3.73 4.10
65 settlements were considered (population size was 1,171,300). * The index IA is a sum of coefficients of air pollutant concentrations (State Committee of
Hydrometeorology, 1989): ∑=
=n
iCiA II
1, where i = 1, … n, n is number of pollutants, IC is a
concentration coefficient of a particular pollutant (averaged per year): IC = СA / СN, where СA is a concentration of an air pollutant, СB is an occupational exposure limit of an air pollutant. An analysis of mortality and prevalence rates in the city of Gatchina (located 42 km south
of Saint Petersburg; 59°34' N, 30°08' E) has similarly shown that the cancer prevalence rate depends mostly on ZEPC density rather than other natural factors (e.g., soil gas radon content) or soil pollution (Table 6.4). In 1989 and 1990, within ZEPC, prevalence rates of

Pathogenic Effect of Fault Zones in the Urban Environment 177
cancers, ischemic cardiac disease, and hypertensive disease were about 3.5, 2, and 1.5 times higher than outside them (Melnikov et al., 1993). Within ZEPC, the total mortality in the settlements of the Saint Petersburg Region was about 2 times higher than that outside them (Table 6.5) (Melnikov, 2003).
Table 6.4. Pearson correlation coefficients between mortality rate and some disease
prevalence rates in the city of Gatchina and some natural/anthropogenic factors (Melnikov et al., 1993)
Age group Mortality and prevalence rate ZEPC
density ZC*
Soil content Radon Cadmium Benzapiren
14–59 ages
Mor
talit
y 1989 0.58 – 0.42 – –
1990 0.57 – – 0.62 0.40
Prev
alen
ce Cancer 0.60 – – – –
Ischemic cardiac disease – 0.44 0.42 – – Hypertensive disease – – – – – Chronic bronchitis – – 0.49 – – Diabetes mellitus 0.32 0.36 – 0.36 –
≥ 60 age
Mor
talit
y 1989 0.49 – 0.36 – –
1990 0.55 – – – 0.40
Prev
alen
ce Cancer 0.67 – – – –
Ischemic cardiac disease – 0.42 0.42 – – Hypertensive disease – – – – – Chronic bronchitis 0.43 – 0.59 – – Diabetes mellitus 0.32 0.48 – – –
The sample size comprised 31 districts of the city; statistically significant correlations (p = 0.05) are presented; dashes are statistically non-significant correlations.
* See comment in Table 6.1.
Table 6.5. Average total mortality rate (per 1,000 population) in the settlements of the Saint Petersburg Region relating to ZEPC
Year Outside ZEPC Within ZEPC 1989 7.2 14.8 1995 12.9 25.0
65 settlements were considered (population size was 1,171,300). The sharp increase of the mortality rate in the early- and mid-1990s resulted from the post-communist
liberal economic policy. Our studies in Saint Petersburg and an adjacent region demonstrated that an age
composition and survival rate of cancer patients does not depend on existence or absence of ZEPC. In any geological situation, the proportion of patients younger than 50 years is about 15%, whereas a five-year disease-free survival proportion ranges from 53% to 56% (Melnikov, 2003).
Investigation of tree morphoses in Saint Petersburg’s parks demonstrated that within ZEPC, the number of trees with forked trunks is 2.5–5 times higher than outside them.

Vyacheslav A. Rudnik and Evgeny K. Melnikov 178
Moreover, 20–60% of trees have forked trunks at ZEPC intersections (Table 6.6). Similar phenomena were observed in Armenia along active faults (Trifonov and Karakhanian, 2004, p. 152).
Table 6.6. Relationship between tree dichotomy and ZEPC in Saint Petersburg’s parks
(Melnikov et al., 1993)
Type of trees Linden Birch Pine
Total Outside Within Total Outside Within Total Outside Within ZEPC ZEPC ZEPC
Total 1,170 428 742 2,414 1,281 1,133 2,596 1,977 619 Normal 1,086 412 674 2,098 1,213 885 2,544 1,956 588 Forked trunks 84 16 68 316 68 248 52 21 31 Forked trunks, % 7.18 3.74 9.16 13.09 5.31 21.89 2.00 1.06 5.01
6.4.3. Influence of Zones of Enhanced Crustal Permeability on Biota: Possible Mechanisms
A mechanism of the adverse effect of ZEPC on human health is not clear. It would be
tempting to explain it by the influence of radon, a well known pathogenic factor (Cothern and Smith, 1987; Henshaw et al., 1990; Bølviken et al., 2003; Appleton, 2005) (Section 3.3.10). Indeed, radon emission via fault and fractured zones can be higher than within adjacent non-fractured areas. Nevertheless, we should reject this hypothesis due to two facts.
First, radon is a heavy gas; its air concentration decreases with altitude, and only basements and ground floor apartments are usually marked by a higher cancer incidence rate. However, the established relationships between the increased incidence rates and ZEPC are true not only for ground floors of apartment buildings, but for upper floors (up to 15th floors) as well.
Second, our study of total prevalence rates in a child population of the city of Vyborg (located 130 km northwest of Saint Petersburg; 60°42' N, 28°45' E) showed that there is a strong dependence of children morbidity on the ZEPC density (Table 6.7) (Melnikov et al., 1993). On the other hand, we did not reveal a dependence of children morbidity on the soil gas radon concentration ranging from 50 to 100 Bq/m3 at local fault zones and fault intersections. Moreover, districts of the city marked by minimal prevalence rates relate to areas with maximal natural background radiation associated with an exposure of Precambrian granites (uranium content is 4–8 g/t, thorium content is up to 30–40 g/t, and potassium content is 3–5%). This is in agreement with previous observations in other territories that demonstrated negative correlations between morbidity rates and natural background radiation level (Haynes, 1988; Cohen, 1995). Such effects may be explained in terms of radiation hormesis; in particular, low doses of natural ionizing radiation may stimulate the immune system (Luckey, 1991) (Section 2.4.1).

Pathogenic Effect of Fault Zones in the Urban Environment 179
Table 6.7. Relationships between the density of ZEPC and the total prevalence rate in a child population of the city of Vyborg (Melnikov et al., 1993)
ZEPC density, km per km2 Prevalence rate (per 1,000 population) 0.5 1,000 2.0 1,200 3.0 1,300 4.0 1,450 The adverse effect of ZEPC on human health may be caused by at least three geogenic
factors: 1. Local geomagnetic anomalies. Such anomalies are usually associated with
magnetized rocks (Gunn and Dentith, 1997). They are often observed within ZEPC, where an intensive rock fracturing forms conditions conductive for igneous intrusions and fluid penetration. It is known that magnetic fields may influence all functional systems of the human organism (Persinger et al., 1973; Dubrov, 1978; Binhi, 2002) (Section 4.2).
2. Air ion anomalies. In buildings located over ZEPC, one may observe a decreased number of air ions, especially negative ones, down to 80–210 per 1 cm3 (Melnikov and Rudnik, 1998; Rudnik, 2002): the optimal concentration is 3,000–5,000 per 1 cm3. A decrease of air ion concentration can adversely affect human health, in particular, suppressing the immune system (Tchijevsky, 1929; Krueger, 1972). The decrease of the air ion concentration may occur due to an interaction between negative air ions and proton gas appearing in fault zones. Experimental studies of Ne–He isotopic systems testify to the proton gas emission in fault zones during tectonic motions (Rudnik, 2002). This happens due to the fragmentation of rocks incorporating volatile components, such as halogens, H2O, and OH group. This results in disruption of the hermeticity of gaseous and solid components, partial dehydroxylation of OH-bearing minerals, and, finally, emission of various gases (e.g., H2), fluids, and metals.
3. Deep-fluid degassing and gas emission via active faults. Data of emanation surveys of Saint Petersburg’s fault zones testify to the existence of atmochemical halos over ZEPC caused by an enhanced emission of potentially harmful gases and substances such as CH4, CO2, alkanes, alkenes, volatile compounds of heavy metals, sulfurous and hydrocarbon compounds, and even natural polycyclic aromatic hydrocarbons (Rudnik and Melnikov, 1998).
Whatever the mechanism is, it is reasonable that incidence rates are higher at ZEPC
intersections than at a single ZEPC. Indeed, fault intersections are marked by more intensive rock fracturing in comparison to single faults. This offers better conditions for gas emanation and fluid migration (Florinsky, 2000).
Alterations of geomagnetic gradients as well as specific gaseous, geochemical, and air ion regime within ZEPC may probably cause disturbances of mitosis and cell development, leading to premature aging, growth acceleration, occurrence of dwarfish and distorted forms, and disproportional expanding of tissues. The increase of plant polymorphism within ZEPC

Vyacheslav A. Rudnik and Evgeny K. Melnikov 180
suggests that similar effects may also be typical for humans. Under a prolonged duration of stay within ZEPC, some individuals may show evidence of aging together with related diseases (e.g., ischemic cardiac disease and diabetes), other individuals may show evidence of growth acceleration with possible disproportions, whereas some other persons may show evidence of somatic dysfunctions connected with disproportional expanding of tissues and tumor occurrence (Rudnik, 2002).
We propose that ZEPC are a factor influencing polymorphism and biodiversity of organisms: strong specimens become stronger, whereas weak specimens are “rejected”. This happens due to alterations in mechanisms of immune and hormonal regulation of homeostasis causing mutations of somatic cells and gametes and leading to oncological diseases, congenital malformations, and chromosome anomalies (Rudnik, 2002). Thus, pathogenic zones play a role of the factor of natural selection leading to the increase of specific and phenotypic diversity of the biosphere (Trifonov and Karakhanian, 2004) (Section 10.3.2.3).
6.5. CONCLUSION Areas of natural biological discomfort are generally associated with ZEPC including
faults and buried paleovalleys. These zones can dramatically affect human health. Compared to ZEPC, technogenic pollution seems to have only a secondary role in causing cancers.
City building design should include geoenvironmental mapping (1:10,000 – 1:50,000 scales) to consider the influence of ZEPC. It is necessary to classify urban territories in terms of biological comfort as well as to reveal:
• Ultra-pathogenic areas unsuitable for living, which are usually located at ZEPC
intersections; and • Areas suitable for recreation activity, hospitals, sanatoriums, and schools, which are
usually situated between ZEPC. Mechanisms of the adverse effect of ZEPC on human health are not clear. We suggest
that they may be connected with a disturbance of mitosis and cell development due to three factors: (a) fluctuation of geomagnetic gradients within fault zones; (b) a specific air ion regime connected with tectonic movements along faults; and (c) a specific gaseous and geochemical regime associated with the deep-fluid degassing via faults. There is a need to carry out a combined medical and geological research of the mechanism of the influence of ZEPC on humans and biota. This may allow one to find effective tools to reduce their negative effects.
ACKNOWLEDGMENTS
Authors thank three anonymous reviewers for useful criticism, as well as P. Jeambrun
(Société Française d’Hydrologie et de Climatologie Médicales, Paris, France) for librarian help.

Pathogenic Effect of Fault Zones in the Urban Environment 181
REFERENCES
Annunziatellis, A., Ciotoli, G., Lombardi, S. and Nolasco, F. (2003). Short- and long- term gas hazard: the release of toxic gases in the Alban Hills volcanic area (central Italy). Journal of Geochemical Exploration, 77, 93–108.
Appleton, J.D. (2005). Radon in air and water. In O. Selinus, B. Alloway, J.A. Centeno, R.B. Finkelman, R. Fuge, U. Lindh and P. Smedley (Eds.), Essentials of medical geology: Impacts of the natural environment on public health (pp. 227–262). Amsterdam, Netherlands: Elsevier.
Astorri, F., Beaubien, S.E., Ciotoli, G. and Lombardi, S. (2002). An assessment of gas emanation hazard using a geographic information system and geostatistics. Health Physics, 82, 358–366.
Bachler, K. (1989). Earth radiation. Manchester, UK: Wordmasters. Bakirov, A.G. (1992). An unusual physical phenomenon in biology. Russian Physics Journal,
35, 234–240. Bates, M., Garret, N., Graham, B. and Read, D. (1998). Cancer incidence, morbidity and
geothermal air pollution in Rotorua, New Zealand. International Journal of Epidemiology, 27, 10–14.
Baxter, P.J., Baubron, J.-C. and Coutinho, R. (1999). Health hazards and disaster potential of ground gas emissions at Furnas volcano, São Miguel, Azores. Journal of Volcanology and Geothermal Research, 92, 95–106.
Beaubien, S.E., Ciotoli, G. and Lombardi, S. (2003). Carbon dioxide and radon gas hazard in the Alban Hills area (central Italy). Journal of Volcanology and Geothermal Research, 123, 63–80.
Betz, H.-D. (1995). Unconventional water detection: field test of the dowsing technique in dry zones. Journal of Scientific Exploration, 9, 1–43 and 159–189.
Binhi, V.N. (2002). Magnetobiology: Underlying physical problems. San Diego, CA: Academic Press.
Boltunov, V.A. and Boltunov, V.V. (1997). Biolocation in hydrotechnical construction: past, present, and future. Hydrotechnical Construction, 31, 635–642.
Bølviken, B., Celius, E.G., Nilsen, R. and Strand, T. (2003). Radon: a possible risk factor in multiple sclerosis. Neuroepidemiology, 22, 87–94.
Burridge, G. (1955). Does the forked stick locate anything? An inquiry into the art of dowsing. Western Folklore, 14, 32–43.
Carapezza, M.L., Badalamenti, B., Cavarra, L. and Scalzo, A. (2003). Gas hazard assessment in a densely inhabited area of Colli Albani Volcano (Cava dei Selci, Roma). Journal of Volcanology and Geothermal Research, 123, 81–94.
Chow, J. (2005). Pendular diagnosis: from dowsing to diagnostic methodology? Seminars in Integrative Medicine, 3, 38–43.
Cohen, B.L. (1995). Test of the linear-no threshold theory of radiation carcinogenesis for inhaled radon decay products. Health Physics, 68, 157–174.
Cothern, C.R. and Smith, J.E. (Eds.) (1987). Environmental radon. New York, NY: Plenum Press.
Curry, M. (1978). Curry-Netz: Das Reaktionsliniensystem als krankheitsauslösender Faktor. München, Germany: Herold.

Vyacheslav A. Rudnik and Evgeny K. Melnikov 182
Deming, D. (2002). Water witching and dowsing. Ground Water, 40, 450–452. Dubrov, A.P. (1978). The geomagnetic field and life. Geomagnetobiology. New York, NY:
Plenum Press. Durand, M. and Scott, B.J. (2005). Geothermal ground gas emissions and indoor air pollution
in Rotorua, New Zealand. Science of the Total Environment, 345, 69–80. Durand, M. and Wilson, J.G. (2006). Spatial analysis of respiratory disease on an urbanized
geothermal field. Environmental Research, 101, 238–245. Dym, W. (2008). Scholars and miners: dowsing and the Freiberg Mining Academy.
Technology and Culture, 49, 833–859. Ellis, A.J. (1917). The divining rod: A history of water witching. Washington, DC: U.S.
Government Printing Office. Florinsky, I.V. (2000). Relationships between topographically expressed zones of flow
accumulation and sites of fault intersection: analysis by means of digital terrain modelling. Environmental Modelling and Software, 15, 87–100.
Freiherr von Pohl, G. (1987). Earth currents: Causative factor of cancer and other diseases. Stuttgart, Germany: Frech.
Fritsch, V. (1955). Das Problem geopathogener Erscheinungen vom Standpunkt der Geophysik. München, Germany: Lehmann.
Gilman, E.A. and Knox, E.G. (1998). Geographical distribution of birth places of children with cancer in the UK. British Journal of Cancer, 77, 842–849.
Gunn, P.J. and Dentith, M.C. (1997). Magnetic responses associated with mineral deposits. AGSO Journal of Australian Geology and Geophysics, 17, 145–158.
Hacker, G.W., Pawlak, E., Pauser, G., Tichy, G., Jell, H., Posch, G., Kraibacher, G., Aigner, A. and Hutter, J. (2005). Biomedical evidence of influence of geopathic zones on the human body: scientifically traceable effects and ways of harmonization. Forsch Komplementärmed Klass Naturheilkd, 12, 315–327.
Hartmann, E. (1982). Krankheit als Standortproblem. Heidelberg, Germany: Haug. Haynes, R.M. (1988). The distribution of domestic radon concentrations and lung cancer
mortality in England and Wales. Radiation Protection Dosimetry, 25, 93–96. Henshaw, D.L., Eatough, J.P. and Richardson, R.B. (1990). Radon as a causative factor in
induction of myeloid leukaemia and other cancers. Lancet, 335, 1008–1012. Horwell, C.J., Patterson, J.E., Gamble, J.A. and Allen, A.G. (2005). Monitoring and mapping
of hydrogen sulphide emissions across an active geothermal field: Rotorua, New Zealand. Journal of Volcanology and Geothermal Research, 139, 259–269.
Kostryukova, N.K. and Kostryukov, O.M. (2002). Local faults of the Earth’s crust – Factor of natural risk. Moscow, Russia: Mining Science Press (in Russian).
Krueger, A.P. (1972). Are air ions biologically significant? A review of a controversial subject. International Journal of Biometeorology, 16, 313–322.
Leitgeb, N. and Lukas, R. (2008) Should hospitals protect from geopathogenic zones? Wiener Medizinische Wochenschrift, 158, 42–48.
Luckey, T.D. (1991). Radiation hormesis. Boca Raton, FL: CRC Press. Melnikov, E.K. (2003). Influence of geological heterogeneities on the health of population of
Saint Petersburg and Leningrad Region. In A.V. Lebedev and V.N. Shurygin, Geologists for the 300th year anniversary of Saint Petersburg (pp. 164–177). Saint Petersburg, Russia: Pangea (in Russian).

Pathogenic Effect of Fault Zones in the Urban Environment 183
Melnikov, E.K., Musiychuk, Y.I., Potiforov, A.I., Rudnik, V.A. and Rymarev, V.I. (1993). Geopathogenic zones – Myth or reality? Saint Petersburg, Russia: All-Russian Scientific Research Institute “Oceangeologia” (in Russian, with English abstract).
Melnikov, E.K. and Rudnik, V.A. (1998). Geoactive zones and their influence on human health. Razvedka i Okhrana Nedr, No. 7/8, 54–57 (in Russian).
Melnikov, E.K., Rudnik, V.A., Musiychuk, Y.I. and Rymarev, V.I. (1994). Pathogenic influence of active fault zones in Saint Petersburg area. Geoecologia, No. 4, 50–69 (in Russian).
Ministry of Health (1999). Hygienic evaluation of soil in residential areas. Moscow, Russia: Ministry of Health.
Osipov, V.I. (1994). Geological hazard zones in Moscow. Vestnik Rossiiskoi Academii Nauk, 64, 32–45 (in Russian).
Persinger, M.A., Ludwig, H.W. and Ossenkopp, K.-P. (1973). Psychophysiological effects of extremely low frequency electromagnetic fields: a review. Perceptual and Motor Skills, 36, 1131–1159.
Rocard, Y. (1964). Actions of a very weak magnetic gradient: the reflex of the dowser. In M.F. Barnothy (Ed.), Biological effects of magnetic fields, Vol. 1 (pp. 279–286). New York, NY: Plenum Press.
Rudnik, V.A. (2002). Mineral substance as a key factor of geological influence on human and environment. In V.I. Kuzmin (Ed.), Role of mineralogical research in studies of ecological problems (theory, practice, and outlook): Proceedings of the Annual meeting of the Russian mineralogical society, Moscow, Russia, May 28–30, 2002 (pp. 170–173). Moscow, Russia: Fedorovsky All-Russian Research Institute for Mineral Resources Press (in Russian).
Rudnik, V.A. and Melnikov, E.K. (1998). Geological factor of human health. Zhizn i bezopasnost, No. 2–3, 154–192 (in Russian).
Sochevanov, N.N., Stetsenko, V.S. and Chekunov, A.Y. (1984). Application of a biolocation method for ore prospecting and geological mapping. Moscow: USSR: Radio i Svyaz (in Russian).
State Committee of Hydrometeorology (1989). Guide on the control of atmospheric pollution. Moscow, USSR: State Committee of Hydrometeorology (in Russian).
Tchijevsky, A.L. (1929). L’aéroionothérapie des maladies pulmonaires. Recherches expérimentales de l’effet de l’air ionisé sur la tuberculose des poumons, la pneumonie et la bronchite. La Presse Thermale et Climatique, 70, 653–665.
Trifonov, V.G. and Karakhanian, A.S. (2004). Geodynamics and the history of civilization. Moscow, Russia: Nauka (in Russian, with English contents, extended summary, and figure captions).
UNSCEAR (2000). Combined effects of radiation and other agents. In United Nations Scientific Committee on the Effects of Atomic Radiation, Sources and effects of ionizing radiation: UNSCEAR 2000 report to the General Assembly, with scientific annexes, Vol. 2: Effects (pp. 73–175). New York, NY: United Nations.


In: Man and the Geosphere ISBN 978-1-60876-387-0 Editor: Igor V. Florinsky, pp. 185-213 © 2010 Nova Science Publishers, Inc.
Chapter 7
HEALTH OF PEOPLE LIVING IN A SEISMICALLY ACTIVE REGION
Alexander V. Shitov
ABSTRACT
Hundreds of millions of people live in seismically active regions around the globe. They are influenced by active tectonic factors on not only days of strong earthquakes, but every day as well. In this chapter, the author analyzes the influence of the geoenvironment on the health of people, living in a seismically active region, the Altai Republic, at long-, medium-, and short-term temporal scales. Correlation analyses of prevalence rates of various nosologies and a set of geological indices demonstrated that there is a long-term influence of terrestrial γ radiation, intrusions, magnetic anomalies, and active faults on the morbidity of some diseases in the adult population. Medium- and short-term medical reactions of the local population on the 2003 Chuya earthquake are studied in the context of its preparation, meteorological and hydrogeological consequences. At a medium-term scale, analysis of time series of incidence rates of various nosologies in the adult, teenager, and child populations demonstrated that incidence dynamics of the total adult morbidity and some nosologies is marked by a gradual rise in 2000–2001, a sharp spike in 2002–2003, and a gradual decay in 2004–2005. This may testify that the earthquake preparation has begun to influence the health of local people about 2–3 years ahead of the main shock. At a short-term scale, a superimposed epoch analysis of time series of emergency calls demonstrated that there was an increase in calls before the earthquake and during aftershocks.
The author supposes that different seismically derived agents influence human health at different temporal scales. At a medium-term scale, changes of a dynamic stress field results in the increase of fracturing along fault zones leading to the rise of the radon emanation and changes in the hydrogeological situation. At a short-term scale, the earthquake preparation causes atmospheric events triggering geomagnetic fluctuations.
There were differences in both the medium- and short-term dynamics of morbidity concerning different nosologies. This may testify that different systems of the human organism are marked by distinct sensitivities to an earthquake as a stress factor.

Alexander V. Shitov 186
Keywords: seismicity; magnetic field; fault; morbidity; emergency calls; time series.
7.1. INTRODUCTION Geological environment controls ecological conditions in many respects. Regional
geological processes and structures are key factors for the formation of a landscape, soil cover, and local climate, which, in turn, determine a biological diversity and natural originality of territory. Geochemical and geophysical properties of rocks determine a biotope environment (Trofimov, 2000). Humans, as a part of biota, can also be affected by geological and geophysical features, conditions, and phenomena. Among these are tectonic activity, faults as pathways for fluid migration and gas emanation, contacts between geological bodies, high-gradient anomalies of the geomagnetic field, geochemical anomalies associated with ore deposits, etc.
Hundreds of millions of people live in seismically active regions around the globe (GSHAP Team, 1999). There are intensive variations of geomagnetic, geoelectric, and gravity fields, pronounced geochemical anomalies, enhanced emanation of deep gases, and maximal gradients of tectonic stress fields in tectonically active regions (Geophysics Study Committee, 1986). Impacts of geochemical anomalies, gas emanations, and the geomagnetic field on human health are discussed in Sections 3.3 and 4.2. Local population is influenced by these factors of active tectonics on not only days of strong earthquakes, but every day as well.
However, previous studies of relations between people’s health and seismic activity have concerned either direct health consequences of earthquakes (Umidova et al., 1969; Petrova and Kamilov, 1970; Dobson et al., 1991; Solomon et al., 1997; Takakura et al., 1997; Lai et al., 2000; Matsuoka et al., 2000; Parati et al., 2001; Watson et al., 2002; Kario et al., 2003; Kamoi et al. 2006a, 2006b) or medium-term health consequences of seismic shocks (Armenian et al., 1998; Inoue-Sakurai et al., 2000; Ogawa et al., 2000; Şalcioğlu et al., 2003; Sokejima et al., 2004; Kamoi et al. 2006a, 2006b; Chen et al., 2007). In both cases, post-traumatic stress disorder (Yehuda, 2002) is commonly assumed as a trigger for a temporal increase in morbidity of mental, cardiovascular, gastroenteric, and endocrine diseases observed after earthquakes in adjacent areas. Exceptions are deaths and injuries by building collapse, an increase of respiratory diseases due to dust effect, and an increase of infectious diseases due to infrastructure damage. Long-term medical effects of active tectonics have received only occasional attention in the context of emission of gases (i.e., H2S and CO2) within relatively small geothermic and volcanic areas (Bates et al., 1998; Annunziatellis et al., 2003; Carapezza et al., 2003; Durand and Wilson, 2006) (Section 3.3.11). Occurrence of some endemic diseases is also sometimes discussed considering geodynamical factors (Section 3.2.2): for example, seismically triggered landslides increase the number of fungi Coccidioides immitis in the atmospheric air that leads to the increase of the incidence rate of coccidioidomycosis (Abrahams, 2002).
People’s health in seismically active regions is not usually analyzed in contexts of (a) a permanent or long-term influence of a wide range of active geological factors, and (b) effects of an earthquake preparation. In particular, it would be reasonable to discuss medium-term health consequences of an earthquake together with medium-term effects of its preparation. In this chapter, the author analyzes the influence of geoenvironment on the health of people,

Health of People Living in a Seismically Active Region 187
living in a seismically active region, the Altai Republic, at long-, medium-, and short-term temporal scales. In particular, medium- and short-term medical reactions of the local population on the 2003 Chuya earthquake are studied in the context of its preparation and abiotic responses, such as meteorological and hydrogeological cascade processes.
7.2. STUDY AREA The Altai Republic is a federal subject (administrative unit) of the Russian Federation
located in the south of Western Siberia, bordering Mongolia, Kazakhstan, and China (Figure 7.1a). The study area includes a complex system of mountain ridges, deep river valleys, and wide intermountain depressions of the Mountain Altai, the Hercynian portion of the Altai mountain country. Elevations range from 230 m up to 4,506 m (Mount Belukha) above sea level.
Figure 7.1. The Altai Republic: (a) geographic position; (b) administrative districts and rural settlement population.

Alexander V. Shitov 188
The study area is located at the junction of taiga, steppe, and semi-desert landscape zones. Forests cover about 25% of the territory. About one third of the territory is located within the permafrost zone. The area is marked by an extreme continental climate (especially in high mountains) with cold prolonged winters and chilly dry summers. Depending on location, mean January temperature ranges from -12° to -32° С, mean July temperature ranges from 9° to 18° С. Mean annual precipitation ranges from 100 mm in intermountain depressions to 1,000 mm on mountain slopes opened to wet winds (Modina, 1997).
7.2.1. Administrative Division and Population The area of the Altai Republic is 92,600 km2. It is divided into ten rural administrative
districts (Figure 7.1b and Table 7.1). The capital is the city of Gorno-Altaysk, the only urban area of the Altai Republic (Figure 7.1b).
In 2007, the population of the Altai Republic was about 207,100 with a population density of about 2.2 people per km2. Urban and rural populations comprise 26.4% and 73.6%, respectively. Male and female populations comprise 47.6% and 52.4%, respectively (Minaev, 2007). Due to complex topography, the rural population is generally distributed along main valleys (Kochergina, 2002) (Figure 7.1b). The population of Gorno-Altaysk is about 54,000.
The main occupation of the local population is agriculture, such as forage and cereal crop growing, stockbreeding (sheep, goats, cattle, horses, yaks, elks, deers, and camels), and apiculture. Crop growing dominates in the Ust-Koksa, Maima, Shebalino, Chemal, and Ust-Kan Districts. Stockbreeding, principally on seasonal mountain pastures, is the only occupation of local inhabitants in the Kosh-Agach and Ulagan Districts.
Table 7.1. Population and geological characteristics of the Altai Republic by rural
districts
District
Are
a, k
m2
Population size (in 2002), persons
Intru
sion
s, km
2
Mag
netic
ano
mal
ies,
km2
Terr
estri
al γ
radi
atio
n an
omal
ies,
km2
Ore
dep
osits
, pe
r km
2
Faul
t len
gth,
km
SLO
occ
urre
nce,
deg
rees
Adu
lt
Teen
ager
Chi
ld
Maima 1,368 18,053 1,398 4,549 64 130 331 0.5 805 0 Choya 4,296 6,782 580 2,248 3,541 2,500 2,500 6 2,453 0 Turochak 10,873 9,891 791 3,218 4,842 1,851 1,127 5 7,735 2 Shebalino 3,507 10,161 894 3,665 230 240 441 2 3,151 2 Ongudai 12,216 10,894 1,056 3,950 1,698 1,800 385 4 8,164 6 Ulagan 18,610 7,468 921 3,911 2,614 3,805 1,450 3 9,394 1 Kosh-Agach 20,380 9,980 1,197 5,923 2,527 2,579 3,037 8 13,114 3 Ust-Kan 6,350 10,632 1,126 4,642 1,243 954 958 4 4,933 3 Ust-Koksa 12,843 11,966 1,213 4,521 1,654 688 519 2 6,675 8 Chemal 3,407 7,005 602 2,205 420 670 851 0 2,232 1
Health of People Living in a Seismically Active Region 189
A minor part of the population is involved in the lumber industry, hunting, commerce, education, management, and recreation (mountain tourism).
The Altai Republic is ideal to study an impact of natural environmental factors on human health, as there is no industrial pollution there.
7.2.2. Geological and Geophysical Characteristics Tectonic development of the Mountain Altai was connected with geodynamic evolution
of the Paleo-Asian ocean during Baikalian, Caledonian, Hercynian, and Alpine cycles of tectogenesis. The modern shape of the Mountain Altai was formed during the Paleogene Period. Neotectonic movements began after removal of the glacial loading (Nekhoroshev, 1958; Goverdovsky, 1991; Dobretsov et al., 1995; Berzin and Kungurtsev, 1996).
The Mountain Altai is in the western part of the Altai–Sayan folding area. It consists of a mosaic of blocks, geosyncline folding systems of different ages. The area is characterized by a complex geological setting, intensive faulting, active neotectonics, and a diversity of ore deposits. Approximately north- and northeast-striking faults dominate (Gusev, 2004; Novikov, 2004). The largest are the Teletskoe, Kurai, and Shapshal thrusts, and the Charysh and Terekta thrust-strike-slip faults (Figure 7.2a).
There were several activization of intrusive magmatism (Goverdovsky, 1991). Devonian diorite-granodiorites and potassium granites are widely distributed in the western part of the Mountain Altai (Figure 7.2c). There are also less common Cambrian basic-ultrabasic intrusions in the north and Ordovician diorites and granodiorites in the east and west of the study area. Granitoid intrusions are marked by an increased rate of terrestrial γ radiation (Kats, 1998) (Figure 7.2d).
Ore deposits were mostly formed under active geodynamical regimes of the Hercynian and Alpine cycles (Goverdovsky, 1991). The Hercynian metallogenic epoch is represented by iron, cobalt, bismuth, gold, and wollastonite ore deposits. The Alpine metallogenic epoch is represented by mercury, silver, molybdenum, tungsten, lithium, tantalum, copper, and rare earth element mineralization and ore deposits (Nekhoroshev, 1958) (Figure 7.2c).
Intensive positive magnetic anomalies are usually associated with basic-ultrabasic intrusions as well as large magnetite and pirrotine ore deposits (Figure 7.2b). Weak positive magnetic anomalies are connected with granite massives and metamorphic rocks. Weak negative magnetic anomalies are related to non-magnetic sedimentary rocks (Zagainov, 1974).
7.2.3. Self-Luminous Objects There is a poorly investigated phenomenon: activization of geophysical fields in zones of
faults and rock heterogeneity caused by intensive pulse ionospheric events and broadband, especially low frequency, electromagnetic radiations (Yasui, 1973). An integrated indicator of the local activization of geophysical fields is an occurrence of natural self-luminous objects (SLO – Dmitriev, 1998).
SLO are marked by high variability in terms of generating conditions and visual appearance (Vorobiev, 1974; Persinger, 1976, 1980, 1984; Persinger and Derr, 1985, 1990;
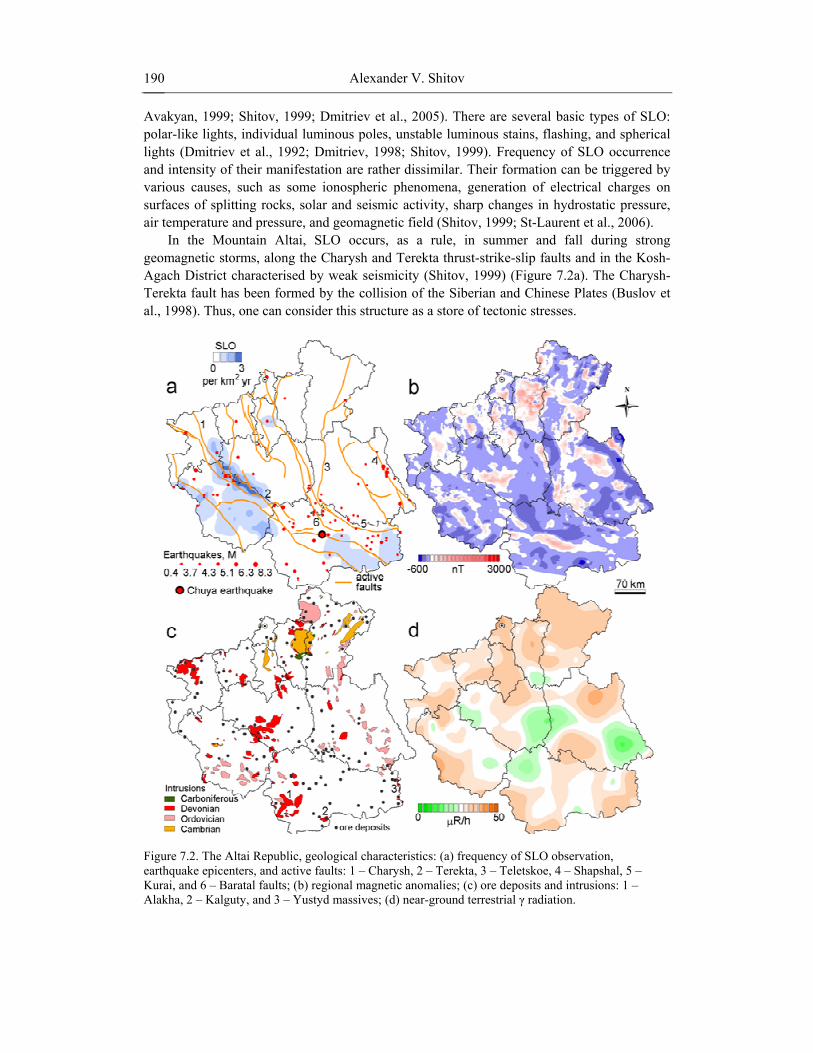
Alexander V. Shitov 190
Avakyan, 1999; Shitov, 1999; Dmitriev et al., 2005). There are several basic types of SLO: polar-like lights, individual luminous poles, unstable luminous stains, flashing, and spherical lights (Dmitriev et al., 1992; Dmitriev, 1998; Shitov, 1999). Frequency of SLO occurrence and intensity of their manifestation are rather dissimilar. Their formation can be triggered by various causes, such as some ionospheric phenomena, generation of electrical charges on surfaces of splitting rocks, solar and seismic activity, sharp changes in hydrostatic pressure, air temperature and pressure, and geomagnetic field (Shitov, 1999; St-Laurent et al., 2006).
In the Mountain Altai, SLO occurs, as a rule, in summer and fall during strong geomagnetic storms, along the Charysh and Terekta thrust-strike-slip faults and in the Kosh-Agach District characterised by weak seismicity (Shitov, 1999) (Figure 7.2a). The Charysh-Terekta fault has been formed by the collision of the Siberian and Chinese Plates (Buslov et al., 1998). Thus, one can consider this structure as a store of tectonic stresses.
Figure 7.2. The Altai Republic, geological characteristics: (a) frequency of SLO observation, earthquake epicenters, and active faults: 1 – Charysh, 2 – Terekta, 3 – Teletskoe, 4 – Shapshal, 5 – Kurai, and 6 – Baratal faults; (b) regional magnetic anomalies; (c) ore deposits and intrusions: 1 – Alakha, 2 – Kalguty, and 3 – Yustyd massives; (d) near-ground terrestrial γ radiation.
Health of People Living in a Seismically Active Region 191
These stresses are released through minor seismic events (М < 3) accompanied by fluctuations of the electromagnetic field. More intensive seismicity (М > 3) is observed in the Kosh-Agach District, another area of SLO observation. There are large magnetic anomalies there connected with the intensive rise of Mount Belukha (Figure 7.2b).
7.2.4. Groundwater The study area is located within a single complex basin composed of unconfined and
pressure subbasins. There are two structural features: the Altai–Sayan folding area of vein groundwater and intermountain basins of stratum groundwater (Kats and Robertus, 2004). Groundwater bodies are confined to aquifer zones and complexes with fracture, vein fracture, karst fracture, and karst water accumulations in terrigenous, carbonate, sedimentary volcanic, volcanic, metamorphic, and intrusive rocks having variable composition and a wide range of ages: from Mesozoic to Proterozoic. Groundwater is confined to Quaternary, Neogene, and Paleogene sediments in intermountain artesian basins. The complex geological, hydrogeological, and tectonic setting of the territory, as well as numerous settlements has caused the development of over 70 different types of water bodies (aquifers, aquifer complexes, and aquifer zones). Over 50% of the groundwater is supplied to the centralized water supply from the Vendian–Cambrian and Cambrian dolomite–limestone aquifer zones and the hydraulically connected Quaternary strata. Individual water supplies in suburban areas originate from the Quaternary sediments on river terraces above flood plains. The hydrochemical composition of groundwater from the Paleozoic rocks is largely calcium bicarbonate, sometimes with a mixed cation composition. The water is fresh (the total dissolved solids (TDS) range from 0.02 to 1.2 g/L). Groundwater in artesian basins also exhibits calcium bicarbonate to sulfate (chloride) sodium calcium–magnesium bicarbonate composition (TDS range from 0.2 to 1.44 g/L – Shitov et al., 2008).
7.2.5. Seismicity and Its Impact on Abiotic Events
7.2.5.1. The 2003 Chuya Earthquake The Mountain Altai is an active seismic area (Zhalkovsky and Muchnaya, 1979;
Kondorskaya and Shebalin, 1982; Rogozhin and Platonova, 2002; Geophysical Survey, 2007) (Figure 7.2a). Increased seismicity is usually observed nearby large depressions there. However, total seismic energy was less than 0.3 TJ over many years. There were three years marked by an increased seismic activity: the total seismic energy was estimated as 1, 1.5, and 2 TJ in 1985, 1996, and 2000, respectively (Emanov et al., 2003).
An earthquake, with a magnitude of 7.5, took place on September 27, 2003 at 11:33:23.3 GMT. Its epicenter (50.04° N, 88.07° E) was located in the Kosh-Agach District, 260 km southeastward of Gorno-Altaysk, in the Chuya River valley (Figure 7.2a). The depth of the hypocenter was 18 km. There were destructions in the Kosh-Agach and Ulagan Districts of the Altai Republic. This event received the name Chuya earthquake. It was the strongest event in the Altai–Sayan region, at least, for the last 40 years (the period of instrumental observations). There were many aftershocks. The strongest ones took place on September 27,

Alexander V. Shitov 192
2003 at 18:52 GMT (М = 6.4) and October 1, 2003 at 01:03:28 GMT (М = 7.0) (Geodakov et al., 2003; Gol’din et al., 2004; Kuznetsov and Khomutov, 2004).
The earthquake caused serious destructions in the village of Beltir, Kosh-Agach District, the closest settlement to the epicenter as well as some minor damages, such as cracks on walls, in other settlement of the Mountain Altai. There were no victims.
The foreshock period (1996–2003) of the earthquake and its aftershock period were singled out in the development of seismic events in Altai. Seismic processes have been developing since 2004 but without large aftershock events. Activization of seismic processes in the Mountain Altai effected the chemical composition of groundwater and peculiarities of meteorological processes that, in their turn, can influence human health (Shitov et al., 2008).
7.2.5.2. Groundwater
Natural hydrochemical anomalies are controlled by the geological situation, the lithogeochemical specialization of rocks, and their lithological, mineralogical, and physicochemical properties. A seismic event may lead to formation of new hydrochemical anomalies and can cause changes in the chemical composition of groundwater (Osika, 1981; King, 1986; King et al., 2006).
During the foreshock period of the 2003 Chuya earthquake, the hydrochemical composition of groundwater changed essentially within the region (Kats and Robertus, 2004; Kats, 2005; Shitov et al., 2006, 2008). The groundwater was generally “diluted” compared to the background concentration. The concentration of nearly all minor components decreased, except for Ca2+ and Mg2+. The pH value increased, while the NH4
+ concentration and TDS decreased. Immediately after the earthquake, groundwater was marked by considerable turbidity: the total suspended solids content ranged from 4.3 to 72 mg/L.
There were pronounced changes in the ion composition of groundwater during the aftershock period and up to the late 2004. The hydrochemical water composition became more complex; its TDS and alkalinity increased. In particular, SO4
2– and Cl– concentrations increased from 8.5 up to 86.4 mg/L and from 4.9 up to 25.5 mg/L, respectively. Average concentrations comprised 80 mg/L for Ca2+, 12 mg/L for Mg2+, 48.99 mg/L for Na+ and K+, 366 mg/L for HCO3
– , 29.45 mg/L for SO42–, and 17.75 mg/L for Cl¯. Concentrations of Al,
Fe, B, Mn, Li, SiO2, F, As, and Sb increased essentially. At the same time, the concentration of nitrogenous compounds decreased by factors 2–10.
The instability in the hydrochemical composition of the groundwater continued in 2005. The ion composition sensitively responded to low-amplitude seismic events. The pH value and F concentration were the most vivid indicators of seismic activity of low amplitude. The pH increase was not connected with particular types of water bodies. pH value seems to depend on hydrological peculiarities and on the aftershock intensity. The number of water bodies with pH > 9 increased considerably after the earthquake. In 2006, this figure was 12%, that is, it decreased three times as compared to that in 2005, but remained four times higher than its value in the foreshock period. The gradual increase of the F concentration was observed during aftershocks: it rose from 0.17 to 0.34 mg/L from 2002 to 2006 (Kats, 2005).
The dynamics of trace element concentration in the groundwater was obviously connected with hydrogeological conditions in the zones of water intake and to the seismic intensity. Hg is used as a hydrochemical indicator of the region as this is a very mobile element rapidly reacting to various processes in the geospheres (Roslyakov and Dmitriev, 1992). Thus, the dynamics of Hg concentration in the groundwater was more consistent than

Health of People Living in a Seismically Active Region 193
that of Ai, Zn, Li, Mn, Cu, Hg, Sb, and As concentrations. A sharp abnormal burst of the Hg concentration was recorded in 2002, before the main earthquake shock, and then a rapid reduction of that was recorded (Figure 7.3a) (Shitov et al., 2008).
Temperature anomalies in the groundwater were recorded in the Gorno-Altaysk area during aftershocks. In February 2004, there were two shocks with magnitudes of 3.4 and 3.1. In some individual water pumps, water temperature increased from 17° C on June 11, 2004 to 48° C on October 1, 2004 (Shitov et al., 2008).
Figure 7.3. Changes in hydrochemical and meteorological parameters connected with the Chuya earthquake: (a) mercury concentration in the groundwater: 1 – supply well, Middle–Lower Cambrian beds, 2 – spring water, Vendian–Lower Cambrian sediments, 3 – spring water, Upper Pleistocene beds; (b) daily trends of the air temperature; (c) daily trends of the atmospheric pressure; (d) dynamics of thunderstorm activity on days before and after the earthquake.
7.2.5.3. Meteorological Phenomena
Heavy fog in the epicentral region and noises near Lake Ogyrak-Kel (7 km from the earthquake epicenter), presumably associated with strong gas emissions, were recorded on the day of the earthquake. A sudden weather change preceded the earthquake. Heavy fog and low cloudiness occurred for the entire day. Dark clouds blocked the sky, fog covered the ground, and snow seemed to fall (Shitov et al., 2004).
Daily trends of air temperature (Figure 7.3b) and atmospheric pressure (Figure 7.3c) were recorded at the weather station in Gorno-Altaysk (Shitov et al., 2008). Daily trends of air temperature and atmospheric pressure were disturbed only on September 22 and 23 during the more than two-week period of observation. This can be important in terms of a considerable modification of background meteorological characteristics.
To reveal mechanisms of the influence of seismic processes on meteorological ones, Dmitriev et al. (2006) analyzed the thunderstorm activity in the Mountain Altai before and after the 2003 Chuya earthquake using the superimposed epoch analysis (Singh and
Alexander V. Shitov 194
Badruddin, 2006). The reduction of thunderstorm activity before the earthquake and its sudden increase after the earthquake was detected (Figure 7.3d). This effect can be explained by an energy exchange between lithosphere and atmosphere by the following model (Shitov et al., 2008).
There is accumulation of elastic stresses during an earthquake preparation process (Sadovskiy et al., 1979; Vorobiev et al., 1979). Diffusive rupture processes cause a stress relaxation and, from a certain moment, it prevails over stress destruction that is indicated by the abnormal behavior of geophysical fields in the epicentral zone. As a rule, the epicentral zone coincides with the maximum of electromagnetic emission (Gokhberg et al., 1995). In some cases, the possibility exists of stress transfer and re-emission of electromagnetic emission along tectonically joined zones over a considerable distance (Sytinskii, 1997).
The voltage of the electric field reaches a value sufficient for micro breakings to appear in the atmosphere during the final phase of an earthquake preparation. The presence of an ionized zone above an epicenter can change the spreading of atmospherics above a seismically active region (Fatkulin et al., 1987). Thus, there are transfers of a part of the earthquake preparation energy from epicentral zones to the ionosphere (Ondoh, 2000; Silina et al., 2001). Energy emission from the Earth’ interior occurs via zones of increased permeability the Earth’s crust, i.e., faults and lineaments. The energy of high-frequency electromagnetic oscillations dissipates in large faults, making an electromagnetic contribution to the regional endogenic heat flow, while the energy of low-frequency waves dissipates into the atmosphere through the same waveguide, where it is consumed for atmospheric events. Gas release (e.g., Hg, 222Rn, and He), excess charge density, and SLO are usually observed in such zones (Dmitriev, 1998; Shitov, 1999).
This model explains the decrease in thunderstorm activity during earthquakes: a local atmospheric electric field discharges, the atmosphere composition and air temperature are abruptly changed, and even local thunderstorm fronts are formed. Transfers of the earthquake preparation energy from epicentral zones to the ionosphere may probably create “ionizing corridors”, which stimulate thunderstorm discharges. The strongest thunderstorm activity on the day of the earthquake was observed near active faults (Dmitriev et al., 2006). An analysis of forest fires caused by thunderstorms in the Mountain Altai in 2003 showed that the affected places were located near active faults in most cases (Shitov et al., 2008). An analysis of thunderstorm fires in 2000–2002 showed a different spatial distribution (Shitov, 2006b).
7.3. MATERIALS AND METHODS The author used a set of geological and geophysical data included the following maps,
scale 1 : 500,000, from a geoecological system of the Altai Republic (Shitov and Kats, 2000): 1. Geological maps representing faults and intrusions (Protchuk, 1977; Gusev, 2004)
(Figure 7.2a and c). 2. Map of ore deposits (Protchuk, 1977; Gusev, 2004) (Figure 7.2c). 3. Map of SLO observations (Dmitriev, 1998; Shitov, 1999) (Figure 7.2a). 4. Map of the near-ground rate of terrestrial γ radiation (Kats, 1998) (Figure 7.2d). 5. Map of the regional magnetic anomalies (Zagainov, 1974) (Figure 7.2b).

Health of People Living in a Seismically Active Region 195
To describe quantitatively geological conditions of administrative districts of the Altai Republic in terms of geological and geophysical parameters under study (viz., faults, intrusions, ore deposits, magnetic anomalies, terrestrial γ radiation, and SLO), two procedures were carried out (Shitov, 1996, 2006a). First, for each district, the author estimated areas of intrusions, magnetic anomalies with intensity >200 nT, and terrestrial γ radiation zones with rate >25 μR/h, as well as total length of faults, number of ore deposits, and SLO occurrence frequency measured in a conventional scale including 8 degrees (Table 7.1). Thus, each district was characterized by six values. This step was done with ArcView GIS 3.1 (© 1992–1998, Environmental Systems Research Institute, Inc.).
Second, to estimate a number of events when humans may visit an area of the intrusion, magnetic and γ radiation anomalies, fault zone, and ore deposit, as well as observe an SLO, the following expression was used:
Gd = (gd / Ad) · Pd (7.1)
where Gd is a number of such events for a particular phenomenon for a particular district, gd is a geological or geophysical characteristic of the district (e.g., intrusion area, fault length, etc.), Ad is an area of the district, and Pd is population size (Table 7.1). Gd was considered as a “geological index” characterizing geological or geophysical phenomena from the standpoint of their influence on the health of people.
Two sets of medical statistical data were analyzed in this study: 1. Annual reports on prevalence and incidence rates in child (0–14 years), teenager (15–
17 years), and adult (18+ years) populations (State Committee of Statistics, 1999). The report covers a list of diseases generally correlated with the International Classification of Diseases (WHO, 2004). The author used a set of the annual reports for each administrative district of the Altai Republic for nine years (1999–2007), i.e., 90 annual reports. To retain homogeneity of these data related to the rural population, reports for the urban population of Gorno-Altaysk were excluded from consideration. Table 7.2 presents data on prevalence rates for the year 2002.
2. Call logs of the emergency medical service (Ministry of Health, 1980) of Gorno-Altaysk. A call log includes brief information on a sick person, such as name, address, age, and preliminary diagnosis concerning the call (in Russia, emergency medical service is operated with direct “hands-on” physician leadership). The author used a set of logs for four years, 2000–2003.
The research focus was on the influence of geoenvironment on the health of people at
three temporal scales, that is, long-, medium-, and short-term scales (over duration of several decades, years, and weeks, respectively). The author presumed that a long-term health effect of geological variables may be reflected by a particular prevalence rate, as this is the total number of cases of the disease within a particular region, including long-standing, chronic, and acute cases. A medium-term effects of geological variables (including those associated with earthquake preparation processes) may be reflected by a particular incidence rate, as this is the total number of new cases of the disease. A short-term effect of the geological situation (e.g., an earthquake) may be manifested by emergency calls.

Alexander V. Shitov 196
Table 7.2. Prevalence rates (per 1,000 adult population) in the year 2002
Nosology District
Tota
l mor
bidi
ty
Cer
tain
infe
ctio
us a
nd p
aras
itic
dise
ases
Neo
plas
ms
Dis
ease
s of t
he b
lood
and
blo
od-
form
ing
orga
ns
Endo
crin
e, n
utrit
iona
l and
met
abol
ic
dise
ases
Men
tal a
nd b
ehav
iora
l dis
orde
rs
Dis
ease
s of t
he n
ervo
us sy
stem
Dis
ease
s of t
he re
spira
tory
syst
em
Dis
ease
s of t
he sk
in a
nd su
bcut
aneo
us
tissu
e
Dis
ease
s of t
he m
uscu
losk
elet
al
syst
em a
nd c
onne
ctiv
e tis
sue
Dis
ease
s of t
he g
enito
urin
ary
syst
em
Maima 1,336.6 38.8 37.3 1.6 43.8 75.2 38.4 333.2 47 91.4 199.7 Choya 1,906.1 22.7 22.3 56.8 24.2 70.6 154.4 551.2 63.1 131.8 226.2 Turochak 1,298.3 51.9 15.1 21.9 77 76.5 45.5 167.9 54.5 144 129.1 Shebalino 1,134.8 8.7 19.8 2.3 23.9 56.2 31.1 242.8 55.1 60.5 74.1 Ongudai 1,087.8 63.9 17.9 12.1 16.3 80.5 19.7 138.5 43.1 70.6 151.6 Ulagan 1,567.2 41.6 14.9 20.5 22.4 38.3 52.2 324.6 71.5 117.7 167.5 Kosh-Agach 1,378.5 45.1 14.8 13.6 19.9 53.4 70.7 274.2 108.8 125.3 101.2 Ust-Kan 1,503.4 44.7 15.8 8.9 56 50.1 27.8 280.2 63.8 93.5 123.3 Ust-Koksa 1,068.9 31.3 11.3 10.9 33.5 72.7 92.2 144.9 35.5 79.6 126.4 Chemal 812.8 34.1 9.4 5.7 11.7 83.4 15.4 104.1 87.2 17.4 73.9
Three types of statistical analysis were applied to three types of medical statistical data: 1. To reveal long-term relationships between the geological situation (that is,
permanently acting geological and geophysical phenomena) and the health of people, the author performed a linear correlation analysis between geological indices and annual prevalence rates in the adult population for nine years, 1999–2007. A sample size n = 10 (districts). Data were processed with Statistica 6 (© 1984–2001, Statsoft, Inc.).
All correlation coefficients < 0.56 were insignificant since a rather small sample was used (Fisher and Yates, 1963). Notice that it was impossible to compare statistically significant correlation coefficients obtained for the same nosology in different years: the use of the small sample size made these coefficients statistically poorly distinguishable. Comparing correlation coefficients with Fisher’s z-transformation, two correlation coefficients are distinguishable if t-value ≥ 1.96 for n = 10, p = 0.05. For example, there is no statistical difference between the following pairs of correlation coefficients: 0.98 and 0.90 (t = 1.54), or 0.93 and 0.59 (t = 1.84). At the same time, there is statistical difference between the following pairs of correlation coefficients: 0.99 and 0.90 (t = 1.20), or 0.95 and 0.65 (t = 1.98).
Thus, one may make a conclusion about a retaining or extinction of a statistical relation during nine years, rather than about strengthening or decaying of that. The administrative division of the Altai Republic (Figure 7.1b) and official rules for preparation of annual reports on prevalence and incidence rates (one report per a district) prevented us from increasing the sample size within the Altai Republic. This problem might be solved by analyzing the morbidity of the entire Altai–Sayan folding area including other administrative units of Russia, Kazakhstan, Mongolia, and China.

Health of People Living in a Seismically Active Region 197
2. To detect a possible medium-term reaction of the human organism on the preparation processes of the 2003 Chuya earthquake, the author analyzed a temporal dynamics of incidence rates in adult, teenager, and child populations of the Kosh-Agach District (Figure 7.1b), which includes the earthquake epicenter (Figure 7.2a). Time series of annual incidence rates were used for the period 1999–2007, i.e., time series length was 9 for each incidence rate. It is obvious that methods of time series analysis cannot be correctly applied to such short series. However, results demonstrated that a visual inspection of the time series is sufficient to detect regularities in their behavior (Section 7.4.2).
3. To find a possible short-term reaction of the human organism on the 2003 Chuya earthquake and its aftershocks, the author applied a superimposed epoch analysis (Singh and Badruddin, 2006) to the time series of emergency calls (total daily number of emergency calls and daily numbers of calls concerning particular diseases). 20 days before and 13 days after the earthquake were analyzed, thus time series length was 34. The analysis was carried out with Microsoft Excel 2000 (© 1985–1999, Microsoft Corporation).
7.4. RESULTS AND DISCUSSION
7.4.1. Long-Term Influence of Geological Factors on Morbidity Correlation coefficients between a particular geological index and a particular prevalence
rate were slightly different in different years because there were differences in prevalence rates in distinct years. Correlation coefficients for the year 2002 (Table 7.3) can be considered as typical. These coefficients are representative to describe the long-term influence of geological factors on morbidity because they relate to the situation in 2002, a year ahead the 2003 Chuya earthquake, that is, they do not express a possible influence of the earthquake.
There are positive correlations between the spatial distribution of intrusions and the prevalence rates of diseases of blood, nervous, and musculoskeletal systems, and the total morbidity in the adult population (Table 7.3). However, this relationship depends on the chemical content of a particular intrusion. Graphic representation of the intrusion index and prevalence rates per each district (Figure 7.4а) demonstrate that subalkaline and alkaline granite intrusions (the Yustyd, Alakha, and Kalguty massives – Figure 7.2c) (Amshinsky, 1983) are marked by the greatest effect on the health of people. In the Ust-Kan and Ulagan Districts, basic intrusions do not influence diseases of blood and nervous systems. There is also a deviation from the relationships “diseases of musculoskeletal system – intrusion” in the Kosh-Agach and Ulagan Districts. The severe climatic conditions in this area may serve as an additional factor for the local increase of the prevalence rate of this nosology. The impact of intrusions on human health may be connected with the increased γ radiation and magnetic anomalies observed there (Section 7.2.2).
Fluctuations of magnetic field influence biological systems (Kirschvink et al., 1985; Binhi, 2002) (Section 4.2). Thus, there are positive correlations between the spatial distribution of magnetic anomalies and the prevalence rates of blood diseases, diseases of nervous, respiratory, genitourinary systems, and the total morbidity in the adult population (Table 7.3; Figure 7.4b and c).
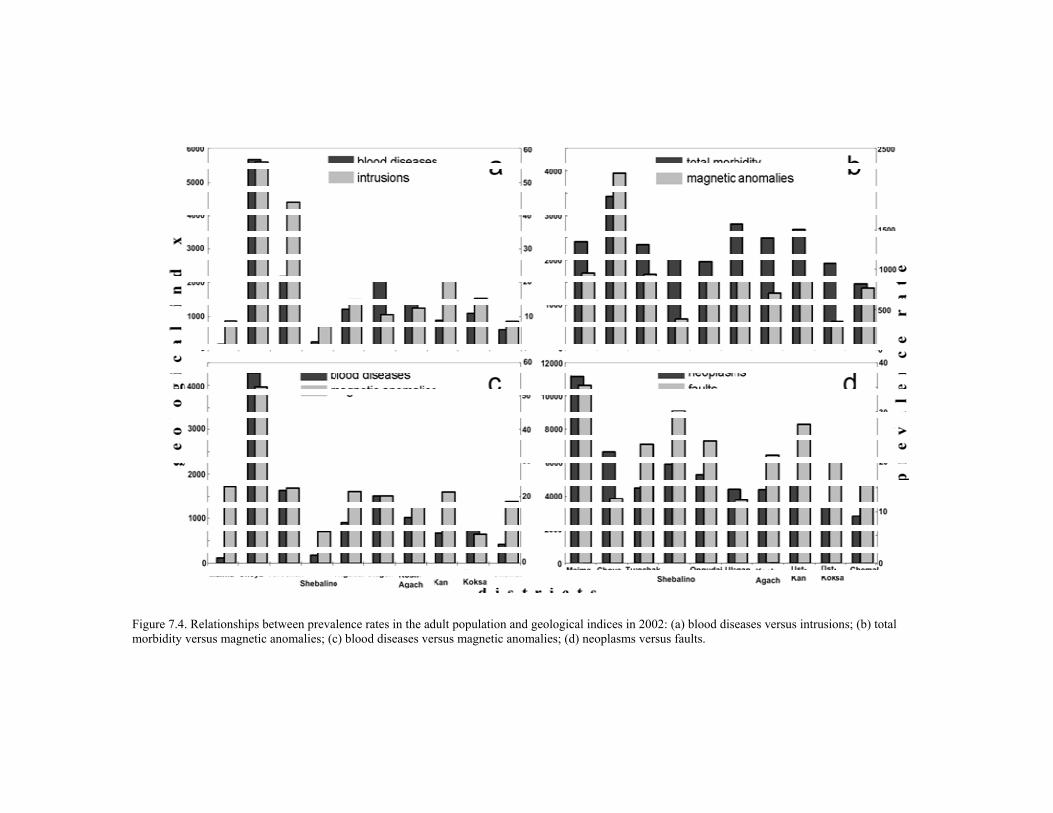
Figure 7.4. Relationships between prevalence rates in the adult population and geological indices in 2002: (a) blood diseases versus intrusions; (b) total morbidity versus magnetic anomalies; (с) blood diseases versus magnetic anomalies; (d) neoplasms versus faults.

Figure 7.5. Medium-term dynamics of incidence rates (per 1,000 population) in the Kosh-Agach District: (a) total adult morbidity; (b) and (c) adult morbidity: 1 – diseases of the musculoskeletal system and connective tissue, 2 – certain infectious and parasitic diseases, 3 – diseases of the skin and subcutaneous tissue, 4 – diseases of the blood and blood-forming organs, 5 – hypertensive diseases, 6 – gastritis, 7 – cerebrovascular diseases, 8 – glomerular, renal tubulo-interstitial diseases, and other diseases of kidney and ureter; (d) teenager morbidity: 1 – diseases of the skin and subcutaneous tissue, 2 – diseases of gallbladder and biliary tract, 3 – diseases of the genitourinary system; (e) and (f) child morbidity: 1 – diseases of the skin and subcutaneous tissue, 2 – diseases of the circulatory system, 3 – diseases of gallbladder and biliary tract, 4 – endocrine, nutritional and metabolic diseases, 5 – diseases of the musculoskeletal system and connective tissue, 6 – congenital malformations, deformations, and chromosomal abnormalities.

Alexander V. Shitov 200
Table 7.3. Correlation coefficients between prevalence rates in the adult population and geological indices for the year 2002
Nosology Geological index
Tota
l mor
bidi
ty
Neo
plas
ms
Dis
ease
s of t
he b
lood
and
blo
od-
form
ing
orga
ns
Dis
ease
s of t
he n
ervo
us sy
stem
Dis
ease
s of t
he re
spira
tory
syst
em
Dis
ease
s of t
he m
uscu
losk
elet
al sy
stem
an
d co
nnec
tive
tissu
e
Dis
ease
s of t
he g
enito
urin
ary
syst
em
Intrusions 0.61 – 0.87 0.66 – 0.63 – Magnetic anomalies 0.74 – 0.87 0.64 0.78 – 0.75 Ore deposits 0.68 0.63 – – 0.74 – – Faults – 0.60 -0.63 – – – – Terrestrial γ radiation anomalies 0.74 – 0.96 0.85 0.78 – 0.60
n = 10; bold are statistically significant correlations with p ≤ 0.05; others are those with 0.05 < p ≤ 0.1; dashes are statistically non-significant correlations. Fault zones, being pathways for fluid migration and gas emanation, can influence human
health (Melnikov et al., 1994) (Chapter 6). Therefore, there are expected correlations between the fault density and the prevalence rates of blood diseases and neoplasms in the adult population (Table 7.3). Dissimilar behavior of the fault index and the neoplasm prevalence rate (Figure 7.4d) may be connected with a thickness variability of the sedimentary cover, which can block fluid migration and gas emanation.
It is known that some natural geochemical anomalies control local permanent increase of prevalence rates of various diseases (Section 3.3). Abnormal contents of chemical elements in soil are often related to ore deposits. This is a basement for geochemical methods of exploration (Glazovskaya et al., 1961). Since the main occupation of the local rural population is the cattle breeding on seasonal mountain pastures, there is a high probability that large number of persons visit areas marked by raised or abnormal mineralization. Indeed, there were correlations between the ore deposit density and the prevalence rates of neoplasms, diseases of the respiratory system, and the total morbidity in the adult population (Table 7.3).
It is known that observation of SLO may lead to temporal dysfunctions, acute and chronic diseases, and even death depending on the observation time, distance between an observer and SLO, and its energetic characteristics (Persinger, 1983, 1988). These effects are probably connected with the pathogenic influence of electromagnetic fields of SLO. However, there are no significant correlations between SLO index and the prevalence rates of the local population. Perhaps, this is connected with episodic closed contacts of rather limited peoples with SLO. Health consequences of these contacts are statistically minor; they cannot change general trends of prevalence rates.

Health of People Living in a Seismically Active Region 201
It is known that low-dose γ-ray exposure may affect human health (UNSCEAR, 2001, 2008). Thus, as expected, the highest and most stable relationships were found for the pair “prevalence rates – terrestrial γ radiation index” (Table 7.3). There are correlations between the spatial distribution of terrestrial radiation anomalies and the prevalence rates of blood diseases, diseases of the nervous, respiratory, and genitourinary systems, as well as the total morbidity in the adult population. There was no correlation with the prevalence rate of neoplasms. This is in agreement with results of epidemiological studies in other regions with an enhanced terrestrial radiation (Nambi and Soman, 1987). This may be attributed to the selective manifestation of the radiation hormesis (Section 2.4.1).
Blood diseases are known indicators of the influence of environmental factors on human health (Stavitsky, 1999). Indeed, the dependence of the prevalence rates of blood diseases on geological and geophysical phenomena under study was marked by the highest correlation coefficients (Table 7.3).
Thus, results of the correlation analysis demonstrated that there are rather high statistical relationships between some nosologies and geological and geophysical phenomena under study. This can testify to the existence of the long-term influence of geological factors on morbidity.
7.4.2. Medium-Term Dynamics of Morbidity The visual analysis of time series of incidence rates in adult, teenager, and child
populations of the Kosh-Agach District demonstrated that incidence dynamics of total adult morbidity and some nosologies is marked by a gradual rise in 2000–2001, a sharp spike in 2002–2003, and a gradual decay in 2004–2005 (Figure 7.5). Such dynamics is typical for diseases of musculoskeletal, circulatory, and genitourinary systems, infectious, endocrine, and cerebrovascular diseases, hypertension, gastritis, diseases of skin, blood, kidney, and gallbladder, as well as chromosomal abnormalities.
Our results are in good agreement with previous analyses of the adult and child morbidity in the Kosh-Agach District (Shchuchinov, 2004; Shestakova and Shesternina, 2004). In particular, Shchuchinov (2004) found that in 2002 child incidence rates of eleven nosologies were half as much as their average rates in 1996–2003, while seven nosologies were marked by twofold average rates. A less pronounced rise of related incidence rates in child populations was also observed in other districts of the Altai Republic in 2002–2003 (Shchuchinov, 2004).
It is well known that some diseases can be associated with psychological posttraumatic stress (Young and Welsh, 2005), which may be induced by natural disasters (e.g., earthquakes). However, this is not the case: the gradual rise of morbidity began in 2000–2001 (Figure 7.5), i.e., 3–4 years ahead the 2003 Chuya earthquake. Moreover, there were no other distinct seismic events in the region, which could directly provoke continuous fears and anxiety, at least, in the last 40 years (Section 7.2.5.1).
The author supposes that this sort of incidence dynamics was connected with changes in the geological environment due to the 2003 Chuya earthquake preparation as follows: There was a gradual change of a dynamic stress field in the region during the earthquake preparation. In some time, a “cracking” of intrusion massives along existed faults and fractures began because of the local stretching, compression, and minor foreshocks. This led

Alexander V. Shitov 202
to the increase of electromagnetic radiation and emission of Rn and other toxic gases via fault zones (it is well known that gas emission can be seismically triggered – Osika, 1981; King et al., 2006). A charge of groundwater with gases and fluids began along fault and fracture lines. This temporally changed hydrochemical characteristics of ground- and surface waters (Section 7.2.5.2).
The closer was a seismic event, the stronger was a manifestation of these changes in the geological environment, which propagation was much broader than an epicentral zone. Thus, geophysical and geochemical “agents” of the earthquake preparation processes had begun to influence the health of local people about 2–3 years ahead of the main shock. The post-influence phase in the relationships “earthquake – health” was mainly observed in 2004, when there were many aftershocks. Then, the seismic impact on the health of local population decayed due to adaptation and influence of other non-geological factors.
The analysis of time series of incidence rates (Figure 7.5) demonstrated that there were clear differences in dynamics of incidence rates of different nosologies in 1999–2007. This may testify that different systems of the human organism are marked by distinct sensitivities to an earthquake as a stress factor. Refinement and verification of this proposal may be done analyzing longer time series of incidence rates, such as for several decades.
Human health is known to be, on the one hand, sensitive to influences and, on the other, quite inherently inert. A duration of a psychosomatic health response associated with posttraumatic stress can range from several weeks to several years (Takakura et al., 1997; Armenian et al., 1998; Ogawa et al., 2000; Sokejima et al., 2004; Chen et al., 2007). This is relevant in the case of the medium-term dynamics of the health of inhabitants the Kosh-Agach District. Indeed, adult incidence rates of some nosologies (e.g., blood, hypertensive, and cerebrovascular diseases – Figure 7.5c) did not return to the pre-earthquake basal level even when four years have elapsed after the earthquake.
7.4.3. Short-Term Dynamics of Morbidity The period before the 2003 Chuya earthquake and especially during aftershocks was
marked by a general increase in emergency calls (Figure 7.6). From September to December 2003, the maximum number of calls occurred on September 26, 2003, the day before the earthquake.
The period before the earthquake and during aftershocks was characterized by a general increase in calls (Figure 7.7а), especially those concerning hypertension (Figure 7.7b). The dynamics of calls concerning vegetative vascular dystonia was characterized by the sharp increase in calls, with a maximum on three days about the main seismic event (Figure 7.7c). Close dynamics was found for calls concerning epilepsy (Figure 7.7g). The number of calls concerning pneumonia was marked by a step-like dynamics, with the maximum on the day of the earthquake and the sharp reduction of number of calls after the earthquake (Figure 7.7e). There was the gradual growth of calls concerning acute respiratory virus infection after the earthquake (Figure 7.7f). Distinct dynamics of calls concerning different diseases may testify that different systems of the human organism are marked by distinct response levels or sensitivities to the earthquake as a stress factor. Decay and increase in calls concerning different nosologies may demonstrate strong/fast and weak/slow adaptation, respectively, to the stress by different systems of the organism.

Health of People Living in a Seismically Active Region 203
Figure 7.6. Total number of emergency calls in Gorno-Altaysk in 2002 and 2003. Graphs were smoothed by ten-neighbors moving average.
Distribution of maximal number of calls by age groups was as follows: For the child population, maximal number of calls was twelve and thirteen on September 22 and 26, respectively (an average background value of calls was six). For the teenager population, maximal number of calls was seven and ten on September 22 and 28, respectively (an average background value of calls was four). For the adult population, maximal number of calls was observed on September 23 and 27. Two age groups, 21–30 and 71–80 years, did the highest number of calls – fifteen – on September 23 and 24, respectively. The average daily number of calls was 25–60 in 2000–2002 and 50–80 in September–December 2003 (Figure 7.6). All these data testifies to the increase in emergency calls at the time of the earthquake and during the aftershocks. There is a need to recall that there were no damages or victims in Gorno-Altaysk.
After the earthquake, suppressed and anxiety moods were typical for most of healthy and sick persons in the Mountain Altai. Somatovegetative symptoms were also expressed, such as general tremor, ectopic heartbeat, headache, dizziness, nausea, as well as uncertainty and unsteadiness while walking. Many persons reported anxiety dreams and nightmares. These disorders were stronger and more frequent among sick persons than among healthy ones. These are typical manifestations of post-traumatic stress disorder (Yehuda, 2002).
It is known that strong emotional reactions, such as fear, lead to changes in the neuroendocrine system resulted in the stress reaction. Under stress, a healthy organism activates the hypophysis-adrenal system, and an adaptation syndrome occurs (Selye, 1956). Under some vascular diseases, stress reaction of an organism can lead to an unbalance of the existing compensation of cerebral and venous blood circulation, such as acute coronary insufficiency, stenocardia, cardiac infarction, hypertension crises, acute cerebral blood circulation disorders, and cerebral stroke (Kario et al., 2003).
The first shocks of the 2003 Chuya earthquake were characterized by an immense emotional stress for the inhabitants, especially those in the epicenter. The continuous aftershock process is a long-acting stress factor causing negative emotions and a long-term stress reaction. Constant waiting for subsequent shocks leads to an extreme stress setting

Alexander V. Shitov 204
conditions for a chronic elevation of arterial blood pressure with its sudden fluctuations at a moment of the direct influence of the stress. There was an increase in calls concerning hypertension (Figure 7.7b) and a peak of calls reporting sudden deaths on the day after the main shock. During the aftershock period, the clinical course of hypertension was marked by an increase in crises, strokes, and excitability manifested by insomnia and motor excitability (Vaulina and Gvozdarev, 2005). These are typical manifestations of cardiovascular diseases: a short increase in morbidity and mortality rates of them is usually observed after earthquakes (Umidova et al., 1969; Petrova and Kamilov, 1970; Dobson et al., 1991; Leor et al., 1996; Kario et al., 1997, 2003; Kloner et al., 1997; Ogawa et al., 2000; Parati et al., 2001).
Emergency calls related to diabetes mellitus and gastroenteric diseases (Figure 7.7h) also became more frequent during and after the 2003 Chuya earthquake. Takakura et al. (1997) were skeptical of psychological stress as a cause of the increase in morbidity rates of peptic ulcer and diabetes. Meanwhile, Aoyama et al. (1998) and Matsushima et al. (1999) explained the increase of patients with gastric ulcer by the earthquake-induced stress. Indeed, stress is supposed to be one of the provoking factors of gastroenteric diseases (Levenstein, 2002) and diabetes mellitus (Golden, 2007). It seems that just the stress was the main reason for the increase in these calls after the 2003 Chuya earthquake.
A moderate increase of respiratory diseases is usually observed after earthquakes because of (a) dust effect, and (b) disaster victims commonly live in shelters (Takakura et al., 1997; Lai et al., 2000; Matsuoka et al., 2000). However, these reasons cannot explain dynamics of either total emergency calls or calls concerning pneumonia and acute respiratory virus infection due to the 2003 Chuya earthquake (Figure 7.7e). First, the earthquake did not cause damages in Gorno-Altaysk (Section 7.2.5.1), so there were no dust in the air or victims in shelters. Second, the increase in emergency calls began several days before the main shock.
The latter remark is true for most of nosologies analyzed (Figure 7.7), except for acute respiratory virus infection (Figure 7.7f) and traumas (Figure 7.7d). At the short-term scale, the earthquake preparation probably influenced human health via (a) meteorological and groundwater events (Sections 7.2.5.2 and 7.2.5.3); (b) local fluctuations of the geomagnetic field usually observed before and during an earthquake along faults adjacent to an epicenter (Kopytenko et al., 1993; Johnston, 1997); and (c) microseismicity causing microvibration and infrasound (Kuznetsov and Khomutov, 2004), which may affect humans (Leventhall et al., 2003).
The gradual growth of calls concerning acute respiratory virus infection after the earthquake (Figure 7.7f) is perhaps associated with psychological distress-induced immunosuppression (Solomon et al., 1997; Inoue-Sakurai et al., 2000). This can also explain the highest number of calls, which occurred in December 2003: it was associated with seasonal diseases, such as flu. There was a similar increase of calls in December 2002, but it was marked by a lower amplitude (Figure 7.6).
Surprisingly, there were mainly inversed relations between the number of calls concerning traumas and seismic activity (Figure 7.7d). Traumas are usually results of a decrease of a personal attention due to various reasons. Decrease of trauma events may indicate a general increase of a personal attention in the population before the main shock. The author supposes that this is some sort of “seismic escape” or “early alert” effect manifested by some animals (Kirschvink, 2000).

Health of People Living in a Seismically Active Region 205
Figure 7.7. Short-term dynamics of emergency calls in Gorno-Altaysk on days before and after the 2003 Chuya earthquake: (a) total number of calls; calls concerning: (b) hypertension, (с) vegetative vascular dystonia, (d) traumas, (e) pneumonia, (f) acute respiratory virus infection, (g) epilepsy, (h) gastroenteric diseases.
7.5. CONCLUSION
There is the long-term influence of terrestrial γ radiation, intrusions, magnetic anomalies,
and active faults on the morbidity of some diseases in the adult population of the Mountain Altai.
The activization of the regional seismicity influenced essentially the health of people in the Altai Republic especially living in the epicentral area of the 2003 Chuya earthquake. At a

Alexander V. Shitov 206
medium-term scale, incidence dynamics of the total adult morbidity and some nosologies was marked by a gradual rise in 2000–2001, a sharp spike in 2002–2003, and a gradual decay in 2004–2005. This may testify that the earthquake preparation has begun to influence the health of local people about 2–3 years ahead of the main shock. After the earthquake, there was decay of the seismic impact on the health of population due to its adaptation and an influence of other non-geological factors. At a short-term scale, the period before the earthquake and during aftershocks was marked by the increase in emergency calls.
The author supposes that different seismically derived agents influence human health at different temporal scales. At a medium-term scale, changes of a dynamic stress field results in the increase of fracturing along fault zones leading to the rise of the electromagnetic and infrasound radiation, radon and other gas emanation, and changes in the hydrogeological situation. At a short-term scale, the earthquake preparation causes atmospheric events triggering geomagnetic fluctuations.
There were differences in both the medium-term dynamics of incidence rates and the short-term dynamics of emergency calls concerning different nosologies. This may testify that different systems of the human organism are marked by distinct sensitivities to an earthquake as a stress factor.
Physicians, especially general practitioners, should be aware of medical effects caused by earthquake preparation processes. They should be in contact with geoscientists to be aware of a current seismic situation in a region. To decrease somatic manifestations of the effects due to psychological stress, it is reasonable to inform systematically inhabitants of seismically active regions about peculiarities and regularities of seismic processes and their potential impacts on human health.
ACKNOWLEDGMENTS The author thanks O.V. Shestakova (Altai Republican Branch, Federal Department for
Control and Protection of Consumer Rights and Human Safety, Gorno-Altaysk, Russia) and employees of the Municipal Medical Emergency Station (Gorno-Altaysk, Russia) for medical statistical data, V.Е. Kats (Territorial Center “Altaigeomonitoring”, Center for Government Monitoring of the Earth’s Interior, Maima, Russia) for fruitful suggestions, and three anonymous reviewers for useful criticism.
REFERENCES
Abrahams, P.W. (2002). Soils: their implications to human health. Science of the Total Environment, 291, 1–32.
Amshinsky, N.N. (Ed.) (1983). Petrochemical characteristics, geochemistry, and radiology of granitoids of the Mountain Altai. Novosibirsk, USSR: Siberian Research Institute of Geology, Geophysics, and Mineral Resources (in Russian).
Annunziatellis, A, Ciotoli, G, Lombardi, S and Nolasco, F. (2003). Short- and long- term gas hazard: the release of toxic gases in the Alban Hills volcanic area (central Italy). Journal of Geochemical Exploration, 77, 93–108.
Health of People Living in a Seismically Active Region 207
Aoyama, N., Kinoshita, Y., Fujimoto, S., Himeno, S., Todo, A., Kasuga, M. and Chiba, T. (1998). Peptic ulcers after the Hanshin-Awaji earthquake: increased incidence of bleeding gastric ulcers. American Journal of Gastroenterology, 93, 311–316.
Armenian, H.K., Melkonian, A.K. and Hovanesian, A.P. (1998). Long term mortality and morbidity related to degree of damage following the 1998 earthquake in Armenia. American Journal of Epidemiology, 148, 1077–1084.
Avakyan, S.V. (1999). Anomalous aerospace phenomena: geophysical aspect. Geomagnetism and Aeronomy, 39, 1–7.
Bates, M., Garret, N., Graham, B. and Read, D. (1998). Cancer incidence, morbidity and geothermal air pollution in Rotorua, New Zealand. International Journal of Epidemiology, 27, 10–14.
Berzin, N.А. and Kungurtsev, L.V. (1996). Geodynamic interpretation of Altai–Sayan geological complexes. Russian Geology and Geophysics, 37, 56–73.
Binhi, V.N. (2002). Magnetobiology: Underlying physical problems. San Diego, CA: Academic Press.
Buslov, M., Delvaux, D., Zykin, V.S. and Novikov, I.S. (1998). Altai Alpine structure: tectonics and evolution. In: Active tectonic continental basins: Interaction between structural and sedimentary processes: Abstracts of the international conference, Gent, Belgium, Apr. 30 – May 2, 1998 (pp. 61–62). Gent, Belgium: University of Gent.
Carapezza, M.L., Badalamenti, B., Cavarra, L. and Scalzo, A. (2003). Gas hazard assessment in a densely inhabited area of Colli Albani Volcano (Cava dei Selci, Roma). Journal of Volcanology and Geothermal Research, 123, 81–94.
Chen, C.H., Tan, H.K., Liao, L.R., Chen, H.H., Chan, C.C., Cheng, J.J., Chen, C.Y., Wang, T.N. and Lu, M.L. (2007). Long-term psychological outcome of 1999 Taiwan earthquake survivors: a survey of a high-risk sample with property damage. Comprehensive Psychiatry, 48, 269–275.
Dmitriev, A.N. (1998). Natural self-luminous objects. Novosibirsk, Russia: Institute of Mathematics, Russian Academy of Sciences (in Russian, with English contents and abstract).
Dmitriev, А.N., Dyatlov, V.L. and Gvozdarev, A.Y. (2005). Unusual phenomena in nature and non-uniform physical vacuum. Biysk, Russia: Biysk Pedagogical University (in Russian).
Dmitriev, А.N., Pocholkov, Y.P., Protasevich, Е.Т. and Skavinsky, V.P. (1992). Plasmogeneration in energoactive zones. Novosibirsk, Russia: United Institute of Geology, Geophysics, and Mineralogy, Russian Academy of Sciences (in Russian).
Dmitriev, А.N., Shitov, А.V., Kocheeva, N.А. and Krechetova, S.Y. (2006). Thunderstorm activity in the Mountain Altai. Gorno-Altaysk, Russia: Gorno-Altaysk University Press (in Russian).
Dobretsov, N.L., Berzin, N.A. and Buslov, M.M. (1995). Opening and tectonic evolution of the Paleo-Asian ocean. International Geology Review, 35, 335–360.
Dobson, A.J., Alexander, H.M., Malcolm, J.A., Steele, P.L. and Miles, T.A. (1991). Heart attacks and the Newcastle earthquake. Medical Journal of Australia, 155, 757–761.
Durand, M. and Wilson, J.G. (2006). Spatial analysis of respiratory disease on an urbanized geothermal field. Environmental Research, 101, 238–245.
Emanov, A.F., Emanov, A.A., Filina, A.G., Kungurtsev, L.V., Leskova, E.V., Sheikina, Z.V. and Yarygina, M.A. (2003). Spatiotemporal analysis of the seismicity within the Altai–

Alexander V. Shitov 208
Sayan fold zone. In S.V. Gol’din (Ed.), Problems of seismology in the 3rd millennium (pp. 73–86). Novosibirsk, Russia: Siberian Branch, Russian Academy of Sciences.
Fatkulin, М.N., Gaivoronskaya, Т.V. and Zelenova, Т.I. (1987). Ionosphere response to aftershocks of the Gazli earthquake (April 1984). Moscow, Russia: Institute of the Earth Magnetism, Ionosphere, and Radiowaves Propagation, Academy of Sciences of the USSR (in Russian).
Fisher, R.A. and Yates, F. (1963). Statistical tables for biological, agricultural and medical research (6th ed.). Edinburgh, UK: Oliver and Boyd.
Geodakov, A.P., Ovsyuchenko, A.N., Platonova, S.G. and Rogozhin, E.A. (2003). Preliminary studies materials of the strong earthquake occurred in Mountain Altai in 2003. Vestnik Otdelenia Nauk o Zemle RAN, 22, http://www.scgis.ru/russian/ cp1251/h_dgggms/1-2003/screp-8.pdf (in Russian, with English abstract).
Geophysical Survey (2007). Seismic monitor map of Altai–Sayan and Baikal regions. Novosibirsk, Russia: Geophysical Survey, Siberian Branch, Russian Academy of Sciences, http://gs.nsc.ru/english/monitor.html
Geophysics Study Committee (1986). Active tectonics. Washington, DC: National Academy Press.
Glazovskaya, M.A., Makunina, A.A., Pavlenko, I.A., Bozhko, M.G. and Gavrilova, I.P. (1961). Geochemistry of landscapes and prospecting in the South Urals. Moscow, USSR: Moscow University Press (in Russian).
Gokhberg, М.B., Morgounov, V.А. and Pokhotelov, O.A. (1995). Earthquake prediction: Seismo-electromagnetic phenomena. London, UK: Gordon and Breach.
Golden, S.H. (2007). A review of the evidence for a neuroendocrine link between stress, depression and diabetes mellitus. Current Diabetes Reviews, 3, 252–259.
Gol’din, S.V., Seleznev, V.S., Emanov, А.F., Filina, А.G., Emanov, А.А., Novikov, I.S., Vysotskii, Е.М., Fateev, А.V., Kolesnikov, Y.I., Podkorytova, V.G., Leskova, Е.V. and Yarygina, М.А. (2004). Chuya earthquake and its aftershocks. Doklady Earth Sciences, 395A, 394–396.
Goverdovsky, V.А. (1991). Magmatic and ore complexes of the Yustyd ore node (Southeastern Altai). Ph.D. Thesis. Novosibirsk, Russia: United Institute of Geology, Geophysics, and Mineralogy, Russian Academy of Sciences (in Russian).
GSHAP Team (1999). Global seismic hazard assessment program. Zurich, Switzerland: GSHAP, http://www.seismo.ethz.ch/gshap/
Gusev, N.I. (Ed.) (2004). Regional geological, hydrogeological, and geoecological study of territories of the Altai Krai and Altai Republic. Geological setting and mineral deposits of the Altai Republic. Saint Petersburg, Russia: Karpinsky Russian Geological Research Institute (in Russian).
Inoue-Sakurai, C., Maruyama, S. and Morimoto, K. (2000). Posttraumatic stress and lifestyles are associated with natural killer cell activity in victims of the Hanshin-Awaji earthquake in Japan. Preventive Medicine, 31, 467–473.
Johnston, M.J.S. (1997). Review of electric and magnetic fields accompanying seismic and volcanic activity. Surveys in Geophysics, 18, 441–476.
Kamoi, K., Tanaka, M., Ikarashi, T. and Miyakoshi, M. (2006a). Effect of the 2004 Mid Niigata Prefecture earthquake on glycemic control in type 1 diabetic patients. Diabetes Research and Clinical Practice, 74, 141–147.
Health of People Living in a Seismically Active Region 209
Kamoi, K., Tanaka, M., Ikarashi, T. and Miyakoshi, M. (2006b). Effect of the 2004 Mid Niigata Prefecture earthquake on patients with endocrine disorders. Endocrine Journal, 53, 511–521.
Kario, K., Matsuo, T., Kobayashi, H., Yamamoto, K. and Shimada, K. (1997). Earthquake-induced potentiation of acute risk factors in hypertensive elderly patients: possible triggering of cardiovascular events after a major earthquake. Journal of the American College of Cardiology, 29, 926–933.
Kario, K., McEwen, B.S. and Pickering, T.G (2003). Disasters and the heart: a review of the effects of earthquake-induced stress on cardiovascular disease. Hypertension Research, 26, 355–367.
Kats, V.Е. (1998). Geoecological study and mapping of the Altai Republic, scale 1:1,000,000: Final report 849. Gorno-Altaysk, Russia: Altai-Geo (in Russian).
Kats, V.Е. (2005). Hydrogeological peculiarities of the groundwater condition in Altai Republic in 2004 (after the Chuya earthquake). In V.I. Krupchatnikov (Ed.), Natural resources of the Mountain Altai, No. 2 (pp. 61–65). Gorno-Altaysk, Russia: Gorno-Altaysk Typography (in Russian).
Kats, V.E. and Robertus, Y.V. (2004). Hydrogeological peculiarities in the epicentral area of the Chuya earthquake. In A.V. Shitov (Ed.), The Altai (Chuya) earthquake: Forecasts, characteristics, and results: Proceedings of the conference, Gorno-Altaysk, Russia, Apr. 23, 2004 (pp. 99–109). Gorno-Altaysk, Russia: Gorno-Altaysk University Press (in Russian).
King, C.-Y. (1986). Gas geochemistry applied to earthquake prediction: an overview. Journal of Geophysical Research, 91, 12269–12281.
King, C.-Y., Zhang, W. and Zhang, Z. (2006). Earthquake-induced groundwater and gas changes. Pure and Applied Geophysics, 163, 633–645.
Kirschvink, J.L. (2000). Earthquake prediction by animals: evolution and sensory perception. Bulletin of the Seismological Society of America, 90, 312–323.
Kirschvink, J.L., Jones, D.S. and MacFadden, B.J. (Eds.) (1985). Magnetite biomineralization and magnetoreception in organisms: A new biomagnetism. New York, NY: Plenum Press.
Kloner, R.A., Leor, J., Poole, W.K. and Perritt, R. (1997). Population-based analysis of the effect of the Northridge earthquake on cardiac death in Los Angeles County, California. Journal of the American College of Cardiology, 30, 1174–1180.
Kochergina, A.I. (2002). Size and composition of population in the Altai Republic. Gorno-Altaysk, Russia: Gorno-Altaysk Typography (in Russian).
Kondorskaya, N.V. and Shebalin, N.V. (Eds.) (1982). New catalog of strong earthquakes in the USSR from ancient times through 1977. Boulder, CO: World Data Center A for Solid Earth Geophysics, NOAA.
Kopytenko, Y.A., Matiashvili, T.G., Voronov, P.M., Kopytenko, E.A. and Molchanov, O.A. (1993). Detection of ultralow frequency emissions connected with the Spitak earthquake and its aftershock activity, based on geomagnetic pulsation data at Susheti and Vardzia observatories. Physics of the Earth and Planetary Interiors, 77, 85–95.
Kuznetsov, V.V. and Khomutov, S.Y. (2004). Results of monitoring of atmospheric electricity, geomagnetic field, and infrasound during the aftershock activity of the Chuya earthquake (Altai, 27.09.2003). In A.V. Shitov (Ed.), The Altai (Chuya) earthquake: Forecasts, characteristics, and results: Proceedings of the conference, Gorno-Altaysk,

Alexander V. Shitov 210
Russia, Apr. 23, 2004 (pp. 66–81). Gorno-Altaysk, Russia: Gorno-Altaysk University Press (in Russian).
Lai, S.-W., Liu, C.-S., Li, C.-I., Tan, C.-K., Ng, K.-C., Lai, M.-M. and Lin, C.-C. (2000). Post-earthquake illness and disease after the Chi-Chi earthquake. European Journal of Internal Medicine, 11, 353–354.
Leor, J., Poole, W.K. and Kloner, R.A. (1996). Sudden cardiac death triggered by an earthquake. New England Journal of Medicine, 334, 413–419.
Levenstein, S. (2002). Psychosocial factors in peptic ulcer and inflammatory bowel disease. Journal of Consulting and Clinical Psychology, 70, 739–750.
Leventhall, G., Pelmear, P. and Benton, S. (2003). A review of published research on low frequency noise and its effects. London, UK: Department for Environment, Food and Rural Affairs.
Matsuoka, T., Yoshioka, T., Oda, J., Tanaka, H., Kuwagata, Y., Sugimoto, H. and Sugimoto, T. (2000). The impact of a catastrophic earthquake on morbidity rates for various illnesses. Public Health, 114, 249–253.
Matsushima, Y., Aoyama, N., Fukuda, H., Kinoshita, Y., Todo, A., Himeno, S., Fujimoto, S., Kasuga, M., Nakase, H. and Chiba, T. (1999). Gastric ulcer formation after the Hanshin-Awaji earthquake: a case study of Helicobacter pylori infection and stress-induced gastric ulcers. Helicobacter, 4, 94–99.
Melnikov, E.K., Rudnik, V.A., Musiychuk, Y.I. and Rymarev, V.I. (1994). Pathogenic influence of active fault zones in Saint Petersburg area. Geoecologia, No. 4, 50–69 (in Russian).
Minaev, A.I. (2007). Demographic geography. Gorno-Altaysk, Russia: Gorno-Altaysk University Press (in Russian).
Ministry of Health (1980). Form 109/u: Call log of emergency medical service. Moscow, USSR: Ministry of Health.
Modina, T.D. (1997). Climates of the Altai Republic. Novosibirsk, Russia: Novosibirsk Pedagogical University (in Russian).
Nambi, K.S.V. and Soman, S.D. (1987). Environmental radiation and cancer in India. Health Physics, 52, 653–657.
Nekhoroshev, V.P. (1958). Geology of Altai. Moscow, USSR: Gosgeoltekhizdat (in Russian). Novikov, I.S. (2004). Morphotectonics of Altai. Novosibirsk, Russia: Siberian Branch,
Russian Academy of Sciences (in Russian). Ogawa, K., Tsuji, I., Shiono, K. and Hisamichi, S. (2000). Increased acute myocardial
infarction mortality following the 1995 Great Hanshin-Awaji earthquake in Japan. International Journal of Epidemiology, 29, 449–455.
Ondoh, T. (2000). Seismo-ionospheric phenomena. Advances in Space Research, 26, 1267–1272.
Osika, D.G. (1981). The fluid regime of the seismically active regions. Moscow, USSR: Nauka (in Russian).
Parati, G., Antonicelli, R., Guazzarotti, F., Paciaroni, E. and Mancia, G. (2001). Cardiovascular effects of an earthquake: direct evidence by ambulatory blood pressure monitoring. Hypertension, 38, 1093–1095.
Persinger, M.A. (1976). Transient geophysical bases for ostensible UFO-related phenomena and associated verbal behavior. Perceptual and Motor Skills, 43, 215–221.

Health of People Living in a Seismically Active Region 211
Persinger, M.A. (1980). Earthquake activity and antecedent UFO report numbers. Perceptual and Motor Skills, 50, 791–797.
Persinger, M.A. (1983). Geophysical variables and behavior: IX. Expected clinical consequences of close proximity to UFO-related luminosities. Perceptual and Motor Skills, 56, 259–265.
Persinger, M.A. (1984). Geophysical variables and behavior: XVIII. Expected perceptual characteristics and local distributions of close UFO reports. Perceptual and Motor Skills, 58, 951–959.
Persinger, M.A. (1988). Geophysical variables and behavior: LIII. Epidemiological considerations for incidence of cancer and depression in areas of frequent UFO reports. Perceptual and Motor Skills, 67, 799–803.
Persinger, M.A. and Derr, J.S. (1985). Geophysical variables and behavior: XXXII. Evaluation of UFO reports in an area of infrequent seismicity: the Carman, Manitoba episode. Perceptual and Motor Skills, 61, 807–813.
Persinger, M.A. and Derr, J.S. (1990). Geophysical variables and behavior: LXII. Temporal coupling of UFO reports and seismic energy release within the Rio Grande Rift System: discriminative validity of the tectonic strain theory. Perceptual and Motor Skills, 71, 567–572.
Petrova, N.S. and Kamilov, F.K. (1970). Blood pressure and hypertensive crises in inhabitants of Tashkent during earthquake in 1966. Terapevtichesky Archiv, 42(1), 37–39 (in Russian).
Protchuk, I.S. (Ed.) (1977). Atlas of the Altai Krai, vol. 1. Barnaul, USSR: Central Board of Geodesy and Cartography (in Russian).
Rogozhin, E.A. and Platonova, S.G. (2002). Focal zones of strong earthquakes of the Mountain Altai in the Holocene. Moscow, Russia: United Schmidt Institute of Physics of the Earth, Russian Academy of Sciences (in Russian).
Roslyakov, N.A. and Dmitriev, A.N. (Eds.) (1992). Katun: Ecogeochemistry of mercury. Novosibirsk, Russia: United Institute of Geology, Geophysics, and Mineralogy, Russian Academy of Sciences (in Russian).
Sadovskiy, M.A., Sobolev, G.A. and Migunov, N.I. (1979). Variations of the natural radiowave emission of the Earth during a severe earthquake in the Carpathians. Doklady, Earth Sciences Sections, 244, 4–6.
Şalcioğlu, E., Başoğlu, M. and Livanou, M. (2003). Long-term psychological outcome for non-treatment-seeking earthquake survivors in Turkey. Journal of Nervous and Mental Disease, 191, 154–160.
Selye, H. (1956). The stress of life. New York, NY: McGraw-Hill. Shchuchinov, L.V. (Ed.) (2004). Health of people and results of work of public health
services of the Altai Republic in the year 2003. Gorno-Altaysk, Russia: Republican Medical Information Analytical Center (in Russian).
Shestakova, О.V. and Shesternina, Z.G. (2004). Towards an influence of the earthquake on the health of people in the Altai Republic. In A.V. Shitov (Ed.), The Altai (Chuya) earthquake: Forecasts, characteristics, and results: Proceedings of the conference, Gorno-Altaysk, Russia, Apr. 23, 2004 (pp. 156–160). Gorno-Altaysk, Russia: Gorno-Altaysk University Press (in Russian).
Shitov, А.V. (1996). Geological and geophysical environment and health of people. In I.F. Mingasov (Ed.), On creation of united regional system for monitoring of the natural

Alexander V. Shitov 212
environment and population in Siberia: Abstracts of the Regional conference, Novosibirsk, Russia, Sept. 17–19, 2006 (pp. 247–248). Novosibirsk, Russia: Siberian Branch, Russian Academy of Sciences (in Russian).
Shitov, A.V. (1999). Natural self-luminous objects as ecological factor of the Mountain Altai. Ph.D. Thesis. Gorno-Altaysk, Russia: Gorno-Altaysk University (in Russian).
Shitov, А.V. (2006a). Ecological and geological factors and their influence on health of the population of the Mountain Altai. Journal Problem Evolutsii Otkrytykh System, 8, 120–133 (in Russian, with English abstract).
Shitov, А.V. (2006b). Ecological consequences of activization of geodynamic processes in the Mountain Altai. Vestnik Tomskogo Universiteta, Bulletin Operativnoi Nauchnoi Informatsii, 72, 118–135 (in Russian, with English abstract).
Shitov, А.V., Dmitriev, А.N. and Gvozdarev, А.Y. (2004). Property of meteorological precursors of the Altai (Chuya) earthquake. In V.I. Trukhin (Ed.), Physical problems of ecology (Ecological physics): Abstracts of the 4th All-Russian conference, Moscow, Russia, June 22–24, 2004 (pp. 187–188). Moscow, Russia: Moscow University Press (in Russian).
Shitov, А.V. and Kats, V.E. (2000). The use of GIS-techniques to produce a geoecological maps of the Altai Republic. In S.V. Dolgovykh (Ed.), Fundamental problems of the environmental protection and ecology of territories in West Siberia (pp. 123–127). Gorno-Altaysk, Russia: Gorno-Altaysk University Press (in Russian).
Shitov, A.V., Kats, V.E. and Khar’kina, M.A. (2008). Ecological-geodynamic evaluation of the Chuya earthquake. Moscow University Geology Bulletin, 63, 171–177.
Shitov, А.V., Ushakova, V.G., Bolbukh, Т.V., Gvozdarev, А.Y. and Kocheeva, N.А. (2006). Thermal springs as indicators of geodynamic activity in the Mountain Altai. In V.Т. Trofimov (Ed.), Problems of engineering geodynamics and ecological geodynamics: Proceedings of the International conference, Moscow, Russia, Feb. 2–3, 2006 (pp. 69–72). Moscow, Russia: Moscow University Press (in Russian).
Silina, A.S., Liperovskaya, E.V., Liperovsky, V.A. and Meister, C.-V. (2001). Ionospheric phenomena before strong earthquakes. Natural Hazards and Earth System Sciences, 1, 113–118.
Singh, Y.P. and Badruddin (2006). Statistical considerations in superposed epoch analysis and its applications in space research. Journal of Atmospheric and Solar-Terrestrial Physics, 68, 803–813.
Sokejima, S., Nakatani, Y., Kario, K., Kayaba, K., Minowa, M. and Kagamimori, S. (2004). Seismic intensity and risk of cerebrovascular stroke: 1995 Hanshin-Awaji earthquake. Prehospital and Disaster Medicine, 19, 297–306.
Solomon, G.F., Segerstrom, S.C., Grohr, P., Kemeny, M. and Fahey, J. (1997). Shaking up immunity: psychological and immunologic changes after a natural disaster. Psychosomatic Medicine, 59, 114–127.
St-Laurent, F., Derr, J.S. and Freund, F.T. (2006). Earthquake lights and the stress-activation of positive hole charge carriers in rocks. Physics and Chemistry of the Earth, A/B/C, 31, 305–312.
State Committee of Statistics (1999). Form 12: Data on morbidities registered in an area served by a medical establishment. Moscow, Russia: State Committee of Statistics of the Russian Federation.

Health of People Living in a Seismically Active Region 213
Stavitsky, R.V. (Ed.) (1999). Blood as indicator of the state of organism and its systems. Moscow, Russia: MNPI (in Russian).
Sytinskii, А.D. (1997). Planetary atmospheric disturbances during strong earthquakes. Geomagnetism and Aeronomy, 37, 256–259.
Takakura, R., Himeno, S., Kanayama, Y., Sonoda, T., Kiriyama, K., Furubayashi, T., Yabu, M., Yoshida, S., Nagasawa, Y., Inoue, S. and Iwao, N. (1997). Follow-up after the Hanshin-Awaji earthquake: diverse influences on pneumonia, bronchial asthma, peptic ulcer and diabetes mellitus. Internal Medicine, 36, 87–91.
Trofimov, V.Т. (Ed.) (2000). Ecological functions of the lithosphere. Moscow, Russia: Moscow University Press (in Russian, with English contents and abstract).
Umidova, Z.I., Arifdzhanov, A.A., Budianskii, M.V., Korolev, G.P., Tarapata, N.P. and Abdullaeva, S.V. (1969). Clinical picture of hypertensive disease during the Tashkent earthquake. Terapevtichesky Archiv, 41(6), 38–40 (in Russian).
UNSCEAR (2001). Hereditary effects of radiation: UNSCEAR 2001 report to the General Assembly, with scientific annex. New York, NY: United Nations.
UNSCEAR (2008). Effects of ionizing radiation: UNSCEAR 2006 report to the General Assembly, with scientific annexes, Vol. 1. New York, NY: United Nations.
Vaulina, O.G. and Gvozdarev, A.Y. (2005). The earthquake influence on the health of students in the Gorno-Altaysk State University. In V.G. Babin (Ed.), Herald of junior scientists (pp. 111–112). Gorno-Altaysk, Russia: Gorno-Altaysk University Press (in Russian).
Vorobiev, А.А. (1974). Physical conditions for setting of the deep substance and seismic events. Tomsk, USSR: Tomsk University Press (in Russian).
Vorobiev, А.А., Samokhvalov, М.А. and Gorelkin, А.F. (1979). Abnormal change of intensity of a natural impulse electromagnetic field in the Tashkent region before earthquake. Uzbeksky Geologichesky Journal, No. 5, 11–15 (in Russian).
Watson, N.F., Doherty, M.J., Dodrill, C.B., Farrell, D. and Miller, J.W. (2002). The experience of earthquakes by patients with epileptic and psychogenic nonepileptic seizures. Epilepsia, 43, 317–320.
WHO (2004). International statistical classification of diseases and health related problems: Tenth revision. Vol. 1: Tabular list (2nd ed.). Geneva, Switzerland: World Health Organization.
Yasui, Y. (1973). A summary of studies on luminous phenomena accompanied with earthquakes. Memoirs Kakioka Magnetic Observatory, 15, 127–138.
Yehuda, R. (2002). Post-traumatic stress disorder. New England Journal of Medicine, 346, 108–114.
Young, C.R. and Welsh, C.J. (2005). Stress, health and disease. Cell Science Reviews, 2, 132–158.
Zagainov, Y.V. (1974). Review of geological and geophysical materials on the Kholzun iron ore deposition zone to select an exploration strategy: Report 1273. Novokuznetsk, USSR: Western Siberian Geological Administration (in Russian).
Zhalkovsky, N.D. and Muchnaya, V.I. (1979). Altai–Sayan region. In: Y.V. Riznichenko (Ed.), Seismic shaking of the USSR territory (pp. 125–128). Moscow, USSR: Nauka (in Russian).

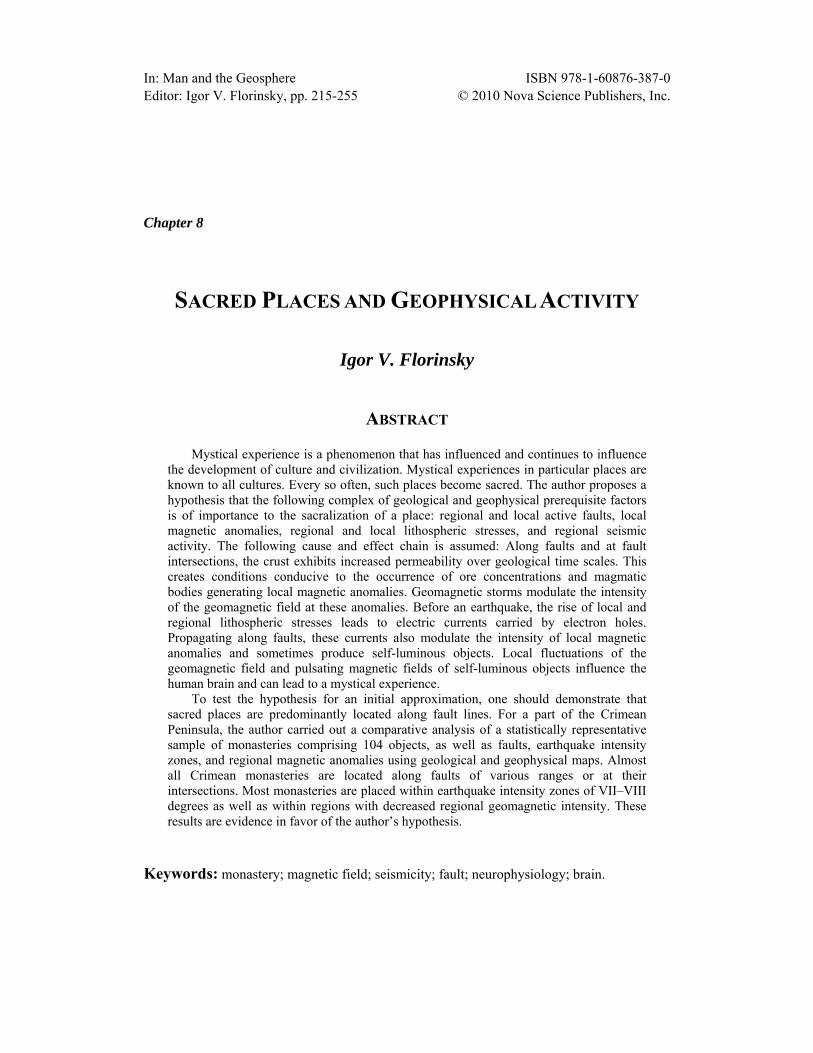
In: Man and the Geosphere ISBN 978-1-60876-387-0 Editor: Igor V. Florinsky, pp. 215-255 © 2010 Nova Science Publishers, Inc.
Chapter 8
SACRED PLACES AND GEOPHYSICAL ACTIVITY
Igor V. Florinsky
ABSTRACT
Mystical experience is a phenomenon that has influenced and continues to influence the development of culture and civilization. Mystical experiences in particular places are known to all cultures. Every so often, such places become sacred. The author proposes a hypothesis that the following complex of geological and geophysical prerequisite factors is of importance to the sacralization of a place: regional and local active faults, local magnetic anomalies, regional and local lithospheric stresses, and regional seismic activity. The following cause and effect chain is assumed: Along faults and at fault intersections, the crust exhibits increased permeability over geological time scales. This creates conditions conducive to the occurrence of ore concentrations and magmatic bodies generating local magnetic anomalies. Geomagnetic storms modulate the intensity of the geomagnetic field at these anomalies. Before an earthquake, the rise of local and regional lithospheric stresses leads to electric currents carried by electron holes. Propagating along faults, these currents also modulate the intensity of local magnetic anomalies and sometimes produce self-luminous objects. Local fluctuations of the geomagnetic field and pulsating magnetic fields of self-luminous objects influence the human brain and can lead to a mystical experience.
To test the hypothesis for an initial approximation, one should demonstrate that sacred places are predominantly located along fault lines. For a part of the Crimean Peninsula, the author carried out a comparative analysis of a statistically representative sample of monasteries comprising 104 objects, as well as faults, earthquake intensity zones, and regional magnetic anomalies using geological and geophysical maps. Almost all Crimean monasteries are located along faults of various ranges or at their intersections. Most monasteries are placed within earthquake intensity zones of VII–VIII degrees as well as within regions with decreased regional geomagnetic intensity. These results are evidence in favor of the author’s hypothesis.
Keywords: monastery; magnetic field; seismicity; fault; neurophysiology; brain.

Igor V. Florinsky 216
8.1. INTRODUCTION
8.1.1. Mystical Experience: Neurophysiological Evidence Altered states of consciousness are a phenomenon, which have influenced and continue
to influence the development of personality, culture, and civilization (Maslow, 1964; Dobkin de Rios and Winkelman, 1989; Tortchinov, 1998). The term “mystical experience” is commonly used to describe a sort of altered state of consciousness characterized by visual and auditory hallucinations, including apparent contacts with divine or supernatural creatures. These contacts are often accompanied by extreme emotions, such as delight, euphoria, horror, panic, etc. Sometimes a person may experience unio mystica, that is, transcendence of space and time, cosmic unity, oneness, and other verbally inexpressible feelings (James, 1902; D’Aquili and Newberg, 1993; Levin and Steele, 2005; Lange and Thalbourne, 2007).
The particular content of mystical experience and its personal interpretation depend on cultural and religious stereotypes of an individual. Like other forms of altered states of consciousness, a mystical experience may be both spontaneous and induced. In the latter case, various accidental and goal-oriented exposures may result in mystical experiences, such as psychedelic drugs, intoxication, fasting, natural and artificial magnetic and electromagnetic fields, extreme conditions in polar regions, deserts, and high mountains, hypoxia, hyperventilation, deep relaxation, physical and emotional overloads, injuries, severe somatic diseases, as well as psychological techniques (e.g., meditation) known in all cultures (Vaitl et al., 2005).
Let us refine the key difference between mystical experience and religiosity (James, 1902). Mystical experience is a result of natural neurophysiological processes, whereas religiosity is developed by instructions and social contacts of a person (D’Aquili and Newberg, 1993, 1998). Religiosity influences the personal interpretation of a mystical experience. The latter may increase a level of personal religiosity. However, religiosity is not a necessary condition for a person to obtain a mystical experience. Mystical experience forms a basis for both religiosity and religion (Tortchinov, 1998). Mystical experience and religiosity may have different neurophysiological correlates. The former is apparently evoked by neural activity of deep structures of the right temporal lobe of the brain (see below), whereas the latter is probably controlled by activity of the right frontal cerebral cortex (Devinsky and Lai, 2008).
It is well known that the brain exhibits functional lateralization. In particular, the right hemisphere is responsible for intuition, emotions, and space perception, whereas the left hemisphere specializes in logic, analytical thinking, and formal linguistic procedures (Bradshaw and Nettleton, 1981; Springer and Deutsch, 1981; Ashbrook, 1996). It is assumed that the development of the individual sense of Self is closely linked with linguistic skills (Jaynes, 1976; Dobrokhotova and Bragina, 1977). This is a basis for the proposal that (a) the sense of Self arises after development of some “critical mass” of neuron chains; (b) functioning of the sense of Self is chiefly controlled by left-hemispheric processes; and (c) the right hemisphere develops an unaware “homolog” of the sense of Self (Persinger and Makarec, 1992; Persinger, 2003; Booth et al., 2005). Properties of the sense of Self and its homolog relate to specializations of the left and right hemispheres, respectively. A person is not usually aware of the information exchange between the sense of Self and its homolog.

Sacred Places and Geophysical Activity 217
According to the Persinger hypothesis (Persinger, 1983b, 1993b; Booth et al., 2005), a mystical experience of a healthy person is a result of natural neurophysiological processes during spontaneous or induced short microseizures in deep structures of the right temporal lobe, such as amygdala and hippocampus (Persinger, 1983b). These microseizures lead to the very short (20–200 ms) activation of interhemispheric neuron pathways through the corpus callosum and hippocampal commissure (Persinger et al., 2000; Persinger and Healey, 2002). These pathways allow awareness to occur between the sense of Self and its homolog (Persinger, 2003). In this instant, a mystical experience takes place. The epiphysis probably plays some role in these processes (Hill and Persinger, 2003).
Several facts support the Persinger hypothesis: (1) Numerous experiments have demonstrated that a short (3–5 min) transcranial
exposure of the right hemisphere to an extremely low frequency weak magnetic field (0.5–10 Hz, 0.1–5 μT, the signal has a complex pulsed form) evokes an experience of the sensed presence in 80% of the general population (Johnson and Persinger, 1994; Cook and Persinger, 1997; Persinger and Healey, 2002; Roll et al., 2002; Booth et al., 2003, 2005; St-Pierre and Persinger, 2006). The sensed presence is a form of mystical experience. It consists in the feeling or apparent observation of a supernatural creature located near the observer (James, 1902; Brugger, 1994). The sensed presence might also be induced by an accidental exposure to extremely low frequency pulsed weak magnetic fields generated by electric and electronic household devices (Persinger et al., 2000, 2001; Persinger and Koren, 2001).
(2) Electroencephalographic measures revealed an increase in spike frequency and domination of theta waves in the temporal lobes of persons who reported mystical experiences (Makarec and Persinger, 1985; Munro and Persinger, 1992). Short (1–2 s) spikes in electrical activity of the temporal lobes were observed during the induced sensed presence (Persinger et al., 2000; Booth et al., 2003).
(3) Personal characteristics and behavior of healthy individuals predisposed to mystical experience are similar to signs of increased temporal lobe lability and minor symptoms of temporal lobe epilepsy, such as low self-esteem, hypertrophic sense of guilt, dependence on circumstances, aggressive irritability, egocentricity, affective viscosity, hypergraphia, frequent dèjá vu, etc. (Waxman and Geschwind, 1975; Persinger, 1983b, 1984b; Makarec and Persinger, 1985; Persinger and Fisher, 1990; Persinger and Makarec, 1993; Saver and Rabin, 1997; Thalbourne et al., 2003). It is common knowledge that temporal lobe epilepsy patients may have mystical experiences (Dewhurst and Beard, 1970; Saver and Rabin, 1997; Ogata and Miyakawa, 1998; Devinsky and Lai, 2008). Clinical practitioners usually consider the sensed presence as an epileptic aura (Landtblom, 2006).
Notice that sometimes it is hard to distinguish a mystical experience from a disease
manifestation, such as psychoses and hallucinations with mystical content (Cook, 2004; Heriot-Maitland, 2008). Therefore, mystical experience is at times considered within the continuum of “normality–disease” states (Persinger and Makarec, 1993; Heriot-Maitland, 2008). There is a criterion to classify a mystical experience as either healthy or pathological: If it leads to the personal degradation, it should be considered as a manifestation of illness.

Igor V. Florinsky 218
Otherwise, a mystical experience is unrelated to psychopathology (Tortchinov, 1998; Clarke, 2001). In this case, it may promote personal growth (Maslow, 1964).
8.1.2. Mystical Experience: Geophysical Factors Among natural and artificial triggers of a mystical experience (Section 8.1.1), magnetic
fields are of principle interest for our study since the geomagnetic field persistently influences all humans.
During geomagnetic storms, variations in the electrical activity of the brain of healthy individuals can be observed (Raevskaya, 1988; Doronin et al., 1998) including unstable states (Belisheva et al., 1995), and acute attacks of mental illnesses (Friedman et al., 1963; Rudakov et al., 1984; Persinger, 1987) including epilepsy (Wool, 1976; Persinger and Psych, 1995). The probability and intensity of a mystical experience increase if geomagnetic activity increases by 10–40 nT during high frequency variations of the geomagnetic field (Persinger, 1988b; Booth et al., 2005). It was proposed that biotropic effects of the geomagnetic field are connected with the structure, exposure time, and dose of short-period fluctuations rather than an increase in their intensity alone (Belisheva et al., 1995).
Within local magnetic anomalies, the frequency of mental illnesses is not different from that in adjacent territories where the geomagnetic field is normal (Travkin and Kolesnikov, 1972). However, the frequency of neurosis and the probability of mystical experiences tangibly increase under exposure to a pulsed magnetic field at local magnetic anomalies (Suess and Persinger, 2001).
Lithospheric magnetic anomalies are usually associated with magnetized rocks, such as ore concentrations, magmatic and ore bodies (Gunn and Dentith, 1997). They are also observed within increased permeability zones of the crust (i.e., along lineaments, faults, and at their intersections – Simonenko, 1968), where intense rock fracturing forms favorable conditions for igneous intrusions and fluid penetration (Kerrich, 1986). Intensity fluctuations of the local magnetic field within these anomalies are enhanced during geomagnetic storms (Kutinov and Chistova, 2004). During earthquake preparation processes, the increase of local and regional lithospheric stresses leads to mechanoelectrical phenomena causing electromagnetic fluctuations. In particular, when rocks are mechanically stressed they can cause electric currents due to electron hole charge carriers (Freund et al., 2006, 2007). These phenomena, which have also been explained by piezoelectric and electrokinetic effects (Stacey, 1964; Parkhomenko and Martynov, 1975; Sobolev et al., 1975; Gokhberg et al., 1995), can lead to local low frequency magnetic field fluctuations (up to 200 nT) observed before earthquakes along adjacent faults (Kopytenko et al., 1993; Johnston, 1997; Yen et al., 2004).
Before strong earthquakes (magnitude > 4), electron hole currents in adjacent faults can cause air ionization and corona discharges (St-Laurent et al., 2006) forming earthquake lights (Popov, 1928; Ulomov, 1971; Derr, 1973; Parkhomenko and Martynov, 1975; St-Laurent, 2000). Most likely, these phenomena also include short-lived natural self-luminous objects (SLO – Lunev, 1992; Shitov, 1999), such as luminous balls and fire columns (Section 7.2.3). According to the Derr–Persinger hypothesis (so-called “tectonic strain theory”), SLO formation is connected with the rise of local and regional lithospheric stresses (Persinger, 1976, 1980, 1984a; Derr and Persinger, 1986). SLO are frequently observed near faults and

Sacred Places and Geophysical Activity 219
fault-controlled river valleys during minor seismic events (magnitude < 2) days or months ahead of a stronger earthquake. SLO can move along fault lines, probably, due to the redistribution of a lithospheric stress (Persinger and Derr, 1985, 1990a; Derr and Persinger, 1990). That is why SLO can be observed within up to 300 km of an earthquake epicenter (Persinger and Derr, 1990b). Natural and anthropogenic fluctuations of hydrological systems can provoke seismic activity and trigger SLO. Among these hydrological events are seasonal runoff fluctuations (Persinger and Derr, 1990a; Derr and Persinger, 1993), fluid injections into the crust (Derr and Persinger, 1990; Persinger and Derr, 1993), and pit flooding (Suess and Persinger, 2001). Usually, there is a temporal gap of up to several months between a hydrological event and SLO occurrence. The gap depends on the distance between points where hydrological and luminous events occurred. This time is necessary to form and redistribute a lithospheric stress (Derr and Persinger, 1990).
SLO characteristics, such as color, size, luminous intensity, and frequency of occurrences depend on the local geological situation (i.e., rock magnetic susceptibility), the presence of magnetic anomalies, topography (e.g., SLO are often observed above hills), and the proximity of technical objects generating electromagnetic fields (e.g., electric power lines). Geomagnetic storms may increase frequency of occurrences of SLO and their luminosity (Persinger, 1985a).
SLO may induce a mystical experience, probably by their magnetic fields. SLO are known to all cultures, but their interpretation depends on cultural and religious stereotypes of the observers (Persinger, 1976; Weightman, 1996). In particular, well-known appearances of the Virgin Mary above a Coptic Orthodox church in Zeitoun, a district of Cairo, Egypt in 1968–1971 were, most likely, SLO generated by the temporally increased seismic activity in the Red Sea (Derr and Persinger, 1989). In 1992, there were SLO observations at the Greensides’ farm near the village of Marmora, Ontario, Canada (Section 4.3.2). They were interpreted as Christ and Virgin Mary appearances. The farm became a Catholic pilgrimage place (Suess and Persinger, 2001). Studies in situ demonstrated that these phenomena were caused by (a) the increased regional seismic activity in 1990–1997, and (b) the rise of local lithospheric stresses due to slow flooding of the open pit on the magnetite deposit situated at 2 km from Marmora (Figure 4.4). Pulsed magnetic field variations with periods of 1–7 s and 10–950 nT amplitudes were measured. This may explain reported feelings of deep relaxation and tranquility, even inability to drive a car, near the Greensides’ farm (Suess and Persinger, 2001): exposure of the brain to pulsed weak magnetic fields induces an effect similar to the action of opiate drugs (Fleming et al., 1994).
Burke and Halberg (2005) reported striking magnetic discontinuities observed at ancient megaliths (henges, pyramids, mounds, and dolmen) in the Americas, Brittany, and southern England. A detailed magnetometric survey of some early medieval heathen cultic complexes (Scythian mounds) in the Altai Mountains demonstrated that their builders used ore-bearing rocks, which generated magnetic microanomalies (Drachev and Shitov, 2007).
Disturbances of the vegetative nervous system and emotional state were registered during visits to these sites (Voronkov et al., 2006). Probably, one of the forms of the Jerusalem syndrome – spontaneous anxiety, weeping, vocalization, and other unexpected behavior of healthy individuals during visits to Israel (Bar-El et al., 2000) – may also be connected with geological and geophysical characteristics of sacred places in this country.

Igor V. Florinsky 220
8.1.3. Statement of the Hypothesis A periodical occurrence of mystical experiences in particular places on the Earth’s
surface is familiar to all cultures and religions. Every so often, these places become sacred pilgrimage centers with sanctuaries, temples, and monasteries (Hughes and Swan, 1986; Chamberlain, 2001). Based on the insight described in the previous subsection, the author proposes that the following complex of geological and geophysical factors is important for the sacralization of a place (Florinsky, 2008):
1. Active faults; 2. Local magnetic anomalies; 3. Regional and local lithospheric stresses; and 4. Regional seismic activity. The author proposes the following cause and effect chain: Along faults and at fault
intersections, the crust exhibits increased permeability over geological time scales. This creates conditions conducive to the occurrence of ore concentrations and magmatic bodies generating local magnetic anomalies. Geomagnetic storms modulate the intensity of the geomagnetic field within these anomalies. Before an earthquake, the rise of local and regional lithospheric stress leads to electron hole currents, which also modulate the intensity of local magnetic anomalies and sometimes produce SLO. Local fluctuations of the geomagnetic field and pulsating magnetic fields of SLO influence the brain and can lead to a mystical experience.
All four prerequisite factors are rather stable in time and space. This provides an opportunity to produce repeated mystical experiences at a particular sacred place. Indeed, the spatial distribution of faults is invariant on the time scale of human history. Although the intensities of local and regional magnetic anomalies vary in the course of time, their locations are stable. Likewise, stress fields and regional seismicity vary with time across an active region (Mogi, 1968; Pustovitenko and Kamenobrodsky, 1976), but they can also be considered as invariant factors on the historical time scale.
To test the hypothesis to a first approximation, one should demonstrate that sacred places are predominantly located along fault lines. One should analyze a statistically representative sample of sacred places complying with two requirements. First, the sample should be homogeneous: one cannot mix sacred places of different types, such as parish temples, monasteries, and sanctuaries, in one sample. Second, the sample should be complete for a particular region: no rejection according to “importance” of a sacred place is tolerated since there are no criteria to determine the importance.
One can compose a representative sample of sacred places with monasteries only. It is incorrect to use samples of parish temples or heathen sanctuaries because of two reasons. First, monasteries are usually founded (at least, in the ideal case) by persons with a strong quest to achieve a contact or unity with God (Bratton, 1988), i.e., mystical experience. This quest should dictate a careful selection of a site to erect a monastery considering personal mystical experience of founders as well as the past local experiences and legends. Political, social, and random factors a priori played a secondary role in this case as compared with a selection of a site for a parish temple.

Sacred Places and Geophysical Activity 221
Second, monasteries are more recent cultic complexes than heathen sanctuaries. This allows one to obtain the most reliable and complete, documented and/or archaeologically supported data on monasteries for a particular region, as well as to localize them in the field or on a map with minimal errors. In contrast, there is a high probability to miss some unknown ancient heathen sanctuaries.
At a continental scale, Fedorov (2004, 2007) reported that Russian Orthodox monasteries are commonly aligned with transregional faults and lineaments of the East European Plain. For regional and local scales, there are no scientific data on relationships between monasteries and geological environment. For any scale, these relationships have never been considered in the context of neurophysiology. In this chapter, the author studies regularities in spatial distribution of monasteries according to their geological and geophysical situation at regional and local scales, as well as explains these regularities in the context of neurophysiological data.
8.2. STUDY AREA The study is exemplified by a part of the Crimean Peninsula. Geologically and
archaeologically, the peninsula has been much studied over the decades. In different historical periods, there were more than 100 monasteries of several denominations distributed over a relatively small area of about 26,000 km2 (Figure 8.1 and Table 8.1).
Figure 8.1. The Crimea: monasteries (see Table 8.1 for description and references); two gray areas are represented in detail in Figure 8.3.

Igor V. Florinsky 222
Table 8.1. Crimean monasteries (Figure 8.1)
# Name Location Reference I. Medieval Byzantine monasteries Vicinity of Chersonese (present-day Sevastopol) 1 St. George Monastery* Cape Fiolent (Tur, 2006, p. 101) 2 Skete Cape Vinogradny (Yashaeva, 1994) 3 Monastery Kazatch Bay, an islet (Markevich, 1909) 4 Mother of God of Blachernai
Monastery Quarantine Ravine (Fomin, 2004)
5 Monastery Sarandinaki Ravine (Yashaeva, 2006) 6 Skete Zefir-Koba Cave, Mount
Sapoune (Yashaeva, 1997)
Vicinity of the Calamita Fortress (present-day Inkerman) 7 Skete Trinity Ravine (Mogarichev, 2005, p. 88) 8 Skete George Ravine (Ibid., p. 87) 9 Skete Inkerman-1 rail station (Ibid., p. 87) 10 St. Sophia Monastery Inkerman-1 rail station (Ibid., p. 86) 11 Monastery Zagaitan Rock, eastern cliff (Ibid., p. 84) 12 Monastery Zagaitan Rock, south-western
cliff (Ibid., p. 83)
13 Skete Gaitan Ravine (Ibid., p. 80) 14 St. Clement Monastery* Monastery Rock, western cliff, (Ibid., p. 74; Tur, 2006, p. 132) 15 Skete Martynov Ravine (Mogarichev, 2005, p. 88)
Cave towns 16 Skete Cherkess-Kermen Ravine (Mogarichev, 2005, p. 115) 17 Monastery Chilter-Marmara (Ibid., p. 89) 18 Monastery Shuldan (Ibid., p. 96) 19 New Saviour Skete* Village of Ternovka (Yashaeva, 2007) Mangoup-Kale: 20 Monastery Southern cliff (Mogarichev, 2005, p. 138) 21 Monastery South-eastern cliff (Ibid., p. 135) 22 Monastery Tabana-Dere Gully (Ibid., p. 139) 23 Monastery Teshkli-Burun Cliff (Ibid., p. 131) 24 Monastery Chilter-Koba (Ibid., p. 145) 25 St. Anastasia Skete* Kachi-Kalyon (Ibid., p. 150) 26 Monastery Tepe-Kermen (Ibid., p. 155) 27 Monastery South Gate, Chufut-Kale (Ibid., p. 171) 28 Dormition of the Mother of
God Monastery* Mariam-Dere Ravine, Bakchisarai
(Tur, 2006, p. 117)
29 Monastery Danillcha-Koba Cave, Village of Sokolinoe
(Republican Committee, 2004)
South Coast 30 St. Elijah Monastery Laspi Bay (Dombrovsky, 1974) 31 Monastery Ifigenia Rock, town of
Kastropol (Ibid.)
32 Monastery Mount Panea, town of Simeiz (Ibid.) 33 Monastery Cape Ai-Thodor (Ibid.) 34 Monastery Palecur Hill, Yalta (Ibid.) 35 St. John Monastery Cape John, Yalta (Ibid.)
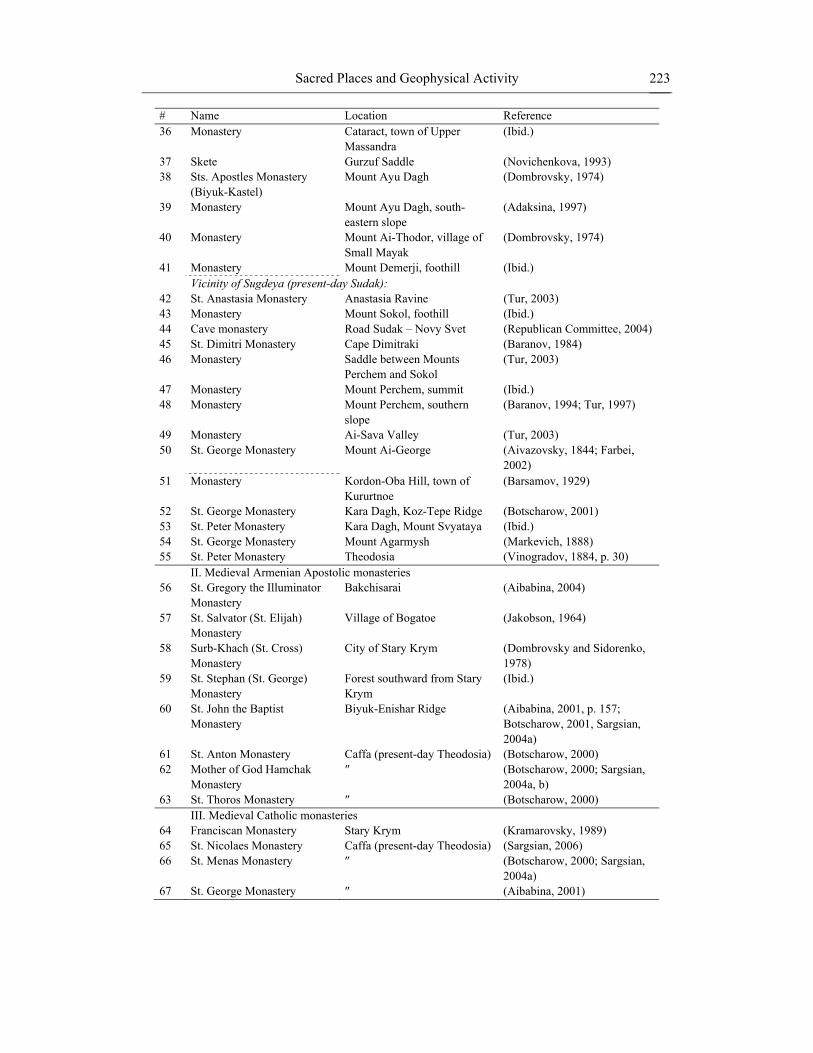
Sacred Places and Geophysical Activity 223
# Name Location Reference 36 Monastery Cataract, town of Upper
Massandra (Ibid.)
37 Skete Gurzuf Saddle (Novichenkova, 1993) 38 Sts. Apostles Monastery
(Biyuk-Kastel) Mount Ayu Dagh (Dombrovsky, 1974)
39 Monastery Mount Ayu Dagh, south-eastern slope
(Adaksina, 1997)
40 Monastery Mount Ai-Thodor, village of Small Mayak
(Dombrovsky, 1974)
41 Monastery Mount Demerji, foothill (Ibid.) Vicinity of Sugdeya (present-day Sudak):
42 St. Anastasia Monastery Anastasia Ravine (Tur, 2003) 43 Monastery Mount Sokol, foothill (Ibid.) 44 Cave monastery Road Sudak – Novy Svet (Republican Committee, 2004) 45 St. Dimitri Monastery Cape Dimitraki (Baranov, 1984) 46 Monastery Saddle between Mounts
Perchem and Sokol (Tur, 2003)
47 Monastery Mount Perchem, summit (Ibid.) 48 Monastery Mount Perchem, southern
slope (Baranov, 1994; Tur, 1997)
49 Monastery Ai-Sava Valley (Tur, 2003) 50 St. George Monastery Mount Ai-George (Aivazovsky, 1844; Farbei,
2002) 51 Monastery Kordon-Oba Hill, town of
Kururtnoe (Barsamov, 1929)
52 St. George Monastery Kara Dagh, Koz-Tepe Ridge (Botscharow, 2001) 53 St. Peter Monastery Kara Dagh, Mount Svyataya (Ibid.) 54 St. George Monastery Mount Agarmysh (Markevich, 1888) 55 St. Peter Monastery Theodosia (Vinogradov, 1884, p. 30) II. Medieval Armenian Apostolic monasteries 56 St. Gregory the Illuminator
Monastery Bakchisarai (Aibabina, 2004)
57 St. Salvator (St. Elijah) Monastery
Village of Bogatoe (Jakobson, 1964)
58 Surb-Khach (St. Cross) Monastery
City of Stary Krym (Dombrovsky and Sidorenko, 1978)
59 St. Stephan (St. George) Monastery
Forest southward from Stary Krym
(Ibid.)
60 St. John the Baptist Monastery
Biyuk-Enishar Ridge (Aibabina, 2001, p. 157; Botscharow, 2001, Sargsian, 2004а)
61 St. Anton Monastery Caffa (present-day Theodosia) (Botscharow, 2000) 62 Mother of God Hamchak
Monastery ″ (Botscharow, 2000; Sargsian,
2004а, b) 63 St. Thoros Monastery ″ (Botscharow, 2000) III. Medieval Catholic monasteries 64 Franciscan Monastery Stary Krym (Kramarovsky, 1989) 65 St. Nicolaes Monastery Caffa (present-day Theodosia) (Sargsian, 2006) 66 St. Menas Monastery ″ (Botscharow, 2000; Sargsian,
2004а) 67 St. George Monastery ″ (Aibabina, 2001)

Igor V. Florinsky 224
Table 8.1. (Continued)
# Name Location Reference IV. Russian Orthodox monasteries 68 St. Vladimir Monastery Sevastopol (Tur, 2006, p. 92) 69 Sts. Kozma and Damyan
Monastery Crimean Mountain Forest Reserve
(Ibid., p. 152)
70 St. Trinity-Paraskeva Convent at Toply
Village of Uchebnoe (Ibid., p. 160)
71 St. Stephan of Surozh Monastery at Kiziltash
Town of Krasnokamenka (Ibid., p. 146)
V. Muslim tekkes 72 Shukurla-Efendi Tekke Gezlev (present-day
Eupatoria) (Zasypkin, 1927; Anokhin and Kutaisov, 2005)
73 Caliph Ahmed-Efendi of Kolech Tekke
″ (Çelebi, 1999)
74 Tekke ″ (Ibid.) 75 Khyzr Shah-Efendi Village of Efendikoi (present-
day Aivovoe) (Ibid.; Monastyrly, 1890b)
76 Tekke Bakchisarai, Eski-Ürt (Monastyrly, 1890b; Bashkirov and Bodaninsky, 1925)
77 Yeshil Jami Tekke Bakchisarai (Monastyrly, 1890b; Bodaninsky, 1916)
78 Sulu-Koba Tekke ″ (Monastyrly, 1890b) 79 Sakyz-Khan Tekke ″ (Ibid.) 80 Yer-Utkan Tekke ″ (Ibid.) 81 Khodji-Suleiman Tekke ″ (Ibid.) 82 Kady-Male Tekke ″ (Ibid.; Voloshinov, 1918) 83 Tekke ″ (Çelebi, 1999) 84 Gazy-Mansur Tekke Mariam-Dere Ravine (Monastyrly, 1890b) 85 Yeni Jami Tekke Ak-Mechet (present-day
Simferopol) (Voloshinov, 1918)
86 Muhammed-Efendi Tekke ″ (Çelebi, 1999) 87 Tekke ″ (Ibid.) 88 Tekke Village of Beshterek (present-
day Donskoe) (Monastyrly, 1890b)
89 Kyrk-Azis Tekke Village of Litvinenkovo (Ibid.) 90 Khan Jami Tekke Kara Sou Bazaar (present-day
Belogorsk) (Monastyrly, 1890b; Zasypkin, 1927)
91–93
Tekkes ″ (Çelebi, 1999)
94 Tahir-Bey Tekke Eski-Kyrym (present-day Stary Krym)
(Çelebi, 1999)
95 Kemal-Ata Tekke ″ (Smirnov, 1886; Kramarovsky, 1989)
96 Ahmed-Efendi Tekke Caffa (present-day Theodosia) (Çelebi, 1999) 97–98
Damad-Efendi Tekkes ″ (Ibid.)
99–104
Tekkes ″ (Ibid.)
* the monastery was resumed by the Russian Orthodox Church.

Sacred Places and Geophysical Activity 225
8.2.1. Monasteries
8.2.1.1. Medieval Byzantine Monasteries Reasons for and times of foundation of Byzantine (Greek Orthodox) monasteries in the
Crimea are still debated. One possibility is that they were founded by monks-iconodules emigrating from Byzantium in the 8th century, in the iconoclastic period (Tur, 2006, p. 27). An alternative proposition is that their foundation was associated with economical and social activity of the local Christian population supported by the Byzantine administration in the 11th–13th centuries (Mogarichev, 2005). Like in other regions, some of the Crimean monasteries were constructed on the locations of heathen sanctuaries. This is certainly known for the skete at Gurzuf Saddle only (Figure 8.1: # 37) (Novichenkova, 1993). The 11th–13th centuries were a golden age of Byzantine monasteries in the Crimea: there were up to sixty monasteries and sketes both in the mountains and on the coast at that time (Figure 8.1 and Table 8.1: # 1–55) (Mogarichev, 2005; Tur, 2006). Most of them were small kinovias for 3–15 monks. A decay of Greek Orthodox monasteries began in the 14th century, after occupation of most of the Crimea by the Golden Horde and Islamization of Tatars. The problem was embellished in 1475, when the Crimean Peninsula was annexed by the Ottoman Empire. Three Greek Orthodox monasteries functioned in the Crimea (Figure 8.1 and Table 8.1: # 1, 28 and 55) by the year 1778, when most Crimean Christians were resettled to the north coast of the Sea of Azov (Tur, 2006, p. 75). Then, only the St. George Monastery functioned (Figure 8.1: # 1). In the mid-19th century, the Russian Orthodox Church (ROC) resumed function of four Byzantine monasteries (Figure 8.1 and Table 8.1: # 14, 19, 25, and 28). However, the Soviet government closed all of them in the 1920s. In the 1990s, the ROC resumed their function (Tur, 2006).
Geographically, one can subdivide the Byzantine monasteries of the Crimea into three groups:
1. Monasteries of the medieval city of Chersonese on the Heraclean Peninsula, and cave
monasteries of the Calamita Fortress near the city of Inkerman (Figure 8.1 and Table 8.1: # 1–15);
2. Monasteries of the South-Western Crimean Mountains located in so-called cave towns, medieval settlements on cuestas of the Inner Ridge of the Crimean Mountains (Figure 8.1 and Table 8.1: # 16–29);
3. Monasteries of the South Coast, from Cape Aya in the west to Cape St. Elijah on the east (Figure 8.1 and Table 8.1: # 30–55).
Monasteries of Chersonese, Calamita, and cave towns included surface edifices and rock-
cut churches, cells, and household premises. Most of rock-cut premises persist today, whereas surface buildings were mainly destroyed. On the South Coast, there were so-called isars, a sort of fortified provincial Byzantine monastery, on coastal hill and rock summits. The remains of their foundations persist. The archaeology of most Byzantine monasteries in the Crimea has been extensively studied (Dombrovsky, 1974; Tur, 2003; Mogarichev, 2005).

Igor V. Florinsky 226
8.2.1.2. Medieval Armenian Apostolic monasteries The foundation of Armenian Apostolic monasteries in the Crimea was connected with the
mass immigration of Armenians in the 13th–14th centuries caused by wars and general instability in Armenia (Mikaelian, 1974). These monasteries were mainly situated in the southeastern Crimea (Figure 8.1 and Table 8.1: # 56–63). They did not function after most of the Crimean Christians had resettled to the north coast of the Sea of Azov in 1778. Archaeologically, these objects are scantily known in comparison with Byzantine monasteries (Jakobson, 1964; Dombrovsky and Sidorenko, 1978). The Surb-Khach Monastery (Figure 8.1: # 58) is the only Armenian Apostolic monastery in the Crimea remaining in relatively good condition. Remains of some other objects were also investigated, excluding monasteries of the city of Caffa (present-day Theodosia) as at this point they are not correctly localized (Botscharow, 2000).
8.2.1.3. Medieval Catholic Monasteries
Foundation of Catholic monasteries in the Crimea was associated with the existence of Genoese colonies there in the 13th–15th centuries (Starokadomskaya, 1974; Botscharow, 2004) and the Vatican’s proselytism (Sargsian, 2006). There were at least four Catholic monasteries (Figure 8.1 and Table 8.1: # 64–67) in the Crimea. Three of them were founded by Armenian Catholics. A church belonging to one of them persists (Figure 8.1: # 67), whereas others were destroyed and cannot be correctly localized. Most likely, these monasteries did not function after 1475, when the Crimea was annexed by the Ottoman Empire.
8.2.1.4. Russian Orthodox monasteries
In the mid-19th century, the ROC resumed function of four Byzantine monasteries (Section 8.2.1.1). Besides these, four new monasteries were founded (Figure 8.1 and Table 8.1: # 68–71). Sites for these monasteries were selected based on their proximity to sacred landscape features, such as rocks and springs, and legends of “miraculous” recoveries in those places (Tur, 2006, p. 86). In the 1920s, the Soviet government closed these monasteries. The ROC resumed their function in the 1990s (Tur, 2006).
8.2.1.5. Muslim tekkes
Tekkes were founded in the Crimea in the 14th century, when members of various Sufi orders, such as Naqshbandi and Suhrawardi, began to visit the peninsula. In the 17th century, there were more than thirty tekkes in the Crimea (Çelebi, 1999) (Figure 8.1 and Table 8.1: # 72–104). One peculiar feature of a tekke was that only a sheikh, the head of an order, lived permanently there. Dervishes traveled nearby or lived with their families, and gathered in the tekke for a relatively short period. The Soviet government closed all of them in the 1920s.
Tekkes are the least known monasteries of the Crimea. In the late 19th – early 20th centuries, there were several attempts to describe them from ethnographic and architectural points of view (Monastyrly, 1890b; Bodaninsky, 1916; Voloshinov, 1918; Zasypkin, 1927). Archaeological studies of tekkes have not been conducted, excluding the only persisting Shukurla-Efendi Tekke in the city of Eupatoria (Figure 8.1: # 72) (Anokhin and Kutaisov, 2005).

Sacred Places and Geophysical Activity 227
8.2.2. Geology
8.2.2.1. General Characteristic Rather complicated topography and geological setting are typical for the territory under
study due to an interaction of the Precambrian East European Platform and the Alpine-Himalayan orogenic belt. It is customary to distinguish three main areas: (a) the Epi-Paleozoic Scythian Plate correlating with the Crimean Plain; (b) the Crimean Meganticlinorium topographically manifested as the Crimean Mountains; and (c) an adjacent foredeep system geomorphologically related to the continental shelf and slope of the Black Sea Basin. One can distinguish several elevated blocks of the Proterozoic folded basement covered by Miocene and Pliocene sediments within the Scythian Plate. The central part of the meganticlinorium – the Main Ridge of the Crimean Mountains – is mainly comprised of Tauric series as well as Middle and Late Jurassic rocks. The Main Ridge and piedmonts include several anticlinoria and synclinoria covered by the Early Cretaceous, Paleogene, and Neogene limestones, clays, and marls (Muratov, 1969).
8.2.2.2. Faults
Two systems of transregional deep mantle faults intersect the Crimean Peninsula: 1. The pre-Riphean approximately north-striking faults of the southern part of the East
European Platform crossing the Ukrainian Shield, Scythian Plate, and extending southward to the Anatolian Peninsula; and
2. The Paleozoic approximately east-striking faults separating the Crimean Mountains from the Crimean Plain and the Black Sea Basin (Figure 8.2) (Chekunov et al., 1965; Pustovitenko and Trostnikov, 1977).
Deep mantle fault zones range in width from 15 to 20 km. They include numerous smaller faults (Pustovitenko and Trostnikov, 1977). The latest reactivation of the fault zones 1, 3, and 4 (Figure 8.2) happened in the Mesozoic time, whereas the latest reactivation of the fault zones 2, 5, and 6 (Figure 8.2) – in the Neotectonic age (Borisenko, 1986).
There is a network of deep crustal faults (Figure 8.2) (Borisenko, 1986). Spatial orientation of regional (Figure 8.2) and local (Figure 8.3) faults is generally controlled by deep crustal faults. Faults of three striking directions dominate:
1. Approximately northeast-striking normal and reverse dip-slip faults with vertical
displacements of up to several hundred meters; 2. Approximately northwest-striking oblique- and strike-slip faults with horizontal
displacements of up to several hundred meters; 3. Approximately north-striking steep sinistral oblique-slip faults with dominant
horizontal displacements of up to 5 km (Rastsvetaev, 1977; Borisenko, 1986). Northeast- and northwest-striking faults probably originated in the Triassic – early
Jurassic time. Being reactivated several times, they are currently active (Borisenko, 1986).

Igor V. Florinsky 228
Figure 8.2. The Crimea: faults and monasteries. Deep mantle fault zones: 1 – Eupatoria-Skadovsk zone, 2 – Salgir-Oktyabrskoe zone, 3 – Orekhovo-Pavlograd zone, 4 – Korsak-Theodosia zone, 5 – Foothill Crimean-Caucasian zone, 6 – Central Crimean-Caucasian zone (Chekunov et al., 1965; Lebedev and Orovetsky, 1966; Pustovitenko and Trostnikov, 1977; Borisenko, 1986). Deep crustal faults: 7 – Kara Dagh fault, 8 – Molbai fault, 9 – Kuchuk-Lambad fault, 10 – Gurzuf fault, 11 – Yalta fault, 12 – Chernaya River fault, 13 – Moinaki fault, 14 – Sasyk fault, 15 – Kacha fault, 16 – Belbek fault, 17 – Kastropol fault, 18 – Demerji fault (Borisenko, 1986), 19 – South Coast fault (Pustovitenko and Trostnikov, 1977), 20 – Agarmysh-Sudak fault (Shtengelov, 1980).
8.2.2.3. Seismicity
The Crimea is a seismically hazardous region. VIII degree earthquakes are possible on the South Coast, from Cape Sarych to the city of Sudak, as well as along some deep mantle and crustal faults (Figure 8.4) (Borisenko, 1986).
Most earthquake epicenters (Figure 8.4) are located on the continental slope of the Black Sea Basin, along the length of the Central Crimean-Caucasian deep mantle fault zone (Figure 8.2). Epicenter numbers increase at the intersection of this fault with the Salgir-Oktyabrskoe and Orekhovo-Pavlograd deep mantle faults (Figure 8.2) (Pustovitenko and Trostnikov, 1977; Borisenko, 1986).
In the 20th century, earthquake epicenters migrated from the land southwestward to the abyssal basin with an average velocity of 1 km per year. The reactivation period of seismic processes in the region is about 240 years (Pustovitenko and Kamenobrodsky, 1976). The last strong earthquake measuring 8 on the Richter scale occurred on September 11–12, 1927. Its epicenter was located offshore, about 25 km from the city of Yalta (Voznesensky, 1927; Muratov, 1969, p. 447).

Sacred Places and Geophysical Activity 229
Figure 8.3. Local faults and monasteries: (a) Sudak vicinities (Shtengelov, 1980; Borisenko, 1986; Saintot et al, 1999); (b) the Heraclean Peninsula: I – North Bay graben, II – Chernaya River graben, III – George dip-slip fault, IV – Fiolent dip-slip fault, and V – Monastery dip-slip fault (Borisenko et al., 1982); a framed area is shown in detail in Figure 8.7a. Arabic numerals denote monasteries (Table 8.1).

Igor V. Florinsky 230
Figure 8.4. The Crimea: earthquake intensity zones (Borisenko, 1986), earthquake epicenters from 63 BC to 1980 (Pustovitenko and Trostnikov, 1977; Borisenko, 1986), and monasteries.
Figure 8.5. The Crimea: regional magnetic anomalies (Makarova, 1974) and monasteries.

Sacred Places and Geophysical Activity 231
8.2.2.4. Geomagnetic Field Regional magnetic anomalies reflect a distribution of magnetized rocks in the sediment
cover and basement (Makarova, 1974). The geomagnetic field intensity is generally decreased in the western Crimea, whereas it is increased in the eastern Crimea (Figure 8.5). The border between the two areas correlates with the Salgir-Oktyabrskoe deep mantle fault zone (Figure 8.2). There is also the large negative regional anomaly with the minimum located offshore, southeastward from Cape Meganome (Figure 8.5).
In the Crimea, local magnetic anomalies correlate with intrusions observed along deep faults (Dvoitchenko, 1928; Lebedev et al., 1963; Avdulov, 1966). Particularly, igneous rocks are marked by the increased content of magnetic components within the Foothill Crimean-Caucasian deep mantle fault zone. Magnetic susceptibility of local intrusive rocks and sediments enclosing them is 126–333 × 10-4 and 3.2–8.8 × 10⁻⁴ SI units, respectively (Lebedev et al., 1963, p. 57). There are also local magnetic anomalies associated with the Kara Dagh volcanic massif and laccolites of the Alushta area (Avdulov, 1966).
8.3. MATERIALS AND METHODS
8.3.1. Monasteries To produce a monastery sample, the author considered cultic complexes with a
monastery status that was documented and/or archaeologically supported (see Table 8.1 for references). This is because in the 19th century, Crimean Tatars used the word “monastery” to refer to remains of all Christian cultic buildings including churches and chapels (Köppen, 1837, p. 12). This led to numerous confusions in the regional and historical literature. As a result, the monastery sample consists of 104 objects (Florinsky, 2008):
• Medieval Byzantine monasteries and sketes, 55 objects; • Medieval Armenian Apostolic monasteries, 9 objects; • Medieval Catholic monasteries, 4 objects; • Russian Orthodox monasteries, 4 objects; • Muslim tekkes, 33 objects. Locations of all monasteries were set on medium-scale topographic maps (General
Headquarters, 1976–1990). Then, they were used to produce a small-scale map of the Crimean monasteries (Figure 8.1).
The author did not insert four cultic complexes with evident monastery status into the sample:
• St. George Russian Orthodox Monastery at Kartelez near the city of Kerch (a
Byzantine monastery resumed by the ROC) (Tur, 2006, p. 142) and a tekke in Kerch (Çelebi, 1999) because they are situated outside of the study area;
• Bishop’s House in the city of Simferopol with the official status of a monastery (Tur, 2006, p. 166) since its administrative purpose is clear;

Igor V. Florinsky 232
• St. Trinity Russian Orthodox Convent in Simferopol since it was founded on the basis of a parish church in 2003.
Several objects with questionable monastery status were also not inserted into the sample
as follows: • Caves at the Baksan Ridge in the Crimean Mountains (Ivanov et al., 1963), a
settlement at Mount Boika (Dombrovsky, 1968), the cave town of Bakla southward from Simferopol, (Mogarichev, 2005, p. 181); and caves at the Karani and Fedyukhin Heights near Sevastopol (Yashaeva, 1997) because there is no firm evidence of monasteries there;
• St. Basil Monastery in Theodosia (Démidoff, 1855, p. 208) since it was not mentioned in other sources and was not localized;
• Several non-localized monasteries (?) near the villages of Morskoe, Bogatovka, and Shchebetovka (Aivazovsky, 1844).
The author did not consider other types of sacred places: • Azises, viz., tombs of local Muslim saints (Monastyrly, 1890a); • Sacred landscape features, such as sacred groves, mountains, rocks, springs, and trees
(Kovalenko, 2001); • Classical and early medieval heathen sanctuaries.
8.3.2. Geology A fault map (Figure 8.2) was compiled using several sources including maps obtained by
the interpretation of geological, geophysical, and remotely sensed data (Chekunov et al., 1965; Lebedev and Orovetsky, 1966; Pustovitenko and Trostnikov, 1977; Borisenko, 1986). The map represents faults of three spatial ranges: deep mantle fault zones, deep crustal faults, and inter-block faults. A map of earthquake intensity zones (Figure 8.4) represents results of the regional seismic zonation carried out employing data on spatial distribution of faults, paleoseismic dislocations, seismogravitational phenomena, and archaeological information on earthquake-related damage (Borisenko, 1986). A map of the regional magnetic anomalies (Figure 8.5) was compiled using data from aeromagnetic and hydromagnetic surveys (Makarova, 1974). Large- and medium-scale maps of magnetic anomalies were not available for the Crimea.
The author carried out a comparative analysis of spatial distribution of monasteries (Figure 8.1) relative to faults (Figure 8.2), earthquake intensity zones (Figure 8.4), and regional magnetic anomalies (Figure 8.5). There are two areas marked by an abnormally high number of monasteries: the vicinity of Sudak and the Heraclean Peninsula. These areas are examined in detail (Figure 8.3).

Sacred Places and Geophysical Activity 233
8.4. RESULTS Let us analyze the distribution of the Crimean monasteries depending on faults (object
numbering below corresponds to that in Figure 8.1 and Table 8.1). There are ten objects running lengthwise with the Kara Dagh fault and attendant inter-
block fault (Figure 8.2): three Byzantine monasteries of the Kara Dagh area (# 51–53), two functioning Russian Orthodox monasteries of St. Stephan of Surozh and St. Trinity-Paraskeva (# 71 and 70), St. Salvator Armenian Apostolic Monastery (# 57), and four tekkes of Kara Sou Bazaar (# 90–93). St. Trinity-Paraskeva Convent is located in the junction node of the Kara Dagh fault with three inter-block faults, St. Salvator Monastery is at the intersection of the Kara Dagh fault with the Orekhovo-Pavlograd fault zone, and tekkes are at the intersection of the Kara Dagh fault with an inter-block fault within the Foothill Crimean–Caucasian fault zone.
One of the two areas of the increased number of Byzantine monasteries (# 42–49) encloses slopes of Mounts Perchem and Sokol in proximity to Sudak (Figure 8.3a). The area is located near an inferred offshore intersection of the Molbai and Sudak-Agarmysh faults, and at the intersection of the Sudak-Agarmysh fault with two inter-block faults (Figure 8.2). The area measures 2.5 by 5 km. The average density of monasteries is one object per 1.5 km2. An analysis of medium-scale maps demonstrated that one-half of the objects are located on intra-block faults (Figure 8.3a).
Remains of a Byzantine monastery (# 40) and the functioning Russian Orthodox Monastery of Sts. Kozma and Damyan (# 69) are located on the Kuchuk-Lambad fault (Figure 8.2), at its intersection with inter-block faults. There are fourteen objects along the Gurzuf fault (Figure 8.2): the skete at Gurzuf Saddle (# 37), a monastery of Tepe-Kermen (# 26) at the intersection with an inter-block fault, and monasteries of the city of Bakchisarai (# 27, 28, 56, and 76–84) at the intersection with the Foothill Crimean-Caucasian fault zone. On the Yalta fault (Figure 8.2), there are remains of two Byzantine monasteries (# 34 and 35), Chilter-Koba monastery (# 24) at the intersection with an inter-block fault, and a tekke (# 75) at the intersection with the Kacha fault. There is a monastery in Danillcha-Koba Cave (# 29) at the intersection of the Belbek fault with an inter-block fault (Figure 8.2).
There are ten objects along the Chernaya River fault (Figure 8.2): remains of a Byzantine monastery at Ifigenia Rock (# 31) are placed at the intersection with the Kastropol fault and two inter-block faults, whereas the area of the increased number of Byzantine monasteries near the Calamita Fortress (# 7–15) is located at the junction node of the North Bay and Chernaya River grabens (Figure 8.3b). The area size and monastery density are the same as in the vicinity of Sudak (see above). Objects 11–14 are close to the east side of the Chernaya River graben, whereas objects 7–10 are to the south side of the North Bay graben. Nearby, there are the Byzantine Monastery of the Mother of God of Blachernai and the Russian Orthodox Monastery of St. Vladimir (# 4 and 68).
Three tekkes of Ak-Mechet (# 85–87) are situated on the Kacha fault (Figure 8.2). Three tekkes in Gezlev (# 72–74) are located at the intersection of the Moinaki and Sasyk faults within the Eupatoria-Skadovsk fault zone. There are five objects along the Demerji fault (Figure 8.2): two tekkes of the city of Stary Krym (# 94 and 95), two Byzantine monasteries (# 41 and 54), and a Franciscan monastery (# 64).

Igor V. Florinsky 234
St. Cross Armenian Apostolic Monastery (# 58) and the Byzantine monasteries of Kachi-Kalyon, Mangoup-Kale, Simeiz, and Ayu Dagh (# 25, 19–23, 32, 38, and 39) are set at inter-block faults. St. Stephan Armenian Apostolic Monastery (# 59) and two Byzantine monasteries (# 36 and 50) are located at junction nodes of inter-block faults. Monasteries of Theodosia (# 55, 60–63, 65–67, and 96–104) are situated within the Foothill Crimean-Caucasian fault zone, near its intersection with the Korsak-Theodosia fault zone (Figure 8.2). Several monasteries of the Heraclean Peninsula (# 1–6) are located at the Eupatoria-Skadovsk and Foothill Crimean-Caucasian fault zones (Figure 8.2), in proximity to their intersection. St. George Monastery and a Byzantine monastery in Sarandinaki Ravine (# 1 and 5) are placed on inter-block faults (Figure 8.3b). Monasteries of the cave towns of Tepe-Kermen, Chilter-Marmara, and Shuldan (# 16–18) are located within the Foothill Crimean-Caucasian fault zone, whereas a tekke in Beshterek (# 88) is set within the Salgir-Oktyabrskoe fault zone.
Thus, almost all Crimean monasteries are situated on fault lines of various ranges or at their intersections (Figures 8.2 and 8.6a). The analysis of the spatial distribution of monasteries relative to the earthquake intensity zones and the regional magnetic anomalies demonstrated that most objects are located within the VII–VIII degree zones (Figures 8.4 and 8.6b), whereas about 70% of monasteries are placed within negative magnetic anomalies of the South-Western Crimea and the Meganome Peninsula (Figures 8.5 and 8.6c).
8.5. DISCUSSION
8.5.1. Faults, Magnetic Anomalies, and Monasteries There is no preferential dependence of monastery location on a particular strike
orientation or kinematic characteristic of faults. Contrary to expectations, there is also no preferential relation between monasteries and fault intersections (Figure 8.6a). Favorable conditions for fluid migration and ore formation exist in these sites due to more intensive rock fracturing in comparison to faults (Kutina, 1969; Fedorov et al., 1989; Florinsky, 2000). Earthquake epicenters frequently occur within fault intersections (Gelfand et al., 1972). At a continental scale, spatial distribution of dynamically developing cities correlates with fault intersections, probably because of increased geophysical activity observed there (Skvortsov, 1991; Zhidkov et al., 1999), which can provoke systematic progressive changes in human group behavior (Section 4.3.1).
Thus, it is not clear why a particular monastery is located at a specific point of a fault. Secondary factors are obviously important in the selection of a site to erect a monastery, such as relative remoteness, availability of water, soil, and forest resources for monastery life and manufacturing.
The selection of a specific point may be connected with the existence of a local magnetic anomaly there. Available geophysical data shows that three Byzantine monasteries (# 51–53) are placed near the local magnetic anomaly (Avdulov, 1966) of the Jurassic volcanic massif of Kara Dagh (Muratov, 1969, p. 308). Byzantine monasteries of Mounts Ayu Dagh and Ai-Thodor (# 38–40) are located at the late Triassic – early Jurassic gabbro-diabase intrusive massives (laccolites) in proximity to Alushta (Muratov, 1969, p. 331) (Figure 8.5). A

Sacred Places and Geophysical Activity 235
Byzantine monastery at Kartelez in the vicinity of Kerch (Tur, 2006, p. 142), located 50 km east of the study area, is placed near the Kartelez iron ore deposit (Muratov, 1974, p. 72).
Figure 8.6. Distribution of monasteries depending to (a) faults and fault intersections; (b) earthquake intensity zone; (c) regional magnetic anomalies.
It is intriguing that one of the two areas of increased density of Byzantine monasteries (Figure 8.3b: # 7–15) is located around a hill with the medieval fortress of Calamita, which is also known as Kalamita (the vicinity of the present-day Inkerman – Mogarichev, 2005, p. 68). Kalamita is usually translated as Reeded (Greek: κάλαμος – reed), as the Chernaya River is reeded there. However, researchers are aware of the name of this fortress from medieval Italian nautical charts. Calamita means “magnet” in some Romance languages including Italian. This word is used as a toponym for areas known for iron ores (e.g., there are iron deposits and mines at the Calamita Peninsula, Elba Island – Benvenuti et al., 2004). Were

Igor V. Florinsky 236
there iron mines near the Crimean Calamita in the Middle Ages? The author has no archaeological or historical evidence. Are there sediments with an increased content of magnetic components in Inkerman’s vicinities? There are generally Neogene oolitic limestones and Paleogene marls and clays there (Borisenko, 2001). The lack of detailed maps of magnetic anomalies hinders a verification of this proposal.
The author calls the reader’s attention to the location of the majority of monasteries within negative regional anomalies of the geomagnetic field (Figure 8.6c). One may speculate that stronger mystical experience could occur at local magnetic anomalies against a background of a decreased regional geomagnetic field during a magnetic field pulsation (a contrast effect).
The role of active faults in the selection of a place for a monastery makes itself evident in the junction of the North Bay and Chernaya River grabens, nearby the Calamita Fortress (Figure 8.3b). There is an Upper Quaternary paleoseismic dislocation there associated with a dip-slip fault bounding the North Bay graben on the north (Borisenko et al., 1982). Catastrophic movements caused by an extremely strong earthquake have generated the dislocation. The fault is recently active: a railway tunnel was damaged there during the 1927 Crimean earthquake (Borisenko, 1986). One of the two areas of increased numbers of Byzantine monasteries is located precisely there (Figure 8.3b: # 7–15).
St. George Monastery at Cape Fiolent (Figure 8.7a) exemplifies the combined role of geological and geophysical factors in the sacralization of landscape features and origination of pilgrimage places. According to the official legend of the ROC (Berthier-Delagard, 1910), Greek fishermen were caught by a heavy storm in the sea nearby Cape Fiolent in the year 891. The storm drove their ship toward sea rocks. Suddenly, they noticed Saint George the Conqueror within a fiery column on top of a sea rock. Immediately afterwards the storm subsided. The rescued crew climbed the rock, and found an icon of St. George there. In memory of this event, a monastery was founded on the steep rocky cliff (Figure 8.7b), and the cross was installed on St. Appearance Rock at a distance of 100 m from the beach (Figure 8.7c).
The author supposes that the legend describes the SLO observation and a related mystical experience. Indeed, there are intensive striped magnetic anomalies ranging from 1,200 to -800 nT on the shelf between Cape Chersonese and the city of Balaclava (Figure 8.3b) (Gorodnitsky et al., 1967). Intrusive bodies associated with faults probably caused them. The cliffs are composed of effusive rocks (Figure 8.3b) with an increased content of magnetic components (Pechersky et al., 1991). There are several intra- and inter-block faults on the land in proximity to St. George Monastery (Figure 8.3b) (Borisenko et al., 1982). It is possible that there are offshore extensions of the faults and a complex offshore node of their intersection or junction at a distance of 1 km from the monastery (Figure 8.3b).
The seismicity is apparent for this territory (Figure 8.4). Variations of the geomagnetic field have been recorded during earthquakes in the Crimea (Dvoitchenko, 1928). Earthquake lights have also been observed there. During the 1927 Crimean earthquake, there were reports of large fiery flares erupting from the Black Sea about 40 km offshore between Sevastopol and Cape Lucullus (Voznesensky, 1927; Popov, 1928).
It is known that SLO are often observed above hills (Persinger, 1976, 1984a). In the case of the St. George’s appearance near Cape Fiolent, SLO probably formed in the sea at the fault intersection, whereas St. Appearance Rock played the role of a hill.

Sacred Places and Geophysical Activity 237
Figure 8.7. St. George Monastery at Cape Fiolent: (a) a remotely sensed image mosaic of the area; (b) a monastery church; (c) St. Appearance Rock (44º30'06" N, 33º30'31" E). Photos by Elizaveta Vershinina.
To avoid misunderstanding, the author should note several obvious facts. First, the foundation and functioning of monasteries depend not only on natural, but on social and

Igor V. Florinsky 238
political factors as well. Thus, the increased number of monasteries near Chersonese (Figure 8.3b), Sugdeya (present-day Sudak – Figure 8.3a), Caffa, and Bakchisarai (Figure 8.1) was also associated with political, religious, and administrative importance of these medieval cities. The Islamization of the Crimean Greeks and Tatars has caused the decay of Byzantine monasteries and concurrent foundation of tekkes. In the mid-19th century, there was a political necessity to re-Christianize the Crimea to integrate it into Russian life. This was the main reason to reactivate some medieval monasteries and to found new ones (Tur, 2006, p. 191). Ideological issues were the key factors for both the closing of monasteries by the Soviet government and their resuming in the post-Soviet era. Second, aside from mystical or religious motivations, there may be other reasons to become a monk. For example, the mass escape of Byzantine men to monasteries in the 7th century (the monk number is estimated at 100,000 persons) was economically motivated (Tur, 2006, p. 21). Third, sacralization of the landscape can be provoked by not only pulsed magnetic fields, but other environmental agents as well. For example, geothermal springs, usually located at fault zones, have been used by Native Americans as a sacred place (Lund, 1996) due to well known healing effects of thermal waters associated with their chemical and gaseous composition (Section 3.4.1). Finally, some sacred places may be selected without regard for geological setting, but maybe because particular persons had, say, biochemically induced unio mystica there (e.g., taking hallucinogenic plants, mushrooms, or drugs – La Barre, 1979; Dobkin de Rios and Janiger, 2003; Partridge, 2003; Griffiths et al., 2006). However, all these factors may be considered as secondary in the selection of the site for a monastery.
8.5.2. Mystical Experience and Human Health Natural and artificial magnetic fields can influence all functional systems of the human
organism (Persinger et al., 1973; Dubrov, 1978; Zhadin, 2001; Palmer et al., 2006) (Section 4.2). However, magnetic fields manifest their biotropic properties in narrow frequency and amplitude ranges (Adey, 1980; Raevskaya, 1988). The influence of magnetic fields can be both positive and negative depending on the intensity, frequency, exposure time, radiation source location, and individual health condition (Persinger et al., 1973; Andronova et al., 1982; Raevskaya, 1988; Markov, 2007). Therefore, it is hard to say if visits to sacred places are healthy for an average person. In particular, it is known that an SLO may induce a range of temporary dysfunctions, acute and chronic diseases, and death, depending on the SLO observation time and energetic characteristics and the distance between the SLO and an observer (Persinger, 1983a, 1988a; Bisson and Persinger, 1993; Shitov, 1999; Suess and Persinger, 2001). This is connected with a potential pathogenic influence of electromagnetic fields (Yakovleva, 1973; Marino and Becker, 1977; Raevskaya, 1988). Besides, there are fluid and gas emanations and geochemical anomalies along faults, lineaments, and at their intersections due to increased permeability of the crust (Kasimov et al., 1978; Trifonov and Karakhanian, 2004; King et al., 2006). On the one hand, such geochemical anomalies can cause temporary dysfunctions and chronic diseases of various nosologies (Persinger, 1987; Melnikov et al., 1994) (Section 3.3; Chapter 6). On the other, sources of healing geological products (e.g., mineral and thermal waters and muds) are also connected with active faults and local geochemical anomalies (Section 3.4).

Sacred Places and Geophysical Activity 239
It is also hard to say if a mystical experience is good for somatic or mental health. There is a stereotype that any mystical experience can improve the general condition of any individual (Levin and Steele, 2005; Lange and Thalbourne, 2007). However, a strong mystical experience can lead to mental and somatic injuries (Boiko, 2001). Probably, the relative metabolic level of brain hemispheres is the key factor responsible for positive or negative psychosomatic effects of a mystical experience (Persinger, 1993b). The possibility of the occurrence of mystical experience increases under the metabolic asymmetry of the brain. This is typical for persons with (a) a dominant right hemisphere, such as right-handed females and left-handers (Persinger and Richards, 1991; Tiller and Persinger, 1994); (b) changes in the structural symmetry of the brain due to injuries (Persinger, 1994); (c) decreased metabolism of the left prefrontal cortex during chronic depression; (d) temporarily decreased activity of the left hemisphere during drowsiness, hypnagogic states, and distress (Persinger and Healey, 2002); and (e) systematic meditative experience (Persinger, 1992). The intensity of mystical experience depends on the lateralization level of mental processes: it can be higher for right-handed men and lower for right-handed females and left-handers (Persinger, 2003). Emotional valence of mystical experience also depends on the lateralization of metabolic processes: pleasant emotions dominate under the increased metabolism of the left hemisphere (Persinger, 1993b, 1994).
The main problem is a trend towards increased frequency of the mystical experience (Persinger, 1993b). One can see a similarity to epilepsy developing from a pathological focus to an epileptic focus, and finally to the epileptic brain; or from repeated single seizures to periodical ones, and finally to the generalization of the disease (Chubinidze and Chubinidze, 1982). During prolonged increased activity of the right hemisphere, frequent mystical experiences lead to the increased expression of the adrenocorticotropic hormone, general immune deficiency, cell immune dysfunctions, and finally oncological diseases. During prolonged increased activity of the left hemisphere, frequent mystical experiences lead to increased immune reaction, activation of lymphocyte expression, and finally autoimmune diseases (Persinger, 1993b).
It is pertinent to recall some rules of traditional Yoga. First, a disciple is instructed to practice techniques triggering mystical experience after comprehensive preparation of the body and mind with special practices (Swami Satyananda Saraswati, 1989; Boiko, 2001). The preparation usually takes no less than five years. There are similar requirements in Sufism (Mekerova, 2005). Second, the aim of some yogic methods, specifically pranayama (breathing exercises), is the creation of equilibrium in the activity of the right and left hemispheres (Swami Satyananda Saraswati, 1989).
This seems contrary to a stereotype of “the healing power” of sacred places. However, one should consider that pilgrims usually spend a short time in monasteries or at adjacent territories: from several hours to several days. As noted above, mystical experiences can lead to the intensive immune reaction under the increased activity of the left hemisphere. This may explain recoveries of non-autoimmune patients after strong religious experiences or visits to sacred places (Persinger, 1993b). Another mechanism can explain “miraculous” recoveries of persons suffering from chronic or incurable autoimmune diseases: A nocturnal exposure of the extremely low frequency pulsed weak magnetic fields (7 Hz, 25–50 nT) for several consequent nights may suppress a hyperactive immune system and hence relieve an autoimmune illness (Cook and Persinger, 2000; Cook et al., 2000). Thus, the exposure time or dose of the pulsed magnetic fields is probably a key factor responsible for positive or negative

Igor V. Florinsky 240
somatic effects of visits to sacred places. Besides, recoveries can be associated with well known therapeutic effects of mineral and thermal water springs (Petraccia et al., 2006) (Section 3.4.1), which are commonly located at monasteries and other sacred places. Finally, one should also consider the possibility of the placebo effect.
As for persons permanently living in monasteries, it is known that an individual usually ceases to care about personal health after obtaining a mystical experience. This may explain a rather short life and death from oncological and autoimmune diseases typical for some famous mystics, such as Sri Ramakrishna and Swami Vivekananda (Rolland, 1929, 1930). It seems that the concept of hormesis – low-dose stimulation and high-dose suppression of a living organism by the same external agent (Calabrese, 1994, 2008) – can be used to interpret such contradictory effects of sacred places.
8.5.3. Geomagnetic Activity, Altered States of Consciousness, and “Paranormal” Skills
It is known that monks, persons who previously had mystical experiences, and people
practicing psychological techniques (e.g., meditation) may possess some “paranormal” abilities, such as telepathy, remote viewing, and other poorly understood phenomena.
Mystical experience results from microseizures in the deep structures of the right temporal lobe (Section 8.1.1). Data from electroencephalography, magnetic resonance imaging, and photon emission tomography demonstrated that other forms of altered states of consciousness, achieved by meditation, religious rites, and hypnosis, have other neurophysiological correlates (Lou et al., 1999; Azari et al., 2001; Dietrich, 2003; Previc, 2006; Lutz et al., 2004). They may involve large cortical areas and deep brain structures. Moreover, different neurophysiological correlates may be activated in different phases of a psychological technique. The same holds true for “paranormal” abilities. For example, a remote viewing phenomenon (Puthoff and Targ, 1974) is associated with the activity of the parietal and occipital cortex (Persinger et al., 2002; Roll et al., 2002). Near-death experiences are speculatively linked to a number of brain structures (Greyson, 2006).
Different types of altered states of consciousness and extrasensory skills are differently stimulated by geomagnetic activity. Like mystical experiences, autoscopy (Brugger et al., 1997) is more probable during periods of the increased geomagnetic activity (Persinger, 1995). Regularities of telepathic skills, such as the forecast of crises, sudden illnesses, and death of relatives and friends, are more complex. A long-term forecast (in a period of several hours or days) does not depend on geomagnetic activity. A short-term forecast (in a matter of minutes) is more probable during decreased geomagnetic activity. A sudden awareness about a death 3–4 days after the event is more probable during increased geomagnetic activity (Persinger, 1985b, 1993a; Schaut and Persinger, 1985). These might testify to a preferential influence of different frequencies or frequency patterns of the geomagnetic field on neurophysiological correlates of the phenomena mentioned. This would be in agreement with the “window effect”, the phenomenon of the preferential biotropy of narrow frequency and amplitude ranges of magnetic fields (Adey, 1980; Raevskaya, 1988; Kleimenova et al., 2007).

Sacred Places and Geophysical Activity 241
8.6. CONCLUSION The author proposed the hypothesis that the complex of geological and geophysical
factors is of importance for the selection of a sacred place: regional and local active faults, local magnetic anomalies, regional and local lithospheric stresses, and regional seismic activity (Florinsky, 2008). The following cause and effect chain is assumed: Along faults and at fault intersections, the crust exhibits increased permeability over geological time scales. This creates conditions conducive to the development of ore concentrations and magmatic bodies generating local magnetic anomalies. Geomagnetic storms modulate the intensity of the geomagnetic field within these anomalies. Before an earthquake, the rise of local and regional lithospheric stress leads to electron hole currents, which also modulate the intensity of local magnetic anomalies and sometimes produce SLO. Local fluctuations of the geomagnetic field and pulsating magnetic fields of SLO influence the brain and can lead to a mystical experience.
The analysis of the statistically representative sample of sacred places and geological and geophysical data lent some credence to this view. Almost all Crimean monasteries are located along faults of various ranges or at their intersections. Most monasteries are placed within earthquake intensity zones of VII–VIII degrees as well as within regions with decreased regional geomagnetic intensity.
Geologically, the Mountain Crimea may be considered as a relatively typical portion of the Alpine–Himalayan collision belt (Trifonov et al., 2002) (Figures 9.10 and 9.12). Therefore, the author supposes that his hypothesis can be applied to almost any part of this vast territory, and the obtained results can be reproduced in other tectonically active regions of the world. For example, the pillar, on which Saint Simeon the Stylite lived for about 40 years, as well as the St. Simeon Monastery near Aleppo, Syria are located on one of the seismically active branches of the St. Simeon fault (Karakhanian et al., 2008). However, many ancient monasteries are situated within platforms (Fedorov, 2004, 2007), which are relatively stable terrains. In this case, applicability of the hypothesis requires a special investigation.
The lack of large-scale data on the geomagnetic field did not allow us to compare spatial distribution of monasteries with local magnetic anomalies. This is a subject of further research. Statistically representative, synchronous geophysical, biochemical, biophysical, and neurophysiological measurements in situ would be useful to furnish insights into mechanisms of the occurrence of mystical experience under exposure of naturally pulsed magnetic fields as well as psychosomatic variations caused by mystical experience.
Researchers of neurophysiological roots of mystical experience have repeatedly stressed that results of their studies cannot support or demolish a hypothesis for the existence of God (D’Aquili and Newberg, 1993; Ashbrook, 1996; Saver and Rabin, 1997). This note also relates to the chapter.
ACKNOWLEDGMENTS The author thanks E.A. Aibabina, S.G. Botscharow (Crimean Branch, Institute of
Archaeology, National Academy of Sciences of Ukraine, Simferopol, Crimea), A.A. Evseev,

Igor V. Florinsky 242
G.A. Kulyasova (Theodosia Regional Museum, Theodosia, Crimea), T.E. Sargsian (Scientific Research Center of Crimeology, Simferopol, Crimea), N.G. Novichenkova (Crimean State Humanitarian University, Yalta, Crimea), A.E. Fedorov (Scientific Seminar “The system of the planet Earth”, Moscow, Russia), and A.I. Poletaev (Geological Faculty, Moscow State University, Moscow, Russia) for expert opinions and discussions, F. Freund (NASA Ames Research Center, Moffett Field, USA), and C. Heriot-Maitland (Oxford Doctoral Course in Clinical Psychology, University of Oxford, UK) for useful criticism, O.V. Starovoitova (Crimean Branch, Institute of Archaeology, National Academy of Sciences of Ukraine, Simferopol, Crimea) and I.A. Druzhinina (Institute of Archaeology, Russian Academy of Sciences, Moscow, Russia) for librarian assistance, M. Dobkin de Rios (California State University, Fullerton, USA) for materials, and B.P. Mulligan (Neuroscience Research Group, Laurentian University, Sudbury, Canada) for linguistic help.
REFERENCES
Adaksina, S.B. (1997). Research of a monastery complex on the south-eastern slope of Mount Ayu Dagh. In V.A. Kutaisov (Ed.), Archaeological studies in the Crimea in 1994 (pp. 11–13). Simferopol, Crimea: Sonat (in Russian).
Adey, W.R. (1980). Frequency and power windowing in tissue interactions with weak electromagnetic fields. Proceedings of the IEEE, 68, 119–125.
Aibabina, E.A. (2001). The art of stone carving in Caffa, the 14th–18th centuries. Simferopol, Crimea: Sonat (in Russian, with English contents, summary, and figure captions).
Aibabina, E.A. (2004). Reliefs and architectural ornaments of Armenian medieval churches in the Crimea. Istoricheskoe Nasledie Kryma, 5, 6–16 (in Russian).
Aivazovsky, G. (1844). Remains of the Christian antiquities in the Crimea (the District of Theodosia). Zapiski Odesskogo Obshchestva Istorii i Drevnostei, 1, 320–328 (in Russian).
Andronova, T.I., Deryapa, I.R. and Solomatin, A.P. (1982). Heliometeotropic reactions of healthy and sick people. Leningrad, USSR: Medicina (in Russian).
Anokhin, V.V. and Kutaisov, V.A. (2005). Tekke in Gezlev. Istoricheskoe Nasledie Kryma, 9, 127–133 (in Russian).
Ashbrook, J.B. (1996). Interfacing religion and the neurosciences: a review of twenty-five years of exploration and reflection. Zygon, 31, 545–572.
Avdulov, M.V. (1966). Gravitational and magnetic fields of the Mountain Crimea. In V.A. Magnitsky, Y.D. Bulange and Y.A. Meshcheryakov (Eds.), The setting of the Black Sea Basin (pp. 27–30). Moscow, USSR: Nedra (in Russian, with English abstract).
Azari, N.P., Nickel, J., Wunderlich, G., Niedeggen, M., Hefter, H., Tellmann, L., Herzog, H., Stoerig, P., Birnbacher, D. and Seitz, R.J. (2001). Neural correlates of religious experience. European Journal of Neuroscience, 13, 1649–1652.
Bar-El, Y., Durst, R., Katz, G., Zislin, J., Strauss, Z. and Knobler, H.Y. (2000). Jerusalem syndrome. British Journal of Psychiatry, 176, 86–90.
Baranov, I.A. (1984). Excavations on Cape Dimitraki near Sudak. In B.A. Rybakov (Ed.), Archaeological discoveries in 1982 (pp. 242–243). Moscow, USSR: Nauka (in Russian).

Sacred Places and Geophysical Activity 243
Baranov, I.A. (1994). Archaeological study of Sugdeya-Soldaya. In V.A. Kutaisov (Ed.), Archaeological studies in the Crimea in 1993 (pp. 37–42). Simferopol, Crimea: Tauria (in Russian).
Barsamov, N.S. (1929). Archaeological excavations in Otuzy in 1927–1928. Izvestiya Tavricheskogo Obshchestva Istorii, Archeologii i Etnografii, 60, 165–169 (in Russian).
Bashkirov, A. and Bodaninsky, U. (1925). Monuments of the Crimean Tatarian past: Eski-Ürt. Novy Vostok, 8/9, 295–311 (in Russian).
Belisheva, N.K., Popov, A.N., Petukhova, N.V., Pavlova, L.P., Osipov, K.S., Tkachenko, S.E. and Baranova, T.I. (1995). Qualitative and quantitative evaluation of the effect of geomagnetic field variations on the functional state of the human brain. Biophysics, 40, 1007–1014.
Benvenuti, M., Boni, M. and Meinert, L. (2004). Skarn deposits in southern Tuscany and Elba Island (central Italy): Field trip guide book (pre-congress B18), the 32nd international geological congress, Florence, Italy, Aug. 20–28, 2004. Roma, Italy: Italian Agency for the Environmental Protection and Technical Services.
Berthier-Delagard, A.L. (1910). On the history of Christianity in the Crimea. Zapiski Imperatorskogo Odesskogo Obshchestva Istorii i Drevnostei, 28, 1–108 (in Russian).
Bisson, C. and Persinger, M.A. (1993). Geophysical variables and behavior. LXXV: Possible increased incidence of brain tumors following an episode of luminous phenomena. Perceptual and Motor Skills, 77, 1088–1090.
Bodaninsky, U. (1916). Monuments in Bakchisarai. Zapiski Krymskogo Obshchestva Estestvoispytatelei i Lyubitelei Prirody, 6, 125–129 (in Russian).
Boiko, V.S. (2001). Yoga: The art of communication. Moscow, Russia: Svetoch (in Russian). Booth, J.N., Koren, S.A. and Persinger, M.A. (2003). Increased proportions of sensed
presences and occipital spikes with 1- and 10-msec. point duration of continuous 7-Hz transcerebral magnetic fields. Perceptual and Motor Skills, 97, 951–952.
Booth, J.N., Koren, S.A. and Persinger, M.A. (2005). Increased feelings of the sensed presence and increased geomagnetic activity at the time of the experience during exposures to transcerebral weak complex magnetic fields. International Journal of Neuroscience, 115, 1053–1079.
Borisenko, L.S. (1986). Geological criteria of seismic activity in the Crimea. Seismological Studies, 9, 38–48 (in Russian, with English abstract).
Borisenko, L.S. (2001). Hydrogeological conditions of submarine groundwater discharge in the Crimea. Water Resources, 28, 15–21.
Borisenko, L.S., Novik, N.N., Tikhonenkov, E.P. and Chebanenko, I.I. (1982). Tectonic features of the south-western part of the Crimean Mountains in the context of the problem of seismic hazard forecast. Tectonica i Stratigrafia, 23, 11–16 (in Russian).
Botscharow, S.G. (2000). Historical topography of Caffa (the late 13th century – 1774): Fortifications, cultic monuments, and water-supply system. Ph.D. Thesis. Moscow, Russia: Moscow State University (in Russian).
Botscharow, S.G. (2001). Notes on historical geography of Genoese Gazaria in XIV–XV centuries. In V.F. Meshcheryakov (Ed.), Problems of history and archaeology of Ukraine: Proceedings of the International conference, Kharkov, Ukraine, May 16–18, 2001 (pp. 89–90). Kharkov, Ukraine: MD (in Russian).
Botscharow, S.G. (2004). Die Notizen in historischer Geografie genuesisch Gasarien XIV–XV Jahrhunderte (Die südliche Kuste der Krym). In V.L. Myts (Ed.), On the antiquities

Igor V. Florinsky 244
of the South Coast of the Crimea and Tauric Mountains (pp. 186–204). Kiev, Ukraine: Stilos (in Russian, with German abstract).
Bradshaw, J.L. and Nettleton, N.C. (1981). The nature of hemispheric specialization in man. Behavioral and Brain Sciences, 4, 51–91.
Bratton, S.P. (1988). The original desert solitaire: early Christian monasticism and wilderness. Environmental Ethics, 10, 31–53.
Brugger, P. (1994). Are ”presences” preferentially felt along the left side of one’s body? Perceptual and Motor Skills, 79, 1200–1202.
Brugger, P., Regard, M. and Landis, T. (1997). Illusory reduplication of one’s own body: phenomenology and classification of autoscopic phenomena. Cognitive Neuropsychiatry, 2, 19–38.
Burke, J. and Halberg, K. (2005). Seed of knowledge, stone of plenty: Understanding the lost technology of the ancient megalith-builders. San Francisco, CA: Council Oak Books.
Calabrese, E.J. (Ed.) (1994). Biological effects of low level exposures: Dose-response relationships. Boca Raton, FL: CRC Press.
Calabrese, E.J. (2008). What is hormesis? In E. Le Bourg and S.I.S. Rattan (Eds.), Mild stress and healthy aging: Applying hormesis in aging research and interventions (pp. 5–19). Amsterdam, Netherlands: Springer.
Çelebi, E. (1999). Travel-book (Fragments describing the Crimea in 1641–1667). Simferopol, Crimea: Dar (in Russian).
Chamberlain, P.G. (2001). Topomystica: investigation into the concept of mystic place. Journal of Cultural Geography, 19, 97–123.
Chekunov, A.V., Garkalenko, I.A. and Kharchenko, G.E. (1965). Ancient Precambrian faults of the southern Russian platform and their extension in the northern Black Sea Coast area. Geophysical Communications, 14, 24–34 (in Russian).
Chubinidze, A.I. and Chubinidze, M.A. (1982). Morphogenesis of epileptic seizures. Journal Neuropatologii i Psychiatrii Imeni S.S. Korsakova, 82, 806–809 (in Russian, with English abstract).
Clarke, I. (2001). Psychosis and spirituality: the discontinuity model. In I. Clarke (Ed.), Psychosis and spirituality: Exploring the new frontier (pp. 129–142). London, UK: Whurr.
Cook, C.C.H. (2004). Psychiatry and mysticism. Mental Health, Religion and Culture, 7, 149–163.
Cook, C.M. and Persinger, M.A. (1997). Experimental induction of the “sensed presence” in normal subjects and an exceptional subject. Perceptual and Motor Skills, 85, 683–693.
Cook, L.L. and Persinger, M.A. (2000). Suppression of experimental allergic encephalomyelitis is specific to the frequency and intensity of nocturnally applied, intermittent magnetic fields in rats. Neuroscience Letters, 292, 171–174.
Cook, L.L., Persinger, M.A. and Koren, S.A. (2000). Differential effects of low frequency, low intensity (< 6 mG) nocturnal magnetic fields upon infiltration of mononuclear cells and numbers of mast cells in Lewis rat brains. Toxicology Letters, 118, 9–19.
D’Aquili, E.G. and Newberg, A.B. (1993). Religious and mystical states: a neuropsychological model. Zygon, 28, 177–200.
D’Aquili, E.G. and Newberg, A.B. (1998). The neuropsychological basis of religion: or why God won’t go away. Zygon, 33, 187–201.
Démidoff, A. (1855). La Crimée. Paris, France: Ernest Bourdin.

Sacred Places and Geophysical Activity 245
Derr, J.S. (1973). Earthquake lights: a review of observations and present theories. Bulletin of the Seismological Society of America, 63, 2177–2187.
Derr, J.S. and Persinger, M.A. (1986). Luminous phenomena and earthquakes in Southern Washington. Experientia, 42, 991–999.
Derr, J.S. and Persinger, M.A. (1989). Geophysical variables and behavior. LIV: Zeitoun (Egypt) apparitions of the Virgin Mary as tectonic strain-induced luminosities. Perceptual and Motor Skills, 68, 123–128.
Derr, J.S. and Persinger, M.A. (1990). Geophysical variables and behavior. LXIII: Quasi-experimental evidence of the tectonic strain theory of luminous phenomena: the Derby, Colorado earthquakes. Perceptual and Motor Skills, 71, 707–714.
Derr, J.S. and Persinger, M.A. (1993). Geophysical variables and behavior. LXXVI: Seasonal hydrological load and regional luminous phenomena (UFO reports) within river systems, the Mississippi valley test. Perceptual and Motor Skills, 77, 1163–1170.
Devinsky, O. and Lai, G. (2008). Spirituality and religion in epilepsy. Epilepsy and Behavior, 12, 636–643.
Dewhurst, K. and Beard, A.W. (1970). Sudden religious conversions in temporal lobe epilepsy. British Journal of Psychiatry, 117, 497–507.
Dietrich, A. (2003). Functional neuroanatomy of altered states of consciousness: the transient hypofrontality hypothesis. Consciousness and Cognition, 12, 231–256.
Dobkin de Rios, M. and Winkelman, M. (1989). Shamanism and altered states of consciousness: an introduction. Journal of Psychoactive Drugs, 21, 1–7.
Dobkin de Rios, M. and Janiger, O. (2003). LSD, spirituality, and the creative process. Rochester, VT: Inner Traditions.
Dobrokhotova, T.A. and Bragina, N.N. (1977). Functional asymmetry and psychopathology of focal brain damages. Moscow, USSR: Medicina (in Russian).
Dombrovsky, O.I. (1968). Medieval monuments on Mount Boika. In O.I. Dombrovsky (Ed.), Archaeological studies of the medieval Crimea (pp. 83–96). Kiev, USSR: Naukova Dumka (in Russian).
Dombrovsky, O.I. (1974). Medieval settlements and “Isars” of the South Coast of the Crimea. In S.N. Bibikov (Ed.), Feudal Taurica (pp. 5–56). Kiev, USSR: Naukova Dumka (in Russian).
Dombrovsky, O.I. and Sidorenko, V.A. (1978). Solkhat and Surb-Khach. Simferopol, USSR: Tauria (in Russian).
Doronin, V.N., Parfent’ev, V.A., Tleulin, S.J., Namvar, R.A., Somsikov, V.M., Drobzhev, V.I. and Chemeris, A.V. (1998). Influence of variations in geomagnetic field and solar activity on human physiological parameters. Biophysics, 43, 610–616.
Drachev, S.S. and Shitov, A.V. (2007). Geophysical characteristics of some archaeological complexes of the Mountain Altai. In N.V. Beloussova and N.A. Maidurova (Eds.), German researchers in Altai: Proceedings of the conference, Gorno-Altaysk, Russia, June 19–20, 2007 (pp. 175–178). Gorno-Altaysk, Russia: Gorno-Altaysk University Press (in Russian).
Dubrov, A.P. (1978). The geomagnetic field and life. Geomagnetobiology. New York, NY: Plenum Press.
Dvoitchenko, P.A. (1928). Schwarzmeererdbeben in der Krim. Bulletin de la Société des Naturalistes et des Amis de la Nature en Crimée, 10, 118–143 (in Russian, with German abstract).

Igor V. Florinsky 246
Farbei, A.M. (2002). Historical essay on investigations in Sudak. In N.M. Kukovalskaya (Ed.), Sugdeya, Surozh, and Soldaya in history and culture of Rus-Ukraine: Proceedings of the conference, Sudak, Crimea, Sept. 16–22, 2002 (pp. 3–13). Kiev, Ukraine: Academperiodika (in Russian).
Fedorov, A.E. (2004). World history and global geological structures. In A.E. Fedorov (Ed.), The system of the planet Earth (Non-conventional problems of geology): Papers of the 12th Scientific seminar, Moscow, Russia, Feb. 4–6, 2004 (pp. 385–420). Moscow, Russia: ROO “The Structural Harmony of the Earth and Planets” (in Russian).
Fedorov, A.E. (2007). Historical and geological commentary to the paper by O.V. Kirichenko. In A.E. Fedorov (Ed.), The system of the planet Earth (Non-conventional problems of geology): Papers of the 14th and 15th Scientific seminars, Moscow, Russia, 2006–2007 (pp. 371–374). Moscow, Russia: LKI Press (in Russian).
Fedorov, A.E., Azarkin, V.N., Lokshin, B.V. and Nogovitsyn, Y.A. (1989). Methods of recognition and investigation of ore-bearing fault structures. Moscow, USSR: All-Union Scientific Research Institute of Economics of Mineral Resources and Prospecting (in Russian).
Fleming, J.L., Persinger, M.A. and Koren, S.A. (1994). Magnetic pulses elevate nociceptive thresholds: comparison with opiate receptor compounds in normal and seizure-induced brain-damaged rates. Electro- and Magnetobiology, 13, 67–75.
Florinsky, I.V. (2000). Relationships between topographically expressed zones of flow accumulation and sites of fault intersection: analysis by means of digital terrain modelling. Environmental Modelling and Software, 15, 87–100.
Florinsky, I.V. (2008). Influence of geological and geophysical factors on spatial distribution of monasteries (in the context of neurophysiological data). In A.E. Fedorov (Ed.), The system of the planet Earth (Non-conventional problems of geology): Papers of the 16th Scientific seminar, Moscow, Russia, 2008 (pp. 515–541). Moscow, Russia: Librokom Press (in Russian).
Fomin, M.V. (2004). The early Christian necropolis and the Monastery of the Mother of God of Blachernai in the suburb of Chersonese. In Problems of history and archaeology of Ukraine: Proceedings of the 5th International conference, Kharkov, Ukraine, Nov. 4–5, 2004 (pp. 74–75). Kharkov, Ukraine: MD (in Russian).
Freund, F., Salgueiro da Silva, M.A., Lau, B.W.S., Takeuchi, A. and Jones, H.H. (2007). Electric currents along earthquake faults and the magnetization of pseudotachylite veins. Tectonophysics, 431, 131–141.
Freund, F.T., Takeuchi, A. and Lau, B.W.S. (2006). Electric currents streaming out of stressed igneous rocks – a step towards understanding pre-earthquake low frequency EM emissions. Physics and Chemistry of the Earth, A/B/C, 31, 389–396.
Friedman, H., Becker, R.O. and Bachman, C.H. (1963). Geomagnetic parameters and psychiatric hospital admissions. Nature, 200, 626–628.
Gelfand, I.M., Guberman, S.I., Izvekova, M.L., Keilis-Borok, V.I. and Ranzman, E.J. (1972). Criteria of high seismicity, determined by pattern recognition. Tectonophysics, 13, 415–422.
General Headquarters (1976–1990). Topographic map, scale 1 : 100,000. Charts: L-36-103, L-36-105, L-36-106, L-36-107, L-36-116, L-36-117, L-36-118, L-36-119, L-36-127, L-36-128, L-36-129. Moscow, USSR: General Headquarters (in Russian).

Sacred Places and Geophysical Activity 247
Gokhberg, М.B., Morgounov, V.А. and Pokhotelov, O.A. (1995). Earthquake prediction: Seismo-electromagnetic phenomena. London, UK: Gordon and Breach.
Gorodnitsky, A.M., Maljauvkin, A.M., Ushakov, C.A. and Shreider, A.A. (1967). The method and some results of the hydromagnetic survey of the north-eastern part of the Black Sea. Vestnik Moscovskogo Universiteta, Series Geology, No. 6, 57–59 (in Russian).
Greyson, B. (2006). Near-death experiences and spirituality. Zygon, 41, 393–414. Griffiths, R.R., Richards, W.A., McCann, U. and Jesse, R. (2006). Psilocybin can occasion
mystical-type experiences having substantial and sustained personal meaning and spiritual significance. Psychopharmacology, 187, 268–283.
Gunn, P.J. and Dentith, M.C. (1997). Magnetic responses associated with mineral deposits. AGSO Journal of Australian Geology and Geophysics, 17, 145–158.
Heriot-Maitland, C.P. (2008). Mysticism and madness: different aspects of the same human experience. Mental Health, Religion and Culture, 11, 301–325.
Hill, D.R. and Persinger, M.A. (2003). Application of transcerebral, weak (1 microT) complex magnetic fields and mystical experiences: are they generated by field-induced dimethyltryptamine release from the pineal organ. Perceptual and Motor Skills, 97, 1049–1050.
Hughes, J.D. and Swan, J. (1986). How much of the Earth is sacred space? Environmental Review, 10, 247–259.
Ivanov, B.N., Dublensky, V.N. and Dombrovsky, O.I. (1963). Basman Caves in the Crimean Mountains. In The Crimean state reserve: 50 years anniversary (pp. 21–32). Simferopol, USSR: Krymizdat (in Russian).
Jakobson, A.L. (1964). Armenian monastery (the 14th century) near Belogorsk in the Crimea. Istoriko-Filologichesky Journal, 27, 230–235 (in Russian).
James, W. (1902). The varieties of religious experience: A study in human nature. New York, NY: Longmans, Green, & Co.
Jaynes, J. (1976). The origin of consciousness in the breakdown of the bicameral mind. Boston, MA: Houghton Mifflin.
Johnson, C.P. and Persinger, M.A. (1994). The sensed presence may be facilitated by interhemispheric intercalation: relative efficacy of the Mind’s Eye, Hemi-Sync Tape, and bilateral temporal magnetic field stimulation. Perceptual and Motor Skills, 79, 351–354.
Johnston, M.J.S. (1997). Review of electric and magnetic fields accompanying seismic and volcanic activity. Surveys in Geophysics, 18, 441–476.
Karakhanian, A.S., Trifonov, V.G., Ivanova, T.P., Avagyan, A., Rukieh, M., Minini, H., Dodonov, A.E. and Bachmanov, D.M. (2008). Seismic deformation in the St. Simeon Monasteries (Qal’at Sim’an), Northwestern Syria. Tectonophysics, 453, 122–147.
Kasimov, N.S., Kovin, M.I., Proskuryakov, Y.V. and Shmelkova, N.A. (1978). Geochemistry of the soils of fault zones (exemplified by Kazakhstan). Soviet Soil Science, 10, 397–406.
Kerrich, R. (1986). Fluid transport in lineaments. Philosophical Transactions of the Royal Society of London, Series A, 317, 219–251.
King, C.-Y., Zhang, W. and Zhang, Z. (2006). Earthquake-induced groundwater and gas changes. Pure and Applied Geophysics, 163, 633–645.
Kleimenova, N.G., Kozyreva, O.V., Breus, T.K. and Rapoport, S.I. (2007). Pc1 geomagnetic pulsations as a potential hazard of the myocardial infarction. Journal of Atmospheric and Solar-Terrestrial Physics, 69, 1759–1764.

Igor V. Florinsky 248
Köppen, P.I. (1837). The Crimean collection. On the antiquities of the South Coast of the Crimea and Tauric Mountains. Saint Petersburg, Russia: Typography of the Imperial Academy of Sciences (in Russian).
Kopytenko, Y.A., Matiashvili, T.G., Voronov, P.M., Kopytenko, E.A. and Molchanov, O.A. (1993). Detection of ultralow frequency emissions connected with the Spitak earthquake and its aftershock activity, based on geomagnetic pulsation data at Susheti and Vardzia observatories. Physics of the Earth and Planetary Interiors, 77, 85–95.
Kovalenko, I.M. (2001). Sacred nature of the Crimea: Essays on cultic and environmental protection traditions of Crimean ethnoses. Kiev, Ukraine: Kiev Ecological and Cultural Center (in Russian).
Kramarovsky, M.G. (1989). Solkhat–Krym: population and topography of the city in the 13th–14th centuries. In G.I. Smirnova (Ed.), Results of archaeological expeditions (pp. 141–157). Leningrad, USSR: State Hermitage (in Russian).
Kutina, J. (1969). Hydrothermal ore deposits in the western United States: a new concept of structural control of distribution. Science, 165, 1113–1119.
Kutinov, Y.G. and Chistova, Z.B., (2004). Hierarchical range of manifestation of alkaline and ultra-alkaline magmatism of the Arkhangelsk diamond province. Their manifestation in geological and geophysical data. Arkhangelsk, Russia: Pravda Severa (in Russian).
La Barre, W. (1979). Peyotl and mescaline. Journal of Psychedelic Drugs, 11, 33–39. Landtblom, A.-M. (2006). The “sensed presence”: an epileptic aura with religious overtones.
Epilepsy and Behavior, 9, 186–188. Lange, R. and Thalbourne, M.A. (2007). The Rasch scaling of mystical experiences: construct
validity and correlates of the Mystical Experience Scale (MES). International Journal for the Psychology of Religion, 17, 121–140.
Lebedev, T.S. and Orovetsky, Y.P. (1966). Peculiarities of the Mountain Crimea tectonics by new geological and geophysical data. Geophysical Communications, 18, 34–41 (in Russian).
Lebedev, T.S., Sobokar, G.T., Orovetsky, Y.P. and Bolyubakh, K.A. (1963). Tectonics of the central northern slope of the Crimean Mountains: Geophysical and geological study. Kiev, USSR: Ukrainian Academic Press (in Russian).
Levin, J. and Steele, L. (2005). The transcendent experience: conceptual, theoretical, and epidemiologic perspectives. Explore, 1, 89–101.
Lou, H.C., Kjaer, T.W., Friberg, L., Wildschiodtz, G., Holm, S. and Nowak, M. (1999). A 15O–H2O PET study of meditation and the resting state of normal consciousness. Human Brain Mapping, 7, 98–105.
Lund, J.W. (1996). Balneological use of thermal and mineral waters in the U.S.A. Geothermics, 25, 103–147.
Lunev, V.I. (1992). Luminous balls in Siberia and the Far East: phenomenology, experiment, hypotheses. Soviet Physics Journal, 35, 256–274.
Lutz, A., Greischar, L., Rawlings, N.B., Ricard, M. and Davidson, R.J. (2004). Long-term meditators self-induce high-amplitude synchrony during mental practice. Proceedings of the National Academy of Sciences, 101, 16369–16373.
Makarec, K. and Persinger, M.A. (1985). Temporal lobe signs: electroencephalographic validity and enhanced scores in special populations. Perceptual and Motor Skills, 60, 831–842.

Sacred Places and Geophysical Activity 249
Makarova, Z.A. (Ed.) (1974). Map of the anomalous magnetic field (ΔТ)а of the USSR (continental part and some adjacent seas), scale 1:2,500,000. Leningrad, USSR: All-Union Geological Research Institute (in Russian).
Marino, A.A. and Becker, R.O. (1977). Biological effects of extremely low frequency electric and magnetic fields: a review. Physiological Chemistry and Physics, 9, 131–147.
Markevich, A.I. (1888). Travel to the city of Stary Krym. Izvestiya Tavricheskoi Uchenoi Archivnoi Commissii, 6, 64–77 (in Russian).
Markevich, A.I. (1909). An islet in the Kazatch Bay as possible place of Pope St. Clement’s decease. Izvestiya Tavricheskoi Uchenoi Archivnoi Commissii, 43, 105–114 (in Russian).
Markov, M.S. (2007). Pulsed electromagnetic field therapy history, state of the art and future. Environmentalist, 27, 465–475.
Maslow, A.H. (1964). Religions, values, and peak experiences. Columbus, OH: Ohio State University Press.
Mekerova, M.D. (2005). Sufism as mystical ascetic way in Islamic culture. Ph.D. Thesis. Stavropol, Russia: Stavropol State University (in Russian).
Melnikov, E.K., Rudnik, V.A., Musiychuk, Y.I. and Rymarev, V.I. (1994). Pathogenic influence of active fault zones in Saint Petersburg area. Geoecologia, No. 4, 50–69 (in Russian).
Mikaelian, V.A. (1974). On the Crimean land: History of Armenian settlements in the Crimea. Yerevan, USSR: Ayastan (in Russian).
Mogarichev, Y.M. (2005). Cave towns in the Crimea. Simferopol, Crimea: Sonat (in Russian, with English summary).
Mogi, K. (1968). Migration of seismic activity. Bulletin of the Earthquake Research Institute, 46, 53–74.
Monastyrly, K.A. (1890a). Azises of Tatars. In F. Lashkov (Ed.), The third training excursion of the Simferopol male gymnasium: Simferopol and its suburbs (pp. 66–68). Simferopol, Russia: Gordievsky Typography (in Russian).
Monastyrly, K.A. (1890b). Mosques, tekkes (monasteries), clergymen, and holidays of Crimean Tatars. In F. Lashkov (Ed.), The third training excursion of the Simferopol male gymnasium: Simferopol and its suburbs (pp. 68–73). Simferopol, Russia: Gordievsky Typography (in Russian).
Munro, C. and Persinger, M.A. (1992). Relative right temporal-lobe theta activity correlates with Vingiano’s hemispheric quotient and the “sensed presence”. Perceptual and Motor Skills, 75, 899–903.
Muratov, M.V. (Ed.) (1969). Geology of the USSR, Vol. 8: The Crimea, Pt. 1: Geological description. Moscow, USSR: Nedra (in Russian).
Muratov, M.V. (Ed.) (1974). Geology of the USSR. Vol. 8: The Crimea, Pt. 2: Mineral resources. Moscow, USSR: Nedra (in Russian).
Novichenkova, N.G. (1993). Sanctuary near the Gurzuf Saddle pass. Archaeologia, No. 1, 54–66 (in Ukrainian, with English abstract).
Ogata, A. and Miyakawa, T. (1998). Religious experiences in epileptic patients with a focus on ictus-related episodes. Psychiatry and Clinical Neurosciences, 52, 321–325.
Palmer, S.J., Rycroft, M.J. and Cermack, M. (2006). Solar and geomagnetic activity, extremely low frequency magnetic and electric fields and human health at the Earth’s surface. Surveys in Geophysics, 27, 557–595.

Igor V. Florinsky 250
Parkhomenko, E.I. and Martynov, Y.N. (1975). Phenomena of electrification and luminescence of minerals during their deformation and destruction. In M.A. Sadovskiy (Ed.), Physics of earthquake focus (pp. 151–159). Moscow, USSR: Nauka (in Russian).
Partridge, C. (2003). Sacred chemicals: psychedelic drugs and mystical experience. In C.H. Partridge and T. Gabriel (Eds.), Mysticisms East and West: Studies in mystical experience (pp. 96–131). Carlisle, UK: Paternoster Press.
Pechersky, D.M., Didenko, A.N., Safonov, V.A., Tikhonov, L.V. and Tselmovich, V.A. (1991). Petromagnetic and paleomagnetic characteristics of the Middle Jurassic volcanism in the Mountain Crimea. Izvestiya Academii Nauk SSSR, Series Geological, No. 3, 85–104 (in Russian).
Persinger, M.A. (1976). Transient geophysical bases for ostensible UFO-related phenomena and associated verbal behavior. Perceptual and Motor Skills, 43, 215–221.
Persinger, M.A. (1980). Earthquake activity and antecedent UFO report numbers. Perceptual and Motor Skills, 50, 791–797.
Persinger, M.A. (1983a). Geophysical variables and behavior. IX: Expected clinical consequences of close proximity to UFO-related luminosities. Perceptual and Motor Skills, 56, 259–265.
Persinger, M.A. (1983b). Religious and mystical experiences as artifacts of temporal lobe function: a general hypothesis. Perceptual and Motor Skills, 57, 1255–1262.
Persinger, M.A. (1984a). Geophysical variables and behavior. XVIII: Expected perceptual characteristics and local distributions of close UFO reports. Perceptual and Motor Skills, 58, 951–959.
Persinger, M.A. (1984b). People who report religious experiences may also display enhanced temporal-lobe signs. Perceptual and Motor Skills, 58, 963–975.
Persinger, M.A. (1985a). Geophysical variables and behavior. XXI: Geomagnetic variation as possible enhancement stimuli for UFO reports preceding earthtremors. Perceptual and Motor Skills, 60, 37–38.
Persinger, M.A. (1985b). Geophysical variables and behavior. XXX: Intense paranormal experiences occur during days of quiet, global, geomagnetic activity. Perceptual and Motor Skills, 61, 320–322.
Persinger, M.A. (1987). Geopsychology and geopsychopathology: mental processes and disorders associated with geochemical and geophysical factors. Experientia, 43, 92–104.
Persinger, M.A. (1988a). Geophysical variables and behavior. LIII: Epidemiological considerations for incidence of cancer and depression in areas of frequent UFO reports. Perceptual and Motor Skills, 67, 799–803.
Persinger, M.A. (1988b). Increased geomagnetic activity and the occurrence of bereavement hallucinations: evidence for melatonin-mediated microseizuring in the temporal lobe. Neuroscience Letters, 88, 271–274.
Persinger, M.A. (1992). Enhanced incidence of the sensed presence in people who have learned to meditate: support for the right hemispheric intrusion hypothesis. Perceptual and Motor Skills, 75, 1308–1310.
Persinger, M.A. (1993a). Geophysical variables and behavior. LXXI: Differential contribution of geomagnetic activity to paranormal experiences concerning death and crisis: an alternative to the ESP hypothesis. Perceptual and Motor Skills, 76, 555–662.

Sacred Places and Geophysical Activity 251
Persinger, M.A. (1993b). Vectorial cerebral hemisphericity as differential sources for the sensed presence, mystical experiences and religious conversions. Perceptual and Motor Skills, 76, 915–930.
Persinger, M.A. (1994). Sense of a presence and suicidal ideation following traumatic brain injury: indications of right-hemispheric intrusions from neuropsychological profiles. Psychological Reports, 75, 1059–1070.
Persinger, M.A. (1995). Out-of-body-like experiences are more probable in people with elevated complex partial epileptic-like signs during periods of enhanced geomagnetic activity: a nonlinear effect. Perceptual and Motor Skills, 80, 563–569.
Persinger, M.A. (2003). The sensed presence within experimental settings: implications for the male and female concept of self. Journal of Psychology, 137, 5–16.
Persinger, M.A. and Derr, J.S. (1985). Geophysical variables and behavior. XXIII: Relations between UFO reports within the Uinta Basin and local seismicity. Perceptual and Motor Skills, 60, 143–152.
Persinger, M.A. and Derr, J.S. (1990a). Geophysical variables and behavior. LXI: UFO reports in Carman, Manitoba and the 1975 Minnesota quake: evidence of triggering by increased volume of the Red River. Perceptual and Motor Skills, 71, 531–536.
Persinger, M.A. and Derr, J.S. (1990b). Geophysical variables and behavior. LXII: Temporal coupling of UFO reports and seismic energy release within the Rio Grande Rift System: discriminative validity of the tectonic strain theory. Perceptual and Motor Skills, 71, 567–572.
Persinger, M.A. and Derr, J.S. (1993). Geophysical variables and behavior. LXXIV: Man-made fluid injections into the crust and reports of luminous phenomena (UFO reports): is the strain field an aseismically propagating hydrological pulse? Perceptual and Motor Skills, 77, 1059–1065.
Persinger, M.A. and Fisher, S.D. (1990). Elevated, specific temporal lobe signs in a population engaged in psychic studies. Perceptual and Motor Skills, 71, 817–818.
Persinger, M.A. and Healey, F. (2002). Experimental facilitation of the sensed presence: possible intercalation between the hemispheres induced by complex magnetic fields. Journal of Nervous and Mental Disease, 190, 533–541.
Persinger, M.A. and Koren, S.A. (2001). Experiences of spiritual visitation and impregnation: potential induction by frequency-modulated transients from an adjacent clock. Perceptual and Motor Skills, 92, 35–36.
Persinger, M.A., Koren, S.A. and O’Connor, R.P. (2001). Geophysical variables and behavior. CIV: Power-frequency magnetic field transients (5 microtesla) and reports of haunt experiences within an electronically dense house. Perceptual and Motor Skills, 92, 673–674.
Persinger, M.A., Ludwig, H.W. and Ossenkopp, K.-P. (1973). Psychophysiological effects of extremely low frequency electromagnetic fields: a review. Perceptual and Motor Skills, 36, 1131–1159.
Persinger, M.A. and Makarec, K. (1992). The feeling of a presence and verbal meaningfulness in context of temporal lobe function: factor analytic verification of the Muses? Brain and Cognition, 20, 217–226.
Persinger, M.A. and Makarec, K. (1993). Complex partial epileptic signs as a continuum from normals to epileptics: normative data and clinical populations. Journal of Clinical Psychology, 49, 33–45.
Igor V. Florinsky 252
Persinger, M.A. and Psych, C. (1995). Sudden unexpected death in epileptics following sudden, intense, increases in geomagnetic activity: prevalence of effect and potential mechanisms. International Journal of Biometeorology, 38, 180–187.
Persinger, M.A. and Richards, P.M. (1991). Tobacyk’s Paranormal Belief Scale and temporal lobe signs: sex differences in the experiences of ego-alien intrusions. Perceptual and Motor Skills, 73, 1151–1156.
Persinger, M.A., Roll, W.G., Tiller, S.G., Koren, S.A. and Cook, C.M. (2002). Remote viewing with the artist Ingo Swann: neuropsychological profile, electroencephalographic correlates, magnetic resonance imaging (MRI), and possible mechanisms. Perceptual and Motor Skills, 94, 927–949.
Persinger, M.A., Tiller, S.G. and Koren, S.A. (2000). Experimental simulation of a haunt experience and elicitation of paroxysmal electroencephalographic activity by transcerebral complex magnetic fields: induction of a synthetic “ghost”. Perceptual and Motor Skills, 90, 659–674.
Petraccia, L., Liberati, G., Masciullo, S.G., Grassi, M. and Fraioli, A. (2006). Water, mineral waters and health. Clinical Nutrition, 25, 377–385.
Popov, S.P. (1928). Mud volcanoes. Priroda, No. 6, 541–554 (in Russian). Previc, F.H. (2006). The role of the extrapersonal brain systems in religious activity.
Consciousness and Cognition, 15, 500–539. Pustovitenko, B.G. and Kamenobrodsky, A.G. (1976). Regularities in migration of
earthquake focuses in the Crimea. In M.A. Sadovskiy (Ed.), Studies in physics of earthquakes (pp. 184–199). Moscow, USSR: Nauka (in Russian).
Pustovitenko, B.G. and Trostnikov, V.N. (1977). On relationship between seismic processes and tectonics in the Crimea. Geophysical Communications, 77, 13–23 (in Russian, with English abstract).
Puthoff, H.E. and Targ, R. (1976). A perceptual channel for information transfer over kilometer distances: historical perspectives and recent research. Proceedings of the IEEE, 64, 329–354.
Raevskaya, O.S. (1988). Geomagnetic field and the human organism. Uspekhi Fiziologicheskikh Nauk, No. 4, 91–108 (in Russian).
Rastsvetaev, L.M. (1977). The Mountain Crimea and the North Black Sea area. In A.I. Suvorov (Ed.), Faults and horizontal movements of mountain chain of the USSR (pp. 95–113). Moscow, USSR: Nauka (in Russian).
Republican Committee (2004). List of monuments of local and national importance located in the Autonomic Republic of Crimea. Simferopol, Crimea: Republican Committee for Cultural Heritage Protection (in Russian).
Roll, W.G., Persinger, M.A., Webster, D.L., Tiller, S.G. and Cook, C.M. (2002). Neurobehavioral and neurometabolic (SPECT) correlates of paranormal information: involvement of the right hemisphere and its sensitivity to weak complex magnetic fields. International Journal of Neuroscience, 112, 197–224.
Rolland, R. (1929). La vie de Ramakrishna. Paris, France: Stock. Rolland, R. (1930). La vie de Vivekananda et l'évangile universel. Paris, France: Stock. Rudakov, Y.Y., Mansurov, S.M., Mansurova, L.G., Portnov, A.A., Polishchuk, Y.I. and
Mazursky, M.B. (1984). Role of sector structure of the interplanetary magnetic field in synchronization of psychophysiological regulation of the human organism. In N.V.

Sacred Places and Geophysical Activity 253
Krasnogorskaya (Ed.), Electromagnetic fields in the biosphere, Vol. 1 (pp. 150–159). Moscow, USSR: Nauka (in Russian).
Saintot, A., Angelier, J. and Chorowicz, J. (1999). Mechanical significance of structural patterns identified by remote sensing studies: a multiscale analysis of tectonic structures in Crimea. Tectonophysics, 313, 187–218.
Sargsian, T.E. (2004a). Armenian memorable records of the 14th century about the political life in the Crimea and construction activity of Crimean Armenians. Istoricheskoe Nasledie Kryma, 8, 148–157 (in Russian).
Sargsian, T.E. (2004b). History of a khachkar. Istoricheskoe Nasledie Kryma, 5, 17–23 (in Russian).
Sargsian, T.E. (2006). Armenian-Catholic relations and activity of Armenian Catholics in the Crimea from memorable records of the 14th–15th centuries. Istoricheskoe Nasledie Kryma, 16, 9–26 (in Russian).
Saver, J.L. and Rabin, J. (1997). The neural substrates of religious experience. Journal of Neuropsychiatry and Clinical Neurosciences, 9, 498–510.
Schaut, G.B. and Persinger, M.A. (1985). Geophysical variables and behavior. XXXI: Global geomagnetic activity during spontaneous paranormal experiences: a replication. Perceptual and Motor Skills, 61, 412–414.
Shitov, A.V. (1999). Natural self-luminous objects as ecological factor of the Mountain Altai. Ph.D. Thesis. Gorno-Altaysk, Russia: Gorno-Altaysk State University (in Russian).
Shtengelov, E.S. (1980). Effect of well exploitation of the Upper Jurassic aquifer on seismicity of the Crimea. Water Resources, 7, 132–139.
Simonenko, T.N. (1968). Manifestation of fault zones of the Earth’s crust in the magnetic field. Geophysical Communications, 26, 5–12 (in Russian, with English abstract).
Skvortsov, A.I. (1991). Brief analysis of the association between cities and tectonics on the Russian Platform. In S.A. Pegov and G.L. Melnikova (Eds.), Modeling of processes of ecological development (pp. 30–35). Moscow, USSR: All-Union Scientific Research Institute of System Investigations (in Russian).
Smirnov, V.D. (1886). Archaeological excursion to the Crimea in summer 1886. Zapiski Vostochnogo Otdeleniya Imperatorskogo Russkogo Archeologicheskogo Obshchestva, 1, 273–302 (in Russian).
Sobolev, G.A., Bogaevsky, V.N., Lementueva, R.A., Migunov, N.I. and Khromov, A.A. (1975). Study of mechanoelectrical phenomena in a seismoactive region. In M.A. Sadovskiy (Ed.), Physics of earthquake focus (pp. 184–223). Moscow, USSR: Nauka (in Russian).
Springer, S.P. and Deutsch, G. (1981). Left brain, right brain. San Francisco, CA: Freeman. St-Laurent, F. (2000). The Saguenay, Quebec, earthquake lights of November 1988 – January
1989. Seismological Research Letters, 71, 160–174. St-Laurent, F., Derr, J.S. and Freund, F.T. (2006). Earthquake lights and the stress-activation
of positive hole charge carriers in rocks. Physics and Chemistry of the Earth, A/B/C, 31, 305–312.
St-Pierre, L.S. and Persinger, M.A. (2006). Experimental facilitation of the sensed presence is predicted by the specific patterns of the applied magnetic fields, not by suggestibility: re-analyses of 19 experiments. International Journal of Neuroscience, 116, 1079–1096.
Stacey, F.D. (1964). The seismomagnetic effect. Pure and Applied Geophysics, 58, 5–22.

Igor V. Florinsky 254
Starokadomskaya, M.K. (1974). Solkhat and Caffa in XIII–XIV centuries. In S.N. Bibikov (Ed.), Feudal Taurica (pp. 162–173). Kiev, USSR: Naukova Dumka (in Russian).
Suess, L.A. and Persinger, M.A. (2001). Geophysical variables and behavior. XCVI: “Experiences” attributed to Christ and Mary at Marmora, Ontario, Canada may have been consequences of environmental electromagnetic stimulation: implications for religious movements. Perceptual and Motor Skills, 93, 435–450.
Swami Satyananda Saraswati (1989). A systematic course in the ancient tantric techniques of Yoga and kriya (2nd ed.). Munger, India: Bihar School of Yoga.
Thalbourne, M.A., Crawley, S.E. and Houran, J. (2003). Temporal lobe lability in the highly transliminal mind. Personality and Individual Differences, 35, 1965–1974.
Tiller, S.G. and Persinger, M.A. (1994). Elevated incidence of a sensed presence and sexual arousal during partial sensory deprivation and sensitivity to hypnosis: implications for hemisphericity and gender differences. Perceptual and Motor Skills, 79, 1527–1531.
Tortchinov, E.A. (1998). Religion of the world: Experience of the transcendence (Transpersonal states and psychological technique). Saint Petersburg, Russia: Orientology Center (in Russian, with English summary).
Travkin, M.P. and Kolesnikov, A.M. (1972). About the influence of the anomalous magnetic field on morbidity rate in the Kursk Magnetic Anomaly area. In Sanitary assessment of magnetic fields: Proceedings of the symposium, Moscow, USSR, May 22–23, 1972 (pp. 23–26). Moscow, USSR: Soviet Academic Press (in Russian).
Trifonov, V.G. and Karakhanian, A.S. (2004). Active faulting and human environment. Tectonophysics, 380, 287–294.
Trifonov, V.G., Soboleva, O.V., Trifonov, R.V. and Vostrikov, G.A. (2002). Recent geodynamics of the Alpine–Himalayan collision belt. Moscow, Russia: Geos (in Russian, with English contents, extended summary, figure captions, and appendices).
Tur, V.G. (1997). Archaeological studies of medieval monastery on Mount Perchem. Archaeology of the Crimea, 1, 117–128 (in Russian, with English abstract).
Tur, V.G. (2003). Archaeological reconnaissance in the south-eastern Crimea. Materials on Archaeology, History, and Ethnography of Tauria, 10, 322–341 (in Russian).
Tur, V.G. (2006). Orthodox monasteries of the Crimea in the 19th – early 20th centuries (2nd rev. enl. ed.). Kiev, Ukraine: Stilos (in Russian).
Ulomov, V.I. (1971). Light and electrical phenomena accompanying earthquakes. In G.A. Mavlyanov (Ed.), Tashkent earthquake of April 26, 1966 (pp. 182–184). Tashkent, USSR: Fan (in Russian).
Vaitl, D., Birbaumer, N., Gruzelier, J., Jamieson, G.A., Kotchoubey, B., Kübler, A., Lehmann, D., Miltner, W.H.R., Ott, U., Pütz, P., Sammer, G., Strauch, I., Strehl, U., Wackermann, J. and Weiss, T. (2005). Psychobiology of altered states of consciousness. Psychological Bulletin, 131, 98–127.
Vinogradov, V.K. (1884). Theodosia: Historical essay. Theodosia, Russia: Typography of the Theodosia District Administration (in Russian).
Voloshinov, I. (1918). Yeni Jami Tekke of silent dervishes in Simferopol. Izvestiya Tavricheskoi Uchenoi Archivnoi Commissii, 54, 356–359 (in Russian).
Voronkov, E.G., Shitov, A.V., Velilyaeva, E.S. and Voronkova, E.G. (2006). Study of vegetative and emotional parameters of the human organism during visits to tectonic faults and the Scythian ritual mound in the Mountain Altai. Vestnik Tomskogo universiteta, Bulletin Operativnoi Nauchnoi Informatsii, 117, 20–32 (in Russian).

Sacred Places and Geophysical Activity 255
Voznesensky, A.V. (1927). Earthquakes of the year 1927 in the Crimea. Priroda, No. 12, 957–974 (in Russian).
Waxman, S.G. and Geschwind, N. (1975). The interictal behavior syndrome of temporal lobe epilepsy. Archives of General Psychiatry, 32, 1580–1586.
Weightman, B.A. (1996). Sacred landscapes and the phenomenon of light. Geographical Review, 86, 59–71.
Wool, F.R. (1976). “Moon rhythms” in the development of an epileptic process. Journal Neuropatologii i Psychiatrii Imeni S.S. Korsakova, 76, 1875–1879 (in Russian, with English abstract).
Yakovleva, M.I. (1973). Physiological mechanisms of the action of electromagnetic fields. Leningrad, USSR: Medicina (in Russian, with English abstract).
Yashaeva, T.Y. (1994). Cave complex in Chersonese suburb. In Y.M. Mogarichev (Ed.), Problems of history and archaeology of the Crimea (pp. 71–81). Simferopol, Crimea: Tauria (in Russian).
Yashaeva, T.Y. (1997). On types of suburb monasteries of medieval Chersonese on the Heraclean Peninsula. In Byzantium and the Crimea: Proceedings of the International symposium, Sevastopol, Crimea, June 6–11, 1997 (pp. 93–95). Sevastopol, Crimea: Aktiar (in Russian).
Yashaeva, T.Y. (2006). The late Byzantine cave lavra in Chersonese. Materials on Archaeology, History, and Ethnography of Tauria, 12(1), 321–360 (in Russian).
Yashaeva, T.Y. (2007). The New Saviour male monastery. In N. Dolenko and Y.M. Mogarichev (Eds.), Orthodox monasteries: Simferopol and the Crimean eparchy, Ukrainian Orthodox Church, Moscow Patriarchate (pp. 189–191). Simferopol, Crimea: Sonat (in Russian).
Yen, H.-Y., Chen, C.-H., Yeh, Y.-H., Liu, J.-Y., Lin, C.-R. and Tsai, Y.-B. (2004). Geomagnetic fluctuations during the 1999 Chi-Chi earthquake in Taiwan. Earth, Planets, and Space, 56, 39–45.
Zasypkin, B.N. (1927). Architectural monuments of Crimean Tatars. Krym, 4, 113–168 (in Russian).
Zhadin, M.N. (2001). Review of Russian literature on biological action of DC and low-frequency AC magnetic fields. Bioelectromagnetics, 22, 27–45.
Zhidkov, M.P., Likhacheva, E.A. and Trifonov, V.G. (1999). Towns, population and active faults on the Russian Plain. Izvestiya Akademii Nauk, Series Geographical, No. 2, 51–57 (in Russian, with English abstract).


In: Man and the Geosphere ISBN 978-1-60876-387-0 Editor: Igor V. Florinsky, pp. 257-305 © 2010 Nova Science Publishers, Inc.
Chapter 9
TECTONIC AND CLIMATIC RHYTHMS AND THE DEVELOPMENT OF SOCIETY
Vladimir G. Trifonov
ABSTRACT
The author discusses the short-period (years to decades) and medium-period (hundreds to thousands years) variations of climatic and tectonic activity and their influences on the human history and recent life. At a regional scale, it is demonstrated that for the last 170 years periodic changes of the Caspian Sea level are the combined result of the water balance variations (mainly caused by climatic changes) and the recent tectonic activity partly manifested by seismicity. The influence of active tectonics consists in the integral effect of various deformations producing changes in the Caspian reservoir volume. Phases of the sea-level fall correspond to the growth of seismicity under the Caspian basins that indicates the extension and sinking of the reservoir. Phases of the sea-level rise correspond to the growth of seismicity under the adjacent uplifts and their slopes that indicates transverse shortening of the reservoir and a decrease in its volume. The climatic and tectonic processes influence the Caspian level mainly in the same direction. The global observations show that the 11-yr and multiple-of-11-yr cyclicity is the most significant among the recent short-period variations of climatic and tectonic activity. This cyclicity influences the economic activity of the society.
The ~1,200-yr (~1,800-yr in one case) cycles are the most important among the medium-period variations of climatic and tectonic activity (i.e., fault movements, earthquakes, and volcanism) in the Middle and Late Holocene. These cycles contributed to the historical crises, which were characterized by social unrest and mass migrations, and changed the balance of political forces. On the other hand, the crises determined breakthroughs to new technologies and new forms of economic and political relations. The crises were manifested in the Alpine–Himalayan orogenic belt and East European Platform. Perhaps they covered the entire Northern hemisphere.
Synchronism of climatic and tectonic events in both short- and medium-term oscillations is possibly caused by the difference in the rotational velocity of the liquid outer core and mantle (the dominant factor), periodic changes in the Earth’s orbital parameters, as well as solar activity. Multiple-of-11-yr cycles correlate with the periodic changes in solar activity, whereas the 1,200-yr cycle is associated with the precession of the geomagnetic axis around the Earth’s rotational axis. The short- and medium-period

Vladimir G. Trifonov 258
variations of climatic and tectonic activity should be considered in planning the sustainable development of the society.
Keywords: oscillations; seismicity; sea level; climate; cycle; history.
9.1. INTRODUCTION The development of humanity was not a continuous progress. Historical documents and
archaeological data demonstrate epochs of rise and fall in the development of individual primitive societies, later states, and ethnoses. Climatic and geodynamic activity, manifested by tectonic movements, earthquakes, and volcanism, varied within the historical time with rhythms of various frequencies. For the contemporary human life and development of the society during the stage of the producing economy, only natural rhythms with periodicity from several years to several thousand years were important. The author differentiates (a) short-period variations with the frequency of years to decades, and (b) medium-period variations with the frequency of several hundred to several thousand years, distinguishing them from the long-period rhythms with periodicity of several ten thousand years and more. The short-period variations can be studied in detail for the last 100–150 years only. They influence the contemporary life and should be considered in construction projects, land use, agriculture, and people’s security. The medium-period variations can be studied in some regions for all of Middle and Late Holocene time. They have influenced the development of the society and should be considered in long-time economic planning, geopolitical forecasts and constructing the future sustainable development of the humanity. The short- and medium-period environmental variations and their influence on humans and the society are discussed in this chapter.
9.2. SHORT-PERIOD VARIATIONS
9.2.1. Contemporary Variations of the Caspian Sea Level
9.2.1.1. Role of Climatic Changes Frequent variations in the Caspian Sea level have been recorded at gauging stations from
the 1830s (Varushchenko et al., 1987; Lilienberg, 1994; Klige et al., 1998). Until 1930 (almost a hundred years), the level varied between -26.6 and -25.6 m (Figure 9.1a). In 1930−1940, it fell to -27.9 m and continued to fall with small variations down to -28.8 m in 1976. In 1978, the level started to rise and reached -26.5 m in 1997. The rise stopped in 1998. A small fall in the level has been recorded for the last ten years.
The water balance in the Caspian Sea in the 20th century was studied to explain the level variations by climatic changes; water losses in the contributing rivers were also considered (Varushchenko et al., 1987; Klige et al., 1998; Kaplin and Selivanov, 1999). The Volga River is the main contributor to the Caspian water (65–70% of the total input), other rivers offer 10–15% of the total input, and precipitation provides under 20%.

Tectonic and Climatic Rhythms and the Development of Society 259
Figure 9.1. Relationships between (a) changes of the Caspian Sea level; (b) variations of the Volga River runoff, thick and dotted lines represent low-frequency and trend components of the variations; and (c) anomalies of the average annual air temperature in the Northern hemisphere, thick line represents low-frequency component of the deviations. The figure was compiled using data from (Lilienberg, 1994; Kaplin and Selivanov, 1999; Klige et al., 2000).
The Caspian water output is mainly composed of evaporation: about 95% from the main basin and about 5% from the Gulf of Kara-Bogaz-Gol. Values of the Caspian water balance components have varied in the 20th century. The average annual standard deviations of the average values reached 18% for the Volga runoff, some 30% for runoff from the other rivers, 20% from atmospheric precipitation, 9% from evaporation from the main basin, and 60% from evaporation from the Kara-Bogaz-Gol, where the large technogenic changes occurred (Getman, 2000). To a first approximation, changes of the Caspian level correlate with these variations (Figure 9.1).
However, there are some essential deviations. For example, a long-term rise of the level in 1978−1997 is not satisfactorily explained. The evaporation and its changes are estimated by indirect manifestations only (cloud, air and water temperature, etc.); those estimates vary from 10 to 20% (Getman, 2000). Changes in the submarine groundwater discharge into the sea are not considered. Its contribution is estimated at about 5% of the Volga runoff. Therefore, although the water balance fluctuations play a significant and possibly leading role in the Caspian level changes, other causes of these changes should be considered. Indeed,

Vladimir G. Trifonov 260
using repeated geodetic measurement data, Lilienberg (1994) found a change in a recent motion regime in the adjacent regions near 1978, when the Caspian level started to rise after the long-term fall. However, information on tectonic processes in the Caspian per se may be obtained only by an analysis of regional seismicity.
9.2.1.2. Seismotectonic Provinces of the Caspian Region
Using a seismological data set (Moinfar et al., 1994; Kondorskaya and Ulomov, 1999; National Earthquake Information Center, 2004), we carried out a comparison of the Caspian level changes and tectonic processes partly reflected by variations of seismicity in various seismotectonic provinces of the Caspian region (Ivanova and Trifonov, 2002). More than 1,200 earthquakes were analyzed for the Caspian region, between 36.5° N and 44° N and between 47.5° E and 54.5° E (Figure 9.2). The annual values of the seismic energy released in provinces were calculated using the following formula (T.G. Rautian, personal communication, 2000):
lgE = 4 + 1.8 · MLH,, (9.1)
where E is seismic energy calculated in J, MLH is earthquake magnitude. Seismotectonic provinces in the region (Figure 9.2) were delineated using the following
criteria: (a) structure of the Earth’s crust (Krasnopevtseva, 1984; Artyushkov, 1993), (b) peculiarities of the Pliocene–Quaternary tectonic development (Milanovskii, 1968; Rastsvetaev, 1973; Kopp, 1997; Leonov et al., 1998; Leonov, 2007), (c) patterns and kinematics of active faults (Trifonov, 1983; Trifonov et al., 1986, 2002), and (d) location of seismic focal zones and their dynamics during the epoch concerned (Figures 9.2 and 9.3). Focal zones are mainly situated in neotectonic structural boundaries characterized by high gradients of geophysical parameters, such as gravitational field and pattern of seismic wave distribution, and Late Cenozoic movements.
The region occupies a part of the Epi-Paleozoic Scythian–Turanian Plate, rebuilt more or less by the Cenozoic movements, and areas of the Alpine tectonics (Ivanova and Trifonov, 2002). The Middle Caspian, the adjacent coasts, and the eastern part of the South Caspian basin (provinces I, II, and VII) belong to the Scythian–Turanian plate, whereas the western and central part of the South Caspian and adjacent coastal areas (provinces III−VI) belong to the Alpine structural belt.
The province I (Figure 9.2) includes the eastern and southeastern parts of the Pliocene–Quaternary uplift of the Great Caucasus (Figure 9.3a) and the Derbent foredeep in the western part of the Middle Caspian Sea. Thickness of the sedimentary cover exceeds 14 km in the foredeep (Figure 9.3b). More than 5 km of it belongs to the Pliocene–Quaternary (Leonov et al., 1998). The main seismic zone with earthquakes with surface-wave magnitudes (MS) up to 6.3 and focal depths down to 110 km is located along the southwestern slope of the foredeep.
Weak Late Cenozoic movements characterize the larger part of the province II (Figure 9.2). The Kara-Bogaz dome with the thinned Earth’s crust (Figure 9.3c) is situated in the south of the province. The Northern and Southern Balkhan fault zones form great structural contrast in the southern side of the dome and correspond to the Krasnovodsk–Balkhan seismic zone with the strongest Kazanjik (1946, MS = 7) and Great Balkhan (2000, MS = 7.4) earthquakes.

Tectonic and Climatic Rhythms and the Development of Society 261
Figure 9.2. Seismotectonic provinces I−VII and earthquake epicenters in the Caspian region (Ivanova and Trifonov, 2002): 1−4 are MS: 1 − <5, 2 − 5−5.9, 3 − 6−6.9, 4 − ≥7; 5 and 6 are depth of hypocenters of earthquakes: 5 − ≤33 km, 6 − >33 km; 7 − the province boundaries; 8 – active faults; 9–11 – areas with different regimes of the Pliocene–Quaternary vertical movements: 9 – a moderate uplift, 10 – an intensive uplift, 11 – subsidence (isopachs of the Pliocene–Quaternary deposits are shown with the interval of 2 km); 12–16 – principal sections of the Earth’s crust: 12 – the basement, 13 – a waveguide within the basement, 14 – the Jurassic–Cretaceous volcanic unit, 15 – the sedimentary cover or its pre-Pliocene part, 16 – Pliocene–Quaternary part of the cover.

Vladimir G. Trifonov 262
Figure 9.3. Schematic deep sections of the provinces in the Caspian region: (a) province I, the coastal part of the Eastern Caucasus (Krasnopevtseva, 1984); (b) province I, the Derbent basin (Krasnopevtseva, 1984; Leonov et al., 1998); (c) province II (Garetsky, 1972); (d) province VII (Artyushkov, 1993; Leonov et al., 1998); (e) province III (Krasnopevtseva, 1984); (f) province VI (Krasnopevtseva, 1984); (g) province IV (Leonov et al., 1998; Ivanova and Trifonov, 2002); (h) province V (Artyushkov, 1993). 1 − the sedimentary cover or its pre-Pliocene part only, 2 − the Pliocene–Quaternary part of the cover, 3 − the Jurassic−Lower Cretaceous volcanic unit, 4 − the crustal basement, 5 − the upper mantle, 6 − crustal and upper mantle waveguides.
In the province VII (Figure 9.2), the thickness of the crustal basement of the Scythian–Turanian type is reduced to 15−20 km beneath the eastern part of the South Caspian basin (Figure 9.3d). The Gorgan foredeep with the thickened sedimentary cover is situated in the south of the province, in front of the Allah Dagh and Eastern Alborz Ranges. Earthquakes with MS ≥ 6 took place there.
The province III is a part of the zone of the Southern Slope of the Great Caucasus (Figure 9.2) contacting a thicker crust of the Great Caucasus. The abrupt change of the crust thickness in this province was caused by sedimentation of deep-water facies in the Late Mesozoic, Paleogene, and Early Miocene on the thinned Paratethys crust. In the Late Cenozoic, the crust thickness was increased by the subsidence of the Lower Kura basin, folding, and thrusting in

Tectonic and Climatic Rhythms and the Development of Society 263
the Southern Slope zone (Krasnopevtseva, 1984; Leonov, 2007) (Figure 9.3e). The strongest Shemakha earthquake (MS = 6.9) happened in 1902.
The province VI (Lower Kura basin – Figure 9.2) is similar to the province VII (Figure 9.3f). The main focal zone is situated in the southern part of the province, on its boundary with the uplifted Talysh Ridge, and is marked by active faults (Trifonov et al., 2002).
The Apsheron Threshold zone (province IV) is formed by en echelon system of folds in the sedimentary cover and corresponds to the deep-seated fault zone between the Epi-Paleozoic continental crust of the Middle Caspian and the thinned crust of the South Caspian basin (Figures 9.2 and 9.3g). The active fault zone strikes along the Threshold and sense of motion on the faults changes from the west to the east. It is mainly reverse in the Great Caucasus and dextral in Turkmenistan (Kopp, 1997; Rastsvetaev, 1973; Trifonov, 1983; Trifonov et al., 1986, 2002). The 1995 Krasnovodsk earthquake (MS = 7.9, the focal depth was 55 km) was the strongest in the region. The 1986 and 1989 events with MS ≥ 6 happened in the Central Caspian near the Moho surface or lower.
The province V occupies the central and western parts of the South Caspian and adjacent uplifts of the Talysh and Western Alborz Ridges (Figure 9.2). These parts of the South Caspian are the deep basin (bathymetric depths are down to 1,000 m), where the crustal basement is thinned to 8−10 km (Figure 9.3h). Thickness of the folded sedimentary cover reaches 20 km (Artyushkov, 1993; Leonov et al., 1998). No less than half of the cover belongs to the Pliocene–Quaternary: thickness of merely the Late Pliocene and Quaternary exceed 6 km in some places (Figure 9.3h). The longitudinal folds and thrusts dominate in the neotectonic setting of the Talysh and Western Alborz. However, the thrust component of motion combines with dextral component in the Talysh and with the sinistral component in the Western Alborz (Berberian, 1976; Berberian et al., 1992; Trifonov et al., 2002). The main seismic zones are situated on the boundary of the deep basin and the adjacent uplifts as well as in the uplifted ridges. The 1990 Rudbar earthquake (MS = 7.4) was the strongest in the Alborz.
Therefore, the seismicity is concentrated in the deep neotectonic basins in the provinces I, III, VI, and VII (the Derbent and Gorgan foredeeps and Lower Kura basin). However, it is also typical for slopes or axes of the Late Cenozoic uplifts in the provinces II, IV, and V. This difference is important for the interpretation of relationships between variations of seismicity and the Caspian level changes.
9.2.1.3. Relations between Seismicity in the Caspian Region and the Caspian Level Fluctuations
The strongest earthquakes give the main contribution to the release of seismic energy. Six earthquakes with MS ≥ 7, seven earthquakes with MS = 6.5−6.9, and twenty earthquakes with MS = 6.0−6.4 were recorded in the region from 1835 until now. Rise of the Caspian level (or deceleration of its fall) were registered after all earthquakes with MS ≥ 6.5, although the rise took place only a year after the Buyin Zara event (1962, MS = 7.2), which is the most remote from the Caspian. The rise reached 30 cm after the 1895 Krasnovodsk earthquake (MS = 7.9), 20 cm after the 1946 Kazanjik earthquake (MS = 7.0), 10 cm after the 1890 Gorgan earthquake (MS = 7.2), and 8 cm after the 1902 Shemakha earthquake (MS = 6.9). The 1990 Rudbar event (MS = 7.4) was accompanied by acceleration of the rise. After earthquakes with MS = 6.0−6.4, the sea-level rise was registered for all events with epicenters in the Caspian

Vladimir G. Trifonov 264
Sea and nearby, and only for 60% of events happened in the region far from the sea. These effects of the strongest earthquakes are probably the results of permanent deformation (leaking) inside the sea bottom.
Therefore, direct influence of the strongest earthquakes can produce the small-scale and probably temporary rise of the Caspian level. However, earthquakes and released seismic energy are only a partial reflection of recent tectonic deformation. Contribution of seismic displacements to the total tectonic motion varies and depends on geological setting. For example, the contribution is more than 50% in central and northern Iran with its thick consolidated part of the Earth’s crust (Jackson and McKenzie, 1988). This estimate can correspond to the contribution of seismic movements in the provinces II and partly VII of the Caspian region. However, in deep sedimentary basins like the Mesopotamian foredeep and the External Zagros, similar to the Derbent foredeep and the South Caspian basin, the calculated contribution is less than 10% (Jackson and McKenzie, 1988). It is probably even less in the lower crust and the upper mantle. If one considers these peculiarities, the registered seismicity can manifest much bigger tectonic movements than the earthquakes themselves, and the role of tectonics in the Caspian level changes can be essential, particularly in the Derbent foredeep and the South Caspian basin.
To estimate relationships between the Caspian level changes and variations of seismicity in the seismotectonic provinces, we ignored small fluctuations and defined the amount of earthquakes with MS ≥ 4.9 in each province during the seven principal stages of the level changes (Ivanova and Trifonov, 2002). These were:
• 1837−1853 stage of the level fall, • 1854−1883 stage of the level rise, • 1884−1910 stage of the relatively stable level, • 1911−1929 stage of the weak fall, • 1930−1940 stage of the quick fall, • 1941−1977 stage of the weak fall, and • 1978−1997 stage of the quick rise of the level. The bigger amount of the earthquakes was typical for the 1930−1940 stage in the
provinces I, III, VI, and VII and for the 1978−1997 stage in the provinces II, IV, and V (Figure 9.4a).
To check this difference more accurately, we used the parameter of seismic power, that is, the average annual value of released seismic energy in the provinces during the stages. The maximum seismic power was typical for the 1884−1910 stage of the stable highest position of the sea level. However, the further seismicity in the provinces I, III, VI, and VII and the provinces II, IV, and V were different (Figure 9.4b).
The seismic power decreased in the second group in the 1911−1929 stage (lgE = 12.6) and became lower than in the first group (lgE = 14.8). These parameters converged in the 1930−1940 stage. However, later, in the stages 1941−1977 and 1978−1997, seismic power decreased in the first group (lgE = 14 and 12.9, respectively) and increased in the second group (lgE = 15.1 and 16.5, respectively).

Tectonic and Climatic Rhythms and the Development of Society 265
Figure 9.4. Relationships between stages in the Caspian level changes and (a) the number of earthquakes with MS ≥ 4.9, and (b) the average annual seismic energy released during these stages (Ivanova and Trifonov, 2002). 1 − Caspian level changes from stage to stage (coarsened), 2 − the highest sea-level variations within the stages, 3 and 4 − the number of earthquakes for each stage divided by its duration (n), or the average annual released seismic energy for each stage (lgE): 3 − in the provinces II, IV, and V; 4 − in the provinces I, III, VI, and VII.
Since some stages contained episodes of the opposite behavior of the Caspian level, we divided the stages to the phases of the one-way regime of the sea level (rise or fall with rates more than 0.05 mm/yr or stable position with fluctuations with smaller rates) and calculated seismic power of the provinces for each phase. The provinces I, III, and VI demonstrated the maximum release of seismic energy during the phases of the sea-level fall. Province VII showed the same, when we excluded the seismic effect of the strongest 1890 Gorgan earthquake happened in the phase of the stable sea level. In the provinces II, IV, and V, seismic power was usually higher for the phases of rise than for those of fall in the sea level. It is the most evident in the province IV (with effect of the 1895 Krasnovodsk earthquake or without it), where the seismic power grew in 1978−1989, when the sea level rose particularly quickly (Ivanova and Trifonov, 2002). The different seismic behavior of the two groups of the provinces is seen in Figure 9.5, which demonstrates average seismic power of the provinces for all phases of rise (36 yr), fall (60 yr), and stable position (58 yr) of the Caspian level.
The similar regularities were found by an analysis of merely 180 registered earthquakes with hypocenters at depths more than 33 km (i.e., in the lower crust and the upper mantle), although 116 of such deep events took place in 1978−1998. The strongest 1895 Krasnovodsk earthquake reduces the deep seismicity in the southeastern part of the region and the first deep earthquake happened in the Krasnovodsk area only in 1970. Until 1978, the deep seismicity was concentrated in the Derbent and Lower Kura basins and all earthquakes took place during sea-level falls. In 1978−1997, when the sea level rose, the deep seismicity reduced in these provinces and increased around and partly within the South Caspian basin. Therefore, the change of the Caspian level regime in 1978 coincides with the rebuilding of seismicity in the lower crust and the upper mantle that shows influence of the deep-seated tectonic processes on sea-level changes.

Vladimir G. Trifonov 266
Figure 9.5. Average annual values of the seismic energy released in the provinces I−VII during all stages of uplift (dark gray), subsidence (white), and stability (dotted) of the Caspian level (Ivanova and Trifonov, 2002). Contribution of the strongest earthquakes: G − 1890 Gorgan, K − 1946 Kazanjik, Kr − 1895 Krasnovodsk, R − 1990 Rudbar, and S − 1902 Shemakha.
The represented data show that activity of the seismic zones within the sinking basins (provinces I, III, VI, and VII) coincides with the Caspian level fall, whereas activity of the zones in the slopes of uplifts surrounding the basins (provinces II, IV, and V) coincides with the level rise. The most important is phase opposition of the seismic zones in the Derbent foredeep and around the South Caspian, because seismic displacement in these deep basins represents only small part of their total recent tectonic motion. This regularity permits us to look for influence of recent deformation of the Caspian reservoir on its water level.
The Middle and South Caspian basins and surrounding ridges are neotectonic structures of the Alpine–Himalayan collision belt. Their recent compression is proved both by morphology of the boundary zones between basins and ridges (Milanovskii, 1968; Berberian et al., 1992; Kopp, 1997) and results of the GPS measurement (McClusky et al., 2000). When the compression increases (growth of seismicity around the South Caspian basin), the transverse shortening of the basins takes place, their volume decreases, and the water level rises. It is accompanied in the South Caspian by acceleration of growth of underwater anticlines that resulted in additional rise of the level. When the compression decreases, the Derbent and other basins sink quicker. This process results in the sea-level fall and is accompanied by increasing seismicity within the basins.
This model was confirmed by an analysis of focal mechanisms of earthquakes carried out using 128 events from the catalogs by Balakina et al. (1996) and Mostryukov and Petrov (1994). Space position of sectors of predominant compression (shortening, P) and extension (lengthening, T) was defined for all the earthquakes within the study area for some temporal interval (Ivanova and Trifonov, 2002). The analysis showed that the 1960–1977 epoch, when the seismicity was concentrated in provinces I, VI, and VII, the transverse horizontal compression decreased. It was vertical in the Derbent foredeep and was trended to the west-north-west direction (along the structures) in the South Caspian. It produced normal faulting, sink of the basins, and the sea-level fall, as the result, in the Derbent foredeep and other

Tectonic and Climatic Rhythms and the Development of Society 267
basins. However, from 1978, position of P and T axes became suitable for strike slip but not normal faulting there. The compression axes turned near the South Caspian basin to east-north-east − west-south-west direction, viz. across the structures. This led to an increased transverse shortening and the sea-level rise as a result.
Changes of composition and physical properties of rocks in the lower crust and the upper mantle could accompany the collision deformation. The 16-km thick high-velocity layer was found just beneath the Moho surface in the Derbent foredeep (Krasnopevtseva, 1984). It gives the negative isostatic anomaly (Artem’ev and Kaban, 1986). It is probably caused by eclogitization of the lower crust rocks. The bigger negative isostatic anomaly in the South Caspian shows that the same process could took place there even in the larger scale (Artyushkov, 1993). The process could produce additional sink of the basins and the sea-level fall.
The recent tectonic processes both deform the Caspian reservoir and can influence an amount of the groundwater recharge. Clays predominate in the Caspian sedimentary cover. The clay sediment contains up to 80% water. Its main part is free (interstitial water) and more than 40% is bound by physical and chemical processes (bound water). The free water is removed to the reservoir by loading the upper sediments and porosity of the sediment decreases down to 8−10% in the depth of 1.5 km. This process does not change the sea level. However, under temperature 100−140° C, tectonic stress and loading of the sediments, montmorillonite (main clay mineral of weathering zone and the Caspian sediments) transforms into hydromica (Kholodov, 1983). The bound water released by this process can reach 10% of the primary weight of the rock. The released water produces abnormally high strata pressure. The main part of the Caspian groundwater is concentrated in the South Caspian basin (Leonov et al., 1998). Because of a high rate of sinking, the removing of interstitial water has been incomplete and an abnormally high strata pressure arrives at depths of 5−6 km. The zone of leaking is registered at the depths of 7−12 km. It corresponds to the area of transformation of montmorillonite to hydromica (Kholodov, 1990). A volume of water, which can be released in those depths in the South Caspian, reaches about 105 km3 that is commensurable with the volume of water of the Caspian Sea (about 0.75 × 10⁵ km3).
The water, released in the abnormally high strata pressure zones, is concentrated in fluid sources and is unloaded in mud volcanoes within the basin and in reservoir beds around it. Formation of new fractures and activation of existed channels during strong earthquakes can unload the fluid source for several months. Even events with MS = 5−6 can produce such hydro-eruptions and epochs of high seismicity can supply the eruption of billions cubic meters of water to the surface. For example, Ivanchuk (1994) estimated the volume of hydro-eruption in the Akhtarma–Poshaly fold, Azerbaijan as 8 km3 that corresponds to 1/5 of the water volume, which is necessary to give the annual rise of the Caspian level to 0.1 m typical for 1982−1997 (Leonov et al., 1998).
Thus, fluctuations of the Caspian level within the last 170 years are the combined result of the water balance variations caused mainly by climatic changes and the recent tectonic events partly manifested by seismicity. The main contribution belongs probably to climatic variations, but active tectonics also plays an essential role. Its influence consists in the integral effect of various deformations producing a change of the Caspian reservoir volume (sinking of basins, transverse shortening, and growth of local underwater anticlines), and

Vladimir G. Trifonov 268
probably variations of the groundwater recharge. The latter can particularly be important in the South Caspian.
The climatic and tectonic processes influence the Caspian level mainly in the same direction, although the author cannot find mutual relations between these two groups of processes. A study of Kaftan and Tatevian (1996) is interesting in this context. They carried out the harmonic analysis of changes of solar activity index and secular variations of the angular rate of the Earth’s rotation and compared them with fluctuations of the Caspian level. The model of the level changes, developed with the first six harmonics of the highest amplitudes, both coincided satisfactorily with the actual level variations and allowed these authors to predict the ending of the level rise in 1997 (Figure 9.6). This is a base to suppose that regulating influence of changes of solar activity and the rate of the Earth’s rotation causes synchronism of frequent variations of climatic and tectonic activity.
Figure 9.6. Caspian Sea level changes: observed (black) and modeled (gray) (after Kaftan and Tatevian, 1996, © Tatevian, 1996; reproduced with kind permission of the author).
9.2.2. Orbital–Astronomical Regulation of the Contemporary Short-Term Variations of Climatic and Tectonic Activity
Tchijevsky (1938) and his followers (Vladimirsky, 1998) grounded cyclic periodicity of solar activity and geomagnetic disturbance and correlated with them changes of climate, crop capacity, locust invasions, epidemics, and so on (Section 4.2.5). They showed the highest stability of the ~11-yr cycle, corresponding to the average period of the Wolf number (relative sunspot number) variations, and showed the existence of periodicities multiple of the ~11-yr cycle: 5–6, 22, 33–35, and ~90 yr. One can see the 10–11-yr (in average) periodicity of the near-ground air temperature both global and (more evident) in the Northern hemisphere in 1850–1990 on Figure 9.7. Lyatkher (2000) paid attention to changes of duration of the

Tectonic and Climatic Rhythms and the Development of Society 269
main ~11-yr cycle within the last 250 years and showed that its variations are also quasi-cyclic with a period of 60–100 yr. There are correlations between solar activity cycles and the amount of earthquakes (Tchijevsky, 1938; Sytinskii, 1987), and average time intervals between earthquakes with M ≥ 7 and the main cycle duration (Lyatkher, 2000). Makarov et al. (1995) found the 9–12 and 5–6-yr cyclicity in time series of the landslide activity in Europe. These cycles manifest a periodicity of moistening, i.e., climatic changes, as well as seismic activity in the Alpine belt, where a significant part of landslides are situated.
Figure 9.7. Deviations of the annual near-ground air temperature from 1850 to 1990 (thin black lines) from the average air temperature for 1951–1980; thick gray lines are low-frequency components of the deviations: (a) the Northern hemisphere, (b) the Southern hemisphere, (c) the globe (after Losev, 2001, © Losev, 2001; reproduced with kind permission of the author).
For the last 400 years, Levi et al. (2002) showed the existence of global rhythms of maxima of the seismic energy release with the most typical period of 20–30 years and not so clear periods of 45, 90, 150, and 195–200 yr. The phases of maximum release of the energy are late relative to the phases of maximum frequency of earthquakes up to 10 yr. For the last 400 years, the 20–30-yr period is also the most typical for the global volcanic eruption rhythms. The tendency of phase opposition between the seismic and volcanic events was found. The 20–26-yr rhythms is characteristic for accretion of larch in the Baikal region from 1362. The 22–30 and 40-yr cycles were detected for the Baikal level changes for the last 250 years, and the 11, 22–25 and 35–37-yr periodicities were registered for the air temperature

Vladimir G. Trifonov 270
variations in the city of Irkutsk from 1881. So, the most characteristic periodicity of the studied natural events is close to, or multiple of the double Wolf cycle (Levi et al., 2002).
Using a catalog of strong earthquakes (MS ≥ 5.7) in the Alpine–Himalayan orogenic belt (Trifonov and Karakhanian, 2004), Senko et al. (2004) analyzed temporal variations of the released seismic energy in a region between 15° E and 80° E as a whole and its seismic provinces and zones for the second part of the 19th and the 20th centuries. The catalog was compiled using a set of regional catalogs and papers describing individual historical earthquakes (Kárník, 1968; Shebalin et al., 1974; Poirer and Taher, 1980; Ambraseys and Melville, 1982; Kondorskaya and Shebalin, 1982; Berberian, 1994; Guidoboni et al., 1994; Moinfar et al., 1994; Ambraseys and White, 1997; Papazachos and Papazachou, 1997; Kondorskaya and Ulomov, 1999; National Earthquake Information Center, 2004; Ekström et al., 2006).
Figure 9.8. The seismic energy E released by earthquakes with MS ≥ 5.7 in the second part of the 19th and 20th centuries in (a) Anatolia, the Crete–Aegean, and Carpathian–Balkan regions, depths of hypocenters ≤70 km; (b) the same area, depths of hypocenters >70 km; (c) the North Anatolian zone; (d) the central part of the Alpine–Himalayan collision belt, depths of hypocenters ≤70 km; (e) the same area, depths of hypocenters >70 km. Histograms were plotted with the 1-yr step and smoothed by the 5-yr moving average (Senko et al., 2004).

Tectonic and Climatic Rhythms and the Development of Society 271
We determined the released energy by the following formula (F.F. Aptikaev, personal communication, 2000):
( )( )10 1.550.90988.1= ++ E M . (9.2)
The 10–12-yr cyclicity predominated in the individual seismic provinces and zones of the
belt and the 22- and ~15-yr cycles were also found in some of them. An increase in the cycle duration was found before and rarely after the strongest earthquakes. For the region as a whole, these cycles sum up and give the more evident 10–11-yr periodicity (Figure 9.8).
On the other hand, many climatologists recognize links between the frequent climatic variations and fluctuations of the Earth’s rotation parameters and, first of all, the angular rate of the rotation. This connection can be mutual because changes of the atmospheric flows and volume of glaciers can influence the rotation rate (Selivanov, 1996).
Gor’kavyi et al. (1995, 1999) compared variations of the annual number of earthquakes and the rate of angular rotation. They distinguished three components of changes in the seismicity: (a) the global 10−15-yr rhythm; (b) a transregional ~3-yr component manifested by the phase opposition for the Northern and Southern hemispheres (a maximum number of earthquakes with Mb ≥ 4 in one hemisphere corresponds to a minimum number of those in another one); and (c) a regional noncyclic component depending on a local tectonic situation. The studies showed high average values of correlation coefficients between the earthquake number in 1964−1990 and modulus of a time derivative of the rate of angular rotation |dΩ / dt|, viz. its acceleration (Table 9.1). The correlation depends on earthquake magnitude, time intervals, and tectonic situation. The correlation is higher for the 1969−1988 interval than for the others. For the globe, correlation coefficients reach high values (>0.5) only for earthquakes with M ≥ 5. The correlation is higher for the intermediate earthquakes (the focal depths are 50−240 km) than for the crustal ones. However, no correlations were found for the deepest (>300 km) events in the subduction zones. Therefore, this relationship is just global and decreases with reduction of the studied territory.
Table 9.1. Correlation coefficients between annual number of earthquakes N and
absolute values of time derivatives of the angular speed of the Earth’s rotation |dΩ/dt| (Gor’kavyi et al., 1999); sample sizes are 27, p ≤ 0.01
Region Magnitude Depth, km Period 1964–1990 1969–1988 Correlation coefficient
Global ≥ 5.0 70–125 0.58 0.83 ≥ 6.0 70–240 0.54 0.76
Spreading zones ≥ 5.1 all depths 0.46 0.55 Western part of the Alpine–Himalayan belt ≥ 4.5 10–30 0.51 0.62
Western active margin of the Pacific ≥ 5.5 65–145 0.50 0.60
North American active margin of the Pacific
≥ 5.1 ≥ 8 0.72 no data ≥ 5.5 ≥ 17 0.78 0.83

Vladimir G. Trifonov 272
Therefore, there is a synchronism in manifestations of seismotectonic and climatic processes with rhythms of years and decades. This cannot be explained by mutual relations between these two groups of processes. However, they are possibly correlated with variations of the orbital parameters of the Earth’s rotation, geomagnetic field, and solar activity, which can be linked to each other.
9.3. Medium-Period Variations: The 1,200–1,800-yr Cycles
9.3.1. Materials and Methods
Before studying relationships between the development of society and natural events
(climatic changes, tectonic movements, earthquakes, volcanic eruptions, and their secondary effects), it is necessary to estimate senses and ways of using the source data. The author limited the analysis (a) by the epoch of producing economy (agriculture and later industry), viz., the Middle and Late Holocene; and (b) by a territory within and around the Alpine–Himalayan orogenic belt, between Greece and Egypt in the west and India and Central Asia in the east (the ancient peoples called it the Eastern Oecumene). This territory is characterized by numerous archeological data and the oldest historical documents, as well as abundant manifestations of seismicity, volcanism, and other geodynamic activity. The climatic changes are clearly manifested there because of general semi-arid conditions. For the comparison, the author represented the results of the similar analysis for the East European Platform.
Databases on human history are full of data on local changes of archaeological cultures, collisions between and within states and cultural communities, etc. In the context of this chapter, it is impossible and useless to analyze all of them. The long-term historical crises (not less than two centuries in typical manifestations) occupying large regions are under our studies. Because we looked for criteria of the crises, which could be find in both developed civilization and primitive community, whose life was reconstructed by small number of archaeological data, the author limited the criteria of crises by signs of three groups of events:
• Signs of social unrest, numerous and strong wars (i.e., destruction of many
settlements and towns in the region, reduction of population, manifested by thinning of cultural layers in the settlements, reduction of number of burials);
• Mass migrations; • Total change of the ethno-political map of the region (i.e., principal changes of
boundaries of archaeological cultures and later states, arrival of new communities and states).
On the other hand, archaeological data and historical documents showed that the crises
determined breakthroughs in the society and its communities to new technologies and new forms of economical and political relations. The crises alternate the epochs of relative stability and slow evolution of the society. Sedimentological, palynological, and geobotanical data have recorded climatic variations.
Strong earthquakes and variations of their frequency and values of the released seismic energy manifested variations of the geodynamic activity for the particular time interval. The catalog of strong earthquakes (MS ≥ 5.7) in the Alpine–Himalayan collision belt (Section

Tectonic and Climatic Rhythms and the Development of Society 273
9.2.2) was used to analyze temporal variations of seismicity (Trifonov and Karakhanian, 2004). The recent instrumental techniques give the opportunity to register almost all crustal earthquakes in the Alpine–Himalayan belt with MS ≥ 5.7. Registration of strong historical earthquakes (recorded in written manuscripts, publications, or documents) is much less complete, particularly before the 19th century AD. The data on single earlier Holocene earthquakes were obtained by techniques of paleoseismicity and archaeoseismicity. Incompleteness of registration of historical and prehistoric events is evident after a comparison of the earthquake recurrence graphs for different epochs. The graphs are normal for the events of the 19th–20th centuries, but they are deformed for the earlier earthquakes. The latter indicates abnormally large numbers of the strongest earthquakes relative to the weaker ones registered incompletely. It is true not only for events with MS = 5.7–6.9, but for some events with MS ≥ 7 as well. The parameters of prehistoric and historical earthquakes before the 19th century cannot be estimated more precisely than ±0.5° for their location and ±0.2 for the magnitude.
Probably, the first description of a strong earthquake can be found in the Book of the prophet Zechariah (The Holy Bible, 1929): ‘And his feet shall stand in that day upon the mount of Olives, which is before Jerusalem on the east; and the mount of Olives shall be cleft in the midst thereof toward the east and toward the west, and there shall be a very great valley; and half of the mountain shall remove toward the north, and half of it toward the south. And ye shall flee by the valley of my mountains; for the valley of the mountains shall reach unto Azel; yea, ye shall flee, like as ye fled from before the earthquake in the days of Uzziah king of Judah; and Jehovah my God shall come, and all the holy ones with thee’ (Zec 14:4–5).
As the years of Uzziah’s reign are known, the earthquake is dated by ca. 760 BC. Its MS have been estimated as 7.3 by analogy with the deformation effect of the later seismic events in the area (Nur, 1991). The Khorkhros cuneiform inscription of the Urartu King Argishti I has approximately the same age. It reports about a seismovolcanic event that helped him to subjugate the town of Bekhura. Its ruins were supposedly identified in Armenia to the southeast of the Lake Sevan. Vertical–dextral offset of the fortress wall to about 1.2 m and possible location of the epicenter near the volcano in 5–10 km southward allowed us to estimate MS = 7.2 (Trifonov and Karakhanian, 2004). These two documented seismic events are unique for the region. More frequent registrations of local earthquakes were initiated in the Classical Greece epoch only.
Berberian (1994) analyzed a catalog of historical earthquakes in Iran and paid attention to the possibility of worse registration and preservation of the data on earthquakes in epochs of wars, political instability, and social unrest. To check the importance of this factor, the author compared the number of recorded strong earthquakes in the Aegean, Greece, Anatolia, and the Eastern Mediterranean and stages of political and social rises and falls in the Byzantine Empire. Generally, results obtained did not demonstrate a correlation (Figure 9.9). However, the mid-15th century (the fall of Constantinople in 1453) is marked by a high number of earthquakes; all known earthquakes with MS ≥ 8 (in the years 365, 859, 1114, 1201, and 1303) coincide with the epochs of decline or transition from prosperity to decline. This shows not the better registration of earthquakes for the satisfactory epochs, but possible contribution of seismicity to social and political decline.

Vladimir G. Trifonov 274
Figure 9.9. Relationships between the number of strong earthquakes in the Crete–Aegean region, Anatolia, and the Eastern Mediterranean and phases of the historical progress (up) and degradation (down) in the Byzantine Empire. Historical changes are shown as an arbitrary curve: progressive periods are curve rises, decline periods are curve decays.
A factor of different completeness of registration is the most appreciable for the analysis of temporal variations of seismicity within local seismic zones. However, its influence smoothes down for the larger territories, thus, the author reduced seismic zones of the central part of the Alpine–Himalayan belt to four seismotectonic provinces (Figure 9.10):
(I) The region of interaction of the African and Anatolian Plates and the European part
of the Eurasian Plate: the Carpathian–Balkan (1) and Crete–Aegean (2) regions, Eastern Mediterranean (3), and the western Anatolia (4);
(II) The western flank and the northern front of the Arabian Plate and the region of its interaction with the Eurasian Plate: the Levant and East Anatolian zones (5), the eastern part of the North Anatolian zone, the Lesser Caucasus (6) and the Great Caucasus (7);
(III) The northeastern part of the region of interaction of the Arabian and Eurasian Plates: the Zagros (8), Alborz and Allah Dagh (9), Makran and the central-eastern Iran (10), Binalud and Kopet Dagh (11);
(IV) The western flank and the northern front of the region of interaction of the Indian and Eurasian Plates: the Indus basin and Beluchistan (12), the western Himalayas, Karakorum, Hindu Kush, Pamirs, the western Kun Lun and the adjacent parts of Tibet and Tarim (13), the western Tien Shan, the Afghan–Tajik basin and the adjacent part of the Turanian Plate (14), the southern (15) and northern (16) Tien Shan.
Histograms of values of seismic energy, released in the provinces I–IV and in the entire
central part of the Alpine–Himalayan belt, are represented in Figure 9.11.

Figure 9.10. Epicenters of strong (MS ≥ 5.7) earthquakes, seismotectonic zones and provinces in the central segments of the Alpine-Himalayan collision belt (Senko et al., 2004).

Figure 9.11. The seismic energy E released by earthquakes with MS ≥ 5.7 in the seismotectonic provinces I–IV and the entire central segments of the Alpine–Himalayan collision belt (T) (Senko et al., 2004). The histograms were plotted with the 50-yr step. The energy released by earthquakes with intermediate hypocenters (deeper than 70 km) is shown by black color.

Tectonic and Climatic Rhythms and the Development of Society 277
To analyze the temporal variations of seismicity in the provinces and in the belt as a whole, it is necessary to consider the following: Until the mid-1st millenium BC, earthquakes were recorded very incompletely by archaeoseismological and paleoseismological means only. The author introduces the term “a stable registration” for the historical seismicity. For the studied seismic zone or province, the stable registration means presence of data about two or more earthquakes for a half-century and absence of the registration gaps for the further 50-yr intervals. The stable registration started in the Aegean region in the second half of the 6th century BC, and in the North Anatolian zone and the Eastern Mediterranean in the second half of the 4th century BC. In the Great Caucasus, it began in the mid-5th century AD, and in the Lesser Caucasus – in the early 8th century. Blossom of the Baghdad Caliphate with its high level of sciences was favorable for the stable registration of seismicity in the Middle East and Central Asia. It began in Zagros and the northern Iran in the 9th century, and in Egypt, the central and eastern Iran, and Central Asia (Bactria and Sogdiana) in the 10th century. The stable registration started in the Christian Carpathian–Balkan in the 12th century. However, in India and the mountains of Central Asia, it began only after the arrival of the English and Russian, respectively, colonial administrations in the mid-19th century. The registration became much more complete in the 19th century and the instrumental technique improved principally the registration in the 20th century.
These considerations give some keys to interpret the histograms of temporal variations of seismicity (Figure 9.11). For example, the peak of seismicity in the 10th–14th centuries AD corresponded to the smaller seismic activity than the peak of the 4th–8th centuries AD because of the essential increase in areas of the stable registration. The peak of the second half of the 17th century was probably no less than the peak of the second half of the 19th – the first half of the 20th centuries because the latter depends partly on the progress in registration.
9.3.2. Historical Crises in the Oecumene In total, the history of Eastern Oecumene during the last six millennia (the Middle and
Late Holocene) was characterized by five crises manifested in social unrest, mass migrations, and political changes (Table 9.2). On the other hand, the crises determined breakthroughs to new technologies and novel forms of economical and political relations.
The first crisis is hypothetical. Probably, just this crisis caused preconditions for formation of the first Sumerian towns-states as well as the complex agricultural communities in the northwestern Black Sea and Balkans regions (the Cucuteni–Tripolie and similar cultures) and in the Transcaucasus (the Kura–Arax culture – Figure 9.12) in the first half of the 4th millennium BC. The first attempts to use bronze took place and the jigger wheel was created. In the Peruvian coast of the Pacific, the cultures arrived, which combined agriculture and sea trades. Complication of the primeval communities of different levels of social development was observed in the northern Chile, Eastern China, and Japan after ca. 3800 BC.
Not so mush data exists about the second crisis of the mid-3rd millennium BC. Confrontation of the oldest Sumerian towns-states increased in that time and finished with the collapse of the Ancient Sumer and the rise of Akkad. In Egypt, starvation took place in the 24th−22nd centuries BC and mortality increased to almost 10 times (Selivanov, 2000). Finally, it led to the collapse of the Old Kingdom.

Figure 9.12. Main Quaternary tectonic features, archaeological cultures, historical units, and sites in the central segments of the Alpine–Himalayan collision belt and the adjacent part of the Eurasian Plate. Green are the Chalcolithic and Bronze Age cultures, tribes, countries, and towns; red are the Ancient and Medieval countries, tribes, and towns. Thick lines are the largest Quaternary faults. AD – the Allah Dagh Range, AG – the Aegean Sea, AT – the Afghan-Tajik basin, BK – the Balkans, BL – Binalud Range, Co – the city of Constantinople, DST – the Dead Sea Transform, EAFZ – the East Anatolian fault zone, HK – the Hindu Kush Mountains, KB – the Gulf of Kara-Bogaz-Gol, KD – Kopet Dagh, Kf – the Khanarassar fault, KK – the Karakorum Mountains, KL – the Kun Lun Mountains, NAFZ – the North Anatolian fault zone, SK – the Sarykamysh basin.

Table 9.2. Multi-century crises of the Middle and Late Holocene
Time Climate Tectonics History The early 4th millennium BC
Arrival of the annual variations in the Oecumene. Start of the El Niño regime in the Pacific.
Strong earthquakes and volcanism in Armenia. Strong earthquakes in the Zagros.
First signs of using bronze. First towns-states in Sumer. Origination and development of the producing economics in the Pacific.
The mid-3rd millennium BC
Aridization in Egypt, Sumer, Near East, the southern Turkmenistan, and the Sevan region.
Strong earthquakes and volcanism in Armenia and Southern Syria.
Decline of early agricultural communities. Transition to the semi-nomadic cattle breeding. Collapse of the Sumer and the Old Egyptian Kingdom.
The second half of the 2nd millennium BC
Aridization in China, Indus Valley, Central Asia, Turkmenistan, Turkey, Transcaucasus, and the Persian Gulf.
Numerous strong earthquakes. Collapse of the Achaean states, Hittite Kingdom, Babylon, and Indus civilization. Migrations of the “Peoples of Sea” and Arameans. Transition to the Iron Age.
The mid- and early second half of the 1st millennium AD
Aridization in Central Asia, Afghanistan, Indus Valley, the Great and Lesser Caucasus, Israel, and North Africa.
Two peaks of seismicity: in the 4th and 6th–7th centuries. Activity lasted up to the 9th century.
Collapse of the Western Roman Empire and the Sassanian Iran. Arabic conquests. Mass migrations and foundation of new states. Formation of the Southern Slavic branch and the first Slavic states.
The 17th–20th centuries The Little Ice Age: cooling and advance of mountain glaciers. Aridization in Central Asia.
Two peaks of seismicity: in the second half of the 17th century and in the late 19th – early 20th centuries.
Reduction of agriculture and starvation in Europe and Russia. Mass migrations. Industrial revolution. The World Wars in the first half of the 20th century. New social-economic concepts.

Vladimir G. Trifonov 280
Reduction of the Early Bronze proto-town settlements occurred in the late 3rd millennium BC in all of Palestine (Marchetti and Nigro, 1998). The same tendency took place in the Balkan–North Black Sea region, where the Cucuteni–Tripolie culture fell into decline: huge and well-designed super-centers transformed into small settlements and finally the cultural system collapsed (Masson, 1999). At the same time, the Geoksjur Oasis (Figure 9.12) perished in Central Asia. Many settlements of the Kura–Arax culture also perished after the mid-3rd millennium; the new settlements concentrated along the largest and deepest rivers or founded in hills and low mountains. A part of the population migrated to the southeast (northwestern Iran) and to the southwest (eastern Turkey and Palestine). The new settlements built in the difficult-to-access sites that demonstrated an increasing threat from the cattle-breeding tribes, immigrated to the traditional Kura–Arax territory. Finally, the Kura–Arax cultural community disintegrated and collapsed in the late 3rd millennium BC (Trifonov and Karakhanian, 2004).
However, in southeastern Europe and southwestern Asia, the second crisis and associate migration of peoples led to the transition from the earlier complex agricultural communities to the cultures of semi-nomadic cattle-breeders using horse for transportation. New features characterized these cultures: social stratification and separation of the military-aristocratic elite (Masson, 1999).
The third crisis is known better. It was connected with the transition from the Bronze Age to the Iron Age. The crisis was marked by complex political events. In the 14th century BC, the political dominant of the Oecumene was the rivalry of Egypt and Hittite Kingdom (Figure 9.12). After long wars, exhausting both states, they concluded the peace treaty in ca. 1284 BC (Zabłocka, 1982). Probably, the resources of Egypt were larger that demonstrated the great construction carried out by Ramesses II after concluding the treaty. After a brief rise in the first half of the 13th century BC, Assyria was weakened by the permanent rivalry with Babylon for hegemony in Mesopotamia and both these states were not powerful in the end of the century (Zabłocka, 1982). After the Achaean towns-states had won their former suzerain, the Minoan Crete, in ca. 1450 BC, they dominated in the Aegean region (Andreev, 1989).
However, the situation changed in the late 13th century BC. The Achaean towns were destroyed and occupied by the invasion of the Dorian and Thracian–Illyrian tribes (Andreev, 1989). This collapsed the Crete–Mycenaean civilization and provoked the mass emigration of the former population, drawing other tribes into the movement. This exodus was perceived in the Near East as invasion of “the Peoples of Sea”. In the treaty between Ramesses II and the Hittite King Hattusilis III, they are called as paid independent allies of the Hittite king (Zabłocka, 1982). However, the tone of the information changed later. In ca. 1234 BC, the text of Pharaoh Merneptah reported about ‘the northern peoples from all countries of the World’, which joined with Libyan tribes and began to pass the Egyptian boundary. These peoples were Akaivasha (Achaeans), Turusha (Etruscans), Shekelesh (Sicelians), Lukka (Lycians), and others. The later (after 1215 BC) notice of Ramesses III in the temple Medinet-Habu at Thebes reported about the invasion of strange peoples: ‘Hatti (Hittite Kingdom), Kode, Carchemish, and Arzawa, Alashiya (small states in Syria) collapsed simultaneously. Warriors moved to Egypt and wave of fire moved before them. They were Peleset (Pelasgians, which were called by Philistines in their new land and give its name to Palestine), Tjeker, Shekelesh, Danuna (Danaeans? – total name of Achaean–Ionian tribes of Greece) and Vashasha’ (Zabłocka, 1982).

Tectonic and Climatic Rhythms and the Development of Society 281
Because of the invasion, the Hittite Kingdom collapsed in ca. 1200 BC, and the former inhabitants and the newcomers founded small Late Hittite states in its territory. After losing this suzerain, Troy (Wilusa of the Hittites) fell in ca. 1180 BC (Korfmann, 2005). Probably, just this event became the historical base for the famous Homer’s poems (Homer, 1996). Newcomers founded new states in Syria and Palestine, where Egypt lost its influence. Because of the difficult victory of Ramesses III in 1190 BC, Egypt held out, but had to permit settling of the newcomers in the Nile Delta.
The Mesopotamian inhabitants underwent the invasion of the Western Semitic nomadic tribes of Aramean from Arabia. The first notices about conflicts with them were dated by the 14th century BC. Until the late 12th century BC, Assyria parried their impact. The Arameans limited themselves by robbery attacks only and did not try to occupy the agricultural territories. However, in the early 11th century BC, the Arameans captured the Middle Euphrates and deprived Assyria of rich agricultural areas and way to Syria. Because of starvation and political instability, Assyria and Babylon could not organize a serious defense. The territory of Assyria was reduced and the Aramean tribe of Chaldeans captured Babylon. The Arameans occupied a part of the Late Hittite states and formed new states in Syria, where they shifted to the settled life. Migration of the Aramean tribes initiated movement of the Jewish nomads. They moved to Palestine, where they mixed with the earlier Jewish population (the people of Moses; Pharaoh Merneptah reported crushing Israel in the late 13th century BC) and relative tribes as well as the Canaanites and shifted to the settled life. Consolidation of the society, caused by a struggle with the adjacent Arameans and Philistines, led to the formation of the Israel state in ca. 1000 BC (Zabłocka, 1982).
A mass migration involved the Arian tribes, which lived a semi-nomadic life in the South Ural region and western Central Asia. The first wave of the Indo-Aryans arrived in Iran in the mid-2nd millennium BC (Frye, 1963). Later they migrated to northwestern India, where they settled in the ruins of the Indus Valley agricultural civilization, which had been formed by Dravidian tribes, relative to the Elam people (Figure 9.12). The first signs of trouble arrived in the first half of the 2nd millennium and degradation became evident in the middle of the millennium. Only several relics of the civilization remained in the oceanic coast and northwestern Hindustan. The Irano-Aryans came to Iran in the late 2nd millennium BC and took control of the mineral resources necessary for the Mesopotamian states. This strengthened Elam controlled trade relations between Mesopotamia and the eastern countries.
The historians explain these changes of political situation in the Eastern Oecumene by inner social and economic difficulties in the civilized societies of Eastern Mediterranean and Near East. The difficulties were caused by extensive agriculture, permanent wars, impoverishment of known mineral resources, and the complication of assimilating the new resources controlled by martial tribes (Zabłocka, 1982). Although the majority of these factors had acted before the crisis, they gave the results only for the crisis. Obviously, there were some additional factors.
Historical collisions of the fourth and fifth crises are well known and are briefly described. The fourth crisis continued from the 4th to the 8th centuries AD. It was the collapse of the Ancient World and transition to the Medieval feudalism. The crisis was marked by the Migration Period and changes in the political map of the Oecumene. At that time, the flourishing classic kingdoms of India degraded and collapsed. The fall of the Western Roman Empire was a very important event, which influenced the European history and cultural development for the next several centuries. The fall was accompanied by the formation of

Vladimir G. Trifonov 282
small temporary states in Europe, the foundation of two new cultural centers, Byzantine and Arabian Caliphate, and the spreading of Christianity and Islam, which became the world’s religions. Quickness strikes were typical for the collapse of both the secular institutions of the Roman Empire and occupation of huge and partly densely populated civilized territories by relatively small tribes of the Arabic nomads. Each of these events lasted only ca. 100 yr. It is written a lot about historical preconditions of the both events. The decline of the Roman society, degradation of the ruling institutions, devaluation of the former culture and ethic principles by dissemination of the Christian ideology, and the economic exhaustion by the permanent struggle with “barbarians” are evident (Gibbon, 2003). The political and economic weakness of the Sassanian Iran is also doubtless. Its last rulers lost the control of the remote provinces (Frye, 1963). Nevertheless, only social-economic factors cannot explain all historical peculiarities of the crisis epoch.
The epoch, starting in the 17th century and continuing up to the early 20th century, can be interpreted as the fifth crisis. It was the crisis of feudalism. The crisis led to the formation of a new social-economic system founded on a free market, democratic society, and quick development of industrial technologies. The crisis was manifested by the formation and collapse of the world colonial system. It was accompanied by the mass migration (mostly to America) and the formation of new world centers of political influence. The 20th century was characterized by the two World Wars, formation and collapse of the totalitarian regimes, and attempts to create a socialistic society. On the other hand, the last crisis coincided with globalization of economy caused by the world expansion of the North American–West European civilization, as well as exacerbation of the general ecological crisis caused by increasing pressure of the society on nature. The last process has strengthened from the 19th century and has threatened the existence of the humanity. The globalization and the world environmental crisis have masked features of the fifth historical crisis.
Therefore, the history of the Eastern Oecumene in the Middle and Late Holocene was characterized by five crises (Table 9.2). Each of them lasted for about three centuries, whereas their social and political consequences could be felt even 100−150 years later. The crises repeated once in ~1,200 yr, whereas intervals between analogous phases of the third and forth crises comprises ~1,800 yr. According to Gumilev (1990), the ~1,200-yr period is typical for the active development of any ethnos.
9.3.3. Relationships between Historical Development and Climatic and Tectonic Rhythms in the Oecumene
The first crisis epoch corresponded with the transition from the early stage of the Atlantic
period to its late stage. The Early Atlantic was characterized by the warmest (for the Holocene) conditions and the heightened humidity in the midlatitudes of the continents. In the final part of that stage, the last essential rise of the oceanic level took place. This could be associated with the catastrophic collapse of glaciers in the West Antarctic (Hughes, 1987). Big storms and high floods accompanied the sea-level rise. The strongest flood in southern Mesopotamia would remain in the people’s memory as the Deluge (Trifonov and Karakhanian, 2008).

Tectonic and Climatic Rhythms and the Development of Society 283
The Late Atlantic climate was more changeable with the heightened humidity but the lower average temperature in the midlatitudes. The danger of floods was reduced in southern Mesopotamia. It gave a possibility for the development of stable settlements of the town type and irrigation system that became the base for formation of the Sumerian civilization. The start of the climatic variations was also found in the Pacific coasts as the El Niño (Southern Oscillation) regime, which produced the periodic (every 3–7 yr) penetration of the cold oceanic waters to the tropical latitudes (Sandweiss et al., 1999). This caused fluctuations in both bioproductivity in the offshore waters and the climatic conditions in the coasts (Section 10.5.3) that influenced formation or development of the producing economics of a part of the coastal population.
At that time, the seismotectonic and volcanic activity occurred in the southeast of the Lake Sevan in the Khanarassar fault zone. The Porak Volcano eruption took place there in the late 5th – early 4th millennium BC. This coincided with (or, probably, was preceded by) a strong earthquake (Trifonov and Karakhanian, 2004). One or two of the same events happened southeastward, in the Syunik pull-apart structure of the Khanarassar zone in the first half of the 4th millennium BC (Karakhanian et al., 1997). These seismotectonic and volcanic events produced fires in the area and coincided with a temporal aridization and some cooling in the Sevan region resulted in a regression of the lake (Sayadian, 1985) (Figure 9.13). The strong earthquakes happened in the early 4th millennium BC in the Central Zagros.
The second crisis coincided with the cooling and aridization that took place in the midlatitudes of the Northern hemisphere in the mid-3rd millennium BC after the Atlantic Optimum. The aridization of the 24th−22nd centuries BC was manifested in Egypt by a sharp fall of the annual Nile freshets that influenced immediately the productivity of agriculture. However, at the end of the millennium, the normal situation was restored and even stronger floods took place during the Pharaoh Amenhotep III reign (Selivanov, 2000). The aridization was more perceptible in the boundaries between deserts and areas of the irrigated agriculture. Probably, just the aridization caused the baneful conflicts between the Sumerian towns-states for control of the water sources of irrigation. The aridization took place in Palestine and adjacent territories in ca. 2300 BC (Nissenbaum, 1994). In southern Turkmenistan, the aridization was manifested by lateral relocation and degradation of the Tedjen River that caused destruction of the Geoksjur Oasis. In the Sevan region the crisis coincided with aridization and the maximum regression of the lake (Sayadian, 1985). The aridization could cause migration of the nomadic tribes from the drought-affected steppes to the agricultural oases that resulted in wars and the destruction of the agricultural communities.
The volcanic activity of the second crisis epoch occurred in southern Syria and the volcanic center of Ararat, where the volcanic products covered settlements and constructions in the middle and early second half of the 3rd millenium BC (Trifonov and Karakhanian, 2008). The signs of strong earthquakes were found in the Central Zagros (Bachmanov et al., 2004) and Pambak–Sevan fault zone in Armenia, where two earthquakes with magnitudes MS ≥ 7.3 and MS ≥ 7.2 destroyed the Kura–Arax settlement of the 26th−22nd centuries BC (Philip et al., 2001).
One of the sources of the third crisis could be climate deterioration (Figure 9.13). In the Indus Valley, the period of 3000−1800 BC was warm and humid that favored the prosperity of the Indus civilization. However, the climate became increasingly arid in the period of 1800−1000 BC. This led to the degradation and fall of the civilization (Dhavalikar, 1991).

Vladimir G. Trifonov 284
Figure 9.13. Relationships between the climatic, volcanic, seismotectonic, and cultural events in the Lake Sevan region (Trifonov and Karakhanian, 2004). Deviations in air temperature and humidity regimes as well as seismic and volcanic activities are shown as arbitrary curves.
The aridization took place within the large territory. It was recorded in the northwest of the Indian shield by regression and drying out of the Lake Didvana (Murzaeva, 1991). In the mountains of Central Asia, the former warm and humid conditions changed by cooling and aridization in the mid-2nd millennium BC. These were accompanied by a glacier advance in the Himalayas in ca. 1000 BC (Bhattacharyya and Yadav, 1991).
The aridization occurred in China (Liu, 1997). In the plains of Central Asia, the aridization coincided with the northward relocation of the Amu Darya River channel toward the Aral Sea and, hence, drying of the Lake Sarykamysh and Uzboi Channel lasted from the early 2nd millennium BC (Velichko, 1993). The aridization increased in the 8th−7th centuries BC when the regression began in the Aral also. The humid Atlantic conditions lasted in the southern Turkmenistan until the late 3rd millennium BC. Later, the aridization progressed; it was accompanied by degradation of forests (Trubikhin, 1989; Murzaeva, 1991). The aridization of steppes in Kazakhstan and Central Asia was one of the causes of migration of the Aryan nomads to Iran and later to India.
The aridization was registered by palynological data in central and northern Turkey (Bottema, 1991) and in the Persian Gulf region (Murzaeva, 1991). It continued in the Lesser Caucasus (the Sevan region) up to the 9th century BC (Figure 9.13). Perhaps, just the aridization in the Arabian steppes was one of the causes forcing the Aramean nomads, which had limited themselves before by the plundering raids on the agricultural oases, to begin their occupation. On the other hand, the aridization weakened the economics of the agricultural communities and made them easier prey for the invaders. In 1500−800 BC, only Palestine was characterized by relative humidification with maximum moistening in the 13th century BC (Figure 9.14) (Issar, 1996; Issar and Zohar, 2007). This caused the immigration of the Jews, Arameans, and Philisians.

Tectonic and Climatic Rhythms and the Development of Society 285
Figure 9.14. Climatic changes in the Eastern Oecumene from the 2nd millenium BC to the 1st millenium AD: 1 – the Indus Valley (Dhavalikar, 1991), 2 – the Himalayas and the Central Asia mountains (Murzaeva, 1991; Velichko, 1993), 3 – the Aral–Sarykamysh region (Velichko, 1993), 4 –southern Turkmenistan (Trubikhin, 1989; Murzaeva, 1991), 5 – Israel (Issar, 1996). Arbitrary curves represent humidification (rise) and aridization (decay).
As discussed in Section 9.3.2, the Egyptian list of “the Peoples of Sea” contains mainly the peoples of the Aegean region, including Crete and Sicily: Danaeans, Achaeans, Pelasgians, and Sicelians. The Aegean region is marked by the high seismicity. The archaeoseismological data showed that the main Achaean towns were destroyed in the 13th century BC by strong earthquakes (Stiros and Jones, 1996) that made easier their conquest by the Dorian and Thracian–Illyrian tribes. One or two strong earthquakes took place in Troy (the northwestern Minor Asia). The first one damaged and deformed the constructions of Troy-VI (Figure 9.15). These constructions continued to serve for the Troy-VI i epoch, which was identified with Homer’s Troy captured by the Achaeans (Homer, 1996). Therefore, it is not clear, whether the first earthquake happened before the Troy-VI i epoch, as Korfmann (2005) considered, or if it occurred just during the Trojan War that helped the Achaeans to win. According to Selivanov (2000), degradation of the Indus civilization, the most evident in the second half of the 2nd millennium, could be caused not only by the social-economic and climatic factors, but by seismic destruction of the irrigation system as well. As the late echo of this epoch of seismotectonic activity, we interpreted the earthquakes in Israel and Armenia in the first half of the 8th century BC. The Armenian earthquake was accompanied by volcanic eruptions, which helped Urartu to subjugate the local tribes in the southeastern Sevan region (the Khorkhor inscription of Argishti I) (Trifonov and Karakhanian, 2004).

Vladimir G. Trifonov 286
Figure 9.15. Seismic destructions in Troy: (a) break of anti-seismic constructions in the eastern part of the Troy VI walls; (b) the clockwise rotation of the wall of the Palace VI M (southern part of the Troy VI); (c) the counter-clockwise rotation of the wall of the Roman epoch (southwestern part of the Troy IX). The contrary seismic rotation of the adjacent constructions of the Troy VI and IX proves that these deformations were produced by different earthquakes.

Tectonic and Climatic Rhythms and the Development of Society 287
The aridization took place in the fourth crisis epoch (Figure 9.14). In Central Asia, the aridization was outlined in the 3rd century AD and lasted until the 11th century. Its indicators were regression of the Lake Sarykamysh and stopping on the Uzboi runoff (Velichko, 1993). The progressing aridization began in the southern Turkmenistan in the late 3rd century (Trubikhin, 1989). In the Indus Valley, the aridization replaced the relatively humid conditions, which had taken place up to the 5th century (Dhavalikar, 1991). The aridization took place in the Sistan basin (the southwestern Afghanistan) and the Sevan region after the humid epoch of the 1st−2nd centuries AD (Murzaeva, 1991). In the Sevan region, the aridization continued from the 5th to 10th centuries; it was accompanied by regression of the lake (Figure 9.13). At the same period, the aridization took place in the northwestern Caucasus and the Great Caucasus glaciers shortened. In Israel, the aridization replaced the relatively humid period of the last centuries BC – the first centuries AD, when the Dead Sea level had been 50 m higher than now and its coast had been near Jericho (Issar, 1996; Issar and Zohar, 2007).
The aridization was pernicious for the Roman Empire. The growth of the population of the city of Rome, which reached 1.5–2 million in the flourishing stage, transformed the agricultural geography of the Empire. Inhabitants of the Apennine Peninsula specialized in cattle-breeding, vegetable-growing, gardening, and production of vines, whereas production of corn and vegetable oil (the main food products) was concentrated in Northern Africa, Syria, and Palestine. The aridization of these regions worsened the complicated problem of supply of the metropolis by food products and precipitated the collapse of the Empire. The aridization reduced the agricultural production in the near-desert provinces of the Sassanian Iran, including Mesopotamia and Central Asia. This complicated the social-political situation and made them easier prey for the Arabians.
In the background there was an increase in the released seismic energy during the second half of the 1st millennium BC and the 1st millennium AD, caused by the beginning of earthquake registration, the epoch of the fourth crisis showed the rise known as the Byzantine tectonic paroxysm. It began in the 4th century AD, when the strongest 365 AD Crete earthquake took place (MS = 8.3). Because of the earthquake, the southwestern and western margins of Crete were uplifted up to 8.5 m (Pirazzoli, 1986), whereas the eastern part of the island was locally subsided down to several meters (Chernov, 2004). This event provoked probably the strong earthquakes in the Adriatic Sea (the city of the Illyrian Epidaurus – Figure 9.12) and in the southern coast of the Mediterranean (the city of Alexandria) and these cities were partly subsided. The strong earthquakes occurred in the 5th−7th centuries in the Aegean region, in western part of the North Anatolian fault zone, and Eastern Mediterranean (Figure 9.11). Two peaks of seismicity can be differentiated within the Byzantine tectonic paroxysm: in the 4th and 6th–7th centuries. Probably, the seismic events in the Levant (Dead Sea Transform) and East Anatolian zones outstripped the events in the North Anatolian zone to several decades (Trifonov and Karakhanian, 2004). In the 8th−9th centuries, the strong earthquakes took place not only in those regions, but in the Armenian Highland, Zagros, northern Iran, and Bactria as well.
The fifth crisis was also characterized by climatic deterioration known as the Little Ice Age (Grove, 1988). Its first signs arrived in the late 16th century. The cooling reached maximum in the 17th century and continued until the 19th century. The cooling occurred in different parts of the Northern hemisphere, from North America to China. Advance of

Vladimir G. Trifonov 288
glaciers was registered in Alaska, Scandinavia, Iceland, the Andes, Alps, Caucasus, Taurus, and other mountains of the Alpine–Himalayan orogenic belt in the 16th−19th centuries. The advance was accompanied by aridization in Central Asia, Tibet, and the Inner Himalayas as well as small humidification in the northwestern Caucasus and Sevan region. The cooling decreased productivity of agriculture and forced peoples to change traditional agricultural practices in some regions. The starvation, caused by high cooling in Britain in the late 17th century, brought bigger losses than the plague epidemic in the 1340s (Selivanov, 2000).
The weak warming with episodes of cooling took place in the 18th−19th centuries. In the 20th century, the warming became more significant: the average near-ground temperature increased to almost 1° C for the century and rose to about 0.75° C more for the last 10−15 years (Losev, 2001). The warming-up has been observed at the global scale, particularly in the Northern hemisphere, but the picture is more variable at the local level. Many scientists explain the warming by an increase of the greenhouse effect because of the rise of the CO2 concentration in the atmosphere. They explain this rise by the Industrial Revolution and population growth or by indirect results of human activity, such as destruction of the natural ecosystems controlling CO2 concentration and the water vapor in the atmosphere. However, Kondratiev and Donchenko (1999) showed that no real evidence exists to estimate correctly the contribution of both technogenic factors and natural oscillations to the recent warming.
Rises in the released seismic energy during the fifth crisis is observed both in the entire central part of the Alpine–Himalayan orogenic belt and its individual seismotectonic provinces and main zones (Figure 9.11). Two peaks of the seismic energy release can be seen: in the second half of the 17th century and in the second half of the 19th century – the first half of the 20th century. If one takes into account an improvement in the registration in the 19th and, especially, 20th centuries, one cannot consider that the first peak was weaker than the second one. However, it is doubtless that the seismicity in the second half of the 20th century (after the crisis) was weaker than in the first half of the century (at the end of the crisis).
Therefore, the crises of the Oecumene were marked by aridization, sometimes accompanied by cooling in higher latitudes. Although these phenomena were not totally coincident in time among different regions, the epochs of climatic deterioration were common. There are grounds to suggest that climatic features of these epochs spread globally. Tectonics processes also activated during these periods. For the last three crises, this is reflected by the greater amount of the released seismic energy. Seismic activity peaks were observed in the beginning and the end of the fifth, fourth, and, perhaps, third crises. Fragmentary paleoseismological and geoarchaeological data allow us to suggest a similar seismic activation for the two earlier crises. It was accompanied by volcanic activity in Armenia and Syria.
Thus, the crises as social phenomena were prepared by the preceding evolution of human communities and, to a considerable extent, were determined by their inner conflicts and relationships with neighbors. On the other hand, deteriorating climatic conditions and tectonic activation were typical for all of the crises, and, apparently, contributed to their development.

Tectonic and Climatic Rhythms and the Development of Society 289
9.3.4. Changes of the Caspian and Black Sea Levels as Manifestations of Tectonic and Climatic Rhythms in the Late Holocene
The Caspian Sea is a closed basin. An analysis of historical, archaeological, geological,
and geomorphologic data gives one a possibility to reconstruct variations of the Caspian level for the last 2,700 years. The level was about -20 m in the 7th–6th centuries BC (Klige et al., 1998), but it fell down to -31 – -33 m in the 3rd–1st centuries BC (Kaplin and Selivanov, 1999). Then, the level rose to about the contemporary altitude, but it began to fall again from the early 5th century AD and reached -30 – -35 m in the 6th–7th centuries (the Derbent regression). From the second half of the 12th century, the level began to rise and reached -25 m or, perhaps, -21 – -22 m by the early 19th century (Rychagov, 1993). The rise ranged up to 8–9 m. Then, the level began to fall till 1977, and then it began to rise until 1998 (Section 9.2.1).
The Derbent regression had important historical consequences. The city of Itil was founded in the Volga delta in the first half of the 8th century as a capital of the Khazar State (Figure 9.12). According to the historical documents, the city included the ruler’s castle in the island and the city itself running along the river over a length of 6 km. Up to 10,000 inhabitants lived in the city. The Russian prince Svyatoslav destroyed it in the years 965–966. In the late 970s, the Khazarians reconstructed part of the city. However, the Russian prince Vladimir finally won the Khazarians in the late 10th century, and Itil lose its role. The last record of Itil was dated by the 12th century as the town of the Ancient Turks. In spite of the exact historical description of the Itil location and its big size, archaeologists could not find it. Gumilev (1966) proposed that Itil was build during the Caspian regression and later was flooded and covered by the Volga sediments. Now this version seems to be doubtless.
The regression is proved by the position of the medieval constructions of the city of Derbent. The city defended the Transcaucasian provinces of Persia (Armenia and Albania) from the North Caspian nomads. In the mid-6th century, the shah Chosroes built the Derbent fortress and the protective wall between the mountain slope and the Caspian. Now a part of the wall is under water and its foundation is situated several meters below sea level.
The Baku fortress gives the chronological data on the end of the regression (Bretanitsky, 1970). Two coastal walls of the fortress stood the Mongolian siege in the first half of the 13th century. However, later the sea level began to rise quickly. Marino Sanuto the Elder, the Venetian geographer, wrote in 1320 that the sea rose ‘to the palm per year and many good towns were flooded’. The Arabian traveler Abd Ar-Rashid wrote in the early 15th century that the walls concerned were situated offshore and bordered the ship mooring. The German researcher Engelbert Kaempfer described the offshore position of the walls in 1683. The walls can be seen in his print as well as in the Samuel Gottlieb Gmelin’s drawing of 1769. Later the sea regressed and the Maritime Boulevard and the Oilmen Avenue were built in the 20th century between the Old Town and the sea. However, the sea level rose after 1978 and flooded them partly.
The Caspian level changes for the last 2,500 years followed the general climatic changes in Eurasia with some delays. The Caspian transgressions in the 1st century BC – 5th century AD and the 12th–18th centuries followed the epochs of warming in the midlatitudes and some humidification in the Mediterranean, Middle East, and Central Asia in the second half of the 1st millennium BC – the 3rd century AD. The Caspian regressions in the 5th–12th and 19th–20th centuries followed the epochs of cooling in the midlatitudes and aridization in the southern

Vladimir G. Trifonov 290
regions in the 4th–8th and 16th–19th centuries. The delay can be caused by different influences of the climatic changes on the rivers flowing into the Caspian and the evaporation of the Caspian itself, because the rivers, main contributors, and the sea are situated on different latitudes.
The Black Sea is the semi-closed basin, which communicates with the Mediterranean Sea and the World Ocean via the system “Bosporus – Sea of Marmara – Dardanelles”. A gradient between the more saline and denser Aegean waters and the more fresh and less dense Black Sea waters causes two contrary flows in the Bosporus: the demersal flow to the Black Sea and the surficial flow to the Aegean Sea. Now the Black Sea level is higher than the Aegean one. The surficial flow has the rate of 1.5 m/s containing almost twice more water than the demersal flow. As a result, about 183 km3 of water pours annually out the Black Sea (Svitoch et al., 1998). The same relationships took place in the Holocene, but the intensity of the demersal flow could vary. For example, for the short epoch in the Early Holocene, it was probably more intensive than the surficial flow (Fedorov, 1978; Ryan et al., 2003).
The communication between the Black Sea and the Mediterranean interrupted or was restricted for some epochs of the Quaternary. Nevertheless, the Quaternary variations of the Black Sea level corresponded in general to variations of levels of the Mediterranean Sea and the World Ocean caused by the climatic changes (Fedorov, 1978; Svitoch et al., 1998; Kaplin and Selivanov, 1999). This is also true for the Holocene. For example, the Hadjibey regression of the Black Sea, dated by the mid-3rd millennium BC (Sadchikova and Chepalyga, 1999), corresponded to the epoch of the second crisis aridization. In this background, the Phanagorian regression of the Black Sea looks unusually.
The Phanagorian regression is proved by the archaeological data. The Ancient Greek towns, founded in the Black Sea coasts in the 6th–5th centuries BC, are partly submerged. Numerous data on the values of flooding were found in the towns of the northern Black Sea: Olvia in the Dniester mouth (Greek Hipanis), Chersoneses in the southwestern Crimea, and towns around the Kerch Straight (Cimmerian Bosporus – Figure 9.16). Some clusters of ceramics and ruins of constructions in Olvia and Phanagoria are submerged to >4 m (Blavatsky, 1967; Kaplin and Selivanov, 1999). Ruins of walls mark the northern flooded margin of Phanagoria in 220–240 m from the coast. Some constructions of Patrae of the 3rd century BC are situated now at the depths of down to 4–4.5 m (Abramov et al., 1998). In the city of Panticapaeum (present-day Kerch), the data were obtained on the flooded port constructions. The Ancient Greek ceramics were found by drilling at the depths of 3.5 m (Nikonov, 1998). Fedorov (1978) described ruins of the town of Nymphaion (Nymphaeum) at the depths of down to 6 m. He wrote about walls of the farmstead with ceramics of the last quarter of the 4th century BC. The walls continue into the sea now; they are covered by 2.2-meter layer of water. Shilik (1991) found ruins of the town of Acra at the depths of down to 3.5 m. The well excavated to 1.1 m was situated in 140 m from the coast and 3 m below sea level. It contained ceramics of the early 4th – early 3rd century BC. Shilik (1991) estimated the regression magnitude as >4.5 m. Residential and economic constructions were probably built not lower than 1–1.5 m above sea level to avoid influence of storm waves. Therefore, their present position 3.5–4.5 m below sea level means the regression magnitude of 5–6 m corresponding to the estimate by Fedorov (1978).

Tectonic and Climatic Rhythms and the Development of Society 291
Figure 9.16. The Ancient Greek towns near the Cimmerian Bosporus (the Kerch Strait) (Trifonov and Karakhanian, 2004).
The rare evidence for the time of the beginning of the Phanagorian regression is the 14C date 3,240 ± 60 (viz., 1600–1435 BC) of the marine sediments underlying the cultural deposits of Olvia. The marine sediments occur on the recent sea level (Shilik, 1977). Therefore, the regression began later. This was corroborated by the following data. According to the Myth of the Argonauts, sailing was difficult in the Bosporus in the 13th century BC (probably, because of the strong counter flow). However, according to Herodotus (1998, p. 264), the navigation did not meet any difficulties in the Classical Greek time (from the 7th century BC), when the regression had occurred and the flow rate had decreased.
In the 1st millennium AD, the regression was followed by the Nymphaeum transgression, when the sea level could reach +1.5–2 m, but it was, most probably, between 0 and +1 m. Fedorov (1978) described a stratotype of the transgression near the ancient town of Nymphaeum, where sands with the marine shells (about 1 m) overlay loam with ceramics and foundations of the town on the 2.5-meter terrace. By these data, Fedorov (1978) considered that the transgression began in the 5th century AD, but it is not quite correct. The estimates of the regression magnitude are based on the present position of the Classical Greek layers and constructions (the 5th–2nd centuries BC). However, Shilik (1977) quoted Dio Chrysostomos’ data that the sea-level rise began in Olvia in the 1st century AD. The economic zone of Patrae, partly covered by water now, spread in the 1st century to the smaller part of the Taman Bay than the zone of 550–270 BC (Abramov et al., 1998). Obviously, the transgression began in the 1st century AD and reached its maximum in the mid-1st millennium. Therefore, the Phanagorian regression began probably during the third crisis and finished during the fourth crisis.
The data on the Mediterranean and some coasts of the World Ocean showed that the sea level was 2–3 m lower than now during the Phanagorian regression, and rose up to the recent level or could be higher to ~0.5 m in the mid-1st millennium AD during the Nymphaeum

Vladimir G. Trifonov 292
transgression (Butzer, 1958; Trifonov and Trifonov, 2006; Trifonov and Karakhanian, 2008). In the Black Sea, the regression reached 5–6 m and the “Nymphaeum” sea level was 0 to +1 m. Therefore, the contrast between the sea levels during the regression and the following transgression was ≤3 m in the Mediterranean and reached ~6 m in the Black Sea. It is necessary to explain the 3-meter difference between these values.
The 2–3-meter regression in the Mediterranean, communicating with the World Ocean, could be caused by some global climatic changes. The simplest explanation of the regression in the Black Sea could also be the climatic change: a decrease of river flowing and/or an increase of evaporation due to the warming in the 1st millennium BC continuing possibly until the 1st or 2nd century AD. As a result, the surficial flow from the Black Sea to the Mediterranean would decrease, and salinity of the Black Sea water would increase.
However, the oxygen isotopic data demonstrated the contrary situation: the δ18О values were lower for the regression than the following transgression (Svitoch et al., 1998). This means that some desalting took place and the Black Sea level continued to be higher than the Mediterranean one during the regression. So, the latter could be caused only by reduction of the salt demersal flow to the Black Sea that could depend on reduction of the Dardanelles or Bosporus depth.
Although the Dardanelles is crossed by the North Aegean active fault (Pavlides, 1996), which generated earthquakes with MS > 7, it seems to be doubtful that the seismotectonic deformation could reduce the demersal flow essentially because the strait is wide and deep enough. The Bosporus represents a system of small basins and bulkheads with the minimum depth of 27.5 m that are cut by active faults branching out the North Anatolian fault zone. Numerous historical strong earthquakes justified their activity (Trifonov and Karakhanian, 2004).
Seismic shifts and landslides could deform the Bosporus bathymetry. Such deformation has two limitations. First, it could not be too big to produce quick flow and erode the soft Pleistocene sediments on the strait bottom. Second, the deformation was not accompanied by essential reduction of the strait width. Herodotus (1998, p. 263) presented the data on width of the strait in the site, where the Persian army of the King Darius crossed the Bosporus in the 5th century BC. The width was four stades (about 710 m) that coincides with the recent width (660 m), considering inaccuracy of the measurement.
We proposed the following hypothetical explanation of the 3-meter difference between values of the Phanagorian regression and the synchronous regression in the Mediterranean (Trifonov and Trifonov, 2006): Seismic activation for the third crisis reduced a depth of the Bosporus in some bulkhead. It was enough to reduce the demersal flow of the salt Mediterranean waters and correspondingly the salinity of the Black Sea. The difference between levels of the Black Sea and the Mediterranean and related rate of the surficial flow from the Black Sea reduced that improved the navigation in the Classical Greek time. Seismic activation for the fourth crisis (the Byzantine tectonic paroxysm) restores the former demersal flow and later the Black Sea water balance approached to the recent conditions. Thus, the peculiarities of the Phanagorian regression were caused by seismotectonic events during the third and fourth historical crises.
Tectonic and Climatic Rhythms and the Development of Society 293
9.3.5. Stages of the Slavdom Generation and Development of the Russian State in Relation to Tectonic and Climatic Rhythms in the Middle and Late Holocene
Were the Late Holocene natural and historical crises manifested in the generation of the
Slavic ethnos and the East Slavic (Russian) political body? Positive answer to this question would mean that the crises were typical not only for the tectonically active Alpine–Himalayan orogenic belt, but also for the territories with weak neotectonic movements and rare earthquakes (e.g., the East European Platform). If the natural factors influenced on the social and political situation in such territories, they were mainly climatic changes.
The Cucuteni–Tripolie agricultural community (Figure 9.12) was the top of the Chalcolithic producing economics in southeastern Europe (Masson, 1999). The culture was formed in the late 5th – early 4th millennia BC. In the second part of the 4th millennium BC and particularly in the first half of the 3rd millennium, being in the stage of mature flourishing, the Cucuteni–Tripolie people contacted with the steppe semi-nomadic tribes, which spread from central Europe up to the Volga region and the Southern Urals and created the megalithic Kurgan cultures (Figure 9.12). Some researchers consider them by the ancestors of the Aryan, Ancient Greek, and Armenian peoples. Using archaeological data, Danilenko (1974) and Rybakov (1981, p. 204) found some cultural and ideological features of the Tripolie inhabitants similar with the Rigveda texts and the features of the later Indo-European cultures of the Bronze Age. Perhaps, the Tripolie inhabitants also belonged to the Indo-Europeans. Rybakov (1981) demonstrated presence of the Tripolie images in the folk art of the East Slavs till the 19th century AD.
The Cucuteni–Tripolie culture degenerated by the mid-3rd millennium BC. It was followed by the Usachevo culture (the 25th–24th centuries BC) collapsed by the late 3rd millennium BC. The decline of the Cucuteni–Tripolie culture and synchronous degradation of the similar Balkan agricultural communities coincided with the mass migration of steppe peoples from central Europe to northern Kazakhstan. In the second half of the 3rd millennium, the Yamnaya culture (Figure 9.12) was formed there, probably, by the Aryan ancestors. Approximately at the same time (the 27th–22nd centuries BC), the Globular Amphorae culture and the Corded Ware culture (also known as the Battle Axe or Single Grave culture) arrived in southern Europe. The distinctive feature of these and similar cultures was domination of cattle breeding with herdsmen in horses and social layering with separation of political leaders and fighting riders. However, these mobile tribes continued to be semi-nomadic and combined cattle-breeding with agriculture (Rybakov, 1981).
The decline of the earlier agricultural communities, built in principles of the primitive equality, and spreading of the semi-nomadic cultures manifested transition to the Bronze Age and fundamental changes in technology, economics, and organization of the society. The patriarchy, heliocentric system, and idea of an immortal soul were originated at the same time (Rybakov, 1981). All these changes coincided with the second historical crisis corresponded to the end of the Atlantic period and characterized by cooling and aridization.
An estimation of the influence of this crisis on the Slavic ethnogenesis depends on the concept of Slavic motherland. Trubachev (2002) argued an opinion that pre-Slavic cultural linguistic community separated from the Indo-European language family in the late 3rd – early 2nd millennia BC in the Middle Danube region. Some scholars extend this area to the entire Danube–Balkan region including even the North Carpathians. The decline of the Balkan and
Vladimir G. Trifonov 294
Cucuteni–Tripolie earlier agricultural communities could promote the separation. The Polish and some Czech scientists argued the Vistula–Oder concept of the Slavic motherland (Parczewski, 2003). It was covered by the Oder–Dnieper concept including the Pripyat–Dnieper region to the Slavic motherland (Niederle, 1902–1924; Rybakov, 1981). By the last concept, peoples of the collapsed Cucuteni–Tripolie and Usachevo cultures, which migrated to the north, could participate in the generation of the pre-Slavs. The creators of the globular amphorae and corded ware could also participate in this process. Therefore, independently on the pre-Slavic motherland concept, the Cucuteni–Tripolie culture contributed to the Slavic generation.
The earliest certainly pre-Slavic culture was the Trzciniec one formed and existed in the 17th–13th centuries BC in the upper Vistula and Oder basins. Rybakov (1981) spread it to the southeast and named the Trzciniec–Komarovo culture. The latter corresponded exactly to the Oder–Dnieper territory of the pre-Slavic motherland. The culture included traditions of the earlier agricultural population as well as the semi-nomads and was characterized by a slow rate of development. The flint tools predominated; the bronze was rear, probably, because of remoteness of its sources.
The important changes took place in the pre-Slavic area in the epoch of the third crisis. The development accelerated in the 13th century BC. The western part of the pre-Slavs became a part of the Lusatian culture considered by some scholars as the ancestor of the German, Baltic, and Slavic tribes (Rybakov, 1981). Just in this culture, the local population began to use the iron. These changes took place also in the eastern part of the pre-Slavic area but a little later. Signs of the iron industry arrived there in the Belogrudovsky culture (the 12th–11th centuries BC) and became usual in the Chernolesskaya culture (the 9th–8th centuries). The second important change was the restoration of the leading role of agriculture modernized with plough.
Rybakov (1981, p. 263) characterized this epoch as follows: ‘A stagnated rate in the development of the Trzciniec tribes was changed by the swift movement in the Chernolesskaya time. It was the second jump after the Globular Amphorae and Corded Ware epochs. That first jump had been triggered by arrival of the bronze and the herdsman cattle-breeding, whereas the second jump was stimulated by the intensification of the tillage plough agriculture and the discovery of new metal, the iron’. Transition to the iron industry was very important for the pre-Slavs. Deposits of copper and tin were absent in their area and bronze was imported from the steppe. The iron minerals and the charcoal fitting the Iron Age technology were abundant in the pre-Slavic territory. This caused jump in the pre-Slavic development.
Divergence of the Slavs to the western and eastern branches was initiated by inclusion of the western part of the pre-Slavs to the Lusatian cultural community, the struggle of the eastern part of the pre-Slavic tribes with the Cimmerians in the 9th–8th centuries, and the Scythian influence in the 7th–3rd centuries (Rybakov, 1981). Even when the branches converged (e.g., in the 3rd century BC – 3rd century AD), their differences remained in traits of the western Przeworsk and eastern Zarubintsy cultures.
The third crisis was characterized by the transition of burial rites: from a bent position to cremation (Rybakov, 1987). The former meant reincarnation and was linked with the agrarian cycle, the latter meant transference of the deceased to the heaven, where the soul could help to ensure the good weather (e.g., a timely rain). On the other hand, the fertility of soil was not forgotten as remains of the cremated deceased were buried in special urns. Perhaps, the

Tectonic and Climatic Rhythms and the Development of Society 295
attention to the meteorological factors of the agricultural productivity was caused by some aridization during the third crisis.
According to Rybakov (1987), the further development of the eastern pre-Slavs was characterized by the culture of Skolots (Scythian-ploughmen, Borysthenites – Figure 9.12) and the Milograd culture of the 7th–4th centuries BC as well as the Zarubintsy (the 3rd century BC – 3rd century AD) and Chernyakhov (the 2nd century AD – the first half of the 5th century) cultures. The Skolots occupied not only the eastern part of the Oder–Dnieper motherland, but also some southern forest–steppe territories. Rybakov (1987) explained this spreading by peaceful relations with the Iranian-language Scythian nomads and close links with the Greek city of Olvia due to the grain trade. Rybakov (1987) identified the more primitive Milograd culture with Neurian tribes of Herodotus (1998, p. 276).
The Sarmatian invasion stopped these social and cultural successes and led to the migration of the pre-Slavs to the northern forest zone, where they formed the more primitive Zarubintsy culture. The further joining of the Black Sea coasts to the Roman Empire caused coming back of a part of the pre-Slavs to the southern lands and their agricultural and social progress on the basis of trade and cultural links with Rome via Olvia (the Chernyakhov culture – Rybakov, 1987).
The fourth crisis was characterized by the decline of the Chernyakhov culture and the mass migration of the Slavs (the second half of the 5th century AD – the first half of the 8th century). The Slavs populated the Balkan Peninsula (the Southern Slavic branch) and spread to the northeast to the territories with the rare Baltic and Ugro-Finnish population (Gumilev, 1989). The basis of the state system was formed in the Middle Dnieper, in the main body of the East Slavic inhabitance. It was resulted by the creation of the powerful East Slavic (Old Russian) state in the 9th century (Rybakov, 1982). The further historical events are well known: the development and decline of the Old Russian state (Kievan Rus), the Tatar-Mongol invasion, and the revival of the united state as the Grand Duchy of Moscow.
The last fifth crisis lasted in the Russian territory from the late 16th century till the late 19th century. It coincided with the Little Ice Age. Beginning of the cooling was marked by several years of bad harvest in the end of reign of Ivan IV the Terrible and during the reign of Boris Godunov. The northern territories, having been formerly by important agricultural regions and subjects of wars to hold them between the princes, lost population. The cooling and correspondingly bad harvests led to starvation and became one of the factors of chaos during the Time of Distemper in the early 17th century. Beginning of the crisis led to migration of people to the southern margins of the Moscow Russia and initiated the search for new ways of existence. One of them was colonization of Siberia. It continued during the 17th century and finished in the 18th century by establishing Russian America (Solov’ev, 1960–1964). Because of the first stage of the crisis, the Russian Empire was formed and strengthened. The dramatic Russian history of the 20th century represents the final stage of the fifth crisis and its consequences.
The fifth crisis was manifested in the North Atlantic by strong cooling. The Danish Strait was filled in ice and the communication with Iceland was essentially difficult already in the 16th century. As a result, the Norman colonies in North America and Greenland perished. The population of Iceland degraded and lost navigation experience. When the Danish seamen arrived there in the early 17th century, they found only about 30,000 inhabitants lived in miserable ground houses and engaged in cattle breeding. The reduction of the population from ~120,000 in the 11th–13th centuries down to ~30,000 in the 17th century was induced by

Vladimir G. Trifonov 296
not only the cooling, but by volcanic eruptions as well (Thorarinsson, 1967). The cooling was probably caused by the degradation of the western branch of the Gulf Stream. However, its eastern branch continued to exist. It turned round the Scandinavian Peninsula, causing its high moistness and growth of glaciers, and followed to the Kara Sea making it navigable in the summer season. The port of Mangasea on the southern coast of the Kara Sea acted in the 17th century. However, the situation changed in the early 18th century: the expedition sent by Peter I could not reach even the islands of Novaya Zemlya because of abundant ice. In the 20th century, the warming took place in Russia: the average near-ground temperature rose to 0.9° C from 1891 to 1998 (Losev, 2001). The warming accelerated for the last decade.
Therefore, the epochs of the second to fifth natural and social political crises in the Eastern Oecumene during the second part of the Holocene coincided with the principal stages in the generation of the Slavic ethnos and the East Slavic (Russian) political body. The second crisis marked the transition from the Chalcolithic to the Bronze Age and led to the separation of the Pre-Slavs from the Indo-European community. The Pre-Slavs inherited relics of earlier agricultural economy and skills of pastoral stockbreeding formed during the crisis. The third crisis marked the transition from the Bronze Age to the Iron Age and, possibly, determined certain isolation of the eastern and western branches of the Pre-Slavs. The fourth crisis included settling of the Slavs in the Balkan Peninsula, spreading the East-Slavic population to the northeast, and laying foundations of the future East Slavic statehood in its core. Finally, the Russian Empire, covering vast areas of the Northern Eurasia, formed during the fifth crisis after the Time of Distemper, whereas dramatic search of new ways took place later, in the 20th century.
The crises were separated by long periods of stable co-existence of large cultural communities or states, some of which were multi-ethnical. Among them are the Cucuteni–Tripolie and Trzciniec–Komarovo cultures, the union of the Skolot tribes, Kievan Rus, the Tsardom of Russia, and partly the Russian Empire in the time span between the two peaks of the last crisis. Unlike these stable epochs, the crises were characterized by social and economic upheavals, dissolution and reconstruction of existing communities, mass migrations, and rapid changes determining transitions of the society to a qualitatively new level.
The coincidence of the crises in the Eastern Oecumene and the East European Platform is the serious argument for the global character of the crises.
9.3.6. Origin of the Medium-Period Climatic and Tectonic Variations The Middle and Late Holocene climatic variations had different duration and were not
synchronous in different parts of the Eastern Oecumene and eastern Europe. However, we identified the epochs when the climatic changes were unidirectional in most regions; such epochs correspond to the historical crises. The seismicity also varied in the Eastern Oecumene. Most seismic zones were marked by seismic cyclicity with the periods of 200–300 or 500–700 yr; cycle phases could not correspond to each other in different zones. However, we identified the common seismic super-cycles, which include the epochs of seismic activation corresponding to the crises. Thus, the synchronous tectonic–climatic cyclicity took place in the Middle and Late Holocene. The ~300-yr critical phases of the cycles repeated every 1,200–1,800 years.

Tectonic and Climatic Rhythms and the Development of Society 297
The influence of astronomic factors on the medium-period cyclicity of natural and social events has been discussed in the scientific literature. Among such factors are peculiarities in the rotation of the Earth and its layers, the Sun–Moon–Earth gravitational interaction, and variations of solar activity. For example, Mikulecký (2007) demonstrated relations between 500-yr cyclicity of solar activity and social and cultural development of the society. By duration, the tectonic–climatic–historical cyclicity discussed in this chapter is similar with the Shnitnikov (1957) rhythms of humidification in the Middle and Late Holocene having periods of 1,500−2,000 yr. The 1,500–1,900-yr fluctuation were found in ocean level changes (Selivanov, 1996). They were probably caused by the climatic variations. The climatic rhythms correspond to the periods of constellation of the Moon, Earth, and Sun, when the tidal force can increase to ≥10% (Shnitnikov, 1957). This could change the oceanic circulation and influence the seismic activity. However, most scientists did not recognize Shnitnikov’s ideas.
Archaeomagnetic studies by Burlatskaya (1987) seem to be very important for the cyclicity discussed. She analyzed the Holocene changes of intensity, inclination, and declination of the geomagnetic field. In the temporal spectra of these parameters, she found typical cycles with periods of 360 ± 40, 600 ± 50, 1,200 ± 50, and 1,800 ± 70 yr (Table 9.3). Considering a reduced number of archaeomagnetic observation of the long duration (enough to identify the cycles with periods of 1,200 and 1,800 yr), Burlatskaya (1987) concluded that the 1,200-yr cycle was the most typical (Figure 9.17).
Figure 9.17. Repeatability of the geomagnetic field variation after correction related to different representativity of observation series of different duration. N is the number of registered cycles of variation in the representative series of observation. The figure was compiled using data from (Burlatskaya, 1987).

Vladimir G. Trifonov 298
Table 9.3. Magnitudes of the geomagnetic field variations (Burlatskaya, 1987) Period, yr Intensity, μТ Inclination, degree Declination, degree 1,800 4−6 2 5−10 1,200 4 2−5 6−8 600 4 1−4 3−5 300−400 2−4 1−5 3−8 The 1,200-yr cycle was credited to the precession of the geomagnetic axis around the
Earth’s rotational axis at angular velocity of 0.3°/yr (Burlatskaya, 1987; Burlatskaya and Ermushev, 1994; Burlatskaya et al., 2006). The 1,800-yr cycle is associated with the global component of the western shift of the geomagnetic axis (Burlatskaya, 1987). Thus, the tectonic–climatic cyclicity discussed is synchronous to the oscillation of geomagnetic activity, which is probably caused by the difference in the rotational velocity of the liquid outer core and mantle.
9.4. CONCLUSION At a regional scale, it is demonstrated that periodic changes of the Caspian Sea level are
the combined result of the water balance variations (mainly caused by climatic changes) and the recent tectonic activity partly manifested by seismicity. The influence of active tectonics consists in the integral effect of various deformations producing periodic changes of the Caspian reservoir volume, and probably variations of the groundwater recharge. Studies in various regions proved that the 11-yr and multiple-of-11-yr cyclicity is the most significant among the recent short-period variations of climatic and tectonic activity. This cyclicity influences the economic activity of the society.
The ~1,200-yr (~1,800-yr in one case) cycles are the most important among the medium-period variations of climatic and tectonic activity in the Middle and Late Holocene. These cycles contributed into the historical crises, which were characterized by social unrest and mass migrations, and changed the balance of political forces. On the other hand, crises determined breakthroughs to new technologies and new forms of economical and political relations. The crises were manifested in both the Alpine–Himalayan orogenic belt and the East European Platform. Perhaps they covered the entire Northern hemisphere.
Synchronism of climatic and tectonic events in both short- and medium-term oscillations is possibly caused by the difference in the rotational velocity of the liquid outer core and mantle (the dominant factor), periodic changes in the Earth’s orbital parameters, as well as solar activity. Multiple-of-11-yr cycles correlate with the periodic changes in solar activity, whereas the 1,200-yr cycle is associated with the precession of the geomagnetic axis around the Earth’s rotational axis.
To provide the sustainable development of humanity, the short- and medium-period variations of climatic and tectonic activity should be considered in construction projects, land use, agriculture, people’s security, and geopolitics.

Tectonic and Climatic Rhythms and the Development of Society 299
ACKNOWLEDGMENTS The represented data were partly collected with the participation of T.P. Ivanova
(Institute of Dynamics of Geospheres, Russian Academy of Sciences, Moscow, Russia), A.S. Karakhanian (Institute of Geological Sciences, National Academy of Sciences of Armenia, Yerevan, Armenia), and D.M. Bachmanov (Geological Institute, Russian Academy of Sciences, Moscow, Russia). S.B. Pavlides (Aristotle University, Thessaloniki, Greece) and S.Z. Tutkun (Çanakkale Onsekiz Mart University, Çanakkale, Turkey) helped to carry out studies in the Troy area, western Turkey. E.R. Senko (Geological Institute, Russian Academy of Sciences, Moscow, Russia) participated in the processing of the seismological data. D.M. Bachmanov also helped to prepare the illustrations. The author cordially thanks these persons for assistance as well as an anonymous reviewer for useful comments. The studies were supported by the Project “Relationships of recent collision and building of mountains and their manifestations in active tectonics” of the Program 6 “Geodynamics and physical properties in the lithosphere and upper mantle of the Earth” of the Department of Earth Sciences, Russian Academy of Sciences.
REFERENCES
Abramov, A.R., Osmanova, S.R. and Taskaev, V.N. (1998). Patrae: Results of studies, 1. Moscow, Russia: Institute of Archaeology, Russian Academy of Sciences (in Russian).
Ambraseys, N.N. and Melville, C.P. (1982). A history of Persian earthquakes. New York, NY: Cambridge University Press.
Ambraseys, N.N. and White, D. (1997). The seismicity of the Eastern Mediterranean Region 550−1 BC: a re-appraisal. Journal of Earthquake Engineering, 1, 603–632.
Andreev, Y.V. (1989). The Crete–Mycenaean world. Greece in the 11th−9th centuries BC by the Homer’s epos data. In I.M. Diakonov (Ed.), History of the ancient world. Vol. 1: The early antiquity (pp. 312–350). Moscow, USSR: Nauka (in Russian).
Artem’ev, M.Y. and Kaban, M.K. (1986). A model isostatic compensation and cross-spectral analysis of the gravity field and external loading (using the Caucasus as an example). Izvestiya, Physics of the Solid Earth, 22, 123–130.
Artyushkov, E.V. (1993). Physical tectonics. Moscow, Russia: Nauka (in Russian). Bachmanov, D.M., Trifonov, V.G., Hessami, K.T., Kozhurin, A.I., Ivanova, T.P., Rogozhin,
E.A., Hademi, M.C. and Jamali, F.H. (2004). Active faults in the Zagros and central Iran. Tectonophysics, 380, 221–241.
Balakina, L.M., Zakharova, A.I., Moskvina, A.M. and Chepkunas, L.S. (1996). Relation of focal mechanisms to regional geological setting. Izvestiya, Physics of the Solid Earth, 32, 204–223.
Berberian, M. (1976). Contribution on the seismotectonics of Iran, Pt. 1. Tehran, Iran: Geological Survey of Iran.
Berberian, M. (1994). Natural hazards and the first earthquake catalogue of Iran. Vol. 1: Historical hazards in Iran prior to 1900. Tehran, Iran: UNESCO, International Institute of Earthquake Engineers and Seismology.
Vladimir G. Trifonov 300
Berberian, M., Qorashi, M., Jackson, J.A, Priestly, K. and Wallace, T. (1992). The Rudbar-Tarom earthquake of 20 June 1990 in NW Persia: preliminary field and seismological observations, and its tectonic significance. Bulletin of the Seismological Society of America, 82, 1726–1755.
Bhattacharyya, A. and Yadav, R.R. (1991). Holocene climatic changes in the western Himalayas. In Abstracts, XIII INQUA congress, Beijing, China, Aug. 2–9, 1991 (p. 26). Beijing, China.
Blavatsky, V.D. (1967). Antique field archaeology. Moscow, USSR: Nauka (in Russian). Bottema, S. (1991). The Late Quaternary vegetation history of north-central Turkey. In
Abstracts, XIII INQUA congress, Beijing, China, Aug. 2–9, 1991 (p. 32). Beijing, China. Bretanitsky, L.S. (1970). Baku. Leningrad, USSR: Iskusstvo (in Russian). Burlatskaya, S.P. (1987). Archaeomagnetism: Study of the ancient geomagnetic field.
Moscow, USSR: Institute of Physics of the Earth, Academy of Sciences of the USSR (in Russian).
Burlatskaya, S.P., Burlatsky, S.F., Burlatsky, A.F. and Didenko, S.A. (2006). Types of variations in the geomagnetic field spectrum. Izvestiya Physics of the Solid Earth, 42, 207–224.
Burlatskaya, S.P. and Ermushev, A.V. (1994). Variation of the geomagnetic field inclination over the past 8400 years. Physics of the Solid Earth, 30, 31–45.
Butzer, K.W. (1958). Quaternary stratigraphy and climate in the Near East. Bonner Geographische Abhandlungen, 24, 1–157.
Chernov, A.A. (2004). Mysteries of submerged towns. Moscow, Russia: Veche (in Russian). Danilenko, V.N. (1974). Eneolithic Ukraine. Kiev, USSR: Naukova Dumka (in Russian). Dhavalikar, M.K. (1991). Environmental changes and historical process. In Abstracts, XIII
INQUA congress, Beijing, China, Aug. 2–9, 1991 (p. 77). Beijing, China. Ekström, G., Dziewonski, A. and Nettles, M. (2006). The global centroid-moment-tensor
project. http://www.globalcmt.org. Fedorov, P.V. (1978). Ponto-Caspian Pleistocene. Moscow, USSR: Nauka (in Russian). Frye, R.N. (1963). The heritage of Persia. Cleveland, OH: World Publishing Company. Garetsky, R.G. (1972). Tectonics of the young platforms of Eurasia. Moscow, USSR: Nauka
(in Russian). Getman, I.F. (2000). The long-time prediction of the Caspian Sea level with using of the
heliogeophysical factors. In N.S. Kasimov (Ed.), Global variations of the environment (pp. 237–254). Moscow, Russia: Nauchny Mir (in Russian).
Gibbon, E. (2003). The decline and fall of the Roman Empire. New York, NY: Modern Library.
Gor’kavyi, N.N., Levitskii, L.S., Taydakova, T.A., Trapeznikov, Y.A. and Fridman, A.M. (1995). The magnitude-dependent correlation of the Earth’s angular speed and its acceleration with occurrence frequency of earthquakes. Izvestiya, Physics of the Solid Earth, 30, 884–889.
Gor’kavyi, N.N., Levitskii, L.S., Taidakova, T.A., Trapeznikov, Y.A. and Fridman, A.M. (1999). Correlation between regional seismicity and the Earth’s rotation irregularity as a function of the earthquake sources depth. Izvestiya, Physics of the Solid Earth, 35, 840–853.
Grove, J.M. (1988). Little Ice Age. London, UK: Routledge.

Tectonic and Climatic Rhythms and the Development of Society 301
Guidoboni, E., Comastri, A. and Traina, G. (1994). Catalogue of ancient earthquakes in the Mediterranean area up to the 10th century. Rome, Italy: Istituto Naazionale di Geofisica.
Gumilev, L.N. (1966). Discovery of Khazaria. Moscow, USSR: Nauka (in Russian). Gumilev, L.N. (1989). Ancient Rus and the Great Steppe. Moscow, USSR: Mysl (in Russian). Gumilev, L. (1990). Ethnogenesis and the biosphere. Moscow, USSR: Progress. Herodotus (1998). The histories. Oxford, UK: Oxford University Press. Homer (1996). The Iliad. The Odyssey. New York, NY: Viking. Hughes, T.J. (1987). Deluge II and the continent of doom: rising sea level and collapsing
Antarctic ice. Boreas, 16, 89–100. Issar, A.S. (1996). La Bible et la science font-elles bon ménage? Les plaies de l’Egypte et de
l’Exode passées au crible de l’hydrogéologie Recherche, 283, 48–54. Issar, A.S. and Zohar, M. (2007). Climate change – Environment and history of the Near East
(2nd ed.) Berlin, Germany: Springer. Ivanchuk, P.P. (1994). Hydrovolcanism in the sedimentary cover of the Earth’s crust.
Moscow, Russia: Nedra (in Russian). Ivanova, T.P. and Trifonov, V.G. (2002). Seismotectonics and contemporary Caspian Sea
level oscillations. Geotectonics, 36, 109–123. Jackson, J. and McKenzie, D. (1988). The relationship between plate motion and seismic
moment tensors, and the rates of active deformation in the Mediterranean and Middle East. Geophysical Journal, 93, 45–73.
Kaftan, V.I. and Tatevian, S.K. (1996). The Caspian Sea level, rotation of the Earth, and solar activity. In A.G. Masevich (Ed.), Space geodesy and recent geodynamics (pp. 122–133). Moscow, Russia: Ministry of Foreign Affairs (in Russian).
Kaplin, P.A. and Selivanov, A.O. (1999). Changes of levels of the Russian seas and development of coasts: Past, present and future. Moscow, Russia: Geos (in Russian).
Karakhanian, A.S., Trifonov, V.G., Azizbekian, O.G. and Hondkarian, D.G. (1997). Relationship of Late Quaternary tectonics and volcanism in the Khanarassar active fault zone, the Armenian Upland. Terra nova, 9, 131–134.
Kárník, V. (1968). Seismicity of the European area, 2 vols. Praha, Czechoslovakia: Academia.
Kholodov, V.N. (1983). Post-sedimentation changes in the elisional basins. Moscow, USSR: Nauka (in Russian).
Kholodov, V.N. (1990). Formation of mineral resources in elisional basins. Part I. South Caspian elisional basin. Lithology and Mineral Resources, 25, 481–498.
Klige, R.K., Danilov, I.D. and Konishchev, V.N. (1998). History of the hydrosphere. Moscow, Russia: Nauchny Mir (in Russian).
Klige, R.K., Kovalevsky, V.S. and Fedorchenko, E.M. (2000). Influence of the global climatic changes on water resources of the Volga basin. In N.S. Kasimov (Ed.), Global variations of the environment (pp. 220–236). Moscow, Russia: Nauchny Mir (in Russian).
Kondorskaya, N.V. and Shebalin, N.V. (Eds.) (1982). New catalog of strong earthquakes in the USSR from ancient times through 1977. Boulder, CO: World Data Center A for Solid Earth Geophysics, NOAA.
Kondorskaya, N.V. and Ulomov, V.I. (Eds.) (1999). Special catalogue of earthquakes of the Northern Eurasia (SECNE). Zurich, Switzerland: Global Seismic Hazard Assessment Program, http://www.seismo.ethz.ch/gshap/neurasia/nordasiacat.txt

Vladimir G. Trifonov 302
Kondratiev, K.Y. and Donchenko, V.K. (1999). Ecodynamics and geopolitics, Vol. 1: Global problems. Saint Petersburg, Russia: Scientific Research Center of Ecological Security (in Russian).
Kopp, M.L. (1997). Lateral escape structures in the Alpine–Himalayan collision belt. Moscow, Russia: Nauchny Mir (in Russian).
Korfmann, M.O. (2005). Troia/Wilusa: Guidebook. Tübingen, Germany: Canakkale-Tübingen Troia Foundation.
Krasnopevtseva, G.V. (1984). Deep structure of the Caucasus seismically active region. Moscow, USSR: Nauka (in Russian).
Leonov, Y.G. (Ed.) (2007). Alpine history of the Great Caucasus. Moscow, Russia: Geos (in Russian).
Leonov, Y.G., Antipov, M.P., Volozh, Y.A., Zverev, V.P., Kopp, M.L., Kostikova, I.A. and Lavrushin, Y.A. (1998). Geological aspects of the problem of variations of the Caspian Sea level. In N.L. Dobretsov and V.I. Kovalenko (Eds.), Global changes of the environment (pp. 30–57). Novosibirsk, Russia: Siberian Branch, Russian Academy of Sciences (in Russian).
Levi, K.G., Yazev, S.A., Zadonina, N.V., Berdnikova, N.E., Voronin, V.I., Glyzin, A.V. and Kusner, Y.S. (2002). Recent geodynamics and heliodynamics. Irkutsk, Russia: Irkutsk State Technical University (in Russian).
Lilienberg, D.A. (1994). New ways to estimate the recent endodynamics of the Caspian region and the problems of its monitoring. Izvestiya Akademii Nauk, Series Geographical, No. 2, 16–35 (in Russian).
Liu, T. (1997). Geological environments in China and global change. In H. Wang, B. Jahn, S. Mei and S.-j. Mei (Eds.), Origin and history of the Earth: Proceedings of the 30th International geological congress, Beijing, China, Aug. 4–14, 1996 (pp. 15–26). Zeist, Netherlands: VSP.
Losev, K.S. (2001). Ecological issues and sustainable development perspectives of Russia in the 21st century. Moscow, Russia: Cosmoinform (in Russian).
Lyatkher, V.M. (2000). Variations in the Earth’s seismic regime caused by changes in the length of the solar cycle. Izvestiya, Physics of the Solid Earth, 36, 891–894.
Makarov, V.I., Kyuntzel, V.V. and Avsyuk, Y.N. (1995). Energy of exogenic geological processes. Geoecologia, No. 2, 3–26 (in Russian).
Marchetti, N. and Nigro, L. (1998). Scavi a Gerico, 1997. Relazione preliminare sulla prima campagna di scavi e prospezioni archeologiche a Tell es-Sultan, Palestina. Roma, Italy: SK7 Stampa e Servizi.
Masson, V.M. (1999). The first civilizations and the World history. Ufa, Russia: Eastern University (in Russian).
McClusky, S., Balassanian, S., Barka, A., Demir, C., Ergintav, S., Georgiev, I., Gurkan, O., Hamburger, M., Hurst, K., Kahle, H., Kastens, K., Kekelidze, G., King, R., Kotzev, V., Lenk, O., Mahmoud, S., Mishin, A., Nadariya, M., Ouzounis, A., Paradisissis, D., Peter, Y., Prilepin, M., Reilinger, R.E., Sanli, I., Seeger, H., Tealeb, A., Toksöz, M.N. and Veis, G. (2000). Global Positioning System constraints on plate kinematics and dynamics in the eastern Mediterranean and Caucasus. Journal of Geophysical Research, 105B, 5695–5720.
Mikulecký, M. (2007). Solar activity, revolutions and cultural prime in the history of mankind. Neuroendocrinology Letters, 28, 749–756.

Tectonic and Climatic Rhythms and the Development of Society 303
Milanovskii, Y.Y. (1968). Neotectonics of the Caucasus. Moscow, USSR: Nedra (in Russian).
Moinfar, A., Mahdavian, A. and Maleki, E. (1994). Historical and instrumental earthquakes data collection of Iran. Tehran, Iran: Iran Cultural Exhibitions Institute.
Mostryukov, A.O. and Petrov, V.A. (1994). Catalog of focal mechanisms of the 1964–1990 earthquakes. Moscow, Russia: National Geophysical Committee (in Russian).
Murzaeva, V.E. (1991). Paleoclimatic changes and related problems of the Quaternary sedimentation. In N.I. Kriger (Ed.), Quaternary geology of the foreign Asia (pp. 150–192). Moscow, USSR: Nauka (in Russian).
National Earthquake Information Center (2004). Earthquake data base. Golden, CO: National Earthquake Information Center, U.S. Geological Survey, http://neic.usgs.gov/neis /epic/database.html
Niederle, L. (1902–1924). Slovanské starožitnosti, Vols. 1–4. Praha, Austria-Hungary and Czechoslovakia: Bursík a Kohout.
Nikonov, A.A. (1998). The flooded ruins of the ancient constructions in the Cimmerian Bosporus coasts (related to the problem of sea level changes). Russian Archaeology, No. 3, 57–66 (in Russian).
Nissenbaum, A. (1994). Sodom, Gomorrah and the other lost Cities of the Plain – a climatic perspective. Climatic Change, 26, 435–446.
Nur, A. (1991). And the walls came tumbling down. New Scientist, 1776, 45–48. Papazachos, B. and Papazachou, C. (1997). The earthquakes of Greece. Thessaloniki, Greece:
Editions Ziti. Parczewski, M. (2003). Remarks on the discussion of Polish archaeologists on the
ethnogenesis of Slavs. Archaeologia Lituana, 4, 138–142. Pavlides, S. (1996). Active faults in Greece. Journal of Earthquake Prediction and Research,
5, 422–430. Philip, H., Avagyan, A., Karakhanian, A, Ritz, J.-F. and Rebai, S. (2001). Estimating slip
rates and recurrence intervals for strong earthquakes along an intracontinental fault: example of the Pambak-Sevan-Sunik fault (Armenia). Tectonophysics, 343, 205–232.
Pirazzoli, P. (1986). The Early Byzantine tectonic paroxysm. Zeitschrift für Geomorphologie, Suppl. 62, 31–49.
Poirer, J.P. and Taher, M.A. (1980). Historical seismicity in the near and Middle East, North Africa, and Spain from Arabic documents (VIIth–XVIIIth century). Bulletin of the Seismological Society of America, 70, 2185–2201.
Rastsvetaev, L.M. (1973). Some peculiarities of the Late Alpine structure of the orogenic regions of the southern USSR and tectonic stress of the modern time. In K.K. Markov and N.I. Nikolaev (Eds.), Neotectonics, modern deposits, and human being, No. 5 (pp. 57–107). Moscow, USSR: Moscow University Press (in Russian).
Ryan, W.B.F., Major, C.O., Lericolais, G. and Goldstein, S.L. (2003). Catastrophic flooding of the Black Sea. Annual Review of Earth and Planetary Sciences, 31, 525–554.
Rybakov, B.A. (1981). Heathenism of the ancient Slavs. Moscow, USSR: Nauka (in Russian). Rybakov, B.A. (1982). Kievan Rus and Russian duchies in the XII–XIII centuries. Moscow,
USSR: Nauka (in Russian). Rybakov, B.A. (1987). Heathenism of the Ancient Russia. Moscow, USSR: Nauka (in
Russian).
Vladimir G. Trifonov 304
Rychagov, G.I. (1993). The Caspian Sea level in the historical time. Vestnik Moscovskogo Universiteta, Series Geography, No. 4, 42–49 (in Russian, with English abstract).
Sadchikova, T.A. and Chepalyga, A.L. (1999). Late Quaternary history of bays of the north-western Black Sea. Bulletin of Commission for Study of the Quaternary, 63, 76–85 (in Russian).
Sandweiss, D.H., Maasch, K.A. and Anderson, D.G. (1999). Transitions in the Mid-Holocene. Science, 283, 499–500.
Sayadian, Y.V. (1985). Sevan as the natural indicator of the Holocene climate. In A.T. Aslanian and Y.V. Sayadian (Eds.), Problems of the Holocene geology: Proceedings of the XI INQUA congress, the Holocene commission symposium, Yerevan, USSR, July 25–30, 1982 (pp. 61–67). Yerevan, USSR: Armenian Academic Press (in Russian).
Selivanov, A.O. (1996). Changes of the World ocean level in Pleistocene–Holocene and evolution of seacoasts. D.Sc. Thesis. Moscow, Russia: Institute of Water Problems, Russian Academy of Sciences (in Russian).
Selivanov, A.O. (2000). Nature, history, culture: Environmental aspects of culture of the peoples of the World. Moscow, Russia: Geos (in Russian).
Senko, E.R., Trifonov, V.G. and Karakhanian, A.S. (2004). Strong earthquakes. In V.G. Trifonov and A.S. Karakhanian, Geodynamics and the history of civilization (pp. 161–228). Moscow, Russia: Nauka (in Russian, with English extended summary and figure captions).
Shebalin, N.V., Kárník, V. and Hadzievski, D. (Eds.) (1974). Catalogue of earthquakes, 2 pts. Skopje, Yugoslavia: UNDP/UNESCO Survey of Seismicity of the Balkan Region.
Shilik, K.K. (1977). Changes of the Black Sea level in the Late Holocene and paleotopography of the ancient archaeological monuments in the northern Black Sea coasts. In P.A. Kaplin and F.A. Shcherbakov (Eds.), Paleogeography and sediments of the Pleistocene in the southern seas of the USSR (pp. 158–163). Moscow, USSR: Nauka (in Russian).
Shilik, K.K. (1991). Discovery of two ancient towns on the Kerch Strait bottom. In M. Lazarov, M. Tatcheva, C. Angelova and M. Georgiev (Eds.), Thracia Pontica: Proceedings of the 4th International symposium, Sozopol, Bulgaria, Oct. 6–12, 1988 (pp. 427–434). Sofia, Bulgaria (in Russian).
Shnitnikov, A.V. (1957). Changes of the total moistening of continents in the Northern hemisphere. Moscow, USSR: Soviet Academic Press (in Russian).
Solov’ev, S.M. (1960–1964). History of Russia from ancient times, Vols. 7–9, 12, 14, 19, 20, 22. Moscow, USSR: Social-Economic Literature Press (in Russian).
Stiros, S. and Jones, R.E. (Eds.) (1996). Archaeoseismology. Athens, Greece: British School at Athens.
Svitoch, A.A., Selivanov, A.O. and Yanina, T.A. (1998). Pleistocene palaeogeographic events in the Ponto-Caspian and Mediterranean basins (data for reconstruction and correlation). Moscow, Russia: Moscow University Press (in Russian).
Sytinskii, A.D. (1987). Relationship between terrestrial seismicity, solar activity, and atmospheric processes. Leningrad, USSR: Hydrometeoizdat (in Russian).
Tchijevsky, A.L. (1938). Les épidemies et les perturbations électromagnetiques du milieu exterieur. Paris, France: Hippocrate.
The Holy Bible (1929). New York, NY: Nelson.

Tectonic and Climatic Rhythms and the Development of Society 305
Thorarinsson, S. (1967). Some problems of volcanism in Iceland. Geologische Rundschau, 57, 1–20.
Trifonov, V.G. (1983). Late Quaternary tectogenesis. Moscow, USSR: Nauka (in Russian). Trifonov, V.G. and Karakhanian, A.S. (2004). Geodynamics and the history of civilization.
Moscow, Russia: Nauka (in Russian, with English contents, extended summary, and figure captions).
Trifonov, V.G. and Karakhanian, A.S. (2008). Dynamics of the Earth and development of the society. Moscow, Russia: OGI Press (in Russian, with English contents and abstract).
Trifonov, V.G., Soboleva, O.V., Trifonov, R.V. and Vostrikov, G.A. (2002). Recent geodynamics of the Alpine–Himalayan collision belt. Moscow, Russia: Geos (in Russian, with English contents, extended summary, figure captions, and appendices).
Trifonov, V.G. and Trifonov, R.V. (2006). Origin and environmental consequences of the Phanagorian regression of the Black Sea. Geoecology, No. 6, 509–521 (in Russian).
Trifonov, V.G., Vostrikov, G.A., Lykov, V.I., Orazsahatov, H. and Skobelev, S.F. (1986). Tectonic aspects of the Kum Dagh 1983 earthquake in the western Turkmenia. Izvestiya Academii Nauk SSSR, Series Geological, No. 5, 3–16 (in Russian).
Trubachev, O.N. (2002). Ethnogenesis and culture of Ancient Slavs (2nd enl. ed.). Moscow, Russia: Nauka (in Russian).
Trubikhin, V.M. (1989). Paleomagnetism and chronology of climatic events in the Late Holocene in the western Turkmenia. In Y.-M.K. Punning (Ed.), Geochronology of the Quaternary: Abstracts of the All-Union meeting, Moscow, USSR, Nov. 14–16, 1989 (p. 66). Tallinn, USSR: Estonian Academic Press (in Russian).
Varushchenko, S.I., Varushchenko, A.N. and Klige, R.K. (1987). Changes of regime in the Caspian Sea and closed basins in the paleotime. Moscow, USSR: Nauka (in Russian).
Velichko, A.A. (Ed.) (1993). Evolution of landscapes and climates of the Northern Eurasia: Late Pleistocene–Holocene; elements of prognosis. Vol. 1: Regional paleogeography. Moscow, Russia: Nauka (in Russian).
Vladimirsky, B.M. (1998). Works of A.L. Tchizhevsky on solar-terrestrial links. Heliobiology on the eve of the XXI century: results, problems, and prospects. Biophysics, 43, 532–536.
Zabłocka, J. (1982). History of the Near East in the antiquity. Wrocław, Poland: Zakład Narodowy im. Ossolińskich (in Polish).

In: Man and the Geosphere ISBN 978-1-60876-387-0 Editor: Igor V. Florinsky, pp. 307-347 © 2010 Nova Science Publishers, Inc.
Chapter 10
HYDROGEN DEGASSING OF THE EARTH: NATURAL DISASTERS AND THE BIOSPHERE
Vladimir L. Syvorotkin
ABSTRACT
The role of natural disasters is very important in humanity’s evolution. The author proposes that there is a common reason for the current intensification of natural disasters at the global scale. This reason is the increase of emission of reduced gases, primarily hydrogen, via degassing from deep within the Earth. The process of inner core crystallization leads to the release of hydrogen, which is then accumulated at the boundary of the liquid core and the mantle and diffuses outward to the Earth’s surface. The gravitational influence of the Moon and Sun on the Earth modulates this process. The impacts of this degassing on the biosphere and humans are three-fold: (1) Passing from the Earth’s core to space, the gas flow affects each geochemical barrier. There are three important consequences: (a) intensification of seismic and volcanic activity; (b) massive decline of aerobic biota and development of blue-green algae in the oceans due to gas outbursts along mid-ocean ridges; and (c) ozone layer depletion over degassing centers. The author presents a theoretical concept of the Earth degassing-driven depletion of the ozone layer. Spatial correlation of the most stable negative ozone anomalies with the major rift zones, degassing channels, and monitoring results of the dynamics of subsoil hydrogen gas content support the author’s concept. (2) A surplus of biologically active ultraviolet (UVB) reaches the Earth’s surface through the negative ozone anomalies. UVB adversely affects biota: in particular, it reduces its productivity, impairing reproduction and development, inducing DNA damage, increasing mutations, and causing immune suppression. It is argued that UVB radiation over the deep degassing centers is one of the geological driving forces for speciation along with topographic barriers, millennial-scale climatic fluctuations associated with the precession of the geomagnetic axis, geomagnetic reversals and excursions, geochemical anomalies, radon emission through active faults, and seismicity. (3) A surplus solar energy in the infrared range, arriving at the Earth’s surface through these same negative ozone anomalies, leads to abnormal heating of local parts of the Earth’s surface. This causes an increase in frequency of short-term regional extreme meteorological events around the world and general destabilization of the atmosphere and ocean known as global warming. The Earth degassing model is used to explain nature and mechanism of El Niño phenomenon. It is

Vladimir L. Syvorotkin 308
argued that the Earth degassing essentially influences evolution of the biosphere including humans and the development of nations at the global scale.
Keywords: hydrogen; degassing; ozone layer; ultraviolet; mutation; El Niño.
10.1. INTRODUCTION The role of natural disasters is very important in humanity’s evolution (Borisenkov and
Pasetsky, 1988; Trifonov and Karakhanian, 2004b; Nur and Burgess, 2008). Let us consider some examples. 3,500 years ago, a tsunami, generated by the explosion of Santorini Volcano in the Aegean Sea likely caused the great Minoan civilization on the Island of Crete to perish (Trifonov and Karakhanian, 2004b, p. 258). The wave height could have been up to 31 m near the north coast of Crete and about 50 m within its narrow bays. After withdrawal from the rocky coast, the height of some of the breaking waves could have been up to 60–100 m. After crossing the Mediterranean Sea, the same tsunami wave likely reached the Nile delta at a probable height of 4 m, where it could have penetrated inland up to ~70 km, seriously disturbing the Egyptian environment. The sharp climatic changes connected with the Southern Oscillation could have caused the practically simultaneous downfall of both the Maya civilization and Tan Dynasty in China. The last Maya calendar was in the year 903 and the rule of the Tan Dynasty ended in the year 907 (Kokin and Kokin, 2008, p. 204). The Hindu Kingdom of Mataram located in Central Java had perished in result of a catastrophic explosion of Merapi Volcano in the year 1006. There were several towns with numerous temples. Natural forces suppressed two attempts of Kublai Khan to conquer Japan. First, the Mongolian navy was drowned by a storm in 1274. Second, the Mongolian fleet with a landing force of more than 100,000 was destroyed by a sudden typhoon in 1281. In September 1541, Ciudad Vieja, the newly founded capital of Guatemala, was destroyed by huge mud flow generated by the break of the crater lake of Agua Volcano and resulted in the loss of 1,300 people (Vinogradov, 1980, p. 107). Other examples can be found in Section 9.3.
Today, the mass media regularly informs the public about natural disasters in different regions of the world causing the loss of hundreds and thousands people. Earthquakes, volcanic eruptions, floods, rock falls, landslides, avalanches, hurricanes, droughts, forest fires, epidemics, and gas bursts in mines are but an incomplete list of catastrophic events, which are a backdrop of current life (Laverov, 1998, 2002; Kasimov and Klige, 2006). The strength and rate of some natural anomalies have had, apparently, no analogies in the past, at least for the period of recorded observations. The set of the natural abnormal events seems to have increased since the early 1980s. They occur more often and often not only in the tectonically active regions, but in aseismic ones as well. The first years of the new millennium showed that anomalies of natural processes are on the increase. The tragic consequences of the 26 December 2004 Sumatra tsunami (Lay et al., 2005), Hurricane Katrina in August 2005 (Brinkley, 2006), and the 2008 Sichuan earthquake (Stone, 2008) will remain in the history of natural disasters.
The author supposes that the Earth is in a “catastrophic” phase of its evolution. The periodicity of such crises is a regularity of the planet’s history (Tchijevsky, 1938; Vladimirsky, 1998) (Chapter 9). To be precise, here we are dealing with epochs with typical

Hydrogen Degassing of the Earth 309
lengths of several years, decades, and centuries. A noteworthy and mysterious peculiarity of the “catastrophic” epochs is simultaneity of various natural disasters, many of which coincide with maximum or minimum of solar activity.
This implies that attempts to understand and explain the cause of natural anomalies should consider (and explain) their complete range. This requirement is also valid for hypotheses of abnormal processes in the atmosphere. The most well known global environmental problems are connected with these processes. These are ozone layer depletion and climate change (global warming). In the both cases, the scientific community perceives the threat arising from industrial gases. Scientific recommendations turned into international agreements – the Montreal and Kyoto Protocols – which should regulate industrial and agricultural activity with the aim to minimize emission of man-made chlorine- and bromine-containing volatile gases (Staehelin et al., 2001) and greenhouse gases (Metz, 2007) to the atmosphere. However, related scientific concepts (Solomon et al., 2007) do not usually consider the natural periodicity of “catastrophic” epochs in planetary evolution.
Atmospheric processes are usually considered separately from the processes in other geospheres. However, it is natural a priori that the atmosphere is a part of the planetary system and inseparably linked with all other geospheres including the solid ones, such as the crust, mantle, and core. The weight of the gas envelope is only one millionth of the total weight of the planet. The atmosphere is a result of a large-scale process of the Earth degassing, which began billions years ago and is continuing up to the present. It is impossible to understand the nature of planetary cataclysms without considering these facts.
The discovery by Tchijevsky (1938) put a difficult task to scientists to explain the synchronicity of the diverse natural processes. What link can exist between epidemics in Africa and floods in South America, or earthquakes in Japan and hurricanes in the Caribbean Sea? Why does the activation of natural disasters at the global scale correspond to rhythms of space phenomena? Is there some common reason or domino principle at work?
The author supposes that there is a common reason for intensification of natural disasters at the global scale, namely, it is the sharp increase of emissions of reduced gases (primarily hydrogen), degassing from deep within the Earth. Syvorotkin (2002) considers three main factors of deep degassing, which affect the biosphere and humans:
1. Streaming from the Earth’s core to space, the gas flow affects each geochemical
barrier. There are three important consequences: (a) intensification of seismic and volcanic activity; (b) massive decline of aerobic biota and development of the blue-green algae in oceans due to gas outbursts along mid-ocean ridges; and (c) ozone layer depletion over degassing centers.
2. Enhanced solar ultraviolet (UV) radiation reaches the Earth’s surface through the formed negative ozone anomalies. Biologically active UV (UVB) adversely affects biota, in particular, reduces its productivity, impairing reproduction and development, inducing DNA damage, increasing mutations, and causing immune suppression.
3. A surplus of solar energy in the infrared (IR) range reaching the Earth’s surface through the formed negative ozone anomalies leads to localized abnormal heating of the Earth’s surface. This causes an increase in frequency of short-term regional extreme meteorological events around the world and general destabilization of the atmosphere and ocean known as global warming.

Vladimir L. Syvorotkin 310
This is essence of the degassing concept of the activation of natural disasters at the global scale. Let us discuss its main components in more detail.
10.2. HYDROGEN CONCEPT OF OZONE LAYER DEPLETION
10.2.1. Theoretical Aspects The author’s concept of ozone layer depletion is based on a proposal that deep gases – H2
and CH4 – may interact with the stratospheric O3 (Syvorotkin, 1996b). It originates within the high stratosphere due to photolysis of oxygen by UV radiation at wavelengths (λ) less than 240 nm and further interacting between atomic and molecular oxygen. Chapman (1930) was the first to consider the interaction of all three types of oxygen (one-, two-, and three-atomic) through photolysis. This process was named the oxygen cycle or Chapman cycle. It can be described as follows:
O2 = O + O (at λ < 240 nm), (10.1) O + O2 + M = O3 + M, (10.2)
where M is N2 and O2,
O + O3 = 2O2, and (10.3) O3 = O + O2 (at λ < 900 nm). (10.4) However, the Chapman cycle can explain only the loss of 20% of the stratospheric O3
(Johnston, 1975). To approximate the real situation, Hampson (1966) has accounted the interaction of O3
with radical OH, the hydrogen cycle. Hydroxyl formation is possible under interaction of H2, CH4, and H2O with atomic oxygen by the general scheme:
⎪⎩
⎪⎨
⎧+=+
⎪⎭
⎪⎬
⎫
HCHOH
OH)D(OH
CHOH
31
2
4
2
(10.5)
The hydrogen cycle can be described as follows: OH + O3 = HO2 + O2, (10.6) HO2 + O3 = OH + 2O2. (10.7) So, 2O3 = 3O2.

Hydrogen Degassing of the Earth 311
In the hydrogen cycle, the chain break occurs as follows: OH + HO2 = H2O + O2, or (10.8) OH + OH = H2O + O. (10.9) The light gases, H2 and CH4, coming from deep within the Earth to the surface, quickly
reach the stratosphere, where they actively react with O3 leading to a separation of H2O. At stratospheric heights, the water freezes and ice stratospheric clouds are formed. In chemical terms, the author’s hypothesis is not original. The author only draws the attention of specialists to the geological sources of ozone-destroying gases (Larin, 1993; Marakushev, 1999), which were not considered before in the atmospheric chemistry. Estimating such sources of ozone-destroying gases in geological terms, the author attempts to show their critical role in the ozone planetary balance.
The main stores and sources of the planetary hydrogen flow is the liquid outer core (Timashev, 1991; Marakushev, 1999; Williams and Hemley, 2001) (Section 1.2). H2 accumulates there under crystallization of the solid core. The important peculiarity of the deep degassing is its irregularity in space and time. The main flow of the deep reduced gas seeps through the rift zones of mid-ocean ridges, which are the main channels of the Earth degassing (Figure 10.1a).
The extent of hydrogen degassing can be estimated from data on methane degassing. CH4, being studied much better, accompanies H2 in comparable quantities during the deep degassing. In the stratosphere, CH4 acts together with H2 in the hydrogen cycle of ozone destruction. In addition, the chlorine cycle of ozone destruction is broken by the following scheme in the presence of CH4 (Perov and Khrgian, 1980):
CH4 + Cl = CH3 + HCl. (10.10) This may play a critical role in reactions between minor components in the stratosphere
since this reaction is direct. Each methane molecule interacts with one chlorine atom and removes it from the ozone-destruction cycle. The endogenous flow of H2 and CH4 in atmosphere reaches up to 2.5–3 Gt/yr (Syvorotkin, 1993, 2002).
From the analysis of carbon isotopy of atmospheric methane, Voitov (2000) concluded that commonly accepted estimates of the methane flow are grossly underestimated. In fact, it is responsible for two-thirds of the total amount of CH4 in the lower atmosphere. It should be stressed that this is also related to the hydrogen flow, which is naturally accompanies CH4 in real gas streams. Model estimations demonstrated that the global rate of methane formation should be about 2.5–9 Gt/yr (Adushkin et al., 1997), i.e., 5–6 times more than the biogenic methane flow. This suggests looking for stronger sources of CH4 from the Earth’s interior.
Let us consider the transport problem, viz., the possibility of H2 and CH4 penetrating into the stratosphere outside of the inter-tropical convergence zone (ITCZ) over locations where they emerge from the Earth’s interior. This assumption is based on proposals that tropo-stratospheric exchange of masses takes place outside of the ITCZ (Perov and Khrgian, 1980; Isidorov, 1990; Golubov et al., 2002). It is natural that the gases are transported by wind. That is why the result of gas injected into the ozone layer depends on the relationship between gas injection strengths and atmosphere conditions.

Vladimir L. Syvorotkin 312
Figure 10.1. Main rifts of the world: (а) global network, (b) the South Polar Region, (c) the North Polar Region (Heezen, 1969; Kropotkin and Titkov, 1981; Milanovskii and Nikishin, 1988): 1 – rift of the East Pacific Rise and its continental extension, 2 – rift of the Mid-Atlantic Ridge, 3 – Rhine-Libyan Rift, 4 – East African Rift, 5 – Red Sea Rift, 6 – rift of the Central Indian Ridge and its continental extension, 7 – rift of the East Indian Ridge and its continental extension, 8 – rift of the West Pacific Ridge, 9 – Circum-Antarctic Rift, 10 – Weddell-Ross Rift, 11 – Lambert Rift. Rift extensions northward from 30º N and southward from 30º S as well as their polar merging are represented according to the author’s interpretation (Syvorotkin, 1996b).
The strong gas flux coupled with the absence of turbulence leads to the formation of negative ozone anomalies over such degassing centers as, for example, in winter Yakutia over diamond fields. Weak fluxes and strong turbulence cause no effect. It is clear that in reality all ranges of effects between these two extreme conditions may take place.
The spatial distribution of the total ozone content (TOC) may be modulated by geomagnetic activity (Kulkarni, 1963; Kondratovich et al., 1988; Khrgian and Kuznetsov, 1996; Storini, 2001). In the Northern hemisphere, for example, an increase of TOC over the Siberian magnetic anomaly is usually associated with strong geomagnetic storms in winter (Belinskaya, 2000). A mechanism of such phenomenon is not clear. There are at least two possible explanations: First, ozone is redistributed due to changes of atmospheric circulation caused by a geomagnetic storm and accompanied Forbush decreases of the galactic cosmic ray flux (Laštovička and Križan, 2005). Second, the geomagnetic field focuses cosmic rays,

Hydrogen Degassing of the Earth 313
while focused protons produce ozone by the radiolysis of O2 (Osechkin et al., 1990) (indeed, it is known that the charged particles flux is enhanced over large magnetic anomalies, e.g., Brazilian, Canadian, Chukchi-Aleutian, and Siberian ones – Martin et al., 1974; Markov and Mustel, 1983). On the other hand, Reid et al. (1976) proposed that the ozone shield may be partially or completely destroyed by solar protons during magnetic reversals, when the geomagnetic field strength is globally declined. Thus, relations between the geomagnetic field and TOC invite further investigation (Vogt et al., 2009).
10.2.2. Spatial Distribution of Negative Ozone Anomalies The spatial distribution of the most stable negative ozone anomalies is a compelling
argument in favor of the hydrogen concept of ozone layer depletion. The spatial distribution of negative ozone anomalies is well documented: global maps of TOC are routinely produced using satellite data from the late 1978 (Ozone Processing Team, 2008). However, these maps were not interpreted from geological point of view. Let us reexamine this interpretation.
10.2.2.1. Antarctic Ozone Hole
It is well known that Antarctica is the region where the ozone layer is subjected to the strongest and most frequent depletion (Solomon, 1999; Staehelin et al., 2001). The author explains this phenomenon by the fact that rifts of the mid-ocean ridges converge near the Antarctic continent (Figure 10.1). Their southern, most active and warmest segments (Anderson and Dziewonski, 1984) merge into the Circum-Antarctic Ridge. Thus, Antarctica is a region over which the most abundant flows of reduced gases are found. In other words, the atmosphere over Antarctica is subjected to maximal ventilation by natural ozone-destroying gases. That is why the effect of ozone depletion is mostly seen here. Within Antarctica, the effect of fluid unloading should be expected under the ice shield. The maximal endogenous activity concentrates on the continuing the main trunks of the oceanic rifts (Figure 10.1b).
Current volcanism is observed there (Figure 3.2). This is especially true for the extension of the rift of the West Pacific Ridge marked by two approximately north-striking features, viz., the western coast of the Ross Sea and a chain of active volcanoes, such as Mount Freeman, Buckle Island, Mount Melbourne, Sturge Island, Mount Morning, and Erebus, one of the most active volcano of the planet (Gushchenko, 1979). Tazieff (1978) suggested that Mounts Terror, Terra Nova, and Byrd, located nearby Mount Erebus, are also active volcanoes. According to geophysical data, there is the Weddell-Ross Rift (Figure 10.1b) separating West and East Antarctica (Houtz and Davey, 1973; Behrendt et al., 1991). Thus, there is a connection of the West Pacific and Mid-Atlantic Ridges there.
The southern branch of the rift zone of the East Pacific Rise “penetrates” in Antarctica in the Amundsen Sea, which is also manifested by the under-ice topography and volcanic activity at Marie Byrd Land. The eastern branch of the rift zone of the East Pacific Rise (Figure 10.1b) deviates toward the Drake Passage and most likely determines the volcanism of the South Shetland Islands (Figure 3.2).
The peculiarity of the geological setting and geodynamics of West Antarctica is determined by fact that the three main oceanic rifts merge there. The fourth, the rift of the Central Indian Ridge, “shoots” to them through East Antarctica. One can find its tracks in the

Vladimir L. Syvorotkin 314
modern volcanism of the Kerguelen and Hard Islands (Figure 3.2) as well as in topography, such as the Prydz Bay and approximately north-striking narrow valley filled with the Amery and Lambert Glaciers. Geophysical data suggests that this is the Lambert intercraton Rift (Figure 10.1b), a graben of 100 km width and 9 km depth (Bentley, 1973; Milanovskii, 1983, p. 231).
Such interpretation of tectonic setting of Antarctica allows one to explain shapes of negative ozone anomalies over it. Indeed, one can see a spatial agreement of the extended part of the negative ozone anomaly (Figure 10.2a and c) with the Atlantic portion of the Weddell-Ross Rift and the southern portion of the Mid-Atlantic Ridge (Figure 10.1a). The other elongated part of the Antarctic ozone hole (Figure 10.2b and c) correlates with the Pacific portion of the Lambert Rift and the southern portion of the East Pacific Rise (Figure 10.1a). One further extended part of the negative ozone anomaly (Figure 10.2d) corresponds to the Indian portion of the Lambert Rift (Figure 10.1a).
Figure 10.2. Global TOC in 2004–2005: (a) Oct. 23, 2005; (b) Oct. 27, 2005; (c) Jan. 28, 2005; (d) Mar. 22, 2005; (e) Nov. 1, 2005; and (f) Nov. 1, 2004. Data obtained by the satellite Earth Probe (Ozone Processing Team, 2008; courtesy of NASA).

Hydrogen Degassing of the Earth 315
Approximately north-striking elongated parts of the ozone hole usually occur over Antarctica in late fall. This may mean the strengthening of the deep degassing in the Antarctic rift structures that is probably connected with nearing the Earth to the perigee of its heliocentric orbit. Increasing gravitational effect of the Sun on the planet influences its liquid outer core where the main storage of planetary hydrogen is dissolved. During this season, the degassing strengthens and ozone layer depletion is observed around the world. One can see the depletions of the ozone layer over the North American continental extension of the East Pacific Rise as well as over the Mid-Atlantic Ridge on October 23, 2005 (Figure 10.2a). It was most pronounced over Antarctica because the Earth’s South Pole is turned toward the Sun during this season.
Degassing of the planetary rift zones and related configurations of negative ozone anomalies change very quickly. In fact, they change over twenty four hours, although the general regularity in the spatial distribution of ozone holes is preserved, as a rule, over several days. For example, of the main oceanic rift zones, only the East Pacific Rise degassed on October 27, 2005 (Figure 10.2b). Degassing levels increased there and decreased at the northern end of the rift, although it is manifested quite distinctly as a blue spot over the USA (Figure 10.2b).
10.2.2.2. Ozone Minimums of the Northern Hemisphere
Let us continue to analyze Figure 10.2b. In the Northern hemisphere, there were negative ozone anomalies over the Mid-Atlantic Ridge and the fault zone of 90º E. The latter is a continental prolongation of the East Indian Ridge. The Yenisei River valley marks it in Siberia. There also were negative ozone anomalies in the Western Europe, where the active degassing zone is the Rhine-Libyan Rift stretching from Scandinavia to Africa (Figure 10.2d).
It should be stressed that one can see the distinct approximately north-striking form of many negative ozone anomalies both in the figures discussed and in other global maps of TOC obtained with satellites in the past few decades (Ozone Processing Team, 2008). These testify to the correlation of negative ozone anomalies with geological structures. Negative ozone anomalies are most frequently manifested over northern terminations of the main trunks of the world rift system (Figure 10.1a).
Bekoryukov (1990) demonstrated that the three most stable minima of TOC in the atmosphere over the Northern hemisphere are over Iceland, the Red Sea, and Hawaiian Islands (Figure 10.3a). It is clear that these places are remote from industrial regions. However, they are the most active parts of the rift systems (hot spots). They are characterized by intense current tholeitic volcanism accompanied by flows of reduced gases. The important peculiarity of these centers is the high 3He / 4He ratio ranging up to 5 × 10⁻⁵ (Sigvaldason, 1966; Kononov et al., 1974; Lupton, 1983; Polyak, 2005). This testifies to the deep nature of the gas flows and/or youth of the degassing system.
10.2.2.3. Negative Ozone Anomalies in the Equatorial Zone
Up to now, it was widely accepted that the ozone layer is stable in the equatorial zone of the planet and its destruction takes place predominantly within the polar regions (Solomon, 1999; Staehelin et al., 2001). Using satellite data, Chernikov et al. (1998) detected a set of the negative ozone anomalies in the equatorial zone. The center of the largest negative ozone anomaly, with an average monthly ozone deficit ranging up to 30%, was located strictly over

Vladimir L. Syvorotkin 316
the most active zone of the East Pacific Rise, located 15–20º southward from the equator (Figure 10.3b).
Figure 10.3. Spatial relations between minimal TOC and centers of deep degassing: (a) areas of the minimal TOC over the Northern hemisphere (Bekoryukov, 1990): TOC contours (Dobson Units) and regions marked by the minimal TOC: 1 – Iceland, 2 – Hawaiian Islands, 3 – Red Sea; (b) negative ozone anomaly (dotted area) over the Equatorial Pacific in January 1998 (Chernikov et al, 1998): 1 – a mantle magma source (Forsyth et al., 1998), 2 – hydrogen sources (Welham and Graig, 1979), 3 – a portion of the East Pacific Rise, 4 – the El Niño area in January 1998 (NASA/JPL/Caltech, 2008), 5 – the Humboldt Current, 6 – spots of a high biological productivity (Vinogradov, 1975), and 7 – fault zones in the coastal waters off Peru and Chile.

Hydrogen Degassing of the Earth 317
There are nine hydrogen sources on the ocean floor there (Welham and Graig, 1979). Abnormally high (even for mid-ocean ridges) heat flow is observed along the axis zone of the East Pacific Rise. The 3He / 4He ratio is 1.3 × 10⁻⁵ in the gas emanation there (Lupton, 1983; Polyak, 1988). It is one of the most powerful hydrothermal systems in the world (Baker et al., 1995). The highest spreading velocity, ranging up to 15–24 cm/yr, was measured there (Walker, 1995). It is a zone of the abnormally low seismic velocity that can be traced down to depth of 150–200 km (Forsyth et al., 1998). The electromagnetic data testifies to the electrical conductivity of the mantle down to depth of 180–200 km. The low seismic velocity region is observed 250 km westward and only 100 km eastward from the ridge. These facts suggest that a huge mantle magma source exists in this region (Figure 10.3b).
From the analysis of satellite maps of TOC, the author found that in the tropics negative ozone anomalies occur most frequently over the Sunda Islands and adjacent regions of the Indian and Pacific Oceans. The role of atmospheric dynamics in the TOC formation increases in the tropical zone. Generally, there is less TOC there, because ozone-destroying gases can easily reach the stratosphere due to strong ascending convection crossing the tropopause. In the tropics, the approximately north-striking negative ozone anomalies are rarely observed as they are carried away by wind. Nevertheless, the wind can still cause latitudinal abnormal spots there.
10.2.2.4. Negative Ozone Anomalies over the Northern Eurasia
For the Northern Eurasia, Figure 10.4a represents the distribution of centers of negative ozone anomalies (more exactly, centers of an average monthly deficit of O3 in comparison with an average long-standing value for a particular ground-based ozone station) for the period from 1991 to 1999. The map allows one to see approximately north-striking bands of centers of negative ozone anomalies. This bands relate to the approximately north-striking faults well known for this territory (Figure 10.4b), that is, the spatial distribution of negative ozone anomalies is controlled by tectonics.
Increase flows of deep ozone-destroying gases, H2 and CH4, have been detected within these faults by various methods in various periods. In particular, sources of H2 and CH4 were observed in the Kola Peninsula, Yakutian kimberlite province, Pre-Caspian region, Ustyurt Plateau, and other places (Osika, 1981; Shcherbakov and Kozlova, 1986; Syvorotkin, 2002). Comparison of these data with the spatial distribution of centers of negative ozone anomalies demonstrated the existence of the powerful hydrogen sources in regions, over which the ozone layer is intensively depleted. These regions include Eastern Siberia. A high concentration of H2 was observed there in the Udachnaya, Yubileynaya, Aikhal, and Mir kimberlite pipes. These kimberlite pipes are connected with a system of deep approximately north-striking faults (Zubarev, 1989). An especially active hydrogen emanation is observed in the Udachnaya pipe. Its output reached 105 m3/day and hydrogen content was about 56%, the rest was mostly CH4. This phenomenon can explain the processes of the intense depletion of the ozone layer over the region. The intense emanation of H2 is also observed around Lake Baikal, where hydrogen content reaches 70–95% in the gas stream in the Tunkin and Selenga River valleys (Shcherbakov and Kozlova, 1986).
Thus, the centers of the largest negative ozone anomalies are located over zones and centers of hydrogen and methane degassing, such as rifts and fault zones or their intersections, as well as over centers of recent tholeitic and alkaline volcanism or ancient ultra alkaline (kimberlite) volcanism.

Vladimir L. Syvorotkin 318
Figure 10.4. Relationships between negative ozone anomalies and faults at the Northern Eurasia: (a) centers of the anomalies observed at ground-based stations in 1991–1999 (Kadygrova, 1992–1996; Chernikov et al., 2000); (b) main approximately north-striking fault zones (Bryukhanov and Mezhelovsky, 1987, p. 58).
Recall that emanation of deep gases is extremely irregular in space and time. The strength of the gas discharge may spontaneously increase a million-fold, and the spatial extent of such gas-dynamic perturbations can spread over ~105 km2 (Osika, 1981). The increase of gas emanation is often connected with seismic events. In Section 10.4, the author provides more supporting evidence that such gas discharges cause the local negative ozone anomalies.
Calc-alkaline volcanism plays the other role in ozone layer depletion. This type of volcanism is mainly manifested around the edge of the Pacific Ocean (Figure 3.2). Geodynamical regime of compression dominates there leading to the generation of numerous intracrustal volcanic centers. Reduced H2 and CH4 are oxidized producing H2O and CO2. Thus, this discharge does not influence the ozone layer. However, evolution of the mantle

Hydrogen Degassing of the Earth 319
basaltic magma of peripheral centers can lead to generation of acid rocks. They can plug a volcano’s throat due to high viscosity resulting in huge explosions (e.g., Mount El Chichón explosion in 1982 and Mount Pinatubo eruption in 1991). Ten millions tons of volcanic dust and million tons of gases enter the stratosphere at one time. They are redistributed by stratospheric jet streams around the globe. In the affected areas, TOC can be reduced by 20–30% over several months (Hofmann and Solomon, 1989; Hofmann and Oltmans, 1993).
10.2.3. Experimental Testing of the Hydrogen Concept The hydrogen concept of ozone layer depletion (Syvorotkin, 1996b) supposes a
synchronism of the strengthening of hydrogen degassing and the decrease of TOC over a particular place of the Earth’s surface. To reveal this correlation, i.e., to test experimentally the hydrogen concept, a station network was organized to monitor the subsoil hydrogen gas content. Equipment for these stations was made at the Moscow Engineering Physics Institute, Russia. The device sensitivity is 0.1 ppm and recording interval is 1 min.
A time series of the subsoil hydrogen gas content was obtained for 44 months of measurements in the Khibiny Mountains, Kola Peninsula, Russia (Syvorotkin et al., 2008). For this period, several spikes of the hydrogen content were observed and all of them correspond to a synchronous decrease of TOC over the Kola Peninsula.
For example, Figure 10.5 describes the synchronism of these processes on April 26–27, 2005. The hydrogen recorder, installed in the Khibiny Mountains, showed an extreme hydrogen content. In the same days, a distinctive decrease of TOC (down to 375 DU) was registered at the Murmansk ozone station (Figure 10.5).
Figure 10.5. The Kola Peninsula: hydrogen release and TOC in April 2005. TOC data were obtained from the Murmansk ozone station (black squares) and the satellite Earth Probe (gray squares).
At the same time, the satellite Earth Probe, performing the global monitoring of TOC, registered the narrow linear zone of the decreasing content (down to 375 DU) of TOC over the Kola Peninsula (Ozone Processing Team, 2008). These results experimentally support the author’s concept of ozone layer depletion. The author notes that the full moon phase was on April 26–27, 2005. Thus, the increased hydrogen emission was due to the gravitational effect of the Moon on the Earth’s liquid outer core, the major planetary reservoir of this gas.

Vladimir L. Syvorotkin 320
10.3. BIOLOGICAL EFFECT OF UV RADIATION
10.3.1. General Observations After determining the cause of ozone layer depletion, let us consider some consequences
of this destruction for biota and humans. UV radiation constitutes only 8% of the total flow of the solar radiation. It can be divided into three ranges in terms of the impact on biota (International Organization for Standardization, 2005):
• Ultraviolet C (UVC), λ = 100–280 nm, • Ultraviolet B (UVB) , λ = 280–315 nm, and • Ultraviolet A (UVA), λ = 315–400 nm. UVB radiation strongly affects biota, but ozone molecules can absorbed it in the
stratosphere. UVA radiation is not absorbed by O3, but is not of special threat. UVC radiation is absorbed not only by O3, but by other atmospheric gases as well, and so practically does not reach the Earth’s surface.
The impact of UVB is well studied (De Gruijl et al., 2003; Caldwell et al., 2003, 2007; Häder et al., 2003, 2007; Norval et al., 2007). Generally, UVB radiation causes species-specific responses marked by a high degree of intraspecies variation. For microorganisms, UVB radiation damages deoxyribonucleic acid (DNA), impairs photosynthesis, and bleaches nitrogen metabolism. It causes molecular damage to lipids and proteins (Häder et al., 2003, 2007).
UVB radiation adversely affects aquatic organisms. It reduces productivity, impairs reproduction and development, and increases mutations for phytoplankton, macroalgae, fish eggs, and larvae. Decreases in biomass productivity due to enhanced UVB are relayed through all levels of the intricate food web, possibly resulting in reduced food production for humans (Häder et al., 2003, 2007).
For plants, UVB radiation causes DNA damage. Growth of the plants is disrupted, dry mass and foliage area are decreased, as well as photosynthesis may be inhibited. The photosynthesis disturbance is critical for plants. Changes of concurrent relationship in the plant realm are observed as UVB radiation increases. Plants can adapt to UVB by accumulation of absorbing pigments in leaves (Caldwell et al., 2003, 2007).
UVB impact on eyes, skin, and immune system of humans is also critical. Due to reflection, 12–25% of the UVB flux can reach the eyes leading to a wide range of eye diseases (e.g., pterygium and cataract). The negative impact on skin is manifested as erythema (solar burn). Photoelastosis – skin shrinkage – is gradually developed over a prolonged exposure to even low doses of UVB. Nonmelanoma skin cancer and melanoma are the more serious consequences of UVB exposure. Skin tumors are developed due to DNA damage. The mechanism of the immune suppression, induced by UVB irradiation, is not quite clear (De Gruijl et al., 2003; Norval et al., 2007).
The positive influence of UV on biota is also well known. Moderate doses of UVB favor the conversion of provitamin D into vitamin D3 playing the important role in the calcium–phosphorus exchange. It decreases the risk of osteomalacia and rickets (Holick, 1995).

Hydrogen Degassing of the Earth 321
10.3.2. Degassing Centers as Areas of Biological Anomalies An actual amounts of UVB reaching the Earth’s surface depend on combination of
several factors including TOC over the area, cloudiness, atmospheric transparency, albedo, altitude above sea level, and latitude. Cloudiness, transparency, and albedo are variable factors governing UV flux. A part of UVB may be absorbed by cloudiness in the troposphere. The importance of the cloudiness is comparable with atmospheric transparency, i.e., the effect of absorption and reflection (dispersion) of UV by aerosols and other air dust particles. The albedo factor is negligible for most soils, is <10% for water, but reaches 90% for snow. An area altitude and latitude are constant factors. The altitude above sea level is functionally connected with the atmospheric transparency and is probably comparable with it in terms of importance. From polar regions to the equator, the effective annual UV-dose increases by about 4% per latitude degree (Dahlback et al., 1989). All these factors are commonly used to estimate the global distribution of the UV flux in terms of UV Index (Repacholi, 2000) (Figure 10.6a).
It is easy to determine a region obtaining the maximal amount of UVB radiation on the Earth. Considering the latitude factor, it should be located on the equator. Concerning height above sea level, there are three potential regions: the Ecuadorian Andes, East African Highlands, and Sunda Islands (Figure 10.6a). However, the ozone layer is most actively depleted over the centers of endogenous degassing (Section 10.2.2). This fact allows one to do an unambiguous choice: the East African equatorial highlands located within the active rift system. All the signs of active hydrogen degassing, such as a lava lake in the crater of the Nyiragongo Volcano and springs with a 3He / 4He ratio ranging from 0.4 × 10⁻⁶ to 2 × 10⁻⁵ (Craig and Lupton, 1978, Craig and Rison, 1982), are present in this location.
Considering biological effects of UVB radiation including its mutagenicity (Section 10.3.1), it would be natural to expect existence of some biological anomalies in East Africa. Let us to describe them briefly.
10.3.2.1. East Africa
Paleontological, archeological, and biomolecular data show that the most probable original homeland of humanity is the area of the East African Rift (Matyushin, 1982; Bowcock et al., 1994; Lahr and Foley, 1998), a huge mountain fault stretching the Near East to the Southern Africa (Figure 10.1a) (Chorowicz, 2005). The most of findings the oldest human ancestors were made in East Africa (Matyushin, 1982; Groves, 1994). Indeed, the human tree, from Oligocene aegyptopithecus and Miocene proconsul to modern human as well as allied gorilla and chimpanzee, grew from the East African Rift. Especially abundant finding of the early hominids were typical for terrains around Lakes Turcana and Victoria. It is also important that, aside from the favorable environmental conditions, mutagens are necessary for the anthropogenesis.

Vladimir L. Syvorotkin 322
Figure 10.6. Global distribution of some bio- and geophysical parameters: (a) an example of UV index estimated on Mar. 21, 2003 (Long, 2003); (b) hearths of the highest diversity of cultivated plants (Vavilov, 1940): 1a – Indian, 1b – Indochinese, 1c – Southeast Asian Island, 2a – Chinese, 2b – Japanese, 3a – Caucasian, 3b – West Asian, 3c – Northwest Indian, 4a – Pyrenean, 4b – Apennine, 4c – Balkan, 4d – Syrian-Egyptian, 5a – Abyssinian, 5b – Mountain Arabian, 6a – Mountain South Mexican, 6b – Central American, 6c – West-Indian Island, 7a – Andean, 7b – Chilotan, and 7c – Bogotan hearths; (c) earthquake epicenters, 1963–1998 (Lowman and Montgomery, 1998; courtesy of NASA).

Hydrogen Degassing of the Earth 323
In addition to natural ionizing radiation of this region (Matyushin, 1974; Lenz, 1979) (Section 2.4.2.1), UVB could serve as a mutagenic factor since UV radiation effectively influences the genetic apparatus damaging DNA molecules (De Gruijl et al., 2003).
It should be noted that the occurrence of Homo habilis in Pliocene corresponds to a powerful planetary surge of volcanism. Its signs are numerous within the East African Rift. According to the author’s concept, this was a time of intense degassing and destruction of the ozone screen of the planet, especially over the degassing centers. The mutations influenced by UVB could have taken place in the late Pliocene in the Equatorial African highlands.
The black color of skin as well as sunburn is the protective reaction of an organism (on the adaptation level) to UVB irradiation (Chaplin, 2004). Within a cell, the pigment melanin is located over the nucleus, protecting the DNA from UV radiation. Generally, there is a planetary rule: the closer to the equator, the darker the skin. One can find dark-skinned population on New Guinea, Melanesia Islands, in Sri Lanka, South India, and Indonesia. However, the darkest-skinned indigenous population is typical for Africa (Chaplin, 2004). An explanation of this fact may be simple. Africa is the only continent with an active rift system. The intensive volcanism was typical for this area over the last millions years (Figure 3.2), i.e., it was synchronous to anthropogenesis. Africa obtained the maximal, in comparison with other equatorial regions of the planet, surplus UVB flux due to ozone depletion by ascending hydrogen flows accompanying basalt eruptions. The population of the continent had to adapt to this UVB amount by developing black skin.
In the eastern Botswana and northeastern Zimbabwe, members of the Wadoma and Talaunda tribes have a genetic defect of autosomal dominant ectrodactyly (Viljoen et al., 1985). Equatorial Africa is a place of origin of several subtypes of the human T-cell lymphotropic virus type I (Van Dooren et al., 2001) causing T-cell leukemia and some other severe diseases. There is a subtype of this virus originated from Melanesia (Gessain et al., 1991), which is also located near the equator in proximity to the centers of hydrogen–methane degassing, such as Cape York Peninsula, Australia, and the Coral Sea. Genetic studies testify that Equatorial Africa is the area of origin of human immunodeficiency virus (HIV) causing acquired immunodeficiency syndrome (Hutchinson, 2001). The center of most stricken by HIV areas is located near rift lakes. More than four million of sick people live in East and Central Africa (UNAIDS and WHO, 2008).
The author supposes that the highest UVB flux on the Earth is probably one of the main reasons for mutations in East Africa. Other reasons are discussed below (Section 10.3.2.3).
10.3.2.2. Galapagos Islands
The Galapagos Islands are situated on the equator 1,000 km westward Ecuador’s coast. The islands are active shield volcanoes producing mostly tholeitic magma. The tectonic position of the Galapagos hot spot is controlled by an intersection of the East Pacific Rise with the Galapagos Rift. Eastward from the Galapagos Islands, there is an active zone of submarine discharge of deep fluids, which carry a huge amount of Mn, Fe, Cu, and other metals (Lupton, 1983; Emelyanov, 2005, p. 221). In other words, the Galapagos Islands, like East Africa, are situated on the equator, in the zone of active deep degassing over which the ozone layer is often depleted. That is why these islands also obtain surplus doses of the UV radiation (Figure 10.6a). Thus, one can expect the manifestation of the biological anomalies there.
Vladimir L. Syvorotkin 324
In this case, the search of anomalies is quite simplified by examining the classical work by Darwin (1845). He had discovered the diversity of the beaks among the local finches. Reflecting on the causes of this diversity within one small group of birds, interconnected by strong relative ties, he had concluded that ‘seeing this gradation and diversity of structure in one small, intimately related group of birds, one might really fancy that from an original paucity of birds in this archipelago, one species had been taken and modified for different ends’ (Darwin, 1845, p. 380).
Eibl-Eibesfeldt (1966) had noted that some Galapagos sea birds have black skin under snow-white feathering, which probably defends them from intense sunrays. He also noted that there are no species similar to Darwin’s finches on many other oceanic islands. Only on two archipelagos – Tristan da Cunha and Hawaii (which are also hot spots) – terrestrial birds have numerous special forms adapted to the environment, similar to that of the Galapagos finches.
Thus, in terms of biodiversity, an analogue of Galapagos Islands are the Hawaiian Islands, a center of degassing and the location of one of the three ozone minimums of the Northern hemisphere (Figure 10.3a). Recently, a number of species of drosophila, very sensitive to mutagenic impacts, exceeded 600. The high level of endemics in flora and fauna allowed Mlot (1995) to call Hawaii “a biological hot spot”. Tristan da Cunha Islands are situated in the southern part of the Mid-Atlantic Ridge, in the zone of its intersection with two large actively degassing diagonal tectonic features over which the ozone layer is often depleted. Modern volcanism is manifested within the islands (Le Roex et al., 1990).
Introduced to such islands, continental biota is affected by the strong UVB radiation. This leads to numerous mutations resulting in the origin of the various beaks among the descendants of one bird species. The forms of beaks may be diverse, but those individuals who have adapted survive with their “mutilated” beak to obtain food.
10.3.2.3. Geological Factors of Speciation
Zonation of the globe according to the UVB level was circumstantially performed by Vavilov (1926, 1992). He discovered seven centers (including twenty secondary hearths) of the origin of cultivated plants (Vavilov, 1940) (Figure 10.6b), or more precisely, centers of their greatest diversity (Harlan, 1971). Vavilov (1926, 1992) explained this phenomenon by the fact that most of the hearths are located in mountain regions; topographic barriers could isolate some plant populations and, hence, develop conditions for speciation. However, these centers also correlate with areas receiving a surplus of UVB (Figure 10.6a). As a rule, these are mountain regions, situated at low latitudes and near rift zones, i.e., the centers of deep degassing. Mutagenicity of the UVB radiation has possibly played one of the key roles of plant speciation.
Kopper and Papamarinopoulos (1978) proposed that the mutagenic potential of the UVB radiation could drastically be increased during geomagnetic reversals and excursions, because the ozone shield may be partially destroyed in such periods (Reid et al, 1976) (Section 10.2.1). These authors pointed to the fact that ‘the Blake excursion, 114,000 B.P. to 108,000 B.P., coincides with the disappearance of Lower Paleolithic tools and the appearance of Middle Paleolithic (Mousterian) tools and Neandertal Man. The Mungo excursion, 37,000 B.P. and/or 32,000 B.P., synchronize with the Middle/Upper Paleolithic boundary and the replacement of Neanderthals by Modern Man’. See also Section 2.4.2.2 for the Kuznetsovs’ hypothesis on mutagenic effects probably associated with geomagnetic reversals and excursions (Kuznetsov and Kuznetsova, 2004).

Hydrogen Degassing of the Earth 325
Neruchev (2007) found that some uranium deposits are located within the Vavilov centers. He proposed that the highest diversity of cultivated plants could be triggered by a mutagenic effect of an enhanced natural background radiation in these terrains. Although ionizing radiation can cause mutations, uranium deposits occupy relatively small areas when compared to the vast territories of the Vavilov centers. Therefore, although uranium deposits could trigger mutations in some localities, there are bound to be mutagenic agents permanently affecting larger areas. The UVB radiation can play this role.
Meanwhile, Trifonov and Karakhanian (2004a) noted that most of the Vavilov centers are situated within seismically active regions (Figure 10.6c). Obviously, an earthquake is a stress factor for biota. Mutagenicity of chronic stress is well known (Belyaev and Borodin, 1982; Badyaev, 2005). Therefore, seismically active regions are considered as areas favourable for speciation (Vorontsov and Lyapunova, 1984; Trifonov and Karakhanian, 2004a). Indeed, most of the endemic species in Armenia are distributed along or near active faults (Trifonov and Karakhanian, 2004a). Compared to aseismic regions, high degrees of chromosomal variability (karyotypic diversification) are typical for rodent populations (e.g., Ellobius talpinus, Mus musculus and Microspalax leucodon) living in seismically active regions (Vorontsov and Lyapunova, 1984). A high degree of chromosomal variability is a prerequisite for speciation.
Another feature of seismically active regions is an abundance of active faults. It is known that faults are channels for fluid migration that leads to the formation of geochemical anomalies (Kasimov et al., 1978; Trifonov and Karakhanian, 2004a). Radon emanation is also typical for active faults zones (Trifonov and Karakhanian, 2004a; King et al., 2006). Its mutagenicity is well known (UNSCEAR, 2000b) (Section 3.3.10). Lenz (1979) proposed that radon, released through active faults prior to earthquakes and dissolved in groundwater, could act as a mutagenic agent for certain hominid populations and some other species (Section 2.4.2.1). Radon release may be provoked by an increase in degassing of lighter gases: heavy radon needs a gas-carrier. An increased concentration of near-ground ozone may be caused by the ionizing radiation of radon (Samokhvalov and Malyshkov, 2002). Ozone mutagenicity is also known (L’Hérault and Chung, 1984; Jorge et al., 2002; Ito et al., 2005). It is known that combined effects of radiation and other mutagenic agents may be larger (synergistic) than a simple sum of the individual effects of each agent (UNSCEAR, 2000a). Therefore, a combined exposure of biota to near-ground ozone and radon probably can take place along active faults leading to an increased number of mutations and hence biodiversity. Relationships between active faults and intraspecific variability in seismically active region are discussed in Chapter 5.
Thus, there are, at least, eight geological driving forces of speciation, probably interacting synergistically:
• Topographic barriers formed by tectonic movements (Mayr, 1963; King and Bailey,
2006; Heads, 2008); • Millennial-scale climatic fluctuations (Hewitt, 2000) associated with the precession
of the geomagnetic axis around the Earth’s rotational axis, which is probably caused by the difference in the rotational velocity of the liquid outer core and mantle (Trifonov and Karakhanian, 2004b) (Section 9.3.6);
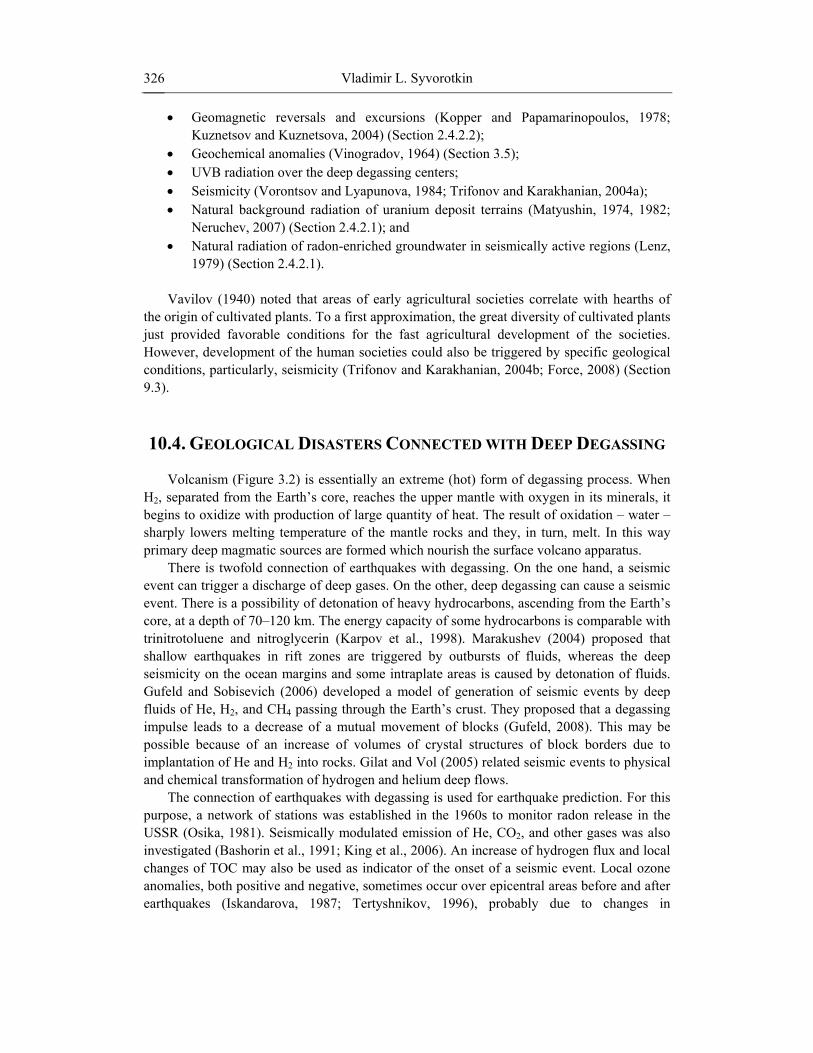
Vladimir L. Syvorotkin 326
• Geomagnetic reversals and excursions (Kopper and Papamarinopoulos, 1978; Kuznetsov and Kuznetsova, 2004) (Section 2.4.2.2);
• Geochemical anomalies (Vinogradov, 1964) (Section 3.5); • UVB radiation over the deep degassing centers; • Seismicity (Vorontsov and Lyapunova, 1984; Trifonov and Karakhanian, 2004a); • Natural background radiation of uranium deposit terrains (Matyushin, 1974, 1982;
Neruchev, 2007) (Section 2.4.2.1); and • Natural radiation of radon-enriched groundwater in seismically active regions (Lenz,
1979) (Section 2.4.2.1). Vavilov (1940) noted that areas of early agricultural societies correlate with hearths of
the origin of cultivated plants. To a first approximation, the great diversity of cultivated plants just provided favorable conditions for the fast agricultural development of the societies. However, development of the human societies could also be triggered by specific geological conditions, particularly, seismicity (Trifonov and Karakhanian, 2004b; Force, 2008) (Section 9.3).
10.4. GEOLOGICAL DISASTERS CONNECTED WITH DEEP DEGASSING Volcanism (Figure 3.2) is essentially an extreme (hot) form of degassing process. When
H2, separated from the Earth’s core, reaches the upper mantle with oxygen in its minerals, it begins to oxidize with production of large quantity of heat. The result of oxidation – water – sharply lowers melting temperature of the mantle rocks and they, in turn, melt. In this way primary deep magmatic sources are formed which nourish the surface volcano apparatus.
There is twofold connection of earthquakes with degassing. On the one hand, a seismic event can trigger a discharge of deep gases. On the other, deep degassing can cause a seismic event. There is a possibility of detonation of heavy hydrocarbons, ascending from the Earth’s core, at a depth of 70–120 km. The energy capacity of some hydrocarbons is comparable with trinitrotoluene and nitroglycerin (Karpov et al., 1998). Marakushev (2004) proposed that shallow earthquakes in rift zones are triggered by outbursts of fluids, whereas the deep seismicity on the ocean margins and some intraplate areas is caused by detonation of fluids. Gufeld and Sobisevich (2006) developed a model of generation of seismic events by deep fluids of He, H2, and CH4 passing through the Earth’s crust. They proposed that a degassing impulse leads to a decrease of a mutual movement of blocks (Gufeld, 2008). This may be possible because of an increase of volumes of crystal structures of block borders due to implantation of He and H2 into rocks. Gilat and Vol (2005) related seismic events to physical and chemical transformation of hydrogen and helium deep flows.
The connection of earthquakes with degassing is used for earthquake prediction. For this purpose, a network of stations was established in the 1960s to monitor radon release in the USSR (Osika, 1981). Seismically modulated emission of He, CO2, and other gases was also investigated (Bashorin et al., 1991; King et al., 2006). An increase of hydrogen flux and local changes of TOC may also be used as indicator of the onset of a seismic event. Local ozone anomalies, both positive and negative, sometimes occur over epicentral areas before and after earthquakes (Iskandarova, 1987; Tertyshnikov, 1996), probably due to changes in

Hydrogen Degassing of the Earth 327
concentrations of near-ground ozone (Ivlev et al., 1998). The direction of TOC change over an epicentral area – its increase or decrease – is probably associated with gas composition released through local faults. A negative anomaly can be developed if H2 and CH4 dominate in the gas outburst, whereas a positive one may occur if radon dominates (Section 10.3.2.3). However, only negative anomalies may be developed over oceanic rift zones due to degassing, as it is doubtful that abyssal radon is able to reach the water surface.
A number of explosions in coalmines sharply increased during two last decades. Russia’s worst mining disaster occurred on March 19, 2007 in the coalmine Ulyanovskaya, Kuzbass (Wikipedia contributors, 2007). 110 persons were killed by the methane blast. This was the newest mine in the region: it was opened in 2002 and equipped with a modern signal-blocked anti-gas system. In the late 2007, there were three gas explosions in the Zasyadko coal mine, Donbass, Ukraine (Wikipedia contributors, 2008). 106 persons were killed.
It is a common view that gas outbursts originate from small hollows among coal layers and the gas has a metamorphic nature. Temporal regularities for such outbursts were established by Khitarov and Voitov (1982). They found the dependence of the deep gas flow intensity in the Khibiny Mountains on the Moon’s phases and the same regularity for the outburst and gas discharges in Donbass mines from 1947 to 1963. These accidents occurred 15 times more often on days close to full and new Moon. The author explains this phenomenon by the gravitational effect of the Moon on the Earth’s liquid outer core, the major planetary stores of H2. Hydrogen–air mixtures can easily be ignited. Flammability and explosive limits of this mixture are 4%–75% and 18.3%–59% by volume, respectively (Hritz, 2006).
Abnormal hydrogen flows are observed in Donbass and Kuzbass regions (Shcherbakov and Kozlova, 1986). H2 is not monitored in mines, although this gas, being lighter, can penetrate into the mine ahead of the methane part of the discharge. The author supposes that the hydrogen and methane mixture from deep within the Earth explodes in the mines rather than the coal methane.
10.5. OZONE LAYER AND CLIMATIC ANOMALIES There are observations of gradual increase of frequency of short-term regional extreme
meteorological events around the world, such as abnormally cold or warm periods in winter and abnormally warm or cold periods in summer (Feng and Epstein, 1996; Plummer et al., 1999; Yan et al., 2002; Bulygina et al., 2007). Extreme weather events are considered as a factor influencing both physical and mental health (Fritze et al., 2008). These events are commonly credited to global warming processes.
Parameters of the ozonosphere are not usually considered to explain weather anomalies. However, the ozone layer regulates heat parameters of the lower atmosphere and stratosphere, which is heated by tens of degrees due to solar radiation absorbed and reradiated by ozone molecules. With ozone depletion, the surplus heat, previously kept by O3 in the stratosphere, “falls” into the troposphere heating near-ground air and water in oceans (MacCracken, 1976; Alexandrov et al., 1982; Kondratovich et al., 1988; Isaev, 2001). Air heating naturally decreases air weight and hence the atmospheric pressure. Suddenly the affected area of lower

Vladimir L. Syvorotkin 328
pressure below a negative ozone anomaly often becomes a regulator for the movement of anticyclones, if they are in the vicinity.
Considering the effect of cooling stratosphere over regions, where the abnormal heating of near-ground air takes place, the message about “global warming” seems to be doubtful. It is more correct to talk about a sharply increased contrast of the weather. Let us discuss and explain this phenomenon.
10.5.1. Abnormal Weather in Europe Recently, abnormally warm weather periods in falls and winters have systematically
happened in Europe (Luterbacher et al., 2007). Usually, heat anomalies temporally and spatially coincide with negative ozone anomalies. For example, the temperature norm was exceeded by several degrees Celsius in November 2005. A negative ozone anomaly occurred over northwestern Russia on October 27–29, 2005. It started to grow and finally covered an area from England to Western Siberia and from Scandinavia to Spain and the Black Sea on November 1, 2005 (Figure 10.2e). The decrease of TOC at the center of this huge anomaly reached 50–60% compared with adjacent areas beyond the anomaly. Geologically, the location of its center is quite regular, since the Gulf of Finland and the southwestern part of the White Sea are rift structures characterized by deep degassing and high seismicity (Garbar, 1996).
Figure 10.2f represents the global TOC observed one year before. The picture is surprisingly similar to that shown in Figure 10.2e. It should be noted that in Europe the center of the negative ozone anomaly is situated over the Oslo Graben, a rift structure. One can see that the most powerful anomalies develop simultaneously in Antarctica and Europe (Figure 10.2f). This topples the concept of ozone layer depletion by man-made chlorine- and bromine-containing volatile gases (Solomon, 1999; Staehelin et al., 2001) adapted to explain negative ozone anomalies over Antarctica.
There is an intensive deep hydrogen degassing in Iceland (Kononov and Polyak, 1974) from the rift of the Mid-Atlantic Ridge. This leads to the ozone depletion (Figure 10.3a). Heating of the ocean water and air through negative ozone anomalies results in (a) the fall of the atmospheric pressure in the North Atlantic, and (b) subsequent shift of the Azores anticyclone northward. This anticyclone brings masses of warm air into the North Atlantic, Arctic Ocean, and Western Europe. This can explain the development of the North Atlantic Oscillation, a phenomenon of sharp difference of atmospheric pressure (Hurrell, 2003). The author supposes that such a “pumping” of the warm air causes the temperature decrease in regions of the Europe, Africa, and Asia located between 40°–30° N that is observed synchronously with European warm anomalies.
The ozone mechanism has two more factors leading to a decrease in the temperature in the troposphere: (a) departure of the Earth’s own radiation to the space trough the ozone window of transparency of 957 nm, especially noticeable at night; and (b) increasing albedo resulting from stratospheric clouds formed from water, which arose from the reaction of the stratospheric O3 and deep H2. Such a combination of heating and cooling effects in the ozone mechanism can explain global temperature contrasts called “global warming”. There are common examples of this phenomenon, such as ice melting in Antarctica, Greenland, Mount Kilimanjaro, Arctic Ocean, and so on. These observations are correct, but all the abnormally

Hydrogen Degassing of the Earth 329
heated areas are situated in zones of strong negative ozone anomalies. Once again, the contrast of energetic flows sharply increased on the planet. This phenomenon cannot be called “global warming”.
10.5.2. Regional Weather Disasters Conditions for origin of tropical cyclones are well studied. In the world ocean, there are
seven areas of their formation. All of them are located nearby the equator. Here, the water repeatedly gets warmed more than critical norm (up to 26.8° С) to depths of several meters within a large area (4–8 × 10⁶ km2) (Khromov and Petrosyanz, 1994).
Negative ozone anomalies may influence the origin of tropical cyclones, since additional heat coming through the depleted ozone layer causes heating of the ocean water. Indeed, the centers of hurricane series origin coincide with intersections of the large tectonic structures, such as rift valleys and fracture zones, which constitute degassing centers (Syvorotkin, 1996b, 2002). Hurricanes Emmy and Frances exemplify this relation (Figure 10.7a). The place of their origin is located over the axis of the Mid-Atlantic Ridge, near its intersection with the Cape Verde fracture zone, which is well-known geochemical anomaly (Udintsev, 1996).
Hurricane trajectories generally coincide with azimuths of the main faults (Baybakov and Martynov, 1976). There are critical/turn points in a trajectory of hurricane movement. Nearing such a point, a hurricane loses velocity, stops, sometimes stationary for some days, and then continues in new direction. Choice of further path may be determined by degassing faults, along and over which the ozone depletion and related water and air heating occur resulting in lowering of the atmospheric pressure. That is why this direction may be preferable for a hurricane. Uranova (1983) showed a connection between trajectories of cyclones and negative ozone anomalies developed over the Rocky Mountains. In 1971–1975, 480 cyclones and the same number of ozone minimums have originated there. An ozone anomaly has usually formed 2–3 days before a cyclone. The trajectories of 184 cyclones, lasting more than two days, generally followed trajectories of preceded ozone minimums (Figure 10.7b). Recent studies favor the view that TOC influences the formation and movement of hurricanes (Zou and Wu, 2005; Wu and Zou, 2008).
The connection of the ozone layer and forest fires is double-sided. On the one hand, outbursts of aerosols in atmosphere over big forest fires are comparable with volcano activity that may cause the destruction of the ozone layer. On the other, the forest fire occurrence is closely connected with climatic factors. Daily and monthly indicators of fire danger are usually calculated using data on the daily air temperature, wind velocity, relative humidity, and precipitation (Stocks and Lynham, 1996). According to the author’s model, these factors strongly depend on the concentration of the stratospheric O3. Therefore, it is not surprising that huge forest fires in California (Minnich, 1983) occur in proximity to the Gulf of California, a rift structure, and the Imperial Valley, continental geothermal area having an elevated 3He / 4He ratio (Lupton, 1983). Negative ozone anomalies are frequently observed in this region (Figure 10.2c).
The abnormal heat, coming through the ozone hole, may cause melting of permafrost leading to technogenic damages (e.g., collapses of building and highways). As some large gas hydrate fields are located in permafrost areas (e.g., Eastern Siberia), so melting of these fields
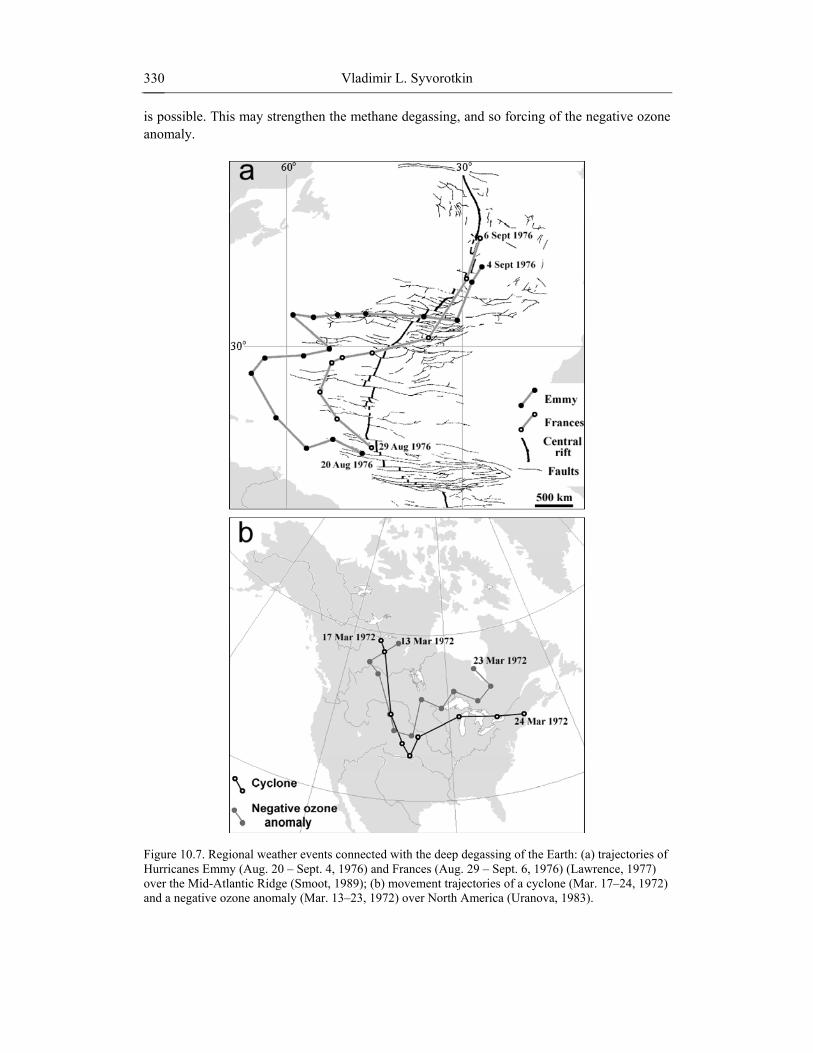
Vladimir L. Syvorotkin 330
is possible. This may strengthen the methane degassing, and so forcing of the negative ozone anomaly.
Figure 10.7. Regional weather events connected with the deep degassing of the Earth: (a) trajectories of Hurricanes Emmy (Aug. 20 – Sept. 4, 1976) and Frances (Aug. 29 – Sept. 6, 1976) (Lawrence, 1977) over the Mid-Atlantic Ridge (Smoot, 1989); (b) movement trajectories of a cyclone (Mar. 17–24, 1972) and a negative ozone anomaly (Mar. 13–23, 1972) over North America (Uranova, 1983).

Hydrogen Degassing of the Earth 331
A detailed discussion of relationships between ozone layer depletion and weather disasters can be found elsewhere (Syvorotkin, 2000, 2001, 2002).
10.5.3. El Niño El Niño (Southern Oscillation) is a complex phenomenon of interdependent changes in
the temperature, pressure, and chemical characteristics of the ocean and atmosphere originating offshore Ecuador, Peru, and Chile (Philander, 1990). The degassing model can explain nature and mechanism of El Niño.
10.5.3.1. Normality
In order to understand the abnormal character of El Niño, let us consider the usual, standard climatic situation off the Pacific Coast of South America. It is determined by the Humboldt (Peruvian) Current driving the cold water of Antarctica along the western shores of South America to the Galapagos Islands on the equator (Figure 10.3b). The trade winds, blowing from the Atlantic Ocean, overcome the high barrier of the Andes and bring showers onto their eastern slopes. Thus, South America’s western coast is a barren stone desert where rainfall rarely occurs; there could be no precipitation at all in some years. The trade winds breaking through to South America’s western coast, when they are damp enough, give rise to surface currents that, moving westward, cause a piling up of water off shore. The surge is relieved by the Cromwell Current (Pacific Equatorial Undercurrent) flowing against the trade winds. This current, 400 kilometers wide and 50 to 300 meters deep, drives huge amounts of water back to the east.
The coastal waters off Peru and Chile are exceedingly productive in sea fauna. Here, within a small space making up a millesimal fraction of the World Ocean, the fish catch (mostly anchovy) is above 20% of the world total. The overabundance of fish attracts vast flocks of piscivorous birds, such as cormorants, pelicans, and gannets. They leave mountains of guano 50–100 m thick, which is rich in nitrogen and phosphorus.
10.5.3.2. Disaster
First, the water temperature rises by several degrees that affect the fish population: the fish either leave the waters or die en masse. Consequently, the seabirds disappear too. Next, the atmospheric pressure in the East Pacific falls, clouds appear in the sky overhead, and the trade winds die down. The air streams change direction over the equatorial zone of the ocean. Now they move from west to east, taking the moisture of the Pacific region and precipitating it on the Peruvian and Chilean coasts.
The scenario takes a particular disastrous turn at the Andean foothills obstructing the passage of western winds and causing the clouds to precipitate. Thus, the narrow coastal line of deserts on the South American western coast is hit by high-floods, mud and rock torrents, and inundations. Simultaneously, the West Pacific Region suffers from terrific drought and its aftermath, such as forest fires in Indonesia and New Guinea, and crop failures in Australia. To cap it all, harmful algal bloom, or “red tide”, turn up all along the shoreline from Chile up to California.

Vladimir L. Syvorotkin 332
The final phase of El Niño, called La Niña, is a dramatic cooling of water in the East Pacific with the temperature dropping by several degrees Celsius. This cold spell persists for a long time.
10.5.3.3. Degassing Scenario
El Niño begins with the warming of the surface waters in the East Pacific, as determined by sea surface temperature measurements, which are subsequently used in model predictions. The measurements are made using buoys that measure ocean temperature and relay these data to research centers via satellites. It thus became possible to forecast the worst bout of El Niño in 1997–1998. However, one cannot tell for sure what causes the ocean water warming. Oceanographers explain it by the change of the wind, whereas meteorologists claim water warming as the cause of the change of the wind (Philander, 1990).
Let us discuss degassing scenario of El Niño (Figure 10.8). The following fact is quite obvious: El Niño takes body and form over the equatorial part of the East Pacific Rise, one of the most active areas of the world rift system (Section 10.2.2.3; Figure 10.3b). Escaping from the rift valley of the East Pacific Rise and reaching the water surface, H2 reacts with oxygen. This reaction gives off heat raising the water temperature. Rather favorable conditions are obtained for oxidizing reactions, as the surface water layer is enriched with oxygen in the course of its wave interaction with the atmosphere.
Can significant amounts of H2 rise to the ocean surface? Measurements show that it can: the concentration of this gas was found to be twice as high over the Gulf of California (Khalil and Rasmussen, 1990). In our case, hydrogen and methane sources have a yearly discharge of 1.6 × 10⁸ m3 on the ocean floor (Welham and Graig, 1979).
Rising from the ocean floor into the stratosphere, H2 forms an ozone hole that allows increased UV and IR solar radiation to penetrate to the surface (Figure 10.8). Failing on the ocean surface, this radiation stimulates the heating of the water, in addition to that caused by sea surface hydrogen oxidation. The additional solar energy appears to be most important for the process. With the heating of the surface water layer, the solubility of carbon dioxide in it diminishes and this gas is released into the atmosphere. For example, an excess of 6 Gt of CO2 escaped into the atmosphere when El Niño went on a rampage in 1982 and 1983 (Monin and Shyshkov, 1991). Furthermore, the process of water evaporation intensifies and clouds appear over the East Pacific. Both water vapor and carbon dioxide are greenhouse gases. These absorb heat radiation and become an excellent accumulator of the extra energy coming from the ozone hole.
Little by little, this process gains in strength and scope. The abnormal heating of the air sends the atmospheric pressure down to give rise to a cyclonic region over the East Pacific. The cyclones upset the normal pattern of the trade winds and the atmospheric dynamics in the area. As a result, the air is “pumped in” from the West Pacific. Since the trade winds subside, the water surge recedes from the Peruvian and Chilean shores, and the Cromwell Current is no longer effective. The significant warming of water produces typhoons, which otherwise are quite rare because of the cooling effect of the Humboldt Current. This area saw ten typhoons from 1980 to 1989, with seven originating in 1982 and 1983, a period when El Niño broke loose.

Hydrogen Degassing of the Earth 333
Figure 10.8. Schematic diagram illustrating the degassing scenario of El Niño (Syvorotkin, 2002). Hydrogen flows (wavy lines) rise from the Earth’s interior via a rift zone. Reaching the stratosphere, H2 depletes the ozone layer, while its chemical reactions yielding water that forms polar stratospheric clouds under the ozone layer. IR and UV solar radiation pouring through the ozone hole heats up the ocean surface. Heat radiation is absorbed by H2O and CO2 and warms up the near-ground air. The atmospheric pressure drops and cyclones are spawned over the degassing zone.

Vladimir L. Syvorotkin 334
It would be natural to explain La Niña by the simultaneous destruction of the ozone layer over both the equator and Antarctica. It causes both the heating of the ocean water (El Niño) and the melting of the Antarctic ice. The huge mass of cold water starts flowing northward. The cold water causes a sharp increase in the temperature gradient between the equatorial and the southern regions of the Pacific. The cold Humboldt Current is thus intensified and it cools the equatorial waters after the degassing has slackened and the ozone layer is restored.
There are some facts supporting the degassing model of El Niño. The years of its violent outbreaks were marked by sharp intensification of seismic activity of the East Pacific Rise (Walker, 1995). It is common knowledge that seismic events are often accompanied by the enhanced degassing of plutonic matter. The plutonic gases – H2, CH3, He, H2S, and NH3 – are marked by different solubility: 0.0181, 0.0331, 0.0138, 2.6, and 700 mL per 1 mL of fresh water, respectively, at a temperature of 20° C and a pressure of 0.1 MPa (Childs, 1958). An increase of water salinity leads to a decrease of gas solubility in water (Horne, 1969). The gases are separated in the ocean water due to their starkly different solubility: H2, CH3, and He find their way to the atmosphere through the water, whereas H2S and NH3 saturate the water over the degassing zones.
In fact, this makes ocean waters swirl with gas. Ship hulls are covered with black spots – a phenomenon called El Pintor (Idyll, 1973). The air over large expanses is filled with the foul odor of H2S. The Walvis Bay in South Africa, famous for abnormal biological productivity, also witnesses periodic ecological crises following the same scenario as those off South America. Gas discharges cause massive death of fish and red tides, and the stink of H2S is felt even as far as 40 kilometers inland (Copenhagen, 1953). Such intense gas emanation is usually explained by the decomposition of organic matter on the ocean floor. Perhaps this H2S comes from the Earth’s interior. This would be more logical, for the gas is released over the rift zone only including dry land as the rift extends inland.
Degassing from the Earth’s interior may simultaneously be intensified in many parts of the world resulting in the destruction of the ozonosphere and appearance of climatic anomalies. For instance, the water warming before El Niño also occurs in oceans other than the Pacific (Anonymous, 1994).
Plutonic degassing can be triggered by cosmogenic factors, such as the gravitational effect of the Sun and Moon on the Earth’s liquid outer core containing the bulk of the planetary pool of H2. Probably, the Earth’s nutation and precession may also influence the plutonic degassing. The cumulative action of these factors, coupled with the effect of processes in the Earth’s interior (e.g., crystallization of the core), may stimulate the planetary degassing causing phenomena like El Niño.
10.5.3.4. Biological Productivity
Why is biological productivity so high off the western coast of South America? It is as high as in feed-rich fish-breeding ponds of Asia and 50,000 times as high as in other parts of the Pacific (Idyll, 1973). This phenomenon is usually explained by up welling or the ebb of warm water from shore, which causes the rise of nitrogen- and phosphorus-rich cold waters from ocean depths. Nitrogen and phosphorus are nutrient components. However, El Niño arrests upwelling because of the change of wind, and thus stops the inflow of nutrient water. Therefore, the fish and seabirds starve or migrate elsewhere in search of food. This looks like perpetual motion: profuse organic life in the surface water is made possible by the abundant nutrient stuff coming from beneath and, in turn, the surfeit of this stuff beneath is made

Hydrogen Degassing of the Earth 335
possible by profuse organic life above, as the dead organic matter is sedimented on the ocean floor.
What is primary and secondary in this circulation? What makes the circulation tick for thousands and thousands of years, judging by the buildup of guano? The very mechanism of wind upwelling is not clear either. The water rise is usually determined by measuring water temperature on different profiles perpendicular to the shoreline. The isotherms obtained from these data show equally low temperatures off shore and deep underneath leading to a conclusion about the rising cold waters. However, this method is hardly correct because the Humboldt Current is responsible for the low temperature off shore. There is another problem: the above profiles are across the shoreline, whereas the prevalent wind blow along it.
The author does not intend to refute the wind upwelling concept based on an actual physical phenomenon. However, all these problems crop up if one comes to deal with this particular zone of the ocean. The author supposes that degassing of plutonic matter causes the abnormal biological productivity of the ocean off the western shores of South America. In fact, the coastal waters off Peru and Chile do not show the same productivity along the entire shore, as it should have been in the case of climatic upwelling. There are two spots (Figure 10.3b). Both of them are controlled by tectonic factors. The first spot lies above a deep rift extending from the ocean into the continent southward of and parallel to the Mendana Rift (6–8° S, 79–81° W). The second, smaller spot is located a bit northward from the Naska Ridge (13–14° S, 76–77° W). These oblique geological structures, extending from the East Pacific Rise toward South America (Figure 10.3b), are actually zones of degassing from which a huge amount of various chemical compounds escapes to the ocean floor. These substances are rich in such vital elements as nitrogen and phosphorus as well as micronutrients (Vinogradov, 1975; Kelley et al., 2002). The coastal waters off Peru and Ecuador have the lowest concentration of oxygen in-depth due to the predominant presence of reduced gases, such as CH4, H2S, and NH3. The thin surface layer (20–30 m) is excessively rich in oxygen owing to the low temperature of water brought in by the Humboldt Current from Antarctica. The surface layer of water above the rift zone, supplying the nutrient substances, offers unique conditions for vital activity.
Notice that there are several territories marked by a marine bioproductivity level close to that of waters of the western shores of South America. The first is the coastal water of the southwestern Africa (Idyll, 1973). The location of the most productive district, the Walvis Bay, is also controlled by tectonics: by a large fault zone extending from the Tristan da Cunha archipelago on the Mid-Atlantic Ridge northeastward to the Namibian coast. This fault zone is topographically manifested as the Walvis Ridge (Pastouret and Goslin, 1974). A cool, oxygen-rich current from Antarctica washes these shores. The second is the ocean off the Kuril Islands also distinguished for the colossal abundance of fish (Mikulin, 2003, p. 62). A cold current passes above the marginal Iona Rift there. The entire fishing fleet of Russia heads for the small water area of the South Kuril Straits during the Pacific saury fishing season. The third is the Kuril Lake at the southern Kamchatka Peninsula, one of the largest spawning grounds of blue back salmon (Oncorhynchus nerka). This lake is believed to be so productive because of the nutrients supplied to its waters by volcanic emanations, since the lake lies between two volcanoes, Ilyinsky and Kambalny (Syvorotkin, 1996a).
However, when the process of degassing intensifies off the South American coast, CH4 and H2 passes through the oxygen-rich surface layer of the water teeming with organic life. The oxygen disappears causing the death of every organism. Nonetheless, it is unlikely for the

Vladimir L. Syvorotkin 336
fauna to die only because of the decrease of bioproductivity of the ocean, as usually explained. This can be caused by the poisonous gases rising from the sea floor, since organism death occurs suddenly and all of the marine community is the victim. Only full-fledged birds leave the zone of famine. Notice that analogous biological catastrophes occur nearby other large fault and rift zones, such as the Walvis Bay, Persian Gulf, Caspian Sea, and Lake Baikal (Copenhagen, 1953; Ehrhardt and Seguin, 1978).
This decimation of biota does not stop the vital activity off the western shores of South America. Oxygen-free and saturated with toxic gases, these waters are a welcome medium for the proliferation of dinoflagellates, one-celled algae. This phenomenon is known as a harmful algal bloom, or red tide, because of the abundance of bright algae, usually red in color (Figueiras et al., 2006). Their color is a protective device against UV rays (Burzin, 1996) dating back to the Proterozoic Era when the Earth had no the ozone layer yet, and water bodies were the targets of intensive UV radiation.
The gas-geochemical model of abnormal bioproductivity and sudden deaths of biota in some areas of the ocean may help to explain other phenomena, such as huge accumulations of fossil fauna in the gray stones and shales in Solnhofen, Germany (Hallam, 1975) and phosphorites of the Moscow Region, Russia (Milanovskii, 1987, p. 209), as well as remains of fish bones filling the shells of cephalopods.
10.6. CONCLUSION A wide range of the natural disasters of recent years is caused by a common reason,
namely, the strengthening of deep hydrogen degassing. Planetary hydrogen stores are concentrated in the liquid outer core. The process of inner core crystallization leads to release of H2, which then accumulates at the boundary of the liquid outer core and mantle and diffuses to the Earth’s surface. The gravitational influence of the Moon and Sun modulates the strength of the Earth degassing. Ascending to the upper mantle layers, H2 reacts with oxygen of crystalline structures leading to its oxidation accompanied by production of heat and water. The water sharply reduces melting temperature of the mantle rocks and, in turn, they melt as well. In this way the primary magmatic sources are formed that leads to increasing volcanism on the planet. Heavy hydrocarbons, accompanying deep gas flows, are able to detonate under conditions found in the mantle. Thus, the strength of degassing stimulates the seismicity. Sea earthquakes cause tsunami. Within land areas, deep hydrogen–methane mixtures can quickly fill mineshafts, resulting in the explosions and fires. Ascending in the stratosphere, H2 destroys the ozone layer. Surplus fluxes of Sun energy in UV and IR ranges occur through ozone holes. The influx of the additional heat energy causes a number of the climatic anomalies known as global warming. Antarctic and Arctic ices melt, while the water gets warm at lower latitudes (El Niño phenomenon), and hurricanes are generated. In mountain areas, downfalls, mud streams, landslides, and floods increase. At midlatitudes, abnormally warm weather may be sharply changed by abnormal coldness.
The grandiose process of the Earth degassing influences the biosphere including humans. Outbursts of the reduced gases on the sea floor result in a massive decline of aerobic biota and active development of blue-green algae. Due to ozone layer depletion by hydrogen and methane outbursts, the UVB flux sharply increases. Microorganism mutations, induced by the

Hydrogen Degassing of the Earth 337
UV radiation, lead to new pathogenic forms, which cause new diseases. UVB-induced immunity suppression is favorable for the dissemination of infectious diseases. Geological disasters caused by the transit of the deep H2 through the lithosphere (i.e., earthquakes and volcanic eruptions) and strengthening of energetic flows due to negative ozone anomalies (e.g., hurricanes, rainfalls, and forest fires) influence both human health and development of society. These can lead to the social violence and even decline of nations (Section 9.3). That is why fundamental studies of the connection of the natural and social crises are quite reasonable.
ACKNOWLEDGMENTS The author is grateful to L.I. Ioganson (Schmidt Institute of Physics of the Earth, Russian
Academy of Sciences, Moscow, Russia) for her friendly linguistic assistance, as well as V.Y. Smorodin (Climate Change Institute, University of Maine, Orono, USA) and N. Laulainen (Pacific Northwest National Laboratory, Richland, USA) for their useful suggestions and linguistic editing.
REFERENCES
Adushkin, V.V., Kudryavtsev, V.P. and Khrustalev, A.B. (1997). About methane flows in atmosphere. In Physical problem of ecology (Physical ecology), Vol. 1: Abstracts of the All-Russian conference, Moscow, Russia, June 23–27, 1997 (pp. 6–7). Moscow, Russia (in Russian).
Alexandrov, E.L., Karol, I.L., Rakipova, L.R., Sedunov, Y.S. and Khrgian, A.K. (1982). Atmospheric ozone and climate change. Leningrad, USSR: Hydrometeoizdat (in Russian).
Anderson, D.L. and Dziewonski, A.M. (1984). Seismic tomography. Scientific American, 251, 60–68.
Anonymous (1994). Indian Ocean may have El Niño of its own. Eos, 75, 585–586. Baker, E.T., German, C.R. and Elderfield, H. (1995). Hydrothermal plumes over spreading-
center axes: global distributions and geological inferences. Geophysical Monograph, 91, 47–71.
Badyaev, A.V. (2005). Stress-induced variation in evolution: from behavioural plasticity to genetic assimilation. Proceedings of the Royal Society B: Biological Sciences, 272, 877–886.
Bashorin, V.N., Galinsky, A.М., Kuchevskaya, I.V., Salnikov, A.I. Sozinova, T.V. and Yanitsky, I.N. (1991). Methodical guide to monitor a helium content in fluids during geodynamical studies and revealing of earthquake precursors. Moscow, USSR: Fedorovsky All-Union Research Institute for Mineral Resources (in Russian).
Baybakov, S.N. and Martynov, А.I. (1976). From the satellite’s orbit to the typhoon eye. Moscow, USSR: Nauka (in Russian).
Behrendt, J.C., LeMasurier, W.E., Cooper, A.K., Tessensohn, F., Tréhu, A. and Damaske, D. (1991). Geophysical studies of the West Antarctic rift system. Tectonics, 10, 1257–1273.

Vladimir L. Syvorotkin 338
Bekoryukov, V.I. (Ed.) (1990). Atlas of the climatic maps of the total content and partional pressure of ozone. Moscow, USSR: Hydrometeoizdat (in Russian).
Belinskaya, A.Y. (2000). Effect of strong geomagnetic storms on total ozone variations above Eastern Siberia. Geomagnetism and Aeronomy, 40, 268–270.
Belyaev, D.K. and Borodin, P.M. (1982). The influence of stress on variation and its role in evolution. Biologisches Zentralblatt, 100, 705–714.
Bentley, C.R. (1973). Crustal structure of Antarctica. Tectonophysics, 20, 229–240. Borisenkov, E.P. and Pasetsky, V.M. (1988). The millennial chronicle of remarkable
phenomena of the nature. Moscow, USSR: Mysl (in Russian). Bowcock, A.M., Ruiz-Linares, A., Tomfohrde, J., Minch, E., Kidd, J.R. and Cavalli-Sforza,
L.L. (1994). High resolution of human evolutionary trees with polymorphic microsatellites. Nature, 368, 455–457.
Brinkley, D. (2006). The great deluge: Hurricane Katrina, New Orleans, and the Mississippi Gulf coast. New York, NY: Morrow.
Bryukhanov, V.N. and Mezhelovsky, N.V. (Eds.) (1987). Space geology of the USSR. Moscow, USSR: Nedra (in Russian).
Bulygina, O.N., Razuvaev, V.N., Korshunova, N.N. and Groisman, P.Y. (2007). Climate variations and changes in extreme climate events in Russia. Environmental Research Letters, 2, 045020, doi:10.1088/1748-9326/2/4/045020.
Burzin, M.B. (1996). Late Vendian (Neoproterozoic III) microbial and algal communities of the Russian Platform: models of facies-dependent distribution, evolution and reflection of basin development. Rivista italiana di Paleontologia e Stratigrafia, 102, 307–315.
Caldwell, M.M., Ballaré, C.L., Bornman, J.F., Flint, S.D., Björn, L.O., Teramura, A.H., Kulandaivelu, G. and Tevini, M. (2003). Terrestrial ecosystems, increased solar ultraviolet radiation and interactions with other climatic change factors. Photochemical and Photobiological Sciences, 2, 29–38.
Caldwell, M.M., Bornman, J.F., Ballaré, C.L., Flint, S.D. and Kulandaivelu, G. (2007). Terrestrial ecosystems, increased solar ultraviolet radiation, and interactions with other climate change factors. Photochemical and Photobiological Sciences, 6, 252–266.
Chaplin, G. (2004). Geographic distribution of environmental factors influencing human skin coloration. American Journal of Physical Anthropology, 125, 292–302.
Chapman, S. (1930). A theory of upper-atmospheric ozone. Memoirs of the Royal Meteorological Society, 3, 103–125.
Chernikov, A.A., Borisov, Y.A., Zvyagintsev, A.M., Kruchenitskii, G.M., Perov, S.P., Sidorenkov, N.S. and Stasyuk, O.V. (1998). Influence of the 1997/98 El Niño on the ozone layer of the Earth. Russian Meteorology and Hydrology, 23, 71–75.
Chernikov, A.A., Borisov, Y.A., Zvyagintsev, A.M., Kruchenitskii, G.M. and Perov, S.P. (2000). Variability of ozone layer in 1979–1999. Atmospheric and Oceanic Optics, 13, 89–95.
Childs, W.H.J. (1958). Physical constants (8th ed., rev.). London, UK: Methuen. Chorowicz, J. (2005). The East African rift system. Journal of African Earth Sciences, 43,
379–410. Copenhagen, W.J. (1953). The periodic mortality of fish in the Walvis region – a
phenomenon within the Benguela Current. South African Division of Fisheries, Investigational Report, 14, 8–35.

Hydrogen Degassing of the Earth 339
Craig, H. and Lupton, J.E. (1978). Helium isotope variations: evidence for mantle plumes at Yellowstone, Kilauea, and the Ethiopian Rift Valley. Eos, 59, 1194.
Craig, H. and Rison, W. (1982). Helium-3: Indian Ocean hotpots and the East African rift. Eos, 63, 1144.
Dahlback, A., Henriksen, T., Larsen, S.H.H. and Stamnes, K. (1989). Biological UV-doses and the effect of an ozone layer depletion. Photochemistry and Photobiology, 49, 621–625.
Darwin, C. (1845). Journal of researches into the natural history and geology of the countries visited during the voyage of H.M.S. Beagle round the world, under the Command of Capt. Fitz Roy, R.A. (2nd enl. and rev. ed.). London, UK: John Murray.
De Gruijl, F.R., Longstreth, J., Norval, M., Cullen, A.P., Slaper, H., Kripke, M.L., Takizawa, Y. and van der Leun, J.C. (2003). Health effects from stratospheric ozone depletion and interactions with climate change. Photochemical and Photobiological Sciences, 2, 16–28.
Ehrhardt, J.-P. and Seguin, G. (1978). Le plankton composition, écologie, pollution. Paris, France: Gauthier-Villares.
Eibl-Eibesfeldt, I. (1966). Galapagos. Die Arche Noah im Pazifik. Leipzig, Germany: Brockhaus.
Emelyanov, E.M. (2005). The barrier zones in the ocean. Berlin, Germany: Springer. Feng, X. and Epstein, S. (1996). Climatic trends from isotopic records of tree rings: the past
100–200 years. Climatic Change, 33, 551–562. Figueiras, F.G., Pitcher, G.C. and Estrada, M. (2006). Harmful algal bloom dynamics in
relation to physical processes. In E. Granéli and J.T. Turner (Eds.), Ecology of harmful algae (pp. 127–138). Berlin: Germany, Springer.
Force, E.R. (2008). Tectonic environments of ancient civilizations in the Eastern Hemisphere. Geoarchaeology, 23, 644–653.
Forsyth, D.W., Scheirer, D.S., Webb, S.C., Dorman, L.M., Orcutt, J.A., Harding, A.J., Blackman, D.K., Phipps Morgan, J., Detrick, R.S., Shen, Y., Wolfe, C.J., Canales, J.P., Toomey, D.R., Sheehan, A.F., Solomon, S.C. and Wilcock, W.S.D. (1998). Imaging the deep seismic structure beneath a mid-ocean ridge: the MELT experiment. Science, 280, 1215–1218.
Fritze, J.G, Blashki, G.A, Burke, S. and Wiseman, J. (2008). Hope, despair and transformation: climate change and the promotion of mental health and wellbeing. International Journal of Mental Health Systems, 2, 13, doi: 10.1186/1752-4458-2-13.
Garbar, D.I. (1996). The Tallinn–Petersburg (Finland) Rift – evidence of the modern riftogenesis within the Eurasian supercontinent. In Neotectonics and modern dynamics of continents and oceans: Abstracts of the 29th Tectonic meeting, Moscow, Russia, Jan. 30 – Feb. 1, 1996 (p. 30). Moscow, Russia (in Russian).
Gessain, A., Yanagihara, R., Franchini, G., Garruto, R.M., Jenkins, C.L., Ajdukiewicz, A.B., Gallo, R.C. and Gajdusek, D.C. (1991). Highly divergent molecular variants of human T-lymphotropic virus type I from isolated populations in Papua New Guinea and the Solomon Islands. Proceedings of the National Academy of Sciences, 88, 7694–7698.
Gilat, A. and Vol, A. (2005). Primordial hydrogen-helium degassing, an overlooked major energy source for internal terrestrial processes. HAIT Journal of Science and Engineering B, 2, 125–167.
Golubov, B.N., Zvyagintsev, A.M., Kruchenitskii, G.M. and Syvorotkin, V.L. (2002). About possible influence of interior degassing on the chemistry of the stratospheric processes in

Vladimir L. Syvorotkin 340
the winter condition of the city of Yakutsk. In A.N. Dmitrievsky and B.M. Valyaev (Eds.), Degassing of the Earth: Geodynamics, deep fluids, oil, and gas: Proceedings of the International conference in commemoration of P.N. Kropotkin, Moscow, Russia, May 20–24, 2002 (pp. 65–68). Moscow, Russia: Geos (in Russian).
Groves, C.P. (1994). The origin of modern humans. Interdisciplinary Science Reviews, 19, 23–34.
Gufeld, I.L. (2008). Physicochemical mechanics of large crustal earthquakes. Journal of Volcanology and Seismology, 2, 55–58.
Gufeld, I.L. and Sobisevich, A.D. (2006). Impulse regional degassing of the Earth stimulates the formation of focuses of strong earthquakes. In A.N. Dmitrievsky and B.M. Valyaev (Eds.), Earth degassing: Deep fluids, oil, gas, and parageneses in the system of combustible deposits: Abstracts of the International conference, Moscow, Russia, May 30 – June 1, 2006 (pp. 92–94). Moscow, Russia: Geos (in Russian).
Gushchenko, I.I. (1979). Explosions of the world volcanoes (catalogue). Moscow, USSR: Nauka (in Russian).
Häder, D.-P., Kumar, H.D., Smith, R.C. and Worrest, R.C. (2003). Aquatic ecosystems: effects of solar ultraviolet radiation and interactions with other climatic change factors. Photochemical and Photobiological Sciences, 2, 39–50.
Häder, D.-P., Kumar, H.D., Smith, R.C. and Worrest, R.C. (2007). Effects of solar UV radiation on aquatic ecosystems and interactions with climate change. Photochemical and Photobiological Sciences, 6, 267–285.
Hallam, A. (1975). Jurassic environments. Cambridge, UK: Cambridge University Press. Hampson, J. (1966). Chemiluminescent emission observed in the stratosphere and
mesosphere. In M. Nicolet (Ed.), Les problèmes météorologiques de la stratosphère et de la mésosphère:Colloque franco-belge, Paris, France, Mar. 8–12, 1965 (pp. 393–440). Paris, France: Presses Universitaires de France.
Harlan, J.R. (1971). Agricultural origins: centers and noncenters. Science, 174, 468–474. Heads, M. (2008). Biological disjunction along the West Caledonian fault, New Caledonia: a
synthesis of molecular phylogenetics and panbiogeography. Botanical Journal of the Linnean Society, 158, 470–488.
Heezen, B.C. (1969). The world rift system: an introduction to the symposium. Tectonophysics, 8, 269–279.
Hewitt, G.M. (2000). The genetic legacy of the Quaternary ice ages. Nature, 405, 907–913. Hofmann, D.J. and Oltmans, S.J. (1993). Anomalous Antarctic ozone during 1992: evidence
for Pinatubo volcanic aerosol effects. Journal of Geophysical Research, D98, 18555–18561.
Hofmann, D.J. and Solomon, S. (1989). Ozone destruction through heterogeneous chemistry following the eruption of El Chichón. Journal of Geophysical Research, D94, 5029–5041.
Holick, M.F. (1995). Environmental factors that influence the cutaneous production of vitamin D. American Journal of Clinical Nutrition, 61, 638S–645S.
Horne, R.A. (1969). Marine chemistry: The structure of water and the chemistry of the hydrosphere. New York, NY: Wiley.
Houtz, R. and Davey, F.J. (1973). Seismic profiler and sonobuoy measurements in Ross Sea, Antarctica. Journal of Geophysical Research, 78, 3448–3468.

Hydrogen Degassing of the Earth 341
Hritz, J. (2006). Hydrogen. In K. O’Connor (Ed.), Glenn safety manual (http://smad-ext.grc.nasa.gov/gso/manual/chapter_06.pdf). Cleveland, OH: NASA Glenn Research Center.
Hurrell, J.W. (2003). North Atlantic and Arctic oscillation. In J.R. Holton, J.A. Curry and J.A. Pyle (Eds.), Encyclopedia of atmospheric sciences (pp. 439–445). London, UK: Academic Press.
Hutchinson, J.F. (2001). The biology and evolution of HIV. Annual Review of Anthropology, 30, 85–108.
Idyll, C.P. (1973). The anchovy crisis. Scientific American, 228, 22–29. International Organization for Standardization (2005). Space environment (natural and
artificial) – Process for determining solar irradiances. The ISO draft standard ISO/DIS 21348. Geneva, Switzerland: International Organization for Standardization.
Isaev, A.A. (2001). Ecological climatology. Moscow, Russia: Nauchny Mir (in Russian). Isidorov, V.A. (1990). Organic chemistry of the Earth’s atmosphere. Berlin, Germany:
Springer. Iskandarova, V.M. (1987). On a possible relationship of the atmospheric ozone with the
earthquakes. Astronomicheskii Tsirkulyar, 1523, 7 (in Russian). Ito, K., Inoue, S., Hiraku, Y. and Kawanishi, S. (2005). Mechanism of site-specific DNA
damage induced by ozone. Mutation Research/Genetic Toxicology and Environmental Mutagenesis, 585, 60–70.
Ivlev, L.S., Davydova-Martinez, V.I., Vargas, O.A. and Martinez, A. (1998). Variability of aerosol, ozone, and sulfur dioxide characteristics in the surface layer on earthquake in West Mexico. Atmospheric and Oceanic Optics, 11, 428–431.
Johnston, H.S. (1975). Global ozone balance in the natural stratosphere. Reviews of Geophysics and Space Physics, 13, 637–649.
Jorge, S.A.C., Menck, C.F.M., Sies, H., Osborne, M.R., Phillips, D.H., Sarasin, A. and Stary, A. (2002). Mutagenic fingerprint of ozone in human cells. DNA Repair, 1, 369–378.
Kadygrova, T.V. (Ed.) (1992–1996). Bulletin on the ozone layer state, Nos. 1–9. Dolgoprudny, Russia: Central Observatory for Aerology (in Russian).
Karpov, I.K., Zubkov, V.S., Bychinskii, V.A. and Artimenko, M.V. (1998). Detonation of heavy hydrocarbons in mantle flows. Russian Geology and Geophysics, 39, 765–773.
Kasimov, N.S. and Klige, R.K. (Eds.) (2006). Recent global changes of the natural environment, 2 vols. Moscow, Russia: Nauchny Mir (in Russian, with English contents).
Kasimov, N.S., Kovin, M.I., Proskuryakov, Y.V. and Shmelkova, N.A. (1978). Geochemistry of the soils of fault zones (exemplified by Kazakhstan). Soviet Soil Science, 10, 397–406.
Kelley, D.S., Baross, J.A. and Delaney, J.R. (2002). Volcanoes, fluids, and life at mid-ocean ridge spreading centers. Annual Review of Earth and Planetary Sciences, 30, 385–491.
Khalil, M.A.K. and Rasmussen, R.A. (1990). Global increase of atmospheric molecular hydrogen. Nature, 347, 743–745.
Khitarov, N.I. and Voitov, G.I. (1982). Solid tides and Earth degassing. Priroda, No. 3, 6–12 (in Russian).
Khrgian, A.K. and Kuznetsov, G.I. (1996). Atmospheric ozone, its variations and geophysical relations. In L.N. Rykunov and E.P. Anisimova (Eds.), Interrelations in the system ‘lithosphere – hydrosphere – atmosphere’ (pp. 241–267). Moscow, Russia: Nedra (in Russian).

Vladimir L. Syvorotkin 342
Khromov, S.P. and Petrosyanz, M.A. (1994). Meteorology and climatology. Moscow, Russia: Moscow University Press (in Russian).
King, C.-Y., Zhang, W. and Zhang, Z. (2006). Earthquake-induced groundwater and gas changes. Pure and Applied Geophysics, 163, 633–645.
King, G. and Bailey, G. (2006). Tectonics and human evolution. Antiquity, 80, 265–286. Kokin, A.V. and Kokin, A.A. (2008). The modern ecological myths and utopias. Saint
Petersburg, Russia (in Russian). Kondratovich, V.P., Osechkin, V.V. and Gnilovskoy, E.V. (1988). On the role of
paramagnetic properties of the atmospheric molecular oxygen in the formation of climatic maximum of the total ozone content. In K.V. Kondratovich, Atmospheric ozone (pp. 42–51). Leningrad, USSR: Leningrad State Meteorological Institute (in Russian).
Kononov, V.I. and Polyak, B.G. (1974). Hydrochemical zoning of Iceland as a reflection of its geologic structure. Doklady, Earth Science Sections, 214, 37–39.
Kononov, V.I., Mamyrin, B.A., Polyak, B.G. and Khabarin, L.V. (1974). Helium isotopes in the thermal waters of Iceland. Doklady, Earth Science Sections, 217, 41–43.
Kopper, J.S. and Papamarinopoulos, S. (1978). Human evolution and geomagnetism. Journal of Field Archaeology, 5, 443–452.
Kropotkin, P.N. and Titkov, G.A. (1981). Extension of riftogenic structures of the Arctic Ocean and Biscay Bay into the Eurasian continent. In A.V. Peive and Y.M. Pushcharovsky (Eds.), Problems of the Earth’s crust tectonics (pp. 207–225). Moscow, USSR: Nauka (in Russian).
Kulkarni, R.N. (1963). Relation between atmospheric ozone and geomagnetic disturbances. Nature, 198, 1189–1191.
Kuznetsov, V.V. and Kuznetsova, N.D. (2004). Impact of the cosmic radiation and long-term variations of the geomagnetic field on the climate and life’s evolution on the Earth. In B.M. Shevtsov (Ed.), Solar-terrestrial bonds and electromagnetic precursors of earthquakes: Proceedings of the 3rd International conference, Paratunka, Russia, Aug. 16–21, 2004, Vol. 2 (pp. 82–104). Petropavlovsk-Kamchatsky, Russia: Institute of Cosmophysical Research and Radio Wave Propagation, Russian Academy of Sciences (in Russian, with English abstract).
L’Hérault, P. and Chung, Y.S. (1984). Mutagenicity of ozone in different repair-deficient strains of Escherichia coli. Molecular and General Genetics, 197, 472–477.
Lahr, M.M. and Foley, R.A. (1998). Towards a theory of modern human origins: geography, demography, and diversity in recent human evolution. Yearbook of Physical Anthropology, 41, 137–176.
Larin, V.N. (1993). Hydridic Earth: The new geology of our primordially hydrogen-rich planet. Calgary, AB: Polar Publishing.
Laštovička, J. and Križan, P. (2005). Geomagnetic storms, Forbush decreases of cosmic rays and total ozone at northern higher middle latitudes. Journal of Atmospheric and Solar-Terrestrial Physics, 67, 119–124.
Laverov, N.P. (Ed.) (1998). Atlas of the temporal variations of natural, anthropogenic, and social processes, Vol. 2: Cyclic dynamics in nature and society. Moscow, Russia: Nauchny Mir (in Russian, with English content).
Laverov, N.P. (Ed.) (2002). Atlas of the temporal variations of natural, anthropogenic, and social processes, Vol. 3: Natural and social spheres as environment parts and objects of impact. Moscow, Russia: Yanus-K (in Russian, with English content).

Hydrogen Degassing of the Earth 343
Lay, T., Kanamori, H., Ammon, C.J., Nettles, M., Ward, S.N., Aster, R.C., Beck, S.L., Bilek, S.L., Brudzinski, M.R., Butler, R., DeShon, H.R., Ekstrom, G., Satake, K. and Sipkin, S. (2005). The Great Sumatra-Andaman Earthquake of 26 December 2004. Science, 308, 1127–1133.
Le Roex, A.P., Cliff, R.A. and Adair, B.J.I. (1990). Tristan da Cunha, South Atlantic: geochemistry and petrogenesis of a basanite-phonolite lava series. Journal of Petrology, 31, 779–812.
Lenz, W.J. (1979). Radon: A factor in human evolution. M.A. Thesis. Stony Brook, NY: State University of New York at Stony Brook.
Long, C.S. (2003). UV Index forecasting practices around the world. SPARC Newsletter, 21, http://www.aero.jussieu.fr/~sparc/News21/21_Long.html
Lowman, P.D. Jr. and Montgomery, B.C. (1998). Preliminary determination of epicenters: 358,214 events, 1963-1998. In DTAM Team, Digital tectonic activity map, Global tectonic datasets: Seismic data. Greenbelt, MD: NASA Goddard Space Flight Center, http://denali.gsfc.nasa.gov/dtam/
Lupton, J.E. (1983). Terrestrial inert gases: isotope tracer studies and clues to primordial components in the mantle. Annual Review of Earth and Planetary Sciences, 11, 371–414.
Luterbacher, J., Liniger, M.A., Menzel, A., Estrella, N., Della-Marta, P.M., Pfister, C., Rutishauser, T. and Xoplaki, E. (2007). Exceptional European warmth of autumn 2006 and winter 2007: historical context, the underlying dynamics, and its phenological impacts. Geophysical Research Letters, 34, L12704, doi:10.1029/2007GL029951.
MacCracken, M.C. (1976). Climatic modeling results from stratospheric perturbations. In Proceedings of the 4th International climatic impact assessment program conference, Cambridge, MA, Feb. 4–7, 1975 (pp. 183–194). Washington, DC: U.S. Department of Transportation.
Marakushev, A.A. (1999). Origin of the Earth and nature of its endogenous activity. Moscow, Russia: Nauka (in Russian).
Marakushev, A.A. (2004). The fluid regime of the renewing the crust of the Earth, other planets, and satellites of the Solar system. In A.E. Fedorov (Ed.), The system of the planet Earth (Non-conventional problems of geology): Papers of the 12th Scientific seminar, Moscow, Russia, Feb. 4–6, 2004 (pp. 268–283). Moscow, Russia: ROO “The Structural Harmony of the Earth and Planets” (in Russian).
Markov, M.N. and Mustel, E.R. (1983). Correlation between solar-terrestrial effects in the troposphere and thermosphere. Soviet Astronomy, 27, 243–245.
Martin, I.M., Rai, D.B., Palmeira, R.A.R., Trivedi, N.B., Abdu, M.A. and da Costa, J.M. (1974). Enhanced low-energy gamma rays at balloon altitude in the Brazilian magnetic anomaly. Nature, 252, 25–27.
Matyushin, G.N. (1974). Role of ionizing radiation in anthropogenesis. In N.N. Kramarenko and A.L. Chepalyga (Eds.), Space and evolution of organisms: Proceedings of the All-Union meeting ‘Space factors and evolution of the organic world’, Moscow, USSR, Feb. 26 – Mar. 1, 1974 (pp. 276–292). Moscow, USSR: Paleontological Institute, Academy of Sciences of the USSR (in Russian).
Matyushin, G.N. (1982). The dawn of mankind. Moscow, USSR: Mysl (in Russian, with English summary).
Mayr, E. (1963). Animal species and evolution. Cambridge, MA: Belknap Press.

Vladimir L. Syvorotkin 344
Metz, B., Davidson, O., Bosch, P., Dave, R. and Meyer, L. (Eds.) (2007). Climate change 2007: Mitigation of climate change. Cambridge, UK: Cambridge University Press.
Mikulin, A.E. (2003). Zoogeography of fishes. Moscow, Russia: All-Russian Scientific Research Institute of Fishing Industry and Oceanography (in Russian).
Milanovskii, Y.Y. (1983). Riftogenesis in the Earth’s history (Riftogenesis on ancient platforms). Moscow, USSR: Nedra (in Russian).
Milanovskii, Y.Y. (1987). Geology of the USSR, Pt. 1. Moscow, USSR: Moscow University Press (in Russian).
Milanovskii, Y.Y. and Nikishin, A.M. (1988). West Pacific rift belt. Bulletin of Moscow Society of Naturalists, Series Geological, 63(4), 3–5 (in Russian).
Minnich, R.A. (1983). Fire mosaics in southern California and northern Baja California. Science, 219, 1287–1294.
Mlot, C. (1995). In Hawaii, taking inventory of a biological hot spot. Science, 269, 322–323. Monin, A.S. and Shyshkov, Y.A. (1991). Dilemma of the warming in the 20th century. In A.I.
Ugryumov (Ed.), Man and natural forces 92 (pp. 47–49). Saint Petersburg, USSR: Hydrometeoizdat (in Russian).
NASA/JPL/Caltech (2008). Ocean surface topography from space: El Niño / La Niña watch. Pasadena, CA: NASA, Jet Propulsion Laboratory, California Institute of Technology, http://sealevel.jpl.nasa.gov/elnino/index.html
Neruchev, S.G. (2007). Uranium and life in the history of the Earth (2nd ed.). Saint Petersburg, Russia: All-Russian Oil Research Prospecting Institute (in Russian).
Norval, M., Cullen, A.P., de Gruijl, F.R., Longstreth, J., Takizawa, Y., Lucas, R.M., Noonan, F.P. and van der Leun, J.C. (2007). The effects on human health from stratospheric ozone depletion and its interactions with climate change. Photochemical and Photobiological Sciences, 6, 232–251.
Nur, A. and Burgess, D. (2008). Apocalypse: Earthquakes, archaeology, and the wrath of God. Princeton, NJ: Princeton University Press.
Osechkin, V.V., Gnilovskoy, E.V. and Kondratovich, K.V. (1990). The effect of galactic cosmic rays on the formation of the spring maximum in the total ozone content in the polar and subpolar regions. Doklady Earth Science Sections, 305, 18–20.
Osika, D.G. (1981). The fluid regime of the seismically active regions. Moscow, USSR: Nauka (in Russian).
Ozone Processing Team (2008). Total Ozone Mapping Spectrometer. Ozone Monitoring Instrument (OMI) maps and data. Washington, DC: NASA Goddard Space Flight Center, http://toms.gsfc.nasa.gov/
Pastouret, L. and Goslin, J. (1974). Middle Cretaceous sediments from the eastern part of Walvis Ridge. Nature, 248, 495–496.
Perov, S.P. and Khrgian, A.K. (1980). The current problem of the atmospheric ozone. Leningrad, USSR: Hydrometeoizdat (in Russian).
Philander, S.G. (1990). El Niño, La Niña, and the Southern oscillation. New York, NY: Academic Press.
Plummer, N., Salinger, M.J., Nicholls, N., Suppiah, R., Hennessy, K.J., Leighton, R.M., Trewin, B., Page, C.M. and Lough, J.M. (1999). Changes in climate extremes over the Australian region and New Zealand during the twentieth century. Climatic Change, 42, 183–202.

Hydrogen Degassing of the Earth 345
Polyak, B.G. (1988). Heat and mass flow from the mantle in major tectonic units of the Earth's crust. Moscow, USSR: Nauka (in Russian, with English content and summary).
Polyak, B.G. (2005). Heat and mass transfer from the mantle: heat flow and He-isotope constraints. Annals of Geophysics, 48, 9–17.
Reid, G.C., Isaksen, I.S.A., Holzer, T.E. and Crutzen, P.J. (1976). Influence of ancient solar-proton events on the evolution of life. Nature, 259, 177–179.
Repacholi, M.H. (2000). Global solar UV index. Radiation Protection Dosimetry, 91, 307–311.
Samokhvalov, M.A. and Malyshkov, S.Y. (2002). Peculiarities of near-ground ozone content over oil and gas fields in the Tomsk Region. In B.A. Sokolov and E.A. Ablia (Eds.), New ideas in geology and geochemistry of oil and gas: Toward the general theory of oil-and-gas presence: Proceedings of the 6th International conference, Moscow, Russia, May 28–31, 2002, Pt. 2 (pp. 150–154). Moscow, Russia: Geos (in Russian).
Shcherbakov, A.V. and Kozlova, N.D. (1986). Occurrence of hydrogen in subsurface fluids and the relationship of anomalous concentrations to deep faults in the USSR. Geotectonics, 20, 120–128.
Sigvaldason, G.E. (1966). Chemistry of thermal waters and gases in Iceland. Bulletin Volcanologique, 29, 589–604.
Smoot, N.C. (1989). North Atlantic fracture-zone distribution and patterns shown by multibeam sonar. Geology, 17, 1119–1122.
Solomon, S. (1999). Stratospheric ozone depletion: a review of concepts and history. Reviews of Geophysics, 37, 275–316.
Solomon, S., Qin, D., Manning, M., Marquis, M., Averyt, K., Tignor, M.M.B., Miller, H.L. Jr. and Chen, Z. (Eds.) (2007). Climate change 2007: The physical science basis. Cambridge, UK: Cambridge University Press.
Staehelin, J., Harris, N.R.P., Appenzeller, C. and Eberhard, J. (2001). Ozone trends: a review. Reviews of Geophysics, 39, 231–290.
Stocks, B.J. and Lynham, T.J. (1996). Fire weather climatology in Canada and Russia. In J.G. Goldammer and V.V. Furyaev (Eds.), Fire in ecosystems of boreal Eurasia (pp. 481–487). Dordrecht, Netherlands: Kluwer.
Stone, R. (2008). An unpredictably violent fault. Science, 320, 1578–1580. Storini, M. (2001). Geomagnetic storm effects on the Earth’s ozone layer. Advances in Space
Research, 27, 1965–1974. Syvorotkin, V.L. (1993). Earth degassing and ozone layer depletion. Priroda, No. 9, 35–45
(in Russian). Syvorotkin, V.L. (1996a). Crust volcanoes of the Kuril–Kamchatka arc. Moscow, Russia:
Geoinformmark (in Russian). Syvorotkin, V.L. (1996b). Riftogenesis and the ozone layer. Moscow, Russia:
Geoinformmark (in Russian, with English abstract). Syvorotkin, V.L. (2000). Hydrogen – the ozone killer. Science in Russia, No. 2, 47–53. Syvorotkin, V.L. (2001). Where from “enfant terrible”? Science in Russia, No. 3, 43–49. Syvorotkin, V.L. (2002). The deep degassing of the Earth and global catastrophes. Moscow,
Russia: Geoinformcenter (in Russian). Syvorotkin, V.L., Nivin, V.A. and Timashev, S.F. (2008). Hydrogen emission monitoring in
the Khibiny Mountains. In A.N. Dmitrievsky and B.M. Valyaev (Eds.), Earth degassing: Geodynamics, deep fluids, oil, gas, and their parageneses: Proceedings of the All-

Vladimir L. Syvorotkin 346
Russian conference, Moscow, Russia, Apr. 22–25, 2008 (pp. 477–479). Moscow, Russia: Geos (in Russian, with English abstract).
Tazieff, H. (1978). Erebus volcan antarctique. Paris, France: Arthaud. Tchijevsky, A.L. (1938). Les épidemies et les perturbations électromagnetiques du milieu
exterieur. Paris, France: Hippocrate. Tertyshnikov, A.V. (1996). The variations of ozone content in the atmosphere above strong
earthquake epicenter. Physics of the Solid Earth, 31, 789–794. Timashev, S.F. (1991). The role of chemical factors in the evolution of natural systems
(chemistry and ecology). Russian Chemical Reviews, 60, 1183–1204. Trifonov, V.G. and Karakhanian, A.S. (2004a). Active faulting and human environment.
Tectonophysics, 380, 287–294. Trifonov, V.G. and Karakhanian, A.S. (2004b). Geodynamics and the history of civilization.
Moscow, Russia: Nauka (in Russian, with English contents, extended summary, and figure captions).
Udintsev, G.B. (Ed.) (1996). Equatorial segment of the Mid-Atlantic Ridge. Paris, France: UNESCO.
UNAIDS and WHO (2008). Sub-Saharan Africa AIDS epidemic update regional summary. Geneva, Switzerland: Joint United Nations Programme on HIV/AIDS and World Health Organization.
UNSCEAR (2000a). Combined effects of radiation and other agents. In United Nations Scientific Committee on the Effects of Atomic Radiation, Sources and effects of ionizing radiation: UNSCEAR 2000 report to the General Assembly, with scientific annexes, Vol. 2: Effects (pp. 73–175). New York, NY: United Nations.
UNSCEAR (2000b). DNA repair and mutagenesis. In United Nations Scientific Committee on the Effects of Atomic Radiation, Sources and effects of ionizing radiation: UNSCEAR 2000 report to the General Assembly, with scientific annexes, Vol. 2: Effects (pp. 1–72). New York, NY: United Nations.
Uranova, L.A. (1983). Distribution of the total ozone content under the forming cyclones over North America (USA). In A.K. Khrgian and N.F. Elansky (Eds.), Atmospheric ozone (pp. 122–128). Moscow, USSR: Nauka (in Russian).
Van Dooren, S., Salemi, M. and Vandamme, A.-M. (2001). Dating the origin of the African human T-cell lymphotropic virus type-I (HTLV-I) subtypes. Molecular Biology and Evolution, 18, 661–671.
Vavilov, N.I. (1926). Studies on the origin of cultivated plants. Bulletin of Applied Botany and Plant Breeding, 16(2), 1–248 (in Russian, with English summary).
Vavilov, N.I. (1940). Theory of the origin of cultivated plants after Darvin. Sovetskaya Nauka, No. 2, 55–75 (in Russian).
Vavilov, N.I. (1992). Origin and geography of cultivated plants. Cambridge, UK: Cambridge University Press.
Viljoen, D., Farrell, H.M., Brossy, J.J., McArthur, M., Maheswaran, M. and Beighton, P. (1985). Ectrodactyly in central Africa. South African Medical Journal, 68, 655–658.
Vinogradov, A.P. (1964). Provinces biogéochimiques et leur rôle dans l’évolution organique. In U. Colombo and G.D Hobson (Eds.), Advances in organic geochemistry: Proceedings of the International meeting, Milan, Italy, 1962 (pp. 317–338). New York, NY: Macmillan.

Hydrogen Degassing of the Earth 347
Vinogradov, M.E. (1975). El Niño destroys the ecosystem of the offshore water. Priroda, No. 7, 32–37 (in Russian).
Vinogradov, Y.B. (1980). Etudes on mudflows. Leningrad, USSR: Hydrometeoizdat (in Russian).
Vladimirsky, B.M. (1998). Works of A.L. Tchizhevsky on solar-terrestrial links. Heliobiology on the eve of the XXI century: results, problems, and prospects. Biophysics, 43, 532–536.
Vogt, J., Sinnhuber, M. and Kallenrode, M.-B. (2009). Effects of geomagnetic variations on System Earth. In K.-H. Glaβmeier, H. Soffel and J.F.W. Negendank (Eds.), Geomagnetic field variations (pp. 159–208). Berlin, Germany: Springer.
Voitov, G.I. (2000). Variability of methane fluxes during the cold Earth degassing. Geochemistry International, 38, 274–280.
Vorontsov, N.N. and Lyapunova, E.A. (1984). Explosive chromosomal speciation in seismic active regions. Chromosomes Today, 8, 289–294.
Walker, D.A. (1995). More evidence indicates link between El Niños and seismicity. Eos, 76, 33–34.
Welham, J.A. and Graig, H. (1979). Methane and hydrogen in East Pacific Rise hydrothermal fluids. Geophysical Research Letters, 6, 829–831.
Wikipedia contributors (2007). Ulyanovskaya mine disaster. In Wikipedia, the free encyclopedia, http://en.wikipedia.org/w/index.php?title=Ulyanovskaya_Mine_ disasterandoldid=169990794
Wikipedia contributors (2008). 2007 Zasyadko mine disaster. In Wikipedia, the free encyclopedia, http://en.wikipedia.org/w/index.php?title=2007_Zasyadko_mine_ disasterandoldid=218328501
Williams, Q. and Hemley, R.J. (2001). Hydrogen in the deep Earth. Annual Review of Earth and Planetary Sciences, 29, 365–418.
Wu, Y. and Zou, X. (2008). Numerical test of a simple approach for using TOMS total ozone data in hurricane environment. Quarterly Journal of the Royal Meteorological Society, 134, 1397–1408.
Yan, Z., Jones, P.D., Davies, T.D., Moberg, A., Bergström, H., Camuffo, D., Cocheo, C., Maugeri, M., Demarée, G.R., Verhoeve, T., Thoen, E., Barriendos, M., Rodríguez, R., Martín-Vide, J. and Yang, C. (2002). Trends of extreme temperatures in Europe and China based on daily observations. Climatic Change, 53, 355–392.
Zou, X. and Wu, Y. (2005). On the relationship between Total Ozone Mapping Spectrometer (TOMS) ozone and hurricanes. Journal of Geophysical Research, 110, D06109, doi:10.1029/2004JD005019.
Zubarev, B.M. (Ed.). (1989). Geology and genesis of diamond fields, Vol. 1. Moscow, USSR: Central Scientific Research Prospecting Institute of Non-Ferrous and Precious Metals (in Russian, with English content).


LIST OF CONTRIBUTORS
Irina G. BOYARSKIKH. Central Siberian Botanical Garden, Russian Academy of Sciences. Zolotodolinskaya St. 101, Novosibirsk, 630090, Russia. email: [email protected]
Igor V. FLORINSKY. Institute of Mathematical Problems of Biology, Russian Academy of
Sciences. Pushchino, Moscow Region, 142290, Russia. email: [email protected] Dmitry M. GRODZINSKY. Department of Biophysics and Radiobiology, Institute of Cell
Biology and Genetic Engineering, National Academy of Sciences of Ukraine. Vasilkovskaya St. 31/17, Kiev, 03022, Ukraine. email: [email protected]
Olga B. LYSENKO. Institute of Environmental Geochemistry, National Academy of
Sciences of Ukraine & Ministry of Emergencies of Ukraine. Palladin Av. 34a, Kiev-142, 03680, Ukraine
Quoc Hao MACH. School of Engineering, Laurentian University. Ramsey Lake Rd.,
Sudbury, Ontario, P3E 2C6, Canada. email: [email protected] Alexey A. MARAKUSHEV. Institute of Experimental Mineralogy, Russian Academy of
Sciences. Institutskaya St. 4, Chernogolovka, Moscow Region, 142432, Russia Sergey A. MARAKUSHEV. Institute of Problems of Chemical Physics, Russian Academy of
Sciences. Chernogolovka, Moscow Region, 142432, Russia. email: [email protected] Evgeny K. MELNIKOV. St. Petersburg State Mining Institute. 21st Line 2, Vasilevsky Island,
Saint Petersburg, 199106, Russia Bryce P. MULLIGAN. Neuroscience Research Group, Laurentian University. Ramsey Lake
Rd., Sudbury, Ontario, P3E 2C6, Canada. email: [email protected] Wolfgang PAUL. Miner’s Christian Mission. Celifodina, Publisher. P.O. 18825, Spokane,
WA 99228, USA. email: [email protected] Igor G. PECHENKIN. Fedorovsky All-Russian Research Institute for Mineral Resources.
Staromonetny Lane 31, Moscow, 119017, Russia. email: [email protected]

List of Contributors 350
Michael A. PERSINGER. Behavioural Neuroscience Program, Departments of Psychology and Biology, Laurentian University. Ramsey Lake Rd., Sudbury, Ontario, P3E 2C6, Canada. email: [email protected]
Vyacheslav A. RUDNIK. Institute of Precambrian Geology and Geochronology, Russian
Academy of Sciences. Makarov Embankment 2, Saint Petersburg, 199034, Russia. email: [email protected]
Alexander V. SHITOV. Gorno-Altaysk State University. Lenkin St. 1, Gorno-Altaysk,
649000, Russia. email: [email protected] Emlen V. SOBOTOVICH. Institute of Environmental Geochemistry, National Academy of
Sciences of Ukraine & Ministry of Emergencies of Ukraine. Palladin Av. 34a, Kiev-142, 03680, Ukraine. email: [email protected]
Lynn SUESS CLOES. Community Futures Development Corporation. 26 Chemaushgon Rd.,
Bancroft, Ontario, K0L 1C0, Canada Vladimir L. SYVOROTKIN. Department of Petrology, Geological Faculty, Lomonosov
Moscow State University. GSP-2, Leninskie Gory, Moscow, 119899, Russia. email: [email protected]
Vladimir G. TRIFONOV. Geological Institute, Russian Academy of Sciences. Pyzhevsky
Lane 7, Moscow, 119017, Russia. email: [email protected] Iosif F. VOLFSON. Russian Geological Society. 2nd Roshchinskaya St. 10, Moscow, 115191,
Russia. email: [email protected], [email protected]

I�DEX
A
acid rain 89
adaptation 34, 52, 56, 81, 160-162, 202, 203, 206, 323
aging 37, 40, 47, 48, 179
Alpine-Himalayan orogenic belt 70, 227, 241, 266, 270-276, 278, 288, 293,
298
Altai-Sayan folding area 189, 191, 196
amino acid 15, 16, 24, 25, 35, 41-43, 81, 95, 99 alanine 16, 41, 42
arginine 16 asparagine 16
aspartate 16
cysteine 16 glutamate 16
glutamin 16, 99
glycine 16, 42, 99
histidine 16, 42
isoleucine 16, 42
leucine 16, 41, 42
lysine 16, 42
methionine 16
ornithine 41, 42
phenylalanine 16, 41, 42 proline 16, 41, 42
selenocysteine 81
serine 16, 42 threonine 16, 41, 42
tryptophan 16
tyrosine 16, 41, 42
valine 16, 42
ammonia 75, 89, 334, 335
analgesia 117, 134
antioxidant 99, 121

Igor V. Florinsky 352
apartment building 172, 175, 176, 178
archaeological culture 272, 278
Andronovo 278
Belogrudovsky 294 Chernolesskaya 294
Chernyakhov 295
Corded Ware 293, 294 Cucuteni-Tripolie 277, 278, 280, 293, 294, 296
Globular Amphorae 293, 294 Kura-Arax 277, 278, 280, 283
Kurgan 278, 293
Lusatian 294 Milograd 295
Przeworsk 294
Trzciniec-Komarovo 294, 296 Yamnaya 278, 293
Zarubintsy 294, 295
Argonauts 291
artist 116, 128, 130
atmosphere 89, 122, 194, 288, 309, 311, 313, 315, 327,
329, 331, 332, 334
aerosol 70, 76, 88, 101, 118, 321, 329 air dust 70, 78, 321
air ion 99, 179, 180
air ionization 218 anticyclone 328
corona discharge 218
cyclone 329, 330, 332, 333 hurricane 308, 329, 336, 337
Emmy 329, 330
Frances 329, 330
Katrina 308
inter-tropical convergence zone 311
power 121, 122
pressure 146, 190, 193, 327-329, 331-333 sferics 119
thunderstorm 193, 194
Ayurveda 90
B
basin
Afghan-Tajik 274, 278
Black Sea 227, 228
Cuu Long 12
Derbent 262, 265, 266
Index
353
Kurai 148
Lower Kura 262, 263, 265
Middle Caspian 260, 263
Powder 75 Sistan 278, 287
South Caspian 260, 262-268
Tarim 274, 278 West Turkmen 73
biologically active substance 95, 97-99, 147 bioproductivity 283, 335, 336
biosynthesis 34, 39
botany Astragalus penduliflorus 146
azonal biocenosis 146
blue honeysuckle (Lonicera caerulea L.) 147-180 botanical survey 152
fruit
bitterness 147, 155, 156, 158, 162
shape 155-160, 162
size 147, 155, 160-162
hallucinogenic plant 238
buried paleovalley 170, 180
C
cape
Ai-Thodor 222
Aya 225 Chersonese 229, 236
Dimitraki 223
Fiolent 222, 229, 236, 237
John 222
Lucullus 230, 236,
Meganome 230, 231, 234
Sarych 228, 230
St. Elijah 225
Vinogradny 222
carbon dioxide 5, 7, 26, 86, 87, 89, 90, 92, 93, 95, 170, 180, 288, 318, 326, 332, 333
dry bath 89
expired 41, 45, 47 volcanic gas 55, 88, 89, 186
cave town 222, 225
Chilter-Marmara 222, 234
Chufut-Kale 222
Kachi-Kalyon 222, 234

Igor V. Florinsky 354
Mangoup-Kale 222, 234
Shuldan 222, 234
Tepe-Kermen 222, 233, 234
charcoal 294 chemical element
abiogenic 35, 45
abiogenic competitor 35, 83 abundance 36, 37
biogenic element 34, 35, 37, 40, 49, 50, 56 Chernobyl accident 84
city, settlement (ancient, medieval)
Acra 290, 291 Ak-Mechet 224, 233
Alexandria 278, 287
Babylon 278 Bakchisarai 222-224, 230, 233, 238
Bekhura 273
Caffa 223, 224, 226, 238
Calamita 222, 225, 229, 233, 235, 236
Chersonese 222, 225, 238
Ciudad Vieja 308
Constantinople 273, 278 Derbent 278, 289
Eski-Kyrym 224
Genoese colony 226 Geoksjur (oasis) 278, 280, 283
Gezlev 224, 233
Illyrian Epidaurus 278, 287 Jericho 278, 287
Jerusalem 273, 278
Kara Sou Bazaar 224, 233
Mangasea 296
Nymphaeum 290, 291
Olvia 278, 290, 291, 295
Panticapaeum 290, 291 Patrae 290, 291
Phanagoria 290
Rome 287, 295 Thebes 280
Troy (Wilusa) 278, 281, 285, 286
city, town (modern) Alushta 230, 231, 234
Antofagasta 80, 81
Aswan 97
Baden-Baden 86
Bakchisarai 222-224, 230, 233, 238
Baku 278, 289
Balaclava 229, 236
Bancroft 116, 124-132
Baranovichi 86

Index
355
Belogorsk 224
Belokurikha 86, 87
Cairo 219
Derbent 278, 289 Eupatoria 95, 224, 226, 230
Gatchina 176, 177
Gorno-Altaysk 187, 188, 191, 193, 195, 203-205 Grado 97
Hveragerði 94 Inkerman 222, 225, 235
Jáchymov 86
Jalalabad 86 Karlovy Vary 86
Kerch 231, 235, 290
Kosh-Agach 187, 188, 190-192, 196-199, 201, 202 Marmora 116, 125, 132-134, 219
Petrozavodsk 98
Pyatigorsk 87
Rotorua 89, 95
Safaga 97
Saint Petersburg 118, 171-177
Saki 95 Sevastopol 222, 224, 229, 230, 232, 236
Simeiz 222, 234
Simferopol 230-232 Solnhofen 336
Stary Krym 223, 224, 230, 233
Sudak 223, 228-230, 232, 233, 238 Theodosia 95, 223, 224, 226, 230, 232, 234
Tskhaltubo 86
Upper Massandra 223
Vyborg 178, 179
Yalta 222, 228, 230
civilization
Crete-Mycenaean 278, 280 Elam 278, 281
Indus (Harappa) 278, 279, 283, 285
Maya 308 Minoan 280, 308
Sumerian 277-279, 283
climate aridization 279, 283-285, 287-290, 293, 295
change 258, 267-269, 272, 279, 283, 285, 289, 290,
292, 293, 296, 298, 309
El Niño (Southern Oscillation) 279, 283, 316, 331-334, 336
El Pintor 334
evaporation 259, 290, 292, 332
fluctuation 325
global warming 309, 327-329, 336
humidification 284, 285, 288, 289, 297

Igor V. Florinsky 356
Kyoto Protocol 309
La Niña 332, 334
Little Ice Age 279, 287, 295
Montreal Protocol 309 North Atlantic Oscillation 328
coalmine 327
compound nitrogen 15
oxygen 5, 14, 15 oxygen-nitrogen 15
phosphoric 15
cosmic rays 50, 54, 312 Crimean Meganticlinorium 227
current
Cromwell 331, 332 Gulf Stream 296
Humboldt (Peruvian) 316, 331, 332, 334, 335
D
degassing 4, 10, 11, 13, 88, 162, 309-311, 315, 316, 321,
323, 324, 326-336
center 309, 312, 321, 323-326, 329 fluid 73, 75, 101, 179, 180
hydrogen 4, 55, 100, 311, 317, 319, 321, 323, 328, 336 methane 317, 323, 330
Deluge 282
dibenzo-α-pyrone 99 diet 37, 40, 43-45
paleodiet 44
vegetarian 44
disease, disorder
blood 197-201
hemochromatosis 47
leukemia 47, 48, 170, 323
cardiovascular 70, 80, 86, 121, 186, 204
arteriosclerosis 93
atherosclerosis 77, 78 hypertension 47, 93, 201-205
ischemic cardiac disease 47, 89, 177, 180
myocardial infarction 89, 118, 119 vegetative vascular dystonia 202, 205
cerebrovascular 119, 199, 201, 202
headache 84, 89, 119, 120, 203
migraine 119, 120
stroke 119, 203, 204

Index
357
climacterium 92
dental
caries 77, 83
fluorosis 77, 88 dermatological 70, 86, 92, 94, 96
psoriasis 95, 97
skin lesion 80, 98 endocrine 186, 196, 199, 201, 203
diabetes mellitus 46, 47, 177, 204 dysthyreosis 84
goiter 84
hyperthyreosis 46 hypothyreosis 46, 47
obesity 46, 47
thyrotoxicosis 84 epidemics 122, 268, 308
epilepsy 130, 202, 205, 217, 218, 239
aura 217
complex partial 128
eye 88, 147, 320
cataract 46, 88, 320
fatigue 79, 84, 118 gall bladder 92
cholecystitis 93
cholelithiasis 93 hypokinesis 92
gastroenteric 186, 204, 205
gastritis 96, 199, 201 gastro-esophageal reflux 92
peptic ulcer 46, 47, 88, 96, 204
genetic 76, 323
ectrodactyly 323
nanism 47
Wilson’s disease 76
genitourinary 70, 100, 196, 197, 199-201 Balkan endemic nephropathy 75
geophagia 94
immune 239 autoimmune 239, 240
deficiency 99, 239
suppression 79, 85, 179, 309, 320 infectious 70, 186, 196, 199, 201, 337
AIDS 82, 323
African trypanosomiasis 81
coccidioidomycosis 75, 186
intoxication 85, 88, 216
mental 70, 80, 186, 196, 218, 239
bipolar disorder 49
Jerusalem syndrome 219
lunacy 123

Igor V. Florinsky 358
post-traumatic stress disorder 186, 201-203
psychoses 217
musculoskeletal 70, 86, 92, 96, 196, 197, 199-201
arthritis 94, 96, 97 arthroses 96
chondrodystrophy 83
multiple sclerosis 86, 170 osteomyelitis 46
osteoporosis 77, 78, 83, 92, 100 post-paralytic atrophy 46
rheumatism 94, 97
rickets 83, 320 skeletal fluorosis 77, 88
neoplasms 70, 196, 197, 200, 201
cancers 46, 51, 75, 80, 82, 84, 85, 170, 172, 173, 175-178, 180, 239
lung cancer 86
melanoma 320
nonmelanoma skin cancer 320
nervous 70, 86, 92, 96, 98, 100, 196, 197, 200, 201,
219
neuralgia 93, 95, 96 nutritional disorder 49, 76, 89
alkaline disease 82
arsenical keratosis 80 arsenicosis 80
black foot 80
cobalt deficiency 78, 79 cretinism 84
endemic 54, 70, 71, 75, 85, 88, 101, 186
endemic goiter 84
enzootic marasmus 79
fluorine deficiency 77
iodine deficiency 84
Kashin-Beck disease 82, 83 Keshan disease 82
pernicious anemia 78
selenium deficiency 81-83 silicon deficiency 78
strontium rickets 83
zinc deficiency 79 plant morphose 172, 177-179
respiratory 70, 88, 89, 99, 186, 196, 197, 200, 201, 204
acute respiratory virus infection 202, 204, 205
asphyxia 88, 89
bronchitis 99, 100, 177
pneumonia 81, 202, 204, 205
pulmonary edema 88, 89
silicosis 78, 88
tuberculosis 78, 100

Index
359
trauma 204, 205
bone fracture 100
closed head injury 134
dome Kara-Bogaz 260
Sarlyk 100
dowsing 172-174 dynamic equilibrium 55
E
Earth crust 4-6, 8, 11-13, 25, 26, 36, 37, 52, 75, 76, 170,
194, 218-220, 238, 241, 260-265, 267, 309,
326 inner core 13, 336
mantle 4, 5, 7, 11, 13, 55, 262, 264, 265, 267, 298,
299, 309, 317, 325, 326, 336
Moho surface 263, 267
outer core 13, 298 rotation 268, 271, 272, 297, 298, 325
South Pole 315
Earth Probe satellite 314, 319 East European Platform 75, 78, 97, 171, 227, 272, 293, 296, 298
electromagnetic field 118, 133, 173, 191, 200, 216, 219, 238 emergency call 195, 197, 202-206
enhanced permeability of the crust 170, 173, 174, 178, 194, 218, 220, 238, 241
endogenous activity 4, 55, 313 enzyme 35, 39, 51, 52, 76, 79-81, 124
cytochrome c oxidase 124
glutamate dehydrogenase 124
glutathione peroxydase 81
glycine reductase 81
phenylalanine ammonia-lyase 146
pyruvate dehydrogenase 80
zinc metalloenzyme 79
epigenesis 73, 75
essential oil 99 evolution 4, 5, 7, 10, 11, 15, 23, 24, 26, 27, 37, 39, 50,
52, 55, 56, 73, 83, 101, 122, 272, 288, 308,
309, 318

Igor V. Florinsky 360
F
fasting 216
fatty acid 99
lauric 99
myristic 99 fault
active 54, 70, 75, 86, 101, 146, 147, 160-162, 170,
178, 179, 190, 194, 205, 220, 236, 238, 241, 260, 261, 263, 292, 325
Baratal 152, 161, 162, 190
Belbek 228, 233 Charysh-Terekta 190
Dead Sea Transform 277, 287 Demerji 228, 233
dip-slip 227, 229, 236
intersection 172, 175, 178, 179, 220, 228, 233, 234, 236, 323, 324, 329
Kacha 228, 233
Kara Dagh 228, 233
Kastropol 228, 233
Kuchuk-Lambad 228, 233 lineament 194, 218, 221, 238
Moinaki 228, 233
Molbai 228, 233 North Aegean 292
oblique 227, 335 Sasyk 228, 233
Shapshal 189, 190
South Coast 228 Sudak-Agarmysh 228, 233
Teletskoe 189, 190
thrust 189, 190, 263
Yalta 228
fault zone 75, 99, 101, 125, 146, 152, 156, 160-162, 170,
178-180, 195, 200, 202, 206, 227, 232, 238,
263, 316-318, 335
East Anatolian 278, 287
Eupatoria-Skadovsk 228, 233, 234
Foothill Crimean-Caucasian 228, 231, 233, 234 Khanarassar 283
Korsak-Theodosia 228, 234
North Anatolian 278, 287, 292 Northern Balkhan 260
Orekhovo-Pavlograd 228, 233
Pambak–Sevan 283
Salgir-Oktyabrskoe 228, 231, 234
Southern Balkhan 260

Index
361
finch 324
flavonoid
flavonol 162
leucoanthocyanin 147 foredeep
Derbent 260, 263, 264, 266, 267
Mesopotamian 264 forensics 44
forest fire 194, 308, 329, 331
mixed coniferous 149, 151
moss cover 151 taiga ecozone 160, 161
understory
herbs 151 shrub cover 151
fulvic acid 99
G
gas
burst 308, 309, 327
emanation 146, 161, 170, 172, 179, 186, 200, 206, 238, 317, 318, 334
solubility 88, 332, 334 geochemical
anomaly 70, 76, 79, 84, 101, 146, 161, 170, 186, 200,
238, 325, 326, 329 barrier 75, 309
halo 70, 73, 77, 89, 101, 161, 172, 174, 179
geodynamic activity 70, 75, 146, 258, 272
geomagnetic
activity 116, 118-124, 131, 134, 218, 240, 298, 312
anomaly 55, 116, 125, 126, 131, 152, 155, 156, 158,
159, 179, 188-191, 194, 195, 197, 198, 200,
205, 218-220, 230-232, 234-236, 241, 312,
313
Brazilian 55, 313 Canadian 55, 313
Chukchi-Aleutian 313
Siberian 55, 313 excursion 55, 324, 326
Blake 55, 324
Jamaica 55
Mungo 55, 324

Igor V. Florinsky 362
field 4, 13, 54, 55, 116-118, 120, 134, 150, 152,
186, 190, 204, 218, 220, 231, 236, 240, 241,
272, 297, 298, 312, 313
gradient 130, 174, 179, 180 K-index 118, 119, 122
magnetometric survey 150, 152, 219
precession 298, 325, 334 reversal 4, 5, 11, 54, 55, 313, 324, 326
Gauss-Matuyama 55 storm 119, 121, 122, 131, 134, 190, 218-220, 241,
312
geopathogenic zone 170, 171, 173, 174 geopsychology 115, 116, 120, 122-124, 131, 135
geothermal
activity 88, 101 field 89, 94, 95, 238, 329
Námafjall 94
Theistareykir 94
glacier 271, 279, 282, 284, 287, 288, 296, 314
Amery 314
Lambert 314
graben Chernaya River 229, 233, 236
North Bay 229, 233, 236
Oslo 328 gravity 123, 171, 186
greenhouse gas 288, 309, 332
Grenville geologic province 125, 132 guano 331, 335
gulf, bay
California 329, 332
Finland 171
Kara-Bogaz-Gol 259, 278
Mexico 12
Persian 278, 279, 284, 336 Taman 291
Walvis 334-336
H
heavy metals 98, 170, 173, 175, 176, 179 hemoglobin 44, 124
historical concept
Oder-Dnieper 294, 295
Vistula-Oder 294
historical crisis 272, 277, 282, 292, 293, 296, 298

Index
363
historical period
Chalcolithic 278, 293, 296
Classical 232, 273, 291, 292
Iron Age 279, 280, 294, 296 Bronze Age 278, 280, 293, 296
Medieval 278, 281
Migration 281 Time of Distemper 295, 296
homeopathy 81, 90 homeostasis 42, 56, 180
homicide 123
hormesis 50, 51, 52, 85, 88, 178, 201, 240 hormone 76, 84, 95
adrenocorticotropic 239
cholecystokinin 92 melatonin 117, 121
thyroxin 83
hot spot 315, 323, 324
human ancestor
aegyptopithecus 321
anthropoid 54
hominid 54, 321, 325 Homo
erectus 55
habilis 323 Neanderthal 324
human organism 40-42, 48, 49, 78, 79, 81, 85, 88, 89, 92, 99,
101, 173, 179, 197, 202, 206, 238 adrenal gland 46, 117, 203
aorta 46, 77
blood 35, 40-43, 45, 47, 51, 78, 92, 119
erythrocyte 43, 47-49
leukocyte 117
lymphocyte 123, 239
plasma 41, 42, 46 bone 40, 43-47, 50, 77, 78, 82-85, 89
collagen 43, 46
brain 35, 40, 41, 45, 46, 54, 55, 78, 117, 120, 121, 123, 131, 132, 134, 216, 218-220, 239-241
amygdala 120, 217
corpus callosum 217 frontal cerebral cortex 216
hippocampal commissure 217
hippocampus 217
hypothalamus 123
left hemisphere 216, 239
neuron 45, 120, 123, 124, 216, 217
pineal organ 117, 119, 217
right hemisphere 120, 121, 131, 216, 217, 239
temporal lobe 216

Igor V. Florinsky 364
duodenum 92
eye 46, 88, 89, 121
fingernail 43-45
keratin 43 gall bladder 92, 96
bile 92
hair 41-46, 49, 54, 77-80, 89 keratin 41, 43
heart 40, 41, 46, 51, 79, 82 diastolic pressure 89, 118
rate 119
systolic pressure 89, 118 immune system 51, 85, 178, 239, 320
kidney 40, 41, 46, 96
liver 40, 41, 43, 46, 78, 80, 82, 84, 96 lung 40, 41, 46, 78, 89
muscle 40, 41, 43, 46
nervous system 78, 92, 99
parasympathetic 92, 121
sympathetic 121
vegetative 219
pancreas 41, 46, 78 saliva 42, 84
sebaceous gland 42
cerumen 42 spleen 40, 41, 46, 84
sweat 42
thymus 40, 41 thyroid 41, 46, 83, 84
tooth enamel 44, 45, 77
urine 42, 45, 47
humic acid 95, 96
hydrocarbon 4-18, 21, 23-26, 75, 76, 95, 100, 179, 326, 336
acetylene 24, 26
alkane 8, 9, 12, 179 alkene 9, 179
asphalt 10, 12, 95, 101
asphaltite 10 benzene 24, 26
bitumen 8, 10, 75, 95, 96, 100
butane 8, 9 coronene 24, 26
ethane 5, 7-10
ethylene 9
kerogen 8
methane 5, 7-9, 26, 311, 317, 323, 327, 330, 332, 334,
336
ozokerite 101
polycyclic aromatic 75, 76, 179
polyyne 26

Index
365
pool 9
propane 5, 8, 9
propylene 9
thermogenic 9 toluene 9
hydrogen 4-12, 15, 26, 35, 42, 47, 93, 309-311, 315-317,
319, 323, 326, 327, 332, 333, 336 -air mixture 327
cycle 310, 311 flux 326
proton gas 179
sulfide 88-90, 92, 95, 170, 186, 334, 335 hydrothermal
field 9, 94, 317
Lost City 9 Rainbow 9
vents 12
hyperventilation 216
hypoxia 128, 216
I
Ichthyostega 54
ideomotor effect 173, 174
immunoglobulin 122 Inca mummies 80
infrared flux 309, 332, 333, 336
infrasound 204, 206
island(s)
Azores 89, 95, 328 Buckle 313
Crete 280, 285, 287, 308 Elba 235
Galapagos 323, 324, 331
Greenland 5, 295, 328 Hard 314
Hawaiian 315, 316, 324
Iceland 93, 94, 288, 295, 315, 316, 328 Java 54, 308
Kerguelen 314
Kunashir 93
Kuril 93, 147, 335
Melanesia 323
New Guinea 323, 331
Novaya Zemlya 296
Sakhalin 147
Igor V. Florinsky 366
Sicily 285
South Shetland 313
Sunda 317, 321
Tristan da Cunha 324, 335 isotope
abundance 36, 37
atomic mass 39, 40 biological fractionation 34, 37
composition 34, 37-49, 51, 56 δ notation 56, 57
deuterium 42, 49
effect kinetic 34, 38, 39, 56
magnetic 38, 39, 46, 56, 118
thermodynamic 38, 39, 56 electric quadrupole moment 36, 37
fractionation 34, 37-40, 43, 46, 47, 49, 56
heavy water 34, 37, 48, 49
magnetic dipole moment 36, 37
nuclear spin 36, 37
radioisotope 37, 48, 50, 84
ratio calcium 43, 47
carbon 7, 10, 40-47, 49, 57, 101
copper 43 helium 315, 317, 321, 329
hydrogen 38, 42-45, 47
iron 43, 45, 47 lead 45
nitrogen 41-46, 49
oxygen 38, 43-45
potassium 40, 46
strontium 45
sulfur 44
zinc 47 shift 45-47, 49, 56
stable 34, 35, 37, 40, 43, 48, 49, 56
tracer 48, 49 triplet-singlet transformation 39
K
ketone acid 81
Kokorya dacitic-rhyolitic complex 150, 152
Index
367
L
lake
Aji Gol 95
Baikal 269, 317, 336 Didvana 284
Kuril 335
Moinaki 95 Onega 98
Saki 95
Sarykamysh 278, 284, 287 Sevan 273, 283-285, 287, 288
Turcana 321 Victoria 321
landslide 75, 186, 269, 292, 308, 336
M
magmatism 5, 6, 11-13, 23, 90, 146, 189, 218, 220, 241,
326, 336
intrusion 11, 12, 125, 179, 188-190, 194, 195, 197, 198, 200, 201, 205, 218, 231
magma chamber 4, 7, 9, 13,
magnetic field 39, 116, 117, 124, 127, 131, 132, 197, 217- 219, 236
massive Kalguty 190, 197
Lovozero alkaline 5
Yustyd 190, 197 megalith 219, 293
metabolism 35, 39, 41, 43, 44, 47, 55, 77-79, 81, 83, 92,
94, 98, 124, 239, 320 microorganism
Aspergillus niger 51
blue-green algae 336
Coccidioides immitis 75, 186
diatom 78, 95 enterococci 99
Escherichia coli 51 penicillia 96
Protozoa 51, 95
staphylococci 99 Staphylococcus aureus 97
streptococci 99

Igor V. Florinsky 368
Streptomyces violaceus 98
mid-ocean ridge 12, 309, 311, 313, 317
Central Indian 312, 313
Circum-Antarctic 312, 313 East Indian 312, 315
East Pacific Rise 312-317, 323, 332, 334, 335
Juan de Fuca 8, 9, 12 Mid-Atlantic 9, 312-315, 324, 328-330, 335
Naska 335 West Pacific 312, 313
minerals, rocks
anhydrite 98 arcanite 101
arsenolamprite 80
arsenopyrite 80 autunite 84
berzelianite 81
bischofite 98
black sands 96, 97
bruggenite 83
calcite 98
carnallite 98 carnotite 84
carrollite 78
cattierite 78 celestite 82
chalcedony 97
chalk 101 chalkomenite 81
clausthalite 81
clay 70, 78, 90, 94, 96
cobaltite 78, 80
coffinite 84
cubic silicon carbide 101
dietzeite 83 dopplerite 95
erythrite 80
feldspar 77, 97 felsite 84
flint 70, 77, 78, 90, 97, 98
fluorapatite 77, 101 fluorite 76, 77
granite 5, 12, 84, 86, 125, 132, 178, 189, 197
graphite 7, 8, 101
gypsum 75, 95, 98, 101
hakite 81
halite 75, 81, 98, 99
hatchettite 101
hemimorphite 79
hydromica 267

Index
369
hydrozincite 79
kaolinite 94
kimberlite 5, 10, 317
klockmannite 81 lautarite 83
lignite 75
linneite 78 lollingite 80
magnetite 18-20, 116, 132-134, 189, 219 mica 77, 97
mimetite 80
monazite 96, 97 montmorillonite 267
opoka 78
orpiment 80 palygorskite 94
pararsenolamprite 80
penroseite 81
pyrite 80
pyrrhotite 18-20
quartz 77, 96, 97
realgar 80 rhyolite 84
rutile 96
sand 70, 90, 96, 97 shungite 10, 70, 90, 98
silica 77, 78, 95, 97
silicate minerals 77, 78 skutterudite 78, 80
smectite 94
smithsonite 79
sphalerite 79
strontianite 82
sylvinite 99
sylvite 98, 99 talc 94
tausonite 82
tiemannite 81 tripoli 78
uraninite 84
zeolite 78 zircon 96, 97
mitochondria 55, 119
monarch
Amenhotep III 283
Argishti I 273, 285
Boris Godunov 295
Chosroes 289
Darius 292
Hattusilis III 280

Igor V. Florinsky 370
Ivan IV the Terrible 295
Kublai 308
Merneptah 280, 281
Peter I 296 Ramesses II 280
Ramesses III 280, 281
Svyatoslav 289 Uzziah 273
Vladimir 289 monastery
Armenian Apostolic 223, 226, 231, 233, 234
Byzantine 222, 225, 226, 231, 233-236, 238 Catholic 223, 226, 231
Chilter-Koba 222, 233
Dormition of the Mother of God 222 Franciscan monastery 223, 233
kinovia 225
Mother of God Hamchak 223
Mother of God of Blachernai 222, 233
Russian Orthodox 221, 224, 226, 231-233
skete 222, 223, 225, 231, 233
St. Anastasia 222, 223 St. Anton 223
St. Appearance Rock 236, 237
St. Clement 222 St. Dimitri 223
St. Elijah 222, 223
St. George 223, 231 St. George at Cape Fiolent 222, 225, 234, 236, 237
St. Gregory the Illuminator 223
St. John 222
St. John the Baptist 223
St. Menas 223
St. Nicolaes 223
St. Peter 223 St. Salvator 223, 233
St. Simeon 241
St. Sophia 222 St. Stephan 223, 234
St. Stephan of Surozh at Kiziltash 224, 233
St. Thoros 223 St. Trinity-Paraskeva Convent 224, 233
St. Vladimir 224, 233
Sts. Apostles 223
Sts. Kozma and Damyan 224, 233
Surb-Khach 223, 226
monosaccharide 16, 18, 21, 25
deoxyribose 16-20, 24
ribose 16-19, 21, 24
Moon 123, 124, 297, 319, 327, 334, 336

Index
371
morphine 117, 134
mount
Agarmysh 223
Ai-George 223 Ai-Thodor 223, 234
Ararat 283
Ayu Dagh 223, 234 Byrd 313
Demerji 223 El Chichón 319
Erebus 313
Freeman 313 Kara Dagh 223, 231, 233, 234
Kilimanjaro 328
Kordon-Oba 223 Mammoth 89
Melbourne 313
Morning 313
Panea 222
Perchem 223, 233
Pinatubo 319
Sapoune 222 Sokol 223, 233
Terror 313
mountains Alborz 262, 263, 274, 278
Allah Dagh 262, 274, 278
Alps 93, 288 Altai 99, 100, 147, 148, 155, 156, 159, 161-163,
187, 189-194, 203, 205, 219
Andes 288, 321, 331
Armenian Highland 287
Balkans 278
Binalud 274, 278
Carpathians 278, 293 Caucasus 93, 99, 287, 288
Crimean
Great Caucasus 260, 262, 263, 274, 277, 278, 287 Hindu Kush 99, 274, 278
Karakorum 274, 278
Khibiny 319, 327 Kopet Dagh 274, 278
Kun Lun 274, 278
Lesser Caucasus 274, 277, 278, 279, 284
Pamirs 93, 274, 278
Rocky 329
Taurus 288
Tibet 274, 278, 288
Tien Shan 274, 278
Urals 82, 99, 293

Igor V. Florinsky 372
Zagros 264, 274, 277-279, 283, 287
Mus musculus 325
Muses 120
mutation 47, 51, 54-56, 86, 101, 180, 309, 320, 323-325, 336
CMP-N-acetylneuraminic acid hydroxylase 55
genomic instability 52, 56 karyotypic diversification 325
microcephalin 55 mutagenic agent 54, 161, 163, 176, 325
myosin heavy chain 55
Y chromosome 55 mycetin 98
mystics, saints
Moses 281 Saint George the Conqueror 236
Saint Simeon the Stylite 241
Sri Ramakrishna 240
Swami Vivekananda 240
Zechariah 273
�
natural selection 24, 52, 56, 161, 163, 180
intrapopulation variability 147, 160, 161 introgressive hybridization 160, 161
micropopulation 147, 156, 158, 160, 161
speciation 37, 50, 52, 56, 101, 146, 147, 161, 324, 325 species extinction 53, 54
trait
dominant 147
morphometric 155, 159, 160-162
recessive 147, 162, 163
neurophysiology 221
action potential 119
axonal connection 128
burst-firing 124, 134
dendritic spine 128 electroencephalography 240
glial cell 120
ion channel 124 Larmor model 118
long term potentiation 117
magnetic resonance imaging 240
microseizure 217, 240
neuron chain 216

Index
373
photon emission tomography 240
quantitative electroencephalography 121
theta-burst 117
transcranial exposure 217 T-type calcium channel 124
nucleic acid 15, 16, 18-20, 24, 79
DNA 15, 18-21, 23, 24, 35, 45, 55 damage 86, 309, 320, 323
repair 51, 52, 56 RNA 15, 18, 19, 21, 23, 24, 35
nucleobase
adenine 16-21, 23, 24 cytosine 16-21, 23
guanine 16-20, 24
thymine 16, 17, 20, 21, 24 uracil 16, 17, 21, 24
nucleoside 17, 21
adenosine 17, 21-23, 39, 80
cytidine 17, 21-23
nucleotide 21, 23
adenosine triphosphate (ATP) 22, 23, 39, 41, 80
O
ocean Arctic 328
Atlantic 331
floor 9, 15, 332, 334, 335 Indian 317
Pacific 317, 318
surface 332, 333
World 290-292, 329, 331
oil
basins 13
Lofoten 13
Namibe 13
black shale 8, 10-12
generation 5, 10, 12 Green River oil shale formation 8
field 4, 12
Rhourde El Baghel 11 White Tiger 12
Pool 5, 9-12
vanadium 10, 11
Oklo natural reactor 54
ontogenesis 45, 47, 52
Igor V. Florinsky 374
ore
deposit 73, 186, 188-190, 194, 195, 200, 235
mineralization 11, 73, 75, 117, 124, 189, 200
occurrence 73 ore-forming system 73-75
catagenetic 73
exfiltration 73, 74 infiltration 73, 75
organic acid 99
compound 13-15, 24, 26, 52, 76
substances 13, 15, 16, 18, 24, 25, 52, 95, 96 origin of life 23, 24, 26
oscillation 20, 41, 123, 194, 288, 298
circadian rhythm 121 cycle 11, 55, 122, 123, 268-272, 294, 296-298
periodicity 122, 258, 268-271, 308, 309
Ostracodermi 54
ozone
depletion 309, 310, 313, 315, 317-320, 323, 327-329,
331, 336
Chapman cycle 310 hole 313-315, 329, 332, 333, 336
layer 309-311, 313, 315, 317-321, 323, 324, 327-
329, 331-334, 336 near-ground 325, 327, 328
radiolysis 313
total ozone content (TOC) 312-317, 319, 321, 326-329
P
paragenesis 15, 18-24
peat 95, 96
peninsula
Anatolian 227
Apennine 287
Calamita 235
Cape York 323 Crimean 221, 225, 227
Heraclean 225, 229, 232, 234
Kamchatka 93, 147, 335 Kola 5, 11, 93, 317, 319
peptide 23, 24
Petroglyphs Provincial Park 132
phosphate 17, 21-24
phospholipid 124

Index
375
photosynthesis 320
C3 plant 44
C4 plant 44
Calvin cycle 44 Hatch–Slack cycle 44
placebo 240
plate African 274
Anatolian 274 Arabian 274, 278
Chinese 190
Eurasian 274, 278 Indian 274, 278
Scythian 227, 260
Siberian 190 Turanian 260, 278
province
Guangxi 80
Guizhou 80
Hubei 82
Hunan 80
Ontario 116, 124, 132, 219 Shaanxi 80
psychology
aggression 123 altered state of consciousness 216
anxiety 123
autoscopy 240 behavior 115, 116, 118, 120, 122-124, 128, 132, 135
bereavement apparition 121
cognitive style 123, 128-130
consciousness 124, 128, 240
creativity 120, 121, 124, 130, 132
dèjá vu 217
dizziness 120 drug 216, 219, 238
hallucination 216, 217
hemispheric dominance 120, 123 hypergraphia 217
hypnagogia 121, 239
hypnopomp 121 hypnosis 240
lateralization 216, 239
left hander 239
meditation 216, 240
memory 117, 124
mystical experience 216-220, 236, 238-241
neuroelectromagnetic 120
neuromatrix 128
partial sensory deprivation 120

Igor V. Florinsky 376
personality 128-130, 216
psychological techniques 216, 240
remote viewing 240
right hander 132 Self 216, 217
semantic memory recall 117
sensed presence 217 slow wave sleep 118
spirituality 120 telepathy 240
Pterosaurs 54
R
radiation background 50-52, 178, 325, 326
hormesis 50-52, 85, 88, 178, 201
low dose 51, 52, 85, 88, 178, 201
terrestrial 50-52, 85, 201
radon bathing 86
emission (emanation) 76, 86, 162, 178, 325
radium decay 86 rate
incidence 77, 83, 84, 120, 121, 172, 173, 175, 176, 178, 179, 186, 195-197, 199, 201, 202, 206
morbidity 51, 75, 78, 82, 85, 86, 178, 186, 196-202, 204-
206 mortality 79, 86, 119, 176, 177, 204, 277
prevalence 47, 77, 86, 176-179, 195-198, 200, 201
red tide 331, 334, 336
reduced gas 309, 311, 313, 315, 335, 336
region
Aegean 270, 273, 274, 277, 280, 285, 287
Alaska 288
Altai Republic 148, 149, 187-191, 194-196, 201, 205
Antarctica 119, 313-315, 328, 331, 334-336
Arkhangelsk Region 83 Atacama Desert 83
Brittany 219
California 329, 331 Central Africa 323
Central Asia 73, 93, 272, 277, 279-281, 284, 285, 287-289
Crimea 93, 95, 221, 225, 226, 228, 230-232, 236, 238
Crimean Plain 227
Donbass 327
Index
377
East Africa 323
East Antarctica 313
East European Plain 221
East Pacific 331, 332 Eastern Siberia 317, 329
Equatorial Africa 323
Hindustan 281 Kuzbass 327
Levant 274, 287 Marie Byrd Land 313
Mediterranean 273, 274, 277, 281, 287, 289
Mesopotamia 264, 280-283, 287 Middle Danube 293
Middle Dnieper 295
Near East 279-281 North America 271, 287, 295, 330
North Atlantic 295, 328
Northern Eurasia 296, 317, 318
Oecumene 272, 277, 279-282, 285, 288, 296
Palestine 280, 281, 283, 284, 287
Polesie 84
Pre-Caspian 317 Saint Petersburg Region 171, 176, 177
Scandinavia 288, 296, 315, 328
Siberia 82, 147, 148, 187, 295, 315, 317, 328, 329 South Africa 334
South America 309, 331, 334-336
South Coast of the Crimea 222, 225, 228 South India 323
South Ural 281
sub-Saharan Africa 82
Thuringia 84
Transbaikalia 82, 87, 93
Transcaucasia 289
Tyrol 81 Urov River Basin 82, 83
Ustyurt 317
Vale das Furnas 95 West Antarctica 282, 313
Yakutia 312, 317
religion 220, 282 Christianity 282
Christianization 238
iconoclastic period 225
iconodule 225
Islam 282
Islamization 225, 238
monk 225, 238, 240
religiosity 216
Russian Orthodox Church 225, 226, 231, 236

Igor V. Florinsky 378
sacred place 219, 220, 232, 238-241
Vatican’s proselytism 226
ridge, range
Biyuk-Enishar 223 Kurai 154, 159, 163
North Chuya 148, 161, 162
South Chuya 163 Talysh 263
Walvis 335 rift
East African 54, 312, 321, 323
Galapagos 323 Lambert 312, 314
Mendana 335
Red Sea 312 Rhine-Libyan 312, 315
Weddell-Ross 312-314
zone 9, 101, 311-313, 315, 324, 326, 327, 333-336
Rigveda 293
Ringer solution 51
river
Ak-Turu 148, 152 Amu Darya 278, 284
Chernaya 235
Chuya 191 Danube 278, 293
Dnieper 278, 294, 295
Euphrates 278, 281 Indus 278, 274, 279, 281, 283, 285, 287
Nile 278, 281, 283
Oder 294, 295
Selenga 317
Uzboi Channel 284, 287
Volga 258, 259, 278, 289, 293
Yenisei 315 rock fracturing 146, 170, 179, 218, 234
runoff 219, 259, 287
rutin 147
S
salt mine 51, 98
sapropel 70, 90, 96
Schumann resonance 116
Scythian mound 219

Index
379
sea
Adriatic 287
Aegean 278, 290, 308
Amundsen 313 Aral 278, 284
Azov 221, 226, 228, 230, 291
Black 93, 221, 227-230, 236, 277, 278, 289, 290-292, 295, 328
Caribbean 309 Caspian 258-268, 278, 289, 290, 298, 336
Coral 323
Dead 287 Kara 296
Marmara 290
Mediterranean 278, 290-292, 308 Okhotsk 147
Red 219, 278, 315, 316
Ross 313
White 328
sea level
Black Sea level 290-292
Caspian level 258, 259, 264-268, 289, 298 Dead Sea level 287
Derbent regression 289
Hadjibey regression 290 Nymphaeum transgression 291, 292
Phanagorian regression 290-292
sedimentary basin 10-12
cover 73, 200, 260-263, 267
seismicity
aftershock 161, 191-193, 197, 202-204, 206
dynamic stress field 201, 206
earthquake
Byzantine tectonic paroxysm 287, 292 2003 Chuya 161, 187, 191-193, 197, 201-205
1927 Crimean 236
1890 Gorgan 263, 265, 266 2000 Great Balkhan 260
1946 Kazanjik 263, 266
1895 Krasnovodsk 263, 265, 266 lights 218, 236
preparation 194, 195, 201, 202, 204, 206, 218
1990 Rudbar 263, 266
1902 Shemakha 263, 266
electron hole current 218, 220, 241
epicenter 116, 190-194, 197, 203, 204, 219, 228, 230,
234, 261, 263, 273, 275, 322
focal zone 260, 263
lithospheric stress 218-220, 241
Igor V. Florinsky 380
mechanoelectricity 218
microseismicity 204
microvibration 204
paleoseismic dislocation 232, 236 seismic activity 70, 75, 134, 161, 163, 186, 190-192, 204, 219,
220, 241, 269, 277, 288, 297, 334
seismic energy 191, 260, 263-266, 269, 270, 272, 274, 276, 287, 288
seismic power 264, 265 seismotectonic province 260, 261, 264, 274, 276, 288
self-luminous object 188-191, 194, 195, 200, 218-220, 236, 238,
241 shield
Baltic 171
Canadian 125 Fennoscandian 26
Ukrainian 227
shilajit 70, 99-101
skin color 323
soil pollution 173-176
spa
ammotherapy 97 balneotherapy 70, 90
moor 70, 90, 95, 96
pelotherapy 70, 95, 96 peloid 94, 95
speleotherapy 98
state (ancient, medieval) Akkad Empire 277
Arabian Caliphate 282
Armenia 273, 283-285, 288, 289
Assyria 280, 281
Babylon 279-281
Bactria 277, 278, 287
Byzantine Empire 225, 238, 273, 274, 282 China 122, 277, 284, 308
Egypt 277, 279-281, 283, 285
Golden Horde 225 Greece 273, 280
Hittite Kingdom 280
India 281, 284 Iran (Persia) 122, 277-282, 284, 287, 289, 292
Israel 281, 285, 287
Japan 122, 277, 308
Kievan Rus 295, 296
Mataram 308
Moscow, Grand Duchy 295
Ottoman Empire 225, 226
Roman Empire 279, 281, 282, 287, 295
Russia, Tsardom 296

Index
381
Russian Empire 295, 296
Sogdiana 277, 278
Syria 280, 281, 283, 287, 288
Urartu 273, 278, 285 state (modern)
Argentina 80
Australia 79, 82, 323, 331 Bangladesh 70, 80
Belarus 84 Canada 8, 9, 116, 125, 130, 219
Chile 70, 80, 81, 83, 277, 316, 331, 332, 335
China 54, 70, 77, 80, 82, 187, 196, 287 Ecuador 321, 323, 331, 335
Egypt 97, 219
Finland 80 Hungary 80
India 54, 70, 77, 86
Indonesia 323, 331
Italy 93, 97
Japan 93, 309
Kazakhstan 187, 196, 284
Kyrgyzstan 87 Lithuania 77
Mexico 70, 80
Montenegro 75 Namibia 335
New Zealand 79, 82, 89, 95
Peru 277, 316, 331, 332, 335 Poland 99
Romania 75
Russia 5, 10, 77-79, 82, 83, 86, 87, 93, 98-100, 118,
148, 171, 187, 196, 296, 319, 328, 335, 336
Senegal 82
Serbia 75
Spain 328 Sri Lanka 323
Sweden 25
Tajikistan 83 Thailand 70, 80
Ukraine 84, 99, 327
USA 8, 75, 82, 86, 315 strait
Bosporus 290-292
Danish 295
Dardanelles 290, 292
Drake Passage 313
Kerch (Cimmerian Bosporus) 290, 291
South Kuril 335

Igor V. Florinsky 382
stratosphere 310, 311, 317, 319, 320, 327, 328, 332, 333,
336
stress 37, 49, 51, 52, 99, 101, 146, 161, 170, 186,
201-204 Sufism 226, 239
azise 232
dervish 226 Naqshbandi 226
Suhrawardi 226 suicide 123
Sun 26, 123, 297, 315, 334, 336
solar activity 119, 122, 268, 269, 272, 297, 298, 309 synergism 116, 123, 176, 325
T
tekke 224, 226, 231, 233, 234, 238
Ahmed-Efendi 224
Caliph Ahmed-Efendi of Kolech 224
Damad-Efendi 224 Gazy-Mansur 224
Kady-Male 224
Kemal-Ata 224 Khan Jami 224
Khodji-Suleiman 224 Khyzr Shah-Efendi 224
Kyrk-Azis 224
Muhammed-Efendi 224 Sakyz-Khan 224
Shukurla-Efendi 224
Sulu-Koba 224
Tahir-Bey 224
Yeni Jami 224
Yer-Utkan 224
Yeshil Jami 224
tectonic
activity 54, 72, 125, 186, 268, 285, 298
movement 180, 189, 258, 264, 272, 293, 325 strain theory 218
tide 86, 123
topographic barrier 324, 325 trace element 10, 55, 70, 76, 78, 89, 90, 94-99, 101, 124,
146, 170, 192
arsenic 80, 81, 125, 132
calcium 82, 83, 92, 191
cobalt 78, 79

Index
383
fluorine 76, 77
iodine 82-84
lead 45, 86, 125
mercury 189, 193 selenium 81-83
silicon 77, 78
strontium 45, 82, 83 uranium 52, 54, 75, 84, 85, 89, 97, 116, 125, 171, 172,
178, 325, 326 zinc 79
traffic accident 123, 172, 174
tribe, ethnos Achaeans 279, 280, 285
Arabic nomads 282
Arameans 279, 281, 284 Aryans 281
Canaanites 281
Chaldeans 281
Cimmerians 294
Crimean Greeks 238
Crimean Tatars 225, 231, 238
Dorians 280, 285 Dravidians 281
Etruscans 280
Hittites 281 Irano-Aryans 281
Indo-Europeans 293
Jewish nomads 281 Khazarians 278, 289
Libyans 280
Lycians 280
Native Americans 238
Neurians 295
Pelasgians (Philistines) 280, 281, 285
Peoples of Sea 279, 280, 285 pre-Slavs 294-296
Sarmatians 295
Scythians 278, 294, 295 Sicelians 280, 285
Skolots (Borysthenites) 278, 295
Slavs 293-296 Thracians-Illyrians 280, 285
troposphere 321, 327, 328

Igor V. Florinsky 384
U
ultraviolet 309, 320
UVB 55, 309, 320, 321, 323-326, 336, 337
index 321, 322
V
Vavilov centers 146, 163, 322, 324-326 virus
human immunodeficiency (HIV) 323
human T-cell lymphotropic type I 323 vitamin 95, 96
B12 78 cobalamin 78, 79
D3 320
volcanism 81, 93, 258, 272, 279, 284
activity 35, 54, 55, 88, 89, 93, 283, 288, 309, 313
alkaline 317
calc-alkaline 318
dust 81
gases 88, 89 laccolite 230, 231, 234
lapilli 88
lava 88 tephra 88
tholeitic 315, 317, 323 ultra alkaline 317
volcano 73
Agua 308 Ilyinsky 335
Kambalny 335
Merapi 308 mud 267
Nyiragongo 321
Porak 283
Santorini 308

Index
385
W
water
balance 258, 259, 267, 292, 298
bicarbonate-sulfate 90
brine 73, 83, 90 carbonated 89, 92
fumarolic 93
groundwater 34, 54, 70, 77-80, 83, 98, 101, 146, 161, 162, 170, 191-193, 202, 204, 259, 267, 268, 298,
325, 326
mineral 70, 86, 87, 89, 90-94, 98, 238, 240 ocean 328, 329, 332, 334
sodium-chloride 90 thermal 70, 81, 90, 91, 93, 238, 240
total dissolved solids (TDS) 90, 95, 191, 192
wax 99 Weber’s law 117
window effect 240
Wolf number 268
Y
Yoga 239
pranayama 239