Ternary feldspar thermometry in granulites from the Oaxacan Complex, Mexico
Upload
independentCategory
view
0download
0
This article appeared in a journal published by Elsevier. The attachedcopy is furnished to the author for internal non-commercial researchand education use, including for instruction at the authors institution
and sharing with colleagues.
Other uses, including reproduction and distribution, or selling orlicensing copies, or posting to personal, institutional or third party
websites are prohibited.
In most cases authors are permitted to post their version of thearticle (e.g. in Word or Tex form) to their personal website orinstitutional repository. Authors requiring further information
regarding Elsevier’s archiving and manuscript policies areencouraged to visit:
http://www.elsevier.com/copyright

Author's personal copy
Pb isotopic variability in the modern-Pleistocene Indus Riversystem measured by ion microprobe in detrital K-feldspar grains
Anwar Alizai a,⇑, Peter D. Clift a, Liviu Giosan b, Sam VanLaningham c,Richard Hinton d, Ali R. Tabrez e, Muhammad Danish e,
The Edinburgh Ion Microprobe Facility (EIMF) d
a School of Geosciences, University of Aberdeen, Meston Building, Aberdeen AB24 3UE, UKb Department of Geology and Geophysics, Woods Hole Oceanographic Institution, Woods Hole, MA 02543, USA
c School of Fisheries and Ocean Sciences, University of Alaska, Fairbanks, AK 99775, USAd Department of GeoSciences, University of Edinburgh, Kings Buildings, West Mains Road, Edinburgh EH9 3JW, UK
e National Institute for Oceanography, ST-47-Block 1, Clifton, Karachi 75600, Pakistan
Received 1 March 2011; accepted in revised form 24 May 2011; available online 22 June 2011
Abstract
The western Himalaya, Karakoram and Tibet are known to be heterogeneous with regard to Pb isotope compositions inK-feldspars, which allows this system to be used as a sediment provenance tool. We used secondary ion mass spectrometry tomeasure the isotopic character of silt and sand-sized grains from the modern Sutlej and Chenab Rivers, together with TharDesert sands, in order to constrain their origin. The rivers show a clear Himalayan provenance, contrasting with grains fromthe Indus Suture Zone, but with overlap to known Karakoram compositions. The desert dunes commonly show 207Pb/204Pband 206Pb/204Pb values that are much higher than those seen in the rivers, most consistent with erosion from Nanga Parbat.This implies at least some origin from the trunk Indus, probably reworked by summer monsoon winds from the SW, ahypothesis supported by bulk Nd and U–Pb zircon dating. Further data collected from Holocene and Pleistocene sands showsthat filled and abandoned channels on the western edge of the Thar Desert were sourced from Himalayan rivers before and at6–8 ka, but that after that time the proportion of high isotopic ratio grains rose, indicating increased contribution from theThar Desert dunes prior to �4.5 ka when flow ceased entirely. This may be linked to climatic drying, northward expansion ofthe Thar Desert, or changes in drainage style including regional capture, channel abandonment, or active local Thar tribu-taries. Our data further show a Himalayan river channel east of the present Indus, close to the delta, in the Nara River valleyduring the middle Holocene. While this cannot be distinguished from the Indus it is not heavily contaminated by reworkingfrom the desert. The Pb system shows some use as a provenance tool, but is not effective at demonstrating whether these Narasediments represent a Ghaggar-Hakra stream independent from the Indus. Our study highlights an important role for eolianreworking of floodplain sediments in arid rivers such as the Indus.� 2011 Elsevier Ltd. All rights reserved.
1. INTRODUCTION
The western Himalaya is a classic region for the study ofcontinental erosion, specifically the relative influence of
climate, tectonics and topography in controlling erosionrates. While modern rates and patterns can be readily mea-sured, past erosion can be harder to constrain. However,the sedimentary record can provide a powerful archive ofpast erosion. In order to decipher these records we needto employ provenance methods to trace sediments back totheir sources. Single grain techniques are much more pow-erful than bulk methods in quantifying the erosional flux
0016-7037/$ - see front matter � 2011 Elsevier Ltd. All rights reserved.
doi:10.1016/j.gca.2011.05.039
⇑ Corresponding author.E-mail address: [email protected] (A. Alizai).
www.elsevier.com/locate/gca
Available online at www.sciencedirect.com
Geochimica et Cosmochimica Acta 75 (2011) 4771–4795

Author's personal copy
from any given source because they allow us to resolve theflux from different parts of the source region. In this studywe employed the Pb isotope characteristics of K-feldspargrains to examine the source of modern sediment, as wellas select Holocene and Pleistocene sediments from the floodplains of the Indus River. This isotope system has an estab-lished track record as a provenance tool in a number ofenvironments (McDaniel et al., 1994; Gwiazda et al.,1996; Hemming et al., 1998; Tyrrell et al., 2006, 2007),and has already been used to discriminate evolving prove-nance within the Palaeogene Indus Suture Zone (Cliftet al., 2001b) and in the Arabian Sea during the Eocene(Clift et al., 2001a). Our work builds on an earlier Pb isoto-pic study of the modern river system (Clift et al., 2002), butprovides significantly more data from the Chenab and Su-tlej Rivers, which drain the Himalaya front. We furtherprovide new data from the sands of the Thar Desert
(Fig. 1), which shed light on its origin and the role it playsin recycling sediment to the modern and Holocene rivers onthe eastern side of the Indus basin.
Clift et al. (2002) demonstrated that different tectonicblocks in the Himalaya–Karakoram–Tibet orogen havedifferent Pb isotope signals and that these are transferredto the rivers on erosion. In the few places where river sedi-ment could be compared with bedrock compositions a goodfirst order correlation was observed. The bedrock of theHimalaya is only patchily surveyed with regard to Pb iso-topes but we argue that characterizing the river sands inplaces where the tectonic affiliation of the bedrock is knownis a good way of determining the range of basement compo-sitions, because a river samples more evenly across theranges than a geologist working in the field. Moreover,since we are interested in drainage reconstructions ratherthan bedrock evolution we are specifically interested in
Fig. 1. Geological map of the Indus River system showing the major tectonic divisions in the western Himalaya, features discussed in the text,together with sample points, shown as black spots. Samples analyzed by Clift et al. (2002) are shown as empty circles. Stars show locations ofbedrock Pb isotope analyses of Scharer et al. (1990) in the Karakoram, of Clift et al. (2002) in the Hindu Kush and of Khan et al. (1997) in theKohistan Arc. Map is modified after Garzanti et al. (2005). The hypothesized course of the extended Ghaggar-Hakra follows that proposed byTripathi et al. (2004). Black lines show the extent of the drainage basins for individual tributaries.
4772 A. Alizai et al. / Geochimica et Cosmochimica Acta 75 (2011) 4771–4795
Author's personal copy
what is being eroded from the mountains, and not necessar-ily all the compositions present in any given river headwa-ter. Although Amidon et al. (2005) demonstrated that inNepal the zircon population mirrored the bedrock outcropAlizai et al. (2011) found that some of the major Indus trib-utaries, and the Indus itself, showed preferential erosion ofcertain parts of the basin. This means that some bedrockcomposition contribute very little to the net sediment fluxfrom the mountains, at least under certain circumstances.
For the first time, we present single grain Pb isotopedata with associated bulk sediment Nd isotopes from Holo-cene and Pleistocene sediments, mostly in the southern andeastern parts of the Indus flood plain. We use Nd to cross-check critical provenance predictions, because this isotopesystem is also sensitive to the age and petrogenesis of sourcerocks. We undertake this study in order to explore whetherthe sources of sediment have been stable over 103–104 yrtime scales and also to test models that have proposed sig-nificant changes in the drainage evolution in the recent geo-logical past (Ghose et al., 1979; Tripathi et al., 2004; Sainiet al., 2009). If major headwater capture had occurred inthe past and the rivers involved are isotopically unique thenit may be possible to identify and date such events usingsediments deposited in the flood plain.
2. SAMPLING STRATEGY
Our study builds on the earlier work of Clift et al. (2002)and our sampling strategy reflects this by extending ouranalysis beyond the earlier emphasis on rivers within theIndus Suture Zone. In order to provide better characteriza-tion of the flux from the Himalaya samples were taken fromthe modern Chenab and Sutlej Rivers close to the pointswhere these reach the range front (Fig. 1). This location isimportant in characterizing the composition of flux fromthe mountains while minimizing the degree of reworkingfrom the sediment stored in the flood plains. The isotopiccharacter of the grains in any given river reflects the diver-sity of the bedrock in its headwaters and the patterns oferosion within the upper catchment. Thus because each riv-er has a different range of rocks exposed in its headwaters ithas a unique isotopic signature. This is especially true whencomparing the arc draining rivers of the upper trunk Indussystem in the west with the Himalaya-draining rivers in theeastern parts of the basin. Samples were taken from withinthe active streams when they were below flood stage, butfrom recently transported materials in sand banks thathad clearly been reworked during the previous monsoonseason. Dune sand was sampled from an active dune closeto Marot in the Punjab (Fig. 1), as well as from the top ofthe section at Chak 102DB (Yazman; Fig. 1). Holocene–Pleistocene sediments were sampled from a series of pitsand coring locations, whose positions are shown in Fig. 1,with precise locations provided in Table 1. The sampled sec-tions are shown graphically in Fig. 2, showing where thesands considered lie within each section and the relatedage control provided largely by 14C AMS dating, describedbelow (Table 2). Sands from Fort Derawar, located on theedge of the Thar Desert, are presumed to have been depos-ited prior to around 4.5 ka and probably after the Younger
Dryas (�11 ka). The younger age limit is derived fromdates from nearby Chak 102DB that indicate an end to flu-vial sedimentation there shortly after 4.5 ka. The channelsare presumed to be younger than the Younger Dryas be-cause the summer monsoon was much weaker prior to10 ka (Fleitmann et al., 2003) and less likely to be able tosupply streams in this region. Such a conclusion is consis-tent with ages from Fort Abbas, which lies in a similar loca-tion to Fort Derawar, and where fluvial sedimentation wasactive around 5.7 ka. We presume that the Fort Derawarsands were deposited as part of a larger Holocene fluvial re-gime based on the age data from Chak 102DB and fromoptically stimulated luminescence (OSL) ages for 4.3–5.9 ka from similar channels located upstream in westernIndia (Saini et al., 2009). This hypothesis is supported byprovisional unpublished OSL ages. In all cases we sampledsands interbedded with clays that were clearly of fluvial fa-cies and not eolian dune sands.
3. SAND PETROLOGY
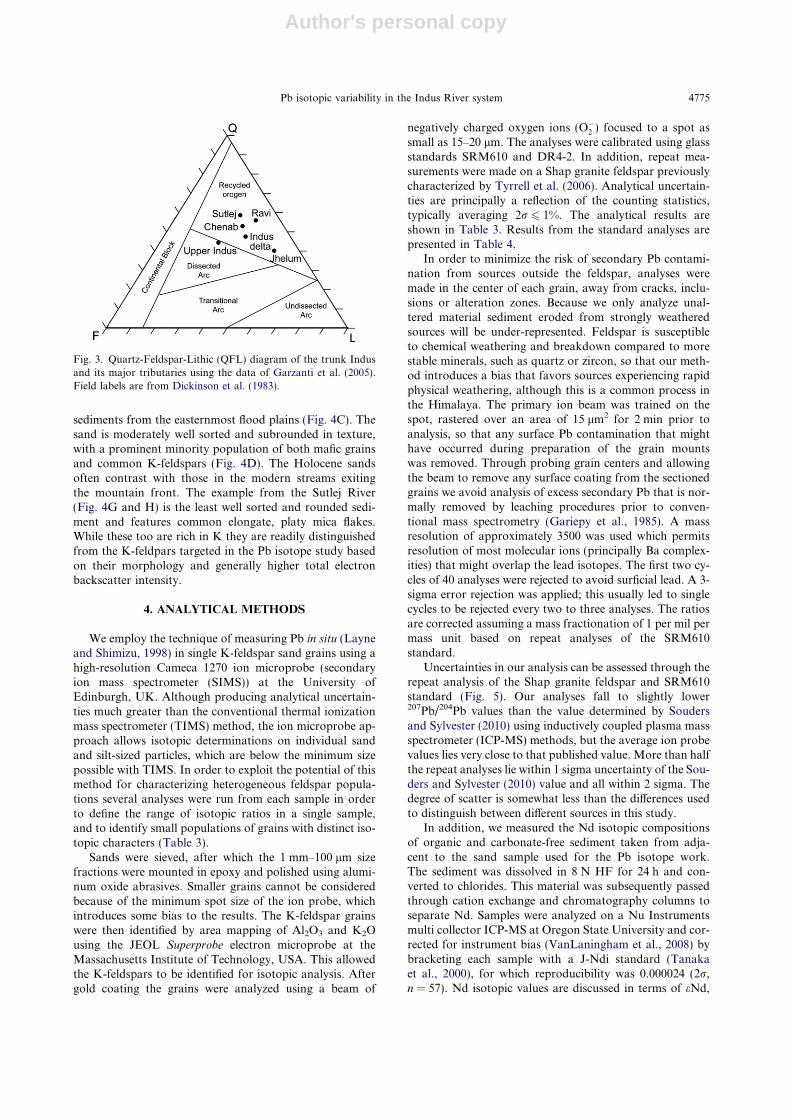
The sands considered in this study were selected to berepresentative of the section or river bed from which theywere taken. They are all quartz and lithic dominated with<15% of mafic heavy minerals. Fig. 3 shows that the sandsof the Indus River systems are mostly characterized withinthe “recycled orogen” field under the scheme of Dickinsonet al. (1983). The upper Indus plots towards the dissectedarc field, reflecting the erosion of the Kohistan arc andthe subduction-related granites of the Karakoram andTranshimalaya. The sands studied here are consistent withthe earlier petrographic work of Garzanti et al. (2005).While there are some differences between different Industributaries in terms of their bulk mineralogy it has beenshown that the composition of sands at the delta has notchanged significantly since the Last Glacial Maximum de-spite significant changes in the bulk isotopic compositionand thermochronology of the apatite, mica and zircon pop-ulations (Clift et al., 2010). This indicates that the bulk min-eralogy of the various source areas does not differ verymuch and that while erosion of the mafic rocks of Kohistanhas proven useful as a provenance indicator on timescales
Table 1List of sampling locations for material used in this study.
Location Type Latitude Longitude
Chenab Fluvial(modern)
N32�40002.310 0 E74�35006.040 0
Sutlej Fluvial(modern)
N30�59006.000 0 E76�31012.000 0
Fort Abbas Pit N29�11024.540 0 E72�52054.540 0
Chak-310,Marot
Pit N29�12038.520 0 E72�29004.980 0
Marot Drilled core N29�12048.960 0 E72�20028.500 0
Chak-102,Yazman
Pit N29�07022.260 0 E71�46010.860 0
Chak Barha Pit N29�05042.300 0 E71�34003.480 0
Fort Derawar Pit N28�45050.400 0 E71�20006.400 0
Fakirabad coresite
Pit N27�11052.830 0 E69�00057.590 0
Pb isotopic variability in the Indus River system 4773

Author's personal copy
>1 � 106 yr (Cerveny et al., 1989) this is not a viable ap-proach for the millennial scale examined here.
Bulk sediment chemical analysis of the modern riversands studied here shows that there is a range of chemicalalteration in the headwater. Alizai et al. (2011) showed thatthe trunk Indus has the least chemical weathering(CIA = 55), while the Jhellum is the most altered of themodern rivers (CIA = 66). The trunk Indus, Beas and Su-tlej sediments appear to be relatively sandy and onlyslightly affected by chemical weathering, indicating thatphysical erosion processes are dominant in theirheadwaters.
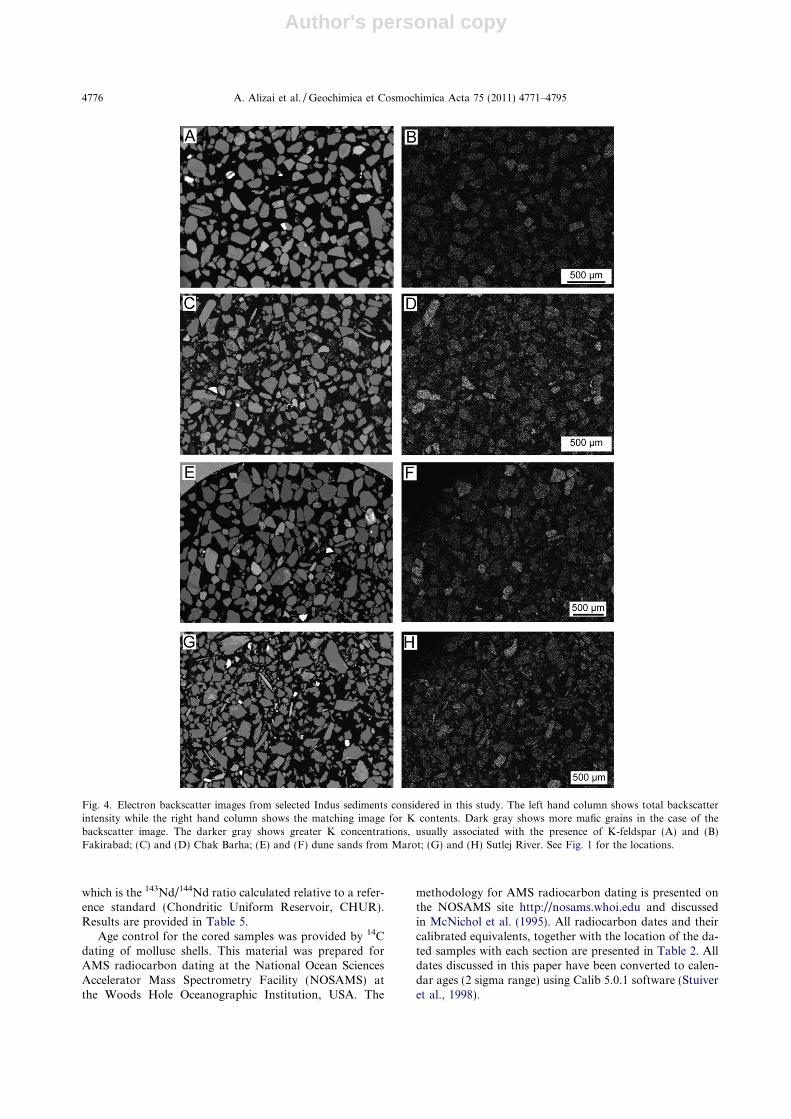
The texture and overall composition of the sediments isshown in Fig. 4, a series of electron backscatter images andK concentration maps for four of the samples displayed inorder to show the diversity of compositions. Sands fromFakirabad are relatively well sorted and moderatelyrounded (Fig. 4A) suggestive of reworking from the eoliansands of the neighboring Thar Desert. Dune sands fromMarot (Fig. 4E) are also moderately rounded but less wellsorted than those from Fakirabad, indicating that at leastsome of the Thar Desert materials are recently reworkedfrom the rivers. Images from the sample taken at ChakBarha are representative of many of the middle Holocene
Fig. 2. Sedimentary logs at the sampling locations for the Holocene–Pleistocene sediments analyzed in this study, showing the depth ofsampling and the age control available for the time of sedimentation. Logs in the frame are drawn at a different scale reflecting their muchgreater length. See Table 1 for precise location data.
Table 2Results of 14C AMS dating for the organic materials recovered from the cores and sampling pits related to sand samples used in this study.
Sample Description 13C F modern Fm error 14C age Age error (yr) D14C Calendar age(2 sigma yrs ago)
Fakirabad, 250 cm depth Gastropod �5.34 0.681 0.003 3080 35 3215–3373Fort Abbas, 348 cm depth Gastropod �2.4 0.5334 0.0023 5050 35 5743–5768Nara borehole, 14.02 m depth Bivalve �6.55 0.5478 0.0016 4830 25 �456.1 5489–5502Nara, 200 cm Bivalve �7.41 0.856 0.003 1250 30 1082–1114Marot, 9.37 m depth Gastropod �3.51 0.4454 0.0027 6500 50 7329–7358
4774 A. Alizai et al. / Geochimica et Cosmochimica Acta 75 (2011) 4771–4795
Author's personal copy
sediments from the easternmost flood plains (Fig. 4C). Thesand is moderately well sorted and subrounded in texture,with a prominent minority population of both mafic grainsand common K-feldspars (Fig. 4D). The Holocene sandsoften contrast with those in the modern streams exitingthe mountain front. The example from the Sutlej River(Fig. 4G and H) is the least well sorted and rounded sedi-ment and features common elongate, platy mica flakes.While these too are rich in K they are readily distinguishedfrom the K-feldpars targeted in the Pb isotope study basedon their morphology and generally higher total electronbackscatter intensity.
4. ANALYTICAL METHODS
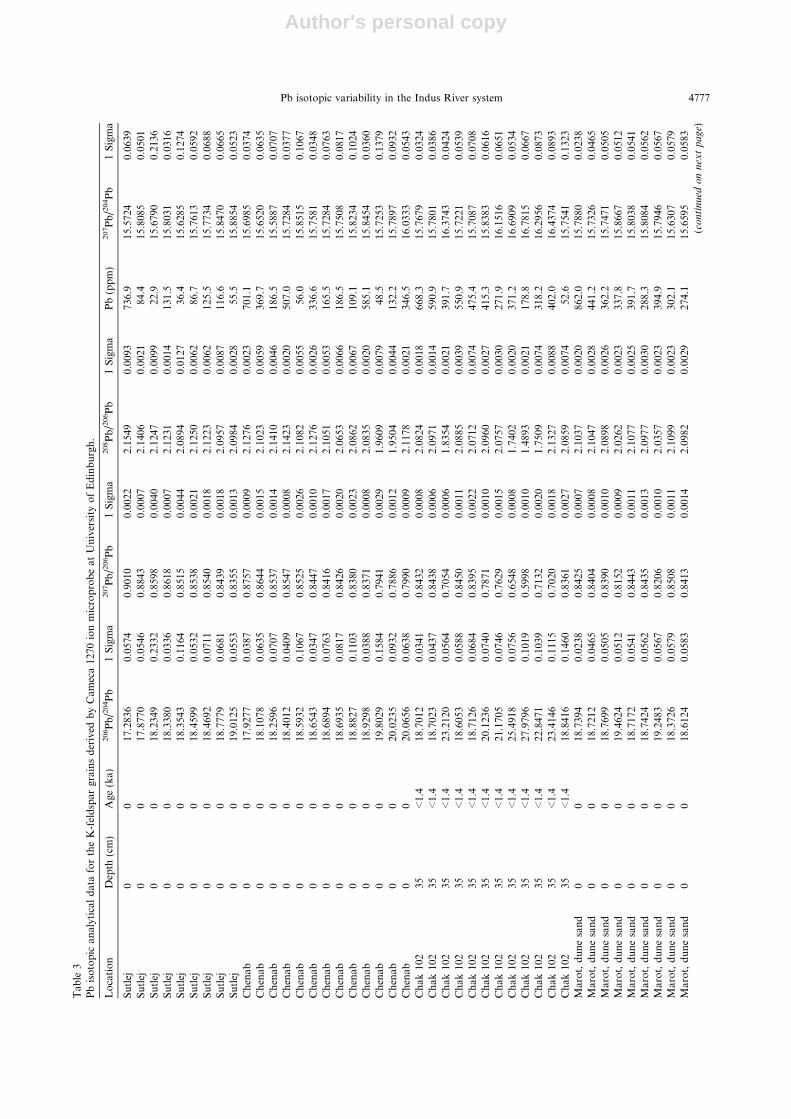
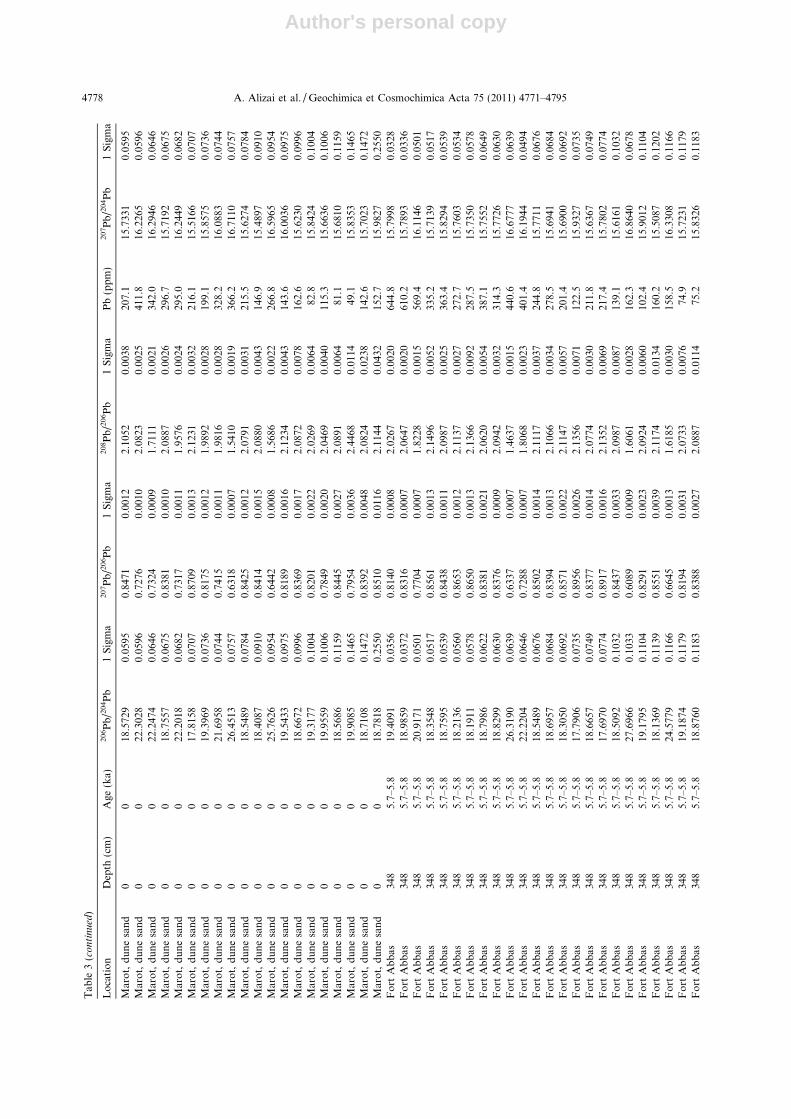
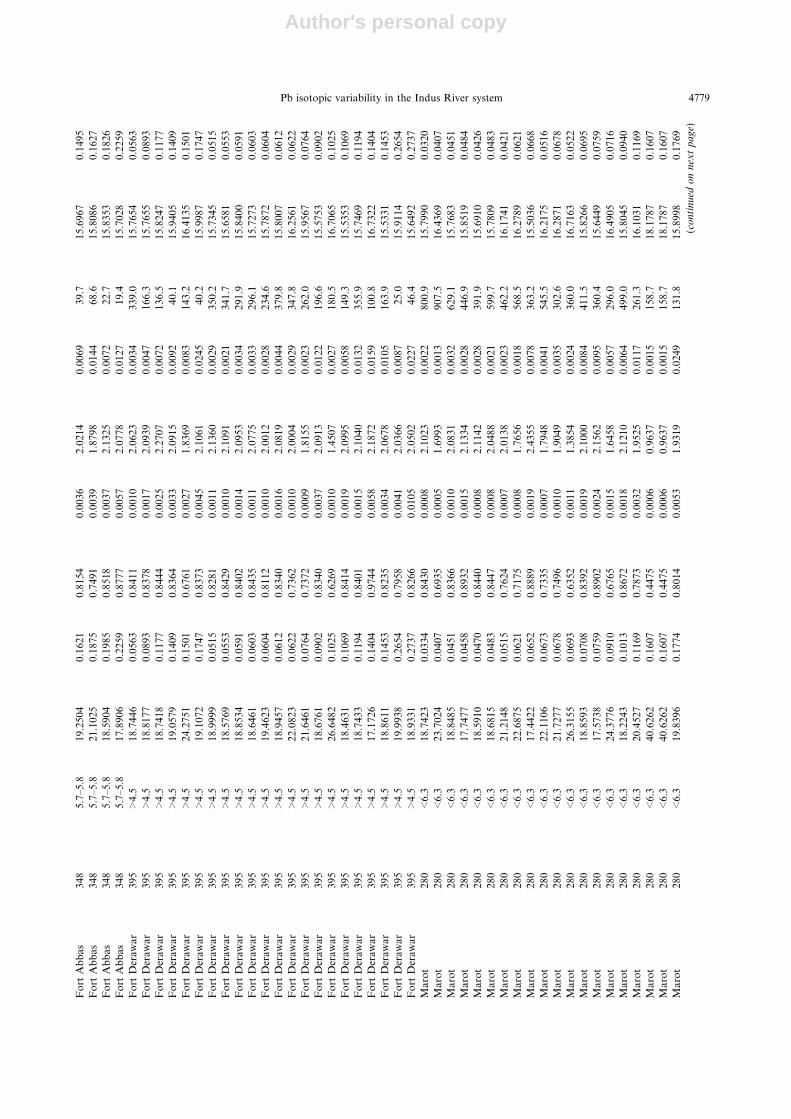
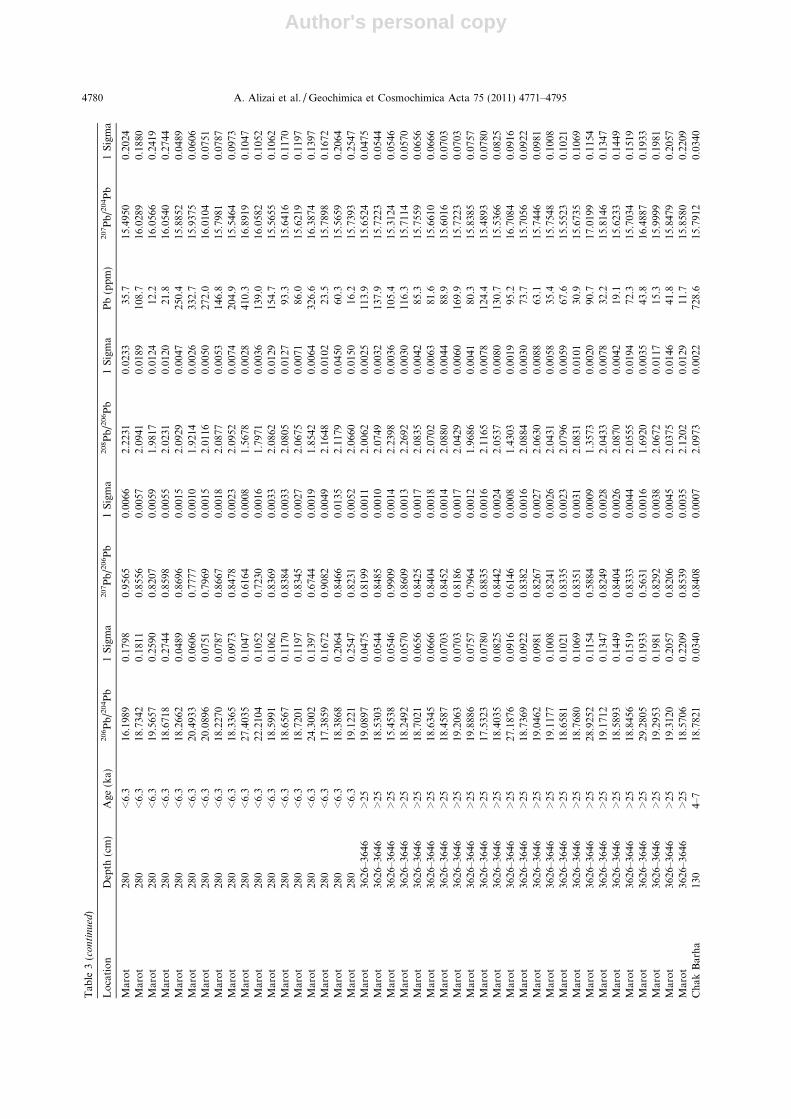
We employ the technique of measuring Pb in situ (Layneand Shimizu, 1998) in single K-feldspar sand grains using ahigh-resolution Cameca 1270 ion microprobe (secondaryion mass spectrometer (SIMS)) at the University ofEdinburgh, UK. Although producing analytical uncertain-ties much greater than the conventional thermal ionizationmass spectrometer (TIMS) method, the ion microprobe ap-proach allows isotopic determinations on individual sandand silt-sized particles, which are below the minimum sizepossible with TIMS. In order to exploit the potential of thismethod for characterizing heterogeneous feldspar popula-tions several analyses were run from each sample in orderto define the range of isotopic ratios in a single sample,and to identify small populations of grains with distinct iso-topic characters (Table 3).
Sands were sieved, after which the 1 mm–100 lm sizefractions were mounted in epoxy and polished using alumi-num oxide abrasives. Smaller grains cannot be consideredbecause of the minimum spot size of the ion probe, whichintroduces some bias to the results. The K-feldspar grainswere then identified by area mapping of Al2O3 and K2Ousing the JEOL Superprobe electron microprobe at theMassachusetts Institute of Technology, USA. This allowedthe K-feldspars to be identified for isotopic analysis. Aftergold coating the grains were analyzed using a beam of
negatively charged oxygen ions (O�2 ) focused to a spot assmall as 15–20 lm. The analyses were calibrated using glassstandards SRM610 and DR4-2. In addition, repeat mea-surements were made on a Shap granite feldspar previouslycharacterized by Tyrrell et al. (2006). Analytical uncertain-ties are principally a reflection of the counting statistics,typically averaging 2r 6 1%. The analytical results areshown in Table 3. Results from the standard analyses arepresented in Table 4.
In order to minimize the risk of secondary Pb contami-nation from sources outside the feldspar, analyses weremade in the center of each grain, away from cracks, inclu-sions or alteration zones. Because we only analyze unal-tered material sediment eroded from strongly weatheredsources will be under-represented. Feldspar is susceptibleto chemical weathering and breakdown compared to morestable minerals, such as quartz or zircon, so that our meth-od introduces a bias that favors sources experiencing rapidphysical weathering, although this is a common process inthe Himalaya. The primary ion beam was trained on thespot, rastered over an area of 15 lm2 for 2 min prior toanalysis, so that any surface Pb contamination that mighthave occurred during preparation of the grain mountswas removed. Through probing grain centers and allowingthe beam to remove any surface coating from the sectionedgrains we avoid analysis of excess secondary Pb that is nor-mally removed by leaching procedures prior to conven-tional mass spectrometry (Gariepy et al., 1985). A massresolution of approximately 3500 was used which permitsresolution of most molecular ions (principally Ba complex-ities) that might overlap the lead isotopes. The first two cy-cles of 40 analyses were rejected to avoid surficial lead. A 3-sigma error rejection was applied; this usually led to singlecycles to be rejected every two to three analyses. The ratiosare corrected assuming a mass fractionation of 1 per mil permass unit based on repeat analyses of the SRM610standard.
Uncertainties in our analysis can be assessed through therepeat analysis of the Shap granite feldspar and SRM610standard (Fig. 5). Our analyses fall to slightly lower207Pb/204Pb values than the value determined by Soudersand Sylvester (2010) using inductively coupled plasma massspectrometer (ICP-MS) methods, but the average ion probevalues lies very close to that published value. More than halfthe repeat analyses lie within 1 sigma uncertainty of the Sou-ders and Sylvester (2010) value and all within 2 sigma. Thedegree of scatter is somewhat less than the differences usedto distinguish between different sources in this study.
In addition, we measured the Nd isotopic compositionsof organic and carbonate-free sediment taken from adja-cent to the sand sample used for the Pb isotope work.The sediment was dissolved in 8 N HF for 24 h and con-verted to chlorides. This material was subsequently passedthrough cation exchange and chromatography columns toseparate Nd. Samples were analyzed on a Nu Instrumentsmulti collector ICP-MS at Oregon State University and cor-rected for instrument bias (VanLaningham et al., 2008) bybracketing each sample with a J-Ndi standard (Tanakaet al., 2000), for which reproducibility was 0.000024 (2r,n = 57). Nd isotopic values are discussed in terms of eNd,
Fig. 3. Quartz-Feldspar-Lithic (QFL) diagram of the trunk Indusand its major tributaries using the data of Garzanti et al. (2005).Field labels are from Dickinson et al. (1983).
Pb isotopic variability in the Indus River system 4775
Author's personal copy
which is the 143Nd/144Nd ratio calculated relative to a refer-ence standard (Chondritic Uniform Reservoir, CHUR).Results are provided in Table 5.
Age control for the cored samples was provided by 14Cdating of mollusc shells. This material was prepared forAMS radiocarbon dating at the National Ocean SciencesAccelerator Mass Spectrometry Facility (NOSAMS) atthe Woods Hole Oceanographic Institution, USA. The
methodology for AMS radiocarbon dating is presented onthe NOSAMS site http://nosams.whoi.edu and discussedin McNichol et al. (1995). All radiocarbon dates and theircalibrated equivalents, together with the location of the da-ted samples with each section are presented in Table 2. Alldates discussed in this paper have been converted to calen-dar ages (2 sigma range) using Calib 5.0.1 software (Stuiveret al., 1998).
Fig. 4. Electron backscatter images from selected Indus sediments considered in this study. The left hand column shows total backscatterintensity while the right hand column shows the matching image for K contents. Dark gray shows more mafic grains in the case of thebackscatter image. The darker gray shows greater K concentrations, usually associated with the presence of K-feldspar (A) and (B)Fakirabad; (C) and (D) Chak Barha; (E) and (F) dune sands from Marot; (G) and (H) Sutlej River. See Fig. 1 for the locations.
4776 A. Alizai et al. / Geochimica et Cosmochimica Acta 75 (2011) 4771–4795
Author's personal copy
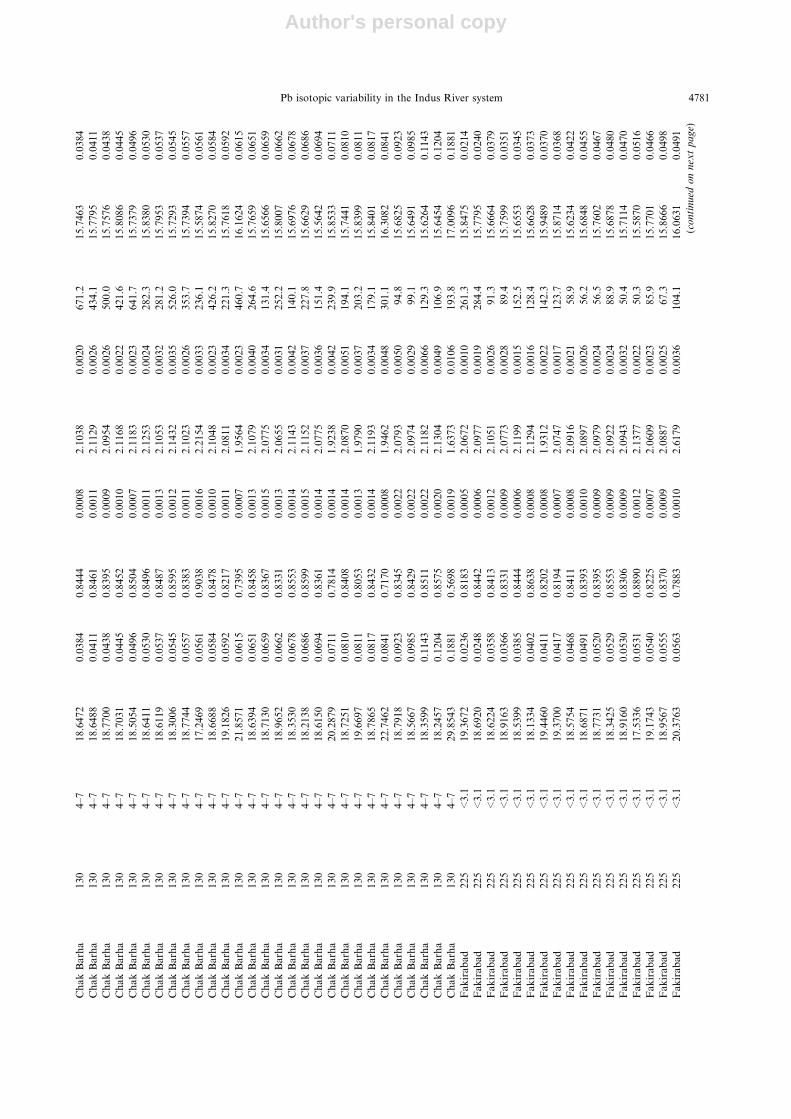
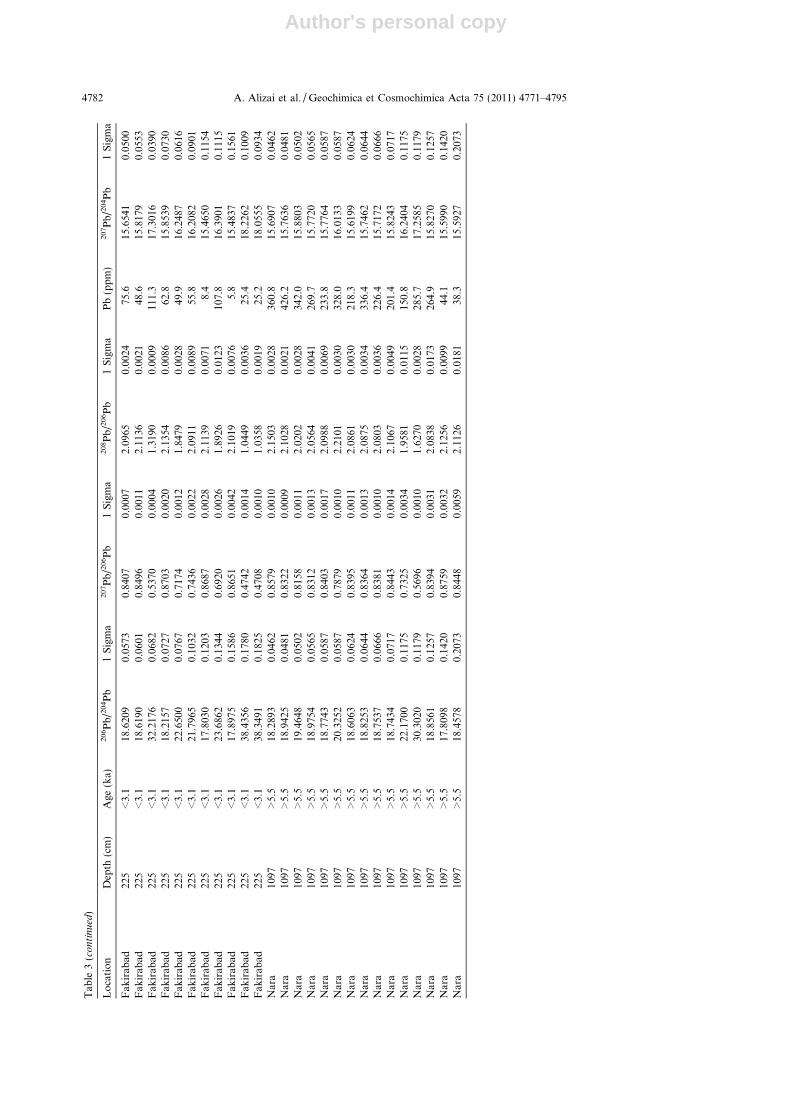
Tab
le3
Pb
iso
top
ican
alyt
ical
dat
afo
rth
eK
-fel
dsp
argr
ain
sd
eriv
edb
yC
amec
a12
70io
nm
icro
pro
be
atU
niv
ersi
tyo
fE
din
bu
rgh
.
Lo
cati
on
Dep
th(c
m)
Age
(ka)
20
6P
b/2
04P
b1
Sig
ma
20
7P
b/2
06P
b1
Sig
ma
20
8P
b/2
06P
b1
Sig
ma
Pb
(pp
m)
20
7P
b/2
04P
b1
Sig
ma
Su
tlej
00
17.2
836
0.05
740.
9010
0.00
222.
1549
0.00
9373
6.9
15.5
724
0.06
39S
utl
ej0
017
.877
00.
0546
0.88
430.
0007
2.14
060.
0021
84.4
15.8
085
0.05
01S
utl
ej0
018
.234
90.
2332
0.85
980.
0040
2.12
470.
0099
22.9
15.6
790
0.21
36S
utl
ej0
018
.338
00.
0336
0.86
180.
0007
2.12
310.
0014
131.
515
.803
10.
0316
Su
tlej
00
18.3
543
0.11
640.
8515
0.00
442.
0894
0.01
2736
.415
.628
50.
1274
Su
tlej
00
18.4
599
0.05
320.
8538
0.00
212.
1250
0.00
6286
.715
.761
30.
0592
Su
tlej
00
18.4
692
0.07
110.
8540
0.00
182.
1223
0.00
6212
5.5
15.7
734
0.06
88S
utl
ej0
018
.777
90.
0681
0.84
390.
0018
2.09
570.
0087
116.
615
.847
00.
0665
Su
tlej
00
19.0
125
0.05
530.
8355
0.00
132.
0984
0.00
2855
.515
.885
40.
0523
Ch
enab
00
17.9
277
0.03
870.
8757
0.00
092.
1276
0.00
2370
1.1
15.6
985
0.03
74C
hen
ab0
018
.107
80.
0635
0.86
440.
0015
2.10
230.
0059
369.
715
.652
00.
0635
Ch
enab
00
18.2
596
0.07
070.
8537
0.00
142.
1410
0.00
4618
6.5
15.5
887
0.07
07C
hen
ab0
018
.401
20.
0409
0.85
470.
0008
2.14
230.
0020
507.
015
.728
40.
0377
Ch
enab
00
18.5
932
0.10
670.
8525
0.00
262.
1082
0.00
5556
.015
.851
50.
1067
Ch
enab
00
18.6
543
0.03
470.
8447
0.00
102.
1276
0.00
2633
6.6
15.7
581
0.03
48C
hen
ab0
018
.689
40.
0763
0.84
160.
0017
2.10
510.
0053
165.
515
.728
40.
0763
Ch
enab
00
18.6
935
0.08
170.
8426
0.00
202.
0653
0.00
6618
6.5
15.7
508
0.08
17C
hen
ab0
018
.882
70.
1103
0.83
800.
0023
2.08
620.
0067
109.
115
.823
40.
1024
Ch
enab
00
18.9
298
0.03
880.
8371
0.00
082.
0835
0.00
2058
5.1
15.8
454
0.03
60C
hen
ab0
019
.802
90.
1584
0.79
410.
0029
1.96
090.
0079
48.5
15.7
253
0.13
79C
hen
ab0
020
.023
50.
0932
0.78
860.
0012
1.95
040.
0044
132.
215
.789
70.
0932
Ch
enab
00
20.0
656
0.06
380.
7990
0.00
092.
1178
0.00
2134
6.5
16.0
333
0.05
43C
hak
102
35<
1.4
18.7
012
0.03
410.
8432
0.00
082.
0824
0.00
1866
8.3
15.7
679
0.03
24C
hak
102
35<
1.4
18.7
023
0.04
370.
8438
0.00
062.
0971
0.00
1459
0.9
15.7
801
0.03
86C
hak
102
35<
1.4
23.2
120
0.05
640.
7054
0.00
061.
8354
0.00
2139
1.7
16.3
743
0.04
24C
hak
102
35<
1.4
18.6
053
0.05
880.
8450
0.00
112.
0885
0.00
3955
0.9
15.7
221
0.05
39C
hak
102
35<
1.4
18.7
126
0.06
840.
8395
0.00
222.
0712
0.00
7447
5.4
15.7
087
0.07
08C
hak
102
35<
1.4
20.1
236
0.07
400.
7871
0.00
102.
0960
0.00
2741
5.3
15.8
383
0.06
16C
hak
102
35<
1.4
21.1
705
0.07
460.
7629
0.00
152.
0757
0.00
3027
1.9
16.1
516
0.06
51C
hak
102
35<
1.4
25.4
918
0.07
560.
6548
0.00
081.
7402
0.00
2037
1.2
16.6
909
0.05
34C
hak
102
35<
1.4
27.9
796
0.10
190.
5998
0.00
101.
4893
0.00
2117
8.8
16.7
815
0.06
67C
hak
102
35<
1.4
22.8
471
0.10
390.
7132
0.00
201.
7509
0.00
7431
8.2
16.2
956
0.08
73C
hak
102
35<
1.4
23.4
146
0.11
150.
7020
0.00
182.
1327
0.00
8840
2.0
16.4
374
0.08
93C
hak
102
35<
1.4
18.8
416
0.14
600.
8361
0.00
272.
0859
0.00
7452
.615
.754
10.
1323
Mar
ot,
du
ne
san
d0
018
.739
40.
0238
0.84
250.
0007
2.10
370.
0020
862.
015
.788
00.
0238
Mar
ot,
du
ne
san
d0
018
.721
20.
0465
0.84
040.
0008
2.10
470.
0028
441.
215
.732
60.
0465
Mar
ot,
du
ne
san
d0
018
.769
90.
0505
0.83
900.
0010
2.08
980.
0026
362.
215
.747
10.
0505
Mar
ot,
du
ne
san
d0
019
.462
40.
0512
0.81
520.
0009
2.02
620.
0023
337.
815
.866
70.
0512
Mar
ot,
du
ne
san
d0
018
.717
20.
0541
0.84
430.
0011
2.10
770.
0025
391.
715
.803
80.
0541
Mar
ot,
du
ne
san
d0
018
.742
40.
0562
0.84
350.
0013
2.09
770.
0030
288.
315
.808
40.
0562
Mar
ot,
du
ne
san
d0
019
.248
30.
0567
0.82
060.
0010
2.03
570.
0023
394.
915
.794
60.
0567
Mar
ot,
du
ne
san
d0
018
.372
60.
0579
0.85
080.
0011
2.10
990.
0023
302.
115
.630
70.
0579
Mar
ot,
du
ne
san
d0
018
.612
40.
0583
0.84
130.
0014
2.09
820.
0029
274.
115
.659
50.
0583
(co
nti
nu
edo
nn
ext
pa
ge)
Pb isotopic variability in the Indus River system 4777
Author's personal copy
Tab
le3
(co
nti
nu
ed)
Lo
cati
on
Dep
th(c
m)
Age
(ka)
20
6P
b/2
04P
b1
Sig
ma
20
7P
b/2
06P
b1
Sig
ma
20
8P
b/2
06P
b1
Sig
ma
Pb
(pp
m)
20
7P
b/2
04P
b1
Sig
ma
Mar
ot,
du
ne
san
d0
018
.572
90.
0595
0.84
710.
0012
2.10
520.
0038
207.
115
.733
10.
0595
Mar
ot,
du
ne
san
d0
022
.302
80.
0596
0.72
760.
0010
2.08
230.
0025
411.
816
.226
50.
0596
Mar
ot,
du
ne
san
d0
022
.247
40.
0646
0.73
240.
0009
1.71
110.
0021
342.
016
.294
60.
0646
Mar
ot,
du
ne
san
d0
018
.755
70.
0675
0.83
810.
0010
2.08
870.
0026
296.
715
.719
20.
0675
Mar
ot,
du
ne
san
d0
022
.201
80.
0682
0.73
170.
0011
1.95
760.
0024
295.
016
.244
90.
0682
Mar
ot,
du
ne
san
d0
017
.815
80.
0707
0.87
090.
0013
2.12
310.
0032
216.
115
.516
60.
0707
Mar
ot,
du
ne
san
d0
019
.396
90.
0736
0.81
750.
0012
1.98
920.
0028
199.
115
.857
50.
0736
Mar
ot,
du
ne
san
d0
021
.695
80.
0744
0.74
150.
0011
1.98
160.
0028
328.
216
.088
30.
0744
Mar
ot,
du
ne
san
d0
026
.451
30.
0757
0.63
180.
0007
1.54
100.
0019
366.
216
.711
00.
0757
Mar
ot,
du
ne
san
d0
018
.548
90.
0784
0.84
250.
0012
2.07
910.
0031
215.
515
.627
40.
0784
Mar
ot,
du
ne
san
d0
018
.408
70.
0910
0.84
140.
0015
2.08
800.
0043
146.
915
.489
70.
0910
Mar
ot,
du
ne
san
d0
025
.762
60.
0954
0.64
420.
0008
1.56
860.
0022
266.
816
.596
50.
0954
Mar
ot,
du
ne
san
d0
019
.543
30.
0975
0.81
890.
0016
2.12
340.
0043
143.
616
.003
60.
0975
Mar
ot,
du
ne
san
d0
018
.667
20.
0996
0.83
690.
0017
2.08
720.
0078
162.
615
.623
00.
0996
Mar
ot,
du
ne
san
d0
019
.317
70.
1004
0.82
010.
0022
2.02
690.
0064
82.8
15.8
424
0.10
04M
aro
t,d
un
esa
nd
00
19.9
559
0.10
060.
7849
0.00
202.
0469
0.00
4011
5.3
15.6
636
0.10
06M
aro
t,d
un
esa
nd
00
18.5
686
0.11
590.
8445
0.00
272.
0891
0.00
6481
.115
.681
00.
1159
Mar
ot,
du
ne
san
d0
019
.908
50.
1465
0.79
540.
0036
2.44
680.
0114
49.1
15.8
353
0.14
65M
aro
t,d
un
esa
nd
00
18.7
108
0.14
720.
8392
0.00
482.
0824
0.02
3814
2.6
15.7
023
0.14
72M
aro
t,d
un
esa
nd
00
18.7
818
0.25
500.
8510
0.01
162.
1144
0.04
3215
2.7
15.9
827
0.25
50F
ort
Ab
bas
348
5.7–
5.8
19.4
091
0.03
560.
8140
0.00
082.
0267
0.00
2064
4.8
15.7
998
0.03
28F
ort
Ab
bas
348
5.7–
5.8
18.9
859
0.03
720.
8316
0.00
072.
0647
0.00
2061
0.2
15.7
893
0.03
36F
ort
Ab
bas
348
5.7–
5.8
20.9
171
0.05
010.
7704
0.00
071.
8228
0.00
1556
9.4
16.1
146
0.05
01F
ort
Ab
bas
348
5.7–
5.8
18.3
548
0.05
170.
8561
0.00
132.
1496
0.00
5233
5.2
15.7
139
0.05
17F
ort
Ab
bas
348
5.7–
5.8
18.7
595
0.05
390.
8438
0.00
112.
0987
0.00
2536
3.4
15.8
294
0.05
39F
ort
Ab
bas
348
5.7–
5.8
18.2
136
0.05
600.
8653
0.00
122.
1137
0.00
2727
2.7
15.7
603
0.05
34F
ort
Ab
bas
348
5.7–
5.8
18.1
911
0.05
780.
8650
0.00
132.
1366
0.00
9228
7.5
15.7
350
0.05
78F
ort
Ab
bas
348
5.7–
5.8
18.7
986
0.06
220.
8381
0.00
212.
0620
0.00
5438
7.1
15.7
552
0.06
49F
ort
Ab
bas
348
5.7–
5.8
18.8
299
0.06
300.
8376
0.00
092.
0942
0.00
3231
4.3
15.7
726
0.06
30F
ort
Ab
bas
348
5.7–
5.8
26.3
190
0.06
390.
6337
0.00
071.
4637
0.00
1544
0.6
16.6
777
0.06
39F
ort
Ab
bas
348
5.7–
5.8
22.2
204
0.06
460.
7288
0.00
071.
8068
0.00
2340
1.4
16.1
944
0.04
94F
ort
Ab
bas
348
5.7–
5.8
18.5
489
0.06
760.
8502
0.00
142.
1117
0.00
3724
4.8
15.7
711
0.06
76F
ort
Ab
bas
348
5.7–
5.8
18.6
957
0.06
840.
8394
0.00
132.
1066
0.00
3427
8.5
15.6
941
0.06
84F
ort
Ab
bas
348
5.7–
5.8
18.3
050
0.06
920.
8571
0.00
222.
1147
0.00
5720
1.4
15.6
900
0.06
92F
ort
Ab
bas
348
5.7–
5.8
17.7
906
0.07
350.
8956
0.00
262.
1356
0.00
7112
2.5
15.9
327
0.07
35F
ort
Ab
bas
348
5.7–
5.8
18.6
657
0.07
490.
8377
0.00
142.
0774
0.00
3021
1.8
15.6
367
0.07
49F
ort
Ab
bas
348
5.7–
5.8
17.6
970
0.07
740.
8917
0.00
162.
1352
0.00
6921
7.4
15.7
802
0.07
74F
ort
Ab
bas
348
5.7–
5.8
18.5
092
0.10
320.
8437
0.00
332.
0987
0.00
8713
9.1
15.6
161
0.10
32F
ort
Ab
bas
348
5.7–
5.8
27.6
966
0.10
330.
6089
0.00
091.
6061
0.00
2816
2.3
16.8
640
0.06
78F
ort
Ab
bas
348
5.7–
5.8
19.1
795
0.11
040.
8291
0.00
232.
0924
0.00
6010
2.4
15.9
012
0.11
04F
ort
Ab
bas
348
5.7–
5.8
18.1
369
0.11
390.
8551
0.00
392.
1174
0.01
3416
0.2
15.5
087
0.12
02F
ort
Ab
bas
348
5.7–
5.8
24.5
779
0.11
660.
6645
0.00
131.
6185
0.00
3015
8.5
16.3
308
0.11
66F
ort
Ab
bas
348
5.7–
5.8
19.1
874
0.11
790.
8194
0.00
312.
0733
0.00
7674
.915
.723
10.
1179
Fo
rtA
bb
as34
85.
7–5.
818
.876
00.
1183
0.83
880.
0027
2.08
870.
0114
75.2
15.8
326
0.11
83
4778 A. Alizai et al. / Geochimica et Cosmochimica Acta 75 (2011) 4771–4795
Author's personal copy
Fo
rtA
bb
as34
85.
7–5.
819
.250
40.
1621
0.81
540.
0036
2.02
140.
0069
39.7
15.6
967
0.14
95F
ort
Ab
bas
348
5.7–
5.8
21.1
025
0.18
750.
7491
0.00
391.
8798
0.01
4468
.615
.808
60.
1627
Fo
rtA
bb
as34
85.
7–5.
818
.590
40.
1985
0.85
180.
0037
2.13
250.
0072
22.7
15.8
353
0.18
26F
ort
Ab
bas
348
5.7–
5.8
17.8
906
0.22
590.
8777
0.00
572.
0778
0.01
2719
.415
.702
80.
2259
Fo
rtD
eraw
ar39
5>
4.5
18.7
446
0.05
630.
8411
0.00
102.
0623
0.00
3433
9.0
15.7
654
0.05
63F
ort
Der
awar
395
>4.
518
.817
70.
0893
0.83
780.
0017
2.09
390.
0047
166.
315
.765
50.
0893
Fo
rtD
eraw
ar39
5>
4.5
18.7
418
0.11
770.
8444
0.00
252.
2707
0.00
7213
6.5
15.8
247
0.11
77F
ort
Der
awar
395
>4.
519
.057
90.
1409
0.83
640.
0033
2.09
150.
0092
40.1
15.9
405
0.14
09F
ort
Der
awar
395
>4.
524
.275
10.
1501
0.67
610.
0027
1.83
690.
0083
143.
216
.413
50.
1501
Fo
rtD
eraw
ar39
5>
4.5
19.1
072
0.17
470.
8373
0.00
452.
1061
0.02
4540
.215
.998
70.
1747
Fo
rtD
eraw
ar39
5>
4.5
18.9
999
0.05
150.
8281
0.00
112.
1360
0.00
2935
0.2
15.7
345
0.05
15F
ort
Der
awar
395
>4.
518
.576
90.
0553
0.84
290.
0010
2.10
910.
0021
341.
715
.658
10.
0553
Fo
rtD
eraw
ar39
5>
4.5
18.8
534
0.05
910.
8402
0.00
142.
0953
0.00
3429
1.9
15.8
400
0.05
91F
ort
Der
awar
395
>4.
518
.646
10.
0603
0.84
350.
0011
2.07
750.
0033
296.
115
.727
30.
0603
Fo
rtD
eraw
ar39
5>
4.5
19.4
623
0.06
040.
8112
0.00
102.
0012
0.00
2823
4.6
15.7
872
0.06
04F
ort
Der
awar
395
>4.
518
.945
70.
0612
0.83
400.
0016
2.08
190.
0044
379.
815
.800
70.
0612
Fo
rtD
eraw
ar39
5>
4.5
22.0
823
0.06
220.
7362
0.00
102.
0004
0.00
2934
7.8
16.2
561
0.06
22F
ort
Der
awar
395
>4.
521
.646
10.
0764
0.73
720.
0009
1.81
550.
0023
262.
015
.956
70.
0764
Fo
rtD
eraw
ar39
5>
4.5
18.6
761
0.09
020.
8340
0.00
372.
0913
0.01
2219
6.6
15.5
753
0.09
02F
ort
Der
awar
395
>4.
526
.648
20.
1025
0.62
690.
0010
1.45
070.
0027
180.
516
.706
50.
1025
Fo
rtD
eraw
ar39
5>
4.5
18.4
631
0.10
690.
8414
0.00
192.
0995
0.00
5814
9.3
15.5
353
0.10
69F
ort
Der
awar
395
>4.
518
.743
30.
1194
0.84
010.
0015
2.10
400.
0132
355.
915
.746
90.
1194
Fo
rtD
eraw
ar39
5>
4.5
17.1
726
0.14
040.
9744
0.00
582.
1872
0.01
5910
0.8
16.7
322
0.14
04F
ort
Der
awar
395
>4.
518
.861
10.
1453
0.82
350.
0034
2.06
780.
0105
163.
915
.533
10.
1453
Fo
rtD
eraw
ar39
5>
4.5
19.9
938
0.26
540.
7958
0.00
412.
0366
0.00
8725
.015
.911
40.
2654
Fo
rtD
eraw
ar39
5>
4.5
18.9
331
0.27
370.
8266
0.01
052.
0502
0.02
2746
.415
.649
20.
2737
Mar
ot
280
<6.
318
.742
30.
0334
0.84
300.
0008
2.10
230.
0022
800.
915
.799
00.
0320
Mar
ot
280
<6.
323
.702
40.
0407
0.69
350.
0005
1.69
930.
0013
907.
516
.436
90.
0407
Mar
ot
280
<6.
318
.848
50.
0451
0.83
660.
0010
2.08
310.
0032
629.
115
.768
30.
0451
Mar
ot
280
<6.
317
.747
70.
0458
0.89
320.
0015
2.13
340.
0028
446.
915
.851
90.
0484
Mar
ot
280
<6.
318
.591
00.
0470
0.84
400.
0008
2.11
420.
0028
391.
915
.691
00.
0426
Mar
ot
280
<6.
318
.681
50.
0483
0.84
470.
0008
2.04
880.
0021
599.
715
.780
90.
0483
Mar
ot
280
<6.
321
.214
80.
0515
0.76
240.
0007
2.01
380.
0023
462.
216
.174
10.
0421
Mar
ot
280
<6.
322
.687
50.
0621
0.71
750.
0008
1.76
560.
0018
568.
516
.278
90.
0621
Mar
ot
280
<6.
317
.442
20.
0652
0.88
890.
0019
2.43
550.
0078
363.
215
.503
60.
0668
Mar
ot
280
<6.
322
.110
60.
0673
0.73
350.
0007
1.79
480.
0041
545.
516
.217
50.
0516
Mar
ot
280
<6.
321
.727
70.
0678
0.74
960.
0010
1.90
490.
0035
302.
616
.287
10.
0678
Mar
ot
280
<6.
326
.315
50.
0693
0.63
520.
0011
1.38
540.
0024
360.
016
.716
30.
0522
Mar
ot
280
<6.
318
.859
30.
0708
0.83
920.
0019
2.10
000.
0084
411.
515
.826
60.
0695
Mar
ot
280
<6.
317
.573
80.
0759
0.89
020.
0024
2.15
620.
0095
360.
415
.644
90.
0759
Mar
ot
280
<6.
324
.377
60.
0910
0.67
650.
0015
1.64
580.
0057
296.
016
.490
50.
0716
Mar
ot
280
<6.
318
.224
30.
1013
0.86
720.
0018
2.12
100.
0064
499.
015
.804
50.
0940
Mar
ot
280
<6.
320
.452
70.
1169
0.78
730.
0032
1.95
250.
0117
261.
316
.103
10.
1169
Mar
ot
280
<6.
340
.626
20.
1607
0.44
750.
0006
0.96
370.
0015
158.
718
.178
70.
1607
Mar
ot
280
<6.
340
.626
20.
1607
0.44
750.
0006
0.96
370.
0015
158.
718
.178
70.
1607
Mar
ot
280
<6.
319
.839
60.
1774
0.80
140.
0053
1.93
190.
0249
131.
815
.899
80.
1769
(co
nti
nu
edo
nn
ext
pa
ge)
Pb isotopic variability in the Indus River system 4779
Author's personal copy
Tab
le3
(co
nti
nu
ed)
Lo
cati
on
Dep
th(c
m)
Age
(ka)
20
6P
b/2
04P
b1
Sig
ma
20
7P
b/2
06P
b1
Sig
ma
20
8P
b/2
06P
b1
Sig
ma
Pb
(pp
m)
20
7P
b/2
04P
b1
Sig
ma
Mar
ot
280
<6.
316
.198
90.
1798
0.95
650.
0066
2.22
310.
0233
35.7
15.4
950
0.20
24M
aro
t28
0<
6.3
18.7
342
0.18
110.
8556
0.00
572.
0941
0.01
8910
8.7
16.0
289
0.18
80M
aro
t28
0<
6.3
19.5
657
0.25
900.
8207
0.00
591.
9817
0.01
2412
.216
.056
60.
2419
Mar
ot
280
<6.
318
.671
80.
2744
0.85
980.
0055
2.02
310.
0120
21.8
16.0
540
0.27
44M
aro
t28
0<
6.3
18.2
662
0.04
890.
8696
0.00
152.
0929
0.00
4725
0.4
15.8
852
0.04
89M
aro
t28
0<
6.3
20.4
933
0.06
060.
7777
0.00
101.
9214
0.00
2633
2.7
15.9
375
0.06
06M
aro
t28
0<
6.3
20.0
896
0.07
510.
7969
0.00
152.
0116
0.00
5027
2.0
16.0
104
0.07
51M
aro
t28
0<
6.3
18.2
270
0.07
870.
8667
0.00
182.
0877
0.00
5314
6.8
15.7
981
0.07
87M
aro
t28
0<
6.3
18.3
365
0.09
730.
8478
0.00
232.
0952
0.00
7420
4.9
15.5
464
0.09
73M
aro
t28
0<
6.3
27.4
035
0.10
470.
6164
0.00
081.
5678
0.00
2841
0.3
16.8
919
0.10
47M
aro
t28
0<
6.3
22.2
104
0.10
520.
7230
0.00
161.
7971
0.00
3613
9.0
16.0
582
0.10
52M
aro
t28
0<
6.3
18.5
991
0.10
620.
8369
0.00
332.
0862
0.01
2915
4.7
15.5
655
0.10
62M
aro
t28
0<
6.3
18.6
567
0.11
700.
8384
0.00
332.
0805
0.01
2793
.315
.641
60.
1170
Mar
ot
280
<6.
318
.720
10.
1197
0.83
450.
0027
2.06
750.
0071
86.0
15.6
219
0.11
97M
aro
t28
0<
6.3
24.3
002
0.13
970.
6744
0.00
191.
8542
0.00
6432
6.6
16.3
874
0.13
97M
aro
t28
0<
6.3
17.3
859
0.16
720.
9082
0.00
492.
1648
0.01
0223
.515
.789
80.
1672
Mar
ot
280
<6.
318
.386
80.
2064
0.84
660.
0135
2.11
790.
0450
60.3
15.5
659
0.20
64M
aro
t28
0<
6.3
19.1
221
0.25
470.
8231
0.00
522.
0660
0.01
5016
.215
.739
30.
2547
Mar
ot
3626
–364
6>
2519
.089
70.
0475
0.81
990.
0011
2.00
620.
0025
113.
915
.652
40.
0475
Mar
ot
3626
–364
6>
2518
.530
30.
0544
0.84
850.
0010
2.07
490.
0032
137.
915
.722
30.
0544
Mar
ot
3626
–364
6>
2515
.453
80.
0546
0.99
090.
0014
2.23
980.
0036
105.
415
.312
40.
0546
Mar
ot
3626
–364
6>
2518
.249
20.
0570
0.86
090.
0013
2.26
920.
0030
116.
315
.711
40.
0570
Mar
ot
3626
–364
6>
2518
.702
10.
0656
0.84
250.
0017
2.08
350.
0042
85.3
15.7
559
0.06
56M
aro
t36
26–3
646
>25
18.6
345
0.06
660.
8404
0.00
182.
0702
0.00
6381
.615
.661
00.
0666
Mar
ot
3626
–364
6>
2518
.458
70.
0703
0.84
520.
0014
2.08
800.
0044
88.9
15.6
016
0.07
03M
aro
t36
26–3
646
>25
19.2
063
0.07
030.
8186
0.00
172.
0429
0.00
6016
9.9
15.7
223
0.07
03M
aro
t36
26–3
646
>25
19.8
886
0.07
570.
7964
0.00
121.
9686
0.00
4180
.315
.838
50.
0757
Mar
ot
3626
–364
6>
2517
.532
30.
0780
0.88
350.
0016
2.11
650.
0078
124.
415
.489
30.
0780
Mar
ot
3626
–364
6>
2518
.403
50.
0825
0.84
420.
0024
2.05
370.
0080
130.
715
.536
60.
0825
Mar
ot
3626
–364
6>
2527
.187
60.
0916
0.61
460.
0008
1.43
030.
0019
95.2
16.7
084
0.09
16M
aro
t36
26–3
646
>25
18.7
369
0.09
220.
8382
0.00
162.
0884
0.00
3073
.715
.705
60.
0922
Mar
ot
3626
–364
6>
2519
.046
20.
0981
0.82
670.
0027
2.06
300.
0088
63.1
15.7
446
0.09
81M
aro
t36
26–3
646
>25
19.1
177
0.10
080.
8241
0.00
262.
0431
0.00
5835
.415
.754
80.
1008
Mar
ot
3626
–364
6>
2518
.658
10.
1021
0.83
350.
0023
2.07
960.
0059
67.6
15.5
523
0.10
21M
aro
t36
26–3
646
>25
18.7
680
0.10
690.
8351
0.00
312.
0831
0.01
0130
.915
.673
50.
1069
Mar
ot
3626
–364
6>
2528
.925
20.
1154
0.58
840.
0009
1.35
730.
0020
90.7
17.0
199
0.11
54M
aro
t36
26–3
646
>25
19.1
712
0.13
470.
8249
0.00
282.
0433
0.00
7832
.215
.814
60.
1347
Mar
ot
3626
–364
6>
2518
.589
30.
1449
0.84
040.
0026
2.08
700.
0042
19.1
15.6
233
0.14
49M
aro
t36
26–3
646
>25
18.8
456
0.15
190.
8333
0.00
442.
0555
0.01
9472
.315
.703
40.
1519
Mar
ot
3626
–364
6>
2529
.280
50.
1933
0.56
310.
0016
1.69
200.
0035
43.8
16.4
887
0.19
33M
aro
t36
26–3
646
>25
19.2
953
0.19
810.
8292
0.00
382.
0672
0.01
1715
.315
.999
90.
1981
Mar
ot
3626
–364
6>
2519
.312
00.
2057
0.82
060.
0045
2.03
750.
0146
41.8
15.8
479
0.20
57M
aro
t36
26–3
646
>25
18.5
706
0.22
090.
8539
0.00
352.
1202
0.01
2911
.715
.858
00.
2209
Ch
akB
arh
a13
04–
718
.782
10.
0340
0.84
080.
0007
2.09
730.
0022
728.
615
.791
20.
0340
4780 A. Alizai et al. / Geochimica et Cosmochimica Acta 75 (2011) 4771–4795
Author's personal copy
Ch
akB
arh
a13
04–
718
.647
20.
0384
0.84
440.
0008
2.10
380.
0020
671.
215
.746
30.
0384
Ch
akB
arh
a13
04–
718
.648
80.
0411
0.84
610.
0011
2.11
290.
0026
434.
115
.779
50.
0411
Ch
akB
arh
a13
04–
718
.770
00.
0438
0.83
950.
0009
2.09
540.
0026
500.
015
.757
60.
0438
Ch
akB
arh
a13
04–
718
.703
10.
0445
0.84
520.
0010
2.11
680.
0022
421.
615
.808
60.
0445
Ch
akB
arh
a13
04–
718
.505
40.
0496
0.85
040.
0007
2.11
830.
0023
641.
715
.737
90.
0496
Ch
akB
arh
a13
04–
718
.641
10.
0530
0.84
960.
0011
2.12
530.
0024
282.
315
.838
00.
0530
Ch
akB
arh
a13
04–
718
.611
90.
0537
0.84
870.
0013
2.10
530.
0032
281.
215
.795
30.
0537
Ch
akB
arh
a13
04–
718
.300
60.
0545
0.85
950.
0012
2.14
320.
0035
526.
015
.729
30.
0545
Ch
akB
arh
a13
04–
718
.774
40.
0557
0.83
830.
0011
2.10
230.
0026
353.
715
.739
40.
0557
Ch
akB
arh
a13
04–
717
.246
90.
0561
0.90
380.
0016
2.21
540.
0033
236.
115
.587
40.
0561
Ch
akB
arh
a13
04–
718
.668
80.
0584
0.84
780.
0010
2.10
480.
0023
426.
215
.827
00.
0584
Ch
akB
arh
a13
04–
719
.182
60.
0592
0.82
170.
0011
2.08
110.
0034
221.
315
.761
80.
0592
Ch
akB
arh
a13
04–
721
.857
10.
0615
0.73
950.
0007
1.95
640.
0023
460.
716
.162
40.
0615
Ch
akB
arh
a13
04–
718
.639
40.
0651
0.84
580.
0013
2.10
790.
0040
264.
615
.765
90.
0651
Ch
akB
arh
a13
04–
718
.713
00.
0659
0.83
670.
0015
2.07
750.
0034
131.
415
.656
60.
0659
Ch
akB
arh
a13
04–
718
.965
20.
0662
0.83
310.
0013
2.06
550.
0031
252.
215
.800
70.
0662
Ch
akB
arh
a13
04–
718
.353
00.
0678
0.85
530.
0014
2.11
430.
0042
140.
115
.697
60.
0678
Ch
akB
arh
a13
04–
718
.213
80.
0686
0.85
990.
0015
2.11
520.
0037
227.
815
.662
90.
0686
Ch
akB
arh
a13
04–
718
.615
00.
0694
0.83
610.
0014
2.07
750.
0036
151.
415
.564
20.
0694
Ch
akB
arh
a13
04–
720
.287
90.
0711
0.78
140.
0014
1.92
380.
0042
239.
915
.853
30.
0711
Ch
akB
arh
a13
04–
718
.725
10.
0810
0.84
080.
0014
2.08
700.
0051
194.
115
.744
10.
0810
Ch
akB
arh
a13
04–
719
.669
70.
0811
0.80
530.
0013
1.97
900.
0037
203.
215
.839
90.
0811
Ch
akB
arh
a13
04–
718
.786
50.
0817
0.84
320.
0014
2.11
930.
0034
179.
115
.840
10.
0817
Ch
akB
arh
a13
04–
722
.746
20.
0841
0.71
700.
0008
1.94
620.
0048
301.
116
.308
20.
0841
Ch
akB
arh
a13
04–
718
.791
80.
0923
0.83
450.
0022
2.07
930.
0050
94.8
15.6
825
0.09
23C
hak
Bar
ha
130
4–7
18.5
667
0.09
850.
8429
0.00
222.
0974
0.00
2999
.115
.649
10.
0985
Ch
akB
arh
a13
04–
718
.359
90.
1143
0.85
110.
0022
2.11
820.
0066
129.
315
.626
40.
1143
Ch
akB
arh
a13
04–
718
.245
70.
1204
0.85
750.
0020
2.13
040.
0049
106.
915
.645
40.
1204
Ch
akB
arh
a13
04–
729
.854
30.
1881
0.56
980.
0019
1.63
730.
0106
193.
817
.009
60.
1881
Fak
irab
ad22
5<
3.1
19.3
672
0.02
360.
8183
0.00
052.
0672
0.00
1026
1.3
15.8
475
0.02
14F
akir
abad
225
<3.
118
.692
00.
0248
0.84
420.
0006
2.09
770.
0019
284.
415
.779
50.
0240
Fak
irab
ad22
5<
3.1
18.6
224
0.03
580.
8413
0.00
122.
1051
0.00
2691
.315
.666
40.
0379
Fak
irab
ad22
5<
3.1
18.9
163
0.03
660.
8331
0.00
092.
0773
0.00
2889
.415
.759
90.
0351
Fak
irab
ad22
5<
3.1
18.5
399
0.03
850.
8444
0.00
062.
1199
0.00
1515
2.5
15.6
553
0.03
45F
akir
abad
225
<3.
118
.133
40.
0402
0.86
380.
0008
2.12
940.
0016
128.
415
.662
80.
0373
Fak
irab
ad22
5<
3.1
19.4
460
0.04
110.
8202
0.00
081.
9312
0.00
2214
2.3
15.9
489
0.03
70F
akir
abad
225
<3.
119
.370
00.
0417
0.81
940.
0007
2.07
470.
0017
123.
715
.871
40.
0368
Fak
irab
ad22
5<
3.1
18.5
754
0.04
680.
8411
0.00
082.
0916
0.00
2158
.915
.623
40.
0422
Fak
irab
ad22
5<
3.1
18.6
871
0.04
910.
8393
0.00
102.
0897
0.00
2656
.215
.684
80.
0455
Fak
irab
ad22
5<
3.1
18.7
731
0.05
200.
8395
0.00
092.
0979
0.00
2456
.515
.760
20.
0467
Fak
irab
ad22
5<
3.1
18.3
425
0.05
290.
8553
0.00
092.
0922
0.00
2488
.915
.687
80.
0480
Fak
irab
ad22
5<
3.1
18.9
160
0.05
300.
8306
0.00
092.
0943
0.00
3250
.415
.711
40.
0470
Fak
irab
ad22
5<
3.1
17.5
336
0.05
310.
8890
0.00
122.
1377
0.00
2250
.315
.587
00.
0516
Fak
irab
ad22
5<
3.1
19.1
743
0.05
400.
8225
0.00
072.
0609
0.00
2385
.915
.770
10.
0466
Fak
irab
ad22
5<
3.1
18.9
567
0.05
550.
8370
0.00
092.
0887
0.00
2567
.315
.866
60.
0498
Fak
irab
ad22
5<
3.1
20.3
763
0.05
630.
7883
0.00
102.
6179
0.00
3610
4.1
16.0
631
0.04
91(c
onti
nu
edo
nn
ext
pa
ge)
Pb isotopic variability in the Indus River system 4781
Author's personal copy
Tab
le3
(co
nti
nu
ed)
Lo
cati
on
Dep
th(c
m)
Age
(ka)
20
6P
b/2
04P
b1
Sig
ma
20
7P
b/2
06P
b1
Sig
ma
20
8P
b/2
06P
b1
Sig
ma
Pb
(pp
m)
20
7P
b/2
04P
b1
Sig
ma
Fak
irab
ad22
5<
3.1
18.6
209
0.05
730.
8407
0.00
072.
0965
0.00
2475
.615
.654
10.
0500
Fak
irab
ad22
5<
3.1
18.6
190
0.06
010.
8496
0.00
112.
1136
0.00
2148
.615
.817
90.
0553
Fak
irab
ad22
5<
3.1
32.2
176
0.06
820.
5370
0.00
041.
3190
0.00
0911
1.3
17.3
016
0.03
90F
akir
abad
225
<3.
118
.215
70.
0727
0.87
030.
0020
2.13
540.
0086
62.8
15.8
539
0.07
30F
akir
abad
225
<3.
122
.650
00.
0767
0.71
740.
0012
1.84
790.
0028
49.9
16.2
487
0.06
16F
akir
abad
225
<3.
121
.796
50.
1032
0.74
360.
0022
2.09
110.
0089
55.8
16.2
082
0.09
01F
akir
abad
225
<3.
117
.803
00.
1203
0.86
870.
0028
2.11
390.
0071
8.4
15.4
650
0.11
54F
akir
abad
225
<3.
123
.686
20.
1344
0.69
200.
0026
1.89
260.
0123
107.
816
.390
10.
1115
Fak
irab
ad22
5<
3.1
17.8
975
0.15
860.
8651
0.00
422.
1019
0.00
765.
815
.483
70.
1561
Fak
irab
ad22
5<
3.1
38.4
356
0.17
800.
4742
0.00
141.
0449
0.00
3625
.418
.226
20.
1009
Fak
irab
ad22
5<
3.1
38.3
491
0.18
250.
4708
0.00
101.
0358
0.00
1925
.218
.055
50.
0934
Nar
a10
97>
5.5
18.2
893
0.04
620.
8579
0.00
102.
1503
0.00
2836
0.8
15.6
907
0.04
62N
ara
1097
>5.
518
.942
50.
0481
0.83
220.
0009
2.10
280.
0021
426.
215
.763
60.
0481
Nar
a10
97>
5.5
19.4
648
0.05
020.
8158
0.00
112.
0202
0.00
2834
2.0
15.8
803
0.05
02N
ara
1097
>5.
518
.975
40.
0565
0.83
120.
0013
2.05
640.
0041
269.
715
.772
00.
0565
Nar
a10
97>
5.5
18.7
743
0.05
870.
8403
0.00
172.
0988
0.00
6923
3.8
15.7
764
0.05
87N
ara
1097
>5.
520
.325
20.
0587
0.78
790.
0010
2.21
010.
0030
328.
016
.013
30.
0587
Nar
a10
97>
5.5
18.6
063
0.06
240.
8395
0.00
112.
0861
0.00
3021
8.3
15.6
199
0.06
24N
ara
1097
>5.
518
.825
30.
0644
0.83
640.
0013
2.08
750.
0034
336.
415
.746
20.
0644
Nar
a10
97>
5.5
18.7
537
0.06
660.
8381
0.00
102.
0803
0.00
3622
6.4
15.7
172
0.06
66N
ara
1097
>5.
518
.743
40.
0717
0.84
430.
0014
2.10
670.
0049
201.
415
.824
30.
0717
Nar
a10
97>
5.5
22.1
700
0.11
750.
7325
0.00
341.
9581
0.01
1515
0.8
16.2
404
0.11
75N
ara
1097
>5.
530
.302
00.
1179
0.56
960.
0010
1.62
700.
0028
285.
717
.258
50.
1179
Nar
a10
97>
5.5
18.8
561
0.12
570.
8394
0.00
312.
0838
0.01
7326
4.9
15.8
270
0.12
57N
ara
1097
>5.
517
.809
80.
1420
0.87
590.
0032
2.12
560.
0099
44.1
15.5
990
0.14
20N
ara
1097
>5.
518
.457
80.
2073
0.84
480.
0059
2.11
260.
0181
38.3
15.5
927
0.20
73
4782 A. Alizai et al. / Geochimica et Cosmochimica Acta 75 (2011) 4771–4795
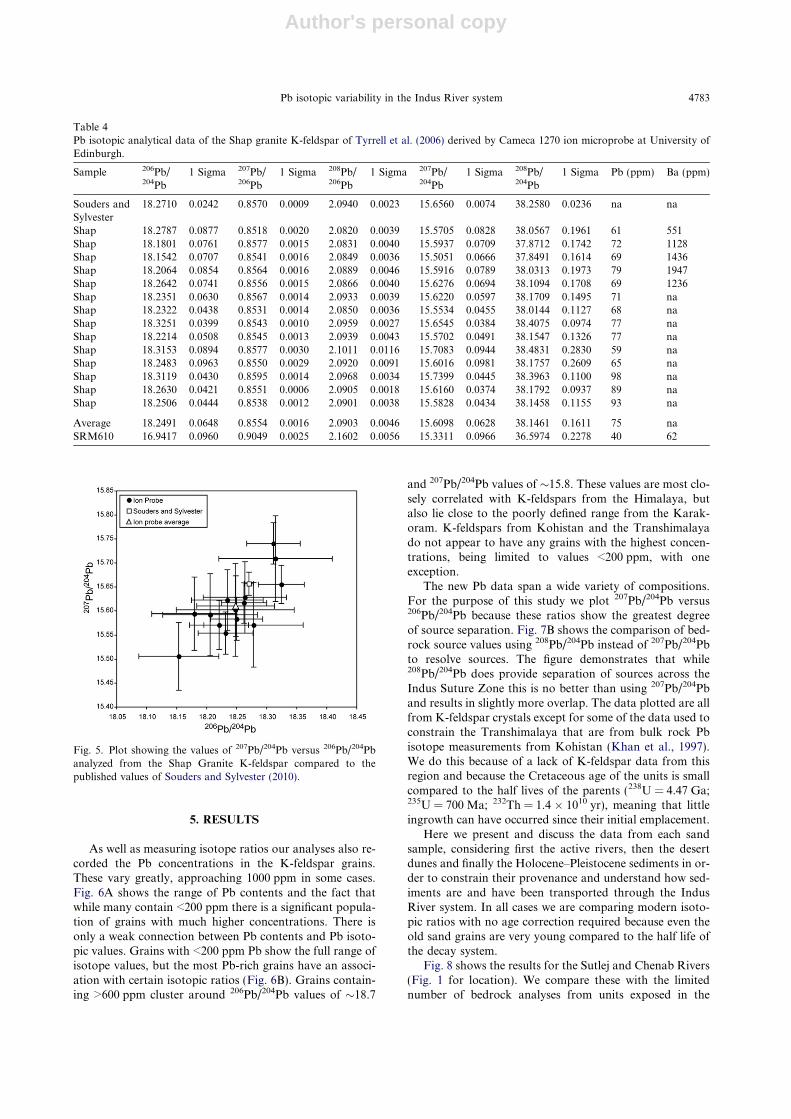
Author's personal copy
5. RESULTS
As well as measuring isotope ratios our analyses also re-corded the Pb concentrations in the K-feldspar grains.These vary greatly, approaching 1000 ppm in some cases.Fig. 6A shows the range of Pb contents and the fact thatwhile many contain <200 ppm there is a significant popula-tion of grains with much higher concentrations. There isonly a weak connection between Pb contents and Pb isoto-pic values. Grains with <200 ppm Pb show the full range ofisotope values, but the most Pb-rich grains have an associ-ation with certain isotopic ratios (Fig. 6B). Grains contain-ing >600 ppm cluster around 206Pb/204Pb values of �18.7
and 207Pb/204Pb values of �15.8. These values are most clo-sely correlated with K-feldspars from the Himalaya, butalso lie close to the poorly defined range from the Karak-oram. K-feldspars from Kohistan and the Transhimalayado not appear to have any grains with the highest concen-trations, being limited to values <200 ppm, with oneexception.
The new Pb data span a wide variety of compositions.For the purpose of this study we plot 207Pb/204Pb versus206Pb/204Pb because these ratios show the greatest degreeof source separation. Fig. 7B shows the comparison of bed-rock source values using 208Pb/204Pb instead of 207Pb/204Pbto resolve sources. The figure demonstrates that while208Pb/204Pb does provide separation of sources across theIndus Suture Zone this is no better than using 207Pb/204Pband results in slightly more overlap. The data plotted are allfrom K-feldspar crystals except for some of the data used toconstrain the Transhimalaya that are from bulk rock Pbisotope measurements from Kohistan (Khan et al., 1997).We do this because of a lack of K-feldspar data from thisregion and because the Cretaceous age of the units is smallcompared to the half lives of the parents (238U = 4.47 Ga;235U = 700 Ma; 232Th = 1.4 � 1010 yr), meaning that littleingrowth can have occurred since their initial emplacement.
Here we present and discuss the data from each sandsample, considering first the active rivers, then the desertdunes and finally the Holocene–Pleistocene sediments in or-der to constrain their provenance and understand how sed-iments are and have been transported through the IndusRiver system. In all cases we are comparing modern isoto-pic ratios with no age correction required because even theold sand grains are very young compared to the half life ofthe decay system.
Fig. 8 shows the results for the Sutlej and Chenab Rivers(Fig. 1 for location). We compare these with the limitednumber of bedrock analyses from units exposed in the
Table 4Pb isotopic analytical data of the Shap granite K-feldspar of Tyrrell et al. (2006) derived by Cameca 1270 ion microprobe at University ofEdinburgh.
Sample 206Pb/204Pb
1 Sigma 207Pb/206Pb
1 Sigma 208Pb/206Pb
1 Sigma 207Pb/204Pb
1 Sigma 208Pb/204Pb
1 Sigma Pb (ppm) Ba (ppm)
Souders andSylvester
18.2710 0.0242 0.8570 0.0009 2.0940 0.0023 15.6560 0.0074 38.2580 0.0236 na na
Shap 18.2787 0.0877 0.8518 0.0020 2.0820 0.0039 15.5705 0.0828 38.0567 0.1961 61 551Shap 18.1801 0.0761 0.8577 0.0015 2.0831 0.0040 15.5937 0.0709 37.8712 0.1742 72 1128Shap 18.1542 0.0707 0.8541 0.0016 2.0849 0.0036 15.5051 0.0666 37.8491 0.1614 69 1436Shap 18.2064 0.0854 0.8564 0.0016 2.0889 0.0046 15.5916 0.0789 38.0313 0.1973 79 1947Shap 18.2642 0.0741 0.8556 0.0015 2.0866 0.0040 15.6276 0.0694 38.1094 0.1708 69 1236Shap 18.2351 0.0630 0.8567 0.0014 2.0933 0.0039 15.6220 0.0597 38.1709 0.1495 71 naShap 18.2322 0.0438 0.8531 0.0014 2.0850 0.0036 15.5534 0.0455 38.0144 0.1127 68 naShap 18.3251 0.0399 0.8543 0.0010 2.0959 0.0027 15.6545 0.0384 38.4075 0.0974 77 naShap 18.2214 0.0508 0.8545 0.0013 2.0939 0.0043 15.5702 0.0491 38.1547 0.1326 77 naShap 18.3153 0.0894 0.8577 0.0030 2.1011 0.0116 15.7083 0.0944 38.4831 0.2830 59 naShap 18.2483 0.0963 0.8550 0.0029 2.0920 0.0091 15.6016 0.0981 38.1757 0.2609 65 naShap 18.3119 0.0430 0.8595 0.0014 2.0968 0.0034 15.7399 0.0445 38.3963 0.1100 98 naShap 18.2630 0.0421 0.8551 0.0006 2.0905 0.0018 15.6160 0.0374 38.1792 0.0937 89 naShap 18.2506 0.0444 0.8538 0.0012 2.0901 0.0038 15.5828 0.0434 38.1458 0.1155 93 na
Average 18.2491 0.0648 0.8554 0.0016 2.0903 0.0046 15.6098 0.0628 38.1461 0.1611 75 naSRM610 16.9417 0.0960 0.9049 0.0025 2.1602 0.0056 15.3311 0.0966 36.5974 0.2278 40 62
Fig. 5. Plot showing the values of 207Pb/204Pb versus 206Pb/204Pbanalyzed from the Shap Granite K-feldspar compared to thepublished values of Souders and Sylvester (2010).
Pb isotopic variability in the Indus River system 4783
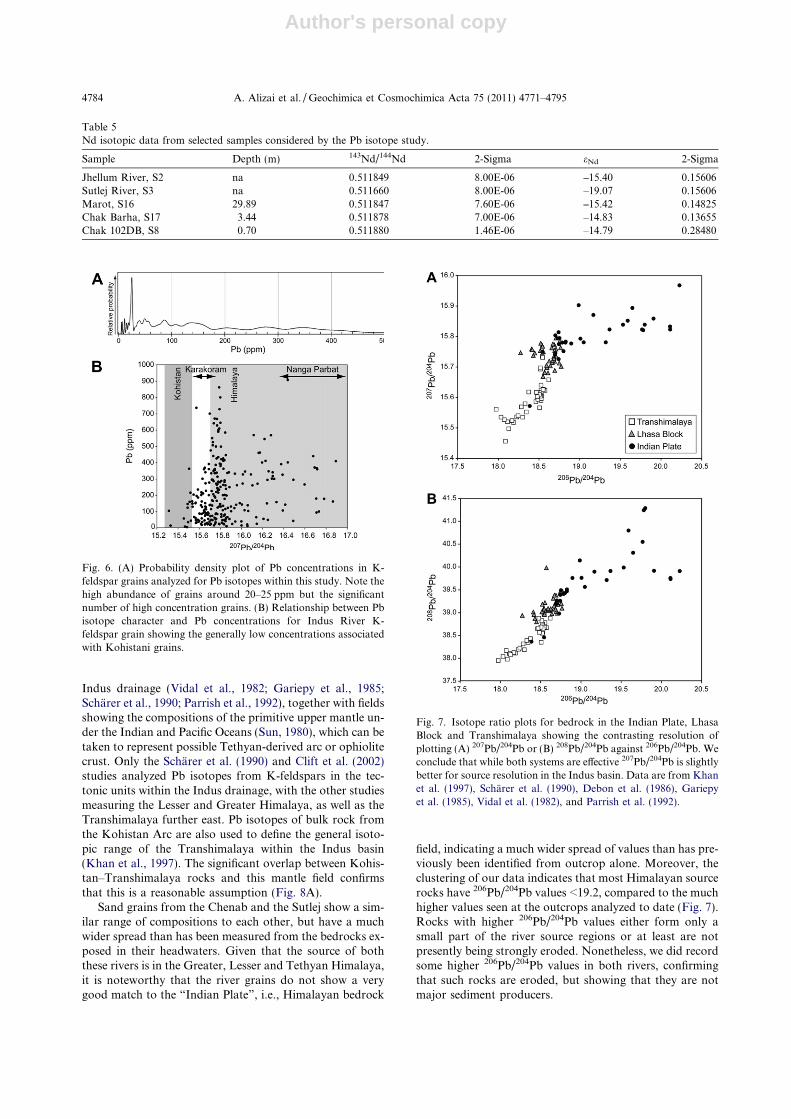
Author's personal copy
Indus drainage (Vidal et al., 1982; Gariepy et al., 1985;Scharer et al., 1990; Parrish et al., 1992), together with fieldsshowing the compositions of the primitive upper mantle un-der the Indian and Pacific Oceans (Sun, 1980), which can betaken to represent possible Tethyan-derived arc or ophiolitecrust. Only the Scharer et al. (1990) and Clift et al. (2002)studies analyzed Pb isotopes from K-feldspars in the tec-tonic units within the Indus drainage, with the other studiesmeasuring the Lesser and Greater Himalaya, as well as theTranshimalaya further east. Pb isotopes of bulk rock fromthe Kohistan Arc are also used to define the general isoto-pic range of the Transhimalaya within the Indus basin(Khan et al., 1997). The significant overlap between Kohis-tan–Transhimalaya rocks and this mantle field confirmsthat this is a reasonable assumption (Fig. 8A).
Sand grains from the Chenab and the Sutlej show a sim-ilar range of compositions to each other, but have a muchwider spread than has been measured from the bedrocks ex-posed in their headwaters. Given that the source of boththese rivers is in the Greater, Lesser and Tethyan Himalaya,it is noteworthy that the river grains do not show a verygood match to the “Indian Plate”, i.e., Himalayan bedrock
field, indicating a much wider spread of values than has pre-viously been identified from outcrop alone. Moreover, theclustering of our data indicates that most Himalayan sourcerocks have 206Pb/204Pb values <19.2, compared to the muchhigher values seen at the outcrops analyzed to date (Fig. 7).Rocks with higher 206Pb/204Pb values either form only asmall part of the river source regions or at least are notpresently being strongly eroded. Nonetheless, we did recordsome higher 206Pb/204Pb values in both rivers, confirmingthat such rocks are eroded, but showing that they are notmajor sediment producers.
Table 5Nd isotopic data from selected samples considered by the Pb isotope study.
Sample Depth (m) 143Nd/144Nd 2-Sigma eNd 2-Sigma
Jhellum River, S2 na 0.511849 8.00E-06 –15.40 0.15606Sutlej River, S3 na 0.511660 8.00E-06 –19.07 0.15606Marot, S16 29.89 0.511847 7.60E-06 –15.42 0.14825Chak Barha, S17 3.44 0.511878 7.00E-06 –14.83 0.13655Chak 102DB, S8 0.70 0.511880 1.46E-06 –14.79 0.28480
Fig. 6. (A) Probability density plot of Pb concentrations in K-feldspar grains analyzed for Pb isotopes within this study. Note thehigh abundance of grains around 20–25 ppm but the significantnumber of high concentration grains. (B) Relationship between Pbisotope character and Pb concentrations for Indus River K-feldspar grain showing the generally low concentrations associatedwith Kohistani grains.
Fig. 7. Isotope ratio plots for bedrock in the Indian Plate, LhasaBlock and Transhimalaya showing the contrasting resolution ofplotting (A) 207Pb/204Pb or (B) 208Pb/204Pb against 206Pb/204Pb. Weconclude that while both systems are effective 207Pb/204Pb is slightlybetter for source resolution in the Indus basin. Data are from Khanet al. (1997), Scharer et al. (1990), Debon et al. (1986), Gariepyet al. (1985), Vidal et al. (1982), and Parrish et al. (1992).
4784 A. Alizai et al. / Geochimica et Cosmochimica Acta 75 (2011) 4771–4795
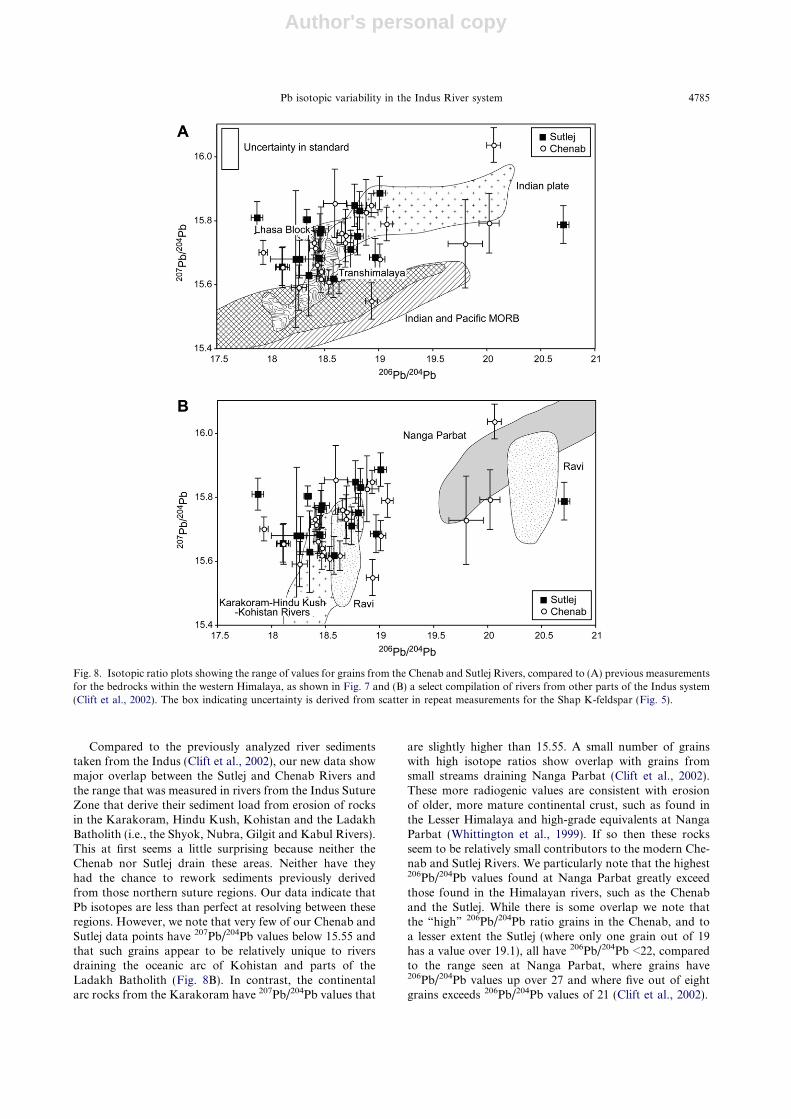
Author's personal copy
Compared to the previously analyzed river sedimentstaken from the Indus (Clift et al., 2002), our new data showmajor overlap between the Sutlej and Chenab Rivers andthe range that was measured in rivers from the Indus SutureZone that derive their sediment load from erosion of rocksin the Karakoram, Hindu Kush, Kohistan and the LadakhBatholith (i.e., the Shyok, Nubra, Gilgit and Kabul Rivers).This at first seems a little surprising because neither theChenab nor Sutlej drain these areas. Neither have theyhad the chance to rework sediments previously derivedfrom those northern suture regions. Our data indicate thatPb isotopes are less than perfect at resolving between theseregions. However, we note that very few of our Chenab andSutlej data points have 207Pb/204Pb values below 15.55 andthat such grains appear to be relatively unique to riversdraining the oceanic arc of Kohistan and parts of theLadakh Batholith (Fig. 8B). In contrast, the continentalarc rocks from the Karakoram have 207Pb/204Pb values that
are slightly higher than 15.55. A small number of grainswith high isotope ratios show overlap with grains fromsmall streams draining Nanga Parbat (Clift et al., 2002).These more radiogenic values are consistent with erosionof older, more mature continental crust, such as found inthe Lesser Himalaya and high-grade equivalents at NangaParbat (Whittington et al., 1999). If so then these rocksseem to be relatively small contributors to the modern Che-nab and Sutlej Rivers. We particularly note that the highest206Pb/204Pb values found at Nanga Parbat greatly exceedthose found in the Himalayan rivers, such as the Chenaband the Sutlej. While there is some overlap we note thatthe “high” 206Pb/204Pb ratio grains in the Chenab, and toa lesser extent the Sutlej (where only one grain out of 19has a value over 19.1), all have 206Pb/204Pb <22, comparedto the range seen at Nanga Parbat, where grains have206Pb/204Pb values up over 27 and where five out of eightgrains exceeds 206Pb/204Pb values of 21 (Clift et al., 2002).
Fig. 8. Isotopic ratio plots showing the range of values for grains from the Chenab and Sutlej Rivers, compared to (A) previous measurementsfor the bedrocks within the western Himalaya, as shown in Fig. 7 and (B) a select compilation of rivers from other parts of the Indus system(Clift et al., 2002). The box indicating uncertainty is derived from scatter in repeat measurements for the Shap K-feldspar (Fig. 5).
Pb isotopic variability in the Indus River system 4785
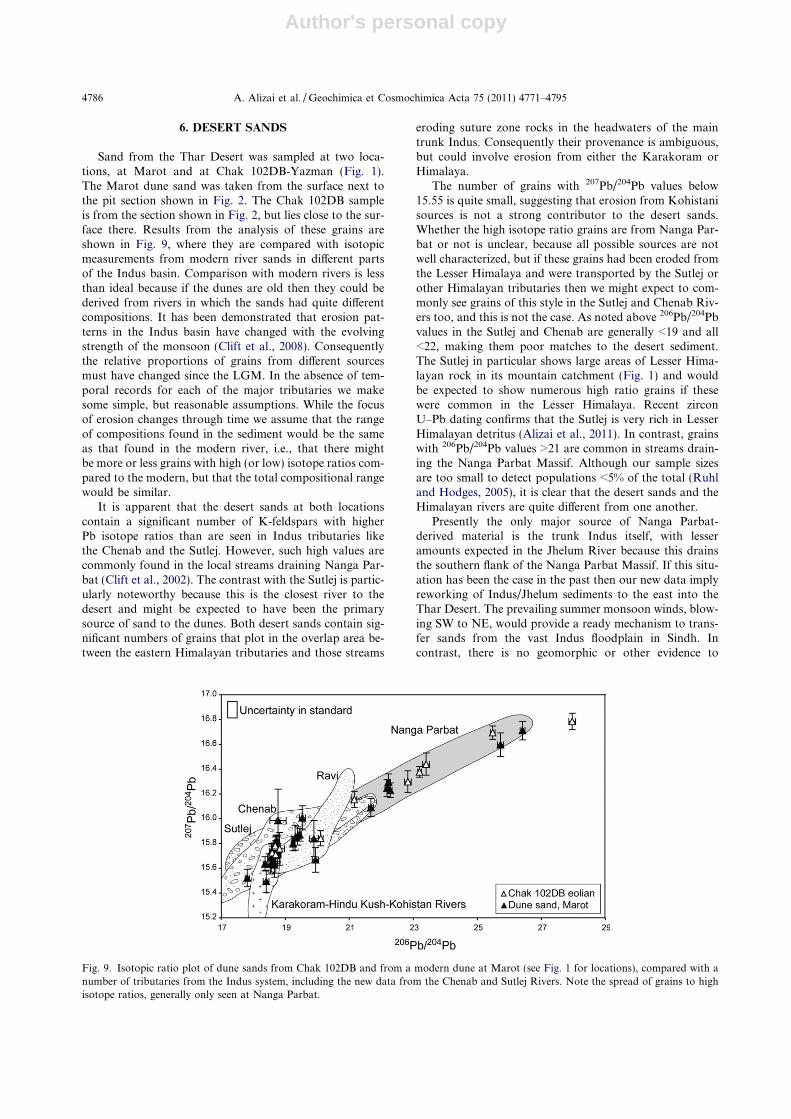
Author's personal copy
6. DESERT SANDS
Sand from the Thar Desert was sampled at two loca-tions, at Marot and at Chak 102DB-Yazman (Fig. 1).The Marot dune sand was taken from the surface next tothe pit section shown in Fig. 2. The Chak 102DB sampleis from the section shown in Fig. 2, but lies close to the sur-face there. Results from the analysis of these grains areshown in Fig. 9, where they are compared with isotopicmeasurements from modern river sands in different partsof the Indus basin. Comparison with modern rivers is lessthan ideal because if the dunes are old then they could bederived from rivers in which the sands had quite differentcompositions. It has been demonstrated that erosion pat-terns in the Indus basin have changed with the evolvingstrength of the monsoon (Clift et al., 2008). Consequentlythe relative proportions of grains from different sourcesmust have changed since the LGM. In the absence of tem-poral records for each of the major tributaries we makesome simple, but reasonable assumptions. While the focusof erosion changes through time we assume that the rangeof compositions found in the sediment would be the sameas that found in the modern river, i.e., that there mightbe more or less grains with high (or low) isotope ratios com-pared to the modern, but that the total compositional rangewould be similar.
It is apparent that the desert sands at both locationscontain a significant number of K-feldspars with higherPb isotope ratios than are seen in Indus tributaries likethe Chenab and the Sutlej. However, such high values arecommonly found in the local streams draining Nanga Par-bat (Clift et al., 2002). The contrast with the Sutlej is partic-ularly noteworthy because this is the closest river to thedesert and might be expected to have been the primarysource of sand to the dunes. Both desert sands contain sig-nificant numbers of grains that plot in the overlap area be-tween the eastern Himalayan tributaries and those streams
eroding suture zone rocks in the headwaters of the maintrunk Indus. Consequently their provenance is ambiguous,but could involve erosion from either the Karakoram orHimalaya.
The number of grains with 207Pb/204Pb values below15.55 is quite small, suggesting that erosion from Kohistanisources is not a strong contributor to the desert sands.Whether the high isotope ratio grains are from Nanga Par-bat or not is unclear, because all possible sources are notwell characterized, but if these grains had been eroded fromthe Lesser Himalaya and were transported by the Sutlej orother Himalayan tributaries then we might expect to com-monly see grains of this style in the Sutlej and Chenab Riv-ers too, and this is not the case. As noted above 206Pb/204Pbvalues in the Sutlej and Chenab are generally <19 and all<22, making them poor matches to the desert sediment.The Sutlej in particular shows large areas of Lesser Hima-layan rock in its mountain catchment (Fig. 1) and wouldbe expected to show numerous high ratio grains if thesewere common in the Lesser Himalaya. Recent zirconU–Pb dating confirms that the Sutlej is very rich in LesserHimalayan detritus (Alizai et al., 2011). In contrast, grainswith 206Pb/204Pb values >21 are common in streams drain-ing the Nanga Parbat Massif. Although our sample sizesare too small to detect populations <5% of the total (Ruhland Hodges, 2005), it is clear that the desert sands and theHimalayan rivers are quite different from one another.
Presently the only major source of Nanga Parbat-derived material is the trunk Indus itself, with lesseramounts expected in the Jhelum River because this drainsthe southern flank of the Nanga Parbat Massif. If this situ-ation has been the case in the past then our new data implyreworking of Indus/Jhelum sediments to the east into theThar Desert. The prevailing summer monsoon winds, blow-ing SW to NE, would provide a ready mechanism to trans-fer sands from the vast Indus floodplain in Sindh. Incontrast, there is no geomorphic or other evidence to
Fig. 9. Isotopic ratio plot of dune sands from Chak 102DB and from a modern dune at Marot (see Fig. 1 for locations), compared with anumber of tributaries from the Indus system, including the new data from the Chenab and Sutlej Rivers. Note the spread of grains to highisotope ratios, generally only seen at Nanga Parbat.
4786 A. Alizai et al. / Geochimica et Cosmochimica Acta 75 (2011) 4771–4795
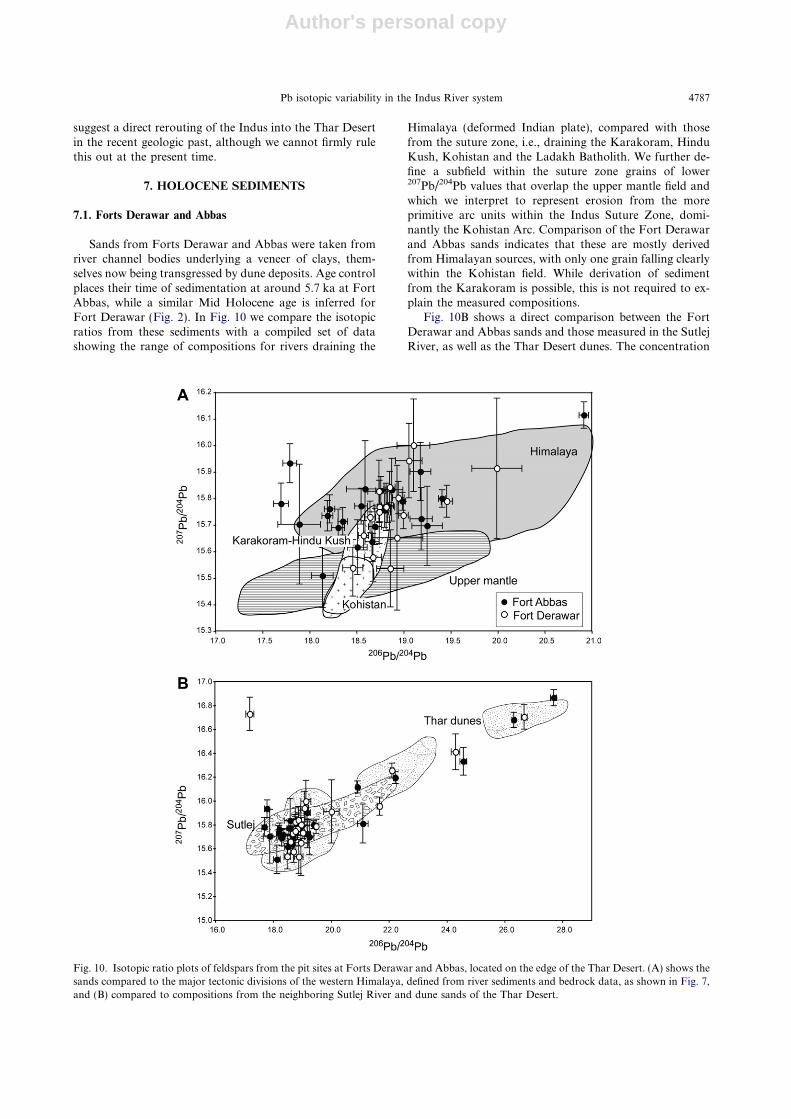
Author's personal copy
suggest a direct rerouting of the Indus into the Thar Desertin the recent geologic past, although we cannot firmly rulethis out at the present time.
7. HOLOCENE SEDIMENTS
7.1. Forts Derawar and Abbas
Sands from Forts Derawar and Abbas were taken fromriver channel bodies underlying a veneer of clays, them-selves now being transgressed by dune deposits. Age controlplaces their time of sedimentation at around 5.7 ka at FortAbbas, while a similar Mid Holocene age is inferred forFort Derawar (Fig. 2). In Fig. 10 we compare the isotopicratios from these sediments with a compiled set of datashowing the range of compositions for rivers draining the
Himalaya (deformed Indian plate), compared with thosefrom the suture zone, i.e., draining the Karakoram, HinduKush, Kohistan and the Ladakh Batholith. We further de-fine a subfield within the suture zone grains of lower207Pb/204Pb values that overlap the upper mantle field andwhich we interpret to represent erosion from the moreprimitive arc units within the Indus Suture Zone, domi-nantly the Kohistan Arc. Comparison of the Fort Derawarand Abbas sands indicates that these are mostly derivedfrom Himalayan sources, with only one grain falling clearlywithin the Kohistan field. While derivation of sedimentfrom the Karakoram is possible, this is not required to ex-plain the measured compositions.
Fig. 10B shows a direct comparison between the FortDerawar and Abbas sands and those measured in the SutlejRiver, as well as the Thar Desert dunes. The concentration
Fig. 10. Isotopic ratio plots of feldspars from the pit sites at Forts Derawar and Abbas, located on the edge of the Thar Desert. (A) shows thesands compared to the major tectonic divisions of the western Himalaya, defined from river sediments and bedrock data, as shown in Fig. 7,and (B) compared to compositions from the neighboring Sutlej River and dune sands of the Thar Desert.
Pb isotopic variability in the Indus River system 4787
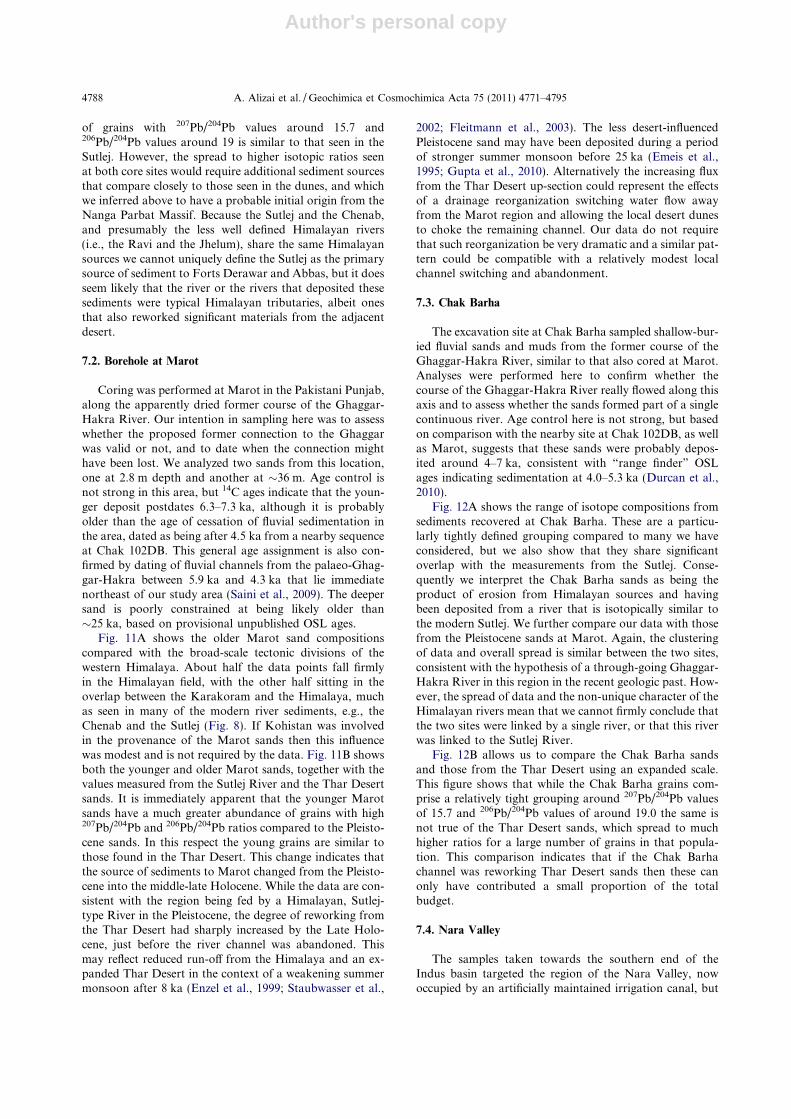
Author's personal copy
of grains with 207Pb/204Pb values around 15.7 and206Pb/204Pb values around 19 is similar to that seen in theSutlej. However, the spread to higher isotopic ratios seenat both core sites would require additional sediment sourcesthat compare closely to those seen in the dunes, and whichwe inferred above to have a probable initial origin from theNanga Parbat Massif. Because the Sutlej and the Chenab,and presumably the less well defined Himalayan rivers(i.e., the Ravi and the Jhelum), share the same Himalayansources we cannot uniquely define the Sutlej as the primarysource of sediment to Forts Derawar and Abbas, but it doesseem likely that the river or the rivers that deposited thesesediments were typical Himalayan tributaries, albeit onesthat also reworked significant materials from the adjacentdesert.
7.2. Borehole at Marot
Coring was performed at Marot in the Pakistani Punjab,along the apparently dried former course of the Ghaggar-Hakra River. Our intention in sampling here was to assesswhether the proposed former connection to the Ghaggarwas valid or not, and to date when the connection mighthave been lost. We analyzed two sands from this location,one at 2.8 m depth and another at �36 m. Age control isnot strong in this area, but 14C ages indicate that the youn-ger deposit postdates 6.3–7.3 ka, although it is probablyolder than the age of cessation of fluvial sedimentation inthe area, dated as being after 4.5 ka from a nearby sequenceat Chak 102DB. This general age assignment is also con-firmed by dating of fluvial channels from the palaeo-Ghag-gar-Hakra between 5.9 ka and 4.3 ka that lie immediatenortheast of our study area (Saini et al., 2009). The deepersand is poorly constrained at being likely older than�25 ka, based on provisional unpublished OSL ages.
Fig. 11A shows the older Marot sand compositionscompared with the broad-scale tectonic divisions of thewestern Himalaya. About half the data points fall firmlyin the Himalayan field, with the other half sitting in theoverlap between the Karakoram and the Himalaya, muchas seen in many of the modern river sediments, e.g., theChenab and the Sutlej (Fig. 8). If Kohistan was involvedin the provenance of the Marot sands then this influencewas modest and is not required by the data. Fig. 11B showsboth the younger and older Marot sands, together with thevalues measured from the Sutlej River and the Thar Desertsands. It is immediately apparent that the younger Marotsands have a much greater abundance of grains with high207Pb/204Pb and 206Pb/204Pb ratios compared to the Pleisto-cene sands. In this respect the young grains are similar tothose found in the Thar Desert. This change indicates thatthe source of sediments to Marot changed from the Pleisto-cene into the middle-late Holocene. While the data are con-sistent with the region being fed by a Himalayan, Sutlej-type River in the Pleistocene, the degree of reworking fromthe Thar Desert had sharply increased by the Late Holo-cene, just before the river channel was abandoned. Thismay reflect reduced run-off from the Himalaya and an ex-panded Thar Desert in the context of a weakening summermonsoon after 8 ka (Enzel et al., 1999; Staubwasser et al.,
2002; Fleitmann et al., 2003). The less desert-influencedPleistocene sand may have been deposited during a periodof stronger summer monsoon before 25 ka (Emeis et al.,1995; Gupta et al., 2010). Alternatively the increasing fluxfrom the Thar Desert up-section could represent the effectsof a drainage reorganization switching water flow awayfrom the Marot region and allowing the local desert dunesto choke the remaining channel. Our data do not requirethat such reorganization be very dramatic and a similar pat-tern could be compatible with a relatively modest localchannel switching and abandonment.
7.3. Chak Barha
The excavation site at Chak Barha sampled shallow-bur-ied fluvial sands and muds from the former course of theGhaggar-Hakra River, similar to that also cored at Marot.Analyses were performed here to confirm whether thecourse of the Ghaggar-Hakra River really flowed along thisaxis and to assess whether the sands formed part of a singlecontinuous river. Age control here is not strong, but basedon comparison with the nearby site at Chak 102DB, as wellas Marot, suggests that these sands were probably depos-ited around 4–7 ka, consistent with “range finder” OSLages indicating sedimentation at 4.0–5.3 ka (Durcan et al.,2010).
Fig. 12A shows the range of isotope compositions fromsediments recovered at Chak Barha. These are a particu-larly tightly defined grouping compared to many we haveconsidered, but we also show that they share significantoverlap with the measurements from the Sutlej. Conse-quently we interpret the Chak Barha sands as being theproduct of erosion from Himalayan sources and havingbeen deposited from a river that is isotopically similar tothe modern Sutlej. We further compare our data with thosefrom the Pleistocene sands at Marot. Again, the clusteringof data and overall spread is similar between the two sites,consistent with the hypothesis of a through-going Ghaggar-Hakra River in this region in the recent geologic past. How-ever, the spread of data and the non-unique character of theHimalayan rivers mean that we cannot firmly conclude thatthe two sites were linked by a single river, or that this riverwas linked to the Sutlej River.
Fig. 12B allows us to compare the Chak Barha sandsand those from the Thar Desert using an expanded scale.This figure shows that while the Chak Barha grains com-prise a relatively tight grouping around 207Pb/204Pb valuesof 15.7 and 206Pb/204Pb values of around 19.0 the same isnot true of the Thar Desert sands, which spread to muchhigher ratios for a large number of grains in that popula-tion. This comparison indicates that if the Chak Barhachannel was reworking Thar Desert sands then these canonly have contributed a small proportion of the totalbudget.
7.4. Nara Valley
The samples taken towards the southern end of theIndus basin targeted the region of the Nara Valley, nowoccupied by an artificially maintained irrigation canal, but
4788 A. Alizai et al. / Geochimica et Cosmochimica Acta 75 (2011) 4771–4795
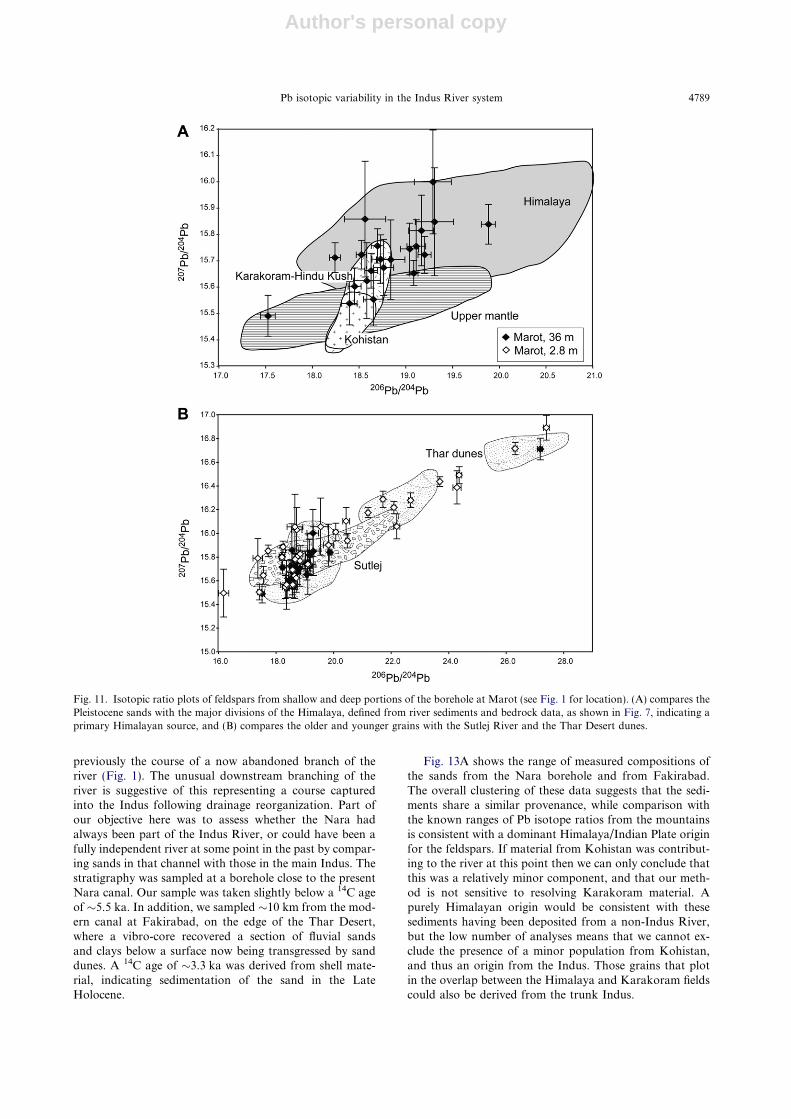
Author's personal copy
previously the course of a now abandoned branch of theriver (Fig. 1). The unusual downstream branching of theriver is suggestive of this representing a course capturedinto the Indus following drainage reorganization. Part ofour objective here was to assess whether the Nara hadalways been part of the Indus River, or could have been afully independent river at some point in the past by compar-ing sands in that channel with those in the main Indus. Thestratigraphy was sampled at a borehole close to the presentNara canal. Our sample was taken slightly below a 14C ageof �5.5 ka. In addition, we sampled �10 km from the mod-ern canal at Fakirabad, on the edge of the Thar Desert,where a vibro-core recovered a section of fluvial sandsand clays below a surface now being transgressed by sanddunes. A 14C age of �3.3 ka was derived from shell mate-rial, indicating sedimentation of the sand in the LateHolocene.
Fig. 13A shows the range of measured compositions ofthe sands from the Nara borehole and from Fakirabad.The overall clustering of these data suggests that the sedi-ments share a similar provenance, while comparison withthe known ranges of Pb isotope ratios from the mountainsis consistent with a dominant Himalaya/Indian Plate originfor the feldspars. If material from Kohistan was contribut-ing to the river at this point then we can only conclude thatthis was a relatively minor component, and that our meth-od is not sensitive to resolving Karakoram material. Apurely Himalayan origin would be consistent with thesesediments having been deposited from a non-Indus River,but the low number of analyses means that we cannot ex-clude the presence of a minor population from Kohistan,and thus an origin from the Indus. Those grains that plotin the overlap between the Himalaya and Karakoram fieldscould also be derived from the trunk Indus.
Fig. 11. Isotopic ratio plots of feldspars from shallow and deep portions of the borehole at Marot (see Fig. 1 for location). (A) compares thePleistocene sands with the major divisions of the Himalaya, defined from river sediments and bedrock data, as shown in Fig. 7, indicating aprimary Himalayan source, and (B) compares the older and younger grains with the Sutlej River and the Thar Desert dunes.
Pb isotopic variability in the Indus River system 4789
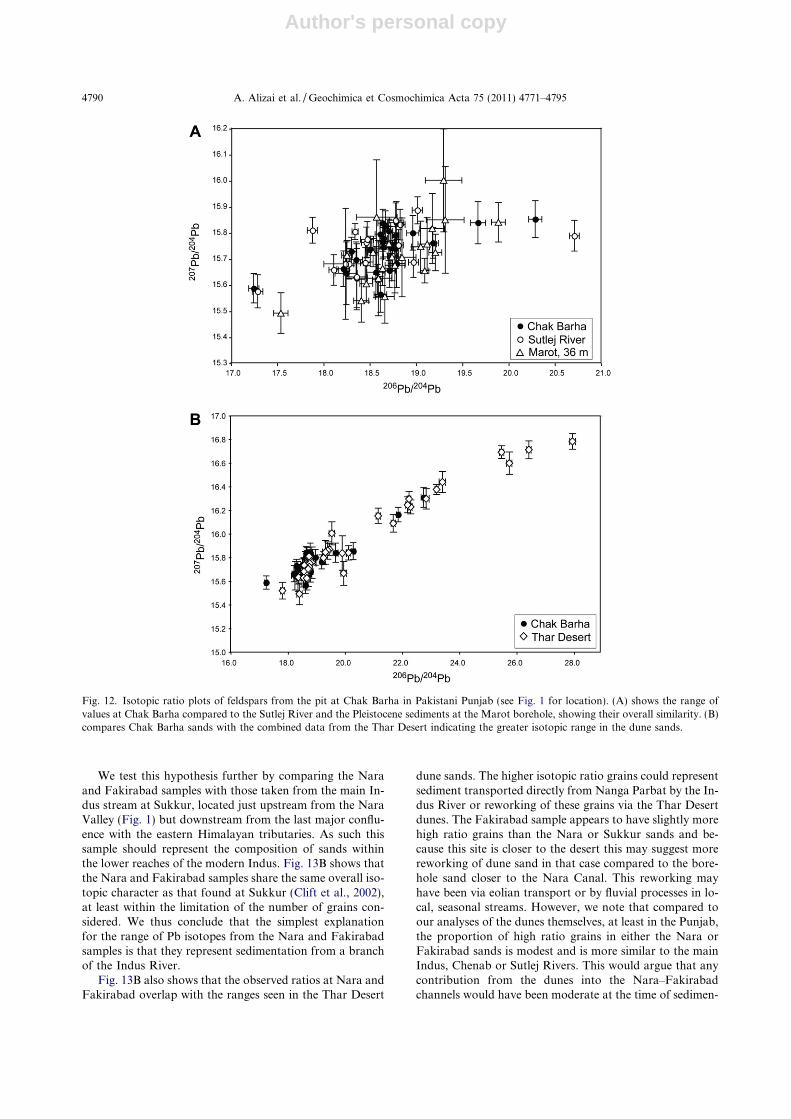
Author's personal copy
We test this hypothesis further by comparing the Naraand Fakirabad samples with those taken from the main In-dus stream at Sukkur, located just upstream from the NaraValley (Fig. 1) but downstream from the last major conflu-ence with the eastern Himalayan tributaries. As such thissample should represent the composition of sands withinthe lower reaches of the modern Indus. Fig. 13B shows thatthe Nara and Fakirabad samples share the same overall iso-topic character as that found at Sukkur (Clift et al., 2002),at least within the limitation of the number of grains con-sidered. We thus conclude that the simplest explanationfor the range of Pb isotopes from the Nara and Fakirabadsamples is that they represent sedimentation from a branchof the Indus River.
Fig. 13B also shows that the observed ratios at Nara andFakirabad overlap with the ranges seen in the Thar Desert
dune sands. The higher isotopic ratio grains could representsediment transported directly from Nanga Parbat by the In-dus River or reworking of these grains via the Thar Desertdunes. The Fakirabad sample appears to have slightly morehigh ratio grains than the Nara or Sukkur sands and be-cause this site is closer to the desert this may suggest morereworking of dune sand in that case compared to the bore-hole sand closer to the Nara Canal. This reworking mayhave been via eolian transport or by fluvial processes in lo-cal, seasonal streams. However, we note that compared toour analyses of the dunes themselves, at least in the Punjab,the proportion of high ratio grains in either the Nara orFakirabad sands is modest and is more similar to the mainIndus, Chenab or Sutlej Rivers. This would argue that anycontribution from the dunes into the Nara–Fakirabadchannels would have been moderate at the time of sedimen-
Fig. 12. Isotopic ratio plots of feldspars from the pit at Chak Barha in Pakistani Punjab (see Fig. 1 for location). (A) shows the range ofvalues at Chak Barha compared to the Sutlej River and the Pleistocene sediments at the Marot borehole, showing their overall similarity. (B)compares Chak Barha sands with the combined data from the Thar Desert indicating the greater isotopic range in the dune sands.
4790 A. Alizai et al. / Geochimica et Cosmochimica Acta 75 (2011) 4771–4795

Author's personal copy
tation, assuming that that the dunes in the southern TharDesert are compositionally like the ones we measured inthe north.
8. MULTIPROXY COMPARISON
The predictions of the Pb isotope data can be crosschecked against the new and existing Nd isotope data forsome of the samples. Fig. 14 shows the range of measuredNd isotopes found in the modern, Holocene and Pleisto-cene sediments. The Chenab River shows a close compari-son between the eNd values in the sediment and knownbedrock values in the Greater Himalaya, consistent withthis being the dominant source to the river. Recent U–Pbzircon dating of this same sample (Alizai et al., 2011) alsoindicates that the Greater Himalaya are the single greatest
source of sediment to the Chenab (�43% of the total), to-gether with an additional 32% of material from the TethyanHimalaya, which have similar Nd isotopes values to theGreater Himalaya and are indistinguishable based on Pbisotopes (Gariepy et al., 1985). Our Pb isotope data are con-sistent with a Greater Himalaya origin in showing a domi-nant clustering of analyses close to the known ranges fromHimalaya bedrock. The Sutlej grains generally plot in thesame part of the Pb isotope diagram as the Chenab(Fig. 8), but do not show the occasional higher 206Pb/204Pbgrains seen in that stream. U–Pb zircon ages and the muchlower eNd value seen in the Sutlej indicate that the LesserHimalaya are important sources of sediment to that river.Our Pb isotope data do not show any clear differences be-tween the Chenab and the Sutlej and we infer that the Pbisotope character of the Lesser Himalaya is not very
Fig. 13. Isotopic ratio plots of feldspars from the core site at Nara and the nearby pit at Fakirabad (see Fig. 1 for locations). (A) Comparisonof the two sands reveals a similar distribution of isotopic values, suggestive of a similar source, and (B) Comparison of the Nara andFakirabad sands with those from the Indus at Sukkur and with the range of values found in Thar Desert dunes.
Pb isotopic variability in the Indus River system 4791
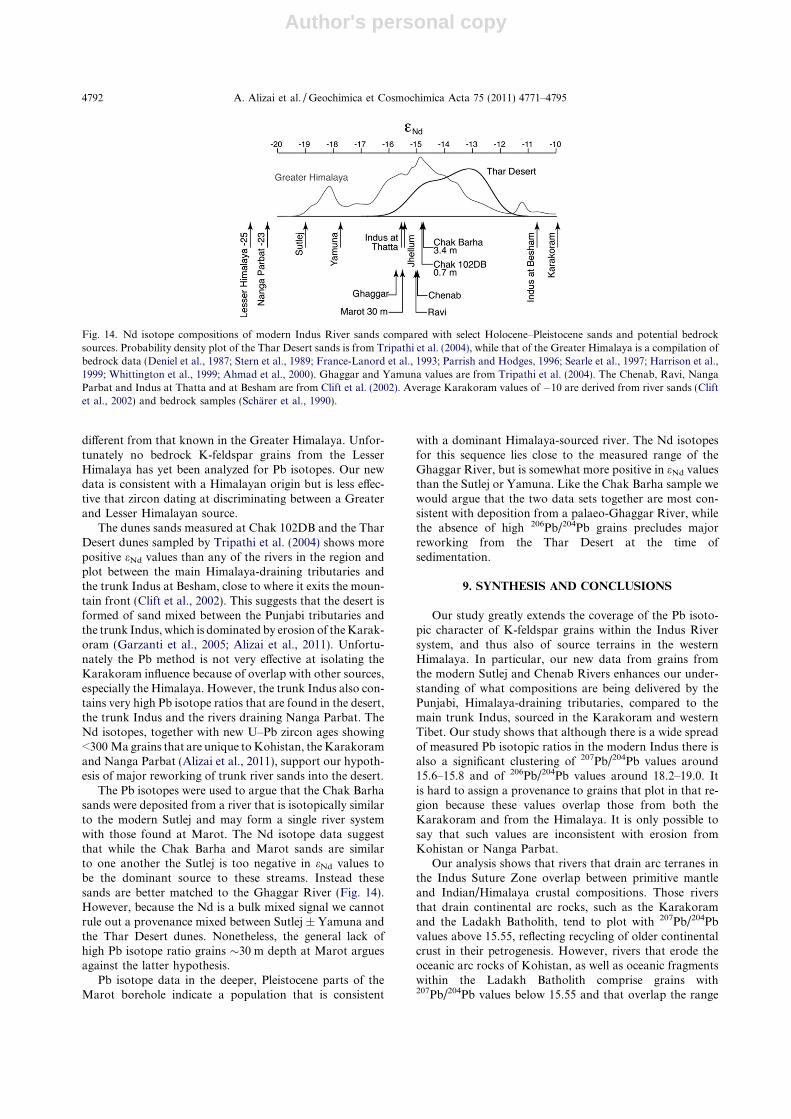
Author's personal copy
different from that known in the Greater Himalaya. Unfor-tunately no bedrock K-feldspar grains from the LesserHimalaya has yet been analyzed for Pb isotopes. Our newdata is consistent with a Himalayan origin but is less effec-tive that zircon dating at discriminating between a Greaterand Lesser Himalayan source.
The dunes sands measured at Chak 102DB and the TharDesert dunes sampled by Tripathi et al. (2004) shows morepositive eNd values than any of the rivers in the region andplot between the main Himalaya-draining tributaries andthe trunk Indus at Besham, close to where it exits the moun-tain front (Clift et al., 2002). This suggests that the desert isformed of sand mixed between the Punjabi tributaries andthe trunk Indus, which is dominated by erosion of the Karak-oram (Garzanti et al., 2005; Alizai et al., 2011). Unfortu-nately the Pb method is not very effective at isolating theKarakoram influence because of overlap with other sources,especially the Himalaya. However, the trunk Indus also con-tains very high Pb isotope ratios that are found in the desert,the trunk Indus and the rivers draining Nanga Parbat. TheNd isotopes, together with new U–Pb zircon ages showing<300 Ma grains that are unique to Kohistan, the Karakoramand Nanga Parbat (Alizai et al., 2011), support our hypoth-esis of major reworking of trunk river sands into the desert.
The Pb isotopes were used to argue that the Chak Barhasands were deposited from a river that is isotopically similarto the modern Sutlej and may form a single river systemwith those found at Marot. The Nd isotope data suggestthat while the Chak Barha and Marot sands are similarto one another the Sutlej is too negative in eNd values tobe the dominant source to these streams. Instead thesesands are better matched to the Ghaggar River (Fig. 14).However, because the Nd is a bulk mixed signal we cannotrule out a provenance mixed between Sutlej ± Yamuna andthe Thar Desert dunes. Nonetheless, the general lack ofhigh Pb isotope ratio grains �30 m depth at Marot arguesagainst the latter hypothesis.
Pb isotope data in the deeper, Pleistocene parts of theMarot borehole indicate a population that is consistent
with a dominant Himalaya-sourced river. The Nd isotopesfor this sequence lies close to the measured range of theGhaggar River, but is somewhat more positive in eNd valuesthan the Sutlej or Yamuna. Like the Chak Barha sample wewould argue that the two data sets together are most con-sistent with deposition from a palaeo-Ghaggar River, whilethe absence of high 206Pb/204Pb grains precludes majorreworking from the Thar Desert at the time ofsedimentation.
9. SYNTHESIS AND CONCLUSIONS
Our study greatly extends the coverage of the Pb isoto-pic character of K-feldspar grains within the Indus Riversystem, and thus also of source terrains in the westernHimalaya. In particular, our new data from grains fromthe modern Sutlej and Chenab Rivers enhances our under-standing of what compositions are being delivered by thePunjabi, Himalaya-draining tributaries, compared to themain trunk Indus, sourced in the Karakoram and westernTibet. Our study shows that although there is a wide spreadof measured Pb isotopic ratios in the modern Indus there isalso a significant clustering of 207Pb/204Pb values around15.6–15.8 and of 206Pb/204Pb values around 18.2–19.0. Itis hard to assign a provenance to grains that plot in that re-gion because these values overlap those from both theKarakoram and from the Himalaya. It is only possible tosay that such values are inconsistent with erosion fromKohistan or Nanga Parbat.
Our analysis shows that rivers that drain arc terranes inthe Indus Suture Zone overlap between primitive mantleand Indian/Himalaya crustal compositions. Those riversthat drain continental arc rocks, such as the Karakoramand the Ladakh Batholith, tend to plot with 207Pb/204Pbvalues above 15.55, reflecting recycling of older continentalcrust in their petrogenesis. However, rivers that erode theoceanic arc rocks of Kohistan, as well as oceanic fragmentswithin the Ladakh Batholith comprise grains with207Pb/204Pb values below 15.55 and that overlap the range
Fig. 14. Nd isotope compositions of modern Indus River sands compared with select Holocene–Pleistocene sands and potential bedrocksources. Probability density plot of the Thar Desert sands is from Tripathi et al. (2004), while that of the Greater Himalaya is a compilation ofbedrock data (Deniel et al., 1987; Stern et al., 1989; France-Lanord et al., 1993; Parrish and Hodges, 1996; Searle et al., 1997; Harrison et al.,1999; Whittington et al., 1999; Ahmad et al., 2000). Ghaggar and Yamuna values are from Tripathi et al. (2004). The Chenab, Ravi, NangaParbat and Indus at Thatta and at Besham are from Clift et al. (2002). Average Karakoram values of �10 are derived from river sands (Cliftet al., 2002) and bedrock samples (Scharer et al., 1990).
4792 A. Alizai et al. / Geochimica et Cosmochimica Acta 75 (2011) 4771–4795
Author's personal copy
of Pacific and Indian Ocean mantle sources. We interpretthese grains to be diagnostic of an oceanic arc source. Suchgrains are not found in the Chenab or Sutlej Rivers.
In addition to the cluster of grains between theKarakoram–Himalaya fields there are a significant numberof grains with high isotopic ratios, i.e., 207Pb/204Pb values>16.1 and 206Pb/204Pb values >20.5. These were foundcommonly in the streams draining Nanga Parbat (Cliftet al., 2002), however this earlier study also identified highvalue grains as comprising a modest proportion of the totalpopulation in the Chenab and the Sutlej. While these grainsare higher in 206Pb/204Pb values than the most commonisotopes cluster they still tend to be lower than the grainsanalyzed from Nanga Parbat draining streams. One possi-ble explanation is that these more radiogenic grains in theChenab and Sutlej are derived from older Lesser Himala-yan-type crust within each of these catchments. This wouldbe consistent with Nd isotope data linking Nanga Parbatand the Lesser Himalaya (Whittington et al., 1999). How-ever, we note that the highest measured values in theChenab and Sutlej were only found in the sample analyzedby Clift et al. (2002) and that these samples were takenwithin the flood plain, not adjacent to the mountain frontas we do here. As a result these earlier samples may havebeen contaminated by reworking from the Thar Desert.Existing measurements from Himalayan bedrock do notshow these extreme isotope ratios (Vidal et al., 1982;Gariepy et al., 1985), but no study to date has analyzedPb isotope in rocks from the Lesser Himalaya. Nonetheless,the Sutlej River crosses a wide expanse of Lesser Himala-yan rock and new zircon U–Pb ages from this same sampleindicate that �58% of the sediment load is derived from theLesser Himalaya (Alizai et al., 2011). If high Pb isotopicvalues are common in the Lesser Himalaya then we mightexpect to have seen many more such grains in this presentstudy. We conclude that while high Pb isotope ratios grainsmay be present in the Lesser Himalaya they are much lesscommon than in streams draining the Nanga ParbatMassif.
Based on this synthesis of the Pb isotopes within thedifferent zones of the Himalaya we can quantitate thesource of the grains in the dunes of the modern Thar Des-ert. Fig. 9 demonstrated that a large number of grains inthe two dune sands analyzed had high, radiogenic Pb iso-topic characteristics. This implies that Nanga Parbat is asignificant supplier of sand grains to this region, presum-ably via the trunk Indus. The Thar Desert is a Pleistocenefeature (Glennie et al., 2002), with phases of accumulationparticularly associated with strengthening of the summermonsoon (Singhvi et al., 2010). We thus envisage the des-ert being built by sand carried by monsoon winds fromthe region of the lower Indus flood plains in Sindh tothe SW into the areas we sampled in the Punjab(Fig. 1). The Punjabi Himalayan-derived rivers appear tomake only modest contribution to the desert dunes, be-cause they lack the high isotopic ratio grains that are seenin the desert and in the trunk Indus. If they were domi-nant then this population would be heavily diluted. Thisconclusion is supported by both bulk sediment Nd iso-topes and U–Pb zircon ages.
Pb isotope data from the Pleistocene sample from theMarot borehole, as well as the Holocene sample from ChakBarha, show a range of isotopic compositions that are bothsimilar to one another and to the modern Himalayan rivers,such as the Sutlej and Chenab. Neither of the palaeo-sam-ples shows many high ratio grains and so we can concludethat reworking from the Thar Desert was not importantwhen these sands were deposited. Instead we envisage sed-imentation as being from a river compositionally like theSutlej. We cannot rule out the possibility that the Sutlej flo-wed further south, close to the Thar Desert at that time.However, our data are also consistent with models that pro-ject a Ghaggar-Hakra River running through this region inthe recent past (Ghose et al., 1979; Saini et al., 2009), be-cause this might be expected to also have a typical Himala-yan composition. Nd isotopic data suggest that theGhaggar would have been a better match to the sands atMarot and Chak Barha.
Some models for the Ghaggar-Hakra River suggest thatthis may have flowed as far as the Arabian Sea as an inde-pendent river (Tripathi et al., 2004). Our analyses from theNara Valley borehole and from Fakirabad should provide atest to this hypothesis. Unfortunately the Pb isotope systemdoes not provide a good separation between the lowerreaches of the Indus and the Himalayan Rivers, such asthe Sutlej and presumably the Ghaggar-Hakra River. Thisis because the characteristic Nanga Parbat grains thatwould show an influence from the trunk Indus are alsofound in the Thar Desert and are reworked into the rivers.They also comprise only a small proportion of the trunk In-dus load. Thus the Holocene sands from the Nara regiontell us only that there was a continuous major river in theNara area and that it was not heavily contaminated byreworking of dunes, but we are unable to say whether thatriver was the Indus or the Ghaggar-Hakra.
Our data support models for the edge of the Thar Desertbeing formerly much wetter and supplied by major Hima-laya-derived streams, which are no longer present in thatarea. Why the streams stopped flowing here is not clearfrom this study, whether that involved headwater capture,or simple drying in a weakening monsoon environment.We do however, see evidence for the gradual demise ofthese rivers in the Punjab area. While the Pleistocene sand(>25 ka) at Marot shows a good Himalayan signature theyounger Holocene sample (<6.3 ka) shows an influx of highisotopic ratio grains that we associate with reworking fromthe dunes. If the river flux from the Himalaya had beendominant at that time, as it was lower in the core, thenthe dune signature would have been diluted by fresh Hima-layan debris, yet this is not the case for the Holocene sam-ple, which shows a composition close to the dunes. Thisimplies a river mostly reworking dune material immediatelyprior to this channel being filled and abandoned after�6.3 ka. What we do not know is whether the river simplymigrated or switched away locally, or if this change repre-sent a major change in the rivers on a regional scale inthe context of a weakening monsoon.
A similar process is seen in the mid Holocene sands atForts Derawar and Abbas, likely deposited around5.7 ka, and certainly not much younger than 4.5 ka, based
Pb isotopic variability in the Indus River system 4793

Author's personal copy
on 14C ages from the Chak 102DB-Yazman region. Likethe younger sand at Marot the Forts Derawar and Abbassands show significant numbers of high isotope ratio grains,implying reworking of sand from the Thar Desert immedi-ately before the end of the fluvial sedimentation at eachlocation. While this could represent the end of fluvial activ-ity around the edge of the Thar Desert entirely this is notrequired by the data at the present time.
We conclude that the Pb isotope system, as applied toK-feldspar grains in modern and ancient Indus River sed-iment can provide useful provenance constraints. How-ever, the method is relatively slow and expensive,making the collection of large statistically robust data setsdifficult. The same is not true of the more rapid andcheaper ICP-MS method for Pb isotopes (Tyrrell et al.,2007), which is more appropriate to sedimentary prove-nance studies that require large numbers of grains to beanalyzed. In addition, several of the sediment sources inthe Indus have overlapping isotopic ranges, so that it isnot always possible to uniquely define the provenance ofany given grain. In this respect U–Pb zircon ages appearto be superior in resolving provenance at least in the Indussystem. Nonetheless, the K-feldspar method does appearto work quite well in fingerprinting the influence of NangaParbat and Kohistan. The present study highlights theimportance of reworking into and out of the Thar Desertas a process in controlling the flux of sediment to the In-dian Ocean via the Indus River system.
ACKNOWLEDGEMENTS
This work was supported by funding from the Natural Environ-mental Research Council (NERC) and the Leverhulme Trust toClift and National Science Foundation through award OCE-0623766 to Giosan. We thank the Natural Environment ResearchCouncil (NERC) for providing analytical time on the Edinburghion probe facility. The paper was improved thanks for rigorous re-views from Michael Flowerdew and Shane Tyrrell.
REFERENCES
Ahmad T., Harris N., Bickle M., Chapman H., Bunbury J. andPrince C. (2000) Isotopic constraints on the structural relation-ships between the Lesser Himalayan series and the HighHimalayan crystalline series, Garhwal Himalaya. Geol. Soc.
Am. Bull. 112(3), 467–477.
Alizai A., Carter A., Clift P. D., VanLaningham S., Williams J. C.and Kumar R. (2011) Sediment provenance, reworking andtransport processes in the Indus River by U–Pb dating ofdetrital zircon grains. Global Planet. Change 76, 33–55.
doi:10.1016/j.gloplacha.2010.11.008.
Amidon W. H., Burbank D. W. and Gehrels G. E. (2005)Construction of detrital mineral populations: insights frommixing of U–Pb zircon ages in Himalayan rivers. Basin Res.
17(4), 463–485.
Cerveny P. F., Johnson N. M., Tahirkheli R. A. K. and Bonis N.R. (1989) Tectonic and geomorphic implications of SiwalikGroup heavy minerals, Potwar Plateau, Pakistan. In Tectonics
of the Western Himalayas. Special Paper, 232 (eds. L. L.Malinconico and R. J. Lillie). Geological Society of America
Boulder, Colorado, pp. 129–136.
Clift P., Giosan L. and Blusztajn J., et al. (2008) Holocene erosionof the Lesser Himalaya triggered by intensified summermonsoon. Geology 36(1), 79–82. doi:10.1130/G24315A.1.
Clift P. D., Giosan L. and Carter A., et al. (2010) Monsoon controlover erosion patterns in the Western Himalaya: possible feed-backs into the tectonic evolution. In Monsoon Evolution and
Tectonic-Climate Linkage in Asia. Special Publication, 342 (eds.P. D. Clift, R. Tada and H. Zheng). Geological Society,
London, pp. 181–213.
Clift P. D., Lee J. I., Hildebrand P., Shimizu N., Layne G. D.,Blusztajn J., Blum J. D., Garzanti E. and Khan A. A. (2002) Ndand Pb isotope variability in the Indus River system; implica-tions for sediment provenance and crustal heterogeneity in thewestern Himalaya. Earth Planet. Sci. Lett. 200(1–2), 91–106.
Clift P. D., Shimizu N., Layne G., Gaedicke C., Schluter H. U., ClarkM. and Amjad S. (2001a) Development of the Indus Fan and itssignificance for the erosional history of the western Himalaya andKarakoram. Geol. Soc. Am. Bull. 113, 1039–1051.
Clift P. D., Shimizu N., Layne G. D. and Blusztajn J. (2001b)Tracing patterns of erosion and drainage in the PaleogeneHimalaya through ion probe Pb isotope analysis of detrital K-feldspars in the Indus Molasse, India. Earth Planet. Sci. Lett.
188(3–4), 475–491.
Debon F., Fort P. L., Sheppard S. M. F. and Sonet J. (1986) Thefour plutonic belts of the Transhimalaya-Himalaya: a chemical,mineralogical, isotopic, and chronological synthesis along aTibet–Nepal section. J. Petrol. 27(1), 219–250.
Deniel C., Vidal P., Fernandez A., Lefort P. and Peucat J. J. (1987)Isotopic study of the manaslu granite (Himalaya, Nepal)–inferences on the age and source of Himalayan leukogranites.Contrib. Min. Petrol. 96(1), 78–92.
Dickinson W. R., Beard S. L., Brackenridge G. R., Erjavec J. L.,Ferguson R. C., Inman K. F., Knepp R. A., Lindberg F. A. andRyber P. T. (1983) Provenance of North American phanerozoicsandstones in relation to tectonic setting. Geol. Soc. Am. Bull.
94, 222–235.
Durcan J. A., Roberts H. M., Duller G. A. T. and Alizai A. H.(2010) Testing the use of range-finder OSL dating to informfield sampling and laboratory processing strategies. Quat.
Geochron. 5, 86–90.
Emeis K. C., Anderson D. M., Doose H., Kroon D. and Schulz-Bull D. (1995) Sea-surface temperatures and the history ofmonsoon upwelling in the northwest Arabian Sea during thelast 500,000 years. Quat. Res. 43, 355–361. doi:10.1006/
qres.1995.1041.
Enzel Y., Ely L. L., Mishra S., Ramesh R., Amit R., Lazar B.,Rajaguru S. N., Baker V. R. and Sandle A. (1999) High-resolution Holocene environmental changes in the Thar Desert,northwestern India. Science 284, 125–128.
Fleitmann D., Burns S. J., Mudelsee M., Neff U., Kramers J.,Mangini A. and Matter A. (2003) Holocene forcing of theIndian monsoon recorded in a stalagmite from southern Oman.Science 300(5626), 1737–1739.
France-Lanord C., Derry L. and Michard A. (1993) Evolution ofthe Himalaya since Miocene time: isotopic and sedimentologicevidence from the Bengal Fan. In Himalayan Tectonics. Special
Publications, 74 (eds. P. J. Treloar and M. P. Searle). Geological
Society, London, pp. 603–621.
Gariepy C., Allegre C. J. and Xu R. H. (1985) The Pb-isotopegeochemistry of granitoids from the Himalaya–Tibet collisionzone: implications for crustal evolution. Earth Planet. Sci. Lett.
74, 220–234.
Garzanti E., Vezzoli G., Ando S., Paparella P. and Clift P. D.(2005) Petrology of Indus River sands: a key to interpreterosion history of the western Himalayan syntaxis. Earth
Planet. Sci. Lett. 229(3–4), 287–302.
4794 A. Alizai et al. / Geochimica et Cosmochimica Acta 75 (2011) 4771–4795
Author's personal copy
Ghose B., Kar A. and Husain Z. (1979) The lost courses of theSaraswati River in the Great Indian Desert: new evidence fromLandsat imagery. Geograph. J. 145(3), 446–451.
Glennie K. W., Singhvi A. K., Lancaster N. and Teller J. T. (2002)Quaternary climatic changes over Southern Arabia and theThar Desert, India. In The Tectonic and Climatic Evolution of
the Arabian Sea Region. Special Publications, 195 (eds. P. D.Clift, D. Kroon, C. Gaedicke and J. Craig). Geological Society,
London, pp. 301–316.
Gupta A. K., Sarkar S., De S., Clemens S. C. and Velu A. (2010)Mid-Brunhes strengthening of the Indian Ocean Dipole causedincreased equatorial East African and decreased Australasianrainfall. Geophys. Res. Lett. 37, L06706. doi:10.1029/
2009GL042225.
Gwiazda R. H., Hemming S. R. and Broecker W. S. (1996)Tracking the sources of icebergs with lead isotopes: theprovenance of ice-rafted debris in Heinrich layer 2. Paleocea-
nography 11(1), 77–93.
Harrison T. M., Grove M., McKeegan K. D., Coath C. D., LoveraO. M. and Le Fort P. (1999) Origin and episodic emplacementof the Manaslu intrusive complex, central Himalaya. J. Petrol.
40(1), 3–19.
Hemming S. R., Broecker W. S., Sharp W. D., Bond G. C.,Gwiazda R. H., McManus J. F., Klas M. and Hajdas I. (1998)Provenance of Heinrich layers in Core V28-82, northeasternAtlantic; 40Ar/39Ar ages of ice-rafted hornblende, Pb isotopesin feldspar grains, and Nd–Sr–Pb isotopes in the fine sedimentfraction. Earth Planet. Sci. Lett. 164(1–2), 317–333.
Khan M. A., Stern R. J., Gribble R. F. and Windley B. F. (1997)Geochemical and isotopic constraints on subduction polarity,magma sources, and palaeogeography of the Kohistan intra-oceanic arc, northern Pakistan Himalaya. J. Geol. Soc. London
154, 935–946.
Layne G. D. and Shimizu N. (1998) Measurement of lead isotoperatios in common silicate and sulfide phases using the Cameca1270 ion microprobe. In Secondary Ion Mass Spectrometry
SIMS XI (ed. G. Gillen). John Wiley, New York, pp. 63–65.
McDaniel D. K., Hemming S. R., McLennan S. M. and Hanson G.N. (1994) Petrographic, geochemical, and isotopic constraintson the provenance of the early Proterozoic Chelmsford forma-tion, Sudbury Basin, Ontario. J. Sediment Res. A 64(2), 362–
372.
McNichol A. P., Gagnon A. R., Osborne E. A., Hutton D. L.,VonReden K. F. and Schneider R. J. (1995) Improvements inprocedural blanks at NOSAMS: reflections of improvements insample preparation and accelerator operation. Radiocarbon
37(2), 683–691.
Parrish R. R. and Hodges K. V. (1996) Isotopic constraints on theage and provenance of the Lesser and Greater Himalayansequences, Nepalese Himalaya. Geol. Soc. Am. Bull. 108(7),
904–911.
Parrish R. R., Hodges K. V. and MacFarlane A. (1992) U–Pb
geochronology of igneous and metamorphic rocks near the main
central thrust in the Langtang area, central Nepal Himalaya, 7th
Himalaya–Karakorum–Tibet workshop. Oxford University, pp.67–68.
Ruhl K. W. and Hodges K. V. (2005) The use of detrital mineralcooling ages to evaluate steady state assumptions in activeorogens: an example from the central Nepalese Himalaya.Tectonics 24(4), TC4015. doi:10.1029/2004TC001712.
Saini H. S., Tandon S. K., Mujtaba S. A. I., Pant N. C. andKhorana R. K. (2009) Reconstruction of buried channel-floodplain systems of the northwestern Haryana plains and
their relation to the ‘Vedic’ Saraswati. Curr. Sci. 97(11), 1634–
1643.
Scharer U., Copeland P., Harrison T. M. and Searle M. P. (1990)Age, cooling history, and origin of post-collisional leucogra-nites in the Karakoram Batholith: a multi-system isotope study.J. Geol. 98(2), 233–251.
Searle M. P., Parrish R. R., Hodges K. V., Hurford A., Ayres M.W. and Whitehouse M. J. (1997) Shisha Pangma leucogranite,South Tibetan Himalaya: field relations, geochemistry, age,origin, and emplacement. J. Geol. 105(3), 295–317.
Singhvi A. K., Williams M. A. J. and Rajaguru S. N., et al. (2010)A 200 ka record of climatic change and dune activity in theThar Desert, India. Quat. Sci. Rev.. doi:10.1016/j.quascirev.2010.08.003.
Souders A. K. and Sylvester P. J. (2010) Accuracy and precision ofnon-matrix matched calibration for lead isotope measurementsof lead-poor minerals by LA-MC-ICPMS. J. Anal. Atom.
Spectrom. 25, 975–988.
Staubwasser M., Sirocko F., Grootes P. M. and Erlenkeuser H.(2002) South Asian monsoon climate change and radiocarbonin the Arabian Sea during early and middle Holocene.Paleoceanography 17(4), 1063. doi:10.1029/2000PA000608.
Stern C. R., Kligfield R., Schelling D., Virdi N. S., Futa K. andPeterman Z. E. (1989) The Bhagirathi leucogranite of HighHimalaya (Garhwal, India): age, petrogenesis, and tectonicimplications. In Tectonics of the Western Himalayas. Special
Paper, 232 (ed. L. L. Malinconico). Geological Society of
America, Boulder, CO, pp. 33–45.
Stuiver M., Reimer P. J. and Bard E., et al. (1998) INTCAL98radiocarbon age calibration. Radiocarbon 40, 1041–1083.
Sun S. S. (1980) Lead isotopic study of young volcanic rocks frommid-ocean ridges, ocean islands and island arcs. Philos. Trans.
Roy. Soc. A 297, 409–445.
Tanaka T., Togashi S. and Kamioka H., et al. (2000) JNdi-1: aneodymium isotopic reference in consistency with LaJollaneodymium. Chem. Geol. 168, 279–281.
Tripathi J. K., Bock B., Rajamani V. and Eisenhauer A. (2004) IsRiver Ghaggur, Saraswati? Geochemical constraints. Curr. Sci.
87(8), 1141–1145.
Tyrrell S., Haughton P. D. W. and Daly J. S. (2007) Drainagereorganization during breakup of Pangea revealed by in-situ Pbisotopic analysis of detrital K-feldspar. Geology 35(11), 971–
974. doi:10.1130/G4123A.1.
Tyrrell S., Haughton P. D. W., Daly J. S., Kokfelt T. F. andGagnevin D. (2006) The use of the common Pb isotopecomposition of detrital K-feldspar grains as a provenance tooland its application to upper Carboniferous paleodrainage,northern England. J. Sediment Res. 76(2), 324–345.
VanLaningham S., Duncan R. A., Pisias N. G. and Graham D. W.(2008) Tracking fluvial response to climate change in the PacificNorthwest: a combined provenance approach using Ar and Ndisotopic systems on fine-grained sediments. Quat. Sci. Rev. 27.
doi:10.1016/j.quascirev.2007.10.018.
Vidal P., Cocherie A. and Le Fort P. (1982) Geochemicalinvestigations of the origin of the Manaslu leucogranite(Himalaya, Nepal). Geochim. Cosmochim. Acta 46, 2279–2292.
Whittington A., Foster G., Harris N., Vance D. and Ayres M.(1999) Lithostratigraphic correlations in the western Himalaya–an isotopic approach. Geology 27(7), 585–588.
Associate editor: Sidney R. Hemming
Pb isotopic variability in the Indus River system 4795
Copyright © 2022 FDOKUMEN