Detrital Controls on Dissolved Organic Matter in Soils: A Field Experiment
Upload
khangminh22Category
view
3download
0
University of South CarolinaScholar Commons
Theses and Dissertations
5-8-2015
Detrital Zircon Analysis of the Taza-Guercif Basinand the Adjacent Rif and Middle Atlas Mountainsof Morocco and X-Ray Fluorescence ChemofaciesAnalysis of the Maness Shale of East TexasJonathan Richard PrattUniversity of South Carolina - Columbia
Follow this and additional works at: https://scholarcommons.sc.edu/etd
Part of the Geology Commons
This Open Access Dissertation is brought to you by Scholar Commons. It has been accepted for inclusion in Theses and Dissertations by an authorizedadministrator of Scholar Commons. For more information, please contact [email protected].
Recommended CitationPratt, J. R.(2015). Detrital Zircon Analysis of the Taza-Guercif Basin and the Adjacent Rif and Middle Atlas Mountains of Morocco and X-Ray Fluorescence Chemofacies Analysis of the Maness Shale of East Texas. (Doctoral dissertation). Retrieved fromhttps://scholarcommons.sc.edu/etd/3071

DETRITAL ZIRCON ANALYSIS OF THE TAZA-GUERCIF BASIN AND THE
ADJACENT RIF AND MIDDLE ATLAS MOUNTAINS OF MOROCCO AND X-RAY
FLUORESCENCE CHEMOFACIES ANALYSIS OF THE MANESS SHALE OF EAST
TEXAS
by
Jonathan Richard Pratt
Bachelor of Science
The Ohio State University, 2008
Submitted in Partial Fulfillment of the Requirements
For the Degree of Doctor of Philosophy in
Geological Sciences
College of Arts and Sciences
University of South Carolina
2015
Accepted by:
David L. Barbeau, Jr., Major Professor
Andrew Leier, Committee Member
Michael Bizimis, Committee Member
Howie Scher, Committee Member
Harry Rowe, Committee Member
Lacy Ford, Vice Provost and Dean of Graduate Studies

ii
© Copyright by Jonathan Richard Pratt, 2015
All Rights Reserved.

iii
DEDICATION
My dissertation is dedicated to my caring and supportive parents, Merle and Lee
Ann Pratt, who continue to foster my love of learning and encourage me in all that I
endeavor.

iv
ACKNOWLEDGEMENTS
The Moroccan portion of my research was supported through several graduate
student research grants including a Geological Society of America Student Research
Grant awarded in 2011, an American Association of Petroleum Geology Grants-in-Aid
Raymond D. Woods Memorial Grant awarded in 2012 and a Sigma Xi Grant-in-Aid of
Research awarded in 2011. Marissa Wright, Jason Titus, Benjamin Oliver and Justin
Davis provided assistance in sample preparation and/or instrument operation at the
University of South Carolina’s Tectonics and Sedimentation Lab. Michael Bizimis and
Elizabeth Bair provided invaluable technical support and aid with LA-ICP-MS method
development at the University of South Carolina’s Center for Elemental Mass
Spectrometry. Matthew Manon and Palma Catravas assisted SEM instrument operation at
the Union College Fission-track Lab. Excellent assistance during our field work was
provided by our driver and guide, Juoadi. I also acknowledge the never-ending assistance
of my manuscript co-authors Dr. David Barbeau, Jr., Dr. John Garver, Dr. Anas Emran
and my compatriot in the field, Tyler Izykowski.
For the research on the Maness Shale, I thank EOG Resources, Inc. for allowing
me to use their data, and in particular, John Chapman and John Becker for their
assistance in granting me this access. Both the XRF and XRD data were acquired by
Nathan Ganser and his helpful team at MUD Geochemical. Finally, I acknowledge the
dedication of Nestor Phillips and Dr. Harry Rowe, my XRF mentors for their continued
support throughout this process.

v
ABSTRACT
The research in this compilation encompasses three studies leveraging quantitative
chemical analyses to interpret the sedimentary record to reconstruct geologic history. The first
study surveys the detrital zircon U-Pb and zircon fission-track geochronology of the sedimentary
Cretaceous Ketama and Tisiren units of the Rif Mountains, and the Bou Rached sandstones of the
Middle Atlas Mountains. All analyzed samples contain a population of Mesoproterozoic
crystallization ages formerly unknown to northwest Africa. Possible sources for these ages
include the Avalonian terranes now present on the northeastern seaboard of North America,
and/or zircons derived from the Amazonian craton and preserved in the Pan-African Volta basin
in central Africa. The detrital zircon spectra of both the Rif and Middle Atlas samples are
dominated by U-Pb ages associated with the Pan-African orogeny (700-560 Ma) and West
African craton (2.2-1.8 Ga). In addition to these ages, the Middle Atlas samples contain a 400-
460 Ma U-Pb population that most likely derived from the Sehoul block, a small Avalonian
allochthon, or from Avalonia itself, recording cross-continental sediment transport during the
Variscan orogeny.
In the second chapter of this work, the combined detrital zircon U-Pb and zircon fission-
track geochronology of the Taza-Guercif basin is analyzed to assess tectonic cause for the closure
of the Rifean Corridor. The Rifean Corridor was the last major Miocene marine connection
between the Atlantic Ocean and Mediterranean Sea that when tectonically severed led to the
Messinian Crisis. A total of 499 U-Pb ages and 98 fission-track ages are presented from the basin
stratigraphy. These ages are compared with the detrital zircon signature for the Rif and Middle

vi
Atlas mountains, which were actively deforming during corridor closure, as a proxy for
tectonism. A key population of Triassic-centered fission-track ages within the basin sediments
indicates that the majority of detrital sediment present in the basin derived from the Middle Atlas
Mountains. The lack of any significant provenance shifts towards a Rif Mountain source during
the emergence of the basin and the closure of the Rifean Corridor suggests that uplift of the
Middle Atlas Mountains was the primary cause for the emergence of the Taza-Guercif basin and
was an important contributor to the Messinian Salinity Crisis.
The final chapter characterizes the depositional and post-depositional history of the
Maness Shale of the East Texas basin. This stratigraphic section is significant to the petroleum
industry as it is interpreted as age equivalent to the nearby prolific hydrocarbon producing Eagle
Ford Shale of South Texas. To evaluate the complexity of and subtlety of this mudrock
dominated section, X-ray fluorescence analysis was applied at 5 cm resolution across four
separate slabbed cores in the Maness Shale. Altogether 5371 samples were analyzed for 29
elemental abundances, generating 155,759 data points. Hierarchical cluster analysis was applied
to divide samples into clusters that display similar covariance of elemental abundances. The
cluster, interpreted as chemofacies, guide the evaluation of the Maness Shale. The cores vary in
the amount of sandy hyperpycnite deposits from an incipient fluvial-deltaic system located to the
north. The deposition of hyperpycnites often coincides with oxygenation events recorded in iron-
rich sediments distinguished by the hierarchical cluster analysis. Oxygenated conditions were
cyclically re-established on a probable precessional time-scale and coincide within increases in
siliciclastic deposition. The analysis shows that the basin never approached the sediment
starvation or anoxic conditions necessary to produce the same organic preservation present in the
Eagle Ford Shale.

vii
PREFACE
In more ways than one, the discipline of stratigraphy is rooted in the past.
Technological advances over the past few decades have made quantitative analysis of the
constituents of sedimentary rocks more accessible, not only in the laboratory, but also in
the field. However, studies of stratigraphy have been slow to embrace the advances in
technology and still often only utilize classic field-based observations that, while valid
and insightful, are often subjective and difficult to test. Generation of quantitative
datasets alleviates this problem, making the data produced in a study readily available for
reevaluation and incorporation into the interpretations of subsequent researchers. More
importantly, however, is that the analytical tools available to the stratigrapher are capable
of providing powerful insight into the rock record and can be leveraged to reconstruct
geologic histories and processes using statigraphic variations that are otherwise
unobservable. Two such quantitative approaches are utilized in my dissertation:
combined detrital zircon U-Pb and fission-track geochronology and hierarchical cluster
analysis of high-resolution X-ray fluorescence data. These quantitative approaches are
particularly useful in challenging areas or lithologies where conventional methods prove
challenging.

viii
Combined detrital zircon U-Pb and fission-track provenance
One of the few analytical tools that has been widely embraced by the stratigraphy
community is detrital zircon U-Pb dating. This technique has become extremely popular
over the past few decades for its use in determining sedimentary provenance. In turn,
provenance studies address a wide range of geologic problems such as paleogeography,
tectonic history and ancient drainage patterns. Large volumes of detrital zircon U-Pb data
now exist for sediments deposited across the globe and across geologic time. However, in
some areas, such as northwest Africa, data remains quite sparse. Furthermore, continental
domains that have experienced long histories of crustal recycling with only small
additions of new crust can cast a ubiquitous regional U-Pb signature over large swaths of
geologic time and terrane. One approach to resolving this issue is to bolster the dataset
with an additional quantitative chronometer. Analyses that can also be performed on
zircon, e.g. fission-track and Lu-Hf dating, are ideal as they require no additional
sampling or separation procedures and also benefit from zircon’s ever present nature in
coarse siliciclastic rocks.
The combination of two chronometers makes for a substantially more informative
and robust dataset. It is such a combined dataset that I use in the first two chapters of my
dissertation to define sediments from Morocco, a particularly difficult location for
conventional detrital zircon U-Pb dating, into chronofacies, or sedimentary units that bear
similar temporal signatures in their U-Pb and zircon fission-track ages. By combining the
crystallization ages recorded in the U-Pb system with low-temperature cooling history
recorded in the zircon fission-track ages, potential source terranes can be further
differentiated even if their zircons share the same origin or subsequent thermal history. In

ix
applying this method to the Rif Mountains, Middle Atlas Mountains and the Taza-
Guercif basin of Morocco, I demonstrate the utility of a combined chronometer approach
to sedimentary provenance studies in an area where such studies are sparse, likely due to
the difficulty of the single chronometer approach.
Hierarchical cluster analysis of high resolution X-ray fluorescence data
Recent advances in mobile handheld energy dispersive X-ray fluorescence
instrumentation have made low-cost, high-resolution and on-site acquisition of X-ray
fluorescence data a viable and attractive option for analyzing stratigraphy. This tool is
particularly well-suited for application to mudstone-dominated successions where low
sedimentation rates and redox reactions create geologically meaningful fine-scale
variability that is difficult to document through visual analysis and the coarser sampling
that is practical for time-intensive laboratory analysis. Each XRF analysis provides 20-30
chemical concentrations, takes only a few minutes per analysis and is non-destructive.
These factors combine to make handheld XRF instruments the ideal tool for acquisition
of high-resolution resolution chemical analysis of stratigraphic sections. The XRF dataset
can then be used to interpret mineralogy, grain size, organic sedimentation and the degree
of sediment oxygenation near the time of deposition.
One of the challenges associated with such a large dataset is leveraging the
massive quantities of multivariate data than can be acquired to their full potential. With
each sampled depth point providing tens of elemental concentrations, it is nearly
impossible to keep track of the elemental changes throughout the stratigraphy without the
aid of statistical analysis. In chapter 3 of my dissertation I apply hierarchical cluster

x
analysis to a high resolution XRF dataset acquired over the Maness Shale of the East
Texas Basin, USA to address this problem. Hierarchical cluster analysis evaluates the
similarity of every sample and iteratively groups them together one at a time based on the
similarity measure chosen by the user. These grouping of samples with similar elemental
signatures are then interpreted as chemofacies. Evaluating the stratigraphic section in the
context of chemofacies allows for the variations the elemental concentrations to be
evaluated simultaneously, lending to a robust geologically-driven interpretation of
changes in the depositional environment.
Dissertation contents
The three chapters of my dissertation are each intended for publication in the
peer-reviewed literature. The first two chapters originate from a research effort evaluating
the provenance of the Taza-Guercif basin, an important type section in Morocco, using
detrital zircon chronofacies as a proxy for the tectonism that led to the dramatic
desiccation of the Mediterranean Sea during the Miocene (5.96-5.33 Ma). This
evaporative event known as the Messinian Salinity Crisis occurred when the former
Rifean Corridor, the last of several Miocene marine connections between the Atlantic
Ocean and Mediterranean Sea that existed prior to the evaporative draw down, was
severed. The closure of the corridor is widely accepted as tectonic in origin, though the
nature of tectonics is not well constrained with the encroachment of the adjacent Rif
and/or Middle Atlas mountain belts possibly contributing tectonic uplift that severed the
Rifean Corridor. The Taza-Guercif basin lies on the southern margin of the former
marine connection and was the first of the basins that comprise the Rifean Corridor to

xi
emerge during closure, making it a key location to understand the early effects of
tectonics on the marine corridor. To this end, I collected arenaceous samples from
throughout the Taza-Guercif basin stratigraphy as well as from the neighboring Rif and
Middle Atlas mountains to evaluate their detrital zircon U-Pb crystallization ages and
fission-track cooling ages to constrain the cause of corridor closure.
Interpretation of the zircon geochronology from the Rif and Middle Atlas
mountain samples resulted in a body of research independent from that of the Taza-
Guercif basin, which spawned the first chapter of my dissertation. Prior to the acquisition
of this data, there were no published quantitative sedimentary geochronological data in
Morocco from rocks younger than the Cambrian. The Mesozoic sediments in the Rif and
Middle Atlas mountains contain zircons with Mesoproterozoic U-Pb crystallization ages,
a population previously unidentified in Morocco, refining the ‘West African’ detrital
zircon signature and originating from an ultimate source in either Amazonia or Avalonia.
In addition to this discovery, the first chapter further constrains the uncertain
paleogeography of the Mesozoic para-autochthonous domains, the Ketama and Tisiren
units of the Rif Mountains by combining the U-Pb and fission-track ages. The data in this
chapter also set the stage for the second chapter that addresses the original goal of the
Moroccan research project, analysis of the Taza-Guercif basin chronofacies as they relate
to the tectonic cause of the Messinian Salinity Crisis. This work has been accepted for
publication in the Journal of Geology under the title “Detrital zircon geochronology of
Mesozoic sediments in the Rif and Middle Atlas belts of Morocco: provenance
constraints and refinement of the ‘West African’ signature” and is authored by Jonathan
R. Pratt, David L. Barbeau, Jr., John I. Garver, Anas Emran and Tyler M. Izykowski.

xii
In the second chapter, the zircon U-Pb and fission-track ages of the Taza-Guercif
basin are compared to the signatures of the Rif and Middle Atlas samples and the
geologic history of these two mountain belts that straddle bound the basin to the
northwest and south. The Taza-Guercif basin evolved under the dual influence of both of
these mountain belts, as recorded in the structure within the basin itself. The changes (or
lack thereof) in the detrital zircon U-Pb and fission-track ages of the sediments contained
within the basin serve as a proxy for the tectonism occurring on the margin of the basin
and therefore contributing the emergence of basin and the severing of the Rifean
Corridor. The data indicates that the basin received a steady supply of sediment from the
Middle Atlas Mountains with no discernable increase in sediment from the Rif
Mountains. This suggests that the Middle Atlas Mountains contributed substantially to
the closure of the Rifean Corridor, though in the literature, the contribution from the
Middle Atlas is usually considered only minor and auxiliary compared to that of the Rif.
The second chapter, “Sedimentary provenance of the Taza-Guercif basin, Rifean
Corridor, Morocco: implications for the Messinian Salinity Crisis” has been submitted for
publication to Geosphere and is authored by Jonathan R. Pratt, David L. Barbeau, Jr.,
Tyler M. Izykowski, John I. Garver and Anas Emran.
The third and final chapter of my dissertation changes focus both spatially and
temporally in geologic history, as well as in the analytical methodology employed. In this
work, I utilize bulk rock elemental compositions derived by X-ray fluorescence to
examine the depositional and post-depositional history of the Upper Cretaceous Maness
Shale in the East Texas basin, USA. The data used in this chapter was provided by EOG
Resources, Inc. and was acquired from four slabbed cores from within the company’s

xiii
acreage in the East Texas basin. This stratigraphic section is of interest to EOG
Resources, Inc. due to its interpreted temporal equivalence with the nearby hydrocarbon
producing Eagle Ford Shale of South Texas. The X-ray fluorescence dataset acquired to
characterize the Maness Shale is massive, consisting of 5371 analyses, sampled at a ~5
cm spacing across four cores, with each analysis providing 29 elemental abundances and
yielding a total of 155,759 data points. To interpret the large dataset, hierarchical cluster
analysis was performed on the data from all four cores, to combine samples with
covarying elemental compositions into statistically defined ‘clusters’. I interpreted these
clusters geologically to redefine them as chemofacies, which I used to guide the
interpretation of chemical variation within the Maness Shale within and between
individual cores.
The variation in chemofacies with stratigraphic section facilitated a sequence
stratigraphic correlation between the cores. The cores varied significantly in the amount
of sedimentation they received from sandy hyperpycnites from an incipient fluvial-deltaic
system located to the north as a function of proximity to the basin axis and distance
seaward from the fluvial outlet(s) to the basin. Basin anoxia, an important factor for
hydrocarbon exploration related to the preservation of organic matter, appears to have an
inverse relationship with detrital flux. Indeed, the presence of hyperpycnites often
coincides with oxygenation events recorded in iron-rich sediments distinguished by the
hierarchical cluster analysis. The result of this study is that the Maness Shale was
deposited from the beginning in a prodeltaic system. Oxygenated conditions were
cyclically re-established due to influence from the fluvial-deltaic system and the basin
never approached the sediment starvation or anoxic conditions necessary to produce the

xiv
same organic preservation present in the Eagle Ford Shale. This work is slated for
submission to an academic journal that has yet to be chosen and is titled “Chemofacies
Analysis of the Maness Shale, East Texas: X-ray fluorescence and Hierarchical Cluster
Analysis.”

xv
TABLE OF CONTENTS
DEDICATION ....................................................................................................................... iii
ACKNOWLEDGEMENTS ........................................................................................................ iv
ABSTRACT ............................................................................................................................v
PREFACE ............................................................................................................................ vii
LIST OF FIGURES .............................................................................................................. xvii
CHAPTER 1: DETRITAL ZIRCON GEOCHRONOLOGY OF MESOZOIC SEDIMENTS IN THE RIF AND
MIDDLE ATLAS BELTS OF MOROCCO: PROVENANCE CONSTRAINTS AND REFINEMENT OF THE
‘WEST AFRICAN’ SIGNATURE ………………………………………………………..……1
1.1 INTRODUCTION ......................................................................................................1
1.2 GEOLOGIC BACKGROUND ......................................................................................4
1.3 METHODS ..............................................................................................................9
1.4 RESULTS ..............................................................................................................17
1.5 DISCUSSION .........................................................................................................21
1.6 CONCLUSIONS .....................................................................................................35
CHAPTER 2: SEDIMENTARY PROVENANCE OF THE TAZA-GUERCIF BASIN, RIFEAN
CORRIDOR, MOROCCO: IMPLICATIONS FOR THE MESSINIAN SALINITY CRISIS ....................47
2.1 INTRODUCTION ....................................................................................................47
2.2 GEOLOGIC BACKGROUND ....................................................................................49
2.3 METHODS ............................................................................................................52
2.4 RESULTS ..............................................................................................................58
2.5 DISCUSSION .........................................................................................................61

xvi
2.6 CONCLUSIONS .....................................................................................................76
CHAPTER 3: CHEMOFACIES ANALYSIS OF THE MANESS SHALE, EAST TEXAS BASIN: X-RAY
FLUORESCENCE AND HIERARCHICAL CLUSTER ANALYSIS ....................................................84
3.1 INTRODUCTION ....................................................................................................84
3.2 GEOLOGIC BACKGROUND ....................................................................................86
3.3 METHODS ............................................................................................................91
3.4 RESULTS ..............................................................................................................96
3.5 DISCUSSION .........................................................................................................97
3.6 CONCLUSIONS ...................................................................................................115
REFERENCES .....................................................................................................................136
APPENDIX A: PERMISSION TO REPRINT (CHAPTER 1) ........................................................157
xvii
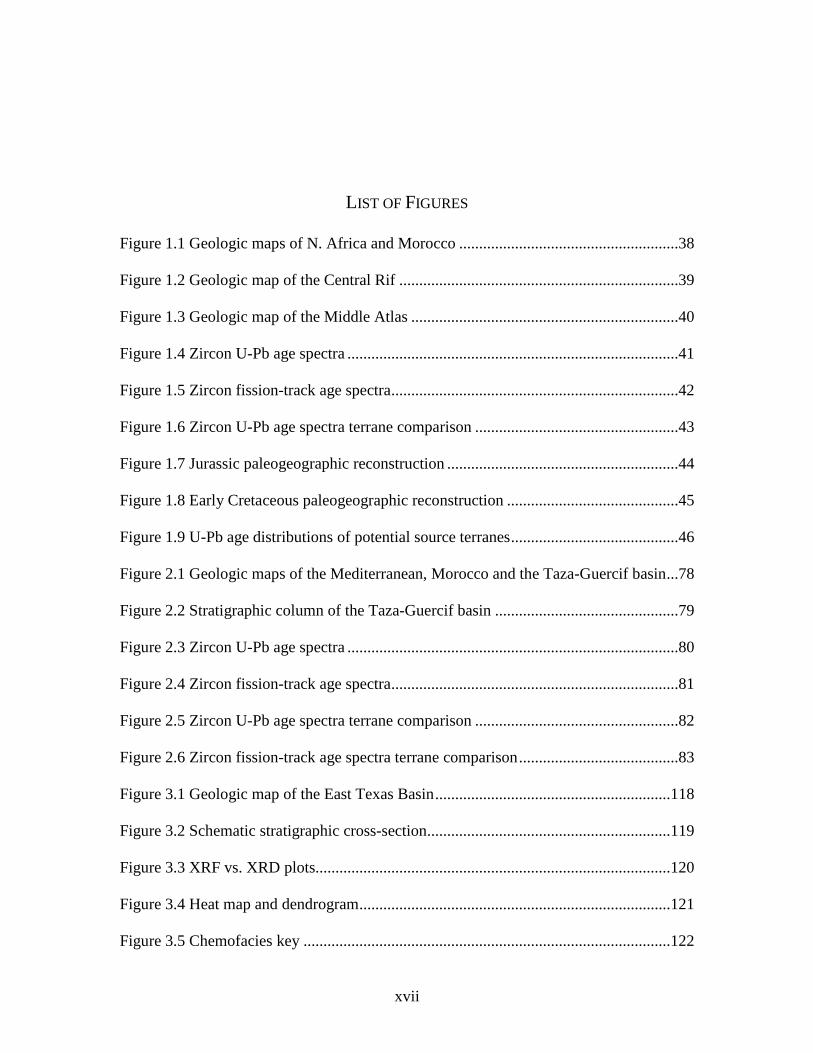
LIST OF FIGURES
Figure 1.1 Geologic maps of N. Africa and Morocco .......................................................38
Figure 1.2 Geologic map of the Central Rif ......................................................................39
Figure 1.3 Geologic map of the Middle Atlas ...................................................................40
Figure 1.4 Zircon U-Pb age spectra ...................................................................................41
Figure 1.5 Zircon fission-track age spectra ........................................................................42
Figure 1.6 Zircon U-Pb age spectra terrane comparison ...................................................43
Figure 1.7 Jurassic paleogeographic reconstruction ..........................................................44
Figure 1.8 Early Cretaceous paleogeographic reconstruction ...........................................45
Figure 1.9 U-Pb age distributions of potential source terranes ..........................................46
Figure 2.1 Geologic maps of the Mediterranean, Morocco and the Taza-Guercif basin ...78
Figure 2.2 Stratigraphic column of the Taza-Guercif basin ..............................................79
Figure 2.3 Zircon U-Pb age spectra ...................................................................................80
Figure 2.4 Zircon fission-track age spectra ........................................................................81
Figure 2.5 Zircon U-Pb age spectra terrane comparison ...................................................82
Figure 2.6 Zircon fission-track age spectra terrane comparison ........................................83
Figure 3.1 Geologic map of the East Texas Basin ...........................................................118
Figure 3.2 Schematic stratigraphic cross-section.............................................................119
Figure 3.3 XRF vs. XRD plots.........................................................................................120
Figure 3.4 Heat map and dendrogram ..............................................................................121
Figure 3.5 Chemofacies key ............................................................................................122

xviii
Figure 3.6 %Ca (XRF) vs. %Calcite (XRD)....................................................................123
Figure 3.7 Core photo – Core W core upper sandstone chemofacies ..............................124
Figure 3.8 Core photo – Core Y cyclic chemofacies .......................................................125
Figure 3.9 %Mo vs. %U ..................................................................................................126
Figure 3.10 Core photo – Core X chemofacies ................................................................127
Figure 3.11 %S vs. %Mn .................................................................................................128
Figure 3.12 %Mg/%Ca (XRF) vs. %Dolomite (XRD) ....................................................129
Figure 3.13 Elemental curves – Core W ..........................................................................130
Figure 3.14 Elemental curves – Core X ...........................................................................131
Figure 3.15 Elemental curves – Composite Core Y-Z .....................................................132
Figure 3.16 Ternary diagrams ..........................................................................................133
Figure 3.17 Sequence stratigraphic correlation ...............................................................134
Figure 3.18 Core photo - hyperpycnites ..........................................................................135

1
CHAPTER 1
DETRITAL ZIRCON GEOCHRONOLOGY OF MESOZOIC SEDIMENTS IN THE RIF AND MIDDLE
ATLAS BELTS OF MOROCCO: PROVENANCE CONSTRAINTS AND REFINEMENT OF THE ‘WEST
AFRICAN’ SIGNATURE1
1.1 Introduction
Morocco is an important region for the study of the tectonic evolution of northwest
Africa. The relatively small region (Fig. 1.1) has experienced several cycles of
orogenesis, including the Pan-African, Variscan and Alpine orogenies, rifting, terrane
accretion, and Cenozoic thermal doming (see Teixell et al., 2005; Babault et al., 2008;
Chalouan et al., 2008; Frizon de Lamotte, 2008; Gasquet et al., 2008; Michard et al.,
2008). Morocco contains a robust and accessible sedimentary record from the
Neoproterozoic to the Recent. However, application of detrital-zircon geochronology to
the region is currently limited and focused primarily on the Neoproterozoic-Cambrian
deposits of the Anti-Atlas Mountains (Thomas et al., 2002; Walsh et al., 2002; Liégeois
et al., 2006 in Gasquet et al., 2008; Abati et al., 2010, 2012; Avigad et al., 2012), and
have been used to understand the composition of the West African craton and the
paleogeography of Neoproterozoic Gondwana. Expansion of the detrital zircon dataset
into younger sedimentary basins in Morocco is necessary to advance understanding of the
1 Pratt, J. R., Barbeau, D. L., Garver, J. I., Emran, A., and T. M. Izykowski. Accepted by Journal
of Geology. Reprinted here with permission of publisher, 2/19/2015.

2
source-to-sink history of region through the Pan-African, Variscan, Atlas and Alpine
orogenies, and to further constrain the Phanerozoic paleogeography of the African
margin.
The samples selected for the present study for detrital zircon U-Pb and detrital
zircon fission-track geochronology come from three Mesozoic stratigraphic units
representing three distinct paleogeographic domains of the Mesozoic North African
margin: the mid-Cretaceous (Aptian-Cenomanian) turbidites of the Tisiren unit of the
Maghrebian ‘Flyschs,’ the Lower Cretaceous (Barremian-Albian) turbidites of the Intrarif
Ketama unit, and the Middle Jurassic (Bathonian-Callovian) Bou Rached sandstones of
the Middle Atlas Mountains. Respectively these sediments were deposited in the
Ligurian-Maghrebian Ocean, the paleomargin of North Africa and a major rift basin on
the African continent (Durand-Delga, 1980; Guerrera et al., 2005; Chalouan et al., 2008;
Frizon de Lamotte et al., 2008). In the earlier Mesozoic these domains were distributed
across the North African margin that was dominated by post-Pangean rifting and
extension of the Carboniferous-Permian Variscan-deformed Moroccan Meseta, which
opened rift basins onshore and narrow oceanic troughs offshore where this study’s strata
were later deposited (Guerrera et al., 2005; Chalouan et al., 2008; Frizon de Lamotte et
al., 2008). In the Late Cretaceous, Africa rotated towards Eurasia initiating complex
Tethyan-Mediterranean subduction geodynamics and the Alpine orogenic cycle that
incorporated the sampled domains into the Cenozoic Rif and Middle Atlas mountain belts
(Gomez et al., 2000; Jolivet et al., 2006; Chalouan et al., 2008; Frizon de Lamotte, 2008).
The data collected from the Rif and Middle Atlas belts presented herein has implications
for several outstanding questions regarding the Mesozoic paleogeography of the North
3
African margin as well as the significance of newly dated ‘exotic’ zircons delivered to
Morocco during the Paleozoic-Mesozoic.
Mesozoic rifting occurred in Morocco on both its western and northern margins
associated with the opening of the Atlantic and Tethyan oceans. The broad corridor
separating these rifted domains is referred to as the West Moroccan Arch and
experienced limited rift-related subsidence (Ghorbal et al., 2007; Saddiqi et al., 2009;
Frizon de Lamotte et al., 2009) partially controlling the recycling of Variscan-deformed
Precambrian-Paleozoic rocks and post-Variscan Triassic rocks during the deposition of
the Bou Rached sandstones (Frizon de Lamotte et al., 2008, 2009).
Our new data from the sampled Jurassic and Cretaceous stratigraphy addresses
aspects of the pre-Alpine relationship between select Mesozoic deposits of the Intrarif,
the Maghrebian flysch trough and African margin to one another. Specifically, we
provide relevant data concerning the relationship between the Intrarif Ketama unit and
the currently adjacent Mesorif of Morocco. The Intrarif was previously interpreted to
represent an intramargin continental block located outboard of the paleomargin deposits
of the Mesorif and separated from them by the Beni Malek serpentinites, interpreted as an
dismembered ophiolitic complex in the intramargin suture (Michard et al., 2007). New
interpretation of oceanic remnants in the Mesorif west of the Beni Malek serpentinites is
inferred to require a substantial sinistral transform displacement of the Intrarif to its
present locations and an origin in continuity with Algeria to the east (Benzaggagh et al.,
2014). This reconstruction places the Intrarif, here represented by the Ketama unit,
between with the Tisiren unit deposits in the Maghrebian flysch trough and the classically
interpreted source of the Tisiren unit turbidites, the Ksour sandstones of western Algeria
4
(Durand-Delga, 1980; Wildi, 1983). Detrital-zircon data from both the Intrarif and
Maghrebian flysch trough are aptly located to place some constraints on this relationship.
Finally, our broad survey of detrital zircon analyses reveals the presence of
significant Mesoproterozoic populations in all three of the sampled domains from across
the margin of Mesozoic North Africa. Northwest Africa has a distinctive and
characteristic gap of zircon ages between 1.6-1.1 Ga as reported in the literature
(Linnemann et al., 2007; Ennih and Liégeois, 2008) and few Mesoproterozoic zircons
(1.6 to 1.1 Ga?) occur to the east in the Saharan metacraton and Arabian-Nubian Shield
(Avigad et al., 2003; Linnemann et al., 2011). The exotic provenance of these
Mesoproterozoic zircons is discussed and two possible scenarios for their delivery to
North Africa are proposed.
1.2 Geologic Background
1.2.1 The Rif
The Rif Mountains form part of a chain of genetically related orogens that extend
from the Betic Mountains in southern Spain, across northern Africa and through the
Calabrian arc into southern Italy. They compose the southern limb of the Betic-Rif
orocline that formed by the thrusting of allochthonous Alboran terrane onto the margins
of southern Iberia and Northwest Africa in the Cenozoic. The Rifean component of the
Betic-Rif orocline is divided into three broad structural domains (Fig. 1.1b) (Chalouan
and Michard et al., 2004): (1) The Internal Zones consist of metamorphic complex
(Ghomarides), remnants of the exotic Alboran domain and overlying Tethyan passive-

5
margin Triassic to Lower Jurassic sedimentary rocks (Dorsale Calcaire); (2) The
Maghrebian ‘Flysch’ domain contains a series of nappes composed of turbidite and
related sedimentary rocks that accumulated on Tethyan ocean crust before being thrust
onto the African margin during suturing of the Alboran domain. In the Central Rif, the
focus of this study, these flysch nappes are represented predominantly by the Tisiren and
Melloussa nappes (Fig. 1.2); (3) The External Zones consist of parautochthonous passive-
margin sedimentary strata that originated along the paleomargin of Africa and have been
thrust farther inland by the convergence associated with the docking of the Alboran
terrane. The External Zones are further subdivided into the Intrarif, Mesorif and Prerif in
order of increasing proximity of deposition to the paleo-margin (Chalouan et al., 2008).
The Ketama unit represents the Intrarif in the Central Rif (Fig. 1.2).
The Internal Zones are thrust over the Magrebian ‘Flysch’ domain, which is in
turn thrust over the External Zones. The External Zones form a complex pattern of
nappes that involved both thin- and thick-skinned thrusting, and are further subdivided
into the Intrarif, Mesorif and Prerif in order of increasing proximity of their origin to the
African margin. The Intrarif are separated from the Mesorif and Prerif by the Beni Malek
ophiolite and the relationship between this domain and the more proximal paleomargin is
less well constrained (Michard et al., 1992, 2007; Benzaggah et al., 2014).
1.2.2 The Ketama unit
The Intrarif Ketama unit is thrust onto the Beni Malek massif, which itself is
composed of greenschist facies metabasites and lherzoites interpreted to represent an

6
oceanic suture between the Intrarif and the continental margin deposits of the Mesorif
(Michard et al. 1992; Michard et al., 2007) or the Maghrebian flysch domain and the
Intrarif (Benzaggagh, 2014). The Ketama unit comprises a Lower and Middle Jurassic
pre-rift and syn-rift succession of limestones and marls overlain by a post-rift succession
of marls progressing up-section into thick Aptian-Albian turbidites (Chalouan et al.,
2008). The Ketama unit is folded and has developed slaty cleavage of an uncertain age
(Crespo-Blanc and Frizon de Lamotte, 2006). A recent study interpreted diagenetic
conditions by ca. 130 Ma in the Jurassic succession (Vasquez et al., 2013), while Lower
Cretaceous rocks yield ZFT and K/Ar ages between 75 and 85 Ma, indicating anchizone
conditions (Azdimousa et al., 1998, 2003; Vasquez et al., 2013). These Cretaceous dates
are controversial (see Michard et al., 2014) and part of the problem lies in the low
metamorphic grade of the sedimentary strata and the abundance of detrital muscovite
contained within (Chalouan et al., 2008). Apatite fission-track ages record cooling at 14
Ma associated with the Alpine exhumation of Ketama unit in the eastern Rif (Azdimousa
et al., 2003).
1.2.3 The Tisiren unit
The Tisiren nappe is the innermost of the nappes within the Maghrebian ‘Flysch’
domain of the Rif Mountains. The succession was originally deposited in the
Mauretanian sub-basin of Ligurian-Maghrebian ocean that formed between Iberia and
Africa during the opening of the central Atlantic (Guerrera et al., 2005; Chalouan et al.,
2008). Near Jebel Tisirene the sedimentary succession is ~850 m thick and begins with a
marl unit that functioned as the basal detachment for the nappe. Two turbidite

7
successions, Valangian to Albian in age, occur above the marl unit and are overlain by a
retrogradational trend of increasing abundance of fine-grained clastic strata through the
Turonian (Durand-Delga et al., 1999). The Tisiren unit is overlain by another ‘pre-flysch’
succession that operates as the detachment between the stratigraphically lower Tisiren
nappe and higher Beni Ider nappe (Durand-Delga et al., 1999; Chalouan et al., 2008).
Whereas Alpine-related tectonism metamorphosed the Ketama unit and eastern Mesorif
(Chalouan et al., 2008 and references therein), the Maghrebian strata are largely
unmetamorphosed.
1.2.4 The Middle Atlas Mountains
The Atlas chain consists of a series of E-W trending subparallel ranges, ridges and
intramontane basins extending across northwestern Africa and the NE-SW Middle Atlas
Mountains of Morocco. The Atlas system is generally considered to be an
intracontinental orogen due to its distance inland from the African margin and the lack of
nappe-stacking, large-scale plutonism or metamorphism (Frizon de Lamotte et al., 2008).
In northern Morocco, the Atlas system primarily consists of the Middle Atlas Mountains,
which diverge obliquely from the High Atlas, and separate the Western Meseta from the
Eastern Meseta (Fig. 1.1b). The High Atlas and Folded Middle Atlas mountains consist
of Late Permian to Early Jurassic failed rift systems that have been inverted during
Cenozoic convergence between Africa and Eurasia (Brede et al., 1992, Frizon de Lamotte
et al., 2008). The Middle Atlas can be divided into the ‘Causse’ or Tabular Middle Atlas
that mostly escaped Cenozoic deformation, and the Folded Middle Atlas, which partially
accommodated African-Eurasian convergence (Frizon de Lamotte et al., 2008).

8
Formations that were to become the Folded Middle Atlas Mountains consist
dominantly of marine Mesozoic and Paleogene strata deposited in the Middle Atlas rift
basin. Deposition began with coarse continental and evaporitic Triassic strata during
early stages of rifting, followed by the accumulation of a thick succession of carbonates,
shales, and marls during the Early Jurassic through Middle Jurassic (Bajocian) Frizon de
Lamotte et al., 2008 and references therein). Following a brief period of mixed clastic,
evaporite and carbonate deposition during the late Middle Jurassic (Bathonian-
Callovian), the Middle Atlas was emergent with the exception of the North Middle Atlas
Gulf until an Early Cretaceous transgression returned marine deposition of mostly
carbonate strata through the middle Eocene (Faure-Muret and Choubert, 1971; Frizon de
Lamotte et al., 2008).
1.2.5 The Bou Rached sandstones
The Bou Rached sandstones are Middle to Upper Jurassic (Zizi, 2002) and correspond to
the ‘couches rouges’ Bathonian-Callovian strata in the Skoura syncline (Charrière et al.,
1994). In the Marmoucha syncline, the Bou Rached sandstones reach a maximum
thickness of ~1200 m with the base of the Bou Rached sandstone succession dated to the
lower Bathonian and the upper termination loosely dated to the lower Kimmeridgian
(Zizi, 2002). Previous works recognize three subdivisions within the Bou Rached
sandstones: (1) a lower unit composed of alternating carbonates and bioclastic
sandstones; (2) a middle unit that consists of calcareous sandstones; and (3) an upper unit
dominated by distinctive yellow- and rust-colored sandstones (Zizi, 2002 and references
therein). Deposition of the sediments occurred under shallow marine conditions as

9
prograding prodeltaic lobes, with sediment transport interpreted from the northeast
(Fedan, 1988).
1.3 Methods
1.3.1 Sampling
For each sample ~4 kg of rock were collected from outcrop exposures. Samples
RF2 (34.973° N, 3.814° W) and RF3 (35.028° N, 3.822° W) were collected from the
Barremian-Albian post-rift succession of the Ketama unit exposed along highway N2
south of Al Hoceima (Fig. 1.2). Sample RF4 (35.107° N, 4.002° W) was collected from
an exposure of the Tisiren nappe ~15 km southwest of the city of Al Hoceima that
represents the Aptian-Cenomanian stratigraphy of this unit in the central Rif (Fig. 1.2).
Samples BR2 (33.913° N, 3.580 W) and BR3 (33.913° N, 3.579° W) were collected from
the upper sandy unit of the Bou Rached sandstones of the northern Middle Atlas
Mountains from exposures in the Marmoucha syncline north of the village of Bou
Rached and separated by ~10 m of section (Fig. 1.3).
1.3.2 Sample Descriptions
The Ketama unit sample RF2 is from a beige, fine- to medium-grained, well-sorted and
weakly metamorphosed quartzarenite collected from extensively folded and jointed,
locally continuous tabular turbidite beds. Individual beds are tens of centimeters thick
and stack to create a homogenous ~10 m thick succession at outcrop scale. Ketama unit

10
sample RF3 is from a gray- to beige-weathering, medium-grained, well-sorted and
weakly metamorphosed quartzarenite-quartzite. Individual beds are locally tabular,
several to tens of centimeters thick, intercalated with red mudstones, intensely folded and
jointed, and contain abundant calcite veins.
Tisiren unit sampled (RF4), is a gray, medium-grained, well-sorted quartzarenite.
Individual sandstone beds at outcrop are several to tens of centimeters thick, tabular and
are homogeneous and continuous at outcrop scale.
Bou Rached sandstones samples BR2 and BR3 were both collected from yellow-
and rust-colored, medium- to thick-bedded limy sandstones. BR2 is fine- to medium-
grained and ~60% quartz, with the remainder composed of carbonate intraclasts, rare
ooids and ~10% carbonate matrix. BR3 is very fine to fine-grained and ~75% quartz.
Carbonate intraclasts are rare and organic material is very common, constituting a matrix
that composes between 15-20% of the sample.
1.3.3 Detrital Zircon U-Pb Geochronology
In the past few decades detrital-zircon geochronology has become an increasingly
prolific tool in sedimentary provenance analysis (Gehrels, 2014) utilizing three systems
of radioactive decay (238U-206Pb, 235U-207Pb and 232Th-208Pb) to produce robust
zircon crystallization ages. The ubiquity of zircon in siliciclastic sedimentary deposits
and felsic to intermediate igneous rocks renders detrital zircon geochronology applicable
to a wide range of sedimentary systems and their potential source regions. Application of
this tool continues to increase, contributing to an ever-expanding repository of detrital

11
zircon data within the literature. Despite the widespread use of detrital zircon
geochronology, the method is not without limitations. In regions that have several
potential sources of the same age, detrital zircon data alone may not provide a distinct
enough fingerprint to identify one terrane from another (Rahl et al., 2003). Coupling
detrital zircon geochronology with a complimentary analysis such as Lu-Hf isotopes (see
Willner and Gerdes, 2008; Avigad et al., 2012), zircon fission-track (Montario and
Garver, 2009; Painter et al., 2014) or (U-Th)/He thermochronology (Rahl et al., 2003)
can often mitigate this complication.
For the present study samples were analyzed for U-Pb geochronology using laser-
ablation single-collector inductively coupled plasma mass-spectrometry (LA-SC-ICP-
MS). Each sample was disaggregated and processed following standard magnetic and
density separations into zircon separates that were mounted in epoxy along with primary
and secondary natural standards (SL2: Gehrels et al., 2008; and R33: Black et al., 2004)
and polished for analysis. All analyses were performed at the University of South
Carolina's Center for Elemental Mass Spectroscopy (CEMS) using a PhotonMachines
193 nm ArF excimer laser with accompanying HelEx ablation chamber directly plumbed
to a Thermo Element2 high-resolution single-collector ICP-MS. Our standard analytical
sequence involves the determination of the isotopic ratios of ~100 randomly selected
zircon grains from each sample, which we correct for down-hole inter-elemental
fractionation and instrument drift by bracketing every five unknowns with a primary
reference standard of known age (SL2 = 563.2 ± 4.8 Ma). We monitor the accuracy of
these corrections by analyzing a secondary reference standard of known age (R33 = 419.3
± 0.4 Ma) after every ~20 unknowns.

12
Analyses of all background, reference standards and unknowns include
assessment of the signal intensities of 202Hg, 204(Pb+Hg), 206Pb, 207Pb, 208Pb,
232Th, 238U using the mass-spectrometry analytical parameters indicated in Table 1.
Each individual reference standard and unknown analysis begins with a ten-second
integration prior to laser-firing to determine the background signal intensities for the
masses of interest, followed by a one-second delay for analyte wash-in, 28 seconds of
analysis during 10 Hz laser ablation by a 25 μm circular spot, and 15 seconds for post-
ablation chamber wash-out and writing of data. Throughout all analyses, the ablation
chamber is flushed with ~1.0 LPM of He carrier gas (~0.6-0.8 LPM and ~0.2-0.4 LPM
through Mass Flow Controllers 1 and 2, respectively), and supplemented by ~1.3 LPM of
Ar sample gas that mixes with the ablation aerosol in a mixing chamber, approximately 6
cm upstream from the plasma torch.
Our post-acquisition processing routine uses the U-Pb Geochronology3 Data
Reduction Scheme (DRS) of the Iolite add-on (Paton et al., 2011) for the Wavemetrics’
IgorPro software package. After semi-automated selection of background, standard and
unknown beam integration windows, spurious analyses (non-zircon, age-zoned grains,
through-drilled grains) revealed by anomalous total beam intensities are manually
removed. The DRS then subtracts interpolated background intensities from standard and
unknown analyte beam intensities, followed by user-monitored modeling of primary
standard time-dependent inter-elemental fractionation, which enables down-hole
fractionation correction of unknowns. Instrument drift is then estimated by interpolation
between corrected reference standard ratios, and the resulting model is used to correct the

13
down-hole corrected ratios of unknown zircons, from which final 238U/206Pb,
235U/207Pb, 232Th/208Pb and 207Pb/206Pb ages are calculated.
After processing in Iolite, all grains with a reported 2 S.D. error greater than 20%
for the calculated 238U/206Pb date are rejected from the dataset. A concordance filter is
then applied to all individual grain analyses with a 238U/206Pb greater than 500 Ma.
Analyses demonstrating less than 70% concordance or greater than 105% concordance
(i.e., 5% reverse discordance) were rejected. The younger dates are retained because
errors caused by low total counts of 207Pb generated by single-collector mass
spectrometry propagate into larger errors in the calculation of the 207Pb/206Pb date.
Both conventional concordia and Tera-Wasserberg plots were created for each sample
before and after the concordance filter was applied to determine if any trends in
discordance were caused from a Pb loss or common Pb contamination that could
extrapolate grain ages back to concordia. No common Pb corrections were applied as
204Pb counts were nearly identical between blank and grain analyses. For grains with a
238U/206Pb date greater than 1.3 Ga, the 207Pb/206Pb date is used.
1.3.4 Zircon Fission-Track Thermochronology
Traditional fission-track dating on zircon is well established using identification
of spontaneous tracks in zircon using optical microscopy (see Bernet and Garver, 2005).
However, in detrital grains with typical uranium concentrations (100-500 ppm) track
densities become poorly resolvable in zircons with Paleozoic and Precambrian cooling
ages (see Garver and Kamp, 2002; Bernet and Garver, 2005; Montario and Garver,

14
2009). Scanning electron microscope high-density fission-track dating (SEM-HDFT) is
an emerging technique that combines a modified etching technique and higher
magnifications to determine high track densities that would have otherwise been over-
etched by standard fission-track methods (Montario & Garver, 2009). The advantage of
this technique is that determination of Paleozoic and Precambrian cooling ages are
possible, but the drawback is that the technique is incredibly time intensive, and
expensive, so data sets are much smaller then traditional analyses. SEM-HD fission-track
dating requires a shorter duration etching, which reveals the tracks such that they are
individually discernible at magnifications of 3,000-10,000x.
This new approach to fission-track dating has been employed to understand the
thermal evolution of Cambro-Ordovician quartzarenites of the Potsdam and Galway
Formations of New York (Montario and Garver, 2009) and Precambrian zircon in the
Powder River basin of Wyoming (Garver and Wold, 2011). With this technique, grains
with track densities up to 3 x 10⁸ tracks/cm2 can be counted, which is about an order of
magnitude greater than achievable by standard optical means. SEM-HD FT dating has
revealed cooling ages in excess of 1.2 Ga, with one grain over 2 billion years old,
providing the oldest detrital zircon fission-track ages reported in the literature (Bernet and
Garver, 2005; Montario and Garver, 2009). One caveat of this method is the inherent bias
caused by the preferential selection of: (1) well-etched grains that may represent a limited
window into the entire grain-age distribution; or (2) grains with low U concentrations. As
such this method is not directly comparable to standard optical zircon fission-track
analysis.

15
Following standard separation and optical inspection of zircon, grain mounts were
made for each sample by embedding several hundred grains in ~2 x 2 cm2 PFA Teflon®
(tetrafluoroethylene-perfluoroalkoxyethene) squares. This abundance of grains per mount
is necessary as a large number are uncountable due to heterogeneous uranium distribution
or a high degree of radiation damage (Bernet and Garver, 2005). Three Teflon® mounts
were made for each sample as well as three natural standards: the Buluk Tuff (16.4 ± 0.2
Ma), Fish Canyon Tuff (27.9 ± 0.5 Ma), and Peach Springs Tuff (18.5 ± 0.1 Ma). The
zircon-embedded Teflon® mounts were then polished using a 9 μm and a 1 μm diamond
slurry.
The polished zircon mounts were then inspected at 500x magnification to assure
the clarity and quality of the polishing. The mounts were then etched for 5-7 hours in a
KOH:NaOH eutectic at 228°C. The ideal etch time differs from sample to sample in that
younger grains require longer etch time than older grains, which have a higher degrees of
radiation damage (Bernet and Garver, 2005). Once removed from the etchant, the mounts
were pressed between two glass plates for 20 minutes at 228°C and then allowed to cool
to room temperature. After flattening, the mounts were cleaned in 100 ml of 6N
hydrochloric acid (20%) for 10 minutes. The mounts were then rinsed in distilled water
and ethanol. The cleaned and flattened mounts were then affixed with a low-uranium,
pre-annealed, freshly cleaved flake of mica with a thickness of about 0.2 mm. Three
Corning CN-5 glass dosimeters, which have a known 238U content of 12.3 ppm, were
also affixed with freshly cleaved flakes of mica.
The mounts and glass dosimeters were sent to Oregon State University’s TRIGA
Mark II Research Reactor (OSTR) for irradiation. During irradiation, the samples
16
received a nominal fluence of 2 x 10¹⁵ neutrons/cm2. After irradiation, mica detectors
were etched in 48% hydrofluoric acid for ~18 minutes at room temperature (20-22°C).
The Teflon® mounts and their corresponding mica detectors were mounted as mirror
images on a petrographic slide using thin section epoxy and a glass cover slip to account
for the difference in height.
A layer of carbon ~8-10 nm thick was then applied to the slides using a sputter-
coater to prevent charging. The grains and micas were then imaged at ~3,000-10,000x
(most at ~5000X) using the secondary electron detector of a Zeiss® EVO50 tungsten-
filament scanning electron microscope. The range of magnifications was due to variations
in grain surface quality and track clarity, however each grain-mica pair was imaged using
the same magnification.
The density of natural and induced fission tracks were calculated through spatial
analysis of the secondary electron images of the grain-mica pairs using ImageJ software.
The number of spontaneous tracks in the zircon, the number of induced tracks in the
mica, and the area of the image used for counting were then entered into ZetaAge and
BinomFit (Brandon, 1996) as well as DensityPlotter (Vermeesch, 2012) software to
determine individual grain ages and peak-fit age populations.

17
1.4 Results
1.4.1 Detrital Zircon U-Pb Geochronology
Tabulated data for all samples are presented in Supplementary Data Table A.1. Of
the 368 grains analyzed, 259 ages passed the error and concordance filters. The majority
of rejected grains failed the concordance filter. Only those grains that passed the
concordance and error filters will be discussed in our analysis. Individual zircon ages
range from 218 to 3099 Ma. Average analytical 2σ error is ~3%. Age spectra are
displayed using two different visualization methods employed on detrital zircon data, the
more common probability density plot (Ludwig, 1999) and the kernel density estimate
(KDE: Vermeesch, 2012). U-Pb ages are displayed in Figure 1.4.
The U-Pb ages from the Intrarif Ketama unit sample RF3 range from 236 to 2790
Ma. The most abundant population contains 37 ages between 480 and 736 Ma with a 602
Ma KDE peak, accounting for 44% of the sample. The second most abundant population
is Paleoproterozoic in age and contains 25% of the population with 21 grains between
1942 and 2216 Ma with a peak at 2040 Ma. The KDE defines a broad Ectasian-Tonian
population with two peaks at 996 and 1213 Ma. The distribution of ages shows a split in
the population between a younger component between 921 and 1005 Ma, and an older
component between 1114 Ma and 1297 Ma. This older population contains 12 grains,
representing 14% of the population. The remaining 17% of ages are represented by three
young ages at 236, 271 and 311 Ma, three Archean ages, a scattering of ages between the
Tonian-Ectasian population and the Paleoproterozoic population and three
Paleoproterozoic ages older than the defined Paleoproterozoic population.

18
In sample RF4 from the Tisiren nappe, the most abundant population defines a
peak at 598 Ma and contains 24 grains and 43% of the sample with ages from 529 to 659
Ma. A Paleoproterozoic population with ages between 1926 and 2216 Ma is the second
most abundant, containing 12 grains and 21% of the population with peaks at 1978 and
2091 Ma. There is also a Ectasian-Tonian population with two different peaks at 953 Ma
and 1161 Ma. Ages contributing to the first peak are broadly distributed and range in age
from 859 to 1032 Ma. The second peak is defined by a tighter cluster of ages between
1122 and 1252 Ma. The Ectasian-Tonian population together comprises 10 grains and
18% of the sample. The remaining 18% of the ages contain three young ages at 244, 300
and 469 Ma, two Archean ages, a cluster of three ages between 1451 and 1519 Ma and
two ages falling off the young and old shoulders of the Paleoproterozoic population.
Analyzed grains from the Middle Atlas Bou Rached Sandstones samples BR2 and
BR3 range in age from 218 to 3099 Ma. The most abundant population contains ages
between 567 Ma and 791 Ma with a peak age at 638 Ma, accounting for 35 ages and 30%
of the sample. The second most abundant population contains 25 Paleoproterozoic ages
between 1870 Ma and 2297 Ma and represents 21% of the sample with poorly defined
peaks. A significant Phanerozoic population is defined by a strong KDE peak at 442 Ma
represented by 17 grains with ages between 360 Ma and 497 Ma that comprise 14% of
the sample ages. Archean ages between 2475 and 2704 Ma contribute to a population
with 11 grains or 9% of the sample. The remaining 25% of the sample includes three
Archean ages outside of the Archean population and a broad distribution of 18
Mesoproterozoic ages and 6 Paleoproterozoic ages between the defined Neoproterozoic
and Paleoproterozoic populations.

19
1.4.2 Zircon Fission-Track Data
Four samples that were analyzed for U-Pb zircon ages (RF3, RF4, BR2 and BR3)
as well as additional sample RF2 were also analyzed for ZFT using the scanning electron
microscopy high-density fission-track dating technique. A total of 61 individual zircon
grains were dated using SEM-HDFT, 24 from the Ketama unit, 11 from the Tisiren unit
and 26 from the Bou Rached sandstone of the Middle Atlas Mountains. Both U-Pb LA-
ICP-MS analysis and fission-track analysis used unique grains from the same zircon
separate thus this paired analysis does not constitute true double-dating. Probability
density plots and kernel density estimates with KDE peak ages and mixture model ages
for each individual sample and unit composites generated with DensityPlotter
(Vermeesch, 2009, 2012) are plotted in Fig. 1.5. The mixture model calculated with
DensityPlotter chooses the number of age components by minimizing the Bayes
Information Criterion and determines their value using a hybrid deterministic and
Markov chain Monte Carlo method (Galbrith & Green, 1990; Sambridge & Compston,
1994; Vermeesch, 2009, 2012). Tabulated age data are found in the supplementary Table
A.2.
The Ketama unit composite of samples RF2 and RF3 displays four KDE peaks.
The main peak falls at 280 Ma and represents 25% of the sample, the second at 450 Ma
with 21% of the sample is derived solely from RF2, the third peak falls at 585 Ma and is
defined by two clusters of ages, one at ca. 540 Ma and a second at ca. 600 Ma, together
representing 21% of the population, and the lowest peak is the youngest at 125 Ma. The
Ketama unit mixture model defines two peaks: one at 107 Ma representing 18% of the
sample, and 330 Ma representing 82% of the sample.

20
Tisiren nappe sample RF4 displays contains eleven grains and displays only one
prominent peak, centered on 338 Ma, and defined by 36% of the analyzed grains. The
remaining peaks are defined by two or fewer ages at 418 Ma (2 gr), 590 Ma (2 gr) and
single grains at 761, 946 and 1661 Ma.
The Bou Rached sandstone ZFT sample composite displays three distinct KDE
peaks at 151, 339 and 432 Ma with 19%, 15% and 27% of the sample, respectively. The
remaining 39% of the ages occur between the first and second population and after the
third population in age, failing to define distinct peaks. The mixture model produced two
peaks, the first at 151 Ma, representing 31% of the sample, and the second at 365 Ma,
representing 69% of the sample.
Comparison of component peak fitting to the kernel density estimates reveals the
possibility that for these Moroccan samples, which are known to have gone through
several cycles of crustal recycling, mixing model peak fitting is over-smoothing sample
cooling distributions and determining one peak for what may be two or three distinct
populations. An example of this can be seen with the Ketama unit composite (Fig. 1.5) in
which the primary peak value falls at 330 Ma between the KDE peaks occurring at 280
and 450 Ma. The low grain counts coupled with the multiple age clusters creates an
overdispersion of cooling ages and prohibit a straightforward binomial fitting approach to
understanding the ZFT data. Given this complexity, results will be discussed using a
combination of KDE peaks and peak fitting results, with emphasis on the former due to
large data dispersion.
21
1.5 Discussion
Over 250 Myr separate the depositional age of the currently dated Paleozoic-
Neoproterozoic stratigraphy of Morocco from that of the Jurassic-Lower Cretaceous
samples presented in this study. Despite this gap in time, only 11% of all grains analyzed
in this study have crystallization ages younger than 500 Ma, demonstrating the degree of
crustal recycling and the limited degree of magmatism in northwestern Africa during this
time. Recycling from older units acts to homogenize the detrital zircon signature of
region making the identification of unique age spectra difficult. Furthermore, <5% of
grains are of Variscan or younger age and only three grains bear Mesozoic ages, all of
which are Triassic. Detrital zircon fission-track analysis yields evidence of cooling ages
that date to as recently as the Late Cretaceous. Combining significant differences in the
U-Pb age spectra between the Rif and Middle Atlas with SEM-HDFT analysis allows for
a differentiation in detrital zircon signature between these three Mesozoic depocenters.
1.5.1 Tisiren unit
The U-Pb zircon ages suggest that the dominant population in the Ketama unit
sample originally derived from the West African craton and its Pan-African margin. The
detrital zircon ages closely resemble those recovered from Ediacaran to Ordovician
sedimentary rocks in the Anti-Atlas Mountains that contain large populations of zircon
from ~540 Ma to ~750 Ma and from 1.8 Ga to 2.2 Ga, with small numbers of grains from
the Archean and a small population between 900 and 1000 Ma in the Middle Cambrian
strata (Abati et al., 2010; Avigad et al., 2012) (Fig. 1.6). Deviation from the U-Pb
22
signature of the West African craton and the Cambrian sedimentary rocks derived from
them occurs as the ages younger than ca. 540 Ma and those between 1.1-1.6 Ga. The ages
younger than those known from the West African craton fall into three broad groups that
are consistent with the timing of regional events in Morocco: (1) Cambrian magmatism in
the Anti-Atlas and Meseta during the rifting associated with the opening of the Rheic
Ocean for ages between 469 and 540 Ma (see Álvaro et al., 2014 and references therein);
(2) widespread Variscan magmatism for ages between 271 and 311 Ma (see Michard et
al., 2008 and references therein); and (3) Triassic rift-related magmatism for the youngest
two ages (see Frizon de Lamotte et al., 2008). The 1.1-1.6 Ga ages cannot be accounted
for in the West African craton, its margin, peri-Gondwanan terranes or in magmatic
suites present north of the Reguibat Arch or west of the Saharan metacraton (Fig. 1.1a).
The presence of these ages will be addressed separately below.
The Tisiren unit was deposited in the Mauretanian sub-basin of the Ligurian-
Maghrebian Ocean between Africa and the ‘AlKaPeCa’ block and is classically
interpreted to contain sediments derived from the Africa continent, specifically the
Algerian Saharan Atlas (Durand-Delga, 1980; Wildi, 1983). The younger, overlying
stratigraphy of the Beni Ider unit is interpreted to have been derived from the
Ghomaride/Malaguide strata of the ‘AlKaPeCa’ block (Zaghloul et al., 2002; 2007; de
Capoa et al., 2007) and was deposited in continuity with the Tisiren unit prior to nappe-
stacking (El Kadiri et al.,2003; Zaghloul et al., 2002; 2007; Chalouan et al., 2008).
A composite of U-Pb detrital zircon ages using only core analyses and avoided
rim analyses from the Rif-equivalent Betic Internal Domain (Platt and Whitehouse, 1999;
Zeck and Whitehouse, 1999, 2002; Zeck and Williams, 2001) are distinctly different (Fig.

23
1.6). Two differences stand out: (1) the relative lack of Variscan-aged zircons present in
RF4 in comparison to the Internal Domain composite; and (2) the far greater abundance
of Paleoproterozoic grains in RF4, which are uncommon in the composite plot. Whereas
the composite does not include samples from the Malaguides, the fine-grained almost
entirely quartzose and mica-poor lithology of RF4 does not lend itself as easily to a
Ghomaride/Malaguide provenance. These differences with the Internal Domain and the
similarity shared with the detrital zircon assemblage of the Ketama unit indicate an
African source for strata of the Tisiren nappe that is consistent with the classical
stratigraphic reconstructions (Durand-Delga, 1980, Wildi, 1983).
Despite the limited number of grains analyzed, the ZFT data from the Tisiren
nappe show three defining features: the lack of Mesozoic cooling ages, a ca. 340 Ma
Variscan cooling event and the abundance of wide-ranging Precambrian ages that
escaped Variscan and Pan-African resetting. The 340 Ma cooling age peak matches the
Variscan period of deformation and magmatism that affected the Eastern Meseta and the
eastern portion of the Western Meseta (Hoepffner et al., 2005; Michard et al., 2008). The
Eastern Meseta was less affected by the subsequent ca. 280 Ma magmatism and
deformation than the Western Meseta (Hoepffner et al. 2005; Michard et al., 2008),
consistent with the lack of younger ages in the ZFT data. The Anti-Atlas are also
consistent with this age distribution, with granitoids yielding zircon fission-track ages at
ca. 330 Ma and companion apatite fission track data that show only minor subsequent
reheating (Sebti et al., 2009; Oukassou et al., 2013). The Variscan cooling ages require a
source no farther south than the Anti-Atlas-Ougarta trend as this constitutes the southern
boundary of the region affected by Variscan tectonics (Michard et al., 2008) while the

24
many Precambrian cooling ages indicate a source unaffected by Phanerozoic reheating
past the partial annealing zone. The source for the Tisiren turbidites from the Middle
Jurassic Ksour sandstones of western Algeria as previously proposed (Wildi, 1983) is
consistent with the ZFT data. The Jurassic Ksour sandstones were deposited in the paleo-
Niger river delta on the African paleomargin, reaching thicknesses up to 2 km (Delfaud
and Zellouf, 1993; Piqué et al., 2002). The paleo-Niger river would have drained
proximal locations including as well as cratonic sources in the interior, providing both the
Variscan and Precambrian cooling ages.
1.5.2 Ketama unit
The U-Pb zircon age distribution in the Ketama unit sample RF3 is nearly
identical in the U-Pb spectra to the Tisiren unit sample RF4 (Fig. 1.4) and is coeval or
slightly older in depositional age. In the U-Pb spectra only Variscan or post-Variscan
crystallization ages might be able to differentiate terranes, of which there are too few
present to do so. The composite ZFT age distribution (RF2 and RF3) contains peaks at
ca. 280 Ma and 585 Ma. RF2 contains a cooling age KDE peak at 449 Ma that is not
present in RF3 but is manifest in the composite distribution (Fig. 1.5). Despite occurring
in the same unit, the two samples of the Ketama unit also differ from one another
significantly, not only due to the 449 KDE peak in RF2 but also in the greater proportion
of post-Variscan (post 280 Ma) ages in RF3 than found in RF2. Due to the dispersion of
the data, the only robust cooling age population occurs ca. 280 Ma, occurring in both
samples, and falls during the latest period of Variscan magmatic intrusion prior to
deposition of the Ketama unit. Magmatism of this age was abundant in the Western

25
Meseta and limited in the Eastern Meseta (Michard et al., 2008). Precambrian cooling
ages could represent sources that were unaffected by or variably reset by the Variscan
orogeny. However, the cluster of ages at ca. 590 Ma representing the Pan-African
orogeny suggests that at least some zircons within the sample were unaffected by the
Variscan orogeny.
The weakly defined ca. 125 Ma cooling peak shortly post-dates the controversial
ca. 130 Ma metamorphic event proposed for the Callovian-Oxfordian stratigraphy of the
Ketama unit (Azdimousa et al., 1998; Vázquez et al., 2013). These ages could correspond
to an Early Cretacous magmatic phase that occurred in the High Atlas between 135 and
110 Ma (Frizon de Lamotte et al., 2008). Alternatively they may represent partially reset
ages originally associated with the Kimmeridgian-Tithonian magmatism preserved in the
suture zone between the Intrarif and Mesorif domains (Michard et al., 2007; Benzaggagh
et al., 2014. It should be noted that one age falls at 72 Ma in this study with a 95%
confidence interval between 43 and 123 Ma, close to previously reported ca. 75 Ma ZFT
ages for the Ketama unit (Azdimousa et al., 1998). When accounting for the 95%
confidence intervals this youngest grain overlaps with the other two grains defining the
Early Cretaceous ca. 125 Ma peak.
The relationship of the Intrarif with the African paleomargin is uncertain with two
significantly different hypotheses proposed (Fig. 1.7). The first argues for an origin of the
Intrarif between the Ligurian-Maghrebian flysch trough and an intramargin hiatus
separating the Intrarif from the Mesorif (Michard et al., 2007). In this reconstruction, the
Intarif and the Ketama unit originated more or less offshore of their present position. The
intramargin hiatus separating the Intrarif from the Mesorif was incorporated into Africa

26
as an intramargin suture represented by the Beni Malek massif. The alternative
reconstruction involves significant translation of the Intrarif block westward from
outboard of the Tell domain of Algeria (Benzaggagh et al., 2014). In this scenario the
Intrarif was not originally outboard of an intramargin suture but was translated along it to
its present position.
Alone, the U-Pb zircon ages from this study are consistent with either scenario
where Ediacaran and Paleoproterozoic sources available to both reconstructed positions
along the paleomargin. The similarity in U-Pb ages between the Ketama unit and the
Tisiren unit appears as an argument for a position of the Ketama unit inboard of the
Tisiren nappe off the margin of Algeria and therefore consistent with the eastern origin of
the Intrarif (Benzaggagh et al., 2014). Almost all of the measured ages are Precambrian
in these samples and reflect a common North African signature, an insufficiently unique
signature to imply continuity between the two units.
The two Ketama unit ZFT age spectra cover approximately the same age range
and both show a strong peaks at ~280 Ma in both the KDEs and mixture models. Aside
from the ~280 Ma peak, RF2 shows a greater proportion of pre-Variscan ages in
comparison with RF3, which displays a larger proportion of post-Variscan ages.
Although there are differences between the two Ketama unit samples, the similar overall
age range and the repeated ~280 Ma peak suggests similar provenance.
These ZFT ages spectra differ from that of the Tisiren unit. In particular the
youngest age in the Tisiren unit is ca. 318 Ma (238-435 Ma 95% C.I.) where the Ketama
unit sample RF2 contains three younger grains (one outside the 95% C.I of the youngest
Tisiren ZFT age) and RF3 contains eight younger grains (two outside the 95% C.I. of the

27
youngest Tisiren ZFT age). The Tisiren unit is also differentiated by the greater presence
and proportion of pre-Pan-African cooling ages, although these data are sparse. Thus it is
intriguing to note that of the eleven dated grains, three have cooling ages that are older
than 700 Ma in the Tisiren unit (RF4). Each of the Ketama unit samples contains one age
older than 700 Ma, both ca. 700-740 Ma. Including the 95% confidence interval, only one
age in the Tisiren unit is distinctly older than 700 Ma and is dated to ca. 1661 Ma (775-
4286 Ma 95% C.I.). Therefore the lack of younger ages and the presence and greater
proportion of pre-Pan-African ages in the Tisiren unit as compared to the Ketama unit
may reflect a sampling bias, but it may indicate different source rocks, and thus is worth
further study.
The ZFT ages of the Ketama unit are consistent with a western, Moroccan source
based on (1) the ca. 280 Ma peak associated with the late Variscan events that were
concentrated in the Western Meseta or Western High Atlas (Hoepffner et al., 2006;
Michard et al., 2008), (2) the presence of Cretaceous cooling ages that may represent
material from magmatism in the central High Atlas and (3) the absence of significant pre-
Pan-African ages in the Tisiren unit and expected to be present in the stable interior-
derived Ksour sandstones.
The Tisiren unit and Ketama unit overlap in age and are expected to contain a
similar detrital zircon history if the Ketama unit originated between the Maghrebian
flysch trough and its interpreted Algerian sediment source. The conundrum is that the
smaller ZFT dataset shows significant differences between the Tisiren and Ketama unit
while the larger, more robust U-Pb age spectra are nearly identical. Our results are
inconclusive regarding the origin of the Ketama unit, but suggest that additional data

28
from the Ksour sandstones in Algeria and the External domain of Morocco may greatly
constrain the paleo-position of the Intrarif.
1.5.2 Bou Rached sandstones
The majority of zircon ages from the Bou Rached sandstones correspond with
ages present in the West African craton and its Pan-African margin(s) with few ages
representing the Variscan orogeny. The Bou Rached age spectra span the 1.1-1.6 Ga gap
typical of older northwest African sources. The 400-460 Ma U-Pb age population
distinguishes the Bou Rached samples from both domains of the Rif and in general felsic
igneous rocks of this age are atypical in northwest Africa. Candidate sources for these
ages include Avalonia and/or the allochthonous Sehoul block with a controversial
Avalonian or Meguma affinity (Simancas et al. 2005; Hoepffner et al., 2006; Michard et
al., 2008, 2010; Tahiri et al., 2010). Avalonia and Meguma have a shared
paleogeographic history since the Neoproterozoic (Murphy et al., 2004; Nance et al.,
2008) and both potentially host zircons derived from the other terrane. In Avalonia,
Ordovician to Devonian plutons, felsic volcanics (Keppie et al., 1997; Hamilton and
Murphy, 2004; Murphy et al., 2008, 2011; Escarraga et al., 2012) and similarly aged
detrital zircons in upper Paleozoic deposits (Fig. 1.8; Murphy and Hamilton, 2000) are
common. A Middle Ordovician to Lower Devonian succession of volcanic rocks and
fine-grained siliciclastic strata also occurs within the Meguma terrane (Murphy and
Nance, 2002). Interestingly, the three youngest grains, ca. 360 Ma, in the Bou Rached
samples match the age of the only dated granitoids in the Sehoul block (Tahiri et al.,
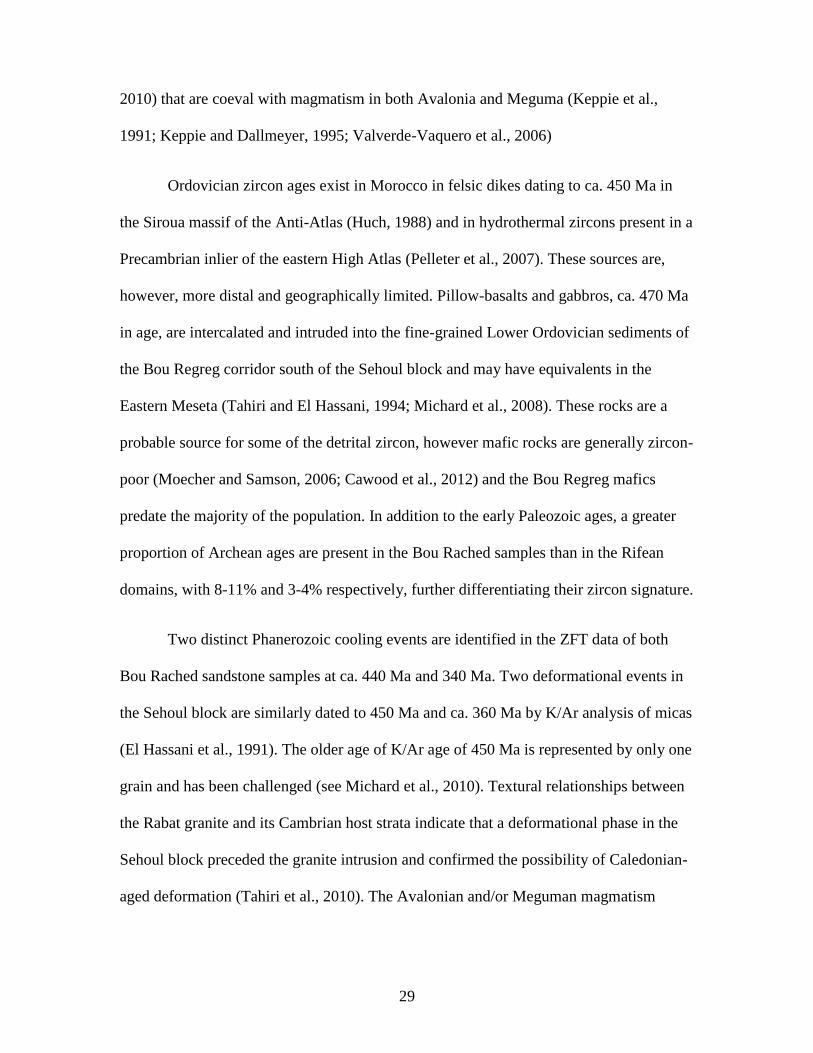
29
2010) that are coeval with magmatism in both Avalonia and Meguma (Keppie et al.,
1991; Keppie and Dallmeyer, 1995; Valverde-Vaquero et al., 2006)
Ordovician zircon ages exist in Morocco in felsic dikes dating to ca. 450 Ma in
the Siroua massif of the Anti-Atlas (Huch, 1988) and in hydrothermal zircons present in a
Precambrian inlier of the eastern High Atlas (Pelleter et al., 2007). These sources are,
however, more distal and geographically limited. Pillow-basalts and gabbros, ca. 470 Ma
in age, are intercalated and intruded into the fine-grained Lower Ordovician sediments of
the Bou Regreg corridor south of the Sehoul block and may have equivalents in the
Eastern Meseta (Tahiri and El Hassani, 1994; Michard et al., 2008). These rocks are a
probable source for some of the detrital zircon, however mafic rocks are generally zircon-
poor (Moecher and Samson, 2006; Cawood et al., 2012) and the Bou Regreg mafics
predate the majority of the population. In addition to the early Paleozoic ages, a greater
proportion of Archean ages are present in the Bou Rached samples than in the Rifean
domains, with 8-11% and 3-4% respectively, further differentiating their zircon signature.
Two distinct Phanerozoic cooling events are identified in the ZFT data of both
Bou Rached sandstone samples at ca. 440 Ma and 340 Ma. Two deformational events in
the Sehoul block are similarly dated to 450 Ma and ca. 360 Ma by K/Ar analysis of micas
(El Hassani et al., 1991). The older age of K/Ar age of 450 Ma is represented by only one
grain and has been challenged (see Michard et al., 2010). Textural relationships between
the Rabat granite and its Cambrian host strata indicate that a deformational phase in the
Sehoul block preceded the granite intrusion and confirmed the possibility of Caledonian-
aged deformation (Tahiri et al., 2010). The Avalonian and/or Meguman magmatism

30
mentioned earlier in this section could also be the source of the Paleozoic Bou Rached
ZFT peaks.
An alternative interpretation of the 440 Ma ZFT peak is that it represents an
Ordovician extensional episode recorded by the similarly aged mafic magmatism in the
Bou Regreg corridor and in the Eastern Meseta Midelt massif (Tahiri and El Hassani,
1994; Michard et al., 2008). This magmatism along with the felsic dikes of the Siroua
massif (Huch, 1988) and the hydrothermal alteration of zircons in the eastern High Atlas
(Pelleter et al., 2007) attest to a significant Ordovician thermal event that may be
recorded in the ZFT data of the Bou Rached sandstones. The ca. 340 Ma cooling ages in
the Bou Rached samples straddles the boundary between Eovariscan deformation of the
Meseta and the main phase of Variscan magmatism and deformation (Michard et al.,
2008). The ZFT mixture model peak at 365 Ma includes the ages of both the ca. 440 and
340 Ma peaks that it occurs between. Given that the 95% confidence interval of
individual grain ages is quite high (>100 Myr), these peaks are statistically
indistinguishable. However, the occurrence of the two KDE peaks in both BR2 and BR3
when evaluated individually (Fig. 1.5) lends credence to the interpretation that these ages
represent two distinct events and that the mixture model is oversmoothing the data.
The youngest KDE cooling age peak in the Bou Rached composite occurs at 151
Ma. This age falls within a period of widespread volcanism in the High Atlas (Frizon de
Lamotte et al., 2008) and more regional hydrothermal activity between 175 and 155 Ma.
Hydrothermal activity is recorded in intercalated carbonates and basalts in the Middle
Atlas (Hamidi et al., 1997; Auajjar and Boulégue, 2002; Dekayir et al., 2005) and the
Oujda Mountains (Arranz et al., 2008). Maximum temperatures during this event are

31
estimated from 150°C (Auajjar and Boulégue, 2002) to 360°C (Arranz et al., 2008). The
151 Ma cooling peak is within error of the upper depositional age limit for the Bou
Rached sandstones in the lower Kimmeridgian (Zizi, 2002). Acquisition of these cooling
ages in situ seems unlikely as only a few zircons are plausibly reset by the Jurassic event,
suggesting that they are inherited.
The Paleozoic ZFT ages are consistent with extensional and contractional events
that were significant on a regional scale and not exclusive to the Sehoul block or
Avalonia. The 400-460 Ma U-Pb age population in the Bou Rached sandstones fit less
readily into the current paleogeographic understanding of Morocco. A convenient
scenario is that these zircons were delivered to Morocco from the Sehoul block or
Avalonia during the Variscan orogeny. Storage of the zircons could have occurred in
synorogenic Carboniferous deposits and/or subsequent Triassic rift deposits. During the
Jurassic these ‘exotic’ zircons may have been delivered to the Middle Atlas basin either
directly from the Sehoul block or from deposits in the Meseta. In either scenario, a
western source to the Bou Rached depocenter is reasonable and consistent with Jurassic
cooling ages that were likely derived from the magmatically heated High Atlas or the
hydrothermally altered ‘Causse’ Atlas. The West Moroccan Arch exhumed and was
eroded through the Middle Jurassic to Early Cretaceous (Ghorbal et al., 2007; Saddiqi et
al., 2009; Frizon de Lamotte, 2008), and this interval includes the time of deposition of
the Bou Rached sandstones. To account for both the U-Pb and ZFT ages, a scenario is
proposed where uplifted and eroded Carboniferous-Triassic deposits located along the
West Moroccan Arch in the Western Meseta or Sehoul block supplied zircons of
Avalonian affinity to the Middle Atlas basin. The drainage area that fed the deltaic

32
deposits of the Bou Rached sandstones included sources with Jurassic-cooled zircons
from either the central High Atlas or the ‘Causse’ Atlas adjacent to the Middle Atlas
basin (Fig. 1.8).
1.5.4 Mesoproterozoic ages
The Mesoproterozoic gap (1600-1100 Ma) in zircon ages is considered a fundamental
feature of rocks of West African affinity (Nance et al., 2008; Abati et al., 2010). Small
populations of Mesoproterozoic zircons have been reported from rocks of the Tassili
Ouan Ahaggar basin on the southern margin of the Tuareg Shield (Linnemann et al.,
2011), the Saharan metacraton (Abdelsalam et al., 2002) and the Arabian-Nubian shield
to the east (Fig. 1.9; Wilde and Youssef, 2002; Avigad et al., 2007; Morag et al., 2011),
but not in proportions as concentrated or covering as great a time span as seen in strata of
this study. It is also important to note that detrital zircon from Ediacaran-Ordovician
strata in the Cadomian Saxo-Thuringia and the Osa-Morena massifs of Iberia
(Linnemann et al., 2007, 2008) and the Mid-German Crystalline Rise (Gerdes and Zeh,
2006) closely resemble that of the Ediacaran-Cambrian deposits in the Anti-Atlas and all
lack significant Mesoproterozoic populations. Collectively these observations and data
imply that the availability of the Mesoproterozoic zircon source(s) to Moroccan
sedimentary systems post-dates the Pan-African orogeny and pre-dates the Jurassic
deposition of the Bou Rached sandstones.
One hypothesis is that delivery of Mesoproterozoic zircons to Morocco occurred
during Ordovician glaciations that covered the West African craton and possibly the

33
Amazonian craton (Ghienne, 2003; Linnemann et al., 2011). Ordovician terrestrial glacial
deposits extend at least to the northern Anti-Atlas and perhaps as far as the Rehamna
massif in the Western Meseta (Le Heron et al., 2007) near the proposed sources of both
the Bou Rached and Rifean deposits. Two possible sources for glacial delivery of the
Mesoproterozoic zircons are the Neoproterozic Volta basin and the Amazonian craton.
The Volta basin is located on the southeastern margin of the West African craton (Fig.
1.1a) and contains abundant detrital zircons with Mesoproterozoic ages in the 1.1-1.6 Ga
West African magmatic gap (Fig. 1.6; Kalsbeek et al., 2008). Sediments within the Volta
basin are interpreted as being derived from the Amazonian craton (Kalsbeek et al., 2008),
which unlike the West African craton experienced Mesoproterozoic orogenesis and
contains abundant rocks of that age (Tassinari et al., 1999; Santos et al., 2000). The
detrital zircon ages presented here cover the majority of the Mesoproterozoic with the
most significant Mesoproterozoic peaks occurring at 1.1-1.3 Ga, which is identical to age
distribution in the Volta basin. An Ordovician glacial source is also proposed for the
Mesoproterozoic detrital zircons in the Tassili Ouan Ahaggar basin in Algeria where
glacially deposited sediments contain several Mesoproterozoic zircons, all of which are
older than 1.3 Ga (Linnemann et al., 2011). Given the discrepancy between the Moroccan
ages reported here and those of the Tassili Ouan Ahaggar basin (the former has grains
between 1.1 and 1.3 and the latter does not), it is unlikely the same point source fed both
sedimentary systems, though glacial delivery of zircons foreign to the West African
craton is still a reasonable hypothesis in both scenarios.
An alternate hypothesis is an Avalonian source of the zircons in the
Mesoproterozoic gap (1.1-1.6 Ga). Mesoproterozoic zircon ages are abundant in the West
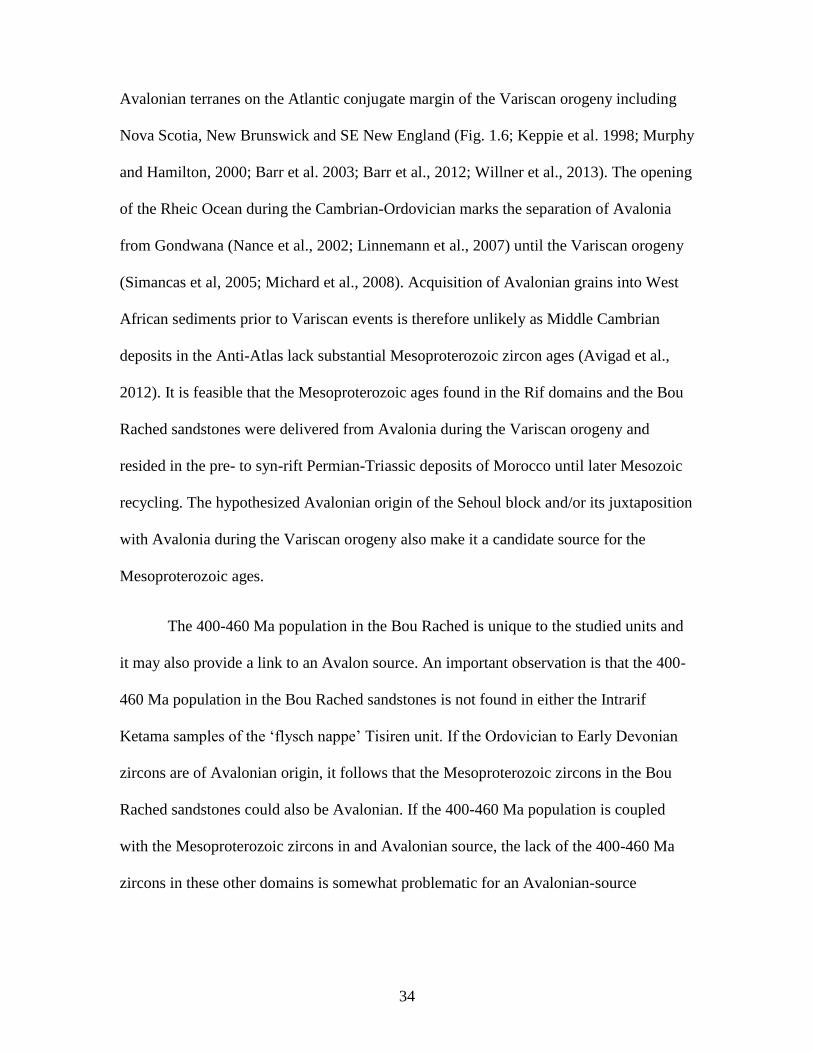
34
Avalonian terranes on the Atlantic conjugate margin of the Variscan orogeny including
Nova Scotia, New Brunswick and SE New England (Fig. 1.6; Keppie et al. 1998; Murphy
and Hamilton, 2000; Barr et al. 2003; Barr et al., 2012; Willner et al., 2013). The opening
of the Rheic Ocean during the Cambrian-Ordovician marks the separation of Avalonia
from Gondwana (Nance et al., 2002; Linnemann et al., 2007) until the Variscan orogeny
(Simancas et al, 2005; Michard et al., 2008). Acquisition of Avalonian grains into West
African sediments prior to Variscan events is therefore unlikely as Middle Cambrian
deposits in the Anti-Atlas lack substantial Mesoproterozoic zircon ages (Avigad et al.,
2012). It is feasible that the Mesoproterozoic ages found in the Rif domains and the Bou
Rached sandstones were delivered from Avalonia during the Variscan orogeny and
resided in the pre- to syn-rift Permian-Triassic deposits of Morocco until later Mesozoic
recycling. The hypothesized Avalonian origin of the Sehoul block and/or its juxtaposition
with Avalonia during the Variscan orogeny also make it a candidate source for the
Mesoproterozoic ages.
The 400-460 Ma population in the Bou Rached is unique to the studied units and
it may also provide a link to an Avalon source. An important observation is that the 400-
460 Ma population in the Bou Rached sandstones is not found in either the Intrarif
Ketama samples of the ‘flysch nappe’ Tisiren unit. If the Ordovician to Early Devonian
zircons are of Avalonian origin, it follows that the Mesoproterozoic zircons in the Bou
Rached sandstones could also be Avalonian. If the 400-460 Ma population is coupled
with the Mesoproterozoic zircons in and Avalonian source, the lack of the 400-460 Ma
zircons in these other domains is somewhat problematic for an Avalonian-source

35
scenario. One solution is that the source of the younger population was localized and did
not contribute to the immediate source of the younger and farther east depocenters.
A third hypothesis is that the subtle differences in the Mesoproterozoic zircons
populations in these studied strata are from several different sources. The two-peaked
Ectasian-Tonian populations in the Ketama and Tisiren units are essentially identical to
one another and they are similar to the age distribution in the Volta Basin. However, the
Mesoproterozoic zircons in the Bou Rached sandstones are more dispersed and more
similar with zircon in the Avalonian age composite (Fig. 1.6). The zircons with
Mesoproterozoic crystallization ages in the Ketama and Tisiren units do not share a
common Variscan cooling history although they may share an older cooling history. The
simplest way to account for this Variscan cooling discrepancy and the homogenized U-Pb
signature is if the Mesoproterozoic zircons were dispersed across the terranes prior to the
Variscan orogeny, consistent with an Early Paleozoic Amazonian source.
1.6 Conclusions
Ages of crystallization and cooling preserved in zircons of the Mesozoic strata of the
Ketama unit, Tisiren unit and Bou Rached sandstones record the superimposed series of
orogenic and rifting events that define Morocco and testify to its long history of
sedimentary recycling. The detrital zircon geochronology of these domains reveals the
utility of applying such techniques to the complex and recycled Phanerozoic sediments of
Morocco. In particular, comparison of these new data with other geologic data from
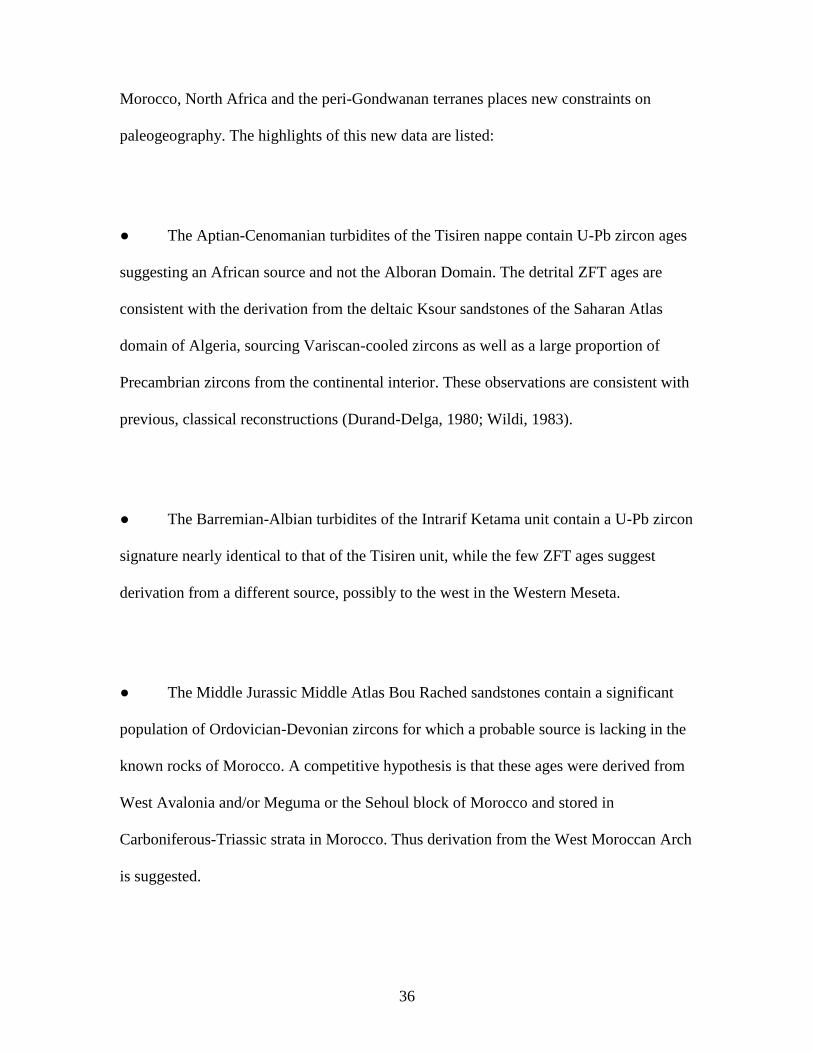
36
Morocco, North Africa and the peri-Gondwanan terranes places new constraints on
paleogeography. The highlights of this new data are listed:
● The Aptian-Cenomanian turbidites of the Tisiren nappe contain U-Pb zircon ages
suggesting an African source and not the Alboran Domain. The detrital ZFT ages are
consistent with the derivation from the deltaic Ksour sandstones of the Saharan Atlas
domain of Algeria, sourcing Variscan-cooled zircons as well as a large proportion of
Precambrian zircons from the continental interior. These observations are consistent with
previous, classical reconstructions (Durand-Delga, 1980; Wildi, 1983).
● The Barremian-Albian turbidites of the Intrarif Ketama unit contain a U-Pb zircon
signature nearly identical to that of the Tisiren unit, while the few ZFT ages suggest
derivation from a different source, possibly to the west in the Western Meseta.
● The Middle Jurassic Middle Atlas Bou Rached sandstones contain a significant
population of Ordovician-Devonian zircons for which a probable source is lacking in the
known rocks of Morocco. A competitive hypothesis is that these ages were derived from
West Avalonia and/or Meguma or the Sehoul block of Morocco and stored in
Carboniferous-Triassic strata in Morocco. Thus derivation from the West Moroccan Arch
is suggested.

37
● All samples display a significant population of Mesoproterozoic zircons in the
previously recognized 1.1-1.6 Ga West African magmatic gap. The ubiquitous presence
of these zircons testifies to a widespread distribution of ‘exotic’ zircons in the Mesozoic.
Two alternative or possibly combined scenarios are proposed to account for
Mesoproterozoic zircons: (1) delivery from Amazonia or the Volta Basin during
Ordovician glaciations and/or (2) delivery from West Avalonia during the Variscan
orogeny. The Mesoproterozoic populations of the Ketama and Tisiren units are most
consistent with the former hypothesis while the Bou Rached sandstones are more
consistent with the latter. Additional detrital zircon U-Pb datasets from strategic
Carboniferous and Ordovician sediments have great potential to constrain the origin of
the Mesoproterozoic zircons.

38
Figure 1.1 A) Generalized geological map of northern Africa (modified after
Linnemann et al., 2011 and references therein). The Anti-Atlas and Maurentide belts
are Pan-African belts exhumed during the Variscan orogeny. Here they are colored
along according to their Pan-African affiliation. Inset shows location of Figure 1b. B)
Simplified geological map of northern Morocco (modified after Hafid et al., 2006,
location of Sehoul block after Michard et al., 2008). Insets show location of Figures 2
and 3.

39
Figure 1.2 Geological map of the Central Rif. Sample locations marked by stars
(modified after Hollard, 1985; Chalouan et al., 2008)

40
Figure 1. 3 Geological map of the Middle Atlas and surrounding basins (modified after
Zizi, 2002). NMAF: North Middle Atlas Fault; SMAF: South Middle Atlas Fault.
Location of Bou Rached samples marked by the red star

41
Figure 1.4 Detrital zircon U-Pb age distributions. Kernel density estimates are filled
curves and probability density plots are unfilled curves with peak values labeled. Pie
charts display percentages of all ages that fall into defined age ranges as shown. See
text for calculation of probability density plots.

42
Figure 1.5 Detrital zircon SEM-HDFT age distributions. Kernel density estimates are filled curves with peaks
values labeled. Dashed lines indicate peak values determined by mixture models and the percentage of grains
contributing to the peak with 2σ percent error labeled. KDEs and mixing models calculated using DensityPlotter
(Vermeesch, 2012). N=number of samples, n=number of individual grains A) Individual samples. B) Data by
stratigraphic unit shown for ages between 0 and 1.0 Ga. One age falls off of the scale at 1.7 Ga in sample RF4.

43
Figure 1.6 Comparison of detrital zircon age spectra of relevant terranes. Construction
parameters are the same as for Figure 4.

44
Figure 1.7 Jurassic paleogeographic sketch (after Zizi et al., 2002 and Frizon de Lamotte
et al., 2009).

45
Figure 1.8 Early Cretaceous paleogeographic sketch (after Michard et al., 2002).
Outlined areas reflect hypothetical sediment delivery areas from corresponding sources.
A) Reconstruction with the Ketama unit positioned intramarginally (modified from
Michard et al., 2007. B) Reconstruction with the Ketama unit inboard of the continental
margin and located east of its present position following the recent reconstruction of
Benzaggagh et al. (2014).
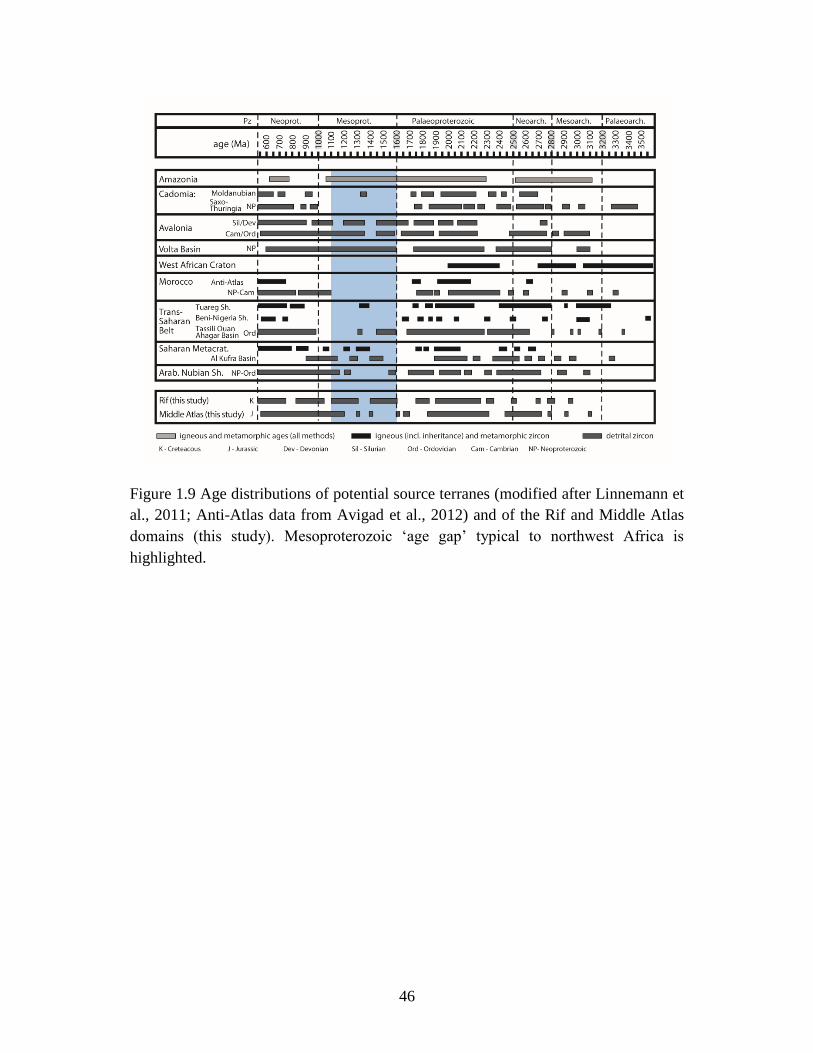
46
Figure 1.9 Age distributions of potential source terranes (modified after Linnemann et
al., 2011; Anti-Atlas data from Avigad et al., 2012) and of the Rif and Middle Atlas
domains (this study). Mesoproterozoic ‘age gap’ typical to northwest Africa is
highlighted.

47
CHAPTER 2
SEDIMENTARY PROVENANCE OF THE TAZA-GUERCIF BASIN, SOUTH RIFEAN
CORRIDOR, MOROCCO: IMPLICATIONS FOR THE MESSINIAN SALINITY CRISIS
2.1 Introduction
In the late Miocene, the connection between the Mediterranean Sea and Atlantic Ocean
was tectonically severed leading to deep evaporative draw-down of Mediterranean sea
level such that the entire basin approached desiccation in an event known as the
Messinian Salinity Crisis (MSC). The MSC sequestered 6% of global ocean salinity into
evaporite deposits (Hsü et al., 1977), created a deep, dry and hot basin that altered global
atmospheric circulation (Murphy et al., 2009), opened passageways for faunal migration
between Europe, Africa and Arabia (Agusti et al., 2006) and ended in the largest flood
the Earth has ever experienced (Hsü et al., 1977, Garcia-Castellanos et al., 2009). The
combined effects of the MSC make it one of the most important oceanic event in the last
20 million years (Krijgsman et al., 1999a). 2
It is widely accepted that the MSC was initiated through the late Miocene
severing of the Betic and Rifean marine corridors (ex. Krijgsman et al., 1999a; 2000;
Duggen et al., 2004, 2005; Jolivet et al., 2006) that connected the Mediterranean basdin
2 Pratt, J. R., Barbeau, D. L., T. M. Izykowski, Garver, J. I. and Anas Emran. Submitted
to Geosphere, 4/12/2015.

48
with the Atlantic Ocean through Spain and Morocco, respectively. Of the major Atlantic
connections, the Rifean corridor of northern Morocco was the last to close (Krijgsman et
al., 1999b; Garcés et al., 2001; Warny et al., 2003), although the exact nature of its
closure is contentious. Regional tectonics are considered the primary driver of corridor
closure because changes to glacio-eustatic sea level (Hodell et al., 1989, 1994) and
sedimentation rates (Krijgsman et al., 1999a) are generally considered to be insufficient
to isolate the Mediterranean Sea. Possible tectonic mechanisms contributing to corridor
closure include craton-ward thrusting in the Rif Mountains following the cessation of
slab-rollback in the western Mediterranean (Jolivet et al., 2006), subduction-delamination
uplift of the Rif Mountains on the African continental margin (Duggen et al., 2003, 2004,
2005) and thermal uplift of the Middle Atlas Mountains above thinned lithosphere.
(Babault et al., 2008; Barbero et al., 2011).
The Taza-Guercif basin lies between the Rif and Middle Atlas Mountains and
experienced structural deformation related to both orogens (Bernini et al., 2000). Rif
orogenesis was driven by the tectonic collision of the allochthonous Alboran Domain
(Internal Zones; Fig 2.1) against the margin of Morocco and deformed through
southward-propagating reverse faults. The Atlas Mountains are controlled by inversion of
normal faults from Triassic-Jurassic extension associated with the opening of the Tethys
Ocean. The central and eastern Rifean Corridor formed above and between Rif and
Middle Atlas structures such that shortening and uplift associated with both orogenic
belts are potential contributors to corridor closure. The Taza-Guercif basin lies just east
of the abutment of the Rifean frontal thrust against the structurally uplifted Tazzeka spur
of the Middle Atlas Mountains (Fig. 2.1). This structural juxtaposition is the probable

49
location the marine connection between the Atlantic Ocean and Mediterranean Sea was
first severed.
The tectonic interference of the two mountain belts makes determining the
contribution of uplift from each belt to corridor closure difficult. Our approach to solving
this problem is to perform a detailed detrital zircon provenance study of the Taza-Guercif
basin stratigraphy as proxy for surface uplift in the Rif and Middle Atlas mountains, the
need for which has been previously recognized (Gomez et al., 2000). Herein we present
results of the first provenance study of the Taza-Guercif basin using a combination of
detrital-zircon U-Pb crystallization ages and fission-track cooling ages. In a companion
paper, the detrital zircon signatures of key elements of the Rif and Middle Atlas
mountains were recently determined using the same methodology (Pratt et al., in press)
and provide detrital zircon signatures for comparison to the Taza-Guercif sediments. The
differences and similarities between the signal in the Taza-Guercif basin and those of the
bounding orogens are used to evaluate the closure of the Rifean Corridor and, by
extension, the initiation of the Messinian Salinity Crisis.
2.2 Geologic Background
The Miocene aged Taza-Guercif basin lies in the former Rifean Corridor of Morocco
(Fig. 2.1). The basin formed in the foreland of the south-vergent Cretaceous-Recent Rif
Mountain fold and thrust belt and lies atop reactivated Middle Atlas Triassic-Jurassic rift-
related faulting. The Rif Mountains are part of the Betic-Rif orocline that rims the
Mediterranean Sea from southern Spain, across the Gibraltar arc and into Morocco (Fig.

50
2.1). This orogenic system formed due to the Cretaceous-Miocene dissection and
accretion of a microcontinent, named the Alboran block in the Rif, during slab roll back
in the eastern Mediterranean (Chalouan et al., 2008 and references therein). In a different
scenario, the Middle Atlas Mountains formed from the Late Cretaceous-Neogene
inversion of a failed Triassic-Jurassic rift system. (Frizon de Lamotte et al., 2008). Both
orogenic systems accommodated the strain in the north African margin due to the
convergence with Eurasia and it is within the context of African-Eurasian convergence
that the Taza-Guercif basin was formed. Hydrocarbon exploration within the Taza-
Guercif basin has provided ample well and seismic data that along with outcrop studies
have constrained the structural and stratigraphic evolution of the Taza-Guercif basin
(Bernini et al., 2000; Krijgsman et al., 1999a; Gelati et al., 2000; Sani et al., 2000, etc.),
from which the following summary is simplified.
The Neogene evolution of the Taza-Guercif basin began in the Tortonian
with the formation of a graben system superimposed on the northeastern
continuation of the Middle Atlas Mountains. The graben-forming extension is
attributed to foreland flexure associated with loading in the external Rif thrust that
reactivated Middle Atlas rift structures (Bernini et al., 2000; Sani et al., 2000) or
distal effects of a sinistral shear zone associated with WSW-vergent thrusting in
the Central Rif (Gomez et al., 2000). The onset of extension was marked by the
deposition of discontinuous continental conglomerates and breccias of the
Tortonian Draa Sidi Saada Formation. Shallow marine sedimentation followed
with the deposition of the Ras el Ksar Formation that is comprised of rippled
sandstones, biolithites and alternating siltstones and mudstones. These strata
51
recorded the assimilation of the Taza-Guercif basin into the Rifean marine corridor.
Continued subsidence led to the deposition of the open marine Melloulou
Formation, the base of which consists of thick and uniform marine marls of its Blue Marl
subunit. In the basin depocenter, two turbidite sandstone systems interfinger with the blue
marls: the finer and more thinly bedded El Rhirane turbidites and the coarser, more
thickly bedded Tachrift turbidites. Current marks suggest a paleoflow from the south,
indicating a source in the Middle Atlas (Gelati et al., 2000). The Tortonian-Messinian
boundary (ca. 7.2 Ma) lies at or near the top of the Tachrift turbidites (Krijgsman et al.,
2000). The turbidites are overlain by the Gypsiferous Marl subunit, which was deposited
after rapid shallowing of the basin between 7.2 Ma and 7.1 Ma (Krijgsman et al., 1999a).
The post-shoaling marl contains abundant gypsum crystals indicating evaporative
conditions and is several hundred meters thick (Fig. 2.2), indicating the continuation of
basin subsidence (Krijgsman et al., 1999a; Gelati et al., 2000).
Compressional forces became dominant in the Taza-Guercif basin during the
early Messinian caused by the encroachment of the south-vergent Rifean thrust front that
inverted pre-existing Middle Atlas Shear Zone structures (Bernini et al., 1999, 2000;
Gomez et al., 2000). At the same time, the westward connection with the Rifean corridor
was progressively restricted, leading to lowering sea levels in the basin. The onset of
basin emergence is marked by the unconformity overlying the Melloulou formation and
the deposition of the overlying Kef ed Deba Formation.
The Kef ed Deba Formation consists of transitional marine facies that are capped
by fluvial-deltaic conglomerates and fossiliferous sandstones (Gelati et al., 2000). These
52
regressive transitional marine facies of the Kef ed Deba Formation are truncated by a
stark regional unconformity that marks the final emergence of the Taza-Guercif basin
between 6.7 and 6.0 M (Krijgsman et al., 1999a, 1999b). Above the unconformity,
continental deposition began with the lacustrine carbonates and fluvial conglomerates of
the Pliocene Bou Irhardaeine Formation (Gelati et al., 2000). The post-emergence
succession evolved under the influence of the transpressional Middle Atlas Shear Zone in
the absence of further Rifean forcing (Bernini et al., 2000).
2.3 Methods
2.3.1 Sampling
The analyzed samples obtained from Taza-Guercif basin stratigraphy represent all
formations with the exception of the monogenetic conglomerates of the Draa Sidi Saada
Formation. In all formations, medium to coarse sandstones were targeted for high zircon
yields, but often only finer grain sandstones were available. In total, nine sandstone
samples were selected for analysis and their locations are shown in Figure 2.1c and
Figure 2.2.
Three samples were collected from the Ras el Ksar Fm. TGB1 was sampled in the
Bab Stout region in the north of the basin ~10 m up-section of the contact with the
underlying Draa Sidi Saada Formation (34.2402°, -3.8564°). The outcrop consists of a 1-
2 m pitted and bioturbated beige fine- to medium-grained sandstone that is tabular and
laterally continuous. Sample TGB2 was collected ~5 m up-section from TGB1, separated
by fine-grained slope-forming rock, and similarly is a 1-2 m thick beige fine- to medium-

53
grained pitted and bioturbated sandstone. Sample TGB14A was collected from a rust-
colored medium-grained sandstone on the uplifted southern margin of the basin near the
contact with the underlying Jurassic substratum in the vicinity of Bou Rached (TGB14A:
33.9224°, -3.5761°). The sampled bed displays a lenticular base that cuts into a marly bed
below. The bed pinches out laterally and where observed is overlain by planar-bedded
sandstones.
Sample TGB12A was collected from the El Rhirane turbidites between the
Melloulou and Zobzit rivers (TGB12A: 33.9944°; -3.7620°). The El Rhirane turbidite
sandstones outcrop in this area across a low rise forming small step-like exposures
separated by slightly thicker intervals of mudstones. The sample is from a ~40 cm thick
tabular bed of rust-colored medium-grained sandstone.
Samples TGB3 and TGB4 were collected east of the Zobzit river within a
coarsening-upwards succession of the Tachrift turbidites that form a ridge overlooking
the village of Timalit (TGB3 and TGB4; 33.9982°, -3.7392°). Each sample was taken
from the uppermost bed of two of different coarsening-upwards intervals. Sampled beds
are ~1.5 m thick and composed of beige medium-grained upward-finding structureless
sandstones. Sample TGB3 is the uppermost of the two samples, occurring ~5 m up-
section from TGB4.
Samples TGB5 and TGB6 were acquired from more arenaceous intervals within
the Gypsiferous Marl subunit exposed east of the Zobzit River on the eastern limb of the
Safsafat anticline (TGB5 & TGB6: 34.0012°, -3.6593°). Similar to the El Rhirane
turbidites, the exposures occur on a low rise with sandstones interbedded within marl
54
forming discrete step-like ridges. TGB5 was acquired from a dark red to brown ~50 cm
thick fine-grained planar-bedded quartz-rich sandstone. TGB6 was sampled ~5-6 m up-
section in a 20-30 cm thick dark red to brown poorly sorted medium- to coarse-grained
sandstone.
Sample TGB10 was collected from the Kef ed Deba Formation within a red
sandstone interval outcropping on the southern exposure of the eastern limb of the
Safsafat anticline (TGB10: 34.0055°, -3.649089°). The sandstone bed is fine-grained,
~50 cm thick, planar bedded and contains abundant pelecypods.
TGB7 is the stratigraphically highest sample analyzed in this study and was
collected from a ~70 cm thick rippled fine- to medium-grained sandstone intercalated
with the conglomerates of the Bou Irhardaeine Formation ~3 m above a regional
unconformity in the Taza-Guercif basin (TGB7: 34.0070°, -3.6492°). The surrounding
pebble-cobble conglomerates are matrix-poor and observed clasts consist almost entirely
of carbonate.
2.3.2 Detrital zircon U-Pb geochronology
Seven samples (TGB1, TGB4, TGB5, TGB7, TGB10, TGB12A, TGB14A) were
analyzed using laser-ablation single-collector inductively coupled plasma mass-
spectrometry (LA-SC-ICP-MS) at the University of South Carolina’s Center for
Elemental Mass Spectrometry (CEMS). Our procedure is detailed in Pratt et al., (in press)
and is only briefly summarized below. Following standard rock disaggregation and zircon
separation techniques, samples were ablated with a PhotonMachines 193 nm ArF excimer

55
laser and the ablated material was plumbed to and analyzed in a Thermo Element2 high-
resolution single-collector ICP-MS. Our analysis measured the signal intensities of
202Hg, 204(Pb+Hg), 206Pb, 207Pb, 208Pb, 232Th and 238U. Each sample analysis
targeted ~100 unknown zircons and incorporated an analysis of the natural zircon
standard SL2 (563.2 ± 4.8 Ma: Gehrels et al., 2008) after every fifth unknown, and R33
(419.3 ± 0.4 Ma; Black et al., 2004) after every twentieth unknown. Each individual grain
analysis included a ten-second ‘blank’ integration followed by 28 seconds of analysis
during 10 Hz ablation by a 25 μm circular spot, followed by 15 seconds for post-ablation
chamber wash-out.
Data reduction was performed in the Iolite software add-on (Paton et al., 2011)
for WaveMetric’s IgorPro software utilizing the U-Pb Geochronology3 Data Reduction
Scheme. Data were corrected for background signals, down-hole fractionation, and
instrument drift to produce the final isotopic ratios and ages. Final analyses with 2σ error
greater than 20% in either the 238U/206Pb or 207U/206Pb ages were disregarded.
Resulting analyses with 238U/206Pb ages older than 500 Ma were subjected to a
concordance filter whereby any grains with greater than 30% normal discordance or
greater than 5% reverse discordance were similarly disregarded. Grains with 238U/206Pb
ages less than 500 Ma were retained regardless of discordance. Herein we use
238U/206Pb ages for grains with ages less than 1.3 Ga, and 207Pb/206Pb ages for grains
with 238U/206Pb ages exceeding 1.3 Ga. This age division was chosen to reduce
individual age uncertainty and to avoid skewing a population that extends across the
more conventional 1.0 Ga age-method division.
56
3.3 Detrital zircon fission-track geochronology
Zircon fission-track thermochronology provides ages at which zircons cool below
a certain temperature, the closure temperature, which is typically ~250°C for average
zircons (Fleischer et al., 1975; Tagami, 2005). These ages are determined using the
density of fission-induced damage trails, or fission-tracks, in the crystal lattice of the
zircons and the rate at which 238U undergoes spontaneous fission. Above the closure
temperature, fission-tracks are repaired and below the closure temperature, fission-tracks
are retained. Thus reheating above the closure temperature resets the fission-track age
(Naeser, 1979; Bernet & Garver, 2005). The distribution of fission-track ages from
detrital zircons in a sedimentary sample can provide a unique signature separate from the
U-Pb crystallization ages. The combination of the two signatures better discriminates
between potential source rocks and is particularly valuable in in areas, such as Morocco,
where crystallization ages are likely to be uniform but have a more heterogeneous low
temperature thermal history.
The zircon-fission track analysis of our samples was performed using the
scanning electron microscope high-density fission-track (SEM-HDFT) technique (e.g.,
Montario & Garver, 2009). This technique utilizes higher magnifications and a gentler
etching techniques to allow the counting of zircon fission-tracks at high densities (3 x 10⁸
tracks/cm2), thereby unlocking cooling ages in highly radiation damaged grains, as are
common to old and/or high [U] crystals. The closure temperature for radiation-damaged
grains lies between ~150-195°C. Details of the technique can be found in Montario &
Garver (2009) and our procedure is presented in detail in Pratt et al., (in press) and will
only be briefly summarized below. This method preferentially targets nearly metamict

57
zircon grains and caution should be applied when comparing directly to results from
conventional optical fission-track analysis.
Zircons were extracted from the same separates produced for the U-Pb analysis to
produce grain mounts for four samples (TGB3, TGB6, TGB12A & TGB14A) in addition
to three mounts of natural standards for zeta calibration: the Buluk Tuff (16.4 ± 0.2 Ma
fission-track age), Fish Canyon Tuff (27.9 ± 0.5 Ma), and Peach Springs Tuff (18.5 ± 0.1
Ma). Etching proceeded for 5-7 hours in a KOH:NaOH eutectic at 228°C. The mounts
were then flattened, cooled and cleaned prior to affixation with a ~0.2 mm mica flake.
The mounts and three glass dosimeters with a 238U content of 12.3 ppm were irradiated
in Oregon State University’s TRIGA Mark II Reactor. Following irradiation, the mica
detectors were etched in 48% HF for ~18 minutes. The mounts and corresponding mica
detectors were mounted as mirror images on petrographic slides with a ~8-10 nm thick
carbon coating and imaged at ~3,000-10,000x using the secondary electron detector of a
Zeiss® EVO50 tungsten-filament scanning electron microscope.
Natural and induced fission-track densities were determined using spatial analysis
of the secondary electron images in the ImageJ software package. The number of
spontaneous fission-tracks preserved in the zircon, and induced fission-tracks in the mica,
and image area were entered into ZetaAge (Brandon, 1996) and DensityPlotter
(Vermeesch, 2009, 2012) to determine grain ages, kernel density estimates (KDE) and
mixture model peaks. The mixture model attempts to fit a discrete number of cooling
events to the fission-track ages where peaks are located at the age of the event and
distribution of ages about the peaks is due to partial resetting (Brandon, 1996). To create
a mixture model DensityPlotter chooses the number of age components by minimizing

58
the Bayes Information Criterion and determines their value using a hybrid
deterministic and Markov chain Monte Carlo method (Vermeesch, 2009, 2012).
The KDE creates a curve of the relative probability that a randomly selected grain
from an infinite population would occur at a given age based on the density
distribution of sampled ages (Vermeesch, 2012).
2.4 Results
2.4.1 Zircon U-Pb results
A total of 638 zircons were analyzed in the course of this study. After error and
concordance filtering, analysis yielded 500 individual zircon U-Pb ages from seven
samples: TGB14A, TGB1, TGB12A, TGB4, TGB5, TGB10 & TGB7 (reported in Table
B.1). Age spectra for individual samples as well as the composite of the Taza-Guercif
basin are shown in Figure 2.3.
The composite of Taza-Guercif basin samples contains ages ranging from
68 to 3570 Ma and contains two dominant populations. The largest population
contains 228 ages between 518 and 693 Ma, representing 45.6% of all analyzed
grains. The second largest population with 78 grains consists of ages that fall
between 1790 and 2185 Ma, and represents 15.6% of the total population. Less
than 9% of all grains are younger than the 518 Ma lower limit of the primary age
peak, and only 7% are older than 2185 Ma. Individual samples are all generally
very similar to the composite spectrum (Fig. 2.3). For brevity, reporting the

59
populations in each individual sample are left to Figure 2.3 and the differences between
individual samples are discussed later in the text.
2.4.2 Zircon fission-track results
Scanning electron microscope high-definition fission-track (SEM-HD-FT)
analysis yielded results from 99 zircon grains from four samples from the Taza-Guercif
basin: samples TGB14A, TGB12A, TGB3, and TGB6. Greater grain counts were
obtained for TGB12A and TGB3, which contain 35 and 40 grains respectively, whereas
the remaining two samples measured 11 & 13 grains (for detailed data for individual ages
see Table C.2). Analysis of a fifth sample, TGB7, was attempted, but yielded too few
appropriate zircons after those for U-Pb analysis were separated. The 95% confidence
interval for individual ages is regularly in excess of 100 Ma above and below the
calculated age. Kernel density estimates (KDEs) and mixture model peaks are generated
for each sample and are shown in Figure 2.4. The mixture model attempts to fit a discrete
number of cooling events to the fission-track ages where peaks are located at the age of
the event and deviation about the peaks is due to partial resetting (REF). The KDE
creates a curve of the probability that a ra the density of grains at a given age if a
population were sampled infinitely
Ras el Ksar sample TGB14A (n=13) produced KDE peaks at 198, 259 and 506
Ma with mixture model peaks occurring at 228±21 Ma, 510±55 Ma and 1037±343 Ma
(Fig. 2.4). The mixture model is in good agreement with the KDE peaks with the
exception that the mixture model lumped the two youngest peaks defined by the KDE.

60
Statistically, the two KDE peaks are inseparable based on the 95% confidence
interval of individual ages.
El Rhirane turbidite sample TGB12A (n=35) displays KDE peaks at 237,
323 and 489 Ma, and mixture model peaks occur at 203±36, 323±27 and 606±78
Ma (Fig. 2.4). The KDE and mixture model peaks occur at similar ages for the
youngest two peaks. A mismatch occurs with the third peak where the mixture
model combines the grains represented by the 489 Ma KDE peak with all older
ages.
The spectra for the Tachrift turbidite sample TGB3 (n=40) yielded three
strong KDE peaks at 181, 323 and 489 Ma. Mixture model peaks for TGB3 were
calculated at 172±19 Ma, 323±37 Ma and 592±50 Ma (Fig. 2.4). The mixture
model and KDE peaks produce similar young peaks and while the oldest peaks in
each model deviate significantly. The issue is the same as TGB12A where the
mixture model lumps the oldest half (52±13%) together to define one peak.
Sample TGB6 from the Gypsifeous Marl (n=11) displays three dominant
KDE peaks at 223, 335 and 957 Ma. Mixture model peaks are calculated at
171±26, 336±29 and 959±300 Ma (Fig. 24). The two models are in near perfect
agreement, with the only difference occurring in the age of the youngest peak.
However, the difference in these ages falls within the 95% confidence interval for
individual grain ages.

61
2.5 Discussion
2.5.1 Basin-scale provenance
Examining the detrital zircon U-Pb crystallization age data from the Taza-Guercif basin
as a whole reveals a dominant ‘Pan-African’ signal as demonstrated by the robust ~520-
700 Ma population (Fig. 2.3). This population combined with the ~1.8-2.2 Ga
Paleoproterozoic U-Pb crystallization ages comprises a signature typical to sediment
derived from the West African craton and its Pan-African margin (Fig. 2.5; Nance et al.,
2004; Abati et al., 2010; Avigad et al., 2012). The smaller crystallization age population
at ~950 Ma is not typical of the West African craton crystalline basement, but has been
identified in Ediacaran-Cambrian exposures in the Anti-Atlas Mountains (Avigad et al.,
2012), in the Internal Zones of the Betic-Rif arc in Spain (Fig. 2.1; Platt & Whitehouse,
1999; Zeck & Whitehouse, 1999, 2002; Zeck & Williams, 2002) as well as in Mesozoic
exposures in the Middle Atlas and Rif mountains (Fig. 2.5; Pratt et al., press).
While it is unsurprising that these northwest African samples show a dominant
signal from the West African craton, the presence of Mesopreoterozoic ages as
represented by a small population peak at ~1190 Ma is significant. To date,
Mesoproterozoic zircons have only been identified in Morocco within the Mesozoic
samples mentioned above. In general, Mesoproterozoic zircon crystallization ages are
rare in the region, occurring only in small abundances in other exposures across North
Africa and not coevally with the ~1190 peak observed here (Thomas et al., 2010;
Linnemann et al., 2011).

62
In the thermochronologic data, all of the studied Taza-Guercif basin strata contain
a zircon fission-track cooling age population centered on the Triassic (Fig. 2.4), spanning
from the Permian to the Late Jurassic (ca. 285-160 Ma). The age range of this cooling
population coincides with late Variscan magmatism that affected the Moroccan Meseta
(Michard et al., 2008 and references therein), the Triassic rifting of the Atlas basins and
the Central Atlantic Magmatic Province lava flows in Morocco (Knight et al., 2004;
Verati et al., 2007; Frizon de Lamotte et al., 2008), and Early Jurassic magmatism that
occurred in the High Atlas (Frizon de Lamotte et al., 2008 and references therein) with
coeval hydrothermal events in the Middle Atlas (Hamidi et al., 1997; Auajjar and
Boulégue, 2002; Dekayir et al., 2005).
All samples except for TGB14A also contain a population of grains with zircon
fission-track ages ~330 Ma, coeval with the early period of Variscan tectonics and
magmatism that affected the Moroccan Meseta and the Anti-Atlas Mountains (Michard et
al., 2008). In the Taza-Guercif basin composite zircon fission-track spectrum, this peak is
the most well-defined and of greatest amplitude (Fig. 2.6). This suggests that the zircons
of this population were not affected by subsequent annealing during the latter phases of
the Variscan orogeny or during the Mesozoic extension that followed.
Samples TGB14A and TGB3 contain a significant KDE cooling age peak in the
Cambrian whereas sample TGB12A displays a minor peak during this time (Fig. 2.4).
The absence of this population in the remaining sample, TGB6 may simply result from its
comparatively small grain count as it otherwise closely resembles TGB12A. These
Proterozoic cooling ages may reflect distinct cooling events but were likely subject to
various degrees of reheating and partial resetting and as such are not diagnostic.

63
2.5.2 Evaluation of the Middle Atlas and Rif mountains as zircon sources
In the late Miocene both the Rif and Middle Atlas mountains were deforming
adjacent to the Taza-Guercif basin. The Middle Atlas Mountains were experiencing broad
thermal uplift (Teixell et al., 2005; Barbero et al., 2007; Babault et al., 2008, etc.) while
the encroachment of the Rif thrust front reactivated Middle Atlas structures and caused
shortening in the Rif domain itself (Bernini et al., 1999, 2000; Gomez et al., 2000). Due
to their immediate proximity to the Taza-Guercif basin and their elevation, these two
mountain ranges are the most likely sources of sediment to the basin. The currently
available data and geologic histories of these potential source areas are compared and
evaluated in relation to the both the detrital zircon U-Pb crystallization ages and the ZFT
cooling ages obtained from the sediments of the Taza-Guercif basin.
2.5.2.1 Middle Atlas
In the Middle Atlas, the only available U-Pb or ZFT data come from the Jurassic
(Bathonian-Callovian) Bou Rached sandstones sampled in the northern Middle Atlas near
the contact with Miocene sediments of the Taza-Guercif basin (Fig. 2.1c; Pratt et al., in
press). These sandstones extend beneath the Draa Sidi Saada and Ras el Ksar formations
and comprise part of the Jurassic substratum as confirmed by borehole and seismic data
(Sani et al., 2000). In some portions of the basin, the sandstones are capped by Upper
Jurassic limestones and in other parts, particularly the margins of the basin, they
immediately underlie the Miocene basin-fill beneath a dramatic angular unconformity.
64
Despite this relationship, the composite U-Pb crystallization age spectrum of the Taza-
Guercif basin does not match that of the Middle Atlas Bou Rached Jurassic sandstones
(Fig. 2.5), although the latter may be a minor contributor to the former.Detrital zircon U-
Pb age spectra from the Bou Rached sandstones contain a 400-500 Ma population that
accounts for less than 0.5% of grains in the Taza Guercif composite age-distribution
curve while comprising more than 10% of the grains in the Bou Rached sandstones. The
Bou Rached sandstones display a characteristic gap in U-Pb ages between 500 and 560
Ma not present in the Taza-Guercif basin samples and contain a larger proportion of
Archean ages (Fig. 2.5).
The two successions also contain different cooling age distributions.
Firstly, the Bou Rached sandstones contain Ordovician-Silurian cooling peaks
that are absent in the Taza-Guercif basin samples. Another difference is observed
in the youngest cooling peaks in the Taza-Guercif basin samples that are Early
Jurassic-Triassic in age, whereas those of the Bou Rached sandstones are Middle
Jurassic and Early Cretaceous. This difference falls within the possible range of
error for individual grains as determined by the 95% confidence interval and may
reflect method and not geology.
While the Bou Rached sandstones lie in closest proximity to the sampled
sediments of the Taza-Guercif basin, the majority of the northern Middle Atlas
outcrops consist of the Lower Jurassic ‘Lias’ platform carbonates. These rocks are
an unlikely source for detrital sediments in the Taza-Guercif basin as the
dominant carbonate lithology is incapable of generating the coarser arenaceous
turbidites and transitional marine sandstones found within the Taza-Guercif basin,

65
though the possibility of a contribution from interbedded quartzose lithologies cannot be
excluded.
Further south in the Middle Atlas, the Jurassic carbonates are overlain by Lower
Cretaceous continental red beds that were subsequently covered in the Late Cretaceous
by sediments deposited during a regional transgression (Faure-Muret and Choubert,
1971; Frizon de Lamotte et al., 2008). The Cretaceous continental and marine
successions are preserved in the southern half of the Middle Atlas and are mostly absent
to the north. This missing cover may represent a viable distal source from the Middle
Atlas to the Miocene Taza-Guercif basin.
2.5.2.2 Rif
Limited data in the Rif Mountains are available for the Ketama and Tisiren units
that represent the External Zones and Maghrebian Flysch Domain, respectively (Fig.
2.1b). The U-Pb crystallization ages from these domains are nearly identical to one
another. The Taza-Guercif basin samples contain U-Pb crystallization age signatures that
closely resemble those of the Rifean samples (Fig. 2.5). The majority of U-Pb ages
shared between the Rif samples and the Taza-Guercif basin samples correspond to the
Pan-African orogeny and West African cratonic signatures while the source of the shared
Mesoproterozoic population is poorly constrained. Given the commonality of the Pan-
African and West African craton ages across the region and the uncertainty of the
temporal and spatial distribution of the Mesoproterozoic ages, this correlation is
insufficient to conclude a source-sink relationship.

66
Analysis of the ZFT cooling age distributions suggests the sampled
domains in the Rif are not the source for the Taza-Guercif basin sediments (Fig.
2.5). A combination of the zircon fission-track cooling ages obtained in the
Tisiren and Ketama units could provide the Variscan age distributions found in
the Taza-Guercif basin. However, both sampled Rif units lack the strong Triassic-
centered cooling age population that is ubiquitous in the Taza-Guercif basin ZFT
spectra.
The Internal Zones of both the Rif and Betic mountains are equivalent and
composed of rocks from the allochthonous Alboran Domain (Chalouan et al.,
2008 and references therein). There are no comparable data published in Internal
Zones of the Rif (Fig. 2.1b), however data exist for the Internal Zones of the Betic
Mountains of Spain. Comparison of the zircon crystallization and cooling age data
from the Betic Alboran Domain (Platt & Whitehouse, 1999; Zeck & Whitehouse,
1999, 2002; Zeck & Williams, 2002) and that of the Taza-Guercif basin indicate
that the latter did not source from the former. Firstly, the Taza-Guercif basin
sediments lack the Paleogene to early Miocene zircon fission-track cooling age
ages commonly recorded in the Alboran Domain, though this may be a product of
selection bias for radiation damaged grains in our ZFT analysis. Secondly, the
Variscan U-Pb crystallization ages that occur in abundance in the Internal domain
are scant in the Taza-Guercif sediments (Fig. 2.5). Finally, the U-Pb zircon data
from the Alboran Domain lack the Mesoproterozoic crystallization ages that occur
in all Taza-Guercif samples.

67
2.5.3 Triassic-centered detrital cooling ages and their possible sources
The Triassic cooling age population that is consistent in zircon fission-track data
across the Taza-Guercif basin samples distinguish them from the available data in the
Bou Rached sandstones of the Middle Atlas as well as the Internal Zones, Maghrebian
Flysch domain and External Zones of the Rif (Figs. 2.4, 2.5; Pratt et al. in press). Even
though the Bou Rached sandstones lack this key zircon fission-track population, the most
likely source for the Triassic cooling populations lie in other strata in the High and
Middle Atlas mountains (Fig. 2.1b). Triassic extension and rifting in the Tethyan domain
formed the High and Middle Atlas rift basins (Frizon de Lamotte et al., 2008) and
domains were marked by magmatism in the Mesozoic.
Magmatic events that may be recorded in the zircon fission-track ages include the
Central Atlantic Magmatic Province (CAMP) magmatism that affected Morocco and is
restricted in age to between 200 and 196 Ma (Knight et al., 2004; Verati et al., 2007). The
cooling age population also encompasses two phases of Jurassic-Early Cretaceous
magmatism followed in the High Atlas at 175-155 Ma and 135-110 Ma (Souhel, 1996;
Frizon de Lamotte et al., 2008). These ages could derive from either the High or Middle
Atlas mountains. Triassic CAMP-related magmatism occurred in both regions and while
only the High Atlas experienced the Jurassic magmatism directly (Frizon de Lamotte,
2008), the Middle Atlas experienced coeval hydrothermal heating (Hamidi et al., 1997;
Auajjar and Boulégue, 2002; Dekayir et al., 2005). These magmatic episodes are
consistent with the range of ages present in the Triassic-centered cooling age population
(Fig. 2.3) and the combination of several events could explain the broad distribution of
ages as seen in the Taza-Guercif basin composite (Fig. 2.6).
68
A source in the Middle and High Atlas domains is supported by the
available thermochronological data outside the Middle Atlas Mountains that
imply that Morocco was mostly subsiding during the Triassic-Early Jurassic and
that regional exhumation is an unlikely cause of the cooling recorded in the
Triassic-Early Jurassic zircon fission-track ages. The western Anti-Atlas and
Western Meseta were located along the West Moroccan Arch, the common rift
shoulder of Tethyan (Atlas) and Atlantic rifting (Frizon de Lamotte, 2008, 2009),
and are the most likely terranes in Morocco to record Triassic-Early Jurassic
exhumation.
Temperature-time models constructed from apatite fission-track (AFT)
data of Variscan granitoids and metamorphic rocks within the Western Meseta
predict cooling below 120° C by ca. 300-250 Ma (Saddiqi et al., 2009; Barbero et
al., 2011) and record subsidence and burial through the Triassic and Jurassic that
reached insufficient temperatures to reset the zircon fission-track system (Ghorbal
et al., 2008; Saddiqi et al., 2009). This data implies that the zircons within the
Variscan and older rocks of the Western Meseta basement most likely retained
their Variscan and older cooling ages. Variscan cooling ages are also retained in
the central and western Anti-Atlas, confirmed by ~310-340 Ma ZFT ages
obtained from the Proterozoic basement that cooled steadily in the absence of
regional exhumation (Sebti et al., 2009; Ruiz et al., 2010; Oukassou et al., 2013).

69
2.5.4 The Middle Atlas Source
The U-Pb zircon crystallization age results of this study as well as those from
previous Moroccan detrital-zircon studies (Abati et al., 2010; Avigad et al., 2012; Pratt et
al., in press) suggest a similar U-Pb signature for the majority of Moroccan stratigraphy,
obscuring robust source-sink correlations using only detrital zircon U-Pb crystallization
ages. As a result we primarily rely on our smaller (and larger error) zircon fission-track
cooling age dataset, integrated with regional geologic relationships, to interpret the
provenance of the Taza-Guercif basin stratigraphy. The ZFT data indicate that the
currently sampled stratigraphy of the Rif and Middle Atlas mountains are not the
dominant source of the Taza-Guercif basin sediments as they do not share the Triassic-
centered cooling population. Therefore, despite the similar U-Pb zircon crystallization
age distributions between the Taza-Guercif basin and the Rif (Pratt et al., in press), we
propose that the dominant zircon source to the Taza-Guercif basin was the Lower
Cretaceous continental successions of the Middle and High Atlas mountains. This
interpretation is based on five lines of reasoning:
(1) The age of the source stratigraphy should be the same age or younger than
the 125-150 Ma ZFT ages found in the basin as these grains are inherited. If these cooling
ages were acquired in the source in situ it is highly unlikely the older cooling ages would
have been retained.
(2) The Middle and High Atlas were the loci of Triassic-Jurassic extension
and associated magmatic and hydrothermal heating that are the inferred source of the
corresponding Triassic-Jurassic cooling peak.

70
(3) A Late Cretaceous transgression inundated the majority of
Morocco, burying older Middle and High Atlas stratigraphy that may have
contained more locally derived sediment containing the Early Jurassic zircon
cooling age signal.
(4) The ‘Lias’ carbonates and the Upper Cretaceous fine-grained
lithologies are unlikely sediment sources for the coarse and zircon-rich sandstones
sampled in the Taza-Guercif basin.
(5) This model is consistent with observed paleocurrent indicators in
the El Rhirane turbidites that suggest a southern Middle Atlas source (Gomez et
al., 2000). Although now mostly preserved on the margins of the uplifted Atlas
Mountains, these Early Cretaceous sandstones likely covered a much wider area
in the Cretaceous and were subsequently eroded during the uplift of the Atlas.
These rocks along with the ‘Lias’ strata supplied sediment to the Taza-Guercif
basin, generating the marls that dominate the basin, as well as the intercalated
turbidite sandstones within.
2.5.5 Provenance evolution
Although the composite U-Pb crystallization age spectrum of the Taza-Guercif basin
suggests a dominant Middle Atlas source of sediment for the Taza-Guercif basin, the
presence or absence of provenance shifts and trends in the basin-fill from opening to
closure is pertinent to constraining the tectonic severing of the Rifean Corridor. The

71
following discussion explores the provenance of each individual sample moving up-
section.
The Ras el Ksar formation samples TGB1 and TGB14A, from the north and south
of the basin respectively, demonstrate at least a partial divergence in sediment
provenance during deposition at the opening of the Taza-Guercif basin. Sample TGB1
from the Bab Stout area contains a Paleozoic U-Pb zircon crystallization signature that
accounts for 25% of single-grain ages within the sample — the largest such signature in
the Taza-Guercif basin samples — and a younger Neoproterozoic peak than present in
the other samples. The sample has the lowest percentage of Mesoproterozoic grains,
lacking the Ectasian-Tonian (~1300-900 Ma) peaks common to other Taza-Guercif basin
samples. These features indicate that the sample may have been partially sourced from
Middle Jurassic sandstones equivalent to the Bou Rached sandstones. These samples may
also have sourced from the west through the Rifean Corridor as the sample location for
TGB1 lies nearer to the paleo-connection with the Saiss basin (Fig. 2.1). The Ras el Ksar
formation sample TGB14A contains fewer grains with Paleozoic U-Pb crystallization
ages than the average for the Taza-Guercif basin samples, and contains the two-peaked
Ectasian-Tonian (~1300-900 Ma) populations (Fig. 2.3), which together suggest a
different provenance from the northern sample (TGB1).
This ZFT cooling age spectra of the Ras el Ksar samples TGB14A (southern Ras
el Ksar) and TGB2 (northern Ras el Ksar) confirm the differentiation in source. Both
samples contain Precambrian and Triassic-centered cooling populations. The difference
between the samples occurs in the Variscan events that are recoded. Sample TGB2
displays a cooling peak at ~330 Ma, consistent with the overall signal of the basin.

72
Uniquely amongst the Taza-Guercif basin samples, TGB14A lacks this peak and
instead contains a peak at ~260 Ma, consistent with late Variscan events (Fig.
2.4).
The stratigraphically up-section turbidite units of the Melloulou Formation
(TGB3 & TGB12A) contain similar U-Pb crystallization age spectra, with each
containing a ‘Pan-African’ signature with a dominant peak at ~615 Ma and a
subordinate peak at ~534 Ma. The spectra differ in the older ages, yet the
similarity is striking for ages younger than 700 Ma, and which is not shared with
any of the other Taza-Guercif basin samples. The age of mixture model peaks
generated for the zircon fission-track cooling age data are similar between the two
units. Significant differences occur only in the Mesozoic cooling populations
where the El Rhirane turbidite sample contains a peak in the Triassic and the
Tachrift turbidite sample contains a peak in the Early Jurassic. This degree of
variation falls within the 95% confidence interval of error for individual ZFT
analyses and it is possible that these peaks represent the same population.
The KDE peak ages for the ZFT spectra are also similar between samples,
again sharing the Variscan peak and with a Triassic peak for the El Rhirane unit
and an Early Jurassic peak for the Tachrift unit. The two Mesozoic peaks fall
within the 95% confidence interval of each of the individual ages that comprise
the populations. Despite the differences in the proportions of each cooling
population between the samples, they occur at the same ages. This suggests that
they were derived from the same general source region. The minor differences
between the samples probably reflect changes in the relative exposure of different

73
rocks within the source area or a modest shift in the locus of erosion. Paleocurrent
indicators in the El Rhirane turbidites indicate a southern source (Bernini et al.,1999),
al.,1999), consistent with erosion of Middle Atlas or High Atlas Mesozoic cover.
Up-section in the post-shallowing Gypsiferous Marl unit of the Melloulou
Formation, the U-Pb zircon crystallization age spectrum of sample TGB5 contains
Tonian and Ectasian age peaks and a distinctive tri-peaked ‘Pan-African’ age distribution.
Zircon fission-track cooling ages of the Gypsiferous Marl unit sample TGB6 generally
coincide with that of the El Rhirane turbidite sample TGB12A, containing Mesozoic
cooling ages represented by a KDE peak at 223 Ma and a mixing model peak at 171 Ma,
alongside a large ~335 Ma Variscan peak in both the KDE and mixing model. These data
suggest that the Gypsiferous Marl unit sandstones were derived from the same source
region as the El Rhirane and Tachrift turbidites.
U-Pb zircon crystallization age spectra from the up-section Kef ed Deba
Formation sample TGB10 and the continental Bou Irhardaeine Formation sample TGB7
show no significant changes from the Gypsiferous Marl sandstone. Both TGB10 & TGB7
contain a tri-peaked ‘Pan-African’ distribution while the magnitude of the Ectasian-
Tonian and the Paleoproterozoic peaks vary slightly. This minor variance may be
attributed to changing exposures in the source region, hydrodynamic sorting or simple
statistics of random grain selection.

74
2.5.6 Implications for the closure of the Rifean Corridor
Our crystallization and cooling age data from detrital zircons of the Taza Guercif
basin suggest that there were no major shifts in provenance between deposition of: (1) the
El Rhirane and Tachrift turbidites deposited when the basin reached its deepest
bathymetry, and (2) the post-shallowing Gypsiferous Marl unit. Thus, the shallowing of
the basin did not shift the source for the Taza-Guercif and the basin continued to subside
throughout the deposition of the thick Gypsiferous Marl unit.
The shallowing was most likely the result of a restricted marine
connection to the west and/or the cessation of tectonic subsidence (Bernini et al.,
1999; Gomez et al., 2000). Basin uplift associated with the advancement of the
Rif thrusts and olistostrome emplacement are an alternative explanation for the
onset of shallowing (Krijgsman et al., 1999; Krijgsman et al., 2000). Detrital
zircons from Taza-Guercif basin strata deposited before and after shallowing
show no obvious provenance shifts in either the fission-track cooling ages or U-
Pb crystallization ages that would suggest increased sediment supply
accompanying uplift in the adjacent Rif Mountains. The presence of the Masgout
and Tazzeka areas as basement highs along the Msoun Arch (Gomez et al., 2000;
Sani et al., 2000) during the Neogene filling of the Taza-Guercif basin may have
prevented Rif sediments from penetrating the Melloulou-Zobzit embayment,
particularly during the deposition of the Gypsiferous Marl unit under shallow
conditions.

75
The shift to an intracontinental basin at ca. 6.7-6.0 Ma marked by the
unconformity between the Kef ed Deba and Bou Irhardaeine formations did not
significantly affect the detrital zircon U-Pb crystallization age distribution in the basin.
basin. The presence of the distinct tri-peaked ‘Pan-African’ zircon crystallization age
signal in the Gypsiferous Marl, Kef ed Deba Formation and Bou Irhardaeine Formation
would not likely have been maintained across their bounding unconformities through a
major shift in provenance. This implies that the final emergence of the basin did not
affect the provenance of basin sediments.
While the subsidence of the Taza-Guercif basin was controlled by loading from
the Rif interacting with Middle Atlas structures and then sediment-loading (Bernini et al.,
1999; 2000; Gomez et al,. 2000; Sani et al., 2000), the availability of sediments that filled
the basin appears to have been controlled by the relative uplift of Middle Atlas
Mountains. Thus, an apparently consistent source of sediments derived from the Middle
Atlas agrees well with models for domal surface uplift of the region beginning ca. 15 Ma
(Barbero et al., 2007; Babault et al., 2008), with intermittent fault-controlled uplift
providing coarse turbidite sedimentation.
The role of thermal uplift of the Middle Atlas has also been proposed to
contribute to the closing of the Saiss basin west of Taza-Guercif basin and the contact of
the Rif and Middle Atlas mountains (Babault et al., 2008). Indeed, the Ras el Ksar
Formation outcrop where TGB14A was collected now lies at an elevation of ~580 m,
~260 m higher than the Ras el Ksar formation outcrops of in the north of the basin where
TGB1 was collected. Today, the northern Middle Atlas drain to the north through the old

76
Taza-Guercif basin depocenter, a scenario that seems relatively unchanged since
the Neogene opening of the Taza-Guercif basin.
2.5.7 Conclusions
Our analysis of the detrital zircon in the Taza-Guercif basin provides the first attempt to
constrain the provenance of the basin sediments under the dual tectonic influence of the
Rif and Middle Atlas mountains to elucidate the forces that severed the Rifean Corridor.
The conclusions from this analysis follow.
Inherited Triassic-centered zircon fission-track cooling ages present in all of the
Taza-Guercif basin samples indicate that the primary source for the basin derived
from the post-Jurassic cover of the Middle and/or High Atlas mountains, with the
proximal position of the former offering a more likely match.
The sediment provenance at the opening of the Taza-Guercif basin was not
uniform across the basin. The northern Ras el Ksar Formation contains significant
zircons with crystallization ages between 400 and 500 Ma — a population found
in the Middle Jurassic sandstones of the Middle Atlas (Pratt et al., in press) —
while the southern Ras el Ksar Formation contains a provenance signal similar to
that seen throughout the rest of the basin-fill.
77
The turbidites of the overlying Melloulou formation differ slightly from one
another but both reflect an overall Middle Atlas provenance. Variations may have
resulted from minor shifts in the locus of erosion or changes in the relative
exposure of different source rocks. These changes may reflect tectonic activity in
the Middle Atlas, a scenario that has been previously proposed (Bernini et al.,
1999; Gelati et al., 2000).
Sediment provenance did not change with the deposition of the Gypsiferous Marl
unit after rapid shallowing of the Taza-Guercif basin and Rifean corridor. The U-
Pb zircon crystallization age spectra do not differ significantly onward through
the Pliocene Bou Irhardaeine Formation, suggesting the Taza-Guercif basin
received the majority of its sediment from a consistent source, suggested here to
be the Middle Atlas Mountains to the south.
There is no indication of increased sedimentation from the Rif Mountains as they
encroached upon the Rifean Corridor in the Messinian. This suggests that the
thermal and contractional uplift of the Middle Atlas played a role in isolating the
Taza-Guercif basin prior to the onset of the Messinian Salinity Crisis in the
Mediterranean. With similar effects of Middle Atlas uplift documented in the
Saiss basin (Babault et al., 2008), across the Rif-Middle Atlas contact, uplift of
the Middle Atlas may have contributed substantially to the closure of the Rifean
Corridor.
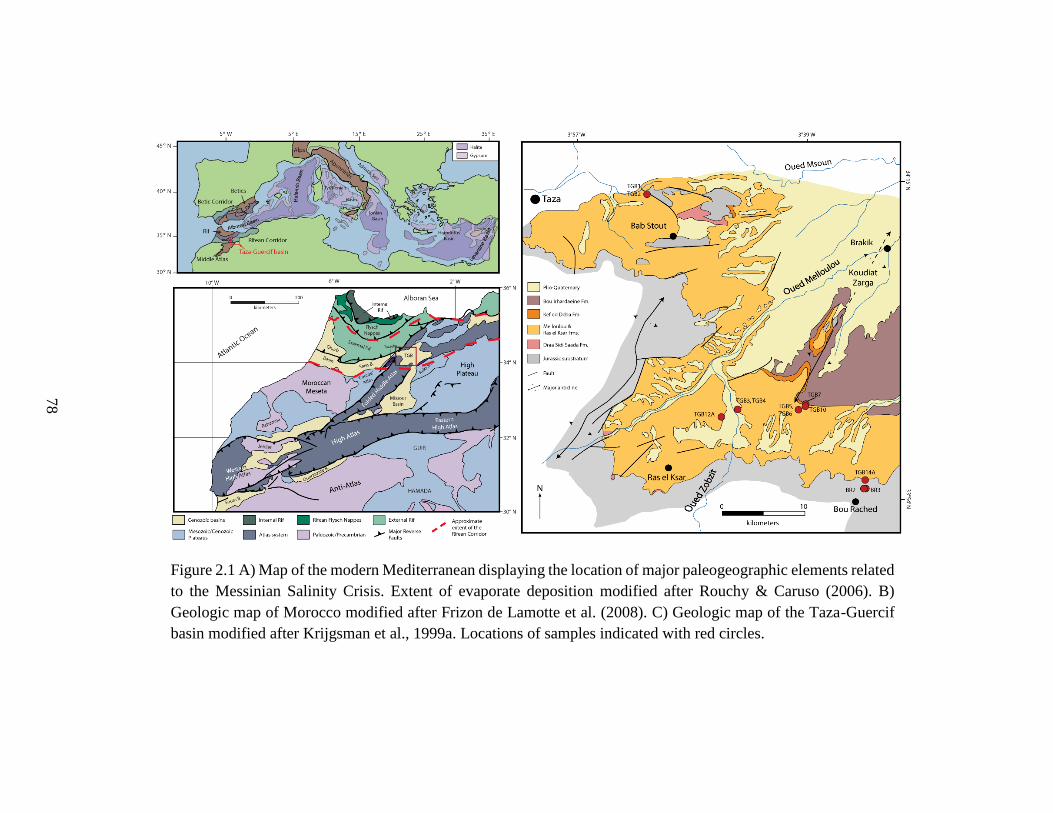
78
Figure 2.1 A) Map of the modern Mediterranean displaying the location of major paleogeographic elements related
to the Messinian Salinity Crisis. Extent of evaporate deposition modified after Rouchy & Caruso (2006). B)
Geologic map of Morocco modified after Frizon de Lamotte et al. (2008). C) Geologic map of the Taza-Guercif
basin modified after Krijgsman et al., 1999a. Locations of samples indicated with red circles.
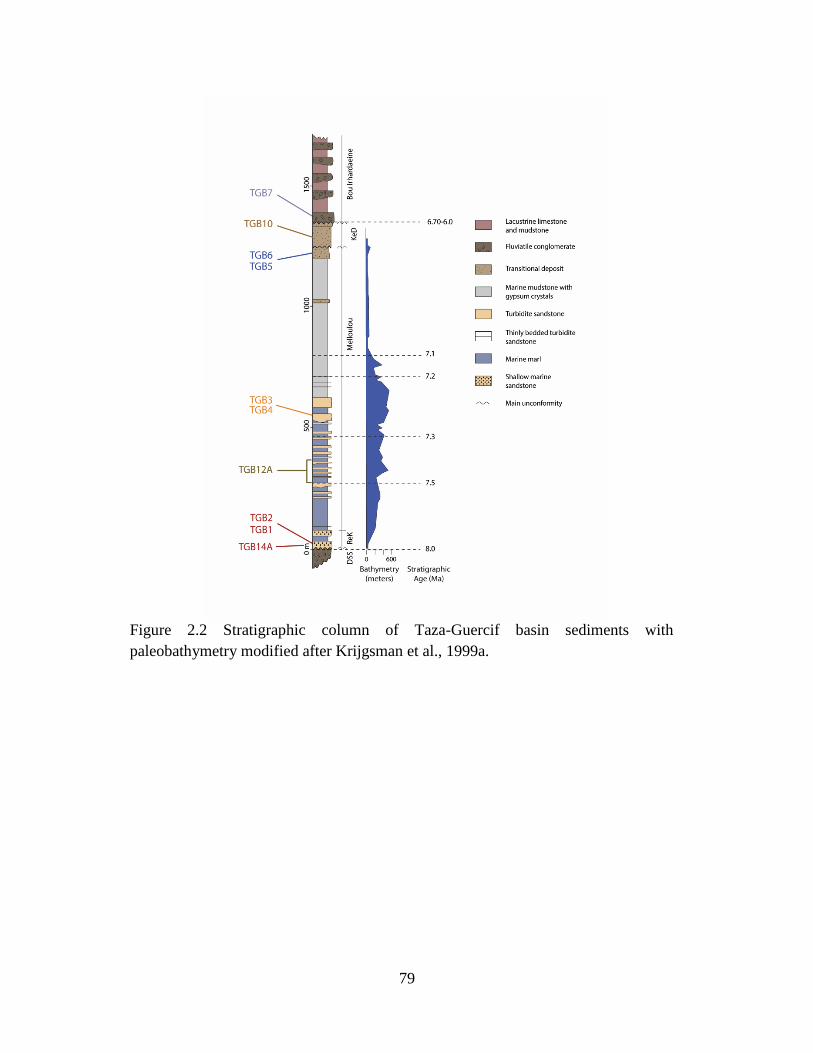
79
Figure 2.2 Stratigraphic column of Taza-Guercif basin sediments with
paleobathymetry modified after Krijgsman et al., 1999a.

80
Figure 2.3 U-Pb zircon age Kernal Density Estimates and pie charts for individual
samples and the Taza-Guercif basin composite. KDEs were generated in
DensityPlotter (Vermeesch, 2009). Left panel displays ages from 0 to 1100 Ma. Right
panel displays full age spectra from 0 to 3500 Ma.

81
Figure 2.4 ZFT age Kernal Density estimates. Mixture model peaks are shown with
dashed lines. KDE and mixture models were generated in DensityPlotter (Vermeesch,
2009).
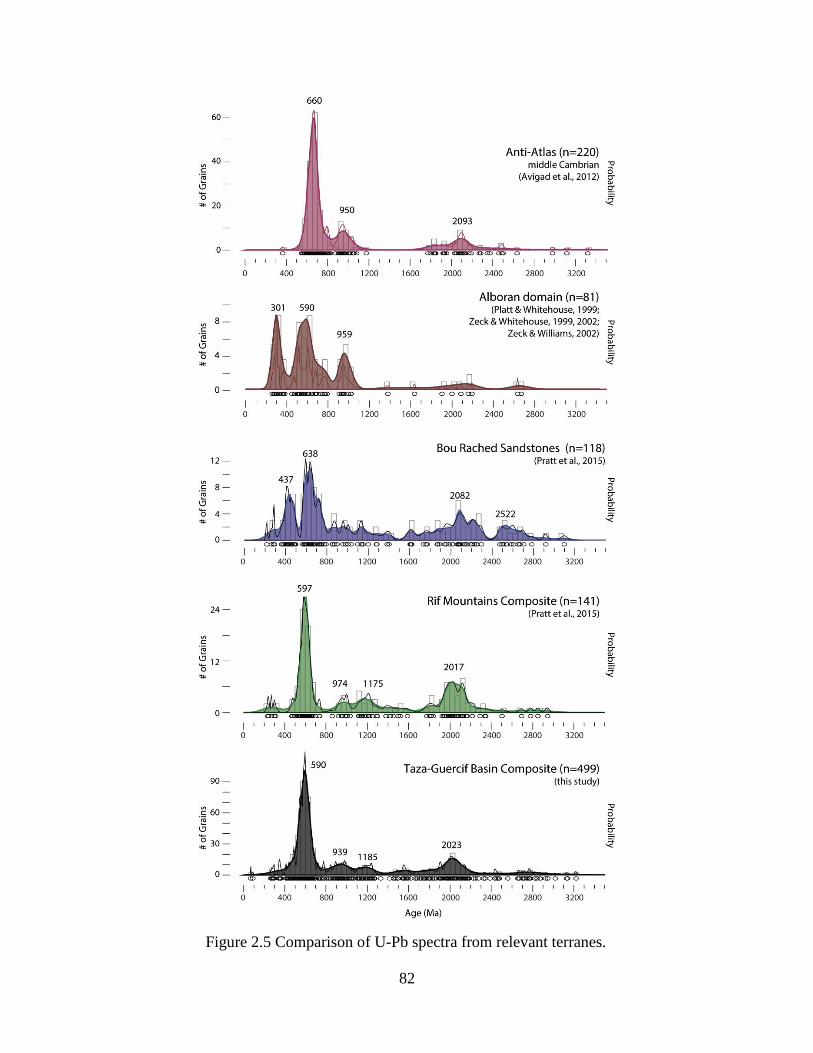
82
Figure 2.5 Comparison of U-Pb spectra from relevant terranes.
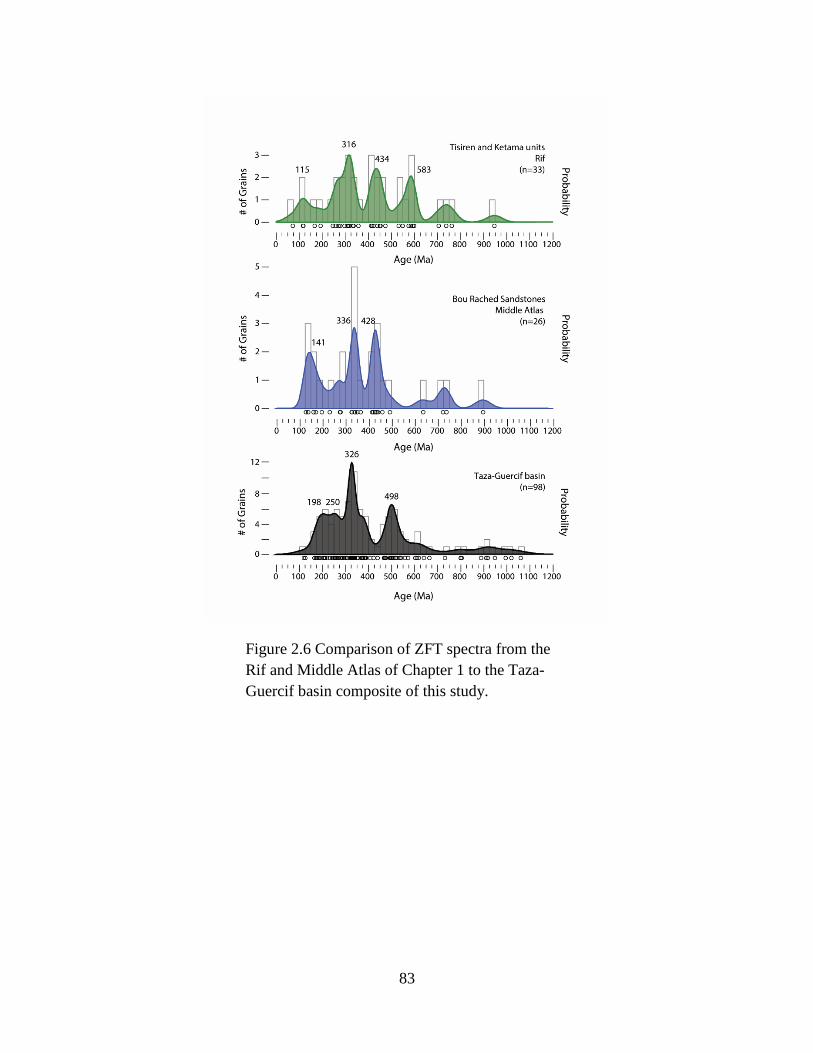
83
Figure 2.6 Comparison of ZFT spectra from the
Rif and Middle Atlas of Chapter 1 to the Taza-
Guercif basin composite of this study.

84
CHAPTER 3
CHEMOFACIES ANALYSIS OF THE MANESS SHALE, EAST TEXAS BASIN: X-RAY
FLUORESCENCE AND HIERARCHICAL CLUSTER ANALYSIS
3.1 Introduction
Chemostratigraphic analysis using X-ray fluorescence is increasingly applied to
subsurface studies with significance to hydrocarbon exploration, particularly in mudstone
dominated successions (Rowe et al., 2008; Rowe et al., 2012; Dahl et al., 2013). This is
in part due to the relatively low expense of portable energy dispersive X-ray fluorescence
instrumentation (ED-XRF), the non-destructive nature of the analysis, rapid data
acquisition and the cm-scale sampling that can be achieved as result of these attributes.
Of particular interest to the petroleum industry is that ED-XRF analysis provides
elemental abundances of Mo, V, U, Cu, Ni and Zn, key geochemical proxies related to
paleo-redox conditions and marine dysoxia-anoxia (Tribovillard et al., 2006) and
therefore the potential for enhanced organic matter preservation. In addition to these
proxies, inorganic elemental abundances are used as proxies for mineralogy, grain-size
and paleoproductivity (Calvert and Pederson, 2007) and therefore paleoenvironmental
reconstructions. To address the facies-scale variability in mudstone dominated systems,
XRF datasets are often acquired at very high resolutions, facilitated by the low-cost of the
analyses where core is already available. High-resolution sampling compounded by the
fact that each XRF analysis yields tens of elemental abundances results in very large

85
multivariate datasets that require special analytical treatment in order to most efficiently
utilize.
This study presents a high-resolution multivariate dataset acquired from four drill
cores representing the upper Washita Group and the Maness Shale of the East Texas
Basin. The Maness Shale is part of the collective ‘Eaglebine’ hydrocarbon reservoir that
is comprised of stratigraphy from both the Woodbine and Eagle Ford formations.
Production in the ‘Eaglebine’ is typically from isolated deltaic sandstones related to both
the Woodbine and Eagle Ford formations (Hentz et al., 2014). The basal stratigraphy of
the ‘Eaglebine,’ the Maness Shale, has also locally produced oil (Adams and Carr, 2010).
The Maness Shale is only known from subsurface and has an uncertain relationship to the
prolific hydrocarbon producing Eagle Ford Shale of South Texas in terms of age,
lithostratigraphy and depositional environment (Hentz and Ruppel, 2010; Hentz et al.,
2014) though both are deposited above a significant regional unconformity above the
Buda Formation (Oliver, 1971; Hentz et al., 2014; Phelps et al., 2014).
The high-resolution XRF dataset over the Maness interval is analyzed to constrain
the depositional environment and history of the Maness Shale using the proxies
mentioned above, and to advance the understanding of the transition between the Maness
Shale and Eagle Ford Formation and the role of the Woodbine fluvio-deltaic system in
Maness Shale deposition. Due to the sheer size of the dataset (155,759 data points: 5371
analyses x 29 elemental abundances), a statistical approach is applied to elucidate
patterns in the data that might otherwise go unnoticed. For this dataset we follow the
approach of Phillips (1991) and apply hierarchical cluster analysis, a technique that

86
statistically relates samples into groups or clusters that can be analyzed as chemofacies,
or samples with specific chemical properties.
The assigned chemofacies are leveraged to interpret a sequence stratigraphic
model for the Maness Shale integrated with observations on the mode of detrital input
and relative post-depositional oxygenation of the sediments. Chemical and chemofacies
analysis as performed at a cm-scale resolution is well-suited to sequence stratigraphic
analysis. This is particularly true in fine-grained clastic rocks where subtle trends may not
be visually observable in core and the resolution of typical geophysical logs is too coarse.
Observations of the relative changes in mineralogy and detrital input within the chemical
data allow for the interpretation of third-fourth order highstand, lowstand and
transgressive systems tracts while abrupt chemical changes assist in defining the
bounding sequence stratigraphic surfaces. Incorporation of chemofacies accentuates these
changes and gives a multivariate context to conventional elemental plots.
3.2 Geologic Background
The East Texas Basin lies in east Texas on the border with Louisiana (Fig. 3.1)
and is a structural embayment of the greater Gulf Coast Basin. The basin originally
formed as part of a failed Triassic-Jurassic rift during the opening of the Gulf of Mexico
(Jackson and Seni, 1983). After the cessation of rifting in the East Texas Basin, tectonic
subsidence was largely controlled by the movement of the thick Louann salt, deposited
during the failed rifting, and from sediment loading by the thick Mesozoic-Cenozoic
succession (Seni and Jackson, 1984; Ambrose et al., 2009). The basin is bounded to the
east by the Sabine Uplift and to the north and west by the Mexia-Talco fault zone,

87
marking the general trend of the Ouachita fold belt. To the southwest the basin
stratigraphy merges with stratigraphy overlying the San Marcos Arch (Hentz and Ruppel,
2010; Hentz et al., 2014). Both the Sabine Uplift and the San Marcos Arch are
expressions of long wavelength basement folding associated with crustal buckling active
during late Mesozoic to Cenozoic tectonics (Laubach and Jackson, 1990). The Edwards
reef trend marks the approximate location of the Cretaceous shelf margin (Wu et al.,
1990) while the classical seaward limit of the basin is the low-relief monoclinal Angelina
Flexure that may have partially silled the basin (Stehli et al., 1972).
3.2.1 Washita Group
The lowermost stratigraphy analyzed in this study is latest Albian in age and
occurs in the upward-deepening Georgetown Formation of the Washita Group (Fig. 3.2).
The Washita Group consists of the Georgetown, Del Rio and Buda Formations (Mancini
& Scott, 2006), all of which are analyzed in this study. The summary of the Washita
Group provided below borrows primarily from the comprehensive work of Phelps et al.
(2014).
The Georgetown Formation is comprised of flooded shelf carbonate mudstones
and wackestones deposited behind the partially age-equivalent Edwards shelf-margin
coral-rudist reef facies. The Georgetown succession sits above a second-order sequence
or supersequence boundary and represents the beginning of a transgressive system tract
marking a major reef-flooding cycle in the Gulf Coast basin. Continued transgression led
to the complete drowning of the reef margin and the deposition of the oyster-bearing Del
Rio or Grayson (East Texas) shale.
88
The Del Rio/Grayson formation contains a second-order maximum flooding
surface, indicating a switch from shelf-deepening to sediment filling of the shelf-rim
paleobathymetry. In-filling of the flooded shelf continued with the deposition of the
Cenomanian-aged Buda Limestone that is comprised of fine-crystalline mudstones and
wackestones. The Buda Limestone is capped by a widespread third-order sequence
boundary (Salvador, 1991; Mancini and Puckett, 2005; Mancini and Scott, 2006). In the
East Texas Basin, the top-Buda sequence boundary is interpreted as a surface of exposure
and hiatus (Hentz et al., 2014).
3.2.2 Eagle Ford Group (South Texas), Maness Shale and Woodbine Group
The stratigraphy overlying the Buda Limestone in the East Texas Basin is divided
on the basis of lithostratigraphy, and the relationships between the units are ambiguously
defined. This study follows the synthesis and stratigraphic framework recently put forth
by Hentz et al. (2014).
On the San Marcos Arch the entire Buda-to-Austin succession is composed of the
Eagle Ford Group (Hentz and Ruppel; 2010), divided into upper and lower units. The
Cenomanian lower Eagle Ford Group comprises the anoxic, organic-rich argillaceous
carbonate ‘shale’ that provides the primary production target of the South Texas ‘Eagle
Ford Shale’ play. The more oxic and siliciclastic strata that define the Cenomanian-
Turonian upper Eagle Ford Group are restricted to the South Texas side of the San
Marcos Arch (Hentz and Ruppel, 2010; Tian et al., 2012). The lower Eagle Ford Group
thins towards and over the San Marcos Arch, penetrating ~80 km into the East Texas
Basin (Hentz et al., 2014).

89
Near the axis of the East Texas Basin, the Buda Limestone is overlain by the
Maness Shale that is defined lithostratigraphically from subsurface data as a mudstone
interval lying below the Woodbine Group sandstone facies (Bailey et al., 1945). In the
region west of the occurrence of Woodbine Group sandstones and east of the San Marcos
Arch lower Eagle Ford Group limit, the basal Buda-to-Austin stratigraphy is poorly
defined. It mostly includes the Pepper Shale, a lithostratigraphic unit defined as age-
equivalent siliciclastic mudstone facies of the Woodbine Group sandstones, of which the
basal portion of Pepper Shale succession is equivalent to the Maness Shale (Hentz et al.,
2014).
In proximity to the East Texas Basin axis the Maness Shale is overlain by the
progradational sandstones of the Cenomanian-aged Woodbine Group. This group is
absent over the San Marcos Arch and was eroded off of the Sabine Uplift (Oliver, 1971;
Ambrose et al., 2009; Adams and Carr, 2010; Hentz et al., 2014). The Woodbine Group
is composed dominantly of siliciclastic sediments shed from Ouachita fold belt (Stehli et
al., 1972) and deposited in fluvial-deltaic, incised valley fill and strand plain (Oliver,
1971). Accommodation for the Woodbine sediments was generated through tectonic
subsidence driven by salt movement (Seni and Jackson, 1984). In our study area in the
southern East Texas Basin, the depositional system of the Woodbine sands begin as
deltaic distributary channels with interdistributary bays controlling the distribution of the
sandstones (Ambrose et al., 2009; Hentz et al., 2014). Unequivocal Woodbine sands only
appear at the top of one of the four cores. As such, the intricacies of Woodbine sandstone
stratigraphy is beyond the scope of this work, though several recent research papers

90
address this topic in the East Texas Basin (Ambrose et al., 2009; Adams and Carr, 2010;
Hentz and Ambrose, 2012; Hentz et al., 2014).
To alleviate the complexity and ambiguity of the stratal relationships in the
southwestern portion of the East Texas Basin, an informal division of the Buda-to-Austin
stratigraphy into an Upper and Lower unit was proposed (Hentz et al., 2014). The
division is based on gamma-ray expressions in borehole where the Lower unit,
immediately overlying the Buda Limestone, exhibits a higher and more variable signature
in comparison to the lower and more consistent gamma-ray expression in the Upper unit
(Hentz et al., 2014). These authors correlate the Lower unit with the Maness shale and
basal Pepper Shale by identifying the presence of retrogradational then progradational
stacking patterns separated by a maximum flooding surface (MFS) in both units above
the Buda Limestone (Hentz et al., 2014). Additionally, previous gamma-ray correlations
across the East Texas Basin, San Marcos Arch and Maverick basin indicate a partial age-
equivalence between the lower Eagle Ford Group of South Texas with newly defined
Lower unit and by extension, the Maness Shale (Hentz and Ruppel, 2010). The Upper
unit consists of the Pepper Shale and is age equivalent with the Woodbine sandstones and
the Eagle Ford Group that overlies them to the east and partially equivalent with the
Lower Eagle Ford Group on the San Marcos Arch (Hentz et al., 2014). As the Woodbine
Group sandstones overly the section analyzed in this study, the name Maness Shale will
be used for the mudstone dominated stratigraphy overlying the top-Buda unconformity.
91
3.3 Methods
3.3.1 Sampled cores
Four slabbed drill cores from Madison and Walker counties in the southwestern
East Texas Basin were made available for this research (Fig. 3.1). Core W is the longest
continuous core at ~365 ft (~111 m) in length and contains strata from the Georgetown,
Del Rio and Buda formations and the basal ~270 ft (~82 m) of the Buda-to-Austin unit.
The remaining cores are either of shorter length or missing significant intervals. The
cores include stratigraphy from the Georgetown, Del Rio, Buda and Maness Shale
formations. All of the core locations lie inboard of the Edwards reef margin and are
overlain by Woodbine sandstones upsection of the cored interval.
3.3.2 XRF data
Sample spacing was chosen at one sample every two inches (~5 cm) in the
Maness Shale while sampling in the Buda, Del Rio and Georgetown formations is
variable, though never more sparser than one sample every four inches (~ 10 cm).
Samples were analyzed from the center of a cleaned flat-slab surface to reduce sampling
bias. However, in order to select analysis spots with stratigraphic meaning, some sample
spots were moved slightly to avoid fractures, veins, large non-planar pyrite
accumulations or clasts.
The analyses were conducted using two Bruker AXS TRACER III-SD ED-XRF
instruments equipped with Rh x-ray tubes, following the method of Rowe et al. (2012),
with some deviations in energy settings and analysis times that are listed below. The
TRACER III beam integrates a cross-sectional area of 4 mm x 3 mm. The beam is

92
pointed upward during analysis while the flat side of the core slab is laid on top, firmly
and carefully to form a strong coupling with the instrument. Each sample spot was
analyzed twice, once with low energy for major elements and a second time with higher
energy for trace elements. Measurements were made at 15 kV and 35 µA for 60 seconds
under vacuum for the major elements and 40 kV and 15.1 µA for 60 seconds for the trace
elements. Prior to analyses of the cores, both TRACER III instruments were calibrated to
reference materials with known elemental concentrations determined by more traditional
ICP-MS or WD-XRF analysis. Inter-element calibrations follow that of Rowe et al.,
(2012). This standard set includes the USGS SDO-1, South African Reference Material
standard (SARM-41) and twenty-four references generated from Eagle Ford, Barnett,
Smithwick, Woodford and Ohio Shale formations (Rowe et al., 2012). Samples in this
analysis were only run for a particular set of elements, majors or trace, once. For
quantification of the reproducibility of this technique, we refer the reader to Rowe et al.,
(2012). For some elements with strong interference peaks, negative values are calculated
due to the inter-element peak corrections. These values, in reality, represent very small
but positive concentrations. Trouble elements include U, Ba and Co. The ED-XRF
analyses measure elemental concentrations of 11 major elements in wt % (Na, Mg, Al, Si,
P, S, K, Ca, Ti, Mn and Fe) and 18 minor and trace elements in ppm (Ba, V, Cr, Co, Ni,
Cu, Zn, Ga, As, Pb, Th, Rb, U, Sr, Y, Zr, Nb and Mo) for 5371 depth-registered samples.
3.3.3 Hierarchical cluster analysis of XRF data
A goal of the high-resolution XRF analysis is to not simply make coarse
stratigraphic divisions, but to significantly and quantitatively differentiate samples into

93
chemofacies or rock samples with similar chemical characteristics. This division is of
paramount importance to observe and evaluate inter-related chemical variance through
the high-frequency cyclicity preserved in laminated mudrocks. The large quantity of
multivariate XRF data makes it difficult to use conventional Cartesian or ternary plots to
recognize patterns in the covariation of elements at such high resolution. To handle such
a large dataset hierarchical cluster analysis (HCA) is employed. HCA is a common
method of multivariate statistical analysis used to determine similarity in large datasets
and has been previously applied to both geological and geochemical data (Parks, 1966;
Phillips, 1991; Shi, 1993; Hashemi & Mehdizadeh, 2014; Huhn et al., 2014).
HCA benefits our study by taking the wealth of chemical data and separating
samples into groups, or clusters, with similar attributes. The particular method of HCA
utilized in this study is called agglomerative HCA (Sneath & Sokal, 1973; Mirkin, 1996)
and was calculated using the analytical software package Spotfire. Clustering begins with
each sample comprising a unique ‘cluster’. Clusters are iteratively linked, based on their
similarity, until all of the samples are linked into a single cluster. Similarity can be
calculated using a number of methods, but for this dataset the Pearson Product
Momentum Correlation was used. This metric measures the covariance of the selected
variables (elements) between samples. A perfect correlation does not imply equal
absolute abundances, but the same proportion of elements relative to one another. The
values to determine the correlation coefficient of multi-sample clusters with other clusters
is calculated using the Unweighted Pair-Group Method with Arithmetic mean (UPGMA)
clustering method. With this method, the distance measure of the daughter cluster is
weighted proportionally to the number of samples within the parent clusters. Once all of

94
the clusters are linked, they can then be divided into a desired number of clusters by
selecting a correlation coefficient where the resultant clusters link with a correlation
coefficient greater than the selected value.
Cluster enrichments are examined quantitatively using the mean abundance (MA)
and standard deviation of an element within each cluster. The mean abundance is
normalized to the population mean abundance (PMA) to create a population specific
enrichment factor called the partitioning index (PI), following the methodology of
Phillips (1991). If an element or group of elements is strongly enriched or strongly
depleted and has a relatively low percent standard deviation, the enrichment or depletion
of these elements can reasonably be considered a defining factor of the
cluster/chemofacies.
One consideration to be made when performing HCA is what samples will be
included in the cluster analysis and how many cluster analyses will be conducted to treat
the dataset. Cluster analysis could be performed for each core individually, on a
particular stratigraphic package across all cores or could incorporate all data from all
cores. Each of these choices is well suited to a particular focus of study. Performing an
analysis on a core-by-core basis is likely to provide the greatest insight on the
stratigraphic complexity on individual cores. However, the clusters computed by the
HCA on a unique core dataset will be unique to that core and not readily correlative to
the clusters computed for other core datasets.
Performing the cluster analysis on a particular portion of the stratigraphy may be
tempting to provide greater detail for that stratigraphy. The caveat for focusing on a
particular section of interest is that if the rock is too similar, the cluster divisions are less

95
likely to be geologically meaningful. It is useful to have ‘anchor’ samples that provide
context in the form of chemical contrast within the dataset. For example, when
performing cluster analysis on an XRF dataset that is focused primarily in argillaceous
shale, an analysis taken on a carbonate bed in an overlying or underlying unit will
significantly increase the range of %Ca values in the dataset to represent a realistic
lithological range. This will dampen the effects of minor %Ca variation in dividing the
shale analyses into clusters and provide context and comparison for those shale samples
that are more carbonate-rich. Furthermore, how many subdivisions are made in the HCA
is user controlled such that detailed subdivisions within the shale are still achievable.
For this study, the aim of which is to provide a regional depositional and post-
depositional sedimentary history of the Maness Shale, it is appropriate to perform HCA
on all samples from all cores. Any subdivision of the stratigraphy above the top-Buda
unconformity would be arbitrary and incorporating the Washita Group into the HCA
provides the carbonate ‘anchor’ mentioned above. The greatest value in clustering all
samples together is in defining clusters, and ultimately chemofacies, that are directly
correlative frome core to core. This approach is well-suited for regional work, whereby
the chemical signature represented by HCA defined chemofacies can be used to correlate
surfaces between cores. Similarly, the presence of different chemofacies in age-
equivalent strata multiple cores can be more easily interpreted in terms of geological
processes since the statistical process is identical.

96
3.3.4 Additional Data
The XRF dataset is supplemented by a smaller x-ray diffraction (XRD; Bish &
Post, 1989) mineralogical dataset consisting of 252 analyses acquired using a BTX XRD.
Powdered samples were acquired from the backs of the cores at depth points matching
those of XRF analyses. In addition to the inorganic chemical data, LECO total organic
carbon (TOC) data were acquired independently of this study by GeoMark was made
available. The TOC dataset consists of 269 samples representing all four cores. However,
as the data were acquired independently, depth matches are few with only 8 TOC-XRF
depth matches. Furthermore, as this data is proprietary, specific TOC values cannot be
shown, however the relative abundance of TOC can be shown for correlation purposes.
Finally, a proprietary suite of typical down-hole geophysical logs were provided,
including gamma ray and resistivity, for all four wells and was used to tie wells at points
outside of the cored interval.
3.4. Results
The ED-XRF instruments were used to analyze 29 elemental abundances for 5371
samples across the cores, yielding a total of 155,759 unique data points. All tabulated
XRF data can be found in Supplementary Data Table C.1. Tabulated XRD data can be
found in Supplementary Data Table C.2. Correlations between the XRF lithological
proxies and the XRD data are shown in Figure 3.3.
The results of the HCA are shown in Figure 3.4. Different correlation coefficients
were used to divide the dataset into varying numbers of clusters in attempt to balance the
goal of generating a detailed differentiation of the dataset with the goal of interpreting

97
geologically definable clusters. The correlation coefficient of 0.227 was chosen to
balance these objectives, dividing the dataset into 9 chemical-covariance defined clusters
or chemofacies. Table C.3 shows the mean abundance, standard deviation in percent and
the partitioning index of each element by cluster used to determine the geologic
significance of the clusters as discussed below.
3.5 Discussion
3.5.1 Defining Chemofacies
The nine clusters selected from the HCA are interpreted as chemofacies in the
following text under the assumption that covariance of elements between samples implies
similar geologic controls on their elemental concentrations. This assumption can certainly
be faulty as statistical correlation could be coincidence or the result of our methodology.
However, the clusters created by the HCA share similar specific chemical characteristics,
allowing them to be classified as chemofacies. Determining what the chemical
characteristics are that define the chemofacies requires analysis of the elemental
enrichments and depletions within each cluster, assessing which enrichments occur in
synchronicity and which elements have little impact on defining the cluster. These
interpretations are compared to the XRD and TOC data for validation and further
constraint. Each cluster is analyzed with these factors in mind and classified geologically
as a chemofacies in the following text. A summarization of the chemofacies
interpretations is found in (Fig. 3.5).

98
Chemofacies A ¬– Sandstone (n=120; 2%)
This chemofacies is defined by the strong enrichment of Si and Cr. Silica has a
mean abundance of 30%, twice that of the population average and with a relatively small
standard deviation of 18%. Cross-plotting %Si vs. %Quartz from the XRD data produces
a moderate positive correlation with an R2 value of .67, indicating that most of the Si is
associated with the quartz phase. Chromium has a mean abundance of 115 ppm and is
enriched to 2.9 times the population average. Other enrichments include P, Mg, Mn and
Zr. The elements, Al, K, Th, Rb and Ga comprise the clay suite of elements. In
sedimentary systems it is widely accepted that under most circumstances Al is generally
present in the clay fraction (Tribovillard et al., 2006; Calvert and Pederson, 2007 and
references therein). The tight clustering of K, Th, Rb and Ga with Al indicate that they
too occur in the clay fraction and when enriched together these elements are indicative of
increase clay content. The clay suite elements are strongly depleted to about 20% of the
population average while Ca is depleted to a lesser degree, still 60% of the population
average.
Cross-plotting %Ca vs. %Calcite from the XRD with only Chemofacies A data
produces a correlation with an R2 value of 0.89 (Fig. 3.6), indicating that the Ca is in the
calcite phase and not in siliciclastic minerals. The major elements Mg and Mn are likely
enriched as part of this calcite occurring either as cement or reworked grains. The Zr and
P enrichments may be hosted by zircon and apatite, respectively. Cross-referencing
sample locations with core photos (Fig. 3.7) confirms that Chemofacies A correlates with
sandstone lithofacies. The small area measured by the XRF beam prohibits a
homogenized measurement of a raw medium- to coarse-grained sandstones when a dozen

99
individual sand grains can fill the cross-sectional area. Whether or not a non-quartz grain
is analyzed in any given sample within the chemofacies is left to chance, as with many
other analyses (XRD, microscopy, etc.)
Chemofacies B – Shaley Sandstone (n=143; 3%)
Chemofacies B is strongly enriched in Si, Zr, Ti & Nb, elements associated with
heavy minerals and coarse clastic material. Silica has a mean abundance of 26%, with a
partitioning index of 1.7. Zirconium is the most enriched element in the chemofacies at
261 ppm, a partitioning index of 2.1. Unlike Chemofacies A, the elements associated
with clay (Al, K, Th, Rb, Ga) show a slight to moderate enrichment, with Al at 7.6% of
the sample, a population index of 1.2. Calcium is extremely depleted at a 2%
concentration. In terms of the Si/Al ratio, Chemofacies B falls much closure to the
population average than to the sandstone Chemofacies A where the Si/Al ratio is on
average 16.0. Examination of core photos demonstrates that Chemofacies B may simply
include both clay and sand horizons (Fig. 3.8), representing a heterogenous lithology as
opposed to a homogenous one.
Chemofacies C – Standard Shale (n=2083, 41%)
Chemofacies C contains the most samples of all of the chemofacies, representing
over 40% of the dataset. The cluster has the largest enrichment of all five clay suite
elements (Al, K, Th, Rb and Ga). The Al enrichment is 1.35 times the population average
at 8.6%. The coarse clastic fraction is enriched to approximately the same degree, with Si
displaying a 1.26 population index at 19%. The Si/Al ratio is 2.2, slightly lower than the

100
population average of 2.4. Lithologically, the chemofacies displays a strong affiliation
with the detrital fraction, but is on average more clay-rich than any other chemofacies.
The chemofacies has the second lowest concentration of Ca after Chemofacies B, with
only 4.4%. Outside of elements with a detrital influence, Chemofacies C shows no
significant enrichments or depletions with the exception of strong and highly variable Mg
and U depletions that have 1730% and 307% standard deviations, indicating little control
on defining the cluster. The strong clay-rich detrital signal, low Ca content and the
concentrations of most non-detrital elements near the population average define
Chemofacies C as a shale with average paleoenvironmental conditions for the dataset.
Chemofacies D – Dysoxic Shale (n=1438, 27%)
Chemofacies D has the second highest number of samples with over one quarter
of the dataset. The cluster is mildly enriched in the clay suite elements and less so in the
coarse clastic elements. The strongest enrichments in the chemofacies occur in U, P and
Ba with population indices of 3.1, 2.6 and 2.2 respectively. U, P and Ba are often used as
proxies of paleoproductivity. U accumulates within sediments under suboxic conditions
governed by the catalytic and bacterial reduction of (VI) to U (IV) (Kochenov et al.,
1977; Lovley et al., 1991; Calvert & Pederson, 2007). Increases in organic flux and the
resultant bacterial respiration cause the redox boundary to shoal within the sediments,
steepening the chemical gradient across the boundary, which in turn increases the flux of
U into the sediments (Rosenthal et al., 1995). Due to this relationship, U is a partial proxy
of organic flux and paleoproductivity and a partial proxy for redox conditions (Calvert
and Pederson, 2007).
101
Phosphorus is a macronutrient and enters marine sediments primarily as deceased
microbiota, most of which is then recycled back into the water column (Benitez-Nelson,
2000). However, the P that is retained may serve as a proxy for organic matter rain rate,
and therefore, paleoproductivity (Calvert & Pederson, 2007 and refences therein).
Phosphorus enrichments can also occur in discrete fossil fish bones and teeth (Froelich et
al., 1982) and are present in the analyzed cores. The non-detrital enrichment of Ba can be
related to the rain of deceased organic carbon out of the water column (Dymond, 1985;
Jeandel et al., 2000; Nair et al., 2005) and hence can serve as a proxy for
paleoproductivity (Dymond, 1985), particularly when normalized to clay content or its
proxy, Al (Calvert & Pederson, 2007).
In addition to the proxies indicating a relatively high paleoproductivity and
organic flux, Chemofacies F shows relative enrichments of the redox sensitive elements
V and Cr that can be used to infer suboxic conditions as well as Mo, Cu, Ni, Zn, As and S
that partition into sediments under sulfate reducing conditions (Calvert & Pederson, 2007
and references therein). Chemofacies D is characterized by the enrichment of the suboxic
proxies and of paleoproductivity proxies and is interpreted to represent a shale deposited
with relatively high concentrations of organic matter that were preserved under suboxic
conditions.
Chemofacies E – U-depleted Dysoxic Shale (n=167, 3%)
Chemofacies E is similar to Chemofacies D, both showing significant
enrichments in the suboxic proxies. On average, Chemofacies E has a greater enrichment
in Mo and V, but many samples with higher concentrations of these elements are found in

102
Chemofacies D. The largest difference between the two chemofacies is that where
Chemofacies D is strongly enriched in U, Chemofacies E is strongly depleted in U (Fig.
3.9). Phosphorus, Sr, and Ba occur with a lower mean abundance in this facies than
Chemofacies D, but this is not a systematic difference with significant overlap in
concentrations between the two chemofacies. It has been demonstrated in modern ocean
basins that the burial efficiency of U is more strongly correlative to organic carbon burial
rates than to redox conditions at the sediment-water interface (Zheng et al., 2002). Here
we interpret the U depletion to represent a lull in organic burial rates while recognizing
the limited strength of this interpretation given the available data. An alternative
explanation for the depletion of U is the presence of weaker reducing conditions within
the chemofacies leading to the reduction of less U(VI) to the U(IV), the species that has a
greater affinity for adsorption onto organic matter (Calvert and Pederson, 2007). This is
unlikely since redox sensitive Fe, Mo, V and S concentrations are appreciable between
Chemofacies D & E.
Chemofacies F – Zn-enriched facies (n=56, 1%)
Chemofacies F is the least abundant chemofacies and has an average mean
population abundance of Ca, the clay suite elements and the coarse clastic elements.
However, with the exception of the two carbonate facies H and I, Chemofacies F has the
highest Ca mean abundance at 11.5%. The chemofacies has a very strong enrichment in
Zn, with an average ~11 times the population average, with a mean abundance of 575
ppm. The second strongest enrichment is in Cu with a mean abundance of 51 ppm and a
population index of 2.5. Iron and S are near population average values, indicating that the

103
excess Zn and Cu does not primarily reside in sulfide phases. Zn and Cu are
preferentially delivered with raining organic matter (Tribovillard et al., 2006 and
references therein) and may reside in the organic fraction. Visual inspection of the cores
reveals that Chemofacies F occurs most frequently in sections with significant
occurrences of inoceramid prisms or foraminiferal debris and alongside Chemofacies D
& E (Fig. 3.10). Bivalves are known to bioaccumulate significant enrichments of metals
and certain species preferentially accumulate Zn and Cu from the environment (King et
al., 2004; Fukunaga & Anderson, 2011). Some inoceramid species were low-oxygen
adapted and often thrived under dysoxic conditions but could not survive true anoxic
bottom waters (Sageman and Bina, 1997; Henderson, 2004). Most benthic species of
foraminifera were likewise oxygen restricted. The link between the Zn and Cu
enrichments with inoceramid and foraminiferal remains is uncertain as other chemofacies
occur in sections of the core densely populated with fossils. The presence of the facies
may represent dysoxic but not sulfidic conditions in the sediments as indicated by the
lack of significant sulfide enrichments co-occurring with major Zn and Cu enrichments.
If the Zn and Cu enrichments are related to benthic organisms, dysoxic as opposed to
anoxic conditions is also a favored interpretation (Berrocoso et al., 2008).
Chemofacies G – Iron-rich facies (n=77, 1%)
Chemofacies G is the most dissimilar from the other chemofacies, linking to the
nearest cluster at a negative correlation coefficient. The chemofacies is strongly enriched
in Co, Mg, Fe, Mn and Ni. Iron reaches a mean abundance of nearly 11%, almost four
times the population average, accounting for the strong depletion in Ca while Al and Si

104
remain near population averages. The strongest enrichment is in Co, displaying a
population index of 36.7 and reaching a mean abundance in the cluster of nearly 0.1%
and a maximum of 0.6%. The chemofacies is also strongly depleted in U, Ba, Cr and Mo,
to the extent that our calibrations provided negative mean abundances that in reality
indicate near zero positive abundances. The depletions in Mo, Ba & U indicate that the
deposits were formed under oxic conditions in the absence of significant organic matter.
Comparing Fe, Mn and S concentrations of the samples shows that some of the samples
within the chemofacies are depleted in Mn and enriched in S, whereas the majority have
no appreciable enrichment in S and a strong enrichment in Mn (Fig. 3.11). This
observation allows the splinting off the S-enriched samples into Chemofacies G.1. In
Chemofacies G.1, the metals are associated with sulfide minerals where the XRD data
show pyrite concentrations up to 40% and in many cases the pyrite occurs as discrete
bands in the core. The occurrence of a banded iron sulfide layer implies that the sulfate
redox boundary remained steady for a relatively long period of time, a phenomenon that
is commonly associated with greatly reduced sedimentation rates (Kasten et al., 1998).
Chemofacies G.1 is named the ‘Sulfidic Iron-rich facies’ chemofacies.
The mean chemical composition of Chemofacies G is most consistent with iron-
rich layers that form from nonsteady-state diagenetic conditions (McGeary & Damuth,
1973; Kasten et al., 1998) as Fe and Mn concentrations are significantly below those in
Fe-Mn crusts and nodules (Skornyakova and Murdmaa, 1992). These layers form from a
downward propagating oxidation front that dissolves Fe that then diffuses upward to
precipitate below the sediment-water interface as oxyhydroxides (Thomson et al., 1984;
Wilson et al., 1986; Jarvis et al., 1987; Kasten et al., 1998). Alternatively the diffusing

105
iron may combine with biocarbonate in alkaline conditions to form diagenetic carbonates.
The initiation of the oxygen ‘burn-down’ results from a significant decrease in organic
carbon burial rate that can occur due to decreased sedimentation rates, increased bottom-
water oxygenation or sedimentation with decreasing organic flux (Wilson et al., 1986;
Kasten et al., 1998). Chemofacies G is named the ‘Oxic Iron-rich facies.’
Chemofacies H – Clean Carbonate (n=995; 19%)
The chemofacies is strongly enriched in Ca with a mean abundance in the cluster
of 31%. The strongest enrichment in the cluster is of Mg, with a mean abundance of 0.9%
and a population index of 3.0 and a standard deviation of 149% of the mean abundance.
The high standard deviation implies that Mg is not a defining characteristic of the cluster.
Smaller enrichments exist in the elements Sr and Mn. Aluminum accounts for only 1% of
the sample while Si comprises 4%. Inspection of the heat map (Fig. 3.4) demonstrates
that the Mg concentrations that raise the mean abundance in the chemofacies is actually
concentrated in a portion of the samples within the cluster. The majority of the
chemofacies is represented by carbonate in the calcite phase. The stoichiometric 1:1
Mg/Ca weight ratio for dolomite is 0.61. The Mg/Ca ratio is on average around .2 within
the high Mg samples. A linear regression of Mg/Ca vs. %Dolomite within Chemofacies
H (Fig. 3.12) yields an R2 value of 0.77 defining a relationship where 4.2 × 10⁻³ Mg/Ca
equals 1.0 %Dolomite. The failure of the HCA to cleanly divide the high Mg samples
from the rest of Chemofacies H is probably due to the majority of measured elements in
the study having some dependence on the detrital fraction.

106
A detailed look at the cluster revealed a small but distinct subcluster containing
only 12 samples within the ‘Clean Carbonate’ that has depleted Ca values as low as 2.5%
and enrichments in Mg, Mn, Mo, V and Fe. The clustering of these samples into the
‘Clean Carbonate’ facies results from the strong inverse relationship between Si and Ca
within these samples and the enrichment of Mg that is likewise enriched in the ‘Clean
Carbonate.’ This sublcluster is labeled Chemofacies H.1 and represented only 0.02% of
our dataset. As such, these samples will not be discussed further, but will present in all
relevant figures.
Chemofacies I – Argillaceous Carbonate (n=292; 5%)
Like Chemofacies H, Chemofacies I has a significant Ca enrichment, though to a
lesser degree. The mean abundance of Ca is 18% with a PI of 1.6. Chemofacies I also
displays a higher Al and Si content at 4.7% and 11%, respectively. In general, the detrital
suite elements, both those associated with the clay (Al, Ga, Rb, Th, K) and the coarse
fractions (Si, Zr, Nb, Ti) are less depleted than in Chemofacies I. Magnesium is depleted
while Mn shows a slight enrichment, indicating that the carbonate mineralogy is
dominantly calcite. The strongest enrichment of Sr is found in Chemofacies I with an
average of 765 ppm. On average the Sr/Ca ratio is 4.2 × 10⁻³ whereas the ratio is half that
in Chemofacies H at 2.1 × 10⁻³. Increases in the Sr/Ca ratio of bulk carbonate rocks of
the Cretaceous were related to increases in calcareous nanoplankton productivity and/or
decreases in sea level (Stoll & Schrag, 2001), however determining the cause would
require independent constraints not available to this study. Chemofacies I comprises
almost all of the informally defined False Buda unit that lies just above the top-Buda

107
unconformity and rarely occurs outside of the unit. The chemofacies is defined as a
limestone with significant detrital constituents or as an argillaceous carbonate.
3.5.2 Geochemical analysis of the Maness Shale
The discussion of the core stratigraphy will focus on the Maness Shale interval
beginning at the top of the informally defined, ‘False Buda’ that is unique to the East
Texas Basin and easily delineated by the HCA as the Argillaceous Carbonate
chemofacies. The underlying Buda, Georgetown and Del Rio formations are represented
primarily by the ‘Clean Carbonate’ chemofacies and are not the focus of this research,
though their incorporation in the HCA is essential to defining the chemofacies throughout
all of the analyzed core. In Core W the Maness Shale interval is 270 ft (~82 m) thick.
Core X is missing 100 ft (~30.5 m) of section between the top of the False Buda and the
beginning of available Maness Shale core. Core Y contains ~155 ft (~47 m) of section
above the False Buda. Core Z begins ~160 ft (~49 m) above the top of the False Buda and
contains ~90 ft (~27 m) of Maness Shale section. The base of Core Z is marked by a high
Si/Al ratio and that corresponds with a negative excursion on the gamma ray logs.
Correlating this gamma-ray signature to Core Y indicates that ~25 ft (~7.5 m) of section
separates the top of the Core Y interval from the sandstone correlative to the base of the
Core Z. The two cores are combined to create a composite section for comparison with
the Core W and Core X. Select elemental abundances and ratios plotted against depth are
shown in Figures 3.13-3.15 and ternary diagrams of the relative abundance of Ca, Si and
Al for each well are given in Figure 3.16.

108
3.5.3 Correlation and chronology
The geochemical dataset is consistent with previous work (Ambrose et al., 2009;
Hentz et al., 2014) indicating that the Maness Shale deposition began above the Buda
Formation during a transgression and contains a significant, third-order maximum
flooding surface (MFS) that is overlain by the earliest stages of progradational to
aggradational Woodbine deposition (Fig. 3.17). The MFS is most distinct in the Core W
where it is chosen on the basis of a shift from decreasing Al to increasing Al, the reverse
shift in the Ca curve, local Mo, V/Al and Ni maxima, reflected in the switch to
stratigraphy represented almost exclusively by the Standard Shale chemofacies. A pair of
distinct Clean Carbonate chemofacies beds lie ~10 (~ 3 m) and 20 ft (~ 6 m) below this
horizon and are readily identifiable in the Core X. An inflection toward lower Ca and
higher Al values occurs above these beds in the Core X coupled with a local dysoxia
maximum, marking the MFS. Correlation of the MFS to Composite Core Y-Z is less
obvious. The Clean Carbonate facies occurring at the very top of the Core Y is
interpreted as the lower of the two carbonate marker beds that occur in the other cores.
The MFS likely occurs between the two wells in the composite.
The data reveal a small sequence with variable expression overlying the MFS and
its subsequent highstand. A forth-order sequence boundary, transgressive surface, and
maximum flooding surface are fully observable in Core X (Fig. 3.17). These features are
arguably observable in the Core W, whereas the gap between the cores in Composite
Core Y-Z obscures this part of the succession. The cause of the lowstand and following
transgression is difficult to pinpoint given the mixture of tectonically controlled
subsidence, eustatic sea level and auto-cyclic deltaic processes affecting the basin. The

109
presence of the Oxic Iron-rich chemofacies at the transgressive surface in both the Core
W and Core X is possibly due to reoxygenation of the sediments during lowered
sedimentation rates or bottom-water oxyenation during flooding or due to shallow waters.
Alternatively, the iron-rich layer may be related to a minor unconformity at the sequence
boundary. Oxygenation is supported by the increased Standard Shale chemofacies
frequency relative to the Dyoxic Shale chemofacies near this horizon in Core X. Above
this oxygenation horizon, the presence of dysoxic group facies declines along with Mo,
V/Al and Ni values in the Core W as regression and increased detrital flux begin to
dominate the system. This turn toward oxic conditions does not occur in Core X at the
end of the transgression as dysoxia proxies return to the same levels as below the first
MFS. In the composite core, the relative increase in oxygenation conditions that occurs
across the core boundary could be attributed to either basin-wide increase in oxygenation
or the lateral shift in core locations.
The onset of aggradation and/or progradation above the second MFS marks the
increased influence of the Woodbine fluvio-deltaic system. This shift is most strongly
expressed in the increase in Al and Si/Al in the Core W and the turn to higher Si/Al
values in the Core X. Composite Core Y-Z does not show this shift strongly as
aggradation occurs from the onset of post-Buda deposition and the correlative surface is
difficult to pinpoint. However, the Core Z shows a significant increase in the abundance
of Shaley Sandstone chemofacies layers and a pronounced increase in Si/Al values at the
level cautiously correlated to the shift to aggradation in Core W and Core X.
In total, 24 sedimentary cycles are identified in the Core W. A complete cycle in
Composite Core Y-Z begins above a flooding surface with deposition of the dysoxic

110
group chemofacies. Within the dysoxic group, the chemofacies are varied including the
U-depleted and Zn-enriched chemofacies along with the Dysoxic Shale. As the cycle
progresses the Standard Shale becomes more prevalent as Al concentration increases
coevally with decreases in Ca, Mo, V/Al and Ni. Farther up-section Shaley Sandstone
and Sandstone mark the apex of the cycle before the next flooding surface or shift toward
more dysoxic facies. The intervals in the cycles dominated by the silica-rich chemofacies
are regularly intercalated with the Oxic Iron-rich chemofacies, marking thorough
oxygenation of the sediments. The components of the cycles differ between the cores but
follow the same general pattern. In Core W the cycles contain far fewer intercalations of
the Sandstone and Oxic Iron-rich facies. In Core X, cycles begin with the Dysoxic Shale
and end with the Standard Shale, showing little detrital influence or relative oxygenation.
Core X also shows fewer intercalations of the U-depleted Dysoxic Shale or the Zn-
enriched chemofacies in the dysoxic intervals than in the other cores.
Precise chronostratigraphic constraints in the section are lacking, however the
top-Buda sequence boundary and the mid-Maness MFS are correlated to 94 and 93.5 Ma,
respectively (Haq et al., 1988; Ambrose et al., 2009). Using these constraints, the average
duration of a cycle falls at ~45 kyr, within the range of Milkankovitch cyclicity,
particularly obliquity. These cycles are correlated into the other cores where appropriate
(Fig. 3.17).
3.5.4 Depositional Environments
Cores W, X and Y-Z demonstrate different depositional sub-environments of a
prodeltaic shelf in agreement with previous interpretations (Oliver, 1971; Adams and

111
Carr, 2010). Composite Core Y-Z records the greatest influence of the deltaic system in
terms of its detrital content and consistent aggradational stratigraphy above the False
Buda. Core Z was taken from near the Woodbine-Eagle Ford basin axis and the Core Y
was taken from closer to the axis than either the Core W or Core X (Fig. 3.1). The basin
axis traces the thickest section between the Buda and Austin formations that correlates to
increased total sandstone thickness and marks the general progradational path of the
Woodbine delta system (Hentz et al., 2014). During the deposition of the Maness Shale
the Composite Core Y-Z stratigraphy was deposited seaward of the Woodbine fluvial
system. From the second depositional cycle and onward Core Y incorporates the
Sandstone and Shaley Sandstone chemofacies and a greater variability in the Si/Al ratio
corresponding with the cyclicity. The sandstones in the core correlating to the sandy
chemofacies are deposited in thin layers between a few millimeters to a few centimeters
thick. The sand layers show scoured bases, both normal and reverse grading, little
bioturbation and significant interlaminated mud (Fig. 3.19), matching the sedimentary
structures associated with hyperpycnites (Battacharya & MacEachern, 2009).
Reworking by waves is evident in preservation of ripple forms and undulating
surfaces (Fig. 3.19). It follows that the mud dominated sections of the cores leading up to
and away from the sandy intervals may also represent hyperpycnal flow deposition. The
control on the abundance of sand in the cores is likely related to the proximity of the river
mouth that is partly controlled by water depth but is also a function of avulsion and
coastal currents. As mentioned previously, water depth trends are interpreted as the first
order cause of the sedimentary cyclicity in the cores, controlling the seaward extension of
the fluvio-deltaic system. The frequency of hyperpycnal flows within a given sandier

112
interval is probably the result of a non-systematic combination of storm frequency and
tectonism in the source region. The occurrence of interpreted hyperpycnal flow deposits
near the base of the Maness Shale in Core Y indicates that the deltaic sediments were
redistributed almost all the way to the shelf margin co-located with the Edwards Reef
trend early on during the Woodbinian.
Such hyperpycnal prodeltaic shelves were common in the Cretaceous Interior
Seaway to the northwest (Bhattacharya & MacEachern. 2009). Accumulation of organic
matter under dysoxic conditions, as evidenced by the frequency of dysoxic group
chemofacies and corroborated by the Ni and TOC curves, was only able to proceed when
detrital influence was at its minimum. Periods of significant hyperpycnal flows are
correlated to oxygenated sediments and poor organic preservation, probably with a causal
relationship. The high frequency of U-depleted Dysoxic Shale and the Zn-enriched facies
within the dysoxic sediments imply that the water column was frequently perturbed and
that bottom-water anoxia was likely never persistent at this location.
Core W shows a depositional evolution that occurred further from the zone of
hyperpycnal flows. The core location is closer to the paleomargin and further from the
basin axis. The core contains fewer intercalations of the Sandstone or Shaley Sandstone
chemofacies during the lowstand of the depositional cycles and thicker sections of
dysoxic group chemofacies above the flooding surfaces. Intercalations of the Oxic Iron-
rich chemofacies are relatively rare and occur less frequently than in Composite Core Y-
Z. In the lower half of Core W, the dysoxic group chemofacies intervals contain a higher
proportion of the Dysoxic Shale relative to the U-depleted Dysoxic Shale and the Zn-
enriched chemofacies relative to Core Y. These observations may indicate that the water
113
column experienced more persistent dysoxia as function of decreased perturbation due to
hyperpycnal flows relative to Core Y. However, dysoxia was probably not the normal
condition of the bottom waters or even the uppermost seafloor sediments as significantly
enriched Mo and V/Al values occur in discrete pulses. As deposition progressed the
stratigraphy became progradational and records consistently oxic conditions. While the
Al concentration increases up-section, the frequency of sandy chemofacies in the core
decreases. Conditions allowing for persistent oxygenation and fine-grained sediment
supply while receiving little coarse-grained sedimentation from the deltaic system are
consistent with an interdistributary bay. As such the Core W stratigraphy is interpreted to
represent a transition from an off-axis prodeltaic shelf margin toward an interdistributary
bay as the Woodbine fluvio-deltaic margin prograded seaward.
The stratigraphy of Core X records a more stable and dysoxic environment than
seen in Core W or Core Y-Z. The core is the most distant from the basin axis and
therefore the probable trend of deltaic sedimentation. The XRF data for Core X
completely lacks either the Sandstone or Shaley Sandstone chemofacies, implying little
sand reached the core location. The Dysoxic Shale is also the most abundant of the
chemofacies in Core X, comprising over half of the XRF analyses in the Maness Shale.
Relatedly, the cyclicity between chemofacies and likewise recorded in Al, Ca and Si/Al
values is muted in Core X relative to the other cores. Oxic Iron-rich chemofacies are rare,
suggesting fewer oxygenation events in the depositional area. The most prominent
intercalations of the Oxic Iron-rich facies occurs at the transgressive surface, correlative
with the oxygenation event in the Core W. Aside from this interval, there is little
evidence of dramatic shifts in the oxygen content of the sediments as reflected by Mo,
114
V/Al and Ni values. The low abundance of the U-depleted Dysoxic Shale and the Zn-
enriched facies alongside the greater abundance of the Dysoxic Shale chemofacies may
also imply more persistent dysoxia if these chemofacies represent perturbations to
bottom-water and/or upper-sediment redox conditions. TOC values are consistently high,
but more variable below the MFS than above. This trend is also reflected in the Mo, V/Al
and Ni curves. Similar stabilization of chemical concentrations occurs above the MFS in
Core W.
Core X shares a coarse-scale evolution with Core W but incorporates more TOC,
formed under more dysoxic-anoxic conditions and did not experience progressive
oxygenation and increased clastic flux above the MFS. Other works interpreted that the
anoxia present in the East Texas Basin was restricted to immediately inboard of the
Edwards shelf margin (Adams and Carr, 2010). This interpretation is not valid for
increased anoxia seen in Core X, as it was deposited significantly inboard of the Edward
shelf margin relative to the other three cores in this study. The correlation that can be
drawn from these data is that a relative absence of siliciclastic sedimentation in the form
of prodeltaic hyperpycnal sands relates to greater dysoxia and TOC preservation.
Whether the hyperpycnites directly cause oxygenation is speculative. This study cannot
discount the possibility that the Core X stratigraphy was deposited in a silled sub-basin.
In particular, the Angelina Flexure may have served as a sill, preventing arrival of
oxygenated deep water during upwelling in the Gulf of Mexico. However, the Angelina
Flexure did not serve to prevent the sedimentation of hyperpycnites further seaward. An
expression of the Angelina Flexure may explain the relatively more dysoxic waters but
appears contrary to the trend of detrital sediment delivery. The sediments in Core X were

115
most likely deposited on the continental shelf sufficiently removed from early Woodbine
sedimentation to be considered a true prodeltaic environment. The stability of the dysoxic
marine environment may be due to a sill at the shelf margin from the older Edwards reef
complex (Adams and Carr, 2010, Figs. 3.6B, 3.14) or the Angelina Flexure.
3.6 Conclusions
HCA cluster analysis of the large XRF dataset performed meaningful subdivisions
relating to differences in lithology, grain-size, paleoredox conditions and
preserved organic content. Interpretation of the clusters as chemofacies and their
application to core stratigraphy accentuates differences in sections of stratigraphy
within or between cores on the basis of multivariate changes that are difficult to
track or display by other means.
The interpretation of chemofacies using intra-population enrichments was
supported by conventional element vs. depth plots and cross-plots. Caution must
be applied as determining the defining characteristics of an automatically
generated cluster is not a straight forward process and the splitting of the dataset
into a particular number of clusters is somewhat arbitrary. For example, in our
dataset, certain geologically meaningful groups were not distinguished (ex. high-
Mg carbonate, oxic and sufidic iron-rich facies) while over-splitting may produce
meaningless clusters. However, when approached carefully, Hierarchical Cluster

116
Analysis is an effective way to reduce large quantities of multivariate
geochemical data into an interpretable dataset.
The evolution of the Maness Shale began as a third-order transgressive systems
tract bounded below by the top-Buda sequence boundary and above by the mid-
Maness MFS that is observed in both chemical data and in other studies utilizing
geophysical logs (Ambrose et al., 2009; Hentz et al., 2014). Above the overlying
thinned highstand, a fourth-order lowstand systems tract and transgressive
systems tract are observable in Core X with a partially unconformable sequence
boundary. Above the second MFS and/or unconformity the influence of the
Woodbine Group fluvio-deltaic system increases as progradation and aggradation
dominate the basin.
Iron-rich layers are intercalated in the stratigraphy generally within sandier facies
and are interpreted to represent oxygenation of the sediments, either due to
decreased organic matter burial rates or bottom water reoxygenation.
High-frequency cyclicity is observed in the elemental data of all the cores and
records interconnected oxygenation and increased detrital flux from the
Woodbine fluvio-deltaic system. These cycles roughly correspond to orbital
cycles of obliquity. The evaluated section represents ~1.1 my based on the 24
observed in Core W.

117
The Maness Shale was deposited on the prodeltaic shelf, seaward of the incipient
Woodbine fluvio-deltaic system. The influence of the delta was variably
expressed in the analyzed stratigraphy as a function of distance from the basin
axis and less so as the distance from the shelf margin. The greater inferred
dysoxia, TOC and carbonate in shale indicate that the Core X sampled
stratigraphy that is transitional between the other Maness cores of this study and
the Lower Eagle Ford Group of South Texas. The relationship between the
dysoxia and the Angelina Flexure is uncertain.

118
Figure 3.1 Map of study area in East Texas Basin modified after Hentz et al. (2014).
Core locations for this study are indicated by red stars.

119
Figure 3.2 Schematic stratigraphic cross-section modified after Hentz et al.
(2014) showing the generalized stratigraphy of the East Texas Basin and its
relationship with the Maverick Basin.

120
Figure 3.3 Cross-plots of XRF data with
XRD data. For color key, see Fig. 5.

121
Figure 3.4 Heat Map and Dendrogram of Hierarchical Cluster Analysis. The normalized abundances of
each element are colored on a red (maximum) – white (average) – blue (minimum) gradient scale.
Colored circles indicate the location on the dendrogram and corresponding heat map of the chemofacies
referenced in the text and Figure 5. Both the dendrograms and heat map reflect the clustering of the data
by elements and by samples

122
Figure 3.5 Summary and color key for chemofacies.

123
Figure 3.6 Cross-plot of %Ca from XRF with %Calcite from
XRD of all samples with appropriate data belonging to
Chemofacies A – Sandstone.

124
Figure 3.6 Core photo of sandstone
bed occurring near the top of Core W.
Colored rings correspond to
chemofacies (see Fig. 5).

125
Figure 3.8 Core photo of an interval in the
Core Y displaying the relationship between
chemofacies A, B, C and G and lithology.
Top left of photo is stratigraphic up. Core
follows downward and to the right down-
section. Colored rings correspond to
chemofacies (see Fig. 5).

126
Figure 3.9 Cross-plot of Mo/Al vs. U/Al. The coarse separation
between facies is reflected in U concentrations. For color key,
see Fig. 5.

127
Figure 3.10 Core photos of an
interval in Core X displaying the
relationship between chemofacies
C, D, E and F. Top left of photo is
stratigraphic up. Core follows
downward and to the right down-
section. Colored rings correspond
to chemofacies (see Fig. 5).
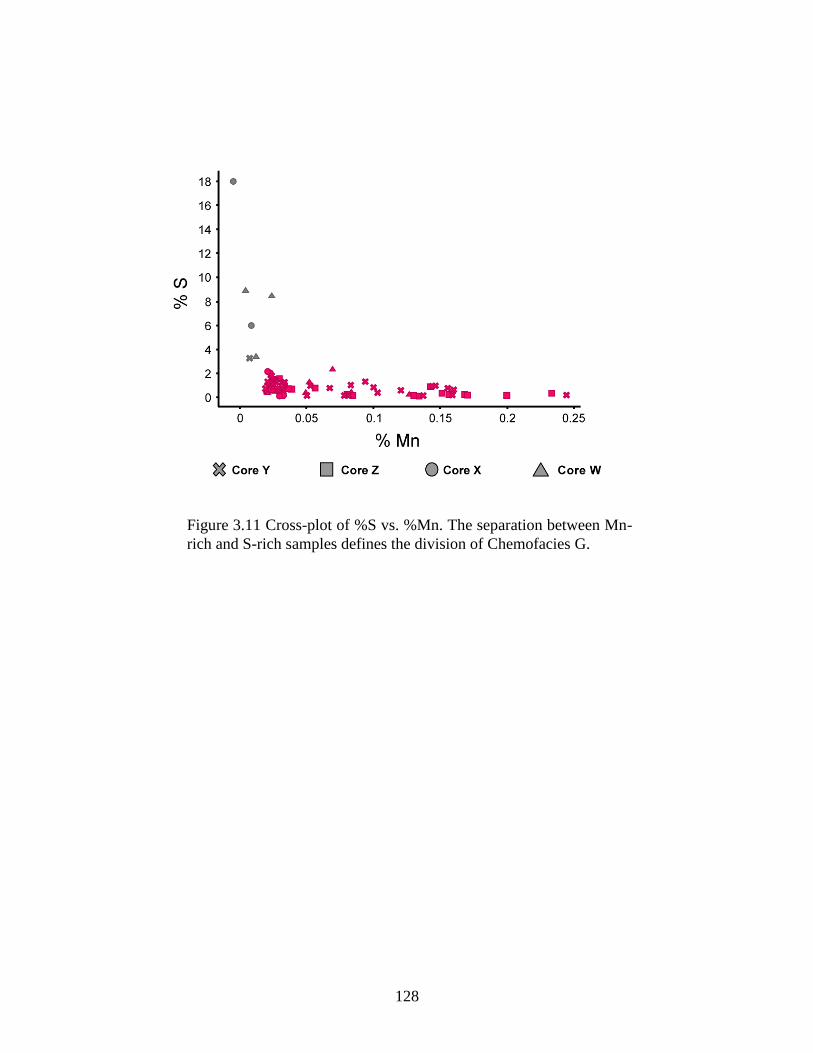
128
Figure 3.11 Cross-plot of %S vs. %Mn. The separation between Mn-
rich and S-rich samples defines the division of Chemofacies G.

129
Figure 3.12 Cross-plot of Mg/Ca from XRF vs. %Dolomite from XRD
for all samples with appropriate data belonging to Chemofacies H –
Clean Carbonate.

130
Figure 3.13 Key elemental curves Core W. Data are colored by chemofacies (for key see Fig. 5).

131
Figure 3.14 Key elemental curves fore Core X. Data are colored by chemofacies (for key see Fig. 5).

132
Figure 3.15 Key elemental curves composite core Y-Z. Data are colored by chemofacies (for key see
Fig. 5).

133
Figure 3.16 Lithologic ternary diagrams for each core. Data are colored by chemofacies
(for key see Fig. 5).
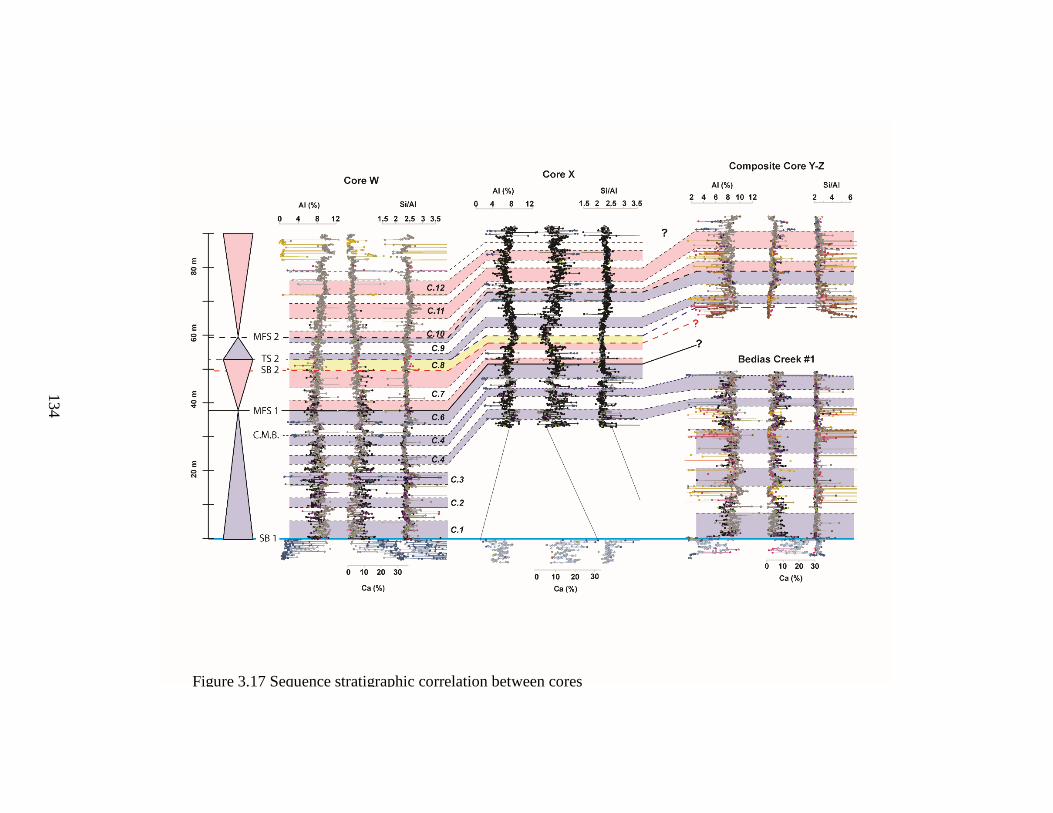
134
Figure 3.17 Sequence stratigraphic correlation between cores

135
Figure 3.18 Core photos of interpreted
hyperpycnites from Core Y.

136
REFERENCES
Abati, J., Aghzer, A. M., Gerdes, A., and Ennih, N., 2010. Detrital zircon ages of
Neoproterozoic sequences of the Moroccan Anti-Atlas belt. Precambrian Research, 181
(1), 115-128.
Abati, J., Aghzer, A. M., Gerdes, A., and Ennih, N., 2012. Insights on the crustal
evolution of the West African Craton from Hf isotopes in detrital zircons from the Anti-
Atlas belt. Precambrian Research, 212, 263-274.
Abdelsalam, M. G., Liégeois, J. P., and Stern, R. J., 2002. The Saharan metacraton.
Journal of African Earth Sciences, 34 (3), 119-136.
Adams, R. L., & Carr, J. P. (2010). Regional depositional systems of the Woodbine,
Eagle Ford, and Tuscaloosa of the US Gulf Coast: Gulf Coast Association of Geological
Societies Transactions, 60, 3-27.
Ambrose, W. A., Hentz, T. F., Bonnaffe, F., Loucks, R. G., Brown Jr, L. F., Wang, F. P.,
& Potter, E. C. (2009). Sequence-stratigraphic controls on complex reservoir architecture
of highstand fluvial-dominated deltaic and lowstand valley-fill deposits in the Upper
Cretaceous (Cenomanian) Woodbine Group, East Texas field: Regional and local
perspectives. AAPG bulletin, 93(2), 231-269.
Álvaro, J. J., Bellido, F., Gasquet, D., Pereira, M., Quesada, C., and Sánchez-García, T.,
2014. Diachronism in the late Neoproterozoic–Cambrian arc-rift transition of North
Gondwana: A comparison of Morocco and the Iberian Ossa-Morena Zone. Journal of
African Earth Sciences.
Arranz, E., Lago, M., Bastida, J., Galé, C., Soriano, J., and Ubide, T., 2008)
Hydrothermal macroscopic Fe-sepiolite from Oujda Mounts (Middle Atlas, Eastern
Morocco). Journal of African Earth Sciences, 52 (3), 81-88.
Auajjar, J., and Boulegue, J., 2002. Dolomites in the Tazekka Pb–Zn district, eastern
Morocco: polyphase origin from hydrothermal fluids. Terra Nova, 14 (3), 175-182.
Avigad, D., Kolodner, K., McWilliams, M., Persing, H., & Weissbrod, T., 2003. Origin
of northern Gondwana Cambrian sandstone revealed by detrital zircon SHRIMP dating.
Geology, 31 (3), 227-230.
Avigad, D., Stern, R. J., Beyth, M., Miller, N., and McWilliams, M. O., 2007. Detrital
zircon U–Pb geochronology of Cryogenian diamictites and Lower Paleozoic sandstone in

137
Ethiopia (Tigrai): age constraints on Neoproterozoic glaciation and crustal evolution of
the southern Arabian–Nubian Shield. Precambrian Research, 154 (1), 88-106.
Agustí, J., Garcés, M., and Krijgsman, W., 2006. Evidence for African–Iberian
exchanges during the Messinian in the Spanish mammalian record. Palaeogeography,
Palaeoclimatology, Palaeoecology, 238 (1), 5-14.
Auajjar, J., and Boulegue, J., 2002. Dolomites in the Tazekka Pb–Zn district, eastern
Morocco: polyphase origin from hydrothermal fluids. Terra Nova, 14 (3), 175-182.
Avigad, D., Gerdes, A., Morag, N., and Bechstädt, T., 2012. Coupled U–Pb–Hf of detrital
zircons of Cambrian sandstones from Morocco and Sardinia: implications for provenance
and Precambrian crustal evolution of North Africa.Gondwana Research, 21 (2), 690-703.
Azdimousa, A., Bourgois, J., Poupeau, G. and Montigny, R., 1998. Histoire thermique du
massif de Kétama (Maroc); sa place en Afrique du Nord et dans les Cordillères Bétiques.
Comptes Rendues de l’Académie des Sciences, 326, 847-853.
Azdimousa A., Bourgois, J., Asebriy, L., Poupeau, G. and Montigny, R., 2003. Histoire
thermique et surrection du Rif externe et des nappes de flyschs associées (Nord Maroc).
Travaux de l’Institut Scientifique, Rabat, 21, 15- 26.
Babault, J., Teixell, A., Arboleya, M. L., and Charroud, M., 2008. A Late Cenozoic age
for long‐wavelength surface uplift of the Atlas Mountains of Morocco. Terra Nova, 20
(2), 102-107.
Bailey, T. L., Evans, F. G., & Adkins, W. S. (1945). Revision of stratigraphy of part of
Cretaceous in Tyler Basin, northeast Texas: AAPG Bulletin, 29, 170-186.
Barbero, L., Jabaloy, A., Gómez-Ortiz, D., Pérez-Peña, J. V., Rodríguez-Peces, M. J.,
Tejero, R., Estupiñán, J., Azdimousa, A., Vázquez, M. and Asebriy, L., 2011. Evidence
for surface uplift of the Atlas Mountains and the surrounding peripheral plateaux:
Combining apatite fission-track results and geomorphic indicators in the Western
Moroccan Meseta (coastal Variscan Paleozoic basement). Tectonophysics, 502 (1), 90-
104.
Barr, S. M., Davis, D. W., Kamo, S., and White, C. E., 2003. Significance of U–Pb
detrital zircon ages in quartzite from peri-Gondwanan terranes, New Brunswick and
Nova Scotia, Canada. Precambrian Research, 126 (1), 123-145.
Barr, S. M., Hamilton, M. A., Samson, S. D., Satkoski, A. M., and White, C. E., 2012.
Provenance variations in northern Appalachian Avalonia based on detrital zircon age

138
patterns in Ediacaran and Cambrian sedimentary rocks, New Brunswick and Nova Scotia,
Canada. Canadian Journal of Earth Sciences,49 (3), 533-546.
Benitez-Nelson, C. R. (2000). The biogeochemical cycling of phosphorus in marine
systems. Earth-Science Reviews, 51(1), 109-135.
Benzaggagh, M., Mokhtari, A., Rossi, P., Michard, A., El Maz, A., Chalouan, A.,
Saddiqi, O.,. and Rjimati, E. C., 2014. Oceanic units in the core of the External Rif
(Morocco): Intramargin hiatus or South-Tethyan remnants?. Journal of Geodynamics, 77,
4-21.
Bernet, M., and Garver, J. I., 2005. Fission-track analysis of detrital zircon. Reviews in
Mineralogy and Geochemistry, 58 (1), 205-237.
Bevier, M. L., White, C. E., and Barr, S. M., 1990. Late Precambrian U-Pb ages for the
Brookville Gneiss, southern New Brunswick. The Journal of Geology, 955-965.
Bhattacharya, J. P., & MacEachern, J. A. (2009). Hyperpycnal rivers and prodeltaic
shelves in the Cretaceous seaway of North America. Journal of Sedimentary Research,
79(4), 184-209.
Bish, D. L. & Post, J. E. (1989). Modern Powder Diffraction: Review in Mineralogy, 20.
Mineralogical Society of America, Washington, D.C.
Bensalah, M. K., Youbi, N., Mahmoudi, A., Bertrand, H., Mata, J., El Hachimi, H.,
Madeira, J., Martins, L., Marzoli, A., Bellon, H., Medina, F., Karroum, M., Karroum L.
A. and Ben, A. M. (2011). The Central Atlantic Magmatic Province (CAMP) volcanic
sequences of Berrechid and Doukkala basins (Western Meseta, Morocco): volcanology
and geochemistry. Comunicacoes Geologicas, 98 (1), 15-27.
Bernini, M., Boccaletti, M., Gelati, R., Moratti, G., Papani, G., and El Mokhtari, J., 1999.
Tectonics and sedimentation in the Taza-Guercif Basin, northern Morocco: implications
for the Neogene evolution of the Rif-Middle Atlas orogenic system. Journal of Petroleum
Geology, 22 (1), 115-128.
Bernini, M., Boccaletti, M., Moratti, G., and Papani, G., 2000. Structural development of
the Taza-Guercif Basin as a constraint for the Middle Atlas Shear Zone tectonic
evolution. Marine and petroleum geology, 17 (3), 391-408.
Black, L. P., Kamo, S. L., Allen, C. M., Davis, D. W., Aleinikoff, J. N., Valley, J. W.,
Mudil, R., Campell, I. H., Korsch, R. J., Williams, I. S. and Foudoulis, C., 2004.
Improved 206Pb/238U microprobe geochronology by the monitoring of a trace-element-

139
related matrix effect; SHRIMP, ID–TIMS, ELA–ICP–MS and oxygen isotope
documentation for a series of zircon standards. Chemical Geology, 205 (1), 115-140.
Brandon, M. T., 1996. Probability density plot for fission-track grain-age samples.
Radiation Measurements, 26 (5), 663-676.
Brede, R., Hauptmann, M., and Herbig, P. D. D. H. G., 1992. Plate tectonics and
intracratonic mountain ranges in Morocco-The Mesozoic-Cenozoic development of the
central High Atlas and the Middle Atlas. Geologische Rundschau, 81 (1), 127-141.
Calvert, S. E., & Pedersen, T. F. (2007). Chapter fourteen: elemental proxies for
palaeoclimatic and palaeoceanographic variability in marine sediments: interpretation and
application. Developments in Marine Geology, 1, 567-644.
Cawood, P. A., Hawkesworth, C. J., & Dhuime, B. 2012. Detrital zircon record and
tectonic setting. Geology, 40(10), 875-878.
Chalouan, A. and Michard, A., 2004. The Alpine Rif Belt (Morocco): A case of mountain
building in a subduction-subduction-transform fault triple junction. Pure and Applied
Geophysics, 161, 489-519.
Chalouan, A., Michard, A., El Kadiri, K., Negro, F., de Lamotte, D. F., Soto, J. I., and
Saddiqi, O., 2008. The Rif Belt. In Michard, A., Saddiqi, O., Chalouan, A and Frizon de
Lamotte, D. (Eds.), Continental evolution: the geology of Morocco. Springer Berlin
Heidelberg, Berlin, Germany, 203-302.
Charrière, A., Dépêche, F., Feist, M., Grambast-Fessard, N., Jaffrezo, M., Peybernès, B.,
and Ramalho, M., 1994. Microfaunes, microflores etpaléoenvironnements successifs dans
la formation d'El Mers (Bathonien-Callovien) du synclinal de Skoura (Moyen-Atlas,
Maroc). Geobios, 27 (2), 157-174.
Crespo-Blanc, A., and de Lamotte, D. F., 2006. Structural evolution of the external zones
derived from the Flysch trough and the South Iberian and Maghrebian paleomargins
around the Gibraltar arc: a comparative study. Bulletin de la Societe geologique de
France, 177 (5), 267-282.
de Capoa, P., Di Staso, A., Perrone, V., and Zaghloul, M. N., 2007. The age of the
foredeep sedimentation in the Betic–Rifian Mauretanian Units: A major constraint for the
reconstruction of the tectonic evolution of the Gibraltar Arc. Comptes Rendus
Geoscience, 339 (2), 161-170.

140
Dahl, T. W., Ruhl, M., Hammarlund, E. U., Canfield, D. E., Rosing, M. T., & Bjerrum,
C. J. (2013). Tracing euxinia by molybdenum concentrations in sediments using handheld
X-ray fluorescence spectroscopy (HHXRF). Chemical Geology, 360, 241-251.
Dekayir, A., Amouric, M., and Olives, J., 2005. Clay minerals in hydrothermally altered
basalts from Middle Atlas, Morocco. Clay Minerals, 40 (1), 67-77.
Delfaud, J. & Zellouf, K., 1995. Existence, durant le Jurassique et le Crétacé inférieur
d’un paléo-Niger coulant du Sud vers le Nord au Sahara occidental. In Arbeyand, F. and
Lorenz, J. (Eds.) Bassins sédimentaires Africains, 93–104. Comité des travaux
historiques et scientifiques, Paris
Duggen, S., Hoernle, K., Van Den Bogaard, P., Rüpke, L., and Morgan, J. P., 2003. Deep
roots of the Messinian salinity crisis. Nature, 422 (6932), 602-606.
Duggen, S., Hoernle, K., van den Bogaard, P., and Harris, C., 2004. Magmatic evolution
of the Alboran region: the role of subduction in forming the western Mediterranean and
causing the Messinian Salinity Crisis. Earth and Planetary Science Letters, 218 (1), 91-
108.
Duggen, S., Hoernle, K., van den Bogaard, P., and Garbe-Schönberg, D., 2005. Post-
collisional transition from subduction-to intraplate-type magmatism in the westernmost
Mediterranean: evidence for continental-edge delamination of subcontinental lithosphere.
Journal of Petrology 46 (6), 1155-1201.
Durand-Delga M., La Méditerranée occidentale, étapes de sa genèse et problèmes
structuraux liés à celle-ci, Mém. Soc. géol. Fr. 10 (1980) 203-224.
Durand-Delga, M., Gardin, S., and Olivier, P., 1999. Datation des flyschs éocrétacés
maurétaniens des Maghrébides: la formation du Jbel Tisirène (Rif, Maroc). Comptes
Rendus de l'Académie des Sciences-Series IIA-Earth and Planetary Science, 328 (10),
701-709.
Dymond, J. (1985). Particulate barium fluxes in the oceans: An indicator of new
productivity. Transactions of the American Geophysical Union, 66, 1275.
El Hassani, A., Huan, S., Hoepffner, C., Whitechurch, H., and Piqué, A., 1991. Une
déformation d'âge ordovicien moyen dans la zone des Sehoul (Meseta marocaine
septentrionale): Regard sur les segments calédoniens au NW de l'Afrique. Comptes
rendus de l'Académie des sciences. Série 2, Mécanique, Physique, Chimie, Sciences de
l'univers, Sciences de la Terre, 312 (9), 1027-1032.

141
El Kadiri, K., El Kadiri, K. E., and Rahouti, A., 2003. Sédimentologie et ichnologie des
calciturbidites du Crétacé supérieur–Oligocène inférieur de la série maurétanienne (nappe
des Béni Ider, Rif septentrional, Maroc): implications paléogéographiques. Bulletin de
l’Institut Scientifique, Rabat, (25), 73-91.
Ennih, N., and Liégeois, J. P., 2008. The boundaries of the West African craton, with
special reference to the basement of the Moroccan metacratonic Anti-Atlas belt.
Geological Society, London, Special Publications, 297 (1), 1-17.
Escarraga, E. A., Barr, S. M., Murphy, J. B., and Hamilton, M. A., 2011. Ordovician A-
type plutons in the Antigonish Highlands, Nova Scotia 1 1 This article is one of a series
of papers published in CJES Special Issue: In honour of Ward Neale on the theme of
Appalachian and Grenvillian geology. Canadian Journal of Earth Sciences, 49 (1), 329-
345.
Faure-Muret, A., and Choubert, G., 1971. Le Maroc. Domaine rifain et atlasique.
Tectonique de l’Afrique, 17-46.
Fedan, B., 1988. Evolution géodynamique d’un basin intraplaque sure décrochements: Le
Moyen Atlas (Maroc) durant le Méso-Cénozoique. Doctoral thesis, Universitv Mohamed
V, Rabat, Morocco.
Frizon de Lamotte, D. F., Zizi, M., Missenard, Y., Hafid, M., El Azzouzi, M., Maury, R.
C.,Charrière, A., Taki, Z., Benammi, M., and Michard, A., 2008. The Atlas system. In
Michard, A., Saddiqi, O., Chalouan, A and Frizon de Lamotte, D. (Eds.), Continental
evolution: the Geology of Morocco. Springer Berlin Heidelberg, Berlin, Germany, 133-
202.
Frizon de Lamotte, D., Leturmy, P., Missenard, Y., Khomsi, S., Ruiz, G., Saddiqi, O.,
Guillocheau, F., and Michard, A., 2009. Mesozoic and Cenozoic vertical movements in
the Atlas system (Algeria, Morocco, Tunisia): an overview. Tectonophysics, 475 (1), 9-
28.
Froelich, P. N., Bender, M. L., Luedtke, N. A., Heath, G. R., & DeVries, T., 1982. The
marine phosphorus cycle. American Journal of Science, 282 (4), 474-511.
Fukunaga, A., & Anderson, M. J. (2011). Bioaccumulation of copper, lead and zinc by
the bivalves Macomona liliana and Austrovenus stutchburyi. Journal of Experimental
Marine Biology and Ecology, 396(2), 244-252.

142
Galbraith, R. F., & Green, P. F., 1990. Estimating the component ages in a finite mixture.
International Journal of Radiation Applications and Instrumentation. Part D. Nuclear
Tracks and Radiation Measurements, 17 (3), 197-206.
Garcés, M., Krijgsman, W., and Agustí, J., 2001. Chronostratigraphic framework and
evolution of the Fortuna basin (Eastern Betics) since the Late Miocene. Basin Research,
13 (2), 199-216.
Garver, J.I., and Kamp, P.J.J., 2002, Integration of zircon color and zircon fission track
zonation patterns in Orogenic belts: Application of the Southern Alps, New Zealand;
Tectonophysics. v. 349, n. 1-4, p. 203-219.
Garver, J.I., and Wold, J.S., 2011, Discordance and dissolution of radiation-damaged
detrital zircon in the Wasatch Formation and adjacent units in the Powder River basin,
Wyoming, Geological Society of America Abstracts with Programs, v.. 43, n. 4, p. 50.
Gasquet, D., Ennih, N., Liégeois, J. P., Soulaimani, A., & Michard, A., 2008. The Pan-
African Belt. In Michard, A., Saddiqi, O., Chalouan, A and Frizon de Lamotte, D. (Eds.),
Continental evolution: the Geology of Morocco. Springer Berlin Heidelberg, Berlin,
Germany, 33-64.
Gehrels, G. E., Valencia, V. A., and Ruiz, J., 2008. Enhanced precision, accuracy,
efficiency, and spatial resolution of U-Pb ages by laser ablation–multicollector–
inductively coupled plasma–mass spectrometry. Geochemistry, Geophysics, Geosystems,
9 (3).
Gehrels, G. E., Valencia, V. A., and Ruiz, J., 2008. Enhanced precision, accuracy,
efficiency, and spatial resolution of U‐Pb ages by laser ablation–multicollector–
inductively coupled plasma–mass spectrometry. Geochemistry, Geophysics, Geosystems,
9 (3).
Gelati, R., Moratti, G., and Papani, G., 2000. The Late Cenozoic sedimentary succession
of the Taza-Guercif Basin, South Rifian Corridor, Morocco. Marine and petroleum
geology, 17 (3), 373-390.
Gerdes, A., and Zeh, A., 2006. Combined U–Pb and Hf isotope LA-(MC-) ICP-MS
analyses of detrital zircons: comparison with SHRIMP and new constraints for the
provenance and age of an Armorican metasediment in Central Germany. Earth and
Planetary Science Letters, 249 (1), 47-61.

143
Ghienne, J. F., 2003. Late Ordovician sedimentary environments, glacial cycles, and
post-glacial transgression in the Taoudeni Basin, West Africa. Palaeogeography,
Palaeoclimatology, Palaeoecology, 189 (3), 117-145
Ghorbal, B., Bertotti, G., Foeken, J., and Andriessen, P., 2008. Unexpected Jurassic to
Neogene vertical movements in ‘stable’parts of NW Africa revealed by low temperature
geochronology. Terra Nova, 20 (5), 355-363.
Gomez, F., Allmendinger, R., and Barazangi, M., 1998. Crustal shortening and vertical
strain partitioning in the Middle Atlas Mountains of Morocco. Tectonics, 17 (4), 520-533.
Gomez, F., Barazangi, M., and Demnati, A., 2000. Structure and evolution of the
Neogene Guercif Basin at the junction of the Middle Atlas Mountains and the Rif Thrust
Belt, Morocco. AAPG bulletin, 84 (9), 1340-1364.
Guerrera, F., Martín-Martín, M., Perrone, V., and Tramontana, M., 2005. Tectono-
sedimentary evolution of the southern branch of the Western Tethys (Maghrebian Flysch
Basin and Lucanian Ocean): consequences for Western Mediterranean geodynamics.
Terra Nova, 17 (4), 358-367.
Hafid, M., Zizi, M., Bally, A. W., & Salem, A. A., 2006. Structural styles of the western
onshore and offshore termination of the High Atlas, Morocco. Comptes Rendus
Geoscience, 338 (1), 50-64.
Hamidi, E. M., Boulangé, B., and Colin, F., 1997. Altération d'un basalte triasique de la
région d'Elhajeb, Moyen Atlas, Maroc. Journal of African Earth Sciences, 24 (1), 141-
151.
Hamilton, M. A., and Murphy, J. B., 2004. Tectonic significance of a Llanvirn age for the
Dunn Point volcanic rocks, Avalon terrane, Nova Scotia, Canada: implications for the
evolution of the Iapetus and Rheic Oceans. Tectonophysics, 379 (1), 199-209.
Haq, B. U., J. Hardenbol, and P. R. Vail, 1988, Mesozoic and Cenozoic
chronostratigraphy and cycles of sea level change. In (Eds. C. K. Wilgus, C. A. Ross, H.
Posamentier, and C. G. St. C. Kendall) Sea-level changes: An integrated approach:
SEPM Special Publication 42, p. 71–108.
Hashemi, S. N., & Mehdizadeh, R. (2014). Application of hierarchical clustering
technique for numerical tectonic regionalization of the Zagros region (Iran). Earth
Science Informatics, 1-14.

144
Henderson, R. A. (2004). A mid-Cretaceous association of shell beds and organic-rich
shale: bivalve exploitation of a nutrient-rich, anoxic sea-floor environment. Palaios,
19(2), 156-169.
Hentz, T. F., & Ruppel, S. C. (2010). Regional lithostratigraphy of the Eagle Ford Shale:
Maverick Basin to East Texas Basin: Gulf Coast Association of Geological Societies
Transactions, v. 60. 325-337.
Hentz, T. F., Ambrose, W. A., & Smith, D. C. (2014). Eaglebine play of the southwestern
East Texas Basin: Stratigraphic and depositional framework of the Upper Cretaceous
(Cenomanian-Turonian) Woodbine and Eagle Ford Groups. AAPG Bulletin, in press.
Hilgen, F. J., Bissoli, L., Iaccarino, S., Krijgsman, W., Meijer, R., Negri, A., and Villa,
G., 2000. Integrated stratigraphy and astrochronology of the Messinian GSSP at Oued
Akrech (Atlantic Morocco). Earth and Planetary Science Letters, 182 (3), 237-251.
Hodell, D. A., Benson, R. H., Kennett, J. P., and Bied, R. E., 1989. Stable isotope
stratigraphy of latest Miocene sequences in northwest Morocco: the Bou Regreg section.
Paleoceanography, 4 (4), 467-482.
Hodell, D. A., Benson, R. H., Kent, D. V., Boersma, A., and Bied, R. E., 1994.
Magnetostratigraphic, biostratigraphic, and stable isotope stratigraphy of an Upper
Miocene drill core from the Salé Briqueterie (northwestern Morocco): A high‐resolution
chronology for the Messinian stage. Paleoceanography, 9 (6), 835-855.
Hollard, H (ed.), 1985. Carte Géologique du Maroc 1:1,000,000. Éditions du Service
Géologique du Maroc.
Hoepffner, C., Soulaimani, A., and Piqué, A., 2005. The Moroccan Hercynides. Journal
of African Earth Sciences, 43 (1), 144-165.
Hsü, K. J., Montadert, L., Bernoulli, D., Cita, M. B., Erickson, A., Garrison, R. E., Kidd,
F., Müller, C. and Wright, R., 1977. History of the Mediterranean salinity crisis. Nature,
267 (5610), 399-403.
Huch, K. M., 1988. Die panafrikanische Khzama Geosutur im zentralen Anti-Atlas.
Petrographie, Geochemie und Geochronologie des Subduktioncomplexes der Tourtit
Ophiollithe und der TachoukachtGneise sowie einiger Kollisiongesteine im Nordosten
des Sirwa-Kristallindoms. Schelzky & Jeep Verlag, Berlin, Germany.
Huhn, S. R. B., Sousa, M. J., de Souza Filho, C. R., & Monteiro, L. V. S. (2014).
Geology of the Riacho do Pontal iron oxide copper-gold (IOCG) prospect, Bahia, Brazil:

145
hydrothermal alteration approached via hierarchical cluster analysis. Brazilian Journal of
Geology, 44(2), 309-324.
Jackson, M. P. A., & Seni, S. J. (1983). Geometry and evolution of salt structures in a
marginal rift basin of the Gulf of Mexico, east Texas. Geology, 11 (3), 131-135.
Jarvis, I., & Higgs, N. (1987). Trace-element mobility during early diagenesis in distal
turbidites: late Quaternary of the Madeira Abyssal Plain, N Atlantic. Geological Society,
London, Special Publications, 31(1), 179-214.
Jeandel, C., Tachikawa, K., Bory, A., & Dehairs, F. (2000). Biogenic barium in
suspended and trapped material as a tracer of export production in the tropical NE
Atlantic (EUMELI sites). Marine Chemistry, 71(1), 125-142.
Jiménez Berrocoso, Á., MacLeod, K. G., Calvert, S. E., & Elorza, J. (2008). Bottom
water anoxia, inoceramid colonization, and benthopelagic coupling during black shale
deposition on Demerara Rise (Late Cretaceous western tropical North Atlantic).
Paleoceanography, 23(3).
Jolivet, L., Augier, R., Robin, C., Suc, J. P., and Rouchy, J. M., 2006. Lithospheric-scale
geodynamic context of the Messinian salinity crisis. Sedimentary Geology, 188, 9-33.
Kalsbeek, F., Frei, D., and Affaton, P., 2008. Constraints on provenance, stratigraphic
correlation and structural context of the Volta basin, Ghana, from detrital zircon
geochronology: An Amazonian connection? Sedimentary Geology, 212 (1), 86-95.
Kasten, S., Freudenthal, T., Gingele, F. X., & Schulz, H. D. (1998). Simultaneous
formation of iron-rich layers at different redox boundaries in sediments of the Amazon
deep-sea fan. Geochimica et cosmochimica acta, 62(13), 2253-2264.
Keppie, J. D., Nance, R. D., Murphy, J. B., & Dostal, J. (1991). Northern appalachians:
Avalon and Meguma terranes. Springer Berlin Heidelberg, Berlin,Germany, 315-333.
Keppie, J. D., and Dallmeyer, R. D., 1995. Late Paleozoic collision, delamination, short-
lived magmatism, and rapid denudation in the Meguma terrane (Nova Scotia, Canada):
constraints from 40Ar/39Ar isotopic data. Canadian Journal of Earth Sciences, 32 (5),
644-659.
Keppie, J. D., Dostal, J., Murphy, J. B., and Cousens, B. L.,1997. Palaeozoic within-plate
volcanic rocks in Nova Scotia (Canada) reinterpreted: isotopic constraints on magmatic
source and palaeocontinental reconstructions.Geological Magazine, 134 (04), 425-447.

146
Keppie, J. D., Davis, D. W., and Krogh, T. E., 1998. U-Pb geochronological constraints
on Precambrian stratified units in the Avalon Composite Terrane of Nova Scotia, Canada:
tectonic implications. Canadian Journal of Earth Sciences, 35 (3), 222-236.
King, C. K., Dowse, M. C., Simpson, S. L., & Jolley, D. F. (2004). An assessment of five
Australian polychaetes and bivalves for use in whole-sediment toxicity tests: toxicity and
accumulation of copper and zinc from water and sediment. Archives of environmental
contamination and toxicology, 47(3), 314-323.
Knight, K. B., Nomade, S., Renne, P. R., Marzoli, A., Bertrand, H., and Youbi, N., 2004.
The Central Atlantic Magmatic Province at the Triassic–Jurassic boundary:
paleomagnetic and 40 Ar/39 Ar evidence from Morocco for brief, episodic volcanism.
Earth and Planetary Science Letters, 228 (1), 143-160.
Kochenov, A. V., Korolev, K. G., Dubinchuk, V. T., & Medvedev, Y. L. (1977).
Experimental data on the conditions of precipitation of uranium from aqueous solutions.
Geochemistry International, 14(6), 82-87.
Krijgsman, W., Langereis, C. G., Zachariasse, W. J., Boccaletti, M., Moratti, G., Gelati,
R., Iaccarino, S., Papani, G. and Villa, G. 1999a. Late Neogene evolution of the Taza–
Guercif Basin (Rifian Corridor, Morocco) and implications for the Messinian salinity
crisis. Marine Geology, 153 (1), 147-160.
Krijgsman, W., Hilgen, F. J., Raffi, I., Sierro, F. J., and Wilson, D. S., 1999. Chronology,
causes and progression of the Messinian salinity crisis. Nature, 400 (6745), 652-655.
Laubach, S. E., & Jackson, M. L. (1990). Origin of arches in the northwestern Gulf of
Mexico basin. Geology, 18 (7), 595-598.
Le Heron, D. P., 2007. Late Ordovician glacial record of the Anti-Atlas, Morocco.
Sedimentary Geology, 201 (1), 93-110.
Liégeois, J. P., Fekkak, A., Bruguier, O., Errami, E., and Ennih, N., 2006. The Lower
Ediacaran (630–610 Ma) Saghro group: an orogenic transpressive basin development
during the early metacratonic evolution of the Anti-Atlas (Morocco). In IGCP485 4th
meeting, Algiers , 57
Linnemann, U., Gerdes, A., Drost, K., and Buschmann, B., 2007. The continuum
between Cadomian orogenesis and opening of the Rheic Ocean: Constraints from LA-
ICP-MS U-Pb zircon dating and analysis of plate-tectonic setting (Saxo-Thuringian zone,
147
northeastern Bohemian Massif, Germany). Geological Society of America Special
Papers, 423, 61-96.
Linnemann, U., Pereira, F., Jeffries, T. E., Drost, K., and Gerdes, A., 2008. The
Cadomian Orogeny and the opening of the Rheic Ocean: the diacrony of geotectonic
processes constrained by LA-ICP-MS U–Pb zircon dating (Ossa-Morena and Saxo-
Thuringian Zones, Iberian and Bohemian Massifs).Tectonophysics, 461 (1), 21-43.
Linnemann, U., Ouzegane, K., Drareni, A., Hofmann, M., Becker, S., Gärtner, A., and
Sagawe, A., 2011. Sands of West Gondwana: An archive of secular magmatism and plate
interactions—A case study from the Cambro-Ordovician section of the Tassili Ouan
Ahaggar (Algerian Sahara) using U–Pb–LA-ICP-MS detrital zircon ages. Lithos, 123 (1),
188-203.
Lovley, D. R., Phillips, E. J., Gorby, Y. A., & Landa, E. R. (1991). Microbial reduction
of uranium. Nature, 350(6317), 413-416.
Ludwig, K. R. (1999). Isoplot/Ex Ver 2.06: a geochronological toolkit for Microsoft
Excel. Berkeley Geochronology Center Special Publications.
Malusa, M. G., Polino, R., Feroni, A. C., Ellero, A., Ottria, G., Baidder, L., and
Musumeci, G., 200). Post‐Variscan tectonics in eastern Anti‐Atlas (Morocco). Terra
Nova, 19 (6), 481-489.
Mancini, E. A., & Puckett, T. M. (2005). Jurassic and Cretaceous transgressive-
regressive (TR) cycles, northern Gulf of Mexico, USA. Stratigraphy, 2(1), 31-48.
Mancini, E. A., & Scott, R. W. (2006). Sequence stratigraphy of Comanchean Cretaceous
outcrop strata of northeast and south-central Texas: Implications for enhanced petroleum
exploration. Gulf Coast Association of Geological Societies Transactions, 56, 539-550
McGeary, D. F., & Damuth, J. E. (1973). Postglacial iron-rich crusts in hemipelagic
deep-sea sediment. Geological Society of America Bulletin, 84(4), 1201-1212.
Michard, A., Feinberg, H., El-Azzab, D., Bouybaouene, M., and Saddiqi, O., 1992. A
serpentinite ridge in a collisional paleomargin setting: the Beni Malek massif, External
Rif, Morocco. Earth and planetary science letters, 113(3), 435-442.
Michard, A., Chalouan, A., Feinberg, H., Goffé, B., & Montigny, R., 2002. How does the
Alpine belt end between Spain and Morocco?. Bulletin de la Société géologique de
France, 173 (1), 3-15.

148
Michard, A., Negro, F., de Lamotte, D. F., and Saddiqi, O., 2007. Serpentinite slivers and
metamorphism in the External Maghrebides: arguments for an intracontinental suture in
the African paleomargin (Morocco, Algeria). Revista de la Sociedad Geológica de
España, 20(3-4), 173-186.
Michard, A., Hoepffner, A., Soulaimana, A. and Baidder, L., 2008. The Variscan Belt. In
Michard, A., Saddiqi, O., Chalouan, A and Frizon de Lamotte, D. (Eds.), Continental
evolution: the geology of Morocco. Springer Berlin Heidelberg, Berlin, Germany, 133-
202.
Michard, A., Soulaimani, A., Hœpffner, C., Ouanaimi, H., Baidder, L., Rjimati, E. C.,
and Saddiqi, O., 2010. The south-western branch of the Variscan Belt: evidence from
Morocco. Tectonophysics, 492(1), 1-24.
Michard A., Chalouan, A., Negro, F. and Saddiqi, O., 2014. Comment on “Evidence of
extensional metamorphism associated to Cretaceous rifting of the North-Maghrebian
passive margin: the Tanger-Ketama Unit (External Rif, Northern Morocoo)” by Vázquez
et al., Geologica Acta 11 (2013), 277-293. Geologica Acta, In press.
Mirkin, B. (1996). Mathematical Classification and Clustering: In (Eds. P. Pardalos & R.
Horst) Nonconvex Optimization and Its Applications, Volume 11, Kluwer Academic
Publishers, The Netherlands.
Missenard, Y., Zeyen, H., Frizon de Lamotte, D., Leturmy, P., Petit, C., Sébrier, M., and
Saddiqi, O., 2006. Crustal versus asthenospheric origin of relief of the Atlas Mountains
of Morocco. Journal of Geophysical Research: Solid Earth (1978–2012), 111(B3).
Moecher, D. P., & Samson, S. D., 2006. Differential zircon fertility of source terranes
and natural bias in the detrital zircon record: Implications for sedimentary provenance
analysis. Earth and Planetary Science Letters, 247(3), 252-266.
Montario, M. J., and Garver, J. I., 2009. The Thermal Evolution of the Grenville Terrane
Revealed through U‐Pb and Fission‐Track Analysis of Detrital Zircon from Cambro‐Ordovician Quartz Arenites of the Potsdam and Galway Formations. The Journal of
Geology, 117 (6), 595-614.
Murphy, J. B., and Nance, R. D., 2002. Sm–Nd isotopic systematics as tectonic tracers:
an example from West Avalonia in the Canadian Appalachians. Earth-Science Reviews,
59 (1), 77-100.

149
Murphy, J. B., Pisarevsky, S. A., Nance, R. D., and Keppie, J. D., 2004a .
Neoproterozoic—Early Paleozoic evolution of peri-Gondwanan terranes: implications for
Laurentia-Gondwana connections. International Journal of Earth Sciences, 93 (5), 659-
682.
Murphy, J. B., Fernández-Suárez, J., Keppie, J. D., and Jeffries, T. E., 2004b. Contiguous
rather than discrete Paleozoic histories for the Avalon and Meguma terranes based on
detrital zircon data. Geology, 32 (7), 585-588.
Murphy, J. B., Fernández-Suárez, J., Jeffries, T., and Strachan, R., 2004c. U–Pb (LA–
ICP-MS) dating of detrital zircons from Cambrian clastic rocks in Avalonia: erosion of a
Neoproterozoic arc along the northern Gondwanan margin. Journal of the Geological
Society, 161 (2), 243-254.
Murphy, J. B., Dostal, J., and Keppie, J. D., 2008. Neoproterozoic–Early Devonian
magmatism in the Antigonish Highlands, Avalon terrane, Nova Scotia: Tracking the
evolution of the mantle and crustal sources during the evolution of the Rheic Ocean.
Tectonophysics, 461 (1), 181-201.
Murphy, J. B., Hamilton, M. A., and LeBlanc, B., 2011. Tectonic significance of Late
Ordovician silicic magmatism, Avalon terrane, northern Antigonish Highlands, Nova
Scotia. Canadian Journal of Earth Sciences, 49 (1), 346-358.
Murphy, L. N., Kirk-Davidoff, D. B., Mahowald, N., and Otto-Bliesner, B. L., 2009. A
numerical study of the climate response to lowered Mediterranean Sea level during the
Messinian Salinity Crisis. Palaeogeography, Palaeoclimatology, Palaeoecology, 279 (1),
41-59.
Oukassou, M., Saddiqi, O., Barbarand, J., Sebti, S., Baidder, L., and Michard, A., 2013.
Post‐Variscan exhumation of the Central Anti‐Atlas (Morocco) constrained by zircon and
apatite fission‐track thermochronology. Terra Nova, 25 (2), 151-159.
Naeser, C. W., 1979. Fission-track dating and geologic annealing of fission tracks. In
Lectures in isotope geology (pp. 154-169). Eds Jäeger, C. and Hunziker, J.C. Springer
Berlin Heidelberg.
Nair, B., Ittekkot, V., Shankar, R., & Guptha, M. V. S. (2005). Settling barium fluxes in
the Arabian Sea: Critical evaluation of relationship with export production. Deep Sea
Research Part II: Topical Studies in Oceanography, 52(14), 1930-1946.
150
Nance, R. D., Murphy, J. B., and Keppie, J. D., 2002. A Cordilleran model for the
evolution of Avalonia. Tectonophysics, 352 (1), 11-31.
Nance, R. D., Murphy, J. B., Strachan, R. A., Keppie, J. D., Gutiérrez-Alonso, G.,
Fernández-Suárez, J., Quesada, C., Linnemann, U., D’lemos, R., and Pisarevsky, S. A.,
2008. Neoproterozoic-early Palaeozoic tectonostratigraphy and palaeogeography of the
peri-Gondwanan terranes: Amazonian v. West African connections. Geological Society,
London, Special Publications, 297 (1), 345-383.
Oliver, W. B. (1971). Depositional systems in the Woodbine Formation (Upper
Cretaceous), northeast Texas: University of Texas at Austin, Bureau of Economic
Geology Report of Investigations, No. 73, 28.
Painter, C. S., Carrapa, B., DeCelles, P. G., Gehrels, G. E., and Thomson, S. N., 2014.
Exhumation of the North American Cordillera revealed by multi-dating of Upper
Jurassic–Upper Cretaceous foreland basin deposits. Geological Society of America
Bulletin, B30999-1.
Parks, J. M. (1966). Cluster analysis applied to multivariate geologic problems. The
Journal of Geology, 74(5), 703-715.
Paton, C., Hellstrom, J., Paul, B., Woodhead, J., and Hergt, J., 2011. Iolite: Freeware for
the visualisation and processing of mass spectrometric data. Journal of Analytical Atomic
Spectrometry, 26 (12), 2508-2518.
Pelleter, E., Cheilletz, A., Gasquet, D., Mouttaqi, A., Annich, M., El Hakour, A.,Deloule,
E., and Féraud, G., 2007. Hydrothermal zircons: a tool for ion microprobe U–Pb dating of
gold mineralization (Tamlalt–Menhouhou gold deposit—Morocco). Chemical Geology,
245 (3), 135-161.
Phelps, R. M., Kerans, C., Loucks, R. G., Da Gama, R. O., Jeremiah, J., & Hull, D.
(2014). Oceanographic and eustatic control of carbonate platform evolution and sequence
stratigraphy on the Cretaceous (Valanginian–Campanian) passive margin, northern Gulf
of Mexico. Sedimentology, 61(2), 461-496.
Phillips, N. D. (1991). Refined Subsidence Analysis as a Means to Constraint Late
Cenozoic Fault Movement, Venture Basin, California (Master’s Thesis). University of
Texas at Austin, Austin, TX.

151
Piqué, A., Tricart, P., Guiraud, R., Laville, E., Bouaziz, S., Amrhar, M., & Ouali, R. A.,
2002. The Mesozoic-Cenozoic Atlas belt (North Africa): an overview. Geodinamica
Acta, 15(3), 185-208.
Platt, J. P., and Whitehouse, M. J.,1999. Early Miocene high-temperature metamorphism
and rapid exhumation in the Betic Cordillera (Spain): evidence from U–Pb zircon ages.
Earth and Planetary Science Letters, 171 (4), 591-605.
Pratt, J. R., Barbeau, D. L., Garver, J. I., Izykowski, T. M. and Emran, A., (in press).
Detrital zircon geochronology of Mesozoic sediments in the Rif and Middle Atlas belts of
Morocco: provenance constraints and refinement of the 'West African' signature. Journal
of Geology, in press.
Rahl, J. M., Reiners, P. W., Campbell, I. H., Nicolescu, S., and Allen, C. M., 2003.
Combined single-grain (U-Th)/He and U/Pb dating of detrital zircons from the Navajo
Sandstone, Utah. Geology, 31 (9), 761-764.
Rosenthal, Y., Lam, P., Boyle, E. A., & Thomson, J. (1995). Authigenic cadmium
enrichments in suboxic sediments: Precipitation and postdepositional mobility. Earth and
Planetary Science Letters, 132(1), 99-111.
Rouchy, J. and Caruso, A., 2006. The Messinian salinity crisis in the Mediterranean
basin: A reassessment of the data and an integrated scenario. Sedimentary Geology, 188-
189.
Rowe, H. D., Loucks, R. G., Ruppel, S. C., & Rimmer, S. M. (2008). Mississippian
Barnett Formation, Fort Worth Basin, Texas: Bulk geochemical inferences and Mo–TOC
constraints on the severity of hydrographic restriction. Chemical Geology, 257(1), 16-25.
Rowe, H., Hughes, N., & Robinson, K. (2012). The quantification and application of
handheld energy-dispersive x-ray fluorescence (ED-XRF) in mudrock chemostratigraphy
and geochemistry. Chemical Geology, 324, 122-131.
Ruiz, G. M. H., Sebti, S., Negro, F., Saddiqi, O., Frizon de Lamotte, D., Stockli, D.,
Foeken, J., Stuart, F., Barbarand, J., and Schaer, J. P., 2011. From central Atlantic
continental rift to Neogene uplift–western Anti‐Atlas (Morocco). Terra Nova, 23 (1), 35-
41.
Saddiqi, O., El Haimer, F. Z., Michard, A., Barbarand, J., Ruiz, G. M. H., Mansour, E.
M., Leturmy, P. and De Lamotte, D. F., 2009. Apatite fission-track analyses on basement

152
granites from south-western Meseta, Morocco: Paleogeographic implications and
interpretation of AFT age discrepancies. Tectonophysics,475 (1), 29-37
Sageman, B. B., & Bina, C. R. (1997). Diversity and species abundance patterns in late
Cenomanian black shale biofacies, Western Interior, US. Palaios, 12(5), 449-466.
Salvador, A. (1991) Origin and development of the Gulf of Mexico Basin. In: The
geology of North America (Ed. A. Salvador), 389-444. Geological Society of America,
Boulder, Co.
Sambridge, M.S. & Compston, W., 1994. Mixture modeling of multi-component data sets
with application to ion-probe zircon ages. Earth and Planetary Science Letters 128, 373–
390.
Sani, F., Zizi, M., and Bally, A. W., 2000. The Neogene–Quaternary evolution of the
Guercif Basin (Morocco) reconstructed from seismic line interpretation. Marine and
petroleum geology, 17 (3), 343-357.
Santos, J. O. S., Hartmann, L. A., Gaudette, H. E., Groves, D. I., Mcnaughton, N., J., and
Fletcher, I. R., 2000. A new understanding of the provinces of the Amazon Craton based
on integration of field mapping and U-Pb and Sm-Nd geochronology. Gondwana
Research, 3 (4), 453-488.
Sebti, S., Saddiqi, O., El Haimer, F. Z., Michard, A., Ruiz, G., Bousquet, R., Baidder, L.
and Frizon de Lamotte, D., 2009. Vertical movements at the fringe of the West African
Craton: First zircon fission track datings from the Anti-Atlas Precambrian basement,
Morocco. Comptes Rendus Geoscience, 341 (1), 71-77.
Seni, S. J., & Jackson, M. P. (1984). Sedimentary Record of Cretaceous and Tertiary Salt
Movement, East Texas Basin: Times, Rates, and Volumes of Salt Flow and Their
Implications for Nuclear Waste Isolation and Petroleum Exploration. Bureau of
Economic Geology, University of Texas at Austin, No. 139, 89.
Shi, G. R. (1993). Multivariate data analysis in palaeoecology and palaeobiogeography—
a review. Palaeogeography, Palaeoclimatology, Palaeoecology, 105(3), 199-234.
Simancas, J. F., Tahiri, A., Azor, A., Lodeiro, F. G., Martínez Poyatos, D. J., and El
Hadi, H., 2005. The tectonic frame of the Variscan–Alleghanian orogen in Southern
Europe and Northern Africa. Tectonophysics, 398 (3), 181-198.

153
Skornyakova, N. S., & Murdmaa, I. O., 1992. Local variations in distribution and
composition of ferromanganese nodules in the Clarion-Clipperton Nodule Province.
Marine Geology, 103 (1), 381-405.
Sneath, P. H., & Sokal, R. R. (1973). Numerical taxonomy. The principles and practice of
numerical classification. W.H. Freeman and Co., San Francisco, USA
Souhel, A. (1996). Le mésozoïque dans le haut-atlas de Béni-Mellal (Maroc):
Stratigraphie, sédimentologie et évolution géodynamique. Strata, 27, 1-249.
Stehli, F. G., Creath, W. B., Upshaw, C. F., & Forgotson Jr, J. M. (1972). Depositional
history of Gulfian Cretaceous of east Texas embayment. AAPG Bulletin, 56(1), 38-67.
Stoll, H. M., & Schrag, D. P. (2001). Sr/Ca variations in Cretaceous carbonates: relation
to productivity and sea level changes. Palaeogeography, Palaeoclimatology,
Palaeoecology, 168(3), 311-336.
Tahiri, A., & El Hassani, A., 1994. L’Ordovicien du Maroc central septentrional. Le
Massif Central marocain et la Meseta orientale, Bull. Inst. Sci. Rabat, vol. spec, 18, 32-
37.
Tahiri, A., Montero, P., El Hadi, H., Martínez Poyatos, D., Azor, A., Bea, F., Simancas,
J. F., González and Lodeiro, F., 2010. Geochronological data on the Rabat-Tiflet
graintoids: their bearing on the tectonics of the Moroccan Variscides. Journal of African
Earth Sciences, 57 (1), 1-13.
Tassinari, C., C., and Macambira, M. J., 1999. Geochronological provinces of the
Amazonian Craton. Episodes-Newsmagazine of the International Union of Geological
Sciences, 22 (3), 174-182
Teixell, A., Ayarza, P., Zeyen, H., Fernandez, M., and Arboleya, M. L., 2005. Effects of
mantle upwelling in a compressional setting: the Atlas Mountains of Morocco. Terra
Nova, 17 (5), 456-461.
Thomas, M. F. H., Bodin, S., Redfern, J., and Irving, D. H. B., 2010. A constrained
African craton source for the Cenozoic Numidian Flysch: implications for the
palaeogeography of the western Mediterranean basin. Earth-Science Reviews, 101 (1), 1-
23.
Thomas, R. J., Chevallier, L. P., Gresse, P. G., Harmer, R. E., Eglington, B. M.,
Armstrong, R. A., de Beer, C. H., Martini J. E. J., de Kock, G. S., Macey, P. H., and
154
Ingram, B. A., 2002. Precambrian evolution of the Sirwa window, Anti-Atlas orogen,
Morocco. Precambrian Research, 118 (1), 1-57.
Thompson, M. D., and Bowring, S. A., 2000. Age of the Squantum" tillite," Boston
Basin, Massachusetts; U-Pb zircon constraints on terminal Neoproterozoic glaciation.
American Journal of Science, 300 (8), 630-655.
Thomson, J., Wilson, T. R. S., Culkin, F., & Hydes, D. J. (1984). Non-steady state
diagenetic record in eastern equatorial Atlantic sediments. Earth and planetary science
letters, 71(1), 23-30.
Tian, Y., Ayers, W. B., & McCain, W. D. (2012). Regional analysis of stratigraphy,
reservoir characteristics and fluid phases in the Eagle Ford Shale, South Texas: Gulf
Coast Association of Geological Societies Transactions, 62, 471-483.
Tribovillard, N., Algeo, T. J., Lyons, T., & Riboulleau, A. (2006). Trace metals as
paleoredox and paleoproductivity proxies: an update. Chemical Geology, 232(1), 12-32.
Valverde-Vaquero, P., van Staal, C. R., McNicoll, V., & Dunning, G. R., 2006. Mid–Late
Ordovician magmatism and metamorphism along the Gander margin in central
Newfoundland. Journal of the Geological Society, 163(2), 347-362.
Vázquez Vílchez, M., Asebriy, L., Azdimousa, A., Jabaloy Sánchez, A., Booth-Rea, G.,
Barbero, L., Mellini, M., and González-Lodeiro, F., 2013. Evidence of extensional
metamorphism associated to Cretaceous rifting of the North-Maghrebian passive margin:
The Tanger-Ketama Unit (External Rif, northern Morocco). Geologica Acta, 11 (3), 277-
293.
Verati, C., Rapaille, C., Féraud, G., Marzoli, A., Bertrand, H., and Youbi, N., 2007. 40
Ar/39 Ar ages and duration of the Central Atlantic Magmatic Province volcanism in
Morocco and Portugal and its relation to the Triassic–Jurassic boundary.
Palaeogeography, Palaeoclimatology, Palaeoecology, 244 (1), 308-325.
Vermeesch, P., 2009. RadialPlotter: A Java application for fission track, luminescence
and other radial plots. Radiation Measurements, 44 (4), 409-410.
Vermeesch, P., 2012. On the visualisation of detrital age distributions. Chemical
Geology, 312, 190-194.
Walsh, G. J., Aleinikoff, J. N., Benziane, F., Yazidi, A., and Armstrong, T. R., 2002. U–
Pb zircon geochronology of the Paleoproterozoic Tagragra de Tata inlier and its
155
Neoproterozoic cover, western Anti-Atlas, Morocco. Precambrian Research, 117 (1), 1-
20.
Warny, S. A., Bart, P. J., and Suc, J. P., 2003. Timing and progression of climatic,
tectonic and glacioeustatic influences on the Messinian Salinity Crisis. Palaeogeography,
Palaeoclimatology, Palaeoecology, 202 (1), 59-66.
Wilde, S., and Youssef, K., 2002. A re-evaluation of the origin and setting of the Late
Precambrian Hammamat Group based on SHRIMP U–Pb dating of detrital zircons from
Gebel Umm Tawat, North Eastern Desert, Egypt. Journal of the Geological Society, 159
(5), 595-604.
Wildi, W. (1983). The orogenic belt of the Rif (Morocco) and the Tell (Algeria, Tunisia)
-structure, stratigraphy, paleogeographic and tectonic evolution from Triassic to the
Miocene. Revue De Geologie Dynamique Et De Geographie Physique, 24(3), 201-297.
Willner, A. P., Gerdes, A., and Massonne, H. J., 2008. History of crustal growth and
recycling at the Pacific convergent margin of South America at latitudes 29–36 S
revealed by a U–Pb and Lu–Hf isotope study of detrital zircon from late Paleozoic
accretionary systems. Chemical Geology, 253 (3), 114-129.
Willner, A. P., Barr, S. M., Gerdes, A., Massonne, H. J., and White, C. E., 2013. Origin
and evolution of Avalonia: evidence from U–Pb and Lu–Hf isotopes in zircon from the
Mira terrane, Canada, and the Stavelot–Venn Massif, Belgium. Journal of the Geological
Society, 170 (5), 769-784.
Wilson, T. R. S., Thomson, J., Hydes, D. J., Colley, S., Culkin, F., & Sørensen, J. (1986).
Oxidation fronts in pelagic sediments: Diagenetic formation of metal-rich layers. Science,
232(4753), 972-975.
Zaghloul, M. N., Guerrera, F., Loiacono, F., Maiorano, P., and Puglisi, D., 2002.
Stratigraphy and petrography of the Beni Ider Flysch in the Tetouan area (Rif chain,
Morocco). Bollettino della Società geologica italiana, 121(1), 69-85.
Zaghloul, M. N., Di Staso, A., De Capoa, P., and Perrone, V., 2007. Occurrence of upper
Burdigalian silexite beds within the Beni Ider Flysch Fm. in the Ksar-es-Seghir area
(Maghrebian Flysch Basin, Northern Rif, Morocco): stratigraphic correlations and
geodynamic implications. Bollettino della Società geologica italiana, 126(2), 223-239.
Zeck, H. P., and Whitehouse, M. J., 1999. Hercynian, Pan-African, Proterozoic and
Archean ion-microprobe zircon ages for a Betic-Rif core complex, Alpine belt, W

156
Mediterranean–consequences for its PTt path. Contributions to Mineralogy and
Petrology, 134 (2-3), 134-149.
Zeck, H. P., and Whitehouse, M. J., 2002. Repeated age resetting in zircons from
Hercynian–Alpine polymetamorphic schists (Betic–Rif tectonic belt, S. Spain)—a U–Th–
Pb ion microprobe study. Chemical Geology, 182 (2), 275-292
Zeck, H. P., and Williams, I. S., 2001. Hercynian metamorphism in nappe core
complexes of the Alpine Betic–Rif belt, western Mediterranean—a SHRIMP zircon
study. Journal of Petrology, 42 (7), 1373-1385.
Zheng, Y., Anderson, R. F., van Geen, A., & Fleisher, M. Q. (2002). Remobilization of
authigenic uranium in marine sediments by bioturbation. Geochimica et Cosmochimica
Acta, 66(10), 1759-1772.
Zizi, M., 2002. Triassic-Jurassic extensional systems and their Neogene reactivation in
northern Morocco (the Rides Prerifaines and Guercif Basin). Notes et Memoires du
Service Geologique du Maroc, 146, 1-138.

157
APPENDIX A - PERMISSION TO REPRINT (CHAPTER 1)

158
Copyright © 2022 FDOKUMEN