The generality of within-session patterns of responding: Rate of reinforcement and session length
Upload
independentCategory
view
0download
0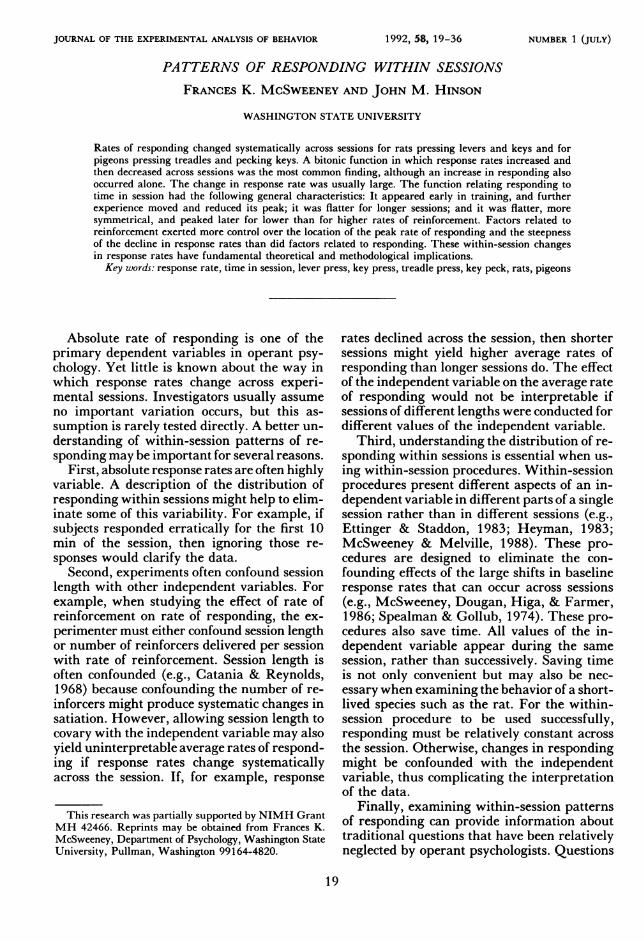
JOURNAL OF THE EXPERIMENTAL ANALYSIS OF BEHAVIOR
PATTERNS OF RESPONDING WITHIN SESSIONS
FRANCES K. MCSWEENEY AND JOHN M. HINSON
WASHINGTON STATE UNIVERSITY
Rates of responding changed systematically across sessions for rats pressing levers and keys and forpigeons pressing treadles and pecking keys. A bitonic function in which response rates increased andthen decreased across sessions was the most common finding, although an increase in responding alsooccurred alone. The change in response rate was usually large. The function relating responding totime in session had the following general characteristics: It appeared early in training, and furtherexperience moved and reduced its peak; it was flatter for longer sessions; and it was flatter, moresymmetrical, and peaked later for lower than for higher rates of reinforcement. Factors related toreinforcement exerted more control over the location of the peak rate of responding and the steepnessof the decline in response rates than did factors related to responding. These within-session changesin response rates have fundamental theoretical and methodological implications.
Key words: response rate, time in session, lever press, key press, treadle press, key peck, rats, pigeons
Absolute rate of responding is one of theprimary dependent variables in operant psy-chology. Yet little is known about the way inwhich response rates change across experi-mental sessions. Investigators usually assumeno important variation occurs, but this as-sumption is rarely tested directly. A better un-derstanding of within-session patterns of re-sponding may be important for several reasons.
First, absolute response rates are often highlyvariable. A description of the distribution ofresponding within sessions might help to elim-inate some of this variability. For example, ifsubjects responded erratically for the first 10min of the session, then ignoring those re-sponses would clarify the data.
Second, experiments often confound sessionlength with other independent variables. Forexample, when studying the effect of rate ofreinforcement on rate of responding, the ex-perimenter must either confound session lengthor number of reinforcers delivered per sessionwith rate of reinforcement. Session length isoften confounded (e.g., Catania & Reynolds,1968) because confounding the number of re-inforcers might produce systematic changes insatiation. However, allowing session length tocovary with the independent variable may alsoyield uninterpretable average rates of respond-ing if response rates change systematicallyacross the session. If, for example, response
This research was partially supported by NIMH GrantMH 42466. Reprints may be obtained from Frances K.McSweeney, Department of Psychology, Washington StateUniversity, Pullman, Washington 99164-4820.
rates declined across the session, then shortersessions might yield higher average rates ofresponding than longer sessions do. The effectof the independent variable on the average rateof responding would not be interpretable ifsessions of different lengths were conducted fordifferent values of the independent variable.
Third, understanding the distribution of re-sponding within sessions is essential when us-ing within-session procedures. Within-sessionprocedures present different aspects of an in-dependent variable in different parts of a singlesession rather than in different sessions (e.g.,Ettinger & Staddon, 1983; Heyman, 1983;McSweeney & Melville, 1988). These pro-cedures are designed to eliminate the con-founding effects of the large shifts in baselineresponse rates that can occur across sessions(e.g., McSweeney, Dougan, Higa, & Farmer,1986; Spealman & Gollub, 1974). These pro-cedures also save time. All values of the in-dependent variable appear during the samesession, rather than successively. Saving timeis not only convenient but may also be nec-essary when examining the behavior of a short-lived species such as the rat. For the within-session procedure to be used successfully,responding must be relatively constant acrossthe session. Otherwise, changes in respondingmight be confounded with the independentvariable, thus complicating the interpretationof the data.
Finally, examining within-session patternsof responding can provide information abouttraditional questions that have been relativelyneglected by operant psychologists. Questions
19
1992, 58, 19-36 NUMBER 1 (JULY)
FRANCES K. McSWEENEY and JOHN M. HINSON
LEEVE:R PREESS
- a
.-0240_6 d - -M. D130--D10
-M. son # D6DDO
2 4 a 8 10 12
REa PREESS
w
0 ,"I
0 2 4 8 10
- D240- 4 W. - D13O-- D10
D6I.- DO12
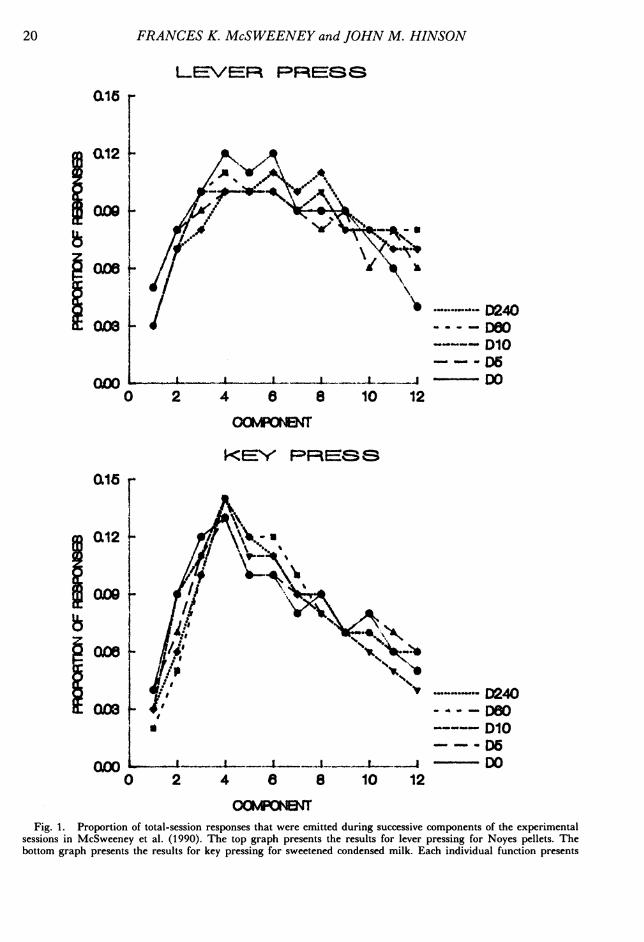
0O#NENFig. 1. Proportion of total-session responses that were emitted during successive components of the experimental
sessions in McSweeney et al. (1990). The top graph presents the results for lever pressing for Noyes pellets. Thebottom graph presents the results for key pressing for sweetened condensed milk. Each individual function presents
Q16
e 012
QS009
0000
Q12
009
OD00
20

WITHIN-SESSION RESPONDING
on such topics as fatigue, satiation, and warm-up effects are most effectively addressed byexamining within-session responding.The present paper uses data from our lab-
oratories to examine the distribution of re-sponding within sessions. The paper is de-signed to emphasize the importance of questionson this topic and to provide directions for fu-ture research, rather than to provide definitiveanswers. In some cases, studies were not de-signed to answer questions about within-ses-sion patterns of responding. Therefore, theirresults are suggestive rather than definitive.
Lever and Key Pressing by RatsMcSweeney, Hatfield, and Allen (1990) at-
tempted to replicate a study by Bacotti (1976)that examined whether changes in the time ofdelivery of a postsession feeding would alterresponding within the session. In this study,rats pressed levers for Noyes pellets or keysfor sweetened condensed milk reinforcers de-livered by multiple variable-interval (VI)1 -min VI 1-min schedules. The componentsof the multiple schedule alternated every 5min, and 12 components were delivered persession. The time at which postsession feed-ings were delivered was varied in five stepsfrom 0 to 240 min after the session. Fortysessions were conducted for the first delay topostsession feedings, and 30 sessions were con-ducted for each subsequent delay. Neither theabsolute rates of responding nor the within-session patterns of responding varied with thedelay to postsession feedings, but a consistentand pronounced pattern of within-session re-sponding emerged for both responses. That is,absolute response rates increased for the first20 min of the session and then decreased.
Figure 1 replots the within-session patternsof responding reported by McSweeney et al.(1990). It presents the proportion of the total-session responses emitted during successivecomponents within the session. Proportionswere calculated by dividing the number of re-sponses emitted during a component by thetotal number of responses emitted during thesession. The plotted proportions are the meansof the proportions calculated over all subjects
and over the last five sessions for which eachdelay was conducted. The top graph presentsthe results for lever pressing for Noyes pellets.The bottom graph presents the results for keypressing for sweetened condensed milk. Thedifferent functions present the results for dif-ferent delays to postsession feedings. Propor-tions have been presented here and throughoutthis paper so that the pattern of respondingwithin the session will be independent of dif-ferences in absolute response rate. (Absolutevalues may be obtained by consulting the citedreferences from which the data were derivedor by writing to either author.) The presen-tation of proportions does not distort the databy obscuring any other functional relations.The results in Figure 1 also represent the
results for individual subjects. Figure 2 pre-sents the proportion of total-session responsesemitted by individual subjects during succes-sive components for lever (top) and key (bot-tom) pressing. The proportions were calcu-lated over the last five sessions for which the60-min postsession feeding delays were con-ducted. Data for the 60-min postsession feed-ings were arbitrarily selected for presentation.
Figure 3 shows that the results presented inFigure 1 also represent the results for individ-ual sessions. It presents the proportion of total-session responses emitted by the first subjectduring successive components for each of thelast five sessions during which the 60-min de-lay to postsession feedings was presented. Re-sults are presented for lever (top) and key (bot-tom) pressing. Data for the 1st subject werearbitrarily selected for presentation.The functions reported in Figures 1, 2, and
3 are orderly. In all cases, response rates in-creased for approximately the first 20 min (four5-min components) of the session and thendecreased. This function was reported for bothresponses, both reinforcers, all subjects, andall sessions. The changes in response ratesacross the session were large. For example, therate of key pressing averaged 15.7 and 27.5responses per minute for the first and 12thcomponents, respectively. It averaged 70.0 re-sponses per minute at its peak in the fourthcomponent. Lever pressing averaged 6.8 and
the results for subjects responding at a particular delay to postsession feedings. The results are for the mean of allsubjects averaged over the last five sessions for which each delay to postsession feeding was presented. The delay values(following D) are in minutes.
21

FRANCES K. McSWEENEY and JOHN M. HINSON
LEVEFs PRFS S
Ar-
0 2 4 6 8 10 12
COMPONENT
KERY PRFESES
0.25
E 0.20
0.15
Y 0.10
E 0.06
0.00
8483
- -821 1 , Si
0 2 4 6 8 10 12
COMPONENTFig. 2. The proportion of total-session responses emitted by individual subjects during successive components in
McSweeney et al. (1990). The top graph presents results for lever pressing; the bottom graph presents results for keypressing. Each function presents the results for a single subject. The results are the means of the last five sessions for
which the 60-min delay to postsession feeding was conducted.
22
0.15 r-
0.10 t
Ei
06 0.05 L-
0.00
.......--SS- ---8S4
S3- - S2
S1
-L

WITHIN-SESSION RESPONDING
LEEVER PRE8SS020 r
2 4 8 8 10 12
OOMPONENT
KEEY PRESS
Q10 F a
- a
0 2 4 6 8 10 12
OOMPONENTFig. 3. The proportion of total-session responses emitted during successive components for individual sessions in
McSweeney et al. (1990). The top graph presents results for lever pressing; the bottom presents results for key pressing.Each individual function presents the results for one of the last five sessions for which the first subject (SI in Figure2) responded during the 60-min delay to postsession feedings. (Reprinted with permission.)
aQ16
Q10
E
06
0ao L0
020
Q16
I06 F
aoo
23
A

24 FRANCES K. McSWEENEY andJOHN M. HINSON
\
L I I I I I
0 1 2 3 4 6
.-. 82408120
- --860-__-- 810
BGHT-MINUTE INTERVALSFig. 4. The proportion of total-session treadle presses emitted during successive 8-min intervals during the session
when pigeons responded on positive conditioned-suppression procedures. Each function presents the results for a
particular stimulus duration (in seconds). Results have been averaged over the last five sessions for which each durationwas presented and are those for the mean of all subjects.
11.9 responses per minute during the first and12th components, respectively. It averaged 19.4responses per minute at its peak in the fourthcomponent. This function appeared even
though the distribution of reinforcers pro-grammed for delivery by the multiple VI VIschedule was flat across the session.
Treadle Pressing by PigeonsFigure 4 presents the results obtained when
pigeons pressed treadles for mixed grain re-
inforcers delivered by a positive conditioned-suppression procedure. Pressing a treadle pro-duced reinforcers according to a VI 1-minschedule. From time to time, a red light ap-peared on the response key located directlyabove the treadle. The stimulus was followedby a response-independent reinforcer. Stimuliwere presented according to a VI 1-min sched-ule, and no reinforcers were delivered duringthe stimulus. The duration of the stimulus var-
ied across conditions in five steps from 10 to240 s. Each stimulus duration was presentedfor 40 sessions. All sessions ended when 40min had elapsed. Reinforcers were 5 s of access
to mixed grain.Figure 4 presents the proportion of the total-
session treadle presses that were emitted dur-ing successive 8-min intervals during the ses-
sion. The results are those for the mean of allsubjects responding during the last five sessionsfor which each stimulus duration was pre-
sented. Each individual function presents theresults for a particular stimulus duration. Re-sults have been presented for 8-min intervals,instead of for the 5-min intervals plotted inthe earlier figures, because the results were
more orderly when plotted for longer periods.Figure 5 presents the results obtained for
individual subjects responding when the stim-ulus was 10, 60, 120, or 240 s long. Each graphpresents the results for a particular stimulusduration, and each function presents the re-
sults for an individual subject. Again, resultshave been averaged over the last five sessionsfor which each stimulus duration was pre-
sented. The results for the 120-s stimulus werevariable from subject to subject. Otherwise,response rates increased and then decreasedduring the session. They reached a peak ap-proximately 20 min after the beginning of thesession. Again, the change in response ratesacross the session was large. Subjects emittedan average of 16% or 17% of their total re-
0.3
02
0.1
IScJ
Q
0.0
24

WITHIN-SESSION RESPONDING
630 a
b
1 2 a 4eOW-4M4E HTERAL8
04 r
02f-
00a
120 S
Ibox
1:t 2 8Eu4r-*4E INL/M8
240 a04r
a-
a-
0 1 2 8ES NI IN I VVALM
Fig. 5. The proportion of total-session treadle presses emitted during successive 8-min intervals during the session.Each graph presents the results for one particular stimulus duration. The functions represent the results for individualsubjects. The results have been averaged over the last five sessions for which a particular stimulus duration was
presented.
sponses in the first and last fifths, but theyemitted 24% of their total responses in the thirdfifth.
Key Pecking by PigeonsFigure 6 presents the proportion of total-
session key pecks emitted during successive5-min intervals by pigeons pecking keys forfood reinforcers delivered on concurrent VI VIschedules. The left side of the figure presentsthe results obtained for subjects responding ontwo-key concurrent schedules. Each schedulewas presented for 14 daily 1-hr sessions (seeHinson & Staddon, 1983, for further details).The right side of the figure presents the resultsobtained for subjects responding on Findley
(1958) concurrent schedules. In this experi-ment, a yellow changeover key controlled a
schedule key signaled by either red or green.Each schedule was presented for 20 30-minsessions (see Hinson & Higa, 1989, for a de-scription of the apparatus). In both experi-ments, the reinforcer was 3 s of access to mixedgrain. Each graph presents the results for themean of the 3 subjects responding calculatedover the last seven sessions for which the sched-ule was presented. The two functions plottedon each graph present the results for the twocomponents of each schedtle.
Figure 7 presents results for individual sub-jects. Again, the proportion of the total-sessionresponses emitted during successive 5-min in-
10 S064
as
ai
I0.8
e
- 4
_ e-8l-811 2 8 4 6EI Wr E NrRAL
04
as
00
--844--- 88---621
4 6
25

FRANCES K. McSWEENEY and JOHN M. HINSON
TW/VC0-KE-Y FlNIDLEEY
VI 60 VI130 VI 30 V1 30
/a //a160
10051
Goo0 2 4 a a 10 12
FE-*f Nl
VI 240 VI C0
c
amo
ata
6 aio
ow
/I ,l_
2 4 0 a 10 12
VI 90 VI 180020 -
06axQ_
OD
1 2 8 4 8 6
nWE#N n8i O
VI 30 VI 90
I I ~ . s 1
1 2 a 4 8 a
VI 90V 1 30
/
'I ~ ~ f
1 2 S 4 8 6
FIV MNMHi
26
£L12
a10
aIo
1aam
aODc
Q12
aio
IceD000
0042
Om
010[cCAiI
aoos
012
0000 2 4 a a t0 12
n*MEJF 3NrMA

WITHIN-SESSION RESPONDING
tervals for subjects responding on concurrentschedules is shown. Each graph presents theresults for a single subject responding on thetwo-key concurrent VI 90-s VI 180-s or theFindley concurrent VI 30-s VI 90-s schedule.The two functions plotted on each graph rep-resent the results for the two components ofeach schedule. Again, data have been averagedover the last seven sessions for which the sched-ule was available. The bitonic function ap-pears for all three two-key concurrent sched-ules and for each individual subject, althoughit is fairly flat for Subject 1. The ascendinglimb of the function appears for all schedulesand subjects for the Findley concurrent sched-ules. It is not apparent in Figure 7 for the firstcomponent for Subject A because the functionreached its peak during the first 3 min. There-fore, Figure 7 does not present a fine enoughresolution of the data for the ascending limbto be apparent. The descending limb did notappear clearly for all Findley concurrentschedules or for individual subjects.The differences between the results for two-
key and Findley concurrent schedules shouldnot be interpreted too strongly. The descendinglimb may have failed to appear for the Findleyconcurrent schedules for minor proceduralreasons (e.g., because sessions were too shortor rates of reinforcement were too high), aswell as because of more fundamental differ-ences between the behavior governed by Find-ley and two-key concurrent schedules.
Factors That Control Within-SessionResponding
Session length. The factors that control thechanges in response rates across the sessionneed to be determined. In this regard, the ex-periment for rats pressing keys was repeatedvarying session length (McSweeney, in press,Experiment 2). All procedural details weresimilar to those listed earlier for key pressingexcept that the following session lengths wereconducted in the following order (the com-ponent duration used to produce each session
length appears in parentheses after the sessionlength): 60 min (300 s), 30 min (150 s), 90min (450 s). Session length was changed byvarying the length of the components whilepresenting a constant 12 components per ses-sion. Subjects responded on a multiple VI1-min VI 1 -min schedule for 30 sessions foreach session length.
Figure 8 presents the proportion of total-session responses emitted during successivecomponents for each session length. The in-dividual functions present the results for dif-ferent session lengths. Responses have beenaveraged over all subjects and over the last fivesessions for which each session length was con-ducted. (Results for individual subjects resem-ble those in Figure 8 and may be found inMcSweeney, in press.) The peak response ratesoccurred during later components for shorterthan for longer sessions. Because componentswere shorter for shorter sessions, peak re-sponse rates occurred approximately the samenumber of minutes after the beginning of thesession for all session lengths. Respondingpeaked between 12.5 and 22.5 min (Compo-nents 6 to 9) for the 30-min sessions, 15 and20 min (Component 4) for the 60-min sessions,and 15 and 37.5 min (Components 3 to 5) forthe 90-min sessions.The functions reported in Figure 8 were
flatter for longer sessions. The proportion ofresponses emitted during the components var-ied from .02 to .11 for the 30-min sessions.They varied from .05 to .11 for the 60- and90-min sessions. This may be a real effect ofsession length, or it may be a statistical artifact.Suppose, for example, that subjects respondedat a very slow rate during the first minute ofthe session regardless of session length. Thisslow responding would influence the reportedproportion of first-component responses morefor shorter than for longer sessions. Becausecomponents are shorter for shorter sessions,responding during the first minute would exerta larger influence on responding during thefirst component for the shorter sessions.
Fig. 6. Proportion of total-session key pecks emitted during successive 5-min intervals for each component of two-key (left) or Findley (right) concurrent VI VI schedules. The results for the two-key concurrent schedules werepreviously reported by Hinson and Staddon (1983). Each graph presents the results for the mean of the 3 subjectsresponding in that experiment. The two functions present the results for the two components. The solid line presentsthe results of the component listed first; the dashed line, the component listed second. The concurrent schedules arereported in seconds. Proportions have been calculated over the last seven sessions for which each schedule was available.
27

FRANCES K. McSWEENEY and
SUBJE-CT 116
0.12
aow
ato
0,120.16
1:amf
aoo
020 r
eA-&
016
aI
2 4 a s 10
NAE NnGTB
aUEBJE=-:.-C 2
ao012 0
m20 r
t . .
0 2 4 a a 10nVE-MNUE NIVX
SUBJEC)T 3
016
O.-
0 0 L I . I IIA.0 2 4 a a 10
a106
o co12
020
0.16
b 0.10
CM0o
JOHN M. HINSON
F=INI DL-E=Y
8UBJEGCT A
/0 -4..
le
1 2 4 6 6
--fRa- rE N r
1 2 4 6 aFWE-MWE NHT1WAU
SU6_JE'DT C
_ ~ ~~_- _
4(/I
---P2
^ P1
0 1 2 4 6 6
RYWAEHiWllI12
nE4NE NK'VVL
28

WITHIN-SESSION RESPONDING
The functions were also more symmetricalaround the middle of the session for the in-termediate session length (60 min) than forlonger and shorter sessions. Wilcoxon signedrank tests showed that the proportion of re-sponses emitted during the first and secondhalves of the sessions differed significantly (p< .05) for the 30-min (p = .04) and 90-min(p = .04) sessions, but not for the 60-min ses-sions (p = .08). More responses were emittedduring the second than during the first half ofthe session when sessions were 30 min long.More responses were emitted during the firstthan during the second halfwhen sessions were90 min long.A one-way within-subject analysis of vari-
ance confirmed that the absolute rates of re-sponding emitted during the entire session alsochanged with session length, F(2, 8) = 4.87,p < .05. The mean response rate emitted dur-ing the 60-min sessions (64.8 responses perminute) was significantly (p < .05) greaterthan that emitted during the 30-min sessions,t(4) = -2.84, M = 36.9 responses per minute,or 90-min sessions, t(4) = 4.11, M = 47.5responses per minute.
Rate of reinforcement. To determine the ef-fect of the programmed rate of reinforcementon the changes in response rates within ses-sions, the experiment for rats pressing leverswas repeated varying the rate of reinforcement(McSweeney, in press, Experiment 1). Sub-jects responded for Noyes pellets on multipleschedules in which the components alternatedevery 5 min. The following schedules werepresented in the following order: multiple VI30 s VI 30 s, multiple VI 2 min VI 2 min,multiple VI 4 min VI 4 min, multiple VI 15s VI 15 s, and multiple VI 1 min VI 1 min.Subjects responded on each of these schedulesfor 30 sessions. Each session ended when 12components had been presented.
Figure 9 presents the proportion of total-session responses emitted during successivecomponents of the multiple schedules. The in-dividual functions present the results for the
Q16 r
012
ODO
QOO
-
I-
2 4 a 8 10 12
---MOO- MOo
0
8UOEB8IVE OOMPONB4T8
Fig. 8. The proportion of total-session responses emit-ted during successive components for the mean of all sub-jects responding in Experiment 2 of McSweeney (in press).Each function presents the results for a different sessionlength. Results have been averaged over the last five ses-sions for which each session length was available. Sessionlengths (values after M) are in minutes. (Reprinted withpermission.)
different multiple schedules. Results have beenaveraged over all subjects and over the last fivesessions for which each schedule was con-ducted. (Results for individual subjects aresimilar to those for the mean of all subjectsand appear in McSweeney, in press.) Thefunctions became flatter as the programmedrate of reinforcement decreased. For example,proportions varied from .02 to .15 for the mul-tiple VI 15-s VI 15-s schedule, but from only.07 to .11 for the multiple VI 4-min VI 4-minschedule.The functions also became more symmet-
rical around the middle of the session as theprogrammed rate of reinforcement decreased.Subjects emitted significantly (p < .05) moreresponses during the first half of the sessionthan during the second half for the VI 15-s (p= .04), VI 30-s (p = .04), and VI 60-s (p =.04) schedules, as assessed by Wilcoxon signedrank tests. The proportion of responses emittedduring the two halves did not differ signifi-
Fig. 7. Proportion of total-session key pecks emitted by individual subjects during successive 5-min intervals forthe two-key concurrent VI 90-s VI 180-s (left) and the Findley concurrent VI 30-s VI 90-s (right) schedules. Eachgraph presents the results for an individual subject. The two functions present the results for the two components. Thesolid line presents the results for the shorter VI schedule; the dashed line, for the longer VI schedule. Proportions havebeen averaged over the last seven sessions for which each schedule was available.
29

FRANCES K. McSWEENEY and JOHN M. HINSON
020
| Q16
50Q10
106
oflo
.-V* 40- - - " V1120
- "WV110
0 2 4 8 10 12
SUCCE81VE COATSNENT8Fig. 9. Proportion of total-session responses emitted during successive components for the mean of all subjects
responding in Experiment 1 of McSweeney (in press). Each function presents the results for a particular VI schedule.Results have been averaged over the last five sessions for which each schedule was presented. Schedule values are inseconds. (Reprinted with permission.)
cantly for the VI 2-min (p = .07) or the VI4-min (p = .89) schedules.The peak rate of responding occurred later
in the session as the programmed rate of re-inforcement decreased (Figure 9). Subjectsemitted the highest proportion of their totalresponses during the first or second componentof the multiple VI 15-s VI 15-s schedule. Sub-jects emitted the highest proportion of theirtotal responses during the sixth component ofthe multiple VI 4-min VI 4-min schedule.
In this experiment, the average rate of re-sponding (responses per minute) emitted overthe entire session increased with increases inthe programmed rate of reinforcement up to120 reinforcers per hour (multiple VI 30-s VI30-s schedule). Response rates decreased witha further increase in reinforcement rate to 240
reinforcers per hour. These results appear inthe top left graph in Figure 10 (taken fromMcSweeney, in press) and are labeled "mean."The results are those for the mean of all sub-jects responding over the last five sessions forwhich each schedule was available. Such de-creases in response rates at high rates of re-inforcement are frequently observed (e.g.,Dougan & McSweeney, 1985; McSweeney &Melville, 1991).The question arises whether response rates
would increase as a monotonic function of rateof reinforcement if factors that changed overthe session (e.g., satiation, fatigue) were pre-vented. The graphs in Figure 10 answer thisquestion. They present the mean rates of re-sponding emitted during the first, third, ninth,and 12th components plotted as a function of
--4
Fig. 10. Rates of responding in Experiment 1 of McSweeney (in press) plotted as a function of programmed ratesof reinforcement. The top left graph presents rates of responding averaged across the entire session. The other graphspresent response rates for the first, third, ninth, and 12th components. All results are for the mean of all subjectsaveraged over the last five sessions for which each schedule was available. (Reprinted with permission.)
I

WITHIN-SESSION RESPONDING
NA1 E NIST
FI~~t
I~~~1/
8o
60
* 40
w
20
10,60 100 160 200 260
R_BIn AT RATE
THiPRD
//
i~~~~
i/ /
-I !
0-- 1 . L__-_A_-
60 100 160 200 260
rW RATE
1IN11tXTH60
40 -
WIUl
60 100 160 200
4FqCRM RATE
TV/ELFT7 H
s0o
20a
I
/~~~~/\IJ3
0 60 100 160 200fGVMWT RATE
86[
80 i-o
§26 T\\ / 'so~~~~~~~~~~~~~~~~~~~~~~~~~~~~~~~~~~~~:II]
31
600
601
401i80 f
201
10
I
70 r
80
w a60
10
40 r
so _
20 L
IO I
10260
N
\0

FRANCES K. McSWEENEY and JOHN M. HINSON
VI 30-8ala r
0.12 1
000
.18 I
ra12
*1' ~/\eX'. k \
8 10 18
OCMNBNT
60 MINUT Es
00X
4I
/I
0a0SF
oo -
o 16a 10
OMCNE
Fig. 11. The proportion of total-sessi(emitted during successive components in E(top axes) and Experiment 2 (bottom axes) of(in press). Results are presented for the Esession of training (circles) and for the meafive sessions of training (triangles) for thesubjects responding on the multiple VI 30-s Vule (top graph) or the 60-min session length (l(Reprinted with permission.)
the programmed rate of reinforcerresults are those for the mean of a
responding during the last five sewhich each schedule was availabgraphs show that response ratemonotonically with increases in theinforcement during the first compresponse rates declined at the highreinforcement for all other compon
Experience. The present bitonicare apparent early in training andspite of much experience with thebution of reinforcers across the sessi11, taken from McSweeney (in pressthe proportion of total-session respe
I
0.12 i
a1o t
outF\
0o0 F
004 1I
&72
-- - LAST-F~FR
0 2 4 a 8 10 12
cka
- 8E8826
Fig. 12. The mean proportion of total-session re-sponses emitted during successive components of a multipleVI VI schedule. The solid line presents the mean pro-portions calculated over Sessions 25 to 30 for which thatschedule was presented. The dashed line presents the meanproportions calculated over Sessions 55 to 60. The resultsare those for the mean of all 5 subjects responding on thisschedule.
ted during successive components of experi-mental sessions. In both graphs, the first ses-sion had been preceded only by earlier sessionsof shaping. The data are those for the meanof all subjects. A bitonic function was present
-- - Lm# even during the first recorded session (Figure-'UT' 11). The effect of further training was to re-
duce the difference between the highest andlowest rates of responding and to move the
on responses peak of the function to the point that was ap-xperiment 1 propriate for that schedule and session dura-
f McSweeney tirst recorded ion.in of the last Figure 12 shows that the function changedmean of all little even when 60 sessions were conducted.
tI 30-s sched- It compares the mean proportion of responsesottom graph). emitted during successive components aver-
aged over Sessions 25 to 30 and over Sessions55 to 60 when rats pressed levers for Noyes
,nent. The pellets delivered by a multiple VI 1-min VI.11 subjects 1 -min schedule. Components were 150 s long,ssions for and 12 components were presented per session.le. These The results are those for the mean of 5 subjects.increased (The results for the mean closely representrate of re- those for individual subjects.) The functiononent, but changed little between Sessions 25 to 30 andLest rate of 55 to 60. Therefore, the function persisted inents. spite of extensive exposure to a flat distributionfunctions of reinforcement across the session.persist in
flot dFitr GENERAL DISCUSSION
;), presents The present results show that respondingnses emit- changed systematically within sessions when
32
% ld.
I

WITHIN-SESSION RESPONDING
subjects responded on several experimentalprocedures. Response rate frequently in-creased to a peak and then decreased. Increasesin response rates were also found alone (seeFigures 6 and 7). These changes in responserates occurred for several responses (key press,lever press, key peck, treadle press), proce-dures (multiple schedules, concurrent sched-ules, positive conditioned suppression), sessionlengths (30 to 90 min), and rates of reinforce-ment (15 to 240 reinforcers per hour). Whenresponse rates changed, the changes were alsofound for all subjects and sessions. The changesappeared in steady-state behavior as well asfor responding early in training.The changes in response rates across the
session appeared in spite of, rather than be-cause of, the distribution of reinforcers acrossthe session. The present VI schedules programa flat distribution of reinforcers across the ses-sion. Therefore, any changes in this distri-bution must be produced by changes in therates of responding, not vice versa.The distribution of reinforcers may have
influenced the bitonic function, however. Thedifference between the highest and lowest re-sponse rates emitted during the session de-creased from the first to the 30th session oftraining (Figure 11). The flat distribution ofreinforcers may have contributed to this de-crease. However, the unchanging distributionof reinforcement within sessions never fullycontrolled the distribution of responding. Re-sponse rates changed systematically within ses-sions even after 60 sessions of exposure to aflat distribution of reinforcement (Figure 12).To the best of our knowledge, this function
has not been previously reported, but severalother studies may be related. Two variableshave traditionally described performance dec-rements in similar situations: fatigue (e.g.,Muscio, 1921) and satiation (e.g., Reese &Hogenson, 1962). Two variables have also de-scribed results similar to the ascending limbof the function. First, priming has been ob-served when electrical brain stimulation is usedas the reinforcer. Priming refers to the factthat subjects may not respond until some freereinforcers have been given (e.g., Olds, 1956;Olds & Milner, 1954). Second, warm-up hasbeen reported, with different definitions, inmany studies, including those on the followingconditioning phenomena: discriminated avoid-ance (e.g., Foree & LoLordo, 1970; Hoffman,Fleshler, & Chorny, 1961), Sidman avoidance
(e.g., Powell, 1970; Wertheim, 1965), punish-ment (e.g., Azrin, 1960; Azrin, Holz, & Hake,1963; Hake & Azrin, 1965; Hake, Azrin, &Oxford, 1967), shock-elicited aggression(Hutchinson, Renfrew, & Young, 1971; Lyons& Ozolins, 1970), and conditioned emotionalresponse procedures (e.g., Rubin & Brown,1969). The early trials for such tasks as psy-chophysical procedures (e.g., Hodos, Leibo-witz, & Bonbright, 1976) or generalizationtests (e.g., Griffin & Stewart, 1977) may alsobe discarded as warm-up trials.The relation between the present results and
these historical observations is not known. Fa-tigue has not been a useful concept when de-scribing the literature on human performancedecrements (e.g., Muscio, 1921). It includesthe effects of too many variables (e.g., effectsat the neural, muscular, and central levels;effects resulting from overload with those re-sulting from underload).
Except for warm-up for avoidance (e.g.,Hineline, 1978a, 1978b), neither priming norwarm-up has been studied in systematic detail.However, what is known suggests that neitherprocedure is related to the present functions.For example, priming is not found for all sub-jects. The ascending limb of the present func-tion is found reliably for all subjects under anyconditions that produce it. The duration ofwarm-up for avoidance is highly variable acrosssubjects (e.g., Badia, Culbertson, & Lewis,1971). The ascending limb of the present func-tion ends at approximately the same time forall subjects. Warm-up for avoidance may alsofail to appear in measures of response rate.Warm-up for avoidance refers to the fact thatsubjects may receive a large proportion of theirtotal session shocks in the first minutes of asession. Interestingly, large changes in thenumber of shocks received may be reported inthe absence of any change in response rate(e.g., Leander, 1973; Powell & Peck, 1969).The present effect is just the opposite. It rep-resents a change in the rate of responding inthe absence of a change in the rate of rein-forcement.
Regardless of its relation to earlier studies,the present function has important theoreticaland methodological implications. To beginwith, it suggests that caution should be usedwhen confounding session length with an in-dependent variable. As argued earlier, manystudies require that either session length oranother variable (e.g., number of reinforcers
33

FRANCES K. McSWEENEY and JOHN M. HINSON
delivered per session) must be confounded withthe independent variable (e.g., rate of rein-forcement). If session length cannot be safelyconfounded, then operant studies will be moredifficult to conduct in the future. The presentresults show that session length cannot be safelyconfounded, at least when rats press keys. Ratesof responding changed significantly with mod-erate changes in session length. For example,the overall response rate almost doubled whenthe session was lengthened from 30 min (M =36.9 responses per minute) to 60 min (M =64.8 responses per minute). Such large changesin response rate would seriously confound theinterpretation of the results.
Second, the present results imply that within-session procedures should be used with cau-tion. Response rates change systematicallyacross experimental sessions. Therefore, ex-periments must be designed to avoid confound-ing the effects of these changes with the effectof the independent variable. Limitations on theuse of within-sessions procedures cannot beprecisely specified at this time. The generalityof the present results is not known. Therefore,within-session procedures might be safely usedin some experiments but not in others. Thelimitations will undoubtedly also depend onmany aspects of the experimental design. Forexample, the inclusion of timeouts during thesession may change the distribution of re-sponding within sessions in unknown ways.
Third, the present results imply that thedistribution of responding within sessions hascomplicated the answer to some theoreticalquestions. Figure 10 shows that rates of re-sponding emitted at the beginning of the ses-sion increase monotonically with increases inthe rate of reinforcement, confirming some the-ories (e.g., Herrnstein, 1970). Responding laterin the session increases up to a point and thendecreases, confirming other theories (e.g.,Baum, 1981; Staddon, 1979). It remains to beseen whether within-session patterns of re-sponding have confounded the effects of otherindependent variables, such as reinforcer sizeor delay.The size and reliability of the present func-
tion, as well as its resistance to the flat distri-bution of reinforcement, suggest that the func-tion is controlled by theoretically importantprocesses. These processes should be identifiedby studying the factors that control the formof the function. The present results provide
limited information on this topic that shouldbe verified by further experiments.To begin with, the results suggest that the
bitonic function reported in several of the fig-ures (e.g., Figures 1 and 3) is not a continuousfunction but is composed of two independentlimbs. For example, Figures 6 and 7 show thatthe ascending limb can appear without thedescending limb. Figures 6 and 7, suggest thatthe descending limb of the function may failto appear when sessions are short. Sessionswere only 30 min long for the Findley con-current schedules in Figures 5 and 6, and thedescending limb of the function sometimesfailed to occur during these procedures.The present results suggest that factors re-
lated to reinforcement (e.g., satiation, priming)exert more control over the peak of the functionand the steepness of the descending limb thanfactors related to responding (e.g., fatigue,warm-up). Most of the present data cannotseparate these variables because higher ratesof reinforcement usually covaried with higherrates of responding. However, Figure 8 pre-sents data critical to separating the effects ofthese variables on the peak of the function.Key pressing for sweetened condensed milkpeaked after approximately 20 min (20 rein-forcers) regardless of session duration. Thiswas true even though the number of emittedresponses was very different for different ses-sion lengths. Subjects emitted a mean of 851.5responses in the first eight components of thesession (20 min) for the 30-min sessions, amean of 1,292.9 responses in the first fourcomponents (20 min) for the 60-min sessions,and a mean of 1,061.0 responses in the firstthree components (22.5 min) for the 90-minsessions. This means that responding reacheda peak after 20 reinforcers or 20 min, regard-less of the number of responses emitted. Datacritical to separating the effects of reinforce-ment from the effects of time are found inFigure 9. It shows that the ascending limb ofthe function is steeper for higher rates of re-inforcement, suggesting that reinforcement ex-erts stronger control over this limb than thepassage of time alone.
Figure 9 presents data critical to separatingthe effects of responding and reinforcement onthe descending limb of the function. One com-parison is critical. Subjects responded fasterbut collected fewer reinforcers on the multipleVI 30-s VI 30-s schedule (M = 32.6 responses

WITHIN-SESSION RESPONDING 35
per minute) than on the multiple VI 15-s VI15-s schedule (M = 18.5 responses per min-ute). Figure 9 shows that the descending limbof the function was steeper for the multiple VI15-s VI 15-s schedule than for the multipleVI 30-s VI 30-s schedule. Therefore, rein-forcement may be more important than re-sponding in controlling the descending limb.The results presented in this paper raise
more questions than they answer. The factorsthat control the changes in response rates acrosssessions should be more carefully determined.For example, the sensitivity of the changes tothe distribution of reinforcers across the sessionshould be studied. The contributions of re-sponse-related and reinforcement-related vari-ables should be more carefully separated.The generality of the changes in response
rates for different schedules, species, reinforc-ers, responses, and procedures should be de-termined. The present data suggest thatchanges may be quite general because theyreport these changes for several different pro-cedures, responses, reinforcers, and species.However, responding may not always changesystematically across the session (e.g., Bloom-field, 1967). The factors that produce the dif-ferent results should be determined.The implications of the present functions
for theories of operant behavior should also beinvestigated. Most theories of operant behavioruse rate of responding as their dependent vari-able. Because the present results show that theaverage rate of responding across the sessionmasks strong regularities in behavior at a moremolecular level, the present results suggest thatmany theories of operant behavior may needrevision. To give just one example, it is gen-erally accepted that changing the rate of re-inforcement changes the average rate of re-sponding over the session. But Figure 9 showsthat this is an incomplete description. Chang-ing the rate of reinforcement also changes thedistribution of responding within the session,even when differences in the absolute rates ofresponding have been eliminated by reportingproportion of total responses rather than re-sponse rates. Newer theories must be formu-lated to capture these regularities.
REFERENCESAzrin, N. H. (1960). Effects of punishment intensity
during variable-interval reinforcement. Journal of theExperimental Analysis of Behavior, 3, 123-142.
Azrin, N. H., Holz, W. C., & Hake, D. F. (1963).Fixed-ratio punishment. Journal of the ExperimentalAnalysis of Behavior, 6, 141-148.
Bacotti, A. V. (1976). Home cage feeding time controlsresponding under multiple schedules. Animal Learning& Behavior, 4, 41-44.
Badia, P., Culbertson, S., & Lewis, P. (1971). Therelative aversiveness of signalled vs. unsignalled avoid-ance. Journal of the Experimental Analysis of Behavior,16, 113-121.
Baum, W. M. (1981). Optimization and the matchinglaw as accounts of instrumental behavior. Journal oftheExperimental Analysis of Behavior, 36, 387-403.
Bloomfield, T. M. (1967). Some temporal properties ofbehavioral contrast. Journal ofthe Experimental Analysisof Behavior, 10, 159-164.
Catania, A. C., & Reynolds, G. S. (1968). A quantitativeanalysis of the responding maintained by intervalschedules. Journal of the Experimental Analysis of Be-havior, 11, 327-383.
Dougan, J. D., & McSweeney, F. K. (1985). Variationsin Herrnstein's ro as a function of alternative rein-forcement rate. Journal of the Experimental Analysis ofBehavior, 43, 215-223.
Ettinger, R. H., & Staddon, J. E. R. (1983). Behavioralcompetition, component duration and multiple sched-ule contrast. Behavioural Analysis Letters, 2, 31-38.
Findley, J. D. (1958). Preference and switching underconcurrent scheduling. Journal of the ExperimentalAnalysis of Behavior, 1, 123-144.
Foree, D. D., & LoLordo, V. M. (1970). Signalled andunsignalled free-operant avoidance in the pigeon. Jour-nal of the Experimental Analysis of Behavior, 13, 283-290.
Griffin, P., & Stewart, D. J. (1977). Line-orientationgeneralization following signalled-reinforcer training.Journal of the Experimental Analysis of Behavior, 25,151-160.
Hake, D. F., & Azrin, N. H. (1965). Conditioned pun-ishment. Journal of the Experimental Analysis of Behav-ior, 8, 279-293.
Hake, D. F., Azrin, N. H., & Oxford, R. (1967). Theeffects of punishment intensity on squirrel monkeys.Journal ofthe Experimental Analysis ofBehavior, 10, 95-107.
Herrnstein, R. J. (1970). On the law of effect. Journalof the Experimental Analysis of Behavior, 13, 243-266.
Heyman, G. M. (1983). A parametric evaluation of thehedonic and motoric effects of drugs: Pimozide andamphetamine. Journal of the Experimental Analysis ofBehavior, 40, 113-122.
Hineline, P. N. (1978a). Warmup in avoidance as afunction of time since prior training. Journal of theExperimental Analysis of Behavior, 29, 87-103.
Hineline, P. N. (1978b). Warmup in free-operant avoid-ance as a function of the response-shock-shock-shockinterval. Journal of the Experimental Analysis of Behav-ior, 30, 281-291.
Hinson, J. M., & Higa, J. J. (1989). Discrete andcontinuous measures of dimensional stimulus control.Journal of the Experimental Analysis of Behavior, 51,199-214.
Hinson, J. M., & Staddon, J. E. R. (1983). Hill-climb-ing by pigeons. Journal of the Experimental Analysis ofBehavior, 39, 2-47.
Hodos, W., Leibowitz, R. W., & Bonbright, J. C., Jr.

36 FRANCES K. McSWEENEY and JOHN M. HINSON
(1976). Near-field visual acuity of pigeons: Effects ofhead location and stimulus luminance. Journal of theExperimental Analysis of Behavior, 25, 129-141.
Hoffman, H. S., Fleshler, M., & Chorny, H. (1961).Discriminated bar-press avoidance. Journal of the Ex-perimental Analysis of Behavior, 4, 309-316.
Hutchinson, R. R., Renfrew, J. W., & Young, G. A.(1971). Effects of long-term shock and associated stim-uli on aggressive and manual responses. Journal of theExperimental Analysis of Behavior, 15, 141-166.
Leander, J. D. (1973). Shock intensity and durationinteractions on free-operant avoidance behavior. Jour-nal of the Experimental Analysis of Behavior, 19, 481-490.
Lyons, D. O., & Ozolins, D. (1970). Pavlovian condi-tioning of shock-elicited aggression: A discriminationprocedure. Journal of the Experimental Analysis of Be-havior, 13, 325-331.
McSweeney, F. K. (in press). Rate of reinforcement andsession duration as determinants of within-session pat-terns of responding. Animal Learning & Behavior.
McSweeney, F. K., Dougan, J. D., Higa, J., & Farmer,V. A. (1986). Behavioral contrast as a function ofcomponent duration and baseline rate of reinforcement.Animal Learning &r Behavior, 14, 173-183.
McSweeney, F. K., Hatfield, J., & Allen, T. M. (1990).Within-session responding as a function of post-sessionfeedings. Behavioural Processes, 22, 177-186.
McSweeney, F. K., & Melville, C. L. (1988). Positivecontrast as a function of component duration using awithin-session procedure. Behavioural Processes, 16, 21-41.
McSweeney, F. K., & Melville, C. L. (1991). Behavioralcontrast as a function of component duration for lever-pressing using a within-session procedure. AnimalLearning & Behavior, 19, 71-80.
Muscio, B. (1921). Is a fatigue test possible? BritishJournal of Psychology, 12, 31-46.
Olds, J. (1956). Runway and maze behavior controlledby basomedial forebrain stimulation in the rat. Journalof Comparative and Physiological Psychology, 49, 507-512.
Olds, J., & Milner, P. (1954). Positive reinforcementproduced by electrical stimulation of septal area andother regions of the rat brain. Journal of Comparativeand Physiological Psychology, 47, 419-427.
Powell, R. W. (1970). The effect of shock intensity uponresponding under a multiple-avoidance schedule. Jour-nal of the Experimental Analysis of Behavior, 14, 321-329.
Powell, R. W., & Peck, S. (1969). Running-wheel ac-tivity and avoidance in the mongolian gerbil. Journalof the Experimental Analysis of Behavior, 12, 779-787.
Reese, T. W., & Hogenson, M. J. (1962). Food satiationin the pigeon. Journal of the Experimental Analysis ofBehavior, 5, 239-245.
Rubin, H. B., & Brown, H. J. (1969). The rabbit as asubject in behavioral research. Journal of the Experi-mental Analysis of Behavior, 12, 663-667.
Spealman, R. D., & Gollub, L. R. (1974). Behavioralinteractions in multiple variable-interval schedules.Journal of the Experimental Analysis of Behavior, 22,471-481.
Staddon, J. E. R. (1979). Operant behavior as adap-tation to constraint. Journal ofExperimental Psychology:General, 108, 48-67.
Wertheim, G. A. (1965). Some sequential aspects ofIRTs emitted during Sidman-avoidance behavior inthe white rat. Journal of the Experimental Analysis ofBehavior, 8, 9-15.
Received July 19, 1991Final acceptance December 10, 1991
Copyright © 2022 FDOKUMEN