Where Are Nurses Working? Employment Patterns by Sub-sector in Ontario, Canada

PATTERNS IN EDUCATION AND SELF-EMPLOYMENT
TOLULOPE OLAREWAJU
Aston Business School, Aston University
Aston Triangle, Birmingham B4 7ET
Tel: +44(0)1212043138, +44(0)7808836580
[email protected], [email protected]
ABSTRACT
This paper argues that self-employed individuals who become employers have different human capital endowments
in terms of educational attainments from self-employed individuals who do not become employers. Using the
Nigerian Living Standards Survey Data for 2004 and 2009, it finds that employers and wage workers consistently
have similar educational attainments while own-account workers exhibit a different educational pattern; it also
highlights significant gender differences. The study contributes to the literature by showing that not distinguishing
employers from own-account workers in the self-employment or entrepreneurship literature could lead to misleading
results. Empirically, employers (especially female employers) have quite significant amounts of education and they
also display characteristics more similar to the pull self-employment and entrepreneurship literature while own-
account workers have lower educational attainments and seem to agree more with the push employment debate in
terms of educational attainments. The study also shows that if men and women had the same endowments in
education, the disparity in self-employment incidence would be reduced.
Keywords: Education, Self-Employment, Developing-Countries, Employers, Own-Account Workers
JEL Classification Codes: J23, J24, J40, J21, R23, I20
INTRODUCTION AND MOTIVATION
The developing country self-employment literature has undergone considerable debate since Harris and Todaro
(1970) along with Ranis and Fei (1961) advocated a model that assumed a stagnant and unproductive informal
sector which serves as a refuge for the urban unemployed and new migrants who resort to informal self-employment
and unemployment. Those authors constructed an explanatory model of developing countries transition from
stagnation to self-sustaining growth. A number of concepts evolved involving urban unemployment, rural-urban
labour migration and the welfare implications of various policies. One of the salient presumptions was that if there is
a higher minimum wage in the wage sector; those in the agricultural sector, the self-employed and the unemployed
would be worse off.
Consequently as regards developing countries, there is a large branch of the literature that views individuals in the
self-employment sector as being pushed there due to lower welfare levels; this school is sometimes called the
pessimistic class (Haywood and Falco 2013). Jhabvala, Sudarshan et al. (2003) propound that informality1 in
developing countries consisting chiefly of the self-employed; is fundamentally a survival activity of the very poor
and disadvantaged workers who are typically unskilled and less educated. This view is further advocated by (Lewis
1954; Turnham and Jaeger 1971; Fields 1980; Squire 1981) who classify this group as the “working poor” who
engage in such activities to escape unemployment. Gindling and Newhouse (2012) report that the self-employed in
developing countries work for themselves and earn little either because they have been rationed out of wage jobs or
because they prefer the autonomy and flexibility of self-employment, and for several years the dominant view was
that large numbers of self-employed workers in developing countries reflected the rationing of employment
opportunities in the wage sector, due to regulations or efficiency wages above the market clearing level (Fields
2004; Tokman 2007; De Mel, McKenzie et al. 2010).
1 Self-employment is sometimes equated with working informally, but equating the two is not empirically correct.
“Informal Employment” is usually thought to comprise those who are outside the protection and regulation of the
state. Fields, G. S. (2013). "Self-Employment in the Developing World."

In general, there are two views on self-employment in developing countries – the pessimistic and optimistic schools;
like the studies already mentioned, Bromley (1978) in an analysis of developing countries that supports the
pessimistic view showed that self-employment is an activity of the underprivileged, Haywood and Falco (2013)
report a large wage premium in Ghana, Tokman (1992) and Loayza (1996) find in Latin-America that self-
employment is a sign of economic failure and a place for the disadvantaged while Mandelman and Montes-Rojas
(2009) report that in Argentina, self-employment is unlikely to be as a result of an optimal and voluntary decision
taken by high-skilled individuals.
Recently however this pessimistic view of the self-employed in LDC’s being a disadvantaged group is being
challenged by an optimistic one arguing that self-employment in developing countries may be a desirable
employment option that individuals self-select and opt for due to a variety of reasons; some pecuniary and others
non-pecuniary (Maloney 2004; Bosch and Maloney 2007; Bosch and Maloney 2010). Office (1972) found that in
Kenya many individuals choose to be self-employed for a variety of reasons; many of them beneficial when
compared to paid employment2. Mohapatra, Rozelle et al. (2007) concluded that self-employment in rural china
showed features of a productive small business sector and not a stop-over for disadvantaged individuals. Bosch and
Maloney (2010) find in Argentina, Brazil and Mexico that a substantial part of the informal sector, particularly the
self-employed, corresponds to voluntary entry3. Advantages in self-employment is also supported by Fields and
Pfeffermann (2003) Balán, Browning et al. (1973) and Gindling (1991).
Lately however, there appears to be a merging of the opposing views into one whereby the self-employed are made
up of both advantaged and disadvantaged workers (Fields 1990; Cunningham and Maloney 2001; Fields 2004;
Fields 2007; Mandelman and Montes-Rojas 2009; Günther and Launov 2012). Cunningham and Maloney (2001)
use cluster analysis to examine business owners in Mexico and show that the self-employed can be grouped into five
clusters with two actually resembling the wage sector. De Mel, McKenzie et al. (2008) finds heterogeneity for self-
2 Although a lot of these reasons were non-pecuniary. 3 However they also found that informal salaried work may correspond more closely to the standard queuing view
especially for younger workers.

employed workers in Sri Lanka and reports that the self-employed should be viewed on two levels; those who are
clearly disadvantaged and lack the potential to grow and others who are advantaged and have high growth prospects.
Gindling and Newhouse (2012) in a study that comprises 74 developing countries also find that 34% of self-
employed workers were successful4.
In particular, Tamvada (2010) measured welfare by household adult equivalent per-capita consumption expenditure
for Indian households and used quantile regressions to find strong empirical evidence that the self-employed who
employed others (employers) had the highest welfare in terms of consumption, while the self-employed with no
employees (own-account workers) had slightly lower returns than salaried employees but a higher welfare than
casual laborers. This study proved that the well-being of the self-employed relative to that of wage employees can
vary significantly across the earnings distribution and also that not distinguishing the employers from own-account
workers could be misleading.
This heterogeneity in self-employment and the fact the literature has only begun to account for it forms the basis of
this study. Are there systemic patterns in self-employment heterogeneity or is it just a random occurrence totally
determined by the luck of the draw? Can the self-employed be classified into more distinctive strata that can aid
policy makers and researchers with policies and research aimed at particular groups of the self-employed? Looking
at self-employment through the lens of educational human capital should thus give us insightful results for a number
of reasons. The literature already agrees that endowments in human capital affects the probability to be in self-
employment significantly (Robinson and Sexton 1994; Casson 1995; Parker 2004; Van der Sluis, Van Praag et al.
2005). Educational human capital has especially been seen as a crucial factor influencing the occupational decision
as individuals seek to maximize their returns on educational investments. Also, education serves as a prerequisite for
most paid sector jobs and a signal to prospective employers at the job market in addition to acting as a sorting
4 The study measured “success” as living in non-poor households (i.e. above the $2/day poverty line).

mechanism both for job seekers and employers. The literature typically reports that in addition to the Lazear (2004)
“Jack of all Trades” theory, higher educational attainments typically reduces the probability of being in self-
employment.
This research finds that the self-employed can be grouped into two distinct groups in terms of educational
attainments; Employers (the self-employed with employees) and Own-account workers (the self-employed with no
employees). Employers’ exhibit educational patterns similar to wage workers while own-account workers exhibit a
different educational pattern that is typical of the general self-employment transition literature. This study therefore
contributes to the self-employment transition literature by showing that the self-employed can be distinguished
systematically based on their educational attainments and self-employment type. Employers particularly need to be
classified differently from own-account workers in the self-employment literature as they display different human
capital in terms of educational attainments.
Distinguishing employers from own-account workers, Earle and Sakova (2000) argue that on the one hand, a self-
employed worker may be a successful business owner exploiting new opportunities and inventing new products,
production processes, and distribution methods. At the other extreme, self-employment status may result from
forced recourse to a residual sector in which the individual's activities and income differ little from those in
unemployment. Based on this they argue that the employers are clearly genuine business owners because employers
are creating jobs for others, implying that they have had some success in their business, they have been able to hire
capital and other inputs to work with their employees and they are most likely engaged in self-employment
voluntarily. This view agrees with the developing country literature as previous research shows that employers
typically have substantial financial capital, origins and different characteristics from own-account workers (Yamada
1996; Hanley 2000; Gollin 2008; Desai 2009). In line with that distinction, this paper thus argues that self-
employed individuals/business owners with employees (employers) are distinct from self-employed
individuals/business owners without employees (own-account workers) in terms of human capital endowments
measured in this case by educational attainments.

As for previous research that has focused on the effect of education on business owner ship motivation, Maloney
(2004) suggests that the size of the self-employed in Mexico, Brazil and Argentina seems to diminish with more
years of schooling. Parker (2004) and Le (1999) are of the opinion that the relationship between education and self-
employment is likely to depend on the econometric specification used although they tend to agree that as education
attainments increase, the probability of being self-employed reduces, while Demirgüc-Kunt, Klapper et al. (2009)
report that having a low level of education is not quite conducive for entrepreneurship and business ownership in the
real sense of the word. The prevailing view seems to be that some education is needed, but not so much that the
opportunity cost tied to education is too high; as prospective business owners might decide to find compensation in
the labor market via wage employment.
The current literature on self-employment and education is summed up succinctly by (Van Praag 2003; Van der
Sluis, Van Praag et al. 2005; Parker 2009). While economic theory suggests that business ownership performance
will be significantly enhanced by schooling (Van Praag 2003; Parker 2009), a meta-analysis done by Van der Sluis,
Van Praag et al. (2005) on developing countries showed that OLS estimates underestimate the self-employment
return to education and that while it is lower in developing countries than developed countries, it is quite significant;
crucially however, education reduced the probability of being in self-employment. The literature seems to indicate
that formal education has a negative relationship with being in self-employment (Blau 1985; Robinson and Sexton
1994).
The literature consensus is that since the costs to acquiring a formal education in developing countries is so high,
individuals might seek to maximize their returns and such investments in human capital by opting for wage/paid
employment. Also these studies seem to indicate that as a prerequisite for being qualified for wage sector jobs is
usually a formal education degree, then the probability for having a wage job increases with higher educational
attainment and thus the probability for being in self-employment reduces as educational attainment increases. Given
that the self-employed in developing countries are thought to be a disadvantaged group by the traditional literature

of Ranis and Fei (1961) and Harris and Todaro (1970), then one would expect the self-employed to also be lacking
in terms of educational human capital. However the distinction between employers and own-account workers is
rarely (if ever) made and to the best of this author’s knowledge, this is the first study distinguishing between
employers and own-account workers educational attainments in a developing country even though Earle and Sakova
(2000) attempt to answer the question in the context of a transition economy.
The rest of the paper is organized as follows: In Section 2, I present the context of the study, Section 3 analyses the
data while in Section 4; I discuss the results. Section 5 concludes with relevant tables and charts in the appendix.
CONTEXT
With a population of 168 million people, Nigeria is the most populous country in Africa and the seventh most
populous in the world. It accounts for 47% of West Africa’s population and one sixth of Africa’s current population.
Nigeria was classed as a lower-middle-income country and was Africa’s second largest economy with a GDP of
$262.6 billion and a GNI per capita of $1,440 in 2012 - at the time of this research. In April 2014, Nigeria via the
National Bureau of Statistics, under the advice and supervision of the World Bank rebased the GDP of the country5
to include sectors that were not previously in the National Income figures especially the telecommunications,
services and entertainment sectors. This increased the country’s GDP for 2013 by 89% to $509.9 billion making
Nigeria the biggest economy in Africa. It is also the biggest oil exporter in Africa, with the largest natural gas
reserves in the continent. According to 2011 estimates, the GDP was comprised of 35.4% agriculture, 33.6%
industry and 31% services $509.9. By 2007 government figures, about 66% of the Nigerian population was in the
labour force, and the country’s population growth rate from 2005 to 2010 was estimated at 2.3% per annum (World-
Bank 2013). Labour force participation rate in Nigeria for adult6 women was 47.9% in 2011, 38.7% in 2007, 38.1%
in 2005 and 37.0% in 2000. For adult men, the labour force participation was recorded at 63.3 % in 2011, 70.6% in
5 Global best practice of rebasing is every 5 years but Nigeria hasn’t rebased in 24 years since 1990.
6 Adult is defined as being between the ages of 15 and 60.
2007, 71.7% in 2005 and 73.7% in 2000 (SLOAN 2014; United-Nations 2014). The Nigerian credit market can be
broadly grouped into the formal and informal sectors. The formal sector is overseen by the Central Bank of Nigeria
(CBN) which reports that most of the lending in the sector is short term in nature and financial institutions require
substantial collateral, making it difficult for prospective business owners to find substantial funds for long term
financing. As a result, self-employment in the country is mostly funded by personal or family savings and other
informal sources.
According to 2004 World Bank estimates, the Nigerian labour force distribution by occupation was 44.6% in
agriculture, 11.5% for industry, and 41.7% for services. 70.9% of men and 74.8% of women in the total civilian
employed labour force reported being self-employed in 2005 (SLOAN 2014). NBS (2014) and Trading-Economics
(2014) report that between 2006 to 2011, the unemployment rate averaged 14.6 % reaching an all time high of
23.9% in December of 2011 and World-Bank (2014) estimates that the poverty headcount ratio for Nigeria was
46% in 2009/2010 and 48% in 2003/2004. These reports would seem to indicate that push self-employment would
exist in Nigeria and most individuals would resort to self-employment to escape unemployment – especially as there
are no unemployment benefits or other social security measures. However, according to the Global Entrepreneurship
Monitor (GEM 2012)7, 68%:63% of male and female entrepreneurs respectively surveyed in Nigeria were
opportunity8 entrepreneurs while 32%:37% of entrepreneurs surveyed where necessity entrepreneurs
9. Hence while
the unemployment and poverty reports suggest the presence of push self-employment, the GEM data suggests that
there is the presence of pull self-employment as well.
In reality, the self-employed in Nigeria are made up of heterogeneous group of individuals with some engaged in
highly skilled capital and technology intensive businesses at one end and others involved in mundane labour
intensive common jobs that have low returns. In addition, Doing Business (DB) ranked Nigeria 147th out of 189
7 While GEM does not give information on self-employment per se, there is a conceptual overlap in the self-
employment and entrepreneurship definitions Kelley, D. J., S. Singer, et al. (2012). "The Global Entrepreneurship
Monitor." 2011 Global Report, GEM 2011.
. 8 i.e pulled into entrepreneurship to pursue opportunities.
9 i.e they had no other work options and needed a source of income.

countries in the doing business index; It also ranked the country 122nd
to start a business. This low score was
primarily due to the low scores on electricity and registering property where it placed 185 out of 189 countries in
both instances. This could be a sign of weaknesses in formal institutions within the country such that running a
business depends significantly on networks to which more educated and connected individuals have better access. In
addition the country has been ranked highly in terms of corruption by TransparencyInternational (2014); further
indicating that social capital and some form of educational attainment could be a significant factor in the success of
self-employment in the country as suggested by (Glaeser, Scheinkman et al. 2003).
METHODOLOGY
First for deciding the probability of being in either in self or paid employment dependant on educational attainments,
this study makes use of a simple probit model. This will enable us observe the educational human capital of all
individuals in self-employment. The Left Hand Side (LHS) has a variable “Selfemp” which is equal to 1 if the
individual is in self employment and 0 if the individual is in paid employment. The Right Hand Side (RHS) has
variables that are common determinants of entry into self-employment in the literature which include; age, sex,
marital status, sector, educational attainments, region of country, and credit constraints.
The first empirical regression for the first exercise is a simple probit model expressed as:
[1]
Where Pr denotes probability and ϕ is the Cumulative Distribution Function (CDF) of the standard normal
distribution. The probit model is estimated via maximum likelihood and parameters β are variables in the literature
that are typically found to influence the probability of being self-employed. There are only two employment options
available; self-employment or paid employment and the estimation is run separately for the sample of men and
women in the data.
The literature also recognizes that gender differences might exist in the nature of self-employment (Parker 2009).
Allen, Langowitz et al. (2007) for instance, found that in all but two countries – Peru and Japan, participation rates
of women in business ownership were substantially lower than that of men. Boden (1999), Caputo and Dolinsky
(1998) and Boden Jr (1996) report that women are more likely than men to shoulder family-related obligations,
especially child rearing, and there is significant evidence that this affects some women’s propensity to become self-
employed. The next estimation thus seeks to find out what would happen to the probability of being self-employed if
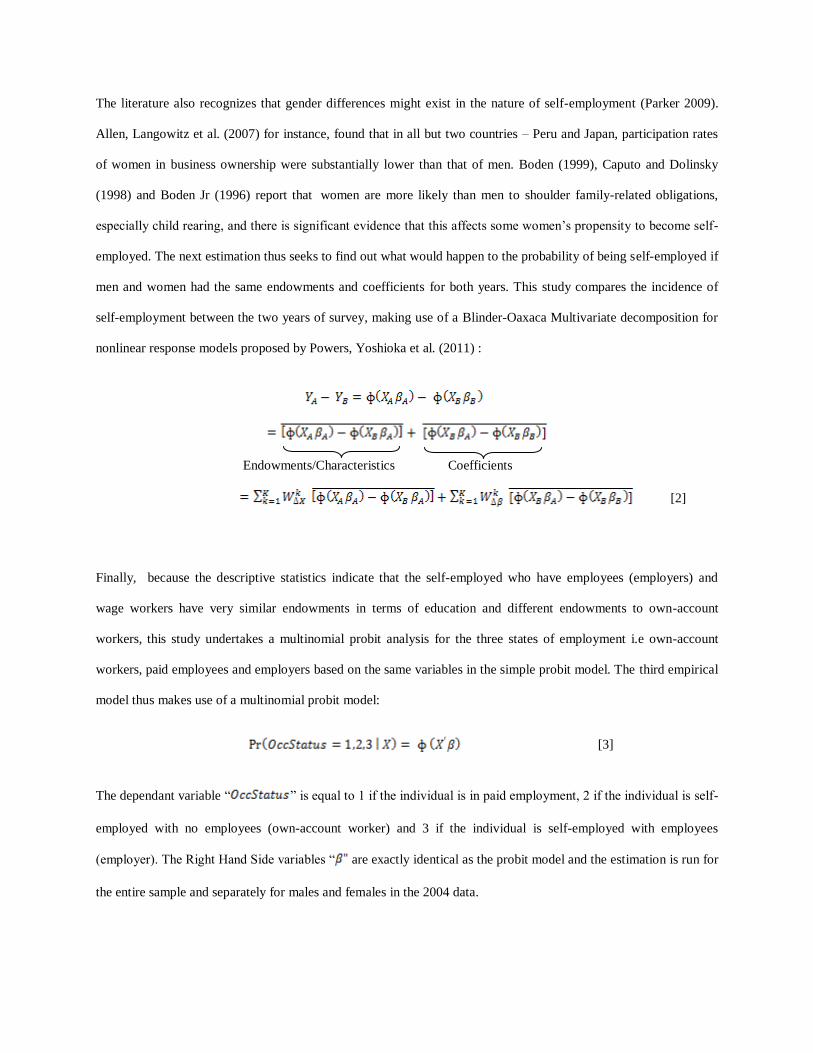
men and women had the same endowments and coefficients for both years. This study compares the incidence of
self-employment between the two years of survey, making use of a Blinder-Oaxaca Multivariate decomposition for
nonlinear response models proposed by Powers, Yoshioka et al. (2011) :
Endowments/Characteristics Coefficients
[2]
Finally, because the descriptive statistics indicate that the self-employed who have employees (employers) and
wage workers have very similar endowments in terms of education and different endowments to own-account
workers, this study undertakes a multinomial probit analysis for the three states of employment i.e own-account
workers, paid employees and employers based on the same variables in the simple probit model. The third empirical
model thus makes use of a multinomial probit model:
[3]
The dependant variable “ ” is equal to 1 if the individual is in paid employment, 2 if the individual is self-
employed with no employees (own-account worker) and 3 if the individual is self-employed with employees
(employer). The Right Hand Side variables “ are exactly identical as the probit model and the estimation is run for
the entire sample and separately for males and females in the 2004 data.

DATA
The data used for this analysis originates from Nigeria Living Standards Survey (NLSS) otherwise known as the
Living Standards Measurement Survey (LSMS) for the years 2004 and 2009. The NLSS is an extensive survey
detailed in its coverage of various topics; it serves as a good basis for in-depth analysis of households and
individuals in the country. This survey was conducted by the Nigerian Bureau of Statistics (NBS) a body that has
undergone training by and receives technical support from the World Bank. The data covers both rural and urban
areas of all the 36 states of Nigeria and the Federal Capital Territory. It samples 100,685 individuals in the 2004
survey and 533,838 individuals in the 2009 survey. The final sample is restricted to individuals between the ages of
16 and 6510
. Only individuals in full time employment are used in this analysis and it excludes the unemployed,
students and retired individuals and everyone who is in the agriculture sector in line with the literature (Maloney
2004; Demirgüc-Kunt, Klapper et al. 2009; Parker 2009).
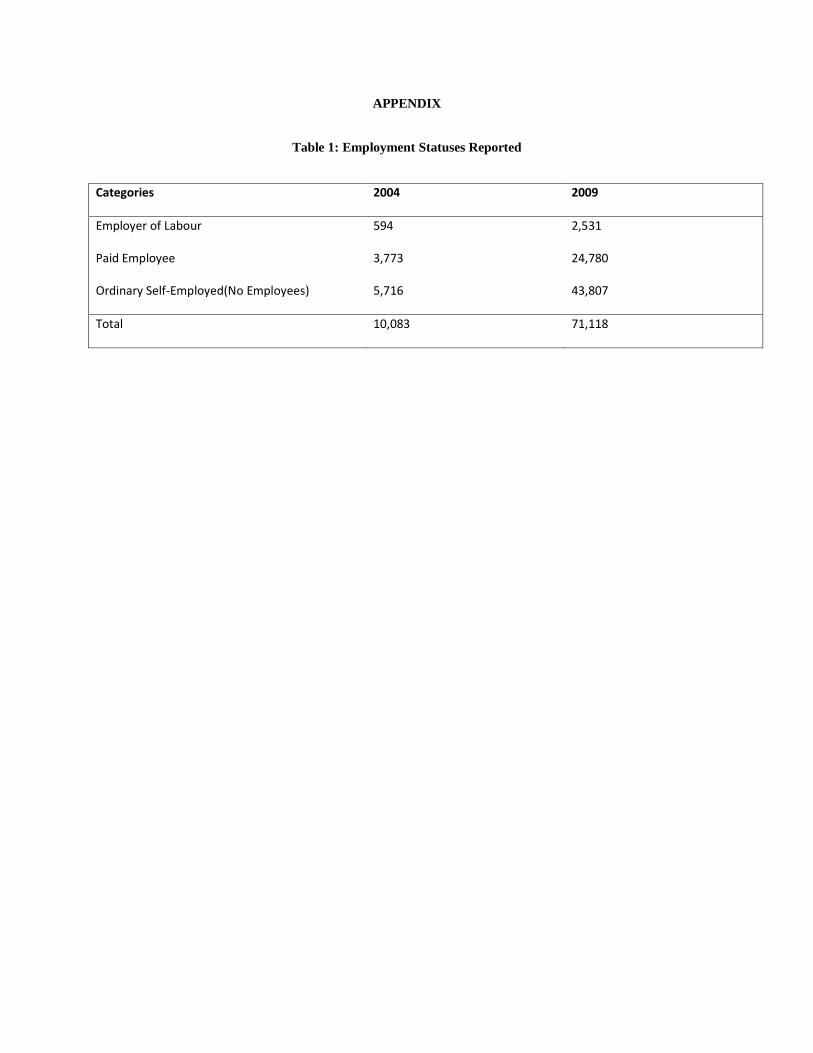
The final dataset contains 10,083 (6,717 male and 3,366 female) and 71,118 (41,299 male and 29,819 female)
individuals from the 2004 and 2009 surveys respectively who are in the labour force and in full-time employment;
crucially it covers the entire country and contains the variables necessary for this analysis. The employment statuses
used from each survey are highlighted in Table 1. As expected, a majority of individuals reported being self-
employed (own-account) workers, the next largest category are the paid employees (wage workers) and the smallest
group are the employers (self-employed with workers).
In terms of educational ability, individuals were grouped into five categories according to their highest educational
attainments. Table 2 reports the distribution of the data according to these groups, prima facie, the greatest number
of individuals have a medium amount of education by the definitions used in Table 2, next is the low education
category, followed by those with a high amount of education, those with no education come after, and last is the
10
16 – 65 is the legal age to enter the labour force and retire respectively in Nigeria.
very high educational category. This indicates from the overall distribution that a very high level of education might
be the hardest to attain as it is the smallest group and requires the highest investment in terms of time and funds
which the literature suggests is limited in a developing country context. For a closer analysis; Table 3 gives each
educational category a value from 1 to 5 with starting from the “no education” to the “very high education” group
and reports the means for each occupational faction, it shows that paid workers have the highest average education,
followed by employers and lastly the own-account workers – this finding is consistent across the years and also
across genders apart from the 2004 female sample and the 2009 overall sample. In light of the research question,
employers and paid employees have very similar educational endowments which differ reasonably from the self-
employed. Table 4 reports various controls used in the econometric estimations and Table 5 provides the summary
statistics for all the variables.
RESULTS
The category of educational attainment that was left out of the simple probit estimation [1] is no education, for
marriage it’s unmarried, for region it’s the mid-belt of the country and for sector, it’s the rural sector. The results are
presented in Table 6 and they indicate that the probability of being in self-employment reduces as educational
attainment increases, especially for highly educated women. These results are robust and consistent. Changing the
base category also leads to a correspondingly direct opposite in the coefficient sign agreeing in broad-spectrum with
(Van der Sluis, Van Praag et al. 2005).
The Wald chi-square statistics, which are significant at the 1% level, indicates that the regression specification is
meaningful. The Pseudo R-squared shows that both samples give a good fit. The R-squared in this case and
especially for both years of the female samples at 22% and 24% and that of the male sample at 11% and 14 % are
quite reasonable. These results are further supported by the significance of the regression estimates, in particular, for
the education variables which are all almost significant at the 1% level.

The regression results indicate the following, First in both years and across genders; age and educational attainment
are the most consistently significant factors that influence probability of being either self-employed or an employer.
The educational variables are highly significant in predicting the probability of being in any of the employment
states. The probability of being self-employed tends to reduce as educational attainment increases. This agrees with
(Le 2002; Maloney 2004; Casson 2005; Van der Sluis, Van Praag et al. 2008).
Compared to those who are not educated, column 1 indicates that males in 2004 who possess a low degree of
education are 19.6% less likely to be in self-employment, those who have a medium level of education are 35.8%
less likely to be in self-employment. For the highly educated, the probability of being self-employed compared to
the non-educated drops to 61% and for the very highly educated it is lower by 64%. Column 3 shows that for males
in 2009, the same pattern is observed generally apart from the low education variable; which becomes positive in
this survey. However, men who have a medium amount of education are 16% less likely to be in self-employment
compared to those with no education. For the highly educated and very highly educated, the figures are 45% and
43% respectively highlighting the negative relationship in general between self-employment and education for
males. For females in both years surveyed, the same pattern is repeated. Column 2 indicates that compared to
females who have no education, those with medium, high and very high educational attainments are 29%, 46% and
70% less likely to be in self-employment respectively. Column 4 repeats that pattern for 2009 with the medium,
highly and very highly educated being 27%, 59% and 70% less likely that the non-educated to be in self-
employment respectively.
Thus the regression results from estimation [1] in Table 6 indicate the following, First in both years and across
genders; age and educational attainment are the most consistently significant factors that influence probability of
being either self-employed or an employee. The probability of being self-employed tends to reduce as educational
attainment increases. This agrees with (Le 2002; Maloney 2004; Casson 2005). Second, Mided (Medium
Educational Level) is crucial across genders in both surveys and seems to be the traditional turning point where self-
employment becomes negatively correlated with education, indicating that individuals need at least some basic form
of education to transition into paid employment. For women the effects of education are more pronounced especially
as the educational levels increase. Women who are very highly educated are the most probable not to be self-
employed.
The results from the Powers, Yoshioka et al. (2011) multivariate decomposition estimation [2] are given in Table 7
and they show that differences in gender endowments accounted for 48% of employment status dissimilarity in 2004
while differences in endowments accounted for 52% of the dissimilarity in 2009. In particular, educational
endowments account for 26% of the difference in self-employment probability between men and women in 2004. In
2009, educational endowments accounted for 49% of differences between the self-employment probability for men
and women. Specifically, if men and women had the same endowments in high education and very high education in
that year; the dissimilarity in employment status would fall by about 28% (13.2 % + 14.5% respectively). By 2009,
if men and women had the same endowments in high education and very high education; the dissimilarity in
employment status would fall by about 39 % (23%+16%). As for educational coefficients, they are mostly
insignificant in 2004 but become significant in the later year which might be indicative of a bais against women.
Finally, after dividing the self-employed into two groups; employers and own-account workers, the bar charts in
Figure 1 show the mean educational endowments of each employment type for both years surveyed. The results
show that employers and wage earners have a similar educational distribution as opposed to ordinary own-account
workers. Clearly there is an observable trend in both surveys; we see that employers of labour tend to be educated to
high levels and so do employees, the most educated group are the employees who theory hypothesizes would need
such educational qualifications as a signal to their prospective employers. Own-account workers tend to belong to
the uneducated category to a significant extent even though some of them are quite considerable educational
attainments11
. Linking this back to the results in Table 6, own-account workers have a high probability of having
lower educational attainments that paid-employees or employers. In-fact Figure 1 confirms Table 3 in showing that
11 Own-Account workers in the data tend to be individuals who are lowly skilled and into mundane forms of
occupation like gardening, car repairs, car washing, electricians, plumbers, petty traders etc while employers tend to
be in areas like trade, accounting, law, medicine, etc with some individuals also in low skilled jobs.

employers and paid-employees have similar educational endowments quite distinct from own-account workers.
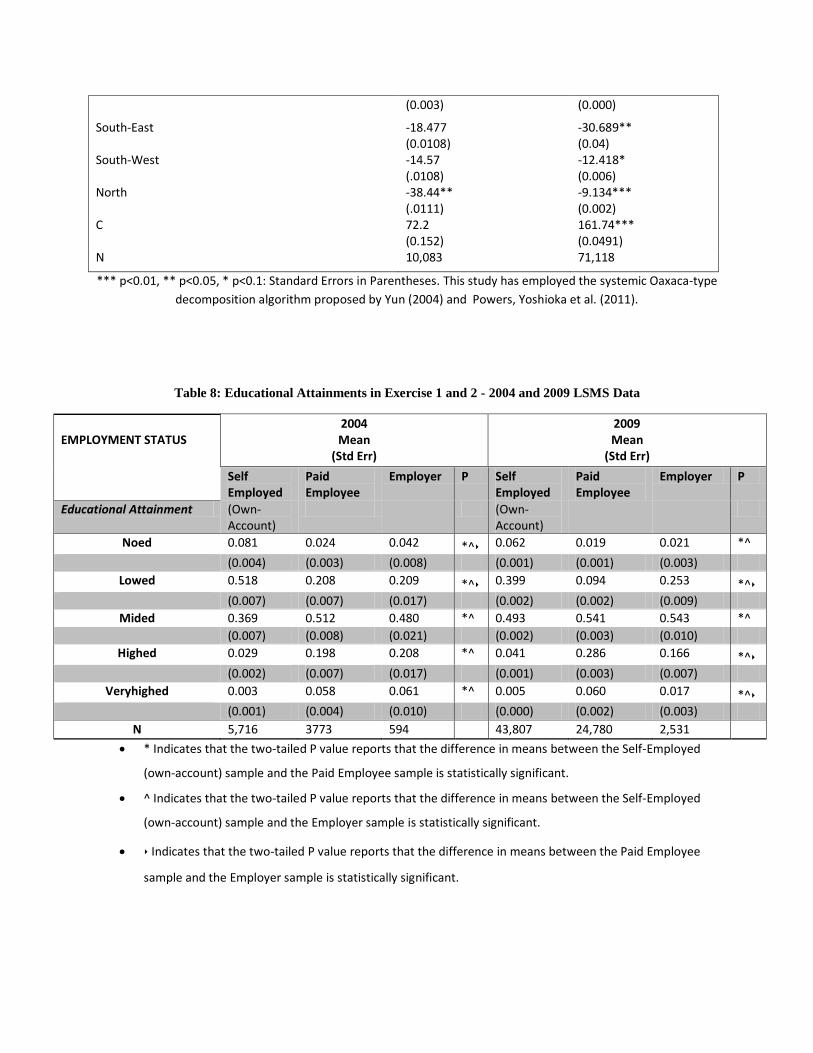
Table 8 reports the mean educational attainment for each occupational category along with results from the t-
statistics showing which means are statistically different. Overall, two-tailed P values observed indicate that
educational means are statistically different for each occupational category except for in certain cases when paid-
employees and employers in the sample have educational means that are not statistically different. The self-
employed own account workers in the sample however continually show a distinct educational pattern compared to
either paid-employees or employers. As can be observed in the bar charts in Figures 1 and 2; with confirmation from
Table 8, employers and wage earners have similar educational distributions as opposed to the ordinary self-
employed own-account workers. Clearly there is an observable trend in both surveys; we see that employers of
labour tend to be educated to high levels and so do employees, the most educated group are the employees who we
suppose would need such educational qualifications as a signal to their prospective employers, those who are self-
employed with no employees tend to be uneducated to a large extent or exhibit lower educational attainments.
This leads naturally into estimation [3]; the multinomial probit designed to capture the educational attainment effects
across the three occupational categories. The Wald chi-square statistics, which are significant at the 1 percent level,
indicates that the regression specification is meaningful. The Log-pseudo likelihood also shows that both samples
give a good fit. The category of educational attainment that was left out of this estimation is no education, for
marriage it’s unmarried, for region it’s the mid-belt of the country and for sector it’s the rural sector – Identical to
estimation [1]. The results are given in Table 9 and they are very interesting; first women who are highly educated
are most unlikely to be found in self-employment without employees; this is not so for men who are evenly
represented across the board in all areas of employment. Also for both genders, a high degree of education increases
the probability of being in paid employment or an employer. There are however some differences between men and
women in the self-employed sector; while women who are highly educated are most unlikely to be found in self-
employment without employees; this is not so for men who are evenly represented in all sectors of employment.
These results are consistent with the last results in Table 6 with some new interesting insights; columns 1 and 4
show that for both males and females, higher educational attainments increase the probability of being a paid

employee, while columns 2 and 5 report the direct opposite for self-employed individuals; higher educational
attainments reduce the probability of being self-employed. As for employers, only the female sample for the
medium and highly educated (Mided and Highed) are significant in column 6, with important implications for our
estimation. The likelihood of men being in paid employment with a low degree of education is significant; this result
is not found for women who need to have at least a medium degree of education before having a significant
probability of being in paid employment. Also, the likelihood of being employers increases for women so long as
they receive a medium to high level of education but men do not need this educational levels to be employers. This
is one of the most significant findings of this study; having a measure of education is very significant in determining
who becomes an employer for women. A closer examination of these female employers shows that they are
concentrated in sectors such as accountancy, law, engineering, clerical services and tailoring. These are “blue collar”
areas where some degree of training is needed hence their educational endowments whereas men are represented
uniformly in all sectors, even in those that do not require a lot of education. In entirety however, the results show
that higher educational attainments reduce the probability of being an own-account worker but increases the
probability of being either in wage employment or an employer.
Taken together, the three empirical exercises show that when employers are separated from own account workers, a
clearer distinction can be made concerning the nature of self-employment in general and also with reference to
gender. Employers and paid employees have similar educational endowments and women in particular need a
substantial amount of education to increase their probability of being either employers or own-account workers. The
contribution of this study is thus a clear distinction among the self-employed as regards educational endowments
and self-employments. The self-employed can be differentiated into employers and own-account workers due to
their disparities in educational human capital.
SUMMARY AND CONCLUSION
This study has made an important contribution to the self-employment literature by investigating the differences in
the educational human capital of employers, own-account workers and wage-workers. It found that self-employed
individuals who employ others (employers) have distinct human capital endowments in terms of education from
self-employed individuals who do not employ others (own-account workers). When the employers and own-account
workers were not separated; the probability of being in self-employment reduced as individuals reported higher
educational endowments indicating that the more educated individuals got, the less likely they were to choose self-
employment as an employment option. This effect was stronger for women and agrees with the finding of (Van der
Sluis, Van Praag et al. 2005). The study also finds that if men and women had equal endowments in education, the
incidence of self-employment would be equalized between the genders.
However, when the self-employed workers were split into own-account workers (self-employed without employees)
and employers (self-employed with employees), compelling patterns emerged. The employers had similar
educational endowments with the wage earners and women employers in particular were found to have a significant
amount of education dissimilar to own-account workers. These findings indicate that employers have quite different
human capital endowments to own-account workers and this should be taken into account in the self-employment
literature. Hence the traditional view of the self-employed as one group should be updated with relevant distinctions
made among the self-employed. Policy makers should also be aware of the differences between these two groups of
the self-employed and appropriate policies can be geared towards each category. Finally, since education increases
the likelihood of women being in paid-employment or employer category, this study further highlights the essential
role for education in developing countries.
REFERENCES
Allen, I. E., N. Langowitz, et al. (2007). "Global entrepreneurship monitor." 2006 Report on Women and Entreprenurship.
Balán, J., H. L. Browning, et al. (1973). Men in a developing society: Geographic and social mobility in Monterrey, Mexico, University of Texas Press Austin.
Blau, D. M. (1985). "Self-Employment and Self-Selection in Developing Country Labor Markets." Southern Economic Journal 52(2).
Boden Jr, R. J. (1996). "Gender and self-employment selection: An empirical assessment." The Journal of socio-economics 25(6): 671-682.
Boden, R. J. (1999). "Flexible Working Hours, Family Responsibilities, and Female Self‐Employment." American Journal of Economics and Sociology 58(1): 71-83.
Bosch, M. and W. F. Maloney (2007). Comparative analysis of labor market dynamics using markov processes: An application to informality, IZA Discussion Papers.
Bosch, M. and W. F. Maloney (2010). "Comparative analysis of labor market dynamics using Markov processes: An application to informality." Labour economics 17(4): 621-631.
Bromley, R. (1978). "Introduction-The urban informal sector: why is it worth discussing?" World Development 6(9): 1033-1039.
Caputo, R. K. and A. Dolinsky (1998). "Women's choice to pursue self-employment: the role of financial and human capital of household members." Journal of small business management 36(3): 8-17.
Casson, M. (1995). Entrepreneurship and business culture, E. Elgar.
Casson, M. (2005). "Entrepreneurship and the theory of the firm." Journal of Economic Behavior & Organization 58(2): 327-348.
Cunningham, W. V. and W. F. Maloney (2001). "Heterogeneity among Mexico’s Microenterprises: An Application of Factor and Cluster Analysis*." Economic Development and Cultural Change 50(1): 131-156.
De Mel, S., D. McKenzie, et al. (2008). "Returns to capital in microenterprises: evidence from a field experiment." The Quarterly Journal of Economics 123(4): 1329-1372.
De Mel, S., D. McKenzie, et al. (2010). Who are the microenterprise owners? Evidence from Sri Lanka on Tokman versus De Soto. International differences in entrepreneurship, University of Chicago Press: 63-87.
Demirgüc-Kunt, A., L. Klapper, et al. (2009). "Entrepreneurship in post-conflict transition: the role of informality and access to finance." World Bank Policy Research Working Paper Series, Vol.
Desai, S. (2009). Measuring entrepreneurship in developing countries, Research paper/UNU-WIDER.
Earle, J. S. and Z. Sakova (2000). "Business start-ups or disguised unemployment? Evidence on the character of self-employment from transition economies." Labour economics 7(5): 575-601.
Fields, G. S. (1980). "Education and income distribution in developing countries: a review of the literature."
Fields, G. S. (1990). "Labour market modelling and the urban informal sector: theory and evidence."

Fields, G. S. (2004). "A guide to multisector labor market models." Working Papers: 86.
Fields, G. S. (2007). "The Harris-Todaro Model."
Fields, G. S. (2013). "Self-Employment in the Developing World."
Fields, G. S. and G. P. Pfeffermann (2003). Pathways out of poverty: Private firms and economic mobility in developing countries, World Bank-free PDF.
Gindling, T. and D. Newhouse (2012). "Self-employment in the developing world." World Bank Policy Research Working Paper(6201).
Gindling, T. H. (1991). "Labor market segmentation and the determination of wages in the public, private-formal, and informal sectors in San Jose, Costa Rica." Economic Development and Cultural Change 39(3): 585-605.
Glaeser, E., J. Scheinkman, et al. (2003). "The injustice of inequality." Journal of Monetary Economics 50(1): 199-222.
Gollin, D. (2008). "Nobody's business but my own: Self-employment and small enterprise in economic development." Journal of Monetary Economics 55(2): 219-233.
Günther, I. and A. Launov (2012). "Informal employment in developing countries: opportunity or last resort?" Journal of Development Economics 97(1): 88-98.
Hanley, E. (2000). "Self-employment in post-communist Eastern Europe: a refuge from poverty or road to riches?" Communist and Post-Communist Studies 33(3): 379-402.
Harris, J. R. and M. P. Todaro (1970). "Migration, unemployment and development: a two-sector analysis." The American Economic Review 60(1): 126-142.
Haywood, L. and P. Falco (2013). "Entrepreneurship versus Joblessness-Explaining the Rise in Self-Employment."
Jhabvala, R., R. M. Sudarshan, et al. (2003). Informal Economy Centrestage: New Structures of Employment, Sage.
Kelley, D. J., S. Singer, et al. (2012). "The Global Entrepreneurship Monitor." 2011 Global Report, GEM 2011.
Lazear, E. P. (2004). "Balanced Skills and Entrepreneurship." The American Economic Review 94(2): 208-211.
Le, A. T. (1999). "Empirical studies of self‐employment." Journal of Economic Surveys 13(4): 381-416.
Le, A. T. (2002). "Empirical studies of self‐employment." Journal of Economic Surveys 13(4): 381-416.
Lewis, W. A. (1954). "Economic development with unlimited supplies of labour." The manchester school 22(2): 139-191.
Loayza, N. V. (1996). The economics of the informal sector: a simple model and some empirical evidence from Latin America. Carnegie-Rochester Conference Series on Public Policy, Elsevier.
Maloney, W. F. (2004). "Informality revisited." World Development 32(7): 1159-1178.
Mandelman, F. S. and G. V. Montes-Rojas (2009). "Is self-employment and micro-entrepreneurship a desired outcome?" World Development 37(12): 1914-1925.
Mohapatra, S., S. Rozelle, et al. (2007). "The rise of self-employment in rural China: Development or Distress?" World Development 35(1): 163-181.

NBS (2014). Statistical Data Portal. http://www.nigerianstat.gov.ng, Nigerian National Bureau of Statistics.
Office, I. L. (1972). Employment, Incomes and Equality: A Strategy for Increasing Productive Employment in Kenya: Report of an Inter-agency Team Financed by the United Nations Development Programme and Organised by the International Labour Office, ILO.
Parker, S. C. (2004). The economics of self-employment and entrepreneurship, Cambridge University Press.
Parker, S. C. (2009). The economics of entrepreneurship, Cambridge University Press.
Powers, D. A., H. Yoshioka, et al. (2011). "mvdcmp: Multivariate decomposition for nonlinear response models." Stata Journal 11(4): 556-576.
Ranis, G. and J. C. Fei (1961). "A theory of economic development." The American Economic Review: 533-565.
Robinson, P. B. and E. A. Sexton (1994). "The effect of education and experience on self-employment success." Journal of Business Venturing 9(2): 141-156.
SLOAN (2014) Ageing and Work: Nigeria
Squire, L. (1981). Employment policy in developing countries; a survey of issues and evidence, Oxford Univ. Press.
Tamvada, J. P. (2010). "Entrepreneurship and welfare." Small Business Economics 34(1): 65-79.
Tokman, V. E. (1992). Beyond regulation: The informal economy in Latin America, Lynne Rienner.
Tokman, V. E. (2007). "Modernizing the informal sector." UN/DESA Working Paper(42): 1-13.
Trading-Economics (2014). Nigeria Economic Indicators, Trading Economics
TransparencyInternational (2014). Corruption By County/Territory. 2013, Transparency International
Turnham, D. and I. Jaeger (1971). "The Employment Problem in Less Developed Countries. A Review of Evidence."
United-Nations (2014). Nigeria: Country Summary
Van der Sluis, J., M. Van Praag, et al. (2005). "Entrepreneurship selection and performance: A meta-analysis of the impact of education in developing economies." The World Bank Economic Review 19(2): 225-261.
Van der Sluis, J., M. Van Praag, et al. (2008). "Education and entrepreneurship selection and performance: A review of the empirical literature." Journal of Economic Surveys 22(5): 795-841.
Van Praag, C. M. (2003). "Business survival and success of young small business owners." Small Business Economics 21(1): 1-17.
World-Bank (2013) World Bank Country Profile: Nigeria.
World-Bank (2014). Nigeria Overview, World Bank.
Yamada, G. (1996). "Urban informal employment and self-employment in developing countries: theory and evidence." Economic Development and Cultural Change 44(2): 289-314.
Yun, M.-S. (2004). "Decomposing differences in the first moment." Economics Letters 82(2): 275-280.
APPENDIX
Table 1: Employment Statuses Reported
Categories 2004 2009
Employer of Labour 594 2,531
Paid Employee 3,773 24,780
Ordinary Self-Employed(No Employees) 5,716 43,807
Total 10,083 71,118

Table 2: Distribution of Educational Attainments/Levels Reported in Surveys
Educational Category Educational Attainments Year
2004 2009
Noed :
No Education
Denotes individuals with no education at all. 610 3,245
Lowed :
Low Education
Denotes individuals with a little degree of education.
[Range from primary school to junior secondary certificate holders]
3,893 20,421
Mided :
Medium Education
Denotes individuals with a moderate degree of education.
[From Senior Secondary Certificate holders to ‘O’ level degree holders
and Nursing School Graduates]
4,275 36,393
Highed :
High Education
Denotes individuals with a high degree of education.
[From B.sc/First degree University holders to individuals with degrees
equivalent to University certificates]
1,038 9,300
Veryhighed :
Very High Education
Denotes individuals with very high educational attainments. [Master’s
degree holders and equivalents to Doctorate degree holders]
267 1,759
N 10,083 71,118
Table 3: Educational Summary Statistics
OCCUPATIONAL CATEGORY
Overall Sample Mean (Std Dev)
Male Sample Mean (Std Dev)
Female Sample Mean (Std Dev)
2004 2009 2004 2009 2004 2009
Employer 3.0218 3.2761 2.9878 2.9523 3.0978 2.7695
(0.0374) (0.0079) (0.0474) (0.0168) (0.0582) (0.031)
Paid Employee 3.0516 3.2743 3.0343 3.2761 3.0959 3.2703
(.1392) (.0050) (0.0168) (.0063) (.0244) (.0079)
Self-Employed 2.344 2.9059 2.3900 2.6183 2.2662 2.4323
(0.00912) (0.0149) (0.0116) (0.0046) (0.0145) (0.0046)
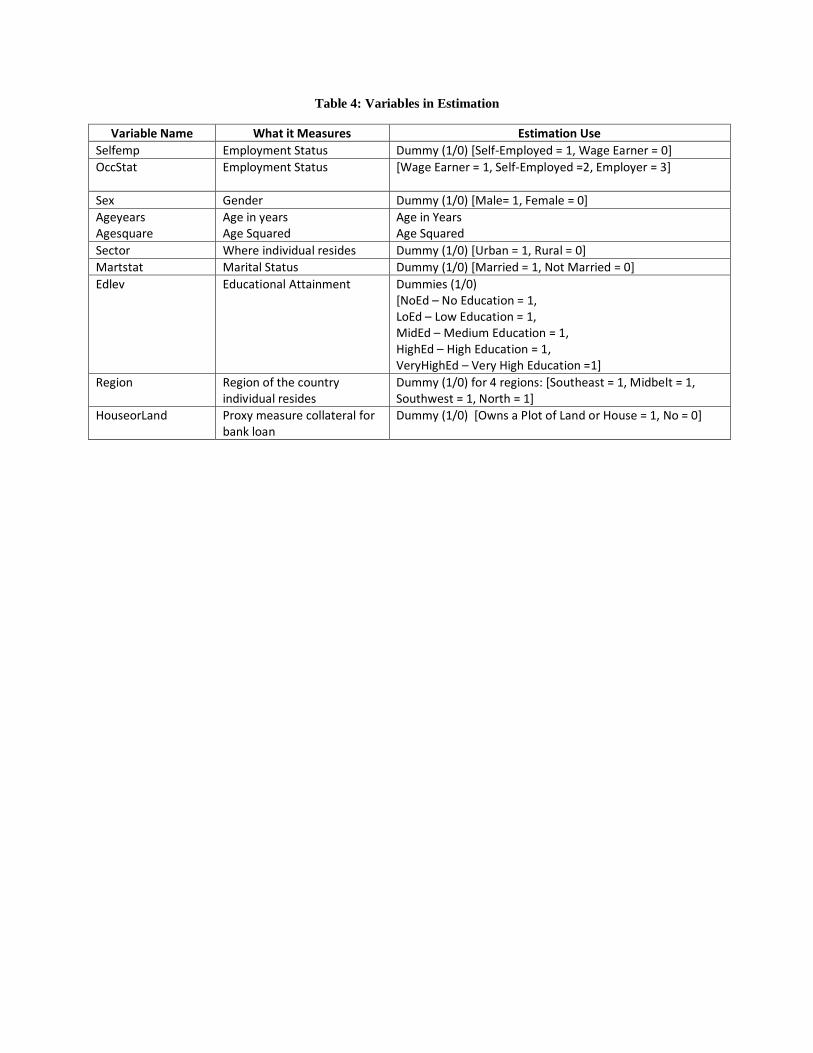
Table 4: Variables in Estimation
Variable Name What it Measures Estimation Use
Selfemp Employment Status Dummy (1/0) [Self-Employed = 1, Wage Earner = 0]
OccStat Employment Status
[Wage Earner = 1, Self-Employed =2, Employer = 3]
Sex Gender Dummy (1/0) [Male= 1, Female = 0]
Ageyears Agesquare
Age in years Age Squared
Age in Years Age Squared
Sector Where individual resides Dummy (1/0) [Urban = 1, Rural = 0]
Martstat Marital Status Dummy (1/0) [Married = 1, Not Married = 0]
Edlev Educational Attainment
Dummies (1/0) [NoEd – No Education = 1, LoEd – Low Education = 1, MidEd – Medium Education = 1, HighEd – High Education = 1, VeryHighEd – Very High Education =1]
Region Region of the country individual resides
Dummy (1/0) for 4 regions: [Southeast = 1, Midbelt = 1, Southwest = 1, North = 1]
HouseorLand Proxy measure collateral for bank loan
Dummy (1/0) [Owns a Plot of Land or House = 1, No = 0]

Table 5: Summary Statistics
VARIABLES
Overall Sample Mean (Std Dev)
Male Sample Mean (Std Dev)
Female Sample Mean (Std Dev)
2004 2009 2004 2009 2004 2009
Dependent variable
Selfemp 0.606 0.681 0.568 0.636 0.664 0.744
(0.0191) (0.0211) (0.0197) (0.0248) (0.0234) (0.0204)
OccStat 1.684717 1.687154 1.657585 1.640524 1.738859 1.751735
(.006) (.002) (.007) (.003) (.009) (.003)
Education
Noed 0.0622 0.0416 0.0615 0.0332 0.0634 0.0532
(0.00954) (0.00642) (0.0111) (0.00592) (0.0110) (0.00800)
Lowed 0.366 0.276 0.351 0.243 0.390 0.323
(0.0199) (0.0196) (0.0239) (0.0215) (0.0237) (0.0190)
Mided 0.408 0.536 0.407 0.553 0.410 0.513
(0.0171) (0.0201) (0.0209) (0.0267) (0.0253) (0.0160)
Highed 0.125 0.123 0.136 0.138 0.109 0.101
(0.0117) (0.0105) (0.00935) (0.0106) (0.0202) (0.0131)
Veryhighed 0.0382 0.0229 0.0447 0.0322 0.0283 0.00986
(0.00678) (0.00396) (0.00804) (0.00634) (0.0130) (0.00154)
Demographics
Age in years 39.84 37.19 41.21 37.42 37.75 36.87
(0.354) (0.374) (0.373) (0.514) (0.564) (0.441)
Sex . 604 .582 .395 .417
(.0098) (.0079) (.0098) (.0079)
Married 0.801 0.895 0.813 0.926 0.783 0.851
(0.0159) (0.00524) (0.0132) (0.00783) (0.0248) (0.00751)
Geographics
Sect1(Urban) 0.4883 0.617 0.476 0.617 0.513 0.618
(0.005) (.0018) (.006) (.0023) (.009) (.0028)
Sect2(Rural) 0.5116 0.382 0.523 0.383 0.487 0.382
(0.005) (.0018) (.006) (.0023) (.009) (.0028)
Controls
South-East 0.3833 0.2836 0.3572 0.2864 0.4361 0.2797
(0.005) (0.002) (0.006) (0.002) (0.009) (0.002)
South-West 0.2942 0.4211 0.2591 0.3891 0.3654 0.4655
(0.005) (0.002) (0.005) (0.002) (0.008) (0.002)
Mid-belt 0.1738 0.1628 0.1999 0.1673 0.1207 0.1564
(0.004) (0.0013) (0.004) (0.002) (0.005) (0.002)
North 0.1487 0.132 0.1837 0.157 0.07774 0.0983
(0.004) (0.0012) (0.005) (0.0017) (0.004) (0.0017)
HouseorLand 0.0615 0.0290 0.0634 0.0270 0.0586 0.0318
(0.00993) (0.00499) (0.0102) (0.00537) (0.0111) (0.00463)
N 10,083 71,118 6,717 41,299 3,366 29,819
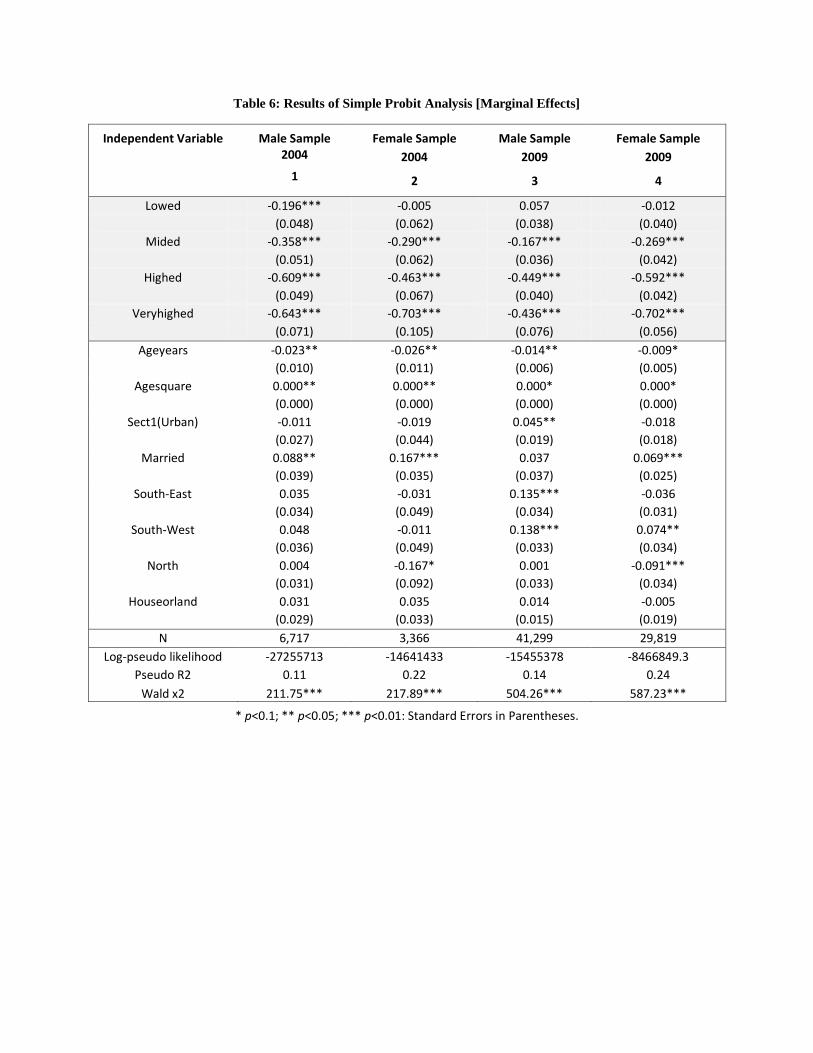
Table 6: Results of Simple Probit Analysis [Marginal Effects]
Independent Variable Male Sample 2004
1
Female Sample
2004
2
Male Sample
2009
3
Female Sample
2009
4
Lowed -0.196*** -0.005 0.057 -0.012
(0.048) (0.062) (0.038) (0.040)
Mided -0.358*** -0.290*** -0.167*** -0.269***
(0.051) (0.062) (0.036) (0.042)
Highed -0.609*** -0.463*** -0.449*** -0.592***
(0.049) (0.067) (0.040) (0.042)
Veryhighed -0.643*** -0.703*** -0.436*** -0.702***
(0.071) (0.105) (0.076) (0.056)
Ageyears -0.023** -0.026** -0.014** -0.009*
(0.010) (0.011) (0.006) (0.005)
Agesquare 0.000** 0.000** 0.000* 0.000*
(0.000) (0.000) (0.000) (0.000)
Sect1(Urban) -0.011 -0.019 0.045** -0.018
(0.027) (0.044) (0.019) (0.018)
Married 0.088** 0.167*** 0.037 0.069***
(0.039) (0.035) (0.037) (0.025)
South-East 0.035 -0.031 0.135*** -0.036
(0.034) (0.049) (0.034) (0.031)
South-West 0.048 -0.011 0.138*** 0.074**
(0.036) (0.049) (0.033) (0.034)
North 0.004 -0.167* 0.001 -0.091***
(0.031) (0.092) (0.033) (0.034)
Houseorland 0.031 0.035 0.014 -0.005
(0.029) (0.033) (0.015) (0.019)
N 6,717 3,366 41,299 29,819
Log-pseudo likelihood -27255713 -14641433 -15455378 -8466849.3
Pseudo R2 0.11 0.22 0.14 0.24
Wald x2 211.75*** 217.89*** 504.26*** 587.23***
* p<0.1; ** p<0.05; *** p<0.01: Standard Errors in Parentheses.
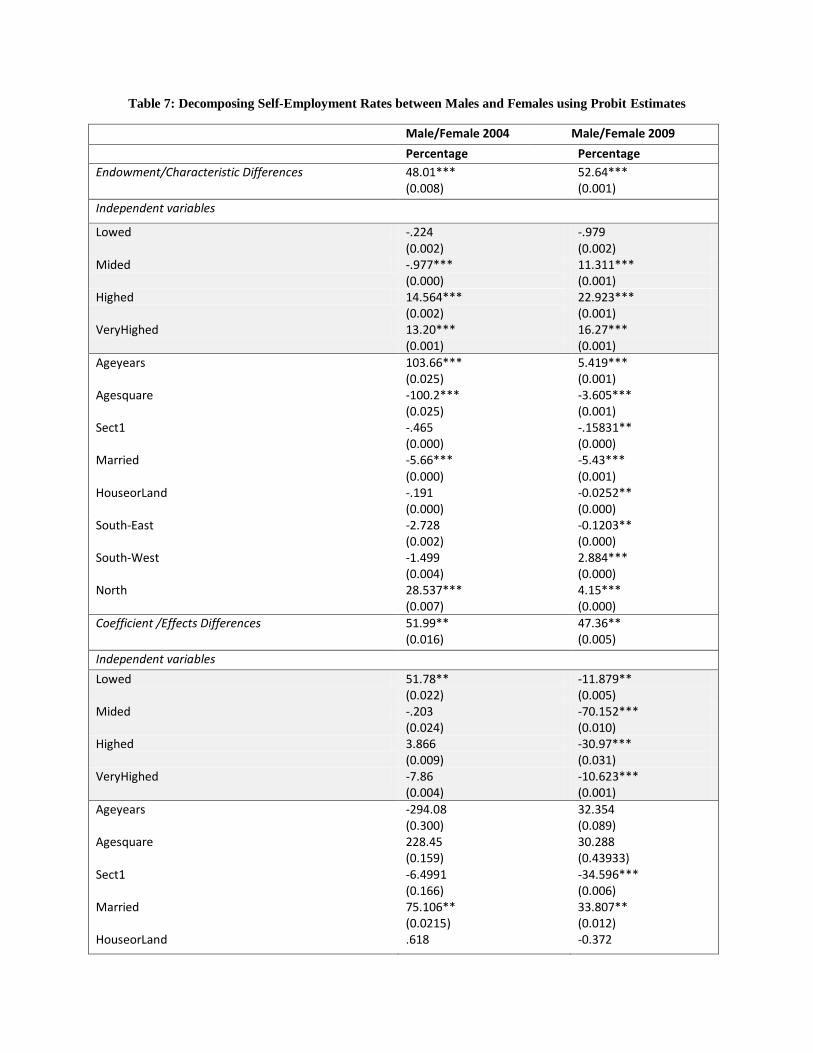
Table 7: Decomposing Self-Employment Rates between Males and Females using Probit Estimates
Male/Female 2004 Male/Female 2009
Percentage Percentage
Endowment/Characteristic Differences 48.01*** (0.008)
52.64*** (0.001)
Independent variables
Lowed -.224 (0.002)
-.979 (0.002)
Mided -.977*** (0.000)
11.311*** (0.001)
Highed 14.564*** (0.002)
22.923*** (0.001)
VeryHighed 13.20*** (0.001)
16.27*** (0.001)
Ageyears 103.66*** (0.025)
5.419*** (0.001)
Agesquare -100.2*** (0.025)
-3.605*** (0.001)
Sect1 -.465 (0.000)
-.15831** (0.000)
Married -5.66*** (0.000)
-5.43*** (0.001)
HouseorLand -.191 (0.000)
-0.0252** (0.000)
South-East -2.728 (0.002)
-0.1203** (0.000)
South-West -1.499 (0.004)
2.884*** (0.000)
North 28.537*** (0.007)
4.15*** (0.000)
Coefficient /Effects Differences 51.99** (0.016)
47.36** (0.005)
Independent variables
Lowed 51.78** (0.022)
-11.879** (0.005)
Mided -.203 (0.024)
-70.152*** (0.010)
Highed 3.866 (0.009)
-30.97*** (0.031)
VeryHighed -7.86 (0.004)
-10.623*** (0.001)
Ageyears -294.08 (0.300)
32.354 (0.089)
Agesquare 228.45 (0.159)
30.288 (0.43933)
Sect1 -6.4991 (0.166)
-34.596*** (0.006)
Married 75.106** (0.0215)
33.807** (0.012)
HouseorLand .618 -0.372
(0.003) (0.000)
South-East -18.477 (0.0108)
-30.689** (0.04)
South-West -14.57 (.0108)
-12.418* (0.006)
North -38.44** (.0111)
-9.134*** (0.002)
C 72.2 (0.152)
161.74*** (0.0491)
N 10,083 71,118
*** p<0.01, ** p<0.05, * p<0.1: Standard Errors in Parentheses. This study has employed the systemic Oaxaca-type
decomposition algorithm proposed by Yun (2004) and Powers, Yoshioka et al. (2011).
Table 8: Educational Attainments in Exercise 1 and 2 - 2004 and 2009 LSMS Data
EMPLOYMENT STATUS
2004 Mean
(Std Err)
2009 Mean
(Std Err)
Self Employed
Paid Employee
Employer P Self Employed
Paid Employee
Employer P
Educational Attainment (Own-Account)
(Own-Account)
Noed 0.081 0.024 0.042 *^‣ 0.062 0.019 0.021 *^
(0.004) (0.003) (0.008) (0.001) (0.001) (0.003)
Lowed 0.518 0.208 0.209 *^‣ 0.399 0.094 0.253 *^‣ (0.007) (0.007) (0.017) (0.002) (0.002) (0.009)
Mided 0.369 0.512 0.480 *^ 0.493 0.541 0.543 *^
(0.007) (0.008) (0.021) (0.002) (0.003) (0.010)
Highed 0.029 0.198 0.208 *^ 0.041 0.286 0.166 *^‣ (0.002) (0.007) (0.017) (0.001) (0.003) (0.007)
Veryhighed 0.003 0.058 0.061 *^ 0.005 0.060 0.017 *^‣ (0.001) (0.004) (0.010) (0.000) (0.002) (0.003)
N 5,716 3773 594 43,807 24,780 2,531
* Indicates that the two-tailed P value reports that the difference in means between the Self-Employed
(own-account) sample and the Paid Employee sample is statistically significant.
^ Indicates that the two-tailed P value reports that the difference in means between the Self-Employed
(own-account) sample and the Employer sample is statistically significant.
‣ Indicates that the two-tailed P value reports that the difference in means between the Paid Employee
sample and the Employer sample is statistically significant.

0.2
.4.6
.8
mea
n o
f em
plo
yee
1 2 3 4 5
0.2
.4.6
.8
mea
n o
f selfem
plo
yedw
ithn
oem
plo
yee
s
1 2 3 4 5
0
.05
.1.1
5
mea
n o
f em
plo
yero
fla
bou
r
1 2 3 4 5
0.2
.4.6
.8
mea
n o
f em
plo
yee
1 2 3 4 5
0.2
.4.6
.8
mea
n o
f selfem
plo
yedw
ithn
oem
plo
yee
s
1 2 3 4 5
Figure 1: Educational Attainment Means for 2004
Employers Wage-Earners Own –Account Workers
Figure 2: Educational Attainment Means for 2009
Employers Wage-Earners Own-Account Workers
Legend: 1 = Noed 2 = Lowed 3= Mided 4 = Highed 5=Veryhighed
0
.01
.02
.03
.04
.05
mea
n o
f em
plo
yero
fla
bou
r
1 2 3 4 5
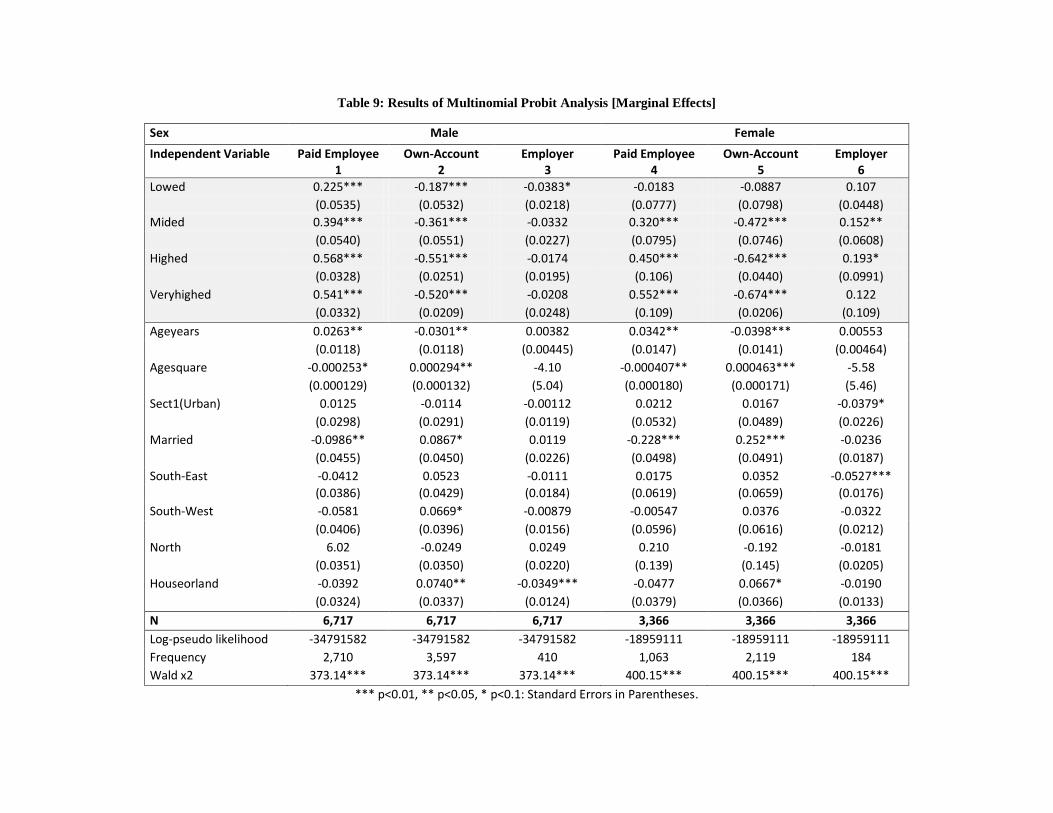
Table 9: Results of Multinomial Probit Analysis [Marginal Effects]
Sex Male Female
Independent Variable Paid Employee 1
Own-Account 2
Employer 3
Paid Employee 4
Own-Account 5
Employer 6
Lowed 0.225*** -0.187*** -0.0383* -0.0183 -0.0887 0.107
(0.0535) (0.0532) (0.0218) (0.0777) (0.0798) (0.0448)
Mided 0.394*** -0.361*** -0.0332 0.320*** -0.472*** 0.152**
(0.0540) (0.0551) (0.0227) (0.0795) (0.0746) (0.0608)
Highed 0.568*** -0.551*** -0.0174 0.450*** -0.642*** 0.193*
(0.0328) (0.0251) (0.0195) (0.106) (0.0440) (0.0991)
Veryhighed 0.541*** -0.520*** -0.0208 0.552*** -0.674*** 0.122
(0.0332) (0.0209) (0.0248) (0.109) (0.0206) (0.109)
Ageyears 0.0263** -0.0301** 0.00382 0.0342** -0.0398*** 0.00553
(0.0118) (0.0118) (0.00445) (0.0147) (0.0141) (0.00464)
Agesquare -0.000253* 0.000294** -4.10 -0.000407** 0.000463*** -5.58
(0.000129) (0.000132) (5.04) (0.000180) (0.000171) (5.46)
Sect1(Urban) 0.0125 -0.0114 -0.00112 0.0212 0.0167 -0.0379*
(0.0298) (0.0291) (0.0119) (0.0532) (0.0489) (0.0226)
Married -0.0986** 0.0867* 0.0119 -0.228*** 0.252*** -0.0236
(0.0455) (0.0450) (0.0226) (0.0498) (0.0491) (0.0187)
South-East -0.0412 0.0523 -0.0111 0.0175 0.0352 -0.0527***
(0.0386) (0.0429) (0.0184) (0.0619) (0.0659) (0.0176)
South-West -0.0581 0.0669* -0.00879 -0.00547 0.0376 -0.0322
(0.0406) (0.0396) (0.0156) (0.0596) (0.0616) (0.0212)
North 6.02 -0.0249 0.0249 0.210 -0.192 -0.0181
(0.0351) (0.0350) (0.0220) (0.139) (0.145) (0.0205)
Houseorland -0.0392 0.0740** -0.0349*** -0.0477 0.0667* -0.0190
(0.0324) (0.0337) (0.0124) (0.0379) (0.0366) (0.0133)
N 6,717 6,717 6,717 3,366 3,366 3,366
Log-pseudo likelihood -34791582 -34791582 -34791582 -18959111 -18959111 -18959111
Frequency 2,710 3,597 410 1,063 2,119 184
Wald x2 373.14*** 373.14*** 373.14*** 400.15*** 400.15*** 400.15***
*** p<0.01, ** p<0.05, * p<0.1: Standard Errors in Parentheses.
Copyright © 2022 FDOKUMEN