Self-Employment Transitions among Older American Workers with Career Jobs
37
Self-Employment Transitions among Older American Workers with Career Jobs Michael D. Giandrea, Ph.D. (corresponding author) U.S. Bureau of Labor Statistics Office of Productivity and Technology Postal Square Building, Room 2180 2 Massachusetts Ave., NE Washington, DC 20212-0001 Email: [email protected] Phone: (202) 691-5628 Kevin E. Cahill, Ph.D. Analysis Group, Inc. 111 Huntington Avenue, 10 th Floor Boston, MA 02199 Email: [email protected] Phone: (617) 425-8380 Joseph F. Quinn, Ph.D. Department of Economics Gasson Hall 103 Boston College Chestnut Hill, MA 02467-3803 Email: [email protected] Phone: (617) 552-2393 April 10, 2008 All views expressed in this paper are those of the authors and do not necessarily reflect the views or policies of the U.S. Bureau of Labor Statistics. The Alfred P. Sloan Foundation supported this research through a grant to the Center on Aging and Work/Workplace Flexibility at Boston College.
Transcript of Self-Employment Transitions among Older American Workers with Career Jobs

Self-Employment Transitions among Older American Workers with Career Jobs
Michael D. Giandrea, Ph.D. (corresponding author)
U.S. Bureau of Labor Statistics Office of Productivity and Technology
Postal Square Building, Room 2180 2 Massachusetts Ave., NE
Washington, DC 20212-0001 Email: [email protected]
Phone: (202) 691-5628
Kevin E. Cahill, Ph.D. Analysis Group, Inc.
111 Huntington Avenue, 10th Floor Boston, MA 02199
Email: [email protected] Phone: (617) 425-8380
Joseph F. Quinn, Ph.D.
Department of Economics Gasson Hall 103 Boston College
Chestnut Hill, MA 02467-3803 Email: [email protected]
Phone: (617) 552-2393
April 10, 2008 All views expressed in this paper are those of the authors and do not necessarily reflect the views or policies of the U.S. Bureau of Labor Statistics. The Alfred P. Sloan Foundation supported this research through a grant to the Center on Aging and Work/Workplace Flexibility at Boston College.

Abstract
What role does self-employment play in the retirement process? Older Americans are staying in the labor force longer than prior trends would have predicted and many change jobs later in life. These job transitions are often within the same occupation or across occupations within wage-and-salary employment. The transition can also be out of wage-and-salary work and into self employment. Indeed, national statistics show that self employment becomes more prevalent with age, partly because self employment provides older workers with opportunities not found in traditional wage-and-salary jobs, such as flexibility in hours worked and independence. This paper analyzes transitions into and out of self employment among older workers who have had career jobs. We utilize the Health and Retirement Study, a nationally-representative dataset of older Americans, to investigate the prevalence of self employment among older workers who made a job transition later in life and to explore the factors that determine the choice of wage-and-salary employment or self employment. We find that post-career transitions into and out of self employment are common and that health status, career occupation, and financial variables are important determinants of these transitions. As older Americans and the country as a whole face financial strains in retirement income in the years ahead, self employment may be a vital part of the pro-work solution.
- 2 -

I. Introduction
Older Americans are staying in the labor force longer than prior trends would have
predicted and they often change jobs later in life.1 In fact, the majority of older Americans who
have had career jobs make a job transition prior to retirement.2 These transitions are often within
the same occupation or across occupations within wage-and-salary employment. The transition
can also be out of wage-and-salary work and into self employment. National statistics show that
self employment becomes more prevalent with age,3 partly because self employment provides
older workers with opportunities not found in traditional wage-and-salary jobs, such as hours
flexibility and independence. This paper examines the prevalence and determinants of a specific
type of self-employment transition – those that serve as a step in the retirement process.
Self-employment transitions prior to retirement are of particular importance to
policymakers and employers. The leading edge of the Baby Boomers have now reached
retirement age, and their movement out of the labor force is expected to strain existing sources of
retirement income. Today, the ratio of workers to retirees is about three to one; by 2030, the
ratio will be two to one.4 As fewer workers support a growing retiree population, policymakers
may look for ways to encourage individuals to remain in the labor force.
Self employment may be one option because self-employed individuals tend to stay in the
labor force longer than wage-and-salary workers. While some of the differences between self-
employed workers and wage-and-salary employees may be explained by selection effects (i.e.,
those who choose self employment are those who would have worked later in life anyway), self
employment offers real advantages that are valued by older workers such as working for oneself
1 See Burkhauser and Quinn (1997). 2 See Cahill, Giandrea, and Quinn (2006). 3 See Hipple (2004). 4 See Social Security Administration Fact Sheet (2007).
- 3 -
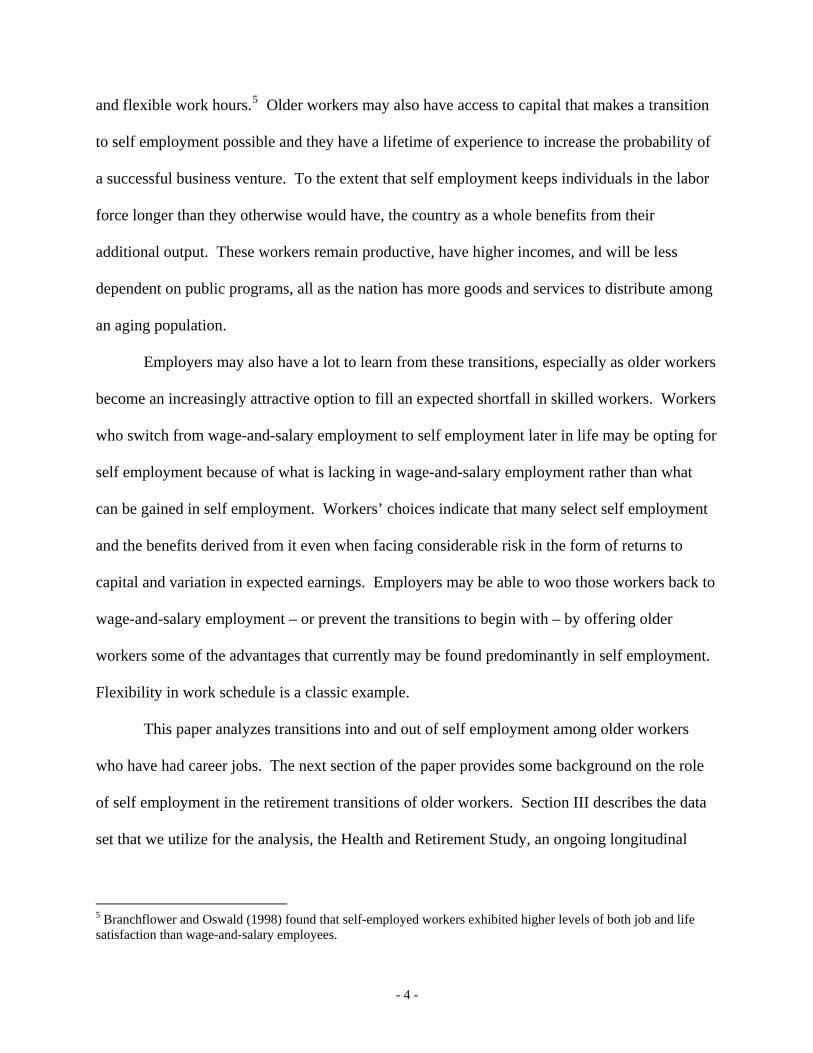
and flexible work hours.5 Older workers may also have access to capital that makes a transition
to self employment possible and they have a lifetime of experience to increase the probability of
a successful business venture. To the extent that self employment keeps individuals in the labor
force longer than they otherwise would have, the country as a whole benefits from their
additional output. These workers remain productive, have higher incomes, and will be less
dependent on public programs, all as the nation has more goods and services to distribute among
an aging population.
Employers may also have a lot to learn from these transitions, especially as older workers
become an increasingly attractive option to fill an expected shortfall in skilled workers. Workers
who switch from wage-and-salary employment to self employment later in life may be opting for
self employment because of what is lacking in wage-and-salary employment rather than what
can be gained in self employment. Workers’ choices indicate that many select self employment
and the benefits derived from it even when facing considerable risk in the form of returns to
capital and variation in expected earnings. Employers may be able to woo those workers back to
wage-and-salary employment – or prevent the transitions to begin with – by offering older
workers some of the advantages that currently may be found predominantly in self employment.
Flexibility in work schedule is a classic example.
This paper analyzes transitions into and out of self employment among older workers
who have had career jobs. The next section of the paper provides some background on the role
of self employment in the retirement transitions of older workers. Section III describes the data
set that we utilize for the analysis, the Health and Retirement Study, an ongoing longitudinal
5 Branchflower and Oswald (1998) found that self-employed workers exhibited higher levels of both job and life satisfaction than wage-and-salary employees.
- 4 -

survey of 12,652 older Americans that began in 1992. Section IV presents the results of our
analysis and Section V summarizes the main points of the paper.
II. Background
A dominant theme in the self-employment literature is the role of financial capital in
entrepreneurship. This section highlights a few key studies that address this theme, and several
studies related to self-employment transitions later in life. Perhaps one of the most informative
studies on self employment is by Evans and Jovanovic (1989), who developed a model of self-
employment based, in part, on the role of liquidity constraints. In this model, a person becomes
self employed if expected income from wage-and-salary employment does not exceed income
from self employment. Using a sample of young men in the National Longitudinal Survey of
Youth, Evans and Jovanovic found that the value of assets had a positive effect on the likelihood
of becoming self employed. Moreover, they found a positive correlation between assets and self-
employment income, which may imply that men with greater assets become more profitable
entrepreneurs.
Holtz-Eakin, Joulfaian, and Rosen (1994a) developed a related model of self employment
where the decision to become an entrepreneur was dependent on assets and personal
characteristics. They found that an inheritance has a positive effect on the probability of
becoming self employed, other things equal, but that the impact of an inheritance decreased with
wealth. This finding confirmed the results presented in Evans and Jovanovic (1989). In another
article Holtz-Eakin, Joulfaian, and Rosen (1994b) found that the receipt of an inheritance while
self employed increased the viability and revenues of the self-employed worker’s business.
- 5 -

Dunn and Holtz-Eakin (2000) investigated not only the relationship between financial
capital and entrepreneurship, but also the impact of human capital on self-employment decisions.
They estimated a model that included own and family assets, demographic variables, and
parents’ self-employment status. Own assets had a positive but small effect on the likelihood of
becoming self-employed, while parents’ self-employment experience exerted a large and positive
impact on the probability of becoming self employed.
Several studies have focused on self employment among older workers. Fuchs (1982)
considered the role of self employment among older workers by focusing on the transitions from
wage-and-salary employment to self employment. He found that the self employed were
significantly more likely to continue to work, particularly by reducing work hours. Other factors
that impacted the employment decision of older workers included health, age, and pension
eligibility. One interesting finding was that the probability of switching from wage-and-salary
employment to self employment was a function of a worker’s occupational experience in jobs
that required skills similar to those needed in self employment. Examples included managerial
and sales positions.
Bruce, Holtz-Eakin, and Quinn (2000) focused on older workers and the transitions
among wage-and-salary employment, self employment, and labor force non-participation using
the first three waves of Health and Retirement Study data. They found that liquidity constraints
played an important role in determining who became self employed. Moreover, they concluded
that health insurance was not an important factor affecting the transition from wage-and-salary to
self employment.
Hipple (2004) documented that self employment became more likely as workers age.
The incidence of unincorporated self employment in 2003 by age bracket was 7.4 percent for
- 6 -

those age 35 to 44, 8.2 percent for those age 45 to 54, 10.5 percent for those age 55 to 64, and
15.3 percent for those 65 and older. Most recently, Zissimopoulos, Maestas, and Karoly (2007)
examined determinants of labor force exit among wage-and-salary and self-employed older
workers, and found that defined benefit pension incentives were significant determinants of why
exit rates were higher among wage and salary workers. Further, using a cross-country
comparison of the United States and Britain, they found that the availability of publicly-provided
health insurance impacted labor force exit.
This paper contributes to the literature by focusing on transitions later in life from wage-
and-salary career jobs into self employment and from self-employed career jobs into wage-and-
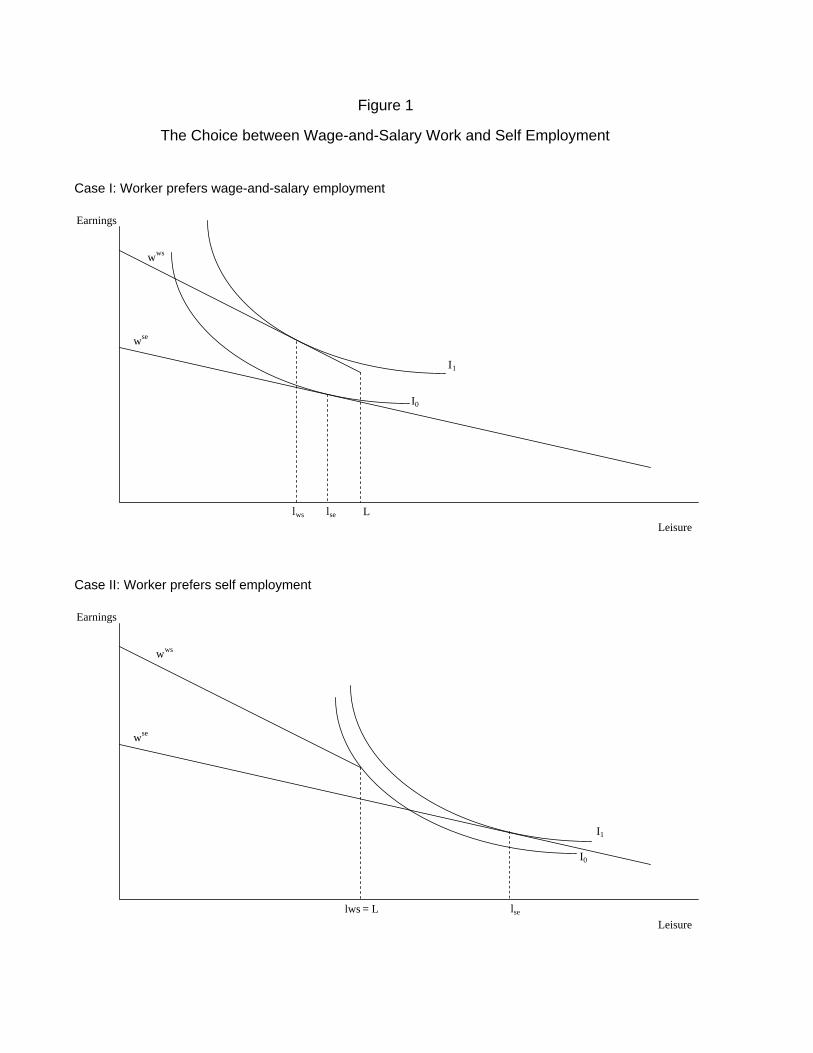
salary employment. One explanation for the shift to self employment later in life may be a
change in preferences for leisure as individuals age and leave full-time career (FTC)
employment. The mechanics behind this explanation can be seen graphically in Figure 1, in
which the choice between wage-and-salary and self employment is simplified by focusing on the
tradeoff between higher wages and hours flexibility (i.e., wage-and-salary workers have higher
earnings relative to self employed workers, but they are constrained in their ability to reduce
hours worked). The hours inflexibility associated with wage-and-salary employment is
illustrated by the vertical line at point L, the maximum amount of leisure allowed under wage-
and-salary employment. In the first case, a worker chooses the higher wages and lower leisure
hours associated with wage-and-salary employment. In the second case, perhaps one that
follows FTC employment, the worker sacrifices higher wages in return for the increased leisure
available with self employment.
The underlying assumption about hours inflexibility in wage-and-salary employment is
supported by several stylized facts. In some cases, high fixed costs per worker related to benefits
- 7 -

such as health insurance limit a firm’s willingness to employ part-time workers. In other cases,
defined-benefit pension rules may result in significantly smaller pension valuations for those
who work part-time (Penner, Perun, and Steuerle, 2002; Burkhauser and Quinn, 1997). While
self employed workers may not experience these constraints on hours worked, they instead
typically face lower wage profiles than comparable full-time wage-and-salary workers.
Hamilton (2000) found a 35 percent earnings differential in favor of wage-and-salary workers
relative to self-employed workers, and Lettau (1994) found that part-time workers earn
substantially less in part-time work than in equivalent full-time work.
Using this simplified framework and the existing literature on self employment as a
guide, we extend the research on retirement transitions more generally by Cahill, Giandrea and
Quinn (2006) to incorporate switches later in life from wage-and-salary employment to self-
employment and vice versa.
III. Data
An ideal data set for this research is the Health and Retirement Study (HRS). The HRS is
a nationally representative panel data set created with the objective of understanding the
antecedents and consequences of retirement, monitoring work disability, and examining the
relationship among health, income and wealth, and the patterns of wealth accumulation and
consumption over time.6 The HRS survey began in 1992 with interviews of over 12,500 people
(known as the Core) aged 51 to 61 years, and their spouses, whatever their age. The interviews
have been repeated every other year since 1992.
The longitudinal nature of the HRS allows us to examine each respondent’s work history
and identify job transitions. For the purposes of this analysis, we define a full-time career job as
6See Juster and Suzman (1995) for a detailed description of the HRS.
- 8 -
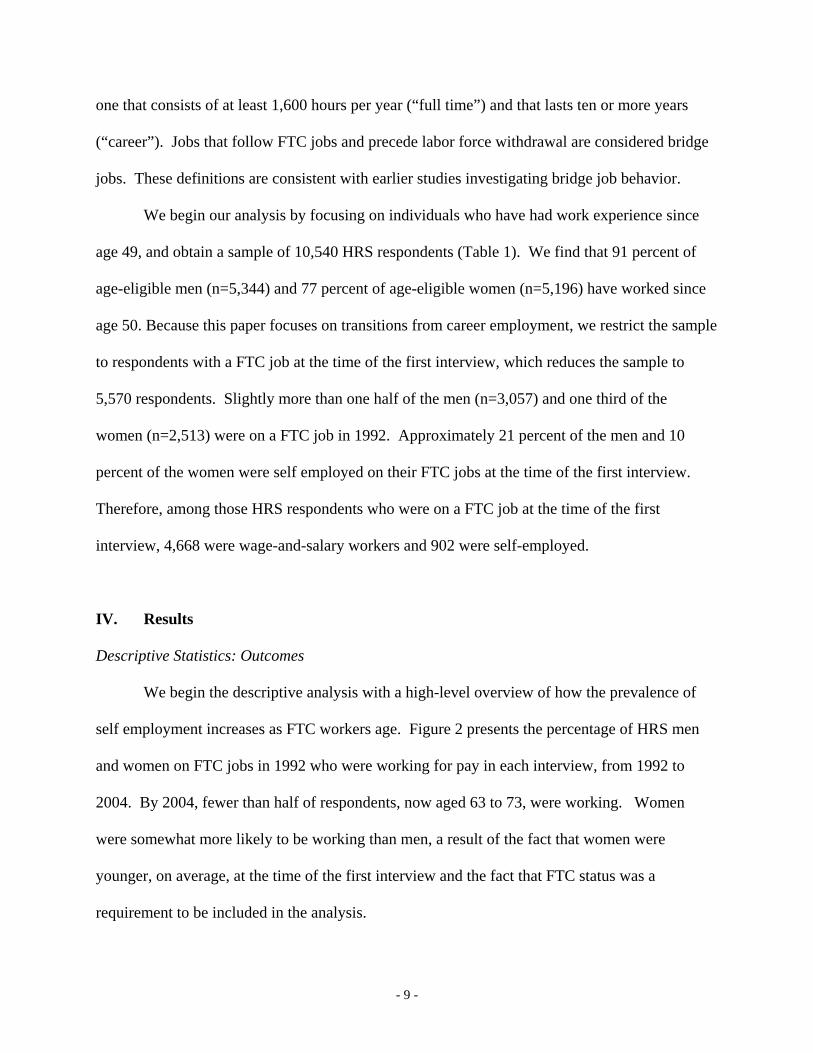
one that consists of at least 1,600 hours per year (“full time”) and that lasts ten or more years
(“career”). Jobs that follow FTC jobs and precede labor force withdrawal are considered bridge
jobs. These definitions are consistent with earlier studies investigating bridge job behavior.
We begin our analysis by focusing on individuals who have had work experience since
age 49, and obtain a sample of 10,540 HRS respondents (Table 1). We find that 91 percent of
age-eligible men (n=5,344) and 77 percent of age-eligible women (n=5,196) have worked since
age 50. Because this paper focuses on transitions from career employment, we restrict the sample
to respondents with a FTC job at the time of the first interview, which reduces the sample to
5,570 respondents. Slightly more than one half of the men (n=3,057) and one third of the
women (n=2,513) were on a FTC job in 1992. Approximately 21 percent of the men and 10
percent of the women were self employed on their FTC jobs at the time of the first interview.
Therefore, among those HRS respondents who were on a FTC job at the time of the first
interview, 4,668 were wage-and-salary workers and 902 were self-employed.
IV. Results
Descriptive Statistics: Outcomes
We begin the descriptive analysis with a high-level overview of how the prevalence of
self employment increases as FTC workers age. Figure 2 presents the percentage of HRS men
and women on FTC jobs in 1992 who were working for pay in each interview, from 1992 to
2004. By 2004, fewer than half of respondents, now aged 63 to 73, were working. Women
were somewhat more likely to be working than men, a result of the fact that women were
younger, on average, at the time of the first interview and the fact that FTC status was a
requirement to be included in the analysis.
- 9 -

As the FTC respondents exited the labor force, the percentage of those working who were
self employed increased substantially (Figure 3). At the time of the 1992 survey, slightly more
than 20 percent of the men were self employed. The percentage of respondents who were self
employed among those who remained working rose in every survey year through 2004, with the
largest increases in the 2002 and 2004 surveys. Between 2000 and 2004, the percentage of men
who were self employed among those who had a FTC job in 1992 and who were still working in
2004 increased more than 7 percentage points to nearly 35 percent. A similar pattern was seen
among the women, although the percentages were considerably lower. Among women with FTC
jobs in 1992 and still working in 2004, about 17 percent were self employed on their 2004 job.
The rise in self employment as workers age is a function of two factors. First, self
employed workers may transition out of the labor force more slowly than wage-and-salary
workers. Second, more wage-and-salary workers could be shifting into self employment as they
grow older than vice versa. The longitudinal nature of the HRS allows us to examine both of
these mechanisms separately. Rates of transition out of the labor force by self-employment and
wage-and-salary status among men with FTC jobs are shown in Figure 4a. Those who were self
employed on their FTC job in 1992 exited the labor force more gradually than those on wage-
and-salary jobs. In particular, about one third of men who were self employed in 1992 were no
longer working by 2004, compared to about 60 percent of the wage-and-salary men. A
difference also exists among the female sample (Figure 4b), although the 10 percentage point
gap between self-employed and wage-and-salary women in 2004 was not quite as large as among
men.
The second explanation for the observed increase in self employment as workers age is
that more wage-and-salary workers shift into self employment than self-employed workers shift
- 10 -

into wage-and-salary employment. In percentage terms, men who were self employed on their
FTC job moved into wage-and-salary worked at a much higher rate (about 23 percent) than
wage-and-salary men moved into self employment (about 11 percent) (Figure 5). But because
there were so many more wage-and-salary workers relative to self-employed workers, about 4 to
1, the net impact was a rise in self employment. Again, a similar story held among women.
Before proceeding with an analysis of determinants, it is important to highlight a key
distinction between the self-employed and wage-and-salary jobs noted above; namely, that those
on self employed jobs are much more likely to be working part time (Table 2). Among men who
were on a wage-and-salary FTC job in 1992 and who were still working in 2002, about three
quarters were working full time in 2002. In contrast, only about 56 percent of their self-
employed counterparts were working full time in 2002. Among women, the gap was even wider.
So it is important to note that while self-employed workers were staying in the workforce later in
life, the hours worked does not appear to match those among wage-and-salary workers, at least
with respect to a full-time, part-time distinction.
To explore outcomes in more detail, we make use of the longitudinal nature of the HRS
and categorize respondents according to their transitions from FTC jobs. Four general outcomes
are possible by 2004: (1) remain on a FTC job, (2) move into self employment, (3) move into
wage-and-salary employment, and (4) exit the labor force directly. Each of these outcomes is
examined separately for those who were wage and salary on their FTC job and for those who
were self employed (Table 3). The four-way outcome analysis results are consistent with the
previous findings.7 Those who were wage and salary on their FTC jobs were less likely to
remain on their FTC jobs as of 2004 and more likely to exit directly from the labor force.
Further, of those who were on a wage-and-salary FTC job in 1992 and who made a transition by 7 See Cahill et al. (2006)
- 11 -

2004, about 12 percent of the men and 10 percent of the women had transitioned into a self-
employment position. Among their counterparts who were self employed on their 1992 FTC job,
about 42 percent of men and 39 percent of women transitioned to a wage-and-salary position.
Descriptive Statistics: Determinants
A key element of this research is to understand who transitions into self employment and
why. To do so, we stratify the four-way outcome variable by various demographic and
economic characteristics for the wage-and-salary and self-employed individuals separately.
Among those who were wage and salary on the FTC job, we focus on the percentage who
switched to self employment among those who made a transition (Tables 4a (demographic
characteristics) and 5a (economic characteristics)). Among those who were self employed on the
FTC job, we examine the percentage who switched to wage-and-salary jobs among those who
made a transition (Tables 4b and 5b).
The major differences in who became self employed during a transition appear to be
related to health status although, to a lesser extent, differences exist for other factors such as age,
education, marital status, and spouse’s employment status (Table 4a). Men who were wage and
salary on their FTC job and who made a transition were much less likely to have become self
employed if they were in fair or poor health. Approximately 4 percent of those in fair or poor
health switched into self employment compared to 15 percent among those in excellent or very
good health. Similar percentages were also associated with a spouse’s health status. Another
large discrepancy among men existed by educational status. Self-employment transitions were
much more common among college-educated men than those who did not complete college (22
percent versus 10 percent). Further, self-employment transitions were somewhat more likely
among men who were married and who had an employed spouse.
- 12 -

Women’s transitions appeared similar to men’s with respect to the impact of the set of
demographic variables included in Table 4a. Two differences are of note. First, wage and salary
women with dependent children were more likely to transition into self employment than those
without dependent children. Second, rates of self employment were not impacted by a husband’s
health status.
Several findings regarding switches into wage-and-salary employment are worth
mentioning. First, younger men were much more likely than older men to switch into wage-and-
salary employment (Table 4b). Health status also positively impacted a switch into wage-and-
salary employment, although differences were not as large as those found for switchers into self
employment. Further, transitions from self employment to wage and salary employment were
much more likely among men without a college degree, who were married, and who had a
spouse in fair or poor health.
As with the findings regarding transitions into self employment, women with dependent
children were more likely to switch employment status when making a transition. In contrast
with the transition into self employment, however, women with a spouse in fair or poor health
were more likely to switch into wage-and-salary employment.
The largest influence among the economic characteristics examined in this study
pertained to wage rates and occupational status of the FTC job. Men who were wage-and-salary
on their FTC jobs were much more likely to transition into self employment if they were high-
wage earners (Table 5a). Fewer than ten percent of those who earned less than $10 per hour
transitioned to a self-employed job, compared to about 18 percent of those who earned $20 to
$50 per hour. About one half of those who earned $50 per hour or more on their wage-and-
salary FTC job transitioned to a self-employed job. Occupational status was also a strong
- 13 -
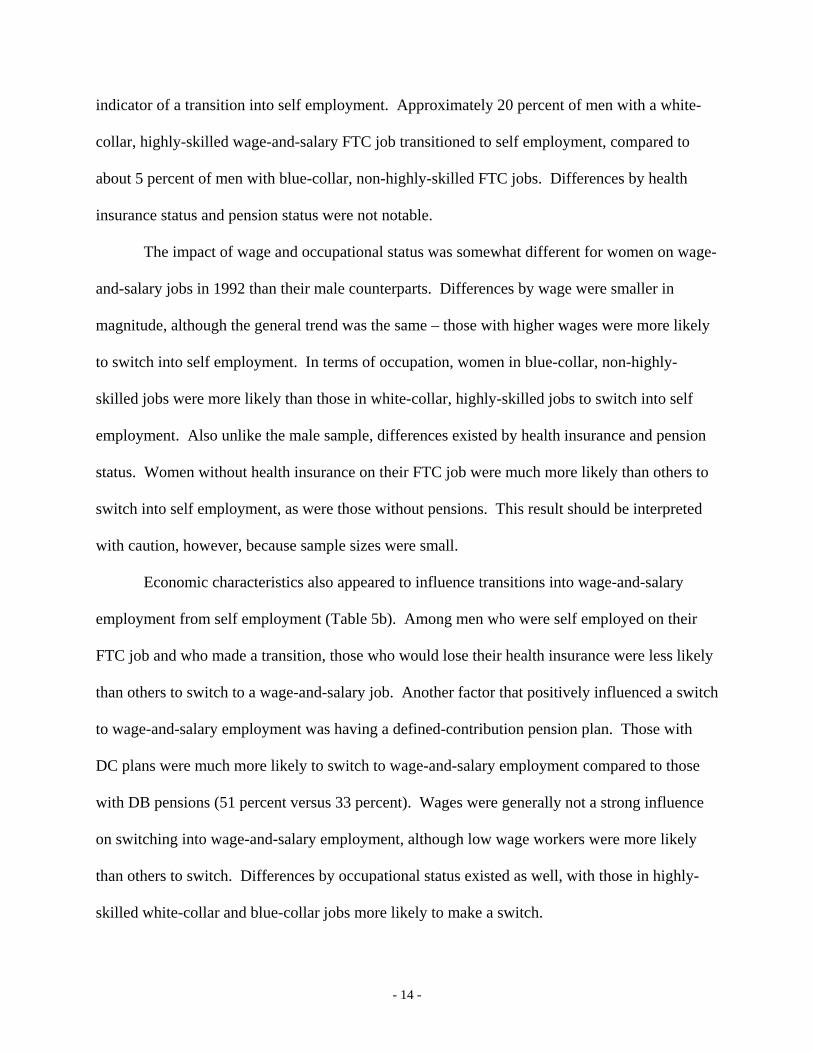
indicator of a transition into self employment. Approximately 20 percent of men with a white-
collar, highly-skilled wage-and-salary FTC job transitioned to self employment, compared to
about 5 percent of men with blue-collar, non-highly-skilled FTC jobs. Differences by health
insurance status and pension status were not notable.
The impact of wage and occupational status was somewhat different for women on wage-
and-salary jobs in 1992 than their male counterparts. Differences by wage were smaller in
magnitude, although the general trend was the same – those with higher wages were more likely
to switch into self employment. In terms of occupation, women in blue-collar, non-highly-
skilled jobs were more likely than those in white-collar, highly-skilled jobs to switch into self
employment. Also unlike the male sample, differences existed by health insurance and pension
status. Women without health insurance on their FTC job were much more likely than others to
switch into self employment, as were those without pensions. This result should be interpreted
with caution, however, because sample sizes were small.
Economic characteristics also appeared to influence transitions into wage-and-salary
employment from self employment (Table 5b). Among men who were self employed on their
FTC job and who made a transition, those who would lose their health insurance were less likely
than others to switch to a wage-and-salary job. Another factor that positively influenced a switch
to wage-and-salary employment was having a defined-contribution pension plan. Those with
DC plans were much more likely to switch to wage-and-salary employment compared to those
with DB pensions (51 percent versus 33 percent). Wages were generally not a strong influence
on switching into wage-and-salary employment, although low wage workers were more likely
than others to switch. Differences by occupational status existed as well, with those in highly-
skilled white-collar and blue-collar jobs more likely to make a switch.
- 14 -

The number of observations for the female sample in several of the economic categories
was too small to draw inferences; however, where observations were sufficient to examine
outcomes, there were some findings of note. Women without pension coverage had a similar
rate of switching into wage-and-salary employment as men without pensions. Unlike the men,
though, low-wage women had the lowest prevalence of switching from self employment to
wage-and-salary employment. Differences by occupational status did not follow any particular
pattern.
Multivariate Analysis
This section examines transitions into self employment in a multivariate context. We
estimate two self-employment models based on HRS respondents who were on a FTC wage-and-
salary job in 1992 and for whom later employment status could be identified. The first
specification is one in which self employment is viewed as a dichotomous decision. The
dependent variable is equal to one if a worker who was on a FTC wage-and-salary job in 1992
ever transitioned into self employment between 1992 and 2004, and equal to zero otherwise.
The second specification examines transitions from wage-and-salary FTC jobs in more detail,
using the four-way dependent variable presented earlier in Tables 4 and 5. The outcomes are
defined as of 2004 and are as follows: (1) remained on a FTC job, (2) moved to a different wage-
and-salary job, (3) moved to a self-employed job, and (4) exited the labor force directly from a
FTC job. The coefficients of each model are estimated for men and women separately using
logistic regression for the first model and multinomial logistic regression for the second model.
The multivariate analysis generally confirms the descriptive findings. Among men, the
logistic regression results show that respondents in fair or poor health or respondents with
spouses in fair or poor health were about five percentage point less likely than otherwise similar
- 15 -

respondents to switch from wage-and-salary FTC jobs to self employment (Table 6a).
Occupational status was also a strong predictor of self-employment transitions, with white-collar,
highly-skilled workers the most likely to switch into self employment. Pension status was also
marginally significant, as those without a pension on the FTC job were more likely to switch into
self employment.
The logistic regression for the female sample revealed fewer statistically-significant
coefficients, but those that were significant appeared consistent with the findings for the male
sample (Table 6b). Two coefficients were significant among women that were not significant for
men. The lack of health insurance appeared to be positively associated with switching into self
employment, all else equal, and home ownership was negatively associated with switching into
self employment (after controlling for wealth). One observation of note is that, like the
descriptive statistics, occupational status was not a significant predictor of switching into self
employment among women.
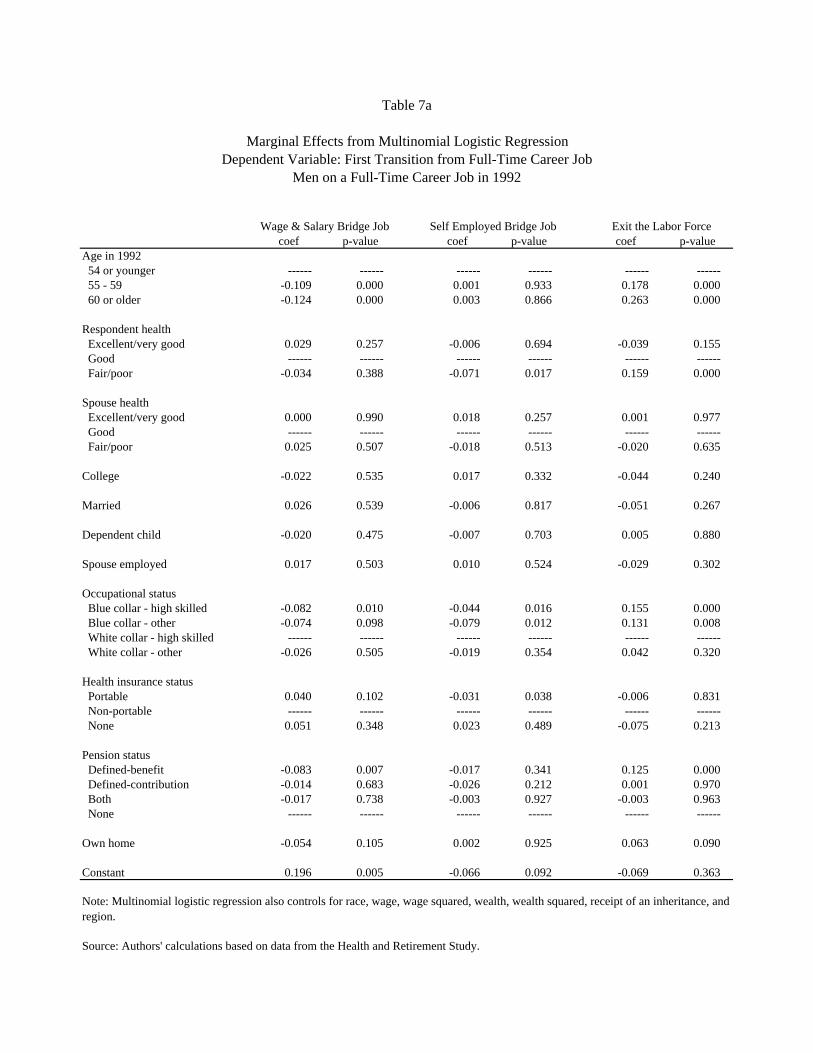
The multinomial logistic regressions reinforced many of the descriptive findings and the
logistic regression results. Again, the main drivers of post-FTC transitions were age, health
status, occupational status, and pension status. Among men, younger respondents were more
likely to switch to a different wage-and-salary job and older men were more likely to exit the
labor force directly (Table 7a). Those in fair or poor health were less likely to take a self-
employed job after FTC wage-and-salary employment and were more likely to exit the labor
force directly. Blue-collar workers were less likely than white-collar workers to take either a
different wage-and-salary or a self-employed job after FTC wage-and-salary employment and
were more likely to exit directly. Sample sizes for women appear to have limited the extent to
which statistical significance could be found. Two findings from the logistic regression remain,
- 16 -

however; women without health insurance and without pensions were less likely to exit the labor
force directly than otherwise similar women (Table 7b).
V. Conclusion
Self employment among the working population increases substantially as workers
approach retirement age. According to data from the Health and Retirement Study, about 20
percent of men aged 51 to 61 in 1992 were self employed, already a sizable proportion. Twelve
years later, more than one third of those working were self employed – an increase of more than
50 percent. Among older women, the increase in self employment was from about 10 percent to
more than 15 percent. The rise in self employment later in life is a result of a combination of
factors, including the fact that self-employed workers tend to stay in the labor force longer than
wage-and-salary workers and that more wage-and-salary workers switch into self employment
later in life than vice versa. Some of the key determinants of these transitions included health
status, spouse’s health status, educational attainment, and occupational status.
The degree to which older Americans switch from wage-and-salary employment to self
employment is an interesting outcome. The implication is that self-employment decisions are
not predetermined during middle age; in fact, it is just the opposite. Older workers exhibit a
great deal of flexibility in their work decisions and appear willing to take on substantial risks
later in life. In a sense, the outcome is intuitive, as older workers are more likely than younger
workers to have access to investment capital. Their lifetime of experience may also help them
avoid many of the pitfalls associated with running a business that may ensnare younger, less
experienced workers.
- 17 -

Policymakers and employers may have a lot to gain by understanding the self-
employment transitions of older Americans, because the decision to remain working later in life
is likely linked to the type of work people will be doing. Self employment, for example,
provides many older workers with the flexibility that they desire in a work schedule. If needs
such as these are met, many older workers may continue to work later in life and be a valuable
resource as the population ages.
- 18 -

References
Bruce, D., Holtz-Eakin, D., & Quinn, J. (2000). Self-Employment and Labor Market Transitions
at Older Ages. Center for Retirement Research at Boston College Working Paper 2000-13.
Retrieved February 15, 2007 from http://www.bc.edu/centers/crr/papers/wp_2000-13.pdf
Burkhauser, R., & Quinn, J. F. (1997) Implementing Pro-Work Policies for Older Americans in
the Twenty-First Century. Preparing for the Baby-Boomers: The Role of Employment. U.S.
Special Committee on Aging, Serial Number 105-7, 60-83.
Cahill, K. E., Giandrea, M. D., & Quinn, J. F. (2006). Retirement Patterns from Career
Employment. The Gerontologist, 46(4), 514-523.
Dunn, T., & Holtz-Eakin, D. (2000). Financial Capital, Human Capital, and the Transition to
Self-Employment: Evidence from Intergenerational Links. Journal of Labor Economics,
18(2), 282-305.
Evans, D. S., & Jovanovic, B. (1989). An estimated model of entrepreneurial choice under
liquidity constraints. The Journal of Political Economy, 97(4), 808-827.
Fuchs, V. R. (1982). Self-Employment and Labor Force Participation of Older Males. The
Journal of Human Resources. 17(3), 339-357.
Hamilton, B. H. (2000). Does Entrepreneurship Pay? An Empirical Analysis of the Returns of
Self-Employment. The Journal of Political Economy, 108(3), 604-631.
Hipple, S. (2004). Self-employment in the United States: an update. Monthly Labor Review,
127(7), 13-23.
Holtz-Eakin, D., Joulfaian, D., & Rosen, H. S. (1994a). Sticking it Out: Entrepreneurial Survival
and Liquidity Constraints. The Journal of Political Economy, 102(1), 53-75.
- 19 -

Holtz-Eakin, D., Joulfaian, D., & Rosen, H. S. (1994b). Entrepreneurial Decisions and Liquidity
Constraints. The RAND Journal of Economics, 25(2), 334-347.
Juster, F. T. & Suzman, R. (1995). An Overview of the Health and Retirement Study. Journal of
Human Resources, 30(Supplement), S7-S56.
Lettau, M. K. (1997). Compensation in Part-Time versus Full-Time Jobs: What if the Job is the
Same? Economics Letters, Vol. 56, 101-106.
Penner, R. G., Perun, P., & Steuerle, E. (2002). Legal and Institutional Impediments to Partial
Retirement and Part-Time Work by Older Workers. Urban Institute. Retrieved from
http://www.urban.org/Publications/410587.html
Social Security Administration Fact Sheet downloaded April 11, 2007 from
http://www.ssa.gov/pressoffice/factsheets/basicfact-alt.pdf
Zissimopoulos, J., Maestas, N., & Karoly, L. (2007). The Effect of Retirement Incentives on
Retirement Behavior: Evidence from the Self-Employed in the United States and England.
University of Michigan Retirement Research Center, WP 2007-155.
- 20 -

Men Women TotalAll HRS Core respondents n 5,869 6,783 12,652
Worked since age 50 n 5,344 5,196 10,540 % of HRS Core 91% 77% 83%
Worked since age 50 and had a FTC job n 4,697 3,470 8,167 % of HRS Core 80% 51% 65% On a FTC job in 1992 n 3,057 2,513 5,570 % of HRS Core 52% 37% 44%
Wage and salary n 2,418 2,250 4,668 % of FTC in 1992 79% 90% 84%
Self employed n 639 263 902 % of FTC in 1992 21% 10% 16%
Source: Authors’ calculations based on data from the Health and Retirement Study.
HRS Core: Respondents Age 51 to 61 in 1992
Table 1
Sample Size, by Gender

n Full Time Part Time Full Time Part Time1992 3,057 100% 0% 100% 0%1994 2,427 96% 4% 86% 14%1996 2,078 91% 9% 73% 27%1998 1,782 86% 14% 65% 35%2000 1,447 80% 20% 61% 39%2002 1,180 72% 28% 56% 44%
n Full Time Part Time Full Time Part Time1992 2,513 100% 0% 100% 0%1994 2,110 92% 8% 85% 15%1996 1,771 88% 12% 65% 35%1998 1,568 84% 16% 70% 30%2000 1,331 77% 23% 63% 37%2002 1,103 72% 28% 51% 49%
Source: Authors’ calculations based on data from the Health and Retirement Study.
Wage & Salary Self Employed
Table 2
Self Employment Status
Sample: HRS Core Respondents on a FTC Job in 1992
Wage & Salary Self Employed
Men
Women
by Full-time/Part-time Status, Year and Gender

Still on a Moved Moved to SE WS
FTC Job to Self Employment Wage and Salary Out (SE+WS+Out) (SE+WS+Out)
Wage and salary Males 10.6% 10.4% 31.7% 47.3% 11.6%Females 17.0 7.9 36.2 38.9 9.5
Self employment Males 23.1 23.3 32.0 21.6 41.6%Females 17.1 26.9 32.1 23.9 38.7
Source: Authors’ calculations based on data from the Health and Retirement Study.
Table 3
Transitions Into and From Self Employment as of 2004Sample: HRS Core Respondents on FTC Jobs in Wave One

Category Still on a Moved to Moved to SE Category Still on a Moved to Moved to SE
Determinants Percentage FTC Job Self Employment Wage & Salary Out (SE+WS+Out) Percentage FTC Job Self Employment Wage & Salary Out (SE+WS+Out)Age in 2004 61 and younger 4.4% 34.2% 6.6% 34.2% 25.0% 10.0% 27.8% 41.1% 8.5% 31.8% 18.7% 14.5% 62 - 64 30.2 21.9 10.8 36.9 30.4 13.8 26.4 22.1 9.8 38.2 29.9 12.6 65 - 69 42.1 10.3 11.3 30.9 47.5 12.6 33.5 10.4 6.8 37.9 45.0 7.5 70 and older 23.3 3.7 13.0 29.9 53.4 13.5 12.3 3.6 8.5 26.9 61.0 8.8
Subjective health status excellent / very good 60.1 14.7 13.0 32.3 40.1 15.2 62.4 24.2 9.5 35.8 30.5 12.6 good 29.8 12.3 10.5 33.3 44.0 12.0 28.5 17.4 6.6 34.1 41.9 8.0 fair / poor 10.1 8.6 4.0 32.8 54.6 4.4 9.1 12.1 4.9 31.5 51.5 5.5
Less than college degree 76.2 12.0 9.1 33.9 44.9 10.4 78.3 20.6 7.4 34.7 37.4 9.3College degree 23.8 17.6 18.3 28.5 35.6 22.2 21.7 23.4 11.4 35.8 29.4 14.9
Received inheritance 20.2 12.7 15.6 30.0 41.8 17.8 17.6 18.9 11.0 35.3 34.7 13.6Never received inheritance 79.8 13.4 10.2 33.3 43.1 11.8 82.4 21.8 7.6 34.8 35.8 9.7
Not married 10.5 13.3 8.3 31.1 47.2 9.6 25.3 13.9 8.1 37.5 40.5 9.4Married 89.6 13.4 11.7 32.8 42.2 13.5 74.7 23.6 8.4 34.1 34.0 10.9
No dependent children 79.4 11.6 11.5 32.6 44.3 13.0 82.4 17.5 8.3 34.9 39.4 10.1Dependent children 20.6 20.0 10.7 32.7 36.6 13.4 17.6 38.6 8.2 35.1 18.2 13.3
No employed spouse 39.5 13.1 10.4 30.6 45.9 12.0 41.6 17.0 8.3 35.4 39.3 10.0Spouse employed 60.5 13.5 11.9 33.9 40.7 13.7 58.4 24.2 8.2 34.6 33.0 10.8 Spouse's health status excellent / very good 58.1 12.4 13.9 32.4 41.3 15.9 53.0 24.2 8.4 35.3 32.1 11.1 good 27.5 14.5 9.9 32.7 42.9 11.6 29.4 21.7 8.0 35.8 34.5 10.2 fair / poor 14.4 15.7 5.6 34.3 44.4 6.6 17.5 25.1 7.8 27.7 39.4 10.4
Source: Authors’ calculations based on data from the Health and Retirement Study.
Men Women
Table 4a
Transitions Into Self Employment as of 2004, by Demographic CharacteristicsSample: HRS Core Respondents on Wage and Salary FTC Jobs in Wave One

Category Still on a Moved to Moved to WS Category Still on a Moved to Moved to WS
Determinants Percentage FTC Job Wage and Salary Self Employed Out (SE+WS+Out) Percentage FTC Job Wage and Salary Self Employed Out (SE+WS+Out)Age in 2004 61 and younger 4.2% 27.8% 38.9% 22.2% 11.1% 53.8% 29.3% 29.5% 24.6% 32.8% 13.1% 34.9% 62 - 64 25.4 45.9 15.6 25.7 12.8 28.8 28.4 22.0 30.5 17.0 30.5 39.1 65 - 69 41.2 29.4 25.4 29.4 15.8 36.0 28.9 16.7 26.7 40.0 16.7 32.0 70 and older 29.3 12.7 26.2 40.5 20.6 30.0 13.5 7.1 32.1 42.9 17.9 34.6
Subjective health status excellent / very good 63.0 34.3 22.5 30.3 12.9 34.3 68.3 23.9 23.2 33.8 19.0 30.6 good 27.4 15.3 27.1 36.4 21.2 32.0 25.0 13.5 42.3 25.0 19.2 48.9 fair / poor 9.5 29.3 22.0 24.4 24.4 31.0 6.7 14.3 21.4 35.7 28.6 25.0
Less than college degree 70.5 29.4 24.8 29.4 16.5 35.0 84.6 18.2 28.4 32.4 21.0 34.7College degree 29.5 26.8 21.3 36.2 15.8 29.0 15.4 34.4 25.0 28.1 12.5 38.1
Received inheritance 27.3 18.0 29.1 39.3 13.7 35.4 24.0 20.0 24.0 40.0 16.0 30.0Never received inheritance 72.7 32.7 21.8 28.2 17.3 32.4 76.0 20.9 29.1 29.1 20.9 36.8
Not married 9.3 22.5 22.5 35.0 20.0 29.0 17.8 18.9 29.7 32.4 18.9 36.7Married 90.7 29.2 23.9 31.0 15.9 33.7 82.2 21.1 27.5 31.6 19.9 34.8
No dependent children 81.2 26.1 24.4 32.7 16.9 33.0 82.2 20.5 26.9 33.3 19.3 33.8Dependent children 18.8 39.5 21.0 25.9 13.6 34.7 17.8 21.6 32.4 24.3 21.6 41.4
No employed spouse 37.0 24.5 24.5 35.2 15.7 32.5 33.7 21.4 27.1 25.7 25.7 34.5Spouse employed 63.0 31.0 23.3 29.2 16.6 33.7 66.4 20.3 28.3 34.8 16.7 35.5 Spouse's health status excellent / very good 68.5 31.6 21.7 31.2 15.6 31.7 57.4 20.4 29.0 35.5 15.1 36.4 good 21.1 28.4 24.7 30.9 16.1 34.4 21.0 20.6 17.7 35.3 26.5 22.3 fair / poor 10.4 12.5 37.5 32.5 17.5 42.9 21.6 22.9 31.4 22.9 22.9 40.7
Source: Authors’ calculations based on data from the Health and Retirement Study.
Men Women
Table 4b
Transitions Out Of Self Employment as of 2004, by Demographic CharacteristicsSample: HRS Core Respondents on Self Employment FTC Jobs in Wave One

Category Still on a Moved to Moved to SE Category Still on a Moved to Moved to SE
Determinants Percentage FTC Job Self Employment Wage & Salary Out (SE+WS+Out) Percentage FTC Job Self Employment Wage & Salary Out (SE+WS+Out)Health insurance status Not covered on career job 5.0% 20.5% 10.3% 39.7% 29.5% 12.9% 7.4% 27.1% 17.0% 39.0% 17.0% 23.3% "Covered, would maintain" coverage 81.2 11.2 11.7 32.0 45.1 13.2 80.2 19.0 6.9 36.1 38.0 8.5 "Covered, would lose" coverage 13.8 21.4 10.7 28.8 39.1 13.6 12.4 25.0 8.2 32.1 34.7 10.9
Pension status No pension 20.0 16.5 10.7 39.1 33.6 12.8 27.1 19.7 12.0 40.2 28.1 14.9 DC only 22.8 18.1 10.9 34.9 36.1 13.4 25.8 24.0 7.1 32.3 36.6 9.3 DB only 50.6 9.4 11.2 28.9 50.5 12.4 43.5 18.9 7.0 32.7 41.4 8.6 DC and DB 6.6 17.7 15.0 33.6 33.6 18.3 3.6 40.0 4.6 40.0 10.0 8.5
Wage rate < $6/hour 5.4 15.1 7.0 46.5 31.4 8.2 12.3 28.0 8.1 39.8 24.2 11.2 $6 - $10/hour 17.5 16.4 7.5 36.4 39.6 9.0 35.2 21.4 8.5 34.6 35.6 10.8 $10 - $20/hour 52.1 12.4 9.5 30.7 47.4 10.8 43.5 18.4 7.4 36.3 37.9 9.1 $20 - $50/hour 23.8 11.5 16.2 31.9 40.3 18.3 8.8 26.0 9.3 29.3 35.3 12.6 > $50/hour 1.3 33.3 33.3 9.5 23.8 50.0 0.3 0.0 20.0 40.0 40.0 20.0
Occupation status White collar, highly skilled 34.5 14.4 16.1 32.0 37.6 18.8 35.0 22.9 9.6 34.8 32.7 12.5 White collar, other 12.8 15.5 13.2 33.2 38.2 15.6 37.3 22.5 6.4 35.7 35.5 8.2 Blue collar, highly skilled 40.5 10.2 8.6 32.2 48.9 9.6 12.3 13.0 5.8 35.0 46.2 6.7 Blue collar, other 12.2 19.1 4.3 34.5 42.1 5.3 15.4 20.8 11.8 33.7 33.7 14.9
Source: Authors’ calculations based on data from the Health and Retirement Study.
Men Women
Table 5a
Transitions Into Self Employment as of 2004, by Economic CharacteristicsSample: HRS Core Respondents on Wage and Salary FTC Jobs in Wave One

Category Still on a Moved to Moved to WS Category Still on a Moved to Moved to WS
Determinants Percentage FTC Job Wage and Salary Self Employed Out (SE+WS+Out) Percentage FTC Job Wage and Salary Self Employed Out (SE+WS+Out)Health insurance status Not covered on career job 20.8% 25.0% 25.0% 37.5% 12.5% 33.3% 21.7% 12.5% 32.5% 32.5% 22.5% 37.1% "Covered, would maintain" coverage 71.2 28.1 25.6 29.2 17.2 35.5 76.1 22.1 25.0 33.6 19.3 32.1 "Covered, would lose" coverage 8.1 35.5 16.1 25.8 22.6 25.0 2.2 25.0 50.0 0.0 25.0 66.7
Pension status No pension 68.4 28.9 20.1 32.3 18.7 28.2 85.6 21.4 25.3 31.5 21.9 32.1 DC only 12.6 31.5 35.2 24.1 9.3 51.4 7.2 26.7 33.3 26.7 13.3 45.5 DB only 14.2 31.2 23.0 34.4 11.5 33.3 6.7 7.1 50.0 42.9 0.0 53.8 DC and DB 4.9 9.5 47.6 28.6 14.3 52.6 0.5 ---- ---- ---- ---- ----
Wage rate < $6/hour 17.2 29.6 31.5 31.5 7.4 44.7 46.6 15.9 20.3 34.8 29.0 24.1 $6 - $10/hour 17.8 25.0 23.2 35.7 16.1 31.0 18.2 22.2 37.0 25.9 14.8 47.6 $10 - $20/hour 33.1 31.7 22.1 29.8 16.4 32.4 19.6 27.6 27.6 34.5 10.3 38.1 $20 - $50/hour 22.3 28.6 24.3 30.0 17.1 34.0 13.5 15.0 30.0 25.0 30.0 35.3 > $50/hour 9.6 30.0 16.7 33.3 20.0 23.8 2.0 ---- ---- ---- ---- ----
Occupation status White collar, highly skilled 38.4 30.3 26.1 29.7 13.9 37.4 30.3 25.4 23.8 33.3 17.5 31.9 White collar, other 19.5 23.8 20.2 32.1 23.8 26.6 30.3 23.8 31.8 34.9 9.5 41.7 Blue collar, highly skilled 24.4 30.5 24.8 31.4 13.3 35.6 3.9 37.5 0.0 37.5 25.0 0.0 Blue collar, other 17.7 27.6 21.1 34.2 17.1 29.1 35.6 12.2 31.1 27.0 29.7 35.4
Source: Authors’ calculations based on data from the Health and Retirement Study.
Table 5b
Men Women
Transitions Out of Self Employment as of 2004, by Economic CharacteristicsSample: HRS Core Respondents on Self Employment FTC Jobs in Wave One

coef p-valueAge in 1992 54 or younger ------ ------ 55 - 59 -0.009 0.499 60 or older 0.002 0.900
Respondent health Excellent/very good 0.005 0.740 Good ------ ------ Fair/poor -0.048 0.067
Spouse health Excellent/very good 0.017 0.257 Good ------ ------ Fair/poor -0.048 0.067
College graduate 0.023 0.162
Married 0.006 0.805
Dependent child -0.001 0.972
Spouse employed -0.002 0.875
Occupational status Blue collar - high skilled -0.040 0.022 Blue collar - other -0.058 0.038 White collar - high skilled ------ ------ White collar - other -0.013 0.500
Health insurance status Portable -0.012 0.406 Non-portable ------ ------ None 0.017 0.577
Pension status Defined-benefit -0.030 0.071 Defined-contribution -0.038 0.048 Both -0.030 0.283 None ------ ------
Own home -0.005 0.801
Constant -0.164 0.000
Source: Authors' calculations based on data from the Health and Retirement Study.
Note: Logistic regression also controls for race, wage, wage squared, wealth, wealth squared, receipt of an inheritance, and region.
Table 6a
Marginal Effects from Logistic RegressionDependent Variable: Switch to Self Employment by 2004
Sample: Men on Wage & Salary FTC Jobs in 1992

coef p-valueAge in 1992 54 or younger ------ ------ 55 - 59 -0.005 0.675 60 or older 0.002 0.918
Respondent health Excellent/very good 0.020 0.091 Good ------ ------ Fair/poor -0.030 0.149
Spouse health Excellent/very good -0.003 0.802 Good ------ ------ Fair/poor -0.005 0.786
College graduate 0.013 0.415
Married 0.002 0.903
Dependent child -0.004 0.775
Spouse employed 0.002 0.851
Occupational status Blue collar - high skilled -0.013 0.501 Blue collar - other 0.012 0.489 White collar - high skilled ------ ------ White collar - other -0.011 0.432
Health insurance status Portable 0.011 0.350 Non-portable ------ ------ None 0.036 0.031
Pension status Defined-benefit -0.035 0.002 Defined-contribution -0.038 0.004 Both -0.066 0.061 None ------ ------
Own home -0.024 0.059
Constant -0.169 0.000
Source: Authors' calculations based on data from the Health and Retirement Study.
Note: Logistic regression also controls for race, wage, wage squared, wealth, wealth squared, receipt of an inheritance, and region.
Table 6b
Marginal Effects from Logistic RegressionDependent Variable: Switch to Self Employment by 2004
Sample: Women on Wage & Salary FTC Jobs in 1992
coef p-value coef p-value coef p-valueAge in 1992 54 or younger ------ ------ ------ ------ ------ ------ 55 - 59 -0.109 0.000 0.001 0.933 0.178 0.000 60 or older -0.124 0.000 0.003 0.866 0.263 0.000
Respondent health Excellent/very good 0.029 0.257 -0.006 0.694 -0.039 0.155 Good ------ ------ ------ ------ ------ ------ Fair/poor -0.034 0.388 -0.071 0.017 0.159 0.000
Spouse health Excellent/very good 0.000 0.990 0.018 0.257 0.001 0.977 Good ------ ------ ------ ------ ------ ------ Fair/poor 0.025 0.507 -0.018 0.513 -0.020 0.635
College -0.022 0.535 0.017 0.332 -0.044 0.240
Married 0.026 0.539 -0.006 0.817 -0.051 0.267
Dependent child -0.020 0.475 -0.007 0.703 0.005 0.880
Spouse employed 0.017 0.503 0.010 0.524 -0.029 0.302
Occupational status Blue collar - high skilled -0.082 0.010 -0.044 0.016 0.155 0.000 Blue collar - other -0.074 0.098 -0.079 0.012 0.131 0.008 White collar - high skilled ------ ------ ------ ------ ------ ------ White collar - other -0.026 0.505 -0.019 0.354 0.042 0.320
Health insurance status Portable 0.040 0.102 -0.031 0.038 -0.006 0.831 Non-portable ------ ------ ------ ------ ------ ------ None 0.051 0.348 0.023 0.489 -0.075 0.213
Pension status Defined-benefit -0.083 0.007 -0.017 0.341 0.125 0.000 Defined-contribution -0.014 0.683 -0.026 0.212 0.001 0.970 Both -0.017 0.738 -0.003 0.927 -0.003 0.963 None ------ ------ ------ ------ ------ ------
Own home -0.054 0.105 0.002 0.925 0.063 0.090
Constant 0.196 0.005 -0.066 0.092 -0.069 0.363
Source: Authors' calculations based on data from the Health and Retirement Study.
Note: Multinomial logistic regression also controls for race, wage, wage squared, wealth, wealth squared, receipt of an inheritance, and region.
Wage & Salary Bridge Job Self Employed Bridge Job Exit the Labor Force
Table 7a
Marginal Effects from Multinomial Logistic RegressionDependent Variable: First Transition from Full-Time Career Job
Men on a Full-Time Career Job in 1992

coef p-value coef p-value coef p-valueAge in 1992 54 or younger ------ ------ ------ ------ ------ ------ 55 - 59 -0.018 0.507 -0.002 0.899 0.180 0.000 60 or older -0.051 0.356 0.009 0.705 0.345 0.000
Respondent health Excellent/very good 0.031 0.266 0.027 0.053 -0.113 0.000 Good ------ ------ ------ ------ ------ ------ Fair/poor -0.059 0.196 -0.021 0.388 0.144 0.001
Spouse health Excellent/very good -0.014 0.652 0.004 0.788 0.005 0.885 Good ------ ------ ------ ------ ------ ------ Fair/poor -0.097 0.025 0.009 0.649 0.074 0.079
College 0.029 0.430 0.011 0.545 -0.057 0.120
Married -0.017 0.679 -0.003 0.876 -0.032 0.463
Dependent child 0.085 0.013 0.005 0.766 -0.192 0.000
Spouse employed -0.022 0.509 0.000 0.983 0.032 0.348
Occupational status Blue collar - high skilled -0.002 0.961 -0.006 0.769 0.084 0.064 Blue collar - other -0.024 0.596 0.027 0.177 0.006 0.891 White collar - high skilled ------ ------ ------ ------ ------ ------ White collar - other 0.007 0.825 -0.021 0.234 0.025 0.449
Health insurance status Portable 0.042 0.103 0.008 0.542 -0.017 0.512 Non-portable ------ ------ ------ ------ ------ ------ None 0.080 0.124 0.049 0.012 -0.135 0.022
Pension status Defined-benefit -0.098 0.001 -0.020 0.133 0.106 0.001 Defined-contribution -0.089 0.008 -0.023 0.137 0.056 0.104 Both 0.064 0.354 -0.060 0.179 -0.122 0.119 None ------ ------ ------ ------ ------ ------
Own home -0.007 0.831 -0.027 0.075 0.056 0.115
Constant 0.205 0.003 -0.118 0.000 -0.064 0.362
Source: Authors' calculations based on data from the Health and Retirement Study.
Note: Multinomial logistic regression also controls for race, wage, wage squared, wealth, wealth squared, receipt of an inheritance, and region.
Wage & Salary Bridge Job Self Employed Bridge Job Exit the Labor Force
Table 7b
Marginal Effects from Multinomial Logistic RegressionDependent Variable: First Transition from Full-Time Career Job
Women on a Full-Time Career Job in 1992
Earnings
wws
wse
I1
I0
lws lse LLeisure
Earnings
wws
wse
I1
I0
lse
Leisure
Figure 1
lws = L
Case I: Worker prefers wage-and-salary employment
Case II: Worker prefers self employment
The Choice between Wage-and-Salary Work and Self Employment

Figure 2
Percent Working, by Gender, 1992 - 2004Sample: HRS Core Respondents On a FTC Job in 1992
0
10
20
30
40
50
60
70
80
90
100
1992 1994 1996 1998 2000 2002 2004
Year
Perc
ent w
orki
ng
MalesFemales

Figure 3
Percent Self Employed among those Working, by Gender, 1992 - 2004Sample: HRS Core Respondents On a FTC Job in 1992
0
5
10
15
20
25
30
35
40
1992 1994 1996 1998 2000 2002 2004
Year
Perc
ent w
orki
ng
MalesFemales

Figure 4a
Percent Working, by Self Employment Status in 1992, 1992 - 2004Sample: HRS Core Males On a FTC Job in 1992
0
10
20
30
40
50
60
70
80
90
100
1992 1994 1996 1998 2000 2002 2004
Year
Perc
ent w
orki
ng
W&SSE
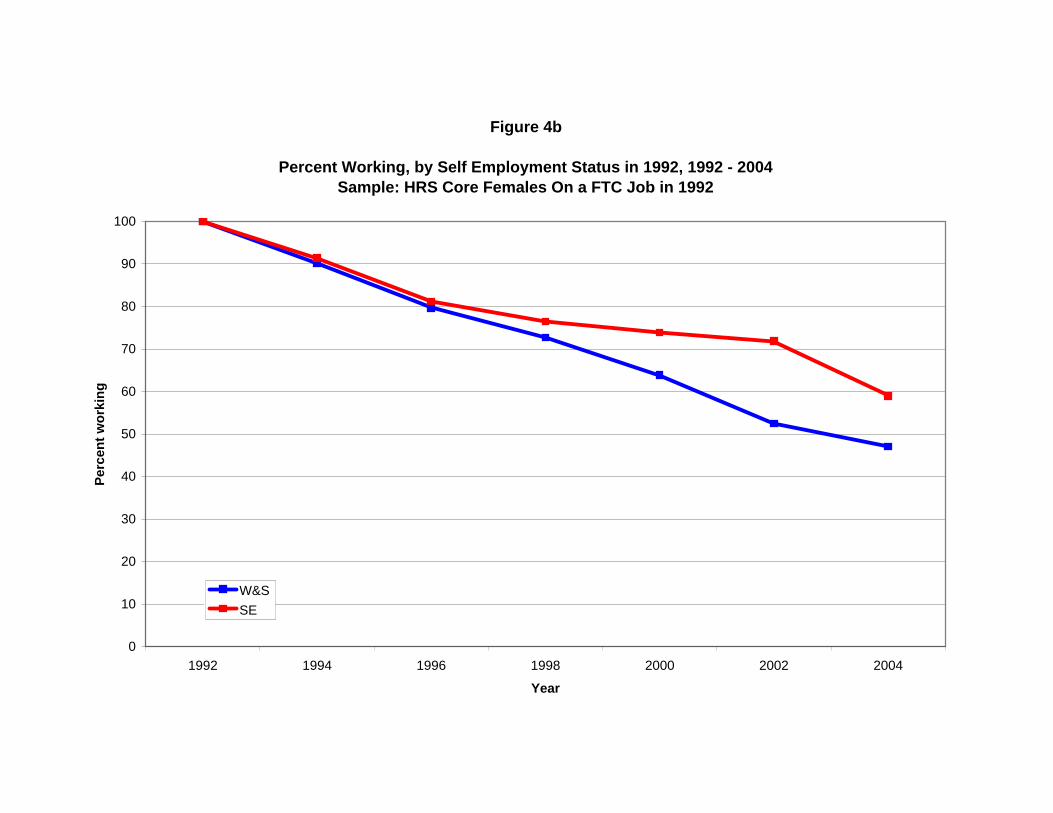
Figure 4b
Percent Working, by Self Employment Status in 1992, 1992 - 2004Sample: HRS Core Females On a FTC Job in 1992
0
10
20
30
40
50
60
70
80
90
100
1992 1994 1996 1998 2000 2002 2004
Year
Perc
ent w
orki
ng
W&SSE
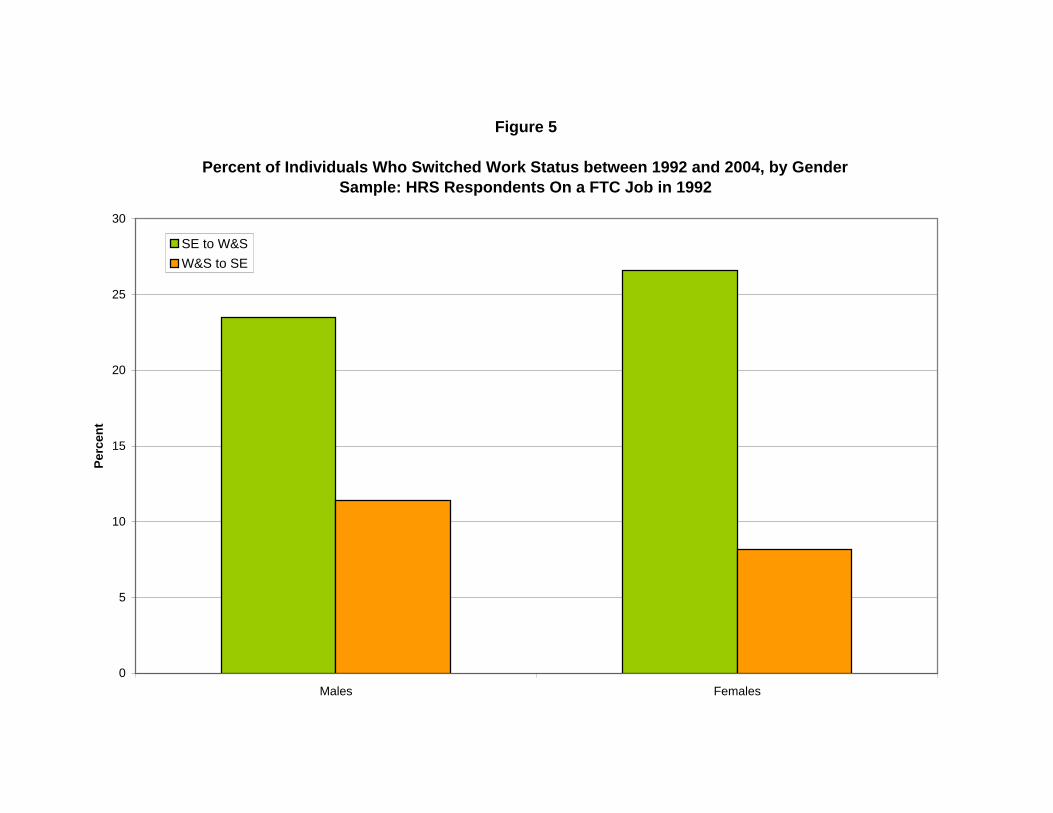
Figure 5
Percent of Individuals Who Switched Work Status between 1992 and 2004, by GenderSample: HRS Respondents On a FTC Job in 1992
0
5
10
15
20
25
30
Males Females
Perc
ent
SE to W&SW&S to SE