Micro- and Meso-Scale Factors Affect the Restoration of Atlantic Forest

Oecologia (2009) 159:661–668
DOI 10.1007/s00442-008-1243-3BEHAVIORAL ECOLOGY - ORIGINAL PAPER
Patch use in time and space for a meso-predator in a risky world
Shomen Mukherjee · Michal Zelcer · Burt P. Kotler
Received: 22 June 2007 / Accepted: 13 November 2008 / Published online: 11 December 2008© Springer-Verlag 2008
Abstract Predator–prey studies often assume a threetrophic level system where predators forage free from anyrisk of predation. Since meso-predators themselves are alsoprospective prey, they too need to trade-oV between food andsafety. We applied foraging theory to study patch use andhabitat selection by a meso-predator, the red fox. We presentevidence that foxes use a quitting harvest rate rule whendeciding whether or not to abandon a foraging patch, andexperience diminishing returns when foraging from a deplet-able food patch. Furthermore, our data suggest that patch usedecisions of red foxes are inXuenced not just by the availabil-ity of food, but also by their perceived risk of predation. Foxbehavior was aVected by moonlight, with foxes depletingfood resources more thoroughly (lower giving-up density) ondarker nights compared to moonlit nights. Foxes reduced riskfrom hyenas by being more active where and when hyenaactivity was low. While hyenas were least active duringmoon, and most active during full moon nights, the reversewas true for foxes. Foxes showed twice as much activity dur-ing new moon compared to full moon nights, suggestingdiVerent costs of predation. Interestingly, resources inpatches with cues of another predator (scat of wolf) weredepleted to signiWcantly lower levels compared to patches
without. Our results emphasize the need for considering riskof predation for intermediate predators, and also shows howpatch use theory and experimental food patches can be usedfor a predator. Taken together, these results may help us bet-ter understand trophic interactions.
Keywords Giving-up densities · Intraguild predation · Optimal foraging · Predation risk · Vulpes vulpes
Introduction
Most theoretical and almost all Weld studies have addressedpredator–prey interactions as a three trophic level phenom-enon (carnivore M herbivore M plant). They assume thatpredators forage free from predation risk, and that theirchoice of habitat is determined primarily by the distributionof their prey (Rosenzweig 1973; Sih et al.1998; Rosenheim2004; Luttbeg and Sih 2004). However, in several aquaticand terrestrial communities, intraguild predation (Poliset al. 1989) is a widespread phenomenon (Polis and Holt1992; Holt and Polis 1997; Rosenheim 1998). In many sys-tems, it is likely that smaller predators forage under riskfrom larger top predators, and this is certain to inXuencetheir behavior and ecology. Top predators impose con-straints on the foraging decisions of the meso-predators,which in turn could also aVect their herbivore prey (Rosen-heim 2004). Thus, predator–prey interactions are often fourtrophic level systems (top predator M meso-predator M
herbivore M plants,) in which meso-predators also have totrade-oV between obtaining food and being safe.
Small mammalian carnivore studies have almost alwaysfocused only on their roles as predators. In many ecosys-tems, several species of predators that diVer in body sizemay coexist (Rosenzweig 1966), and in such systems small
Communicated by Roland Brandl.
S. Mukherjee (&) · M. Zelcer · B. P. KotlerMitrani Department of Desert Ecology, Blaustein Institutes for Desert Research, Ben-Gurion University of the Negev, Sede Boqer 84990, Israele-mail: [email protected]
Present Address:M. ZelcerPharmaceutical R&D, Perrigo Israel Pharmaceuticals, P.O. Box 16, Yeruham 80500, Israel
123

662 Oecologia (2009) 159:661–668
carnivores themselves may become prospective prey tolarger predators (see Ralls and White 1995; Helldin et al.2006), or might suVer harassment and injury (e.g., interac-tions between hyenas and lions, Kruuk 1972) that mayaVect their hunting abilities. For example, interferencecompetition from wolves limits the distribution and abun-dance of coyotes (Berger and Gese 2007). Even thoughsuch interactions between diVerent sized carnivores haveoften been documented (Donadio and Buskirk 2006, andreferences within), rarely has any study addressed interac-tions between predation risk and foraging behavior of ameso-predator. Most studies (e.g., Ralls and White 1995)have instead focused on quantifying the actual predationevents (i.e., intraguild predation), although these eventsmay be diYcult to document in many systems. Top preda-tors do not only kill or injure, but may also induce fear inmeso-predators. Since this has the potential to aVect boththeir behavior and ecology (e.g., increased vigilance,reduced activity, avoiding certain areas, etc.), a focus onunderstanding risk-driven foraging behavior can at times bemuch more important than quantifying actual predationevents (Brown et al. 1999). Also, since relative body size,trophic relationships, and taxonomic relatedness are impor-tant factors governing the frequency and intensity of inter-speciWc predation, there is a need to focus on the role thatpredation risk plays in determining the foraging behavior ofmeso-predators (Case and Gilpin 1974; Polis et al. 1989).
We used patch use theory and experimental food patchesto study the foraging behavior of a free-living meso-preda-tor (the red fox, Vulpes vulpes) exposed to changing risk ofpredation. In particular, we used the giving-up densityapproach (Brown 1988, 1992) based on an extension ofCharnov’s (1976) marginal value theorem. Charnov’s the-ory states that an animal feeding from a resource patch, inwhich harvest rate declines with time, should stay in thepatch until its harvest rate equals the environmental aver-age. When the forager also has to contend with risk of pre-dation and has alternative activities, it should quit adepletable food patch when the beneWt derived from itspresent harvest rate [i.e., patch quitting harvest rate (QHR)]no longer exceeds the sum of metabolic, predation, andmissed opportunity costs of foraging (Brown 1988). Theresource density at which the forager leaves the patch is itsgiving-up density (GUD).
In the Negev Desert, Israel, red foxes co-occur with twolarger predators and hence may face substantial risk. Usingpatch use behavior and activity data, we tested the follow-ing predictions regarding trade-oVs between food andsafety for foxes. Since moonlight aVects the foragingbehavior of various desert organisms (Kotler et al. 1991,2002), we predicted higher GUDs (less amount of foodharvested) for foxes on full moon nights for two reasons:(1) foxes may be exposed to higher risk of predation (or
harassment) from larger predators (e.g., the porcupinesdescribed by Brown and Alkon 1990), or (2) hunting ismore proWtable on moonlit nights due to better visibility,which makes it easier to locate active prey, thus increasingmissed opportunity cost of foraging in assay patches. Pro-viding GUDs are higher on moonlit nights, reduced activityon moonlit nights would support hypothesis 1, and higheractivity would support hypothesis 2. Here, activity andGUD data complement each other.
Microhabitat may also aVect risk of predation andGUDs. “Bush” and “open” are the two main microhabitatsin desert systems. If having clear, unobstructed sightlines isimportant for foxes for predator detection, then foragingpatches placed in the open should have the lower GUD. Ifconcealment from a larger predator is more important, thenpatches in the bush microhabitat should be of greater value(lower GUD, Brown and Alkon 1990).
Finally, odors may provide clues for a forager regardingthe whereabouts and identity of its predators (Dickman andDoncaster 1984). If so, then we expected higher GUDs inpatches with predator cue.
Before applying the GUD approach to wild foxes, weWrst standardized our assay patches, and tested the twomain assumptions (a forager experiences diminishingreturns, and uses QHR rule while exploiting resourcepatches) of optimal patch use theory with captive foxes. Wethen applied this technique to wild foxes. We show thatfoxes respond to food patches in much the same way as dosmall mammals, hence showing the applicability of con-cepts from foraging theory to carnivores. Though the use ofoptimal patch use techniques have been more prevalent inthe study of small mammals (especially rodents), we showhow such an approach should also prove valuable for study-ing predators, especially as they are often rare, secretive,and at times diYcult to study directly.
Methods
Experiments with the captive foxes were conducted at theBeer Sheva Zoo (Beer Sheva, Israel), and the Weld studytook place at the Holot Mashabim Nature Reserve(31.01° N and 34.45° E) in the north-central Negev Desert,Israel, between 1999 and 2000. The Holot Mashabim areareceives an average rainfall of 108 mm. It has two distincthabitats, the sandy areas containing patches of semi-stabi-lized and stabilized sand dunes with Artemisia monospermaand Retama raetam as the dominant plant species, and theloess plateau containing high amounts of loessal soil with adense, Wrm soil crust. The dominant plants in this habitatare Noaea mucronata and Thymelaea hirsuta.
The red fox (Vulpes vulpes) is the most common smallcarnivore (3–4.5 kg) in the study area as well as in the
123

Oecologia (2009) 159:661–668 663
entire Middle East (Mendelssohn and Yom-Tov 1999). It isa solitary, mainly nocturnal, and territorial animal with anomnivorous diet consisting mainly of rodents, insects,arachnids, birds, reptiles, fruits, and human refuse (Men-delssohn and Yom-Tov 1999). C.R. Dickman and B.P.K.(unpublished data) found that desert gerbils constituted26% of its diet at our study site. Larger predators in ourstudy area are the striped hyena (Hyaena hyaena, 25–55 kg) and the wolf (Canis lupus pallipes, 18–22 kg).
Testing diminishing returns and equalization of GUDs
We presented six captive adult foxes with artiWcial foodpatches. Each patch consisted of an 18 l bucket (29 cmdiameter and 36 cm height) with ten pieces of chick (eachwet piece weighing approximately 8 g, feathers included)mixed into 16 l sand. The buckets were placed into a holecut into a wooden platform, so that its lip was Xush with theplatform. Each fox foraged individually from its own foodpatch. Its foraging was interrupted after diVerent amountsof feeding time (cumulative time), and the remaining piecesof chick counted (its GUD). We obtained a total of 39 datapoints from the six foxes (mean § SD data points per indi-vidual; 6.5 § 0.84), and this data was used to quantify therelationship between the amounts of food harvested versusthe cumulative time spent in the resource patch (i.e., theharvest rate curve). As a forager depletes a patch, its har-vest rate declines through time, i.e., a forager experiencesdiminishing returns. As it continues to forage, in time, itsharvest rate in that patch becomes so low that it is better forthe forager to stop foraging from it (Brown 1988; Kotlerand Brown 1990). Thus a harvest rate curve that risessteeply Wrst and then Xattens oV would signify diminishingreturns.
A forager that uses a QHR rule for patch exploitationshould equalize GUDs between resource patches diVeringin initial resource abundance. We tested this assumptionwith wild red foxes in the Weld by oVering them resourcepatches with diVerent initial amounts of food. Ten stationsof assay patches (same as above) were set in sandy habitats.Each station had two patches (buckets) with unequal initialresource abundance, one with 10 and the other with 20pieces of chick. The distance between the patches at a sta-tion was small enough (2–3 m apart) to allow negligibletravel time between them, and conditions at each patchwere as similar as possible to ensure similar metabolic, pre-dation, and missed opportunity cost of foraging. Chickpieces were placed in these patches just before sunset, andGUDs collected by sieving the sand and counting theremaining pieces of chicks at dawn. The tendency to equal-ize GUDs at a station was tested using the ratio of GUDsbetween the rich (high density) and poor (low density)patch. The experiment was repeated for 11 nights, and an
average of the ratios of all the stations was calculated foreach night (one data point each night), yielding a total of 11data points. The initial ratio between patches in a given sta-tion was 2:1, and a ratio of GUDs signiWcantly less thanthis was deemed as evidence in support of equalization ofGUDs. To a forager, time is “money”; hence the time itsaves by equalizing GUDs can be used in other Wtness-enhancing activities or to harvest other patches (Valone andBrown 1989).
Foraging behavior of foxes and their predator/competitor
Fox GUDs were collected across two microhabitats (bushand open) and four moon phases (full, wane, new, and wax-ing) in loess and sandy habitats. The Weld site was Wrstdivided into diVerent sections of loess and sandy habitats.In the 1st year (1999), a sandy and a loess area (600 mapart) were selected as study areas. Within each area, tenGUD stations spaced 60 m apart were established. In thefollowing year, two more areas were added (one in eachhabitat type), but the numbers of GUD stations in the twolocations were reduced to Wve in each (from ten). Thus, intotal we had two replicates each of sandy habitat and loesshabitat, with Wve GUD stations within each replicate. Thedistance between two habitat types and stations within ahabitat was kept the same, at 600 and 60 m, respectively.
In the 2nd year, we also tested the eVect of predator cueon the patch use behavior of foxes in the wild. We placed awolf scat at each of the Wve stations in one of the two areasin each habitat type, creating a treated and control sectionwithin each habitat. GUDs were setup before dusk in all 20stations (with wolf scats next to the ten stations), and thesewere collected at dawn. We used fresh wolf feces obtainedfrom a captive wolf at the beginning of each moon phaseand kept frozen until use. There are three reasons why weused wolf scat instead of hyena scats: (1) prior to theseexperiments we did not know that wolves were rare at ourstudy site; (2) since wolves were available in a nearby zoo,we could obtain suYcient quantities of fresh wolf scats forour experiment; and (3) several studies (e.g., Thurber et al.1992; Berger and Gese 2007) have shown wolves to pose asigniWcant threat to smaller carnivores.
Each GUD station had two patches, one near a bush (a1 m perennial shrub, representing the bush microhabitat)and the other 2–3 m away in the open (representing theopen microhabitat) with each patch containing ten pieces ofchick mixed in 16 l sand. Patches were provisioned beforedusk, and the GUDs collected at dawn. The foragers wereidentiWed up to speciWc level from tracks around a patch.These experiments were carried out for three consecutivenights per moon phase, during the Wrst summer month, andfor two consecutive nights per moon phase in the followingmonth.
123

664 Oecologia (2009) 159:661–668
Fox GUD data from the wild were Wrst checked for nor-mality using a one sample KS-test, Lilliefors option, andalso checked for homogeneity of variance by viewing resid-uals against estimated Wgures. Post-Hoc tests were carriedout using Tukey's HSD test. Activity data were analyzedusing SYSTAT 7.0 (Wilkinson et al. 1992).
Foxes and their predator activity were quantiWed in thetwo habitats using sand tracking. Before dusk, the substrateof a 1 km long and 80 cm wide tracking transect wassmoothed in each habitat. For making the transects in sandwe used a squeegee, while in the loess we used a 1.5-mlong metal pole wrapped with barbed wire (which helped tobreak the hard crust and to create a loose, relatively smoothsurface) dragged behind a vehicle. Transects weresmoothed each evening and activity (numbers of trackcrossings) recorded the following dawn. In these transectswe also recorded the shortest distance between a line of foxtracks and the nearest bush (a perennial shrub, at least 1 mhigh and 0.5 m wide). Any fox tracks more than 3 m awayfrom a bush were considered to be in the open. These tran-sect data were collected on the same nights as the patch useexperiment. Transects were located at least 500 m from theGUD patches to avoid aVecting the experiment.
Results
Diminishing returns and equalization of GUDs
Fox harvest rates, i.e., the amounts of food harvested versusthe cumulative time spent in the resource patch, showed asigniWcant positive linear relationship (r2 = 0.496,P < 0.001, F = 36.405, N = 39), but showed a stronger qua-dratic Wt (r2 = 0.902, P < 0.0001, F = 161.6, N = 39;Fig. 1). The F of improvement from a linear to a quadraticWt is highly signiWcant (P < 0.001). The slopes of the har-vest rate curves decreased as the time spent foragingincreased (Fig. 1), indicating that the foxes experiencediminishing returns from their harvest as they increasedtheir foraging time (Charnov 1976).
The foxes did not perfectly equalize GUDs among pairsof patches. They only tended to equalize GUDs. The aver-age ratios of GUDs between rich and poor patches was 1.7,and diVered signiWcantly (t10,0.05 = 2.861, P = 0.017) fromthe initial ratio of 2. This signiWcant diVerence suggeststhat foxes did devote more time/eVort to exploiting thericher patch, leaving it with a lower GUD, and resulting inGUD ratios lower than 2. Under-use of rich patches sug-gests that foxes did not have perfect information aboutpatch quality. Perfect information would have resulted inGUD ratios not diVering from 1 (Valone and Brown 1989).Nonetheless, they can assess patch quality and exploit timeaccordingly.
Foraging behavior of foxes and their predators/competitors
Moon phase aVected patch use by foxes. Fox GUDs weresigniWcantly aVected by moon phase only in the 2nd year,but in both years similar trends were recorded (ANOVA,repeated measures, 1999: MS = 19.96, F3,39 = 2.38,P = 0.21; 2000: MS = 21.112, F3,84 = 6.34, P = 0.05).GUDs on new and waning nights were signiWcantly lowerthan those during the waxing phase (Tukey HSD post-hoctest, P = 0.02 and P = 0.016, respectively).
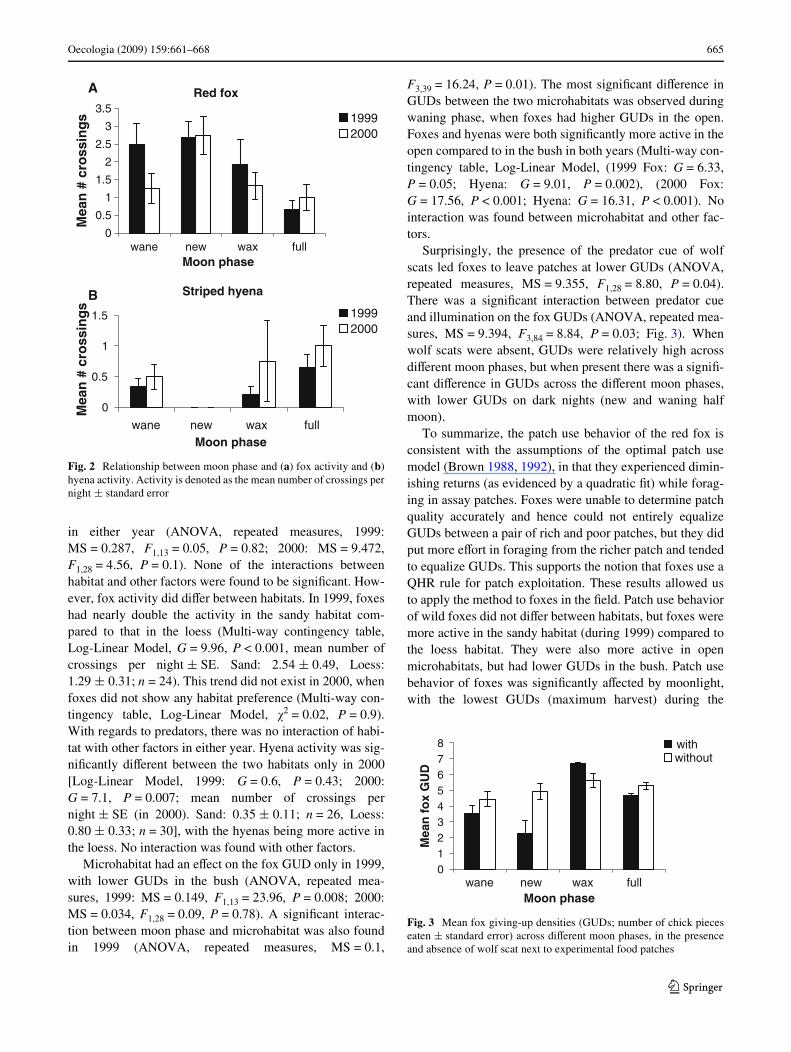
Moon phase similarly aVected activity. Moon phase hada signiWcant eVect on fox activity as measured by trackingplots in both years (Multi-way contingency table, Log-Lin-ear Model, 1999: �2 = 16.36, P = 0.001; 2000: �2 = 8.36,P = 0.015). Fox activity during both years was signiWcantlyhigher during new moon compared to full moon [Mann–Whitney tests (Bonferroni adjusted), 1999: u = 46,P = 0.04; 2000: u = 150.5, P = 0.05, Fig. 2a]. In 2000, asigniWcant diVerence was also found between the new andwaning half moon (u = 52, P = 0.04).
Hyena activity was also aVected by moon phase but, incontrast to the foxes, hyenas were least active during newmoon (Fig. 2b). In 1999, although moon phase had a sig-niWcant eVect on hyena activity (Multi-way contingencytable, Log-Linear Model, G = 13.76, P = 0.001), no diVer-ences were found between moon phases using t-tests. In2000, however, levels of activity during new moon weresigniWcantly lower than during a full moon (Mann–Whit-ney, u = 48, P = 0.03; Fig. 2b). Wolf activity data werescarce and hence are not presented in our results.
Foxes responded less strongly to habitat. Fox GUDs didnot diVer signiWcantly between the sandy and loess habitats
Fig. 1 Harvest rate curves of captive red foxes indicating that theyexperience diminishing returns (a signiWcant quadratic Wt) when for-aging from a depletable food patch
0
1
2
3
4
5
6
7
8
9
10
0 200 400 600 800
Time feeding (s)
# ch
ick
pie
ces
eate
n
0
1
2
3
4
5
6
7
8
9
10
0 200 400 600 800
Time feeding (s)
# ch
ick
pie
ces
eate
n
123
Oecologia (2009) 159:661–668 665
in either year (ANOVA, repeated measures, 1999:MS = 0.287, F1,13 = 0.05, P = 0.82; 2000: MS = 9.472,F1,28 = 4.56, P = 0.1). None of the interactions betweenhabitat and other factors were found to be signiWcant. How-ever, fox activity did diVer between habitats. In 1999, foxeshad nearly double the activity in the sandy habitat com-pared to that in the loess (Multi-way contingency table,Log-Linear Model, G = 9.96, P < 0.001, mean number ofcrossings per night § SE. Sand: 2.54 § 0.49, Loess:1.29 § 0.31; n = 24). This trend did not exist in 2000, whenfoxes did not show any habitat preference (Multi-way con-tingency table, Log-Linear Model, �2 = 0.02, P = 0.9).With regards to predators, there was no interaction of habi-tat with other factors in either year. Hyena activity was sig-niWcantly diVerent between the two habitats only in 2000[Log-Linear Model, 1999: G = 0.6, P = 0.43; 2000:G = 7.1, P = 0.007; mean number of crossings pernight § SE (in 2000). Sand: 0.35 § 0.11; n = 26, Loess:0.80 § 0.33; n = 30], with the hyenas being more active inthe loess. No interaction was found with other factors.
Microhabitat had an eVect on the fox GUD only in 1999,with lower GUDs in the bush (ANOVA, repeated mea-sures, 1999: MS = 0.149, F1,13 = 23.96, P = 0.008; 2000:MS = 0.034, F1,28 = 0.09, P = 0.78). A signiWcant interac-tion between moon phase and microhabitat was also foundin 1999 (ANOVA, repeated measures, MS = 0.1,
F3,39 = 16.24, P = 0.01). The most signiWcant diVerence inGUDs between the two microhabitats was observed duringwaning phase, when foxes had higher GUDs in the open.Foxes and hyenas were both signiWcantly more active in theopen compared to in the bush in both years (Multi-way con-tingency table, Log-Linear Model, (1999 Fox: G = 6.33,P = 0.05; Hyena: G = 9.01, P = 0.002), (2000 Fox:G = 17.56, P < 0.001; Hyena: G = 16.31, P < 0.001). Nointeraction was found between microhabitat and other fac-tors.
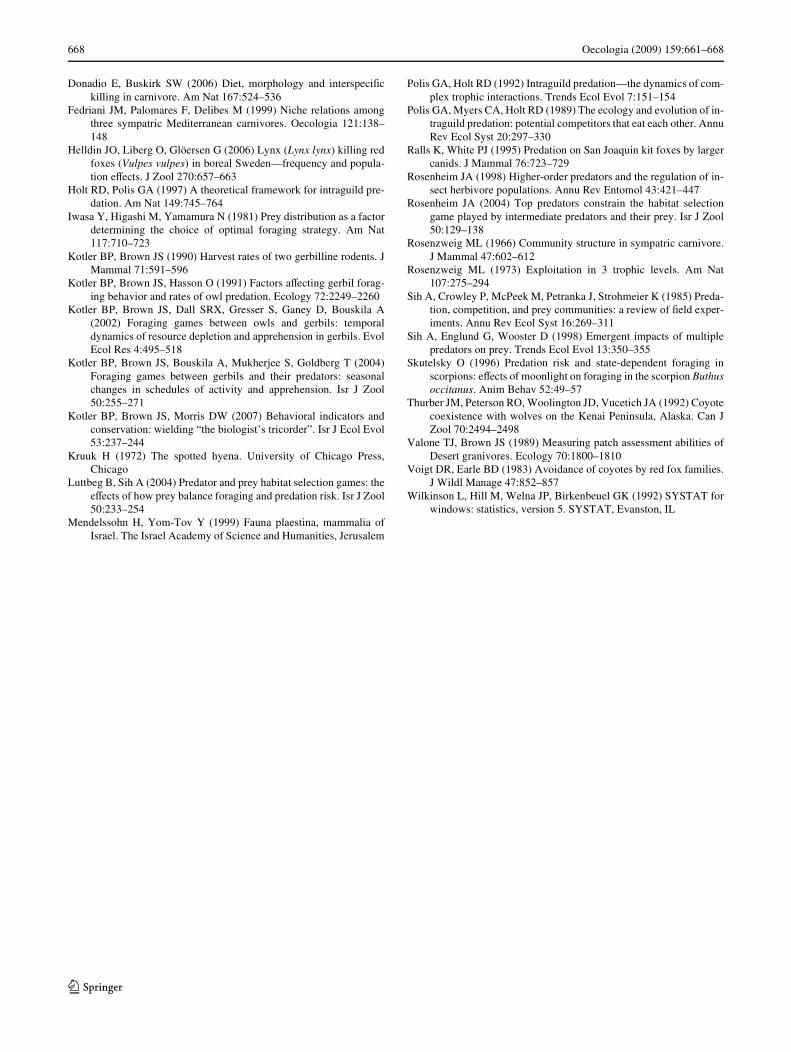
Surprisingly, the presence of the predator cue of wolfscats led foxes to leave patches at lower GUDs (ANOVA,repeated measures, MS = 9.355, F1,28 = 8.80, P = 0.04).There was a signiWcant interaction between predator cueand illumination on the fox GUDs (ANOVA, repeated mea-sures, MS = 9.394, F3,84 = 8.84, P = 0.03; Fig. 3). Whenwolf scats were absent, GUDs were relatively high acrossdiVerent moon phases, but when present there was a signiW-cant diVerence in GUDs across the diVerent moon phases,with lower GUDs on dark nights (new and waning halfmoon).
To summarize, the patch use behavior of the red fox isconsistent with the assumptions of the optimal patch usemodel (Brown 1988, 1992), in that they experienced dimin-ishing returns (as evidenced by a quadratic Wt) while forag-ing in assay patches. Foxes were unable to determine patchquality accurately and hence could not entirely equalizeGUDs between a pair of rich and poor patches, but they didput more eVort in foraging from the richer patch and tendedto equalize GUDs. This supports the notion that foxes use aQHR rule for patch exploitation. These results allowed usto apply the method to foxes in the Weld. Patch use behaviorof wild foxes did not diVer between habitats, but foxes weremore active in the sandy habitat (during 1999) compared tothe loess habitat. They were also more active in openmicrohabitats, but had lower GUDs in the bush. Patch usebehavior of foxes was signiWcantly aVected by moonlight,with the lowest GUDs (maximum harvest) during the
Fig. 2 Relationship between moon phase and (a) fox activity and (b)hyena activity. Activity is denoted as the mean number of crossings pernight § standard error
Striped hyena
0
0.5
1
1.5
wane new wax fullMoon phase
Mea
n #
cro
ssin
gs 1999
2000
19992000
Red fox
0
0.5
1
1.5
2
2.5
3
3.5
wane new wax fullMoon phase
Mea
n #
cro
ssin
gs
A
B
Fig. 3 Mean fox giving-up densities (GUDs; number of chick pieceseaten § standard error) across diVerent moon phases, in the presenceand absence of wolf scat next to experimental food patches
012345678
wane new wax fullMoon phase
Mea
n f
ox
GU
D
withwithout
123

666 Oecologia (2009) 159:661–668
waning and new phase. Foxes were also most active duringnew moon nights compared to full moon nights. Hyenas onthe other hand were more active in the loess, and they toopreferred open areas. Hyena activity was also signiWcantlyaVected by moonlight levels, with lowest activity during thenew moon. These data suggest that foxes avoid hyenas, andperceive a foraging cost arising from risk from hyenas.Finally, the presence of predator cue had a signiWcant eVecton the patch use decisions of foxes, with lower GUDs inpatches where the cue was present.
Discussion
Here we showed that predators, too, conform to theassumptions of optimal patch use theory. First, foxestended to equalize GUDs between patches of diVerent ini-tial densities, supporting a QHR patch departure strategy asopposed to a Wxed number or Wxed time strategy (Valoneand Brown 1989). Although foxes were unable to assesspatch quality with complete accuracy, they still spent moretime/eVort in richer patches. Their under-exploitation ofricher patches (an average GUD ratio of 1.7 between richand poor patch), suggests the use of Bayesian sampling toestimate QHR (Iwasa et al. 1981; Valone and Brown 1989).This implies that a fox perceives its environment to be het-erogeneous, has an a priori expectation of patch quality,and updates its estimate of patch quality while foragingfrom it. The information that the red fox acquires aboutpatch quality may not be complete, but it is enough toenable it to make the optimal foraging decisions regardingthe amount of eVort and time it should devote to a patch.
Second, the signiWcant F of improvement obtained by add-ing the quadratic term to a linear model for harvest rates dem-onstrates that foxes experienced diminishing returns whileexploiting a depletable food patch. Since foxes followed aQHR rule and experienced diminishing returns in our assaypatches, we applied Brown’s (1988) patch use model forunderstanding their foraging behavior in a risky world.
Perceived risk of predation gives rise to a foraging costthat can be measured both qualitatively and quantitatively.A forager’s GUD, its QHR, and its activity patterns acrosstime and space can all provide us with estimates that helpus better understand the costs and consequences of preda-tion risk (Brown and Kotler 2004). Foxes responded moststrongly to changing risk factors during our study. LowGUDs along with the higher activity of foxes on darkernights reveal that the foxes perceived moonless nights to besafer. Increased activity on darker nights when hyenas wereleast active allowed foxes to avoid these predators andreduce their risk. Higher fox activity (along with highGUDs) during full moon nights would have suggestedhigher missed opportunity costs (MOC) of foraging (Brown
1988), i.e., foxes devoted more time to alternative activi-ties, such as hunting, maintaining territories, etc., than toforaging in their assay patches. That did not happen.Instead, we found reduced fox activity and high GUDs dur-ing full moon nights, indicating higher costs of predationon these nights.
These results are not consistent with foxes responding tochanging resource availability. Since several studies (e.g.,Kotler et al. 2002, 2004) have shown reduced rodent activ-ity during moonlit nights (and higher activity on darknights), one might guess that the high GUDs and reducedfox activity during moonlit nights is a result of foxes adjust-ing their behavior to changing prey availability. However,this alternative hypothesis would actually predict lowerGUDs on bright nights because the lower hunting successof foxes should increase their marginal value of energy andthereby decease their cost of predation [the cost of preda-tion is given by � · F/(oF/oe), where � is the risk of preda-tion, F is survivor’s Wtness, and (oF/oe) is the marginalvalue of energy, Brown 1988]. Also, since desert rodentsconstitute only 26% of the diet of red foxes in our Weld site(Chris Dickman and B.P.K., unpublished data), it is lesslikely that the foxes will synchronize their activity com-pletely with that of the rodents, i.e., being least active dur-ing the full moon. Thus, taken together, our GUD andactivity results suggest that foxes reduce predation risk byshifting activity to darker nights, a result similar to thatfound in other taxa such as porcupines (Brown and Alkon1990) and scorpions (Skutelsky 1996).
Intraguild predation (Sih et al. 1985) can give rise totemporal and/or spatial segregation that helps reduce risk ofpredation and promote coexistence among sympatric carni-vores. In our system, we Wnd some evidence for this. Foxesreduced their chances of interaction with hyenas by beingless active in the loess habitat where hyenas are mostactive. This should help reduce the encounter rate with pre-dators and hence the risk. Similar active avoidance of thehabitats frequented by larger predators has been recorded inother systems, e.g., foxes avoid areas extensively used bylynxes (Fedriani et al. 1999) and coyotes (Voigt and Earle1983), and coyotes avoid areas used by wolves (Berger andGese 2007).
Interestingly, foxes showed similar GUDs in sand andloess. Equal GUDs might signify similar costs of foragingin the two habitats. The lower activity of foxes in the loesssuggests that only some foxes are willing to take more riskand forage there. This indicates some form of densitydependence, where foxes adjust their density between thetwo habitats in order to equalize Wtness and GUDs.
Foxes perceived less risk from predators when foragingin the bush microhabitat where they had lower GUDs thanin the open. Foraging close to bushes may help reduce thechances of being detected by their predators, thus reducing
123

Oecologia (2009) 159:661–668 667
predation risk. This anti-predator response is similar to thatobserved in many desert rodents (see Kotler et al. 2002).Interestingly, even though foxes preferred foraging nearbushes, they were more active in the open. Open terrainmay have allowed them clearer sightlines, thus increasingtheir predator detection ability. Detecting a predator earlymay be crucial for a prey, as it can give it enough time toescape and thus survive. Alternatively, the higher activitylogged in the open in tracking plots may reXect the use ofthe open to travel between patches.
Prey often evaluate predation risk using direct cues (e.g.,feces and urine) and respond by either dispersing or aggre-gating (Dickman 1992). We used wolf scats, a cue that iseasily manipulated. The highly signiWcant interactionbetween predator cue and moon phase (Fig. 3) yet againreiterates the importance of moonlight on the foraging deci-sions of the red foxes. However, contrary to our predic-tions, foxes had lower GUDs in stations with cue. The lowGUDs could be because the feces provided information tothe foxes regarding its predator’s whereabouts, i.e., an olderscat may indicate that a predator had visited, but has likelymoved on. Another possibility is that, in the presence ofhyenas, foxes prefer to be closer to wolves. Since hyenasare more common in the area, they are more of a threat tothe foxes. In this situation, the foxes may possibly beneWtby staying closer to the lesser threat, i.e., the wolves,because wolves may help deter hyenas.
Under natural conditions foxes may not often forage inpatches that resemble those used in our experiments. How-ever, the relevance of the GUD results does not depend onhow closely these patches resemble a natural patch. Rather,it depends on whether GUDs can reveal the costs and bene-Wts of foraging. For this, foxes need to experience diminish-ing returns while exploiting the artiWcial patches, assesspatch quality, and use a QHR patch departure. The foxes doall of these things.
Though our patches more closely resemble scavengingbehavior than hunting rodent prey, our results may still berelevant to these situations. While hunting for rodent preyin a natural resource patch (necessarily much larger thanour artiWcial patches), foxes capture prey infrequently. Assuch, they cannot depend on harvest rates per se whendeciding when to depart the patch. If instead they can esti-mate capture probabilities, they can then base their patchdeparture on the expected patch value. This is also a QHRrule of sorts. Consequently, foraging behavior as revealedby GUDs should also reXect the costs and beneWts faced byfoxes hunting rodents.
Regardless of the nature of the resource patch exploitedby foxes, the salient points of this study are that: (1) preda-tors often forage in a context of diminishing returns, be it inregards to actual harvest rates (as in our experiments) orexpectations of prey capture; and (2) foraging decisions of
meso-predators are inXuenced by risk from their own pre-dators, regardless of the food they are exploiting. OursimpliWcation of the system, by oVering non-responsiveprey in food patches, allowed us to apply an optimal patchuse model that has been successfully tested with severalorganisms.
Studying the behavior of small carnivores based on for-aging theory is easy compared to techniques such as radiotelemetry, measuring predation rates, etc., but, more thanthat, it allows the foragers to tell us how they perceive theirown environment. Measures of patch use and activity are infact behavioral indicators that yield information not only onbehavior, but also on population well-being (Kotler et al.2007). Behavioral responses are, by their nature, rapid, andso reXect the current situation better than responses reX-ected in population dynamics. Thus they can be more eVec-tive in helping us understand trophic interactions in anygiven system. Evidence from diVerent systems, showingthat risk from larger predators aVects the movement andforaging decisions of meso-predators, suggests a need forsimilar experiments to help understand ecological andbehavioral interactions at a range of trophic levels.
Acknowledgments Thanks to Beer Sheva Zoo, Aviv (Ranger, HolotMashabim Nature Reserve) and the Israel Nature and National ParksProtection Authority. We would like to thank Amos Bouskila for hisvaluable advice at all stages of this study. We also thank Yaron Ziv andAziz Subach for their ideas and suggestions. We thank Toby Goldbergfor her assistance during Weldwork. M.Z. would like to thank YaVa andItay for their support and immense technical help. We would also liketo thank Joel Brown, Barney Luttbeg and an anonymous reviewer fortheir valuable comments. The experiments comply with the currentlaws of Israel.
References
Berger KM, Gese EM (2007) Does interference competition withwolves limit the distribution and abundance of coyotes? J AnimEcol 76:1075–1085
Brown JS (1988) Patch use as an indicator of habitat preference, pre-dation risk, and competition. Behav Ecol Sociobiol 22:37–47
Brown JS (1992) Patch use under predation risk: I. Models and predic-tions. Ann Zool Fenn 29:301–309
Brown JS, Alkon PU (1990) Testing values of crested porcupine habi-tats by experimental food patches. Oecologia 83:512–518
Brown JS, Kotler BP (2004) Hazardous duty pay and the foraging costof predation. Ecol Lett 7:999–1014
Brown JS, Laundre JW, Gurung M (1999) The ecology of fear: optimalforaging, game theory, and trophic interactions. J Mammal80:385–399
Case TJ, Gilpin ME (1974) Interference competition and niche theory.Proc Natl Acad Sci USA 71:3073–3077
Charnov EL (1976) Optimal foraging, marginal value theorem. TheorPopul Biol 9:129–136
Dickman CR (1992) Predation and habitat shift in the house mouse,Mus domesticus. Ecology 73:313–322
Dickman CR, Doncaster CP (1984) Responses of small mammals tored fox (Vulpes vulpes) odour. J Zool 204:251–253
123
668 Oecologia (2009) 159:661–668
Donadio E, Buskirk SW (2006) Diet, morphology and interspeciWckilling in carnivore. Am Nat 167:524–536
Fedriani JM, Palomares F, Delibes M (1999) Niche relations amongthree sympatric Mediterranean carnivores. Oecologia 121:138–148
Helldin JO, Liberg O, Glöersen G (2006) Lynx (Lynx lynx) killing redfoxes (Vulpes vulpes) in boreal Sweden—frequency and popula-tion eVects. J Zool 270:657–663
Holt RD, Polis GA (1997) A theoretical framework for intraguild pre-dation. Am Nat 149:745–764
Iwasa Y, Higashi M, Yamamura N (1981) Prey distribution as a factordetermining the choice of optimal foraging strategy. Am Nat117:710–723
Kotler BP, Brown JS (1990) Harvest rates of two gerbilline rodents. JMammal 71:591–596
Kotler BP, Brown JS, Hasson O (1991) Factors aVecting gerbil forag-ing behavior and rates of owl predation. Ecology 72:2249–2260
Kotler BP, Brown JS, Dall SRX, Gresser S, Ganey D, Bouskila A(2002) Foraging games between owls and gerbils: temporaldynamics of resource depletion and apprehension in gerbils. EvolEcol Res 4:495–518
Kotler BP, Brown JS, Bouskila A, Mukherjee S, Goldberg T (2004)Foraging games between gerbils and their predators: seasonalchanges in schedules of activity and apprehension. Isr J Zool50:255–271
Kotler BP, Brown JS, Morris DW (2007) Behavioral indicators andconservation: wielding “the biologist’s tricorder”. Isr J Ecol Evol53:237–244
Kruuk H (1972) The spotted hyena. University of Chicago Press,Chicago
Luttbeg B, Sih A (2004) Predator and prey habitat selection games: theeVects of how prey balance foraging and predation risk. Isr J Zool50:233–254
Mendelssohn H, Yom-Tov Y (1999) Fauna plaestina, mammalia ofIsrael. The Israel Academy of Science and Humanities, Jerusalem
Polis GA, Holt RD (1992) Intraguild predation—the dynamics of com-plex trophic interactions. Trends Ecol Evol 7:151–154
Polis GA, Myers CA, Holt RD (1989) The ecology and evolution of in-traguild predation: potential competitors that eat each other. AnnuRev Ecol Syst 20:297–330
Ralls K, White PJ (1995) Predation on San Joaquin kit foxes by largercanids. J Mammal 76:723–729
Rosenheim JA (1998) Higher-order predators and the regulation of in-sect herbivore populations. Annu Rev Entomol 43:421–447
Rosenheim JA (2004) Top predators constrain the habitat selectiongame played by intermediate predators and their prey. Isr J Zool50:129–138
Rosenzweig ML (1966) Community structure in sympatric carnivore.J Mammal 47:602–612
Rosenzweig ML (1973) Exploitation in 3 trophic levels. Am Nat107:275–294
Sih A, Crowley P, McPeek M, Petranka J, Strohmeier K (1985) Preda-tion, competition, and prey communities: a review of Weld exper-iments. Annu Rev Ecol Syst 16:269–311
Sih A, Englund G, Wooster D (1998) Emergent impacts of multiplepredators on prey. Trends Ecol Evol 13:350–355
Skutelsky O (1996) Predation risk and state-dependent foraging inscorpions: eVects of moonlight on foraging in the scorpion Buthusoccitanus. Anim Behav 52:49–57
Thurber JM, Peterson RO, Woolington JD, Vucetich JA (1992) Coyotecoexistence with wolves on the Kenai Peninsula, Alaska. Can JZool 70:2494–2498
Valone TJ, Brown JS (1989) Measuring patch assessment abilities ofDesert granivores. Ecology 70:1800–1810
Voigt DR, Earle BD (1983) Avoidance of coyotes by red fox families.J Wildl Manage 47:852–857
Wilkinson L, Hill M, Welna JP, Birkenbeuel GK (1992) SYSTAT forwindows: statistics, version 5. SYSTAT, Evanston, IL
123
Copyright © 2022 FDOKUMEN