Passive samplers for air quality monitoring in a Brazilian university
11
148 Int. J. Environment and Pollution, Vol. 53, Nos. 1/2, 2013 Copyright © 2013 Inderscience Enterprises Ltd. Passive samplers for air quality monitoring in a Brazilian university Letícia Canal Vieira* and Eduardo Pavan Korf University of Passo Fundo (UPF), São José District, BR 285, 99052-900, Passo Fundo, Brazil E-mail: [email protected] E-mail: [email protected] *Corresponding author Luciana Londero Brandli Environment and Civil Engineering Post Graduation, University of Passo Fundo, São José District, BR 285, 99052-900, Passo Fundo, Brazil E-mail: [email protected] Abstract: The aim of this paper was to evaluate the applicability of passive samplers for the monitoring and diagnosis of air pollution at Passo Fundo University, focusing on atmospheric pollutants NO 2 and O 3 . The samplers were built in accordance with already verified methodologies and were placed in several locations in the university campus, namely: energy generator, pool heating boiler, entrance porch, an exhaustion chamber and a place with less anthropic influence to represent the blank. Higher concentrations of pollutants were encountered in the samplers located near the energy generator, followed by the ones in the boiler. Nevertheless, all the results were pursuant to the Brazilian legislation for air quality. The cost of these samplers was also considered and was regarded as viable for academic use and as a first step in air quality control. Keywords: air quality monitoring; Ficks’s law; higher education institutions; nitrogen dioxide; ozone; passive samplers; air pollution. Reference to this paper should be made as follows: Vieira, L.C., Korf, E.P. and Brandli, L.L. (2013) ‘Passive samplers for air quality monitoring in a Brazilian university’, Int. J. Environment and Pollution, Vol. 53, Nos. 1/2, pp.148–158. Biographical notes: Letícia Canal Vieira graduated in Environmental Engineering at the University of Passo Fundo (2012). This paper is the product of her graduation project. Eduardo Pavan Korf received his Master degree in Engineering from the Federal University of Rio Grande do Sul in 2011 and graduate in Environmental Engineering from the University of Passo Fundo in 2010. Since 2010, he has been a Professor in Environmental Engineering Course at the Passo Fundo University and has been researching the topics: environmental monitoring such as air pollution, environmental modelling and environmental geotechnics.
Transcript of Passive samplers for air quality monitoring in a Brazilian university

148 Int. J. Environment and Pollution, Vol. 53, Nos. 1/2, 2013
Copyright © 2013 Inderscience Enterprises Ltd.
Passive samplers for air quality monitoring in a Brazilian university
Letícia Canal Vieira* and Eduardo Pavan Korf University of Passo Fundo (UPF), São José District, BR 285, 99052-900, Passo Fundo, Brazil E-mail: [email protected] E-mail: [email protected] *Corresponding author
Luciana Londero Brandli Environment and Civil Engineering Post Graduation, University of Passo Fundo, São José District, BR 285, 99052-900, Passo Fundo, Brazil E-mail: [email protected]
Abstract: The aim of this paper was to evaluate the applicability of passive samplers for the monitoring and diagnosis of air pollution at Passo Fundo University, focusing on atmospheric pollutants NO2 and O3. The samplers were built in accordance with already verified methodologies and were placed in several locations in the university campus, namely: energy generator, pool heating boiler, entrance porch, an exhaustion chamber and a place with less anthropic influence to represent the blank. Higher concentrations of pollutants were encountered in the samplers located near the energy generator, followed by the ones in the boiler. Nevertheless, all the results were pursuant to the Brazilian legislation for air quality. The cost of these samplers was also considered and was regarded as viable for academic use and as a first step in air quality control.
Keywords: air quality monitoring; Ficks’s law; higher education institutions; nitrogen dioxide; ozone; passive samplers; air pollution.
Reference to this paper should be made as follows: Vieira, L.C., Korf, E.P. and Brandli, L.L. (2013) ‘Passive samplers for air quality monitoring in a Brazilian university’, Int. J. Environment and Pollution, Vol. 53, Nos. 1/2, pp.148–158.
Biographical notes: Letícia Canal Vieira graduated in Environmental Engineering at the University of Passo Fundo (2012). This paper is the product of her graduation project.
Eduardo Pavan Korf received his Master degree in Engineering from the Federal University of Rio Grande do Sul in 2011 and graduate in Environmental Engineering from the University of Passo Fundo in 2010. Since 2010, he has been a Professor in Environmental Engineering Course at the Passo Fundo University and has been researching the topics: environmental monitoring such as air pollution, environmental modelling and environmental geotechnics.

Passive samplers for air quality monitoring in a Brazilian university 149
Luciana Londero Brandli received her PhD in Production Engineering from the Federal University of Santa Catarina in 2004. Since then she has been a Professor in the Master Program in Environment and Civil Engineering at Passo Fundo University and has been researching how to apply sustainability in high education institution.
This paper is a revised and expanded version of a paper entitled ‘Air quality monitoring using passive samplers in a Brazilian university’ presented at the 7th Conference of the Environmental Management for Sustainable Universities (EMSU), Istambul, 2013.
1 Introduction
Many studies have produced evidence that air pollution has adverse effects on human health, and that it is responsible for the increase of cases of respiratory diseases, which reflect in an increase in public health costs (Li et al., 2012). There are established standards within legislation for air quality; however, to ensure that these legal requirements are carried out, a monitoring process is necessary.
Passo Fundo University (UPF), situated in the north of the state of Rio Grande do Sul, Brazil, is involved in activities that potentially cause air pollution. Currently, it has approximately 20,000 students, who transform this campus into a small town (Brandli et al., 2011). Therefore, besides the movement of vehicles, other varied activities occur, such as sewage treatment, energy generation, chemical laboratories, and others. These all produce atmospheric pollutants that require monitoring for their control. Among the main ones, we have methane (CH4), volatile hydrocarbons (VOC), nitrogen oxide (NOx), sulphur oxide (SOx), carbon monoxide (CO), carbon dioxide (CO2), particulate matter (PM) and acid vapours.
The difficulty in monitoring air quality occurs due to the fact that pollutants are generally found in low concentrations in the atmosphere as a result of the process of dispersion and dilution (Cruz and Campos, 2008). Besides, active monitoring, using automatic portable equipment or fixed installations is almost always burdensome, requiring considerable investment, trained personnel to operate it and the supply of constant electrical energy. This makes this monitoring model ineffective, giving rise to the necessity of alternatives in regions where this technique is not viable (Cruz and Campos, 2002).
Because of the emissions from UPF, air pollution monitoring has become a necessity and the idea is to make a diagnosis of air quality in this location and also to study a viable technology for the reality of the institution. One of the viable alternatives, from a practical and economic perspective, is the use of passive samplers to measure air pollutants. It is also important to emphasise that no official (e.g., by environmental agencies) air monitoring is done in Passo Fundo or in nearby cities. Fixed air monitoring stations are not a common reality in Brazil, especially because of the costs associated with them; therefore, passive samplers can be a good qualitative way to verify air quality at sites outside the university campus as well.
There are various types of passive samplers with various applications. One of them is the use of plants, mosses, and lichens, known as biomonitoring. Another one is the construction of badge or tube type samplers with low cost materials which are based on
150 L.C. Vieira et al.
principles such as diffusion or absorption with subsequent permeation of gas or vapour molecules through a membrane (Cruz and Campos, 2002).
Many studies have been carried out using passive samplers for monitoring the more diverse types of pollutants, such as SO2 (Cruz et al., 2004), NO2 (Sekine et al., 2008; Melchert and Cardoso, 2006), O3, H2S (Campos et al., 2010), polycyclic aromatic hydrocarbons (Tao et al., 2008; Cornelissen et al., 2008; Zhang et al., 2011), persistent organic pollutants (Melymuk et al., 2011; Chaemfa et al., 2009), polychlorinated biphenyl (Cornelissen et al., 2008), metals, and PM (Brait and Antoniosi Filho, 2010). The majority of these studies were conducted in emerging countries, which illustrates that passive samplers represent an accessible alternative for monitoring air quality. Among the advantages is the ease of installation at the site, the low construction and installation costs, the limited need for maintenance after installation, low cost laboratory analyses, no electrical energy required, and little variation in price for their use in different regions (Krupa and Legge, 2000).
Air quality standards in Brazil are established by CONAMA 003/90 Resolution (Brasil, 1990), which determines the primary standards – maximum concentrations of a pollutant which can be found in the atmosphere, and secondary standards – concentration levels that produce minimum adverse effects in the population. Ideally, pollutants should be below the secondary standard to ensure a healthy and favourable environment.
With the aim of evaluating the applicability of passive samplers for the monitoring and diagnosis of air pollution at UPF, the general focus of this study is on evaluating and verifying the viability of using a passive sampler for atmospheric pollutants NO2 and O3, using the methodologies available in the literature.
2 Materials and methods
The samplers were constructed at the beginning of July 2012 and the monitoring period went from July 2012 to January 2013. The samplers were installed on Campus 1 of UPF in locations which have different sources of pollution, most of them regarded as fixed sources. The monitored pollutants were NO2 and O3. These pollutants were chosen because they are common in urban regions. The main source of NO2 is the burning of fossil fuels, and ozone is a secondary pollutant which can be formed from NO2; its presence is also responsible for the increase in cardiovascular and respiratory diseases (Hoek et al., 2002).
2.1 Monitoring sites
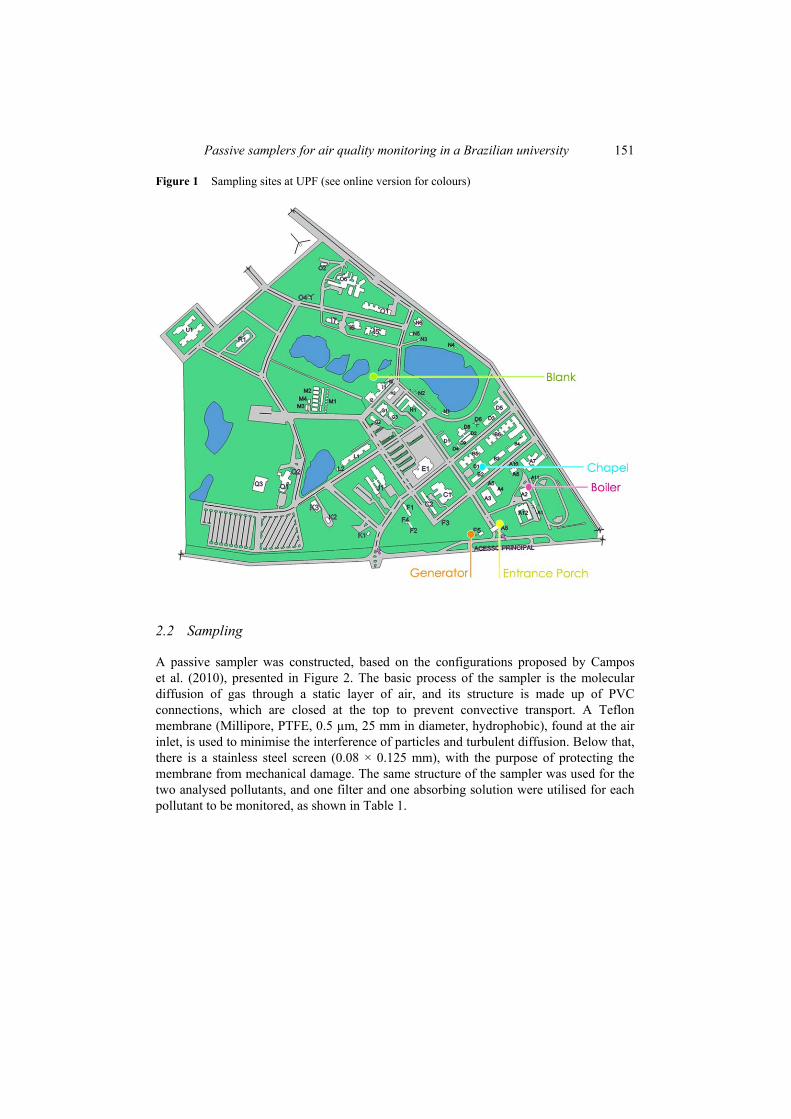
The choice of the monitoring sites was based on the sources of atmospheric pollutants found at the university, as illustrated in Figure 1. Therefore, P1 is found near the exit of gases from the energy generator; P2 at the entrance porch of the university, whose aim was to monitor motor vehicle emissions; P3 near the pool heating boiler; P4 at the exit of the exhaustion chamber of one of the chemistry laboratories; and P5 in the most isolated location – a place free from an anthropic source of pollution which could thus be used as ‘the blank’.
Passive samplers for air quality monitoring in a Brazilian university 151
Figure 1 Sampling sites at UPF (see online version for colours)
2.2 Sampling
A passive sampler was constructed, based on the configurations proposed by Campos et al. (2010), presented in Figure 2. The basic process of the sampler is the molecular diffusion of gas through a static layer of air, and its structure is made up of PVC connections, which are closed at the top to prevent convective transport. A Teflon membrane (Millipore, PTFE, 0.5 µm, 25 mm in diameter, hydrophobic), found at the air inlet, is used to minimise the interference of particles and turbulent diffusion. Below that, there is a stainless steel screen (0.08 × 0.125 mm), with the purpose of protecting the membrane from mechanical damage. The same structure of the sampler was used for the two analysed pollutants, and one filter and one absorbing solution were utilised for each pollutant to be monitored, as shown in Table 1.

152 L.C. Vieira et al.
Figure 2 Passive sampler used for monitoring pollutants, (a) scheme of the sampler (b) actual sampler
(a)
(b)
Table 1 Specifications of the passive samplers
Pollutant Filter Absorbing solution Reference
NO2 Cellulose filter (Whatman 40)
KI 5.0 × 10⁻¹ mol L–1 + KOH 2.0 × 10⁻¹ mol L–1
in methyl alcohol. Campos et al.
(2010)
O3 Fibreglass paper filter (GF 50/A)
Make a paste of 50 g starch in 20 mL distilled water and place it in 50 mL boiling distilled water for five minutes. Put the solution aside for 24 hours and dissolve 1.0 g of potassium carbonate followed by 10.0 g of potassium iodate and dilute it to 100 mL.
Bucco (2010)
The samplers were installed once per month during the monitoring period for five days and were placed at least 2 m from the ground. They hung down directly from nearby structures or trees. After the exposure period, the samplers were removed and were wrapped in aluminium foil and stored under refrigeration until pollutant concentrations were analysed.
Passive samplers for air quality monitoring in a Brazilian university 153
2.3 Analysis of pollutants
To analyse the concentration of pollutants in the filters, UV/VIS colour spectrophotometry methods were used. For the analysis of NO2, the modified Griess-Saltzman (Saltzman, 1954) method, described by Campos et al. (2010), was used, and Bucco’s (2010) method was used for O3.
The concentration of pollutants in the external environment was determined, following the principle of Fick’s first law of diffusion, as demonstrated in Equation 1, described by Campos et al. (2010).
m LCD A t
⋅=
⋅ ⋅ (1)
where
C external concentration (environment) of gas (μg m–3)
m total collected mass (μg)
L length of line of diffusion (m)
D coefficient of diffusion (m2 h–1), obtained from the literature, according to Massman (1998), 0.3769 m2h–1 for NO2 and 0.3999 m2h–1 for O3
A cross-sectional area of the line of diffusion (m2)
t sampling time (h).
The total collected mass (m) is the one obtained by the previously mentioned analytical methods and determined by equation (2).
extract extractm C V= × (2)
where
Cextract Is the result obtained in the analyses which have a unit of mass/volume.
Vextract Is the quantity of extract used to obtain the value of Cextract. Vextract is 0.005 L for NO2 and 0.025 L for O3.
3 Results and discussion
Figures 3 and 4 illustrate, respectively, the data obtained from the NO2 and O3 samplers. It is possible to observe that there is a similarity among the concentrations obtained for NO2 at the sites during the monitoring periods. The similarities for O3, were more evident during August and September. The absence of results for the blank in October occurred because the samplers were not found at the moment of their removal. It should be emphasised that this is a qualitative analysis, because there is no monitoring station or active monitoring equipment to prove that these values reflect the reality. However, they are believed to be close to the real concentrations once the same sampler was used and validated by Campos et al. (2010). The accuracy was 10-19%, compared to the 25% limit recommended by the European Union.
154 L.C. Vieira et al.
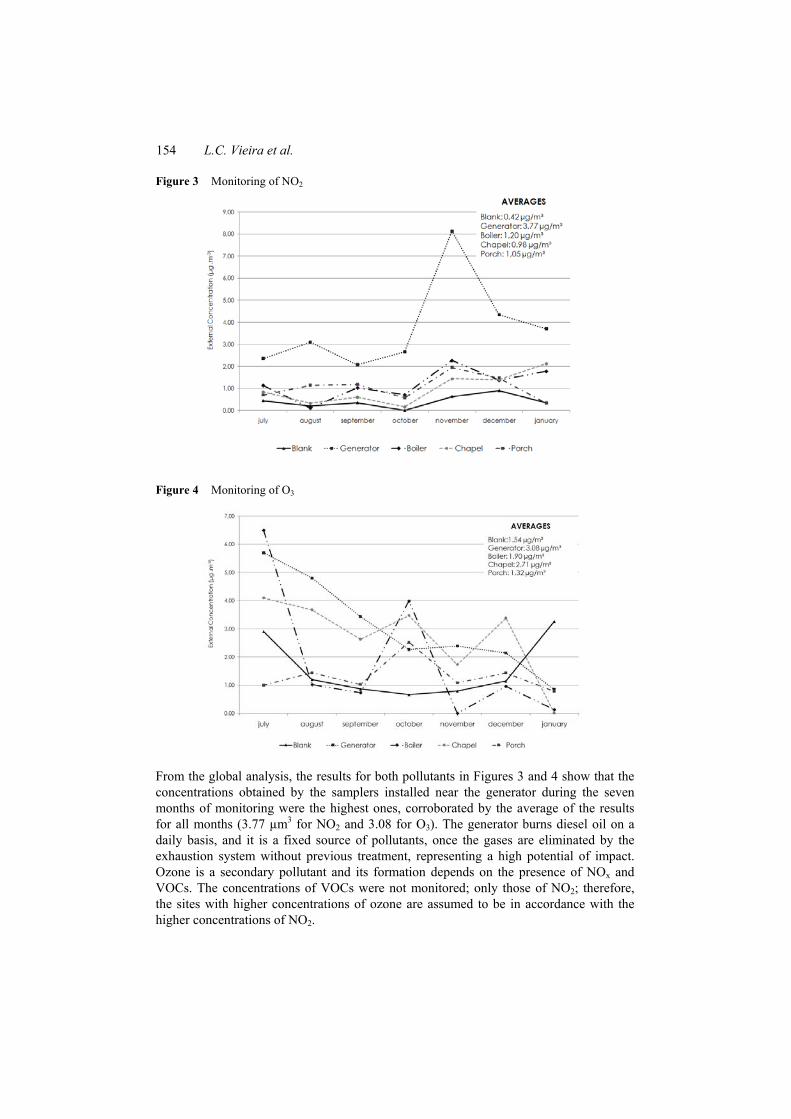
Figure 3 Monitoring of NO2
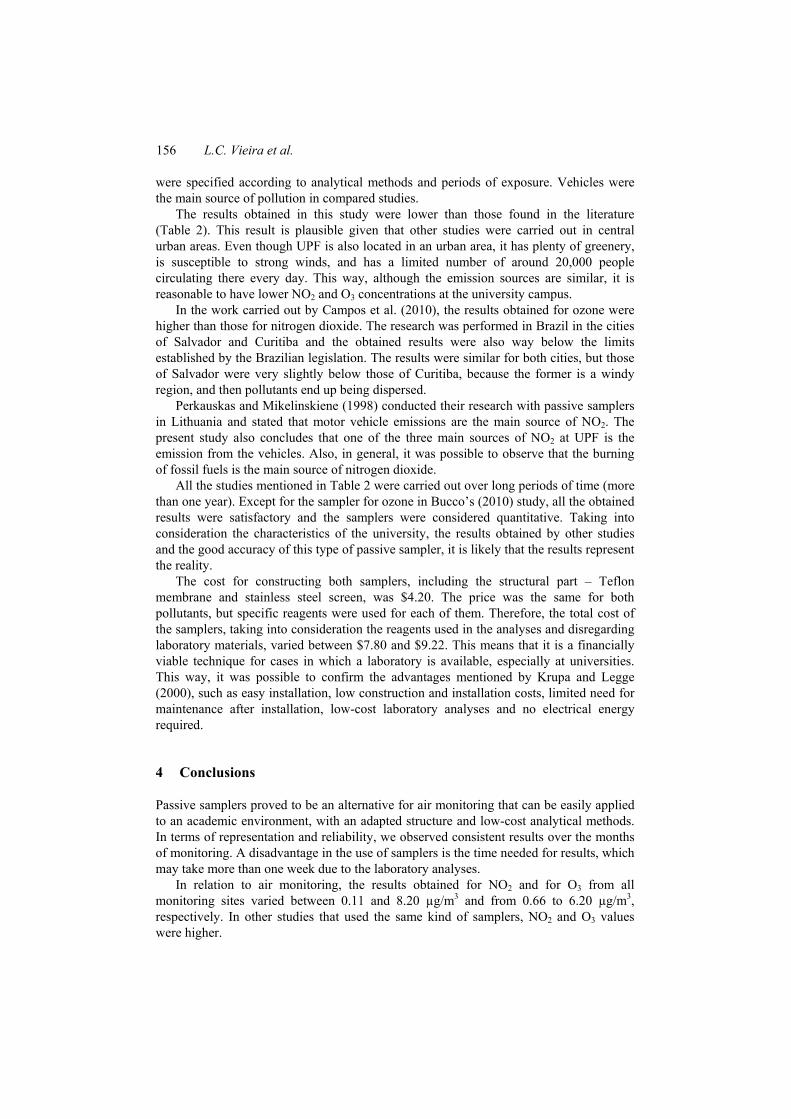
Figure 4 Monitoring of O3
From the global analysis, the results for both pollutants in Figures 3 and 4 show that the concentrations obtained by the samplers installed near the generator during the seven months of monitoring were the highest ones, corroborated by the average of the results for all months (3.77 µm3 for NO2 and 3.08 for O3). The generator burns diesel oil on a daily basis, and it is a fixed source of pollutants, once the gases are eliminated by the exhaustion system without previous treatment, representing a high potential of impact. Ozone is a secondary pollutant and its formation depends on the presence of NOx and VOCs. The concentrations of VOCs were not monitored; only those of NO2; therefore, the sites with higher concentrations of ozone are assumed to be in accordance with the higher concentrations of NO2.

Passive samplers for air quality monitoring in a Brazilian university 155
This appears to be true if we consider that the generator for both pollutants yielded the highest concentrations and the boiler had the second highest concentration of NO2 (average of 1.20 µm3) and the third highest concentration of ozone (average of 1.90 µm3). In a study carried out by Watson et al. (2001), the gases exhausted from burning diesel systems, as in the case of the energy generator of UPF and the boiler, were the major sources of a wide range of volatile organic compounds. Presumably, VOCs are found in both places and the presence of NO2 was also confirmed, making these sites favourable to ozone formation.
However, the second location with the highest concentration of ozone was the exit of the exhaustion chamber (average of 2.71 µm3), and the monitoring site with low levels of NO2 (average of 0.98 µm3). It should be recalled that all the NOx compounds (NO, NO2, NO3, NO5) can form ozone and not just NO2. Notwithstanding, many volatile organic compounds are reagents used in laboratories and should be utilised in the exhaustion chamber exactly because of their volatility. The combination of these two factors is a possible explanation for the higher concentrations of ozone.
During the seven months of observation, the third site with consistently high concentrations was the entrance porch because of the daily number of vehicles going in and out of the campus (averages of 1.05 for NO2 µm3 and 1.32 µm3 for O3). Although this is considered to be a moving source, significant levels were recorded for NO2 and O3. This is justified by the number of vehicles, which averages 5,000 cars, 300 urban public transport vehicles and 230 intercity buses and vans (UPF, 2012). It can also be observed that the concentrations of both pollutants at these sites in the holiday months of July and January were lower as a result of the reduction in the volume of traffic at the university.
In relation to nitrogen dioxide, the maximum concentrations obtained, taking into consideration the variations at the site and the time period, were 8.20 µg/m3 in the generator during November (Figure 3) a value way below the legal recommendations (190 µg/m3), which should not be exceeded more than once a year. Observing the annual arithmetic mean of 100 µg/m3, established by the secondary standard, the situation is deemed satisfactory.
The maximum ozone concentrations (Figure 4) were 6.20 µg/m3 in the boiler in July. Both the primary and secondary standards only show the concentrations that should not be exceeded at any time during the year: 160 µg/m3. Therefore, the values obtained for ozone are also well below the limits established by the legislation. Table 2 Results for passive samplers obtained by different authors
Author NO2 (µg/m³) O3 (µg/m³)
Present study 0.11 to 8.20 0.66 to 6.20 Campos et al. (2010) 3.60 to 12 17 to 37 Bucco (2010) 18. 99 to 56.12 SRNO Ayers et al. (1998) 8 to 24 NAS Perkauskas and Mikelinskiene (1998) 9 to 80 NAS
Note: SRNO – satisfactory results not obtained; NAS – not analysed in the study.
Table 2 illustrates the minimum and maximum concentrations of pollutants obtained in this study and in other studies. It should be emphasised that all the studies were concerned with air monitoring in urban areas using passive samplers, with a similar structure to that utilised in this study (badge type with the same compounds), all of which
156 L.C. Vieira et al.
were specified according to analytical methods and periods of exposure. Vehicles were the main source of pollution in compared studies.
The results obtained in this study were lower than those found in the literature (Table 2). This result is plausible given that other studies were carried out in central urban areas. Even though UPF is also located in an urban area, it has plenty of greenery, is susceptible to strong winds, and has a limited number of around 20,000 people circulating there every day. This way, although the emission sources are similar, it is reasonable to have lower NO2 and O3 concentrations at the university campus.
In the work carried out by Campos et al. (2010), the results obtained for ozone were higher than those for nitrogen dioxide. The research was performed in Brazil in the cities of Salvador and Curitiba and the obtained results were also way below the limits established by the Brazilian legislation. The results were similar for both cities, but those of Salvador were very slightly below those of Curitiba, because the former is a windy region, and then pollutants end up being dispersed.
Perkauskas and Mikelinskiene (1998) conducted their research with passive samplers in Lithuania and stated that motor vehicle emissions are the main source of NO2. The present study also concludes that one of the three main sources of NO2 at UPF is the emission from the vehicles. Also, in general, it was possible to observe that the burning of fossil fuels is the main source of nitrogen dioxide.
All the studies mentioned in Table 2 were carried out over long periods of time (more than one year). Except for the sampler for ozone in Bucco’s (2010) study, all the obtained results were satisfactory and the samplers were considered quantitative. Taking into consideration the characteristics of the university, the results obtained by other studies and the good accuracy of this type of passive sampler, it is likely that the results represent the reality.
The cost for constructing both samplers, including the structural part – Teflon membrane and stainless steel screen, was $4.20. The price was the same for both pollutants, but specific reagents were used for each of them. Therefore, the total cost of the samplers, taking into consideration the reagents used in the analyses and disregarding laboratory materials, varied between $7.80 and $9.22. This means that it is a financially viable technique for cases in which a laboratory is available, especially at universities. This way, it was possible to confirm the advantages mentioned by Krupa and Legge (2000), such as easy installation, low construction and installation costs, limited need for maintenance after installation, low-cost laboratory analyses and no electrical energy required.
4 Conclusions
Passive samplers proved to be an alternative for air monitoring that can be easily applied to an academic environment, with an adapted structure and low-cost analytical methods. In terms of representation and reliability, we observed consistent results over the months of monitoring. A disadvantage in the use of samplers is the time needed for results, which may take more than one week due to the laboratory analyses.
In relation to air monitoring, the results obtained for NO2 and for O3 from all monitoring sites varied between 0.11 and 8.20 µg/m3 and from 0.66 to 6.20 µg/m3, respectively. In other studies that used the same kind of samplers, NO2 and O3 values were higher.

Passive samplers for air quality monitoring in a Brazilian university 157
In addition, the results from the various monitoring sites at the university campus were, in general, below those recommended by the legislation and are not a cause for concern. It could also be observed that the energy generator was the site where pollution was higher. Thus, we recommend treating combustion gases before they are discharged into the atmosphere.
Future studies should consider the use of the same sampler structure for other pollutants such as VOCs and SOx. It is necessary to find appropriate absorbent solutions and analytical methods. A literature review can be conducted or new methods can be developed. Also, the possibility of correlating the results with meteorological data (e.g., rainfall, solar radiation, and wind speed) should be considered.
References Ayers, G.P., Keywood, M.D., Gillett, R., Manins, P.C., Malfroy, H. and Bardsley, T. (1998)
‘Validation of passive diffusion samplers for SO2 and NO2’, Atmospheric Environment, Vol. 32, No. 20, pp.3587–3592.
Brait, C.H.H. and Antoniosi Filho, N.R. (2010) ‘Desenvolvimento e aplicação de sistema passivo de coleta de poluentes atmosféricos para monitoramento de Cd, Cr, Pb, Cu, Fe, Mn, Zn e particulados totais’, Química Nova, Vol. 33, No. 1, pp.7–13, São Paulo.
Brandli, L.L., Frandoloso, M. and Tauchen, J. (2011) ‘Improving the environmental work at University of Passo Fundo, Brazil – towards an environmental management system’, Brazilian Journal of Operations & Production Management, Vol. 8, No. 1, pp.1–24.
Brasil (1990) Resolução CONAMA n°. 003, de 28 de junho de 1990, Diário Oficial da União, Brasília, de 22/08/90, pp.15937–15939, Seção I.
Bucco, M.V.S. (2010) Construção e testes de validação de amostradores passivos para dióxido de nitrogênio e ozônio, Dissertação (Mestrado Profissional em Meio Ambiente Urbano e Industrial/Meio Ambiente Urbano e Industrial), Setor de Tecnologia, Universidade Federal do Paraná, Curitiba.
Campos, V.P., Cruz, L.P.S., Godoi, R.H.M., Godoi, A.F.L. and Tavares, T.M. (2010) ‘Development and validation of passive samplers for atmospheric monitoring of SO2’, Microchemical Journal, Vol. 96, No. 1, pp.132–138.
Chaemfa, C., Barber, J.L., Kim, K., Harner, T. and Jones, K.C. (2009) ‘Further studies on the uptake of persistent organic pollutants (POPs) by polyurethane foam disk passive air samplers’, Atmospheric Environment, Vol. 43, No. 25, pp.3843–3849.
Cornelissen, G., Arp, H.P.H., Pettersen, A., Hauge, A. and Breedveld, G.D. (2008) ‘Assessing PAH and PCB emissions from the relocation of harbor sediments using equilibrium passive samplers’, Chemosphere, Vol. 72, No. 10, pp.1581–1587.
Cruz, L.P.S. and Campos, V.P. (2002) ‘Amostragem passiva de poluentes atmosféricos. Aplicação ao SO2’, Química Nova, Vol. 25, No. 3, pp.406–411, São Paulo.
Cruz, L.P.S. and Campos, V.P. (2008) ‘Métodos de amostragem e análise para compostos reduzidos de enxofre atmosférico’, Química Nova, Vol. 31, No. 5, pp.1180–1189, São Paulo.
Cruz, L.P.S., Campos, V.P., Silva, A.M.C. and Tavares, T.M. (2004) ‘A Field evaluation of a SO2 passive sampler in tropical industrial and urban air’, Atmospheric Environment, Vol. 38, No. 37, pp.6425–6429.
Hoek, G., Brunekreef, B., Goldbohm, S., Fischer, P. and van den Brandt, P.A. (2002) ‘Association between mortality and indicators of traffic-related air pollution in the Netherlands: a cohort study’, The Lancet, Vol. 360, No. 9341, pp.1203–1209.
Krupa, S.V. and Legge, A.H. (2000) ‘Passive sampling of ambient, gaseous air pollutants: an assessment from an ecological perspective’, Environmental Pollution, Vol. 107, No. 1, pp.31–45.

158 L.C. Vieira et al.
Li, J., Ewart, G., Kraft, M. and Finn, P.W. (2012) ‘The public health benefits of air pollution control’, Journal of Allergy and Clinical Immunology, Vol. 130, No. 1, pp.22–23.
Massman, W.J. (1998) ‘A review of the molecular diffusivities of H2O, CO2, CH4, CO, O3, SO2, NH3, N2O, NO, and NO2 in air, O2 and N2 near STP’, Atmospheric Environment, Vol. 32, No. 2, pp.1111–1127.
Melchert, W.R. and Cardoso, A.A. (2006) ‘Construção de amostrador passivo de baixo custo para determinação de dióxido de nitrogênio’, Química Nova, Vol. 29, No. 2, pp.365–367.
Melymuk, L., Robson, M., Helm, P.A. and Diamond, M.L. (2011) ‘Evaluation of passive air sampler calibrations: selection of sampling rates and implications for the measurement of persistent organic pollutants in air’, Atmospheric Environment, Vol. 45, No. 10, pp.1867–1875.
Perkauskas, D. and Mikelinskiene, A. (1998) ‘Evaluation of SO2 and NO2 concentration levels in Vilnius (Lithuania) using passive diffusion samplers’, Environmental Pollution, Vol. 102, No. S1, pp.249–252.
Saltzman, B.E. (1954) ‘Colorimetric microdetermination of nitrogen dioxide in the atmosphere’, Analytical Chemistry, Vol. 26, No. 12, pp.1949–1955.
Sekine, Y., Watts, S.F., Rendell, A. and Butsugan, M. (2008) ‘Development of highly sensitive passive sampler for nitrogen dioxide using porous polyethylene membrane filter as turbulence limiting diffuser’, Atmospheric Environment, Vol. 42, No. 18, pp.4079–4088.
Tao, S. et al. (2008) ‘A directional passive air sampler for monitoring polycyclic aromatic hydrocarbons (PAHs) in air mass’, Environmental Pollution, Vol. 156, No. 2, pp.435–441.
UPF (2012) Duplicação da BR-285 é discutida [online] http://www.upf.br/vfjk (accessed 15 November 2012).
Watson, J.G., Chow, J.C. and Fujita, E.M. (2001) ‘Review of volatile organic compound source apportionment by chemical mass balance’, Atmospheric Environment, Vol. 35, No. 9, pp.1567–1584.
Zhang, Y., Deng, S., Liu, Y., Shen, G., Li, X., Cao, J., Wang, X., Reid, B. and Tao, S. (2011) ‘A passive air sampler for characterizing the vertical concentration profile of gaseous phase polycyclic aromatic hydrocarbons in near soil surface air’, Environmental Pollution, Vol. 159, No. 3, pp.694–699.


![Passive design[1]](https://static.fdokumen.com/doc/165x107/63215c9580403fa2920cb59b/passive-design1.jpg)