passage of shad - at thebonneville fishways - Scientific ...
36
PASSAGE OF SHAD AT THE BONNEVILLE FISHWAYS j Marine Biological Laboratory L iviAR3 ir-53 WOODS HOLE, MASS. SPECIAL SCIENTIFIC REPORT: FISHERIES No. 94 JMITEP STATES DEPARTMENT OF THE INTERIOR FISH AND WILDLIFE SERVICE
-
Upload
khangminh22 -
Category
Documents
-
view
0 -
download
0
Transcript of passage of shad - at thebonneville fishways - Scientific ...
PASSAGE OF SHAD
AT THE BONNEVILLE FISHWAYSjMarine Biological Laboratory
LiviAR3 ir-53
WOODS HOLE, MASS.
SPECIAL SCIENTIFIC REPORT: FISHERIES No. 94
JMITEP STATES DEPARTMENT OF THE INTERIOR
FISH AND WILDLIFE SERVICE

Explanatory Note
The series embodies results of investigations, usually of restricted
scope, intended to aid or direct management or utilization practices and
as guides for administrative or legislative action. It is issued in
limited quantities for the official use of Federal, State or cooperating
agencies and in processed form for economy and to avoid delay in publica-
tion.
Washington, D. C.
March 1953

United States Department of the Interior, Douglas McKay, Secretary-Fish and Wildlife Service, Albert M. Day, Director
PASSAGE OF SHAD AT THE BONNEVILLE FISHWAYS
3y G. B. TalbotFishery Research Biologist
Special Scientific Reports Fisheries No. 9h

CONTENTS
Page
Description of Bonneville fish ladders • 1
Time of passage compared with flow and temperature 8
Bradford Island counts compared with Washington Shore ladder counts. . lU
Hourly counts at Bonneville fishways l5
Fish locks 20
Mortalities in fish ladders 22
Swimiring activities within the ladders 26
Other fishways ascended by shad 27
Summary and conclusions. . 28
Literature cited 29
PASSAGE OF SHAD AT THE BONNEVILLE FISHWAYS
In the last 50 years the catch of shad (Alosa sapidissima) on the
Atlantic coast has dwindled to less than a fifth of its former size.
Because of concern about the shad fishery, the Atlantic States Marine
Fisheries Commission sponsored legislation that provided for a 6-year
study of this valuable natural resource. The Fish and VJildlife Service,
as the primary research agency of the Commission, began this study in
1950.
An evident factor in the decline of the shad was the erection of
dams that prevented the fish from ascending streams to reach their naturalspawning grounds. Although many of these dams had fish ladders intended
to pass fish upstream, the shad generally did not use the ladders. Con-sequently, a part of the investigation of the Atlantic-coast shad has been
a search for suitable methods of passing shad over obstructions. At the
beginning of the study the only fishvjays we knew of that were utilized byshad were those at Bonneville Dam on the Columbia River in the PacificNorthwest, and a soecial study was raade of the passage of shad by thosefishways. This paper is a report of that study.
In the study, William H. Rees (now with the State of WashingtonDepartment of Fisheries) made the observations at Bonneville Da-n and com-
piled and analyzed part of the data^* C. J. Burner and K. G, Weber made
many helpful suggestions during the progress of the studyj R. A. Fredinand Co H. Walburg helped prepare the statistical analysesj C. E. Atkinsonhelped plan and carry out the study; and Harlan B. Holmes gave specialhelp in obtaining unpublished records, supplied much of the factualinformation, and suggested methods of analyzing the data. I am indebtedto Ivan Donaldson, resident biologist at Bonneville Dam, for his help andsuggestions, and to the Corps of Engineers for the use of unpublishedrecords and for the map and ohotographs.
Description of Bonneville Fish Ladders
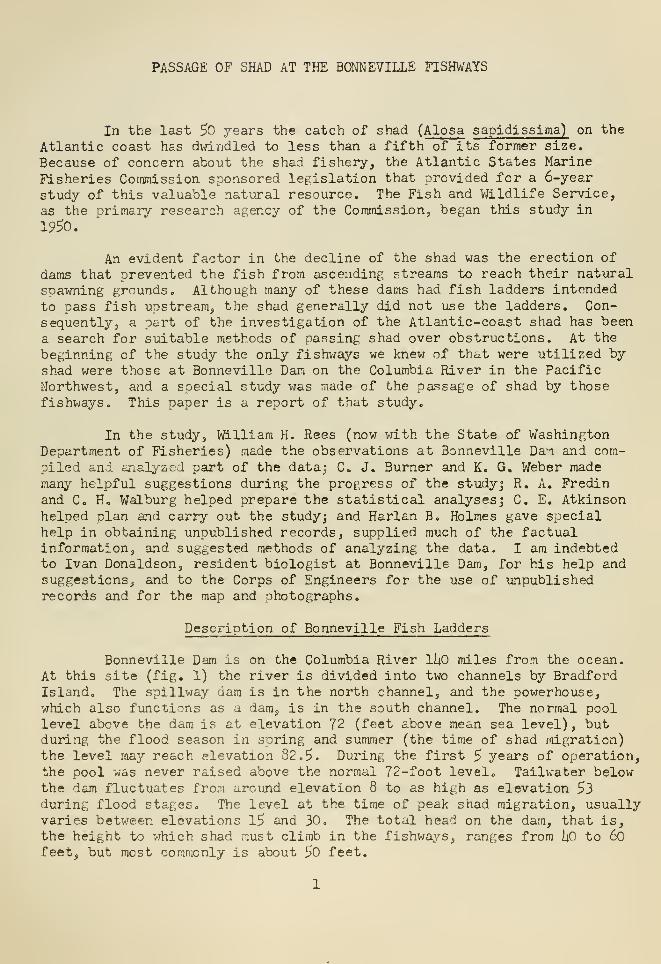
Bonneville Dam is on the Columbia River lUo miles from the ocean.
At this site (figo 1) the river is divided into two channels by BradfordIsland. The spillway dam is in the north channel, and the powerhouse,which also functions as a dam, is in the south channel. The normal poollevel above the dam is at elevation 72 (feet above mean sea level), butduring the flood season in spring and summer (the time of shad migration)the level may reach elevation 82.5. During the first 5 years of operation,the pool w^as never raised above the normal 72-foot level. Tailwater belowthe dam fluctuates from around elevation 8 to as high as elevation 53during flood stages. The level at the time of peak shad migration, usuallyvaries between elevations l5 and 30. The total head on the dam, that is,the height to vjhich shad must climb in the fishways, ranges from kD to 60feet, but most commonly is about 50 feet.
N G
COLUMB/^
i

Fish-passing facilities include the Washington Shore fish ladder
at the north end of the spillway dam and the Bradford Island fish ladder
with entrances on the south end of the spillway dam and on the north end
of the powerhouse. Fish locks are located at each end of the spillway dam
and on the south end of the powerhouse j these have not been used exten-
sively, but are available in case of emergencies.
The Washington Shore ladder is 37 feet wide, and the BradfordIsland ladder is hO feet wide. Both ladders narrow to 30 feet in the
lower sections where they are usually flooded by tailwater. Each ladder
circles around the end of the dam from the lower to the higher water level.
At l6-foot intervals th^re are cross partitions 6 feet in height (fig. 2).
The toT5 of each successive cross partition, or weir, is 1 foot higher thanthe one next below. These weirs continue up the ladder to the elevationlevel of 70 feet. Above this point the ladders are like a level-flooredflume. At l6-foot intervals along this up^er section there. are guides in
which stop logs can be added to form weirs. In this 'jay additional pools
can be added to extend the steps up to the high forebay level of 82.5 feet.
Water flows down the ladder, spilling over each successive weir,
and forms a series of pools, each one a foot lower than the one above
(figo 3) . In each ifieir between pools there is at the bottom a submerged
opening (fi^'. 2) 2 feet square, through which fish may pass inthoi^t coraing
to the surface. These openings alternate from near one side to near the
other in successive weirs.
At both sides of the spillxjay dam at the lower end of the fishwaysare expanded entrances to the ladders which are supplied with auxiliarywater through gratings in the floor. These are called collecting systems.
Their purpose is to supply sufficient attraction water so that the fish can
find the ladders. A collecting system extends all across the lower face of
the powerhouse, and the flow within this system can be directed to orientthe fish to the fish-passing facilities on either side or both sides of the
powerhouse.
The UO~foot-wide ladder usually carries approximately 200 second-
feet of flow from headwater. Approximately 20 second-feet of this passes
through the 2-foot-square orifice in each weir; the remainder flows over the
crest of the weir. This quantity of flow causes the water level in eachpool to be about 12 inches higher than the crest of the weir below it. Thewater surface "draws do^m" as it passes over the weir, to give a depth ofapproximately 10 inches over the crest of the weir (fig. 3).
The Washington Shore collection system is designed to supply an
additional 1,000 second-feet of water. A similar set of facilities at the
south end of the spillway is desi^-,Tied to supplj'' the spillway branch of the
Bradford ladder with 1,000 second-feet. Two auxiliary iijater intakes whichsupply the powerhou^-e collection system have a combined capacity of 2,U00
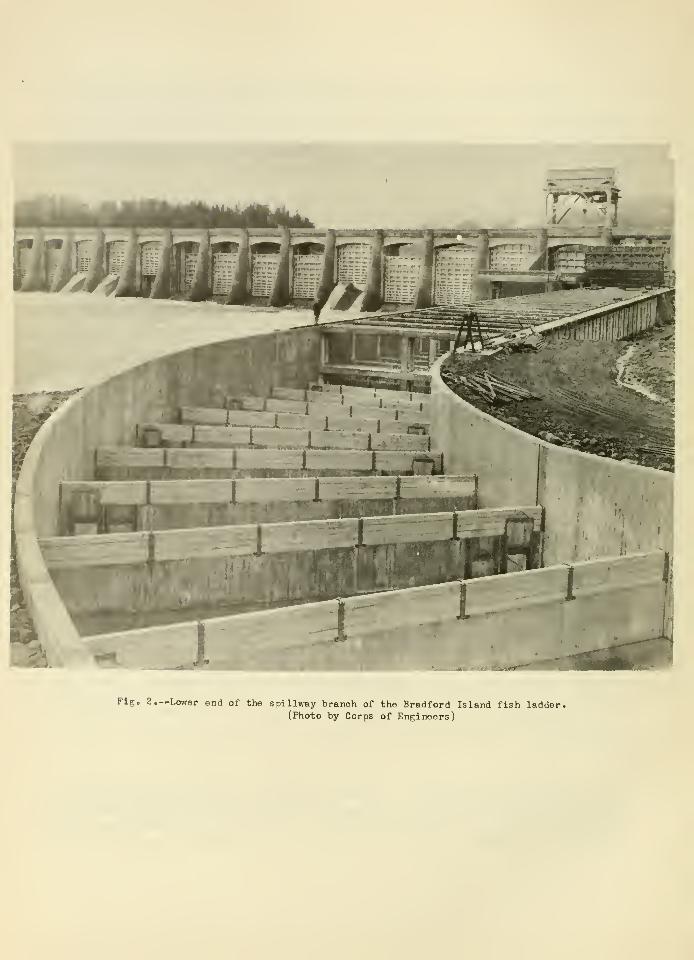
Fig. 2.—Lower end of the spillway branch of the Bradford Island fish ladder.(Photo by Corps of Engineers)
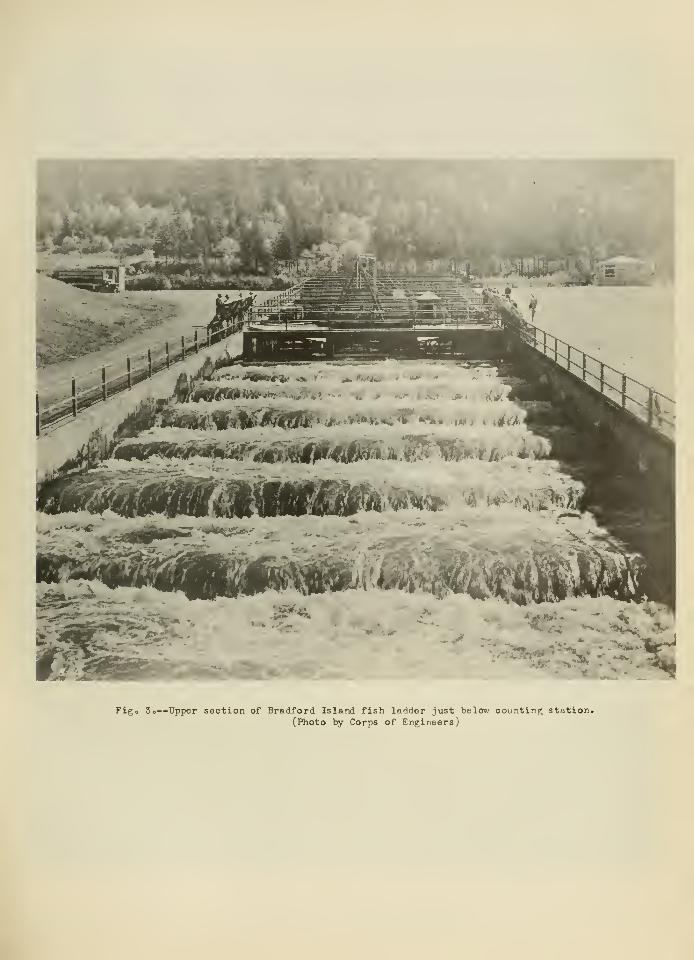
Figo 3o—Upper section of Bradford Island fish ladder just below counting station.(Photo by Corps of Engineers)
second-feet. Picket barriers across one spillway gate adjacent to each of
the fishway entrances on the spillway dam also furnish attraction water for
the fishways. Each of these supplies approximately 3,000 second-feet of
water.
Counting stations are located near the upper end of each ladder so
that the number of fish ascending may be counted (fig. U) . At each station
there is a picketed barrier in which is a 2-foot-wide opening through which
the fish can pass. A submerged white board is located under the opening as
an aid in identification of species. Before 1950, both counting stations
were at weir elevation 70. Early in 19^0 the Washington Shore counting
station was moved to the head of the ladder, where it is at headwater level
and where the fish, after being counted, pass directly into the forebay.
In 1951 the Bradford Island counting station was also moved to the head of
the ladder.
In the design of the ladders no provision was made for the counting
stations. Their installation at weir 70 caused complications in adjustment
of the ladder. As there is no significant drop in water level at the count-
ing barrier, one weir, and hence 1 foot of elevation was lost. To provide
a large pool immediately below the counting station, a weir was omitted
there. Similarly to create a large pool above the counting station a third
weir was omitted. After 19h2, when the pool level xvas allowed to rise aboveelevation 72, adjustments were made to compensate for the loss of 1 foot (of
a total of 3) of ladder elevation by adding 1; inches to the rise at the threeweirs immediately belo;-j the counting station. At normal forebay levels no
additional wfeirs were needed, but at the highest forebay level the 2 feetlost through the eliminatif^n of weirs 70 and 71 had to be regained by increas-ing the height of the v^eirs between the counting station and the upper endof the fishway.
The shad is considered a relatively unimportant species on theColumbia Hiverj the fishways were constructed and are operated mainly forthe passage of the more valuable salmonoid fishes whose spawning groundsare above the dam. A record is kept, however, of the miscellaneous speciesusing the fishways, and counts of shad passing up the ladders have beenmade each year since 1938 when the fish-passing devices were completed.As shown in table 1, the number of shad using all fish-passing facilitiesat Bonneville Dam each year has varied considerably, from 2,8I|8 in 19ii3 to
9U}526 in I9I1.5 (U, S» Army, Corps of Engineers, 1950) , Shad have been countedat Bonneville as early as May 13 and as late: as October 30, but the bulkof the run usually passes the dam during the month of July. The one excep-tion is the year I9I1O when a larger percentage xvas taken in June than inJuly.
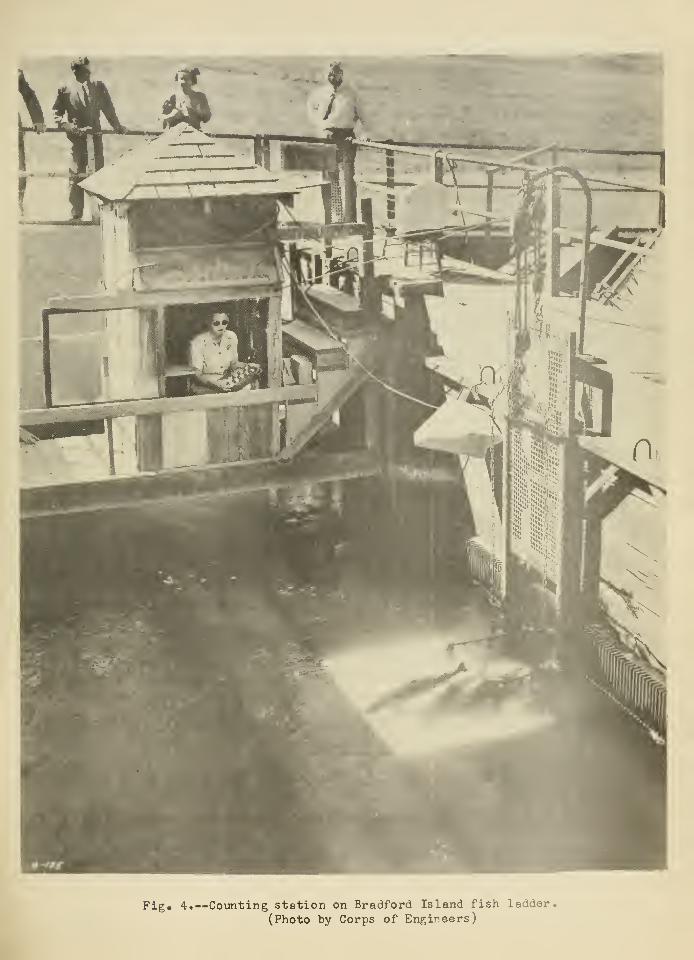
Fig. 4.—Counting station on Bradford Island fish ladder.
(Photo by Corps of Engineers)
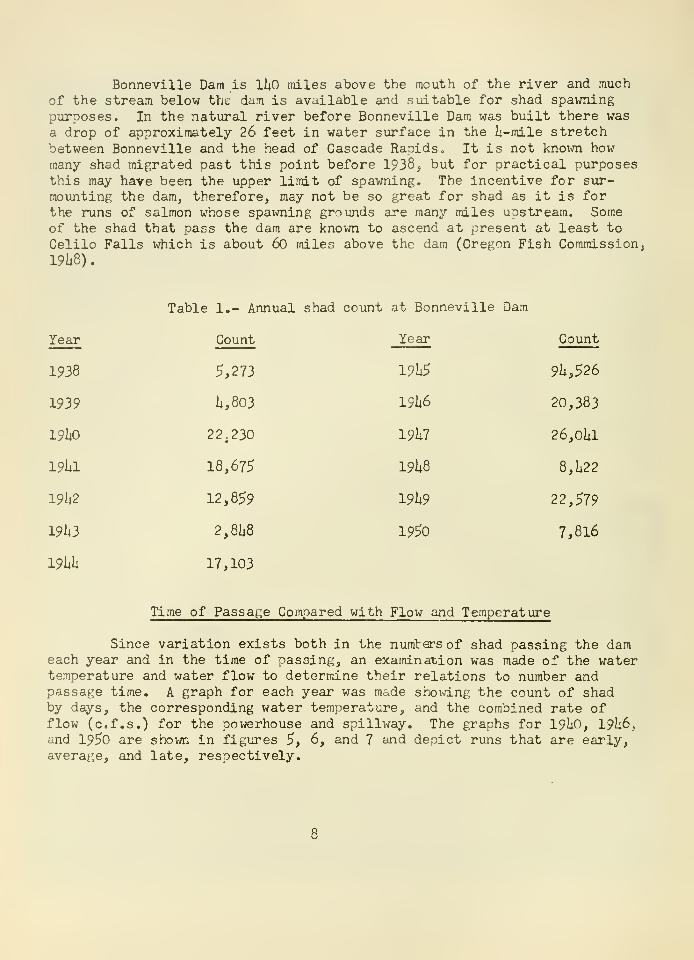
Bonneville Dam is liiO miles above the mouth of the river and muchof the stream below tht dam is available and suitable for shad spawningpurposes. In the natural river before Bonneville Dam was built there was
a drop of approximately 26 feet in water surface in the U-mile stretchbetween Bonneville and the head of Cascade Rapids « It is not known howmany shad migrated past this point before 1938^ but for practical purposesthis may have been the upper limit of spawning. The incentive for sur-moimting the dam, therefore, may not be so great for shad as it is forthe runs of salmon whose spawning grounds are many miles upstream. Someof the shad that pass the dam are known to ascend at present at least to
Celilo Falls which is about 6o rniles above the dam (Oregon Fish Coramissionj
19l;8)
.
Year
1938
1939
19liO
191^1
19l;2
191^3
19Uh
Table 1,- Annual shad count at Bonneville Dam
Count Year
5,273
a, 803
22^230
18,675
12,859
2,8ii8
17,103
19U5
19h6
19h7
19h8
19h9
1950
Count
9ii,526
20,383
26,oia
8,U22
22,579
7,816
Time of Passage Compared with Flow and Temperature
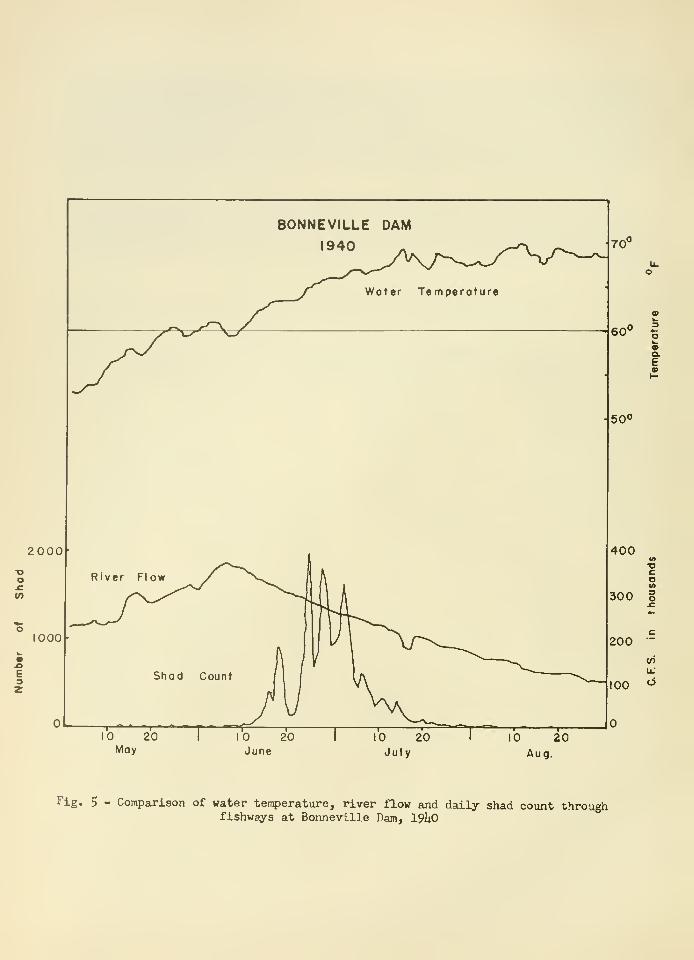
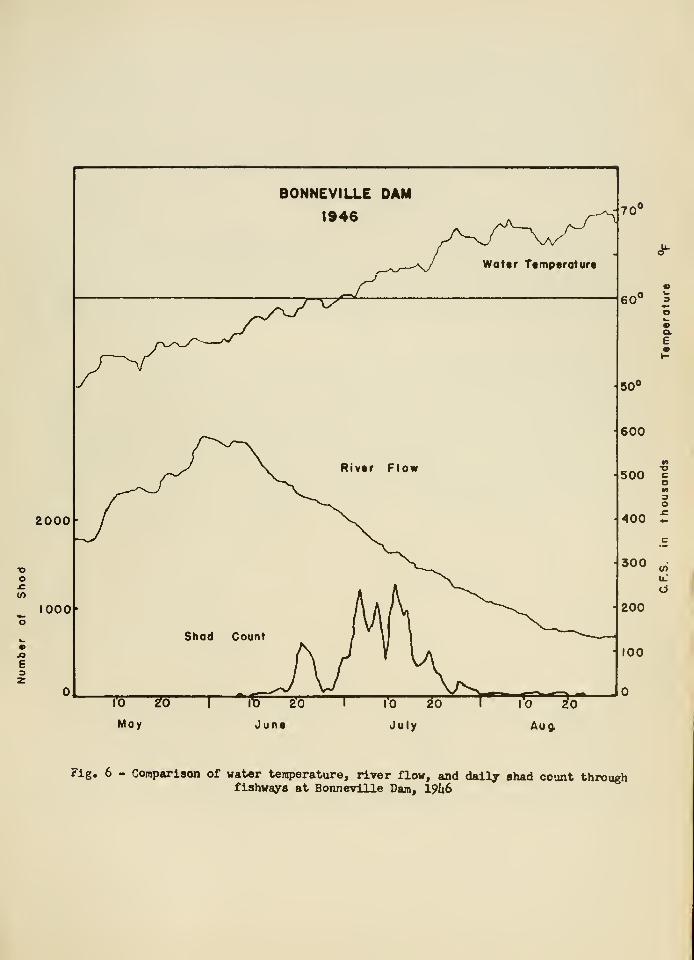
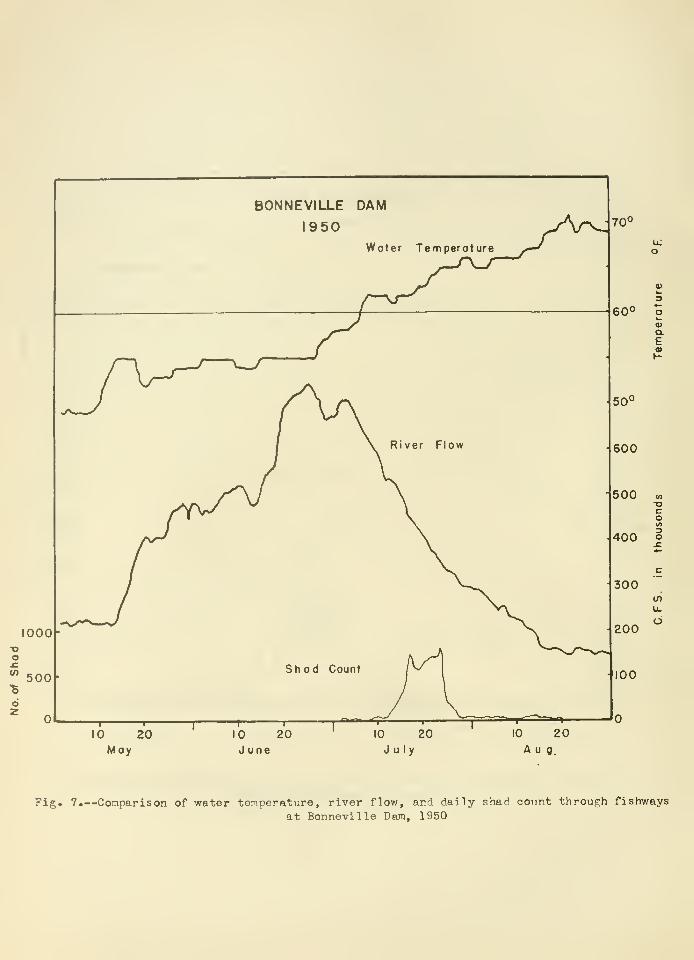
Since variation exists both in the numtersof shad passing the dameach year and in the time of passing, an exainination was made of the watertemperature and water flow to determine their relations to number andpassage time. A graph for each year was made showing the count of shadby daj'^s, the corresponding water temperature, and the combined rate offlow (c.f.s.) for the powerhouse and spillway. The graphs for 19liO, 19U6,and 1950 are shown in figures 5, 6, and 7 and depict runs that are early,average, and late, respectively.
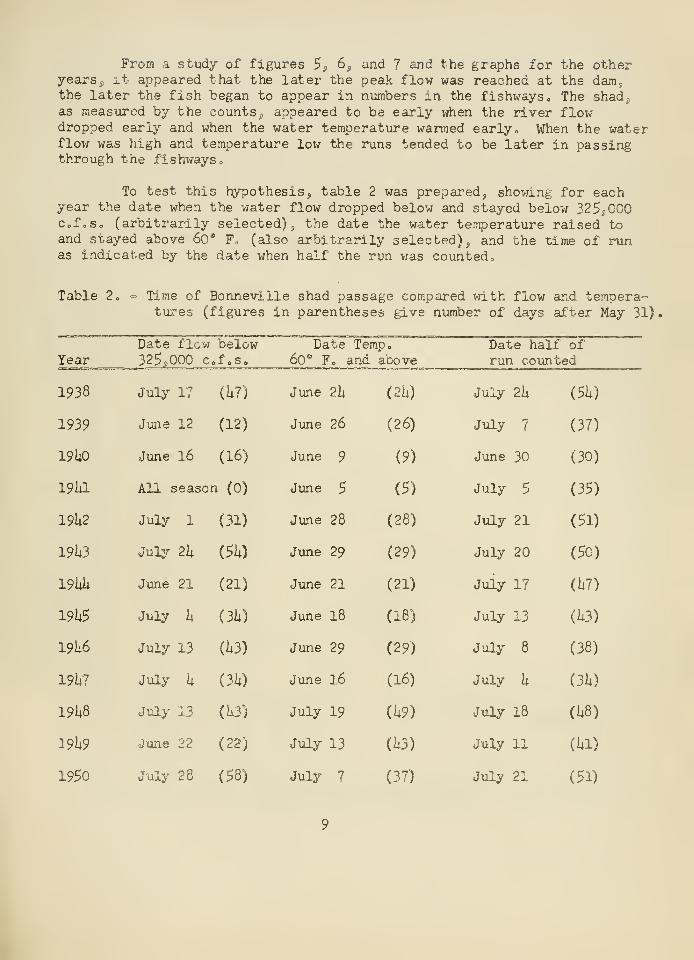
From a study of figures 5;, 6^ and 7 and the graphs for the otheryears^, it appeared that the later the peak flow was reached at the dam,the later the fish began to appear in numbers in the fishwayso The shades
as measured by the counts.^, appeared to be early when the river flowdropped early and when the water temperature warmed earlyo When the xjater
flow was iiigh and temperature low the runs tended to be later in passingthrough the fishwaySo
To test this hypothesis ^ table 2 was prepared, showing for eachyear the date when the water flow dropped below and stayed below 325s, 000cfoSo (arbitrarily selected), the date the water temperature raised toand stayed above 6o* F, (also arbitrarily selected)^ and the time of runas indicated by the date when half the run was counted^
Table 2„ = Time of Borjieville shad passage compared xjith flow and tempera-tures (figures in parentheses give number of days after May 31)
•
Year
2000
"D
CA
E3
1000
River Flow
BONNEVILLE DAM
1940
•oCo(A
60° I«a.E
50°
400
Fig. 5 - Comparison of water temperature, river flow and daily shad count throughfishways at Bonneville Dam, 19li0
2000
oo
(O
E3
1000
BONNEVILLE DAM
1946
Riv«r Flow
Water Ttmperoturt
60" 3oma.
E
so°
600
500 cow3O
400 t
300
200
100
C)
Jun« July Au^
Fig. 6 - Comparison of water ten?)erature, river flow, and daily shad count throughfishways at Bonneville Dam, 19U6
1000Do
"5
6
500
10 20May
BONNEVILLE DAM
950Woter Temperature
10 20June Aug.
Fig. 7,—Comparison of water temperature, river flow, and daily shad count through fishways
at Bonneville Dam, 1950
The effects of river flow and temperature upon the time of run
were evaluated by a multiple-regression analysis using the figures shown
in parentheses in table 2. The following subscripts were used in express-
ing the results; R = time of run, F ::: time of low river flowy and T =time of high temperature o A value of Rr,tF = Oo70 was obtained, which is
significant at the 5-percent level. A value of R^ = OoU9 was obtained,
showing that approximately half of the variation in time of arrival ofrun at Bonneville can be attributed to the variation in flow and tempera-ture (Snedecorj I9I46)
.
A linear-regression analysis showed that there was a sifinifi-
cant correlation at the 5-percent level between flow and time of run,
(""RF = 0.666), The correlation coefficient for temperature and time wasnot quite significant at the 5-percent level (rj^ j _ 0.5U)« Similarly,the correlation coefficient for flow and temperature was not quite signifi-cant at the 5-percent level (rp-j _ 0.5^5) . A value of D.553 for both of
these correlations is necessary for significance at the 5-percent level(Snedecor, I9U6)
,
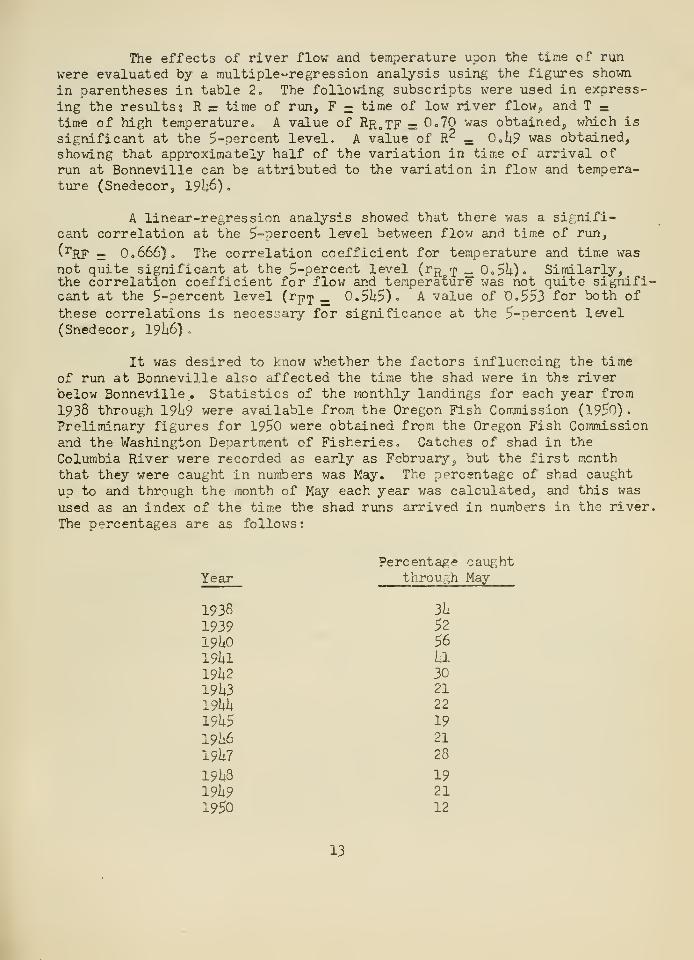
It was desired t-o know whether the factors influencing the timeof run at Bonneville also affected the time the shad were in the riverbelow Bonneville , Statistics of the monthly landings for each year from1938 through 19h9 were available from the Oregon Fish Commission (1950)
.
Preliminary figures for 1950 were obtained from the Oregon Fish Commissionand the Washington Department of Fisheries, Catches of shad in the
Columbia River were recorded as early as February, but the first monththat they were caught in numbers was May. The percentage of shad caught
up to and through the month of May each year was calculated, and this was
used as an index of the time the shad runs arrived in numbers in the river.
The percentages are as follows:
Percentage caughtYear through May
1938 3ii
1939 5219I4O 56
19hl la
19U2 30
19U3 21
19hi; 22
19h5 19
I9U6 21
19U7 28
19h8 19191^9 211950 12
13
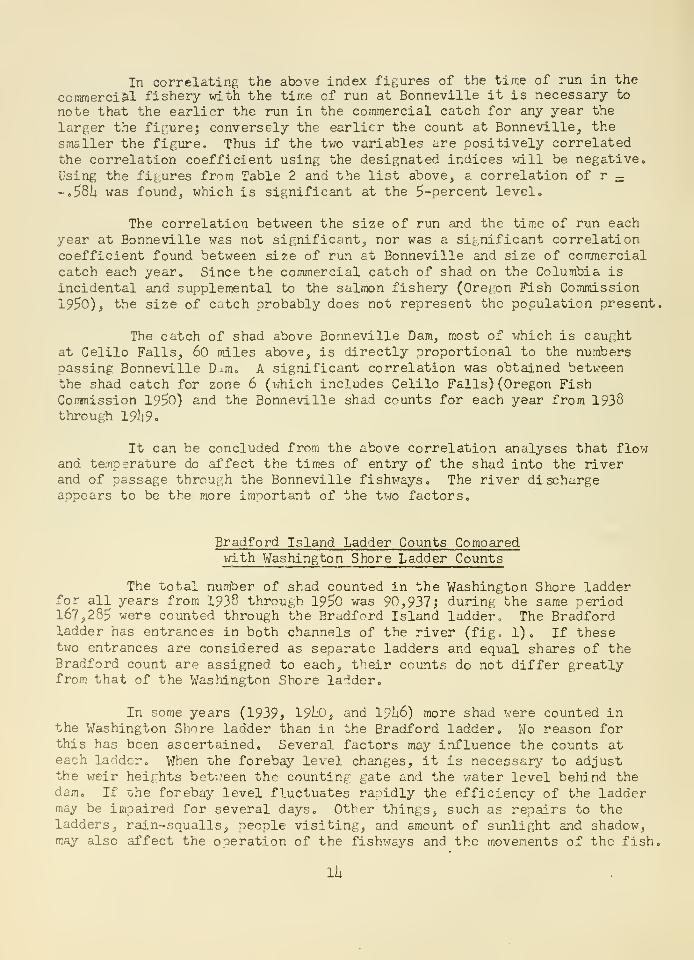
In correlating the above index figures of the time of run in the
commercial fishery idth the time of run at Bonneville it is necessary to
note that the earlier the run in the commercial catch for any year the
larger the fit'ure; conversely the earlier the count at Bonneville, the
smaller the figure. Thus if the two variables are positively correlatedthe correlation coefficient using the designated indices will be negative.
Using the figures from Table 2 and the list above, a correlation of r :::
-,58ii was found, which is significant at the 5-percent level.
The correlation between the size of run and the time of run eachyear at Bonneville was not significant, nor was a significant correlationcoefficient found between size of run at Bonneville and size of commercialcatch each year. Since the commercial catch of shad on the Columbia is
incidental and supplemental to the salmon fishery (Ore[:on Fish Commission
1950), the size of catch probably does not represent the population present.
The catch of shad above Bonneville Dam, most of which is caughtat Celilo Falls, 60 miles above, is directly proportional to the numberspassing Bonneville D-tm. A significant correlation was obtained betweenthe shad catch for zone 6 (iirhich includes Celilo Falls) (Oregon FishConmission 19^0) and the Bonneville shad counts for each year from 1938through 19ii9.
It can be concluded from the above correlation analyses that flowand temperature do affect the times of entry of the shad into the riverand of passage through the Bonneville fishways. The river dischargeappears to be the more important of the two factors,
Bradford Island Ladder Counts Comparedwith Washington Shore Ladder Counts
The total number of shad counted in the Washington Shore ladderfor all years from 1938 through 19^0 was 90,937; during the same period167,285 were counted through the Bradford Island ladder. The Bradfordladder has entrances in both channels of the river (fig. 1). If thesetwo entrances are considered as separate ladders and equal shares of theBradford count are assigned to each, their counts do not differ greatlyfrom that of the Washington Shore ladder.
In some years (1939> 19U0, and I9U6) more shad were counted inthe Washington Shore ladder than in the Bradford ladder. No reason forthis has been ascertained. Several factors may influence the counts ateach ladder. When the forebay level changes, it is necessary to adjustthe weir heights between the counting gate and the water level behind thedam. If the forebay level fluctuates rapidly the efficiency of the laddermay be impaired for several days. Other things, such as repairs to theladders, rain-squalls, people visiting, and amount of sunlight and shadow,may also affect the operation of the fishways and the movements of the fish.
Ih
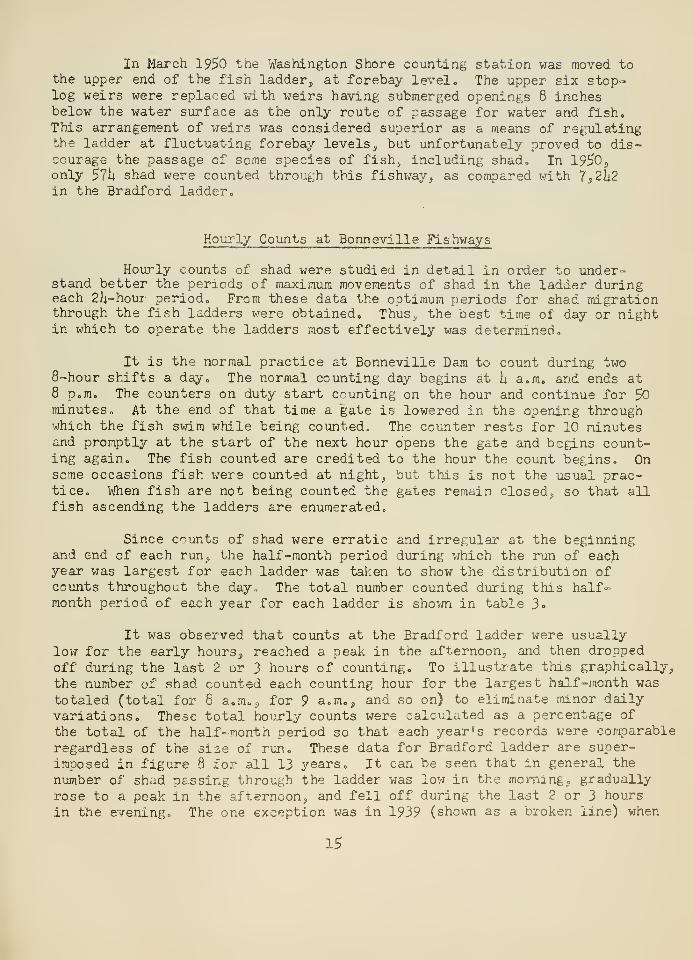
In March 19^0 tne Washington Shore counting station was moved tothe upper end of the fish ladder, at forebay level. The upper six stop-log weirs were replaced with weirs having submerged openings 8 inchesbelow the water surface as the only route of passage for water and fish.This arrangement of weirs was considered superior as a means of regulatingthe ladder at fluctuating forebay levels, but unfortunately proved to dis-courage the passage of some species of fish, including shado In 19^0^only 57i| shad were counted through this fishway, as compared with 7j2li2
in the Bradford ladder
«
Hourly Counts at Bonneville Fishways
Hourly counts of shad were studied in detail in order to under-stand better the periods of maximum movements of shad in the ladder duringeach 2l|.-hour period. From these data the optimum periods for shad migrationthrough the fish ladders were obtained. Thus,, the best time of day or nightin which to operate the ladders most effectively was determined.
It is the normal practice at Bonneville Dam to count during two8-hour shifts a day. The normal counting day begins at h a,m, and ends at8 p,m. The counters on duty start counting on the hour and continue for 50minutes. At the end of that time a gate is lowered in the opening throughwhich the fish swim while being counted^ The counter rests for 10 minutesand promptly at the start of the next hour opens the gate and begins count-ing again. The fish counted are credited to the hour the count begins. Onsome occasions fish were counted at nighty but this is not the usual prac-tice. When fish are not being counted the gates remain closed, so that allfish ascending the ladders are enumerated.
Since counts of shad were erratic and irregular at the beginningand end of each run, the half-month period during which the run of eachyear was largest for each ladder was taken to show the distribution ofcounts throughout the day., The total number counted during this half«month period of each year for each ladder is shown in table 3«
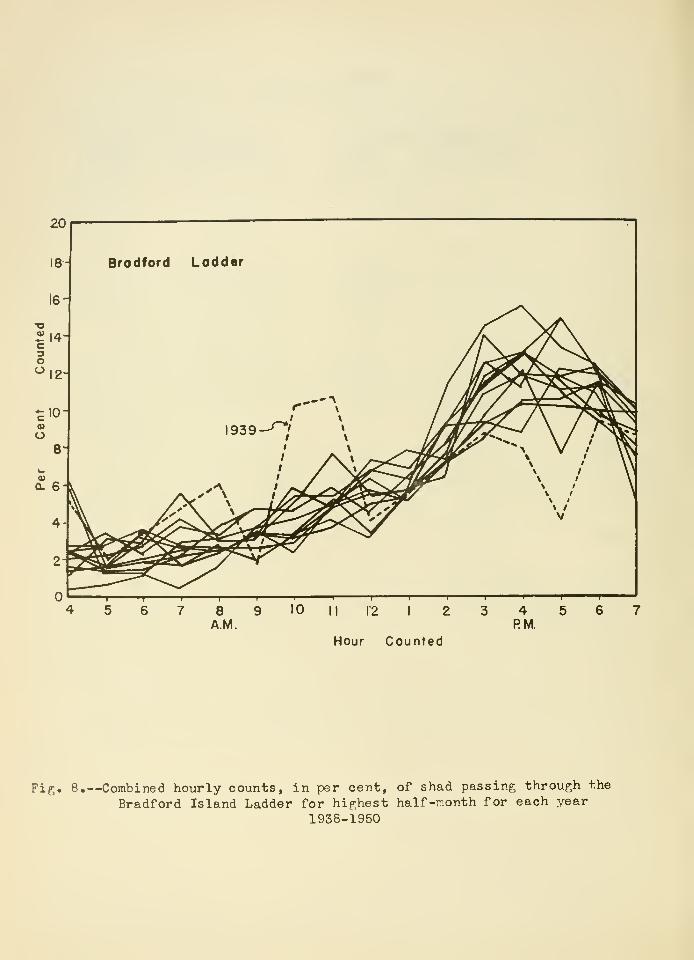
It was observed that counts at the Bradford ladder were usuallylow for the early hours^ reached a peak in the afternoon, and then droppedoff during the last 2 or 3 hours of counting. To illustrate this graphically,
the number of shad counted each counting hour for the largest half-month was
totaled (total for 6 a„m,j for 9 a.m., and so on) to eliminate minor daily
variations o These total hourly counts were calculated as a percentage of
the total of the half-month period so that each year's records were comparable
regardless of the sise of rim. These data for Bradford ladder are super-
imposed in figure 3 for all 13 years. It can be seen that in general the
number of shad passing through the ladder was low in the morning _, graduallyrose to a peak in the afternoon, and fell off during the last 2 or 3 hours
in the evening. The one exception was in 1939 (shown as a broken line) when
15
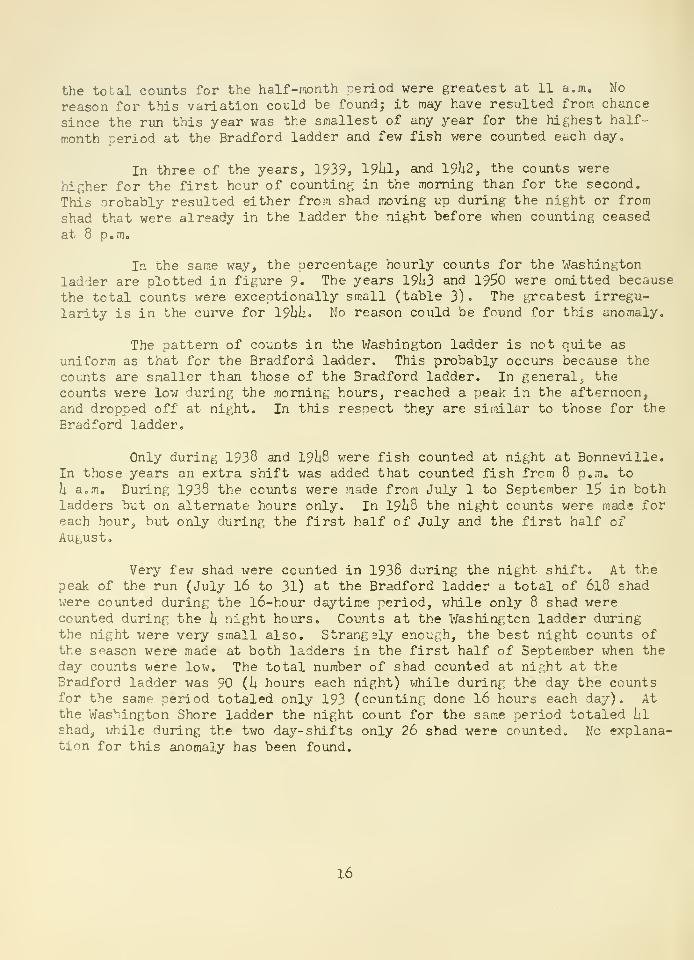
the total counts for the half-month period were greatest at 11 aom. No
reason for this variation could be found; it may have resulted from chance
since the run this year was the smallest of any year for the highest half-
month period at the Bradford ladder and few fish were counted each day.
In three of the years, 1939, 19^1, and 19U2, the counts were
higher for the first hour of counting in the morning than for the second.
This probably resulted either from shad moving up during the night or from
shad that were already in the ladder the night before when counting ceased
at 8 Pom.
In the same way, the percentage hourly counts for the Washingtonladder are plotted in figure 9. The years 19^3 and 19$0 were orrdtted because
the tobal counts were exceptionally small (table 3), The greatest irregu-
larity is in the curve for 19lih, No reason could be found for this anomaly.
The pattern of counts in the Washington ladder is not quite as
uniform as that for the Bradford ladder. This probably occurs because thecoijits are smaller than those of the Bradford ladder. In general, thecounts were low during the morning hours, reached a peak in the afternoon,and dropped off at night. In this resnect they are similar to those for the
Bradford ladder.
Only during 1938 and I9I48 were fish counted at night at Bonneville.In those years an extra shift was added that counted fish from 8 p.m. to
h a.m. During 1938 the counts were made from July 1 to September 15 in bothladders but on alternate hours only. In I9U8 the night counts were mads foreach hour, but only during the first half of July and the first half ofAugust.
Very few shad \-jere counted in 1938 during the night shift. At the
peak of the run (July I6 to 31) at the Bradford ladder a total of 6I8 shadwere counted during the l6-hour daytime period, vjhile only 8 shad werecounted during the h night hours. Counts at the Washington ladder duringthe night were very small also. Strangely enough, the best night counts ofthe season were made at both ladders in the first half of September when theday counts were low. The total number of shad counted at night at theBradford ladder was 90 (It hours each night) while during the day the countsfor the same period totaled only 193 (counting done I6 hours each day). Atthe Washington Shore ladder the night count for the same period totaled Iil
shad, while during the two day-shifts only 26 shad were counted. No explana-tion for this anomaly has been found.
16
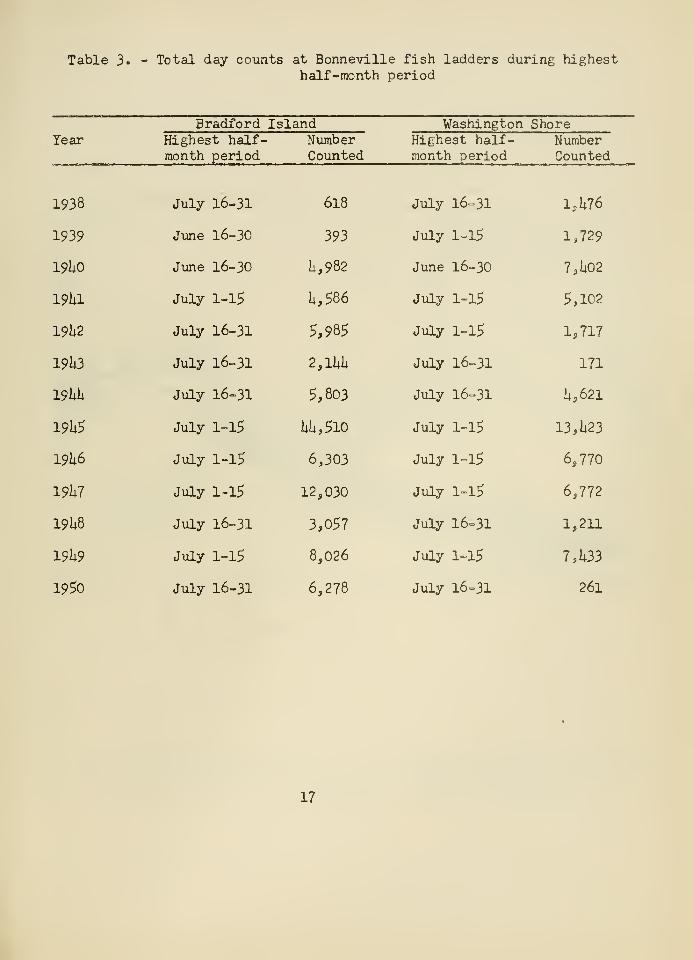
Table 3. - Total day counts at Bonneville fish ladders during highesthalf-month period
Bradford IslandYear
Washington ShoreHighest half-month period
NumberCounted
Highest half-month period
NumberCounted
1938
1939
19iiO
19U1
19h2
19U3
19hh
19h$
19h6
19h7
19U8
19U9
1950
July 16-31
June 16-30
June 16-30
July 1-15
July 16-31
July 16=31
July 16-31
July 1-15
July 1-15
July 1-15
July 16-31
July 1-15
July 16-31
6l8
393
U,982
i;,586
5,985
2,liiii
5,803
W;,5io
6,303
12,030
3,o57
8,026
6,278
July 16-31
July 1-15
June 16-30
July 1-15
July 1-15
July 16=31
July 16-31
July 1=15
July 1-15
July 1-15
July 16-31
July 1-15
July 16-31
1,U76
1,729
7,U02
5,102
1,717
171
li,62l
13,ii23
6,770
6,772
1,211
7,li33
261
17
5-T
7 8AM
10 II 12 I
Hour Counted
T4 5RM.
Fig. 8,—Combined hourly counts, in per cent, of shad passing through the
Bradford Island Ladder for highest half-month for each year
1938-1950

10 II 12 I 2
Hour Counted
Fig. 9.—Combined hourly counts, in percent, of shad passinp, through the
Washinf!;ton Shore Ladder for hif!;hest half-month for each year
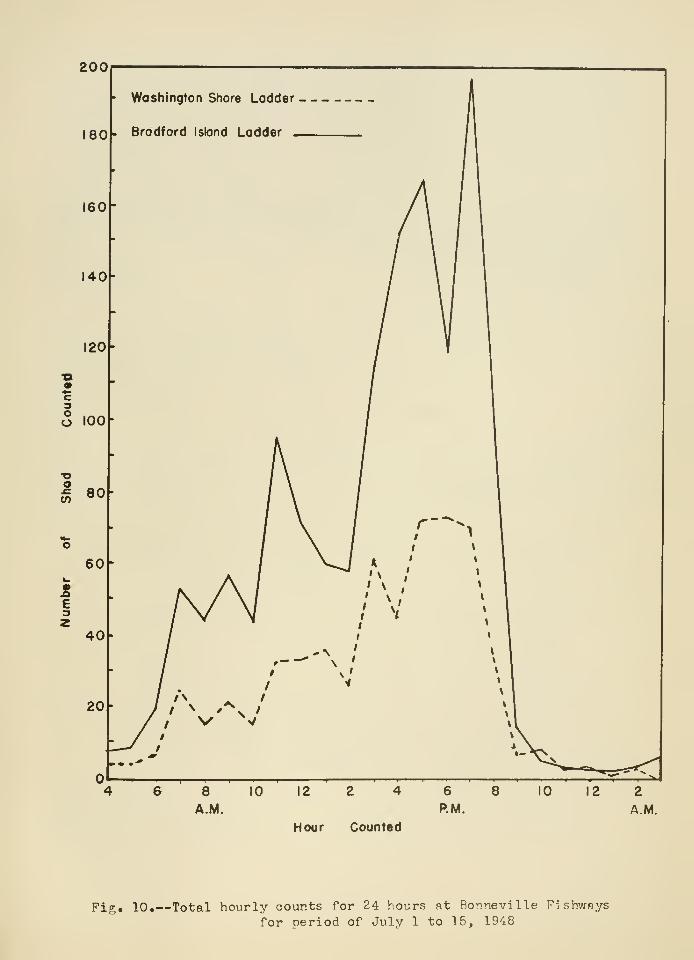
In 19ii8 the shad run through the fishways was about twice as
large as that of 1938, and the night counts were made each hour. This
gives a "better idea of the movement of shad at ni[,ht as compared with
that during the daytime. Figure 10 shows the total counts for each hour
of the day at each ladder for the period July l-l5. The day counts (h a.m.
to 7 p.m.) follow the same pattern as indicated in figures 8 and 9 except
that during this particular period (the first half of July rather than the
last half) the peak counts were later in the afternoon than previously shown.
The largest night counts were made during the hours iromediately
follovdng the day counts, but except for the counts at 8 p.m. they were verys.iall in comparison with the day counts. It would appear from figure 10,
and from figures 8 and 9) that it would be more advantageous so far as shad
are concerned to shift the day counts 1 hour later—that is, start at 5 a.m.
and count until 9 p.m.
Fish Locks
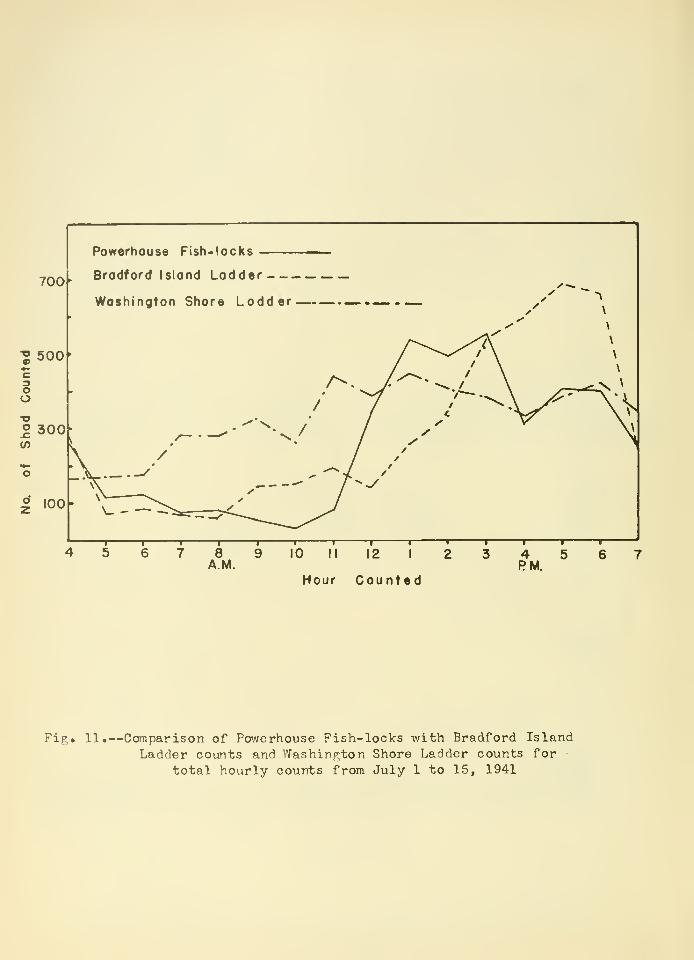
The fish locks have not been used to any extent at Bonneville Dam,
and few shad were assisted by these devices except in I9UI. During that
year an extension of the powerhouse for the addition of four more turbinesinterfered with the powerhouse branch of the Bradford ladder, and the power-house fish locks were used that season to give full opportunity for passageof fish.
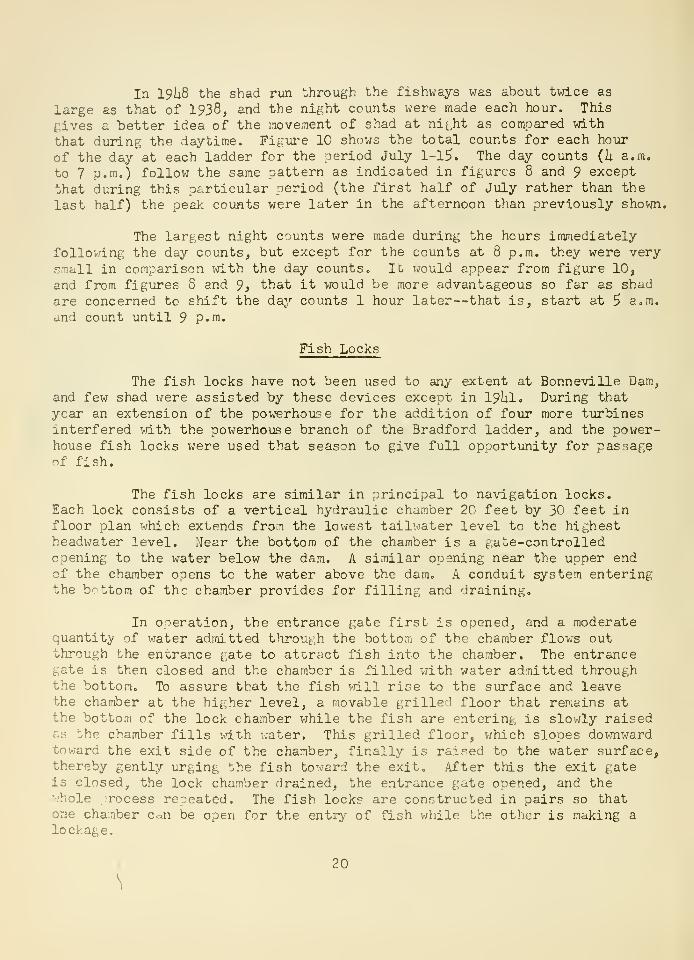
The fish locks are similar in principal to navigation locks.Each lock consists of a vertical hydraulic chamber 20 feet by 30 feet infloor plan which extends from the lowest tailwater level to the highestheadwater level. Near the bottom of the chamber is a gate-controlledopening to the water below the dam. A similar opening near the upper endof the chamber opens to the water above the dam. A conduit system enteringthe bottom of the chamber provides for filling and draining.
In operation, the entrance gate first is opened, and a moderatequantity of water admitted throuji.h the bottom of the chamber flows outthrough the entrance gate to attract fish into the chamber. The entrancegate is then closed and the chamber is filled with water admitted throughthe bottom. To assure that the fish will rise to the surface and leavethe chamber at the higher level, a movable grilled floor that remains atthe bottom of the lock chamber while the fish are entering is slowly raisedas the chamber fills '.irith water. This grilled floor, which slopes dovrnwardtoward the exit side of the chamber, finally is raised to the water surface,thereby gently urging the fish toward the exit. After this the exit gateis closed, the lock chamber drained, the entrance gate opened, and the•.'hole process repeated. The fish locks are constructed in pairs so thatone chamber can be open for the entry of fish while the other is making a
lockage.
20
200
180
160
140
120
6
o 100
oV)
Washington Shore Lodder
. Bradford Islond Ladder .
E
1 I I »^T—^—T^-^^ . 1 11 !
8 10 12 2 4 6
A.M. P.M. A.M.
Hour Counted
Fig. 10.—Total hourly counts for 24 hours at Bonneville Fishways
for period of July 1 to 15, 1948
700
"Ssooh
° 100
Powerhouse Fish-locks
Brodford Island Ladder
Washington Shore Ladder
—
1
1 1 1
—
10 II 12 I
Hour Counted
8A.M.
4 5RM.
Fig. 11 .—Comparison of Powerhouse Fish-locks with Bradford Island
Ladder counts and Washington Shore Ladder counts for •
total hourly counts from July 1 to 15, 1941
In I9UI the powerhouse fish lock was operated throughout thetime of the shad runo The half-month period of highest counts that yearwas the same for all three fish-passing facilities. The counts for eachfishway during this period of highest counts are shown in figure 11. Thetrends of counts for the Bradford ladder and the fish locks arfe similarexcept that the peak counts in the locks occurred 2 or 3 hours earlier thanin the Bradford ladder. If the locks and ladder were assisting the samegroup of fishj as they might well have been^ the difference of -a couple ofhours of peak count might be the time it takes the shad to ascend to thecounting station on the ladder. Those in the locks are lifted immediatelyfrom the lower water level to the higher, elii-ninating the time necessary to
svdm to the higher level. On the Washington Shore, the peak counts wereearlier than in either of the other two facilitiesj as has already beenshown in figure 9, this seems to be a characteristic of the WashingtonShore ladder.
For the whole season, U, 939 shad were assisted over the dam bythe fish locks as compared with 5,806 by the Bradford Island ladder and7,862 by the Washington Shore ladder. It can be seen from this and fromfigure 11 that the powerhouse fish locks apparently were almost as effec-tive as the ladders in assisting shad over the dam^
Mortalities in Fish Ladders
During some years the shad experienced considerable difficultyin ascending the ladders. This occurred, or at least was especiallynoticed, above the counting stations. A statement to this effect isfound in the I9U8 report of fish passage over Bonneville Dam, U. S. Arinj'',
Corps of Engineers, I9U8, which reads:
When the forebay is raised, due to high flood water,
to elevation + 82 feet it is necessary to raise the weirsabove the weir 70 counting station a total of ten feet,
so as to create a gradual rise to the 82 level. Whenthese weirs are raised by addition of stop logs, inimicalhydraulic conditions are created for shad migrationabove the weir 70 counting station. Many shad disliketo, or cannot ascend through this area and consequentlybecome weakened and are then forced at;ainst the picketedfish leads where the water velocity imprisons them untilthey die. Mortalities as high as 1$% and 2Q% have beensustained in past years^ however, in I9U8 the losses were
minor .......
In I9U9 the shad run began after the water had lowered somevjhat
below the maximum of 82.5 feet, and this species apparently negotiatedthe fish ladders vjith ease as stated in the 19ii9 report (19h9, U, S.
Army, Corps of Engineers) 5 " . . . with less rigorous hydraulicconditions in existence above the weir 69 counting station, the shad
were able to ascend with cast to the forebay."
23
Past records of the resident biologist at Bonneville Dam were
examined for notes concerning shad passages, mortalities, or related
data. Remarks concerning mortalities of shad in the fishways were
found for four years. They are as follows:
19hh:
Shad in large nuiabers passed over the dam duringJuly. Considerable difficulty was experienced at Brad-ford Island in getting these fish to continue up the lad-der after passing the counting station. They lay in thepool above. At first only a few fish were lost againstthe barrier, but the losses mounted until several hundreda day were lost. It is conservatively estimated that some300 dead were removed from the barrier during the month.Every possible c^nbi nation of weir adjustment and waterflow was tried to induce the fish to work up the ladder.Finallv, after some difficulty, the best adjustments weremade ±/ ^ and in a few days most of the fish had workedtheir way up the ladder, although a few persisted inremaining above the counting station,
19h^:
The 19h^ shad run was by far the largest ever tooccur at Bonneville. Shad have proved to be a most diffi-cult fish to pass over the fish ladders successfully,particularly above the counting stations. Above eachcounting station there is, under normal conditions, a
pool of more or less quiet water of low velocity. Itis here that the shad like to remain and refuse to moveon up the ladder. Many different adjustments were triedin an effort to induce the fish to move upstream. Itwas found that the most satisfactory flow conditions werea strong, direct surface flow '.jhich forced the fish toswim strongly against it. Not having a resting place,the fish gradually 'moved up the ladder. In the quietwater, the fish would gather in large schools and swimaimlessly back and forth until many of the weaker oneswould fall back against the barrier and die.
1/ The best adjustments referred to in the above paragraph createda strong surface flow.
2h
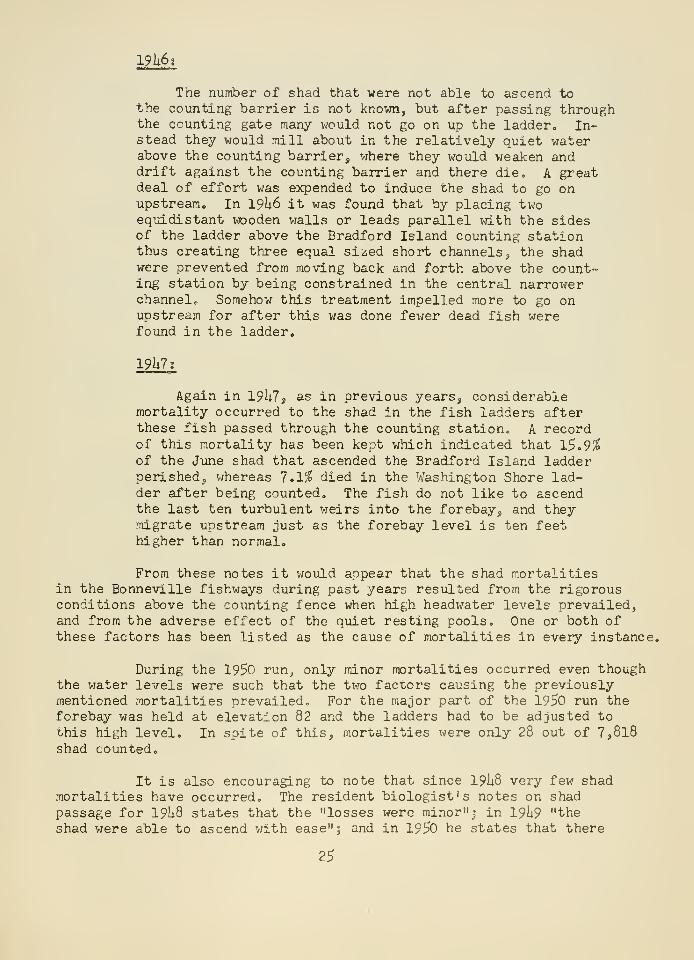
The number of shad that were not able to ascend tothe counting barrier is not known, but after passing throughthe counting gate many would not go on up the ladder. In-stead they would mill about in the relatively quiet waterabove the counting barrier, where they would weaken anddrift against the counting barrier and there die. A greatdeal of effort was expended to induce the shad to go onupstream. In 19U6 it was found that by placing twoequidistant xrooden walls or leads parallel with the sidesof the ladder above the Bradford Island counting stationthus creating three equal sized short channels, the shadwere prevented from moving back and forth above the count-ing station by being constrained in the central narrowerchannel. Somehow this treatment impelled more to go onupstream for after this was done fewer dead fish werefound in the ladder.
19U7
;
Again in 19^7, as in previous years, considerablemortality occurred to the shad in the fish ladders afterthese fish passed through the counting station, A recordof this mortality has been kept which indicated that l5.9^of the June shad that ascended the Bradford Island ladderperished, whereas 7.1^ died in the Washington Shore lad-der after being counted. The fish do not like to ascendthe last ten turbulent weirs into the forebay, and theymigrate upstream just as the forebay level is ten feethigher than normal.
From these notes it would appear that the shad mortalitiesin the Bonneville fishways during past years resulted from the rigorousconditions above the counting fence when high headwater levels prevailed,and from the adverse effect of the quiet resting pools. One or both ofthese factors has been listed as the cause of mortalities in every instance.
During the 1950 run^ only minor mortalities occurred even thoughthe water levels were such that the two factors causing the prei/iously
mentioned mortalities prevailed. For the major part of the 1950 run theforebay was held at elevation 82 and the ladders had to be adjusted to
this high level. In spite of this, mortalities were only 28 out of 7,8l8shad counted.
It is also encouraging to note that since 19U8 very few shadmortalities have occurred. The resident biologist's notes on shadpassage for 19U8 states that the "losses were minor"; in 19U9 "theshad were able to ascend with ease"; and in 1950 he states that there
25
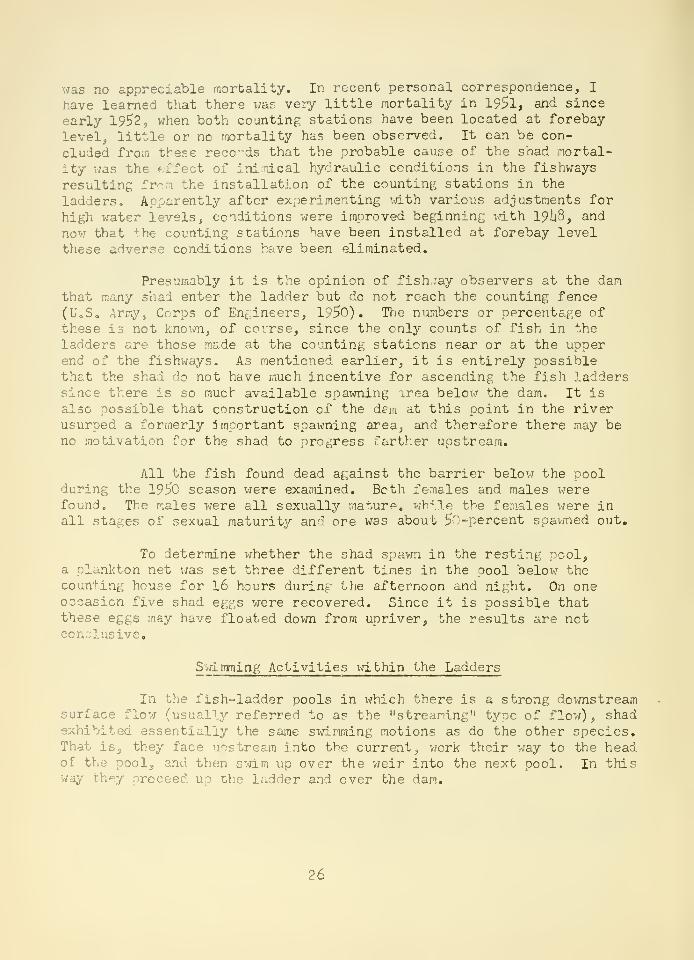
was no appreciable mortality. In recent personal correspondence, I
have learned that there i/as very little mortality in 195l, and since
early 1952, when both counting stations have been located at forebay
level, little or no raortality has been observed. It can be con-
cluded from these reco^-ds that the probable cause of the shad mortal-
ity was the effect of ini.nical hydraulic conditions in the fishways
resulting from the installation of the counting stations in the
ladders. Apparently after experimenting with various adjustments forhigh water levels, conditions were improved beginning with 19h3, and
now that the counting stations have been installed at forebay levelthese adverse conditions have been eliminated.
Presumably it is the opinion of fish.;ay observers at the damthat many shad enter the ladder but do not reach the counting fence(U.S. Army, Corps of Enf;ineers, 19^0) , Itie numbers or percentage ofthese is not knovm, of coirse, since the only counts of fish in the
ladders are those made at the counting stations near or at the upperend of the fishways. As mentioned earlier, it is entirely possiblethat the shad do not have much incentive for ascending the fish ladderssince there is so mucl" available spawning area below the dam. It isalso possible that construction of the dcm at this point in the riverusurped a formerly important spawning area, and thersfore there may beno motivation for the shad to progress farther upstream.
All the fish found dead against the barrier below the poolduring the 19I?C season were examined. Beth females and males werefound. The males irere all sexually maturf^, while the females were inall stages of sexual maturity aw^ ore was about 5o-percent spawned out.
To determine whether the shad spavm in the resting pool,a plankton net was set three different times in the pool beloX'J thecounting house for l6 hours during:- the afternoon and night. On oneoccasion five shad eggs were recovered. Since it is possible thatthese eggs may have floated down from upriver, the results are notconclusive,
Swinming Activities within the Ladders
In the fish-ladder pools in which there is a strong downstreamsurface flow (usually referred to as the "streaming" type of flow), shadexhibited essentially the same swimming motions as do the other species.That is, they face upstream into the current^ work their way to the headof the pool, and then swim up over the weir into the next pool. In thisway the;/ proceed up the ladder and over the dam.
26
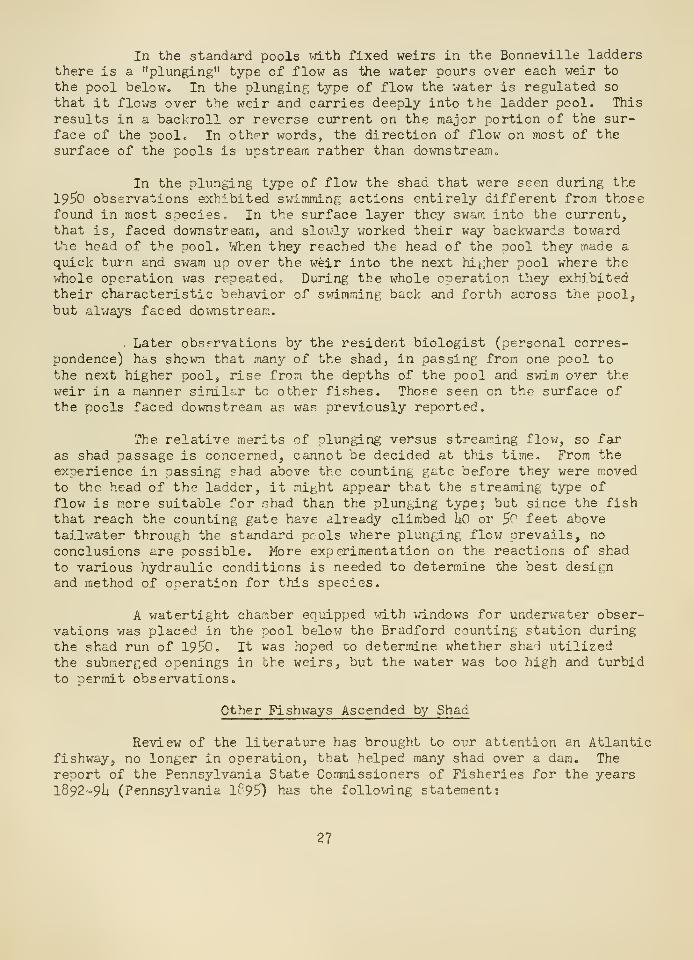
In the standard pools id.th fixed weirs in the Bonneville laddersthere is a "plunging" type of flow as the water pours over each weir to
the pool below. In the plunging type of flow the water is regulated so
that it flows over the weir and carries deeply into the ladder pool. This
results in a backroll or reverse current on the major portion of the sur-face of the poolo In other words, the direction of flow on most of thesurface of the pools is upstream rather than downstream.
In the plunging type of flow the shad that were seen during the
19^0 observations exhibited swimming actions entirely different from thosefound in most species. In the surface layer they swam into the current,that is, faced downstream, and slowly worked their way backwards towardthe head of the pool. When they reached the head of the pool they made a
quick turn and swam up over the weir into the next higher pool where thewhole operation was repeated,. During the whole operation they exhibitedtheir characteristic behavior of swimming back and forth across the pool,but always faced downstream.
Later observations by the resident biologist (personal corres-pondence) has shown that many of the shad, in passing from one pool tothe next higher pool, rise from the depths of the pool and swim over the
weir in a manner similar to other fishes. Those seen on the surface ofthe pools faced downstream as was previously reported.
The relative merits of plunging versus streaming flow, so faras shad passage is concerned, cannot be decided at this time. From theexperience in passing shad above the counting gate before they were movedto the head of the ladder, it might appear that the streaming type of
flow is m.ore suitable for .shad than the plunging type; but since the fishthat reach the counting gate have already climbed UO or 5o feet abovetailwater through the standard pools where plunging flow prevails, noconclusions are possible. More experimentation on the reactions of shad
to various hydraulic conditions is needed to determine the best designand method of operation for this species.
A watertight chamber equipped ;d.th ;d.ndows for underwater obser-vations was placed in the pool below the Bradford counting station during
the shad run of 1950. It was hoped to determine whether shad utilizedthe submerged openings in the weirs, but the water was too high and turbidto permit observations.
Other Fishways Ascended by Shad
Review of the literature has brought to our attention an Atlanticfishway, no longer in operation, that helped many shad over a dam. Thereport of the Pennsylvania State Commissioners of Fisheries for the yearsl892-9h (Pennsylvania If 95) has the follomng statement:
27
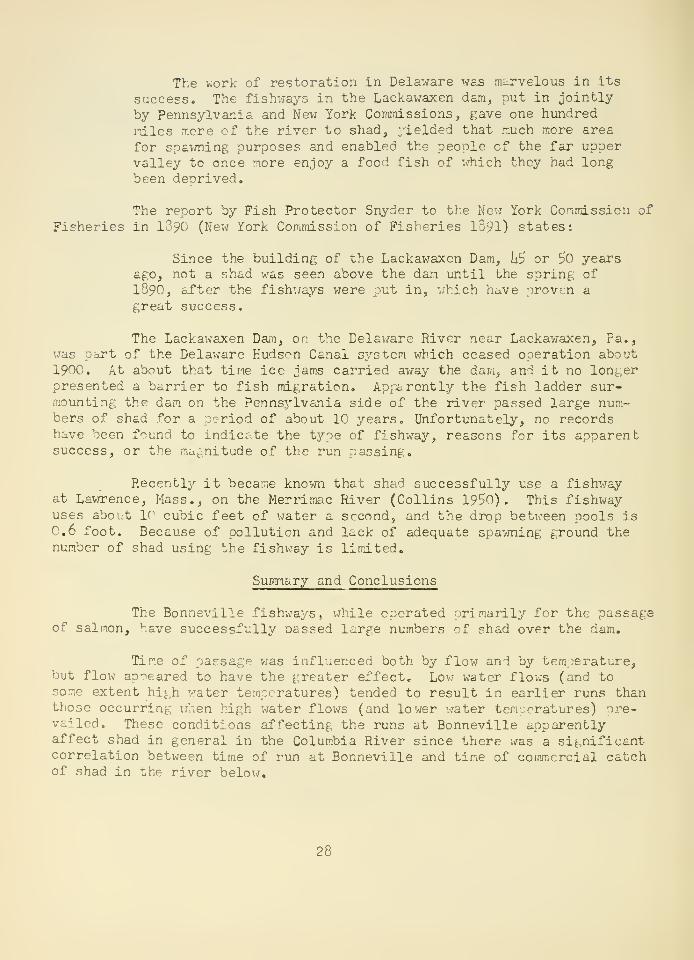
The work of restoration in Delaware was miJ?velous in its
success. The fishuays in the Lackawaxen dam, put in jointly
by Pennsylvania and New York Corriniissions, gave one hundred
ifiiles more of the river to shad, .jdelded that much more area
for spawning purposes and enabled the people of the far uppervalley to once more enjoy a food fish of which they had longbeen deprived.
The report by Fish Protector Snyder to the Nevr York Commission of
Fisheries in l39C (New York Commission of Fisheries 1391) states:
Since the building of the Lackawaxen Dam, hi or 50 yearsago, not a shad was seen above the dam imtil the spring of
1890, after the fishuays were put in, vhich have nrovcn a
great success.
The Lackawaxen Dam, on the Delaware River near Lackawaxen, Pa.,was part of the Delaware Hudson Canal system which ceased operation about1900. At about that tine ice jams carried away the dam, and it no longerpresented a barrier to fish migration. Appiirently the fish ladder sur-mounting the dam on the Pennsylvania side of the river passed large num-bers of shad for a period of about 10 years. Unfortunately, no recordshave been found to indict..te the tj^pe of fishway, reasons for its apparentsuccess, or the magnitude of the run passing.
Recently it beca.r.e known that shad successfully use a fishwayat Lawrence, Mass., on the Merrirnac River (Collins 195o) . This fishwayuses about ic' cubic feet of vjater a second, and the drop between pools isC,6 foot. Because of pollution and lack of adequate spawning ground thenumber of shad using the fishvjay is limited.
Summary and Conclusions
The Bonneville fishways, \jhile operated primaril:/ for the passageof salmon, have successfully oassed large numbers of shad over the dam.
Time of passage was influenced both by flow and by temperature,but flow appeared to have the greater effect. Low water flows (and tosome extent high water temperatures) tended to result in earlier runs thanthose occurring x-/hen high water flows (and lower water ten.eratures) nre-vailed. These conditions affecting the runs at Bonneville apparentlyaffect shad in general in the Columbia River since there was a significantcorrelation between time of run at Bonneville and time of commercial catchof shad in the river below.
28
A study of the time of daily migration through the fish laddersillustrated that peak migrations occur during the day—usually in the
afternconso From o\ar analysis of the data it would appear that counts 1
hour later than those regularly made at Bonneville would be more usefulfor recording passage of shad.
The fish locks^ though not regularly operated, appear to be aseffective as the ladders in passing shad.
Some mortality occurred in the fish ladders and appeared to becaused by a reluctance on the part of the shad to leave the quiet restingpools above the counting station at high forebay levels. This can bealleviated by proper adjustment of weirs and water flow in the upperpools J and has been eliminated entirely by moving the counting stationsto forebay levels.
In view of the success of the Bonneville fishways, it is proba-ble that inaccessibility of the entrance or lack of attractive currentswas responsible for the lack of success in passing shad in many of theearly fishways. These two factors have been listed by Mugnier andSwartz i' as the probable reason for failure of the two previous fishwaysconstructed at Holyoke Dam, Massachusetts. As mentioned in their report,present plans for the new fish-passage facilities at Holyoke Dam includean experimental phase to determine methods of inducing shad to enterfish-passing devices.
The success in passing shad over dams at Bonneville, Lackawaxen,and L3.wrence demonstrates that shad can be induced to use fishways as
readily as do salmon. The difficulties inherent in the problem areprobably no grteater than similar ones already overcome for the salmonoidfishes.
LITERATURE CITED
COLLINS, GERALD B<
1951. A fishway that shad ascend. U. S, Fish and Wildlife Ser-vice. Spscial scientific report: Fisheries No. 65.
NEW YORK (STATE) COMMISSION OF FISHERIES.
1891. 19th report . . , for the year 189O,
V Mugnier, Alston D., and Albert H. Swartz. 1951. Report of the investi-gations for and tentative design of the fishway at Holyoke, Massachusetts.Manuscript,
29
OREGON FISH COMMISSION.
19l|8. Shad caught at Celilo Falls on the Columbia River. Researchbriefs 1(2) August 19h8.
1951. Fisheries statistics of Oregon. Contribution No. I6.
PENNSYLVANIA FISH COMMISSION.
1895. Report ... for the years l392-l893-l89U.
SNEDECOR, GEORGE W.
I9U6. Statistical methods. l|th ed. Iowa State College Press,Ames, Iowa.
U. S. ARMY, CORPS OF ENGINEERS.
I9U7. Power, navl^,ation and fish facilities on the Columbia Riverat Bonneville Dam, Bonneville, Oregon and Washington.
19^3. Annual report. Office of the District Engineer, Portland,Oregon. Passage of fish over Bonneville Dam, ColumbiaRiver, Oregon and Washington.
19U9. Annual report. Office of the District Engineer, Portland,Oregon. Passage of fish over Bonneville Dam, ColumbiaRiver, Oregon and Washington.
19^0. Annual report, Office of the District Engineer, Portland,Oregon. Passage of fish over Bonneville D-tm, ColumbiaRiver, Oregon and Washington.
30
37619

MBLWHpl.Lib;an^- serials
11 li
5 WHSE 01076iiiiH