Participation in the National School Lunch Program Recovers over Time Following an Initial Decline...
7
Participation in the National School Lunch Program and food security: An analysis of transitions into kindergarten ☆ Irma Arteaga, Colleen Heflin ⁎ Truman school of Public Affairs, University of Missouri, United States abstract article info Article history: Received 4 June 2014 Received in revised form 16 September 2014 Accepted 18 September 2014 Available online 28 September 2014 Keywords: Food insecurity National school lunch program Kindergarten We use variation in state kindergarten eligibility dates to explore the protective effects of NSLP participation on household food security by focusing on the research question: What is the impact of the NSLP on household food insecurity among households with a kindergarten-aged child in the Early Childhood Longitudinal Study — Birth cohort (ECLS-B)? Our modeling approach provides consistent support for the contention that the NLSP reduces food insecurity. Additionally, we find that paying full price for school lunch is associated with increases in food insecurity among our low-income sample. Sensitivity analysis demonstrates that controlling for the reduction in child care hours among low-income households does not diminish the size of the NSLP effect. Additionally, school entry is not associated with reductions in food insecurity among families whose incomes are above 185% of the federal poverty line. Finally, our findings are robust to excluding twins. This finding is consistent with a growing literature documenting the benefits of school lunch programs but is unique for the focus on the period of school entry, at time when behavioral and cognitive patterns of school outcomes are being established for the future. © 2014 Elsevier Ltd. All rights reserved. 1. Introduction The impact of food insecurity on children's development is well doc- umented. From a developmental perspective, it is believed that food in- security has cumulative effects at different stages of development beginning in the prenatal period (Bhattacharya, Currie, & Haider, 2004; Cook & Frank, 2008; Duncan, Brooks-Gunn, & Klebanov, 1994; Morgane, Austin-LaFrance, Bronzino, et al., 1993; Pollit, 1994; Scholl & Johnson, 2000). During infancy, hunger has negative effects during the period of neurodevelopment. Controlled experiments with animals sug- gest that hunger results in irreversible damage to brain development such as that associated with the insulation of neural fibers (Yaqub, 2002). The damage associated with a lack of nutritional intake accumu- lated during the first 2 years of life include susceptibility to infections, slowed cognitive development, slow growth, susceptibility to chronic diseases, girls are at higher risk of having low-birth weight babies, and other non-health related problems such as reduced school performance, increased school dropouts and reduced productivity during adulthood (Hoddinott, Beherman, Maluccio, Flores, & Martorell, 2008). During schooling years, food insecurity is associated with poor school performance and academic achievement (Roustit, Hamelin, Grillo, Martin, & Chauvin, 2010; Maluccio et al., 2006; Cook & Frank, 2008). Neurologists and psychologists suggest that the impact of food insecurity on learning can be attributed to two mechanisms. First, there is a direct effect on cerebral functioning, which defines child's cognitive abilities. Second, there is an indirect effect on physi- cal and psychological health that contributes to distraction, absentee- ism and low motivational abilities for learning. Thus, the evidence indicates that the effects of nutritional inadequacy persist across childhood but that the causal mechanisms may vary at different pe- riods of biological, cognitive and social development. We examine the change in household food security as children enter kindergarten and are able to access the National School Lunch Program (NSLP). While others have examined the effect of NLSP on children's nu- tritional outcomes, (Bartfeld & Dunifon, 2006; Frisvold, 2013; Gundersen, Kreider, & Pepper, 2012), our paper is unique for its focus on the transition to kindergarten, a time period that is especially impor- tant for future school success. Specifically, we exploit variation in NLSP participation directly related to the age of children and state of resi- dence. In order to access the NSLP program, children must be enrolled in formal kindergarten programs (i.e. not Headstart or other forms of child care), usually as part of an elementary school system. Kindergar- ten enrollment in largely based on turning age 5 by a cut-off point, which varies by state from August 1 in Missouri to January 1 in Connect- icut (National Center for Education Statistics, US Department of Educa- tion, 2013). Children and Youth Services Review 47 (2014) 224–230 ☆ We gratefully acknowledge funding received from the Southern Rural Development Center at Mississippi State University through the RIDGE program at USDA. Daniella Bolaños provided excellent research assistance. Errors remain the responsibility of the au- thors alone. ⁎ Corresponding author. 229 Middlebush Hall, Truman School of Public Affairs, University of Missouri, Columbia, MO 65211, United States. http://dx.doi.org/10.1016/j.childyouth.2014.09.014 0190-7409/© 2014 Elsevier Ltd. All rights reserved. Contents lists available at ScienceDirect Children and Youth Services Review journal homepage: www.elsevier.com/locate/childyouth
-
Upload
independent -
Category
Documents
-
view
0 -
download
0
Transcript of Participation in the National School Lunch Program Recovers over Time Following an Initial Decline...

Children and Youth Services Review 47 (2014) 224–230
Contents lists available at ScienceDirect
Children and Youth Services Review
j ourna l homepage: www.e lsev ie r .com/ locate /ch i ldyouth
Participation in the National School Lunch Program and food security: Ananalysis of transitions into kindergarten☆
Irma Arteaga, Colleen Heflin ⁎Truman school of Public Affairs, University of Missouri, United States
☆ We gratefully acknowledge funding received from thCenter at Mississippi State University through the RIDGBolaños provided excellent research assistance. Errors remthors alone.⁎ Corresponding author. 229 Middlebush Hall, Tru
University of Missouri, Columbia, MO 65211, United State
http://dx.doi.org/10.1016/j.childyouth.2014.09.0140190-7409/© 2014 Elsevier Ltd. All rights reserved.
a b s t r a c t
a r t i c l e i n f oArticle history:Received 4 June 2014Received in revised form 16 September 2014Accepted 18 September 2014Available online 28 September 2014
Keywords:Food insecurityNational school lunch programKindergarten
We use variation in state kindergarten eligibility dates to explore the protective effects of NSLP participation onhousehold food security by focusing on the research question:What is the impact of the NSLP on household foodinsecurity among households with a kindergarten-aged child in the Early Childhood Longitudinal Study — Birthcohort (ECLS-B)? Our modeling approach provides consistent support for the contention that the NLSP reducesfood insecurity. Additionally, we find that paying full price for school lunch is associated with increases in foodinsecurity among our low-income sample. Sensitivity analysis demonstrates that controlling for the reductionin child care hours among low-income households does not diminish the size of the NSLP effect. Additionally,school entry is not associated with reductions in food insecurity among families whose incomes are above185% of the federal poverty line. Finally, our findings are robust to excluding twins. This finding is consistentwith a growing literature documenting the benefits of school lunch programs but is unique for the focus onthe period of school entry, at time when behavioral and cognitive patterns of school outcomes are beingestablished for the future.
© 2014 Elsevier Ltd. All rights reserved.
1. Introduction
The impact of food insecurity on children's development is well doc-umented. From a developmental perspective, it is believed that food in-security has cumulative effects at different stages of developmentbeginning in the prenatal period (Bhattacharya, Currie, & Haider,2004; Cook & Frank, 2008; Duncan, Brooks-Gunn, & Klebanov, 1994;Morgane, Austin-LaFrance, Bronzino, et al., 1993; Pollit, 1994; Scholl &Johnson, 2000). During infancy, hunger has negative effects during theperiod of neurodevelopment. Controlled experimentswith animals sug-gest that hunger results in irreversible damage to brain developmentsuch as that associated with the insulation of neural fibers (Yaqub,2002). The damage associated with a lack of nutritional intake accumu-lated during the first 2 years of life include susceptibility to infections,slowed cognitive development, slow growth, susceptibility to chronicdiseases, girls are at higher risk of having low-birth weight babies, andother non-health related problems such as reduced school performance,increased school dropouts and reduced productivity during adulthood(Hoddinott, Beherman, Maluccio, Flores, & Martorell, 2008).
e Southern Rural DevelopmentE program at USDA. Daniellaain the responsibility of the au-
man School of Public Affairs,s.
During schooling years, food insecurity is associated with poorschool performance and academic achievement (Roustit, Hamelin,Grillo, Martin, & Chauvin, 2010; Maluccio et al., 2006; Cook & Frank,2008). Neurologists and psychologists suggest that the impact offood insecurity on learning can be attributed to two mechanisms.First, there is a direct effect on cerebral functioning, which defineschild's cognitive abilities. Second, there is an indirect effect on physi-cal and psychological health that contributes to distraction, absentee-ism and low motivational abilities for learning. Thus, the evidenceindicates that the effects of nutritional inadequacy persist acrosschildhood but that the causal mechanisms may vary at different pe-riods of biological, cognitive and social development.
We examine the change in household food security as children enterkindergarten and are able to access the National School Lunch Program(NSLP).While others have examined the effect of NLSP on children's nu-tritional outcomes, (Bartfeld & Dunifon, 2006; Frisvold, 2013;Gundersen, Kreider, & Pepper, 2012), our paper is unique for its focuson the transition to kindergarten, a time period that is especially impor-tant for future school success. Specifically, we exploit variation in NLSPparticipation directly related to the age of children and state of resi-dence. In order to access the NSLP program, children must be enrolledin formal kindergarten programs (i.e. not Headstart or other forms ofchild care), usually as part of an elementary school system. Kindergar-ten enrollment in largely based on turning age 5 by a cut-off point,which varies by state fromAugust 1 inMissouri to January 1 in Connect-icut (National Center for Education Statistics, US Department of Educa-tion, 2013).
225I. Arteaga, C. Heflin / Children and Youth Services Review 47 (2014) 224–230
In this paper, we use this variation in state eligibility rules to explorethe protective effects of NSLP participation on household food securityby focusing on the research question: What is the impact of the NSLPon household food insecurity among households with a kindergarten-aged child? We use data from the Early Childhood Longitudinal Study —
Birth cohort (ECLS-B) with state kindergarten enrollment policies as aninstrument for participation in the NLSP. We begin by summarizingprior research on food and nutrition programs available to childrenaround the time of kindergarten entry. Then we explain our modelingstrategy and our use of the variation in kindergarten enrollment policiesto address known selection problems with participation in school lunchprograms. Results with sensitivity analyses follow. Our findings suggestthat participation in the NLSP among kindergartners is associated with asignificant reduction in the probability of being food insecure. This findingis consistentwith a growing literature documenting the benefits of schoollunch programs but is unique for the focus on the period of school entry,at a time when behavioral and cognitive patterns of school outcomes arebeing established for the future.
1.1. Literature review
The federal food and nutritional safety net designed to address theserious issue of childhood food insecurity is currently a patchwork. Pro-gram services may be delivered in the form of vouchers, (near) cashsupplements, or directly as food. Services may be available to specificmembers of the household only or to the entire household. In additionto household income eligibility, children's eligibility for a specific pro-gram may depend upon their age and the income level of others intheir day-care or school. The result of this hodge-podge of food and nu-tritional programs is that different households with similar incomelevels and number of children, may be receiving substantially differentbundles of food assistance. The Supplemental Nutrition Assistance Pro-gram(SNAP) is the sole program that provides consistent nutritional as-sistance across the life course.
While variationmay occur across the entire childhood period, there isa significant transition in the types of food and nutrition programs forwhich children qualify as children reach age five and become age eligibleto enter kindergarten. Before age five, children are age eligible for WICand may receive nutritional assistance through child care programssuch as the Child and Adult Care Food Program (CACFP). After age five,children are no longer eligible for WIC and are much less likely to havecontact with a child care center that participates in CACFP. Preliminaryanalyses by the Heflin, Arteaga, and Gable (2012) using the Early Child-hood Longitudinal Study—Birth Cohort and similar methods to thoseused here suggest that household food insecurity increases by 7–13%when children reach month 61 and age out of eligibility for theWIC pro-gram. We seek to explore whether transitions into kindergarten and ac-cess to the National School Lunch, the main sources of nutritionalsupplementation for school-aged children, reduce food insecurity.
The NSLP is administered at the school level, with upwards of 97% ofpublic schools participating in the NSLP. Participation in the NSLP hastraditionally been limited to those who qualify based on categorical el-igibility or income eligibility. Children can be categorical eligible for theNSLP based on their household participation in other federal means-tested programs, such as SNAP or TANF. Income eligibility is establishedby demonstrating that gross household income is below 130% of thefederal poverty line for freemeals, or between 130 and 185% of the pov-erty line for reducedmeals. Beginning in 2012, schools with at least 40%of their students qualifying for freemeals based on categorical eligibilitycan qualify for community eligibility inwhichmeals are provided free toall children. Community eligibility is currently being phased in and wasnot an option during the time period of this study (Food and NutritionService, 2011). The NSLP also provides snacks to children during after-school programs. However, additional variation in the value of the nu-tritional benefit occurs through the school schedule (number of instruc-tion days; traditional calendar with summers off versus year-round
with a month off every 3 months) and the availability of the SummerFood Service Program, which serves meals during “vacation” months.In fiscal year 2011, over 31 million students received a free orreduced-price lunch daily. According to Dahl and Scholz (2011), partic-ipation rates among eligible children are 75% for the NSLP.
While theNSLP provides a stable source of food for children enrolledin school, the extent to which the NSLP is directly supportive of house-hold food security is unclear. NSLP participation is high among the pop-ulation at risk of food security: Two-thirds of households with foodinsecurity among children report participation in the free or reduced-price school lunchprogram in the last 30days (Nord, 2009). It is unclear,however, what the nature of the relationship is between the NLSP andfood insecurity. As has been foundwith other food assistance programs,it is likely that thosewho are food insecure aremore likely to participatein the NSLP and that analysis of the relationship is hampered by thenon-random process of NSLP program participation. Themost commonapproach has been to use a two-stage estimator that relies upon instru-ments (Gao, Ishdorj, & Higgins, 2012; Gundersen & Oliveira, 2001;Jensen, 2002; Kabbani & Kmeid, 2005;Mykerezi &Mills, 2010) althoughnew evidence is emerging using regression discontinuity (Frisvold,2013; Heflin et al., 2012).
While most studies of program participation focus on the food stampprogram (now known as SNAP), there are three studies that have tried toestimate causal effects of NSLP participation on food insecurity. Kabbaniand Kmeid (2005) use CPS data from April 1995, 1997, 1999 and 2001and find that participation in the NSLP was associated with lower oddsof food insecurity for households with school-age children. In contrast,Gao et al. (2012) examine the relationship between NSLP participationand food insecurity using the third School Nutrition Dietary Assessmentstudy (SNDA-III) sponsored by the Food and Nutrition Service (FNS) ofUSDA. Mathematica Policy Research, Inc. collected data from 287 schoolsin 94 districts from 2314 students over the 2004–2005 school year to ac-cess the dietary quality of school mean programs. Gao et al. (2012) em-ploy an instrumental variable approach, using if the child has enoughtime to eat their school lunch as an identifying instrument, to predict par-ticipation in the NSLP. Their models suggest that there is no relationshipbetween NSLP participation and children's food insecurity. On the otherhand, Gundersen et al. (2012) use data from NHANES for the period2001 to 2004 to study the impact of NSLP on child outcomes. Under aset of assumptions, they found that NSLP reduces food insecurity by atleast 6% using a non-parametric approach, bounding methods, and alarge age range of children—thosewho are between6 and17 years of age.
The lack of clear evidence regarding the efficacy of the NSLP on foodinsecurity is somewhat surprising given the recent evidence that schoolfood programs are effective at improving child outcomes. AlthoughDunifon and Kowaleski-Jones reported in 2003 that participation inthe NSLP do not indicate positive results for child outcomes, Bartfeldand Dunifon (2006), Gundersen et al. (2012), and Frisvold (2013) allfind positive effects of school food programs on child outcomes, suchas obesity, child's health, math scores, and reading scores.
1.2. Data
In order to estimate the effect of participation in the National SchoolLunch Program (NSLP) on food insecurity, we use the Early ChildhoodLongitudinal Survey, Birth Cohort (ECLS-B). We focus our analysis onhouseholds with children who are eligible to receive free or reducedlunch, those who live in households with income levels at or below185% of the federal poverty line.
1.3. Early childhood longitudinal study, birth-cohort
The Early Childhood Longitudinal Study, Birth Cohort (ECLS-B) isconducted by the National Center for Education Statistics (NCES) to ex-amine the development, health and learning environment of a single co-hort of US children who were born in 2001. It utilizes a multi-reporter,
226 I. Arteaga, C. Heflin / Children and Youth Services Review 47 (2014) 224–230
multi-method design to gather extensive information about children'shome, parenting practices and behavior, as well as educational experi-ences. The ECLS-B collects data for 10,700 children and was designedto contain a nationally representative sample of ethnically and socio-economically diverse families followed in four waves: 9 months,24 months, 48 months and at kindergarten entrance. This last wave ofdata was collected at two different points in time: 7000 childrenattended kindergarten in 2006 and 3700 children attended kindergar-ten (or went directly to grade 1 without going to kindergarten) in2007. One of the main advantages of the Early Childhood LongitudinalStudy Birth—Cohort is that it contains information on the exact datewhen the child was born and when the child was interviewed.Restricting the sample to children living in households with incomesat or below 185% of the federal poverty level yields a sample size of3850 children.1
1.4. State kindergarten entrance age cut-offs
In order to access the NSLP, children must be enrolled in kindergar-ten. Kindergarten enrollment in largely based on age eligibility, whichvaries by state. For example, in order to begin their kindergarten year,Alaska requires children to reach age 5 on or before August 15 whileConnecticut requires children to reach age 5 on or before January 1. Cal-ifornia is currently phasing in an earlier age cut-off,moving the deadlinefrom age 5 by December 2 in 2011 to age 5 by September 1 in 2014.Eight states have cut-off dates in August, 28 in September, 3 in October,1 in November, 2 in December and just 1 in January. Additionally, eightstates allow Local Education Agencies to decide the kindergarten en-trance age (National Center for Education Statistics, US Department ofEducation, 2013).
2. Methods
We are interested in studying the average effect of the NSLP amongeligible households. As children become age eligible for kindergartenenrollment, how does access to the NSLP program influence householdfood insecurity? To examine this question,we need to identify the coun-terfactual—what would have happened to NSLP participants if they hadnot participated in the program upon school entry. Because children ei-ther participated in the program or did not participate in the program, itis impossible to compare the identical case in both states. This is knownin the literature as a selection problem. In addition, we cannot simplyuse children who did not participate in the NSLP as a counterfactualfor those who did participate, because there may be many reasonswhy they did not participate in the program. Even after controlling forobserved characteristics, we are unlikely to observe all the factors thataffect the participation decision. In the case of estimating treatment ef-fects of food and nutrition programs it has been noted that eligiblehouseholds tend to select into participation when they have a higherneed (Currie, 2003).2 The presence of this positive selection problemmeans that unless we control for the selection process, participation infood and nutrition programs is likely to be associated with increasedlevels of food insecurity. To address the selection problem, we use anidentification strategy which relies upon instrumental variable models.
1 While the Current Population Survey (CPS) is considered the preferred dataset foranalyses of household food insecurity, exact age in months is not provided nor is schoolenrollment information for children. As a consequence, only approximate age is available,a significant problem given our identification strategy using the kindergarten age cut-offmonth. We estimated general models of the probability of being observed food insecurefor children aged five to six using the state of residence as an instrument for NSLP partic-ipation using theDecember 2001–2011 CPS. Thesemodels support our findings presentedhere. However, given that the counterfactual cannot be cleanly identified without schoolenrollment or precise age, we only show our findings for the ECLS-B.
2 It is also possible that selection occurs in the opposite direction in thatmore informedhouseholds are the ones that participate. However, empirically positive selection is gener-ally considered to be the larger problem of the two.
We begin by estimating probit models for the probability ofexperiencing food insecurity as a function of participation in the NSLPand other known correlates of food insecurity (household income, num-ber of household members, child age, child gender, child race, parentaleducation, urban/rural residency, and parental marital status). Thisnaïve model does not control for the selection process into NLSP andis expected to show a positive correlation between NSLP and foodinsecurity.
Thenwe address the selection problemby using the relative distancefrom children's birthdates to the kindergarten eligibility rules whichvary by state and year. For example, Missouri requires children toreach age 5 on or before August 1 to begin their kindergarten year. Ifchild X's birthday is on August 1, then, our instrument will take avalue of zero. If child Y's birthday is July 1, then the child was onemonth older than the required age to start kindergarten, so our instru-ment takes a value of +1. If on the other hand, child Z turns 5 by Sep-tember 1, then this child cannot start kindergarten until next year; buthe or she was just one month behind, so our instrument takes a valueof −1. Our strategy exploits the fact that children who are very closein age to their state's kindergarten eligibility cut-off date should be, onaverage, very similar to children on the other side of the cut-off. Becausenot all children begin kindergarten when age eligible, we do not haveperfect compliance and a fuzzy regression discontinuity design isemployed. This means that NSLP participation is instrumented byusing the relative distance from children's birthdates to the state kin-dergarten eligibility rule in an instrumental variable set up. As such,we interpret all model results as a local average treatment effect.
2.1. Measures
Our outcome of interest is food insecurity in households with chil-dren. The ECLS-B administered the USDA's food security module,which consists of 18 questions, 10 items for households in general and8 items specifically for children. Examples of these questions include:“In the last 12 months, did you ever eat less than you felt you should be-cause there wasn't enough money to buy food?” and “In the last12 months, did any of your children ever skip a meal because therewasn't enough money for food?” For the full battery of questions, seeNord (2009). Based on the existing standard in the field and USDA'sguidelines, when zero to two itemsof the total 18were affirmatively en-dorsed, a household is categorized as food secure; when three or moreitems were affirmatively counted, a household is considered foodinsecure.
We use two different measures of food insecurity, a 12-month mea-sure and a measure of persistent food insecurity. Because the ECLS-Bquestionnaire only asked about the last 12 months, we created a persis-tent food insecuritymeasure, using the option “almost everymonth” forquestions referring to frequency. Sample items include, “Did you orother adults in your household ever cut the size of your meals or skipmeals because there wasn't enough money for food? (If yes) Howoften did this happen? (1) Almost every month; (2) Some months,but not every month; and (3) In only 1 or 2 months.” When two ormore items of the total six questions documenting frequencywere affir-matively endorsed, a household was categorized as persistently foodinsecure.
Our preferred measure is the persistent food insecurity measure.Our rationale is that by relying upon identification strategies thatfocus on the impact of the NSLP on food insecurity during the transi-tion to kindergarten, we needed to be certain that our food securitymeasure is not including periods of food insecurity that only occurredbefore kindergarten entry. However, it is important to notice that thecorrelation between the 30 day measure and the 12-month measureis high and statistically significant. Others have found similar results(Nord, 2013).
Following the lead of Dunifon andKowaleski-Jones (2003), ourmainmeasure is based on parental reports of if the child usually eats a free- or

Table 1Marginal effects of the National School Lunch Program on food insecurity.
Probit IV probit
Food insecurity, 12-month measureCounterfactual: full-priced school lunchparticipants (n = 1600)
NSLP program 0.0846 ⁎⁎ −0.7046 ⁎⁎⁎
(0.0386) (0.2080)Counterfactual: does not eat school lunch(n = 3850)
NSLP program 0.0650 ⁎ −0.7429 ⁎⁎⁎
(0.0390) (0.2087)Full-priced school lunch −0.0341 0.7697 ⁎⁎⁎
(0.0359) (0.1916)
Food Insecurity, persistent measureCounterfactual: full-priced school lunchparticipants (n = 1600)
NSLP program 0.0177 ⁎⁎⁎ −0.4368(0.0058) (1.7844)
Counterfactual: does not eat school lunch(n = 3850)
NSLP program 0.0246 −0.7286 ⁎⁎⁎
(0.0162) (0.2338)Full-priced school lunch −0.0216 ⁎ 0.7823 ⁎⁎⁎
(0.0125) (0.1908)
NOTE: Authors' calculations based on ECLS-B data. Reported sample size rounded tonearest 50.Models include controls for age of child, gender, race and ethnicity, urban/rural, educationof parents, marital status, income and month of the interview.Robust standard errors shown in parentheses.⁎ p b 0.10.⁎⁎ p b 0.05.⁎⁎⁎ p b 0.01.
227I. Arteaga, C. Heflin / Children and Youth Services Review 47 (2014) 224–230
reduced-price lunch provided by the school. However, we also take ad-vantage of an additional measure, “Does CHILD usually receive a com-plete lunch offered at school?” We combine these two variables tocreate a measure of if the child eats a full-price meal at school. Our re-sults show model estimates for two different counterfactuals: 1)among children who eat school lunch, what is the effect of the freeand reduced price program on household food insecurity (n = 1600);and 2) what is the effect of the free and reduced price program (andfull-priced meals) on household food insecurity relative to not eatinga school lunch at all (n = 3850). The later models have the advantageof allowing us to observe the relationship between paying full pricefor school lunch on food insecurity among households with children.3
3. Results of probit using age relative to state kindergarten entrycut-off as IV
3.1. Persistent food insecurity
Table 1 presents probit and IV probit models for the ECLS-K samplebelow 185% of the federal poverty line. We begin by presenting probitmodel results for the probability of reporting food insecurity withoutcorrecting for positive selection into the NSLP program; in the secondmodel, we present results using the age relative to the kindergartencut-off date for the state as an instrumental variable. The Wald test forendogeneity is statistically significant in all models presented.4 Allmodels include controls for the child's age, gender, race, maternal edu-cation, marital status, urban/rural residency, household income, andmonth of interview.
Beginning with the top panel and left column of Table 1, we presentresults using the 12-month measure of food insecurity. The probit re-sults show a positive and statistically significant relationship betweenparticipation in the NLSP program and food insecurity, relative to chil-dren who pay full priced meals. This positive selection into the NLSPprogram with respect to household food insecurity is both expectedand consistent with the prior literature and the reason that we use aninstrumental variable approach as our second step in the analysis.
Using the fuzzy regression discontinuity approach which reliesupon the distance from the state kindergarten age cut-off to identifyparticipation in the NLSP program, we observe that NSLP participationin the second stage model is negatively associated with food insecuri-ty and statistically significant regardless of the counterfactual group.5
The marginal effect is − .7046 when the counterfactual is childrenthat pay for their school lunch and − .7429 when the comparison ischildren that do not eat school lunch. Interestingly, we see that payingfull-price for school lunch is associated with an increase in food inse-curity relative to children who do not eat school lunch among all chil-dren below 185% of the federal poverty line. This suggests that theNLSP program is providing a critical source of support among house-holds who benefit from it. It is important to remember that these sub-stantively largemarginal effects represent the local average treatmenteffect and not the average treatment effect for all participants in theNSLP program.
Moving to the bottom panel of Table 1, results are presented forthe persistently food insecure measure, which are largely consistentwith those in the top panel. Probit results once again indicate thatNSLP participation is associated with a positive and statistically
3 Neither comparison group is perfect. For example, the group eating full-priced lunch ismore advantaged in terms of household incomes, parental education, and marital statusthan the group eating free and reduced lunch. Additionally, the full-priced lunch groupis less likely to report receiving food stamps, Medicaid or welfare.
4 We conducted a test of relevance of instruments, test of endogeneity and test of over-identifying restrictions and all of these tests indicated that the IV probit model was thepreferred one.
5 First stage results are shown in Appendix Table 2.
significant effect on the probability of being food insecure, relativeto childrenwho pay for their school lunch, suggesting that positive se-lection bias is present. In our IV probit model, we find that participat-ing in the NSLP, relative to childrenwho pay for their school lunch, hasa negative but statistically insignificant relationship with householdfood insecurity. However, when we estimate our models against thecounterfactual of children who do not eat school lunch results againconfirm those for the 12 month measure. In IV probit models that ad-dress the endogeneous selection process into NLSP, we find that par-ticipation in the free and reduced lunch program has a strong andnegative effect on the probability of being persistently food insecure,relative to not eating school lunch. Once again, students that payfull-price for school meals have a substantially large and statisticallysignificant increase in their probability of being food insecure, relativeto those children who do not eat school lunch. Thus, both measures offood insecurity confirm that participation in the NLSP is associatedwith reductions in food insecurity among households with childrenand that paying full price for school lunch increases the probabilityof food insecurity.
3.2. Sensitivity analysis
While our main models on different measures of food insecurityyield consistent findings regarding the protective effect oftransitioning into the NSLP program upon kindergartner entry forhousehold food insecurity, we also present two additional sensitivityanalyses aimed to reduce concerns that the effect that we are identi-fying is due to school entry and not specifically participation in theNSLP. The first analysis incorporates information regarding childcare explicitly; the second focuses on presenting results for thosewho do not qualify for the NSLP.
It is likely that for many families school entry is associated with re-duced costs, such as those from lower child care expenses, which im-prove household food security irrespective of NSLP participation.
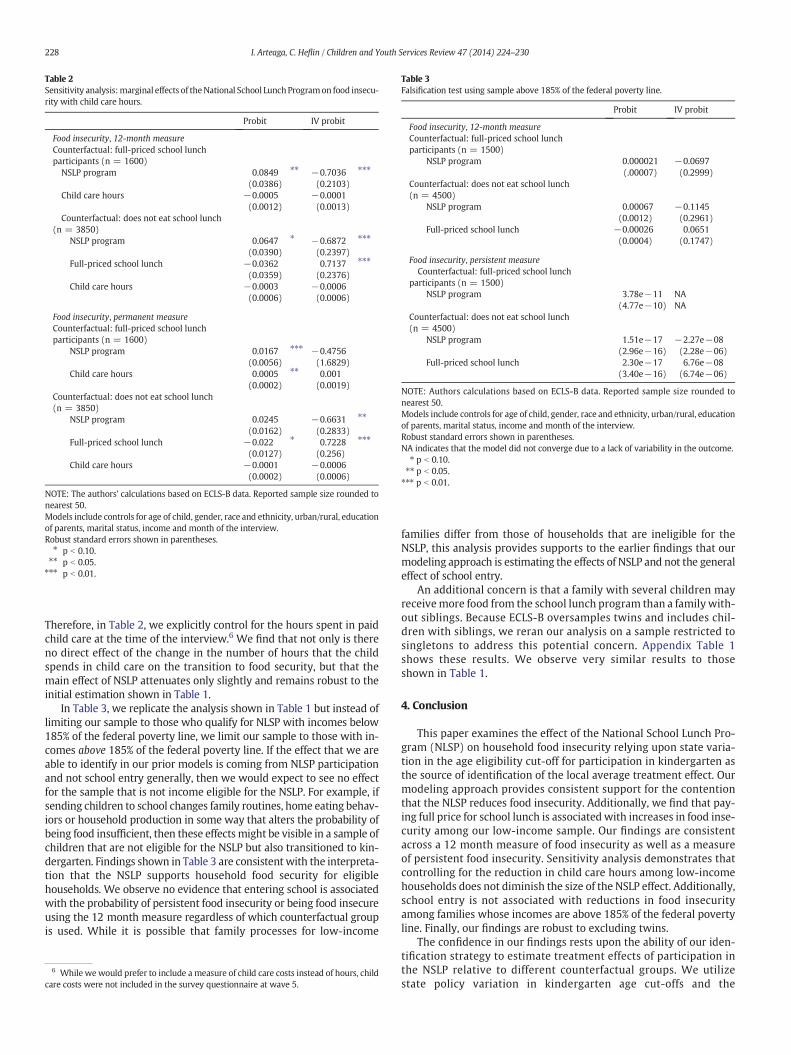
Table 2Sensitivity analysis:marginal effects of theNational School LunchProgramon food insecu-rity with child care hours.
Probit IV probit
Food insecurity, 12-month measureCounterfactual: full-priced school lunchparticipants (n = 1600)
NSLP program 0.0849 ⁎⁎ −0.7036 ⁎⁎⁎
(0.0386) (0.2103)Child care hours −0.0005 −0.0001
(0.0012) (0.0013)Counterfactual: does not eat school lunch
(n = 3850)NSLP program 0.0647 ⁎ −0.6872 ⁎⁎⁎
(0.0390) (0.2397)Full-priced school lunch −0.0362 0.7137 ⁎⁎⁎
(0.0359) (0.2376)Child care hours −0.0003 −0.0006
(0.0006) (0.0006)
Food insecurity, permanent measureCounterfactual: full-priced school lunchparticipants (n = 1600)
NSLP program 0.0167 ⁎⁎⁎ −0.4756(0.0056) (1.6829)
Child care hours 0.0005 ⁎⁎ 0.001(0.0002) (0.0019)
Counterfactual: does not eat school lunch(n = 3850)
NSLP program 0.0245 −0.6631 ⁎⁎
(0.0162) (0.2833)Full-priced school lunch −0.022 ⁎ 0.7228 ⁎⁎⁎
(0.0127) (0.256)Child care hours −0.0001 −0.0006
(0.0002) (0.0006)
NOTE: The authors' calculations based on ECLS-B data. Reported sample size rounded tonearest 50.Models include controls for age of child, gender, race and ethnicity, urban/rural, educationof parents, marital status, income and month of the interview.Robust standard errors shown in parentheses.⁎ p b 0.10.⁎⁎ p b 0.05.⁎⁎⁎ p b 0.01.
Table 3Falsification test using sample above 185% of the federal poverty line.
Probit IV probit
Food insecurity, 12-month measureCounterfactual: full-priced school lunchparticipants (n = 1500)
NSLP program 0.000021 −0.0697(.00007) (0.2999)
Counterfactual: does not eat school lunch(n = 4500)
NSLP program 0.00067 −0.1145(0.0012) (0.2961)
Full-priced school lunch −0.00026 0.0651(0.0004) (0.1747)
Food insecurity, persistent measureCounterfactual: full-priced school lunch
participants (n = 1500)NSLP program 3.78e−11 NA
(4.77e−10) NACounterfactual: does not eat school lunch(n = 4500)
NSLP program 1.51e−17 −2.27e−08(2.96e−16) (2.28e−06)
Full-priced school lunch 2.30e−17 6.76e−08(3.40e−16) (6.74e−06)
NOTE: Authors calculations based on ECLS-B data. Reported sample size rounded tonearest 50.Models include controls for age of child, gender, race and ethnicity, urban/rural, educationof parents, marital status, income and month of the interview.Robust standard errors shown in parentheses.NA indicates that the model did not converge due to a lack of variability in the outcome.
⁎ p b 0.10.⁎⁎ p b 0.05.
⁎⁎⁎ p b 0.01.
228 I. Arteaga, C. Heflin / Children and Youth Services Review 47 (2014) 224–230
Therefore, in Table 2, we explicitly control for the hours spent in paidchild care at the time of the interview.6 We find that not only is thereno direct effect of the change in the number of hours that the childspends in child care on the transition to food security, but that themain effect of NSLP attenuates only slightly and remains robust to theinitial estimation shown in Table 1.
In Table 3, we replicate the analysis shown in Table 1 but instead oflimiting our sample to those who qualify for NLSP with incomes below185% of the federal poverty line, we limit our sample to those with in-comes above 185% of the federal poverty line. If the effect that we areable to identify in our prior models is coming from NLSP participationand not school entry generally, then we would expect to see no effectfor the sample that is not income eligible for the NSLP. For example, ifsending children to school changes family routines, home eating behav-iors or household production in some way that alters the probability ofbeing food insufficient, then these effects might be visible in a sample ofchildren that are not eligible for the NSLP but also transitioned to kin-dergarten. Findings shown in Table 3 are consistent with the interpreta-tion that the NSLP supports household food security for eligiblehouseholds. We observe no evidence that entering school is associatedwith the probability of persistent food insecurity or being food insecureusing the 12 month measure regardless of which counterfactual groupis used. While it is possible that family processes for low-income
6 While wewould prefer to include a measure of child care costs instead of hours, childcare costs were not included in the survey questionnaire at wave 5.
families differ from those of households that are ineligible for theNSLP, this analysis provides supports to the earlier findings that ourmodeling approach is estimating the effects of NSLP and not the generaleffect of school entry.
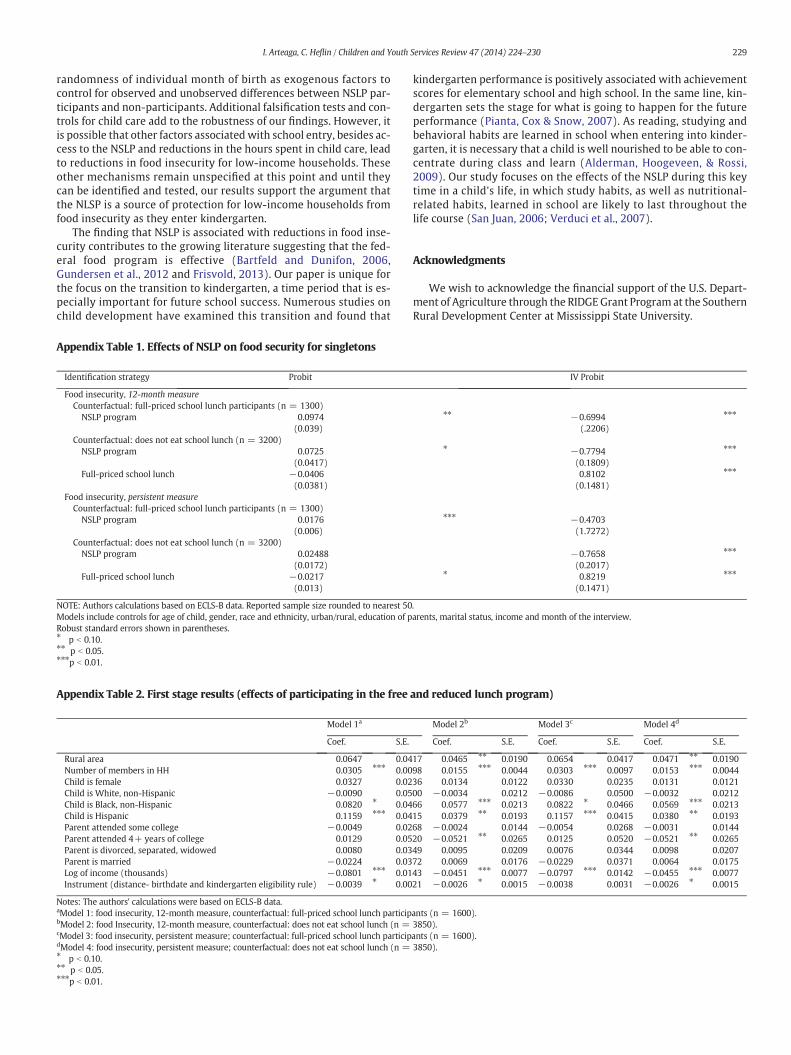
An additional concern is that a family with several children mayreceivemore food from the school lunch program than a family with-out siblings. Because ECLS-B oversamples twins and includes chil-dren with siblings, we reran our analysis on a sample restricted tosingletons to address this potential concern. Appendix Table 1shows these results. We observe very similar results to thoseshown in Table 1.
4. Conclusion
This paper examines the effect of the National School Lunch Pro-gram (NLSP) on household food insecurity relying upon state varia-tion in the age eligibility cut-off for participation in kindergarten asthe source of identification of the local average treatment effect. Ourmodeling approach provides consistent support for the contentionthat the NLSP reduces food insecurity. Additionally, we find that pay-ing full price for school lunch is associated with increases in food inse-curity among our low-income sample. Our findings are consistentacross a 12 month measure of food insecurity as well as a measureof persistent food insecurity. Sensitivity analysis demonstrates thatcontrolling for the reduction in child care hours among low-incomehouseholds does not diminish the size of the NSLP effect. Additionally,school entry is not associated with reductions in food insecurityamong families whose incomes are above 185% of the federal povertyline. Finally, our findings are robust to excluding twins.
The confidence in our findings rests upon the ability of our iden-tification strategy to estimate treatment effects of participation inthe NSLP relative to different counterfactual groups. We utilizestate policy variation in kindergarten age cut-offs and the
229I. Arteaga, C. Heflin / Children and Youth Services Review 47 (2014) 224–230
randomness of individual month of birth as exogenous factors tocontrol for observed and unobserved differences between NSLP par-ticipants and non-participants. Additional falsification tests and con-trols for child care add to the robustness of our findings. However, itis possible that other factors associated with school entry, besides ac-cess to the NSLP and reductions in the hours spent in child care, leadto reductions in food insecurity for low-income households. Theseother mechanisms remain unspecified at this point and until theycan be identified and tested, our results support the argument thatthe NLSP is a source of protection for low-income households fromfood insecurity as they enter kindergarten.
The finding that NSLP is associated with reductions in food inse-curity contributes to the growing literature suggesting that the fed-eral food program is effective (Bartfeld and Dunifon, 2006,Gundersen et al., 2012 and Frisvold, 2013). Our paper is unique forthe focus on the transition to kindergarten, a time period that is es-pecially important for future school success. Numerous studies onchild development have examined this transition and found that
kindergarten performance is positively associated with achievementscores for elementary school and high school. In the same line, kin-dergarten sets the stage for what is going to happen for the futureperformance (Pianta, Cox & Snow, 2007). As reading, studying andbehavioral habits are learned in school when entering into kinder-garten, it is necessary that a child is well nourished to be able to con-centrate during class and learn (Alderman, Hoogeveen, & Rossi,2009). Our study focuses on the effects of the NSLP during this keytime in a child's life, in which study habits, as well as nutritional-related habits, learned in school are likely to last throughout thelife course (San Juan, 2006; Verduci et al., 2007).
Acknowledgments
We wish to acknowledge the financial support of the U.S. Depart-ment of Agriculture through the RIDGE Grant Program at the SouthernRural Development Center at Mississippi State University.
Appendix Table 1. Effects of NSLP on food security for singletons
Identification strategy
Probit IV ProbitFood insecurity, 12-month measureCounterfactual: full-priced school lunch participants (n = 1300)
NSLP program 0.0974 ⁎⁎ −0.6994 ⁎⁎⁎(0.039)
(.2206) Counterfactual: does not eat school lunch (n = 3200) NSLP program 0.0725 ⁎ −0.7794 ⁎⁎⁎(0.0417)
(0.1809) Full-priced school lunch −0.0406 0.8102 ⁎⁎⁎(0.0381)
(0.1481) Food insecurity, persistent measureCounterfactual: full-priced school lunch participants (n = 1300)
NSLP program 0.0176 ⁎⁎⁎ −0.4703(0.006)
(1.7272) Counterfactual: does not eat school lunch (n = 3200) NSLP program 0.02488 −0.7658 ⁎⁎⁎(0.0172)
(0.2017) Full-priced school lunch −0.0217 ⁎ 0.8219 ⁎⁎⁎(0.013)
(0.1471)NOTE: Authors calculations based on ECLS-B data. Reported sample size rounded to nearest 50.Models include controls for age of child, gender, race and ethnicity, urban/rural, education of parents, marital status, income and month of the interview.Robust standard errors shown in parentheses.⁎ p b 0.10.⁎⁎ p b 0.05.⁎⁎⁎p b 0.01.
Appendix Table 2. First stage results (effects of participating in the free and reduced lunch program)
Model 1a
Model 2b Model 3c Model 4dCoef.
S.E. Coef. S.E. Coef. S.E. Coef. S.E.Rural area
0.0647 0.0417 0.0465 ⁎⁎ 0.0190 0.0654 0.0417 0.0471 ⁎⁎ 0.0190 Number of members in HH 0.0305 ⁎⁎⁎ 0.0098 0.0155 ⁎⁎⁎ 0.0044 0.0303 ⁎⁎⁎ 0.0097 0.0153 ⁎⁎⁎ 0.0044 Child is female 0.0327 0.0236 0.0134 0.0122 0.0330 0.0235 0.0131 0.0121 Child is White, non-Hispanic −0.0090 0.0500 −0.0034 0.0212 −0.0086 0.0500 −0.0032 0.0212 Child is Black, non-Hispanic 0.0820 ⁎ 0.0466 0.0577 ⁎⁎⁎ 0.0213 0.0822 ⁎ 0.0466 0.0569 ⁎⁎⁎ 0.0213 Child is Hispanic 0.1159 ⁎⁎⁎ 0.0415 0.0379 ⁎⁎ 0.0193 0.1157 ⁎⁎⁎ 0.0415 0.0380 ⁎⁎ 0.0193 Parent attended some college −0.0049 0.0268 −0.0024 0.0144 −0.0054 0.0268 −0.0031 0.0144 Parent attended 4+ years of college 0.0129 0.0520 −0.0521 ⁎⁎ 0.0265 0.0125 0.0520 −0.0521 ⁎⁎ 0.0265 Parent is divorced, separated, widowed 0.0080 0.0349 0.0095 0.0209 0.0076 0.0344 0.0098 0.0207 Parent is married −0.0224 0.0372 0.0069 0.0176 −0.0229 0.0371 0.0064 0.0175 Log of income (thousands) −0.0801 ⁎⁎⁎ 0.0143 −0.0451 ⁎⁎⁎ 0.0077 −0.0797 ⁎⁎⁎ 0.0142 −0.0455 ⁎⁎⁎ 0.0077 Instrument (distance- birthdate and kindergarten eligibility rule) −0.0039 ⁎ 0.0021 −0.0026 ⁎ 0.0015 −0.0038 0.0031 −0.0026 ⁎ 0.0015Notes: The authors' calculations were based on ECLS-B data.aModel 1: food insecurity, 12-month measure, counterfactual: full-priced school lunch participants (n = 1600).bModel 2: food Insecurity, 12-month measure, counterfactual: does not eat school lunch (n = 3850).cModel 3: food insecurity, persistent measure; counterfactual: full-priced school lunch participants (n = 1600).dModel 4: food insecurity, persistent measure; counterfactual: does not eat school lunch (n = 3850).⁎ p b 0.10.⁎⁎ p b 0.05.⁎⁎⁎p b 0.01.

230 I. Arteaga, C. Heflin / Children and Youth Services Review 47 (2014) 224–230
References
Alderman, H., Hoogeveen, H., & Rossi, M. (2009). Preschool nutrition and subsequentschooling attainment: Longitudinal evidence from Tanzania. Economic Developmentand Cultural Change, 57(2), 239–260.
Bartfeld, J., & Dunifon, R. (2006). State‐level predictors of food insecurity among house-holds with children. Journal of Policy Analysis and Management, 25(4), 921–942.
Bhattacharya, J., Currie, J., & Haider, S. (2004). Poverty, food insecurity, and nutritionaloutcomes in children and adults. Journal of Health Economics, 23, 839–862.
Cook, J., & Frank, D. (2008). Food security, poverty, and human development in the UnitedStates. Annals of the New York Academy of Sciences, 40, 1–16.
Currie, J. (2003). US food and nutrition programs. In R. Moffitt (Ed.),Means tested transferprograms in the US. University of Chicago Press (Chapter4).
Dahl, Molly, & Scholz, John Karl (2011). The National School Lunch Program and SchoolBreakfast Program: Evidence on participation and noncompliance. University ofWisconsin, Institute for Research on Poverty working paper.
Duncan, J., Brooks-Gunn, J., & Klebanov, P. (1994). Economic deprivation and early child-hood development. Child Development, 65, 296–318.
Dunifon, Rachel, & Kowaleski-Jones, Lori (2003). The influences of participation in theNational School Lunch Program and food insecurity on child well-being. The SocialService Review, 77(1), 72–92.
Food and Nutrition Service (March 24, 2011). USDA announces universal meal service op-tion to boost school meal participation in high-poverty areas. FNS Office of Communica-tions (FNS Release No. 0001.11).
Frisvold, D. (2013). Nutrition and cognitive achievement: An evaluation of the SchoolBreakfast Program. Working paper.
Gao, X., Ishdorj, A., & Higgins, L. (2012). Impact of the National School Lunch Program onchildren's food security. Selected paper prepared for presentation at the Southern Agri-cultural Economics Association Annual Meeting Birmingham, Alabama, February 4–7,2012.
Gundersen, C., Kreider, B., & Pepper, J. (2012). The impact of the National School LunchProgram on child health: A nonparametric bounds analysis. Journal of Econometrics,166(1), 79–91.
Gundersen, C., & Oliveira, V. (2001). The food stamp program and food insufficiency.American Journal of Agricultural Economics, 83(4), 875–887.
Heflin, C., Arteaga, I., & Gable, S. (2012). Families with hungry children and the transitionfrom preschool to kindergarten. University of Kentucky Center for Poverty Researchdiscussion paper series, DP2012-19. Retrieved May 17, 2014 from. http://www.ukcpr.org/Publications/DP2012-19.pdf
Hoddinott, J., Beherman, J., Maluccio, J., Flores, R., & Martorell, R. (2008). Effect of a nutri-tion intervention during early childhood on economic productivity in Guatemalanadults. The Lancet, 371(9610), 411–416.
Jensen, H. H. (2002). Food insecurity and the food stamp program. American Journal of Ag-ricultural Economics, 84(5), 1215–1228.
Kabbani, N. S., & Kmeid, M. Y. (2005). The role of food assistance in helping food insecurehouseholds escape hunger. Review of Agricultural Economics, 27, 439–445.
Maluccio, J. A., Hoddinott, J., Behrman, J. R., Martorell, R., Quisumbing, A., & Stein, A. D.(2006). The impact of an experimental nutritional intervention in childhood on educationamong Guatemalan adults. International food policy research institute (IFPRI). Foodconsumption and nutrition division (FCND).
Morgane, P., Austin-LaFrance, R., Bronzino, J., et al. (1993). Prenatal malnutrition and de-velopment of the brain. Neuroscience Bio-behavior Review, 17, 91–128.
Mykerezi, E., & Mills, B. (2010). The impact of food stamp program participation onhousehold food insecurity. American Journal of Agricultural Economics, 92(5),1379–1391.
National Center for Education Statistics, US Department of Education (2013). State re-quirements for kindergarten entrance and attendance. by state. [Data file]. Data re-trieved from. http://nces.ed.gov
Nord, Mark (September 2009). Food security in households with children: Prevalence, sever-ity, and household characteristics. US Department of Agriculture. Economic ResearchService (Economic Information Bulletin Number 56).
Nord, Mark (2013). To what extent is food insecurity in U.S. households frequent or per-sistent? Journal of Human and Environmental Nutrition, 8, 109–127.
Pianta, R. C., Cox, M. J., & Snow, K. L. (2007). School readiness and the transition to kinder-garten in the era of accountability. Paul H Brookes Publishing.
Pollit, E. (1994). Poverty and child development: relevance of research in developingcountries to the United States. Child Development, 65, 997S–1001S.
Roustit, C., Hamelin, A.M., Grillo, F., Martin, J., & Chauvin, P. (2010). Food insecurity: Couldschool food supplementation help break cycles of intergenerational transmission ofsocial inequalities? Pediatrics, 126(6), 1174–1181.
San Juan, P. F. (2006). Dietary habits and nutritional status of school aged children inSpain. Nutrición Hospitalaria, 21(3), 374–378.
Scholl, T., & Johnson, W. (2000). Folic acid: Influence on the outcome of pregnancy.Medical Journal of Clinical Nutrition, 71, 1295S–1303S.
Verduci, E., Radaelli, G., Stival, G., Salvioni, M., Giovannini, M., & Scaglioni, S. (2007). Die-tary macronutrient intake during the first 10 years of life in a cohort of Italian chil-dren. Journal of Pediatric Gastroenterology and Nutrition, 45(1), 90–95.
Yaqub, S. (2002). ‘Poor children grow into poor adults’: Harmful mechanisms or over‐de-terministic theory? Journal of International Development, 14(8), 1081–1093.