
Participation in the Community Rating System of NFIP: An Empirical Analysis of North Carolina...
35
Participation in the Community Rating System of NFIP: An Empirical Analysis of North Carolina Counties Craig E. Landry* and Jingyuan Li** Abstract In order to motivate flood insurance purchase and promote flood hazard awareness and mitigation, the Community Rating System (CRS) of National Flood Insurance Program (NFIP), credits floodplain management activities and awards premium discounts for insurance purchase. CRS, however, has been marked by a lack of active participation since its inception. Little empirical evidence exists to shed light on what factors influence the local adoption of hazard mitigation activities. The objective of this project is to provide such evidence through an examination of patterns in CRS participation in 100 North Carolina counties from 1991 to 1996. Specifically, we examine the influence of flood experience, hydrological risk, local capacity, and socioeconomic factors on county hazard mitigation decisions. Results indicate that flood experience and physical risk factors increase likelihood of local hazard mitigation adoption. We find evidence that the proportion of senior citizens within a county has negative influence on CRS participation, and that flood hazard mitigation activities at the county level are more likely when a greater number of nested of municipalities participate. CEDB Subject Headings: hazard, floods, regulation, regression analysis * Associate Professor, Department of Economics; Assistant Director, Center for Natural Hazard Research, East Carolina University, Greenville, NC (252)328-6383, E-mail: [email protected] ** Doctoral Student, Coastal Resources Management, East Carolina University, Greenville, NC (252)328- 5719, E-mail: [email protected] This research was partially funded by RENCI@ECU – Center for Coastal Systems Informatics and Modeling. We thank Andrew Keeler and seminar participants at Center for Natural Resource Economics and Policy, 3 rd National Forum on Socioeconomic Research in Coastal Systems in New Orleans, LA and The Coastal Society’s 22 nd Conference in Wilmington, NC for helpful comments.
-
Upload
independent -
Category
Documents
-
view
0 -
download
0
Transcript of Participation in the Community Rating System of NFIP: An Empirical Analysis of North Carolina...

Participation in the Community Rating System of NFIP: An Empirical Analysis of North Carolina Counties
Craig E. Landry* and Jingyuan Li**
Abstract
In order to motivate flood insurance purchase and promote flood hazard awareness and
mitigation, the Community Rating System (CRS) of National Flood Insurance Program (NFIP),
credits floodplain management activities and awards premium discounts for insurance
purchase. CRS, however, has been marked by a lack of active participation since its inception.
Little empirical evidence exists to shed light on what factors influence the local adoption of
hazard mitigation activities. The objective of this project is to provide such evidence through an
examination of patterns in CRS participation in 100 North Carolina counties from 1991 to 1996.
Specifically, we examine the influence of flood experience, hydrological risk, local capacity, and
socioeconomic factors on county hazard mitigation decisions. Results indicate that flood
experience and physical risk factors increase likelihood of local hazard mitigation adoption. We
find evidence that the proportion of senior citizens within a county has negative influence on
CRS participation, and that flood hazard mitigation activities at the county level are more likely
when a greater number of nested of municipalities participate.
CEDB Subject Headings: hazard, floods, regulation, regression analysis
* Associate Professor, Department of Economics; Assistant Director, Center for Natural Hazard Research, East Carolina University, Greenville, NC (252)328-6383, E-mail: [email protected] ** Doctoral Student, Coastal Resources Management, East Carolina University, Greenville, NC (252)328-5719, E-mail: [email protected] This research was partially funded by RENCI@ECU – Center for Coastal Systems Informatics and Modeling. We thank Andrew Keeler and seminar participants at Center for Natural Resource Economics and Policy, 3rd National Forum on Socioeconomic Research in Coastal Systems in New Orleans, LA and The Coastal Society’s 22nd Conference in Wilmington, NC for helpful comments.
Participation in the Community Rating System of NFIP: An Empirical Analysis of North Carolina Counties
1. Introduction
Flooding events, including coastal, estuarine, riverine, and flash floods, cause considerable losses to
individuals and businesses in the United States. In recent decades, over 80 percent of all presidentially
declared disaster losses have been attributed to flooding. The average damages from floods in the United
States are $115 million per week (Burby 2001), and property damages caused by flooding have been
increasing at an alarming rate. Data from Federal Emergency Management Agency (FEMA) indicate that
significant floods caused more than $5 billion in average annual damage to property from 1993 to 2007
compared to about $0.6 billion from 1978 to 1992.
As a part of floodplain management and flood loss reduction programs, the National Flood Insurance
Program (NFIP) has been successful in helping flood victims get back on their feet. FEMA estimates that
over 940,000 claims, totaling approximately $14 billion, have been paid from 1978 to 2004, and FEMA
maintains that flood damage is reduced by nearly $1 billion a year as a result of the NFIP floodplain
management regulations for new construction (FEMA 2007). The total insured value nationwide has
grown from $214 billion in 1990 (Michel-Kerjan and Kousky 2010) to $1.2 trillion in 2009
(Congressional Budget Office 2009), and NFIP has accumulated a net deficit of $3 billion after 37 years
of operation, this being prior to 2005 – a record loss year (Wharton 2008). Prior studies have identified
potential improvements to the program, such as more comprehensive and timely updates to Flood
Insurance Rate Maps (FIRMs), the alleviation of repetitive losses for some parcels, and increasing
premiums for some policyholders so that they more accurately reflect risk.
In order to increase flood hazard awareness, motivate flood insurance purchase, and promote flood hazard
mitigation, the Community Rating System (CRS) credits 18 community floodplain management activities
in four broad categories: (1) public information; (2) flood mapping and regulation; (3) flood damage
reduction; and (4) flood preparedness. FEMA classifies the portfolio of community flood management
practices on a ten point scale, reflecting the overall level of mitigation. The CRS classification determines
premium discounts for insurance purchases under the NFIP, which range from five to 45 percent.
Increased flood hazard awareness can lead to improved investment and development decisions and
increase flood insurance market penetration. Because the level of risk and expected loss can be influenced
by individual and community action, adjustment of flood insurance rates to reflect mitigation efforts can
provides a financial incentive for flood hazard mitigation projects. If rates are not adjusted to reflect
efforts to protect assets, those with insurance do not have proper incentives to undertake such actions. (In

economics, this problem is known as moral hazard.) In addition, by offering CRS credit for updating of
flood risk data, accuracy of flood hazard information can be maintained or improved over time, leading to
better delineation of flood hazard areas within a community.
In the federal-state-local floodplain management nexus, each level of government can play a role in flood
loss reduction. The federal government has preeminent regulatory authority and financial capacity to
provide assistance in flood management and protection projects and administer disaster relief to flood
victims. Given increasing pressure on federal funds, the high cost of structural flood protection works,
and community requests for more regulatory control, there has been a movement towards building
stronger state capacity to implement flood loss programs (Burby 2006, ASFPM 2007). Experience
suggests that effective local management occurs in the presence of strong state floodplain management
programs. Burby (2005) finds evidence that insured losses to residential property from natural disaster are
significantly reduced if the state mandates local comprehensive plans with hazard mitigation elements
(which are currently optional in some U.S. states). Other roles of state governments include providing
direct technical assistance to local government, training local floodplain mangers, managing or assisting
with hazard mitigation activities, and implementing permit processes.
Under the authority delegated by federal and state governments, local governments are primarily
responsible for zoning and planning, while sharing in the management of hazard mitigation activities
within their jurisdictions. As such, local governments can play a critical role in flood hazard mitigation
(Prater and Lindell 2000). Mileti (1999) suggests that hazard mitigation should be focused at the local
level through land use controls and building codes. CRS mitigation measures include programs to inform
people about potential hazards, plans that promote disaster preparedness, regulations designed to limit
vulnerability though building or other standards, and projects that reduce the likelihood or extent of
hazard. Many of these measures could successfully protect floodplain resources and minimize flood
losses by improving the efficiency of NFIP (Zahran, et al. 2008, Brody, et al. 2007 Local participation in
CRS, however, is low. As of January 2008, 1080 communities, representing only five percent of NFIP-
eligible communities, have enrolled in the CRS. Despite the logical partnership between state and local
managers, it can be challenging to coordinate activities across the state and local level.
Previous researchers have placed special emphasis on individual decision processes with respect to hazard
mitigation (Kunreuther 1996, Kunreuther, et al. 1998, Mileti 1999, Siegrist and Gutscher 2008).
Individuals often do not process hazard mitigation decisions in a perfectly rational way because they are
influenced by previously held attitudes and beliefs, do not know the full range of alternative actions, and
often do a poor job of utilizing hazard information (Mileti 1999). Many hazard mitigation measures have

elements of local public goods, as they provide community-wide benefits and individuals in the
community are not excluded once they have been made available. Little empirical evidence exists,
however, to shed light on what factors influence the establishment of local hazard mitigation projects.
This study examines the influence of flood experience, hydrological risk factors, local capacity, and
socioeconomic factors on community hazard mitigation decisions as indicated by CRS participation,
through examination of patterns in CRS involvement across 100 counties in North Carolina from 1991 to
1996. We test a number of hypotheses previously offered to explain why some local governments adopt
hazard mitigation measures while others do not. The results contribute to a better understanding of
community decision making under natural hazard risk and help to assess vulnerability by providing
information on mitigation decisions. Through an improved understanding of factors that motivate hazard
mitigation, state governments and FEMA can better encourage participation in the CRS and similar
voluntary, incentive-based programs in order to provide for better protection from flood hazards.
2. Background
Scholars generally recognize two types of hazard mitigation that can be adopted for flood risk.
Traditional flood damage mitigation focused on structural engineering methods, such as dams, levees, and
channel improvements. FEMA (1986) estimates over $7 billion in public monies were spent on large
scale flood control works between the mid-50s and mid-80s. Zahran, et al. (2008) estimate that an
increase in the number of dams in Texas decreased the odds of death or injury due to flood by 22.6
percent. Due to increasing population and development pressures, however, average annual flood
property damage in the U.S. is rising continually: the National Center for Atmospheric Research estimates
that the flood related damage increases from 2.03 billion 1983-1992 to 5.52 billion 1993-2002
(http://www.flooddamagedata.org/index.html) . The overwhelming expense and adverse environmental
effects of structural flood mitigation works have lead to more emphasis being place on smaller scale non-
structural mitigation methods. Non-structural measures include land use planning, zoning ordinances,
building codes, flood warning systems, emergency planning, flood insurance, and so forth. This study
focuses primary attention on non-structural mitigation, as recognized by the Community Rating System
of the National Flood Insurance Program (though CRS does award credit for structural flood protection
works in some items of the 500 and 600 series).
National Flood Insurance Program (NFIP)
In order to provide recovery resources for flood disaster (Kunreuther and Roth 1998), reduce the public
burden of disaster relief payments (Kriesel and Landry 2004), and dissuade uneconomic uses from
locating in flood hazard areas (Burby 2001), the US Congress passed the National Flood Insurance Act of
1968. This act created the National Flood Insurance Program (NFIP), which has two primary goals:
identification of flood hazard at a fine spatial scale and mitigation of hazard through planning, zoning,
improved building standards, and provision of insurance for businesses and households (Burby 2001).
NFIP is a voluntary joint venture between federal and state governments, private insurance companies,
and local communities. Participating communities are required to adopt and enforce floodplain
management ordinances and construction standards in flood hazard areas (Dixon, et al. 2006). The
federal government is primarily responsible for conducting detailed hydrological assessments used to
produce flood insurance rate maps (FIRMs) and setting flood insurance premium schedules. The state
governments hold regulatory authority over insurance contracts in their state. Under the Write Your Own
(WYO) program, private insurers sell and service policies, with the premiums (net of administrative fees
that go to private insurers) deposited in a federally operated flood insurance fund, which then pays all
claims (Kunreuther 1996). Based on FEMA‟s statistics, currently more than 20,000 communities across
the United States and its territories participate in the NFIP (roughly 75 percent of all communities in the
United States) with an estimated 4.5 million policies in force by 2006 (Dixon, et al. 2006).
FEMA estimates that flood damage is reduced by nearly $1 billion a year as a result of the NFIP
floodplain management regulations for new construction. Prior studies, however, highlight numerous
shortcomings of the program. First, community participation does not necessarily imply that individual
property owners will opt to purchase flood insurance. According to FEMA, only 2.5 million of the nearly
10 million households in flood-prone areas had purchased flood insurance by 1995 (Kunreuther 1996).
Dixon, et al. (2006) estimate the NFIP nationwide market penetration rate for signal family homes in
Special Flood Hazard Areas (SFHAs) was 49 percent in 2003. Second, Flood Insurance Rate Maps
(FIRMs), which FEMA uses to delineate the flood hazard areas within a community, are not updated
frequently. Thus, the risk designation conveyed by FIRMs can produce severe underestimates in some
areas (Michel-Kerjan and Kousky 2010). Third, FEMA offers Pre-FIRM properties explicitly subsidized
premiums, which are 30 to 40 percent of the full-risk premium. Price Waterhouse Coopers (1999)
concludes that the premiums of some Pre-FIRM properties are much less than what would be required to
cover payouts, partly due to repetitive losses for particular parcels. Moreover, there exists significant
skepticism over whether NFIP rate schedules for new construction (referred to as “actuarial”) accurately
reflect expected loss; prior to the 2005 hurricane season (a record loss year), NFIP exhibited a cumulative
deficit of $3 billion after 37 years of operation (Wharton 2008). Finally, research in coastal housing
markets has produced evidence that flood zone designation and insurance premiums convey risk
information to potential buyers in housing market; thus allowing premiums to reflect objective risk
assessment is important in providing incentives for better individual investment and mitigation decision

(Krutilla 1966; MaDonald, et al. 1990; Bin, Kruse, and Landry 2008; Bin, et al.2008). Chivers and Flores
(2002), however, provide contradictory evidence suggesting a majority of people in Colorado did not
acquire information about flood risk and cost of insurance until after property purchase.
Community Rating System (CRS)
In order to increase flood hazard awareness, motivate flood insurance purchase, and promote flood hazard
mitigation, the CRS was instituted by Federal Insurance Administration (FIA) as a voluntary program for
NFIP-participating communities. The goals of this program are to reduce flood loss through community-
level mitigation projects, facilitate accurate insurance rating, and promote the public‟s awareness of flood
hazard and insurance. When flood management activities of a CRS community comply with these goals,
flood insurance premiums for its citizenry are adjusted to reflect mitigation efforts to effectively reduce
flood risk (Kunreuther and Roth 1998).
The CRS credits 18 community floodplain management activities which are organized under four broad
categories: (1) Public information, (2) Flood mapping and regulation, (3) Flood damage reduction, and (4)
Flood preparedness (see table 1). FEMA classifies the portfolio of community flood management
practices on a ten point scale, reflecting the overall level of mitigation. The CRS classification determines
the premium discounts which range from 0 percent to a maximum of 45 percent (see Table 2). All
communities that are in full compliance with the NFIP and are in the regular phase of the program but
have not taken additional measures to reduce flood risks receive a CRS rating of 10 – no flood insurance
premium discount. CRS class 1 requires the most credit points and gives the greatest premium discount of
45%. Each year, local governments can submit documentation to a specialist from the Insurance Services
Office, Incorporated (ISO – an independent contractor that handles certification for CRS) to verify that
they are continuing to perform hazard management activities for which they receive CRS credit, and they
can apply to receive credit for new hazard management initiatives that improve their classification.
CRS provides premium discounts for residents in a qualified community in an effort to encourage hazard
mitigation and individual participation in NFIP. Since rates are adjusted to reflect risk, CRS can help to
alleviate moral hazard. By offering CRS credit for updating of flood risk data, information on flood
hazard can be updated, expanded, and refined, and may become more accurate over time, leading to better
delineation of flood hazard areas within a community. Flood Damage Reduction activities (series 500 -
see Table 1) include acquisition, relocation, or retrofitting of existing high-risk structures, which could
prevent repetitive losses. Finally, CRS credit is provided if a community‟s real estate agents (and others
involved in land development and investment decisions) advise prospective floodplain occupants about
flood hazard and the flood insurance purchase requirement for mortgaged properties in the SFHA.
In an analysis of 832 large scale flooding events in Texas between 1997 and 2001, Zahran, et al. (2008)
find suggestive evidence that community hazard mitigation programs promoted by CRS resulted in
significantly lower loss of human lives. Aside from this, little empirical evidence exists to shed light on
the effectiveness of CRS, in particular whether the system reduces property damage, has had an effect on
flood insurance purchase, heightens awareness, or improves management of flood hazard.
Limiting its potential effectiveness, CRS has been marked by a lack of active participation since its
inception. As of January 2008, only 5% of all the NFIP communities were enrolled in CRS; of the 469
NFIP communities in North Carolina, only 75 (slightly over 15%) have a CRS score that is less than 10
(implying that they have initiated activities to improve awareness and reduce risk - and applied for CRS
credit). The main objective of this study is to provide empirical evidence related to community decisions
involving flood risk mitigation efforts. We examine participation in CRS across a panel of North Carolina
counties to test a number of hypotheses that previous researches have offered to explain why relatively
few local governments adopt hazard mitigation. In the next section, we examine the literature on hazard
mitigation to derive testable propositions on physical, risk, capacity, and socioeconomic factors that could
affect community decisions on hazard mitigation.
3. Literature Review: Hazard Mitigation
Considerable attention has been devoted to consideration of individual decision processes with respect to
hazard mitigation. Kunreuther (1996) concludes that subjective underestimation of probability and high
discount rates are two principal reasons why individuals under-invest in loss reduction measures. A set of
controlled experiments conducted by Kunreuther, et al. (1998) suggests that most households do not take
into account the benefits of voluntary mitigation actions over a long period when purchasing hazard
protections because they do not perceive the expected benefits to be large enough to justify the upfront
expenditure. A telephone survey of 1,241 households in six hurricane-prone areas revealed that 62% of
residents had not installed hurricane shutters and other mitigation measures either before or after
Hurricane Andrew, even though they were aware of the option (Kleindorfer and Kunreuther 1999).
Empirical studies suggest personal flood experience is an important factor in motivating mitigation
behavior. A face-to-face interview in Switzerland found that people without flooding experience
underestimate the negative effects evoked by such an event (Siegrist and Gutscher 2008). A study in UK
shows that information about flood hazard is insufficient to promote individual purchase of flood-
protection devices, particularly among people who had no flood experience (Soane, et al. 2010). Browne
and Hoyt (2000) find that market penetration of flood insurance is higher in states that have suffered
floods in the recent past. Overall, however, individuals often do not process hazard mitigation decisions in

a perfectly rational way because they are likely to be influenced by previously held attitudes and beliefs,
do not know the full range of alternative actions, and often do a poor job of utilizing hazard information
(Mileti 1999).
A primary federal policy objective is to reduce loss of life and damage to property from natural disasters
through mandated building codes, infrastructure design, and emergency warning systems. In accord with
the delegation of responsibility for planning activities, there appears to be a general consensus in the
planning literature that hazard mitigation policy should be carried out at the local level. Since hazard
identification and assessment are costly and complex, hazard mitigation programs require that local
governments maintain certain resources, such as financial capital, personnel, and equipment. While
resources and capacity certainly increase as one moves from the local to state or national level, local
conditions vary widely and can change rapidly; knowledge of local circumstances and capabilities
increase as one moves down to local jurisdictions (Perry and Lindell 2003). An analysis of effectiveness
in floodplain management programs in 1,203 local jurisdictions shows that varying physical constraints
require different mixes of program components in order to mitigate hazards (Burby and French 1985).
In their study of disaster impacts on communities, Lindell and Prater (2003) argue that individual efforts
at hazard mitigation will not necessarily provide adequate protection for the entire community. Therefore,
they suggest that efforts at hazard reduction need to be coordinated at the community level. Many hazard
mitigation measures have elements of local public goods, as they provide community-wide benefits and
individuals in the community are not excluded once they have been provided. Thus, from an economic
perspective, hazard mitigation will be undersupplied by private market decisions.
Since natural hazards are large scale events, mitigation and planning largely depend upon local capacity,
which is influenced by trained staff and budget (Kunreuther and Roth 1998). According to Prater and
Lindell (2000), the amount of governmental resources that are allocated to hazard mitigation is highly
dependent on the available fiscal resources in a jurisdiction. Due to different locales and histories, the
extent of on-hand resources and skills may significantly differ from one community to another (Perry and
Lindell 2003). Previous researchers have examined policy implementation and pointed out that strong
mitigation capacity is most likely to be found in larger communities and communities with higher
property values (Burby and French 1981, Godschalk 2003). Therefore, local government revenue, which
is mainly derived from taxes on property, is likely to directly influence community mitigation capacity.
Communities‟ reluctance to adopt high-cost warning systems demonstrates that the financial resources
constraints are significant inhibitors of community mitigation capacity (Mileti 1999).

Community support is the one of the key factors for local government adoption of flood hazard mitigation
projects. Burby (1998) provides four principle reasons to explain why local governments are often
reluctant to adopt land use and planning measures for reducing risks. First, just as do individuals, local
government officials often underestimate the risks involved in developing flood plain areas unless they
have recently experienced a flood event. Disaster events can open “windows of opportunity” by exposing
vulnerability and focusing the political agenda on hazard mitigation issues (Kingdon 1984; Berkes 2007).
Second, benefits of hazard mitigation are only realized after disasters occur and are difficult to quantify,
but the costs are incurred immediately and are easy to calculate (Prater and Lindell 2000). Therefore,
other problems, such as crime control and improving quality of education, usually garner more attention
and funding compared with hazard mitigation projects. For example, many communities are reluctance to
adopt warning systems because of high upfront cost with no immediate payback (Mileti 1999). Third, due
to scenic beauty, hazard-prone areas tend to be prime real estate. Development in such areas can have
immediate and obvious tax revenue benefits for local communities, which can be more salient that
associated risks. Finally, remedial actions for existing buildings, such as relocation and reinforcement are
costly and technically difficult. After a 1972 mass flooding in Rapid City, SD, the city council moved
1100 families and 157 businesses out of flood-prone areas at a cost of $48 million in federal aid and $16
million in local matching funds (1972 dollars). For relocation to be an effective strategy there must be
available space and a willingness to move on the part of citizens.
Despite these limitations, many communities that face the greatest exposure to flood risk have made
significant strides in reducing risk through local hazard mitigation projects. After the catastrophic flood
along the Miami River in 1913, local government created the Miami Conservancy District, which built
levees and five dry dams to control flooding. This project was funded almost entirely by local tax
initiatives. In his book, Mileti (1999) argues that local governments have an obligation to adopt hazard
mitigation programs that promote public safety. Hazard scholars claim local government officials must
be proactive in making a strong commitment to hazard mitigation (Burby 1997; May, et al. 1997; Dalton
and Burby 1994; May, et al. 1996; Burby, et al. 1998). Floodplain management, however, is sometimes
viewed by local government personnel as someone else‟s responsibility (Burby, et al. 1985), and the
reluctance of local elected officials to advocate such measures is identified as a primary impediment in
hazard mitigation (Burby 1998). Despite this barrier, citizens can apply direct and indirect pressure to
motivate hazard mitigation on the part of local government officials through elections, town hall
meetings, editorials in local papers, and public opinion polls which provide an opportunity for feedback
on the performance of local officials (Prater and Lindell 2000). Though it is ambiguous as to whether
citizens will be active in this role if their own perceptions of the likelihood and consequence of natural
hazards are inaccurate or unclear. We hypothesize that community characteristics can influence local
government decision-making process and the amount of hazard mitigation that takes place locally. In
addition, the overall level of risk in the community should influence hazard mitigation. Higher perceived
risk should motivate more mitigation, all else being equal. We use these intuitive propositions, built upon
previous literature, to structure our empirical analysis.
Our study is most similar to that of Brody, et al. (2009). These authors examine adaptive management
and policy learning for flood mitigation as reflected in CRS scores in Florida counties from 1999 to 2005.
Specifically, they track annual point totals for the four CRS mitigation series (described in Table 1) for 52
of the 67 Florida counties that exhibit some level of participation in the CRS. They use population-
adjusted measures of CRS points and regression covariates to account for both participating counties and
nested municipalities, and examine the influence of hydrologic conditions, flood disaster history,
socioeconomic and human capital controls on CRS points. Their results suggest that flood history induces
flood policy adaptation and the frequency of events is more influential than the level of damage;
jurisdictions with greater proportion of land in the 100-year floodplain have lower CRS points, which the
authors attribute to higher levels of mitigation expense. CRS points tend to be greater in wealthier and
more highly educated jurisdictions. Local governments in Florida have tended to focus on less expensive
mitigation measures, such as information provision and flood information updating, to earn CRS points,
rather than costly structural measures, such as parcel acquisition and retro-fitting. Brody and his
colleagues‟ work provides important initial empirical evidence on how local jurisdictions adjust flood
mitigation activities over time. Critical questions remain, however, as to what drives initial
implementation of hazard mitigation – what distinguishes those communities that are active in flood
hazard mitigation form those that are not. We build upon the study of Brody, et al., but focus on
participation in CRS in order to learn about what influences community willingness to adopt flood hazard
mitigation measures.
4. Data
We analyze flood hazard mitigation projects, as indicated by CRS participation, in all 100 North Carolina
counties between 1991 and 1996. The NFIP is implemented at a multi-jurisdictional scale, which allows
for counties, cities, and towns to enroll in CRS and receive credit for hazard mitigation activities. The list
of CRS communities and their 2008 CRS scores are available on the FEMA website
(http://www.fema.gov/pdf/nfip/manual200805/19crs.pdf). With publicly available data, we are unable to
observe many of the variables of interest at scales below the county level, so we confine our analysis to
NC counties and save a multi-jurisdictional analysis for future research. Since CRS was initiated in 1990,
the time period of 1991 to 1996 encompasses initial enrollment activities of most North Carolina counties

(with the exceptions being Caldwell and Pitt). By focusing on this time frame and periods that just
preceded it, we are able to examine factors that influence counties‟ decision to join (or not join) CRS. A
drawback associated with focusing on this period of time is that some data (such as digital flood maps)
are unavailable. A summary of the variables to be used in our analysis is presented in Table 3. The
dependent variable, CRS participation (which equals one for counties participation in CRS and zero for
non-CRS counties), comes from ISO.
The explanatory variables are organized under four broad categories. First, four flood experience
variables are proposed to account for the history and severity of community flood hazard. These variables
include data on flood events and property damage in each county. We postulate that more experience with
floods and higher losses in previous year(s) will motivate more stringent hazard mitigation, increasing the
likelihood of CRS participation. While hazard exposure can influence political will and public support of
hazard mitigation (Clary 1985, Burby and Dalton 1994), laborious and protracted planning, permitting,
and implementation processes may introduce significant time lags between hazard events and successful
completion of mitigation projects (NOAA 2010). We use previous five years rolling cumulative flood
events and previous one year flood events (as well as property damage) to analyze the reaction of local
policy processes to long- and short-term hazard experience. Our flood experience variables include
events in the distant and recent past in order to account for a legacy of mitigation and longer term
investments associated with “windows of opportunity” that opened in the past, while also allowing for
short term impacts of recent storms on mitigation activities.
Second, we use three control variables that reflect a county‟s hydrological conditions and overall level of
flood risk. Our first control variable measures the average annual precipitation (1991-1996) at weather
stations within the county and is provided by State Climate Office of North Carolina. The rainiest
counties face a higher probability of riverine and flash floods, which could be a catalyst for local flood
hazard mitigation. Given their position in the watershed, coastal counties convey floodwaters to the ocean
and can suffer coastal flooding and storm surge problems due to hurricanes and Nor‟easters. Thus, we
expect the 20 North Carolina Coastal Area Management Act (CAMA) counties to be more likely to adopt
flood hazard mitigation activities due to the higher level of flood risk (all else being equal). Digital data
on area of surface water bodies (such as streams, rivers, lakes, reservoirs, and shorelines) were collected
from North Carolina Center for Geographic Information and Analysis. The percentage land cover of
water bodies in a county is calculated with ArcGIS software; we expect a higher likelihood of mitigation
for counties with a greater proportion of surface water. Unfortunately, we are unable to use proportion of
land in the SFHA as a covariate, because digital flood hazard maps in North Carolina Floodplain
Mapping Program are available only back to 2008.

Third, we explore four variables reflecting local capacity and competing priorities that could influence
adoption of mitigation activities. Data on per capita county property taxes represent local government
financial resources available for hazard mitigation projects. We expect counties with greater tax revenue
to be more likely to engage in flood hazard mitigation. We account for other potential county policy
priorities, such as crime control and education quality. The pressing needs of such “here and now” issues
may attract more attention, time, and money and can crowd out hazard mitigation initiatives (Prater and
Lindell 2000). We use county public school expenditures per student to measure the local governments‟
level of investment in school quality; these data were collected from North Carolina Department of Public
Instruction. We use the crime rate to proxy for the competing concerns over criminal activity in the
county; the number of reported crimes (including murder, forcible rape, robbery, aggravated assault,
burglary, larceny, and motor vehicle theft) per household was derived from NC Department of Justice.
We expect concern over education quality and crime control could shift attention and funding away from
hazard mitigation projects, and we thus expect negative coefficients on these variables. We expect more
densely populated areas to be more likely to engage in hazard mitigation due to greater benefit of flood
protection accruing to more local residents. We find a highly significant correlation between population
and housing density, so we include only housing density in our analysis.
Lastly, we explore the influence of community characteristics on local hazard mitigation. Social factors
to be studied include median household income, the percentage of senior citizens, and percentage of
citizens with a bachelor or graduate degree. We expect that the likelihood of flood hazard mitigation is
increasing in the level of education, all else being equal. Median household income provides a proxy for
the level of individual wealth. We conjecture that wealthier communities may exhibit a greater demand
for hazard mitigation, but since wealthier households are better able to afford individual mitigation
measures and insurance they may put less pressure on local governments for hazard mitigation. The
proportion of senior citizens in a community may correlate with individual flood experience, which could
increase the likelihood of local hazard mitigation. North Carolina, however, has become a popular
retirement destination due to the state‟s varied terrain, moderate climate, reasonable housing prices, and
special tax exemptions for military and other federal employees‟ retirement pay. This has lead to
increasing numbers of migrating retirees, many of which may have limited experience with flood hazards.
Thus, our expectations of the impact of proportion of senior citizens on hazard mitigation activities are
ambiguous.

Since the structure of NFIP rests on a multi-jurisdictional configuration which allows for participating
counties, towns, and cities, the time of enrollment of CRS for county and municipalities within the county
may vary. To account for this structure, we count the number of participating CRS municipalities that are
nested within the county. Since the damage from flooding may occur at a large geographic scale, hazard
assessment and management requires communication and coordination amongst the county and its
municipalities. The county and municipalities can share technologies (GIS Mapping), resources (hazard
mitigation personnel), and information. We expect more flood hazard mitigation activities to be
undertaken where a higher proportion of municipalities participate due to technology spillovers and
agglomeration effects (which can lower the cost of hazard mitigation). Lastly, with many floodplain
management workshops and conferences offered each year, more information on flood hazard mitigation,
including CRS activities, becomes available for local floodplain managers over time. We explore this
effect by examining the impact of the length of time that the county has been enrolled in NFIP. Variable
definitions and summary statistics for the dataset are presented in Table 4.
5. Model Specification
Our dependent variable, CRS participation, takes on only two values: zero and one, which indicates
whether or not the county participates in the Community Rating System. Ordinary Least Squares (OLS)
in this case is known as the linear probability model (LPM). The LPM is generally regarded as
inappropriate, since the dependent variable takes only limited values and the error term will be
heteroskedastic. As one of Qualitative Response Models, the logit and probit models are widely used
when the dependent variable takes discrete values (Mckelvey and Zavoina 1975, Matyas 1992, Greene
2002, Wooldridge 2002). We begin with a latent variable model:
where is a latent (unobservable) variable which represents community ‟s propensity to adopt CRS
activities (i.e., implement projects to lower flood risk); is a vector of explanatory variables which are
organized under four broad categories discussed above; is a vector of unknown parameters to be
estimated, and is a random error term.
The observed is related to latent response variable by:
Therefore, the response probability is:
When the error term has a standard normal distribution: , it gives rise to the probit model:

where is standard normal cumulative distribution function. When the error term has a standard
logistic distribution, it gives rise to the logit model:
The probit and logit models constrain E to lie between 0 and 1 which overcomes the linear
probability model‟s limitations. Since the logistic distribution is similar to the normal distribution (except
with heavier tails), the two models produce similar effects estimates and give very similar predictions in
most applications (Geene 2002). In both cases, the parameter vector ( ) and associated standard errors are
obtained by Maximum Likelihood Estimation (MLE).
The likelihood function and log-likelihood function (which is used for estimation purposes) are given by:
and
,
respectively. Given the estimated parameter and associated standard errors, we are interested in the effects
of a change in the independent variables on the response probabilities . If is continuous,
the partial effect of on depneds on through :
,
where
. Compared with LPM, summarizing the partial effects of logit and probit
models is less straightforward because the scale factor, depends on . A handy way to get the
magnitude of the partial effects is to estimate average partial effects (APEs):
where the APEs scale factor, (
for the probit model and
for the logit model. If is discrete, the marginal effect is computed as the difference in the
estimated probabilities with and and other variables at their means.
Panel Data Methods
Aside from the limited values of the dependent variable, our dataset has annual observations for each
county from 1991 to 1996, which forms a combined time-series, cross-sectional dataset, also known as
longitudinal or panel data. An advantage of panel data over the cross-sectional format is that it allows the
analyst to account for cross-sectional unobserved heterogeneity. For instance, in a typical cross-sectional
regression analysis, the researcher can account for observable heterogeneity using covariates; in our
application, this would include county characteristics, such as property tax revenue, housing units, and
population. In some cases, the covariate effects are of direct interest to test hypotheses about causation or
correlation, while in others they are introduced as control variables. If, however, there are other
unobserved factors influencing the counties‟ propensity to conduct flood hazard mitigation activities, the
regression parameter estimates can be inconsistent (creating bias in parameter estimates that does not
decrease or disappear as the sample size increases). For our application, local government officials‟
perceptions of flood hazard and opinions of flood hazard mitigation project, as well as idiosyncratic
features like history or culture, which are unobserved or unobservable, may affect CRS participation, and
thus controlling for unobserved heterogeneity could be very important.
To control for unobserved heterogeneity, we consider the unobserved effects panel data model for latent
dependent variable:
,
where ci represents unobserved , time-invariant cross-sectional effect for unit i. Random effects and fixed
effects are two approaches to estimate this model under strict exogeneity of the explanatory variables
( ). The random effects approach to estimating involves specifying a distribution for
components of the error term, and εit, under the assumption that is orthogonal to , so
. The random effects probit model has been considered in several research papers (e.g.,
Bjorklund 1985, Clark 2003, Das and Arthur 1999, Gerlach and Stephan 1996, Korpi 1997, Schwarze
2003, Winkelmann and Winkelmann 1998). An alternative specification, the fixed effects approach
attempts to estimate the individual ci, or condition them out of the likelihood function. For the probit
model, the fixed effects specification can typically not be estimated due to the incidental parameters
problem, which inhibits identification of fixed effect parameters. For the logit model, the fixed effects
specification is only suitable when there is variability in the dependent variable at the level of the cross-
section – this applies to only a small proportion of observations in our dataset.
Random Effects Probit Model
We focus on a panel of 100 NC counties over a period of 6 years. In the unobserved effects latent
variable model:

, =1,2,…,100, =1,2,…,6, where
where and , Var( )=1+
. The importance of the unobserved effect is
measured as
which is the correlation between across any two time period (Wooldrige 2002,
Greene 2002). Standard statistical packages reports estimated rho and its standard error along with
other random effects probit parameters, which allows for straightforward testing of the presence of
unobserved, time-invariant cross-sectional effects. The density function of conditional
on :
where
. Since is unobserved, Wooldridge
(2002) integrates out producing the joint distribution function:
Estimates of and can be obtained by maximizing the conditional log-likelihood function (the log of
the joint distribution function above). The robust covariance matrix can be obtained by:
where is from fitted model. Estimates the partial effects of on the response probability
are calculated at the average value of =0), so the APEs for continuous are given by:
Endogeneity of Covariates
The issue of endogeneity arises whenever an explanatory variable is correlated with the error term, either
because of the omitted variables, measurement error, or simultaneity (Wooldridge 2002). In our study, we
are concerned about endogeniety bias due to simultaneity: some explanatory variables are jointly
determined with the dependent variable. It is helpful to outline a heuristic framework in order to provide
the background for the specifications:
where is a vector including all other covariates in Table 4. Simultaneity in property damage (for both
the five-year and single-year lag) can arise because property damage stemming from floods is influenced
by lagged CRS participation decisions. Consider the equation:
If , the exogeneity assumptions ( would be violated. If (as would be
expected), the regression estimate of will be attenuated (downward biased) and inconsistent, and
regression estimates for covariates that are correlated with past property damage may also be biased. In
order to address this problem, we estimate two versions of the regression model, one with flood events as
the experience variable and the other with property damage. To the extent that parameter estimates for
other covariates are similar across the two models, we express confidence in the results that use property
damage as an experience measure. Nonetheless, the parameters on property damage will be downward
biased (by an unknown magnitude).
6. Results
In addition to the random effects probit model (RPM), we also estimate a linear probability model (LPM
– which is simply ordinary least squares with a binary dependent variable) and a pooled probit model
(PPM – which has the probit structure outlined above, but does not account for time-invariant, cross-
sectional unobserved heterogeneity). All models are estimated using STATA statistic analysis software.
The estimation results for each of the three models with comparable Average Partial Effects (APEs) are
shown in table 5 (flood events specification) and table 6 (flood damage specification). Concerned with
endogeneity of property damage, we focus primary attention on the result in Table 5. The LPM, PPM, and
RPM estimates include robust standard errors. The signs for the covariate parameters, which indicate the
direction of impact on probability of participation in CRS, are mostly consistent across all three models,
and when the disagree, the discrepancies are generally not statistically significant. The exception is
education (college), which is estimated to have a positive effect in the LPM but a negative effect in the
RPM. As a whole, the LPM model‟s variables explain 53.67% of the variance in the CRS participation
across NC counties. The probit and logit models use maximum likelihood estimates derived from an
iterative process (instead of minimizing the sum of squared errors), so the standard R-square measure
does not apply. McFadden (1974) suggests the measure (pseudo R-squared), where is
value of the log-likelihood function for the estimated model, and is the value of log-likelihood function
in the model with only an intercept. The pseudo R-squared ranges from 0 to 1 with higher values
indicating better fit. While not directly comparable to the conventional R-square, both pseudo R-squares
indicate very good fit for the maximum likelihood models - pseudo R-sq=65% for the pooled probit
model and pseudo R-sq=56% for the for the random effects probit. The number of statistically significant
covariates decreases from ten to nine when we move from the most basic LPM to the more appropriate
RPM. To account for unobserved heterogeneity, the random effects probit model is employed under the
assumption of strict exogeneity of the explanatory variables. The statistically significant rho
parameter indicates the existence of an unobserved time invariant effect at the cross-sectional
level. Therefore, our explanation of the results focuses primarily on the random effect probit model
(RPM), while making some comparisons with LPM and PPM as more basic models.
We consider both versions of the model to discuss the impact of flood experience on CRS participation.
In Table 5, neither previous five years flood events nor single year lag flood events have significant
impact on CRS participation for the RPM. We do, however, find statistically significant and positive
effects for the LPM and PPM; results indicate that an additional flood event in previous five years
increases likelihood of CRS participation by 4.2% and 4.5% for the LPM and PPM, respectively. The
single-year lag flood event variable is statistically significant and negative in the PPM, suggesting that an
additional flood in the previous year decreases likelihood of participating in CRS by 2.6%. In Table 6, the
RPM results indicate that an additional one thousand dollars property damage in previous five years
(5yrs_damage) increases likelihood of participation by 0.066% (not statistically significant in LPM),
while results of the PPM shows same amount damage (5yr_damage) increases likelihood of participation
by only about 0.0024%. The single year lag property damage exhibits an unexpected negative sign (which
is statistically significant). Due to simultaneity of CRS participation and property damage, we believe
these estimates are downward biased. This suggests that all marginal effects are lower bounds, so that
impacts of the previous five years‟ damage are greater than what is presented above. The negative
estimate for single-year lag of property damage should not be interpreted as causation; it likely reflects
the effectiveness of CRS participation in lower the magnitude of property damage. Overall, long term
experience with flood events appears to encourage local hazard mitigation activities (as reflected in CRS
participation).
In their study, Prater and Lindell (2000) conclude that public support for hazard mitigation activities
peaks in the six months immediately after the disaster. It may, however, take much longer for the political
process to allocate resources for hazard mitigation purposes after a “window of opportunity” has opened.
The statistical significance and magnitude of the previous five-year flood events indicates that hazard
mitigation initiatives may operate on significant time lags. The result is not robust, however, as 5-year

flood events is not statistically significant in our preferred RPM. The single-year lag flood event variable
was generally not statistically significant, except for the PPM, in which it was negative (suggesting that
an additional flood in the previous year decreases likelihood of participating in CRS by 2.6%). This may
reflect local resources being devoted to recovery efforts before attention can be turned to hazard
mitigation (over the longer term). Previous five-year property damage attribute to flooding also increases
the likelihood of CRS participation, but estimated effects are biased downward due to simultaneity.
Similar biases plague the lag of single-year property damage – resulting in a negative coefficient.
We account for potential variability in flood risk across counties with a number of covariates –average
annual precipitation (from 1991-1996), a dummy variable for CAMA counties (meant to capture
additional risk associated with downstream riparian flooding and storm surge), and water body coverage
(measured as percentage of total county area). Our expectations are that higher risk factors will be
associated with greater likelihood of participation. Results indicate that counties with greater average
rainfall and a greater proportion of water body are more likely to participation in CRS. Focusing on
RPM, a one-inch increase in annual precipitation increases participation likelihood by 8.4% and a one
percent increase in the proportion of water body in a county increases the likelihood of CRS participation
by 1.8%. The estimates from Table 6 are roughly equivalent. From an economic and public policy
perspective, these results are encouraging, as they suggest that flood hazard mitigation is more likely to
occur in areas that face greater flood risk.
Surprisingly, the marginal effect for CAMA counties is statistically significant and negative in Tables 5
and 6, suggesting that CAMA counties are less likely to participate in CRS (all else being equal). The
average partial effects are -0.66% in the RPM (w/ flood events) and -1.3% in the RPM (w/ property
damage). Coastal counties are exposed to storm surge, coastal flooding associated with upstream rainfall
and coastal storms, and erosion hazards. In North Carolina, under the Coastal Area Management Act
(CAMA) of 1974, all 20 counties classified as „coastal‟ have been required to prepare local land use plans
that include provisions for storm hazard mitigation, post-disaster recovery, and evacuation (Beatly, et al.
2002). Under CRS Activity 430 Higher Regulatory Standards, state-mandated regulatory standards
(SMS), which are included in NC CAMA regulations, are credited up to 45 CRS points. In North
Carolina, only coastal counties receive SMS credit associated with CAMA regulations. To explore
whether coastal counties are receiving CRS credit for higher mandated regulatory standards, we analyze
CRS point data from 2002 – 2008. (CRS points data are not currently available for the time period 1991
– 1996.) A two sample t-test reveals that the mean of CRS points for Activity area 430 is significantly
greater for participating CAMA counties (t = -1.863, p-value < 0.03, df = 123). We interpret CAMA

CRS counties‟ higher Activity 430 points as indicating a rather limited impact of the mandated CAMA
program on county-level flood hazard mitigation (or at least a failure on the part of county officials to
translate hazard mitigation into flood insurance premium discounts by applying for CRS credit). Our data
suggest that, aside from the mandated activities, CAMA counties are not as active in hazard mitigation (as
reflected in CRS participation), but the estimated effect is small. It is possible, however, that coastal flood
hazard mitigation is occurring at the level of waterfront towns and cities, rather than at the county
jurisdiction. The multi-jurisdictional scale of NFIP and CRS makes this possible. The fact that many
coastal counties in North Carolina have limited commercial and residential development, except along
river, estuary, and oceanfront shorelines could give rise to such mitigation patterns. Mitigation activities
across the various jurisdictions remain an important area for future research.
The estimated average partial effect of per capita property tax levy exhibits a positive and statistically
significant sign, which abides our expectations that financial capacity would increase the likelihood of the
policy adoption. Results for the RPM (with flood events) indicate that a $10 increase in average property
tax per capita increases the likelihood of CRS participation by 2.3%, while the RPM (with property
damage) puts the marginal effect at 1.5%. These findings imply that flood hazard mitigation is more
likely to occur in wealthier districts with greater tax revenue and that poorer districts with less financial
capacity may be more vulnerable to flood hazard. We find mixed results concerning competing local
public policy priorities. The level of local expense for education (measured on per pupil basis) reflects
local government investment in public school quality. We expect this could be a strong competitor with
hazard mitigation projects for the limited local budget. The estimated coefficients for local expense per
student are negative (as expected) but not statistic significant in RPMs. The estimates are significant in
LPM (w/ flood events), with a $1 increase in expenditures per student decreasing likelihood of
participation by 2.04%, and in the LPM and PPM (with property damage), with marginal effects of of -
2.4% and -1.4%, respectively. We also consider crime. The estimated effects of crimes per household on
CRS participation are significant, but with unexpected positive signs. A doubling of the crime rate
increases the likelihood of CRS participation by 4.8% in the PPM (w/ flood events), but has a large
impact in the RPM (w/ flood events), estimated at 37.9%.. This result may be due to correlation between
crime and population density (Corr (crime, population density) =0.9101) (as benefits of hazard mitigation
are likely greater in densely populated area). A better proxy for public safety would be the local budget
for public safety or police protection (for which data are unavailable). The statistically significant and
positive coefficient on Hu_density indicates that more densely developed counties are more likely to
participate. According to the result of RPM, increasing houses per square mile by one unit increases the
probability of participation by 0.38%. This could indicate a pure benefit effect (as more homes exposed to
risk increases the benefit of mitigation), but could also reflect greater local government financial capacity
(tax base).
Holding flood experience, hydrological risk factors, and level of resources constant, the influence of
median household income on likelihood of participation in CRS is positive but not statistically significant
in the RPM (w/ flood events). The estimated coefficients in LPM and PPM (w/ flood events) are
negative, but not statistically significant. The percentage of senior citizens in a community has significant
and negative impact on likelihood of participation in CRS. In RPM (w/flood events), the probability of
participation decreases 0.435% for a 1% increase in proportion of senior citizens; we find similar results
for LPM (w/ flood events) and LPM and RPM (w/ property damage). We expect that this result may be
driven by migration patterns of retirees (Deller 1995). Having a temperate climate, varied natural
resources, low cost of living, and favorable tax treatment for former federal employees, North Carolina
has witnessed a tremendous influx of migrating retirees. Due to scenic beauty, hazard-prone areas tend to
be primary destinations for the retiree migration. The potential increase in tax base is particularly
attractive to local governments, but many of the migrant retirees may be uninformed about potential flood
hazards. This is a plausible explanation for the negative effect of senior population, and suggests that
targeted information campaign and education initiatives could be effective at improving flood hazard
mitigation in some areas. The estimated coefficient of College is negative and significant. Our prior
expectations were that counties with more educated residents might have higher demand for mitigation
projects that can lower flood damage. This is a surprising result that deserves further exploration in future
research. For each model, the estimated coefficient for CRS_Muni is positive and statistically significant
at 5% level, and it has a very strong impact on CRS participation. Increasing the number of participating
municipalities within a county by one increases the county participation probability by 38.3% in the RPM
(w/ flood events - 40.8% in the RPM with flood damage). We construe this as evidence of strong
agglomeration and spillover effects in local hazard mitigation. Since hazard identification, management,
and mitigation requires specialized equipment and expertise, more involvement by nested towns and cities
could increase the likelihood of county participation. Causation could also go in the other direction.
Lastly, we find that the number of years since joining regular NFIP has positive but insignificant impact
on likelihood of participating in CRS.
7. Conclusions and Policy Implications
While the dynamics of weather patterns play an important role in the recent growth of damaging floods in
the U.S., intensive development in floodplains and extensive population growth in low lying and coastal
areas have increased human beings‟ exposure to flood hazard. The communities that engage in hazard

mitigation planning and management activities are less prone to flood hazard and recover faster from
disaster than those communities which do not (NOAA 2010). The CRS rewards communities for
undertaking mitigation activities beyond the minimum requirements of NFIP with reduced flood
insurance premiums. Most of the rewarded activities, such as stricter regulation of building codes,
relocation of repetitive loss properties, and education and outreach can reduce injuries, deaths, and
damages and increase the communities‟awareness of and resilience to flood hazards. Since CRS uses
standardized quantitative measures for representing local hazard mitigation activities, it provides an
excellent source of information for empirical analysis of community hazard mitigation decisions.
Evidence of the effectiveness of CRS has been provided in a study by Brody, et al. (2007), which
indicates that flood damage can be decreased by approximately 15% by increasing CRS rating by 1unit.
Participation in CRS, however, is as low as five percent of eligible NFIP communities nationwide.
Similar to CRS, the NFIP is voluntary, but there are strong incentives for participation in NFIP: flood
insurance is generally not available unless the community enrolls in NFIP, and disaster assistant grants
are presumably not available to non-participating local governments (though this provision is not usually
enforced in the wake of a disaster). As a result, community participation in the NFIP has been high, 75%
of all US communities by 2006 (Dixon, et al. 2006). CRS offers incentives for participation in local
hazard mitigation (in the form of reduced flood insurance premiums for individuals in the community),
but has met much lower levels of participation. Bealthely, et al. (1994) argue that a number of CRS
measures could simply be made mandatory as conditions of participation in NFIP. Burby (2006) suggests
the federal government could shift the focus of the flood insurance program from individuals and
businesses to community-level insurance (presumably with the flood premium based on flood hazard
exposure within the jurisdiction, and individual levies reflecting individual level risk) in order to increase
local government commitment to prepare comprehensive plans that pay attention to hazard mitigation.
Given substantial variability in local physical, political, and social conditions, the existing voluntary
framework for local hazard mitigation may have advantages in allowing locals to identify “low-hanging
fruit” while tailoring their hazard mitigation plans to local factors and concerns. In the entire floodplain
management network, disaster assistance and flood insurance are handled at the federal level due to the
existence of greater financial capacity and the larger policy base needed for risk pooling; state
government is to provide policy guidance, technical assistance, and integration of floodplain management
issues within the state; local government, however, is the nexus of comprehensive planning, including
floodplain management, within their jurisdictions. What drives community participation in CRS within
the current framework is an important policy question.
This study provides empirical evidence that describes how county level factors contribute to adoption of
local hazard mitigation projects as recognized by CRS. Understanding the effect of these factors on
community-level decision making can provide for broader knowledge of protection from and
vulnerability to natural hazards and can inform the mitigation-related education and outreach efforts of
NFIP and CRS. Although information campaigns have had limited success in improvement of
households‟ awareness of flood risk (Prater and Lindell 2000), we find that previous flood experience and
physical risk factors have significant influence on voluntary local hazard mitigation activities. And, we
find evidence of greater hazard mitigation in more densely developed areas. Our empirical models
explore the impact of previous flood events and flood related property damage over both the long
(previous five years) and short term (previous year). We find mixed results for the impact of flood events
– flood events in the previous five years increase the likelihood of participation in CRS in two of our
models, but not the preferred model. Flood events in the previous year have a negative impact on
likelihood of participation in one model, which we interpret as reflecting a focus on other issues (such as
recovery) rather than hazard mitigation in the short term following a flood. We find significant impact of
the property damage related to floods, but our empirical estimates are downward biased due to
simultaneity of property damage and CRS participation. Overall, these results indicate that historic flood
impacts could be a more important driver of local hazard mitigation activities than more recent events.
Prater and Lindell (2000) argue that the immediate aftermath of hazard events open up a “window of
opportunity” for local hazard mitigation activities, but this window soon closes as attention shifts to other
pertinent issues, such as job creation, school quality, transportation, and crime. While we find evidence of
positive correlation between local mitigation activity and local financial capacity, our results are not
consistent with previous literature characterization of “windows of opportunity”, as we do find evidence
that flood impacts can influence hazard mitigation over longer time periods. We did try using different
time lags for flood experience (e.g., two- and three-years), but found no statistically significant effects for
more recent flooding events. The effects found for historical flooding may indicate that certain
communities that had have experienced hazards were more likely to enroll in CRS at the program
inception, and those communities continue to obtain credits for hazard mitigation activities, while other
communities are more resistant to voluntary hazard mitigation (and remain unconvinced of the potential
benefits even in the wake of flood events). Therefore, FEMA and state agencies could take a more active
role in demonstrating successful hazard mitigation programs after local flood events, especially focusing
on non-CRS participants. This information sharing project could help local governments understand of
the potential benefits of the flood hazard mitigation projects, which could strengthen their own flood
protection programs.
Moreover, our results suggest that physical risk factors play a significant role in the likelihood of CRS
participation, as does the density of development. With respect to our hydrological risk variables, we find
increasing water body percentage of total land area and greater average rainfall within a county each
significantly increases the likelihood of CRS participation. Meanwhile, mitigation activities are more
likely to occur in densely developed counties. This is encouraging, as it suggests that voluntary adoption
of hazard mitigation activities is more likely to occur in areas that face greater risk and in areas that are
more densely developed. Likelihood of mitigation, however, is lower in coastal counties (that face greater
flood risk due to downstream riparian flooding and storms surge), but the effect is not very large. The
CAMA regulations that apply to these counties mandate setback rules and building code standards to
protect coastal communities from erosion, wind, and storm surge. CRS credits CAMA counties for State-
mandated Regulatory Standards (SMS) up to 45 CRS points under Activity 430. A t-test shows that the
coastal CRS counties have higher score under Activity 430 than non-oceanfront CRS counties (from 2002-
2008). The 45 points awarded, however, are very small and potentially inconsequential in relation to the
total points necessary to decrease CRS score to receive additional discount on flood insurance premiums.
The lower participation level in coastal counties may indicate a lack of appreciation for flood hazard or
hazard mitigation in general. It is also possible that CRS participation is occurring in the smaller
waterfront towns and cities in coastal counties (where development is often more focused).
We find evidence that the proportion of senior and college-educated citizens within a county have
negative influences on the likelihood of CRS participation. By offering significant tax advantages for
military and other federal retirees and due to attractive recreation opportunities, North Carolina has
become a primary destination state for retirement. Data from the U.S. Census (He and Schachlter 2003)
indicates that North Carolina witnessed a 22% senior net migration rate from 1995 to 2000, which ranks
5th in US. While we do not observe senior migration rates in our data, age structure of the community
could reflect these retiree migration patterns. Migrating seniors can induce significant potential for
economic development in scenic, rural communities, and local elected officials may focus more on this
development opportunity (which can create significant economic benefits and a larger tax base) and less
on potential changes in vulnerability to natural hazards that can be associated with rapid economic
development. Migrating retirees from outside the state may be less aware and knowledgeable of flood
hazard and thus could put less pressure on local government to engage in flood hazard mitigation. This
result has implications for targeting of knowledge and outreach programs. Unlike the study of Brody, et
al. (2009), our random effect probit model finds a negative and statistically significant impact for
proportion of college (and higher degree) educated citizens attributed to CRS participation.
Holding risk and population factors constant, the average county property tax levy has a large, positive,
and statistically significant impact on CRS participation. This indicates that financial capacity is an
important determinant of flood hazard mitigation (supporting the findings of Prater and Lindell (2002)),
and suggests that vulnerability may be higher in poorer communities with lower property tax revenue. In
a recent report, NOAA Community Service Center (CSC) (2010) summarizes a number of factors that
contribute to specific risk and resilience-related behavior derived from a series of structured interviews
with local planners. This report concludes that barriers to hazard planning include competing priorities,
among other factors. We find some evidence of competing priorities on CRS participation, as education
expenditures is statistically significant and negative in some models, but the estimated effect of crime rate
is positive (and significant – which was unexpected). The crime rate result may reflect the high
correlation between population density and level of crime. We were, however, limited by available data
in exploring this phenomenon. Future research should attempt to explore the extent to which other local
problems (transportation and economic development) crowd out investments in hazard mitigation.
The CRS community divisions rest on a multi-jurisdictional scale which includes towns, cities, and
counties. Therefore, the county and nested municipalities may exhibit divergent flood-loss reduction
efforts with separate floodplain management ordinance and regulations. In their study, Brody, et al.
(2009) use population-adjusted measures of CRS activities, CRS score, and community-level covariates
to account for nested municipalities and the county itself in their county scale analysis. They find that
local governments adjust their policies to improve risk management efforts after flooding events. Our
analysis is a contribution to the limited literature exploring the influence of flood experience, hydrological
risk, financial capacity, and socio-economic factors on local hazard mitigation decisions. We focus on the
CRS participation decision and only on the county level, primarily because data on covariates are not
readily available at lower jurisdiction levels. We find evidence of agglomeration and spillover effects
among the various jurisdiction levels, as the probability of county participation is augmented by the
presence of nested participating cities and towns; the magnitude of this effect is quite large at 38.2% for a
one unit increase in nested municipality. A more detailed and thorough analysis of the relationship
between hazard mitigation at the level of counties and cities & towns remains an important area for future
research.
References
Amemiya, T. (1985). “Advanced Econometrics.” Cambridge, MA: Harvard University Press.
Anderson, M. B. (2000). “Vulnerability to Disaster and Sustainable Development: A General Framework
for Assessing Vulnerability.” P. 11–25 in R.Pielke, Jr. and R.PielkeSr., eds. Storms (Vol. 1).
London: Routledge.
Association of State Floodplain Managers (ASFM) (2003) “Effective State Floodplain Management
Programs 2003.”
Association of State Floodplain Managers (ASFM) (2007) “National Flood Programs and Policies in
Review 2007.”
Beatley, T., Brower, D. J., and Schwab, A. K. (1994). “An introduction to coastal zone management.”
Washington, DC: Island Press.
Berkes, F. (2007). “Understanding Uncertainty and Reducing Vulnerability: Lessons from Resilience
Thinking.” Natural Hazards 41(2), 283-295.
Bin, O., Crawford, T., Kruse, J., and Landry, C.E. (2008). “Viewscapes and Flood Hazard: Coastal
Housing Market Response to Amenities and Risk.” Land Economics, 84(3), 434–448.
Bin, O., Kruse, J., and Landry, C.E. (2008). “Flood Hazards, Insurance Rates, and Amenities: Evidence
from the Coastal Housing Market.” Risk and Insurance, 75(1), 63–82.
Bjorklund, A. (1985). “Unemployment and Mental Health: Some Evidence from Panel Data.”
Journal o f Human Resources, 20, 469-483.
Brody, S.D., Zahran, S., Maghelal, P., Grover, H., and Highfi eld, W. (2007). “The rising costs of floods:
Examining the impact of planning and development decisions on property damage in Florida.”
Journal of the American Planning Association 73(3), 330–345.
Brody, S.D., Zahran, S., Highfield, W.E., Bernhardt, S.P., and Vedlitz, A. (2009). “Policy learning for
flood mitigation: A longitudinal assessment of the community rating system in Florida.” Risk
Analysis (6), 912-929.
Brody,S.D., Highfield W.E., Kang, J.E, (2011) “Rising Waters: The Causes and Consequences of
Flooding in the United States.” Cambridge University Press, 2011.
Browne, M.J. and Hoyt, R.E. (2000) “The Demand for Flood Insurance: Empirical Evidence.” Journal of
Risk and Uncertainty 20(3), 291-306.
Butler J.S., and Moffitt. R, (1982) “A Computationally Efficient Quadrature Procedure for the One-
Factor Multinomial Probit Model. Econometrica, 50(3), 761-764.
Burby, R.J., and French, S.P. (1981). “Coping with floods: the land use management paradox.” Journal
of the American Planning Association, 47(3), 289-300.

Burby, R. J., and French, S. P., Eds. Cigler, B. A., Kaiser, E. J., Moreau, D. H., and Stiftel, B. (1985).
“Flood Plain Land Use Management: A National Assessment.” Boulder, CO: Westview.
Burby, R.J., May, P.J., Berke, P.R., Dalton, L.C., French,S.P., and Kaiser, E.J. (1997). “Making
Governments Plan: State Experiments in Managing Land Use.” Baltimore, MD: Johns Hopkins
University Press.
Burby, R.J. Eds. (1998). “Cooperating with Nature: Confronting Natural Hazards with Land-use Planning
for Sustainable Communities.” Washington, DC: Joseph Henry Press.
Burby, R.J. (2001). “Flood insurance and floodplain management: the US experience.” Environmental
Hazard, 3,111-122.
Burby, R. J. (2005). “Have state comprehensive planning mandates reduced insured losses from natural
disasters?” Natural Hazards Review, 6 (2), 67–81.
Burby, R. J. (2006). “Hurricane Katrina and the paradoxes of government disaster policy: Bringing about
wise governmental decisions for hazardous areas.” Annals of the American Academy of Political and
Social Science (604),171-91.
Chamberlain, G. (1980). “Analysis of Covariance with Qualitative Data.” Review of Economic Studies.
47, 225-238.
Chivers, J. and Flores N. E. (2002). “Market Failure in Information: The National Flood Insurance
Program.” Land Economics 78, 515-521.
Clark, A. E. (2003). “Unemployment as a Social Norm: Psychological Evidence from Panel Data.”
Journal of Labor Economics, 21(2), 323-51.
Clary, B.B. (1985). “The Evolution and Structure of Natural Hazard Policies.” Public Administration
Review, 40, 20–28.
Dalton, L. C., and Burby, R. J. (1994). “Mandates, plans and planners: Building local commitment to
development management.” Journal of the American Planning Association, 60(4), 444–461.
Das, M., and Arthur, C. S. (1999). “Comparing Predictions and Outcomes: Theory and Application to
Income Changes.” Journal of the American Statistical Association, 94, 75-85.
Deller, S. C. (1995). “Economic impact of retirement migration.” Economic Development Quarterly, 9(1),
25-39.
Dixon, L., Clancy, N., Seabury, S. A., and Overton, A. (2006). “The National Flood Insurance Program‟s
Market Penetration Rate, estimates and policy implications.” Research and Development Corporation
(RAND) research paper sponsored by FEMA.
Federal Emergency Management Agency (FEMA). (1986). A Unified National Program for Floodplain
Management. http://www.fema.gov/hazard/flood/pubs/lib100.shtm
FEMA (2007) National Flood Insurance Program (NFIP) Community Rating System (CRS)
Coordinators‟ Manual,
http://training.fema.gov/EMIWeb/CRS/2007%20CRS%20Coord%20Manual%20Entire.pdf
Gerlach, K., and Stephan, G. (1996). “A paper on unhappiness and unemployment in Germany.”
Economics Letters, 52, 325-30.
Godschalk, D.R. (2003). “Urban Hazard Mitigation: Creating Resilient Cities.” Natural Hazard Review,
(4)3, 136-143.
Greene, W.H. (2002). Econometric Analysis (5th edition). Upper Saddle River, NJ: Prentice Hall.
He, W. and J. P. (2003) Schachter, “Internal Migration of the Older Population: 1995 to 2000,” Census
2000 Special Reports, U.S. Census Bureau.
Kingdon, J.W. (1984). “Agendas, Alternatives, and Public Policies.” New York: Harper Collins.
Kleindorfer P.R., and Kunreuther H. (1999). “The complementary Roles of Mitigation and Insurance in
Managing Catastrophic Risk.” Risk Analysis, 19, 727-738.
Kriesel, W. and Landry, C.E. (2004). “ Participation in the National Flood Insurance Program: An
Empirical Analysis of Coastal Properties.” Risk and Insurance, 71, 405-420.
Korpi, T. (1997). “Is utility related to employment status? Employment, unemployment, labor market
policies and subjective well-being among Swedish youth.” Labour Economics, 4, 125-47.
Krutilla, J.V. (1966). “An Economic Approach to Coping with Flood Damage.” Water Resources
Research 2(2), 183-90.
Kunreuther, H. (1996). “Mitigating Disaster Losses through Insurance.” Journal of Risk and Uncertainty,
12(2-3), 171-187.
Kunreuther, H., Onculer, A. and Slovic, P., (1998). Time Insensitivity for Protective Investments. Journal
of Risk Uncertainty, 16, 279–299
Kunreuther, H., and Roth Sr., R.J. (Ed) (1998). “Paying the Price: The Status and Role of Insurance
Against Natural Disasters in the United States.” Washington. DC: Joseph Henry/National Academy
Press.
Lindell, M.K., and Prater, C.S. (2003). “Assessing Community Impacts of Natural Disasters.” Natural
Hazards Review, 4, 176-185.
MacDonald, D.N., White, H.L., Taube, P.M., and Huth, W.L. (1990). “Flood Hazard Pricing and
Insurance Premium Differentials: Evidence from the Housing Market.” Journal of Risk and
Insurance, 57, 654-63.
May, P., Burby, R., Ericksen, N., Handmer, J., Dixon, J., Michaels, S., Smith, D. (1996). “Environmental
Management and Governance: Intergovernmental Approaches to Hazards and Sustainability.”
Routledge, London.
Matyasl, L., and Sevestr, P. (1992). “The Econometrics of Panel Data. Boston.” MA: Kluwer Academic
Publishers.
Michel-Kerjan, E., and Kousky C. (2010). “Come Rain or Shine: Evidence on Flood Insurance Purchase
in Florida.” Journal of Risk and Insurance, 77(2), 369-397.
Mileti, D.S. (1999). “Disasters by Design: A Reassessment of Natural Hazards in the United States.”
Washington, DC: Joseph Henry Press.
National Oceanic and Atmospheric (NOAA) Administration Coastal Services Center (CSC) (2010).
“Hazard and Resiliency Planning: Perceived Benefits and Barriers Among Land Use Planners, Final
Research Report.”
http://www.csc.noaa.gov/publications/social_science/NOAACSCResearchReport.pdf
Perry, R.W. and Lindell M.K. (2003). “Preparedness for emergency response: guidelines for the
emergency planning process.” Disasters, 27(4), 336–350.
Prater, C. S., and Lindell, M. K. (2000). “The politics of hazard mitigation.” Nature Hazards Review,
1(2), 73–82.
Price Waterhouse Coopers LLP, (1999).” Study of the economic effects of charging actuarially based
premium rates for pre-FIRM structures.” Washington, May 14, 1999.
Schwarze, J. (2003) “Using Panel Data on Income Satisfaction to Estimate the Equivalence Scale
Elasticity.” Review of Income and Wealth, 49, 359-372.
Siegrist, M. and Gutscher, H.(2008). “Natural Hazards and Motivation for Mitigation Behavior: People
Cannot Predict the Affect Evoked by a Severe Flood.” Risk Analysis, 28(3), 771-778.
Soane E, Schubert I, Challenor P, Lunn R, Narendran S, Pollard S, (2010) "Flood perception and
mitigation: the role of severity, agency, and experience in the purchase of flood protection, and the
communication of flood information" Environment and Planning A 42(12) 3023 – 3038.
Wharton Risk Management and Decision Processes Center, (2008). “Managing Large-Scale Risks in a
New Era of Catastrophes.” Philadelphia, PA: University of Pennsylvania.
Winkelmann, L., and Winkelmann, R. (1998). “Why are the unemployed so unhappy? Evidence from
panel data.” Economica, 65, 1-15.
Wooldridge, J. M. (2002). “Econometric Analysis of Cross-Section and Panel Data.” Cambridge
Massachusetts: MIT Press.
Zahran, S., Brody S.D., Peacock W.G., Vedliz A. and Grover H. (2008). “Social Vulnerability and the
natural and built environment: a model of flood casualties in Texas.” Disaster, 32(4).
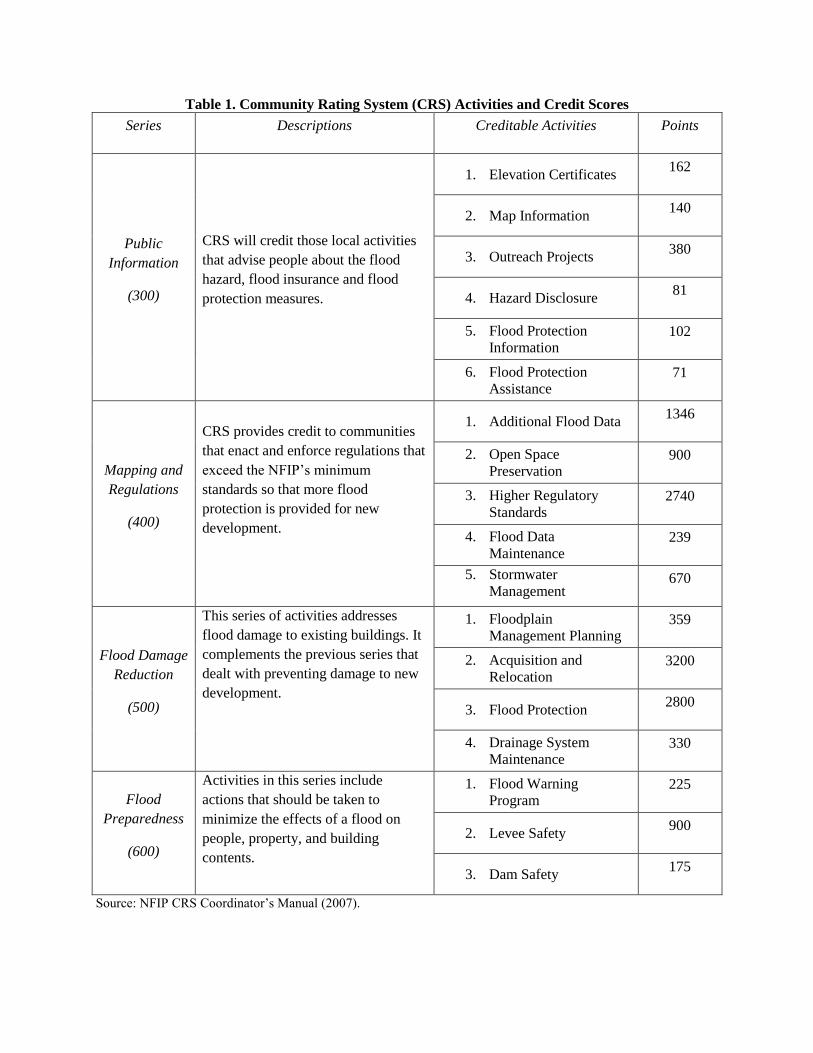
Table 1. Community Rating System (CRS) Activities and Credit Scores
Series Descriptions Creditable Activities Points
Public
Information
(300)
CRS will credit those local activities
that advise people about the flood
hazard, flood insurance and flood
protection measures.
1. Elevation Certificates 162
2. Map Information 140
3. Outreach Projects 380
4. Hazard Disclosure 81
5. Flood Protection
Information 102
6. Flood Protection
Assistance 71
Mapping and
Regulations
(400)
CRS provides credit to communities
that enact and enforce regulations that
exceed the NFIP‟s minimum
standards so that more flood
protection is provided for new
development.
1. Additional Flood Data 1346
2. Open Space
Preservation 900
3. Higher Regulatory
Standards 2740
4. Flood Data
Maintenance 239
5. Stormwater
Management 670
Flood Damage
Reduction
(500)
This series of activities addresses
flood damage to existing buildings. It
complements the previous series that
dealt with preventing damage to new
development.
1. Floodplain
Management Planning 359
2. Acquisition and
Relocation 3200
3. Flood Protection 2800
4. Drainage System
Maintenance 330
Flood
Preparedness
(600)
Activities in this series include
actions that should be taken to
minimize the effects of a flood on
people, property, and building
contents.
1. Flood Warning
Program 225
2. Levee Safety 900
3. Dam Safety 175
Source: NFIP CRS Coordinator‟s Manual (2007).
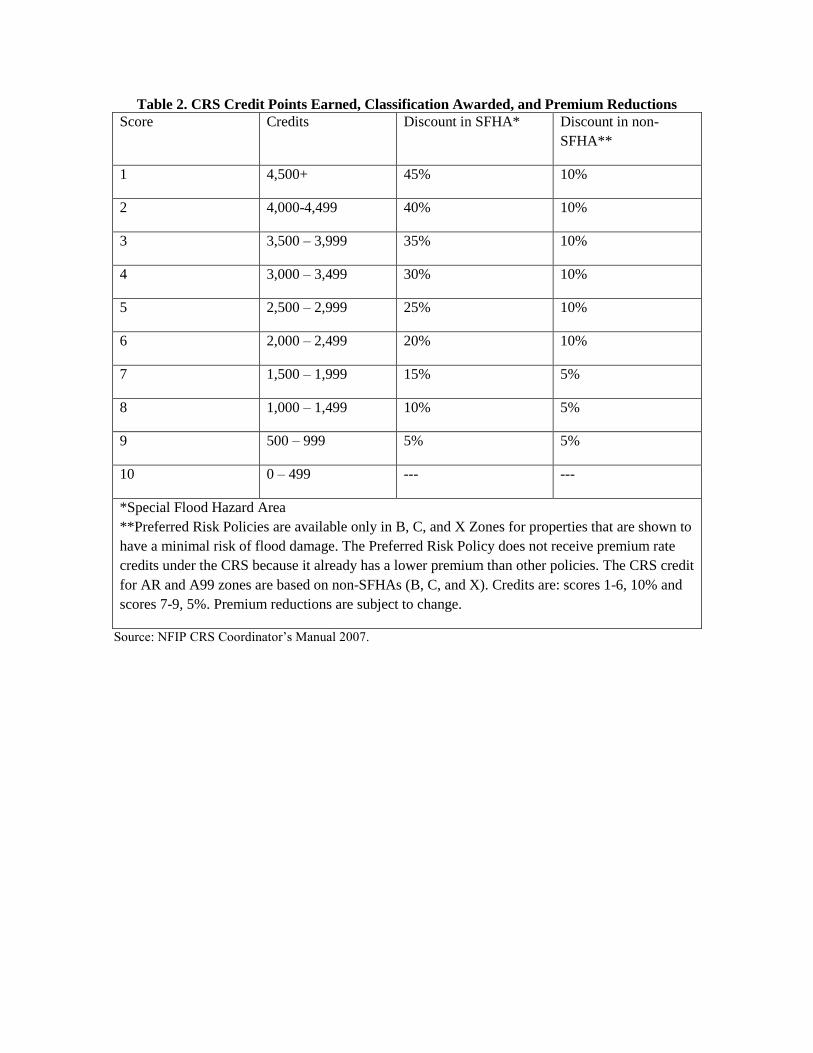
Table 2. CRS Credit Points Earned, Classification Awarded, and Premium Reductions
Score Credits Discount in SFHA* Discount in non-
SFHA**
1 4,500+ 45% 10%
2 4,000-4,499 40% 10%
3 3,500 – 3,999 35% 10%
4 3,000 – 3,499 30% 10%
5 2,500 – 2,999 25% 10%
6 2,000 – 2,499 20% 10%
7 1,500 – 1,999 15% 5%
8 1,000 – 1,499 10% 5%
9 500 – 999 5% 5%
10 0 – 499 --- ---
*Special Flood Hazard Area
**Preferred Risk Policies are available only in B, C, and X Zones for properties that are shown to
have a minimal risk of flood damage. The Preferred Risk Policy does not receive premium rate
credits under the CRS because it already has a lower premium than other policies. The CRS credit
for AR and A99 zones are based on non-SFHAs (B, C, and X). Credits are: scores 1-6, 10% and
scores 7-9, 5%. Premium reductions are subject to change.
Source: NFIP CRS Coordinator‟s Manual 2007.
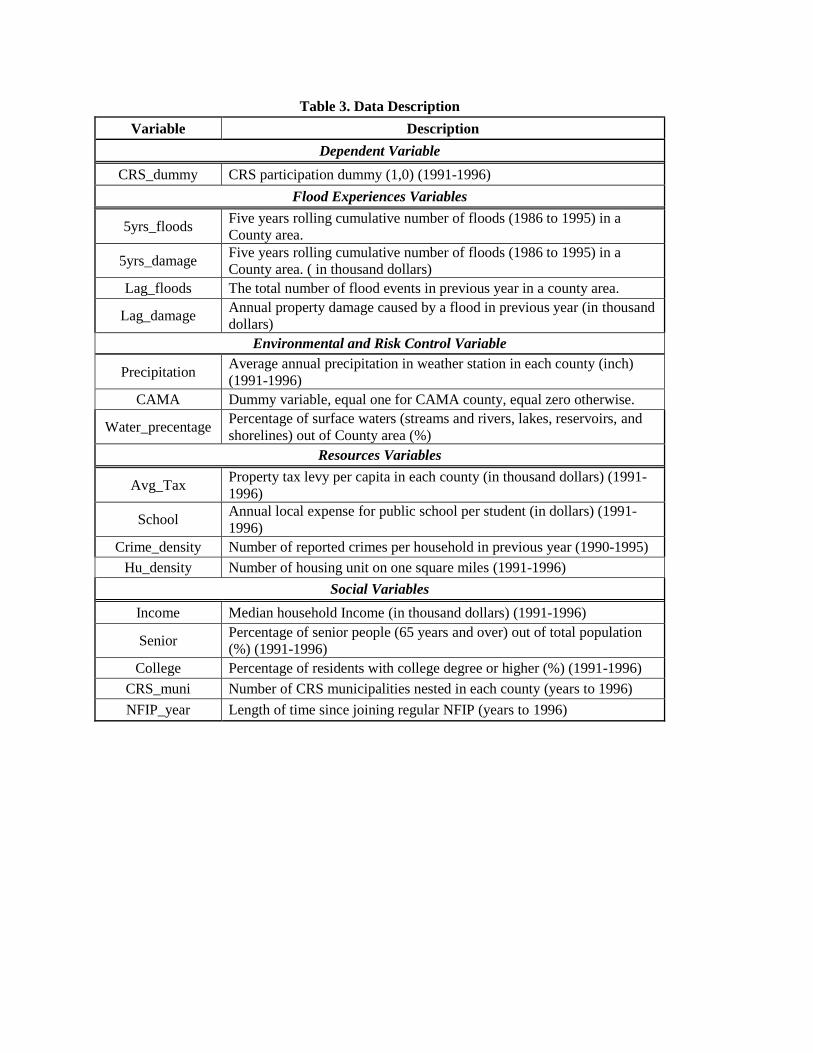
Table 3. Data Description
Variable Description
Dependent Variable
CRS_dummy CRS participation dummy (1,0) (1991-1996)
Flood Experiences Variables
5yrs_floods Five years rolling cumulative number of floods (1986 to 1995) in a
County area.
5yrs_damage Five years rolling cumulative number of floods (1986 to 1995) in a
County area. ( in thousand dollars)
Lag_floods The total number of flood events in previous year in a county area.
Lag_damage Annual property damage caused by a flood in previous year (in thousand
dollars)
Environmental and Risk Control Variable
Precipitation Average annual precipitation in weather station in each county (inch)
(1991-1996)
CAMA Dummy variable, equal one for CAMA county, equal zero otherwise.
Water_precentage Percentage of surface waters (streams and rivers, lakes, reservoirs, and
shorelines) out of County area (%)
Resources Variables
Avg_Tax Property tax levy per capita in each county (in thousand dollars) (1991-
1996)
School Annual local expense for public school per student (in dollars) (1991-
1996)
Crime_density Number of reported crimes per household in previous year (1990-1995)
Hu_density Number of housing unit on one square miles (1991-1996)
Social Variables
Income Median household Income (in thousand dollars) (1991-1996)
Senior Percentage of senior people (65 years and over) out of total population
(%) (1991-1996)
College Percentage of residents with college degree or higher (%) (1991-1996)
CRS_muni Number of CRS municipalities nested in each county (years to 1996)
NFIP_year Length of time since joining regular NFIP (years to 1996)

Table 4. Data Statistics Summary
Variable Mean Std. Dev. Min Max
CRS_dummy 0.138 0.346 0 1
5yrs_floods 1.457 1.340 0 7
5yrs_damage 92.773 419.868 0 6066.27
Lag_floods 0.530 0.693 0 6
Lag_damage 39.194 304.714 0 6059.09
Precipitation 50.072 7.231 37.266 77.916
CAMA 0.200 0.400 0 1
Water_percentage 9.096 29.163 0 225.516
Avg_Tax 0.277 0.098 0.1 0.666
School 0.909 0.302 0.382 2.1
Crime_density 0.106 0.061 0 0.376
Hu_density 63.883 73.256 4.8053 498.279
Income 32.651 6.289 20.4 50.700
Senior 14.242 3.709 4.6467 33.227
College 13.932 7.051 6.77 49.340
CRS_muni 0.465 1.213 0 8
NFIP_year 6.983 4.960 0 23

Table 5. Estimation Result with Flood Events
Models LPM (OLS) Pooled Probit
Radom Effect Probit
Variables Estimated Coeff. Coef. APEs Coef. APEs
(SE) (SE)
(SE)
5yrs_floods 0.043** 0.506** 0.0454 0.076 0.0055
(0.012) (0.097)
(0.566)
Lag_floods -0.023 -0.295* -0.0265 -0.483 -0.0331
0.023 (0.180)
(0.655)
Precipitaion 0.002** 0.063** 0.0057 0.592** 0.0835
(0.001) (0.012)
0.172)
CAMA -0.067** -1.923** -0.0850 -13.482** -0.0066
(0.035) (0.610)
(4.109)
Water_percentage 0.005** 0.065** 0.0058 0.308** 0.0179
(0.001) (0.014)
(0.067)
Avg_Tax 0.396** -0.552 -0.0496 20.452** 2.2497
(0.206) (1.405)
(10.016)
School -0.204** -0.664 -0.0596 -0.234 -0.0182
(0.090) (0.686)
(3.507)
Crime_density -0.252 5.368** 0.4818 38.085** 3.7988
(0.205) (1.670)
(11.593)
Hu_density 0.002** 0.015** 0.0014 0.043** 0.0038
(0.0002) (0.002)
(0.017)
Income -0.003 -0.004 -0.0004 0.125 0.0127
(0.002) (0.022)
(0.195)
Senior -0.006** -0.053 -0.0047 -1.058** -0.0044
(0.003) (0.035)
(0.437)
College 0.007** -0.002 -0.0002 -0.451** -0.0132
(0.003) (0.023)
(0.215)
CRS_muni 0.064** 0.719** 0.0645 4.701** 0.3826
(0.016) (0.152)
(0.945)
NFIP_year -0.001 -0.042 -0.0038 0.227 0.0188
(0.002) (0.028)
(0.198)
Constant -0.024** -5.638 - -40.436** -
(0.103) (1.052)
(10.673)
Pseduo R^2 0.537 0.650
0.560
Log-likelihood - -83.37 - -49.18 -
Obs 580 580
580
Note: * means that the estimation is significant at 10%; ** means that the estimation is significant at 5%.
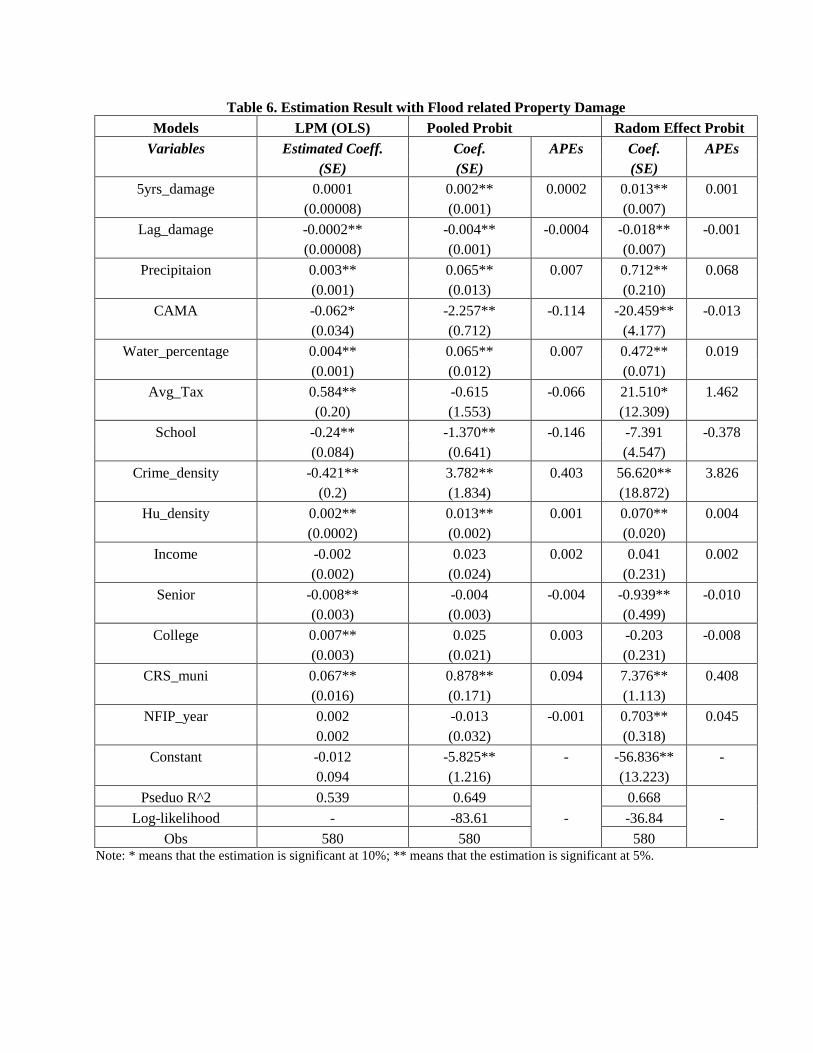
Table 6. Estimation Result with Flood related Property Damage
Models LPM (OLS) Pooled Probit
Radom Effect Probit
Variables Estimated Coeff. Coef. APEs Coef. APEs
(SE) (SE)
(SE)
5yrs_damage 0.0001 0.002** 0.0002 0.013** 0.001
(0.00008) (0.001)
(0.007)
Lag_damage -0.0002** -0.004** -0.0004 -0.018** -0.001
(0.00008) (0.001)
(0.007)
Precipitaion 0.003** 0.065** 0.007 0.712** 0.068
(0.001) (0.013)
(0.210)
CAMA -0.062* -2.257** -0.114 -20.459** -0.013
(0.034) (0.712)
(4.177)
Water_percentage 0.004** 0.065** 0.007 0.472** 0.019
(0.001) (0.012)
(0.071)
Avg_Tax 0.584** -0.615 -0.066 21.510* 1.462
(0.20) (1.553)
(12.309)
School -0.24** -1.370** -0.146 -7.391 -0.378
(0.084) (0.641)
(4.547)
Crime_density -0.421** 3.782** 0.403 56.620** 3.826
(0.2) (1.834)
(18.872)
Hu_density 0.002** 0.013** 0.001 0.070** 0.004
(0.0002) (0.002)
(0.020)
Income -0.002 0.023 0.002 0.041 0.002
(0.002) (0.024)
(0.231)
Senior -0.008** -0.004 -0.004 -0.939** -0.010
(0.003) (0.003)
(0.499)
College 0.007** 0.025 0.003 -0.203 -0.008
(0.003) (0.021)
(0.231)
CRS_muni 0.067** 0.878** 0.094 7.376** 0.408
(0.016) (0.171)
(1.113)
NFIP_year 0.002 -0.013 -0.001 0.703** 0.045
0.002 (0.032)
(0.318)
Constant -0.012 -5.825** - -56.836** -
0.094 (1.216)
(13.223)
Pseduo R^2 0.539 0.649
0.668
Log-likelihood - -83.61 - -36.84 -
Obs 580 580
580
Note: * means that the estimation is significant at 10%; ** means that the estimation is significant at 5%.