Papers in Population Ageing No. 2 - UNFPA Asia-Pacific
122
-
Upload
khangminh22 -
Category
Documents
-
view
1 -
download
0
Transcript of Papers in Population Ageing No. 2 - UNFPA Asia-Pacific


Papers in Population Ageing No. 2
Migration and Intergenerational Solidarity:Evidence from Rural Thailand
John KnodelJiraporn KespichayawattanaSuvinee WiwatwanichChanpen Saengtienchai
UNFPA Thailandand Country Technical Services Teamfor East and South-East Asia, BangkokSeptember 2007

Acknowledgements
This report is the culmination of several yearsof work that started with a pilot project consistingof 29 open-ended interviews by the researchteam in 2004 with older age parents withmigrant children in four rural communities inThailand. We are most grateful to these parentswho shared in detail their experiences andfeelings related to their relationships with boththeir migrant and non-migrant children. Welearned enormously from them. It was mainlythe insights they provided that enabled us todevelop a survey questionnaire that we believeat least starts to capture the richness and complexityof their experience and that of other parents intheir situation. Thus in a very real sense ourcurrent project grew out of what these parentstold us about their own lives. We are gratefulto the Population Studies Center of the Universityof Michigan for supporting that pilot projectwith funds provided by a grant from the MellonFoundation entitled “Research and Training inthe Demography of Urbanization, InternalMigration, and Urban Life in DevelopingCountries”. We also thank Zachary Zimmer forhelpful comments he made on earlier versionsof the questionnaire.
We are of course also greatly indebted to theover 1,000 parents who were willing to beinterviewed for the survey on which this reportis based. The interviews were sometimes quitelong and the information we asked quite detailed.Yet with few exceptions the respondents seemedpatient and understanding of the need for theinformation they provided. Funding for theMigration Impact Survey was provided by agrant to the Chulalongkorn University, Faculty ofNursing from the Thailand Research Fund (TRF)through the National Health Foundation (NHF).We are very grateful to the guidance providedby reviewers recruited by the funding agencies toevaluate our proposal. Last but not least, we aregrateful to the Thailand Country Office of theUnited Nations Population Fund (UNFPA) whomade the technical assistance of the senior authorpossible through a special services agreement(SSA). In particular, we thank Mr. G. Giridhar,Director of Country Technical Services Team-Bangkok and UNFPA Country Representativein Thailand for his confidence in our researcheffort and for his patience during the lengthyperiod it took us to carry out the work.
iv
John KnodelPopulation Studies Center, University of Michigan
Jiraporn KespichayawattanaFaculty of Nursing, Chulalongkorn University
Suvinee WiwatwanichFaculty of Nursing, Chulalongkorn University
Chanpen SaengtienchaiIndependent Researcher

Foreword
v
Population ageing is an inevitable consequenceof sustained decline in fertility together withincreasing longevity. It is taking place at a muchfaster rate in the developing countries today thanin the developed countries since the 1960s. Forexample, it is estimated that in East Asia, olderpersons of age 60 years and above will outnumberchildren of 15 years and below by the year 2018.In Thailand, this tipping point will be reachedby 2020. Such emerging shifts in age structurewill have significant implications to policies andprogrammes for older persons.
The International Conference on Population andDevelopment (ICPD) held in Cairo in September1994 called for: (a) enhancing self reliance andpromoting quality of life of older persons; (b)developing systems of improving health care aswell as systems of economic and social security inold age; and (c) providing formal and informalsupport to enhance the ability of families to takecare of elderly within the family. The MadridInternational Plan of Action on Ageing (MIPAA)adopted at the Second World Assembly on Ageingin Madrid in 2002 echoed the need for similaractions.
UNFPA’s work in population ageing is nowguided by MIPAA with its three priority area:(a) older persons and development; (b) advancinghealth and well being into old age; and (c) ensuringenabling and supportive environment. The Fundwill continue to advocate for effective policyresponse to this emerging challenge and formainstreaming ageing issues into nationaldevelopment frameworks and poverty reductionstrategies.
The Country Technical Services Team (CST) ofUNFPA in Bangkok recently launched the series,Papers in Population Ageing, with the firstissue providing a situation analysis at the regionaland country level. This second publication inthat series, based on a study conducted by Prof.John Knodel and his team, examines the impactof out-migration from rural areas in Thailandon intergenerational solidarity. With increasingmigration of young adults from rural areas to thetowns and cities, Thailand offers an interestingcase to examine the implications of migration formaintenance of relationships among familymembers of different generations. The Reportprovides extensive evidence from the firstsystematic survey focusing specifically on thisissue. It thus provides a unique basis for assessingthe complex implications of out-migration onolder parents remaining behind in rural areas. I wish to thank the research team led by ProfessorJohn Knodel, the senior author, consisting of theproject director, Ms. Jiraporn Kespichayawattana andher able associates Ms. Suvinee Wiwatwanichand Chanpen Saengtienchai. The research addressesthis important but under researched topic andprovides findings that are very relevant toformulation of realistic policies for improving thelives of the rural elderly in Thailand. Thesefindings could also be relevant to other countrieswith similar circumstances.
G. GiridharDirector CST for E & SE Asia
and UNFPA Representative in Thailand

Acronyms
ADL Activities of Daily Living
IADL Instrumental Activities of Daily Living
MCA Multiple Classification Analysis
MIS The Migration Impact Survey
NHF National Health Foundation
SSA Special Services Agreement
SWET The Survey of Welfare of Elderly in Thailand
TRF Thailand Research Fund
UNFPA United Nations Population Fund
vi

Contents
Acknowledgements ............................................................................................................................................................... iv
Foreword ..................................................................................................................................................................................... v
Acronyms ................................................................................................................................................................................... vi
Executive Summary .............................................................................................................................................................. xi
Section 1: Introduction ..................................................................................................................................................... 1
Section 2: Socio-Economic Context ......................................................................................................................... 3
Section 3: Data and Measures .................................................................................................................................... 63.1 Source of data ............................................................................................................................ 63.2 Measures and definitions ......................................................................................................... 8
Section 4: Basic Characteristics of Respondents ........................................................................................... 10
Section 5: Family and Living Arrangements ....................................................................................................... 21
Section 6: Children’s Support to Aged Parents ................................................................................................. 256.1 Material support and household assistance .......................................................................... 256.2 Social support and contact ....................................................................................................... 326.3 Health care assistance ................................................................................................................ 34
Section 7: Parents’ Contributions to Migrant Children ................................................................................. 38
Section 8: Impacts on Parents’ Well-Being ........................................................................................................ 448.1 Current economic status ........................................................................................................... 468.2 Satisfaction with children .......................................................................................................... 518.3 Desertion of parents ................................................................................................................ 53
Section 9: Conclusions .................................................................................................................................................... 58
Endnotes ...................................................................................................................................................................................... 61
Bibliography .............................................................................................................................................................................. 64
Annex I: Methodology of the Migration Impact Survey ............................................................................ 67
Annex II: Questionnaire for the Migration Impact Survey ........................................................................ 73
Annex III: Guidelines for Semi-Structured Interviews with Community Leadersin Connection with the Migration Impact Survey ..................................................................... 106
vii

List of Tables Page
Table 1: Number of respondents in the Migration Impact Survey,by age cohort and province ............................................................................................................. 7
Table 2: Basic demographic characteristics of respondents, by age cohort ............................................. 10Table 3: Indicators of material well-being, by age cohort ......................................................................... 12Table 4: Per cent with children in selected locations, by age cohort of respondent ............................ 14Table 5: Socio-demographic characteristics of children, by age cohort
of respondent (parent) ..................................................................................................................... 15Table 6: Location and migration of children, by age cohort of respondent (parent) ......................... 17Table 7: Socio-demographic characteristics of children, by location relative to parent .......................... 18Table 8. Household composition and living arrangements, by age cohort ........................................... 22Table 9: Work status, sources of income and sources of material support, by age cohort .............. 26Table 10: Material support and household assistance from coresident children
age 16 and over, by age and marital status of child .................................................................. 27Table 11: Per cent of respondents living in a household with selected items, per cent
for whom a child bought the item, and per cent distribution of the childrenwho bought the item according to location of child at the time ........................................... 30
Table 12: Major assistance provided to parents by children and location of childat the time .......................................................................................................................................... 32
Table 13: Attitudes related to migration and health care and assistance from migrantchildren in relation to health care ................................................................................................... 35
Table 14: Problems and assistance with physical functioning, activities of daily living (ADL)and instrumental activities of daily living (IADL), by age cohort ........................................... 37
Table 15: Major financial assistance provided by parents to children and locationof child at the time .......................................................................................................................... 39
Table 16: Grandchild care, by age cohort of respondent ............................................................................ 41Table 17: Per cent distributions of migrant children and parents according to the net
balance of material exchanges between migrant children and parents,by age cohort of parents ................................................................................................................. 46
Table 18: Current subjective and objective economic status scores by selectedpotential influences ............................................................................................................................ 48
Table 19: Current subjective and objective economic status scores by numberof migrant children ........................................................................................................................... 50
Table 20: Per cent of current migrant children age 16 and older who had minimalor no social contact with respondent and provided little or no materialsupport during prior year ................................................................................................................ 54
Table 21: Per cent distribution of respondents who have at least one child whocurrently lives outside the district according to hierarchical categories of the levelof social contact or material support by at least one child during the prior year,by age cohort of respondent .......................................................................................................... 56
Table 22: Per cent distribution of respondents according to hierarchical categoriesof the level of social contact or material support by at least one child duringthe prior year, by number of children age 16 and over ............................................................ 57
viii

List of Figures Page
Figure 1: Trends in living arrangements of Thai parents age 60 and over, based onnational surveys of older persons ................................................................................................. 4
Figure 2: Number of living children (% distribution), by age cohort ..................................................... 11
Figure 3: Current health status, by age cohort .............................................................................................. 11
Figure 4: Per cent of households with selected possessions: Comparison of the 1995Survey of Welfare of Elderly in Thailand (SWET) and 2006 MigrationImpact Survey (MIS) ......................................................................................................................... 13
Figure 5: Subjective and objective economic status scores (in percentiles), by agecohort and province .......................................................................................................................... 14
Figure 6: Per cent of children of older age parents who live outside their parents’ provinceof residence, by age: Comparison of the 1995 Survey of Welfare of Elderly inThailand (SWET) and the 2006 Migration Impact Survey (MIS) ........................................... 20
Figure 7: Per cent living with or nearby a child among respondents with and without anychild outside the province, by age cohort ..................................................................................... 23
Figure 8: Living arrangements of parents by number of living children and livingarrangements of children by size of sibship ............................................................................... 23
Figure 9: Household composition in relation to grandchildren ................................................................ 24
Figure 10: Per cent of non-coresident children age 16 and over providing different typesof support to parents during prior year, by location of child ................................................ 28
Figure 11: Per cent of non-coresident children age 16 and over who gave over 5,000 bahtto parents in prior year, by location relative to parent and type of area ............................... 29
Figure 12: Frequency of visits between non-coresident children and parents during prior year,by location of child ........................................................................................................................... 33
Figure 13: Phone possession and frequency of phone contact between migrant childrenand parents during prior year, by location of child ................................................................... 34
Figure 14: Most frequent contact with any child among respondents with at least onemigrant child (living outside of district), by age cohort ............................................................ 34
Figure 15: Per cent distribution of location of children who are main providers ofassistance for parents who have difficulties with physical functioning, activitiesof daily living (ADL), and instrumental activities of daily living (IADL) ............................. 37
Figure 16: Per cent of respondents who gave major financial help and per cent whoprovided farm produce to a migrant child among respondents who hadat least one migrant child ................................................................................................................ 41
Figure 17: Per cent distribution of migrant children according to amount remittedto respondent in prior year, by whether the respondent (parent of migrant)is caring for the migrant’s own child ............................................................................................. 43
ix

Figure 18: Per cent distributions of children who ever migrated according to net balance ofmaterial exchanges with parents during entire period away, by initial destination ................ 44
Figure 19: Per cent of respondents who coreside with at least one child age 16 or older,by the number of children who ever migrated and by number of migrant childrenwho currently live in urban areas ................................................................................................... 49
Figure 20: Adjusted mean subjective and objective current economic status scores ................................ 51
Figure 21: Per cent of respondents according to degree of satisfaction with financialand other material support provided, by current migration status of childrenage 16 and over ................................................................................................................................. 51
Figure 22: Per cent of respondents who are very satisfied with assistance from childrenwith health care and care when ill, by current migration status of childrenage 16 and over and age cohort of respondent .......................................................................... 52
Figure 23. Per cent of respondents who are very satisfied with assistance, concern andrespect from children, by current migration status of children age 16 and over .................. 53
x

Executive Summary
Migration of adult children from rural areas is aninexorable component of the socio-economic changetaking place throughout the developing world.How this migration affects the well-being of theolder age parents who remain behind is a matterof considerable debate. International forumsconcerned with advocacy and mass media accountstend to see the dispersion of children, especiallyto urban areas, as undermining the family andleading to the loss of economic, social andpsychological support and personal care to elderlyparents from absent children. In contrast socialscientists tend to depict migration as benefitingeconomically both migrant children and familymembers who remain behind and stress the abilityof families to adapt to changing circumstances.
The Migration Impact Survey, conducted in 2006in Thailand, is the first survey to directly focus onthis issue and provides a unique source forexploring the subject based on systematicallycollected data. The survey purposively targetedthree age cohorts (50-54, 60-64 and 70-79) andprovides information on the economic, social,physical and psychological well-being of therespondent as well as detailed information abouteach of the respondent’s children. The particularchoice of cohorts permits comparisons associatedwith life course stages and changing family sizeassociated with past fertility decline, features thatare likely to bear on the impact that migrationof adult children could have on older age parents.A total of 1011 interviews were completed inrural or peri-urban localities in three provinces(Nakorn Ratchasima, Si Sa Ket, and KamphaengPhet) with relatively similar numbers obtainedfor each cohort in each province.
Migration of young adults from rural and peri-urban areas is very common in Thailand. Thevast majority of the survey respondents have at
least one child who left the parents’ district andabout three-fourths have at least one child thatcurrently lives outside their province and a fewhave a child currently living abroad. There isvery little difference across the cohorts in theserespects. Return migration is also common.Almost 30 per cent of those who migrated hadreturned by the time the survey took place.According to the respondents, concern aboutparents’ welfare was said to be a major reason forreturning for 60 per cent of the migrant childrenwho did return.
The results make clear that contrary to alarmistviews promoted by the mass media and someadvocacy groups, in Thailand migration of adultchildren has not led to widespread desertionof rural elderly. Very few rural elderly have lostcontact with all their children and been left tofend for themselves. Rather, most older age parentsstill live with or very nearby an adult child andthe large majority of migrant children maintainsocial contact with parents and provide at leastsome financial support. Moreover, children whohave moved to urban areas, especially to Bangkok,are more likely to provide significant remittancesthan children who migrated to elsewhere inThailand, likely reflecting the greater earningopportunities in cities, and are at least as likely tomaintain social contact, a process facilitated bythe higher proportion of urban than rural migrantswho have phones. Thus fears that urban settings,and hence the process of urbanization, particularlyerode the filial allegiances of migrant childrenseem unwarranted.
The ability of migrant children and their parentsin Thailand to maintaining social contact hasclearly been enhanced by the development ofcellar phone technology and the sharply reducedcosts of calls thus greatly expanding accessibility
xi

to persons with modest incomes. In contrast toless than a decade ago when phones were a rarityin rural households, most older persons in ruralareas and their migrant children now have accessto one. According to our survey, two thirds ofmigrant children talked with the respondent atleast once a month on the phone and fourfifths had phone contact at least several timesduring the past year. Such contact permitsmaintenance of social support despite geographicalseparation. The greatly improved ability tocommunicate by phone also means that parentscan reach geographically dispersed childrenquickly in case of a health crisis. In addition,improved roads and means of transportationenable children living elsewhere to more rapidlyreach parents to provide assistance and atleast temporary care if no children reside nearby.
Although migration of younger family membersto urban areas in Thailand has not lead to theany substantial desertion of rural elderly, it islinked to both benefits and disadvantages forolder age parents who remain behind. Remittances,especially when the amount of support is quitesubstantial, contribute to parents’ material well-being.Such financial help includes paying for majorhousehold appliances, paying for significantimprovements of the parents’ home, or evenbuying a new house for the parents. In general,longer distance migration results in greaterfinancial benefits for parents than shorter distancemigration. Migration abroad has the greatestmaterial benefits but is relatively rare. Migrationwithin Thailand has more favourable financialconsequences for parents when it is to urbanareas. Children who move away but remain inthe local area also contribute financially to parentsbut on average in lesser amounts than childrenwho migrate elsewhere.
Material exchanges between parents and migrantchildren occur in both directions. It is not unusualfor parents to provide major financial supportto children, including those who migrated, inresponse to special circumstances. A substantialshare of older age parents also provide animportant service for migrant children by takingresponsibility for grandchildren left in their
care. Thus the net balance of material exchangesbetween parents and their migrant children is notnecessarily in the parents favour. Results fromthe Migration Impact Survey indicate that whilethe net balance more often than not favoursparents the chances of being so is considerablygreater with respect to children who migrateto Bangkok than elsewhere in Thailand.
Migration impedes services requiring face-to-facecontact. Children who remain near, and especiallythose who remain coresident, are much moreimportant sources of services that need to beperformed frequently and on a sustained basis tobe meaningful such as assistance with householdchores, help with most types of householdeconomic activities, or providing meals. It is notuncommon, however, for migrant children totake parents for treatment outside the parents’locality, presumably to superior facilities, or totemporarily return home to care for parents incase of a serious illness.
Some idea of what the future holds for ruralelderly in Thailand is suggested by the age 50-54cohort of respondents. Despite their substantiallysmaller family sizes compared to older cohorts,they are just as likely to have children whomigrate and as a result are less likely to live with agrown child. Since smaller family sizes make itmore difficult to have both children remaining athome and others migrating, unless migrationreduces, coresidence is likely to continue to declineas future cohorts with even smaller familiesenter the elderly age span. Given that the surveyresults indicate that living with a grown childis associated with a number of advantages forparents, the declining trend in coresidence raisesconcerns about its impact on the well being ofThailand’s future elderly. The experience of the50-54 cohort provides some basis for optimism inthis respect. This cohort is even less likely thantheir older counterparts to have lost contactwith children who migrate as indicated by higherfrequencies of both visits and phone calls.Moreover, despite their smaller family sizes andlower levels of coresidence, they are at least aslikely as the older parental cohorts to say thatthey are very satisfied with their children in
EXECUTIVE SUMMARY
xii

terms of all the forms of support and assistanceasked about in the survey.
Clearly migration of grown children has bothbenefits and disadvantages for the ‘left behind’parents that often vary with the life course stagesof the parents and their adult children. Given thecross-sectional nature of the Migration Impactsurvey data and the descriptive nature of theanalyses, causal connections remain uncertain.Nevertheless, the results are at least suggestive ofa Thai family in which parents and adult childrenexercise human agency to adapt to the changesin the social and economic environment broughtabout by development in ways that are notnecessarily detrimental to their intergenerationalrelations. Overall, most rural based parents andtheir migrant children appear to be adapting tothe increasing need to live separately in waysthat permit maintaining family relationships andproviding each other with support.
The rapid transition to low fertility severaldecades ago will pose new challenges for the nextgeneration of elderly parents and their smallernumber of adult children. Thus the currentsituation, in which some siblings migrate whileothers remain with their rural elderly parents’,will become increasingly difficult to maintain.This could substantially change the implications ofmigration for the well being of the parents,especially when illness or frailty sets in and dailypersonal assistance is needed. It thus seems
likely that in future decades, as parents with smallfamilies become common within the oldest agegroups, there will be an increasing need forcommunity based health services to meet theneeds of elders who require long term personalcare but who have no adult child living nearbyto provide it. Hence in planning for meeting theneeds of rural elderly in the future, the governmentwould be wise to expand community based healthservices for frail and chronically ill elders.Fortunately the Thai government is makingsome efforts in this direction already. Forexpanded community based programmes to havemaximum success, however, efforts need to bemade to change prevailing attitudes to increasethe acceptability of critical personal care fromothers besides adult children.
At this point, it is premature to conclude that thebalance between positive and negative effects ofmigration for rural Thai elders will necessarilybecome less favourable. Many other changes willaccompany the shift in numbers of living children.Thus adjustments to changing living arrangementswill occur in a different social, economic, andtechnological context than has prevailed duringthe period of the present research. Monitoring thesituation of rural Thai elders in this changingcontext is crucial for developing and modifyingpolicies and programmes that realistically addressthe needs of the rapidly increasing older population.The findings documented in this report shouldprovide a useful baseline for such efforts.
EXECUTIVE SUMMARY
xiii

1
Section 1: Introduction
The present report explores the impact of migrationof adult children in Thailand on the well-beingof their parents who remain behind in rural orperi-urban areas. It is based primarily on a recentsurvey especially designed for this purpose. Thedata relate to a wide range of potential impactsand permit examination of both positive andnegative consequences for the parents. This reportfocused on implications for economic and socialwell-being. As far as we are aware, this is the firstsurvey specifically designed to address the impactof migration of children on older age parents,not only in Thailand but in South-East Asia andperhaps other regions of the developing worldas well. It provides a unique opportunity toshed light of the applicability of the differentperspectives described below within a particularlyinteresting social, economic and cultural setting.
During the last four decades, Thailand experiencedprofound demographic change including arapid transition from high to low fertility andlarge increases in life expectancy. As a result, thepopulation is ageing and the size of the olderpopulation has increased substantially. During mostof this period, economic development proceededrapidly resulting in a shift in the labour force awayfrom agriculture together providing the impetusfor large scale migration of young adults fromrural to urban areas in search of non-agriculturalemployment (Osaki, 1999; Curran et al., 2003). Atthe same time, old age support, as in much of thedeveloping world, remained largely a familyresponsibility, depending particularly on thefulfillment of the filial obligations of adultchildren. Under such circumstances, the migrationof young rural adults to urban areas in the courseof economic development is often viewed with alarmin the mass media and among observers concernedwith the well-being of rural elderly (e.g., Bernama,2007; Charasdamrong, 1992; Charoenpo, 2007).
This alarmist view is summarized succinctly in the2nd UN World Assembly on Ageing Plan ofAction: “In many developing countries... the ageingpopulation is marked in rural areas, owing to theexodus of young adults. Older persons may beleft behind without traditional family supportand even without adequate financial resources”(United Nations, 2002, paragraph 29). Evidencesupporting this position, however, is typicallyanecdotal and systematic empirical investigationsare largely lacking (Kreager, 2006). Similarstatements of concern are echoed throughout theliterature on ageing in developing countries(e.g., Jamuna, 1997; Kosberg & Garcia, 2004;Sen, 1994, p. 10; UNFPA, 2002a, p. 19; UNFPA,2002b, forward). In addition, the fact that personsapproaching older ages will have fewer children todepend on in their later years as a result of thefertility decline of past decades is seen as potentiallyfurther threatening their welfare (Jones, 1993;Kinsella, 1988; UNFPA, 2002b, forward). Thesenegative portrayals of the impacts of migration andreduced family size fit within a broader argumentthat the general process of ‘modernization’ ordevelopment, of which urbanization and thetransition to low fertility are parts, is underminingthe extended family including its function asa source of old age support (Aboderin, 2004;Hermalin, 2003).
Much of the academic literature on migration,especially as related to the developing world,provides an alternative perspective. Both theoreticalarguments and empirical studies depict theconsequences in a more positive light. Migrationis typically seen as part of a household strategy todiversify risks for families and as benefiting bothmigrant and non-migrant members, includingpresumably older age parents who remain in theplace of origin (Cai, 2003; Stark & Lucas, 1988; Stark& Bloom, 1985; Vanwey, 2004). This literature,

2
however, rarely specifically addresses the impactson older age parents in the sending areas.Moreover, the focus of these studies is typicallylimited to implications for economic exchangesrather than the fuller range of support thatchildren potentially provide parents such associal interaction, assistance with daily living,and caregiving services related to health.
One perspectivein the academicliterature thatdoes consider abroader range ofthe impacts dealswith how familyrelations andstructure changeas societies passfrom agrarian toindustrial andthen to postin-dustrial forms.This perspectiveprovides boththeoretical reason-ing and empiricalevidence sugges-ting that impacts on the type of support beingconsidered are responsive to changing contexts.From this perspective, modernization does not leadto the demise of extended family relations butinstead to a modified version that is adapted to thechanged circumstances and the dispersion of itsmembers (Litwak, 1960; Litwak & Kulis, 1987;Smith, 1998). According to this view, advances intechnology, especially with respect to transportationand communication, permit family members tomaintain close contact and to fulfill some, if notall, of the responsibilities to each other, includingfilial obligations to older age parents that previouslyrequired geographical proximity. The proponentsof this view recognize that different services vary
in their dependence on geographic proximity(Litwak & Kulis, 1987). Key determiningdimensions are: (1) the extent to which servicesrequire face-to-face contact, and (2) the frequencywith which the service must be delivered to beeffective. Also of importance is the duration thatthe service is needed. Services dependent onfrequent face-to-face contact over long durations
require proximity.If face to faceinteraction is notnecessary, thensocial contact andcertain types ofemotional sup-port, for example,can be sustainedover the phonefor reasonablylong periods. Inaddition someservices are neededonly for shortperiods of timeeven though theyrequire frequentface-to-face contactduring that period
as in the case of temporary health crises. Thesecan be met by short visits of children who live ata distance by using modern means of transportationand taking temporary absences from work.
So far, the concept of a ‘modified extended family’has mainly been discussed in the context ofeconomically advanced Western countries.Nevertheless, the modes through which importantfamily functions can be fulfilled over geographicaldistance and the extent to which they are maintainedin a changing society merit exploration in othersettings. Thailand provides a particularly interestingcase for this purpose given the rapid pace atwhich development has been taking place.
SECTION 1: INTRODUCTION
“Typical house in rural northeastern Thailand”.

3
Section 2: Socio-Economic Context
In the three decades between 1975 and 2005, thenumber of Thais age 60 and older more thantripled to over 7 million and their share of thetotal population more than doubled from 5.5 to11.3 per cent (UN Population Division, 2007). Theincreasing share of older persons in the populationis largely attributable to the substantial reductionof fertility during the last few decades. Accordingto the United Nations, the total fertility rate fellfrom over 6 in the early 1960s to under 2 by theturn of the 21st century with by far most of thedecline occurring before 1990 (UN PopulationDivision, 2007). At the same time, life expectancyincreased by almost 20 years since the early 1950s.Since the current generation of older Thaisestablished their families when fertility was stillhigh, persons aged 60 and over still averagedover 4 living children in 2002 (Knodel et al., 2005).However, those in their early 50s averaged lessthan 3 living children, reflecting the past trendsin fertility decline (original calculations). At thesame time, the adult children of older personstend to have much smaller families with few desiringmore than two children (Knodel et al., 1992).
Between the 1960s and the economic crisis thatengulfed much of the region in the late 1990s,Thailand experienced annual rates of economicgrowth that typically were among the highest inthe world. After several years of negative growthduring the crisis, rapid economic growth resumed(US CIA, 2007). The share of the labour forceengaged in agriculture fell from over three-fourthsto well under half. Just in the decade or sofollowing the early 1990s, according to World Bank(2006) estimates, the share of the labour forceengaged in agriculture fell from 59 to 47 per centfor men and from 62 to 43 per cent for women.Substantial urbanization accompanied this shiftwith the share of the total population in urbanareas rising from under 20 per cent in 1960 to
almost a third by 2005 (UN Population Division,2007).1 One result of the outflow of youngeradults to find employment in urban areas is thatpopulation ageing has been even more extensive inrural compared to urban areas. According to the2000 census of Thailand, 9.8 per cent of the ruralpopulation was age 60 and older compared to9.3 per cent in provincial urban areas and 7.9per cent in Bangkok (original calculations). Still,despite rapid urbanization, most of Thailand’spopulation still remains in rural areas and thisis particularly the case for the older population.
As in other South-East Asian societies and indeedmuch of the developing world, the familytraditionally has taken primary responsibility forolder persons in Thailand. Widespread normssupporting filial obligations to parents underlie theexisting system of intergenerational relations andgovernment policy is geared towards reinforcingfamily responsibility for support and care of olderpersons (Knodel et al., 1995; Thailand, Ministryof Public Health, 2004). Parents also typically feela continuing obligation to ensure their children’swell-being, and intergenerational exchangesof support and services remain pervasive (Knodelet al., 2000; Knodel, Chayovan, et al., 2005). Livingarrangements of older aged parents and adultchildren have been closely intertwined with thissystem of support exchanges. A vast majority ofolder Thais either live with or very near at least oneof their adult children. Nevertheless, as Figure 1shows, national surveys indicate that the percentageof parents age 60 and over who coreside with atleast one of their children declined from 80 to 68per cent in the 16 years between 1986 and 2002.However, the decline in the per cent who eitherlive with a child or close enough to have dailycontact with the child declined more modestlyand even in 2002, almost four-fifths of older ageThai parents were in this situation.

4
Although the family remains the main source ofsupport for older persons, several governmentprogrammes provide formal sources of assistance.In 1993 the government started a programmeto provide monthly subsistence allowances forindigent old persons in rural areas. Since then theprogramme has expanded and the amount of theallowances has increased. At the time of thefieldwork for the survey on which the presentreport is based, the monthly amount of theallowance was typically 300 baht per recipient(equivalent to about US $8 based on the exchangerate at the time) although the amount hassubsequently been raised to 500 baht. Theprogramme operates in virtually all rural andperi-urban areas and central government funds aresometimes supplemented by local organizationsadministering the programme. Although theoriginal intention is to provide allowancesonly for those who are indigent, some localadministrations have broadened eligibilitycriteria considerably and a few even aim for nearuniversal coverage.
In addition to welfare allowances for elderly,two major government-sponsored plans provideretirement benefits in Thailand. The longest-standing (but changing) covers government andstate enterprise employees. As such, it covers onlya small minority of older persons, particularly
Figure 1: Trends in living arrangements of Thai parents age 60 and over, based on nationalsurveys of older persons
Source: Knodel et al., 2000; Original tabulations from the 2002 Survey of Elderly in Thailand conducted by the National Statistical Office.Notes: 2002 results include coresidence and daily contact with children-in-law as well as children.
in rural and peri-urban areas. Starting in 1998, asecond scheme covers employees in privateenterprises under the Social Security Act. However,because entitlement to full old age benefits islimited to employees who contribute for at least15 years, this scheme does not benefit the currentolder population.
In 1989, the Ministry of Public Health establisheda free medical care programme for disadvantagedolder people that has been extended to cover allaged 60 and more years. In 2001, a new plan forlow-cost health coverage for the general publicwas introduced but older people continued to beentitled to free services for most health problems.After the change in government in 2006,universal free government health service was initiatedfor Thais regardless of age who were not coveredby another plan. Thai government and stateenterprise employees and their spouses, parents andchildren are entitled to health insurance benefitsthat are superior to those now available free to thegeneral public (Tangcharoensathien, Supachutikuland Lertiendumrong, 1999). In some cases, thesebenefits continue after retirement. Although fewolder persons in rural areas qualify as retired civilservants, a more significant number are likely tobenefit as parents of an adult child who is currentlyemployed as a civil servant. Thus if a childmigrates and takes a civil service job in the
SECTION 2: SOCIO-ECONOMIC CONTEXT
80
91
74
90
68
79
0
10
20
30
40
50
60
70
80
90
100
% coresident with a child % coresident with a child or sees a
child daily
Pe
r c
en
t
1986
1995
2002

5
place of destination, the parents who remainbehind would benefit from better health carecoverage as a result.
In 2003, the Ministry of Social Development andHuman Security initiated a pilot project of HomeCare-givers to train and maintain a corps of localvolunteers to assist elderly in their communitieswho are in need of home care or other assistance.The goal is to provide community based homecare and facilitate access to health and socialservices on a wide scale for those elderlyespecially in need of such help, especially elderlywho can not care for themselves but lack a caregiver, are deserted, live alone, or receive inadequatecare (Thailand, The National Commission on
the Elderly, 2006). By 2006, model projects hadbeen established in all 75 provinces. In January2007, the Thai Cabinet approved a plan toexpand the Project of Home Care-givers overthe next five years with the goal of achievingcomplete national coverage by fiscal year 2012-2013 with programmes anticipated in all localities.The Ministry of Public Health also launched aHome Health Care for the Elderly Programmein 2005 to provide home health services andvisits for those elderly who are frail, chronicallyill, or in needs of care. The project aims to developa system of community health services for theelderly and also strengthen family and communityabilities in taking care of the elderly who needlong term care.
SECTION 2: SOCIO-ECONOMIC CONTEXT

6
Section 3: Data and Measures
3.1 Source of dataThis report relies primarily on data from theMigration Impact Survey (MIS) conducted inOctober and November 2006 by the ChulalongkornUniversity Faculty of Nursing. The surveyenquired about economic, social, psychologicaland physical health issues. To our knowledgeit is the first survey to focus specifically onimpact of migration on older age parents. Fundingfor the Migration Impact Survey was providedby a grant to the Chulalongkorn University,Faculty of Nursing from the Thailand ResearchFund (TRF) through the National HealthFoundation (NHF). Technical assistance wasprovided under a special services agreement (SSA)from the Thailand Country office of the UnitedNations Population Fund (UNFPA). The researchteam consisted of the project director JirapornKespichayawattana, associate investigators SuvineeWiwatwanich and Chanpen Saengtienchai,and project consultant John Knodel. A fullerdescription of the survey methodology is providedin Annex I.
The questionnaire solicited detailed informationabout various types of current support beingprovided to parents as well as major lifetimematerial exchanges between parents and childrenin relation to the current migration status andmigration history of the children. Most informationabout support and intergenerational exchangesis specific to the individual child involved and totheir location in relation to parents at the time.The content of the questionnaire drew considerablyon the research team’s previous research on thetopic based mainly on open-ended interviews in2004 (Kespichayawattana & Wiwatwanich 2005;Knodel & Saengtienchai, 2007). In addition tothe survey questionnaire, the research teamconducted semi-structured interviews with key
informants (typically village headmen and healthcentre personnel) in each sample site to obtainbackground information about the locality. Thefull questionnaire is provided as Annex II andthe key informant interview guidelines as Annex III.
The study design specified equal numbers ofrespondents in three age cohorts (50-54, 60-64and 70-79) who had at least one living child.These particular cohorts were chosen because theydiffer both in terms of the number of adultchildren they have and the life course stage theyare in, features that are likely to bear on theimpact that migration of adult children could haveon older age parents. Given the past timing offertility decline in Thailand, persons age 50-54in 2006 had the fewest children and the 70-79cohort the most. Of particular interest is thatsubstantial proportions of the 50-54 cohort haveonly two or three children and thus can providesome indication of how smaller family sizeswill affect the expectations and welfare of futurecohorts of elderly. In contrast, the need for longterm personal care is common only at a much laterstage of the life cycle when frailty and chronicillnesses are prevalent. Thus health problemswill be greatest for the 70-79 cohort and leastfor the 50-54 cohort. If out-migration leads toa shortage of local children who can provide neededpersonal assistance and health care, this shouldbe most evident for the cohort age 70-79.2 Finally,economic activity and the ability to supportoneself decreases as persons reach older ages andwill be highest for the youngest and lowest forthe oldest cohorts. Thus the three cohorts differin all these crucial respects with the intermediatecohort of persons age 60-64 representing atransitional stage in the life course between largerand smaller family sizes, better and worse health,and full and reduced or ceased economic activity.

7
The survey covered rural and peri-urban sites in3 purposively selected provinces, two in theNorth-East and one in the lower North. Majorurban areas were excluded given the focus onparents left behind by migrant children whosedestination often was such areas. Peri-urban areaswere included as we expect similar forces operatein both rural and peri-urban areas that lead toout migration of children. The northeastern andlower northern regions were selected because theyare sufficiently distant from Bangkok (a majordestination for adult children who migrate) andin the case of the lower north also sufficiently farfrom Chiang Mai (a likely destination in thenorth) and thus migration would often involvesubstantial geographical separation betweenparents and migrant children. This in turn shouldincrease the likelihood that impacts of migrationwill be salient. In addition, the provinces werechosen to reflect a range of economic conditionsas indicated by different mean household incomes.3
As Table 1 shows, a total of 1011 interviewswere completed with relatively similar numbersobtained for each cohort.4 Somewhat fewerinterviews were obtained for Nakorn Ratchasima,the province where field work commenced, thanfor the other two provinces. This likely reflects theslower pace of interviewing during the initialdays of fieldwork as interviewers became morefamiliar with the questionnaire and the researchteam learned how to handle the logistics fieldworkmore efficiently.
We relied on ‘family folders’ kept at the local healthcentres to select individuals to interview. Althoughin principle, the family folders are kept up todate to allow for persons entering or exiting thepopulation in practice persons dying or movingwere often not removed. Although some allowancewas made for this by initially selecting morepotential eligible respondents than targeted, theproblem was more severe than anticipated. Thussome individuals selected for interview wereineligible because they had died or left the samplesite. In addition, a number of selected individualswere either temporarily away from the area ornot at home during the time the survey team wasin their area. To make up for shortfalls in thenumber of respondents who could be interviewedfrom the original sample selection, replacementrespondents were sought. Overall, among the totalinterviews completed, 40 per cent representedeither replacement for individuals originally selectedfrom the site or additionally selected persons tomake up for shortfalls from another site. Thus,although the original sample design called forrepresentative probability samples of each cohortin each survey site, in practice a substantial shareof the sample was recruited on a quasi-conveniencebasis. The high proportion of replacementinterviews likely skews the sample towards personswho are home during the day and do not workaway from home. A more detailed accounting ofreplacement interviews, the reasons for replacements,and the potential implications for the analysis isincluded in Annex I.
Table 1: Number of respondents in the Migration Impact Survey, by age cohort and province
Number of respondents by age cohort
50-54 60-64 70-79 Total
Nakorn Ratchasima 101 110 105 316
Si Sa Ket 115 115 124 354
Kamphaeng Phet 118 111 112 341
Total 334 336 341 1011
Notes: The 50-54 cohort refers primarily to persons born 1951-1955 but includes 11 person born in 1950 and 1 born in 1956; the60-64 cohort refers primarily to persons born 1941-1945 but includes 6 person born in 1940 and 9 born in 1946; the 70-79 cohortrefers primarily to persons born 1927-1936 but includes 1 person born in 1926 and 5 born in 1937.
SECTION 3: DATA AND MEASURES

8
Although the survey interviewed older age parents,the questionnaire included extensive questionsabout their individual children. Thus informationis available not only for respondents themselvesbut for a total of almost 4000 children of therespondents. It is important to recognize thatsome results presented are based on respondentsas the unit of analysis others are based on theirchildren as the unit of analysis. In addition,analyses or sometimes conditioned on subsets ofrespondents or children. For example, an analysismay be based only on respondents who have atleast one child living outside their local districtor province while others may be based only onchildren who have ever migrated or are currentlyliving outside the parents’ local district or province.
3.2 Measures and definitionsRespondents were asked where each of their livingchildren currently resided in relation to themselveswith answers pre-coded as follows: same household,next door or very nearby, same village, same sub-district (tambol), same district (amphoe), sameprovince (changwat), different province, Bangkok,and abroad.5 They were also asked if the childlived in an urban, peri-urban or rural area. Thusthe survey permits detailed examination of howdifferent types of child residential mobility impacton parental well-being. The questionnaire alsoincluded sections directed at obtaining informationabout children who ever migrated as well as returnmigrants. We note that defining what constitutesmigration is to some extent an arbitrary matter(Bell et al., 2002). For these sections we definemigration quite broadly as moving out of thedistrict in which the parents lived at the time forat least one year. This enables us to compareeffects of migration involving shorter distances,which we define as moves across district boundariesbut within the same province, from longer distancemigration that involves crossing a provincialboundary. We note that most studies of migrationin Thailand are limited to examination of longerdistance migration as we define it.
The questionnaire section asking about childrenwho migrated specifically refers to children whomoved away from where their parents lived at thetime. However, in some analyses we rely on the
present location of children in relation to parentsto define migrant children. In some cases, currentdifferences in the location of parents and theirchildren may result from parents moving ratherthan the children. To assess the extent to whichthis could be the case, we asked respondents wherethey lived at the time their oldest child was age 15and in cases where they had lived in a differentsub-district (tambol) from their present one, howlong they were living in the present sub-district.The results indicate that 95 per cent of respondentshave lived in the same province since theiroldest child was age 15 and 90 per cent havelived in the same district. Among those who hadlived in a different district or province over halfhad lived in the same sub-district for 20 ormore years. Thus it is unlikely that in more thana small percentage of cases the parent rather thanthe child had been the one to move out of thedistrict or province.
The survey contains both subjective and objectiveinformation that can be used to measure currentmaterial well-being of respondents. Based on thisinformation we construct two measures of economicstatus. One measure relies on the two subjectiveitems in the questionnaire, one of which askedinterviewers to judge the economic status of therespondent’s household based on the appearanceof the house and the other asked respondentsto assess their own economic situation relativeto others in their community. Answers to bothitems are recorded on a five point scale rangingfrom very poor to well-off.6 A single compositeindex of subjectively judged economic status iscalculated by adding together responses to thetwo questions such that higher values representbetter economic situations.7
Objective measures of material well-being areprovided by information on five characteristics ofthe house and 11 different possible householdpossessions. The five house characteristics are thetypes of structure, roof, floor and toilet andwhether the house has running water.8 The 11household possessions are TV, video player,refrigerator, telephone (either landline or cell),microwave, washing machine, furniture set,computer, air conditioner, motorcycle, and car or
SECTION 3: DATA AND MEASURES

9
truck. A single composite index of objectivelymeasured household economic status is constructedfrom the combined set of 16 house characteristicsand household possessions using principalcomponent analysis to derive weights (Filmer &Pritchett, 2001). For the purpose of presentation,
both the composite subjective and objectiveeconomic status indices are each ranked andexpressed in terms of percentiles with a meanof 50. The two measures are correlated but onlymoderately (Pearson correlation coefficient=.64).
SECTION 3: DATA AND MEASURES

10
Section 4: Basic Characteristicsof Respondents
The basic social and demographic characteristicsof the respondents are shown in Table 2. Womenmodestly outnumber men, almost one third ofrespondents live in peri-urban areas, and virtuallyall are Buddhists.9 None of these characteristicsdiffer substantially across age cohorts. Howeverthe per cent who are currently married and livingwith their spouse decreases sharply across successive
cohorts. While the vast majority of the 50-54cohort is married and live with their spouse, thisis the case for just less than half of those in theirseventies. In addition, while being illiterate orunable to read without difficulty characterizesmore than a third of respondents, this isconsiderably more common among the oldestcohort than the other two.
Table 2: Basic demographic characteristics of respondents, by age cohort
Age cohort
Total 50-54 60-64 70-79
% of respondents who are
Women 56.2 57.5 53.6 57.5
Peri-urban residents 31.6 29.3 31.0 34.3
Buddhist 99.5 100.0 98.8 99.7
Married, living with spouse 69.7 84.1 75.9 49.6
Illiterate or reads with difficulty 35.6 30.8 32.1 43.7
Education (% distribution)
None 11.4 5.7 9.2 19.1
1-3 years 8.3 5.1 7.1 12.6
4 years 71.2 76.6 72.0 65.0
Beyond basic primary 9.1 12.6 11.6 3.2
Total 100 100 100 100
The lower rates of illiteracy and reading difficultyamong younger cohorts reflect the expansionof public education over the period whenthe different cohorts were of school age. Althoughthe cohorts span a period when changes occurredin the educational system, a compulsory basiclower level primary education of four years ofschooling was common to all. Thus a fourthgrade education is by far the most frequentlevel of schooling for respondents and characterizeslarge majorities in all three cohorts and provinces.
Only 3 per cent of the oldest cohort went beyond4 years while almost a third had either noeducation or less than the basic four years ofschool. In contrast, studying beyond 4th gradewas more common for the two youngercohorts although even for the 50-54 year olds theproportion is modest. At the same time, notcompleting at least four years of basic primaryschool was considerably less common for theyounger cohorts, especially for the 50-54 yearold cohort.

11
As anticipated by the research design, the threecohorts differ considerably with respect to familysize. The mean number of living children is2.8, 3.9 and 5.1 respectively for the 50-54, 60-64and 70-79 cohorts. As Figure 2 shows, thesedifferences in means correspond to quite differentdistributions of family sizes for the three cohorts.Only slightly over a fifth of persons aged 50-54had four or more children compared to overthree-fourths of those in their 70s. In contrastalmost half of those 50-54 had two or fewerchildren compared to only 13 per cent of thosein their 70s. Still, one child families were fairlyuncommon even for the 50-54 cohort.
Figure 2: Number of living children(% distribution), by age cohort
third of respondents in their 70s assessed theircurrent health to be poor or very poor comparedto only 18 per cent of those 50-54. The secondindicator is the per cent who have at least oneserious functional limitation defined as having alot of difficulty with or being unable to performat least one of 5 activities necessary for functioningphysically: walking, lifting, crouching, graspingand climbing stairs. Just over half of respondentsin their 70s have at least one such limitation, alevel three times as high as reported by the 50to 54 cohort. The third indicator is the per centwho have either a lot of difficulty with or areunable to perform at least one of four normalactivities of daily living: eating, dressing, bathing,and standing up. In general, fewer respondentsreported ADL problems than functional limitations.However over a fifth of the oldest cohort reportedproblems compared to only 5 per cent of those50-54.
As described in the discussion of measuresabove, the survey collected both subjective andobjective information on material well-being. AsTable 3 shows, by far the most common subjectiveassessment of economic status is ‘average’, whetherbased on the judgement of the respondentsthemselves or that of the interviewers. Almost
One important consideration when choosing theparticular age cohorts to interview was to span arange of life course stages associated with differingneeds for personal care assistance due to healthproblems and frailty. Figure 3 provides threemeasures indicative of health status for the differentage cohorts. The measures are based on questionsasking respondents to assess their own healthand to indicate if they had difficulties with anyof five normal functional activities or four activitiesof daily living (ADL). The results clearly confirmthat the three cohorts differ substantially interms of their health status and presumably theirneed for personal care assistance.
The first indicator shown is the per cent whoreported their health to be either poor or verypoor on a five-point scale in which the otherchoices were average, good or very good. One
SECTION 4: BASIC CHARACTERISTICS OF RESPONDENTS
Notes: Poor health includes respondents who reported theirhealth as poor or very poor. A serious functional disabilityrefers to having a lot of difficulty with or being unable toperform at least one of 5 physical functions: walking, lifting,crouching, grasping and climbing stairs. A serious ADLproblem refers to having a lot of difficulty with or beingunable to perform at least one of four activities: eating,dressing, bathing, and standing up.
Figure 3: Current health status, by age cohort
9
46
39
17
7
3127
10
22
52
77
0
10
20
30
40
50
60
70
80
90
50-54 (mean = 2.8) 60-64 (mean = 3.9) 70-79 (mean = 5.1)
Age cohort
Pe
r c
en
t
1 2 3 4+
18 17
5
2427
10
33
51
22
0
10
20
30
40
50
60
Poor health (self reported) Has a serious functional
limitation
Has a serious ADL problem
Pe
r c
en
t
50-54
60-64
70-79

12
60 per cent of respondents’ self assessments andjust over half of interviewers’ assessments fellinto this middle category. Among those notjudged to be average, intermediate categories ofbelow and above average were considerably morecommon than either of the two more extreme
categories of very poor or well off for both selfand interviewer assessments. The distributionsof self and interviewer assessments differ onlymodestly across cohorts with a slight tendency forless favourable rating to be more common withincreased age.
Table 3: Indicators of material well-being, by age cohort
Age cohort
Total 50-54 60-64 70-79
Subjective measuresSelf assessed SES (% distribution)
Well-off 1.9 1.8 1.2 2.6
Above average 13.6 15.9 11.9 12.9
Average 58.9 59.6 59.5 57.5
Below average 16.3 14.4 17.9 16.7
Very poor 9.4 8.4 9.5 10.3
Total 100 100 100 100
Interviewer assessed SES (% distribution) (a)
Well-off 4.1 4.2 4.0 4.2
Above average 22.7 23.9 24.2 20.1
Average 50.5 52.3 50.0 49.2
Below average 18.8 16.1 18.0 21.9
Very poor 3.9 3.5 3.7 4.5
Total 100 100 100 100
Objective measures% whose dwelling has:
Flush toilet or latrine with a septic tank 79.2 77.5 82.1 78.0
Running water 69.9 71.3 71.1 67.4
Corrugated cement or tile roof 37.7 39.5 35.4 38.1
Vinyl, tile, of finished wood floor 24.4 22.5 26.5 24.3
% whose household has:
TV 95.4 97.3 96.1 92.9
Refrigerator 81.6 84.4 83.0 77.4
Telephone (landline or cell) 73.1 83.2 76.2 60.1
Motorcycle 68.8 78.7 68.5 59.4
Video 54.5 65.6 53.9 44.1
Washing machine 38.3 44.9 38.1 32.1
Furniture 32.0 34.7 33.3 27.9
Car or truck 27.2 33.5 27.1 21.2
Computer 11.6 11.4 12.2 11.2
Microwave 5.5 5.1 6.0 5.3
Air conditioner 5.3 4.2 6.5 5.0
(a) Based on house appearance.
SECTION 4: BASIC CHARACTERISTICS OF RESPONDENTS

13
Objective information on economic well-beingincludes characteristics of the dwelling unit andhousehold possessions. A substantial majority ofrespondents in all three cohorts live in dwellingswith a flush toilet or a latrine with a septic tank.Most dwellings also have running water. Roofsand floors made of higher quality materials areless common. Overall, the prevalence of thesehousing quality features differs only modestlyacross cohorts.
The most common household possessionregardless of cohort is a television followed by arefrigerator with 95 per cent of householdsoverall having a television and over 80 per centhaving a refrigerator. Almost three-fourths livein households in which at least one member hasa telephone although the per cent is highestfor the 50-54 cohort and distinctly lowest forthe oldest cohort. At the other extreme, fewhouseholds have a microwave oven or an airconditioner. Differences in possession of mosthousehold items are modest across cohortsalthough the oldest cohort generally lives inhouseholds least likely to have each of the variouspossessions shown. The fact that a householdcontains a particular possession does not mean thatit necessarily belongs to the respondent.Nevertheless the presence of items can serve asan indicator of the general economic status ofthe household in which the respondent livesand therefore provide relevant information ontheir material well-being.
As noted earlier, despite the temporary setbackassociated with the economic crisis in Thailandthat was precipitated in 1997 and lasted severalyears, economic growth and improving standardsof living have characterized much of the periodduring recent decades. Combined with technologicalchange, this has resulted in more widespreadownership of a wide variety of householdpossessions. This is reflected in Figure 4 whichcompares the percentage of households havingselected possessions according to the Surveyof Welfare of Elderly in Thailand (SWET)conducted in 1995 and the Migration ImpactSurvey (MIS) which was carried out of 11 yearslater. Although the results are not directly
comparable given the very different sample designs,the comparison nevertheless strongly suggest thatmajor increases in household possessions haveoccurred during the interim period. To increasecomparability, results from SWET are limited tothe equivalent age cohorts at the time as targetedin the MIS. In addition, SWET results are restrictedto respondents in rural areas (which at the timeof SWET also included most of what laterbecame the officially designated peri-urban areasincluded in the MIS sample).
Figure 4: Per cent of households with selectedpossessions: Comparison of the 1995 Surveyof Welfare of Elderly in Thailand (SWET) and2006 Migration Impact Survey (MIS)
The percentage of households possessing eachof the items shown in is noticeably higher inMIS than in SWET and in most cases verysubstantially so. The most dramatic change is withrespect to the possession of a phone, reflectingthe widespread introduction and rapid spreadof mobile (cellular) phones in the interveningperiod between the surveys. Indeed, it wasextremely rare for any rural household to havea phone in 1995. In sharp contrast, by 2006almost three fourths of the households in theMIS sample had one. Also striking is the increasein the percentage of households owning a videoplayer, again reflecting technological advanceswith the development and widespread marketingof DVD players in recent years.
Note: Results for SWET refer to a national sample and arelimited to parents in the equivalent age cohorts as in MIS(50-54, 60-64 and 70-79) who live in rural areas as definedat the time.
SECTION 4: BASIC CHARACTERISTICS OF RESPONDENTS
62
50
5
55
1014
1
82
7369
55
27
5
95
0
10
20
30
40
50
60
70
80
90
100
TV
Refri
gerato
r
Phone
Moto
rcyc
le
Video p
laye
r
Car/t
ruck
Air co
nditioner
Pe
r ce
nt
SWET (1995)
MIS (2006)

14
Composite indices (expressed as percentiles)summarizing the subjective and objective measuresof economic status are displayed in Figure 5 bycohort and province. Modest differences in bothmeasures are evident across cohorts with somedecline apparent in the average score with age,especially when based on objective items. Thusthe 50-54 cohort has the highest average scoreand the 70-79 cohort the lowest for both scales.
Figure 5: Subjective and objective economicstatus scores (in percentiles), by age cohortand province
More pronounced differences are evident acrossprovinces. Both scores are lowest for Si Sa Ketand highest for Nakorn Ratchasima. Differencesare particularly pronounced with respect tocomposite index of objective measures with theaverage for Si Sa Ket respondents below the 40th
percentile and slightly above 60th percentile forthose in Nakorn Ratchasima. Thus as intended,the research design appears to capture a range ofsettings with respect to economic conditions.10 Thisis even more evident when the economic statusscores are compared across the 18 research sitesamong which the average percentiles range from alow of 38 to a high 70 for the subjective compositeindex and from 25 to 81 for the objective index.
The vast majority of respondents has at least onemigrant child and most have a child who migratedto an urban area. As Table 4 shows, 87 per centof respondents have at least one child who evermoved away from the district where they lived atthe time and over 80 per cent have a child currentlyliving outside their present district. Most havechildren who moved a significant distance with over75 per cent of respondents having at least one childliving outside the province where they presently
Table 4: Per cent with children in selected locations, by age cohort of respondent
By age cohort
Total 50-54 60-64 70-79
% of respondents with any children who:
ever moved out of district 87.3 86.5 89.3 86.2
currently live out of district 81.3 81.1 82.4 80.4
currently live out of province a 75.9 74.9 78.6 74.2
currently live in an urban area out of district 68.5 68.9 71.1 65.7
currently live in Bangkok area 48.4 44.3 54.8 46.0
currently live abroad 4.3 3.6 3.6 5.6
returned to district from out of district 29.6 26.9 32.7 29.0
By province
Total Nakorn Ratchasima Si Sa Ket Kamphaeng Phet
% of respondents with any children who:
ever moved out of district 87.3 85.1 87.9 88.9
currently live out of district 81.3 78.2 82.8 82.7
currently live out of province a 75.9 70.3 78.8 78.0
currently live in an urban area out of district 68.5 62.7 73.7 68.6
currently live in Bangkok area 48.4 37.7 59.3 46.9
currently live abroad 4.3 6.0 2.0 5.0
returned to district from out of district 29.6 34.5 27.7 27.0
(a) includes Bangkok and abroad.
SECTION 4: BASIC CHARACTERISTICS OF RESPONDENTS
5250 48
55
4649
5452
45
61
38
53
0
10
20
30
40
50
60
70
50-54 60-64 70-79 NakornRatchasima
Si Sa Ket KamphaengPhet
Province Age cohort
Pe
rce
nti
le
Subjective score
Objective score

15
reside. Despite differences in family sizes, there islittle difference in these respects across the threecohorts.
Most respondents have children who moved tourban areas, with over two-thirds having at leastone child living in an urban area outside their owndistrict and almost half having at least one childcurrently living in the Bangkok area. Differencesacross cohorts are only modest in these respects.In addition, experiencing the return of a migrantchild is not uncommon. About 30 per cent havea child who returned after living out of the parentaldistrict with little difference evident by cohort.Provincial differences in most of the indicatorsshown in Table 4 are relatively minor. The mostpronounced is between the distinctly higher percent of Si Sa Ket respondents who have at least
one child living in the Bangkok area comparedto respondents elsewhere.
In total, the respondents have almost 4000 livingchildren. As Table 5 shows, almost all are theirown biological children with only about 3 per centbeing step or adopted children.11 The children areequally divided between sons and daughters. Thelarge majority is currently or has previously beenmarried. Only a small percentage is still in school.The per cent who has married increases with theage of the parents’ cohort, accounting for onlymodestly over half of the children of parents age50-54 compared to almost 90 per cent of childrenof parents in their 70s. In contrast, 16 per centof children of parents 50-54 are still currently inschool compared to virtually none of the childrenof older parents.
Table 5: Socio-demographic characteristics of children, by age cohort of respondent (parent)
Age cohort of parent
Total 50-54 60-64 70-79
N of cases 3972 927 1313 1732
% who are:
own (not step or adopted) 96.7 95.7 97.6 96.6
sons 49.7 48.8 48.5 51.2
ever-married 77.6 54.3 79.9 88.4
currently in school 4.7 15.8 2.7 0.3
Age (% distribution)
under 16 1.8 6.5 .9 0.0
16-19 2.7 8.8 1.5 .3
20-24 7.0 20.3 5.6 1.1
25-29 14.6 35.1 14.4 3.9
30-39 39.4 28.2 60.2 29.5
40+ 34.5 1.0 17.4 65.2
Total 100 100 100 100
Mean age 35.6 25.9 33.8 42.2
Education (% distribution)
less than grade 4 4.4 2.4 4.3 5.5
grades 4-7 (primary) 54.9 33.8 52.9 67.7
lower secondary 14.6 23.3 15.2 9.4
upper secondary 15.8 24.9 16.8 10.1
beyond secondary 10.4 15.6 10.8 7.3
% with children of their own 69.8 43.0 70.9 83.2
Mean number of children among those with children 1.9 1.5 1.8 2.1
SECTION 4: BASIC CHARACTERISTICS OF RESPONDENTS

16
The vast majority of respondents’ children areadults themselves. Less than 2 per cent overall areunder age 16 and even among children of theyoungest cohort, 85 per cent are age 20 or older.12
Nevertheless, there is still a big difference inage distributions of children across the threecohorts of parents. Over 40 per cent of the childrenof the oldest cohort are age 40 or older, over70 per cent of children of the youngest cohortare under age 30. The education of the childrenis considerably higher on average than that oftheir parents. Almost all children received atleast a basic primary education of four yearsregardless of their parents’ cohort.13 However, inline with the general trends towards increasingeducation in Thailand, the children of the youngestcohort completed the greatest amount ofschooling while those of the oldest cohort the least.Over 60 per cent of the children of parents age50-54 studied beyond the primary level comparedto only a little more than a fourth of the childrenof the cohort in their 70s.
The per cent of respondents’ children whothemselves have children varies substantially acrosscohorts. Less than half of the children of parents50-54 had children of their own compared toover 80 per cent of the children of parents intheir 70s. Among those who had children oftheir own, the mean number is relatively small,reflecting the low levels of fertility that haveprevailed in Thailand over the last several decades.Even the children of parents in their seventieshave an average of only slightly more than twochildren themselves.
Overall, as Table 6 indicates, migration is quitecommon among the respondents’ children asindicated by the fact that almost 60 per cent hadever moved outside of their parents’ district.Moreover, as indicated by the median age atwhich children first migrate, half do so by age 20.Both the proportion who have migrated and theirmedian age at first migration are somewhat lowerfor the children of respondents in the youngestcohort. This unlikely signifies trends but ratherreflects the fact that these children are on averageyounger and have not had as long a periodof opportunity to move away than children ofolder cohorts.
Of the children who moved out of their parents’district, a substantial minority subsequently returnedand is currently living in the district. This is higherfor children of respondents age 50-54 than for theolder cohorts. This possibly reflects a process forsome of the children by which more permanentdepartures are preceded by less permanent moves.Such a process would not yet have played itselfout as fully for the youngest cohort’s children asfor those of the older cohorts who have had alonger period of time to return and then leaveagain. However, one major reason for returningis concern about the parents’ welfare. According tothe respondents, such concern was said to be amajor reason for returning for 60 per cent of themigrant children who did return. Moreover, theper cent of return migrants for whom concernabout parents plays a major role increases withthe age of the parents, likely reflecting the poorerhealth status of older parents compared to youngerones (as indicated in Figure 3).
Overall, just over two fifths of respondents’children are currently living in the same village astheir parents, almost evenly divided betweenthose who coreside in the same household andthose who live in independent households.However, the balance between these two situationsvaries sharply among the children of the differentparental cohorts. Children of the youngest cohortare far more likely to coreside in their parents’household than in a different household within thevillage while the opposite is true for the childrenof the oldest cohort. At the same time, childrenof parents age 60-64 are evenly divided in thisrespect. These differences reflect the different lifecourse stages of children of the three parentalcohorts, particularly in relation to marital status.Many of the children of the youngest cohort havenot yet married and remain in their parents’household while those of the older cohorts havemarried and established their own household, ina number of cases adjacent to or nearby theirparents or elsewhere in the village. Overall, whencoresident and non-coresident children areconsidered collectively, it is somewhat more likelyfor children of the oldest cohort to be in the samevillage as their parents than for children of theyounger two cohorts.
SECTION 4: BASIC CHARACTERISTICS OF RESPONDENTS

17
Among children who do not live in the samevillage, a modest share lives either in the samedistrict or the same province as a parent. Howevermost of the children who do not reside in theparents’ village are in a different province. Thisis highest for children of the 50-54 year-oldcohort among whom half are no longer in theirparents’ province and lowest for children of theoldest cohort among whom only just over a thirdlive outside the province. A modest share ofchildren who do not live in their parents’ villagestill remain in the same province representingabout 16 per cent of all children. This share islowest for children of persons 50-54 and highestfor those with parents in their 70s. In addition,among this group of children, more are still in
the same district as the parents, and thus notvery far away, than in a different district in theprovince. Of those who are no longer in theparents’ province, only few have moved out of thecountry with international migrants representingabout 1 per cent of the children of each of thethree cohorts.
Table 7 compares the socio-demographiccharacteristics of children according to their currentlocation relative to parents. For this purpose wedistinguish four categories of children: coresidentwith parents, not coresident but in the same district(local movers), outside the district but in the sameprovince (shorter distant migrants), and not inthe province (longer distance migrants).14
Table 6: Location and migration of children, by age cohort of respondent (parent)
Age cohort of parent
Total 50-54 60-64 70-79
N of cases 3972 927 1313 1732
% who ever moved out of parents district 58.3 52.5 60.7 59.6
Median age at first migration 20.0 18.0 20.0 20.0
Among those who moved, % who returned 16.5 21.6 16.1 14.3to parents district
Among those who returned, % for whom concern 62.1 55.2 61.6 68.0for parents was a major reason
Current location of children relative to parent(% distribution)
in same household 20.3 30.0 19.3 15.7
in same village, different household 21.3 8.2 19.2 29.9
in same district, not in village 9.8 5.6 9.5 12.3
in same province, not in district 6.4 6.3 5.1 7.4
in another province 41.0 48.5 45.9 33.4
abroad 1.2 1.4 1.0 1.3
Total 100 100 100 100
Type of area if in Thailand (% distribution) (a)
Bangkok 21.7 27.0 24.7 16.7
other urban 15.1 19.4 14.9 13.0
peri/semi-urban (b) 17.2 16.5 16.7 18.0
rural 45.9 37.1 43.7 52.4
Total 100 100 100 100
(a) Excludes 45 children for which type of area is unknown.(b) Includes children in areas in the sample that are peri-urban (tetsabaan tambol) and children living elsewhere who are reportedto live in semi-urban or somewhat urban areas.
SECTION 4: BASIC CHARACTERISTICS OF RESPONDENTS

18
Coresident children are distinctly younger onaverage than those outside the household. Overone fourth is under age 25 compared to far lowershares in each of the other three categories. Thusthey are least likely among the four groups tobe married or to have children of their own andmost likely still to be in school. Among the otherthree groups, those who are longer distancemigrants are the youngest with over 60 per centbeing in their later 20s or 30s. Thus they aresomewhat less likely to be married or havechildren of their own than local movers orshorter distance migrants who tend to be older.
The per cent who are sons is lowest amongcoresident children and highest among those
Table 7: Socio-demographic characteristics of children, by location relative to parent
Parent’s Same Same OutsideTotal househol district province province
N of cases 3972 802 1230 253 1687
Age (% distribution)
under 25 11.5 25.2 3.7 6.8 11.5
25-29 14.6 18.6 6.2 12.4 19.1
30-39 39.4 38.3 36.0 39.4 42.4
40+ 34.5 18.0 54.2 41.4 27.0
Total 100 100 100 100 100
Mean age 35.6 30.5 40.1 37.7 34.5
% of the children who:
are sons 49.7 44.9 48.3 60.1 51.5
ever married 77.6 47.3 95.8 85.4 77.7
have children of their own 69.7 41.6 91.6 77.5 66.0
live in an urban area (a) 41.5 0.0 7.6 55.7 86.1
are currently in school 4.7 14.6 0.7 3.6 3.1
Education (% distribution)
less than grade 4 4.4 5.5 5.9 4.0 2.7
grades 4-7 (primary) 54.9 45.2 69.9 47.0 49.8
lower secondary 14.6 17.5 10.6 11.5 16.6
upper secondary 15.8 19.6 8.6 19.4 18.6
beyond secondary 10.4 12.2 5.0 18.2 12.3
Total 100 100 100 100 100
(a) Includes children reported as living in urban or semi-urban areas or in Bangkok but not children living in peri-urban areas(tetsabaan tambol) in the sample sites.
who are shorter distance migrants. This likelyreflects the cultural tendency to have a marrieddaughter live with parents as documented inprevious research (Knodel et al., 1992; Sobieszczyket al., 2003). A correlate of this is that sonswho marry are more likely to join their wives’households than married daughters are to jointheir husbands’ household. This could explainthe dominance of sons among children who areshorter distant migrants since a reasonable sharemay have married wives who come from the sameprovince but a different district. Longer distancemigrants, however, are rather evenly dividedbetween sons and daughters. Only a few amonglocal movers (i.e., those who have left thehousehold and remained in the same district)
SECTION 4: BASIC CHARACTERISTICS OF RESPONDENTS

19
reside in urban areas while among migrants,and particularly those who have left the province,the majority are currently in urban areas.
Consistent with their younger age, coresidentchildren are by far the most likely to be still inschool. Educational attainment also differs amongthe four groups of children. It is difficult,however, to distinguish between the extent towhich this is a result of selection associated withmigration or simply a matter of the different agedistributions of the children in the four groups.The latter is likely to account for much of thedifference given that in recent decades educationallevels have been rising fairly rapidly in Thailand.Non-coresident children who reside in the samedistrict as the parents are clearly the least educatedbut they are also the oldest. At the same time,there is only modest difference in the educationof distributions of the other three groups.
Although results from the Migration ImpactSurvey are not directly comparable with resultsfrom earlier national surveys of older persons, acomparison of the per cent of children of older
persons who live outside their parents’ provincesuggests that migration of young adults fromrural areas has increased substantially duringthe last decade or so. Figure 6 shows the percent of grown children of older persons wholive in a different province than their parentas indicated by the 1995 Survey of Welfare ofElderly in Thailand (SWET) and by the 2007Migration Impact Survey (MIS). To increasecomparability, SWET results are limited to thechildren of the equivalent age cohorts ofparents at the time as targeted in MIS andare restricted to children of parents in ruralareas. The results are presented according to theage of the children.
At all ages except 16-18 a substantially higherpercentage of children of MIS respondents areliving in a different province than their parentsthan found in SWET. This suggests that migrationincreased substantially in the intervening 12 years.The exception of the 16-18 year olds likelyreflects the rapid spread during the interveningperiod of secondary level education, which keeps
SECTION 4: BASIC CHARACTERISTICS OF RESPONDENTS
“Elderly couple with coresident daughter and grandchildren and visiting migrant daughter”.

20
SECTION 4: BASIC CHARACTERISTICS OF RESPONDENTS
Figure 6: Per cent of children of older age parents who live outside their parents’ province ofresidence, by age: Comparison of the 1995 Survey of Welfare of Elderly in Thailand (SWET) andthe 2006 Migration Impact Survey (MIS)
Note: Results for SWET refer to a national sample and are limited to parents in the equivalent age cohorts as in MIS (50-54, 60-64and 70-79) who live in rural areas as defined at the time.
children in local schools longer and thus postponesthe age of leaving home. Given that the MIScovers only three provinces and SWET is basedon a national probability sample (and does notinclude any of the three MIS provinces), thecomparison is only suggestive. Nevertheless, the
differences are so dramatic that they likelyreflect a genuine substantial increase in migration.Moreover, such an increase is consistent with thedecline in coresidence between older personsand their adult children that, as noted earlier,has been occurring in recent decades in Thailand.
21
57 56 57
53
49
46
40
33
31
38
4140
34
31
26 2727
0
10
20
30
40
50
60
16-18 19-21 22-24 25-27 28-30 31-33 34-36 37-39 40+
Age
Pe
r c
en
t
MIS (2006)
SWET (1995)

21
Section 5: Family and LivingArrangements
situations vary by age cohort although in oppositedirections. While living alone increases withage, living only with a spouse decreases. Again,increased widowhood at older ages undoubtedlyaccounts for the cohort differences. Only about5 per cent overall live with others without eithera spouse or a child present.
Among the total sample, it is relatively uncommonto have all children living relatively far away.Indeed, over 70 per cent have a child in thehousehold or living very nearby and over three-fourths have a child at least in the same village.Less than a fifth has no child living within thesame district and fewer than 15 per cent have nochild within the province. Results presented inTable 8 also make clear that living alone orwith only a spouse does not necessarily meanthat all children are far away. Overall, amongrespondents who live alone, just over 40 per centhave a child living next door or very nearbyand fully half have at least one child who resideswithin the same village. Moreover less than afifth has no child living in the district andfewer than 15 per cent are without a child in theprovince. Likewise, over a third of those wholive only with a spouse have a child living nextdoor or very nearby and over 40 per cent havea child at least in the same village. Those livingonly with a spouse, however, are more likely tohave no child in the district and fully a thirdhas no child in the province.
There is considerable variation across cohorts inthese respects. For the youngest cohort, most wholive alone or with only a spouse do not have achild either nearby or in the village and the majorityhave no child in the district or even the province.
Undoubtedly the most common concern amongobservers who view migration of adult childrenaway from rural areas as threatening the well-beingof their older age parents relates to the potentialimpact on living arrangements and the possibilitythat all children move far away and ‘abandon’their parents. In societies such as Thailand, wheretraditionally coresidence of parents and adultchildren has been an important feature of thefamilial system of old age support, increases inthe proportion of parents who are left with nochild near enough by to provide daily assistancewith personal care or household chores or contributeto household economic activities is viewed asworrisome. Of particular concern are elders whoare left completely on their own without aspouse or any children nearby.
Table 8 examines household composition andliving arrangements focusing on the location ofchildren. A majority (58 per cent) of respondentsstill live with at least one of their children.This differs only modestly by cohort. Howevercoresidence with a child at least age 16 varies farmore by cohort. Just under half of respondentsage 50-54 live with a child age 16 or more comparedto over 60 per cent of respondents in theirseventies. For the two younger cohorts, mostwho live with children also live with a spouse. Incontrast, most respondents in their 70s whocoreside with children have no spouse present,reflecting the toll of mortality leading to increasedwidowhood with advancing age. Solitary livingis relatively rare among respondents in oursurvey. Overall less than 7 per cent live in aone-person household. More common is livingonly with a spouse, a situation reported bynearly 17 per cent of respondents overall. Both

22
In contrast, substantial majorities of the oldestcohort living alone or only with a spouse atleast have a child in the village and relativelyfew have no child within the province. The resultsin these respects for those who live alone amongthe youngest cohort, however, are based on only asmall number of cases and thus should beconsidered with caution.
The extent to which migration has left parentsdistant from children depends how migration isdefined. When we consider the combined results
of both shorter and longer distance migrationthen almost a fifth of parents have no child intheir own district. If instead we consider onlylonger distance migration (i.e., outside the parent’sprovince) then less than 15 per cent of parents areleft with no child in the same province. However,the impact is most pronounced for the youngestcohort and least for the oldest. For examplealmost a third of parents age 50-54 has nochild residing in the same district compared toonly 7 per cent of those in their 70s.
Table 8: Household composition and living arrangements, by age cohort
Age cohort of parent
Total 50-54 60-64 70-79
Household composition in relation to spouseand children (% distribution)
alone 6.5 3.6 6.0 10.0
with spouse only 16.5 19.5 16.7 13.5
with spouse, others, but no children 14.4 18.0 16.7 8.8
with children but no spouse 19.0 9.0 12.5 35.2
with spouse and children 38.8 46.7 42.6 27.3
with others only 4.7 3.3 5.7 5.3
Total 100 100 100 100
Among all respondents:
% coresident with any child 57.8 55.7 55.1 62.5
% coresident with a child age 16 or older 54.9 48.8 53.3 62.5
% with a child very nearby 72.2 61.1 71.4 83.9
% with a child very nearby or in village 76.1 63.5 75.6 88.9
% with no child in same district 18.3 32.0 16.4 6.7
% with no child in same province 14.3 26.0 12.2 5.0
Among those who live alone:
% with a child very nearby 40.9 (0.0) 25.0 64.7
% with a child very nearby or in village 50.0 (8.3) 35.0 73.5
% with no child in same district 31.8 (83.3) 35.0 11.8
% with no child in same province 25.8 (83.3) 25.0 5.9
Among those who live with only a spouse:
% with a child very nearby 35.3 15.4 39.3 58.7
% with a child very nearby or in village 43.7 21.5 50.0 67.4
% with no child in same district 44.3 70.8 32.1 21.7
% with no child in same province 33.5 53.8 23.2 17.4
Notes: Results in parentheses based on less that 20 cases.
SECTION 5: FAMILY AND LIVING ARRANGEMENTS

23
As already noted, although the cohorts differconsiderably in family size, they are quite similarwith respect to the per cent that have at least onemigrant child, with approximately three-fourthsof each cohort having at least one child livingoutside the province (see Table 4 above). However,as Figure 7 illustrates, the impact of having amigrant child on living arrangements is far greaterfor the youngest cohort and far less for theoldest. Among respondents 50-54 with at leastone child living outside the province, only slightlymore than half live with or very nearby one oftheir children compared to over 80 per cent of therespondents in their seventies. At the same time,regardless of cohort, over 90 per cent ofrespondents who have no child currently livingoutside the province live with or nearby at leastone of their children.
Figure 7: Per cent living with or nearby a childamong respondents with and without any childoutside the province, by age cohort
The differences in apparent impact of migrationon the living arrangements of the three cohortsare likely in large part a function of differencesin family sizes. The relationship between familysize and the per cent of parents living with ornearby a child is illustrated in Figure 8. The percent of respondents who coresided or live verynearby a child increases substantially with thenumber of children the respondent has. Onlyhalf of respondents with one child live with ornearby that child compared to over 80 per centof those with four or more children.
Figure 8: Living arrangements of parentsby number of living children and livingarrangements of children by size of sibship
Also shown in Figure 8 is the per cent of childrenwho live with or very nearby a parent according totheir sibship size. Children in a sibship of one(i.e., who have no sibling) are most likely to livewith or nearby their parents followed by thosewith only one sibling. The effect of sibship sizelargely disappears for sibships of three or more.While half of children with no sibs reside with ornearby a parent, only about a third of childrenin sibships of four or more do so. This suggeststhat the implications of migration for parent’sliving arrangements are likely taken intoconsideration when children decide whether or notto move away. Quite possibly the fact that thedeparture of an only child would result in theparents having no child nearby leads parents todiscourage migration or acts as a deterrent to thechild moving out of the household or leavingits immediate vicinity.
Another aspect of changing living arrangementsthat is often thought to affect the well-being ofolder persons in rural areas relates to grandchildren.Migration, especially to urban areas where childcarecan interfere with employment and affordablelodging is often not appropriate for raising youngchildren. Thus migration may not only result inolder persons back home having no adult childin the household but also leave them responsiblefor raising grandchildren who are left behind bytheir migrant children. Examination of household
SECTION 5: FAMILY AND LIVING ARRANGEMENTS
52
98
66
95
82
93
0
10
20
30
40
50
60
70
80
90
100
Among those with a child outside
province, % living with/nearby a child
Among those with no child outside
province, % living with/nearby a child
Per
cen
t
50-54
60-64
70-79
0505
64
41
67
35
81
34
0
10
20
30
40
50
60
70
80
90
% of parents living with or nearby a child
by number of children
% of children living with or nearby a
parent by sibship size
Per
cen
t
1
2
3
4 4+

24
composition in relation to grandchildren, presentedin Figure 9, shows that just over half of therespondents overall have at least one grandchildpresent although differences are evident acrosscohorts. The absence of a grandchild is mostcommon among the youngest cohort while the twoolder cohorts differ only modestly in this respect.The relatively low proportion of the youngestcohort that has a grandchild present undoubtedlyreflects the fact that their own children are atyounger ages and thus considerably less likely tobe married with offspring of their own comparedto the children of older respondents.
household but no resident child or child in-law.Most such situations undoubtedly represent casesin which a migrant child has left their own youngchildren to be cared for by the grandparents.15
About a fifth of respondents in the two youngercohorts live in skip generation households. Forrespondents in their seventies, the proportion isconsiderably less, likely reflecting the fact thatmost of their grandchildren have already grownup and no longer need to be looked after.
Of course, the living arrangements of any cohortcan change as parent’s age. Some migrant childrenof the younger cohorts will return and coreside orlive nearby parents in the future, perhaps even inresponse to increased needs of their parents forpersonal care. Other children will move away.Thus levels of coresidence or living nearbychildren among respondents may increase or decreaseas they age, particularly for those in their early50s. Still, the strong association between smallfamily size and the absence of children who coresideor live nearby suggest that in the future, the effectof migration of children on living arrangementsof older age parents is likely to increase as personswith small families increasingly fill the ranksof the elderly. In addition the very low recentfertility of adults in reproductive ages mayreduce the extent of skip generation households.How all this will impact on the well-being of theelderly, however, depends on how livingarrangements and location of children affect thevarious types of material and non-material supportschildren provide parents in old age, issues weexamine in Section 6.
Figure 9: Household composition in relationto grandchildren
Note: Skip generation households are those with a coresidentgrandchild but no coresident child or child-in-law.
Particularly interesting is the substantial proportionof households who live in a “skip generation”situation, defined for the purpose of the presentanalysis as having a resident grandchild in the
SECTION 5: FAMILY AND LIVING ARRANGEMENTS
58
23
19
44
36
20
42
46
12
0
10
20
30
40
50
60
70
No grandchildren in
household
Grandchildren and child or
child-in-law in household
Skip generation
household
Per
cen
t
50-54
60-64
70-79

25
Section 6: Children’s Supportto Aged Parents
6.1 Material support and householdassistancePrevious research has documented that olderThais depend mainly on their own work andsupport from children for income and meetingmaterial needs with the balance shifting from workto children with advancing age (Chayovan et al.,1988; Chayovan & Knodel, 1997). In the MIS, anumber of different questions provide informationon sources of income and material support.Respondents were asked whether or not theyworked, whether they received government welfareallowances, whether they received income fromseveral different types of sources, and which ofthese sources was the most important. In addition,respondents were asked about money and foodthat each child provided them during the past year.
As Table 9 shows, the percentage of respondentswho report they currently work depends very muchon the cohort to which they belong. The vastmajority of respondents age 50-54 currently workbut only about a third of those in their seventiesare economically active. Receipt of governmentwelfare is limited largely to persons age 60 andabove reflecting the fact that the main source ofthese payments is the monthly allowanceprogramme for elderly for which eligibility starts atage 60. The expansion of the programme isevident from the fact that almost half of personsin their seventies report receiving allowances.As recently as 2002, far fewer elderly werereceiving the allowances (Knodel et al., 2005).
When asked about sources of income, as inprevious national surveys, the two most importantare clearly their own or spouse’s work and moneyfrom their children (or grandchildren). The large
majority of respondents in the two youngercohorts have income from their own or theirspouse’s work but less than half of those in theirseventies report work as a source of income. Incontrast, substantial majorities of all three cohortsreport that children (or grandchildren) provideincome, with 90 per cent of the oldest cohortcompared to just under three fourths of persons50-54 doing so. Income from other sources is farless common. Apparently some respondents whoreport that they received government allowanceswhen asked directly do not consider this whenresponding to what their sources of income are.This is indicated by the fact that the per centwho report income from other sources is lowerthan the per cent who report receiving a governmentallowance for the two older cohorts.
When asked their most important source ofincome, own or spouse’s work is clearly the mostfrequently cited source by the youngest cohortwhile children (or grandchildren) are the mostfrequently cited by the oldest cohort. Only 16 percent of the 50-54 cohort reported children asthe most important source compared to 60 percent of persons in their seventies. The differencesacross cohorts in this respect likely reflectchanges in dependence on children over the lifecourse rather than a trend towards reduced filialsupport from children of parents who will reachmore elderly ages in the near future. We note thatpercentages of each age cohort that report childrenas their most important source of income arealmost identical to results based on ruralrespondents in the same age groups in the 1995Survey of Welfare of Elderly in Thailand.While this comparison is not conclusive becausethe samples are not directly comparable, it is at least

26
suggestive that little change has occurred inthe dependence on children for income amongolder persons during the previous decade or so.
Responses to questions concerning the contributionsof each child during the past year indicate thatthe vast majority of respondents received atleast some money from their children. In somecases the amounts were very small and likely oflittle more than token significance. Neverthelessover 80 per cent of respondents received at least1,000 baht (approximately US $25 at the time) andover half more than 5,000 baht (ca. US $125) fromat least one of their children in the past year.About half also report that at least one childprovided money either on a monthly or regularbasis. In general, the provision of money does notdiffer greatly across cohorts although the youngest
cohort was most likely to receive over 5,000 bahtwhile the oldest cohort was most likely to receiveregular income from a child. In addition tomonetary support, over half of the respondentsreport they received at least weekly contributionsof food although this differs sharply across cohortswith the highest percentages reported by the oldestcohort. This may in part reflect greater need onthe part of the oldest respondents for assistancein procuring food but also likely reflects thehigher proportions of the oldest cohort wholive with or very nearby a child.
When considering material support and householdassistance provided by children to older age parentsit is important to recognize that the meaning ofsuch support from coresident children is moredifficult to interpret than when it come from a non-
Table 9: Work status, sources of income and sources of material support, by age cohort
Age cohort of parent
Total 50-54 60-64 70-79
% who work 62.2 87.1 66.9 33.1
% who receive government welfare 23.7 3.0 18.8 49.0
% who get income from:
own or spouse’s work 71.7 94.9 78.3 42.5
children (or grandchildren) 83.3 74.2 86.0 89.7
rent, interest or investment 11.4 9.0 12.2 12.9
other 11.0 3.3 6.8 22.6
Most important source (% distribution)
own or spouse’s work 53.3 79.3 56.3 24.9
children (or grandchildren) 36.3 15.9 33.0 59.5
rent, interest or investment 2.5 0.9 3.0 3.5
other 3.4 0.9 2.4 6.7
more than one 4.5 3.0 5.4 5.3
Total 100 100 100 100
% who receive from one or more children:
any money 88.6 82.3 91.7 91.8
at least 1,000 baht last year 83.1 79.9 86.3 83.0
at least 5,000 baht last year 56.4 61.1 56.0 52.2
monthly/regular monetary support 50.7 48.2 49.1 54.8
at least weekly contributions of food 57.5 41.6 58.3 72.1
SECTION 6: CHILDREN’S SUPPORT TO AGED PARENTS

27
coresident child. In particular, provision of moneyor food to parents by a coresident child may befor communal benefit including for the child whoprovides the money or food. Thus interpretationof material support from coresident childrenis more ambiguous than support provided bynon-coresident children.
In addition to questions asked about all children,the MIS questionnaire includes two questions aboutcontributions to the household by each member 16
and older and thus such information is availableonly for coresident children. One question askedabout material support to the household andthe other about assistance with household chores.Table 10 summarizes several measures of materialsupport and household assistance from coresidentchildren to the household and the parents. Sincesome coresident children, especially those whoare young and single, may still be primarilydependent on parents for support rather than acontributor to the support of the household,
Table 10: Material support and household assistance from coresident children age 16 and over,by age and marital status of child
Age and marital status
Single (never married) Ever married,Total
Age 16-22 Age 23+ all ages
N of cases 737 65 277 379
% who support the household financially 77.8 32.9 72.9 90.7
Amount of money given to parents in previousyear (% distribution)
none 39.8 68.8 44.2 30.4
less than 100 Baht 6.3 6.3 5.4 6.9
1,000-5,000 Baht 24.8 13.8 19.9 30.7
more than 5,000 Baht 29.2 11.3 30.4 32.0
Total 100 100 100 100
% who regularly provided money 36.4 18.8 36.6 39.9
Frequency of proving food to parents (% distribution)
rarely or not at all 25.7 63.8 31.2 13.8
at least monthly 7.6 8.8 6.5 8.2
at least weekly 66.6 27.5 62.3 78.0
Total 100 100 100 100
Help with household chores (% distribution)
none 13.0 15.2 14.8 11.1
some 40.5 49.4 48.7 32.6
a lot 46.5 35.4 36.5 56.2
Total 100 100 100 100
% who regularly helped with work or business 38.8 38.8 38.4 39.2
Note: Excludes 65 coresident children under age 16.
SECTION 6: CHILDREN’S SUPPORT TO AGED PARENTS

28
results are shown separately by marital statusand for single children by age (divided into thosewho are 16-22 and those who were older).16
The extent to which coresident children age 16 andabove is reported to help support the householdfinancially differs considerably by age and maritalstatus. In general, coresident married childrencontribute most to the material support of parentsand household and younger single children least.Less than a third of coresident young singlechildren contribute financially to the householdcompared to almost three-fourths of older singlechildren and over 90 per cent of the ever marriedchildren. Information on the amount of moneythat coresident children provide parents is consistentwith the information on financial support of thehousehold. Over two thirds of coresident youngersingle children are reported not to contribute anymoney during the prior year compared to underone-third of married children, with older singlechildren falling in between. Married children are alsomore likely to provide substantial amounts ofmoney and to regularly provide money than singlechildren, although the difference between marriedand older single children is modest.
Most coresident children provide food to theparents on a regular basis. Again this differsconsiderably by age and marital status. Almosttwo-thirds of younger single children contributefood only rarely or not at all while over threefourths of ever married children provide foodat least weekly. Married children also are morelikely to help a lot with household chores comparedto single children of any age. Finally, just undertwo fifths of coresident children are reported toassist with the parents’ work or business with littledifference evident across the three groups ofcoresident children.
The contribution to material support of parents bynon-coresident children is shown in Figure 10according to their location relative to the parents.The results make clear that financial support ismore likely from migrant children, particularlythose at greater distances, than from local movers.In contrast, the closer the child lives to the parent,the more likely are contributions that requirepersonal contact.
The top panel of Figure 10 represents provision ofmoney during the prior year. The majority ofchildren regardless of location provided at leastsome money to the parents although in somecases the amount is less than 1,000 baht and thusunlikely to affect parents’ material well-being.Regardless of the amount of money provided,there is a clear tendency for children living nearbyto be less likely to provide money compared tothose who live further away. In particular childrenin Bangkok and the small number who live abroadcontribute the most. In general, only a minorityof non-coresident children provide money monthlyor on some other regular basis. However, againthere is a tendency for those in Bangkok andthose abroad to be more likely to do so than thoseliving elsewhere. For all measures of monetary
Figure 10: Per cent of non-coresident childrenage 16 and over providing different typesof support to parents during prior year, bylocation of child
(a) Money
(b) Non-monetary help
SECTION 6: CHILDREN’S SUPPORT TO AGED PARENTS
5965 63
70
78
85
39
4749
61
70
21
34
39
65
1618
26
31
83
11
171219
0
10
20
30
40
50
60
70
80
90
In village Other
village
Other
district
Other
province
Bangkok Abroad
Pe
r c
en
t
Any money
1,000+ baht
Over 5,000baht
Providesregularly
51
30
17
10
4
16
8
11
3
19
9
9
20
10
20
30
40
50
60
In village Other
village
Other
district
Other
province
Bangkok Abroad
Pe
r ce
nt
Food at leastweekly
Regularlyassists work
Householdchores atleast weekly

29
support, non-coresident children who live in thesame village as the parents rank the lowestcompared to children in other locations.
The lower panel of Figure 10 indicates the percent of non-coresident children who providenon-monetary assistance to the parents. Themeasures shown include providing food at leastweekly, providing regular assistance with the parent’swork or business, and helping with householdchores at least weekly. On all three measures,non-coresident children in the village rankeddistinctly higher than children living elsewhere.In general, the percentage of children providingregular help on any of these three dimensionsdeclines with distance from parents and is extremelylow for children living in other provinces, inBangkok, or abroad. These results are hardlysurprising given the practical difficulty of providingservices that largely require personal contact forchildren at considerable geographical distancesfrom their parents.
Figure 11 examines whether there is a differencein monetary support provided by non-coresidentchildren in rural and urban areas. The resultsmake clear that regardless of whether the child is alocal mover remaining in the same district or ashorter or longer distant migrant, those who endup in urban areas are far more likely to providesignificant amounts of money, defined in thiscase as over 5,000 baht, during the past year thanthose who ended up in rural areas. Moreoverlonger distant migrant, especially those in urbanareas but to a lesser extent also those in rural areas,are more likely to send significant amounts ofmoney than their counterparts among local moversor shorter distance migrants. It thus appears thatit is an advantage for the parents in terms ofmonetary support if their child moves or migratesto an urban area.
Our previous research indicated that besidesroutine material support, children often are the oneswho pay for household appliances and otheramenities including vehicles. In addition childrensometimes provide major gifts or financial assistanceto parents for major expenses such as building anew house or expanding or making major
improvements on an existing one (Knodel &Saengtienchai, 2007). Adult children may alsoassist parents by contributing labour to build,expand or improve a home. The MIS questionnaireincluded a series of questions about householdpossessions, who paid for them, and if it was achild, where that child was living at the time.Additional questions asked about major gifts tothe parents and contributions of children topaying for or helping with the labour for buildingor improving the parents’ house, including whetherthe amount of help was a little, a moderateamount, or a lot.
Table 11 provides results concerning assistancefrom children with regards to household appliancesas well as vehicles. We note that the items shownoften do not specifically belong to the parent butrather to some other household member or tothe household generally. Nevertheless, as part ofthe household, the parents presumably benefitfrom the presence of at least many of the itemsshown. For the cases in which children paid forthe item, the table shows their distributionaccording to whether they were coresident, notin the household but within the district (i.e., localmovers), or outside the district (i.e., migrants) atthe time.
Figure 11: Per cent of non-coresident childrenage 16 and over who gave over 5,000 baht toparents in prior year, by location relative toparent and type of area
Note: Excludes children living abroad. Urban areas refer tolocations reported as Bangkok, urban, or semi-urban. Ruralincludes peri-urban (tetsabaan tambol) sample sites.
SECTION 6: CHILDREN’S SUPPORT TO AGED PARENTS
1113
16
2928
40
0
5
10
15
20
25
30
35
40
45
In same district (local
movers)
In province but not same
district (shorter distance
migrant)
Outside province (longer
distance migrant)
Pe
r ce
nt
wh
o g
ave
ov
er
5,0
00
ba
ht Rural
Urban

30
The results make clear that children are importantproviders of household possessions. Children paidin the majority of cases for all but two of the 11different items shown, often accounting fortwo-thirds or more of the purchases. The extentto which coresident children versus those livingoutside the household, and particularly thosechildren who were migrants at the time, variesconsiderably with the particular item beingconsidered. For example, in about half of thecases, migrant children paid for the television andrefrigerator, the two most common appliances inhouseholds among those shown. For most otheritems, except large motor vehicles (car or truck),migrant children paid in a substantial minority ofcases. Children who had moved out of thehousehold but remained in the local area accountfor only a very small percentage of the purchases.It is not possible to make precise comparisons ofthe likelihoods that a coresident, local mover, ormigrant child paid for any item since we do not
Table 11: Per cent of respondents living in a household with selected items, per cent for whoma child bought the item, and per cent distribution of the children who bought the item accordingto location of child at the time
Amongthose in % distribution of children who bought the item
Household household according to location of child at the time (a)
Household possession has item with item,(%) a child In parent’s In same
Elsewhere Totalbought the household amphoeitem (%)
Color TV 95.4 64.9 40.4 6.3 53.3 100
Refrigerator 81.6 59.3 45.5 4.6 49.9 100
Telephone 73.1 68.2 53.4 5.8 40.8 100
Motorcycle 68.8 52.6 67.4 3.3 29.2 100
Video/DVD player 54.5 73.6 51.6 3.3 45.1 100
Washing machine 38.3 64.0 60.0 2.4 37.6 100
Furniture set 32.0 41.9 56.0 4.5 39.6 100
Large vehicle (car/truck) 27.2 39.6 80.4 5.9 13.7 100
Computer 11.6 66.4 64.9 5.4 29.7 100
Microwave oven 5.5 65.5 67.6 2.9 29.4 100
Air conditioner 5.3 52.8 61.5 3.8 34.6 100
(a) Excludes a small number of cases where location of the child is unclear or more than one child in different locations bought item.
SECTION 6: CHILDREN’S SUPPORT TO AGED PARENTS
“Elderly mother inremote rural areatalking on cell phonewith migrant childin Bangkok”.

31
“Elderly father with refrigerator purchased by migrant son”.
SECTION 6: CHILDREN’S SUPPORT TO AGED PARENTS
know the distribution ofchildren overall in relationto their location at the timeof acquisition. However,the fact that currentlyalmost two-fifths of non-coresident children livewithin the same district asthe parents, the muchlower percentage accountingfor purchases comparedto those who live outsidethe district strongly suggestthat they are much lesslikely than migrant childrento provide this type ofmaterial assistance (seeTable 6).
Table 12 addresses theextent to which childrenhad ever provided expen-sive gifts and majorassistance with regards tothe parents’ house. Overalljust over a fourth ofparents received gold orsome major gift from oneof their children at sometime although less thanone tenth of children arereported to have madesuch a gift. Two thirds ofthe children who gavegold or a major giftwere living outside thedistrict at the time. Clearly
that children provided at least some labour tobuild or improve the house and almost a fifth saidthat the amount of labour provided was a lot.However in the case of providing labour, justover half of the children who did so werecoresident at the time and most of the remainderwere living within the same district. Only a verymodest per cent of the children who providedlabour assistance for building or improving thehouse were living outside the district. Thus whilemigrant children are an important source offinancial assistance to parents with regards to
migrant children are an important source for thistype of material support.
Just over two fifths of parents said that childrenprovided at least some help in paying for buildingor improving the parents’ house and over a fourthreported receiving a lot of help in this respect.Among those children who did provide help,slightly over half were living outside the districtwhen the assistance was provided, both in thecase of providing any help and in providing a lotof help. Just over a fourth of parents indicated

32
building or improving the house, coresidenceand local movers are important as sources ofnon-financial help in these matters.
6.2 Social support and contactInteraction with grown children, including face-to-face contact, is a valued and important source ofsocial and emotional support for most older-ageparents. Since the migration of children greatlyreduces opportunities for frequent face-to-faceinteractions, it potentially undermines such support.Still, geographical separation does not precludemaintaining periodic face-to-face contact throughvisits or keeping in touch through phone calls.Visits, of course, can be in either direction withparents going to children or children coming toparents. The MIS questionnaire simply asked asingle question about how often the respondentand each particular child visited each other inthe previous year without distinguishing thedirection of the visit. Previous research, however,makes clear that the large majority of visits betweenolder age parents and their migrant children inThailand involve the child coming to visit theparents rather than vice versa (Chayovan & Knodel,1997; Knodel & Saengtienchai, 2007).17
Figure 12 indicates the frequency of visits betweennon-coresident children (excluding those livingnext door or very nearby) and parents duringthe prior year. There is a clear association between
the location of the child and the frequency ofvisits with the parent. Not surprisingly, the furtheraway the child resides, the less frequent are visitswith parents. While the vast majority of childrenwho live in the same village see their parents atleast weekly and many on a daily basis, few wholive in a different province, and even fewer who liveabroad, see parents more than several times a year.
Although frequent visits from distant children asnot common, there is a strong tradition in Thailandthat adult children who have left home return topay respects to their parents during the 3-day ThaiNew Year holiday (Songkran). Thus it is extremelyrare for a migrant child not to see a parent at leastannually. Fully 85 per cent of children who liveoutside the parents’ province visited the parents atleast once during the prior year and even amongthose who are abroad half of them did. Clearly itis unusual for a parent to lose all face-to-facecontact with any of their children and extremelyrare to lose face-to-face contact with all of theirchildren. Among the 822 respondents who haveat least one child residing outside their district, only32 have not seen any of their migrant childrenduring the past year and among these, only 7 didnot have other children who were coresident orliving very nearby. Thus although migrationclearly reduces face-to-face contact with somechildren, it rarely leaves older-age parents devoidof face to face contact with all.
Table 12: Major assistance provided to parents by children and location of child at the time
Child gave Child helped pay to build Child provided labour to
gold or or improve house build or improve house
major item Any help A lot of help Any labour A lot of labour
% of parents who received 27.0 41.0 27.1 27.0 18.3from any child
% of children who gave to parent 9.1 18.5 8.6 15.0 8.6
Location of child at the time(% distribution)
coresident 23.7 38.4 37.5 52.8 52.2
in same district 9.0 10.4 7.7 34.2 34.8
outside district 67.2 51.1 54.9 13.0 13.0
Total 100 100 100 100 100
SECTION 6: CHILDREN’S SUPPORT TO AGED PARENTS

33
Social support between older age parents and theirgrown children does not necessarily require face-to-face interactions. In the last few years thewidespread availability of mobile phones andreduced cost of calls has literally revolutionizedthe ability of rural parents and their childrenliving elsewhere, especially in urban areas, to contacteach other. Today’s older Thais apparently feelphone contact can substitute for visits whenchildren live far away. Over 80 per cent of MISrespondents in each of the three age cohorts saidthey agreed with the statement “Children wholive far away do not need to visit frequently ifthey often call their parents on the phone.”
As noted above, a substantial majority ofrespondents live in households where at least somemember has a phone. Overall, only 27 per cent ofrespondents live in a household without a phone.Moreover, among these respondents, 93 per centknow someone living nearby who has a phone andover three-fourths had used that person’s phone.Thus at present, in sharp contrast to only a fewyears ago, very few older-age persons lack reasonablyeasy access to a phone. In rural areas this is largelya function of mobile phones. Among the house-holds with a phone in our sample, over 91 per centhave a mobile phone while only 27 per cent had alandline phone (with 18 per cent having both).
As Figures 13a and b indicate, the large majorityof migrant children (defined as living outside theparents’ district), regardless of location, have aphone. Approximately a third of all migrantchildren had at least weekly phone contact withthe parent during the past year.18 Among thosewho did not speak weekly with the parent, manystill had occasional phone contact. Thus over60 per cent of migrant children had at leastmonthly contact and the large majority hadphone contact at least several times during theyear. Only modest differences are evident betweenchildren living within the same province but in adifferent district and those living in a differentprovince. Even children who live abroad differlittle from those who remained in Thailand interms of frequency of phone contact. However, amore noticeable difference is evident betweenmigrants living in urban areas and those outsideurban areas in Thailand. While there is littledifference between migrants in Bangkok andthose in other urban areas in Thailand both aremore likely than migrants to rural areas to havefrequent phone contact with parents. This is at leastin part likely to be because migrants in urbanareas are more likely to have phones of theirown, probably reflecting higher urban that ruralincomes and perhaps more convenient phoneservice availability in urban cities and town thanin the countryside.
A common implication of discussions that viewmigration of children as a serious treat toolder-age parents’ well-being is that migrationleaves the parents socially isolated from all theirchildren. Yet older-age parents in Thailand oftenhave children who live with them or very nearbyeven when some of their children migrate. Inaddition, visiting or phone contact with migrantchildren is common. Thus it seems unlikely thatmigration would often result in social isolationfrom all children. Figure 14 addresses this issue.It indicates the per cent distribution of respondentswho have at least one migrant child (defined asliving outside the parents’ district) according tothe most frequent contact they have with anyof their children.
Figure 12: Frequency of visits between non-coresident children and parents during prioryear, by location of child
Note: Results for same village exclude children who live nextdoor or very nearby.
SECTION 6: CHILDREN’S SUPPORT TO AGED PARENTS
88
74
50
29
3
0
88
77
55
10
0
91
82
53
13
9593
85
50
96
99
97
98
0
10
20
30
40
50
60
70
80
90
100
Same village Same
subdistrict
Same district Same
province
Different
province
Abroad
Pe
r c
en
t
At least weekly
At least monthly
At least several times
At least once
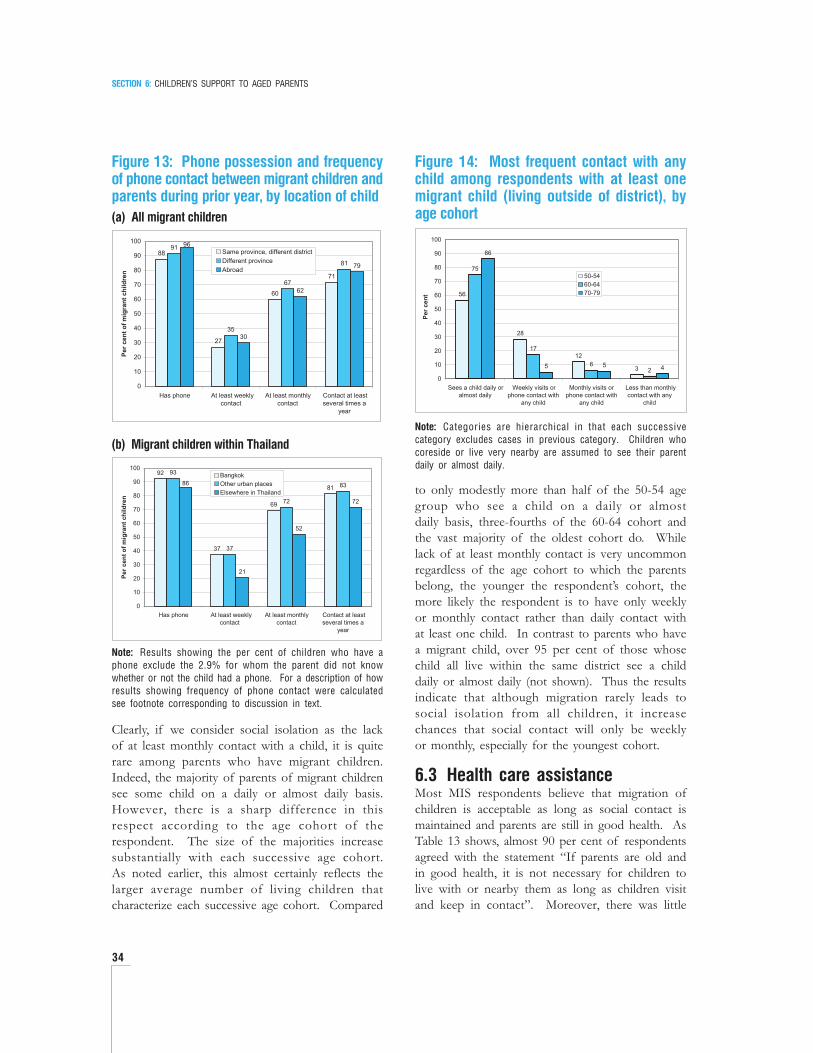
34
to only modestly more than half of the 50-54 agegroup who see a child on a daily or almostdaily basis, three-fourths of the 60-64 cohort andthe vast majority of the oldest cohort do. Whilelack of at least monthly contact is very uncommonregardless of the age cohort to which the parentsbelong, the younger the respondent’s cohort, themore likely the respondent is to have only weeklyor monthly contact rather than daily contact withat least one child. In contrast to parents who havea migrant child, over 95 per cent of those whosechild all live within the same district see a childdaily or almost daily (not shown). Thus the resultsindicate that although migration rarely leads tosocial isolation from all children, it increasechances that social contact will only be weeklyor monthly, especially for the youngest cohort.
6.3 Health care assistanceMost MIS respondents believe that migration ofchildren is acceptable as long as social contact ismaintained and parents are still in good health. AsTable 13 shows, almost 90 per cent of respondentsagreed with the statement “If parents are old andin good health, it is not necessary for children tolive with or nearby them as long as children visitand keep in contact”. Moreover, there was little
Clearly, if we consider social isolation as the lackof at least monthly contact with a child, it is quiterare among parents who have migrant children.Indeed, the majority of parents of migrant childrensee some child on a daily or almost daily basis.However, there is a sharp difference in thisrespect according to the age cohort of therespondent. The size of the majorities increasesubstantially with each successive age cohort.As noted earlier, this almost certainly reflects thelarger average number of living children thatcharacterize each successive age cohort. Compared
Figure 13: Phone possession and frequencyof phone contact between migrant children andparents during prior year, by location of child(a) All migrant children
(b) Migrant children within Thailand
Note: Results showing the per cent of children who have aphone exclude the 2.9% for whom the parent did not knowwhether or not the child had a phone. For a description of howresults showing frequency of phone contact were calculatedsee footnote corresponding to discussion in text.
Figure 14: Most frequent contact with anychild among respondents with at least onemigrant child (living outside of district), byage cohort
Note: Categories are hierarchical in that each successivecategory excludes cases in previous category. Children whocoreside or live very nearby are assumed to see their parentdaily or almost daily.
SECTION 6: CHILDREN’S SUPPORT TO AGED PARENTS
88
27
60
71
91
35
67
81
30
62
79
96
0
10
20
30
40
50
60
70
80
90
100
Has phone At least weekly
contact
At least monthly
contact
Contact at least
several times a
year
Pe
r c
en
t o
f m
igra
nt
ch
ild
ren
Same province, different district
Different province
Abroad
92
37
69
81
93
37
72
83
21
52
72
86
0
10
20
30
40
50
60
70
80
90
100
Has phone At least weekly
contact
At least monthly
contact
Contact at least
several times a
year
Pe
r c
en
t o
f m
igra
nt
ch
ild
ren
Bangkok
Other urban places
Elsewhere in Thailand
56
28
12
3
75
17
62
86
5 5 4
0
10
20
30
40
50
60
70
80
90
100
Sees a child daily or
almost daily
Weekly visits or
phone contact with
any child
Monthly visits or
phone contact with
any child
Less than monthly
contact with any
child
Pe
r c
en
t
50-54
60-64
70-79

35
As Table 13 indicates, migrant children are by nomeans totally detached from assisting with healthcare of their parents. Almost a fourth ofrespondents who ever had a migrant child (i.e., hadever moved away from the parents’ district)reported that a child living elsewhere helpedthem get medical care either at the place where thechild was living or somewhere else away fromthe parents’ own area. Respondents in theyoungest age cohort were less likely than olderrespondents to have been taken elsewhere by amigrant child for health care, perhaps reflectingthe lower likelihood they would have neededsuch assistance given their younger age and betterhealth status than their older counterparts. Thegeneral finding that it is not unusual for a
difference across the three age cohorts ofrespondents in the per cent who agreed. However,less than 30 per cent said it was acceptable whenasked “If parents are old and not in goodhealth and all their children live elsewhere, is itacceptable if their children hire someone to helpthe parents?” Furthermore over 80 per cent ofrespondents believe that under the samecircumstances, it better for parents to ask a child tomove back to take care of them rather than forparents to move and join a child. Again theseopinions differed little among the three cohorts.Thus the prospect of frail health seems to changeolder persons’ acceptance of living without achild nearby and obliges at least some child toreturn if all have moved away.
Table 13: Attitudes related to migration and health care and assistance from migrant childrenin relation to health care
Age cohort
Total 50-54 60-64 70-79
Among all respondents, % who agree that:
“If parents are old and in good health, it is not necessaryfor children to live with or nearby them as long as childrenvisit and keep in contact”. 88.8 89.8 91.7 85.0
“If parents are old and not in good health and older childrenlive elsewhere, it is acceptable if their child hire someoneelse to help the parents”. 27.8 30.0 22.6 30.8
“if parents are old and not in good health and all theirchildren live elsewhere, it is better for parents to aska child to move back than to join the children”. 81.9 84.7 79.5 81.5
Among respondents who ever had at least one migrantchild (i.e., living in a different the district):
% who were taken somewhere else for health careby a migrant child. 24.1 16.8 27.0 28.0
% ever seriously ill. 40.5 39.0 43.5 38.7
% for whom a migrant child returned to provide careduring the most recent episode among those whowere ever seriously ill. 48.7 36.0 47.9 61.8
SECTION 6: CHILDREN’S SUPPORT TO AGED PARENTS

36
parent to have been taken for health serviceselsewhere by a migrant child is consistent withresults from our earlier research based onopen-ended interviews that suggested somehealth benefits for parents from having a migrantchild. In particular, many children who migrateto Bangkok or other urban areas likely gainknowledge of the better health facilities andservices available in large urban centres than fromwhere their parents live. These children can thenfacilitate parents’ access to superior health serviceswhen serious illnesses or health conditions develop(Kespichayawattana and Wiwatwanich, 2005).
Although children who live beyond a convenientcommuting distance from parents will not be ableto provide long-term care for chronic conditions,they still may be able to return at critical timesshould a parent experience a serious acute illness.As shown in Table 13, approximately 40 per centof respondents who had a migrant child indicatedthey had ever been seriously ill, a share that doesnot vary by cohort. Among respondents with amigrant child and who were ever seriously ill,almost half reported that a migrant child hadreturned to provide care when they were lastseriously ill. In this case, substantial differences areevident across age cohorts with the per cent havinga child return increasing with age of the parent.The association with age may reflect an increasingseverity of illness with age, a decreasing likelihoodthat a spouse would be present to assist andfewer migrant at the time the illness occurred.19
Chronic illness and frailty among parents posemore intractable barriers for assistance frommigrant children. As Table 14 shows slightly overhalf of respondents reported having any difficultyat all with any of the five normal functionalactivities or four activities of daily living describedearlier (see discussion of Figure 3). This variesgreatly, however, with the age cohort. Respondentsin their seventies are twice as likely to report anysuch problem as those aged 50-54. At the sametime, considerably less than half of those whoindicated they had any problem received assistance.In many of these cases the problem was likelynot severe and could be handled by the respondentsthemselves. Among those who did receive
assistance, a child was most likely the main personto provide that assistance. Again this differsconsiderably by age cohort with only about athird of those aged 50-54 and 60-64 reportinga child as the main assistance provider comparedto over 60 per cent of those in their seventies.This difference in large part reflects a lower likelihoodfor a spouse to be the main assistance provideramong the oldest cohort, no doubt due to higherrates of widowhood and frailer conditions ofthe spouses who still survive compared to theiryounger counterparts.
In addition to questions about physical functioningand basic activities of daily living, the MIS alsoasked about difficulties with five instrumentalactivities of daily living (IADL): cooking, handlinghousehold money, doing housework, washingclothes, and taking transportation. Table 14indicates that just over two fifths of respondentsreported difficulty with one or more of theseactivities. Of those who reported a difficulty withIADL, a substantially higher per cent receivedassistance than in the case of difficulties withphysical functioning and ADL. Also the likelihoodof assistance with IADL varies little by cohort.Again, overall a child is the most likely person toprovide assistance with IADL but this varies bycohort. A child was much more commonly the mainperson for the oldest cohort than for the youngest.In brief then, children play an important role inhelping older age parents with chronic physicalproblems but much more commonly for parentsat advanced ages than those who are younger.
Not surprisingly, as Figure 15 clearly shows, whena child provides main assistance for physicalfunctioning and ADL or for IADL, the childusually coresides with the respondent. A distantsecond in importance in this respect are childrenwho live next door or very nearby. Clearly childrenwho live outside the village including thosewho have migrated to more distant locations veryrarely provide this type of assistance. As researchelsewhere has shown, separation throughgeographical distance, even small distances, simplymake it impractical for a child to provide theday to day care that someone who is frail orchronically ill requires (Litwak & Kulis, 1987).
SECTION 6: CHILDREN’S SUPPORT TO AGED PARENTS

37
Table 14: Problems and assistance with physical functioning, activities of daily living (ADL)and instrumental activities of daily living (IADL), by age cohort
Age cohort
Total 50-54 60-64 70-79
Physical functioning physical functioning or activitiesof daily living
% reporting any difficulty 52.7 34.1 53.6 70.1
Among respondents who report a difficulty,% who receive assistance 38.0 33.3 33.0 43.9
Main person proving assistance (% distribution)
Spouse 29.7 55.3 42.4 13.3
Child 48.0 31.6 35.6 61.0
Grandchild 11.4 7.9 13.6 11.4
Other 10.9 5.3 8.5 14.3
Total 100 100 100 100
Instrumental activities of daily living
% who reporting any difficulty 41.0 22.5 39.0 61.3
Among respondents who report a difficulty,% who receive assistance 60.9 61.3 56.5 63.5
Main person proving assistance (% distribution)
Spouse 21.4 43.5 31.1 8.3
Child 51.6 30.4 40.5 65.2
Grandchild 11.5 6.5 9.5 14.4
Other 15.5 19.6 18.9 12.1
Total 100 100 100 100
Figure 15: Per cent distribution of location of children who are main providersof assistance for parents who have difficulties with physical functioning,activities of daily living (ADL), and instrumental activities of daily living (IADL)
SECTION 6: CHILDREN’S SUPPORT TO AGED PARENTS
81
68
9
19
4
96 4
0
10
20
30
40
50
60
70
80
90
Child providing main assistance with
physical functioning & ADL
Child providing main assistance with
IADL
Pe
r c
en
t
In same house as R
Next-door/nearby
Same village
Elsewhere

38
Section 7: Parents’ Contributionsto Migrant Children
Exchanges of material support and services betweenparents and adult children can flow in eitherdirection. So far our focus has been on supportprovided by children to their parents. Previousresearch in Thailand makes clear that adult childrenare more likely to provide routine monetarysupport to older age parents than the reverse(Chayovan & Knodel, 1997). Nevertheless, as ourearlier qualitative research revealed, parents cansometimes be an important source of financialsupport for adult children when special circumstancesarise that require large amounts of money suchas establishing a business, paying educational feesfor grandchildren, or buying a house or property.In addition, with regards to migrant children,especially those who leave their rural home forurban areas and non-agricultural employment,parents sometimes contribute to their materialsupport by supplying them with rice or otherproduce from their farm or village (Knodel &Saengtienchai, 2007).
Unlike previous surveys of older persons inThailand, the MIS included two questions aboutmajor financial assistance that respondents mayhave provided at some time to their children. Thefirst question inquired about loans or gifts ofat least 5,000 baht to any of their children whilethe second question asked whether respondentshad ever paid for a large expense (excludingcosts for education) or given an expensive item toany of their children. Respondents who repliedaffirmatively in either case were asked if theamount involved 10,000 baht or more. In additionthey were asked where the child was located atthe time assistance was provided.
Table 15 provides some measures of the extentto which parents provided major financial assistanceto their children. Just over 60 per cent of parentsindicated that they had provided at least onechild with major financial assistance of one or bothof the types asked about. Approximately halfhad loaned or given money amounting to atleast 5,000 baht and a third had given at least10,000 baht to one or more children. Almost athird also indicated that they had paid a largeexpense for or given an expensive gift to one ormore of their children. For about two thirdsof these the value was 10,000 baht or more.
Almost a third of children of respondents receivedone or the other or both of these forms of majorfinancial assistance from their parents at sometime. About equal proportions had received aloan or money or had their parents pay a largeexpense for them. Those who received financialassistance included children who were coresident,local movers, or migrants at the time. Substantialproportions of those who received these types ofassistance fall in each of these categories. Theinformation in the survey does not permit anyprecise determination of whether migrationaffects the likelihood of receiving major financialassistance. Nevertheless some rough indication ofwhether or not migrant children are more orless likely than those who remained nearby toreceive major financial assistance is provided bya comparison of children who ever migratedand those who never migrated. Based on thiscomparison, included in Table 15, there appearsto be little difference. We note that the comparisonis only approximate since some of the children

39
who migrated received the assistance while theywere still in the local area of the parents and ina fair share of cases coresident with them atthe time.20
Figure 16 examines the extent that the differentcohorts of respondents provided any majorfinancial assistance (defined as giving a loanor money of at least 5,000 baht or paying amajor expense) and the extent to which theyprovided farm produce on a more or lessregular basis to their migrant children. Theresults refer only to parents who have at leastone child who ever migrated out of the parents’district and only the assistance during the timechild was living away. There is a negative
association between the age of the cohort andthe per cent who provided either type ofassistance to a migrant child. Over two fifthsof the youngest cohort of parents who have amigrant child gave at least one of these childrenmajor financial assistance. In contrast, only 28per cent of those in their seventies who hadmigrant children ever provided major financialassistance to any of them. For all cohorts, ahigher percentage provided migrant childrenwith local produce. Even among the oldestcohort, over half indicated that they did so.
Besides providing material assistance in the form offinancial aid or farm produce, parents can provideimportant services for their children. For coresident
SECTION 7: PARENTS’ CONTRIBUTIONS TO MIGRANT CHILDREN
Table 15: Major financial assistance provided by parents to children and location of childat the time
Loaned or gave Paid large expense
Any major substantial for a child (other than
financial amount of money (b) for education)
assistance (a)
At least At least Any large At least5,000 baht 10,000 baht expense 10,000 baht
% of parents who gave to any child 60.5 49.4 33.3 31.8 21.6
% of children who received 32.5 21.0 14.4 18.3 12.9
Location of child at the time(% distribution)
coresident 38.1 25.8 26.4 52.4 42.8
in same district 26.7 30.4 30.1 22.5 29.8
outside district 35.2 43.9 43.5 25.1 27.4
Total 100 100 100 100 100
% of children who receivedby migration status:
never left district 31.6 19.2 12.8 18.9 14.6
ever left district (c) 33.1 22.3 15.5 17.9 11.7
(a) Represents either giving or loaning at least 5,000 baht, paying any large expense, or both; the distribution of children by locationis based on the combined distributions for the two components thus allowing for being in different locations in cases where a childreceived both.
(b) Includes situations where parent provided collateral for a loan to the child.
(c) Includes all children who ever lived outside the district and thus some may have received assistance before migrating or afterreturning from living away.

40
SECTION 7: PARENTS’ CONTRIBUTIONS TO MIGRANT CHILDREN
children, these can include a wide range of domesticchores including routine housework, cooking,laundry, and minding the house. Parents can alsoassist with childcare for grandchildren from boththeir coresident and non-coresident adult sonsand daughters thus freeing them to engage ineconomic activity outside the home. In the caseof migrant sons and daughters, the parents mayvirtually take over full responsibility for raising the
“Taking care of a grandchild whose parents have migrated”.
grandchildren acting in effect as the grandchildren’sfoster parents.
As Table 16 shows, the vast majority of MISrespondents have grandchildren although thepercentage varies with age cohort. Among the50-54 cohort over one fourth have no grandchildcompared to much lower proportions of theolder cohorts. This reflects the fact that the

41
SECTION 7: PARENTS’ CONTRIBUTIONS TO MIGRANT CHILDREN
Table 16: Grandchild care, by age cohort of respondent
Age cohort
Total 50-54 60-64 70-79
% who have no grandchildren 10.7 26.9 4.8 0.6
Among those with at least one grandchild:
% who ever went to care for a grandchild who livedelsewhere for at least 3 months 5.5 3.7 6.3 6.2
% who ever took care of a coresident grandchild whoseparent lived elsewhere 47.0 50.8 49.1 42.2
% who still are caring for a coresident grandchild whoseparent lives elsewhere 26.8 37.7 28.4 17.7
Among grandchildren cared for by respondent:
Median age of grandchild when care began <1.0 <1.0 <1.0 <1.0
Location of absent parent of grandchild (% distribution)
Very nearby 6.5 6.7 5.1 8.1
In same sub-district 3.8 1.7 1.8 7.7
Elsewhere 89.6 91.7 93.1 84.1
Total 100 100 100 100
Who paid most expenses of raising the grandchild(% distribution)
The parents 61.2 66.9 55.1 64.2
The respondent 25.2 22.7 29.3 22.4
Shared expenses equally 10.5 8.3 12.5 9.8
Other arrangement 3.0 2.2 3.1 3.5
Total 100 100 100 100
Figure 16: Per cent of respondents whogave major financial help and per cent whoprovided farm produce to a migrant childamong respondents who had at least onemigrant child
Note: A migrant child refers to any child who was living out ofthe parents’ district at the time assistance was provided.
children of the youngest cohort are substantiallyyounger and in many cases have not yet marriedor started a family of their own. Among thosewho do have at least one grandchild, only a smallpercentage have gone to where a migrant childlives in order to take care of a grandchild forany extended period of time (defined as at leastthree months). Much more common is caringfor a grandchild in the respondent’s own homein cases where the grandchild’s parent hasmoved elsewhere. Close to half of all respondentshave ever taken care of a grandchild underthese circumstances and over one-fourth still doso in the absence of the grandchild’s parents.This varies considerably by age cohort of therespondent. The per cent that still care fora grandchild declines sharply with age. Thisassociation with age in part reflects the somewhat
41
62
37
59
28
52
0
10
20
30
40
50
60
70
Gave a migrant child major financial help Provided migrant child with produce
Pe
r c
en
t
50-54
60-64
70-79

42
SECTION 7: PARENTS’ CONTRIBUTIONS TO MIGRANT CHILDREN
“Proud parents of successful migrant children”.
lower lifetime experience of caring for a grandchildof an absent parent especially among the oldestcohort as just discussed. However, probably amore important influence is that the grandchildrenof older respondents are more likely to begrown and no longer need care.
Table 16 also makes clear that grand child carebegins at an early age. Regardless of the agecohort of the respondent, the median age ofthe grandchild at the time grandparental care
began was under 1 year old. The vast majority ofcases in which a grandchild has been cared forin the absence of a coresident parent involvesituations in which the parents are migrantsand have left the district where the grandparentlives. This varies only modestly by cohort ofthe respondent. In well over half the caseswhere a respondent has cared for a grandchildin the absence of the parent, the parentsthemselves have been the main contributor tothe expenses of raising the grandchild. In

43
SECTION 7: PARENTS’ CONTRIBUTIONS TO MIGRANT CHILDREN
only about a fourth of the cases is the respondentpaying most expenses. In the remainder of thecases the respondent and the grandchild’sparent share expenses more or less equally orhave made some other arrangement.
As Figure 17 clearly shows, migrant childrenwho left their own children in care of grandparentsare far more likely than other migrant childrento remit substantial amounts to their ownparents. More than 60 per cent of migrantchildren who left a child of their own behindgave more than 5,000 baht to the respondent inremittances during the prior year. This is almost
Figure 17: Per cent distribution of migrant children according to amount remittedto respondent in prior year, by whether the respondent (parent of migrant) is caringfor the migrant’s own child
twice the percentage of other migrant children.Moreover less than a fifth of those who leftchildren behind remitted little or no money toparents during the past year, a level half thatfor other migrant children.
In brief, older-age parents in skip generationhouseholds do not necessarily suffer economicallyfrom caring for a grandchild whose parents areabsent. At the same time, remittances from themigrant parent of the grandchildren may largely gofor expenses associated with the coresidentgrandchildren rather than for the direct benefit ofthe older age parents with whom they live.
38
19
30
21
32
61
0
10
20
30
40
50
60
70
Has no child under care of respondent Has child under care of respondent
Pe
r c
en
t
None or under 1,000 baht
1,000-5,000 baht
Over 5,000 baht

44
As noted in the introduction, migration of adultchildren can potentially impact a variety ofdimensions of the well-being of their rural olderage parents who remain behind. Assessing theseimpacts can be quite complex, especially sincedeterminants of whether a child migrates or notand to where a child migrates are themselvestypically intertwined with other determinants ofparents’ well-being. Thus separating cause and effectis a major challenge and to the extent possible,requires complex statistical analyses that arebeyond the scope of the present report.Nevertheless exploratory analyses can provide atleast suggestive results. We first explore theextent to which the balance of material exchangesbetween respondents and their migrant childrenfavour one party or the other. We then turn tothe relationship between migration of childrenand respondents’ current economic status.Following this, we explore the associations betweenmigration of children and overall satisfactionwith the children. Finally we assess the extent towhich migration results in the desertion andneglect of parents.
The balance of material exchanges. As previousanalyses in this report have illustrated, materialexchanges between parents and their migrantchildren flow in both directions and take placeover the entire span of time that migrant childrenreside in localities that are geographically separatedfrom their parents. To measure whether the netbalance of support exchanges has favoured theparent or the migrant child more, we askedrespondents the following question for each childwho ever resided for at least a year outside thedistrict in which the respondent lives: “Thinkingabout the entire time that this child has lived
Section 8: Impacts on Parents’Well-Being
Figure 18: Per cent distributions of childrenwho ever migrated according to net balanceof material exchanges with parents duringentire period away, by initial destination
The results show a clear relationship betweenthe initial migration destination and the net balanceof material support exchanges. Shorter distantmigrants who moved to a different district butremained in the same province as the parents areclearly the least likely to have contributed moreto the parents than the parents contributed tothem and the most likely to have been the net
away, would you say this child contributed more toyour and your spouse’s material support or thatyou contributed more to the child’s materialsupport?” Responses are coded into four categories:(1) the child contributed more (2) the parentscontributed more, (3) both parties contributedequally to each other, and (4) neither partycontributed to the support of the other. For ouranalysis, we combine the last two categories into asingle category indicating no net effect.21 Resultsare shown in Figure 18 according to the initialdestination to which the child migrated.22
47
66
23
7
28
21
35
45
3129
3433
0
10
20
30
40
50
60
70
Same province
(different district)
Other province
(excl. Bangkok)
Bangkok Abroad
Pe
r c
en
t
Child contributed more
Parents contributed more
No net effect

45
beneficiary in the exchanges of material support.Indeed, the percentage of these children for whomthe balance is in their favour is more than twicethe percentage for whom the balance is in favourof their parents. In contrast, among all threecategories of longer distant migrants, the percentageof cases for which the balance favours theparents is higher than the percentage for whomthe balance favours the migrant child. However,this difference is very modest for children whomigrated to some other province within Thailandbut not Bangkok. Migrants who went to Bangkokare far more likely to have contributed more totheir parents than the reverse with the percentagein which the exchanges favoured the parentbeing more than twice that in which the exchangesfavoured the migrant child. The difference is evengreater for the small number of migrant childrenwho went abroad among whom two thirdscontributed more to the parent than the reverse andless than a tenth received more support fromparents than they gave. Clearly the extent to whichparents gain more material support from migrantchildren than they give depends on where amigrant child moved. Migration to Bangkok issubstantially more favorable for parents in thisrespect than is migration to other provinces inThailand. Moreover, shorter distance migrationwithin the parents’ province appears to leavemigrant children more dependent on theirparents than the reverse.
Table 17 examines the balance of exchanges ofmaterial support in association with the age cohortof the parents. Two sets of results are shown.The upper half refer to migrant children as theunit of analysis and the bottom half to respondentas the unit of analysis. The top half presents theper cent distribution of migrant children withrespect to which party contributed more to thematerial support of the other. Overall, migrantchildren are more likely to be net contributors totheir parents’ support than the reverse (39 per centversus 29 per cent). However, this favourablebalance towards parents is limited to the childrenof the two older cohorts of respondents. Themost favourable balance for parents is evidentamong children of the oldest cohort with almosttwice as many having contributed more support
to their parents than they received. Among childrenof parents age 50-54, the percentages are in thereverse direction. Only a third of their migrantchildren were net contributors to parents’ materialsupport and fully two fifths were net receivers. Onefactor that contributes to the unfavourable supportbalance for parents associated with migrant childrenof the youngest cohort is that a substantial shareof the children (16 per cent) is still in school.In contrast, only 3 per cent of children ofrespondents 60-64 and less than 1 per cent ofchildren of respondents in their 70s are stillattending school. This affects the direction ofthe intergenerational support balance becausechildren still in school typically remain dependenton parents and even if they earn some income itis unlikely to be sufficient for them to contributemuch to their parents’ support. If children inschool are excluded, then the share of migrantchildren of respondents age 50-54 whose parentsare net gainers rises to 35 per cent and almostequals the share who are net gainers themselveswhich declines to 37 per cent (not shown in table).
In order to calculate a respondent based measureof the net balance in intergenerational exchanges ofsupport with children who migrated, the numberof migrant children of the respondent for whomthe net balance was favourable to the parents iscompared to the number of migrant children forwhom the net balance was favourable to the child.If children who were net contributors of supportto a respondent outnumber those who were netreceivers, the net balance for the respondent isjudged to be in favour of the respondent. If thereverse is true, the net balance is judged to be infavour of the migrant children. In cases wherethe numbers are equal or if for all migrantchildren neither the parent nor the migrant childcontributed to each other’s support, the balance ischaracterized as not in favour either party. Therespondent based pattern of results, shown inthe lower half of the table, is fairly similar to thechild based results in the upper half. Overallthe net balance of material exchanges is morelikely to be in favour of parents than theirmigrant children. Again, this holds only for thetwo oldest cohorts of parents while the reverseis the case for parents in the 50-54 age range.
SECTION 8: IMPACTS ON PARENTS’ WELL-BEING

46
Parents in their seventies are least likely toexperience a net balance in favour of theirmigrant children and most likely to experiencea net balance in favour of neither.
It is not possible to determine if the distinctivepattern for the younger cohort of parents simplyreflects life course differences among cohorts orinstead a recent shift in the balance ofintergenerational exchanges between parents andtheir migrant children. If the latter, we wouldexpect the present predominant balance infavour of migrant children for the 50-54 cohortto persist over time as they and their migrantchildren advance in age. Alternatively, the patterncurrently observed for this youngest cohort ofparents may simply be a function of conditionsthat generally characterize earlier life course stagesof parents and migrant children compared toconditions at later stages. In this case, we wouldexpect the balance to shift in favour of parents asthe 50-54 year old cohort ages and eventuallyto resemble the current pattern for the 60-64and 70-79 cohorts by the time the 50-54 cohort
reaches those ages. At a minimum, as the youngercohort ages with time, the effect on supportexchanges resulting from still having substantialnumbers of migrant children in school willdissipate. In brief, whether or not the results forthe youngest cohort reflect a basic change inintergenerational support relationships betweenmigrant children and their older age ruralparents compared to the past remains an openquestion that can be raised but not resolved bythe present study.
8.1 Current economic statusExamination of the current economic status of ruralparents in relationship to the migration of theirchildren may provide some indication of theimpact of migration on their material well-being.However, there are many other potential factorsthat influence current economic status and, to theextent they are also associated with migration ofchildren, can confound results. Thus interpretingany association between current economic statusand migration of children needs to take theseother influences into account. In our analysis,
Table 17: Per cent distributions of migrant children and parents according to the net balanceof material exchanges between migrant children and parents, by age cohort of parents
Age cohort of parent
Total 50-54 60-64 70-79
% distribution of migrant children with respect to relativeamount of material support exchanged between the parentand migrant child
Child contributed more 39.3 32.6 43.2 40.2
Equal amounts (a) 31.5 27.4 27.9 37.9
Parent (respondent) contributed more 29.3 40.0 29.0 21.9
Total 100 100 100 100
% distribution of parents (respondents) with respect to netbalance of exchanges of material support with migrant children
Net balance in favour of parent (respondent) 41.4 30.7 46.3 46.8
Net balance in favour of neither 25.3 26.4 22.3 27.3
Net balance in favour of migrant children 33.3 42.9 31.4 25.9
Total 100 100 100 100
Migrant children include any child who ever moved outside the district in which the parent resided at the time of the move.
(a) Includes cases in which, for all migrant children, neither child nor parent contributed to each other’s material support.
SECTION 8: IMPACTS ON PARENTS’ WELL-BEING

47
we control for the following likely relevantcharacteristics of respondents: age cohort, provinceand type of area of residence, coresidence status,total number of children age 16 or older andself-assessed prior economic status. This lastvariable is conceptually important to includegiven that parents’ economic situation at the timewhen children reach an age when migrationtypically occurs may influence the decision tomigrate as well as be associated with their currenteconomic status. Under these circumstances, abuild-in association between migration and currenteconomic status would exist and complicateinterpretation of results. With this in mind, MISrespondents were asked to assess their economicstatus relative to others in the communitywhen their oldest child was age 18 (an age whenmigration of children starts to become likely).23
The subjective and objective measures of currenteconomic status described earlier serve as dependentvariables when exploring associations betweenchildren’s migration and parents’ material well-being. Table 18 shows the association between thetwo indices and the control variables mentionedabove. Results are shown both unadjusted andstatistically adjusted by multiple classificationanalysis (MCA) for each of the other variables inthe table. Statistical significance is indicated byp-values based on analysis of variance.
Most of the characteristics show reasonably clearassociations with the economic status indices. Ingeneral, the patterns of relationship are similarfor the subjective and objective measures ofeconomic status and are only modestly alteredby statistical adjustment for the other variables.Older age cohorts are associated with lower meaneconomic status scores. Respondents in NakornRatchasima score the highest and those in Si Sa Ketthe lowest. Respondents in peri-urban sites andthose who live with at least one child aged 16 andover are better off than those in rural sites andthose who are not coresident. The number ofchildren age 16 and over shows an erraticrelationship with both measures of currenteconomic status that does not achieve statisticalsignificance at even the .100 level when adjustedfor the influence of the other variables. However
respondents with only one child score loweston both measures after adjusting for the othervariables. Finally, better self assessed economicstatus at the time when the oldest child was 18is generally associated with better subjectivelymeasured current economic status but showsno consistent relationship with the objectivelymeasured score. Nevertheless, as discussedabove, this variable is conceptually importantto include in the analysis.
Our analyses exploring the impact of migrationof children on material well-being of parents usesthree measures of migration: (1) the number ofchildren who ever moved out of the parents’district; (2) the number of children currently inurban areas outside of the parents’ district; and (3)whether or not any child currently lives abroad.The first measure is the broadest and includesboth children who have remained away as well asthose who returned to their parents’ districtafter leaving. The second measure is of specialinterest given that the discussion concerning theimpact of migration on rural parents left behindis often framed in terms of urbanization andmigration to urban areas. Although only a fewchildren live abroad, they are of particular interestgiven that analyses presented above showed thatthey were the most likely to contribute more toparents than parents contribute to them (Figure 18)and were particularly likely to give significantamounts of money to parents during the previousyear (see Figure 10a).
As the results in Table 18 clearly showed, coresidencewith an adult child is strongly associated withbetter current economic status. This is notsurprising given that having adult children in ahousehold is likely to bring in income and increasethe number of people able to purchase appliancesand afford other household amenities as well asto make house improvements.24 At the same time,coresidence is likely to be related to migrationsince each child who migrates reduces the pool ofchildren available to coreside. Thus beforepresenting results of our analysis relating migrationof children and current economic status, it isimportant to consider the interrelationshipbetween migration of children and the coresidence
SECTION 8: IMPACTS ON PARENTS’ WELL-BEING

48
Table 18: Current subjective and objective economic status scores by selected potential influences
Subjective economic Objective economic
N of casesstatus score status score
(mean percentile rank) (mean percentile rank)
Unadjusted Adjusted Unadjusted Adjusted
Age cohort
50-54 324 52.4 53.3 54.1 54.3
60-64 335 49.7 49.8 51.6 51.7
70-79 339 48.2 47.3 44.7 44.4
P-value .138 .050 0.000 0.000
Province
Nakorn Ratchasima 307 55.1 53.9 60.4 58.4
Si Sa Ket 351 46.3 47.3 38.5 39.6
Kamphaeng Phet 340 49.5 49.5 52.6 53.3
P-value .000 .011 .000 .000
Type of area
Peri-urban 315 54.6 53.4 58.9 55.3
Rural 683 48.0 48.6 46.0 47.6
P-value .001 .013 .000 .000
Any coresident child age 16+
No 450 47.7 47.8 43.7 43.4
Yes 548 52.0 51.9 55.3 55.6
P-value .012 .021 .000 .000
Number of children age 16+
1 62 45.7 44.6 48.9 47.5
2-3 449 51.7 50.8 53.6 52.0
4-5 289 47.2 48.3 46.2 48.3
6+ 198 51.9 52.7 48.0 48.9
P-value .053 .131 .005 .263
Self-assessed economic status relativeto others when oldest child was age 18
Much better 42 55.9 55.7 49.0 47.5
Somewhat better 179 57.0 56.8 54.0 53.7
About average 503 50.1 50.3 49.1 49.8
Below average 169 46.4 46.1 48.7 47.9
Much worse 105 41.7 41.5 50.4 49.7
P-value .000 .000 .367 .289
Note: Adjusted results are based on multiple classification analysis (MCA) and control for each of the other variables in the table.
SECTION 8: IMPACTS ON PARENTS’ WELL-BEING

49
status of the respondent. As Figure 19 showsthere is a strong relationship between the two. Asexpected, the more children who have migrated orthe more who currently reside in urban areasoutside the respondent’s district, the less likely therespondent is to coreside with an adult child.25
The important implication of this interrelationshipis that there is likely a trade-off between thepositive impacts of coresidence and positiveimpacts of migration with respect to the measuresof parents’ material well-being.
Table 19 shows three sets of results representingthe association between each of the three measuresof migration of children and the mean percentilerank of respondents on the subjective and objectivemeasures of current economic status. Bothunadjusted results and results statistically adjustedby MCA for the variables included in Table 18are shown. In order to allow for a tradeoffbetween the impacts of coresidence and migration,the adjusted results are presented in two steps.The first step excludes coresidence status of therespondent from the variables being controlledwhile the second step controls for all variablesincluding coresidence.
The most consistent results relate to whether or notany child currently lives abroad. Regardless of
Figure 19: Per cent of respondents whocoreside with at least one child age 16 orolder, by the number of children who evermigrated and by number of migrant childrenwho currently live in urban areas
Note: Results exclude 4 respondents who have no children age16 and over.
whether results are adjusted or not, those fewparents with children living abroad score higheron both indices of economic status than those whohave no children abroad. With respect to the muchmore common situation of having childrenwho migrated internally within Thailand, theresults are more complicated. The unadjustedresults show little consistent relationship betweencurrent economic status and either the numberof children who ever migrated or the numberwho are currently in urban areas outside the parents’district.26 None of these unadjusted associationscome close to conventional levels of statisticalsignificance. When results are statisticallyadjusted for all the control variables exceptcoresidence, there is little change and all theassociations remain non-significant at even the.100 level. However when the coresidence statusof the respondent is included in the set of controlvariables, the results are reasonably consistentin indicating that having children who evermigrated or who are currently in urban areas areboth associated with better current economicstatus. The comparison between the two sets ofstatistically adjusted results suggest that theeffect of migration on reducing coresidencecounteracts the effect of migration on providingeconomic support to parents. Thus whilemigration can be beneficial to parents materially,this is only the case if its negative affect oncoresidence is controlled for in the analysis.Otherwise it appears that there is neither a clearpositive or negative impact of migration onparents’ material well-being.
To more directly examine the trade-off betweenthe effects of coresident children age 16 andover and migrant children on material well-beingof parents Figure 20 compares mean subjectiveand objective economic status scores forrespondents in different combinations of situations.The results are statistically adjusted by MCA forage cohort, type of locality, province, and totalnumber of children age 16 and older.27 The toppanel compares combinations of coresidencestatus of the respondent and whether or not therespondent has at least one child currently living ina different district. The bottom panel comparescombinations of coresidence status and whether
SECTION 8: IMPACTS ON PARENTS’ WELL-BEING
81
72
6459
53
4444
32
0
10
20
30
40
50
60
70
80
90
100
Number of children who ever moved
away from parents' district
Number of children age 16+ who
currently live in urban areas outside of
parents' district
Pe
r c
en
t
0 1 2 3+

50
or not the respondent has at least one childcurrently in an urban area in a different district.28
Respondents who coreside with a child and haveat least one migrant child score the highest on boththe subjective and objective measures of economicstatus and the small number who are neithercoresident nor have a migrant child score the lowest.This holds both when considering whetherrespondents have any currently migrant child or
only any urban migrant child. With respect to atrade-off between coresidence and havingmigrant children, the results suggest that coresidentrespondents with no migrant children are better offthan those who are not coresident but have amigrant child. The difference is quite modestwhen based on mean subjective scores butconsiderably greater when based on meanobjective scores. It is possible that the much largeradvantage of coresidence only over having migrant
Table 19: Current subjective and objective economic status scores by number of migrantchildren
Subjective economic Objective economicstatus score status score
(mean percentile rank) (mean percentile rank)
Measure of migration used N of Adjusted Adjustedin the analysis
(a) cases Not for all Adjusted Not for all Adjusted
adjusted except for all adjusted except for allcoresi- variables coresi- variablesdence dence
Number of children who evermoved out of parents’ district
None 119 50.7 49.7 48.1 51.2 49.8 45.6
1 200 46.9 46.4 45.6 49.1 47.1 45.0
2 277 51.3 50.7 50.7 51.2 49.9 50.0
3 or more 402 50.6 51.6 52.4 49.4 51.7 54.0
P-value .348 .251 .077 .760 .368 .002
Number of children currentlyin urban areas outside ofparents’ district
(b)
None 307 48.1 48.2 47.0 51.0 50.0 47.2
1 293 50.0 49.4 49.1 50.4 49.3 48.5
2 222 52.9 53.0 53.7 50.7 50.9 52.6
3 or more 176 50.0 50.9 52.6 47.2 50.1 54.4
P-value .306 .113 .050 .521 .931 .032
Any children living abroad
No 955 49.4 49.5 49.5 49.5 49.6 49.5
Yes 43 65.0 63.4 63.6 63.5 60.9 61.5
P-value .000 .001 .001 .002 .008 .004
Notes: Statistical adjustment is based on multiple classification analysis (MCA) and controls for age cohort, type of locality (rural orperi-urban), province, self-assessed economic status of respondent relative to others in community when oldest child was age 18,and number of children age 16 and older. Each of the three sets of results incorporate only the measure of migration.(a) Each set of results incorporates only the measure of migration to which it refers.(b) Excluding children under age 16.
SECTION 8: IMPACTS ON PARENTS’ WELL-BEING

51
children associated with the objective economicstatus score is biased towards showing an advantagefor coresidence. As mentioned previously, theobjective score is based in part on householdpossessions some of which likely belong to thecoresident children and may not contribute to therespondent’s own material well-being. Nevertheless,the general impression given by the results inFigure 20 suggest that while there is some trade-off for parents between the benefits of coresidenceand the benefits of having migrant children,co-residing with a grown child contributessomewhat more to their material well-being thandoes migration of children.
8.2 Satisfaction with childrenMIS respondents were asked a number ofquestions concerning how satisfied they wereoverall with their children in terms of a numberof aspects of potential support and assistance aswell the concern and respect that children provide.More specifically, questions addressed satisfactionwith financial and material support, health careneeds, help with household chores, help withpersonal affairs, showing personal concern for therespondent, and respect for the respondent’sopinion. Figure 21 shows the per cent ofrespondents according to the degree of satisfactionthey feel concerning the financial and materialsupport that their children as a whole provided.29
Results are shown according to the current migrationstatus of the respondents children aged 16 andover. Respondents are grouped into threecategories, those whose children all currently livewithin the same district as the respondent, thosewho have children both living within and outsidethe district, and those whose children all liveoutside the district.
Figure 20: Adjusted mean subjective andobjective current economic status scores(a) By coresidence and children living outsiderespondent’s district
(b) By coresidence and children living in an urbanarea outside respondent’s district
Notes: Results exclude 4 respondents who have no childrenage 16 and over. Coresidence refers to living with at leastone child age 16 or over. Results are statistically adjusted byMCA for age cohort, type of locality, province and number ofchildren age 16 or over.
Figure 21: Per cent of respondents accordingto degree of satisfaction with financial andother material support provided, by currentmigration status of children age 16 and over
Note: Results exclude 4 respondents who have no childrenage 16 and over.
Overall only a small minority of respondentsexpressed dissatisfaction with the financial andother material support they received from theirchildren. In addition, there is no difference in theper cent who are dissatisfied with the supportbetween respondents who have no migrant children
SECTION 8: IMPACTS ON PARENTS’ WELL-BEING
5356
50
55
48
4444
35
0
10
20
30
40
50
60
70
Subjective economic status
score
Objective economic status
score
Me
an
pe
rce
nti
le r
an
k
Coresident &children outsidedistrict
Coresident & nochildren outsidedistrict
Not coresident &children outsidedistrict
Not coresident &no childrenoutside district
54
49
53
49
4444
40
57
0
10
20
30
40
50
60
70
Subjective economic status
score
Objective economic status
score
Me
an
pe
rce
nti
le r
an
k
Coresident &children in urbanarea
Coresident & nochildren in urbanarea
Not coresident &children in urbanarea
Not coresident &no children inurban area
10
32
59
7
38
55
10
38
52
0
10
20
30
40
50
60
70
Dissatisfied Somewhat satisfied Very satisfied
Pe
r c
en
t
No child out of district
Some children out of district
All children out of district

52
and those whose children all reside out of thedistrict. Also, regardless of the migration status oftheir children, more than half of respondentsindicated they were very satisfied with the materialsupport provided by their children. Still, modestdifferences are evident. Respondents who have nochild living out of the district are most likely to bevery satisfied and those whose children are allresiding out of the district are the least likely.Thus the results suggest only a modest butsomewhat negative impact of migration of childrenon parent satisfaction with material support.
Serious functional limitations as well as chronichealth problems are likely to require frequentand often daily personal care on a long-termbasis. Since providing such care necessitatesgeographical proximity of the care giver, migrantchildren are not in a position to give it. Otherhealth needs such as care during an acute illnessor help with visits to medical facilities foroccasional checkups or treatments typicallyinvolve shorter term assistance and thus can be metby temporary visits from children who live somedistance away if someone nearer is not available.Since serious physical health problems and relatedcare needs increase with age, any adverse impactsassociated with the migration of children withrespect to meeting these needs are likely to be morepronounced for parents of more advanced agesthan for younger parents. As noted earlier,one rationale for including persons in theirseventies in the MIS sample was to ensurerepresentation of persons at ages when substantiallonger term needs for personal care are common.As results presented above verify (see Figure 3),this oldest cohort clearly has the poorest healthamong the three cohorts targeted by the survey.
Figure 22 examines the association between themigration status of children and the per cent ofrespondents in each age cohort who indicatethat they are very satisfied with the help theirchildren provides with health care needs and careduring illness. For each cohort, respondentswhose children all reside outside the district are lesslikely than others to say they are very satisfiedwith the health care provided by children. Still,almost two thirds of respondents from the
youngest and middle cohorts whose children alllive away say they were very satisfied. For theoldest cohort, less than half of those respondentswhose children are all currently migrants say theyare very satisfied with health care assistance fromthe children. This likely reflects to the greaterprobability that this cohort, compared to theyounger two, has health care needs related tochronic conditions that would benefit fromcontinual care and hence necessitate physicalproximity rather than needs that can be met bytemporary short-term visits from children livingat some distance.
Figure 22: Per cent of respondents who arevery satisfied with assistance from childrenwith health care and care when ill, by currentmigration status of children age 16 and overand age cohort of respondent
Note: Results exclude 4 respondents who have no childrenage 16 and over.
Figure 23 addresses several other aspects ofsatisfaction with children in relation to the migrationstatus of their children. These include satisfactionwith help provided with household chores, helpprovided with personal affairs, showing personalconcern about the respondent, and respecting therespondent’s opinion. In each case, the resultsindicate the per cent of respondents who saidthey were very satisfied with the children overallin these regards.
As discussed at the start of this report, someservices that adult children can provide for theirolder age parents need to be done relativelyfrequently and on a continuous basis and hence
SECTION 8: IMPACTS ON PARENTS’ WELL-BEING
83
73 7275 75
65 65
48
74
0
10
20
30
40
50
60
70
80
90
100
50-54 60-64 70-79
Pe
r c
en
t
No child out of district
Some children out of district
All children out of district

53
require geographical proximity while others do not.While material support can be provided at adistance by sending or bringing remittances,meaningful help with household chores or withpersonal affairs are likely to be of sufficient valueonly if provided frequently and over an extendedperiod of time. This is probably the reason whythe per cent who indicate they are very satisfiedwith the help their children provide with householdchores and with personal affairs is much loweramong respondents whose children all currentlyreside out of the respondent’s district. Indeedthe differentials in satisfaction according tomigration status are substantially greater thanthose indicated for material support (see Figure 21)and to a lesser extent for health care (see Figure 22).On the other hand, personal concern and respectdo not necessarily require either frequent expressionor geographical proximity. For example, conveyingconcern and respect for parents during visits orthrough phone contact could be sufficient to satisfyparents. The results in Figure 23 suggest thatthis is indeed the case. Regardless of themigration status of their children, close to three-fourths of respondents say they are very satisfiedwith the level of personal concern and the levelof respect shown by their children.
Figure 23: Per cent of respondents who arevery satisfied with assistance, concern andrespect from children, by current migrationstatus of children age 16 and over
Note: Results exclude 4 respondents who have no childrenage 16 and over.
8.3 Desertion of parentsAs noted in the introduction, mass media accounts,advocacy literature, and even declarations frominternational forums typically imply that migrationof young adults in the developing world leadsto the widespread desertion of the rural elderlyparents left behind. Any evidence provided istypically anecdotal. Almost totally lacking arestudies that address this issue with systematicempirical evidence. Data from the MIS providean opportunity to remedy this situation.
Before examining this issue, it is necessary todefine what constitutes desertion. For the presentstudy desertion is defined in terms of the frequencyof social contact between children and parentsand extent of material support provided to parentsby children during the previous year. Since desertioncan be a matter of degree, we use two alternativesets of measures. The first is more extreme andrefers to a total lack of contact or support duringthe prior year. The second refers to situations inwhich contact and support are at most onlyminimal. More specifically, the second measureencompasses both situations in which there is nocontact or support as well as situations in whichcontact involves only one visit during the year andless than monthly phone contact and in whichmaterial support consists of less than 1,000 bahtand no substantial gifts of food. In some sensethis second measure is more a reflection of neglectthan desertion but for convenience we refer to thetwo sets of measures as indications of desertion.30
Assessments of the extent of desertion can beaddressed either from the perspective of childrenor parents. Results based on children as the unitof analysis reveal how commonly children desertparents. In contrast, results based on parent as theunit of analysis determine how many parents aredeserted by their children. Since at present mostolder-age parents in Thailand have at leastseveral children, even if some desert or neglectthem, others may not. Thus the percentage ofparents who are deserted by all their childrenwill be substantially less than the percentage ofchildren who desert their parents.
SECTION 8: IMPACTS ON PARENTS’ WELL-BEING
59
73 72
53
58
73 74
30
38
7371
66
0
10
20
30
40
50
60
70
80
90
Help with household
chores
Help with personal
business and affairs
Personal concern Respect
Pe
r c
en
t
No child out of district
Some children out of district
All children out of district

54
We first examine desertion from the perspectiveof migrant children. Results are shown inTable 20 according to several characteristics of thechild as well as the age cohort of the parent(i.e., the respondent). Estimates of desertion
are shown based only on the lack of socialcontact (i.e., without considering materialsupport) as well as on the combination of lackof social contact and material support.
Table 20: Per cent of current migrant children age 16 and older who had minimal or no socialcontact with respondent and provided little or no material support during prior year
% who had no social contact % who had minimal or noand provided no material social contact and provided
support little or no material supportBase N
NoNo
Minimal orMinimal or
contact (a) contact or
no contact (a) no contact
support or support
Total 1914 8.1 6.3 21.8 15.1
Location of child (b)
Bangkok 852 7.4 5.7 21.1 13.1
Other urban places (c) 677 6.2 5.4 17.3 13.6
Elsewhere in Thailand 337 12.9 8.6 30.8 20.9
Abroad 48 14.1 4.7 35.1 10.8
Gender of child
Son 1008 9.9 7.1 24.6 17.3
Daughter 906 6.2 4.9 18.7 11.6
Education of child
Primary or less 1001 11.5 8.1 30.2 20.1
Lower secondary 304 8.9 7.6 20.5 13.5
Upper secondary 355 2.9 2.3 12.1 8.5
Beyond secondary 250 1.6 1.6 4.9 2.8
Age of child
Under 30 557 3.5 2.9 11.2 7.4
30-40 804 7.8 5.5 20.5 13.1
40+ 553 13.3 10.1 34.5 24.1
Marital status of child
Never married 470 7.0 5.1 15.3 8.7
Ever married 1434 7.9 5.9 23.4 16.0
Age-cohort of respondent
50-54 509 3.7 2.9 11.0 6.9
60-64 679 6.9 5.4 19.0 13.1
70-79 726 12.3 8.8 31.9 21.3
Notes: No contact refers to having no visits or phone contact in last year; no material support means providing no money or foodin last year; minimal or no contact means did not visit at least twice and did not have phone contact at least monthly during lastyear; minimal or no support means did not provide at least 1,000 baht or any food during last year.(a) Results exclude 64 cases in which phone contact was not reported and can not be implied (see text footnote 18).(b) The 15 cases whose location is unknown and the 27 for whom the respondent did not know the type of area in which the childlived have been distributed proportionately.(c) Urban includes as areas described as semi-urban well.
SECTION 8: IMPACTS ON PARENTS’ WELL-BEING

55
Clearly few migrant children can be considered tohave totally deserted their older age rural parents.Only 8 per cent neither had visits nor phone contactwith their parent during the past year and only 6per cent also did not provide any material support.Even based on the broader indicator of desertion,only slightly more than a fifth of migrant childrenoverall had no more than minimal social contactwith the respondent. Moreover, some of thesechildren still provided at least modest materialsupport so that only 15 per cent lacked more thanminimal contact and did not provide at leasta moderate amount of material support.
Among migrant children, the small numbers wholive abroad are most likely to lack social contact withparents.31 This is unsurprising given the muchgreater difficulty that visiting from abroad wouldentail compared to visiting from within Thailandand the difficulty and expense of internationalphone calls compared to domestic calls. Even so,a substantial majority who live abroad do maintainsocial contact with parents. Moreover, most whohad little or no social contact during the yearstill provided parents with material support. Thuswhen lack of contact and material support areconsidered together, children living abroad nolonger stand out in comparison to other migrantchildren as being more likely to have deserted theirparents. Among migrant children in Thailand,the measures of lack of contact and support arelower for those in Bangkok and other urbansettings than those living elsewhere. A verysubstantial majority, however, maintain more thanminimal contact with parents regardless of place ofresidence and a moderate share of those who donot nevertheless provide at least modest materialsupport.
Several patterns are quite clear with regards to therelationship between apparent desertion of parentsand characteristics of the migrant children.Daughters are less likely than sons to desertparents. Education is inversely associated withdesertion with the least educated children by farbeing the most likely and the best educated theleast likely to have little or no social contact or toprovide support to parents. There is a clearassociation between age of the child and desertion
of parents, with levels lowest among childrenunder 30 and highest among those aged 40 andabove. Also migrant children who have marriedare more prone to desert parents than those whoare still single. This may reflect competingdemands on migrant children who have families oftheir own to raise and thus have less time andresources to devote to parents. This may alsoaccount in part for the greater lack of contactand support noted for older children given thatmarried children tend to be older than thosewho are single. Finally, there is a clear associationbetween the age cohort of the parent and the lackof contact and support from their migrantchildren. Children of the youngest cohort ofrespondents are by far the least likely to desertparents while those of the oldest cohort are themost likely to do so.
As discussed above, a large majority of MISrespondents with migrant children also have non-migrant children who live with them, very nearby,or within the same locality. Moreover, even if someof a respondent’s migrant children are neglectful,others may maintain contact or provide materialsupport. Thus while being neglected or desertedby one or more migrant children may be distressingto respondents, it by no means implies that theyare deserted by all their children. In order to assessthe extent to which migration leads to the desertionof parents, we use a hierarchical index of socialcontact and material support. The first categoryincludes respondents who live with or very neara child age 16 or older. Clearly these respondentsare not socially isolated from all children andare virtually certain to interact with at least one ona daily basis. The next category includesrespondents who do not live with or very nearbya child but who see a child at least monthly. Thethird category represents respondents who donot see a child monthly but have at least monthlyphone contact with one or more. The fourthcategory of respondents includes those who lackmonthly contact with any child but who receivemeaningful material support from at least one(defined as at least 1,000 baht, regular monetarycontributions, or at least monthly provision offood during the prior year). The final categoryconsists of the remainder of respondents and
SECTION 8: IMPACTS ON PARENTS’ WELL-BEING

56
thus represents those who lack both monthlycontact and substantial material support fromany child. As such, these parents representthose who have been deserted by their children.
The per cent distribution of respondents withat least one migrant child according to thishierarchical index is provided in Table 21. Theresults make clear that very few Thai parentswho have migrant children are deserted by alltheir children. Overall almost two-thirds live withor very nearby a child and the vast majority of theremainder either sees or has phone contact witha child at least monthly. This leaves only 3 per
Table 21: Per cent distribution of respondents who have at least one child who currently livesoutside the district according to hierarchical categories of the level of social contact or materialsupport by at least one child during the prior year, by age cohort of respondent
Age cohort
Total 50-54 60-64 70-79
Hierarchical categories of level of contact or material support
Lives with or very nearby a child age 16 or older 64.6 46.9 65.0 81.8
Saw a child at least monthly 18.0 23.2 20.9 9.9
Talked with a child on the phone at least monthly 14.5 26.6 12.3 4.7
Received at least moderate material support (a) 1.7 1.8 1.1 2.2
None of the above 1.2 1.5 0.7 1.5
Total 100 100 100 100
Notes: Categories of social contact or material support are hierarchical in that cases falling in a prior category are excluded fromsubsequent categories.(a) Moderate material support includes any of the following: receiving at least 1,000 baht, regular monetary support, or at least monthlyprovision of food during the prior year.
cent of parents who have less than monthlysocial contact with at least one child. Moreover,more than half of respondents who have onlyinfrequent or no contact with a child receivedmeaningful material support during the pastyear from at least one. Thus few older agerural parents in Thailand are totally desertedeven if some of their migrant children areneglectful. Interviews with the key informants atthe research sites confirm this. With only oneexception they were universal in denying thatthere were more than a very few cases ofdeserted older persons, if any, that they knewabout in their communities.
While the share of parents with migrant childrenwho are out of social contact with all theirchildren differs little among the three age cohorts,the type of social contact does vary substantially.Over four fifths of the oldest cohort has atleast one child living with or very nearby themcompared to two thirds of the middle cohort andless than half of the youngest cohort. Both theyoungest and middle cohort make up a fairamount of this difference through frequentvisits with a child. Particularly important forthe youngest cohort is reliance on phone contact.This undoubtedly reflects the fact that amongrespondents who do not live with or very
nearby a child, the youngest cohort is least likelyto have a child living within the same village ordistrict and most likely to have all of theirchildren living outside their district.32 Theexperience of the 50-54 cohort indicates thatthe recent spread of telephones, especially cellphones, can mitigate what likely would otherwisebe more prevalent social isolation of those olderaged parents who have no children within easyvisiting distance.
Although the 50 to 54 cohort has considerablyless children on average than the older cohorts,given the past trend of fertility decline in Thailand,
SECTION 8: IMPACTS ON PARENTS’ WELL-BEING

57
future cohorts entering older ages will have evenless children, with a substantial majority having onlytwo. It is thus interesting to examine therelationship between social isolation and family sizebased on the current data set. Table 22 presentsthe per cent distribution of respondents by familysize according to the hierarchical categories oflevel of social contact and material support. Resultsare based on the full sample (rather than justthose who have migrant children) and suggestthat only those respondents who have just one
child have a substantially increased risk oflacking social contact and material support fromany child. Among the remainder, there is littledifference in the per cent who lack social contact orthe per cent who lack both social contact andmoderate material support. Family size is, however,associated with the type of social contact.Respondents who have fewer children are morelikely than those with larger families to rely ontelephone contact and less likely to coreside orlive very nearby one of their children.
Table 22: Per cent distribution of respondents according to hierarchical categories of thelevel of social contact or material support by at least one child during the prior year, bynumber of children age 16 and over
Number of children age 16 and over
Total 1 2 3 4 +
Hierarchical categories of level of contactor material support
Lives with or very nearby a child 70.1 50.0 60.0 65.7 79.6age 16 or older
Saw a child at least monthly 15.4 19.1 19.1 17.8 12.1
Talked with a child on the phone at least monthly 11.8 17.6 18.2 13.9 7.2
Received at least moderate material support (a) 1.5 4.4 1.4 2.2 0.8
None of the above 1.2 8.8 1.4 0.4 0.4
Total 100 100 100 100 100
Base N 1007 68 220 230 489
Notes: Categories of social contact or material support are hierarchical in that cases falling in a prior category are excluded fromsubsequent categories.(a) Moderate material support includes any of the following: receiving at least 1,000 baht, regular monetary support, or at least monthlyprovision of food during the prior year.
SECTION 8: IMPACTS ON PARENTS’ WELL-BEING

58
Section 9: Conclusions
As discussed in the introduction to this report,several alternative perspectives exist for interpretingthe impact of migration on older age parentswho in rural areas of the developing world.These include the ‘alarmist’, the ‘household strategy’and the ‘modified extended family’ perspectives.Our results are least consistent with and indeedlargely contradict the ‘alarmist’ perspective thatviews massive migration of young adults to thecities as leading to widespread desertion of theirelderly parents left behind in the rural areas.While there are deserted elderly in rural Thailandwho have lost contact with their children andhave been left behind to fend for themselves,such situations are still quite rare. Rather, thelarge majority of migrant children in Thailandmaintain social contact with parents and mostprovide at least some financial support. Thusmigration, at least so far, has not led to widespreaddesertion of rural elderly. Moreover, children whohave moved to urban areas, especially to Bangkok,are more likely to provide significant remittancesthan children who migrated to elsewhere inThailand, likely reflecting the greater earningopportunities in cities, and are at least as likelyto maintain social contact, a process facilitated bythe higher proportion of urban than rural migrantswho have phones. Thus fears that urban settings,and hence the process of urbanization, particularlyerode the filial allegiances of migrant childrenseem unwarranted.
The ‘household strategy’ perspective views migrationof rural adults as a way to diversify economic risksfor the household and as benefiting both migrantsand family members who remain behind.According to this perspective, migrant children inthe non-agricultural sector are subject to differentcycles of economic risk than their rural parentswho remain in agricultural households. Thus eachcan serve as a form of insurance for the other
while at same time each can contribute to thematerial welfare of the other in their own way.Our findings provide some support for this view.Respondents in the survey indicated in morethan half of the cases when a child migrated that,at the time of the move, they thought it wouldbenefit both the child and themselves. Exchangesoccur between rural parents and their migrantchildren which appear to benefit both. Migrantchildren often provide parents with remittances aswell pay for major household appliances and homeimprovements while parents sometimes providefarm produce as well as occasional major financialassistance, including using their assets as collateralfor loans. Also parents who have both coresidentand migrant children appear to be slightly betteroff than coresident parents with no migrantchildren. However, parents with migrant childrenbut who are not coresident are worse off thanparents who coreside but have no migrant children.Since migration reduces the pool of childrenavailable to coreside, it increases the chances thatan older age parent will have to forgo thebenefits associated with coresidence. Thus inthis respect the findings are somewhat at oddswith the ‘household strategy’ perspective.
Most consistent with our results is the ‘modifiedextended family’ perspective. It postulates that,although migration associated with developmentleads extended family members to be geographicallydispersed, advances in transportation andcommunication technology that accompanydevelopment permit members to maintainrelationships and continue to fulfill at least someof the associated obligations. Thus while livingarrangements and household structure change,family ties and assistance remain in tact althoughin modified forms. Our findings clearly documenthow important cellar phone technology has becomefor enhancing the ability of migrant children and

59
their parents in Thailand to maintain social contact.In contrast to less than a decade ago when phoneswere a rarity in rural households, most olderpersons in rural areas and their migrant childrennow have access to one. According to our survey,two thirds of migrant children talked with therespondent at least once a month on the phoneand four fifths had phone contact at least severaltimes during the past year. Such contact permitsmaintenance of social support despite geographicalseparation. The greatly improved ability tocommunicate by phone also means that parentscan reach geographically dispersed children quicklyin case of a health crisis. Also improvementsin roads and means of transportation allowschildren living elsewhere to more rapidly reachparents to provide assistance and at least temporaryprovide care if no children reside nearby. In theserespects changes in Thailand with regards tomaintaining intergenerational relationships andmeeting filial obligations are consistent with the‘modified extended family’ perspective.
The preceding analyses of the Migration ImpactSurvey reveal that outflow of adult children fromrural areas has multifaceted and complex implicationsfor the welfare of their older age parents whoremain behind. Clearly migration has both benefitsand disadvantages for the ‘left behind’ parentsthat often vary with the life course stages of theparents and their adult children. Given that thedata are cross-sectional and the descriptive natureof the analyses, causal connections remainuncertain. Nevertheless, the results are at leastsuggestive of a Thai family in which parentsand adult children exercise human agency toadapt to the changes in the social and economicenvironment brought about by developmentin ways that are not necessarily detrimental torelations between the generations. For example,although the youngest cohort of respondents hasconsiderably fewer children and are least likelyto coreside with a grown child, they are at least aslikely as the older cohorts to say that they arevery satisfied with their children in terms of allthe forms of support and assistance asked aboutin the survey. In addition, social contact betweenmigrant children and parents, both in terms ofvisits and phone calls, is more frequent for this
cohort than for their older counterparts. Overall,most rural based parents and their migrantchildren appear to be adapting to the increasingneed to live separately in ways that permitmaintaining family relationships and providingeach other with material support and social contact.
The rapid transition to low fertility severaldecades ago will pose new challenges to maintainingthe well being of the next generation of elderlyparents and their smaller number of adult children.Our results reveal that receipt of financial supportfrom children and satisfaction with it is at leastas likely among the younger cohort of parentscompared to older parents thus suggestingproblems with material support will not necessarilybecome worse. However, the smaller familysizes of future elderly will mean that the currentsituation of older cohorts, in which some childrenmigrate while other siblings remain with theirrural elderly parents’, will become increasinglydifficult to maintain. This is clearly evident thesubstantially higher percentages of the youngestcohort whose children have all migrated out ofthe district. The lack of coresident or nearbychildren could substantially change the implicationsof migration with respect to personal caregivingfrom children when frailty and chronic healthconditions require such assistance. While it is truethat the youngest cohort of respondents is aslikely to say that they are satisfied with healthassistance provided by children, unlike oldercohorts, few younger parents require longer termcare at their current stage of life.
It thus seems likely that in future decades, asparents with small families become common withinthe oldest age groups, there will be an increasingneed for community based health services to meetthe needs of elders who require long termpersonal care but who have no adult child nearbyto provide it. Thus in planning for meeting theneeds of rural elderly in the future, the governmentwould be wise to expand community based healthservices for frail and chronically ill elders. Therecently adopted plan to expand the HomeCare-giver Project initiated by the Ministry ofSocial Development and Human Security to trainand sponsor community based volunteers to help
SECTION 9: CONCLUSIONS

60
provide care and assistance to local elderly seemsparticularly appropriate in this respect. Expansionof the Home Health Care Programme of theMinistry of Public Health to help meet the morespecific medical needs of ill elderly after hospitaldischarge would also be useful. For expandedcommunity based programmes to have maximumsuccess, however, efforts need to be made to changeprevailing attitudes to increase the acceptability ofcritical personal care from others besides adultchildren.
Still it is premature to conclude that the balancebetween positive and negative effects of migrationfor rural Thai elders will necessarily become lessfavorable in the future. Many other changeswill accompany the shift in numbers of livingchildren such as expansions and improvementsin public and private health provision, socialsecurity and other forms of formal support, rapidlyincreasing computer literacy and associatedmeans of communication, and improvements inthe educational composition of both adultchildren and their older age parents as bettereducated cohorts move up the age structure.Thus modifications in intergenerational familyforms will occur in a different social, economic,and technological context than has prevailedduring the period of the present research. Thefact that the cultural roots of filial obligationstill appear to remain strong in Thailand suggeststhat some accommodation to this changingsituation may well emerge.
Continuing to monitor the situation of rural Thaielders in this changing context is thus an obviouspriority for any future social research agenda inThailand. Doing so holds considerable potentialfor contributing to the theoretical and conceptualdebates surrounding issues of ageing, family,and intergenerational relations. It is also crucialfor developing informed polices and programmesthat realistically address the needs of the rapidlyincreasing older population. The findingsdocumented in this report provide a usefulbaseline for such efforts. For example, they includethe first systematic evidence on the increasingimportance of phone contact between older ageparents and adult children and the firstdocumentation of non-routine major materialsupport exchanges and thus provide a basis forassessing future changes in these critical respects.Future research also needs to pay particularattention to attitudinal changes with regards tointergenerational obligations. Comparisons withresults from the present study can help injudging the direction of any such changes.Documenting changes in living arrangementsand the geographical proximity of adult childrenrelative to their older age parents will continueto be interest. At the same time, their implicationsfor the multiple facets of older age well-beingwill continue to change. Providing an adequatebasis for understanding the complex dynamicsinvolved provides a real challenges for futureresearch on population ageing in Thailand.
SECTION 9: CONCLUSIONS

61
Endnotes
1 Some of the increase in the per cent urbanresults from reclassification of areas from ruralto urban as the nature of the local economyand expansion of municipal facilities andservices transformed their character.
2 Although this potential effect should beeven more evident for persons in their 80s,potential practical difficulties in interviewingvery old persons lead us to limit our oldestcohort to persons in their 70s.
3 According to data from the National StatisticalOffice (NSO), mean per household incomesaveraged over 1996, 1998, 2000, 2002 and 2004(in Thai Baht) in the three selected provinces are7,744 for Sri Sa Ket, 9,505 for NakornRatchasima, and 11,126 for Kamphaeng Phet(original calculations from NSO data).
4 A small number of respondents were bornone year later or one year earlier than therange set for the cohort (see Annex I). Sincethe numbers are small and the deviation inage is only one year, they are included inthe cohort to which their birth year is adjacent.
5 When recording answers, interviewers treatedthe categories as hierarchical in the sense thatthe appropriate location for a child was thenearest location that qualified.
6 Although the two subjective measures ofeconomic status are positively correlated(Spearman correlation=.48) identical assessmentsoccurred for less than half of the cases.
7 In a modest number of cases (42) theinterviewer did not see the respondent’shouse and thus could not render judgement.In these cases the self assessment score wasdoubled to form the combined index.
8 Type of structure is ranked on a five pointscale with hut, bamboo or wooden one storyhouse corresponding to 0 and two or morestory cement house or shop housecorresponding to 4. Type of roof was rankedon a four point scale with thatch, leaf, orgrass corresponding to 0 and tile correspondingto 3. Type of floor is ranked on a four pointscale with dirt, bamboo or thatch correspondingto 0 and tile, parquet or polished woodcorresponding to 3. Type of toilet is ranked
on a four point scale with no facility or pittoilet corresponding to 0 and flush toiletcorresponding to 3. Running water is coded 0if the house has no running water and 1 ifhas it.
9 One of the sample sites was in the processhaving its status upgraded to tetsabaantambol. Since the change had already beenapproved and would soon take place, weclassify respondents in this site as residing ina peri-urban area even though at the time ofthe survey the process had not been completed.
10 We note that the ordering of the threeprovinces with respect to economic level differsfrom that reflected in the mean per householdincomes cited from NSO statistics. This isnot surprising since our sample was notdesigned to be representative of the provincesand in fact excludes the main urban centres.However both sources indicate that Si Sa Ketis distinctly poorer than the other two provinces.
11 For the purpose of the survey, only stepchildren whom the respondent helped raiseare counted as among the respondents’ children.
12 Among all respondents, only 4 (all in the50-54 cohort) had no child age 16 or older.
13 The period of time when the children ofthe respondents were of school age spansa number of decades during which theeducational system in Thailand underwentchanges including changes in the level ofcompulsory education and the number ofgrades within the primary level, which variedbetween 4 to 7. (Knodel, 1997).
14 The classification of migrant status is based oncurrent residence of children relative to parentsand thus does not take into account priormoves. Thus some who are currently classifiedas local movers or shorter distance migrantshave at an earlier time migrated outside theprovince but subsequently returned. Inaddition, many will likely move again in thefuture and switch from one category toanother. In a few cases in which childrencurrently live in a different district or provincefrom the respondent, the parent movedaway rather than the child. For convenience,however, when basing migrant status on currentresidence (rather than on the respondent’s
SECTION 9: CONCLUSIONS

62
account of children who ever mover away),we classify these children as migrants.
15 In a small number of cases the parent of thegrandchild may have died rather than havemigrated.
16 Among the younger group of single children,48% were still attending school compared toonly 4% of the older single children and 3%of the married children, suggesting that manyof the younger single children are largelydependents of the parents rather than maincontributors to their support.
17 For example, according to the national 1995Survey of the Welfare of the Elderly inThailand, 84% of the adult children of ruralparents aged 50 and older who lived in adifferent province had visited their parentwhile only 37% had been visited by theirparent (original calculation).
18 The question about phone contact was onlyasked in relation to each child who livedbeyond the sub-district for whom therespondent said the child had a phone. Thusno direct information on frequency of phonecalls is available for 170 of the 1879 childrenoutside the district (the reference group formigrant children in Figure 13) who had nophone. For the 79 children in this situationwhose parent lived in a household with nophone, phone contact is assumed to be lessthan several times a year given that it wouldbe difficult to reach parents even if the childcould borrow someone else’s phone. Alsofor an additional 25 cases whose parentlived in a household with a phone but who inthe last year did not visit, send money,give food or help in household, the childlikely has lost contact with the parents andthus phone contact for them is also assumedto be less than several times a year. Thesituation for the remaining 66 cases isless certain given that the child apparentlyis still in contact with the parent and couldmore easily reach their parent if they usedsomeone else’s phone. Thus these 66 casesare excluded from the tabulations on phonecontact.
19 In just over 1% of cases the parent reportedgoing to be cared for by the migrant children.
The fact that this is quite low compare tothe earlier findings that almost a fourth ofparents were taken somewhere for health careby migrant children suggests that the latterinvolved primarily chronic illness whilesituations where migrant children return togive care involve acute illnesses.
20 Among children who ever migrated andreceived a substantial loan or money, two thirdswere living outside the parents’ district at thetime. However, among those for whom theparents paid for a substantial expense justslightly over two fifths were living outsidethe district and half were actually coresidentat the time the expense was paid.
21 Four cases coded as ‘other’ are included withthe ‘no net effect’ category. Evidence thatthe responses to the question on the netbalance of support are reasonably valid isprovided by comparisons with informationfrom other questions on the contributions ofparents to migrant children and the supportprovided to parents from migrant children. Forexample, among migrant children for whomthe reported net balance of support favoursparents, 87% are reported to have providedregular support to parents at least part of thetime while away and only 14% are reported asreceiving substantial financial assistance fromthe parents during this time. In contrast,among those for whom the reported netbalance of support favours the migrant child,only 36% are reported as having providedregular support and 35% as receiving substantialfinancial assistance from parents while away.
22 Since migrant children do not necessarilyremain in their initial destination, some of thechildren are currently in a different locationcategory as that shown in Figure 18. Forexample, approximately 17% of children whoat one time migrated outside the parents’district have returned and are now residingwithin the parents’ district and thus are formerbut not current migrants. Among thosewho went to a different province excludingBangkok, 72% still remain in this category.Among children who went to Bangkokinitially, 68% remain in Bangkok. Of thosewho have gone abroad, 69% remain abroad.
SECTION 9: CONCLUSIONS

63
23 That there is no simple association betweenmigration of children and prior economicstatus is suggested by the lack of any statisticallysignificant relationship at even the .100 levelbetween self assessed economic status ofrespondents at the time their oldest child was18 and the three main measures of migrationthat serve as independent variables in oursubsequent analysis: the number of childrenwho ever moved away from their parents’district, the number of children who currentlylive in an urban area outside the district of theparents, and the number of children whocurrently live abroad. The lack of statisticalsignificance characterizes both unadjustedresults and results statistically adjusted byMCA that control for the respondent’s agecohort, type of locality, province, and numberof children age 16 and older. One possiblereason for the lack of association is thatthe measure of prior economic status is tooimprecise to adequately to detect it.Nevertheless, to the extent the results are valid,they suggest that prior economic status ofparents has little consistent effect on migrationof children and thus increase the chancesthat associations found between currenteconomic status and the migration of childrenreflect the influence of migration on materialwell-being rather than the reverse.
24 As noted in the discussion of our constructionof the objective economic status variable,household possessions that contribute to higherscores do not necessarily belong to therespondent, although in many but probablynot all circumstances the respondent maystill gain benefit from them. Thus theobjective economic status score for coresidenthouseholds may exaggerate the level ofmaterial well-being of the respondent.
25 The association between coresidence andwhether or not any child currently lives abroadis not included in Figure 19 because so fewchildren are abroad. Overall 55% ofrespondents with any child abroad coresidewith a child 16 or older compared to 53%of those who do not.
26 The number of children who ever migratedincludes the small number who are currentlyabroad since in most instances these childrenmoved to elsewhere in Thailand before goingabroad.
27 Statistically unadjusted results, not shown, arevery similar to the statistically adjusted results.
28 Combinations of coresidence and having achild abroad are not shown because of thevery small number of respondents who have achild currently living abroad. Among the 43respondents who currently have at least onechild abroad, there is almost no difference ineither the mean subjective or mean objectivecurrent economic scores between those whoare coresident and those who are not. Bothgroups have mean economic status scores wellabove respondents with no child living abroad.
29 Because relatively few respondents indicatedthey were either very or somewhat dissatisfied,these two responses have been combined intoa single category for presentation. In addition,1.3% of respondents were coded as does notapply. Since these consisted almost entirely ofcases in which little or no material supportwas provided, they are included with the‘dissatisfied’ category.
30 Children can neglect their older aged parentsin other ways as well, for example by failingto provide personal care or other services thatthe parents may need and can be presenteven when social contact is frequent. Forexample, a coresident child or one living nextdoor may fail to provide needed materialsupport or care. However, neglect in the contextof frequent social contact is unrelated tomigration and thus beyond the scope of thepresent study.
31 Note that the MIS did not ask about receiptof letters, one method of contact that mighthave been particularly important for childrenabroad.
32 Among respondents who are not coresidentwith nor live very nearby a child age 16 orolder but have at least one child age 16 orolder living outside the district, 81% of the50-54 cohort, 59% of the 60-64 cohort and46% of the 70-79 cohort have no child livingin their district.
SECTION 9: CONCLUSIONS

64
Aboderin, Isabella. (2004) – Modernisation andAgeing Theory Revisited: Current Explanationsof Recent Developing World and HistoricalWestern Shifts in Material Family Support forOlder People. Ageing and Society 24:29-50.
Bell, M., M. Blake, P. Boyle, O. Duke-Williams &G. Hugo. (2002) – “Cross-National Comparisonof Internal Migration: Issues and Measures”.Journal of the Royal Statistical Society 165(3):435-64.
Bernama. (2007) – “Act needed to compel childrento take care of elderly parents”, New Straits Times(Kuala Lumpur), 6 April 2007.
Cai Qain. (2003) – Migrant remittances and familyties: a case study in China. International Journalof Population Geography 9:471-83.
Chayovan, Napaporn & John Knodel. (1997) –Chulalongkorn University, Institute ofPopulation Studies, Bangkok.
Chayovan, Napaporn, Malinee Wongsith & ChanpenSaengtienchai. (1988) – Chulalongkorn University,Institute of Population Studies, Bangkok,Thailand.
Charasdamrong, Prasong. (1992) – “The Misery ofThose Left Behind”, Bangkok Post, 10 May 1992.
Charoenpo, Anucha. (2007) – “Govt to care forabandoned elderly” Bangkok Post, 12 April 2007,section 1, p. 2.
Curran, Sara, F. Garip, C. Chung & K. Tangchonlatip.(2003) – Migration, cumulative causation andgender: evidence from Thailand. Conference onAfrican Migration in Comparative Perspective,Johannesburgh, South Africa, 4-7 June 2003.
Filmer, D. & L.H. Pritchett. (2001) - EstimatingWealth Effects Without Expenditure Data – orTears: an Application to Educational Enrollmentsin States of India. Demography 38(1):115-32.
Hermalin, Albert. (2003) – Theoretical perspectives,measurement issues, and related research. InHermalin, Albert (ed.), The Well-Being of theElderly in Asia: A Four-Country Comparative Study.University of Michigan Press, Ann Arbor,Michigan, 101–41.
Jamuna, D. (1997) – Stress dimensions amongcaregivers of the elderly. Indian Journal of MedicalResearch 106:381-88.
Jones, Gavin. (1993) – Consequences of RapidFertility Decline for Old Age Security. In RichardLeete and Iqbal Alam (eds.), Revolution in AsianFertility: Dimensions, Causes and Implications, 275-295. Oxford: Clarion Press.
Kespichayawattana, Jiraporn & Suvinee Wiwatwanich.(2005) – The Impacts of Migration on PhysicalHealth and Psychological Well-being ofthe Elderly Parents Left-behind: A Study fromRural Thailand. Presentation at InternationalWorkshop on The Impacts of Migration onthe “Left-Behind” in Asia Hanoi, Viet Nam,10-11 March 2005.
Kinsella, Kevin. (1988) – Aging in the Third World.International Population Reports Series P-95,No. 79. U.S. Department of Commerce, Bureauof the Census. Washington, D.C.: GovernmentPrinting Office.
Knodel, John. (1997) – “The Closing of theGender Gap in Schooling: The Case ofThailand”. Comparative Education 33(1):61-86.
BIBLIOGRAPHY

65
Knodel, John, Napaporn Chayovan & SiriwanSiriboon. (1992) – The Impact of FertilityDecline on Familial Support for the Elderly –an Illustration From Thailand. Populationand Development Review 18(1):79-103.
Knodel, John, Napaporn Chayovan, SiriwanGraiurapong & Chutima Suraratdecha C. (2000)– Ageing in Thailand: an Overview of Formaland Informal Support. In Ageing in the Asia-PacificRegions: Issues and Policies, ed. Phillips David,243-266 pp. London: Routledge. 243-266 pp.
Knodel, John, Napaporn Chayovan, PreeyaMithranon, Pattama Amornsirisomboon &Supraporn Arunraksombat. (2005) – Thailand’sOlder Population: Social and Economic Support asassessed in 2002. National Statistical Office,Bangkok, Thailand.
Knodel, John, Napaporn Chayovan & SiriwanSiriboon S. (1992) – The Familial SupportSystem of Thai Elderly: An Overview.Asia-Pacific Population Journal 7(3):105-26.
Knodel, John, Chanpen Saengtienchai. (2007) –Rural Parents with Urban Children: Social andEconomic Implications of Migration on theRural Elderly in Thailand. Population, Space andPlace 13(3):193-210.
Knodel, John, Chanpen Saengtienchai & WerasitSittitrai. 1995. The Living Arrangements ofElderly in Thailand: Views of the Populace.Journal of Cross-Cultural Gerontology 10:79-111.
Kosberg, J.I. & J.L. Garcia. (2004) – Change intraditional roles for elderly men and women.BOLD 14(3):3-10.
Kreager, Philip. (2006) – Migration, Social Structureand Old-Age Support Networks: a Comparisonof Three Indonesian Communities. Ageing &Society 26:37-60.
Litwak, Eugene. (1960) – Geographic-Mobility andExtended Family Cohesion. American SociologicalReview 25(3):385-94.
Litwak, Eugene & S Kulis. (1987) – Technology,Proximity, and Measures of Kin Support. Journalof Marriage and the Family 49(3):649-61.
Osaki, Keiko. (1999) – Economic interactions ofmigrants in their households of origin: arewomen more reliable supporters? Asian and PacificMigration Journal 84:447-71.
Sen, Kasturi. (1994) – Ageing: Debates on DemographicTransition and Social Policy. London, Zed BooksLtd.
Smith, G.C. (1998) – Residential separation andpatterns of interaction between elderly parentsand their adult children. Progress in HumanGeography 22(3):368-84.
Sobieszczyk Teresa, John Knodel & NapapornChayovan. (2003) – Gender and Well-Beingamong the Elderly: Evidence from Thailand.Ageing & Society 23(6):701-35.
Stark, O. & D.E. Bloom. (1985) – The NewEconomics of Labor Migration. AmericanEconomic Review 75(2):173-8.
Stark, O. & R.E.B. Lucas. (1988) – Migration,Remittances, and the Family. Economic Developmentand Cultural Change 36(3):465-81.
Tangcharoensathien, Viroj, Anuwat Supachutikul,and Jongkol Lertiendumrong. (1999) –The social security scheme in Thailand: whatlessons can be learned? Social Science and Medicine,48, 913-923.
Thailand, Ministry of Public Health. (2004) – ICPDat 10: Progress and Challenges in Implementing thePoA, Thailand Bangkok: Ministry of PublicHealth.
Thailand, The National Commission on the Elderly.(2006) – Situation of the Thai Elderly 2005.Bangkok: Ministry of Social Development andHuman Security.
United Nations. (2002) – Report of the Second WorldAssembly on Ageing: Madrid, 8-12 April 2002.United Nations: New York.

66
United Nations Population Division. (2007) – WorldPopulation Prospects: The 2006 Revision and WorldUrbanization Prospects: The 2005 Revision, http://esa.un.org/unpp, accessed Tuesday, 29 May 2007.
United Nations Population Fund (UNFPA). (2002a)– Population Ageing and Development: Social, Healthand Gender Issues. United Nations, New York.
United Nations Population Fund (UNFPA). (2002b)– Situation and voices: The older poor and excluded inSouth Africa and India. United Nations, New York.
US Central Intelligence Agency. (2007) – The WorldFactbook: Thailand <https://www.cia.gov/cia/publications/factbook/geos/th.html#Econ>,Accessed March 26, 2007.
Vanwey, L. (2004) – Altruistic and contractualremittances between male and female migrantsand households in rural Thailand. Demography41(4):739-56.
World Bank. (2006) – 2006 World DevelopmentIndicators. Washington, D.C.: World Bank.

67
Annex I: Methodology of theMigration Impact Survey
localities outside officially designated municipalareas (tetsabaan) and peri-urban as sub-district levelmunicipal areas (tetsabaan tambol). Major urbanareas (tetsabaan muang) were excluded form thesampling universe. The limitation of the sampleto three age cohorts in three provinces reflects acompromise between budget constraints and theneed to have sufficient numbers of respondentsin different categories of substantive interest forthe topic under investigation.
The sample design called for selecting 18 samplesites: 3 districts (amphoe) within each province; 2sub-districts (tambol) within each district; andone health centre in sub-district if more than onehealth centre existed (which was true for 5sub-districts). The plan was to interview 18cases in each cohort in each of 18 sample sites.This would result in 54 interviews per site or324 per province for a total of 972 interviews.
Sampling of cases within each province involvedseveral stages. Based on household registrationdata, three districts were chosen proportional tosize (based on the combined rural and peri-urbanpopulation). Then within each of the selecteddistricts, two sub-districts were selected proportionalto size. Since ultimately we planned to use localhealth centre registers to obtain lists of potentialrespondents, for the five sub-districts that hadmore than one health centre (including communityhospitals if any population within an eligibletambol was under their jurisdiction), we selectedone health centre proportional to number ofhouseholds under their jurisdiction.
We relied on ‘family folders’ keep at the healthcentres for each household under their jurisdiction
Survey instrumentsThe research team developed an original surveyquestionnaire specifically for the purpose of assessingthe impact of migration of adult children on ruralparents. Much of the content was influenced byearlier qualitative research conducted by the teamon the topic. The questionnaire included detailedquestions on the background and current situationof parents and children and various types supportexchanges between them both currently and in thepast. Most information about support exchangesis specific to the individual child involved andto their location in relation to parents at the time.Extensive pretesting was conducted by the fullresearch team during three separate field tripsin three different provinces.1 The full questionnaireis provided in Annex II.
The research team also conducted semi-structuredinterviews with key informants in each samplesite. The interviews asked about backgroundinformation concerning the locality includingchanges in community level conditions over time,the extent of migration during the recent past, andout-migration of older persons to join migrantchildren living elsewhere. These interviews weretape recoded with permission of the key informant.The full set of interview guidelines are providedin Annex III.
Sample designThe survey design targeted respondents who hadat least one living child and resided in rural orperi-urban areas in three provinces (NakornRatchasima, Si Sa Ket, and Kamphaeng Phet).The respondents were to be divided equallyamong three age cohorts: 50-54, 60-64 and 70-79.For the purpose of sampling we defined rural as

68
to select individuals to interview. Each healthcentre is required to maintain a family folder withbasic information about household membersincluding their year of birth. This informationis available in a computerized database at thehealth centres (and usually in hand written hardcopies). The source for the database is acombination of official household registrationdata maintained by the Ministry of Interior,periodic surveys conducted by village healthvolunteers, information from household membersthemselves during visits to the health centres, andclient health records. Staff at health centres cansearch the database using a programme designedfor this purpose. To draw a sample of potentialrespondents for the survey, we asked the healthcentre at each sample site to provide us with a listof all persons in the database born during theyears that corresponded to our cohorts. Thisinformation was usually obtained several weeksin advance of the actual survey at the site.2
In principle, the family folders are supposed tobe periodically updated to allow for personsentering or exiting the population includingremoving those who died. However, to allow forthe possibility that the database was not fully corrector up to date and that some persons mightnot be willing or available to interview, weselected 25 potential persons to interview foreach cohort even though we were aiming for 18interviews. Cases were selected using a fixedinterval calculated by dividing the total numberof persons in the list for the cohort by 25 andstarting with the case at the midpoint of the firstinterval. Names in the lists were stratified byvillage (mubaan) within each sample site thusensuring a geographically diverse sample withinthe site.
Survey implementationData collection took place during Octoberand November 2006 and was supervised by theresearch team. Interviewers were graduatestudents at the Chulalongkorn University Facultyof Nursing and Faculty of Psychology. Threedays of in-class training were provided in Bangkokand one day of practice interviews in the fieldfor the original group of interviewers just prior
to the start of the survey. Training includedinstructions about obtaining informed consent andhow to sensitively handle situations which mightarise in which questions asked were emotionallystressful for respondent. The interviewers’ abilityto deal with such matters was enhanced by theirnursing background or, in the case of thepsychology students, the fact all were majoringin counselling.
Unfortunately not all of the interviewers originallyrecruited were able to remain with the survey duringthe entire period of fieldwork. Thus additionalinterviewers were recruited after the survey began.All newly recruited interviewers received a halfday training before joining fieldwork and someadditional orientation in the field. In addition,before conducting interviews of their own, eachjoined an experienced interviewer to first observeand then jointly conduct an interview. At leastone member of the research team observed eachinterviewer at an early stage, regardless of whenthey joined the fieldwork, in order to providecorrective guidance. In total 30 different personsincluding the three Thai investigators themselvesconducted interviews. At any one time, however,only about half of the full team of interviewerswere actually in the field.
The median interview time was 45 minutes.However, interview time varied considerably, rangingfrom just under 20 minutes to over two hours.Interviews with respondents who had manychildren, especially if many had migrated, tookparticularly long to complete because the amountof information to be collected was substantiallygreater than in other cases. For example, interviewswith respondents who had 8 or more childrenof whom most had migrated took almost twiceas long as interviews with respondents withtwo or fewer children none of whom had migrated.
The total of interviews completed was 1011 andthus modestly exceeded the 972 originally planned.A total of 33 interviews, however, are withrespondents whose year of birth falls outside therange of the targeted cohorts by one year. Sincethe number is modest and the deviation onlyone year, these cases have been retained and

69
for analytical purposes are included in the agecohort to which their birth year is adjacent.This involves 6 cases for the 70-79 cohort; 9for the 60-64 cohort and 12 for the 50-54 cohort.
Respondents were located with the help of localintermediaries, typically village health volunteers(aw saw maw) and staff from the local healthcentre. Interviews typically took place at therespondent’s home although some were conductedat the place of work. Other persons were allowedto assist respondents answer factual questionsbut told not to assist with opinion or attitudequestions. Most commonly the person who helpedwas the spouse of the respondent although childrenalso helped. Overall someone other than therespondent assisted in answering questions injust under half (47%) of the interviews but onlyin 7% was the help judged by the interviewer tobe “often”. Help in answering the questionnairediffered by age cohort with others helping“often” for 3% of the 50-54 cohort, 6% ofthe 60-64 cohort and 14% of the 70-89 cohort.
One major problem that became apparent fromthe start of the survey was that most of thefamily folder datasets from which we drew thesample of individuals to be interviewed werenot in fact up-to-date. In particular, persons whomoved out or who died were often not removedfrom the database. Also in some cases the selectedindividual was ineligible for other reasons suchas being single or childless or was born in a yeardifferent than in the records and fell outside theranges of the targeted age cohorts. Potentialrespondent’s whose physical or mental healthcondition was such that it would seriously impede
or prevent an interview were also replaced.3 Inaddition, a number originally selected individualswere either temporarily away from the samplesite or not available for interview during the timethe survey team visited their area, even thoughthe team started interviewing early in themorning and continued into early evening.
In virtually all sites, the number of personsamong the 25 originally selected for eachcohort who could be interviewed was insufficientto meet the planned quota of 18 interviews.When a person was unavailable for interview, areplacement was sought from the list who was thesame sex, in the same age cohort, and lived inthe same village as the originally selected individual.In some sites additional respondents were alsorecruited to make up for shortfalls in other sites.
As Table A1 shows, among the total interviewscompleted, approximately 40% representedreplacements either for individuals originallyselected from the site or shortfalls from anothersite. The extent to which interviews involvedreplacement respondents varied considerably bycohort and to a lesser extent by province.Replacement interviews were most common forthe youngest age cohort and least common for theoldest. Fully half of the 50-54 age cohortinterviews were with replacement respondents,likely reflecting the greater tendency for personsin this age group compared to those in olderones to be economically active and work outsidethe home and thus less accessible for interview.Among the three provinces, replacement was leastfrequent in Nakorn Ratchasima, the provincewhere the survey started. This may in part
Table A1: Per cent of interviews that were replacements for or additions to cases onesoriginally selected from health centre registers
% replacement interviews by age cohort
50-54 60-64 70-79 Total
Nakorn Ratchasima 45.5 31.8 23.8 33.5
Si Sa Ket 51.3 40.9 30.6 40.7
Kamphaeng Phet 52.5 47.7 33.0 44.6
Total 50.0 40.2 29.3 39.8

70
reflect the greater effort made to check on theaccuracy of the lists of potential individuals tointerview in advance of the fieldwork for thisprovince compared to the other two and thesomewhat longer period of time allowed for thefieldwork in the province.
Table A2 indicates the reasons for replacementinterviews. The most common reason for needingto replace originally selected individuals was thatthe person sought was not at home, accounting
for 37% of replacements. Together, individuals wholeft the area or who were deceased account forabout a third of the replacements. Most of therest were due to either the fact they turned out tobe ineligible (e.g., were childless or the wrong age)or were unknown to the intermediaries who assistedus and could not be located. Only one personsdirectly refused to be interviewed. The lowrefusal rate probably reflects the fact that localhealth staff, who usually were personally knowto the respondent, helped arrange for the interviews.
Table A2: Reasons for replacement interviews (per cent distribution)
50-54 60-64 70-79 Total
Number replaced 155 142 101 398
Reason for replacement (% distribution) a
Dead 5.5 12.0 31.3 14.5
Moved out of area 26.0 13.0 14.5 18.6
Ineligible 10.2 13.9 12.0 11.9
Unknown to local informants 15.0 17.6 13.3 15.4
Refused 0.0 0.9 0.0 0.3
Physically or cognitively unable 1.6 0.9 3.6 1.9
Not at home 41.7 41.7 25.3 37.4
a Excludes 80 out of 398 cases for which a record was kept but no reason was checked.
There are some differences in reasons forreplacement among the age cohorts. Replacementdue to death was rarely required for the youngestcohort and but necessary for almost a third oforiginally selected persons for the oldest cohort. Incontrast moving away from the sample site was aconsiderably more common reason for replacementamong the younger cohort than the other two.Although replacements due to inability to answera questionnaire for reasons of cognitive or physicalhealth impairment were not common, they weremost frequent among the oldest cohort.
The high portion of replacement interviews forreasons due to persons not being at homemeans that in practice some of the sample wasrecruited on a quasi-convenience basis ratherthan on a strict probability basis as originallyplanned. As a result, the sample is likelyskewed towards those who were home during
the day. One possible implication of this wouldbe that persons who worked outside the householdare underrepresented as they would prone to notbeing home when the interviewers were locatingrespondents to interview.
To gain some sense of the magnitude of thispotential bias, Table A3 compares the per cent ofrespondents who indicated they were currentlyworking based on results from the 2000 censusand round 3 of the 2002 labour force survey (LFS).To increase comparability, both census and LFSresults are restricted to the three provinces includedin the MIS. Information on whether or notsomeone was working outside the home is notavailable from any of the three sources. However,if persons who worked outside the home aredisproportionately absent from the migrationimpact survey (MIS), this should still be reflectedin lower proportions reporting that they are

71
working than in the other sources. One problem isthat the questions used to measure work statusdiffer in the three sources. The census asked ifpersons worked during the previous year, theLFS if persons worked during the past seven days,while the MIS simply asked if the respondentworked without reference to any time period.Also neither the census nor LFS data permit
tabulations that are based on rural and peri-urbanareas combined and exclude major urban areas asis the case with the MIS sample. Thus comparisonscan be made either between rural populations inall three sources or between the total populationincluding periurban and larger municipal areas inthe case of the census and the LFS but excludingmajor urban areas for the MIS.
Table A3: Per cent working by sex and age, MIS compared to 2000 census and 2002 LabourForce Survey (Round 3), MIS provinces only
Rural onlyRural
Census LFS 2002and urban
aLFS 2002
MIS2000 (work last
MIS Census(work last
(working)(work last 7 days)
(working) 20007 days)
year)(work last
year)
Men
50-54 97.1 95.8 95.9 95.8 95.1 95.6
60-64 84.1 82.6 74.7 82.7 80.4 72.0
70-79 51.0 44.1 30.1 47.6 43.6 29.5
Women
50-54 83.3 90.1 80.5 80.7 87.7 78.8
60-64 54.2 70.4 52.8 53.1 67.6 50.8
70-79 23.8 28.6 5.2 22.4 28.2 6.2
Note: census and labour force survey results represent original calculations; census results are from the 1% sample. The censusquestion asked if the person worked during the past year; the labour force survey asked if persons worked in last 7 days; and theMIS question simply asked if the person was working.a The census and LFS include all urban areas while the MIS only includes peri-urban areas (tetsabaan tambol) and excludes majorurban areas (tetsabaan muang).
The results are generally similar whether they arelimited to the rural population only or to thecombined rural and urban populations in thedifferent sources. For men, there is little differencebetween the proportion in each age cohort whoare working as indicated by the census and MISbut both sources yield higher levels than theLFS for the 60-64 and 70-79 age cohorts. Thislikely reflects differences is in the wording of thequestion in the three sources and suggests thatin the MIS respondents were taking a broadview work when answering the question aboutworking rather than narrowly thinking of being
engaged specifically at the time of the survey.For women, the per cent who report themselvesas working in the MIS is also higher than in theLFS although only modestly so for the first twocohorts but lower for each cohort than indicatedby the census. In general, the results do notsuggest that the MIS sample is seriously skewedtowards persons who are economically inactivealthough this is likely so to some extent forwomen. Thus the substantial share of replacementinterviews in the MIS seems at worst to onlymodestly compromise how representative it is inat least this respect.

72
Data preparationQuestionnaire editing and data entry were doneprimarily by a subset of persons who had servedas interviewers. Although most of the questionsinvolved pre-coded answers, a small numberrequired subsequent coding prior to do data entry.Because of the complex nature of the questionnaire,data entry required the formation of 10 separatefiles depending to whom the questions beingcoded referred. The main file consisted ofinformation corresponding directly to therespondent. Other files referred to questionsconcerning children in general, migrant children,return migrant children, and grandchildren, andchildren involved in certain types of specificexchanges during their lifetime. Each file includedidentification information to permit linkinginformation about the same child during analysis.Extensive data cleaning took place in three stages:correcting out of range or invalid values; correctinginternal inconsistencies within each of the 10data files; and correcting inconsistencies betweenseparate data files.
Endnotes
1 Pretesting took place 6-9 January 2006 inPhitsanulok province, 2-6 May in Uthai Thaniprovince, and 29 August in Ayutthayaprovince.
2 Since interviews were to be conducted inOctober and November 2006 consideredpersons born in the years 1952-1956 toconstitute the 50-54 age cohort, persons bornin the years 1942-1946 to constitute the 60-64age cohort, and persons born in the years1927-1936 to constitute the 70-79 age cohort.This means that the small number of personsborn in the last year defining each age cohortwho had not yet passed their birthday aretechnically a month or two younger that ofthe lower age limit of the cohort whenconsidered in terms of age at last birthday.Because information on birth years tends to bemore precise than reported ages, we preferthe use of birth years to define the cohorts.For convenience, however, we retain theterm age cohort in the text age as it is morereadily interpretable for readers.
3 Originally the design called for proxyinterviews in such cases but only one proxyinterview took place.

73
Annex II: Questionnaire for theMigration Impact Survey
COVER SHEET
Questionnaire number: ________ (to be added after survey is completed)
Name of interviewer: _______________________________________
[Interviewer: Copy from Screening sheet]
Screening sheet ID number: ________
Name of respondent: ______________________________________
Year of Birth as determined by respondent: ___________________
Sex of respondent1 male2 female
Is this a proxy interview (because selected respondent is unable to carry out interview)?1 yes2 no � skip to date of interview
If proxy interview, indicate the following about the person serving as proxy relation of proxy to intendedrespondent: _______________________
age of proxy: ________sex of proxy: 1 male 2 female
Date of interview: Date: ________ Day __________ MonthTime interview starts: __________ Hour _________ Minute
If interview is interrupted:Time of interruption: ________ Hour _________ MinuteDate interview resumes: ___________________________________Time interview resumes: ______ Hour ________ Minute
To be filled out by project staff
Task Name
Supervisor
Person editing questionnaire
Data entry person

74
Section A. Household Schedule
A1. We would like to know some information about everyone you live with here in your household.Let’s start by listing everyone who regularly lives here starting with yourself.
List everyone who lives in the same household with the respondent and their relationship to the respondent before askingthe detailed information about each one. Be sure to list the designated respondent as the first person and the spouse(if appropriate) as the second. If more than 10 household members, continue on a second questionnaire.
Ask if 16 or older
(a) (b) (c) (d) (e) (f) (g)Line no. Nick-name Relationship Sex Completed Does (name) Does (name)
or initials to R 1 = M Age help support help much with(see codes) 2 = F HH financially? HH chores?
1 = yes, 2 = no 1 = yes, much2 = some
3 = not at all
1 1 (self)
2
3
4
5
6
7
8
9
10
Codes for relationship to R
1 self 6 grandchild 11 sibling/sibling-in law
2 spouse 7 niece/nephew 12 other relative
3 child of R (including adopted) 8 parent 13 non-relative
4 step child of R (child of spouse not R) 9 parent-in-law
5 child-in-law 10 grand parent

75
Section B. Basic Background and Attitudes
B1. What is your religion?1. Buddhism2. Islam3. Christian4. Other (specify _____________________________________ )
B2. What is your ethnicity?1. Thai2. Chinese3. Thai-Chinese4. Khmer5. Other (specify _____________________________________ )
B3. Normally when you converse with household members, what language do you use?1. Standard Thai2. Northeastern Thai/Lao3. Northern Thai4. Southern Thai5. Chinese6. Khmer7. Other (specify _____________________________________ )
B4. What is the highest level of schooling you finished?Grade _____________ (0 = never went to school)Other (specify ________________________________________ )
B5. (If highest grade is Paw 4 or less) Can you read and write easily?1. easily2. with difficulty or read only3. can not read or write
B6. What is your current marital status1. currently married, living with spouse � B112. currently married, not living with spouse � B83. separated or divorced � B84. widowed
B7. How long ago did your spouse die?1. less than a year (state months ________ ) � B112. 1 year or more (state years ________ ) � B11
B8. How old is your (ex-)spouse? ________ years old (99 = dead)
B9. Where is your (ex-)spouse living?1. in same amphoe2. elsewhere8. dead9. do not know

76
B10. How long have you and your (ex-)spouse not been living together?________ years (if less than 1 write 0)
B11. What is the highest level of schooling your (ex-)spouse finished?Grade _______________ (0 = never went to school; 99 = don’t know)Other (specify _______________________________________ )
B12. (If highest grade is Paw 4 or less or does not know level) Can your (ex-)spouse can your read andwrite easily?1. easily2. with difficulty or read only3. can not read or write
B13. Are you currently covered by any kind of health insurance or health benefits?[Multiple answers permitted, circle all that apply]1. no2. 30 baht health card with taw (fee exemption)3. 30 baht health card (normal)4. civil service insurance5. government social security6. other (specify ______________________________________ )9. unsure
B14. Do you and/or your spouse currently receive any kind of financial benefits from the governmentwelfare or from NGOs?1. yes (specify _______________________________________ )2. no
B15. Have either you or your spouse been married before?1. no2. respondent has3. spouse has4. both have
[Interviewer : Stress to the respondent that for questions B16-B18, we want the respondent’s opinion about whatis appropriate for elderly persons generally; If spouse or others are present, mention that in this section we want therespondent’s own opinion so they should not help answer.]
B16. If parents are old and not in good health but all their children live elsewhere, which is betterfor them?1. Stay where they are and ask a child to move back to take care of them2. Go to live with one of their children who can care for them3. Not sure
B17. If parents are old and not in good health and all their children live elsewhere, is it acceptable if theirchild hire someone to help the parents?1. It is acceptable for the children to hire someone to help2. It is not acceptable3. Not sure

77
B18. Here are some statements about parents and their children. Do you agree or disagree with them?
Agree Disagree Depends Not sure
A. If parents are old and in good health, it is notnecessary for children to live with or nearby themas long as children visit and keep in contact 1 2 3 4
B. Children living elsewhere should give parentsmoney if parents are in financial difficulty 1 2 3 4
C. Even if parents are financially well off, childrenliving elsewhere should give parents money 1 2 3 4
D. Children who live far away do not need to comevisit frequently if they often call their parentson the phone 1 2 3 4
E. Children should support and care for their parentsin old age even if they have their own familiesto support 1 2 3 4

78
Section C. Child Roster
C1. How many living sons and daughters of your own do you have including step and adopted children?[enter 0 if none]A. ________ own childrenB. ________ adopted childrenC. ________ step children that respondent helped raise (see B18)
C2. I would like to ask you about each of your children, including any adopted children and step childrenthat you helped raise. Please tell me their names starting with the oldest.
[Interviewer: Make sure that the number of children in chart below equals the sum of own, adopted and step childrenmentioned in C1A, B & C].
Child column number 1 2 3 4 5 6 7 8
A. Nick-name
B. Is (name) a own, adopted or step child?1. own child 1 1 1 1 1 1 1 12. adopted child 2 2 2 2 2 2 2 23. step child 3 3 3 3 3 3 3 3
C. Sex1. son 1 1 1 1 1 1 1 12. daughter 2 2 2 2 2 2 2 2
D. Completed age
E. Is (name) attending school?1. yes 1 1 1 1 1 1 1 12. no 2 2 2 2 2 2 2 29. don’t know 9 9 9 9 9 9 9 9
F. Highest grade completed(or current grade if in school)[If less than upper secondary level � I]
G. Did (name) ever live away from home toattend school?1. yes 1 1 1 1 1 1 1 12. no � I 2 2 2 2 2 2 2 2
H. At that time, did you pay for (name’s)schooling and living expenses?1. yes, paid most or all 1 1 1 1 1 1 1 12. yes, paid part 2 2 2 2 2 2 2 23. no, did not pay or paid only little 3 3 3 3 3 3 3 3

79
I. Where does (name) live?1. in same house as respondent � J 1 1 1 1 1 1 1 12. next-door or very nearby � P 2 2 2 2 2 2 2 23. same village � O 3 3 3 3 3 3 3 34. same tambol, different village � O 4 4 4 4 4 4 4 45. same amphoe, different tambol � K 5 5 5 5 5 5 5 56. same province, different amphoe � K 6 6 6 6 6 6 6 67. different province � K 7 7 7 7 7 7 7 78. Bangkok � L 8 8 8 8 8 8 8 89. Abroad � L 9 9 9 9 9 9 9 999. don’t know � L 99 99 99 99 99 99 99 99
J. [if in same household] Line number inhousehold schedule � P
K. Is where (name) lives rural or urban?1. rural 1 1 1 1 1 1 1 12. urban 2 2 2 2 2 2 2 23. semi-urban 3 3 3 3 3 3 3 39. not sure 9 9 9 9 9 9 9 9
L. Does (name) have a phone?1. yes 1 1 1 1 1 1 1 12. no � O 2 2 2 2 2 2 2 29. don’t know 9 9 9 9 9 9 9 9
M. If you need to call (name) do you knowthe number to call?1. yes 1 1 1 1 1 1 1 12. no 2 2 2 2 2 2 2 2
N. How often do you talk with (name)on the phone?1. never 1 1 1 1 1 1 1 12. only a few times 2 2 2 2 2 2 2 23. several time a year 3 3 3 3 3 3 3 34. every month or so 4 4 4 4 4 4 4 45. several times a month 5 5 5 5 5 5 5 56. weekly or more often 6 6 6 6 6 6 6 6
O. How often do you and (name)visit each other?1. daily or several times per week 1 1 1 1 1 1 1 12. weekly or several times per month 2 2 2 2 2 2 2 23. monthly or every few months 3 3 3 3 3 3 3 34. several times per year 4 4 4 4 4 4 4 45. once a year 5 5 5 5 5 5 5 56. less than once a year 6 6 6 6 6 6 6 67. never 7 7 7 7 7 7 7 7

80
P. If child is under age 16 check here and go to next child.If age 16 or older continue –<16 –<16 –<16 –<16 –<16 –<16 –<16 –<16
Q. How many children does (name) have?[if none write 0]
R. Marital status?1. single 1 1 1 1 1 1 1 12. married 2 2 2 2 2 2 2 23. divorce/separated 3 3 3 3 3 3 3 34. cohabiting but not married 4 4 4 4 4 4 4 49. don’t know 9 9 9 9 9 9 9 9
S. Is (name) working?1. yes 1 1 1 1 1 1 1 12. no � U 2 2 2 2 2 2 2 29. don’t know 9 9 9 9 9 9 9 9
T. What type of work does (name) do?1. farming for self/family 1 1 1 1 1 1 1 12. labour (hired) 2 2 2 2 2 2 2 23. regular employment (with steady wage or salary) 3 3 3 3 3 3 3 34. self employed (describe job) 4 4 4 4 4 4 4 45. other (describe job) 5 5 5 5 5 5 5 56. did not work 6 6 6 6 6 6 6 69. don’t know 9 9 9 9 9 9 9 9
U. During the past year has (name)given you or your spouse any money?1. no � W 1 1 1 1 1 1 1 12. yes, but only once or twice 2 2 2 2 2 2 2 23. yes, several times 3 3 3 3 3 3 3 34. yes, monthly or regularly 4 4 4 4 4 4 4 4
V. Was the total amount (name) gave over the year,less than 1,000, between 1,000 and 5,000,or more than 5,000 Baht?1. less than 1,000 1 1 1 1 1 1 1 12. 1,000-5,000 2 2 2 2 2 2 2 23. over 5,000 3 3 3 3 3 3 3 3
W. During the past year has (name)given you food frequently?1. no or only once in a while 1 1 1 1 1 1 1 12. at least monthly 2 2 2 2 2 2 2 23. at least weekly 3 3 3 3 3 3 3 3
X. During the past year has (name) helped you withhousehold chores frequently?1. no or only once in a while 1 1 1 1 1 1 1 12. at least monthly 2 2 2 2 2 2 2 23. at least weekly 3 3 3 3 3 3 3 3

81
Y. During the past year has (name)helped you with your work or business?1. no 1 1 1 1 1 1 1 12. for a short time 2 2 2 2 2 2 2 23. regularly 3 3 3 3 3 3 3 38. does not have any work needing help 8 8 8 8 8 8 8 8
Z. Do you feel you could discuss your worriesand problems freely with (name)1. not very much 1 1 1 1 1 1 1 12. some 2 2 2 2 2 2 2 23. yes quite freely 3 3 3 3 3 3 3 3
C3. [Interviewer: Go back and check C2I and count how many children live inside and outside the respondent’s amphoe.Record your count below and confirm with respondent, correcting where necessary]
Now just to make sure I have this correct, according to what you told me, you haveA. ________ children living in this amphoe andB. ________ children living outside this amphoe. Is that right?
C4. Can you tell me if you had any of the following problems, to whom would you most likely askto help?[If respondent mentions several children, probe to see if one is more likely than others]
Specific child/ Child but More than Someone other
children mentioned not sure one child than child Unsurewhich one (specify)
You have financial 1 name____ col.___ 2 3 all 4 __________ 5difficulties (name____ col.___ ) 6 more than 2 8 Other answer
(name____ col.___ ) but not all
You need personal care 1 name____ col.___ 2 3 all 4 __________ 5because you are ill (name____ col.___ ) 6 more than 2 8 Other answer
(name____ col.___ ) but not all

82
Section D. Residence, Housing, Savings, Possessions
D1. Where were you living when your oldest child was about 15 years old?1. same tambol � D42. same amphoe but different tambol3. same province but different amphoe4. different province ( _________________________________ )5. other ( __________________________________________ )9. no child 15 or older
D2. How long have you lived in this tambol?________ years (if less than 1 year write 0)
D3. Where did you live before you lived in this tambol?2. same amphoe but different tambol3. same province but different amphoe4. different province ( _________________________________ )5. other (explain _____________________________________ )
[Interviewer: Base answers to D7 – D9 on observation if possible; otherwise ask respondent]D4. What type of house does the respondent live in?
1. hut or shack2. one story wooden or bamboo house3. wooden house, raised floor on posts, with open lower level4. wooden house, raised floor, with lower level walled in5. one story cement/stucco house6. two or more story cement/stucco house7. wooden shop-house/row-house8. cement row house/shop-house/townhouse9. other ____________________________________________
D5. What material is the roof of the house made of?1. thatch/leaves/grass2. corrugated tin3. shingles4. corrugated cement5. tiles6. other ____________________________________________
D6. What is the ground floor of the house mostly made of?1. earth/sand/clay/bamboo strips/thatch/palm2. wood planks3. cement4. vinyl5. ceramic tiles/marble6. parquet or polished wood7. other _____________________________________________

83
D7. What kind of toilet facility do members of your household use?(Check all that apply)1. flush toilet2. latrine with septic tank or connected to sewer3. latrine without septic tank4. pit toilet5. no facility/field
D8. Do you have running water inside your house?1. yes2. no
D9. [for interviewer to judge – do not ask respondent] Based on the appearance of the respondent’s house, howdo you judge the economic status of the household to be?1. quite well off2. somewhat above average3. average4. somewhat below average5. very poor9. did not see
D10. Who owns the house that you live in?1. self (and/or spouse) � D122. one of R’s children (column number in child file _________________ )3. parents or parents-in-law � D124. landlord (pays rent) � D165. other (specify ____________________________________________ ) � D12
D11. Did you give the house to your child?1. yes2. no � D16
D12. Did any of your children help pay for buying, building or making major improvements (such asenlarging it or changing the roof or wall material) for the house?1. yes2. no � D14
D13. Which of your children helped pay for buying, building or making major improvements for the house.[Interviewer: find the child roster column number and ask the questions below for each child that helped]
A. Nick-name B. Child C. In total, did (name) D. Where did (name)roster contribute only a little, live at the time?column a moderate amount or a lot? 1 with parentnumber 1 only a little 2 in same tambol not with parent
2 a moderate amount 3 in same amphoe, different tambol3 quite a lot 4 elsewhere
5 other (explain)
1 1 2 3 1 2 3 4 5
2 1 2 3 1 2 3 4 5
3 1 2 3 1 2 3 4 5
4 1 2 3 1 2 3 4 5

84
D14. Did any of your children help with the labour to build or make major improvements for the house?1. yes2. no � D16
D15. Which of your children helped with labour to build or make major improvements for the house?[Interviewer: find the child roster column number and ask the questions below for each child that helped]
A. Nick-name B. Child C. In total, did (name) D. Where did (name)roster help only a little, a moderate live at the time?column amount or a lot? 1 with parentnumber 1 only a little 2 in same tambol not with parent
2 a moderate amount 3 in same amphoe, different tambol3 quite a lot 4 elsewhere
5 other (explain)
1 1 2 3 1 2 3 4 5
2 1 2 3 1 2 3 4 5
3 1 2 3 1 2 3 4 5
4 1 2 3 1 2 3 4 5
D16. Do you or your spouse own any land (other than the house plot)?1 yes (number of rai _______________________________ )2 no � D19
D17. What is this land used for?[Check all that apply]1. rice farming2. orchard3. other crops4. not currently in use5. other (specify ____________________________________ )
D18. Do you use this land yourself or do others use it?[Check all that apply]1. by self or spouse2. by own children3. by others with payment (share cropping or rental)4. by others without payment5. other ___________________________________________

85
D19. Do you or members of your household have any of these items?
1) Has 2) Did one of 3) Column 4) Where did (name) liveitem? your children number in C2 at the time?1 = Yes buy this item? of child who 1 with parent2 = No 1 yes � next paid 88 more 2 in same tambol not
column than one with parent2 no � next 99 deceased 3 in same amphoe,item different tambol3 other (explain) 4 elsewhere4 child-in-law 5 other (explain)
a) color TV 1 2 1 2 3 1 2 3 4 5
b) video/DVD player 1 2 1 2 3 1 2 3 4 5
c) refrigerator 1 2 1 2 3 1 2 3 4 5
d) computer 1 2 1 2 3 1 2 3 4 5
e) furniture set 1 2 1 2 3 1 2 3 4 5(store bought)
f) washing machine 1 2 1 2 3 1 2 3 4 5
g) air conditioner 1 2 1 2 3 1 2 3 4 5
h) motorcycle 1 2 1 2 3 1 2 3 4 5
i) car/truck 1 2 1 2 3 1 2 3 4 5
j) microwave oven 1 2 1 2 3 1 2 3 4 5
D20. Did any of your children ever buy or give you or your spouse anything major, such as gold, land,livestock, or equipment to help you make your living?1. yes2. no � D22
D21. Please tell me which of your children bought these things and what they were.[Interviewer: find the child roster column number and ask the questions below for each child that gave something]
A. Nick-name B. Child C. What did the child give D. Where did (name) live at the time?roster or buy for you 1 with parentcolumn 2 in same tambol not with parentnumber 3 in same amphoe, different tambol
4 elsewhere5 other (explain)
1 1 2 3 4 5
2 1 2 3 4 5
3 1 2 3 4 5
4 1 2 3 4 5
5 1 2 3 4 5

86
D22. Does your house have a telephone (landline) or does anyone in the household have a mobile phone?1. yes landline phone2. yes mobile phone3. yes both landline and mobile phone4. no � D24
D23. Who bought the phone(s) among those in your house?[Check all that apply]1. self or spouse � D262. son or daughter living in household (column number in child file ________ ) � D263. son or daughter not living in household (column number in child file ________ ) � D264. other � D26
D24. Do you know someone nearby who has a phone or mobile phone you could use if you needed to?1. yes2. no � D26
D25. Have you ever used this other person’s phone/mobile phone to make or receive a call?1. yes, both made and received calls2. yes made calls only3. yes received calls only4. no
D26. Have you or your spouse ever given or loaned at least 5,000 baht to any of your children?1. yes2. no � D283. arranged loan by providing collateral
D27. Please tell me which of your children you gave or loaned a large amount of money.[Interviewer: find the child roster column number and ask the questions below for each child that gave something]
A. Nick- B. Child C. About how much D. Has the loan been E. Where did (name)name roster did you give or loan? repaid? live at the time?
column 1 under 10,000 1 yes in full 1 with parentnumber 2 10-100,000 2 in part 2 in same tambol
3 over 100,000 3 not at all not with parent4 was gift 3 in same amphoe,
different tambol4 elsewhere5 other (explain)
1 1 2 3 1 2 3 4 1 2 3 4 5
2 1 2 3 1 2 3 4 1 2 3 4 5
3 1 2 3 1 2 3 4 1 2 3 4 5
4 1 2 3 1 2 3 4 1 2 3 4 5
5 1 2 3 1 2 3 4 1 2 3 4 5

87
D28. Not counting education, have you ever paid a large expense for or given an expensive item to any ofyour children?1. yes2. no � next section
D29. Please tell me which of your children you gave this to.[Interviewer: enter child roster column number and ask the questions below for each child mentioned.]
A. Nick-name B. Child C. About how much was the D. Where did (name) live at the time?roster money or gift worth? 1 with parentcolumn 1 under 10,000 2 in same tambol not with parentnumber 2 10-100,000 3 in same amphoe, different tambol
3 over 100,000 4 elsewhere5 other (explain)
1 1 2 3 1 2 3 4 5
2 1 2 3 1 2 3 4 5
3 1 2 3 1 2 3 4 5
4 1 2 3 1 2 3 4 5
5 1 2 3 1 2 3 4 5

88
Section E. Health
E1. How would you rate your physical health at the present time? Would you say it is very good, good,fair, poor or very poor?1. very good2. good3. fair4. poor5. very poor
E2. Do you have any chronic illness?1. yes (specify _______________________________________ )2. no
E3. Think back to the time your oldest child was about age 18, how would you say your health was atthat time? Would you say it was very good, good, fair, poor or very poor?1. very good2. good3. fair4. poor5. very poor9. oldest child not yet 18
E4. How long ago was the last time you had a serious acute illness or serious injury that prevented youfrom doing your usual daily activities?________ years ago (0 = less than a year ago)99 never had a serious illness � E9
E5. How long did that illness or injury last?1. less than a month2. 1-2 months3. 3-5 months4. 6-12 months5. more than a year
E6. Did any child who was living away at the time return to help care for you at that time?1. yes [write name and child roster column no for each mentioned]
(name ________________ ; child roster column no. ________ )(name ________________ ; child roster column no. ________ )
2. no (includes no child living away at time)3. went to stay with child during illness
E7. Who would you say was the person that helped you most at that time?1. spouse2. child (name ________________ ; child roster column no. ________ )3. son in law4. daughter in law5. grandchild6. other person (specify ________________________________ )8. no one helped � E9

89
E8. Who else helped at that time, for example did someone you haven’t mentioned help take you to thedoctor, help you take medicine or provide daily care you needed? [Circle all that apply]1. spouse2. children (child roster column no. ________ )3. son in law4. daughter in law5. grandchild6. other person (specify ________________________________ )8. no one else helped
E9. I am now going to ask you if you have any difficulty doing a number of physical tasks on your ownwithout assistance. Do you with have any difficulty …. ?
i. Do you have any difficulty? ii. How much difficulty?
A. Walking 200-300 meters? 1 yes � ask ii 1 some2 no � ask next task 2 a lot
3 cannot do
B. Lifting or carrying 1 yes � ask ii 1 somesomething as heavy as 5 kg.? 2 no � ask next task 2 a lot
3 cannot do
C. Crouching or squatting? 1 yes � ask ii 1 some2 no � ask next task 2 a lot
3 cannot do
D. Using fingers to grasp 1 yes � ask ii 1 someor handle? 2 no � ask next task 2 a lot
3 cannot do
E. Walking up and down 1 yes � ask ii 1 somea set of stairs 2 no � E10 2 a lot
3 cannot do
E10. Now I would like to ask you about things people need to do to take care of themselves. Do youhave any difficulty doing . . . . without help?
i. Do you have any difficulty ii. How much difficulty
A. Eating? 1 yes � ask ii 1 some2 no � ask next task 2 a lot
3 cannot do
B. Getting dressed and 1 yes � ask ii 1 someundressed? 2 no � ask next task 2 a lot
3 cannot do
C. Bathing yourself? 1 yes � ask ii 1 some2 no � ask next task 2 a lot
3 cannot do
D. Getting up when 1 yes � ask ii 1 someyou are lying down? 2 no � ask next task 2 a lot
3 cannot do

90
E10x. Interviewer: indicate if the respondent has difficulty any of the 5 items in E9 or any of the 4items in E101. ________ yes, has one or more difficulties � ask E112. ________ no, has no difficulty with any � skip to E12
E11. Who would you say was the person that helps you most?1. spouse2. child or children (name ______________ ; child roster column no. ________ )3. son in law4. daughter in law5. grandchild6. other person (specify _______________________________ )8. no one helps
E12. Now I would like to ask you about things people need to do to take care of their house. Do youhave any difficulty doing . . . . without help?
i. Do you have any difficulty? ii. How much difficulty?A. Cooking? 1 yes � ask ii 1 some
2 no � ask next task 2 a lot8 DNA � next task 3 cannot do
B. Handling household 1 yes � ask ii 1 somemoney? 2 no � ask next task 2 a lot
8 DNA � next task 3 cannot doC. Doing housework 1 yes � ask ii 1 some
like cleaning? 2 no � ask next task 2 a lot8 DNA � next task 3 cannot do
D. Washing clothes 1 yes � ask ii 1 some2 no � ask next task 2 a lot8 DNA � next task 3 cannot do
E. Taking transportation? 1 yes � ask ii 1 some2 no � ask next task 2 a lot
3 cannot do
E12x. Interviewer: indicate if the respondent has difficulty any of the five items in E12:1. ________ yes, has one or more difficulties � ask E132. ________ no, has no difficulty with any � skip to E13x
E13. Who would you say was the person that helped you most?1. spouse2. child or children (name ______________ ; child roster column no. ________ )3. son in law4. daughter in law5. grandchild6. other person (specify ________________________________ )8. no one helps

91
E13x. Interviewer: Indicate if the respondent is currently married and living with spouse:1. ________ yes is currently married and living with spouse � ask E142. ________ no, not is currently married or not living with spouse � skip to E17
E14. How is the physical health of your spouse at the present time? Is it very good, good, fair, poor orvery poor?1. very good2. good3. fair4. poor5. very poor
E15. Does your spouse need any help caring for him/herself, like bathing and getting dressed.1. yes2. no � E17
E16. Who is the person that helps your spouse the most?1. respondent does2. child or children (name _________________ ; child roster column no. ________ )3. son in law4. daughter in law5. grandchild6. other person (specify _______________________________ )
E17. Think back to the time your oldest child was about age 18, how was the physical health of yourspouse at that time? Would you say it was very good, good, fair, poor or very poor?1. very good2. good3. fair4. poor5. very poor8. dead or separated at the time9. oldest child not yet 18
[Interviewer: if spouse or others are present, mention that for the remaining questions in this section, we want the respondentto answer him or herself, so they should not help answer]E18. I would like to ask you about your current feelings regarding your life related to your children. I will
read a statement and would like you to tell me whether you feel it is true, partly true or not truewith regards to your situation.
True Partly Not true Don’ttrue know
A. You and your children (and among children) 1 2 3 9get along well together
B. Your children are doing well with their lives 1 2 3 9C. You and your children can depend on each other for help 1 2 3 9D. You think too much about your problems 1 2 3 9E. When something bad happens you can accept it 1 2 3 9F. You are bored with things around you 1 2 3 9

92
E19. Have you ever considered that you might go to live in an old persons home?1. yes2. no3. do not know what an old persons home is
E20. Now I would like to ask about government services for the elderly. We would like to know if youknow of theses services, if you used them and your satisfaction with the service.[If under age 60 ask only column 1 except for item B]
1. Ever heard of 2. Ever use or 3. How satisfiedservice? receive service? were you?1 yes 1 yes 1 very2 no � next item 2 no next item 2 somewhat9 DK � next item 9 DK � next item 3 not satisfied
A. Elderly club 1 2 9 1 2 9 1 2 3
B. Community health service centre 1 2 9 1 2 9 1 2 3
C. Elderly health clinic in 1 2 9 1 2 9 1 2 3government hospital
D. Welfare allowance elderly 1 2 9 1 2 9 1 2 3

93
Section F. Economic Activity and Situation
F1x. Interviewer: Look at children roster and indicate if oldest child is at least age 18:1. ________ oldest child 18 or older2. ________ oldest child under age 18
Preface to F1 to F7: I would like to ask some questions about your current situation and also about yoursituation when your oldest child was about age 18. Let’s start with your current situation.[Interviewer: If the oldest child is under age 18, only ask about the current situation.]
A. Current B. Situation when
situation oldest childwas age 18
F1. How do you judge your economic status relativeto others in your community?1. much better 1 12. somewhat better 2 23. about average 3 34. below average but not much worse 4 45. much worse 5 5
F2. Which of the following (were) your sources of support?[Ask each separately]a. own and/or spouse’s work 1 = yes 2 = no 1 = yes 2 = nob. children/grandchildren 1 = yes 2 = no 1 = yes 2 = noc. rent/interest/investments 1 = yes 2 = no 1 = yes 2 = nod. other (specify) 1 = yes 2 = no 1 = yes 2 = no
F3. (if more than one source in F2) Of all of these,what is you most important source of support?1. own and/or spouse’s work 1 12. children/grandchildren 2 23. rent/interest/investments 3 34. other (specify) 4 45. all equal 5 5
F4. Are (were) you working?1. yes 1 12. no � F6 2 23. other (specify) 3 3
F5. What type of work do (did) you do? ( ____________ ) ( ____________ )[write down actual response and record all codes that apply]1. farming for self 1 12. hired farm labour 2 23. hired non-farm labour 3 34. fishing 4 45. skilled work – self employed 5 56. salaried employee – low level 6 6

94
7. white collar employee 7 78. vendor without permanent shop 8 89. small shop owner 9 910. own business with employees 10 1011. other 11 11
F6. Is (was) your spouse working?1. yes 1 12. no 2 � F1B 2 � G1X3. other (specify) 3 39. separated or widowed at time to which question refers 9 � F1B 9 � G1X
F7. What type of work does (did) your spouse do?[write down actual response and record all codes that apply]1. farming for self 1 12. hired farm labour 2 23. hired non-farm labour 3 34. fishing 4 45. skilled work – self employed 5 56. salaried employee – low level 6 67. white collar employee 7 78. vendor without permanent shop 8 89. small shop owner 9 910. own business with employees 10 1011. other 11 11
Go to F1B Go to F1B

95
Section G. Returned Migrant Children
G1x. Interviewer: check C3 indicate if the respondent has children living in same amphoe (including those coresidentand living nearby)1. ________ has children living in same amphoe � ask G22. ________ no children living in same amphoe � next section
G2. You said you have children currently living with you and/or children living in this amphoe. Have anyof these children ever lived elsewhere outside of this amphoe continuously for at least a year or more?1. yes2. no � next section
G3. Please tell me how many children returned to this amphoe after living away?________ number
Now I would like to ask you about the children who returned after living for at least a year elsewhere.Please tell me their nick-names.[Interviewer: if more than one, record nicknames first and then ask full set of questions about the first before askingabout the second, etc. If more than three who returned use additional questionnaire]
Returned Returned Returnedmigrant 1 migrant 2 migrant 3
Nick-name of child
G4. Column number in child roster in section C
G5. Where does (name) currently live?1. with respondent 1 1 12. next door/nearby 2 2 23. same village but not nearby 3 3 34. same tambol but not same village 4 4 45. elsewhere in amphoe 5 5 5
G6. Before returning, did (name) live in this provinceor elsewhere?1. in province 1 1 12. outside province 2 2 2
G7. What was (name) doing at the place s/hereturned from? (multiple answers allowed)1. working 1 1 12. studying 2 2 23. taking care of home and family 3 3 34. military service 4 4 45. other (describe activity) 5 5 59. don’t know 9 9 9
G8. What was the main kind of work (name)did to earn living at last place before moving back?1. farming for self/family 1 1 12. labour (hired) 2 2 2

96
3. regular employment (with steady wage or salary) 3 3 34. self employed (describe job) 4 4 45. other (describe job) 5 5 56. did not work 6 6 69. don’t know 9 9 9
G9. How long ago did (name) move back?[Interviewer: record in years with less than 1 year = 0]
G10. How long was (name) away before moving back?[Interviewer: If left and returned more than once, counttotal time away; record in years with less than 1 year = 0]
G11. Was concern about problems you (or your spouse)had a major reason why (name) returned?1. yes 1 1 12. no 2 2 29. don’t know 9 9 9
G12. Were any adult children living with or nearbyyou before (name) moved back?1. children lived with me and also nearby � G14 1 1 12. children lived with me but not nearby � G14 2 2 23. children lived nearby but not with me 3 3 34. no adult children lived with or nearby me 4 4 45. other (explain) 5 5 5
G13. Did you need someone to return at the timeto live with or nearby you?1. yes 1 1 12. no 2 2 2
G14. Did (name) have any children who livedwith you at the time s/he moved back?1. no 1 1 12. yes 2 2 2
G15. All in all, do you think that it was goodfor you that (name) returned?1. good 1 1 12. not good 2 2 23. no difference 3 3 39. does not know; has no opinion 9 9 9
G16. All in all, do you think that it was goodfor (name) that s/he returned?1. good 1 1 12. not good 2 2 23. no difference 3 3 39. does not know; has no opinion 9 9 9

97
Section H. Migrant Children
Interviewer: This section refers to children who migrated to a different amphoe regardless of where the parents lived at thetime the children left. Note this includes:
______ children who moved away from parents when the parents themselves may have lived elsewhere______ children who moved away but have returned______ deceased children who migrated
Note that migration refers to moving out of the amphoe for at least one year.
H1. I would like to ask about your children who migrated. Can you tell me how many children in totalhave ever moved away from you to live in a different amphoe from where you lived, including anychildren who moved away but have since returned?________ number who ever moved away (if 0 � next section)
H2. Please think about the about the time when the last child left to live elsewhere.How was your health at that time?1. good2. fair3. poor
H3. How was your spouse’s health at that time ?1. good2. fair3. poor4. widowed or separated at the time
H4. Were you or your spouse working at that time?1. yes, both were2. only respondent was working3. only spouse was working4. no, neither worked
Can you remind me of the names of your children who left you to live elsewhere including those whoreturned?[Interviewer: first write down the names of the children (H5) who lived elsewhere before asking the remaining questions;if more that 6 children who migrated use an additional questionnaire]
1 2 3 4 5 6
H5. Nick-name
H6. Column number in child roster in section C(if child deceased write ‘died’ and code as 99)
H7. Before (name) first moved away fromthe amphoe you lived in, was (name)still living with you or had (name) alreadymoved out of your house?1. lived with us 1 1 1 1 1 12. already moved out of house 2 2 2 2 2 2

98
H8. What order was (name) among thosewho ever left to live outside the amphoeyou lived in?1. first or only one to leave 1 1 1 1 1 12. neither first nor last to leave 2 2 2 2 2 23. last to leave 3 3 3 3 3 3
H9. About how old was (name) when (name)first moved away?
H10. Before moving away, did (name)help support your household?1. yes 1 1 1 1 1 12. no 2 2 2 2 2 23. other (specify) 3 3 3 3 3 3
H11. What was the main reason (name)moved away? [Multiple answers permitted]1. to find or take work 1 1 1 1 1 12. as part of his/her job at the time 2 2 2 2 2 23. to marry or follow spouse 3 3 3 3 3 34. to continue education 4 4 4 4 4 45. military service 5 5 5 5 5 56. other (specify) 6 6 6 6 6 6
H12. Where did (name) move to at that time?1. different amphoe but same province 1 1 1 1 1 12. different province 2 2 2 2 2 23. Bangkok � H14 3 3 3 3 3 34. 4 abroad � H14 4 4 4 4 4 49. don’t know � H14 9 9 9 9 9 9
H13. Was the area (name) moved torural or urban?1. rural 1 1 1 1 1 12. urban 2 2 2 2 2 23. semi-urban 3 3 3 3 3 39. not sure 9 9 9 9 9 9
H14. At the time (name) left were other childrenstill living with you in your household?1. yes � H16 1 1 1 1 1 12. no 2 2 2 2 2 2
H15. At that time were other children livingelsewhere in your village?1. yes 1 1 1 1 1 12. no 2 2 2 2 2 2

99
H16. Whose idea was it mainly for(name) to leave?1. you and/or your spouse � H18 1 1 1 1 1 12. (name) him/herself 2 2 2 2 2 23. siblings of (name) 3 3 3 3 3 34. friends of (name) 4 4 4 4 4 45. relatives 5 5 5 5 5 56. other (specify) 6 6 6 6 6 6
H17. Did you agree with (name) that itwas okay to leave?1. yes, agreed 1 1 1 1 1 12. no, did not agree 2 2 2 2 2 23. left it up to child 3 3 3 3 3 3
H18. Did you (or your spouse) help pay theexpenses for (name) to move orset up at the destination?1. yes we paid all or most of expenses 1 1 1 1 1 12. yes we paid some 2 2 2 2 2 23. no we did not pay 3 3 3 3 3 34. we only loaned money 4 4 4 4 4 4
H19. Did you worry about if (name) livingelsewhere when s/he left?1. thought child would be okay 1 1 1 1 1 12. worried some 2 2 2 2 2 23. worried a lot 3 3 3 3 3 3
H20. At the time (name) moved awaydid you feel that (name) wouldhave a better life as a result?1. yes 1 1 1 1 1 12. no 2 2 2 2 2 23. uncertain 3 3 3 3 3 3
H21. At that time, did you think you (name)would be better able to support youfinancially as a result?1. yes 1 1 1 1 1 12. no 2 2 2 2 2 23. unsure 3 3 3 3 3 34. did not think about it 4 4 4 4 4 4
H22. Thinking about the entire time that(name) has lived away, did (name) provideyou with regular financial support?1. yes all or most of the time away 1 1 1 1 1 12. yes but only some of the time away 2 2 2 2 2 23. did not provide regular support 3 3 3 3 3 3

100
H23. Thinking about the entire time that (name)has lived away, did you ever provide (name)food that you produced on a regular basis?1. yes 1 1 1 1 1 12. no 2 2 2 2 2 23. other (specify) 3 3 3 3 3 3
H24. Thinking about the entire time that (name)has lived away, would you say s/hecontributed more to your and your spouse’smaterial support or that you have contributedmore to (name’s) material support?1. (name) contributed more to our support 1 1 1 1 1 12. we contributed more to (name’s) support 2 2 2 2 2 23. about equally 3 3 3 3 3 34. neither contributed to the other’s support 4 4 4 4 4 45. other (specify) 5 5 5 5 5 5
H25. Has any child who lived away from here ever helped you go to get medical care somewhere else?1. yes, to area where (name) lived2. yes but to somewhere other than where (name) lived3. yes, both to area where (name) lived and somewhere else4. no (including did not need medical care)
H26. Have you or your spouse ever gone to stay for more than a month with one of your children whomoved to live elsewhere?1. yes2. no � H28
H27. What were the reasons you (or your spouse)stayed with the child for a month or longer?[Multiple answers permitted]1. help with child care2. help with caregiving to (name) or family3. to be cared for by (name) or family4. to get medical treatment where (name) lived5. just to visit6. to avoid problems at home7. other (specify _____________________________________ )
H28. Altogether, would you say you feel pride in your children who have moved away.1. yes2. no3. other (specify _____________________________________ )

101
Section I. Grandchildren
I1. Now I would like to ask you about your grandchildren. Have you ever gone to take care of agrandchild who lived elsewhere for at least 3 months?1. yes2. no � I39. has no grandchildren � next section
I2. Whose children did you go to care for?
Record name parent of grandchildren Name: Name: Name: Name:___________ ___________ ___________ ___________
Record column number in child Col. No: Col. No: Col. No: Col. No:roster or code 99 if parent is dead 99 parent dead 99 parent dead 99 parent dead 99 parent dead
I3. Have you ever taken care of a grandchild who lived with you for at least a year but whose parent didnot live with you?[Interviewer : this question includes both grandchildren who currently live with the respondent as well as any whopreviously lived with the respondent]1. yes2. no � I6
I4. How many grandchildren in total did you care for? ______ (number)
I5. I would like to have some information about each of the grandchildren who you took care of for atleast a year when their parents were not with you.[Interviewer: if more than 4 please use an additional questionnaire to continue].
A. Please tell me the grandchild’snicknames ___________ ___________ ___________ ___________
B. Which of your children is this Name: Name: Name: Name:person’s parent Record name Record ___________ ___________ ___________ ___________column number in child roster or Col. No: Col. No: Col. No: Col. No:code 99 if parent is dead 99 parent dead 99 parent dead 99 parent dead 99 parent dead
C. Since what age did (name) start tolive with you?Record age ________ or88 = since birth/soon after birth ___________ ___________ ___________ ___________
D. For how many years in total didthis grandchild live with you?[estimate total time if staynot continuous]________ years ___________ ___________ ___________ ___________88 = still living in household

“It is not by muscle, speed or physical dexterity that great things areachieved, but by reflection, force of character, and judgement; and inthese qualities old age is usually not only not poorer, but is even richer”
Marcus Tullius Cicero, Roman Senator (106-43 B.C.)

102
E. Where did (name of the childwho was the parent) live when youcared for this grandchild?[if more than one place record whereshe was most of the time]2 = next door/nearby 2 2 2 23 = elsewhere in village or tambol 3 3 3 34 = outside tambol 4 4 4 45 = dead 5 5 5 5
F. Who paid for most of theexpenses of raising the grandchildwhen the grandchild was livingwith you?1. the grandchild’s parents paid 1 1 1 1
most or all2. we paid most or all 2 2 2 23. both we and the grandchild’s 3 3 3 3
parents shared4. other (specify) 4 4 4 4
I6. Did any grandchildren who lived with their parents most of the time come and stay with you at leasta few months each year going back and forth between you and the parents?1. yes2. no

103
Section J. Expectations and Satisfaction
J1x. Interviewer: Please check C3 and indicate if the respondent has children living in this amphoe1. ________ has children living in this amphoe � continue to J12. ________ has no children living in this amphoe � skip to J2x
J1. Do you expect any of your children who are living in this amphoe to move away in the future?1. yes, but not all2. yes, all3. no4. unsure
J2x. Interviewer: Please check C4 and indicate if the respondent has children living outside this amphoe1. ________ has children living outside this amphoe � continue to J32. ________ has no children living outside this amphoe � skip to J7
J3. Do you expect any of your children living outside of this amphoe to move here in the future?1. yes, but not all2. yes, all3. no � J54. unsure � J5
J4. Would one reason they would move here be to help care for you in your old age?1. yes2. no3. unsure
J5. Do you expect to move to live with any of your children who live elsewhere in the future?1. yes2. no � J73. unsure � J7
J6. Why would you join your child elsewhere?1. to have them look after me2. to help them3. both for them to care for me and for me to help them4. other (specify _____________________________________ )
J7. In your old age, do you expect one of your children to help and care for you?1. yes2. no � J103. unsure � J10
J8. Which of your children would be the most likely to care for you in your old age?Name ________ Column number in child roster ________88 more than 1 child � J1099 unsure

104
J9. Would the child who cares for you in your old age get special consideration in your inheritance plan?1. yes, the child would be rewarded through inheritance2. no3. has not yet decided8. has only one child9. nothing to bequeath
J10. Overall can you tell me how satisfied you are with your children in terms of the following?
Very Somewhat Somewhat Very Does notdissatisfied dissatisfied satisfied satisfied apply
A. Financial and material support 1 2 3 4 9they provide
B. Help with household chores 1 2 3 4 9
C. Help with personal affairs outside 1 2 3 4 9household
D. Taking care of you when ill 1 2 3 4 9
E. Overall assessment of taking 1 2 3 4 9care of you
F. Personal concern they show for you 1 2 3 4 9
G. Respect for you opinion 1 2 3 4 9

105
Section K. Interviewer’s Comments
K1. How much of the interview was completed1. Entire interview2. Mostly completed3. Less than half completed
K2. Was anyone else present during the interview for more than a few minutes:1. Yes2. No � K5
K3. If yes: Who?1. Spouse2. Child(ren) Write child # ________ Write child # ________ Write child # ________3. Daughter-in-law or Son-in Law. Write child # that this child-in-law is married to ________4. Other Relative5. Other Non-relative
K4. Did persons present help the respondent answer questions?1. Yes, often2. Yes, only limited amount3. No, not at all9. Proxy interview
K5. Did the respondent (or proxy) seem to understand the questions?1. Very well2. Acceptably3. With some difficulty4. with much difficulty
K6. Did the respondent (or proxy) cooperate?1. Very well2. Acceptably3. Not well
Time interview ends ________ Hour ________ Minute

106
Annex III: Guidelines forSemi-Structured Interviewswith Community Leaders inConnection with the MigrationImpact Survey
1. How common is it for young adults to migrate out of the locality? Has this increased or decreasedover recent years (see the last decade). If so why?
2. How do villagers in general view outmigration of young adults? Do they see it positively, negativelyor some of both?
3. How do the parents of those who migrate out view this? Do they see themselves benefiting orbeing disadvantaged or some of both as a result?
4. Are there any older parents in the village who have been deserted completely by their children? Probefor details of the circumstances of each case especially in connection with the migration of their children.
5. Do older persons who have children living far away, particularly in cities, visit those children? If sodo they go for only short visits or do they sometimes go for extended stays?
6. Have any older persons in your community moved out to follow adult children who have migratedelsewhere to go and live with them permanently (it is important to probe thoroughly to make sure theinformant is not simply saying people don’t do this). Ask about the details of the circumstances that ledto the older aged parents to move.
7. How common is it for adult children who have migrated out to return to live again in this locality?To what extent, if any, is their return related to the circumstances of their parents?
8. Where do older persons go for health care? (Distinguish between minor illnesses and serious onesrequiring major treatments and hospitalization). Probe if older persons go to provincial hospitals or tohospitals in larger cities such as Bangkok or Chiang Mai for health care or hospitalization. If so if this isrelated to having adult children living in those places?

107
9. How does the 30 baht scheme affect older persons use of health care facilities? Are they generallysatisfied with this scheme?
10. How have health facilities changed over the last decade in this area?
11. What major changes have occurred during the last decade in this area? In particular probe aboutchanges in the availability of schools, roads, and means of transportation.
12. How common are mobile phones in this locality. Do most households have them. Are householdswho do not have one able to access one from others in the locality?
13. In this area, are there any services for elderly provided by government or NGO? Are they used verymuch? (Probe: why or why each of the following are or are not used much.)
A. Elderly clubB. Community elderly health service centerC. Home visit volunteer for elderlyD. Welfare allowance for elderlyE. Home improvement assistant for elderly
14. The government is considering introducing some services for elderly persons. Please tell us if few,some or most elderly in your community would find the following types of services useful?
Service description 1 Very 2 Some but 3 Most 9 Not surefew/none not most
A. common area for organized exercise 1 2 3 9for elderly
B. common reading and educational 1 2 3 9activities room
C. mobile medical clinic for elderly 1 2 3 9
D. provision of a daily meal to homes 1 2 3 9of elderly
E. home visits to help with 1 2 3 9household chores
F. day care centre for elderly 1 2 3 9
G. home nursing care for serious illness 1 2 3 9
15. Are there any services that we did not mention that you believe would be particularly useful forelderly in this community?
[Write “none” if respondent answers no.]
Specify______________________________________________________________________________

108
Papers in Population Ageing
No. 1: Population Ageing in East and South-East Asia: Current Situation and Emerging Challengesby Ghazy Mujahid, 2006
No. 2: Migration and Intergenerational Solidarity: Evidence from Rural Thailandby John Knodel, Jiraporn Kespichayawattana, Suvinee Wiwatwanichand Chanpen Saengtienchai, 2007