PaPa John's InternatIonal 2012 annual rePort
109
PAPA JOHN’S INTERNATIONAL 2012 ANNUAL REPORT
-
Upload
khangminh22 -
Category
Documents
-
view
1 -
download
0
Transcript of PaPa John's InternatIonal 2012 annual rePort

2012
PaPa John’s InternatIonal2012 annual rePort
2012John h. sChnatterFounder, Chairman and Chief Executive Officer
norBorne P. Cole, Jr. (2*) (4)Vice-Chairman of the Board Silver Eagle Distributors, LP, An Anheuser-Busch InBev distributor
ChrIstoPher l. ColeMan (1) (3) Managing Director, Rothschild - London
PhIlIP GuarasCIo (3)Chairman and Chief Executive Officer of PG Ventures LLC, a marketing consulting firm
olIVIa F. KIrtleY (1*) (2)Business Consultant
MarK s. shaPIro (1) (3)Executive Producer Dick Clark Productions
WIllIaM M. street (1) (3*) Business Consultant
W. Kent taYlor (2) Founder, Chairman and Chief Executive Officer of Texas Roadhouse
eXeCutIVe oFFICers
John h. schnatterFounder, Chairman and Chief Executive Officer
anthony n. thompson Executive Vice President, Chief Operating Officer, and President PJ Food Service
lance F. tuckerSenior Vice President, Chief FinancialOfficer, Chief Administrative Officer, and Treasurer
andrew M. VargaSenior Vice President and Chief Marketing Officer
timothy C. o’hernSenior Vice President and Chief Development Officer
steve M. ritchieSenior Vice President, North and Latin American Operations and Global OST
thomas V. sterrett Senior Vice President, International
DIreCtors
nuMBers InDICate BoarD CoMMIttees:(1) Audit Committee(2) Compensation Committee(3) Corporate Governance and Nominating Committee(4) Lead Independent Director
*Committee Chair

corporate information
international markets
Corporate headquarters2002 Papa John’s Boulevard Louisville, Kentucky 40299 502-261-7272
stock listingPapa John’s stock is listed on The NASDAQ Global Select Market under the ticker symbol PZZA
annual MeetingThe annual meeting of stockholders will be held Wednesday, May 1, 2013, 11:00 A.M. (E.D.T) at: Papa John’s International, Inc. 2002 Papa John’s Boulevard Louisville, Kentucky 40299
Independent Public accountantsErnst & Young LLP
transfer agentComputershare Shareholder Services P.O. Box 43078 Providence, RI 02940 www.computershare.com/investor 800-622-6757 (US, Canada, Puerto Rico) 781-575-4735 (non-US)
Investor relationsLance F. Tucker Senior Vice President, Chief Financial Officer, Chief Administrative Officer, and Treasurer 502-261-4218
Corporate Communications – Media relationsSteve E. Higdon Vice President, Global Communications 502-261-4710
Forward-looking statementsThis report includes non-historical or “forward-looking” statements concerning future events or conditions. Important risk factors, which could cause actual results to differ materially from these statements, are set forth in Item 1A. Risk Factors in the accompanying Form 10-K.
For More InformationTo learn more about Papa John’s, or to order online, visit our website at www.papajohns.com
Note: International Locations as of December 30, 20122012 Markets entered – Azerbaijan, Guam, Lebanon
Mexico
Canada
El SalvadorNicaragua
Costa Rica
EcuadorColumbia
Peru
Chile
Cayman IslandsDominican Republic
Puerto Rico
Panama
Venezuela
Trinidad & Tobago
United Kingdom
Russia
Bahrain
Malaysia
OmanSaudi Arabia
China
Philippines
South KoreaEgypt
India
Cyprus
Qatar
Ireland
KuwaitJordan
Turkey
UAE
When the Board of Directors asked me to step back in as CEO at the end of 2008, I had no idea how fantastic the next four years would be. We’ve been fortunate both financially and operationally with successes on many fronts. I attribute a large part of these achievements to a fantastic business model and a fantastic group of people working together. In fact, it was the legendary 19th century industrialist, Andrew Carnegie, who said: “Teamwork is the ability to work together toward a common vision. The ability to direct individual accomplishment toward organizational objectives. It is the fuel that allows common people to attain uncommon results.”
to our shareholders, Franchisees, supply Partners and team Members:
Azerbaijan
LebanonGuam
That appropriately describes Papa John’s 2012 performance: approximately 100,000 team members and franchisees worldwide working together towards a common objective and achieving uncommon results. I am pleased to report that, in the face of continued economic headwinds and competitive pressures, our company delivered outstanding results in 2012, and has a solid, proven business model which we are confident will continue to deliver strong results for the foreseeable future.
highlights of our 2012 results include:
• Earnings per diluted share of $2.58 for full-year 2012, representing a 19.4% increase over 2011.
• North American comparable sales increase of 3.6%, marking the ninth consecutive year of positive or even domestic system-wide comparable sales.
• International comparable sales increase of 7.1%.
• 280 net worldwide restaurant openings, representing the highest number of global net restaurant openings in more than 10 years.
These solid results were delivered at the direction of one of the most talented executive leadership teams we’ve had at Papa John’s. Their knowledge of the industry and their respective disciplines, as well as their collaborative approach to the business, continue to motivate all team members to work together towards driving results.
That spirit of teamwork also has helped us grow our global footprint of restaurants, which continues to be
the fuel that powers our brand. In 2012 we celebrated several milestone openings, including the opening of the 4,000th restaurant in our global system, as well as the 200th restaurant in the United Kingdom, and the first Papa John’s restaurants in Azerbaijan, Lebanon and Guam. With approximately 1,400 restaurants in our global development pipeline, the majority of which are scheduled to open over the next six years, the future of the Papa John’s brand is bright throughout the world.
My optimism around our global growth also is based on the solid year our international business delivered in 2012 with strong comp sales and a 21.7% increase in system sales over 2011. And, most importantly, our international operations achieved profitability in 2012. On the development front, international grew its base by 16.7% with the opening of 137 net new restaurants in 2012. While I am pleased with our international growth numbers, I’m even more excited by the fact that we are partnering with franchisees committed to the brand and committed to delivering on our “Better Ingredients. Better Pizza.” brand promise.
Our brand promise continues to resonate with consumers in the US and around the world. In 2012 we were honored with two prestigious industry awards. Papa John’s earned Brand of the Year honors in the pizza category of the 2012 Harris Poll Equitrend Study, and for the 11th time in the past 13 years Papa John’s was rated tops in customer satisfaction among limited-service restaurants in the 2012 American Customer Satisfaction Index (ACSI). We are honored and humbled by the fact that consumers continue to recognize and reward Papa John’s for our sharp focus on product quality and customer satisfaction.
We delivered these strong results during a year faced with a still tenuous global economy and ever increasing competitive pressures. Despite these challenges, Papa John’s has been, and will continue to be, pragmatic in its approach as we continue to build shareholder value. Our solid financial footing, conservative balance sheet and sound financial discipline are buttressed by our company’s strong core values and an evolving culture where collaboration, accountability and excellence are expected and rewarded. As I introduced in my letter last year, all of this supports the three main pillars of the business that continue to be vital to our long-term success: Quality, Branding and technology.
Quality is the core of Papa John’s. It is something we are fanatical about and it is something we will spare no expense to ensure. “Better Ingredients. Better Pizza.” is not just a slogan, it’s a promise of quality and is the hallmark of our business. Quality is the foundation with which:
• Our original hand-tossed dough is still made fresh, never frozen.
• We continue to use all-natural, fresh-packed tomato sauce not from concentrate.
• Our cheese is still made from 100% mozzarella.
• We continue to use other superior-quality ingredients, including baby Papabella mushrooms and vegetables fresh cut in our restaurants daily.
Quality also is woven throughout the fabric of our Branding. We continue to partner only with those who can help us tell our “Better Ingredients. Better Pizza.” story to wider audiences around the world. In 2012, we completed the third year of our three-year sponsorship with the NFL, with Papa John’s the Official Pizza of the NFL and the Super Bowl, and extended the agreement for the long term. We also were able to enhance our partnership by teaming up with Denver Broncos quarterback Peyton Manning. Not only did he appear in an advertising campaign for us last fall that continued through this year’s Super Bowl, he also became a franchisee, partnering in 22 restaurants in the Denver market. Going forward, we will continue to seek out leading partners from various industries around the world to partner with to help us grow our brand.
We also continue to believe that a strong technology platform is critical to our success. In 2012 we launched online ordering in Canada, and made great strides in developing and executing strategies to reach more consumers through various social and electronic media channels around the world. We will continue to invest in technology to position ourselves at the forefront of the rapidly evolving technological world, to meet consumer demands and position our restaurants for optimum growth.
Looking forward, while there is still economic and political uncertainty in many parts of the world, Papa John’s is well-positioned to benefit
from a proven business model and growing consumer demand for better quality pizza. Staying on offense, gives me confidence in our ability to deliver high-quality growth through gains in market share and margins.
With approximately 100,000 franchisees and team members worldwide collaboratively working toward the common objective of growing Papa John’s around the world, I’m excited for what the future holds for our brand. Thank you for your continued support and patronage.
John H. Schnatter Founder, Chairman and Chief Executive Officer
Four-Year Financial highlights
Note: The results for 2009 and 2010 are presented on a non-GAAP basis for comparability purposes. See the Investor Relations section of our website which contains the GAAP to non-GAAP reconciliations.

UNITED STATES
SECURITIES AND EXCHANGE COMMISSION
Washington, D.C. 20549
FORM 10-K (Mark One)
[X] Annual Report pursuant to Section 13 or 15(d) of the Securities Exchange Act of 1934
For the fiscal year ended December 30, 2012
or
[ ] Transition report pursuant to Section 13 or 15(d) of the Securities Exchange Act of 1934
For the transition period from _____________________ to _______________________
Commission File Number: 0-21660
PAPA JOHN’S INTERNATIONAL, INC. (Exact name of registrant as specified in its charter)
Delaware 61-1203323
(State or other jurisdiction of (I.R.S. Employer
incorporation or organization) Identification No.)
2002 Papa Johns Boulevard
Louisville, Kentucky 40299-2367
(Address of principal executive offices) (Zip Code)
(502) 261-7272
(Registrant's telephone number, including area code)
Securities registered pursuant to Section 12(b) of the Act: (Title of Each Class) (Name of each exchange on which registered)
Common Stock, $.01 par value The NASDAQ Stock Market LLC
Securities registered pursuant to Section 12(g) of the Act:
None
Indicate by check mark if the registrant is a well-known seasoned issuer, as defined in Rule 405 of the
Securities Act. Yes [X] No [ ]
Indicate by check mark if the registrant is not required to file reports pursuant to Section 13 or Section 15(d) of
the Act. Yes [ ] No [X]
Indicate by check mark whether the registrant (1) has filed all reports required to be filed by Section 13 or
15(d) of the Securities Exchange Act of 1934 during the preceding 12 months (or for such shorter period that the
registrant was required to file such reports), and (2) has been subject to such filing requirements for the past 90 days.
Yes [X] No [ ]
Indicate by check mark whether the registrant has submitted electronically and posted on its corporate Website,
if any, every Interactive Data File required to be submitted and posted pursuant to Rule 405 of Regulation S-T
(§232.405 of this chapter) during the preceding 12 months (or for such shorter period that the registrant was required
to submit and post such files). Yes [X] No [ ]
Indicate by check mark if disclosure of delinquent filers pursuant to Item 405 of Regulation S-K (§229.405 of
this chapter) is not contained herein, and will not be contained, to the best of registrant’s knowledge, in definitive
proxy or information statements incorporated by reference in Part III of this Form 10-K or any amendment to this
Form 10-K. [ ]
Indicate by check mark whether the registrant is a large accelerated filer, an accelerated filer, a non-accelerated
filer or a smaller reporting company. See the definitions of “large accelerated filer,” “accelerated filer” and “smaller
reporting company” in Rule 12b-2 of the Exchange Act.
Large accelerated filer [X] Accelerated filer [ ]
Non-accelerated filer [ ] Smaller reporting company [ ]
Indicate by check mark whether the registrant is a shell company (as defined in Rule 12b-2 of the Act).
Yes [ ] No [X]
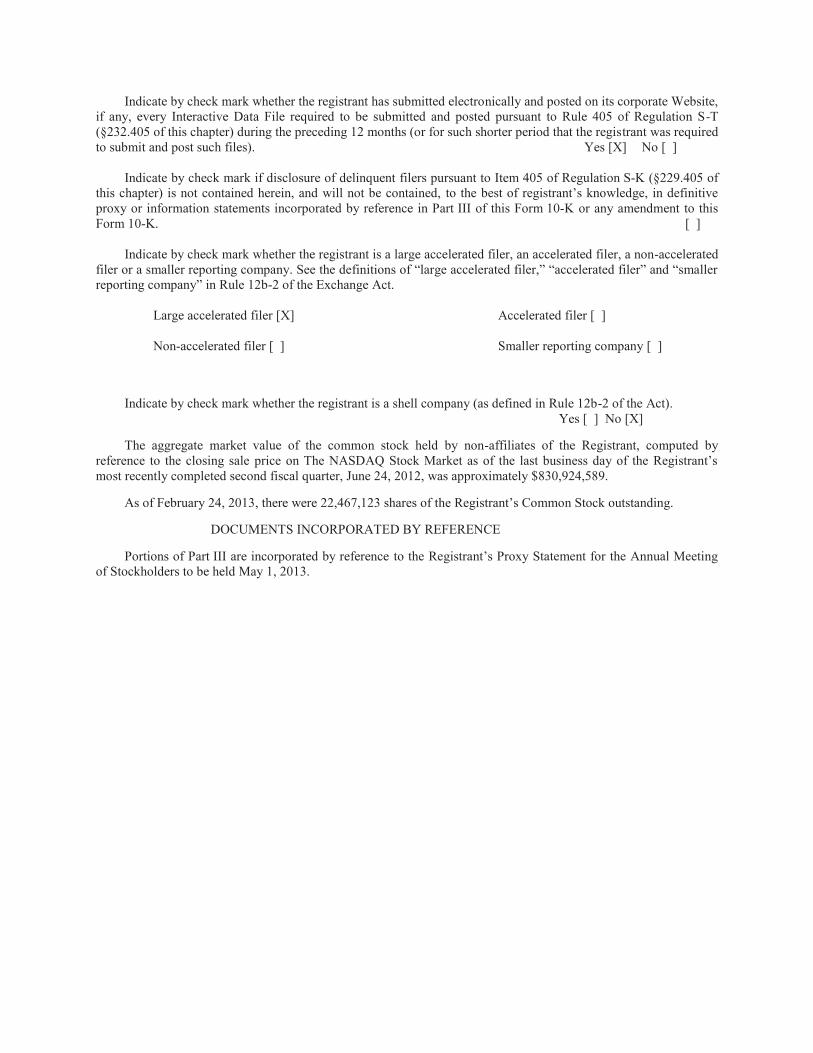
The aggregate market value of the common stock held by non-affiliates of the Registrant, computed by
reference to the closing sale price on The NASDAQ Stock Market as of the last business day of the Registrant’s
most recently completed second fiscal quarter, June 24, 2012, was approximately $830,924,589.
As of February 24, 2013, there were 22,467,123 shares of the Registrant’s Common Stock outstanding.
DOCUMENTS INCORPORATED BY REFERENCE
Portions of Part III are incorporated by reference to the Registrant’s Proxy Statement for the Annual Meeting
of Stockholders to be held May 1, 2013.

TABLE OF CONTENTS
Page
PART I
Item 1. Business 1
Item 1A. Risk Factors 11
Item 1B. Unresolved Staff Comments 16
Item 2. Properties 16
Item 3. Legal Proceedings 18
Item 4. Mine Safety Disclosures 18
PART II
Item 5. Market for Registrant’s Common Equity, Related Stockholder Matters
and Issuer Purchases of Equity Securities 21
Item 6. Selected Financial Data 24
Item 7. Management’s Discussion and Analysis of
Financial Condition and Results of Operations 25
Item 7A. Quantitative and Qualitative Disclosures About Market Risk 50
Item 8. Financial Statements and Supplementary Data 52
Item 9. Changes in and Disagreements with Accountants
on Accounting and Financial Disclosure 93
Item 9A. Controls and Procedures 93
Item 9B. Other Information 94
PART III
Item 10. Directors, Executive Officers and Corporate Governance 95
Item 11. Executive Compensation 95
Item 12. Security Ownership of Certain Beneficial Owners
and Management and Related Stockholder Matters 95
Item 13. Certain Relationships and Related Transactions, and Director Independence 96
Item 14. Principal Accounting Fees and Services 96
PART IV
Item 15. Exhibits, Financial Statement Schedules 96

1
PART I
Item 1. Business
General
Papa John’s International, Inc. (referred to as the “Company”, “Papa John’s” or in the first person
notations of “we”, “us” and “our”) operates and franchises pizza delivery and carryout restaurants and, in
certain international markets, dine-in and restaurant-based delivery restaurants under the trademark “Papa
John’s”. The first Company-owned Papa John’s restaurant opened in 1985 and the first franchised
restaurant opened in 1986. At December 30, 2012, there were 4,163 Papa John’s restaurants in operation,
consisting of 696 Company-owned and 3,467 franchised restaurants operating domestically in all 50
states and in 35 countries. Our Company-owned restaurants include 182 restaurants operated under four
joint venture arrangements. We also own and operate restaurants in Beijing and North China (48 units at
December 30, 2012).
Papa John’s has defined six reportable segments: domestic Company-owned restaurants, domestic
commissaries (Quality Control Centers), North America franchising, international operations, variable
interest entities (“VIEs”) and “all other” business units. North America is defined as the United States
and Canada. Domestic is defined as the contiguous United States. See “Management’s Discussion and
Analysis of Financial Condition and Results of Operations” and “Note 21” of “Notes to Consolidated
Financial Statements” for financial information about these segments for the fiscal years ended December
30, 2012, December 25, 2011 and December 26, 2010.
All of our periodic and current reports filed with the Securities and Exchange Commission (“SEC”)
pursuant to Section 13(a) or 15(d) of the Securities and Exchange Act of 1934, as amended, are available,
free of charge, through our website located at www.papajohns.com, including our Annual Report on Form
10-K, quarterly reports on Form 10-Q, current reports on Form 8-K and any amendments to those reports.
Those documents are available through our website as soon as reasonably practicable after we
electronically file them with the SEC. We also make available free of charge on our website our
Corporate Governance Guidelines, Board Committee Charters, and our Code of Ethics, which applies to
Papa John's directors, officers and employees. Printed copies of such documents are also available free of
charge upon written request to Investor Relations, Papa John’s International, Inc., P.O. Box 99900,
Louisville, KY 40269-0900. You may read and copy any materials filed with the SEC at the SEC’s Public
Reference Room at 100 F Street, NE, Washington, DC 20549. You may obtain information on the
operation of the Public Reference Room by calling the SEC at 1-800-SEC-0330. This information is also
available at www.sec.gov. The references to these website addresses do not constitute incorporation by
reference of the information contained on the websites, which should not be considered part of this
document.
Strategy
Our goal is to build the strongest brand loyalty in the pizza industry. The key elements of our strategy
include:
High Quality Menu Offerings. Domestic Papa John’s restaurants offer a menu of high-quality pizza along
with side items, including breadsticks, cheesesticks, chicken poppers and wings, dessert items and canned
or bottled beverages. Papa John’s traditional crust pizza is prepared using fresh dough (never frozen).
Papa John’s pizzas are made from a proprietary blend of wheat flour, cheese made from 100% real
mozzarella, fresh-packed pizza sauce made from vine-ripened tomatoes (not from concentrate) and a
proprietary mix of savory spices, and a choice of high-quality meat (100% beef, pork and chicken with no
fillers) and vegetable toppings. Domestically, all ingredients and toppings can be purchased from our

2
Quality Control Center (“QC Center”) system, which delivers to individual restaurants twice weekly. To
ensure consistent food quality, each domestic franchisee is required to purchase dough and tomato sauce
from our QC Centers and to purchase all other supplies from our QC Centers or other approved suppliers.
Internationally, the menu may be more diverse than in our domestic operations to meet local tastes and
customs. QC Centers outside the U.S. may be operated by franchisees pursuant to license agreements or
by other third parties. We provide significant assistance to licensed international QC Centers in sourcing
approved quality suppliers.
In addition to our fresh dough traditional crust pizza, we offer a thin crust pizza, which is a par-baked
product produced by a third-party vendor. Our traditional crust pizza offers a container of our special
garlic sauce and a pepperoncini pepper. Each thin crust pizza is served with a packet of special seasonings
and a pepperoncini pepper.
We continue to test new product offerings both domestically and internationally. The new products can
become a part of the permanent menu if they meet certain established guidelines.
Efficient Operating System. We believe our operating and distribution systems, restaurant layout and
designated delivery areas result in lower restaurant operating costs and improved food quality, and
promote superior customer service. Our QC Center system takes advantage of volume purchasing of food
and supplies, and provides consistency and efficiencies of scale in fresh dough production. This
eliminates the need for each restaurant to order food from multiple vendors and commit substantial labor
and other resources to dough preparation.
Commitment to Team Member Training and Development. We are committed to the development and
motivation of our team members through training programs, incentive and recognition programs and
opportunities for advancement. Team member training programs are conducted for corporate team
members, and offered to our franchisees electronically and at training locations across the United States
and internationally. We offer performance-based financial incentives to corporate and restaurant team
members at various levels.
Marketing. Our marketing strategy consists of both national and local components. Our domestic national
strategy includes national advertising via television, print, direct mail, digital and social media channels.
Our online and digital marketing activities have increased significantly over the past several years in
response to increasing consumer use of online and mobile web technology.
Our local restaurant-level marketing programs target consumers within the delivery area of each
restaurant through the use of local TV, radio, print materials, targeted direct mail, store-to-door flyers,
digital display advertising, email marketing, text messages and local social media. Local marketing efforts
also include a variety of community-oriented activities within schools, sports venues and other
organizations supported with some of the same advertising vehicles mentioned above.
In international markets, we target customers who live or work within a small radius of a Papa John’s
restaurant. Certain markets can effectively use television and radio as part of their marketing strategies.
The majority of the marketing efforts include using print materials such as flyers, newspaper inserts, in-
store marketing materials, and to a growing extent, digital marketing such as display, search engine
marketing, email, and SMS text. Local marketing efforts, such as sponsoring or participating in
community events, sporting events and school programs, are also used to build customer awareness.
Strong Franchise System. We are committed to developing and maintaining a strong franchise system by
attracting experienced operators, supporting them to expand and grow their business and monitoring their
compliance with our high standards. We seek to attract franchisees with experience in restaurant or retail
operations and with the financial resources and management capability to open single or multiple

3
locations. We devote significant resources to provide Papa John’s franchisees with assistance in restaurant
operations, management training, team member training, marketing, site selection and restaurant design.
Unit Sales and Investment Costs
We are committed to maintaining strong unit economics. In 2012, the 615 domestic Company-owned
restaurants included in the full year’s comparable restaurant base generated average unit sales of
$953,000 (53-week basis). North America franchise sales per unit on average are lower than Company-
owned restaurants as a higher percentage of our Company-owned restaurants are located in more heavily
penetrated markets.
The average cash investment for the eight domestic traditional Company-owned restaurants opened
during the 2012 fiscal year, exclusive of land, was approximately $240,000 per unit, excluding tenant
allowances that we received. With few exceptions, domestic restaurants do not offer a dine-in area, which
reduces our restaurant capital investment.
We define a “traditional” domestic Papa John’s restaurant as a delivery and carryout unit that services a
defined trade area. We consider the location of a traditional restaurant to be important and therefore
devote significant resources to the investigation and evaluation of potential sites. The site selection
process includes a review of trade area demographics, target population density and competitive factors.
A member of our development team inspects each potential domestic Company-owned restaurant location
and substantially all franchised restaurant locations before a site is approved. Our restaurants are typically
located in strip shopping centers or freestanding buildings that provide visibility, curb appeal and
accessibility. Our restaurant design can be configured to fit a wide variety of building shapes and sizes,
which increases the number of suitable locations for our restaurants. A typical domestic inline or end cap
Papa John’s restaurant averages 1,100 to 1,500 square feet with visible exterior signage. A majority of
restaurants in the United States have installed a lobby enhancement re-design package over the last two
years. The cost of the lobby enhancement re-design package approximated $10,000 to $15,000 per
restaurant.
“Non-traditional” Papa John’s restaurants generally do not provide delivery service but rather provide
walk-up or carry-out service to a captive customer group within a designated facility, with continuous
operations in a facility such as a food court at an airport, university or military base or an event-driven
service at facilities such as sports stadiums or entertainment venues. Non-traditional units are designed to
fit the unique requirements of the venue.
Most of our international Papa John’s restaurants are slightly smaller and average between 900 and 1,400
square feet; however, in order to meet certain local customer preferences, some international restaurants
have been opened in larger spaces to accommodate both dine-in and restaurant-based delivery service,
typically with 35 to 100 seats.
Development
A total of 368 Papa John’s restaurants were opened during 2012, consisting of 28 Company-owned (eight
in North America and 20 in Beijing and North China) and 340 franchised restaurants (182 in North
America and 158 international), while 88 Papa John’s restaurants closed during 2012, consisting of five
Company-owned (three in North America and two in Beijing and North China) and 83 franchised
restaurants (44 in North America and 39 international).
During 2013, we expect net unit growth of approximately 230 to 260 units (110 to 125 net openings for
North America and 120 to 135 net openings for international). International franchised unit expansion
includes an emphasis on markets in the Americas, the United Kingdom, the Middle East and Asia.

4
Although most of our domestic Company-owned markets are well-penetrated, our Company-owned
growth strategy is to continue to open domestic restaurants in existing markets as appropriate, thereby
increasing consumer awareness and enabling us to take advantage of operational and marketing
efficiencies. Our experience in developing markets indicates that market penetration through the opening
of multiple restaurants in a particular market results in increased average restaurant sales in that market
over time. We have co-developed domestic markets with some franchisees or divided markets among
franchisees, and will continue to utilize market co-development in the future, where appropriate.
Of the total 3,204 North American restaurants open as of December 30, 2012, 648 or 20% were
Company-owned (including 182 units owned in joint venture arrangements with franchisees in which the
Company has a majority ownership position). The Company expects the percentage of domestic
Company-owned units to decline over the next several years, because future net openings will be more
heavily weighted toward franchise units.
Of the 959 international restaurants open as of December 30, 2012, 48 or 5% were Company-owned
(located in Beijing and North China). We plan to continue to grow our international units during the next
several years, most of which will be franchised.
QC Center System and Supply Chain Management
Our domestic QC Centers, comprised of nine full-service regional production and distribution centers and
one distribution-only center that is in the process of converting to a full-service center, supply pizza
dough, food products, paper products, smallwares and cleaning supplies twice weekly to each restaurant
throughout the contiguous United States. The primary difference between a full-service QC Center and a
distribution-only center is that full-service QC Centers produce fresh pizza dough in addition to providing
other food and paper products used in our restaurants. This system enables us to monitor and control
product quality and consistency, while lowering food and other costs. The QC Center system capacity is
continually evaluated in relation to planned restaurant growth, and facilities are developed or upgraded as
operational or economic conditions warrant.
We own full-service international QC Centers in the United Kingdom, Mexico City, Mexico and Beijing,
China. Other international full-service QC Centers are licensed to franchisees or non-franchisee third
parties, and are generally located in the markets where our franchisees have restaurants.
We set quality standards for all products used in our restaurants and designate approved outside suppliers
of food and paper products that meet our quality standards. In order to ensure product quality and
consistency, all domestic Papa John’s restaurants are required to purchase tomato sauce and dough from
our QC Centers. Franchisees may purchase other goods directly from our QC Centers or other approved
suppliers. National purchasing agreements with most of our suppliers generally result in volume discounts
to us, allowing us to sell products to our restaurants at prices we believe are below those generally
available in the marketplace. Within our domestic QC Center system, products are distributed to
restaurants by refrigerated trucks leased and operated by us or transported by a dedicated logistics
company.
Marketing Programs
Our local restaurant-level marketing programs target consumers within the delivery area of each
restaurant through the use of local TV, radio, print materials, targeted direct mail, store-to-door flyers,
digital display advertising, email marketing, text messages and local social media. Local marketing efforts
also include a variety of community-oriented activities within schools, sports venues and other
organizations supported with some of the same advertising vehicles mentioned above.

5
Domestic Company-owned and franchised Papa John’s restaurants within a defined market are required
to join an area advertising cooperative (“Co-op”). Each member restaurant contributes a percentage of
sales to the Co-op for market-wide programs, such as television, radio, digital and print advertising, and
sports sponsorships. The rate of contribution and uses of the monies collected are determined by a
majority vote of the Co-op’s members. The contribution rate for Co-ops may generally not be below 2.0%
without approval from Papa John’s.
The restaurant-level and Co-op marketing efforts are supported by media, print, digital and electronic
advertising materials that are produced by Papa John’s Marketing Fund, Inc. (“PJMF”), an unconsolidated
non-profit corporation. PJMF produces and buys air time for Papa John’s national television commercials,
buys digital media such as banner advertising, paid search-engine advertising, social media advertising
and marketing, and SMS text and email, in addition to other brand-building activities, such as consumer
research and public relations activities. Domestic Company-owned and franchised Papa John’s restaurants
are required to contribute a certain minimum percentage of sales to PJMF. The contribution rate to PJMF
can be increased above the required minimum contribution rate if approved by the governing board of
PJMF up to certain levels, and beyond those levels if approved by a supermajority of domestic
restaurants. The contribution rate averaged 3.05% in 2010 and has been 4.0% since 2011.
We provide both Company-owned and franchised restaurants with pre-approved marketing materials and
catalogs for the purchase of uniforms and promotional items. We also provide direct marketing services to
Company-owned and franchised restaurants using customer information gathered by our proprietary
point-of-sale technology (see “Company Operations – Domestic Point-of-Sale Technology”). In addition,
we provide database tools, templates and training that allow operators to set their own local email
marketing, text messaging and social media.
Our proprietary digital ordering platform allows customers to order online. Our platform includes “plan
ahead ordering,” Spanish-language ordering capability, and enhanced mobile web ordering for our
customers, including Papa John's iPhone® and Android® applications. We also have a Papa Rewards®
program, which is an online customer loyalty program designed to increase loyalty and frequency of
consumer use of our online/digital ordering platform. We receive a percentage-based fee from U.S.
franchisees for online sales, in addition to royalties, to defray development and operating costs associated
with our digital ordering platform.
We also offer our customers the opportunity to purchase a reloadable gift card marketed as the “Papa
Card.” The Papa Card is sold as either a plastic gift card purchased in our restaurants, or an online digital
card purchased at our web site. Additionally, we sell Papa Cards to consumers through third-party
retailers, sell bulk orders of cards to business entities and organizations, and continue to explore other
Papa Card distribution opportunities. The Papa Card may be redeemed for delivery, carryout, online and
mobile web orders and is accepted at all Papa John’s traditional domestic restaurants.
In international markets, we target customers who live or work within a small radius of a Papa John’s
restaurant. Certain markets can effectively use television and radio as part of their marketing strategies.
The majority of the marketing efforts include using print materials such as flyers, newspaper inserts, in-
store marketing materials, and to a growing extent, digital marketing such as display, search engine
marketing, email, and SMS text. Local marketing efforts, such as sponsoring or participating in
community events, sporting events and school programs, are also used to build customer awareness.
Company Operations
Domestic Restaurant Personnel. A typical Papa John’s Company-owned domestic restaurant employs a
restaurant manager and approximately 20 to 25 hourly team members, many of whom work part-time.

6
The manager is responsible for the day-to-day operation of the restaurant and maintaining Company-
established operating standards. We seek to hire experienced restaurant managers and staff and provide
comprehensive training programs in areas such as operations and managerial skills. We also employ
directors of operations who are responsible for overseeing an average of seven Company-owned
restaurants. Additional levels of operations senior management and corporate staff also support the field
teams in many areas, including but not limited to quality assurance, food safety, training, marketing and
technology. We seek to motivate and retain personnel by providing opportunities for advancement and
performance-based financial incentives.
Training and Education. The Global Operations Support and Training (“GOST”) department is
responsible for creating tools and materials for the training and development of both corporate and
franchise team members. We believe training is very important to delivering consistent operational
execution. Operations personnel complete our management training program and ongoing development
programs, including multi-unit training in which instruction is given on all aspects of our systems and
operations.
Domestic Point-of-Sale Technology. Our proprietary PROFIT SystemTM
, point-of-sale technology
(“POS”), is in place in all North America traditional Papa John’s restaurants. We believe this technology
facilitates fast and accurate order-taking and pricing, reduces paperwork and allows the restaurant
manager to better monitor and control food and labor costs, including facilitation of managing food
inventory and placing orders from the domestic QC Centers. We believe the PROFIT System also
enhances restaurant-level marketing capabilities. Polling capabilities allow us to obtain restaurant
operating information, providing us with timely access to sales and customer information. The PROFIT
System is also closely integrated with our digital ordering solutions in all domestic traditional Papa John’s
restaurants, enabling Papa John’s to offer nationwide digital ordering to our customers. We are currently
in the process of developing our next generation PROFIT System.
Domestic Hours of Operation. Our domestic restaurants are open seven days a week, typically from
11:00 a.m. to 12:30 a.m. Monday through Thursday, 11:00 a.m. to 1:30 a.m. on Friday and Saturday and
12:00 noon to 11:30 p.m. on Sunday. Carryout hours are generally more limited for late night, for security
purposes.
Franchise Program
General. We continue to attract franchisees with significant restaurant and retail experience. We consider
our franchisees to be a vital part of our system’s continued growth and believe our relationship with our
franchisees is good. As of December 30, 2012, there were 3,467 franchised Papa John’s restaurants
operating in all 50 states and 35 countries. During 2012, 340 (182 North America and 158 international)
franchised Papa John’s restaurants were opened. As of December 30, 2012, we have development
agreements with our franchisees for approximately 300 additional North America restaurants, the
majority of which are committed to open over the next two to three years, and agreements for
approximately 1,100 additional international franchised restaurants, the majority of which are scheduled
to open over the next six years. There can be no assurance that all of these restaurants will be opened or
that the development schedule set forth in the development agreements will be achieved.
Approval. Franchisees are approved on the basis of the applicant’s business background, restaurant
operating experience and financial resources. We seek franchisees to enter into development agreements
for single or multiple restaurants. We require each franchisee to complete our training program or to hire
a full-time operator who completes the training and has either an equity interest or the right to acquire an
equity interest in the franchise operation. Outside the United States, we will allow an approved operator
bonus plan to substitute for the equity interest.

7
North America Development and Franchise Agreements. We enter into development agreements with our
franchisees in North America for the opening of a specified number of restaurants within a defined period
of time and specified geographic area. Substantially all existing franchise agreements have an initial 10-
year term with a 10-year renewal option. We have the right to terminate a franchise agreement for a
variety of reasons, including a franchisee’s failure to make payments when due or failure to adhere to our
policies and standards. Many state franchise laws limit the ability of a franchisor to terminate or refuse to
renew a franchise.
We provide assistance to Papa John’s franchisees in selecting sites, developing restaurants and evaluating
the physical specifications for typical restaurants. We provide layout and design services and
recommendations for subcontractors, signage installers and telephone systems to Papa John’s franchisees.
Our franchisees can purchase complete new store equipment packages through an approved third-party
supplier. In addition, we sell replacement smallwares and related items to our franchisees. Each
franchisee is responsible for selecting the location for its restaurants but must obtain our approval of
restaurant design and location based on accessibility and visibility of the site and targeted demographic
factors, including population density, income, age and traffic.
Under our standard domestic development agreement, the franchisee is required to pay, at the time of
signing the agreement, a non-refundable fee of $25,000 for the first restaurant and $5,000 for any
additional restaurants. The non-refundable fee is credited against the standard $25,000 franchise fee
payable to us upon signing the franchise agreement for a specific location. Generally, a franchise
agreement is executed when a franchisee secures a location. Our current standard development agreement
requires the franchisee to pay a royalty fee of 5% of sales and the majority of our existing franchised
restaurants also have a 5% royalty rate in effect.
Domestic Franchise Development Incentives. Over the past few years, we have offered various
development incentive programs for domestic franchisees to increase unit openings. Such incentives
included the following for 2012 traditional openings: (1) no franchise fee (standard fee is $25,000); (2)
the waiver of some or all of the 5% royalty fee for a limited period of time, not to exceed 18 months; (3) a
credit for the portion of the purchase of certain equipment; and (4) a credit to be applied toward a future
food purchase, under certain circumstances. Our 2013 incentives will be similar to those offered in 2012.
We believe the development incentive programs have accelerated unit openings and expect they will
continue to do so in 2013.
Marketing Fund Incentives. In 2012, domestic franchisees could earn up to a 45 basis point royalty rebate
(against our standard 5.0% royalty rate) by meeting certain sales growth targets in consideration for
agreeing to set the marketing fund rate over a multi-year period. The royalty rebate incentives will
continue throughout 2013.
Domestic Franchise Support Initiatives. From time to time, we offer additional discretionary support
initiatives to our domestic franchisees, including:
Food cost relief by lowering the commissary margin on certain commodities sold by PJ Food
Service, Inc. (“PJFS”) to the franchise system and by providing incentive rebate opportunities;
Targeted royalty relief and local marketing support to assist certain identified franchisees or
markets; and
Restaurant opening incentives.
In 2013, we plan to continue domestic franchise support initiatives. We believe the support programs
have mitigated potential unit closures and strengthened our brand.

8
International Development and Franchise Agreements. We opened our first franchised restaurant outside
the United States in 1998. We define “international” as all markets outside the United States and Canada.
In international markets, we have either a development agreement or a master franchise agreement with a
franchisee for the opening of a specified number of restaurants within a defined period of time and
specified geographic area. Under a master franchise agreement, the franchisee has the right to
subfranchise a portion of the development to one or more subfranchisees approved by us. Under our
current standard international development agreement, the franchisee is required to pay total fees of
$25,000 per restaurant: $5,000 at the time of signing the agreement and $20,000 when the restaurant
opens or on the agreed-upon development date, whichever comes first. Under our current standard master
franchise agreement, the master franchisee is required to pay total fees of $25,000 per restaurant owned
and operated by the master franchisee, under the same terms as the development agreement, and $15,000
for each subfranchised restaurant – $5,000 at the time of signing the agreement and $10,000 when the
restaurant opens or on the agreed-upon development date, whichever comes first.
Our current standard international master franchise and development agreement provides for payment to
us of a royalty fee of 5% of sales, with no provision for increase during the initial term. The remaining
terms applicable to the operation of individual restaurants are substantially equivalent to the terms of our
domestic franchise agreement. From time to time, development agreements will be negotiated at other-
than-standard terms for fees and royalties. We also offer various development incentives to help drive net
unit growth.
Non-traditional Restaurant Development. We had approximately 200 non-traditional restaurants at
December 30, 2012. These agreements generally cover venues or areas not originally targeted for
traditional unit development and have terms differing from the standard agreement.
Franchisee Loans. Selected franchisees have borrowed funds from us, principally for the purchase of
restaurants from us or other franchisees or for use in the construction and development of new restaurants.
Loans made to franchisees typically bear interest at fixed or floating rates and in most cases are secured
by the fixtures, equipment and signage of the restaurant and/or are guaranteed by the franchisees’ owners.
At December 30, 2012, net loans outstanding totaled $17.1 million. See “Note 11” of “Notes to
Consolidated Financial Statements” for additional information.
Domestic Franchise Insurance Program. Our franchisees may elect to purchase various insurance
policies, such as health insurance, non-owned automobile and workers’ compensation, through our
wholly-owned insurance agency, Risk Services Corp. (“Risk Services”). Various third-party commercial
insurance companies provide fully-insured coverage for these lines of business to franchisees
participating in the franchise insurance program offered by Risk Services.
Domestic Franchise Training and Support. Our domestic field support structure consists of franchise
business directors, each of whom is responsible for serving an average of approximately 130 franchised
units. Our franchise business directors maintain open communication with the franchise community,
relaying operating and marketing information and new initiatives between franchisees and us. Franchise
business directors report to one of three regional division vice presidents, who report to the Senior Vice
President, North and Latin American Operations and Global OST.
Every franchisee is required to have a principal operator approved by us who satisfactorily completes our
required training program. Principal operators for traditional restaurants are required to devote their full
business time and efforts to the operation of the franchisee’s traditional restaurants. Each franchised
restaurant manager is also required to complete our Company-certified management training program.
Ongoing supervision of training is monitored by the GOST team. Multi-unit franchisees are encouraged
to appoint training store general managers or hire a full-time training coordinator certified to deliver
Company-approved training programs.

9
International Franchise Operations Support. We employ international business directors who are
responsible for supporting one or more franchisees. The international business directors report to one of
three regional vice presidents or report directly to the respective Senior Vice President. Additional levels
of senior management and corporate staff also support the international field teams in many areas,
including but not limited to food safety, quality assurance, training, marketing and technology.
Franchise Operations. All franchisees are required to operate their Papa John’s restaurants in compliance
with our policies, standards and specifications, including matters such as menu items, ingredients, and
restaurant design. Franchisees generally have full discretion to determine the prices to be charged to
customers, but we have the authority to set maximum price points for nationally advertised promotions.
Franchise Advisory Council. We have a Franchise Advisory Council (“FAC”) that consists of Company
and franchisee representatives of domestic restaurants. We also have a franchise advisory council in the
United Kingdom (“UK FAC”). The FAC and UK FAC and subcommittees hold regular meetings to
discuss new product and marketing ideas, operations, growth and other relevant issues. Certain domestic
franchisees have also formed a separate franchise association for the purpose of communicating and
addressing issues, needs and opportunities among its members.
We currently communicate with, and receive input from, our franchisees in several forms, including
through the FAC, UK FAC, annual operations conferences, system communications, national conference
calls and various regional meetings conducted with franchisees throughout the year. Monthly webcasts
are also conducted by the Company to discuss current operational, marketing or other issues affecting the
franchisees’ business. We are committed to communicating with our franchisees and receiving input from
them.
Industry and Competition
The United States Quick Service Restaurant pizza industry (“QSR Pizza”) is mature and highly
competitive with respect to price, service, location, food quality and variety. There are well-established
competitors with substantially greater financial and other resources than Papa John’s. The category is
largely fragmented and competitors include international, national and regional chains, as well as a large
number of local independent pizza operators. Some of our competitors have been in existence for
substantially longer periods than Papa John’s and can have higher levels of restaurant penetration and
stronger, more developed brand awareness in markets where we compete. According to industry sources,
domestic QSR Pizza category sales, which includes dine-in, carry-out and delivery, had sales of
approximately $32.6 billion in 2012, or an increase of 0.5% from the prior year.
With respect to the sale of franchises, we compete with many franchisors of restaurants and other
business concepts. In general, there is also active competition for management personnel and attractive
commercial real estate sites suitable for our restaurants.
Government Regulation
We, along with our franchisees, are subject to various federal, state and local laws affecting the operation
of our respective businesses. Each Papa John’s restaurant is subject to licensing and regulation by a
number of governmental authorities, which include health, safety, sanitation, building and fire agencies in
the state or municipality in which the restaurant is located. Difficulties in obtaining, or the failure to
obtain, required licenses or approvals can delay or prevent the opening of a new restaurant in a particular
area. Our full-service QC Centers are licensed and subject to regulation by state and local health and fire
codes, and the operation of our trucks is subject to Department of Transportation regulations. We are also
subject to federal and state environmental regulations.

10
We are subject to Federal Trade Commission (“FTC”) regulation and various state laws regulating the
offer and sale of franchises. The laws of several states also regulate substantive aspects of the franchisor-
franchisee relationship. The FTC requires us to furnish to prospective franchisees a franchise disclosure
document containing prescribed information. Substantive state laws that regulate the franchisor-
franchisee relationship presently exist in a substantial number of states, and bills have been introduced in
Congress from time to time that would provide for federal regulation of the U.S. franchisor-franchisee
relationship in certain respects if such bills were enacted. The state laws often limit, among other things,
the duration and scope of non-competition provisions and the ability of a franchisor to terminate or refuse
to renew a franchise. Some foreign countries also have disclosure requirements and other laws regulating
franchising and the franchisor-franchisee relationship. National, state and local government regulations or
initiatives, including health care legislation, “living wage,” menu labeling, or other current or proposed
regulations and increases in minimum wage rates affect Papa John’s as well as others within the
restaurant industry. As we expand internationally, we are subject to applicable laws in each jurisdiction
where franchised units are established.
Trademarks, Copyrights and Domain Names
Our rights in our principal trademarks and service marks are a significant part of our business. We own
the federal registration of the trademark “Papa John’s.” We have also registered “Pizza Papa John’s and
design” (our logo), “Better Ingredients. Better Pizza.”, “Pizza Papa John’s Better Ingredients. Better
Pizza. and design” and “Papa Rewards” as trademarks and service marks. We also own federal
registrations for several ancillary marks, principally advertising slogans. We have also applied to register
our primary trademark, “Pizza Papa John’s and design,” in more than 100 foreign countries and the
European Community. We are aware of the use by other persons in certain geographical areas of names
and marks that are the same as or similar to our marks. It is our policy to pursue registration of our marks
whenever possible and to vigorously oppose any infringement of our marks.
We hold copyrights in certain packaging, training and promotional materials used in our business. In
addition, we have registered and maintain Internet domain names, including “Papajohns.com.”
Employees
As of December 30, 2012, we employed approximately 18,800 persons, of whom approximately 16,400
were restaurant team members, approximately 900 were restaurant management personnel, approximately
600 were corporate personnel and approximately 900 were QC Center and Preferred Marketing Solutions,
Inc. (“Preferred,” our wholly-owned print and promotions subsidiary) personnel. Most restaurant team
members work part-time and are paid on an hourly basis. None of our team members is covered by a
collective bargaining agreement. We consider our team member relations to be good.

11
Item 1A. Risk Factors
We are subject to various risks that could have a negative effect on our business, financial condition and
results of operations. These risks could cause actual operating results to differ from those expressed in
certain “forward looking statements” contained in this Form 10-K as well as in other Company
communications. Although we believe our expectations are based on reasonable assumptions, actual
results may differ materially from those in the forward-looking statements as a result of various factors:
We face substantial competition from other food industry competitors, and our results of operations can
be negatively impacted by the actions of one or more of our competitors.
The QSR Pizza category and the restaurant industry in general are intensely competitive, and there are
many well-established competitors with substantially greater financial and other resources than the Papa
John’s system. Some of these competitors have been in existence for a substantially longer period than
Papa John’s and may be better established in the markets where restaurants operated by us or our
franchisees are, or may be, located. Demographic trends, traffic patterns, the type, number and location of
competing restaurants, and changes in pricing or other marketing initiatives or promotional strategies,
including new product and concept developments, by one or more of our major competitors can have a
rapid and adverse impact on our sales and earnings and our system-wide restaurant operations.
Changes in consumer preferences or discretionary consumer spending could adversely impact our
results.
Changes in consumer preferences and trends (for example, changes in dietary preferences that could
cause consumers to avoid pizza in favor of foods that are perceived as healthier, lower-calorie or
otherwise based on their nutritional content) could adversely affect our restaurant business. Also, our
success depends to a significant extent on numerous factors affecting consumer confidence or
discretionary consumer income, including higher tax rates domestically or in international markets, and
adverse economic conditions such as continued high levels of unemployment, high fuel and energy costs
and reduced access to credit. Such factors could cause consumers to spend less on food or shift to lower-
priced products. Further adverse changes in these factors could reduce sales or inhibit our ability to
increase pricing, either of which could materially adversely affect our results of operations.
Food safety and quality concerns may negatively impact our business and profitability.
Incidents or reports of food- or water-borne illness or other food safety issues, food contamination or
tampering, employee hygiene and cleanliness failures or improper employee conduct at our restaurants
could lead to product liability or other claims. Such incidents or reports could negatively affect our brand
and reputation as well as our revenues and profits. Similar incidents or reports occurring at quick service
restaurants unrelated to us could likewise create negative publicity, which could negatively impact
consumer behavior towards us.
In addition, we rely on our domestic and international suppliers, as do our franchisees, to provide quality
ingredients and to comply with applicable laws and industry standards. A failure of one of our domestic
or international suppliers to meet our quality standards, or meet domestic or international food industry
standards, could result in a disruption in our supply chain and negatively impact our brand and our
business and profitability.

12
Our success depends on the differentiation of our brand and maintaining the value and quality reputation
of our brand.
Our results depend upon our ability to differentiate our brand and our reputation for quality. Our brand
has been highly rated in U.S. surveys and we strive to build the value of our brand as we develop
international markets. The value of our brand and demand for our products could be damaged by
incidents that harm consumer perceptions of the Company and our brand, such as product recalls, food
safety issues, privacy breaches, and related negative publicity. Social media can be used to promote
adverse consumer perceptions with significantly greater speed and scope than traditional media outlets.
As a result, the value of our brand and the demand for our products could be damaged and have an
adverse effect on our financial results.
We may not be able to execute our strategy or achieve our planned growth targets, which could
negatively impact our business and our financial results.
Our growth strategy depends on the Company’s and our franchisees’ ability to open new restaurants and
to operate them on a profitable basis. Planned growth targets and the ability to operate new and existing
restaurants profitably are affected by economic, regulatory and competitive conditions and consumer
buying habits. Increased commodity or operating costs, including but not limited to employee
compensation and benefits or insurance costs, could slow the rate of new store openings or increase the
number of store closings. Our business is susceptible to adverse changes in local, national and global
economic conditions, which could make it difficult for us to meet our growth targets. Additionally, we or
our franchisees may face challenges securing financing, finding suitable store locations at acceptable
terms or securing required domestic or foreign government permits and approvals.
Our franchisees remain dependent on the availability of financing to remodel or renovate existing
locations or construct and open new restaurants. The reduced availability of credit has required, and may
continue to require, the Company to provide financing to certain franchisees and prospective franchisees
in order to mitigate store closings or allow new units to open. If we are unable or unwilling to provide
such financing, our results of operations may be adversely impacted. To the extent we provide financing
to franchisees in domestic and international markets, our results could be negatively impacted by the
credit performance of our franchisee loans, particularly if our franchisees encounter worsening economic
or political conditions in their markets.
Our stock price could decline or experience volatility if we do not meet expectations of the market for
earnings per share, comparable store sales, net restaurant openings or revenue growth.
Our results of operations and the operating results of our franchisees may be adversely impacted by
increases in the cost of food ingredients and other commodities.
We are exposed to ongoing commodity volatility, and an increase in the cost, or sustained high levels of
the cost, of cheese or other commodities could adversely affect the profitability of our system-wide
restaurant operations, particularly if we are unable to increase the selling price of our products to offset
costs. Cheese, historically representing 35% to 40% of our food cost, and other commodities can be
subject to significant cost fluctuations due to weather, availability, global demand and other factors that
are beyond our control. Additionally, increases in fuel, utility, and insurance costs could adversely affect
the profitability of our restaurant and QC Center businesses. Our domestic franchisees buy substantially
all of their food products from our QC Center business. We have pricing arrangements with certain of our
suppliers that reset on time frames ranging from monthly to annually. For our Company-owned
restaurants, we also have forward pricing arrangements for a portion of our cheese purchases.

13
Our dependence on a sole supplier or a limited number of suppliers for some ingredients could result in
disruptions to our business.
Domestic restaurants purchase substantially all food and related products from our QC Centers.
Domestically, we are dependent on sole suppliers for our cheese and flour products, and internationally
we are dependent on a sole supplier for substantially all our cheese. Alternative sources may not be
available on a timely basis to supply these key ingredients or be available on terms as favorable to us as
under our current arrangements. Our corporate and franchised restaurants could also be harmed by any
prolonged disruption in the supply of products from or to our QC Centers due to weather, crop disease,
and other events beyond our control. Insolvency of key suppliers could also negatively impact our
business.
Our international operations are subject to increased risks and other factors that may make it more
difficult to achieve or maintain profitability or meet planned growth rates.
Our international operations could be negatively impacted by changes in international economic, political
and health conditions in the countries in which the Company or our franchisees operate. In addition, there
are risks associated with differing business and social cultures and consumer preferences, diverse and
sometimes uncertain or unstable government regulations and structures, limited availability and high cost
of suitable restaurant locations, and difficulties in sourcing high-quality ingredients and other
commodities in a cost-effective manner. In addition, our international operations are subject to additional
factors, including compliance with anti-corruption and other foreign laws, and various currency
regulations and fluctuations. Accordingly, there can be no assurance that our international operations will
maintain profitability or meet planned growth rates.
We are subject to numerous laws and regulations governing our workforce and our operations. Changes
in these laws, including health care legislation and minimum wage increases or additional laws could
increase costs for our system-wide operations.
Domestic system-wide restaurant operations are subject to federal and state laws governing such matters
as wages, benefits, working conditions, citizenship requirements and overtime. A significant number of
hourly personnel employed by our franchisees and us are paid at rates closely related to the federal and
state minimum wage requirements. Accordingly, further increases in the federal minimum wage or the
enactment of additional state or local minimum wage increases above federal wage rates would increase
labor costs for our system-wide operations. Additionally, current conditions may make it easier for
workers to form unions, potentially resulting in higher costs. Local government agencies have also
implemented ordinances that restrict the sale of certain food or drink products. Compliance with
additional government mandates, including menu labeling requirements, could increase costs and be
harmful to system-wide restaurant sales.
U.S. health care reform law enacted in 2010 requires employers such as us to provide health insurance for
all qualifying employees or pay penalties for not providing coverage. We are evaluating the impact the
new law will have on our domestic operations, and although we cannot predict with certainty the financial
impact of the legislation, we, like other industry competitors, expect that the requirement that we provide
more extensive health benefits to employees than we currently provide, and/or fund a larger portion than
previously funded, could impact our results of operations beginning in 2014.
Domestically and internationally, we operate in an increasingly complex regulatory environment, and the
cost of regulatory compliance is increasing. Failure to comply with applicable U.S. and international
labor, health care, food, anti-bribery and corruption, consumer and other laws, may result in civil and
criminal liability, damages, fines and penalties. This could harm our reputation, limit our ability to grow
and adversely affect our financial performance.

14
Our expansion into emerging or under-penetrated domestic and international markets may present
increased risks.
Any or all of the risks listed above could be especially harmful to the financial viability of our franchisees
in under-penetrated or emerging markets in addition to international markets with unstable political
climates. A decline in or failure to improve financial performance for such franchisees could lead to
reduced new restaurant openings or unit closings at greater than anticipated levels and therefore adversely
impact our ability to achieve our targets for growth and results of operations as well as have a negative
impact on market share.
Our business and brand may be harmed should the services of our Founder, John Schnatter, as Chief
Executive Officer, Chairman or brand spokesman terminate for any reason. Failure to effectively execute
succession planning could harm our Company and brand.
John H. Schnatter, our Founder, Chairman and Chief Executive Officer (CEO), does not serve under an
employment agreement and we do not maintain key man life insurance on Mr. Schnatter. We also depend
on Mr. Schnatter’s image and his services as spokesman in our advertising and promotion materials.
While we have entered into a license agreement with Mr. Schnatter related to the use of certain
intellectual property related to his name, likeness and image, our business and brand may be harmed if
Mr. Schnatter’s services were not available to the Company for any reason or the reputation of Mr.
Schnatter was negatively impacted. In addition, failure to effectively execute succession planning could
harm our Company and brand.
Changes in purchasing practices by our domestic franchisees could harm our commissary business.
Although our domestic franchisees currently purchase substantially all food products from our QC
Centers, they are only required to purchase tomato sauce, dough and other items we may designate as
proprietary or integral to our system from our QC Centers. Any changes in purchasing practices by
domestic franchisees, such as seeking alternative approved suppliers of food products or ingredients,
could adversely affect the financial results of our QC Centers and the Company.
We may be required to resort to litigation to protect our intellectual property rights, which could
negatively affect our results of operations.
We depend on our Papa John’s brand name and rely on a combination of trademarks, copyrights, service
marks and similar intellectual property rights to promote our brand. We believe the success of our
business depends on our continued ability to use our existing trademarks and service marks to increase
brand awareness and further develop our brand, both domestically and abroad. We may not be able to
adequately protect our intellectual property rights and we may be required to resort to litigation to enforce
such rights. Litigation could result in high costs and diversion of resources, which could negatively affect
our results of operations, regardless of the outcome.
Disruptions of our critical business or information technology systems could harm our ability to conduct
normal business.
We rely heavily on information systems, including digital ordering solutions, through which a significant
portion of our domestic sales originate. We also rely heavily on point-of-sale processing in our restaurants
for data collection and payment systems for the collection of cash, credit and debit card transactions, and
other processes and procedures. Our ability to efficiently and effectively manage our business depends on
the reliability and capacity of these technology systems.

15
Our systems could be damaged or interrupted by power loss through various technological failures or acts
of God. In particular, we may experience occasional interruptions of our digital ordering solutions, which
make online ordering unavailable or slow to respond, negatively impacting sales and the experience of
our customers. If our digital ordering solutions do not perform with adequate speed, our customers may
be less inclined to return to our digital ordering solutions, as frequently or at all. If our systems do not
operate properly, we may need to upgrade or replace these systems, which could require material capital
investment from us and our franchisees. Part of our technology infrastructure is specifically designed for
us and our operational systems, which could cause unexpected costs, delays or inefficiencies when
infrastructure upgrades are needed. Significant portions of our technology infrastructure are provided by
third parties, and the performance of these systems is largely beyond our control. Failure of our third
party systems, and backup systems, to adequately perform, particularly as our online sales grow, could
harm our business and the satisfaction of our customers. In addition, we may not have or be able to obtain
adequate protection or insurance to mitigate the risks of these events or compensate for losses related to
these events, which could damage our business and reputation and be expensive and difficult to remedy or
repair.
We may incur significant costs resulting from a security breach, including a breach of confidential
customer information from our digital ordering business.
We are subject to a number of privacy and data protection laws and regulations. Our business requires the
collection and retention of large volumes of internal and customer data, including credit card data and
other personally identifiable information of our employees and customers housed in the various
information systems we use. The integrity and protection of that customer, employee and Company data
is critical to us. Although we take significant steps to prevent security breaches, such as theft of customer
and Company information, failure to prevent fraud or security breaches could result in significant costs to
us and have a material adverse effect on our business.
We have been and will continue to be subject to various types of litigation, including class and collective
action litigation, which could subject us to significant damages or other remedies.
We and our restaurant industry competitors are subject to the risk of litigation from various parties,
including vendors, customers, franchisees and employees. We are involved in a number of lawsuits,
claims, investigations, and proceedings consisting of intellectual property, employment, consumer,
commercial and other matters arising in the ordinary course of business. We are currently a defendant in
cases containing class action allegations. Plaintiffs in these types of class action lawsuits often seek
recovery of very large or indeterminate amounts, and the magnitude of the potential loss relating to such
lawsuits may not be accurately estimated. We evaluate all of the claims and proceedings involving us to
assess the expected outcome and where necessary we estimate the amount of potential losses to us. In
many cases, particularly the class action cases, we may not be able to estimate the amount of potential
losses and/or our estimates may prove to be insufficient. These assessments are made by management
based on the information available at the time made and require the use of a significant amount of
judgment, and actual outcomes or losses may materially differ. Regardless of whether any claims against
us are valid, or whether we are ultimately held liable, such litigation may be expensive to defend and may
divert resources away from our operations and negatively impact earnings.
We may be subject to impairment charges.
Impairment charges are possible if our subsidiaries located in the United Kingdom (“PJUK”) and China
or previously acquired domestic restaurants perform below our expectations. This would result in a
decrease in our reported asset value and reduction in our net income.

16
Our results of operations could be materially impacted as a result of the credit risk of operators of leases
for which we remain contingently liable.
We remain contingently liable for certain restaurant and commissary leases previously operated by us and
subsequently sold or refranchised. We enter into these arrangements as part of the process of disposing of
or refranchising our stores in the ordinary course of business. While the new operators are the primary
obligors under such assigned leases, we could be liable in the event that one or more new operators are
unwilling or unable to make any required lease payments. Continuing weakness in the economy and
difficulty in credit markets could make it difficult for these operators to meet their contractual
commitments. If these operators default on the leases and we are unable to sublease the properties for
which we remain contingently liable, it could have a material impact on our results of operations.
Item 1B. Unresolved Staff Comments
None.
Item 2. Properties
As of December 30, 2012, there were 4,163 Papa John’s restaurants system-wide. The following tables
provide the locations of our restaurants. We define “North America” as the United States and Canada and
“domestic” as the contiguous United States.
North America Restaurants:
Company Franchised Total
Alabama………………………………………………………… - 73 73
Alaska........................................................................................... - 6 6
Arizona …………………………………………………………. 39 37 76
Arkansas………………………………………………………... - 23 23
California……………………………………………………….. - 209 209
Colorado………………………………………………………... 22 25 47
Connecticut……………………………………………………... - 11 11
Delaware………………………………………………………... - 15 15
District of Columbia……………………………………………. - 10 10
Florida…………………………………………………………... 46 221 267
Georgia …………………………………………………………. 86 60 146
Hawaii........................................................................................... - 14 14
Idaho……………………………………………………………. - 11 11
Illinois........................................................................................... 6 115 121
Indiana.......................................................................................... 41 84 125
Iowa.............................................................................................. - 23 23
Kansas........................................................................................... 13 19 32
Kentucky………………………………………………………... 42 70 112
Louisiana……………………………………………………….. - 61 61
Maine…………………………………………………………… - 6 6
Maryland………………………………………………………... 60 40 100
Massachusetts…………………………………………………... - 19 19
Michigan………………………………………………………... - 43 43
Minnesota..................................................................................... 30 15 45
Mississippi.................................................................................... - 30 30
Missouri........................................................................................ 41 33 74
Montana........................................................................................ - 10 10
Nebraska....................................................................................... - 17 17

17
North America Restaurants (continued): Company Franchised Total
Nevada………………………………………………………….. - 22 22
New Hampshire………………………………………………… - 2 2
New Jersey……………………………………………………… - 87 87
New Mexico……………………………………………………. - 17 17
New York………………………………………………………. - 127 127
North Carolina………………………………………………….. 83 77 160
North Dakota…………………………………………………… - 5 5
Ohio…………………………………………………………….. - 152 152
Oklahoma……………………………………………………….. - 28 28
Oregon………………………………………………………….. - 16 16
Pennsylvania……………………………………………………. - 94 94
Rhode Island……………………………………………………. - 5 5
South Carolina………………………………………………….. 6 54 60
South Dakota…………………………………………………… - 10 10
Tennessee……………………………………………………….. 29 76 105
Texas……………………………………………………………. 78 159 237
Utah…………………………………………………………….. - 33 33
Vermont………………………………………………………… - 1 1
Virginia…………………………………………………………. 26 112 138
Washington…………………………………………………....... - 51 51
West Virginia…………………………………………………… - 23 23
Wisconsin………………………………………………………. - 26 26
Wyoming……………………………………………………….. - 6 6
Total U.S. Papa John’s Restaurants…………………………. 648 2,483 3,131
Canada………………………………………………………….. - 73 73
Total North America Papa John’s Restaurants……………… 648 2,556 3,204
International Restaurants:
Azerbaijan………………………………………………………. - 1 1
Bahrain………………………………………………………….. - 19 19
Cayman Islands……………………………………………......... - 1 1
Chile.............................................................................................. - 18 18
China............................................................................................. 48 132 180
Colombia...................................................................................... - 16 16
Costa Rica..................................................................................... - 14 14
Cyprus........................................................................................... - 9 9
Dominican Republic..................................................................... - 10 10
Ecuador......................................................................................... - 13 13
Egypt............................................................................................. - 13 13
El Salvador................................................................................... - 10 10
Guam............................................................................................ - 1 1
India.............................................................................................. - 29 29
Ireland........................................................................................... - 44 44
Jordan............................................................................................ - 6 6
Kuwait.......................................................................................... - 25 25
Lebanon........................................................................................ - 3 3
Malaysia........................................................................................ - 19 19
Mexico.......................................................................................... - 57 57
Nicaragua...................................................................................... - 2 2

18
International Restaurants (continued): Company Franchised Total
Oman............................................................................................ - 6 6
Panama.......................................................................................... - 4 4
Peru............................................................................................... - 19 19
Philippines.................................................................................... - 13 13
Puerto Rico................................................................................... - 14 14
Qatar............................................................................................. - 10 10
Russia............................................................................................ - 40 40
Saudi Arabia................................................................................. - 6 6
South Korea.................................................................................. - 72 72
Trinidad........................................................................................ - 6 6
Turkey........................................................................................... - 17 17
United Arab Emirates................................................................... - 21 21
United Kingdom........................................................................... - 212 212
Venezuela..................................................................................... - 29 29
Total International Papa John’s Restaurants............................ 48 911 959
Note: Company-owned Papa John’s restaurants include restaurants owned by majority-owned
subsidiaries. There were 182 such restaurants at December 30, 2012 (22 in Colorado, 26 in Maryland, 30
in Minnesota, 78 in Texas, and 26 in Virginia).
Most Papa John’s restaurants are located in leased space. The initial term of most domestic restaurant
leases is generally five years with most leases providing for one or more options to renew for at least one
additional term. Generally, the leases are triple net leases, which require us to pay all or a portion of the
cost of insurance, taxes and utilities. Additionally, we lease our Company-owned restaurant sites in
Beijing and North China. At December 30, 2012, we leased and subleased to franchisees in the United
Kingdom 142 of the 212 franchised Papa John’s restaurant sites. The initial lease terms on the franchised
sites are generally 10 to 15 years. The initial lease terms of the franchisee subleases are generally five to
ten years. In connection with the 2006 sale of our former Perfect Pizza operations in the United Kingdom,
we remain contingently liable for payment under approximately 40 lease arrangements, primarily
associated with Perfect Pizza restaurant sites.
Seven of our ten domestic QC Centers are located in leased space, including the following locations:
Raleigh, NC; Denver, CO; Phoenix, AZ; Des Moines, IA; Portland, OR; Pittsburgh, PA; and Cranbury,
NJ. Our remaining three locations are in buildings we own, located in: Orlando, Florida; Dallas, Texas;
and Louisville, Kentucky. Additionally, our corporate headquarters and our printing operations are
located in Louisville, KY in buildings owned by us. Internationally, we own a full-service QC Center in
the United Kingdom and lease office space near London. We also lease our QC Centers and office space
in Beijing, China and Mexico City, Mexico.
Item 3. Legal Proceedings
The information contained under the heading “Litigation” in “Note 17” of “Notes to Consolidated
Financial Statements” is incorporated by reference into this Item 3. We are party to various legal
proceedings arising in the ordinary course of business, but, except as set forth in the items herein, are not
currently a party to any legal proceeding that management believes could have a material adverse effect
on the Company.
Item 4. Mine Safety Disclosures
None.

19
EXECUTIVE OFFICERS OF THE REGISTRANT
Set forth below are the current executive officers of Papa John’s:
Name
Age (a)
Position
First Elected
Executive Officer
John H. Schnatter 51 Founder, Chairman and Chief Executive
Officer
1985
Timothy C. O’Hern 49 Senior Vice President and Chief
Development Officer
2005
Steve M. Ritchie 38 Senior Vice President, North and Latin
American Operations and Global OST
2012
Thomas V. Sterrett 52 Senior Vice President, International
2010
Anthony N. Thompson 46 Executive Vice President, Chief
Operating Officer, and President PJ
Food Service
2009
Lance F. Tucker 43 Senior Vice President, Chief Financial
Officer, Chief Administrative Officer,
and Treasurer
2011
Andrew M. Varga 47 Senior Vice President and Chief
Marketing Officer
2009
(a) Ages are as of January 1, 2013.
John H. Schnatter created the Papa John’s concept. The first Papa John’s Company-owned restaurant
opened in 1985. He currently serves as Founder, Chairman and Chief Executive Officer. He previously
served as Interim Chief Executive Officer from December 2008 to April 2009, Executive Chairman of the
Company from 2005 until May 2007, as Chairman of the Board and Chief Executive Officer from 1990
until 2005, and as President from 1985 to 1990 and from 2001 until 2005.
Timothy C. O'Hern was appointed Senior Vice President and Chief Development Officer in July 2012. He
previously served as Senior Vice President, Development since June 2009, a position he previously held
from 2005 until 2007. From 2002 until 2005 and from 2007 until 2009, he managed the operations of a
Papa John's franchisee in which he has an ownership interest. Prior to his departure from Papa John's in
2002, Mr. O'Hern held various positions, including Vice President of Global Development from February
2001 to 2002, Vice President of U.S. Development from March 1997 to February 2001, Director of
Franchise Development from December 1996 to March 1997 and Construction Manager from November
1995 to December 1996. He has been a franchisee since 1993.
Steve M. Ritchie was appointed Senior Vice President, North American Operations & Global OST in
August 2011, where he is responsible for all aspects of restaurant operations for company-owned
restaurants and franchised units in the continental United States, Canada, Alaska and Hawaii, and he
assumed additional responsibility for Latin American operations in July 2012. Mr. Ritchie has served in
various capacities of increasing responsibility since joining Papa John’s in 1996. From December 2010

20
until August 2011, he served as Senior Vice President, Operations and Global OST, where he was
responsible for leading the company’s domestic company-owned restaurant operations. In July 2010, he
was named Vice President, Operations & Global OST, where he was responsible for overseeing all
aspects of the company’s global operating support functions and strategic initiatives. Since 2006, he also
has served as a franchise owner of multiple units in the Company’s Midwest Division.
Thomas V. Sterrett was named Senior Vice President, International in August 2010. Mr. Sterrett has
served as Division Vice President from 2007 to 2010 (Midwest and South Divisions), Operations Vice
President for the Company’s Midwest Division from 2005 to 2007, Director of Operations in the
Nashville, Tennessee market from 2003 to 2005 and District Manager of the South Florida market from
1995 to 2003. Prior to joining Papa John’s, Mr. Sterrett spent eleven years with Dominos both as an
employee and a franchisee.
Tony Thompson was appointed Chief Operating Officer in July 2012, after previously serving as
Executive Vice President, Global Operations since July 2011. Mr. Thompson has served as President, PJ
Food Service since May 2010. Mr. Thompson joined Papa John's in 2006 and has held the positions of
Executive Vice President, North American Operations from December 2010 to July 2011, Senior Vice
President, PJ Food Service from 2009 to May 2010 and Vice President, QCC Operations from 2006 to
2009. Prior to joining Papa John's, Mr. Thompson worked for the Scotts Company for six years as Plant
Manager, Director of Marysville Operations and Director of Lawn and Controls Operations. Before
joining the Scotts Company, Mr. Thompson spent four years with Conagra Grocery Products Company
and seven years in various roles with Gulf Coast Coca Cola.
Lance F. Tucker was appointed Chief Administrative Officer in July 2012 and Chief Financial Officer
and Treasurer in February 2011. Mr. Tucker previously held the positions of Chief of Staff and Senior
Vice President, Strategic Planning from June 2010 to February 2011, after serving as Chief of Staff and
Vice President, Strategic Planning since June 2009. Mr. Tucker was previously employed by the
Company from 1994 to 1999 working in its finance department. From 2003 to 2009, Mr. Tucker served
as Chief Financial Officer of Evergreen Real Estate, a company owned by John Schnatter. Mr. Tucker is a
licensed Certified Public Accountant.
Andrew M. Varga was appointed Senior Vice President and Chief Marketing Officer in August 2009. Mr.
Varga joined Papa John’s after 21 years with Brown-Forman Corporation. Mr. Varga served as Senior
Vice President/Director of Marketing for Brown-Forman from 2007 until 2009, responsible for the
company’s Wines and Spirits portfolio in the North American Region. From 2004 to 2007, Mr. Varga
was Senior Vice President/Managing Director, Wines Marketing, with global responsibility for the wine
portfolio.
There are no family relationships among our executive officers and other key personnel.

21
PART II
Item 5. Market for Registrant’s Common Equity, Related Stockholder Matters and Issuer
Purchases of Equity Securities
Our common stock trades on The NASDAQ Global Select Market tier of The NASDAQ Stock Market
under the symbol PZZA. As of February 24, 2013, there were 743 record holders of common stock.
However, there are significantly more beneficial owners of our common stock than there are record
holders. The following table sets forth, for the quarters indicated, the high and low closing sales prices of
our common stock, as reported by The NASDAQ Stock Market.
2012 High Low
First Quarter 40.43$ 36.57$
Second Quarter 49.38 36.78
Third Quarter 52.78 45.75
Fourth Quarter 54.00 47.05
2011 High Low
First Quarter 30.55$ 27.54$
Second Quarter 34.27 29.62
Third Quarter 33.79 27.47
Fourth Quarter 37.92 29.54
Since our initial public offering of common stock in 1993, we have not paid cash dividends on our
common stock.
Papa John’s Board of Directors has authorized the repurchase of up to $1.1 billion of common stock
under a share repurchase program that began December 9, 1999, and expires September 29, 2013. This
includes $50 million of authorization by the Board of Directors in December 2012 and an additional $50
million authorized in February 2013. Through December 30, 2012, a total of 49.7 million shares with an
aggregate cost of $959.6 million and an average price of $19.29 per share have been repurchased under
this program. Subsequent to year-end, we acquired an additional 5,000 shares at an aggregate cost of
$254,000. Approximately $115.2 million remained available under the Company’s share repurchase
program as of February 24, 2013.

22
The following table summarizes our repurchase activity by fiscal period during 2012 (in thousands,
except per share amounts):
Total Number Maximum Dollar
Total Average of Shares Purchased Value of Shares
Number Price as Part of Publicly that May Yet Be
of Shares Paid per Announced Plans Purchased Under the
Fiscal Period Purchased Share or Programs Plans or Programs
12/26/2011 - 01/22/2012 60 $37.72 47,533 $219,292
01/23/2012 - 02/19/2012 - - * 47,533 $219,292
02/20/2012 - 03/25/2012 312 $37.09 47,845 $207,719
03/26/2012 - 04/22/2012 248 $37.57 48,093 $198,391
04/23/2012 - 05/20/2012 22 $38.67 48,115 $197,561
05/21/2012 - 06/24/2012 315 $46.78 48,430 $182,810
06/25/2012 - 07/22/2012 264 $47.12 48,694 $170,390
07/23/2012 - 08/19/2012 111 $51.25 48,805 $164,710
08/20/2012 - 09/23/2012 140 $52.05 48,945 $157,392
09/24/2012 - 10/21/2012 103 $52.46 49,048 $151,959
10/22/2012 - 11/18/2012 48 $52.80 49,096 $149,409
11/19/2012 - 12/30/2012 653 $52.03 49,749 $115,444
* There were no share repurchases during this period.
Our share repurchase authorization increased from $975.0 million to $1.1 billion as of February 24, 2013.
For presentation purposes, the maximum dollar value of shares that may be purchased was adjusted
retroactively to December 26, 2011.
The Company utilizes a written trading plan under Rule 10b5-1 under the Securities Exchange Act of
1934, as amended, from time to time to facilitate the repurchase of shares of our common stock under this
share repurchase program. There can be no assurance that we will repurchase shares of our common stock
either through a Rule 10b5-1 trading plan or otherwise.
In May 2012, 13,000 shares of the Company’s common stock were acquired from employees to satisfy
minimum tax withholding obligations that arose upon (i) vesting of restricted stock granted pursuant to
approved plans, and (ii) distribution of shares of common stock issued pursuant to deferred compensation
obligations.

23
Stock Performance Graph The following performance graph compares the cumulative total return of the Company's common stock to the NASDAQ Stock Market (U.S.) Index and a group of the Company's peers consisting of U.S. companies listed on NASDAQ with standard industry classification (SIC) codes 5800-5899 (eating and drinking places). Relative performance is compared for the five-year period extending through the end of fiscal 2012. The graph assumes the value of the investments in the Company's common stock and in each index was $100 at the end of fiscal 2007, and, with respect to the index and peer group, that all dividends were reinvested.
0.00
50.00
100.00
150.00
200.00
250.00
Dec. 30, 2007 Dec. 28, 2008 Dec. 27, 2009 Dec. 26, 2010 Dec. 25, 2011 Dec. 30, 2012
100.00 77.75 107.90 122.12 167.24 233.51100.00 61.17 87.93 104.13 104.69 123.85
100.00 54.95 100.95 135.92 174.35 202.93
Papa John’s International, Inc.
NASDAQ Stock Market (U.S. Companies)
NASDAQ Stocks (SIC 5800-5899 U.S. Companies) Eating and Drinking

24
Item 6. Selected Financial Data
The selected financial data presented for each of the fiscal years in the five-year period ended December
30, 2012, were derived from our audited consolidated financial statements. The selected financial data
below should be read in conjunction with “Management’s Discussion and Analysis of Financial
Condition and Results of Operations” and the “Consolidated Financial Statements” and Notes thereto
included in Item 7 and Item 8, respectively, of this Form 10-K. As described in “Note 3” of “Notes to
Consolidated Financial Statements,” we restated certain financial data to correct errors in our accounting
for noncontrolling interests related to our joint ventures.
(In thousands, except per share data)
Dec. 30, Dec. 25, Dec. 26, Dec. 27, Dec. 28,
2012 2011 2010 2009 2008
(As Restated) (As Restated) (Unaudited -
As Restated)
Income Statement Data 53 weeks 52 weeks 52 weeks 52 weeks 52 weeks
North America revenues:
Domestic Company-owned restaurant sales 592,203$ 525,841$ 503,272$ 503,818$ 533,255$
Franchise royalties (2) 79,567 73,694 69,631 62,083 60,592
Franchise and development fees 806 722 610 912 1,722
Domestic commissary sales 545,924 508,155 454,506 417,689 431,650
Other sales 51,223 50,912 51,951 54,045 61,415
International revenues:
Royalties and franchise and development fees (3) 19,881 16,327 13,265 11,780 11,858
Restaurant and commissary sales (4) 53,049 42,231 33,162 28,223 25,849
Total revenues 1,342,653 1,217,882 1,126,397 1,078,550 1,126,341
Operating income (5) 99,807 87,017 86,744 95,218 65,486
Investment income 750 755 875 629 848
Interest expense (2,162) (2,981) (4,309) (11,660) (7,536)
Income before income taxes 98,395 84,791 83,310 84,187 58,798
Income tax expense 32,393 26,324 27,247 26,702 19,980
Net income, including redeemable noncontrolling interests 66,002 58,467 56,063 57,485 38,818
Income attributable to redeemable noncontrolling interests (6) (4,342) (3,732) (3,485) (3,756) (2,022)
Net income, net of redeemable noncontrolling interests 61,660$ 54,735$ 52,578$ 53,729$ 36,796$
Basic earnings per common share 2.63$ 2.19$ 2.00$ 1.94$ 1.31$
Earnings per common share - assuming dilution 2.58$ 2.16$ 1.99$ 1.93$ 1.30$
Basic weighted average shares outstanding 23,458 25,043 26,328 27,738 28,124
Diluted weighted average shares outstanding 23,905 25,310 26,468 27,909 28,264
Balance Sheet Data
Total assets 438,408$ 390,382$ 417,492$ 396,009$ 385,464$
Total debt 88,258 51,489 99,017 99,050 130,654
Redeemable noncontrolling interests, including
mandatorily redeemable 18,217 15,030 13,484 14,175 11,594
Total stockholders’ equity 181,514 205,647 195,608 173,145 129,986
Year Ended (1)
(1) We operate on a 52-53 week fiscal year ending on the last Sunday of December of each year. The
2012 fiscal year consisted of 53 weeks and all other years above consisted of 52 weeks. The
additional week resulted in additional revenues of approximately $21.5 million and additional
income before income taxes of approximately $4.1 million, or $0.11 per diluted share for 2012.
(2) North America franchise royalties were derived from franchised restaurant sales of $1.85 billion in
2012, $1.71 billion in 2011, $1.62 billion in 2010, $1.58 billion in 2009 and $1.53 billion in 2008.
(3) International royalties were derived from franchised restaurant sales of $388.4 million in 2012,
$320.0 million in 2011, $258.8 million in 2010, $222.2 million in 2009 and $196.5 million in 2008.
(4) Restaurant sales for international Company-owned restaurants were $16.2 million in 2012, $12.4
million in 2011, $11.0 million in 2010, $10.3 million in 2009 and $8.1 million in 2008.

25
(5) The operating results include the consolidation of BIBP Commodities, Inc. (“BIBP”), which
increased operating income approximately $21.4 million in 2010 (including a reduction in BIBP’s
cost of sales of $14.2 million associated with PJFS’s agreement to pay to BIBP for past cheese
purchases an amount equal to its accumulated deficit). BIBP increased operating income by $23.3
million in 2009 and reduced operating income by $8.6 million in 2008 (break-even results in 2011).
See “Note 5” of “Notes to Consolidated Financial Statements” for additional information. Operating
income also includes domestic and international restaurant closure, impairment and disposition
losses of $8.8 million in 2008.
(6) Represents the redeemable noncontrolling interests’ allocation of income for our joint venture
arrangements.
Item 7. Management’s Discussion and Analysis of Financial Condition and Results of Operations
Introduction
Papa John’s International, Inc. (referred to as the “Company,” “Papa John’s” or in the first person
notations of “we,” “us” and “our”) began operations in 1985 with the opening of the first Papa John’s
restaurant in Jeffersonville, Indiana. At December 30, 2012, there were 4,163 Papa John’s restaurants in
operation, consisting of 696 Company-owned and 3,467 franchised restaurants. Our revenues are
principally derived from retail sales of pizza and other food and beverage products to the general public
by Company-owned restaurants, franchise royalties, sales of franchise and development rights, sales to
franchisees of food and paper products, printing and promotional items, risk management services, and
information systems and related services used in their operations.
New unit openings in 2012 were 368 as compared to 321 in 2011 and 325 in 2010 and unit closings in
2012 were 88 as compared to 84 in 2011 and 148 in 2010. We expect net unit growth of approximately
230 to 260 units during 2013. Our expansion strategy is to cluster restaurants in targeted markets, thereby
increasing consumer awareness and enabling us to take advantage of operational, distribution and
advertising efficiencies.
We continue to generate strong sales in our domestic Company-owned restaurants even in a very
competitive market environment. Average annual Company-owned sales for our most recent comparable
restaurant base were $953,000 for 2012 (53-week year), compared to $897,000 for 2011 and $863,000 for
2010 (2011 and 2010 are on a 52-week basis). Average sales volumes in new markets are generally lower
than in those markets in which we have established a significant market position. The comparable sales
for domestic Company-owned restaurants increased 5.6% in 2012, increased 4.1% in 2011, and decreased
0.6% in 2010. The comparable sales for North America franchised units increased 2.9% in 2012, 3.1% in
2011 and 0.3% in 2010. “Comparable sales” represents sales generated by restaurants open for the entire
twelve-month period reported.
We strive to obtain high-quality restaurant sites with good access and visibility, and to enhance the
appearance and quality of our restaurants. We believe these factors improve our image and brand
awareness. The average cash investment for the eight domestic Company-owned restaurants opened
during 2012 was approximately $240,000, compared to the $260,000 investment for the eight units
opened in 2011, exclusive of land and any tenant improvement allowances we received in both years.
Approximately 43% of our revenues for 2012, compared to 47% of our revenues for 2011 and 45% of our
revenues for 2010, were derived from the sale to franchisees of food and paper products, printing and
promotional items, risk management services and information systems equipment and software and
related services by us. We believe that, in addition to supporting both Company and franchised
profitability and growth, these activities contribute to product quality and consistency throughout the
Papa John’s system.

26
Critical Accounting Policies and Estimates
The results of operations are based on our consolidated financial statements, which were prepared in
conformity with accounting principles generally accepted in the United States. The preparation of
consolidated financial statements requires management to select accounting policies for critical
accounting areas as well as estimates and assumptions that affect the amounts reported in the consolidated
financial statements. The Company’s significant accounting policies are more fully described in “Note 2”
of “Notes to Consolidated Financial Statements.” Significant changes in assumptions and/or conditions in
our critical accounting policies could materially impact the operating results. We have identified the
following accounting policies and related judgments as critical to understanding the results of our
operations.
Fiscal Year
The Company follows a fiscal year ending on the last Sunday of December, generally consisting of 52
weeks made up of four 13-week quarters. The 13-week quarters consist of two four-week periods
followed by one five-week period. Our 2012 fiscal year consisted of 53 weeks, including a six-week
period in the fourth quarter. The additional week resulted in additional revenues of approximately $21.5
million and additional income before income taxes of $4.1 million, or $0.11 per diluted share for both the
fourth quarter and full year of 2012.
Accounting Policies
Allowance for Doubtful Accounts and Notes Receivable
We establish reserves for uncollectible accounts and notes receivable based on overall receivable aging
levels and a specific evaluation of accounts and notes for franchisees and other customers with known
financial difficulties.
Intangible Assets – Goodwill
We evaluate goodwill annually in the fourth quarter or whenever we identify certain triggering events or
circumstances that would more-likely-than-not reduce the fair value of a reporting unit below its carrying
amount. Such tests are completed separately with respect to the goodwill of each of our reporting units.
Financial Accounting Standards Board (“FASB”) Accounting Standards Update (“ASU”) 2011-08,
“Testing Goodwill for Impairment,” permits us to first assess qualitative factors to determine whether it is
more-likely-than-not that the fair value of a reporting unit is less than its carrying amount as a basis for
determining whether it is necessary to perform the two-step quantitative goodwill impairment test. We
applied the qualitative assessment to our domestic Company-owned restaurants and China reporting unit,
which is included in our international reporting segment. As a result of our qualitative analysis, we
determined that it was more-likely-than-not that the fair value of our domestic Company-owned
restaurants and China reporting unit was greater than the carrying amounts.
ASU 2011-08 allows us to bypass the qualitative assessment and perform the two-step quantitative
goodwill impairment test if indicators are present. We applied the quantitative test for our subsidiary
located in the United Kingdom (“PJUK”), which represents $15.4 million of goodwill as of December 30,
2012. Under the two-step quantitative goodwill impairment test, the fair value of the reporting unit is
compared to its respective carrying amount including goodwill. If the fair value exceeds the carrying
amount, then no impairment exists. If the carrying amount exceeds the fair value, further analysis is
performed to assess impairment. The fair value was calculated using an income approach that projected
net cash flow over a 10-year discrete period and a terminal value, which were discounted using

27
appropriate rates. The selected discount rates considered the risk and nature of our PJUK reporting unit’s
cash flow and the rates of return market participants would require to invest their capital in the PJUK
reporting unit. Additionally, we made various estimates and assumptions in determining the fair value,
including growth rates.
The fair value of PJUK exceeded the carrying value by 37%. We believe our PJUK reporting unit will
continue to improve its operating results through ongoing growth initiatives, by increasing Papa John’s
brand awareness in the United Kingdom, improving sales and profitability for individual franchised
restaurants and increasing PJUK franchised net unit openings over the next several years. If adverse
economic events occur in the United Kingdom, there is risk of future impairment charges.
Subsequent to completing our annual qualitative and quantitative goodwill impairment tests, no
indications of impairment were identified.
Insurance Reserves
Our insurance programs for workers’ compensation, general liability, owned and non-owned automobiles,
property, and health insurance coverage provided to our employees are funded by the Company up to
certain retention levels. Losses are accrued based upon undiscounted estimates of the aggregate retained
liability for claims incurred using certain third-party actuarial projections and our claims loss experience.
The estimated insurance claims losses could be significantly affected should the frequency or ultimate
cost of claims differ significantly from historical trends used to estimate the insurance reserves recorded
by the Company.
Deferred Income Tax Accounts and Tax Reserves
Papa John’s is subject to income taxes in the United States and several foreign jurisdictions. Significant
judgment is required in determining Papa John’s provision for income taxes and the related assets and
liabilities. The provision for income taxes includes income taxes paid, currently payable or receivable and
those deferred.
Deferred tax assets and liabilities are determined based on differences between financial reporting and tax
basis of assets and liabilities, and are measured using enacted tax rates and laws that are expected to be in
effect when the differences reverse. Deferred tax assets are also recognized for the estimated future
effects of tax loss carryforwards. The effect on deferred taxes of changes in tax rates is recognized in the
period in which the new tax rate is enacted. Valuation allowances are established when necessary on a
jurisdictional basis to reduce deferred tax assets to the amounts we expect to realize. As of December 30,
2012, we had a net deferred income tax liability of approximately $400,000.
Tax authorities periodically audit the Company. We record reserves and related interest and penalties for
identified exposures as income tax expense. We evaluate these issues and adjust for events, such as
statute of limitations expirations, court rulings or audit settlements, which may impact our ultimate
payment for such exposures. We recognized reductions of $738,000, $1.9 million and $550,000 in our
income tax expense associated with the finalization of certain income tax issues in 2012, 2011 and 2010,
respectively (see “Note 15” of “Notes to Consolidated Financial Statements”).
Restatement of Previously Issued Financial Statements
In connection with the evaluation of the accounting for newly formed joint ventures in 2012, we reviewed
our accounting for our previously existing joint venture arrangements. As a result of our review, we
determined an error occurred in the accounting for one joint venture agreement, which contained a
mandatorily redeemable feature added through a contract amendment in the third quarter of 2009. This

28
provision contained in the 2009 contract amendment was not previously considered in determining the
classification and measurement of the noncontrolling interest. In addition, we determined an additional
redeemable noncontrolling interest was incorrectly classified in shareholders’ equity and should be
classified as temporary equity, which impacted the consolidated balance sheets and statements of
stockholders’ equity. As such, we are restating our previously issued consolidated financial statements
for the fiscal years 2011, 2010 and 2009. The correction of the error related to the mandatorily
redeemable noncontrolling interest had an impact on our consolidated statements of income, interest
expense, income tax expense, and net income which is reflected herein for 2011 and 2010. The
corrections were recorded to our “Unallocated Corporate Expenses” segment. Additionally, the
corrections had no impact on total revenues, operating income, or operating cash flows and had no impact
on our compliance with debt covenants in any periods presented. See “Note 3” of “Notes to Consolidated
Financial Statements” for additional information.
Items Impacting Comparability; Non-GAAP Measures
The following table reconciles our financial results as reported under accounting principles generally
accepted in the United States (“GAAP”) to certain non-GAAP measures. We present these non-GAAP
measures to adjust for certain items which we believe impact the comparability of our results of
operations.
Year Ended
Dec. 30, Dec. 25, Dec. 26,
(In thousands, except per share amounts) 2012 2011 2010
(As Restated) (As Restated)
Total revenues, as reported 1,342,653$ 1,217,882$ 1,126,397$
53rd week of operations (a) (21,500) - -
Total revenues, as adjusted 1,321,153$ 1,217,882$ 1,126,397$
Income before income taxes, as reported 98,395$ 84,791$ 83,310$
53rd week of operations (a) (4,145) - -
Incentive Contribution (b) 2,971 - -
Income from BIBP cheese purchasing entity (c) - - (6,804)
Income before income taxes, as adjusted 97,221$ 84,791$ 76,506$

29
Items Impacting Comparability; Non-GAAP Measures (continued)
Year Ended
Dec. 30, Dec. 25, Dec. 26,
(In thousands, except per share amounts) 2012 2011 2010
(As Restated) (As Restated)
Net income, as reported 61,660$ 54,735$ 52,578$
53rd week of operations (a) (2,634) - -
Incentive Contribution (b) 1,955 - -
Income from BIBP cheese purchasing entity (c) - - (4,339)
Net income, as adjusted 60,981$ 54,735$ 48,239$
Earnings per diluted share, as reported 2.58$ 2.16$ 1.99$
53rd week of operations (a) (0.11) - -
Incentive Contribution (b) 0.08 - -
Income from BIBP cheese purchasing entity (c) - - (0.16)
Earnings per diluted share, as adjusted 2.55$ 2.16$ 1.83$
(a) The Company follows a fiscal year ending on the last Sunday of December, generally consisting of 52
weeks made up of four 13-week quarters. In 2012, the Company’s fiscal year consisted of 53 weeks,
with the additional week added to the fourth quarter (14 weeks) results.
(b) In connection with a new multi-year supplier agreement, the Company received a $5.0 million
supplier marketing payment in 2012. The Company is recognizing the supplier marketing payment
evenly as income over the five-year term of the agreement ($1.0 million per year). The Company then
contributed the supplier marketing payment to the Papa John’s Marketing Fund (“PJMF”), an
unconsolidated, non-profit corporation, for the benefit of domestic restaurants. The Company’s
contribution to PJMF was fully expensed in 2012.
PJMF elected to distribute the $5.0 million supplier marketing payment to the domestic system as
advertising credits in 2012. Our domestic Company-owned restaurants’ portion of the advertising
credits resulted in an increase in income before income taxes of approximately $1.0 million in 2012.
The overall impact of the two transactions described above, which are collectively defined as the
“Incentive Contribution,” was a reduction in income before income taxes of approximately $3.0
million in 2012 (or a reduction to diluted earnings per share of approximately $0.08).
(c) BIBP was a franchisee-owned corporation that conducted a cheese-purchasing program on behalf of
Company-owned and franchised restaurants operating in the United States through February 2011. As
the primary beneficiary of the variable interest entity, we consolidated the operating results of BIBP.
BIBP operated at break-even for the first two months of 2011 and the 2010 consolidation impact of
BIBP on income before income taxes was $6.8 million. The 2010 consolidation impact of BIBP on
income before income taxes excluded a reduction in BIBP’s cost of sales of $14.2 million associated
with PJFS’s agreement to pay to BIBP for past cheese purchases an amount equal to its accumulated
deficit (“BIBP Settlement”). Accordingly, BIBP recorded a decrease of $14.2 million in cost of sales
and PJFS recorded a corresponding increase in cost of sales in 2010. This transaction did not have
30
any impact on the Company’s 2010 consolidated income statement results since both PJFS and BIBP
are fully consolidated.
The non-GAAP results shown above, which exclude the items impacting comparability, should not be
construed as a substitute for or a better indicator of the Company’s performance than the Company’s
GAAP results. Management believes presenting the financial information without these items is important
for purposes of comparison to prior year results. In addition, management uses these non-GAAP measures
to allocate resources, and analyze trends and underlying operating performance. Annual cash bonuses,
and certain long-term incentive programs for various levels of management, are based on financial
measures that exclude the Incentive Contribution. See “Discussion of Operating Results” for further
analysis regarding the impact of these items.
In addition, we present free cash flow in this report, which is a non-GAAP measure. We define free cash
flow as net cash provided by operating activities (from the consolidated statements of cash flows) less the
purchases of property and equipment. We view free cash flow as an important measure because it is one
factor that management uses in determining the amount of cash available for discretionary investment.
Free cash flow is not a term defined by GAAP and as a result our measure of free cash flow might not be
comparable to similarly titled measures used by other companies. Free cash flow should not be construed
as a substitute for or a better indicator of our performance than the Company’s GAAP measures. See
“Liquidity and Capital Resources” for a reconciliation of free cash flow to the most directly comparable
GAAP measure.
The presentation of the non-GAAP measures in this report is made alongside the most directly
comparable GAAP measures.

31
Percentage Relationships and Restaurant Data and Unit Progression
The following tables set forth the percentage relationship to total revenues, unless otherwise indicated, of
certain income statement data, and certain restaurant data for the years indicated:
Year Ended (1)
Dec. 30, Dec. 25, Dec. 26,
2012 2011 2010
(As Restated) (As Restated)
Income Statement Data: 53 weeks 52 weeks 52 weeks
North America revenues:
Domestic Company-owned restaurant sales 44.1% 43.2% 44.7%
Franchise royalties 5.9 6.1 6.2
Franchise and development fees 0.1 0.1 0.0
Domestic commissary sales 40.7 41.7 40.4
Other sales 3.8 4.2 4.6
International revenues:
Royalties and franchise and development fees 1.5 1.3 1.2
Restaurant and commissary sales 3.9 3.4 2.9
Total revenues 100.0 100.0 100.0
Costs and expenses:
Domestic Company-owned restaurant cost of sales (2) 23.2 24.1 22.1
Domestic Company-owned restaurant operating expenses (2) 57.1 56.9 57.7
Domestic commissary and other expenses (3) 92.0 92.2 91.4
Income from the franchise cheese purchasing
program, net of minority interest (4) 0.0 0.0 (0.5)
International operating expenses (5) 84.6 84.5 88.7
General and administrative expenses 9.8 9.2 9.8
Other general expenses 0.6 0.8 0.8
Depreciation and amortization 2.4 2.7 2.9
Total costs and expenses 92.6 92.9 92.3
Operating income 7.4 7.1 7.7
Net interest expense (0.1) (0.1) (0.3)
Income before income taxes 7.3 7.0 7.4
Income tax expense 2.4 2.2 2.4
Net income, including redeemable noncontrolling interests 4.9 4.8 5.0
Less: income attributable to redeemable noncontrolling interests (0.3) (0.3) (0.3)
Net income, net of redeemable noncontrolling interests 4.6% 4.5% 4.7%

32
Year Ended (1)
Dec. 30, Dec. 25, Dec. 26,
2012 2011 2010
Restaurant Data: 53 weeks 52 weeks 52 weeks
Percentage increase (decrease) in comparable domestic
Company-owned restaurant sales (6) 5.6% 4.1% (0.6%)
Number of Company-owned restaurants included in the
most recent full year's comparable restaurant base 615 581 577
Average sales for Company-owned restaurants included
in the most recent comparable restaurant base $953,000 $897,000 $863,000
Papa John's Restaurant Progression:
North America Company-owned:
Beginning of period 598 591 588
Opened 8 8 5
Closed (3) (1) (2)
Acquired from franchisees 57 - -
Sold to franchisees (12) - -
End of period 648 598 591
International Company-owned:
Beginning of period 30 21 26
Opened 20 9 8
Closed (2) - (2)
Acquired from franchisees - - 1
Sold to franchisees - - (12)
End of period 48 30 21
North America franchised:
Beginning of period 2,463 2,346 2,246
Opened 182 166 182
Closed (44) (49) (82)
Acquired from Company 12 - -
Sold to Company (57) - -
End of period 2,556 2,463 2,346
International franchised:
Beginning of period 792 688 609
Opened 158 138 130
Closed (39) (34) (62)
Acquired from Company - - 12
Sold to Company - - (1)
End of period 911 792 688
Total Papa John's restaurants - end of period 4,163 3,883 3,646
(1) We operate on a 52-53 week fiscal year ending on the last Sunday of December of each year. The
2010 and 2011 fiscal years consisted of 52 weeks and the 2012 fiscal year consisted of 53 weeks.
The additional week in 2012 resulted in additional revenues of approximately $21.5 million and
additional income before income taxes of approximately $4.1 million, or $0.11 per diluted share.
(2) As a percentage of domestic Company-owned restaurant sales.
(3) As a percentage of domestic commissary sales and other sales on a combined basis.
(4) As a percentage of total Company revenues; the income is a result of the consolidation of BIBP, a
VIE. The sales reported by BIBP are eliminated in consolidation.
(5) As a percentage of international restaurant and commissary sales.
(6) Includes only Company-owned restaurants open throughout the periods being compared.

33
Results of Operations
2012 Compared to 2011
Discussion of Revenues
Consolidated revenues increased $124.8 million, or 10.2%, to $1.34 billion in 2012, compared to $1.22
billion in 2011. The 53rd
week of operations in 2012 approximated $21.5 million, or 1.8%. The increase in
revenues was primarily due to the following:
Domestic Company-owned restaurant sales increased $66.4 million, or 12.6%, in 2012, primarily
due to an increase in comparable sales of 5.6%, the net acquisition of 50 restaurants in the Denver
and Minneapolis markets from a franchisee in the second quarter of 2012, and $10.6 million, or
2.0%, benefit from the 53rd
week of operations.
North America franchise royalty revenues increased approximately $5.9 million, or 8.0%, in
2012, due to an increase in comparable sales of 2.9%, an increase in net franchise units over the
prior year, and a $1.4 million, or 1.8%, benefit from the 53rd
week of operations. These increases
were slightly offset by reduced royalties attributable to the Company’s net acquisition of the 50
restaurants noted above.
Domestic commissary sales increased $37.8 million, or 7.4%, in 2012, primarily due to higher
commissary product volumes primarily resulting from increases in the volume of restaurant sales.
The benefit from the 53rd
week of operations was approximately $8.5 million, or an increase of
1.7%.
International revenues increased $14.4 million, or 24.5%, in 2012, primarily due to an increase in
the number of restaurants and an increase in comparable sales of 7.1%, calculated on a constant
dollar basis, which excludes the impact of foreign currency translation. The benefit from the 53rd
week of operations was approximately $800,000, or 1.4%.
Discussion of Operating Results
Our income before income taxes totaled $98.4 million in 2012, as compared to $84.8 million in 2011, an
increase of approximately $13.6 million. Income before income taxes is summarized in the following
table on a reporting segment basis (in thousands):
(a) (a) Increase
2012 2011 (Decrease)
53 weeks 52 weeks
(As Restated)
Domestic Company-owned restaurants (b) 38,114$ 28,980$ 9,134$
Domestic commissaries 34,317 30,532 3,785
North America franchising 69,332 66,222 3,110
International 3,063 (165) 3,228
All others 2,889 (441) 3,330
Unallocated corporate expenses (c) (48,958) (39,727) (9,231)
Elimination of intersegment profits (362) (610) 248
Income before income taxes 98,395$ 84,791$ 13,604$

34
(a) The 53rd
week of operations increased income before income taxes by approximately $4.1 million
in 2012 as follows: Increase
(Decrease)
Domestic company-owned restaurants 1,609$
Domestic commissaries 1,200
North America franchising 1,414
International 414
All others 215
Unallocated corporate expenses (707)
Income before income taxes 4,145$
(b) Includes the benefit of a $1.0 million advertising credit from PJMF related to the Incentive
Contribution in 2012. See “Items Impacting Comparability; Non-GAAP Measures” above for
further information about the Incentive Contribution.
(c) Includes the impact of the Incentive Contribution in 2012 ($4.0 million increase in expense).
Changes in income before income taxes for 2012 are summarized on a segment basis as follows:
Domestic Company-owned Restaurant Segment. Domestic Company-owned restaurants’
income before income taxes increased $9.1 million from the prior comparable period, including
approximately $1.6 million related to the 53rd
week of operations. The remaining increase was
due to the previously noted comparable sales increase, favorable commodity costs, and various
supplier incentives.
Domestic Commissary Segment. Domestic commissaries’ income before income taxes
increased $3.8 million in 2012 as compared to the comparable 2011 period. Approximately $1.2
million of the increase was due to the impact of the 53rd
week of operations. The remaining
increase was primarily due to higher commissary product volumes resulting from increased sales
volumes from the previously noted increase in net units and comparable sales.
North America Franchising Segment. North America franchising income before income taxes
increased approximately $3.1 million in 2012, including approximately $1.4 million related to the
53rd
week of operations in 2012. The remaining increase was due to the previously mentioned
royalty revenue increase, partially offset by both an increase in development incentive costs and a
reduction in royalties attributable to the Company’s net acquisition of the 50 Denver and
Minneapolis restaurants.
International Segment. The international segment reported income before income taxes of
approximately $3.1 million in 2012 compared to a loss of approximately $165,000 in 2011. The
improvement in operating results of $3.2 million was primarily due to increased royalties due to
growth in the number of units and a comparable sales increase of 7.1%, and improved operating
results in our United Kingdom commissary. The 53rd
week of operations increased operating
results by approximately $400,000 in 2012.
All Others Segment. The “All others” segment reported operating income of approximately $2.9
million in 2012, representing an increase of approximately $3.3 million, as compared to the
corresponding 2011 period. The increase was primarily due to an improvement in our online and
mobile ordering (“eCommerce”) business. This improvement was somewhat offset by reduced

35
operating results at our wholly-owned print and promotions subsidiary, Preferred Marketing
Solutions (“Preferred”).
Unallocated Corporate Segment. Unallocated corporate expenses increased $9.2 million in
2012, as compared to the prior year, including approximately $700,000 related to the 53rd
week of
operations. The components of unallocated corporate expenses were as follows (in thousands):
Year Ended Year Ended
December 30, December 25, Increase
2012 2011 (Decrease)
(As Restated)
General and administrative (a) 37,618$ 24,807$ 12,811$
Supplier marketing payment (b) 4,000 - 4,000
Net interest expense 1,476 2,300 (824)
Depreciation expense 7,193 8,021 (828)
Franchise incentives and initiatives (c) - 3,234 (3,234)
Perfect Pizza lease obligation (d) (135) 832 (967)
Other (income) expense (e) (1,194) 533 (1,727)
Total unallocated corporate expenses 48,958$ 39,727$ 9,231$
(a) The increase in unallocated general and administrative costs was primarily due to increases in
legal costs, including estimated costs associated with the tentative settlement of the Agne
litigation (see “Note 17” of “Notes to Consolidated Financial Statements” for additional
information), short-term management incentives, insurance costs, and higher costs related to
our operators’ conference.
(b) See “Items Impacting Comparability; Non-GAAP Measures” above for further information
about the Incentive Contribution.
(c) In 2011, we offered non-recurring incentives to domestic franchisees for meeting certain
sales targets, including driving comparable sales, transactions and online sales. Other
incentives offered are included in the North America Franchising segment.
(d) The Perfect Pizza lease obligation relates to rents, taxes and insurance associated with the
former Perfect Pizza operations in the United Kingdom. See the notes to the consolidated
financial statements for additional information.
(e) Other (income) expense improved primarily due to the prior year including both higher costs
related to our online customer loyalty program and disposition and valuation costs associated
with certain systems and other equipment.
Diluted earnings per share were $2.58 in 2012, compared to $2.16 in 2011, an increase of $0.42, or
19.4%. The 2012 diluted earnings per share include the benefit of the 53rd
week of operations ($0.11 per
diluted share increase), partially offset by the decrease of $0.08 per diluted share attributable to the
Incentive Contribution. Diluted earnings per share increased $0.14 due to the reduction in weighted
average shares outstanding (5.7% reduction).
Review of Consolidated Operating Results
Revenues. Domestic Company-owned restaurant sales were $592.2 million for 2012 compared to $525.8
million for 2011. The 12.6% increase was primarily due to a 5.6% increase in comparable sales and the

36
net acquisition of 50 restaurants in Denver and Minneapolis from a franchisee in the second quarter of
2012, and $10.6 million, or 2.0%, benefit from the 53rd
week of operations.
North America franchise sales increased 7.9% to $1.85 billion, from $1.71 billion in 2011, as domestic
franchise comparable sales increased 2.9% and equivalent units increased 3.6%. “Equivalent units”
represents the number of restaurants open at the beginning of a given period, adjusted for restaurants
opened, closed, acquired or sold during the period on a weighted average basis. North America franchise
sales are not included in our consolidated statements of income; however, our North America franchise
royalty revenue is derived from these sales. North America franchise royalties were $79.6 million,
representing an increase of 8.0% from the comparable period, including a $1.4 million, or 1.8% increase
from the 53rd
week of operations in 2012. The remaining increase in royalties was primarily due to the
previously noted increase in franchise sales.
Average weekly sales for comparable units include restaurants that were open throughout the periods
presented below. The comparable sales base for domestic Company-owned and North America franchised
restaurants, respectively, includes restaurants acquired by the Company or divested to franchisees during
the previous twelve months. Average weekly sales for non-comparable units include restaurants that were
not open throughout the periods presented below and include non-traditional sites. Average weekly sales
for non-traditional units not subject to continuous operation are calculated based upon actual days open.
The comparable sales base and average weekly sales for 2012 and 2011 for domestic Company-owned
and North America franchised restaurants consisted of the following:
Domestic
Company-
owned
North
America
Franchised
Domestic
Company-
owned
North
America
Franchised
Total domestic units (end of period) 648 2,556 598 2,463
Equivalent units 624 2,415 589 2,332
Comparable sales base units 615 2,190 581 2,135
Comparable sales base percentage 98.6% 90.7% 98.6% 91.6%
Average weekly sales - comparable units 17,987$ 14,870$ 17,248$ 14,459$
Average weekly sales - total non-comparable units* 12,604$ 10,389$ 11,218$ 10,708$
Average weekly sales - all units 17,908$ 14,453$ 17,164$ 14,142$
*Includes 215 traditional units in 2012 and 183 in 2011 and 158 non-traditional units in 2012 and 134 in 2011.
Year Ended Year Ended
December 30, 2012 December 25, 2011
North America franchise and development fees were approximately $800,000 in 2012, or an increase of
approximately $100,000 from 2011.
Domestic commissary sales increased 7.4% to $545.9 million in 2012, from $508.2 million in the prior
comparable period. The increase was primarily due to higher commissary product volumes resulting from
increases in the volume of restaurant sales. Our commissaries charge a fixed dollar mark-up on the cost of
cheese. Cheese prices are based upon the block price, which decreased to an average price of $1.69 per
pound in 2012 from the $1.80 per pound in 2011.
Other sales increased $300,000 to $51.2 million in 2012. The increase primarily resulted from an increase
in online sales, partially offset by a decline in sales at Preferred.
37
International franchise sales were $388.4 million in 2012, compared to $320.0 million in 2011.
International franchise sales are not included in our consolidated statements of income; however, our
international royalty revenue is derived from these sales. Total international revenues were $72.9 million
for 2012 compared to $58.6 million in 2011, reflecting an increase in the number of Company-owned and
franchised restaurants in addition to the 7.1% increase in comparable sales, calculated on a constant dollar
basis. Our PJUK operations represented 51% of international revenues in both 2012 and 2011.
Costs and Expenses. The restaurant operating margin at domestic Company-owned units was 19.7% in
2012 (19.5% excluding the $1.0 million advertising credit from PJMF) compared to 19.0% in 2011. The
increase of 0.7% consisted of the following differences:
Cost of sales was 0.9% lower as a percentage of sales in 2012 due to lower commodity costs,
primarily cheese; 2012 also included various supplier incentives.
Salaries and benefits were 0.5% higher as a percentage of sales in 2012, primarily due to higher
bonuses paid to general managers.
Advertising and related costs as a percentage of sales were relatively flat year-over-year and
included a $1.0 million advertising credit received from PJMF. The higher costs, excluding the
advertising credit, were due to increased local advertising, including additional costs for newly
acquired markets.
Occupancy costs and other operating costs, on a combined basis, as a percentage of sales, were
0.2% lower in 2012 reflecting the benefit of increased sales.
Domestic commissary and other operating margin was 8.0% in 2012, compared to 7.8% in 2011,
consisting of the following differences:
Cost of sales was 0.3% lower as a percentage of revenues in 2012, as compared to 2011 due to
lower commodity costs, primarily cheese, which has a fixed-dollar markup and due to the benefit
of increased online sales.
Salaries and benefits were 0.1% higher as a percentage of revenues in 2012, as compared to the
same period of 2011.
Other operating expenses were 0.1% higher as a percentage of revenues in 2012, as compared to
2011.
International operating expenses were relatively consistent at 84.6% of international restaurant and
commissary sales in 2012 as compared to 84.5% in 2011. An increase in operating expenses, primarily
associated with the new Company-owned restaurants in China, was substantially offset by an
improvement in operating results in the United Kingdom.
General and administrative expenses were $131.6 million, or 9.8% of revenues for 2012, as compared to
$111.6 million, or 9.2% of revenues for 2011. The increase in general and administrative expenses is due
to increases in legal costs, including estimated costs associated with the tentative settlement of the Agne
litigation, short-term management incentives, insurance costs, and higher costs related to our operators’
conference. The 53rd
week of operations in 2012 increased general and administrative expenses by
approximately $700,000.

38
Other general expenses reflected net expense of $8.3 million in 2012, as compared to $9.8 million in 2011
as detailed below (in thousands):
Increase
2012 2011 (Decrease)
Supplier marketing payment (a) 4,000$ -$ 4,000$
Franchise and development incentives and initiatives (b) 3,194 4,921 (1,727)
Provision for uncollectible accounts and notes receivable 826 379 447
Disposition and impairment losses (c) 362 1,745 (1,383)
Pre-opening restaurant costs 321 273 48
Perfect Pizza lease obligation (d) (135) 832 (967)
Other (income) expense (e) (255) 1,617 (1,872)
Total other general expenses 8,313$ 9,767$ (1,454)$
(a) See “Items Impacting Comparability; Non-GAAP Measures” above for further information about the
Incentive Contribution.
(b) Includes incentives provided to domestic franchisees for opening restaurants. The 2011 amount
includes approximately $3.2 million in incentives offered to domestic franchisees for meeting certain
sales targets, including driving comparable sales, transactions and online sales, which were not
offered in 2012.
(c) Disposition and impairment losses include costs associated with the disposition of certain systems
and other equipment, which were higher in 2011.
(d) The Perfect Pizza lease obligation relates to rents, taxes and insurance associated with the former
Perfect Pizza operations in the United Kingdom.
(e) The decrease is primarily a result of 2011 including higher costs related to our online customer
loyalty program.
Depreciation and amortization was $32.8 million, or 2.4% of revenues for 2012, as compared to $32.7
million, or 2.7% of revenues, for 2011.
Net interest. Net interest expense was approximately $1.4 million in 2012, compared to $2.2 million in
2011. The decrease in net interest costs reflects a lower effective interest rate and a reduction in interest
expense associated with a change in redemption value of noncontrolling interest in a joint venture whose
noncontrolling interest is deemed mandatorily redeemable. See “Notes 2, 3, 4 and 22” of the “Notes to
Consolidated Financial Statements” for additional information.
Income Tax Expense. Our effective income tax rate was 32.9% in 2012 compared to 31.0% in 2011. Our
effective income tax rate may fluctuate for various reasons, including the settlement or resolution of
specific federal and state issues. We recognized reductions of $738,000 and $1.9 million in our income
tax expense associated with the finalization of certain income tax issues in 2012 and 2011, respectively.
2011 Compared to 2010
Discussion of Revenues
Consolidated revenues increased 8.1% to $1.22 billion in 2011 compared to $1.13 billion in 2010,
primarily consisting of the following:
Domestic Company-owned restaurant sales increased $22.6 million, or 4.5%, in 2011 primarily
due to an increase in comparable sales of 4.1%.

39
North America franchise royalty revenues increased approximately $4.1 million, or 5.8% in 2011
due to an increase in comparable sales of 3.1%, and an increase in the number of franchised
restaurants.
Domestic commissary sales increased $53.6 million, or 11.8% in 2011 primarily due to an
increase in the prices of certain commodities, most notably cheese, and an increase in sales
volumes.
International revenues increased $12.1 million, or 26.1% in 2011, primarily due to an increase in
the number of restaurants and an increase in comparable sales of 5.1%, calculated on a constant
dollar basis. In 2010, the international segment included revenues from Company-owned
restaurants located in the United Kingdom, which were sold in the third quarter of 2010.
Discussion of Operating Results
Our income before income taxes totaled $84.8 million in 2011, as compared to $83.3 million in 2010, an
increase of approximately $1.5 million. Excluding the impact of BIBP (income before income taxes of
$6.8 million, excluding the BIBP Settlement), our income before income taxes increased approximately
$8.3 million, or 10.8%.
Income before income taxes is summarized in the following table on an operating segment basis (in
thousands):
Increase
2011 2010 (Decrease)
(As Restated) (As Restated)
Domestic Company-owned restaurants 28,980$ 31,619$ (2,639)$
Domestic commissaries * 30,532 14,188 16,344
North America franchising 66,222 62,229 3,993
International (165) (4,771) 4,606
All others (441) 1,847 (2,288)
Unallocated corporate expenses (39,727) (42,237) 2,510
Elimination of intersegment profits (610) (519) (91)
Income before income taxes, excluding BIBP 84,791 62,356 22,435
BIBP, a variable interest entity * - 20,954 (20,954)
Total income before income taxes 84,791$ 83,310$ 1,481$
* The full-year 2010 results for domestic commissaries were reduced by the BIBP Settlement and the
full-year 2010 results for BIBP were increased by the BIBP Settlement. There was no impact on the
consolidated results of operations since PJFS and BIBP are fully consolidated into the Company’s
results.
Changes in income before income taxes for 2011, excluding the impact of BIBP (income before income
taxes of $6.8 million, excluding the BIBP Settlement), are summarized on a segment basis as follows:
Domestic Company-owned Restaurant Segment. Domestic Company-owned restaurants’
income before income taxes decreased $2.6 million from the prior comparable period. The
decrease was due to increased commodity costs, primarily cheese, partially offset by incremental
profits from higher comparable sales.

40
Domestic Commissary Segment. Domestic commissaries’ income before income taxes
increased $16.3 million in 2011 over the comparable 2010 period comprised of the following (in
thousands): Year Ended
December 25,
2011
Year Ended
December 26,
2010 Decrease
Income before income taxes, excluding the
BIBP Settlement 30,532$ 28,338$ 2,194$
BIBP Settlement - (14,150) 14,150
Total segment income before income taxes 30,532$ 14,188$ 16,344$
Domestic commissaries’ income before income taxes, excluding the BIBP Settlement, increased
$2.2 million over the prior year. The increase was due to a higher operating income dollar margin
attributable to higher sales volumes, partially offset by increased costs attributable to higher fuel
prices.
North America Franchising Segment. North America franchising income before income taxes
increased approximately $4.0 million in 2011 as compared to the comparable 2010 period. The
increase was due to the previously mentioned royalty revenue increase.
International Segment. The international segment reported operating losses of $165,000 in 2011
and approximately $4.8 million in 2010. The improvement in operating results of $4.6 million
was primarily due to increased royalties due to growth in the number of units and a comparable
sales increase of 5.1%, and improved operating results in our Beijing and North China restaurants
as well as our United Kingdom commissary. Additionally, the prior year results included start-up
costs associated with our Company-owned commissary in the United Kingdom that opened in
2010.
All Others Segment. The “All others” segment reported an operating loss of approximately
$400,000 in 2011, representing a decrease of approximately $2.3 million, as compared to the
corresponding 2010 period. The decrease was primarily due to a decline in the operating results
of our online and mobile ordering (“eCommerce”) business, partially offset by improvements in
operating income at our wholly-owned print and promotions subsidiary, Preferred Marketing
Solutions (“Preferred”). The decline in the operating results of our eCommerce business was
primarily due to an increase in infrastructure and support costs attributable to the new online
ordering system. Additionally, online revenues decreased in 2011 due to lower online and mobile
fees charged.
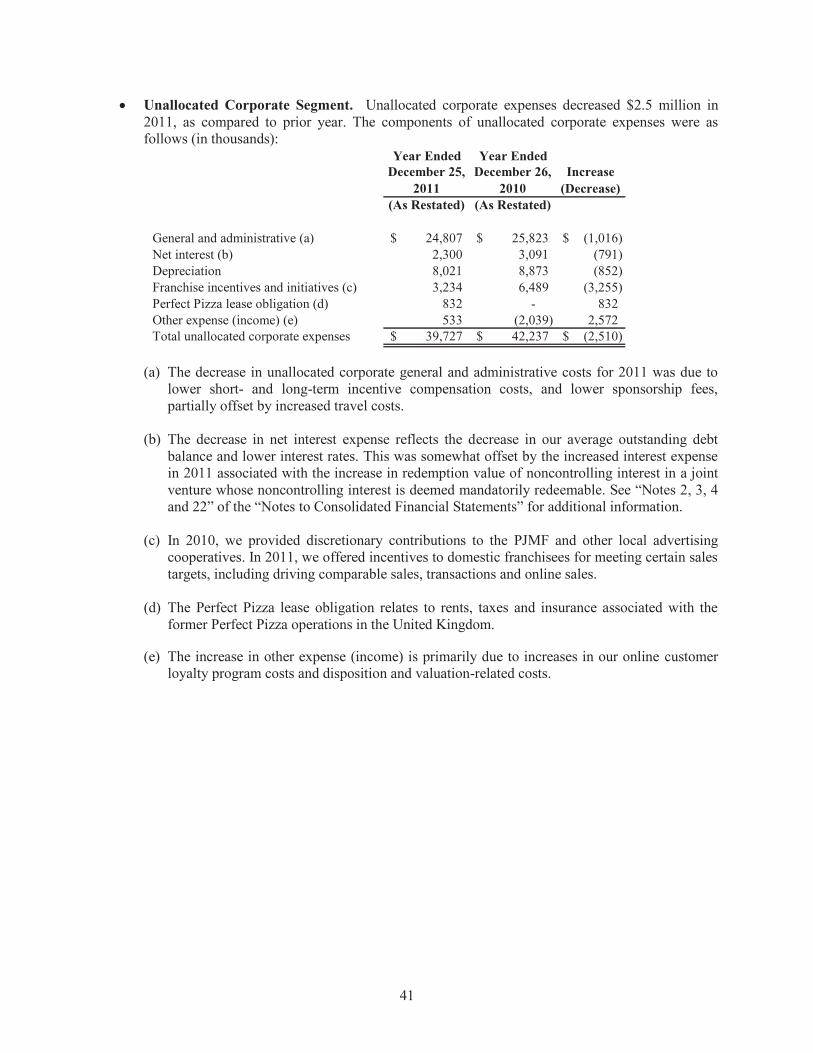
41
Unallocated Corporate Segment. Unallocated corporate expenses decreased $2.5 million in
2011, as compared to prior year. The components of unallocated corporate expenses were as
follows (in thousands):
Year Ended Year Ended
December 25,
2011
December 26,
2010
Increase
(Decrease)
(As Restated) (As Restated)
General and administrative (a) 24,807$ 25,823$ (1,016)$
Net interest (b) 2,300 3,091 (791)
Depreciation 8,021 8,873 (852)
Franchise incentives and initiatives (c) 3,234 6,489 (3,255)
Perfect Pizza lease obligation (d) 832 - 832
Other expense (income) (e) 533 (2,039) 2,572
Total unallocated corporate expenses 39,727$ 42,237$ (2,510)$
(a) The decrease in unallocated corporate general and administrative costs for 2011 was due to
lower short- and long-term incentive compensation costs, and lower sponsorship fees,
partially offset by increased travel costs.
(b) The decrease in net interest expense reflects the decrease in our average outstanding debt
balance and lower interest rates. This was somewhat offset by the increased interest expense
in 2011 associated with the increase in redemption value of noncontrolling interest in a joint
venture whose noncontrolling interest is deemed mandatorily redeemable. See “Notes 2, 3, 4
and 22” of the “Notes to Consolidated Financial Statements” for additional information.
(c) In 2010, we provided discretionary contributions to the PJMF and other local advertising
cooperatives. In 2011, we offered incentives to domestic franchisees for meeting certain sales
targets, including driving comparable sales, transactions and online sales.
(d) The Perfect Pizza lease obligation relates to rents, taxes and insurance associated with the
former Perfect Pizza operations in the United Kingdom.
(e) The increase in other expense (income) is primarily due to increases in our online customer
loyalty program costs and disposition and valuation-related costs.

42
Variable Interest Entities. BIBP generated income before income taxes of $21.0 million in
2010, which primarily consisted of the BIBP Settlement and income associated with cheese sold
to domestic Company-owned and franchise restaurants of $1.7 million and $5.6 million,
respectively. BIBP reported break-even results for the first two months of 2011, at which time we
terminated the purchasing arrangement with BIBP. The following table summarizes the impact of
BIBP prior to the required consolidating eliminations on our consolidated statements of income
for the years ended December 25, 2011 and December 26, 2010 (in thousands):
Year Ended
December 25,
2011
December 26,
2010
BIBP sales 25,117$ 153,014$
Cost of sales 25,100 131,549
General and administrative expenses 17 91
Total costs and expenses 25,117 131,640
Operating income - 21,374
Interest expense - (420)
Income before income taxes (a) -$ 20,954$
(a) Income before income taxes for the year ended December 26, 2010, was $6.8 million,
excluding the BIBP Settlement.
Diluted earnings per share were $2.16 in 2011, compared to $1.99 per diluted share in 2010 (including a
$0.16 per share gain from the consolidation of BIBP). Excluding the impact of BIBP in 2010, diluted
earnings per share increased $0.33, or 18.0% ($2.16 in 2011 compared to $1.83 in 2010). Diluted
weighted average shares outstanding decreased 4.4% in 2011 from the prior year period. Diluted earnings
per share increased $0.09 due to the reduction in shares outstanding.
Review of Consolidated Operating Results
Revenues. Domestic Company-owned restaurant sales were $525.8 million for 2011 compared to $503.3
million for 2010. The 4.5% increase was primarily due to a 4.1% increase in comparable sales.
North America franchise sales increased 6.1% to $1.71 billion, from $1.62 billion in 2010, as domestic
franchise comparable sales increased 3.1% and equivalent units increased 4.5%. North America franchise
royalties were $73.7 million, representing an increase of 5.8% from the comparable period. The increase
in royalties was primarily due to the previously noted increase in franchise sales. The impact of the
royalty rate increase to 5.0% (0.25% increase over 2010) was substantially offset by the franchisees’
ability to earn up to a 0.25% royalty rebate by meeting certain sales growth targets and an additional
0.20% royalty rebate by making specified re-imaging restaurant lobby investments.

43
The comparable sales base and average weekly sales for 2011 and 2010 for domestic Company-owned
and North America franchised restaurants consisted of the following:
Domestic
Company-
owned
North
America
Franchised
Domestic
Company-
owned
North
America
Franchised
Total domestic units (end of period) 598 2,463 591 2,346
Equivalent units 589 2,332 586 2,231
Comparable sales base units 581 2,135 577 2,074
Comparable sales base percentage 98.6% 91.6% 98.5% 93.0%
Average weekly sales - comparable units 17,248$ 14,459$ 16,599$ 14,057$
Average weekly sales - total non-comparable units* 11,218$ 10,708$ 11,562$ 12,177$
Average weekly sales - all units 17,164$ 14,142$ 16,521$ 13,924$
*Includes 183 traditional units in 2011 and 165 in 2010 and 134 non-traditional units in 2011 and 111 in 2010.
Year Ended Year Ended
December 25, 2011 December 26, 2010
North America franchise and development fees were approximately $700,000 in 2011 or an increase of
approximately $100,000 from 2010. The increase was due to an increase in transfer and cancellation fees,
partially offset by a decrease in opening fees as there were a greater number of restaurants opening with
no fee in 2011 in accordance with our development incentive programs.
Domestic commissary sales increased 11.8% to $508.2 million in 2011 from $454.5 million in the prior
comparable period. The increase was primarily due to an increase in the prices of certain commodities,
most notably cheese, and an increase in sales volumes. Our commissaries charge a fixed dollar mark-up
on the cost of cheese. Cheese prices are based upon the block price, which increased to an average price
of $1.80 per pound in 2011 from the $1.59 BIBP block price in 2010.
Other sales decreased $1.0 million to $50.9 million in 2011. The decrease primarily resulted from a
decline in sales at Preferred, and a reduction in the online fee charged to our domestic franchisees.
International franchise sales were $320.0 million in 2011, compared to $258.8 million in 2010. Total
international revenues were $58.6 million for 2011 compared to $46.4 million in 2010, reflecting an
increase in the number of restaurants in addition to the 5.1% increase in comparable sales, calculated on a
constant dollar basis. These increases were partially offset by the prior year’s inclusion of revenues from
Company-owned restaurants located in the United Kingdom, which were sold in the third quarter of 2010.
Our PJUK operations represented 51% of international revenues in both 2011 and 2010.
Costs and Expenses. The restaurant operating margin at domestic Company-owned units was 19.0% in
2011 compared to 20.2% (19.9% excluding BIBP) in 2010. Excluding the impact of consolidating BIBP,
restaurant operating margin decreased 0.9% in 2011 as compared to the corresponding period in 2010,
consisting of the following differences:
Cost of sales were 1.7% higher as a percentage of sales in 2011 as compared to 2010 due to the
impact of higher commodities costs, principally cheese, wheat and meats.
Salaries and benefits were 0.4% lower as a percentage of sales in 2011 compared to 2010,
reflecting the benefit of increased sales.
Advertising and related costs as a percentage of sales were relatively flat year-over-year.
Occupancy costs and other operating costs, on a combined basis, as a percentage of sales, were
0.4% lower in 2011 reflecting the benefit of increased sales.

44
Domestic commissary and other operating margin was 7.8% in 2011, compared to 8.6% in 2010.
Domestic commissary and other operating margin decreased 0.8% in 2011, consisting of the following
differences:
Cost of sales was 0.9% higher as a percentage of revenues in 2011, as compared to 2010. Cost of
sales increased primarily due to the impact of higher commodities costs, primarily cheese, wheat
and meats. In addition, a reduction in online fee revenue from franchisees and an increase in
eCommerce support costs contributed to the increases in cost of sales.
Salaries and benefits were 0.4% lower as a percentage of revenues in 2011, as compared to the
same period of 2010, reflecting the benefit of increased sales.
Other operating expenses were 0.3% higher as a percentage of revenues in 2011, as compared to
2010, primarily due to an increase in distribution costs from increased fuel prices.
We recorded income before income taxes from the franchise cheese-purchasing program, net of
noncontrolling interest, of $5.6 million in 2010 (no impact in 2011 through February, at which time the
purchasing agreement with BIBP was terminated). The results in 2010 only represented the portion of
BIBP’s operating income related to the proportion of BIBP cheese sales to franchisees. The total impact
of the consolidation of BIBP on Papa John’s income before income taxes was $21.0 million in 2010
(including the BIBP Settlement). See the summary of BIBP’s operating results in the Variable Interest
Entities caption for additional information on BIBP’s 2011 and 2010 results.
International operating expenses in 2011 were 84.5% of international restaurant and commissary sales as
compared to 88.7% in 2010. The improvement in operating expenses, as a percentage of sales, was due
to both improvements in operating results in our Beijing and North China restaurants and our PJUK
commissary. Our 2010 results also included start-up costs associated with our PJUK commissary.
General and administrative expenses were $111.6 million, or 9.2% of revenues for 2011, as compared to
$110.0 million, or 9.8% of revenues for 2010. The increase in general and administrative expenses is due
to an increase in travel costs, payroll and other taxes, and employee incentives, partially offset by lower
short- and long-term incentive compensation costs and lower sponsorship fees.
Other general expenses reflected net expense of $9.8 million in 2011, as compared to $9.0 million in 2010
as detailed below (in thousands):
Increase
2011 2010 (Decrease)
Impairment and disposition losses (a) 1,745$ 894$ 851$
Provision (credit) for uncollectible accounts and notes receivable 379 (27) 406
Pre-opening restaurant costs 273 149 124
Franchise and development incentives and initiatives (b) 4,921 7,533 (2,612)
Perfect Pizza lease obligation (c) 832 - 832
Other (d) 1,617 481 1,136
Total other general expenses 9,767$ 9,030$ 737$
(a) Disposition and impairment losses include costs associated with the disposition of certain systems
and other equipment.
(b) The 2010 amounts include discretionary contributions to the PJMF and other local advertising
cooperatives of $6.5 million and incentives to franchisees for opening new restaurants of $1.0
million. The 2011 amounts include approximately $3.2 million in incentives offered to domestic
franchisees for meeting certain sales targets, including driving comparable sales, transactions and
online sales in 2011 and $1.7 million in incentives to franchisees for opening new restaurants.

45
(c) The Perfect Pizza lease obligation relates to rents, taxes and insurance associated with the former
Perfect Pizza operations in the United Kingdom.
(d) Other expense increased primarily due to costs associated with our online customer loyalty program.
Depreciation and amortization was $32.7 million, or 2.7% of revenues, for 2011 as compared to $32.4
million, or 2.9% of revenues, for 2010.
Net interest. Net interest expense was approximately $2.2 million in 2011, compared to $3.4 million in
2010. The decrease in net interest costs reflects a lower average outstanding debt balance and lower
effective interest rates. This was somewhat offset by the increased interest expense in 2011 associated
with the increase in redemption value of noncontrolling interest in a joint venture whose noncontrolling
interest is deemed mandatorily redeemable. See “Notes 2, 3, 4 and 22” of the “Notes to Consolidated
Financial Statements” for additional information.
Income Tax Expense. Our effective income tax rate was 31.0% in 2011 compared to 32.7% in 2010
(32.4% in 2010, excluding BIBP). Our effective income tax rate may fluctuate for various reasons,
including the settlement or resolution of specific federal and state issues. We recognized reductions of
$1.9 million and $550,000 in our income tax expense associated with the finalization of certain income
tax issues in 2011 and 2010, respectively.
Liquidity and Capital Resources
Our long-term debt is comprised entirely of the outstanding balance under our revolving line of credit.
The balance was $88.3 million as of December 30, 2012 and $51.5 million as of December 25, 2011.
In September 2010, we entered into a five-year, $175.0 million unsecured revolving credit facility
(“Credit Facility”) that replaced a $175.0 million unsecured Revolving Credit Facility (“Old Credit
Facility”). The Credit Facility was amended in November 2011 (the “Amended Credit Facility”), which
extended the maturity date of the Credit Facility to November 30, 2016. Under the Amended Credit
Facility, outstanding balances accrue interest at a margin of 75 to 150 basis points over the London
Interbank Offered Rate (“LIBOR”) or other bank developed rates at our option (previously interest
accrued at a margin of 100 to 175 basis points over LIBOR). The commitment fee on the unused balance
under the Amended Credit Facility ranges from 17.5 to 25.0 basis points. The increment over LIBOR and
the commitment fee are determined quarterly based upon the ratio of total indebtedness to earnings before
interest, taxes, depreciation and amortization (“EBITDA”), as defined by the Amended Credit Facility.
Outstanding balances under the Old Credit Facility were charged interest at 50 to 100 basis points over
LIBOR or other bank developed rates, at our option.
We have used interest rate swaps to hedge against the effects of potential interest rate increases on
borrowings under our revolving credit facility. In 2012, we had a swap with a fixed rate of 0.53%, as
compared to LIBOR, with a notional amount of $50.0 million. Subsequent to year end (effective
December 31, 2012), we amended our interest rate swap agreement with a notional amount of $50.0
million to extend the maturity date through December 30, 2015. The amendment resulted in a change to
the fixed rate of interest (to 0.55% from 0.53%) but did not impact the notional amount of the interest rate
swap agreement. See “Note 9” of “Notes to Consolidated Financial Statements” for additional
information.

46
Our Amended Credit Facility contains affirmative and negative covenants, including the following
financial covenants, as defined by the Amended Credit Facility:
Permitted Ratio
Actual Ratio for the
Year Ended
December 30, 2012
Leverage Ratio Not to exceed 2.5 to 1.0 0.8 to 1.0
Interest Coverage Ratio Not less than 3.5 to 1.0 5.2 to 1.0
Our leverage ratio is defined as outstanding debt divided by consolidated EBITDA for the most recent
four fiscal quarters. Our interest coverage ratio is defined as the sum of consolidated EBITDA and
consolidated rental expense for the most recent four fiscal quarters divided by the sum of consolidated
interest expense and consolidated rental expense for the most recent four fiscal quarters. We were in
compliance with all covenants for each of our 2012 quarters and at December 30, 2012.
Cash flow provided by operating activities was $104.4 million for the full-year 2012 as compared to
$101.0 million in 2011, primarily due to higher net income, partially offset by unfavorable working
capital changes.
Cash flow provided by operating activities increased to $101.0 million in 2011 from $92.6 million in
2010. The consolidation of BIBP increased cash flow from operations by approximately $6.8 million in
2010. Excluding the impact of the consolidation of BIBP, cash flow was $101.0 million in 2011 as
compared to $85.8 million in 2010, primarily due to higher net income and favorable working capital
changes, including deferred income taxes.
The Company’s free cash flow for the last three years was as follows (in thousands):
Dec. 30, Dec. 25, Dec. 26,
2012 2011 2010
Net cash provided by operating activities 104,379$ 101,008$ 92,581$
Gain from BIBP cheese purchasing entity - - (6,804)
Purchase of property and equipment (42,628) (29,319) (31,125)
Free cash flow (a) 61,751$ 71,689$ 54,652$
Year Ended
(a) We define free cash flow as net cash provided by operating activities (from the consolidated
statements of cash flows) excluding the impact of BIBP, less the purchases of property and
equipment. See “Items Impacting Comparability; Non-GAAP Measures” for more information
about this non-GAAP measure, its limitations and why we present free cash flow alongside the
most directly comparable GAAP measure.
We require capital primarily for the development, acquisition, renovation and maintenance of restaurants,
the development, renovation and maintenance of commissary facilities and equipment and the
enhancement of corporate systems and facilities, including technological enhancements. Purchases of
property and equipment amounted to $42.6 million, $29.3 million, and $31.1 million in 2012, 2011 and

47
2010, respectively, and are summarized by operating segment in “Note 21” of “Notes to Consolidated
Financial Statements.”
Our Board of Directors has authorized the repurchase of our common stock through September 29, 2013
of $1.1 billion, including $50 million authorized in December 2012 and $50 million authorized in
February 2013. The following is a summary of our common share repurchases for the last three years (in
thousands, except average price per share):
Fiscal
Year
Number of
Shares
Repurchased
Total Cash
Paid
Average
Price Per
Share
2010 1,881 $46,936 $24.95
2011 2,084 $65,323 $31.35
2012 2,276 $106,095 $46.61
Subsequent to year end, we acquired an additional 5,000 shares at an aggregate cost of $254,000.
Approximately $115.2 million remained available under the Company’s share repurchase program as of
February 24, 2013.
The outstanding principal balance under our revolving line of credit was $88.3 million in 2012, $51.5
million in 2011, and $99.0 million in 2010. The increase in 2012 was due to increased share repurchases.
Contractual obligations and payments as of December 30, 2012 due by year are as follows (in thousands):
Less than 1
Year 1-3 Years 3-5 Years
After 5
Years Total
Contractual Obligations:
Revolving line of credit (1) -$ -$ 88,258$ -$ 88,258$
Interest payments (2) 1,016 2,032 788 - 3,836
Total debt 1,016 2,032 89,046 - 92,094
Operating leases 34,073 56,803 36,582 32,227 159,685
Total contractual obligations 35,089$ 58,835$ 125,628$ 32,227$ 251,779$
Payments Due by Period
(1) We utilize an interest rate swap to hedge against our variable rate debt. The value of our interest rate
swap was $104,000 at December 30, 2012 and was recorded in other long-term liabilities in the
consolidated balance sheet.
(2) Represents estimated interest payments on our revolving line of credit balance outstanding as of
December 30, 2012. The interest payments assume the outstanding balance on our $175.0 million
unsecured revolving line of credit will remain at $88.3 million until the maturity date of November
30, 2016. Interest payments are calculated based on LIBOR plus the applicable margin in effect at
December 30, 2012, and considers the amended interest rate swap agreement in effect until December
30, 2015 (interest rate of 0.55%). The actual interest rates on the variable indebtedness incurred and
the amount of our indebtedness could vary from those used to compute the above interest payments.

48
See “Note 9” of “Notes to Consolidated Financial Statements” for additional information concerning
our debt and credit arrangements.
The above table does not include $3.4 million of unrecognized tax benefits since we are not able to make
reasonable estimates of the period of cash settlement with respect to the taxing authority. Additionally,
the above table does not include $18.2 million of redeemable and mandatorily redeemable noncontrolling
interests as we are not able to predict the timing of the redemptions.
Off-Balance Sheet Arrangements
The off-balance sheet arrangements that are reasonably likely to have a current or future effect on the
Company’s financial condition are operating leases of Company-owned restaurant sites, QC Centers,
office space and transportation equipment.
We guarantee leases for certain Papa John’s domestic franchisees, who purchased restaurants that were
previously Company-owned, as well as in the United Kingdom in connection with the 2006 sale of our
former Perfect Pizza operations. We are contingently liable on these leases. These leases have varying
terms, the latest of which expires in 2018. As of December 30, 2012, the estimated maximum amount of
undiscounted payments the Company could be required to make in the event of nonpayment by the
primary lessees was $4.7 million, net of amounts reserved of approximately $300,000 related to the
Perfect Pizza operations. No liability has been recorded related to the other guarantees.
We have certain other commercial commitments where payment is contingent upon the occurrence of
certain events. Such commitments include the following by year (in thousands):
Less than 1-3 3-5 After
1 Year Years Years 5 Years Total
Other Commercial Commitments:
Standby letters of credit 19,931$ -$ -$ -$ 19,931$
Amount of Commitment Expiration Per Period
See “Notes 9, 12 and 17” of “Notes to Consolidated Financial Statements” for additional information
related to contractual and other commitments.

49
Forward-Looking Statements
Certain matters discussed in this report, including information within Management’s Discussion and
Analysis of Financial Condition and Results of Operations, and other Company communications
constitute forward-looking statements within the meaning of the federal securities laws. Generally, the
use of words such as “expect,” “estimate,” “believe,” “anticipate,” “will,” “forecast,” “plan,” “project,” or
similar words identify forward-looking statements that we intend to be included within the safe harbor
protections provided by the federal securities laws. Such statements may relate to projections concerning
business performance, revenue, earnings, contingent liabilities, resolution of litigation, commodity costs,
margins, unit growth, and other financial and operational measures. Such statements are not guarantees of
future performance and involve certain risks, uncertainties and assumptions, which are difficult to predict
and many of which are beyond our control. Therefore, actual outcomes and results may differ materially
from those matters expressed or implied in such forward-looking statements. The risks, uncertainties and
assumptions that are involved in our forward-looking statements include, but are not limited to:
aggressive changes in pricing or other marketing or promotional strategies by competitors which
may adversely affect sales; and new product and concept developments by food industry
competitors;
changes in consumer preferences and adverse general economic and political conditions,
including increasing tax rates, and their resulting impact on consumer buying habits;
the impact that product recalls, food quality or safety issues, and general public health concerns
could have on our restaurants;
failure to maintain our brand strength and quality reputation;
the ability of the company and its franchisees to meet planned growth targets and operate new and
existing restaurants profitably, which could be impacted by challenges securing financing, finding
suitable store locations or securing required domestic or foreign government permits and
approvals;
increases in or sustained high costs of food ingredients and other commodities;
disruption of our supply chain due to sole or limited source of suppliers or weather, drought,
disease or other disruption beyond our control;
increased risks associated with our international operations, including economic and political
conditions in our international markets and difficulty in meeting planned sales targets and new
store growth for our international operations;
increased employee compensation, benefits, insurance, regulatory compliance and similar costs,
including increased costs resulting from federal health care legislation;
the credit performance of our franchise loan program;
the impact of the resolution of current or future claims and litigation, and current or proposed
legislation impacting our business;
currency exchange and interest rates;
failure to effectively execute succession planning, and our reliance on the services of our Founder
and CEO, who also serves as our brand spokesperson;
credit risk associated with parties to leases of restaurants and commissaries, including those
Perfect Pizza locations formerly operated by us, for which we remain contractually liable; and
disruption of critical business or information technology systems, and risks associated with
security breaches, including theft of company and customer information.
These and other risk factors are discussed in detail in “Part I. Item 1A. – Risk Factors” of this report. We
undertake no obligation to update publicly any forward-looking statements, whether as a result of future
events, new information or otherwise, except as required by law.

50
Item 7A. Quantitative and Qualitative Disclosures About Market Risk
Our debt at December 30, 2012 was comprised of an $88.3 million outstanding principal balance on our
$175.0 million unsecured revolving line of credit. The interest rate on the revolving line of credit is
variable and is based on the London Interbank Offered Rate (LIBOR) plus a margin of 75 to 150 basis
points as amended effective November 2011, tiered based upon debt and cash flow levels, or other bank
developed rates at our option.
In August 2011, we entered into a new interest rate swap agreement that provides for a fixed rate of
0.53%, as compared to LIBOR, with a notional amount of $50.0 million. Subsequent to year end
(effective December 31, 2012), we amended our interest rate swap agreement with a notional amount of
$50.0 million to extend the maturity date through December 30, 2015. The amendment resulted in a
change to the fixed rate of interest (to 0.55% from 0.53%) but did not impact the notional amount of the
interest rate swap agreement. Previously, we had two interest rate swap agreements that expired in
January 2011. The previous swap agreements provided for fixed rates of 4.98% and 3.74%, as compared
to LIBOR, with each having a notional amount of $50.0 million.
The effective interest rate on the revolving line of credit, including the impact of the interest rate swap
agreement, was 1.1% as of December 30, 2012. An increase in the present interest rate of 100 basis points
on the line of credit balance outstanding as of December 30, 2012, net of the swap, would increase
interest expense by $383,000.
We do not enter into financial instruments to manage foreign currency exchange rates since only 5.4% of
our total revenues are derived from sales to customers and royalties outside the United States.
In the ordinary course of business, the food and paper products we purchase, including cheese
(historically representing 35% to 40% of our food cost), are subject to seasonal fluctuations, weather,
availability, demand and other factors that are beyond our control. We have pricing agreements with some
of our vendors, including forward pricing agreements for a portion of our cheese purchases for our
domestic Company-owned restaurants, which are accounted for as normal purchases; however, we still
remain exposed to on-going commodity volatility.
As previously discussed in “Critical Accounting Policies and Estimates,” we had a purchasing
arrangement with a third-party entity, BIBP, formed at the direction of our Franchise Advisory Council,
for the sole purpose of reducing cheese price volatility to restaurants operating in the United States. In
February 2011, we terminated this purchasing arrangement with BIBP and BIBP ceased operations. Over
99% of our franchisees have entered into a cheese purchasing agreement with PJFS. The cheese
purchasing agreement specifies that PJFS will charge the franchisees a predetermined price for cheese on
a monthly basis. Any difference between the amount charged to franchisees and the actual price paid by
PJFS for cheese will be recorded as a receivable from or a payable to the franchisees, to be repaid based
upon a predetermined formula outlined in the agreement.
Consolidation accounting requires the portion of BIBP operating income (loss) related to domestic
Company-owned restaurants to be reflected as a reduction (increase) in the “Domestic Company-owned
restaurant expenses – cost of sales” line item, thus reflecting the actual market price of cheese had the
purchasing arrangement not existed. The consolidation of BIBP had a significant impact on our 2010
operating results. BIBP had no impact in 2011, as BIBP had break-even results while operating through
February 2011.

51
The following table presents the actual average block price for cheese by quarter in 2012, 2011 and 2010
and the average BIBP block price by quarter for 2010 (not applicable in 2011 and 2012). Also presented
is the projected full-year 2013 average block price (based on the February 24, 2013 Chicago Mercantile
Exchange cheese futures prices for 2013):
2013 2012 2011
Projected Block Block BIBP Actual
Market Price Price Block Price Block Price
Quarter 1 1.689$ 1.522$ 1.695$ 1.595$ 1.431$
Quarter 2 1.749 1.539 1.736 1.529 1.407
Quarter 3 1.840 1.750 2.006 1.572 1.597
Quarter 4 1.808 1.939 1.760 1.645 1.578
Full Year 1.772$ 1.692$ 1.799$ 1.585$ 1.503$
2010

52
Item 8. Financial Statements and Supplementary Data
Report of Independent Registered Public Accounting Firm
The Board of Directors and Stockholders of Papa John’s International, Inc. and Subsidiaries
We have audited the accompanying consolidated balance sheets of Papa John’s International, Inc. and
Subsidiaries as of December 30, 2012 and December 25, 2011, and the related consolidated statements of
income, comprehensive income, stockholders' equity, and cash flows for each of the three years in the
period ended December 30, 2012. Our audits also included the financial statement schedule listed in the
Index at Item 15(a)(2). These financial statements and schedule are the responsibility of the Company's
management. Our responsibility is to express an opinion on these financial statements and schedule based
on our audits.
We conducted our audits in accordance with the standards of the Public Company Accounting Oversight
Board (United States). Those standards require that we plan and perform the audit to obtain reasonable
assurance about whether the financial statements are free of material misstatement. An audit includes
examining, on a test basis, evidence supporting the amounts and disclosures in the financial statements.
An audit also includes assessing the accounting principles used and significant estimates made by
management, as well as evaluating the overall financial statement presentation. We believe that our audits
provide a reasonable basis for our opinion.
In our opinion, the financial statements referred to above present fairly, in all material respects, the
consolidated financial position of Papa John’s International, Inc. and Subsidiaries at December 30, 2012
and December 25, 2011, and the consolidated results of their operations and their cash flows for each of
the three years in the period ended December 30, 2012, in conformity with U.S. generally accepted
accounting principles. Also, in our opinion, the related financial statement schedule, when considered in
relation to the basic financial statements taken as a whole, presents fairly in all material respects the
information set forth therein.
As discussed in Note 3 to the consolidated financial statements, the 2010 and 2011 consolidated financial
statements have been restated to correct for errors in the accounting for certain redemption features of the
noncontrolling interests of joint venture agreements.
We also have audited, in accordance with the standards of the Public Company Accounting Oversight
Board (United States), Papa John’s International, Inc. and Subsidiaries’ internal control over financial
reporting as of December 30, 2012, based on criteria established in Internal Control—Integrated
Framework issued by the Committee of Sponsoring Organizations of the Treadway Commission and our
report dated February 28, 2013, expressed an adverse opinion thereon.
/s/ Ernst & Young LLP
Louisville, Kentucky
February 28, 2013

53
Report of Independent Registered Public Accounting Firm
The Board of Directors and Stockholders of Papa John’s International, Inc. and Subsidiaries
We have audited Papa John’s International, Inc. and Subsidiaries’ internal control over financial reporting as of
December 30, 2012, based on criteria established in Internal Control—Integrated Framework issued by the
Committee of Sponsoring Organizations of the Treadway Commission (the COSO criteria). Papa John’s
International, Inc. and Subsidiaries’ management is responsible for maintaining effective internal control over
financial reporting, and for its assessment of the effectiveness of internal control over financial reporting included in
the accompanying “Management’s Report on our Internal Control over Financial Reporting.” Our responsibility is
to express an opinion on the company’s internal control over financial reporting based on our audit.
We conducted our audit in accordance with the standards of the Public Company Accounting Oversight Board
(United States). Those standards require that we plan and perform the audit to obtain reasonable assurance about
whether effective internal control over financial reporting was maintained in all material respects. Our audit
included obtaining an understanding of internal control over financial reporting, assessing the risk that a material
weakness exists, testing and evaluating the design and operating effectiveness of internal control based on the
assessed risk, and performing such other procedures as we considered necessary in the circumstances. We believe
that our audit provides a reasonable basis for our opinion.
A company’s internal control over financial reporting is a process designed to provide reasonable assurance
regarding the reliability of financial reporting and the preparation of financial statements for external purposes in
accordance with generally accepted accounting principles. A company’s internal control over financial reporting
includes those policies and procedures that (1) pertain to the maintenance of records that, in reasonable detail,
accurately and fairly reflect the transactions and dispositions of the assets of the company; (2) provide reasonable
assurance that transactions are recorded as necessary to permit preparation of financial statements in accordance
with generally accepted accounting principles, and that receipts and expenditures of the company are being made
only in accordance with authorizations of management and directors of the company; and (3) provide reasonable
assurance regarding prevention or timely detection of unauthorized acquisition, use or disposition of the company’s
assets that could have a material effect on the financial statements.
Because of its inherent limitations, internal control over financial reporting may not prevent or detect misstatements.
Also, projections of any evaluation of effectiveness to future periods are subject to the risk that controls may become
inadequate because of changes in conditions, or that the degree of compliance with the policies or procedures may
deteriorate.
A material weakness is a deficiency, or combination of deficiencies, in internal control over financial reporting, such
that there is a reasonable possibility that a material misstatement of the company’s annual or interim financial
statements will not be prevented or detected on a timely basis. In their assessment, management has identified a
material weakness in internal controls over the accounting for noncontrolling interests of joint venture agreements.
Specifically, the review controls in place with respect to non-routine contractual changes or amendments related to
these agreements were not effective. We also have audited, in accordance with the standards of the Public
Accounting Oversight Board (United States), the consolidated balance sheets of Papa John’s International, Inc. and
Subsidiaries as of December 30, 2012 and December 25, 2011, and the related consolidated statements of income,
comprehensive income, stockholders' equity, and cash flows for each of the three years in the period ended
December 30, 2012. This material weakness was considered in determining the nature, timing and extent of audit
tests applied in our audit of those financial statements, and this report does not affect our report dated February 28,
2013, which expressed an unqualified opinion on those financial statements.
In our opinion, because of the effect of the material weakness described above on the achievement of the objectives
of the control criteria, Papa John’s International, Inc. and Subsidiaries has not maintained effective internal control
over financial reporting as of December 30, 2012, based on the COSO criteria.
/s/ Ernst & Young LLP
Louisville, Kentucky
February 28, 2013

54
Papa John’s International, Inc. and Subsidiaries
Consolidated Statements of Income
(In thousands, except per share amounts) Years Ended
December 30, December 25, December 26,
2012 2011 2010
North America revenues: (As Restated) (As Restated)
Domestic Company-owned restaurant sales 592,203$ 525,841$ 503,272$
Franchise royalties 79,567 73,694 69,631
Franchise and development fees 806 722 610
Domestic commissary sales 545,924 508,155 454,506
Other sales 51,223 50,912 51,951
International revenues:
Royalties and franchise and development fees 19,881 16,327 13,265
Restaurant and commissary sales 53,049 42,231 33,162
Total revenues 1,342,653 1,217,882 1,126,397
Costs and expenses:
Domestic Company-owned restaurant expenses:
Cost of sales 137,378 126,887 111,010
Salaries and benefits 163,260 142,093 137,840
Advertising and related costs 54,583 49,035 47,174
Occupancy costs 34,734 32,278 32,343
Other operating expenses 85,847 75,558 72,997
Total domestic Company-owned restaurant expenses 475,802 425,851 401,364
Domestic commissary and other expenses:
Cost of sales 454,108 426,955 382,150
Salaries and benefits 38,083 35,141 34,063
Other operating expenses 57,298 53,188 46,890
Total domestic commissary and other expenses 549,489 515,284 463,103
Income from the franchise cheese-purchasing program,
net of noncontrolling interest - - (5,634)
International operating expenses 44,853 35,674 29,429
General and administrative expenses 131,591 111,608 109,954
Other general expenses 8,313 9,767 9,030
Depreciation and amortization 32,798 32,681 32,407
Total costs and expenses 1,242,846 1,130,865 1,039,653
Operating income 99,807 87,017 86,744
Investment income 750 755 875
Interest expense (2,162) (2,981) (4,309)
Income before income taxes 98,395 84,791 83,310
Income tax expense 32,393 26,324 27,247
Net income, including redeemable noncontrolling interests 66,002 58,467 56,063
Less: income attributable to redeemable noncontrolling interests (4,342) (3,732) (3,485)
Net income, net of redeemable noncontrolling interests 61,660$ 54,735$ 52,578$
Basic earnings per common share 2.63$ 2.19$ 2.00$
Earnings per common share - assuming dilution 2.58$ 2.16$ 1.99$
Basic weighted average shares outstanding 23,458 25,043 26,328
Diluted weighted average shares outstanding 23,905 25,310 26,468
Supplemental data (see Note 16):
Revenues - affiliates 29,310$ 28,078$ 24,290$
See accompanying notes.

55
Papa John's International, Inc. and Subsidiaries
Consolidated Statements of Comprehensive Income
(In thousands)
December 30, December 25, December 26,
2012 2011 2010
(As Restated) (As Restated)
Net income, including redeemable noncontrolling interests 66,002$ 58,467$ 56,063$
Other comprehensive income (loss), before tax:
Foreign currency translation adjustments 1,128 864 (523)
Interest rate swaps (114) 258 3,756
Defined benefit pension plan 45 (45) 83
Other comprehensive income (loss), before tax 1,059 1,077 3,316
Income tax effect:
Foreign currency translation adjustments (1,110) - -
Interest rate swaps 42 (93) (1,352)
Defined benefit pension plan (16) 16 (31)
Income tax effect (1,084) (77) (1,383)
Other comprehensive income (loss), net of tax (25) 1,000 1,933
Comprehensive income, including redeemable noncontrolling interests 65,977 59,467 57,996
Less: Comprehensive income, redeemable noncontrolling interests (4,342) (3,732) (3,485)
Comprehensive income, net of redeemable noncontrolling interests 61,635$ 55,735$ 54,511$
See accompanying notes.
Years Ended

56
Papa John’s International, Inc. and Subsidiaries
Consolidated Balance Sheets
(In thousands, except per share amounts)
December 30, December 25,
2012 2011
(As Restated)
Assets
Current assets:
Cash and cash equivalents 16,396$ 18,942$
Accounts receivable (less allowance for doubtful
accounts of $3,057 in 2012 and $3,034 in 2011) 43,585 27,487
Accounts receivable - affiliates (no allowance for doubtful
accounts in 2012 and 2011) 1,062 682
Notes receivable (no allowance for doubtful accounts in 2012 and 2011) 4,577 4,221
Inventories 22,178 20,091
Deferred income taxes 10,279 7,636
Prepaid expenses 12,782 10,210
Other current assets 7,767 5,555
Total current assets 118,626 94,824
Net property and equipment 196,661 181,910
Notes receivable, less current portion (less allowance for doubtful
accounts of $5,028 in 2012 and $5,905 in 2011) 12,536 11,502
Goodwill 78,958 75,085
Other assets 31,627 27,061
Total assets 438,408$ 390,382$
Liabilities and stockholders’ equity
Current liabilities:
Accounts payable 32,624$ 32,966$
Income and other taxes payable 10,429 3,969
Accrued expenses and other current liabilities 60,528 44,198
Total current liabilities 103,581 81,133
Deferred revenue 7,329 4,780
Long-term debt 88,258 51,489
Deferred income taxes 10,672 6,692
Other long-term liabilities 40,674 36,676
Total liabilities 250,514 180,770
Redeemable noncontrolling interests 6,380 3,965
Stockholders’ equity:
Preferred stock ($.01 par value per share; authorized 5,000 shares,
no shares issued) - -
Common stock ($.01 par value per share; authorized 50,000 shares,
issued 37,088 in 2012 and 36,656 in 2011) 371 367
Additional paid-in capital 280,905 262,456
Accumulated other comprehensive income 1,824 1,849
Retained earnings 356,461 294,801
Treasury stock (14,847 shares in 2012 and 12,637 shares in 2011, at cost) (458,047) (353,826)
Total stockholders' equity 181,514 205,647
Total liabilities, redeemable noncontrolling interests and stockholders' equity 438,408$ 390,382$
See accompanying notes.
Years Ended
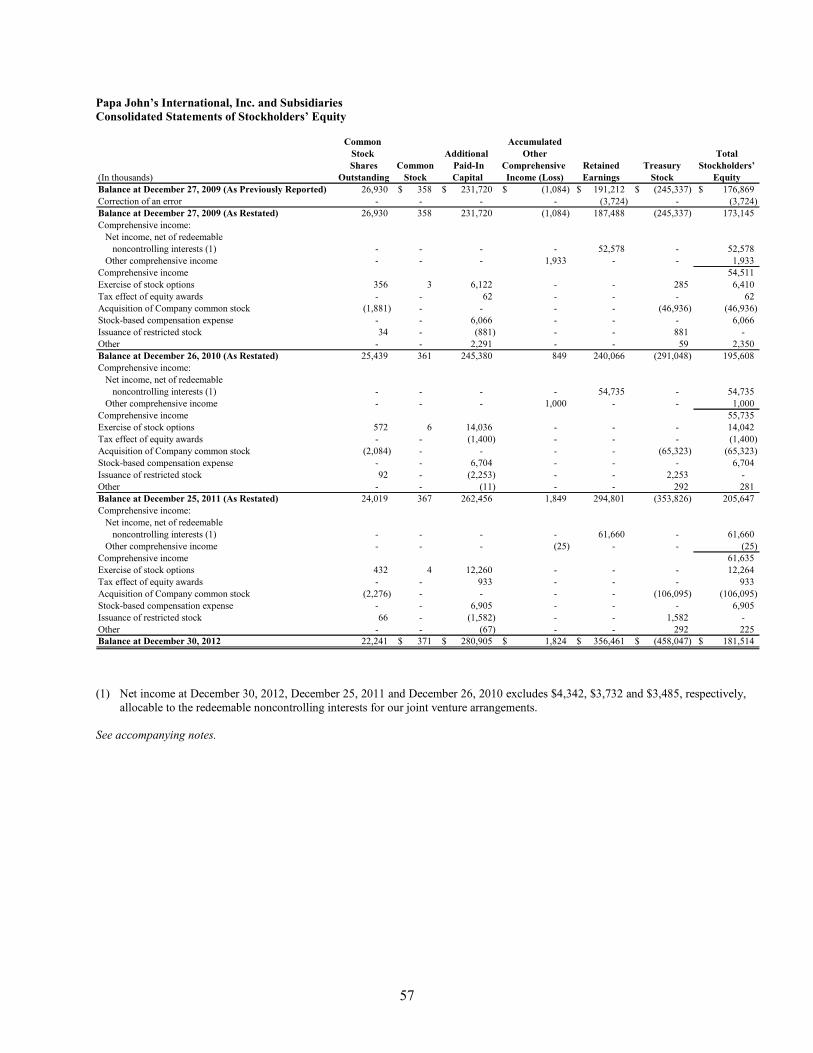
57
Papa John’s International, Inc. and Subsidiaries
Consolidated Statements of Stockholders’ Equity
Common Accumulated
Stock Additional Other Total
Shares Common Paid-In Comprehensive Retained Treasury Stockholders’
(In thousands) Outstanding Stock Capital Income (Loss) Earnings Stock Equity
Balance at December 27, 2009 (As Previously Reported) 26,930 358$ 231,720$ (1,084)$ 191,212$ (245,337)$ 176,869$
Correction of an error - - - - (3,724) - (3,724)
Balance at December 27, 2009 (As Restated) 26,930 358 231,720 (1,084) 187,488 (245,337) 173,145
Comprehensive income:
Net income, net of redeemable
noncontrolling interests (1) - - - - 52,578 - 52,578
Other comprehensive income - - - 1,933 - - 1,933
Comprehensive income 54,511
Exercise of stock options 356 3 6,122 - - 285 6,410
Tax effect of equity awards - - 62 - - - 62
Acquisition of Company common stock (1,881) - - - - (46,936) (46,936)
Stock-based compensation expense - - 6,066 - - - 6,066
Issuance of restricted stock 34 - (881) - - 881 -
Other - - 2,291 - - 59 2,350
Balance at December 26, 2010 (As Restated) 25,439 361 245,380 849 240,066 (291,048) 195,608
Comprehensive income:
Net income, net of redeemable
noncontrolling interests (1) - - - - 54,735 - 54,735
Other comprehensive income - - - 1,000 - - 1,000
Comprehensive income 55,735
Exercise of stock options 572 6 14,036 - - - 14,042
Tax effect of equity awards - - (1,400) - - - (1,400)
Acquisition of Company common stock (2,084) - - - - (65,323) (65,323)
Stock-based compensation expense - - 6,704 - - - 6,704
Issuance of restricted stock 92 - (2,253) - - 2,253 -
Other - - (11) - - 292 281
Balance at December 25, 2011 (As Restated) 24,019 367 262,456 1,849 294,801 (353,826) 205,647
Comprehensive income:
Net income, net of redeemable
noncontrolling interests (1) - - - - 61,660 - 61,660
Other comprehensive income - - - (25) - - (25)
Comprehensive income 61,635
Exercise of stock options 432 4 12,260 - - - 12,264
Tax effect of equity awards - - 933 - - - 933
Acquisition of Company common stock (2,276) - - - - (106,095) (106,095)
Stock-based compensation expense - - 6,905 - - - 6,905
Issuance of restricted stock 66 - (1,582) - - 1,582 -
Other - - (67) - - 292 225
Balance at December 30, 2012 22,241 371$ 280,905$ 1,824$ 356,461$ (458,047)$ 181,514$
(1) Net income at December 30, 2012, December 25, 2011 and December 26, 2010 excludes $4,342, $3,732 and $3,485, respectively,
allocable to the redeemable noncontrolling interests for our joint venture arrangements.
See accompanying notes.

58
Papa John’s International, Inc. and Subsidiaries
Consolidated Statements of Cash Flows
(In thousands)
December 30, December 25, December 26,
2012 2011 2010
Operating activities (As Restated) (As Restated)
Net income, including redeemable noncontrolling interests 66,002$ 58,467$ 56,063$
Adjustments to reconcile net income to net cash provided by operating activities:
Disposition and impairment losses 269 1,200 479
Provision for uncollectible accounts and notes receivable 1,674 1,037 917
Depreciation and amortization 32,798 32,681 32,407
Deferred income taxes 2,035 9,345 4,944
Stock-based compensation expense 6,905 6,704 6,066
Excess tax benefit on equity awards (1,967) (741) (359)
Other 2,961 4,556 (743)
Changes in operating assets and liabilities, net of acquisitions:
Accounts receivable (18,048) (4,298) (5,022)
Inventories (1,947) (2,689) (1,848)
Prepaid expenses (2,572) (2,514) (1,303)
Other current assets (1,667) 1,486 773
Other assets and liabilities (3,952) (877) 50
Accounts payable (342) 1,397 4,579
Income and other taxes payable 6,460 2,180 480
Accrued expenses and other current liabilities 12,209 (5,685) (5,830)
Deferred revenue 3,561 (1,241) 928
Net cash provided by operating activities 104,379 101,008 92,581
Investing activities
Purchases of property and equipment (42,628) (29,319) (31,125)
Loans issued (4,903) (3,492) (2,637)
Repayments of loans issued 3,642 5,357 3,918
Acquisitions, net of cash acquired (6,175) - -
Proceeds from divestitures of restaurants 908 - 1,397
Other 36 68 12
Net cash used in investing activities (49,120) (27,386) (28,435)
Financing activities
Net proceeds (repayments) on line of credit facility 36,769 (47,511) -
Excess tax benefit on equity awards 1,967 741 359
Tax payments for restricted stock issuances (855) (1,041) -
Proceeds from exercise of stock options 12,264 14,042 6,410
Acquisition of Company common stock (106,095) (65,323) (46,936)
Net proceeds from issuance of redeemable noncontrolling interests 2,052 - -
Distributions to redeemable noncontrolling interest holders (4,256) (3,669) (3,147)
Other 225 160 96
Net cash used in financing activities (57,929) (102,601) (43,218)
Effect of exchange rate changes on cash and cash equivalents 124 92 62
Change in cash and cash equivalents (2,546) (28,887) 20,990
Cash and cash equivalents at beginning of year 18,942 47,829 26,839
Cash and cash equivalents at end of year 16,396$ 18,942$ 47,829$
See accompanying notes.
Years Ended

59
Papa John’s International, Inc. and Subsidiaries
Notes to Consolidated Financial Statements
1. Description of Business
Papa John’s International, Inc. (referred to as the “Company,” “Papa John’s” or in the first person
notations of “we,” “us” and “our”) operates and franchises pizza delivery and carryout restaurants under
the trademark “Papa John’s,” currently in all 50 states and 35 countries. Substantially all revenues are
derived from retail sales of pizza and other food and beverage products to the general public by
Company-owned restaurants, franchise royalties, sales of franchise and development rights, and sales to
franchisees of food and paper products, printing and promotional items, risk management services, and
information systems and related services used in their operations.
2. Significant Accounting Policies
Principles of Consolidation
The accompanying consolidated financial statements include the accounts of Papa John’s and its
subsidiaries. Our financial results include BIBP Commodities, Inc. (“BIBP”), a variable interest entity
(“VIE”) for which we were the primary beneficiary. The results of our Company-owned operations in
Mexico and China are consolidated one month in arrears. The results of our inactive captive insurance
subsidiary, RSC Insurance Services, Ltd. (“RSC”), are consolidated one quarter in arrears. All
intercompany balances and transactions have been eliminated.
Fiscal Year
Our fiscal year ends on the last Sunday in December of each year. All fiscal years presented consist of 52
weeks except for the 2012 fiscal year, which consists of 53 weeks.
Use of Estimates
The preparation of consolidated financial statements in conformity with accounting principles generally
accepted in the United States requires management to make estimates and assumptions that affect the
amounts reported in the consolidated financial statements and accompanying notes. Significant items that
are subject to such estimates and assumptions include allowance for doubtful accounts and notes
receivable, intangible assets, online customer loyalty program obligation, insurance reserves and income
tax reserves. Although management bases its estimates on historical experience and assumptions that are
believed to be reasonable under the circumstances, actual results could significantly differ from these
estimates.
Revenue Recognition
Franchise fees are recognized when a franchised restaurant begins operations, at which time we have
performed our obligations related to such fees. Fees received pursuant to development agreements which
grant the right to develop franchised restaurants in future periods in specific geographic areas are deferred
and recognized on a pro rata basis as franchised restaurants subject to the development agreements begin
operations. Retail sales from Company-owned restaurants and franchise royalties, which are based on a
percentage of franchise restaurant sales, are recognized as revenues when the products are delivered to or
carried out by customers.

60
2. Significant Accounting Policies (continued)
Domestic production and distribution revenues are comprised of food, promotional items and supplies
sold to franchised restaurants located in the United States and are recognized as revenue upon shipment of
the related products to the franchisees. Information services, including software maintenance fees, help
desk fees and online ordering fees are recognized as revenue as related services are provided and are
included in other sales. Insurance commissions are recognized as revenue over the term of the policy
period and are included in other sales.
International revenues are comprised of restaurant sales, royalties and fees received from foreign
franchisees and the sale and distribution of food to foreign franchisees, and are recognized consistently
with the policies applied for revenues generated in the United States.
Cash Equivalents
Cash equivalents consist of highly liquid investments with maturity of three months or less at date of
purchase. These investments are carried at cost, which approximates fair value.
Accounts Receivable
Substantially all accounts receivable are due from franchisees for purchases of food, paper products,
restaurant equipment, printing and promotional items, risk management services, information systems and
related services, and for royalties from December sales. Credit is extended based on an evaluation of the
franchisee’s financial condition and, generally, collateral is not required. A reserve for uncollectible
accounts is established as deemed necessary based upon overall accounts receivable aging levels and a
specific review of accounts for franchisees with known financial difficulties.
Inventories
Inventories, which consist of food products, paper goods and supplies, smallwares, and printing and
promotional items, are stated at the lower of cost, determined under the first-in, first-out (FIFO) method,
or market.
Property and Equipment
Property and equipment are stated at cost. Depreciation is recorded using the straight-line method over the
estimated useful lives of the assets (generally five to ten years for restaurant, commissary and other
equipment, and 20 to 40 years for buildings and improvements). Leasehold improvements are amortized
over the terms of the respective leases, including the first renewal period (generally five to ten years).
Depreciation expense was $32.1 million in 2012, $31.9 million in 2011 and $31.4 million in 2010.
Leases
Lease expense is recognized on a straight-line basis over the expected life of the lease term. A lease term
often includes option periods, available at the inception of the lease, when failure to renew the lease
would impose a penalty to us. Such penalty may include the recognition of impairment on our leasehold
improvements should we choose not to continue the use of the leased property.

61
2. Significant Accounting Policies (continued)
Intangible Assets - Goodwill
Financial Accounting Standards Board (“FASB”) Accounting Standards Update (“ASU”) 2011-08,
“Testing Goodwill for Impairment,” was effective for annual and interim goodwill impairment tests
performed for fiscal years beginning after December 15, 2011; however, early adoption was permitted.
We elected to early adopt the provisions of ASU 2011-08 in fiscal 2011.
ASU 2011-08 permits us to first assess qualitative factors to determine whether it is more-likely-than-not
that the fair value of a reporting unit is less than its carrying amount as a basis for determining whether it
is necessary to perform the two-step quantitative goodwill impairment test. Under the two-step
quantitative goodwill impairment test, the fair value of the reporting unit is compared to its respective
carrying amount including goodwill. If the fair value exceeds the carrying amount, then no impairment
exists. If the carrying amount exceeds the fair value, further analysis is performed to assess impairment.
Because market prices of our reporting units are not readily available, we make various estimates and
assumptions in determining the estimated fair values of our reporting units. The estimated fair value is
based on an income approach, with an appropriate risk adjusted discount rate, and a market approach
where appropriate. Significant assumptions inherent in the methodologies are employed and include such
estimates as discount rates, growth rates and certain market transaction multiples.
We evaluate goodwill annually in the fourth quarter or whenever we identify certain triggering events or
circumstances that would more-likely-than-not reduce the fair value of a reporting unit below its carrying
amount. Such tests are completed separately with respect to the goodwill of each of our reporting units.
Events or circumstances that might indicate an interim evaluation is warranted include, among other
factors, unexpected adverse business conditions, macro and reporting unit specific economic factors (for
example, deteriorating results in comparison to projections, commodity inflation, or loss of key
personnel), unanticipated competitive activities, and acts by governments or courts.
Under ASU 2011-08, companies can bypass the qualitative assessment and move directly to the
quantitative assessment for any reporting unit in any period if management believes that it is more
efficient or there is a risk of impairment. All companies can elect to resume performing the qualitative
assessment in any subsequent period. We applied the qualitative assessment for our domestic Company-
owned restaurants and China reporting unit, which is included in our international reporting segment. As
a result of our qualitative analysis, we determined that it was more-likely-than-not that the fair value of
our domestic Company-owned restaurants and China reporting unit were greater than their carrying
amounts.
With respect to the reporting unit for our subsidiary located in the United Kingdom (“PJUK”), which
represents $15.4 million of goodwill as of December 30, 2012, we bypassed the qualitative assessment
and performed the two-step quantitative goodwill impairment test, which indicated the fair value
exceeded the carrying amount by 37%. The fair value was calculated using an income approach that
projected net cash flow over a 10-year discrete period and a terminal value, which were discounted using
appropriate rates. The selected discount rate considers the risk and nature of our PJUK reporting unit’s
cash flow and the rates of return market participants would require to invest their capital in the PJUK
reporting unit. We believe our PJUK reporting unit will continue to improve its operating results through
ongoing growth initiatives, by increasing Papa John’s brand awareness in the United Kingdom, improving
sales and profitability for individual franchised restaurants and increasing PJUK franchised net unit
openings over the next several years. Future impairment charges could be required if adverse economic
events occur in the United Kingdom.

62
2. Significant Accounting Policies (continued)
Subsequent to completing our annual qualitative and quantitative goodwill impairment tests, no
indications of impairment were identified.
Deferred Costs
We defer certain information systems development and related costs that meet established criteria.
Amounts deferred, which are included in property and equipment, are amortized principally over periods
not exceeding five years beginning in the month subsequent to completion of the related information
systems project. Total costs deferred were approximately $2.7 million in 2012, $1.5 million in 2011 and
$2.0 million in 2010. The unamortized information systems development costs approximated $5.8 million
and $4.1 million as of December 30, 2012 and December 25, 2011, respectively.
Deferred Income Tax Accounts and Tax Reserves
We are subject to income taxes in the United States and several foreign jurisdictions. Significant
judgment is required in determining our provision for income taxes and the related assets and liabilities.
The provision for income taxes includes income taxes paid, currently payable or receivable and those
deferred.
Deferred tax assets and liabilities are determined based on differences between financial reporting and tax
basis of assets and liabilities, and are measured using enacted tax rates and laws that are expected to be in
effect when the differences reverse. Deferred tax assets are also recognized for the estimated future
effects of tax loss carryforwards. The effect on deferred taxes of changes in tax rates is recognized in the
period in which the new tax is enacted. Valuation allowances are established when necessary on a
jurisdictional basis to reduce deferred tax assets to the amounts we expect to realize. As of December 30,
2012, we had a net deferred tax liability of approximately $400,000.
Tax authorities periodically audit the Company. We record reserves and related interest and penalties for
identified exposures as income tax expense. We evaluate these issues and adjust for events, such as statute
of limitations expirations, court rulings or audit settlements, which may impact our ultimate payment for
such exposures. We recognized reductions of $738,000, $1.9 million and $550,000 in our income tax
expense associated with the finalization of certain income tax issues in 2012, 2011 and 2010, respectively.
See Note 15 for additional information.
Advertising and Related Costs
Advertising and related costs include the costs of domestic Company-owned local restaurant activities
such as mail coupons, door hangers and promotional items and contributions to Papa John’s Marketing
Fund, Inc. (“PJMF”), an unconsolidated non-profit corporation, and various local market cooperative
advertising funds (“Co-op Funds”). Contributions by domestic Company-owned and franchised
restaurants to PJMF and the Co-op Funds are based on an established percentage of monthly restaurant
revenues. PJMF is responsible for developing and conducting marketing and advertising for the Papa
John’s system. The Co-op Funds are responsible for developing and conducting advertising activities in a
specific market, including the placement of electronic and print materials developed by PJMF. We
recognize domestic Company-owned restaurant contributions to PJMF and the Co-op Funds in which we
do not have a controlling interest in the period in which the contribution accrues. The net assets of the Co-
op Funds in which we possess majority voting rights, and thus control the cooperatives, are included in
our consolidated balance sheets.

63
2. Significant Accounting Policies (continued)
Foreign Currency Translation
The local currency is the functional currency for our foreign subsidiaries located in the United Kingdom,
Mexico and China. Earnings and losses are translated into U.S. dollars using monthly average exchange
rates, while assets and liabilities are translated using year-end exchange rates. The resulting translation
adjustments are included as a component of accumulated other comprehensive income (loss) net of
income taxes.
Stock-Based Compensation
Compensation expense for equity grants is estimated on the grant date, net of projected forfeitures. Stock
options are valued using a Black-Scholes option pricing model. Our specific assumptions for estimating
the fair value of options are included in Note 19. Restricted stock is valued based on the market price of
the Company’s shares on the date of grant.
Fair Value Measurements and Disclosures
Fair value is determined based on the price that would be received to sell the asset or paid to transfer the
liability to a market participant. Fair value is a market-based measurement, not an entity-specific
measurement.
The guidance requires that assets and liabilities carried at fair value be classified and disclosed in one of
the following categories:
Level 1: Quoted market prices in active markets for identical assets or liabilities.
Level 2: Observable market-based inputs or unobservable inputs that are corroborated by market
data.
Level 3: Unobservable inputs that are not corroborated by market data.
Our financial assets and liabilities that were measured at fair value on a recurring basis as of December
30, 2012 and December 25, 2011 are as follows:
Carrying
(In thousands) Value Level 1 Level 2 Level 3
December 30, 2012
Financial assets:
Cash surrender value of life insurance policies * 13,551$ 13,551$ -$ -$
Financial liabilities:
Interest rate swap 104 - 104 -
December 25, 2011
Financial assets:
Cash surrender value of life insurance policies * 11,387$ 11,387$ -$ -$
Interest rate swap 11 - 11 -
* Represents life insurance policies held in our non-qualified deferred compensation plan.
Fair Value Measurements

64
2. Significant Accounting Policies (continued)
There were no transfers among levels within the fair value hierarchy during fiscal 2011 or 2012.
The fair value of our interest rate swap is based on the sum of all future net present value cash flows. The
future cash flows are derived based on the terms of our interest rate swap, as well as considering
published discount factors, and projected London Interbank Offered Rates (“LIBOR”).
Derivative Financial Instruments
We recognize all derivatives on the balance sheet at fair value. At inception and on an ongoing basis, we
assess whether each derivative that qualifies for hedge accounting continues to be highly effective in
offsetting changes in the cash flows of the hedged item. If the derivative meets the hedge criteria as
defined by certain accounting standards, depending on the nature of the hedge, changes in the fair value
of the derivative are either offset against the change in fair value of assets, liabilities or firm
commitments through earnings or recognized in accumulated other comprehensive income until the
hedged item is recognized in earnings. The ineffective portion of a derivative’s change in fair value, if
any, is immediately recognized in earnings.
We recognized a loss of $114,000 ($72,000 after tax) in 2012, income of $258,000 ($165,000 after tax)
in 2011 and income of $3.8 million ($2.4 million after tax) in 2010, in accumulated other comprehensive
income for the net change in the fair value of our interest rate swap. The ineffective portion of our hedge
was $25,000 in 2010 (none in 2011 or 2012). See Note 9 for additional information on our debt and
credit arrangements.
Earnings per Share
The calculations of basic earnings per common share and earnings per common share – assuming dilution
for the years ended December 30, 2012, December 25, 2011 and December 26, 2010 are as follows (in
thousands, except per share data):
2012 2011 2010
(As Restated) (As Restated)
Basic earnings per common share:
Net income, net of redeemable noncontrolling interests 61,660$ 54,735$ 52,578$
Weighted average shares outstanding 23,458 25,043 26,328
Basic earnings per common share 2.63$ 2.19$ 2.00$
Earnings per common share - assuming dilution:
Net income, net of redeemable noncontrolling interests 61,660$ 54,735$ 52,578$
Weighted average shares outstanding 23,458 25,043 26,328
Dilutive effect of outstanding equity awards 447 267 140
Diluted weighted average shares outstanding 23,905 25,310 26,468
Earnings per common share - assuming dilution 2.58$ 2.16$ 1.99$
Shares subject to options to purchase common stock with an exercise price greater than the average
market price for the year were not included in the computation of earnings per common share – assuming
dilution because the effect would have been antidilutive. The weighted average number of shares subject
to antidilutive options was 273,000 in 2011 and 1.5 million in 2010 (none in 2012).

65
2. Significant Accounting Policies (continued)
Redeemable Noncontrolling Interests
Noncontrolling interests associated with our joint ventures that are mandatorily redeemable are reported
in other long-term liabilities in our consolidated balance sheets at redemption value. Other redeemable
noncontrolling interests associated with our joint ventures are reported in the temporary equity section of
our consolidated balance sheets (between total liabilities and stockholders’ equity).
For our joint ventures, consolidated net income is required to be reported separately at amounts
attributable both to the parent and the redeemable noncontrolling interest. Additionally, disclosures are
required to clearly identify and distinguish between the interests of the parent company and the interests
of the noncontrolling owners, including a disclosure on the face of the consolidated statements of income
attributable to the redeemable noncontrolling interest holder.
See Notes 3, 4 and 22 for additional information regarding our redeemable noncontrolling interests.
New Accounting Pronouncements
The Company adopted the required ASUs 2011-05 and 2011-12, “Comprehensive Income: Presentation
of Comprehensive Income,” in 2012 on a retrospective basis. The updated guidance does not change the
components of comprehensive income, but eliminates certain options for presenting comprehensive
income in the financial statements. In accordance with this updated guidance, we no longer present
components of comprehensive income in our consolidated statements of stockholders’ equity. Instead, we
are now required to present components of comprehensive income in either one continuous financial
statement with two sections, net income and comprehensive income, or in two separate but consecutive
statements. We elected the two separate statement approach in the accompanying financial statements.
Reclassifications
Certain other prior year amounts in the consolidated balance sheets and the consolidated statements of
cash flows have been reclassified to conform to the current year presentation, which also had no effect on
current or previously reported net income.
Subsequent Events
The Company evaluated subsequent events through the date the financial statements were issued and
filed. See Note 9 for information regarding our interest rate swap amendment and Note 17 for subsequent
information regarding litigation. There were no other subsequent events that required recognition or
disclosure.
3. Restatement of Previously Issued Financial Statements
In connection with the evaluation of the accounting for newly formed joint ventures in 2012, we reviewed
our accounting for our previously existing joint venture arrangements. As a result of our review, we
determined an error occurred in the accounting for one joint venture agreement, which contained a
mandatorily redeemable feature added through a contract amendment in the third quarter of 2009. This
provision contained in the 2009 contract amendment was not previously considered in determining the
classification and measurement of the noncontrolling interest. In addition, we determined that an
additional redeemable noncontrolling interest was incorrectly classified in shareholders’ equity and
should be classified as temporary equity. As such, we are restating our previously issued consolidated

66
3. Restatement of Previously Issued Financial Statements (continued)
financial statements for the years ended December 25, 2011, December 26, 2010 and December 27, 2009
to correct the errors.
To correctly reflect the appropriate measurement of the mandatorily redeemable noncontrolling interest,
we recorded a $3.7 million adjustment, net of income taxes, to ending 2009 retained earnings in our
consolidated statements of stockholders’ equity to adjust the previously reported balance to its redemption
value as of December 27, 2009. Additionally, we also corrected the classification errors of the redeemable
noncontrolling interests from permanent equity to either other long-term liabilities or redeemable
noncontrolling interests in our consolidated balance sheets, as detailed in the tables below.
In our 2010 and 2011 consolidated statements of income, interest expense, income tax expense, and net
income were affected as a result of adjusting the mandatorily redeemable noncontrolling interest to its
redemption value. The impact of the restatements on the consolidated balance sheets, consolidated
statements of income, and consolidated statements of cash flows by year is outlined in the tables below.
The corrections had no impact on total revenues, operating income or operating cash flows and had no
impact on our compliance with debt covenants in any periods presented.
The following tables summarize the corrections by financial statement line item (in thousands, except per
share data):
As Previously
Reported Adjustments As Restated
Consolidated balance sheet
Noncurrent deferred income tax liabilities 9,147$ (2,455)$ 6,692$
Other long-term liabilities 25,611 11,065 36,676
Redeemable noncontrolling interests - 3,965 3,965
Retained earnings 298,807 (4,006) 294,801
Noncontrolling interests in subsidiaries 8,569 (8,569) -
Total stockholders' equity 218,222 (12,575) 205,647
Consolidated statement of income
Interest expense 1,497$ 1,484$ 2,981$
Income before income taxes 86,275 (1,484) 84,791
Income tax expense 26,888 (564) 26,324
Net income, including noncontrolling interests 59,387 (920) 58,467
Net income, net of noncontrolling interests 55,655 (920) 54,735
Comprehensive income 60,387 (920) 59,467
Basic earnings per common share 2.22 (0.03) 2.19
Earnings per common share - assuming dilution 2.20 (0.04) 2.16
Consolidated statement of cash flows
Net income 59,387$ (920)$ 58,467$
Deferred income taxes 9,909 (564) 9,345
Other 3,072 1,484 4,556
Net cash provided by operating activities 101,008 - 101,008
December 25, 2011

67
3. Restatement of Previously Issued Financial Statements (continued)
As Previously
Reported Adjustments As Restated
Consolidated balance sheet
Noncurrent deferred income tax liabilities (assets) 341$ (1,892)$ (1,551)$
Other long-term liabilities 26,604 9,972 36,576
Redeemable noncontrolling interests - 3,512 3,512
Retained earnings 243,152 (3,086) 240,066
Noncontrolling interests in subsidiaries 8,506 (8,506) -
Total stockholders' equity 207,200 (11,592) 195,608
Consolidated statement of income
Interest expense 5,338$ (1,029)$ 4,309$
Income before income taxes 82,281 1,029 83,310
Income tax expense 26,856 391 27,247
Net income, including noncontrolling interests 55,425 638 56,063
Net income, net of noncontrolling interests 51,940 638 52,578
Comprehensive income 57,358 638 57,996
Basic earnings per common share 1.97 0.03 2.00
Earnings per common share - assuming dilution 1.96 0.03 1.99
Consolidated statement of cash flows
Net income 55,425$ 638$ 56,063$
Deferred income taxes 4,553 391 4,944
Other 286 (1,029) (743)
Net cash provided by operating activities 92,581 - 92,581
December 26, 2010
As Previously
Reported Adjustments As Restated
Consolidated statement of stockholders' equity
Retained earnings 191,212$ (3,724)$ 187,488$
Noncontrolling interests in subsidiaries 8,168 (8,168) -
Total stockholders' equity 185,037 (11,892) 173,145
December 27, 2009

68
4. Redeemable Noncontrolling Interests
Papa John’s has joint ventures in which there are redeemable noncontrolling interests, including the
following as of December 30, 2012, December 25, 2011 and December 26, 2010:
Redeemable
Noncontrolling
Number of Restaurant Papa John's Interest
Restaurants Locations Ownership Ownership
December 30, 2012
Star Papa, LP 78 Texas 51% 49%
Colonel's Limited, LLC 52 Maryland and Virginia 70% 30%
PJ Minnesota, LLC 30 Minnesota 80% 20%
PJ Denver, LLC 22 Colorado 60% 40%
December 25, 2011
Star Papa, LP 76 Texas 51% 49%
Colonel's Limited, LLC 52 Maryland and Virginia 70% 30%
December 26, 2010
Star Papa, LP 75 Texas 51% 49%
Colonel's Limited, LLC 52 Maryland and Virginia 70% 30%
The income before income tax attributable to these joint ventures for the last three years was as follows
(in thousands):
2012 2011 2010
Papa John's International, Inc. 6,823$ 6,184$ 5,658$
Redeemable noncontrolling interests 4,342 3,732 3,485
Total income before income tax 11,165$ 9,916$ 9,143$
Year Ended
The Colonel’s Limited, LLC agreement contains a mandatory redemption clause and accordingly the
Company has recorded this noncontrolling interest as a liability at its redemption value in other long-term
liabilities.
As part of the other joint venture agreements, the noncontrolling interest holders maintain the option to
require the Company to purchase their interests. Since redemption of the noncontrolling interests is
outside of the Company’s control, the noncontrolling interests are presented in the caption “Redeemable
noncontrolling interests” in the consolidated balance sheets.
The Star Papa, LP agreement contains a redemption feature that is not currently redeemable, but it is
probable to become redeemable in the future. Due to specific valuation provisions contained in the
agreement, this noncontrolling interest has also been recorded at its carrying value in temporary equity.

69
4. Redeemable Noncontrolling Interests (continued)
The PJ Minnesota, LLC and PJ Denver, LLC agreements contain redemption features that are currently
redeemable and, therefore, these noncontrolling interests have been recorded in temporary equity at their
current redemption values, which approximate their carrying values.
The redeemable noncontrolling interest holders’ equity associated with these joint ventures totaled $6.4
million as of December 30, 2012 and $4.0 million as of December 25, 2011.
As more fully described in Note 3, we corrected errors in our accounting for our noncontrolling interests
related to our joint ventures.
5. Accounting for Variable Interest Entities
The Consolidation topic of the ASC provides a framework for identifying variable interest entities
(“VIEs”) and determining when a company should include the assets, liabilities, noncontrolling interests
and results of activities of a VIE in its consolidated financial statements.
In general, a VIE is a corporation, partnership, limited liability company, trust, or any other legal structure
used to conduct activities or hold assets that either (1) has an insufficient amount of equity to carry out its
principal activities without additional subordinated financial support, (2) has a group of equity owners
that are unable to make significant decisions about its activities, or (3) has a group of equity owners that
do not have the obligation to absorb losses or the right to receive returns generated by its operations.
Consolidation of a VIE is required if a party with an ownership, contractual or other financial interest in
the VIE (“a variable interest holder”) is obligated to absorb a majority of the risk of loss from the VIE’s
activities, is entitled to receive a majority of the VIE’s residual returns (if no party absorbs a majority of
the VIE’s losses), or both. A variable interest holder that consolidates the VIE is called the primary
beneficiary. Upon consolidation, the primary beneficiary generally must initially record all of the VIE’s
assets, liabilities and noncontrolling interests at fair value and subsequently account for the VIE as if it
were consolidated based on majority voting interest. The variable interest holder is also required to make
disclosures about VIEs in which it has significant variable interest even when it is not required to
consolidate.
Through February 2011, we had a purchasing agreement with BIBP, a special-purpose entity formed at
the direction of our Franchise Advisory Council, for the sole purpose of reducing cheese price volatility to
domestic system-wide restaurants. BIBP was an independent, franchisee-owned corporation. BIBP
purchased cheese at the market price and sold it to our distribution subsidiary, PJ Food Service, Inc.
(“PJFS”), at a fixed price. PJFS in turn sold cheese to Papa John’s restaurants (both Company-owned and
franchised) at a set price. PJFS purchased $25.1 million of cheese for the three months ended March 27,
2011 and $153.0 million of cheese during 2010 from BIBP.
Prior to the termination of the purchasing agreement with BIBP, we recognized the operating losses
generated by BIBP when BIBP’s shareholders’ equity was in a net deficit position. Further, we
recognized the subsequent operating income generated by BIBP up to the amount of any losses previously
recognized. Prior to ceasing operating activities, BIBP operated at break-even for the three months ended
March 27, 2011. We recognized pre-tax income of $21.0 million ($13.5 million net of tax, or $0.51 per
diluted share) in 2010, reflecting BIBP’s operating income (losses), net of BIBP’s shareholders’ equity.

70
5. Accounting for Variable Interest Entities (continued)
BIBP had an accumulated deficit (representing prior purchases of cheese by PJFS from BIBP at below
market prices) of $14.2 million at December 26, 2010. PJFS agreed to pay BIBP the amount equal to the
accumulated deficit at December 26, 2010. Accordingly, BIBP recorded a decrease of $14.2 million in
cost of sales and PJFS recorded a corresponding increase in cost of sales. This transaction did not have
any impact on our 2010 consolidated income statement results since both PJFS and BIBP are fully
consolidated.
In February 2011, we terminated the purchasing agreement with BIBP and BIBP no longer has operating
activities. Over 99% of our domestic franchisees have entered into a cheese purchasing agreement with
PJFS. The cheese purchasing agreement requires participating domestic franchisees to purchase cheese
through PJFS, or to pay the franchisee’s portion of any accumulated cheese liability upon ceasing to
purchase cheese from PJFS when a liability exists. The cheese purchasing agreement specifies that PJFS
will charge the franchisees a predetermined price for cheese on a monthly basis. Any difference between
the amount charged to franchisees and the actual price paid by PJFS for cheese is recorded as a receivable
from or a payable to the franchisees, to be repaid based upon a predetermined formula outlined in the
agreement.
6. Acquisitions
During the second quarter of 2012, we completed the acquisition of 56 franchised Papa John’s restaurants
located in the Denver and Minneapolis markets. The purchase price, which was paid in cash, was $5.2
million net of divestiture proceeds of $700,000 from the sale of six restaurants located in the Denver
market to an existing franchisee. This business combination was accounted for by the purchase method of
accounting, whereby operating results subsequent to the acquisition date are included in our consolidated
financial results.
The preliminary purchase price of the acquisition has been allocated based on initial fair value estimates
as follows (in thousands):
Property and equipment 1,602$
Reacquired franchise right 245
Goodwill 3,830
Other, including cash 239
Total purchase price 5,916$
The excess of the purchase price over the aggregate fair value of net assets acquired was allocated to
goodwill, all of which is eligible for deduction over 15 years under the U.S. tax regulations.
On July 23, 2012, Papa John’s and a third party formed a limited liability company (PJ Minnesota, LLC)
to operate the previously acquired Minneapolis restaurants. The Company’s equity (80% ownership) in
the operations was funded by the contribution of the acquired restaurants, while the third party’s equity
(20% ownership) was funded through a $275,000 loan issued by Papa John’s and a $25,000 cash
contribution. There was no gain or loss on this transaction. We are required to fully consolidate the
financial results of this limited liability company and report the redeemable noncontrolling interest as
temporary equity in the section between total liabilities and stockholders’ equity in our consolidated
balance sheets. See Note 4 for additional information.

71
6. Acquisitions (continued)
On September 24, 2012, Papa John’s and a third party formed a limited liability company (PJ Denver,
LLC) to operate the previously acquired Denver restaurants. The Company’s equity (60% ownership) in
the operations was funded by the contribution of the acquired restaurants and cash (total value of $2.5
million), while the third party’s equity (40% ownership) was funded by a cash contribution of $1.7
million. There was no gain or loss on this transaction. We are required to fully consolidate the financial
results of this limited liability company and report the redeemable noncontrolling interest as temporary
equity in the section between total liabilities and stockholders’ equity in our consolidated balance sheets.
See Note 4 for additional information.
There were no significant acquisitions or divestitures during 2011 and 2010.
7. Goodwill
The following summarizes changes to the Company’s goodwill, by reporting segment (in thousands):
Domestic
Company-
owned
Restaurants International (a)
All
Others Total
Balance as of December 26, 2010 55,260$ 19,001$ 436$ 74,697
Foreign currency adjustments - 388 - 388
Balance as of December 25, 2011 55,260 19,389 436 75,085
Acquisitions (b) 3,943 - - 3,943
Divestitures (636) - - (636)
Foreign currency adjustments - 566 - 566
Balance as of December 30, 2012 58,567$ 19,955$ 436$ 78,958$
(a) The international goodwill balances for all years presented are net of accumulated impairment of $2.3
million associated with our PJUK reporting unit, which was recorded in fiscal 2008.
(b) Includes 56 restaurants located in the Denver and Minneapolis markets and one restaurant in another
market.
For fiscal 2012 and 2011, as permitted by ASU 2011-08, we performed a qualitative analysis for our
domestic Company-owned restaurants and our China reporting unit. For our PJUK reporting unit, which
is included in the international reporting segment, we performed a quantitative analysis. For our 2010
annual goodwill impairment assessments, we performed a quantitative goodwill impairment test for all
reporting units. Upon completion of our goodwill impairment tests in 2012, 2011 and 2010, no
impairment charges were recorded.

72
8. Restaurant Impairment and Dispositions
The following table summarizes restaurant impairment and disposition losses (gains) included in other
general expenses in the accompanying consolidated statements of income during 2012, 2011 and 2010
(in thousands):
2012 2011 2010
Net book value of divested restaurants 1,219$ -$ 2,828$
Cash proceeds received 908 - 1,397
Fair value of notes receivable (1) 160 - 1,431
Total consideration at fair value (1) 1,068 - 2,828
Loss on restaurants sold 151 - -
Loss (gain) on domestic restaurant closures 125 (203) 95
Adjustment to long-lived asset impairment reserves - 117 158
Total restaurant impairment and disposition losses (gains) 276$ (86)$ 253$
(1) We sold 12 Company-owned restaurants to franchisees in both 2012 and 2010 (none in 2011). As a
part of the agreements to sell the restaurants, we received notes totaling $160,000 in 2012 and $1.4
million in 2010.
9. Debt and Credit Arrangements
Our long-term debt is comprised entirely of the outstanding balance under our revolving line of credit.
The balance was $88.3 million as of December 30, 2012 and $51.5 million as of December 25, 2011.
In September 2010, we entered into a five-year, $175.0 million unsecured revolving credit facility
(“Credit Facility”) that replaced a $175.0 million unsecured Revolving Credit Facility (“Old Credit
Facility”). The Credit Facility was amended in November 2011 (the “Amended Credit Facility”), which
extended the maturity date of the Credit Facility to November 30, 2016. Under the Amended Credit
Facility, outstanding balances accrue interest at 75 to 150 basis points over the London Interbank Offered
Rate (“LIBOR”) or other bank developed rates at our option (previously interest accrued at 100 to 175
basis points over LIBOR). The commitment fee on the unused balance under the Amended Credit Facility
ranges from 17.5 to 25.0 basis points. The increment over LIBOR and the commitment fee are determined
quarterly based upon the ratio of total indebtedness to earnings before interest, taxes, depreciation and
amortization (“EBITDA”), as defined by the Amended Credit Facility. Outstanding balances under the
Old Credit Facility were charged interest at 50 to 100 basis points over LIBOR or other bank developed
rates, at our option. The remaining availability under the Amended Credit Facility, reduced for
outstanding letters of credit, approximated $66.8 million as of December 30, 2012. The fair value of the
outstanding debt approximates the carrying value since the debt agreements are variable-rate instruments.
The Amended Credit Facility contains customary affirmative and negative covenants, including financial
covenants requiring the maintenance of specified fixed charges and leverage ratios. At December 30,
2012, we were in compliance with these covenants.

73
9. Debt and Credit Arrangements (continued)
In August 2011, we entered into a new interest rate swap agreement that provides for a fixed rate of
0.53%, as compared to LIBOR, with a notional amount of $50.0 million. Subsequent to year end
(effective December 31, 2012), we amended our interest rate swap agreement with a notional amount of
$50.0 million to extend the maturity date through December 30, 2015. The amendment resulted in a
change to the fixed rate of interest (to 0.55% from 0.53%) but did not impact the notional amount of the
interest rate swap agreement. Previously, we had two interest rate swap agreements that expired in
January 2011. The previous swap agreements provided for fixed rates of 4.98% and 3.74%, as compared
to LIBOR, with each having a notional amount of $50.0 million.
Our swaps are derivative instruments that are designated as cash flow hedges because the swaps provide a
hedge against the effects of changes in our variable interest rates on borrowings. The effective portion of
the gain or loss on the swap is reported as a component of accumulated other comprehensive income and
reclassified into earnings in the same period or periods during which the swap affects earnings. Gains or
losses on the swap representing either hedge ineffectiveness or hedge components excluded from the
assessment of effectiveness are recognized in current earnings. Amounts payable or receivable under the
swap are accounted for as adjustments to interest expense. As of December 30, 2012, the swap is a highly
effective cash flow hedge.
The following tables provide information on the location and amounts of our swaps in the accompanying
consolidated financial statements (in thousands):
Fair Values of Derivative Instruments
Derivatives designated as hedging instruments:
Balance Sheet Location
Fair Value
Dec. 30, 2012 Balance Sheet Location
Fair Value
Dec. 25, 2011
Interest rate swaps Other long-term liabilities 104$ Other long-term assets 11$
There were no derivatives that were not designated as hedging instruments.
Liability Derivatives Asset Derivatives

74
9. Debt and Credit Arrangements (continued)
Effect of Derivative Instruments on the Consolidated Financial Statements
Derivatives -
Cash Flow
Hedging
Relationships
Amount of Gain
or (Loss)
Recognized in
Accumulated
OCI on
Derivative
(Effective
Portion)
Location of Gain
or (Loss)
Reclassified
from
Accumulated
OCI into Income
(Effective
Portion)
Amount of Gain
or (Loss)
Reclassified
from
Accumulated
OCI into Income
(Effective
Portion)
Location of Gain
or (Loss)
Recognized in
Income on
Derivative
(Ineffective
Portion and
Amount
Excluded from
Effectiveness
Testing)
Amount of Gain
or (Loss)
Recognized in
Income on
Derivative
(Ineffective
Portion and
Amount
Excluded from
Effectiveness
Testing)
Interest rate swaps:
2012 (72)$ Interest expense (150)$ Interest expense -$
2011 165$ Interest expense (341)$ Interest expense 65$
2010 2,404$ Interest expense (4,131)$ Interest expense (25)$
The weighted average interest rates for the credit facilities, including the impact of the previously
mentioned swap agreements, were 1.3%, 1.9% and 5.2% in fiscal 2012, 2011 and 2010, respectively.
Interest paid, including payments made or received under the swaps, was $967,000 in 2012, $1.6 million
in 2011 and $5.4 million in 2010. As of December 30, 2012, the $104,000 liability associated with the
interest rate swap was expected to be reclassified into earnings in 2013. Subsequent to year end (effective
December 31, 2012), we amended our interest rate swap agreement with a notional amount of $50.0
million to extend the maturity date through December 30, 2015. The amendment resulted in a change to
the fixed rate of interest (to 0.55% from 0.53%) but did not impact the notional amount of the interest rate
swap agreement.
10. Net Property and Equipment
Net property and equipment consists of the following (in thousands):
2012 2011
Land 32,776$ 32,735$
Buildings and improvements 86,219 85,907
Leasehold improvements 96,652 90,855
Equipment and other 249,055 231,059
Construction in progress 23,262 5,159
Total property and equipment 487,964 445,715
Less accumulated depreciation and amortization (291,303) (263,805)
Net property and equipment 196,661$ 181,910$

75
11. Notes Receivable
Selected franchisees have borrowed funds from our wholly-owned subsidiary, Capital Delivery, Ltd.,
principally for use in the acquisition, construction and development of their restaurants. We have also
entered into loan agreements with certain franchisees that purchased restaurants from us or from other
franchisees. Loans outstanding were approximately $17.1 million and $15.7 million on a consolidated
basis as of December 30, 2012 and December 25, 2011, respectively, net of allowance for doubtful
accounts.
Notes receivable bear interest at fixed or floating rates and are generally secured by the assets of each
restaurant and the ownership interests in the franchisee. The carrying amounts of the loans approximate
fair value. Interest income recorded on franchisee loans was approximately $631,000 in 2012, $665,000
in 2011 and $794,000 in 2010 and is reported in investment income in the accompanying consolidated
statements of income.
Based on our review of certain borrowers’ economic performance and underlying collateral value, we
established allowances of $5.0 million and $5.9 million as of December 30, 2012 and December 25, 2011,
respectively, for potentially uncollectible notes receivable. The following summarizes changes in our
notes receivable allowance for doubtful accounts (in thousands):
Balance as of December 26, 2010 9,951$
Recovered from costs and expenses (35)
Deductions, including notes written off (4,011)
Balance as of December 25, 2011 5,905
Charged to costs and expenses 280
Deductions, including notes written off (1,157)
Balance as of December 30, 2012 5,028$
12. Insurance Reserves
Our insurance programs for workers’ compensation, general liability, owned and non-owned automobiles,
property, and health insurance coverage provided to our employees are funded by the Company up to
certain retention levels. Losses are accrued based upon undiscounted estimates of the aggregate retained
liability for claims incurred using certain third-party actuarial projections and our claims loss experience.
The estimated insurance claims losses could be significantly affected should the frequency or ultimate
cost of claims differ significantly from historical trends used to estimate the insurance reserves recorded
by the Company. The following table summarizes changes in our insurance program reserves (in
thousands):
Balance as of December 26, 2010 18,987$
Expense 20,668
Payments (20,377)
Balance as of December 25, 2011 19,278
Expense 27,728
Payments (24,703)
Balance as of December 30, 2012 22,303$

76
12. Insurance Reserves (continued)
We are a party to standby letters of credit with off-balance sheet risk associated with our insurance
programs. The total amount committed under letters of credit for these programs was $19.9 million at
December 30, 2012.
13. Accrued Expenses
Accrued expenses and other current liabilities consist of the following (in thousands):
2012 2011
Salaries, benefits and bonuses 22,370$ 13,982$
Insurance reserves, current 11,532 9,215
Purchases 9,903 4,764
Rent 6,314 6,242
Consulting and professional fees 1,766 1,911
Utilities 1,240 1,420
Customer loyalty program 1,137 1,339
Marketing 1,079 635
Other 5,187 4,690
Total 60,528$ 44,198$
14. Other Long-term Liabilities
Other long-term liabilities consist of the following (in thousands):
2012 2011
(As Restated)
Deferred compensation plan 12,775$ 10,793$
Mandatorily redeemable noncontrolling interests 11,837 11,065
Insurance reserves 10,771 10,063
Other 5,291 4,755
Total 40,674$ 36,676$
15. Income Taxes
A summary of the provision for income taxes follows (in thousands):
2012 2011 2010
Current: (As Restated) (As Restated)
Federal 26,065$ 14,383$ 19,049$
Foreign 1,669 1,273 1,171
State and local 2,624 850 2,083
Deferred (federal and state) 2,035 9,818 4,944
Total 32,393$ 26,324$ 27,247$

77
15. Income Taxes (continued)
Significant deferred tax assets (liabilities) follow (in thousands):
2012 2011
(As Restated)
Accrued liabilities 10,412$ 7,604$
Accrued bonuses 5,365 2,447
Other assets and liabilities 11,492 12,140
Stock options 5,377 5,091
Other 4,643 4,704
Foreign net operating losses 7,896 7,474
Valuation allowance on foreign net operating
losses and foreign deferred tax assets (8,240) (7,474)
Total deferred tax assets 36,945 31,986
Deferred expenses (4,581) (3,497)
Accelerated depreciation (15,966) (13,477)
Goodwill (12,269) (10,426)
Other (4,522) (3,642)
Total deferred tax liabilities (37,338) (31,042)
Net deferred (liability) asset (393)$ 944$
The Company had approximately $32.5 million and $28.8 million of foreign tax net operating loss
carryovers as of December 30, 2012 and December 25, 2011, respectively, for which a full valuation
allowance has been provided. A substantial majority of our foreign tax net operating losses do not have an
expiration date.

78
15. Income Taxes (continued)
The reconciliation of income tax computed at the U.S. federal statutory rate to income tax expense for the
years ended December 30, 2012, December 25, 2011 and December 26, 2010 is as follows in both dollars
and as a percentage of income before income taxes ($ in thousands):
Income Tax
Expense
Income
Tax Rate
Income Tax
Expense
Income
Tax Rate
Income Tax
Expense
Income
Tax Rate
Tax at U.S. federal statutory rate 34,438$ 35.0% 29,677$ 35.0% 29,159$ 35.0%
State and local income taxes 1,936 2.0% 1,702 2.0% 1,896 2.3%
Foreign income taxes 1,669 1.7% 1,273 1.5% 1,171 1.4%
Settlement of certain tax issues (738) (0.8%) (1,912) (2.3%) (550) (0.7%)
Income of consolidated partnerships attributable
to redeemable noncontrolling interests (1,604) (1.6%) (1,379) (1.6%) (1,297) (1.6%)
Non-qualified deferred compensation
plan (income) loss (355) (0.4%) 153 0.2% (434) (0.5%)
Tax credits and other (2,953) (3.0%) (3,190) (3.8%) (2,698) (3.2%)
Total 32,393$ 32.9% 26,324$ 31.0% 27,247$ 32.7%
2012 2011 2010
(As Restated) (As Restated)
Income taxes paid were $25.3 million in 2012, $15.6 million in 2011 and $21.7 million in 2010.
The Company files income tax returns in the U.S. federal jurisdiction and various states and foreign
jurisdictions. The Company, with few exceptions, is no longer subject to U.S. federal, state and local, or
non-U.S. income tax examinations by tax authorities for years before 2008. The Company is currently
undergoing examinations by various tax authorities. The Company anticipates that the finalization of
these current examinations and other issues could result in a decrease in the liability for unrecognized tax
benefits (and a decrease of income tax expense) of approximately $400,000 during the next 12 months.
The Company had $3.4 million of unrecognized tax benefits at December 30, 2012 of which, if
recognized, would affect the effective tax rate. A reconciliation of the beginning and ending liability for
unrecognized tax benefits is as follows (in thousands):
Balance at December 26, 2010 3,331$
Reductions for tax positions of prior years (95)
Reductions for lapse of statute of limitations (248)
Balance at December 25, 2011 2,988
Additions for tax positions of prior years 664
Reductions for lapse of statute of limitations (222)
Balance at December 30, 2012 3,430$
The Company recognizes accrued interest and penalties related to unrecognized tax benefits as a part of
income tax expense. The Company’s 2012 and 2011 income tax expense includes interest benefits of
$137,000 and $368,000, respectively. The Company has accrued approximately $846,000 and $985,000
for the payment of interest and penalties as of December 30, 2012 and December 25, 2011, respectively.

79
16. Related Party Transactions
Certain of our officers and directors own equity interests in entities that franchise restaurants. Following
is a summary of full-year transactions and year-end balances with franchisees owned by related parties,
PJMF and Papa Card, Inc. (in thousands):
2012 2011 2010
Revenues from affiliates:
Commissary sales 23,145$ 22,132$ 19,137$
Other sales 2,394 2,352 1,961
Franchise royalties 3,771 3,579 3,192
Franchise and development fees - 15 -
Total 29,310$ 28,078$ 24,290$
Accounts receivable - affiliates 1,062$ 682$ 624$
We paid $1.1 million in 2012, $1.0 million in 2011 and $443,000 in 2010 for charter aircraft services
provided by an entity owned by our Founder, Chairman and Chief Executive Officer.
The Company offers customers the opportunity to earn points through the Papa Rewards® program. The
points can be redeemed at Papa John’s restaurants. For certain national promotions, PJMF reimburses
domestic restaurants for the costs associated with the redeemed points (i.e., primarily food costs). During
2012, Company-owned restaurants received $3.0 million from the PJMF under this reimbursement
program.
In connection with a new multi-year supplier agreement, the Company received a $5.0 million supplier
marketing payment in 2012. The Company is recognizing the supplier marketing payment evenly as
income over the five-year term of the agreement ($1.0 million per year). The Company then contributed
the supplier marketing payment to the PJMF, an unconsolidated, non-profit corporation, for the benefit of
domestic restaurants. The Company’s contribution to the PJMF was fully expensed in 2012. PJMF
elected to distribute the $5.0 million supplier marketing payment to the domestic system as advertising
credits in 2012. Our domestic Company-owned restaurants’ portion of the advertising credits resulted in
an increase in income before income taxes of approximately $1.0 million in 2012.
We contributed $6.0 million in 2010 to the PJMF as discretionary advertising contributions (none in 2011
and 2012).
See Note 5 for information related to our purchasing agreement with BIBP.

80
17. Litigation, Commitments and Contingencies
Litigation
The Company is involved in a number of lawsuits, claims, investigations and proceedings, including
those specifically identified below, consisting of intellectual property, employment, consumer,
commercial and other matters arising in the ordinary course of business. In accordance with ASC 450
“Contingencies,” the Company has made accruals with respect to these matters, where appropriate, which
are reflected in the Company’s financial statements. We review these provisions at least quarterly and
adjust these provisions to reflect the impact of negotiations, settlements, rulings, advice of legal counsel
and other information and events pertaining to a particular case.
Agne v. Papa John’s International, Inc. et al. is a class action filed on May 28, 2010 in the United States
District Court for the Western District of Washington seeking damages for violations of the Telephone
Consumer Protection Act and Washington State telemarketing laws alleging, among other things that
several Papa John’s franchisees retained a vendor to send unsolicited commercial text message offers
primarily in Washington and Oregon. The court granted plaintiff’s motion for class certification in
November 2012; we filed a petition for permission to appeal the court’s ruling on class certification to the
United States Court of Appeals for the Ninth Circuit.
On February 13, 2013, the parties tentatively agreed to the financial terms of a settlement of the litigation,
with additional terms to be finalized, subject to Court approval. A reasonable estimate of the total cost of
the settlement has been provided for in these financial statements. Actual costs will be impacted by the
claimant participation rate, but we do not expect actual costs to be materially different from our estimates.
We expect the majority of the settlement payments to be made during the next 12 months.
Perrin v. Papa John’s International, Inc. and Papa John’s USA, Inc. is a conditionally certified collective
action filed in August 2009 in the United States District Court, Eastern District of Missouri, alleging that
delivery drivers were reimbursed for mileage and expenses in violation of the Fair Labor Standards Act.
Approximately 3,900 drivers out of a potential class size of 28,800 have opted into the action. A motion
to certify five additional state classes is pending and could result in another 14,000 plaintiffs if granted.
We intend to vigorously defend against all claims in this lawsuit. However, given the inherent
uncertainties of litigation, the outcome of this case cannot be predicted and the amount of any potential
loss cannot be reasonably estimated. A negative outcome in this case could have a material adverse effect
on the Company.
Leases
We lease office, retail and commissary space under operating leases, which have an average term of five
years and provide for at least one renewal. Certain leases further provide that the lease payments may be
increased annually based on the fixed rate terms or adjustable terms such as the Consumer Price Index.
PJUK, our subsidiary located in the United Kingdom, leases certain retail space, which is primarily
subleased to our franchisees. We also lease the tractors and trailers used by our distribution subsidiary,
PJFS, for an average period of seven years. Total lease expense was $28.7 million in 2012, $25.7 million
in 2011 and $24.5 million in 2010, net of sublease payments received.
We subleased certain sites to our Papa John’s franchisees located in the United Kingdom in 2012, 2011
and 2010 and received payments of $3.8 million, $3.7 million and $3.1 million, respectively, which are
netted with international operating expenses.

81
17. Litigation, Commitments and Contingencies (continued)
Future gross lease costs, future expected sublease payments and net lease costs as of December 30, 2012,
are as follows (in thousands):
Future
Expected
Gross Lease Sublease Net Lease
Year Costs Payments Costs
2013 34,073$ 3,740$ 30,333$
2014 30,614 3,573 27,041
2015 26,189 3,339 22,850
2016 21,012 3,050 17,962
2017 15,570 2,933 12,637
Thereafter 32,227 16,397 15,830
Total 159,685$ 33,032$ 126,653$
As a result of assigning our interest in obligations under property leases as a condition of the
refranchising of certain restaurants, we are contingently liable for payment of approximately 50 domestic
leases. These leases have varying terms, the latest of which expires in 2018. As of December 30, 2012,
the estimated maximum amount of undiscounted payments the Company could be required to make in the
event of nonpayment by the primary lessee was $2.9 million. As the fair value of the guarantees is not
considered significant, no liability has been recorded.
In connection with the 2006 sale of our former Perfect Pizza operations in the United Kingdom, we
remain contingently liable for payment of approximately 40 leases, which have varying terms with most
expiring by the end of 2015. As the initial party to the lease agreements, we are liable to the extent the
primary obligor does not satisfy its payment obligations. As of December 30, 2012, the estimated
maximum amount of undiscounted rental payments we would be required to make in the event of non-
payment under these leases is approximately $1.8 million, net of amounts reserved of approximately
$300,000.
The Company’s headquarters facility is leased under a capital lease arrangement with the City of
Jeffersontown, Kentucky in connection with the issuance of $80.2 million in Industrial Revenue Bonds.
The bonds are held 100% by the Company and, accordingly, the bond obligation and investment and
related interest income and expense are eliminated in the consolidated financial statements resulting in the
Company’s net investment cost being reported in net property and equipment.
18. Share Repurchase Program
The Company’s Board of Directors has authorized the repurchase of up to $1.1 billion of common stock
through September 29, 2013, including $50 million authorized in December 2012 and $50 million
authorized in February 2013, of which $115.2 million remained available for repurchase at February 24,
2013. Subsequent to year end, the Company acquired an additional 5,000 shares at an aggregate cost of
$254,000. Funding for the share repurchase program has been provided through a credit facility,
operating cash flow, stock option exercises and cash and cash equivalents.

82
19. Equity Compensation
We award stock options and restricted stock (both time- and performance-based) from time to time under
the Papa John’s International, Inc. 2011 Omnibus Incentive Plan and other such agreements as may arise.
There are approximately 4.3 million shares of common stock authorized for issuance and remaining
available under the 2011 Omnibus Incentive Plan as of December 30, 2012, which includes 2.0 million
shares transferred from the Papa John’s International, Inc. 2008 Omnibus Incentive Plan. Option awards
are granted with an exercise price equal to the market price of the Company’s stock at the date of grant.
Options outstanding as of December 30, 2012 generally expire five or ten years from the date of grant and
vest over a three-year period.
We recorded stock-based employee compensation expense of $6.9 million in 2012, $6.7 million in 2011
and $6.1 million in 2010. The total income tax benefit recognized in the income statement for share-based
compensation arrangements was $2.4 million in 2012 and $2.2 million in both 2011 and 2010. At
December 30, 2012, there was $6.3 million of unrecognized compensation cost related to nonvested
option awards and restricted stock, of which the Company expects to recognize $4.3 million in 2013, $1.8
million in 2014 and $236,000 in 2015.
Stock Options
Options exercised included 432,000 shares in 2012, 572,000 shares in 2011 and 356,000 shares in 2010.
The total intrinsic value of the options exercised during 2012, 2011 and 2010 was $7.5 million, $4.6
million and $2.6 million, respectively. Cash received upon the exercise of stock options was $12.3
million, $14.0 million and $6.4 million during 2012, 2011 and 2010, respectively, and the related tax
benefits realized were approximately $2.6 million, $1.7 million and $943,000 during the corresponding
periods.
Information pertaining to option activity during 2012 is as follows (number of options and aggregate
intrinsic value in thousands): Weighted
Weighted Average
Number Average Remaining Aggregate
of Exercise Contractual Intrinsic
Options Price Term Value
Outstanding at December 25, 2011 1,428 $27.19
Granted 254 37.29
Exercised (432) 28.36
Cancelled (50) 30.62
Outstanding at December 30, 2012 1,200 $28.78 3.43 $28,938
Vested or expected to vest at December 30, 2012 1,167 $28.59 3.51 $28,152
Exercisable at December 30, 2012 652 $25.67 1.52 $17,748

83
19. Equity Compensation (continued)
The following is a summary of the significant assumptions used in estimating the fair value of options
granted in 2012, 2011 and 2010:
2012 2011 2010
Assumptions (weighted average):
Risk-free interest rate 1.1% 1.5% 1.8%
Expected dividend yield 0.0% 0.0% 0.0%
Expected volatility 37.8% 41.2% 42.5%
Expected term (in years) 6.0 3.7 3.7
The risk-free interest rate for the periods within the contractual life of an option is based on the U.S.
Treasury yield curve in effect at the time of grant. Expected volatility was estimated by using the
Company’s historical share price volatility for a period similar to the expected life of the option.
Options granted in 2012 vest in equal installments over three years and expire ten years after grant. The
expected term for these options represents the period of time that options granted are expected to be
outstanding and was calculated using the simplified method prescribed by Securities and Exchange
Commission rules and regulations as there was insufficient historical detail to be used as an alternative
basis to estimating the term. The expected term for options granted in 2011 and 2010 that expire five
years from the grant date was based on an analysis of actual historical exercises and forfeitures.
The weighted average grant-date fair values of options granted during 2012, 2011 and 2010 was $14.08,
$9.50 and $9.13, respectively. The Company granted 254,000, 403,000 and 445,000 options in 2012,
2011 and 2010, respectively.
Restricted Stock
In 2012, 2011 and 2010, we granted shares of restricted stock that were time-based and vest in equal
installments over three years. These restricted shares are intended to focus participants on our long-range
objectives, while at the same time serving as a retention mechanism. Additionally, in 2012 we granted
approximately 54,000 performance-based restricted stock units to executive management. The fair value
of the restricted stock is based on the market price of the Company’s shares on the grant date. These
awards cliff-vest at the end of three years based upon the Company’s achievement of a compounded
annual growth rate of earnings per share and the achievement of certain sales and unit growth metrics.

84
19. Equity Compensation (continued)
Information pertaining to restricted stock activity during 2012, 2011 and 2010 is as follows (shares in
thousands): Weighted
Average
Grant-Date
Shares Fair Value
Total as of December 27, 2009 270 28.34$
Granted 171 27.13
Forfeited (123) 30.77
Vested (34) 26.40
Total as of December 26, 2010 284 26.62
Granted 160 29.07
Forfeited (78) 26.99
Vested (116) 27.27
Total as of December 25, 2011 250 28.19
Granted 133 37.18
Forfeited (37) 30.92
Vested (78) 27.77
Total as of December 30, 2012 268 32.39$
20. Employee Benefit Plans
We have established the Papa John’s International, Inc. 401(k) Plan (the “401(k) Plan”), as a defined
contribution benefit plan, in accordance with Section 401(k) of the Internal Revenue Code. The 401(k)
Plan is open to employees who meet certain eligibility requirements and allows participating employees
to defer receipt of a portion of their compensation and contribute such amount to one or more investment
funds. At our discretion, we may make matching contribution payments, which are subject to vesting
based on an employee’s length of service with us.
In addition, we maintain a non-qualified deferred compensation plan available to certain employees and
directors. Under this plan, the participants may defer a certain amount of their compensation, which is
credited to the participants’ accounts. The participant-directed investments associated with this plan are
included in other long-term assets ($13.6 million and $11.4 million at December 30, 2012 and December
25, 2011, respectively) and the associated liabilities ($12.8 million and $10.8 million at December 30,
2012 and December 25, 2011, respectively) are included in other long-term liabilities in the
accompanying consolidated balance sheets.
At our discretion, we contributed a matching payment of 1.5% in 2012 and 2011 (no match in 2010) of a
participating employee’s earnings deferred into both the 401(k) Plan and the non-qualified deferred
compensation plan. Such costs were $630,000 in 2012 and $550,000 in 2011 (none in 2010).
PJUK, the Company’s United Kingdom subsidiary, provided a pension plan that was frozen in 1999.
There are 12 participants in the PJUK pension plan. The Company recorded expense of $154,000,
$268,000 and $258,000 associated with the pension plan for the fiscal years ended 2012, 2011 and 2010,
respectively. The pension plan was fully funded at December 30, 2012. The Company is taking steps to
transfer the remaining assets and liabilities of the pension plan to an outside insurance company.

85
21. Segment Information
We have defined six reportable segments: domestic Company-owned restaurants, domestic commissaries,
North America franchising, international operations, variable interest entities (“VIEs”) and “all other”
units.
The domestic Company-owned restaurant segment consists of the operations of all domestic (“domestic”
is defined as contiguous United States) Company-owned restaurants and derives its revenues principally
from retail sales of pizza and side items, such as breadsticks, cheesesticks, chicken poppers, chicken
wings, dessert pizza and soft drinks to the general public. The domestic commissary segment consists of
the operations of our regional dough production and product distribution centers and derives its revenues
principally from the sale and distribution of food and paper products to domestic Company-owned and
franchised restaurants. The North America franchising segment consists of our franchise sales and support
activities and derives its revenues from sales of franchise and development rights and collection of
royalties from our franchisees located in the United States and Canada. The international operations
segment principally consists of our Company-owned restaurants and distribution sales to franchised Papa
John’s restaurants located in the United Kingdom, Mexico and China and our franchise sales and support
activities, which derive revenues from sales of franchise and development rights and the collection of
royalties from our international franchisees. International franchisees are defined as all franchise
operations outside of the United States and Canada. BIBP, which operated through February 2011, was a
VIE in which we were deemed the primary beneficiary, as defined in Note 5, and is the only activity
reflected in the VIE segment. All other business units that do not meet the quantitative thresholds for
determining reportable segments, which are not operating segments, we refer to as our “all other”
segment, which consists of operations that derive revenues from the sale, principally to Company-owned
and franchised restaurants, of printing and promotional items, risk management services, and information
systems and related services used in restaurant operations, including our online and other technology-
based ordering platforms.
Generally, we evaluate performance and allocate resources based on profit or loss from operations before
income taxes and eliminations. Certain administrative and capital costs are allocated to segments based
upon predetermined rates or actual estimated resource usage. We account for intercompany sales and
transfers as if the sales or transfers were to third parties and eliminate the activity in consolidation.
Our reportable segments are business units that provide different products or services. Separate
management of each segment is required because each business unit is subject to different operational
issues and strategies. No single external customer accounted for 10% or more of our consolidated
revenues. The accounting policies of the segments are the same as those described in the summary of
significant accounting policies (see Note 2).

86
21. Segment Information (continued)
Our segment information is as follows:
(In thousands) 2012 2011 2010
(As Restated) (As Restated)
Revenues from external customers:
Domestic Company-owned restaurants 592,203$ 525,841$ 503,272$
Domestic commissaries 545,924 508,155 454,506
North America franchising 80,373 74,416 70,241
International 72,930 58,558 46,427
All others 51,223 50,912 51,951
Total revenues from external customers 1,342,653$ 1,217,882$ 1,126,397$
Intersegment revenues:
Domestic commissaries 171,212$ 151,423$ 135,005$
North America franchising 2,267 2,163 2,045
International 229 215 909
Variable interest entities (1) - 25,117 153,014
All others 11,606 10,468 12,061
Total intersegment revenues 185,314$ 189,386$ 303,034$
Depreciation and amortization:
Domestic Company-owned restaurants 13,242$ 12,965$ 13,155$
Domestic commissaries 4,738 4,633 4,522
International 2,824 2,398 2,368
All others 4,801 4,663 3,489
Unallocated corporate expenses 7,193 8,022 8,873
Total depreciation and amortization 32,798$ 32,681$ 32,407$
Income (loss) before income taxes:
Domestic Company-owned restaurants 38,114$ 28,980$ 31,619$
Domestic commissaries (2) 34,317 30,532 14,188
North America franchising 69,332 66,222 62,229
International 3,063 (165) (4,771)
Variable interest entities (3) - - 20,954
All others 2,889 (441) 1,847
Unallocated corporate expenses (48,958) (39,727) (42,237)
Elimination of intersegment profits (362) (610) (519)
Total income before income taxes 98,395$ 84,791$ 83,310$
(1) The intersegment revenues for variable interest entities of $25.1 million in 2011 and $153.0 million in
2010 are attributable to BIBP.
(2) The 2010 operating income for domestic commissaries includes an increase in cost of sales of $14.2
million associated with PJFS’s agreement to pay to BIBP for past cheese purchases an amount equal
to its accumulated deficit.
(3) Represents BIBP’s income before income taxes, net of noncontrolling interest income, for each year.
The 2010 income before income taxes for BIBP includes a reduction in BIBP’s cost of sales of $14.2
million associated with PJFS’s agreement to pay to BIBP for past cheese purchases an amount equal
to its accumulated deficit.

87
21. Segment Information (continued)
(In thousands) 2012 2011 2010
Property and equipment:
Domestic Company-owned restaurants 184,322$ 176,506$ 165,434$
Domestic commissaries 101,082 85,714 82,162
International 22,389 17,413 17,574
All others 37,221 33,984 32,335
Unallocated corporate assets 142,950 132,098 127,184
Accumulated depreciation and amortization (291,303) (263,805) (239,318)
Net property and equipment 196,661$ 181,910$ 185,371$
Expenditures for property and equipment:
Domestic Company-owned restaurants 9,319$ 14,094$ 9,124$
Domestic commissaries 14,314 5,612 2,795
International 4,865 1,733 4,835
All others 3,342 1,792 8,151
Unallocated corporate 10,788 6,088 6,220
Total expenditures for property and equipment 42,628$ 29,319$ 31,125$
22. Quarterly Data - Unaudited, in Thousands, except Per Share Data
Our quarterly select financial data is as follows:
2012 1st 2nd 3rd 4th
(As Restated) (As Restated) (As Restated)
Total revenues (a) 331,276$ 318,579$ 325,514$ 367,284$
Operating income (a) 27,256 24,327 21,205 27,019
Net income 16,981 14,289 13,031 17,359
Basic earnings per common share 0.71$ 0.60$ 0.56$ 0.76$
Earnings per common share - assuming dilution 0.69$ 0.59$ 0.55$ 0.74$
2011 1st 2nd 3rd 4th
(As Restated) (As Restated) (As Restated) (As Restated)
Total revenues (a) 312,467$ 293,534$ 305,668$ 306,213$
Operating income (a) 27,211 19,155 16,958 23,693
Net income 15,976 12,068 10,800 15,891 (b)
Basic earnings per common share 0.63$ 0.47$ 0.43$ 0.66$
Earnings per common share - assuming dilution 0.62$ 0.47$ 0.43$ 0.65$
Quarter
Quarter
(a) Restatement as described in Notes 3 and 4, had no impact on revenues or operating income.
(b) Net income previously reported in the 2011 Unaudited Quarterly Data table was $15,981.

88
22. Quarterly Data - Unaudited, in Thousands, except Per Share Data (continued)
All quarterly information above except for the fourth quarter of 2012 is presented in 13-week periods.
The fourth quarter of 2012 includes a 14-week period, which increased operating income approximately
$4.1 million, or $0.11 per diluted share. The Incentive Contribution reduced first quarter 2012 operating
income by approximately $3.7 million, or $0.10 per diluted share, and increased each of the second, third
and fourth quarters of 2012 by approximately $250,000. See “Items Impacting Comparability; Non-
GAAP Measures” of “Item 7. Management’s Discussion and Analysis of Financial Condition and Results
of Operations” for additional information.
Quarterly earnings per share on a full-year basis may not agree to the consolidated statements of income
due to rounding.
Restated Interim Financial Information
The following tables present amounts previously reported and restated as a result of the errors associated
with the accounting for our joint venture arrangements (in thousands). See Notes 3 and 4 for additional
information.
As
Previously
Reported As Restated
Condensed consolidated balance sheet
Noncurrent deferred income tax liabilities 7,264$ 4,954$
Other long-term liabilities 23,795 34,992
Redeemable noncontrolling interests - 4,777
Retained earnings 315,551 311,782
Noncontrolling interests in subsidiaries 9,895 -
Total stockholders' equity 227,835 214,171
Condensed consolidated statement of comprehensive income
Interest expense (income) 288$ (94)$
Income before income taxes 27,138 27,520
Income tax expense 9,068 9,213
Net income, including noncontrolling interests 18,070 18,307
Net income, net of noncontrolling interests 16,744 16,981
Comprehensive income 18,281 18,518
Basic earnings per common share 0.70 0.71
Earnings per common share - assuming dilution 0.69 0.69
Consolidated statement of cash flows
Net income, including noncontrolling interests 18,070$ 18,307$
Deferred income taxes (1,057) (912)
Other 678 296
Net cash provided by operating activities 44,093 44,093
March 25, 2012
Three Months Ended
As of and For The

89
22. Quarterly Data - Unaudited, in Thousands, except Per Share Data (continued)
As
Previously
Reported As Restated
As
Previously
Reported As Restated
Condensed consolidated balance sheet
Noncurrent deferred income tax liabilities 9,648$ 7,044$ 9,648$ 7,044$
Other long-term liabilities 23,638 35,170 23,638 35,170
Redeemable noncontrolling interests - 4,458 - 4,458
Retained earnings 330,320 326,071 330,320 326,071
Noncontrolling interests in subsidiaries 9,137 - 9,137 -
Total stockholders' equity 225,546 212,160 225,546 212,160
Condensed consolidated statements of comprehensive income
Interest expense 282$ 1,056$ 570$ 962$
Income before income taxes 24,240 23,466 51,378 50,986
Income tax expense 8,299 8,005 17,367 17,218
Net income, including noncontrolling interests 15,941 15,461 34,011 33,768
Net income, net of noncontrolling interests 14,769 14,289 31,513 31,270
Comprehensive income 15,490 15,010 33,771 33,528
Basic earnings per common share 0.62 0.60 1.32 1.31
Earnings per common share - assuming dilution 0.61 0.59 1.30 1.29
Consolidated statement of cash flows
Net income, including noncontrolling interests 34,011$ 33,768$
Deferred income taxes 1,946 1,797
Other 2,480 2,872
Net cash provided by operating activities 65,162 65,162
June 24, 2012 June 24, 2012
Three Months Ended Six Months Ended
As of and For The As of and For The

90
22. Quarterly Data - Unaudited, in Thousands, except Per Share Data (continued)
As
Previously
Reported As Restated
As
Previously
Reported As Restated
Condensed consolidated balance sheet
Noncurrent deferred income tax liabilities 10,508$ 7,830$ 10,508$ 7,830$
Other long-term liabilities 24,611 36,269 24,611 36,269
Redeemable noncontrolling interests - 4,820 - 4,820
Retained earnings 343,471 339,101 343,471 339,101
Noncontrolling interests in subsidiaries 9,430 - 9,430 -
Total stockholders' equity 217,806 204,006 217,806 204,006
Condensed consolidated statements of comprehensive income
Interest expense 284$ 478$ 854$ 1,440$
Income before income taxes 21,057 20,863 72,435 71,849
Income tax expense 7,112 7,038 24,479 24,256
Net income, including noncontrolling interests 13,945 13,825 47,956 47,593
Net income, net of noncontrolling interests 13,151 13,031 44,664 44,301
Comprehensive income 15,192 15,072 48,963 48,600
Basic earnings per common share 0.57 0.56 1.89 1.87
Earnings per common share - assuming dilution 0.55 0.55 1.85 1.84
Consolidated statement of cash flows
Net income, including noncontrolling interests 47,956$ 47,593$
Deferred income taxes 647 424
Other 3,789 4,375
Net cash provided by operating activities 94,773 94,773
September 23, 2012 September 23, 2012
Three Months Ended Nine Months Ended
As of and For The As of and For The

91
22. Quarterly Data - Unaudited, in Thousands, except Per Share Data (continued)
As
Previously
Reported As Restated
Condensed consolidated balance sheet
Noncurrent deferred income tax liabilities (assets) 1,138$ (1,030)$
Other long-term liabilities 12,219 22,677
Redeemable noncontrolling interests - 3,146
Retained earnings 259,579 256,042
Noncontrolling interests in subsidiaries 7,899 -
Total stockholders' equity 223,416 211,980
Condensed consolidated statement of comprehensive income
Interest expense 608$ 1,335$
Income before income taxes 26,780 26,053
Income tax expense 9,231 8,955
Net income, including noncontrolling interests 17,549 17,098
Net income, net of noncontrolling interests 16,427 15,976
Comprehensive income 18,822 18,371
Basic earnings per common share 0.64 0.63
Earnings per common share - assuming dilution 0.64 0.62
Consolidated statement of cash flows
Net income, including noncontrolling interests 17,549$ 17,098$
Deferred income taxes 2,664 2,388
Other 43 770
Net cash provided by operating activities 26,687 26,687
March 27, 2011
Three Months Ended
As of and For The

92
22. Quarterly Data - Unaudited, in Thousands, except Per Share Data (continued)
As
Previously
Reported As Restated
As
Previously
Reported As Restated
Condensed consolidated balance sheet
Noncurrent deferred income tax liabilities 3,485$ 1,283$ 3,485$ 1,283$
Other long-term liabilities 12,478 23,153 12,478 23,153
Redeemable noncontrolling interests - 3,648 - 3,648
Retained earnings 271,703 268,110 271,703 268,110
Noncontrolling interests in subsidiaries 8,528 - 8,528 -
Total stockholders' equity 223,801 211,680 223,801 211,680
Condensed consolidated statements of comprehensive income
Interest expense 293$ 383$ 901$ 1,718$
Income before income taxes 19,067 18,977 45,847 45,030
Income tax expense 6,014 5,980 15,245 14,935
Net income, including noncontrolling interests 13,053 12,997 30,602 30,095
Net income, net of noncontrolling interests 12,124 12,068 28,551 28,044
Comprehensive income 12,539 12,483 31,361 30,854
Basic earnings per common share 0.48 0.47 1.12 1.10
Earnings per common share - assuming dilution 0.47 0.47 1.11 1.09
Consolidated statement of cash flows
Net income, including noncontrolling interests 30,602$ 30,095$
Deferred income taxes 4,332 4,022
Other 316 1,133
Net cash provided by operating activities 52,925 52,925
June 26, 2011 June 26, 2011
Three Months Ended Six Months Ended
As of and For The As of and For The

93
22. Quarterly Data - Unaudited, in Thousands, except Per Share Data (continued)
As
Previously
Reported
As
Restated
As
Previously
Reported
As
Restated
Condensed consolidated balance sheet
Noncurrent deferred income tax liabilities 7,110$ 4,710$ 7,110$ 4,710$
Other long-term liabilities 11,542 22,545 11,542 22,545
Redeemable noncontrolling interests - 3,558 - 3,558
Retained earnings 282,826 278,910 282,826 278,910
Noncontrolling interests in subsidiaries 8,245 - 8,245 -
Total stockholders' equity 212,554 200,393 212,554 200,393
Condensed consolidated statements of comprehensive income
Interest expense 282$ 804$ 1,183$ 2,522$
Income before income taxes 16,846 16,324 62,693 61,354
Income tax expense 4,906 4,707 20,151 19,642
Net income, including noncontrolling interests 11,940 11,617 42,542 41,712
Net income, net of noncontrolling interests 11,123 10,800 39,674 38,844
Comprehensive income 11,687 11,364 43,048 42,218
Basic earnings per common share 0.45 0.43 1.57 1.54
Earnings per common share - assuming dilution 0.44 0.43 1.55 1.52
Consolidated statement of cash flows
Net income, including noncontrolling interests 42,542$ 41,712$
Deferred income taxes 5,219 4,711
Other 1,272 2,611
Net cash provided by operating activities 87,216 87,216
September 25, 2011 September 25, 2011
Three Months Ended Nine Months Ended
As of and For The As of and For The
Item 9. Changes in and Disagreements with Accountants on Accounting and Financial Disclosure
None.
Item 9A. Controls and Procedures
(a) Evaluation of Disclosure Controls and Procedures
As of the end of the period covered by this report, we carried out an evaluation, under the supervision and
with the participation of our management, including our CEO and CFO, of the effectiveness of our
disclosure controls and procedures (as defined in Rules 13a-15(e) and 15d-15(e) of the Securities
Exchange Act of 1934, as amended).
A control system, no matter how well designed and operated, can provide only reasonable, not absolute,
assurance that the control system’s objectives will be met. Because of the inherent limitations in all
control systems, no evaluation of controls can provide absolute assurance that all control issues have been
detected. The design of any system of controls is based in part on certain assumptions about the
likelihood of future events, and there can be no assurance that any design will succeed in achieving its
stated goals under potential future conditions, regardless of how remote.

94
Item 9A. Controls and Procedures (continued)
Based upon the evaluation, our CEO and CFO have concluded that our disclosure controls and procedures
were not effective at a reasonable assurance level as of December 30, 2012 solely as a result of the
material weakness identified in Management's Report on our Internal Control over Financial Reporting
related to accounting for certain redemption features of our noncontrolling interests as discussed below.
(b) Management’s Report on our Internal Control over Financial Reporting
Our management is responsible for establishing and maintaining adequate internal control over financial
reporting, as such term is defined in Rule 13a-15(f) promulgated under the Exchange Act. Our internal
control system is designed to provide reasonable assurance to our management and the board of directors
regarding the preparation and fair presentation of published financial statements. All internal control
systems, no matter how well designed, have inherent limitations. Therefore, even those systems
determined to be effective can provide only reasonable assurance with respect to financial statement
preparation and presentation.
Our management, including our CEO and CFO, assessed the effectiveness of our internal control over
financial reporting using the criteria set forth by the Committee of Sponsoring Organizations of the
Treadway Commission (“COSO”) in Internal Control—Integrated Framework. This evaluation identified
a material weakness in our internal control regarding our accounting for certain redemption features of the
noncontrolling interests of our joint venture agreements. Specifically, the review controls in place with
respect to non-routine contractual changes or amendments were not effective. A material weakness is a
deficiency, or combination of deficiencies, in internal control over financial reporting such that there is a
reasonable possibility that a material misstatement of the company’s annual or interim financial
statements will not be prevented or detected on a timely basis. The material weakness in our internal
controls resulted in the restatement of our 2010 and 2011 financial statements included in this report. As
a result, management believes that our internal control over financial reporting was not effective as of
December 30, 2012, based on the COSO criteria.
Ernst & Young LLP, an independent registered public accounting firm, has audited the Consolidated
Financial Statements included in this Annual Report on Form 10-K and, as part of its audit, has issued an
attestation report, included herein, on the effectiveness of our internal control over financial reporting.
(c) Changes in Internal Control over Financial Reporting
The error identified related to the incorrect accounting for certain redemption features of our
noncontrolling interests. We have implemented certain remedial measures including a review of all
existing joint venture agreements to ensure the accounting for any such redemption features was in
compliance with U.S. generally accepted accounting principles. In addition, we are in the process of
developing enhanced control procedures designed to ensure proper accounting for any future non-routine
contractual changes or amendments to existing joint venture agreements. The material weakness cannot
be considered remediated until the applicable remedial controls operate for a sufficient period of time and
management has concluded, through testing, that these controls are operating effectively.
Except as otherwise discussed above, there were no changes in our internal control over financial
reporting that have materially affected or are reasonably likely to materially affect such controls,
including any corrective actions with regard to significant deficiencies and material weaknesses.
Item 9B. Other Information
None.

95
PART III
Item 10. Directors, Executive Officers and Corporate Governance
Information regarding executive officers is included above under the caption “Executive Officers of the
Registrant” at the end of Part I of this Report. Other information regarding directors, executive officers
and corporate governance appearing under the captions “Corporate Governance,” “Item 1, Election of
Directors,” “Section 16(a) Beneficial Ownership Reporting Compliance” and “Executive Compensation /
Compensation Discussion and Analysis” is incorporated by reference from the Company’s definitive
proxy statement, which will be filed with the Securities and Exchange Commission no later than 120 days
after the end of the fiscal year covered by this Report.
We have adopted a written code of ethics that applies to our directors, officers and employees. We intend
to post all required disclosures concerning any amendments to, or waivers from, our code of ethics on our
website to the extent permitted by NASDAQ. Our code of ethics can be found on our website, which is
located at www.papajohns.com.
Item 11. Executive Compensation
Information regarding executive compensation appearing under the captions “Executive Compensation /
Compensation Discussion and Analysis,” “Compensation Committee Report” and “Certain Relationships
and Related Transactions – Compensation Committee Interlocks and Insider Participation” is
incorporated by reference from the Company’s definitive proxy statement, which will be filed with the
Securities and Exchange Commission no later than 120 days after the end of the fiscal year covered by
this Report.
Item 12. Security Ownership of Certain Beneficial Owners and Management and Related
Stockholder Matters
The following table provides information as of December 30, 2012 regarding the number of shares of the
Company’s common stock that may be issued under the Company’s equity compensation plans.
(c)
(a) (b) Number of securities
Number of Weighted remaining available
securities to be average for future issuance
issued upon exercise exercise price under equity
of outstanding of outstanding compensation plans,
options, warrants options, warrants excluding securities
Plan Category and rights and rights reflected in column (a)
Equity compensation plans approved
by security holders 1,200,091 $28.78 4,264,146
Equity compensation plans not
approved by security holders * 83,888
Total 1,283,979 $28.78 4,264,146
* Represents shares of common stock issuable pursuant to the non-qualified deferred compensation plan.
The weighted average exercise price (column b) does not include any assumed price for issuance of shares
pursuant to the non-qualified deferred compensation plan.

96
Information regarding security ownership of certain beneficial owners and management and related
stockholder matters appearing under the caption “Security Ownership of Certain Beneficial Owners and
Management” is incorporated by reference from the Company’s definitive proxy statement, which will be
filed with the Securities and Exchange Commission no later than 120 days after the end of the fiscal year
covered by this Report.
Item 13. Certain Relationships and Related Transactions, and Director Independence
Information regarding certain relationships and related transactions, and director independence appearing
under the captions “Corporate Governance” and “Certain Relationships and Related Transactions” is
incorporated by reference from the Company’s definitive proxy statement, which will be filed with the
Securities and Exchange Commission no later than 120 days after the end of the fiscal year covered by
this Report.
Item 14. Principal Accounting Fees and Services
Information regarding principal accounting fees and services appearing under the caption “Ratification of
the Selection of Independent Auditors” is incorporated by reference from the Company’s definitive proxy
statement, which will be filed with the Securities and Exchange Commission no later than 120 days after
the end of the fiscal year covered by this Report.
PART IV
Item 15. Exhibits, Financial Statement Schedules
(a)(1) Financial Statements:
The following consolidated financial statements, notes related thereto and reports of independent auditors
are included in Item 8 of this Report:
Reports of Independent Registered Public Accounting Firm
Consolidated Statements of Income for the years ended December 30, 2012, December 25, 2011
and December 26, 2010
Consolidated Statements of Comprehensive Income for the years ended December 30, 2012,
December 25, 2011 and December 26, 2010
Consolidated Balance Sheets as of December 30, 2012 and December 25, 2011
Consolidated Statements of Stockholders’ Equity for the years ended December 30, 2012,
December 25, 2011 and December 26, 2010
Consolidated Statements of Cash Flows for the years ended December 30, 2012, December 25,
2011 and December 26, 2010
Notes to Consolidated Financial Statements

97
(a)(2) Financial Statement Schedules:
Schedule II – Valuation and Qualifying Accounts
Charged to
Balance at (recovered from) Balance at
Beginning of Costs and Additions / End of
Classification Year Expenses (Deductions) Year
(in thousands)
Fiscal year ended December 30, 2012:
Deducted from asset accounts:
Reserve for uncollectible accounts receivable 3,034$ 1,394$ (1,371)$ (1) 3,057$
Reserve for franchisee notes receivable 5,905 280 (1,157) (1) 5,028
Valuation allowance on foreign net operating losses 7,474 766 - 8,240
16,413$ 2,440$ (2,528)$ 16,325$
Fiscal year ended December 25, 2011:
Deducted from asset accounts:
Reserve for uncollectible accounts receivable 2,795$ 1,072$ (833)$ (1) 3,034$
Reserve for franchisee notes receivable 9,951 (35) (4,011) (1) 5,905
Valuation allowance on foreign net operating losses 8,123 (649) - 7,474
20,869$ 388$ (4,844)$ 16,413$
Fiscal year ended December 26, 2010:
Deducted from asset accounts:
Reserve for uncollectible accounts receivable 2,791$ 1,350$ (1,346)$ (1) 2,795$
Reserve for franchisee notes receivable 10,858 (433) (474) (1) 9,951
Valuation allowance on foreign net operating losses 7,158 965 - 8,123
20,807$ 1,882$ (1,820)$ 20,869$
(1) Uncollectible accounts written off, net of recoveries and reclassifications between accounts and notes receivable reserves.
All other schedules for which provision is made in the applicable accounting regulation of the Securities
and Exchange Commission are not required under the related instructions or are inapplicable and,
therefore, have been omitted.
(a)(3) Exhibits:
The exhibits listed in the accompanying index to Exhibits are filed as part of this Form 10-K.

98
SIGNATURES
Pursuant to the requirements of Section 13 or 15(d) of the Securities Exchange Act of 1934, the
Registrant has duly caused this report to be signed on its behalf by the undersigned, thereunto duly
authorized.
Date: February 28, 2013 PAPA JOHN’S INTERNATIONAL, INC.
By: /s/ John H. Schnatter
John H. Schnatter
Founder, Chairman and
Chief Executive Officer
Pursuant to the requirements of the Securities Exchange Act of 1934, this report has been signed below by
the following persons on behalf of the Registrant and in the capacities and on the dates indicated.
Signature Title Date
/s/ John H. Schnatter Founder, Chairman and February 28, 2013
John H. Schnatter Chief Executive Officer
(Principal Executive Officer)
/s/ Norborne P. Cole, Jr. Director February 28, 2013
Norborne P. Cole, Jr.
/s/ Christopher L. Coleman Director February 28, 2013
Christopher L. Coleman
/s/ Philip Guarascio Director February 28, 2013
Philip Guarascio
/s/ Olivia F. Kirtley Director February 28, 2013
Olivia F. Kirtley
/s/ Mark S. Shapiro Director February 28, 2013
Mark S. Shapiro
/s/ William M. Street Director February 28, 2013
William M. Street
/s/ W. Kent Taylor Director February 28, 2013
W. Kent Taylor
/s/ Lance F. Tucker Senior Vice President, Chief February 28, 2013
Lance F. Tucker Financial Officer, Chief Administrative
Officer and Treasurer (Principal Financial
Officer and Principal Accounting Officer)

99
EXHIBIT INDEX
Exhibit
Number Description of Exhibit
3.1 Our Amended and Restated Certificate of Incorporation. Exhibit 3.1 to our Registration
Statement on Form S-1 (Registration No. 33-61366) is incorporated herein by reference.
3.2 Our Certificate of Amendment of Amended and Restated Certificate of Incorporation.
Exhibit 3 to our Quarterly Report on Form 10-Q for the quarterly period ended June 29,
1997, is incorporated herein by reference.
3.3 Our Restated By-Laws. Exhibit 3.1 to our report on Form 8-K dated December 5, 2007 is
incorporated herein by reference.
4.1 Specimen Common Stock Certificate. Exhibit 4.1 to our Annual Report on Form 10-K for
the fiscal year ended December 31, 1995 (Commission File No. 0-21660) is incorporated
herein by reference.
4.2 Amended and Restated Certificate of Incorporation and Restated By-Laws (see Exhibits
3.1, 3.2 and 3.3 above) are incorporated herein by reference.
10.1* Papa John’s International, Inc. Deferred Compensation Plan, as amended through
December 5, 2012.
10.2* Employment Agreement between Papa John’s International, Inc. and Anthony N.
Thompson Effective March 5, 2012, as Amended December 21, 2012.
10.3* Employment Agreement between Papa John’s International, Inc. and Lance F. Tucker
Effective March 5, 2012, as Amended December 21, 2012.
10.4* Employment Agreement between Papa John’s International, Inc. and Andrew M. Varga
Effective March 5, 2012, as Amended December 21, 2012.
10.5* Employment Agreement between Papa John’s International, Inc. and Timothy C. O’Hern
Effective March 5, 2012, as Amended December 21, 2012.
10.6* Papa John’s International, Inc. 2008 Omnibus Incentive Plan. Exhibit 10.1 to our
Registration Statement on Form S-8 (Registration No. 333-150762) dated May 5, 2008 is
incorporated herein by reference.
10.7* Papa John’s International, Inc. 2011 Omnibus Incentive Plan. Exhibit 4.1 to our report
on Form 8-K as filed on May 3, 2011 is incorporated herein by reference.
10.8* Agreement for Service as Chairman between John H. Schnatter and Papa John’s
International, Inc. Exhibit 10.1 to our report on Form 8-K as filed on August 15, 2007 is
incorporated herein by reference.

100
10.9* Agreement for Service as Founder between John H. Schnatter and Papa John’s
International, Inc. Exhibit 10.1 to our report on Form 8-K as filed on August 15, 2007 is
incorporated herein by reference.
10.10* Amendment and Restated Exclusive License Agreement between John H. Schnatter and
Papa John’s International, Inc. Exhibit 10.1 to our report on Form 8-K as filed on May
19, 2008 is incorporated herein by reference.
10.11* Papa John’s International, Inc. Severance Pay Plan. Exhibit 10.1 to our report on Form
10-Q filed on May 1, 2012, is incorporated herein by reference.
10.12* Employment Agreement between Papa John’s International, Inc. and Christopher J.
Sternberg dated March 5, 2012. Exhibit 10.2 to our Report on Form 8-K as filed on
March 7, 2012 is incorporated herein by reference.
10.13* Separation and Consulting Agreement and Release between Christopher J. Sternberg and
Papa John’s International, Inc. Exhibit 10.1 to our report on Form 10-Q as filed on July
31, 2012 is incorporated herein by reference.
10.14* Agreement and Release between J. David Flanery and Papa John’s International, Inc.
Exhibit 10.1 to our report on Form 8-K/A filed on March 25, 2011 is incorporated herein
by reference.
10.15* Agreement and Release between J. Jude Thompson and Papa John’s International, Inc.
Exhibit 10.1 to our report on Form 8-K as filed on April 15, 2011 is incorporated herein
by reference.
10.16 $175,000,000 Revolving Credit Facility by and among Papa John’s International, Inc.,
the Guarantors party thereto, RSC Insurance Services, Ltd., a Bermuda company, the
Banks party thereto, PNC Bank, National Association, as Administrative Agent,
JPMorgan Chase Bank, N.A., as Syndication Agent, U.S. Bank, National Association, as
Co-Documentation Agent, Bank of America, N.A., as Co-Documentation Agent, Fifth
Third Bank, as Co-Documentation Agent, PNC Capital Markets LLC, as Joint Lead
Arranger and as Joint Bookrunner, and J.P. Morgan Securities LLC, as Joint Lead
Arranger and as Joint Bookrunner dated September 2, 2010. Exhibit 10.1 to our report on
Form 8-K as filed on September 9, 2010 is incorporated by reference.
10.17 First Amendment to Credit Agreement by and among Papa John’s International, Inc. the
Guarantors party thereto, RSC Insurance Services, Ltd., a Bermuda company, PNC Bank,
National Association, as a Bank and as Administrative Agent, JPMorgan Chase Bank,
N.A., as a Bank and as Syndication Agent, Bank of America, N.A., as a Bank and as Co-
Documentation Agent, Fifth Third Bank, as a Bank and as Co-Documentation Agent,
U.S. Bank, National Association, as a Bank and as Co-Documentation Agent, and Branch
Banking and Trust Company, as a Bank, dated November 30, 2011. Exhibit 10.1 to our
report on Form 8-K filed December 1, 2011 is incorporated by reference.
21 Subsidiaries of the Company.
23 Consent of Ernst & Young LLP.
31.1 Section 302 Certification of Chief Executive Officer Pursuant to Exchange Act Rule 13a-
15(e).

101
31.2 Section 302 Certification of Chief Financial Officer Pursuant to Exchange Act Rule 13a-
15(e).
32.1 Section 906 Certification of Chief Executive Officer Pursuant to 18 U.S.C. Section 1350,
As Adopted Pursuant to Section 906 of the Sarbanes-Oxley Act of 2002.
32.2 Section 906 Certification of Chief Financial Officer Pursuant to 18 U.S.C. Section 1350,
As Adopted Pursuant to Section 906 of the Sarbanes-Oxley Act of 2002.
101 Financial statements from the Annual Report on Form 10-K of Papa John’s International,
Inc. for the year ended December 30, 2012, filed on February 28, 2013, formatted in
XBRL: (i) the Consolidated Statements of Income, (ii) the Consolidated Statements of
Comprehensive Income, (iii) the Consolidated Balance Sheets, (iv) the Consolidated
Statements of Stockholders’ Equity, (v) the Consolidated Statements of Cash Flows and
(vi) the Notes to Consolidated Financial Statements.
__________________ *Compensatory plan required to be filed as an exhibit pursuant to Item 15(c) of Form 10-K.
The Exhibits to this Annual Report on Form 10-K are not contained herein. The Company will
furnish a copy of any of the Exhibits to a stockholder upon written request to Investor Relations,
Papa John’s International, Inc., P.O. Box 99900, Louisville, KY 40269-0900.

corporate information
international markets
Corporate headquarters2002 Papa John’s Boulevard Louisville, Kentucky 40299 502-261-7272
stock listingPapa John’s stock is listed on The NASDAQ Global Select Market under the ticker symbol PZZA
annual MeetingThe annual meeting of stockholders will be held Wednesday, May 1, 2013, 11:00 A.M. (E.D.T) at: Papa John’s International, Inc. 2002 Papa John’s Boulevard Louisville, Kentucky 40299
Independent Public accountantsErnst & Young LLP
transfer agentComputershare Shareholder Services P.O. Box 43078 Providence, RI 02940 www.computershare.com/investor 800-622-6757 (US, Canada, Puerto Rico) 781-575-4735 (non-US)
Investor relationsLance F. Tucker Senior Vice President, Chief Financial Officer, Chief Administrative Officer, and Treasurer 502-261-4218
Corporate Communications – Media relationsSteve E. Higdon Vice President, Global Communications 502-261-4710
Forward-looking statementsThis report includes non-historical or “forward-looking” statements concerning future events or conditions. Important risk factors, which could cause actual results to differ materially from these statements, are set forth in Item 1A. Risk Factors in the accompanying Form 10-K.
For More InformationTo learn more about Papa John’s, or to order online, visit our website at www.papajohns.com
Note: International Locations as of December 30, 20122012 Markets entered – Azerbaijan, Guam, Lebanon
Mexico
Canada
El SalvadorNicaragua
Costa Rica
EcuadorColumbia
Peru
Chile
Cayman IslandsDominican Republic
Puerto Rico
Panama
Venezuela
Trinidad & Tobago
United Kingdom
Russia
Bahrain
Malaysia
OmanSaudi Arabia
China
Philippines
South KoreaEgypt
India
Cyprus
Qatar
Ireland
KuwaitJordan
Turkey
UAE
When the Board of Directors asked me to step back in as CEO at the end of 2008, I had no idea how fantastic the next four years would be. We’ve been fortunate both financially and operationally with successes on many fronts. I attribute a large part of these achievements to a fantastic business model and a fantastic group of people working together. In fact, it was the legendary 19th century industrialist, Andrew Carnegie, who said: “Teamwork is the ability to work together toward a common vision. The ability to direct individual accomplishment toward organizational objectives. It is the fuel that allows common people to attain uncommon results.”
to our shareholders, Franchisees, supply Partners and team Members:
Azerbaijan
LebanonGuam
That appropriately describes Papa John’s 2012 performance: approximately 100,000 team members and franchisees worldwide working together towards a common objective and achieving uncommon results. I am pleased to report that, in the face of continued economic headwinds and competitive pressures, our company delivered outstanding results in 2012, and has a solid, proven business model which we are confident will continue to deliver strong results for the foreseeable future.
highlights of our 2012 results include:
• Earnings per diluted share of $2.58 for full-year 2012, representing a 19.4% increase over 2011.
• North American comparable sales increase of 3.6%, marking the ninth consecutive year of positive or even domestic system-wide comparable sales.
• International comparable sales increase of 7.1%.
• 280 net worldwide restaurant openings, representing the highest number of global net restaurant openings in more than 10 years.
These solid results were delivered at the direction of one of the most talented executive leadership teams we’ve had at Papa John’s. Their knowledge of the industry and their respective disciplines, as well as their collaborative approach to the business, continue to motivate all team members to work together towards driving results.
That spirit of teamwork also has helped us grow our global footprint of restaurants, which continues to be
the fuel that powers our brand. In 2012 we celebrated several milestone openings, including the opening of the 4,000th restaurant in our global system, as well as the 200th restaurant in the United Kingdom, and the first Papa John’s restaurants in Azerbaijan, Lebanon and Guam. With approximately 1,400 restaurants in our global development pipeline, the majority of which are scheduled to open over the next six years, the future of the Papa John’s brand is bright throughout the world.
My optimism around our global growth also is based on the solid year our international business delivered in 2012 with strong comp sales and a 21.7% increase in system sales over 2011. And, most importantly, our international operations achieved profitability in 2012. On the development front, international grew its base by 16.7% with the opening of 137 net new restaurants in 2012. While I am pleased with our international growth numbers, I’m even more excited by the fact that we are partnering with franchisees committed to the brand and committed to delivering on our “Better Ingredients. Better Pizza.” brand promise.
Our brand promise continues to resonate with consumers in the US and around the world. In 2012 we were honored with two prestigious industry awards. Papa John’s earned Brand of the Year honors in the pizza category of the 2012 Harris Poll Equitrend Study, and for the 11th time in the past 13 years Papa John’s was rated tops in customer satisfaction among limited-service restaurants in the 2012 American Customer Satisfaction Index (ACSI). We are honored and humbled by the fact that consumers continue to recognize and reward Papa John’s for our sharp focus on product quality and customer satisfaction.
We delivered these strong results during a year faced with a still tenuous global economy and ever increasing competitive pressures. Despite these challenges, Papa John’s has been, and will continue to be, pragmatic in its approach as we continue to build shareholder value. Our solid financial footing, conservative balance sheet and sound financial discipline are buttressed by our company’s strong core values and an evolving culture where collaboration, accountability and excellence are expected and rewarded. As I introduced in my letter last year, all of this supports the three main pillars of the business that continue to be vital to our long-term success: Quality, Branding and technology.
Quality is the core of Papa John’s. It is something we are fanatical about and it is something we will spare no expense to ensure. “Better Ingredients. Better Pizza.” is not just a slogan, it’s a promise of quality and is the hallmark of our business. Quality is the foundation with which:
• Our original hand-tossed dough is still made fresh, never frozen.
• We continue to use all-natural, fresh-packed tomato sauce not from concentrate.
• Our cheese is still made from 100% mozzarella.
• We continue to use other superior-quality ingredients, including baby Papabella mushrooms and vegetables fresh cut in our restaurants daily.
Quality also is woven throughout the fabric of our Branding. We continue to partner only with those who can help us tell our “Better Ingredients. Better Pizza.” story to wider audiences around the world. In 2012, we completed the third year of our three-year sponsorship with the NFL, with Papa John’s the Official Pizza of the NFL and the Super Bowl, and extended the agreement for the long term. We also were able to enhance our partnership by teaming up with Denver Broncos quarterback Peyton Manning. Not only did he appear in an advertising campaign for us last fall that continued through this year’s Super Bowl, he also became a franchisee, partnering in 22 restaurants in the Denver market. Going forward, we will continue to seek out leading partners from various industries around the world to partner with to help us grow our brand.
We also continue to believe that a strong technology platform is critical to our success. In 2012 we launched online ordering in Canada, and made great strides in developing and executing strategies to reach more consumers through various social and electronic media channels around the world. We will continue to invest in technology to position ourselves at the forefront of the rapidly evolving technological world, to meet consumer demands and position our restaurants for optimum growth.
Looking forward, while there is still economic and political uncertainty in many parts of the world, Papa John’s is well-positioned to benefit
from a proven business model and growing consumer demand for better quality pizza. Staying on offense, gives me confidence in our ability to deliver high-quality growth through gains in market share and margins.
With approximately 100,000 franchisees and team members worldwide collaboratively working toward the common objective of growing Papa John’s around the world, I’m excited for what the future holds for our brand. Thank you for your continued support and patronage.
John H. Schnatter Founder, Chairman and Chief Executive Officer
Four-Year Financial highlights
Note: The results for 2009 and 2010 are presented on a non-GAAP basis for comparability purposes. See the Investor Relations section of our website which contains the GAAP to non-GAAP reconciliations.

PaPa John’s InternatIonal2012 annual rePort
John h. sChnatterFounder, Chairman and Chief Executive Officer
norBorne P. Cole, Jr. (2*) (4)Vice-Chairman of the Board Silver Eagle Distributors, LP, An Anheuser-Busch InBev distributor
ChrIstoPher l. ColeMan (1) (3) Managing Director, Rothschild - London
PhIlIP GuarasCIo (3)Chairman and Chief Executive Officer of PG Ventures LLC, a marketing consulting firm
olIVIa F. KIrtleY (1*) (2)Business Consultant
MarK s. shaPIro (1) (3)Executive Producer Dick Clark Productions
WIllIaM M. street (1) (3*) Business Consultant
W. Kent taYlor (2) Founder, Chairman and Chief Executive Officer of Texas Roadhouse
eXeCutIVe oFFICers
John h. schnatterFounder, Chairman and Chief Executive Officer
anthony n. thompson Executive Vice President, Chief Operating Officer, and President PJ Food Service
lance F. tuckerSenior Vice President, Chief FinancialOfficer, Chief Administrative Officer, and Treasurer
andrew M. VargaSenior Vice President and Chief Marketing Officer
timothy C. o’hernSenior Vice President and Chief Development Officer
steve M. ritchieSenior Vice President, North and Latin American Operations and Global OST
thomas V. sterrett Senior Vice President, International
DIreCtors
nuMBers InDICate BoarD CoMMIttees:(1) Audit Committee(2) Compensation Committee(3) Corporate Governance and Nominating Committee(4) Lead Independent Director
*Committee Chair