Pallutian Project - USAID
79
Pallutian Project .- ,:..: R . . ? , = .t.J .i-: - . :,-. , . 2 -. ... *7....." -:* 8 ;.,.4?1-L+2 -2; %:+ , >,. , : : a 8 "r A ' 4 -:: ,t7p .F@sz .. _ .I. ~3 - 'I :-.!+ -- LY, I.. . ,.I, L. -. .p ~3 .P ...... ... .- - ..,I 'A@ .. , .LA ,. -- , -- , , e;\g .-. - c - :' ,, / . ,, ; :.'.-.rc ,: ' '. k2 -. .. - __. - _ a , ni--*.3 r.:-:-:-.& .J ,.---A <- ? . , i .kt . < . V .. .,. -. , . -.-h. 2 -. . ,.. , , > ,--8, :, ., < ". -.. .-:.-ly I -. S" .- . .
-
Upload
khangminh22 -
Category
Documents
-
view
0 -
download
0
Transcript of Pallutian Project - USAID
Pallutian Project .- ,:..: R
. . ? ,= .t.J
.i-: - . :,-. , .
2 -. ... *7....."
-:* 8 ;.,.4?1-L+2
-2; %:+ ,> ,. ,::a 8 "r A' 4 -:: ,t7p .F@sz .. _ . I . ~3 - 'I :-.!+
-- L Y ,
I.. . ,.I, L. -. .p ~3 .P . . . . . . ... .- - ..,I 'A@ . . , .LA , . - -
, - - , , e;\g .-. - c - :'
, , / . , ,
; :.'.-.rc ,: ' '. k2 -. .. - __. - _ a , ni--*.3
r.:-:-:-.& .J ,.---A < - ?
. , i .kt . < . V .. .,. -. , . -.-h. 2 -. . ,.. , , >
,--8, :, ., < ". -.. .-:.-ly
I - . S" .-
. .

MACH Management of Aquatic
Ecosystems tlirougliCommutri@ H~sbandry
Draft Final Report on
MACH-Kaliakoir Pollution Project
December, 2001
A project of the Goi*ernrnenr of Bangladesh Sponsored by USAID
Project Parlners: Winrock Inferndona1
Bangladesh Centre for Advanced Studies (BCAS) Centerlor Natural Resource Studies (CNH)
CAIUTAS Bangladah
BOD BEMP
BAT
BGMEA
BTMA BC AS
BELA
COD CNRS
CP
CPA
CIlrl
DAP
DHHS
DOE
DOF DO
DCCI ECA
ECR
EU EMAS
ETP
EQS GDP
GOB IS0 Kwh
LGED MACH MOEF
MCCI
NGO
PRA SPIES
TSS
USAID
UNEP
USEPA
WMA WTO
ACRONYMS AND ABBREVUTIONS
Biochemical Oxygen Demand
Bangladesh Environmental Management Program
Best Available Technology Bangladesh Garment Manufacturers & Exporters Association
Bangladesh Textile Mills Association
Bangladesh Centre for Advanced Studies Bangladesh Environmental Lawyers Association
Chemical Oxygen Demand
Centre for Natural Resource Studies
Cleaner Production
Cleaner Production Auditing
Colour Identification Number
Diammonium Phosphate
Department of Health & Human Services
Department of Environment
Department of Fisheries
Dissolved Oxygen
Dhaka Chamber of Commerce & Indusby
Environment Conservation Act 1995
Environment Conservation Rules 1997 European Union Environrnental Management Audit System
Effluent Treatment Plant
Environmental Quality Standard
Gmss Domestic Product
Government of Bangladesh International Standard Organization
Kilowatt Hour
Local Government Engineering Department Management of Aquatic Ecosystem through Community Husband~y
Ministry of Environment & Forest
Metropolitan Chamber of Commerce & Industry
Non Government Organilation
Participatory Resource Assessment
Sustainable Productivity Improvement for Export Success
Total Suspended Solid
United States Agency for International Development
United Nations Environmental Program
United States Environmental Protection Agency
Waste Minimization Audit
World Trade Organization

EXECUTIVE SUMMARY
1. INTRODUCTION
Mach Background
Recognizing the need for new approaches to floodplain and wetlands resource management, the Government of Bangladesh and the United States Agency for International Development (USAID) are jointly implementing MACH: Management of Aquatic Ecosystem through Community Husbandry. MACH is concerned with all wetlands resources- water, fish, plants, wildlife and others- over entire floodplain ecosystems (beels, seasonal floodplains, rivers).
MACH'S main concern is to demonstrate community-based approaches that will ensure the long term sustainability of all wetland resources. To achieve that goal MACH will, with community support, address issues that impact the long term sustainability of wetland habitats.
Pollution Issues
The MACH Turag-Bangshi site is on the northern edge of the Dhaka-Tongi Savar industrial belt and is home to 1 I industrial plants including a major tannery, several textile and textile dying plants, metal anodizing as well over 300 poultry farms. Most of the emuents from these flow into Ratanpur Khal or canal which then discharges into Mokesh beel and then into the Turag River which in turn connects with the Buriganga and Shitaylaka Rivers.
As part of the initial MACH activities RRAs, PRAs, courtyard meeting as well as various community meetings were conducted. At most of these meetings pollution was identified the major problem affecting the wetlands and fishery of Mokash Beel as well as the health and livelihood of the local population. In a PRA meeting, on 29 September, 1999, that included all concerned Union Parishad members as well as other resource users it was recommended that MACH:
Identify the types and sources of pollution
Work with industrialists and others to seek a solution.
2. POLLUTION PROBLEbIS O F THE TURAG BANGSHI BASIN
In response to community requests MACH carried out a series of water q u a l i ~ investigations. Physical examination reveals that the pollutants discharged by the ab0i.e- mentioned industries seriously affect Ratanpur Khal and Mokash Beel in Kaliakoir and its surrounding canals and rivers. The water is noisome and colored, fish are either not present or decreasing and those fish remaining when caught are reported to smell of kerosene and ha\.ing a bitter taste. The main Ratanpur Khal is essentially biologically dead and the tosicity is expanding to downstream areas. In the dry season, Mokash Beel is badly

affected by these pollutants. This stream is the main source of water for stock watering, imgation and is used for washing, bathing, and other uses by the local community.
In addition, 'end of pipe' samples of the most polluting industries were carried out. In all cases the concentration of heavy metals, BOD and COD were found to be higher than the national standards. Significant seasonal variation was also observed, the pollution level being naturally higher during the dry season.
Table-1: Median values of heavy metals in sediments in different locations of Mokesh Bee1 Ecosystem (Aymon Textile, Bridge Khal, Mazukhan Khal, Apex Tannery, Rahim Textile, Khan Chemicals)
This analysis of sediment parameters indicates that the concentration of heavy metals shown above significantly exceeds international limits.
Parameter Cadmium (n=6) Chromium (n=6) Lead (n=6)
Zinc (n=6)
Table-2: Median values of different parameters in water in different locations of Mokesh Bee1 Ecosystem (Aymon Textile, Rahim Textile, Apex Tannery, Khan Chemicals, Ratanpur Khal, Bridge Khal, Mazukhan Khal)
Indusbialists Meetings
Median values (mg/l)
1.35 44
77.25 450
The results shown above were reported to community members. Based on community requests and the above results MACH sought meetings with the concerned industries. A meeting was held with industrialists to discuss these issues and seek in December 1999. At that meeting, MACH agreed to work directly with concerned industrialists to identify processes in their industries that cause pollution. The industries agreed to allow our staff to
I Bmgladesh Standard. Garcne hugu6 28. 1997 for waste discharge quality s ~ ~ ~ ~ d a r d s for industrial units or projects . . 11
Range values (mg/l) (0.6 - 4.2)
(21.5 - 5640) (46.5 -189.5) (90 - 882)
benchmark their environmental performance and to work with their staff to identify cleaner production options.
In addition, we let the indistries know that the project would conduct water quality assessments over the period of a year while these assessments were taking place.
3. ACTIVITIES AND FINDINGS
A variety of activities took place these included: a. Benchmarking of Environmental Performance of selected industries. b. Assessment of Cleaner Production Options C. Continued Water Quality Monitoring d. Testing of the use of water hyacinth to reduce heavy metal contamination. e. Final Meeting with the community and industrialists to report findings.
a. Assessing and Benchmarking Environmental Performance of Rahim and Aymon Textile Dyeing, Printing and Finishing Mills
Details of the inventory are to be found in the text where assessment and benchmarking of the environmental performance of two textile dyeing units to assess of those industries (Rahim & Aymon)took place. In addition, suggestions were give to clean up operations were proposed. The following parameters were considered:
b. Pollution Prevention - Cleaner Production Options
Environmental Parameters
Cleaner Production (CP) techniques offer improvements in industrial processes and management that can reduce the volume of pollution generated, increase production efficiencies, and reduce operating costs.
Main Categories
Raw Material Consumption
Energy Consumption I I Consumption of Water
Emissions
I t introduces the concepts of environmentaVcleaner production audit with a background of various types of audits and discusses, in detail, the various preparatoly activities and aspects that need to be considered while planning a cleaner production audit by the industries concerned.
Sub-Categories
Non-renewable raw materials Renewable raw materials I
Electric energy
Thermal energy
Water emissions (BOD & COD) The findings as detailed in the text show that Bangladesh industries exceed international norms in almost all of the above categories.

In the wntext of cleaner production, the following -11s justify a need for conducting a cleaner production audit in an industrial operation.
A good cleaner production audit:
defines sources, quantities and types of waste generated; collates information on unit operations, raw materials, products, water and energy usage and wastes generated;
highlights process inefficiencies and areas of poor management; helps set targets for cleaner production and prioritize cleaner production measures; permits the development of cost-effective waste management strategies; raises awareness in the work-force regarding the benefits of cleaner production; as a result of all the above, helps to improve process efficiency and reduced wastes.
The Cleaner Production Audit methodology has been adapted to the MACH pollution projects. The systematic approach to conducting a cleaner production audit is demonstrated to the two of the industries (Rahim & Aymon textile ) were as follows:
Define the Objectives and Swpe of the Audit Formation of an Environmental Examination Team
* Pre-assessment: Listing of Unit Operations and Constructing Process Flow Diamams
* 1mGementation of the Obvious and Simple Implementable Options Exhaustive Material Balance: Process Inputs and Outputs Synthesis and Identification of Avenues for Cleaner Production
The various ways of achieving cleaner production which was disseminated to the industries were as follows :
1. Good housekeeping practices 2. Equipment modification 3. Process modification/retrofitting 4. Raw material substitution 5. Product modification 6. Innovative manufacturing technology
Additionally:
1. By-product recovery from the waste 2. Recycling the waste (with or without treatment) in the production
process itself 3. Reuse of waste (with or without treatment) in some other process.
c. Placement of Water Hyacinth in Ratanpur Khal to Assess Absorption of Heavy Metals from Industrial Effluents
An experiment was undertaken to reduce heavy metal in the effluent by placing water hyacinth in two separate spots in Ratanpur Khal. Placement of water hyacinth in two spots

was completed and water quality monitored over a eight month period. A reduction in concentrations of heavy metals was measured.
The major activity held during the period was a workshop held on June 9,2001 a! LGED. Participants of the MACH Pollution Workshop were industrialists h m the main Kaliakhair industries, local community and Resource Management Organization members, concerned Union Parishad Members and Chairpersons, Upazilla central government representatives, as well as members of the MACH Steering Committee from the Ministries of Environment, Ministry and Department of Fisheries, the Planning Commission and others.
The purpose of the workshop was to review MACH activities to date and suggest ways to further abate the pollution problems of Ratanpur Khal, Mokesh Beel and the Turag River and to continue the dialogue between industry, the community and government.
4. MACH ACHIEVEMENTS
Since the work started from March 2000 and continued until March 2001 and included the following activities:
Good working relationship with industry; Raised local level awareness on the pollution issues; Kerosene Management in Textile Dyeing, Printing & Finishing Mills: On discussions and demonstration to Rahim Textile and Aymon Textile mills have replaced kerosene which is an environmental friendly chemical Albatose SE. C.P options for the industries have been identified; Assessment and Benchmarking of Environmental performances of the Rahim & Aymon Textile (dyeing, printing and finishing mill) has been conducted. Experimental procedures have been undertaken to find an affordable means to make the colorless effluent. Results are positive.
5. CONCLUSIONS & RECOMMENDATIONS
In general, MACH recommends a bottom up community-based approach to resource management. However, in the case of industries and industrial pollution community action has had little or no influence on the activities of industrialists. Ongoing publicity campaigns in national dailies. legal action by national dailies and attempts to work directly with the industries have not wholly successful. It is unlikely that a community-based approach by itself will be fully successful in reducing effluents.
MACH in its relations with industrialists purposely took a non-confrontational approach. attempting to establish a relationship with industrialists that would encourage their cooperation. Industrialists work with MACH on a voluntary basis. It has become apparent that this approach is only partly successful. All industrialists were willing to work with the
v
project in the review of industrial practices with a view to improving efficiency as well as the design of appropriate treatment plants but none were willing to take significant steps to reduce effluent toxicity.
Bangladesh has the legal b e w o r k to control industrial pollution. At present DOE is the only body empowered to bring prosecutions under the environmental legislation and regulation. However, there is a lack of enforcement of the existing laws and regulation primarily due to lack of capacity of the DOE in terns of political will, qualified manpower and physical resources.
MACH has found that industries pay lip service to environmental issues; some industries going so far as to include effluent treatment plants and in some cases even meet the Bangladesh ECA 95' and ECR 97'. However, few of these treatment plants are actually operated nor are the environmental management plans implemented. As in many environmental issues, a lack of accountable local and national govemment agencies, a lack of effective local planning and zoning ensures that change does not occur. Pollution has many technical aspects but is at heart, like other environmental problems, a governance issue. Given the current realities it is admitted by most industrialists and agreed by envirohentalists that:
In the short tern, control of industrial effluents will only occur when so required by buyers and their host nations. Independent thud party audits leading to performance as well as management certification are a fundamental requirement. In the long tern, empowerment of elected and accountable local govemment to deternine community land use, based on national goals and standards, and backed up by aggressive GOB regulators are a fundamental requirement.
Recommendations
a. Governance, Policy and Consensus Building.
Key elements needed to solve this problem lie in the development of the political will and then undertaking the policy changes needed fo effect change. This requires establishing the constituencies within communities both local and national as well as within the govemment and industry who could support these changes. In addition international buyers, national manufacturers and organizations such as the BGMEA (Bangladesh Garment Manufacturers & Exporters Association), Bangladesh Textile Mills Association (BTMA) must be consulted and convinced that it is in their long term best interest to support these initiatives. Finally, support for govemment institutions concerned with control of industrial pollution must be a part of any program.
MACH will work with the Wetlands Network or others to achieve a consensus and make the policy changes needed to affect changes.

Task-1 Consensus Building
Build constituencies within communities, government and industry to affect change.
Task 2. Industrial Zoning
Sectoral Industrial zoning policy to be adopted by GOB through a regulatory framework, MACH will work with the DOEYBEMP project in the development of those recommendations.
b. Technical Recommendations for Future Action
The following activities are being suggested for facilitating implementation of MACH Pollution Sub-component at Kaliakor.
Task 1. Provide technical assistance to the industries for the implementation of Cleaner Production Program.
Work with specific industries willing to implement cleaner production activities.
Task 2. Physical Intervention
A pilot project is recommended to undertake development of an economically feasible treatment method for decolorizing the effluent and reducing BOD levels. This will serve as a model for other industrial entrepreneurs to adopt on a cost effective basis, which can be replicated. MACH will work with the DOEBEMP project in this area.
Task 3. Monitoring and awareness building in beneficiary community
Task 4. Special studies on Pollution
Task 5. Outreach Program
Task 1. Ban on undesirable dyes and pigments are strictly enforced.
Task 2. Compliance of the environmental requirement is examined jointly by the enforcing authority and the representatives of the civil society.
vii
TABLES OF CONTENTS
Page
EXECUTIVESUMMARY 1. INTRODUCTION
1.1 Background
1.2 Mach and Indusirial Pollution
1.3 Overview of Industry in Bangladesh
1.4 Program Objectives
2. POLLUTION PROBLEM OF TURAG BANGSHI BASIN
3. FINDINGS AND DISCUSSION
3.1 Assessment of Baseline Pollution- Chemical Analysis
3.2 Review of the Effects of the Pollutants Found in the Area
3.3 Interaction with Local Community
3.4 Consultative Meeting with the Industries
3.5 Assessing and Benchmarking Environmental Performance of Rahim
and Aymon Textile Dyeing, Printing and Finishing Mills
3.5.1 Scope of Investigation
3.5.2 Factory Profiles
3.5.3 Results
3.5.4 Assessment and Comparison with Selected Reference Levels
3.5.5 Explanatory Analysis of Environmental Inventory Results
3.6 Placement of Water Hyacinth in Ratanpw Khal To Assess Adsorption of Heavy Metals From Industrial Emuents
3.6.1 Introduction 3.6.2 Physical Intervention of Water Hyacinth
4. POLLUTION PREVENTION-CLEANER PRODUCTION OPTIONS
4.1 General Principles
4.2 Types of Environmental Audits
4.3 The Cleaner Production Audit Concept
4.4 Reasons for Conducting a Cleaner Production Audit m
viii
i-vii 1-4
1
1
2
3

4.5 Steps in Cleaner Production Auditing
4.6 Defining Objectives and Scope of the Audi! Program
4.7 Defining Objectives
4.8 Defining Scope
4.9 Establishing Goals
4.10General Identification of Cleaner Production Options
4.10.1 Cleaner Production Concept
4.10.2 Advantages of Cleaner Production over End of Pipe Approach
5. MACH POLLUTION WORKSHOP
6. ACHIEVEMENT
7. CONCLUSION & RECOMMENDATION
TABLES
Median values of heavy metals in sediments in different locations of Mokesh Beel Ecosystem Sediment Quality Guidelines for the Protection of Aquatic Life- Canadian Environmental Quality Guidelines Median values of different parameters in water in different locations of Mokesh Beel Ecosystem Environmental Parameters Production Profiles of Factories Heavy metal concentration in water at Harinhata culvert Heavy metal concentration in water at railway Bridge Characteristics of effective goal Cleaner production potential for a range of options Cleaner production options for textile and dyeing industry suggested to Rahim & Aymon Textile to be implemented by them
FIG L'R ES
Figure-l : Location of Project Area Figure-2: Location of Industries showing sampling sites Figure-): Photograph showing pollutants in the major industries Figure-4 & Figure-5: Bar Chart for water analysis Figure-6: Bar Chart for concentration of pollutants in Dry Season - Ratanpur
Khal

Figure-7: Bar Chart for concentration of pollutants in Rainy Season- Ratanpur Khal
Figure-8: Typical Process Flow Chart for Textile Dyeing and Printing Mills Figure-9: Photograph showing water hyacinth analysis in Ratanpur Khal Figure-l 0: Types of Environmental Auditing Figure-l I: Step by Step audit Methodology recommended by United Nations
Environment Program Figure-12: Step by step audit methodology recommended by CDG-SEAPO
ANNEXURE
Annex-I: Test Results on Sediment Quality & Waste Water near the discharge point of local industries
Annex-2: Results of Chemical Analysis- Water Hyacinth Annex-3: Findings of the Workshop
1.1 Background
The floodplains of Bangladesh form one of the world's most important wetlands. Home to hundreds of species of unique plants, fish, birds and other wildlife, critical habitat for thousands of migrating b i i and most importantly a source of income and nutrition for millions of people in Bangladesh. The people of Bangladesh, its government, and others have long recognized that these wetland habitats are in decline. Alarmingly, in spite of a series of fisheries enhancement programs over the past 15 years, the inland fisheries and floodplain catch of Bangladesh, as well as the overall plant and animal bio-diversity within the floodplains, continues to decline.
Recognizing the need for new approaches to floodplain and wetlands resource management, the Government of Bangladesh and the United States Agency for International Development - . (USAID) are jointly implementing MACH: Management of Aquatic Ecosystem &rough Community Husbandry. The overall goal of the MACH is the promotion of community based resource management and use of floodplain resources for the sustainable supply of food to the poor of Bangladesh. The major purpose of this project is to demonstrate to communities, local government and policy makers the viability of a community approach to sustainable natural resource management and habitat conservation in Bangladesh over an entire flood plain. MACH is concerned with all wetlands resources- water, fish, plants, wildlife and others- over entire floodplain ecosystems (beds, seasonal floodplains, rivers) not just single water bodies. Therefore, MACH addresses wetland problems beyond the confines of an individual beel or haor- and address watershed, pollution and other issues that impact MACH wetlands.
The MACH community includes all of those using or dependent on wetlands either nutritionally or economically. Furthermore, recognizing that the reduction of fishing pressure is likely to be a critical part of reviving the floodplain fisheries, MACH has included supplemental income-generating activities that will be focused on fishers and others directly dependent on fishing.
The program agreement was signed between the two Governments in May 1998. Three sites were identified as the project areas: Hail Haor of Moulavibazar District, the Lower Turag- Bongshi River Basin in Gazipur and Tangail Districts, and the Upper Kangsa-Malijhee River Basin in Sherpur District. In all of these areas, MACH with community support are working to restore wetland physical and biological functions through management and physical interventions that include: re-vegetation, excavation of key beels and canals, and establishing fish sanctuaries and other activities.
1.2 MACH and Industrial Pollution
MACH'S main concern is to demonstrate community-based approaches that will ensure the long term sustainability of wetland products. To achieve that goal MACH will, with community support, address issues that impact the long term sustainability of wetland habitats.
The Turag-Bongshi MACH site in Khaliakhair Upazilla, Gazipur District, as shown in Fig.- 1 lies on the periphery of the Dhaka-Savar-Tongi industtial triangle. Work at that site began in April-May 1999 with a series of community meetings that culminated in an open forum meeting in August 1999. That meeting included attendees &om D i c f Upazilla and Union governments as well as fishers and resource users. At that meeting, it was suggested that one of the major problems affecting the local wetlands was industrial pollution. Community members felt that the pollution has a serious impact on the productivity of Mokash Beel as well as affecting the health and livelihood of the local population. A recommendation of the meeting was that MACH:
Identify the types and sources of pollution Work with industrialists and others to seek a solution.
1.3 Overview of Industry in Bangladesh
It has been the policy of every Bangladesh Government since the early 80's to support industrial growth. The reason is that Bangladesh requires a high rate of GDP growth, some think over 8% per year (AmChambl997), in order to significantly raise living standards. It is agreed by almost all environmentalists and many agriculturists that present agriculture and rural livelihood practices with their dependence on water, land, fish and other natural resources are unsustainable. Given Bangladesh's large population, small land area and limited natural resources all parties, politicians, civil society and environmentalists, recognize that export based industrialization is a requirement for rapid econolnic growth.
Industrial growth in Bangladesh has followed the following pattern:
The inevitable consequence of this policy in widespread industrial pollution. Effluents released by industry have reached very high levels especially in the industrial areas of the country. The reason is the lack of a land use planning or zoning and the subsequent unplanned establishment of manufacturing facilities without consideration for their potential environment impacts. Water and air pollution are the most prevalent forms of industrial pollution in the country, but solid and hazardous wastes are also of increasing concern. Effluents from these industries have become a threat to the fisheries, wetlands, water supplies and human health of this country.
Year 1993-94 1994-95 1995-96 1996-97 1997-98 1998-99
Currently the major sources of industrial pollution in Bangladesh are leather tanning, textile (dyeing, printing, weaving & finishing), ship breaking, paper and pulp, fertilizer, sugar,
% Growth Rate 7.6 8.6 5.3 3.5 I
8.1 5.0
Source: BBS 1997.

BESTAVAILABLE COPY
steel, oil refining, chemical, pharmaceutical, and other small scale agro-based and agro- allied industries.
1.4 Program Objectives
In response to community requests MACH carried out a series of water quality investigations. The results were reported to community members. Based on their request MACH sought meetings with the concerned industries and a program was developed to seek improvements in water quality with the industrialists. A meeting was held with industrialists at the MACH office in December 1999. Since that meeting MACH has been working directly with concerned industrialists to reduce pollutant discharge, to identify imovative ways to reduce pollution in the Ratanpur Khal, and to continue to monitor industrial effluents.
The objective in the initial phase of MACH Pollution Sub-component was to identify the types and source of pollutants in the T-B basin. The overall objectives were to :
Phase I
Water quality investigations as the type and the nature of pollution
Identification of the most polluting industries and initial quantification of pollution level
Interaction with the Local Community
Consultative Meeting with the Industrialists held December 1999.
Once those pollutants and sources were identified MACH with concerned industrialists entered the second phase of the program to achieve the following:
Development of a good working relationship with the industries
Raising the awareness of industrialists to the extent of the problem and the reasons (both commercial and altruistic) and to solve these problems
Identification of Cleaner Production Options for specific industries to be provide to the respective industries
Awareness raising, mobilizing support and initiating discussions for appropriate solutions by the industries. The captains of the most polluting industries were included in the process
Assessment and Benchmarking of Environmental performances of the two major polluting dyeing industries;

Canyout experimental work to develop an inexpensive way to make the effluent colorless;
Assistance to the industries in the basic design of Effluent Treatment Plants ;
Specific intervention such as removal of heavy metal using water hyacinth clusters in the selected canal sections were implemented, examined and analyzed;
Presentation of the outcomes of the study to the Industrialists, the Community and Government representatives.
Assessment of the present status of pollution with qualitative and quantitative analysis;
Creation of awareness and capacity building of the industrialist in order to reduce pollution;
Review of best practices
Development of a strategy to manage industrial pollution.

2. POLLUTION PROBLEM OF TURAG BANGSHI BASIN
At the Turag-Bangshi site Mokesh bee1 is receiving effluents from industries, which are affecting the fishery, soil, water and even human health. Test results on waste waters and sediments near the discharge point of local industries indicate that industries are discharging toxic heavy metals, sulfides and other poisonous chemicals in concentrations higher than the nationally accepted standards. The local tannery, textile and poultry industries are the main sources of pollution in the area. The industries are. using various kinds of chemicals and are discharging pollutants into Ratanpur Khal and Mokesh Beel as effluents.
The main chemicals used in tanneries are common salt, sodium sulfide, chromium sulfate. FAD liqueur, formic acid, ammonium chloride, dyes, glazing agents, etc. In textile dyeing and printing industries the main chemicals used are. caustic soda, hydrogen peroxide, liqueur - .
ammonia, urea, DAP (Diammonium Phosphate), biding agents and emulsion Additionally textile industries use a vat dying process, which uses sulfur dyes as well as pigments and dyes (both organic and heavy metal based) such as acid reds and yellow, direct black, direct violet etc.
The Metal Anodizing industries are electroplating ones that use HCI, HNO3. Discharged untreated effluents are highly acidic that was found through tests of the samples taken from the vicinity of the industries. Additionally, Zn content is also high in the area that is confirmed by chemical analysis.
The poultry industries with their inherent degradation are also deteriorating the local environment quality. These industries are partly responsible for the high BOD levels of the local khals. About 300 medium to large poultry farms are in operation in Khaliakoir. MACH through CNRS and using FtF volunteers is working with the poultry industry to find ways to reduce wastes. The major pollutants form these industries are organic wastes, which have a direct bearing on the BOD values of the water bodies around the area.
Initially the following industries were considered to be polluting:
1. Apex Tannery 2. Aymon Textile 3. Rahim Textile 4. Gumti Textile 5. Bangladesh Thai Aluminium 6. Devine Textile 7. Newtex Mill limited 8. Uttra Textile 9. Apex Textile and Finishing 10. Kajoli Khamar (Poultry) 1 1. Dhaka Hatchery (Poultry)

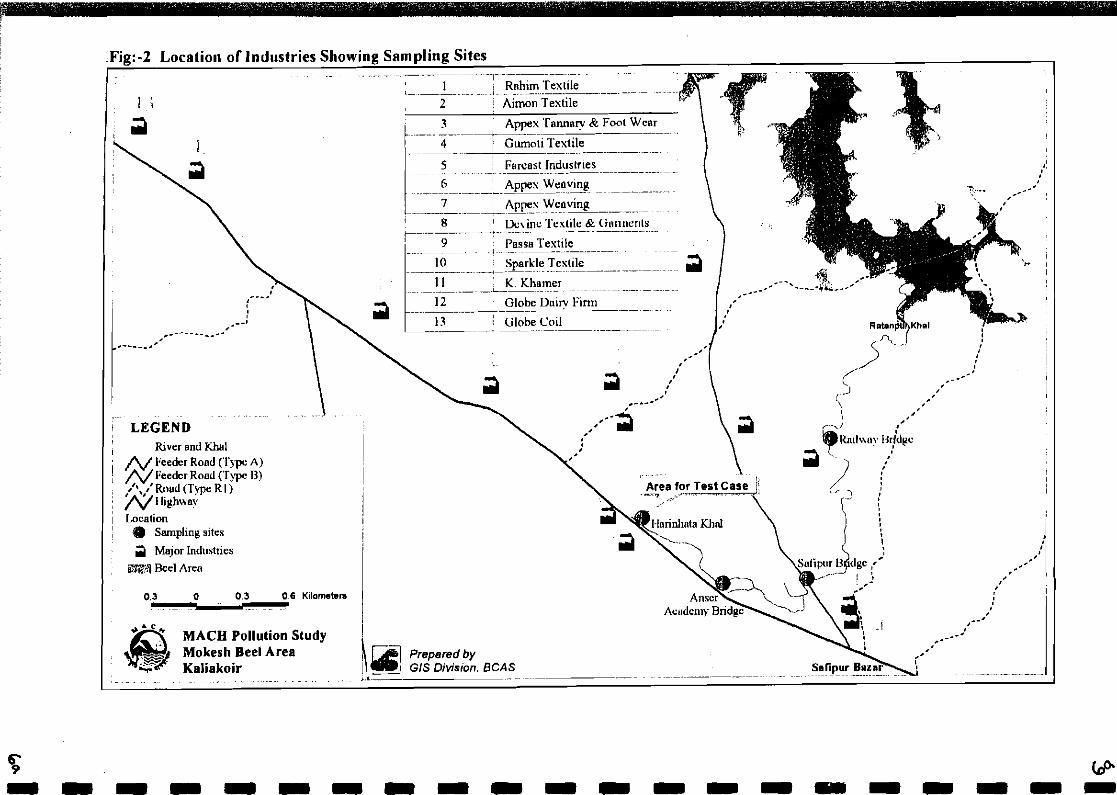
In order to assess the extent of pollution samples were collected for chemical analysis h m Ratanpur Khal at spots shown in Fig. 2. Test results on waste waters and sediments near the discharge point of industries are presented in Annex 1.
Physical examination reveals that the pollutants discharged by the above-mentioned industries (Fig. 3) seriously affect Ratanpur Khal and Mokash Beel in Kaliakoir and its surrounding canals and rivers. The water is noisome and colored, water birds are rarely found, fish are either not present or decreasing and those fish remaining are reported to smell of kerosene and having a bitter taste. The main Ratanpur Khal is biologically dead and the toxicity is expanding to downstream areas. In the dry season, Mokash Beel is badly affected by these pollutants. This stream is the main source of water for stock watering, irrigation and is used for washing, bathing, and other uses by the local community.

End of pipe c'.Aymon Testile)
. C I
Cnd o f pipe (Rahim Text i le)
r. oilzcrlon or ~ i 3 1 e r sample
Fig:- 3
BEST AVABAglS COPY ,
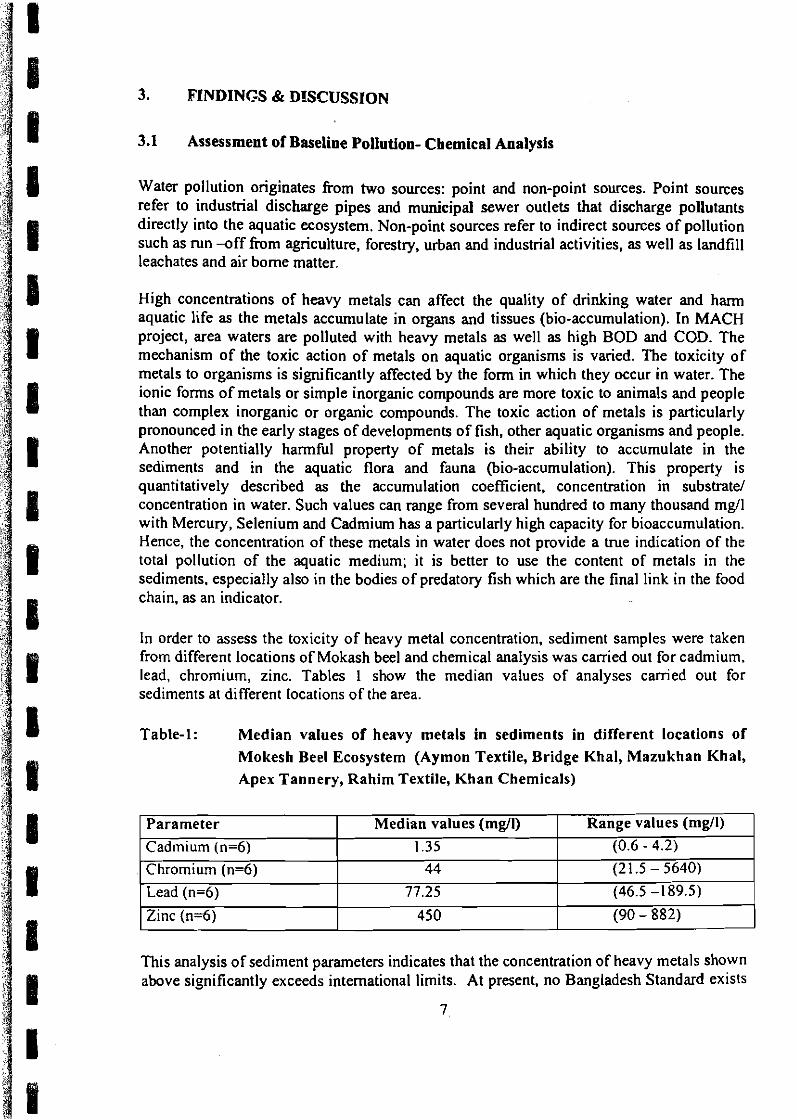
3. FINDINGS & DISCUSSION
3.1 Assessment of Baseline Pollution- Chemical Analysis
Water pollution originates from two sources: point and non-point sources. Point sources refer to industrial discharge pipes and municipal sewer outlets that discharge pollutants directly into the aquatic ecosystem. Non-point sources refer to indirect sources of pollution such as run -off from agriculture, forestry, urban and industrial activities, as well as landfill leachates and air borne matter.
High concentrations of heavy metals can affect the quality of drinking water and h a m aquatic life as the metals accumulate in organs and tissues (bio-accumulation). In MACH project, area waters are polluted with heavy metals as well as high BOD and COD. The mechanism of the toxic action of metals on aquatic organisms is varied. The toxicity of metals to organisms is significantly affected by the form in which they occur in water. The ionic forms of metals or simple inorganic compounds are more toxic to animals and people than complex inorganic or organic compounds. The toxic action of metals is particularly pronounced in the early stages of developments of fish, other aquatic organisms and people. Another potentially harmful property of metals is their ability to accumulate in the sediments and in the aquatic flora and fauna (bio-accumulation). This property is quantitatively described as the accumulation coefficient, concentration in substrate/ concentration in water. Such values can range from several hundred to many thousand m d l with Mercury, Selenium and Cadmium has a particularly high capacity for bioaccumulation. Hence, the concentration of these metals in water does not provide a true indication of the total pollution of the aquatic medium; it is better to use the content of metals in the sediments. especially also in the bodies of predatory fish which are the final link in the food chain, as an indicator.
In order to assess the toxicity of heavy metal concentration, sediment samples were taken from different locations of Mokash beel and chemical analysis was carried out for cadmium, lead, chromium, zinc. Tables I show the median values of analyses carried out for sediments at different Iocations of the area.
Table-1: Median values of heavy metals in sediments in different locations of Mokesh Beel Ecosystem (Aymon Textile, Bridge Khal, Mazukhan Khal, Apex Tannery, Rahim Textile, Khan Chemicals)
This analysis of sediment parameters indicates that the concentration of heavy metals shown above significantly exceeds international limits. At present, no Bangladesh Standard exists
Range values (mgll) (0.6 - 4.2) (21.5 - 5640) (46.5 -189.5)
(90 - 882)
Parameter Cadmium (n=6) Chromium (n=6)
Lead (n=6) Zinc (n=6)
Median values (mgll) 1.35
44
77.25
450

for heavy metals in sediments. Table 2 provides Canadian standards, which establish maximum permissible levels for the protection of aquatic life.
Table 2: Sediment Quality Guidelines for the Protection of Aquatic Life -Canadian Environmental Quality ~uidelines'
In order to assess the quality of Mokash Bee1 ecosystem, samples of wastewater were collected from seven different locations. The test results are as follows and the data is presented in bar chart from in Figure 4 & 5. There is a marked seasonal variation in pollution level for the rainy and dry seasons. In the dry season, the situation is seriously aggravated. The concentrations of heavy metals increases and BOD and COD values almost doubles during the dry season compared to wet season. This is shown in Figures 6 & 7.
Parameter
Cadmium (Cd)
Chromium (Cr)
Lead (Pb)
Zinc(Zn)
Table-3: Median values of different parameters in water in different locations of Mokesh Beel Ecosystem (Aymon Textile, Rahim Textile, Apex Tannery, Khan Chemicals, Ratanpur Khal, Bridge Kbal. Mazukhan Kbal)
Unit (mglkg)
0.6
37.3
35
123
I Canadian Council of Ministers For the envimnrnent 1999. updated 2001 ' Bangladesh Standard. Gazene AuguS 28. 1997 for waste discharge quality uandards for industrial units or projects 8

Water Analysis Median Yulves in mg/l (kaliokoir area)
I
COD (Range 350-1600) TSS (Range 115-427)
Water Analysis ktedian Values in ng/l
WpW- 1.6102) Wreze 1745) 1 Median u@ (Kaltakoir area) Standard r&l @an&hh water quality standanl) j

Seasonal Variation of ~oliu&m Levels --- --
Water Pol lut ion Levels in Ratarspur K h a l Dry Season
0.35 - I 0.30 -
0.25 -
0 .20 - - -. .
0.15 -
0.10 -
0.05 -
0 .oo r
I I I
P b (m g/l) c d (mg/l) " ' c r (rn g i l l Is
10 Waste Water Results Bangladesh Standard I Seasonal Varia~on of Pollutiron Levels II
C o n cen tra tion of 0 th er Parameters in Water
BOD (mg/l) COD (mgfl)
MI W a s t e W a t e r I Bangladesh Standard

I Seasonal Variation of Poliution Levels
r -
Concentration of Heavy Metal in Wafer - I
Rainy Season I I I
I I
I
2 I -- . -. . . . . . - -. . . . . . -
I zn (mg/l) Pb (mgll) Cd (mg/l) I
Results of Water Bangladesh Standard - I
1 Seasonal Variation of Pollution Levels I t
Concentrarim of other parameters in ?Voter
I I '. 4 - I
#
BOD (mg/l) COD (mgll)
Resuf ts of Water B a n g l a d e s h Standard I
3.2 Review of the Effects of the Pollutants Found hi the Area
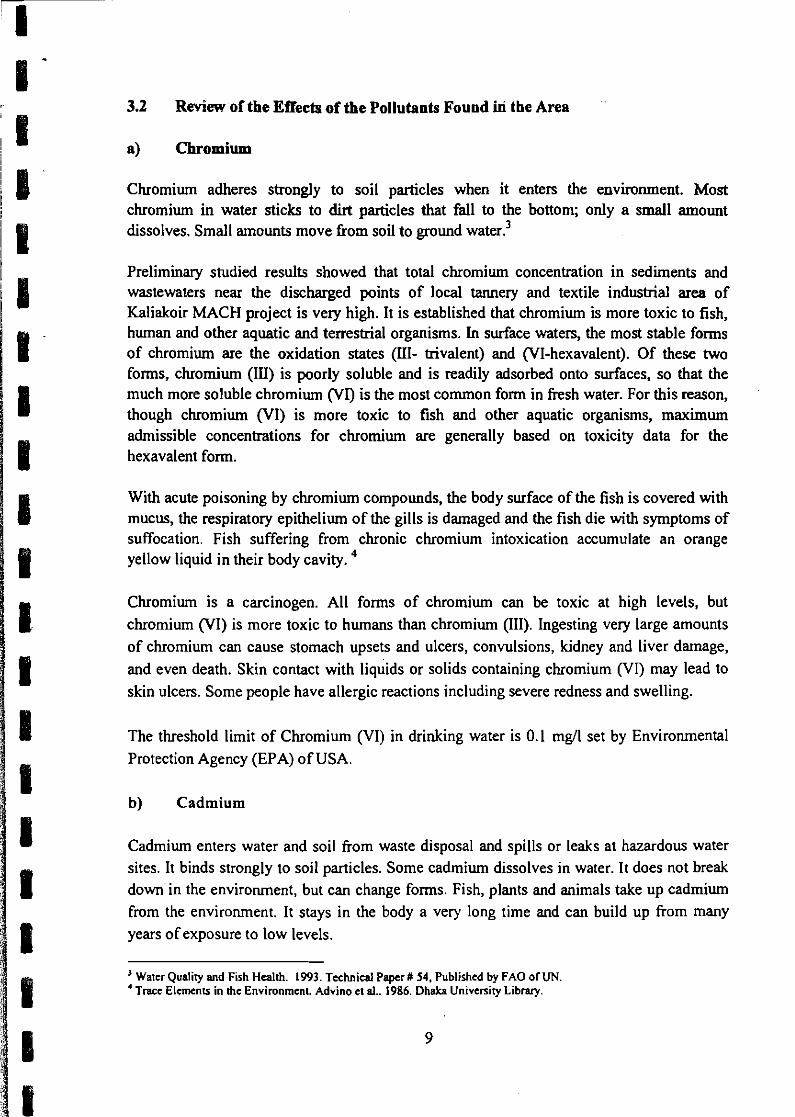
a) Chromium
Chromium adheres strongly to soil particles when it enters the environment. Most chromium in water sticks to dirt particles that fall to the bottom; only a small amount dissolves. Small amounts move fiom soil to ground water?
Preliminary studied results showed that total chromium concentration in sediments and wastewaters near the discharged points of local tannery and textile industrial area of Kaliakoir MACH project is very high. It is established that chromium is more toxic to fish, human and other aquatic and terrestrial organisms. In surface waters, the most stable fonns of chromium are the oxidation states (111- trivalent) and (VI-hexavalent). Of these two forms, chromium (111) is poorly soluble and is readily adsorbed onto surfaces, so that the much more soluble chromium (VI) is the most common fonn in fresh water. For this reason, though chromium (VI) is more toxic to fish and other aquatic organisms, maximum admissible concentrations for chromium are generally based on toxicity data for the hexavalent fonn.
With acute poisoning by chromium compounds, the body surface of the fish is covered with mucus, the respiratory epithelium of the gills is damaged and the fish die with symptoms of suffocation. Fish suffering from chronic chromium intoxication accumulate an orange yellow liquid in their body cavity.
Chromium is a carcinogen. All forms of chromium can be toxic at high levels, but chromium (VI) is more toxic to humans than chromium (111). Ingesting very large amounts of chromium can cause stomach upsets and ulcers, convulsions, kidney and liver damage, and even death. Skin contact with liquids or solids containing chromium (VI) may lead to skin ulcers. Some people have allergic reactions including severe redness and swelling.
The threshold limit of Chromium (VI) in drinking water is 0.1 mgll set by Environmental Protection Agency (EPA) of USA.
b) Cadmium
Cadmium enters water and soil from waste disposal and spills or leaks at hazardous water sites. It binds strongly to soil particles. Some cadmium dissolves in water. It does not break dowrin the environment, but can change forms. Fish, plants and animals take up cadmium from the environment. It stays in the body a very long time and can build up from many years of exposure to low levels.
' Watcr Quality and Fish Health. 1993. Technical Paper # 54, Published by F A 0 of UN. ' Tracc Elcmenrr in thc Envimnrncnt. Advino ct a].. 1986. Dhaka Univcrsity Library.
A very low concentration of cadmium may affect fish, other aquatic organisms and people. Generally, cadmium in surface waters is found together with zinc but at .much lower concentrations. The cadmium present in surface waters may be either dissolved or insoluble. Of the dissolved forms, those that may be poisonous to fish include the simple ion and various inorganic and organic complex ions. Apart from an acute toxic action, which is similar to that of other toxic metals (damage to the central nervous system and parenchyma tours organs), very small concentrations of cadmium may produce specific chronic effects after a long exposure period. An adverse influence of long exposure to cadmium upon the maturation, hatchability and development of larvae in some species of fish was recorded at concentrations as low as 0.002 mg/l. The maximum admissible cadmium concentration in water is 0.001 mg/l for Cyprinids. The preliminary results in MACH project area showed higher value than the maximum admissible cadmium concentration in water. The acute lethal concentration of cadmium for different species of fish is from 2 to 20 mg per litre.'
Long tern exposure to lower levels of cadmium in air, food or water leads to a builds up of cadmium in the kidneys and possible kidney disease. Other potential long term effects are lung damage and fragile bones.
The Department of Health and Human Services (DHHS) of USA has determined that cadmium and cadmium compounds may reasonably be anticipated to be carcinogens. The National Environmental Quality Standards (EQS) allows 0.005 mgll of drinking water.
C) Zinc
Zinc poisoning of fish is most frequently encountered in aquatic organisms and some species of fish such as Cyprinids, especially their fry. The lethal concentrations ranged from 0.01 to 0.1 mg per litre in some species of fish especially for Cyprinids. The concentration of zinc in MACH project area is higher than the lethal range. The clinical symptoms and patho-anatomic picture of zinc poisoning include laboured breathing and, in Cyprinids, gasping for air at the water surface. The typical patho-anatomic appearance includes a large amount of mucus on body surface, under the gill covers and in the gills.
d) Lead
Lead pollution occurred in the MACH-project area. Source of pollution is not only the effluents lead based dye but also pigment (printing operation) in textile industries. In surface water, lead largely accumulates in bottom sediments at concentrations ranged 2 to 3 orders of magnitude greater than in the water.
"admium in the Environment. Nriagy el al. 1980. Ecological Cycling-Pan I, INST Savar 10
Acute lead toxicity is characterized initially by damage to the gill epithelium; the affected fish are killed by suffocation. The chemical studied results is two to three times higher than the maximum admissible lead concentration in water which is of 0.07 mg per litre for Cyprinids.
Lead concentration of 80 pg/100 g of blood is the maximal concentration tolerated by adults without apparent ill effect. Children are considerably more susceptible, some youngsters having shown symptoms of poisoning even though the lead concentration was only 60 pg. Above the 80 pg level in adults, the blood, kidneys, and nervous tissue are advetsely affected. Brain tissue may be irreversibly damaged. Ordinarily the brain is protected from the toxic materials in the blood, but heavy metals such as lead appear to be an exception. Some of the early symptoms of lead toxicity include headache, weakness, loss of appetite and fatigue, as well as mental depression, apathy, and lack of ambition. Lead poisoning can interfere with the normal process of reproduction. It can injure both sperm and egg cells. Exposure of a pregnant mother to high levels of lead may result in damage to the fetus.
The ambient water quality criterion for lead is recommended to be identical to the existing drinking water standard which is 0.05 m g .
e) Sulfide
Sulfide is also present in local industrial effluents in MACH project area including those from tanneries and dyeing textiles. Sodium sulfide from tanneries and sulfide dyes from textile dyes finishing units are the main sources. The lethal concentrations for different fish species range from 0.4 to 4 mg/l (e.g. carps). According to the prelimina~y results, it is stated that sulfide concentrations in MACH project are 3 to 10 limes higher than the lethal concentrations.
f) Oils and refined products
In the MACH project area concentrations of oils and refined products in water are higher in two to five order than the maximum admissible concentrations (0.003 to 0.025 mg I1 for fish). The sources of oils and refined products in MACH project area are local textiles and tannery industries.
The sources of oil and grease are mainly from the kerosene used in the textile dyeing units and waste lubricant and waste oil from captive power generative units. Even very small discharges can produce a large area of "sheen" in which the thickness of the oil is about 1 micron.
'Quality Criteria For Water. 1986. United Statcs EnvimnmentalProtection Agency 11

In general, oils and most of.the refined products have a narcotic effect on fish; acute symptoms are effects on the nervous system and respiratory activity. The main clinical symptoms include an initial increased activity and respiratory rate followed by a loss of balance, loss of response to stimuli, reduced activity, shallow respiratory movements, and ultimately death.
The scales of the dead fish are dull in colour and are covered with mucus; the skin shows local congestion, the epidermis fractures and peels off, and surface wounds may occur in some cases. Damage to the cornea of the eyes may lead to blindness. The gills show severe dystrophic effects and necrosis and there may also be a proliferation of the respiratory epithelial cells and hypertrophy of the mucus cells. Prolonged exposure to oils at low concentrations can cause severe degenerative macrobiotic effects in the kidneys of the fish and in their eggs. The dead fish have an oily odour and flavour. This has been observed in the MACH project areas.
Therefore, toxicity is not the only harmful consequence associated with oil pollution; the aquatic ecosystem in general, and fish farming in particular, can be badly affected by the oil smell and taint of the water and of the organisms living there. For this reason, a sensory assessment is preferred to toxicological analyses in determining the highest admissible amounts of oil and oil products that can be present in water; on this basis the highest admissible concentrations are in the range of 0.003 to 0.025 mg /I.
Chemical dyestuffs have also been attracting the attention of toxicologists in recent years. These can be present in the emuents from textile productions of MACH project area. Although these coloured effluents are, like oils, very conspicuous even at very great dilution's they seldom cause severe damage to the fish and other aquatic organisms.
The mechanism of toxic action of emuents containing dyestuffs on fish is not direct in the majority of cases. If the water is heavily polluted with coloured organic waste, the increase in the organic content alone can lead to an oxygen deficit. Other dyes may increase or decrease the water pH. Some, e.g. aniline, can act as methaemoglobin poisons and as carcinogenic substances.
The clinical symptoms of fish poisoning by different dyes are not specific. The patho- anatomic changes that indicate such poisoning may include a change in body colour due to the particular dyestuff, and the organs inside the fish body may also take on an intensive colour, e.g. as with malachite green which group of dyes are very toxic to fish.
h) Chemical Oxygen Demand (COD)
The preliminary results of COD in MACH project area is very high. It is higher by one to two order of magnitude than for the optimal range for Cyprinids in water (20-30 mg 0 2 per
litre). If industrial pollution is continuing at the present rate, then the aquatic organisms in the MACH project area may be endangered very soon.
i) Dissolved Oxygen (DO)
Different aquatic organisms have different requirements for the concentration of oxygen dissolved in water. Some species of fish have the more demanding requirements for oxygen in water, for example, optimum concentration of oxygen for Cyprinids is 6-8 mg fl; and if the level declines below 1.5 to 2.0 mgil. mgil they begin to show signs of suffocation. The preliminary results of the sample areas in MACH project showed two to four time lower values than the optimum concentration of oxygen for Cyprinids (6-8 mgil).
The oxygen requirements of fish also depend on a number of other factors, including the temperature, pH, and C02 level of the water, and the metabolic rate of fish.
Besides these, preliminary results of the total dissolved solids (range: 500 to 1800 mgil) and total suspended solids (range: 160 to 600 mgll) are higher than the Bangladesh standard of 50 and 150 mgil respectively. All of the studied results showed higher values.
Considering all of these studied results, it is concluded that MACH project area is heavy polluted.
3.3 Interaction with Local Community
The people within MACH project area in Kaliakoir are seriously affected by pollution problem. MACH arranged a daylong workshop in Kaliakoir on 29 September 1999 for the management of natural resources in the area. All the chairmen and members of the three Union Parishads and other stakeholders including fishermen, farmers etc. attended the workshop. The participants from the local community in the workshop highlighted the pollution problem and expressed great concerns of reduction of fish production due to pollution. Local people also formed a committee to urge the industries to minimise pollution.
In fact, over the last one year through series of meetings with the users and stakeholders, industrial pollution problem has been identified as a single most issue of concern. It is also reported that frequent courtyard meetings take place in the villages of the area where the pollution issues are discussed in terms of the way it is affecting their lives. The Iocd contaminated water is currently being used for irrigation, livestock drinking water and there is concern that toxic and harmful substances may enter the food chain.
3.4 Consultative Meeting with the Industrialists
On completion of the chemical analyses a process of dialogue with the industrialists was initiated with an aim to raise awareness amongst them about the environmental degradation of the area and to persuade them to take corrective measures. As a first step a consultative meeting was held between MACH project and the industrialists in December 1999.
After the consultative meeting, the owner of identified industries agreed to take help from MACH in order to clean up their operations and reduce industrial pollution.
In the meeting, it was unanimously agreed that industrial pollution exists in the MACH project area Among industrialists Mr. Nasim Manzur of Apex Tannery, Mr. Mahbubul Huq of Aymon Textiles and Mr. Ali Haiti Atoned of Gumti Textiles also agreed to play active roles in next round consultative meeting to finalise the program for steps to be taken to mitigate pollution problem in the area. Mr. Nasim Manzur of Apex Tannery highlighted the international consequences on export in the nea futxre if the industries are not cleaned up. He also mentioned that even though Apex tannery operate anETP it has very little impact because the other industries in the area are discharging their effluents without treatment. Therefore, he emphasized on the importance of a joint effort to make the area environmentally sound.
3.5 Assessing and Benchmarking Environmental Performance of Rahim and Aymon Textile Dyeing, Printing and Finishing Mills
A detailed environmental inventory was undertaken in two textile and dyeing units to assess and benchmark the environmental performance of these industries and suggestions to clean up operations were proposed.
This section assesses the environmental performance of two Textile Dyeing and Finishing factories in KhaliaKhair.
Following the standard methodologies7, recommended in the Sustainable Productivity Improvement for Export Success (SPIES) model, data and information collected from the two factories was used to assess environmental performance according to some selected parameters as described in Table-4, and then compared with international and Bangladesh norms. The analysis is presented in a way that facilitates benchmarking between the two companies as well. The following steps were followed to canyout this assessment study.
Establishment of inputloutput inventory tables for the both factories.
7 Responding to Global Standards, May - 1998. United Nations Industrial Development Organization, Vierno Aumia
14

Selection of international, national and best availabie technology (BAT) reference levels.
Comparison of the inventory data with the selected reference levels.
Interpretation and analysis of results.
Table-4: Environmental Parameters
I
Raw Material Consumption Non-renewable raw materials 1 Main Categories
Renewable raw materials Energy Consumption Electric energy
Sub-categories 1
3.5.1 Scope of Investigation
I
Consumption of Water Emissions
Investigation was carried out at the process stages as per process flow chart presented in Fig. 8. This flow chart was tailored to the specific production patterns in each factory and used as the basis for making the inventory of input output data. Environmental load (parameters) at each process stage have been calculated on the basis of primary data collected from the factories. In addition, whenever necessary, secondary information has been used to supplement and facilitate calculations.
Thermal energy
Water emissions B O D & COD)
The functional unit for calculating environmental loads is assumed to be 1 kg of finished product, and, restricts the inventory analysis to the factory gate (system boundary).
The results and analysis of the performance studies are organised according to the following formats :
Production profiles of the two factories (Table-5).
Summary of inventory results of the two factories. Analysis and benchmarking of performance relating to environmental parameters.
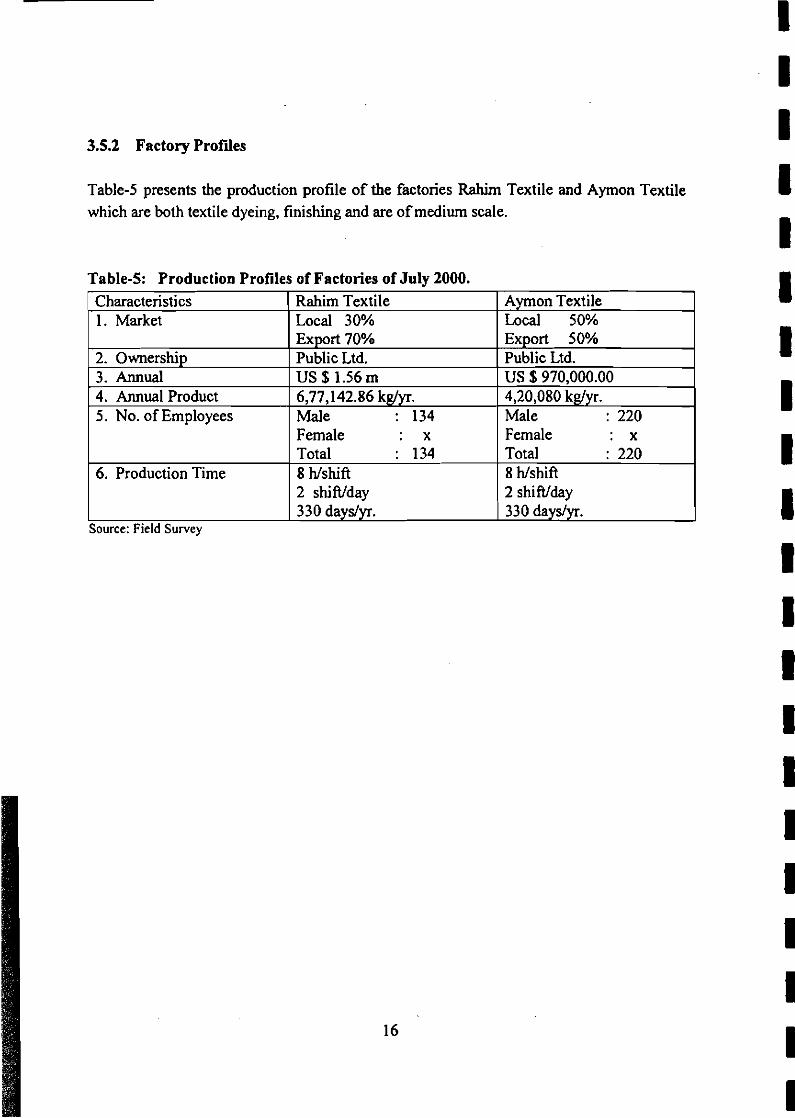
3.5.2 Factory Profdes
Table-5 presents the production profile of the factories Rahim Textile and Aymon Textile which are both textile dyeing, finishing and are of medium scale.
Table-5: Production Profiles of Factories of July 2000.
I . .
I Female : x I Female : x I
2. Ownership 3. Annual 4. Annual Product 5. No. of Employees
I Total : 134 I Total : 220 6. Production Time 1 8 Idshift 1 8 Idshift
Export 70% Public Ltd. US $ 1.56111 6,77,142.86 kg/yr. Male : 134
Export 50% Public Ltd. US $970,000.00 4,20,080 kglyr. Male : 220
2 shiwday 330 daystyr.
2 shiwday 330 dayslyr.
Source: Field Survey

Printing lhUC
alender m
Figure-8: Typical Process Flow Chart for Textile Dyeing and Printing Mills
Z = Jigger MIC
3.5.3 Results
Results of the assessment of environmental performance of the two factories considering the
following six parameters:
Energy Consumption (electrical and thermal).
Material Consumption (chemical and dye stuff)
Water Consumption.
Waste Water.
Biological Oxygen Demand (BOD)
Chemical Oxygen Demand (COD)
Folding hl/C
Folding M/C
Folding hl/C
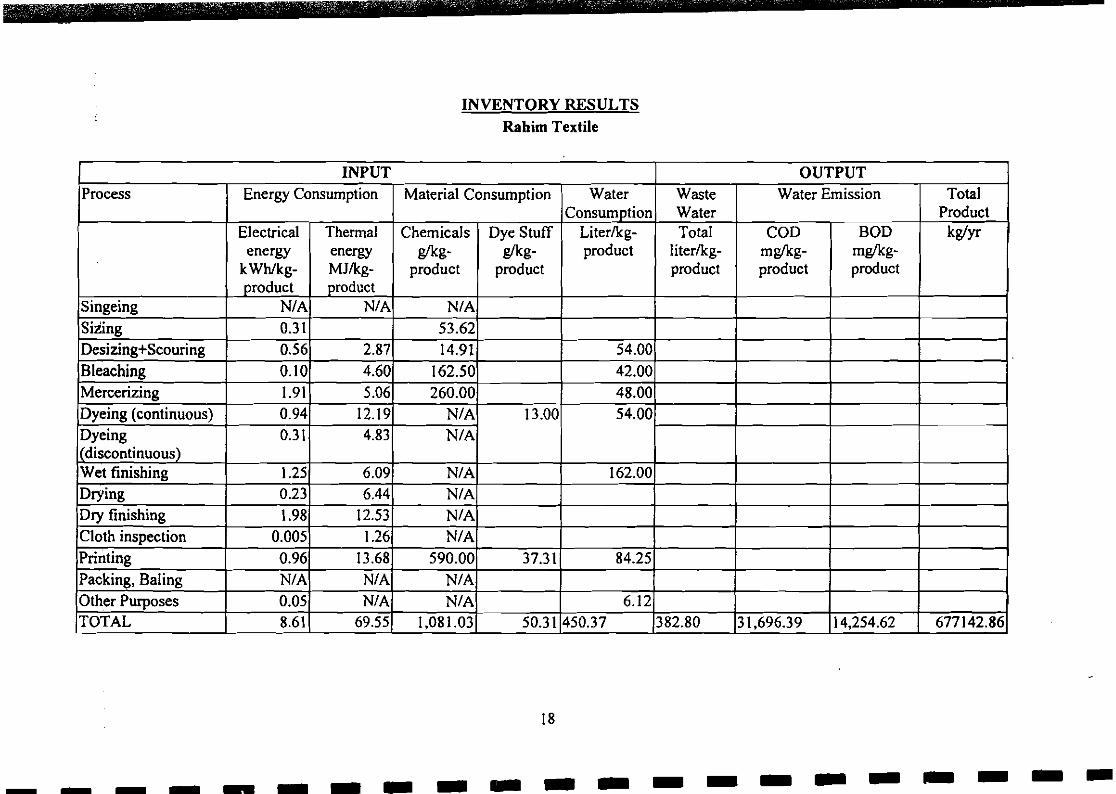
INVENTORY RESULTS Rahim Textile
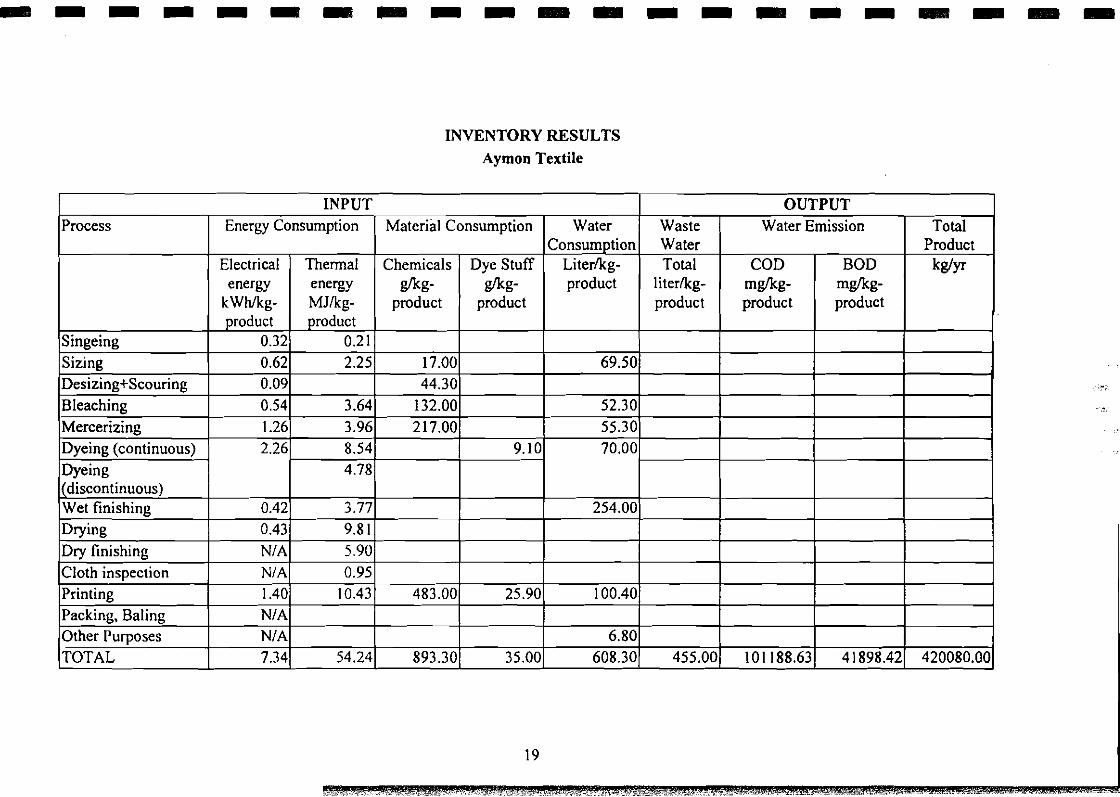
INVENTORY RESULTS Aymon Textile
Water Emission
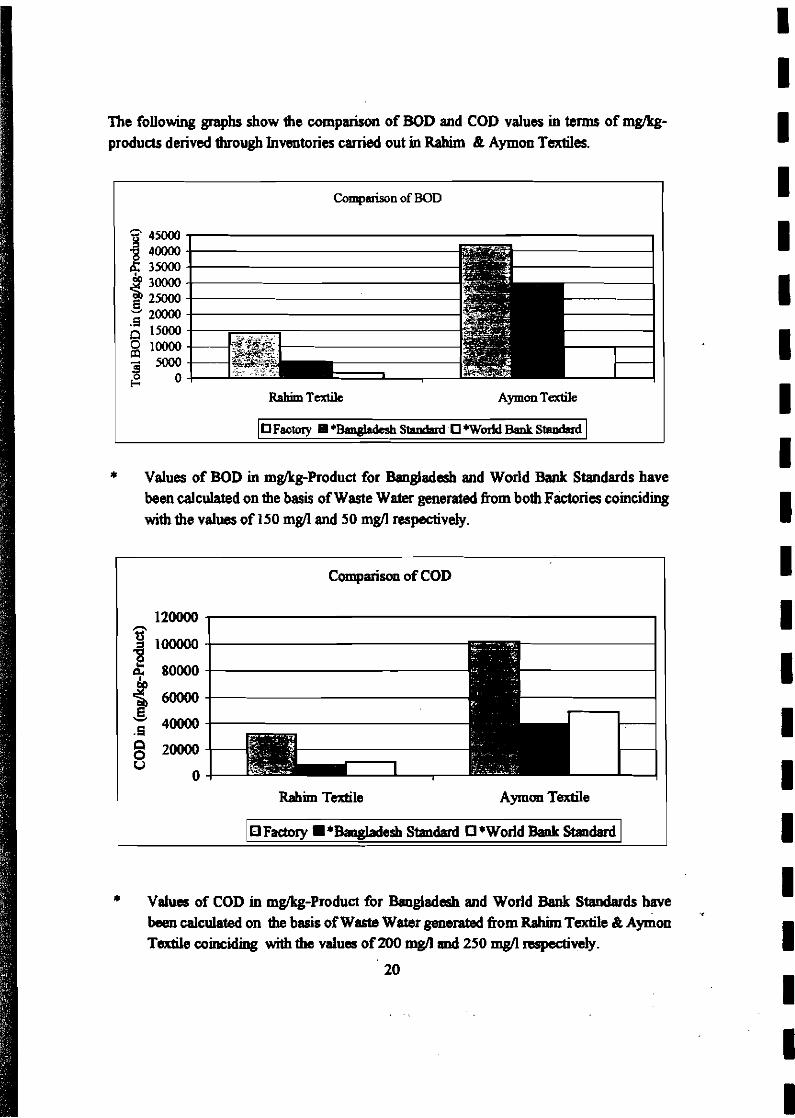
The following graphs show the comparison of BOD and COD values in terms of mg/kg- produds derived through Inventories carried out in Rahim Bt Aymon Textiles.
I Comparison of BOD I
Aymon Tertile
* Values of BOD in mgkg-Product for Bangladesh and World Bank Standards have been calculated on fhe basii of Waste Water generated from both Factories coinciding with the values of 150 mgl and 50 mgn respectively.
Comparison of COD
Rahim Textile Aymon T d e I 1 I3 Factory I*Bagladesh Standerd *World B d Standard I
* Values of COD in mg/kg-Product for Banglade41 and World Bank Standards have been calculated on fb basis of Waste Water generated from Rahhn Textile & Aymon Textile coinciding with the. values of ZOO mgfl and 250 mg/l rsopectively.
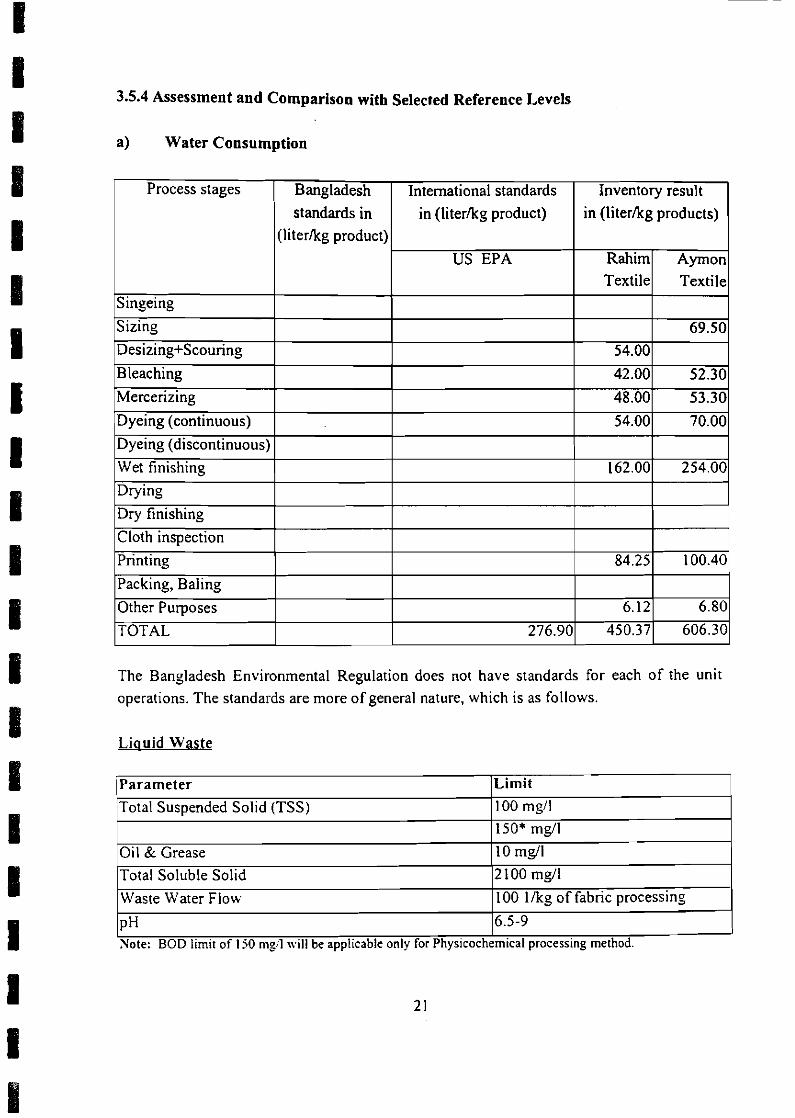
3.5.4 Assessment and Comparison with Selected Reference Levels
a) Water Consumption
The Bangladesh Environmental Regulation does not have standards for each of the unit operations. The standards are more of general nature, which is as follows.
Liauid Waste
Parameter ]Limit
~ o t a l Suspended Solid (TSS) 1 I00 mgll
"
Oil & Grease 10 mg/l
Total Soluble Solid 2100 mg/l
1 waste Water Flow 1100 likg of fabric processing
I. I
Note: BOD limit of 150 mg;l \\.ill be applicable only for Physicochemical processing method.

7 Cornparim of T d Water Consumption
Mi Textile Aymoo Textile USEPA
Inventory Result Reference Level
INFERENCE
o Both factories consume much more water in process related purpose compared to the USEPA standard.
o Both factories use very high amount of water in wet finishing stages.
o Howeva comparatively b& b r i a consume very less mount of w k ~ in non- productive purposes
o There is a clear need to reducs total wata consumption in both factories through recycling, change in process technology w d by following bMer housekeeping practices in order to reduce the presure on the natural resource and also to reduce the environmental degradation of the adjoining areas.

BAT = Best Available Technology.
3) E0ergyceaau&p(ion
Comparison of Total Energy Consumption I
Factory
Rahim Textile
Aymon Textile BAT
Rahim Textile Aymon Textile BAT
lnvw~tory Result Refereace Levels
Total Energy in &Whkg-Product)
27.39
21.98
13.70
.- - 1 Total E E l d c a l 'thermal 1
INFERENCE
Electrical Energy in (kwholkpproduct)
8.61
7.34
7.50
o Total energy consumption by both faaories exceed by more than 100% and 60% respectively in comparison to BAT.
'Ihermal Energy in (kWhtMg-Product
18.78
14.64
6.30
o Consumption of electrical energy by both factories are very close to BAT reference. This is due to the fact both these factories use modem electrical appliances.
o Consumption of thermal energy is almost three times more by Rahim Textile and is almost two times more by Aymon Textile than that of BAT.
o There is a n&d for both factories to take energy conservation measures so that the consumption is closer to best available technologies (BAT) and thereby reduce pressure on natural resource used as fuel.
23
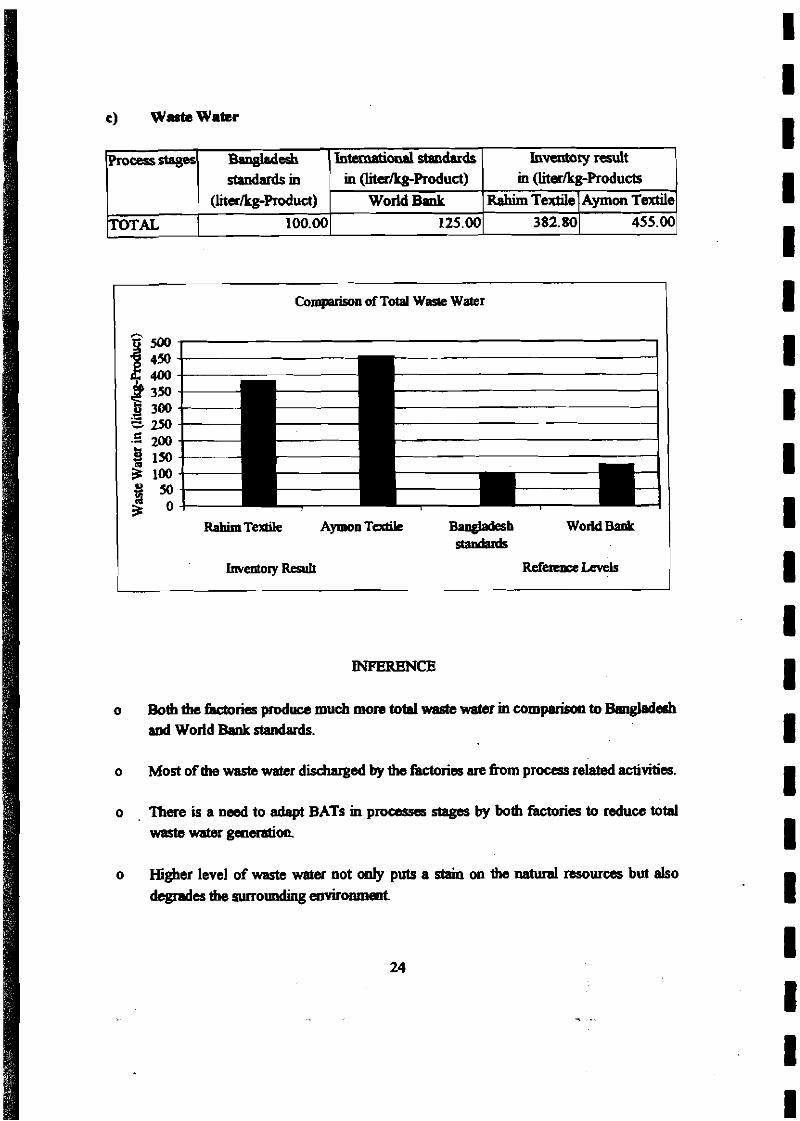
Compi.son of Total W ~ a e Water
Rahim T e a AymonTcrrtiL -h World Bank aBadardr
o Boththe~rissproducemuchmomtDtaagste~iawm~tDBwglrderh and Wodd Bank standards.
Invea~&~ry result in (IiterkeProducts
Rahim Textile IAymon T d e 382.801 455.00
o Most of the waste weter discharged by ihn factories are firom proceu r e W activities.
Internhd*dards in (IiterIkg-Product)
World Bmlr 125.00
process^
TOTAL
o . mere is a need to adapt BATS in processes stages by both factories to reduce total wasts Watergmd01~
&u&de& Etandardsin
(Iituk~Product) 100.00
o Higher level of waste water not only puts a stain on ihn natural resourc~s but also degrades the surrouudmg eovironment

INFERENCE
d) Waste Emissions: Biological Oxygen Demand (BOD)
o Bangladesh's standard for BOD effluent is three times higher than the norms set by the World Bank. The values of BOD for both factories are much more higher than the World Bank standards even higher than the Bangladesh standard which is much less stringent.
Analytical Value which is measured at the end of pipe Rahim Textile
Aymon Textile Bangladesh Standard World Bank Standard
o In addition to the use of chemical inputs in process related operations, a substantial amount of BOD (and COD) is generated from non-process related activities such as machine cleaning and cleaning of area where dyeing and mercerizing take place.
BOD in (mgfliter)
407.00 212.00 150.00 50.00
o The main reason behind Rahim Textile generating effluent with higher BOD value (407 mgA) than Aymon ex tile (212 mgll) is that Rahim Textile is an older plant having inadequate process control compared to Aymon Textile which has been set up more recently. The value of BOD in terms of mg/kg for Rahim Textile is lower because higher production capacity.
o The proper utilisation of chemical inputs at process stages, utilization of BAT and good housekeeping practices would result in lower BOD values closer to reference standards.
e) Water Emissions: Chemical Oxygen Demand (COD)
Analytical Value which is measured at the end of pipe Rahim Textile Aymon Textile Bangladesh Standard
World Bank Standard
COD in (mgAiter)
905.00 512.00 200.00 250.00

INFERENCE
o Both of the factories have very high levels of COD in comparisons to the Bangladesh and World Bank standards.
o As in the case of BOD, desizing and scouring operations are mainly responsible for the high values of COD, indicating that careful utilization of chemical inputs at these stages may be effective in bringing down COD loads. In addition to these measures, application of BAT and good housekeeping may be applied to reduce COD value to a desirable level.
3.5.5 Explanatory Analysis of Environmental Inventory Results
a) Consumption of Water
In this study, total water consumption in literskg- product is assumed as the sum of water consumed for direct production at each process stages and for indirect production activities, i.e. not directly related to the product.
The study gives total water consumption from the inventory of the two factories in parallel with water consumption norms for textile industries provided by USEPA. At present, in Bangladesh, no water consumption standard is exists for textile industry. However, the USEPA standard has been used as a reference for this comparison analysis.
b) Consumption of Energy
Minimizing of energy use in industrial process is one way of reducing environmental impacts that arise a result of energy generation. Best Available Technology (BAT) which minimize energy use (electrical and thermal) has been used as one of the reference levels for comparing inventory data.
In this study, the assessment of energy consumption has been carried out under two scenarios: first, electrical energy in kWhkg-product and thermal energy in MJkg- product separ:ately; and second, the energy consumption, i.e. the electrical energy and the thermal energy consumption together by converting both energy types to one common unit in kWhkg-product using a conversion factor 1 MJ = 0.27 kwh.
i. Electrical Energy
Electrical energy required by the BAT for the production of 1 kg of finished product in kwh is used as a reference for comparison. There is no Bangladesh standard for Electrical Energy consumption.
ii. Thermal Energy
Thermal energy in the textile industries used to generate steam, heat, and for captive
generation of electricity and to some extent electricity as well as to bum of loose surface fibrers at the singeing process state. In both the industries use of thermal energy is higher than BAT because of lower fuel efficiencies of the installations and lack of adequate process control
C) Waste Water
Waste water from textile dyeing and printing mills includes discharge from fibre preparation, fabric preparation, dyeing, finishing operations. In case of both of the factories, addition to process waste water, a small amount of waste water generated as a result of non-production related activities such as machine cleaning, boiler treatment etc. In this study, contaminates of concern regarding waste water are dyes, which are often sources of metals, salt, and color in emuent; Size, which have high BOD and COD levels and surfactants, which are strongly linked to aquatic toxicity
The total production related waste water prescribed by the World Bank (125 literkg- product) and Bangladesh (100 literkg-product) have been taken as a reference level for the comparison of the amount of waste water discharged from the factories.
It was not possible to measure the amount of waste water arising from each stage of the production process in both factories. Therefore, for this study total amount of waster water discharged from factories A & B were considered for the comparison analysis.
A total of 382.80 literkg-product waste water is generated by Rahim Textile, which is about three times more than the World Bank standard. Only 6.12 literkg-product of water is consumed by non-production related activities most of the waste water is generated from production related activities.
Total amount of waste water generated by Aymon Textile is 455.00 literkg-product. Only 6.80 literkg-production water is consumed in non-production related activities,
bulk of the waste water generated is generated mostly from production related activities.
d) Water Emissions
Textile dyeing, printing & finishing mill produces various pollutants with effluent of which only Biological Oxygen Demand (BOD) and Chemical Oxygen Demand (COD) have been considered in this study.
BOD & COD are Mainly generated as a result of chemicals used in production processes. BOD and COD are also emitted from several non-process chemicals, such as machine cleaners, cleaning of chemical stores and dyeing and printing areas. These have also been considered in the present analysis. However, in this study, it was not possible to measure the values of BOD and COD from each process stage of the assessed factories. The comparison was only done on the basis of the total value of BOD and COD in the discharged effluent (end of pipe values)
I. BOD
The ratio of BOD to COD in Rahim Textile is found to be 1 :2.2 and in Aymon Textile is found to be 1 :2.4. However, the BOD value in the effluent from Rahim Textile is higher by 257.00 mgkg-product and 357.00 mgkg-product than the value fixed by effluent standards for the textile industry in Bangladesh and by the World Bank respectively. The ratio between BOD and COD generally represents the degree to which the wastes are difficult to biodegrade. Ratios ranging between 1:2 and 1:3 would imply good potential biodegradability. For textile effluents from both the factories these ratios lies in this range. Proper utilization of chemical inputs at process stages, utilization of BAT and good housekeeping practices should apply to lower BOD values closes to reference standards. In order to achieve this an Effluent Treatment plants should be installed.
ii. COD
It was possible to measure COD values for each process stage for Rahim Textiles and Aymon Textiles. However a comparison has been made with total COD loads with standards set by the GOB and the World Bank. The end of pipe COD values were found to be significant higher than the set standards. This is due to non treatment of the waste water.
In order to decrease COD value of the effluents, proper utilization of chemicals inputs at process stages, utilization of BAT and good house keeping practices should be applied.
3.6 Placement Of Water Hyacinth In Ratanpur Khal To Assess Absorption Of Heavy Metals From Industrial Effluents
3.6.1 Introduction
Water-hyacinth (Eickhomia), one of the most abundantly found aquatic weeds which multiple rapidly. It is a very remarkable plant, trapping the sunlight to build up immense stores of cellulose and intercepting the soluble salts washed out of the soil and storing them in the tissues. Depending on the size of the plant, character of stems, leaves, length of roots etc. the water-hyacinth can be grouped into three types.
Type I The water-hyacinth of this type is very big. Stems are long and thin with less vacuum. Leaves are deep green, big and erect. Roots are 10 to 90 cm long. The rhizomes are generally 1 to 25 long, occasionally producing internodes. These plants are very luxuriant in growth and multiply very rapidly. The average height of the plant is about 45 cm in the mature stage but generally ranges from 30 to 70 cm.
Type I1 Plants of this type are medium in growth with much vacuum stems. Leaves are green and medium in size. Roots are generally 10 to 30 cm long but very small in diameter. Internodes have stolens about 50 cm long and 20 to 30 cm in height.
Type I11 Water-hyacinth of this type is dwarf but the multiplication rate is very high. Stems are vacuum, round and slightly reddish. Leaves are small, round and less green than those of other two types. Roots are 5 to 15 cm long and form dense fibre. The plants are normally less than 20 cm long.
Aquatic plants, such as Azolla, duckweed, water-hyacinth etc., have been found to accumulate heavy metals efficiently. Water-hyacinth accumulates heavy metals, such as cadmium, mercury, chromium, arsenic, zinc etc. efficiently from water. Absorption depends on various factors, such as concentration of pollutants in water, type of water-hyacinth, nutrient presence in water, temperature, etc. Among the various species of water-hyacinth the type 1 species has very good capacity of absorbing heavy metals.
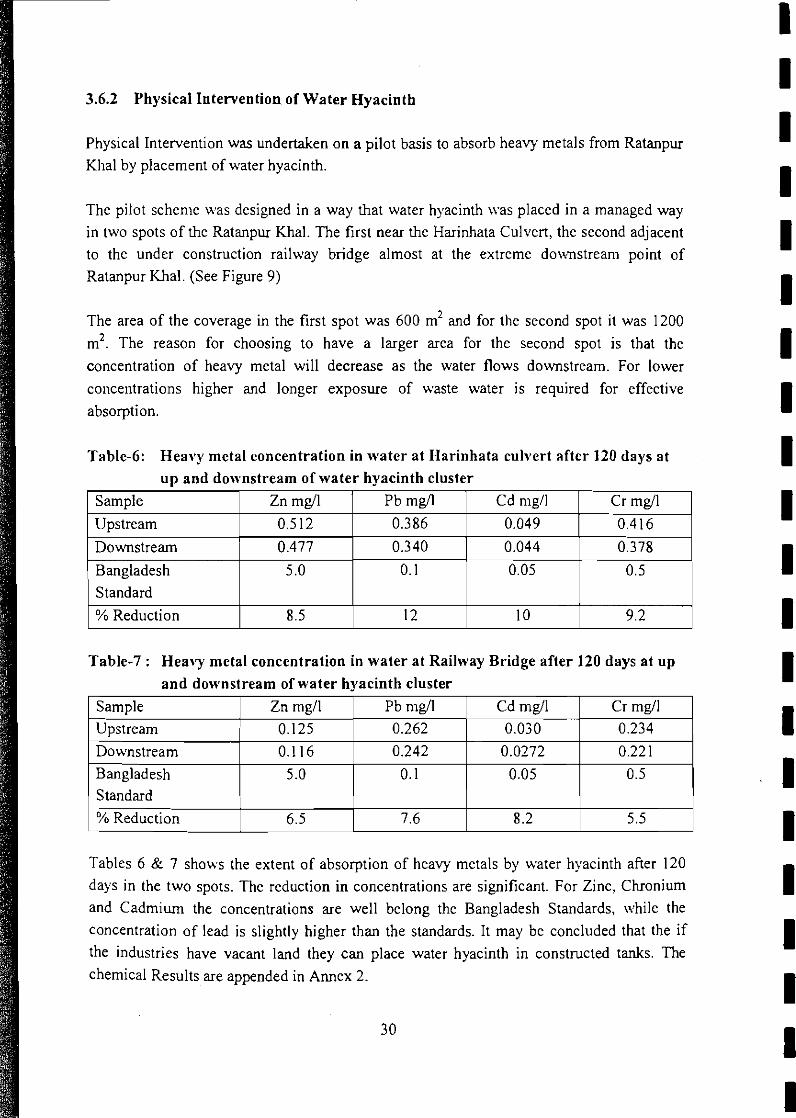
3.6.2 Physical Intervention of Water Hyacinth
Physical Intervention was undertaken on a pilot basis to absorb heavy metals from Ratanpur Khal by placement of water hyacinth.
The pilot scheme was designed in a way that water hyacinth \\.as placed in a managed way in two spots of the Ratanpur Khal. The first near the Harinhata Culvert, the second adjacent to the under construction railway bridge almost at the extreme do\xmstream point of
Ratanpur Khal. (See Figure 9)
The area of the coverage in the first spot was 600 m2 and for the second spot it was 1200
m2. The reason for choosing to have a larger area for the second spot is that the
concentration of heavy metal will decrease as the water flows downstream. For lower
concentrations higher and longer exposure of waste water is required for effective
absorption.
Table-6: Heavy metal concentration in water at Harinhata culvert aftcr 120 days at
Table-7 : Hea\y metal concentration in water a t Railway Bridge after 120 days at up
u p and downstream of water hyacinth cluster
Sample
Upstream
Downstream
Bangladesh Standard
% Reduction
Tables 6 Br 7 shows the extent of absorption of heavy metals by water hyacinth after 120
days in the two spots. The reduction in concentrations are significant. For Zinc, Chronium and Cadmium the concentrations are well belong the Bangladesh Standards, \xzhile the
concentration of lead is slightly higher than the standards. It may be concluded that the if
the industries have vacant land they can place water hyacinth in constructed tanks. The chemical Results are appended in Annex 2.
and downstream of water hyacinth cluster
Zn mg/l
0.512
0.477
5.0
8.5
Sample
Upstream
Downstream Bangladesh Standard
% Reduction
Pb mg/l
0.386
0.340
0.1
12
Pb mg/l
0.262
0.242
0.1
7.6
Zn mgll 0.125
0.116
5.0
6.5
Cd mgll
0.049
0.044
0.05
10
Cd mgll
0.030
0.0272
0.05
8.2
Cr mg/l
0.416
0.378
0.5
9.2
Cr mg/l 0.234
0.22 1 0.5
5.5

I Fig-9: Water Hyacinth Cam S t d y in Ratanpur
Selectim of fiesh water hyacinth
Placement of fresh water hyacinth at Harinhata Cutvert area
. ' - Sample &om
H a d m test emti. arm
4.1 General Principles
Cleaner Production (CP) techniques offer improvements in industrial processes and management that can reduce the volume of pollution generated, increase production efficiencies, and reduce operating costs.
The first step to a program, undertaken in an industry, is necessarily an environmentallcleaner production audit. Naturally, the success of the cleaner production program and thus the benefits of the same can be realized only if a thorough and effective audit is carried out. Careful and meticulous planning and the necessary preparatory work for an audit exercise is therefore a pre-requisite for making the maximum use of this exercise.
However, it should be noted at this point that the audit exercise is a highly site specific activity and a strict methodology or algorithm cannot be followed universally, Rather, the details of the methodology vary from place to place and industry t o industry depending upon its specific conditions. What follows here is more or less a broad methodology in generic terms, which will provide an excellent starting point and will be useful while planning a site-specific cleaner production audit.
This chapter introduces the concepts of environmentaVcleaner production audit with a background of various types of audits and discusses, in detail, the various preparatory activities and aspects that need to be considered while planning a cleaner production audit by the industries concerned.
4.2 Types of Environmental Audits
Traditionally, there are various types of audits that are being carried out in industries. It is essential at this point to clearly understand this categorization and also the differences between the types of environmental audit, which are primarily based upon the objectives of the audit exercise. Fig.-10 illustrates the types of environmental auditing. As can be seen from the Fig.-10, two categories viz. Pollution Prevention Audit and Waste Minimization Audit can be pursued, depending upon the objectives of the audit program. Clearly, the emphasis is on source reduction in a pollution prevention audit, whereas in waste minimization audit, all the techniques viz. source reduction, waste recyclinglreuse and waste treatment could be employed with the objective of reducing the waste leaving the industry, not only at its' source.
Waste Minimization Audit (WMA) is a term frequently used in the United States of America and Canada to refer to assessment of inputs, processes and outputs with an interest in finding methods and practices for minimizing waste and reducing resource consumption.
3 1

Traditionally, WMA does not include examination of the product itself and restricts the analysis mainly to the production processes. Further, there is no explicit Profit Mmrimization motive.
Fig. 10: Types of environmental auditing
Eco-Audit is a concept and requirement in vogue in European countries, particularly Germany. Apart from the overall environmental assessment, Eco-Audit focuses on a detailed examination of inputs, manufacturing processes and outputs from a production system and suggests elimination, modifications or substitutions for enabling specific compliance to emissions as well as products. While in some of the sectors, Eco-Audit is considered a tool for qualifying eco-labeling, its scope resembles closely the Environmental Management Audit Systems (EMAS). Identification of cleaner production options to increase companies profitability is perhaps not the main focus of an eco-audit. In the eco- audit, environmental compliance, related to processes, products and the work environment are some of the major concerns.

43 The Cleaner Production Audit Concept
Cleaner Production is a term defined and promoted by the Industry and Environment Office of the UNEP in Paris, the term Cleaner Production Audit is a relatively new entity. UNEP has used in its Audit fi-amework various steps, which are primarily derived fiom the North American experience.
One of the quoted definition of Clean Production Audit is (Jackson, 1991) :
A clean production audit is a management tool comprising a systematic,
documented, periodic and objective review of a companies processes, products and operations, designed to identify and provide information about opportunities to reduce environmental hazard, by reducing the use of hazardous substances in the product life cycle.
In a more practical context, Cleaner Production Audit may also be defined as :
The application of a systematic, documented, continuous, objective and participatory procedure
* to assess the functioning of existing or proposed production systems (including the raw materials and finished products);
* to identify and implement relevant management actions and policy measures; and
to accomplish the integrated objectives of increased profitability, resource conservation, environmental protection and improvement.
4.4 Reasons for Conducting a Cleaner Production Audit
There could be various reasons for conducting a cleaner production audit depending upon the objectives as described earlier. Legislative compliance could be the prime concern in many instances. In some other instances, there could be need to reduce the treatment plant costs, both capita1 and operating, that would then demand a reduction in the quantity and strength of some priority pollutants, including metals such as chromium, copper, lead and chromium, or pollutants such as phenols and cyanides). In some cases, it is not only the cost of waste treatment, but also the cost and availability of resources that forces the industry to take a comprehensive look at the production process and identify opportunities to minimize resource consumption and also waste generation. These then has form the objectives of an audit exercise for the polluting industries at Kaliakoir.
In the context of cleaner production, the following reasons justify a need for conducting a cleaner production audit in an industrial operation.
A good cleaner production audit:
• defines sources, quantities and types of waste generated; • collates information on unit operations, raw materials, products, water and energy
usage and wastes generated; highlights process inefficiencies and areas of poor management;
helps set targets for cleaner production and prioritize cleaner production measures; a permits the development of cost-effective waste management strategies; a raises awarenesi in the work-force regarding the benefits of cleaner production;
as a result of all the above, helps to improve process efficiency and reduced wastes.
A cleaner production audit, therefore, is a very important part of an on-going program designed to achieve a maximum resource optimization and process performance. It enables management to take a comprehensive look at the site or process to facilitate an understanding of material flows and to focus its attention on areas where cleaner production, and therefore cost saving is possible. This has been carried out two major polluting industries in the MACH project at Kaliakoir i.e. Rahim & Ayrnon Textile Industry.
4.5 Steps in Cleaner Production Auditing (CPA)
There are a number of audit methodologies suggested. These methodologies however, follow more or less similar lines. Fig.s 11 and 12 illustrate two such Audit methodologies - one as recommended by the United Nations Environment Programme and United Nations Industrial Development Organization (1991) and the other by South East Asia Programme Office of the Gennan Development Agency - CDG.
The Cleaner Production Audit methodology mentioned above has been adapted to the MACH pollution projects. The systematic approach to conducting a cleaner production audit is described in terms of the following distinct phases as has been carried out are as follows :
Define the Objectives and Scope of the Audit Formation of an Environmental Examination Team Pre-assessment: Listing of Unit Operations and Constructing Process Flow
Diagrams * Implementation of the Obvious and Simple Implementable Options
Exhaustive Material Balance: Process Inputs and Outputs Synthesis and Identification of Avenues for Cleaner Production
These steps, and thus the Cleaner Production Audit methodology, are discussed in detail in subsequent sections.

4.6 Defming Objectives and Scope of the Audit Program
Defining the Scope and Objectives of the proposed audit exercise essentially comprises the very first step to the cleaner production audit program.
PHASE 1: PREASSESSMENT Step I prepare and organise audit team and resources
Step 2 divide process into unit operations
INPUTS PROCESS OUTPUT
Step 4 determine inputs Step 7 quantify produclrJby-products Step 5 record water usage Step 8 account for wastewater Step 6 measure current levels Step 9 account for gaseous emissions
of waste reuse/recyclig Step 10 account for off-site wastes
I PHASE 2: MATERIAL BALANCE
I I DERIVE A MATERIAL BALANCE
4 Step I I assemble input and output information Step I2 derive a preliminary material balance Step 13 and 14 evaluate and refine material balance
[ P F Y WASTE REDUCTION OPTIONS 'i Step IS identify obvious waste reduction measures
I
I Step 19 undertake environmental and economic evaluation of waste reduction options. list
PHASE 3: viable options J
Fig. 11: S t e p Step audit methodology recommended by United Nations Environment Program
and United Nations industrial Development Organization (1991)
SYNTHESIS I
L---, WASTE REDUCTION ACTION PLAN
Step 20 design and implement a waste reduction action plan to achieve improved process
\ efficiency
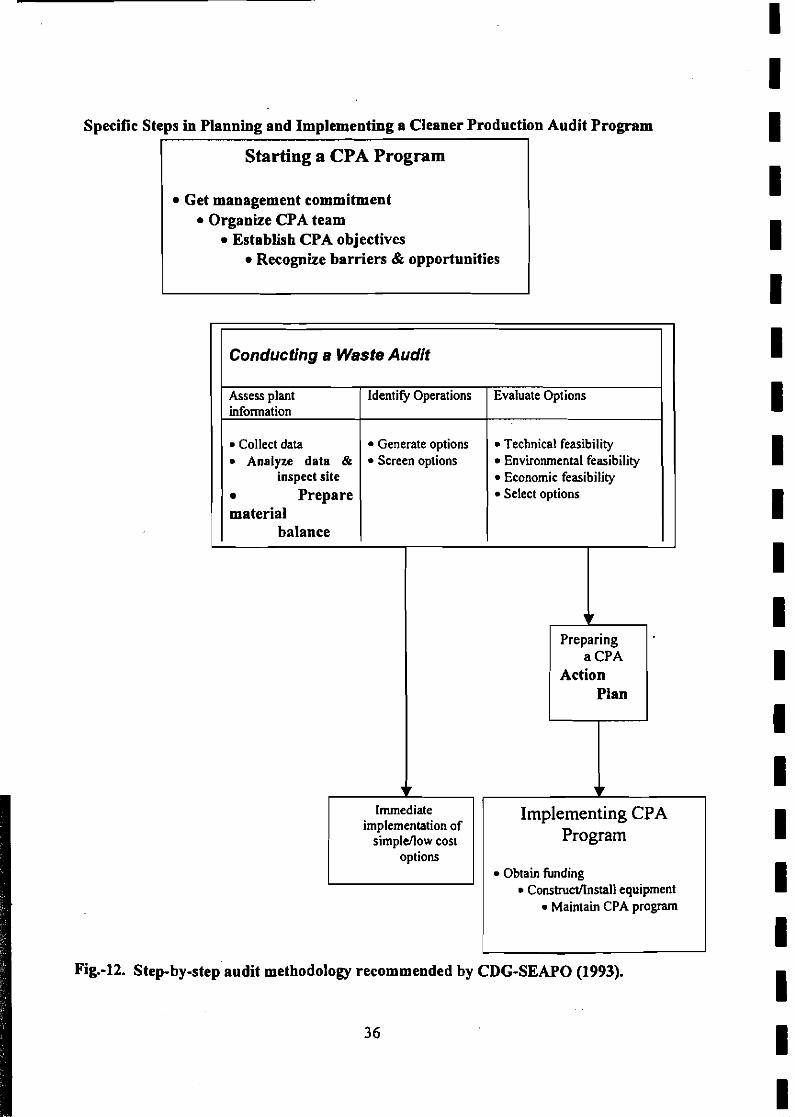
Specific Steps in Planning and Implementing a Cleaner Production Audit Progrem
Starting a CPA Program
Get management commitment Organize CPA team
Establish CPA objectives Recognize barriers & opportunities
Fig.-12. Step-by-step audit methodology recommended by CDG-SEAPO (1993).
Conducting a Waste Audit
Evaluate Options
Technical feasibility Environmental feasibility Economic feasibility Select options
Assess plant information
Collect data Analyze data &
inspect site Prepare
material balance
Identify Operations
Generate options Screen options
* Preparing
a CPA Action
Plan
.
v v Immediate
implementation of simplellow con
options
Implementing CPA Program
Obtain funding Consmctnnstall equipment
Maintain CPA program

4.7 Defming Objectives
One of the objectives was to identify the cleaner production audit exercise with reference to the specific conditions, requirements and importantly the priority problems of the concerned industrial unit.
Typically, the broad objectives for the cleaner production audit exercise would be:
Legislative Compliance, e.g. filing the environmental audit report with the concerned
authority, meeting the stipulated standards etc. Reduction in waste management costs
Reduction in resource, energy consumption
Improving public relations
Management information
The cleaner production program for preventing waste and emissions is not intended to be a one-time activity. Hence, the broad objectives set by the industty may not be fulfilled in one year, so these may span a longer duration, say for the next 5 or 10 years. However, when the specific goals are set for the particular audit program, they should be set in such a way that the longer term objective can be achieved through these short terms goals in a step-by-step manner.
The outcome of this first phase could be in terms of an Environmental Policy Statement as prepared by the top management of the industty. This should be properly devised and adequately publicized in order to get more involvement and commitment from all the concerned employees of the industty.
4.8 Defining Scope
Once the objectives have been broadly outlined, it is then essential to restrict the scope of this proposed exercise to the priority problems only. Thus, defining the scope of the proposed exercise forms the second basic step of this exercise.
In order to define the scope, one needs to identify the priority issues. Ideally, the objectives would be set based on these priority issues, hence they would have been clearly identified in the initial phase. However, here they need to be considered again while restricting the scope of audit exercise.
Specifically, this is m e when the prime objective of the audit program is to reduce waste andfor resource consumption, which it then needs to focus on the important issues rather more sharply. In this case the identified pollution problems could be prioritized as, water
pollution problem, such as BOD, COD, pH, Heavy metals, Kerosene, Phenol, Sulphids etc at Ratanpur Khal. In some other instances, it could be excessive water consumption in the production process when compared to the available standard norms.
Secondly, it is important to restrict the scope of the audit exercise in terms of time. This implies that available time for conducting the cleaner production audit exercise and accordingly define the scope. This has been a major concern for this project. The reason being that time available for comprehensive CP audits of all the industries in the area was too short. This was mainly also due to industries unable to spare sufficient time and manpower required.
Similarly, the required (and available) resources other than manpower, e.g. necessary support services for sampling, laboratory analysis, data collection, compilation and interpretation for the audit exercise. These requirements should then be weighed against the likely outcome of the audit program, to anive at the optimum level of detail that can be reached during the cleaner production audit.
This means that after spending weeks for extensive field measurements, sampling and laboratory analysis - which implies a substantial monetary investment - the monetary benefits likely to be achieved due to reduced waste and/or resource consumption should be substantial enough to justify these expenses. A professional judgment in this case needs to be made with the help of production personnel, in future between the Industries and MACH Pollution Project to implement the CP options recommended to them at the end of the current phase of the project.
4.9 Establishing Goals
Having defining the objectives and restricting the scope of the exercise to the priority issues, specific goals need to be established. The goals established at this point however, need to be more specific and importantly quantitative. Well defined goals help to focus effort and build consensus to the extent possible. Setting up quantitative, measurable goals, though difficult, is worth the effort as it indicates a commitment and expectations. Moreover, the goals can be specified for each individual department or unit and thus gain involvement and momentum for the cleaner production program.
Table-8 presents a list of typical characteristics of effective goals. It is important that the industry" long term objectives and environmental policy are incorporated into the relevant individual department goals.
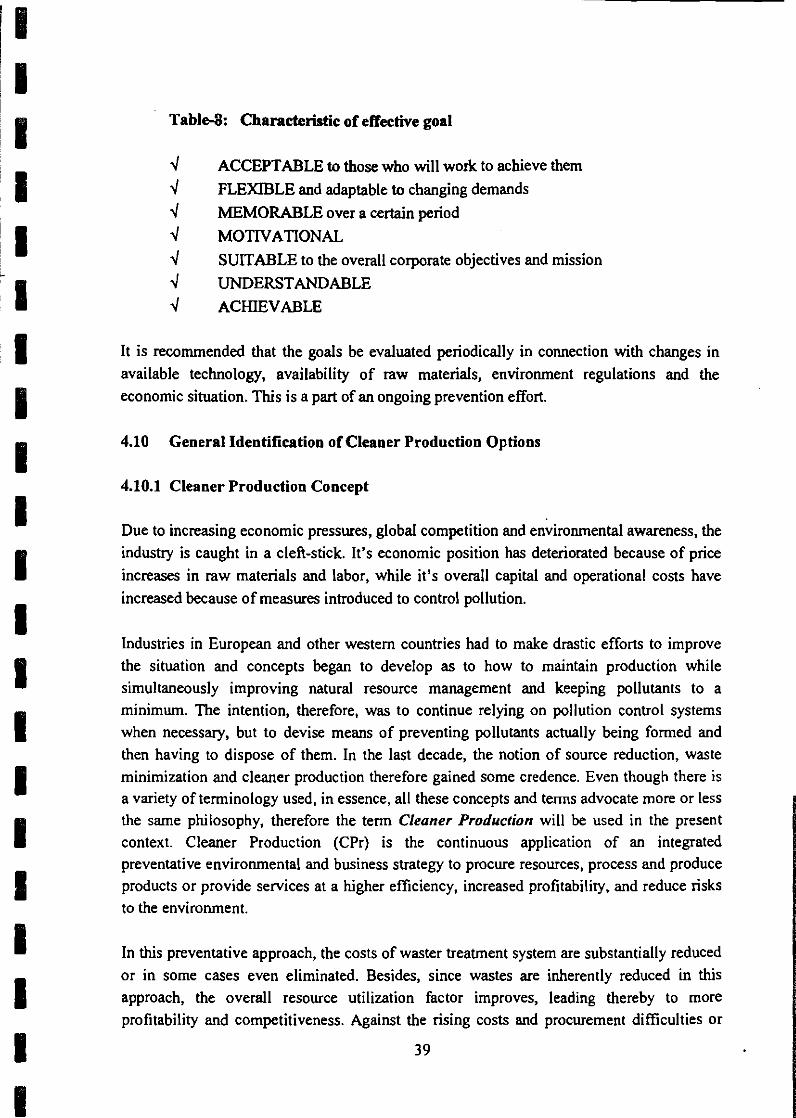
Table-8: C h a r a c t e ~ e of effective goal
4 ACCEPTABLE to those who will work to achieve them 4 FLEXIBLE and adaptable to changing demands 4 MEMORABLE over a certain period
.( MOTIVATIONAL 4 SUITABLE to the overall corporate objectives and mission 4 UNDERSTANDABLE 4 ACHIEVABLE
It is recommended that the goals be evaluated periodically in connection with changes in available technology, availability of raw materials, environment regulations and the economic situation. This is a part of an ongoing prevention effort.
4.10 General Identification of Cleaner Production Options
4.10.1 Cleaner Production Concept
Due to increasing economic pressures, global competition and environmental awareness, the industry is caught in a cleft-stick. It's economic position has deteriorated because of price increases in raw materials and labor, while it's overall capital and operational costs have increased because of measures introduced to control pollution.
Industries in European and other western countries had to make drastic efforts to improve the situation and concepts began to develop as to how to maintain production while simultaneously improving natural resource management and keeping pollutants to a minimum. The intention, therefore, was to continue relying on pollution control systems when necessary, but to devise means of preventing pollutants actually being formed and then having to dispose of them. In the last decade, the notion of source reduction, waste minimization and cleaner production therefore gained some credence. Even though there is a variety of terminology used, in essence, all these concepts and terns advocate more or less the same philosophy, therefore the term Cleaner Production will be used in the present context. Cleaner Production (CPr) is the continuous application of an integrated preventative environmental and business strategy to procure resources, process and produce products or provide services at a higher efficiency, increased profitability, and reduce risks to the environment.
In this preventative approach, the costs of waster treatment system are substantially reduced or in some cases even eliminated. Besides, since wastes are inherently reduced in this approach, the overall resource utilization factor improves, leading thereby to more profitability and competitiveness. Against the rising costs and procurement difficulties or
39

resources such as water, chemicals and energy, these benefits, in some cases, even overshadow the benefit of the savings on waste treatment costs.
The various ways of achieving cleaner production are as follows :
1. Good housekeeping practices 2. Equipment modification 3. Process modification/retrofitting 4. Raw material substitution 5. Product modification 6. Innovative manufacturing technology
However, it is important to note that source reduction is one of the means to achieve a reduction in the waste generation from industrial operations and thus cleaner production. There are other ways to reduce waste and their undesirable impacts on the environment. These include:
1. By-product recovery from the waste 2. Recycling the waste (with or without treatment) in the production
process itself 3. Reuse of waste (with or without treatment) in some other process.
Table 9: Cleaner Production potential for a range of options.
Cleaner production potential
2 0 % - 3 0 %
30% - 50 %
> 50%
Implementation period
( 1 year
1-3 years
( 3 years
Range of options
Good housekeeping and better process control Equipment modification and/or technology changes including recycling Product and/or Process change
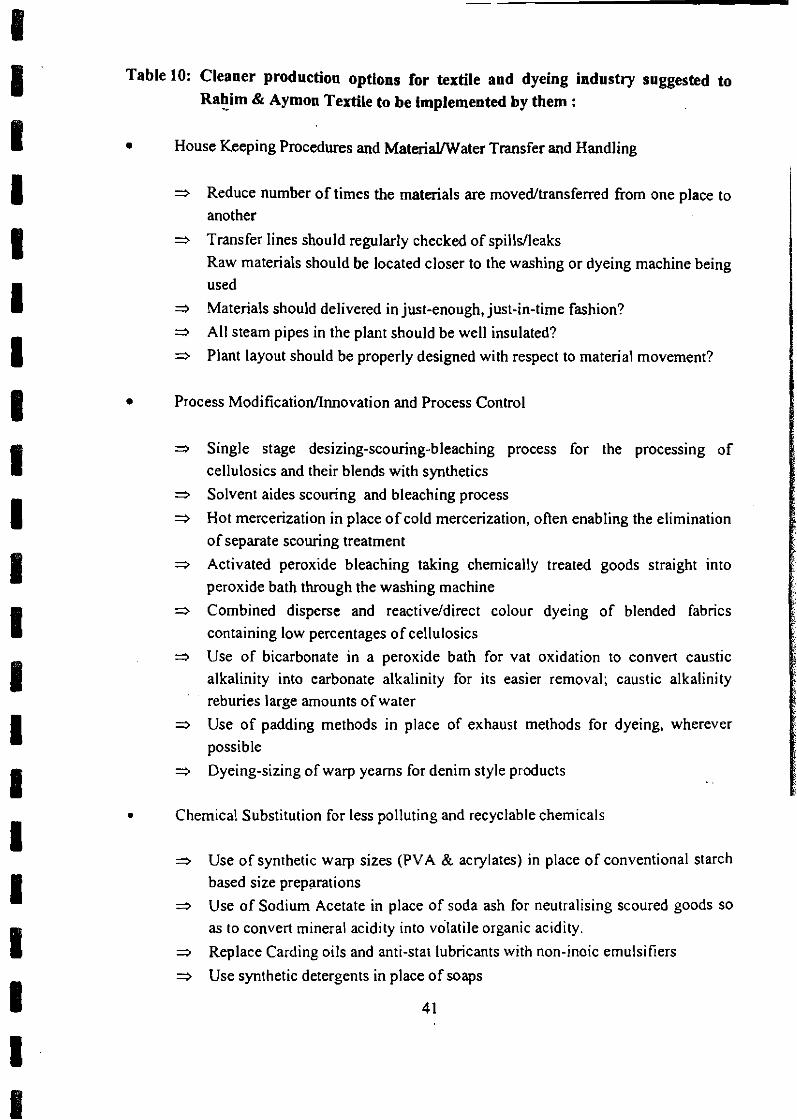
Table 10: Cleaner production options for textile and dyeing industry suggested to
Rahim & Aymon Textile to be implemented by them : ..
House Keeping Procedures and MateriallWater Transfer and Handling
3 Reduce number of times the materials are moved/transferred from one place to another
3 Transfer lines should regularly checked of spilldleaks Raw materials should be located closer to the washing or dyeing machine being used
=, Materials should delivered in just-enough, just-in-time fashion? All steam pipes in the plant should be well insulated?
3 Plant layout should be properly designed with respect to material movement?
Process Modification/Innovation and Process Control
3 Single stage desizing-scouring-bleaching process for the processing of cellulosics and their blends with synthetics Solvent aides scouring and bleaching process
3 Hot mercerization in place of cold mercerization, often enabling the elimination of separate scouring treatment
Activated peroxide bleaching taking chemically treated goods straight into peroxide bath through the washing machine Combined disperse and reactiveldirect colour dyeing of blended fabrics containing low percentages of cellulosics
Use of bicarbonate in a peroxide bath for vat oxidation to convert caustic alkalinity into carbonate alkalinity for its easier removal; caustic alkalinity reburies large amounts of water
3 Use of padding methods in place of exhaust methods for dyeing, wherever possible
3 Dyeing-sizing of warp yearns for denim style products
. Chemical Substitution for less polluting and recyclable chemicals
Use of synthetic warp sizes (PVA & acrylates) in place of conventional starch based size preparations Use of Sodium Acetate in place of soda ash for neutralising scoured goods so as to convert mineral acidity into volatile organic acidity.
3 Replace Carding oils and anti-stat lubricants with non-inoic emulsifiers
3 Use synthetic detergents in place of soaps

Use of sodium bicarbonate in place of acetic acid in conjunction with peroxide or perborate for oxidation of vat dyestuffs
=. Use of durable resin finishes in place of temporary starch finishes
=. Use all-aqueous pthalogen blue dyeing in place of solvent based pthalogen blue dyeing which requires specialty axilliw products
=. Use monochlorobenzene in place of other carriers for dyeing Dacron
In-Process ReuseRecycling Options
Reuse of dye solutions from the dye bath
=. Recovery of Caustic Soda in Mercerising
Recovery of Size in cotton processing
All of these techniques can result in substantial reduction in the quantity, toxicity and the pollutional strength of waste. The residual waste could then be treated and disposed of in a more safe and environment friendly manner while meeting the required effluentlemission standards.
4.10.2 Advantages of Cleaner Production over End of Pipe Approach
As stated earlier, Cleaner Production is achieved by the continuous application of an integrated preventive environmental strategy to processes and products so as to reduce risks to humans and the environment. For processes this means conserving raw materials and energy and reducing the quantity and toxicity of all emissions. Risks are reduced as the total amount of waste that is generated is reduced, including possible elimination of risk exerting harmful substances. Preventing the generation of waste or reducing the use of potentially harmful substances in manufacturing processes also helps to ensure worker safety. For products, this means to reduce impacts along the entire life cycle - from material extraction to disposal. Adoption of cleaner production approach in waste management has led a number of industries to post profit margins increases by as much as 40%. From an economic standpoint cleaner production thus helps to improve productivity and in some instances the quality of the articles produced, enabling the firm to become more competitive.
An industry, with an effective cleaner production program, may will be the lowest cost producer and therefore have a significant competitive edge. A cleaner production program can typically result into following economic benefits (Cornpiledfrom various sources):
Raw material consumption, hence costs are reduced - MateriaVchemicals consumption are reduced - Water consumption is reduced
42
- Energy consumption is reduced
- Raw materials handling and storage losses are reduced
Waste treatment cost is reduced - Energy consumption in treating waste is reduced - Amount of chemicals required for treating waste are reduced - Reduced manpower and equipment requirements for on-site pollution control
and treatment
Process efficiency is improved - Product yield is improved - Equipment availability is increased - Specific energy requirements are reduced - Housekeeping is improved - Pollution potential is reduced
Waste disposal cost is reduced - Quantity of waste material generated is reduced
Less storage space required, thus freeing more space for production - Waste material are segregated which leads to generation of less contaminated
waste which can be sold to other industries andlor can be used to reclaim useful raw materials
- Area required for solid waste disposal is reduced
There are several other intangible benefits of cleaner production which cannot be easily quantified in terms of conventional economic parameters. Such benefits include:
- decreased long term liabilities for clean up of waste materials - decreased worker health risks - improved public image of the industry - probability of becoming a licensee of adopted CPr technologies - increased investor confidence - improved customer satisfaction - possibly improved product quality
Cleaner production has thus emerged as an essential pre-requisite for any sound Environmental Management program in an industry

5. MACH POLLUTION WORKSHOP
As planned a final workshop was held to present finding to Industrialists, local community and government. This was held on 9 June 2001 at LGED Bhaban in Dhaka. Participants of the MACH Pollution Workshop were industrialists from the main Kaliakhair industries, local community and Resource Management Organization members, concerned Union Parishad Members and Chairpersons, Upazilla central government representatives, as well as members of the MACH Steering Committee from the Ministries of Environment, Ministry and Department of Fisheries, the Planning Commission and others. Total attendance at the workshop was above Fifty. The purpose of the workshop was to review MACH findings and activities and suggest ways to further abate the pollution problems of Ratanpur Khal, Mokesh Bee1 and the Turag River.
The materials preceding this section were presented at the workshop. In addition a presentation was given by BELA' regarding the existing legal regulations surrounding pollution issues. A discussion followed with the outcome and recommendations shown below:
The CP options suggested cannot be implemented by the industries because of lack of skilled manpower and adequate experience. The project can assist the industries in this respect.
Assist in providing basic design for affordable Effluent Treatment Plant (ETP).
A pilot project for decolourising the effluent should be undertaken. The industries may
consider financial contributing for the hardware and chemical requirement, while MACH can may provide Technical Assistance setting up the pilot project and eventually design scale-up as per requirement of individual industry.
It has already been observed that water hyacinth is effectively removing the heavy metals from the effluent. The model can be used by the industr~es to remove heavy metals from effluents within their factory premises.
Findings of the workshop are presented at Annex 3
' BELA. Bangladesh Environmental Lawyers Association 44
6. MACH ACHIEVEMENTS
Since the work started h m March 2000 and continued until March 2001 and included the following activities:
Contacts were established with the industrial entrepreneurs;
Assessed peoples perception and responses of the local communities to industrial
pollution problems by attending MACH project meetings and discussions with key informants;
Raised local level awareness on the pollution issues;
Ground breaking with the industries to gain access in order to assess their operational practices;
Testing of individual industries effluent;
Based on the test results and environmental inventory, 'Clean Production' options for the industries were identified (Rahim & Aymon Textile) by examining the existing operational practices;
Assessment and Benchmarking of Environmental performances of the Rahim & Aymon
Textile (dyeing, printing and finishing mill) has been conducted. The industries were made aware their levels of pollution in comparison with National standards, World Bank standards and USEPA standards.
An experimental project has been undertaken to find a cheap and affordable way to
make the effluent from different industries colorless. The tests are continuing. If the results are positive a pilot project may be undertaken in one of the industries to enable real scale design of decolourisation plant. Decolourisation of the effluent will partially remove the heavy metals and other inorganics and organics.
On persuasion Rahim Textile which is the largest dyeing and finishing factory in the
project area has agreed to set up an effluent treatment plant. MACH-BCAS provided Rahim Textiles with basic concept and design of the ETP. The contract for construction has been awarded to a commercial organization and work is almost completed. It is expected that, on start-up of the ETP, there will be significant reduction in pollution of Ratanpur Khal.
An experiment was undertaken to reduce heavy metal in the effluent by placing water hyacinth in two separate spots in Ratanpur Khal. Placement of water hyacinth in two spots was completed and water quality monitored over a eight month period. A reduction in concentrations of heavy metals was measured.
After MACH interventions APEX Tannery who used to operate their ETP on a irregular basis because of high running cost have agreed to operate their ETP on a regular basis. Apex Tannery has requested BCAS to fmd out a way to dispose the sludge generated from ETP and also to make their effluent more colorless. BCAS will contact the local
brick manufacturers during this dry season to look into possibilities of mixing the sludge with brick making mate-rial.
poult^^ waste Management: There are large number of small, medium and large poultry farms in the areas. Usual way of poultry waste disposal was to dump in adjacent land and water bodies. The initial positive achievements has been to convince Kajoli Kharnar, which is a large scale poultry farm to use their waste to produce bio-gas for their internal uses. The sludge h m the Bio-gas plants is being used by the local farmers as fertilizer and part of the poultry waste is also used by fish farmers. Dhaka hatchery, which is also a large poultry farm, has asked for assistance from MACH-BCAS on Bio- gas technology.
Kerosene Management in Textile Dyeing, Printing & Finishing Mills: In the Mokesh
Beel area, fish fiom the wetlands used to have strong odour of kerosene. This was due to the fact that all the textiles mills in the areas used kerosene for the dyeing, printing and finishing process. On discussions and demonstration to Rahim Textile and Aymon Textile mills have replaced kerosene which is an environmental friendly chemical Albatose SE. This has drastically reduced the kerosene concentration in Mokesh Bee1 and Ratanpur Khal.
Succeeded in bringing together representative of key industrial enterprises, local
community, policy makers in a workshop where detailed technical and legal issues were presented.
7. CONCLUSION & RECOMMENDATION
Bangladesh and its people need industry. They need the jobs and taxes that industry provides. In most situations, MACH advises a bottom up community based approach to resource management but given the present situation it is unlikely that approach by itself will be fully successful in reducing effluents.
MACH in its relations with industrialists purposely took a non-confrontational approach, attempting to establish a relationship with industrialists that would encourage their cooperation. Industrialists work with MACH on a voluntary basis. It has become apparent that this approach is only partly successful. All industrialists were willing to work with the project in the review of industrial practices with a view to improving efficiency as well as the design of appropriate treatment plants. MACH was successful in significantly reducing the use of kerosene within the project area. Only some of the industrialist was willing to fully put the various plans into practice.
Bangladesh has the legal framework to control industrial pollution. At present DOE is the only body empowered to bring prosecutions under the environmental legislation and regulation. However, it must be remembered that industries in Bangladesh are in the main privately held and operated by the most powerful individuals and families in the country. In addition there is a lack of enforcement of the existing laws and regulation primarily due to lack of capacity of the DOE both in terms of manpower resources and adequate knowledge.
MACH has found that industries pay lip service to environmental issues. Some go so far as to include effluent treatment plants and in some cases even meet the Bangladesh ECA 95' and ECR 97'. Nevertheless, we found no cases where industries were fully responsive to community requests for change or willing to take substantive steps to reduce effluents. More important is the lack of political will to address these issues. As in many environmental issues, a lack of accountable local government and national government agencies, a lack of effective local planning and zoning ensures that change does not occur. Pollution has many technical aspects but is at heart, like other environmental problems, a governance issue. Given the current realities it is admitted by most industrialists and agreed by environmentalists that:
In the short term, control of industrial effluents will only occur when so required by buyers and their host nations. 'Green labeling' as required by the EU or similar mechanisms supported through the World Trade Organization (WTO) could be effective in affecting change.
Independent third party audits leading to performance as well as management cerrificarion are a fundamental requirement. Management and process certification throigh IS0 14000 or similar standards would be helpful but are by themselves meaningless unless tied to performance audits.

In the long term, empowerment of elected and accountable local government to determine cornmkty land use, based on national goals and standards, and backed up by aggressive GOB regulators are a fundamental requirement.
7.1 Recommendations- Governance, Policy and Consensus Building.
Key elements needed to solve this problem lie in the development of the political will and then undertaking the policy changes needed to effect change. This requires establishing the constituencies within communities both local and national as well as within the government and industry who could support these changes. In addition international buyers, national manufacturers and organizations such as the BGMEA (Bangladesh Garment Manufacturers & Exporters Association), Bangladesh Textile Mills Association (BTMA) must be consulted and convinced that it is in their best interest to support these initiatives. Finally, support for government institutions concerned with control of industrial pollution must be a part of any program.
MACH is not tasked with nor is it in a position to address pollution issues on a national level. However, MACH is in a position to work with and attempt to influence other Government organizations, NGOs and projects working on those lines. If funds are made available, through the GOB-MACH Support Programs, MACH will work with the Wetlands Network or others to achieve a consensus and make the policy changes needed to affect changes.
Task-1 Consensus Building
Build constituencies within communities, government and industry to affect change.
Work with BTMA, BGMEA and others related organizations to raise their awareness on the impacts of industrial pollution. In addition work with other ProjectsMGOs and DOElDOF to build a national constituency for change in this area.
I Task 2. Industrial Zoning
~ Specific Activity:
I Sectoral Industrial zoning policy to be adopted by GOB through a regulatory framework.
At present, no zoning policy exists for setting up industry in Bangladesh. Industries are established wherever infiastmctwe is available without concern for environmentally sensitive areas, ability to treat wastes, lack of capacity of local officials to assess or deal with the risks of an individual industry.
48
The MACH Pollution Rogram would stimulate the actors (DOE, MOEF, Ministry of law, Ministry of Land, DCCI, MCCI etc.) though the MACH Steering Committee or other venues to initiate formulation of a industrial zoning policy which should be adopted by the GOB.
Highly polluting industries (designated as 'Red' Categoly by ECA 95') should be located in clusters where effluent treatment and other issues can be dealt with in more efficient manner.
7.2 Technical Recommendations for Future Action
Along with the The following are the technical issues that need addressing in order to achieve
The following activities are being suggested for facilitating implementation of MACH Pollution Sub-component at Kaliakor.
Pro~osed Technical Tasks of MACH Pollution Proiect
Task 1. Provide technical assistance to the industries for the implementation of Cleaner Production Program.
Specific Activity:
- Carry out further environmental audits of the concerned industly; - Develop and implement a strategy to reduce waste production and energy consumption
where economically feasible, and replace raw materials which have an unacceptable impact on the environment or human health;
- Implement a training program on Cleaner Production; - Publicize the results through workshops, seminars and media of the Cleaner Production
implementation program both within the industry and externally; - Provide assistance to Industries to get "Green Labelling" (like IS0 14000) for achieving
improvements in environmental performance.
Task 2. Physical Intervention
Specific Activity:
A Pilot project should be undertaken for developing an economically feasible treatment method for decolorizing the emuent. This will serve as a model for other industrial entrepreneurs to adopt on a cost effective basis which can be replicated. The pilot treatment units should be located within one of the polluting industries. As outcome of the pilot project, it is considered that about 90% of color removal is achievable, and in addition, 40% reduction in BOD and suspended solids can also be achieved.
a. MACH Pollution Project will provide only detailed design and cost estimate for the pilot project.
b. The industries will finance and implement the dewlourization plant jointly. This will be finalised after completion of detailed design and cost estimate.
Task 3. Monitoring and awareness building in beneficiary community
Specific Activity:
Monitoring of the ecosystem is crucial to evaluate the effectiveness of different measures to protect it. To sustain the monitoring system the cooperation of the beneficiary community is essential.
As monitoring is very expensive, minimum number of suitable indicators are to be chosen. The choice of indicators is very much important. Indicators should be
easily measurable require less sophisticated equipment (as much as possible) minimum number of indicators represent the whole ecosystem.
An institutional setup is to be established to conduct the monitoring activities regularly. Beneficiary community may be linked with this setup. In addition to monitoring by qualified staffs within the industries, monitoring by the community themselves will also provide substantial useful information. - MACH Pollution Project will oversee the monitoring program and necessary technical assistance (tools, equipment, training the staffetc.) will be provided.

Task 4. Special studies on Pollution
Specific Activity:
Conventional and modem treatment technology may not always remove or reduce specific pollution load fiom the wastewater effectively at a reasonable cost. Requirement of highly skilled manpower and costs for both investment and O&M may not encourage the industries to adopt such technologies.
Removal of Heavy metal and Sludge disposal technology requires special attention. Chemical coagulation will remove certain amount of heavy metal. The use of water hyacinth in removing heavy metal in the Phase-I shows promising result. The khal can not be used on a permanent basis. This treatment may be undertaken by industries who have adequate land, however, the disposal of water hyacinth should be done as an environmental friendly manner within the industry.
Sludge disposal in an environmentally friendly is not currently practiced because of financial constraints. It is to be mentioned that in Phase-I, Apex Tannery has requested BCAS to find out a way to dispose the sludge generated from their ETP. In such cases, special studies are to be undertaken to reduce the pollution load and disposal of sludge using simple technology and materials at low cost.
Task 5. Outreach Program
Specific Activity:
Workshops and seminars with different stakeholders, articles published in newspaper and magazine, may be used as effective tools to disseminate information and to raise overall national awareness on the specific achievements/failure of individual industries in abating pollution. h a n g i n g tours for journalists, govt. officials and representative from civil society will also be undertaken for them to assess the progress of the pollution project.
Intervention on Policv Aspects
Task 1. Ban on undesirable dyes and pigments are strictly enforced. -
Specific Activity:
Necessary policy should be adopted to prohibit banned dyes and pigments by increasing tariff on bamed dyes and pigments and reduction of tariff on environmentally friendly dyes.
MACH Steering Committee to take necessary measures through Department of Environment (DOE) to ensure that the banned dyes and chemicals can not be imported without CM who should take necessag actions ,bough tariff commission.
5 1

It is to be mentioned that MACH Pollution project (Phase-I) has already identified the list of the banned dyes and safer alternatives for those dyes and pigments.
Task 2. Compliance of the environmental requirement is examined jointly by the enforcing authority and the representatives of the civil society.
Specific Activity:
The Industrial Effluent Quality Standards promulgated in 1997 under the Environmental Conservation Act of 1995 should not be enforced strictly. Noting that environmental clearance is already a part of the approval process of any industrial Goject. At present the DOE is the only body empowered to bring prosecution under the environmental legislation and regulations. However, DOE does not have the resources to effectively monitor and enforce these rules and regulations.
In case of non-compliance by any of the industry in the project area after Phase-& MACH Pollution Project will create pressure on the offenders through the MACH Steering Committee and use international supply chain pressures.
Annex -1
Test Results on Sediment Quality &Waste Water near the discharge point of local industries
Laboratory Test Result - Sediment Quality
Note: Chemical Analysis were performed in the Aftab Biotech Research Centre, Bajitpur, Results are reproduced from Test Result Sheet
Laboratory Test Result - Waste water Quality
Note: Chemical Analysis were performed in the Aftab Biotech Research Centre, Bajitpur, Results are reproduced from Test Result Sheet

Sample NO. ICadmlum (cd) IRoot (mancsl) Ishoot ( W g ) l L d (W&) 1W-d. Body IRemrk -
Table-2: Heavy metal concenlratlons in Freah Walerhyacinfhlmm taliakoir placed in brinhata Culvert
3.8
3.2 . -
Refnark
Sample No. 1Lead (Pb) l ~ w t (rnglkg) )Shoot (rnglkg) ILeaf (mglkg) )whole Body \Remark 2lFresh New Water-Hyacinlh 1 54.01 66.01 50.01 56.71
I 1 [Fresh New Water-Hyacinth I 37.71 42.01 . ~
35.01 .. -
33.21 7
0.5 1 5
Whole Body 828 14.6 4L7
Test Case Arm
I (Average 45.9 1 54.01 42.5 ( 47.51 i
5.0 3.5
ZlPdluted Otd Waterhyacinth 1 JPdlutad Old Waterh~sciMh
Leaf(mgnyl) 6.0 2.5 4.3
6.0 4.5
Shcet(mg&I) 58.5
0 3 3.8
Remark
Rwt(rn&g) 184.0 32.2
108.1
Sample No. 2 1
Whde Body 120.0
Chromlum (Cr) Polluted Old Watahyadnb PM okl water-hyacinth A-
1 S M (mg&I) )~saf(mglkg)
116.01 120.0
I-
Sample No. 2
J
1
Whole Body 2.5 2.3 2.4
Leaf (mghg) 0.4 1.0 0.7
Harlnhata Culvert Area Zinc (Zn) from Kailakolr Fresh new Watnrhyrdnm
Remark -
.
Sample No. 2 1
-. 103.0 -, 112.0 . - - 8
Root (rnglkp) 124.0
Fresh new WatM-hy-
~ o o t (&kg) 4.5 3.5 4.0
Cadrnlum (Cd) Fresh NEW Water-Hyacin* Fre& New Water-HMnm - Average
Whole Body 8 6 5 3 7.0
Leaf (mglkg) 6.0 1.7
. 3,D
114.0, 119.0'
shmt (mglkg) 2.5 2.5 2.5
Remark Shoot (mglkg) 11.6 6.5 9.1
Root (rnglkg) 8.3 7.6 8.0
Sample Na 2 1
Chromium (Cr) Fresh New WaLer-Hy- Fresh New Water-Hyrcinm Average

Table-4: Heavy metal soncentrations in Fr-h Waterhyacinth from Mirzapur placed in railway Bridge
Sample No. Lead (Pb) R d (mglkg) Shwt (mglkg) Leaf (mgkg) W e Body Remark
1 Fresh New Water-Hyacinth 53.5 41.5 35.5 43.5
Test Case Area
Sample No.
1
Shmt (maikg)
76.5
Harlnhata culvert Area Zlnc (Zn) from Mlrupur
Fresh new Water-hyacinth
R d (&)
135.0
Remark Leaf (mgny))
123.0
Whde Body
111.5

HHvy metal mnantntibrv in P l d Water hyxlnth fmm R a i l m y Bridge T u t C u e Anr I I I I I I

Managing Industrial Pollution Workshop
10 A.M. Saturday, 09 June, 2001 LGED Meeting Room
Agargaon, D h a k a
(Organized by MACH-BCAS)
Findines of the w o r k s h o ~
Dr. A. Atiq Rshman, Executive Director, BCAS presided over the wdrkshop. Participants consisted of representatives of industries in the area, Chairman, Member of the local Union Parishads, Representatives of Resource Management Committee (RMC) formed in the area under MACH Project, local elites, members of the MACH National Steering Committee, and four executing partners of MACH Project.
Opening the discussion, Mr. Darrell Deppert, Chief of Party, MACH Project welcomed the participants and mentioned that this was the second workshop on management of industrial pollution. The first was held in December 1999 in MACH office, where representatives of industries had mended. In that workshop the existence of the problem in the area was agreed upon and it was decided to make a further study to ascertain the magnitude of the problem and find ways and means for to resolution. The purpose of the present workshop was to review the findings so far, discuss achievements and recommend future course of actions to be taken, amongst others, by industries as well as MACH project.
Mr. W.J. Collis, Senior Natural Resource Adviser, MACH project stated that MACH was a GOB project with sustainable use of wetland resources as its goal, and for that purpose, it had adopted collaborative community co-management approach including all stakeholders. MACH, in its approach, considers through adaptive management an entire wetland and all factors impacting that wetland. Mr. Collis hiehlinhted the environmental services of wetlands which included - - recharging of ground water after filteration and purification, protection of communities from floods, sustainable supply of fish and other food in addition to serving as a home for a good number of flora and fauna. ~ G h G ~ h t i n ~ rural dependence on aquatic resources, Mr. Collis s h e d that 50% of all consumed animal protein came from fish. In MACH area, 85% of households get protein from fish and the natural vegetation collection runs upto 65% for food and 40°% for fodder, medicine and fuel. He also highlighted the collaborative community comanagement of resource approach adopted in MACH areas and stated that MACH as a project considers an entire wetland and all factors impacting that wetland and is concerned with restoration of wetland function through adaptive manaeement. Exolainine interest of MACH. in industrial oollution. Mr. Collis said that in Kaliakoir. - - industrial pollution had been identified by rural people as the most important environmental issue facing Mokash beel. In addition. the MACH proiect National Steering Committee had requested the
to furnish practical recommendationsihai would effectively reduce industrial poll;tion in the wetlands. On the other hand, the industries also need to pay attention to the issue primarily for the reason that we all live in this country and, left unabated, all the pollutants were finding their way into the water we drink, the food that we eat and the air we breath. At the same time, we are to remember about future quality control restrictions which may be imposed by World Trade Organization (WTO), and also Eco-labeling which may be EU requirement by 2002-2003. Unless steps are taken in right earnest, export of goods from Bangladesh may be affected and buyers abroad may be under pressure not to buy such goods. Mr. Collis ended said that the purpose of the workshop was not to raise an accusing.finger but to welcome free discussion and to arrive at a reasonable solution.

Mr. Iqbd Knbir from Bangladesh Env. kwyer's .beorintion (BELA) stated that there wge a number of laws and regulations in the country on the subject of environment, but hardly effective. Finally, the Environmental Cooservation Act was enacted in 1995 and Environment Consewation Rules wrre formulated in 1997. The existing Mustrial Policy of the government contains provisions for clean industrial environment. All these authoriw the DG, Dep-ent of Environment W E ) with the authority to inspect and ban the polluting indtlstries. New industries need a environmental cleanliness certificate from the DOE. Old on- are to attain the standard withi a prescribed time limit. These certificates require renewal every year. Despite all these, according to a DOE repoG there are now about 1100 polluting industries in the country. Only one case has been filed so far against a poultry farm. This shows the institutional weakness and inadequacy of the DOE. Indum'es on the other hand are very conscious to claim their right through writ or civil suit but not very attentive to fulfilling their obligations.
Mr. Kabir emphasized the need for change in outlook and respect for law. He also stressed upon the need to strengthen institutional set-up and raising of awartness, coupled with implementation of existing laws through effective coordination.
Dr. hi.L Sharif, Research Rllow. BCAS and his colleague Dr. H.K. Daa had carried out a study to determine the extent of pollution in the area. In his presentation Dr. Sharif stated that when MACH became aware of the pollution problem, it carried out an initial chemical test to determine the extent. The parameters tested wen BOD, COD, heavy metals in the sediment, total dissolved solids, total suspended solids and oils and greases. The result revealed that concentration of all the parameters tested were higher than the Bangladesh standard set under the Environmental Conservation Act 1995 and Environmental Conservation Rules 1997.
As an innovative method, a special intervention was undertaken by placing water hyacinth in two different spots of Ratanpur khal to assess the extent of heavy metal absorption from the effluent. The results were encouraging.
The approach towards solving the problem was interaction with the industrialists aod development of a good working relationship to gain access to the industries to assess and identify the specific rensons and sources of pollution. Assessment and benchmarking of environmental performance of two industries were carried out (Rahim Textiles and Aymon Textiles). It was found that BOD, COD, water consumption, energy consumption and quantity of wastewater were far higher than the Bangladesh standard, World Bank standard and USEPA standards. A set of cleaner production options was suggested to the industries, which, on adoption, could improve the pollution problem.
Dr. Sharif also reported that the result of this dialogue with the polluting industries had so far been encouraging and he highlighted the good working relationship with industries.
Mr. A.A.K. Cboudhury (Ruben). DGM, APEX Weaving and Finishing Mill representing the APEX group of industries stated that only latest machineries and eco-friendly chemicals were used by them. For heavy metal, they had a treatment plant which could take care of only sludge and not colouring of the waste water. APEX group of industries were aware of environmental consciousness of foreign buyers. He assured of full cooperation in the matter and said that in future they would attempt to decolour the wastewater. He thanked MACH and expected closer cooperation in the matter in future.
Mr. Fazlul Huq, Adviser, Gomati Textiles appreciated the participatory approach and hinted about present bypassing of law through bribing concerned government agencies. He said that if adoption of technical devices coupled with monetary gain could be demonstrated, it would immediately attract the industrialists and adoption of measure would be quick. Dr. Sharif s paper might be sent to industrialists so that the cost-benefit ratio was understood clearly.
Mr. Zulfiqar Ali, Shikdar, Secretary, Knliakoir Poultry Owners Association stated that in their area, most of the poultry farms were small to medium si+c with 1 to 3 thousand birds, but still pollution occumd due to present unsatisfactory disposal of the bird droppings. But with technical
assistance fmm MACHCNRS,. they have bsea successful in controlling the fly menace by upto - 6We7Wo and were now considering ways and means to q c l e the birds droppings.
Mr. Z. A Khan from Aymon T d e a welcomed the participatory approach. Although dyes needed by Aymon Textiles were imported from tstablished sellers, he a d m i that the problem of pollution existed in the area. He cited example of Grameen Knitwear whose treatment plant had costed about Taka one crore. ?be question of survival in a keen competitive markt discouraged
- industrialists from investing in pollution treatment. Technical help from the project for low cost plant would be welcome. He also suggested that charging of lower rate of interest on fund used for setting up treatment plants may encourage industrialists. At the same time checking malpractice in government ofices will ensure stricter implementation.
Members of the local community represented by Chairmen and Members of Union Parishads participated in the workshop. They all highlighted the bad effects of the local industrial pollution. However, they also welcomed MACH'S e f i t to raise awareness amongst the industries and suggesting them ways to mitigate the local water pollution. They strongly recommended that the effort should continue.
Mr. Latifur Rnhman, Activity Manager, MACH Project, USAID said that in whatever field MACH Project worked, its basic approach was participatory. ?he aim was to involve all concerned, arrive at agreed ways of resolution and then implement these. The same procedure had been followcd in its attempt to find a resolution to the pollution problem in Kaliakoir and he was happy to note that many concrete suggestions had come up through the workshop. He further said that MACH was a pilot project and good achievements could be replicated elsewhere.
Mr. Azharul Huq Mazumdar, Mission Environmental ONier, USAID reiterated MACH Project's participatory approach and appreciated the suggested course of action that had come up through the workshop. He expected that on the basis of consensus achieved, these would be gradually implemented to mitigate the pollution problem in Kaliakoir.
Dr. A. Atiq Rnhman, Chairperson and Executive Director, BCAS in his concluding remarks thanked the participants for sacrificing their holiday to attend the workshop and said that open- minded discussion was essential for resolution of a problem like the present one. He emphasized that if we were not careful in mending our ways today, there may be problem tomorrow. While proposing acceptance of the recommendation made in the workshop, particularly those presented by Dr. M. I. Sharif, he said that financial, technical and institutional recommendations had been made and once adopted, these could be taken up step by step for implementation. Decolouring of the aftluent water and stopping the use of Kerosene totally could be the first steps. Initial expenses for implementation would be cost effective in the long run and, if needed, industries could join hands in the effort and minimize cost. Dr. Atiq again thanked all present for their contribution and concluded saying that we had been able to identify the issues involved and, at least, some of the initial steps required to be taken could be used as the start for the next phase of work. He also thanked the representatives of the industrial units for their wholehearted cooperation.