Paleo-fluid composition determined from individual fluid inclusions by Raman and LIBS: Application...
15
Paleo-fluid composition determined from individual fluid inclusions by Raman and LIBS: Application to mid-proterozoic evaporitic Na–Ca brines (Alligator Rivers Uranium Field, northern territories Australia) Donatienne Derome a , Michel Cathelineau a, ⁎ , Cécile Fabre a , Marie-Christine Boiron a , David Banks b , Thérèse Lhomme a , Michel Cuney a a UMR7566 G2R and CREGU, BP239, 54506 Vandoeuvre-les-Nancy Cedex—France b School of Earth and Environment, University of Leeds, Leeds LS2, 9JT, UK Accepted 10 October 2006 Editor: R.L. Rudnick Abstract Detailed determination of the composition of individual fluid inclusions in the H 2 O–NaCl–Ca(Mg)–Cl 2 system from microthermometry data may be difficult because (i) the melting of salt hydrates is often unclear, (ii) salts or salt hydrates are often metastable, and iii) eutectic temperatures are often difficult to relate precisely to a unique salt–water system. These problems can be circumvented by using a Raman microprobe to identify the salt hydrates and to measure the chlorinity, by using Laser Induced Breakdown Spectroscopy (LIBS) to determine cation ratios, and by cross-checking the data from these independent techniques at each step in the determination of the fluid inclusion composition. Data from individual inclusion analysis are then completed by crush–leach technique data on bulk samples. This methodology was applied to a case study, the mineralized faults and associated breccia located in the Alligator Rivers Uranium Field (middle Proterozoic Kombolgie Subgroup, Northern Territory, Australia). Faults are cemented by euhedral quartz containing a variety of fluid inclusions with a wide range of ice-melting temperatures, from near 0 °C down to about − 50 °C. The approach has permitted the identification of three types of fluids: an Na-rich brine with variable Mg concentrations, a Ca-rich brine with low Mg concentrations, and a lower salinity fluid. The Ca and Na-brines mixed with each other and a less saline end-member. On the basis of Cl/ Br and cation ratios, the Na-brine is interpreted as a primary brine, resulting from the evaporation of seawater. It is inferred that the Na- brine evolved chemically during its interaction with the Ca-rich lithologies from Proterozoic basement, forming subsequently a Ca-brine through Na–Ca exchange reactions. Thus, the fault system, which affects both the base of the Kombolgie sandstone and its basement, represents active drainage zones where different fluid reservoirs were connected, and thus a place where fluid mixing was highly favored. © 2006 Elsevier B.V. All rights reserved. Keywords: Fluid inclusions; Raman analysis; LIBS; System NaCl–CaCl 2 –H 2 O; Alligator Rivers Uranium Field Chemical Geology 237 (2007) 240 – 254 www.elsevier.com/locate/chemgeo ⁎ Corresponding author. Tel.: +33 3 83 68 47 31; fax: +33 3 83 68 47 01. E-mail address: [email protected] (M. Cathelineau). 0009-2541/$ - see front matter © 2006 Elsevier B.V. All rights reserved. doi:10.1016/j.chemgeo.2006.10.015
-
Upload
independent -
Category
Documents
-
view
0 -
download
0
Transcript of Paleo-fluid composition determined from individual fluid inclusions by Raman and LIBS: Application...

(2007) 240–254www.elsevier.com/locate/chemgeo
Chemical Geology 237
Paleo-fluid composition determined from individual fluid inclusionsby Raman and LIBS: Application to mid-proterozoic evaporitic
Na–Ca brines (Alligator Rivers Uranium Field,northern territories Australia)
Donatienne Derome a, Michel Cathelineau a,⁎, Cécile Fabre a, Marie-Christine Boiron a,David Banks b, Thérèse Lhomme a, Michel Cuney a
a UMR7566 G2R and CREGU, BP239, 54506 Vandoeuvre-les-Nancy Cedex—Franceb School of Earth and Environment, University of Leeds, Leeds LS2, 9JT, UK
Accepted 10 October 2006
Editor: R.L. Rudnick
Abstract
Detailed determination of the composition of individual fluid inclusions in the H2O–NaCl–Ca(Mg)–Cl2 system frommicrothermometry data may be difficult because (i) the melting of salt hydrates is often unclear, (ii) salts or salt hydrates are oftenmetastable, and iii) eutectic temperatures are often difficult to relate precisely to a unique salt–water system. These problems can becircumvented by using a Raman microprobe to identify the salt hydrates and to measure the chlorinity, by using Laser InducedBreakdown Spectroscopy (LIBS) to determine cation ratios, and by cross-checking the data from these independent techniques ateach step in the determination of the fluid inclusion composition. Data from individual inclusion analysis are then completed bycrush–leach technique data on bulk samples.
This methodology was applied to a case study, the mineralized faults and associated breccia located in the Alligator Rivers UraniumField (middle Proterozoic Kombolgie Subgroup, Northern Territory, Australia). Faults are cemented by euhedral quartz containing avariety of fluid inclusions with a wide range of ice-melting temperatures, from near 0 °C down to about −50 °C. The approach haspermitted the identification of three types of fluids: an Na-rich brine with variable Mg concentrations, a Ca-rich brine with low Mgconcentrations, and a lower salinity fluid. The Ca and Na-brines mixed with each other and a less saline end-member. On the basis of Cl/Br and cation ratios, the Na-brine is interpreted as a primary brine, resulting from the evaporation of seawater. It is inferred that the Na-brine evolved chemically during its interaction with the Ca-rich lithologies from Proterozoic basement, forming subsequently a Ca-brinethrough Na–Ca exchange reactions. Thus, the fault system, which affects both the base of the Kombolgie sandstone and its basement,represents active drainage zoneswhere different fluid reservoirs were connected, and thus a placewhere fluidmixingwas highly favored.© 2006 Elsevier B.V. All rights reserved.
Keywords: Fluid inclusions; Raman analysis; LIBS; System NaCl–CaCl2–H2O; Alligator Rivers Uranium Field
⁎ Corresponding author. Tel.: +33 3 83 68 47 31; fax: +33 3 83 68 47 01.E-mail address: [email protected] (M. Cathelineau).
0009-2541/$ - see front matter © 2006 Elsevier B.V. All rights reserved.doi:10.1016/j.chemgeo.2006.10.015
241D. Derome et al. / Chemical Geology 237 (2007) 240–254
1. Introduction
Formation waters in sedimentary basins often containsignificant amounts of cations other than Na+, such asCa2+, Mg2+, Li+, as shown by the aqueous fluids from oilfields, evaporitic strata and deep basins (Carpenter et al.,1974; Fisher and Kreitler, 1987; Kharaka et al., 1987;Wilson and Long, 1993; Fontes andMatray, 1993; Hyeongand Capuano, 2001). For paleofluids trapped within fluidinclusions, bulk analyses are generally obtained by crush-ing and leaching the host minerals (Bottrell et al., 1988;Banks and Yardley, 1992; Gleeson et al., 2001), a pro-cedure that is meaningful when there is only one dominantfluid population. Microthermometry gives information onthe salinity of the fluid inclusion (most frequently ex-pressed as equivalent wt.% eq. NaCl or wt.% eq. CaCl2),but it does not always enable, a detailed reconstruction ofthe composition of individual fluid inclusions in the H2O–NaCl–Ca(Mg)Cl2 systems for two reasons: (i) the exactmelting of salt hydrates is often difficult to observe, andthus the chronology of phase transitions cannot be es-tablished, and (ii) metastability of salts or salt hydratesoften renders the use of phase transitions problematic(Roedder, 1984;Dubessy et al., 1992). These problems canbe circumvented by using Raman microprobe to identifythe salt hydrates and to estimate the chlorinity (Mernaghand Wilde, 1989; Dubessy et al., 2002), by using LaserInduced Breakdown Spectroscopy (LIBS) to determinecation ratios (Fabre et al., 1999), and using microthermo-metry that remains indispensable to exclude aberrant re-sults due to, invisible-to-the-eye, trapped solids within thefluid inclusion, and to observe the temperature of lastmelting. Cross-checking the data from these independenttechniques at each step in the determination of the fluidinclusion composition allows the composition of the fluidto be validated.
This methodology was applied to a case study,located in the middle Proterozoic Kombolgie Subgroup,along the northern margin of the McArthur basin,Northern Territory, Australia, where brine mixing waspreviously deduced from microthermometric data(Derome et al., 2003). Several earlier fluid inclusionstudies of quartz cements (in sandstones, and faults) inmiddle Proterozoic sedimentary basins described a widerange of ice-melting temperatures, from near 0 °C downto about −50 °C, initially interpreted by Durak et al.(1983) as due to the presence of Ca2+, Mg2+ and Li+ inaddition to Na+ on the basis of microthermometric data.
Microthermometric investigations of fluids from sevenlocalities have shown the existence of brines, with similarfeatures to those cited above, intimatelymixed in euhedralquartz crystals (Derome et al., 2003). These euhedral
quartz crystals contain fluid inclusions (N20 μm), that aresuitable for in-situ analysis. The present study has twogoals: (1) to demonstrate the efficiency of cross-checkingdifferent independent analytical techniques to obtain thecomposition of individual fluid inclusions and (2) to applythis method to natural samples in order to determine thecomposition and the hydrodynamic regime of paleofluidsin the Kombolgie Subgroup, near the unconformity withthe Paleoproterozoïc basement. For the latter objective,additional data for the trace element content (Sr, Ba, Li)was obtained using a new configuration of the LIBStechnique (Fabre et al., 2005). The crush–leach techniquewas used to determine the halogen molar ratios, and toprovide additional data on trace element concentrations.
2. Analytical methods
Low temperature microthermometry was performed ona Chaix-Meca cooling stage (Poty et al., 1976) mounted onan Olympus optical microscope equipped with a ×80objective. The eutectic, ice and hydrate melting tempera-tures (respectively Te, Tmice, Tmhyd) were measured. Ho-mogenization temperatures (Th) were measured using aUSGS-Fluid inc. cooling–heating stage on the same inclu-sions previously studied. The stages were calibrated withmelting-point standards at TN25 °C and natural and syn-thetic fluid inclusions at Tb0 °C. The rate of heating wasmonitored in order to obtain an accuracy of ±0.2 °C duringfreezing, ±1 °C below 200 °C. Due to the difficulties inobserving the first melting (eutectic) or hydrate melting inthe presence of ice, the uncertainty of Te and Tmhyd mayreach ±5 °C and even larger for small fluid inclusions(∼5 μm). A DILOR LABRAM Raman spectrometer wasused for chlorinity measurements using the procedure des-cribed in Dubessy et al. (2002) on the same inclusionsstudied by microthermometry. Chlorinity is given in mol/kg H2O. This technique was also used for the identificationof salt hydrates (Dubessy et al., 1982; Bakker, 2001).
LIBS was used to determine the cation ratios of indi-vidual fluid inclusions that do not contain solids. Theexcitation source was a Nd-YAG (266 nm) laser focusedonto the fluid inclusion through a Cassegrain-type opticalmicroscope (Dilor, Lille, France). The emission lines ofthe plasma produced by the ablation, are characteristic ofthe dissolved cations. These were directly analyzed by aspectrometer with a multichannel detector (Boiron andDubessy, 1994; Fabre et al., 1999). This method mainlydetects Na+, Ca2+, Mg2+, K+, and Li+. The results aregiven as cation mole ratios calculated from the relativeintensities of their emission lines calibratedwith standardsof known composition (Fabre et al., 1999). The detectionlimits range from 10 ppm for Ca to 100 ppm for K (Fabre,
242 D. Derome et al. / Chemical Geology 237 (2007) 240–254
2000). As this technique is destructive, it is used onlywhen all the other techniques have been applied to thesame individual inclusion.
Crush–leach analysis was performed using themethoddescribed in Banks et al. (2000). Approximately 1 g ofcleaned quartz was crushed and leached with an acidifiedLa-solution for cation analysis and doubly distilled waterfor anion analysis. Cations were analyzed by ICP-MS andanions by ion chromatography. Both types of solutionwere also analyzed by flame emission spectroscopy forNa, K and Li.
2.1. Analytical procedure
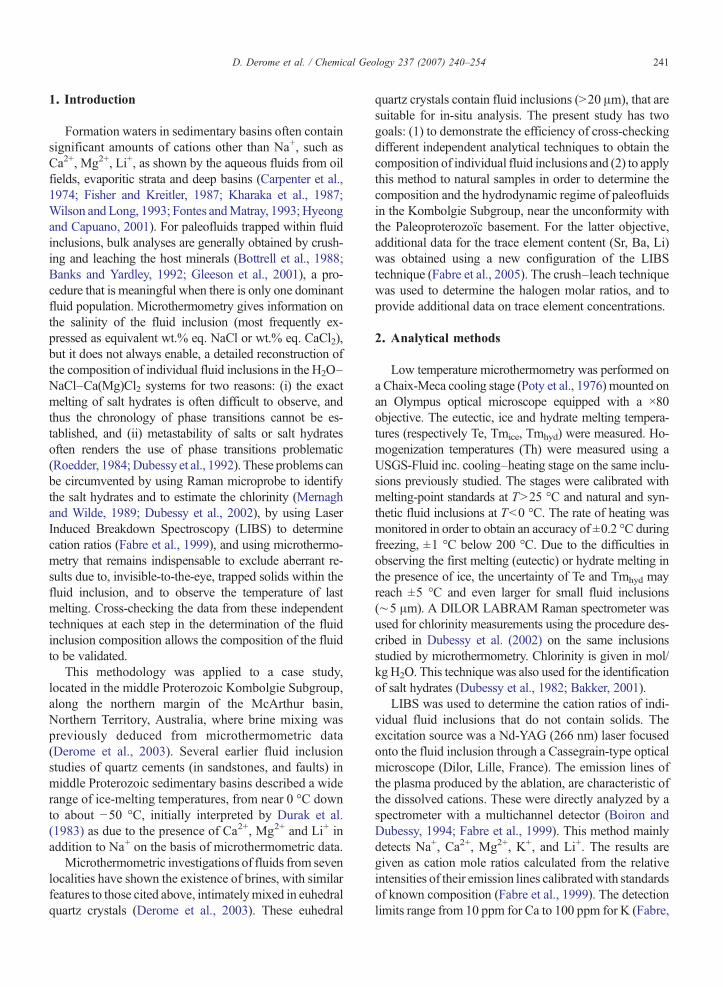
Phase changes (Te, Tmice, Tmhyd) were carefullyobserved in fluid inclusions by cyclic freezing (Haynes,1985) during the cooling runs. Two scenarios weredistinguished (Fig. 1):
(i) When salt hydrates were observed within fluid in-clusions, successive heating and freezing runs wereperformed to induce the growth of awell-crystallizedsolid. The identification was carried out by theRaman microprobe at −175 °C (Dubessy et al.,1982). Then to obtain the relative proportion of eachsalt, the melting temperatures of ice and/or hydratewere plotted in the appropriate phase diagram
Fig. 1. Flow diagram of a fluid inclusion study using microthermometry, R
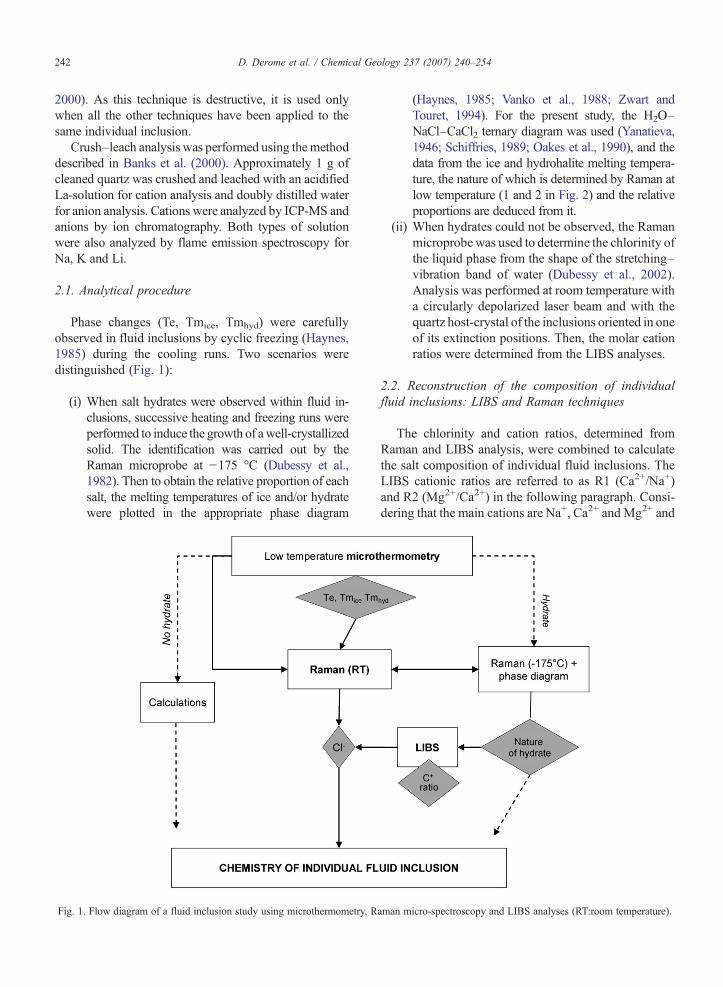
(Haynes, 1985; Vanko et al., 1988; Zwart andTouret, 1994). For the present study, the H2O–NaCl–CaCl2 ternary diagram was used (Yanatieva,1946; Schiffries, 1989; Oakes et al., 1990), and thedata from the ice and hydrohalite melting tempera-ture, the nature of which is determined by Raman atlow temperature (1 and 2 in Fig. 2) and the relativeproportions are deduced from it.
(ii) When hydrates could not be observed, the Ramanmicroprobe was used to determine the chlorinity ofthe liquid phase from the shape of the stretching–vibration band of water (Dubessy et al., 2002).Analysis was performed at room temperature witha circularly depolarized laser beam and with thequartz host-crystal of the inclusions oriented in oneof its extinction positions. Then, the molar cationratios were determined from the LIBS analyses.
2.2. Reconstruction of the composition of individualfluid inclusions: LIBS and Raman techniques
The chlorinity and cation ratios, determined fromRaman and LIBS analysis, were combined to calculatethe salt composition of individual fluid inclusions. TheLIBS cationic ratios are referred to as R1 (Ca2+/Na+)and R2 (Mg2+/Ca2+) in the following paragraph. Consi-dering that the main cations are Na+, Ca2+ and Mg2+ and
aman micro-spectroscopy and LIBS analyses (RT:room temperature).
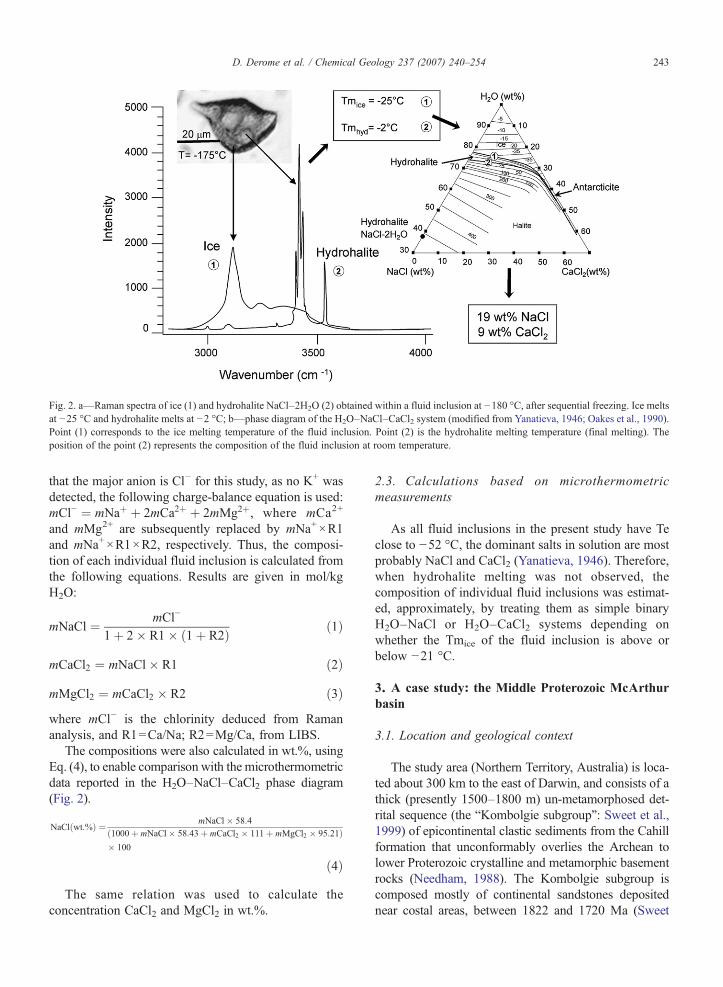
Fig. 2. a—Raman spectra of ice (1) and hydrohalite NaCl–2H2O (2) obtained within a fluid inclusion at −180 °C, after sequential freezing. Ice meltsat −25 °C and hydrohalite melts at −2 °C; b—phase diagram of the H2O–NaCl–CaCl2 system (modified from Yanatieva, 1946; Oakes et al., 1990).Point (1) corresponds to the ice melting temperature of the fluid inclusion. Point (2) is the hydrohalite melting temperature (final melting). Theposition of the point (2) represents the composition of the fluid inclusion at room temperature.
243D. Derome et al. / Chemical Geology 237 (2007) 240–254
that the major anion is Cl− for this study, as no K+ wasdetected, the following charge-balance equation is used:mCl− ¼ mNaþ þ 2mCa2þ þ 2mMg2þ, where mCa2+
and mMg2+ are subsequently replaced by mNa+×R1and mNa+×R1×R2, respectively. Thus, the composi-tion of each individual fluid inclusion is calculated fromthe following equations. Results are given in mol/kgH2O:
mNaCl ¼ mCl−
1þ 2� R1� ð1þ R2Þ ð1Þ
mCaCl2 ¼ mNaCl� R1 ð2Þ
mMgCl2 ¼ mCaCl2 � R2 ð3Þwhere mCl− is the chlorinity deduced from Ramananalysis, and R1=Ca/Na; R2=Mg/Ca, from LIBS.
The compositions were also calculated in wt.%, usingEq. (4), to enable comparison with the microthermometricdata reported in the H2O–NaCl–CaCl2 phase diagram(Fig. 2).
NaClðwt:%Þ ¼ mNaCl� 58:4ð1000þ mNaCl� 58:43þ mCaCl2 � 111þ mMgCl2 � 95:21Þ� 100
ð4ÞThe same relation was used to calculate the
concentration CaCl2 and MgCl2 in wt.%.
2.3. Calculations based on microthermometricmeasurements
As all fluid inclusions in the present study have Teclose to −52 °C, the dominant salts in solution are mostprobably NaCl and CaCl2 (Yanatieva, 1946). Therefore,when hydrohalite melting was not observed, thecomposition of individual fluid inclusions was estimat-ed, approximately, by treating them as simple binaryH2O–NaCl or H2O–CaCl2 systems depending onwhether the Tmice of the fluid inclusion is above orbelow −21 °C.
3. A case study: the Middle Proterozoic McArthurbasin
3.1. Location and geological context
The study area (Northern Territory, Australia) is loca-ted about 300 km to the east of Darwin, and consists of athick (presently 1500–1800 m) un-metamorphosed det-rital sequence (the “Kombolgie subgroup”: Sweet et al.,1999) of epicontinental clastic sediments from the Cahillformation that unconformably overlies the Archean tolower Proterozoic crystalline and metamorphic basementrocks (Needham, 1988). The Kombolgie subgroup iscomposed mostly of continental sandstones depositednear costal areas, between 1822 and 1720 Ma (Sweet

244 D. Derome et al. / Chemical Geology 237 (2007) 240–254
et al., 1999). It probably reached a thickness of about4.5 km and the pressure at the base of the basin wasestimated to 1125±250 bar (Derome et al., 2003). Thestudy area hosts world-class unconformity-type uraniumdeposits that mainly occur at the western margin of theArnhem Land Plateau (northwest McArthur Basin; Sweetet al., 1999), and are hosted close to the unconformity butwithin the basement in theAlligator RiversUranium Field(ARUF). Faults and breccias studied in the present paperrepresent the upper extension of fault systems affectingthe basement aswell as the overlying sandstones as shownin Fig. 3a and b, and are characterized by similar fluidtypes to those recognized within the basement (Derome etal., 2003). All uranium deposits in the Alligator RiversUranium Field, except Nabarlek, are located in the LowerCahill Formation. The oldest age for uranium depositionwas estimated using U–Pb dating on whole rock samplesat 1737±20 Ma for the Ranger deposit (Ludwig et al.,1987). Jabiluka, Nabarlek, and Koongarra deposits havebeen dated between 1600 and 1650Ma using Sm–Nd andRb–Sr methods on uraninites (Maas, 1989), and morerecently ca. 1680 Ma (Polito et al., 2005) using U–Pb onuraninite from Jabiluka.
In quartz breccia zones related to fault affecting boththe basal Kombolgie sandstones and in the basementrocks, previous studies have shown a rather similarsequence of silicification of sandstones and faultcementation, probably in relation with desilicification
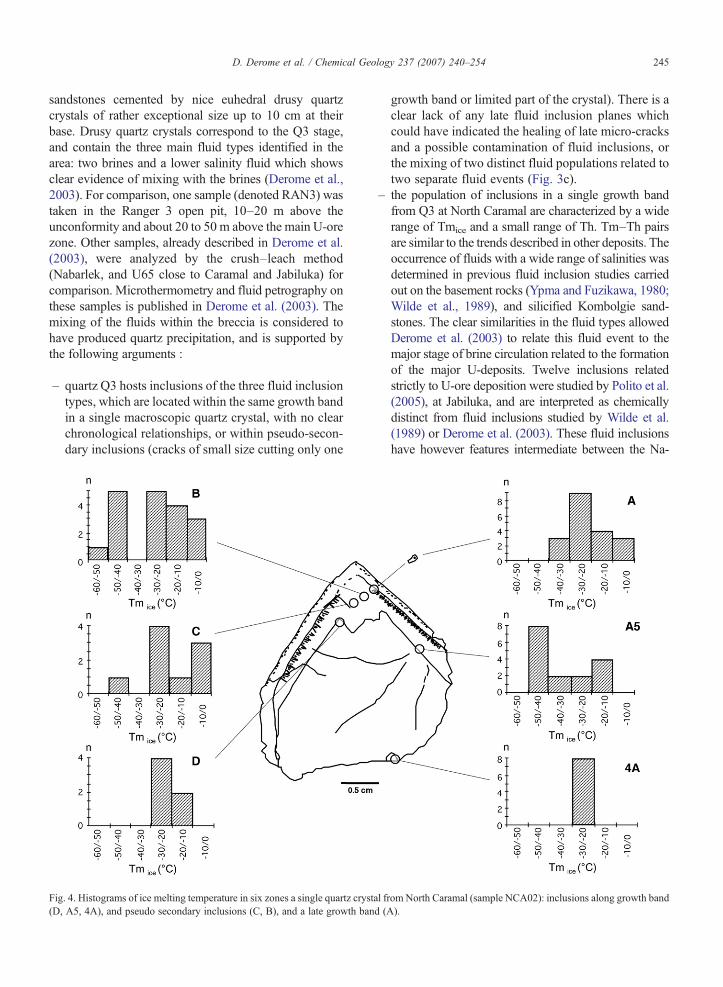
Fig. 3. a—“Vein-type” hydraulic breccia crosscutting the Kombolgie sandston(Northern Territory, Australia). b—Detail of drusy quartz and breccia. The qwithout solids in drusy quartz, ideal for LIBS analysis.
processes related to water–rock interactions during themain stage of U-deposition, as described in detail inunconformity related Canadian deposits (Lorilleuxet al., 2002). In several localities, e.g.10 km south ofthe Nabarlek deposit, at North Caramal and Caramal(and U65) U-showings, South Horn and Jabiluka U-deposit, several quartz generations were distinguished:i) Q1: diagenetic epitaxial quartz overgrowths on detritalquartz grains that correspond to the first stage of thesandstone cementation, Q2: quartz filling intergranularvoids that correspond to pervasive silicification repre-sentative of a later stage of cementation probably coevalof Q3, Q3: millimetres to several centimetres long drusyquartz crystals cementing breccia bodies that crosscutthe sandstones corresponding to the third stage ofsandstone silicification, linked to a fracturation eventand Q4: euhedral amethyst quartz overgrowths on Q3that represents the latest silicification event observed inthe studied samples.
3.2. Analyzed samples and fluid inclusion petrography
Hydraulic breccias, which are especially frequentalong faults affecting both the bottom of the basin andthe basement, were sampled at North Caramal (samplesNCA02 and NCA03), and Caramal (CA001) onoutcrops at 20 to 30 m above unconformity (Fig. 3aand b). Breccias are formed of angular blocks of
es and cemented by drusy quartz, North Caramal area, McArthur Basinuartz crystals are commonly 2–3 cm long. c—Large fluid inclusions
245D. Derome et al. / Chemical Geology 237 (2007) 240–254
sandstones cemented by nice euhedral drusy quartzcrystals of rather exceptional size up to 10 cm at theirbase. Drusy quartz crystals correspond to the Q3 stage,and contain the three main fluid types identified in thearea: two brines and a lower salinity fluid which showsclear evidence of mixing with the brines (Derome et al.,2003). For comparison, one sample (denoted RAN3) wastaken in the Ranger 3 open pit, 10–20 m above theunconformity and about 20 to 50 m above the main U-orezone. Other samples, already described in Derome et al.(2003), were analyzed by the crush–leach method(Nabarlek, and U65 close to Caramal and Jabiluka) forcomparison. Microthermometry and fluid petrography onthese samples is published in Derome et al. (2003). Themixing of the fluids within the breccia is considered tohave produced quartz precipitation, and is supported bythe following arguments :
– quartz Q3 hosts inclusions of the three fluid inclusiontypes, which are located within the same growth bandin a single macroscopic quartz crystal, with no clearchronological relationships, or within pseudo-secon-dary inclusions (cracks of small size cutting only one
Fig. 4. Histograms of ice melting temperature in six zones a single quartz cryst(D, A5, 4A), and pseudo secondary inclusions (C, B), and a late growth ban
growth band or limited part of the crystal). There is aclear lack of any late fluid inclusion planes whichcould have indicated the healing of late micro-cracksand a possible contamination of fluid inclusions, orthe mixing of two distinct fluid populations related totwo separate fluid events (Fig. 3c).
– the population of inclusions in a single growth bandfrom Q3 at North Caramal are characterized by a widerange of Tmice and a small range of Th. Tm–Th pairsare similar to the trends described in other deposits. Theoccurrence of fluids with a wide range of salinities wasdetermined in previous fluid inclusion studies carriedout on the basement rocks (Ypma and Fuzikawa, 1980;Wilde et al., 1989), and silicified Kombolgie sand-stones. The clear similarities in the fluid types allowedDerome et al. (2003) to relate this fluid event to themajor stage of brine circulation related to the formationof the major U-deposits. Twelve inclusions relatedstrictly to U-ore deposition were studied by Polito et al.(2005), at Jabiluka, and are interpreted as chemicallydistinct from fluid inclusions studied by Wilde et al.(1989) or Derome et al. (2003). These fluid inclusionshave however features intermediate between the Na-
al from North Caramal (sample NCA02): inclusions along growth bandd (A).

Table 1Summary of results from microthermometry, Raman and LIBS analyses of individual fluid inclusions, and their corresponding compositions
Microthermometry Composition(from phase diagram)
Ramananalyses
LIBS Composition from Raman and LIBS(wt.%)
Locality Samples IF N° Te Tmice
(°C)Tmhyd
(°C)Th(°C)
NaCl(wt.%)
CaCl2(wt.%)
H2O(wt.%)
Cl (mol/kg H2O)
Na/Ca(1/R1)
Ca/Mg(1/R2)
NaCl CaCl2 MgCl2 H2O
Ca-rich brineNorth Caramal NCA02 A5-9 −61 −44 98 28.9 71.1 6 0.2 2.1 23 0 74.9
NCA02 A-18 −57 −39 110 27.9 72.1 5.7 0.1 1.2 22.9 0 75.9NCA02 B-9 −61 −43 103 28.7 71.3 5.5 0.1 0.8 22.6 0 76.6NCA02 B-5 −61 −42 103 28.4 71.6 5 0.1 1.3 20.5 0 78.2
Caramal CA001 2 −55 −27 −0.9 116 16 11 73 5.6 1.1 10 8.1 14 1.7 76.2CA001 1 −55 −28 −1 115 14.5 12.5 73 5.1 1.1 8.2 14.2 0 77.6
Na-rich brineNorth Caramal NCA02 A-1 −39 −27 8 122 16.5 11 72.5 5.7 2.5 1 10.2 7.2 6.2 76.4
NCA02 4A-7 −59 −26 −5 117 16.5 10 73.5 5.6 5.0 18.8 5.7 0 75.6NCA02 B-21 −86 −47 101 29.5 70.5 5.5 2.5 13.2 10.7 0 76.1NCA02 B-2 −56 −45 115 29.1 70.9 6 3.3 16.8 8.8 0 74.4NCA02 B-12 −68 −29 114 25.4 74.6 4 3.3 11.8 6.8 0 81.3NCA02 C-3 −55 −26 110 24.4 75.6 5 5.0 3 14.6 6.2 1.3 77.9NCA02 C-1 −51 −25 107 24.1 75.9 4.8 5.0 3 14.2 5.7 1.4 78.6NCA03 D-1 −68 −25 −3 97 19.5 6.5 74 5 10.0 18.2 4.2 0 77.6NCA03 C-7 −64 −26 118 24.4 75.6 5.5 5.0 17.6 6.4 0 75.9NCA03 B-4 −74 −28 127 25.3 74.7 5.3 5.0 10 17.5 5.6 0.3 76.6NCA03 B-5 −74 −28 128 25.3 74.7 5.3 2.5 5 11.6 9.6 1.8 77
Caramal CA001 4 −55 −28 2 121 15 12.5 72.5 5 3.3 14 8.3 0 77.7Ranger RAN3 4A-2 −59 −21 −23.9 15.5 5.5 79 3.9 5.0 13.9 4.5 0 81.6
Brackish waterNorth Caramal NCA02 A13 −55 −11 130 15 85 3.2 10.0 13.2 2.4 0 84.4
NCA02 A5-4 −58 −15 124 18.5 81.5 3.4 0.1 0.9 15 0 84.1NCA02 B-4 −50 −11 128 15.2 84.8 3 5.0 10.8 3.9 0 85.3NCA02 A5-7 −58 −12 126 16.4 83.6 4.3 1.0 6.7 12.8 0 80.5NCA02 B-7 −50 −11 130 15.5 84.5 3 3.3 9.3 5.4 0 85.3NCA02 A-8 −46 −10 135 13.8 86.2 2.1 5.0 7.7 3.1 0 89.2NCA02 C-8 −48 −8 140 12.3 87.7 1.8 2.5 10 4.9 4 0.4 90.8NCA02 B-14 −42 −4 150 6.3 93.7 1 3.3 3.3 2.2 0 94.6NCA03 C-1 −39 −8 127 12.1 88 1.8 3.3 5 5.5 3.2 0.6 90.8
Caramal CA001 5 −40 −8.5 157.4 12.3 87.7 2.2 10.0 9.7 1.6 0 88.7CA001 3 −37 −7 −30 126 4 6 90 1.8 1.4 3.9 5.3 0 90.7
Ranger RAN3 4A-6 −55 −19 −22.9 13.5 9 77.5 3.8 1.7 8.4 9.4 0 82.2RAN3 4A-32 −47 −6 9.2 90.8 1.5 10.0 6.9 1.1 0 92
Inclusion numbers for sample NCA02 from North Caramal refer to zones indicated in Fig. 4 (A, B, C, A5, 4A).
246 D. Derome et al. / Chemical Geology 237 (2007) 240–254
brine and the less saline fluid defined by Derome et al.(2003). They have eutectic temperatures around −35±5 °C, and finalmelting from−18 °C to−4 °C, but couldnot be homogenized due to the possible presence ofgases produced by radiolysis (large vapor bubble)although no Raman data are available to confirm this(Polito et al., 2005). Such fluids are compatible with thefluid types described in all localities, but represent onlya part of the fluid system.
Inclusions in quartz Q3 from the Caramal area (NorthCaramal and Caramal) are quite large, and are clearly
hosted in growth bands within the euhedral quartz. Theyare considered as primary fluid inclusions and have muchlarger sizes (20–60 μm) than all other inclusionsdescribed within the silicified sandstones or the alteredbasement rocks. They often possess an irregular orrectangular shape, with their elongation oriented perpen-dicular to the growth zones of the drusy quartz. Theywereconsidered as representative of the main process of quartzdeposition, and provided adequate material for a detailedstudy of the compositions of the main fluid types relatedwith the U-mineralization process. Fluid inclusion planesfrom the mineralized basement are less favorable because
247D. Derome et al. / Chemical Geology 237 (2007) 240–254
of their smaller size and the frequent presence of trappedsolids. A detailed study was thus carried out on the tworepresentative quartz crystals from the same breccia atNorth Caramal, where a set of about 25 large solid-freefluid inclusions (Fig. 4, Table 1) were carefully selectedwith the aim of performing in-situ analysis. Comparisonswith representative inclusions from Caramal and RangerU-deposit were also carried out. The fluid inclusion studywas performed on doubly-polished sections of 100 μmthickness. At room temperature, all the fluid inclusionscontain a liquid phase and a vapor bubble (the bubbleoccupies approximately 15 vol.% of the inclusions).
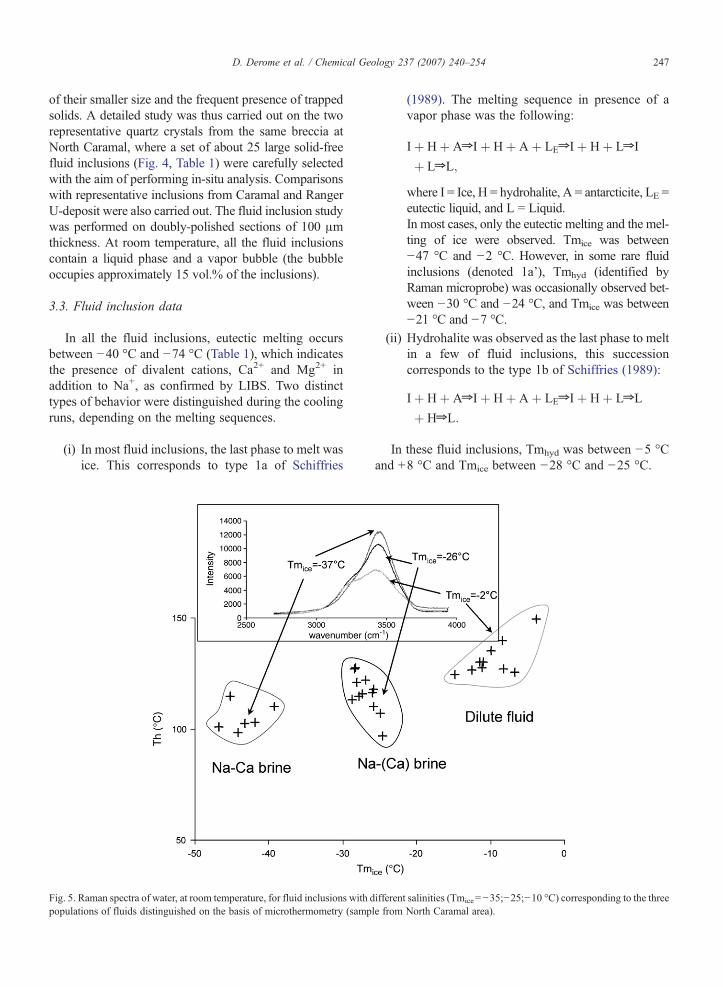
3.3. Fluid inclusion data
In all the fluid inclusions, eutectic melting occursbetween −40 °C and −74 °C (Table 1), which indicatesthe presence of divalent cations, Ca2+ and Mg2+ inaddition to Na+, as confirmed by LIBS. Two distincttypes of behavior were distinguished during the coolingruns, depending on the melting sequences.
(i) In most fluid inclusions, the last phase to melt wasice. This corresponds to type 1a of Schiffries
Fig. 5. Raman spectra of water, at room temperature, for fluid inclusions with dpopulations of fluids distinguished on the basis of microthermometry (samp
(1989). The melting sequence in presence of avapor phase was the following:
Iþ Hþ AZ Iþ Hþ Aþ LEZ Iþ Hþ LZ I
þ LZL;
where I = Ice, H = hydrohalite, A = antarcticite, LE =eutectic liquid, and L = Liquid.In most cases, only the eutectic melting and the mel-ting of ice were observed. Tmice was between−47 °C and −2 °C. However, in some rare fluidinclusions (denoted 1a'), Tmhyd (identified byRaman microprobe) was occasionally observed bet-ween −30 °C and −24 °C, and Tmice was between−21 °C and −7 °C.
(ii) Hydrohalite was observed as the last phase to meltin a few of fluid inclusions, this successioncorresponds to the type 1b of Schiffries (1989):
Iþ Hþ AZ Iþ Hþ Aþ LEZ Iþ Hþ LZL
þ HZL:
In these fluid inclusions, Tmhyd was between −5 °Cand +8 °C and Tmice between −28 °C and −25 °C.
ifferent salinities (Tmice=−35;−25;−10 °C) corresponding to the threele from North Caramal area).
248 D. Derome et al. / Chemical Geology 237 (2007) 240–254
In a few fluid inclusions, there was evidence of metasta-bility. During the first low temperature measurement Tmice
was observed between−30 °C and−40 °C. However, afterrepeating the measurements 3 or 4 times, hydrohalite fi-nally nucleated andmelted between−5 °C and +5 °C, afterice. In such rare cases the Tmice was close to −25 °C.
All the inclusions homogenized to the liquid phasebetween 97 °C and 150 °C. The microthermometric dataare presented in Table 1 and Fig. 5, and grouped accordingto the Raman spectra typical of the three salinity ranges.This diagram shows that the fluid inclusions with thehighest salinity (i.e. the lowest Tmice) have the lowesthomogenization temperatures. Although these data in-clude different samples, this observation is repeatedwithin single growth zones in individual quartz crystals(Dubessy et al., 2003), and is repeated on a district scale of50 km (Derome et al., 2003).
Fig. 6. LIBS spectra of Na–Ca–Li–Sr bearing fluid inclusions, with enlargemCaramal sample).
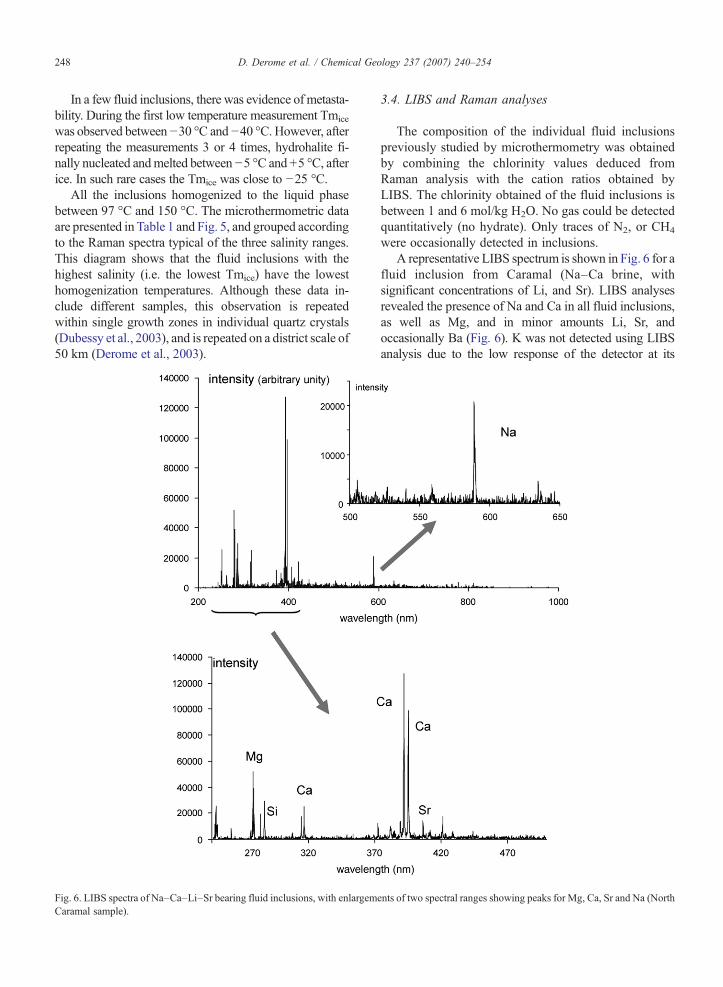
3.4. LIBS and Raman analyses
The composition of the individual fluid inclusionspreviously studied by microthermometry was obtainedby combining the chlorinity values deduced fromRaman analysis with the cation ratios obtained byLIBS. The chlorinity obtained of the fluid inclusions isbetween 1 and 6 mol/kg H2O. No gas could be detectedquantitatively (no hydrate). Only traces of N2, or CH4
were occasionally detected in inclusions.A representative LIBS spectrum is shown in Fig. 6 for a
fluid inclusion from Caramal (Na–Ca brine, withsignificant concentrations of Li, and Sr). LIBS analysesrevealed the presence of Na and Ca in all fluid inclusions,as well as Mg, and in minor amounts Li, Sr, andoccasionally Ba (Fig. 6). K was not detected using LIBSanalysis due to the low response of the detector at its
ents of two spectral ranges showing peaks for Mg, Ca, Sr and Na (North
249D. Derome et al. / Chemical Geology 237 (2007) 240–254
wavelength. Mg concentrations are distinctly different inthe Na and Ca brines, and have a large degree of scatter.Themolar Na/Ca ratio is between 0.1 and 10 andCa/Mg isbetween 1 and 10 (Table 1). Li, Sr and Ba were detected inthe two brines, but their concentrations were notdetermined quantitatively.
3.5. Composition of the paleofluids
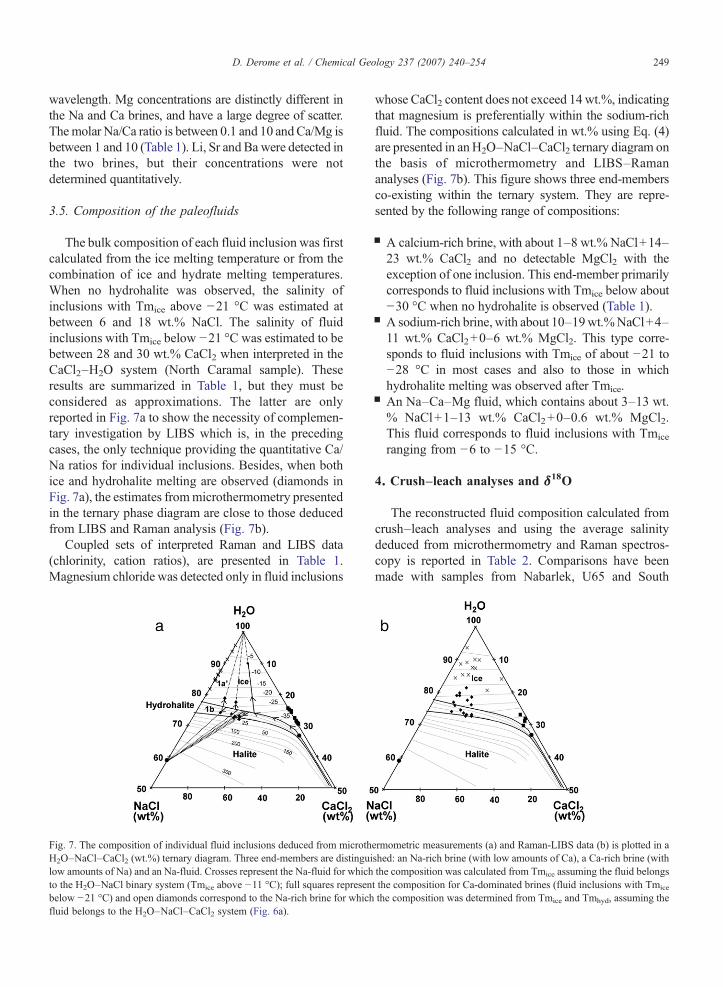
The bulk composition of each fluid inclusion was firstcalculated from the ice melting temperature or from thecombination of ice and hydrate melting temperatures.When no hydrohalite was observed, the salinity ofinclusions with Tmice above −21 °C was estimated atbetween 6 and 18 wt.% NaCl. The salinity of fluidinclusions with Tmice below −21 °C was estimated to bebetween 28 and 30 wt.% CaCl2 when interpreted in theCaCl2–H2O system (North Caramal sample). Theseresults are summarized in Table 1, but they must beconsidered as approximations. The latter are onlyreported in Fig. 7a to show the necessity of complemen-tary investigation by LIBS which is, in the precedingcases, the only technique providing the quantitative Ca/Na ratios for individual inclusions. Besides, when bothice and hydrohalite melting are observed (diamonds inFig. 7a), the estimates frommicrothermometry presentedin the ternary phase diagram are close to those deducedfrom LIBS and Raman analysis (Fig. 7b).
Coupled sets of interpreted Raman and LIBS data(chlorinity, cation ratios), are presented in Table 1.Magnesium chloride was detected only in fluid inclusions
Fig. 7. The composition of individual fluid inclusions deduced from microthH2O–NaCl–CaCl2 (wt.%) ternary diagram. Three end-members are distinguilow amounts of Na) and an Na-fluid. Crosses represent the Na-fluid for whichto the H2O–NaCl binary system (Tmice above −11 °C); full squares represenbelow −21 °C) and open diamonds correspond to the Na-rich brine for whichfluid belongs to the H2O–NaCl–CaCl2 system (Fig. 6a).
whose CaCl2 content does not exceed 14wt.%, indicatingthat magnesium is preferentially within the sodium-richfluid. The compositions calculated in wt.% using Eq. (4)are presented in anH2O–NaCl–CaCl2 ternary diagram onthe basis of microthermometry and LIBS–Ramananalyses (Fig. 7b). This figure shows three end-membersco-existing within the ternary system. They are repre-sented by the following range of compositions:
▪ A calcium-rich brine, with about 1–8 wt.% NaCl+14–23 wt.% CaCl2 and no detectable MgCl2 with theexception of one inclusion. This end-member primarilycorresponds to fluid inclusions with Tmice below about−30 °C when no hydrohalite is observed (Table 1).
▪ A sodium-rich brine, with about 10–19wt.%NaCl+4–11 wt.% CaCl2+0–6 wt.% MgCl2. This type corre-sponds to fluid inclusions with Tmice of about −21 to−28 °C in most cases and also to those in whichhydrohalite melting was observed after Tmice.
▪ An Na–Ca–Mg fluid, which contains about 3–13 wt.% NaCl+1–13 wt.% CaCl2+0–0.6 wt.% MgCl2.This fluid corresponds to fluid inclusions with Tmice
ranging from −6 to −15 °C.
4. Crush–leach analyses and δ18O
The reconstructed fluid composition calculated fromcrush–leach analyses and using the average salinitydeduced from microthermometry and Raman spectros-copy is reported in Table 2. Comparisons have beenmade with samples from Nabarlek, U65 and South
ermometric measurements (a) and Raman-LIBS data (b) is plotted in ashed: an Na-rich brine (with low amounts of Ca), a Ca-rich brine (withthe composition was calculated from Tmice assuming the fluid belongst the composition for Ca-dominated brines (fluid inclusions with Tmice
the composition was determined from Tmice and Tmhyd, assuming the
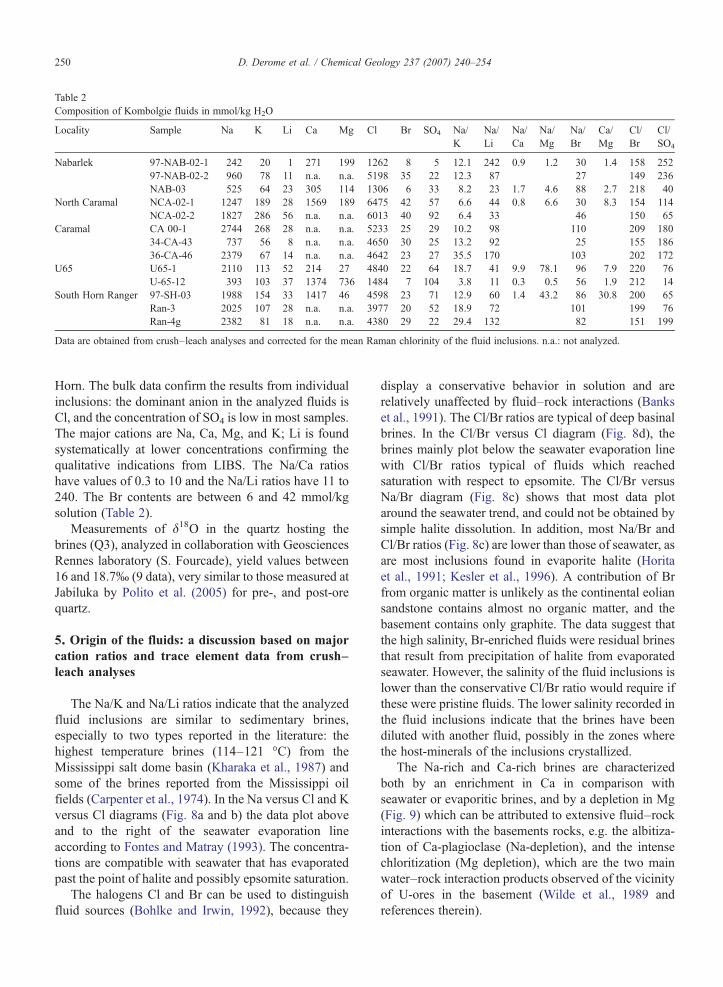
Table 2Composition of Kombolgie fluids in mmol/kg H2O
Locality Sample Na K Li Ca Mg Cl Br SO4 Na/K
Na/Li
Na/Ca
Na/Mg
Na/Br
Ca/Mg
Cl/Br
Cl/SO4
Nabarlek 97-NAB-02-1 242 20 1 271 199 1262 8 5 12.1 242 0.9 1.2 30 1.4 158 25297-NAB-02-2 960 78 11 n.a. n.a. 5198 35 22 12.3 87 27 149 236NAB-03 525 64 23 305 114 1306 6 33 8.2 23 1.7 4.6 88 2.7 218 40
North Caramal NCA-02-1 1247 189 28 1569 189 6475 42 57 6.6 44 0.8 6.6 30 8.3 154 114NCA-02-2 1827 286 56 n.a. n.a. 6013 40 92 6.4 33 46 150 65
Caramal CA 00-1 2744 268 28 n.a. n.a. 5233 25 29 10.2 98 110 209 18034-CA-43 737 56 8 n.a. n.a. 4650 30 25 13.2 92 25 155 18636-CA-46 2379 67 14 n.a. n.a. 4642 23 27 35.5 170 103 202 172
U65 U65-1 2110 113 52 214 27 4840 22 64 18.7 41 9.9 78.1 96 7.9 220 76U-65-12 393 103 37 1374 736 1484 7 104 3.8 11 0.3 0.5 56 1.9 212 14
South Horn Ranger 97-SH-03 1988 154 33 1417 46 4598 23 71 12.9 60 1.4 43.2 86 30.8 200 65Ran-3 2025 107 28 n.a. n.a. 3977 20 52 18.9 72 101 199 76Ran-4g 2382 81 18 n.a. n.a. 4380 29 22 29.4 132 82 151 199
Data are obtained from crush–leach analyses and corrected for the mean Raman chlorinity of the fluid inclusions. n.a.: not analyzed.
250 D. Derome et al. / Chemical Geology 237 (2007) 240–254
Horn. The bulk data confirm the results from individualinclusions: the dominant anion in the analyzed fluids isCl, and the concentration of SO4 is low in most samples.The major cations are Na, Ca, Mg, and K; Li is foundsystematically at lower concentrations confirming thequalitative indications from LIBS. The Na/Ca ratioshave values of 0.3 to 10 and the Na/Li ratios have 11 to240. The Br contents are between 6 and 42 mmol/kgsolution (Table 2).
Measurements of δ18O in the quartz hosting thebrines (Q3), analyzed in collaboration with GeosciencesRennes laboratory (S. Fourcade), yield values between16 and 18.7‰ (9 data), very similar to those measured atJabiluka by Polito et al. (2005) for pre-, and post-orequartz.
5. Origin of the fluids: a discussion based on majorcation ratios and trace element data from crush–leach analyses
The Na/K and Na/Li ratios indicate that the analyzedfluid inclusions are similar to sedimentary brines,especially to two types reported in the literature: thehighest temperature brines (114–121 °C) from theMississippi salt dome basin (Kharaka et al., 1987) andsome of the brines reported from the Mississippi oilfields (Carpenter et al., 1974). In the Na versus Cl and Kversus Cl diagrams (Fig. 8a and b) the data plot aboveand to the right of the seawater evaporation lineaccording to Fontes and Matray (1993). The concentra-tions are compatible with seawater that has evaporatedpast the point of halite and possibly epsomite saturation.
The halogens Cl and Br can be used to distinguishfluid sources (Bohlke and Irwin, 1992), because they
display a conservative behavior in solution and arerelatively unaffected by fluid–rock interactions (Bankset al., 1991). The Cl/Br ratios are typical of deep basinalbrines. In the Cl/Br versus Cl diagram (Fig. 8d), thebrines mainly plot below the seawater evaporation linewith Cl/Br ratios typical of fluids which reachedsaturation with respect to epsomite. The Cl/Br versusNa/Br diagram (Fig. 8c) shows that most data plotaround the seawater trend, and could not be obtained bysimple halite dissolution. In addition, most Na/Br andCl/Br ratios (Fig. 8c) are lower than those of seawater, asare most inclusions found in evaporite halite (Horitaet al., 1991; Kesler et al., 1996). A contribution of Brfrom organic matter is unlikely as the continental eoliansandstone contains almost no organic matter, and thebasement contains only graphite. The data suggest thatthe high salinity, Br-enriched fluids were residual brinesthat result from precipitation of halite from evaporatedseawater. However, the salinity of the fluid inclusions islower than the conservative Cl/Br ratio would require ifthese were pristine fluids. The lower salinity recorded inthe fluid inclusions indicate that the brines have beendiluted with another fluid, possibly in the zones wherethe host-minerals of the inclusions crystallized.
The Na-rich and Ca-rich brines are characterizedboth by an enrichment in Ca in comparison withseawater or evaporitic brines, and by a depletion in Mg(Fig. 9) which can be attributed to extensive fluid–rockinteractions with the basements rocks, e.g. the albitiza-tion of Ca-plagioclase (Na-depletion), and the intensechloritization (Mg depletion), which are the two mainwater–rock interaction products observed of the vicinityof U-ores in the basement (Wilde et al., 1989 andreferences therein).
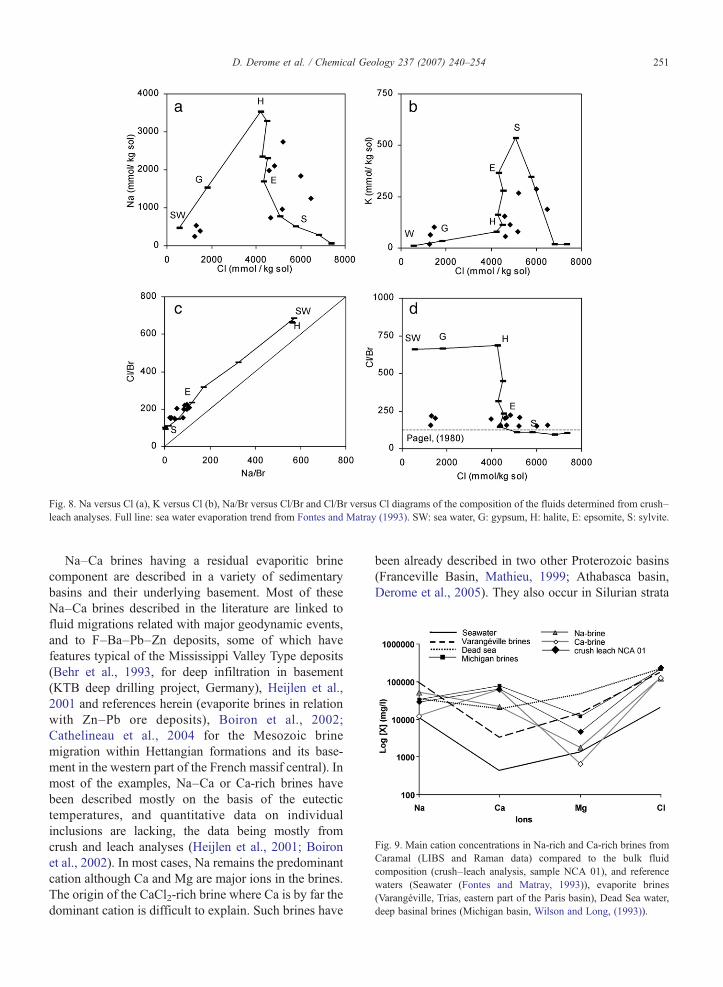
Fig. 9. Main cation concentrations in Na-rich and Ca-rich brines fromCaramal (LIBS and Raman data) compared to the bulk fluidcomposition (crush–leach analysis, sample NCA 01), and referencewaters (Seawater (Fontes and Matray, 1993)), evaporite brines(Varangéville, Trias, eastern part of the Paris basin), Dead Sea water,deep basinal brines (Michigan basin, Wilson and Long, (1993)).
Fig. 8. Na versus Cl (a), K versus Cl (b), Na/Br versus Cl/Br and Cl/Br versus Cl diagrams of the composition of the fluids determined from crush–leach analyses. Full line: sea water evaporation trend from Fontes and Matray (1993). SW: sea water, G: gypsum, H: halite, E: epsomite, S: sylvite.
251D. Derome et al. / Chemical Geology 237 (2007) 240–254
Na–Ca brines having a residual evaporitic brinecomponent are described in a variety of sedimentarybasins and their underlying basement. Most of theseNa–Ca brines described in the literature are linked tofluid migrations related with major geodynamic events,and to F–Ba–Pb–Zn deposits, some of which havefeatures typical of the Mississippi Valley Type deposits(Behr et al., 1993, for deep infiltration in basement(KTB deep drilling project, Germany), Heijlen et al.,2001 and references herein (evaporite brines in relationwith Zn–Pb ore deposits), Boiron et al., 2002;Cathelineau et al., 2004 for the Mesozoic brinemigration within Hettangian formations and its base-ment in the western part of the French massif central). Inmost of the examples, Na–Ca or Ca-rich brines havebeen described mostly on the basis of the eutectictemperatures, and quantitative data on individualinclusions are lacking, the data being mostly fromcrush and leach analyses (Heijlen et al., 2001; Boironet al., 2002). In most cases, Na remains the predominantcation although Ca and Mg are major ions in the brines.The origin of the CaCl2-rich brine where Ca is by far thedominant cation is difficult to explain. Such brines have
been already described in two other Proterozoic basins(Franceville Basin, Mathieu, 1999; Athabasca basin,Derome et al., 2005). They also occur in Silurian strata
252 D. Derome et al. / Chemical Geology 237 (2007) 240–254
from the Michigan Basin (Wilson and Long, 1993;Davisson and Criss, 1996) and have been describedfrom direct sampling and analysis of deep brines inbasement rocks in the Canadian shield (Frape and Fritz,1987) and within the Bohemian basement (KTB,Lodemann et al., 1997). The origin of the Ca-brines isstill the object of discussion as two distinct models, oneof infiltration of evaporite brines (Behr et al., 1993) andthe other of deep formation of brines in relation withgeotectonic processes (Lodemann et al., 1997) areproposed, even for the same geological case such asthe KTB. Such high calcium contents are generallyconsidered as the result of the interaction between NaCl-rich brines and Ca-rich rocks (Wilson and Long, 1993;Hanor, 1994; Davisson and Criss, 1996). Interaction ofNaCl-rich brines with Ca-rich minerals (e.g. albitizationof plagioclase, choritization of pyroxene and amphi-bole) in the basement lithologies is thus the most likelyexplanation for the CaCl2-rich brines found at Caramaland other localities from Kombolgie basin.
For a mean temperature of 150 °C, the δ18O of thefluid that would have been in equilibrium with quartz isbetween 0.9 and 3.3‰ (most values lie around 1.5±0.5‰), typically within the range of values proposed byPolito et al. (2005) for the U-bearing fluids (0 to 8‰) atJabiluka. On the basis of the δ18O values, these fluidscannot be pristine marine waters. Such isotopicsignatures are more typical of fluids equilibrated atlow-temperatures (100–150 °C) and at low fluid/rockratios with sedimentary rocks. Like many examples ofbasinal brines, the isotopic compositions of the highlysaline fluids are most likely the result of severalprocesses, including evaporation (the evaporitic brinecomponent) and mixing (e.g., Knauth and Beeunas,1986), combined with the interaction of the fluids with18O-enriched sediments at temperatures of 100 to150 °C (e.g. Taylor, 1987; Kyser and Kerrich, 1990).
6. Conclusions
The comparison between the independent analyticalmethods (microthermometry, LIBS, Raman and crush–leach analyses) points out the efficiency of couplingLIBS and Raman spectroscopy to reconstruct thedetailed composition of individual fluid inclusions,especially when the inclusions undergo unsuspectedmetastable phase transitions. When hydrohalite wasobserved, the bulk composition determined from the iceand hydrate melting temperatures was in good agree-ment with the Raman and LIBS analyses. However, theRaman microprobe remains indispensable in identifyinghydrates and LIBS is recommended to detect other
cations, such as Mg2+, Sr2+, Li+, and Ba2+. This isparticularly the case for fluid inclusions that haveeutectic melting temperatures lower than those of binarysystems (H2O–NaCl; H2O–CaCl2…) for which morecomplex compositions are indicated, involving bothNa+, Ca2+ and probably other cations.
This approach has permitted the identification ofthree types of fluids that migrated in the KombolgieFormation in relation with the main fluid activityresponsible for the major U-deposits: an Na-rich brinewith occasional Mg concentrations, a Ca-rich brine withlow Mg concentrations, and a lower salinity fluid. TheCa and Na-brines mixed with each other and also mixedwith a less saline end-member. These three fluid-endmembers and their mixing trends are also observed on aregional scale (Derome et al., 2003) in all the studiedlocalities. A wide range of compositions between theend-members suggest that fluid mixing occurred in thebreccia zone itself during periods of fluid influx, as nocomplete homogenization of the fluids compositions hasoccurred. These three fluid types are found either in thefaulted sandstones or within the faulted basement inrelation with U-ores. It can be noted that recent studiesclaim that U-ore fluids were distinct from those relatedto the main silicification events affecting the studiedfaults. At Jabiluka, all fluid types were found in closerelation with the ores within the basement. We thereforedisagree with conclusions from Polito et al. (2005) whoconsidered quartz Q3 as late and unrelated to U-oredeposition, on the basis of U–Pb discordia ages. Asthere are no relationships between primary inclusions inquartz, and the quasi-continuous and episodic loss of Ufrom the uraninite lattice, a process observed in most U-ores and which cannot be used for dating fluid events,this indirect dating of fluids has no chronological ortextural support.
The brines are enriched in Br, and are interpreted asresidual brines probably linked to the evaporite layerswhich are found in the McArthur basin. Brines evolvedchemically during their interaction with the Proterozoicbasement and the mid-Proterozoic siliciclastic sediments,as the Ca concentrations are likely the result of interactionof the Na-brine and Ca-rich lithologies. The Ca-enrich-ment probably occurred when the fluid migrated fromshallow levels in the basin down to the contact with thebasement along and below the unconformity. Thus, thebreccia bodies at the base of the Kombolgie sandstonerepresent active drainage zones where different fluid re-servoirs were connected, and thus a place where fluidmixing was highly favored. These fluid movements areconsidered as related to themain processes responsible forthe U-mineralization at the unconformity or below.
253D. Derome et al. / Chemical Geology 237 (2007) 240–254
Acknowledgements
The AREVA Company is gratefully thanked for thefinancial support and for providing samples for the fluidinclusion study from the Alligator Rivers Uranium Field(ARUF). The Gdr Transmet and CEA are acknowledgedfor the financial support of the analytical developmentof the LIBS technique. Serge Fourcade is warmlyacknowledged for his contribution to quartz isotopeanalyses. L. Diamond, U. Hein, and A. van den Kerkhofare thanked for their helpful comments and editorialhandling.
References
Bakker, R.J., 2001. CombinedRaman Spectroscopy andLowTemperatureMicrothermometry: ECROFI XVI, Porto, 2001, pp. 15–18.
Banks, D.A., Yardley, B.W.D., 1992. Crush–leach analysis of fluidinclusions in small natural and synthetic samples. Geochim.Cosmochim. Acta 56, 245–248.
Banks, D.A., Davies, G.R., Yardley, B.W.D.,McCaig, A.M., Grant, N.T.,1991. The chemistry of brines from an Alpine thrust system in theCentral Pyrenees: an application of fluid inclusion analysis to thestudy of fluid behaviour in orogenesis. Geochim. Cosmochim. Acta55, 1021–1030.
Banks, D.A., Giuliani, G., Yardley, B.W.D., Cheilletz, A., 2000.Emerald mineralisation in Colombia: fluid chemistry and the roleof brine mixing. Miner. Depos. 35, 699–713.
Behr, H.J., Horn, E.E., van den Kerkhof, A.M., Reutel, C., Topp, J.,1993. Crustal fluids of the continental deep drilling project (KTB)at 0–7000 m. KTB Report, vol. 93-2, pp. 451–454.
Bohlke, J.K., Irwin, J.J., 1992. Laser microprobe analyses of noble gasisotopes and halogens in fluid inclusions: analyses of micro-standards and synthetic inclusions in quartz. Geochim. Cosmo-chim. Acta 56, 187–201.
Boiron, M.C., Dubessy, J., 1994. Determination of fluid inclusioncompositions. microanalytical techniques. In: Frezzotti, M.L., DeVivo, B. (Eds.), Fluid Inclusions in Minerals: Methods andApplications—Short Course of the Working Group (IMA)“Inclu-sions In Minerals”: Siena, Virginia Tech, pp. 45–71.
Boiron, M.C., Cathelineau, M., Banks, D.A., Buschaert, S., Fourcade,S., Coulibaly, Y., Boyce, A., Michelot, J.L., 2002. Fluid transfer ata basement/cover interface. Part II: large-scale introduction ofchlorine into the basement by mesozoic basinal brines. Chem.Geol. 192, 121–140.
Bottrell, S.H., Yardley, B., Buckley, F., 1988. A modified crush–leachmethod for the analysis of fluid inclusion electrolytes. Bull.Mineral. 111, 279–290.
Carpenter, A.B., Trout, M.L., Pickett, E.E., 1974. Preliminary reporton the origin and chemical evolution of lead- and zinc-rich brinesin central Mississippi. Econ. Geol. 69, 1191–1206.
Cathelineau, M., Fourcade, S., Clauer, N., Buschaert, S., Rousset, D.,Boiron, M.C., Martineau, F., Meunier, A., Lavastre, V., Javoy, M.,2004. Dating multistage paleofluid percolations: a K–Ar and 18O/16O study of fracture illites from altered hercynian plutonites at thebasement cover interface (Poitou High, France). Geochim.Cosmochim. Acta 68, 2529–2542.
Davisson, L.M., Criss, R.E., 1996. Na–Ca–Cl relations in basinalfluids. Geochim. Cosmochim. Acta 60, 2743–2752.
Derome, D., Cuney, M., Cathelineau, C., Fabre, M., Dubessy, J.,Bruneton, P., Hubert, A., 2003. A detailed fluid inclusion study insilicified breccias from theKombolgie sandstones (Northern Territory,Australia): inferences for the genesis of middle-Proterozoic uncon-formity-type uranium deposits. J. Geochem. Explor. 80, 259–275.
Derome, D., Cathelineau, M., Cuney, M., Fabre, C., Lhomme, T.,2005. Evidences of brine mixings in the McArthur Riverunconformity-type uranium deposit (Saskatchewan, Canada).Implications on genetic models. Econ. Geol. 100, 1529–1545.
Dubessy, J., Audeoud, D., Wilkins, R., Kosztolanyi, C., 1982. The useof the Raman microprobe mole in the determination of theelectrolytes dissolved in the aqueous phase of fluid inclusions.Chem. Geol. 37, 137–150.
Dubessy, J., Boiron, M.C., Moissette, A., Monnin, C., Sretenskaya, N.,1992. Determination of water, hydrates and pH in fluid inclusionsby micro-Raman spectrometry. Eur. J. Miner. 4, 885–894.
Dubessy, J., Lhomme, T., Boiron, M.C., Rull, F., 2002. Determinationof chlorinity in aqueous fluids using Raman spectroscopy of thestretching band of water at room temperature: application to fluidinclusions. Appl. Spectrosc. 56, 99–106.
Dubessy, J., Derome, D., Sausse, J., 2003. Numerical modelling offluid mixings in the H2O–NaCl system. Applications to the NorthCaramal uranium prospect (Australia). Chem. Geol. 194, 25–39.
Durak, B., Pagel,M., Poty, B., 1983. Températures et salinités des fluidesau cours des silicifications diagénétiques d'une formation gréseusesurmontant un gisement d'uranium du socle : l'exemple des grèsKombolgie (Australie). C. R. Acad. Sci. Paris 296, 571–574.
Fabre, C., 2000. Reconstitution chimique des paléofluides parspectrométrie d'emission optique couplée à l'ablation laser.Application aux fluides alpins et fluides de bassins, UnpublishedPhD thesis, Université Henry Poincaré, 296 p.
Fabre, C., Boiron, M.C., Dubessy, J., Moissette, A., 1999. Determi-nation of ions in individual fluid inclusions by laser ablationoptical emission spectroscopy: development and applications tonatural fluid inclusions. J. Anal. At. Spectrom. 14, 913–922.
Fabre, C., Dubessy, J., Boiron,M.C., Derome, D., Lacour, J.L., Fichet, P.,Menut, D., 2005. Laser Induced Breakdown Spectroscopy (LIBS)combined with Spectroscopy of Luminescence Resolved in Time(SLRT): an original tool for Earth Science applications. ECROFIXVIII, Sienna, 2005.
Fisher, R.S., Kreitler, C.W., 1987. Geochemistry and hydrodynamicsof deep-basin brines, Palo Duro Basin, Texas, U.S.A. Appl.Geochem. 2, 459–476.
Fontes, J.C., Matray, J.M., 1993. Geochemistry and origin offormation bines from the Paris Basin, France. 1. Brines associatedwith Triassic salts. Chem. Geol. 109, 149–175.
Frape, S., Fritz, P., 1987. Geochemical trends for groundwaters fromthe Canadian Shield. In: Fritz, P., Frape, S.K. (Eds.), Saline Waterand Gases in Crystalline Rocks. Geol. Assoc. Canad. Spec. Pap.,vol. 33, pp. 19–38.
Gleeson, S.A., Wilkinson, J.J., Stuart, F.M., Banks, D.A., 2001. Theorigin and evolution of base metal mineralising brines andhydrothermal fluids. Geochim. Cosmochim. Acta 65, 2067–2079.
Haynes, F.M., 1985. Determination of fluid inclusion compositions bysequential freezing. Econ. Geol. 80, 1436–1439.
Hanor, J.S., 1994. Origin of saline fluids in sedimentary basins. In:Parnell, J. (Ed.), Geofluids: Origin and Migration of Fluids inSedimentary Basins. Geological Society of London SpecialPublication, vol. 78, pp. 151–174.
Heijlen, W., Muchez, P., Banks, D., 2001. Origin and evolution of highsalinity, Zn–Pb mineralizing fluids in the Variscides of Belgium.Miner. Depos. 36, 165–176.

254 D. Derome et al. / Chemical Geology 237 (2007) 240–254
Horita, J., Friedman, T.J., Lazar, B., Holland, H.R., 1991. The compositionof Permian seawater. Geochim. Cosmochim. Acta 55, 417–432.
Hyeong, K., Capuano, R.M., 2001. Ca/Mg of brines in Miocene/Oligocene clastic sediments of the Texas Gulf Coast: buffering bycalcite/disordered dolomite equilibria. Geochim. Cosmochim.Acta 65, 3065–3080.
Kesler, S.E., Martini, A.M., Appold, M.S., Walter, L.M., Huston, T.J.,Furman, F.C., 1996. Na–Cl–Br systematics of fluid inclusionsfrom Mississippi Valley-type deposits, Appalachian basin: con-straints on solute origin and migration paths. Geochim. Cosmo-chim. Acta 60, 225–233.
Kharaka, Y.K., Maest, A.E., Carothers, W.W., Law, L.M., Lamothe, P.J.,Fries, T.L., 1987. Geochemistry of metal-rich brines from centralMississippi Salt dome Basin, USA. Appl. Geochem. 2, 543–561.
Knauth, L.P., Beeunas, M.A., 1986. Isotope geochemistry of fluidinclusions in Permian halite with implications for the isotopichistory of ocean water and the origin of saline formation waters.Geochim. Cosmochim. Acta 50, 419–433.
Kyser, T.K., Kerrich, R., 1990. Geochemistry of fluids in tectonicallyactive crustal regions. In: Nesbitt, B.E. (Ed.), Short Course onFluids in Tectonically Active Regimes of the Continental Crust.Min. Assoc. Canada, Vancouver, vol. 18, pp. 133–230.
Lodemann, M., Fritz, P., Wolf, M., Ivanovich, M., Hansen, B., Nolte, E.,1997. On the origin of saline fluids in the KTB (continental deepdrilling project of Germany). Appl. Geochem. 2, 831–849.
Lorilleux, G., Jebrak, M., Cuney, M., Baudemont, D., 2002. Polyphasehydrothermal breccias associated with unconformity-related ura-nium mineralizations (Canada): from fractal to structural signifi-cance. J. Struct. Geol. 24, 323–338.
Ludwig, K.R., Grauch, R.I., Nutt, C.J., Nash, J.T., Frishman, D.,Simmons, K.R., 1987. Age of uranium mineralization at Jabilukaand Ranger uranium uranium deposits, Northern territory,Australia: new U–Pb isotope evidence. Econ. Geol. 82, 857–874.
Maas, R., 1989. Nd–Sm isotope constrains on the age and origin ofunconformity-type deposits in the Alligator Rivers Uranium Field,Northern Territory, Australia. Econ. Geol. 84, 64–90.
Mathieu, R., 1999. Reconstitution des paleocirculations fluides et desmigrations élémentaires dans l'environnement d'Oklo (Gabon) etdes argilites de Tournemire (France), Unpublished PhD Thesis,Institut National Polytechnique de Lorraine, Nancy 518 p.
Mernagh, T.P., Wilde, A.R., 1989. The use of the laser Ramanmicroprobe for the determination of salinity in fluid inclusions.Geochim. Cosmochim. Acta 53, 765–771.
Needham, R.S., 1988. Geology of the Alligator Rivers uranium field,Northern Territory. Bull. Bureau of Mineral Resources, Geologyand Geophysics, Australia, vol. 224.
Oakes, C.S., Bodnar, R.J., Simonson, J.M., 1990. The system NaCl–CaCl2–H2O: I. The ice liquidus at 1 atm total pressure. Geochim.Cosmochim. Acta 54, 603–610.
Polito, P.A., Kyser, T.K., Thomas, D., Marlatt, J., Drever, G., 2005.Re-evaluation of the petrogenesis of the Proterozoic Jabilukaunconformity-related uranium deposit, Northern Territory, Aus-tralia. Miner. Depos. 40, 257–288.
Poty, B., Leroy, J., Jachimovicz, L., 1976. Un nouvel appareil pour lamesure des températures sous le microscope: l'installation de laplatine microthermométrique CHAIXMECA. Bull. Soc. Fr.Mineral. Cristallogr. 99, 182–186.
Roedder, E., 1984. Fluid Inclusions. Mineralogical Society ofAmerica, Virginia. 644 pp.
Schiffries, C.M., 1989. Liquid-absent aqueous fluid inclusions andphase equilibria in the system CaCl2–NaCl–H2O. Geochim.Cosmochim. Acta 54, 611–619.
Sweet, I.P., Brakel, A.T., Carson, L., 1999. TheKombolgie Subgroup—anew look at an old “formation”. AGSO Res. Newsl. 30, 26–28.
Taylor, B.E., 1987. Stable isotope geochemistry of ore-forming fluids.In: Kyser, T.K. (Ed.), Short Course in Stable Isotope Geochemistryof Low Temperature Fluids. Min. Assoc. Canada, Saskatoon,vol. 13, pp. 337–345.
Vanko, D.A., Bodnar, R.J., Sterner, S.M., 1988. Synthetic fluidinclusions: VIII. Vapor saturated halite solubility in part of thesystem NaCl–CaCl2–H2O, with application to fluid inclusionsfrom oceanic hydrothermal systems. Geochim. Cosmochim. Acta52, 2451–2456.
Wilde, A.R., Mernagh, T.P., Bloom, M.S., Hoffmann, C., 1989. Fluidinclusion evidence on the origin of some Australian unconformity-related uranium deposits. Econ. Geol. 84, 1627–1642.
Wilson, T.P., Long, D.T., 1993. Geochemistry and isotope chemistry ofCa–Na–Cl brines in the Silurian strata, Michigan Basin, U.S.A.Appl. Geochem. 8, 507–524.
Yanatieva, O.K., 1946. Polythermal solubilities in the systems CaCl2–MgCl2–H2O and CaCl2–NaCl–H2O. Zhur. Priklad. Khim. 19,709–722.
Ypma, P.J.M., Fuzikawa, K., 1980. Fluid inclusion and oxygen isotopestudies of the Nabarlek and Jabiluka uranium deposits, NorthernTerritory, Australia. In: IAEA (Ed.), Uranium in the Pine CreekGeosyncline: Vienna, pp. 375–395.
Zwart, E.W., Touret, L.R., 1994. Melting behavior and composition ofaqueous fluid inclusions in fluorite and calcite: applications withinthe system H2O–CaCl2–NaCl. Eur. J. Mineral. 6, 773–786.