Palaeomagnetism and magnetostiatigraphy of Triassic strata in the Sangre de Cristo Mountains and...
19
Geophys. J. Int. (1996) 124,935-953 Palaeomagnetism and magnetostratigraphy of Triassic strata in the Sangre de Cristo Mountains and Tucumcari Basin, New Mexico, USA Roberto S. Molina-Garza,' John W. Geissman,' Spencer G. Lucas2 and Rob Van der VOO~ 'Department of Earth and Planetary Sciences, University of New Mexico, Albuquerque, N M , 87131-1116, USA New Mexico Museum of Natural History and Science, 1810 Mountain Road NW, Albuquerque, N M , 87104, USA Department of Geological Sciences, University of Michigan, Ann Arbor, MI, 48109-1063, USA Accepted 1995 October 18. Received 1995 October 10; in original form 1995 February 16 SUMMARY We report palaeomagnetic data and a composite magnetic polarity sequence for Middle and Upper Triassic rocks assigned to the Anton Chico Member of the Moenkopi Formation and Chinle Group, respectively, exposed along the eastern flank of the Sangre de Cristo Mountains and in the Tucumcari Basin of eastern and northeastern New Mexico. Thermal demagnetization isolates a well-defined, dual polarity, character- istic magnetization, carried in most cases by haematite and interpreted as an early acquired chemical remanent magnetization (CRM). Characteristic magnetizations from 74 palaeomagnetic sites (one site=one bed) are used to define a magnetic polarity sequence, which we correlate with previously published Triassic data obtained from both marine and non-marine rocks. Preliminary correlation suggests that the resolution of magnetostratigraphic data derived from continental strata is not necessarily of lesser quality than that from marine rocks. On the basis of the magnetostratigraphic data, a profound unconformity is believed to separate lower-middle Norian and upper Norian- Rhaetian strata of the Chinle Group. Palaeomagnetic poles derived from selected sites in steeply dipping (> 85") strata for the Middle Triassic (Anisian, -240 Ma: 50"N 121"E; N = 8), late Carnian-early Norian (- 225 Ma: 53"N 104"E; N = 16), and late Norian- Rhaetian (- 208 Ma: 59"N 77"E; N = 8) are in relatively good agreement with previously published data for the Moenkopi Formation and Chinle Group and related strata in southwest North America. None the less, comparison with palaeomagnetic poles obtained from gently dipping or flat-lying Triassic strata from this study (Anisian, 46"N 112"E; N = 13; late Carnian, 54"N 87"E; N = 12) and previously published Triassic poles in southwest North America suggest that a modest 'apparent rotation' not greater than about 5" affects declinations from steeply dipping rocks. The distribution of palaeomagnetic poles indicates - 25" (angular distance) of apparent polar wander between about 240 and 208 Ma. Key words: magnetostratigraphy, New Mexico, palaeomagnetism, sediments, Triassic. INTRODUCTION Extending the magnetic polarity sequence to the early Mesozoic and Palaeozoic requires palaeomagnetic sampling of strata now exposed on the continents. The magnetic polarity record derived from stratigraphic sequences can, in principle, provide as good a resolution as the late Mesozoic and Cenozoic sea-floor record (e.g. Lowrie et al. 1982). Thus far, acquisition of polarity data for Triassic and older rocks has been hampered for several reasons, including the lack of attention to numerous stratigraphic sequences, absence of primary magnetizations, and inadequate bio- or chronostratigraphic control. The importance of extending the magnetic polarity time scale to the early Mesozoic and late Palaeozoic cannot be overstated. Magnetostratigraphy is an invaluable tool for global and regional correlation of strata as well as geological events of global significance, such as mass extinctions. Furthermore, studies of long-term changes in the frequency of polarity reversals provide important information for the dynamo 0 1996 RAS 935
-
Upload
independent -
Category
Documents
-
view
0 -
download
0
Transcript of Palaeomagnetism and magnetostiatigraphy of Triassic strata in the Sangre de Cristo Mountains and...
Geophys. J . Int. (1996) 124,935-953
Palaeomagnetism and magnetostratigraphy of Triassic strata in the Sangre de Cristo Mountains and Tucumcari Basin, New Mexico, USA
Roberto S. Molina-Garza,' John W. Geissman,' Spencer G. Lucas2 and Rob Van der V O O ~ 'Department of Earth and Planetary Sciences, University of New Mexico, Albuquerque, N M , 87131-1116, USA
New Mexico Museum of Natural History and Science, 1810 Mountain Road NW, Albuquerque, N M , 87104, USA Department of Geological Sciences, University of Michigan, Ann Arbor, MI, 48109-1063, U S A
Accepted 1995 October 18. Received 1995 October 10; in original form 1995 February 16
SUMMARY We report palaeomagnetic data and a composite magnetic polarity sequence for Middle and Upper Triassic rocks assigned to the Anton Chico Member of the Moenkopi Formation and Chinle Group, respectively, exposed along the eastern flank of the Sangre de Cristo Mountains and in the Tucumcari Basin of eastern and northeastern New Mexico. Thermal demagnetization isolates a well-defined, dual polarity, character- istic magnetization, carried in most cases by haematite and interpreted as an early acquired chemical remanent magnetization (CRM). Characteristic magnetizations from 74 palaeomagnetic sites (one site=one bed) are used to define a magnetic polarity sequence, which we correlate with previously published Triassic data obtained from both marine and non-marine rocks. Preliminary correlation suggests that the resolution of magnetostratigraphic data derived from continental strata is not necessarily of lesser quality than that from marine rocks. On the basis of the magnetostratigraphic data, a profound unconformity is believed to separate lower-middle Norian and upper Norian- Rhaetian strata of the Chinle Group. Palaeomagnetic poles derived from selected sites in steeply dipping (> 85") strata for the Middle Triassic (Anisian, -240 Ma: 50"N 121"E; N = 8), late Carnian-early Norian (- 225 Ma: 53"N 104"E; N = 16), and late Norian- Rhaetian (- 208 Ma: 59"N 77"E; N = 8) are in relatively good agreement with previously published data for the Moenkopi Formation and Chinle Group and related strata in southwest North America. None the less, comparison with palaeomagnetic poles obtained from gently dipping or flat-lying Triassic strata from this study (Anisian, 46"N 112"E; N = 13; late Carnian, 54"N 87"E; N = 12) and previously published Triassic poles in southwest North America suggest that a modest 'apparent rotation' not greater than about 5" affects declinations from steeply dipping rocks. The distribution of palaeomagnetic poles indicates - 25" (angular distance) of apparent polar wander between about 240 and 208 Ma.
Key words: magnetostratigraphy, New Mexico, palaeomagnetism, sediments, Triassic.
INTRODUCTION
Extending the magnetic polarity sequence to the early Mesozoic and Palaeozoic requires palaeomagnetic sampling of strata now exposed on the continents. The magnetic polarity record derived from stratigraphic sequences can, in principle, provide as good a resolution as the late Mesozoic and Cenozoic sea-floor record (e.g. Lowrie et al. 1982). Thus far, acquisition of polarity data for Triassic and older rocks has been hampered
for several reasons, including the lack of attention to numerous stratigraphic sequences, absence of primary magnetizations, and inadequate bio- or chronostratigraphic control. The importance of extending the magnetic polarity time scale to the early Mesozoic and late Palaeozoic cannot be overstated. Magnetostratigraphy is an invaluable tool for global and regional correlation of strata as well as geological events of global significance, such as mass extinctions. Furthermore, studies of long-term changes in the frequency of polarity reversals provide important information for the dynamo
0 1996 RAS 935
936 R. S. Molina-Garza et al.
theories and the time-scales associated with core-mantle interactions.
Recent efforts to extend the magnetic polarity time-scale into the Permian and Triassic have focused on palaeontolog- ically well-characterized rocks (dated by ammonoids and/or conodonts), and links to the Triassic time-scale are relatively straightforward. Tethyan pelagic marine sections (Muttoni & Kent 1994; Muttoni et al. 1994; Gallet et al. 1992, 1993, 1994) have provided a detailed magnetostratigraphy for parts of the Middle and Late Triassic. Similarly, magnetostratigraphic data are available for rocks in the Canadian Arctic Archipelago proposed as stratotypes defining the Early Triassic stages (Ogg & Steiner 1991), and high-resolution data have been published for proposed Permo-Triassic boundary sections in Sichuan Province in southern China and the Nammal Gorge in Pakistan (Steiner et al. 1989; Heller et al. 1988; Haag & Heller 1991).
Magnetostratigraphic data have been available for non- marine Permian and Triassic rocks for some time (Picard 1964; McMahon & Strangway 1968; Helsley 1969; Helsley & Steiner 1974; Reeve & Helsley 1972). Usually, temporal reso- lution of non-marine sequences is low, and correlation with the geological time-scale is difficult. The reliability of magnetos- tratigraphic records from redbeds has also been controversial (Larson et al. 1982). Recent magnetic polarity studies for the Early and Middle Triassic from redbeds in western and southwestern North America (Shive, Steiner & Huycke 1984; Molina-Garza et al. 1991; Steiner, Morales & Shoemaker 1993) suggest that relatively reliable records of short-duration polarity intervals have been observed, in turn suggesting that reliable magnetostratigraphic data may be recoverable from non-marine strata. Recent studies, however, have faced prob- lems similar to those of early workers: temporal resolution is poor and biostratigraphic data scarce. Continuous coring of continental rift deposits of the Newark Supergroup in the Newark Basin has provided the most detailed Late Triassic data in non-marine strata (Kent, Witte & Olsen 1995). Data from the Newark basin can be linked to the Triassic time-scale via radiometric dating and an interpreted astronomically calibrated cyclostratigraphy (Van Houten 1962; Olsen 1986).
To establish the Late Triassic magnetic polarity sequence as recorded in the Chinle Group and related strata of southwest- ern North America, we obtained palaeomagnetic and mag- netostratigraphic data for non-marine Triassic strata from the southern end of the Sangre de Cristo Mountains and from the Tucumcari Basin of northeastern and eastern New Mexico. Preliminary results of the magnetostratigraphic correlation within the Chinle Group were published in Molina-Garza, Geissman & Lucas (1993). The recent availability of magnetos- tratigraphic data from well-dated Upper Triassic marine and non-marine sequences and improved temporal resolution of the biostratigraphy of the Chinle Group (e.g. Lucas 1993) provide an opportunity to establish a Late Triassic magnetic polarity time-scale and to examine the related problem of correlation of the marine and non-marine biochronologies. Palaeomagnetic and magnetostratigraphic data have been previously published for flat-lying Triassic strata in the Tucumcari basin of eastern New Mexico: the Middle Triassic Anton Chico Member of the Moenkopi Formation (Steiner & Lucas 1992); and the Upper Triassic Bull Canyon (formerly upper shale member) and Redonda Formations of the Chinle Group (Bazard & Butler 1991; Reeve & Helsley 1972). The
data presented here provide a refined structure and calibration of the North American apparent polar wander path (APWP).
GEOLOGY AND SAMPLING
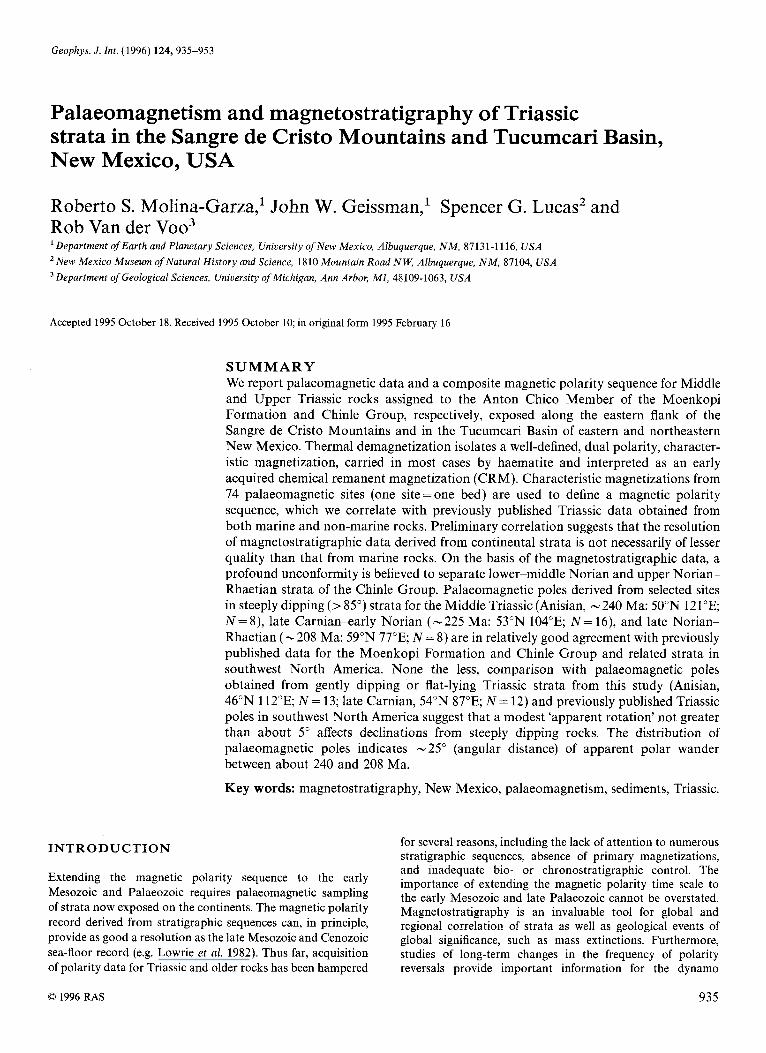
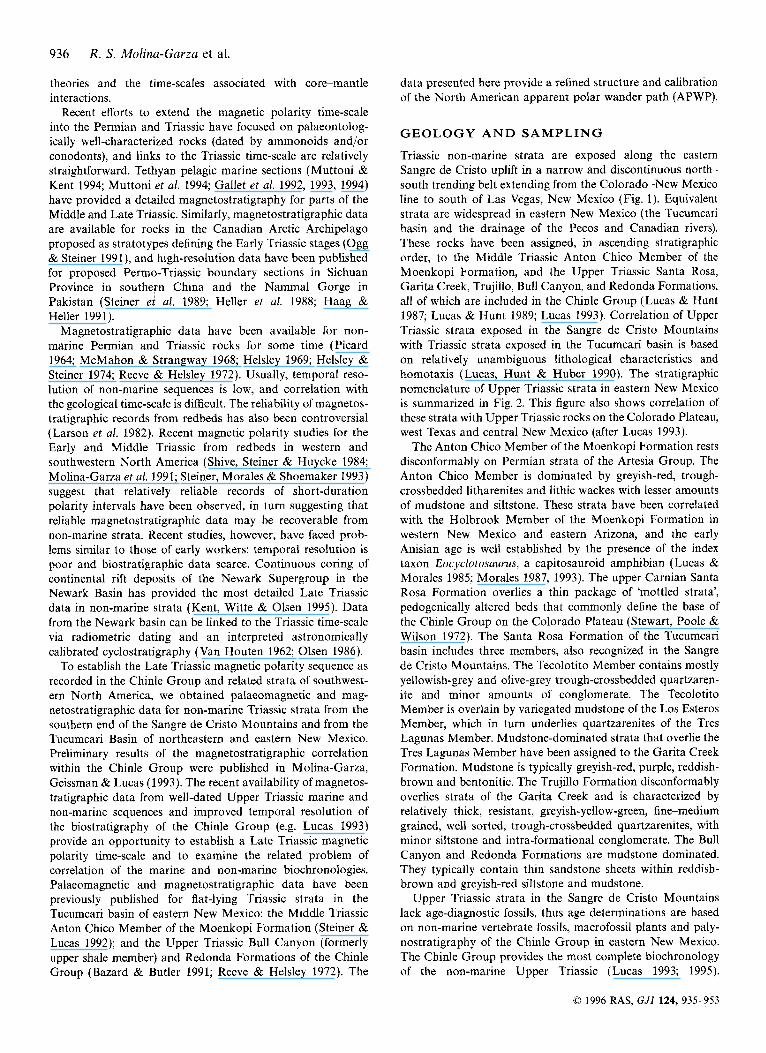
Triassic non-marine strata are exposed along the eastern Sangre de Cristo uplift in a narrow and discontinuous north- south trending belt extending from the Colorado-New Mexico line to south of Las Vegas, New Mexico (Fig. 1). Equivalent strata are widespread in eastern New Mexico (the Tucumcari basin and the drainage of the Pecos and Canadian rivers). These rocks have been assigned, in ascending stratigraphic order, to the Middle Triassic Anton Chico Member of the Moenkopi Formation, and the Upper Triassic Santa Rosa, Garita Creek, Trujillo, Bull Canyon, and Redonda Formations, all of which are included in the Chinle Group (Lucas & Hunt 1987; Lucas & Hunt 1989; Lucas 1993). Correlation of Upper Triassic strata exposed in the Sangre de Cristo Mountains with Triassic strata exposed in the Tucumcari basin is based on relatively unambiguous lithological characteristics and homotaxis (Lucas, Hunt & Huber 1990). The stratigraphic nomenclature of Upper Triassic strata in eastern New Mexico is summarized in Fig. 2. This figure also shows correlation of these strata with Upper Triassic rocks on the Colorado Plateau, west Texas and central New Mexico (after Lucas 1993).
The Anton Chico Member of the Moenkopi Formation rests disconformably on Permian strata of the Artesia Group. The Anton Chico Member is dominated by greyish-red, trough- crossbedded litharenites and lithic wackes with lesser amounts of mudstone and siltstone. These strata have been correlated with the Holbrook Member of the Moenkopi Formation in western New Mexico and eastern Arizona, and the early Anisian age is well established by the presence of the index taxon Eocyclotosaurus, a capitosauroid amphibian (Lucas & Morales 1985; Morales 1987, 1993). The upper Carnian Santa Rosa Formation overlies a thin package of ‘mottled strata’, pedogenically altered beds that commonly define the base of the Chinle Group on the Colorado Plateau (Stewart, Poole & Wilson 1972). The Santa Rosa Formation of the Tucumcari basin includes three members, also recognized in the Sangre de Cristo Mountains. The Tecolotito Member contains mostly yellowish-grey and olive-grey trough-crossbedded quartzaren- ite and minor amounts of conglomerate. The Tecolotito Member is overlain by variegated mudstone of the Los Esteros Member, which in turn underlies quartzarenites of the Tres Lagunas Member. Mudstone-dominated strata that overlie the Tres Lagunas Member have been assigned to the Garita Creek Formation. Mudstone is typically greyish-red, purple, reddish- brown and bentonitic. The Trujillo Formation disconformably overlies strata of the Garita Creek and is characterized by relatively thick, resistant, greyish-yellow-green, fine-medium grained, well sorted, trough-crossbedded quartzarenites, with minor siltstone and intra-formational conglomerate. The Bull Canyon and Redonda Formations are mudstone dominated. They typically contain thin sandstone sheets within reddish- brown and greyish-red siltstone and mudstone.
Upper Triassic strata in the Sangre de Cristo Mountains lack age-diagnostic fossils, thus age determinations are based on non-marine vertebrate fossils, macrofossil plants and paly- nostratigraphy of the Chinle Group in eastern New Mexico. The Chinle Group provides the most complete biochronology of the non-marine Upper Triassic (Lucas 1993; 1995).
0 1996 RAS, GJI 124, 935-953
Pulaeomugnetism and magnetostratigraphy 931
Figure 1. Simplified outcrop map of Triassic strata (stippled) in the Tucumcari basin and surrounding areas of eastern New Mexico. Sampling localities (stars) are (1) La Cueva, (2) San Sebastian Canyon, ( 3 ) Montezuma Gap and (4) Garita Creek.
Relatively good temporal resolution is based on a succession of four distinct tetrapod faunas (mostly phytosaurs and aeto- saurs) designated 'faunachrons' A to D by Lucas (1993) and named by Lucas & Hunt (1993; Fig. 2). A late Carnian age (Tuvalian) for the base of the Santa Rosa Formation (Otischalkian faunachron) is indicated by the primitive phyto- saur Paleorhinus (Hunt & Lucas 1991). The contact between the Santa Rosa and Garita Creek formations is conformable. The upper members of Santa Rosa Formation and the Garita Creek Formation are also late Carnian. Lucas (1993) assigns these strata to the Adamanian faunachron. They are included in the Dinophyton floral zone of Ash (1980) and correlated with the lower Petrified Forest Formation of the Colorado Plateau. The late Carnian-early Norian age of the Trujillo Formation is based on vertebrate fauna of the Revueltian faunachron (Lucas & Hunt 1989; Lucas 1993), fossil plants restricted to the Dinophyton zone of Ash (1980), and palyno- morphs belonging to the New Oxford-Lockatong palynozone of the Newark Supergroup (Cornet 1993). The Bull Canyon Formation (originally upper shale member of the Chinle Formation) conformably overlies the Trujillo beds and is also of Revueltian faunachron age. It contains a rich fossil-
vertebrate fauna assigned to the early Norian (Lucas 1990; Lucas & Hunt 1989). Age-equivalent strata in western New Mexico and eastern Arizona include the Painted Desert Member and Correo Sandstone of the Petrified Forest Formation. Dinosaur-rich faunas in the Redonda Formation, as well as more evolutionary advanced phytosaur fossils than those observed in the Bull Canyon Formation, suggest a late Norian-Rhaetian age (Apachean faunachron) for the Redonda Formation (Lucas 1990; Lucas & Hunt 1993). Two intra- Chinle Group unconformities separate upper Carnian-lower Norian strata, and early-middle Norian-late Norian-Rhaetian strata, respectively (Fig. 2).
26 palaeomagnetic sites were collected from the Anton Chico Member at localities in Montezuma Gap (35.56"N 105.27"W, along New Mexico Highway 65) and La Cueva (35.92"N 105.25"W; along New Mexico Highway 3; Fig. 1). At Montezuma Gap we also collected three sites from the upper beds of the Upper Permian (Guadalupian) Artesia Group. The Upper Triassic section was sampled at Montezuma Gap and San Sebastian Canyon (35.66"N 105.28"W; 34 sites approxi- mately 1.5 km north of Highway 65, and one site in the Jurassic Entrada Formation). The Garita Creek Formation was
0 1996 RAS, GJI 124, 935-953
938 R. S. Moliaa-Garza et al.
Stratigraphic nomenclature Chinle Group (after Lucas 1993).
C E N T R A L EASTERN WEST
PLATEAU TEXAS MEXICO N E W NEW F a u n a c h r o n COLORADO
M E X I C 0
Membr.
Figure 2. Simplified stratigraphic nomenclature and correlation of the Upper Triassic Chinle Group of southwestern North America.
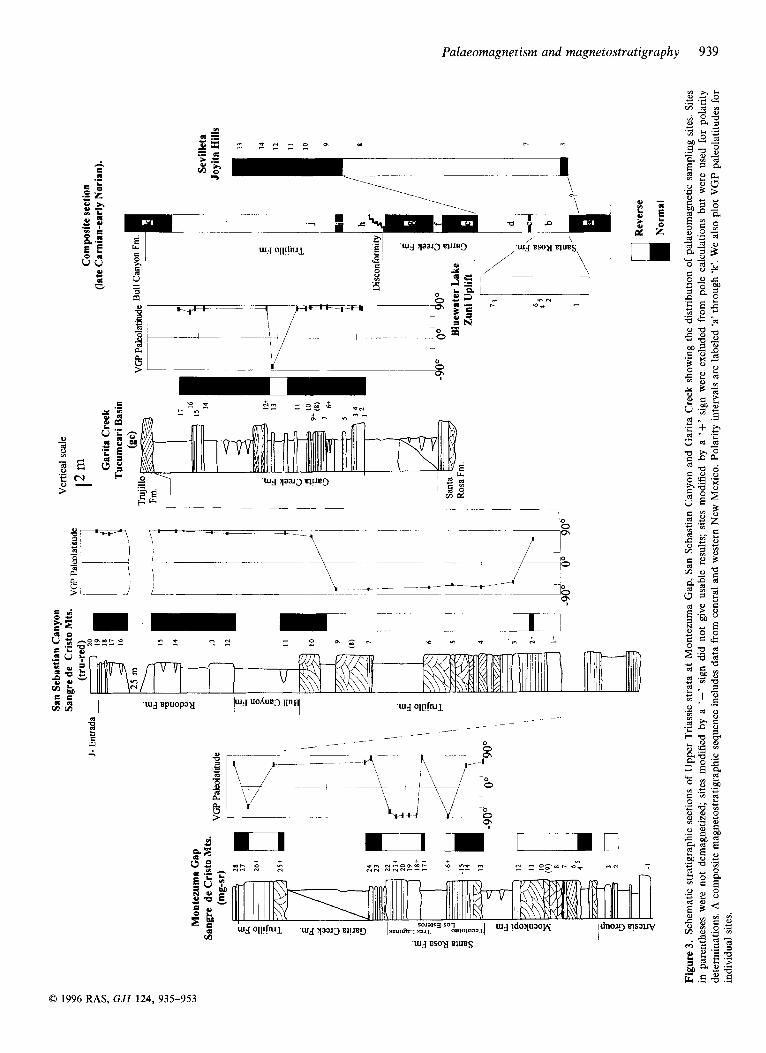
sampled at its type locality in the Tucumcari basin (35.29"N 104.40"W; 17 sites along New Mexico Highway 405). At Montezuma Gap and San Sebastian Canyon strata strike to the north and dip steeply (> 85"). Sites collected at La Cueva are from gently east-dipping Anton Chico strata (dips - 40"), whereas the Garita Creek Formation is horizontal at its type locality. A great majority of the sites were collected from individual sandstone or siltstone beds between a few and tens of centimetres in thickness. Sites at the base of the Trujillo Formation comprise samples collected transversely from as many as three thick (- 1 m) adjacent sandstone beds. Mudstone intervals were sparsely sampled because they are not suitable for drilling and are poorly exposed. Schematic stratigraphic sections with palaeomagnetic sites are illustrated in Fig. 3. The sections overlap and yield a near-complete stratigraphic record of the Triassic in this area. The largest stratigraphic gaps are within the Bull Canyon and Redonda Formations. Samples were drilled as standard 2.5 cm diameter cores and oriented using a clinometer and a magnetic compass; orientations were verified with a sun compass where possible. In the laboratory one or more 2.1 cm long specimens were cut from each sample.
PALAEOMAGNETIC ANALYSIS
The natural remanent magnetization (NRM) of the samples collected at Montezuma Gap was measured on a two-axis ScT cryogenic magnetometer at the University of Michigan; a three-axis 2G Enterprises cryogenic magnetometer at the University of New Mexico was used for the rest of the collection. Samples were subjected to progressive thermal or
alternating field (AF) demagnetization. Thermal demagnetiz- ation proved more capable in isolating the characteristic remanence, but a few specimens from selected sites were demagnetized using alternating fields. Thermal demagnetiz- ation of pilot samples (typically two per site) was carried out in up to 24 steps; abbreviated sequences of six to 12 steps were used in the rest of the samples. The vectorial composition of the NRM was interpreted from inspection of orthogonal demagnetization diagrams (Zijderveld 1967). Directions of magnetization components were calculated using principal component analysis (PCA) methods (Kirschvink 1980).
Samples are characterized by moderate magnetic moments per unit volume, of the order of to lo-' A m-'. Typical demagnetization diagrams are depicted in Figs 4 to 6. In most samples a south-southeast- or north-northwest-directed shal- low magnetization is isolated at temperatures above 600 "C. This magnetization is interpreted as the characteristic mag- netization (ChRM). A north-directed and moderately steep positive magnetization commonly overprints the ChRM. Results obtained from each formation are discussed in detail below.
Anton Chico Member
Most Anton Chico sites were collected in very fine-grained, light reddish-brown or purplish-brown, silty sandstone. Their behaviour upon thermal demagnetization is relatively straight- forward. A great majority of the samples exhibit one or two components of magnetization (Figs 4a and b). The first compo- nent is unblocked below about 550°C and comprises about
0 1996 RAS, GJI 124, 935-953
San
Seba
stia
n C
anyo
n Sa
ngre
de
Cri
sto
Mts
. (tr
u-re
d)
Ver
tical
scal
e
l2 G
arita
Cre
ek
Tuc
umca
ri B
asin
VG
P Pa
leol
attu
de
I1
J-
Ent
rada
C
ompo
site
sect
ion
(late
Car
nian
-ear
ly N
oria
n).
--- -
\ I
Mon
tezu
ma
Gap
Sa
ngre
de
Cri
sto
Mts
. (m
g-sr
)
Sevi
lleta
Jo
yita
Hill
s
13
14
12
II I9
10
GP
Paleo
latitu
de
IZt
13
E; Y U e!
Y In
V e
I /i I i
/’ i i
1 p
i 8
1 I
24
20
19
I8+
17
+ .;; y
13
-!
I i !
M
Blu
ewat
er L
ake
Zuni
Upl
ift
-9w
, Sa
nta
Rosa
Fm
73
465
(! 465 1 :o
6 J
I
Rev
erse
3 N
orm
al
Fig
ure
3. S
chem
atic
str
atig
raph
ic s
ectio
ns o
f U
pper
Tri
assi
c st
rata
at
Mon
tezu
ma
Gap
, Sa
n Se
bast
ian
Can
yon
and
Gar
ita
Cre
ek s
how
ing
the
dist
ribu
tion
of p
alae
omag
netic
sam
plin
g si
tes.
Site
s in
par
enth
eses
wer
e no
t de
mag
netiz
ed; s
ites
mod
ifie
d by
a ‘
-’
sign
did
not
giv
e us
able
res
ults
; site
s m
odif
ied
by a
‘+’ s
ign
wer
e ex
clud
ed f
rom
pol
e ca
lcul
atio
ns b
ut w
ere
used
for
pol
arity
de
term
inat
ions
. A
com
posi
te m
agne
tost
ratig
raph
ic s
eque
nce
incl
udes
dat
a fr
om c
entr
al a
nd w
este
rn N
ew M
exic
o. P
olar
ity i
nter
vals
are
labe
led
‘a’ t
hrou
gh ‘
k‘. W
e al
so p
lot
VG
P pa
leol
atitu
des
for
indi
vidu
al s
ites.
940 R. S. Molina-Garza et al.
Mo=237mA/m
1cll.A (b) me053
Mod.6mA/m pu rm
N N
.c) Ic3.A (d)
N
MOa.3mA
lc3.E-lc14.F W
1; lc3e
M0=3.4mA/rn; Ic14f
22jN
- N
r155A
sr19.B
U P N
srl3.E
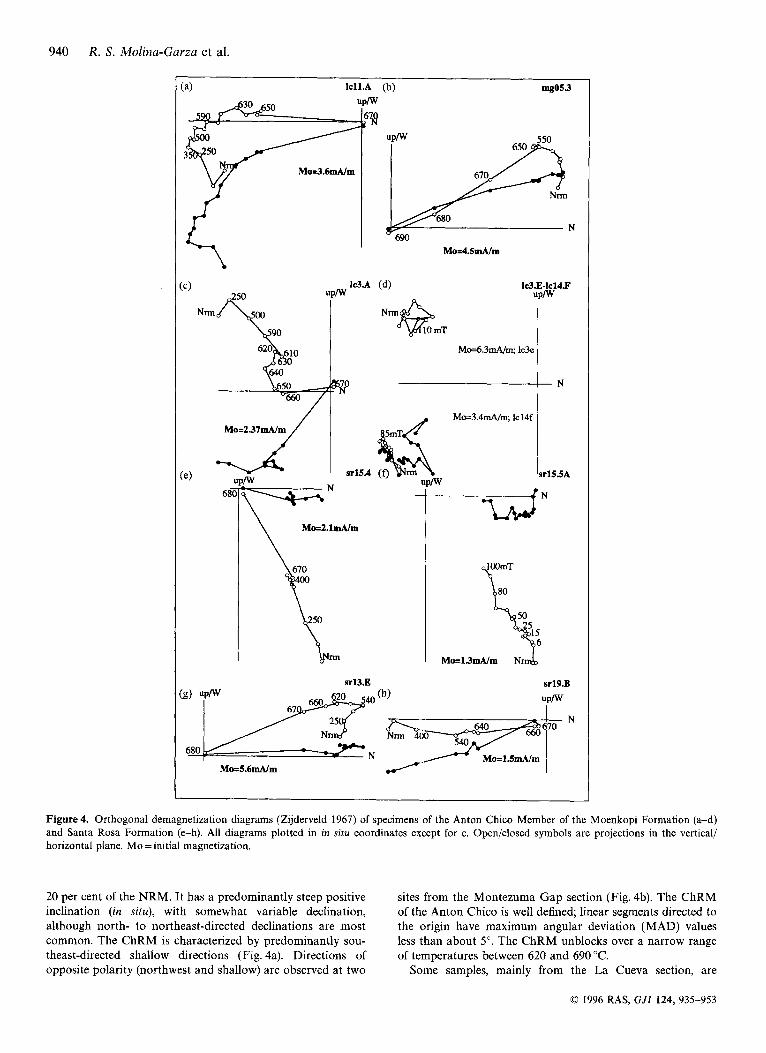
Figure 4. Orthogonal demagnetization diagrams (Zijderveld 1967) of specimens of the Anton Chico Member of the Moenkopi Formation (a-d) and Santa Rosa Formation (e-h). All diagrams plotted in in situ coordinates except for c. Open/closed symbols are projections in the vertical/ horizontal plane. Mo = initial magnetization.
20 per cent of the NRM. It has a predominantly steep positive sites from the Montezuma Gap section (Fig. 4b). The ChRM inclination (in situ), with somewhat variable declination, of the Anton Chico is well defined; linear segments directed to although north- to northeast-directed declinations are most the origin have maximum angular deviation (MAD) values common. The ChRM is characterized by predominantly sou- less than about 5". The ChRM unblocks over a narrow range theast-directed shallow directions (Fig. 4a). Directions of of temperatures between 620 and 690 "C. opposite polarity (northwest and shallow) are observed at two Some samples, mainly from the La Cueva section, are
0 1996 RAS, G J I 124, 935-953
Palaeomagnetism and magnetostratigraphy 941
[c) gc9.A
FN (e) tru3.A
UD/W
tN7.A UD/W
\ M o = 4 . l d r n
(t: w 1 N
bcl1.C
N
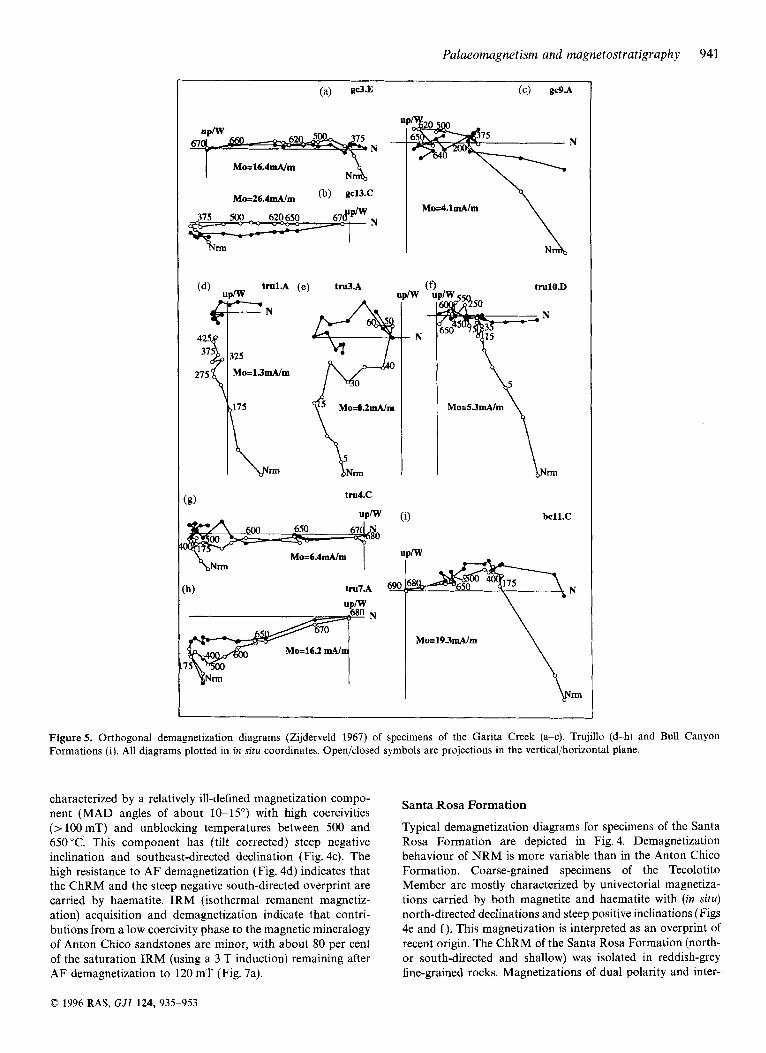
Figure 5. Orthogonal demagnetization diagrams (Zijderveld 1967) of specimens of the Garita Creek (a-c), Trujillo (d-h) and Bull Canyon Formations (i). All diagrams plotted in in sztu coordinates. Open/closed symbols are projections in the vertical/horizontal plane.
characterized by a relatively ill-defined magnetization compo- nent (MAD angles of about 10-15') with high coercivities (> 100 mT) and unblocking temperatures between 500 and 650 ''C; This component has (tilt corrected) steep negative inclination and southeast-directed declination (Fig. 4c). The high resistance to AF demagnetization (Fig. 4d) indicates that the ChRM and the steep negative south-directed overprint are carried by haematite. IRM (isothermal remanent magnetiz- ation) acquisition and demagnetization indicate that contri- butions from a low coercivity phase to the magnetic mineralogy of Anton Chico sandstones are minor, with about 80 per cent of the saturation IRM (using a 3 T induction) remaining after AF demagnetization to 120 mT (Fig. 7a).
Santa Rosa Formation
Typical demagnetization diagrams for specimens of the Santa Rosa Formation are depicted in Fig. 4. Demagnetization behaviour of NRM is more variable than in the Anton Chico Formation. Coarse-grained specimens of the Tecolotito Member are mostly characterized by univectorial magnetiza- tions carried by both magnetite and haematite with ( in situ) north-directed declinations and steep positive inclinations (Figs 4e and f ) . This magnetization is interpreted as an overprint of recent origin. The ChRM of the Santa Rosa Formation (north- or south-directed and shallow) was isolated in reddish-grey fine-grained rocks. Magnetizations of dual polarity and inter-
0 1996 RAS, G J I 124, 935-953
942 R. S . MuEina-Garza et al.
(a) red13.G (b) red17.E
Mo=632mA/m
redl8.B (d) red19.B
Nm-95mT
N L3 Mo=4.7mA/m
te) ent2O.A
ent2O.lB k
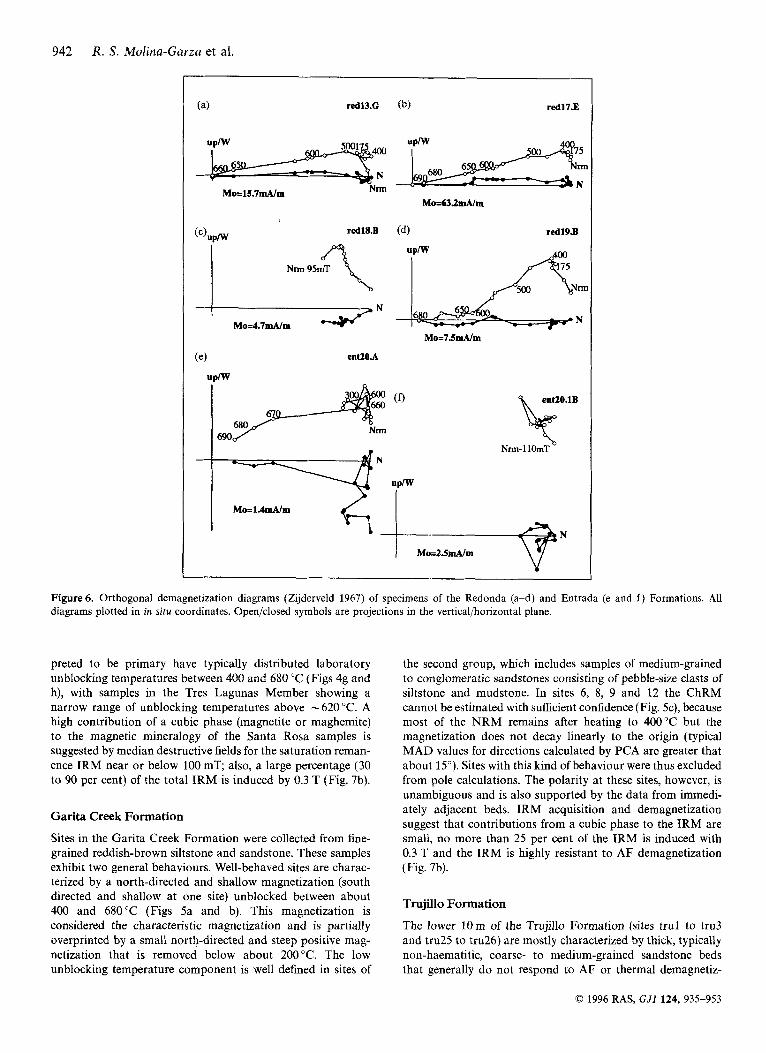
Figure 6. Orthogonal demagnetization diagrams (Zijderveld 1967) of specimens of the Redonda (a-d) and Entrada (e and f ) Formations. All diagrams plotted in in situ coordinates. Open/closed symbols are projections in the vertical/horizontal plane.
preted to be primary have typically distributed laboratory unblocking temperatures between 400 and 680 "C (Figs 4g and h), with samples in the Tres Lagunas Member showing a narrow range of unblocking temperatures above - 620 "C. A high contribution of a cubic phase (magnetite or maghemite) to the magnetic mineralogy of the Santa Rosa samples is suggested by median destructive fields for the saturation reman- ence IRM near or below 100 mT; also, a large percentage (30 to 90 per cent) of the total IRM is induced by 0.3 T (Fig. 7b).
Garita Creek Formation
Sites in the Garita Creek Formation were collected from fine- grained reddish-brown siltstone and sandstone. These samples exhibit two general behaviours. Well-behaved sites are charac- terized by a north-directed and shallow magnetization (south directed and shallow at one site) unblocked between about 400 and 680°C (Figs 5a and b). This magnetization is considered the characteristic magnetization and is partially overprinted by a small north-directed and steep positive mag- netization that is removed below about 200 "C. The low unblocking temperature component is well defined in sites of
the second group, which includes samples of medium-grained to conglomeratic sandstones consisting of pebble-size clasts of siltstone and mudstone. In sites 6, 8, 9 and 12 the ChRM cannot be estimated with sufficient confidence (Fig. 5c), because most of the NRM remains after heating to 400°C but the magnetization does not decay linearly to the origin (typical MAD values for directions calculated by PCA are greater that about 15"). Sites with this kind of behaviour were thus excluded from pole calculations. The polarity at these sites, however, is unambiguous and is also supported by the data from immedi- ately adjacent beds. IRM acquisition and demagnetization suggest that contributions from a cubic phase to the IRM are small, no more than 25 per cent of the IRM is induced with 0.3 T and the IRM is highly resistant to A F demagnetization (Fig. 7b).
Trujillo Formation
The lower 10m of the Trujillo Formation (sites trul to tru3 and tru25 to tru26) are mostly characterized by thick, typically non-haematitic, coarse- to medium-grained sandstone beds that generally do not respond to AF or thermal demagnetiz-
0 1996 RAS, GJl 124, 935-953

Palaeomugnetism and magnetostratigraphy 943
IRM acquis. &d # .Gf;
0 4
Induction (mT)
10 103 104
0
Induction (mT)
Figure 7. Normalized IRM acquisition and AF demagnetization of the saturation remanence IRM for selected specimens.
ation. Some samples are characterized by a low-unblocking- temperature component in the direction of the recent dipole field (Fig. 5d); demagnetization trajectories of those samples typically bypass the origin, indicating the presence of more than one component. Demagnetization trajectories hint at the fact that the higher-unblocking-temperature magnetization remaining during progressive demagnetization is south to southeast directed and thus that the samples are reversely magnetized. The polarity was not solely interpreted from demagnetization trajectories, as some specimens in this interval yield southeast magnetizations (with large MAD values but unambiguous polarity; Fig. 5e). Demagnetization trajectories of some specimens from sites tru25 and tru2 indicate character- istic magnetizations of (questionable) normal polarity. Other sites higher in the section provide excellent estimates of the ChRM of this unit, with well-defined, high-unblocking- temperature and shallow magnetizations that decay to the origin between 500 and 680 "C (Figs 5g and h). Typically, this is overprinted by a steep magnetization removed with AF (Fig. 5f). The large contribution of a cubic phase to the magnetic mineralogy of the Trujillo Formation is evident from IRM experiments (Fig. 7c). This observation, combined with the relatively low coercivities observed (Fig. 5g), suggests that prominent north-directed steep positive overprint at sites trulO and bc l l is carried by magnetite or maghemite.
Redonda Formation
Samples from the Redonda Formation yield generally straight- forward demagnetization results, although the remanence is generally multi-vectorial. The ChRM is in all cases north directed and shallow, unblocking between about 500 and
690 "C (Figs 6a and b). Two distinct magnetization components that are different from the recent dipole field are superimposed on the ChRM, and are only revealed during thermal demag- netization. Some specimens from sites redl3 and redl5 near the base of the formation are characterized by an ill-defined and small magnetization component, generally removed between 200 and 400 "C (Fig. 6a), which has south-southwest- directed declinations and shallow inclinations. It is unclear whether this magnetization reflects recording of a reverse polarity field soon after the high-unblocking-temperature mag- netization was locked in, or whether it reflects partial overprint- ing at a much later time. The mean derived from all samples containing this magnetization is poorly defined and not statisti- cally different from the ChRM. Specimens from sites 17 to 19, all within the uppermost 5 m of the Redonda Formation, are characterized by an intermediate unblocking temperature over- print (Fig. 6d), removed between 400 and 600 "C with (in situ) moderately steep negative inclinations and north-directed dec- lination. Separation of this overprint from the ChRM is generally straightforward. One site collected in the Middle Jurassic (Callovian) Entrada Formation immediately overlying the Redonda Formation gives a high-unblocking-temperature (and high-coercivity) magnetization indistinguishable from the intermediate temperature overprint in the uppermost 5 m of the Redonda Formation (Fig. 6e). Because of their similarity to the ChRM of the Entrada Formation, we interpret inter- mediate-temperature magnetizations in the Redonda Formation as secondary, with an age identical to that of the Jurassic sandstones. High resistance to AF demagnetization suggest that the ChRM and the intermediate temperature overprint observed in samples of the Redonda Formation are carried by haematite.
0 1996 RAS, GJI 124,935-953
944 R. S . Molina-Garza et al.
ROCK MAGNETISM AND IDENTIFICATION O F MAGNETIC CARRIERS
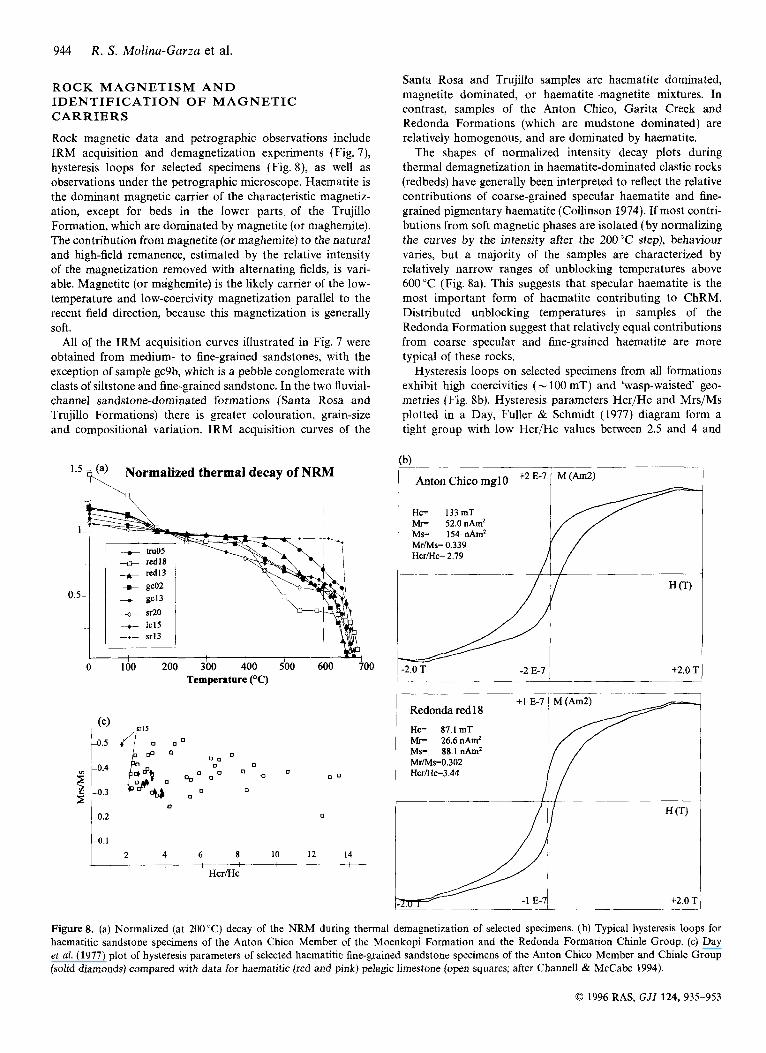
Rock magnetic data and petrographic observations include IRM acquisition and demagnetization experiments (Fig. 7), hysteresis loops for selected specimens (Fig. S), as well as observations under the petrographic microscope. Haematite is the dominant magnetic carrier of the characteristic magnetiz- ation, except for beds in the lower parts of the Trujillo Formation, which are dominated by magnetite (or maghemite). The contribution from magnetite (or maghemite) to the natural and high-field remanence, estimated by the relative intensity of the magnetization removed with alternating fields, is vari- able. Magnetite (or maghemite) is the likely carrier of the low- temperature and low-coercivity magnetization parallel to the recent field direction, because this magnetization is generally soft.
All of the IRM acquisition curves illustrated in Fig. 7 were obtained from medium- to fine-grained sandstones, with the exception of sample gc9b, which is a pebble conglomerate with clasts of siltstone and fine-grained sandstone. In the two fluvial- channel sandstone-dominated formations (Santa Rosa and Trujillo Formations) there is greater colouration, grain-size and compositional variation. IRM acquisition curves of the
(a) Normalized thermal decay of NRM bh 1
0.5
0 I00 200 300 400 500 600 700 Temperature ("C)
1-0.2 0 1''' 2; 4 6 8 10 12 14
HcrEIc
Santa Rosa and Trujillo samples are haematite dominated, magnetite dominated, or haematite-magnetite mixtures. In contrast, samples of the Anton Chico, Garita Creek and Redonda Formations (which are mudstone dominated) are relatively homogenous, and are dominated by haematite.
The shapes of normalized intensity decay plots during thermal demagnetization in haematite-dominated clastic rocks (redbeds) have generally been interpreted to reflect the relative contributions of coarse-grained specular haematite and fine- grained pigmentary haematite (Collinson 1974). If most contri- butions from soft magnetic phases are isolated (by normalizing the curves by the intensity after the 200°C step), behaviour varies, but a majority of the samples are characterized by relatively narrow ranges of unblocking temperatures above 600 "C (Fig. 8a). This suggests that specular haematite is the most important form of haematite contributing to ChRM. Distributed unblocking temperatures in samples of the Redonda Formation suggest that relatively equal contributions from coarse specular and fine-grained haematite are more typical of these rocks.
Hysteresis loops on selected specimens from all formations exhibit high coercivities (- 100 mT) and 'wasp-waisted' geo- metries (Fig. 8b). Hysteresis parameters Hcr/Hc and Mrs/Ms plotted in a Day, Fuller & Schmidt (1977) diagram form a tight group with low Hcr/Hc values between 2.5 and 4 and
Anton Chico mglO
Hc= 133mT MI= 52.0 nAm2 Ms= 154 nAm' Mr/Ms= 0.339 Hcr/Hc= 2.79
I +- H cr)
1 -2.0 T -2 E-7 1 +2.0 1
Figure 8. (a) Normalized (at 200°C) decay of the NRM during thermal demagnetization of selected specimens. (b) Typical hysteresis loops for haematitic sandstone specimens of the Anton Chico Member of the Moenkopi Formation and the Redonda Formation Chinle Group. (c) Day et al. (1977) plot of hysteresis parameters of selected haematitic fine-grained sandstone specimens of the Anton Chico Member and Chinle Group (solid diamonds) compared with data for haematitic (red and pink) pelagic limestone (open squares; after Channel1 & McCabe 1994).
0 1996 RAS, G J I 124, 935-953
Palaeomagnetism and magnetostratigraphy 945
high Mrs/Ms values of about 0.3 (Fig. 8c). Two outliers are specimens from site sr15, whose demagnetization character- istics are different than those of all other sites. We compare these values with those from red and pink Tethyan pelagic limestone, whose magnetization is typically carried by haema- tite (Channel1 & McCabe 1994). Pelagic limestones (Fig. 8) are characterized by a large spread in Hcr/Hc values, with values as high as 35. The difference between the two popu- lations suggests a fundamental difference between the charac- teristics of haematite in pelagic limestone and redbeds. Pelagic limestones are typically devoid of coarse-grained specular haematite and have lower and more distributed unblocking temperature spectra than redbeds.
INTERPRETATION
The North American APWP
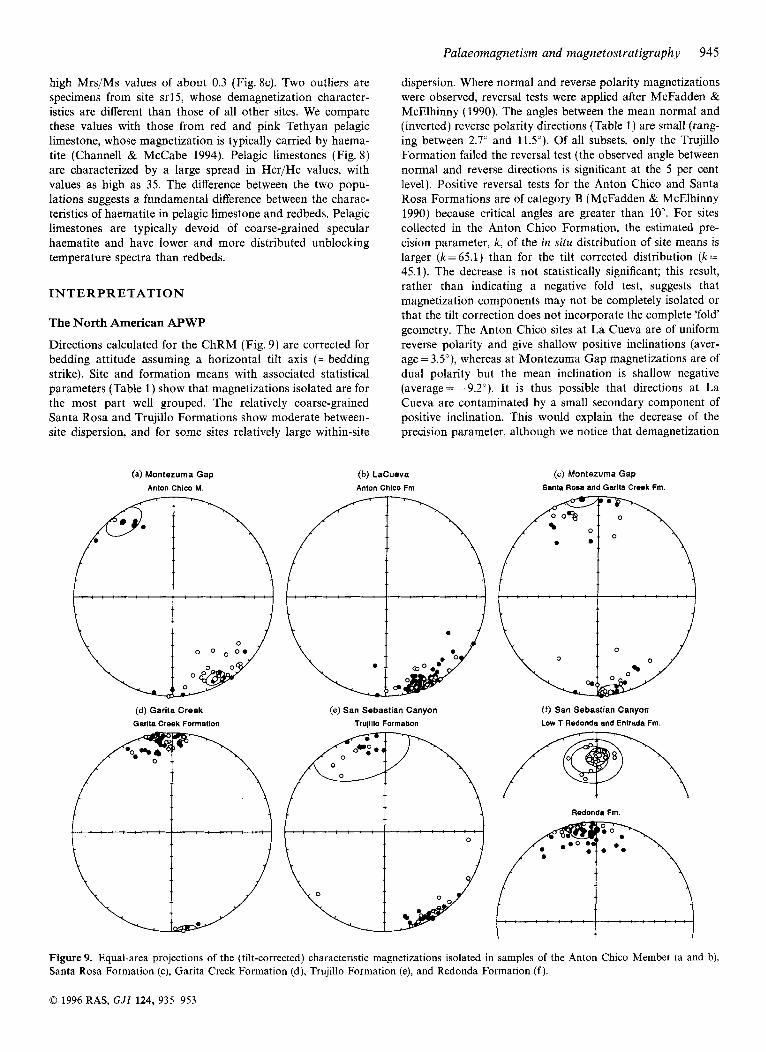
Directions calculated for the ChRM (Fig. 9) are corrected for bedding attitude assuming a horizontal tilt axis (=bedding strike). Site and formation means with associated statistical parameters (Table 1) show that magnetizations isolated are for the most part well grouped. The relatively coarse-grained Santa Rosa and Trujillo Formations show moderate between- site dispersion, and for some sites relatively large within-site
(a) Montezuma Gap
Anton Chico M.
(d) Garila Creek Garita Creek Formation
dispersion. Where normal and reverse polarity magnetizations were observed, reversal tests were applied after McFadden & McElhinny (1990). The angles between the mean normal and (inverted) reverse polarity directions (Table 11 are small (rang- ing between 2.7" and 11.5"). Of all subsets, only the Trujillo Formation failed the reversal test (the observed angle between normal and reverse directions is significant at the 5 per cent level). Positive reversal tests for the Anton Chico and Santa Rosa Formations are of category B (McFadden & McElhinny 1990) because critical angles are greater than 10". For sites collected in the Anton Chico Formation, the estimated pre- cision parameter, k, of the in situ distribution of site means is larger ( k = 65.1) than for the tilt corrected distribution ( k = 45.1). The decrease is not statistically significant; this result, rather than indicating a negative fold test, suggests that magnetization components may not be completely isolated or that the tilt correction does not incorporate the complete 'fold' geometry. The Anton Chico sites at La Cueva are of uniform reverse polarity and give shallow positive inclinations (aver- age = 3.5"), whereas at Montezuma Gap magnetizations are of dual polarity but the mean inclination is shallow negative (average= -9.2"). It is thus possible that directions at La Cueva are contaminated by a small secondary component of positive inclination. This would explain the decrease of the precision parameter, although we notice that demagnetization
(b) LaCueva
Anton Chico Fm
(c) Montezuma Gap
Sanfa Rosa and Garita Creek Fm.
(e) San Sebastian Canyon Trujillo Formation
0 San Sebastian Canyon Low T Redonda and Entrada Frn
Redonda Fm.
Figure 9. Equal-area projections of the (tilt-corrected) characteristic magnetizations isolated in samples of the Anton Chico Member (a and b), Santa Rosa Formation (c), Garita Creek Formation (d), Trujillo Formation (e), and Redonda Formation ( f ) .
0 1996 RAS, GJI 124, 935-953

946 R. S. Molina-Garza et al.
Table 1. Palaeomagnetic data and statistical parameters. Sangre de Cristo uplift and Tucumcari basin, eastern New Mexico. Dis-Iis (Dtc- Itc) = Site mean declination and inclination in geographic (tilt corrected) coordinates. N/n =number of samples (sites) demagnetized/used for site mean calculation. * Indicates sites excluded from the final calculation according to the selection criteria n c 3 , k c 15, and a95 > 20. Mean poles are the Fisherian mean of site VGPs. 7, y* = reversal test parameters after McFadden & McElhinny (1990).
Site D(')is I(') is D(") tc I(')lc Mn k u95C) VGP Site D(O)is I(O)is D(") lc I ( O ) IC M n k a95C) VCP 'N "E "N 'E
Garit8 Creek Pm. - Garita Creek (late Carnian) Bernnl (Late Permian) mg2 1642 3 8 5 1364 -155 5\5 2100 mg3 1690 30 3 I44 I - I 0 4 5\5 4 3 0 M a n 166.7 34.1 140.3 -13.0 IVsnlnpler Anton Chico Fm. -Mootnuma Gap (Mddle Triassic) mg4 161 5 24 5 3244 7 2 5\5 n-r mg5 347 1 -270 331 4 13 3 5\5 mgb I580 2 4 3 1562 -230 5\5 mg7 1678 2 8 0 I S I S -145 5\5 mg8 1693 2 1 0 1541 - 8 4 7\7 mglO 163 1 2 8 5 1387 5 3 5\5 mgl l 1700 2 7 6 1435 - 2 7 5\5 mgl2 1725 - 8 2 179 I 2 I 4W normal 3264 9 7 7 reverse 1523 - 8 6 33 Mean 166.2 21.8 152 3 -9.2 8\8 Anton Chico Fm. -Ln Cuevn (Mddle Tnamc) 1~01. 1545 2 3 6 1459 3 0 4\4 lc02 1598 23 8 1497 6 1 3\3 lcO3. I51 6 I6 I 1480 - 4 6 3\3 Ic04. 174 5 9 3 1698 3 6 5\5 lc05 1564 23 9 1472 4 3 5\5 lc06 167 1 1 4 2 161 I 2 8 5\5 lc07 1618 2 4 6 1507 7 8 5\5
lc09 1720 194 1614 9 8 5\5 lCl0 1630 2 0 9 1539 5 6 4\4 Icl I 1655 1 5 7 1589 3 0 3\3 Icl2' 1563 23 1 1476 3 6 5\5 lc13 1601 114 1574 - 3 6 5\5 lc14 1661 1 1 5 1620 0 1 5\5 lc15 I552 2 8 0 1438 7 0 5\5 lc16 1702 134 1639 4 1 5\5 Icl7 1539 1 1 5 I525 - 7 1 5\5 Mean 162.7 18.5 155 1 3 5 13\17 Sanla Rosa Fm.-Montuuma-Gap (late Carnisn) sr13 I0 -109 343 7 -5 1 5\3 sr14 334 5 -242 333 I 24 5 5\5 sr16* 1798 - 2 6 1773 5 0 5\1 ~ 1 7 . 3527 6 5 3583 - 1 7 5\3 ~118' I54 1 -05 1760 I 8 I 5\5 sr19 1643 0 I 171 6 - 5 5 4\4 sr2O 1686 - 1 9 1722 0 8 4\4 sr21' 1695 - 7 9 1777 I 8 5\5 rr22 1727 5 1 1643 I I 4\4 Ganla Crcek Fm. - Montuuma Gnp (late Camisn) gc23 3527 6 8 3557 -46 5\5 gc24 147 8 I 3509 -259 5\5
normal 3484 -2 5 21 reverse 351 4 -5 I 23 Memn 352 8 -3.4 347.5 -09 7\12
lCO8 1628 2 0 9 1537 5 5 515
24 5 34 0 48 0 72 0 12 0 28 5 52 0
241 0 25 0 I6 0 31.6
I3 7 41 6 I I 8 6 3
301 4 273 6 61 2
250 2 427 3 147 2 81 3 124 26 6 133 6 22 0 375 8 30 4 108 5
23 8 23 2
I I 0 9 0
75 5 62 0 8 5 18 5
20 0 29 0 10 2 I 5 6 23.8
5 3 1 1 8
I S 8 13 5 I3 4 9 1 I7 9 I4 6 10 7 5 9 123 6 4 10 0
2s 8 19 4 37 6 33 0 4 4 4 6 9 9 4 8 3 7 7 6 13 8 22 6 I S I 6 6 I6 7 4 0 14 I 4.0
25 8 16 I
39 1 27 0 106 I I 7 27 8 21 9
17 5 14 5 10 5 7 9 12.6
41 6 1407 gcol 353 9 -87 4 5 2 1308 gc02 3569 -109 43.5 135.8 8~03-W 3600 -I I 3
gc05 351 I -I2 I 4 4 2 1288 gc06' 3579 6 6 5 1 0 1238 gc07 5 2 1 3 58 I 1230 5 1 8 1240 5 0 6 118 1 3 9 6 1336 41 9 1277 5 5 5 7 6 3
y 5 9 y*=146
50.2
40 9 41 8 45 2 5 1 I 41 2 48 7 41 7 44 2 45 6 44 3 47 7 41 7 50 0 50 3 38 1 49 2 48 9 45.8
48 9 56 8 51 9 53 6 63 5 56 3 54 I 53 5 51 0
51 9 40 0
121.0
122 6 1173 123 5 91 I 120 7 104 2 1156 1129 101 8 1126 107 I I20 6 I l l 4 103 7 123 2 99 8 1193 111.9
100 0 128 3 79 I 77 6 83 6 90 0 88 I 78 6 100 2
81 7 8 6 3
y=4.0 y.=12 7
52.1 95.5
diagrams of Anton Chico samples show nearly linear trajector- ies to the origin above 630°C (Fig. 4a). For late Carnian and early Norian sites the precision parameter remains basically unchanged after tilt correction.
Palaeomagnetic poles were calculated from site virtual geo- magnetic poles (VGPs) for the Middle Triassic, late Carnian- early Norian, and late Norian. Sites with poorly defined means ( k < 15; n<3; and a95>20") were excluded. A total of 11 sites were excluded from mean pole calculations using this criterion. Sitesmgl, sr15 and trul did not give usable results; sites gd3-04 and tru27-28 were collected from the same layers and were combined in the final calculations.
The mean Middle Triassic, mid-Late Triassic, and late Late Triassic palaeomagnetic poles from the Sangre de Cristo Mountains (Table 2, Fig. 10) are statistically distinct from one another, and they reproduce the main features of the North American Triassic APWP. The poles are spread along an
6\6 55 6 5\5 143 0 8\8 2376 5\5 524 5\5 142 5\5 266 9
p09* 3 0 5 9 4\4 12 2 g c l 0 3509 1 I 5\5 190 @ I I 3558 120 5\5 36 7 gc12' 3547 126 4\6 4 9 gc13 171 4 0 I 5\5 156 5 ~ c l 4 3526 6 8 4\4 42 3 gc15 3499 -08 6\6 152 8 gc16 342 5 120 616 64 1 gc17 351 8 7 5 4\4 2196 normal 3539 - I 0 59 3 2 5 reverse 1714 0 1 5 1565 Mean 353 5 -0.3 12\17 5 9 9 Trujillo Formation-Montuuma Cap (early Norian) tru25' 3364 142 3356 -15 I 7l3 8 8 tm26* 1564 3 5 3 1464 3 5 6U 1 ~ 2 7 2 8 3343 -195 3423 2 9 5 IOU 2 6 8 Trujillo Formation-San Sebastian Canyon (early Nonan) 1 ~ 2 ' 3406 -209 3376 8 8 7U rru3 1668 3 5 9 141 7 -123 6U 6 3 2 lm4 1774 1 0 8 1572 6 9 5\3 I07 I IN5 1720 1 5 7 I53 1 1 0 5\5 53 1 tru6 1708 1 2 7 1562 0 2 414 9 4 3 11u7 1717 158 1620 - 7 2 5\5 4 5 5 "9 1726 225 1642 -149 4\4 1132 l W l 0 143 -197 3447 5 5 4\4 193 Bull Canyon Formstion-Snn Sebastian Canyon (early Norian) bcl I 348 3 -13 I 3543 185 4\4 33 6 normal 3448 2 5 16 169 reverse 1534 0 6 2 6 5 2 4 Mffln 3394 7 7 9\14 29 1 Redonda Formation-San Sebsstian Canyon (late Nonsn) red12 3475 6 5 3563 1 4 0 4\4 1348 red13 3553 1 0 8 3510 7 0 6\6 6 2 1 redl4 3557 0 8 2 5 5 1 5\5 5 9 7 red15 3516 -51 3572 100 9 5 1246 red16 3556 2 4 3594 5 7 5\5 3 5 0 redl7 3336 - 0 2 5 3 27 1 4\4 50 I
red I9 9 0 - 1 1 9 3589 3 I 9 5 5 8 4 Mean 359 1 7 9 8\8 5 4 7 Redonds Formation-San Sebsstian Cmnyon (low Temperature) red17 3544 -278 3448 188 5\5 36 I red I 8 2 I -23 8 3487 II 8 6\7 9 6 5 redl9 3593 -273 3453 145 5\5 1225 Entrada Formalion (lower Middle Jurassic) en120 357 I 2 8 8 343 7 167 4\4 20 2 Mean 358.3 -27.0 3456 1 5 4 4\4 491 4
red I8 III 2 8 2 3 - 8 8 n 7 3 0 8
9 1 4 9 9 851 6 4 49 1 SO3 3 6 4 9 0 756 1 0 7 4 7 8 888 2 0 6 580 796 4 7 5 5 0 665 275 575 700 1 8 0 542 913 1 2 8 6 0 5 841 4 6 6 6 0 7 864 6 I 53 8 9 0 2 143 574 8 9 4 5 4 53 I 9 2 6 8 4 566 1085 6 1 5 7 6 910 3 3 y=2 7 6 1 y*=6 6 5.1 54.1 86 7
44 3 41 0 1076 4 4 0 1250
2 4 3 6 4 7 1179
526 1134 156 443 1341 120 4 5 4 1082 106 460 1154 9 5 4 7 9 1118
8 7 586 1059 1 7 8 492 985
II 5 540 1064
16 I 63 3 8 9 5 9 2 y=llX 4 0 y*=9 9 9.7 53.3 110.6
7 9 6 1 2 824 8 I 568 91 3 100 568 702 6 9 593 802 13 1 5 7 2 758 13 I 6 8 2 608 11 I 499 71 2 10 I 5 5 9 7 6 7 7.6 58.5 76.5
129 6 0 5 1064 6 9 585 9 6 7 6 9 587 1037
21 0 59 I 1074 4 1 59.3 103.5
approximately east-west-trending arc of about 25" length. Each of the VGP distributions is typically elliptical and elongate along the trend of the APWP (Fig. 10, Table 2). To assess the uncertainties introduced by the tectonic correction, data from steeply dipping strata were compared with results from similar age but gently dipping or flat-lying strata. If the tilt axis is not horizontal, a systematic bias will affect the palaeomagnetic declinations. For the geometry of the tilt axis and directions of magnetization at Montezuma Gap and San Sebastian Canyon, a tilt axis inclined by about 5" will affect the declination by about the same amount.
A comparison of palaeomagnetic directions from steeply dipping strata and horizontal or gently dipping strata (below) suggests that a small, though appreciable, apparent tectonic rotation of less than 5" in an anticlockwise sense may affect declinations. The small number of samples collected from Upper Permian strata do not allow for a tectonic interpret-
0 1996 RAS, GJI 124, 935-953
Palaeomagnetism and magnetostratigraphy 947
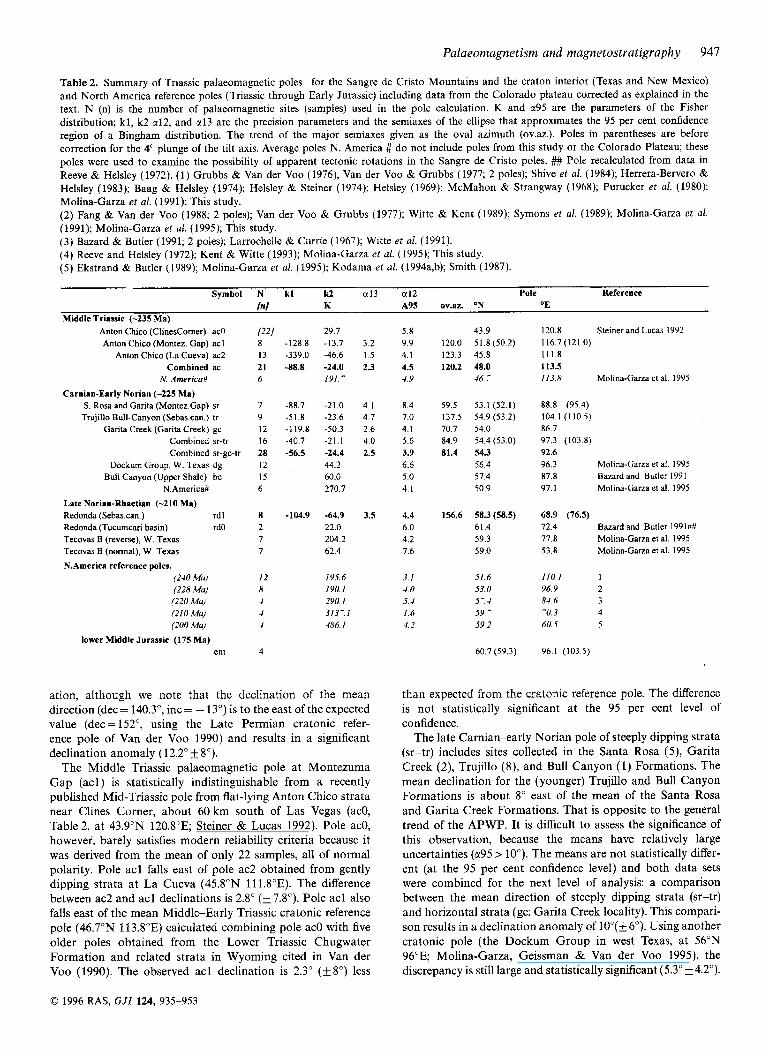
Table 2. Summary of Triassic palaeomagnetic poles for the Sangre de Cristo Mountains and the craton interior (Texas and New Mexico) and North America reference poles (Triassic through Early Jurassic) including data from the Colorado plateau corrected as explained in the text. N (n) is the number of palaeomagnetic sites (samples) used in the pole calculation. K and a95 are the parameters of the Fisher distribution; k l , k2 a12, and a13 are the precision parameters and the semiaxes of the ellipse that approximates the 95 per cent confidence region of a Bingham distribution. The trend of the major semiaxes given as the oval azimuth (ov.az.). Poles in parentheses are before correction for the 4" plunge of the tilt axis. Average poles N. America # do not include poles from this study or the Colorado Plateau; these poles were used to examine the possibility of apparent tectonic rotations in the Sangre de Cristo poles. ## Pole recalculated from data in Reeve & Helsley (1972). ( 1 ) Grubbs & Van der Voo (1976), Van der Voo & Grubbs (1977; 2 poles); Shive et al. (1984); Herrera-Bervero & Helsley (1983); Baag & Helsley (1974); Helsley & Steiner (1974); Helsley (1969); McMahon & Strangway (1968); Purucker et al. (1980); Molina-Garza et al. (1991); This study. (2) Fang & Van der Voo (1988; 2 poles); Van der Voo & Grubbs (1977); Witte & Kent (1989); Symons et al. (1989); Molina-Garza et al. (1991); Molina-Garza et al. (1995); This study. (3) Bazard & Butler (1991; 2 poles); Larrochelle & Currie (1967); Witte et al. (1991). (4) Reeve and Helsley (1972); Kent & Witte (1993); Molina-Garza et al. (1995); This study. (5) Ekstrand & Butler (1989); Molina-Garza et al. (1995); Kodama et al. (1994a,b); Smith (1987).
Symbol N kl k2 a13 a12 Pole Reference
Anton Chico (Clinescorner) acO Anton Chico (Montez. Gap) acl
Anton Chico (La Cueva) ac2 Combined ac
N Arnerrcu# Carnian-Early Norian (-225 Ma)
S. Rosa and Garita (Montez.Gap) sr Trujillo Bull-Canyon (Sebaxcan.) tr
Garita Creek (Garita Creek) gc Combined sr-tr Combined sr-gc-tr
Dockum Group, W. Texas dg Bull Canyon (Upper Shale) bc
N.America# Late Noriao-Rhnetian (-210 Ma) Redonda (Sebas.can.) rd 1 Redonda (Tucumcari basin) rdO Tecovas B (reverse), W. Texas Tecovas B (normal), W. Texas N.America reference poles.
(240 Mu) (228 Mu) 1220 Mu) (210 Mu) (200 Mu)
lower Middle Jurassic (175 Ma) ent
P-21 8 13 21 6
7 9 12 16 28 12 15 6
8 2 7 7
12 8 4 4 4
4
In1 K A95 ov.az ON OE Middle Triassic (-235 Ma)
29.7 -128.8 -13.7 -339.0 -46.6 -88.8 -24.0
1YI.-
-88.7 -21.0 -51.8 -23.6 -119.8 -50.3 -40.7 -21.1 -56.5 -24.4
44.2 60.0 270.7
-104.9 -64.9 22.0 204.2 62.4
195.6 IY1.I 2YO. I 31371 486. I
3.2 1.5 2.3
4 1 4.7 2 6 4 0 2.5
3.5
ation, although we note that the declination of the mean direction (dec= 140.3", inc= - 13") is to the east of the expected value (dec = 152", using the Late Permian cratonic refer- ence pole of Van der Voo 1990) and results in a significant declination anomaly (12.2" 8").
The Middle Triassic palaeomagnetic pole at Montezuma Gap (acl) is statistically indistinguishable from a recently published Mid-Triassic pole from flat-lying Anton Chico strata near Clines Corner, about 60 km south of Las Vegas (acO, Table 2, at 43.9"N 120.8"E Steiner & Lucas 1992). Pole acO, however, barely satisfies modern reliability criteria because it was derived from the mean of only 22 samples, all of normal polarity. Pole acl falls east of pole ac2 obtained from gently dipping strata at La Cueva (45.8"N 111.8"E). The difference between ac2 and acl declinations is 2.8" (k7.8"). Pole acl also falls east of the mean Middle-Early Triassic cratonic reference pole (46.7"N 113.8"E) calculated combining pole acO with five older poles obtained from the Lower Triassic Chugwater Formation and related strata in Wyoming cited in Van der Voo (1990). The observed acl declination is 2.3" (i-8") less
5.8 9.9 4.1 4.5 4.9
8.4 7.0 4. I 5.6 3.9 6.6 5.0 4.1
4.4 6.0 4.2 7.6
3. I 4.0 5.4 1.6 4.2
43 9 120 0 51 8 (50 2) 1233 4 5 8 120.2 48.0
46 - 59.5 53.1 (52.1) 137.5 54.9 (53 2) 70.7 54.0 84.9 54.4 (53.0) 81.4 54.3
56 4 57.4 50.9
156.6 58.3 (58.5) 61.4 59.3 59.0
51.6 53.0 5-.4 59. - 59.2
60.7 (59.3)
120.8 Steiner and Lucas 1992 116.7(121 0) 111.8 113.5 113 8 Molina-Garza et al. 1995
88.8 (95.4) 104.1(1105) 86.7 97.3 (103.8) 92.6 96.3 Molina-Garza et al. 1995 87.8 Bazard and Butler 1991 97. I Molina-Garza et al. 1995
68.9 (76.5) 72.4 77.8 Molina-Garza et al. 1995 53.8 Molina-Garza et al. 1995
Bazard and Butler 1991##
110.1 1 96. Y 2 84.6 3 -0.3 4 60.5 5
96.1 (103.5)
than expected from the cratonic reference pole. The difference is not statistically significant at the 95 per cent level of confidence.
The late Carnian-early Norian pole of steeply dipping strata (sr-tr) includes sites collected in the Santa Rosa ( S ) , Garita Creek (2), Trujillo (8), and Bull Canyon (1) Formations. The mean declination for the (younger) Trujillo and Bull Canyon Formations is about 8" east of the mean of the Santa Rosa and Garita Creek Formations. That is opposite to the general trend of the APWP. It is difficult to assess the significance of this observation, because the means have relatively large uncertainties ( ~ 9 5 > loo). The means are not statistically differ- ent (at the 95 per cent confidence level) and both data sets were combined for the next level of analysis: a comparison between the mean direction of steeply dipping strata (sr-tr) and horizontal strata (gc: Garita Creek locality). This compari- son results in a declination anomaly of lo"(* 6"). Using another cratonic pole (the Dockum Group in west Texas, at 56"N 96"E Molina-Garza, Geissman & Van der Voo 1995), the discrepancy is still large and statistically significant (5.3" k4.2").
0 1996 RAS, GJI 124, 935-953
948 R. S . Molina-Garza et al.
i
50" X
40"
x
x
30"
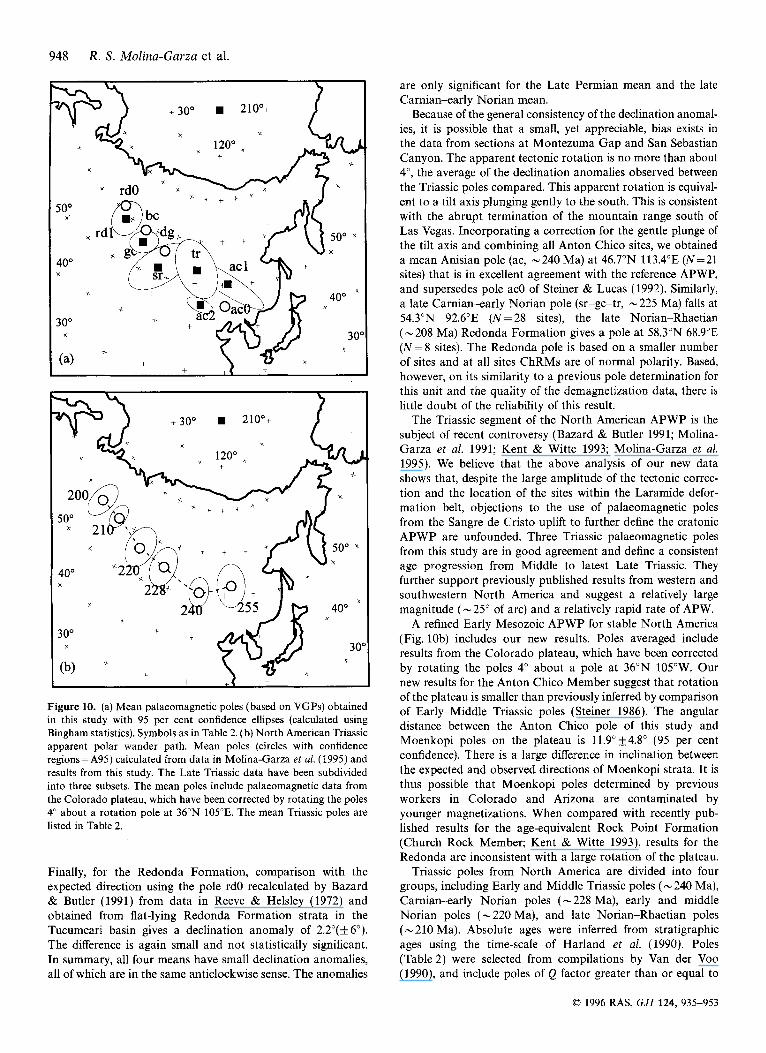
Figure 10. (a) Mean palaeomagnetic poles (based on VGPs) obtained in this study with 95 per cent confidence ellipses (calculated using Bingham statistics). Symbols as in Table 2. (b) North American Triassic apparent polar wander path. Mean poles (circles with confidence regions=A95) calculated from data in Molina-Garza et al. (1995) and results from this study. The Late Triassic data have been subdivided into three subsets. The mean poles include palaeomagnetic data from the Colorado plateau, which have been corrected by rotating the poles 4" about a rotation pole at 36"N 105"E. The mean Triassic poles are listed in Table 2.
Finally, for the Redonda Formation, comparison with the expected direction using the pole rdO recalculated by Bazard & Butler (1991) from data in Reeve & Helsley (1972) and obtained from flat-lying Redonda Formation strata in the Tucumcari basin gives a declination anomaly of 2.2"(+ 6"). The difference is again small and not statistically significant. In summary, all four means have small declination anomalies, all of which are in the same anticlockwise sense. The anomalies
are only significant for the Late Permian mean and the late Carnian-early Norian mean.
Because of the general consistency of the declination anomal- ies, it is possible that a small, yet appreciable, bias exists in the data from sections at Montezuma Gap and San Sebastian Canyon. The apparent tectonic rotation is no more than about 4", the average of the declination anomalies observed between the Triassic poles compared. This apparent rotation is equival- ent to a tilt axis plunging gently to the south. This is consistent with the abrupt termination of the mountain range south of Las Vegas. Incorporating a correction for the gentle plunge of the tilt axis and combining all Anton Chico sites, we obtained a mean Anisian pole (ac, - 240 Ma) at 46.7"N 113.4"E (N = 21 sites) that is in excellent agreement with the reference APWP, and supersedes pole acO of Steiner & Lucas (1992). Similarly, a late Carnian-early Norian pole (sr-gc-tr, -225 Ma) falls at 54.3"N 92.6"E (N = 28 sites), the late Norian-Rhaetian (- 208 Ma) Redonda Formation gives a pole at 58.3"N 68.9"E (N = 8 sites). The Redonda pole is based on a smaller number of sites and at all sites ChRMs are of normal polarity. Based, however, on its similarity to a previous pole determination for this unit and the quality of the demagnetization data, there is little doubt of the reliability of this result.
The Triassic segment of the North American APWP is the subject of recent controversy (Bazard & Butler 1991; Molina- Garza et al. 1991; Kent & Witte 1993; Molina-Garza et al. 1995). We believe that the above analysis of our new data shows that, despite the large amplitude of the tectonic correc- tion and the location of the sites within the Laramide defor- mation belt, objections to the use of palaeomagnetic poles from the Sangre de Cristo uplift to further define the cratonic APWP are unfounded. Three Triassic palaeomagnetic poles from this study are in good agreement and define a consistent age progression from Middle to latest Late Triassic. They further support previously published results from western and southwestern North America and suggest a relatively large magnitude ( -25" of arc) and a relatively rapid rate of APW.
A refined Early Mesozoic APWP for stable North America (Fig. lob) includes our new results. Poles averaged include results from the Colorado plateau, which have been corrected by rotating the poles 4" about a pole at 36"N 105"W. Our new results for the Anton Chico Member suggest that rotation of the plateau is smaller than previously inferred by comparison of Early-Middle Triassic poles (Steiner 1986). The angular distance between the Anton Chico pole of this study and Moenkopi poles on the plateau is 11.9OIfI4.8" (95 per cent confidence). There is a large difference in inclination between the expected and observed directions of Moenkopi strata. It is thus possible that Moenkopi poles determined by previous workers in Colorado and Arizona are contaminated by younger magnetizations. When compared with recently pub- lished results for the age-equivalent Rock Point Formation (Church Rock Member; Kent & Witte 1993), results for the Redonda are inconsistent with a large rotation of the plateau.
Triassic poles from North America are divided into four groups, including Early and Middle Triassic poles ( - 240 Ma), Carnian-early Norian poles (-228 Ma), early and middle Norian poles ( - 220 Ma), and late Norian-Rhaetian poles (-210 Ma). Absolute ages were inferred from stratigraphic ages using the time-scale of Harland et al. (1990). Poles (Table 2) were selected from compilations by Van der Voo (1990), and include poles of Q factor greater than or equal to
0 1996 RAS, GJI 124, 935-953
Palaeonzagnetism and magnetostratigraphy 949
four. We excluded poles superseded by more recent investi- gations, such as the Church Rock pole of Reeve (1975) and the Newark pole of McIntosh, Hargraves & West (1985). The location of the Early Jurassic cusp (-200 Ma) at about 60"N 60"E is from Molina-Garza et al. (1995). The Hettangian pole for the Newark extrusive zone and the poles published by Van Fossen, Flynn & Forsythe (1986) were excluded because of questions raised by Molina-Garza et al. (1995) and Kodama et al. (1994a) regarding their reliability; in particular, structural complications associated with their proximity to the border fault of the Newark basin and the observation of a thermal overprint of presumed Hettangian age in the Culpeper basin by Kodama et al. (1994b), which is significantly displaced from the Hettangian pole of Witte & Kent (1990).
A preliminary palaeopole derived from one site in the Middle Jurassic Entrada Formation (Callovian?, - 175 Ma) and sec- ondary magnetizations in the Redonda Formation falls at 59.2"N 103.5"E (Fig. lob). Based on demagnetization behav- iour, the intermediate unblocking temperature magnetization isolated in the Redonda Formation is not a composite mag- netization resulting from simultaneous removal of the present- day field and a Late Triassic field (such a composite would result in a shallow to intermediate positive inclination vector). Because we report four VGPs, we can only offer a tentative interpretation that magnetizations in the Entrada Formation
are near primary, and low-temperature secondary magnetiza- tions in the uppermost beds of the Redonda were acquired during remanence acquisition in the overlying Entrada beds, possibly by remobilization of fine-grained haematite due to weathering.
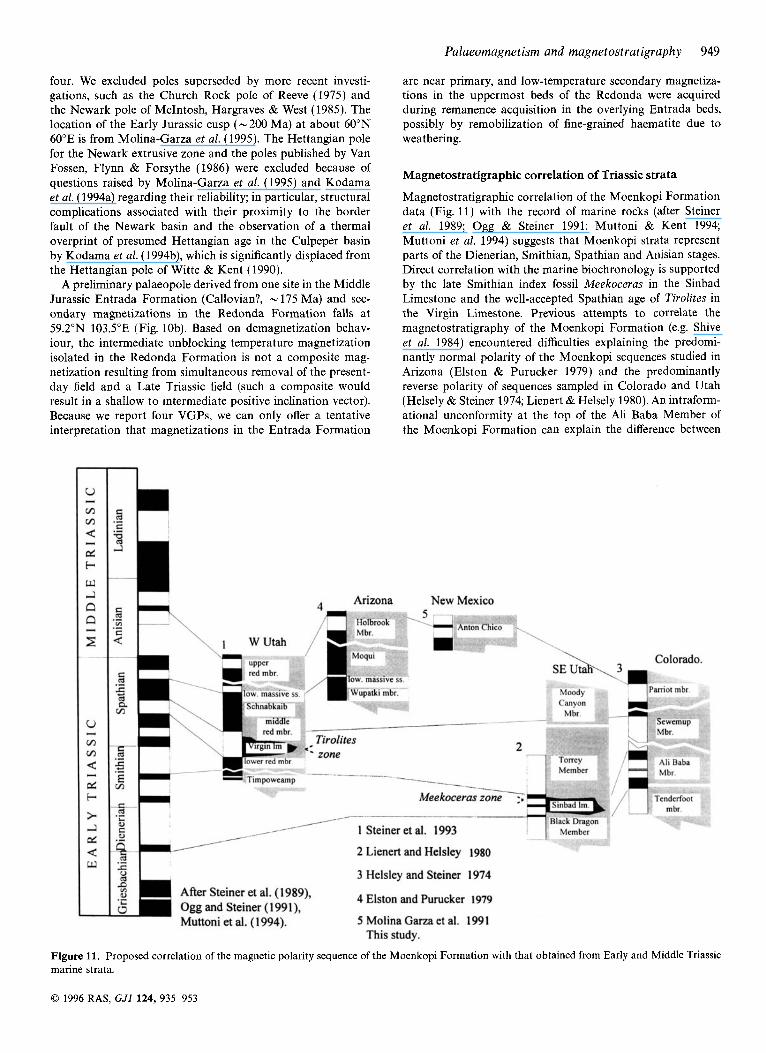
Magnetostratigraphic correlation of Triassic strata
Magnetostratigraphic correlation of the Moenkopi Formation data (Fig. 11) with the record of marine rocks (after Steiner et al. 1989; Ogg & Steiner 1991; Muttoni & Kent 1994; Muttoni et al. 1994) suggests that Moenkopi strata represent parts of the Dienerian, Smithian, Spathian and Anisian stages. Direct correlation with the marine biochronology is supported by the late Smithian index fossil Meekoceras in the Sinbad Limestone and the well-accepted Spathian age of Tirolites in the Virgin Limestone. Previous attempts to correlate the magnetostratigraphy of the Moenkopi Formation (e.g. Shive et al. 1984) encountered difficulties explaining the predomi- nantly normal polarity of the Moenkopi sequences studied in Arizona (Elston & Purucker 1979) and the predominantly reverse polarity of sequences sampled in Colorado and Utah (Helsely & Steiner 1974; Lienert & Helsely 1980). An intraform- ational unconformity at the top of the Ali Baba Member of the Moenkopi Formation can explain the difference between
New Mexico
3 Helsley and Steiner I974
4 Elston and Purucker 1979
5 Molina Garza et al. 1991
After Steiner et al. (1989), Ogg and Steiner (1 99 1 ), Muttoni et al. (1 994).
.C
This study.
Figure 11. Proposed correlation of the magnetic polarity sequence of the Moenkopi Formation with that obtained from Early and Middle Triassic marine strata.
0 1996 RAS, GJI 124, 935-953
950 R. S . Molina-Garza et al.
the sections studied in Colorado and Arizona (Fig. 11). Our correlation suggests that the Sewemup Member in Colorado is correlative with the Virgin Limestone and the middle Red Member in western Utah and that the Wupatki Member in Arizona is younger than the Sewemup Member. This corre- lation is supported by new lithostratigraphic data (Lucas 1995) that indicate the Sinbad Limestone intertongues eastwards with the Ali Baba Member in the Canyonlands area, eastern Utah (Lucas 1995), not with the Sewemup Member as pre- viously stated (Shoemaker & Newman 1959). A second un- conformity separates Holbrook Member strata from the underlying Moqui Member. Litho- and biostratigraphic corre- lation of the Anton Chico and Holbrook Members is well established (Morales 1987; Lucas & Morales 1985). Correlation of Holbrook strata with the Parriot Member in Colorado and the upper Red Member in western Utah is less certain. i; E
- m
0 r-- z
I WI I
R--
Kent m et a1 ( 1995)
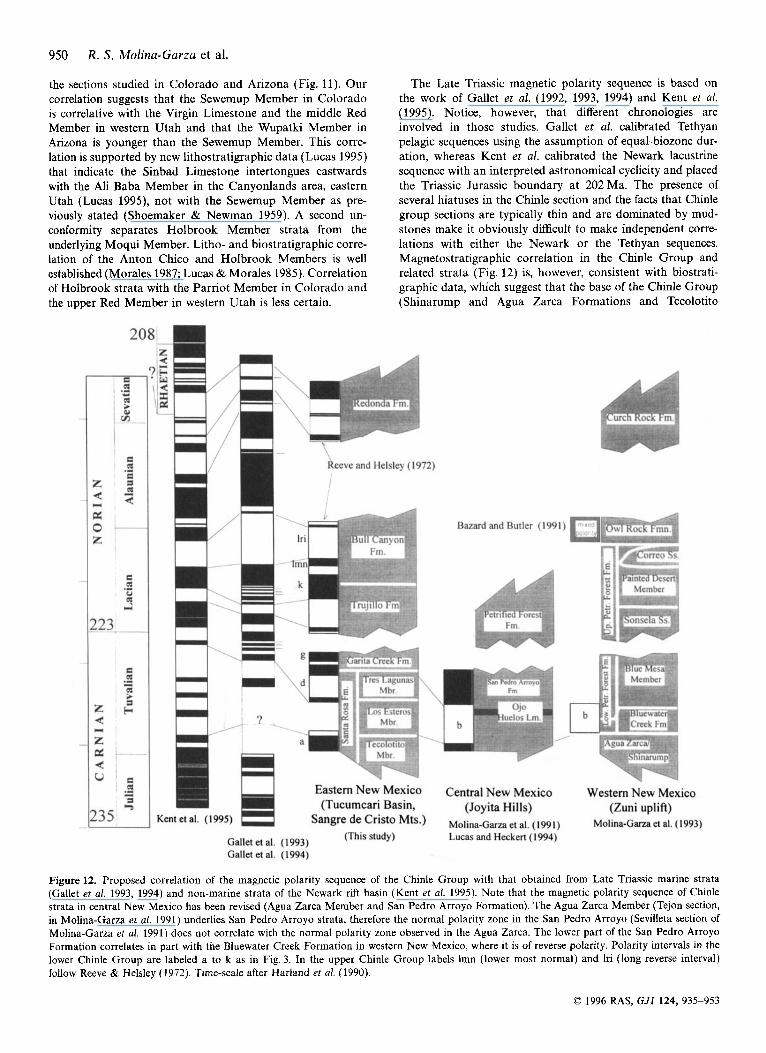
The Late Triassic magnetic polarity sequence is based on the work of Gallet et al. (1992, 1993, 1994) and Kent et al. ( 1995). Notice, however, that different chronologies are involved in those studies. Gallet et al. calibrated Tethyan pelagic sequences using the assumption of equal-biozone dur- ation, whereas Kent et al. calibrated the Newark lacustrine sequence with an interpreted astronomical cyclicity and placed the Triassic-Jurassic boundary at 202 Ma. The presence of several hiatuses in the Chinle section and the facts that Chinle group sections are typically thin and are dominated by mud- stones make it obviously difficult to make independent corre- lations with either the Newark or the Tethyan sequences. Magnetostratigraphic correlation in the Chinle Group and related strata (Fig. 12) is, however, consistent with biostrati- graphic data, which suggest that the base of the Chinle Group (Shinarump and Agua Zarca Formations and Tecolotito
\,eve and Helsley (1972)
1 Bazard and Butler (1991
Eastern New Mexico (Tucumcari Basin,
Sangre de Cristo Mts.)
Central New Mexico (Joyita Hills)
Molina-Garza et al. (1991) (This study) Lucas and Heckert (1994) Gallet et al. (1993)
Gallet et al. (1994)
Western New Mexico (Zuni uplift)
Molina-Garza et al. (1993)
Figure 12. Proposed correlation of the magnetic polarity sequence of the Chinle Group with that obtained from Late Triassic marine strata (Gallet et al. 1993, 1994) and non-marine strata of the Newark rift basin (Kent et al. 1995). Note that the magnetic polarity sequence of Chinle strata in central New Mexico has been revised (Agua Zarca Member and San Pedro Arroyo Formation). The Agua Zarca Member (Tejon section, in Molina-Garza et al. 1991) underlies San Pedro Arroyo strata, therefore the normal polarity zone in the San Pedro Arroyo (Sevilleta section of Molina-Garza et af. 1991) does not correlate with the normal polarity zone observed in the Agua Zarca. The lower part of the San Pedro Arroyo Formation correlates in part with the Bluewater Creek Formation in western New Mexico, where it is of reverse polarity. Polarity intervals in the lower Chinle Group are labeled a to k as in Fig. 3. In the upper Chinle Group labels lmn (lower most normal) and hi (long reverse interval) follow Reeve & Helsley (1972). Time-scale after Harland et al. ( 1990).
0 1996 RAS, GJI 124, 935-953
Palaeomagnetism and magnetostratigraphy 95 1
Member of the Santa Rosa Formation) are lower Tuvalian (lower upper Carnian). The time represented by strata of Otischalkian faunachron (early Tuvalian) is difficult to assess. These strata are generally thin and apparently of predomi- nantly normal polarity. Pelagic sections sampled by Gallet et aI. (1992, 1993, 1994) do not contain early Tuvalian data, and temporal resolution in age-equivalent strata in the Newark basin (Stockton Formation) is relatively poor (Kent et al. 1995). Nonetheless, biostratigraphic data (Huber, Lucas & Hunt 1993) suggest that the lower strata of the Chinle Formation correlate in part with the Stockton Formation of the Newark Supergroup. The lower beds of the Santa Rosa Formation are Paleorhinus bearing strata of the Otischalkian faunachron (Lucas 1993; Lucas & Hunt 1993). Puleorhinus occurs in the lower Tuvalian Opponitzcher Schichten strata of the Austrian Alps (Hunt & Lucas 1991) and the Pekin Formation of the Chatham Group in North Carolina (Huber et al. 1993). In Fig. 12 we suggest that predominantly normal polarity intervals at the base of the Stockton and Chinle sections are correlative, at least in part.
Comparison of the Chinle composite with the Tethyan polarity sequence suggests that very short polarity intervals of duration of about lo4 yr near the Carnian-Norian boundary and in the lower Norian (Lacian 1) are not recorded by Chinle strata (Fig. 12). These short events were also not observed in the Carnian-Norian Newark record (the b + , c- and d + zones of Kent et al. 1995). The reliability of short intervals in the pelagic sequence is questionable because some are defined by a single sample. The Chinle sequence, however, reproduces some of the main features of the Late Triassic marine and non-marine records. We correlate long reversed polarity inter- vals in the Bluewater Creek Formation, Lower San Pedro Arroyo Formation, and Tres Lagunas Member of the Santa Rosa Formation (intervals b and d; Fig. 3) with the dominantly reversed intervals in the Lockatong Formation and the late Tuvalian pelagic record.
The comparison of polarity sequences suggests that most of the middle Norian (the Alaunian of the pelagic sequence, and middle Norian zones f + to h + in the Newark sequence) is not represented by Chinle strata in eastern New Mexico. The presence of a profound hiatus had been previously inferred based on the more advanced characteristics of phytosaurs in the Redonda Formation and more abundant dinosaur fossils. Lucas (1991, 1993) suggested the base of the Redonda Formation is an unconformity (Tr-5 unconformity) of basin- wide extent in the Chinle Group depositional basin. Hunt (1991) first suggested, followed by Lucas (1993) and Lucas & Hunt ( 1993), that vertebrate fossils from the Redonda Formation indicate a possible Rhaetian age.
Our sampling in the Bull Canyon and Redonda Formation is much less detailed than that of Reeve & Helsley (1972). The magnetostratigraphy is consistent with the polarity sequence of Reeve & Helsley (1972). The lowermost beds and the uppermost beds of the Redonda at Luciana Mesa and Redonda Mesa in eastern New Mexico are of normal polarity. The lack of exposure did not allow us to sample a 25 m interval of the Redonda at San Sebastian Canyon. Unfortunately, from the section published by those authors, it is unclear whether or not a complete Bull Canyon (upper shale) sequence was collected. Thus, the normal polarity observed at the top of the Trujillo Formation and in one site in the Bull Canyon Formation in the San Sebastian section (our interval k; Figs 3
and 12) may or may not be the ‘lowermost normal interval’ of Reeve & Helsley (1972, p. 3797). Based on the general thickness of the Bull Canyon Formation we believe that a complete Bull Canyon section was not sampled by those authors and that the lowermost reverse interval of Reeve & Helsley (1972) overlies our interval k. We thus correlate most of the Bull Canyon’s ‘long reverse interval’ with the upper Lacian (Lacian 3, KTB-) reversed interval in the pelagic sequence and the reversed interval containing the Perkaise Member of the Passaic Formation (e -). This is consistent with sequence stratigraphic correlation in western North America, which indicates that the Painted Desert Member of the Petrified Forest Formation (Bull Canyon equivalent) includes the late early Norian Mugnus ammonite zone (Lucas 1991). The proposed correlation of the Redonda Formation with the late Sevatian pelagic sequence (Fig. 12) is rather tenuous. The possible Rhaetian age for the Redonda Formation (Hunt 1991) makes it permissible for these strata to be correlated with a younger part of the sequence, such as the upper k- zone of the Newark basin.
Data presented here are the first attempt to obtain a complete magnetostratigraphy for the Chinle Group; for that reason we regard our proposed correlations as preliminary. The reliability of the record needs to be further examined by testing its reproducibility, and more detailed sampling of mudstone-dominated sequences may improve its resolution. Greater resolution may be obtained by sampling additional sections on the Colorado plateau, which have received relatively little attention.
ACKNOWLEDGMENTS
Most of this research was supported by a post-doctoral fellowship from the Ford Foundation to Molina-Garza. We wish to thank Katerina Petronotis and Gary Acton for their help during sample collection. We also thank D. Kent for a detailed review and for making available to us a pre-print of magnetostratigraphic work of the Newark Supergroup, and G. Muttoni for making available a pre-print of magnetostrati- graphic work of the Middle Triassic. We also thank A. Heckert for his assistance in the field.
REFERENCES
Ash, S.R., 1980. Upper Triassic floral zones of North America, in Biostratigraphy of fossil plants, successional and paleoecological analy- sis, pp. 153-170, eds Dilcher D.L. & Taylor T.N., Dowden, Hutchinson & Ross, Stroudsburg, PA.
Baag, C.G. & Helsley, C.E., 1974. Evidence of penecontemporaneous magnetization of the Moenkopi Formation, J. geophys. Res., 79, 3308-3320.
Bazard, D.R. & Butler, R.F., 1991. Paleomagnetism of the Chinle and Kayenta Formations, New Mexico and Arizona, J . geophys. Res.,
Channell, J.E.T. & McCabe, C., 1994. Comparison of magnetic hyster- esis parameters of unremagnetized and remagnetized limestones, J . geophys. Res.. 99, 4613-4623.
Collinson, D.W., 1974. The role of pigment and specularite in the remanent magnetism of red sandstones, Geophys. J. R. astr. SOC.,
Cornet, B., 1993. Applications and limitations of palynology in age, climatic, and paleoenvironmental analyses of Triassic sequences in North America, in The nonmarine Triassic, pp. 75-93, eds Lucas
96, 9847-9872.
38, 253-264.
0 1996 RAS, GJI 124, 935-953
952 R. S. Molina-Garza et al.
S.G. & Morales M., New Mexico Museum of Natural History and Science Bulletin, 3, 75-93.
Day, R., Fuller, M. & Schmidt, V.A., 1977. Hysteresis properties of titanomagnetites: grain-size and compositional dependence, Phys. Esrth. planet. Int., 13, 260-267.
Ehstrand, E.J. & Butler, R.F., 1989. Paleomagnetism of the Moenave Formation: Implications for the Mesozoic North America apparent polar wander path, Geology, 84, 1653-1655.
Elston, D.P. & Punicker, M.E., 1979. Detrital magnetization in red beds of the Moenkopi Formation (Triassic), Gray Mountain, Arizona, J. geophys. Res., 84, 1653-1665.
Fang, W. & Van der Voo, R., 1988. Paleomagnetism of Middle-Late Triassic plutons in southern Maine, Tectonophysics, 156, 51-88.
Gallet, Y., Besse, J., Krystyn, L., Theveniaut, H. & Marcoux, J., 1993. Magnetostratigraphy of the Kavur Tepe section (southwest Turkey): A magnetic polarity time scale for the Norian, Earth planet. Sci. Lett., 117, 443-456. '
Gallet, Y., Besse, J., Krystyn, L., Theveniaut, H. & Marcoux, J., 1994. Magnetostratigraphy of the Mayerling section (Austria) and Erenkolu Mezarlik (Turkey) section: Improvement of the Carnian (Late Triassic) magnetic polarity time scale, Earth planet. Sci. Lett.,
Gallet, Y., Besse, J., Krystyn, L., Marcoux, J. & Theveniaut, H., 1992. Magnetostratigraphy of the Late Triassic Bolucektasi Tepe section (southwest Turkey): implications for changes in magnetic reversal frequency, Phys. Earth planet. Inter., 73, 85-108.
Grubbs, K.L. & Van der Voo, R., 1976. Structural deformation of the Idah-Wyoming Overthrust Belt (U.S.A.), Tectonophysics, 33, 321-336.
Haag, M. & Heller, F., 1991. Late Permian to Early Triassic magnetos- tratigraphy, Earth planet. Sci. Lett., 107, 42-54.
Harland, W.B., Armstrong, R.L., Cox, A.V., Craig, L.E., Smith, A.G. & Smith, D.F., 1990. A geologic Time Scale, Cambridge University Press, Cambridge.
Heller, F., Lowrie, W., Li, H. & Wang, J., 1988. Magnetostratigraphy of the Permian-Triassic boundary section at Shangsi (Guangyuan, Sichuan Province, China), Earth planet. Sci. Lett., 88, 348-356.
Helsley, C.E., 1969. Magnetic reversal stratigraphy of the Lower Triassic Moenkopi Formation of western Colorado, Geol. SOC. Am.
Helsley, C.E. & Steiner, M.B., 1974. Paleomagnetism of the Lower Triassic Moenkopi Formation, Geol. Soc. Am. Bull., 85, 457-464.
Herrera-Bervero, E. & Helsley, C.E., 1983. Paleomagnetism of a polarity transition in the Lower (?) Triassic Chugwater Formation, Wyoming, J . geophys. Res., 88, 3506-3522.
Huber, P., Lucas, S.G. & Hunt, A.P., 1993. Revised age and correlation of the Upper Triassic Chatham Group (Deep River basin, Newark Supergroup), North Carolina, Southeastern Geology, 33, 171-193.
Hunt, A.P., 1991. Redonda Formation and Rock Point Member of the Chink Formation (southwestern United States): are they Rhaetian (latest Triassic) in age, Geol. SOC. Am. Abstr. with Prog., 23, 35.
Hunt, A.P. & Lucas, S.G., 1991. The Paleorhinus biochron and the correlation of the nonmarine Triassic of Pangea, Paleontology,
Kent, D.V. & Witte, W.K., 1993. Slow apparent polar wander for North America in the Late Triassic and large Colorado plateau rotation, Tectonics, 12, 291-300.
Kent, D.V., Witte, W.K. & Olsen, P.E., 1995. Late Triassic-Earliest Jurassic geomagnetic polarity sequence and paleolatitudes from drill cores in the Newark rift basin, eastern North America, J. Geophys. Res., 100, 14965-14988.
Kirschvink, J.L., 1980. The least squares line and plane and the analysis of paleomagnetic data: examples from Siberia and Morroco, Geophys. J. R. astr. SOC., 62, 699-718.
Kodama, K.P., Cioppa, M.Y., Sherwood, E. & Warnock, A.C., 1994b. Paleomagnetism of baked sedimentary rocks in the Newark and Culpeper basins: Evidence for the J-1 cusp and significant Late
125, 173-191.
Bull., 80, 2431-2450.
34,487-501.
Triassic apparent polar wander from the Mesozoic basins of North America, Tectonics, 13, 917-928.
Kodama, K.P., Hedlund, C., Gosse, J. & Strasser, J., 1994a. Rotated paleomagnetic poles from the Sassamanville Syncline, Newark basin, southeastern Pennsylvania, J. geophys. Res., 99, 4643-4654.
Larrochelle, A. & Currie, K.L., 1967. Paleomagnetic studies of igneous rocks of the Manicouagan structure, Quebec, J . geophys. Res., 72,
Larson, E.E., Walker, T.R., Patterson, P.E., Hoblitt, R.P. & Rosenbaum, J.G., 1982. Paleomagnetism of the Moenkopi Formation, Colorado plateau: basis for long-term model of acqui- sition of chemical remanent magnetism in red beds, J. geophys. Rex, 87, 1081-1106.
Lienert, B.R. & Helsely, C.E., 1980. Magnetostratigraphy of the Moenkopi Formation at Bears Ears, Utah, J. geophys. Res., 85,
Lowrie, W., Napoleone, G., Perch-Nielsen, K., Premoli-Silva, 1. & Toumarkine, K., 1982. Paleogene magnetic stratigraphy in Umbrian pelagic carbonate rocks: The Contessa sections, Gubbio, Geol. SOC. Am. Bull., 93, 414-432.
Lucas, S.G., 1990. Towards a vertebrate biochronology of the Triassic, Albertiana, 8, 36-41.
Lucas, S.G., 1991. Sequence stratigraphic correlation of nonmarine and marine Late Triassic biochronologies, western United States, Albertiana, 9, 11-18.
Lucas, S.G., 1993. The Chink Group: Revised stratigraphy and biochronology of Upper Triassic nonmarine strata in the western United States, in Aspects of Mesozoic geology and paleontology of the Colorado plateau, pp. 27-50, ed. Morales M., Museum of north- ern Arizona Bull., 59.
Lucas, S.G., 1995. The Triassic Sinbad Formation and correlation of the Moenkopi Group, Canyonlands National Park, Utah, in National Park Service Paleontological Research, p. 54-51, eds Santucci, V. & McClelland, L., Natural Resources Publication Office, Denver.
Lucas, S.G. & Hunt, A.P., 1987. Stratigraphy of the Anton Chico and Santa Rosa Formations, Triassic of east-central New Mexico, J . Arizona-Nevada Acad. Sci., 22, 21-33.
Lucas, S.G. & Hunt, A.P., 1989. Revised stratigraphy in the Tucumcari basin, east-central New Mexico, in Dawn of the age of the dinosaurs in the American southwest, pp. 150-170, eds Lucas, S.G. & Hunt, A.P., New Mexico Museum of Natural History.
Lucas, S.G. & Hunt, A.P., 1993. Tetrapod biochronology of the Chink Group (Upper Triassic), western United States, in The nonmarine Triassic, pp. 327-329, eds Lucas, S.G. & Morales, M., New Mexico Museum of Natural History & Sci. Bull., 3.
Lucas, S.G. & Morales, M., 1985. Middle Triassic amphibian, in Santa Rosa-Tucumcari Region, pp. 56-58, eds Lucas, S.G. & Zidek, J., New Mexico Geol. SOC. Guidebook 36, University of New Mexico Press, Albuquerque.
Lucas, S.G., Hunt, A.P. & Huber, P., 1990. Triassic stratigraphy in the Sangre de Cristo Mountains: New Mexico. New Mexico Geol. SOC. Guidebook 41, 305-318.
McFadden, P.L. & McElhinny, 1990. Classification of the reversal test in paleomagnetism, Geophys. J . Int., 103, 725-729.
McIntosh, W.C., Hargraves, R.B. & West, C.L., 1985. Paleomagnetism and oxide mineralogy of Upper Triassic to Lower Jurassic red beds and basalts in the Newark Basin. Geol. SOC. Am. Bull., 96, 463-480.
McMahon, B.E. & Strangway, D.W., 1968. Stratigraphic implications of paleomagnetic data from Upper Paleozoic-Lower Triassic redbeds of Colorado. Geol. SOC. Am. Bull., 79, 417-428.
Molina-Garza, R.S., Geissman, J.W. & Lucas, S.G., 1993. Late Carinian-early Norian magnetostratigraphy from nonmarine strata, Chink Group, New Mexico. Contributions to the Triassic magnetic polarity time scale and the correlation of nonmarine and marine Triassic faunas, in The nonmarine Triassic, pp. 345-352, eds Lucas, S.G. & Morales, M., New Mexico Museum of Natural History & Sci. Bull.. 3.
4163-4169.
1475-1480.
0 1996 RAS, GJI 124, 935-953
Palaeomagnetism and magnetostratigraphy 953
Molina-Garza, R.S., Geissman, J.W. & Van der Voo, R., 1995. Paleomagnetism of the Dockum Group (Upper Triassic), northwest Texas: Further evidence for the J-1 cusp in the North America APWP and implications for Colorado plateau rotation and rate of Triassic APW, Tectonics, 14, 979-993.
Molina-Garza, R.S., Geissman, J.W., Van der Voo, R., Lucas, S.G. & Hayden, S., 1991. Paleomagnetism of the Moenkopi and Chinle Formations in central New Mexico: Implications for the North American apparent polar wander path and Triassic magnetostratig- raphy, J. geophys. Res., 96, 14 239-14 262.
Morales, M., 1987. Terrestrial fauna and flora from the Triassic Moenkopi Formation of the southwestern United States, J. Arizona- Nevada Acad. Sci., 22, 1-19.
Morales, M., 1993. Tetrapod biostratigraphy of the lower-middle Triassic Moenkopi Formation, in The nonmarine Triassic, pp. 355-358, eds Lucas, S.G. & Morales, M., New Mexico Museum of Natural History & Sci. Bull., 3.
Muttoni, G. & Kent, D.V., 1994. Paleomagnetism of latest Anisian (Middle Triassic) sections of the Prezzo Limestone and Buchtenstein Formation, southern Alps, Italy, Earth planet. Sci. Lett., 122, 1-18.
Muttoni, G., Channel, J.E.T., Nicora, A. & Rettori, R., 1994. Magnetostratigraphy and biostratigraphy of an Anisian-Ladinian (Middle Triassic) boundary section from Hydra (Greece), Palaeogeog. Palaeoclimat. Palaeoecol., 11 1, 249-262.
Ogg, J.G. & Steiner, M.B., 1991. Early Triassic magnetic polarity time scale-integration of magnetostratigraphy, ammonite zonation and sequence stratigraphy from stratotype sections (Canadian Artic Archipelago), Earth planet. Sci. Lett., 107, 69-89.
Olsen, P.E., 1986. A 40-million-year lake record of early Mesozoic orbital climatic forcing, Science, 234, 842-848.
Picard, M.D., 1964. Paleomagnetic correlation of units within Chugwater (Triassic) Formation, west-central Wyoming, Bull. Am. Assoc. Petrol. Geol., 48, 269-291.
Purucker, M.D., Elston, D.P. & Shoemaker, E.M., 1980. Early acqui- sition of characteristic magnetization in red beds of the Moenkopi Formation (Triassic), Gray Mountain, Arizona, J. geophys. Res.,
Reeve, S.C., 1985. Paleomagnetic studies of sedimentary rocks of Cambrian and Triassic age, PhD Thesis, University of Texas at Dallas, TX.
Reeve, S.C. & Helsley, C.E., 1972. Magnetic reversal sequence in the upper portion of the Chinle Formation, Montoya, New Mexico. Geol. SOC. Am. Bull., 83, 3795-3812.
Shive, P.N., Steiner, M.B. & Huycke, D.T., 1984. Magnetostratigraphy, paleomagnetism, and remanence acquisition in the Triassic Chugwater Formation of Wyoming, J . geophys. Res., 89, 1801-1815.
Shoemaker, E.M. & Newman, W.L., 1959. Moenkopi Formation (Triassic? and Triassic), in Salt Anticline region, Colorado and Utah, Am. Assoc. Petrol. Geol. Bull., 43, 1835-1851.
85, 997-1012.
Smith, W.A., 1987. Paleomagnetic results from a crosscutting system of northwest and north-south trending diabase dikes in the North Carolina Piedmont, Tectonophysics, 136, 137-150.
Steiner, M.B., 1986. Rotation of the Colorado plateau, Tectonics, 5 , 649-660.
Steiner, M.B. & Lucas, S.G., 1992. A Middle Triassic paleomagnetic pole for North America, Geol. Soc. Am. Bull., 104, 993-998.
Steiner, M.B., Morales, M. & Shoemaker, E.M., 1993. Magnetostratigraphic, biostratigraphic and lithologic correlations in Triassic strata of the western US., in Applications of Paleomagnetism to Sedimentary Geology, Spec. Publ. 49, pp. 41-58, eds Aissaoui, D.M., McNeill, D.F. & Hurley, N.F., SEPM, Tulsa, OK.
Steiner, M.B., Ogg, J.G., Zhang, 2. & Sun, S., 1989. The Late Permian/Early Triassic magnetic polarity time scale and plate motions of South China. J. geophys. Res., 94, 7343-7363.
Stewart, J.H., Poole, F.G. & Wilson, R.F., 1972. Stratigraphy and origin of the Chinle Formation and related Upper Triassic strata in the Colorado plateau region, US Geol. Surv. Prof. Pap., 690.
Symons, D.T.A., Bormann, R.E. & Jans, R.P., 1989. Paleomagnetism of Triassic redbeds of the lower Fundy Group and Mesozoic tectonism of the Nova Scotia platform, Canada, Tectonophysics,
Van der Voo, R., 1990. Phanerozoic paleomagnetic poles from Europe and North America and comparisons with continental reconstruc-
. tions, Rev. Geophys., 28, 167-206. Van der Voo, R. & Grubbs, K.L., 1977. Paleomagnetism of the
Chugwater redbeds revisited (Wyomings, U.S.A.), Tectonophysics,
Van Fossen, M.C., Flynn, J.J. & Forsythe, R.D., 1986. Paleomagnetism of Early Jurassic rocks, Watchung Mountains, Newark Basin: evidence for complex rotation along the border fault, Geophys. Res. Lett., 13, 185-188.
Van Houten, F.B., 1962. Cyclic sedimentation and the origin of analcime-rich Upper Triassic Lockatong Formation, west-central New Jersey and adjacent Pennsylvania, Am. J. Sci., 260, 561-576.
Witte, W.K. & Kent, D.V., 1989. A middle Carnian to early Norian (225Ma) paleopole from sediments of the Newark Basin, Pennsylvania, Geol. SOC. Am. Bull., 101, 1118-1126.
Witte, W.K. & Kent, D.V., 1990. The paleomagnetism of red beds and basalts of the Hettangian extrusive zone, Newark Basin, New Jersey, J. geophys. Res., 95, 17 533-17 545.
Witte, W.K., Kent, D.V. & Olsen, P.E., 1991. Magnetostratigraphy and paleomagnetic poles from Late Triassic-earliest Jurassic strata of the Newark Basin, Geol. SOC. Am. Bull., 103, 1648-1662.
Zijderveld, J.D.A., 1967. A.C. demagnetization of rocks: Analysis of results, in Methods in rock magnetism and paleomagnetism, pp.254-286, eds Collison, D.W., Creer, K.M. & Runcorn, S.K., Elsevier, Amsterdam.
164, 13-24.
44, T27PT33.
0 1996 RAS, GJI 124, 935-953